Summer 2022 Gems & Gemology - GIA
135
VOLUME LVIII Diamonds from Guyana Surface Features of Ekanite from Sri Lanka A Study of Gems from Napoleon III’s Crown A New Source of Amber in Vietnam SUMMER 2022 THE QUARTERLY JOURNAL OF THE GEMOLOGICAL I NSTITUTE OF AMERICA
-
Upload
khangminh22 -
Category
Documents
-
view
2 -
download
0
Transcript of Summer 2022 Gems & Gemology - GIA

VOLUME LVIII
Diamonds from Guyana
Surface Features of Ekanite from Sri Lanka
A Study of Gems from Napoleon III’s Crown
A New Source of Amber in Vietnam
SUMMER 2022
THE QUARTERLY JOURNAL OF THE GEMOLOGICAL INSTITUTE OF AMERICA

EDITORIAL 137 Diamonds from Guyana, Ekanite from Sri Lanka, a New Amber Source in
Vietnam, and More... Duncan Pay
FEATURE ARTICLES 138 A Look at Diamonds and Diamond Mining in Guyana
Roy Bassoo and Kenneth Befus Reports on diamonds from Guyana’s alluvial deposits, including mining history and practices.
156 The Shape of Ekanite Lutz Nasdala, K.A. Geeth Sameera, G.W.A. Rohan Fernando, Manfred Wildner, Chutimun Chanmuang N., Gerlinde Habler, Annalena Erlacher, and Radek Škoda Discusses the unusual surface characteristics of ekanite from secondary deposits in Sri Lanka.
168 A Gemological and Spectroscopic Study with Mobile Instruments of “Emeralds” from the Coronation Crown of Napoleon III Stefanos Karampelas, Eloïse Gaillou, Annabelle Herreweghe, Farida Maouche, Ugo Hennebois, Sophie Leblan, Bérengère Meslin Sainte Beuve, Michel Lechartier, Didier Nectoux, and Aurélien Delaunay An examination of 45 gems from the coronation crown of Napoleon III, using nondestruc-tive mobile spectroscopic and gemological testing methods.
184 Characteristics of Newly Discovered Amber from Phu Quoc, Vietnam Le Ngoc Nang, Pham Trung Hieu, Lam Vinh Phat, Pham Minh Tien, Ho Nguyen Tri Man, and Ha Thuy Hang Offers the first detailed summary of amber from the Vietnamese island of Phu Quoc and a comparison with Baltic, Dominican, and Burmese material.
196 Natural Radioactivity in Select Serpentinite-Related Nephrite Samples: A Comparison with Dolomite-Related Nephrite Dariusz Malczewski, Michał Sachanbiński, and Maria Dziurowicz Uses gamma-ray spectrometry to directly measure internal radioactivity in green nephrite from deposits in Poland, Russia, Canada, and New Zealand.
REGULAR FEATURES 214 Lab Notes
Orange benitoite • Set of blue “rough” stones • Type IIb De Beers Cullinan Blue diamond • Green diamond with unusual radiation stains • 10 ct HPHT-treated CVD-grown diamond • Reported Cassis pearl from Florida • RFID device in South Sea bead cultured pearl necklaces • A star and cat’s-eye color-change sapphire • Bicolor cuprian tourmaline
226 G&G Micro-World Apatite cluster in emerald • Blue apatite in garnet • Large diamond in diamond • Network of etch channels in diamond • Eye pattern in rock • Filler patterns in fracture-filled emerald • Flux synthetic beryl overgrowth • “Boomerang” in topaz • Quarterly Crystal: Cinnabar in fluorite
234 Colored Stones Unearthed A look at inclusions in gemstones and what they mean for gemologists and geoscientists.
244 Gem News International Aquamarine with unusual etch features • Topaz in red beryl • Cat’s-eye omphacite fei cui jade • Three-rayed asterism in quartz • Zircon with strong photochromic effect • Myne London • Glass-and-quartz triplet imitating emerald • Heated ruby: A costly mistake • Yellow sapphires with unstable color • Spring 2022 auction highlights • The Big Find: Fifty years of Maine tourmaline • Brilliance at the Natural History Museum of Los Angeles County • American diamonds at the Smithsonian • The GIA Alumni Collective
Summer 2022 VOLUME 58, No. 2
p. 146
p. 170
p. 184
p. 226
p. 219
p. 266

Customer Service (760) 603-4200 [email protected]
Subscriptions Copies of the current issue may be purchased for $29.95 plus shipping. Subscriptions are $79.99 for one year (4 issues) in the U.S. and $99.99 elsewhere. Cana-dian subscribers should add GST. Discounts are avail-able for renewals, group subscriptions, GIA alumni, and current GIA students. To purchase print subscrip-tions, visit store.gia.edu or contact Customer Service. For institutional rates, contact Customer Service.
Database Coverage Gems & Gemology’s impact factor is 2.045, accord-ing to the 2021 Journal Citation Reports by Clarivate Analytics (issued June 2022). G&G is abstracted in Thomson Reuters products (Current Contents: Phys-ical, Chemical & Earth Sciences and Science Cita-tion Index—Expanded, including the Web of Knowledge) and other databases. For a complete list of sources abstracting G&G, go to gia.edu/gems-gemology, and click on “Publication Information.”
Manuscript Submissions Gems & Gemology, a peer-reviewed journal, welcomes the submission of articles on all aspects of the field. Please see the Author Guidelines at gia.edu/gems-gemology or contact the Managing Editor. Letters on articles published in G&G are also welcome. Please note that Field Reports, Lab Notes, Gem News International, Micro-World, Colored Stones Un-earthed, Diamond Reflections, and Charts are not peer-reviewed sections but do undergo technical and editorial review.
Copyright and Reprint Permission Abstracting is permitted with credit to the source. Libraries are permitted to photocopy beyond the lim-its of U.S. copyright law for private use of patrons. Instructors are permitted to reproduce isolated arti-cles and photographs/images owned by G&G for noncommercial classroom use without fee. Use of photographs/images under copyright by external par-ties is prohibited without the express permission of the photographer or owner of the image, as listed in the credits. For other copying, reprint, or republica-tion permission, please contact the Managing Editor.
Gems & Gemology is published quarterly by the Gemological Institute of America, a nonprofit educa-tional organization for the gem and jewelry industry.
Postmaster: Return undeliverable copies of Gems & Gemology to GIA, The Robert Mouawad Campus, 5345 Armada Drive, Carlsbad, CA 92008.
Our Canadian goods and service registration number is 126142892RT.
Any opinions expressed in signed articles are under-stood to be opinions of the authors and not of the publisher.
Editorial Staff
Production Staff
Editorial Review Board
About the Cover This 95.5 × 64.0 mm figure of a grizzly bear with a freshly caught salmon is carved from Canadian nephrite jade from the Polar Jade mine in northwest British Columbia. The measurement of natural radioactivity concentrations in nephrite from Canada and other major sources is the subject of a feature article from this issue. Photo by Robert Weldon/GIA; courtesy of Jade West Group (Blaine, Washington). Printing is by L+L Printers, Carlsbad, CA.
GIA World Headquarters The Robert Mouawad Campus 5345 Armada Drive Carlsbad, CA 92008 USA © 2022 Gemological Institute of America All rights reserved. ISSN 0016-626X
Creative Director Faizah Bhatti
Production and Multimedia Specialist Michael Creighton
Photo/Video Producer Kevin Schumacher
Photographer Robert Weldon
Multimedia Associate Christopher Bonine
Video Production Albert Salvato
Editor-in-Chief Duncan Pay
Managing Editor Stuart D. Overlin [email protected]
Editor Brooke Goedert
Editorial Coordinator Erica Zaidman
Editors, Lab Notes Thomas M. Moses Shane F. McClure
Editors, Micro-World Nathan Renfro Elise A. Skalwold John I. Koivula
Editors, Gem News Gagan Choudhary Christopher M. Breeding Guanghai Shi
Editors, Colored Stones Unearthed Aaron C. Palke James E. Shigley
Editor, Diamond Reflections Evan M. Smith
Contributing Editors James E. Shigley Raquel Alonso-Perez
Editor-in-Chief Emeritus Alice S. Keller
Technical Editors Tao Z. Hsu Jennifer Stone-Sundberg
Assistant Editor Erin Hogarth
Ahmadjan Abduriyim Tokyo, Japan
Timothy Adams San Diego, California
Edward W. Boehm Chattanooga, Tennessee
James E. Butler Washington, DC
Alan T. Collins London, UK
Sally Eaton-Magaña Carlsbad, California
John L. Emmett Brush Prairie, Washington
Emmanuel Fritsch Nantes, France
Eloïse Gaillou Paris, France
Al Gilbertson Carlsbad, California
Gaston Giuliani Nancy, France
Lee A. Groat Vancouver, Canada
Yunbin Guan Pasadena, California
Peter Heaney University Park, Pennsylvania
Richard W. Hughes Bangkok, Thailand
Jaroslav Hyršl Prague, Czech Republic
Dorrit Jacob Canberra, Australia
A.J.A. (Bram) Janse Perth, Australia
Mary L. Johnson San Diego, California
Stefanos Karampelas Paris, France
Lore Kiefert Lucerne, Switzerland
Simon Lawson Maidenhead, UK
Ren Lu Wuhan, China
Thomas M. Moses New York, New York
Laura Otter Canberra, Australia
Aaron C. Palke Carlsbad, California
Ilene Reinitz Chicago, Illinois
Nathan Renfro Carlsbad, California
Benjamin Rondeau Nantes, France
George R. Rossman Pasadena, California
Sudarat Saeseaw Bangkok, Thailand
Karl Schmetzer Petershausen, Germany
Andy Shen Wuhan, China
Guanghai Shi Beijing, China
James E. Shigley Carlsbad, California
Elisabeth Strack Hamburg, Germany
Nicholas Sturman Bangkok, Thailand
D. Brian Thompson Florence, Alabama
Fanus Viljoen Johannesburg, South Africa
Wuyi Wang New York, New York
Christopher M. Welbourn Reading, UK
Chunhui Zhou New York, New York
J.C. (Hanco) Zwaan Leiden, The Netherlands
gia.edu/gems-gemology
EDITORIAL GEMS & GEMOLOGY SUMMER 2022 137
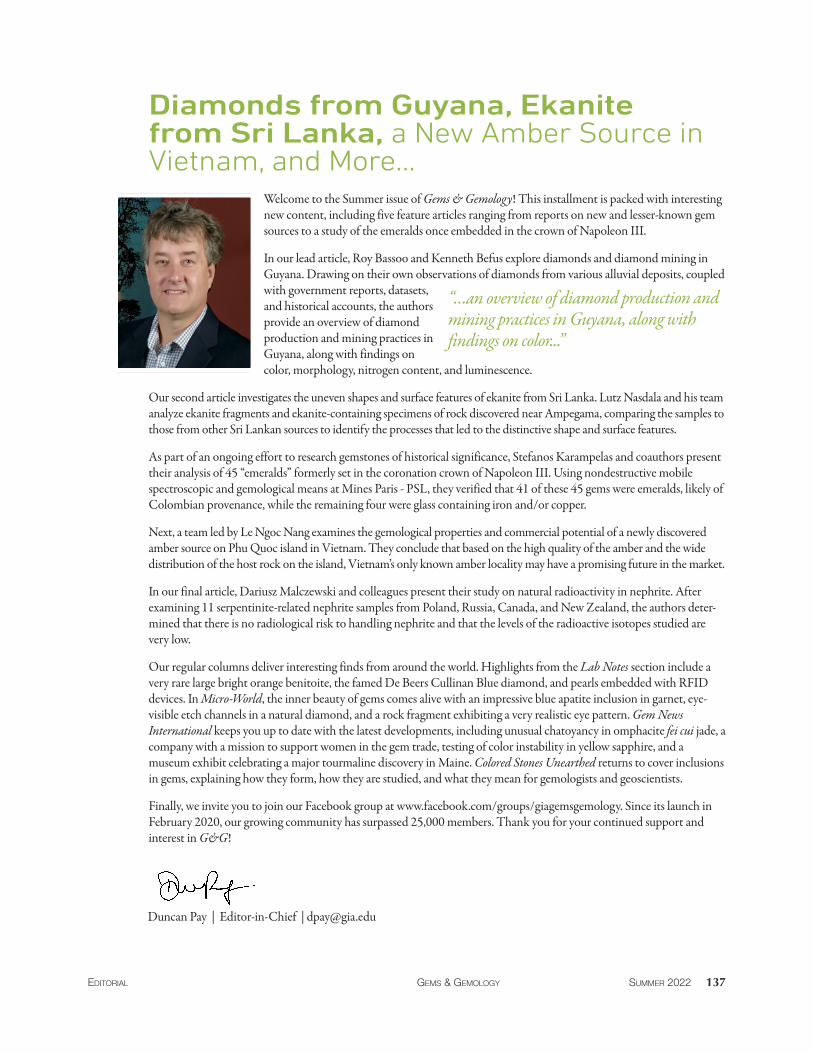
Welcome to the Summer issue of Gems & Gemology! This installment is packed with interesting new content, including five feature articles ranging from reports on new and lesser-known gem sources to a study of the emeralds once embedded in the crown of Napoleon III.
In our lead article, Roy Bassoo and Kenneth Befus explore diamonds and diamond mining in Guyana. Drawing on their own observations of diamonds from various alluvial deposits, coupled with government reports, datasets, and historical accounts, the authors provide an overview of diamond production and mining practices in Guyana, along with findings on color, morphology, nitrogen content, and luminescence.
Our second article investigates the uneven shapes and surface features of ekanite from Sri Lanka. Lutz Nasdala and his team analyze ekanite fragments and ekanite-containing specimens of rock discovered near Ampegama, comparing the samples to those from other Sri Lankan sources to identify the processes that led to the distinctive shape and surface features.
As part of an ongoing effort to research gemstones of historical significance, Stefanos Karampelas and coauthors present their analysis of 45 “emeralds” formerly set in the coronation crown of Napoleon III. Using nondestructive mobile spectroscopic and gemological means at Mines Paris - PSL, they verified that 41 of these 45 gems were emeralds, likely of Colombian provenance, while the remaining four were glass containing iron and/or copper.
Next, a team led by Le Ngoc Nang examines the gemological properties and commercial potential of a newly discovered amber source on Phu Quoc island in Vietnam. They conclude that based on the high quality of the amber and the wide distribution of the host rock on the island, Vietnam’s only known amber locality may have a promising future in the market.
In our final article, Dariusz Malczewski and colleagues present their study on natural radioactivity in nephrite. After examining 11 serpentinite-related nephrite samples from Poland, Russia, Canada, and New Zealand, the authors deter-mined that there is no radiological risk to handling nephrite and that the levels of the radioactive isotopes studied are very low.
Our regular columns deliver interesting finds from around the world. Highlights from the Lab Notes section include a very rare large bright orange benitoite, the famed De Beers Cullinan Blue diamond, and pearls embedded with RFID devices. In Micro-World, the inner beauty of gems comes alive with an impressive blue apatite inclusion in garnet, eye-visible etch channels in a natural diamond, and a rock fragment exhibiting a very realistic eye pattern. Gem News International keeps you up to date with the latest developments, including unusual chatoyancy in omphacite fei cui jade, a company with a mission to support women in the gem trade, testing of color instability in yellow sapphire, and a museum exhibit celebrating a major tourmaline discovery in Maine. Colored Stones Unearthed returns to cover inclusions in gems, explaining how they form, how they are studied, and what they mean for gemologists and geoscientists.
Finally, we invite you to join our Facebook group at www.facebook.com/groups/giagemsgemology. Since its launch in February 2020, our growing community has surpassed 25,000 members. Thank you for your continued support and interest in G&G!
Diamonds from Guyana, Ekanite from Sri Lanka, a New Amber Source in Vietnam, and More...
“…an overview of diamond production and mining practices in Guyana, along with findings on color...”
Duncan Pay | Editor-in-Chief | [email protected]

138 DIAMONDS FROM GUYANA GEMS & GEMOLOGY SUMMER 2022
Situated on the northern edge of South America, Guyana (figure 1) is the continent’s only Eng-lish-speaking nation. Originally, Guyana was
populated by the first nations of Akawaio, Carib, Patamona, Lokono, Macushi, Pemon, Waiwai, Wapishana, and Warao. Dutch, French, and finally English colonialism brought advances in agriculture and technology. Sadly, these advances were also in-tertwined with the violent history of transatlantic slavery and indentured servitude. Laborers from Ghana, Togo, India, China, and Portugal were brought to Guyana, either by force or voluntarily. The colonial economy was based on the cultivation of sugarcane throughout the nineteenth and twenti-eth centuries. Guyana’s legacy of colonialism has been one of violence, racism, and poverty, which peaked during the social upheavals of the 1960s (Spencer, 2007). It has been difficult for Guyana to fully divorce itself from its colonial past. However, Guyana today is a peaceful and diverse mix of cul-tures and ethnic groups from around the world. This little melting pot of different languages, clothing styles, cuisines, traditional dance, and music has
birthed a culture that is distinctly Guyanese (Rodney, 1981; Ishmael, 2013; https://guyanatourism.com).
Guyana’s population is concentrated near the coastal deltas. Most of the population is engaged in agriculture, as the tropical climate, flat terrains, and fertile soils support sugarcane and rice cultivation. The scenery becomes increasingly pristine as one moves inland. Cultivated plains and infrastructure give way to tropical rainforests and rolling hills car-
peted by the Amazon jungle. The country’s western boundary is dominated by the towering, flat-topped tepuis of the Roraima Mountains (figure 2). It is within the mountainous northwest where most of the diamond deposits are located. The lead author,
A LOOK AT DIAMONDS AND DIAMOND MINING IN GUYANA Roy Bassoo and Kenneth Befus
FEATURE ARTICLES
Diamonds have been mined in Guyana for more than 130 years and are traded in major diamond centers in Belgium, Israel, and the United Arab Emirates. Notwithstanding this long history, the primary source rocks of Guyana’s dia-monds remain a mystery. The diamonds are likely detrital material derived from sedimentary rocks of the Roraima Supergroup, but a primary igneous, kimberlitic source has not been eliminated. Diamond exploration and mining in Guyana remain a mostly artisanal endeavor. In a similar fashion, scientific studies have rarely addressed these di-amonds’ provenance and formation, and very few were aimed at a gemological audience. Here we present a detailed gemological description of Guyana’s diamonds to serve as a comparison with other diamond populations in the Guiana Shield and globally. We use our direct observations of diamonds from various alluvial deposits in Guyana. We combine government reports and datasets as well as historical accounts to provide an overview of diamond production and mining practices in Guyana. Details concerning color, morphology, nitrogen content, and lumines-cence are also included.
In Brief • Guyana has contributed to the global supply of dia-
monds for more than 130 years.
• Guyanese diamonds are prized for their clarity and green colors.
• Morphology and luminescence suggest that recycled paleoplacer diamonds and more recent primary dia-monds coexist in the same deposit.
• Guyana’s alluvial deposits host not only diamonds and gold but also underexploited ruby, sapphire, and topaz.
See end of article for About the Authors and Acknowledgments. GEMS & GEMOLOGY, Vol. 58, No. 2, pp. 138–155, http://dx.doi.org/10.5741/GEMS.58.2.138 © 2022 Gemological Institute of America

a Guyanese native, grew up hearing about jungle diamonds found deep in the mountainous interior, a topic that sparked his imagination and scientific curiosity.
Geologically, the diamond-bearing rocks that occur in the country’s interior are part of the Guiana Shield, which is exposed over ~3,000,000 km2 along
the northern margin of the Amazonian Craton (figure 3). The evolution of the Guiana Shield was domi-nated by episodes of accretionary mountain-building events during Archean to Proterozoic times, evi-denced by outcrops of quartzite, schists, gneisses, greenstone belts, and amphibolites (Tassinari, 1997; Reis et al., 2000; Fraga et al., 2009; Kroonenberg et
DIAMONDS FROM GUYANA GEMS & GEMOLOGY SUMMER 2022 139
Figure 1. Google Earth satellite image of northern South America showing various diamond occurrences in Brazil (BV—Boa Vista, TE—Tepequém), Venezuela (CO—Los Coquitos, GU—Guaniamo), Guyana (EK—Ekereku, JW—Jawalla, KM—Kamarang, KU—Kurupung, KW—Konawaruk, MK—Maikwak, MM—Monkey Mountain), Suriname (NA—Nassau, RO—Rosebel), and French Guiana (DC—Dachine).
VENEZUELA
GUYANA
SURINAME
FRENCHGUIANA
BRAZIL
5˚N
0˚N
Major placer diamond deposits
Primary diamond deposits
Placer diamond occurrences
Cayenne
Georgetown
Paramaribo
Ciudad BolivarCiudad Bolivar
MM
BVTE
GU
COEK
KM JW
MK
KU
KW
DC
NARO
N
250 km50˚W60˚W
SOUTH AMERICA
Figure 2. Left: Roraima Mountain tepuis (elevation ~2000 m) near the source of the Kurupung River in Guyana. Right: Outcrop of Roraima Supergroup rocks. Photos by Kenneth Befus.

al., 2016). In western Guyana, the basement rocks of the Guiana Shield are unconformably overlain by the Roraima Supergroup, which is an interbedded, 2300 m thick sequence of sandstones, conglomer-ates, and ash-fall tuffs with an age of 2.12–1.78 Ga (billions of years), deposited from rocks eroding from earlier greenstone terranes (Priem et al., 1973; Santos et al., 2003). Paleoproterozoic mafic dikes of the Avanavero Suite crosscut the entire Roraima Super-group sequence.
Throughout much of the Phanerozoic (the time since the Cambrian ~541 million years ago), the region has been a stable craton, only modified by erosion and
deposition of sedimentary sequences. The Upper Pro-terozoic was marked by a period of uplift with no ev-idence of sedimentation (Gibbs and Barron, 1993). Since the late Triassic, drainage patterns and deposi-tional systems have evolved in response to faulting and rifting associated with the opening of the Atlantic Ocean. Where cratonic igneous and metamorphic rocks are buried, Guyana’s jungle interior is underlain by a complex network of high alluvial, terrace, alluvial flat, riverbed, buried channel, and plateau deposits (fig-ure 4). These repeated cycles of erosion and deposition have led to complex diamond placer deposits with variable provenances and timing.
140 DIAMONDS FROM GUYANA GEMS & GEMOLOGY SUMMER 2022
Figure 3. Modern simplified geologic map of the Guiana Shield. The Amazonian Craton consists of the Guiana and Guaporé Shield, separated by fluvial cover of the Amazon drainage basin (Gibbs and Barron, 1993; Kroonenberg et al., 2016). Note the current extent of the Roraima Supergroup (red dashed border), from which most diamonds of the Guiana Shield are derived (AM—Amatuk, BV—Boa Vista, CO—Los Coquitos, DC—Dachine, EK—Ekereku, GU—Guaniamo, JW—Jawalla, KM—Kamarang, KU—Kurupung, KW—Konawaruk, MK—Maikwak, MM—Mon-key Mountain, NA—Nassau, RO—Rosebel, TE—Tepequém). Modified from Kroonenberg et al. (2016) and refer-ences therein.
Georgetown
Paramaribo
Ciudad BolivarCiudad BolivarProto Atlantic Ocean
Cayenne
MM
BVTE
GU
CO
EK
KM JW
MK
KU
KW
DC
NARO
AM
GuianaShield
GuaporéShield
WestAfrican Craton
AmazonianCraton
60˚W70˚W
5˚N
0˚N
Platform cover
Shield/craton
Roraima Supergroup sandstones, conglomerates, and ash-fall tuffs (2.12–1.78 Ga)
Paleoproterozoic granitoids and felsic volcanics (1.99–1.95 Ga)
Paleoproterozoic granulites and charnockites (2.08–1.98 Ga)
Paleoproterozoic greenstone belts (2.26–2.09 Ga)
Archean metamorphic rocks (>2.5 Ga)
Phanerozoic sedimentary rocks (<0.5 Ga)
Mesoproterozoic sedimentary rocks (1.3–1.2 Ga)
Mesoproterozoic felsic intrusives (1.59–1.51 Ga)
Paleoproterozoic migmatite gneisses (1.86–1.72 Ga)
Paleoproterozoic granitoids and felsic volcanics (1.89–1.81 Ga)
Paleoproterozoic mafic intrusives (<1.79 Ga)
Placer diamond deposits
Primary diamond deposits
N
250 km

DIAMONDS FROM GUYANA GEMS & GEMOLOGY SUMMER 2022 141
Figure 4. Top: Buried alluvial diamond de-posit underlying a fine-grained aeolian sand deposit, with Guyanese geo technician Nigel Blackman standing for scale. Photo by Roy Bassoo. Bottom: Close-up view of an alluvial deposit. Photo by Uwe Van Dijk.
Alluvial diamond deposit
Aeolian sand deposit
Alluvial diamond deposit

GUYANA’S DIAMOND PRODUCTION According to the Guyana Bureau of Statistics, mining accounted for ~12% of the country’s GDP from 2000
to 2019. Gold is by far the most important mineral resource, accounting for ~82% of all exported ore re-sources by monetary value. Diamonds are third most
142 DIAMONDS FROM GUYANA GEMS & GEMOLOGY SUMMER 2022
Figure 5. Diamond pro-duction (green bars) in Guyana (Kimberley Process Rough Dia-mond Statistics, n.d.) and price of gold (dashed red line) per troy ounce (National Mining Association, n.d.). Also plotted is the historical average pro-duction per year (gray dashed line).
400,000 1600
1200
800
400
2000500,000
300,000
200,000
100,000
01911 1931 1951
68,068 carats
1971 1991 2009
Diamond productionPrice of gold
YEAR
DIAMOND PRODUCTION IN GUYANAC
AR
ATS
PRIC
E PE
R T
RO
Y O
UN
CE
(USD
)Figure 6. Global price per carat value of diamond-producing countries for 2020 (left). Guyana’s historical diamond price per carat and average price per carat indicated by the gray dashed line (top right) and exports versus produc-tion (bottom right) (Kimberley Process Rough Diamond Statistics, n.d.).
$175.11 per carat
$164.49
LesothoNamibia
ChinaBrazil
LiberiaSierra Leone
TanzaniaGuyana
BotswanaCentral African Republic
IndiaAngola
South AfricaCameroon
RussiaCanada
Republic of CongoVenezuelaZimbabwe
GuineaIvory Coast
GhanaAustralia
Dem. Republic of Congo
260
220
180
140
100
200,000
150,000
50,000
0
100,000
1000 200 300 400 500 2008 2010 2012 2014 2016 2018 2020
Production
Export
2020 PRICE PER CARAT (USD) YEAR
CO
UN
TRY
PRIC
E PE
R C
AR
AT
(USD
)C
AR
ATS

important and currently account for 2% of all ex-ported ore materials (second is bauxite at 16%). His-torically, diamond production is intimately tied to gold mining because both tend to be found in the same alluvial deposits. When gold prices are low, miners tend to extract more diamonds, which is one explanation for the cyclical nature of diamond pro-duction in Guyana (figure 5).
Although it is not well publicized, Guyana has contributed to the global supply of diamonds for more than 130 years. Their trade name has been “British diamonds,” hinting at the country’s colonial past (Persaud, 2010). In the twenty-first century, Guyana’s declared diamond production has averaged ~68,000 carats per year (figure 5). In 2004, Guyana recorded its highest production to date of 445,540 carats. From 2008 to 2012, there was a steady decline in production, likely exacerbated by financial chal-lenges associated with the 2008 global financial cri-sis. After 2012, there was a steady increase in diamond production. Production today, however, re-mains relatively low, which can be attributed to ris-ing gold prices (figure 5). With a historical average price per carat of US$175 (figure 6), Guyana’s dia-monds remain fairly profitable when compared to the global average price per carat of US$151 in 2020 (figure 6, left). They fall within the per-carat price range of diamonds from Sierra Leone (US$186) and Botswana (US$148) (figure 6). Declared diamonds are taxed at a 3% royalty and 2% withholding tax (Guyana Geology and Mines Commission, https://ggmc.gov.gy/law/all).
There remains room for expansion and increased production. Marketing is one such possible avenue to growth. From the 1920s to the 1980s, Guyana’s production was limited mostly to rough diamond sales in the UK, Trinidad, and Barbados (Lee, 1981). Since the 1990s, a growing number of Guyanese-owned and operated manufacturing houses have started to polish and set diamonds into beautiful pieces (figure 7).
DIAMOND MINING IN GUYANA Diamond exploration has been driven mostly by Guyanese artisanal miners who prospect along river-banks for unconventional, and locally specific, detri-tal indicator minerals to which they ascribe fanciful names. “Sweetman,” “cantankerer,” “blue jacket,” and “tin” refer to waterworn quartz, ruby, sapphire, and rutile, respectively (figure 8). Other diamond in-dicator minerals include topaz, jasper, zircon, il-
menite, gold, tourmaline, minor garnet, and chromite (figure 8). The Guyana Geology and Mines Commission (GGMC) is the regulatory body that oversees mining, safety, environmental protection, and education in diamond mining and geology. Al-though this resource is available, most miners are not well educated in prospecting or alluvial processes. Instead, they frequently rely on anecdotal evidence and superstition, only prospecting in areas that have produced diamonds in the past. The result is that the discovery and exploitation of new dia-mond deposits is very rare. Regardless, production has continued to provide income for artisanal miners for more than 100 years since the first discovery of diamonds in 1887 on the Potaro River (Lee, 1981).
DIAMONDS FROM GUYANA GEMS & GEMOLOGY SUMMER 2022 143
Figure 7. This brownish yellow diamond from Guyana, a 1.01 ct pear brilliant measuring 7.39 × 5.19 × 3.62 mm, is set beneath a colorless round bril-liant diamond. Photo by Nathan Renfro; courtesy of Michelle Bassoo.

Artisanal mining in Guyana was born in the decades after the abolition of slavery in 1838. Many freed slaves of predominantly West African heritage sought a livelihood away from the sugar plantations and their former slave owners (Josiah, 2011).
Prospecting and hand mining for gold and diamonds in the relatively unexplored and undeveloped inte-rior offered both literal and metaphorical independ-ence. Toward the end of the nineteenth century, these artisanal miners were called “pork knockers”
144 DIAMONDS FROM GUYANA GEMS & GEMOLOGY SUMMER 2022
Figure 8. Top left: Washed alluvial gravel sample in a batel (a gold panning tool made of iron with a riffled inte-rior). Top right: Accessory minerals found with Guyana diamonds, including rounded quartz, jasper, and rutile (field of view 17 cm). Photos by Uwe Van Dijk. Recovered corundum (bottom left) and topaz (bottom right) of var-ious colors. Photos by Roy Bassoo.
Jasper
Diamond Quartz
Rutile

(figure 9). This nickname is likely a creolization of “pork noshers,” a label applied to artisanal miners because of their consumption of salted and cured pork. It is theorized that a predominantly Jewish di-amond merchant class coined this term (J. Krakowsky, pers. comm., 2019). Legendary pork knockers, spinning tales of fist-sized diamonds and hills topped with gold, have stirred the public’s imagination. The stories of Makantali, who wore all white and flung money into the air when arriving at the port of Bartica, and Gold Dawg, who became the first person in his village to own a car (Bascom, 1996), add enchantment to the mining industry in Guyana even today.
Artisanal “pork knocking” today is typically a small-scale, independent or cooperative effort. Oper-ations are conducted on a tribute basis, where an ar-tisanal miner receives a share of the proceeds. These
miners divert water channels using mud and wood dams. Pickaxes and shovels are used to move prospective diamond gravels into manmade ponds screened with 0.2–1.0 cm sieves. Sediment <0.2 cm is discarded into the holding ponds. The artisanal miners also excavate small pits of 6–7 m depth that are shored up using cut timber (Lee, 1981). Larger groups of miners may form collectives and syndi-cates. Alternatively, claim owners contract small teams to prospect alluvial deposits. Individual min-ers are sometimes paid a salary, but diamonds are often used as currency in the jungle for purchasing fuel, services, and food (Persaud, 2010). Complemen-tary activities that support the mining industry in-clude food service, bookkeeping, and cleaning. Larger-scale ventures rely upon heavy equipment and techniques borrowed from the gold industry. Placer deposits are removed by an excavator and formed
DIAMONDS FROM GUYANA GEMS & GEMOLOGY SUMMER 2022 145
Figure 9. Wood carving (left) and historical photograph (right) of an unknown early twentieth-century Afro-Guyanese “pork knocker” at the Guyana National Museum, which shows how little capital investment was re-quired to pursue economic independence. To his left is a small sluice box for filtering gold and diamonds from sediment called a “tom and box” (Lee, 1981). Notice he carries on his head an iron batel of conical shape and rif-fled interior used not only for panning but also to protect the wearer from the sun. He also carries cooking utensils, a cutlass, and a handcrafted wooden pipe for smoking. Worn just below his left knee is a red cotton cloth, believed to protect against rheumatoid arthritis and ensure good fortune. The wariishi secured to his head is handwoven from palm fronds and serves as a supply basket. Photos by Roy Bassoo.

146 DIAMONDS FROM GUYANA GEMS & GEMOLOGY SUMMER 2022
Figure 10. Top: Hy-draulic mining of allu-vial deposits. Photo by Roy Bassoo. Bottom: Ex-amining a sieve “wash” for diamonds. Photo by James Herbison.

into a slurry using hydraulic techniques, and this slurry is then pumped to a sluice box and jig to ex-tract both gold and diamonds (figures 10–12). Heavy minerals, including diamond, are then handpicked from the rest of the washed and sieved minerals and stored for sale (see video at www.gia.edu/gems-gemology/summer-2022-diamonds-from-guyana).
In the early years, a “bush trader” ventured into the field to sell food, liquor, and equipment in ex-change for diamonds. This practice has evolved to be-come more stationary, where a bush trader owns a property near a port town specifically for transactions. Today, miners often carry their own diamond parcels to the capital city of Georgetown, visiting different brokers to gather quotes before confirming a sale. The
economics of the diamond trade in Guyana are influ-enced heavily by market fluctuations, fuel supply, and the rainy season. Heavy rains in May–June and Sep-tember–October significantly limit mining activity. In the offseason, miners seek alternative forms of em-ployment in the construction, security, or food service industries. However, off-season unemployment is widespread (J. Krakowsky, pers. comm., 2019). Miners are often poorly educated on the relative value of in-dividual diamonds in their parcels, tending to rely solely on carat weight as the metric of value. There is a need for educational outreach in this regard, where an improved understanding of how rough diamonds are manufactured into cut diamonds would improve the negotiating position of local miners.
DIAMONDS FROM GUYANA GEMS & GEMOLOGY SUMMER 2022 147
Figure 12. A typical small- to medium-scale diamond mining operation in Guyana using a diamond jig attached to a sluice box. Photo by Roy Bassoo.
Diamond jig
Sluice box Excavated alluvial placer
Figure 11. A campsite of artisanal miners. Photos by Roy Bassoo.

148 DIAMONDS FROM GUYANA GEMS & GEMOLOGY SUMMER 2022
Figure 13. Top left: Guyanese dia monds recovered by artisanal mining. Top right: Gem-quality Guyanese dia-monds. Photos by Kenneth Befus. Bottom: Selected specimens highlighting color and morphology. Photo by Nathan Renfro.
2 mm
8 mm 5 mm

GUYANA’S DIAMONDS Color and Size. Economically viable diamonds in Guyana are small, mostly ranging from 0.1 to 0.4 ct. Diamonds with sizes up to 10 ct have been found but are uncommon. The largest gem-quality stones ever recovered were 56.75 and 42 ct, found in the Ewang region in 1926 and in the Perenong region in 2001, respectively (Persaud, 2010). Polished Guyanese dia-monds are predominantly near-colorless, with ap-proximately 93% of them G–J and 7% K–M, and very rarely in white or near-opaque bodycolors (J. Krakowsky, pers. comm., 2019).
Of special note, many of Guyana’s rough dia-monds (~42%) display green to green-blue skins or green spotting that covers up to ~100% of the surface area (figure 13). While diamonds with a green body-color are rare (figure 14) (Bassoo et al., 2021), they are relatively abundant in Guyana compared to other sources such as Brazil, Ghana, and Zimbabwe (Breed-ing et al., 2018). Guyana has a relatively higher abun-dance of green diamonds because the placer diamonds may have resided within the sedimentary environ-ment for up to two billion years (Bassoo et al., 2021). Diamonds thus may accumulate radioactive damage over hundreds of millions of years. Alpha, beta, and gamma radiation from nearby radioactive minerals such as zircon, monazite, and potassium feldspar cre-ated vacancy and interstitial defects in the diamonds. Photoluminescence spectroscopy reveals these va-cancy defects to have a zero phonon line (ZPL) at 741 nm and are classed as the GR1 or neutral vacancy (V0) defect. Vacancy defects absorb in the red portion of the visible spectrum and, in the presence of nitrogen
defects, reflect/trans mit green wavelengths. Further-more, the type of radiation influences the intensity and depth of green color penetration in the diamond, with gamma radiation creating the deepest penetra-tion of green color and alpha radiation the least (Breeding et al., 2018; Eaton-Magaña et al., 2018).
Morphology and Surface Textures. Guyana’s dia-monds range in crystal shape from octahedral to do-decahedral and occasionally display flattened cuboid forms. Twinned diamonds and aggregates are rare. Fine stepped, lamellar trigonal faces are common, whereas flat faces and sharp edges are not. Resorption textures such as terraces, teardrop hillocks, and dis-solution pits are found in 95% of the diamonds (figure 15). Flat-bottom dissolution pits including trigons ac-count for ~69% of all dissolution pits and frequently penetrate into the {111} crystal faces (Bassoo et al., 2021). Most of the octahedral diamonds have resorbed edges and can be fully resorbed to dodecahedrons. Late-stage etching features such as corrosion sculp-tures, shallow depressions, ruts, and glossy surfaces are observed in two-thirds of the diamonds.
Edge abrasion, found in 44% of the abraded dia-monds, is the most commonly observed surface tex-ture (figure 15). Most Guyanese diamonds have some degree of surface abrasion from minor scratches and edge abrasion. Some have no apparent surface abrasion, however. This distinction subdi-vides Guyana’s diamonds into 85% abraded and 15% non-abraded (Bassoo et al., 2021). Abraded dia-monds may reflect an older population with a long history of repeated transport within streams and
DIAMONDS FROM GUYANA GEMS & GEMOLOGY SUMMER 2022 149
Figure 14. Left and center: Two greenish blue Guyanese diamonds (~0.27 and ~0.10 ct) from the GIA collection, donated by Roger Krakowsky. Photos by Roy Bassoo. Right: A larger diamond with a green skin (~6 ct). Photo by James Krakowsky.

rivers. Non-abraded diamonds may reflect a shorter distance and/or time of transport. Alternatively, the 15% non-abraded population may be derived from undiscovered kimberlites or lamproites (Bassoo et al., 2021). Abraded and non-abraded diamonds also display differences in luminescence.
Luminescence. Guyana’s diamonds display lumines-cence colors of blue, green, orange, yellow, red, and turquoise (figure 16) (Bassoo et al., 2021). Of 472 dia-monds, the abraded diamonds dominantly show green to turquoise (~60%) and some blue (~20%) cathodoluminescence responses. Non-abraded dia-
150 DIAMONDS FROM GUYANA GEMS & GEMOLOGY SUMMER 2022
Figure 16. Luminescence responses of Guyana’s diamonds. UV luminescence (280–315 nm) response colors (top) and cathodoluminescence response colors (bottom). Photos by Roy Bassoo.
Figure 15. Examples of Guyanese diamond surface morphology. Photos by Roy Bassoo.
100 μm 200 μm 200 μm 200 μm 200 μm 200 μm
200 μm 500 μm 200 μm 200 μm
Trigons
Non-abraded Abraded Edge abrasion Percussive marks
Hexagons Tetragons Trapezoids Hillocks Rut
UV luminescence colors
Cathodoluminescence colors
Yellow Green Orange Red
YellowBlue Green Orange Red Turquoise

monds cathodoluminesce predominantly blue (~60%) and moderate green to turquoise (~25%). Ul-traviolet (UV) luminescence (280–315 nm) also yields a distinction between abraded and non-abraded sam-ples. Abraded diamonds luminesce green (~85%) pre-dominantly with very minor orange, red, and yellow (~8%). In contrast, ~50% of the non-abraded dia-monds show green UV luminescence, and a larger proportion (~45%) exhibit none at all.
Cathodoluminescence spectroscopy reveals de-fect changes preserved within diamonds that have resided within metasedimentary rocks for billions of years. Cathodoluminescence spectroscopy is a technique that can be used to infer primary or sec-ondary diamond sources. Most kimberlite-derived diamonds have a blue luminescence response (Bu-lanova, 1995; Lindblom et al., 2005). Blue lumines-cence is often related to the N3 defect (ZPL ~503 nm), which consists of three nitrogen atoms sur-rounding a vacancy (Clark et al., 1992; Shigley and Breeding, 2013). Metamorphosed paleoplacers, such as those in Guyana, tend to preserve a smaller pop-ulation of blue luminescent diamonds compared to green and other luminescence response colors (Bruce et al., 2011; Kopylova et al., 2011). Green lumines-cence could be related to the H3 to H4 defect, con-sisting of more complex arrangements of four nitrogen atoms surrounding two vacancies (H3) or two nitrogen atoms separated by a vacancy (H4) (Shigley and Breeding, 2013). A change from blue lu-
minescence to green or other colors corresponding with a shift in ZPL from ~503 nm to higher wavenumbers has been observed in diamonds from unmetamorphosed and metamorphosed rocks, re-spectively (Iakoubovskii and Adriaenssens, 1999; Collins et al., 2005; Bruce et al., 2011). The Roraima Supergroup, from which Guyana’s abraded dia-monds are likely derived, has been metamorphosed to zeolite and greenschist facies (Beyer et al., 2015). This observation may explain the relative propor-tion of blue to green luminescence response colors of Guyanese diamonds.
Composition and Inclusions. The carbon isotope composition (δ13C) of Guyanese diamonds ranges from –2.8 to –16.1‰, similar to that of Brazilian dia -monds (Tappert et al., 2006). The carbon isotopic composition of Guyana’s diamonds indicates they formed from upper mantle rocks (Bassoo et al., 2021). Nitrogen contents can be as high as ~2000 ppm, with >50% being type IaAB (figure 17). A small percentage (~9%) are type IaB, having more nitrogen platelets. Type IIa and IaA diamonds are of similar abundances, within 6% of each other. No type IIb or Ib diamonds have been reported. The ni-trogen type and concentration were used to derive a residence temperature of ~1120°C, indicating that Guyanese diamonds are lithospheric (Bassoo et al., 2021). Inclusion composition also indicates an upper mantle origin.
DIAMONDS FROM GUYANA GEMS & GEMOLOGY SUMMER 2022 151
Figure 17. Distribution of nitrogen type in Guyanese diamonds (Bassoo et al., 2021).
52.7%
16.8%
8.7%
21.9%
Type IaAType IaABType IaBType IIa
NITROGEN AGGREGATION TYPE

Inclusions occur in ~15% of the diamonds and have been identified by comparing their Raman spec-tra with those in the RRUFF spectra database (La-fuente et al., 2016; Bassoo et al., 2021). Most of the inclusions in Guyanese diamonds consist of forsterite, enstatite, and chromite, indicating the di-amonds formed from peridotitic upper mantle rocks. There are some diamonds that contain rutile, coesite, and clinopyroxene, and these are interpreted to have formed from eclogitic upper mantle rocks (Bassoo et al., 2021). Raman thermobarometry of entrapped olivine and Cr-pyrope inclusions indicates internal pressures of ∼6.2 GPa, again lending evidence to their formation in the upper mantle (Bassoo and Befus, 2021). Guyana’s diamonds are typical of peridotitic to eclogitic cratonic diamonds.
COMPARISONS TO OTHER DIAMONDS FROM NORTHERN SOUTH AMERICA Guyana’s diamonds are part of a larger story about the evolution of cratons and residence within sedimentary systems. Their morphological and geochemical fea-tures compare and distinguish them from other dia-monds of the Guiana Shield in northern South America (figure 18). Important deposits occur in Brazil, Venezuela, Suriname, and French Guiana.
Alluvial diamonds are mined in Brazil and Suri-name. In the Guiana Shield portion of northern Brazil, diamonds are recovered from alluvial terraces shed from conglomerates of the Tepequém Forma-tion (Santos et al., 2003; Reis et al., 2017). The dia-monds are generally 2–3 mm in size and occur in a flattened octahedral to dodecahedral form. They are colorless to gray, oftentimes resorbed, and contain peridotitic-type inclusions such as forsterite (Araújo et al., 2011). The Tepequém Formation represents a regional high-energy, depositional basin that was a diamond sink, synchronous with emplacement by several episodes of kimberlite volcanism within the Guiana Shield during the middle Paleoproterozoic (>2.0 Ga) (Santos et al., 2003; Schulze et al., 2006). In Suriname, alluvial diamonds are thought to be de-rived from rocks of the Rosebel Formation (Naipal et al., 2020). These are colorless to brown to slightly green, and green skins are common (figure 18, top). Resorption textures including trigons and frosting are common, and inclusions such as forsterite and ensta-tite are peridotitic. French Guiana is also home to primary diamond-bearing igneous sources, but these are metamorphosed ultramafic and pyroclastic shoshonites or lamprophyres found in the Dachine
region. These diamonds are very small (~1 mm), gray-ish yellow to brown, irregular to cuboid (figure 18, middle), and mostly contain sulfide inclusions (Car-tigny, 2010; Smith et al., 2016).
Alluvial diamond data from Venezuela is difficult to assess because illegal mining and smuggling are prevalent (e.g., Blore, 2006). Also, most alluvial de-posits are located in inaccessible parts of the Amazon jungle near the Brazil and Guyana borders, where iso-lated Amerindian tribes such as the Yanomami are leery of outsiders (Heylmun, 2001). Further west in Venezuela is the Guaniamo area, where there exists a unique deposit of primary diamond-bearing kim-berlite dikes (Capdevila et al., 1999; Channer et al., 2001; Kaminsky et al., 2000, 2004; Smith et al., 2016). Guaniamo diamonds are small, ranging from 1 to 2 mm, and colorless to gray with common green skins, frequently occurring in resorbed dodecahe-drons and octahedrons (figure 18, bottom). Diamonds from Guaniamo contain inclusions of the predomi-nantly eclogitic variety, including almandine garnet, clinopyroxene, rutile, ilmenite, pyrrhotite, and co-esite (Taylor, 1999; Kaminsky et al., 2000).
CONCLUSIONS Guyana’s diamonds are found in gravels along the eastern edge of the Roraima Supergroup. Most origi-nate as paleoplacers from as yet unknown rocks of the Roraima Supergroup. Similar alluvial diamonds are found in nearby Venezuela, Brazil, and Suriname, suggesting the Roraima is a common source. Indeed, these paleoplacers represent a regional diamond ter-rane with a lateral extent of at least 450,000 km2. Di-amonds from Guyana are of scientific interest because they are survivors of >2 Ga of weathering and erosion. As such, they are >2 billion-year-old xenocrysts from the mantle, brought to the surface by some of the earth’s oldest kimberlite or lamproite eruptions. They are an important source of informa-tion on the cratonic root of northern South America during the Paleoproterozoic (Schulze et al., 2006; Bas-soo and Befus, 2021).
There is opportunity for expanded economic use of Guyana’s diamonds. Although small, they are val-ued for their lack of color and their clarity, especially as melee stones. Artisanal mining practices result in a relatively low price point, and they are not subject to prohibitive taxation. With continued exploration efforts, new paleoplacer deposits are sure to be dis-covered. The discovery of a primary kimberlite de-posit should not be expected, but abrasion and
152 DIAMONDS FROM GUYANA GEMS & GEMOLOGY SUMMER 2022

DIAMONDS FROM GUYANA GEMS & GEMOLOGY SUMMER 2022 153
Figure 18. Top: Diamonds (0.10–2.12 ct) from Suriname; from Naipal et al. (2020). Middle: French Guiana dia-monds; from Cartigny (2010). Bottom: Alluvial diamonds from Guaniamo, Venezuela. Photo by Maha Tannous; courtesy of Ric Taylor.
2 mm
1 mm
4 mm

luminescence information could indicate that some stones have experienced little transport and thermal alteration. We also recognize an opportunity for the exploration and improved recovery of other gem-stones. Ruby, sapphire, and topaz are considered in-dicator minerals for gold and diamonds. There is no
common knowledge regarding their quality or sources. Tourmaline is also present but has only been documented as schorl. Such diverse gem and mineral wealth bodes well for future discoveries in this Eng-lish-speaking nation with an established gemstone mining and trade network.
154 DIAMONDS FROM GUYANA GEMS & GEMOLOGY SUMMER 2022
Araújo D.P., Santos R.V., Souza V., Chemale F., Dantas E. (2011) Diamantes Serra do Tepequém: Resultados preliminares. 12th Simpósio da Amazônia, October 2–5, 2011, Boa Vista, Roraima, Brazil.
Bascom H. (1996) Makantali. Carifesta XI, Georgetown, Guyana. Bassoo R., Befus K. (2021) Composition of the sub-cratonic mantle
of the Guiana Shield inferred from diamond-hosted inclusions. Geochemistry, Geophysics, Geosystems, Vol. 22, No. 6, http://dx.doi.org/10.1029/2021GC009841
Bassoo R., Befus K., Liang P., Forman S., Sharman G. (2021) Deci-phering the enigmatic origin of Guyana’s diamonds. American Mineralogist, Vol. 106, No. 1, pp. 54–68, http://dx.doi.org/10.2138/am-2020-7486
Beyer S.R., Hiatt E.E., Kyser K., Drever G.L., Marlatt J. (2015) Stratigraphy, diagenesis and geological evolution of the Paleo-proterozoic Roraima Basin, Guyana: Links to tectonic events on the Amazon Craton and assessment for uranium mineral-ization potential. Precambrian Research, Vol. 267, pp. 227–249, http://dx.doi.org/10.1016/j.precamres.2015.06.017
Blore S.G., Ed. (2006) The lost world: Diamond mining and smug-gling in Venezuela. Partnership Africa Canada, Ottawa, Oc-casional Paper, Vol. 16, 20 pp.
Breeding C.M., Eaton-Magaña S., Shigley J.E. (2018) Natural-color green diamonds: A beautiful conundrum. G&G, Vol. 54, No. 1, pp. 2–27, http://dx.doi.org/10.5741/GEMS.54.1.2
Bruce L.F., Kopylova M.G., Longo M., Ryder J., Dobrzhinetskaya L.F. (2011) Luminescence of diamonds from metamorphic rocks. American Mineralogist, Vol. 96, No. 1, pp. 14–22, http://dx.doi.org/10.2138/am.2011.3467
Bulanova G.P. (1995) The formation of diamond. Journal of Geo-chemical Exploration, Vol. 53, No. 1-3, pp. 1–23, http://dx.doi.org/10.1016/0375-6742(94)00016-5
Capdevila R., Arndt N., Letendre J., Sauvage J.F. (1999) Diamonds in volcaniclastic komatiite from French Guiana. Nature, Vol. 399, No. 6735, pp. 456–458, http://dx.doi.org/10.1038/20911
Cartigny P. (2010) Mantle related carbonados? Geochemical in-
sights from diamonds from the Dachine komatiite (French Guiana). Earth and Planetary Science Letters, Vol. 296, No. 3-4, pp. 329–339, http://dx.doi.org/10.1016/j.epsl.2010.05.015
Channer D.M.D., Egorov A., Kaminsky F. (2001) Geology and structure of the Guaniamo diamondiferous kimberlite sheets, south-west Venezuela. Revista Brasileira de Geociências, Vol. 31, No. 4, pp. 615–630, http://dx.doi.org/10.25249/0375-7536.2001314615630
Clark C.D., Collins A.T., Woods G.S. (1992) Absorption and lumi-nescence spectroscopy. In J.E. Field, Ed., The Properties of Nat-ural and Synthetic Diamond. Academic Press, London, pp. 35–69.
Collins A., Connor A., Ly C.-H., Shareef A. (2005) High-tempera-ture annealing of optical centers in type-I diamond. Journal of Applied Physics, Vol. 97, No. 8, article no. 083517, http://dx.doi.org/10.1063/1.1866501
Eaton-Magaña S., Breeding C.M., Shigley J.E. (2018) Natural-color blue, gray, and violet diamonds: Allure of the deep. G&G, Vol. 54, No. 2, pp. 112–131, http://dx.doi.org/10.5741/GEMS.54.2.112
Fraga L.M., Macambira M.J.B., Dall’Agnol R., Costa J.B.S. (2009) 1.94–1.93 Ga charnockitic magmatism from the central part of the Guyana Shield, Roraima, Brazil: Single-zircon evaporation data and tectonic implications. Journal of South American Earth Sciences, Vol. 27, No. 4, pp. 247–257, http://dx.doi.org/10.1016/j.jsames.2009.02.007
Gibbs A.K., Barron C.N. (1993) The Geology of the Guiana Shield. Oxford University Press, New York.
Heylmun E.B. (2001) Placer diamonds in Venezuela. International California Mining Journal, Vol. 70, No. 7, pp. 21–23.
Iakoubovskii K., Adriaenssens G.J. (1999) Photoluminescence in CVD diamond films. Physica Status Solidi (a), Vol. 172, No. 1, pp. 123–129, http://dx.doi.org/10.1002/(SICI)1521-396X(199903)172:1%3C123::AID-PSSA123%3E3.0.CO;2-E
Ishmael O. (2013) The Guyana Story: From Earliest Times to In-dependence. Xlibris, Bloomington, Indiana.
Josiah B. (2011) Migration, Mining, and the African Diaspora:
REFERENCES
ACKNOWLEDGMENTS The authors sincerely thank James Krakowsky (general manager of Kays Diamond Enterprise Ltd.) for his gemological input and samples donated for study. Gordon Nestor (manager at the Guyana Geology and Mines Commission) provided valuable lo-gistical support. We are grateful to Jim Shigley of GIA for his en-couragement to prepare this article for the gemological community. We also thank Rachelle Turnier and Aaron Palke of GIA for their assistance in identifying corundum specimens.
ABOUT THE AUTHORS Dr. Bassoo is a Guyanese geoscientist and consulting geologist who is currently a postdoctoral researcher at GIA in Carlsbad, California. Dr. Befus is a petrologist and volcanologist who serves as a professor of geology at Baylor University in Waco, Texas.

DIAMONDS FROM GUYANA GEMS & GEMOLOGY SUMMER 2022 155
Guyana in the Nineteenth and Twentieth Centuries. Palgrave Macmillan, Basingstoke, UK.
Kaminsky F.V., Zakharchenko O.D., Griffin W.L., Channer D.M.DeR., Khacchatryan-Blinova G.K. (2000) Diamond from the Guaniamo area, Venezuela. Canadian Mineralogist, Vol. 38, No. 6, pp. 1347–1370, http://dx.doi.org/10.2113/gscanmin.38.6.1347
Kaminsky F.V., Sablukov S.M., Sablukova L.I., Channer D.M.D. (2004) Neoproterozoic “anomalous” kimberlites of Guani-amo, Venezuela: Mica kimberlites of “isotopic transitional” type. Lithos, Vol. 76, No. 1-4, pp. 565–590, http://dx.doi.org/10.1016/j.lithos.2004.03.035
Kimberley Process Rough Diamond Statistics (n.d.) Public Statistics Area, https://kimberleyprocessstatistics.org/public_statistics
Kopylova M.G., Afanasiev V.P., Bruce L.F., Thurston P.C., Ryder J. (2011) Metaconglomerate preserves evidence for kimberlite, diamondiferous root and medium grade terrane of a pre-2.7 Ga Southern Superior protocraton. Earth and Planetary Sci-ence Letters, Vol. 312, No. 1-2, pp. 213–225, http://dx.doi.org/10.1016/j.epsl.2011.09.057
Kroonenberg S.B., de Roever E.W.F., Fraga L.M., Reis N.J., Faraco T., Lafon J.-M., Cordani U., Wong Th.E. (2016) Paleoproterozoic evolution of the Guiana Shield in Suriname: A revised model. Netherlands Journal of Geosciences, Vol. 95, No. 4, pp. 491–522, http://dx.doi.org/10.1017/njg.2016.10
Lafuente B., Downs R.T., Yang H., Stone N. (2016) The power of databases: The RRUFF project. In T. Armbruster and R.M. Danisi, Eds., Highlights in Mineralogical Crystallography. W. de Gruyter GmbH, Berlin, pp. 1–29.
Lee R.J. (1981) Diamond production in Guyana. Journal of Gem-mology, Vol. 17, No. 7, pp. 465–479.
Lindblom J., Hölsä J., Papunen H., Häkkänen H. (2005) Lumi-nescence study of defects in synthetic as-grown and HPHT diamonds compared to natural diamonds. American Miner-alogist, Vol. 90, No. 2-3, pp. 428–440, http://dx.doi.org/10.2138/am.2005.1681
Naipal R., Zwaan J.C., Kroonenberg S.B., Kriegsman L.M., Mason P.R.D. (2020) Diamonds from the Nassau Mountains, Suri-name. Journal of Gemmology, Vol 37, No. 2, pp. 180–191.
National Mining Association (n.d.) Historical gold prices – 1833 to present, http://www.nma.org/pdf/g_prices.pdf
Persaud K. (2010) The diamond industry and exploration for dia-monds in Guyana. Guyana Geology and Mines Commission.
Priem H.N.A., Boelrijk N.A.I.M., Hebeda E.H., Verdurmen E.A.Th., Verschure R.H. (1973) Age of the Precambrian Ro-raima formation in northeastern South America: Evidence from isotopic dating of Roraima pyroclastic volcanic rocks in Suriname. GSA Bulletin, Vol. 84, No. 5, pp. 1677–1684,
http://dx.doi.org/10.1130/0016-7606(1973)84%3C1677:AOT-PRF%3E2.0.CO;2
Reis N.J., de Faria M.S.G., Fraga L.M., Haddad R.C. (2000) Orosirian calc-alkaline volcanism and the Orocaima event in the northern Amazonian Craton, eastern Roraima State. Re-vista Brasileira de Geociências, Vol. 30, No. 3, pp. 380–383.
Reis N.J., Nadeau S., Fraga L.M., Betiollo L.M., Faraco M.T.L., Reece J., Lachhman D., Ault R. (2017) Stratigraphy of the Ro-raima Supergroup along the Brazil-Guyana border in the Guiana Shield, Northern Amazonian Craton—Results of the Brazil-Guyana Geology and Geodiversity Mapping Project. Brazilian Journal of Geology, Vol. 47, No. 1, pp. 43–57, http://dx.doi.org/10.1590/2317-4889201720160139
Rodney W. (1981) A History of the Guyanese Working People, 1891–1905. Johns Hopkins University Press, Baltimore.
Santos J.O.S., Potter P.E., Reis N.J., Hartman L.A., Fletcher I.R., Mc-Naughton N.J. (2003) Age, source and regional stratigraphy of the Roraima Supergroup and Roraima-like outliers in northern South America based on U–Pb geochronology. Geo lo gical Soci-ety of America Bulletin, Vol. 115, No. 3, pp. 331–348, http://dx.doi.org/10.1130/0016-7606(2003)115%3C0331: ASARSO%3E2.0.CO;2
Schulze D.J., Canil D.M., Channer D.M.D., Kaminsky F.V. (2006) Layered mantle structure beneath the western Guyana Shield, Venezuela: Evidence from diamonds and xenocrysts in Guaniamo kimberlites. Geochimica et Cos-mochimica Acta, Vol. 70, No. 1, pp. 192–205, http://dx.doi.org/10.1016/j.gca.2005.08.025
Shigley J.E., Breeding C.M. (2013) Optical defects in diamond: A quick reference chart. G&G, Vol. 49, No. 2, pp. 107–111, http://dx.doi.org/10.5741/GEMS.49.2.107
Smith B.M., Walter J.W., Bulanova G.P., Mikhail S., Burnham A.D., Gobbo L., Kohn S.C. (2016) Diamonds from Dachine, French Guiana: A unique record of early Proterozoic subduction. Lithos, Vol. 265, pp. 82–95, http://dx.doi.org/10.1016/j.lithos.2016.09.026
Spencer S. (2007) A Dream Deferred: Guyana, Identities Under the Colonial Shadow. Hansib Publications, London.
Tappert R., Stachel T., Harris J.W., Muehlenbachs K., Brey G.P. (2006) Placer diamonds from Brazil: Indicators of the composi-tion of the Earth’s mantle and the distance to their kimberlitic sources. Economic Geology, Vol. 101, No. 2, pp. 453–470, http://dx.doi.org/10.2113/gsecongeo.101.2.453
Tassinari C.C.G. (1997) The Amazonian Craton. In M.J. De Wit and M.J. Ashwal, Eds., Greenstone Belts. Clarendon Press, Ox-ford, pp. 558–566.
Taylor R. (1999) Gem News: A visit to Venezuelan diamond mines. G&G, Vol. 35, No. 4, pp. 209–210.
gia.edu/gems-gemology
For online access to all issues of GEMS & GEMOLOGY from 1934 to the present, visit:

156 THE SHAPE OF EKANITE GEMS & GEMOLOGY SUMMER 2022
In secondary gem deposits in Sri Lanka, ekanite is a rare mineral, but when found, it frequently oc-curs with gem characteristics. Rough pebbles have
remarkable outer shapes that show concave dents and hollows (figure 1). Apart from its shape, the gemological properties of ekanite resemble those of the borosilicate kornerupine. The most highly valued stones from Sri Lankan deposits are clear, transpar-ent, and show a vivid yellowish green that is remi-niscent of the tender leaves of banana plants (figure 2). Most ekanite specimens are rich in inclusions and show a turbid aspect and in some cases four-rayed as-terism (Gübelin, 1961). Ekanite (ideally Ca2ThSi8O20) is a phyllosilicate whose thorium content of about 24 wt.%, along with minor uranium, causes harmful radioactivity (Tennakone, 2011) that makes stones unsuitable for setting in daily-worn jewelry, though different assessments seem to exist. Ashbaugh (1988) found that gem ekanite is tens of times more radioac-tive than “low zircon” stones of comparable weight. Gübelin (1961) came to the conclusion that ekanites could be worn in jewelry without any greater harm, whereas De Silva (2008) mentioned “three reported deaths due to keeping ekanites at close proximity to three gem dealers.” High-quality faceted ekanites are nevertheless highly sought-after collector items, even though prospective buyers should exercise safe handling.
Ekanite is named after its discoverer, Francis Leo Danvil Ekanayake (1898–1971), a Colombo-based customs officer and Fellow of the Gemmological As-sociation of Great Britain. Ekanayake’s contempo-raries considered him a capable and painstaking gemologist with a flair for the unusual (Mitchell,
THE SHAPE OF EKANITE Lutz Nasdala, K.A. Geeth Sameera, G.W.A. Rohan Fernando, Manfred Wildner, Chutimun Chanmuang N., Gerlinde Habler, Annalena Erlacher, and Radek Škoda
FEATURE ARTICLES
Despite its high thorium content, and consequent radioactivity, ekanite is still commonly traded in the Sri Lankan gem market. Gem-quality ekanite is derived from several gravel deposits in the country. However, rough speci-mens do not show rounded shapes that would be expected for stones transported by water; rather, they have remarkably uneven surfaces with multitudes of hollows, bumps, and cavities. Only after the recent discovery of ekanite in its host calc-silicate rock near Ampegama, Southern Province, can the striking shapes be understood. Fluid-driven alteration of ekanite, still inside the host rock, results in the formation of banded nodules with het-erogeneous disintegration rims of an earthy consistency. These rims are readily removed by weathering, whereas the interior remnant consisting of chemically and physically resistant, unaltered ekanite persists.
See end of article for About the Authors and Acknowledgments. GEMS & GEMOLOGY, Vol. 58, No. 2, pp. 156–167, http://dx.doi.org/10.5741/GEMS.58.2.156 © 2022 Gemological Institute of America
Figure 1. This specimen (2.95 g, 22 mm in longest dimension) from Ellawala, Sabaragamuwa Province, shows the typical surface texture of rough ekanite found in Sri Lankan placers. Photo by Man-fred Wildner.

1961), in addition to being well-versed in rare gem minerals (Gübelin, 1961). In 1953, Ekanayake came across two unusual glassy cabochons in the local Colombo gem market that originated from a river-bed gem pit near Ellawala. Immediately he was con-vinced he had found a new gem species, whereas others considered the material to be devitrified nat-ural or antique glass (Mitchell, 1954). Ekanayake’s conviction was supported by the observation that the material, despite being a glass, contained numerous acicular inclusions having crystallographic orienta-tion (Mitchell, 1961). Investigations continued for more than seven years, until a note describing the new mineral was published (Anderson et al., 1961).
The original ekanite was characterized as meta -mict by Anderson et al. (1961). The notion of metam-ict goes back to Brøgger (1893), who used metamikte to describe a class of minerals that show well-shaped crystal forms despite being amorphous. Today, the term is applied irrespective of the outer form to de-lineate minerals that were initially crystalline but transformed to a glassy state due to internally or ex-ternally sourced irradiation over time (Hamberg, 1914; Ewing et al., 1987; Ewing, 1994). It took more than two decades after the initial description until a non-metamict ekanite (tetragonal space group I422) was found in the Tombstone Mountains of Canada’s Yukon Territory (Szymański et al., 1982).
Over the intervening years, ekanite has been dis-covered in several other localities in Sri Lanka (Dis-sanayake and Rupasinghe, 1993; Mathavan et al., 2000; Nasdala et al., 2017; Sameera et al., 2020a,b; see figure 3) and other countries (e.g., Demartin et al., 1982; Walstrom and Dunning, 2003; Russo et al.,
2013). One remarkable feature of Sri Lankan ekanite is that most specimens, unlike other gems in placer deposits, are not water-worn crystals or rounded peb-bles. Rather, the rough material typically shows
THE SHAPE OF EKANITE GEMS & GEMOLOGY SUMMER 2022 157
In Brief • Despite being found in gravel deposits, Sri Lankan gem
ekanites do not show rounded but remarkably uneven shapes.
• Only recently, ekanite was found in its calc-silicate host rock.
• Here, ekanites show features of fluid-driven alteration progressing inward, and botryoidal growth of alteration products leads to convex surface shapes of the prod-uct-phase aggregates.
• After weathering of the alteration products, chemically durable ekanite remnants having concave surface fea-tures are left.
Figure 2. In transmitted light, many ekanite specimens show an at-tractive yellowish green color. The rough stone (2.90 g) measures 20 mm in longest dimen-sion and the cut stones are 0.65 ct and 2.73 ct. All the specimens origi-nate from placers near Okkampitiya, Uva Province. Photo by Manfred Wildner.

shapes that—along with the green color—bear a strong resemblance to moldavite-type tektite (see again fig-ure 1; compare to Bouška, 1994; Hyršl, 2015). The un-derlying causes of the rough surface textures in ekanite are discussed in the present paper, along with an explanation of why attempts by local gem dealers to enhance ekanite by heat treatment invariably fail.
SAMPLES AND EXPERIMENTAL METHODS The authors have studied ekanite fragments and ekanite-containing specimens of calc-silicate rock we collected in a quarry near Ampegama (for a brief petrological description, see Sameera et al., 2020a), located about 20 km north-northwest of the city of Galle in Southern Province (see again figure 3). Ekan-ite specimens from Ellawala in Sabaragamuwa Province and Okkampitiya in Uva Province were photographed to illustrate the typical shapes of this mineral in Sri Lankan gem placers. These are the lead author’s samples, purchased from local miners.
Four Ampegama rock samples containing ekanite were impregnated with Araldite epoxy and cut using a diamond saw blade. A polished section and an ex-posed 25 mm thin section attached to a glass slide were produced from each rock sample. Thin sections were carbon-coated for back-scattered electron (BSE) imaging and electron probe micro-analysis (EPMA), as described below. In addition, double-side polished
plane-parallel sections (250 and 1020 μm thickness) were prepared from a separated ekanite fragment. After measuring the refractive index and obtaining optical absorption spectra, the slabs were heat-treated in air (the 250 mm slab at 1400°C and the 1020 μm slab at 750°C) for 48 h. After gentle repol-ishing, even the (now dull) 250 μm slab was found to be still too thick for optical absorption spectroscopy and therefore thinned to 110 μm thickness. After we obtained another optical absorption spectrum, this slab was embedded in epoxy and subjected to chemo-mechanical repolishing with an alkaline colloidal sil-ica suspension on a polyurethane plate, for the removal of potential near-surface strain. After being coated with carbon, it was subjected to forward-scat-tered electron (FSE) imaging, as described below.
Specific gravity was determined by weighing three ekanite chips in distilled water and in air. A drop of liquid detergent was added to the distilled water to de-crease surface tension. Refraction of the polished slab was measured using a Krüss ER601-LED refractome-ter equipped with a diode lamp emitting 589 nm light. Both measurements were repeated five times.
Macroscopic luminescence images were taken using a long-wave UV lamp or 385 nm LED illumina-tion. Photomicrographs of thin sections (including op-tical images in plane-polarized transmitted-light mode and luminescence images in reflected-light mode)
158 THE SHAPE OF EKANITE GEMS & GEMOLOGY SUMMER 2022
Figure 3. Simplified geo-logical map of southern Sri Lanka (modified from Mathavan and Fernando, 2001; Kröner et al., 2013). Locations of ekanite occurrences are highlighted in red (major cities are in black). Question marks between Highland Complex and Wanni Complex were adopted from the original refer-ences; they indicate that the boundary is uncertain and merely inferred based on field evidence.
Ratnapura
COLOMBO
80°E
Matara
Nuwara Eliya
?
81°E
Badulla
Buttala
Ampara
B
KO
K
?Ellawala
Okkampitiya
Ampegama
Galle
Kurunegala
Kandy
Rakwana
Passara
Makumbura
6°N
7°N
N
0 50 km
Highland Complex
B = Buttala KlippeK = Kataragama KlippeKO = Kuda Oya Klippe
Kadugannawa Complex
Miocene to Quaternary
Ranna Complex
Wanni Complex
Vijayan Complex

were obtained by means of a modified Olympus BX-series microscope equipped with a USH-103OL mer-cury burner and DP 70 digital camera, using a UV-transmissive XL Fluor 4×/340 objective (numeri-cal aperture 0.28). Here, luminescence images were obtained with a beam splitter and filters in the optical pathway that allowed us to illuminate the sample with UV light (<370 nm wavelength) and to photo-graph only the sample’s visible emissions (>400 nm wavelength). BSE and FSE images were obtained in an FEI Quanta 3D FEG dual-beam field-emission gun scanning electron microscope (FEG-SEM) operated at 15 kV and 4 nA. The sample tilt was 70°, and the FSE detector position was adjusted to yield predominant orientation contrast. For the basic principles of FSE orientation-contrast imaging, see Prior et al. (1996).
Major-element analyses were done using wave-length-dispersive X-ray spectrometry on a Cameca SX 100 EPMA system operated at 15 kV. The beam current was set to 20 nA for analyzing unaltered (or “fresh”) ekanite and 10 nA for alteration products. The focal-spot diameter of the electron beam was 8–10 μm. The following minerals and synthetic mate-rials were used for calibration (lines analyzed and peak counting times are quoted in parentheses): an-dalusite (Al-Kα, 20 s), wollastonite (Si-Kα, 20 s; Ca-Kα, 20 s), almandine (Fe-Kα, 20 s), vanadinite (Pb-Mα, 120 s), CaTh(PO4)2 (Th-Mα, 20 s) and UO2 (U-Mβ, 80 s). Background counting times were half of the respective peak counting times. Cameca’s Peaksight software, which is based on the method of Ziebold (1967), was used to calculate detection lim-its. Matrix correction and data reduction were done using the modified ϕ(ρz) routine of Merlet (1994). Ad-ditional EPMA experimental details are described elsewhere (Breiter et al., 2009; Škoda et al., 2015).
Room-temperature optical absorption spectra were obtained using a Bruker IFS66v/S spectrometer equipped with a mirror-optics IR-scope II microscope and quartz beam splitter. The following combinations of light sources and detectors were used: W lamp and Ge detector (for the spectral range 7500–10000 cm–1), W lamp and Si detector (10000–20000 cm–1), and Xe lamp and GaP detector (20000–26000 cm–1). All optical absorption spectra therefore consist of a combination of three sub-spectra, which were aligned to match in absorbance if necessary. Circular areas 200 μm in di-ameter were analyzed in transmission geometry.
Room-temperature Raman spectra of inclusions in ekanite were obtained from chips and polished sections, and photoluminescence (PL) spectra of the alteration rims were obtained from thin sections.
Analyses were done using a Horiba LabRAM HR Evolution spectrometer. This dispersive system was equipped with an Olympus BX-series optical micro-scope and a Peltier-cooled, Si-based charge-coupled device detector. Raman spectra of the inclusions in ekanite were excited using a 473 nm diode laser (11 mW at the sample), Raman measurements of the al-teration rims were conducted with a 633 nm He-Ne (10 mW) and a 785 nm diode laser (24 mW), and PL was excited using an external, air-cooled 407 nm diode laser (500 mW; unfocused laser beam). The emitted PL and Raman scattered light, respectively, were collected using a 50× objective (numerical aper-ture 0.50; free working distance 10.6 mm) and dis-persed using a diffraction grating with 1800 grooves per millimeter. The spectral resolution was about 1 cm–1. More experimental details are described else-where (Zeug et al., 2018).
RESULTS AND DISCUSSION General Characterization. Near Ampegama, ekanite is found as a rare constituent of a calc-silicate meta-morphic rock composed primarily of diopside, wollas-tonite, K-feldspar, and scapolite, occasionally together with minor fluorite and graphite (Sameera et al., 2020a). Ekanite mostly occurs as xenomorphic nod-ules up to 3 cm in size. Many but not all of them are surrounded by orange to pale brownish alteration rims with an earthy consistency. In fresh conditions, the mineral is vivid olive green to yellowish green. Close to the alteration rims, it may in some cases show dis-coloration and appear greenish blue (figure 4A). The material is transparent and exhibits conchoidal to un-even fracture. Unaltered ekanite has a vitreous luster and is isotropic. As ekanite is in fact tetragonal, the observed isotropy indicates that the material is pres-ent in a metamict (i.e., glassy) state. Its RI was 1.59 ± 0.01, and the SG was determined as 3.27 ± 0.01. Ekan-ite is apparently non-luminescent under both long-wave and short-wave UV light.
The results of EPMA chemical analyses are sum-marized in table 1. Ekanite from Ampegama, if unal-tered, has a relatively uniform chemical composition that corresponds to the formula Ca2Th0.9U0.1Si8O20 (calculated on the basis of 20 oxygen atoms per for-mula unit). The composition is fairly similar to that of ekanite from Ellawala (Anderson et al., 1961) and Okkampitiya (Nasdala et al., 2017). To the best of our knowledge, no analysis of ekanite from Rakwana in Sabaragamuwa Province, Passara in Uva Province (both were quoted by Dissanayake and Rupasinghe,
THE SHAPE OF EKANITE GEMS & GEMOLOGY SUMMER 2022 159

1993), or Makumbura in Southern Province (Sameera et al., 2020b) has been undertaken thus far.
Concordant 206Pb/238U and 207Pb/235U ratios of ekan-ite from Okkampitiya (Nasdala et al., 2017) indicate
160 THE SHAPE OF EKANITE GEMS & GEMOLOGY SUMMER 2022
Figure 4. A: Transmitted-light photo of a rough ekanite (field of view 6 mm) from Ampegama with alteration-induced dis-coloration and characteristic conchoidal fracture. It contains a large K-feldspar and numerous acicular inclusions. B: Needles in the glassy host have a crystallographically controlled orientation conforming to the host’s previously tetragonal symme-try (field of view 1.6 mm). C: Partially filled hollow needle (field of view 120 μm). D: Xenomorphic thorite inclusion associ-ated with silica glass, wollastonite, and apatite (field of view 630 μm). Photomicrographs by Chutimun Chanmuang N.
A B
C D
TABLE 1. Mean chemical composition (in wt.%) of Ampegama ekanite and its alteration products, obtained by EPMA analysis.
Major oxidesa Unaltered ekanite (n = 13)
Alteration rim (colorless) (n = 6)
Alteration rim (brownish) (n = 7)
Detection limit
Al2O3 0.13 ± 0.01a,b 0.30 ± 0.33 0.14 ± 0.04 0.03
SiO2 56.2 ± 0.3 43.3 ± 1.4 51.8 ± 7.6 0.03
CaO 13.26 ± 0.11 9.82 ± 0.33 8.13 ± 4.26 0.05
FeO 0.23 ± 0.03 0.33 ± 0.03 0.18 ± 0.11 0.07
PbO 0.81 ± 0.05 0.83 ± 0.23 0.52 ± 0.17 0.10
ThO2 27.5 ± 0.5 35.0 ± 0.4 27.5 ± 2.8 0.13
UO2 2.61 ± 0.63 3.61 ± 0.32 2.76 ± 1.93 0.19
Total 100.7 ± 0.6 93.3 ± 1.3 91.1 ± 3.4
aThe elements F, Na, Mg, P, Sc, Ti (all 0.05), Mn (0.07), Sr (0.15), Y (0.08), Zr (0.11), La (0.15), Ce (0.16), Pr (0.24), Nd (0.23), and Sm (0.12) were also sought for, but mean concentrations were below the EPMA detection limits (values in brackets, in wt.%).
bAll errors are quoted at the 2σ level.

that lead is mainly radiogenic and hence was widely excluded during the primary growth of this mineral. Assuming the same is true for the Ampegama ekanite, the measured mean concentrations of thorium (24.2 wt.%), uranium (2.30 wt.%), and lead (0.75 wt.%; con-verted from the respective oxide concentrations quoted in table 1) are converted to a “chemical age” (Montel et al., 1996; Suzuki and Kato, 2008) of roughly 525 Ma. From this age and present thorium and uranium con-centrations, and using the equation of Murakami et al. (1991), a time-integrated self-irradiation dose of 14.0 × 10¹⁹ alpha events per gram of material is calculated. This value exceeds the threshold of Sri Lankan zircon to alpha-event amorphization (Zhang et al., 2000; Nas-dala et al., 2002) by about one order of magnitude. It explains the present glassy state of ekanite as resulting from extensive radioactive self-irradiation of initially tetragonal ekanite over long time periods.
This assignment is also supported by microscopic observations. Similar to ekanite from Ellawala (Mitchell, 1961; Gübelin, 1961), the Ampegama ekanite contains numerous acicular fluid and two-
phase inclusions that show a crystallographically controlled orientation of needles with the long axes at 90° angles to each other (figure 4, A and B). This is explained by the primary formation of tetragonal ekanite with crystallographically oriented inclusions within the host crystal, followed by irradiation-in-duced vitrification of ekanite that did not affect the orientations of the inclusions. Some of the needles are filled incompletely (figure 4C). Solid inclusions of irregular shape (figure 4D), determined by Raman spectroscopy, include thorite, quartz and silica glass, K-feldspar, apatite, wollastonite, and calcite.
Optical Absorption and Heat Treatment. Optical ab-sorption spectra obtained from a natural ekanite slab and its heat-treated analogues are presented in figure 5. The green color of natural (metamict) ekanite is due to two main spectral features. First, there is an absorp-tion continuum, tentatively assigned to defect-related “color centers” (see, for instance, Greenidge, 2018), that gradually increases toward the blue–violet–UV range of the electromagnetic spectrum. Second, there
THE SHAPE OF EKANITE GEMS & GEMOLOGY SUMMER 2022 161
Figure 5. Optical absorption spectra of green metamict ekanite, its analogue annealed at 750°C (left; sample thick-nesses 1.02 mm), and a brownish green chip that was annealed at 1400°C (right; sample thickness 110 μm). The reference spectrum of a green “low zircon” was obtained from sample N-17 (described in detail by Nasdala et al., 2002). The reference spectrum of irradiation-spotted diamond is from Nasdala et al. (2013) and that of U4+-doped ZrSiO4 from Zeug et al. (2018). Reference spectra are presented on an arbitrary absorbance scale. Spectral ranges that are invisible to the human eye have gray background shade. Note the vast increase of the linear absorption coefficient after high-temperature treatment of ekanite.
8
6
4
2
0
150
100
50
10000 15000 20000 25000 10000 15000 20000 25000
1000 800 600 500 400 1000 800 600 500 400
Ekanite (annealed at 750˚C)Ekanite (natural)
Metamict zirconGreen-spotteddiamond
Ekanite (annealed at 1400˚C)U4+-doped ZrSiO4
WAVENUMBER (cm–1) WAVENUMBER (cm–1)
WAVELENGTH (nm) WAVELENGTH (nm)
OPTICAL ABSORPTION SPECTRA
LIN
EAR
AB
SOR
PTIO
N C
OEF
FIC
IEN
T (c
m–1
)
LIN
EAR
AB
SOR
PTIO
N C
OEF
FIC
IEN
T (c
m–1
)

is a pronounced absorption band in the red to orange range whose maximum lies near 15700 cm–1 (637 nm wavelength). This band could be assigned to Fe2+ or Fe2+–Fe3+ charge transfer (Smith, 1978; compare to Ten-nakone, 2011), which appears rather unlikely, how-ever, because of the low iron concentration of 0.18 wt.% (converted from the FeO content of 0.23 wt.% quoted in table 1). Note that Okkampitiya ekanite (see again figure 2) is vivid yellowish green in spite of its even lower iron content of only 0.11 wt.% (Nasdala et al., 2017). Alternative assignments of the red-orange band include the—strongly broadened—analogue of the main U4+ absorption band in zircon (Kempe et al., 2016), or an analogue of defect absorption in diamond (GR1 = neutral carbon vacancy; Clark and Walker, 1973; Nasdala et al., 2013) or zircon (electron-hole de-fect; Kempe et al., 2016). In the case of the latter, it ap-pears likely that the red-orange absorption band of metamict ekanite is assigned to an oxygen-site va-cancy. Clarification of the issue might require syn-thetic ekanite to be subjected to ion-irradiation experiments.
The green color is explained by the joint effect of a short-wavelength absorption continuum and a red-orange band that bracket a “reduced absorption win-dow” in the green to yellow range, at around 17850 cm–1 (560 nm). The fact that ekanite also transmits well in the long-wavelength range below 15000 cm–1 (above 665 nm) does not significantly affect the col-oration, because of the relatively poor sensitivity of the human eye in this spectral range.
Although Sri Lankan ekanite typically has green hues that are quite attractive for gem purposes, local dealers have undertaken several—always ineffec-tive—attempts to enhance its color by heating. Pub-lished results on how metamict ekanite responds to heating are decidedly contradictory. According to An-derson et al. (1961), recrystallization of the metamict material to a tetragonal phase with a body-centered unit cell occurs in the range 650–1000°C. This unit cell was later assigned to “true crystalline ekanite” by Szymański et al. (1982). At temperatures above 1000°C, Anderson et al. (1961) observed remelting and formation of huttonite (ThSiO4). In contrast, Zeug et al. (2015) found that ekanite remains glassy and transparent up to 900°C, while the yellowish green color becomes slightly more bluish (see also fig-ure 5, left). Zeug et al. (2015) detected initial nucle-ation of several poorly ordered phases only at around 1000°C. Between 1100 and 1450°C, crystalline ekan-ite formed, without any sign of melting. The 1450°C annealing product was identified as ekanite using X-
ray powder diffraction and Raman spectroscopy (Nas-dala et al., 2017). In agreement with this latter result, heating of Ampegama ekanite to 750°C in the present study did not affect the metamict state, and heating to 1400°C yielded polycrystalline, tetragonal ekanite.
Recrystallized ekanite has an unattractive appear-ance, as it is brownish green to pale brownish and non-transparent. Mitchell (1961) described it as “putty-colored.” Compared to the transparent metam-ict starting material, the increase of the absorption continuum toward low wavelengths is depleted, and the total absorbance is about 30–40 times higher (figure 5, right). There are a number of narrow lines we assign to tetravalent uranium, based on their similarity to the absorption of U4+ in zircon (compare to Richman et al., 1967; Mackey et al., 1975). The huge increase in total absorbance, visually recognizable from the loss of transparency, is assigned to the transformation of a glass to a polycrystalline compound. The texture of the annealing product is visualized through FSE imaging (figure 6): The material consists mainly of numerous polygonal, variably oriented ekanite crystals up to 50 mm in size. Minor phases (USiO4, silica, Ca3Si3O9, and others) occur as inclusions inside the ekanite crystals or along grain boundaries. Note that in initial recrys-tallization stages in a glassy phase, nucleation of other
Figure 6. Forward-scattered electron (FSE) image of ekanite annealed at 1400°C showing predominantly crystal-orientation contrast. The majority of the flawed material (>98 vol.%) consists of polycrys-talline ekanite whose individual polygonal crystals have diverse orientations, indicated by different lev-els of gray. Image by Gerlinde Habler.
20 μm
162 THE SHAPE OF EKANITE GEMS & GEMOLOGY SUMMER 2022

phases may be energetically favored (Capitani et al., 2000). Also, high-temperature heating typically causes loss of the radiogenic lead, which in turn disturbs the initial equilibrium of Th+U+Pb with Ca and Si. Slight deviation of the total composition from that of ekanite necessarily leads to minor formation of other phases (for analogous effects in the annealing of zircon, see Nasdala et al., 2002). Both the presence of nanocrystals of these additional phases and the high number of grain boundaries of fine-grained ekanite aggregates cause loss of transparency and increased absorption. In sum-mary, heating of metamict ekanite below the temper-ature of spontaneous nucleation (about 1000°C) has minor effects, whereas high-temperature annealing of the material leads to the formation of a dull, polycrys-talline compound. The latter is therefore ill-advised in attempting enhancement.
Study of Alteration Products. In the host rock, green ekanite is typically surrounded (or even completely replaced) by yellowish gray to ochre assemblages of secondary phases (figure 7A). These phases are inter-preted as products of fluid-driven alteration processes,
which is supported by their strongly deficient EPMA totals (table 1). Deficient analytical totals of alteration products may be caused by the presence of light ele-ments that are not analyzed in the EPMA, and they may also be due to their common sub-micrometer porosity (Pointer et al., 1988; Nasdala et al., 2009).
In plane-polarized transmitted light (figure 8), the alteration rims appear heterogeneous, often with a banded texture, and consist of colorless and brownish domains and zones. Compared to unaltered ekanite, the colorless alteration phase is strongly depleted in silicon and calcium, whereas thorium is notably en-riched (table 1). The brownish domains show pro-nounced heterogeneity. Some yield lower and others higher BSE intensity, compared to the neighboring un-altered ekanite (figure 8, far left images). Correspond-ingly the chemical composition of the brownish domains is decidedly heterogeneous, indicated by large standard deviations from the mean values (table 1). In cross-polarized transmitted light (figure 8), the colorless alteration material does not show any inter-ference color, indicating that it has a glassy structure. The majority of brown regions, in contrast, show low
THE SHAPE OF EKANITE GEMS & GEMOLOGY SUMMER 2022 163
Figure 7. A: Hand-specimen (width 10.5 cm) of calc-silicate rock from Ampegama, containing several clear, dark bottle-green ekanite nodules surrounded by yellow-to-ochre alteration products. Some smaller nodules are altered completely (three are marked by arrows). B: Only the alteration products show intense greenish luminescence under the long-wave UV lamp. C: PL image of a polished rock specimen (field of view 14 mm) obtained under 385 nm LED illumination. Alteration of the central metamict ekanite has started from the outer rim and internal frac-tures. Photos by Manfred Wildner.
A C
B

birefringence. In some of the dark brown regions (fig-ure 8, bottom row), aragonite was detected, whereas the identification of all other alteration material using Raman spectroscopy failed, as no evaluable band pat-terns were obtained. Interestingly, there is no signifi-cant lead loss in the alteration products, compared to fresh ekanite. The virtually unvaried presence of lead in the alteration products may indicate either that these phases did not exclude lead upon formation or that alteration occurred soon after ekanite formation, with subsequent transformation of thorium and ura-nium to lead in the alteration products themselves. Further investigations will be needed to address this issue.
Most of the alteration products show distinct greenish luminescence under UV or violet-blue ex-citation, while the fresh ekanite appears inert (figures 7 and 8). A representative PL spectrum is presented in figure 9. We assign the broad-band green emission to hexavalent uranium ions that are present in the form of (UO2)2+ (i.e., uranyl) groups. The observation of green, uranyl-related emission is consistent with significant concentrations of uranium and relatively low concentrations of iron in the alteration products (table 1; compare to Gaillou et al., 2008). Only arag-onite-containing zones yield even more intense PL
(figure 8, far bottom right image); here the green uranyl-related band is overlain by a broad band in the orange-red range whose cause remains unknown.
The PL spectra of many, but not all, uranyl-con-taining crystalline minerals show a pattern consist-ing of energetically equidistant bands (Gorobets and Sidorenko, 1974; deNeufville et al., 1981; Wang et al., 2008). Such patterns are also observed from natural opal (Fritsch et al., 2015; Othmane et al., 2016), syn-thetic glasses (Mahurin et al., 2003), and even uranyl ions and complexes in solutions (McGlynn and Smith, 1961; Moulin et al., 1995). For comparison, we collected the PL spectra of the uranyl-containing species metatobernite, hyalite, and a uranyl glass under the same conditions (figure 9). Thus, the pres-ence or absence of a pattern of equidistant bands does not depend on the host’s crystallinity. Such patterns are assigned to the coupling of electronic transitions with oscillations of the linear O=U=O groups. Ener-getic differences among neighboring bands depend on the frequencies of uranyl stretching vibrations and hence allow the calculation of U=O bond distances (Jones, 1959). The observation that the studied alter-ation rims yield non-structured emission is ascribed to an overlay of many vibrational modes, due to ex-tensive irregularity of U=O bonds caused by exten-
164 THE SHAPE OF EKANITE GEMS & GEMOLOGY SUMMER 2022
Figure 8. Two series of BSE, plane-polarized transmitted-light, cross-polarized transmitted light, and PL images (from left to right) showing heterogeneous alteration rims surrounding fresh metamict ekanite in the center. The alteration rims emit intense green, uranyl-related photoluminescence. 30 μm thin section; field of view 1.72 mm. BSE images by Chutimun Chanmuang N., all others by Lutz Nasdala.

sively irregular arrangements of nearest neighbor atoms in the glassy structure.
In optical microscopy, the practical benefit of the intense uranyl luminescence of the alteration prod-ucts is that the shape of the central remnant of fresh ekanite, which does not luminesce, is easily recog-nized (figure 10). The latter exhibits concave surface features analogous to that of rough ekanite speci-mens (compare to figure 1). The formation of concave surfaces is therefore explained by the alteration of ekanite in its host rock, whose identity for all sec-ondary deposits remains unknown. Fluid-driven al-teration presumably has progressed inward, resulting in concentrically grown reaction rims of secondary phases, at the expense of primary ekanite.
CONCLUSIONS The physical properties, chemical composition, and general appearance of Ampegama ekanite are broadly similar to ekanite from other Sri Lankan locations, ex-cept that the material is not found in a secondary de-posit but in situ. In the calc-silicate host rock, fluid-driven chemical alteration decomposes primary ekanite, and the botryoidal growth of alteration prod-ucts leads to convex surface shapes of the product-phase aggregates, which in turn result in the concave shapes of the ekanite remnant. It is a simple conclu-sion by analogy that the same may have happened in the (still unknown) host rocks of ekanite found near Ellawala and Okkampitiya. After weathering of the host rock, the soft and earthy alteration products are effectively removed, leaving behind rough ekanite with their dimpled surface patterns. As rough ekanite specimens found near Ellawala and Okkampitiya gen-
THE SHAPE OF EKANITE GEMS & GEMOLOGY SUMMER 2022 165
Figure 9. PL spectrum (407 nm excitation) of the green-luminescing alteration rim surrounding ekanite, com-pared with the spectra of three other uranyl-bearing substances.
15000 17500 20000 22500
600 550 500 450700 650
Alteration rim around ekaniteUranyl glassHyaliteMetatorbernite
WAVENUMBER (cm–1)
PL SPECTRA
WAVELENGTH (nm)IN
TEN
SITY
Figure 10. Pair of plane- polarized transmitted-light (left) and photoluminescence (right) photo micrographs of a strongly altered ekanite nod-ule in its host calc-silicate rock (30 μm thin section). The central, well-preserved remnant of metamict ekan-ite is colorless and non-lumi-nescent; its irregular shape corresponds to that of rough specimens found in placers. Photo micrographs by Lutz Nasdala; field of view 5.1 mm.

erally show high degrees of preservation of such sur-face features, in most cases virtually without abrasion signs, transport pathways from the point of weather-
ing of the host rock to the place of deposition must be short. Consequently, it appears likely that the ekanite is rather eluvial or colluvial.
166 THE SHAPE OF EKANITE GEMS & GEMOLOGY SUMMER 2022
ACKNOWLEDGMENTS Most of the samples studied herein were obtained during a February 2020 field trip co-organized by E. Gamini Zoysa. Ex-port permission for rock samples was kindly granted by the Ge-ological Survey and Mines Bureau. Sample preparation was done by Andreas Wagner. Gerald Giester, Christoph A. Hauzenberger, Friedrich Koller, and Robert F. Martin are thanked for helpful discussions. Constructive comments and suggestions of three anonymous peers are gratefully acknowl-edged. Authors LN and AE acknowledge travel support from the Faculty of Geosciences, Geography and Astronomy, Uni-versity of Vienna.
ABOUT THE AUTHORS Professor Dr. Nasdala is chairholder for Mineralogy and Spec-troscopy, Prof. Dr. Wildner and Dr. Chanmuang N. are re-searchers, and Ms. Erlacher is a student, at the Institut für Mineralogie und Kristallographie, University of Vienna. Mr. Sameera is a geologist working at the Geological Survey and Mines Bureau in Sri Jayawardenepura Kotte, and student at the Postgraduate Institute of Science, University of Peradeniya. Prof. Dr. Fernando is chairholder for Geology at the Department of Physics, Faculty of Natural Sciences, The Open University of Sri Lanka in Nugegoda. Dr. Habler is a researcher at the Department für Lithosphärenforschung, Vienna University. Dr. Škoda is a re-searcher at the Department of Geological Sciences, Faculty of Science, Masaryk University in Brno.
Anderson B.W., Claringbull G.F., Davis R.J., Hill D.K. (1961) Ekan-ite, a new metamict mineral from Ceylon. Nature, Vol. 190, No. 4780, p. 997, http://dx.doi.org/10.1038/190997a0
Ashbaugh C.E. III (1988) Gemstone irradiation and radioactiv-ity. G&G, Vol. 24, No. 4, pp. 196–213, http://dx.doi.org/10.5741/GEMS.24.4.196
Bouška V. (1994) Moldavites: The Czech Tektites. Stylizace, Prague, 69 pp.
Breiter K., Copjaková R., Škoda R. (2009) The involvement of F, CO2, and As in the alteration of Zr-Th-REE-bearing accessory minerals in the Hora Svaté Kateriny A-type granite, Czech Re-public. The Canadian Mineralogist, Vol. 47, No. 6, pp. 1375–1398, http://dx.doi.org/10.3749/canmin.47.6.1375
Brøgger W.C.A. (1893) Amorf. In C. Blangstrup et al., Eds., Salmonsens Store Illustrerede Konversationsleksikon 1. Brø-drene Salmonsen, Copenhagen, pp. 742–743.
Capitani G.C., Leroux H., Doukhan J.C., Ríos S., Zhang M., Salje E.K.H. (2000) A TEM investigation of natural metamict zir-cons: Structure and recovery of amorphous domains. Physics and Chemistry of Minerals, Vol. 27, No. 8, pp. 545–556, http://dx.doi.org/10.1007/s002690000100
Clark C.D., Walker J. (1973) The neutral vacancy in diamond. Pro-ceedings of the Royal Society of London A: Mathematical, Physical and Engineering Sciences, Vol. 334, No. 1597, pp. 241–257, http://dx.doi.org/10.1098/rspa.1973.0090
De Silva N. (2008) Ekanite – discovery of a new rare gemstone by Mr FDL Ekanayake. http://jewelry-blog.internetstones.com/ekanite-discovery-of-a-new-rare-gemstone-by-mr-fdl-ekanayake/ (accessed April 19, 2022).
Demartin F., Gramaccioli C.M., Liborio G., Tumaini C. (1982) Ekan-ite nei proietti vulcanici di Pitigliano (Grosseto). Rendiconti della Società Italiana di Mineralogia e Petrologia, Vol. 38, No. 3, pp. 1401–1406.
deNeufville J.P., Kasdan A., Chimenti R.J.L. (1981) Selective de-tection of uranium by laser-induced fluorescence: a potential remote-sensing technique. 1: Optical characteristics of uranyl geologic targets. Applied Optics, Vol. 20, No. 8, pp. 1279–1296, http://dx.doi.org/10.1364/AO.20.001279
Dissanayake C.B., Rupasinghe M.S. (1993) A prospectors’ guide map to the gem deposits of Sri Lanka. G&G, Vol. 29, No. 3, pp. 173–181, http://dx.doi.org/10.5741/GEMS.29.3.173
Ewing R.C. (1994) The metamict state: 1993—The centennial. Nu-
clear Instruments and Methods in Physics Research Section B: Beam Interactions with Materials and Atoms, Vol. 91, No. 1-4, pp. 22–29, http://dx.doi.org/10.1016/0168-583X(94)96186-7
Ewing R.C., Chakoumakos B.C., Lumpkin G.R., Murakami T. (1987) The metamict state. MRS Bulletin, Vol. 12, No. 4, pp. 58–66, http://dx.doi.org/10.1557/S0883769400067865
Fritsch E., Megaw P.K.M., Spano T.L., Chauviré B., Rondeau B., Gray M., Hainschwang T., Renfro N. (2015) Green-luminescing hyalite opal from Zacatecas, Mexico. Journal of Gemmology, Vol. 34, No. 6, pp. 490–508.
Gaillou E., Delaunay A., Rondeau B., Bouhnik-le-Coz M., Fritsch E., Cornen G., Monnier C. (2008) The geochemistry of gem opals as evidence of their origin. Ore Geology Reviews, Vol. 34, No. 1-2, pp. 113–126, http://dx.doi.org/10.1016/j.oregeorev.2007.07.004
Gorobets B.S., Sidorenko G.A. (1974) Luminescence of secondary uranium minerals at low temperatures. Soviet Atomic Energy, Vol. 36, No. 1, pp. 5–12, http://dx.doi.org/10.1007/BF01123095
Greenidge D. (2018) Investigations of color center phenomena in topaz and quartz through electron spin resonance with reference to optical absorption and nuclear magnetic resonance: Implica-tions for extended mineral applications. Malaysian Journal of Fundamental and Applied Sciences, Vol. 14, pp. 142–149, http://dx.doi.org/10.11113/mjfas.v14n1-2.958
Gübelin E.J. (1961) Ekanite – another new metamict gem from Ceylon. G&G, Vol. 10, No. 6, pp. 163–179, 191.
Hamberg A. (1914) Die radioaktiven Substanzen und die geologische Forschung. Geologiska Föreningen i Stockholm Förhandlingar, Vol. 36, No. 1, pp. 31–96, http://dx.doi.org/10.1080/11035891309449550
Hyršl J. (2015) Gem News International: Moldavites: natural or fake? G&G, Vol. 51, No. 1, pp. 103–105.
Jones L.H. (1959) Determination of U-O bond distance in uranyl complexes from their infrared spectra. Spectrochimica Acta, Vol. 15, No. 6, pp. 409–411, http://dx.doi.org/10.1016/S0371-1951(59)80333-7
Kempe U., Trinkler M., Pöppl A., Himcinschi C. (2016) Coloration of natural zircon. The Canadian Mineralogist, Vol. 54, No. 3, pp. 635–660, http://dx.doi.org/10.3749/canmin.1500093
Kröner A., Rojas-Agramonte Y., Kehelpannala K.V.W., Zack T., Hegner E., Geng H.Y., Wong J., Barth M. (2013) Age, Nd–Hf iso-topes, and geochemistry of the Vijayan Complex of eastern and southern Sri Lanka: A Grenville-age magmatic arc of unknown derivation. Precambrian Research, Vol. 234, pp. 288–321,
REFERENCES

THE SHAPE OF EKANITE GEMS & GEMOLOGY SUMMER 2022 167
http://dx.doi.org/10.1016/j.precamres.2012.11.001 Mackey D.J., Runciman W.A., Vance E.R. (1975) Crystal-field calcu-
lations for energy levels of U4+ in ZrSiO4. Physical Review B, Vol. 11, pp. 211–218, https://dx.doi.org/10.1103/PhysRevB.11.211
Mahurin S.M., Dai S., Schumacher R.F. (2003) Spectroscopic de-termination of heterogeneities in uranyl-doped glasses. Journal of Non-Crystalline Solids, Vol. 325, No. 1-3, pp. 70–75, http://dx.doi.org/10.1016/S0022-3093(03)00364-8
Mathavan V., Fernando G.W.A.R. (2001) Reactions and textures in grossular-wollastonite-scapolite calc-silicate granulites from Ma-ligawila, Sri Lanka: Evidence for high-temperature isobaric cool-ing in the meta-sediments of the Highland Complex. Lithos, Vol. 59, No. 4, pp. 217–232, http://dx.doi.org/10.1016/S0024-4937(01)00057-3
Mathavan V., Kalubandara S.T., Fernando, G.W.A.R. (2000) Occur-rences of two new types of gem deposits in the Okkampitya gem field, Sri Lanka. Journal of Gemmology, Vol. 27, No. 2, pp. 65–72.
Merlet C. (1994) An accurate computer correction program for quan-titative electron probe microanalysis. Microchimica Acta, Vol. 114/115, pp. 363–376, http://dx.doi.org/10.1007/BF01244563
McGlynn S.P., Smith J.K. (1961) The electronic structure, spectra, and magnetic properties of actinyl ions. Part I. The uranyl ion. Journal of Molecular Spectroscopy, Vol. 6, No. 1, pp. 164–187, https://dx.doi.org/10.1016/0022-2852(61)90237-5
Mitchell R.K. (1954) Some notes on unusual gems. Journal of Gemmology, Vol. 4, No. 5, pp. 210–211.
——— (1961) Ekanite – Ceylon gemmologist discovers new min-eral. Journal of Gemmology, Vol. 8, No. 3, pp. 96–98.
Montel J.-M., Foret S., Veschambre M., Nicollet C., Provost A. (1996) Electron microprobe dating of monazite. Chemical Geol-ogy, Vol. 131, No. 1-4, pp. 37–53, http://dx.doi.org/10.1016/0009-2541(96)00024-1
Moulin C., Decambox P., Moulin V., Decaillon J.G. (1995) Ura-nium speciation in solution by time-resolved laser-induced flu-orescence. Analytical Chemistry, Vol. 67, No. 2, pp. 348–353, http://dx.doi.org/10.1021/ac00098a019
Murakami T., Chakoumakos B.C., Ewing R.C., Lumpkin G.R., Weber W.J. (1991) Alpha-decay event damage in zircon. Amer-ican Mineralogist, Vol. 76, No. 9-10, pp. 1510–1532.
Nasdala L., Lengauer C.L., Hanchar J.M., Kronz A., Wirth R., Blanc P., Kennedy A.K., Seydoux-Guillaume A.-M. (2002) Annealing radiation damage and the recovery of cathodoluminescence. Chemical Geology, Vol. 191, No. 1-3, pp. 121–140, http://dx.doi.org/10.1016/S0009-2541(02)00152-3
Nasdala L., Kronz A., Wirth R., Váczi T., Pérez-Soba C., Willner A., Kennedy A.K. (2009) The phenomenon of deficient electron mi-croprobe totals in radiation-damaged and altered zircon. Geochim-ica et Cosmochimica Acta, Vol. 73, No. 6, pp. 1637–1650, http://dx.doi.org/10.1016/j.gca.2008.12.010
Nasdala L., Grambole D., Wildner M., Gigler A.M., Hainschwang T., Zaitsev A.M., Harris J.W., Milledge J., Schulze D.J., Hofmeister W., Balmer W.A. (2013) Radio-colouration of diamond: A spectroscopic study. Contributions to Mineralogy and Petrology, Vol. 165, No. 5, pp. 843–861, http://dx.doi.org/10.1007/s00410-012-0838-1
Nasdala L., Corfu F., Blaimauer D., Chanmuang C., Ruschel K., Škoda R., Wildner M., Wirth R., Zeug M., Zoysa E.G. (2017) Neoproterozoic amorphous “ekanite” (Ca2Th0.9U0.1Si8O20) from Okkampitiya, Sri Lanka: A metamict gemstone with excellent lead-retention performance. Geology, Vol. 45, No. 10, pp. 919–922, http://dx.doi.org/10.1130/G39334.1
Othmane G., Allard T., Vercouter T., Morin G., Fayek M., Calas G. (2016) Luminescence of uranium-bearing opals: Origin and use as a pH record. Chemical Geology, Vol. 423, pp. 1–6, http://dx.doi.org/10.1016/j.chemgeo.2015.12.010
Pointer C.M., Ashworth J.R., Ixer R.A. (1988) The zircon-thorite min-eral group in metasomatized granite, Ririwai, Nigeria 2. Zoning, alteration and exsolution in zircon. Mineralogy and Petrology, Vol. 39, No. 1, pp. 21–37, http://dx.doi.org/10.1007/BF01226260
Prior D.J., Trimby P.W., Weber U.D., Dingley D.J. (1996) Orienta-
tion contrast imaging of microstructures in rocks using forescatter detectors in the scanning electron microscope. Min-eralogical Magazine, Vol. 60, No. 403, pp. 859–869, http://dx.doi.org/10.1180/minmag.1996.060.403.01
Richman I., Kisliuk P., Wong E.Y. (1967) Absorption spectrum of U4+ in zircon (ZrSiO4). Physical Review, Vol. 155, No. 2, pp. 262–267, https://dx.doi.org/10.1103/PhysRev.155.262
Russo M., Campostrini I., Demartin F. (2013) Nuove specie minerali al Monte Somma: V. L'ekanite. Micro, Vol. 11, pp. 142–144.
Sameera K.A.G., Fernando G.W.A.R., Dharmapriya P.L. (2020a) First report on in-situ occurrences of ekanite from Galle, south-western Highland Complex, Sri Lanka. In N.H. Koralegedara and A. Ratnayake, Eds., Proceedings of the 36th Annual Tech-nical Sessions “Global Challenges and the Role of Geologists.” Geological Society of Sri Lanka, p. 3.
Sameera K.A.G., Wickramasinghe W.A.G.K., Harankahawa S.B., We-likanna C.R., de Silva K.T.U.S. (2020b) Radiometric surveying for Th and U mineralization in southwestern, Sri Lanka: Radiologi-cal, mineralogical and geochemical characteristics of the radioac-tive anomalies. Journal of the Geological Society of Sri Lanka, Vol. 21, No. 2, pp. 57–80, http://dx.doi.org/10.4038/jgssl.v21i2.49
Škoda R., Plášil J., Jonsson E., Copjaková R., Langhof J., Vašinová Galiová M. (2015) Redefinition of thalénite-(Y) and discredita-tion of fluorthalénite-(Y): A re-investigation of type material from the Österby pegmatite, Dalarna, Sweden, and from addi-tional localities. Mineralogical Magazine, Vol. 79, No. 4, pp. 965–983, http://dx.doi.org/10.1180/minmag.2015.079.4.07
Smith G. (1978) Evidence for absorption by exchange-coupled Fe2+–Fe3+ pairs in the near infra-red spectra of minerals. Physics and Chemistry of Minerals, Vol. 3, No. 4, pp. 375–383, http://dx.doi.org/10.1007/BF00311848
Suzuki K., Kato T. (2008) CHIME dating of monazite, xenotime, zircon and polycrase: Protocol, pitfalls and chemical criterion of possibly discordant age data. Gondwana Research, Vol. 14, No. 4, pp. 569–586, http://dx.doi.org/10.1016/j.gr.2008.01.005
Szymański J.T., Owens D.R., Roberts A.C., Ansell H.G., Chao G.Y. (1982) A mineralogical study and crystal-structure determina-tion of nonmetamict ekanite, ThCa2Si8O20. The Canadian Min-eralogist, Vol. 20, No. 1, pp. 65–75.
Tennakone K. (2011) Thorium minerals in Sri Lanka, history of ra-dioactivity and thorium as a future energy source: A compendium to commemorate the International Year of Chemistry 2011. Jour-nal of the National Science Foundation of Sri Lanka, Vol. 39, No. 2, pp. 97–111, http://dx.doi.org/10.4038/jnsfsr.v39i2.3170
Walstrom R.E., Dunning G.E. (2003) The Baumann Prospect, Chickencoop Canyon, Tulare County, California. Mineralogi-cal Record, Vol. 34, pp. 159–166.
Wang Z., Zachara J.M., Liu C., Gassman P.L., Felmy A.R., Clark S.B. (2008) A cryogenic fluorescence spectroscopic study of uranyl carbonate, phosphate and oxyhydroxide minerals. Ra-diochimica Acta, Vol. 96, No. 9-11, pp. 591–598, http://dx.doi.org/10.1524/ract.2008.1541
Zeug M., Ruschel K., Blaimauer D., Lengauer C.L., Nasdala L. (2015) Effects of radiation damage on the Nd3+ luminescence of ekanite, ThCa2Si8O20. In G.B. Andreozzi and F. Bosi, Eds., Pro-ceedings of the 8th European Conference on Mineralogy and Spectroscopy, Rome, Italy, September 9–11, 2015. Periodico di Mineralogia, Vol. 84, pp. 197–198.
Zeug M., Nasdala L., Wanthanachaisaeng B., Balmer W.A., Corfu F., Wildner M. (2018) Blue zircon from Ratanakiri, Cambodia. Journal of Gemmology, Vol. 36, No. 2, pp. 112–132.
Zhang M., Salje E.K.H., Farnan I., Graeme-Barber A., Daniel P., Ewing R.C., Clark A.M., Leroux H. (2000) Metamictization of zircon: Raman spectroscopic study. Journal of Physics: Con-densed Matter, Vol. 12, No. 8, pp. 1915–1925, http://dx.doi.org/10.1088/0953-8984/12/8/333
Ziebold T.O. (1967) Precision and sensitivity in electron micro-probe analysis. Analytical Chemistry, Vol. 39, No. 8, pp. 858–861, http://dx.doi.org/10.1021/ac60252a028

168 STUDY OF GEMS FROM THE CROWN OF NAPOLEON III GEMS & GEMOLOGY SUMMER 2022
The collection of the French crown jewels was established on June 15, 1530, by Francis I and enriched by later kings and emperors, such as
Henry II, Henry IV, Louis XIV, Napoleon I, Louis XVIII, and Napoleon III. This important collection of loose gemstones and high-end jewelry included many significant gems: the Regent, Grand Sancy, and French Blue (later Hope) diamonds; the Grand Sapphire; and the Côte de Bretagne red spinel (see Bapst, 1889 and Morel, 1988 for details on the col-lection and its history). It is worth mentioning that most of the jewels were kept as individual stones and used in custom settings designed for each new sovereign, and then dismantled again when a succes-sor came to power.
After the end of the French Empire, the crown jewels were exhibited twice in Paris, in 1878 at the Exposition Universelle (World’s Fair) and in 1884 in the State Room at the Louvre. Both exhibitions
were heavily guarded and attracted large crowds of admirers. However, the popularity of the two events did not prevent the unprecedented sale of this na-tional treasure.
During the French Third Republic, most of the crown jewels were dismantled and sold at an auction at the Louvre, held May 12–23, 1887. The auction was intended to get rid of these symbols of royalty and empire. Some unset gems, however, were put
A GEMOLOGICAL AND SPECTROSCOPIC STUDY WITH MOBILE INSTRUMENTS OF “EMERALDS” FROM THE CORONATION CROWN OF NAPOLEON III Stefanos Karampelas, Eloïse Gaillou, Annabelle Herreweghe, Farida Maouche, Ugo Hennebois, Sophie Leblan, Bérengère Meslin Sainte Beuve, Michel Lechartier, Didier Nectoux, and Aurélien Delaunay
FEATURE ARTICLES
Forty-five “emeralds,” formerly set in the coronation crown of Napoleon III, were studied using nondestructive mobile spectroscopic and gemological means. Adorned with emeralds, diamonds, and gold, the crown was cre-ated in 1855 by royal jeweler Alexandre Gabriel Lemonnier but dismantled in 1887 for the auctioning of the French crown jewels. Some of the emeralds were donated to the École des Mines (Paris School of Mines, now known as Mines Paris - PSL) in 1887, prior to the auction. Our examination revealed that 41 out of 45 gems were indeed natural emeralds, presenting no evidence of clarity enhancement. Their gemological characteristics and age suggest a Colombian provenance. The other four samples were determined to be artificial glass con-taining iron and/or copper and possibly other chromophores. These glass imitations could have been set when the crown was created or shortly thereafter. This study is part of an effort to examine gemstones of historical meaning and significance worldwide.
In Brief • Forty-five “emeralds” formerly set in the coronation
crown of Napoleon III were studied with nondestruc-tive mobile gemological and spectroscopic means.
• Of these, 41 samples were found to be natural emer-alds from Colombia without clarity enhancement.
• Four samples were found to be artificial glass con-taining iron and/or copper and possibly other chromo phores; no evidence of recently fabricated glass was found.
See end of article for About the Authors and Acknowledgments. GEMS & GEMOLOGY, Vol. 58, No. 2, pp. 168–183, http://dx.doi.org/10.5741/GEMS.58.2.168 © 2022 Gemological Institute of America

aside and given to various French museums, includ-ing the French Natural History Museum, the Louvre, and the École des Mines, all in Paris. On February 8, 1887, the École des Mines received two small dia-monds, 915 pearls, 96 Colombian emeralds, 177 Siberian amethysts, and 59 Brazilian pink topazes (figure 1). For additional historical background on the French crown jewels, see Morel (1988).
Since the late twentieth century, the Louvre has bought back a few pieces of jewelry, which are on ex-hibit at the Apollo Gallery and in the Apartments of Napoleon III. The National Museum of Natural His-tory in Paris displays its loose gems from the French
crown jewels as part of the “Earth’s Treasures” ex-hibit. Most of the other gems and jewels are still in private collections, though a few have found their way into museums, including the Napoleon dia-mond necklace (Gaillou and Post, 2007) and the Hope diamond (Patch, 1976; Balfour, 1987; Post and Farges, 2014) at the Smithsonian Institution in Wash-ington, DC.
This article presents the results of research con-ducted on emeralds formerly mounted in Napoleon III’s coronation crown. It follows previous scientific articles dedicated to the study of historic gems in mu-seums worldwide (e.g., Bosshart, 1989; Kane et al.,
STUDY OF GEMS FROM THE CROWN OF NAPOLEON III GEMS & GEMOLOGY SUMMER 2022 169
Figure 1. The original document detailing the donation of the unset gems from the French crown jewels to the École des Mines, dated February 8, 1887. There are three lines in the list-ing that mention emer-ald: 46 beads of emerald (not part of this study), 16 emeralds weighing 16.79 carats total, and 34 small emeralds weighing 10.03 carats total. Catalog no. M.4849, year 1887, ENSMP Mineralogy Mu-seum collection. Photo by Didier Nectoux; © Museum of Mineralogy, Mines Paris - PSL.

1990; Fritsch et al., 2007; Gaillou and Post, 2007; Gail-lou et al., 2010, 2012, 2022; Galopim de Carvalho, 2014; Post and Farges, 2014; Farges et al., 2015). These gems from the crown were kept in the vault of the museum of the École des Mines in Paris until 2016, when the museum opened an exhibition of gems from the French crown jewels. The present paper is part of an ongoing project on the study of the gems previously adorning historic jewels, led by the French Gemmo-logical Laboratory (LFG) and the Museum of Mineral-ogy, Mines Paris - PSL, which owns the gems.
The crown (figure 2, left) was created in 1855 by royal jeweler Alexandre-Gabriel Lemonnier and pre-sented at the “Exposition Universelle” in Paris the same year. Lemonnier’s very similar crown for Em-press Eugénie is shown in figure 2 (right). Napoleon III’s crown was adorned at the bottom part with eight large emeralds ranging from 14.5 to 23.7 ct (with a total weight of more than 150 carats) as well as eight large diamonds weighing 17.00 to 26.33 ct that were previously mounted in another royal crown. These diamonds included the 19.07 ct Grand Mazarin, the 19.22 ct De Guise, and the 25.53 ct Fleur-de-Pêcher. Fifty smaller “emeralds” were also incorporated: 34
rectangular step-cut stones forming an equator around the globe atop the crown (and topped with a diamond cross) with a total weight of 10.03 carats, and 16 round and oval brilliant-cut stones circling the midsection, with a total weight of 17.26 carats. Morel (1988, p. 338) notes that shortly after the crown’s creation, the eight large diamonds were re-moved and later used in other jewels of Empress Eu-génie, replaced by “strass” (artificial glass, possibly containing lead) imitations. Morel also noted that the emeralds were left set in the crown.
Five years after the fall of the empire, the eight large emeralds were restituted to Empress Eugénie on October 5, 1875. In 1887, Napoleon III’s crown was melted down and the stones were separated into different suites. During the auction of the French crown jewels in May 1887, the eight large diamonds were sold to the highest bidder (the diamond cross was sold to the jeweler Boucheron earlier that year). The 50 smaller “emeralds” were part of the donation to the École des Mines. Today, 33 of the 34 gems from the upper part of the crown as well as 12 of the 16 gems from the midsection are cataloged in the Museum’s collection, and these are presented below.
170 STUDY OF GEMS FROM THE CROWN OF NAPOLEON III GEMS & GEMOLOGY SUMMER 2022
Figure 2. Left: A reproduction of the crown of Napoleon III, displayed at the Abeler collection of crowns and re-galia in Wuppertal, Germany. Modified from Wikimedia Commons. Right: The royal jeweler Lemonnier also pro-duced a very similar crown for Empress Eugénie in 1855. Photo by Stéphane Maréchalle; courtesy of RMN-Grand Palais (Louvre Museum).

MATERIALS AND METHODS Examined here are the 45 green stones, reportedly emeralds, that were donated during the Third Repub-lic’s historical deposit of 1887 into the collection of the École des Mines (formally the École Normale Supérieure des Mines de Paris, or ENSMP), now called Mines Paris - PSL. The catalog numbers of the school’s mineral, gem, meteorite, and rock collection still bear the initials “ENSMP,” all entered under a single catalog number: all entered under a single old catalog number: M. 4849.
This study investigates some of the 96 emeralds that were part of this original donation; the 46 emer-ald beads are excluded. We only focus on the gems mentioned as “16 emeralds of 16.79 carats” and “34 emeralds of 10.03 carats” in total weight (see again figure 1), as these can be traced back to the corona-tion crown of Napoleon III. Among the 50 emeralds donated in 1887, 45 of them are still in the museum’s collection, the curators having no record of the re-maining five.
As the ENSMP collection has evolved over the 135 years since the gems from the crown jewels ar-rived, the donation that was deposited under a single reference number was dispatched into several catalog numbers. The 50 emeralds from Napoleon III’s crown were divided into three series. The first series con-sists of the previously mentioned 34 emeralds from the top part of the crown, under the name ENSMP 69880, 33 of which are still in the collection (figure 3 and table 1; note that sample ENSMP 69880_5 is missing). The second series of 16 emeralds from the midsection of the crown was split into at least two catalog numbers—four stones under ENSMP 69881 and eight under ENSMP 69866 (figure 4 and table 1)—while the last four remain missing. The reason for splitting this second series is not clear, but as we will see later, series ENSMP 69881 has characteris-tics unlike the others.
As the set of 45 samples is considered a national treasure, the project had to be conducted on-site at the Museum of Mineralogy, Mines Paris - PSL. Be-
STUDY OF GEMS FROM THE CROWN OF NAPOLEON III GEMS & GEMOLOGY SUMMER 2022 171
Figure 3. The 33 emeralds of suite ENSMP 69880, originally set in the crown of Napoleon III, ranging from 0.180 to 0.408 ct. Photo by Eloïse Gaillou; © Museum of Mineralogy, Mines Paris - PSL.

172 STUDY OF GEMS FROM THE CROWN OF NAPOLEON III GEMS & GEMOLOGY SUMMER 2022
TABLE 1. Properties of samples from the crown of Napoleon III.
Reference number Weight (ct) Dimensions (mm) Shape/Cutting Style
ENSMP 69866_1 1.156 7.12–7.19 × 3.48 Round/Brilliant
ENSMP 69866_2 1.071 7.11–7.22 × 3.42 Round/Brilliant
ENSMP 69866_3 0.955 6.90 × 6.23 × 3.67 Oval/Brilliant
ENSMP 69866_4 1.339 7.06–7.18 × 4.11 Round/Brilliant
ENSMP 69866_5 1.036 7.10–7.21 × 3.23 Round/Brilliant
ENSMP 69866_6 0.929 6.92–7.13 × 3.10 Round/Brilliant
ENSMP 69866_7 1.091 6.95–7.19 × 3.40 Round/Brilliant
ENSMP 69866_8 0.854 6.93–7.07 × 3.07 Round/Brilliant
ENSMP 69880_1 0.366 4.67 × 3.73 × 3.05 Rectangular/Step
ENSMP 69880_2 0.299 4.43 × 3.78 × 2.45 Rectangular/Step
ENSMP 69880_3 0.408 4.77 × 3.81 × 3.23 Rectangular/Step
ENSMP 69880_4 0.293 4.44 × 3.59 × 2.65 Rectangular/Step
ENSMP 69880_6 0.305 4.60 × 3.69 × 2.52 Rectangular/Step
ENSMP 69880_7 0.317 4.48 × 3.72 × 2.71 Rectangular/Step
ENSMP 69880_8 0.310 4.14 × 3.85 × 3.03 Rectangular/Step
ENSMP 69880_9 0.342 4.38 × 3.71 × 2.91 Rectangular/Step
ENSMP 69880_10 0.358 4.65 × 3.73 × 2.90 Rectangular/Step
ENSMP 69880_11 0.214 3.86 × 3.42 × 2.47 Rectangular/Step
ENSMP 69880_12 0.364 4.54 × 3.72 × 3.03 Rectangular/Step
ENSMP 69880_13 0.361 4.62 × 3.70 × 3.10 Rectangular/Step
ENSMP 69880_14 0.303 4.67 × 3.67 × 2.66 Rectangular/Step
ENSMP 69880_15 0.343 4.44 × 3.68 × 2.91 Rectangular/Step
ENSMP 69880_16 0.344 4.61 × 3.70 × 2.80 Rectangular/Step
ENSMP 69880_17 0.315 4.60 × 3.64 × 2.48 Rectangular/Step
ENSMP 69880_18 0.371 4.63 × 3.74 × 3.06 Rectangular/Step
ENSMP 69880_19 0.331 4.54 × 3.66 × 2.84 Rectangular/Step
ENSMP 69880_20 0.236 3.88 × 3.45 × 2.44 Rectangular/Step
ENSMP 69880_21 0.317 4.47 × 3.69 × 2.81 Rectangular/Step
ENSMP 69880_22 0.381 4.70 × 3.71 × 3.18 Rectangular/Step

cause of this constraint, the samples were studied using LFG’s mobile spectrometers as well as classical
gemological tools. The samples and their dimensions are listed in table 1. All samples were examined with
STUDY OF GEMS FROM THE CROWN OF NAPOLEON III GEMS & GEMOLOGY SUMMER 2022 173
TABLE 1 (continued). Properties of samples from the crown of Napoleon III.
Reference number Weight (ct) Dimensions (mm) Shape/Cutting Style
ENSMP 69880_23 0.318 4.54 × 3.61 × 2.64 Rectangular/Step
ENSMP 69880_24 0.297 4.61 × 3.64 × 2.54 Rectangular/Step
ENSMP 69880_25 0.240 3.87 × 3.47 × 2.68 Rectangular/Step
ENSMP 69880_26 0.327 4.55 × 3.69 × 2.75 Rectangular/Step
ENSMP 69880_27 0.245 3.91 × 3.65 × 2.57 Rectangular/Step
ENSMP 69880_28 0.229 3.90 × 3.40 × 2.56 Rectangular/Step
ENSMP 69880_29 0.217 3.93 × 3.81 × 2.09 Rectangular/Step
ENSMP 69880_30 0.287 3.97 × 3.50 × 3.02 Rectangular/Step
ENSMP 69880_31 0.233 4.34 × 3.88 × 2.08 Rectangular/Step
ENSMP 69880_32 0.247 3.91 × 3.62 × 2.42 Rectangular/Step
ENSMP 69880_33 0.221 3.91 × 3.61 × 2.27 Rectangular/Step
ENSMP 69880_34 0.180 3.83 × 3.67 × 1.88 Rectangular/Step
ENSMP 69881_1 0.939 5.86–5.87 × 4.04 Round/Brilliant
ENSMP 69881_2 0.703 5.28–5.39 × 3.83 Round/Brilliant
ENSMP 69881_3 0.929 5.84–5.87 × 3.98 Round/Brilliant
ENSMP 69881_4 0.919 5.80–5.83 × 3.92 Round/Brilliant
Figure 4. A: The eight emeralds from suite ENSMP 69866, ranging from 0.854 to 1.339 ct. B: The four stones from suite ENSMP 69881, weighing from 0.703 to 0.939 ct. Photos by Eloïse Gaillou; © Museum of Mineralogy, Mines Paris - PSL.
A B

classic gemological tools. Observation was performed using a Zeiss Stemi 508 binocular microscope (mag-nification up to 80×) equipped with a fiber-optic light source and an incorporated camera to acquire photos all mounted on an Eickhorst Gemmaster base. Lumi-nescence was examined using a 6-watt ultraviolet lamp (Vilber Lourmat VL-6.LC) with long-wave UV (365 nm) and short-wave UV (254 nm) light, equipped with a CN-6 darkroom (10 cm distance between the sample and the lamp). Refractive indexes were taken with a refractometer and mass and density with a hydro static balance.
Raman and photoluminescence (PL) spectra were obtained using a mobile Raman spectrometer (Magi-labs GemmoRaman-532SG) with a 532 nm laser exci-tation and spectral resolution of 11 cm–1, ranging for Raman spectra from 200 to 2000 cm–1 (with 1 second exposure time and 4 accumulations) and for PL spectra from 540 to 760 nm (0.3 to 0.4 second exposure time and 30 accumulations). All spectra were acquired with the laser pointing at the table, the flattest part of the stone. Calibration of the Raman spectrometer was made with a diamond, using its 1331.8 cm–1 Raman line. Due to this study requiring the use of a mobile instrument, the spectral resolution was over 10 cm–1. This precluded us from reaching a conclusion regard-ing the alkali content, which would have required the use of the exact position and full width at half maxi-mum of the band at 1070 cm–1 to differentiate emeralds containing either low or high concentrations of alkali elements (Huong et al., 2014; Bersani et al., 2014; Jehlička et al., 2017; Karampelas et al., 2019). Indeed, in order to obtain the real shape of this band, relatively high spectral resolution (<2 cm–1) must be used in the acquisition of the Raman spectra. Moreover, the spec-tral resolution of the instrument could also affect the exact position of the PL bands. For example, if the spec-tral resolution is not optimal, the real shape of the band is not obtained and it appears broader and in slightly shifted positions. The suggestion that the exact posi-tion of the Cr3+ R1 line can give information regarding an emerald’s country of origin (Moroz et al., 2000; Thomson et al., 2014) should be considered with cau-tion. Visible/near-infrared (Vis-NIR) spectra were ac-quired from 365 to 1000 nm using a mobile instrument (0.05 to 0.10 seconds acquisition time and 50 accumu-lations) with an integrating sphere (Magilabs Gemmos-phere). Fourier-transform infrared (FTIR) spectra were obtained with a mobile instrument (Bruker Alpha II) in the 400 to 8000 cm–1 range (4 cm–1 spectral resolu-tion and 100 scans) using a DRIFT accessory as a beam condenser (Hainschwang et al., 2006).
RESULTS AND DISCUSSION
Gemological Properties and Appearance. Dimen-sions, weights, and shapes and cutting styles of the 45 examined samples are presented in table 1. The first suite of 33 gems (ENSMP 69880) consists of rec-tangular step cuts, weighing from 0.180 to 0.408 ct (figure 3). The total weight of the 33 samples from series ENSMP 69880 is 9.919 carats instead of the 10.030 carats mentioned in the archives, registering all 34 original samples. The second suite (ENSMP 69866) is composed of eight roundish brilliants (one with a more oval shape), weighing from 0.854 to 1.339 ct, for a total weight of 8.431 carats (figure 4A). The last suite (ENSMP 69881) is composed of four round brilliants weighing from 0.703 to 0.939 ct (fig-ure 4B), for a total weight of 3.49 carats.
All 33 rectangular gems of suite ENSMP 69880 (figure 3) and all eight roundish gems of suite ENSMP 69866 (figure 4A) presented a vivid green color. The four round-shaped stones from suite ENSMP 69881 displayed instead an intense green with a slightly yel-lowish tint (figure 4B). The refractive index of sam-ples from series ENSMP 69866 and ENSMP 69880 varied from 1.570 to 1.588, and their specific gravity values from 2.60 to 2.75, consistent with beryl. The color observed for those samples was consistent with the emerald variety of beryl. All samples were inert under UV lamp excitation, except for one (ENSMP 69866_3) that exhibited a weak red fluorescence to long-wave UV only. This difference in fluorescence behavior could be explained by a slightly larger ratio of chromium to iron in this emerald; fluorescence is present when the ratio is significant and becomes less intense with a decrease in chromium to iron ratio (Bosshart, 1991b).
Samples from series ENSMP 69881 presented completely different characteristics: a refractive index of about 1.64, a specific gravity between 3.56 and 3.78 (depending on the stone), and a chalky yel-lowish fluorescence that was weaker to long-wave UV than to short-wave UV. The RI, SG, and UV re-action are similar to those observed in artificial glass containing lead (Nassau, 1980; Webster and Ander-son, 1983).
Macroscopic and Microscopic Observations. Stan-dard macroscopic observation revealed surface-reach-ing cracks in some samples (figure 5). This could be attributed to multiple uses of gems in different jew-elry pieces over time. This practice of reusing gem-stones from the French crown jewels, sometimes
174 STUDY OF GEMS FROM THE CROWN OF NAPOLEON III GEMS & GEMOLOGY SUMMER 2022

even recutting them, is well known (e.g., Bapst, 1889; Morel, 1988). The purpose was to create contempo-rary pieces of jewelry in style with the era, which then could be used by the new ruler. Interestingly, sample ENSMP 69881_3 shows a conchoidal fracture (figure 5D).
Under the microscope, samples from suites ENSMP 69866 and ENSMP 69880 (41 of the 45 stud-ied samples) presented natural features such as multi -phase inclusions with jagged outlines, color zoning, transparent crystals (possibly carbonates), and gota de aceite (Spanish for “drop of oil”) patterns (figures 6
STUDY OF GEMS FROM THE CROWN OF NAPOLEON III GEMS & GEMOLOGY SUMMER 2022 175
Figure 5. Photos of speci-mens from this study presenting visible cracks and fractures, possibly due to multiple uses in jewelry. A: ENSMP 69866_3 (0.955 ct). B: ENSMP 69880_2 (0.299 ct). C: ENSMP 69880_6 (0.305 ct). D: ENSMP 69881_3 (0.929 ct). Pho-tos by B.M.S. Beuve/LFG (A) and U. Henne -bois/LFG (B–D); © Museum of Mineral-ogy, Mines Paris - PSL.
A B
C D
Figure 6. A: Color zon-ing observed in ENSMP 69880_9; field of view 2 mm. B and C: Multi-phase inclusions with jagged outlines observed in ENSMP 69880_23 and in ENSMP 69866_4; fields of view 1.2 and 0.5 mm, respectively. D: A transparent crystal (possibly a carbonate) observed in ENSMP 69880_22; field of view 1 mm. Photomicrographs by Ugo Hennebois/LFG; © Museum of Mineral-ogy, Mines Paris - PSL.
A B
C D

and 7). Inclusions with jagged outlines are observed in natural emeralds from Colombia and occasionally from Afghanistan, China, and a small occurrence in Zambia (specifically from Musakashi and not the more productive Kafubu deposits), as well as mines of more academic interest (Bosshart, 1991b; Saeseaw et al., 2014, 2019; Schmetzer, 2014; Krzemnicki et al., 2021). The gota de aceite appearance such as that ob-served in ENSMP 69866_2 (figure 7) is documented in emeralds from Colombia but seldom observed in emeralds from other origins (Ringsrud, 2008; Hain-schwang, 2010; Fritsch et al., 2017). These structures display octagonal color zoning due to fibrous growth at a fast growth rate, followed by a later growth episode, possibly slower, which filled the space be-tween the fibers. The gota de aceite appearance is most likely due to light scattering at the irregular in-terface between the two growth episodes (Fritsch et al., 2017). No indications of treatment, such as the clarity enhancement applied to emerald since well be-fore the fourteenth century (Johnson et al., 1999; Kiefert et al., 1999), were observed microscopically in any of these samples. The four samples from suite ENSMP 69881 presented no mineral inclusions. Only
one displayed “flow patterns” (figure 8), along with bubbles characteristic of glass (Webster and Anderson, 1983; Gübelin and Koivula, 1986).
Raman Spectroscopy. Raman spectra of three repre-sentative samples, from suites ENSMP 69866 and ENSMP 69880, are presented in figure 9A. Spectra showed bands typical of beryl. The vibration at around 685 cm–1 is linked to Be-O stretching; at around 1070 cm–1, the vibration is related to Si-O and/or Be-O stretching, along with a less intense band at around 1010 cm–1 due to Si-O stretching. The weaker bands between 200 and 600 cm–1 are linked to Si6O18 ring vibrations (Adams and Gardner, 1974; Hagemann et al., 1990; Kim et al., 1995; Moroz et al., 2000; Bersani et al., 2014; Jehlička et al., 2017). The spectra presented some differences in the relative in-tensities of the Raman bands (see again figure 9A). These result from the different crystallographic ori-entations in which the gems are cut and the spectra acquired. The band at around 685 cm–1 is the most in-tense, with the bands at around 1010 and 1070 cm–1 having a similar intensity (e.g., sample ENSMP 69880_3, red line in figure 9A) when the spectrum is acquired with the laser beam parallel to the c-axis of the crystal. When spectra are acquired with the laser perpendicular to the c-axis of the crystal (e.g., sample ENSMP 69866_1, black line in figure 9A), the band at 1070 cm–1 is slightly more intense than that at 685 cm–1, while the band at around 1010 cm–1 is signifi-cantly less intense (Moroz et al., 2000; Bersani et al., 2014; Jehlička et al., 2017; Karampelas et al., 2019). All samples from suites ENSMP 69866 and ENSMP 69880 (representing 41 of the 45 samples) showed the
176 STUDY OF GEMS FROM THE CROWN OF NAPOLEON III GEMS & GEMOLOGY SUMMER 2022
Figure 7. Gota de aceite structures observed in ENSMP 69866_2; field of view 1.5 mm. Photo -micrograph by Ugo Hennebois/LFG; © Museum of Mineralogy, Mines Paris - PSL.
Figure 8. These “flow patterns” were observed in ENSMP 69881_3; field of view 2 mm. Photo -micrograph by Ugo Hennebois/LFG; © Museum of Mineralogy, Mines Paris - PSL.

beryl-related Raman bands, which only differ in rel-ative intensity.
Raman spectra of all samples from suites ENSMP 69866 and ENSMP 69880 presented strong lumines-cence phenomena above 2000 cm–1 (i.e., from the yel-low to the red part of the electromagnetic spectrum). For that reason, it was impossible using this instru-ment to study the type I water (lacking a nearby al-kali ion) and type II water (with alkali ions nearby) vibrations appearing at around 3609 and 3598 cm–1, respectively (Huong et al., 2010; Bersani et al., 2014; Jehlička et al., 2017; Karampelas et al., 2019).
Raman spectra of two of the four samples from suite ENSMP 69881 are presented in figure 9B. The spectra showed broad bands at slightly different po-sitions, similar to those observed in glassy silicates, with Si-O stretching and bending and corresponding Raman bands at around 1000 cm–1 and 500 cm–1, re-spectively (Colomban et al., 2006). Glasses are rela-tively poor Raman scatterers, and the signal-to-noise ratio of the mobile Raman instrument did not allow us to draw clear conclusions; however, the spectra are similar to those observed in lead glass (Colomban et al., 2006; Robinet et al., 2006; Ben Kacem et al., 2017). This kind of glass (e.g., “flint glass,” which may display a relatively high refractive index—up to
2.00, depending on lead content—and dispersion) is known to have been manufactured for several cen-turies (Ben Kacem et al., 2017).
Photoluminescence Spectroscopy. PL spectra of all ENSMP 69866 and ENSMP 69880 samples presented a sharp band at around 680 nm and another more in-tense sharp band at around 684 nm. These emission bands are linked to Cr3+ R2 and R1 lines, respectively, in the beryl structure. They are accompanied by a broad band in the red part of the visible range, centered around 710 nm (see two examples in figure 10A), pos-sibly also linked to chromium (Wood, 1965; Moroz et al., 2000; Thomson et al., 2014). Positions and relative intensities of the R lines presented some orientation effects (see again figure 10A). In the studied samples, the R1 line ranged from 683.7 to 683.9 nm, similar to some emeralds from Colombia as well as some from Russia and Afghanistan (Thomson et al., 2014; Karam-pelas et al., 2019).
The four ENSMP 69881 samples presented a broad PL band at 560 nm with a shoulder at around 580 nm, less intense for sample ENSMP 69881_2 (fig-ure 10B, black line), along with a broader band cen-tered at around 700 to 710 nm, with different relative intensities for the two samples (see again figure 10B).
STUDY OF GEMS FROM THE CROWN OF NAPOLEON III GEMS & GEMOLOGY SUMMER 2022 177
Figure 9. Raman spectra obtained using a mobile instrument with 532 nm laser excitation, in the range of 200 to 1200 cm–1, of some typical samples (all spectra are shifted for clarity). A: Typical spectra for the ENSMP 69866 and 69880 suites, showing vibrations characteristic of beryl. The differences from spectrum to spectrum are due to dif-ferent crystallographic orientations of the gems; the spectrum of 69866_1 is obtained nearly perpendicular to the c-axis, and the spectrum of 69880_3 is obtained nearly parallel to the c-axis. B: Typical spectra for the ENSMP 69881 suite, showing large bands sometimes detected in glass, centered at slightly different positions.
200 400 600 800 1000 1200 200 400 600 800 1000 1200
685
1010
1070480
490
790
775
960
975 1040
1030
RAMAN SHIFT (cm–1) RAMAN SHIFT (cm–1)
RAMAN SPECTRA
INTE
NSI
TY
INTE
NSI
TY
A BENSMP 69866_1ENSMP 69880_17ENSMP 69880_3
ENSMP 69881_1ENSMP 69881_2

The bands in the green part are possibly due to oxy-gen deficiency–related centers (Skuja, 1998). In the red part of the spectra, the observed bands might be due to non-bridging oxygen-hole centers in glass (Sakurai et al., 1999). Green luminescence under UV light can be found in glass imitations of gems (Web-ster and Anderson, 1983).
Visible/Near-Infrared (Vis-NIR) Spectroscopy. Two typical Vis-NIR spectra of samples from suites ENSMP 69866 and ENSMP 69880 are shown in figure 11A. All 41 stones from these suites presented similar spectra. The broad absorptions at around 430 and 610 nm are both linked to Cr3+ and V3+ in beryl. The two sharp bands of weak intensity at around 680 nm are due to Cr3+ R1 and R2 lines. No absorptions linked to iron are observed in the near-infrared part of the elec-tromagnetic spectrum (Wood and Nassau, 1968; Bosshart, 1991b; Saeseaw et al., 2014, 2019; Schmet-zer, 2014). Most natural emeralds from Colombia, as well as some from Afghanistan and a small occur-rence recently discovered in Zambia, present spectra without any absorption linked to iron, or with low- to medium-intensity bands linked to iron in the NIR region (Bosshart, 1991b; Saeseaw et al., 2014, 2019; Giuliani et al., 2019; Giuliani and Groat, 2019; Karampelas et al., 2019; Krzemnicki et al., 2021). The
slight differences in position and relative intensity of the absorption bands are also due to crystallographic orientation effects. The small sharp band at around 960 nm is due to the presence of water in beryl.
Figure 11B presents two Vis-NIR spectra of the suite of four ENSMP 69881 specimens, all four spec-tra being similar in shape. A large absorption band centered at around 800 nm due to Fe2+ and/or Cu2+ is observed, along with a total absorption (cut off) from 380 to 400 nm due to Fe3+ (or Fe3+-S2−) and a transmis-sion window in the green part of the visible range at around 510 nm (Schreurs and Brill, 1984; Carl et al., 2007; Meulebroeck et al., 2010, 2011). Using this mo-bile Vis-NIR instrument, a clear image of the absorp-tion in the NIR (above 1000 nm) and in the UV (below 365 nm) cannot be obtained to better charac-terize the exact cause of the color. However, we ob-served no absorption bands due to elements used for recent glass coloration. For example, the use of chromium began after the second half of the nine-teenth century, and it was not observed in any of the studied glasses (Meulebroeck et al., 2016).
Infrared (IR) Absorption Spectroscopy. Figure 12A presents a typical FTIR spectrum of a sample from series ENSMP 69866 (black line). At around 3500 cm−1, a total absorption is observed, which is due to
178 STUDY OF GEMS FROM THE CROWN OF NAPOLEON III GEMS & GEMOLOGY SUMMER 2022
Figure 10. Typical PL spectra of the samples studied, in the range of 540 to 750 nm (spectra are shifted for clarity). A: In the ENSMP 69866 and 69880 suites, PL bands related to chromium in the beryl structure in the red part of the electromagnetic spectrum are observed in all spectra. B: In the ENSMP 69881 suite, large bands possibly due to oxygen-related centers in glass are observed. Both spectra show the Raman bands below 570 nm.
540 570 600 630 660 690 720 540 570 600 630 660 690 720 750
680
580
700
710
560
684
710
Ramanbands
750
WAVELENGTH (nm) WAVELENGTH (nm)
PL SPECTRA
INTE
NSI
TY
INTE
NSI
TY
ENSMP 69880_3ENSMP 69866_1
ENSMP 69881_1ENSMP 69881_2
A B

vibrations linked to the stretching of water mole-cules in the beryl structure. The combination water bands are situated in the range of 4500 to 8000 cm−1. For example, a series of bands at around 5270 cm−1 due to type I water (without an alkali ion nearby) and type II water (with alkali ions nearby) can be ob-served (Wood and Nassau, 1967, 1968). In the NIR re-gion at about 1400 nm (7142 cm−1), the absorption is due to type I water; at around 1408 nm (7102 cm−1), the band is due to type II water (figure 12, A and B). Using the mobile FTIR instrument, the signal-to-noise ratio in the NIR (i.e., above 6500 cm−1) was sometimes low and the bands were not always well resolved (see again figure 12A). However, in all spec-tra of samples from suites ENSMP 69866 and ENSMP 69880, the bands due to type I water were of equal or greater intensity than those due to type II water. This characteristic was also observed for emeralds with low alkali element concentration, such as those from Colombia (Saeseaw et al., 2014; Karampelas et al., 2019). From 2200 to 2850 cm−1, some weak bands linked to H2O, D2O, CO2, and chlorine were observed (de Donato et al., 2004; Rondeau et al., 2008). Notably, beryl’s FTIR spectra also presented strong crystallographic orientation phenomena: The relative intensity of these bands
varied when spectra were acquired under different crystallographic orientations. No bands linked to clarity enhancement of emerald, which are com-monly observed at around 3000 cm–1 (Johnson et al., 1999; Kiefert et al., 1999), were identified in any of these samples.
In figure 12A, a typical spectrum of a sample from the ENSMP 69881 suite is also presented in red. It is similar to the FTIR spectrum produced by other ar-tificial glasses (Stephan, 2020; Cooper et al., 2020). Below 3200 cm–1, large bands due to combination modes and overtones of silicate glasses are observed. The bands at around 3500 cm–1 are possibly due to symmetric stretching of water molecules and/or stretching vibrations of the Si-OH group. The weaker bands at around 4500 cm–1 are due to combination Si-OH modes (Efimov and Pogareva, 2006).
Summary of Results. Of the 45 samples, 41 were con-firmed to be emerald (suites ENSMP 69866 and 69880). As these stones are of gem quality and were set in the crown of Napoleon III in 1855, we can ex-clude any “young” emerald provenances, such as mines in Zambia and Zimbabwe, or even historic de-posits with emeralds of lesser gem quality, such as those in Egypt and Austria (Giuliani et al., 2000, 2019).
STUDY OF GEMS FROM THE CROWN OF NAPOLEON III GEMS & GEMOLOGY SUMMER 2022 179
Figure 11. Visible/near-infrared (Vis-NIR) spectra from 365 to 1000 nm of representative samples of the different suites. All spectra are shifted for clarity. A: Representative spectra of suites ENSMP 69866 and 69880. Bands re-lated to both chromium and vanadium in the beryl structure are observed at around 430 and 610 nm. Crystallo-graphic orientation can affect the exact position and relative intensity of these bands. B: Representative spectra of suite ENSMP 69881. These show a large band centered at around 800 nm, possibly due to ferrous iron (and/or cop-per), and a cutoff from 380 to 400 nm, possibly due to ferric iron (possibly with the participation of sulfur).
600 700 800 900 1000400 500 600 700 800 900 1000400 500
425 615
600800
680
960
435
WAVELENGTH (nm) WAVELENGTH (nm)
VIS-NIR SPECTRA
AB
SOR
BA
NC
E
AB
SOR
BA
NC
E
A BENSMP 69866_1ENSMP 69880_3
ENSMP 69881_2ENSMP 69881_1

From the sixteenth century until the early twentieth century, the vast majority of gem-quality emeralds originated from Colombia (Keller, 1981; Bosshart, 1991a, Giuliani et al., 2000; Schmetzer et al., 2020).
The existence of the specific inclusion scene (e.g., three-phase inclusions with jagged outlines and gota de aceite), the fact that the NIR band related to type I water in beryl is of equal or greater intensity than the band related to type II water (signifying the pres-ence of relatively low concentrations of alkali met-als), and the absence of iron-related absorption bands in the Vis-NIR spectra all suggest that the samples came from Colombian mines. None of the samples presented microscopic or spectroscopic evidence of clarity enhancement. Emeralds with similar charac-teristics are found in other jewels from the same pe-riod (Keller, 1981; Karampelas and Wörle, 2022).
The microscopic and spectroscopic data of the four samples from suite ENSMP 69881 were found to be consistent with artificial glass. This was first ac-counted for in the museum’s internal gem identifica-tion report by one of the authors (FM), who made the determination using classic gemological tools in the 2010s. Their relatively high refractive index and spe-cific gravity values point toward artificial glass con-
taining lead. The spectroscopic characteristics of the artificial glasses from Napoleon III’s crown do not present any evidence of a recently fabricated glass. It is therefore possible that these imitations were part of the 1887 donation and not substituted at a later stage at the museum. Still, the cut and shape differ signifi-cantly from the identified emeralds, suggesting they were not set at the same time as the original crown’s creation in 1855. Instead, they could have been re-placements shortly thereafter, when the eight large main diamonds were removed for use in other jewels created for Empress Eugénie (Morel, 1988).
Additional nondestructive measurements of the trace elements with a well-calibrated energy-disper-sive X-ray fluorescence (EDXRF) spectrometer might help to further study the fabrication of the green glasses and also support the Colombian origin of the emeralds. Moreover, the use of a Raman spectrometer with more than one laser excitation wavelength and better spectral resolution, combined with the use of spectrometers covering the UV region down to 250 nm and the NIR up to 1500 nm, would provide fur-ther assistance in identifying the fabrication of the green glasses and further confirming the emeralds’ Colombian origin.
180 STUDY OF GEMS FROM THE CROWN OF NAPOLEON III GEMS & GEMOLOGY SUMMER 2022
Figure 12. FTIR spectra of representative samples in this study. All spectra are shifted for clarity. A: FTIR spectra in the range of 2000 to 8000 cm–1 for samples ENSMP 69866_5 and ENSMP 69881_3. Bands characteristic of vibra-tions in the beryl structure are observed in the black spectrum, and large bands linked to glass are observed in the red spectrum. B: FTIR spectrum in the range of 1300 to 1500 nm (about 7692–6666 cm–1) of sample ENSMP 69866_5. The intensity of the band at about 1400 nm (due to type I water) is stronger than the intensity of the band at about 1408 nm (due to type II water).
2000 3000 4000 5000 6000 80007000
14001408
1300 1325 1350 1375 1400 1425 1450 1475 1500
WAVENUMBER (cm–1) WAVELENGTH (nm)
FTIR SPECTRA
AB
SOR
BA
NC
E
AB
SOR
BA
NC
E
A BENSMP 69866_5ENSMP 69881_3
ENSMP 69866_5

CONCLUSIONS AND PERSPECTIVES In all, 41 out of 45 samples from ENSMP 69866 and ENSMP 69880 showed natural inclusions along with standard gemological observations characteristic of emerald. The Vis-NIR spectra presented absorption bands characteristic of Cr3+ and V3+, while iron-related bands were not observed in any of the spectra. In the NIR region, as analyzed by FTIR spectroscopy, the bands due to type I water were of equal or greater in-tensity than those due to type II water. A combination of spectroscopic and classic gemological methods points to Colombia as the most likely source of these 41 natural emeralds, given the crown’s age.
The four samples from suite ENSMP 69881 pre-sented different characteristics. Classic gemological testing methods identified them as artificial glasses containing lead. Their Vis-NIR spectra revealed Fe2+ and/or Cu2+ as well as Fe3+ (or Fe3+-S2−) as the main causes of their coloration. We uncovered no evi-dence of the glass having been recently fabricated. Consequently, it is possible that these four artificial glass stones were set in the crown prior to their do-nation to the École des Mines. Morel (1988, p. 338) reports that the eight large diamonds were removed from the crown not long after its creation and re-placed by “strass” (glass imitations, possibly con-taining lead). The substitution of these green glass stones for the original emeralds could have occurred at the same time.
As part of an ongoing collaboration between the LFG and the Mineralogy Museum of the École des Mines, the authors will continue investigating other gems that once belonged to the French crown jewels. It is only logical that in addition to exhibiting these gems, the Museum seeks to understand the science behind them, as educational and outreach tools. As this set of gems is considered a priceless national treasure, such studies can only be conducted within the Museum, using classical nondestructive gemo-
logical tools and mobile spectrometers. In the last two decades, several instruments useful for charac-terizing gems in situ have been developed in mobile versions, drawing the interest of researchers from various disciplines (Reiche et al., 2004; Petrová et al., 2012; Barone et al., 2016; Panczer et al., 2021; Karam-pelas and Wörle, 2022).
Only a few gemstones that once belonged to crown jewels or regalia have been scientifically examined—some still belong to royalty (Spain and the United Kingdom, for example), while others have been stud-ied for their historical or artistic merit but not their gemological value. However, there has been a stronger desire over the last few decades to overcome these bi-ases, and some museums are putting national treas-ures under their microscopes and spectrometers, publishing and sharing their results. We can acknowl-edge George Bosshart for conducting one of the first gemological studies of the Dresden Green, a 41 ct di-amond from one of the oldest museums in the world, the Green Vaults (1723) in Dresden, Germany (Bosshart, 1989). As the French crown jewels were dis-persed in 1887, a few pieces eventually landed in mu-seums equipped with instruments and researchers willing to study great and historical gem treasures, such as the Hope diamond and the Napoleon diamond necklace at the Smithsonian Institution (Gaillou and Post, 2007; Gaillou et al., 2010, 2012, 2022; Post and Farges, 2014) and the Grand Sapphire of Louis XIV at the National Museum of Natural History in Paris (Farges et al., 2015). These gemstones are all remark-able not only for their history and consummate lap-idary and jewelry skills, but also for the overall quality of the stones themselves and our understanding of their geologic and geographic origin. We can only hope that more museums will allow in situ nondestructive studies of their gemstones, whether set in jewels or not, in order to tell the full story and offer these treas-ures the appreciation they deserve.
STUDY OF GEMS FROM THE CROWN OF NAPOLEON III GEMS & GEMOLOGY SUMMER 2022 181
ABOUT THE AUTHORS Dr. Karampelas ([email protected]) is chief gemologist, Mrs. Herreweghe, Mr. Hennebois, Mrs. Leblan, and Mrs. Meslin Sainte Beuve are gemologists, and Mr. Delaunay is director, at the Labora-toire Français de Gemmologie (LFG) in Paris. Dr. Gaillou ([email protected]) is curatrix, Mrs. Maouche is exhibit specialist, Mr. Lechartier is technician, and Dr. Nectoux is curator and director, of the Museum of Mineralogy, Mines Paris - PSL.
ACKNOWLEDGMENTS Sophie Guermann from University of Neuchâtel, Switzerland, is thanked for some of the information on the history of the crown. Constructive comments and suggestions of three anonymous re-viewers are gratefully acknowledged.

182 STUDY OF GEMS FROM THE CROWN OF NAPOLEON III GEMS & GEMOLOGY SUMMER 2022
Adams D.M., Gardner I.R. (1974) Single-crystal vibrational spec-tra of beryl and dioptase. Journal of the Chemical Society, Dalton Transactions, Vol. 14, pp. 1502–1505, http://dx.doi.org/10.1039/dt9740001502
Balfour I. (1987) Famous Diamonds. Collins, London, 224 pp. Bapst G. (1889) Histoire des Joyaux de la Couronne de France, Ha-
chette, Paris, 749 pp. Barone G., Mazzoleni P., Raneri S., Jehlička J., Vandenabeele P.,
Lottici P.P., Lamagna G., Manenti A.M., Bersani D. (2016) Raman investigation of precious jewelry collections preserved in Paolo Orsi regional museum (Siracusa, Sicily) using portable equipment. Applied Spectroscopy, Vol. 70, No. 9, pp. 1420–1431, http://dx.doi.org/10.1177/0003702816662592
Ben Kacem I., Gautron L., Coillot D., Neuville D.R. (2017) Structure and properties of lead silicate glasses and melts. Chemical Geology, Vol. 461, pp. 104–114, http://dx.doi.org/10.1016/j.chemgeo.2017.03.030
Bersani D., Azzi G., Lambruschi E., Barone G., Mazzoleni P., Raneri S., Longobardo U., Lottici P.P. (2014) Characterization of emeralds by micro-Raman spectroscopy. Journal of Raman Spectroscopy, Vol. 45, No. 11-12, pp. 1293–1300, http://dx.doi.org/10.1002/jrs.4524
Bosshart G. (1989) The Dresden Green. Journal of Gemmology, Vol. 21, No. 6, pp. 351–362.
——— (1991a) Emeralds from Colombia (Part 1). Journal of Gem-mology, Vol. 22, No. 6, pp. 355–361.
——— (1991b) Emeralds from Colombia (Part 2). Journal of Gem-mology, Vol. 22, No. 7, pp. 409–425.
Carl R., Gerlach S., Rüssel C. (2007) The effect of composition on UV-Vis-NIR spectra of iron doped glasses in the systems Na2O/MgO/SiO2 and Na2O/MgO/Al2O3/SiO2. Journal of Non-Crystalline Solids, Vol. 353, No. 3, pp. 244–249, http://dx.doi.org/10.1016/j.jnoncrysol.2006.11.010
Colomban P., Tournie A., Bellot-Gurlet L. (2006) Raman identifica-tion of glassy silicates used in ceramics, glass and jewellery: A tentative differentiation guide. Journal of Raman Spectroscopy, Vol. 37, No. 8, pp. 841–852, http://dx.doi.org/10.1002/jrs.1515
Cooper A., Price J., Breitzmann H. (2020) Lab Notes: Artificial glass imitating a Paraíba tourmaline. G&G, Vol. 56, No. 4, pp. 518–520.
de Donato P., Cheilletz A., Barres O., Yvon J. (2004) Infrared spec-troscopy of OD vibrators in minerals at natural dilution: Hy-droxyl groups in talc and kaolinite, and structural water in beryl and emerald. Applied Spectroscopy, Vol. 58, No. 5, pp. 521–527, http://dx.doi.org/10.1366/000370204774103336
Efimov A.M., Pogareva V.G. (2006) IR absorption spectra of vitre-ous silica and silicate glasses: The nature of bands in the 1300 to 5000 cm–1 region. Chemical Geology, Vol. 229, No. 1-3, pp. 198–217, http://dx.doi.org/10.1016/j.chemgeo.2006.01.022
Farges F., Panczer G., Benbalagh N., Riondet G. (2015) The Grand Sapphire of Louis XIV and the Ruspoli sapphire. G&G, Vol. 51, No. 4, pp. 392–409, http://dx.doi.org/10.5741/GEMS.51.4.392
Fritsch E., Rondeau B., Hainschwang T., Quellier M.-H. (2007) A contribution to the understanding of pink color in diamond: The unique, historical «Grand Condé». Diamond and Related Materials, Vol. 16, No. 8, pp. 1471–1474, http://dx.doi.org/10.1016/j.diamond.2006.12.006
Fritsch E., Rondeau B., Devouard B., Pinsault L., Latouche C. (2017) Why are some crystals gem quality? Crystal growth considera-tions on the “gem factor.” The Canadian Mineralogist, Vol. 55, No. 4, pp. 521–533, http://dx.doi.org/10.3749/canmin.1700013
Gaillou E., Post J.E. (2007) An examination of the Napoleon Dia-mond Necklace. G&G, Vol. 43, No. 4, pp. 352–357, http://dx.doi.org/10.5741/GEMS.43.4.352
Gaillou E., Wang W, Post J.E., King J.M., Butler J.E., Collins A.T., Moses T.M. (2010) The Wittelsbach-Graff and Hope diamonds: Not cut from the same rough. G&G, Vol. 46, No. 2, pp. 80–88,
http://dx.doi.org/10.5741/GEMS.46.2.80 Gaillou E., Post J.E., Rost D., Butler J.E. (2012) Boron in natural
type IIb blue diamonds: Chemical and spectroscopic measure-ments. American Mineralogist, Vol. 97, No 1, pp. 1–18, http://dx.doi.org/10.2138/am.2012.3925
Gaillou E., Maouche F., Barthe A., Nectoux D., Lechartier M. (2022) Émeraudes historiques de la collection de l’École Nationale Supérieure des Mines de Paris. Le Règne Minéral, in press.
Galopim de Carvalho R. (2014) Evolution of diamond cuts in Por-tuguese jewellery and sacred objects during the 16th–18th cen-turies: A brief review. Journal of Gemmology, Vol. 34, No. 2, pp. 114–128.
Giuliani G., Groat L.A. (2019) Geology of corundum and emerald gem deposits. G&G, Vol. 55, No. 4, pp. 464–489, http://dx.doi.org/10.5741/GEMS.55.4.464
Giuliani G., Chaussidon M., Schubnel H.-J., Piat D.H., Rollion-Bard C., France-Lanord C., Giard D., de Narvaez D., Rondeau B. (2000) Oxygen isotopes and emerald trade routes since an-tiquity. Science, Vol. 287, No. 5453, pp. 631–633, http://dx.doi.org/10.1126/science.287.5453.631
Giuliani G., Groat L.A., Marshall D., Fallick A.E., Branquet Y. (2019) Emerald deposits: A review and enhanced classification. Miner-als, Vol. 9, No. 2, 63 pp., http://dx.doi.org/10.3390/min9020105
Gübelin E.J., Koivula J.I. (1986) Photoatlas of Inclusions in Gemstones, Volume 1. Opinio Publishers, Basel, Switzer-land, 532 pp.
Hagemann H., Lucken A., Bill H., Gysler-Sanz J., Stalder H.A. (1990) Polarized Raman spectra of beryl and bazzite. Physics and Chemistry of Minerals, Vol. 17, No. 5, pp. 395–401, http://dx.doi.org/10.1007/BF00212207
Hainschwang T. (2010) Une description de quelques émeraudes extraordinaires, les émeraudes gota de aceite et les émeraudes étoilées. Revue de l’Association Française de Gemmologie, Vol. 171, pp. 7–9.
Hainschwang T., Notari F., Fritsch E., Massi L. (2006) Natural, un-treated diamonds showing the A, B and C infrared absorptions (“ABC diamonds”), and the H2 absorption. Diamond and Re-lated Materials, Vol. 15, No. 10, pp. 1555–1564, http://dx.doi.org/10.1016/j.diamond.2005.12.029
Huong L.T.-T., Häger T., Hofmeister W. (2010) Confocal micro-Raman spectroscopy: A powerful tool to identify natural and synthetic emeralds. G&G, Vol. 46, No. 1, pp. 36–41, http://dx.doi.org/10.5741/GEMS.46.1.36
Huong L.T.-T., Hofmeister W., Häger T., Karampelas S., Kien N.D.-T. (2014) A preliminary study on the separation of natural and synthetic emeralds using vibrational spectroscopy. G&G, Vol. 50, No. 4, pp. 287–292, http://dx.doi.org/10.5741/GEMS.50.4.287
Jehlička J., Culka A., Bersani D., Vandenabeele P. (2017) Compar-ison of seven portable Raman spectrometers: Beryl as a case study. Journal of Raman Spectroscopy, Vol. 48, No. 10, pp. 1289–1299, http://dx.doi.org/10.1002/jrs.5214
Johnson M.L., Elen S., Muhlmeister S. (1999) On the identification of various emerald filling substances. G&G, Vol. 35, No. 2, pp. 82–107, http://dx.doi.org/10.5741/GEMS.35.2.82
Kane R.E., McClure S.R., Menzhausen J. (1990) The legendary Dresden Green diamond. G&G, Vol. 26, No. 4, pp. 248–266, http://dx.doi.org/10.5741/GEMS.26.4.248
Karampelas S., Wörle M. (2022) Spectroscopic study of the coloured gems in a 19th century pendant from Einsiedeln Abbey. Journal of Raman Spectroscopy, Vol. 53, No. 3, pp. 563–569, http://dx.doi.org/10.1002/jrs.6194
Karampelas S., Al-Shaybani B., Mohamed F., Sangsawong S., Al-Alawi A. (2019) Emeralds from the most important occur-rences: Chemical and spectroscopic data. Minerals, Vol. 9, No. 9, p. 561 (29 pp.), http://dx.doi.org/10.3390/min9090561
Keller P.C. (1981) Emeralds of Colombia. G&G, Vol. 17, No. 2, pp. 80–92, http://dx.doi.org/10.5741/GEMS.17.2.80
REFERENCES

STUDY OF GEMS FROM THE CROWN OF NAPOLEON III GEMS & GEMOLOGY SUMMER 2022 183
Kiefert L., Hänni H.A., Chalain J.-P., Weber W. (1999) Identification of filler substances in emeralds by infrared and Raman spec-troscopy. Journal of Gemmology, Vol. 26, No. 8, pp. 501–520.
Kim C.C., Bell M.I., McKeown D.A. (1995) Vibrational analysis of beryl (Be3Al2Si6O18) and its constituent ring (Si6O18). Physica B: Condensed Matter, Vol. 205, No. 2, pp. 193–208, http://dx.doi.org/10.1016/0921-4526(94)00290-C
Krzemnicki M.S., Wang H.A.O., Büche S. (2021) A new type of emerald from Afghanistan’s Panjshir Valley. Journal of Gem-mology, Vol. 37, No. 5, pp. 474–495.
Meulebroeck W., Baert K., Wouters H., Cosyns P., Ceglia A., Cagno S., Janssens K., Nys K., Terryn H., Thienpont H. (2010) The identification of chromophores in ancient glass by the use of UV-Vis-NIR spectroscopy. Conference Proceedings SPIE Pho-tonics Europe - Optical Sensing and Detection, p. 77260D, http://dx.doi.org/10.1117/12.853666
Meulebroeck W., Cosyns P., Baert K., Wouters H., Cagno S., Janssens K., Terryn H., Nys K., Thienpont H. (2011) Optical spectroscopy as a rapid and low-cost tool for the first-line analy-sis of glass artefacts: A step-by-step plan for Roman green glass. Journal of Archaeological Science, Vol. 38, No. 9, pp. 2387–2398, http://dx.doi.org/10.1016/j.jas.2011.04.023
Meulebroeck W., Wouters H., Nys K., Thienpont H. (2016) Au-thenticity screening of stained glass windows using optical spectroscopy. Scientific Reports, Vol. 6, article no. 37726, 10 pp., http://dx.doi.org/10.1038/srep37726
Morel B. (1988) The French Crown Jewels. Fonds Mercator, Antwerp, 417 pp.
Moroz I., Roth M., Boudeulle M., Panczer G. (2000) Raman microspec-troscopy and fluorescence of emeralds from various deposits. Jour-nal of Raman Spectroscopy, Vol. 31, No. 6, pp. 485–490, http://dx.doi.org/10.1002/1097-4555(200006)31:6%3C485::AID-JRS561%3E3.0.CO;2-M
Nassau K. (1980) Gems Made by Man. Chilton Book Company, Radnor, Pennsylvania, 364 pp.
Panczer G., Romeo E., Riondet G. (2021) The book of hours of King Francis I of France: History and gemmological analysis. Journal of Gemmology, Vol. 37, No. 6, pp. 580–595.
Patch S.S. (1976) Blue Mystery: The Story of the Hope Diamond. Smithsonian Institution Press, Washington, DC.
Petrová Z., Jehlička J., Čapoun T., Hanus R., Trojek T., Goliáš V. (2012) Gemstones and noble metals adorning the sceptre of the Faculty of Sciences of Charles University in Prague: Integrated analysis by Raman and XRF handheld instruments. Journal of Raman Spectroscopy, Vol. 43, No. 9, pp. 1275–1280, http://dx.doi.org/10.1002/jrs.4043
Post J.E., Farges F. (2014) The Hope diamond: Rare gem, historic jewel. Rocks & Minerals, Vol. 89, No 1, pp. 16–26, http://dx.doi.org/10.1080/00357529.2014.842831
Reiche I., Pages-Camagna S., Lambacher L. (2004) In situ Raman spectroscopic investigations of the adorning gemstones on the reliquary Heinrich’s Cross from the treasury of Basel Cathedral. Journal of Raman Spectroscopy, Vol. 35, No. 8-9, pp. 719–725,
http://dx.doi.org/10.1002/jrs.1197 Ringsrud R. (2008) Gota de aceite: Nomenclature for the finest
Colombian emeralds. G&G, Vol. 44, No. 3, pp. 242–245, http://dx.doi.org/10.5741/GEMS.44.3.242
Robinet L., Coupry C., Eremin K., Hall C. (2006) The use of Raman spectrometry to predict the stability of historic glasses. Journal of Raman Spectroscopy, Vol. 37, No. 7, pp. 789–797, http://dx.doi.org/10.1002/jrs.1540
Rondeau B., Fritsch E., Peucat J.-J., Nordrum F.S., Groat L.A. (2008) Characterization of emeralds from a historical deposit: Byrud (Eidsvoll), Norway. G&G, Vol. 44, No. 2, pp. 108–122, http://dx.doi.org/10.5741/GEMS.44.2.108
Saeseaw S., Pardieu V., Sangsawong S. (2014) Three-phase inclusions in emerald and their impact on origin determination. G&G, Vol. 50, No. 2, pp. 114–132, http://dx.doi.org/10.5741/GEMS.50.2.114
Saeseaw S., Renfro N.D., Palke A.C., Sun Z., McClure S.F. (2019) Geographic origin determination of emerald. G&G, Vol. 55, No. 4, pp. 614–646, http://dx.doi.org/10.5741/GEMS.55.4.614
Sakurai Y., Nagasawa K., Nishikawa H., Ohki Y. (1999) Charac-teristic red photoluminescence band in oxygen-deficient silica glass. Journal of Applied Physics, Vol. 86, No. 1, pp. 370–373, http://dx.doi.org/10.1063/1.370740
Schmetzer K. (2014) Letters: Analysis of three-phase inclusions in emerald. G&G, Vol. 50, No. 4, pp. 316–319.
Schmetzer K., Martayan G., Ortiz J.G. (2020) History of the Chivor emerald mine, part I (1880–1925): From rediscovery to early production. G&G, Vol. 56, No. 1, pp. 66–109, http://dx.doi.org/10.5741/GEMS.56.1.66
Schreurs J.W.H., Brill R.H. (1984) Iron and sulfur related colors in ancient glasses. Archaeometry, Vol. 26, No. 2, pp. 199–209, http://dx.doi.org/10.1111/j.1475-4754.1984.tb00334.x
Skuja L. (1998) Optically active oxygen-deficiency-related centers in amorphous silicon dioxide. Journal of Non-Crystalline Solids, Vol. 239, No. 1-3, pp. 16–48, http://dx.doi.org/10.1016/S0022-3093(98)00720-0
Stephan M. (2020) Lab Notes: Clarity-enhanced glass imitating emerald. G&G, Vol. 56, No. 1, p. 133.
Thomson D.B., Kidd J.D., Aström M., Scarani A., Smith C.P. (2014) A comparison of R-line photoluminescence of emeralds from different origins. Journal of Gemmology, Vol. 34, No. 4, pp. 334–343.
Webster R., Anderson B.W. (1983) Gems: Their Sources, Descrip-tions and Identification, 4th ed. Butterworth-Heinemann, Ox-ford, UK, 1044 pp.
Wood D.L. (1965) Absorption, fluorescence, and Zeeman effect in emerald. The Journal of Chemical Physics, Vol. 42, No. 10, pp. 3404–3410, http://dx.doi.org/10.1063/1.1695742
Wood D.L., Nassau K. (1967) Infrared spectra of foreign molecules in beryl. The Journal of Chemical Physics, Vol. 47, No. 7, pp. 2220–2228, http://dx.doi.org/10.1063/1.1703295
——— (1968) Characterization of beryl and emerald by visible and infrared absorption spectroscopy. American Mineralogist, Vol. 53, No. 5-6, pp. 777–800.

184 AMBER FROM PHU QUOC, VIETNAM GEMS & GEMOLOGY SUMMER 2022
Amber, an organic gemstone fossilized from tree resin (Ross, 1999), comes from several sources globally, most notably the Baltic region, Myan-
mar, the Dominican Republic, and Indonesia. Amber from each locality shows distinctive characteristics. In 2020, a sandstone miner working on the Vietnamese island of Phu Quoc came across an orange-yellow ma-terial buried inside the sandstone layers. He collected loose and bedrock-hosted samples, the largest up to 10 cm (figure 1), and submitted them to Liu Gemological
Research and Application Center (LIULAB) in Ho Chi Minh City, where they were identified as amber. With the miner’s help, the authors visited the site to collect amber samples. During our field trip, we found a sec-ond deposit, also in a sandstone mine, located about a kilometer from the first amber outcrop (figure 2).
In the present study, Phu Quoc amber was char-acterized with standard gemological methods and Fourier-transform infrared spectroscopy (FTIR). Our results, combined with other published data from Baltic, Burmese, and Dominican amber (Wolfe et al.,
CHARACTERISTICS OF NEWLY DISCOVERED AMBER FROM PHU QUOC, VIETNAM Le Ngoc Nang, Pham Trung Hieu, Lam Vinh Phat, Pham Minh Tien, Ho Nguyen Tri Man, and Ha Thuy Hang
FEATURE ARTICLES
The authors examine the gemological properties and commercial potential of a new source of amber, discovered in 2020 on the Vietnamese island of Phu Quoc. It is the only known amber locality in Vietnam so far. The Phu Quoc amber possesses reddish orange to orangy yellow hues and is transparent, with sizes up to 10 cm. The samples exhibited strong blue fluorescence under ultraviolet light (both long-wave and short-wave). Internally, they displayed disk-like inclusions and gas bubbles, but few botanical inclusions were found. Their characteristic FTIR peaks can be distinguished from those of amber found in other sources worldwide. Although amber from Phu Quoc is a recent discovery and has only been investigated in two small areas, its commercial potential is promising based on the samples’ quality and the wide distribution of the host rock on the island.
In Brief • Vietnamese amber was first discovered on the island of
Phu Quoc in 2020.
• The amber is characterized by strong blue fluorescence under UV lighting and weak green fluorescence under daylight-equivalent illumination.
• Amber nodules were found in sandstone, accompa-nied by veins of black jet. The wide coverage of sand-stone on the island suggests the possibility of additional discoveries.
• Phu Quoc amber’s gemological properties are rela-tively similar to those from other global sources, but it can be differentiated by FTIR spectroscopy.
See end of article for About the Authors and Acknowledgments. GEMS & GEMOLOGY, Vol. 58, No. 2, pp. 184–194, http://dx.doi.org/10.5741/GEMS.58.2.184 © 2022 Gemological Institute of America
Figure 1. Amber from Phu Quoc: matrix measuring approximately 6 × 10 cm and a 1.69 ct, 11.93–9.41 × 4.98 mm cabochon of transparent, orangy red amber set in a 14K gold ring. Photo by Le Ngoc Nang.

2009; Leelawatanasuk et al., 2013; Sun et al., 2015; Zhang et al., 2020), allowed us to compare the Phu Quoc samples with amber from commercially im-portant sources.
GEOLOGICAL SETTING The island of Phu Quoc lies in the Gulf of Thailand, about 45 km off the southwestern coast of Vietnam. The island has an area of 574 km2. The terrain con-
AMBER FROM PHU QUOC, VIETNAM GEMS & GEMOLOGY SUMMER 2022 185
Figure 2. Geological map of northern Phu Quoc, from Duong et al. (1998) and modified by Le Ngoc Nang (2021). The two study areas (1 and 2) were visited in November 2020.
Holocene sediments
Pleistocene sediments
Neogene sedimentary rocks
Fault
Sample location
N
Ha Noi
Vinh
HueHoang Sa
Gulf of Thailand
1
2
Truong Sa
Ho Chi Minh
Phu Quoc
Study area
Hainan
NhaTrang
LAOS
CHINA
THAILAND
CAMBODIA VIETNAM
A
B
2 km
10˚20'
10˚20'
10˚10'104˚ 00'
104˚ 00'

sists mainly of low mountains, with the highest peak standing at 607 m (Duong et al., 1998). The amber sites found so far are in an area that is easily accessi-ble by vehicle.
The geological formations in Phu Quoc are mostly sandstone and siltstone from the Miocene to the Holocene. The Phu Quoc amber source lies in the northern center of the island (figure 2), mainly containing Neogene sedimentary rocks, and is di-vided into two parts. The lower part is interbedded conglomerate, sandstone, and gray and green silt-
stone, distributed on the eastern margin of the is-land; the upper part is jet- and amber-bearing quartz sandstone with cross-bedding structure, distributed throughout most of northern Phu Quoc (My and Linh, 2005). The upper part is unconformably over-lain by Holocene sediments.
The Phu Quoc amber is hosted in gray to whitish gray and fine- to medium-grained sandstone (My and Linh, 2005; Fyhn et al., 2010) (figure 3). Found in sandstone as nodules, samples are nearly round or distorted oval in shape, varying in size from a few
186 AMBER FROM PHU QUOC, VIETNAM GEMS & GEMOLOGY SUMMER 2022
Figure 3. A: Sandstone mine (site 1). B and C: Nodules of amber found in sandstone boulders, recovered from a depth of 15–20 m at site 1. Photos by Lam Vinh Phat.
A
B C
Amber
10 cm 1 cm

centimeters to 10 centimeters. The boundary be-tween amber and sandstone is clear but uneven and difficult to detach (figures 1 and 3). Surrounding amber in sandstone is black jet in the form of plates, with veins in matrix ranging in size from a few cen-timeters to several tens of centimeters. Part of the amber boundary is in contact with the sandstone, and the rest is attached to the jet. The sedimentary rocks containing amber are situated at a depth of about 15–20 m and are about 30 m thick, accompa-nied by lamellar-like jet. The amber-bearing sedi-mentary rock is quartz sandstone with massive structure. Rock-forming minerals are >90% quartz and <10% cement (sericitized clay minerals), as seen under a petrographic microscope (figure 4).
MATERIALS AND METHODS A total of 38 amber samples (31 loose samples and 7 samples in matrix) were collected from two loca-tions (sites 1 and 2) on November 17 and 18, 2020. These consisted of 26 samples (22 loose and 4 in matrix) from site 1 and 12 samples (nine loose and three in matrix) from site 2. In addition, we received three samples (two loose and one in matrix) from the sandstone mine worker from site 1. Twelve of the Phu Quoc samples were used for research analy-sis: two loose samples (nos. 1 and 2) from the mine
worker, and ten samples (nos. 3–12: eight loose and two in matrix) from the authors’ set of 38 samples from both sites (figure 2). The samples were chosen based on size and quality. Five samples were cut into cabochons by one of the authors (PMT), and seven were kept rough (figure 5). For refractive index and FTIR measurements, the authors selected rough samples that had at least one flat-polished surface, were free of pores, and weighed more than 5 ct. The amber-bearing sandstones consisted mainly of amber and jet.
We used three additional samples from Myanmar (A-3), the Baltic Sea (Poland, A-2), and the Domini-can Republic (A-1) to compare with the Phu Quoc amber by conducting gemological testing and FTIR advanced analysis at LIULAB (figure 5). Those three samples belong to the collection of minerals and gems of the Faculty of Geology, University of Sci-ence, Ho Chi Minh City.
Standard gemological methods were used to con-firm the identity of the studied samples as amber. The amber’s color was observed under a 60 W GLS LED daylight bulb (5000–6000K). Specific gravity values for samples 1–6 and 9–12 were measured using a hydro-static scale, and their refractive indexes were recorded with a standard gemological refractometer. A polar-iscope was used to observe optical features on the
AMBER FROM PHU QUOC, VIETNAM GEMS & GEMOLOGY SUMMER 2022 187
Figure 4. An amber-bearing sandstone thin section containing quartz (Qtz) and a small amount of cement (Cm; mainly sericitized clay minerals) surround-ing the quartz grains. Photomicrograph by Ha Thuy Hang; field of view 0.6 mm.
Qtz
Qtz
Qtz
Qtz
Cm
Cm

same samples. Fluorescence reaction was tested on all the samples under ultraviolet light, both long-wave (365 nm) and short-wave (254 nm). Internal features were observed under a Carton SPZV50 gemological
microscope with 7× to 50× magnification. A 3 μm thin section of amber-bearing sandstone was examined under an Olympus CH-2 petrographic microscope at magnifications of 100×, 200×, and 400×.
188 AMBER FROM PHU QUOC, VIETNAM GEMS & GEMOLOGY SUMMER 2022
Figure 5. The amber samples used in this study were in bedrock, rough, or cut into cabochons. Samples 1–12 are from Phu Quoc, A-1 from the Dominican Republic, A-2 from the Baltic region, and A-3 from Myanmar. Photos by Le Ngoc Nang.
1
2
3
4
5
6 7
9
10 8
11
12
A-1 A-2A-3

For all samples, a hot needle test was applied to check for the characteristic scent of natural resin. We also checked the reaction to acetone as a means of separating amber from copal. Amber does not react with acetone, while copal reacts with acetone after 20 seconds (Ross, 1999).
Twelve amber samples—nine from Phu Quoc and one each from the Baltic Sea, Myanmar, and the Dominican Republic—were analyzed using an Agi-lent Cary 630 FTIR spectrometer. Data were ac-quired with a spectral range of 4000–650 cm–1, a resolution of 8 cm–1, and a scan time of 32 s.
RESULTS AND DISCUSSION Under daylight-equivalent illumination, the amber samples from Phu Quoc were predominantly reddish orange or orangy yellow. Black patches and spots in some samples (6 and 10) were preserved flora (tree bark). The samples exhibited predominantly subvit-
reous to resinous luster, and many samples displayed good transparency (figure 5). The samples also exhib-ited a white streak.
Gemological Characteristics. The specific gravity val-ues of the 10 tested samples ranged from 1.03 to 1.04, corresponding to the SG of amber (Ross, 1999; Sun et al., 2015). These same 10 samples were singly refrac-tive and had refractive index values ranging from 1.540 to 1.543, also consistent with amber (Ross, 1999; Sun et al., 2015) (table 1). Under long-wave and short-wave UV light, all Phu Quoc amber samples displayed strong to very strong light blue fluorescence (figure 6, top). They emitted green fluorescence on the surface under daylight-equivalent illumination (figure 6, bot-tom right) or against a dark background. The fluores-cence phenomenon of the Phu Quoc amber is similar to that of Dominican and Indonesian amber (Poinar, 2010; Leelawatanasuk et al., 2013; Liu et al., 2014;
AMBER FROM PHU QUOC, VIETNAM GEMS & GEMOLOGY SUMMER 2022 189
Figure 6. Luminescence of Phu Quoc amber. All of the samples emitted strong to very strong light blue fluores-cence in both long-wave (top left) and short-wave (top right) UV light. The bodycolor of Phu Quoc amber sample 3 is reddish orange (bottom left) and emitted weak green fluorescence under daylight-equivalent illumination (bottom right). Photos by Le Ngoc Nang.
1 cm
1 cm 1 cm
1 cm

Kocsis et al., 2020; Zhang et al., 2020). However, the Phu Quoc amber showed weaker fluorescence under daylight than Dominican or Indonesian amber.
Hot needle testing on all 12 amber samples re-leased the natural scent of resin, distinguishing it from the burning scent of synthetic polymer (Ross, 1999). None of the Phu Quoc samples reacted to acetone, proving they were amber and not copal (Ross, 1999).
Optical Characteristics. Under the polariscope, the Phu Quoc amber presented the phenomenon of al-ternately blinking light and dark when rotated every
45°. Although there are no detailed studies to explain the phenomenon, this optical characteristic known as anomalous double refraction (ADR) is commonly seen under a polariscope. Accordingly, internal stress helps to explain the degree of anomalous extinction in amber (Kratochvíl, 2009).
Internal Characteristics. The Phu Quoc samples con-tained four types of internal characteristics: gas bub-bles, disk-like inclusions (spangle) with a colorless core inside, round-film inclusions, and flora inclusions (figure 7 and table 1). Gas bubble inclusions indicating
190 AMBER FROM PHU QUOC, VIETNAM GEMS & GEMOLOGY SUMMER 2022
TABLE 1. Gemological properties of amber from Phu Quoc, Vietnam.
Sample no. Weight (ct) Color Shape SG RI Inclusions
1 17.92 Yellowish orange Irregular 1.04 1.540 Spangle, gas bubble
2 22.11 Intense reddish orange Irregular 1.06 1.541 Spangle, gas bubble, flora
3 7.22 Reddish orange Irregular NA NA Gas bubble, flora
4 10.03 Intense reddish orange Irregular 1.04 1.542 Gas bubble, flora
5 5.18 Orangy red Irregular 1.05 1.540 Gas bubble, flora
6 5.10 Brownish yellowish orange Pear 1.05 1.541 NA
7 122.77a Yellow Roundish nodule NA NA NA
8 76.40a Reddish orange In matrix NA NA Gas bubble, flora
9 1.69 Reddish orange Oval 1.05 1.541 Spangle, gas bubble
10 1.99 Intense bluish reddish orange Drop 1.04 1.543 Gas bubble
11 0.82 Reddish orange Oval 1.04 1.542 Spangle, gas bubble
12 1.05 Orangy yellow Oval 1.03 1.542 Spangle, gas bubble
A-1 4.68 Yellow Near-round 1.04 NA None
A-2 7.16 Orangy yellow Near-round 1.07 1.542 Spangle, gas bubble
A-3 11.94 Yellow-orange Drop 1.03 1.540 Gas bubble, insect
aTotal weight of sample, including host rock, in grams. NA: not available

the origin as tree resin (viscous and cool) are found in amber from most sources worldwide. In Phu Quoc samples, the gas bubble inclusions were accompanied by a typical flow structure. The disk-like inclusions contained air bubbles at the center, suggesting the condition of Phu Quoc amber, which were influenced by geothermal heat due to sedimentary depth (depth of burial) (Ross, 1999). Round-film inclusions are quite commonly seen, and they are also the spangles that reflect light to create interference colors. The flora in-clusions were remnants of reddish brown wood fibers. Significantly, insects were not found in any of the amber samples inspected, unlike amber from most other sources (Penney, 2016).
FTIR Analysis. The FTIR spectra of the Phu Quoc samples shown in figure 8A include peaks at 2923, 2861, 2100, 1695, 1455, 1379, 1261, 1156, 970, and 815 cm–1. The FTIR results of Baltic, Burmese, and
Dominican amber are shown in figure 8, B–D. The re-sults were consistent with previously published FTIR spectra of Burmese amber (Jiang et al., 2020), Baltic amber (Guiliano et al., 2007; Wolfe et al., 2009), and Dominican amber (Xin et al., 2021).
Phu Quoc amber exhibited an absorption band at around 2900 cm–1 with two peaks at 2923 and 2861 cm–1, representing the stretching vibration of the sp3 hybridized C-H bond of the methyl and methylene groups (Guiliano et al., 2007). These are the typical ab-sorption bands of amber and plastic or materials con-taining the C-H bond.
In the range of 2800–1800 cm–1, Phu Quoc amber displayed a weak band at 2100 cm–1 caused by alkyne C≡C stretching, which was similar to that of Domini-can samples. Meanwhile, Burmese and Baltic amber did not show any significant bands in this region.
The spectral range between 1800 and 1200 cm–1 for Phu Quoc amber included a peak at 1455 cm–1 for
AMBER FROM PHU QUOC, VIETNAM GEMS & GEMOLOGY SUMMER 2022 191
Figure 7. Inclusions in Phu Quoc amber. A: A spangle with an inclu-sion at the center. B: Gas bubbles assembled with botanical rem-nants. C: A spangle with interference colors. D: Tree bark remnants. Photomicrographs by Le Ngoc Nang; fields of view 4.5 mm (A and C) and 5.5 mm (B and D).
A B
C D

methylene (CH2) bending and another at 1379 cm–1 for methyl (CH3) bending (Pavia et al., 2014). The strong absorption bands at 1695 and 1261 cm–1 are related to C=O stretching and C-O carbonyl bonds, respectively (possibly ester and acid). The simultaneous presence of the peaks shows that there are many types of car-bonates in this amber’s composition (Sun et al., 2015). In the 1800–1200 cm–1 range, the spectral absorption bands were similar to those of the Dominican samples. Meanwhile, the absence of a 1261 cm–1 peak in Burmese and Baltic amber differentiated them from Phu Quoc amber.
Between 1200 and 800 cm–1, the Phu Quoc amber displayed weak absorption peaks at 1156, 970, and 815 cm–1, while Burmese, Baltic, and Dominican amber displayed medium absorption peaks at 1149, 1031, 975, and 813 cm–1. The weak 1156 cm–1 peak is
assigned to C-O stretching of tertiary alcohol (Pavia et al., 2014). Additionally, the Baltic amber presented a spectral peak at 888 cm–1. For Phu Quoc amber, no peaks were detected at 3048, 1642, and 887 cm–1, proving it was genuine amber rather than copal (Sun et al., 2015).
The FTIR spectra of Phu Quoc samples exhib-ited characteristics similar to those of Baltic, Burmese, and Dominican amber. However, the spectra of Phu Quoc amber displayed some charac-teristics unique to the deposit. The existence of 1261 and 1156 cm–1 bands and the absence of 3450 and 1149 cm–1 peaks revealed distinguishing fea-tures in both composition and polymer structures. These differences play an important role in defining the geographic origin of amber from global sources (including Phu Quoc amber).
192 AMBER FROM PHU QUOC, VIETNAM GEMS & GEMOLOGY SUMMER 2022
Figure 8. FTIR spectra of amber from Phu Quoc (A) and other sources (B–D).
650 1150 1650 2150 2650 3150 3650
650 1150 1650 2150 2650 3150 3650 650 1650 21501150 2650 3150 3650
650 1650 21501150 2650 3150 3650
2923
813
975
1031
1149
1228
1375
1448
1720
2853
2920
3450
813
975
1149
1257 1377 1457
1720
2100
2866
2924
3388
3380
2922
28551695
144911491031888
8131375
28611455
1379
815
970
1695
2100
1156
1261
1.00
0.95
0.90
0.85
0.80
0.75
0.70
0.65
0.60
1.00
0.95
0.90
0.85
0.80
0.75
0.70
1.00
1.00
0.98
0.96
0.94
0.92
0.90
0.98
0.96
0.94
0.92
0.90
WAVENUMBER (cm–1) WAVENUMBER (cm–1)
WAVENUMBER (cm–1)WAVENUMBER (cm–1)
FTIR SPECTRA
TRA
NSM
ITTA
NC
ETR
AN
SMIT
TAN
CE
TRA
NSM
ITTA
NC
ETR
AN
SMIT
TAN
CE
Phu Quoc amber Baltic amber
Burmese amber Dominican amber
A B
C D
No. 1No. 2No. 4No. 5No. 6No. 9No. 10No. 11No. 12

COMMERCIAL POTENTIAL Based on our initial evaluation, Phu Quoc amber is of high enough quality to be suitable for jewelry manufacturing (figures 1 and 9). The color ranges from highly valued yellowish orange to orangy red, similar to that of Baltic and Burmese amber. Most are transparent, especially the samples smaller than 1 cm. The Phu Quoc amber is suitable for cabochons and carvings. Although we carried out our research within a small area, the sandstone formation (amber host rock) covers almost the entire island (My and Linh, 2005), suggesting the possibility of finding amber over a wide area. While these factors signal
the commercial potential of Phu Quoc amber, fur-ther assessment is needed.
CONCLUSIONS Standard gemological properties, FTIR spectroscopy, and other tests confirmed that the samples represent the first Vietnamese source of amber. The material’s attractive color, transparency, and size make it suit-able for jewelry. In addition, the wide distribution of the Neogene sandstone host rock on this island in-dicates strong commercial potential. With the dis-covery of amber on Phu Quoc, Vietnam could become an important supplier of this organic gem.
AMBER FROM PHU QUOC, VIETNAM GEMS & GEMOLOGY SUMMER 2022 193
Figure 9. Gem-quality amber from Phu Quoc: an 11.16 ct rough and cabochons weighing 1.02–1.40 ct. Photo by Le Ngoc Nang.
ABOUT THE AUTHORS Le Ngoc Nang is a postgraduate in the Faculty of Geology at the University of Science (https://en.hcmus.edu.vn), Vietnam National University Ho Chi Minh City, and CEO of Liu Gemological Re-search and Application Center. Dr. Pham Trung Hieu is associate professor in the Faculty of Geology at the University of Science, Vietnam National University Ho Chi Minh City. Lam Vinh Phat is manager of gemstone identification, and Pham Minh Tien is a technical specialist, at Liu Gemological Research and Application Center. Ho Nguyen Tri Man is a lecturer in the Faculty of Geology and Petroleum Engineering at the University of Technology, Viet-
nam National University. Ha Thuy Hang is a lecturer in the Faculty of Geology at the University of Science, Vietnam National Univer-sity Ho Chi Minh City.
ACKNOWLEDGMENTS The authors sincerely thank Mr. Nguyen Thanh Nha from the Insti-tute of Chemical Technology for his support in utilizing advanced analysis methods. We also express gratitude to our clients for the use of their samples to carry out this research. This research was funded by Vietnam National University Ho Chi Minh City (VNU-HCM) under grant number C2022-18-31.

194 AMBER FROM PHU QUOC, VIETNAM GEMS & GEMOLOGY SUMMER 2022
Duong C.T. et al. (1998) Report on the result of geological mapping and mineral exploration. Ha Tien – Phu Quoc map series, scale 1:50.000, South Vietnam Geological Mapping Division, General Department of Geology and Minerals of Vietnam (in Vietnamese).
Fyhn M.B., Petersen H.I., Mathiesen A., Nielsen L.H., Pedersen S.A., Lindström S., Bojesen-Koefoed J.A., Abatzis I., Boldreel L.O. (2010) Vietnamese sedimentary basins: Geological evolu-tion and petroleum potential. GEUS Bulletin, Vol. 20, pp. 91–94, http://dx.doi.org/10.34194/geusb.v20.4990
Guiliano M., Asia L., Onoratini G., Mille G. (2007) Applications of diamond crystal ATR FTIR spectroscopy to the characteri-zation of ambers. Spectrochimica Acta Part A: Molecular Bio-molecular Spectroscopy, Vol. 67, No. 5, pp. 1407–1411, http://dx.doi.org/10.1016/j.saa.2006.10.033
Jiang X., Zhang Z., Wang Y., Kong F. (2020) Gemmological and spectroscopic characteristics of different varieties of amber from the Hukawng Valley, Myanmar. Journal of Gemmology, Vol. 37, No. 2, pp. 144–162.
Kocsis L., Usman A., Jourdan A.-L., Hassan S.H., Jumat N., Daud D., Briguglio A., Slik F., Rinyu L., Futó I. (2020) The Bruneian record of “Borneo amber”: A regional review of fossil tree resins in the Indo-Australian Archipelago. Earth-Science Reviews, Vol. 201, ar-ticle no. 103005, http://dx.doi.org/10.1016/j.earscirev.2019.103005
Kratochvíl P. (2009) Structure and properties of polymers. Materi-als Science and Engineering, Vol. 1, pp. 135–156. In R.D. Rawl-ings, Ed., Encyclopedia of Life Support Systems, EOLSS Publishers, Oxford, UK.
Leelawatanasuk T., Wathanakul P., Paramita S., Sutthirat C., Sriprasert B., Bupparenoo P. (2013) The characteristics of amber from Indonesia. The Australian Gemmologist, Vol. 25, No. 4, pp. 142–145.
Liu Y., Shi G., Wang S. (2014) Color phenomena of blue amber. G&G, Vol. 50, No. 2, pp. 134–140, http://dx.doi.org/ 10.5741/GEMS.50.2.134
My B.P., Linh T.H. (2005) On the stratigraphy and age of continental sediments in the Phu Quoc Island, Tho Chu and An Thoi archi-pelagoes, Kien Giang Province. Journal of Geology, pp. A/291.
Pavia D.L., Lampman G.M., Kriz G.S., Vyvyan J.A. (2014) Intro-duction to Spectroscopy, 5th ed. Cengage Learning, Stamford, Connecticut.
Penney D. (2016) Amber Palaeobiology: Research Trends and Per-spectives for the 21st Century. Siri Scientific Press.
Poinar G. (2010) Palaeoecological perspectives in Dominican amber. In Proceedings Annales de la Société entomologique de France, Vol. 46, Taylor & Francis, pp. 23–52.
Ross A. (1999) Amber. Harvard University Press, Cambridge, Mas-sachusetts, 112 pp.
Sun T.T., Kleišmantas A., Nyunt T.T., Minrui Z., Krishnaswamy M., Ying L.H. (2015) Burmese amber from Hti Lin. Journal of Gemmology, Vol. 34, No. 7, pp. 606–615.
Wolfe A.P., Tappert R., Muehlenbachs K., Boudreau M., McKellar R.C., Basinger J.F., Garrett A. (2009) A new proposal concerning the botanical origin of Baltic amber. Proceedings of the Royal Society B, Vol. 276, No. 1672, pp. 3403–3412, http://dx.doi.org/10.1098/rspb.2009.0806
Xin C., Li Y., Wang Y., Shi G. (2021) Characterisation of patchy blue and green colouration in Dominican blue amber. Journal of Gemmology, Vol. 37, No. 7, pp. 702–715.
Zhang Z., Jiang X., Wang Y., Kong F., Shen A.H. (2020) Fluores-cence characteristics of blue amber from the Dominican Re-public, Mexico, and Myanmar. G&G, Vol. 56, No. 4, pp. 484–496, http://dx.doi.org/10.5741/GEMS.56.4.484
REFERENCES
gia.edu/gems-gemology
For online access to all issues of GEMS & GEMOLOGY from 1934 to the present, visit:


196 RADIOACTIVITY IN SERPENTINITE-RELATED NEPHRITE GEMS & GEMOLOGY SUMMER 2022
Nephrite jade is an almost monomineral rock made of full-grained (felted), cryptocrystalline amphiboles (actinolite and tremolite) (Łoboś
et al., 2008; Adamo and Bocchio, 2013; Gil et al., 2020; Gao et al., 2020). Nephrite usually appears green with varying degrees of saturation but may also exhibit white, gray, black, yellow, brown, and red col-oration (Luo et al., 2015; Gil et al., 2020). In most cases, the color of nephrite is influenced by Cr3+, Fe2+, and Fe3+ ions that produce a wide range of light to dark green hues (Suturin et al., 1980; Hobbs, 1982). The in-tensity of the green coloration is mainly a function of the total iron content (Wilkins et al., 2003; Grapes and Yun, 2010). This sometimes creates mottled, striped, or veined varieties with marbled patterns.
Nephrite’s internal structure typically appears fi-brous, with an intricately woven microstructure of thin tremolite filaments and microtubules that form kidney-like shapes. The name “nephrite” thus de-rives from the Greek word for kidney (Łoboś et al., 2008). It is characterized by a high degree of compact-ness and coherence as well as extreme compressive strength. One nephrite from British Columbia, Canada, exhibited a fracture strength of about 200 MN m–2 (Makepeace and Simandl, 2001). By contrast, nephrite has a hardness of approximately 6.5 on the Mohs scale. The specific gravity of nephrite usually ranges between 2.90 and 3.06 (Żaba, 2006). The main global economic deposits of nephrite jade occur in Canada, Russia, China, the United States, South Korea, New Zealand, Australia, Poland, Italy, and Switzerland. These are usually classified as:
1. Endogenic deposits formed as a result of geo-logical processes of internal origin. The origin of these deposits relates to serpentinites
NATURAL RADIOACTIVITY IN SELECT SERPENTINITE-RELATED NEPHRITE SAMPLES: A COMPARISON WITH DOLOMITE-RELATED NEPHRITE Dariusz Malczewski, Michał Sachanbiński, and Maria Dziurowicz
FEATURE ARTICLES
The published literature offers only a few records of direct measurement of the natural radioactivity in nephrite. The present study used high-purity germanium (HPGe) low-background gamma-ray spectrometry to measure activity concentrations of primordial radionuclides in 11 serpentinite-related nephrite (ortho-nephrite) samples from deposits in Poland, Russia, Canada, and New Zealand, along with three samples of rodingite and serpen-tinite from a nephrite deposit in Nasławice, Poland. All nephrite samples exhibited very low 40K, 232Th, and 238U activity concentrations that fell within the range of published values for ultrabasic and basic rocks. The nephrite samples from Jordanów (Poland) gave the highest uranium and thorium activity concentration values. Two sam-ples of plagiogranitic rodingite showed significantly higher 238U and 232Th activity concentrations than the values measured for nephrite. Nephrite thorium and uranium concentrations correlated strongly (r = 0.98), and the corresponding Th/U ratios appear unique according to geographical location. The mean estimated potassium, thorium, and uranium concentrations from ortho-nephrite analyzed here were compared with corresponding mean values previously reported for dolomite-related nephrite (para-nephrite). The comparison indicates that the ortho-nephrites studied have similar uranium concentrations but lower mean potassium concentrations and higher mean thorium concentrations than those reported for para-nephrite in the literature.
See end of article for About the Authors and Acknowledgments. GEMS & GEMOLOGY, Vol. 58, No. 2, pp. 196–213, http://dx.doi.org/10.5741/GEMS.58.2.196 © 2022 Gemological Institute of America

(ortho-nephrite, serpentinite-related nephrite) and dolomites (para-nephrite, dolomite-re-lated nephrite).
2. Exogenic deposits representing secondary placer deposits of nephrite blocks associated with river and stream sediments, for instance, in East Sayan (Russia), New Zealand, and British Columbia (Canada).
This study measured the radioactivity concentra-tion of 40K, 232Th, and 238U in ortho-nephrite samples from five known nephrite deposits using gamma-ray spectrometry. A major goal of this research was to as-certain whether, as valued decorative stones and gemstones, nephrite may pose a radiological risk to those who handle them, such as artisans or collec-tors. The authors also sought to compare Th/U ratios of ortho- and para-nephrite. As a secondary goal, the research sought evidence that Th/U concentration ratios vary with the geographic origin of nephrite. The results were compared with limited data avail-able from previous studies on samples from the same localities. Previously published data consist prima-rily of potassium concentrations but also include thorium and uranium concentrations reported for para-nephrite and obtained by other analytical meth-ods (Leaming, 1978; Łoboś et al., 2008; Grapes and Yun, 2010; Burtseva et al., 2015; Gil et al., 2015).
Dolomite-related nephrite forms at the contact between dolomite marble and a granitic intrusion or siliceous metasediments (Nichol, 2000; Yui and Kwon, 2002; Gil et al., 2015). Different formation processes cause ortho-nephrite and para-nephrite to vary in terms of their concentrations of transition metals and trace elements. Due primarily to lower iron and chromium concentrations, para-nephrite displays lighter colors ranging from white to light green (Luo et al., 2015). Ratios of iron to magnesium and concentrations of chromium, nickel, cobalt, and manganese distinguish para-nephrite from ortho-nephrite. Along with trace element concentrations, hydrogen and oxygen stable isotopic ratios have been used to determine the geographic origin of se-lect dolomite-related nephrite deposits (Gao et al., 2020). As many concentrations of minor elements overlap for both types of nephrite, expanding the range of trace element determinations and overall geochemical datasets could refine models and crite-ria for distinguishing dolomite-related and serpenti-nite-related nephrite. Expanded geochemical datasets also offer greater accuracy and precision to studies of nephrite provenance.
Consensus holds that ortho-nephrite forms due to initial rodingitization and subsequent serpentinite transformation under the influence of gabbroic or acid magma injection (Gil et al., 2015). Genetic relations between these phases and associated rock types thus warranted investigation of both serpentinite and rodingite that co-occur at the Nasławice locality.
MATERIALS AND METHODS This study analyzed samples of gem-quality ortho-nephrite originating from Poland (Nasławice, Jor-danów), Russia (Siberia, East Sayan), Canada (British Columbia), and New Zealand (South Island). Pol-ished nephrite samples referred to as NS1, NS2, and NS3 (table 1 and figure 1, A–C) were collected by M. Sachanbiński from an active serpentinite and nephrite quarry in Nasławice (Łoboś et al., 2008).
Raw jade samples referred to as JR1, JR2, and JR3 (table 1 and figure 1, D–F) belong to the collection of M. Sachanbiński and come from the historic jade quarry in Jordanów (Prichystal, 2013). Nephrite in Nasławice and nearby Jordanów occurs in serpenti-nite of the Gogołów-Jordanów Massif (GJM), which forms part of the Ślęża Ophiolite, itself part of the Mid-Sudetic Ophiolite (Gil, 2013; Gil et al., 2020). These nephrites occur as irregular bodies within the so-called black wall, a chlorite body within a contact zone of rodingite dikes and serpentinite. The serpen-tinites in Jordanów and Nasławice host completely transformed gabbro and plagiogranites as well as par-tially rodingitized leucogranites. Nephrite from Jor-danów and Nasławice is considered of high gemological quality and usually appears green but without uniform coloration. Varied shades of green create unique patterns on the material’s surface.
RADIOACTIVITY IN SERPENTINITE-RELATED NEPHRITE GEMS & GEMOLOGY SUMMER 2022 197
In Brief • Gamma-ray measurements indicate very low 40K,
232Th, and 238U activity concentrations in 11 serpenti-nite-related (ortho-nephrite) samples.
• Two samples of plagiogranitic rodingite from a nephrite deposit in Nasławice (Poland) showed significantly higher 238U and 232Th activity concentrations than those measured for nephrite samples.
• Thorium and uranium concentrations correlate posi-tively and linearly in the ortho-nephrites analyzed.
• Nephrite, a valued decorative stone and gemstone, does not pose a radiological risk to artisans or collectors.

198 RADIOACTIVITY IN SERPENTINITE-RELATED NEPHRITE GEMS & GEMOLOGY SUMMER 2022
Figure 1. Photographs of ortho-nephrite samples analyzed. A: From Nasławice (NS1), 7 cm in length. B: From Nasławice (NS2), 7 cm in length. C: From Nasławice (NS3), 3 cm in length. D: From Jordanów (JR1), 4 cm in length. E: From Jordanów (JR2), 4 cm in length. F: From Jordanów (JR3), 4 cm in length. G: From Siberia (SB1), 3 cm in length. H: From Siberia (SB2), 3 cm in length. I: From Siberia (SB3), 3 cm in length. J: Bear carving from British Columbia (CN1), 7 cm in length. K: From New Zealand (NZ1), ~7 cm across. All photos by D. Malczewski.
A B C
D E F
G H I
J K

Actinolite represents the main mineral comprising nephrite, and secondary minerals include chlorite, antigorite, grossular, chromite, and iron oxides.
Russian nephrite samples SB1, SB2, and SB3 (table 1 and figure 1, G–I) belong to the collection of M. Sachanbiński. These were donated by a Russian ge-ologist during the International Mineralogical Asso-ciation conference in Novosibirsk, Russia, in September 1978. The samples come from the Ospa deposit located in the East Sayan nephrite-bearing area (southern folded periphery of the Siberian cra-ton). This deposit represents an apo-ultrabasic nephrite (Burtseva et al., 2015). Nephrite from the de-posit appears greenish blue in color and exhibits dif-ferent degrees of saturation (Suturin et al., 1980). Mineral compositions consist primarily of actinolite and tremolite fibers, pyroxene, diopside, serpentine, talc, chromite, graphite, and fuchsite. Accessory mineral content ranges from 0.5 to 1.5%. All of the above-mentioned nephrite samples from Nasławice and Jordanów (Poland) and Siberia (Russia) will be do-nated to the Mineralogical Museum of the Univer-sity of Wrocław (Poland).
Canadian sample CN1 is a dark green nephrite carved in the form of a small bear (table 1 and figure 1J). This carving also belongs to the collection of M. Sachanbiński and was purchased during the 17th Gen-eral Meeting of the IMA in Toronto in August 1998. It was made by a First Nations artisan using material from British Columbia, where more than 50 nephrite occurrences have been reported. These consist of in-dividual blocks, talus blocks, boulder fields, and in situ bodies that occur primarily at contacts between serpentinite and cherts, or other metasedimentary and igneous rocks formed in submarine environments. Secondary minerals in the nephrite include spinel, diopside, uvarovite, titanite, chlorite, and talc (Leam-ing, 1978; Makepeace and Simandl, 2001).
Nephrite sample NZ1 from the South Island of New Zealand exhibits a waxy luster and blackish green color (table 1, figure 1K). This sample was do-nated to the Mineralogical Museum at the Institute of Earth Sciences, University of Silesia by L. Sajkowski, a Polish geologist living and working in New Zealand. Grapes and Yun (2010) describe this nephrite from northern Westland as occurring as rare pebbles and boulders weighing up to several tons, found in glacial outwash gravels and till. They also appear in streams and rivers that drain the nephrite source area of the pounamu ultramafic rocks located in the northern part of the Southern Alps (Ireland et al., 1984; Cooper, 1995).
Samples RN1, RN2, and RN3 represent rodingite (table 1). Rodingite is a rare type of metasomatic rock consisting of grossular, diallage, and accessory magnetite, apatite, and serpentinized olivine. It can be enriched in epidote, prehnite, and vesuvianite (Bell et al., 1911; O’Brien and Rodgers, 1973; Hatzi-panagiotou and Tsikouras, 2001; Kobayashi and Kaneda, 2010; Heflik et al., 2014). The samples and rock type are considered to have high ornamental value. The analyzed samples belong to the collec-tion of S. Madej from the University of Wrocław and come from an active serpentinite and jade quarry in Nasławice. Dubińska et al. (2004) distin-guish two types of rodingite. The first type, boninite rodingite, contains relict clinopyroxene and vesu-vianite, garnet, and diopside. The second type, pla-giogranite rodingite, contains relics of checkerboard albite and hydrogrossular, clinozoisite, zoisite, and late diopside. Macroscopically, samples RN1 and RN2 (plagiogranite rodingites; figure 2, A and B) ex-hibit alternating, fine-grained, light and pink-col-ored laminae and medium-grained, dark gray laminae. In their study of the phase compositions of this type of rodingite, Szełęg (2006) reported quartz (approx. 63%), zoisite (approx. 25%), carbon-ate-hydroxyl apatite, hydrogrossular, albite, and smaller amounts of apatite, titanite, chromite, uraninite, and thorianite. Sample RN3 (boninite rodingite) (figure 2C) exhibits dull to light green color and varied mineral composition.
Sample SRN (table 1, figure 2D) belongs to the collection of M. Sachanbiński and represents a typi-cal serpentinite from the deposit in Nasławice. Ser-pentinites occurring there formed as a result of complex, long-term transformation of harzburgite and lherzolite (Dubińska and Gunia, 1997). These be-long to the Gogołów-Jordanów Serpentinite Massif of the Ślęża Ophiolite and probably formed at around 400 Ma (million years ago) (Gil et al., 2015). The ser-pentinite from Nasławice appears dark green in color and consists primarily of antigorite and sometimes contains olivine, bronzite, diallage, diopside, and hornblende. They sometimes resemble nephrite or are nephritized to varying degrees. Subordinate min-erals include magnesite, braunite, chromite, apatite, garnet, and others. Macroscopically, these minerals are prized for their decorative value. The use of ser-pentinite as tools or decorative objects dates back to the Neolithic (around 3000 BCE) in Lower Silesia. The stone was originally used in tools and weapons (e.g., axes, knives, and hoes) and is used today in or-namental objects (see box A).
RADIOACTIVITY IN SERPENTINITE-RELATED NEPHRITE GEMS & GEMOLOGY SUMMER 2022 199

The activity concentrations (in Bq kg–1) of the nat-urally occurring radionuclides in nephrite, rodingite,
and serpentinite samples, shown in table 1, were measured using a GX4018 gamma-ray spectrometry
200 RADIOACTIVITY IN SERPENTINITE-RELATED NEPHRITE GEMS & GEMOLOGY SUMMER 2022
Figure 2. Samples of rodingite and serpentinite from Nasławice. A: Plagiogranitic rodingite (RN1), 4 cm in length. B: Plagiogranitic rodingite (RN2), 6 cm in length. C: Boninitic rodingite (RN3), 6.5 cm in length. D: Serpentinite (SRN), 6 cm in length. All photos by D. Malczewski.
A B
C D
The practical and ornamental use of nephrite jade by hu-mans dates back to at least the early Neolithic. Because its fracture yields sharp, durable edges, nephrite was ini-tially used to make axes, knives, scrapers, and other sim-ple cutting tools. A pile deposit discovered along the shores of Lake Constance, Switzerland, contained 30,000 jade axes weighing a total of 6000 kg (Hobbs, 1982; Prichystal, 2013). A younger Stone Age site near Jor-danów (Jordansmuhl) in Lower Silesia, Poland, is inter-preted as a serpentinite and nephrite mining and processing center (Prichystal, 2013). A block of jade weighing over two tons excavated from the Jordanów site in 1889 was on display in the New York Metropoli-tan Museum of Art (Gil, 2013).
Jade continues to be used for ornamental and decora-tive objects such as jewelry and art. Some of the highest-quality nephrite, referred to as pounamu in the Maori language, is mined in New Zealand (Hobbs, 1982; Prichys-tal, 2013). The Maori utilized jade for ornaments, art, and tools—in the latter case until the introduction of metal in the nineteenth century. Chinese culture and artwork have featured jade since its earliest inception, and jade carving is particularly well developed in East Asia (Douglas, 2005; Wang, 2011). Nephrite jade has been considered a symbol of wealth and power, and thus many jade artifacts have survived intact into modern times. From antiquity to the present day, nephrite jade has been considered a store of value and items made from it have been prized as gifts.
BOX A: USE OF NEPHRITE JADE

system at the Laboratory of Natural Radioactivity, Institute of Earth Sciences, University of Silesia (Malczewski et al., 2018a, 2018b; see also box B). The system uses a high-purity germanium (HPGe) detec-
tor (45.2% efficiency) in a lead and copper shield (10.2 cm) with a multichannel-buffer Lynx instrument. The energy resolutions of the detector were 0.8 keV at 122 keV and 1.7 keV at 1330 keV. Each sample was
RADIOACTIVITY IN SERPENTINITE-RELATED NEPHRITE GEMS & GEMOLOGY SUMMER 2022 201
TABLE 1. Measured radionuclide activity concentrations and calculated weight con cen - trations of 40K, 232Th, and 238U from ortho-nephrite, rodingite, and serpentinite samples.a
40K 232Th 238U
Rock/Sample Bq kg–1 Total K wt.%b Bq kg–1 ppm Bq kg–1 ppm
Nephrite
NS1 1.5 0.005 0.5 0.12 1.6 0.13
NS2 1.2 0.004 0.6 0.15 1.8 0.15
NS3 5.5 0.018 2.0 0.49 4.5 0.36
JR1 17 0.055 4.4 1.08 19 1.34
JR2 13 0.042 4.7 1.16 20 1.62
JR3 14 0.045 4.3 1.06 17 1.38
SB1 5.1 0.016 1.9 0.47 6.2 0.50
SB2 6.8 0.022 2.0 0.49 5.9 0.48
SB3 5.1 0.016 1.9 0.47 6.6 0.53
CN1 27 0.087 0.8 0.20 1.2 0.10
NZ1 4.2 0.014 1.5 0.37 1.3 0.11
Rodingite
RN1 14 0.045 130 32.0 292 23.6
RN2 28 0.091 18 4.43 172 13.9
RN3 2.7 0.009 4.6 1.13 10 0.81
Serpentinite
SRN 1 0.003 0.7 0.17 1.1 0.09
aMeasurement uncertainties are plotted with this data in figures 4–7.
bThe following conversion factors were used: K (wt.%) = 40K (Bq kg–1)/309.11; Th (ppm) = 232Th (Bq kg–1)/4.06; and U (ppm) = 238U (Bq kg–1)/12.35 (International Atomic Energy Agency, 2003). Uncertainties fell within 5–10% of measured values for activity concentrations below 2 Bq kg–1 .

analyzed for 96 h. The activity concentrations of 232Th and 238U were determined based on the gamma-ray activity concentrations of 208Tl, 212Pb, and 228Ac for thorium, and 214Pb and 214Bi for uranium. Ra-dionuclide activity concentrations were calculated from the following gamma-ray transitions (energy in keV): 40K (1460.8); 208Tl (583.1, 860.5, 2614.5); 212Pb (238.6, 300.1); 214Pb (242, 295.2, 351.9); 214Bi (609.3, 1120.3, 1764.5); and 228Ac (338.32, 911.6, 964.6, 969.1). Laboratory Sourceless Calibration Software (LabSOCS) and Genie 2000 v.3.4 software packages were both used to analyze spectra, calibrate effi-ciency, and determine radionuclides.
Consistency of the activity concentrations calcu-lated for gamma-ray transitions for a given multiline radionuclide (e.g., 208Tl, 214Bi, 214Pb, and 228Ac) were checked using line activity consistency evaluator (LACE) analysis. For all measurements, the multiline radionuclides gave activity concentration ratios ap-proaching unity. The average minimum detectable
activity concentration (MDA) for measured radionu-clides was 0.1 Bq kg–1. Figure 3 shows examples of gamma-ray spectra for nephrite samples NS1 and JR1 and rodingite sample RN1.
RESULTS AND DISCUSSION Table 1 lists measured activity concentrations for 40K, 232Th, and 238U in Bq kg–1 and calculated potassium (wt.%), thorium (ppm), and uranium (ppm) concentra-tions for nephrite, rodingite, and serpentinite samples.
40K. As seen in figure 4 and table 1, the 40K activity concentrations recorded for nephrite samples analyzed ranged from 1.2 Bq kg–1 for NS2 to 27 Bq kg–1 for CN1. Nephrite from Nasławice, Jordanów, and Siberia gave average values of 2.7, 15, and 5.7 Bq kg–1, respectively. The New Zealand nephrite (NZ1) had an intermediate value of 4.2 Bq kg–1. The average value for all samples was 9.1 Bq kg–1 (figure 4). These values exceed 40K ac-
202 RADIOACTIVITY IN SERPENTINITE-RELATED NEPHRITE GEMS & GEMOLOGY SUMMER 2022
Natural radioactivity results from the spontaneous decay of naturally occurring radioisotopes. All elements having an atomic number greater than 83 consist only of radioac-tive isotopes. The three natural types of radioactive nuclei decay include alpha (α, emission of helium nuclei), beta (β, emission of electrons or positrons), and gamma (γ, emis-sion of the shortest electromagnetic waves) decay. The SI unit of radioactivity is the becquerel (Bq), equal to one decay per second. The becquerel replaced the curie (Ci), the unit equal to 3.7 × 10¹⁰ disintegrations per second or the radioactivity of 1 g of 226Ra (1 Bq = 0.27 × 10⁻¹⁰ Ci). The main source of radioactivity in minerals, rocks, and soils derives from the 232Th, 235U, 238U decay series, and 40K (non-series). The 232Th, 235U, and 238U series consist of 6 α and 4 β, 7 α and 4 β, and 8 α and 6 β decays, respectively. Many of the α and β decays are accompanied by gamma-ray ra-diation. The major gamma transitions from potassium, thorium, and uranium are commonly used in estimating weight concentrations based on measured activity concen-trations. Due to the low natural abundance of 235U (0.72% of natural uranium), the activity concentration of this iso-tope is usually negligible compared to that of 238U. Its ac-tivity concentration is thus not taken into account.
Typical soils and carbonate rocks give average 40K, 232Th, and 238U activity concentrations of 400, 30, and 35 Bq kg–1 and 80, 7, and 27 Bq kg–1, respectively (Van Schmus, 1995; UNSCEAR, 2000). Among the most com-mon rock types, acidic igneous rocks such as granite and rhyolite give the highest radioactivity values. These typ-
ically range from 900–1400, 50–200, and 37–72 Bq kg–1
for 40K, 232Th, and 238U, respectively. The activity concentration index assesses radiologi-
cal hazards to human health posed by building materials, including rock surfaces used in paneling or countertops. The European Union standard index I, as defined by the European Atomic Energy Community (2013), represents the sum of three isotopic fractions expressed as:
where ARa, ATh, and AK represent 226Ra (238U), 232Th, and 40K (Bq kg–1) activity concentrations in surroundings or material. The value of index I should not exceed unity, which corresponds to the indoor dose rate of 1 mSv y–1. The sievert (Sv) is the SI unit of equivalent dose and ef-fective dose equal to 1 J kg–1. The external hazard index Hex is also commonly used to evaluate the radiological risk of building materials. It is calculated as follows:
An Hex index equal to unity corresponds to an external gamma-ray dose of 1.5 mSv y–1 from a material. With a few exceptions, the overwhelming majority of rock building materials are characterized by I and Hex values less than one. All ortho-nephrites measured in this study have extremely low average I and Hex values of 0.04 and 0.03, respectively.
BOX B: NATURAL RADIOACTIVITY
I = +ARa
300 Bq kg–1+
ATh
200 Bq kg–1
AK
3000 Bq kg–1
Hex = +ARa
370 Bq kg–1+
ATh
259 Bq kg–1
AK
4810 Bq kg–1

RADIOACTIVITY IN SERPENTINITE-RELATED NEPHRITE GEMS & GEMOLOGY SUMMER 2022 203
Figure 3. Gamma-ray spectra from nephrite sample NS1 (A), nephrite sample JR1 (B), and rodingite sample RN1 (C). Characteristic gamma-ray emitters are marked above the cor-responding peaks. Note the different y-axis count scales for the three samples.
50
0
600
450
300
150
0
16000
12000
8000
4000
0
150
100
200
0 500 1500 2000 2500 30001000
0 500 1500 2000 2500 30001000
0 500 1500 2000 2500 30001000
TI-2
08
TI-2
08TI
-208
TI-2
08
TI-2
08TI
-208TI-2
08B
i-214
Bi-2
14
Bi-2
14
Bi-2
14
Bi-2
14
Bi-2
14
Bi-2
14
Bi-2
14
Bi-2
14B
i-214
Bi-2
14
Bi-2
14
Bi-2
14
Bi-2
14
Bi-2
14B
i-214
Bi-2
14
Bi-2
14K-
40Bi-2
12
Bi-2
14B
i-214
Bi-2
14
Bi-2
14
Bi-2
14B
i-214
K-40
K-40
Ac-
228
Ac-
228
Ac-
228
Ac-
228
Ra-
226
U-2
35
Ac-
228
Ac-
228
Ac-
228
Bi-2
12
Pb-2
12
Pb-2
12Pb
-214
Pb-2
12Pb
-212
Pb-2
12
Pb-2
09Pb
-209
Pb-2
12Pb
-214
Pb-2
14Pb
-214
Ac-
228
Ac-
228
Ac-
228
Ac-
228
TI-2
08TI
-208
TI-2
08
TI-2
08
Pb-2
14
Ra-
226
Pb-2
14
Ra-
226
ANephrite sample NS1
CRodingite sample RN1
BNephrite sample JR1
ENERGY (keV)
CO
UN
TSC
OU
NTS
CO
UN
TSGAMMA RAY SPECTRA

tivity concentration values estimated from ultramafic rocks (~ 0.3 Bq kg–1; Van Schmus, 1995) and serpenti-
nite (1 Bq kg–1) but fell below average values measured in gabbros from Lower Silesia (73 Bq kg–1; Plewa and
204 RADIOACTIVITY IN SERPENTINITE-RELATED NEPHRITE GEMS & GEMOLOGY SUMMER 2022
Figure 5. Measured 232Th activity concen-tration values. The thick horizontal line represents the average 232Th values from all samples. The thin hori-zontal line represents the 232Th activity con-centration for the ser-pentinite sample (SRN). The thin vertical lines are error bars.
3
2
1
0
5
4
6
NS1 NS2 NS3 JR1
JR2
JR3
SB1
SB2
SB3
CN1NZ1
2.2
0.7
Average 232Th value from all samples232Th activity concentration from serpentinite sample
NEPHRITE SAMPLE NO.
232
Th (
Bq
kg–1
)
MEASURED 232Th ACTIVITY CONCENTRATION VALUES
Figure 4. Measured 40K activity concentration values. The thick hori-zontal line represents the average 40K value measured from all sam-ples in this study. The thin horizontal line rep-resents the 40K activity concentration for the serpentinite sample (SRN). The thin vertical lines are error bars.
15
10
5
0
25
20
30
NS1 NS2 NS3 JR1
JR2
JR3
SB1
SB2
SB3
CN1NZ1
9.1
1
Average 40K value from all samples40K activity concentration from serpentinite sample
NEPHRITE SAMPLE NO.
40 K
(B
q kg
–1)
MEASURED 40K ACTIVITY CONCENTRATION VALUES

Plewa, 1992). Typical granites give values ranging from 900–1400 Bq kg–1.
232Th. As seen in table 1 and figure 5, the nephrite from Jordanów had the highest activity concentra-tion values associated with 232Th series isotopes. Val-ues of 4.3, 4.4, and 4.7 Bq kg–1 yielded an average 232Th activity concentration of 4.5 Bq kg–1. The sam-ples from Siberia and Nasławice (NS3) showed the second-highest values at about 2 Bq kg–1. Sample NZ1 had a similar value of 1.5 Bq kg–1. The samples from Nasławice (NS1 and NS2) gave the lowest 232Th activity concentrations of 0.5–0.6 Bq kg–1. Sample CN1 also had a low value of 0.8 Bq kg–1. All samples combined gave an average 232Th activity concentra-tion of 2.2 Bq kg–1 (figure 5). All measured activity concentrations exceeded values reported for ultraba-sic rocks of an order of 10–2 Bq kg–1 (Van Schmus, 1995). The 232Th activity concentration for all sam-ples except NS1 and NS2 exceeded that measured from SRN (0.7 Bq kg–1). Activity concentrations for nephrite samples analyzed fell below the average es-timated for gabbros from Lower Silesia (6.4 Bq kg–1) and well below that previously estimated for gran-ites, which give 232Th activity concentrations ranging from 50–200 Bq kg–1 with an average of 70 Bq kg–1 (Eisenbud and Gesell, 1997).
238U. Table 1 and figure 6 show that the nephrite sam-ples from Jordanów had the highest average activity concentration associated with 238U series isotopes (19 Bq kg–1). Samples from Siberia gave the second-high-est average value at 6.3 Bq kg–1. Samples CN1 and NZ1 showed the lowest 238U activity concentrations of 1.2 and 1.3 Bq kg–1, respectively. As with their 40K and 232Th values, the NS1 and NS2 nephrites from Nasławice gave lower 238U activity concentration val-ues (1.6 and 1.8 Bq kg–1) relative to sample NS3 (4.5 Bq kg–1). All samples had higher 238U activity concen-tration values than those measured from ultrabasic rocks (~0.1 Bq kg–1; Van Schmus, 1995) and from the serpentinite sample SRN (1.1 Bq kg–1). As shown in figure 6, the 238U activity concentration average of 7.7 Bq kg–1 measured for all nephrite samples exceeded the average of 4.1 Bq kg–1 measured from gabbros (Plewa and Plewa, 1992). This relatively high value arises from the significantly higher 232Th activity con-centration measured in the nephrite samples from Jordanów. The calculated mean for the ortho-nephrites analyzed fell below the previously reported average values for granite of 40 Bq kg–1 (Eisenbud and Gesell, 1997).
This study also compared 40K, 232Th, and 238U ac-tivity concentrations from ortho-nephrite with those previously measured from marbles using the same
RADIOACTIVITY IN SERPENTINITE-RELATED NEPHRITE GEMS & GEMOLOGY SUMMER 2022 205
Figure 6. Measured 238U activity concentration values. The thick hori-zontal line represents the average 238U value from all samples in this study. The thin hori-zontal line represents the 238U activity con-centration for the ser-pentinite sample (SRN). The thin vertical lines are error bars.
12
8
4
0
20
16
24
NS1 NS2 NS3 JR1
JR2
JR3
SB1
SB2
SB3
CN1NZ1
7.7
1.1
Average 238U value from all samples238U activity concentration from serpentinite sample
NEPHRITE SAMPLE NO.
23
8 U (
Bq
kg–1
)MEASURED 238U ACTIVITY CONCENTRATION VALUES

technique. Calcite marbles from the Sławniowice quarry (Lower Silesia, Poland) and Alpine marbles from the vicinity of Aussois (France) gave average 232Th activity concentration values of 2.4 Bq kg–1 (Malczewski and Żaba, 2012; Moska, 2019). This ap-proximated average value for 232Th (2.2 Bq kg–1) was measured from the ortho-nephrites analyzed. The 238U activity concentrations in calcite marbles ranged from 16–23 Bq kg–1. Nephrite 238U activity concentra-tions ranged from 2 to 20 Bq kg–1 with an average value of ~8 Bq kg–1. The measured 40K activity con-centrations for calcite marbles ranged from 12–80 Bq kg–1, while that for nephrite ranged from 1.2–27 Bq kg–1 with an average of 9 Bq kg–1. The dolomite mar-bles collected from the Sławniowice mine gave 40K activity concentrations of 122 Bq kg–1 and 232Th activ-ity concentrations of 5 Bq kg–1. These exceeded values measured from calcite marbles, but the two rock types exhibited similar 238U concentrations of ~13 Bq kg–1. The ortho-nephrites analyzed gave comparable 232Th and 238U activity concentration values but lower 40K activity concentration values relative to those of calcite and dolomite marbles. Based on their analyses using an HPGe detector, Fares et al. (2011) reported a
higher average 238U activity concentration of 57 Bq kg–1 for commercial marbles from Egypt.
Rodingite. As noted earlier, the rodingite samples as-sociated with the Nasławice and Jordanów nephrite deposits classify as boninite (RN3) and plagiogranite rodingite (RN1 and RN2). As shown in table 1 and figure 7, sample RN1 gave the highest 238U and 232Th activity concentrations of 292 and 130 Bq kg–1, re-spectively. These values significantly exceed the ac-tivity concentrations of all examined nephrites and activity concentrations of typical granites of 40 and 70 Bq kg–1 for 238U and 232Th, respectively (Eisenbud and Gesell, 1997). Sample RN2 also exhibited high uranium activity concentration but lower thorium-related activity concentration relative to sample RN1. The high 238U and 232Th activity concentration values in RN1 and RN2 rodingite samples likely re-flect the presence of accessory zircon, thorianite, and uraninite (Szełęg, 2006). As expected, sample RN3, which was collected from a body in direct contact with the nephrite-bearing zone, exhibited signifi-cantly lower 238U and 232Th activity concentrations than samples RN1 and RN2. Activity concentrations
206 RADIOACTIVITY IN SERPENTINITE-RELATED NEPHRITE GEMS & GEMOLOGY SUMMER 2022
Figure 7. Measured 40K, 232Th, and 238U activity concentration values for rodingite. The thin and thick horizontal lines respectively show the average 232Th and 238U activity concentra-tions in typical granites (Eisenbud and Gesell, 1997). The thin vertical lines are error bars.
150
100
50
0
250
200
300
RN1 RN2 RN3
70
40
Average 232Th value activity concentrationsAverage 238U value activity concentrations40K232Th238U
RODINGITE SAMPLE NO.
(Bq
kg–1
)
MEASURED 40K, 232Th, AND 238U ACTIVITY CONCENTRATION VALUES

measured from RN3 for 238U (10 Bq kg–1) and 232Th (5 Bq kg–1) exceeded those observed in ortho-nephrite samples from Nasławice, Siberia, British Columbia, and South Island but resembled those measured from the Jordanów samples. The rodingite samples exhib-ited relatively low 40K activity concentrations with a mean value of 15 Bq kg–1, which exceeded the mean value of 9.1 Bq kg–1 measured from the nephrite sam-ples. As with 238U and 232Th activity concentrations, sample RN3 gave the lowest 40K activity concentra-tion of 3 Bq kg–1. Samples RN1 and RN2 gave higher activity concentrations of 14 and 28 Bq kg–1. These resembled values measured from the Jordanów nephrite samples and from CN1.
Comparison of K, Th, and U Concentrations with Previous Data. Concentrations estimated for potas-sium (wt.%), thorium (ppm), and uranium (ppm) showed similar trends among the samples as those observed for the 40K, 232Th, and 238U activity concen-tration values. Nephrite potassium concentrations varied from 0.004 wt.% for sample NS2 to 0.087 wt.% for sample CN1, and the samples overall gave a mean value of 0.03%. Concentrations estimated for potassium, thorium, and uranium generally resem-bled the few previously obtained results for ortho-nephrite from the same locations. The nephrite samples from Nasławice in particular showed similar potassium concentrations. Łoboś et al. (2008) report average potassium concentrations of 0.004, 0.008, and 0.016 wt.% for three types of nephrite based on elec-tron microscope analysis. These values correspond to 40K activity concentrations of approximately 1.2, 2.5, and 5.0 Bq kg–1 and thus agree very well with activity concentrations measured from samples NS1, NS2, and NS3 by gamma-ray spectrometry (table 1). Prompt gamma neutron activation energy analysis (PGAA) indicated a bulk-rock potassium concentra-tion of about 0.016 wt.% for the Jordanów nephrite sample. This value corresponds to a 40K activity con-centration of less than 5 Bq kg–1 (Gil et al., 2015). The concentration value and associated 40K activity con-centration fell below values obtained by this study for the three samples from Jordanów, which gave an av-erage potassium concentration of 0.050 wt.% and an average 40K activity concentration of 15 Bq kg–1 (table 1). Extensive studies by Leaming (1978) and Nichol (2000) report an average potassium concentration of 0.038 wt.% and a corresponding 40K activity concen-tration of 12 Bq kg–1 for Canadian nephrite from British Columbia. Gamma-ray measurements (table 1) of sample CN1 indicate a higher but comparable
40K activity concentration value of 27 Bq kg–1 (0.087 wt.%). Grapes and Yun (2010) report average potas-sium concentrations for South Island nephrite of 0.012 wt.% based on electron microprobe analysis. These correspond to a 40K activity concentration of 3.8 Bq kg–1 and fall within the measurement uncer-tainty of potassium values obtained for sample NZ1 (4.2 Bq kg–1 and 0.014 wt.%). The above-mentioned literature sources provide no data on thorium and ura-nium concentrations.
Ortho-nephrite samples from the East Sayan area exhibit relatively large differences in potassium, tho-rium, and uranium concentrations. Inductively cou-pled plasma–mass spectrometry (ICP-MS) analysis gave average potassium concentrations of 0.05 wt.% (16 Bq kg–1 of 40K) for samples from the area (Burtseva et al., 2015). This value exceeds the average value of 0.016 wt.% (6 Bq kg–1 of 40K) obtained for samples SB1, SB2, and SB3. Burtseva et al. (2015) reported av-erage thorium and uranium concentrations for nine samples of 0.06 ppm (~0.3 Bq kg–1 for thorium) and 0.05 ppm (~0.6 Bq kg–1 for uranium). The present study obtained mean thorium and uranium activity concentrations of 1.9 and 6.2 Bq kg–1, corresponding to concentrations of 0.48 and 0.51 ppm from East Sayan nephrite (table 1).
Comparison of K, Th, and U Concentrations Meas-ured from Para-Nephrite. Luo et al. (2015) present de-tailed laser ablation–inductively coupled–mass spectrometry (LA-ICP-MS) trace element data for 138 samples collected directly from eight major dolomite-related nephrite deposits in East Asia. Fig-ure 8 compares mean potassium, thorium, and ura-nium concentrations reported in Luo et al. (2015) with results from ortho-nephrite samples reported in this study. As seen in figure 8A, the ortho-nephrites exhibit an average potassium concentra-tion of 0.03 wt.%, whereas the para-nephrites from East Asia exhibit an average potassium concentra-tion of 0.07 wt.% (22 Bq kg–1) with standard devia-tions of 0.02 and 0.04%, respectively. Nichol (2000) reports a mean potassium concentration of 0.1 ± 0.02 wt.% for para-nephrite samples from southern Aus-tralia. This corresponds to a 40K activity concentra-tion of approximately 30 Bq kg–1, a value that resembles that measured for sample CN1, which gave the highest 40K activity concentration among the ortho-nephrite samples (table 1). Similarly, dolomite-related nephrite from Val Malenco (Italy) had a mean potassium concentration of 0.04 ± 0.004 wt.%, which slightly exceeded the average values
RADIOACTIVITY IN SERPENTINITE-RELATED NEPHRITE GEMS & GEMOLOGY SUMMER 2022 207

obtained for ortho-nephrites reported here. A con-centration of 0.04 wt.% potassium corresponds to a 40K activity concentration of about 12 Bq kg–1. This estimate resembles values measured for the Jor-danów nephrites (table 1). Results also show that the
mean potassium concentration calculated from ortho-nephrite 40K activity concentration generally falls below that measured for para-nephrite (figure 8A). However, potassium concentrations often over-lap for both types of nephrite. Serpentinite-related nephrites gave an estimated average thorium con-centration of 0.55 ± 0.30 ppm, which exceeds that estimated for para-nephrite (0.26 ± 0.18 ppm or 1.1 ± 0.7 Bq kg–1) by a factor of two (figure 8B). The rela-tively large dispersion of thorium concentrations for both types of nephrite means that value ranges par-tially overlap. Excluding the Jordanów samples with the highest thorium concentrations gives a calcu-lated mean of 0.35 for the remaining serpentinite-re-lated nephrites. This value still exceeds the values estimated for dolomite-related nephrite. As shown in figure 8C, serpentinite-related nephrites gave an average U concentration of 0.63 ± 0.57 ppm, while dolomite-related nephrites had an average uranium concentration of 0.74 ± 0.44 ppm (9.1 ± 5.4 Bq kg–1). Ortho-nephrite and para-nephrite showed very sim-ilar average uranium concentrations, but samples from different nephrite deposit locations give rela-tively variegated values. In summary, the relatively large standard deviations associated with calculated mean potassium, thorium, and uranium concentra-tions suggest that these parameters alone would not be enough to clearly distinguish ortho-nephrite from para-nephrite but may serve as approximate indica-tors of host rock type, especially in terms of their potassium and thorium parameters.
Correlations Between Th and U Concentrations. As seen in figure 9, 232Th and 238U concentrations corre-late strongly in ortho-nephrites analyzed and give a correlation coefficient of 0.98. A fitted line shows samples NS1 and NZ1 deviate slightly from this trend. Figure 9 shows that Jordanów samples (JR1–JR3) form a distinct data cluster with uranium concentrations ranging from 1.3 to 1.7 ppm and tho-rium concentrations from 1.0 to 1.2 ppm. All other ortho-nephrite samples range from about 0.1 to 0.6 ppm in terms of both uranium and thorium concen-trations. A gap of 0.7 to 1.3 ppm for uranium and 0.6 to 1.0 for thorium thus exists between the Jordanów samples and others. Excluding the CN1 sample, other samples also show strong K-Th and K-U correlations (table 1).
The dolomite-related nephrites from deposits in East Asia studied by Luo et al. (2015) showed weaker correlations between average thorium and uranium concentrations. These gave average thorium concen-
208 RADIOACTIVITY IN SERPENTINITE-RELATED NEPHRITE GEMS & GEMOLOGY SUMMER 2022
Figure 8. Comparison of calculated average concen-trations of potassium (wt.%), thorium (ppm), and ura-nium (ppm) in ortho-nephrites (serpentine-related, darker green bar) analyzed in this study and from para-nephrite (dolomite-related, lighter green bar) data reported by Luo et al. (2015). The thin vertical lines are error bars.
0.12
0.08
0.04
0.00
0.03
0.07
A
0.90
0.60
0.30
0.00
0.55
0.26
B
1.50
1.00
0.50
0.00
0.63
0.74
C
Serpentinite-relatedDolomite-related
Serpentinite-relatedDolomite-related
Serpentinite-relatedDolomite-related
K (w
t. %
)Th
(pp
m)
U (
ppm
)CALCULATED AVERAGE CONCENTRATIONS

trations of 0.07 to 0.70 ppm and uranium concentra-tions from 0.2 to 1.4 ppm. Data from these para-nephrites show a high degree of visible scatter, and linear regression gives a correlation coefficient of 0.42
(figure 10). The weaker correlation between thorium and uranium concentrations for para-nephrite (figure 10) compared to that observed for ortho-nephrite (fig-ure 9) most likely arises from greater differentiation of
RADIOACTIVITY IN SERPENTINITE-RELATED NEPHRITE GEMS & GEMOLOGY SUMMER 2022 209
Figure 9. Correlation between thorium (ppm) and uranium (ppm) for ortho-nephrites ana-lyzed in this study. The solid line represents the linear fit of Th (ppm) = 0.16 + 0.62 × U (ppm), with a correlation coef-ficient of r = 0.98.
1.6
1.4
1.2
1.0
0.8
0.6
0.4
0.2
0.00.0 0.2 0.4 0.6 0.8 1.0 1.2 1.4 1.6 1.8
NZ1
CN1
NS2
NS1
NS3 SB2 SB1
SB3
JR3
JR2JR1
r = 0.98
U (ppm)
Th (
ppm
)U vs. Th
Figure 10. Correlation between thorium (ppm) and uranium (ppm) for para-nephrites based on data reported in table 2 of Luo et al. (2015). The solid line represents a linear fit of Th (ppm) = 0.13 + 0.17 × U (ppm), with a correlation coef-ficient of r = 0.42.
0.8
0.7
0.6
0.5
0.4
0.3
0.2
0.1
0.00.0 0.2 0.4 0.6 0.8 1.0 1.2 1.4 1.6 1.8
r = 0.42
U (ppm)
Th (
ppm
)
U vs. Th

thorium and uranium concentrations in dolomites (and carbonates in general), which are the host rocks for para-nephrite.
Th/U Concentration Ratios. As shown in figure 11, Th/U ratios for the serpentinite-related nephrites vary from 0.70 to 3.51 with an average value of 1.30. The average Th/U concentration ratios were 1.11 ± 0.12, 0.73 ± 0.02, and 0.95 ± 0.05 for nephrite from Nasławice, Jordanów, and Siberia, respectively. Nephrite from these locations can be differentiated within standard deviations based on their Th/U ratio (figure 11). Despite its higher thorium and uranium concentrations, sample NS3 gave a Th/U ratio simi-lar to that of samples NS1 and NS2. Samples CN1 and NZ1 gave relatively higher Th/U ratios of 2.03 ± 0.14 and 3.51 ± 0.25, respectively.
The data presented by Luo et al. (2015) indicates a calculated mean Th/U value of 0.5 for dolomite-re-lated nephrite. This value falls below the value of 1.3 estimated for serpentinite-related nephrite by the present study (figure 11). The calculated values of 1.3 and 0.5 for serpentinite- and dolomite-related nephrite (respectively) resemble Th/U concentration ratios in the host rocks. Serpentinites and their peri-dotite protoliths both exhibit a Th/U ratio of approx-
imately 2 (Van Schmus, 1995; Pasquale et al., 2001). As listed in table 1, the serpentinite from Nasławice (SN1) gave a ratio of 1.9, which approaches the mean value estimated for ortho-nephrite. Previous studies of dolomite and dolomite marble using gamma-ray spectrometry show that the average Th/U ratio for these rocks is about 0.5 (Chiozzi et al., 2002; Mal-czewski et al., 2005; Malczewski and Żaba, 2012; Moska, 2019). Generally, carbonate rocks have a mean Th/U value of 0.8 (Van Schmus, 1995). Again, the average value of the Th/U ratio calculated for the para-nephrites based on the results obtained by Luo et al. (2015) agrees well with those reported for car-bonate rocks and especially dolomites.
CONCLUSIONS This study reports gamma-ray spectrometric analy-sis of serpentinite-related nephrite samples from several well-known global localities. Measurements indicate very low 40K, 232Th, and 238U activity con-centrations that pose no radiological risk. Measured activity concentrations fell below values reported in the literature for acid igneous rocks. By contrast, the mean 40K, 232Th, and 238U activity concentration values exceeded average values reported in litera-ture sources for ultrabasic rocks and, to a lesser ex-
210 RADIOACTIVITY IN SERPENTINITE-RELATED NEPHRITE GEMS & GEMOLOGY SUMMER 2022
Figure 11. Concentra-tion ratios of Th/U. The thick horizontal line shows the average for ortho-nephrites in the present study. The thin horizontal line shows the average for para-nephrites based on data reported by Luo et al. (2015). The thin vertical lines are error bars.
3
2
1
0
4
5
NS1 NS2 NS3 JR1
JR2
JR3
SB1
SB2
SB3
CN1NZ1
1.3
0.5
Average for ortho-nephritesAverage for para-nephrites
NEPHRITE SAMPLE NO.
Th (
ppm
) /
U (
ppm
)Th/U CONCENTRATION RATIOS

tent, for serpentinites. Compared to gabbroic rocks from Lower Silesia (Poland), the ortho-nephrites ex-
hibited lower 40K and 232Th activity concentrations and slightly higher 238U activity concentrations. The
RADIOACTIVITY IN SERPENTINITE-RELATED NEPHRITE GEMS & GEMOLOGY SUMMER 2022 211
Figure 12. This 90 × 20 mm nephrite carving is from the Kutcho Jade mine in northwest British Columbia, Canada. Photo by Robert Weldon; courtesy of Jade West Group.

measured serpentinite-related nephrites were char-acterized by extremely low average values of radio-logical hazard indices I and Hex of 0.04 and 0.03, with the upper levels of both indices equal to unity. Calculated thorium (ppm) and uranium (ppm) con-centrations strongly correlate. Nephrite from Nasławice, Jordanów, and Siberia show distinct
Th/U ratios, indicating that this parameter may dis-tinguish material from these respective localities. Our results suggest that relative to para-nephrite, ortho-nephrite (figure 12) exhibits lower potassium concentration values and higher thorium concen-trations. Both types of nephrite jade exhibit similar uranium concentrations.
212 RADIOACTIVITY IN SERPENTINITE-RELATED NEPHRITE GEMS & GEMOLOGY SUMMER 2022
Adamo I., Bocchio R. (2013) Nephrite jade from Val Malenco, Italy: Review and update. G&G, Vol. 49, No. 2, pp. 98–106, http://dx.doi.org/10.5741/GEMS.49.2.98
Bell J.M., de Courcey Clarke E., Marshall P. (1911) Geology of the Dun Mountain Subdivision. New Zealand Geological Survey, Bulletin No. 12, pp. 31–35.
Burtseva M.V., Ripp G.S., Posokhov V.F., Murzintseva A.E. (2015) Nephrites of East Siberia: Geochemical feature and problems of genesis. Russian Geology and Geophysics, Vol. 56, No. 3, pp. 402–410, http://dx.doi.org/10.1016/j.rgg.2015.02.003
Chiozzi P., Pasquale V., Verdoya M. (2002) Naturally occurring radio activity at the Alps-Apennines transition. Radiation Measurements, Vol. 35, No. 2, pp. 147–154, http://dx.doi.org/10.1016/S1350-4487(01)00288-8
Cooper A.F. (1995) Nephrite and metagabbro in the Haast Schist at Muddy Creek, northwest Otago, New Zealand. New Zealand Journal of Geology and Geophysics, Vol. 38, No. 3, pp. 325–332, http://dx.doi.org/10.1080/00288306.1995.9514660
Douglas J.G. (2005) A review of some recent research on early Chi-nese jades. In Scientific Examination of Art: Modern Tech-niques in Conservation and Analysis. National Academies Press, Washington, DC, pp. 206–214.
Dubińska E., Gunia P. (1997) The Sudetic ophiolite: Current view on its geodynamic model. Geological Quarterly, Vol. 41, No. 1, pp. 1–20.
Dubińska E., Bylina P., Kozłowski A., Dörr W., Nejbert K., Schas-tok J., Kulicki C. (2004) U-Pb dating of serpentinization: Hydro -thermal zircon from a metasomatic rodingite shell (Sudetic ophiolite, SW Poland). Chemical Geology, Vol. 203, No. 3-4, pp. 183–203, http://dx.doi.org/10.1016/j.chemgeo.2003.10.005
Eisenbud M., Gesell T. (1997) Environmental Radioactivity Con-centration from Natural, Industrial and Military Sources. Aca -demic Press, San Diego.
European Atomic Energy Community (2013) Council Directive
EU 2013/59/Euratom. Laying down basic safety standards for protection against the dangers arising from exposure to ionising radiation.
Fares S., Yassene A.A.M., Ashour A., Abu-Assy M.K., Abd El-Rah-man M. (2011) Natural radioactivity and the resulting radiation doses in some kinds of commercially marble collected from dif-ferent quarries and factories in Egypt. Natural Science, Vol. 3, No. 10, pp. 895–905, http://dx.doi.org/10.4236/ns.2011.310115
Gao K., Fang T., Lu T., Lan Y., Zhang Y., Wang Y., Chang Y. (2020) Hydrogen and oxygen stable isotope ratios of dolomite-related nephrite: Relevance for its geographic origin and geological sig-nificance. G&G, Vol. 56, No. 2, pp. 266–280, http://dx.doi.org/10.5741/GEMS.56.2.266
Gil G. (2013) Petrographic and microprobe study of nephrites from Lower Silesia (SW Poland). Geological Quarterly, Vol. 57, No. 3, pp. 395–404, http://dx.doi.org/10.7306/gq.1101
Gil G., Barnes J.D., Boschi C., Gunia P., Szakmány G., Bendö Z., Raczyński P., Péterdi B. (2015) Origin of serpentinite-related nephrite from Jordanów and adjacent areas (SW Poland) and its comparison with selected nephrite occurrences. Geologi-cal Quarterly, Vol. 59, No. 3, pp. 457–472, http://dx.doi.org/10.7306/gq.1228
Gil G., Bagiński B., Gunia P., Madej S., Sachanbiński M., Jokubauskas P., Belka Z. (2020) Comparative Fe and Sr isotope study of nephrite deposits hosted in dolomitic marbles and ser-pentinites from the Sudetes, SW Poland: Implications for Fe-As-Au-bearing skarn formation and post-obduction evolution of the oceanic lithosphere. Ore Geology Reviews, Vol. 118, article no. 103335, http://dx.doi.org/10.1016/j.oregeorev.2020.103335
Grapes R.H., Yun S.T. (2010) Geochemistry of a New Zealand nephrite weathering rind. New Zealand Journal of Geology and Geophysics, Vol. 53, No. 4, pp. 413–426, http://dx.doi.org/10.1080/00288306.2010.514929
Hatzipanagiotou K., Tsikouras B. (2001) Rodingite formation from
REFERENCES
ACKNOWLEDGMENTS This work was partially supported by the National Science Cen-tre of Poland through grant no. 2018/29/B/ST10/01495 and the research program at the Institute of Earth Sciences, Univer-sity of Silesia, ZB-14-2020. We thank the Mineralogical Mu-seum at the Institute of Earth Sciences, University of Silesia, and Stanisław Madej for the New Zealand jade sample and rodingite samples used in this research. The authors would like to thank Sandra Malczewska for the digital processing of pho-tos according to publication requirements.
ABOUT THE AUTHORS Dr. Malczewski is a nuclear physicist and assistant professor at the Institute of Earth Sciences of the University of Silesia (Poland), specializing in the field of natural and anthropogenic radioactivity in the geosphere and researching metamict minerals as natural analogues for understanding the storage of high-level nuclear waste. Professor Sachanbiński, who specializes in the physics of minerals, gemology, and mineralogy, is an emeritus professor at the University of Wrocław and teaches at the College of Arts and Management in Wrocław. Dr. Dziurowicz is a geologist, geophysi-cist, and assistant professor at the Institute of Earth Sciences of the University of Silesia, specializing in natural and anthropogenic environmental radioactivity.

RADIOACTIVITY IN SERPENTINITE-RELATED NEPHRITE GEMS & GEMOLOGY SUMMER 2022 213
diorite in the Samothraki ophiolite, NE Aegean, Greece. Geo-logical Journal, Vol. 36, No. 2, pp. 93–109, http://dx.doi.org/10.1002/gj.887
Heflik W., Natkaniec-Nowak L., Dumańska-Słowik A. (2014) Rodingite from Nasławice and the other occurrences of these rocks in Lower Silesia (SW Poland). Geological Quarterly, Vol. 58, No. 1, pp. 31–40.
Hobbs J.M. (1982) The jade enigma. G&G, Vol. 18, No. 1, pp. 3–19, http://dx.doi.org/10.5741/GEMS.18.1.3
International Atomic Energy Agency (2003) IAEA-TECDOC-1363: Guidelines for radioelement mapping using gamma ray spec-trometry data. Vienna.
Ireland T.R., Reay A., Cooper A.F. (1984) The Pounamu ultramafic belt in the Dietrich Range, Westland, New Zealand. New Zealand Journal of Geology and Geophysics, Vol. 27, No. 3, pp. 247–256.
Kobayashi S., Kaneda H. (2010) Rodingite with Ti- and Cr-rich vesuvianite from the Sartuohai chromium deposit, Xinjiang, China. Journal of Mineralogical and Petrological Sciences, Vol. 105, No. 3, pp. 112–122, http://dx.doi.org/10.2465/jmps.081224
Leaming S.F. (1978) Jade in Canada. Geological Survey of Canada, Paper 78-19. Energy, Mines & Resources, Canada, 59 pp.
Łoboś K., Sachanbiński M., Pawlik T. (2008) Nephrite from Nasławice in Lower Silesia (SW Poland). Przegl ąd Geologiczny, Vol. 56, No. 11, pp. 991–999 (in Polish with English abstract).
Luo Z., Yang M., Shen A.H. (2015) Origin determination of dolomite-related white nephrite through iterative-binary linear discriminant analysis. G&G, Vol. 51, No. 3, pp. 300–311, http://dx.doi.org/10.5741/GEMS.51.3.300
Makepeace K., Simandl G.J. (2001) Jade (nephrite) in British Co-lumbia, Canada. Program and Extended Abstracts for 37th Forum on the Geology of. Industrial Minerals 37, pp. 209– 210.
Malczewski D., Żaba J. (2012) Natural radioactivity in rocks of the Modane-Aussois region (SE France). Journal of Radioanalytical and Nuclear Chemistry, Vol. 292, No. 1, pp. 123–130, http://dx.doi.org/10.1007/s10967-011-1428-9
Malczewski D., Teper L., Lizurek G., Dorda J. (2005) In situ gamma-ray spectroscopy in common rock raw materials mined in Kraków vicinity, Poland. In Naturally Occurring Radioac-tive Materials (NORM IV): Proceedings of an International Conference Held in Szczyrk, Poland, 17–21 May 2004. IAEA-TECDOC-1472. International Atomic Energy Agency, Lan-ham, Maryland, pp. 368–376.
Malczewski D., Dziurowicz M., Krzykawski T., Grabias A. (2018a) Spectroscopic characterization and thermal recrystallization study of an unknown metamict phrase from Tuften Quarry, Southern Norway. The Canadian Mineralogist, Vol. 56, No. 4, pp. 365– 373, http://dx.doi.org/10.3749/canmin.1800015
Malczewski D., Dziurowicz M., Krzykawski T., Stryjewski A. (2018b)
222Rn and 220Rn emanations from zircon crystals as a function of absorbed alpha-doses. The Canadian Mineralogist, Vol. 56, No. 4, pp. 451–462, http://dx.doi.org/10.3749/canmin.1700089
Moska A. (2019) Natural and anthropogenic radioactivity of the Opava Mountains and their western foreland. PhD thesis. University of Silesia, Katowice, Poland (in Polish with English abstract).
Nichol D. (2000) Two contrasting nephrite jade types. Journal of Gemmology, Vol 27, No. 4, pp. 193–200.
O’Brien J.P., Rodgers K.A. (1973) Xonitlite and rodingites from Wairere, New Zealand. Mineralogical Magazine, Vol. 39, No. 302, pp. 233–240.
Pasquale V., Verdoya M., Chiozzi P. (2001) Radioactive heat gen-eration and its thermal effects in the Alps-Apennines boundary zone. Tectonophysics, Vol. 331, No. 3, pp. 269–283, http://dx.doi.org/10.1016/S0040-1951(00)00294-8
Plewa M., Plewa S. (1992) Petrophysics. Geological Publishing House, Warsaw, 326 pp. (in Polish).
Prichystal A. (2013) Lithic Raw Materials in Prehistoric Times of Eastern Central Europe. Masaryk University, Brno, Czech Republic.
Suturin A.N., Zamaletdinov R.S., Letnikov F.A., Sekerin A.P. Bur-makina G.V., Suturina T.A., Platonov A.N., Belitchenko V.P., Vokhmentser A.Y. (1980) Mineralogy and genesis of nephrites in the USSR. In Sidorenko, Eds., Gem Minerals: Proceeding of the XI General Meeting of IMA, Novosibirsk, September 4–10, 1978 (in Russian).
Szełęg E. (2006) Crystalochemistry of titanite from Lower Silesian. PhD thesis. University of Silesia, Katowice, Poland (in Polish).
UNSCEAR (2000) Sources and Effects of Ionizing Radiation: Vol I. United Nations Scientific Committee on the Effects of Atomic Radiation. UNSCEAR 2000 Report to the General As-sembly, with Scientific Annexes. United Nations, New York.
Van Schmus W.R. (1995) Natural radioactivity of the crust and the mantle. In T.J. Ahrens, Ed., Global Earth Physics: A Handbook of Physical Constants. AGU Reference Shelf I, American Geo-physical Union, Washington, DC, pp. 283–291.
Wang R. (2011) Progress review of the scientific study of Chinese ancient jade. Archaeometry, Vol. 53, No. 4, pp. 674–692, http://dx.doi.org/10.1111/j.1475-4754.2010.00564.x
Wilkins C.J., Tennant W.C., Williamson B.E., McCammon C.A. (2003) Spectroscopic and related evidence on the coloring and constitution of New Zealand jade. American Mineralogist, Vol. 88, No. 8-9, pp. 1336–1344, http://dx.doi.org/10.2138/am-2003-8-917
Yui T.F., Kwon S.T. (2002) Origin of a dolomite-related jade deposit at Chumcheon, Korea. Economic Geology, Vol. 97, No. 3, pp. 593–601, http://dx.doi.org/10.2113/gsecongeo.97.3.593
Żaba J. (2006) Illustrated Dictionary of Rocks and Minerals. Videograf II Ltd., Katowice, Poland (in Polish).
gia.edu/gems-gemology
For online access to all issues of GEMS & GEMOLOGY from 1934 to the present, visit:

Rare Orange BENITOITE
A bright orange benitoite (figure 1) weighing 2.29 ct was recently ex-amined at the Carlsbad laboratory. Standard gemological testing re-vealed a refractive index of 1.756 to over the limit (OTL) and a specific gravity of 3.68. The fluorescence re-action was strong orange in long-wave ultraviolet light and medium blue in short-wave UV (figure 2). The benitoite was slightly color-zoned orange and blue; the blue por-tion’s pleochroism was very light blue and darker blue, while the or-ange portion’s pleochroism was orangy yellow and dark orange. Mi-croscopic examination showed al-tered crystals with discoid fractures (figure 3) and strong doubling. The discoid fractures were consistent with heated benitoite.
Benitoite is a barium titanium sil-icate (BaTiSi3O9) known as the Cali-fornia state gem, and it only occurs in gem quality in San Benito County, California. The New Idria District produces medium to medium-dark blue and lighter blue colors. Accord-ing to a previous study published in G&G, pink and colorless examples are considered rare. In addition, heat treatment of lighter-color or colorless benitoite may result in an orange color. Since only a small portion of
the treated material successfully changes color, orange benitoite is con-sidered rare (B.M. Laurs et al., “Beni-toite from the New Idria District, San Benito County, California,” Fall 1997 G&G, pp. 166–187).
This benitoite was faceted by Bill Vance of Vance Gems, who stated that the rough was colorless prior to heat treatment. The bright orange color and large size make this an ex-ceptional example of orange benitoite. Very few of these have been examined at GIA, and this 2.29 ct gemstone is the largest example we have observed.
Amy Cooper and Nathan Renfro
214 LAB NOTES GEMS & GEMOLOGY SUMMER 2022
Lab NotesEditors Thomas M. Moses | Shane F. McClure
© 2022 Gemological Institute of America
GEMS & GEMOLOGY, Vol. 58, No. 2, pp. 214–225.
Editors’ note: All items were written by staff members of GIA laboratories.
Figure 1. The size and bright color of this 2.29 ct orange benito ite are exceptionally rare.
Figure 3. The orange benitoite contained several discoid frac-tures with healed fringes, consis-tent with heat-treated benitoite. Field of view 2.33 mm.
Figure 2. The orange benitoite’s response to long-wave (left) and short-wave UV (right).

Interesting Set of BLUE “ROUGH” GEMSTONES The selling of simulants and syn-thetics mixed with parcels of natural stones is an old form of deception. It usually happens close to mines, where inexperienced buyers assume the gemstones come directly from the source—and where advanced testing is likely not available prior to the purchase.
The Carlsbad laboratory recently received a group of four blue rough
stones (figure 4) submitted as natural sapphire for identification and origin reports. The largest weighed 48.63 ct and measured approximately 22.88 × 19.67 × 15.19 mm. The material was partially fashioned, with evidence of polish lines on the surfaces. Careful microscopic examination revealed multiple gas bubbles, distinct flow marks associated with blue coloration, and conchoidal fractures. Weak snake pattern bands were observed under the polariscope. The hydrostatic specific
gravity was 2.48. These observations suggested a glass imitation, which was confirmed by comparing the infrared spectrum with that of manmade glass.
The next two were more convinc-ing imitations of natural sapphire. They weighed 9.17 and 6.21 ct and measured approximately 16.00 × 10.06 × 8.30 mm and 10.31 × 9.38 × 8.71 mm, respectively. Resin that coated the surface (figure 5) resembled matrix composed of natural minerals com-monly seen on natural corundum rough. The resin started to melt with the touch of a hot pointer. Brownish materials trapped in cavities resembled iron oxide stains one would expect to see in natural rough. Though difficult to see inside of the stones due to their rough surfaces, a few gas bubbles were observed through a small transparent area. Raman spectroscopy matched co-rundum, and immersion in water (fig-ure 6) revealed curved blue banding. Laser ablation–inductively coupled plasma–mass spectrometry (LA-ICP-MS) detected no gallium and revealed trace elements of impurities consistent with synthetic corundum. Hydro static specific gravity values were 3.76 and 3.59, respectively. Both values were below the SG of corundum (3.9–4.05), a result of the lower SG of the resin on the surface. Both were reported as la-boratory-grown sapphire with a com-ment stating, “Imitation matrix and resin is present on the surface.”
LAB NOTES GEMS & GEMOLOGY SUMMER 2022 215
Figure 5. A resin imitation of matrix on the surface of a laboratory-grown sapphire. Field of view 7.19 mm.
Figure 4. This set consists of a 48.63 ct piece of manmade glass (left), 9.17 and 6.21 ct laboratory-grown sapphires with resin imitation of matrix on the surface (center), and an 8.46 ct natural blue sapphire rough (right).
Figure 6. Curved blue banding visible in the 6.21 ct laboratory-grown sapphire immersed in water.

The last piece of rough was a blue stone weighing 8.46 ct and measuring 13.85 × 9.89 × 7.60 mm. The frosted natural surface made it difficult to see inside the stone, but some natural-looking fingerprints and strong, straight inky blue banding were ob-served. The Raman spectrum matched with corundum, and a hy-drostatic SG of 3.96 confirmed it. The stone was immersed in methylene io-dide to confirm the zoning was straight and not curved. Medium chalky blue fluorescence to short-wave UV and a strong 3309 cm–1 series in its Fourier-transform infrared (FTIR) spectrum proved that heat treatment had been applied to the stone. LA-ICP-MS revealed natural chemistry, including about 200 ppma iron and other trace elements such as gallium (~25 ppma), vanadium (~3.5 ppma), magnesium (~35 ppma), chro-mium (~1.5 ppma), and titanium (~80 ppma). Based on appearance, color zoning, and chemistry, this stone was reported as natural sapphire, heat treated, with Madagascar as the coun-try of origin.
This was an interesting study of how synthetics and simulants can be mixed with their natural counterparts to misrepresent a parcel. However, careful examination and standard gemological testing are usually enough to identify them correctly.
Najmeh Anjomani
DIAMONDS The Type IIb De Beers Cullinan Blue Diamond Type IIb blue diamonds are extremely rare in nature. When people think of blue diamonds, the Hope diamond im-mediately springs to mind. The famed 45.52 ct Fancy Deep grayish blue cushion-cut treasure, now housed in the Smithsonian National Museum of Natural History in Washington, DC, has a long and fascinating history. First examined by GIA in 1960 and graded by GIA in 1988 (R. Crowning-shield, “Grading the Hope diamond,” Summer 1989 G&G, pp. 91–94), it
shares many special gemological char-acteristics with other rare type IIb (boron-containing) diamonds such as the Wittelsbach-Graff, once assumed to be cut from the same rough crystal as the Hope. Here we report another special diamond of this group.
Recently graded by GIA and the re-cipient of a special monograph report was a 15.10 ct (17.47 × 11.53 × 7.94 mm) Fancy Vivid blue cut-cornered rectangular step cut. Named the De Beers Cullinan Blue diamond (figure 7; see video at www.gia.edu/gems-gem-ology/summer-2022-lab-notes-de-beers-cullinan-blue), it was cut from a 39.34 ct rough type IIb diamond crys-tal mined by Petra from the Cullinan
(formerly Premier) mine in South Af-rica. Compared to the Hope and Wit-telsbach-Graff, both of which were mined in the Golconda region of India, the De Beers Cullinan Blue has some important similarities in gemological and spectroscopic features but shows clear variations. Natural type IIb blue diamonds over 10 carats are exceed-ingly rare.
The blue color is distributed evenly throughout the stone. Visual observation under a gem microscope revealed a very clean stone. No in-clusions or graining were observed. Accordingly, the diamond received a clarity grade of Internally Flawless. Under conventional long-wave and short-wave UV radiation, it showed no observable fluorescence or phos-phorescence. This feature is dramat-ically different from that of the Hope and Wittelsbach-Graff, two large type IIb blue diamonds that exhibit strong and prolonged red phospho-rescence to conventional short-wave UV radiation.
The absorption spectrum in the mid-infrared region showed typical absorption features related to boron in diamond, such as strong absorp-tion at ~2800 cm–1 and a weak absorp-tion peak in the range of 1332–1200 cm–1 (figure 8). The intensities of these absorptions indicated a high
216 LAB NOTES GEMS & GEMOLOGY SUMMER 2022
Figure 7. The 15.10 ct De Beers Cullinan Blue diamond.
Figure 8. The mid-infrared spectrum of the type IIb De Beers Cullinan Blue diamond.
5
15
10
0
6000 5000 3000 2000 10004000
WAVENUMBER (cm–1)
MID-INFRARED SPECTRUM
AB
SOR
PTIO
N C
OEF
FIC
IEN
T (c
m–1
)

concentration of uncompensated boron of ~0.33 ppm. Natural type IIb diamonds typically contain 0.24–0.36 ppm (E. Gaillou et al., “Study of the Blue Moon diamond,” Winter 2014 G&G, pp. 280–286). The diamond’s boron concentration is close to that of the Hope (~0.36 ppm) and higher than that of the Wittelsbach-Graff (~0.19 ppm). Absorption from boron is the main contributor of color in natural type IIb diamonds.
Observation with a gemological
microscope equipped with crossed po-larizers revealed a clear tatami pattern with a dark gray color (figure 9). Both the Wittelsbach-Graff and the Hope have different patterns and higher in-terference colors, a good indication that the De Beers Cullinan Blue has a much less distorted lattice structure. Under very strong short-wave UV, this diamond showed a weak aqua blue fluorescence with a subtle net-work of dislocations in the crystal structure, a pattern clearly different from the tight mosaic patterns ob-served in the Hope and the Wittels-bach-Graff (figure 10) (Gaillou et al., 2014).
These blue diamonds are among the rarest of gems. Recent research (E. Smith et al., “Blue boron-bearing dia-monds from Earth’s lower mantle,” Nature, Vol. 560, No. 7716, 2018, pp. 84–87) has demonstrated that their boron derived from pieces of the earth’s crust sinking to the extremely deep depths of diamond formation. The gemological characteristics of the De Beers Cullinan Blue suggest it is one of these superdeep diamonds. Its combination of Fancy Vivid blue color grade in a step cut (a cut that does not enhance color, unlike other faceting
styles) (see video), 15.10 ct weight, and Internally Flawless clarity grade is ex-ceptionally rare. It will remain one of the world’s most important diamonds.
Paul Johnson, A’Dhi Lall, Madelyn Dragone, and Stephanie Persaud
The Grass Is Always Greener… The Carlsbad laboratory recently ex-amined a 0.97 ct Fancy grayish green diamond submitted for colored dia-mond grading service. Microscopic examination revealed a colorless dia-mond with green radiation stains scattered across the pavilion (figure 11).
These radiation stains were par-ticularly unusual due to their linear appearance and resembled blades of grass in their morphology and color. These stains were prevalent along in-tentionally preserved rough natural diamond surfaces on the pavilion. Faceted surfaces along the pavilion were polished with particular effort to retain some of the green radiation stains. The resultant internal reflec-tion of green light to the table created a uniform green bodycolor in this rare and beautiful diamond.
LAB NOTES GEMS & GEMOLOGY SUMMER 2022 217
Figure 9. Observed with cross-polarized light was a strong ta-tami strain pattern with a dark gray color.
Figure 10. Under very strong short-wave UV, a weak aqua blue fluorescence with a subtle net-work of dislocations was ob-served (top). After exposure, a weak pinkish red phosphores-cence was observed (bottom).
Figure 11. Blade-like green radiation stains. Also indicated is the boundary of the close-up view of the green stains in figure 12. Field of view 2.9 mm.
Figure 12

Surface photomicrographs re-vealed long, linear, and acicular in-dentations concentrated near the center of the radiation stains (figure 12). Indentations crosscut flat-bot-tomed trigons, suggesting they post-dated diamond dissolution in the earth’s mantle (e.g., R. Tappert and M. Tappert, Diamonds in Nature: A Guide to Rough Diamonds, Springer, Heidelberg, 2011). The green stains along the polished surface indicate that the radiation stains penetrated some depth into the diamond. These features have been observed pre-viously at GIA (e.g., Spring 2021 G&G Micro-World, pp. 66–67; Spring
2022 G&G Micro-World, pp. 64–65) and may result from acicular to tabu-lar radioactive minerals precipitating directly on the diamond surface in a paleoplacer to recent alluvial environ-ment (e.g., R. Lauf, Mineralogy of Uranium and Thorium, Schiffer Pub-lishing, Ltd., Atglen, Pennsylvania, 2016). Radiation damage created va-cancies in the diamond lattice, which absorb red light and reflect green light, resulting in the green color of the ra-diation stains. Uncharged or neutral vacancies produce a photolumines-cence response near the 741 nm zero phonon line called the GR1 defect (e.g., J.E. Shigley and C.M. Breeding,
“Optical defects in diamond: A quick reference chart,” Summer 2013 G&G, pp. 107–111). The GR1 defect area from photoluminescence spectra can be measured and mapped to indi-cate the spatial distribution of this de-fect coincident with the radiation stains (figure 13).
It is unusual to see green radiation stains of this shape that correspond with indentations on a diamond sur-face. These features could be a com-monly overlooked characteristic of green diamonds.
Michaela Stephan, Roy Bassoo, and Lo Combs
10 ct HPHT-Treated CVD LABORATORY-GROWN DIAMOND Recent years have seen several size milestones for faceted diamonds grown by chemical vapor deposition (CVD). In all the published reports that commented on treatment, these record-size CVD diamonds were indi-cated to be as-grown and with no in-dications of post-growth treatment (Winter 2016 Lab Notes, pp. 414–416; “IGI Hong Kong certifies largest CVD grown diamond to date,” 2020, https://www.igi.org/gemblog/igi-hong-kong-certifies-largest-cvd-grown-diamond-to-date/; Spring 2022 Lab Notes, pp. 54–56). For other re-cent milestone CVD diamonds re-ported within the trade, we could not confirm whether they were as-grown or treated. At the time of publication, the current benchmark is a 30.18 ct H-color diamond reportedly grown by Ethereal Green Diamond (Rapaport News, June 12, 2022).
Against this backdrop, a notable 10.04 ct CVD-grown diamond (figure 14) was recently submitted to the Carlsbad laboratory for a laboratory-grown diamond report. This emerald-cut stone with G color and VS2 clarity had several growth remnants, including a cloud of dark non-dia-mond carbon. As with all laboratory-grown diamonds, it underwent extensive testing including spectro-scopy to verify its CVD origin. IR ab-sorption spectroscopy identified it as
218 LAB NOTES GEMS & GEMOLOGY SUMMER 2022
Figure 12. Radiation stains on the rough diamond’s surface also pen-etrate to a polished side (left). Viewed with reflected light, the surface shows acicular indentations coincident with green stains (right).
Flat bottomtrigon
Rough
Polished
Radiation stain
Rough
Polished
150 µm 150 µm
Figure 13. Left: Map of the integrated area beneath the GR1 defect peak of the radiation stains on the diamond surface, derived from photolumines-cence spectroscopy. Right: Reflected light image of the surface showing ra-diation stains (outlined in red) coincident with acicular indentations. The measurements were taken with a 532 nm laser at 1 mW power, 25 μm confocal spot size, 5 μm step size, and 100 Hz.
100 µm 100 µm
GR1 AREA (cm2)3.0 6.0 9.0 12.0 15.0 18.0

type IIb with an uncompensated boron concentration of ~2 ppb. Spec-tral features such as the lack of a 468 nm peak in photoluminescence along with the coloration in the Dia-mondView fluorescence imaging (fig-ure 15) confirmed it had undergone post-growth treatment (W. Wang et
al., “CVD synthetic diamonds from Gemesis Corp.,” Summer 2012 G&G, pp. 80–97).
Many CVD-grown diamonds are subjected to high-pressure, high-tem-perature (HPHT) treatment after growth to remove a brownish appear-ance caused by extended defects (such as vacancy-related complexes). The brown color often correlates with a faster CVD growth rate, which the manufacturer uses knowing the color can be reduced by treatment after-ward. It appears that when manufac-turers create a CVD diamond of record-setting size, the growth is per-formed so slowly that subsequent HPHT treatment is not required for a colorless to near-colorless grade.
While some 80% of colorless to near-colorless CVD-grown diamonds have been subjected to post-growth treatment to reduce their brownish coloration (S. Eaton-Magaña et al., “Laboratory-grown diamond: A gem-ological laboratory perspective,” Jour-
nal of Gems & Gemmology, Vol. 23, No. 6, 2021, pp. 25–39), this treatment is not often applied to larger stones. Therefore, evidence of HPHT treat-ment in a CVD-grown diamond larger than 10 carats is noteworthy. These products will likely become more commonplace in the future.
Sally Eaton-Magaña
PEARLS A Reported Cassis Pearl from Key West, Florida
The Carlsbad laboratory recently ex-amined an oval non-nacreous pearl weighing 29.78 ct and measuring 17.86 × 15.64 × 14.58 mm (figure 16). The pearl possessed a uniform pinkish or-ange bodycolor and a porcelaneous sur-face with flame structures. The flames were short and wide and tapered to a point. This fine, well-formed flame structure looked like a homogeneous spotted pattern throughout the pearl’s
LAB NOTES GEMS & GEMOLOGY SUMMER 2022 219
Figure 16. This oval pinkish orange porcelaneous pearl weighing 29.78 ct and measuring 17.86 × 15.64 × 14.58 mm was reportedly found in a queen helmet conch (Cassis madagascariensis), shown on the left with various Cassis species shells. Shells courtesy of Robin Willis.
Figure 15. The green and blue flu-orescence colors in this Diamond -View image confirm post-growth treatment of the 10.04 ct CVD-grown diamond.
Figure 14. This 10.04 ct G-color CVD-grown diamond proved to have been HPHT treated.

surface (figure 17, left), yet the flame forms were evident at high magnifica-tion under the microscope (figure 17, right). Subsequently, Raman spectro-scopic analysis with a 514 nm argon-ion laser verified the pearl was composed of aragonite, with peaks at 154, 181, 192, 207, 704, and 1085 cm–1 (J. Urmos et al., “Characterization of some biogenic carbonates with Raman spectroscopy,” American Mineralo-gist, Vol. 76, 1991, pp. 641–646); two strong polyene peaks at 1131 and 1523 cm–1 were indicative of natural color (C. Hedegaard et al., “Molluscan shell pigments: An in situ resonance Raman
study,” Journal of Molluscan Studies, Vol. 72, No. 2, 2006, pp. 157–162). Real-time microradiography (RTX) re-vealed a dark gray oval void-like fea-ture in the center and a growth ring in the outer area of the pearl (figure 18). Such a void can be found in natural pearls from a number of porcelaneous pearl-producing mollusks.
Orange porcelaneous pearls are produced from various marine gastro-
pod species such as queen conch (Lo-batus gigas), Melo species, Cassis species, and horse conch (Fasciolarii-nae subfamily). The flame characteris-tics and pinkish orange bodycolor of this pearl were unlike those of orange porcelaneous pearls previously sub-mitted to GIA. The client who sub-mitted the pearl stated that it was found inside a queen helmet conch in the early 1960s by Bert Matcovich (fig-
220 LAB NOTES GEMS & GEMOLOGY SUMMER 2022
Figure 17. Left: This porcelaneous pearl exhibited a fine, well-formed flame structure covering the entire surface, and a homogeneously spotted pattern was visible with the unaided eye. Right: Under magnification with fiber-optic illumination, the wide and spiky flame structure was evident. Field of view 2.90 mm.
Figure 18. RTX imaging revealed the growth structure of the pearl: an ovalish void-like feature of less radiopacity in the center and a growth ring in the outer area.
Figure 19. This photo shows the pearl and the queen helmet shell in which it was found. Photo courtesy of the Bert Matcovich family.

ure 19), who owned a shell shop in Key West, Florida. Born into a family of shellers with more than 60 years of ex-perience, Matcovich fished the waters off Key West for conchs and visited local shrimp boats daily in the 1960s to purchase various types of shells. This pearl was a remarkable discovery.
Queen helmet, also known as em-peror helmet, is the common name for a marine gastropod species called Cassis madagascariensis, which be-longs to the Cassidae family. The species is generally distributed in the tropical western Atlantic, including the Caribbean Sea (J.H. Leal, “Gastro-pods,” in K.E. Carpenter, The Living Marine Resources of the Western Central Atlantic, Vol. 1, Rome: Food and agriculture organization of the United Nations, 2002, pp. 99–127). Queen helmet shells have large, thick whorls with short spires, and three rows of knobs often appear on the body. They have a flat large parietal shield next to an aperture, and the color ranges from pale cream to deep salmon, often with a dark orangy brown color between the “teeth” (see again figure 19). Owing to their signif-icant thickness, these colorful shells are widely used for cameo carving.
Cassis pearls typically have a fine and slender flame structure, often with intersecting flames. Their colors traditionally range from light orange to orangy brown, sometimes with patchy color. This pearl was unlike typical Cassis pearls examined by GIA, and its mollusk identity could not be confirmed with gemological testing. Nonetheless, this fine large natural non-nacreous pearl and its discovery story from six decades ago are noteworthy.
Artitaya Homkrajae, Michaela Stephan, and Amiroh Steen
RFID Device Embedded in South Sea Bead Cultured Pearl Necklaces New technologies are increasingly being applied to cultured pearls, and it is exciting to witness developments in pearl traceability. GIA’s Bangkok laboratory recently received two
South Sea bead cultured pearl neck-laces, each consisting of 29 pearls ranging from 14.80 to 15.90 mm in diameter (strand A, figure 20A) and 14.40 × 14.20 mm to 16.20 mm in di-ameter (strand B, figure 21A). General observation under a binocular micro-scope revealed clear aragonite plate-lets characteristic of nacreous pearls, with no indications of treatment.
Real-time microradiography (RTX) revealed obvious demarcation features separating the shell bead nucleus from the overlying nacre layers. The nacre thickness range was consistent with bead cultured pearls produced by the Pinctada maxima mollusk (N. Stur-man et al., “Bead cultured and non-bead cultured pearls from Lombok, Indonesia,” Fall 2016 G&G, pp. 288–297). However, the most striking fea-ture was the presence of some
electronic components within a few of the pearls. They were visible as opaque white squares with a stepped pattern in keeping with previously examined samples containing radio-frequency identification (RFID) devices (H.A. Hänni and L.E. Cartier, “Tracing cul-tured pearls from farm to consumer: A review of potential methods and solu-tions,” Journal of Gemmology, Vol. 33, No. 7-8, 2013, pp. 239–246; Spring 2020 Lab Notes, pp. 134–136). Interest-ingly, only a single pearl in strand A (figure 20, B–D) and five pearls in strand B (figure 21, B–D) contained an RFID device. The device is usually po-sitioned off the center of the bead to avoid being drilled.
GIA’s Hong Kong lab has also begun seeing similar features in re-cent submissions (figure 22, A–B). The team compared the RTX data with
LAB NOTES GEMS & GEMOLOGY SUMMER 2022 221
Figure 20. A: Necklace of South Sea bead cultured pearls, 14.80–15.90 mm in diameter. B and C: Real-time microradiography (RTX) revealed one bead cultured pearl in the necklace containing an RFID device showing an obvious demarcation of typical shell bead nuclei. The em-bedded electronic component is visible as a white opaque stepped square feature. D: When aligned at right angles to the previous direc-tion, the electronic component is harder to see but can be observed within a long, sharp laminated plane separating the two parts of the shell bead nucleus.
A
C D
B

some known bead cultured pearls containing an RFID device (figure 22,
C–D) and confirmed that they were identical. The previous studies men-
tioned earlier describing RFID devices in bead cultured pearls have shown that these nuclei are produced by a patented pearl technology invented by Fukui Shell Nucleus Factory, which also supplies laminated beads to cer-tain pearl farms. This explains the link between the laminating tech-nique and its application in the pro-duction of RFID shell beads.
The use of RFID shell beads is known to assist in the storage of cer-tain data such as a pearl farm’s loca-tion, mollusk data, and harvest date. However, a specific RFID reader is re-quired to retrieve the data, so we were unable to obtain the infor-mation stored within these particu-lar devices. Since the RFID devices do not influence their external ap-pearance, the pearls containing a shell bead nucleus with such compo-nents are still identified as bead cul-tured pearls. Because the RFID device could increase the weight and have a misleading effect if unde-tected, a special comment is rou-tinely included on GIA pearl identification reports as a means of disclosure. While pearl tracing tech-nology has not been extensively adopted by the cultured pearl indus-try, the increasing number of elec-tronic devices in shell bead nuclei submitted to the laboratory is note-worthy. GIA will continue to mon-itor and provide updates to the pearl trade and consumers.
Nanthaporn Nilpetploy and Ying Wai Au
Combination of Phenomena in Star and Cat’s-Eye Color-Change SAPPHIRE The Tokyo lab recently examined a transparent 20.49 ct violet to purple color-change double cabochon sap-phire, measuring 16.67 × 14.69 × 8.51 mm (figure 23) with a specific gravity of 3.99 and a spot refractive index of 1.77. Usually a star sapphire is only polished on one side, and the unpol-ished side does not show any phenom-ena. But this stone was polished on both sides, which resulted in a unique
222 LAB NOTES GEMS & GEMOLOGY SUMMER 2022
Figure 21. A: Necklace of South Sea bead cultured pearls, 14.40 × 14.20 mm to 16.20 mm in diameter. B–D: RTX analysis revealed five bead cultured pearls containing an off-center RFID device within the shell bead nucleus.
A
C D
B
Figure 22. A: Necklace of South Sea bead cultured pearls, 10.04–12.21 mm in diameter. B: RTX analysis of one of the pearls in the necklace revealed an RFID device. C: The internal structure was compared with two known bead cultured pearls containing RFID devices from GIA Hong Kong’s ref-erence collection, and they proved to be identical. D: RTX clearly showed the outline of the square RFID device, as well as the sawn plane and small recess where the RFID device had been placed.
A
C D
B

combination of phenomena. Side A displayed a six-rayed star. Side B also displayed a six-rayed star, but one line
containing two of the rays was much stronger, which made the phenome-non reminiscent of a cat’s-eye.
Chatoyancy is displayed when light reflects off a set of dense parallel elongated inclusions, such as needles; asterism occurs when such a set of inclusions is oriented in mul-tiple directions. In the case of this stone, side A with the distinct six-rayed star had three sets of dense par-allel needles and platelets close to the surface, intersecting at 60° angles (figure 24), which is common with six-rayed asterism. Side B also had three sets of these needles close to the surface, but the needles were more concentrated in one of the di-rections, producing a cat’s-eye effect (figures 24 and 25). Interestingly, the chatoyancy in Side B and one line of asterism in Side A are contributed by the same group of needles.
Although color-change star sap-phire is not particularly rare, color-change cat’s-eye sapphire is far less common. Color-change sapphire with asterism on one side and chatoyancy on the other is without question a “phenomenal” gem.
Masumi Saito and Yusuke Katsurada
LAB NOTES GEMS & GEMOLOGY SUMMER 2022 223
Figure 24. Side A: Intersecting sets of parallel needle inclusions producing six-rayed asterism. Field of view 5.8 mm. The photomicrograph is not aligned with the inset.
Figure 25. Side B: Set of parallel needle inclusions producing chatoyancy. Field of view 5.8 mm. The photomicrograph is not aligned with the inset.
Figure 23. This 20.49 ct star sap-phire with a combination of phenomena exhibited a color change from violet (top) to pur-ple (bottom). Side A is shown in these photos.

Bicolor Cuprian TOURMALINE A bicolor gem has two colors in one stone. Ametrine is a well-known bi-color gem, a purple and yellow quartz combining amethyst and citrine. In
addition to the ametrine variety of quartz, other colored gemstones such as corundum and tourmaline can be naturally bicolor, although most of them do not have a specific variety
name. Most bicolor gem materials are cut to show different colors that are obvious when viewed in face-up orientation.
The Tokyo laboratory recently ex-amined a bicolor rectangular step cut weighing 1.62 ct and measuring 9.14 × 5.47 × 3.71 mm (figure 26). The color was gradually distributed from bluish green to dark yellowish green along the length. This stone was doubly refractive with a refractive index of 1.620–1.640 and a specific gravity of 3.10. Microscopic observa-tion revealed networked fluid inclu-sions and strong doubling. The stone was identified as tourmaline by these gemological features.
Paraíba tourmaline, a certain type of copper-bearing tourmaline, has been one of the most sought-after gemstones in the trade over the last three decades. In 2012, the Laboratory Manual Harmonisation Committee (LMHC) updated the definition of Pa-raíba tourmaline as “a blue (electric blue, neon blue, violet blue), bluish green to greenish blue, green (or yel-lowish green) tourmaline of medium-light to high saturation and tone (relative to this variety of tourmaline), mainly due to the presence of copper and manganese.” Visible/near-infrared (Vis-NIR) absorption was collected with GIA’s custom-made UV-Vis spec-trometer to determine the chromo-phore. To be considered Paraíba tourmaline, the copper-related absorp-
224 LAB NOTES GEMS & GEMOLOGY SUMMER 2022
Figure 26. The 1.62 ct bicolor copper-bearing tourmaline.
Figure 27. Vis-NIR absorbance of the whole tourmaline (top), the bluish green portion (middle), and the dark yellowish green portion (bottom). Copper absorption is in the red (approximately 730 nm) and near-infrared regions (approximately 980 nm). Iron absorption is only in the red region (approximately 730 nm). Spectra are stacked for clarity.
400 500 600 700 800 900 1000
WAVELENGTH (nm)
VIS-NIR SPECTRA
AB
SOR
BA
NC
E
Mn Fe Cu
Bluish green 22826 566 7850
Dark yellowish green 17233 11287 4953
Detection limit (ppmw) 7.13 3.10 0.11
TABLE 1. Mn, Fe, and Cu concentrations on each side of the bicolor tourmaline, measured by LA-ICP-MS (in ppmw, average of three spots).

tion needs to be dominant and the color appearance should be within the defined range.
Non-polarized absorption spectra of the whole stone showed two bands in the red and near-infrared regions (figure 27, black line). To measure the spectra of each color separately, one half of the gem was covered with opaque black cardboard to allow light to pass through only one color at a time. The results indicated that the dominant chromophore was different (figure 27; bluish green and dark green lines at the middle and bottom, re-spectively)—the bluish green part is colored by copper, whereas the dark yellowish green part is colored by iron (P.B. Merkel and C.M. Breeding, “Spectral differentiation between copper and iron colorants in gem tourmalines,” Summer 2009 G&G, pp. 112–119).
The trace element composition of each differently colored region was analyzed by laser ablation–induc-tively coupled plasma–mass spec-trometry (LA-ICP-MS). As shown in table 1, the bluish green side shows lower iron (566 ppmw) and higher copper (7850 ppmw), and the dark yel-lowish green side shows higher iron (11287 ppmw) and lower copper (4953 ppmw). Comparing the different Vis-NIR absorption patterns of these por-tions (figure 27), the association of copper and iron for each color portion is in agreement with Merkel and Breeding (2009). By virtue of its color and its chromophore, only the bluish green portion is consistent with the definition of Paraíba tourmaline.
Sometimes we encounter cuprian tourmaline with chemical zoning, which has varying trace element con-centrations within. A drastic differ-
ence, as in the case of this bicolor tourmaline with a non-Paraíba iron-colored portion, is not typical. The dark yellowish green part could have been polished off to make this a typi-cal Paraíba tourmaline.
Yusuke Katsurada
LAB NOTES GEMS & GEMOLOGY SUMMER 2022 225
PHOTO CREDITS Nathan Renfro—1–3; Annie Haynes—4, 14; Najmeh Anjomani—5, 6; Towfiq Ahmed—7; Madelyn Dragone—9; Stephanie Persaud—10; Michaela Stephan—11, 12; Roy Bassoo—12; Taryn Linzmeyer—15; Robert Weldon—16, 17 (left); Artitaya Homkrajae—17 (right); Ami-roh Steen—18; Nuttapol Kitdee—20A, 21A; Tony Leung—22A; Shunsuke Nagai—23; 24 (inset), 25 (inset), 26; Yusuke Katsurada—24, 25
Join our growing G&G Facebook group of more than 25,000 members, connecting gem enthusiasts from all over the world!

Apatite Cluster in Zambian Emerald This author recently studied a 1.68 ct faceted emerald containing several inclusions, including blocky fluid in-clusions, transparent brownish crystals, needles, and particle clouds. These inclusions as well as the trace ele-ment chemistry supported a Zambian geographic origin. The emerald also exhibited elongated transparent crys-tals that resembled amphibole. In this case, Raman spec-troscopy confirmed the mineral as apatite. Interestingly, this apatite formed a distinct inclusion cluster consist-ing of a large hexagonal prismatic crystal (a morphology typical of the mineral) associated with a multitude of rod- and bamboo-shaped crystals in various directions (figure 1). Other solid crystals observed in Zambian em-erald include mica, actinolite (amphibole), quartz, zir-con, and chromite.
Apatite, a common phosphate mineral, has previously been reported in various forms and in many other types of gems such as corundum, spinel, feldspar, and garnet, and it is not surprising to find it in emerald. However, this is the first time the author has encountered this fantastic form of apatite in emerald.
Ungkhana Atikarnsakul GIA, Bangkok
Blue Apatite in Tanzanian Garnet In the micro-world, it can be challenging to identify inclu-sions based on sight alone, as many minerals can have a sim-ilar appearance. Occasionally, though, some inclusions have characteristic features that can aid in their identification.
Recently this author had the opportunity to observe a pyrope-spessartine garnet, reportedly from Lindi Province, Tanzania, that contained blue crystal inclusions ensconced among intersecting needles (figure 2). Analysis with micro-Raman spectroscopy identified the inclusions as apatite. Apatites are known for their bright blue hues, and these inclusions offered an attractive example.
226 MICRO-WORLD GEMS & GEMOLOGY SUMMER 2022
Figure 1. An inclusion cluster consisting of a hexago-nal prismatic apatite crystal and many rod- and bam-boo-shaped crystals of apatite in a Zambian emerald. Photomicrograph by Ungkhana Atikarnsakul; field of view 3.60 mm.
© 2022 Gemological Institute of America
GEMS & GEMOLOGY, VOL. 58, NO. 2, pp. 226–233.
About the banner: The surface of this synthetic amethyst shows a multitude
of rhombohedral crystal faces. Photomicrograph by Nathan Renfro; field of
view 15.67 mm.
Editor: Nathan Renfro
Contributing Editors: Elise A. Skalwold and John I. Koivula

While this sample hails from Tanzania, blue apatite has previously been reported as an inclusion in garnet from Madagascar (Winter 2020 G&G Micro-World, p. 526). These inclusions’ distinctive appearance may help gemol-ogists recognize the material in other samples, but further analysis should be performed to identify them definitively.
E. Billie Hughes Lotus Gemology, Bangkok
Large Diamond Inclusion in Diamond Recently, the authors examined a 2.01 ct Faint green round brilliant diamond with a fascinating diamond crystal in-clusion that displayed a transparent, ghost-like appearance. Due to the large size of this nearly invisible crystal, the stone was given a clarity grade of SI2.
Photomicrography was used to document the features of this inclusion. Triangular etch features, also known as
MICRO-WORLD GEMS & GEMOLOGY SUMMER 2022 227
Figure 2. Blue apatite crystals are beautifully framed by prominent rutile needles in a gar-net from Tanzania. Photo micrograph by E. Billie Hughes; field of view 3.5 mm.

trigons, were seen on the inclusion (figure 3). These are typi-cally natural growth markings of diamonds, confirming the inclusion as diamond. The diamond crystal inclusion ap-peared to have sharp and easily recognizable faces. Images with cross-polarized light show strain between the inclu-sion and the host diamond (figure 4). A DiamondView image also reveals the diamond crystal inclusion (figure 5).
Generally, the beauty and value of a diamond increase with the absence of inclusions. Yet the presence of a dia-mond inclusion gave this diamond a certain distinction, which in the authors’ opinion added to its beauty and value.
Luthfia Syarbaini, A’Dhi Lall, and Paul Johnson GIA, New York
Natural Diamond with Extensive Network of Etch Channels The authors recently examined a 5.19 ct type IIa natural diamond (figure 6) displaying numerous etch channels (fig-ure 7). Etch channels are open tubes whose formation is re-lated to dissolution processes within the stone. They form due to the dissolution of dislocations inside the crystal dur-ing or after growth and can result in various patterns; most commonly, they form as trigons or rarely as channels that appear as parallel lines, zigzags, or “worm-like” structures (T. Lu et al., “Observation of etch channels in several nat-ural diamonds,” Diamond and Related Materials, Vol. 10, 2001, pp. 68–75, and references therein; Spring 2018 G&G
228 MICRO-WORLD GEMS & GEMOLOGY SUMMER 2022
Figure 3. Trigons seen on a diamond crystal inclu-sion visible through the crown of a round brilliant diamond. Photomicrograph by A’Dhi Lall; field of view 2.11 mm.
Figure 5. DiamondView image of the diamond inclu-sion in the diamond host. Image by Luthfia Syarbaini.
Figure 4. Strain be-tween the host dia-mond and the diamond inclusion is revealed by the interference colors in cross-polarized light. Photo micrograph by A’Dhi Lall; field of view 13.55 mm.

Micro-World, pp. 66–67). Etch channels terminate at typi-cally rhombic openings visible at the surface of the stone (Spring 2018 G&G Micro-World, pp. 66–67). The extensive
network of etch channels in this diamond resulted in an I2 clarity grade.
Photoluminescence (PL) mapping using 455 and 532 nm laser excitation (figures 8 and 9) revealed an increase in the GR1, 3H, and TR12 centers along the walls of the etch channels; all of these centers are defects associated with radiation exposure. The nitrogen vacancy centers NV0
(zero-phonon line [ZPL] at 575 nm) and NV– (ZPL at 637
MICRO-WORLD GEMS & GEMOLOGY SUMMER 2022 229
Figure 7. A network of natural etch channels gives this diamond a distinctive appearance. Most of the channels have a width of ~100–150 μm, while some (e.g., lower left) show evidence of brown radiation stains. Photomicrograph by Nathan Renfro; field of view 4.69 mm.
Figure 6. This 5.19 ct diamond with I color and I2 clarity displays numerous etch channels visible to the eye. Photo by Annie Haynes.
Figure 8. Left: False-color map showing the peak area intensity of the radiation-related TR12 center (ZPL at 469.9 nm); this 455 nm PL map was compiled from 18,768 spectra collected at 45 μm pixel size. Right: The false-color map overlain with a reflected light image of the table facet. Most of the etch channels seen in the false-color map correspond with an opening observed on the table.
TR12
Inte
nsit
y
0
10K
2 mm

nm) were also concentrated along these channels. The con-centration of these defects along the etch channels suggests that radioactive fluids once flowed through the tubes. The radioactive fluids had an impact on the areas in direct con-tact, creating elevated concentrations of radiation-related peaks. Other prominent PL peaks along the cavities were centered at 474, 598.75, and 461.5 nm. The radiation in these fluids would have been low enough to not create much observable staining, as patches of green to brown color associated with radiation staining were not observed in most of the etch channels. However, there were some isolated spots of green radiation stains and some channels with a brownish appearance (figure 7) and elevated concen-trations of radiation-related features (figures 8 and 9). Ad-ditionally, the exposure to radioactive fluids must have occurred after the diamond was brought to the near-surface region following kimberlite eruption, as these radiation-re-lated features would not withstand the high temperatures within the mantle.
Similar radiation features have previously been ob-served in another stone with cavities (Spring 2020 Lab Notes, pp. 126–127), but to a much lesser degree. The ex-tensive network of etch channels within this diamond is one more example of the extraordinary possibilities within the natural world.
Taryn Linzmeyer and Sally Eaton-Magaña GIA, Carlsbad
Eye Pattern in a Rock Fragment Recently, the authors encountered a partially polished rock fragment measuring 14.50 × 9.43 × 2.43 mm and
weighing 3.45 ct that exhibited a very realistic eye pattern (figure 10). Various shades of yellow and green material formed the pupil and iris, while a distinctive white outline surrounded the iris as a sclera. Microscopic observation revealed different microcrystalline minerals. Raman spec-troscopy identified pyroxene, feldspar, and quartz as the most abundant minerals. Energy-dispersive X-ray fluores-cence (EDXRF) analysis revealed silicon as the dominant element, while traces of iron and potassium were also de-tected.
Naturally formed eye patterns in gems are rare but do exist, such as a “dragon’s eye” in a fire agate (Winter 2015 G&G Micro-World, p. 441) and a radial eye structure in a sapphire (Summer 2017 G&G Micro-World, pp. 244–245). While the textures in rocks are much more diverse than those in single-mineral gemstones, observing such a unique feature is always exciting.
Ching Yin Sin GIA, Hong Kong
Piradee Siritheerakul GIA, Bangkok
Fracture-Filled Emerald with Mysterious Filler Patterns Emeralds are known to have natural cracks or fractures. The filling of surface-reaching fractures with various oils and resins is the most common practice to minimize frac-tures to improve an emerald’s appearance. The author re-cently examined a 3.04 ct emerald that revealed a mysterious filler pattern along the fractures, resembling a
230 MICRO-WORLD GEMS & GEMOLOGY SUMMER 2022
40
20
0
60
100
120
80
140
0 1000 2000 3000 4000 5000 6000 7000
LATERAL DIMENSION (μm)
NO
RM
ALI
ZED
PEA
K A
REA
RA
TIO
(GR
1/D
IAM
ON
D R
AM
AN
) GR1 INTENSITY ACROSS DIAMOND TABLE
Figure 9. GR1/Raman peak area ratios calcu-lated from the 532 nm PL map (inset) cutting across multiple channels along the orange line. Higher GR1/Raman areas are concentrated along the etch channels.

labyrinth and convolution (figure 11). Fracture filling can be identified using various methods. In this case, it dis-played a chalky fluorescence under long-wave ultraviolet flashlight and was also detected with simple microscopic observation and fiber-optic lighting. The internal graining, irregular two-phase inclusions, and long needles within this stone indicated a natural origin. This was a unique and visually interesting pattern in the fracture filling material of an emerald.
Ungkhana Atikarnsakul GIA, Bangkok
Flux-Grown Synthetic Beryl Overgrowth Most of the synthetic beryl currently on the market has been created by a hydrothermal process. Hydrothermally grown crystals have obviously different crystal forms com-pared to their natural counterparts. Hydrothermal syn-thetics are often easily identified by their typical zigzag- or chevron-patterned graining and color zoning. Flux-grown synthetics, though less common, are able to form more natural-looking crystals. However, despite having natural forms, flux synthetics contain many unusual inclusions that clearly distinguish them from their natural counter-
MICRO-WORLD GEMS & GEMOLOGY SUMMER 2022 231
Figure 11. Emerald filler with labyrinth- and convolution-like pattern. Photomicrographs by Ungkhana Atikarnsa-kul; fields of view 2.0 mm (left) and 2.7 mm (right).
Figure 10. An eye pat-tern complete with pupil, iris, and sclera is clearly visible in this rock fragment. Photo-micrograph by Polthep Sukpanish; field of view 12.5 mm.

parts. Copper platelets that form within the crystal either from contamination or intentionally introducing metal in the growth material are obvious indications of synthetic origin. Flux fingerprints are another easily observed type of inclusion unique to flux synthetic crystals.
Weighing 211.78 ct, the hexagonal doubly terminated crystal in figure 12 looks like a natural beryl crystal at first glance. Eye-visible well-formed copper platelets and wispy flux fingerprints indicate that the stone did not form natu-rally. A closer look revealed reddish clouds of well-formed minute copper platelets and copper crystals. Euhedral red rod-like crystals of columbite were scattered throughout, similar to those in a natural sample. Partially healed ten-sion cracks with white secondary flux particles were also present. A few areas throughout the crystal had unique thin angular and jagged films containing blue flux liquid and gas bubbles (figure 13). Areas with higher clarity reveal the boundary between the natural aquamarine seed crystal and the flux overgrowth. This stone is a product of synthetic flux beryl overgrowth on a natural aquamarine seed crystal produced in a Russian synthetic gem facility.
Jamie Price GIA, Carlsbad
“Boomerang” Inclusion in a Rough Topaz A 21.46 ct colorless rough topaz was recently submitted to Taiwan Union Lab of Gem Research (TULAB) for identifi-cation service. Microscopic observation showed a few pris-matic brown inclusions with submetallic luster. One of the inclusions was a unique twinned crystal composed of two
prismatic crystals forming a 120° intersection angle. With its shape and backdrop, the twinned crystal resembled a boomerang flying across the sky (figure 14). This inclusion was later confirmed to be tantalite-(Mn), based on Raman spectroscopy and comparison with the RRUFF database. Polarized light and reflected illumination were adopted to reduce doubling and obtain clearer photomicrographs, and the images were processed to extend depth of field.
Shu-Hong Lin Institute of Earth Sciences,
National Taiwan Ocean University Taiwan Union Lab of Gem Research, Taipei
Tsung-Ying Yang, Kai-Yun Huang, and Yu-Shan Chou Taiwan Union Lab of Gem Research, Taipei
232 MICRO-WORLD GEMS & GEMOLOGY SUMMER 2022
Figure 14. The “boomerang” inclusion in this topaz was confirmed by Raman spectroscopy to be a twinned crystal of tantalite-(Mn). Photomicrograph by Shu-Hong Lin; field of view 0.71 mm.
Figure 12. Doubly terminated flux synthetic beryl crystal, measuring 32.45 × 30.36 × 25.29 mm. Photo by Annie L. Haynes.
Figure 13. A suite of columbite rods, copper crystals, and a large air bubble seen within a film of blue flux liquid. Photomicrograph by Jamie Price; field of view 7.19 mm.

Quarterly Crystal: Cinnabar in Fluorite This issue’s Quarterly Crystal deals with a 362.09 ct crystal cluster of fluorite and calcite recently examined by the au-thors. The 55.79 × 42.80 × 38.63 mm specimen was color-less and transparent to translucent and played host to several small bright red to dark red well-formed trigonal crystals, visible in figure 15. These crystals were all situ-ated on the same growth plane in the fluorite portion.
The fluorite and calcite specimen was obtained from Jordi Fabre of Fabre Minerals in Barcelona. It is from the Emilio
mine in the Caravia mining area in the Asturias region of northwestern Spain. The Emilio mine is known to produce fluorite crystals with inclusions of various sulfides, including cinnabar. Therefore, the pure red bodycolor of these inclu-sions, together with the trigonal symmetry shown in figure 16, strongly suggested they were cinnabar. Using Raman mi-crospectrometry, we were able to identify the inclusions as cinnabar, thereby confirming our initial impression.
John I. Koivula and Nathan Renfro GIA, Carlsbad
MICRO-WORLD GEMS & GEMOLOGY SUMMER 2022 233
Figure 15. Several bright red to dark red well-formed trigonal crystals of cinnabar highlight the interior of the flu-orite crystals in this flu-orite and calcite cluster from Spain. Photo by Diego Sanchez.
Figure 16. A combination of optical microscopy and Raman analysis served to identify the tri-gonal inclusions as the mercury sulfide cinnabar. Photomicrograph by Na-than Renfro; field of view 2.35 mm.

234 COLORED STONES UNEARTHED GEMS & GEMOLOGY SUMMER 2022
Gem inclusions are mineral crystals or cavities filled with fluid and/or gas that occur in a host gemstone. Many gems contain microscopic inclusions (ranging in size from >1 mm down to submicroscopic nanoscale inclusions) that can reveal much about the host material. As a result, the use of the microscope (or loupe) to examine these inclu-sions offers one of the most important methods available for gem identification.
Inclusions are important for determining the natural, synthetic, or treated character of a gem, and for establishing the likely geographic origin of a valuable colored stone. In addition to their usefulness for identification, inclusions cause certain distinctive and desirable optical phenomena such as asterism and chatoyancy, as well as some of the fea-tures used in clarity grading. In this new installment of “Colored Stones Unearthed,” we will discuss inclusions in gems—how they form, how they are studied, and what they mean not only for gemologists but also for geoscientists.
Brief History of Inclusion Studies While the study of inclusions might seem to be a modern concept requiring the use of advanced microscopes with sophisticated optical lenses, early naturalists did have some basic knowledge of how inclusions could be used to understand the geological history of a gem. Consider
amber, for instance. By observing insects trapped in amber, Pliny the Elder was able to conclude that amber represents fossilized tree resin (Ball, 1950) (figure 1).
However, it was only much later that inclusions began to be classified and studied in a more systematic fashion. The pioneering scientist Robert Boyle was perhaps one of the first to describe inclusions in gems—“a specimen of quartz with a cavity containing a fluid with a moveable gas bubble, and reddish brown hair-like inclusions in amethyst” (Boyle, 1672). With the improvements in design and functionality of optical microscopes beginning in the late 1700s, scientists started to use them to examine tiny features in rocks and minerals (Kile, 2003, 2013). Déodat
Inclusions in Gemstones James E. Shigley, Aaron C. Palke, John I. Koivula, and Nathan D. Renfro
Figure 1. Inclusions of insects entombed in amber, such as these two wasps captured in an eternal em-brace, offered ancient naturalists a clue to the geolog-ical origins of this gemstone. Photomicrograph by John I. Koivula.
Editors: Aaron C. Palke | James E. Shigley
© 2022 Gemological Institute of America
GEMS & GEMOLOGY, VOL. 58, NO. 2, pp. 234–242.
Editors’ note: Questions or topics of interest should be directed to Aaron Palke ([email protected]) or James Shigley ([email protected]).

de Dolomieu discussed the presence of a hydrocarbon fluid (petroleum oil) in quartz in 1792. In 1819, Chester Dewey detailed a quartz specimen from Massachusetts that dis-played a cavity containing a liquid with a moveable bubble and several black or brown particles (1818, pp. 345–346). Noted scientists Humphry Davy (1822), David Brewster (1826, 1827, 1844, 1845a,b, 1863), and William Nicol (1828) each described minerals that contained inclusions consist-ing of one or more fluids and moveable gas bubbles. In 1854, Johann Reinhard Blum and his coauthors published a book discussing various mineral inclusions they had ob-served. By linking observations on mineral inclusions and host rock formation, Henry Clifton Sorby (1858) became one of the founders of the geological science of petrography with an article titled “On the microscopical structure of crystals, indicating the origin of minerals and rocks.” An
1862 article by Gustav Rose identified the presence of ori-ented, needle-like inclusions, such as those seen in the star ruby in figure 2, as the cause of asterism in minerals. The first descriptions of inclusions specifically in gem minerals were published in several articles by Henry Sorby in 1869 and by Isaac Lea between 1866 and 1876. Other reports on solid and fluid inclusions in various minerals followed (e.g., Hartley, 1876, 1877).
The use of inclusions to understand a gem’s geological growth environment can be understood with the examples shown in figures 3–6. Ruby derived from extremely pure calcite (CaCO3) marble, as in the deposits of Mogok, Myan-mar, often contains calcite inclusions (figure 3), whereas magnesium-rich spinel from the same geological region in Mogok will likely contain magnesium-rich dolomite [CaMg(CO3)2] (figure 4). Similarly, emeralds from mica-rich
COLORED STONES UNEARTHED GEMS & GEMOLOGY SUMMER 2022 235
Figure 2. Oriented in-clusions such as the ru-tile needles in this ruby were recognized as the cause of asterism early on in the study of inclu-sions. Photomicrograph by Nathan Renfro; field of view 1.80 mm.
Figure 3. The geological growth environment of marble-hosted rubies from Myanmar (left) is reflected in their in-ternal features, such as calcite inclusions (right). Photos by Robert Weldon (left; courtesy of William F. Larson) and Nathan Renfro (right; field of view 1.44 mm).

rocks called schists, such as Russian emeralds, often con-tain mica inclusions (figure 5). On the other hand, emeralds from the hydrothermal deposits in Colombia, where the gems occur in veins rich in carbonate, quartz, and pyrite, often contain inclusions of carbonate minerals. Figure 6 shows an exceptional example of a carbonate inclusion, which itself contains a pyrite inclusion that perfectly
matches the mineralogy seen in many emerald-bearing hand samples from Colombia.
Beginning in the 1940s, the well-known European gemologist Eduard Gübelin began publishing a series of im-portant articles in Gems & Gemology and Journal of Gem-mology on inclusions and the evidence they could provide on the geologic and geographic origin of the host gemstone
236 COLORED STONES UNEARTHED GEMS & GEMOLOGY SUMMER 2022
Figure 4. Left: Magnesium-rich spinel often forms in impure marbles where the magnesium-rich mineral dolomite is present. Right: These spinels contain inclusions where carbonate minerals are more likely to be dolomite than calcite, as seen in this dolomite-filled negative crystal. Photos by Robert Weldon (left) and Nathan Renfro (right; field of view 1.30 mm).
Figure 5. Emeralds from mica-rich schists, such as Russian emeralds (left), display inclusions that give away their geological origins, such as fields of dark mica platelets (right). Photos by Robert Weldon (left; courtesy of R.T. Boyd Limited) and Nathan Renfro (right; field of view 2.04 mm).

(e.g., Gübelin, 1944–1946, 1948, 1950, 1953, 1969, 1974). Dr. Gübelin’s publications were followed by several impor-tant books on gem inclusions coauthored by John Koivula (1986, 2005, 2008) that have been widely used and appre-ciated by the gemological community. Hollister and Craw-ford (1981), Roedder (1984), Samson et al. (2003), and Chi et al. (2020) contributed technical summaries on fluid in-clusion research.
Inclusions in Minerals and Gems Minerals frequently contain small inclusions of foreign ma-terials (solids, liquids, and gases) that were trapped during mineral formation, and these can be seen with magnifica-tion. Crystals that formed during metamorphism by solid-state recrystallization, or almost entirely in the solid state without significant involvement of fluids, can display solid inclusions. Those that occur in igneous and sedimentary rocks were formed in the presence of a geological fluid and, as a result, can contain single or multiphase inclusions of that fluid (as well as solid or vapor inclusions). These geo-logical fluids consist of high-density silicate or carbonatite melts, low-density water-rich fluids or vapors, and, in rare cases, organic hydrocarbons (oils). Following crystallization, the mineral crystals in all of these rock types can become cleaved or fractured one or more times, and these cleavages and fractures can later become healed in the presence of liq-uid or gaseous fluids. Tiny amounts of these fluids can re-main as inclusions along the healed zone (figure 7). The crystal form of the host mineral typically determines the morphology of these fluid inclusions. Fluid inclusions usu-ally have a geometric, angular shape that reflects the typical
crystal forms of the host. For this reason, these fluid inclu-sions are often referred to as “negative crystals.”
While either solid or liquid at the time of their original entrapment in crystals at high temperatures in the earth,
COLORED STONES UNEARTHED GEMS & GEMOLOGY SUMMER 2022 237
Figure 6. Left: Emerald from Chivor, Colombia, on carbonate and pyrite matrix. Right: Inclusions in Colombian emeralds provide evidence of their unique geological origins, such as this pyrite within a carbonate inclusion. Pho-tos by Robert Weldon (left; courtesy of Cornerstone Minerals and Greg Turner) and Jonathan Muyal (right; vertical field of view 2.34 mm).
Figure 7. Fluid inclusions with exsolved gas bubbles and daughter crystals in a beryl host. These fluid inclusions entered the host through a fracture. The fracture healed itself, trapping blebs of this fluid with the negative crys-tal form seen here. Photomicrograph by Nathan Renfro.

inclusions can undergo phase changes during cooling of the host crystals as the host rocks are brought toward the earth’s surface. Near the surface, inclusions of fluids nor-mally remain as fluids, while melt inclusions normally so-lidify to some type of glass or other solid (figure 8). In some cases, a fluid can separate into two fluids that are immis-cible (i.e., do not mix with one another at cooler tempera-tures). Solid inclusions can also undergo changes to lower-density or secondary alteration phases.
At elevated temperatures in the earth, minerals can ac-commodate greater amounts of foreign impurity elements in their crystal structures. But when the minerals cool in the earth’s crust, these impurity elements can no longer be contained, and they are usually expelled from the structure (exsolved) as inclusions of different minerals (such as rutile needles in sapphire). At lower pressures and temperatures near the earth’s surface, gases originally dissolved in inclu-sion fluids can also be exsolved as distinct gas bubbles within water or carbon dioxide or some other fluid. Sec-ondary or “daughter” crystals can also form by coming out of the solution from the fluid in the inclusion (figure 7).
Inclusions occur either individually or in small groups. Sometimes they are abundant enough to affect the trans-parency of the host mineral. They often occur randomly in the host crystal. But they may also form along certain crys-tallographic directions, color zones, or healed fractures, or they can occur in geometric patterns related to the crystal symmetry of the host. Solid inclusions can exhibit their own crystal shape, have a rounded or irregular appearance, or adopt the negative crystal shape of the host mineral. Gemologists categorize inclusions based on their appear-ance (shape, size, transparency, color, luster, contrast with the host, and orientation) and their association with other mineral inclusions.
Inclusions and their host gemstones can have various age relationships with one another, although this forma-
tion relationship cannot always be clearly established based on visual or other evidence. Protogenetic primary solid inclusions were present before the host mineral formed, and the mineral grew around and entrapped them—these may display irregular or partly dissolved shapes. Syngenetic primary solid, liquid, or gas inclusions formed at the same time as the host mineral by being trapped on growing crystal faces. Solid inclusions some-times have well-formed crystal shapes that represent either their morphology or a morphology imposed on them by the host. Epigenetic secondary inclusions formed after the host by exsolution along a rehealing cleavage or fracture.
Scientific Study and Geological Importance of Inclusions The study of solid and fluid inclusions provides a way for the scientist to reconstruct events and processes in the ge-ological past. Fluid inclusions represent actual, and often quite rare, samples of the geological fluids that existed at some time in the history of rocks and minerals. As such, they can provide information on the physical and chemical conditions that were present during and after rock forma-tion. In particular, studies of inclusions can reveal infor-mation on:
Temperature: When a mineral and the fluid inclusions within it cool over geologic time, they shrink at different rates. The inclusion fluid shrinks faster than the solid crys-tal host, and this difference is evident in the exsolution over time of a gas bubble within the fluid at temperatures existing near the earth’s surface (see figure 9). Through gradual, controlled heating of the crystal sample and ob-serving when the gas bubble disappears back into the fluid (homogenizes), one can estimate the temperature that ex-isted when the inclusion itself first formed.
238 COLORED STONES UNEARTHED GEMS & GEMOLOGY SUMMER 2022
Figure 8. This glassy melt inclusion within a Montana sapphire (left) was originally trapped as a fluid magma that quenched to a glass upon cooling. This can be seen when these inclusions are polished down to the surface. The material inside the inclusion does not flow away, indicating it has quenched to a solid, glassy state (right). Photo -micrographs by Aaron Palke; fields of view 1.26 mm (left) and 0.72 mm (right).

Pressure: Once the chemical composition of the fluid in-clusions is identified, scientists can use experimental lab-oratory data on similar fluids to get a sense of the pressures that existed at the time and the environment in which the inclusions were trapped in the host mineral.
Density: With data on chemical composition, along with the density and individual volume of the various phases present in a fluid inclusion, the total average density of all the phases in the inclusion can be calculated. This result is important for understanding the types of fluids and their circulation in the earth’s crust.
Chemical Composition: The liquids, the solids, and in some cases the gases present in inclusions can be analyzed to obtain information on the chemical environment of in-clusion formation in the earth’s crust and mantle. Inclu-sions provide important geological information on the deep earth that may not be available from any other source.
Geologic Age Dating: When solid inclusions in mineral crystals contain small amounts of radioactive trace ele-ments, it is possible to determine the geologic age of the inclusion (figure 10). Radioactive elements undergo a spe-cific decay over known periods of geologic time, so careful
COLORED STONES UNEARTHED GEMS & GEMOLOGY SUMMER 2022 239
Figure 9. When warmed slightly by the well light of a microscope, the carbon dioxide and gas bubble fluid inclu-sion in this quartz will homogenize to a single fluid (left). When cooled slightly, this fluid separates into distinct gas and fluid phases (right). Photomicrographs by Nathan Renfro; field of view 2.56 mm.
Figure 10. A zircon inclusion polished down to the surface of the host sapphire, viewed in backscattered electron imaging (left) and cathodoluminescence imaging (right) using scanning electron microscopy (SEM). Secondary ion mass spectrometry (SIMS) analysis pits are seen in the image on the left. These analytical tools are able to deter-mine the age of the zircon inclusion, giving an upper limit on the age of the sapphire host. Images by Rachelle Turnier, University of Wisconsin/GIA.

determination of these elements can be used to calculate mineral formation ages.
Application of Inclusion Research: The abundance and frequent occurrence of inclusions in a variety of geologic samples offers numerous opportunities for inclusion stud-ies that support a multitude of geological investigations, such as:
• Verifying the geologic conditions of formation of ore deposits, providing a tool for the field exploration of new deposits
• Determining the conditions of formation, mineral-ogy, and geologic history of rocks found in many types of crustal and upper mantle environments (some results cannot be obtained any other way)
• Inspecting fluid inclusions that contain hydrocar-bons, which can be important for oil exploration
• Determining the metamorphic or magmatic prove-nance of certain minerals found today in sediments and sedimentary rock formations
• Ascertaining the conditions and geological ages of dia monds and coexisting mineral phases in the lower crust and mantle
• Hypothesizing the conditions of geotectonic events such as crustal formation and subduction, mountain building and erosion, volcanism, metamorphism, and sedimentation
• Studying trapped organisms and vegetation found as fossil inclusions in amber to provide information on the ancient biosphere
• Using gases trapped in inclusion fluids to study the ancient atmosphere
Gemological Importance of Inclusions For the gemologist, inclusion studies combined with doc-umentation of standard physical properties provide the basis for gem identification. In some instances, particular inclusions uniquely identify a gemstone and its geographic origin. Observation of inclusions is carried out using a gemological microscope and various lighting configura-tions. These may include brightfield, darkfield, fiber-optic lighting at different orientations to the sample, shadowing, use of polarizing or colored filters, and other image-pro-cessing techniques. Since the 1950s, inclusion photography has been an essential part of gemological education (see Koivula, 1981, 2003; Renfro, 2015a,b).
Inclusions are often the key to determining the geo-graphic origin of gemstones. Some gems contain inclusions that are very specific to certain localities. Parisite inclu-sions in an emerald are a diagnostic indicator of Colombian origin (figure 11). In other cases, inclusions are one piece of the puzzle, such as the long, slender rutile silk seen in a Sri Lankan sapphire (figure 12).
Inclusions are an important clue in identifying treat-ments applied to gemstones. The observation of internal diffusion of blue color around relict rutile silk in a sapphire offers evidence of high-temperature heat treatment meant to enhance the stone’s blue color (figure 13). Microscopy is arguably the most important way to identify many treat-ments such as heat treatment, dyes, and clarity enhance-ment through fracture filling.
240 COLORED STONES UNEARTHED GEMS & GEMOLOGY SUMMER 2022
Figure 11. Parisite in-clusions in emerald are a diagnostic indicator of a Colombian origin. Photomicrograph by Jonathan Muyal; field of view 0.82 mm.

COLORED STONES UNEARTHED GEMS & GEMOLOGY SUMMER 2022 241
Figure 13. The rutile silk in this sapphire has been dissolved into the corundum lattice by heat treat-ment at high temperature, creating blue coloration around the partially dissolved silk. Photomicrograph by Nathan Renfro.
Figure 12. Long, slender rutile silk inclusions in sap-phire are an indicator, although not diagnostic, of a Sri Lankan origin. Photomicrograph by Nathan Renfro.
Figure 14. Rutile needle inclusions in a quartz host. Cross-polarized light shows off the Brazil-law twinning in the quartz, creating a spectacular display of light. Photo micrograph by Nathan Renfro; field of view 20.05 mm.
Inclusions as Natural Art Inclusions in gems serve as visual works of natural art (figure 14). Fortuitous geological processes in the earth created these inclusions in natural, untreated gems with-out any human intervention. Their shape, appearance, color(s), and in some cases the constraints imposed by the crystal symmetry of the mineral host all combine to cre-ate an inclusion “scene” that is entirely unique and never to be repeated. The artistic nature of inclusions is perhaps best illustrated by a series of photomicrograph charts cre-ated by Nathan Renfro and others that have appeared in
Gems & Gemology since 2016 (Renfro et al., 2016; 2017a,b; 2018; 2019; 2021).
The field of gemological research exists at a fascinating intersection between the cold, dispassionate scientific method and the impassioned and provocative world of aes-thetics and art. So perhaps it is fitting that these inclusions that tell us so much about the history and genesis of gems can also move and touch us as works of art. Future install-ments will further explore the ways in which scientific in-quiry of the geology of colored stones can deepen our appreciation of these gems.

242 COLORED STONES UNEARTHED GEMS & GEMOLOGY SUMMER 2022
Ball S.H. (1950) A Roman Book on Precious Stones: Including an English Modernization of the 37th Booke of the Historie of the World by C. Plinius Secundas. Gemological Institute of Amer-ica, Los Angeles.
Blum J.R., Leonhard G., Seyfert A.H., Söchting E. (1854) Die Ein-schlüsse von Mineralien in Krystallisirten Mineralien. Naturkundige Verhandelingen van de Hollandsche Maatschappij der Wetenschappen te Haarlem, Vol. 9, 264 pp.
Boyle R. (1672) An Essay about the Origine & Virtues of Gems. W. Godbid, London, 185 pp.
Brewster D. (1826) On the existence of two new fluids in the cav-ities of minerals, which are immiscible, and possess remark-able physical properties. Philosophical Transactions of the Royal Society of Edinburgh, Vol. 10, No. 1, pp. 1–41, http://dx.doi.org/10.1017/S0080456800024133; Vol. 10, No. 2, pp. 407–427
——— (1827) Notice respecting the existence of the new fluid in a large cavity in a specimen of sapphire. Edinburgh Journal of Science, Vol. 6, No. 1, pp. 155–156.
——— (1844) On crystals in the cavities of topaz, which are dis-solved by heat, and re-crystallize on cooling. Report of the Four-teenth Meeting of the British Association for the Advancement of Science – Notices and Abstracts of Miscellaneous Commu-nications, pp. 9–10.
——— (1845a) On the existence of peculiar crystals in the cavities of topaz. Proceedings of the Royal Society of Edinburgh, Vol. 2, No. 26, pp. 23–25.
——— (1845b) On the existence of crystals with different primi-tive forms and physical properties in the cavities of minerals, with additional observations on the new fluids in which they occur. Transactions of the Royal Society of Edinburgh, Vol. 16, No. 1, pp. 11–22.
——— (1863) On the pressure cavities in topaz, beryl and dia-mond, and their bearing on geological theories. Philosophical Magazine, Vol. 25, No. 167, pp. 174–180.
Chi G., Diamond L.W., Lu H., Lai J.Q., Chu H. (2020) Common problems and pitfalls in fluid inclusion study: A review and dis-cussion. Minerals, Vol. 11, No. 1, article no. 7, http://dx.doi.org/10.3390/min11010007
Davy H. (1822) On the state of water and aeriform matter in cav-ities found in certain crystals. Philosophical Transactions of the Royal Society of London, Vol. 112, No. 1, pp. 367–376.
Dewey C. (1819) Sketch of the mineralogy and geology of the vicinity of Williams’ College, Williamstown, Massachusetts. American Journal of Science, Vol. 1, No. 4, pp. 337–346.
de Dolomieu D.G. (1792) Sur de l'huile de pétrole dans le cristal de roche et les fluides élastiques tirés du quartz. Journal de Physique, Vol. 40, No. 1, pp. 318–319.
Gübelin E.J. (1944–1946) Gemstone inclusions. G&G, Vol. 4, No. 10, pp. 142–149; Vol. 4, No. 11, pp. 158–163; Vol. 4, No. 12, pp. 174–179; Vol. 5, No. 1, pp. 205–210; Vol. 5, No. 5, pp. 294–300; Vol. 5, No. 6, pp. 318–323.
——— (1948a) Gemstone inclusions. Journal of Gemmology, Vol. 1, No. 7, pp. 7–39.
——— (1948b) Die diagnostische Bedeutung der Einschlüsse in Edelsteinen. Schweizerische Mineralogische und Petrographis-che Mitteilungen, Vol. 28, No. 1, pp. 146–156.
——— (1950) Diagnostic importance of inclusions in gemstones. Journal of Gemmology, Vol. 2, No. 7, pp. 281–303.
——— (1953) Inclusions as a Means of Gemstone Identification. Gemological Institute of America, Los Angeles, 220 pp.
——— (1969) On the nature of mineral inclusions in gemstones. G&G, Vol. 13, No. 2, pp. 42–56 and No. 3, pp. 74–88.
——— (1974) Internal World of Gemstones. ABC Edition, Zurich, 234 pp.
Gübelin E.J., Koivula J.I. (1986) Photoatlas of Inclusions in Gem-
stones. ABC Edition, Zurich, 532 pp. ——— (2005) Photoatlas of Inclusions in Gemstones, Volume 2.
Opinio Publishers, Basel, Switzerland, 830 pp. ——— (2008) Photoatlas of Inclusions in Gemstones, Volume 3.
Opinio Publishers, Basel, Switzerland, 672 pp. Hartley W.N. (1876) On the presence of liquid carbon dioxide in
mineral cavities. Journal of the Chemical Society of London, Vol. 29, pp. 137–143.
——— (1877) Mineral cavities and their contents. Popular Science Review, Vol. 16, No. 2, pp. 119–129 (and Journal of the Chem-ical Society of London, Vol. 31, pp. 241–249).
Hollister L.S., Crawford M.L., Eds. (1981) Fluid Inclusions—Ap-plications to Petrology. Topics in Mineral Sciences, Mineralog-ical Association of Canada, Vol. 6.
Kile D.E. (2003, 2013) The petrographic microscope: Evolution of a mineralogical research instrument. Mineralogical Record, Special Publication 1, pp. 1–96 and Vol. 44, No. 3, pp. 303–322.
Koivula J.I. (1981) Photographing inclusions. G&G, Vol. 17, No. 3, pp. 132–142.
——— (2003) Photomicrography for gemologists. G&G, Vol. 39, No. 1, pp. 4–23.
Lea I. (1866, 1869, 1876) Notes on microscopic crystals included in some minerals. Proceedings of the Academy of Natural Sci-ences of Philadelphia, Vol. 18, pp. 110–113; Vol. 21, pp. 4, 119–121; Vol. 28, pp. 98–107.
Nicol W. (1828) Observations on the fluids contained in crystal-lized minerals. Edinburgh New Philosophical Magazine, Vol. 5, pp. 94–96.
Renfro N. (2015a) The application of differential interference con-trast microscopy to gemmology. Journal of Gemmology, Vol. 34, No. 7, pp. 616–620.
——— (2015b) Digital photomicrography for gemologists. G&G, Vol. 51, No. 2, pp. 144–159. http://dx.doi.org/10.5741/GEMS.51.2.144
Renfro N.D., Koivula J.I., Muyal J., McClure S.F., Schumacher K., Shigley J.E. (2016) Chart: Inclusions in natural, synthetic, and treated emerald. G&G, Vol. 52, No. 4, pp. 402–403, http://dx.doi.org/10.5741/GEMS.52.4.402
——— (2017a) Chart: Inclusions in natural, synthetic, and treated sapphire. G&G, Vol. 53, No. 2, pp. 213–214, http://dx.doi.org/10.5741/GEMS.53.2.213
——— (2017b) Chart: Inclusions in natural, synthetic, and treated ruby. G&G, Vol. 53, No. 4, pp. 457–458, http://dx.doi.org/10.5741/GEMS.53.4.457
——— (2018) Chart: Inclusions in natural, synthetic, and treated diamond. G&G, Vol. 54, No. 4, pp. 428–429, http://dx.doi.org/10.5741/GEMS.54.4.428
——— (2019) Chart: Inclusions in natural, treated, synthetic, and imitation opal. G&G, Vol. 55, No. 2, pp. 244–245, http://dx.doi.org/10.5741/GEMS.55.2.244
Renfro N.D., Koivula J.I., McClure S.F., Schumacher K., Shigley J.E. (2021) Chart: Micro-features of spinel. G&G, Vol. 57, No. 1, pp. 46–49, http://dx.doi.org/10.5741/GEMS.57.1.46
Roedder E. (1984) Fluid inclusions. Reviews in Mineralogy, Vol. 12. Mineralogical Society of America, Chantilly, Virginia, 644 pp.
Rose G. (1862) Über den Asterismus der Krystalle, insbesondere des Glimmers und des Meteoreisens. Monatsberichte der Könglichen Preussische Akademie der Wissenschaften zu Berlin, pp. 614–618.
Samson I., Anderson A., Marshall D., Eds. (2003) Fluid Inclusions: Analysis and Interpretation, Topics in Mineral Sciences. Min-eralogical Association of Canada, Vol. 32.
Sorby H.C. (1858) On the microscopical structure of crystals, indi-cating the origin of minerals and rocks. Quarterly Journal of the Geological Society of London, Vol. 14, No. 1/2, pp. 453–500.
——— (1869) On the microscopical structure of some precious stones. Monthly Microscopical Journal, Vol. 1, pp. 220–224.
REFERENCES

The GIA® G&G Facebook group is a forum where more than 25,000 gemologists and gem lovers share and discuss gemological discoveries, especially the findings published here in Gems & Gemology.
If you are mesmerized by gem sources, inclusions and other characteristics,this is the community for you!
Join us today at www.facebook.com/groups/giagemsgemology
e and discuss gemological discoveries, especially the findings published
y gem sources, inclusions and other characteristics,
oups/giagemsgemology
©GIA 2022. GIA® and Gemological Institute of America® are registered trademarks of Gemological Institute of America, Inc.

COLORED STONES AND ORGANIC MATERIALS
A large aquamarine with unusual etch features from Xin-jiang, China. Etch features are commonly seen in beryl crystals (e.g., T. Lu, “Interesting etch features and cavities in beryl and quartz,” Spring 2002 GNI, pp. 102–103). Their formation is related to various factors during or after crys-tal growth, both internal and external, including chemical composition, lattice defect types and their distribution, pressure-temperature conditions of the forming environ-ment, solvent composition, and dissolution time (R. Ku-rumathoor and G. Franz, “Etch pits on beryl as indicators of dissolution behaviour,” European Journal of Mineralogy, Vol. 30, No. 1, 2018, pp. 107–124).
Recently, Shino Gold Jewelry (Shanghai) Co. submitted a large piece of rough aquamarine crystal to the National Gemstone Testing Center (NGTC) lab in Beijing for iden-tification service. The crystal, weighing 778 g (figure 1, top), was claimed to have been mined in the Altay region of Xinjiang, China. Standard gemological testing revealed a refractive index of 1.577–1.583 and a specific gravity of 2.69. These values were typical for aquamarine and were confirmed by the infrared and Raman spectra. The numer-ous hexagonal etch features on the (0001) crystal face (fig-ure 1, bottom), combined with the contents in the fissures (mainly kaolinite and hematite) identified by Raman spec-troscopy, indicate that the crystal is of natural origin. No-tably, one of the etch features has not been previously reported to our knowledge—the crystal had two hexagonal dissolution cavities with openings about 3 mm in diame-
244 GEM NEWS INTERNATIONAL GEMS & GEMOLOGY SUMMER 2022
© 2022 Gemological Institute of America
GEMS & GEMOLOGY, VOL. 58, NO. 2, pp. 244–268.
Editors’ note: Interested contributors should send information and illustra-tions to Stuart Overlin at [email protected] or GIA, The Robert Mouawad Campus, 5345 Armada Drive, Carlsbad, CA 92008.
GEM NEWS INTERNATIONALContributing Editors Gagan Choudhary, Gem Testing Laboratory, Jaipur, India ([email protected])
Christopher M. Breeding, GIA, Carlsbad ([email protected])
Guanghai Shi, School of Gemmology, China University of Geosciences, Beijing ([email protected])
Figure 1. This 778 g (approximately 11 × 4 cm) aquama-rine crystal from Xinjiang displays a unique natural etch pattern (detail in bottom photo). Photos by Ting Zheng; courtesy of Shino Gold Jewelry (Shanghai) Co.
Other etch pitsUnusual etch channeland cavities

ter, connected by a hexagonal etch channel 4 cm long and parallel to the c-axis (figures 2 and 3). Interestingly, the etch channel appeared to be empty and penetrated throughout the crystal.
The formation of this etch feature cannot be fully ex-plained at present. One possible explanation is that it is related to the defects (dislocations) parallel to the c-axis, which control the locations of the preferred dissolution process (T. Lu et al., “Observation of etch channels in sev-eral natural diamonds,” Diamond & Related Materials,
Vol. 10, No. 1, 2001, pp. 68–75). Also, the formation of these special etch features is affected by different dissolu-tion rates in different directions of the crystal. The se-lected dissolution on the (0001) plane was very slow, while the dissolution rate along the c-axis was significantly faster, resulting in the special funnel-shaped etch pits con-nected by a very long etch channel.
Ting Zheng ([email protected]), Qian Deng, and Taijin Lu
National Gemstone Testing Center, Beijing
Topaz crystals in red beryl. Gem-quality beryl comes in various colors, including green, yellow, pink, and rarely red, which has only been mined in the state of Utah to
GEM NEWS INTERNATIONAL GEMS & GEMOLOGY SUMMER 2022 245
Figure 2. Schematic diagram of the etch feature par-allel to the c-axis of the aquamarine crystal.
c-axis
(0001)
Figure 4. A 0.22 ct emerald-cut red beryl (5.08 × 3.12 × 1.91 mm). Photo by Huixin Zhao.
Figure 3. The etch features of the crystal: two hexagonal dissolution cavities connected by a hexagonal etch chan-nel. The channel (left) is about 4 cm long and empty throughout, and the openings have a hexagonal funnel shape (right). Photomicrographs by Chao Liu (left; field of view 23 mm) and Ting Zheng (right; field of view 6.25 mm).

date. Recently, a red beryl (figure 4) was submitted to Guild Gem Laboratories in Shenzhen for identification. This emerald-cut sample weighed 0.22 ct and exhibited a highly saturated red color. The refractive index values of 1.562–1.569 and birefringence of 0.007 were consistent with
beryl. Multiple analytical methods were applied, including FTIR and UV-Vis-NIR spectroscopy, and EDXRF for chem-ical analysis. FTIR confirmed the sample as beryl (figure 5), and the UV-Vis-NIR spectrum showed a prominent manganese-related broad band centered at 540 nm, as well as a weak iron-inducted band at 370 nm (figure 6).
EDXRF results showed that the beryl was rich in iron (16920 ppm) and manganese (2586 ppm), along with a trace amount of zinc (787 ppm). Such results were very close to previously reported values for red beryl from the Wah Wah Mountains of Utah: 15000 ppm iron, 2000 ppm man-ganese, and 700 ppm zinc, respectively (J.E. Shigley and E.E. Foord, “Gem-quality red beryl from the Wah Wah Moun-tains, Utah,” Winter 1984 G&G, pp. 208–221).
Microscopic observation revealed several two-phase fluid inclusions along the healed fissures, and purple-blue flashes were clearly seen within the open fissures, which indicated clarity enhancement by organic fillers. This was confirmed by FTIR, with peaks at 2854, 2871, 2927, and 2963 cm–1. Two transparent crystal inclusions were present and exposed to the surface near the girdle, showing a pris-matic crystal habit (figure 7). Within the included crystals, a series of cleavage layers were prominent. Further testing by micro-confocal Raman spectroscopy in the 100–1200 cm–1 range showed distinct peaks at 240, 267, 285, 332, 430, 456, and 927 cm–1, results that agree with topaz ac-cording to the RRUFF online database (figure 8).
Topaz rhyolites are widely distributed across the west-ern United States, and red beryl occurs in topaz-bearing
246 GEM NEWS INTERNATIONAL GEMS & GEMOLOGY SUMMER 2022
Figure 5. The infrared reflectance spectrum confirmed the identity of the red beryl.
4000 3500 3000 2500 2000 1500 1000 500
0.6
0.4
0.2
0.0
Red beryl
WAVENUMBER (cm–1)
FTIR SPECTRUM
REF
LEC
TAN
CE
Figure 7. Exposed crystal inclusions in the red beryl showed a fine columnar shape and distinct cleavage fissures. Photomicrograph by Huixin Zhao; field of view 1.6 mm.
Figure 6. The UV-Vis-NIR spectrum of the red beryl shows a weak peak at 370 nm (Fe3+) and an intense peak at 540 nm (Mn3+).
300 400 500 600 700 800 900 1000
540
3701.0
0.8
0.6
Red beryl
WAVELENGTH (nm)
UV-VIS-NIR SPECTRUM
AB
SOR
BA
NC
E

rhyolites (J.E. Shigley et al., “Red beryl from Utah: A re-view and update,” Winter 2003 G&G, pp. 302–313). Hence, it is not surprising to see topaz as a mineral inclu-sion in red beryl, although such an observation does not appear to have been reported before.
Yujie Gao, Dan Ju ([email protected]), and Huixin Zhao
Guild Gem Laboratories, Shenzhen, China
Unusual cat’s-eye omphacite fei cui jade. A round cabo-chon set in a ring with round brilliant and rose-cut dia-monds (figure 9) was recently submitted to the National Center of Quality Inspection and Testing on Gold-Silver Products (NGGC) for examination. The center stone, measuring approximately 7.4 × 7.0 mm in diameter, pos-sessed a vivid green bodycolor and exhibited pronounced chatoyancy with a vibrant green sheen. FTIR analysis (fig-ure 10) revealed that the stone was natural untreated om-phacite-type fei cui jade, with a typical fingerprint spectrum corresponding with omphacite, a broad absorp-tion band centered at 3500 cm–1 caused by the hydrous in-terstitial minerals, and the functional group region showing no absorption of any organic filling material com-monly used in bleaching and filling treatment, such as Bisphenol A epoxy resin. Subsequent micro-Raman imag-ing and spectroscopic analysis confirmed the sample as a
fairly pure omphacite aggregate, considering that no other mineral impurity was observed or identified (figure 11).
GEM NEWS INTERNATIONAL GEMS & GEMOLOGY SUMMER 2022 247
200 400 600 800 1000
927
456430332
285
267
240
RAMAN SHIFT (cm–1)
RAMAN SPECTRAIN
TEN
SITY
Topaz inclusionTopaz R050405
Figure 8. The Raman spectrum of the crystal inclusion agreed with the topaz spectrum in the RRUFF database.
Figure 9. This green omphacite fei cui jade (7.4 × 7.0 mm) displayed chatoyancy under fiber-optic light. Photo by Bowen Zhao.

The strongest Raman peaks at 682 cm–1 and 1023 cm–1 were attributed to symmetrical Si-Ob-Si stretching/bend-ing and symmetrical Si-Onb stretching, respectively. Ob refers to the bridging oxygens, while Onb represents non-bridging oxygens in silicon tetrahedra.
Element analysis with energy-dispersive X-ray fluores-cence (EDXRF) showed that the sample’s major elements were silicon, calcium, aluminum, magnesium, and iron, consistent with omphacite, whose IMA formula is (Ca,Na)(Mg,Fe,Al)Si2O6). It is well known that the Fe2+-in-
248 GEM NEWS INTERNATIONAL GEMS & GEMOLOGY SUMMER 2022
Figure 10. Both the functional group region (left) and the fingerprint region (right) of the sample’s IR absorption spectrum were collected with a diffuse reflectance accessory. A K-K transform was applied to the fingerprint spec-trum collected.
6000 5500 5000 4500 4000 3500 3000 2500 2000 1500 1000 500
530573
1075
2.7
2.4
2.1
1.8
1.5
1.2
0.9
1.1
0.9
0.8
0.6
0.4
0.2
0.0
WAVENUMBER (cm–1) WAVENUMBER (cm–1)
FTIR SPECTRA
AB
SOR
BA
NC
E
AB
SOR
BA
NC
E
1200 1000 800 600 400 200
1023
682
411 370
RAMAN SHIFT (cm–1)
RAMAN SPECTRA
INTE
NSI
TY
Chatoyant omphaciteOmphacite R110038Jadeite R050220
Figure 11. The sample’s Raman shift confirmed its mineral species. The sample matched well with the RRUFF spec-trum for omphacite but differed considerably from the RRUFF spec-trum for jadeite. The spectra are shifted ver-tically for clarity.

duced grayish bluish green bodycolor is most common among the green omphacite varieties. However, this cha-toyant sample was characterized by a relatively high chromium content (Cr2O3 ≈ 0.22 wt.%), producing a more saturated and purer green bodycolor rather than a dull green one. This color feature was confirmed by UV-Vis-NIR spec-troscopy, with only a single transmittance band centered at 535 nm appearing in the visible range (figure 12).
Microscopic observation with finely tuned fiber-optic light revealed a parallel-arrayed fibrous texture throughout the sample (figure 13). Meanwhile, a vague honeycomb-like pattern was observed at two specific sides near the gir-dle (the 12 and 6 o’clock positions of the cabochon in figure 9). Thus, under reflected light the stone presented a cha-toyant sheen parallel to the ring band.
Based on our current knowledge, this green omphacite fei cui jade was probably from Guatemala. Translucent fei cui jade with such fine texture, vivid green bodycolor, and
even color distribution has always been considered of high quality and rarity, but the chatoyancy of this sample offered additional value.
Xiaoyu Lv, Bowen Zhao, and Xiaoying Lu National Center of Quality Inspection and Testing on
Gold-Silver Products (NGGC), Shanghai
Three-rayed asterism in quartz. Asterism is a well-known (if not the most familiar) optical phenomenon observed in numerous gem species. In transparent or translucent gem-stones, a series of parallel inclusions consisting of tiny nee-dles or channels produces a distinct light band by a complex process of scattering and reflection of light. If the gemstone is cut as a cabochon, the light band, which is oriented per-pendicular to the needle or channel axis, generally produces a sharp light line on the surface of the gemstone, an effect known as chatoyancy. If several series of parallel inclusions
GEM NEWS INTERNATIONAL GEMS & GEMOLOGY SUMMER 2022 249
300 400 500 600 700 800 900 1000
692
1.3
1.2
1.1
1.0
0.9
WAVELENGTH (nm)
UV-VIS-NIR SPECTRUMA
BSO
RB
AN
CE
Figure 12. Two broad ab-sorption bands centered around ~430 and ~650 nm were formed with the contributions of both iron and chromium. The 692 nm peak convinc-ingly indicated the pres-ence of Cr3+.
Figure 13. The om-phacite fei cui jade’s parallel-arrayed fibrous texture (left) and vague honeycomb-like pattern (right), shown in fiber-optic illumination. Photo micrographs by Bowen Zhao; fields of view 10.45 mm (left) and 8.81 mm (right).

are present, we observe several intersecting light bands pro-ducing asterism. The number of rays in a star depends on the number of intersecting light bands. For example, two in-tersecting light bands produce four-rayed stars, three inter-secting light bands produce six-rayed stars, and so on.
A single star is observed if all needles or channels are oriented parallel to a single plane. If the inclusions are found in different planes, we might observe several stars on the surface of a cabochon or sphere (K. Schmetzer et al., “Dual-color double stars in ruby, sapphire, and quartz: Cause and historical account,” Summer 2015 G&G, pp. 112–143). This effect can be due to the symmetry of the host, which causes several series of non-planar needles (e.g., in cubic spinel or garnet). Multi-asterism is also pro-duced by several series of needles that are independent of each other, as in quartz or beryl (K. Schmetzer and M. Glas, “Multi-star quartzes from Sri Lanka,” Journal of Gemmol-ogy, Vol. 28, No. 6, 2003, pp. 321–332). A combination of these two variants is observed in garnet. All different vari-ants may be designated as a “network of stars.”
The present contribution describes three-rayed asterism, a phenomenon that does not really fit into the generally ac-cepted knowledge about the formation of asterism and multi-asterism. This variant of asterism in quartz is a rare optical phenomenon mentioned briefly by Gübelin and Koivula (Photoatlas of Inclusions in Gemstones, Volume 2, 2005, Opinio-Verlag, Basel, Switzerland, p. 548) and by Stein-bach (Asterism: Gems with a Star, 2016, MPS Publishing and Media, Idar-Oberstein, Germany, pp. 649–651). Hain-schwang (Fall 2007 GNI, pp. 261–262) observed two three-rayed stars on quartz cabochons with chlorite inclusions. The two stars had one ray in common and were observed upon rotation of the cabochon, with one of the three-rayed stars observed at another end of the ray that is shared by both stars. Hainschwang assumed that the optical phenom-enon was caused by the chlorite inclusions, but the forma-tion mechanism is not completely understood.
Our observation is based on the examination of four star quartz samples, which came from the private collec-tion of one of the authors (MPS). The quartz cabochons
were purchased at various gem and mineral fairs and were said by the vendors to originate from Brazil; further details on locality are unknown. The properties of the cabochons are summarized in table 1.
Upon first view, the samples showed broad light bands forming a three-rayed star, with all branches of the star originating from a center (figure 14). The single branches of the three-rayed stars move along the surface of the cabo-chons after rotation of the stone or a change of the position of the light source or the observer. So far, this observation is consistent with the features of light bands generally ob-served in asteriated gemstones. But in “normal” gemstones (e.g., star rubies or star sapphires), we see three intersecting light bands forming a six-rayed star.
250 GEM NEWS INTERNATIONAL GEMS & GEMOLOGY SUMMER 2022
Sample Transparency Weight (ct) Shape Size Orientation of c-axis
A Transparent 287 Round45 mm diameter
21 mm heightAbout 45° inclined to
the base
B Transparent 463 Round52 mm diameter
24 mm heightApproximately parallel
to the base
C Transparent 69.5 Oval32 × 22 mm diameter
15 mm height Not determined
D Transparent 93.5 Irregular34 × 28 mm diameter
13 mm heightApproximately parallel
to the base
TABLE 1. Properties of quartz samples showing a network of three-rayed stars.
Figure 14. Asterism with a three-rayed star seen on a quartz cabochon (sample B) in reflected light with fiber-optic illumination. Photo by Martin P. Steinbach.

Surprisingly, upon rotation of the cabochons it was de-tected that the samples did not show a single three-rayed star but a multi-star network. Rotating each quartz cabo-chon in a direction in which it was possible to follow one of the light bands on the cabochon’s surface, at some point this branch of the star ended in another center of a three-rayed star. Repeating this procedure, another center of a three-rayed star was occasionally detected, unless the branches of the three-rayed star ended at the girdle (figure 15).
Figure 16 shows a schematic representation of the multi-star networks observed in the four samples. It must be un-derscored that the different patterns drawn represent lines on curved domes of the different cabochons. If the branches of the stars are in a position close to the girdle, some lines
GEM NEWS INTERNATIONAL GEMS & GEMOLOGY SUMMER 2022 251
Figure 15. Upon rotation of sample A, the center of a three-rayed star moves to the girdle and another center of a three-rayed star comes into sight (D); upon further rotation, this star is also moved. The sequence A to F shows the optical phenomenon described. Photos by Karl Schmetzer; reflected light, fiber-optic illumination.
A B C
D E F
Figure 16. Schematic representation of the multi-star net-work observed on the four quartz cabochons (samples A–
D in table 1). The red lines represent the light bands observed on the surface upon various rotations. The pat-terns in A and B were observed on the round cabochons; sample C was an oval cabochon, while sample D was an irregularly shaped cabochon. The direction of the c-axis
for the three transparent samples is also indicated.
c
c
c
A B
C D

that appear almost straight in the middle of the cabochon will appear more or less curved. So far, due to the different orientations of the cabochons and the different shapes, each sample represents only part of a full star network that would be seen on the surface of a complete sphere.
All the samples revealed a dense pattern of needle-like to fibrous inclusions (figure 17) typically described as rutile (J. Hyršl and G. Niedermayr, Magic World: Inclusions in Quartz, 2003, Bode Verlag, Haltern, Germany, pp. 82–139). However, these inclusions are mostly bent or curved, and no series of parallel needles or channels were seen under the magnification of a gemological microscope (up to 100×). It is uncertain how these curved rutile inclusions, sometimes described as “fibers” or “hairs,” contribute to the phenomenal pattern observed.
The mechanism responsible for the observed multi-star network is unknown; it could be caused by structural fea-tures or inclusions. However, quartzes with similar rutile inclusion patterns from Brazil (as shown in figure 17) and elsewhere generally do not show three-rayed asterism or the type of three-rayed asterism network described here. It is possible to create a single three-dimensional network by a combination of the variants seen in figure 16, A–D. But this would be highly speculative, since we cannot (based on the samples available) prove that all variants seen so far contribute to one single pattern.
Karl Schmetzer Petershausen, Germany
Martin P. Steinbach Idar-Oberstein, Germany
A zircon with strong photochromic effect. Recently, a 6.54 ct oval faceted gemstone with greenish blue color (figure 18, left) was sent to Taiwan Union Lab of Gem Research (TULAB) for identification. The specific gravity of this stone was 4.68, and the refractive index was over the limit of the refractometer. Microscopic observation showed strong bire-fringence. In addition to standard gemological testing, Raman spectroscopy and comparison with the zircon refer-ence spectrum R050203 from the RRUFF database (figure 19) confirmed it was a zircon. It was particularly worth not-ing that this zircon showed a significant color change from greenish blue to very dark yellowish green (figure 18) when exposed to a long-wave ultraviolet lamp.
To determine the extent of the color change and whether it was permanent or reversible, the zircon was first exposed to long-wave UV light for one minute and then under 10W white LED light for another minute (the light sources were placed approximately 3 cm away from the gemstone). After repeating this process several times with each exposure one minute longer than the previous time, we confirmed that the color changed from medium light greenish blue with strong saturation to a medium dark greenish yellow with lower sat-uration after two minutes of long-wave UV light exposure. However, the greenish yellow color gradually returned to the stable greenish blue color after photobleaching with LED white light for 30 minutes. Therefore, the stone was a pho-tochromic zircon with reversible color change (as reported in N.D. Renfro, “Reversible color modification of blue zircon by long-wave ultraviolet radiation,” Fall 2016 G&G, pp. 246–251). After the color change reached its full extent under long-wave UV light, the zircon was analyzed by visible spec-
252 GEM NEWS INTERNATIONAL GEMS & GEMOLOGY SUMMER 2022
Figure 17. Fibrous inclu-sions in a quartz cabo-chon from Brazil showing three-rayed as-terism. Photomicrograph by Karl Schmetzer; im-mersion, field of view 7.6 mm.

troscopy to record its continuous spectral change during the photobleaching process every six minutes (figure 20). The re-sulting spectra revealed that the light transmittance in the
range between 450 nm and 550 nm gradually increased dur-ing the photobleaching process, and the greenish blue color finally returned to a stable state after 30 minutes.
GEM NEWS INTERNATIONAL GEMS & GEMOLOGY SUMMER 2022 253
150 650 1150 1650 2150 2650 3150 3650 4150
RAMAN SHIFT (cm–1)
RAMAN SPECTRA
INTE
NSI
TY
Zircon R050203Greenish blue zircon
Figure 19. The stacked Raman spectra of the greenish blue zircon and a zircon reference spectrum from the RRUFF database; spec-tra are normalized and baseline-corrected.
Figure 18. This 6.54 ct zircon showed a significant color change from medium light greenish blue (left) to very dark yellowish green (right) after exposure to long-wave UV for two minutes, and the color was reversible during the photobleaching process with LED white light. Photos by Kai-Yun Huang.

Although this type of photochromic zircon has previ-ously been reported, a zircon over 6 ct with such a signifi-cant photochromic effect is still rare and worth noting, especially since it exhibited a distinct difference in hue, tone, and saturation.
Shu-Hong Lin Institute of Earth Sciences,
National Taiwan Ocean University Taiwan Union Lab of Gem Research, Taipei
Yu-Shan Chou and Kai-Yun Huang Taiwan Union Lab of Gem Research, Taipei
RESPONSIBLE PRACTICES
Myne London: Sourcing emeralds with a mission. In 2018, sisters Fiona Wellington and Kate Murray Gordos founded Myne London (www.mynelondon.co.uk), a Lon-don-based ethical emerald supplier with a goal of support-ing women in the gem trade. Their emeralds are sourced from lesser-known mines in Swat Valley, Pakistan, where they aim to create a sustainable and responsible emerald industry and a lasting positive economic impact in the
community. Inspired by their childhood memories of Pak-istan, Wellington and Gordos are dedicated to making Swat Valley’s emeralds globally recognized for their trace-ability and intense vivid green color (figure 21), all while empowering women.
Myne London partners with local groups in the Swat Valley region, including miners and mine owners. In addi-tion to sourcing the emeralds directly from the miners, Myne London is committed to keeping the lapidary work in Islamabad and providing opportunities for women. Part-nering with a local company, they train and hire Pakistani women to cut and polish the emeralds (figure 22), a profes-sion traditionally dominated in the region by men. Myne London, which employs a 75% female workforce, collabo-rates with jewelry designers worldwide—mainly women—to create exquisite pieces featuring the high-quality emerald melee, in addition to designing its own fine jew-elry collections.
But Wellington and Gordos aspire to do even more for their female lapidaries. In 2021, they started the Myne Lon-don Foundation, a charitable organization designed to give their employees better access to education, which is lim-ited for girls in the country. Illiteracy rates are higher than
254 GEM NEWS INTERNATIONAL GEMS & GEMOLOGY SUMMER 2022
Figure 20. Visible spectra of the zircon (after UV light exposure) during the photobleaching process were recorded every six minutes. The gradually decreasing spectral change implied that the color tended to stabilize.
0
0.2
0.4
0.6
0.8
1.0
400 450 500 550 600 650 700 750 800
WAVELENGTH (nm)
TRA
NSM
ITTA
NC
EVISIBLE SPECTRA
Photobleaching 0 min
Photobleaching 18 min
Photobleaching 6 min
Photobleaching 24 min
Photobleaching 12 min
Photobleaching 30 min

50% for adult women in Pakistan. The money raised by the foundation assists the daughters of female employees with tuition costs, school uniforms, and transportation. Without money to pay for these costs, children in the northern regions of Pakistan often do not attend school. The foundation receives 10% of Myne London’s profits.
In March 2022, Myne London hosted an inaugural char-ity ball for the foundation, raising nearly $20,000, which has already been put to good use in Pakistan. “We imme-diately actioned to pay for the daughter of one of our lap-idary workers to attend school from now on in Islamabad. She is six years old. We plan to provide this for her for as long as she wishes to stay in education,” said Wellington. “We also are committed to find ways to support girls in sport, because that is a great leveler and improves confi-dence as well as health.”
Outside of Pakistan, Myne London continues its ethos of women’s economic empowerment by collaborating with women around the world in jewelry design. Last year, the company partnered with Los Angeles–based jewelry de-signer Octavia Zamagias of Octavia Elizabeth, who shares the same social goals. Using 18K gold, Zamagias created several stunning pieces featuring Swat Valley emeralds (fig-ure 23). Looking ahead, Myne London is planning jewelry collaborations with three other talented women—two based in London and the other in Florence.
The firm recently partnered with Opsydia, a gemstone security specialist, to permanently place its brand logo be-neath the surface of the Swat Valley emerald melee. En-couraged by Opsydia’s success placing identifiers in melee diamonds, Myne London aims to promote traceability using this innovative technology.
With all their success in Swat Valley, Myne London hopes to expand to other areas of the world someday, using the same model for ethics, traceability, and women’s em-
powerment. But for now, they remain focused on the women and emeralds of Swat Valley.
Erica Zaidman GIA, Carlsbad
GEM NEWS INTERNATIONAL GEMS & GEMOLOGY SUMMER 2022 255
Figure 22. Eighty percent of the Pakistani lapidaries working in the Myne London workshop are women. Photo courtesy of Myne London.
Figure 23. Ring designed by Octavia Elizabeth in 18K gold featuring 1.24 carats of Swat Valley emerald. Photo courtesy of Octavia Elizabeth/Myne London.
Figure 21. Emerald rough from Swat Valley, Pakistan. Photo courtesy of Myne London.

SYNTHETICS AND SIMULANTS
Unusual glass-and-quartz triplet imitation of emerald. Re-cently, an 11.30 ct emerald-cut sample sold as an emerald (figure 24) was provided by an anonymous jewelry manu-facturer, who suspected an imitation. It resembled a natu-ral emerald with its vivid bluish green color, inclusion abundance, and a vitreous luster. However, examination identified it as a glass-and-quartz triplet, an occasionally convincing imitation of emerald.
When examined via water immersion in a direction par-allel to the girdle plane, one can observe that this triplet was made of two pieces of colorless material (crown and pavil-ion), with a green cement slice in between (figure 25). Using water for the immersion test to observe the internal charac-teristics did not corrode the sample and yielded better ex-perimental results. No inclusions were observed in the crown. Microscopic examination revealed two-phase (liquid and gas) inclusions, cracks (figure 26A), and lace-like par-tially healed fissures in the pavilion (figure 26B). In the mid-dle cement layer, no gas bubbles were observed along the separation plane in the assemblage, unlike doublets previ-ously described (H.A. Hänni and U. Henn, “Modern dou-blets, manufactured in Germany and India,” Journal of Gemmology, Vol. 34, No. 6, 2015, pp. 479–482; Spring 2019 Lab Notes, p. 92). However, the very thin layer of solidified cement (approximately 10 μm thick; figure 26C) showed a maze-like pattern under the microscope (figure 26D).
This triplet had refractive indexes of 1.515 (crown) and 1.544–1.553 (pavilion) and a hydrostatic specific gravity of 2.59. Its fluorescence under long-wave UV radiation was green for the crown and blue-white for the pavilion (affected by the fluorescence of the cement) and inert for both the crown and pavilion under short-wave UV radiation. No ob-vious absorption was observed with a handheld portable spectroscope, and no reaction was observed with the Chelsea filter.
The EDXRF and FTIR results identified the crown as soda-lime-silica glass (69.97 wt.% SiO2, 15.25 wt.% Na2O, and 8.94 wt.% CaO) with characteristic peaks at 1061 (asym-metric vibration modes of the Si-O-Si network), 770 (sym-metric vibration modes of the Si-O-Si network), 968 (stretching vibration of the Si-O non-bridging oxygen group),
256 GEM NEWS INTERNATIONAL GEMS & GEMOLOGY SUMMER 2022
Figure 25. Illuminated with diffused transmitted light with water immersion, the assembled nature of this 11.30 ct triplet was obvious in profile view (top image shows a slight downward view, and bottom image shows a slight upward view). The pavilion is nearly colorless (both top and bottom images) due to the refraction and scatter-ing of the green cement by a large number of inclu-sions, while the crown is colorless and clean under a certain observation angle (bottom image). Photo by Biqian Xing.
Figure 24. This 11.30 ct sample (18.9 × 14.0 × 8.8 mm) was found to be a triplet composed of colorless glass and quartz held together by green cement. Photo by Biqian Xing.
Soda-lime-silica glass
Quartz
Soda-lime-silica glass
Quartz

and 465 cm–1 (Si-O-Si and O-Si-O bending modes) (figure 27) (A. Agarwal and M. Tomozawa, “Determination of fictive
temperature of soda-lime silicate glass,” Journal of the Amer-ican Ceramic Society, Vol. 78, No. 3, 1995, pp. 827–829; S.I.
GEM NEWS INTERNATIONAL GEMS & GEMOLOGY SUMMER 2022 257
A B
C D
Figure 26. Microscopic observation of the triplet revealed numer-ous cracks (A), fluid in-clusions, and lace-like partially healed fissures (B) in the pavilion. C: The cement slice could be seen under reflected light (as shown by the arrow). D: A maze-like pattern in the cement slice. Photomicrographs by Biqian Xing; fields of view 2.51 mm (A), 10.37 mm (B), 2.71 mm (C), and 1.15 mm (D).
1400 1200 1000 800 600 400
1061
968
1174
11401084
770
800781
693
540
488
454
465
WAVENUMBER (cm–1)
FTIR SPECTRA
REF
LEC
TAN
CE
Glass (crown)Quartz (pavilion)
Figure 27. FTIR spec-troscopy identified the crown of the triplet as glass (peaks at 1061, 968, 770, and 465 cm–1) and the pavilion as quartz (peaks at 1174, 1140, 1084, 800, 781, 693, 540, 488, and 454 cm–1). Spectra are stacked for clarity.

Amma et al., “Specular reflectance (SR) and attenuated total reflectance (ATR) infrared (IR) spectroscopy of transparent flat glass surfaces: A case study for soda lime float glass,” Journal of Non-Crystalline Solids, Vol. 428, 2015, pp. 189–196). The pavilion was identified as quartz, with 99.54 wt.% SiO2 and characteristic FTIR peaks at 1174, 1140, 1084 (an-tisymmetric stretching vibrations of the SiO4 tetrahedron), 800 (SiO4 symmetric stretching), 781 (SiO4 symmetric stretching), 693 (Si-O-Si bending transition modes), 540, 488, and 454 cm–1 (figure 27) (A. Hahn et al., “Using Fourier trans-form infrared spectroscopy to determine mineral phases in sediments,” Sedimentary Geology, Vol. 375, 2018, pp. 27–35). Unfortunately, the green cement was too thin to analyze with a micro-infrared spectrometer or Raman spectrometer.
The triplet was a typical imitation of emerald but sur-prisingly convincing when viewed table-up with the un-aided eye. With its extremely thin cement slice, maze-like pattern, and lack of bubbles, even a jewelry manufacturer might mistake it for emerald. This investigation reminds us that the examination of potentially composite stones cannot be ignored.
Biqian Xing, Guanghai Shi, and Wenqing Liu China University of Geosciences, Beijing
TREATMENTS
Ruby: An expensive mistake. Gemologists at Bangkok’s Lotus Gemology recently received a 6 ct ruby for identifi-cation. Declared to be an untreated ruby from Mozam-bique, the stone featured a superb vivid red color of a type that is often termed “pigeon’s blood” in the trade. As it was also of good clarity and well cut, it was obvious we were dealing with a gem of potentially high value.
The UV-Vis-NIR spectrum was typical for ruby/syn-thetic ruby. The infrared spectrum revealed peaks at 3309 and 3232 cm–1. The 3232 cm–1 peak generally indicates that
a stone has been subjected to artificial heat treatment. We proceeded to examine the gem in the microscope, where we found two additional pieces of evidence of heat treatment.
The first feature was rutile silk of a type that is typical of rubies from East Africa. In these stones, the silk consists of high-relief needles of rutile with attached unidentified “daughter” crystals of another substance of lower relief. In the case of heat-treated stones, the daughter crystals will sometimes show a partial breakdown (“GIA Lab reports on low-temperature heat treatment of Mozambique ruby,” GIA Research News, April 28, 2015). Small amounts of breakdown in the form of irregular white patches were found in this stone (figure 28).
But the most obvious evidence of heat treatment was the presence of spall marks (figure 29), which are solidified
258 GEM NEWS INTERNATIONAL GEMS & GEMOLOGY SUMMER 2022
Figure 29. Spall marks on the surface of the Mozambique ruby prove it was heat treated after cutting and polish-ing. Note that some of the spall marks have dark halos around them. Photomicrographs by Richard W. Hughes; fields of view 2.0 and 2.5 mm.
Figure 28. Silk in corundum often unmixes into two dif-ferent solid phases, one highly reflective (rutile) and the other of lower relief (ilmenite or hematite-ilmenite). When the Mozambique ruby was heated, the lower-re-lief crystals began to break down, developing irregular white patches, as shown in the yellow circle. Photomi-crograph by Richard W. Hughes; field of view 1 mm.

droplets of material on the surface that melted or were dis-solved during heating. These spall marks across the stone showed that the ruby had been heated after cutting and not repolished following the treatment. We can only guess about the reasons for heating such a valuable gem, but there is no doubt that this particular roll of the dice was a losing gamble because the potential improvement in ap-pearance is slight compared to the large price difference be-tween untreated and heated ruby. We concluded that this was a heat-treated Mozambique ruby.
Richard W. Hughes Lotus Gemology, Bangkok
Yellow sapphires with unstable color. In recent years, one concern our laboratory has heard from clients and from other gemologists is the issue of color stability in corun-
dum. Some sapphires, particularly those with a strong yel-low component (including padparadscha sapphire), contain unstable color centers that may fade when the stone is ex-posed to light and/or heat (K. Nassau and G.K. Valente, “The seven types of yellow sapphire and their stability to light,” Winter 1987 G&G, pp. 222–231). We regularly test for this in the laboratory by conducting a fade test. Most of the sapphires we encounter that have an unstable color are unheated stones.
Recently an orange sapphire of approximately 10 ct was submitted for testing (figure 30). Microscopic examination revealed signs of heat treatment, with partially dissolved silk, several glassy discoids (figure 31), and melted crystals (figure 32). A fade test was conducted by placing the stone approximately 5 cm under a 120-watt incandescent spot-light for at least an hour, and a dramatic difference was ob-
GEM NEWS INTERNATIONAL GEMS & GEMOLOGY SUMMER 2022 259
Figure 31. A cluster of glassy discoids suggests that this sapphire has been heat treated. Photomicrograph by E. Billie Hughes; field of view 4.0 mm.
Figure 32. This small crystal with a melted appear-ance provides evidence that the specimen has under-gone heat treatment. Photomicrograph by E. Billie Hughes; field of view 3.5 mm.
Figure 30. Left: Before a fade test, this approximately 10 ct sapphire displayed a strong orange hue. Right: After the fade test, the orange color became less pronounced and the stone appeared yellow. Photos by Ronnakorn Manorotkul.

served. The color had changed from orange to a vivid yellow (again, see figure 30).
Under normal conditions, high-temperature heat treat-ment (at least 1200–1300°C) will bleach any color centers that might be present. This suggests that the orange color was activated after the heat treatment. It is possible that this occurred either by subjecting the stone to artificial irradiation or by placing it in sunlight (Nassau and Valente, 1987). How-ever, we are unable to state definitively what process was used to activate the orange color.
Several weeks later, we tested another yellow sapphire of approximately 18 ct (figure 33). In this instance, the stone’s features were consistent with those of unheated sapphire. Again, a fade test was performed with the 120-watt spotlight, which mildly warmed the stone to approx-imately 100°C. Its color also faded after the fade test, and the owner was informed. The owner explained that they had previously put the sapphire in direct sunlight, which would have brought the color back to what was likely its stable state, a process described by Nassau.
To test this, we placed the stone in direct sunlight for 30 minutes, and the more intense yellow color did return. Unfortunately, placing the gem in direct sunlight behind a window in our office did not have the same effect.
Upon seeing the color return after being placed in direct sunlight, we decided to try another fade test, this time using a light source that would not warm up the stone. An XD-300 xenon light source was used, and the stone was placed within 5 cm of a fiber-optic light guide connected to this source. After exposure to this cooler light source for over an hour, the color did not fade. This suggests that the mild heat of the 120-watt spotlight, not just the light, faded the stone’s color
and that the more intense yellow color displayed after expo-sure to sunlight could indeed be considered the stable color.
We have since adjusted our fade tests to be light-only by switching to this cooler light source to avoid the heat generated with the 120-watt spotlight.
Our experience with these sapphires has been a fasci-nating case study in the color stability of yellow sapphire. This example reinforces the importance of considering all possibilities when testing stones in the laboratory. We do not fully understand the exact causes of these changes, and much remains to be learned.
E. Billie Hughes Lotus Gemology, Bangkok
AUCTION REPORTS
Spring 2022 auction highlights. The De Beers Cullinan Blue was the early buzz of the spring 2022 auction season, with the 15.10 ct Fancy Vivid blue step-cut diamond far surpassing Sotheby’s presale estimate of $48 million. Bring-ing $57.5 million, the diamond was the largest of its color to ever appear at auction and also the third most valuable diamond of any color to sell at auction. (To read more about GIA’s examination of the De Beers Cullinan Blue, see Lab Notes in this issue, pp. 216–217.)
The season continued in Geneva, with Christie’s auc-tioning two diamonds weighing more than 200 ct each at the Magnificent Jewels sale on May 11, beginning with the largest white diamond ever sold at auction. Named the Rock (figure 34), the GIA-graded 228.31 ct, G-color, VS1 pear-shaped diamond sold for $21.9 million, or $96,000 per
260 GEM NEWS INTERNATIONAL GEMS & GEMOLOGY SUMMER 2022
Figure 33. Before a fade test, the unheated sapphire of approximately 18 ct displayed a highly saturated yellow hue (left). After a fade test involving light and mild heat, the color faded to a pale yellow (right). Once the stone was exposed to sunlight for 30 minutes, the more intense yellow color displayed before the fade test came back. The sapphire was then subjected to a light-only fade test, and the more saturated yellow color remained stable. Photos by Ronnakorn Manorotkul.

carat. The previous record holder for the largest white dia-mond sold at auction weighed 163.41 ct and was sold by Christie’s in 2017.
The second diamond, the Red Cross (figure 35), re-turned to Christie’s for a third time at auction. It was first sold at Christie’s in 1918 to benefit the British Red Cross
during World War I. At 205.07 ct, the GIA-graded Fancy In-tense yellow cushion cut fetched $14.3 million, or $70,000 per carat, after 11 minutes of competitive bidding, setting an auction record price for a Fancy Intense yellow dia-mond. A portion of the proceeds benefited the Interna-tional Committee of the Red Cross.
GEM NEWS INTERNATIONAL GEMS & GEMOLOGY SUMMER 2022 261
Figure 34. At 228.31 ct, the Rock is the largest white diamond ever sold at auction. Photo courtesy of Christie’s.

A jadeite necklace (figure 36; opposite page) was the top lot at Christie’s May 25 Hong Kong sale, selling for $8.8 million after 11 minutes of bidding. The stunning piece fea-tures 33 perfectly round, exceptionally large jadeite beads ranging from 12.3 to 15.0 mm in diameter, with an 11 ct Burmese ruby clasp surrounded by oval brilliant diamonds.
In June, the focus returned to diamonds at Christie’s final Magnificent Jewels auction of the season in New
York. The 103.49 ct Light of Africa (figure 37), the fifth most valuable colorless diamond ever offered at Christie’s, surpassed its presale estimate of $18 million, with the win-ning bid coming in at just over $20 million—an incredible $195,000 per carat. The GIA-graded emerald-cut type IIa diamond was cut and polished from a 299 ct rough stone unearthed from the Cullinan mine.
Erica Zaidman
262 GEM NEWS INTERNATIONAL GEMS & GEMOLOGY SUMMER 2022
Figure 35. The 205.07 ct Red Cross diamond set an auction record price for a Fancy In-tense yellow diamond at Christie’s Geneva Magnificent Jewels sale. Photo courtesy of Christie’s.
Figure 37. The 103.49 ct Light of Africa diamond sold for an impressive $195,000 per carat at Christie’s Magnificent Jewels sale in New York. Photo courtesy of Christie’s.

GEM NEWS INTERNATIONAL GEMS & GEMOLOGY SUMMER 2022 263
Figure 36. This necklace featuring 33 jadeite beads was the top lot at Christie’s Magnificent Jewels sale in Hong Kong. Photo courtesy of Christie’s.

MUSEUM EXHIBITIONS
The Big Find: Celebrating 50 years of Maine tourmaline. October 2022 will mark 50 years since North America’s largest and most significant unearthing of gem-quality
tourmaline. The astounding 1972 discovery, known as “The Big Find,” unveiled vast pockets of tourmaline of every color at an abandoned mine near the top of Plumbago Mountain in Newry, Maine. Yielding more than a ton of tourmaline rough from 1972 to 1974, The Big Find
264 GEM NEWS INTERNATIONAL GEMS & GEMOLOGY SUMMER 2022
Figure 38. These 12 tour-malines from The Big
Find will be featured in one-of-a-kind jewelry
pieces. Photos courtesy of the Maine Mineral &
Gem Museum.

reawakened gem mining in the state of Maine. To cele-brate the 50th anniversary of this historic discovery, the newly opened Maine Mineral & Gem Museum has big plans underway.
The Big Find: A Legend Continues began last year when the museum sought jewelry designers from across the country to create jewelry using 12 stones from the 1972 find, ranging in weight from 9.78 to 49.30 ct (figure 38). Twelve designers selected by jury are now at work crafting one-of-a-kind pieces to be presented on October 8, 2022, at a runway extravaganza in Newry. Event and
ticket information can be found at https://mainemineral-museum.org/the-big-find/.
The museum is also commemorating the anniversary with special tourmaline exhibits and guest lectures all year, including various Maine tourmaline carvings on loan from the GIA Museum (figure 39). After the event, all 12 pieces of tourmaline jewelry will be on display at the Maine Mineral & Gem Museum and then at the 2023 Tuc-son Gem & Mineral Show before being auctioned off to raise money for the museum.
Erica Zaidman
GEM NEWS INTERNATIONAL GEMS & GEMOLOGY SUMMER 2022 265
Figure 39. Tourmaline bears on a frosted quartz base, carved by Gerhard Becker using tourmaline from The Big Find in Newry, Maine. Gifted to GIA by John Staver and currently on loan to the Maine Mineral & Gem Museum. (See more tourmaline carvings from GIA’s collection at www.gia.edu/gia- museum-tourmaline-carvings.) Photo by Orasa Weldon.

Brilliance Exhibit at the Natural History Museum of Los Angeles County. A special exhibit of rare gems and miner-als, entitled Brilliance: The Art and Science of Rare Jewels, was recently displayed at the Natural History Museum of Los Angeles County. The exhibit was available for viewing
from December 8, 2021, through February 21, 2022, in the Gem Vault in the museum’s Gem and Mineral Hall (figure 40). Over one hundred spectacular objects—necklaces, bracelets, rings, earrings, and unmounted gems (many the creations of master jewelry designer Robert Procop)—were
266 GEM NEWS INTERNATIONAL GEMS & GEMOLOGY SUMMER 2022
Figure 40. Inside the vault room of the Brilliance: The Art and Science of Rare Jewels exhibit. Photo courtesy of the Natural History Museum of Los Angeles County.
Figure 41. Left: The 46.39 ct Fancy blue Ce-leste diamond and a 100.92 ct colorless dia-mond were but two of the exquisite gems on display at the Natural History Museum of Los Angeles County. Right: This 108.03 ct blue sap-phire from Sri Lanka is exceptional in terms of its clarity, color, and size. Photos courtesy of the Natural History Museum of Los Angeles County; courtesy of Robert Procop.

on display along with mineral specimens from the mu-seum’s collection. Colorless and fancy-color diamonds, ru-bies, sapphires, emeralds, as well as color-change and asteriated gems and other spectacular specimens, were rep-resented (figures 41 and 42). By allowing the public to view
and appreciate these unique treasures, this museum event provided an understanding of how gems and minerals are used today in a variety of fields, from jewelry design to sci-entific research. Crystals of gem minerals represent prod-ucts of some optimum conditions for natural mineral formation, and the study of rough and faceted gems is in-creasingly used by scientists today to better understand Earth’s history.
James E. Shigley and Brooke Goedert GIA, Carlsbad
Smithsonian’s Great American Diamonds exhibit. Two extraordinary American diamonds (figure 43) have found a home at the Smithsonian’s National Museum of Natural History, where they were unveiled as part of the new Great American Diamonds exhibit in June. The 16.87 ct Free-dom diamond, the largest faceted diamond of U.S. origin, was fashioned from a 28 ct crystal unearthed at Colorado’s Kelsey Lake mine in 1997. The cushion-cut diamond is now set in a ring donated by Robert E. and Kathy G. Mau. The second diamond on exhibit, the emerald-cut Uncle Sam, was faceted from the largest uncut American dia-mond crystal ever discovered at 40.23 ct. Uncovered at Arkansas’ Crater of Diamonds in 1924, the flawless 12.42 ct pinkish brown stone was recently recovered from a pri-vate collection (after being missing for decades) and do-nated by Peter Buck. This is the first time the Uncle Sam has been exhibited in more than 50 years.
While diamonds from the United States are exception-ally rare, the two mines in Colorado and Arkansas pro-duced tens of thousands of carats of rough diamonds, from 1919 to 1926 at the Crater of Diamonds and 1996 to 2001 at Kelsey Lake. “Most people are surprised to learn that di-amonds have been mined in the United States, and as the
GEM NEWS INTERNATIONAL GEMS & GEMOLOGY SUMMER 2022 267
Figure 42. The 79.39 ct Royal Pink sapphire is, accord-ing to the designer, the largest vivid natural pink sap-phire in the world. Courtesy of Robert Procop.
Figure 43. Left: The 16.87 ct Freedom, from Kelsey Lake in Colorado, is the largest faceted diamond from the U.S. Right: The 12.42 ct Uncle Sam is the largest faceted diamond from Arkansas, cut from a 40.23 ct crystal uncov-ered at the Crater of Dia-monds. Photo by James Tiller and Brittany M. Hance; courtesy of De-partment of Mineral Sci-ences, Smithsonian Institution.

national museum, we are delighted to introduce these great American diamonds to our visitors,” said Dr. Jeffrey Post, the museum’s curator-in-charge of gems and minerals.
Joining these two impressive donations in the Great American Diamonds exhibit are two uncut diamonds from the museum’s existing collection. The Canary, a golden yellow crystal weighing 17.85 ct, is one of the largest uncut diamonds from Arkansas. The 6.45 ct Colorado, which dis-plays the typical octahedral shape of a natural diamond crystal, was recovered from the kimberlite host rock during mining operations at Kelsey Lake. As part of the Smith-sonian’s National Gem and Mineral Collection, these four stones are among more than 10,000 precious stones and pieces of jewelry, including the iconic Hope diamond.
Erica Zaidman
ANNOUNCEMENTS
GIA Alumni Collective. GIA’s alumni association has a new name, a fresh look, and up-to-date features. With a mission to connect GIA graduates around the world, provide oppor-tunities for continuing education, and foster networking throughout the gem and jewelry industry, the GIA Alumni Collective (figure 44) builds on the association’s long history with updates that better reflect the creativity, technical savvy, entrepreneurship, and vitality of GIA’s alumni.
After successfully completing a GIA program or course, alumni can register for the Collective and stay informed about all the resources available to them by visiting the new GIA Alumni Collective website. The new online commu-nity, collective.gia.edu, serves as a “central hub” where members can add their profile to the directory, engage and connect directly with other members and global chapters, join “virtual” chapters, register to attend professional events, access more than 20 Continuing Education semi-nars at a 10% discount, and more.
“The new GIA Alumni Collective website and online community is a reflection of our diverse alumni network. The collaboration with chapter leaders and other members brings new energy and a modern look that connects our global network and provides a space to experience the fu-ture of gems and jewelry,” says Cathryn Ramirez, execu-tive director of alumni development and continuing education at GIA.
GIA has more than 155,000 active alumni in 58 chapters spanning the globe—33 in the Americas, 16 in Asia, and three apiece in Europe, the Middle East, and Africa. While chapters host their own meetings and events, chapters often co-host to provide additional networking opportunities. The GIA Alumni Collective hosts annual events at the AGTA Tucson and JCK Las Vegas trade shows where hundreds of alumni from all over the world meet up with longtime friends and colleagues and foster new relationships.
268 GEM NEWS INTERNATIONAL GEMS & GEMOLOGY SUMMER 2022
Figure 44. The new GIA Alumni Collective of-fers a robust educa-tional and networking platform for GIA gradu-ates worldwide.