
SU09.pdf - GIA
100
T HE QUARTERLY JOURNAL OF THE GEMOLOGICAL I NSTITUTE OF A MERICA S 2009 P 79– 156 VOLUME 45 N 2 VOLUME XLV SUMMER 2009 G & G Celebrating 75 Years of G&G The Diamond Type System Identifying Cu-Bearing Tourmaline Andalusite Anniversary th 1934–2009
-
Upload
khangminh22 -
Category
Documents
-
view
0 -
download
0
Transcript of SU09.pdf - GIA
THE QUARTERLY JOURNAL OF THE GEMOLOGICAL INSTITUTE OF AMERICA
SU
MM
ER2009
PA
GES
79–156V
OLU
ME
45N
O.2
VOLUME XLV SUMMER 2009
GEM
S & G
EMO
LOG
Y
Celebrating 75 Years of G&G
The Diamond Type System
Identifying Cu-Bearing Tourmaline
Andalusite
Anniversary
th
1934–2009
GIA’s Retailer Support Kit has been developed to help
sales associates educate the public about diamonds,
the 4Cs, and thoroughly explain a GIA grading report.
Take full advantage of all that GIA has to offer by visiting
www.retailer.gia.edu
To order your FREE kit, log on to www.retailer.gia.edu
A $97.00 value, shipping
and handling extra.
Because Public Education Happens at the Counter.
GIA launches Retailer Support Kit and website
RTGG09
GMSGG
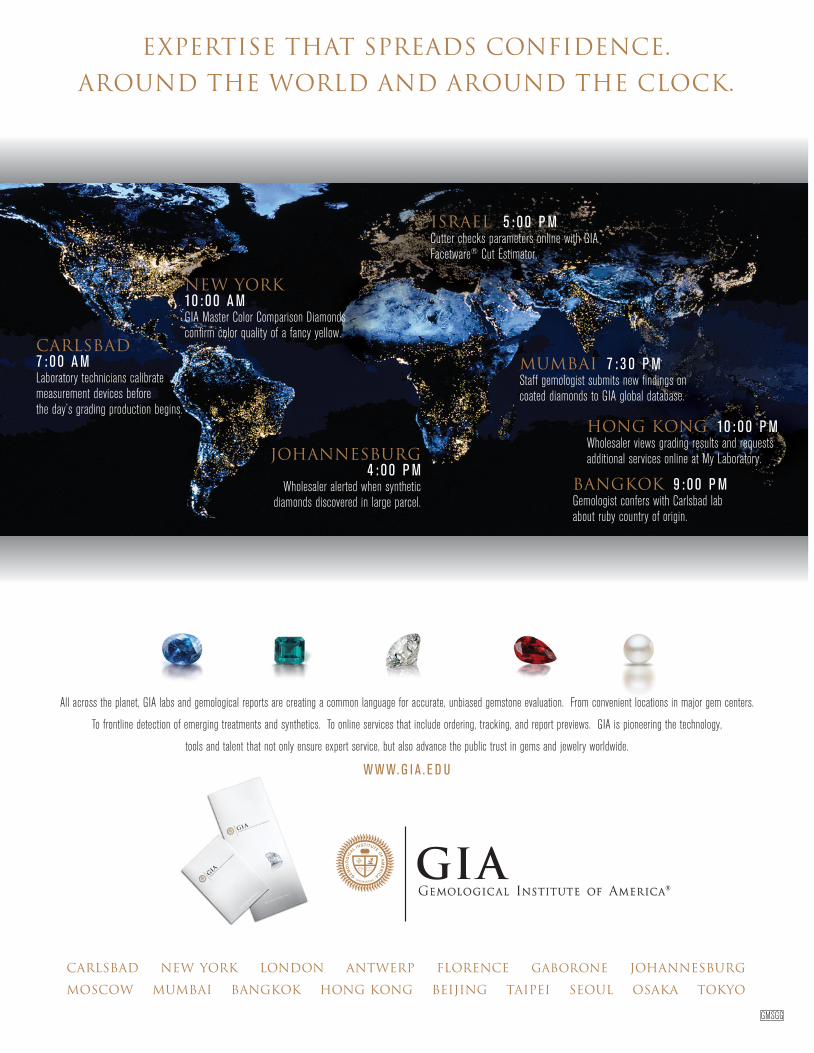
EXPERTISE THAT SPREADS CONFIDENCE.
AROUND THE WORLD AND AROUND THE CLOCK.
All across the planet, GIA labs and gemological reports are creating a common language for accurate, unbiased gemstone evaluation. From convenient locations in major gem centers.
To frontline detection of emerging treatments and synthetics. To online services that include ordering, tracking, and report previews. GIA is pioneering the technology,
tools and talent that not only ensure expert service, but also advance the public trust in gems and jewelry worldwide.
W W W. G I A . E D U
NEW YORK10 : 0 0 A MGIA Master Color Comparison Diamonds
confirm color quality of a fancy yellow.CARLSBAD7 : 0 0 A MLaboratory technicians calibrate
measurement devices before
the day’s grading production begins.
MUMBAI 7 : 3 0 P MStaff gemologist submits new findings on
coated diamonds to GIA global database.
ISRAEL 5 : 0 0 P MCutter checks parameters online with GIA
Facetware® Cut Estimator.
BANGKOK 9 : 0 0 P MGemologist confers with Carlsbad lab
about ruby country of origin.
JOHANNESBURG4 : 0 0 P M
Wholesaler alerted when synthetic
diamonds discovered in large parcel.
HONG KONG 10 : 0 0 P MWholesaler views grading results and requests
additional services online at My Laboratory.
CARLSBAD NEW YORK LONDON ANTWERP FLORENCE GABORONE JOHANNESBURG
MOSCOW MUMBAI BANGKOK HONG KONG BEIJING TAIPEI SEOUL OSAKA TOKYO
®
pg. 81
pg. 118
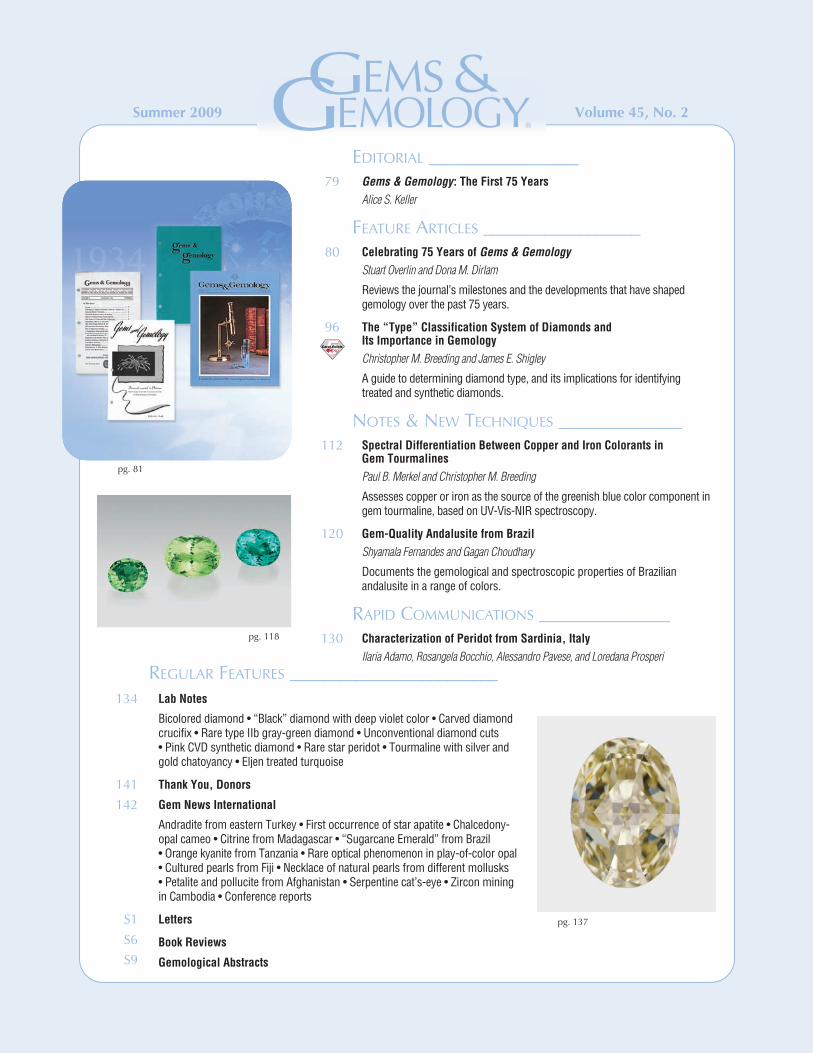
Volume 45, No. 2Summer 2009
134
141
142
S1
S6
S9
REGULAR FEATURES _________________________Lab Notes
Bicolored diamond • “Black” diamond with deep violet color • Carved diamondcrucifix • Rare type IIb gray-green diamond • Unconventional diamond cuts • Pink CVD synthetic diamond • Rare star peridot • Tourmaline with silver andgold chatoyancy • Eljen treated turquoise
Thank You, Donors
Gem News International
Andradite from eastern Turkey • First occurrence of star apatite • Chalcedony-opal cameo • Citrine from Madagascar • “Sugarcane Emerald” from Brazil • Orange kyanite from Tanzania • Rare optical phenomenon in play-of-color opal• Cultured pearls from Fiji • Necklace of natural pearls from different mollusks • Petalite and pollucite from Afghanistan • Serpentine cat’s-eye • Zircon miningin Cambodia • Conference reports
Letters
Book Reviews
Gemological Abstracts
pg. 137
EDITORIAL _________________Gems & Gemology: The First 75 YearsAlice S. Keller
FEATURE ARTICLES __________________Celebrating 75 Years of Gems & GemologyStuart Overlin and Dona M. Dirlam
Reviews the journal’s milestones and the developments that have shaped gemology over the past 75 years.
The “Type” Classification System of Diamonds and Its Importance in GemologyChristopher M. Breeding and James E. Shigley
A guide to determining diamond type, and its implications for identifying treated and synthetic diamonds.
NOTES & NEW TECHNIQUES ______________Spectral Differentiation Between Copper and Iron Colorants in Gem TourmalinesPaul B. Merkel and Christopher M. Breeding
Assesses copper or iron as the source of the greenish blue color component ingem tourmaline, based on UV-Vis-NIR spectroscopy.
Gem-Quality Andalusite from BrazilShyamala Fernandes and Gagan Choudhary
Documents the gemological and spectroscopic properties of Brazilianandalusite in a range of colors.
RAPID COMMUNICATIONS _______________Characterization of Peridot from Sardinia, ItalyIlaria Adamo, Rosangela Bocchio, Alessandro Pavese, and Loredana Prosperi
Carat Points
79
80
112
120
130
96
Editor-in-ChiefAlice S. [email protected]
Managing EditorThomas W. [email protected]
Technical EditorEmily V. [email protected]
Consulting EditorCarol M. Stockton
Contributing EditorJames E. Shigley
EditorBrendan M. LaursGIA, The Robert Mouawad Campus5345 Armada DriveCarlsbad, CA 92008(760) [email protected]
Associate EditorStuart D. [email protected]
Circulation CoordinatorMartha Rivera(760) 603-4000, ext. [email protected]
Editors, Lab NotesThomas M. Moses Shane F. McClure
Editor, Gem News InternationalBrendan M. Laurs
Editors, Book ReviewsSusan B. JohnsonJana E. Miyahira-SmithThomas W. Overton
Editors, Gemological AbstractsBrendan M. LaursThomas W. Overton
EDITORIALSTAFF
SUBSCRIPTIONS
MANUSCRIPTSUBMISSIONS
COPYRIGHTAND REPRINTPERMISSIONS
Copies of the current issue may be purchased for $19.00 in the U.S., $22.00 elsewhere. Online subscriptions, and print subscrip-tions sent to addresses in the U.S., are $74.95 for one year (4 issues), $194.95 for three years (12 issues). Print subscriptions sentelsewhere are $85.00 for one year, $225.00 for three years. Combination print/online subscriptions are $99.95 in the U.S. and$110.00 elsewhere for one year, and $269.95 in the U.S. and $300.00 elsewhere for three years. Canadian subscribers should addGST. Discounts are available for group subscriptions, renewals, GIA alumni, and current GIA students. To purchase subscriptions and single print issues, visit www.gia.edu/gemsandgemology or contact the Circulation Coordinator.Electronic (PDF) versions of all articles and sections from Spring 1981 forward can be purchased at gia.metapress.com for $10each. Full issue access can be purchased for $20. To obtain a Japanese translation of Gems & Gemology, contact GIA Japan, Okachimachi Cy Bldg., 5-15-14 Ueno, Taitoku, Tokyo 110, Japan. Our Canadian goods and service registration number is 126142892RT.Gems & Gemology’s impact factor is 1.227 (ranking 11th out of the 26 journals in the Mineralogy category), according toThomson Scientific’s 2007 Journal Citation Reports (issued July 2008). Gems & Gemology is abstracted in ThompsonScientific products (Current Contents: Physical, Chemical & Earth Sciences and Science Citation Index—Expanded, includ-ing the Web of Knowledge) and other databases. For a complete list, see www.gia.edu/gemsandgemology.Gems & Gemology welcomes the submission of articles on all aspects of the field. Please see the Guidelines for Authors onour Website, or contact the Managing Editor. Letters on articles published in Gems & Gemology are also welcome.Abstracting is permitted with credit to the source. Libraries are permitted to photocopy beyond the limits of U.S. copyright lawfor private use of patrons. Instructors are permitted to photocopy isolated articles for noncommercial classroom use withoutfee. Copying of the photographs by any means other than traditional photocopying techniques (Xerox, etc.) is prohibited with-out the express permission of the photographer (where listed) or author of the article in which the photo appears (where no pho-tographer is listed). For other copying, reprint, or republication permission, please contact the Managing Editor.Gems & Gemology is published quarterly by the Gemological Institute of America, a nonprofit educational organiza-tion for the gem and jewelry industry, The Robert Mouawad Campus, 5345 Armada Drive, Carlsbad, CA 92008.Postmaster: Return undeliverable copies of Gems & Gemology to GIA, The Robert Mouawad Campus, 5345 Armada Drive,Carlsbad, CA 92008.Any opinions expressed in signed articles are understood to be the opinions of the authors and not of the publisher.
Shigeru AkamatsuTokyo, Japan
Edward W. BoehmSolana Beach, California
James E. ButlerWashington, DC
Alan T. CollinsLondon, UK
John EmmettBrush Prairie,Washington
Emmanuel Fritsch Nantes, France
Jaroslav Hyr`́slPrague, Czech Republic
A. J. A. (Bram) JansePerth, Australia
Alan JobbinsCaterham, UK
Mary L. JohnsonSan Diego, California
Anthony R. KampfLos Angeles, California
Robert E. KaneHelena, Montana
Lore KiefertNew York, New York
Michael KrzemnickiBasel, Switzerland
Thomas M. MosesNew York, New York
Mark NewtonCoventry, UK
George RossmanPasadena, California
Kenneth ScarrattBangkok, Thailand
James E. ShigleyCarlsbad, California
Christopher P. SmithNew York, New York
Christopher M.WelbournReading, UK
PRODUCTIONSTAFF
EDITORIALREVIEW BOARD
Art Director G&G Online: Karen Myers gia.metapress.com
Since its debut in January 1934, Gems & Gemology has published groundbreaking research on diamonds, coloredstones, and pearls. The lead article in this issue, by Stuart Overlin and Dona M. Dirlam, celebrates G&G’s 75thanniversary with a look back at the journal’s history, which has coincided with the dramatic growth of gemologyas a scientific field. The selection of G&G covers was photographed by Robert Weldon. Composite image designedby Karen Myers.
Color separations for Gems & Gemology are by Pacific Plus, Carlsbad, California. Printing is by Allen Press, Lawrence, Kansas.© 2009 Gemological Institute of America All rights reserved. ISSN 0016-626X
ABOUTTHE COVER
DATABASECOVERAGE
®
www.gia.edu/gemsandgemology

read with interest and more than a little nostalgia the leadarticle in this issue by Stuart Overlin and Dona Dirlam,which reviews Gems & Gemology’s first 75 years. As this
manuscript wended its way through the review and revisionprocess, it evolved into, in the words of British reviewer AlanJobbins, “a history of the development of modern gemology.”
Yet the journal is more than just words and pictures on paper.Behind every article, lab note, or gem news update is a greatdeal of hard work and often personal sacrifice. There is also abook’s worth of anecdotes. Although I cannot speak for the full75 years, I have been part of G&G for more than a third of thatperiod, since 1980.
I already knew Dick Liddicoat and had a great deal of respectfor his work as head of GIA and G&G when I first agreed torefurbish the journal. My respect only grew as we workedtogether to implement the journal’s editorial philosophy: topromote the science of gemology for the protection of the jew-eler, the gem dealer, and the public. When an author insistedon less stringent editing and less accountability, Mr. Liddicoatalways reminded me that our first obligation was to the reader,and to the reader we had to be true. On one occasion, a dis-gruntled would-be author said what others have probablythought: that what I really needed was “a good punch in thenose.” Mr. Liddicoat promptly called him, demanded an apolo-gy, and then banned him from having any further contact withme. I could not have asked for a better defender.
Actually, there are hundreds of authors who have been terrific towork with, who have shelved their personal and professionallives to deliver a solid article on an important topic. KeithProctor moved to Santa Monica for weeks at a time to write hispegmatites of Minas Gerais series in the mid-1980s. And morethan once we faxed page proofs across the Atlantic to Dr. KarlSchmetzer on Christmas Eve, so he could work on the articleafter his family had finished celebrating the holiday. DonaDirlam wrote part of her 1992 “Gem Wealth of Tanzania” arti-cle sitting at my backyard patio table, while Bob Kammerlingroutinely spent evenings treating emeralds in his kitchen as hewrote and revised and then revised some more.
But perhaps my favorite author—yes, I do have a favorite—was Dr. Edward Gübelin. When I took over as managing edi-tor in 1981, he found the new peer-review process far moredemanding than any he had encountered previously. At onepoint, during a visit from a GIA colleague, he said he didn’tthink he could go through it again. Two hours later, though,as his guest was preparing to leave, Dr. Gübelin handed hima paper, asking: “Do you think Mrs. Keller would like thisone?” To this day, I treasure the exquisite letters he sent and
will always be grateful for his decision to endow the Dr.Edward J. Gübelin Most Valuable Article Award in perpetuity.
Equally important have been the members of the editorial reviewboard. A few years ago, I received a letter from Dr. ConnieHurlbut, an original member of the board established in 1981. Hehad just closed his office at Harvard and no longer had access tohis library. Perhaps he should resign from G&G, he suggested. Hewas, after all, turning 98 that year. Yet he was as sharp at 98 aswhen I first met him two decades earlier—and he continued toparticipate as a reviewer until his death just shy of his 100th birth-day. Some reviewers have read manuscripts while in the field inMadagascar, Myanmar, and China. Others have done so from ahospital bed, or after a long day in the classroom or the laborato-ry. Some make a few key comments, while others—such as thelegendary John Sinkankas—are willing to rewrite an entire paperto make it tighter, more accurate, and easier to read.
Many have also contributed to the “look” of the journal, intheir efforts to get the right gem materials, line illustrations, orlocality shots. For example, to createthe Winter 1994 cover, John King andTom Moses borrowed more than $17million (at the time) in colored dia-monds from several dealers and assem-bled the collection in a small room atGIA’s New York Laboratory. Haroldand Erica Van Pelt photographed thestones in a single session, expertly cap-turing their colors.
But these are only a few of the men and women who havecontributed to G&G over the years. Others diligently preparedLab Notes or Gem News International entries, or kindly provid-ed samples for us to study and report on. Still others wadedthrough the gemological literature to deliver the book reviewsand abstracts that have kept our readers up to date, or providedphotos that captured the essence of a new gem material, inter-nal feature, or locality.
We at Gems & Gemology are proud to be part of this interna-tional effort to promote the science of gemology through reli-able, well-vetted research. We are grateful to our contributors,grateful for the support we have had from GIA all these years,and grateful to you—our readers—for sharing our passion forgemology.
Alice S. Keller • Editor-in-Chief • [email protected]
EDITORIAL GEMS & GEMOLOGY SUMMER 2009 79
I

issues, as well as in William George Shuster’s 2003book, Legacy of Leadership: A History of the Gemo-logical Institute of America.)
Shipley also saw another need: a periodical thatwould keep gemologists informed of developmentsand discoveries in the nascent field and keep themconnected to GIA and AGS. He was no doubt influ-enced by The Gemmologist, the monthly journalbegun by NAG in 1931 that was billed as a publica-tion for “the jeweler, connoisseur, expert and manu-facturer.” Shipley started with a short-lived newslet-ter titled Gemology: Bulletin of the GemologicalInstitute of America in 1931. Gems and Gemolo-gists, which followed in August 1933, was a prospec-tus for a future publication. If 2,000 initial subscrip-tions were sold, the cover announced, GIA wouldhave the resources to create the periodical. In an edi-torial that acknowledged the influence of PresidentFranklin Roosevelt’s recently enacted New Deal,Shipley laid out the foundations of a grassroots
CELEBRATING 75 YEARS OFGEMS & GEMOLOGY
Stuart Overlin and Dona M. Dirlam
Authors’ note: The original, smaller-format issues, from January 1934through Winter 1980–1981, may be downloaded free of charge onthe G&G website, www.gia.edu/gemsandgemology. To locate specificarticles from past issues, please refer to the subject and author indexesalso featured on the site.
See end of article for About the Authors and Acknowledgments.GEMS & GEMOLOGY, Vol. 45, No. 2, pp. 80–95.© 2009 Gemological Institute of America
Gems & Gemology, the professional quarterly of GIA, debuted in 1934. Appearing in the 306thissue, this article looks back at the first 75 years. By reviewing the journal’s milestones, it also tracesthe history of modern gemology, as the articles, notes, and news updates in G&G represent a virtu-al encyclopedia of the developments that have influenced the science into the 21st century.
80 CELEBRATING 75 YEARS OF G&G GEMS & GEMOLOGY SUMMER 2009
hen the January 1934 premier issue ofGems & Gemology rolled off the presses,the world was in the throes of the Great
Depression—daunting odds for any publication, letalone one devoted to an obscure field in its infancy.But one man’s vision made all the difference.
Gems & Gemology (figure 1) was the brainchildof Robert M. Shipley, founder of the GemologicalInstitute of America. Shipley (figure 2) had oncebeen a successful retail jeweler in Wichita, Kansas.After his business fell apart in 1927, he left Americafor Europe and, while living in Paris, completedgemology courses offered by Great Britain’sNational Association of Goldsmiths (NAG). Hereturned to the United States in 1929, settled in LosAngeles, and set out to professionalize America’sgem and jewelry industry.
The enthusiastic response to his evening gemlectures at the University of Southern California ledShipley to incorporate GIA in Los Angeles inFebruary 1931. The Institute aimed to safeguard thefuture of the gem and jewelry industry through edu-cation, instruments, and laboratory services. In1934, Shipley created a sister organization, theAmerican Gem Society (AGS), as a professionalassociation of jewelers. GIA and AGS were head-quartered under the same roof until their amicableparting 13 years later. (A more complete account ofRobert Shipley and his founding of the two organi-zations appears in G&G’s Spring and Summer 1978
W
“gemological movement” that would educateAmerican jewelers and protect the gem-buying pub-lic. With features such as a history of the Pigott dia-mond, GIA news bulletins, a report on the WorldJewelry Trade Congress, and a gem quiz, the loneissue of Gems and Gemologists succeeded inlaunching Gems & Gemology.
BIRTH OF THE JOURNALGems & Gemology debuted with the January 1934issue. The journal’s aim was set forth on the cover,in what would now be called a mission statement:
A bi-monthly periodical, without paid advertising,supported by subscriptions from Gemologists andother gem enthusiasts, aims to increase the gemmerchant’s knowledge and ability in order that hemay protect more thoroughly his customers’ bestinterests.
Intent on making the journal an independent, unbi-ased source of gemological research and informa-tion, Shipley established a policy of no advertisingbeyond GIA products and services.
From its first issue, G&G offered a broad mix ofeditorial content. Pages were devoted to profiles offamous diamonds such as the Jonker, Orloff, andRegent; tips on using the loupe and other basicgemological instruments; book reviews; and run-ning segments such as a beginner’s glossary andHenry Briggs’s gemological encyclopedia, which ranfrom the premier issue to 1943. Throughout theseearly years, the journal sought to give jewelers andgemologists a common language with which theycould communicate. Another staple was GIA and
AGS news, as the journal sought to promote thegemological movement.
Gems & Gemology, along with every otheraspect of the two organizations in the 1930s, was afamily affair operated out of Shipley’s Los Angeles
CELEBRATING 75 YEARS OF G&G GEMS & GEMOLOGY SUMMER 2009 81
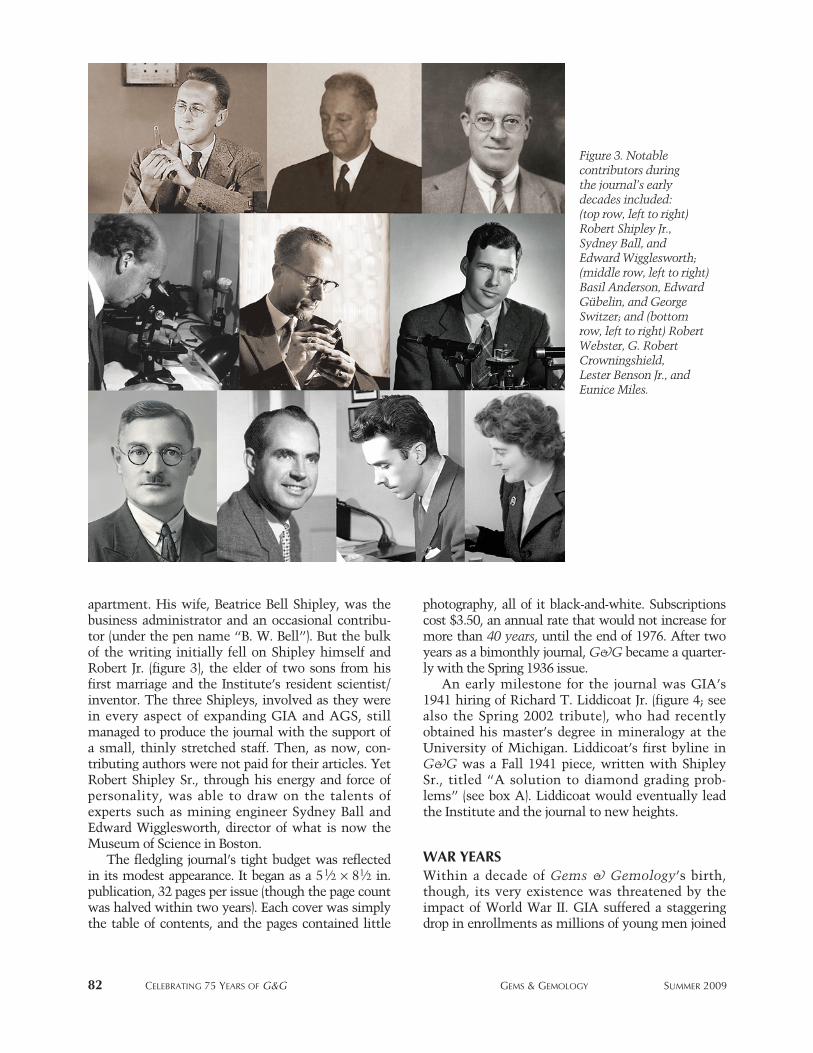
Figure 2. Former retail jeweler Robert M. Shipley(1887–1978) founded the Gemological Institute ofAmerica in 1931 and established its quarterly journalthree years later. Shipley nurtured Gems & Gemologyuntil his retirement in 1952.
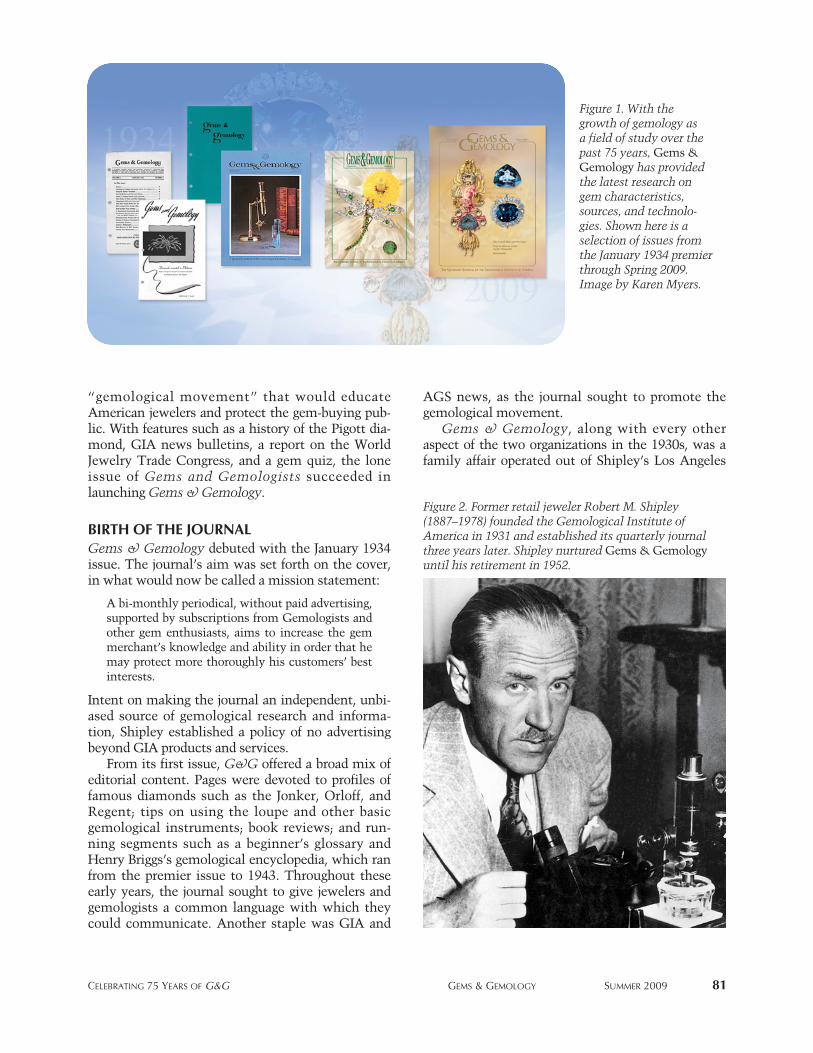
Figure 1. With thegrowth of gemology as a field of study over thepast 75 years, Gems &Gemology has providedthe latest research ongem characteristics,sources, and technolo-gies. Shown here is aselection of issues fromthe January 1934 premierthrough Spring 2009.Image by Karen Myers.
82 CELEBRATING 75 YEARS OF G&G GEMS & GEMOLOGY SUMMER 2009
apartment. His wife, Beatrice Bell Shipley, was thebusiness administrator and an occasional contribu-tor (under the pen name “B. W. Bell”). But the bulkof the writing initially fell on Shipley himself andRobert Jr. (figure 3), the elder of two sons from hisfirst marriage and the Institute’s resident scientist/inventor. The three Shipleys, involved as they werein every aspect of expanding GIA and AGS, stillmanaged to produce the journal with the support ofa small, thinly stretched staff. Then, as now, con-tributing authors were not paid for their articles. YetRobert Shipley Sr., through his energy and force ofpersonality, was able to draw on the talents ofexperts such as mining engineer Sydney Ball andEdward Wigglesworth, director of what is now theMuseum of Science in Boston.
The fledgling journal’s tight budget was reflectedin its modest appearance. It began as a 51⁄2 × 81⁄2 in.publication, 32 pages per issue (though the page countwas halved within two years). Each cover was simplythe table of contents, and the pages contained little
photography, all of it black-and-white. Subscriptionscost $3.50, an annual rate that would not increase formore than 40 years, until the end of 1976. After twoyears as a bimonthly journal, G&G became a quarter-ly with the Spring 1936 issue.
An early milestone for the journal was GIA’s1941 hiring of Richard T. Liddicoat Jr. (figure 4; seealso the Spring 2002 tribute), who had recentlyobtained his master’s degree in mineralogy at theUniversity of Michigan. Liddicoat’s first byline inG&G was a Fall 1941 piece, written with ShipleySr., titled “A solution to diamond grading prob-lems” (see box A). Liddicoat would eventually leadthe Institute and the journal to new heights.
WAR YEARSWithin a decade of Gems & Gemology’s birth,though, its very existence was threatened by theimpact of World War II. GIA suffered a staggeringdrop in enrollments as millions of young men joined
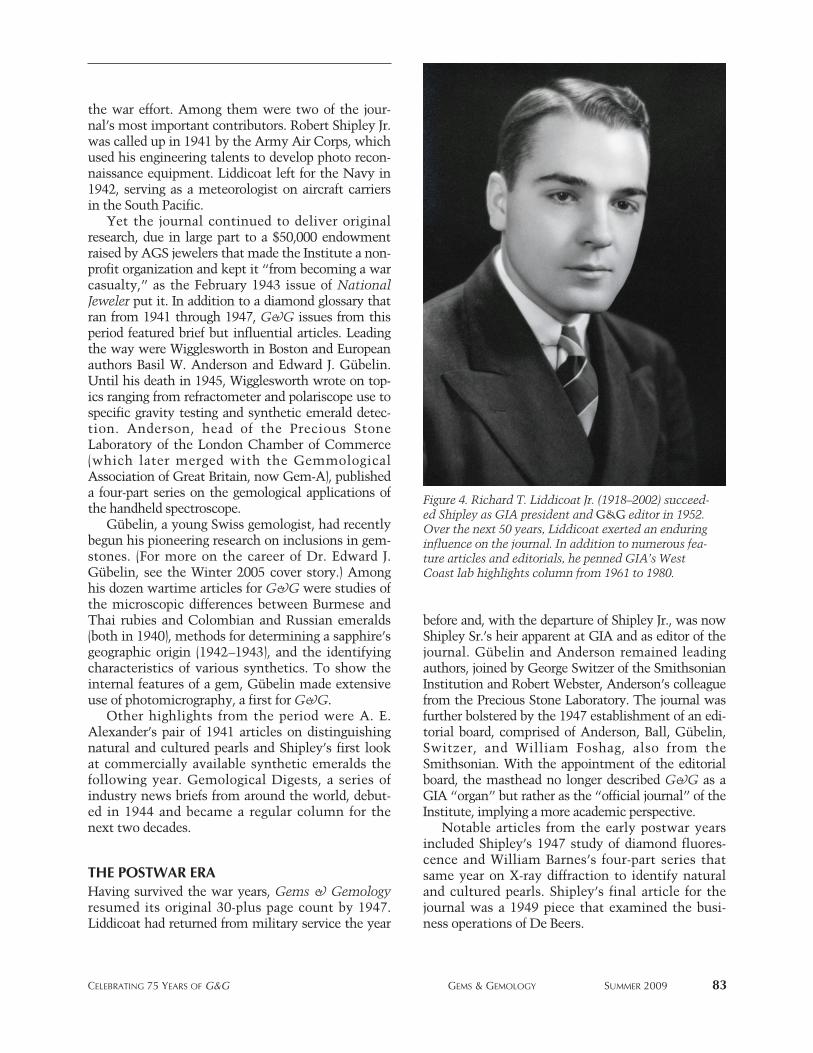
Figure 3. Notable contributors during the journal’s earlydecades included: (top row, left to right)Robert Shipley Jr.,Sydney Ball, andEdward Wigglesworth;(middle row, left to right)Basil Anderson, EdwardGübelin, and GeorgeSwitzer; and (bottomrow, left to right) RobertWebster, G. RobertCrowningshield, Lester Benson Jr., and Eunice Miles.
CELEBRATING 75 YEARS OF G&G GEMS & GEMOLOGY SUMMER 2009 83
the war effort. Among them were two of the jour-nal’s most important contributors. Robert Shipley Jr.was called up in 1941 by the Army Air Corps, whichused his engineering talents to develop photo recon-naissance equipment. Liddicoat left for the Navy in1942, serving as a meteorologist on aircraft carriersin the South Pacific.
Yet the journal continued to deliver originalresearch, due in large part to a $50,000 endowmentraised by AGS jewelers that made the Institute a non-profit organization and kept it “from becoming a warcasualty,” as the February 1943 issue of NationalJeweler put it. In addition to a diamond glossary thatran from 1941 through 1947, G&G issues from thisperiod featured brief but influential articles. Leadingthe way were Wigglesworth in Boston and Europeanauthors Basil W. Anderson and Edward J. Gübelin.Until his death in 1945, Wigglesworth wrote on top-ics ranging from refractometer and polariscope use tospecific gravity testing and synthetic emerald detec-tion. Anderson, head of the Precious StoneLaboratory of the London Chamber of Commerce(which later merged with the GemmologicalAssociation of Great Britain, now Gem-A), publisheda four-part series on the gemological applications ofthe handheld spectroscope.
Gübelin, a young Swiss gemologist, had recentlybegun his pioneering research on inclusions in gem-stones. (For more on the career of Dr. Edward J.Gübelin, see the Winter 2005 cover story.) Amonghis dozen wartime articles for G&G were studies ofthe microscopic differences between Burmese andThai rubies and Colombian and Russian emeralds(both in 1940), methods for determining a sapphire’sgeographic origin (1942–1943), and the identifyingcharacteristics of various synthetics. To show theinternal features of a gem, Gübelin made extensiveuse of photomicrography, a first for G&G.
Other highlights from the period were A. E.Alexander’s pair of 1941 articles on distinguishingnatural and cultured pearls and Shipley’s first lookat commercially available synthetic emeralds thefollowing year. Gemological Digests, a series ofindustry news briefs from around the world, debut-ed in 1944 and became a regular column for thenext two decades.
THE POSTWAR ERAHaving survived the war years, Gems & Gemologyresumed its original 30-plus page count by 1947.Liddicoat had returned from military service the year
before and, with the departure of Shipley Jr., was nowShipley Sr.’s heir apparent at GIA and as editor of thejournal. Gübelin and Anderson remained leadingauthors, joined by George Switzer of the SmithsonianInstitution and Robert Webster, Anderson’s colleaguefrom the Precious Stone Laboratory. The journal wasfurther bolstered by the 1947 establishment of an edi-torial board, comprised of Anderson, Ball, Gübelin,Switzer, and William Foshag, also from theSmithsonian. With the appointment of the editorialboard, the masthead no longer described G&G as aGIA “organ” but rather as the “official journal” of theInstitute, implying a more academic perspective.
Notable articles from the early postwar yearsincluded Shipley’s 1947 study of diamond fluores-cence and William Barnes’s four-part series thatsame year on X-ray diffraction to identify naturaland cultured pearls. Shipley’s final article for thejournal was a 1949 piece that examined the busi-ness operations of De Beers.
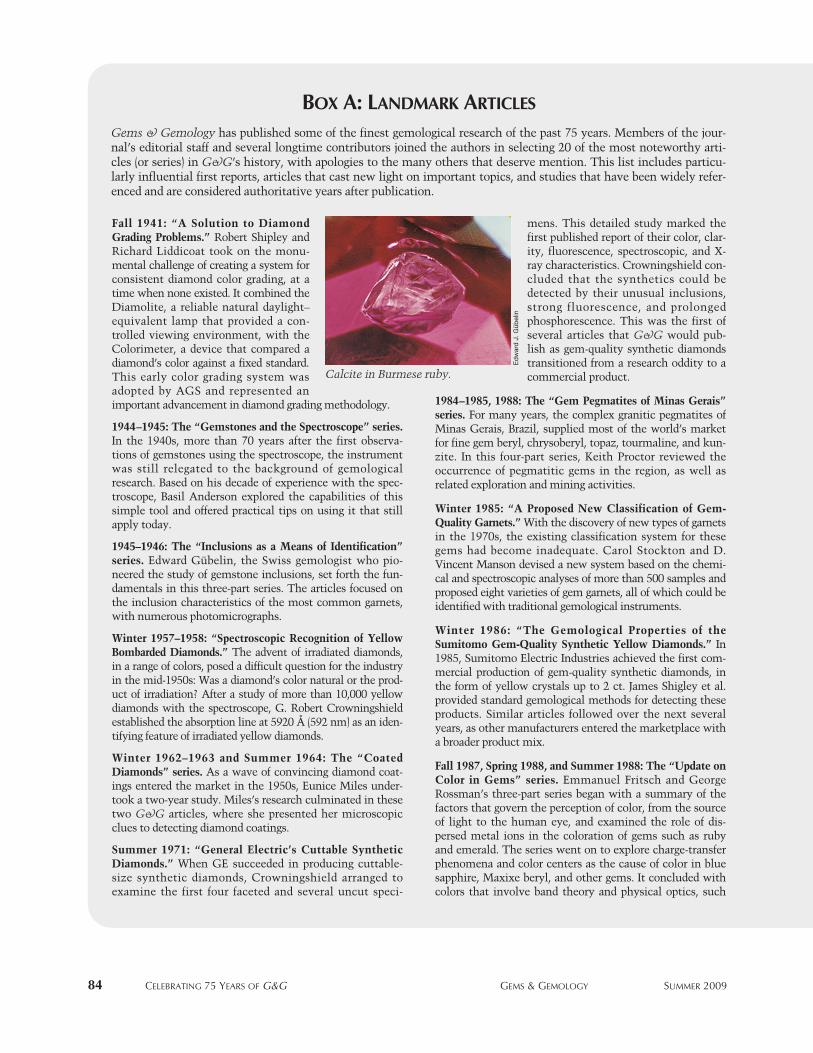
Figure 4. Richard T. Liddicoat Jr. (1918–2002) succeed-ed Shipley as GIA president and G&G editor in 1952.Over the next 50 years, Liddicoat exerted an enduringinfluence on the journal. In addition to numerous fea-ture articles and editorials, he penned GIA’s WestCoast lab highlights column from 1961 to 1980.
84 CELEBRATING 75 YEARS OF G&G GEMS & GEMOLOGY SUMMER 2009
Fall 1941: “A Solution to DiamondGrading Problems.” Robert Shipley andRichard Liddicoat took on the monu-mental challenge of creating a system forconsistent diamond color grading, at atime when none existed. It combined theDiamolite, a reliable natural daylight–equivalent lamp that provided a con-trolled viewing environment, with theColorimeter, a device that compared adiamond’s color against a fixed standard.This early color grading system wasadopted by AGS and represented animportant advancement in diamond grading methodology.
1944–1945: The “Gemstones and the Spectroscope” series.In the 1940s, more than 70 years after the first observa-tions of gemstones using the spectroscope, the instrumentwas still relegated to the background of gemologicalresearch. Based on his decade of experience with the spec-troscope, Basil Anderson explored the capabilities of thissimple tool and offered practical tips on using it that stillapply today.
1945–1946: The “Inclusions as a Means of Identification”series. Edward Gübelin, the Swiss gemologist who pio-neered the study of gemstone inclusions, set forth the fun-damentals in this three-part series. The articles focused onthe inclusion characteristics of the most common garnets,with numerous photomicrographs.
Winter 1957–1958: “Spectroscopic Recognition of YellowBombarded Diamonds.” The advent of irradiated diamonds,in a range of colors, posed a difficult question for the industryin the mid-1950s: Was a diamond’s color natural or the prod-uct of irradiation? After a study of more than 10,000 yellowdiamonds with the spectroscope, G. Robert Crowningshieldestablished the absorption line at 5920 Å (592 nm) as an iden-tifying feature of irradiated yellow diamonds.
Winter 1962–1963 and Summer 1964: The “CoatedDiamonds” series. As a wave of convincing diamond coat-ings entered the market in the 1950s, Eunice Miles under-took a two-year study. Miles’s research culminated in thesetwo G&G articles, where she presented her microscopicclues to detecting diamond coatings.
Summer 1971: “General Electric’s Cuttable SyntheticDiamonds.” When GE succeeded in producing cuttable-size synthetic diamonds, Crowningshield arranged toexamine the first four faceted and several uncut speci-
mens. This detailed study marked thefirst published report of their color, clar-ity, fluorescence, spectroscopic, and X-ray characteristics. Crowningshield con-cluded that the synthetics could bedetected by their unusual inclusions,strong fluorescence, and prolongedphosphorescence. This was the first ofseveral articles that G&G would pub-lish as gem-quality synthetic diamondstransitioned from a research oddity to acommercial product.
1984–1985, 1988: The “Gem Pegmatites of Minas Gerais”series. For many years, the complex granitic pegmatites ofMinas Gerais, Brazil, supplied most of the world’s marketfor fine gem beryl, chrysoberyl, topaz, tourmaline, and kun-zite. In this four-part series, Keith Proctor reviewed theoccurrence of pegmatitic gems in the region, as well asrelated exploration and mining activities.
Winter 1985: “A Proposed New Classification of Gem-Quality Garnets.” With the discovery of new types of garnetsin the 1970s, the existing classification system for thesegems had become inadequate. Carol Stockton and D.Vincent Manson devised a new system based on the chemi-cal and spectroscopic analyses of more than 500 samples andproposed eight varieties of gem garnets, all of which could beidentified with traditional gemological instruments.
Winter 1986: “The Gemological Properties of theSumitomo Gem-Quality Synthetic Yellow Diamonds.” In1985, Sumitomo Electric Industries achieved the first com-mercial production of gem-quality synthetic diamonds, inthe form of yellow crystals up to 2 ct. James Shigley et al.provided standard gemological methods for detecting theseproducts. Similar articles followed over the next severalyears, as other manufacturers entered the marketplace witha broader product mix.
Fall 1987, Spring 1988, and Summer 1988: The “Update onColor in Gems” series. Emmanuel Fritsch and GeorgeRossman’s three-part series began with a summary of thefactors that govern the perception of color, from the sourceof light to the human eye, and examined the role of dis-persed metal ions in the coloration of gems such as rubyand emerald. The series went on to explore charge-transferphenomena and color centers as the cause of color in bluesapphire, Maxixe beryl, and other gems. It concluded withcolors that involve band theory and physical optics, such
BOX A: LANDMARK ARTICLES
Gems & Gemology has published some of the finest gemological research of the past 75 years. Members of the jour-nal’s editorial staff and several longtime contributors joined the authors in selecting 20 of the most noteworthy arti-cles (or series) in G&G’s history, with apologies to the many others that deserve mention. This list includes particu-larly influential first reports, articles that cast new light on important topics, and studies that have been widely refer-enced and are considered authoritative years after publication.
Ed
war
d J
. Güb
elin
Calcite in Burmese ruby.

CELEBRATING 75 YEARS OF G&G GEMS & GEMOLOGY SUMMER 2009 85
as the play-of-color in opal and the blue sheen of moon-stone feldspars.
Summer 1989: “The Characteristics and Identification ofFilled Diamonds.” In the late 1980s, the filling of surface-reaching cracks in diamonds with high-RI glass to enhanceclarity became the most controversial diamond treatmentup to that point. As the industrystruggled to deal with the issue, JohnKoivula and coauthors describedclear-cut methods to detect the fill-ing. Their study also marked thebeginning of G&G’s unprecedentedreporting of treatments involvingcolorless diamonds, the mainstay ofthe industry.
Fall 1990: “Gem-Quality Cuprian-Elbaite Tourmalines from São Joséda Batalha, Paraíba, Brazil.” Theintroduction of exceptionally brightblue and green tourmalines from theBrazilian state of Paraíba in 1989 cap-tivated the colored stone world. Inone of the first reports on “Paraíba”tourmaline, Emmanuel Fritsch and coauthors described thegems and performed quantitative chemical analyses, whichrevealed that the striking colors were related to unusuallyhigh concentrations of copper. They also examined the roleof heat treatment.
Spring 1991: “Age, Origin, and Emplacement ofDiamonds: Scientific Advances in the Last Decade.”Melissa Kirkley, John Gurney, and Alfred Levinson’sdefinitive review was a key resource for understanding theformation of diamonds millions of years ago, as well as themechanisms that brought them to the surface. The articleresonated beyond the gemological community, becomingwidely cited in the geological literature.
Summer 1991: “Fracture Filling of Emeralds: Opticon andTraditional ‘Oils.’” The filling of surface-reaching fracturesin emerald has long been a widespread practice, but as epoxyresins began to replace traditional fillers, the trade demand-ed to know more about these new substances. RobertKammerling and coauthors examined the most widely usedepoxy resin, Opticon, and found that it could be detected byestablished methods.
Winter 1994: “Color Grading of Colored Diamonds in theGIA Gem Trade Laboratory.” During the 1980s, coloreddiamonds became more prevalent and far more popularthan ever before. Amid this newfound appreciation for“fancies,” John King and a team of colleagues presentedthe GIA Laboratory’s updated system for color gradingthese diamonds, as well as the theory behind it.
Winter 1995 and Spring 1996: The “History of DiamondSources in Africa” series. Since 1867, Africa has been the
world’s most important diamond source. A. J. A. (Bram) Jansechronicled the history of African diamond exploration andmining with this two-part series. South Africa was reviewedin part one, followed by East and West Africa in part two.
Fall 1996: “De Beers Natural versus Synthetic DiamondVerification Instruments.” Christopher M. Welbourn and
colleagues from the De Beers DTCResearch Centre introduced a pair ofinstruments specially designed todistinguish synthetic diamonds: theDiamondSure and the Diamond-View. The DiamondSure detects thepresence of the 415 nm opticalabsorption line found in nearly allnatural diamonds but not in synthet-ics. The DiamondView produces afluorescence image from which thedistinctive growth structures of nat-ural and synthetic stones can bedetermined.
Fall 1998, Fall 2001, and Fall 2004:The “Diamond Cut” series. Of allthe diamond quality factors, cut is
the most difficult to evaluate objectively. Following a 15-year study that used computer modeling and observationtesting, GIA researchers found that the combination ofproportions is more important than any individual propor-tion value, and that attractive diamonds can be cut in awider range of proportions than traditionally thought pos-sible. The study resulted in the 2005 launch of GIA’s dia-mond cut grading system for round brilliants.
Summer 2000: “Characteristics of Nuclei in ChineseFreshwater Cultured Pearls.” In the late 1990s, the excep-tional size and quality of some freshwater cultured pearlsfrom China sparked debate over the growth process used,particularly claims that they were being beaded with rejectcultured pearls. Based on the study of some 41,000 samples,Kenneth Scarratt, Thomas Moses, and Shigeru Akamatsudetermined that these freshwater cultured pearls werebeing grown with mantle tissue only, using larger musselsand new tissue-insertion techniques, and that they could beidentified with established X-radiographic methods.
Summer 2003: “Beryllium Diffusion of Ruby andSapphire.” The first major colored stone challenge of the21st century was the heat treatment of corundum involv-ing diffusion with beryllium. Stones artificially colored bythe process were being sold undisclosed, which sent shock-waves through the colored stone market. John Emmett andcoauthors tackled the issue with this 52-page article, thelongest in the journal’s history. Their study found that stan-dard gemological testing could identify many of thesegoods, whereas quantitative chemical analysis by secondaryion mass spectrometry (SIMS) and LA-ICP-MS wererequired for the rest.
Har
old
&E
rica
Van
Pel
t
Cu-bearing tourmalines from Paraíba, Brazil.
86 CELEBRATING 75 YEARS OF G&G GEMS & GEMOLOGY SUMMER 2009
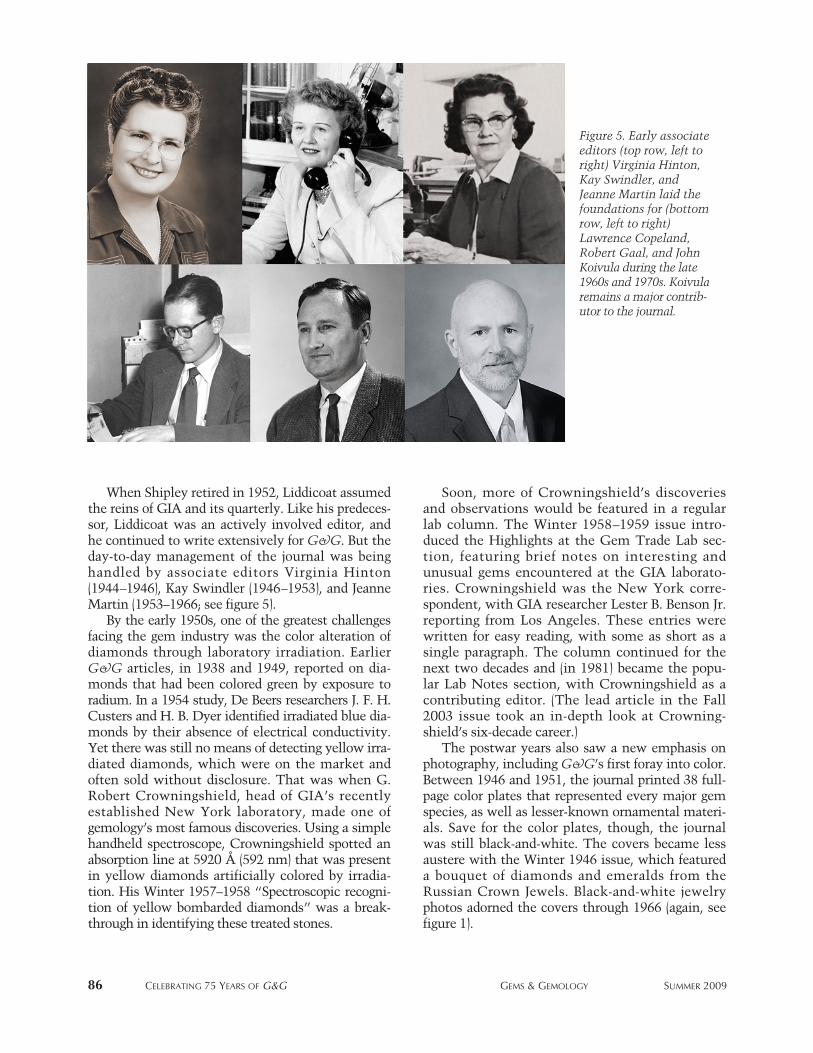
When Shipley retired in 1952, Liddicoat assumedthe reins of GIA and its quarterly. Like his predeces-sor, Liddicoat was an actively involved editor, andhe continued to write extensively for G&G. But theday-to-day management of the journal was beinghandled by associate editors Virginia Hinton(1944–1946), Kay Swindler (1946–1953), and JeanneMartin (1953–1966; see figure 5).
By the early 1950s, one of the greatest challengesfacing the gem industry was the color alteration ofdiamonds through laboratory irradiation. EarlierG&G articles, in 1938 and 1949, reported on dia-monds that had been colored green by exposure toradium. In a 1954 study, De Beers researchers J. F. H.Custers and H. B. Dyer identified irradiated blue dia-monds by their absence of electrical conductivity.Yet there was still no means of detecting yellow irra-diated diamonds, which were on the market andoften sold without disclosure. That was when G.Robert Crowningshield, head of GIA’s recentlyestablished New York laboratory, made one ofgemology’s most famous discoveries. Using a simplehandheld spectroscope, Crowningshield spotted anabsorption line at 5920 Å (592 nm) that was presentin yellow diamonds artificially colored by irradia-tion. His Winter 1957–1958 “Spectroscopic recogni-tion of yellow bombarded diamonds” was a break-through in identifying these treated stones.
Soon, more of Crowningshield’s discoveriesand observations would be featured in a regularlab column. The Winter 1958–1959 issue intro-duced the Highlights at the Gem Trade Lab sec-tion, featuring brief notes on interesting andunusual gems encountered at the GIA laborato-ries. Crowningshield was the New York corre-spondent, with GIA researcher Lester B. Benson Jr.reporting from Los Angeles. These entries werewritten for easy reading, with some as short as asingle paragraph. The column continued for thenext two decades and (in 1981) became the popu-lar Lab Notes section, with Crowningshield as acontributing editor. (The lead article in the Fall2003 issue took an in-depth look at Crowning-shield’s six-decade career.)
The postwar years also saw a new emphasis onphotography, including G&G’s first foray into color.Between 1946 and 1951, the journal printed 38 full-page color plates that represented every major gemspecies, as well as lesser-known ornamental materi-als. Save for the color plates, though, the journalwas still black-and-white. The covers became lessaustere with the Winter 1946 issue, which featureda bouquet of diamonds and emeralds from theRussian Crown Jewels. Black-and-white jewelryphotos adorned the covers through 1966 (again, seefigure 1).
Figure 5. Early associateeditors (top row, left toright) Virginia Hinton,Kay Swindler, andJeanne Martin laid thefoundations for (bottomrow, left to right)Lawrence Copeland,Robert Gaal, and JohnKoivula during the late1960s and 1970s. Koivularemains a major contrib-utor to the journal.
CELEBRATING 75 YEARS OF G&G GEMS & GEMOLOGY SUMMER 2009 87
THE SIXTIES AND SEVENTIESThe 1960s began on a somber note with the untime-ly death in 1961 of Lester Benson, whose LosAngeles lab column was carried on by Liddicoat.The G&G editor also produced two of the decade’smost notable articles: 1962’s “Developing the pow-ers of observation in gem testing,” and “Cultured-pearl farming and marketing” in 1967. EuniceMiles, the first female gemologist at the GIA labo-ratory, addressed one of the New York diamondindustry’s most pressing concerns with two arti-cles on detecting coated diamonds (at the end of1962 and in 1964). But with growing demand forGIA’s new diamond grading services, gemologicalresearch assumed a lower priority at the Institute,and few other scientific studies would be conduct-ed until the establishment of GIA Research in1976.
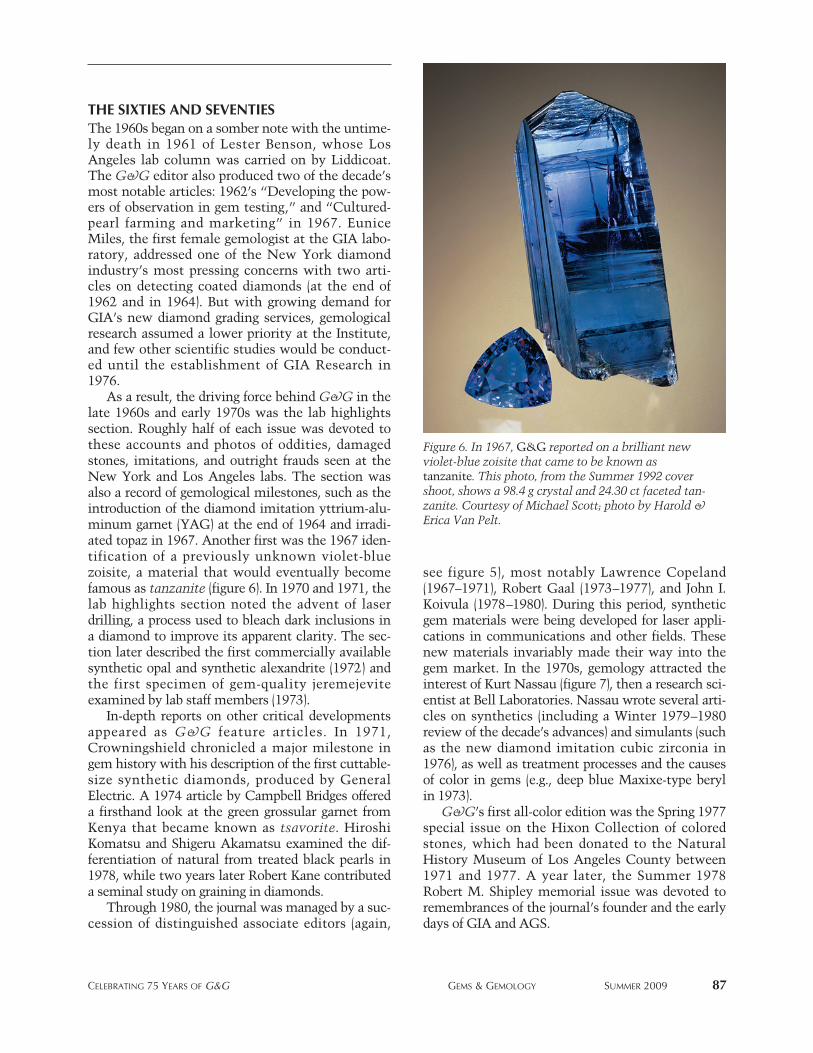
As a result, the driving force behind G&G in thelate 1960s and early 1970s was the lab highlightssection. Roughly half of each issue was devoted tothese accounts and photos of oddities, damagedstones, imitations, and outright frauds seen at theNew York and Los Angeles labs. The section wasalso a record of gemological milestones, such as theintroduction of the diamond imitation yttrium-alu-minum garnet (YAG) at the end of 1964 and irradi-ated topaz in 1967. Another first was the 1967 iden-tification of a previously unknown violet-bluezoisite, a material that would eventually becomefamous as tanzanite (figure 6). In 1970 and 1971, thelab highlights section noted the advent of laserdrilling, a process used to bleach dark inclusions ina diamond to improve its apparent clarity. The sec-tion later described the first commercially availablesynthetic opal and synthetic alexandrite (1972) andthe first specimen of gem-quality jeremejeviteexamined by lab staff members (1973).
In-depth reports on other critical developmentsappeared as G&G feature articles. In 1971,Crowningshield chronicled a major milestone ingem history with his description of the first cuttable-size synthetic diamonds, produced by GeneralElectric. A 1974 article by Campbell Bridges offereda firsthand look at the green grossular garnet fromKenya that became known as tsavorite. HiroshiKomatsu and Shigeru Akamatsu examined the dif-ferentiation of natural from treated black pearls in1978, while two years later Robert Kane contributeda seminal study on graining in diamonds.
Through 1980, the journal was managed by a suc-cession of distinguished associate editors (again,
see figure 5), most notably Lawrence Copeland(1967–1971), Robert Gaal (1973–1977), and John I.Koivula (1978–1980). During this period, syntheticgem materials were being developed for laser appli-cations in communications and other fields. Thesenew materials invariably made their way into thegem market. In the 1970s, gemology attracted theinterest of Kurt Nassau (figure 7), then a research sci-entist at Bell Laboratories. Nassau wrote several arti-cles on synthetics (including a Winter 1979–1980review of the decade’s advances) and simulants (suchas the new diamond imitation cubic zirconia in1976), as well as treatment processes and the causesof color in gems (e.g., deep blue Maxixe-type beryl in 1973).
G&G’s first all-color edition was the Spring 1977special issue on the Hixon Collection of coloredstones, which had been donated to the NaturalHistory Museum of Los Angeles County between1971 and 1977. A year later, the Summer 1978Robert M. Shipley memorial issue was devoted toremembrances of the journal’s founder and the earlydays of GIA and AGS.
Figure 6. In 1967, G&G reported on a brilliant newviolet-blue zoisite that came to be known astanzanite. This photo, from the Summer 1992 covershoot, shows a 98.4 g crystal and 24.30 ct faceted tan-zanite. Courtesy of Michael Scott; photo by Harold &Erica Van Pelt.

88 CELEBRATING 75 YEARS OF G&G GEMS & GEMOLOGY SUMMER 2009
A NEW ERAIn 1980, with GIA’s 50th anniversary a year away,Liddicoat and the board of governors decided it wastime to revitalize the Institute’s flagship publication.Koivula, eager to return to his highly regarded geminclusion research and photomicrography, steppedaside and Alice Keller (figure 8) was chosen to takeover as managing editor. Unlike her predecessors,Keller was not a gemologist, but she had an extensivebackground in peer-reviewed medical and businessjournals. She immediately put a lasting imprint onG&G, beginning with the Spring 1981 issue, whichwas headlined by Gübelin’s article on peridot fromthe Red Sea island of Zabargad and Nassau’s updateon cubic zirconia.
Keller’s debut issue was a dramatic departure forthe journal. It had a larger format (81⁄2 × 11 in.) andtwice the page count. But the most striking feature ofthe redesigned G&G was its emphasis on high-quali-ty color photography, which finally did justice to thesubtle nuances of gems and their eye-visible andmicroscopic features. With the next issue, Summer1981, the renowned team of Harold and Erica VanPelt (figure 9) began taking artistic cover shots andlead photos for feature articles. Over the years, TinoHammid, Robert Weldon, Shane McClure, and MahaTannous also contributed significantly, whileKoivula’s photomicrographs captured the internalworld of gems (he shared some of his techniques in
Figure 7. Among themost prolific contribu-tors from recent decadesare: (top row, left toright) Kurt Nassau, Robert Kane, and Emmanuel Fritsch; and (bottom row, left toright) John King, AlfredLevinson, James Shigley,and Karl Schmetzer.Shigley is also contribut-ing editor of G&G andeditor of the Gems &Gemology in Reviewseries; King is editor ofthe Colored Diamondsbook in that series.Levinson was editor ofthe GemologicalAbstracts section from1997 to 2005.
Figure 8. Editor-in-chief Alice Keller’s transformation ofG&G began with the Spring 1981 issue. She was later
joined by editor Brendan Laurs and managing editor TomOverton, who bring geological, gemological, and legalexpertise to the journal. Photo by Kevin Schumacher.
CELEBRATING 75 YEARS OF G&G GEMS & GEMOLOGY SUMMER 2009 89
Spring 2003’s “Photomicrography for gemologists”).Complementing the photos were numerous colorillustrations, including detailed maps and graphs.
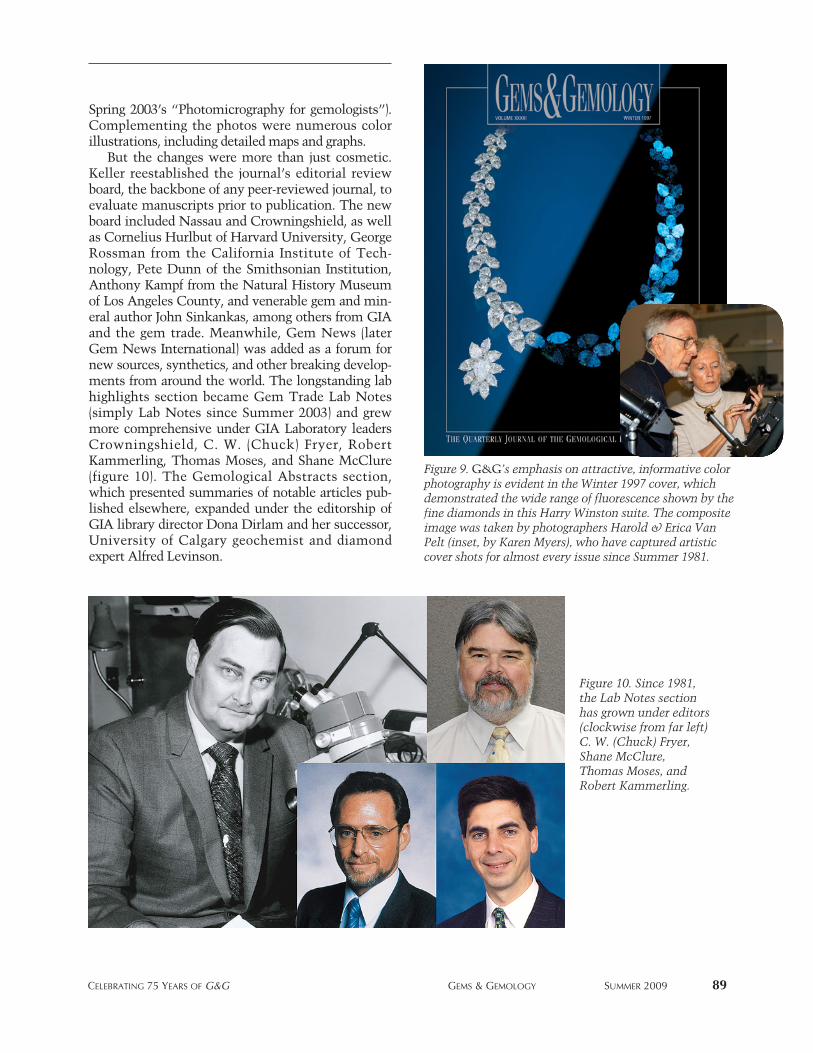
But the changes were more than just cosmetic.Keller reestablished the journal’s editorial reviewboard, the backbone of any peer-reviewed journal, toevaluate manuscripts prior to publication. The newboard included Nassau and Crowningshield, as wellas Cornelius Hurlbut of Harvard University, GeorgeRossman from the California Institute of Tech-nology, Pete Dunn of the Smithsonian Institution,Anthony Kampf from the Natural History Museumof Los Angeles County, and venerable gem and min-eral author John Sinkankas, among others from GIAand the gem trade. Meanwhile, Gem News (laterGem News International) was added as a forum fornew sources, synthetics, and other breaking develop-ments from around the world. The longstanding labhighlights section became Gem Trade Lab Notes(simply Lab Notes since Summer 2003) and grewmore comprehensive under GIA Laboratory leadersCrowningshield, C. W. (Chuck) Fryer, RobertKammerling, Thomas Moses, and Shane McClure(figure 10). The Gemological Abstracts section,which presented summaries of notable articles pub-lished elsewhere, expanded under the editorship ofGIA library director Dona Dirlam and her successor,University of Calgary geochemist and diamondexpert Alfred Levinson.
Figure 10. Since 1981,the Lab Notes sectionhas grown under editors(clockwise from far left)C. W. (Chuck) Fryer,Shane McClure,Thomas Moses, andRobert Kammerling.
Figure 9. G&G’s emphasis on attractive, informative colorphotography is evident in the Winter 1997 cover, whichdemonstrated the wide range of fluorescence shown by thefine diamonds in this Harry Winston suite. The compositeimage was taken by photographers Harold & Erica VanPelt (inset, by Karen Myers), who have captured artisticcover shots for almost every issue since Summer 1981.

90 CELEBRATING 75 YEARS OF G&G GEMS & GEMOLOGY SUMMER 2009
In 1982, G&G debuted a pair of perennial Springissue features. The Most Valuable Article Award,voted on by readers and later renamed in honor ofGübelin, offers recognition and a monetary prize asan incentive for authors. The G&G Challenge, amultiple-choice quiz based on the previous year’sarticles, promotes continuing education in this rapid-ly developing field.
The Spring 1986 “China” issue, an unprecedent-ed look at the country’s gem resources, was the firstof several special editions of the redesigned journal.Retrospectives of the 1980s and 1990s (Spring 1990and Winter 2000) reviewed major developments foreach decade in five key areas: gem sources (includinga world map and table of important localities), syn-thetics, treatments, new technologies, and jewelrystyles. In addition, the Fall 1999 and Fall 2006 issueswere devoted to presentations by industry leadersand prominent researchers at GIA’s third and fourthInternational Gemological Symposiums.
The Impact of Technology. The changes in G&Gcoincided with a virtual revolution in gemology.Technological advances in the 1980s began to fostermore precise, sophisticated forms of gem synthesis,resulting in an influx of high-quality syntheticrubies, sapphires, and emeralds. Although GE hadproduced the first jewelry-quality synthetic dia-monds for experimental purposes years earlier,Sumitomo was the first to make such materialcommercially available—initially for industrial use.During this decade, G&G covered the Ramaura andLechleitner synthetic rubies, among others, as wellas the Sumitomo and De Beers gem-quality synthet-ic diamonds. At the same time, experimentation inother fields, such as high-pressure physics andmaterials science, brought a new generation ofenhanced gems to the fore. The traditional gaugesand scopes—and even electron microprobe analysisand UV-visible absorption spectroscopy, techniquesfirst applied in the 1970s—were not always suffi-cient to characterize these materials. Out of thisnecessity came new tools for gemological discovery.
Many of these new identification technologiesinvolved spectroscopic methods, which measurethe absorption or emission of electromagnetic radi-ation to determine a gem material’s compositionand characteristics. Several advanced forms ofspectroscopy were introduced to gemologiststhrough the pages of Gems & Gemology duringthe 1980s, most notably infrared, energy-dispersiveX-ray fluorescence, and Raman. The decade alsosaw further development of the electron micro-probe as a useful tool in measuring the chemicalcomposition of gem materials. The increasinglytechnical nature of the submitted manuscripts ledKeller to add the position of technical editor to thejournal’s staff in 1985. Carol M. Stockton, a well-published GIA researcher, held the post for morethan 20 years and continues to support G&G asconsulting editor.
In the 1990s and 2000s, advances in diamond syn-thesis and challenging new treatments would foreverchange the way gemologists looked at diamonds,rubies, and sapphires. Following on the broader appli-cation of Raman analysis for gem identification, laserablation–inductively coupled plasma–mass spec-trometry (LA-ICP-MS)—also adapted from otherresearch disciplines—emerged as an important tech-nique for quantitative chemical analysis of gemmaterials. However, not all of gemology’s new meth-ods were borrowed from other fields: A 1996 articlepresented two instruments developed by De Beers
Figure 11. Shown here is a recent model of the DTCDiamondView, which was introduced to gemologistsin a 1996 G&G article by Chris Welbourn et al. It isone of many advanced technologies that have figuredprominently in the journal since the 1980s. Photo byKevin Schumacher.
CELEBRATING 75 YEARS OF G&G GEMS & GEMOLOGY SUMMER 2009 91
researchers specifically for detecting synthetic dia-monds. One of them, the DiamondView, produces aluminescence image revealing the growth structureof the diamond being tested, thereby indicating itsnatural or synthetic origin (figure 11).
Gem Sources. During the 1980s, reviews andupdates on classic colored stone localities—Colombia, Burma (Myanmar), Sri Lanka, Pakistan,Kashmir, Afghanistan, and Thailand—prevailed inthe pages of G&G. To this day, Keith Proctor’s four-part “Gem pegmatites of Minas Gerais” series,which appeared between 1984 and 1988, serves as acomprehensive overview of the major occurrencesin this gem-rich Brazilian state. But this decade andthe next also saw increased exploration and theemergence of new localities. Soon after the discov-ery of unusually vivid green and blue copper-bearingtourmalines at a mine in northeastern Brazil,Emmanuel Fritsch headed a 1990 report on thesenew “Paraíba” tourmalines. The following year,Robert Kane led a report on rubies and fancy sap-phires from Vietnam, and in 1992, Dirlam et al. sur-veyed the colored stone wealth of Tanzania.
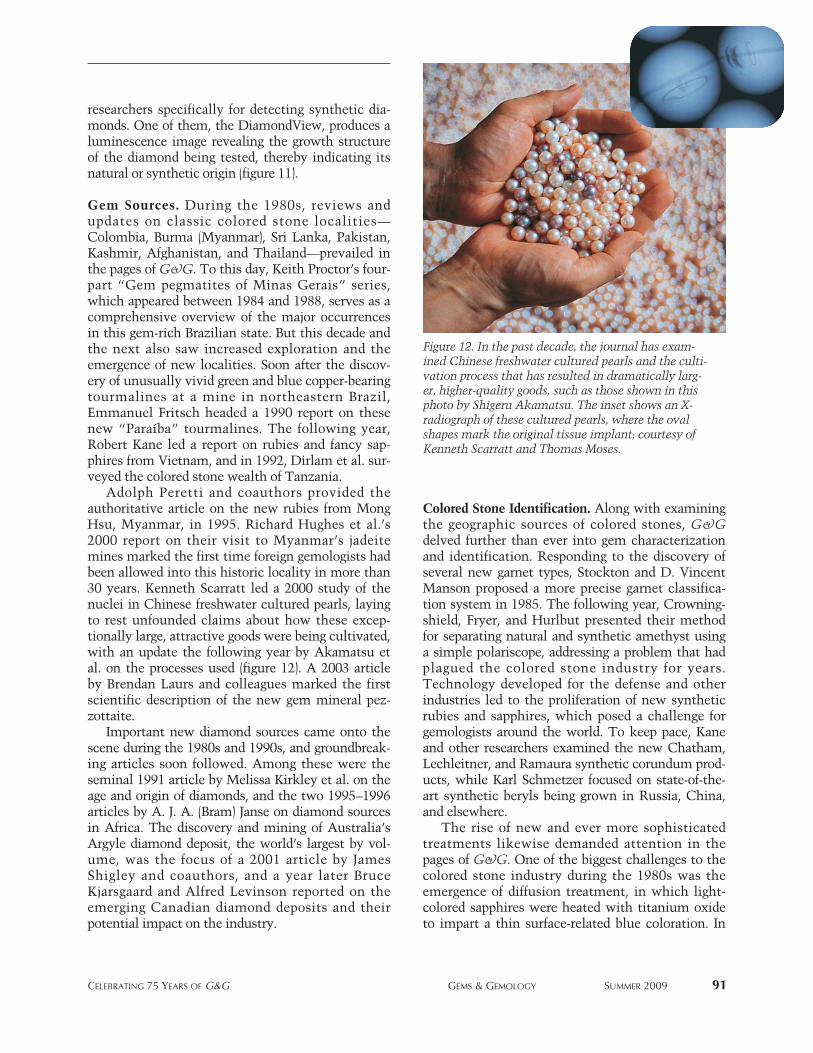
Adolph Peretti and coauthors provided theauthoritative article on the new rubies from MongHsu, Myanmar, in 1995. Richard Hughes et al.’s2000 report on their visit to Myanmar’s jadeitemines marked the first time foreign gemologists hadbeen allowed into this historic locality in more than30 years. Kenneth Scarratt led a 2000 study of thenuclei in Chinese freshwater cultured pearls, layingto rest unfounded claims about how these excep-tionally large, attractive goods were being cultivated,with an update the following year by Akamatsu etal. on the processes used (figure 12). A 2003 articleby Brendan Laurs and colleagues marked the firstscientific description of the new gem mineral pez-zottaite.
Important new diamond sources came onto thescene during the 1980s and 1990s, and groundbreak-ing articles soon followed. Among these were theseminal 1991 article by Melissa Kirkley et al. on theage and origin of diamonds, and the two 1995–1996articles by A. J. A. (Bram) Janse on diamond sourcesin Africa. The discovery and mining of Australia’sArgyle diamond deposit, the world’s largest by vol-ume, was the focus of a 2001 article by JamesShigley and coauthors, and a year later BruceKjarsgaard and Alfred Levinson reported on theemerging Canadian diamond deposits and theirpotential impact on the industry.
Colored Stone Identification. Along with examiningthe geographic sources of colored stones, G&Gdelved further than ever into gem characterizationand identification. Responding to the discovery ofseveral new garnet types, Stockton and D. VincentManson proposed a more precise garnet classifica-tion system in 1985. The following year, Crowning-shield, Fryer, and Hurlbut presented their methodfor separating natural and synthetic amethyst usinga simple polariscope, addressing a problem that hadplagued the colored stone industry for years.Technology developed for the defense and otherindustries led to the proliferation of new syntheticrubies and sapphires, which posed a challenge forgemologists around the world. To keep pace, Kaneand other researchers examined the new Chatham,Lechleitner, and Ramaura synthetic corundum prod-ucts, while Karl Schmetzer focused on state-of-the-art synthetic beryls being grown in Russia, China,and elsewhere.
The rise of new and ever more sophisticatedtreatments likewise demanded attention in thepages of G&G. One of the biggest challenges to thecolored stone industry during the 1980s was theemergence of diffusion treatment, in which light-colored sapphires were heated with titanium oxideto impart a thin surface-related blue coloration. In
Figure 12. In the past decade, the journal has exam-ined Chinese freshwater cultured pearls and the culti-vation process that has resulted in dramatically larg-er, higher-quality goods, such as those shown in thisphoto by Shigeru Akamatsu. The inset shows an X-radiograph of these cultured pearls, where the ovalshapes mark the original tissue implant; courtesy ofKenneth Scarratt and Thomas Moses.

92 CELEBRATING 75 YEARS OF G&G GEMS & GEMOLOGY SUMMER 2009
1990, Kane et al. addressed the identification ofthese treated sapphires, the first of three G&G arti-cles on a process that would change the face of theruby and sapphire industry in the 21st century.When the corundum trade was rocked by the emer-gence of “deep” diffusion with beryllium in 2002(figure 13), John Emmett et al.’s comprehensive2003 article laid out the mechanics of the treatmentand clues to its identification. One year later, SSEF’sMichael Krzemnicki and Henry Hänni helpeddescribe a new detection method for Be diffusion,laser-induced breakdown spectroscopy (LIBS).
During the 1990s especially, the emerald tradewas hit by numerous scandals over undisclosed clar-ity enhancement. Although common for decades,the oiling of emeralds was not well understood byconsumers, and the use of new and different frac-ture-filling substances challenged trade and publicacceptance of the treatment. Concerns about the sta-
bility of these new filling materials led to a 1991 arti-cle by Kammerling et al. that examined their effec-tiveness. In 1999, a series of articles presented detec-tion criteria for different emerald fillers and GIA’spolicy for grading them. GIA’s emerald research pro-ject culminated in a 2007 article analyzing the dura-bility of various emerald fillers (figure 14).
Diamond Treatments. For most of the journal’s exis-tence, colored stone treatments and synthetics werethe hot-button topics. While articles were publishedon diamond grading, simulants such as CZ, andoccasionally coating and irradiation treatments, thediamond industry remained relatively untouched byproblems that had long plagued colored stones. Thatended in 1987, with the discovery that surface-reach-ing cracks in diamonds were being filled with a lead-based glass to improve their apparent clarity. Unlikeirradiation, an issue limited to colored diamonds,glass filling directly affected colorless diamonds.Koivula et al. responded with a 1989 article on theidentifying characteristics of these goods, whileKammerling and colleagues delivered a 1994 follow-up (figure 15).
In 1999, the industry was again shaken by theemergence of a new treatment for colorless dia-monds—one that permanently removed brown col-oration from type IIa stones yet left little gemologi-cal evidence. Lazare Kaplan International subsidiaryPegasus Overseas Ltd., the distributor of the treateddiamonds, announced that GE had developed theprocess and that hundreds of these goods had passedthrough gem laboratories undetected. G&G respond-ed with a series of investigations, beginning withThomas Moses et al.’s Fall 1999 “Observations onGE-processed diamonds: A photographic record,”which revealed characteristic internal features ofthese diamonds and confirmed the use of a high-pressure, high-temperature (HPHT) treatment
Figure 14. Mary Johnson’s2007 article on emeraldfillers investigated theirdurability over time andunder common conditionsof wear and cleaning. Thefissures in this 0.74 ct emer-ald filled with Araldite 6010(left) partially emptied outafter 30 minutes of ultrason-ic cleaning (right).
Figure 13. In 2002, the industry learned that berylliumdiffusion was being used to significantly alter thecolor of corundum, changing pink stones (such as
those on the left of this photo by Sriurai Scarratt) topink-orange after treatment (right). This was dramati-
cally illustrated by Shane McClure’s inset photo of a0.51 ct pink sapphire that had been cut in half, with
the portion on the right undergoing Be diffusion.

method. Subsequent issues provided additionalimportant clues, first by Karl Schmetzer and then byDe Beers researchers David Fisher and RaymondSpits. In 2000, Christopher Smith and coauthorsoffered an in-depth gemological and spectroscopicanalysis of diamonds before and after HPHT process-ing (figure 16).
Diamond Synthetics and Imitations. Although GEhad created gem-quality synthetic diamonds on asmall scale in the early 1970s, technical barriers andhigh production costs kept them in the experimen-tal stage for more than a decade. Starting withSumitomo in 1985, as noted earlier, a number ofmanufacturers began to achieve commercial pro-duction of gem-quality synthetic diamonds forindustrial purposes, a development with seriousimplications for the jewelry industry. Several arti-cles on the characterization and identification ofsynthetic diamonds appeared in the journal into the21st century (figure 17), most of them spearheadedby GIA research director James Shigley.
While these early synthetic diamonds were creat-ed by the same basic method—heating carbon with ametal flux at high temperatures and high pressure
inside a large press—the technique of chemicalvapor deposition (CVD) emerged in the 2000s. TheCVD synthetics had very different gemological andspectroscopic characteristics, requiring a new roundof intensive research. Landmark articles on CVDsynthetic diamonds, led by GIA’s Wuyi Wang andDe Beers researchers Philip Martineau et al., wouldfollow in the pages of G&G.
Even diamond simulants saw advances in tech-nology, with the introduction of synthetic moissan-ite as a jewelry material in the 1990s. A 1997 articleby Nassau and coauthors showed how to identifythis new imitation, which could not be detected bythe thermal conductivity probes then in wide use.
Diamond Cut and Diamond Grading. GIA had begungrading diamonds in the 1950s, but by the 1980s itwas clear that refinements to the system were neces-sary. One of the earliest concerns was the need for acut grade. Thus began a 15-year research project,which culminated in a series of G&G articles thatlaid out the basis for the Institute’s cut-grading sys-tem for round brilliant diamonds, launched in 2005.Color grading saw advances as well, for both fancy-color and colorless stones. In 1994, John King and a
CELEBRATING 75 YEARS OF G&G GEMS & GEMOLOGY SUMMER 2009 93
Figure 16. High-pres-sure, high-tempera-ture (HPHT) treat-ment removed thebrown colorationfrom this 0.97 ct typeIIa diamond (cour-tesy of the GübelinGem Lab).
Figure 15. The late 1980s saw the introduction of a new treatment that used lead-based glass to fill surface-reach-ing cracks in diamonds to improve their apparent clarity. The left and center photos show a 0.20 ct diamond beforeand after filling. G&G articles noted identifying features of these treated diamonds, such as the “flash effect” seenon the right (magnified 29×). Photomicrographs by Shane F. McClure.
94 CELEBRATING 75 YEARS OF G&G GEMS & GEMOLOGY SUMMER 2009
team of coauthors presented the GIA Laboratory’supdated system for color grading fancy-color diamonds; this was followed over the next severalyears by companion articles on grading blues, pinks,and yellows. In 2008, King spearheaded a comprehen-sive article outlining the development of GIA’s colorgrading system for D-to-Z diamonds.
Scientific and Industry Reviews. Not all G&G arti-cles are based on original research—many of the jour-nal’s most important contributions have beenreviews of developments in the field. EmmanuelFritsch and George Rossman’s three-part “Color ingems” series in 1987 and 1988 remains a seminal ref-erence on the topic two decades later. In 1988, nucle-ar engineer Charles E. Ashbaugh III provided a com-prehensive review of the physics and methods ofgemstone irradiation. William Boyajian, then GIA’spresident, wrote the 1988 classic “An economicreview of the past decade in diamonds,” which setthe stage for similar in-depth analyses of the state ofthe diamond trade. Menahem Sevdermish et al. pro-filed the rise of India’s diamond cutting industry in1998, and Russell Shor contributed 2005’s update on
the state of the global diamond industry. In 2007,Janse took on the monumental task of compilingglobal rough diamond production statistics since1870. That same year, Shor analyzed the economicsof the cultured pearl industry.
Jewelry History and Fashion. Along with its morescientific studies, Gems & Gemology also pub-lished scholarly articles on jewelry history and fash-ion. Looking back to the turn of the 20th century,jewelry historian Elise Misiorowski examined ArtNouveau and Edwardian jewelry (figure 18) in 1986and 1993. J. Mark Ebert’s 1983 article captured thecreative spirit of the Art Deco period of the 1920sand 1930s, as did Sally Thomas’s 1987 article cover-ing jewelry from the 1940s to the 1960s. In 1985,Dirlam and coauthors reviewed pearl fashion fromantiquity through modern times. The importance ofgemstone durability in jewelry design and manufac-turing was featured in Deborah Martin’s 1987 arti-cle and accompanying chart.
TWENTY-FIRST CENTURY DEVELOPMENTSHaving stepped down as GIA president in 1983,Liddicoat remained chairman and G&G editor-in-chief until his death in 2002. After his passing,Alice Keller was named editor-in-chief. GeologistBrendan Laurs, the journal’s senior editor since 1997and a widely published expert on global gemsources, became editor. Attorney and copyright spe-cialist Tom Overton has been managing editor since2002 (again, see figure 8).
Meanwhile, a number of G&G products havesupplemented the quarterly issues. Illustrated wallcharts, a more regular feature under longtime artdirector Karen Myers, provide easy reference andhave become popular educational and sales tools.These include a world map of gem localities andcharts of commercially available gem treatments,synthetic diamonds, and beryllium-diffused corun-dum. Another valuable resource has been the cumu-lative indexes, which help users access the subjectsand authors that have appeared in the journal since1981. Printed every five years from 1990 to 2005, theindex has been updated online each year since 2005.That same year, the journal launched the Gems &Gemology in Review book series, each volume a col-lection of G&G articles and news briefs on a particu-lar topic. Edited by James Shigley, the series to dateincludes Synthetic Diamonds (2005), ColoredDiamonds (2006), and Treated Diamonds (2008).
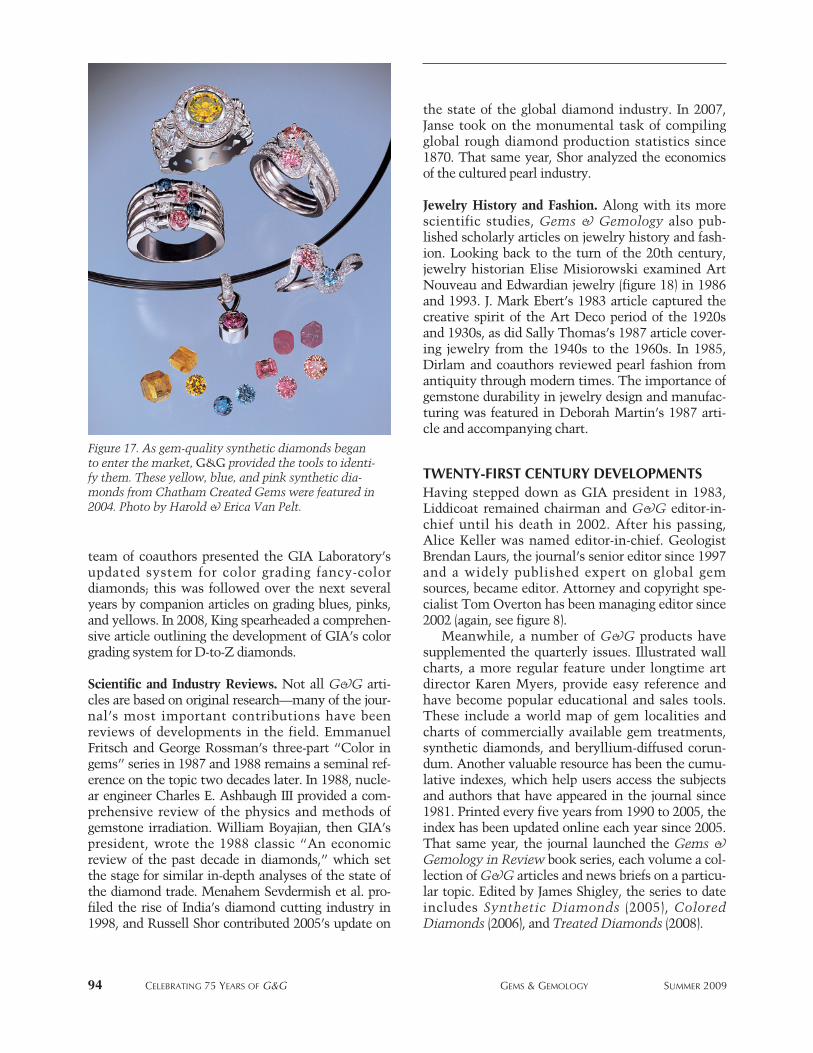
Figure 17. As gem-quality synthetic diamonds beganto enter the market, G&G provided the tools to identi-fy them. These yellow, blue, and pink synthetic dia-monds from Chatham Created Gems were featured in2004. Photo by Harold & Erica Van Pelt.
In the late 1990s, G&G began delivering contentelectronically on the GIA website, and updates fromthe journal became a regular feature in the GIAInsider, the Institute’s free electronic newsletter.Today, articles and issues—from the most recent backto 1981—can be downloaded at gia.metapress.com(with all earlier issues and a data depository availablefor free along with the indexes at www.gia.edu/gandg).What started as a small publication for Americanjewelers has become a professional journal reachinga worldwide audience of jewelers, gemologists, edu-cators, and researchers. G&G is delivered to morethan 100 countries, with a Japanese version providedby GIA Japan.
Since 1981, G&G has received 31 honors for edito-rial excellence and print quality, including 12 GoldCircle Awards for best peer-reviewed journal from theAmerican Society of Association Executives and five
Gold Ink Awards, the nation’s most respected printcompetition. In 2004, Gems & Gemology was accept-ed into the database of the Institute for ScientificInformation (now the Thomson Reuters database), theworld’s most prestigious resource for indexing and ref-erencing academic journals. To date, G&G is the onlygemological journal to achieve this recognition.
SUMMARYJust as print production has shifted from film pho-tography and linotype machines to digital photogra-phy and desktop publishing, the field of gemologyhas witnessed changes that were unimaginable 75years ago. Once, gemologists used only a few basictests and techniques (refractive index, specific gravi-ty, fluorescence, prism spectroscope, and micro-scopic examination). Today, they rely on a multi-tude of sophisticated instruments and speciallytrained technicians. Gems & Gemology has intro-duced its readers to these new methods, educatedthem on how to use and interpret the results, andhelped them determine when the identification of agem material requires more advanced testing.Throughout, the journal has remained committedto its original purpose, set forth in the first issue’seditorial: providing “accurate and up-to-date infor-mation concerning gem-stones.”
In the process, G&G has become a powerfulforum for up-to-date technical information, derivedfrom global research efforts, that has been rigorouslyreviewed and insightfully illustrated. As long as thereare new gem localities and gem features to explore,new treatment processes and synthetic materials toaddress, and technological innovations to embrace,the role of Gems & Gemology will remain crucial.
CELEBRATING 75 YEARS OF G&G GEMS & GEMOLOGY SUMMER 2009 95
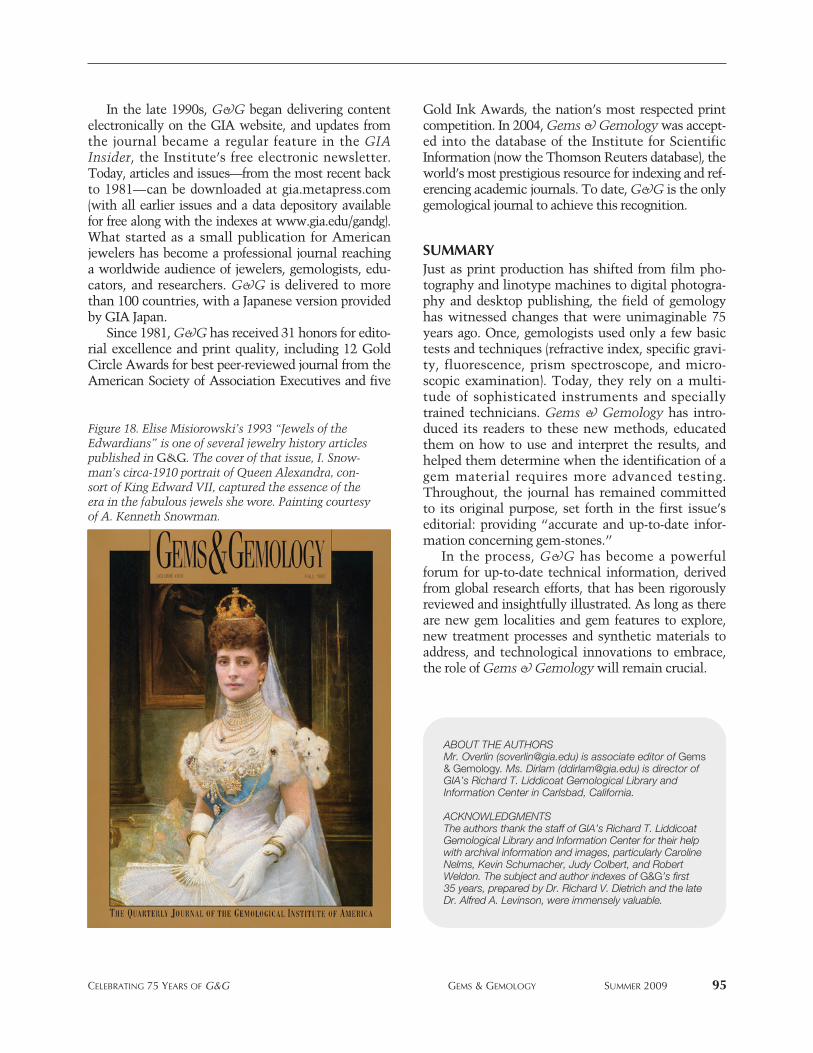
Figure 18. Elise Misiorowski’s 1993 “Jewels of theEdwardians” is one of several jewelry history articlespublished in G&G. The cover of that issue, I. Snow-man’s circa-1910 portrait of Queen Alexandra, con-sort of King Edward VII, captured the essence of theera in the fabulous jewels she wore. Painting courtesyof A. Kenneth Snowman.
ABOUT THE AUTHORSMr. Overlin ([email protected]) is associate editor of Gems& Gemology. Ms. Dirlam ([email protected]) is director ofGIA’s Richard T. Liddicoat Gemological Library andInformation Center in Carlsbad, California.
ACKNOWLEDGMENTSThe authors thank the staff of GIA’s Richard T. LiddicoatGemological Library and Information Center for their helpwith archival information and images, particularly CarolineNelms, Kevin Schumacher, Judy Colbert, and RobertWeldon. The subject and author indexes of G&G’s first 35 years, prepared by Dr. Richard V. Dietrich and the lateDr. Alfred A. Levinson, were immensely valuable.
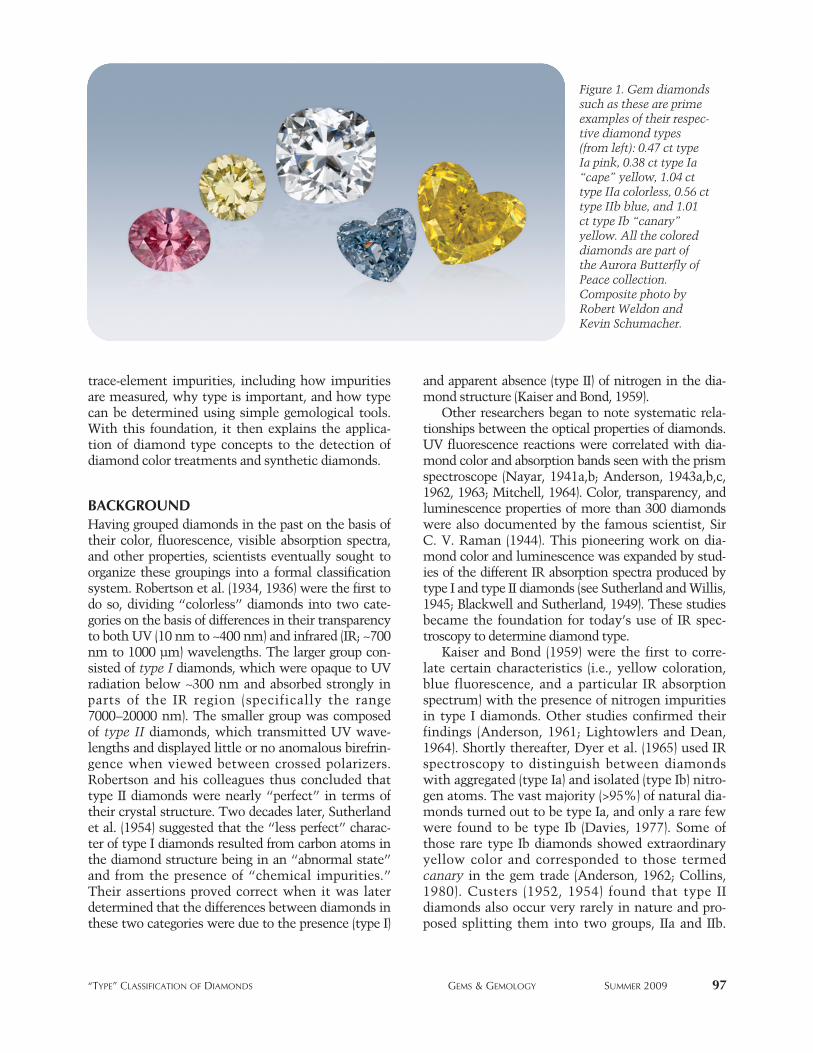
critical to evaluating the relationships between dia-mond growth, color (e.g., figure 1), and response tolaboratory treatments. With the increasing availabili-ty of treated and synthetic diamonds in the market-place, gemologists will benefit from a more completeunderstanding of diamond type and of the value thisinformation holds for diamond identification.
Considerable scientific work has been done onthis topic, although citing every reference is beyondthe scope of this article (see, e.g., Robertson et al.,1934, 1936; and Kaiser and Bond, 1959). Brief gemo-logical discussions of diamond types appeared inShigley et al. (1986), Fritsch and Scarratt (1992), andSmith et al. (2000), and more-detailed descriptionswere given in Wilks and Wilks (1991) and Collins(2001). Nevertheless, repeated inquiries received atGIA indicate that many practicing gemologists donot have a clear understanding of the basics of dia-mond type. This article offers a readily accessible,gemology-specific guide to diamond type and related
THE “TYPE” CLASSIFICATIONSYSTEM OF DIAMONDS AND ITS
IMPORTANCE IN GEMOLOGY
Christopher M. Breeding and James E. Shigley
See end of article for About the Authors and Acknowledgments.GEMS & GEMOLOGY, Vol. 45, No. 2, pp. 96–111.© 2009 Gemological Institute of America
Diamond “type” is a concept that is frequently mentioned in the gemological literature, but its rel-evance to the practicing gemologist is rarely discussed. Diamonds are broadly divided into twotypes (I and II) based on the presence or absence of nitrogen impurities, and further subdividedaccording to the arrangement of nitrogen atoms (isolated or aggregated) and the occurrence ofboron impurities. Diamond type is directly related to color and the lattice defects that are modi-fied by treatments to change color. Knowledge of type allows gemologists to better evaluate if adiamond might be treated or synthetic, and whether it should be sent to a laboratory for testing.Scientists determine type using expensive FTIR instruments, but many simple gemological tools(e.g., a microscope, spectroscope, UV lamp) can give strong indications of diamond type.
96 “TYPE” CLASSIFICATION OF DIAMONDS GEMS & GEMOLOGY SUMMER 2009
emologists have dedicated much time andattention to separating natural from syn-thetic diamonds, and natural-color from
treated-color diamonds. Initially, these determina-tions were based on systematic observations madeusing standard gemological tools such as a micro-scope, desk-model (or handheld) spectroscope, andultraviolet (UV) lamps. While these tools remainvaluable to the trained gemologist, recent advancesin synthetic diamond growth, as well as irradiationand high-pressure, high-temperature (HPHT) treat-ment techniques, have rendered them less defini-tive in identifying synthetic and color-treated dia-monds. Thus, most gemological laboratories nowuse more-sophisticated scientific techniques such asabsorption and photoluminescence spectroscopy todetect treatments and synthetics.
These developments in gem diamond identifica-tion have introduced many scientific terms and con-cepts into the gemological literature. One of the mostimportant of these concepts is diamond “type.” Thediamond type classification system is widely used indiamond research, because it provides a convenientway to categorize diamonds based on their chemicaland physical properties. Understanding this system is
G
trace-element impurities, including how impuritiesare measured, why type is important, and how typecan be determined using simple gemological tools.With this foundation, it then explains the applica-tion of diamond type concepts to the detection ofdiamond color treatments and synthetic diamonds.
BACKGROUNDHaving grouped diamonds in the past on the basis oftheir color, fluorescence, visible absorption spectra,and other properties, scientists eventually sought toorganize these groupings into a formal classificationsystem. Robertson et al. (1934, 1936) were the first todo so, dividing “colorless” diamonds into two cate-gories on the basis of differences in their transparencyto both UV (10 nm to ~400 nm) and infrared (IR; ~700nm to 1000 µm) wavelengths. The larger group con-sisted of type I diamonds, which were opaque to UVradiation below ~300 nm and absorbed strongly inparts of the IR region (specifically the range7000–20000 nm). The smaller group was composedof type II diamonds, which transmitted UV wave-lengths and displayed little or no anomalous birefrin-gence when viewed between crossed polarizers.Robertson and his colleagues thus concluded thattype II diamonds were nearly “perfect” in terms oftheir crystal structure. Two decades later, Sutherlandet al. (1954) suggested that the “less perfect” charac-ter of type I diamonds resulted from carbon atoms inthe diamond structure being in an “abnormal state”and from the presence of “chemical impurities.”Their assertions proved correct when it was laterdetermined that the differences between diamonds inthese two categories were due to the presence (type I)
and apparent absence (type II) of nitrogen in the dia-mond structure (Kaiser and Bond, 1959).
Other researchers began to note systematic rela-tionships between the optical properties of diamonds.UV fluorescence reactions were correlated with dia-mond color and absorption bands seen with the prismspectroscope (Nayar, 1941a,b; Anderson, 1943a,b,c,1962, 1963; Mitchell, 1964). Color, transparency, andluminescence properties of more than 300 diamondswere also documented by the famous scientist, Sir C. V. Raman (1944). This pioneering work on dia-mond color and luminescence was expanded by stud-ies of the different IR absorption spectra produced bytype I and type II diamonds (see Sutherland and Willis,1945; Blackwell and Sutherland, 1949). These studiesbecame the foundation for today’s use of IR spec-troscopy to determine diamond type.
Kaiser and Bond (1959) were the first to corre-late certain characteristics (i.e., yellow coloration,blue fluorescence, and a particular IR absorptionspectrum) with the presence of nitrogen impuritiesin type I diamonds. Other studies confirmed their findings (Anderson, 1961; Lightowlers and Dean,1964). Shortly thereafter, Dyer et al. (1965) used IR spectroscopy to distinguish between diamondswith aggregated (type Ia) and isolated (type Ib) nitro-gen atoms. The vast majority (>95%) of natural dia-monds turned out to be type Ia, and only a rare fewwere found to be type Ib (Davies, 1977). Some ofthose rare type Ib diamonds showed extraordinaryyellow color and corresponded to those termedcanary in the gem trade (Anderson, 1962; Collins,1980). Custers (1952, 1954) found that type II diamonds also occur very rarely in nature and pro-posed splitting them into two groups, IIa and IIb.
“TYPE” CLASSIFICATION OF DIAMONDS GEMS & GEMOLOGY SUMMER 2009 97
Figure 1. Gem diamondssuch as these are primeexamples of their respec-tive diamond types(from left): 0.47 ct typeIa pink, 0.38 ct type Ia“cape” yellow, 1.04 cttype IIa colorless, 0.56 cttype IIb blue, and 1.01ct type Ib “canary” yellow. All the coloreddiamonds are part of the Aurora Butterfly ofPeace collection.Composite photo byRobert Weldon andKevin Schumacher.
98 “TYPE” CLASSIFICATION OF DIAMONDS GEMS & GEMOLOGY SUMMER 2009
The latter diamonds were blue (sometimes grayishblue, gray, or brown) and exhibited electrical con-ductivity (Custers, 1955; Anderson, 1960, 1962).Further work demonstrated that boron was theimpurity that gave rise to the unique properties oftype IIb diamonds (Wentorf and Bovenkirk, 1962;Chrenko, 1973).
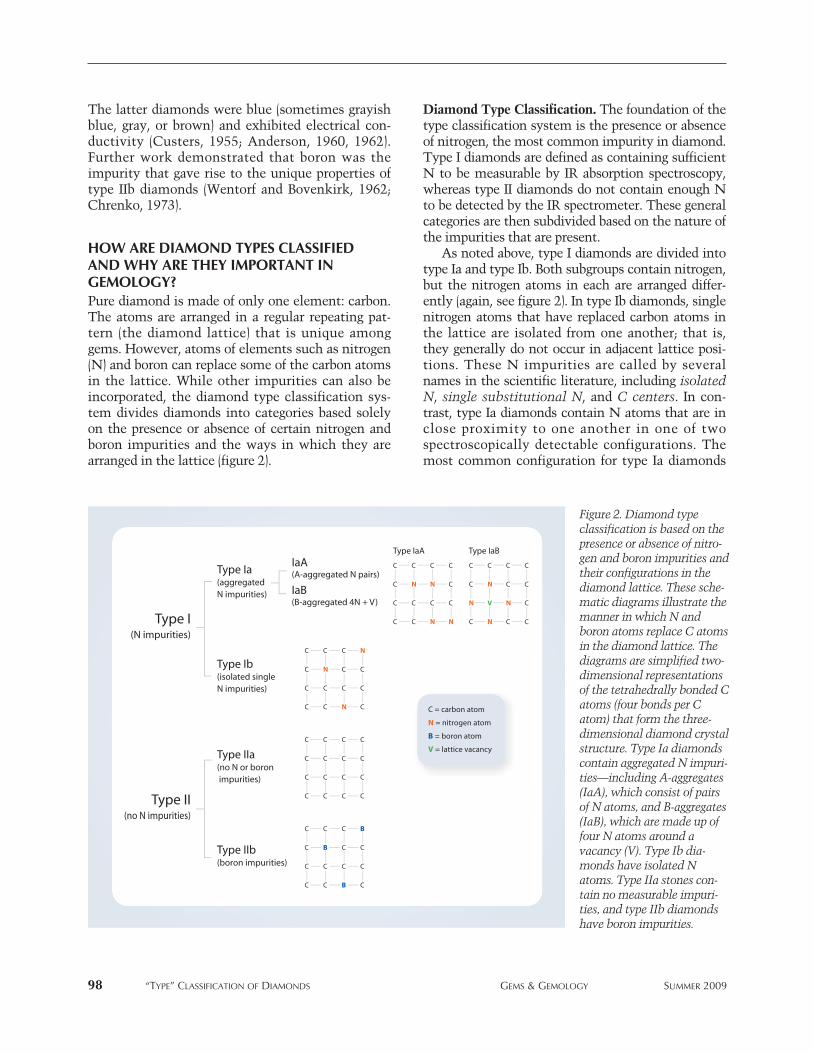
HOW ARE DIAMOND TYPES CLASSIFIED AND WHY ARE THEY IMPORTANT INGEMOLOGY? Pure diamond is made of only one element: carbon.The atoms are arranged in a regular repeating pat-tern (the diamond lattice) that is unique amonggems. However, atoms of elements such as nitrogen(N) and boron can replace some of the carbon atomsin the lattice. While other impurities can also beincorporated, the diamond type classification sys-tem divides diamonds into categories based solelyon the presence or absence of certain nitrogen andboron impurities and the ways in which they arearranged in the lattice (figure 2).
Diamond Type Classification. The foundation of thetype classification system is the presence or absenceof nitrogen, the most common impurity in diamond.Type I diamonds are defined as containing sufficientN to be measurable by IR absorption spectroscopy,whereas type II diamonds do not contain enough Nto be detected by the IR spectrometer. These generalcategories are then subdivided based on the nature ofthe impurities that are present.
As noted above, type I diamonds are divided intotype Ia and type Ib. Both subgroups contain nitrogen,but the nitrogen atoms in each are arranged differ-ently (again, see figure 2). In type Ib diamonds, singlenitrogen atoms that have replaced carbon atoms inthe lattice are isolated from one another; that is,they generally do not occur in adjacent lattice posi-tions. These N impurities are called by severalnames in the scientific literature, including isolatedN, single substitutional N, and C centers. In con-trast, type Ia diamonds contain N atoms that are inclose proximity to one another in one of twospectroscopically detectable configurations. Themost common configuration for type Ia diamonds
Figure 2. Diamond type classification is based on thepresence or absence of nitro-gen and boron impurities andtheir configurations in thediamond lattice. These sche-matic diagrams illustrate themanner in which N andboron atoms replace C atomsin the diamond lattice. Thediagrams are simplified two-dimensional representationsof the tetrahedrally bonded Catoms (four bonds per Catom) that form the three-dimensional diamond crystalstructure. Type Ia diamondscontain aggregated N impuri-ties—including A-aggregates(IaA), which consist of pairsof N atoms, and B-aggregates(IaB), which are made up offour N atoms around avacancy (V). Type Ib dia-monds have isolated Natoms. Type IIa stones con-tain no measurable impuri-ties, and type IIb diamondshave boron impurities.
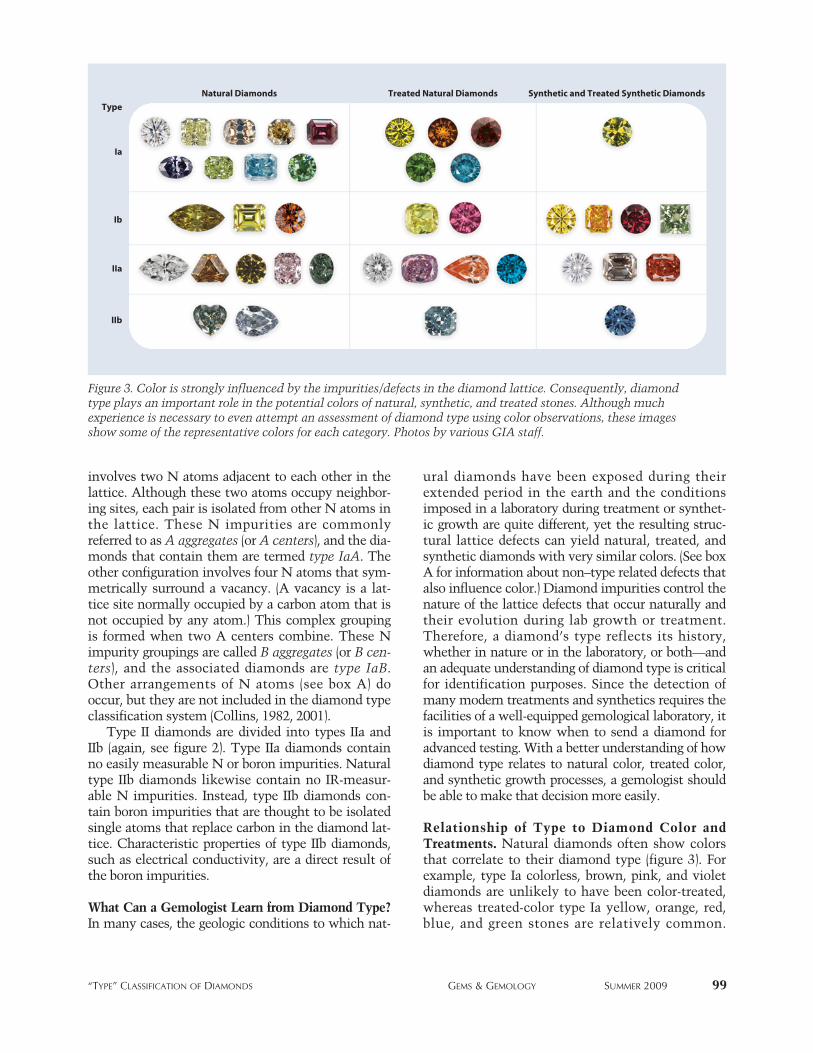
“TYPE” CLASSIFICATION OF DIAMONDS GEMS & GEMOLOGY SUMMER 2009 99
involves two N atoms adjacent to each other in thelattice. Although these two atoms occupy neighbor-ing sites, each pair is isolated from other N atoms inthe lattice. These N impurities are commonlyreferred to as A aggregates (or A centers), and the dia-monds that contain them are termed type IaA. Theother configuration involves four N atoms that sym-metrically surround a vacancy. (A vacancy is a lat-tice site normally occupied by a carbon atom that isnot occupied by any atom.) This complex groupingis formed when two A centers combine. These Nimpurity groupings are called B aggregates (or B cen-ters), and the associated diamonds are type IaB.Other arrangements of N atoms (see box A) dooccur, but they are not included in the diamond typeclassification system (Collins, 1982, 2001).
Type II diamonds are divided into types IIa andIIb (again, see figure 2). Type IIa diamonds containno easily measurable N or boron impurities. Naturaltype IIb diamonds likewise contain no IR-measur-able N impurities. Instead, type IIb diamonds con-tain boron impurities that are thought to be isolatedsingle atoms that replace carbon in the diamond lat-tice. Characteristic properties of type IIb diamonds,such as electrical conductivity, are a direct result ofthe boron impurities.
What Can a Gemologist Learn from Diamond Type?In many cases, the geologic conditions to which nat-
ural diamonds have been exposed during theirextended period in the earth and the conditionsimposed in a laboratory during treatment or synthet-ic growth are quite different, yet the resulting struc-tural lattice defects can yield natural, treated, andsynthetic diamonds with very similar colors. (See boxA for information about non–type related defects thatalso influence color.) Diamond impurities control thenature of the lattice defects that occur naturally andtheir evolution during lab growth or treatment.Therefore, a diamond’s type reflects its history,whether in nature or in the laboratory, or both—andan adequate understanding of diamond type is criticalfor identification purposes. Since the detection ofmany modern treatments and synthetics requires thefacilities of a well-equipped gemological laboratory, itis important to know when to send a diamond foradvanced testing. With a better understanding of howdiamond type relates to natural color, treated color,and synthetic growth processes, a gemologist shouldbe able to make that decision more easily.
Relationship of Type to Diamond Color andTreatments. Natural diamonds often show colorsthat correlate to their diamond type (figure 3). Forexample, type Ia colorless, brown, pink, and violetdiamonds are unlikely to have been color-treated,whereas treated-color type Ia yellow, orange, red,blue, and green stones are relatively common.
Figure 3. Color is strongly influenced by the impurities/defects in the diamond lattice. Consequently, diamondtype plays an important role in the potential colors of natural, synthetic, and treated stones. Although muchexperience is necessary to even attempt an assessment of diamond type using color observations, these imagesshow some of the representative colors for each category. Photos by various GIA staff.
Type
Ia
Ib
IIa
IIb
Natural Diamonds Treated Natural Diamonds Synthetic and Treated Synthetic Diamonds

Natural type Ib diamonds are almost always brown,yellow, or orange, whereas their artificially irradiatedand annealed counterparts are usually pink to red.HPHT treatment can produce yellow in an off-colortype Ib diamond. HPHT processes may enhance typeIIa brownish diamonds to appear colorless or pink,
and may produce blue in some type IIb diamonds.However, HPHT treatment cannot alter a type Ia dia-mond to colorless (except rare pure IaB), so if a gemol-ogist determines that a colorless diamond is type Ia,it is usually not necessary to send it to a gemologicallaboratory for further testing (the few colorless syn-
100 “TYPE” CLASSIFICATION OF DIAMONDS GEMS & GEMOLOGY SUMMER 2009
Several lattice defects contribute to the color of dia-mond even though they are not involved in theassignment of diamond type. Most of these featuresselectively absorb light in the visible range of theelectromagnetic spectrum to produce color, and theycan be seen with a gemological spectroscope or aUV-Vis-NIR absorption spectrometer. These defectsare commonly mentioned in the scientific andgemological literature. A brief description of each isgiven below (from Clark et al., 1979; Collins, 1982,2001; Zaitsev, 2001; and GIA staff observations).
N3 (415 nm): This defect consists of three nitrogenatoms surrounding a vacancy. In addition to con-tributing to yellow color in “cape” diamonds, it canalso produce blue luminescence in response to long-wave UV radiation.
N2 (478 nm): This broad absorption is associatedwith N3 and is part of the well-known “cape” spec-trum in many yellow diamonds. It is also related tonitrogen impurities.
480 nm: This broad band is a defect of unknown ori-gin that commonly produces yellow or orange colorin type Ia diamonds. Strong yellow fluorescence istypical of diamonds colored by this mechanism.
H4 (496 nm): This defect consists of four nitrogenatoms separated by two vacancies. It is created whena vacancy migrates through the diamond lattice andcombines with a B-aggregated nitrogen impurity. H4produces yellow color in diamond.
H3 (503.2 nm): This is an uncharged defect consistingof two nitrogen atoms separated by a vacancy [i.e.,(N-V-N)0]. H3 absorption alone creates yellow color,while the defect can also produce green lumines-cence in response to illumination.
3H (503.5 nm): This defect is thought to be related toan interstitial carbon atom in the diamond lattice. It iscreated by radiation damage and often occurs with the
GR1. On rare occasions, 3H absorbs strongly enoughto enhance the green color caused by GR1 absorption.
550 nm: This broad band is poorly understood andthought to be associated with plastic deformation ofthe diamond lattice. This is the most common defectthat produces pink-to-red color in natural diamonds,but it is also common in brown stones.
NV0 (575 nm): This defect consists of a nitrogenatom adjacent to a vacancy; it is in a neutral chargestate. In combination with the 637 nm defect, theNV0 center produces pink color in most treated pinkdiamonds as well as in a few natural pink stones.
595 nm: This band is a nitrogen-related defect ofuncertain structure. It is commonly associated withlaboratory irradiation and annealing of diamond toproduce green, yellow, or pink colors, but it is alsopresent as a weak feature in many natural-color greenor yellow diamonds.
NV− (637 nm): This defect consists of a nitrogen atomadjacent to a vacancy. This defect is in a negativecharge state. In combination with the 575 nm defect,the NV- center produces pink color in most treatedpink diamonds as well as a few natural stones.
GR1 (741 nm): This defect is a single, unchargedvacancy in the diamond lattice. It is common inmost natural and artificially irradiated type Ia and IIablue or green diamonds. Although outside the visiblespectral range (~400–700 nm), strong absorption byGR1 produces related bands at the red end of thespectrum that result in green or blue color.
H2 (986 nm): This is a negatively charged defect thatconsists of two nitrogen atoms separated by a vacancy[i.e., (N-V-N)−]. It is closely related to H3 and is com-monly cited as evidence for HPHT treatment in typeIa diamonds. Occasionally, H2 (and related broad bandabsorptions) can be so intense that the combination ofH3 and H2 produces a strong green bodycolor.
BOXA: SUMMARY OF COLOR-PRODUCING DIAMONDDEFECTS NOT RELATED TO DIAMONDTYPE

thetic diamonds currently on the market are type IIa). Most permanent (i.e., not related to surface coat-
ings) diamond treatments add, change, or removecolor by reorganizing defects in the diamond lattice.Diamond type may determine whether or not thenecessary color-causing defects can be produced ordestroyed during the treatment process to achievethe desired result. Irradiation is routinely performedon all types of diamonds to produce green or blue col-ors, so type is not very useful in that case. However,if irradiation is followed by heating to temperaturesof 800–1000°C to produce a yellow or pink color,then the diamond type of the starting material is crit-ical. Type I diamonds will often change to intenseyellow, orange, pink, or red with irradiation followedby annealing, whereas type II diamonds rarely devel-op intense colors in these hues due to the lack of
impurities (primarily N) needed to create complex,color-producing defects. Therefore, it is useful for agemologist to understand that type II diamonds arenot likely to have been subjected to treatmentsinvolving irradiation followed by annealing.
The detection of HPHT treatment requires aneven better knowledge of diamond type (Fisher andSpits, 2000; Smith et al., 2000). In most cases, HPHTtreatment will only decolorize a type IIa diamond(see figure 4). The HPHT conditions cause changesin the brown, deformed regions in these stones,allowing them to become colorless to near-colorless.Occasionally, HPHT treatment can change type IIdiamonds to pink or blue. When a type I brownstone is subjected to similar treatment conditions,the presence of N impurities causes it to change tovarious shades of yellow (again, see figure 4). Thus, a
“TYPE” CLASSIFICATION OF DIAMONDS GEMS & GEMOLOGY SUMMER 2009 101
Figure 4. The effects ofHPHT treatment arestrongly dependent onthe diamond type of thestarting material. TypeIIa brown diamonds canbe decolorized becausethe brown color associ-ated with plastic defor-mation is sensitive tothe effect of high tem-peratures and pressures;usually, no new colorcenters are formed dueto the absence of signifi-cant N impurities.Conversely, type Iabrown diamonds con-tain abundant aggregat-ed N impurities thattrap vacancies duringtreatment to createcomplex H3 defects andalso break down aggre-gates to release isolatednitrogen; both of theseprocesses contribute tothe newly formed yel-low bodycolor.
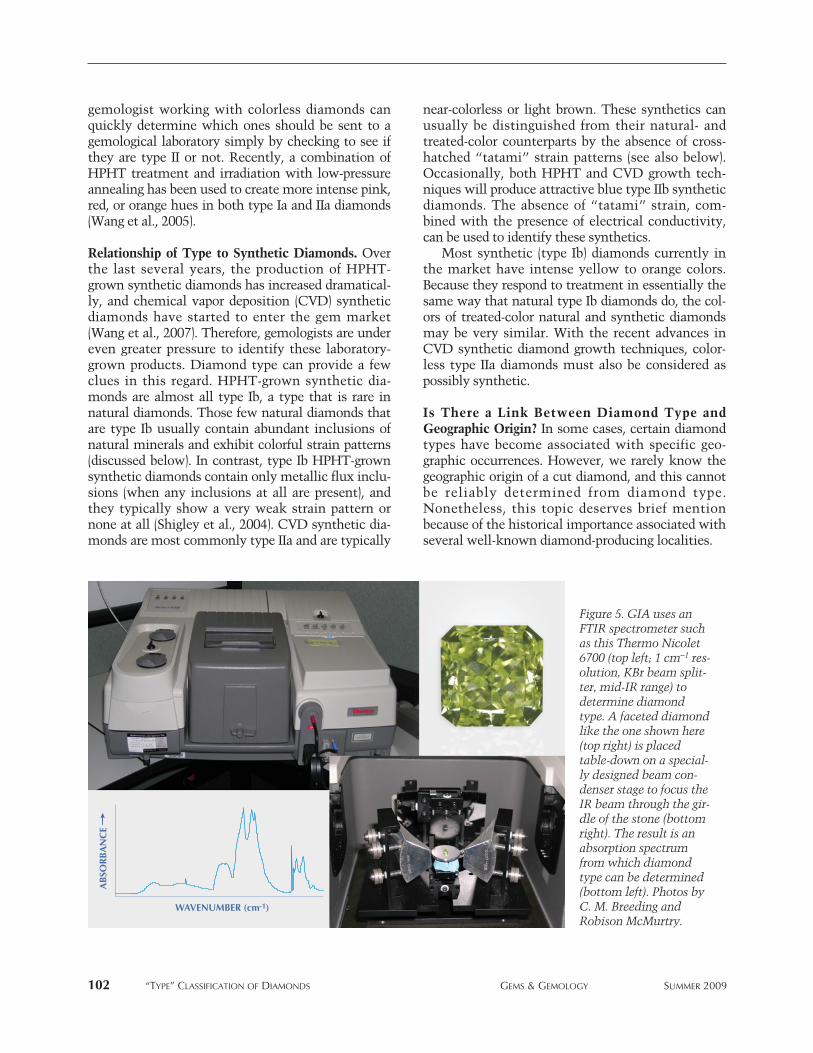
102 “TYPE” CLASSIFICATION OF DIAMONDS GEMS & GEMOLOGY SUMMER 2009
gemologist working with colorless diamonds canquickly determine which ones should be sent to agemological laboratory simply by checking to see ifthey are type II or not. Recently, a combination ofHPHT treatment and irradiation with low-pressureannealing has been used to create more intense pink,red, or orange hues in both type Ia and IIa diamonds(Wang et al., 2005).
Relationship of Type to Synthetic Diamonds. Overthe last several years, the production of HPHT-grown synthetic diamonds has increased dramatical-ly, and chemical vapor deposition (CVD) syntheticdiamonds have started to enter the gem market(Wang et al., 2007). Therefore, gemologists are undereven greater pressure to identify these laboratory-grown products. Diamond type can provide a fewclues in this regard. HPHT-grown synthetic dia-monds are almost all type Ib, a type that is rare innatural diamonds. Those few natural diamonds thatare type Ib usually contain abundant inclusions ofnatural minerals and exhibit colorful strain patterns(discussed below). In contrast, type Ib HPHT-grownsynthetic diamonds contain only metallic flux inclu-sions (when any inclusions at all are present), andthey typically show a very weak strain pattern ornone at all (Shigley et al., 2004). CVD synthetic dia-monds are most commonly type IIa and are typically
near-colorless or light brown. These synthetics canusually be distinguished from their natural- andtreated-color counterparts by the absence of cross-hatched “tatami” strain patterns (see also below).Occasionally, both HPHT and CVD growth tech-niques will produce attractive blue type IIb syntheticdiamonds. The absence of “tatami” strain, com-bined with the presence of electrical conductivity,can be used to identify these synthetics.
Most synthetic (type Ib) diamonds currently inthe market have intense yellow to orange colors.Because they respond to treatment in essentially thesame way that natural type Ib diamonds do, the col-ors of treated-color natural and synthetic diamondsmay be very similar. With the recent advances inCVD synthetic diamond growth techniques, color-less type IIa diamonds must also be considered aspossibly synthetic.
Is There a Link Between Diamond Type andGeographic Origin? In some cases, certain diamondtypes have become associated with specific geo-graphic occurrences. However, we rarely know thegeographic origin of a cut diamond, and this cannotbe reliably determined from diamond type.Nonetheless, this topic deserves brief mentionbecause of the historical importance associated withseveral well-known diamond-producing localities.
Figure 5. GIA uses anFTIR spectrometer suchas this Thermo Nicolet6700 (top left; 1 cm−1 res-olution, KBr beam split-ter, mid-IR range) todetermine diamondtype. A faceted diamondlike the one shown here(top right) is placedtable-down on a special-ly designed beam con-denser stage to focus theIR beam through the gir-dle of the stone (bottomright). The result is anabsorption spectrumfrom which diamondtype can be determined(bottom left). Photos byC. M. Breeding andRobison McMurtry.
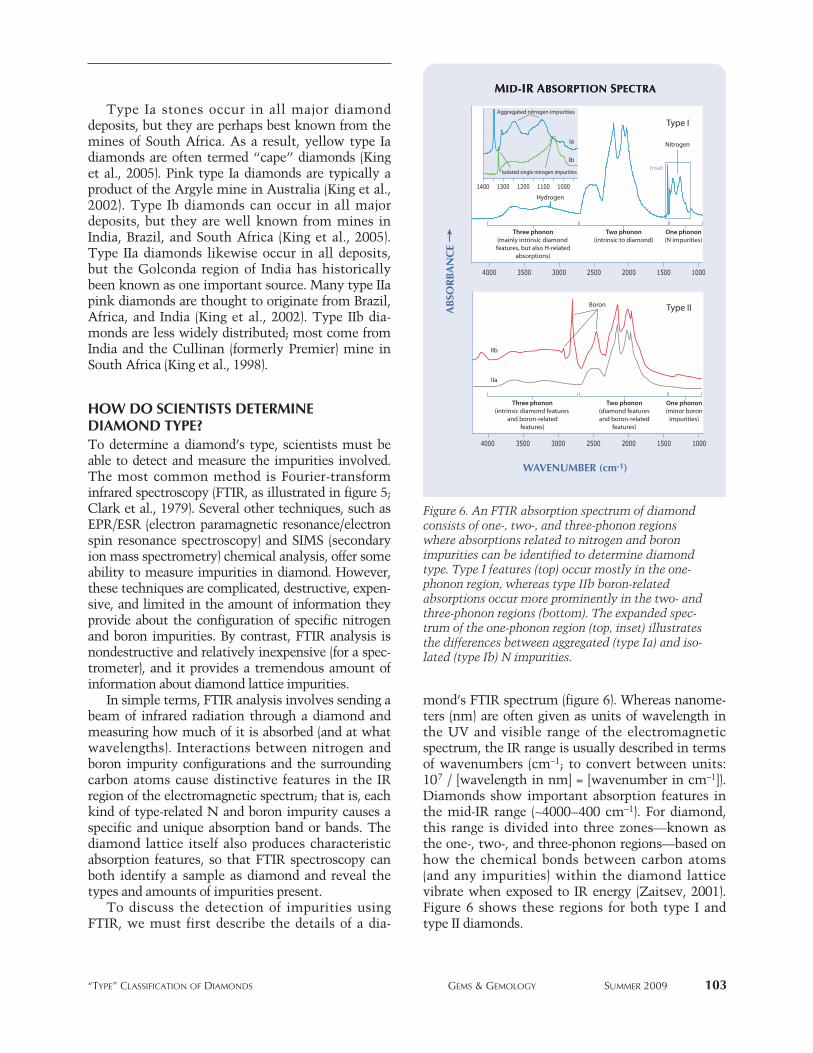
“TYPE” CLASSIFICATION OF DIAMONDS GEMS & GEMOLOGY SUMMER 2009 103
Type Ia stones occur in all major diamonddeposits, but they are perhaps best known from themines of South Africa. As a result, yellow type Iadiamonds are often termed “cape” diamonds (Kinget al., 2005). Pink type Ia diamonds are typically aproduct of the Argyle mine in Australia (King et al.,2002). Type Ib diamonds can occur in all majordeposits, but they are well known from mines inIndia, Brazil, and South Africa (King et al., 2005).Type IIa diamonds likewise occur in all deposits,but the Golconda region of India has historicallybeen known as one important source. Many type IIapink diamonds are thought to originate from Brazil,Africa, and India (King et al., 2002). Type IIb dia-monds are less widely distributed; most come fromIndia and the Cullinan (formerly Premier) mine inSouth Africa (King et al., 1998).
HOW DO SCIENTISTS DETERMINE DIAMOND TYPE?To determine a diamond’s type, scientists must beable to detect and measure the impurities involved.The most common method is Fourier-transforminfrared spectroscopy (FTIR, as illustrated in figure 5;Clark et al., 1979). Several other techniques, such asEPR/ESR (electron paramagnetic resonance/electronspin resonance spectroscopy) and SIMS (secondaryion mass spectrometry) chemical analysis, offer someability to measure impurities in diamond. However,these techniques are complicated, destructive, expen-sive, and limited in the amount of information theyprovide about the configuration of specific nitrogenand boron impurities. By contrast, FTIR analysis isnondestructive and relatively inexpensive (for a spec-trometer), and it provides a tremendous amount ofinformation about diamond lattice impurities.
In simple terms, FTIR analysis involves sending abeam of infrared radiation through a diamond andmeasuring how much of it is absorbed (and at whatwavelengths). Interactions between nitrogen andboron impurity configurations and the surroundingcarbon atoms cause distinctive features in the IRregion of the electromagnetic spectrum; that is, eachkind of type-related N and boron impurity causes aspecific and unique absorption band or bands. Thediamond lattice itself also produces characteristicabsorption features, so that FTIR spectroscopy canboth identify a sample as diamond and reveal thetypes and amounts of impurities present.
To discuss the detection of impurities usingFTIR, we must first describe the details of a dia-
mond’s FTIR spectrum (figure 6). Whereas nanome-ters (nm) are often given as units of wavelength inthe UV and visible range of the electromagneticspectrum, the IR range is usually described in termsof wavenumbers (cm−1; to convert between units:107 / [wavelength in nm] = [wavenumber in cm−1]).Diamonds show important absorption features inthe mid-IR range (~4000–400 cm−1). For diamond,this range is divided into three zones—known asthe one-, two-, and three-phonon regions—based onhow the chemical bonds between carbon atoms(and any impurities) within the diamond latticevibrate when exposed to IR energy (Zaitsev, 2001).Figure 6 shows these regions for both type I andtype II diamonds.
Figure 6. An FTIR absorption spectrum of diamondconsists of one-, two-, and three-phonon regionswhere absorptions related to nitrogen and boronimpurities can be identified to determine diamondtype. Type I features (top) occur mostly in the one-phonon region, whereas type IIb boron-relatedabsorptions occur more prominently in the two- andthree-phonon regions (bottom). The expanded spec-trum of the one-phonon region (top, inset) illustratesthe differences between aggregated (type Ia) and iso-lated (type Ib) N impurities.
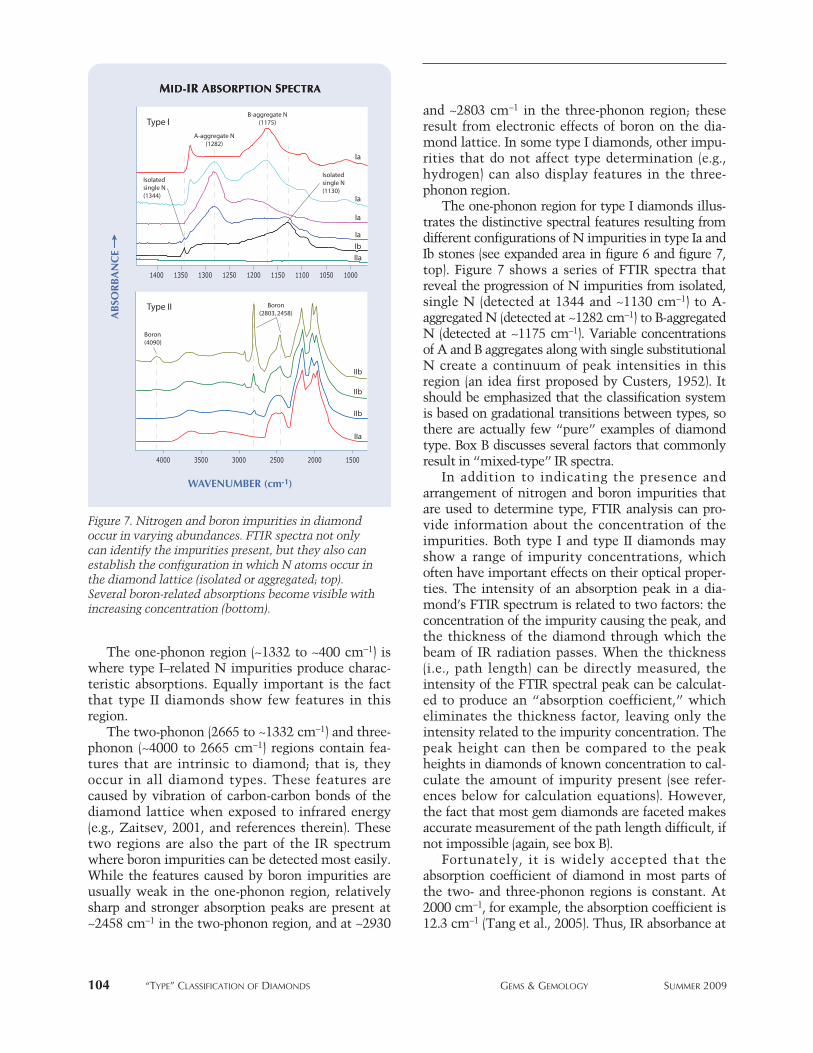
104 “TYPE” CLASSIFICATION OF DIAMONDS GEMS & GEMOLOGY SUMMER 2009
The one-phonon region (~1332 to ~400 cm−1) iswhere type I–related N impurities produce charac-teristic absorptions. Equally important is the factthat type II diamonds show few features in thisregion.
The two-phonon (2665 to ~1332 cm−1) and three-phonon (~4000 to 2665 cm−1) regions contain fea-tures that are intrinsic to diamond; that is, theyoccur in all diamond types. These features arecaused by vibration of carbon-carbon bonds of thediamond lattice when exposed to infrared energy(e.g., Zaitsev, 2001, and references therein). Thesetwo regions are also the part of the IR spectrumwhere boron impurities can be detected most easily.While the features caused by boron impurities areusually weak in the one-phonon region, relativelysharp and stronger absorption peaks are present at~2458 cm−1 in the two-phonon region, and at ~2930
and ~2803 cm−1 in the three-phonon region; theseresult from electronic effects of boron on the dia-mond lattice. In some type I diamonds, other impu-rities that do not affect type determination (e.g.,hydrogen) can also display features in the three-phonon region.
The one-phonon region for type I diamonds illus-trates the distinctive spectral features resulting fromdifferent configurations of N impurities in type Ia andIb stones (see expanded area in figure 6 and figure 7,top). Figure 7 shows a series of FTIR spectra thatreveal the progression of N impurities from isolated,single N (detected at 1344 and ~1130 cm−1) to A-aggregated N (detected at ~1282 cm−1) to B-aggregatedN (detected at ~1175 cm−1). Variable concentrationsof A and B aggregates along with single substitutionalN create a continuum of peak intensities in thisregion (an idea first proposed by Custers, 1952). Itshould be emphasized that the classification systemis based on gradational transitions between types, sothere are actually few “pure” examples of diamondtype. Box B discusses several factors that commonlyresult in “mixed-type” IR spectra.
In addition to indicating the presence andarrangement of nitrogen and boron impurities thatare used to determine type, FTIR analysis can pro-vide information about the concentration of theimpurities. Both type I and type II diamonds mayshow a range of impurity concentrations, whichoften have important effects on their optical proper-ties. The intensity of an absorption peak in a dia-mond’s FTIR spectrum is related to two factors: theconcentration of the impurity causing the peak, andthe thickness of the diamond through which thebeam of IR radiation passes. When the thickness(i.e., path length) can be directly measured, theintensity of the FTIR spectral peak can be calculat-ed to produce an “absorption coefficient,” whicheliminates the thickness factor, leaving only theintensity related to the impurity concentration. Thepeak height can then be compared to the peakheights in diamonds of known concentration to cal-culate the amount of impurity present (see refer-ences below for calculation equations). However,the fact that most gem diamonds are faceted makesaccurate measurement of the path length difficult, ifnot impossible (again, see box B).
Fortunately, it is widely accepted that theabsorption coefficient of diamond in most parts ofthe two- and three-phonon regions is constant. At2000 cm−1, for example, the absorption coefficient is12.3 cm−1 (Tang et al., 2005). Thus, IR absorbance at
Figure 7. Nitrogen and boron impurities in diamondoccur in varying abundances. FTIR spectra not onlycan identify the impurities present, but they also canestablish the configuration in which N atoms occur inthe diamond lattice (isolated or aggregated; top).Several boron-related absorptions become visible withincreasing concentration (bottom).

“TYPE” CLASSIFICATION OF DIAMONDS GEMS & GEMOLOGY SUMMER 2009 105
2000 cm−1 is proportional to the thickness of thesample, allowing any IR spectrum to be normalizedto remove the effects of variation in thickness orpath length (i.e., it does not matter how much the
light bounces around inside the diamond; figure 8).After normalization, the intrinsic two- and three-phonon region diamond peaks are removed by sub-tracting a pure type IIa spectrum from the unknown
Most diamonds contain characteristic features ofmore than one diamond type, and many factors con-tribute to the prevalence of mixed-type diamondspectra. The first factor is the process of nitrogenaggregation. When diamonds crystallize, all N impu-rities are thought to occur as single atoms in the lat-tice (Collins et al., 2005). As the diamonds reside athigh temperatures and pressures at great depths inthe earth for very long periods of time, the N atomsmove around in the lattice and aggregate into groups.When two N atoms combine, an A-aggregate forms,and when two A-aggregates combine (with a vacancybetween them), a B-aggregate forms. This tendencyfor nitrogen aggregation helps explain the rarity oftype Ib versus type Ia natural diamonds.
This progression of N impurity aggregation goesnearly to completion for some natural diamonds(Collins et al., 2005), which results in almost “pure”type IaB, but in many cases multiple configurationsof nitrogen impurities coexist in a single crystal dueto incomplete aggregation (Hainschwang et al.,2006).
Another factor causing mixed-type spectra is thatmost type I diamonds contain zones with differentamounts or configurations of nitrogen in the samecrystal (e.g., Breeding, 2005; Chadwick, 2008). Thisfact, combined with the way in which IR spectra arecollected from a faceted diamond, makes it nearlyimpossible to avoid mixed-type spectra. To obtain aspectrum, the technician must orient the diamond sothat the IR beam can pass through it to a detector onthe opposite side. Faceted diamonds force light tobounce around inside and not pass directly through,making the task of recording FTIR spectra difficult.Typically, diamonds are placed table-down on a spe-cially designed stage in the FTIR instrument (again,see figure 5) to allow the beam to pass through oppo-site sides of the girdle region, where minimum inter-nal reflection should occur. Absorption occurs across
the entire distance (or path length) through whichthe IR beam passes. Thus, if any variations in Nimpurities occur in a diamond along this path, theyare automatically added together to produce a mixed-type IR spectrum.
The mixture of diamond types is not unique tonatural diamonds. Most (HPHT) synthetic diamondsgrow as type Ib. If they are subjected to high tempera-tures, either during or after laboratory growth, the Natoms tend to aggregate to produce type Ia syntheticswith remnant concentrations of isolated N atoms.Similarly, if boron is introduced into the growthchamber (N is also present because it is difficult toexclude from the growth environment), a mixed-typediamond is formed. When visible color zones occur,such as in some mixed-type (Ib + IIa + IIb) syntheticdiamonds such as that seen in figure B-1 (Shigley etal., 2004), distinguishing between zones of differenttype can be done on the basis of color. This isbecause different impurities produce different colorsand are well known to be enriched in particular dia-mond growth sectors (Welbourn et al., 1996).
BOX B: WHY ARE MIXED-TYPE DIAMONDS COMMON?
Figure B-1. This HPHT-grown synthetic diamond,seen immersed in water, shows growth zones withdifferent diamond types. The yellow zone is type Ib,the colorless zones are type IIa, and the blue zonesare type IIb. Only synthetic diamonds commonlyshow mixtures of nitrogen and boron impurities inthe same crystal. Photo from Shigley et al. (2004);magnified 20×.
Type IIa
Type IIb
Type Ib

106 “TYPE” CLASSIFICATION OF DIAMONDS GEMS & GEMOLOGY SUMMER 2009
diamond spectrum, leaving a baseline-referencedspectrum showing only those absorption peakscaused by impurities. These peak intensities can bemeasured and impurity concentrations calculatedfrom them using equations derived from diamondswith known impurity concentrations (Kiflawi et al.,1994; Boyd et al., 1994, 1995). The end result is ameasurement of the absolute concentration ofimpurities of various configurations in a diamond.Most of the nitrogen impurity concentrationsreported in the literature are calculated in this way.
HOW CAN A GEMOLOGIST INFER DIAMOND TYPE? Unlike scientists in universities and gemologicallaboratories, most gemologists do not have expen-sive analytical instruments available to them foreveryday use. Fortunately, some common gemolog-ical tools can provide insights into the impuritiespresent in a diamond and, correspondingly, its type.
Absorption Spectrum: Desk-model/HandheldSpectroscope. The spectroscope has long been usedto detect color treatments in diamond (Crowning-shield, 1957), but it also provides some information
about diamond type. It can be especially useful foridentifying most type I diamonds. Type II (as wellas some pure type IaA and Ib) diamonds rarelyshow absorption lines in the spectroscope. Thepresence of a 415 nm line (N3 defect; see box A)and its accompanying “cape” lines at 435, 452, 465,and 478 nm indicate that a diamond is type Ia (fig-ure 9A) because, in order for these lines to appear,the diamond must contain aggregated nitrogenimpurities. For similar reasons, the presence of aline at ~503 nm (H3 defect; again, see box A) is alsoa good indication that a diamond is type I. Verystrong general absorption up to ~450 nm may sug-gest the presence of abundant isolated, single N intype Ib diamonds, but plastic deformation in someother types of diamonds can produce a similarabsorption pattern.
Inclusions and Strain Patterns: GemologicalMicroscope. While most diamonds contain crystalsthat were trapped during growth, a few inclusionsare considered characteristic of certain diamondtypes (see Crowningshield, 1994). Type Ib naturaldiamonds commonly contain clusters of small nee-dle-like inclusions that are usually associated withyellow color zoning and rarely occur in other dia-mond types (GIA staff observations; figure 9B). Fine-grained, patterned clouds that form cross-likeshapes are common in type Ia diamonds that con-tain high concentrations of hydrogen impurities(known as “asteriated” diamonds; see Wang andMayerson, 2002; Rondeau et al., 2004, and refer-ences therein). Synthetic type Ib diamonds oftenshow distinctive color zoning or metallic flux inclu-sions under magnification (Shigley et al., 2004).
Strain-free diamond is optically isotropic, mean-ing that it appears dark in all directions betweencrossed polarizers. However, almost all natural dia-monds exhibit some degree of lattice distortionformed during crystallization or caused by post-growth plastic deformation. As a result, a variety ofstrain patterns and interference colors can be seenwith crossed polarizers in a gemological micro-scope. One pattern of cross-hatched lines, known as“tatami” strain, is considered characteristic of typeII natural and treated-color diamonds (Smith et al.,2000; figure 9C). The tatami pattern has also beenobserved in some pure type IaB and type Ib dia-monds with very low nitrogen concentration(Chalain, 2003; GIA staff observations). To ourknowledge, this pattern has never been observed insynthetic diamonds of any type.
Figure 8. The concentration of N impurities in a dia-mond can be determined from the FTIR absorptionspectrum. The concentration of each form of nitrogenis calculated from its absorption coefficient at a spe-cific wavelength. The spectrum of a “pure” type IIadiamond is subtracted to eliminate the absorptioncoefficients in the diamond-intrinsic region (i.e., thoserelated only to carbon). When several forms of nitro-gen are present in the sample—here, A and B aggre-gates—a deconvolution of the bands is necessarybecause they overlap.
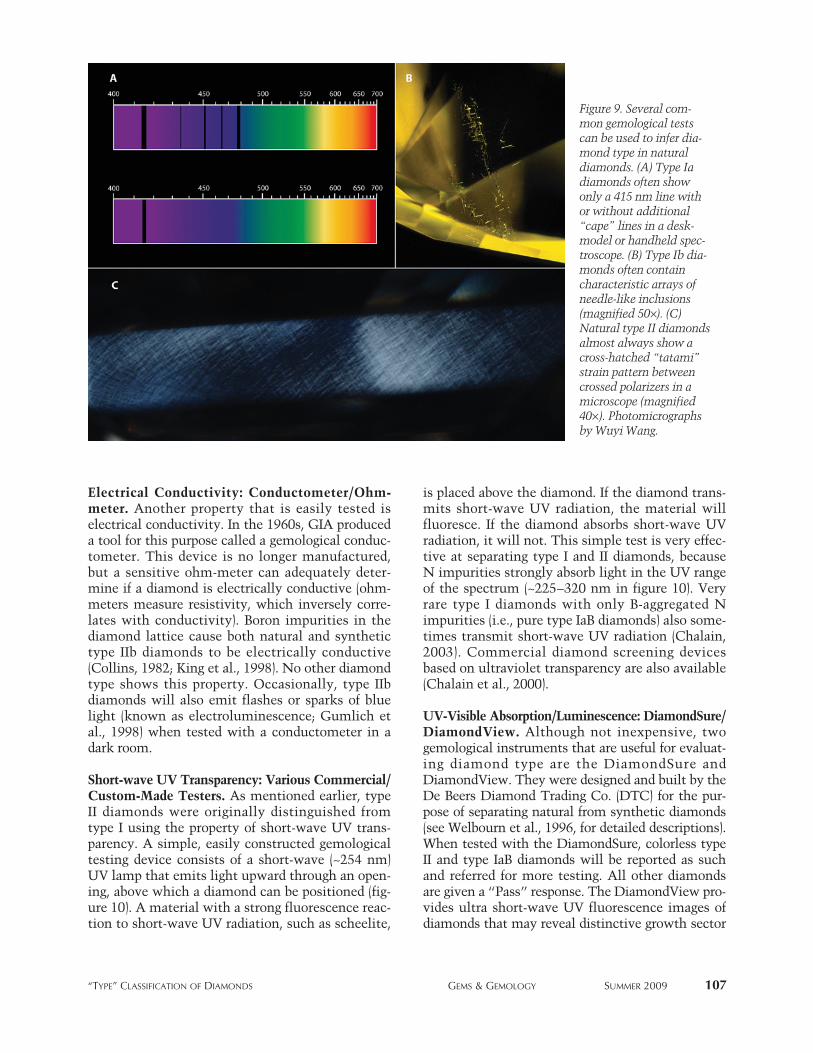
Electrical Conductivity: Conductometer/Ohm-meter. Another property that is easily tested iselectrical conductivity. In the 1960s, GIA produceda tool for this purpose called a gemological conduc-tometer. This device is no longer manufactured,but a sensitive ohm-meter can adequately deter-mine if a diamond is electrically conductive (ohm-meters measure resistivity, which inversely corre-lates with conductivity). Boron impurities in thediamond lattice cause both natural and synthetictype IIb diamonds to be electrically conductive(Collins, 1982; King et al., 1998). No other diamondtype shows this property. Occasionally, type IIbdiamonds will also emit flashes or sparks of bluelight (known as electroluminescence; Gumlich etal., 1998) when tested with a conductometer in adark room.
Short-wave UV Transparency: Various Commercial/Custom-Made Testers. As mentioned earlier, typeII diamonds were originally distinguished fromtype I using the property of short-wave UV trans-parency. A simple, easily constructed gemologicaltesting device consists of a short-wave (~254 nm)UV lamp that emits light upward through an open-ing, above which a diamond can be positioned (fig-ure 10). A material with a strong fluorescence reac-tion to short-wave UV radiation, such as scheelite,
is placed above the diamond. If the diamond trans-mits short-wave UV radiation, the material willfluoresce. If the diamond absorbs short-wave UVradiation, it will not. This simple test is very effec-tive at separating type I and II diamonds, becauseN impurities strongly absorb light in the UV rangeof the spectrum (~225–320 nm in figure 10). Veryrare type I diamonds with only B-aggregated Nimpurities (i.e., pure type IaB diamonds) also some-times transmit short-wave UV radiation (Chalain,2003). Commercial diamond screening devicesbased on ultraviolet transparency are also available(Chalain et al., 2000).
UV-Visible Absorption/Luminescence: DiamondSure/DiamondView. Although not inexpensive, twogemological instruments that are useful for evaluat-ing diamond type are the DiamondSure andDiamondView. They were designed and built by theDe Beers Diamond Trading Co. (DTC) for the pur-pose of separating natural from synthetic diamonds(see Welbourn et al., 1996, for detailed descriptions).When tested with the DiamondSure, colorless typeII and type IaB diamonds will be reported as suchand referred for more testing. All other diamondsare given a “Pass” response. The DiamondView pro-vides ultra short-wave UV fluorescence images ofdiamonds that may reveal distinctive growth sector
“TYPE” CLASSIFICATION OF DIAMONDS GEMS & GEMOLOGY SUMMER 2009 107
Figure 9. Several com-mon gemological testscan be used to infer dia-mond type in naturaldiamonds. (A) Type Iadiamonds often showonly a 415 nm line withor without additional“cape” lines in a desk-model or handheld spec-troscope. (B) Type Ib dia-monds often containcharacteristic arrays ofneedle-like inclusions(magnified 50×). (C)Natural type II diamondsalmost always show across-hatched “tatami”strain pattern betweencrossed polarizers in amicroscope (magnified40×). Photomicrographsby Wuyi Wang.
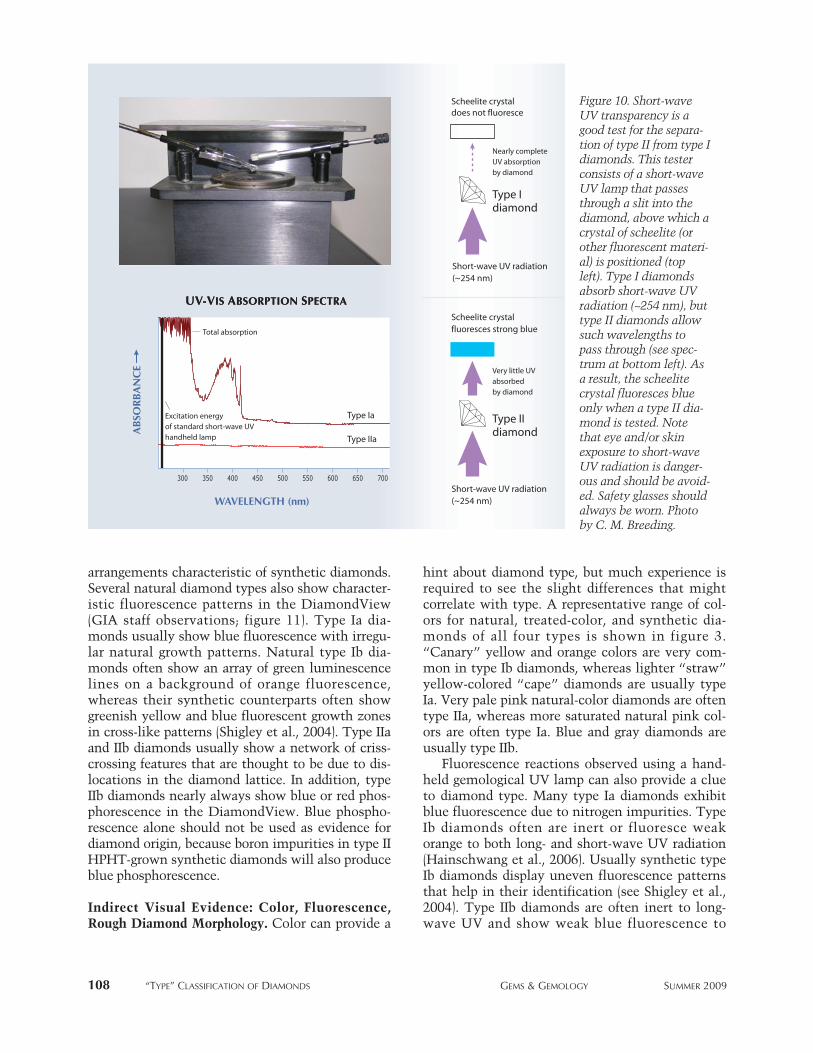
arrangements characteristic of synthetic diamonds.Several natural diamond types also show character-istic fluorescence patterns in the DiamondView(GIA staff observations; figure 11). Type Ia dia-monds usually show blue fluorescence with irregu-lar natural growth patterns. Natural type Ib dia-monds often show an array of green luminescencelines on a background of orange fluorescence,whereas their synthetic counterparts often showgreenish yellow and blue fluorescent growth zonesin cross-like patterns (Shigley et al., 2004). Type IIaand IIb diamonds usually show a network of criss-crossing features that are thought to be due to dis-locations in the diamond lattice. In addition, typeIIb diamonds nearly always show blue or red phos-phorescence in the DiamondView. Blue phospho-rescence alone should not be used as evidence fordiamond origin, because boron impurities in type IIHPHT-grown synthetic diamonds will also produceblue phosphorescence.
Indirect Visual Evidence: Color, Fluorescence,Rough Diamond Morphology. Color can provide a
hint about diamond type, but much experience isrequired to see the slight differences that mightcorrelate with type. A representative range of col-ors for natural, treated-color, and synthetic dia-monds of all four types is shown in figure 3.“Canary” yellow and orange colors are very com-mon in type Ib diamonds, whereas lighter “straw”yellow-colored “cape” diamonds are usually typeIa. Very pale pink natural-color diamonds are oftentype IIa, whereas more saturated natural pink col-ors are often type Ia. Blue and gray diamonds areusually type IIb.
Fluorescence reactions observed using a hand-held gemological UV lamp can also provide a clueto diamond type. Many type Ia diamonds exhibitblue fluorescence due to nitrogen impurities. TypeIb diamonds often are inert or fluoresce weakorange to both long- and short-wave UV radiation(Hainschwang et al., 2006). Usually synthetic typeIb diamonds display uneven fluorescence patternsthat help in their identification (see Shigley et al.,2004). Type IIb diamonds are often inert to long-wave UV and show weak blue fluorescence to
108 “TYPE” CLASSIFICATION OF DIAMONDS GEMS & GEMOLOGY SUMMER 2009
Figure 10. Short-waveUV transparency is agood test for the separa-tion of type II from type Idiamonds. This testerconsists of a short-waveUV lamp that passesthrough a slit into thediamond, above which acrystal of scheelite (orother fluorescent materi-al) is positioned (topleft). Type I diamondsabsorb short-wave UVradiation (~254 nm), buttype II diamonds allowsuch wavelengths topass through (see spec-trum at bottom left). Asa result, the scheelitecrystal fluoresces blueonly when a type II dia-mond is tested. Notethat eye and/or skinexposure to short-waveUV radiation is danger-ous and should be avoid-ed. Safety glasses shouldalways be worn. Photoby C. M. Breeding.

short-wave UV, in addition to occasional blue orred phosphorescence (King et al., 1998). Unlike theDiamondView, gemological UV lamps emit lower-energy UV radiation and the phosphorescence oftype IIb diamonds is not always visible.
A few aspects of rough diamond shape and sur-face texture are strongly indicative of type as well.For example, sorters have recognized that, unliketype I stones, type II diamond crystals typicallyoccur in irregular or flattened shapes and do notexhibit crystallographic faces (Wilks and Wilks,1991). Sunagawa (2001) suggested that this is dueto the latter experiencing greater degrees of fractur-ing and breakage in their ascent to the earth’s sur-face during eruptions of kimberlitic or lamproiticmagmas, whereas type I diamonds tend to retaintheir original crystal morphology during magmatransport.
Multiple Tests are Optimal When InvestigatingDiamond Type. Each of the properties and gemo-logical tools mentioned above provides some indi-cation of diamond type without the use of an FTIRspectrometer. They are most powerful, however,when used in combination. For example, type IIdiamonds can easily be distinguished from type I
on the basis of short-wave UV transparency andstrain patterns. Types IIa and IIb can easily be sepa-rated on the basis of electrical conductivity. Thelargest group of natural diamonds, type I, is a bitharder to subdivide, but with practice it is still usu-ally possible. Type Ia diamonds commonly show415 nm or “cape” lines in the spectroscope, where-as type Ib diamonds often show strong generalabsorption from <400 to ~450 nm. The presence ofneedle-like inclusions in type Ib diamond helpsreinforce the diamond type evaluation. Table 1 pro-vides a summary of the technical and gemologicalinformation discussed in this article for representa-tive natural diamonds of each type. Shigley et al.(2004) provide an excellent reference chart forHPHT-grown synthetic diamonds, and Wang et al.(2007) gives information for CVD synthetics.
CONCLUSIONSRecent advances in diamond growth and treatmenthave led to a greater dependence on sophisticatedanalytical instrumentation to distinguish naturalfrom synthetic and natural-color from treated-colordiamonds. However, we have shown that many ofthe standard tools used by gemologists in the trade
“TYPE” CLASSIFICATION OF DIAMONDS GEMS & GEMOLOGY SUMMER 2009 109
Figure 11. Natural dia-monds of each type showdistinctive fluorescencecolors and patterns whenexamined with the DTCDiamondView ultra-short-wave UV unit.Type Ia diamonds com-monly show blue fluores-cence with straight-to-wavy growth patterns(A), whereas type Ib dia-monds often fluoresceorange with green linescaused by the H3 defect(B). Both type IIa and IIbdiamonds usually showblue-fluorescent web-likedislocation networks (C,D). Type IIb diamondsalmost always show dis-tinctive phosphorescence(either blue or red) in theDiamondView (inset).Photos by C. M. Breedingand Andy Shen.
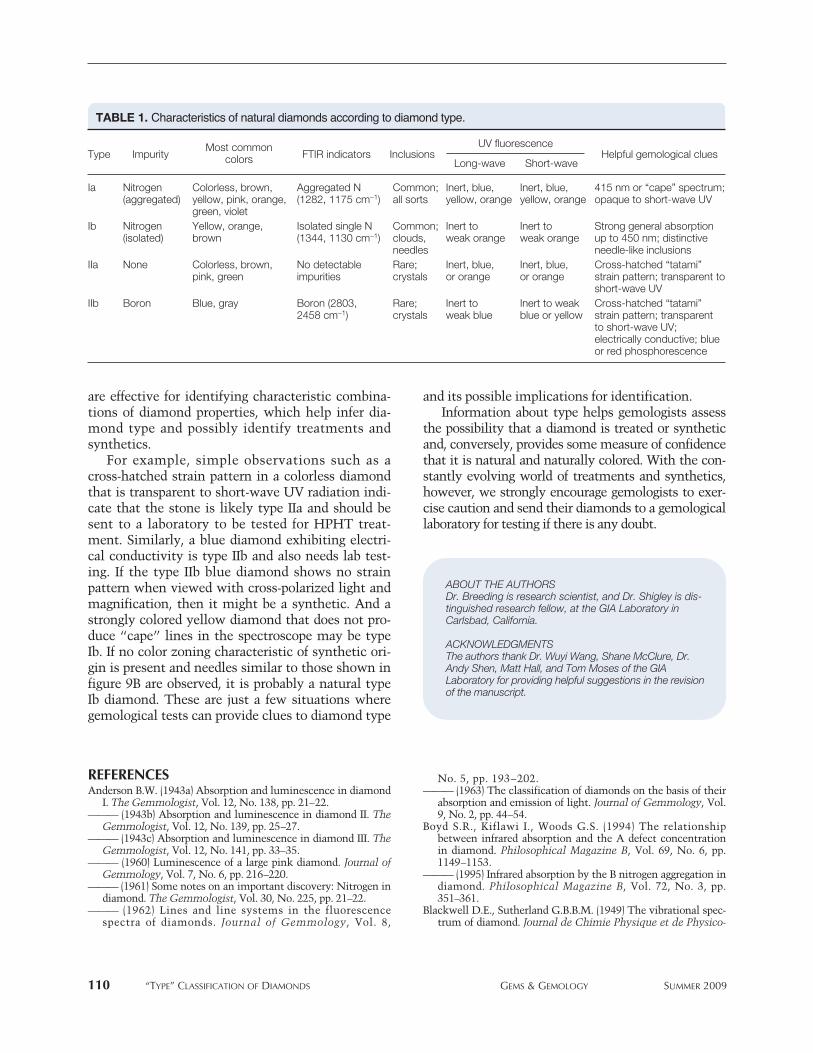
are effective for identifying characteristic combina-tions of diamond properties, which help infer dia-mond type and possibly identify treatments andsynthetics.
For example, simple observations such as across-hatched strain pattern in a colorless diamondthat is transparent to short-wave UV radiation indi-cate that the stone is likely type IIa and should besent to a laboratory to be tested for HPHT treat-ment. Similarly, a blue diamond exhibiting electri-cal conductivity is type IIb and also needs lab test-ing. If the type IIb blue diamond shows no strainpattern when viewed with cross-polarized light andmagnification, then it might be a synthetic. And astrongly colored yellow diamond that does not pro-duce “cape” lines in the spectroscope may be typeIb. If no color zoning characteristic of synthetic ori-gin is present and needles similar to those shown infigure 9B are observed, it is probably a natural typeIb diamond. These are just a few situations wheregemological tests can provide clues to diamond type
and its possible implications for identification. Information about type helps gemologists assess
the possibility that a diamond is treated or syntheticand, conversely, provides some measure of confidencethat it is natural and naturally colored. With the con-stantly evolving world of treatments and synthetics,however, we strongly encourage gemologists to exer-cise caution and send their diamonds to a gemologicallaboratory for testing if there is any doubt.
110 “TYPE” CLASSIFICATION OF DIAMONDS GEMS & GEMOLOGY SUMMER 2009
TABLE 1. Characteristics of natural diamonds according to diamond type.
Type Impurity FTIR indicators Inclusions Helpful gemological clues
Ia Nitrogen Colorless, brown, Aggregated N Common; Inert, blue, Inert, blue, 415 nm or “cape” spectrum;(aggregated) yellow, pink, orange, (1282, 1175 cm−1) all sorts yellow, orange yellow, orange opaque to short-wave UV
green, violetIb Nitrogen Yellow, orange, Isolated single N Common; Inert to Inert to Strong general absorption
(isolated) brown (1344, 1130 cm−1) clouds, weak orange weak orange up to 450 nm; distinctiveneedles needle-like inclusions
IIa None Colorless, brown, No detectable Rare; Inert, blue, Inert, blue, Cross-hatched “tatami” pink, green impurities crystals or orange or orange strain pattern; transparent to
short-wave UVIIb Boron Blue, gray Boron (2803, Rare; Inert to Inert to weak Cross-hatched “tatami”
2458 cm−1) crystals weak blue blue or yellow strain pattern; transparentto short-wave UV;electrically conductive; blue or red phosphorescence
Most commoncolors
UV fluorescence
Long-wave Short-wave
ABOUT THE AUTHORSDr. Breeding is research scientist, and Dr. Shigley is dis-tinguished research fellow, at the GIA Laboratory inCarlsbad, California.
ACKNOWLEDGMENTS The authors thank Dr. Wuyi Wang, Shane McClure, Dr.Andy Shen, Matt Hall, and Tom Moses of the GIALaboratory for providing helpful suggestions in the revisionof the manuscript.
REFERENCESAnderson B.W. (1943a) Absorption and luminescence in diamond
I. The Gemmologist, Vol. 12, No. 138, pp. 21–22.——— (1943b) Absorption and luminescence in diamond II. The
Gemmologist, Vol. 12, No. 139, pp. 25–27.——— (1943c) Absorption and luminescence in diamond III. The
Gemmologist, Vol. 12, No. 141, pp. 33–35.——— (1960) Luminescence of a large pink diamond. Journal of
Gemmology, Vol. 7, No. 6, pp. 216–220.——— (1961) Some notes on an important discovery: Nitrogen in
diamond. The Gemmologist, Vol. 30, No. 225, pp. 21–22.——— (1962) Lines and line systems in the fluorescence
spectra of diamonds. Journal of Gemmology, Vol. 8,
No. 5, pp. 193–202.——— (1963) The classification of diamonds on the basis of their
absorption and emission of light. Journal of Gemmology, Vol.9, No. 2, pp. 44–54.
Boyd S.R., Kiflawi I., Woods G.S. (1994) The relationshipbetween infrared absorption and the A defect concentrationin diamond. Philosophical Magazine B, Vol. 69, No. 6, pp.1149–1153.
——— (1995) Infrared absorption by the B nitrogen aggregation indiamond. Philosophical Magazine B, Vol. 72, No. 3, pp.351–361.
Blackwell D.E., Sutherland G.B.B.M. (1949) The vibrational spec-trum of diamond. Journal de Chimie Physique et de Physico-
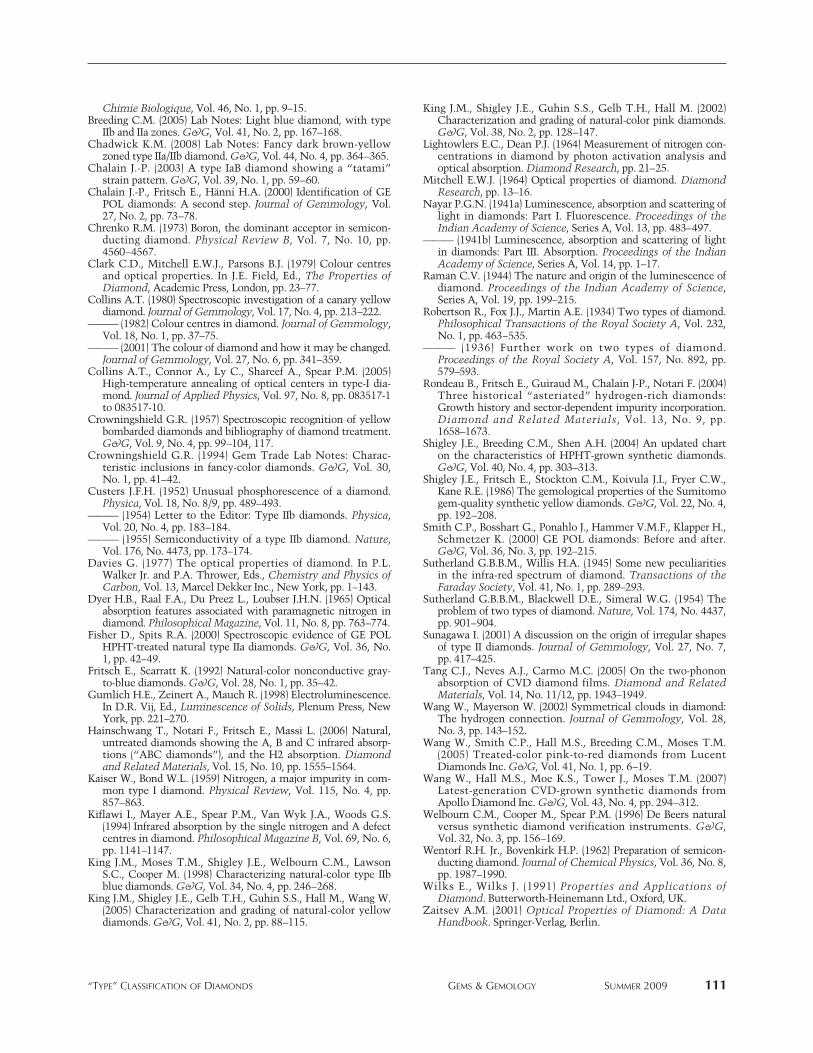
“TYPE” CLASSIFICATION OF DIAMONDS GEMS & GEMOLOGY SUMMER 2009 111
Chimie Biologique, Vol. 46, No. 1, pp. 9–15.Breeding C.M. (2005) Lab Notes: Light blue diamond, with type
IIb and IIa zones. G&G, Vol. 41, No. 2, pp. 167–168.Chadwick K.M. (2008) Lab Notes: Fancy dark brown-yellow
zoned type IIa/IIb diamond. G&G, Vol. 44, No. 4, pp. 364–365.Chalain J.-P. (2003) A type IaB diamond showing a “tatami”
strain pattern. G&G, Vol. 39, No. 1, pp. 59–60.Chalain J.-P., Fritsch E., Hänni H.A. (2000) Identification of GE
POL diamonds: A second step. Journal of Gemmology, Vol.27, No. 2, pp. 73–78.
Chrenko R.M. (1973) Boron, the dominant acceptor in semicon-ducting diamond. Physical Review B, Vol. 7, No. 10, pp.4560–4567.
Clark C.D., Mitchell E.W.J., Parsons B.J. (1979) Colour centresand optical properties. In J.E. Field, Ed., The Properties ofDiamond, Academic Press, London, pp. 23–77.
Collins A.T. (1980) Spectroscopic investigation of a canary yellowdiamond. Journal of Gemmology, Vol. 17, No. 4, pp. 213–222.
——— (1982) Colour centres in diamond. Journal of Gemmology,Vol. 18, No. 1, pp. 37–75.
——— (2001) The colour of diamond and how it may be changed.Journal of Gemmology, Vol. 27, No. 6, pp. 341–359.
Collins A.T., Connor A., Ly C., Shareef A., Spear P.M. (2005)High-temperature annealing of optical centers in type-I dia-mond. Journal of Applied Physics, Vol. 97, No. 8, pp. 083517-1to 083517-10.
Crowningshield G.R. (1957) Spectroscopic recognition of yellowbombarded diamonds and bibliography of diamond treatment.G&G, Vol. 9, No. 4, pp. 99–104, 117.
Crowningshield G.R. (1994) Gem Trade Lab Notes: Charac-teristic inclusions in fancy-color diamonds. G&G, Vol. 30,No. 1, pp. 41–42.
Custers J.F.H. (1952) Unusual phosphorescence of a diamond.Physica, Vol. 18, No. 8/9, pp. 489–493.
——— (1954) Letter to the Editor: Type IIb diamonds. Physica,Vol. 20, No. 4, pp. 183–184.
——— (1955) Semiconductivity of a type IIb diamond. Nature,Vol. 176, No. 4473, pp. 173–174.
Davies G. (1977) The optical properties of diamond. In P.L.Walker Jr. and P.A. Thrower, Eds., Chemistry and Physics ofCarbon, Vol. 13, Marcel Dekker Inc., New York, pp. 1–143.
Dyer H.B., Raal F.A., Du Preez L., Loubser J.H.N. (1965) Opticalabsorption features associated with paramagnetic nitrogen indiamond. Philosophical Magazine, Vol. 11, No. 8, pp. 763–774.
Fisher D., Spits R.A. (2000) Spectroscopic evidence of GE POLHPHT-treated natural type IIa diamonds. G&G, Vol. 36, No.1, pp. 42–49.
Fritsch E., Scarratt K. (1992) Natural-color nonconductive gray-to-blue diamonds. G&G, Vol. 28, No. 1, pp. 35–42.
Gumlich H.E., Zeinert A., Mauch R. (1998) Electroluminescence.In D.R. Vij, Ed., Luminescence of Solids, Plenum Press, NewYork, pp. 221–270.
Hainschwang T., Notari F., Fritsch E., Massi L. (2006) Natural,untreated diamonds showing the A, B and C infrared absorp-tions (“ABC diamonds”), and the H2 absorption. Diamondand Related Materials, Vol. 15, No. 10, pp. 1555–1564.
Kaiser W., Bond W.L. (1959) Nitrogen, a major impurity in com-mon type I diamond. Physical Review, Vol. 115, No. 4, pp.857–863.
Kiflawi I., Mayer A.E., Spear P.M., Van Wyk J.A., Woods G.S.(1994) Infrared absorption by the single nitrogen and A defectcentres in diamond. Philosophical Magazine B, Vol. 69, No. 6,pp. 1141–1147.
King J.M., Moses T.M., Shigley J.E., Welbourn C.M., LawsonS.C., Cooper M. (1998) Characterizing natural-color type IIbblue diamonds. G&G, Vol. 34, No. 4, pp. 246–268.
King J.M., Shigley J.E., Gelb T.H., Guhin S.S., Hall M., Wang W.(2005) Characterization and grading of natural-color yellowdiamonds. G&G, Vol. 41, No. 2, pp. 88–115.
King J.M., Shigley J.E., Guhin S.S., Gelb T.H., Hall M. (2002)Characterization and grading of natural-color pink diamonds.G&G, Vol. 38, No. 2, pp. 128–147.
Lightowlers E.C., Dean P.J. (1964) Measurement of nitrogen con-centrations in diamond by photon activation analysis andoptical absorption. Diamond Research, pp. 21–25.
Mitchell E.W.J. (1964) Optical properties of diamond. DiamondResearch, pp. 13–16.
Nayar P.G.N. (1941a) Luminescence, absorption and scattering oflight in diamonds: Part I. Fluorescence. Proceedings of theIndian Academy of Science, Series A, Vol. 13, pp. 483–497.
——— (1941b) Luminescence, absorption and scattering of lightin diamonds: Part III. Absorption. Proceedings of the IndianAcademy of Science, Series A, Vol. 14, pp. 1–17.
Raman C.V. (1944) The nature and origin of the luminescence ofdiamond. Proceedings of the Indian Academy of Science,Series A, Vol. 19, pp. 199–215.
Robertson R., Fox J.J., Martin A.E. (1934) Two types of diamond.Philosophical Transactions of the Royal Society A, Vol. 232,No. 1, pp. 463–535.
——— (1936) Further work on two types of diamond.Proceedings of the Royal Society A, Vol. 157, No. 892, pp.579–593.
Rondeau B., Fritsch E., Guiraud M., Chalain J-P., Notari F. (2004)Three historical “asteriated” hydrogen-rich diamonds:Growth history and sector-dependent impurity incorporation.Diamond and Related Materials, Vol. 13, No. 9, pp.1658–1673.
Shigley J.E., Breeding C.M., Shen A.H. (2004) An updated charton the characteristics of HPHT-grown synthetic diamonds.G&G, Vol. 40, No. 4, pp. 303–313.
Shigley J.E., Fritsch E., Stockton C.M., Koivula J.I., Fryer C.W.,Kane R.E. (1986) The gemological properties of the Sumitomogem-quality synthetic yellow diamonds. G&G, Vol. 22, No. 4,pp. 192–208.
Smith C.P., Bosshart G., Ponahlo J., Hammer V.M.F., Klapper H.,Schmetzer K. (2000) GE POL diamonds: Before and after.G&G, Vol. 36, No. 3, pp. 192–215.
Sutherland G.B.B.M., Willis H.A. (1945) Some new peculiaritiesin the infra-red spectrum of diamond. Transactions of theFaraday Society, Vol. 41, No. 1, pp. 289–293.
Sutherland G.B.B.M., Blackwell D.E., Simeral W.G. (1954) Theproblem of two types of diamond. Nature, Vol. 174, No. 4437,pp. 901–904.
Sunagawa I. (2001) A discussion on the origin of irregular shapesof type II diamonds. Journal of Gemmology, Vol. 27, No. 7,pp. 417–425.
Tang C.J., Neves A.J., Carmo M.C. (2005) On the two-phononabsorption of CVD diamond films. Diamond and RelatedMaterials, Vol. 14, No. 11/12, pp. 1943–1949.
Wang W., Mayerson W. (2002) Symmetrical clouds in diamond:The hydrogen connection. Journal of Gemmology, Vol. 28,No. 3, pp. 143–152.
Wang W., Smith C.P., Hall M.S., Breeding C.M., Moses T.M.(2005) Treated-color pink-to-red diamonds from LucentDiamonds Inc. G&G, Vol. 41, No. 1, pp. 6–19.
Wang W., Hall M.S., Moe K.S., Tower J., Moses T.M. (2007)Latest-generation CVD-grown synthetic diamonds fromApollo Diamond Inc. G&G, Vol. 43, No. 4, pp. 294–312.
Welbourn C.M., Cooper M., Spear P.M. (1996) De Beers naturalversus synthetic diamond verification instruments. G&G,Vol. 32, No. 3, pp. 156–169.
Wentorf R.H. Jr., Bovenkirk H.P. (1962) Preparation of semicon-ducting diamond. Journal of Chemical Physics, Vol. 36, No. 8,pp. 1987–1990.
Wilks E., Wilks J. (1991) Properties and Applications ofDiamond. Butterworth-Heinemann Ltd., Oxford, UK.
Zaitsev A.M. (2001) Optical Properties of Diamond: A DataHandbook. Springer-Verlag, Berlin.

112 NOTES & NEW TECHNIQUES GEMS & GEMOLOGY SUMMER 2009
he availability of copper-bearing tourmaline fromMozambique (Abduriyim and Kitawaki, 2005;
Laurs et al., 2008) has intensified the gemological inter-est that was first generated after discovery of cuprian
tourmaline in Brazil’s “Paraíba” State (Fritsch et al.,1990; Abduriyim et al., 2006, and references therein)and later in Nigeria (Smith et al., 2001; Abduriyim etal., 2006, and references therein). In 2007, theLaboratory Manual Harmonization Committee pro-posed that blue (“electric” blue, “neon” blue, violet-blue), bluish green to greenish blue, or green elbaitetourmaline of moderate-to-high saturation colored bytraces of Cu and Mn be called “Paraíba” tourmaline,regardless of geographic origin.
Analytical procedures used to quantify Cu con-tent include laser ablation–inductively coupled plas-ma–mass spectroscopy (LA-ICP-MS), electron-microprobe analysis, and energy-dispersive X-ray fluorescence (EDXRF; Fritsch et al., 1990; Abduriyimet al., 2006; Laurs et al., 2008). However, a simpler,less expensive supplementary procedure for evaluat-ing Cu content is desirable in instances where costor convenience is important. The visible–nearinfrared (Vis-NIR) spectroscopic instrumentationdescribed in this article is easy to use, portable, andcosts as little as $3,500. It can perform a measure-ment in one minute or less, on a rough or polishedgem sample of any size.
Both iron as Fe2+ (Faye et al., 1968; Mattson andRossman, 1987) and copper as Cu2+ (Fritsch et al.,1990; Laurs et al., 2008) can impart greenish bluecoloration to gem tourmaline. The required absorp-tion near 700 nm is associated with metal ions indistorted octahedral environments (Burns, 1993).Thus, whether coloration is due to Fe and/or Cucannot reliably be distinguished by looking at a
T
See end of article for About the Authors and Acknowledgments.GEMS & GEMOLOGY, Vol. 45, No. 2, pp. 112–119.© 2009 Gemological Institute of America
Paul B. Merkel and Christopher M. Breeding
The authors used Vis-NIR spectral measurementscombined with LA-ICP-MS data to investigatethe usefulness of absorption spectra for differenti-ating between copper and iron as sources ofgreenish blue coloration in gem tourmaline.While both Cu2+ and Fe2+ produce absorptionbands with maxima near 700 nm, Cu2+ also hasa strong band with a maximum near 900–925nm, where absorption due to Fe2+ is typically ata minimum. In addition, Vis-NIR spectroscopysuccessfully identified Cu in pink/purple and vio-let stones that could be candidates for heat treat-ment. For the blue, green, and violet Cu-bearingtourmalines of pale-to-moderate color intensityin this study, weight percent of CuO could beestimated from the absorbance at 900 nm. Thisrelatively inexpensive identification method mayprove to be a valuable screening tool for Cu-bearing tourmaline.
NOTES & NEW TECHNIQUES
SPECTRAL DIFFERENTIATIONBETWEEN COPPER AND IRON
COLORANTS IN GEM TOURMALINES

NOTES & NEW TECHNIQUES GEMS & GEMOLOGY SUMMER 2009 113
sample. In this study, we analyzed 26 gem tourma-lines by Vis-NIR spectroscopy and LA-ICP-MS, andcompared the two sets of data to investigate thepotential for spectral differentiation between Cuand Fe as chromophores. An additional objective ofthis study was to determine whether the absorptionnear 900 nm could be used to estimate Cu contentin tourmaline colored by this element.
MATERIALS AND METHODSWe studied 26 faceted and preformed tourmalines(figure 1). They are designated in table 1 accordingto the predominant color observed: blue and green-ish blue (B), green and bluish green (G), pink (P), vio-let (V), and greenish yellow (Y). Most of the Cu-bear-ing tourmalines were from Mozambique, but wealso included samples from Brazil and Nigeria. Mostof the non-Cu-bearing tourmalines were fromAfghanistan, Brazil, Mozambique, and Namibia.One “chrome” uvite, from Tanzania, was alsoincluded for comparison. The greenish yellow sam-ple was added because Mozambique tourmalines ofvery similar color and with no spectral evidence ofCu2+ are being sold as copper-bearing (e.g., on eBay);it was included to illustrate that not all greenishyellow tourmalines from Mozambique derive theirblue color component in the spectrum (i.e., absorp-tion at 700 nm) from Cu2+.
For each sample, we determined specific gravityhydrostatically and measured refractive indices usinga standard gemological refractometer. Vis-NIR spec-tra were collected with two different spectrometers.We analyzed most of the larger samples using a
Perkin-Elmer Lambda 950 spectrometer equippedwith a 150 mm integrating reflectance sphere, in therange 350–1150 nm. The gem was held (~5° from nor-mal) in the jaws of center-mount sampling modulePELA-9038, and the beam was directed through thetable and reflected back off the pavilion facets.Smaller samples (<1 cm) could not be reliably mea-sured with this configuration, because they did notcompletely intercept the beam. They were insteadmeasured using a StellarNet EPP2000-CXR CCDarray spectrometer with an SL1 tungsten-kryptonlight source and a R400-7-VisNIR bifurcated fiber-optic reflectance probe, in the range 400–900 nm.These smaller gems were usually placed table-downon a white reflective standard. The small tip of thefiber-optic probe, providing both the analyzing beamand the collection of transmitted light, was placednear the culet and aimed toward the table. The beamreflected off the white standard back through thetable to the probe. Intensity measurements with andwithout the gem in place allowed absorbance to bedetermined.
For both techniques, the approximate path of theanalyzing beam consisted essentially of a dual tra-verse between the table and the culet. Both spec-trometers provided absorbance vs. wavelengthdirectly (uncorrected for path length). Spectral maxi-ma of gems measured on both spectrometers wereidentical, and absorbance values were within ~10%.Some polarized absorption spectra were obtainedusing the Lambda 950 spectrometer in the transmis-sion mode together with a calcite polarizer.
Trace- and major-element analyses of all sampleswere obtained at the GIA Laboratory in Carlsbad
Figure 1. These 26faceted and preformedtourmalines (weightslisted in table 1) wereanalyzed for this study.Left to right, top row:B1–B8; second rowfrom top: G1–G8; sec-ond row from bottom:P1–P5; bottom row: P6, P7, V1, V2, and Y1.Photo by P. Merkel.

114 NOTES & NEW TECHNIQUES GEMS & GEMOLOGY SUMMER 2009
using a Thermo X Series II ICP-MS with a NewWave UP-213 laser ablation sampling system. Weanalyzed two random locations on the girdle of eachgem, and processed the data using boron as an inter-nal standard.
To investigate the effects of heating on the Vis-NIR spectra of Cu-bearing tourmalines, we mea-sured the absorption spectra of 10 additional pre-forms (2–12 g; spectrally indicated to contain Cu)
that were initially various shades of violet orbrownish violet both before and after heating forone hour at ~600°C (and for three samples, afterbeing heated again to ~700°C for one hour).Although heating for one hour at 550°C is usuallysufficient to fully remove the pink color compo-nent, traces of Mn3+ absorption have remained insome stones under this condition. The intention inthis study was to investigate whether somewhat
TABLE 1. Properties and absorption data for the 26 tourmaline samples in this study.
A/L (cm−1) A/L (cm−1) A/L (cm−1) EstimatedDescription Locality RIa SG at 525 nm at 700 nm at 900 nm path length,
(Mn2+) (Cu2+, Fe2+) (Cu2+) L (cm)
B1 0.80 ct greenish Brazil 1.619–1.641 3.09 3.028 0.028 1.862 0.249 3.029 2.686 0.70blue
B2 4.02 ct greenish Namibia 1.620–1.639 3.09 1.454 2.972 bdl 0.239 1.562 0.265 1.30blue
B3 1.44 ct greenish Nigeria 1.619–1.638 3.06 0.204 bdl 0.291 0.113 1.440 2.307 0.75blue
B4 8.93 ct greenish Afghanistanc 1.619–1.639 3.06 0.331 0.126 bdl 0.101 0.484 0.078 1.50blue
B5 5.67 ct blue Brazil 1.620–1.639 3.08 0.508 0.278 bdl 0.119 1.477 0.255 1.30B6 14.50 ct greenish Mozambique 1.621–1.637 3.04 0.018 bdl 0.076 0.021 0.308 0.475 1.70
blueB7 7.50 ct greenish Afghanistan 1.62–1.63 3.05 0.264 0.571 0.001 0.048 0.594 0.047 1.65
blueB8 36.33 ct greenish Mozambique 1.62–1.64 3.05 0.016 bdl 0.025 0.020 0.182 0.286 2.80
blueG1 3.29 ct bluish Mozambique 1.620–1.640 3.09 3.365 0.018 0.177 0.051 0.717 1.087 1.15
greenG2 2.42 ct bluish Brazil 1.620–1.640 3.09 0.978 1.706 0.001 0.073 1.880 0.051 1.00
greenG3 8.81 ct green Africa 1.622–1.642 3.09 5.572 0.112 0.136 0.106 0.669 0.775 1.60G4 32.30 ct bluish Afghanistan 1.620–1.638 3.07 1.272 1.012 bdl 0.109 0.525 0.058 2.00
greenG5 14.21 ct green Mozambique 1.620–1.639 3.07 0.443 0.557 bdl 0.107 0.423 0.061 2.05G6 7.24 ct yellow- Mozambique 1.624–1.640 3.07 0.714 1.134 0.006 0.181 0.557 0.081 1.55
greenG7 46.16 ct bluish Mozambique 1.620–1.639 3.06 0.258 0.015 0.039 0.037 0.272 0.407 2.80
greenG8 1.64 ct green Tanzaniad 1.618–1.639 3.08 0.011 bdl bdl 0.682 0.393 0.043 0.90P1 6.68 ct pink Brazil 1.620–1.639 3.05 1.219 0.081 bdl 0.612 0.135 0.207 1.30P2 8.87 ct pink Nigeria 1.620–1.640 3.06 0.876 bdl 0.002 0.933 0.284 0.491 1.50P3 2.84 ct purple Mozambique 1.620–1.640 3.05 1.206 bdl 0.173 1.038 0.622 1.314 1.05P4 11.50 ct pink Mozambique 1.620–1.639 3.04 0.289 bdl 0.042 0.488 0.282 0.398 1.70P5 50.07 ct pink Mozambique 1.62–1.64 3.06 0.408 0.038 0.028 0.346 0.321 0.398 2.20P6 13.55 ct pinkish Mozambique 1.620–1.640 3.06 1.415 bdl 0.070 0.336 0.309 0.470 1.90
purpleP7 29.02 ct purplish Mozambique 1.619–1.639 3.05 2.234 0.007 0.045 0.400 0.350 0.469 2.60
pinkV1 5.05 ct violet Mozambique 1.62–1.64 3.07 2.402 bdl 0.478 1.325 1.783 1.508 1.20V2 14.28 ct violet Mozambique 1.62–1.63 3.06 1.056 bdl 0.209 0.628 0.853 1.013 1.50Y1 10.51 ct greenish Mozambique 1.625–1.640 3.07 0.394 0.108 bdl 0.272 0.330 0.082 1.80
yellow
a RI values of preforms were measured to the hundredths. b Average of two LA-ICP-MS analyses; bold type indicates gems with moderate-to-high levels (>0.05 wt.% oxides) of Mn, Fe, and Cu. Abbreviation: bdl = below detection limit.
c Likely but uncertain origin.d Uvite, containing ~7.80 wt.% Mg, 2:1 Ca:Na, 0.21 wt.% V, and 0.01 wt.% Cr.
Sampleno.
MnO(wt.%)b
FeO(wt.%)b
CuO(wt.%)b
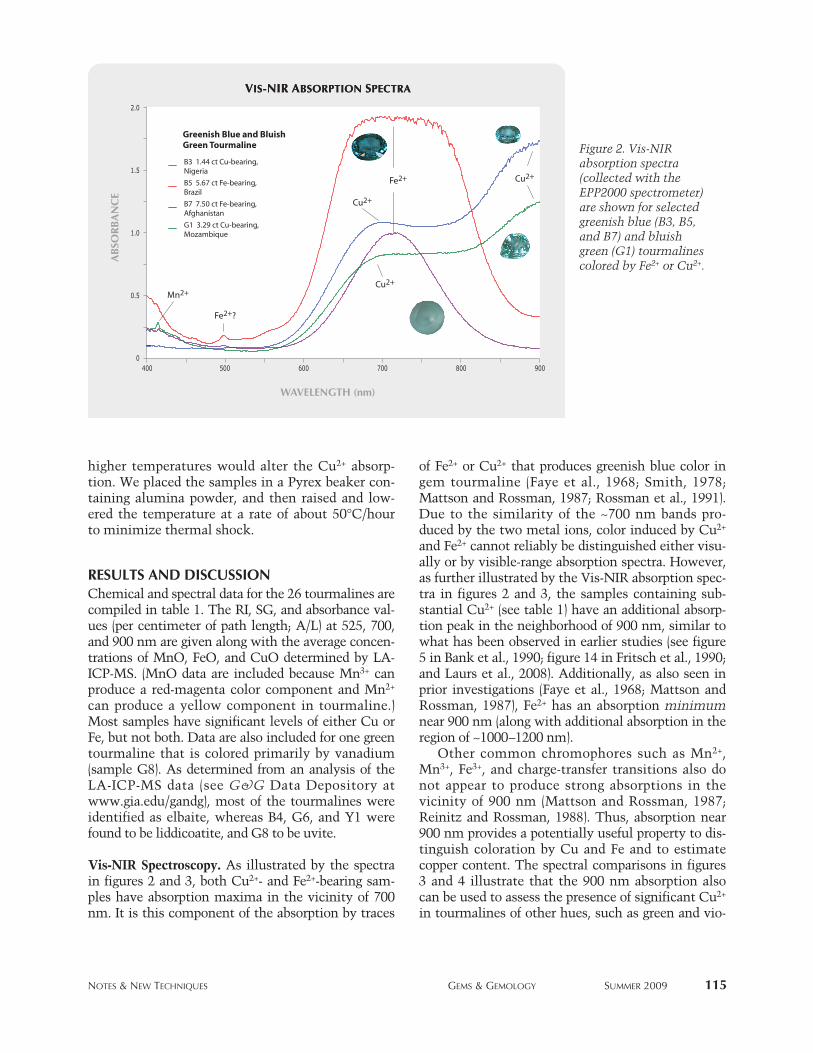
NOTES & NEW TECHNIQUES GEMS & GEMOLOGY SUMMER 2009 115
higher temperatures would alter the Cu2+ absorp-tion. We placed the samples in a Pyrex beaker con-taining alumina powder, and then raised and low-ered the temperature at a rate of about 50°C/hourto minimize thermal shock.
RESULTS AND DISCUSSIONChemical and spectral data for the 26 tourmalines arecompiled in table 1. The RI, SG, and absorbance val-ues (per centimeter of path length; A/L) at 525, 700,and 900 nm are given along with the average concen-trations of MnO, FeO, and CuO determined by LA-ICP-MS. (MnO data are included because Mn3+ canproduce a red-magenta color component and Mn2+
can produce a yellow component in tourmaline.)Most samples have significant levels of either Cu orFe, but not both. Data are also included for one greentourmaline that is colored primarily by vanadium(sample G8). As determined from an analysis of theLA-ICP-MS data (see G&G Data Depository atwww.gia.edu/gandg), most of the tourmalines wereidentified as elbaite, whereas B4, G6, and Y1 werefound to be liddicoatite, and G8 to be uvite.
Vis-NIR Spectroscopy. As illustrated by the spectrain figures 2 and 3, both Cu2+- and Fe2+-bearing sam-ples have absorption maxima in the vicinity of 700nm. It is this component of the absorption by traces
of Fe2+ or Cu2+ that produces greenish blue color ingem tourmaline (Faye et al., 1968; Smith, 1978;Mattson and Rossman, 1987; Rossman et al., 1991).Due to the similarity of the ~700 nm bands pro-duced by the two metal ions, color induced by Cu2+
and Fe2+ cannot reliably be distinguished either visu-ally or by visible-range absorption spectra. However,as further illustrated by the Vis-NIR absorption spec-tra in figures 2 and 3, the samples containing sub-stantial Cu2+ (see table 1) have an additional absorp-tion peak in the neighborhood of 900 nm, similar towhat has been observed in earlier studies (see figure5 in Bank et al., 1990; figure 14 in Fritsch et al., 1990;and Laurs et al., 2008). Additionally, as also seen inprior investigations (Faye et al., 1968; Mattson andRossman, 1987), Fe2+ has an absorption minimumnear 900 nm (along with additional absorption in theregion of ~1000–1200 nm).
Other common chromophores such as Mn2+,Mn3+, Fe3+, and charge-transfer transitions also donot appear to produce strong absorptions in thevicinity of 900 nm (Mattson and Rossman, 1987;Reinitz and Rossman, 1988). Thus, absorption near900 nm provides a potentially useful property to dis-tinguish coloration by Cu and Fe and to estimatecopper content. The spectral comparisons in figures3 and 4 illustrate that the 900 nm absorption alsocan be used to assess the presence of significant Cu2+
in tourmalines of other hues, such as green and vio-
Figure 2. Vis-NIRabsorption spectra (collected with theEPP2000 spectrometer)are shown for selectedgreenish blue (B3, B5,and B7) and bluishgreen (G1) tourmalinescolored by Fe2+ or Cu2+.

116 NOTES & NEW TECHNIQUES GEMS & GEMOLOGY SUMMER 2009
let, which contain additional colorants. The greencoloration of G2 and G3 in figure 3 may arise in partfrom Mn2+ contributions to blue absorption (whichincludes the narrow band at ~415 nm; Rossman andMattson, 1986) combined with the red absorption byFe2+ and/or Cu2+ near 700 nm. Substantial Mn3+
absorption at ~510–530 nm contributes to the colorof the pink and violet samples in figure 4. The spec-trum of V3+-colored green uvite sample G8 (see foot-note d in table 1 and Schmetzer et al., 2007) is alsoincluded in figure 3 for comparison.
Without exception, the samples in our studywith moderate-to-strong absorption features near900 nm had substantial levels of Cu. In contrast,those with substantial absorbance near 700 nm andlow absorbance near 900 nm had significant levels ofFe and minimal Cu (again, see table 1). Absorptionspectra of all the samples of this study, as well ascomplete LA-ICP-MS data, are available in the G&GData Depository.
Blue, greenish blue, and green tourmalines withsubstantial absorbance at 900 nm but greaterabsorbance at 700 nm may be colored by a combina-tion of Fe2+ and Cu2+, because for gems colored byCu2+ alone (e.g., G1 and B3 in figure 2) there is usu-ally greater absorbance at 900 nm than at 700 nm.G3 was the only sample examined that had moder-ate levels of both iron (0.112 wt.% FeO) and copper(0.136 wt.% CuO); as with the other Cu-bearing
gems, the strong absorption near 900 nm shows thepresence of copper (figure 3). The relativeabsorbances at 700 and 900 nm suggest that most ofthe absorption near 700 nm in G3 is also due to cop-per. The lack of absorption near 520 nm and thesharp band near 415 nm implies that the Mn in G3is in the form of Mn2+. This African gem was report-edly from Namibia, but it could be of Nigerian ori-gin; to our knowledge, Cu has not been reported inNamibian tourmaline.
The absorbance features near 900 nm for P5 and P6 in figure 4 are consistent with their Cu contents. The absorbance value for P5 is substan-tial despite its low Cu content due to the relativelylong analyzing path length for this large gem. Thisresult and similar behavior for B8, G7, and P7 illus-trate that CuO levels as low as ~0.03 wt.% canreadily be detected spectrally in large stones. Incontrast, the behavior in figure 4 of P1, which con-tains some Fe but no Cu, exemplifies a situationwhere caution must be exercised in spectrallyassessing the presence of Cu. Relatively weakabsorptions near 700 and 900 nm in pink or redtourmaline such as P1 may be related to Mn3+
rather than Cu2+. A low-intensity Mn3+ band hasbeen observed previously near 700 nm (Manning,1973; Reinitz and Rossman, 1988), and a weakMn3+ band has also been reported in the region of~900–1025 nm in thin-layer synthetic elbaite with
Figure 3. These Vis-NIRabsorption spectra (collected with theEPP2000 spectrometer)are from green tourma-lines colored primarilyby Cu2+ (G3), Fe2+ (G2,G3), or V3+ (G8).
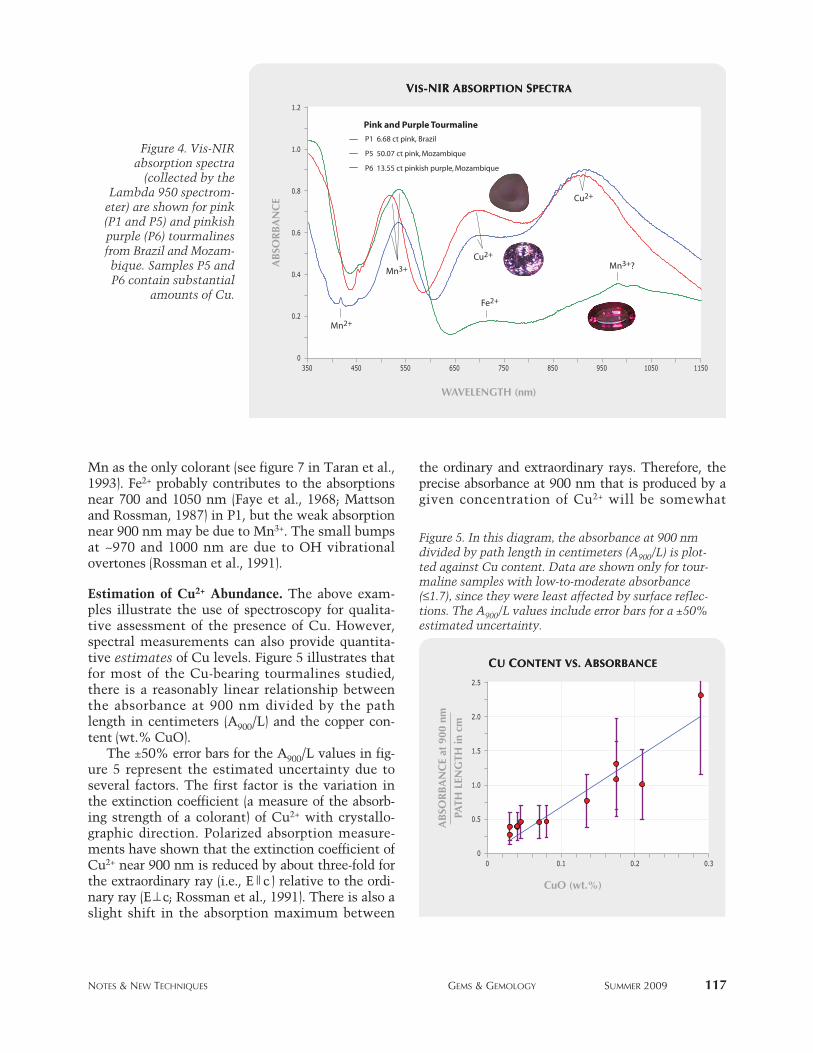
Mn as the only colorant (see figure 7 in Taran et al.,1993). Fe2+ probably contributes to the absorptionsnear 700 and 1050 nm (Faye et al., 1968; Mattsonand Rossman, 1987) in P1, but the weak absorptionnear 900 nm may be due to Mn3+. The small bumpsat ~970 and 1000 nm are due to OH vibrationalovertones (Rossman et al., 1991).
Estimation of Cu2+ Abundance. The above exam-ples illustrate the use of spectroscopy for qualita-tive assessment of the presence of Cu. However,spectral measurements can also provide quantita-tive estimates of Cu levels. Figure 5 illustrates thatfor most of the Cu-bearing tourmalines studied,there is a reasonably linear relationship betweenthe absorbance at 900 nm divided by the pathlength in centimeters (A900/L) and the copper con-tent (wt.% CuO).
The ±50% error bars for the A900/L values in fig-ure 5 represent the estimated uncertainty due toseveral factors. The first factor is the variation inthe extinction coefficient (a measure of the absorb-ing strength of a colorant) of Cu2+ with crystallo-graphic direction. Polarized absorption measure-ments have shown that the extinction coefficient ofCu2+ near 900 nm is reduced by about three-fold forthe extraordinary ray (i.e., E⎟⎟ c) relative to the ordi-nary ray (E⎟–c; Rossman et al., 1991). There is also aslight shift in the absorption maximum between
the ordinary and extraordinary rays. Therefore, theprecise absorbance at 900 nm that is produced by agiven concentration of Cu2+ will be somewhat
NOTES & NEW TECHNIQUES GEMS & GEMOLOGY SUMMER 2009 117
Figure 5. In this diagram, the absorbance at 900 nmdivided by path length in centimeters (A900/L) is plot-ted against Cu content. Data are shown only for tour-maline samples with low-to-moderate absorbance(≤1.7), since they were least affected by surface reflec-tions. The A900/L values include error bars for a ±50%estimated uncertainty.
Figure 4. Vis-NIRabsorption spectra
(collected by theLambda 950 spectrom-
eter) are shown for pink(P1 and P5) and pinkishpurple (P6) tourmalinesfrom Brazil and Mozam-bique. Samples P5 andP6 contain substantial
amounts of Cu.
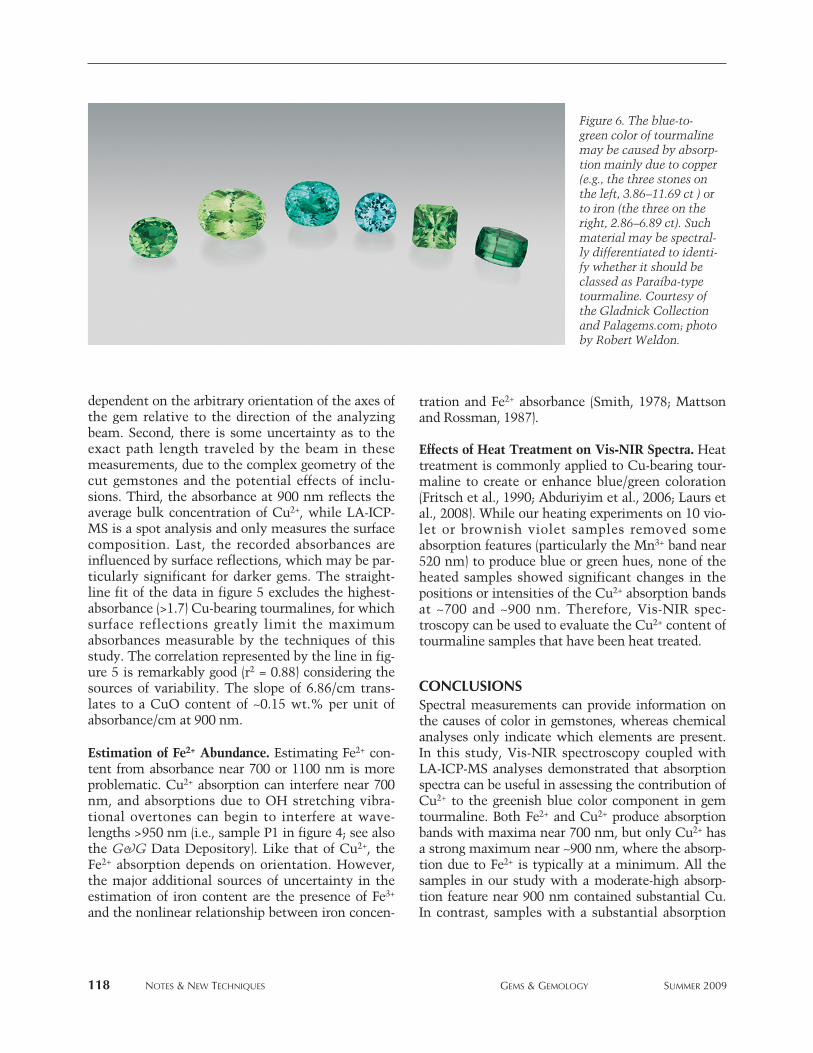
118 NOTES & NEW TECHNIQUES GEMS & GEMOLOGY SUMMER 2009
dependent on the arbitrary orientation of the axes ofthe gem relative to the direction of the analyzingbeam. Second, there is some uncertainty as to theexact path length traveled by the beam in thesemeasurements, due to the complex geometry of thecut gemstones and the potential effects of inclu-sions. Third, the absorbance at 900 nm reflects theaverage bulk concentration of Cu2+, while LA-ICP-MS is a spot analysis and only measures the surfacecomposition. Last, the recorded absorbances areinfluenced by surface reflections, which may be par-ticularly significant for darker gems. The straight-line fit of the data in figure 5 excludes the highest-absorbance (>1.7) Cu-bearing tourmalines, for whichsurface reflections greatly limit the maximumabsorbances measurable by the techniques of thisstudy. The correlation represented by the line in fig-ure 5 is remarkably good (r2 = 0.88) considering thesources of variability. The slope of 6.86/cm trans-lates to a CuO content of ~0.15 wt.% per unit ofabsorbance/cm at 900 nm.
Estimation of Fe2+ Abundance. Estimating Fe2+ con-tent from absorbance near 700 or 1100 nm is moreproblematic. Cu2+ absorption can interfere near 700nm, and absorptions due to OH stretching vibra-tional overtones can begin to interfere at wave-lengths >950 nm (i.e., sample P1 in figure 4; see alsothe G&G Data Depository). Like that of Cu2+, theFe2+ absorption depends on orientation. However,the major additional sources of uncertainty in theestimation of iron content are the presence of Fe3+
and the nonlinear relationship between iron concen-
tration and Fe2+ absorbance (Smith, 1978; Mattsonand Rossman, 1987).
Effects of Heat Treatment on Vis-NIR Spectra. Heattreatment is commonly applied to Cu-bearing tour-maline to create or enhance blue/green coloration(Fritsch et al., 1990; Abduriyim et al., 2006; Laurs etal., 2008). While our heating experiments on 10 vio-let or brownish violet samples removed someabsorption features (particularly the Mn3+ band near520 nm) to produce blue or green hues, none of theheated samples showed significant changes in thepositions or intensities of the Cu2+ absorption bandsat ~700 and ~900 nm. Therefore, Vis-NIR spec-troscopy can be used to evaluate the Cu2+ content oftourmaline samples that have been heat treated.
CONCLUSIONSSpectral measurements can provide information onthe causes of color in gemstones, whereas chemicalanalyses only indicate which elements are present.In this study, Vis-NIR spectroscopy coupled withLA-ICP-MS analyses demonstrated that absorptionspectra can be useful in assessing the contribution ofCu2+ to the greenish blue color component in gemtourmaline. Both Fe2+ and Cu2+ produce absorptionbands with maxima near 700 nm, but only Cu2+ hasa strong maximum near ~900 nm, where the absorp-tion due to Fe2+ is typically at a minimum. All thesamples in our study with a moderate-high absorp-tion feature near 900 nm contained substantial Cu.In contrast, samples with a substantial absorption
Figure 6. The blue-to-green color of tourmalinemay be caused by absorp-tion mainly due to copper(e.g., the three stones onthe left, 3.86–11.69 ct ) orto iron (the three on theright, 2.86–6.89 ct). Suchmaterial may be spectral-ly differentiated to identi-fy whether it should beclassed as Paraíba-typetourmaline. Courtesy ofthe Gladnick Collectionand Palagems.com; photoby Robert Weldon.

NOTES & NEW TECHNIQUES GEMS & GEMOLOGY SUMMER 2009 119
band near 700 nm, but low absorbance near 900 nm,had significant levels of Fe and little or no Cu.Spectral analysis cannot replace more quantitativeprocedures such as LA-ICP-MS or even EDXRF.Based on this study, however, absorption measure-ments in the region of 900–925 nm appear to be arelatively quick and simple means for assessing thepresence of Cu in gem tourmaline, the key criterionfor designation of a stone as “Paraíba” or “Paraíba-type” (e.g., figure 6). Furthermore, in blue, green, andviolet gems of pale-to-moderate color intensity, itwas possible to estimate wt.% CuO within ~50%accuracy. Spectral measurements may also aid inselecting off-color Cu-bearing tourmalines that aresuitable candidates for heat treatment.
We have shown that simple CCD array spec-trometers with fiber-optic reflectance probes offer arelatively portable and inexpensive method to screenrough or faceted gem tourmalines (even small sam-ples) for Cu. Most common Vis-NIR spectrometersin gemological laboratories are not well suited tomeasure Cu2+ concentrations because they are con-figured to measure transmittance of light through asample, and therefore are useful for performing rea-sonably quantitative measurements only on parallel-polished slabs or on faceted gemstones with fairlylarge parallel facets. Nevertheless, fiber-optic probeattachments or small integrating sphere accessoriesmay be compatible with some more-traditional spectrometers.
REFERENCESAbduriyim A., Kitawaki H. (2005) Gem News International: Cu-
and Mn-bearing tourmaline: More production fromMozambique. G&G, Vol. 41, No. 4, pp. 360–361.
Abduriyim A., Kitawaki H., Furuya M., Schwarz D. (2006)Paraíba-type copper-bearing tourmaline from Brazil, Nigeria,and Mozambique: Chemical fingerprinting by LA-ICP-MS.G&G, Vol. 42, No. 1, pp. 4–21.
Bank H., Henn U., Bank F.H., v. Platen H., Hofmeister W. (1990)Leuchtendblaue Cu-führende Turmaline aus Paraíba, Brasilien.Zeitschrift der Deutschen Gemmologischen Gesellschaft, Vol.39, No. 1, pp. 3–11.
Burns R.G. (1993) Mineralogical Applications of Crystal FieldTheory, 2nd ed. Cambridge University Press, Cambridge, UK.
Faye G.H., Manning P.G., Nickel E.H. (1968) The polarized opti-cal absorption spectra of tourmaline, cordierite, chloritoid andvivianite: Ferrous-ferric electronic interaction as a source ofpleochroism. American Mineralogist, Vol. 53, pp. 1174–1201.
Fritsch E., Shigley J.E., Rossman G.R., Mercer M.E., MuhlmeisterS.M., Moon M. (1990) Gem-quality cuprian-elbaite tourma-lines from São José da Batalha, Paraíba, Brazil. G&G, Vol. 26,No. 3, pp. 189–205.
Laurs B.M., Zwaan J.C., Breeding C.M., Simmons W.B., BeatonD., Rijsdijk K.F., Befi R., Falster A.U. (2008) Copper-bearing(Paraíba-type) tourmaline from Mozambique. G&G, Vol. 44,No. 1, pp. 4–30.
Manning P.G. (1973) The effect of second-nearest-neighbor inter-
action on Mn3+ absorption in pink and black tourmalines.Canadian Mineralogist, Vol. 11, pp. 971–977.
Mattson S.M., Rossman G.R. (1987) Fe2+-Fe3+ interactions in tour-maline. Physics and Chemistry of Minerals, Vol. 14, pp.163–171.
Reinitz I.M., Rossman G.R. (1988) Role of natural irradiation intourmaline coloration. American Mineralogist, Vol. 73, pp.822–825.
Rossman G.R., Mattson S.M. (1986) Yellow, Mn-rich elbaite withMn-Ti intervalence charge transfer. American Mineralogist,Vol. 71, pp. 599–602.
Rossman G.R., Fritsch E., Shigley J.E. (1991) Origin of color incuprian elbaite from São José da Batalha, Paraíba, Brazil.American Mineralogist, Vol. 76, pp. 1479–1484.
Schmetzer K., Bernhardt H.-J., Dunaigre C., Krzemnicki M.S.(2007) Vanadium-bearing gem-quality tourmalines fromMadagascar. Journal of Gemmology, Vol. 30, pp. 413–433.
Smith G. (1978) Evidence for absorption by exchange-coupledFe2+-Fe3+ pairs in the near infrared spectra of minerals. Physicsand Chemistry of Minerals, Vol. 3, pp. 375–383.
Smith C.P., Bosshart G., Schwarz D. (2001) Gem News Inter-national: Nigeria as a new source of copper-manganese-bearingtourmaline. G&G, Vol. 37, No. 3, pp. 239–240.
Taran M.N., Lebedev A.S., Platonov A.N. (1993) Optical absorp-tion spectroscopy of synthetic tourmalines. Physics andChemistry of Minerals, Vol. 20, pp. 209–220.
ABOUT THE AUTHORSDr. Merkel ([email protected]) is a senior scientistin the Department of Chemistry and the Center for Photo-induced Charge Transfer at the University of Rochester,New York. Dr. Breeding is a research scientist at the GIALaboratory in Carlsbad, California.
ACKNOWLEDGMENTSThe authors thank Dr. George Rossman (California Instituteof Technology, Pasadena) for helpful comments and sug-gestions, and Kim Rockwell (former staff gemologist, GIALaboratory, Carlsbad) for assistance in collecting gemologi-cal data.

article are available in the G&G Data Depository(www.gia.edu/gandg).
MATERIALS AND METHODSFrom the parcel of rough, we randomly selectedabout 150 specimens for examination that rangedfrom ~0.4 to 3 g. We studied 15 samples in detail fortheir crystallographic features, surface markings,cleavage directions, and pleochroism with respect tocrystallographic orientation. These samples exhibit-ed a variety of colors: green, yellowish green tobrownish green, brownish pink, and distinctly bicol-ored green/pink. In addition, we selected six samplesof the pinkish brown to brownish pink variety chias-tolite, which displayed distinct (sometimes partial)cross-shaped arrangements of dark inclusions. About20% of the 150 specimens were chiastolite, and theyranged in diaphaneity from transparent to opaque.
We selected 72 of the 150 specimens, of moderatecommercial quality, for fashioning on the basis oftheir coloration, clarity, and projected yield. Of these,18 were faceted (figure 2) and the other 54 were leftpreformed. The preformed stones were categorizedinto three color groups: green (17 specimens), brown-ish pink (14), and strongly pleochroic pinkishbrown/yellowish green (23). On an additional sevenspecimens (figure 3), we polished the largest parallelsurfaces so we could obtain RI readings and examinetheir internal features.
Standard gemological tests—including color obser-vations, SG measurements, fluorescence reactions,and visible-range spectroscopy—were performed onall samples. RI and optic sign were measured only on
GEM-QUALITY ANDALUSITEFROM BRAZIL
Shyamala Fernandes and Gagan Choudhary
See end of article for About the Authors and Acknowledgments.GEMS & GEMOLOGY, Vol. 45, No. 2, pp. 120–129.© 2009 Gemological Institute of America
120 NOTES & NEW TECHNIQUES GEMS & GEMOLOGY SUMMER 2009
he name andalusite is derived from the Andalusiaregion of southern Spain, where the mineral was
first discovered (Dana and Ford, 1992). Gem-qualitymaterial is known from Brazil (Espírito Santo andMinas Gerais States), Sri Lanka, the United States,Madagascar, Russia (Siberia), Myanmar (O’Donoghue,2006), and China (Liu, 2006). Andalusite varietiesinclude highly pleochroic brownish pink/green (e.g.,figure 1), Mn-rich bright green (“viridine”), and chias-tolite. The last is typically opaque and features a darkcross-shaped pattern formed by carbonaceous inclu-sions (Webster, 1994; O’Donoghue, 2006).
This article reports the properties recorded froman ~1 kg parcel of medium-quality andalusite thatwas purchased from a gem merchant in Jaipur, India,who deals in rough from Brazil. The exact source ofthe andalusite in Brazil was, unfortunately, notavailable. Additional photos to accompany this
NOTES & NEW TECHNIQUES
T
Widely known as a rock-forming mineral,andalusite is not frequently encountered as agem material. This article documents the gemo-logical and spectroscopic properties of numer-ous rough and cut samples of gem-qualityandalusite from Brazil. The color varied fromyellowish green and green to brownish pink(including bicolored green and brownish pink),and some were faceted with the pleochroic col-ors attractively oriented. Transparent samples ofthe chiastolite variety of andalusite were partic-ularly interesting. All the samples displayed acomplex growth pattern, with the various inclu-sions oriented along the growth directions. Heattreatment produced subtle changes in color, ifany, but fracture filling with resin resulted inobvious improvements in apparent clarity.

the seven polished slices and the 18 faceted samples.To determine the variations in refractive index withrespect to crystallographic axis, we polished theprism faces [(110), (11
—0), (11
–0), (1
–10)], one of the cor-
ners [representing (100) or (010)], and the pinacoidalface (001) of one prismatic crystal. RI was measuredwith a GemLED refractometer. We obtained hydro-static SG values using a Mettler Toledo CB 1503electronic balance. Fluorescence was tested usingstandard long-wave (366 nm) and short-wave (254nm) UV bulbs. Absorption spectra were observedusing a desk-model GIA Prism 1000 spectroscope.We examined internal features with both a binoculargemological microscope and a horizontal microscope
with immersion, using fiber-optic and other forms of lighting (including darkfield and brightfield).
Qualitative energy-dispersive X-ray fluorescence(EDXRF) chemical analyses of 31 green and brown-ish pink preforms, the seven polished slices, and the18 faceted samples were performed with aPANalytical Minipal 2 instrument using two differ-ent conditions. Elements with lower atomic number(e.g., Al and Si) were measured at 4 kV tube voltageand 0.850 mA tube current with no filter; transitionand heavier elements were analyzed at 25 kV and0.025 mA using an Al filter.
Infrared spectra of 31 preforms (green and brown-ish pink), 15 crystals (4–15 mm thick), seven pol-ished slices, and five faceted samples that had under-gone fracture-filling processes were recorded in the6000–400 cm−1 range at a standard resolution of 4cm−1; 50 scans per sample were recorded with aNicolet Avatar 360 Fourier-transform infrared (FTIR)spectrometer at room temperature in transmissionmode. We collected multiple spectra to find the ori-entation of best transmission (depending on thethickness and transparency of the samples), consid-ering the pleochroic colors and crystallographic axes.
Raman analysis was performed on five roughsamples and two polished slices in two directions—along the c-axis and along the a- or b-axis—in the2000–100 cm−1 range using a Renishaw InVia Ramanconfocal microspectrometer with 514 nm Ar-ionlaser excitation, an exposure time of 10 seconds perscan, and 10 scans per sample.
We selected 24 rough samples for heat-treatment
NOTES & NEW TECHNIQUES GEMS & GEMOLOGY SUMMER 2009 121
Figure 2. Eighteen andalusite samples (0.15–0.58 ct)were faceted to display the range of color. Photo byG. Choudhary.
Figure 3. Seven andalusite specimens (0.81–3.87 ct)were polished as slices for inclusion studies and RIreadings. Photo by G. Choudhary.
Figure 1. Brazil is a source of rare gem-qualityandalusite, as shown by this exceptional 17.96 ctstone. Due to its strong dichroism, both pleochroic col-ors are distinctly visible. Courtesy of Palagems.com,Fallbrook, California; photo by Robert Weldon.
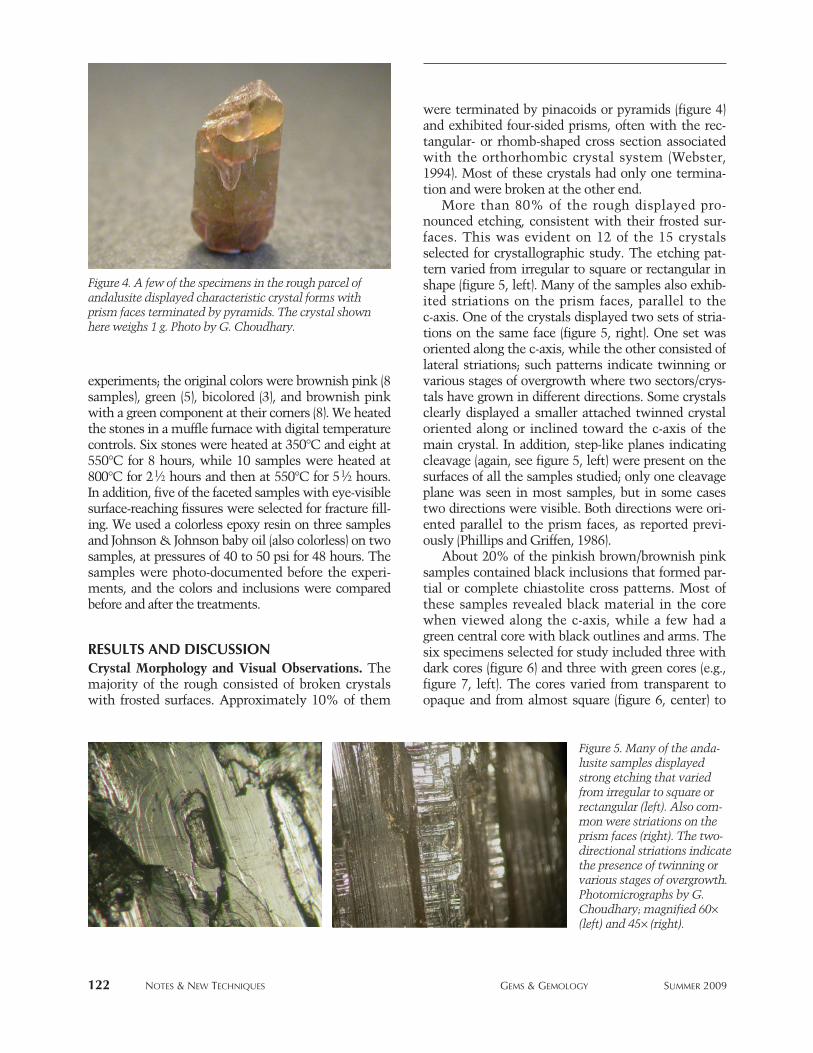
122 NOTES & NEW TECHNIQUES GEMS & GEMOLOGY SUMMER 2009
experiments; the original colors were brownish pink (8samples), green (5), bicolored (3), and brownish pinkwith a green component at their corners (8). We heatedthe stones in a muffle furnace with digital temperaturecontrols. Six stones were heated at 350°C and eight at550°C for 8 hours, while 10 samples were heated at800°C for 21⁄2 hours and then at 550°C for 51⁄2 hours.In addition, five of the faceted samples with eye-visiblesurface-reaching fissures were selected for fracture fill-ing. We used a colorless epoxy resin on three samplesand Johnson & Johnson baby oil (also colorless) on twosamples, at pressures of 40 to 50 psi for 48 hours. Thesamples were photo-documented before the experi-ments, and the colors and inclusions were comparedbefore and after the treatments.
RESULTS AND DISCUSSIONCrystal Morphology and Visual Observations. Themajority of the rough consisted of broken crystalswith frosted surfaces. Approximately 10% of them
were terminated by pinacoids or pyramids (figure 4)and exhibited four-sided prisms, often with the rec-tangular- or rhomb-shaped cross section associatedwith the orthorhombic crystal system (Webster,1994). Most of these crystals had only one termina-tion and were broken at the other end.
More than 80% of the rough displayed pro-nounced etching, consistent with their frosted sur-faces. This was evident on 12 of the 15 crystalsselected for crystallographic study. The etching pat-tern varied from irregular to square or rectangular inshape (figure 5, left). Many of the samples also exhib-ited striations on the prism faces, parallel to the c-axis. One of the crystals displayed two sets of stria-tions on the same face (figure 5, right). One set wasoriented along the c-axis, while the other consisted oflateral striations; such patterns indicate twinning orvarious stages of overgrowth where two sectors/crys-tals have grown in different directions. Some crystalsclearly displayed a smaller attached twinned crystaloriented along or inclined toward the c-axis of themain crystal. In addition, step-like planes indicatingcleavage (again, see figure 5, left) were present on thesurfaces of all the samples studied; only one cleavageplane was seen in most samples, but in some casestwo directions were visible. Both directions were ori-ented parallel to the prism faces, as reported previ-ously (Phillips and Griffen, 1986).
About 20% of the pinkish brown/brownish pinksamples contained black inclusions that formed par-tial or complete chiastolite cross patterns. Most ofthese samples revealed black material in the corewhen viewed along the c-axis, while a few had agreen central core with black outlines and arms. Thesix specimens selected for study included three withdark cores (figure 6) and three with green cores (e.g.,figure 7, left). The cores varied from transparent toopaque and from almost square (figure 6, center) to
Figure 4. A few of the specimens in the rough parcel ofandalusite displayed characteristic crystal forms withprism faces terminated by pyramids. The crystal shownhere weighs 1 g. Photo by G. Choudhary.
Figure 5. Many of the anda-lusite samples displayedstrong etching that variedfrom irregular to square orrectangular (left). Also com-mon were striations on theprism faces (right). The two-directional striations indicatethe presence of twinning orvarious stages of overgrowth.Photomicrographs by G.Choudhary; magnified 60×(left) and 45× (right).
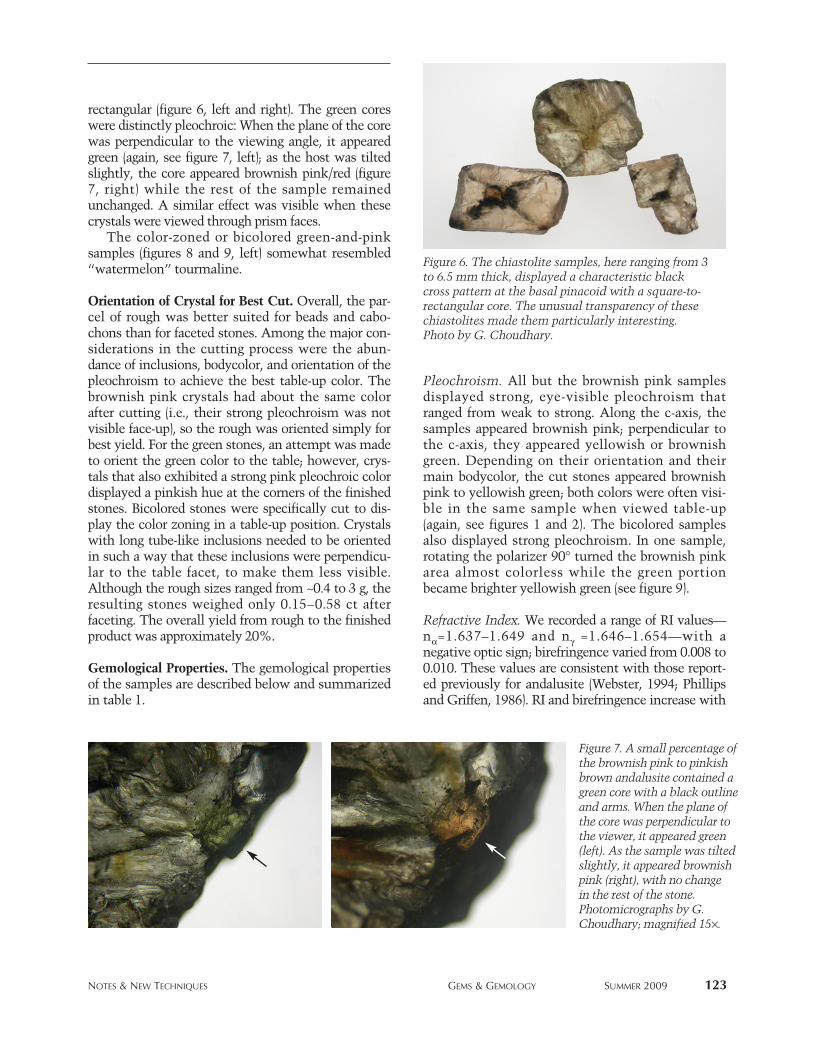
NOTES & NEW TECHNIQUES GEMS & GEMOLOGY SUMMER 2009 123
rectangular (figure 6, left and right). The green coreswere distinctly pleochroic: When the plane of the corewas perpendicular to the viewing angle, it appearedgreen (again, see figure 7, left); as the host was tiltedslightly, the core appeared brownish pink/red (figure7, right) while the rest of the sample remainedunchanged. A similar effect was visible when thesecrystals were viewed through prism faces.
The color-zoned or bicolored green-and-pinksamples (figures 8 and 9, left) somewhat resembled“watermelon” tourmaline.
Orientation of Crystal for Best Cut. Overall, the par-cel of rough was better suited for beads and cabo-chons than for faceted stones. Among the major con-siderations in the cutting process were the abun-dance of inclusions, bodycolor, and orientation of thepleochroism to achieve the best table-up color. Thebrownish pink crystals had about the same colorafter cutting (i.e., their strong pleochroism was notvisible face-up), so the rough was oriented simply forbest yield. For the green stones, an attempt was madeto orient the green color to the table; however, crys-tals that also exhibited a strong pink pleochroic colordisplayed a pinkish hue at the corners of the finishedstones. Bicolored stones were specifically cut to dis-play the color zoning in a table-up position. Crystalswith long tube-like inclusions needed to be orientedin such a way that these inclusions were perpendicu-lar to the table facet, to make them less visible.Although the rough sizes ranged from ~0.4 to 3 g, theresulting stones weighed only 0.15–0.58 ct afterfaceting. The overall yield from rough to the finishedproduct was approximately 20%.
Gemological Properties. The gemological propertiesof the samples are described below and summarizedin table 1.
Pleochroism. All but the brownish pink samplesdisplayed strong, eye-visible pleochroism thatranged from weak to strong. Along the c-axis, thesamples appeared brownish pink; perpendicular tothe c-axis, they appeared yellowish or brownishgreen. Depending on their orientation and theirmain bodycolor, the cut stones appeared brownishpink to yellowish green; both colors were often visi-ble in the same sample when viewed table-up(again, see figures 1 and 2). The bicolored samplesalso displayed strong pleochroism. In one sample,rotating the polarizer 90° turned the brownish pinkarea almost colorless while the green portionbecame brighter yellowish green (see figure 9).
Refractive Index. We recorded a range of RI values—nα=1.637–1.649 and nγ =1.646–1.654—with a negative optic sign; birefringence varied from 0.008 to0.010. These values are consistent with those report-ed previously for andalusite (Webster, 1994; Phillipsand Griffen, 1986). RI and birefringence increase with
Figure 6. The chiastolite samples, here ranging from 3to 6.5 mm thick, displayed a characteristic blackcross pattern at the basal pinacoid with a square-to-rectangular core. The unusual transparency of thesechiastolites made them particularly interesting.Photo by G. Choudhary.
Figure 7. A small percentage ofthe brownish pink to pinkishbrown andalusite contained agreen core with a black outlineand arms. When the plane ofthe core was perpendicular tothe viewer, it appeared green(left). As the sample was tiltedslightly, it appeared brownishpink (right), with no change in the rest of the stone.Photomicrographs by G.Choudhary; magnified 15×.

the increasing percentage of Mn (as in the viridinevariety) to as high as 1.690 with birefringence ofabout 0.025 (Phillips and Griffen, 1986), although notin our specimens. Measurements of the orientedsample revealed that the pinacoidal face (001), or α-ray direction, gave the lowest RIs and birefringence(0.008), while the polished corner (100) or (010) gavethe highest values (with maximum birefringence of0.009), indicating that it represented the b-axis or γ-ray direction. Such variations were reported previous-ly by Kerr (1959) and Phillips and Griffen (1986).
Specific Gravity. The samples had SG values in the3.11–3.16 range. Webster (1994) listed SG values of3.15–3.17, while Phillips and Griffen (1986) report-ed 3.13–3.16. The SG values of our samples aresimilar, though a few specimens had slightly lowervalues (probably due to fractures and surface-reach-ing inclusions).
Fluorescence. The samples were inert to long-waveUV radiation but fluoresced yellowish green toshort-wave UV; the intensity varied from moderateto strong. Webster (1994) and O’Donoghue (2006)
124 NOTES & NEW TECHNIQUES GEMS & GEMOLOGY SUMMER 2009
TABLE 1. Properties of the Brazilian andalusite specimens studied for this report.
Property Description
Color range Green, yellowish green to brownish green, brownish pink, bicolored green/pink, and pinkish brown (chiastolite)
Pleochroism Brownish pink (parallel to the c-axis)Yellowish or brownish green (perpen-dicular to the c-axis)
Diaphaneity Transparent to opaqueRefractive index nα = 1.637–1.649
nγ = 1.646–1.654Birefringence 0.008-0.010Optic sign Biaxial negative Specific gravity 3.11–3.16UV fluorescence
Long-wave InertShort-wave Moderate to strong yellowish green
Visible-range absorption Diffuse band at ~455 (weak to strong)spectrum in some samples
Microscopic features Two types of curved inclusions, minute films/discs, numerous mineral inclusions, “fingerprints,” pinpoints, twinning/growth patterns, cross pat-terns in chiastolite varieties
EDXRF analysis Presence of Al, Si, Fe, Ca, and Cr (twospecimens had Zn and Cu, probably due to contamination from the polish-ing wheels); no Mn detected in any samples
FTIR analysis Complete absorption up to 2100 cm−1;peaks at ~3687, 3652, and 3624 cm−1;twin peaks at ~3520 and 3460 cm−1; shoulders at ~3280 and 3095 cm−1
Raman analysis Several sharp peaks at ~1063, 917, 550, 463, 356, 325, and 290 cm−1; smaller peaks at ~1120, 850, and 717 cm−1
Figure 9. Many of theandalusite samples exhibit-ed color zoning in greenand brownish pink (left), acombination reminiscentof bicolored tourmalines.When the polarizer wasrotated 90°, the brownishpink area turned almostcolorless, while the greenportion became brighteryellowish green (right).Photomicrographs by G.Choudhary; magnified 25×.
Figure 8. Many bicolored samples of andalusiteappeared to display various growth stages, withtheir colors separated by a sharp plane marked bybrown granular inclusions. Photomicrograph byG. Choudhary; magnified 25×.

reported similar fluorescence reactions for andalusitefrom Brazil.
Absorption Spectrum. With a desk-model spectro-scope, a number of samples displayed a weak-to-strong diffuse band in the blue region at ~455 nm.When viewed along the c-axis, the absorptionappeared weaker than in the perpendicular direc-tion. Some samples did not exhibit any absorption.
Microscopic Features. The samples displayed a widerange of internal patterns, such as curved features,mineral inclusions, and various twinning/growthpatterns.
Curved Inclusion Features. Many samples containednumerous curvilinear inclusions, of which two differ-ent varieties were defined: Type 1 inclusions occurredin the pleochroic brownish pink/green stones, whiletype 2 were present in some chiastolitic samples.
The type 1 curved inclusions were colorless andtransparent, and had associated fine fringe-like filmsoriented perpendicular to their length (figure 10, left),giving the impression of icicles on branches. Thecross sections of the inclusions appeared rectangular
(figure 10, center), and between crossed polarizersthey were birefringent (figure 10, right), indicatingtheir mineral nature. Gübelin and Koivula (2008)reported sillimanite fibers in andalusite from SantaTeresa in Minas Gerais, Brazil. The possibility ofthese inclusions being sillimanite cannot be ruledout, since their appearance seems consistent withthe orthorhombic crystal form. Many of these inclu-sions also had a coating of some brownish epigeneticmaterial where they reached the surface (again, seefigure 10, left). EDXRF analysis of polished sliceswith these surface-reaching inclusions revealed thepresence of Cu and Zn, which were absent fromthose without such surface-reaching inclusions. TheCu and Zn may have originated from the polishingwheels used, which contained these elements.
The type 2 curved inclusions appeared to begrowth tubes filled with a brown or black material.Some samples displayed these tubes in parallel bun-dles oriented in various directions (figure 11, left).Each direction terminated at a sharp plane. In onespecimen, these planes created a rectangular/squareprofile. They also appeared to run across the stone(similar to a twin plane) in different directions. Athigher magnification, the tubes appeared to contain
NOTES & NEW TECHNIQUES GEMS & GEMOLOGY SUMMER 2009 125
Figure 11. Type 2 curvedinclusions consist of tubesthat are filled with a blackmaterial. In some samples,groups of these tubes were oriented in various directions(left). At higher magnification,the black material appearsgranular (right). Photomicro-graphs by G. Choudhary;magnified 30× (left, in immersion) and 80× (right).
Figure 10. Type 1 curved inclusions are colorless and transparent, often with fine fringes (left and center). Theyappear birefringent between crossed polarizers, indicating their mineral nature (right). Note the stained surfaceand angle of curvature of these tubes, which are bent almost 90°. Photomicrographs by G. Choudhary; magnified40× (left), 80× (center, brightfield illumination), and 70× (right, crossed polarizers).

126 NOTES & NEW TECHNIQUES GEMS & GEMOLOGY SUMMER 2009
a black granular material (figure 11, right). Similarinclusions have been reported in “trapiche” tour-maline (Hainschwang et al., 2007), where growthchannels are oriented in two directions. In our chi-astolite specimens, the varying orientations of thetubes may be attributed to twinning or differentstages of growth, as also indicated by the sharpgrowth zoning described below.
The angle of curvature in both types of inclu-sions typically was almost 90° (e.g., figure 10), whilesome appeared closer to 45°, as if originating frompyramidal faces. Most of the inclusions were orient-ed parallel to the c-axis.
A few samples displayed an interesting pattern of
type 2 tubes (figure 12). A central green core exhibit-ed curved tubes parallel to the c-axis, while the sur-rounding portions contained tubes that radiatedfrom the boundary with the core. The authors havepreviously observed a similar pattern of black tubesin chiastolites. Such a growth pattern indicates dif-ferent growth stages and directions of the overgrownareas, and is a characteristic of chiastolite.
Straight tubes with slightly wavy surfaces (figure13), oriented parallel to the c-axis, were also observedin the yellow-green and bicolored samples, as well asin the chiastolite with green cores.
Figure 12. In a few chiastolite specimens, a green corecontained tubes oriented parallel to the c-axis, whilethe surrounding area hosted tubes in a radiating pat-tern. Similar patterns of black tubes have beenobserved previously in chiastolite by the authors.Photomicrograph by G. Choudhary; magnified 25×.
Figure 13. Straight tubes with wavy surfaces, oriented parallel to the c-axis, were present in someof the andalusite samples. Photomicrograph by G. Choudhary; magnified 60×.
Figure 14. The andalusites commonly contained filmor platelet-like inclusions that appeared to be orientedalong the c-axis (vertical in this view), giving astringer-like pattern as in figure 10 (left). Photomicro-graph by G. Choudhary; magnified 65×.
Figure 15. In one sample, small films/fractures wereassociated in places with conical tube-like features(similar to nail-head spicules). These films were ori-ented roughly along the basal plane (horizontal in thisview), while the conical “tubes” were along the c-axis.Also note the growth zoning parallel to the c-axis. Inaddition, many scattered tiny inclusions were visiblethat could not be resolved clearly. Photomicrographby G. Choudhary; magnified 80×.
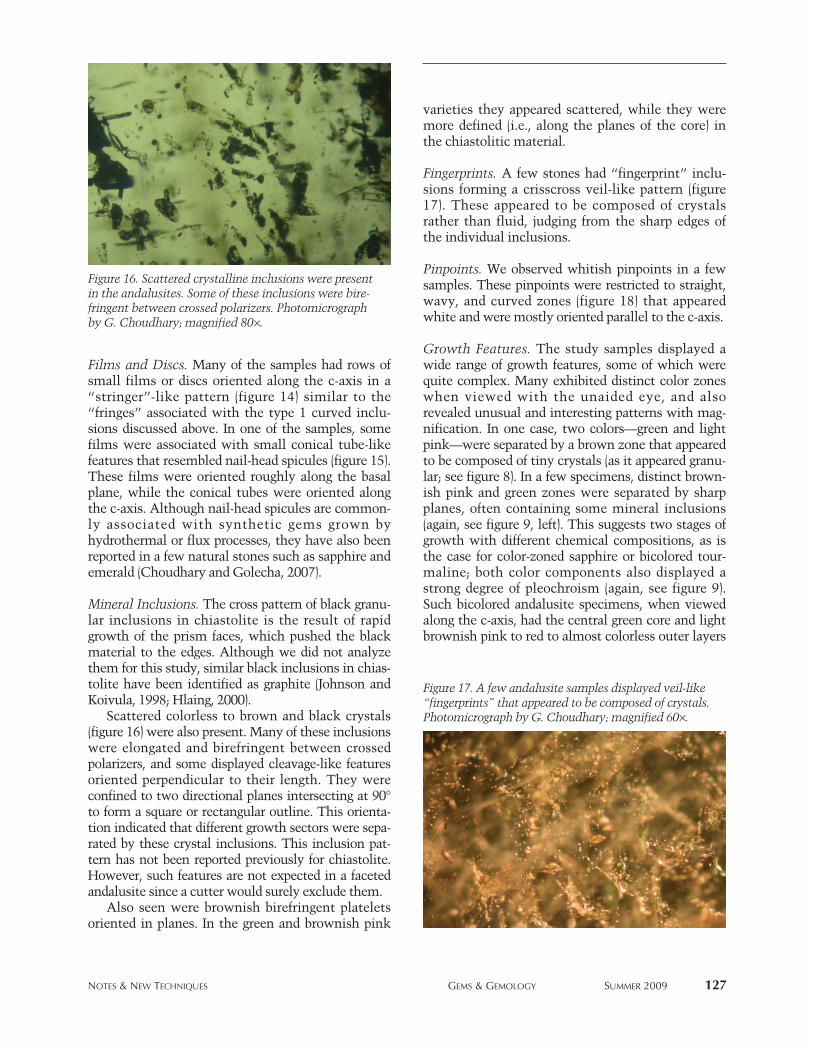
NOTES & NEW TECHNIQUES GEMS & GEMOLOGY SUMMER 2009 127
Films and Discs. Many of the samples had rows ofsmall films or discs oriented along the c-axis in a“stringer”-like pattern (figure 14) similar to the“fringes” associated with the type 1 curved inclu-sions discussed above. In one of the samples, somefilms were associated with small conical tube-likefeatures that resembled nail-head spicules (figure 15).These films were oriented roughly along the basalplane, while the conical tubes were oriented alongthe c-axis. Although nail-head spicules are common-ly associated with synthetic gems grown byhydrothermal or flux processes, they have also beenreported in a few natural stones such as sapphire andemerald (Choudhary and Golecha, 2007).
Mineral Inclusions. The cross pattern of black granu-lar inclusions in chiastolite is the result of rapidgrowth of the prism faces, which pushed the blackmaterial to the edges. Although we did not analyzethem for this study, similar black inclusions in chias-tolite have been identified as graphite (Johnson andKoivula, 1998; Hlaing, 2000).
Scattered colorless to brown and black crystals(figure 16) were also present. Many of these inclusionswere elongated and birefringent between crossedpolarizers, and some displayed cleavage-like featuresoriented perpendicular to their length. They wereconfined to two directional planes intersecting at 90°to form a square or rectangular outline. This orienta-tion indicated that different growth sectors were sepa-rated by these crystal inclusions. This inclusion pat-tern has not been reported previously for chiastolite.However, such features are not expected in a facetedandalusite since a cutter would surely exclude them.
Also seen were brownish birefringent plateletsoriented in planes. In the green and brownish pink
varieties they appeared scattered, while they weremore defined (i.e., along the planes of the core) inthe chiastolitic material.
Fingerprints. A few stones had “fingerprint” inclu-sions forming a crisscross veil-like pattern (figure17). These appeared to be composed of crystalsrather than fluid, judging from the sharp edges ofthe individual inclusions.
Pinpoints. We observed whitish pinpoints in a fewsamples. These pinpoints were restricted to straight,wavy, and curved zones (figure 18) that appearedwhite and were mostly oriented parallel to the c-axis.
Growth Features. The study samples displayed awide range of growth features, some of which werequite complex. Many exhibited distinct color zoneswhen viewed with the unaided eye, and alsorevealed unusual and interesting patterns with mag-nification. In one case, two colors—green and lightpink—were separated by a brown zone that appearedto be composed of tiny crystals (as it appeared granu-lar; see figure 8). In a few specimens, distinct brown-ish pink and green zones were separated by sharpplanes, often containing some mineral inclusions(again, see figure 9, left). This suggests two stages ofgrowth with different chemical compositions, as isthe case for color-zoned sapphire or bicolored tour-maline; both color components also displayed astrong degree of pleochroism (again, see figure 9).Such bicolored andalusite specimens, when viewedalong the c-axis, had the central green core and lightbrownish pink to red to almost colorless outer layers
Figure 16. Scattered crystalline inclusions were presentin the andalusites. Some of these inclusions were bire-fringent between crossed polarizers. Photomicrographby G. Choudhary; magnified 80×.
Figure 17. A few andalusite samples displayed veil-like“fingerprints” that appeared to be composed of crystals.Photomicrograph by G. Choudhary; magnified 60×.

128 NOTES & NEW TECHNIQUES GEMS & GEMOLOGY SUMMER 2009
following the crystal shape with a square-to-rectan-gular profile.
Many samples also displayed growth zones thatwere oriented parallel to the prism face or the c-axis(again, see figure 15). Some of the chiastolite sam-ples also exhibited wavy alternating yellow andbrown color and growth zones.
EDXRF Analysis. Qualitative EDXRF analysis wasperformed on polished samples as well as preforms.The samples were oriented to analyze both brown-ish pink and green areas to check for variations inchemical composition; this included color-zonedsamples as well as those of different homogeneousbodycolors. However, no chemical variations wereobserved. The analyses revealed the presence of Aland Si, as expected for andalusite. A minor amountof Fe was also detected, along with traces of Ca andCr. Manganese was not detected in any of the sam-ples, consistent with the low birefringence and theRI values.
FTIR Spectroscopy. The FTIR spectra displayedcomplete absorption below 2100 cm−1 and a numberof bands of varying intensity in the 3800–3000 cm−1
region (figure 19): three at ~3687, 3652, and 3624cm−1 in most samples; a pair at about 3520 and 3460cm−1 in almost all samples; two bands at ~3280 and3095 cm−1 in most samples; and weak features at~3380 and 3170 cm−1.
All the features recorded in this study are in thewater region of the IR spectrum and correspond tovibrations and stretching of OH molecules (Busignyet al., 2004; Balan et al., 2006). Although andalusiteis considered an anhydrous mineral, this suggeststhe presence of some water (H2O or OH), either in
the structure or in inclusions. The bands at 3520 and3460 cm−1 suggest that OH dipoles lie within the{001} basal plane of andalusite (Burt et al., 2007);these two features appeared much stronger when thespectra were collected along the c-axis or in thebrownish pink direction.
Raman Analysis. No directional variations wererecorded in the Raman spectra. There were severalsharp peaks at ~1063, 917, 550, 463, 356, 325, and290 cm−1, with smaller peaks at ~1120, 850, and 717cm−1. The spectral pattern is similar to those report-ed for andalusites in the RRUFF project database(www.rruff.info). Peaks in the 1150–800 cm−1 regionarise from Si-O stretching, while those below 600cm−1 are due to complex motions between O, OH,and SiO4 (Wang et al., 2002), suggesting the pres-ence of OH in the structure of the andalusite.
Treatment Experiments. Heat treatment at 350°Cand 550°C yielded no noticeable change in color;heating at 800°C resulted in only a subtle lighteningof the bodycolor, though it has been reported previ-ously that “olive” green andalusite from Brazilchanges to pink and brown, and then to colorless, at800°C (Nassau, 1994).
Microscopic examination of the samples heated atthe lower temperatures did not reveal any observableeffects. In the samples that were heated to 800°C,however, some changes were observed, though they
Figure 19. The infrared absorption spectra revealed anumber of weak-to-strong peaks in the 3800–3000 cm−1
region in both pleochroic directions. The peaks at3520 and 3460 cm−1 were much stronger in the brown-ish pink direction (parallel to the c-axis), suggestingthe presence of OH dipoles in the basal plane.
Figure 18. Fine whitish pinpoints arranged in straight,curved, or wavy zones were observed in a few anda-lusite samples. Photomicrograph by G. Choudhary;magnified 65×.
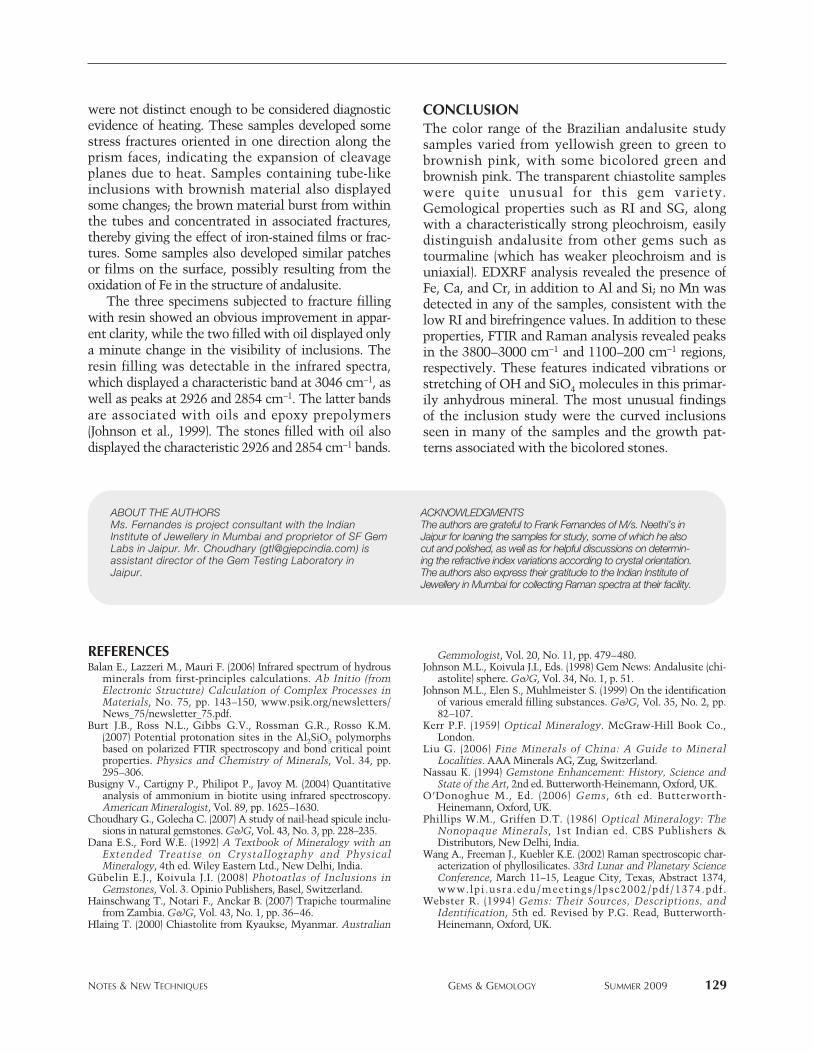
NOTES & NEW TECHNIQUES GEMS & GEMOLOGY SUMMER 2009 129
were not distinct enough to be considered diagnosticevidence of heating. These samples developed somestress fractures oriented in one direction along theprism faces, indicating the expansion of cleavageplanes due to heat. Samples containing tube-likeinclusions with brownish material also displayedsome changes; the brown material burst from withinthe tubes and concentrated in associated fractures,thereby giving the effect of iron-stained films or frac-tures. Some samples also developed similar patchesor films on the surface, possibly resulting from theoxidation of Fe in the structure of andalusite.
The three specimens subjected to fracture fillingwith resin showed an obvious improvement in appar-ent clarity, while the two filled with oil displayed onlya minute change in the visibility of inclusions. Theresin filling was detectable in the infrared spectra,which displayed a characteristic band at 3046 cm−1, aswell as peaks at 2926 and 2854 cm−1. The latter bandsare associated with oils and epoxy prepolymers(Johnson et al., 1999). The stones filled with oil alsodisplayed the characteristic 2926 and 2854 cm−1 bands.
CONCLUSIONThe color range of the Brazilian andalusite studysamples varied from yellowish green to green tobrownish pink, with some bicolored green andbrownish pink. The transparent chiastolite sampleswere quite unusual for this gem variety.Gemological properties such as RI and SG, alongwith a characteristically strong pleochroism, easilydistinguish andalusite from other gems such astourmaline (which has weaker pleochroism and isuniaxial). EDXRF analysis revealed the presence ofFe, Ca, and Cr, in addition to Al and Si; no Mn wasdetected in any of the samples, consistent with thelow RI and birefringence values. In addition to theseproperties, FTIR and Raman analysis revealed peaksin the 3800–3000 cm−1 and 1100–200 cm−1 regions,respectively. These features indicated vibrations orstretching of OH and SiO4 molecules in this primar-ily anhydrous mineral. The most unusual findingsof the inclusion study were the curved inclusionsseen in many of the samples and the growth pat-terns associated with the bicolored stones.
REFERENCESBalan E., Lazzeri M., Mauri F. (2006) Infrared spectrum of hydrous
minerals from first-principles calculations. Ab Initio (fromElectronic Structure) Calculation of Complex Processes inMaterials, No. 75, pp. 143–150, www.psik.org/newsletters/News_75/newsletter_75.pdf.
Burt J.B., Ross N.L., Gibbs G.V., Rossman G.R., Rosso K.M.(2007) Potential protonation sites in the Al2SiO5 polymorphsbased on polarized FTIR spectroscopy and bond critical pointproperties. Physics and Chemistry of Minerals, Vol. 34, pp.295–306.
Busigny V., Cartigny P., Philipot P., Javoy M. (2004) Quantitativeanalysis of ammonium in biotite using infrared spectroscopy.American Mineralogist, Vol. 89, pp. 1625–1630.
Choudhary G., Golecha C. (2007) A study of nail-head spicule inclu-sions in natural gemstones. G&G, Vol. 43, No. 3, pp. 228–235.
Dana E.S., Ford W.E. (1992) A Textbook of Mineralogy with anExtended Treatise on Crystallography and PhysicalMineralogy, 4th ed. Wiley Eastern Ltd., New Delhi, India.
Gübelin E.J., Koivula J.I. (2008) Photoatlas of Inclusions inGemstones, Vol. 3. Opinio Publishers, Basel, Switzerland.
Hainschwang T., Notari F., Anckar B. (2007) Trapiche tourmalinefrom Zambia. G&G, Vol. 43, No. 1, pp. 36–46.
Hlaing T. (2000) Chiastolite from Kyaukse, Myanmar. Australian
Gemmologist, Vol. 20, No. 11, pp. 479–480.Johnson M.L., Koivula J.I., Eds. (1998) Gem News: Andalusite (chi-
astolite) sphere. G&G, Vol. 34, No. 1, p. 51.Johnson M.L., Elen S., Muhlmeister S. (1999) On the identification
of various emerald filling substances. G&G, Vol. 35, No. 2, pp.82–107.
Kerr P.F. (1959) Optical Mineralogy. McGraw-Hill Book Co.,London.
Liu G. (2006) Fine Minerals of China: A Guide to MineralLocalities. AAA Minerals AG, Zug, Switzerland.
Nassau K. (1994) Gemstone Enhancement: History, Science andState of the Art, 2nd ed. Butterworth-Heinemann, Oxford, UK.
O’Donoghue M., Ed. (2006) Gems, 6th ed. Butterworth-Heinemann, Oxford, UK.
Phillips W.M., Griffen D.T. (1986) Optical Mineralogy: TheNonopaque Minerals, 1st Indian ed. CBS Publishers &Distributors, New Delhi, India.
Wang A., Freeman J., Kuebler K.E. (2002) Raman spectroscopic char-acterization of phyllosilicates. 33rd Lunar and Planetary ScienceConference, March 11–15, League City, Texas, Abstract 1374,www.lpi.usra.edu/meetings/lpsc2002/pdf/1374.pdf.
Webster R. (1994) Gems: Their Sources, Descriptions, andIdentification, 5th ed. Revised by P.G. Read, Butterworth-Heinemann, Oxford, UK.
ABOUT THE AUTHORSMs. Fernandes is project consultant with the IndianInstitute of Jewellery in Mumbai and proprietor of SF GemLabs in Jaipur. Mr. Choudhary ([email protected]) isassistant director of the Gem Testing Laboratory inJaipur.
ACKNOWLEDGMENTSThe authors are grateful to Frank Fernandes of M/s. Neethi’s inJaipur for loaning the samples for study, some of which he alsocut and polished, as well as for helpful discussions on determin-ing the refractive index variations according to crystal orientation.The authors also express their gratitude to the Indian Institute ofJewellery in Mumbai for collecting Raman spectra at their facility.

130 RAPID COMMUNICATION GEMS & GEMOLOGY SUMMER 2009
eridot has been reported from many sources world-wide, but the localities with historical or contempo-
rary commercial importance are Zabargad (Egypt), Arizona(United States), Myanmar, China, Vietnam, Ethiopia,Tanzania, and Pakistan (Shigley et al., 1990, 2000; Kane, 2004).
Some attractive peridot has also been found in Italy(Bianchi Potenza et al., 1989, 1991). Gem-quality stones(e.g., figure 1), typically <3 ct when faceted, have beenrecovered from an area near Pozzomaggiore, close to thecity of Sassari, in northwestern Sardinia (figure 2). Theolivine occurs in peridotite mantle xenoliths (figure 3)embedded in Plio-Pleistocene alkali basalts (Dupuy et al.,1987). These nodules range up to 30 cm in diameter andcontain a typical peridotite assemblage of olivine, orthopy-roxene, clinopyroxene, and spinel (Dupuy et al., 1987). Thenodules are clearly visible in great abundance in this area,especially in excavations made for road construction andalso in blocks used as building materials (Bianchi Potenzaet al., 1991). The olivine-bearing basalts have been wellknown to Italian mineral collectors for years, though thereare no reliable records of the amount of gem materialrecovered to date. The present study provides a detailedcharacterization of this Sardinian peridot.
Materials and Methods. We examined 10 faceted gemsranging from 0.14 to 2.53 ct (see, e.g., figure 1) and twopieces of rough measuring approximately 0.5–1 cm, allobtained from six fragments sampled in nodules recoveredin situ from basaltic rocks near Pozzomaggiore. All thefaceted samples were examined by standard gemologicalmethods to determine their optical properties, specificgravity, UV fluorescence, and microscopic features.
Quantitative chemical analyses of major and minorelements (Mg, Si, Mn, Fe, and Ni) were performed on pol-ished surfaces of two rough samples using an ARL electronmicroprobe in wavelength-dispersive mode. We deter-mined trace elements (Li, B, Na, Ca, Sc, Ti, V, Cr, Co, Zn)in the same samples by laser ablation–inductively coupledplasma–mass spectrometry (LA-ICP-MS).
Mid-infrared (4000–400 cm−1) spectra were collectedfrom two rough samples in transmission mode using aNicolet Nexus FTIR spectrometer. Powdered samples
CHARACTERIZATION OF PERIDOT FROMSARDINIA, ITALY
Ilaria Adamo, Rosangela Bocchio, Alessandro Pavese, and Loredana Prosperi
Gem-quality peridot is occasionally found as mantlexenoliths within basalts near Pozzomaggiore, innorthwestern Sardinia, Italy. The gemological prop-erties and spectroscopic features of this material areconsistent with the measured chemical compositionof Fo91Fa9, typical of peridot from other localitiesworldwide. Although not yet mined commercially,this stone represents a promising gem material.
P
See end of article for About the Authors and Acknowledgments.GEMS & GEMOLOGY, Vol. 45, No. 2, pp. 130–133.© 2009 Gemological Institute of America
Figure 1. These peridots from Sardinia (0.31–2.53 ct)are among the samples investigated for this report.
Photo by Kevin Schumacher.
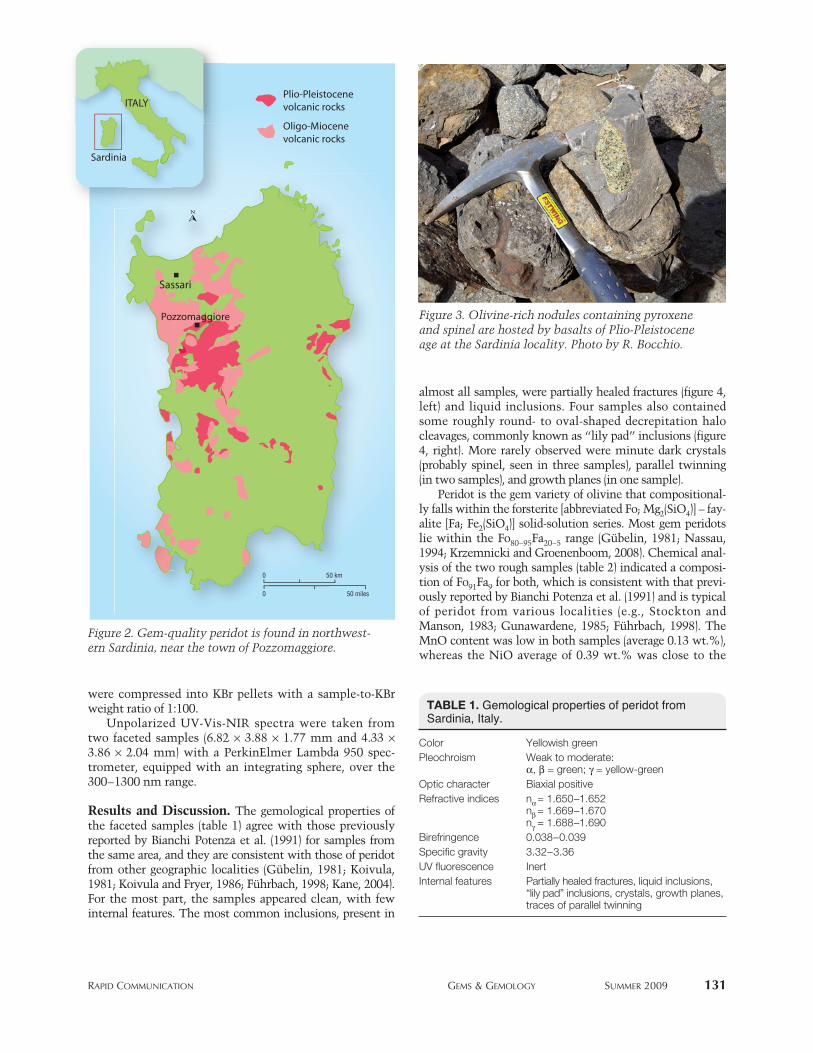
RAPID COMMUNICATION GEMS & GEMOLOGY SUMMER 2009 131
were compressed into KBr pellets with a sample-to-KBrweight ratio of 1:100.
Unpolarized UV-Vis-NIR spectra were taken fromtwo faceted samples (6.82 × 3.88 × 1.77 mm and 4.33 ×3.86 × 2.04 mm) with a PerkinElmer Lambda 950 spec-trometer, equipped with an integrating sphere, over the300–1300 nm range.
Results and Discussion. The gemological properties ofthe faceted samples (table 1) agree with those previouslyreported by Bianchi Potenza et al. (1991) for samples fromthe same area, and they are consistent with those of peridotfrom other geographic localities (Gübelin, 1981; Koivula,1981; Koivula and Fryer, 1986; Führbach, 1998; Kane, 2004).For the most part, the samples appeared clean, with fewinternal features. The most common inclusions, present in
almost all samples, were partially healed fractures (figure 4,left) and liquid inclusions. Four samples also containedsome roughly round- to oval-shaped decrepitation halocleavages, commonly known as “lily pad” inclusions (figure4, right). More rarely observed were minute dark crystals(probably spinel, seen in three samples), parallel twinning(in two samples), and growth planes (in one sample).
Peridot is the gem variety of olivine that compositional-ly falls within the forsterite [abbreviated Fo; Mg2(SiO4)] – fay-alite [Fa; Fe2(SiO4)] solid-solution series. Most gem peridotslie within the Fo80–95Fa20–5 range (Gübelin, 1981; Nassau,1994; Krzemnicki and Groenenboom, 2008). Chemical anal-ysis of the two rough samples (table 2) indicated a composi-tion of Fo91Fa9 for both, which is consistent with that previ-ously reported by Bianchi Potenza et al. (1991) and is typicalof peridot from various localities (e.g., Stockton andManson, 1983; Gunawardene, 1985; Führbach, 1998). TheMnO content was low in both samples (average 0.13 wt.%),whereas the NiO average of 0.39 wt.% was close to the
Figure 2. Gem-quality peridot is found in northwest-ern Sardinia, near the town of Pozzomaggiore.
Figure 3. Olivine-rich nodules containing pyroxeneand spinel are hosted by basalts of Plio-Pleistoceneage at the Sardinia locality. Photo by R. Bocchio.
TABLE 1. Gemological properties of peridot from Sardinia, Italy.
Color Yellowish green Pleochroism Weak to moderate:
α, β = green; γ = yellow-green Optic character Biaxial positive Refractive indices nα= 1.650–1.652
nβ = 1.669–1.670nγ = 1.688–1.690
Birefringence 0.038–0.039 Specific gravity 3.32–3.36 UV fluorescence Inert Internal features Partially healed fractures, liquid inclusions,
“lily pad” inclusions, crystals, growth planes,traces of parallel twinning
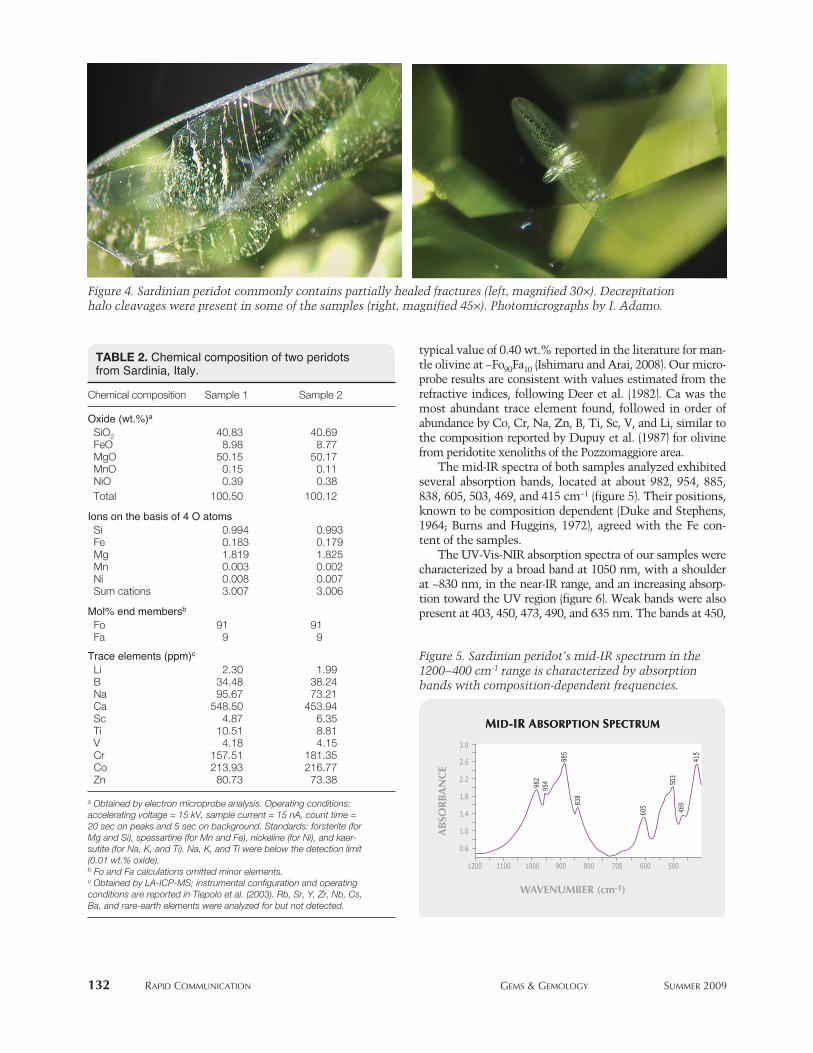
132 RAPID COMMUNICATION GEMS & GEMOLOGY SUMMER 2009
typical value of 0.40 wt.% reported in the literature for man-tle olivine at ~Fo90Fa10 (Ishimaru and Arai, 2008). Our micro-probe results are consistent with values estimated from therefractive indices, following Deer et al. (1982). Ca was themost abundant trace element found, followed in order ofabundance by Co, Cr, Na, Zn, B, Ti, Sc, V, and Li, similar tothe composition reported by Dupuy et al. (1987) for olivinefrom peridotite xenoliths of the Pozzomaggiore area.
The mid-IR spectra of both samples analyzed exhibitedseveral absorption bands, located at about 982, 954, 885,838, 605, 503, 469, and 415 cm−1 (figure 5). Their positions,known to be composition dependent (Duke and Stephens,1964; Burns and Huggins, 1972), agreed with the Fe con-tent of the samples.
The UV-Vis-NIR absorption spectra of our samples werecharacterized by a broad band at 1050 nm, with a shoulderat ~830 nm, in the near-IR range, and an increasing absorp-tion toward the UV region (figure 6). Weak bands were alsopresent at 403, 450, 473, 490, and 635 nm. The bands at 450,
TABLE 2. Chemical composition of two peridotsfrom Sardinia, Italy.
Chemical composition Sample 1 Sample 2
Oxide (wt.%)a
SiO2 40.83 40.69FeO 8.98 8.77MgO 50.15 50.17MnO 0.15 0.11NiO 0.39 0.38Total 100.50 100.12
Ions on the basis of 4 O atomsSi 0.994 0.993Fe 0.183 0.179Mg 1.819 1.825Mn 0.003 0.002Ni 0.008 0.007Sum cations 3.007 3.006
Mol% end membersb
Fo 91 91Fa 9 9
Trace elements (ppm)c
Li 2.30 1.99B 34.48 38.24Na 95.67 73.21Ca 548.50 453.94Sc 4.87 6.35Ti 10.51 8.81V 4.18 4.15Cr 157.51 181.35Co 213.93 216.77Zn 80.73 73.38
a Obtained by electron microprobe analysis. Operating conditions:accelerating voltage = 15 kV, sample current = 15 nA, count time =20 sec on peaks and 5 sec on background. Standards: forsterite (forMg and Si), spessartine (for Mn and Fe), nickeline (for Ni), and kaer-sutite (for Na, K, and Ti). Na, K, and Ti were below the detection limit(0.01 wt.% oxide).b Fo and Fa calculations omitted minor elements.c Obtained by LA-ICP-MS; instrumental configuration and operating conditions are reported in Tiepolo et al. (2003). Rb, Sr, Y, Zr, Nb, Cs, Ba, and rare-earth elements were analyzed for but not detected.
Figure 5. Sardinian peridot’s mid-IR spectrum in the1200–400 cm-1 range is characterized by absorptionbands with composition-dependent frequencies.
Figure 4. Sardinian peridot commonly contains partially healed fractures (left, magnified 30×). Decrepitationhalo cleavages were present in some of the samples (right, magnified 45×). Photomicrographs by I. Adamo.

RAPID COMMUNICATION GEMS & GEMOLOGY SUMMER 2009 133
473, and 490 nm were visible with a hand spectroscope aswell, with total absorption below ~440 nm. All these spec-tral features, which have been observed in peridot fromother localities (see, e.g., Kammerling and Koivula, 1995;Führbach, 1998), are due to the presence of Fe2+ (Burns,1970), confirming that iron is mainly responsible for the col-oration. However, some absorption bands could also be con-tributed by the other chromophores in our samples, such aschromium (Rossman, 1988).
On the basis of the samples examined, the Sardinianperidot cannot be distinguished from peridot of otherknown localities.
Conclusions. The physical and chemical properties ofperidot from near the town of Pozzomaggiore in north-western Sardinia lie within the range of those reported forperidot specimens sampled worldwide. Thus far, becauseof the greater availability and larger sizes of peridot fromother localities, the Sardinian material has remained with-in the Italian gemological community. The results of thisstudy indicate that Sardinian peridot is worthy of atten-tion as a gem material, and might have a market niche ifproperly mined and distributed.
ABOUT THE AUTHORSDr. Adamo ([email protected]) is a postdoctoral fellow,and Drs. Bocchio and Pavese are professors of mineralogy,at the University of Milan, Italy. Dr. Prosperi is director of theItalian Gemological Institute laboratory in Milan.
ACKNOWLEDGMENTSThe authors are grateful to Dr. Massimo Tiepolo (CNR—Geosciences and Georesources Institute, Pavia, Italy) for LA-ICP-MS analyses, and Drs. Valentina Palanza and GiorgioSpinolo (University of Milan–Bicocca, Italy) for UV-Vis-NIRspectroscopy. The Geosciences and GeotechnologiesDepartment of the University of Milan–Bicocca, and Dr.Vanda Rolandi, are acknowledged for assistance with takingphotomicrographs. The manuscript benefited from the criti-cal reviews of Drs. Lore Kiefert and Mary L. Johnson.
REFERENCESBianchi Potenza B., De Michele V., Liborio G., Nana G.P. (1989)
Olivine from Val Malenco (Sondrio), Italy: A material of gemmo-logical interest. La Gemmologia, Vol. 14, No. 3–4, pp. 23–33 [inItalian].
Bianchi Potenza B., De Michele V., Liborio G., Rizzo R. (1991)Olivines from Sardinia (Italy): A material of gemmological inter-est. La Gemmologia, Vol. 16, pp. 17–28 [in Italian].
Burns R.G. (1970) Crystal field spectra and evidence of cation order-ing in olivine minerals. American Mineralogist, Vol. 55, No.9/10, pp. 1608–1632.
Burns R.G., Huggins F.E. (1972) Cation determinative curves forMg-Fe-Mn olivines from vibrational spectra. AmericanMineralogist, Vol. 57, No. 5/6, pp. 967–985.
Deer W.A., Howie R.A., Zussman J. (1982) Orthosilicates. Rock-Forming Minerals, Vol. 1A, 2nd ed. Longman, London, pp. 3–336.
Duke D.A., Stephens J.D. (1964) Infrared investigation of the olivinegroup minerals. American Mineralogist, Vol. 49, No. 9/10, pp.1388–1406.
Dupuy C., Dostal J., Bodinier J.-L. (1987) Geochemistry of spinelperidotite inclusions in basalts from Sardinia. MineralogicalMagazine, Vol. 51, No. 362, pp. 561–568.
Führbach J.R. (1998) Peridot from the Black Rock Summit lavaflow, Nye County, Nevada, USA. Journal of Gemmology, Vol.26, No. 2, pp. 86–102.
Gübelin E. (1981) Zabargad: The ancient peridot island in the RedSea. G&G, Vol. 17, No. 1, pp. 2–8.
Gunawardene M. (1985) Peridot from Ratnapura district, Sri Lanka.Journal of Gemmology, Vol. 19, No. 8, pp. 692–702.
Ishimaru S., Arai S. (2008) Nickel enrichment in mantle olivinebeneath a volcanic front. Contributions to Mineralogy and
Petrology, Vol. 156, No. 1, pp. 119–131.Kane R.E. (2004) The creation of a magnificent suite of peridot jew-
elry: From the Himalayas to Fifth Avenue. G&G, Vol. 40, No. 4,pp. 288–302.
Kammerling R.C., Koivula J.I. (1995) An examination of peridot fromEthiopia. Australian Gemmologist, Vol. 19, No. 4, pp. 190–194.
Koivula J.I. (1981) San Carlos peridot. G&G, Vol. 17, No. 4, pp.205–214.
Koivula J.I., Fryer C.W. (1986) The gemological characteristics ofChinese peridot. G&G, Vol. 22, No. 1, pp. 38–40.
Krzemnicki M.S., Groenenboom P. (2008) Gem News Inter-national: Colorless forsterite from Mogok, Myanmar. G&G,Vol. 44, No. 3, pp. 263–265.
Nassau K. (1994) Synthetic forsterite and synthetic peridot. G&G,Vol. 30, No. 2, pp. 102–108.
Rossman G.R. (1988) Optical spectroscopy. In F. C. Hawthorne, Ed.,Spectroscopic Methods in Mineralogy and Geology, Reviews inMineralogy, Vol. 18, Mineralogical Society of America,Washington, DC, pp. 207–254.
Shigley J.E., Dirlam D.M., Laurs B.M., Boehm E.W., Bosshart G.,Larson W.F. (2000) Gem localities of the 1990s. G&G, Vol. 36,No. 4, pp. 292–335.
Shigley J.E., Dirlam D.M., Schmetzer K., Jobbins E.A. (1990) Gemlocalities of the 1980s. G&G, Vol. 26, No. 1, pp. 4–31.
Stockton C.M., Manson D.V. (1983) Peridot from Tanzania. G&G,Vol. 19, No. 2, pp. 103–107.
Tiepolo M., Bottazzi P., Palenzona M., Vannucci R. (2003) A laserprobe coupled with ICP-double focusing sector-field mass spec-trometer for in situ analysis of geological samples and U-Pb datingof zircon. Canadian Mineralogist, Vol. 41, No. 2, pp. 259–272.
Figure 6. The UV-Vis-NIR spectrum of Sardinian peri-dot is mainly characterized by Fe2+ absorption features.
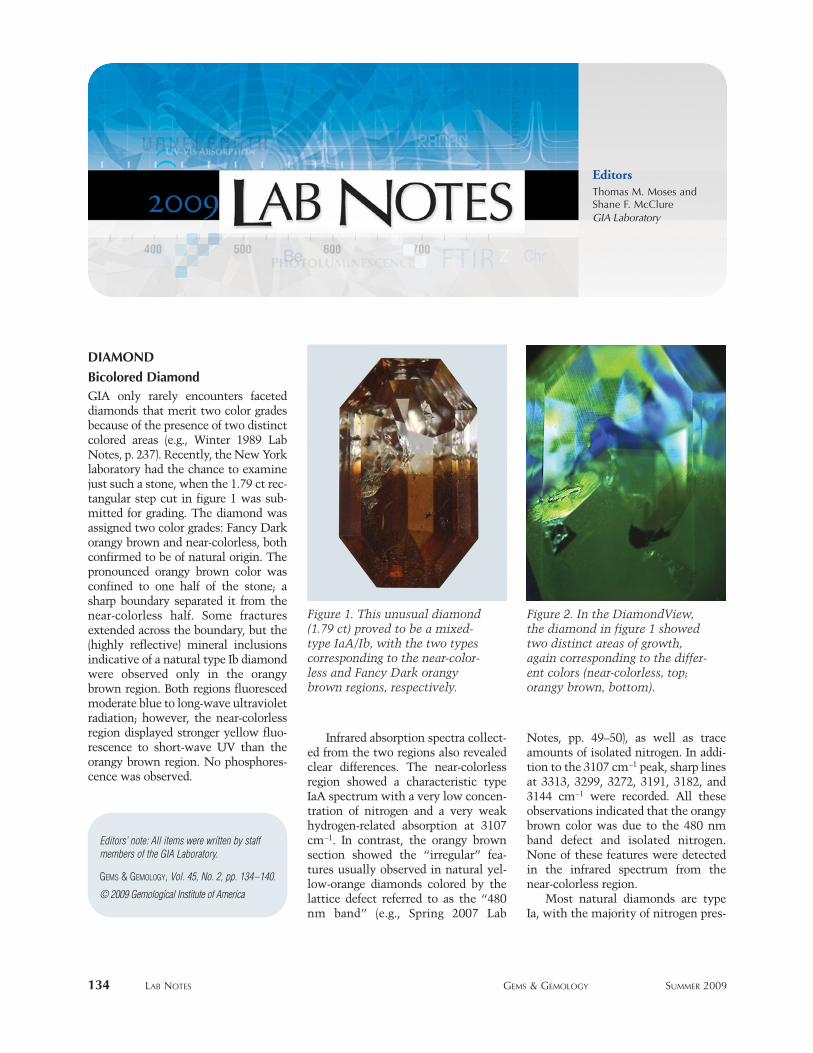
134 LAB NOTES GEMS & GEMOLOGY SUMMER 2009
DIAMOND
Bicolored DiamondGIA only rarely encounters faceteddiamonds that merit two color gradesbecause of the presence of two distinctcolored areas (e.g., Winter 1989 LabNotes, p. 237). Recently, the New Yorklaboratory had the chance to examinejust such a stone, when the 1.79 ct rec-tangular step cut in figure 1 was sub-mitted for grading. The diamond wasassigned two color grades: Fancy Darkorangy brown and near-colorless, bothconfirmed to be of natural origin. Thepronounced orangy brown color wasconfined to one half of the stone; asharp boundary separated it from thenear-colorless half. Some fracturesextended across the boundary, but the(highly reflective) mineral inclusionsindicative of a natural type Ib diamondwere observed only in the orangybrown region. Both regions fluorescedmoderate blue to long-wave ultravioletradiation; however, the near-colorlessregion displayed stronger yellow fluo-rescence to short-wave UV than theorangy brown region. No phosphores-cence was observed.
Infrared absorption spectra collect-ed from the two regions also revealedclear differences. The near-colorlessregion showed a characteristic typeIaA spectrum with a very low concen-tration of nitrogen and a very weakhydrogen-related absorption at 3107cm–1. In contrast, the orangy brownsection showed the “irregular” fea-tures usually observed in natural yel-low-orange diamonds colored by thelattice defect referred to as the “480nm band” (e.g., Spring 2007 Lab
Notes, pp. 49–50), as well as traceamounts of isolated nitrogen. In addi-tion to the 3107 cm–1 peak, sharp linesat 3313, 3299, 3272, 3191, 3182, and3144 cm–1 were recorded. All theseobservations indicated that the orangybrown color was due to the 480 nmband defect and isolated nitrogen.None of these features were detectedin the infrared spectrum from thenear-colorless region.
Most natural diamonds are typeIa, with the majority of nitrogen pres-
EditorsThomas M. Moses andShane F. McClureGIA Laboratory
© 2009 Gemological Institute of America
GEMS & GEMOLOGY, Vol. 45, No. 2, pp. 134–140.
Editors’ note: All items were written by staffmembers of the GIA Laboratory.
Figure 1. This unusual diamond(1.79 ct) proved to be a mixed-type IaA/Ib, with the two typescorresponding to the near-color-less and Fancy Dark orangybrown regions, respectively.
Figure 2. In the DiamondView,the diamond in figure 1 showedtwo distinct areas of growth,again corresponding to the differ-ent colors (near-colorless, top;orangy brown, bottom).

LAB NOTES GEMS & GEMOLOGY SUMMER 2009 135
ent as IaA aggregates. Type Ib singlysubstituted nitrogen rarely occurs innatural diamonds. When present innatural stones, it can cause an orange-yellow (“canary”) color, occasionallywith brownish or, rarely, reddishmodifiers (e.g., Fall 2008 Lab Notes,pp. 255–256). This bicolored dia-mond contained both type Ia aggre-gated nitrogen and type Ib isolatednitrogen. While it is not unusual for adiamond to contain different forms ofnitrogen aggregates, the sharply defineddistribution of these defects withrespect to the distinct color zones isunusual.
DiamondView imaging indicatedthat this stone may have crystallizedduring two different periods of growthand in two different growth environ-ments (figure 2). Distinct differences indefect configuration between the twosections also suggest that the nitrogenaggregation process after diamondcrystallization in the mantle may havebeen affected by factors (e.g., occur-rence of other lattice defects) in addi-tion to temperature and duration.
Erica Emerson, Paul Johnson,and Wai Win
“Black” Diamond with Deep Violet ColorBlack diamonds are not uncommon inthe gem trade, but naturally coloredexamples are relatively rare. Mostblack diamonds currently in the mar-ket are produced by the heating offractured diamond to high tempera-tures in a vacuum to induce graphiti-zation of the feathers and inclusions.The result is a nearly opaque stonethat contains so much graphite thatthe diamond will conduct an electriccurrent. In the past, treatmentsinvolving heavy-dose irradiation orirradiation plus annealing have alsobeen used to produce black diamondsthat are, in reality, very dark greenwhen viewed with strong fiber-opticillumination. On occasion, we haveseen other very dark colors, such asorange and blue. Naturally coloredblack diamonds typically containabundant dark inclusions (sometimes
graphite) that cause the stones toappear black when viewed face-up.Dense, dark-colored hydrogen cloudshave also been reported as a naturalcause of black color in diamonds (seeLab Notes: Fall 2008, p. 254; Spring2009, pp. 54–55).
Recently, we examined an inter-esting 0.4 ct marquise brilliant in theCarlsbad laboratory. The tone of thediamond was so dark when it wasviewed face-up that the stone wasgraded Fancy black (figure 3, top).Table-down examination in a whitetray, however, revealed that the body-color of the diamond was in fact a verydeep violet (figure 3, bottom). This isremarkable because we had not previ-ously seen a violet diamond with sucha dark tone.
The diamond’s infrared absorptionspectrum (see the G&G Data Deposi-tory at www.gia.edu/gandg) showedthat it was type Ia with very high con-centrations of nitrogen and hydrogen
impurities. As is typical of naturalhydrogen-rich violet diamonds, thestone contained shallow etch pits andcavities, and fluoresced yellow to bothlong- and short-wave UV radiation (C.van der Bogert et al., “Gray-to-blue-to-violet hydrogen-rich diamonds fromthe Argyle mine, Australia,” Spring2009 G&G, pp. 20–37).
This marquise cut represents anextremely rare type of black diamond.It was issued a “natural” color originreport.
Christopher M. Breeding andKimberly M. Rockwell
Carved Diamond CrucifixIt is not unusual to see carved dia-monds submitted to the laboratory foridentification. Over the years, theyhave come in many forms, such ascarved fish (Spring 1983 Lab Notes, p.73) or dice (Fall 1985 Lab Notes, p.172). Carved diamonds with religiousthemes have also been submitted,including one fashioned as a Hamsa,symbolizing the protective hand of thecreator (Fall 2001 Lab Notes, p. 214),and another cut in the image of theBuddha (Fall 1996 Gem News, p. 215).In reviewing our records, however, itdoes not appear that we have previous-ly examined a crucifix such as the oneshown in figure 4.
This piece consisted of a carving ofChrist on a white metal cross; theChrist figure was determined to bediamond by Raman analysis. Thegrayish appearance of the diamondwas due to numerous graphite-con-taining fractures. There was also evi-dence of the rough diamond crystal atone point on the carving, a corner of atrigon and some striations.
While many diamond carvingstoday are created using lasers, theclient stated that this crucifix hadbeen fashioned by a now-deceasedIndian master carver using just handtools. Only a skilled craftsman withexceptional patience could performthis type of carving, in this detail. Toour knowledge, this diamond crucifixis unique.
Garry Du Toit
Figure 3. This 0.4 ct diamond wasgraded Fancy black. When viewedthrough the pavilion (bottom), thestone shows deep violet color.

136 LAB NOTES GEMS & GEMOLOGY SUMMER 2009
Rare Type IIb Gray-Green DiamondNatural type IIb diamonds are very rare.Among those we have examined in theGIA Laboratory, only about half showeda pure blue color, with the other halfdisplaying an additional gray compo-nent due to varying levels of saturation.Two of the most famous type IIb dia-monds, the Hope and the Wittelsbach,were color graded Fancy Deep grayishblue. Occasionally, brown diamondswith type IIb characteristics have alsobeen seen (e.g., Summer 1977 LabNotes, p. 307; Winter 2008 Lab Notes,pp. 364–365). Recently, staff membersin the New York laboratory had theopportunity to examine an extremelyrare type IIb diamond for which thedominant color was green.
The 5.41 ct marquise brilliant cutin figure 5 was color graded FancyDark gray-green. With magnification,the diamond showed only minor frac-tures reaching the surface. It had noreaction to either long- or short-waveUV radiation, which is characteristicof type IIb diamonds. When examinedunder the strong short-wave UV radia-
tion of the DiamondView, it showedmoderately strong blue florescenceand weak red phosphorescence.
Infrared and photoluminescence
spectroscopy revealed features ob-served in other natural type IIb dia-monds. No evidence of artificial irradi-ation was detected. However, someunusual features were observed in theultraviolet-visible–near infrared region(see the spectrum in the G&G DataDepository at www.gia.edu/gandg). Incontrast to typical blue IIb diamonds,which often show a uniform increasein absorption from the UV toward thelower energy/longer wavelength side,this diamond displayed increasingabsorption from ~500 nm toward thehigher energy/shorter wavelength side.As a result, a transmission windowwas created from ~500 to 525 nm,leading to the dominant green hue.This increase in absorption from ~500nm to shorter wavelengths is very like-ly caused by plastic deformation of thecrystal lattice, a common feature inmany natural diamonds.
A natural type IIb diamond with adominant green hue is extremely rare.This unusual color is a result of theright combination of boron concen-tration, intensity of plastic deforma-tion, and influence of the cut style.
Paul Johnson and Jason Darley
Unconventional Diamond CutsIn March, the New York lab received anumber of diamonds with unusual andunconventional facet distributions.They ranged in shape from round andcushion to pear and rectangular, but allhad one feature in common: a fullyfaceted dome-shaped crown, witheither no table at all or only a tiny“culet”-style facet in the center of thecrown (figure 6). We were surprised tosee these experimental cuts beingapplied to fairly large diamonds, mostof them between 2 and 7 ct, as well asto diamonds of different colors.
Diamond cuts that lack a tablefacet invariably pose challenges forcalculating overall dimensions andcrown and pavilion angles, since typi-cally the table serves as the basic ref-erence plane against which theseangles are measured. The cut descrip-tion (shape and cutting style) alsobecomes more difficult, because none
Figure 5. This highly unusualFancy Dark gray-green diamond(16.54 × 9.13 × 5.87 mm) provedto be type IIb.
Figure 4. This unique crucifix (27.12 × 7.24 × 4.25 mm) consisted of a carveddiamond set on a white metal cross.

LAB NOTES GEMS & GEMOLOGY SUMMER 2009 137
of the standard terms in the GIA lexicon fully explain these designs.
We were pleasantly surprised,however, to see that a number of thestones showed a balanced contrastpattern, which is very unusual fornontraditional diamond cuts (andeven for the standard fancy cuts).When we compared one of the roundshapes with a round brilliant cut (grad-ed by GIA as “Excellent”) of the samediameter, the latter appeared darker
overall, with a less subtle contrast pat-tern. We have not analyzed the lightpath by ray tracing, but we believethat the fragmented specular reflec-tion or glare of the additional crownfacets, in combination with an effi-cient light-path migration inside thediamond, results in this brighter andmore sparkly look.
We contacted the client andlearned that this new cut has beenpatented and will be marketed as“Antwerp Twins.” The name waschosen to reflect the cut’s city of ori-gin and the fact that these diamondshave two “dome-faceted” sides (crownand pavilion), as shown in figure 7.
While unconventional cuts can bechallenging to measure, classify, andgrade, we appreciate the opportunityto view the results of this type ofinnovation.
Ronnie Geurts
Pink CVD SYNTHETIC DIAMONDGem-quality synthetic diamondsgrown by chemical vapor deposition(CVD) were introduced to the jewelrymarket several years ago, but only alimited number of stones have been
submitted to the GIA Laboratory fortesting, and those have been near-col-orless or brown (see, e.g., Lab Notes:Spring 2008, pp. 67–69; Summer 2008,pp. 158–159; Winter 2008, pp.365–367). Recently, however, we iden-tified a rare CVD synthetic diamondwith a distinct pink coloration.
This 0.54 ct cushion cut, originallysubmitted for a colored diamond grad-ing report, was graded Fancy brownishpink (figure 8). Although comparableto that seen in many natural counter-
Figure 6. The Antwerp Twins cut is used on different shapes, such as those shown here (2.27, 4.17, and 2.08 ct).Note the fully faceted crown on each diamond and the small culet-style facet in the center of the yellow oval.
Figure 8. This 0.54 ct Fancybrownish pink cushion cut (4.97× 4.90 × 2.60 mm) was identifiedas a CVD synthetic diamond.
Figure 7. This side view of the2.08 ct round-cut Antwerp Twinsdiamond in figure 6 shows theunusual “dome” faceting of thecrown and pavilion.
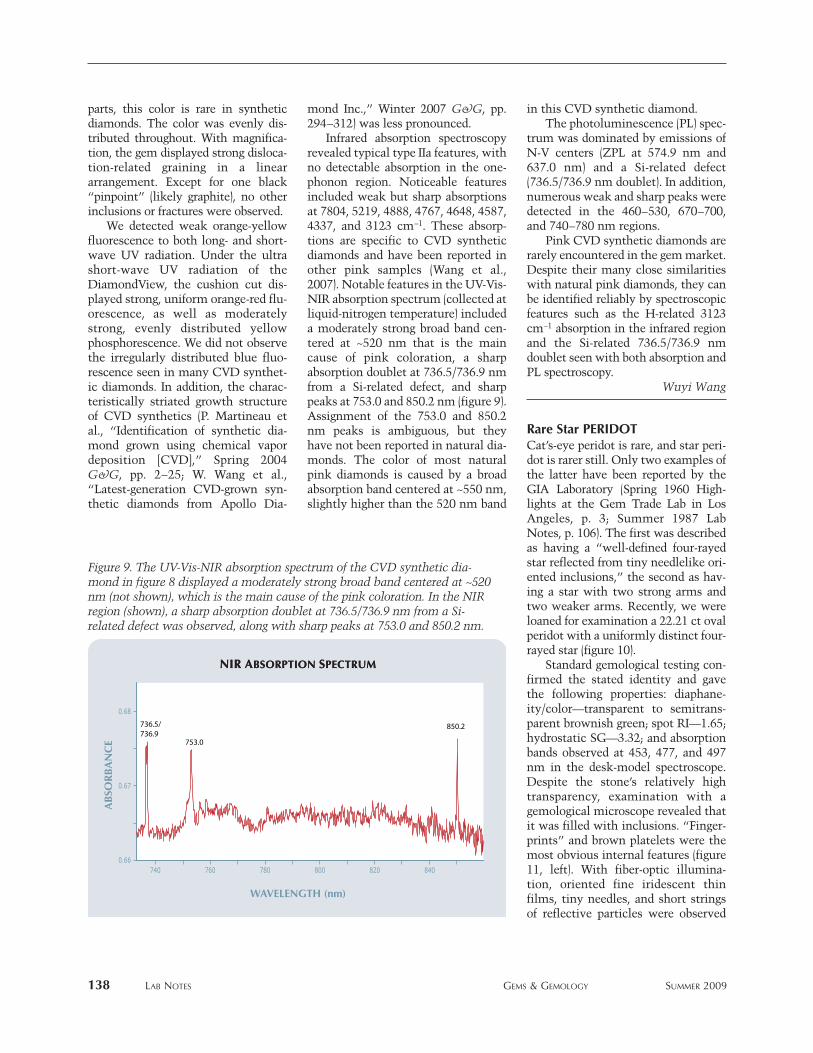
138 LAB NOTES GEMS & GEMOLOGY SUMMER 2009
parts, this color is rare in synthetic diamonds. The color was evenly dis-tributed throughout. With magnifica-tion, the gem displayed strong disloca-tion-related graining in a lineararrangement. Except for one black“pinpoint” (likely graphite), no otherinclusions or fractures were observed.
We detected weak orange-yellowfluorescence to both long- and short-wave UV radiation. Under the ultrashort-wave UV radiation of theDiamondView, the cushion cut dis-played strong, uniform orange-red flu-orescence, as well as moderatelystrong, evenly distributed yellowphosphorescence. We did not observethe irregularly distributed blue fluo-rescence seen in many CVD synthet-ic diamonds. In addition, the charac-teristically striated growth structureof CVD synthetics (P. Martineau etal., “Identification of synthetic dia-mond grown using chemical vapordeposition [CVD],” Spring 2004G&G, pp. 2–25; W. Wang et al.,“Latest-generation CVD-grown syn-thetic diamonds from Apollo Dia-
mond Inc.,” Winter 2007 G&G, pp.294–312) was less pronounced.
Infrared absorption spectroscopyrevealed typical type IIa features, withno detectable absorption in the one-phonon region. Noticeable featuresincluded weak but sharp absorptionsat 7804, 5219, 4888, 4767, 4648, 4587,4337, and 3123 cm–1. These absorp-tions are specific to CVD syntheticdiamonds and have been reported inother pink samples (Wang et al.,2007). Notable features in the UV-Vis-NIR absorption spectrum (collected atliquid-nitrogen temperature) includeda moderately strong broad band cen-tered at ~520 nm that is the maincause of pink coloration, a sharpabsorption doublet at 736.5/736.9 nmfrom a Si-related defect, and sharppeaks at 753.0 and 850.2 nm (figure 9).Assignment of the 753.0 and 850.2nm peaks is ambiguous, but theyhave not been reported in natural dia-monds. The color of most naturalpink diamonds is caused by a broadabsorption band centered at ~550 nm,slightly higher than the 520 nm band
in this CVD synthetic diamond. The photoluminescence (PL) spec-
trum was dominated by emissions ofN-V centers (ZPL at 574.9 nm and637.0 nm) and a Si-related defect(736.5/736.9 nm doublet). In addition,numerous weak and sharp peaks weredetected in the 460–530, 670–700,and 740–780 nm regions.
Pink CVD synthetic diamonds arerarely encountered in the gem market.Despite their many close similaritieswith natural pink diamonds, they canbe identified reliably by spectroscopicfeatures such as the H-related 3123cm–1 absorption in the infrared regionand the Si-related 736.5/736.9 nmdoublet seen with both absorption andPL spectroscopy.
Wuyi Wang
Rare Star PERIDOTCat’s-eye peridot is rare, and star peri-dot is rarer still. Only two examples ofthe latter have been reported by theGIA Laboratory (Spring 1960 High-lights at the Gem Trade Lab in LosAngeles, p. 3; Summer 1987 LabNotes, p. 106). The first was describedas having a “well-defined four-rayedstar reflected from tiny needlelike ori-ented inclusions,” the second as hav-ing a star with two strong arms andtwo weaker arms. Recently, we wereloaned for examination a 22.21 ct ovalperidot with a uniformly distinct four-rayed star (figure 10).
Standard gemological testing con-firmed the stated identity and gavethe following properties: diaphane-ity/color—transparent to semitrans-parent brownish green; spot RI—1.65;hydrostatic SG—3.32; and absorptionbands observed at 453, 477, and 497nm in the desk-model spectroscope.Despite the stone’s relatively hightransparency, examination with agemological microscope revealed thatit was filled with inclusions. “Finger-prints” and brown platelets were themost obvious internal features (figure11, left). With fiber-optic illumina-tion, oriented fine iridescent thinfilms, tiny needles, and short stringsof reflective particles were observed
Figure 9. The UV-Vis-NIR absorption spectrum of the CVD synthetic dia-mond in figure 8 displayed a moderately strong broad band centered at ~520nm (not shown), which is the main cause of the pink coloration. In the NIRregion (shown), a sharp absorption doublet at 736.5/736.9 nm from a Si-related defect was observed, along with sharp peaks at 753.0 and 850.2 nm.

LAB NOTES GEMS & GEMOLOGY SUMMER 2009 139
throughout (figure 11, right); theseabundant inclusions were the cause ofthe asterism. We performed Ramanspectroscopy in an attempt to identifythe platelets, but the spectra showedtoo much interference from the hostperidot. As many of the plateletsappeared brown in transmitted light,the possibilities include phlogopite,biotite, or even the ilmenite that wassuggested for the peridot in theSummer 1987 Lab Note.
Accurately photographing theasterism proved quite challenging. Asa result, the image in figure 10 is acomposite of two digital photos—onefocusing on the star, the other on theoutline of the cabochon.
Donna Beaton
TOURMALINE with Silver andGold Chatoyancy In the Fall 2001 Lab Notes (pp.218–219), we reported on a 1.51 ct starsapphire double cabochon that dis-played a six-rayed “silvery” star on oneside and a six-rayed “golden” star onthe opposite side. This effect was dueprimarily to color zoning and the dis-tance of the phenomenon-causinginclusions from the surface of the gem.
We recently had the opportunity
to examine a cat’s-eye tourmaline,said to be from Mozambique, thatdisplayed a similar dual-color phe-nomenon. The 5.44 ct double cabo-chon (figure 12) was loaned for exam-ination by Leon M. Agee (AgeeLapidary, Deer Park, Washington).The 12.01 × 10.59 × 5.46 mm gemdisplayed a strong silvery white eyeon one side and a deep golden browneye of almost equal intensity andsharpness on the other. When thecabochon was positioned between
two light sources and then rotated,both eyes could be made to open andclose dramatically, as would be expect-ed in a fine cat’s-eye chrysoberyl.
Microscopic examination revealedvery strong color zoning, with a gold-en brownish yellow zone positionedparallel to a near-colorless achroitelayer. The near-colorless side con-tained numerous very fine, uniformlydistributed growth tubes of the sortrequired to produce strong chatoyan-cy. Reflections from these inclusions
Figure 11. The star peridot had numerous inclusions of brown platelets (left,magnified 75×), though these could not be identified by Raman spectroscopy.Fiber-optic illumination revealed the abundant fine needles, thin films, andparticle strings (right, magnified 85×) that caused the peridot’s asterism.
Figure 10. This unusual 22.21 ctperidot displayed a distinct four-rayed star.
Figure 12. Fashioned from tourmaline reportedly mined in Mozambique,this 5.44 ct double cabochon displays silver chatoyancy on one side and agolden eye on the other.
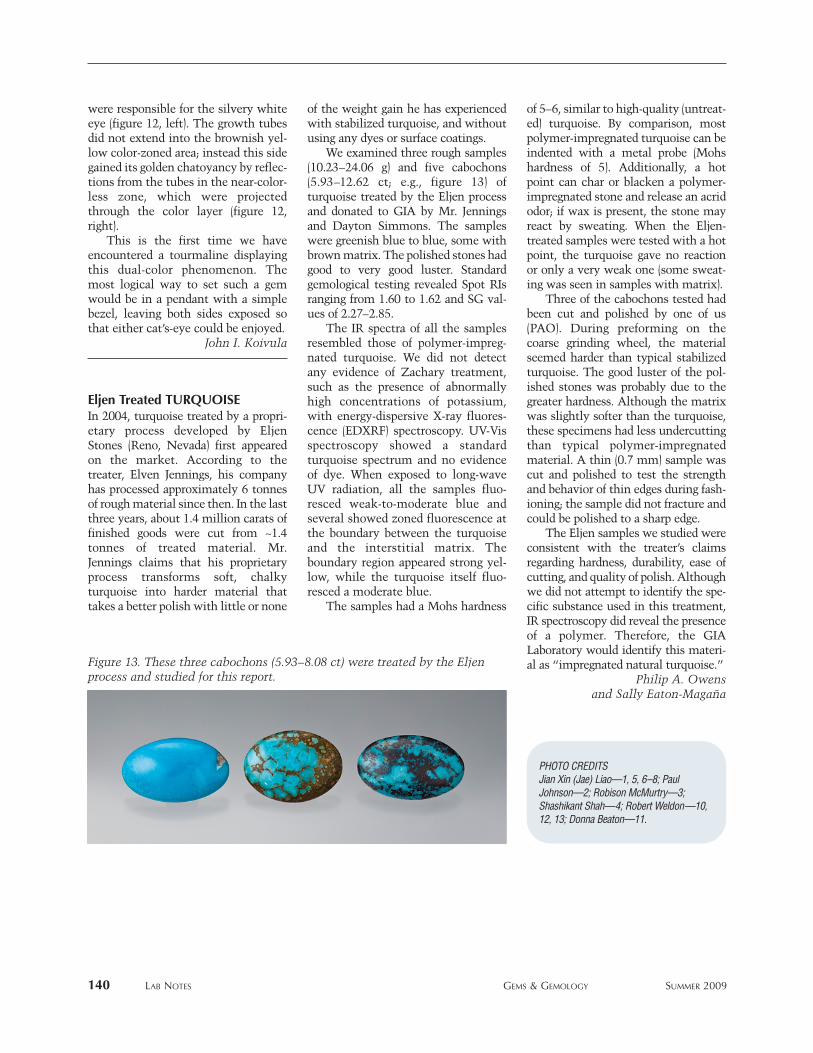
140 LAB NOTES GEMS & GEMOLOGY SUMMER 2009
were responsible for the silvery whiteeye (figure 12, left). The growth tubesdid not extend into the brownish yel-low color-zoned area; instead this sidegained its golden chatoyancy by reflec-tions from the tubes in the near-color-less zone, which were projectedthrough the color layer (figure 12,right).
This is the first time we haveencountered a tourmaline displayingthis dual-color phenomenon. Themost logical way to set such a gemwould be in a pendant with a simplebezel, leaving both sides exposed sothat either cat’s-eye could be enjoyed.
John I. Koivula
Eljen Treated TURQUOISE In 2004, turquoise treated by a propri-etary process developed by EljenStones (Reno, Nevada) first appearedon the market. According to thetreater, Elven Jennings, his companyhas processed approximately 6 tonnesof rough material since then. In the lastthree years, about 1.4 million carats offinished goods were cut from ~1.4tonnes of treated material. Mr.Jennings claims that his proprietaryprocess transforms soft, chalkyturquoise into harder material thattakes a better polish with little or none
of the weight gain he has experiencedwith stabilized turquoise, and withoutusing any dyes or surface coatings.
We examined three rough samples(10.23–24.06 g) and five cabochons(5.93–12.62 ct; e.g., figure 13) ofturquoise treated by the Eljen processand donated to GIA by Mr. Jenningsand Dayton Simmons. The sampleswere greenish blue to blue, some withbrown matrix. The polished stones hadgood to very good luster. Standardgemological testing revealed Spot RIsranging from 1.60 to 1.62 and SG val-ues of 2.27–2.85.
The IR spectra of all the samplesresembled those of polymer-impreg-nated turquoise. We did not detectany evidence of Zachary treatment,such as the presence of abnormallyhigh concentrations of potassium,with energy-dispersive X-ray fluores-cence (EDXRF) spectroscopy. UV-Visspectroscopy showed a standardturquoise spectrum and no evidenceof dye. When exposed to long-waveUV radiation, all the samples fluo-resced weak-to-moderate blue andseveral showed zoned fluorescence atthe boundary between the turquoiseand the interstitial matrix. Theboundary region appeared strong yel-low, while the turquoise itself fluo-resced a moderate blue.
The samples had a Mohs hardness
of 5–6, similar to high-quality (untreat-ed) turquoise. By comparison, mostpolymer-impregnated turquoise can beindented with a metal probe (Mohshardness of 5). Additionally, a hotpoint can char or blacken a polymer-impregnated stone and release an acridodor; if wax is present, the stone mayreact by sweating. When the Eljen-treated samples were tested with a hotpoint, the turquoise gave no reactionor only a very weak one (some sweat-ing was seen in samples with matrix).
Three of the cabochons tested hadbeen cut and polished by one of us(PAO). During preforming on thecoarse grinding wheel, the materialseemed harder than typical stabilizedturquoise. The good luster of the pol-ished stones was probably due to thegreater hardness. Although the matrixwas slightly softer than the turquoise,these specimens had less undercuttingthan typical polymer-impregnatedmaterial. A thin (0.7 mm) sample wascut and polished to test the strengthand behavior of thin edges during fash-ioning; the sample did not fracture andcould be polished to a sharp edge.
The Eljen samples we studied wereconsistent with the treater’s claimsregarding hardness, durability, ease ofcutting, and quality of polish. Althoughwe did not attempt to identify the spe-cific substance used in this treatment,IR spectroscopy did reveal the presenceof a polymer. Therefore, the GIALaboratory would identify this materi-al as “impregnated natural turquoise.”
Philip A. Owens and Sally Eaton-Magaña
PHOTO CREDITSJian Xin (Jae) Liao—1, 5, 6–8; PaulJohnson—2; Robison McMurtry—3;Shashikant Shah—4; Robert Weldon—10,12, 13; Donna Beaton—11.
Figure 13. These three cabochons (5.93–8.08 ct) were treated by the Eljenprocess and studied for this report.
The Aaron Group
Dr. Suman Agrawal
Almaza Jewelers(Ziad H. Noshie)
American Pearl Company
Amsterdam Sauer
Aurafin Oro America
Banks InternationalGemology, Inc.(Daniel & Bo Banks)
The Bell Group/Rio Grande
Allan Caplan
Chatham Created Gems, Inc.(Thomas H. Chatham)
PierLuigi Dalla Rovere
The De Beers Group
Debbie and Mark Ebert
Fabricjewelry
Dallas R. Hales
Dr. H. Tracy Hall
Dr. Gary R. and Barbara E. Hansen
James Y. Hung, M.D.
Inta Gems Inc.
J.O. Crystal Company, Inc.(Judith Osmer)
JewelAmerica, Inc.(Zvi & Rachel Wertheimer)
Kazanjian Bros, Inc.
KCB Natural Pearls(K.C. Bell)
William F. & Jeanne H. Larson
Honoring Betty H. Llewellyn
Stephen Lentz
Sophie Leu
Marshall and Janella Martin
Roz & Gene Meieran
Nancy B & Company
Kurt Nassau, Ph.D.
John & Laura Ramsey
R. Ed Romack
Art Sexauer
Shades of the Earth(Laura & Wayne Thompson)
Ambaji Shinde
S.H. Silver Company(Stephen & Eileen Silver)
Dr. Geoffrey A. Smith
D. Swarovski & Co
Touraine Family Trust
United States Pearl Co.(James & Venetia Peach)
Robert H. Vanderkay
Vicenza Fair
$50,000 to $99,999
Custom and Estate Jewels
(Mona Lee Nesseth, G.G.)
Zultanite Gems LLC
$10,000 to $49,999
Cos Altobelli
American Gem TradeAssociation
Jerry Bearman
Dudley Blauwet
George Brooks
Fine Gems International(Robert E. Kane)
Scott Isslieb
Christopher L. Johnston
Dona Leicht
Dimitri Mantheakis
Mark Mauthner
Mayfield’s
Donald & Ruth Milliken
Joe & Anne Ondraka
Tommy Wu
Mary E. Wurst, A.J.P.
$5,000 to $9,999
Colgem Coldiam(Israel and Oren Eliezri)
House of Onyx, Inc.
Alice Keller
Nick & Marguerita Michailidis
Robert J. Mulligan
Jose Guillermo Ortiz
Abe Suleman
$2,500 to $4,999
Barker & Co.
Scott Davies
Henry Dunay Designs
Syed Iftikhar Hussain
Patricia MB Gotthilf
Nanda Kulathunga
Michael LaBate II
Levisons Jewelry Inc.
Minerales y Metales del Oriente(Ramiro Rivero)
New Era Gems
Hussain Rezayee
Don & Barbara Waisman
Wild & Petsch Lapidaries
$1,000 to $2,499
Aurora Gems Inc.
(Alan Bronstein)
Si & Ann Frazier
JOEB Enterprises
(Edward Boehm)
Dr. Mary Johnson
Nature’s Geometry
(Brian Cook)
Nitin N. Pattni
Joseph A. Rott
Hal Stewart Jr.
Thomas & Lisa Trozzo
$500 to $999
Pirapan Belmont
Dr. Jaroslav Hyr´s̀l
Dr. A. J. A. (Bram) Janse
Kaufman Enterprises
(Mark Kaufman)
Mary Healey’s Fine Jewelry
Michael Beaudry, Inc.
microWorld of Gems
(Kristi A. Koivula)
Moyer Jewelers, Inc.
David & Marydean Patterson
Platinum Guild International
Schramsberg Vineyards
Steve Stribling
Under $500
AmbarAzul, LCC
Zohreh Amini
Neda Baraati
Beth Bayard
Mr. & Mrs. James E. Bie
John Clyma, G.G.
Cornell’s Jewelers
Fabrice Danet
Janet Davidi
Dawson’s Fine Jewelry, Ltd.
(Gregg W. Dawson)
Mahkmout Douman
Elegant Gems Ltd.
(Brent Malgarin, G.G.)
Garrard & Co.
Gem & Jewelry Institute of
Thailand
The Gem Trader
(Bradley J. Payne)
Gems Foundation
Geological Survey of Namibia
Al Gilbertson
Aura Godoy
Harold Ha
David Anthony Hayes
Frank W. Heiser
Than Htike
Dr. Arunas Kleismantus
Kim Knox
Alf Larsson
Michele Macri
Mariana Magtaz
Marle’s Gemstone Service
Mawingu Gems
Virginia Mizgiriene
Kazimeras Mizgiris
Oceanview Mines, LLC
Randy Joe Peach
Randy Price
Norb & Jean Rau
Restifo’s Jewelry
(Vincent A. Restifo)
Rio Tinto Diamonds
Sara Ritchie
Rockland Kenya Ltd.
Nora & Norma Stevens
Donald N. & Judith Stone Family
Bharat Thakarar
Greta Helene
Wasserman/Goodman
M. Yoshizawa
$100,000 and higher
*
*
* All are cumulative donations

COLORED STONES AND ORGANIC MATERIALSAndradite from Erzincan, eastern Turkey. In October 2007,Alexandra Woodmansee (Rock Logic, Glencoe, Minnesota)informed GIA about a new find of demantoid in Turkey.She obtained some rough and cut samples of this materialin time for the 2008 Tucson gem shows, and loaned severalpieces to GIA for examination. Her supplier, KeremÖzütemiz (Truva Mining Ltd., Ankara, Turkey), also exhib-ited the garnet in Tucson, in both 2008 and 2009. Heinformed one of us (BML) that he owned the claim, locatednear Erzincan, 700 km east of Ankara. Due to the long andsevere winters, he mines the area for only three months ofthe year (June through August). Using a pneumatic ham-mer and hand tools, he produced ~300 g of cuttable materi-al in 2007, and ~120 g in 2008, although most was fairlysmall and included. To date, he has had about 20 stones cut(in Germany) that range from 0.5 to 1.2 ct, as well as anabundance of melee-sized material, totaling ~300 carats.
A gemological examination of 13 stones that Mrs.Woodmansee obtained from Mr. Özütemiz showed that sixwere andradite (including some demantoid) and seven weregrossular (tsavorite). The presence of grossular could not beexplained, but Mr. Özütemiz indicated that those stonesmay have been introduced into the parcel at the cutting
factory. The six andradite samples (figure 1; 0.15–0.38 ct)were characterized for this report: color—orangy brown,brownish yellow, yellow-green, and yellowish green (thefour yellow-green to yellowish green samples were deman-toid); RI—>1.81; hydrostatic SG—3.82–3.93 (brown/yellowsamples) and 4.17–4.43 (green samples); inert to both long-and short-wave UV radiation; and a 440 nm cutoff visiblewith the desk-model spectroscope. Microscopic examina-tion revealed radiating curved fibrous needles with associ-ated fractures (some of which contained a transparent filleror partially dried residue), blocky “fingerprints,” and cubicgrowth zoning. Except for the high SG values, these proper-ties are typical for andradite (e.g., M. O’Donoghue, Ed.,Gems, 6th ed., Butterworth-Heinemann, Oxford, UK, 2006,pp. 206–210). In addition, the demantoid samples had dis-tinct brown and green cubic color zoning, similar to thatseen previously in two samples of andradite from Iran (seeSpring 2007 Gem News International [GNI], pp. 65–67).
Quantitative chemical analysis of the six andraditeswas performed by electron microprobe at the University of Oklahoma (see details in the G&G Data Depository atwww.gia.edu/gandg), and revealed the garnets contained93.4–98.9 mol% andradite component. The demantoidsamples contained significant levels of Cr (0.09–1.45 wt.%Cr2O3), while the orangy brown andradite had the highestTi content (0.13 wt.% TiO2).
Alethea Inns ([email protected])GIA Laboratory, Carlsbad
Brendan M. Laurs
142 GEM NEWS INTERNATIONAL GEMS & GEMOLOGY SUMMER 2009
Editor’s note: Interested contributors should send informa-tion and illustrations to Brendan Laurs at [email protected] orGIA, The Robert Mouawad Campus, 5345 Armada Drive,Carlsbad, CA 92008. Original photos will be returned afterconsideration or publication.
GEMS & GEMOLOGY, Vol. 45, No. 2, pp. 142–155© 2009 Gemological Institute of America
Figure 1. These andradites (0.15–0.38 ct) were report-edly cut from rough produced in eastern Turkey in
mid-2007. Photo by Kevin Schumacher.
EditorBrendan M. Laurs ([email protected])
Contributing EditorsEmmanuel Fritsch, CNRS, Institut des Matériaux Jean Rouxel (IMN), University of Nantes, France([email protected])
Michael Krzemnicki, SSEF Swiss Gemmological Institute, Basel, Switzerland ([email protected])
Franck Notari, GemTechLab,Geneva, Switzerland([email protected])
Kenneth V. G. Scarratt, GIA Laboratory, Bangkok, Thailand ([email protected])

GEM NEWS INTERNATIONAL GEMS & GEMOLOGY SUMMER 2009 143
Star apatite—first occurrence in the gem world. At the2004 Tucson gem shows, one of these contributors (MPS)purchased a few stones represented as star aquamarinefrom an Indian company based in Bangkok. The gemsreportedly came from India or Sri Lanka.
Although chatoyant aquamarine is relatively common,aquamarine with a four- or six-rayed star is very rare (see J.Hyr`́sl, “Some new unusual cat’s-eyes and star stones,”Journal of Gemmology, Vol. 27, No. 8, 2001, pp. 456–460).Two of the so-called star aquamarines appeared somewhatdifferent, prompting further examination.
The two medium brownish green cabochons (5.63 and6.65 ct) were examined at the German GemmologicalInstitute (EPI). Under spot illumination, they showed fourdistinct rays (e.g., figure 2). Standard gemological testinggave a spot RI of 1.64 and an SG of 3.18. Neither reading fitaquamarine, and the Mohs hardness of 5 (tested on theback of the cabochons) showed that they were softer thanberyl. With the handheld spectroscope, a clear absorptiondoublet in the yellow region was visible. In the polar-iscope, the specimens were transparent enough to show auniaxial optic figure. Colorless to yellowish green dichro-ism was fairly strong. These properties identified the twosamples as apatite.
With magnification, it was apparent that a parallelnetwork of narrow, irregularly shaped tubes and perpen-dicularly oriented tiny cracks were responsible for theasterism (figure 3). To further characterize these unusualapatites, energy-dispersive X-ray fluorescence spec-troscopy (EDXRF) and Raman analyses were performedon both stones by the SSEF Swiss Gemmological Institutein Basel. EDXRF detected major amounts of Ca and P,with traces of Cl. This result pointed to apatite-(CaCl),formerly known as chlorapatite. Raman analysis con-firmed the identification, with distinct peaks at 1058,1030, 963, 579, and 446 cm−1 that matched the referencespectrum for apatite.
Apatite occurs in a wide range of colors, such as white,yellow, green, blue, brown, violet, and black. While cat’s-eye apatite has been found in Brazil, India, Russia, Sri
Lanka, and Tanzania, to the best of our knowledge starapatite has not been previously reported.
Martin P. Steinbach ([email protected])Steinbach–Gems with a Star
Idar-Oberstein, GermanyBernhard Bruder
German Gemmological InstituteOhlsbach, Germany
A chalcedony-opal cameo with remarkable inclusions. Acameo believed to be carnelian (red-orange chalcedony)was borrowed from the Dobrée Archaeological Museum inNantes, France, for examination. The ~2.7 × 2.3 cm gem,set in a gold tie pin, depicted the right profile of a beardedmale figure with a headband (figure 4). Little is known ofthe cameo’s history except that it appeared to be of classi-cal Greek manufacture. The headband and backgroundwere brown in reflected light, while the rest of the carvingwas predominantly dark orange.
The RI, measured with some difficulty using the spotmethod, ranged from 1.53 to 1.55, a little low for chal-cedony; the SG could not be determined because of themounting. The cameo luminesced very weak greenish yel-low to long-wave UV radiation and bright yellowish greento short-wave UV. While pure chalcedony is normallyinert, this luminescence behavior is typical of uranium-bearing common opal, raising the possibility of a chal-cedony-opal mixture.
To test this hypothesis, we obtained a Raman spec-trum (using a Bruker RFS 100 Fourier-transform spectrometer) and compared it to that of a reference graychalcedony. The positions of the sharp peaks were identi-cal, but there was a broad underlying signal below thetypical chalcedony peaks in the cameo spectrum. Sub-tracting the reference spectrum from the cameo patternresulted in a signal with a broad band around 335 cm−1
and an even broader one around 3000 cm−1, consistent with
Figure 2. This 5.63 ct star apatite was sold as aqua-marine. Photo by K. Sieber.
Figure 3. Parallel channel-like inclusions with irregu-lar shapes and perpendicularly oriented tiny cracksare responsible for the asterism in the star apatite.Photomicrograph by K. Sieber; image width 8.8 mm.

144 GEM NEWS INTERNATIONAL GEMS & GEMOLOGY SUMMER 2009
opal-CT. We performed additional luminescence analysiswith a Jobin-Yvon Fluorolog 3 spectrometer with 315 nmexcitation, and compared the cameo’s emission spectrum toreference luminescence spectra for opal. The spectra hadsimilar shape and peak positions at about 415 nm (intrinsicopal luminescence, never observed in chalcedony), 504, 524,548, and 574 nm (uranyl emission in opal), further indica-tion that the luminescence indeed originated from an opalcomponent (E. Fritsch et al., “Luminescence of oxidized
porous silicon: Surface-induced emissions from disorderedsilica micro- to nano-textures,” Journal of Applied Physics,Vol. 90, No. 9, 2001, pp. 4777–4782).
We therefore believe that the cameo was fashionedfrom a chalcedony-opal mixture, primarily the former,with the small opal component responsible for the lumi-nescence behavior and slightly lower RI as well as theextra Raman signal. Chalcedony with similar lumines-cence is known from Mexico, but whether such materialis actually a mixture with opal has not been determined(John I. Koivula, pers. comm., 2009).
The cameo was also remarkable for its inclusions.Although it was not apparent in reflected light, transmit-ted light demonstrated that the color zoning was due tovariations in the density of red-orange, near-sphericalinclusions (again, see figure 4). These likely consisted ofhematite (see E. J. Gübelin and J. I. Koivula, Photoatlas ofInclusions in Gemstones, Vol. 2, Opinio Publishers,Basel, Switzerland, 2005, p. 360). They ranged from 0.01to 0.4 mm in diameter, and some were striated like cir-cled pearls. A few of the inclusions were flat with anempty core, causing them to appear crescent-shaped orcircular (figure 5). Considering the size range of theseinclusions, the hematite that formed them must havebeen quite finely divided, as shown by their red-orange(rather than metallic gray) appearance. The headband andbackground of the cameo contained very few inclusions,while the face and especially the hair layers were denselypopulated with them. A coloration by hematite inclu-sions is consistent with the carnelian-like appearance ofthe cameo.
Emmanuel FritschClothilde Feydieu and Julie Fauran
Bordeaux University, FranceYves Lulzac
Centre de Recherche Gemmologique, Nantes, FranceBenjamin Rondeau
CNRS Team 6112, Laboratoire de Planétologie et Géodynamique,
University of Nantes, France
Figure 4. In transmitted light, this unusual chalcedony-opal cameo (~2.7 × 2.3 cm; Dobrée ArchaeologicalMuseum no. 927.1.1438) shows banding due to thevariable density of near-spherical red-orange inclusions,probably hematite. Photomicrograph by E. Fritsch.
Figure 5. A few of theinclusions in the cameoare flat and lack a core,giving rise to a crescent-shaped (left) or circularappearance (right).Photomicrographs by E.Fritsch; magnified 180×.

Citrine from Andongologo, Madagascar. Deposits of natu-ral citrine are not common, and most citrine is producedby heat treating amethyst. A new source of untreated cit-rine has been found in central Madagascar, at Andongo-logo, located 24 km southwest of Antsirabe at coordinates19°59.510′ S, 46°50.884′ E. The deposit has been mined forrock crystal for a few years, but in February 2009 somenew veins were found that contain citrine and smokyquartz. Using simple hand tools, 14 miners have excavatedtunnels and shafts down to 15 m. So far, 300 kg of citrinehave been produced.
The citrine is mined from quartz veins hosted byweathered Precambrian quartzites. The veins range up to0.5 m wide, and locally contain cavities filled with pris-matic crystals of smoky quartz and citrine. The crystalsare well formed (some are doubly terminated) and range upto 30 cm long (e.g., figure 6). The crystal terminations andrims are smoky, whereas their core is brownish yellow. To this contributor’s knowledge, quartz is the only miner-al found in the cavities.
Much of the citrine is transparent, and this contributoris aware of faceted stones ranging from 30 to 385 ct from~4,000 carats that have been cut. The color of the facetedstones varies from light-to-medium pale yellow to brown-ish yellow (e.g., figure 7). The material shows moderatedichroism, and RI measurements of 17 stones gave valuesof 1.544–1.553 (birefringence 0.009). No inclusions wereseen in the cut samples examined.
Historically, the main source of citrine in Madagascaris located 110 km west of Antsirabe, on top of Bevitsika(“lots of ants”) Mountain. The Bevitsika citrine is alsohosted by quartz veins in Precambrian quartzites. For atleast 20 years, large amounts of natural citrine and rockcrystal have been mined there sporadically during the dryseason (May to November). However, there has been noproduction at Bevitsika for the past two years.
Fabrice Danet ([email protected])Style Gems, Antsirabe, Madagascar
“Sugarcane Emerald” from Brazil. In 2007, some unusualberyl crystals (e.g., figure 8) were found during mining oper-ations in northern Bahia State, Brazil, by John Papajohn andCesar Menezes of JP International Rough Mining &Colored Gemstones Inc. (Campo Formoso, Bahia). The findoccurred at 180 m depth and yielded ~1 tonne of material,including 600 kg of well-formed crystals. The company’sfive mines in the mountains of Serra de Jacobina atCarnaíba near Campo Formoso had previously producedmostly dark-colored emeralds and mineral specimens inmica schist. However, the material from this find wastranslucent bluish green, with white mottled veins and abamboo stalk–like appearance. Many of the well-developed
GEM NEWS INTERNATIONAL GEMS & GEMOLOGY SUMMER 2009 145
Figure 6. The quartz from Andongologo (here, up to 25cm long) typically has smoky outer zones and citrinecores. Some of the crystals are doubly terminated, asshown in the inset (30 cm long). Photos by F. Danet.
Figure 7. These faceted citrines from Andongologoweigh 83 and 138 ct. Photo by F. Danet.
Figure 8. These crystals of “Sugarcane Emerald” (104and 77.6 g) were recovered from Bahia State, Brazil.Photo by H. Serras-Herman.
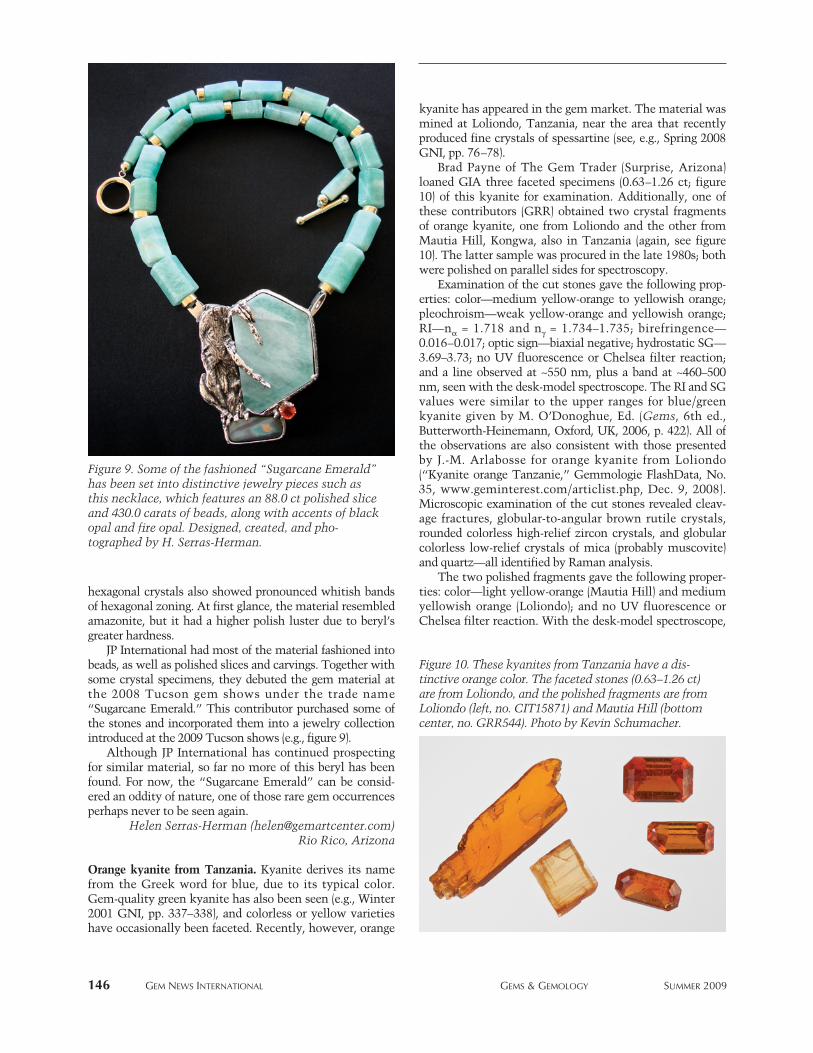
146 GEM NEWS INTERNATIONAL GEMS & GEMOLOGY SUMMER 2009
hexagonal crystals also showed pronounced whitish bandsof hexagonal zoning. At first glance, the material resembledamazonite, but it had a higher polish luster due to beryl’sgreater hardness.
JP International had most of the material fashioned intobeads, as well as polished slices and carvings. Together withsome crystal specimens, they debuted the gem material atthe 2008 Tucson gem shows under the trade name“Sugarcane Emerald.” This contributor purchased some ofthe stones and incorporated them into a jewelry collectionintroduced at the 2009 Tucson shows (e.g., figure 9).
Although JP International has continued prospectingfor similar material, so far no more of this beryl has beenfound. For now, the “Sugarcane Emerald” can be consid-ered an oddity of nature, one of those rare gem occurrencesperhaps never to be seen again.
Helen Serras-Herman ([email protected])Rio Rico, Arizona
Orange kyanite from Tanzania. Kyanite derives its namefrom the Greek word for blue, due to its typical color.Gem-quality green kyanite has also been seen (e.g., Winter2001 GNI, pp. 337–338), and colorless or yellow varietieshave occasionally been faceted. Recently, however, orange
kyanite has appeared in the gem market. The material wasmined at Loliondo, Tanzania, near the area that recentlyproduced fine crystals of spessartine (see, e.g., Spring 2008GNI, pp. 76–78).
Brad Payne of The Gem Trader (Surprise, Arizona)loaned GIA three faceted specimens (0.63–1.26 ct; figure10) of this kyanite for examination. Additionally, one ofthese contributors (GRR) obtained two crystal fragmentsof orange kyanite, one from Loliondo and the other fromMautia Hill, Kongwa, also in Tanzania (again, see figure10). The latter sample was procured in the late 1980s; bothwere polished on parallel sides for spectroscopy.
Examination of the cut stones gave the following prop-erties: color—medium yellow-orange to yellowish orange;pleochroism—weak yellow-orange and yellowish orange;RI—nα = 1.718 and nγ = 1.734–1.735; birefringence—0.016–0.017; optic sign—biaxial negative; hydrostatic SG—3.69–3.73; no UV fluorescence or Chelsea filter reaction;and a line observed at ~550 nm, plus a band at ~460–500nm, seen with the desk-model spectroscope. The RI and SGvalues were similar to the upper ranges for blue/greenkyanite given by M. O’Donoghue, Ed. (Gems, 6th ed.,Butterworth-Heinemann, Oxford, UK, 2006, p. 422). All ofthe observations are also consistent with those presentedby J.-M. Arlabosse for orange kyanite from Loliondo(“Kyanite orange Tanzanie,” Gemmologie FlashData, No.35, www.geminterest.com/articlist.php, Dec. 9, 2008).Microscopic examination of the cut stones revealed cleav-age fractures, globular-to-angular brown rutile crystals,rounded colorless high-relief zircon crystals, and globularcolorless low-relief crystals of mica (probably muscovite)and quartz—all identified by Raman analysis.
The two polished fragments gave the following proper-ties: color—light yellow-orange (Mautia Hill) and mediumyellowish orange (Loliondo); and no UV fluorescence orChelsea filter reaction. With the desk-model spectroscope,
Figure 9. Some of the fashioned “Sugarcane Emerald”has been set into distinctive jewelry pieces such asthis necklace, which features an 88.0 ct polished sliceand 430.0 carats of beads, along with accents of blackopal and fire opal. Designed, created, and pho-tographed by H. Serras-Herman.
Figure 10. These kyanites from Tanzania have a dis-tinctive orange color. The faceted stones (0.63–1.26 ct)are from Loliondo, and the polished fragments are fromLoliondo (left, no. CIT15871) and Mautia Hill (bottomcenter, no. GRR544). Photo by Kevin Schumacher.
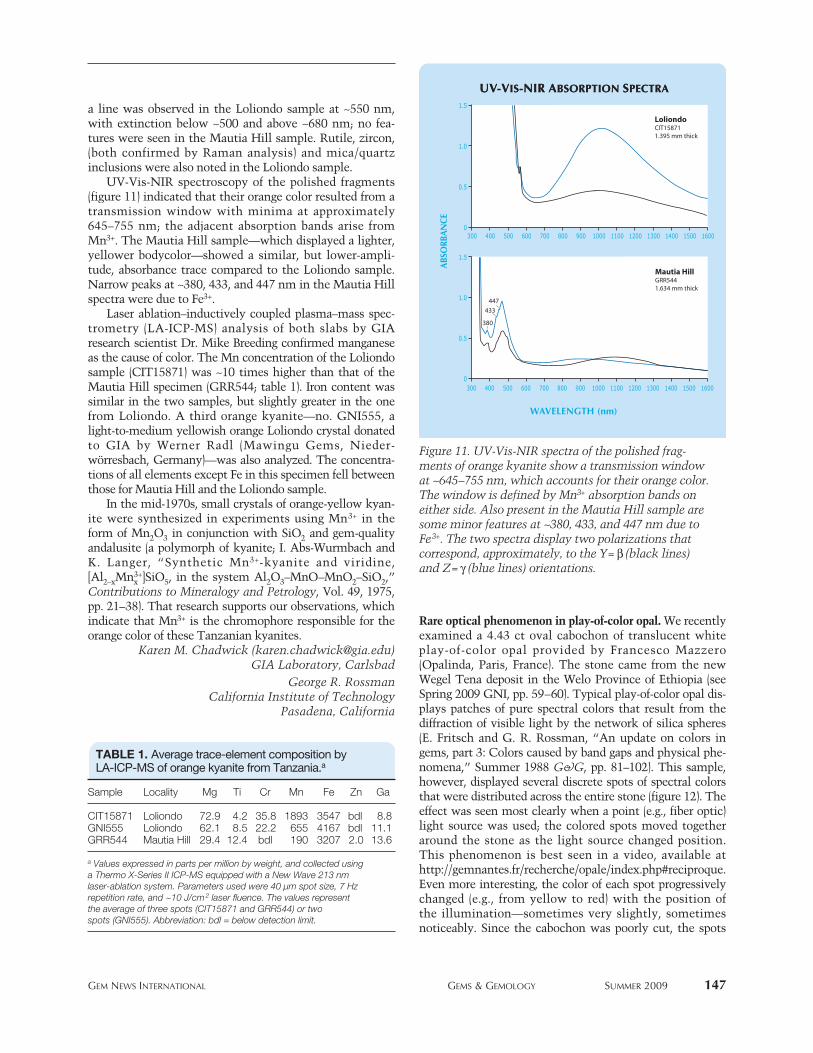
GEM NEWS INTERNATIONAL GEMS & GEMOLOGY SUMMER 2009 147
a line was observed in the Loliondo sample at ~550 nm,with extinction below ~500 and above ~680 nm; no fea-tures were seen in the Mautia Hill sample. Rutile, zircon,(both confirmed by Raman analysis) and mica/quartzinclusions were also noted in the Loliondo sample.
UV-Vis-NIR spectroscopy of the polished fragments(figure 11) indicated that their orange color resulted from atransmission window with minima at approximately645–755 nm; the adjacent absorption bands arise fromMn3+. The Mautia Hill sample—which displayed a lighter,yellower bodycolor—showed a similar, but lower-ampli-tude, absorbance trace compared to the Loliondo sample.Narrow peaks at ~380, 433, and 447 nm in the Mautia Hillspectra were due to Fe3+.
Laser ablation–inductively coupled plasma–mass spec-trometry (LA-ICP-MS) analysis of both slabs by GIAresearch scientist Dr. Mike Breeding confirmed manganeseas the cause of color. The Mn concentration of the Loliondosample (CIT15871) was ~10 times higher than that of theMautia Hill specimen (GRR544; table 1). Iron content wassimilar in the two samples, but slightly greater in the onefrom Loliondo. A third orange kyanite—no. GNI555, alight-to-medium yellowish orange Loliondo crystal donatedto GIA by Werner Radl (Mawingu Gems, Nieder-wörresbach, Germany)—was also analyzed. The concentra-tions of all elements except Fe in this specimen fell betweenthose for Mautia Hill and the Loliondo sample.
In the mid-1970s, small crystals of orange-yellow kyan-ite were synthesized in experiments using Mn3+ in theform of Mn2O3 in conjunction with SiO2 and gem-qualityandalusite (a polymorph of kyanite; I. Abs-Wurmbach andK. Langer, “Synthetic Mn3+-kyanite and viridine,[Al2–xMnx
3+]SiO5, in the system Al2O3–MnO–MnO2–SiO2,”Contributions to Mineralogy and Petrology, Vol. 49, 1975,pp. 21–38). That research supports our observations, whichindicate that Mn3+ is the chromophore responsible for theorange color of these Tanzanian kyanites.
Karen M. Chadwick ([email protected])GIA Laboratory, Carlsbad
George R. RossmanCalifornia Institute of Technology
Pasadena, California
Rare optical phenomenon in play-of-color opal. We recentlyexamined a 4.43 ct oval cabochon of translucent whiteplay-of-color opal provided by Francesco Mazzero(Opalinda, Paris, France). The stone came from the newWegel Tena deposit in the Welo Province of Ethiopia (seeSpring 2009 GNI, pp. 59–60). Typical play-of-color opal dis-plays patches of pure spectral colors that result from thediffraction of visible light by the network of silica spheres(E. Fritsch and G. R. Rossman, “An update on colors ingems, part 3: Colors caused by band gaps and physical phe-nomena,” Summer 1988 G&G, pp. 81–102). This sample,however, displayed several discrete spots of spectral colorsthat were distributed across the entire stone (figure 12). Theeffect was seen most clearly when a point (e.g., fiber optic)light source was used; the colored spots moved togetheraround the stone as the light source changed position. This phenomenon is best seen in a video, available athttp://gemnantes.fr/recherche/opale/index.php#reciproque.Even more interesting, the color of each spot progressivelychanged (e.g., from yellow to red) with the position of the illumination—sometimes very slightly, sometimesnoticeably. Since the cabochon was poorly cut, the spots
TABLE 1. Average trace-element composition by LA-ICP-MS of orange kyanite from Tanzania.a
Sample Locality Mg Ti Cr Mn Fe Zn Ga
CIT15871 Loliondo 72.9 4.2 35.8 1893 3547 bdl 8.8GNI555 Loliondo 62.1 8.5 22.2 655 4167 bdl 11.1GRR544 Mautia Hill 29.4 12.4 bdl 190 3207 2.0 13.6
a Values expressed in parts per million by weight, and collected usinga Thermo X-Series II ICP-MS equipped with a New Wave 213 nmlaser-ablation system. Parameters used were 40 µm spot size, 7 Hzrepetition rate, and ~10 J/cm2 laser fluence. The values representthe average of three spots (CIT15871 and GRR544) or two spots (GNI555). Abbreviation: bdl = below detection limit.
Figure 11. UV-Vis-NIR spectra of the polished frag-ments of orange kyanite show a transmission windowat ~645–755 nm, which accounts for their orange color.The window is defined by Mn3+ absorption bands oneither side. Also present in the Mautia Hill sample aresome minor features at ~380, 433, and 447 nm due toFe3+. The two spectra display two polarizations thatcorrespond, approximately, to the Y= β (black lines)and Z= γ (blue lines) orientations.
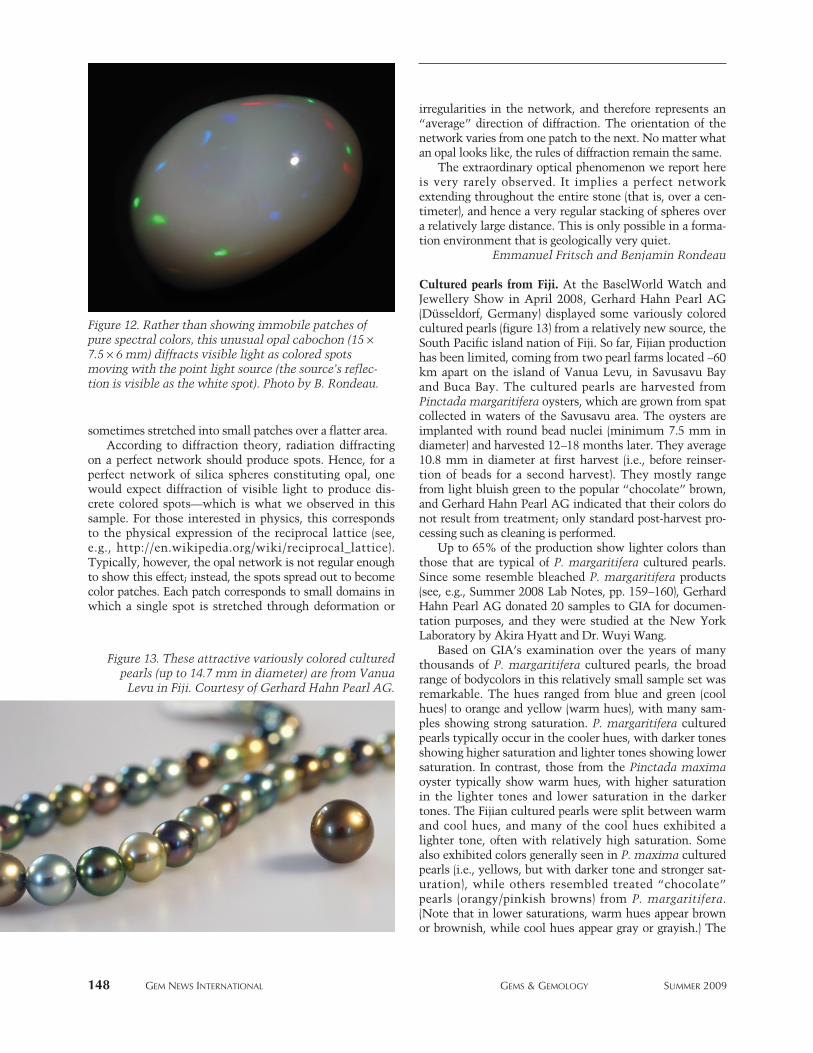
sometimes stretched into small patches over a flatter area. According to diffraction theory, radiation diffracting
on a perfect network should produce spots. Hence, for aperfect network of silica spheres constituting opal, onewould expect diffraction of visible light to produce dis-crete colored spots—which is what we observed in thissample. For those interested in physics, this correspondsto the physical expression of the reciprocal lattice (see,e.g., http://en.wikipedia.org/wiki/reciprocal_lattice).Typically, however, the opal network is not regular enoughto show this effect; instead, the spots spread out to becomecolor patches. Each patch corresponds to small domains inwhich a single spot is stretched through deformation or
irregularities in the network, and therefore represents an“average” direction of diffraction. The orientation of thenetwork varies from one patch to the next. No matter whatan opal looks like, the rules of diffraction remain the same.
The extraordinary optical phenomenon we report hereis very rarely observed. It implies a perfect networkextending throughout the entire stone (that is, over a cen-timeter), and hence a very regular stacking of spheres overa relatively large distance. This is only possible in a forma-tion environment that is geologically very quiet.
Emmanuel Fritsch and Benjamin Rondeau
Cultured pearls from Fiji. At the BaselWorld Watch andJewellery Show in April 2008, Gerhard Hahn Pearl AG(Düsseldorf, Germany) displayed some variously coloredcultured pearls (figure 13) from a relatively new source, theSouth Pacific island nation of Fiji. So far, Fijian productionhas been limited, coming from two pearl farms located ~60km apart on the island of Vanua Levu, in Savusavu Bayand Buca Bay. The cultured pearls are harvested fromPinctada margaritifera oysters, which are grown from spatcollected in waters of the Savusavu area. The oysters areimplanted with round bead nuclei (minimum 7.5 mm indiameter) and harvested 12–18 months later. They average10.8 mm in diameter at first harvest (i.e., before reinser-tion of beads for a second harvest). They mostly rangefrom light bluish green to the popular “chocolate” brown,and Gerhard Hahn Pearl AG indicated that their colors donot result from treatment; only standard post-harvest pro-cessing such as cleaning is performed.
Up to 65% of the production show lighter colors thanthose that are typical of P. margaritifera cultured pearls.Since some resemble bleached P. margaritifera products(see, e.g., Summer 2008 Lab Notes, pp. 159–160), GerhardHahn Pearl AG donated 20 samples to GIA for documen-tation purposes, and they were studied at the New YorkLaboratory by Akira Hyatt and Dr. Wuyi Wang.
Based on GIA’s examination over the years of manythousands of P. margaritifera cultured pearls, the broadrange of bodycolors in this relatively small sample set wasremarkable. The hues ranged from blue and green (coolhues) to orange and yellow (warm hues), with many sam-ples showing strong saturation. P. margaritifera culturedpearls typically occur in the cooler hues, with darker tonesshowing higher saturation and lighter tones showing lowersaturation. In contrast, those from the Pinctada maximaoyster typically show warm hues, with higher saturationin the lighter tones and lower saturation in the darkertones. The Fijian cultured pearls were split between warmand cool hues, and many of the cool hues exhibited alighter tone, often with relatively high saturation. Somealso exhibited colors generally seen in P. maxima culturedpearls (i.e., yellows, but with darker tone and stronger sat-uration), while others resembled treated “chocolate”pearls (orangy/pinkish browns) from P. margaritifera.(Note that in lower saturations, warm hues appear brownor brownish, while cool hues appear gray or grayish.) The
148 GEM NEWS INTERNATIONAL GEMS & GEMOLOGY SUMMER 2009
Figure 12. Rather than showing immobile patches ofpure spectral colors, this unusual opal cabochon (15 ×7.5 × 6 mm) diffracts visible light as colored spotsmoving with the point light source (the source’s reflec-tion is visible as the white spot). Photo by B. Rondeau.
Figure 13. These attractive variously colored culturedpearls (up to 14.7 mm in diameter) are from Vanua
Levu in Fiji. Courtesy of Gerhard Hahn Pearl AG.

GEM NEWS INTERNATIONAL GEMS & GEMOLOGY SUMMER 2009 149
diverse color range of the cultured pearls is also seen in thehost P. margaritifera shells (e.g., figure 14).
UV-Vis-NIR reflectance spectra are given in figure 15for four categories of the Fijian cultured pearls: brown (fivesamples), yellow (seven), green (five), and blue (three). Thebrown samples showed decreases in reflectance due toabsorptions at 290, 495, and 700 nm—believed to be relat-ed to organic pigments—that were superimposed on anearly flat background. These spectral features are similarto those of naturally colored brown Tahitian culturedpearls. The absorptions at 290, 495, and 700 nm were alsodistinct for the yellow samples, but the overall spectrawere sloped toward lower wavelengths. The absorptions at
495 and 700 nm were very weak in the green samples, butthe 295 nm band was consistently strong. In addition, theslope of the spectra in the 400–700 nm region for the greensamples was opposite that of the yellow samples. In theblue cultured pearls, the three bands related to organic pig-ments were clearly observed, and in general the reflectanceincreased with decreasing wavelength. The spectroscopicdata indicate that all of the tested cultured pearls were ofnatural color. X-radiography showed that they were beadcultured, as represented by Gerhard Hahn Pearl AG.
The Fijian farms together produce ~40,000 culturedpearls (or 125 kg) yearly and have ~100,000 oysters undercultivation. The farms are operated by the J. Hunter PearlsFiji Pearling Conservancy under the country’s Environ-mental Code of Practice, to ensure that any negative envi-ronmental impact is minimized.
Marisa Zachovay ([email protected])Pebbles LLC, Delray Beach, Florida
Rare necklace made of natural pearls from different mol-lusks. The Gübelin Gem Lab recently received a necklaceconsisting of 29 larger pearls and numerous smaller pearlsand diamonds for routine gemological identification (figure16). Ten of the larger pearls were “cream” colored, and 19were various shades of purple; they were near-spherical tobutton to baroque shaped, and they ranged from 4.6 to 20.7mm in longest dimension. Five of the purple pearls had anacreous appearance, while all the others were porcela-neous. Ultraviolet fluorescence, Raman spectra, spotrefractive index readings, EDXRF chemical data, andmicroscopic characteristics of all samples were consistentwith saltwater pearls. The natural origin of these pearlswas indicated by the fact that they originated from mol-lusks that are not used for cultivation.
One of the cream-colored pearls showed a flame struc-ture, as observed in pearls produced by mollusks such asTridacna species and Veneridae family bivalves, as well asby some gastropods. The nine other cream-colored pearls didnot reveal any structure, as was the case for the Veneridaepearls described in the Winter 2008 GNI section (pp.374–375), as well as for natural pearls from other mollusks.
Five of the 19 purple pearls revealed a honeycombstructure in the microscope (figure 17). Raman spectrashowed aragonite peaks, along with bands at about 1520and 1130 cm−1 due to a mixture of polyacetylenic pig-ments. To our knowledge, purple-hued pearls with thesecolor, structure, and Raman characteristics only come frombivalves belonging to the Veneridae family. Four other pur-ple pearls of comparable shape and color had similarRaman spectra; however, they did not show a honeycombstructure, as also documented in Veneridae pearls (see GNIentry cited above). These observations suggest that nine ofthe 19 colored pearls were from Veneridae family mollusks.
Five of the remaining 10 purple pearls had a nacreousstructure (figure 18), but they lacked strong overtones. Thisis probably because the aragonite layers were thicker thanis commonly observed in nacreous pearls, both natural and
Figure 14. The shells of the P. margaritifera oystersthat are used to produce the Fijian cultured pearlsshow a diversity of colors. Courtesy of J. Hunter Pearls.
Figure 15. UV-Vis-NIR reflectance spectroscopy ofbrown, yellow, green, and blue cultured pearls fromFiji indicated that all these colors are natural. Photosby Sood Oil Chia.

150 GEM NEWS INTERNATIONAL GEMS & GEMOLOGY SUMMER 2009
cultured. Raman spectra showed aragonite peaks, as well asbands at about 1490 and 1100 cm−1. The positions of thesebands suggest that this coloration is also due to a mixtureof polyacetylenic pigments, but with a larger polyenicchain than has been documented in Veneridae pearls. Toour knowledge, the only pearls with similar color, Ramanspectra, and nacreous structure are those from theMytilidae family. The other five purple pearls, which werenon-nacreous, had similar Raman spectra. They also appearto originate from a mollusk of the Mytilidae family, assuch pearls may have a porcelain-like appearance.
To our knowledge, this is the first time that mixedpurple-hued pearls from the Veneridae and Mytilidae fami-lies have been observed in the same necklace. A combina-tion of classical and advanced gemological analysis appearsto be a promising approach for the identification of themollusk family to which a pearl belongs.
Stefanos Karampelas ([email protected]) and Eric Erel
Gübelin Gem Lab, Lucerne, Switzerland
Colorless petalite and pollucite from Laghman, Afghanistan.Farooq Hashmi (Intimate Gems, Jamaica, New York) recent-ly loaned GIA three colorless stones (figure 19), which hebelieved to be petalite (14.98 ct) and pollucite (11.30 and12.10 ct) from Laghman Province, Afghanistan. He pur-chased the rough in Peshawar, Pakistan, between 2007 and2008. The stones were reportedly byproducts of pegmatitemining for tourmaline and other gems. Mr. Hashmi said hesaw several kilograms of both gem materials in the Peshawarmarket, but he understands from local gem dealers that nei-ther of them is being actively mined.
Petalite and pollucite are both known to be hosted inlithium-rich granitic pegmatites, and they have a Mohs hard-
Figure 16. This necklace contains 29 pearls (4.6–20.7mm in largest dimension) that proved to be from atleast two different mollusk families. Courtesy ofBoghossian S.A., Geneva; photo by Evelyne Murer.
Figure 17. The honeycomb structure observed in thisnon-nacreous pearl can be attributed to a simple pris-matic arrangement of aragonite formed by paralleland adjacent prisms that do not strongly interlockalong their mutual boundaries. Photomicrograph byE. Erel; field of view ~3.0 mm high.
Figure 18. Nacreous structures on this pearl form alayered aragonitic structure consisting of polygonalto rounded tablets arranged in broad, regularlyformed parallel sheets. Photomicrograph by E. Erel;field of view ~3.4 mm high.
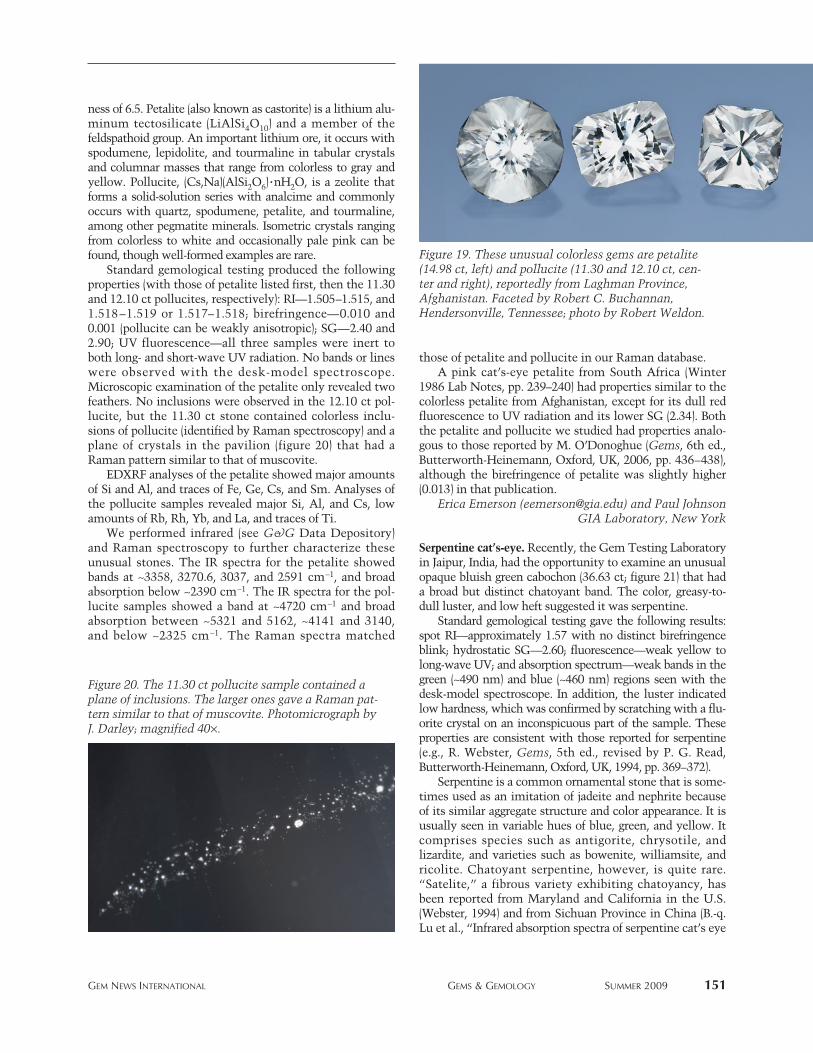
GEM NEWS INTERNATIONAL GEMS & GEMOLOGY SUMMER 2009 151
ness of 6.5. Petalite (also known as castorite) is a lithium alu-minum tectosilicate (LiAlSi4O10) and a member of thefeldspathoid group. An important lithium ore, it occurs withspodumene, lepidolite, and tourmaline in tabular crystalsand columnar masses that range from colorless to gray andyellow. Pollucite, (Cs,Na)(AlSi2O6)·nH2O, is a zeolite thatforms a solid-solution series with analcime and commonlyoccurs with quartz, spodumene, petalite, and tourmaline,among other pegmatite minerals. Isometric crystals rangingfrom colorless to white and occasionally pale pink can befound, though well-formed examples are rare.
Standard gemological testing produced the followingproperties (with those of petalite listed first, then the 11.30and 12.10 ct pollucites, respectively): RI—1.505–1.515, and1.518–1.519 or 1.517–1.518; birefringence—0.010 and0.001 (pollucite can be weakly anisotropic); SG—2.40 and2.90; UV fluorescence—all three samples were inert toboth long- and short-wave UV radiation. No bands or lineswere observed with the desk-model spectroscope.Microscopic examination of the petalite only revealed twofeathers. No inclusions were observed in the 12.10 ct pol-lucite, but the 11.30 ct stone contained colorless inclu-sions of pollucite (identified by Raman spectroscopy) and aplane of crystals in the pavilion (figure 20) that had aRaman pattern similar to that of muscovite.
EDXRF analyses of the petalite showed major amountsof Si and Al, and traces of Fe, Ge, Cs, and Sm. Analyses ofthe pollucite samples revealed major Si, Al, and Cs, lowamounts of Rb, Rh, Yb, and La, and traces of Ti.
We performed infrared (see G&G Data Depository)and Raman spectroscopy to further characterize theseunusual stones. The IR spectra for the petalite showedbands at ~3358, 3270.6, 3037, and 2591 cm−1, and broadabsorption below ~2390 cm−1. The IR spectra for the pol-lucite samples showed a band at ~4720 cm−1 and broadabsorption between ~5321 and 5162, ~4141 and 3140,and below ~2325 cm−1. The Raman spectra matched
those of petalite and pollucite in our Raman database. A pink cat’s-eye petalite from South Africa (Winter
1986 Lab Notes, pp. 239–240) had properties similar to thecolorless petalite from Afghanistan, except for its dull redfluorescence to UV radiation and its lower SG (2.34). Boththe petalite and pollucite we studied had properties analo-gous to those reported by M. O’Donoghue (Gems, 6th ed.,Butterworth-Heinemann, Oxford, UK, 2006, pp. 436–438),although the birefringence of petalite was slightly higher(0.013) in that publication.
Erica Emerson ([email protected]) and Paul Johnson GIA Laboratory, New York
Serpentine cat’s-eye. Recently, the Gem Testing Laboratoryin Jaipur, India, had the opportunity to examine an unusualopaque bluish green cabochon (36.63 ct; figure 21) that hada broad but distinct chatoyant band. The color, greasy-to-dull luster, and low heft suggested it was serpentine.
Standard gemological testing gave the following results:spot RI—approximately 1.57 with no distinct birefringenceblink; hydrostatic SG—2.60; fluorescence—weak yellow tolong-wave UV; and absorption spectrum—weak bands in thegreen (~490 nm) and blue (~460 nm) regions seen with thedesk-model spectroscope. In addition, the luster indicatedlow hardness, which was confirmed by scratching with a flu-orite crystal on an inconspicuous part of the sample. Theseproperties are consistent with those reported for serpentine(e.g., R. Webster, Gems, 5th ed., revised by P. G. Read,Butterworth-Heinemann, Oxford, UK, 1994, pp. 369–372).
Serpentine is a common ornamental stone that is some-times used as an imitation of jadeite and nephrite becauseof its similar aggregate structure and color appearance. It isusually seen in variable hues of blue, green, and yellow. Itcomprises species such as antigorite, chrysotile, andlizardite, and varieties such as bowenite, williamsite, andricolite. Chatoyant serpentine, however, is quite rare.“Satelite,” a fibrous variety exhibiting chatoyancy, hasbeen reported from Maryland and California in the U.S.(Webster, 1994) and from Sichuan Province in China (B.-q.Lu et al., “Infrared absorption spectra of serpentine cat’s eye
Figure 19. These unusual colorless gems are petalite(14.98 ct, left) and pollucite (11.30 and 12.10 ct, cen-ter and right), reportedly from Laghman Province,Afghanistan. Faceted by Robert C. Buchannan,Hendersonville, Tennessee; photo by Robert Weldon.
Figure 20. The 11.30 ct pollucite sample contained aplane of inclusions. The larger ones gave a Raman pat-tern similar to that of muscovite. Photomicrograph byJ. Darley; magnified 40×.
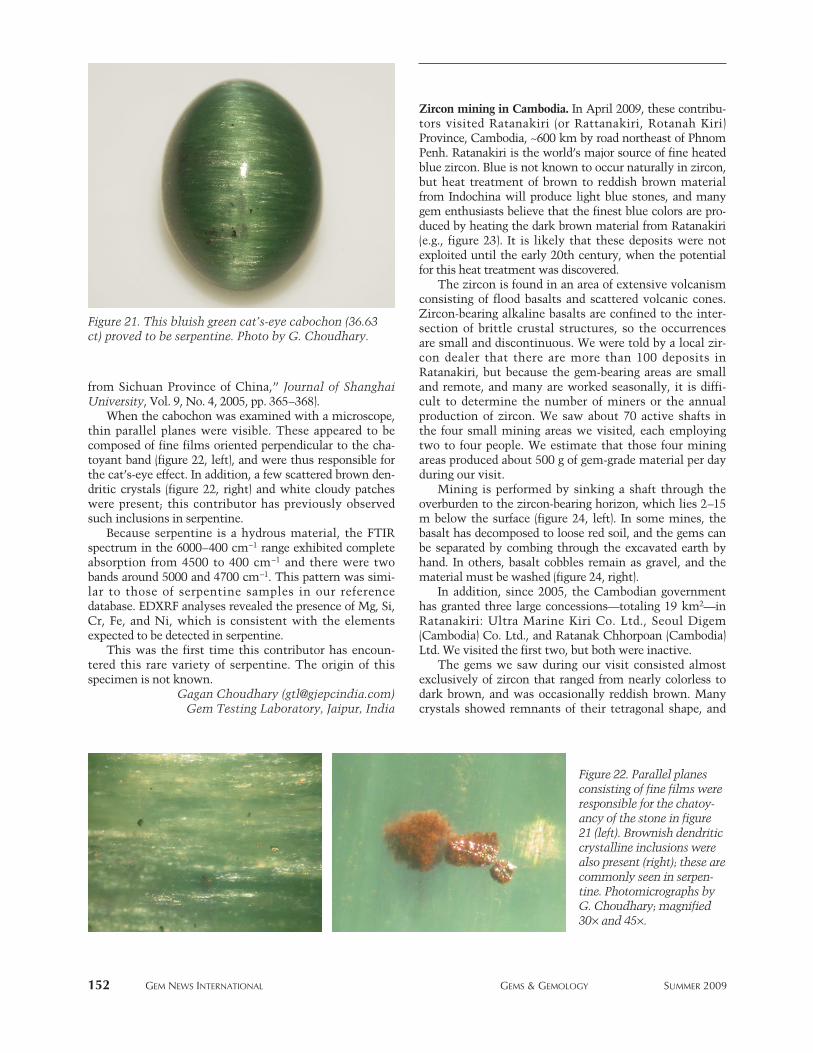
152 GEM NEWS INTERNATIONAL GEMS & GEMOLOGY SUMMER 2009
from Sichuan Province of China,” Journal of ShanghaiUniversity, Vol. 9, No. 4, 2005, pp. 365–368).
When the cabochon was examined with a microscope,thin parallel planes were visible. These appeared to becomposed of fine films oriented perpendicular to the cha-toyant band (figure 22, left), and were thus responsible forthe cat’s-eye effect. In addition, a few scattered brown den-dritic crystals (figure 22, right) and white cloudy patcheswere present; this contributor has previously observedsuch inclusions in serpentine.
Because serpentine is a hydrous material, the FTIRspectrum in the 6000–400 cm−1 range exhibited completeabsorption from 4500 to 400 cm−1 and there were twobands around 5000 and 4700 cm−1. This pattern was simi-lar to those of serpentine samples in our referencedatabase. EDXRF analyses revealed the presence of Mg, Si,Cr, Fe, and Ni, which is consistent with the elementsexpected to be detected in serpentine.
This was the first time this contributor has encoun-tered this rare variety of serpentine. The origin of thisspecimen is not known.
Gagan Choudhary ([email protected])Gem Testing Laboratory, Jaipur, India
Zircon mining in Cambodia. In April 2009, these contribu-tors visited Ratanakiri (or Rattanakiri, Rotanah Kiri)Province, Cambodia, ~600 km by road northeast of PhnomPenh. Ratanakiri is the world’s major source of fine heatedblue zircon. Blue is not known to occur naturally in zircon,but heat treatment of brown to reddish brown materialfrom Indochina will produce light blue stones, and manygem enthusiasts believe that the finest blue colors are pro-duced by heating the dark brown material from Ratanakiri(e.g., figure 23). It is likely that these deposits were notexploited until the early 20th century, when the potentialfor this heat treatment was discovered.
The zircon is found in an area of extensive volcanismconsisting of flood basalts and scattered volcanic cones.Zircon-bearing alkaline basalts are confined to the inter-section of brittle crustal structures, so the occurrencesare small and discontinuous. We were told by a local zir-con dealer that there are more than 100 deposits inRatanakiri, but because the gem-bearing areas are smalland remote, and many are worked seasonally, it is diffi-cult to determine the number of miners or the annualproduction of zircon. We saw about 70 active shafts inthe four small mining areas we visited, each employingtwo to four people. We estimate that those four miningareas produced about 500 g of gem-grade material per dayduring our visit.
Mining is performed by sinking a shaft through theoverburden to the zircon-bearing horizon, which lies 2–15m below the surface (figure 24, left). In some mines, thebasalt has decomposed to loose red soil, and the gems canbe separated by combing through the excavated earth byhand. In others, basalt cobbles remain as gravel, and thematerial must be washed (figure 24, right).
In addition, since 2005, the Cambodian governmenthas granted three large concessions—totaling 19 km2—inRatanakiri: Ultra Marine Kiri Co. Ltd., Seoul Digem(Cambodia) Co. Ltd., and Ratanak Chhorpoan (Cambodia)Ltd. We visited the first two, but both were inactive.
The gems we saw during our visit consisted almostexclusively of zircon that ranged from nearly colorless todark brown, and was occasionally reddish brown. Manycrystals showed remnants of their tetragonal shape, and
Figure 22. Parallel planesconsisting of fine films wereresponsible for the chatoy-ancy of the stone in figure21 (left). Brownish dendriticcrystalline inclusions werealso present (right); these arecommonly seen in serpen-tine. Photomicrographs byG. Choudhary; magnified30× and 45×.
Figure 21. This bluish green cat’s-eye cabochon (36.63ct) proved to be serpentine. Photo by G. Choudhary.
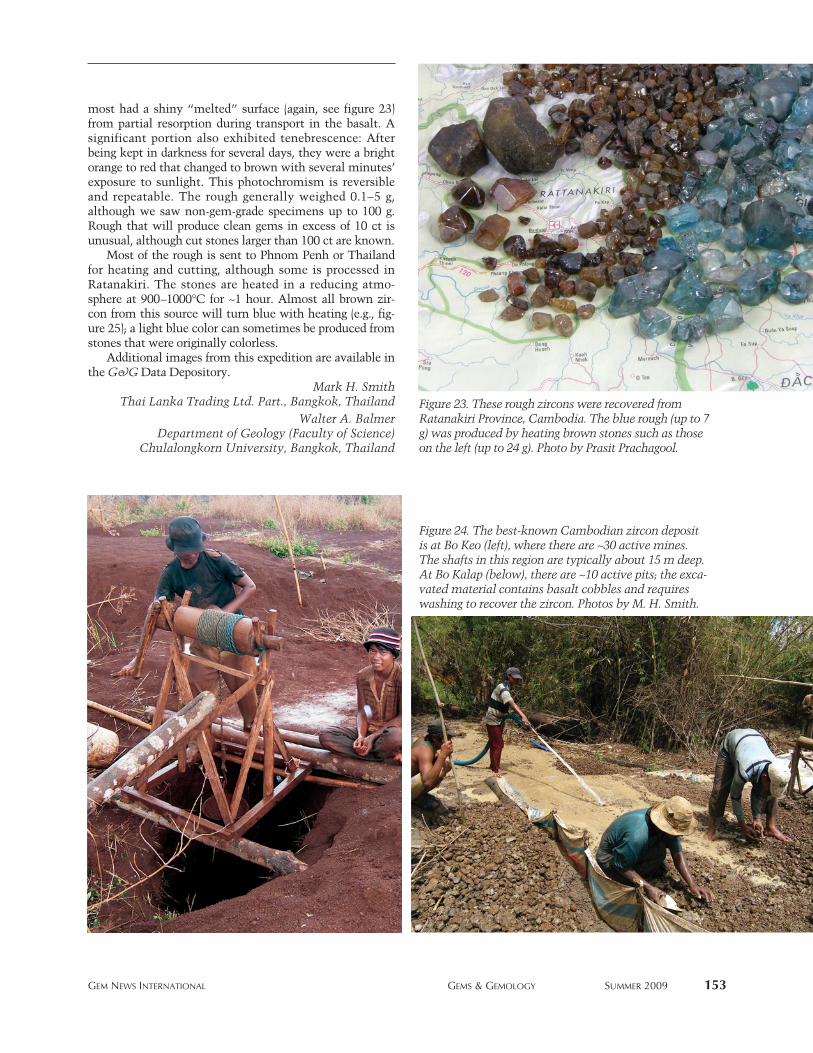
most had a shiny “melted” surface (again, see figure 23)from partial resorption during transport in the basalt. Asignificant portion also exhibited tenebrescence: Afterbeing kept in darkness for several days, they were a brightorange to red that changed to brown with several minutes’exposure to sunlight. This photochromism is reversibleand repeatable. The rough generally weighed 0.1–5 g,although we saw non-gem-grade specimens up to 100 g.Rough that will produce clean gems in excess of 10 ct isunusual, although cut stones larger than 100 ct are known.
Most of the rough is sent to Phnom Penh or Thailandfor heating and cutting, although some is processed inRatanakiri. The stones are heated in a reducing atmo-sphere at 900–1000°C for ~1 hour. Almost all brown zir-con from this source will turn blue with heating (e.g., fig-ure 25); a light blue color can sometimes be produced fromstones that were originally colorless.
Additional images from this expedition are available inthe G&G Data Depository.
Mark H. SmithThai Lanka Trading Ltd. Part., Bangkok, Thailand
Walter A. BalmerDepartment of Geology (Faculty of Science)
Chulalongkorn University, Bangkok, Thailand
GEM NEWS INTERNATIONAL GEMS & GEMOLOGY SUMMER 2009 153
Figure 23. These rough zircons were recovered fromRatanakiri Province, Cambodia. The blue rough (up to 7g) was produced by heating brown stones such as thoseon the left (up to 24 g). Photo by Prasit Prachagool.
Figure 24. The best-known Cambodian zircon depositis at Bo Keo (left), where there are ~30 active mines.The shafts in this region are typically about 15 m deep.At Bo Kalap (below), there are ~10 active pits; the exca-vated material contains basalt cobbles and requireswashing to recover the zircon. Photos by M. H. Smith.

CONFERENCE REPORTSGIT 2008. After being postponed in December 2008 due topolitical unrest in Bangkok, the second Gem and JewelryInstitute of Thailand (GIT) conference, GIT 2008, was heldMarch 9–12, 2009. Some 500 participants attended thetwo-day conference, which was followed by a two-dayfield trip to Kanchanaburi and the Bo Phloi sapphire mine.Parallel sessions saw 50 speakers, and there were approxi-mately the same number of posters on display. Onlyselected oral presentations are mentioned in this report,since these authors were unable to attend all sessions. Theconference proceedings (extended abstracts) are availablein book or CD-ROM format by contacting the GIT atwww.git.or.th.
After the opening ceremony, hosted by GIT DirectorDr. Wilawan Atichat and Thai Deputy Minister ofCommerce Alongkorn Ponlaboot, the conference startedwith three keynote speakers. Vichai Assarasakorn, presi-dent of the Thai Gem and Jewelry Traders Association,gave an impressive overview of the Thai gem and jewelrybusiness. He was followed by Massimo Zucchi (StudioZucchi Design, Milan, Italy), who discussed globalizationand branding, and Dr. Joerg Fischer-Buehner (Legor GroupSRL, Bressanvido, Italy), who lectured on palladium cast-ing for jewelry.
Strategic marketing in emerging markets was dis-cussed by Dr. Krittinee Nuttavuthisit (ChulalongkornUniversity, Bangkok), and the new era of jewelry designin Thailand was reviewed by Dr. Veerawat Sirivesmas(Silpakorn University, Bangkok). One of these contribu-tors (LK) presented an overview of the Tom Lantos JADEAct, its implications for the trade, and possible alternativeruby sources.
Hyun Min Choi (Hanmi Lab, Seoul, Korea) examinedphotoluminescence characteristics of HPHT-processednatural type IIa diamonds. Dr. Walter Balmer(Chulalongkorn University) gave a presentation on behalfof Swiss gemologist George Bosshart, who was unable to
attend. Mr. Bosshart’s research focuses on distinguishingnatural from artificially colored green diamonds; the pre-sentation introduced the properties of untreated greendiamonds and the natural radiation mechanisms thatproduce this color.
An interesting report on rubies from Fiskenæsset,Greenland, was given by Pornsawat Wathanakul of GIT(for Greg Davison of True North Gems, Vancouver,British Columbia, Canada, who could not attend). A pairof garnet lectures was given by Dr. Karl Schmetzer(Petershausen, Germany) and GIT’s Dr. Visut Pisutha-Arnond. Dr. Claudio Milisenda (German GemmologicalAssociation, Idar-Oberstein) reported on his study of redlabradorite-andesine feldspars and offered some promis-ing results based on FTIR data on the distinction oftreated versus untreated stones. A thought-provokingtalk about experimental heating of Cu-bearing tourma-line was given by Thanong Leelawatanasuk (GIT).Boontawee Sriprasert (Department of MineralResources, Bangkok) discussed heat-treatment experi-ments on red spinel from Myanmar. Dr. ChakkaphanSutthirat (Chulalongkorn University) gave an introduc-tion to heat-treatment experiments on sapphire from theAwissawella deposit in Sri Lanka. Dr. AhmadjanAbduriyim (Gemmological Association of All Japan—Zenhokyo, Tokyo) presented his findings on treatedgreen amber.
The SSEF Swiss Gemmological Institute’s Dr. MichaelKrzemnicki described modern, portable instruments foradvanced testing in the gemological laboratory, includingUV-Vis and laser-induced breakdown spectrometers.Dominic Mok (AGIL Ltd., Hong Kong) gave a controver-sial lecture on advanced testing of jadeite jade (called FeiCui by the Chinese). After describing the different colorsof jadeite, he mentioned that kosmochlor and omphaciteare also called Fei Cui in the Chinese market. Thisbrought strong reactions from some attendees, as thesetwo materials are considered much less valuable thantrue jadeite.
Dr. Henry Hänni (SSEF) delivered an overview of thedifferent types of cultured pearls, and Kenneth Scarratt(GIA Thailand) discussed nautilus pearls.
After the conference, the two-day field trip tookapproximately 80 participants to the Bo Phloi gem fieldabout 170 km northwest of Bangkok. The field lies with-in Quaternary sediments and covers an area of about1200 km2. The largest sapphire deposit in Thailand’swestern region, it is operated by SAP Mining Co. Ltd. asan open-pit mine. The gem-bearing layers are 1–8 mthick at depths of 6–19 m. The gravel is brought to awashing site to concentrate the gem corundum before itis hand-sorted. In addition to sapphire, miners haverecovered black spinel, black pyroxene, and red garnet.
Lore Kiefert ([email protected])AGTA Gemological Testing Center, New York
Evan CaplanOmi Gems, Los Angeles
154 GEM NEWS INTERNATIONAL GEMS & GEMOLOGY SUMMER 2009
Figure 25. With heat treatment, most Ratanakiri zir-con turns blue. The large emerald cut weighs 30.45 ct.
Courtesy of Thai Lanka Trading.

GEM NEWS INTERNATIONAL GEMS & GEMOLOGY SUMMER 2009 155
Sinkankas Spinel Symposium. The seventh annual sympo-sium in honor of John Sinkankas took place April 18,2009, at GIA in Carlsbad. Co-hosted by GIA and the SanDiego Mineral and Gem Society, the sold-out event wasattended by 152 people.
After opening remarks by convener Roger Merk (Merk’sJade, San Diego, California), Si Frazier (El Cerrito, California)reviewed historical spinels and noted that some of themwere quite large, such as the ~400 ct red spinel that was setin Catherine II’s (Russian) crown. Edward Boehm (JoebEnterprises, Solana Beach, California) indicated that the~500 ct Sumerian Spinel in the Iranian crown jewels mostlikely came from the old mines in present-day Tajikistan.He also illustrated how most famous “rubies” in royal andecclesiastical regalia are actually spinels. If not for spinel,ruby would not have achieved the fame it enjoys today.
Dr. William B. “Skip” Simmons (University of NewOrleans) covered the mineralogy and crystallography of thespinel group. Of the 22 spinel species recognized by theInternational Mineralogical Association, only one (spinelsensu stricto) is an important gem material. Jennifer L.Stone-Sundberg (Saint-Gobain Crystals, Washougal,Washington) reviewed the historical and contemporarygrowth of synthetic spinel. Today the material produced forgem use comes mainly from China and Russia; it can beidentified by its higher RI values (for Verneuil- andCzochralski-grown products), inclusions (for flux-grown aswell as the flame-fusion products), chemical composition,fluorescence, and Raman spectroscopy.
Jo Ellen Cole (Cole Appraisal Services, Vista, California)examined spinel pricing, and noted that there was a sharpincrease in the cost of rough/cut material during 2000–2002;prices have continued to rise since then. Bill Larson (PalaInternational, Fallbrook, California) reviewed the mainsources of spinel: Tajikistan (Kukh-i-Lal), Myanmar (Mogokand Nanyaseik), Sri Lanka, Vietnam (Luc Yen), andTanzania (Morogoro, Tunduru, and Mahenge). The rare Co-colored blue spinel comes from Sri Lanka and Tunduru.
Meg Berry (Mega Gem, Fallbrook, California) illus-trated the recutting of spinel, in which she improved lop-sided, windowed, and damaged stones by keeping theoriginal tables and paying attention to spinel’s ~40° criti-cal angle; major improvements in appearance wereattained, with a cutting yield of 56%–76%. RobertWeldon (GIA, Carlsbad) provided suggestions for pho-tographing spinel—applicable to other gems as well—that include using shallow depth-of-field to highlightinteresting inclusions, positioning a reflector to helpeliminate a “bow-tie” effect in problematic cuts, and, inasteriated stones, placing the reflection from a pinpointlight source in the center of the stars.
John Koivula (GIA, Carlsbad) reviewed the variety ofinternal features found in spinel, including mineral inclu-sions (e.g., rutile, carbonates, graphite, hematite, högbomite,Fe-sulfides, sphene, uraninite, and zircon) and fluid inclu-sions (both secondary and primary). He also noted that spinelforms inclusions in other gems, such as in sapphire and
grossular (hessonite) from Sri Lanka. Dr. George Rossman(California Institute of Technology, Pasadena) reviewed theprimary causes of color in spinel: Cr3+ (pink-to-red), Co2+
(blue), and Fe3+ (usually with Fe2+; blue to green to lavender).Also, the following colorants have been used in syntheticspinel: Mn3+ (yellow), Cu2+ (blue), and Ti3+ (blue-green).
The theme of next year’s Sinkankas Symposium (dateto be determined) will be feldspar.
Brendan M. Laurs
ANNOUNCEMENTSGems issue of Elements. The June 2009 issue of the earthsciences magazine Elements focuses on key aspects ofgemology: how gems occur in nature, the role of geo-chemistry in characterizing them, the challenge of non-destructively identifying faceted samples, the detectionof treatments and synthetics, and the use of pearls andcorals as organic gem materials. The issue’s guest editorsare G&G contributors Emmanuel Fritsch and BenjaminRondeau. Visit www.elementsmagazine.org.
Responsible Jewellery Council announces Code ofPractice. The Responsible Jewellery Council (RJC; for-merly the Committee for Responsible JewelleryPractices) outlined its supply chain Code of Practice cer-tification system at a March 25 news conference at theBaselWorld Fair. The RJC certifies mine-to-market activ-ities in areas of sustainable mining practices, includingfair wages, benefits to local communities, health andsafety standards, ethical trading, and environmentalrespect. During the second half of 2009, the RJC willmake independent auditors available to verify each mem-ber firm’s adherence to Code of Practice standards andissue the appropriate certificate. The RJC has 85 mem-bers (including GIA) in the diamond and gold mining,manufacturing, and retailing sectors. More information can be obtained at www.responsiblejewellery.com.
ERRATAThe Spring 2009 article by F. Farges et al., “The FrenchBlue and the Hope: New data from the discovery of a his-torical lead cast,” contained the following errors.
1. The estimated error of the density of the lead cast on p.13 should have been given as 11.2 ± 0.1 g/cm3.
2. The entries for footnotes a and b in table 1 on p. 10were inadvertently switched, and the entry for footnoteb is incorrect. Footnote a should read 1 grain, poids demarc ~~ 0.0531147 g ~~ 0.2655735 ct (Lionet, 1820).Footnote b should read 1 ligne = 2.2558 mm (Morel,1988).
3. The name of the company that performed the scanning,Matrix Diamond Technology, was incorrect.
Gem & Gemology regrets the errors.

Si LETTERS/BOOK REVIEWS/GEMOLOGICAL ABSTRACTS GEMS & GEMOLOGY SUMMER 2009
The Gems & Gemology Letters, Book Reviews, and Gemological Abstracts sections are available only in electronic(PDF) format. These sections are available free of charge both on the G&G web site (www.gia.edu/gemsandgemology) andas part of G&G Online (gia.metapress.com), and are paginated separately from the rest of the issue.
These sections are also included in this full-issue PDF. Accordingly, the Table of Contents included in this file liststhese additional sections, and thus differs from the Table of Contents in the print version. For these reasons, this PDF isnot the official version of this issue—the “journal of record” for this issue is the combined print/online version that wasreleased to subscribers.
LETTERS/BOOK REVIEWS/GEMOLOGICAL ABSTRACTS

MORE ON D-to-Z DIAMOND COLOR GRADINGI enjoyed reading “Color Grading ‘D-to-Z’ Diamonds atthe GIA Laboratory” (Winter 2008, pp. 296–321). It isalways great to learn how things are done at the GIA lab.Although I feel it would have been better to present anddiscuss much of this information at least eight yearsago, it is nonetheless good to see the lab publish its stan-dards for policy, procedures, and equipment.
That said, I write to say how strongly I disagree withthe authors’ conclusion that “a standard light source fordiamond color grading should have key characteristics ofdaylight, including a UV component” (p. 320, italicsmine). In their introduction, the authors stress theimpact of color grade on the price of diamonds, and theygo on to review the development of the GIA system andthe various modifications that have occurred since themid-1950s. Then they admit that, “at times, the result-ing adjustments have appeared to conflict with earlierstatements” (p. 296, italics mine). As the authors pointout, all of the early literature, including that from GIA,indicated that the “true bodycolor” of a diamond shouldbe determined in light that is similar to indirect northerndaylight but with a minimum of UV radiation.
I began working at the GIA lab (on San Vicente Blvd.in Los Angeles) in 1975, shortly after GIA GemInstruments introduced the new DiamondLite withVerilux lamps, which had “a new coating that mini-mized UV emission as compared to similar lamps. . . .”(p. 302). And yes, as a GIA lab employee for the nextthree years, I “often promoted the minimized UV emis-sion in these lamps” (p. 302), generally to diamond deal-ers who had submitted stones for grading and thoughtthe color grade should have been higher. If the stone hadmedium blue or stronger fluorescence, I would explainthat it probably appeared to have a higher color grade inthe lighting environment the dealer used because of UVemission, and that we, at the GIA lab, were using special-ly developed, standardized lamps with a minimum of UVemissions to determine each diamond’s true bodycolor.
When I became aware, in 1995, that the Veriluxlamps in the GIA DiamondLite emitted a good deal ofUV radiation, I assumed that the lamps had undergone achange in manufacture, and were not the same as thoseused in 1974 (see T. E. Tashey, “The effect of fluores-cence on the color grading and appearance of white andoff-white diamonds,” The Professional Gemologist, Vol.3, No. 1, 2000, pp. 5–7). The authors seem to disagree:
“Indeed, the lamps chosen in the ’70s had a small, butnot negligible, UV component. And we continue to seethis UV component in lamps chosen since then” (p. 306,italics mine). Not negligible, indeed. If the authors arecorrect—that the Verilux lamps, even the original onesfrom 1974, have such a strong UV component—I wouldhave to conclude that a lot of fluorescent diamonds weremisgraded between 1974 and 2000.
The authors emphasize that millions of diamonds (flu-orescent and not) have been graded under the proceduresthey describe and that it would be wrong to change grades,based on new procedures, for all of the possible resubmis-sions of previously graded diamonds. Personally, I don’tknow. The authors emphasize how careful the graders areand how procedures are designed to be repeatable so thatthe lab will always get the correct color grade of a dia-mond, and how their “research has shown that skilledgraders reach a point of visual tolerance (i.e. the range ofrepeatability) . . . at slightly less than one-fifth of a grade atbest” (p. 308). Such repeatable consistency for a lab wouldbe commendable. And yet a strongly fluorescent diamond,which in my experience (see Tashey, 2000) can have itsapparent color lowered by two to four letter grades whenusing a UV filter (see below) in the standard viewing envi-ronment used by GIA, is not considered to be of any signif-icance? Is this lower grade not the true bodycolor of thediamond, which all historical literature has advised shouldbe used to determine the real value of a diamond?
The authors acknowledge that the blue fluorescence ofsome diamonds can alter their appearance in certain light-ing environments by canceling out a portion of their yel-low bodycolor. They propose to standardize the amount ofUV emissions for the effective color grading of diamonds.They do this by using a standard lamp with a standardlevel of UV emission (though this level may decay overtime) and defining a standard viewing distance:
For consistency, we use a distance of 8–10 in. (20–25 cm)between the lamps and the diamond. Bringing a fluores-cent diamond closer to the lamps may result in a strongerfluorescent impact. For instance, a yellow diamond withstrong blue fluorescence could appear less yellow (i.e., tohave a higher color grade) as it gets closer to the lamps.Moving the same diamond more than 10 in. from thelamps will have the opposite effect; that is, the color willappear more yellow (a lower color grade) (p. 304).
While this is indeed a standard, is it the best possiblestandard for the evaluation of a diamond’s color grade?
LETTERS GEMS & GEMOLOGY SUMMER 2009 S1
S2 LETTERS GEMS & GEMOLOGY SUMMER 2009
I personally think not, considering the high amount ofUV emission in this proposed standard lighting environ-ment, unless one also includes on the grading report aletter grade determined in a similar standard viewingenvironment with no UV component.
I was shocked when I first discovered in 1995, byshielding the Verilux lamps in the GIA DiamondLite witha clear Makrolon plastic film (which acts as a UV filter),that stones with very strong blue fluorescence couldappear three or four letter grades lower in color. Similarly,after sharing my findings and offering others someMakrolon film for their own experiments, several of mycolleagues and former associates were as shocked as I wasto see these dramatic color shifts in strongly fluorescentdiamonds. I believe this to be a very significant issue inthe accurate color grading of D-to-Z diamonds, and I can-not accept GIA’s recommendation for their standard view-ing environment.
As a consultant to the World Gemological Institute inIsrael from 2005 to 2007, I oversaw that lab’s transitionfrom the GIA DiamondLite (DL) to the GIA Diamond-Dock (DD) as the standard environment for color grading.During the transition, over a three- to four-week period,all stones were observed in both environments to checkfor any discrepancies. As a UV filter was used with theDL to grade diamonds with medium or stronger blue UVfluorescence, we also used it with the DD. Because thedistance from the lamp to the grading tray is greater inthe DD than in the DL, one can imagine that the UVcomponent might be somewhat reduced. We found thatstones with medium or stronger blue fluorescence had thesame color in the DL and the DD when viewed without aUV filter. They shifted to the same lower grades whenexamined with the filter. It should be noted that theVerilux lamps in the DD are thicker and have more thantwice the wattage of the lamps in the DL.
I think the GIA DiamondDock has made significantimprovements over the DiamondLite, and, except for theissue of the high UV emission from its Verilux lamps, itmakes a very good standard viewing environment for dia-mond color grading. It is larger and more grader friendly;it has a neutral gray background for better color discrimi-nation and less grader eye fatigue; the distance from thelamps to the grading shelf is greater (from approximately5 inches in the DL to approximately 7 inches in the DD);and it provides a vastly improved grading tray. This is alarge, very white, nonfluorescent plastic, pivotable, V-shaped tray that will hold a complete master set of 10 to12 stones and still have plenty of working distancebetween stones for accurate color discrimination.
I’ll conclude with the description of a diamond mylaboratory examined in October 2008: a 0.89 ct marquisebrilliant with very strong blue fluorescence. In the DLwithout a UV filter, the stone was graded table-down asa high D. In the face-up position, compared to the face-up appearance of a 1.0 ct E master stone, the E masterlooked very slightly yellow. But with the UV filter in
place, when graded table-down, the color grade shifted toa low H. In the face-up position, because the diamondwas a marquise brilliant (a fancy cut that will generallyshow more color face-up than a round brilliant of thesame size and bodycolor), it was very slightly less yellowthan a 1.0 ct J master in its face-up position, and consid-erably more yellow than the 1.0 ct H master. The dia-mond was also examined in a DiamondLite modified byDazor Inc. to use LED lighting. We found that the dia-mond appeared the same in this LED lighting environ-ment, in both the face-up and table-down positions, as itdid in the DiamondLite with a UV filter.
How is such a diamond to be described and gradedwith consistency and accuracy? I have concluded thatthe best procedure for strongly fluorescent diamonds,going forward, would be to issue a report listing two dif-ferent color grades in two different standard lightingenvironments, both similar to natural daylight, but onewith and one without a UV component (of course, natu-ral daylight has a UV component, but the strength of thatcomponent differs significantly from direct sunlight tonorthern, indirect daylight). This additional informationwould be useful to the owners of strong blue fluorescentdiamonds, alerting them to the fact that the diamondmay look different in different lighting environments.
My lab graded the 0.89 ct marquise-cut diamond asG color, as in our opinion this was a fair compromise. Iwonder how the GIA Lab would grade it. How is thisdiamond, and how are other strongly fluorescent dia-monds, to be valued? Based on the higher color grade,with a large deduction for the strong blue fluorescence?Or based on the lower color grade, with a large premiumfor the strong blue fluorescence? Personally I prefer, andprofessionally I practice, the latter.
Thomas E. Tashey Jr.Professional Gem Sciences
Chicago, Illlinois
MORE ON THE WITTELSBACH BLUEIn our recent article on the Wittelsbach Blue (Winter 2008,pp. 348–363), we noted that despite “exhaustive efforts”we had been unable to locate the “Dr. Klaus Schneider”whose research was the basis for much of K. de Smet’sbook, The Great Blue Diamond (1963). This work hasbeen used as an important source for historical informa-tion on the Wittelsbach Blue by many authors (e.g.,Tillander, 1965, 1996; Heiniger, 1974; Legrand, 1980;Khalidi, 1999; Balfour, 2001; Bari and Sautter, 2001;Bharadwaj, 2002; Manutchehr-Danai, 2005; Erichsen,2006; Christie’s, 2008). During our research, however, wediscovered that many of the statements therein had noarchival basis, and we sought to contact Schneider or atleast review his records in hopes of clarifying these incon-sistencies. Although we had met with no success at thetime the G&G article went to press, we wish to reportthat further work has finally cleared up this mystery.
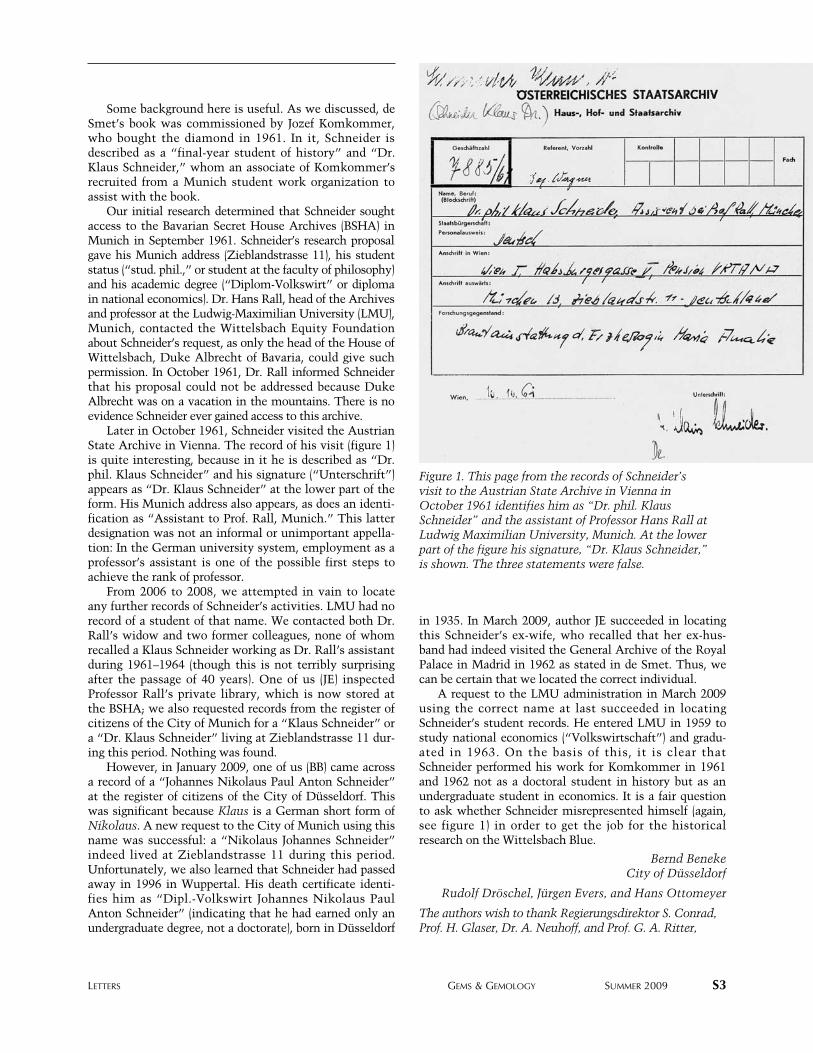
LETTERS GEMS & GEMOLOGY SUMMER 2009 S3
Some background here is useful. As we discussed, deSmet’s book was commissioned by Jozef Komkommer,who bought the diamond in 1961. In it, Schneider isdescribed as a “final-year student of history” and “Dr.Klaus Schneider,” whom an associate of Komkommer’srecruited from a Munich student work organization toassist with the book.
Our initial research determined that Schneider soughtaccess to the Bavarian Secret House Archives (BSHA) inMunich in September 1961. Schneider’s research proposalgave his Munich address (Zieblandstrasse 11), his studentstatus (“stud. phil.,” or student at the faculty of philosophy)and his academic degree (“Diplom-Volkswirt” or diplomain national economics). Dr. Hans Rall, head of the Archivesand professor at the Ludwig-Maximilian University (LMU),Munich, contacted the Wittelsbach Equity Foundationabout Schneider’s request, as only the head of the House ofWittelsbach, Duke Albrecht of Bavaria, could give suchpermission. In October 1961, Dr. Rall informed Schneiderthat his proposal could not be addressed because DukeAlbrecht was on a vacation in the mountains. There is noevidence Schneider ever gained access to this archive.
Later in October 1961, Schneider visited the AustrianState Archive in Vienna. The record of his visit (figure 1)is quite interesting, because in it he is described as “Dr.phil. Klaus Schneider” and his signature (“Unterschrift”)appears as “Dr. Klaus Schneider” at the lower part of theform. His Munich address also appears, as does an identi-fication as “Assistant to Prof. Rall, Munich.” This latterdesignation was not an informal or unimportant appella-tion: In the German university system, employment as aprofessor’s assistant is one of the possible first steps toachieve the rank of professor.
From 2006 to 2008, we attempted in vain to locateany further records of Schneider’s activities. LMU had norecord of a student of that name. We contacted both Dr.Rall’s widow and two former colleagues, none of whomrecalled a Klaus Schneider working as Dr. Rall’s assistantduring 1961–1964 (though this is not terribly surprisingafter the passage of 40 years). One of us (JE) inspectedProfessor Rall’s private library, which is now stored atthe BSHA; we also requested records from the register ofcitizens of the City of Munich for a “Klaus Schneider” ora “Dr. Klaus Schneider” living at Zieblandstrasse 11 dur-ing this period. Nothing was found.
However, in January 2009, one of us (BB) came acrossa record of a “Johannes Nikolaus Paul Anton Schneider”at the register of citizens of the City of Düsseldorf. Thiswas significant because Klaus is a German short form ofNikolaus. A new request to the City of Munich using thisname was successful: a “Nikolaus Johannes Schneider”indeed lived at Zieblandstrasse 11 during this period.Unfortunately, we also learned that Schneider had passedaway in 1996 in Wuppertal. His death certificate identi-fies him as “Dipl.-Volkswirt Johannes Nikolaus PaulAnton Schneider” (indicating that he had earned only anundergraduate degree, not a doctorate), born in Düsseldorf
in 1935. In March 2009, author JE succeeded in locatingthis Schneider’s ex-wife, who recalled that her ex-hus-band had indeed visited the General Archive of the RoyalPalace in Madrid in 1962 as stated in de Smet. Thus, wecan be certain that we located the correct individual.
A request to the LMU administration in March 2009using the correct name at last succeeded in locatingSchneider’s student records. He entered LMU in 1959 tostudy national economics (“Volkswirtschaft”) and gradu-ated in 1963. On the basis of this, it is clear thatSchneider performed his work for Komkommer in 1961and 1962 not as a doctoral student in history but as anundergraduate student in economics. It is a fair questionto ask whether Schneider misrepresented himself (again,see figure 1) in order to get the job for the historicalresearch on the Wittelsbach Blue.
Bernd BenekeCity of Düsseldorf
Rudolf Dröschel, Jürgen Evers, and Hans Ottomeyer
The authors wish to thank Regierungsdirektor S. Conrad,Prof. H. Glaser, Dr. A. Neuhoff, and Prof. G. A. Ritter,
Figure 1. This page from the records of Schneider’svisit to the Austrian State Archive in Vienna inOctober 1961 identifies him as “Dr. phil. KlausSchneider” and the assistant of Professor Hans Rall atLudwig Maximilian University, Munich. At the lowerpart of the figure his signature, “Dr. Klaus Schneider,”is shown. The three statements were false.

S4 LETTERS GEMS & GEMOLOGY SUMMER 2009
Ludwig-Maximilian University, Munich; Dr. G. Gonsa,Austrian State Archive, Vienna; Mr. P. Gutmann, Munich;Dr. G. Immler and Archivoberinspektor A. Leipnitz,Bavarian Secret House Archive, Munich; Mrs. M. Rall andMrs. A. Ludden, Munich; AOR G. Reiprich, Bavarian StateArchive, Munich; Mrs. B. Schneider, Hamburg; and MR G.Tiesel, Bavarian State Ministry of Justice and ConsumerProtection.
REFERENCESBalfour I. (2001) Famous Diamonds. Christie, Manson &
Woods, London.Bari H., Sautter V. (2001) Diamonds: In the Heart of the Earth,
in the Heart of the Stars, at the Heart of Power. ViloInternational, Paris.
Bharadwaj M. (2002) Great Diamonds of India. India BookHouse Pvt., Nariman Point, Mumbai.
Christie’s (2008) Jewels: The London Sale (10 December 2008).Auction catalogue, Christie, Manson & Woods, London.
Erichsen J.K., Heinemann K. (2006) Bayerns Krone 1806, 200Jahre Königreich Bayern [Bavaria’s Crown 1806, 200 YearsKingdom Bavaria]. Bavarian Administration of Castles,Gardens and Lakes, Munich.
Heiniger E.A., Heiniger J. (1974) The Great Book of Jewels. NewYork Graphic Society, Boston.
Khalidi O. (1999) Romance of the Golconda Diamonds.Grantha Corp., Middletown, NJ, in association with MapinPublishing, Ahmedabad, India.
Legrand J. (1981) Der Diamant, Mythos, Magie und Wirklich-keit [Diamond: Myth, Magic and Reality]. Herder, Freiburg,Germany.
Manutchehr-Danai M. (2005) Dictionary of Gems andGemology. Springer-Verlag, Berlin, Germany.
de Smet K. (1963) The Great Blue Diamond: The Wittels-bacher, Crown Witness to Three Centuries of EuropeanHistory. Standaard-Boekhandel, Antwerp-Amsterdam.
Tillander H. (1965) Six centuries of diamond design. Journal ofGemmology, Vol. 9, No. 11, pp. 380–401.
Tillander H. (1995) Diamond Cuts in Historic Jewellery. ArtBooks International, London.
INCONSISTENCIES IN “THE FRENCH BLUE AND THE HOPE”In their article presenting a new model of the FrenchBlue (Spring G&G, pp. 4–19), Farges et al. used a newlydiscovered lead cast to confirm the possibility of theHope diamond being cut from the French Blue. Duringtheir research, they created a three-dimensional model ofthe cast based on the shadow projections obtained by anOctonus Helium Rough 1:4 scanner operated by MatrixDiamond Technology. The dimensions of the model are30.37 × 25.50 × 12.87 mm, which match those of the leadcast within 20 microns accuracy. (This model is availableat www.octonus.com/oct/projects/frenchblue.phtml.)
From my analysis of the 3D model, I disagree withsome of the statements made in the article. First, it is clearthat its maximum diameter is actually 30.44 mm: Theinclination of the maximum diameter to the direction of
the length measurement is 4.4°, as illustrated in figure 1. IfBrisson (1787) measured this true maximum diameter, andthe edges of the lead cast have indeed been rounded andworn down over two centuries, then Brisson’s data matchthe lead model in this dimension much better than theauthors believed because of their assumption that Brissonmeasured a smaller, “non-tilted” diameter.
Next, the authors estimate the French Blue’s dimen-sions as 29.99 × 23.96 × 12.11 mm on the basis of Brisson’smistakes in measuring the Regent diamond. However, theauthors did not specify their correction factor and method.Taking into account that the correction factors for theRegent are in the 1.028–1.035 range, while the correctionfactors for the French Blue height and width used by theauthors were 1.034–1.035, a height of 12.11 requires a cor-rection factor of 1.055. Using the 1.034–1.035 correctionfactor, the height would be 12.35 mm.
Finally, to correct the weight of the French Blue basedon the lead cast, the authors used historical data afterBion (1791) and Brisson (1787). The weight was used as amain criterion to determine the model’s accuracy. Theauthors used results after Morel and converted 2681⁄8grains (Bion) and 260 grains (Brisson) to 69.00 ± 0.05 mod-ern carats, as their weight estimate; this estimate wasused later to adjust the dimensions of the lead cast tomatch the diamond’s presumed weight. To obtain theweight represented by the reduced lead cast, the authorsused the weight of the lead cast (which is not given in thearticle), the cast’s density (which was determined bychemical analysis of the metal surface), and the density ofthe French Blue according to Brisson. This resulted in68.3 ± 0.2 ct. The discrepancy in the estimates wasexplained by different factors of the lead cast’s productionand storage. As a result, the conclusion was made that thelead cast models the French Blue well.
However, there are several problems with thisapproach.
First, 2681⁄8 grains (Bion) equal 71.22 modern carats,while 260 grains (Brisson) correspond to 69.05 moderncarats. The authors do not explain why different ratioswere used for recalculation of grains into carats for theBion and Brisson data.
Second, the 3D model developed on the basis of thelead cast obtained by an Octonus Helium Rough 1:4 scan-ner operated by Matrix Diamond Technology resulted in71.4 ± 0.2 modern carats; this was not mentioned by theauthors at all.
Third, the discrepancy between the dimensions of thelead cast and Brisson’s data is as much as 0.6 mm, andthe authors’ data had a final error range of up to 1.5 mm.
Last, the chemical composition of the lead cast’s sur-face could differ significantly from its internal chemicalcomposition. If the authors chose not to rely on the weightcalculated on the basis of the 3D model, they should havemeasured the lead cast volume by, for example, hydrostat-ic weighing. This would have provided a more reliableweight estimate to reduce the diamond density.

LETTERS GEMS & GEMOLOGY SUMMER 2009 S5
The issues above compel one of two conclusions:Either the French Blue weighed more than 71 ct or, if theauthors consider 69 ct to be the true weight, then the 3Dmodel based on the lead cast should be reduced to a sizecorresponding to 69 ct before the comparison with themodels of the French Blue and Hope Diamond. However,this decrease in model parameters would make the con-clusion that the Hope Diamond could have been recutfrom the French Blue doubtful (figure 2).
In order to increase the accuracy and reliability of theanalysis, I suggest it is necessary to use the 3D models ofthese objects directly, not by comparison with 2D projec-tions (which have an accuracy of only 43 pixels/mm). Fora 3D model comparison, there are programs likeAutoCad, Solidworks, or software for rough diamondallocation, such as PacorClient developed by OctoNus,whose products were used by the authors in the course oftheir research.
Sergey SivovolenkoOctoNus Finland OY
Tampere, Finland
ReplyWe welcome Dr. Sivovolenko’s comments. We do wishto point out that, for space reasons, the published ver-sion of the paper was shorter than the version that wasoriginally submitted, so it was not possible to include allrelevant details.
First, we do not feel it is appropriate in such a paper toargue that one type of software is better than another.Second, a difference of 2.5 ct (out of 69 ct, followingBrisson, 1787), depending on the software used, corre-sponds to an error of 0.3 mm in the dimensions of the cast,which is surely within the error range resulting from wearor shrinkage given its manufacture sometime before 1812.Third, we have no doubt that Brisson’s 1787 measure-ments are accurate to the 0.03 ct level and 2⁄10 of a mil-limeter based on comparison of his reports of the Regentand Hortensia diamonds with modern measurements.
Our goal was not to conduct an analytical study ofthe lead cast per se but to help reconstruct a mythic dia-mond. The lead cast is the best model known to date ofthe French Blue, as it has unique features (such as asym-metries) that are also present in the 1889 drawing. Thereis no record of any other diamond of that size with thatpeculiar cut, so there is no doubt that this cast is a repli-ca of the French Blue and the only remaining artifact ofthe largest blue diamond ever cut.
Our research is now focusing on a second lead cast ofanother well-known (and lost) diamond and that of amythic sapphire (also recut) that were found in the sameset of donations.
François FargesMNHN, ParisScott Sucher
Tijeras, New Mexico
Figure 2. Based on the Helium 3D model, the weightof the French Blue would be at least 71.38 ct.Reducing the weight to 69.05 ct, as given in Farges etal., would require reducing the dimensions as shown.
Figure 1. The maximum diameter of the French Bluemodel is actually 30.44 mm, if the measurement istaken in a direction slightly inclined from a linedirectly across the table.
S6 BOOK REVIEWS GEMS & GEMOLOGY SUMMER 2009
09 Editors
Susan B. JohnsonJana E. Miyahira-SmithThomas W. Overton
BookReviews
MikimotoBy Nick Foulkes, 80 pp., illus., publ. by Assouline Publishing[www.assouline.com], New York,2008. US$18.95
Assouline Publishing has a reputationfor releasing sparkling and glamorousbooks with pretty pictures worthy ofthe coffee table, and its profile ofMikimoto is no different. This slimbook is equal parts biography ofKokichi Mikimoto (1858–1954), time-line of the company he founded at theturn of the 20th century, and broadhistory of the pearl itself. NickFoulkes, the British journalist and his-torian known as much for his dapperappearance as for his reporting, haswritten on luxe topics such as trenchcoats, the Marbella Club, Bentleys,and the rise of America’s upper class.And with Mikimoto’s pearls, Foulkesimparts the same nostalgic sheenwith which he inevitably coats eachof his subjects.
Foulkes begins with a comprehen-sive overview of the pearl throughouthistory, focusing on its myths and leg-ends, its literary and artistic refer-ences, and its popularity among rulersof all cultures and civilizations. Infact, his detailed account of the vari-ous queens and kings who wor-shipped the pearl may draw moreattention than Mikimoto’s own lifeand company history. Did you know,for example, that Cleopatra had ataste for pearls dissolved in vinegar?
Foulkes then delves into KokichiMikimoto’s childhood and earlyyouth, highlighting his humble ori-gins as the son of a noodle maker, his
involvement in “marine product”(the arrangement of pearl, mother-of-pearl, and shellfish displays), and hismarriage to Ume, a member of thesamurai social elite. It is said that theuntimely death of Ume at the age of32 propelled him to work tirelessly atperfecting his brand and product inthe ensuing years.
The history of the company isdescribed as a quick ebb and flow ofsuccesses and setbacks: Mikimotoand Ume creating their first culturedpearls in 1893 (despite a devastatingcase of red tide that had killed morethan 5,000 oysters the previous year),his first success in culturing perfectlyspherical pearls, the opening of hisfirst shop—in Tokyo’s Ginza dis-trict—in 1899, the company’s difficul-ties during World War II, and its swiftresurgence afterward.
What is absent from the history ofMikimoto’s pearl business is any dis-cussion of his competition. Foulkessays that Mikimoto was backed bynaval officer Yanagi, and relied onprevious studies by Professor KakichiMitsukuri in his quest to assist naturein culturing pearls, but he does notmention the work of others such asTokichi Nishikawa or Tatsuhei Mise.Likewise, his discussion of the com-pany’s grading scale and practices isnever balanced by any perspectivefrom authorities outside the Miki-moto organization.
The second half of the book iscomposed solely of photos, providedby Mikimoto or taken from fashionmagazines, that highlight culturedpearl trends over the 20th century.These photos are the most worth-
while element of the book, as theyinclude some of Mikimoto’s mostfamous and exquisite designs, such asYagurama (“Wheels of Arrows”) fromthe World Exposition of Paris in 1937,shown in both its deconstructed formand its assemblage as a sash clip.
The book appeals to the same audi-ence as every other volume inAssouline’s inventory: the social eliteand those aspiring to the top. Foulkesis no stranger to this audience, andjudging from the way he praises thebrand’s quality and immortality, itseems that he might sell a strand ofMikimoto’s cultured pearls better thanany sales clerk at Saks or Bergdorf.
SHANNON ADDUCCINew York
The Occurrence of Diamondsin South AfricaBy M. G. C. Wilson, N. McKenna, andM. D. Lynn; 105 pp. with two wallcharts, illus., publ. by Council forGeoscience [www.geoscience.org.za],Pretoria, South Africa, 2007.US$68.00
This is a slim softcover book on dia-mond occurrences in South Africa. Itdoes not focus on the geology of dia-mond deposits or the mineralogy andchemistry of kimberlite or the crystal-lography of diamond, but rather itdescribes the various deposits inSouth Africa, both primary and sec-ondary, where diamonds have beenfound. The first 20 pages present agood summary of our general knowl-edge of diamond: physical properties;

BOOK REVIEWS GEMS & GEMOLOGY SUMMER 2009 S7
classification of gem, industrial, andsynthetic diamonds; the history of dia-mond discoveries; the diamond mar-ket; classification and genetic modelsof diamond deposits; ages of intrusionof kimberlites; and methods of explo-ration for kimberlites and alluvial dia-mond deposits. Not discussed are thesubjects of nitrogen atoms in the dia-mond lattice, the division of diamondsinto different types, and carbon andnitrogen isotopes in diamond. Further,the two kimberlite groups (I and II)and the role of indicator minerals indiamond exploration are only brieflymentioned. However, these omissionsare unavoidable in a concise, easilyunderstood text.
There are, however, errors thatshould have been avoidable. In thesection on history of discoveries, it iscorrect that the town of Kimberleywas named in 1873 after Lord JohnWodehouse, the first earl of Kim-berley, who was at the time theSecretary for the Colonies in London.He was not, as is stated on page 8, thegovernor of South Africa and highcommissioner for southern Africa.Nor was the first diamond found onthe farm Dorstfontein. In April 1860,that large farm had been divided intoDutoitspan, Bultfontein, and Vooruit-zigt, and the first diamond was foundin the mortar of the farm house onDutoitspan.
The section on primary sourcescontains two beautiful and instructivefull-page color illustrations (figures 2and 5 on pp. 13 and 16) on the originof diamond and the intrusion of kim-berlite pipes. However, it appears thatthe color coding for the shale andsandstone in the stratigraphic profilein figure 4 (p. 15) has been reversed.Also, it is difficult to distinguish thecolor coding of the maps in figure 6 (p.19) and figure 7 (p. 22), depicting thedifferent groups of kimberlite andtheir ages; nor is it adequatelyexplained what the symbols K1, K2,K12, and K21 represent. It also comesas a surprise to see in figure 8 (p. 22)that 67% of the South African kim-berlites fall in the 120 Ma age group,as all the traditionally known and eco-
nomic kimberlites around Kimberleyare in the 80–85 Ma group. The editorshould have spotted that the y-axis offigure 9 (on p. 30), representing SouthAfrica’s percentage of world produc-tion, goes up to the 120% mark.
The sections on the distribution ofkimberlites in relation to structural/tectonic features and on the genesis ofalluvial deposits and their methods ofexploration are well described andeasy to understand. While primarydeposits are discussed in just 20pages, alluvial deposits receive a 50-page treatment, since the book isaimed at those who might invest inthe less capital-intensive alluvialmining sector.
The book is accompanied by twolarge maps printed on sturdy, glossypaper. The main map, “DiamondDeposits and Kimberlites of SouthAfrica, Lesotho and Swaziland,” isderived from the De Beers database forthis area. Simplified geology is shownin color on the map and in the legend,and every diamondiferous kimberliteand alluvial diamond deposit appearson the map and in the legend. Thesymbols for kimberlites are colorcoded (K1, K2, etc.) but again difficultto distinguish and inadequatelyexplained. The second map, “Alluvial-Diamond Occurrences of the North-west Province,” highlights farms onwhich mining licenses have beenissued, historical production is record-ed, and recent workings have beenconfirmed by field visits. This is theregion between Mafikeng-Lichten-burg-Ventersdorp to Potchefstroom inthe north and Schweizer Reneke-Wolmaransstad to Bloemhof in thesouth. Scrutinizing the map and thetext, one can see that that not all allu-vial deposits have been investigated indetail and additional economic ven-tures may await.
In summary, this is a most usefulbook for readers familiar with SouthAfrica. For casual readers, the infor-mation on individual occurrences isperhaps a bit too specific and detailed.
A. J. A. (BRAM) JANSEArchon Exploration
Perth, Western Australia
Gemlore: Ancient Secrets andModern Myths from the StoneAge to the Rock AgeBy Diane Morgan, 232 pp., publ. byGreenwood Press [www.greenwood.com], Westport, CT, 2008. US$55.00
Gem lore arises from a constellationof sociocultural beliefs and traditions.The universally appealing mystiquethat surrounds gems springs fromimagination and magical thinkingthat morphs and mutates on contactwith real people and events. Gemlorecompiles many of gems’ greatestfables and twice-told tales, multipliedexponentially over the ages.
Prolific author Diane Morgan isadjunct professor of religion and phi-losophy at Pennsylvania’s WilsonCollege. She has written many bookson related subjects, such as emerald’smystique and Eastern religious expe-riences in American life. As she con-veys in her excellent introduction,Morgan appreciates the power ofbelief as perhaps the strongest magicof all.
Morgan chooses to profile 34 gemslong associated with mythical pow-ers—most of which were well knownto the world’s ancient and distant civi-lizations—such as lapis lazuli, peridot,and the chalcedonies. Whether a gemis revered by denizens of the 21st cen-tury or has been relegated to the dun-geons of fashion, the author addresseseach with humility and respect.
Each chapter begins with a syn-opsis of the gem’s hardness, chemi-cal composition, geographic distribu-tion, and other physical information.Next are the stone’s mystical linkswith planetary bodies, zodiac signs,anniversaries, chakras, and dreammeanings.
Morgan’s narrative provides cross-cultural accounts of each gem’s lore as it courses through ancient civiliza-tions to modern crystal healers. While many of these tales will befamiliar to gem and birthstone enthu-siasts, Morgan entertains readers withobscure associations, historical quotes,and tidbits of medical anthropology.Contemporary gem and crystal healers

S8 BOOK REVIEWS GEMS & GEMOLOGY SUMMER 2009
give older tales a modern-to-occulttwist, thereby tweaking each stone’slore with a new spin that may seedfurther myth and mystery for futuregenerations.
The author’s unconventionalsourcing style contributes to a some-times staccato narrative. Shunningfootnotes, Morgan instead employsfrequent quotation marks and repeti-tive attributions to her short list ofreferences. In contrast to each chap-ter’s synoptic opening, the narrativedrifts between epochs and occasional-ly loses organizational structure.References to the teachings of Greco-Roman physician Galen are followedin nearly the same breath by com-ments from a modern crystal writerwho calls herself Melody. Are theytruly all the same?
Morgan relies heavily on the Bookof Secrets, a text the author calls acompendium of 2,000 years of gossip,which may date to at least the 13thcentury. While the brief bibliographygives modern sources—heavily repre-sented by crystal therapists—no refer-ence to Secrets is provided. The book’sindex, however, is commendable.
Gem enthusiasts and those inter-ested in the symbolic allure of gemsshould find this book enjoyable, if notindispensable. Morgan’s wry and oftenunexpected wit adds a dose of humor,while her informed perspective pro-vides readers with an engagingroundup of gem magic’s relentless gripon our collective imagination.
MATILDE PARENTELibertine
Indian Wells, California
Gems & Jewelry Appraising:Techniques of ProfessionalPractice, 3rd Ed.By Anna M. Miller, edited by GailBrett Levine, 235 pp., illus., publ. byGemstone Press [www.gemstone-press.com], Woodstock, VT, 2009.$39.99
This third edition of the late AnnaMiller’s classic guide is better de-
scribed as a new-century update, andit does an admirable job of bringingone of the first “how-to-be-an-apprais-er” books up to the present day.Edited by Gail Brett Levine, arenowned jewelry appraiser in herown right and a self-described protégéof Miller’s, this latest edition followsthe organization of its predecessors,eliminating most obsolete entries andadding important new information.The subtitle is what the book is reallyabout—it lays out much of what ajewelry appraiser may encounter inthe daily, weekly, or monthly practiceof the profession.
In speaking to the novice, thebook discusses what a professionalappraiser is, explains how to open apractice, and answers key questionsfor the uninitiated. It continues withthe basic appraisal concepts of pur-pose and function and limiting condi-tions, and handling the typical insur-ance appraisal. Most of the signifi-cant elements of the process areaddressed, section by section, withnew information superseding thatfrom previous editions. For example,the discussion of digital photography,which did not exist in the first edi-tion and was only in its infancy inthe second, now reflects the currentstate of the art.
The characteristics of value in var-ious gem categories have been updat-ed where necessary (i.e., treatments,synthetics, etc.), with an expandedsection on pearls to reflect how muchthat sector of the trade has grown.Not surprisingly, the sections on peri-od and ethnic jewelry are largelyunchanged, but there have been revi-sions to the sections on coins and sil-ver flatware and hollowware. Theappendix with charts, tables, andsample reports has been expanded, ashave the glossary and bibliography.One disappointing element is that thesame black-and-white photographsfrom the first edition are still beingused, with a few more added in thenew sections.
Where the book falls short is inreminding the reader about the impor-tance of actual experience in the trade.
Seemingly hidden among the pagesare a few key statements, such as,“Recognizing the limits of yourknowledge and getting help whenneeded will keep you out of trouble”(p. 127). The danger of not repeatingthis idea regularly is that it might leadnovices to think they only need toread a “how-to” book, take a fewclasses on theory, and do some onlineresearch to somehow bypass the manyyears, if not decades, of trade experi-ence required to become a true profes-sional appraiser.
Overall, this new edition for the21st century provides a good startingpoint for the novice and a wealth ofreference information for the veteranappraiser.
CHARLES I. CARMONAGuild Laboratories, Inc.
Los Angeles
OTHER BOOKS RECEIVEDThe Opal Story: A Guidebook. ByAndrew Cody and Damien Cody, 39pp. with DVD supplement, illus., publ.by the authors [www.nationalopal.com], Melbourne, Australia, 2008,US$37.00. This wonderful, beautifullyillustrated and produced little book isbest described as a love letter to opal.Into less than 40 pages, the authorshave packed virtually everything thebeginning opal enthusiast could wantto know about this stone’s history,formation, mining, production, char-acteristics, care, and basic valuation.A seven-minute DVD supplement isincluded.
TWO
Growth and Morphology of QuartzCrystals Natural and Synthetic. ByIchiro Sunagawa, Hideo Iwasaki, andFumiko Iwasaki, 202 pp., illus., publ.by Terrapub [www.terrapub.co.jp],Tokyo, 2009, ¥7500. This bookdetails the growth and morphology ofnatural and synthetic quartz. Thegrowth of chalcedony and opal is alsoaddressed.
TWO

09gemological
Abstracts
GEMOLOGICAL ABSTRACTS GEMS & GEMOLOGY SUMMER 2009 S9
COLORED STONES AND ORGANIC MATERIALSEinige Gedanken zu Jadeit-Jade [Some thoughts about jadeite-
jade]. H. A. Hänni [[email protected]], Gemmologie:Zeitschrift der Deutschen Gemmologischen Gesell-schaft, Vol. 57, No. 1–2, 2008, pp. 5–12 [in German].
This article addresses three issues: Why is jadeite not transpar-ent? Why is most jadeite green? Why is the chemical composi-tion not always constant? The answer to the first question isthe polycrystalline structure of jadeite: Light is scattered at thegrain boundaries. The transparency of the stone is essentiallyinfluenced by the size and homogeneity of the grains, and canbe clearly enhanced by filling of the pores. The answer to theother two questions can be found in the fact that jadeite,NaAlSi2O6, forms a solid-solution series with kosmochlor,NaCrSi2O6. Isomorphic replacement of Al by Cr in jadeite cor-relates with increasing green color. Jadeite also forms a solu-tion series with omphacite, a Ca- and Fe-bearing clinopyrox-ene. Variations in jadeite composition are due to isomorphicreplacement by kosmochlor and omphacite components. Anew standard introduced in Hong Kong allows for smallamounts of these impurities in jadeite, as long as a specificgravity of 3.4 and a refractive index of 1.688 are not exceeded.This type of jadeite is called Fei Cui in China. RT
The geochemistry of gem opals as evidence of their origin. E.Gaillou [[email protected]], A. Delaunay, B.Rondeau, M. Bouhnik-le-Coz, E. Fritsch, G. Cornen, andC. Monnier, Ore Geology Reviews, Vol. 34, 2008, pp.113–126.
The authors provide evidence that the geologic and geo-
EDITORSBrendan M. Laurs
Thomas W. OvertonGIA, Carlsbad
REVIEW BOARDEdward R. Blomgren
Owl’s Head, New York
Annette Buckley Austin, Texas
Jo Ellen ColeVista, California
Sally Eaton-MagañaGIA, Carlsbad
R. A. HowieRoyal Holloway, University of London
Edward JohnsonGIA, London
Paul JohnsonGIA Laboratory, New York
Guy LalousAcademy for Mineralogy, Antwerp, Belgium
Kyaw Soe MoeWest Melbourne, Florida
Keith A. MychalukCalgary, Alberta, Canada
Francine PayetteEast Victoria Park, Western Australia
James E. ShigleyGIA Research, Carlsbad
Russell ShorGIA, Carlsbad
Elise SkalwoldIthaca, New York
Jennifer Stone-SundbergPortland, Oregon
Rolf Tatje Duisburg, Germany
Dennis A. ZwigartState College, Pennsylvania
This section is designed to provide as complete a record aspractical of the recent literature on gems and gemology. Articlesare selected for abstracting solely at the discretion of the sectioneditors and their abstractors, and space limitations may requirethat we include only those articles that we feel will be of greatestinterest to our readership.
Requests for reprints of articles abstracted must be addressed tothe author or publisher of the original material.
The abstractor of each article is identified by his or her initials atthe end of each abstract. Guest abstractors are identified by theirfull names. Opinions expressed in an abstract belong to the abstrac-tor and in no way reflect the position of Gems & Gemology or GIA.
© 2009 Gemological Institute of America
graphic origin of opals can be deduced from the concen-trations of the main impurities (defined as >500 ppm)and trace elements (<500 ppm) they contain. Based on astudy of 77 gem-quality opals and 10 host rocks from 10countries, they concluded that the chemical composi-tion of an opal is genetically linked to that of its hostrock. This conclusion appears to hold true for bothforms of play-of-color opal (amorphous opal-A and poor-ly crystalline opal-CT), regardless of the amount ofweathering the host rock has endured. The Ba and rare-earth element (REE) concentrations of the gem opalsand their host rocks were nearly identical, suggestingthat the opals were derived from fluids that circulatedthrough those same rocks. Opals from sedimentaryenvironments were shown to have relatively high Baconcentrations (118–300 ppm) and “typical” REE pat-terns (depletion from light REE to heavy REE, withoutany noticeable Eu or Ce anomalies). Opals with vol-canic origins had lower Ba concentrations (<110 ppm)and typical REE patterns, along with a negative anoma-ly for Eu and, depending on oxidation conditions, a posi-tive or negative anomaly for Ce. Geochemical data forMexican opals from volcanic host rocks and Australianopals from sedimentary sources are used to illustratethese relationships.
While there are sufficient differences in geochemicalsignatures to determine opal provenance at the regionalscale, identifying more specific geographic sources (suchas mines) within the same geologic setting requires fur-ther study. With additional geochemical data on moresamples, along with other observations such as inclu-sion analysis, the approach described here could bedeveloped into a method for fingerprinting the prove-nance of play-of-color opals. Other observations linked ahigh iron concentration (>1000 ppm) to suppressed lumi-nescence and darker colors (from yellow to brown) inopal. Green luminescence in opal is associated withminute amounts of uranium (<1 ppm).
KAM
Identification visuelle des différents ivoires [Visual identi-fication of different types of ivory]. I. Reyjal, Revuede Gemmologie, No. 164, June 2008, pp. 22–27 [inFrench].
Ivory is defined as material originating from the dentitionof one of seven animal species: elephant, mammoth,warthog, hippopotamus, walrus, sperm whale, and nar-whal. The visual characteristics of ivory from each ofthese sources are described, including size, color, polish,growth patterns and lines, and Schreger angles (the anglesbetween the cross-hatched lines seen in cross section).These characteristics help identify ivory and distinguishits origin. Two frequent ivory substitutes are alsodescribed: the endosperms of tagua palm trees (vegetableor palm ivory) and the casques of helmeted hornbill birds(hornbill ivory). RT
Inside rubies. C. P. Smith, C. R. Beesley, E. Q. Darenius,and W. M. Mayerson, Rapaport Diamond Report,Vol. 37, No. 47, 2008, pp. 140–148.
Fine-quality Burmese rubies set the standard by whichrubies from other parts of the world are judged. However,Burmese rubies recently became a subject of U.S. legisla-tion—the Tom Lantos Block Burmese JADE (Junta’s Anti-Democratic Efforts) Act of 2008.
Dealers prohibited from supplying Burmese rubies tothe U.S. market are looking for alternate ruby sources,and the authors indicate there are about 20 other coun-tries. These deposits are concentrated in two regionswhere major orogenic episodes have occurred. One ofthese events produced the Himalayas and several associ-ated mountain chains ~55 million years ago (Ma); thisruby-bearing region extends from Afghanistan, Pakistan,and Tajikistan, into Nepal and east to Myanmar andVietnam. The other event, the Pan-African Orogeny(800–450 Ma), is responsible for ruby deposits in southernIndia, Sri Lanka, Madagascar, and East Africa. Rubies thatformed during orogenic episodes are typically related tometamorphic growth conditions, with the finest-qualitystones hosted by marbles. However, some deposits have amagmatic origin; that is, the rubies formed in the mantleand then were transported to the surface during eruptiveevents.
One of the authors (CPS) devised a ruby classificationscheme to differentiate rubies’ geologic origins—meta-morphic or magmatic—based on their gemological fea-tures. The latter pages of the article illustrate thisscheme, with photomicrographs of (1) internal featuresthat differentiate stones from various localities and (2) theprincipal treatments used on rubies. AB
Weight of production of emeralds, rubies, sapphires, andtanzanite from 1995 through 2005. T. R. Yager, W.D. Menzie, and D. W. Olson, U.S. GeologicalSurvey Open-File Report 2008-1013, 2008, 9 pp.,http://pubs.usgs.gov/of/2008/1013.
Estimating colored stone production is inherently difficultdue to the nature of the industry (e.g., lack of governmentoversight or reporting, significant variations in the qualityof rough, and countless small-scale mining operations).These factors also undermine effective regulation, and col-ored stones—like diamonds—have the potential to fundarmed conflict and illegal activities. This paper marks thefirst attempt by the U.S. Geological Survey (USGS) toestablish global production statistics by country for emer-ald, ruby, sapphire, and tanzanite. A table for each gemshows the inferred production of rough (in kilograms) from1995 through 2005. The study estimates the carat weightof imports to the U.S. from the top five countries of origin.It also discusses various influences on gem production,such as new and declining gem sources, mining operationsand technology, and other market factors such as enhance-ment processes and political pressures. The authors’
S10 GEMOLOGICAL ABSTRACTS GEMS & GEMOLOGY SUMMER 2009

GEMOLOGICAL ABSTRACTS GEMS & GEMOLOGY SUMMER 2009 S11
sources include annual USGS Mineral Questionnairesreturned from producing countries, export data, companyreports, and the trade literature. The paper acknowledgesthat the monetary value of production is even more diffi-cult to estimate because of complex and rapidly changingmarket variables. Nevertheless, the authors provide foreach gem variety: (1) the systems used to value them, (2)the average per-carat values for rough, and (3) the highlyvariable price ranges for cut goods. ERB
DIAMONDSA colourless natural diamond showing strong orange and
mixed coloured fluorescence images. T. Lu, T.Odaki, K. Yasunaga, and H. Uesugi [[email protected]],Australian Gemmologist, Vol. 23, No. 4, 2008, pp.337–340.
A 0.31 ct type Ia colorless brilliant-cut diamond wascharacterized by standard gemological testing, fluores-cence imaging, and UV-Vis-NIR, IR, Raman, and photo-luminescence (PL) spectroscopy. The sample displayedstrong orange fluorescence to long-wave UV radiation,and it showed mixed-color fluorescence when exposedto the ultra-short-wave radiation of the DiamondView.The UV-Vis-NIR absorption spectrum and PL emissionsrevealed a weak band at 480 nm and a distinct Ni-relat-ed doublet in the PL spectrum at 883 and 885 nm. Theauthors suggest that for this diamond, which did nothave the defects that typically produce the 480 nm band,Ni might be a component in the 480 nm band defect andmight also play a role in the orange long-wave fluores-cence. RAH
The iciest ice. M. Kerawala, CIM Magazine, Vol. 3, No. 7,2008, pp. 70–73.
Canada’s Diavik diamond mine (operated by a Rio Tintosubsidiary as a joint venture with Harry WinstonDiamond Corp.) is undergoing a $700 million expansion toextend its life to 2020 or beyond. This article offers aglimpse of the mine’s history and its plans for the decadeahead.
The Diavik mine is located on East Island in theNorthwest Territories. The site’s entire infrastructure—including an airstrip, housing, and amenities for work-ers—had to be built from scratch, starting in 2001. Whileair travel is used year-round, heavier loads can only bedelivered during a two-month span when the winter roadis open for truckers. This road services three diamondmines and various exploration projects in the region; over85% of it traverses lake ice and must be constantly mon-itored. It takes approximately 15 hours to reach Diavikfrom Tibbitt (a 373 km trip). Shipments must be careful-ly planned in advance to ensure that all the year’s sup-plies are delivered during those two months.
Safety and environmental savvy are critical to man-
agement of the Diavik mine. To help support the commu-nity, two-thirds of Diavik employees are local residents,with half of that group being aboriginals. Due to safetyconcerns in the frigid temperatures, workers are notrequired to perform any task they deem to be unsafe.Diavik recycles heat from its power plants for use in itsshop, processing plants, and housing.
Diavik has already started augmenting the existinginfrastructure to support the transition to undergroundproduction, which is expected to be completed by 2012.Further development will also take place at an adjacentpipe, where open-pit mining is just beginning and produc-tion is expected in late 2009. Diavik plans to continuedrilling at a nearby site to better define an unmined pipe.The company also budgeted $10 million in 2008 for anaggressive exploration program on its claim block aroundthe mine site. Joshua Sheby
A Northern Star: Canada’s first diamond mine celebratesa milestone. D. Zlotnikov, CIM Magazine, Vol. 3,No. 7, 2008, pp. 40–43.
In late 2008, the Ekati mine in Canada’s NorthwestTerritories (NWT) celebrated its 10th anniversary of opera-tion. Under its current plan, the mine can remain activeuntil 2020. However, this could be extended to 2040 aslong as operating costs are low enough ($50/tonne ore) toexploit less-accessible diamond-bearing pipes. The key tothis is maintaining current efficiencies while developingadditional cost-saving steps with minimal impact on theenvironment. Ekati runs entirely on diesel power, thoughwind and hydropower are being investigated as energyalternatives. To reduce fuel consumption and greenhousegas emissions, Ekati has implemented several measures,such as installing motion-sensing light switches in offices,recycling waste heat from generators, and minimizing theidling time of vehicles.
To ensure that northern residents benefit from thediamond wealth being extracted, Ekati has four ImpactBenefit Agreements with aboriginal landowners and aSocio-Economic Agreement with the NorthwestTerritories government. Although Ekati is only contrac-tually obligated to spend 70% of its money within theNWT, it consistently exceeds that amount (e.g., 81% in2007). In fact, diamond mining and processing nowaccount for 40% of the NWT’s gross domestic product.Besides spending money within the community, Ekatihires and trains NWT natives (67% of its workforce, 39%of whom are local aboriginals). The mine also encourageslocal schoolchildren to complete their education byshowing them opportunities awaiting them at the mineafter they finish school. As a result, more high schoolstudents are graduating and actively seeking higher edu-cation. In supporting the environment and the communi-ty, Ekati has played a significant role in the NorthwestTerritories.
Joshua Sheby
The origin of cratonic diamonds—Constraints from min-eral inclusions. T. Stachel [[email protected]]and J. W. Harris, Ore Geology Reviews, Vol. 34,2008, pp. 5–32.
Mineral inclusions in diamonds provide unique informa-tion on both (1) the physical and chemical environmentdeep in the earth’s mantle, and (2) the conditions underwhich diamonds form. This article reviews the geologicorigin of diamonds formed in the mantle beneath conti-nental cratons on the basis of geochemical data for nearly5,000 silicate, oxide, and sulfide mineral inclusions. Thesedifferent kinds of inclusions are conventionally dividedinto three categories that represent their principal mantlesource rocks. Peridotitic inclusions appear to be related torocks of peridotite composition that originated by meltextraction in Archean equivalents of mid-ocean ridges orsimilar shallow, low-pressure environments. Eclogiticinclusions broadly reflect more basaltic source composi-tions, again in shallow environments along subductionzones. Websteritic inclusions are less well defined, butthey appear to originate from pyroxenitic source rocksintermediate in composition between peridotite and eclog-ite. Geothermometry data suggest that diamonds with allthree types of inclusions formed and then were kept undersimilar thermal conditions in the mantle. Depths of for-mation are believed to have been <200 km, with the dia-monds precipitating from upward-percolating carbonate-bearing melts/fluids. JES
GEM LOCALITIESAmbre mésoaméricain [Mesoamerican amber]. G. L.
Cattaneo [[email protected]], Revue de Gemmo-logie, No. 165, 2008, pp. 9–16 [in French].
This article reports on Mesoamerican amber from theDominican Republic and central Chiapas, Mexico.Dominican and Mexican ambers come from related legu-minous Hymenaea trees. The estimated ages of theseambers vary from 20 to 17 Ma (Miocene) and 30 to 20 Ma(Oligocene to Miocene) for Dominican amber, and 26 to 22Ma (Oligocene to Miocene) for Mexican amber. Meso-american amber contains no succinic acid and is thereforeclassified as retinite. Mesoamerican ambers come in manynatural colors, mainly different shades of yellow but alsosome rarer orange-“cognac,” “cognac,” and “cherry”-redhues. Most Mesoamerican amber has a high degree oftransparency and, unlike Baltic amber, does not need to beclarified. However, the presence of organic (and rarely inor-ganic) inclusions may result in low-quality brownish yel-low to brown to blackish brown specimens. Dominicanand Mexican ambers can have a beautiful green-blue orblue-violet-green fluorescence, best seen with reflectedlight (especially sunlight). Rare “blue” amber is minedonly at La Cumbre in the Dominican Republic, where theaverage annual yield does not exceed 25 kg. Its intense flu-
orescence in reflected light suggests the presence of pery-lene hydrocarbons.
Since 1996, a rare variety of red amber has been minedalmost exclusively in Chiapas, and 2007 production wasestimated at no more than 10 kg. The red color is due toan external oxidation layer caused by contamination frompercolated water saturated with iron compounds. Somerare green amber from Chiapas (<0.6 kg mined annually) issaid to be colored by the effects of colloidal dispersion oforganic particles present in the “amber macromolecule.”
The majority of Dominican amber is mined from sec-ondary deposits and occurs in layers of lignite or carbona-ceous clay interspersed with beds of sandstone. Mexicanamber comes from primary deposits and occurs in lensesof lignite interspersed with carbonaceous layers.
FP
Color-change apatite from Kazakhstan. A. A. Zharinov, V.V. Ponomarenko [[email protected]], and I. V.Pekov, Rocks & Minerals, Vol. 83, No. 2, 2008, pp.148–151.
Large crystals of apatite exhibiting a distinct color changehave been produced from the Akzhailyau Mountains ofKazakhstan. The area is located in the Semipalatinskregion in the eastern part of the country near the borderwith China. These mountains consist of three parallelridges that attain a maximum elevation of ~1500 m. Theapatite is found in quartz-feldspar pegmatite bodies thatare associated with granites comprising a large exposedpluton. Pegmatites were first found in the area in the mid-1940s, and some 200 sizeable bodies have produced largecrystal-filled pockets containing quartz, feldspar, micas,apatite, and several rare minerals. One large pegmatitepocket measured about 4 × 4 × 4 m in volume. The pris-matic apatite crystals measure up to 6 cm long, and varyfrom translucent to transparent. They appear yellowishbrown in daylight, pink under incandescent light, andgreenish yellow in fluorescent light. Possible inclusionminerals in the apatite are monazite, albite (cleavelandite),muscovite, and dark smoky quartz. Electron microprobeanalysis revealed the presence of various rare-earth ele-ments (Ce, Nd, La, Sm, and Pr) in the apatite, which mayaccount for the color-change behavior. Stones up to 15 cthave been faceted from this material. JES
Opali di fuoco del Brasile [Fire opals from Brazil]. F.Caucia, C. Ghisoli, and V. Bordoni, Rivista Gem-mologica Italiana, Vol. 3, No. 3, 2008, pp. 179–188[in Italian].
While most fire opals come from the well-known Mexicandeposits, they are also mined from a number of smallerdeposits in Oregon (Opal Butte), Indonesia, and Ethiopia.In the 1970s, fire opals were discovered in Brazil: nearCampos Grande (in Rio Grande do Sul State), São Geraldodo Araguaia (Pará State), and Castelo do Piauí (Piauí State).The authors studied a number of yellow-to-red fire opals
S12 GEMOLOGICAL ABSTRACTS GEMS & GEMOLOGY SUMMER 2009
GEMOLOGICAL ABSTRACTS GEMS & GEMOLOGY SUMMER 2009 S13
from Brazil by standard gemological techniques, powder X-ray diffraction, scanning electron microscopy, and LA-ICP-MS, and the results were compared with data for fire opalsfrom other sources. Measurements of SG and RI alonewere not diagnostic of origin, and Fe was confirmed as thecause of the orange bodycolor. RT
Ornamental variscite: A new gemstone resource fromWestern Australia. M. Willing [[email protected]], S. Stöcklmayer, and M. Wells, Journalof Gemmology, Vol. 31, No. 3/4, 2008, pp. 111–124.
This article provides an in-depth characterization ofvariscite from Woodlands Station, Western Australia,including its geologic occurrence and mineralogical associ-ations. Data obtained from standard gemological testingand petrographic thin section analysis, as well as SEM-EDS, XRD, EDXRF, and Vis-NIR reflectance spectroscopy,are summarized in numerous figures and tables.
The authors include an overview of variscite occur-rences and mining worldwide, which is supplemented bya detailed look at archeological finds from the Neolithicperiod and the Roman Empire (when it was often referredto as callais or callainite). Despite the long history ofvariscite mining, there are few sources of ornamental-quality material, and most of the goods on the marketcome from stockpiled rough mined in Nevada or Utah.The Woodlands Station deposit represents an importantnew source of variscite, and its distinctive textural char-acteristics yield attractive objets d’art.
The variscite is hosted in siltstone and occurs in twotextures: fibrous and equigranular. Color photos illustratethe wide range of its appearance. Reflectance spec-troscopy indicates that while Cr3+ is the main chro-mophore, variscite can also incorporate vanadium in sev-eral oxidation states. X-ray diffraction analysis confirms itto be “Meßbach-type” in association with metavariscite,a dimorph of variscite. Inclusions of elemental gold forma rare feature: discrete platelets or granules that are easilyvisible in dark green variscite. Matrix material was shownto consist of iron oxides, quartz, crandallite, and alunite.
ES
The Woodlands variscite–gold occurrence in the northGascoyne region of Western Australia. E. H. Nickel,R. M. Hough, M. R. Verrall, E. Hancock, A. M.Thorne, and D. Vaughan, Australian Journal ofMineralogy, Vol. 14, No. 1, 2008, pp. 27–36.
The Woodlands variscite occurrence, near Mt. Egerton, islocated in an area of phosphate mineralization within azone ~0.5 m thick that can be traced for at least 1 km; itconsists of several thin seams 10–50 mm thick. Viewed inhand specimen, the variscite is typically bluish green withirregular yellowish brown patches consisting mostly ofcrandallite, making it attractive gemological material. Thecolor of the variscite varies from white to dark bluish greenand appears to depend on grain size. EDXRF and SEM-EDS
analyses of the variscite show an appreciable but variable Sicontent, 1–3 wt.% Fe, up to 0.2 wt.% Cr, and up to 0.4wt.% V. Gold is observable in some of the variscite fromthe main vein, with an overall content of 17 ppm Au. Theparagenesis is also discussed. RAH
Winza rubies identified. A. Peretti [[email protected]], F.Peretti, A. Kanpraphai, W. P. Bieri, K. Hametner,and D. Günther, Contributions to Gemology, No.7, 2008.
The authors present the results of a characterization studyof gem rubies and sapphires from a relatively new localitynear the village of Winza in central Tanzania. Since high-quality rubies were accidentally discovered in this remoteregion in the fall of 2007, artisanal miners have recoveredstones at the surface or in vertical shafts from an area cov-ering several square kilometers.
This report begins with a summary of the region’sgeology. The rubies occur in association with amphibo-lites as rhombohedra or as tapered prismatic euhedral andsubhedral crystals up to several centimeters long in a gar-net-pargasite host rock. Weathering of the host rock nearthe surface distributed loose corundum crystals in thesoil. Most are red to purplish red (occasionally violet orblue). In many instances, the corundum displays internalcolor zones with banded or irregular areas that are blue,pink, or both. Solid inclusions identified include apatite,chlorite, garnet, pargasite, pyrite, spinel, and talc. Whitishparticle clouds and both primary and secondary fluidinclusions are also common, as is crystallographic growthzoning. Especially distinctive in Winza rubies are flat orneedle-like inclusions, the latter exhibiting unusualcurved or spiral patterns in some cases.
Minor and trace-element data obtained by LA-ICP-MSanalysis showed small amounts of Ni (up to ~25 ppm), anunusual trace element in natural corundum. Multipleanalyses along the traverses of color-zoned crystals corre-lated trace-element contents with coloration. Heatingexperiments on Winza rubies using traditional techniqueswere not very successful, producing orange coloration anddiminishing transparency. Heat treatment appears to bedetectable by infrared spectroscopy. JES
INSTRUMENTS AND TECHNIQUESIdentification of taaffeite and musgravite using a non-
destructive single-crystal X-ray diffraction tech-nique with an EDXRF instrument. A. Abduriyim[[email protected]], T. Kobayashi, andC. Fuduka, Journal of Gemmology, Vol. 31, No. 1/2,2008, pp. 43–54.
Taaffeite (Mg3Al8BeO16) and musgravite (Mg2Al6BeO12) aremineral species that belong to the taaffeite mineral group.Both are optically uniaxial and have hexagonal lattices,and they have similar chemical compositions and crystal
structures. Because of these shared characteristics, theycannot be distinguished through standard gemologicaltesting. Taaffeite and musgravite are differentiated only bytheir symmetries (hexagonal vs. trigonal, respectively) anddifferent lattice-cell constants. Techniques with high reso-lution and accuracy—such as single-crystal and powder X-ray diffraction, electron microprobe analysis, and Ramanspectroscopy—are also effective in distinguishing the min-erals. This article describes an EDXRF instrument modi-fied for use as a single-crystal X-ray diffraction apparatus.It operates using a special rotating and tilting stage thatnondestructively determines diffraction patterns to distin-guish the minerals according to their symmetries, unit-celldimensions, and space groups. GL
Magnetic susceptibility, a better approach to defining gar-nets. D. B. Hoover [[email protected]], C. Wil-liams, B. Williams, and C. Mitchell, Journal ofGemmology, Vol. 31, No. 3–4, 2008, pp. 91–103.
Using a new, nondestructive method of gem testing, theauthors demonstrate how the major end-member composi-tion of any garnet can be confidently predicted by plottingits RI against measured magnetic susceptibility. On thisdiagram, eight end-member garnets are plotted so that anyunknown sample can be placed in the appropriate ternaryarea. This method shows how previous methods of identi-fying garnets (e.g., by their color, RI, and absorption spec-trum) are inadequate to correctly identify mineral composi-tions within the garnet group. Magnetic susceptibility mea-surements (as opposed to determination of the unit celldimensions) can be carried out with inexpensive equip-ment available to most gemologists and mineralogists.
RAH
Specular reflectance infrared spectroscopy—A review andupdate of a little exploited method for gem identifica-tion. T. Hainschwang [[email protected]] and F. Notari, Journal of Gemmology,Vol. 31, No. 1/2, 2008, pp. 23–29.
Vibrational spectroscopy, which comprises Raman andinfrared spectroscopy, is a very important tool in gemolog-ical analysis. However, Raman systems are expensive, andinfrared spectroscopy may require destructive sectioningor powdering of the investigated material. This articledescribes an alternative: specular reflectance infrared spec-troscopy. This method detects only those peaks due tomajor compositional components of a material. Because ofthis sensitivity to chemical composition and molecularcoordination, such a spectrum serves as a fingerprint of amaterial.
The authors have been building an extensive databaseof specular reflectance FTIR spectra since 2001. Anymaterial can be rapidly identified if the matching refer-ence spectrum is available. Even in the absence of a refer-ence spectrum, an experienced user can obtain significantclues to a material’s identity by relating its major peaks to
those of a mineralogical group. The technique is also use-ful for identifying jewelry-mounted gemstones or verysmall surface-reaching inclusions. Its speed, precision,and relatively low cost make it an important tool forgemological laboratories. GL
JEWELRY HISTORYThe innovative techniques and unusual materials of Art
Nouveau jewelry. Y. J. Markowitz and S. Ward,Antiques, Vol. 174, No. 1, 2008, pp. 56–63.
During the Art Nouveau movement (roughly, from the1890s up to the First World War), a small group of avant-garde European artists helped redefine and revolutionizethe design and fabrication of what had become a tired andpredictable art form. Complex adornments were often fab-ricated from parts that could be assembled to fit elaboratearmatures that allowed the wearer to display the piece indifferent ways (e.g., as either a brooch or a hair ornament).Metal treatments such as oxidation were also used toachieve different effects and act as a foil for enamels andother materials.
Part of the innate charm of Art Nouveau jewels istheir use of unusual and often inexpensive materials inartistic designs produced with consummate technicalskill. Horn was first used by René Lalique at the Salon ofthe Société des Artistes Français in 1896, and was quicklyadopted by other Continental jewelers, includingGaillard, Vever, and Aucoc. Lalique and Gaillard werenoted for treating some portions of their designs to pro-duce a delicate iridescent “bloom” on the surface of thehorn. Other “unusual” materials included glass andenamel, which were sometimes combined masterfully byLalique. Detailed photos complement the descriptions offabrication and manufacturing techniques. Each item isanalyzed in terms of construction, materials, finish, anddesign.
The jewelry in this article is from an exhibition titled“Imperishable Beauty: Art Nouveau Jewelry,” which wasat the Museum of Fine Arts in Boston in 2008 and will beon view at the Cincinnati Art Museum from October 24,2009, to January 25, 2010. JEC
Rocks solid. S. Cooperman, Forbes, December 8, 2008. Art Deco jewelry has always been popular among seriouscollectors, but it may also have investment possibilities.The cachet of Art Deco has been on the rise since the late1970s, following a long period when it was out of favor(with some pieces even being disassembled for resale).Despite its increasing popularity, auction houses haverepeatedly underestimated the value of the pieces, as evi-denced by their sales prices being well above their auctionestimates. Demand is expected to stay high, since ArtDeco was an era of limited production when jewelrycraftsmanship was at its peak.
S14 GEMOLOGICAL ABSTRACTS GEMS & GEMOLOGY SUMMER 2009

GEMOLOGICAL ABSTRACTS GEMS & GEMOLOGY SUMMER 2009 S15
The introduction of platinum enabled Cartier to startthe monochrome or “white-on-white” trend, and VanCleef adopted it for its innovative “invisible” settings.Baguette-, trapezoid-, and trillion-cut stones were intro-duced during this period. When color came into vogue,the “fruit-salad” style was created, incorporating con-trasting gem materials such as “crystal,” turquoise,malachite, lapis lazuli, coral, onyx, and jade; pieces withCartier’s “tutti-frutti” style are still among the mostsought-after designs. The discovery of King Tut’s tomb in1922 also had an impact on the period, which saw VanCleef depicting pharaohs and Cartier using scarabs. ArtDeco pieces without colored stones and diamonds alsoexist, created by independent jeweler-artists whoseunconventional designs were entirely outside the realmof the traditional motifs established by the big jewelryhouses. Signed Art Deco pieces command a premium atauction, but unsigned work with fine craftsmanshipshould not be dismissed. Collectors must be patient nowthat Art Deco jewelry is getting harder to find.
Michele Kelley
Study of the provenance of Belgian Merovingian garnetsby PIXE at IPNAS cyclotron. F. Mathis [[email protected]], O. Vrielynck, K. Laclavetine, G.Chene, and D. Strivay, Nuclear Instruments andMethods in Physics Research B, Vol. 266, 2008, pp.2348–2352.
A 2002 road excavation in the Walloon area of Belgiumuncovered a 5th century cemetery containing 436 tombs.Archeological excavations led to the discovery of about 60jewels inlaid with red garnets. The PIXE technique wasused to analyze the garnets, utilizing a 3.1 MeV protonbeam at the IPNAS cyclotron of the University of Liege,Belgium. The garnets had a mostly homogeneous compo-sition and thus were probably from a single source. Thestudy confirms that PIXE in external-beam mode is a pow-erful tool for evaluating the provenance of archeologicalgarnets. DAZ
JEWELRY RETAILINGA diamond is forever . . . but the hard-hit jewelry industry
is in a state of flux. S. Buxbaum, The Secured Lender,November/December 2008, pp. 64–66.
Traditional retail jewelers have been affected more severelythan many others by the economic downturn. However,the industry is also witnessing a deep competitive shifttoward internet sellers. The author chronicles the successof internet retailer Blue Nile and quotes a prediction by theJewelers Board of Trade that many mid-market indepen-dent stores will probably go out of business during the nextfive years. Lenders who take jewelry in secured lendingtransactions must be aware that its value can be subjective,influenced by fashion and workmanship. RS
Economic downturn: A challenge or opportunity?Jewellery News Asia, No. 293, 2009, pp. 50–52.
Manufacturers of stylish jewelry made from alternative(non-precious) metals have an opportunity to gain salesamong hard-pressed middle-income consumers in Asia. Inaddition, manufacturers of such products may find it easi-er to keep bank financing while gold hovers at a near-record price. Manufacturers are warned against discount-ing too deeply, because they may need ample profit mar-gins to survive the economic downturn. RS
Romancing the stone. K. Field [[email protected]],Chain Store Age, November 2008, pp. 29–31.
Blue Nile, the internet diamond seller, has seen its salesincrease from $14 million in 1999—its first year of opera-tion—to $319 million in 2007. According to CEO DianeIrvine, the company operates on a 22% gross margin, com-pared to an average of 50% for a typical brick-and-mortarjeweler. While the company acknowledged difficulties asthe economy deteriorated in the fall of 2008, Irvine said itcould remain profitable and poised for growth. RS
SYNTHETICS AND SIMULANTSEffect of seed sizes on growth of large synthetic diamond
crystals. C. Zhang [[email protected]], R. Li, H.Ma, S. Li, and X. Jia, Journal of Materials Scienceand Technology, Vol. 24, No. 2, 2008, pp. 153–156.
The authors grew synthetic diamond crystals via the tem-perature-gradient method (high pressure and high tempera-ture) using seed crystals ranging from 0.5 to 2.5 mm. Allwere grown using the same temperature gradient, at 5.5GPa and 1550 K, in a cubic anvil apparatus. The carbonsource was high-purity graphite, and the catalyst/solventwas a Ni-Mn-Co alloy (ratio of 70:25:5 by weight). Thegrowth surface was the (111) face. The diffusion of carbonin the metal solvent was simulated and analyzed by finiteelement analysis (FEA).
The authors demonstrated that by increasing the seedsize and keeping all other variables constant, the crystalsgrew at a faster rate. However, larger seeds correlated to adecrease in the quality of crystals produced. With a 1.0mm seed, the resulting diamond had no metal inclusions.A 1.8 mm seed led to a few small, sheet-like metal inclu-sions, while a 2.5 mm seed resulted in large, blocky metalinclusions. FEA was used to simulate and report on thecarbon diffusion process, since actual diamond growthunder these conditions cannot be observed in situ. FEAshowed that the carbon super-concentration at the seedsurface is inhomogeneous—it increases symmetricallyabout the center of the growth surface, where it is lowest.The slower growth rate at the center of the crystalexplains why metal inclusions tend to be concentratedthere and not on the edges—the growing crystals simplyenwrap the molten metal solvent, which quenches to
form solid inclusions when the experiment is terminated.It also explains why a larger growth surface, with a greaterdifference in carbon concentration and consequently agreater difference in growth rate from center to rim, leadsto larger metal inclusions. JS-S
L’ambra: i falsi (Parte V) [Amber: The fakes (Part V)]. G. L.Cattaneo [[email protected]] and F. Talami,Rivista Gemmologica Italiana, Vol. 3, No. 3, 2008,pp. 189–195 [in Italian].
A considerable number of materials that imitate genuineamber play an important role in the amber market. Withthe development of plastics, a series of synthetic polymershave been used, especially celluloid, Bakelite, methacrylate(i.e., acrylic glass, Plexiglas, or Perspex), polystyrene, andpolyester. Early examples of imitation resins are found inVictorian and Edwardian jewelry dating back as far as 1870.Specific gravities, refractive indices, and characteristicodors produced by hot point testing are given for thesematerials. During the 1960s to 1980s, a simulant calledPolybern was produced in East Germany, Poland, andLithuania. It was composed of amber fragments andpolyester. Frequently, amber fragments are also processedto form “pressed” amber (reconstructed amber). Last,immature natural resins called copal are used as substitutesfor genuine amber. Today, most of this material comesfrom Colombia and Madagascar, with ages of 80–1,000years (compared to Baltic amber, at 40–50 million years).Inclusions are not conclusive for separating natural,untreated amber from its many simulants. Although natu-ral inclusions (mostly insects and spiders) are highly prized,these can be artificially introduced into both natural amberand amber substitutes. RT
TREATMENTSEnhanced optical properties of chemical vapor deposited
single crystal diamond by low-pressure/high-tem-perature annealing. Y.-F. Meng, C.-S. Yan, J. Lai, S.Krasnicki, H. Shu, T. Yu, Q. Liang, H.-k. Mao, andR. J. Hemley [[email protected]], Proceedings ofthe National Academy of Sciences, Vol. 105, No.46, 2008, pp. 17620–17625.
Single-crystal chemical vapor deposition (SC-CVD) syn-thetic diamond was grown at very high growth rates (upto 150 µm/hour) by microwave plasma–assisted tech-niques. The resulting gem-quality SC-CVD synthetic“plates” had faces up to ~1 cm2 and ranged from 0.2 to6.0 mm thick. The addition of a small amount of nitro-gen to the synthesis gas (CH4) produced optically homo-geneous, hydrogen-containing type IIa brown crystalswith low nitrogen content (<10 ppm) and strong, broadUV-visible absorption. The crystals were annealed in ahydrogen environment at low pressure (<300 torr, lessthan half of atmospheric pressure) and high temperature
(up to 2200°C) for several hours without graphitization. The low-pressure, high-temperature (LPHT) annealing
enhanced the optical properties of the SC-CVD crystals,observed as significant decreases in the intensity of spec-tral features in the UV, visible, and infrared absorptionand photoluminescence spectra. Decreases in sharp spec-tral features indicate a reduction of nitrogen-vacancy-hydrogen defects during annealing, which the authorsascribe to an increase in the relative concentration ofnitrogen-vacancy centers in annealed material. Thehydrogen-assisted alteration of defect structures in SC-CVD crystals with LPHT annealing is different from thealteration of natural brown type IIa diamonds duringHPHT annealing, where decreases in optical absorptionare caused by the removal of defects associated with plas-tic deformation.
The authors note that LPHT annealing of SC-CVDsynthetic diamonds to enhance their optical propertiescan be performed in CVD growth chambers as a post-growth treatment, and is unconstrained by crystal size.LPHT-annealed SC-CVD synthetics may have technicaland scientific applications such as in quantum comput-ing. Of gemological interest are the relatively large, gem-quality specimens produced and their decolorization byLPHT treatment. Emily V. Dubinsky
Pre-harvest colour-treated akoya unveiled. JewelleryNews Asia, No. 284, 2008, pp. 60–62.
Tanabe Pearl Farm of Mie, Japan, announced a new treat-ment process to produce pink, green, blue, and lavenderakoya cultured pearls by injecting a colored liquid intothe oysters. The developer of the process, TomokazuTanabe, claimed the colors were not dyes but “a combina-tion of man’s efforts and nature’s power.” Thus far, thetreated akoyas form only a very small percentage ofTanabe’s production, and none have been marketed. AJapanese laboratory, the Gem Science Academy of Tokyo,has provided several techniques for identifying them.Their UV-Vis-NIR reflectance spectra are much differentfrom those of untreated or conventionally dyed akoya cul-tured pearls. In addition, X-radiographs can detect themetallic compounds that were injected into the oysters.
RS
Visually distinguishing A-jadeite from B-jadeite. J. Li[[email protected]], X. Liu, Z. Zhang, Y. Luo, Y.Cheng, and H. Liu, Journal of Gemmology, Vol. 31,No. 3/4, 2008, pp. 125–131.
After first discussing the distinctions between A-jadeiteand B-jadeite in the context of the Chinese gem trade, theauthors describe visual skills that can aid in the separa-tion of these two types. A-jadeite is defined as materialthat has been carved and polished, with minimal waxapplied to enhance the luster. Mild acid is consideredacceptable as a bleaching agent, provided it does not dam-age the jadeite’s structure; also, iron-containing A-jadeite
S16 GEMOLOGICAL ABSTRACTS GEMS & GEMOLOGY SUMMER 2009
GEMOLOGICAL ABSTRACTS GEMS & GEMOLOGY SUMMER 2009 S17
may be heated to give it a red color. B-jadeite has beenprocessed with strong acid, and the resulting pores filledwith wax or polymer resin. C-jadeite (bleached and dyed)is not addressed.
Visual distinctions are described, illustrated withcolor photos, and discussed in terms of: (1) surface lusteror comparative reflectance differences, (2) distribution ofcolor on the surface, (3) internal inclusion patterns, (4)internal behavior of light resembling the adularescence ofmoonstone, (5) microfractures and their relationship tocolor distribution, and (6) item size and quality and theintricacy of the carving. For example, the internal yellowglow found in A-jadeite distinguishes it from B-jadeite,which exhibits a white-blue reflection. The underlyingreasons for this effect, as well as other observations listedabove, are discussed in detail. Careful attention to thesefeatures is required for an accurate determination, thoughthe potential for error still exists and advanced laboratoryequipment may be required. ES
MISCELLANEOUSArtisanal diamond cooperatives in Sierra Leone: Success
or failure? E. A. Levin [[email protected]] andA. B. Turay, Diamond Development InitiativePolicy Brief, June 2008, 4 pp.
In Sierra Leone, a U.S.-led attempt to establish diamondmining and marketing cooperatives is an apparent failure.Between 1999 and 2005, the five cooperatives funded bythe Integrated Diamond Management Program, under theU.S. Agency for International Development (USAID), pro-duced 320 stones weighing a total of 60.37 carats, valuedat $4,390. This NGO report alleges that there were manyreasons for the failure, including USAID’s withdrawal offunding for most of the cooperatives, the working of siteswith unproven diamond resources, the lack of miningexpertise, delays (the country’s civil war had not yet endedwhen the program began), theft, and weather problems.The report recommends that future projects include sur-veys to study whether the lands actually contain dia-monds, pay more attention to local hierarchies in settingup the cooperatives, give adequate training to the diamonddiggers, and provide mechanized mining equipment whereneeded. RS
Diamonds, development and democracy. N. Oppen-heimer, World Policy Journal, Fall 2008, pp.211–217.
While diamonds and other commodities have fueled civilwar and conflict in a number of African nations, thesenatural resources can assist with growth and developmentif governments and their citizens choose that direction.The author, chairman of the De Beers Group, notes suc-
cesses in Botswana, pointing out that well-managed dia-mond resources have moved that nation from being oneof the world’s poorest 40 years ago, to one of the mostsuccessful economies in Africa today. Botswana can serveas a roadmap for other African countries to establish func-tioning, effective democracies; deploy natural resourcesinto public goods; and form innovative 50/50 partnershipsbetween government and large investors. The reportstresses that, while the West often views Africa as a sin-gle entity, it is a continent of 54 separate nations, eachwith its own strengths and weaknesses. The author endswith a report on the effectiveness of the KimberleyProcess. RS
Eco-friendly production: The first step to sustainability.Jewellery News Asia, No. 290, 2008, pp. 56–57.
Jewelry manufacturers in Hong Kong are preparing forpotential future environmental regulations by buildingcleaner and more efficient factories. Industry officials saythat implementing waste reduction strategies would pro-duce the best results in large-scale plants that processlarge quantities of precious material. New strategic equip-ment includes air showers for catching gold dust andlaser-welding machines that work at rates of secondsinstead of minutes. While eco-friendly production is morecostly, saving valuable materials can sometimes pay forthe equipment in a matter of months and improve long-term cost effectiveness. AB
Jadeite auction results suggest cooling trade, market.Jewellery News Asia, No. 243, 2009, pp. 63–64.
The October 2008 Myanma Gems, Jade, and PearlEmporium saw record low business, with 59.5% of thelots selling, bringing in a total of $163 million. However,some top jade lots did sell for much more than their pre-sale reserve. One was estimated at $101,000 but sold for$868,000. Another, estimated at $25,500, sold for$399,000. In 2008, Myanmar’s government sold 12,829tonnes of jade for a total of $720 million. RS
Why China manufacturers are optimistic despite globalslowdown. Jewellery News Asia, No. 290, 2008, pp.81–84.
During the global financial crisis, Chinese diamond jewel-ry manufacturers have turned their attention from export-ing to the United States to creating branded jewelry linesfor their domestic market. Several polished diamondwholesalers observed that Chinese consumers are broad-ening their preferences to include diamonds above 0.50 ctand SI clarity, both of which had been a difficult sell there.The manufacturers are also establishing closer ties to localretailers in promoting their branded diamond jewelrypieces, noting the need to pay more attention to fashiontrends and changes in the retail environment. RS

GIA’s Retailer Support Kit has been developed to help
sales associates educate the public about diamonds,
the 4Cs, and thoroughly explain a GIA grading report.
Take full advantage of all that GIA has to offer by visiting
www.retailer.gia.edu
To order your FREE kit, log on to www.retailer.gia.edu
A $97.00 value, shipping
and handling extra.
Because Public Education Happens at the Counter.
GIA launches Retailer Support Kit and website
RTGG09
GMSGG
EXPERTISE THAT SPREADS CONFIDENCE.
AROUND THE WORLD AND AROUND THE CLOCK.
All across the planet, GIA labs and gemological reports are creating a common language for accurate, unbiased gemstone evaluation. From convenient locations in major gem centers.
To frontline detection of emerging treatments and synthetics. To online services that include ordering, tracking, and report previews. GIA is pioneering the technology,
tools and talent that not only ensure expert service, but also advance the public trust in gems and jewelry worldwide.
W W W. G I A . E D U
NEW YORK10 : 0 0 A MGIA Master Color Comparison Diamonds
confirm color quality of a fancy yellow.CARLSBAD7 : 0 0 A MLaboratory technicians calibrate
measurement devices before
the day’s grading production begins.
MUMBAI 7 : 3 0 P MStaff gemologist submits new findings on
coated diamonds to GIA global database.
ISRAEL 5 : 0 0 P MCutter checks parameters online with GIA
Facetware® Cut Estimator.
BANGKOK 9 : 0 0 P MGemologist confers with Carlsbad lab
about ruby country of origin.
JOHANNESBURG4 : 0 0 P M
Wholesaler alerted when synthetic
diamonds discovered in large parcel.
HONG KONG 10 : 0 0 P MWholesaler views grading results and requests
additional services online at My Laboratory.
CARLSBAD NEW YORK LONDON ANTWERP FLORENCE GABORONE JOHANNESBURG
MOSCOW MUMBAI BANGKOK HONG KONG BEIJING TAIPEI SEOUL OSAKA TOKYO