Wind speed variability across the UK between 1957 and 2011
55
This is the pre-peer reviewed version of the following article: Watson S J, Kritharas P and Hodgson G J (2013). ‘Wind Speed Variability across the UK between 1957 and 2011', Wind Energy (2013) Early View, which has been published in final form at http://onlinelibrary.wiley.com/doi/10.1002/we.1679/abstract. Wind Speed Variability across the UK between 1957 and 2011 (Short Title: Wind speed variability across the UK between 1957 and 2011) S J Watson, P Kritharas and G J Hodgson Centre for Renewable Energy Systems Technology, School of Electronic, Electrical and Systems Engineering, Holywell Park, Loughborough University, Ashby Road, Loughborough, Leicestershire, LE11 3TU, UK Email: [email protected], Tel.: +44 1509 635348, Fax: +44 1509 635341 Abstract: Using surface data from 57 UK meteorological stations, a national (BADC- 57) and regional wind index for the UK has been calculated for the period 1983 to 2011. For a subset of seven stations, an additional national index (BADC-7) has been calculated for the period 1957 to 2011. The indices show an annual variability of 4% over their respective periods corresponding to a variation in typical wind turbine capacity factor of 7%. These indices are compared with indices calculated from other sources, namely: an index generated using a gridded dataset of observed values interpolated across the UK; an index calculated from an area bounding the UK using the ERA-40 reanalysis dataset; indices calculated from bilinear interpolation of the ERA-40
Transcript of Wind speed variability across the UK between 1957 and 2011

This is the pre-peer reviewed version of the following article: Watson S J,
Kritharas P and Hodgson G J (2013). ‘Wind Speed Variability across the UK
between 1957 and 2011', Wind Energy (2013) Early View, which has been
published in final form at
http://onlinelibrary.wiley.com/doi/10.1002/we.1679/abstract.
Wind Speed Variability across the UK between 1957 and 2011
(Short Title: Wind speed variability across the UK between 1957 and 2011)
S J Watson, P Kritharas and G J Hodgson
Centre for Renewable Energy Systems Technology, School of Electronic, Electrical and
Systems Engineering, Holywell Park, Loughborough University, Ashby Road,
Loughborough, Leicestershire, LE11 3TU, UK
Email: [email protected], Tel.: +44 1509 635348, Fax: +44 1509 635341
Abstract: Using surface data from 57 UK meteorological stations, a national (BADC-
57) and regional wind index for the UK has been calculated for the period 1983 to 2011.
For a subset of seven stations, an additional national index (BADC-7) has been
calculated for the period 1957 to 2011. The indices show an annual variability of 4%
over their respective periods corresponding to a variation in typical wind turbine
capacity factor of 7%. These indices are compared with indices calculated from other
sources, namely: an index generated using a gridded dataset of observed values
interpolated across the UK; an index calculated from an area bounding the UK using the
ERA-40 reanalysis dataset; indices calculated from bilinear interpolation of the ERA-40
reanalysis dataset to the 57 and seven stations; and another independent UK wind index.
The indices show variation in trends with all showing some level of decline with the
exception of that generated using the ERA-40 reanalysis dataset averaged over the UK
which shows a significant increase. The various indices show varying degrees of
agreement with correlation coefficients, after trends are removed, ranging between
0.611-0.979. The effect of changes in site exposure, instrument bias and measuring
height were considered for the BADC-7 and BADC-57 indices. The change in
instrument measurement height appears to have a significant biasing effect and it is
likely that this along with changes in exposure at urban sites have caused the decline in
annual wind speeds observed for some of the indices. There does not appear to be
evidence for significant changes in large area (mesoscale) surface roughness. The
correlation between annual mean wind speeds at the seven surface station sites used to
calculate the BADC-7 index is seen to be quite weak indicating very localised variations
in inter-annual variability. When regional differences in the index are investigated, it is
seen that wind speeds show a very slight decline across the UK in all regions except the
south-east, which shows a slight increase. The greatest decrease is seen in the north-
west. These changes are in the same direction as the tentative predictions given by
climate models for future changes in wind speed across the UK, though the uncertainty
is large given the large degree of inter-annual variation.
Keywords: wind, index, variability, long-term, reanalysis
1. INTRODUCTION
An understanding of variation in long term wind speed is important in several sectors
such as where wind loading on structures needs to be assessed or where long term
energy yields for wind farms needs to be evaluated. Knowledge of wind variability is
particularly important for wind farm developers and operators to minimise long term
risk due to fluctuations in annual revenue.
A wind index provides an indication of the mean wind speed, usually annually and/or
monthly, relative to the calculated long-term mean wind speed (Garrad Hassan, 2008).
An alternative method is the concept of a wind index based on ‘significant wind events’
e.g. (Mason et al, 2005) for the purpose of predicting certain oceanic events relevant to
fish reproduction. However, an index based on anomalous events is not useful for the
prediction of long-term energy yields from wind farms. What is required is a time
history of mean wind speed values at regular (say annual) intervals.
Using a wind index it is possible to estimate the energy production of a wind farm based
on a historical record of mean wind speed. The wind index can also provide an
indication of long term trends in mean wind speed and can be used to provide a
financial estimate of the impact of any periods of unavailability (Harman and Morgan,
2005). Trend information is particularly useful given that a wind farm might have a 20-
30 year production lifetime and therefore the wind climate might change significantly
from that assumed at the planning stage.
The aim of this work was to reconstruct, from surface observations of wind speed, a
wind index which would indicate the variability of the wind climate on a timescale at
least as long as the expected lifetime of a wind farm site (>25 years) and would allow a
regional analysis of wind speed variability across the UK. This was extended (>50
years) using as long a period as possible from the observations available, whilst still
giving a representative UK average. The index was analysed both nationally and
regionally and compared with wind indices calculated from other sources including
reanalysis data and surface observations interpolated onto a regular grid.
The research reported here is the first known published analysis of a UK wind index
using surface station observations for a period of greater than 50 years and with an
analysis of regional variation. It also provides a contrast between wind indices derived
from spatially smoothed data sets, e.g. analysis data, and point values from
meteorological stations.
2. BACKGROUND
2.1. Historic long term wind speed trends
There has been a volume of work investigating historic wind speed trends using indirect
indications of wind speed, including reanalysis datasets and historic pressure fields.
An analysis of six-hourly cyclone activity between 1959 and 1997 from the NCEP-
NCAR reanalysis (McCabe et al, 2001) suggested a decrease in cyclone frequency but a
slight increase in intensity for mid-latitudes (300N-60
0N) and an increase in cyclone
frequency and intensity for high-latitudes (600N-90
0N). Another study of the six-hourly
NCEP-NCAR reanalysis dataset between 1949-1999 produced six winter indices
including extreme wind speed (Paciorek et al, 2002). This work suggested an increasing
wind speed trend for the UK over the period of between 1.5-2.5 m/s per 50 years. In
(Wang et al, 2009), a number of pressure triangles over the north-eastern Atlantic were
studied to infer the geostrophic wind over the period 1874-2007. The results of this
study indicated maximum storminess in the North Sea around 1990. A steadily
increasing trend in the geostrophic wind was determined in the north-eastern extent of
the region studied, whereas a decline was observed in the western extent. Over Great
Britain, the geostrophic wind was found to be reasonably steady, except during the
summer where a slight decline was observed. For the north-eastern Atlantic region as a
whole, it was found that during the summer, storminess appeared to have declined,
except that the south-western areas (including north-west Scotland) showed no
noticeable trends. From a similar analysis of pressure data from Sweden for the period
1780 to 2005 using an Eulerian framework, no overall change in storminess was
observed, though significant decadal swings were observed (Bärring and Fortuniak,
2009). This work highlighted the importance of studying a long enough period when
trying to determine climate changes.
A study of wind speed trends in north-western Europe (Atkinson et al, 2006) concluded
that there was a reasonable degree of correlation between indices in the UK, Germany,
Denmark and the Netherlands with a similar declining trend over the 15-year period
1990-2005. A study of 850hPa winds from the NCEP-NCAR reanalysis dataset,
focussing primarily on the Baltic (Pryor and Barthelmie, 2003), showed for the grid cell
at 550
N, 50
E, that the time series displayed a number of features, namely a peak in
1967, an increase during 1970s and 1980s, a low around 1987 and a declining trend
during the 1990s.
2.2. Future projected trends
There is an increasing interest in projected changes to the wind climate over the next
century and a number of authors have studied the output from several GCMs (Global
Climate Models) and RCMs under different CO2 forcing scenarios.
The output of the ECHAM5 GCM for several climate change scenarios was studied
indicating an increase in extreme winds with higher wind speeds over Britain, the North
Sea, the Baltic Sea and nearby coastal regions during the 21st century (Pinto et al,
2007). In (Pryor et al, 2006) when HadCM3 output data were examined under the SRES
A2 high emissions scenario, it was found that there was a high degree of correlation of
latitudinally integrated wind indices in Europe, balanced around 45°N. This research
also found that there was evidence for a slightly reduced annual cycle amplitude
European wide comparing 1990-2001 with 2088-2099. It is concluded in (Pryor et al,
2006) that though there is generally little evidence for future changes in spatial or
temporal variability of wind indices, this is uncertain due to model biases. In (Cradden
et al. 2012) future projections for wind speed are shown comparing HadCM3 and
ECHAM5 for several climate change scenarios. Both models indicated decreasing wind
speeds during the summer and increasing during the winter by the end of the 21st
century. However, this work also highlighted significant uncertainties and discrepancies
between the models.
Another analysis of HadCM3 output data, considering the SRES A2A and B2A
scenarios over the period 1990-2099 (Leckebusch and Ulbrich, 2004), showed projected
increasing winter (Oct-Mar) 10m wind speeds over south-eastern England and slightly
decreasing wind speeds over the north-west. However, in the same research, it was
found that the regional HadRM3H model output gave a slightly different pattern with an
increase to the north-east and a slight decrease in the central and southern UK.
Although, differences are seen for the different climate change scenarios, research
looking at the RCA3 RCM model suggests projected future change in 60m wind speeds
across the British Isles for the period 2021-2060 with wind speeds increasing in the
south-east and decreasing in the north of Scotland under the A2 scenario, albeit with
some localised inhomogeneities across this south-north gradient (Nolan et al. 2012).
An analysis of nine simulations from six GCMs under the SRES A1B scenario (Donat
el al, 2010) showed a projected future increase in storms in the Eastern Atlantic, near
the British Isles and in the North Sea. The research also suggested an associated
increase in storm intensity over large parts of central Europe towards the end of the 21st
Century.
A simulation by the RCAO regional climate model of the percentage change in the 90th
percentile of winter (DJF) daily maximum wind speed in Europe, between the 1961–
1990 and the 2071– 2100 periods (Beniston et al, 2007) showed a projected gradient
south-east to north-west with an increase in south-east Europe (5-10%) and a much
lower increase in the north-west (0-2.5%). A further regional climate model analysis
(Rockel and Woth, 2007) showed a projected change in the total number of storm peaks
from 1961–1990 to 2071–2100, as simulated by the RCMs CHRM and CLM with a
decline in the north-west and an increase in the south-eastern UK.

Recent UK climate projects have considered a range of meteorological variables,
though projected changes to wind speeds over the UK are particularly uncertain.
Nevertheless, the UK Met. Office Hadley Centre has produced two reports which are
relevant in this regard. The first (Brown et al, 2009) suggests that there is evidence for
an overall slight reduction in wind speeds over the UK, but largest in the north-west
with possibly a slight increase in the south-east, most pronounced in the summer, by
2070-2099. The report does, however, note an RCM bias to lower than observed wind
speeds in Scotland and Wales and higher in low-lying regions of England. The second
report (Sexton and Murphy, 2010) suggests that averaged over the entire UK, there is
expected to be a small reduction in mean wind speeds, though regional differences are
not so clear. However, there is some evidence for a slight reduction in Scotland and a
smaller reduction or no change in southern England by 2070-99. An analysis of the
UKCIP02 climate change scenarios (Harrison et al. 2008) suggested by 2080,
significant reductions in wind speeds over Northern Ireland particularly in the summer
and smaller increases in Northern Scotland most notably in late spring/early summer. In
England and Wales, wind speeds were projected to slightly reduce in the autumn and
increase in winter.
2.3. A comparison of wind indices
With the growth in wind power world-wide, there has been an increased interest in
assessing inter-annual variation in temporal ‘windiness’ of a region for the purposes of
evaluating variability in wind energy generation. This is important from an economic
viewpoint to know the variation in likely annual revenue from a wind farm over its
lifetime. Wind indices fall into four broad categories:
Those derived directly from surface wind speed observations, e.g. (Früh W-G.
2013, Hodgetts, 2011)
Those derived from observations of wind energy generation, e.g. the Danish
wind energy index (Nielsen, 2004), the German IWET index and Windex-CBS
in the Netherlands;
Those derived from pressure gradients in the form of geostrophic winds
triangulated from site pressure observations, e.g. (Bakker and van den Hurk,
2012, Bärring and Fortuniak, 2009, Wang et al. 2009);
Those derived from numerical weather prediction (NWP) models such as
reanalysis data, with or without regional downscaling, e.g. (Pryor and
Barthelmie, 2003, Pryor et al. 2006).
The first type of index relates directly to observations of surface wind speed and is thus
capable of indicating variations in regional wind climate. The disadvantage of this type
of index is the sensitivity to very localised effects. The second category has similar
benefits and also relates directly to wind energy. However, changes over time of the
portfolio of turbines used to generate such indices and non-availability of machines due
to outages can create inhomogeneities (Bakker et al. 2012). The third and fourth
categories have the advantage over the first two of filtering out most local scale
anomalies due to factors such as local microclimates, local orography, changes in site
exposure, changes in instrumentation, etc. On the other hand, using such spatially
smoothed datasets can also mask local and regional differences in wind variability.
Regional Climate Models (RCMs) can be used to try and downscale reanalysis datasets,
but it has been found that the datasets so derived significantly underestimate inter-
annual variability (Rasmussen et al. 2011). In addition, such models do not capture the
variable spatial characteristics of the wind (Pryor et al. 2009, Pryor and Barthelmie
2010, Höglund et al. 2009).
Differences in surface wind speeds and large scale circulations have been reported by
researchers (Vautard et al., 2010) and much of the difference has been attributed to
changes in surface roughness. Site specific gust factors were used in a study of
meteorological stations in the Netherlands to assess the impact of surface roughness on
long term wind speed trends suggesting an approximately equal influence of climate,
large scale (mesoscale) surface roughness changes and local roughness changes (Wever,
2012). It is possible to distinguish to some extent the influence of these factors
comparing trends inferred from different indices (Bakker et al. 2012). For example,
indices inferred from pressure gradients and NWP models are relatively insensitive to
changes in surface roughness.
3. DATA
3.1. Surface Observations from the UK MIDAS via the BADC
The UK Met Office produces a data set of land surface observations from 1853 to the
present date. This data set is held on the Met Office Integrated Data Archive System
(MIDAS) and is available via the British Atmospheric Data Centre (BADC). The
MIDAS data set contains a large number of observations covering a variety of
meteorological parameters including mean wind speed (British Atmospheric Data
Centre, 2009). Wind observations are typically 10-minute means in knots, with the 10-
minute mean recorded on the hour and are typically made at a height of 10m above the
land surface, though this has not necessarily been the case historically as will be
discussed later in this paper.
3.2. ERA-40 Re-analysis Dataset
The ERA-40 re-analysis was produced by assimilating a large number of different
meteorological datasets including: satellite measurements, ship-borne and buoy
observations, land-based surface observations, upper air measurements and remote
sensing observations (Uppala et al, 2005). The assimilated data have been output onto
both a 2.50 x 2.5
0 grid and a 1
0 x 1
0 grid at six hourly intervals covering the period
1957-2002. It should be noted that land-based surface wind speed observations were not
used as input to the assimilation, though the assimilating model produces output surface
wind speeds on the regular array of grid points including those over land. In this work,
10m values of the u (eastward) and v (northward) wind speed components from the 10 ×
10 grid were used.
3.3. UKCIP Met. Office Gridded Dataset
Monthly and annual averages of a range of meteorological parameters, initially for the
period 1961-2001, were generated by the UK Meteorological Office (Met. Office) using
data observed from all of the available surface stations, with gaps in data filled to avoid
biasing the results. Gap filling was carried out by spatially interpolating the missing
data at a site from the six closest stations for 13 of the meteorological parameters,
though not wind speed (Perry and Hollis, 2005a). In the case of wind speed, some data
substitution was carried out, but the details of this are not reported (Perry and Hollis,
2005b). The resulting dataset was produced for the UK Climate Impacts Programme
(UKCIP) to provide a consistent time series of climatological variables which could be
used in long term climate studies. The data have been interpolated onto a 5km x 5km
grid using spatial interpolation and multiple linear regression taking into account a
number of parameters including easting/northing, altitude, proximity to the coast, and
local urbanisation. Errors in interpolating to this grid were assessed and for monthly
mean wind speed, the root mean squared error was found to be 5.5 knots (2.8m/s). It
should be noted that time-varying urban effects were not considered. No mention is
made in (Perry and Hollis, 2005a, Perry and Hollis, 2005b) of any correction made for
time-varying changes in instrument height. Station openings and closures over the
period used to generate this climatological dataset meant that the number of stations
used to infer the gridded climatological data has changed over the period. This will have
some implications for continuity of the wind speed data. The average number of stations
available for the generation of the wind speed gridded data over the period was 70. Here
we have used the mean monthly values of wind speed which were available for the
period 1969-2006.
3.4. The Garrad Hassan Wind Index
The renewable energy engineering consultancy company Garrad Hassan (now known as
GL-Garrad Hassan) formerly published a UK wind index. When compared with other
European indices this showed a reasonable level of agreement (Thomas et al, 2009).
Although, the methodology behind this index and the exact list of stations used to
generate the index was not publicised, it was stated by Garrad Hassan that this index
was calculated using data from 50 meteorological stations spread throughout the UK
(Hodgetts, 2011). The index used in this work was a 13-year index normalised over the
period 1995-2007.
4. METHODOLOGY
4.1. Criteria for Station Selection to Calculate Index from the BADC MIDAS Data
There are a large number of UK sites which report data to the Met. Office (~50,000)
which are organised into a number of categories according to the type of data message
produced. For a wind index, the most appropriate stations are in the synoptic network.
These stations have an average spacing of less than 50km. Some of these stations are
part of the global synoptic network and data are exchanged internationally in near real-
time. It is thus expected that the synoptic network will have the most complete
observational record and that the majority of these stations will continue to provide
observations in the future. The availability of a complete record of observations is
crucial for an accurate wind index. Future continuity is important as any index should
be continually updated with new data. However, for the wind indices to be accurate they
must be representative in terms of both temporal and geographical coverage. The
observations from the synoptic stations within the MIDAS database did not alone meet
these criteria and so the synoptic data were augmented with observations from selected
stations within the Met Office climatological station network. Two indices were
generated from the MIDAS data: one for the period 1983 to 2011 (29-year index) and
the second for the period 1957 to 2011 (55-year index). The first index was generated to
encompass a relatively large number of stations with a good geographical coverage. The
second index was constructed with the purpose of producing as long a continuous index
as possible but still encompassing a representative number of sites.
Prior to the selection of the stations, a quality assessment procedure was applied to the
data to avoid discrepancies and erroneous, missing or duplicated values. The MIDAS
data contain a number of quality flags relating to the recorded values. For the mean
wind speed, a value of zero in the associated quality flag indicates an unreliable
observation. In order to exclude any unreliable records, a condition was set that
observations would be included only if they met the non-zero quality flag criterion. As a
consequence of this criterion, there were significant gaps in the data for some stations.
Therefore, a supplementary criterion for selecting the stations was the completeness of
the data recorded and stored. An initial requirement was set for the total available
recorded hours to be ≥75% of the total theoretical hours. The availability figure of 75%
was chosen so that there were enough data to accurately represent the wind climate at
each individual station but not to exclude too many stations from the index. Similarly,
the available recorded hours per annum had to be ≥75% of total number of hours in the
year. A further criterion was that any station that met the previous requirements must
have no more than 15 days per month (i.e. half of each month) of missing consecutive
records. If so, the station was excluded. This was necessary as long periods of missing
data would skew the results by missing some of the seasonal variation. In fact, once this
initial criterion had been set, the actual average availability of data for the stations
filtered was 98% with the lowest individual station data availability being 89% as
shown in Table 2. A final criterion was set that the stations used in the study were still
operational. The reason for this being the intention that a future consistent index could
be maintained. When the criteria were applied, 57 stations were included in the 1983-
2011 BADC MIDAS Index and from these 57 stations (known henceforth as the

BADC-57 stations), 7 stations were selected to be included in the 1957-2011 BADC
MIDAS Index (known henceforth as the BADC-7 stations). The reason for the much
lower number of stations for the longer index was simply that fewer stations met the
required criteria over this much longer period. Each station was assigned to one of six
UK regions, based on its geographical location. The BADC-57 and BADC-7 stations
selected are as shown in Table 2 along with their UK Met. Office station identifier,
region number to which they have been allocated and data availability for the 29-year
and 55-year index (if applicable). Figure 1 shows a map of the stations.
Figure 1: The BADC-57 (open circles) and BADC-7 (closed triangles) stations used in
the generation of the 29-year and 55-year indices, respectively. Latitude and longitude
are in degrees north and east respectively.
4.2. Analysis of local factors that may affect wind speed measurements
The principal difficulty in producing a reliable wind index based on observed surface
wind speed measurements is ensuring consistency and homogeneity of the data. Over
time, site exposure can change, instruments can be replaced or recalibrated and
measurement heights or locations can be altered.
Instrument and height measurement changes
Using information from the UK Meteorological Office Archive, instrument changes
were deduced for the BADC-7 and BADC-57 stations. Table 3 summarises the changes
for the BADC-7 stations used in the study. It can be seen that on average four different
instruments were used to record wind speed over the 55-year period of interest.
Different types of anemometers have been used at different periods. The Dines pressure
tube type anemometer tended to have a better response to lower wind speeds than the
Munro anemometer (British Atmospheric Data Centre, 2009). In addition, the newer
Vector anemometers have a better response at lower wind speeds than the Munro type.
These facts will have some biasing effect on the wind speed measured, though it is
difficult to quantity this. It is also worth noting that the effective height of measurement
has also changed significantly over the period, generally reducing over time, though
there are some exceptions to this, e.g. Lerwick.
In order to ensure a consistent height for all wind speed values, wind speed data at all
sites (both the BADC-7 and BADC-57 stations) were corrected to an effective height of
10m using an adiabatic logarithmic profile:
(
) (1)
where u is wind speed at the height of interest z, is the friction velocity in the surface
layer (assumed constant), κ is von Kármán’s constant (=0.4) and is the surface
roughness length assumed to be 0.03m for all sites. This value is appropriate for short
grass which is typical of a rural meteorological station. Figure 2 shows an example of
the annual mean wind speed values for Boscombe Down with and without correction to
an effective height of 10m. It can be seen in this case that the correction makes a
significant difference to the wind speed values in the earlier years of the time series.
The value of roughness length (0.03m) was chosen as being fairly representative of a
rural site. It is possible that this might vary anywhere in the range of 0.01m to 0.08m for
the sites studied. Therefore, a sensitivity analysis of the change in wind speed as a
function of roughness length between 0.01m and 0.08m was performed. However, it
was found that there was negligible difference to the wind speed when corrected to 10m
using this range of roughness values.
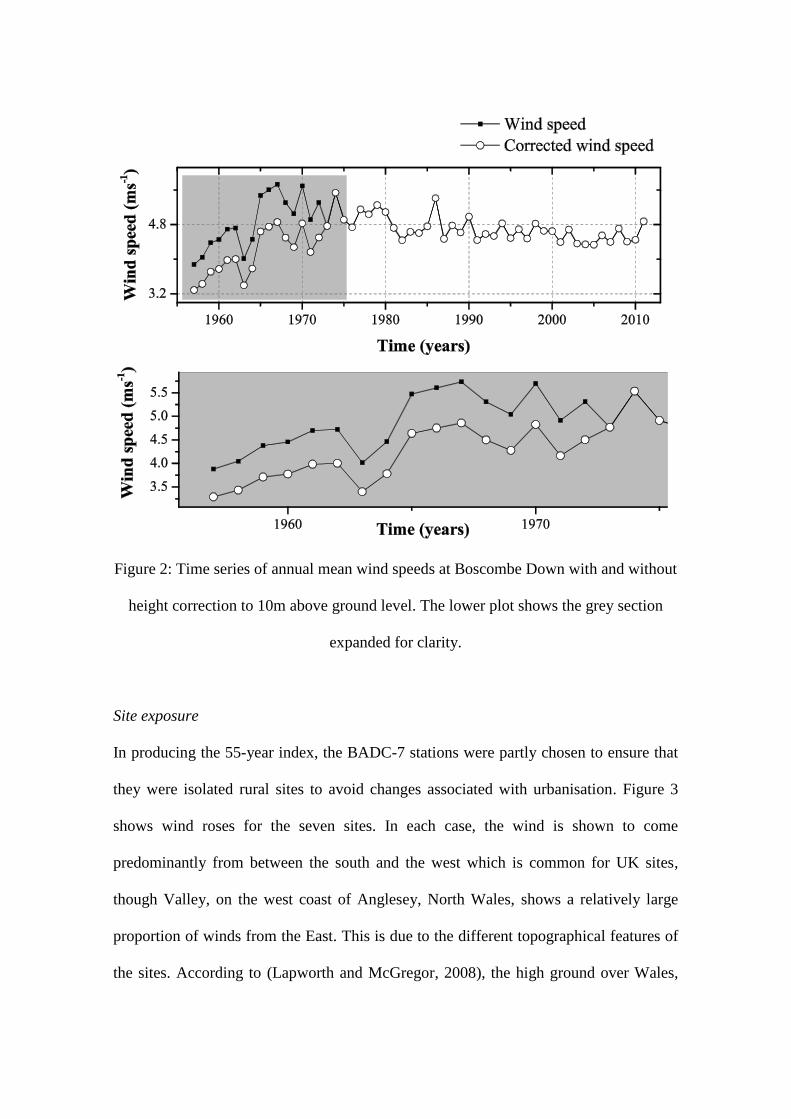
Figure 2: Time series of annual mean wind speeds at Boscombe Down with and without
height correction to 10m above ground level. The lower plot shows the grey section
expanded for clarity.
Site exposure
In producing the 55-year index, the BADC-7 stations were partly chosen to ensure that
they were isolated rural sites to avoid changes associated with urbanisation. Figure 3
shows wind roses for the seven sites. In each case, the wind is shown to come
predominantly from between the south and the west which is common for UK sites,
though Valley, on the west coast of Anglesey, North Wales, shows a relatively large
proportion of winds from the East. This is due to the different topographical features of
the sites. According to (Lapworth and McGregor, 2008), the high ground over Wales,
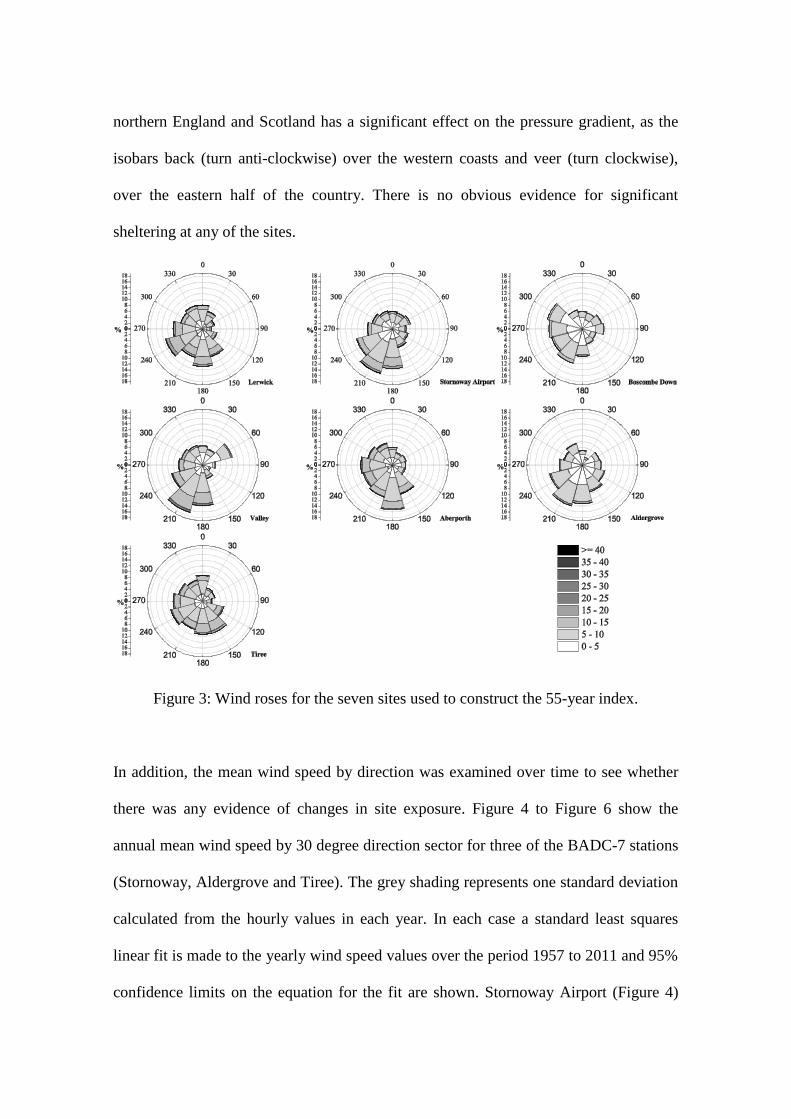
northern England and Scotland has a significant effect on the pressure gradient, as the
isobars back (turn anti-clockwise) over the western coasts and veer (turn clockwise),
over the eastern half of the country. There is no obvious evidence for significant
sheltering at any of the sites.
Figure 3: Wind roses for the seven sites used to construct the 55-year index.
In addition, the mean wind speed by direction was examined over time to see whether
there was any evidence of changes in site exposure. Figure 4 to Figure 6 show the
annual mean wind speed by 30 degree direction sector for three of the BADC-7 stations
(Stornoway, Aldergrove and Tiree). The grey shading represents one standard deviation
calculated from the hourly values in each year. In each case a standard least squares
linear fit is made to the yearly wind speed values over the period 1957 to 2011 and 95%
confidence limits on the equation for the fit are shown. Stornoway Airport (Figure 4)
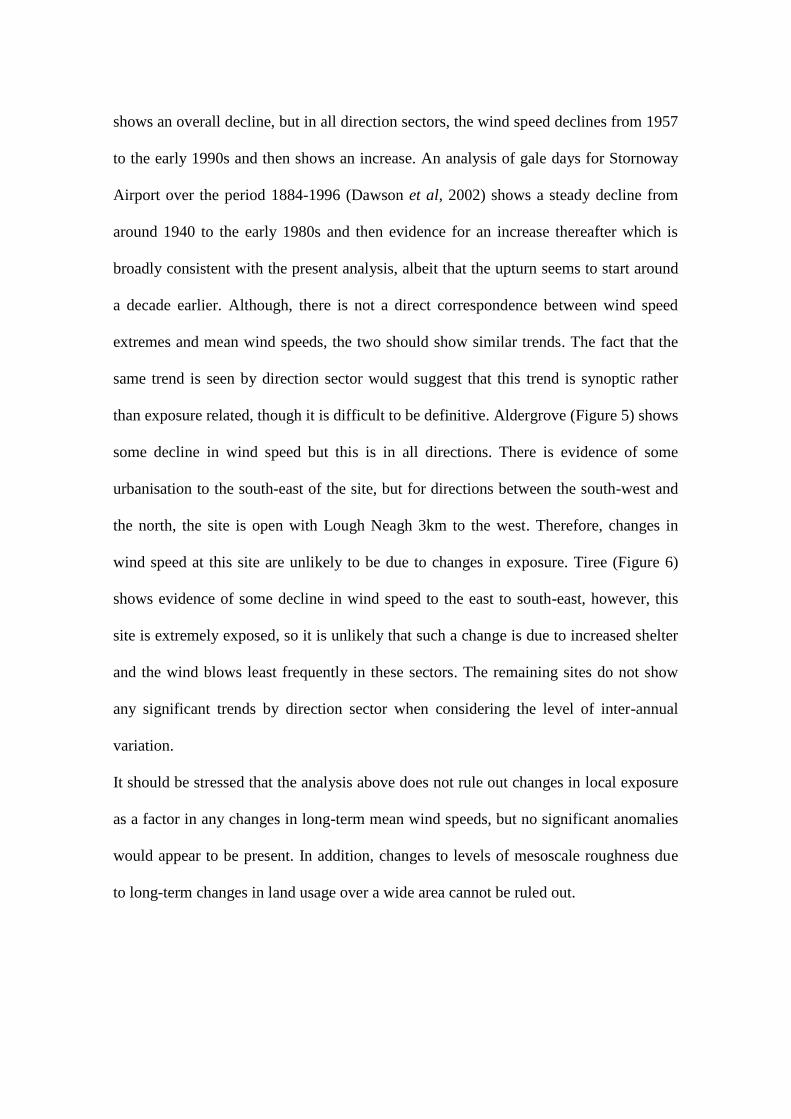
shows an overall decline, but in all direction sectors, the wind speed declines from 1957
to the early 1990s and then shows an increase. An analysis of gale days for Stornoway
Airport over the period 1884-1996 (Dawson et al, 2002) shows a steady decline from
around 1940 to the early 1980s and then evidence for an increase thereafter which is
broadly consistent with the present analysis, albeit that the upturn seems to start around
a decade earlier. Although, there is not a direct correspondence between wind speed
extremes and mean wind speeds, the two should show similar trends. The fact that the
same trend is seen by direction sector would suggest that this trend is synoptic rather
than exposure related, though it is difficult to be definitive. Aldergrove (Figure 5) shows
some decline in wind speed but this is in all directions. There is evidence of some
urbanisation to the south-east of the site, but for directions between the south-west and
the north, the site is open with Lough Neagh 3km to the west. Therefore, changes in
wind speed at this site are unlikely to be due to changes in exposure. Tiree (Figure 6)
shows evidence of some decline in wind speed to the east to south-east, however, this
site is extremely exposed, so it is unlikely that such a change is due to increased shelter
and the wind blows least frequently in these sectors. The remaining sites do not show
any significant trends by direction sector when considering the level of inter-annual
variation.
It should be stressed that the analysis above does not rule out changes in local exposure
as a factor in any changes in long-term mean wind speeds, but no significant anomalies
would appear to be present. In addition, changes to levels of mesoscale roughness due
to long-term changes in land usage over a wide area cannot be ruled out.
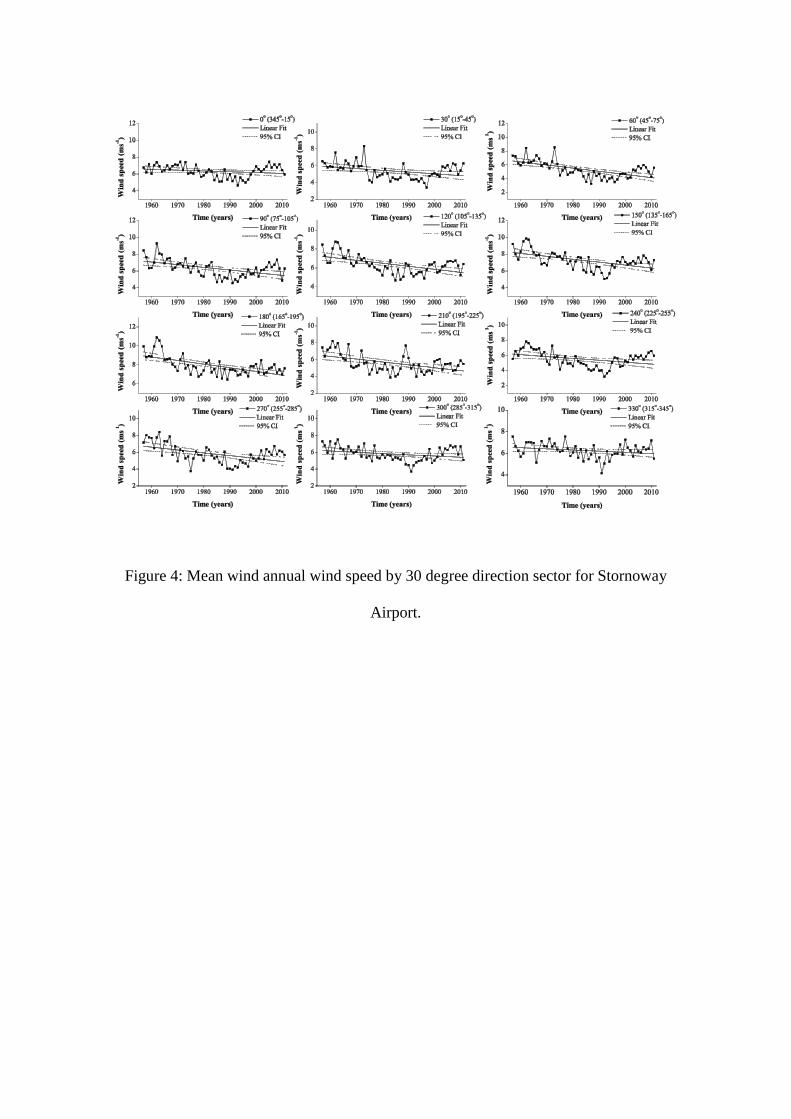
Figure 4: Mean wind annual wind speed by 30 degree direction sector for Stornoway
Airport.
Figure 5: Mean wind annual wind speed by 30 degree direction sector for Aldergrove.
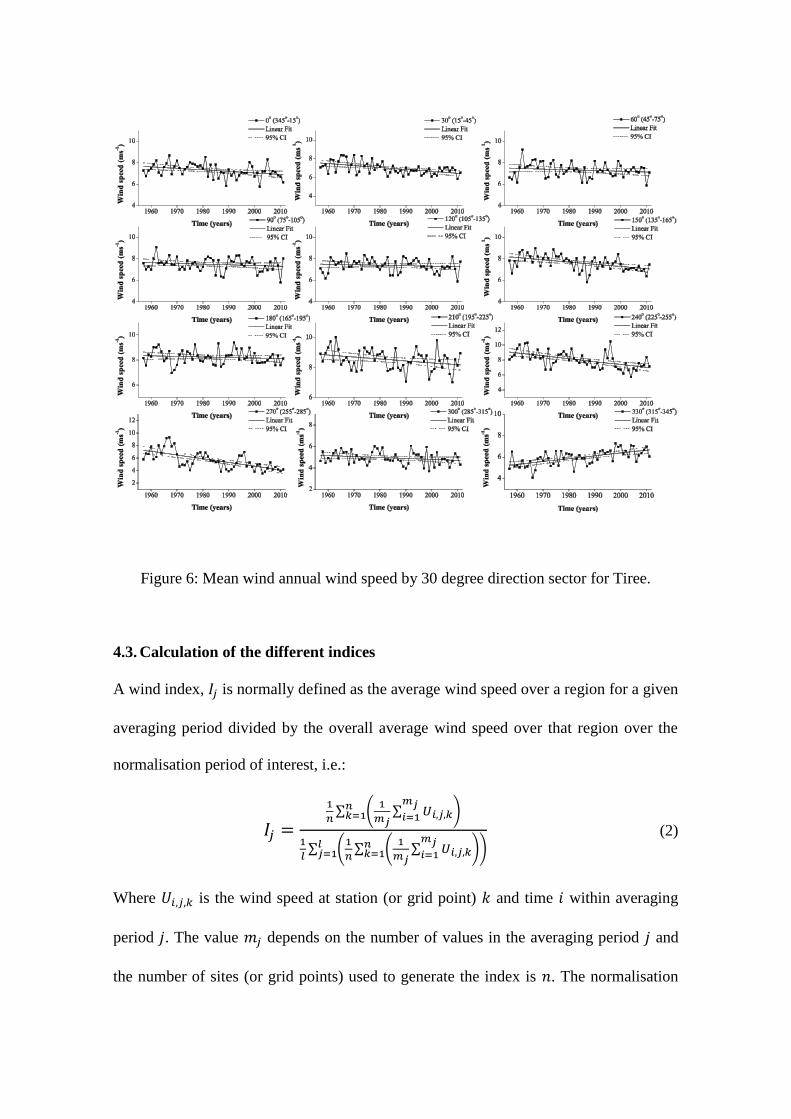
Figure 6: Mean wind annual wind speed by 30 degree direction sector for Tiree.
4.3. Calculation of the different indices
A wind index, is normally defined as the average wind speed over a region for a given
averaging period divided by the overall average wind speed over that region over the
normalisation period of interest, i.e.:
∑ (
∑ )
∑ (
∑ (
∑ )
)
(2)
Where is the wind speed at station (or grid point) and time within averaging
period . The value depends on the number of values in the averaging period and
the number of sites (or grid points) used to generate the index is . The normalisation

period consists of averaging periods. For example, if an annual index is being
generated over a period of years, then would be the number of hours in year
Indices were calculated using Equation 2 from:
1. the hourly wind speed values from the BADC-7 and BADC-57 stations;
2. six-hourly wind speed values from the 10 × 1
0 u (eastward) and v (northward)
10m wind speed components of the ERA-40 reanalysis dataset averaged over the
UK extending from 80W to 2
0E and 51
0N to 60
0N (132 grid points);
3. six-hourly wind speed values bilinearly interpolated to the BADC-7 and BADC-
57 stations from the 10 × 1
0 u (eastward) and v (northward) 10m wind speed
components of the ERA-40 reanalysis dataset;
4. monthly wind speed values at the 5km × 5km grid points covering the UK from
the UKCIP Met. Office gridded data set.
Table 1 summarises the parameters used in Equation 2 for the generation of the
different indices. The BADC indices were calculated over several normalisation periods
for comparison with the indices calculated using the ERA-40 reanalysis data and the
UKCIP Met. Office gridded dataset. In the case of the Garrad Hassan index, this was
pre-calculated. The details of how this was done are not publicised, but given that it is
based on observed hourly values, the calculation will be done using an equation similar
to Equation 2 with a normalisation period years.
5. RESULTS
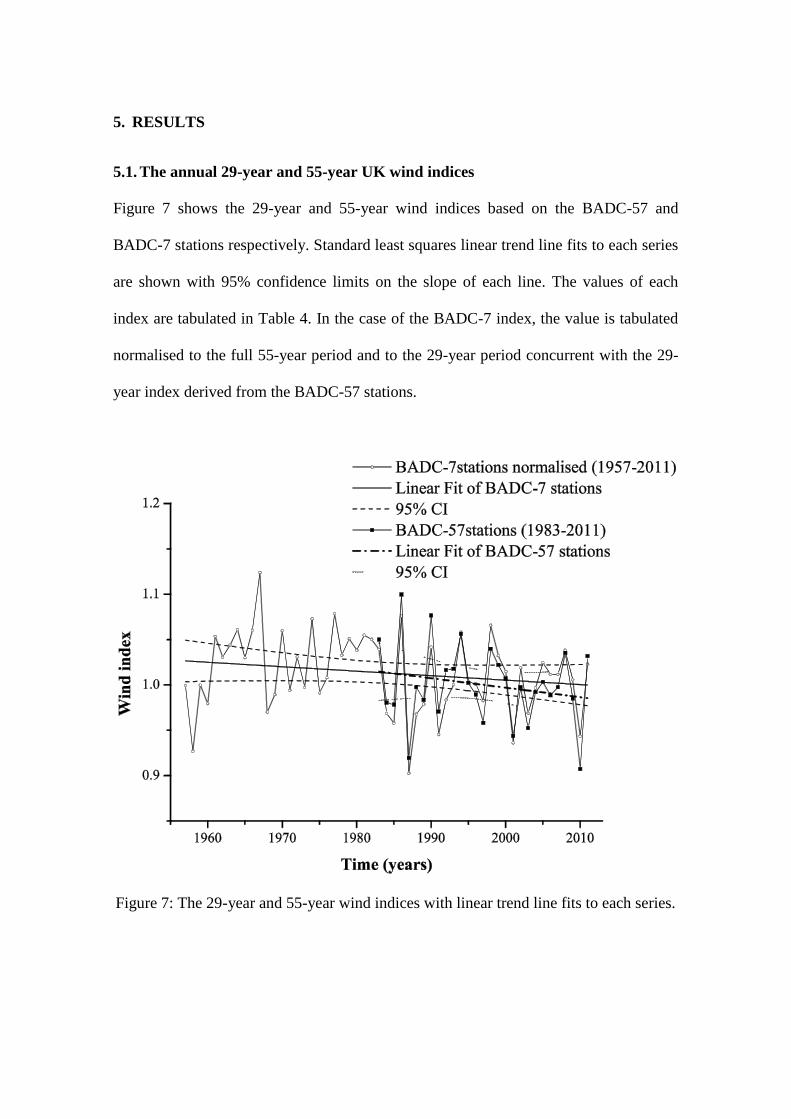
5.1. The annual 29-year and 55-year UK wind indices
Figure 7 shows the 29-year and 55-year wind indices based on the BADC-57 and
BADC-7 stations respectively. Standard least squares linear trend line fits to each series
are shown with 95% confidence limits on the slope of each line. The values of each
index are tabulated in Table 4. In the case of the BADC-7 index, the value is tabulated
normalised to the full 55-year period and to the 29-year period concurrent with the 29-
year index derived from the BADC-57 stations.
Figure 7: The 29-year and 55-year wind indices with linear trend line fits to each series.
There is a good degree of agreement between the two indices for the period 1983-2011
with a Pearson correlation coefficient of 0.89. Averaged over the longer 55-year period,
there does not seem to be any significant change in annual mean wind speeds, though
there is a slight decrease when averaged over the shorter 29-year period. It can be seen
that from the late 1950s until the late 1960s, there was a significant increase in annual
mean wind speeds followed by a rapid decrease and another increase throughout the
1970s into the early 1980s. Between the mid-1980s and 2011, there have been some
significant low wind speed years including 1987, 2001 and 2010. Although 2010 was
the lowest wind speed year over the 29-year period, it was not unusual when compared
with the 55-year period, an observation consistent with (Früh, 2013). The standard
deviation of both indices was found to be 0.04.
Figure 8 shows a comparison between the BADC-7 station wind index calculated over
the shorter normalisation period 1958-2001 for comparison with the wind index
calculated using the ERA-40 reanalysis data averaged over the UK. It can be seen that
the BADC-7 index shows a slight declining trend whereas the ERA-40 data shows a
slight increasing trend over the same period. The features in the two series are similar,
but there are also noticeable differences. Figure 9 shows a similar comparison between
the BADC-7 index and the wind index calculated using the ERA-40 reanalysis data
interpolated to the locations of the seven stations over the period 1958-2001. The two
indices show similar behaviour, though in the latter half of the period, there is some
difference. In this case, both indices show a slight decline with the ERA-40 index
showing a greater decline than the BADC-7 station index.
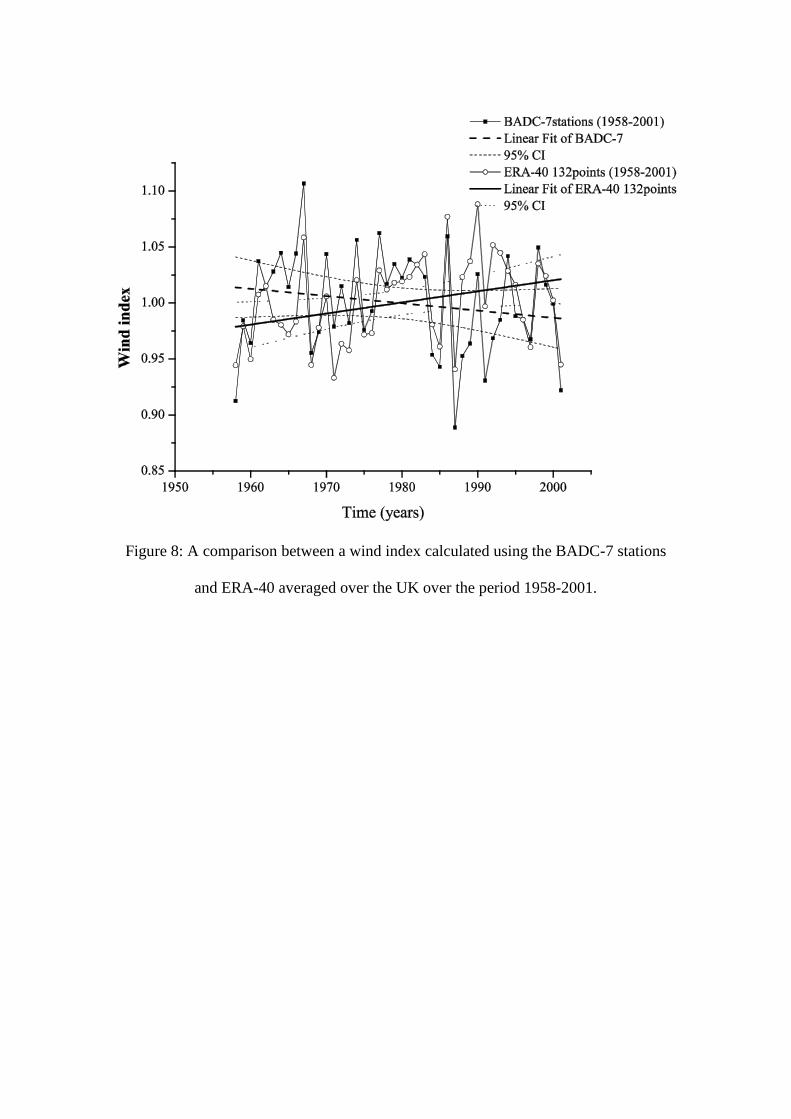
Figure 8: A comparison between a wind index calculated using the BADC-7 stations
and ERA-40 averaged over the UK over the period 1958-2001.
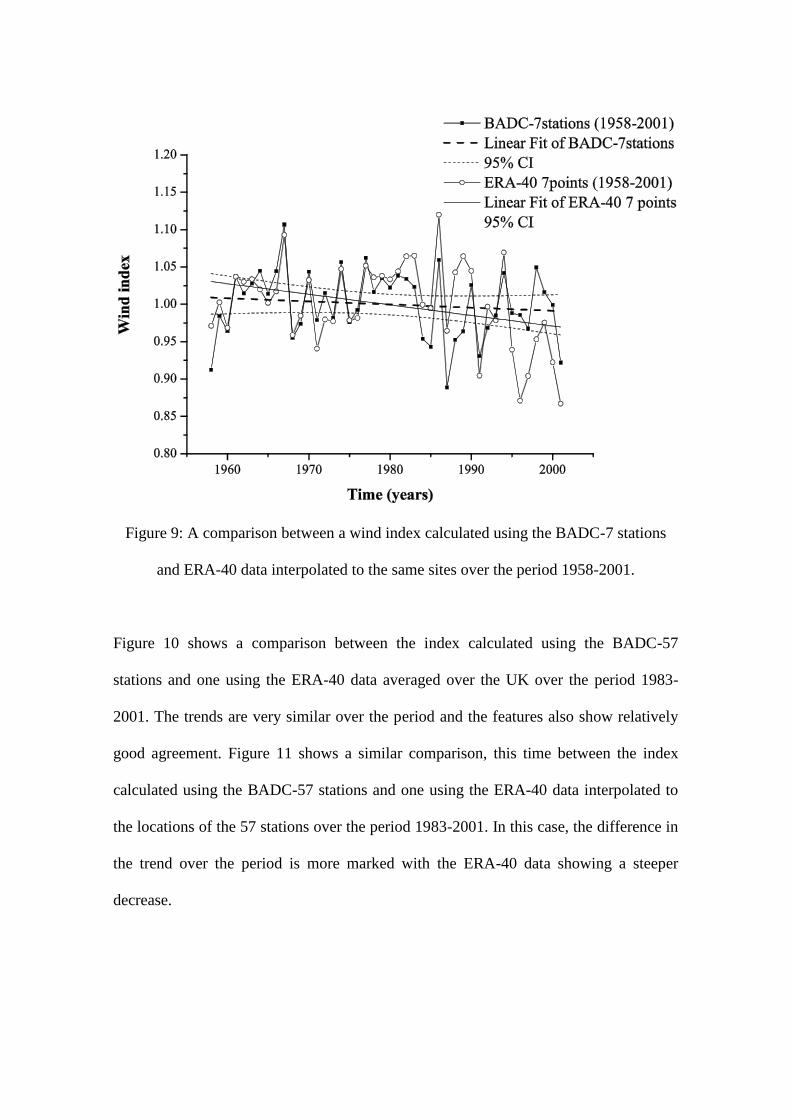
Figure 9: A comparison between a wind index calculated using the BADC-7 stations
and ERA-40 data interpolated to the same sites over the period 1958-2001.
Figure 10 shows a comparison between the index calculated using the BADC-57
stations and one using the ERA-40 data averaged over the UK over the period 1983-
2001. The trends are very similar over the period and the features also show relatively
good agreement. Figure 11 shows a similar comparison, this time between the index
calculated using the BADC-57 stations and one using the ERA-40 data interpolated to
the locations of the 57 stations over the period 1983-2001. In this case, the difference in
the trend over the period is more marked with the ERA-40 data showing a steeper
decrease.
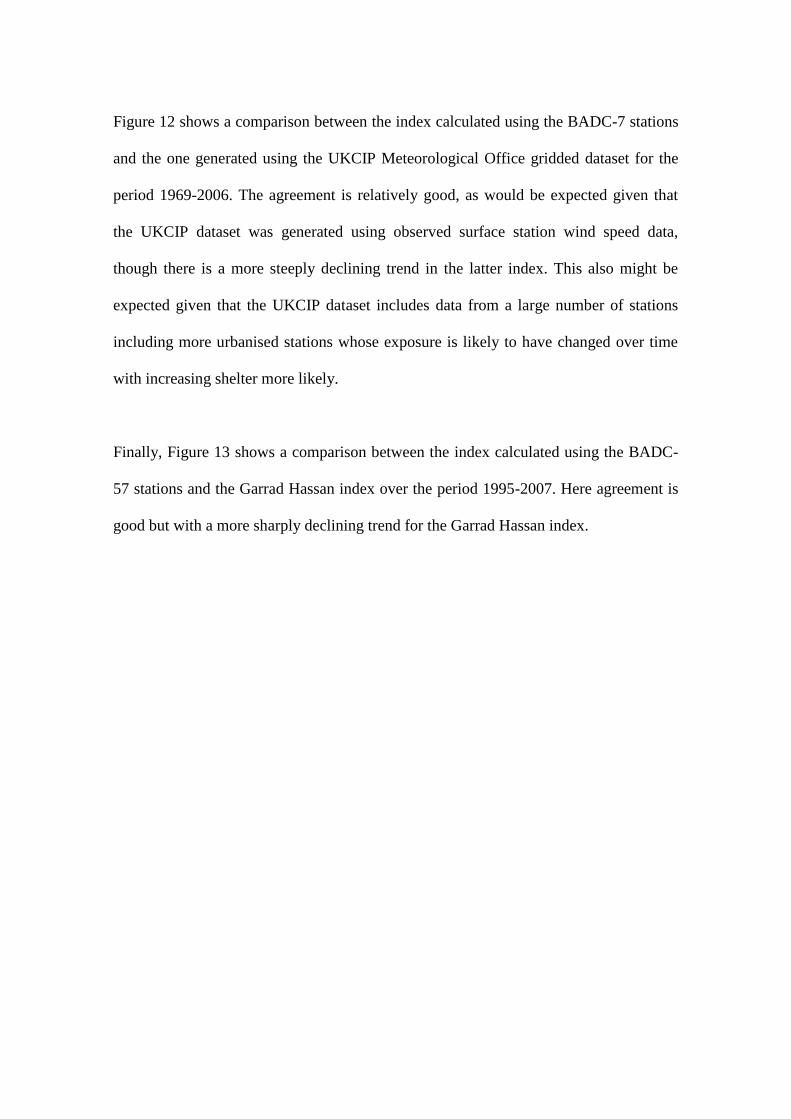
Figure 12 shows a comparison between the index calculated using the BADC-7 stations
and the one generated using the UKCIP Meteorological Office gridded dataset for the
period 1969-2006. The agreement is relatively good, as would be expected given that
the UKCIP dataset was generated using observed surface station wind speed data,
though there is a more steeply declining trend in the latter index. This also might be
expected given that the UKCIP dataset includes data from a large number of stations
including more urbanised stations whose exposure is likely to have changed over time
with increasing shelter more likely.
Finally, Figure 13 shows a comparison between the index calculated using the BADC-
57 stations and the Garrad Hassan index over the period 1995-2007. Here agreement is
good but with a more sharply declining trend for the Garrad Hassan index.
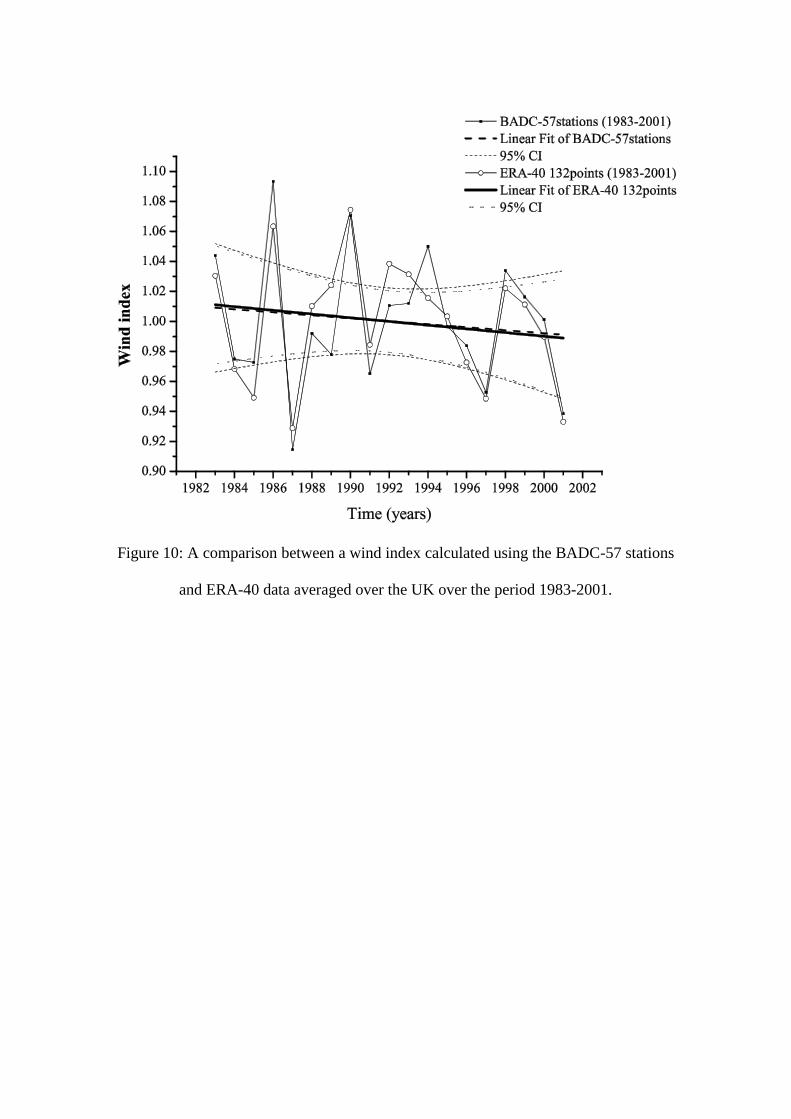
Figure 10: A comparison between a wind index calculated using the BADC-57 stations
and ERA-40 data averaged over the UK over the period 1983-2001.
Figure 11: A comparison between a wind index calculated using the BADC-57 stations
and ERA-40 data interpolated to the same sites over the period 1983-2001.
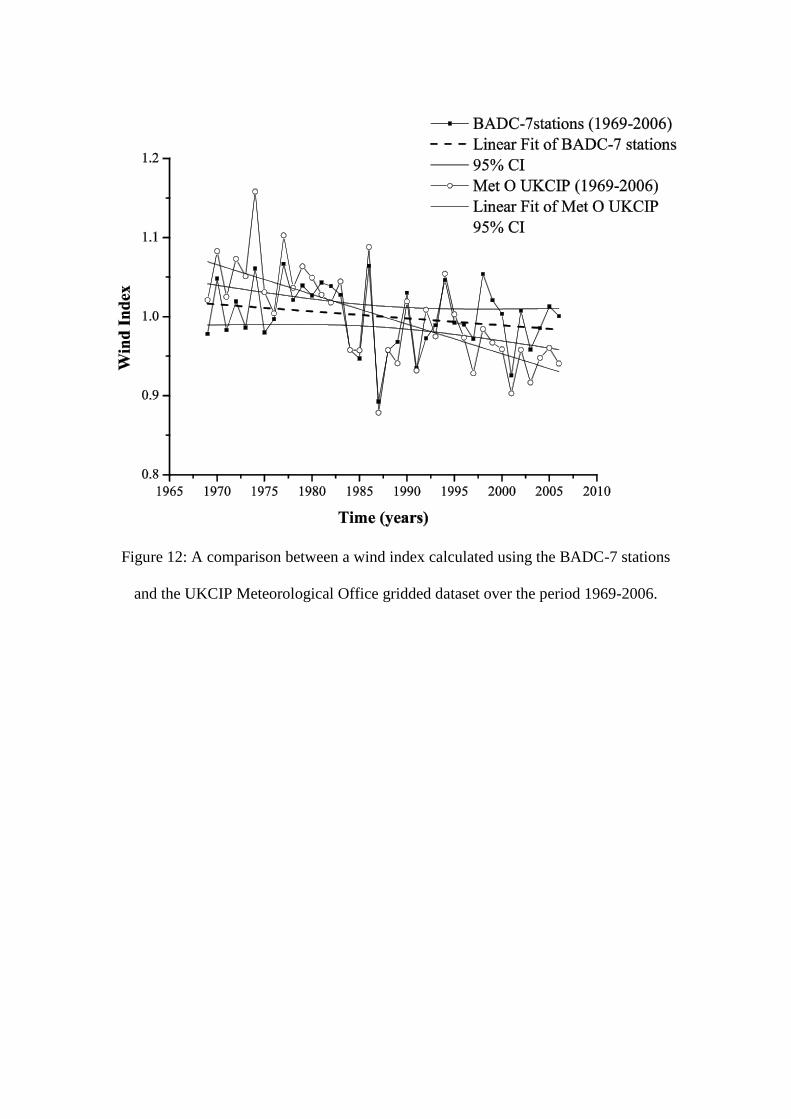
Figure 12: A comparison between a wind index calculated using the BADC-7 stations
and the UKCIP Meteorological Office gridded dataset over the period 1969-2006.
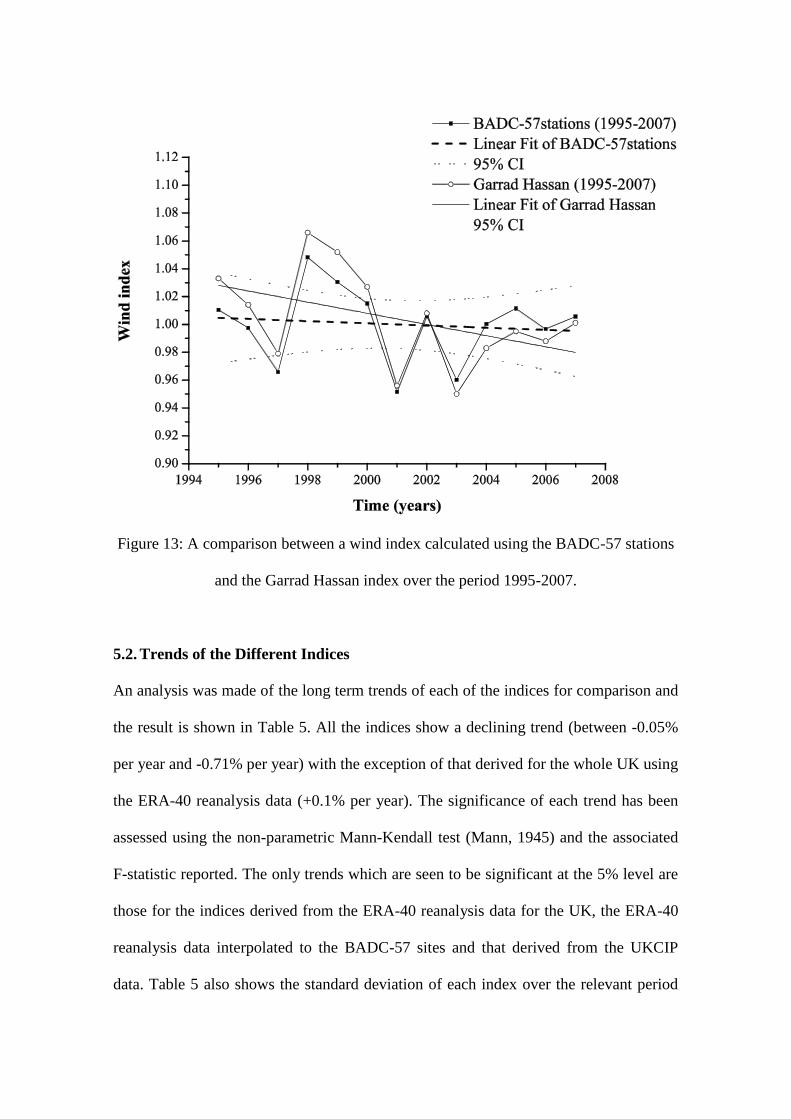
Figure 13: A comparison between a wind index calculated using the BADC-57 stations
and the Garrad Hassan index over the period 1995-2007.
5.2. Trends of the Different Indices
An analysis was made of the long term trends of each of the indices for comparison and
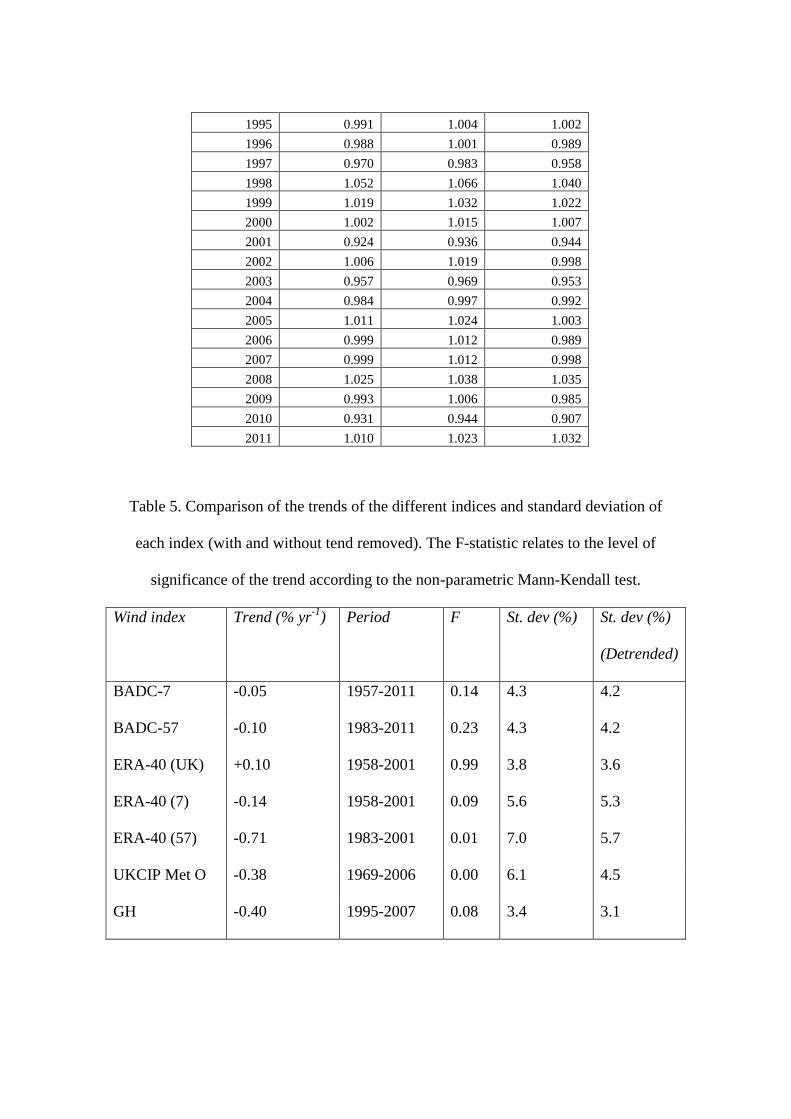
the result is shown in Table 5. All the indices show a declining trend (between -0.05%
per year and -0.71% per year) with the exception of that derived for the whole UK using
the ERA-40 reanalysis data (+0.1% per year). The significance of each trend has been
assessed using the non-parametric Mann-Kendall test (Mann, 1945) and the associated
F-statistic reported. The only trends which are seen to be significant at the 5% level are
those for the indices derived from the ERA-40 reanalysis data for the UK, the ERA-40
reanalysis data interpolated to the BADC-57 sites and that derived from the UKCIP
data. Table 5 also shows the standard deviation of each index over the relevant period
with and without the trend removed. The BADC-7 and BADC-57 indices show a
standard deviation of 4.3% (4.2% detrended). The largest level of variation is seen for
the ERA-40 index interpolated to the BADC-57 sites with a standard deviation of 7.0%
(5.7% detrended).
Strictly, the Mann-Kendall test assumes no autocorrelation in the data. To assess this,
autocorrelations for the de-trended indices were assessed up to a lag of 10 and the
results shown in Table 6. Those autocorrelations significant at the 5% level are marked
in bold according to the formula: ⁄ √ ⁄ , where N is the number of annual values
in each series. It can be seen that there is little evidence of autocorrelation in any of the
series. Although the Garrad Hassan index appears to show significant autocorrelations
at high lags, the significance level is not valid for these lags for such a short time series
(N=13).
The difference in trends and variability between the indices are partly due to the
different periods over which they have been calculated. However, much of the
difference will be due to the different levels of spatial averaging. The ERA-40 index
averaged over the UK includes all grid cells in a square box over the UK, some of
which will be over areas of sea as well as land in contrast to the other indices. The
largest decreasing trends are seen for the ERA-40 index interpolated to the BADC-57
sites, the UKCIP index and the Garrad Hassan index. The ERA-40 index interpolated to
the BADC-7 sites shows a steeper decline than the BADC-7 index (-0.14% per year
compared with -0.05% per year) but neither trend is significant. This would suggest that
local or large scale (mesoscale) changes in surface roughness do not appear to be

significant, at least for the BADC-7 sites. The UKCIP index shows a steeper
(significant) level of decline (-0.38% per year) than the BADC-7 index over a similar
period of time. This suggests that changes in local surface roughness or instrument
measurement height might be a factor.
The steepest rates of decline are seen in the ERA-40 index interpolated to the BADC-57
stations for the period 1983-2011 (-0.71% per year) and the Garrad Hassan index for the
period 1995-2007 (-0.40% per year) which suggest a more significant decline in wind
speeds in recent times, though the BADC-57 index over a similar period shows a much
smaller decline (-0.10% per year) which is not seen to be significant. Again, as the
ERA-40 index is not sensitive to changes in surface roughness, changes in surface
roughness (which are likely to be positive) are not likely to be a factor. The fact that the
ERA-40 index averaged over the UK shows a positive and significant trend (+0.10%
per year) suggests either the coupling between surface and upper level winds has
changed over time, or that wind speeds over the sea have increased over the period in
contrast to that seen for the land-based grid points.
The Garrad Hassan index shows the lowest level of variability though this is likely due
to the shorter period over which this index is calculated. The ERA-40 index averaged
over the UK shows the least variability which may be due to the fact that this averaged
over the largest area and includes some areas of sea where wind speeds are less
variable. The ERA-40 index interpolated to the BADC-57 sites shows the greatest
variability which would be consistent given the concentration of land-based sites upon
which the index is based.
5.3. Correlation Between the Different Indices
In order to quantify the degree of agreement between the different indices, the Pearson
correlation coefficient was calculated using selected combinations of the concurrent
annual index values. The value was calculated before and after any long term linear
trend was removed. The results of this analysis are shown in Table 7. There is a high
degree of correlation between the indices calculated using the surface station data, i.e.
the BADC-7, BADC-57 and GH indices. The correlation between the BADC-7 and
ERA-40 index is somewhat lower. The BADC-7 index is calculated using a relatively
small number of point observations whereas the ERA-40 index is more spatially
homogeneous. In addition, the ERA-40 index is based on six-hourly rather than hourly
data, though this should still capture the main features of diurnal variation and is
unlikely to introduce bias. The correlation between the BADC-57 and ERA-40 index is
better. This is consistent with the previous observation in that 57 stations will provide a
higher degree of spatial smoothing. The correlation between the BADC-7 and the UK
Met. Office gridded dataset lies somewhere in between. Both are generated with surface
observations, though the latter would be expected to exhibit a greater degree of spatial
smoothing given the much larger number of stations used to generate the 5km × 5km
grid.
In order to analyse the degree of spatial smoothing of the BADC-7 stations, the Pearson
correlation coefficient was calculated between each combination of the seven sites using
the annual mean wind speeds at each site. The results of this are shown in Table 8. In
addition, the correlation coefficient is plotted as a function of distance in Figure 14. The
overall level of correlation even at relatively short distances is relatively low and shows
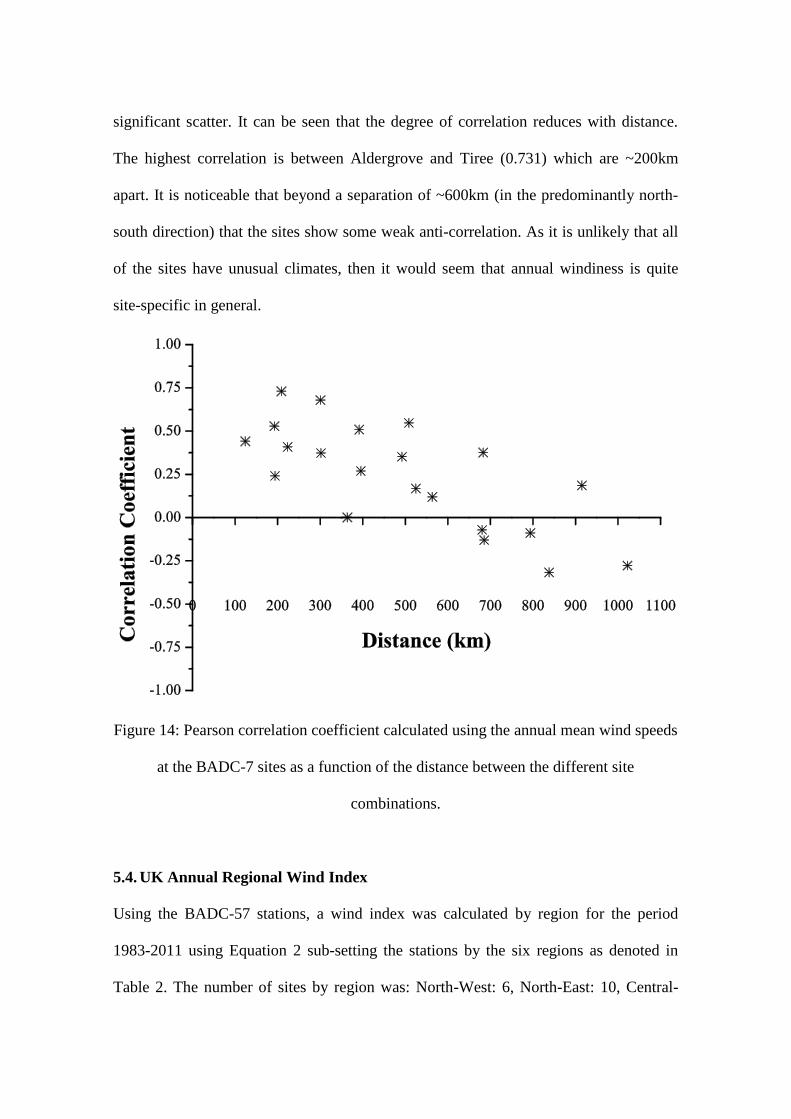
significant scatter. It can be seen that the degree of correlation reduces with distance.
The highest correlation is between Aldergrove and Tiree (0.731) which are ~200km
apart. It is noticeable that beyond a separation of ~600km (in the predominantly north-
south direction) that the sites show some weak anti-correlation. As it is unlikely that all
of the sites have unusual climates, then it would seem that annual windiness is quite
site-specific in general.
Figure 14: Pearson correlation coefficient calculated using the annual mean wind speeds
at the BADC-7 sites as a function of the distance between the different site
combinations.
5.4. UK Annual Regional Wind Index
Using the BADC-57 stations, a wind index was calculated by region for the period
1983-2011 using Equation 2 sub-setting the stations by the six regions as denoted in
Table 2. The number of sites by region was: North-West: 6, North-East: 10, Central-

West: 9, Central-East: 10, South-West: 13, South-East: 9. Figure 15 shows this wind
index for the six regions. It can be seen that there is a general trend to decreasing wind
speeds in all regions except the south-east which shows a slightly increasing trend. The
largest decreasing trend is in the north-west. When these trends were analysed in more
detail, it was found that the greatest declines occurred in the winter months and the
smallest in the summer, with the south-east region showing a significant increasing
trend during the summer months. It should be stressed that these trends are tentative
given the large degree of inter-annual variation.
Figure 15: UK wind index by region generated using the BADC-57 stations over the
period 1983-2011.
6. THE EFFECT OF WIND SPEED VARIABILITY ON WIND ENERGY
The theoretical power in the wind varies as the third power of the wind speed, so small
changes in wind speed could be expected to translate to rather larger changes in wind
power. In fact, a modern MW-sized wind turbine wind turbine will start to regulate
above ~9m/s, so the change in annual energy yield from a turbine will not increase as
rapidly as the third power of the wind speed. The capacity factor of a wind turbine is
defined as the average energy produced by a turbine over a representative period, e.g. a
year, divided by that which would have been produced had the turbine operated at full
output during that entire period. Using the power curve from a Vestas V80 2MW wind
turbine, it is possible to calculate the expected capacity factor assuming a given average
wind speed at hub height. The capacity factor will also depend on the distribution of
wind speeds. A two-parameter Weibull distribution is commonly used to describe the
distribution of wind speeds at a site with its cumulative form given as (Burton et al,
2001):
( ) ( (
)
) (3)
Where ( ) denotes the probability that a wind speed will exceed a value ,
is the scale parameter and is the shape parameter. For most UK sites, a value of
close to 2 is common. In this case, the Weibull distribution becomes a Rayleigh
distribution and:
√ (4)
Where is the mean wind speed at the site. Using such a Rayleigh distribution, the
capacity factor for a Vestas V80 2MW turbine is calculated and is shown as a function
of mean wind speed in Figure 16. It can be seen that the capacity factor goes up fairly
linearly with mean wind speed until around 9m/s and then reduces more slowly,
flattening off near 14m/s. This is due to a combination of the turbine regulating at 9m/s,
reaching rated wind speed at around 14m/s and shutting down at 25m/s.
If a mean wind speed of 7m/s is assumed at 80m hub height, then a 4% variation (one
standard deviation) in wind speed, as seen for the BADC-7 and BADC-57 indices,
represents a variation in capacity factor and associated annual energy yield of 7%. A 7%
variation in wind speed, as seen for the ERA-40 index interpolated to the BADC-57
sites, would represent a variation in capacity factor and annual energy yield of 13%.

Figure 16: Capacity factor of a Vestas V80 2MW turbine as a function of mean wind
speed.
7. CONCLUSIONS
This paper has presented two wind indices for the UK based on surface station
observations of wind speed: one based on seven stations (BADC-7) over a 55-year
period (1957-2011) and a second based on 57 stations (BADC-57) over a 29 year period
(1983-2011). These indices have been compared with indices generated using a gridded
dataset of values interpolated from UK stations, three indices calculated using the ERA-
40 reanalysis dataset and another UK wind index. The directional wind speed at the
BADC-7 stations was examined and there was found to be no obvious evidence of
changes in site exposure or instrument location which could affect the continuity of
wind speeds at these stations. There have, however, been notable changes in instrument
height at many of the stations included in the two indices and, as a result, wind speed
observations at all stations were corrected to 10m above ground level. An attempt been
made to assess trends in long term wind speed values for each of the indices and to
investigate the degree of correlation between them. These trends have been identified
using linear regression and their significance assessed using a Mann-Kendall test.
The principal findings of this paper are that:
The BADC-7 and BADC-57 indices agree reasonably well over the common 1983-
2011 period with a correlation coefficient of 0.887 (0.917 when trends are
removed);
The inter-annual variation of the BADC-7 and BADC-57 indices was found to be
4%;
This variation equates to a standard deviation in wind farm capacity factor of 7%;
From the late 1950s until the late 1960s, there was an apparent increase in annual
mean wind speeds followed by a rapid decrease and another increase throughout the
1970s into the early 1980s. Between the mid-1980s and 2011, there have been some
notable low wind speed years including 1987, 2001 and 2010;
When compared to the other indices, similar trends in wind variability are seen,
though correlations vary between 0.60 and 0.92 (0.61 and 0.98 when trends are
removed) reflecting the different levels of spatial smoothing, different averaging
periods and site specific effects;
All of the indices show declining trends (between -0.05% per year to -0.71% per
year) with the exception of the ERA-40 index calculated over the UK which shows
an increase (+0.1% per year), though not all of these trends were found to be
significant;
The differences in trends do not suggest that increases in large area (mesoscale)
roughness are a significant factor but there may be differences in trends between
land and sea;
Local changes in exposure and changes in measurement height may have had an
influence, particularly for the UKCIP index;
When the correlation between annual mean wind speeds at the BADC-7 sites is
analysed, it is found to be relatively weak indicating that inter-annual variability is
very localised;
Similarly, when the BADC-57 index is broken down by region, differences in inter-
annual variability are seen across the UK. In addition, there appears to be a general
trend to decreasing wind speeds in all regions except the south-east and the largest
decreasing trend is seen in the north-west. The greatest declines are seen in the
winter months and least in the summer, where the south-east region shows an
increasing trend. However, the uncertainty on these trends is large considering the
large degree of inter-annual variation.
8. ACKNOWLEDGEMENTS
The authors would like to thank Dr Graham Parton of the British Atmospheric Data
Centre (BADC) who offered some interesting insights with respect to UK wind fields.
The authors would also like to thank the UK Met Office and the BADC for providing
access to the UKCIP gridded dataset and the MIDAS data, respectively. The authors are
grateful to the staff of the Met. Office archive in Exeter for providing access to records
related to the meteorological stations used in this research.
9. REFERENCES
Atkinson N, Harman K, Lynn M, Schwarz A and Tindal A. 2006, Long-term wind
speed trends in northwestern Europe. Proceedings of the BWEA28 conference,
Glasgow, October 2006 [Internet]. Available from http://www.gl-
garradhassan.com/assets/downloads/Long_term_wind_speed_trends_in_northwestern_
Europe.pdf, last accessed 22nd
February 2013.
Bakker AMR and van den Hurk BJJM. 2012. Estimation of persistence and trends in
geostrophic wind speed for the assessment of wind energy yields in Northwest Europe.
Climate Dynamics 39:767–782.
Bakker AMR, van den Hurk BJJM and Coelingh JP. 2012. Decomposition of the
windiness index in the Netherlands for the assessment of future long-term wind supply.
Wind Energy. Published online: DOI: 10.1002/we.1534.
Bärring L and Fortuniak K. 2009. Multi-indices analysis of southern Scandinavian
storminess 1780–2005 and links to interdecadal variations in the NW Europe–North Sea
region. International Journal of Climatology 29: 373–384.
Beniston M, Stephenson DB, Christensen OB, Ferro CAT, Frei F, Goyette S, Halsnaes
K, Holt T, Jylhä K, Koffi B, Palutikof J, Schöll R, Semmler T and Woth K. 2007.
Future extreme events in European climate: an exploration of regional climate model
projections. Climatic Change 81: 71–95.
British Atmospheric Data Centre. 2009. Met Office surface data users guide, [Internet].
Available from http://badc.nerc.ac.uk/data/ukmo-midas/ukmo_guide.html, last accessed
24th
February 2013.
Brown S, Boorman P, McDonald R and Murphy J. Interpretation for use of surface
wind speed projections from the 11-member Met Office Regional Climate Model
ensemble. 2009. Technical Report, Met. Office, Hadley Centre, Exeter, UK.
Burton T, Sharpe D, Jenkins N and Bossanyi E. 2001. Wind Energy Handbook. John
Wiley and Sons Ltd, Chichester, ISBN 0-472-48997-2.
Cradden LC, Harrison GP and Chick JP. 2012. Will climate change impact on wind
power development in the UK? Climatic Change 115: 837–852.
Dawson AG, Hickey K, Holt T, Elliott L, Dawson S, Foster IDL, Wadhams P,
Jonsdottir I, Wilkinson J, McKenna J, Davis NR and Smith DE. 2002. Complex North
Atlantic Oscillation (NAO) Index signal of historic North Atlantic storm-track changes.
The Holocene 12: 363-369.
Donat MG, Leckebusch GC, Pinto JG, Ulbrich U. 2010. European storminess and
associated circulation weather types: future changes deduced from a multi-model
ensemble of GCM simulations. Climate Research 42: 27-43.
Nielsen P. 2004. New Danish wind energy index calculation. Available from
http://www.vindstat.dk/PDF_sider/Windindex_DK_new_short.pdf, last accessed 21st
August 2013.
Früh W-G. 2013. Long-term wind resource and uncertainty estimation using wind
records from Scotland as example. Renewable Energy 50: 1014-1026.
Garrad Hassan. 2008. UK Wind Speed Index, [Internet]. Available from
http://web.archive.org/web/20080223103132/www.garradhassan.com/services/ghindex/
, last accessed 24th
February 2013.
Harman K and Morgan C. 2005. Use of regional wind energy indices to predict long-
term wind farm production and to assess portfolio effect. Proceedings of the World
Renewable Energy Congress 2005, Aberdeen, UK.
Harrison G, Cradden L and Chick J. 2008. Preliminary assessment of climate change
impacts on the UK onshore wind energy resource. New Energy Sources 30: 1286-1299.
Lapworth A and McGregor J. 2008. Seasonal variation of the prevailing wind direction
in Britain. Weather 63: 365–368.
Hodgetts B. 2011. A statistical review of recent wind speed trends in the UK.
Proceedings of RenewableUK 2011, 25th
– 27th
October 2011, Manchester UK.
Available online at: http://www.gl-
garradhassan.com/assets/downloads/A_Statistical_Review_of_Recent_Wind_Speed_Tr
ends_in_the_UK.pdf, last accessed 22nd
February 2013.
Höglund A, Meier HEM, Broman H and Kriez E. 2009 Validation and correction of
regionalised ERA-40 wind fields over the Baltic Sea using the Rossby Centre
Atmospheric model RCA3.0 Oceanografi Swedish Meteorological and Hydrological
Institute report Number 97, 29pp.
Leckebusch GC and Ulbrich U. 2004. On the relationship between cyclones and
extreme windstorm events over Europe under climate change. Global and Planetary
Change 44: 181–193.
Mann HB. 1945. Nonparametric tests against trend. Econometrica 13: 245–259.
Mason E, Santos AMP and Peliz AJ. 2005. Western Iberian winter wind indices based
on significant wind events. Ocean Science Discussions 2: 105-127.
McCabe GJ, Clark MP and Serreze MC. 2001. Trends in northern hemisphere surface
cyclone frequency and intensity, Journal of Climate 14: 2763-2768.
Nolan P, Lynch P, McGrath R, Semmler T and Wang S. 2012. Simulating climate
change and its effects on the wind energy resource of Ireland. Wind Energy 15:593–608.
Paciorek CJ, Risbey JS, Ventura V and Rosen RD. 2002. Multiple indices of northern
hemisphere cyclone activity, winters 1949–99. Journal of Climate 15: 1573-1590.
Perry M and Hollis D. 2005. The development of a new set of long-term climate
averages for the UK. International Journal of Climatology 25: 1023-1039.
Perry M and Hollis D. 2005. The generation of monthly gridded datasets for a range of
climatic variables over the UK. International Journal of Climatology 25: 1041-1054.
Pinto JG, Ulbrich U, Leckebusch GC, Spangehl T, Reyers M and Zacharias S. 2007.
Changes in storm track and cyclone activity in three SRES ensemble experiments with
the ECHAM5/MPI-OM1 GCM. Climate Dynamics 29: 195-201.
Pryor SC and Barthelmie RJ. 2003. Long-term trends in near-surface flow over the
Baltic. International Journal of Climatology 23: 271-289.
Pryor SC, Barthelmie RJ and Schoof JT. 2006. Inter-annual variability of wind indices
across Europe. Wind Energy 9: 27-38.
Pryor SC, Barthelmie RJ, Young DT, Takle ES, Arritt RW, Flory D, Gutowski WJ,
Nunes A and Roads J. 2009. Wind speed trends over the contiguous United States.
Journal of Geophysical Research 114: D14105.
Pryor SC and Barthelmie RJ. 2010. Climate change impacts on wind energy: a review.
Renewable and Sustainable Energy Reviews 14: 430–37.
Rasmussen D, Holloway T, Nemet G. 2011. Opportunities and challenges in assessing
climate change impacts on wind energy - a critical comparison of wind speed
projections in California. Environmental Research Letters 6: 024008 (9pp).
Rockel B and Woth K. 2007. Extremes of near-surface wind speed over Europe and
their future changes as estimated from an ensemble of RCM simulations. Climatic
Change 81: 267–280.
Sexton DMH and Murphy J. 2010. UKCP09: Probabilistic projections of wind speed.
Met. Office, Hadley Centre, Exeter, UK [Internet]. Available from:
http://ukclimateprojections.defra.gov.uk/media.jsp?mediaid=87845&filetype=pdf last
accessed 24th
February 2013.
Thomas P, Cox S and Tindal A. 2009. Long term wind speed trends in northwestern
Europe. Proceedings of the European Wind Energy Conference, Marseilles, 16th
– 19th
March 2009.
Uppala SM et al. 2005. ERA-40 Re-analysis. Quarterly Journal of the Royal
Meteorological Society 131: 2961-3012.
Vautard R, Cattiaux J, Yiou P, Thépaut J and Ciais P. 2010. Northern Hemisphere
atmospheric stilling partly attributed to an increase in surface roughness. Nature
Geoscience 3: 756–761.
Wang XL, Zwiers FW, Swail VR and Feng Y. 2009. Trends and variability of
storminess in the Northeast Atlantic region, 1874–2007. Climate Dynamics 33: 1179–
1195.
Wever N. 2012. Quantifying trends in surface roughness and the effect on surface wind
speed observations. Accepted for publication in Journal of Geophysical Research. DOI:
10.1029/2011JD017118.

Table 1. Summary of the parameters used in Equation 2 for calculation of the different
indices.
Index
(years)
BADC-7 Hourly
values
Year 7 (stations) 38, 44,
55
Hours in
year
BADC-57 Hourly
values
Year 57 (stations) 13, 19,
29
Hours in
year
ERA-40 Six-hourly
values
Year Bilinear interpolation to either BADC-7 or
BADC-57 sites; average of grid points
over entire UK (80W to 2
0E, 50
0N to
610N)
44 Six-hourly
values in
year
UKCIP Monthly
values
Year All grid points covering UK 38 Months in
year

Table 2. List of stations used in the 29- and 55-year Wind Indices. Those stations used
to generate the 55-year index (BADC-7) are shown in italics.
Identifier Name Region Availability
29years 55years 9 Lerwick North-East 99.7% 99.4%
10 Sella Ness North-East 98.9%
23 Kirkwall North-East 98.7%
32 Wick Airport North-East 97.8%
54 Stornoway Airport North-West 99.0% 99.0%
113 Aviemore North-East 97.8%
132 Kinloss North-East 99.9%
137 Lossiemouth North-East 99.7%
161 Dyce North-East 94.7%
170 Peterhead Harbour North-East 93.2%
235 Leuchars North-East 99.3%
315 Boulmer Central-East 99.5%
346 Linton on Ouse Central-East 98.4%
384 Waddington Central-East 99.9%
386 Cranwell Central-East 99.1%
393 Coningsby Central-East 99.8%
409 Marham South-East 99.5%
432 Gorleston South-East 94.9%
440 Wattisham South-East 99.7%
461 Bedford South-East 98.3%
513 Bingley, No 2 Central-East 95.5%
527 High Bradfield Central-East 89.0%
533 Church Fenton Central-East 99.3%
556 Nottingham, Watnall Central-East 99.0%
583 Wittering South-East 99.2%
605 Brize Norton South-West 99.2%
613 Benson South-East 99.0%
643 Shawbury Central-West 99.4%
674 Avonmouth South-West 96.0%
708 Heathrow South-East 99.1%
744 East Malling South-East 94.0%
775 Manston South-East 98.5%
842 Hurn South-West 99.6%
847 Middle Wallop South-West 99.4%
886 Lyneham South-West 97.8%
888 Larkhill South-West 99.3%
889 Boscombe Down South-West 99.7% 99.2%
908 Machrihanish North-West 98.4%
918 Dunstaffnage North-West 96.7%
982 Salsburgh North-West 96.1%
1023 Eskdalemuir Central-West 99.4%
1039 West Freugh Central-West 99.5%
1046 Ronaldsway Central-West 100.0%
1090 Blackpool, Squires Gate Central-West 98.4%
1145 Valley Central-West 99.5% 99.7%
1180 Bala Central-West 97.5%
1198 Aberporth South-West 99.5% 99.7%
1215 Milford Haven Conservancy Road South-West 99.1%
1302 Yeovilton South-West 98.8%
1336 Plymouth, Mountbatten South-West 96.4%
1346 Chivenor South-West 96.6%
1395 Camborne South-West 99.8%
1450 Aldergrove Central-West 99.6% 99.9%
1467 Ballypatrick Forest North-West 95.6%
1529 Orlock Head Central-West 95.3%
17414 Leeming Central-East 99.8%
18974 Tiree North-West 98.5% 99.5%
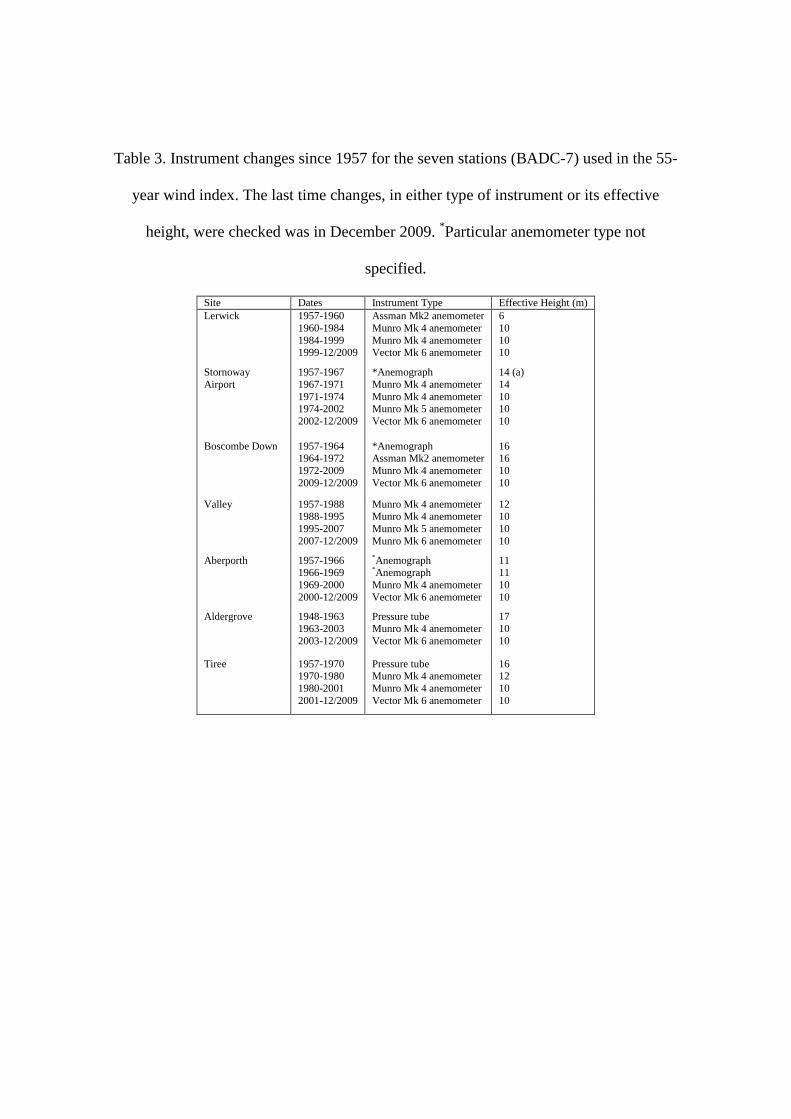
Table 3. Instrument changes since 1957 for the seven stations (BADC-7) used in the 55-
year wind index. The last time changes, in either type of instrument or its effective
height, were checked was in December 2009. *Particular anemometer type not
specified.
Site Dates Instrument Type Effective Height (m)
Lerwick 1957-1960
1960-1984
1984-1999 1999-12/2009
Assman Mk2 anemometer
Munro Mk 4 anemometer
Munro Mk 4 anemometer Vector Mk 6 anemometer
6
10
10 10
Stornoway
Airport
1957-1967
1967-1971
1971-1974 1974-2002
2002-12/2009
*Anemograph
Munro Mk 4 anemometer
Munro Mk 4 anemometer Munro Mk 5 anemometer
Vector Mk 6 anemometer
14 (a)
14
10 10
10
Boscombe Down 1957-1964 1964-1972
1972-2009
2009-12/2009
*Anemograph Assman Mk2 anemometer
Munro Mk 4 anemometer
Vector Mk 6 anemometer
16 16
10
10
Valley 1957-1988
1988-1995
1995-2007
2007-12/2009
Munro Mk 4 anemometer
Munro Mk 4 anemometer
Munro Mk 5 anemometer
Munro Mk 6 anemometer
12
10
10
10
Aberporth 1957-1966 1966-1969
1969-2000
2000-12/2009
*Anemograph *Anemograph
Munro Mk 4 anemometer
Vector Mk 6 anemometer
11 11
10
10
Aldergrove 1948-1963 1963-2003
2003-12/2009
Pressure tube Munro Mk 4 anemometer
Vector Mk 6 anemometer
17 10
10
Tiree 1957-1970 1970-1980
1980-2001
2001-12/2009
Pressure tube Munro Mk 4 anemometer
Munro Mk 4 anemometer
Vector Mk 6 anemometer
16 12
10
10
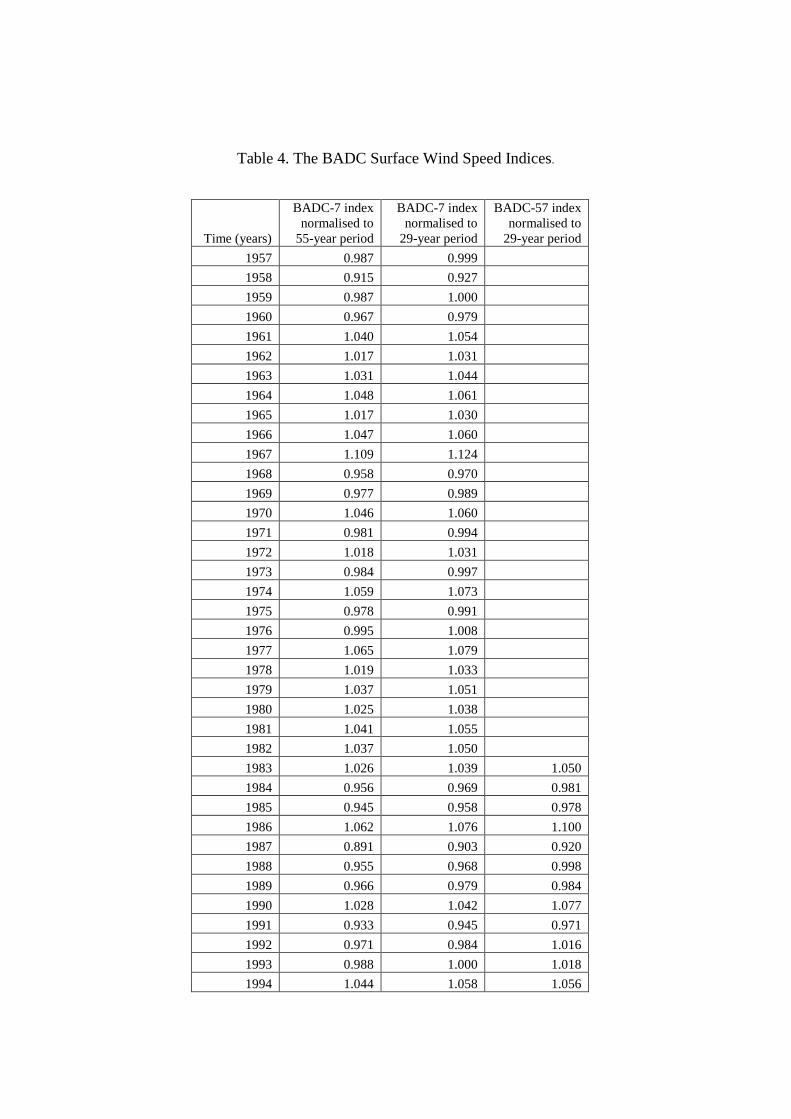
Table 4. The BADC Surface Wind Speed Indices.
Time (years)
BADC-7 index
normalised to
55-year period
BADC-7 index
normalised to
29-year period
BADC-57 index
normalised to
29-year period
1957 0.987 0.999
1958 0.915 0.927
1959 0.987 1.000
1960 0.967 0.979
1961 1.040 1.054
1962 1.017 1.031
1963 1.031 1.044
1964 1.048 1.061
1965 1.017 1.030
1966 1.047 1.060
1967 1.109 1.124
1968 0.958 0.970
1969 0.977 0.989
1970 1.046 1.060
1971 0.981 0.994
1972 1.018 1.031
1973 0.984 0.997
1974 1.059 1.073
1975 0.978 0.991
1976 0.995 1.008
1977 1.065 1.079
1978 1.019 1.033
1979 1.037 1.051
1980 1.025 1.038
1981 1.041 1.055
1982 1.037 1.050
1983 1.026 1.039 1.050
1984 0.956 0.969 0.981
1985 0.945 0.958 0.978
1986 1.062 1.076 1.100
1987 0.891 0.903 0.920
1988 0.955 0.968 0.998
1989 0.966 0.979 0.984
1990 1.028 1.042 1.077
1991 0.933 0.945 0.971
1992 0.971 0.984 1.016
1993 0.988 1.000 1.018
1994 1.044 1.058 1.056
1995 0.991 1.004 1.002
1996 0.988 1.001 0.989
1997 0.970 0.983 0.958
1998 1.052 1.066 1.040
1999 1.019 1.032 1.022
2000 1.002 1.015 1.007
2001 0.924 0.936 0.944
2002 1.006 1.019 0.998
2003 0.957 0.969 0.953
2004 0.984 0.997 0.992
2005 1.011 1.024 1.003
2006 0.999 1.012 0.989
2007 0.999 1.012 0.998
2008 1.025 1.038 1.035
2009 0.993 1.006 0.985
2010 0.931 0.944 0.907
2011 1.010 1.023 1.032
Table 5. Comparison of the trends of the different indices and standard deviation of
each index (with and without tend removed). The F-statistic relates to the level of
significance of the trend according to the non-parametric Mann-Kendall test.
Wind index Trend (% yr-1
) Period F St. dev (%) St. dev (%)
(Detrended)
BADC-7 -0.05 1957-2011 0.14 4.3 4.2
BADC-57 -0.10 1983-2011 0.23 4.3 4.2
ERA-40 (UK) +0.10 1958-2001 0.99 3.8 3.6
ERA-40 (7) -0.14 1958-2001 0.09 5.6 5.3
ERA-40 (57) -0.71 1983-2001 0.01 7.0 5.7
UKCIP Met O -0.38 1969-2006 0.00 6.1 4.5
GH -0.40 1995-2007 0.08 3.4 3.1
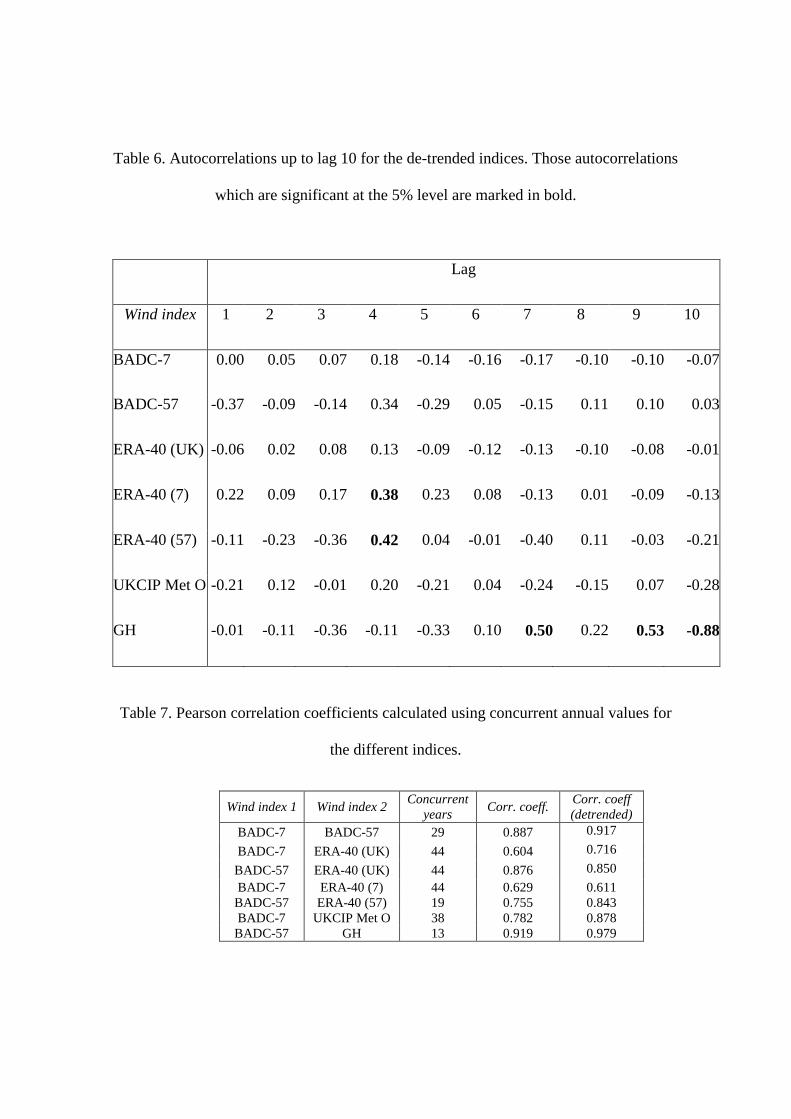
Table 6. Autocorrelations up to lag 10 for the de-trended indices. Those autocorrelations
which are significant at the 5% level are marked in bold.
Lag
Wind index 1 2 3 4 5 6 7 8 9 10
BADC-7 0.00 0.05 0.07 0.18 -0.14 -0.16 -0.17 -0.10 -0.10 -0.07
BADC-57 -0.37 -0.09 -0.14 0.34 -0.29 0.05 -0.15 0.11 0.10 0.03
ERA-40 (UK) -0.06 0.02 0.08 0.13 -0.09 -0.12 -0.13 -0.10 -0.08 -0.01
ERA-40 (7) 0.22 0.09 0.17 0.38 0.23 0.08 -0.13 0.01 -0.09 -0.13
ERA-40 (57) -0.11 -0.23 -0.36 0.42 0.04 -0.01 -0.40 0.11 -0.03 -0.21
UKCIP Met O -0.21 0.12 -0.01 0.20 -0.21 0.04 -0.24 -0.15 0.07 -0.28
GH -0.01 -0.11 -0.36 -0.11 -0.33 0.10 0.50 0.22 0.53 -0.88
Table 7. Pearson correlation coefficients calculated using concurrent annual values for
the different indices.
Wind index 1 Wind index 2 Concurrent
years Corr. coeff.
Corr. coeff
(detrended)
BADC-7 BADC-57 29 0.887 0.917
BADC-7 ERA-40 (UK) 44 0.604 0.716
BADC-57 ERA-40 (UK) 44 0.876 0.850
BADC-7 ERA-40 (7) 44 0.629 0.611
BADC-57 ERA-40 (57) 19 0.755 0.843
BADC-7 UKCIP Met O 38 0.782 0.878
BADC-57 GH 13 0.919 0.979

Table 8. Pearson correlation coefficients calculated using annual mean wind speed
values for combinations of the BADC-7 sites.
Aldergrove Boscombe
Down
Lerwick Stornoway Tiree Valley
Aberporth 0.373 0.409 0.186 -0.130 0.547 0.441
Aldergrove 0.351 -0.071 0.270 0.731 0.529
Boscombe Down -0.277 -0.317 0.376 0.680
Lerwick 0.002 0.168 -0.089
Stornoway 0.241 0.119
Tiree 0.508