Wind and seismic effects - NIST Technical Series Publications
636
, /i:iJ !!"™^jeismic Effects Proceedings of the 30th Joint Meeting NIST SP 931 QC 1 00 DEPARTMENT OF COMMERCE inology Administration anal Institute of Standards and Technology NO. 931 1998
-
Upload
khangminh22 -
Category
Documents
-
view
2 -
download
0
Transcript of Wind and seismic effects - NIST Technical Series Publications
, /i:iJ !!"™^jeismic EffectsProceedings of the 30th Joint Meeting
NIST SP 931
QC
1 00 DEPARTMENT OF COMMERCEinology Administration
anal Institute of Standards and Technology
NO. 931
1998
rhe National Institute of Standards and Technology was established in 1988 by Congress to "assist industry in
the development of technology . . . needed to improve product quality, to modernize manufacturing processes,
to ensure product reliability . . . and to facilitate rapid commercialization ... of products based on new scientific
discoveries."
NIST, originally founded as the National Bureau of Standards in 1901, works to strengthen U.S. industry's
competitiveness; advance science and engineering; and improve public health, safety, and the environment. One
of the agency's basic functions is to develop, maintain, and retain custody of the national standards of
measurement, and provide the means and methods for comparing standards used in science, engineering,
manufacturing, commerce, industry, and education with the standards adopted or recognized by the Federal
Government.
As an agency of the U.S. Commerce Department's Technology Administration, NIST conducts basic and
applied research in the physical sciences and engineering, and develops measurement techniques, test
methods, standards, and related services. The Institute does generic and precompetitive work on new and
advanced technologies. NIST's research facilities are located at Gaithersburg, MD 20899, and at Boulder, CO 80303.
Major technical operating units and their principal activities are listed below. For more information contact the
Publications and Program Inquiries Desk, 301-975-3058.
Office of the Director• National Quality Program
• International and Academic Affairs
Technology Services• Standards Services
• Technology Partnerships
• Measurement Services ''
.
• Technology Innovation
• Information Services
Advanced Technology Program• Economic Assessment
• Information Technology and Applications
• Chemical and Biomedical Technology
• Materials and Manufacturing Technology
• Electronics and Photonics Technology -
Manufacturing Extension PartnershipProgram• Regional Programs
• National Programs
• Program Development
Electronics and Electrical EngineeringLaboratory• Microelectronics
• Law Enforcement Standards •
• Electricity
• Semiconductor Electronics
• Electromagnetic Fields'
• Electromagnetic Technology'
• Optoelectronics'
Chemical Science and TechnologyLaboratory• Biotechnology
• Physical and Chemical Properties^
• Analytical Chemistry
• Process Measurements
• Surface and Microanalysis Science
Physics Laboratory• Electron and Optical Physics
• Atomic Physics
• Optical Technology
• Ionizing Radiation
• Time and Frequency'
• Quantum Physics'
Materials Science and EngineeringLaboratory• Intelligent Processing of Materials
• Ceramics
• Materials Reliability'
• Polymers
• Metallurgy
• NIST Center for Neutron Research
Manufacturing EngineeringLaboratory• Precision Engineering
• Automated Production Technology
• Intelligent Systems
• Fabrication Technology
• Manufacturing Systems Integration
Building and Fire ResearchLaboratory• Structures
• Building Materials
• Building Environment
• Fire Safety Engineering
• Fire Science
Information Technology Laboratory• Mathematical and Computational Sciences^
• Advanced Network Technologies
• Computer Security
• Information Access and User Interfaces
• High Performance Systems and Services
• Distributed Computing and Information Services
• Software Diagnostics and Conformance Testing
'At Boulder, CO 80303.
^Some elements at Boulder, CO.
Wind andSeismicEffects
NIST SP 931
PROCEEDINGS OFTHE 30TH JOINT
MEETING OFTHE U.S.-JAPAN
COOPERATIVE PROGRAMIN NATURAL RESOURCES
PANEL ON WIND ANDSEISMIC EFFECTS
Issued August 1998
Building and Fire Research Laboratory
National Institute of Standards and TechnologyGaithersburg, MD 20899
U.S. DEPARTMENT OF COMMERCEWilliam M. Daley, Secretary
TECHNOLOGY ADMINISTRATIONGary R. Bachula, Acting Under Secretary for Technology
National Institute of Standards and Technology
Raymond G. Kammer, Director
Noel J. Raufaste
EDITOR

National Institute of Standards and Technology Special Publication 931
Natl. Inst. Stand. Technoi. Spec. Publ. 931, 588 pages (Aug. 1998)
CODEN: NSPUE2
U.S. GOVERNMENT PRINTING OFFICEWASHINGTON: 1998
For sale by the Superintendent of Documents, U.S. Government Printing Office, Washington, DC 20402-9325
PREFACE
This publication contains the Proceedings of the 30th Joint Meeting ofthe U.S.-Japan Panel on Wind and
Seismic Effects. The meeting was held at the National histitute of Standards and Technology in
Gaithersburg, Maryland during 12-15 May 1998. Fourty-five papers were written, 22 by U.S. members
and 23 by Japanese members. Thirty-eight papers were presented orally; 20 by the U.S. -side and 19 by the
Japan-side. They were organized around seven themes: 1. Special Session in Celebration of the Panel's 30*
Anniversary, 2. Storm Surge and Tsunamis, 3. Earthquake Engineering, 4. Joint Cooperative Research
Programs, 5. Real Time Information Acquisition and Dissemination, 6. Wind Engineering, and 7. Reviews
of the Panel's 1 1-Task Committee Activities and Highlights ofRecent Task Committee Workshops.
Eighteen Japan-side and 32-U.S.-side experts participated in these meetings
Two papers were presented at a mini-symposia conducted at USGS in Golden, CO during the technical site
visit segment of the Joint Panel Meeting. The Japan-side paper is included in these proceedings in the
section, Manuscripts Presented at Mini-Symposium.
BACKGROUND
Responding to the need for improved engineering and scientific practices through exchange of technical
data and information, research personnel, and research equipment, the United States and Japan in 1961
created the U.S. -Japan Cooperative Science Program. Three collateral programs comprise the Cooperative
Science Program. The U.S.-Japan Cooperative Program in Natural Resources (UJNR), one of the three,
was created in January 1964. The objective ofUJNR is to exchange information on research results and
exchange scientists and engineers in the area of natural resources for the benefit of both countries. UJNRis composed of 18 Panels each responsible for specific technical subjects.
The Panel on Wind and Seismic Effects was established in 1969. Nineteen U.S. and seven Japanese
agencies participate with representatives of private sector organizations to develop and exchange
technologies aimed at reducing damages fi^om high winds, earthquakes, storm surge, and tsunamis. This
work is produced through collaboration between U.S. and Japanese member researchers working in 11 task
committees. Each committee focuses on specific technical issues, e.g., earthquake strong motion data. The
Panel provides the vehicle to exchange technical data and information on design and construction of civil
engineering lifelines, buildings, and water front structures, and to exchange high wind and seismic
measurement records. Annual meetings alternate between Japan and the United States (odd numbered
years in Japan; even numbered years in the United States). These one-week technical meetings provide the
forum to discuss ongoing research and research results; one-week technical study tours follow the meetings.
The National Institute of Standards and Technology (NIST) provides the U.S. -side chair and secretariat.
The Public Works Research Institute (PWRI), Japan, provides the Japan Side chair and secretariat.
Cooperative research is done through formal Panel Programs. In 1981, cooperative research in Large-
Scale Testing was started under the auspices of the Panel. Also, in 1981, joint research on Reinforced
Concrete Structures was initiated. Full-scale testing was performed at the Building Research Institute
(BRI), one of the six Japanese members' organizations, with supporting tests in Japan and in the United
States Two years later, a joint research program on Steel Structures was initiated. Full-scale testing again
was led by BRI with supportmg tests in the United States and Japan. The U.S.-Japan coordinated program
iii
for Masonry Building Research was started in 1985. A U.S.-Japan coordinated program on Precast
Seismic Structural Systems was initiated in 1991. A joint program on Seismic Performance of Composite
and Hybrid Structures was initiated in 1993. In 1994, a joint program was started on Physical and
Numerical Simulation of Structural Damages Due to Liquefaction and Development of Countermeasure
Techniques.
Task Committee meetings, exchanges of data and information through technical presentations at annual
Panel meetings, exchanges of guest researchers, visits to respective research laboratories and informal
interactions between Panel meetings, joint workshops and seminars, and joint cooperative research
programs all contribute to the development and effective delivery of knowledge that has influenced design
and construction practices in both countries. Guest research exchanges have advanced the state of
technology in areas of steel, concrete, and masonry structures under seismic forces; developed techniques to
analyze risks from liquefaction; modeled water seepage in dam foundations; performed comparative
analyses of seismic design of U.S. and Japanese bridges.
Direct communication between counterpart country organizations is the cornerstone of the Panel. Effective
infonnation exchanges and exchanges of personnel and equipment have strengthened domestic programs of
both countries. There are opportunities for experts in various technical fields to get to know their foreign
counterparts, conduct informal exchanges, bring their respective views to the frontiers of knowledge, and
advance knowledge of their specialties.
The Panel's activities resulted in improved building and bridge standards and codes and design and
construction practices in hydraulic structures in both countries, for example:
created and exchanged digitized earthquake records used as the basis of design and research for
Japan and the United States;
transferred earthquake engineering information and strong-motion measurement techniques for use
by seismically active countries, e.g., Australia, Canada, Italy, Mexico, Peru, Taiwan, Turkey, and
North Africa;
produced data that advanced retrofit techniques for bridge structures;
developed field test data for use in aerodynamic retrofit of bridge structures;
produced fiiU-scale test data that advanced seismic design standards for buildings;
advanced technology for repairing and strengthening reinforced concrete, steel, and masonry
structures;
improved in-situ measurement methods for soil liquefaction and stability under seismic loads;
created a database comparing Japanese and U.S. standard penetration tests to improve prediction
of soil liquefaction;
created a database on storm surge and tsunamis and verified mathematical models of tsunami and
storm surge warning systems;
established a library resource of current research on wind and earthquake engineering and on storm
surge and tsunamis;
published proceedings of Panel meetings. Task Committee Workshops, and special publications
such as List of Panel Publications and translated two-volume series on earthquake resistant
construction using base isolation systems;
gained better knowledge of both countries' research, design, and construction capabilities fi^om in-
depth visits to the host country's laboratories and building and public work projects. Results of
such visits contribute to creation ofnew Task Committees, agendas for Joint Panel meetings and
iv

task committee workshops, visits of U.S.-Japan researchers, and joint collaborative research.
fflGHLIGHTS OF THE JOINT TECHNICAL MEETING, 12-15 MAY 1998
The Panel celebrated its 30th joint meeting under the Theme, Wind and Seismic Effectsfor the NewMillennium.
Technical presentations highlighted important work by the U.S. and Japan Panel:
software emphasis for mitigation—beyond more resistant structures to emergency
practices and national land management,
completing our Panel's work—more attention is needed for mitigation incentives
and a focused 20-year effort to provide those technologies that will end disasters,
good correlations produced for real time component tests with systems simulation,
construction of a 20 m x 15 m, 1200 ton full-scale Japanese 3-D shake table test
facility by 2005,
modeling long period surface waves at boundaries of deep sedimentary basins,
important surface wave effects for long period sea floor motions,
opportunities for systematic modeling of earthquake response of dams,
design and retrofit criteria for welded steel moment frames,
seismic isolation materials and systems for buried structures,
framework for performance-based design of buildings,
bases for major revisions of highway bridge design criteria,
physical and mental health of disaster survivors and disaster responders,
broad range of complementary work in developing disaster information systems;
they should be distributed, open, and integrated with normal operating systems,
systematic use of Deer Island bridge to develop and improve models for wind
response of bridges,
Japanese are developing new technologies and new design concepts for next
generation of record long span bridges (2700 m) in earthquakes and typhoon areas,
practical, rational techniques for increasing wind and seismic resistance of
housing.
new seismic design guidelines for concrete filled tubes, R/C column to steel beam
systems, concrete core with exterior steel frame (hybrid wall system).
new technologies in GPS application and geospatial analysis to mitigate disasters.
Panel Task Committee (T/C) activities grow in strength. The Panel created a new T/C on Seismic
Information Systems to adapt information technology to reducing earthquake losses and two T/Cs
were consolidated to better focus on intelligent structures. Interest was evident to pursue joint work
in public health issues resulting from natural disasters. The T/C structure is an effective vehicle to
explore in depth modem seismic and wind technologies being used by both countries. Four T/C
workshops/conferences were held in the past year; ten workshops and joint meetings are planned
for the coming year.
The UJNR Panels on Wind and Seismic Effects, Fire Research and Safety, and Earthquake
Research are contributing to the U.S./Japan Natural Disaster Reduction Effort of the CommonAgenda.
V

The Panel's newsletter is effective in disseminating its information. The Panel's Web Site is
considered useful in deploying information to Japan and U.S. design and construction
organizations. NIST will continue to maintain the Web Site during the next year. The site is
available at http://www.bfTl.nist.gov/info/ujnr
HIGHLIGHTS OF THE TECHNICAL SITE VISITS 11 AND 16-21 MAY 1998
During the 30th Joint meeting of the Panel on Wind and Seismic Effects the delegation visited ten technical
sites in the greater Washmgton, DC, Denver, and San Francisco metropolitan areas. Fourteen, eight, and
nine Japan members participated in these site visits, respectively.
1. U.S. Army Topographic Engineering Center (www.tec.army.mil/tec_mission.html).
Dr. William Roper, Director, Topographic Engineering Center (TEC), Panel co-chair of Task Committee
"G" Seismic Information Systems, hosted the delegation. TEC supports the Army in developing terrain
visualization models, computer image generation, 3-D graphics, distributed interactive simulation,
precision surveying and mapping; global positioning system (GPS) development; image analysis;
geographic information systems (GIS); data/image fusion and virtual reality modeling of the environment.
TEC is developing capabilities to model human interactions with the environment and model environmental
restoration and conservation.
Two TEC staff demonstrated enhanced environmental and terrain capabilities for distributed interactive
simulations and discussed TEC's development of 3-D visualization capabilities to demonstrate virtual
reality environments. In artificial intelligence for terrain analysis, TEC is developing R&D methods for
automated terrain reasoning to support modeling and simulation of environmental impacts from burning,
smoke flow, droughts, and hazardous wastes.
TEC staff have developed large data bases of geological, vegetation, and atmospheric spectral signatures
(visible, thermal, fluorescence). Thermal infrared reflectance spectra reveal high spectral resolution
information about the geological and vegetation components on the surface of the earth and the atmosphere.
Radar images too are used to develop images of areas obscured by clouds to interpret the image beneath.
Of particular interest to the Panel is TEC's DrawLand. This software, developed by TEC, visualizes terrain
data. It behaves like a flight simulator; what is seen on the monitor changes in response to how one
manipulates the controls of a virtual vehicle. DrawLand reads from CD Roms; raster map data can be
draped to create the appearance of a 3-D map. DrawLand has used imagery from sources such as Landsat,
SPOT, and aerial photography. TEC developed this capability in 1994 with 10 m accuracy. Resolution
capabilities of 2 m to 3 m accuracy exist to measure tides, map topography, and to determine elevation data
surface water flow.
The Panel will benefit by having access to these capabilities in appropriate work such as its new Task
Committee on Seismic Information Systems. Simulations of the built environment may be performed using
data from topographic maps to model damages caused by fires and tsunamis following earthquakes or
damages from earthquakes and high winds to the built environment.
TEC is one of four laboratories of the U.S. Army Corps of Engineers. It is located in Alexandria, VA and
employs about 600 staff operating with a $120 million budget.
vi
2. National Building Museum (www.nbm.org/intro.htm). The delegation visited the 1887 Pension
Building (now the National Building Museum) designed by Montgomery C. Meigs, who was Quartermaster
General in charge of provisions during the Civil War. The building was constructed to serve as the
government office for disbursing government checks to Civil War veterans and to their widows. Later, it
was occupied by a variety of Government agencies. Created by an act of Congress in 1985, the building
was designated the National Building Museum to serve as a focal point for permanent and temporary
exhibitions; resource for collecting artifacts of design and construction; publisher of books and journals,
and oflFers a variety ofprograms ranging from workshops on building crafts to tours of landmark buildings
and construction sites, as well as films, lectures, concert series, and symposia.
The delegation visited one of the many exhibits. Breaking Through the Creative Engineer. This exhibit
explores how creativity is expressed through the work ofmodem engineers. Its focus is on the creative
impulse of the people who strive to give shape to the material world, built environment, and systems of
information and power. Case studies in the exhibition are intended to stimulate reflection about the kind of
thinking that allows an engineer to break through the ordinary and give birth to something novel. The
displays are organized around eight themes that suggest some elements of engineering creativity and
creativity in other areas of life: challenging, connecting, visualizing, collaborating, harmonizing,
improvising, reorienting, and synthesizing.
Some interesting statistics about the Washington, DC National Building Museum reveals the original
construction cost was $887,000. It is 122 m by 1 1 1 m, 23 m to cornice level; constructed of 15,500,000
bricks with brick and terra cotta ornament; its terra cotta exterior frieze is 366 m long and 0.9 m high
representing a continuous parade of Civil War military units. The Great Hall measures 96 m by 35 m and
is 48 m at its highest point. Its Corinthian columns are among the tallest interior columns in the world
measuring 23 m high; 2.4 m in diameter; 7.6 m in circumference each made of 70,000 bricks and painted to
resemble Sienna marble. There are 72 ground floor Doric-style columns (terra cotta covered with cement)
and 72 second floor Ionic-style columns (cast iron). Two hundred forty four busts reside in niches high
above the center court that represent members of building occupations. A clever system of windows, vents,
and open archways provided complete air circulation throughout the building; cooling in the summer and
heating in the winter.
3. Colorado State University, Fluid Dynamics and Diffusion Laboratory
(http://www.lance.colostate.edu/depts/ce/netscape/depts/fluid_mechanics/faculty.html). Professor Robert
Meroney, Director, Fluid Dynamics and Diffusion Laboratory (FDDL) and staff hosted the delegation to
discuss fluid mechanics and wind engineering research performed at FDDL. Professor Meroney reviewed
work performed by the boundary-layer wind tunnels used in support of fundamental investigations of
turbulence and turbulent diffusion. Research centers on wind engineering and wind effects on buildings and
structures including low-speed turbulent flow, atmospheric flow near the earth's surface and around bluff
bodies; computational fluid mechanics; physical modeling of the atmospheric boundary layer and flow
phenomena within this layer; and wind tunnel testing of environmental design for urban centers and
air-pollution control.
Dr. Jack Cermak, University Distinguished Professor and founder ofFDDL, reviewed wind research
developed during the last three decades. Professor Cermak noted a variety of laboratory investigations
performed by FDDL. They include wind forces on proposed tall buildings and long-span bridges, wind
forces on low-rise buildings, atmospheric diffusion near energy producing and storage facilities, and other
vii
wind engineering projects. Wind research is performed for sponsors from consulting firms, research
institutes and industrial firms throughout the United States. Often these studies identify new areas of
needed research.
Professor Meroney reviewed the Colorado State/Texas Tech Universities (TTU) Cooperative Program in
Wind Engineering supported by the National Science Foundation. The program is evaluating and mitigating
the effects of severe wind storms on low-rise buildings. Experiments at the TTU field site and in FDDL's
wind tunnels are examining external and internal pressures and wind loads under severe thunderstorm,
tornado and hurricane wind conditions. This joint effort is examining the economic implications of code
improvements, wind engineering, and insurance incentives through surveys and impact analysis
programming.
Dr. Bogusz Bienkiewicz, FDDL Professor and member of the Panel's Task Committee "E" on Design for
Wind and Wind Hazard Mitigation, reviewed his research in bridge aerodynamics and research being
performed at FHWA under a guest researcher assignment. Some of his novel research addresses
aerodynamics of racing boats, optimizing human ski positions, and helmet design that reduce drag.
A tour of the FDDL highlighted three wind tunnels. The 12.2 m long test section of the Meteorological
Wind Tunnel is capable of independently heating and cooling air to generate thermally stratified flows. The
tunnel is used to study flow characteristics of the atmospheric surface layer and to measure wind pressures
on buildings and structures. The delegation observed meteorological wind turmel research on correlated
laser light visualization and pressure measurements. FDDL's Industrial Aerodynamic Wind Turmel's test
section is 1.8 m wide by 18.3 m long with adjustable ceiling height ranging from 1.5 m to 2.1 m. A 3 msection of the lower boundary can be heated to 93 .3 °C. The Open Circuit Gust Wind Tunnel is equipped
with a 3 .7 m long test section that is 0.9 m wide and 0.9 m high. A 6-blade fan variable speed motor
generates wind speeds ranging from 0.3 m/s to 9.14 m/s. Other FDDL tunnels include the Environmental
Wind Turmel, Thermal Stratification Wind Tunnel, Transpiration Wind Tunnel, and the Separation Wind
Tunnel.
FDDL is in the Department of Civil Engineering, Colorado State University, Golden CO.
4. U.S. Geological Survey (geohazards.cr.usgs.gov). The delegation was welcomed by Dr. Randall
Updike, Chief Scientist, Geohazards Team and Drs. E.V. Leyendecker and Erdal Saffak, and by staff of
the Geologic Hazards and National Earthquake Information Center. The delegation was informed of
mapping work performed by USGS in Golden, CO. They are developing ground motion maps and national
seismic hazard maps for use in the development of U.S. seismic design maps. Also, these maps are used in
the regulation of waste disposal sites, highway design, insurance, loss estimation, and damage mitigation.
This data is available by CD Roms and maps are available on the Internet. This work forms the basis for
the 1997 Recommended Provisions of the National Earthquake Hazards Reduction Program.
A mini-symposium was carried out with Dr. Arthur Tarr, USGS and Dr. Michio Okahara, Director, Bridge
and Structures Department, PWRI. Dr. Tarr discussed his work in developing dynamic mapping of
earthquake and landslide resources for distribution on the Internet. The soon to be published Internet maptechnology will permit rapid assessments of specific maps of specific locations. USGS used the January
1994 Northridge earthquake data to test their modeling in the development of the geologic hazards
interactive maps for seismic intensity contours in real time. As new information is made available, the maps
are automatically recontoured. The system facilitates assessments of damaged structures and buildings.
viii
This work will be a valuable contribution to the Panel's new Task Committee "G" on Seismic Information
Systems.
Dr. Michio Okahara discussed PWRI's research, following the January 1995 Kobe earthquake, on seismic
retrofit of bridge substructures involving the redesign of reinforced concrete columns. The redesigned
columns used base isolators in conjunction with a spiral reinforcements retrofit design. In areas of soil
liquefaction, micro-piles were used. This paper is part of the Proceedings of the 30th Joint Meeting of the
Panel on Wind and Seismic Effects.
During a review of USGS' National Earthquake Information Center (NEIC) the delegation learned of its
mission to provide earthquake information to FEMA and other Federal Agencies, all 50-States, to
worldwide scientists and engineers, and the public through the printed and electronic medium. Within 30
minutes following an earthquake, NEIC alerts FEMA and each of the affected States and the media about
earthquake severity information, location and magnitude of the earthquake, and earthquake source
parameters. This information aids disaster relief officials and scientists in evaluating earthquake hazards.
NEIC works closely with the Japan Meteorological Agency and similar other country organizations.
USGS Central Region, Geologic Hazards, is in Golden, CO. The Geologic Hazards Team conducts global
investigations of earthquake, geomagnetic, and landslide hazards. The Team consists of eight research
groups and three information centers.
5. Natural Hazards Information Center (www.colorado.edu/hazards). The delegation was hosted
by Dr. Dennis S. Mileti, Center Director and Dr. Mary Fran Myers, Center Co-Director. The delegation
was informed of the Center's four key roles:
o Publishes a bimonthly Natural Hazards Observer that reaches over 14,000 subscribers. The
newsletter features information on disaster issues; hazards research; political and policy developments;
world, national, and state program activities; upcoming conferences; and recent publications. Also, the
Center produces a semimonthly E-mail newsletter Disaster Research.
o Performs in-house research and a grant program enabling "quick response" study of disasters.
Recently the Center completed a 6-year study and published its 1,200 page draft final report on National
Assessment ofNatural Hazards. This seminal work was performed through many groups. The latter
program permits social scientists to go immediately to the site of a disaster to obtain information that might
otherwise be lost. Their findings are subsequently published by the Center in brief Quick Response
Reports.
0 Hosts an annual workshop, conducted each summer for the past 23 years in Colorado, the
workshops bring the public and private sector together to share hazard-related problems and ideas for their
solutions. The workshop involves participants ranging fi^om researchers, hazard managers, government
officials, professional and nongovernmental organization representatives.
o Maintains a library research services with more than 14,000 books, articles, reports, journals, and
other documents on the social, economic, and behavioral aspects of natural disasters. The holdings are
cataloged in a computerized, bibliographic database. With this resource, the Center staff responds daily to
requests for information from federal, state, and local officials, researchers, members of private and
nonprofit organizations, and other concerned individuals around the world.
ix
The Panel is encouraged to use relevant Center services during its planning of Task Committee activities
and joint research.
The Center is at the University of Colorado, Boulder. Its goal is to increase communication between
hazard/disaster researchers and those individuals, agencies, and organizations that are actively working to
reduce disaster damage and suffering. The Natural Hazards Center has a variety of resources available
from the Internet.
6. Pacific Gas and Electric Corporation (http://www.pge.com/welcome.html). Dr. Lloyd Cluff,
Manager, Geosciences Department, reviewed his work assessing earthquake hazards and vulnerability of
PG&E's facilities. Dr. Cluff stressed the importance of producing good design for nonstructural elements.
Failures of nonstructural elements was the reason for closing PG&E's facilities which did not exhibit
exterior structural damages. PG&E is performing a tsunami study to assess damages to PG&E's facilities
following a major earthquake on the Juan de Fuga Plate near Eureka, CA. PG&E has appropriated $2
billion for a 15 year to 20 year program to replace gas pipelines and to develop earthquake response
planning and post earthquake inspection programs. The PG&E staff involved in earthquake engineering is
small; PG&E collaborates with consultants.
The delegation centered their discussions on the restoration of PG&E's four-building headquarters complex
following the 1989 Loma Prieta Earthquake and restoration of some powerplants and buildings damaged
from the San Fernando and Loma Prieta earthquakes. Eric Elsesser of Forell/Elsesser Engineers, Inc.
reviewed his work in seismic restoration/strengthening of PG&E's four-headquarters 1920s vintage
buildings' design, restoration, and strengthening following the 1989 Loma Prieta earthquake. The site is on
deep bay mud with immersed wooded pile foundations. The original buildings were steel-frame with non-
load bearing unreinforced masonry tile infill. The buildings' exterior walls are terra cotta tiles. A variety of
structural evaluations and options including demolishing the complex and construct anew were considered
before choosing a massive structural shear-wall design as the best solution for rehabilitation. Base-isolation
was considered and rejected as a solution. All wood piles were tied to a concrete foundation and into newreinforced walls. The terra cotta tile facade was articulated by cutting the tiles, fastening them to backing
brick and setting it in concrete. The building's interiors were gutted, strengthened and repaired, and the
infrastructure modernized. The total cost for this work was $180 million. The design and construction costs
were $120 million; the remainder represents the costs of disrupting the staff and renting new facilities. A$21 million tax incentive was provided by the State since PG&E maintained the architectural integrity of
the building.
PG&E has a $12 million 5 -year applied research program with USGS in Menlo Park and with the Pacific
Earthquake Engineering Research Center at UC Berkeley that centers on equipment venerability evaluation,
building vulnerability, earthquake source characterization, ground deformation and ground motion. Also,
PG&E and PEER are working on research to reduce damages following ignition of fires from earthquakes.
PG&E's research activities and long-range planning to reduce damages from earthquakes is of muchinterest to the Panel and for possible collaborative efforts by some Panel's member laboratories.
PG&E headquarters is located in San Francisco. It provides electric service to over 4-million customers
(households and businesses) using mixtures of energy resources such as natural gas, hydropower,
geothermal and nuclear energy and wind and solar power. Its service area spans 182,000 km^ within 48 of
California's 58 counties, with a population of more than 13 million people. PG&E and other utilities in the
state are regulated by the California Public Utilities Commission. PG&E has developed consumer
X
information on preparing for an earthquake (including design guidelines on bracing your water heater) and
preparing for storms. This information is available on the Web at
www.pge.com/customer_services/emergency/emerquake.html and at
http://www.pge.com/customer_services/emergency/storm.html respectively.
7. Pacific Earthquake Engineering Research (PEER) Center
(http://peer.berkeley.edu/html/about_peer.htmI). Professor Jack P. Moehle, PEER Director hosted the
delegation. In Professor's Moehle's overview of PEER, he highlighted current research on performance-
based earthquake engineering, response of unsafe concrete bridges, bridge response to ground motions, and
safety and reliability of utility systems and lifelines. PEER developed an interactive Web site of research
results from searches of experimental results and data. Professor Moehle told us he attended a San
Francisco design review meeting, earlier in the morning, to review plans of a 41 -story precast momentframe office building that proposes to use the NIST-Pankow developed precast concrete beam-column
connection system able to withstand large inelastic deformations due to earthquakes and strong winds.
Three PEER papers were discussed. Dawn Lehman, graduate student, reviewed "Repair ofModerately and
Severely Damaged Bridge Columns" an investigation of seismic performance of bridge columns and four-
methods of repair that included a mechanical coupler and varying amounts of epoxy injections with and
without column jackets. Professor Raymond Seed reviewed his work, "Numerical Modeling and
Smiulation of Seismic Soil-Pile-Stmcture Interaction Experiments" on predicting seismic soil-pile-stmcture
mteractions under seismic loading from shaking table tests at U.C. Berkeley. Professor Gregory Fenves
reviewed, "A Database of Experimental Results on Earthquake Protective Systems Hardware." This on-line
database, PROSYS, accesses experimental results from passive protective systems such as seismic
isolation and energy dissipation systems, elastomeric and sliding seismic isolators, damping devices, and
other active and semi-active response control approaches. The three papers will be published in the
Proceedings of the 30th Panel Meeting.
The delegation visited PEER'S Earthquake Simulator Laboratory at the Richmond Field Station. The
simulator is 6 m by 6 m in plan and configured to produce three cotranslational components of motion._
The simulator can be used to subject structures weighing up to 580 kN to horizontal and vertical ground
accelerations up to 1.5 g. The dynamic response, at 25 percent of the shake table capacity, of base isolators
to three seismic records: Kobe; Newhall; and El Centro was being evaluated at the time of the visit.
During a visit to the Hayward fault (Berkeley Campus sits atop the Hayward fault), the delegation was
informed of a recently developed uniform rating system to evaluate the seismic vulnerability of over 150
Berkeley campus buildings. This work was performed during a 6-month period at a cost of about
$200,000. The study identified 50 buildings that were rated poor to resisting seismic loads; they will
require an estimated $700,000 to $1 million to retrofit. Berkeley has applied for fiinding from FEMA and
other sources to perform the retrofit. A decision was made that it is more cost-effective to strengthen these
buildings than demolish them.
PEER is a national earthquake engineering research center headquartered at UC Berkeley. It was
established in 1998 by the National Science Foundation (NSF) and the participating universities and funded
by NSF, the State of California, the University of California, the State of Washington, the University of
Washington, and business and industry partners. It consists of a consortium of faculty researchers, core
universities, and affiliated institutions that conduct programs in research, education and outreach, and
information dissemination. PEER supports a business and industry partner program.
xi
8. California Department of Transportation CALTRANS (www.dot.ca.gov/). Mr. Thomas Post,
Chief, Earthquake Engineering Division, Caltrans and a Panel member hosted the delegation at the Caltrans
Oakland facility and later, with the delegation and staff, visited the San Francisco-Oakland Bay Bridge.
Mr. Post reviewed the repair and strengthening performed on the San Francisco-Oakland Bay Bridge
following the Loma Prieta earthquake. Underway is a $125 million retrofit program to reduce seismic risks
to the west section and during the interim period before a new east section is constructed in 2003. The
design is to withstand a magnitude 8.0 earthquake of a 1000 year to 2000-year return period. The bridge is
retrofitted to remain operational following this design earthquake. As part of the work, Caltrans will be
installing 96 dampers (500 K range) in the west section, clamping them from the cable to the main chord.
The west section foundations and bents have been strengthened and bracing added to its legs. Friction
pendulum isolators were installed at the top of the legs at the lower chord.
Feasibility studies were performed to estimate the costs of fiiUy retrofitting the east section of the bridge
versus construction of a new bridge. Cost of the retrofitting is in the $900 million range and of a new east
section, cost is estimated at $1.2 billion. A decision was made to construct a new east section. In May1998, the Metropolitan Transportation Commission (MTC) selected two bridge design options for the east
section for fiirther analysis. They are a single tower suspension bridge and a single tower cable-stayed
bridge. T.Y. Lin Intemational/Moffatt & Nichol Engineers, the joint-venture architectural and engineering
team retained by Caltrans, is developing the designs to the stage of 30% completion so that a final
evaluation can be made. When the new bridge is open for traffic in 2003, the old bridge will be dismantled
and sold in sections for use by other countries.
The single tower suspension bridge concept will complement the other suspension bridges around the Bay:
the Golden Gate, the Richmond-San Rafael bridges, and the western span of the Bay Bridge. The single
steel tower will consist of four columns with horizontal link beams to add seismic strength to the tower.
The decks are supported by suspending cables attached to a single main cable, which extends above the
spine of the span. The suspending cables are attached to the inside of the decks, until near the tower, they
traverse to the outside of the decks.
The single tower cable-stayed bridge concept consists of two concrete towers with an elliptical
cross-section which gradually tapers toward the top. The two legs are joined by articulated link beams
which strengthen the tower's seismic reliability. At the top of the tower, the link beams are protected and
enclosed by a "lens." The cables are arranged in a semi-fan pattern and are splayed symmetrically fi^om the
central tower to the outside of the decks. This cable arrangement creates a spatial envelope and portal
enclosure through which all vehicles and pedestrians pass. The deck is a closed steel box within the
cable-supported span and a concrete box girder with ribs at the east viaduct portion of the bridge.
MTC is the transportation planning, coordinating, and financing agency for the nine-county San Francisco
Bay Area. Created by the state Legislature in 1970, MTC fiinctions as the regional transportation planning
agency, a state designation, and for federal purposes, as the region's metropolitan planning organization.
MTC is responsible for the Regional Transportation Plan, a comprehensive blueprint for the development
ofmass transit, highway, airport, seaport, railroad, bicycle and pedestrian facilities.
Caltrans' headquarters is in Sacramento, CA. They are responsible for the design, construction,
maintenance, and operation of the California State Highway System, and that portion of the Interstate
Highway System within the state's boundaries. Alone and in partnership with Amtrak, Caltrans also is
xii
involved in the support of intercity' passenger rail service in California, and is a leader in promoting the use
of alternative modes oftransportation. The current framework of Caltrans was set down by Assembly Bill
69 m 1972.
9. San Francisco City Hall Seismic Retrofit (\\wv.dnai.com/~mbt/projdes/cit}'hall.html). Mr. Peter
Borberg, project manager of Turner Construction and Mr. Paul Rodler, Principal and structural engineer of
Forell/Elsesser Engineers, Inc hosted the delegation to discuss retrofitting the 1915 Beaux Arts San
Francisco City Hall. Turner Construction, the general manager of this seismic retrofit project awarded a
$103 million lump sum contract to Forell/Elsesser Engineers Inc. Forell/Elsesser is the prime
architect/engineer firm performing the seismic retrofit of the 47,983 m^ building; they are working with the
San Francisco Bureau of Architecture who serves as the Executive Architect, and with the City and Count}'
of San Francisco. The total cost of seismic upgrade is $181 million and includes $38 million for employee
relocation. A Change Order resulting from California's 1997 Proposition A, to upgrade the building's
mechanical and electrical sy stems, extended the original 32-month construction schedule to
44 months. The building will be opened on New Year's Eve 1998.
The structural work is designed to withstand a 475-year magnitude 8 earthquake. The repair work
mvolved; mstallmg a new base isolation s> stem for the entire Cit} Hall building — 530-1 m diameter
rubber-lead core base isolators (designed to 0.5 m displacement) and 66 slider isolators under the ground
floor. The building's columns w ere decoupled from the ground, supported and jacked to permit removal of
the lower 1 m of column and set on temporary- steel cruciform column supports. The new isolators were
installed on a new slab-on-grade and a reinforced mat was built around each column footing. The isolators
were tested for 635 mm deflection at 1500 K loading and to 216 mm for properties and qualit}' control. Amoat was constructed around the building to accommodate ground shaking. Shear w-alls, thicker than 1 mwere installed in the basement and tied into the floor. A first floor wall system of about 0.7 m thick with a
10 mm thick steel plate extended along the light court up to the roof Collector beams and new floor
bracing were added. Structural strengthening was performed for the rotunda, dome, stairs and elevator
shafts.
The architectural work includes new programming and space planning for the entire ground floor; replacing
hollow clay tile walls; repairing the interior and exterior stone work; replacing the architectural finishes;
and re-attaching stone arches and stone ornaments. The repair design maintained the soft first story to
permit for long-vibration displacements. The exterior massive granite stairs were rebuilt with an
underla\Tnent stair slider bearing on the ground step. The slider bearing was fabricated of Teflon on
stainless steel to allow movement in case of an earthquake. The architectural work emphasizes preservation
of the building's historical fabric and significance, bringing the building back to its original architectural
finishes, exposing ornamentation and ceilings, opening the two light wells for public use.
The 94 m by 124 m b\' 124 m height of dome City Hall is listed on the National Register of Historic
Places. Its rotunda is a grand intenor space and a landmark for the citizens of San Francisco. This City
Hall replaced the first city hall which was destroyed in the 1906 San Francisco earthquake.
Following the renovation work. Dr. Hsi-Ping Liu, Structural Engineer from USGS presented USGS' work
in instrumenting of selected San Francisco facilities near its four deep bore holes. Data records from these
bore holes were used in developing ground shaking amplification mapping.
10. National Weather Service (http://www.nws.mbay.net/). The delegation was hosted by Mr.
xiii
Charles Morrill, Warning Coordination Meteorologist, National Weather Service (NWS) Forecast Office
for the San Francisco Bay Area (located in Monterey). The office issues marine and land weather forecasts
and warnings and provides semiweekly water temperature measurements, from Alaska to Mexico, of water
skin temperatures from satellites. The information is available on the Web and from other sources. The
NWS Climate Diagnostic Center is responsible for providing seasonal climate prediction and for year-to-
year climate forecasts. NWS is in the process of upgrading its weather forecasting systems to advance its
understanding ofhow sea temperature in the Pacific affect precipitation over the continental United States.
The delegation discussed research with three researchers offering papers on this topic. Dr. Wendell Nuss,
Naval Post Graduate School (NPGS) briefed the delegation on a major 1998 west coast winter storm field
experiments. Following the impact of El Nino, NOAA researchers, in collaborating with the U.S. Naval
Research Laboratory, are working to improve numerical weather forecast models that will better simulate
the present and future states of the atmosphere. These forecasts are in the 36 hour to 48 hour range and will
be shared in another NOAA initiative that seeks to improve forecasts in the 0 to 12-hour range along the
California coast. Improved observations and measurements are sought by measuring vertical profiles of
wind, temperature, and moisture in the atmosphere. Measurements will be taken fi-om deployed instrument
packages over the Pacific and by aircraft and by satellites.
Dr. Elizabeth Ritchie of the NPGS reviewed her work in developing numerical model studies of typhoon
flows over the Japan islands. Modeling is underway at the 1 km range producing finer resolution and
understanding the effects of mountains on storms and rainfall. The model is approximating real time
weather during the approach and landfall of typhoons.
Dr. Joseph Golden, OAR and co-chair of the Panel's Task Committee on Design for Wind and WindHazard Mitigation reviewed new NOAA technologies for forecasting weather. The United States has about
160 new Doppler weather radar stations and about 45 airports use Doppler radars for wind shear warnings.
NOAA is working with industry to design instruments to measure wind speed at 100 m/s. They are
experimenting with GPS dropsondes and through Doppler-on-wheels to better predict hurricanes before
landfall and to model wind. NOAA is seeking new systems to collect wind measures such as: severe storm
anemometers; unmanned aircraft to release recorders into storms; and use of appropriate DOD "Star Wars"
advanced technologies. NOAA is featuring a global change program with several Federal Agencies and the
National Academies of Science and Engineering. They are performing new work in measuring stratospheric
ozone depletion and field investigations to characterize ozone losses. NOAA's coastal damage mitigation
strategies for hurricanes and other coastal storms include: improve forecasting of 24 hour to 48 hours;
reduce required excavation times; provide safe refiiges of "last resort"; improve coastal and offshore
observations; redirect development in high risk areas; and establish and enforce wind resistant building
codes (the latter by working with NIST).
The mission of the National Weather Service is to provide weather and flood warnings, public forecasts
and advisories for all of the United States, its territories, adjacent waters and ocean areas, primarily for the
protection of life and property. NWS data and products are provided to private meteorologists for the
provision of all specialized services. OAR is the principal weather and space weather research arm of
NOAA and works synergistically with the NWS.
Noel J. Raufaste, Secretary-General
U.S. -side Panel on Wind and Seismic Effects
xiv
ABSTRACT
This publication is the Proceedings of the 30th Joint Meeting of the U.S.-Japan Panel on Wind andSeismic Effects. The meeting was held at the National Institute of Standards and Technology,
Gaithersburg, Maryland, during 12-15 May 1998. The Proceedings include the agenda, list of Panel
members, Panel Resolutions, the 45 technical papers written for this joint meeting, and the Panel's 11-
Task Committee Reports.
Thirty-nine oral presentations centered on seven themes: 1 . Special Session in Celebration of the Panel's
30th Anniversary, 2. Storm and Surge Tsunamis, 3. Earthquake Engineering, 4. Joint Cooperative
Research Programs, 5. Real Time Information Acquisition and Dissemination, 6. Wind Engineering and
7. Reviews of the Panel's 1 1 -Task Committee Activities and Highlights of Recent Task Committee
Workshops. The Panel provides the vehicle to exchange technical data and information on design and
construction of civil engineering lifelines, buildings, water front, and coastal structures. Panel findings
continue to influence ongoing structural engineering research and contribute to the revision and creation
of U.S. and Japanese building codes and standards.
KEYWORDS: Bridges; building technology; concrete; design criteria; disaster reduction; earthquakes;
geotechnical engineering; GPS, ground failures; lifelines; liquefaction; risk assessment; seismic; shaking
table; standards; storm surge; structural engineering; tsunamis; and wind loads.
XV

TABLE OF CONTENTS
PREFACE iii
ABSTRACT , xv
AGENDA: 30th JOINT MEETING PANEL on WIND AND SEISMICEFFECTS xxiii
PANEL MEMBERS:
JAPAN-SIDE DELEGATION xxxvii
JAPAN-SIDE MEMBERSHIP: PANEL on WIND AND SEISMICEFFECTS xxxix
U.S.-SIDE MEMBERSHIP: PANEL on WIND AND SEISMIC li
PANEL TASK COMMITTEE MEMBERS Ixi
RESOLUTIONS Ixvii
SPECIAL SESSION in CELEBRATION of the PANEL'S 30th ANNIVERSARY
National Disasters and Protective Measures in Japan 3
Yasutake Inoue
Completing Our Panel's Work 13
Richard N. Wright
THEME: STORM SURGE and TSUNAMIS
Tsunami and Storm Surge Characteristics Based on Long-Term
Tide Observations 23
Toshihiko Nagai, Kazuteru Sugahara, Hiroshi Watanabe,
Koji Kawaguchi, Masahiro Mihara and Katsumi Takashima
International Responses to Pacific Tsunami Warnings and Watches 33
Michael E. Blackford
xvii
THEME: EARTHQUAKE ENGINEERING
Real-time Hybrid Vibration Experiments with a 2-Degree-of-Freedom
Model 41
Keiichi Tamura and Hiroshi Kobayashi
A Vision for the Future ofStrong-Motion Recording 50
Roger D. Borcherdt
Project on 3-D Full-Scale Earthquake Testing Facility—First Report.... 55
Keiichi Ohtani, Tsuneo Katayama and Heki Shibata
Strong Motionfrom Surface Waves in Deep Sedimentary Basins 69
William B. Joyner
Performance Based Design for Port Structures 84
Susumu lai and Koji Ichii
Analysis ofSea-Floor Earthquake Data 97
Charles E. Smith and David M. Boore
Effect ofReservoir-Subbottom Energy Absorption on Hydrodynamic
Forces on Dams 116
Robert L. Hall, Luis de Bejar, Keith J. Sjostrom and Enrique E. Matheu
A Study on Stress in Concrete Gravity Dam using Seismic Data during
Kobe Earthquak 130
Takashi Sasaki, Tsuneo Uesaka and Isao Nagayama
Seismic Analysis ofHoover Dam 144
Larry K. Nuss
Development and Operation ofLarge Centrifuge at PWRI 158
Osamu Matsuo, Tatsuya Tsutsumi, Mitsu Okamura,
Tetsuya Sasaki and Kunio Nishi
The Influence ofConfining Stress on Liquefaction Resistance 167
M. E. Hynes, R. S. Olsen and D. E. Yule
Evaluation ofthe Seismic Capacity ofan Existing Thick Wall Reinforced
Concrete Structure Using Probabilistic Criteria 185
F. Loceff, G. Mertz and G. Rawls
xviii
Development ofan Analysis ofStructural Steel Fracture and Development
of Technical Solutions « 196
Hiroyuki Yamanouchi, Akiyoshi Mukai and Takashi Hasegawa
Design Guidelinesfor the Seismic Modification of Welded Steel MomentFrame Buildings 201
John L. Gross
Draft Manualfor Seismic Isolation Design of Underground
Structures 211
Shigeki Unjoh, Jun-ichi Hoshikuma, Kazuhiro Nagaya and
Kazuhiko Murai
Comparison between the Affected Population ofIndirect Health Effects
after the 1995 Great Hanshin-Awaji Earthquake 224
Keiko Ogawa, Ichiro Tsuji, Shigem Hisamichi and Keishi Shiono
New Frameworkfor Performance Based Design ofBuilding Structures -
Design Flow and Social System 234
Hisahiro Hiraishi, Masaomi Teshigawara, Hiroshi Fukuyama,
Taiki Saito, Watara Gojo, Hidoe Fujitani, Yuji Ohashi, Izum Okawaand Hirashi Okada
Highway Bridge Seismic Design: How Current Research May Affect
Future Design Practice 248
Ian M. Friedland, W. Phillip Yen, Ronald L. Mayes and John O'Fallon
Development ofPerformance-Based Building Code in Japan — Framework
ofSeismic and Structural Provisions 260
Hisahiro Hiraishi, Mitsumasu Midorikawa, Masaomi Teshigawara and
Wataru Gojo
THEME: REAL-TIME INFORMATION ACQUISITION and DISSEMINATION
American Red Cross — Centersfor Disease Control and Prevention Health
Impact Surveillance Systemfor Natural Disasters 275
Enrique Paz-Argandona and Josephine Malilay
Development ofthe Disaster Information System (DIS/Earthquakes) 286
Kazuo Okayama, Takaharu Kiriyama and Seishi Yabuuchi
Recent FEMA Activities in Earthquake Risk Analysis and Mitigation 300
Stuart Nishenko, Claire Drury and Jeff Milheizler
xix
Seismic Information System for Civil Infrastructures 306
Hideki Sugita and Tomofumi Nozaki
New Development in Seismic Risk Analysisfor Highway Systems 319
Stuart D. Werner, Craig E. Taylor, James E. Moore II, John B. Mander
John B. Jemigan and Howard H. M. Hwang
Devastating Network in Miura Peninsula Japan 344
Makoto Watabe and Satomi Hirokawa
Geospatial Analysis Support to Natural Disasters 350
Wilham E. Roper
THEME: WIND ENGINEERING
Analysis of Wind and Wind Effects Revisited — A Case Study ofDeer Isle-
Sedgewick Bridge 377
D. W. Marsh, B. Bienkiewicz and H. R. Bosch
New Generation Trans-Strait Road Projects and the State ofTechnology Development 392
Michio Okahara and Masahiro Nishitani
New Hurricane Wind Structures and Wind Speed Measurements 407
Peter G. Black and Fank D. Marks, Jr.
Consideration on Flutter Characteristics ofsuper Long-Span Bridges ...415
Hiroshi Sato, Katsuya Ogihara and Ken-ichi Ogi
Structural Controlfor Wind and Earthquake Loads: NSF's Coordinated
Research Program 424
M. P. Singh and T. T. Soong
Wind and Seismic Research for Improved Engineering Consensus
Standards and Housing Construction 433
Jay H. Crandell and William Freebome
THEME: SUMMARY ofJOINT COOPERATIVE RESEARCH PROGRAMS
U.S.-Japan Cooperative Earthquake Engineering Research Program on
Composite and Hybrid Structures — Current Status ofJapan-side
Research 443
Isao Nishiyama, Hiroyuki Yamamouchi and Hisahiro Hiraishi
XX

U.S.-Japan Cooperative Earthquake Research Program on Composite andHybrid Structures — U.S.-side Progress .'. 452
Subhash C. Goel
MANUSCRIPTS PRESENTED at MINI-SYMPOSIUM
Development ofNew High Bridge Piers Containing Spiral
Reinforcement 459
Michio Okahara, Jiro Fukui, Takuya Adachi, Moriyuki Okoshi
and Koga Yasuyuki
U.S.-side Presentation addressed the U.S. Geological Survey development
of ground motion maps and siesmic intensity contours that will be available
on the Internet. (No manuscript available).
MANUSCRIPTS AUTHORED for PANEL MEETING but NOT PRESENTED ORALLY
Shaking Table on Base Isolated House Model 477
Hiroyuki Yamanouchi, Mitsumasa Midorikawa and Masanori liba
Dense Strong Motion Instrument Array in Sendai 484
Izuru Okawa, Toshihide Kashima and Shin Koyama
Deposition ofOil Spilledfrom a Russian Tanker on Coasts 492
Fuminori Kato and Shinji Sato
GIS with Mobile Communication for Countermeasure Against Natural
Disaster 502
Naoki Takayama
Aerodynamic Databases and Electronic Standardsfor Wind Loads:
A Pilot Application 506
Timothy Whalen, Emil Simiu, Gilliam Harris, Jason Lin and
David Surry
GPS Monitoring ofStructures: Recent Advances 515
Mehmet Celebi, Will Prescott, Ross Stein, Ken Hudnut, Jeff Behr
and Steve Wilson
APPENDIX: Summaries of Task Committee Reports 529
xxi

AGENDA30th JOINT MEETING
PANEL on WIND AND SEISMIC EFFECTS12-15 May 1998
Sunday 10 MayDelegation Arrives
Monday 11 MayTechnical Visits, Army Topographic Engineering Center and National Building Museum
Tuesday 12 May
0925 Meet in Lobby of Holiday Inn for NIST Shuttle to Administration Building
0930 Travel by bus to NIST
WIND AND SEISMIC EFFECTS FOR THE NEW MILLENNIUM
1000 OPENING CEREMONIES(Employees Lounge, NIST Administration Building)
Call to order by Noel J. RAURA.STE, Secretary- General US-side Panel
Opening remarks by Raymond ICAMMER, Director, National Institute of
Standards and Technology
Remarks by Takao KURAMOCHI, Counsellor for Science and Technology,
Embassy of Japan
Remarlcs by Richard N. WRIGHT, Chairman US-Side Panel on Wind and
Seismic Effects, and Director, Building and Fire Research Laboratory
Remarlcs by Yasutake INOUE, Chairman Japan-Side Panel on Wind and Seismic
Effects, and Director- General, Public Works Research Institute
Introduction of U.S. Members by U.S. Panel Chairman
Introduction of Japan Members by Japan Panel Chairman
Elect Joint Meeting Chairman
Adopt Agenda
1120 Break
xxiii
SPECIAL SESSION TO CELEBRATE THE PANELS 30TH ANNIVERSARY
1140-1240 THEME 1 -- SPECIAL SESSION IN CELEBRATION OFTHE PANELS 30TH ANNIVERSARY
Chairman: Mr. Yasutake INOUE
1 140 Natural Disasters and Protective Measures in Japan, Yasutake INOUE* PWRI1200 Completing our Panel's Work, Richard N. WRIGHT*, NIST1220 Discussion
1240 Adjourn
1245 Group Photograph
1300 Lunch: Hosted by Raymond KAMMER, Director, National Institute of
Standards and Technology, NIST Lunch Club
THEME 2 - STORM SURGE AND TSUNAMIS
1400-1500 Technical Session - STORM SURGE AND TSUNAMIS
Chairman: Mr Yasutake INOUE
1400 Tsunami and Storm Surge Characteristics Based on Long-Term Tide Observa-
tions, Toshihiko NAGAI, Kazuteru SUGAHARA, Hiroshi WATANABE, Koji
KAWAGUCHI, PHRI, Masahiro MIHARA, ECHO Corporation and Katsumi
TAKASHIMA, Coastal Ocean Research Corporation. Presented by Shigetoshi
KOBAYASHI* PWRC1420 International Responses to Pacific Tsunami Warnings and Watches, Mike
BLACICFORD*, NOAA1440 Discussion
1500 Break
* denotes presenter
xxiv
TASK COMMITTEE MEETINGS
1 5 1 5 - 1 700 Task Committee Meetings
T/C A Strong-Motion Data and Applications, BFRL Conf. Room B-317, Bldg. 226
Dr. Susumu lAI (Japan-side Chair) and Dr. Roger BORCHERDT (U.S.-side
Chair)
T/C B Testing and Evaluation Procedures for Building Systems, BFRL Conf. RoomB-221, Bldg 226
Mr. Keiichi OHTANl (Japan-side Chair) and Dr. U.S. LEW (U.S.-side Chair)
T/Cs C & G Design Evaluation and Improvement of Structures and
Structural Control and Intelligent Material Systems, Admin. Bldg. NISTEmployees Lounge
Dr. Hisahiro HIRAISHI (Japan-side Chair) and Dr. Ken CHONG (U.S.-side
Chair)
Dr Jun-ichi HOSHIKUMA (Japan-side Acting Chair) and Dr. Shi-Chi LIU(U.S.-side Chair)
T/C D Earthquake Engineering for Dams, BFRL Conf. Room A-368, Bldg. 226
Mr Takashi SASAICI (Japan-side Acting Chair) and Dr. Robert HALL (U.S.-side
Chair)
T/C E Design for Wind and Wind Hazard Mitigation, BFRL Conf. Room B-245
Bldg 224
Dr Hiroshi SATO (Japan-side Chair) Dr Joseph GOLDEN (U.S.-side Chair)
T/C F Disaster Prevention Methods for Lifeline Systems, ITL Conf. Room B-1 1
1
Bldg 225
Dr Keiichi TAMURA (Japan-side Acting Chair) and Dr. Riley CHUNG (U.S.-
side Chair)
1700 Conclusion of Day 1
1 700 Depart NIST by bus to Holiday Irm
U.S.-side Panel Hosted Reception
1745 Bus depart Holiday Inn for residence of Dr. and Mrs. Charles SMITH for 30th
Joint Panel Celebration
2200 Adjourn and, by bus, return to hotel
2245 Arrive at hotel
XXV
Wednesday 13 May
0740 Meet in lobby of Holiday Inn for NIST Shuttle Bus to Administration Building
0745 Travel by bus to NIST
THEME 3 - EARTHQUAICE ENGINEERING
0830-1230 Technical Session - Earthquake Engineering Part 1
Chairman: Dr. Richard WRIGHT
0830 Real-Time Hybrid Vibration Experiments with a 2-Degrees-of-Freedom Model,
Keiichi TAMURA* and Hiroshi KOBAYASHI, PWRI0850 A Vision for the Future of Strong-Motion Recordings, Roger BORCHERDT*,
USGS0910 Project on 3-D Full-Scale Earthquake Testing Facility -First Report, Keiichi
OHTANI*, Tsuneo KATAYAMA and Held SHIBATA, NIED0930 Discussion
0950 Strong Motion from Surface Waves in Deep Sedimentary Basins, William
JOYNER*, USGS1010 Performance Based Design for Port Structures, Susumu lAI* and Koji ICHII,
PHRl1030 Analysis of Sea Floor Earthquake Data, Charles SMITH*, MMS and David
BOORE, USGS1050 Discussion
1110 Break
1130 Effect of Reservoir-Subbottom Energy Absorption on Hydrodynamic Forces on
Dams, Robert HALL*, Louis de BEJAR, Keith SJOSTROM, and Enrique
MATHEW, WES1 150 A Study on Stress in Concrete Gravity Dams Using Seismic Data During Kobe
Earthquake, Takashi SASAIO*, Tsuneo UESAKA and Isao NAGAYAMA, PWRI1210 Seismic Analysis of Hoover Dam, by Larry NUSS, BUREC1230 Discussion
1250 Adjourn for Lunch
1300 Lunch: Hosted by Dr. William ANDERSON, Hazard Reduction Program, Civil
and Mechanical Infrastructure Systems Division, National Science Foimdation,
NIST Lunch Club
xxvi
1400-1500 Technical Session - Earthquake Engineering (Continued)
Chairman: Dr. Richard WRIGHT
1400 Development and Operation of Large Centrifuge at PWRI, Osamu MATSUO,Tatsuya TSUTSUMI, Mitsu OKAMURA*, Tetsuya SASAIG, PWRI and Kunio
NISHI, Hazama Corporation
1420 The Influence of Continuing Stress on Liquefaction Resistance, Mary Ellen
HYNES*, WES1 440 Evaluation of the Seismic Capacity of an Existing Thick Wall Reinforced
Concrete Structure using Probabilistic Criteria by Frederick LOCEFF, George
RAWLS, and Greg MERTZ*, DOE1500 Discussion
1520 Break
TASK COMMITTEE MEETINGS
1535-1715 Task Committee Meetings
T/C H Soil Behavior and Stability During Earthquakes, Admin. Bldg., NISTEmployees Lounge
Dr. Mitsu OKAMURA (Japan-side Chair) and Dr. Mary Ellen HYNES, U.S.-
side Chair)
T/C I Storm Surge and Tsunamis, BFRL Conf. Room A-368, Bldg. 226Dr. Shigetoshi ICOBAYASHI (Japan-side Acting Chair) and Mr. Michael
BLACICFORD (U.S.-side Chair)
T/C ) Wind and Earthquake Engineering for Transportation Systems, BFRL Conf.
Room B-221 (Bldg. 226)
Dr. Michio OKAHARA (Japan-side Acting Chair) and Dr. Phillip YEN (U.S.-
side Acting Chair)
T/C IC Wind and Earthquake Engineering for Offshore and Coastal Facilities,
Admin. Bldg. BFRL Conf. Room B-245, Bldg. 224
Dr. Susumu lAI (Japan-side Acting Chair) and Dr. Charles SMITH (U.S.-side
Chair)
New T/C Seismic Information Systems, BFRL Conf. Room B-317, Bldg. 226
Mr. Takaharu IGRIYAMA and Dr. Hideld SUGITA (Japan-side Preliminary Co-
Chairs) and Dr. William ROPER and Mr. Stuart NISHENKO (U.S.-side
Preliminary Co-Chairs)
1715 Conclusion of Day 2
1 720 Depart NIST by NIST van and Holiday Irm van to Holiday Inn
xxvii

1 745 Travel by NIST bus to the National Academy of Sciences
1830 U.S. -side hosted dinner at Members Room, NAS2100 Return by bus to Holiday Inn by sightseeing portions of Washington,
DC
xxviii
Thursday 14 May
0740 Meet in Lobby of Holiday Inn
0745 Travel by bus to NIST
THEME 3 - EARTHQUAICE ENGINEERING - PART II
0820-1 140 Technical Session - Earthquake Engineering-Part II
Chairman: Mr. Yasutake INOUE
0820 Development of an Analysis of Structural Steel Fracture and Development of
Technical Solution, Hiroyuld YAMANOUCHI, Aldyoshi MUIOU* and Tal<ashi
HASEGAWA, BRI
0840 Design Guidelines for the Seismic Modification ofWSME Buildings, John
GROSS*, NIST0900 Draft Manual for Seismic Isolation Design of Underground Structures, Shigeki
UNJOH, Jun-ichi HOSHIICUMA*, Kazuhiro NAGAYA and ICazuhiko MURA[,PWRI
0920 Comparison Between Affected Populations of Indirect Health Effects after the
1995 Great Hanshin-Awaji Earthquake, Keiko OGAWA*, Ichirou TSUJI,
Shigeru HISAMICHl, Tohoku University and Keishi SHIONO, Nagaolca
Technology College
0940 Discussion
1000 Break
1020 New Framework for Performance-Based Design of Building Structures-Design
Flow and Social System, Hisahiro HIRAISHI*, Masaomi TESHIGAWARA,Hiroshi FUIOUYAMA, Taild SAITOH, Wataru GOJO, Hideo FUJITANI, Yuji
OHASHI, Izuru OKAWA and Hisashi OKADA, BRI
1040 Highway Bridge Seismic Design: How Current Research May Affect Future
Design Practices, Ian FRIEDLAND, NCEER, W. PhilUp YEN*, FHWA, Ronald
L. MAYES, DIS, and John D. OTALLON, FHWA1 100 Development of Performance-Based Design Building Code in Japan-Framework
of Structural and Seismic Provisions, Hisahiro HIRAISHI*, Mitsumasa
MIDORIKAWA, Masaomi TESHIGAWARA and Wataru GOJO, BRI
1120 Discussion
1140 Break
xxix
THEME 4 - SUMMARY RECENT PANEL WORICSHOPS
Chairman: Mr. Yasutake INOUE
1200-1255 Worlcshop Reports
1200 Task Committees B&C, 4th U. S.-Japan Technical Coordinating Committee
Meeting on Composite and Hybrid Structural Systems, 12-14 October 1997,
Monterey CA, USA. (Presented by Hisahiro HIRA.SHI, BRI)
1210 Task Committee E, 1st Workshop on Design for Wind and Wind Hazard
Mitigation, 7-9 October 1997, East-West Center, University of Hawaii, HI,
USA. (Presented by Joseph GOLDEN, NOAA)1220 Task Committee F, 7th Workshop on Earthquake Disaster Prevention for
Lifeline Systems, 4-5 November 1997, Seattle, WAUSA. (Presented by Keiichi
TAMURA, PWRI)1230 Task Committee J, 13th Bridge Workshop, 2-3 October 1997, Tsukuba Japan.
(Presented by Phillip YEN, FHWA)1240 Discussion
1255 Adjourn for lunch
1300 Lunch: Hosted by Michael ARMSTRONG, Associate Director, Mitigation
Directorate, Federal Emergency Management Agency
THEME 5 REAL TIME INFORMATION ACQUISITIONAND DISSEMINATION
Chairman: Mr Yasutake INOUE
1400-1720 Technical Session - Real Time Information Acquisition and
Dissemination
1400 American Red Cross/CDC Health Impact Surveillance System for Natural
Disasters, Enrique PAZ-ARGANDONA* and Josephine MALILAY, CDC1420 Development of the Disaster Information System (DlS/Earthquakes), ICazuo
OICAYAMA, Takaharu KllRIYAMA*, and Seishi YABUUCHl, NLA1440 Recent FEMA Activities in Earthquake Risk Analysis and Mitigation, Stuart
NISHENKO* and Gil JAMIESON, FEMA (with a demonstration of HAZUSduring the break)
1500 Seismic Information System for Civil Infrastructures, Hideki SUGITA*,
Tomofumi NOZAG and Tadashi HAMADA, PWRI1520 Discussion
1540 Break
XXX

1600 New Developments in Seismic Risk Analysis for Highway Systems, Stuart D.
WERNER Seismic Systems &l Engineering Consultants, Craig E. TAYLOR,Natural Hazards Management Inc., James E. Moore II, Uruversity of Southern
California, and John B. MANDER, State University of New York at Buffalo,
John B. JERNIGAN, Ellers, Oakley Chester Sc Rilce & Howard H.M. HWANG,Univ. of Memphis
1620 Devastation Network in Miura Peninsula, Japan, Makoto WATABE*, Keio
University and Satomi HIROKAWA, Yokosuka City
1640 Geospatial Analysis Support to Natural Disasters, William ROPER*, CORPS1700 Discussion
1 720 Conclusion of Day 3
1 725 Return to hotel by van
1800 Individual hosted dinners
xxxi
Friday 15 May
0735 Meet in Lobby of Holiday Inn
0740 Travel by bus to N IST
THEME 6 - WIND ENGINEERING
Chairman: Dr. Richard WRIGHT
0800-1040 Technical Session - Wind Engineering
0800 Analysis of Wind and Wind Effects Revisited - A Case Study of Deer Isle-
Sedgwick Bridge, D.W MARSH and B. BIENICIEWICZ, CSU and Harold
BOSCH, FHWA0820 Next Generation Trans-Strait Road Projects and the State of Technology
Development, Michio OKAHARA* and Masahiro NISHITANI, PWRI0840 New Hurricane Wind Structures and Wind Speed Measurements, Peter
BLACK* and Frank MARKS, NOAA0900 Discussion
0920 Consideration on Flutter Characteristics of Super Long-Span Bridges, Hiroshi
SATO*, Katsuya OGIHARA and Ken-ichi OGI, PWRI0940 Structural Control Research in the U.S. for Wind and Earthquake Loading, M.
P SINGH*, VPI andTT SOONG, State University of NY-Buffalo
1000 Wind and Seismic Research for Improved Engineering Consensus Standards and
Housing Construction, Jay CRANDELL*, NAHBRC and William FREEBORNE,HUD
1020 Discussion
1040 Break
THEME 7 - SUMMARY JOINT COOPERATIVE RESEARCH PROGRAMS
Chairman: Dr. Richard WRIGHT
1100-1200 Technical Session - Joint Cooperative Research Programs
1 100 U.S.-Japan Cooperative Earthquake Engineering Research Program on
Composite and Hybrid Structures -Japan Side Plans and Accomplishments, Isao
NISHIYAMA, Hiroyuld YAMANOUCHI and Hisahiro HIRAISHI (Building
Research Institute) Presented by Aldyoshi MUICAJ*, BRI
1 120 U.S.-Japan Cooperative Earthquake Engineering Research Program on
Composite and Hybrid Structures - U.S.-side Progress, Subhash Goel, Subhash
GOEL*, University of Michigan
1140 Discussion
1200 Break
xxxii
TASK COMMITTEE REPORTS AND RESOLUTIONS
1215-1255 Report of Task Committees
Chairman: Dr Richard WRIGHT
T/C A Strong-Motion Data and AppUcations
T/C B Testing and Evaluation Procedures for Building Systems
T/C C Evaluation and Improvement of Structures
T/C D Earthquake Engineering for Dams
1255 Adjourn for Lunch
1300 Lunch: Hosted by Dr. John FILSON, Acting Coordinator, Earthquake Hazard
Program, US Geological Survey, NIST Lunch Club
1400-1520 Report of Task Committees (Continued)
T/C E Design for Wind and Wind Hazard Mitigation
T/C F Disaster Prevention Methods for Lifeline Systems
T/C G Structural Control and Intelligent Materials Systems
T/C H Soil Behavior and Stability During Earthquakes
T/C 1 Storm Surge and Tsunami
T/C J Wind and Earthquake Engineering for Transportation Systems
T/C IC Wind and Earthquake Engineering for Offshore and Coastal Facilities
New T/C Seismic Information Systems
1520-1535 Break
1535-1620 Adoption of Final Resolutions
1620-1630 Break
xxxiii
CLOSING CEREMONIES
1630 Call to Order by Noel J. RAUFASTE, Secretary-General, U.S.-Side Panel
Closing Remarks by Yasutake INOUE, Chairman Japan-Side Panel
Closing Remarlcs by Richard N. WRIGHT, Chairman U.S.-Side Panel
1650 Conclusion of 30th Joint Panel Technical Sessions
1655 Depart NIST by bus to Holiday Inn
1 800 Depart Holiday Inn by Bus
1900 Japan-side hosted dinner
2130 Return to hotel by bus
xxxiv

LIST OF PANEL MEMBERS

30th JOINT PANEL MEETINGJAPAN-SIDE DELEGATION
Mr. Yasutake Inoue
Director-General,
Public Works Research Institute
Ministry of Construction
1 Asahi, Tsukuba-shi, Ibaraki-ken
305 Japan
Dr. Michio Okahara
Director, Structure and Bridge Department
Public Works Research Institute
Ministry of Construction
1 Asahi, Tsukuba-shi, Ibaraki-ken
305 Japan
Dr. Hiroshi Sato
Head, Structure Division
Public Works Research Institute
Ministry of Construction
1 Asahi, Tsukuba-shi, Ibaraki-ken
305 Japan
Dr. Hideki Sugita
Head, Earthquake Disaster Prevention
Technology Division
Public Works Research Institute
Ministry of Construction
1 Asahi, Tsukuba-shi, Ibaraki-ken
305 Japan
Dr. Keiichi Tamura
Head, Ground Vibration Division
Public Works Research Institute
Ministry of Construction
1 Asahi, Tsukuba-shi, Ibaraki-ken
305 Japan
Dr. Hisahiro Hiraishi
Director, Structural Engineering Department
Building Research Institute
Ministry of Construction
1 Tatehara, Tsukuba-shi, Ibaraki-ken
305 Japan
Mr. Akiyoshi Mukai
Head, Aerodynamics Division
Building Research Institute
Ministry of Construction
1 Tatehara, Tsukuba-shi, Ibaraki-ken
305 Japan
Mr. Keiichi Ohtani
Director, Disaster Prevention Research
Division
National Research Institute for Earth Science
and Disaster Prevention
Science and Technology Agency
3-1 Tennodai, Tsukuba-shi, Ibaraki-ken
305 Japan
Dr. Susumu lai
Chief, Geotechnical Earthquake Engineering
Laboratory
Port and Harbour Research Institute
Ministry of Transport
3-1-1 Nagase, Yokosuka-shi, Kanagawa-ken
239 Japan
Prof Makoto Watabe
Environment and Information Department
Keio University
5322 Endo, Fujisawa-shi, Kanagawa-ken
252 Japan
xxxvii

TEMPORARY MEMBERS
Dr. Mitsu Okamura
Senior Research Engineer
Soil Dynamics Division
Public Works Research Institute
Ministry of Construction
1 Asahi, Tsukuba-shi, Ibaraki-ken
305 Japan
Mr. Takao Masui
Senior Planning Officer for Disaster
Prevention
Disaster Prevention Bureau
National Land Agency
1-2-2 Kasumigaseki, Chiyoda-ku, Tokyo
100 Japan
Mr. Takaharu Kiriyama
Deputy Director, Earthquake Disaster
Countermeasure Division
Disaster Prevention Bureau
National Land Agency
1-2-2 Kasumigaseki, Chiyoda-ku, Tokyo
100 Japan
Dr. Keiko OgawaDivision of Public Health
Postgraduate School of Medicine
Tohoku University
2- 1 Seiryo, Aoba-ku, Sendai-shi, Miyagi-ken
980-77 Japan
Dr. Shigetoshi Kobayashi
Executive Director, Public Works Research
Center
1-6-4 Taito, Taito-ku, Tokyo
110 Japan
Mr. Takashi Sasaki
Senior Research Engineer
Dam Structure Division
Public Works Research Institute
Ministry of Construction
1 Asahi, Tsukuba-shi, Ibaraki-ken
305 Japan
Mr. Kazushige Endo
Senior Research Engineer
Earthquake Disaster Prevention Technology
Division
Public Works Research Institute
Ministry of Construction
1 Asahi, Tsukuba-shi, Ibaraki-ken
305 Japan
Dr. J^n-ichi Hoshikuma
Research Engineer
Earthquake Engineering Division
Public Works Research Institute
Ministry of Construction
1 Asahi, Tsukuba-shi, Ibaraki-ken
305 Japan
xxxviii

JAPAN-SroE MEMBERSHIP: PANEL ON WIND AND SEISMIC EFFECTS
STEERING COMMITTEE MEMBERS
Mr. Yasukake Inoue
Chairman, Japan-side Panel on Wind and
Seismic Effects
Director-General, Public Works Research
Institute
Ministry of Construction
1, Asahi, Tsukuba-shi, Ibaraki-ken 305-0804
Tel: 0298-64-2821
Fax: 0298-64-2148
Dr. Michio Okahara
Secretary-General, Japan-side Panel on Wind
and Seismic Effects
Director, Structure and Bridge Department
Public Works Research Institute
Ministry of Construction
1, Asahi, Tsukuba-shi, Ibaraki-ken 305-0804
Tel: 0298-64-2211
Fax: 0298-64-0565
E-mail: [email protected]
Dr. Hisahiro Hiraishi
Director, Department of Structural
Engineering
Building Research Institute
Ministry of Construction
1, Tatehara, Tsukuba-shi, Ibaraki-ken
305-0802
Tel: 0298-64-6633
Fax: 0298-64-6773
E-mail: [email protected]
Dr. Susumu lai
Chief, Geotechnical Earthquake Engineering
Laboratory
Port and Harbour Research Institute
Ministry of Transport
Nagase, 3-1-1, Yokosuka-shi, Kanagawa-ken
239-0826
Tel: 0468-44-5028
Fax: 0468-44-0839
E-mail: [email protected]
Dr. Keishi Ishimoto
Director, Road Department
Civil Engineering Research Institute
Hokkaido Development Agency
1-3, Hiragishi, Toyohira-ku, Sapporo-shi,
Hokkaido 062-0802
Tel: 011-841-5198
Fax: 011-841-9747
E-mail: [email protected]
Dr. Toshio Iwasaki
President, Civil Engineering Research
Laboratory
1- 18, Kanda Suda-cho, Chiyoda-ku, Tokyo
101
Tel: 03-3254-9481
Fax: 03-3254-9448
Mr. Takashi Kaminosono
Head, Construction Techniques Division
Department ofProduction Engineering
Building Research Institute
Ministry of Construction
1, Tatehara, Tsukuba-shi, Ibaraki-ken
305-0802
Tel: 0298-64-6665
Fax: 0298-64-6774
E-mail: [email protected]
Prof Kazuhiko Kawashima
Professor, Department of Civil Engineering
Tokyo Institute of Technology
2- 12-1, 0-okayama, Meguro-ku, Tokyo 152
Tel: 03-5734-2922
Fax: 03-3729-0728
E-mail: [email protected]
xxxix
Mr. Osamu Matsuo
Head, Soil Dynamics Division
Earthquake Disaster Prevention Research
Center
Public Works Research Institute
Ministry of Construction
1, Asahi, Tsukuba-shi, Ibaraki-ken 305-0804
Tel: 0298-64-2933
Fax: 0298-64-2576
E-mail: [email protected]
Mr. Chikahiro MinowaCooperative Research Officer
National Research Institute for Earth Science
and Disaster Prevention
3-1, Tennodai, Tsukuba-shi, Ibaraki-ken 305
Tel: 0298-51-1611
Fax: 0298-51-5658
E-mail: [email protected]
Mr. Yasuyuki Miyamoto
Director, Road Disaster Prevention Section
Road Bureau
Ministry of Construction
2-1-3, Kasumigaseki, Chiyoda-ku, Tokyo 100
Tel: 03-5251-1896
Fax: 03-5251-1949
Mr. Toshitaka Miyata
Director, International Affairs Division
Economic Affairs Bureau
Ministry of Construction
2-1-3, Kasumigaseki, Chiyoda-ku, Tokyo 100
Tel: 03-3580-4311
Fax: 03-3502-3955
Mr. Eishi Mochizuki
Head, Seismology and Volcanology Research
Division
Meteorological Research Institute
Japan Meteorological Agency
1-1, Nagamine, Tsukuba-shi, Ibaraki-ken 305
Tel: 0298-53-8675
Fax: 0298-51-3730
Mr. Yoshinori Murakami
Director, Disaster Countermeasure Office
Coast Administration and Disaster Prevention
Division
Ports and Harbours Bureau
Ministry of Transport
2-1-3, Kasumigaseki, Chiyoda-ku, Tokyo
100-8989
Tel: 03-3580-7021
Fax: 03-5511-8280
Mr. Nobuo Nagai
Director, Geographic Department
Geographical Survey Institute
Ministry of Construction
1, Kitasato, Tsukuba-shi, Ibaraki-ken 305
Tel:0298-64-2667
Fax:0298-64-1804
E-mail: [email protected]
Dr. Nobuyuki Narita
Member of Executive Board, Public Works
Research Center
17-15, Yawata-6, Ichikawa-shi, Chiba-ken
272-0021
Tel: 047-335-0324
Fax: 047-335-0324
Mr. Kazuhiro Nishikawa
Head, Bridge Division
Structure and Bridge Department
Public Works Research Institute
Ministry of Construction
1, Asahi, Tsukuba-shi, Ibaraki-ken 305-0804
Tel: 0298-64-2905
Fax: 0298-64-0565
E-mail: [email protected]
xL
Dr. Isao Nishiyama
Head, Housing Construction Division
Department of Production Engineering
Building Research Institute
Ministry of Construction
1, Tatehara, Tsukuba-shi, Ibaraki-ken
305-0802
Tel: 0298-64-2151
Fax: 0298-64-6774
E-mail: [email protected]
Mr. Fumiaki Nomura .
Director, Office ofDisaster Prevention
Research Planning Division
Research and Development Bureau
Science and Technology Agency
2-2-1, Kasumigaseki Chiyoda-ku, Tokyo100-8966
Tel: 03-3503-8164
Fax: 03-3503-8169
Mr. Keiichi Ohtani
Director, Disaster Prevention Research
Division
National Research Institute for Earth Science
and Disaster Prevention
Science and Technology Agency3- 1, Tennodai, Tsukuba-shi, Ibaraki-ken 305
Tel: 0298-51-1611 ex.321
Fax: 0298-52-8512
E-mail: [email protected]
Dr. Hisashi Okada
Associate Director for Composite Structures,
Department of Structural Engineering
Building Research Institute
Ministry of Construction
1, Tatehara, Tsukuba-shi, Ibaraki-ken
305-0802
Tel: 0298-64-6641
Fax: 0298-64-6773
E-mail: [email protected]
Prof Tsuneo Okada
, Professor, Dipertment of Architecture and
Building Engineering
Shibaura Institute of Technology
3-9-14 Shibaura, Minato-ku, Tokyo 108-0023
Tel: 03-5476-2452
Fax: 03-5476-2446
Dr. Izuru OkawaHead, Building Engineering Division
International Institute of Seismology and
Earthquake Engineering
Building Research Institute
Ministry of Construction
1, Tatehara, Tsukuba-shi, Ibaraki-ken
305-0802
Tel: 0298-64-6758
Fax: 0298-64-6777
E-mail: [email protected]
Mr. Kazuo OkayamaDirector, Earthquake Disaster
Countermeasure Division
Disaster Prevention Bureau
National Land Agency
1-2-2, Kasumigaseki, Chiyoda-ku, Tokyo100-8972
Tel: 03-3501-5693
Fax: 03-3501-5199
Mr. Hiroshi Sasaki
Director, Building Disaster Prevention Section
Housing Bureau
Ministry of Construction
2- 1-3, Kasumigaseki, Chiyoda-ku, Tokyo 100
Tel: 03-3580-4311
Fax: 03-3580-7050
xLi
Dr. Hiroshi Sato
Head, Structure Division
Structure and Bridge Department
Public Works Research Institute
Ministry of Construction
1, Asahi, Tsukuba-shi, Ibaraki-ken 305-0804
Tel: 0298-64-2874
Fax: 0298-64-0565
E-mail: [email protected]
Dr. Shinji Sato
Head, Coast Division
River Department
Public Works Research Institute
Ministry of Construction
1, Asahi, Tsukuba-shi, Ibaraki-ken 305-0804
Tel: 0298-64-2327
Fax:0298-64-1168
E-mail: [email protected]
Mr. Tatsuyuki Shimazu
International Cooperation Coordinator,
International Affairs Division
Science and Technology Agency
2-2-1, Kasumigaseki, Chiyoda-ku, Tokyo 100
Tel: 03-3593-0362
Fax: 03-3581-5909
Dr. Takahiro Sugano
Chief, Structural Dynamics Laboratory
Structural Engineering Division
Port and Harbour Research Institute
Ministry of Transport
3- 1-1, Nagase, Yokosuka-shi, Kanagawa-ken
239-0826
Tel: 0468-44-5029
Fax: 0468-44-0839
E-mail: [email protected]
Dr. Yasumasa Suzuki
Director, Hydraulic Engineering Division
Port and Harbour Research Institute
Ministry of Transport
3-1-1, Nagase, Yokosuka-shi, Kanagawa-ken
239-0826
Tel: 0468-44-5009
Fax: 0468-41-3888
Mr. Masaaki Takeuchi
Senior Assistant for Disaster Prevention,
Planning Division
Administration Department
Japan Meteorological Agency
1-3-4, Ohtemachi, Chiyoda-ku, Tokyo 100
Tel: 03-3212-8341 Ext. 2225
Fax: 03-3211-2453
Dr. Keiichi Tamura
Head, Ground Vibration Division
Earthquake Disaster Prevention Research
Center
Public Works Research Institute
Ministry of Construction
1, Asahi, Tsukuba-shi, Ibaraki-ken 305-0804
Tel: 0298-64-2926
Fax: 0298-64-0598
E-mail: [email protected]
Dr. Masaomi Teshigawara
Head, Structure Division
Department of Structural Engineering
Building Research Institute
Ministry of Construction
1, Tatehara, Tsukuba-shi, Ibaraki-ken 305
Tel: 0298-64-6753
Fax: 0298-64-6773
E-mail: [email protected]
Dr. Takaaki UdaDirector, River Department
Public Works Research Institute
Ministry of Construction
1, Asahi, Tsukuba-shi, Ibaraki-ken 305-0804
Tel: 0298-64-2211
E-mail: [email protected]
xLii
Mr. Tsuneo Uesaka
Director, Dam Department
Public Works Research Institute
Ministry of Construction
1, Asahi, Tsukuba-shi, Ibaraki-ken 305-0804
Tel; 0298-64-2211
Fax: 0298-64-2688
Dr. Shigeki Unjoh
Head, Earthquake Engineering Division
Earthquake Disaster Prevention Research
Center
Public Works Research Institute
Ministry of Construction
1, Asahi, Tsukuba-shi, Ibaraki-ken 305-0804
Tel: 0298-64-2932
Fax: 0298-64-0598
E-mail: [email protected]
Dr. Tatsuo UwabeChief, Earthquake Disaster Prevention
Laboratory
Structural Engineering Division
Port and Harbour Research Institute
Ministry of Transport
3-1-1, Nagase, Yokosuka-shi, Kanagawa-ken
239-0826
Tel: 0468-44-5030
Fax: 0468-44-0839
E-mail: [email protected]
Prof Makoto Watabe
Professor, Faculty of Environmental
Information
Keio University
5322, Endo, Fujisawa-shi Kanagawa-ken 252
Tel: 0466-47-5111
Fax: 0466-47-5041
Mr. Shoin Yagi
Director, Typhoon Research Department
Meteorological Research Institute
Japan Meteorological Agency
1-1, Nagamine, Tsukuba-shi, Ibaraki-ken 305
Tel: 0298-53-8663
Fax: 0298-53-8735
Dr. Hiroyuki Yamanouchi
Director, Code and Evaluation Research
Center
Building Research Institute
Ministry of Construction
1, Takehara, Tsukuba-shi, Ibaraki-ken
305-0802
Tel: 0298-64-6688
Fax: 0298-64-67701
E-mail: [email protected]
Mr. Joji Yanagawa
Director, Disaster Management Division
River Bureau
Ministry of Construction
2-1-3, Kasumigaseki, Chiyoda-ku, Tokyo 100
Tel: 03-3580-4311 Ext. 3431
Fax: 03-5251-1946
Dr. Masahiko Yasuda
Director, Earthquake Disaster Prevention
Research Center
Public Works Research Institute
Ministry of Construction
1, Asahi, Tsukuba-shi, Ibaraki-ken 305-0804
Tel: 0298-64-2829
Fax: 0298-64-0598
E-mail: [email protected]
Mr. Hitoshi Yoshida
Head, Fill-type Dam Division
Dam Department
Public Works Research Institute
Ministry of Construction
1, Asahi, Tsukuba-shi, Ibaraki-ken 305-0804
Tel: 0298-64-2413
Fax: 0298-64-0164
E-mail: [email protected]
xLiii

SECRETARIES COMMITTEEMEMBERS
Dr. Michio Okahara
Secretary-General, Japan-side Panel on Wind
and Seismic Effects
Director, Structure and Bridge Department
Public Works Research Institute
Ministry of Construction
1, Asahi, Tsukuba-shi, Ibaraki-ken 305-0804
Tel: 0298-64-2211
Fax: 0298-64-0565
E-mail: okahara@pwri,gojp
Mr. Jiro Fukui
Head, Foundation Engineering Division
Structure and Bridge Department
Public Works Research Institute
Ministry of Construction
1, Asahi, Tsukuba-shi, Ibaraki-ken 305-0804
Tel: 0298-64-2211
Fax: 0298-64-0565
E-mail: [email protected]
Dr. Hisahiro Hiraishi
Director, Department of Structural
Engineering
Building Research Institute
Ministry of Construction
1, Tatehara, Tsukuba-shi, Ibaraki-ken
305-0802
Tel: 0298-64-6633
Fax: 0298-64-6773
E-mail: [email protected]
Mr. Masakatsu Horino
Head, Planning Division
Geographic Department
Geographical Survey Institute
Ministry of Construction
1, Kitasato, Tsukuba-shi, Ibaraki-ken 305
Tel: 0298-64-5917
Fax: 0298-64-1804
E-mail: [email protected]
Dr. Susumu lai
Chief, Geotechnical Earthquake Engineering
Laboratory
Port and Harbour Research Institute
Ministry of Transport
3-1-1, Nagase, Yokosuka-shi, Kanagawa-ken
239-0826
Tel: 0468-44-5028
Fax: 0468-44-4095
E-mail: [email protected]
Prof Kazuhiko Kawashima
Professor, Department of Civil Engineering
Tokyo Institute of Technology
2- 12-1 0-okayama, Meguro-ku Tokyo 152
Tel: 03-5734-2922
Fax: 03-3729-0728
E-mail: [email protected]
Mr. Osamu Matsuo
Head, Soil Dynamics Division
Earthquake Disaster Prevention Research
Center
Public Works Research Institute
Ministry of Construction
1, Asahi, Tsukuba-shi, Ibaraki-ken 305-0804
Tel: 0298-64-2211
Fax: 0298-64-0598
E-mail: [email protected]
Mr. Chikahiro MinowaCooperative Research Officer
National Research Institute for Earth Science
and Disaster Prevention
3- 1, Tennodai, Tsukuba-shi, Ibaraki-ken 305
Tel: 0298-51-1611
Fax: 0298-51-5658
E-mail: [email protected]
xLiv
Mr. Akiyoshi Mukai
Head, Aerodynamics Division
Department of Structural Engineering
Building Research Institute
Ministry of Construction
1, Tatehara, Tsukuba-shi, Ibaraki-ken
305-0802
Tel: 0298-64-6643
Fax: 0298-64-6773
E-mail: [email protected]
Mr. Kazuhiro Nishikawa
Head, Bridge Division
Structure and Bridge Department
Public Works Research Institute
Ministry of Construction
1, Asahi, Tsukuba-shi, Ibaraki-ken 305-0804
Tel: 0298-64-2905
Fax: 0298-64-0565
E-mail: [email protected]
Dr. Nobuyuki OgawaHead, Earthquake Engineering Laboratory
National Research Institute for Earth Science
and Disaster Prevention
Science and Technology Agency
3-1, Tennodai, Tsukuba-shi, Ibaraki-ken 305
Tel: 0298-51-1611
Fax: 0298-51-5658
E-mail: [email protected]
Mr. Keiichi Ohtani
Director, Disaster Prevention Research
Division
National Research Institute for Earth Science
and Disaster Prevention
Science and Technology Agency
3-1, Tennodai, Tsukuba-shi, Ibaraki-ken, 305
Tel: 0298-51-1611 Ext. 321
Fax: 0298-52-8512
E-mail: ohtani@knetgk,k-net,bosai.go.jp
Dr. Hisashi Okada' Associate Director for Composite Structures,
Department of Structural Engineering
Building Research Institute
Ministry of Construction
1, Tatehara, Tsukuba-shi, Ibataki-ken
305-0802
Tel: 0298-64-6641
Fax: 0298-64-6773
E-mail: [email protected]
Mr. Masami Okada
Head, First Research Laboratory
Seismology and Volcanology Research
Department
Meteorological Research Institute
Japan Meteorological Agency
Ministry of Transport
1-1, Nagamine, Tsukuba-shi, Ibaraki-ken 305
Tel: 0298-53-8677
Fax: 0298-51-3730
Mr. Hidetsugu OnumaDirector, Research Planning and Coordination
Section
Administration Division
Civil Engineering Research Institute
Hokkaido Development Agency
1-3, Hiragisi, Toyohira-ku, Sapporo-shi,
Hokkaido 062
Tel: 011-841-1111
Fax: 011-824-1226
E-mail: [email protected]
Dr. Hiroshi Sato
Head, Structure Division
Structure and Bridge Department
Public Works Research Institute
Ministry of Construction
1, Asahi, Tsukuba-shi, Ibaraki-ken 305-0804
Tel: 0298-64-2874
Fax: 0298-64-0565
E-mail: [email protected]
xLv
Mr. Masashi Sato
Head, Structure Division
Civil Engineering Research Institute
Hokkaido Development Bureau
1-3, Hiragishi, Toyohira-ku, Sapporo-shi,
Hokkaido 062
Tel: 011-841-1111
Fax: 011-820-2714
Dr. Shinji Sato
Head, Coast Division
River Department
Public Works Research Institute
Ministry of Construction
1, Asahi, Tsukuba-shi, Ibaraki-ken 305-0804
Tel: 0298-64-2327
Fax: 0298-64-1168
E-mail: [email protected]
Dr. Hideki Sugita
Head, Earthquake Disaster Prevention
Technology Division
Earthquake Disaster Prevention Research
Center
Public Works Research Institute
Ministry of Construction
1, Asahi, Tsukuba-shi, Ibaraki-ken 305-0804
Tel: 0298-64-3244
Fax: 0298-64-0598
E-mail: [email protected]
Dr. Keiichi Tamura
Head, Ground Vibration Division
Earthquake Disaster Prevention Research
Center
Public Works Research Institute
Ministry of Construction
1, Asahi, Tsukuba-shi, Ibaraki-ken 305-0804
Tel: 0298-64-2926
Fax: 0298-64-0598
E-mail: [email protected]
Mr. Nobuyuki Tsuneoka
Head, International Cooperation Division
Planning and Research Administration
Department
Public Works Research Institute
Ministry of Construction
1, Asahi, Tsukuba-shi, Ibaraki-ken 305-0804
Tel: 0298-64-4412
Fax: 0298-64-4322
E-mail: [email protected]
Dr. Shigeki Unjoh
Head, Earthquake Engineering Division
Earthquake Disaster Prevention Research
Center
Public Works Research Institute
Ministry of Construction
1, Asahi, Tsukuba-shi, Ibaraki-ken 305-0804
Tel: 0298-64-2932
Fax: 0298-64-4424
E-mail: [email protected]
Dr. Tatsuo UwabeChief, Disaster Prevention Laboratory
Structural Engineering Division
Port and Harbour Research Institute
Ministry of Transport
3-1-1, Nagase, Yokosuka-shi, Kanagawa-ken
239-0826
Tel: 0468-44-5030
Fax: 0468-44-0839
E-mail: [email protected]
Dr. Masahiko Yasuda
Director, Earthquake Disaster Prevention
Research Center
Public Works Research Institute
Ministry of Construction
1, Asahi, Tsukuba-shi, Ibaraki-ken 305-0804
Tel: 0298-64-2829
Fax: 0298-64-0598
E-mail: [email protected]
xLvi
Mr. BQtoshi Yoshida
Head, Fill-type Dam Division
Dam Department
Public Works Research Institute
Ministry of Construction
1, Asahi, Tsukuba-shi, Ibaraki-ken 305-0804
Tel: 0298-64-2413
Fax: 0298-64-0164
E-mail: [email protected]
ASSOCIATE MEMBERS
Dr. Minoru Fujiwara
ChiefEngineer
Road Management Technology Center
9-9, Hisamatsu-cho, Nihonbashi, Chuo-ku,
Tokyo 103-0005
Tel: 03-5695-2711
Fax: 03-5695-2715
Dr. Masami Fukuoka
Honorable Chairman
Public Works Research Center
1-6-4, Taito, Taito-ku, Tokyo 110
Tel: 03-3835-3609
Dr. Masaya Hirosawa
Professor, Kogakuin University
1-24-2-91, Nishishinjuku, Shinjuku-ku, Tokyo
163
Tel: 03-3342-1211
Dr. Shiro Ibukiyama
President, Kogyokusha College of Technology
5-14-2, Nishigotanda, Shinagawa-ku, Tokyo
141
Tel: 03-3493-5671
Dr. Kaoru Ichihara
President, Public Works Research Center
1-6-4, Taito, Taito-ku, Tokyo 110
Tel: 03-3835-3609
Dr. Ryuichi lida
President, Japan Dam Engineering Center
2-4-5, Azabudai, Minato-ku, Tokyo 110
Tel: 03-3433-7811
Dr. Takashi lijima
President, Sekisui-jushi Co., Ltd.
1-11-1, Kaigan, Minato-ku, Tokyo 106
Tel: 03-5400-1850
Dr. Toshio Iwasaki
President, Civil Engineering Research
Laboratory
1-18, Kandasuda-cho, Chiyoda-ku, Tokyo 101
Tel: 03-3254-9481
Fax: 03-3254-9448
Mr. Shunichiro Kamijo
Mtsui Construction Co., Ltd.
3- 10-1, Iwamoto-cho, Chiyoda-ku, Tokyo
106
Tel: 03-5223-3921
Mr. Kenji Kawakami
Adviser, Kubota Corporation
3-1-3, Nihonbashi-muromachi, Cyuoh-ku,
Tokyo 103
Tel: 03-3245-3660
Dr. Eiichi Kuribayashi
Professor, Toyohashi University of
Technology
1-1, Hibarigaoka, Tenpaku-cho,
Toyohashi-shi, Aichi-ken 440
Tel: 0532-44-6967
Mr. Mitsuru Nagao
President, Japan Construction Mechanization
Association
3-5-8, Shibakoen, Minato-ku, Tokyo 105
Tel: 03-3433-1501
xLvii
Dr. Seiji Nakano
Formerly, Professor, Tokyo Denki University
2-2, Kandanishiki-cho, Chiyoda-ku, Tokyo
101
Tel: 03-5280-3501
Dr. Kazuto Nakazawa
President, Regional Development Consultants
Inc.
1- 18, Kandasuda-cho, Chiyoda-ku, Tokyo 101
Tel: 03-3831-2916
Fax: 03-3836-4048
Dr. Nobuyuki Narita
Member of Executive Board, Public Works
Research Center
17-15, Yawata-6, Ichikawa-shi, Chiba-ken
272-0021
Tel: 047-335-0324
Fax: 047-335-0324
Dr. Setsuo NodaPresident, Coastal Development Institute of
Technology
3- 16, Hayabusa-cho, Chiyoda-ku, Tokyo
102-0092
Tel: 03-3234-5861
Fax: 03-3234-5877
Dr. Shin Okamoto
Director-General, Building Technology
Research Institute
The Building Center of Japan
3-2-2, Toranomon, Minato-ku, Tokyo 105
Tel: 03-3458-1011
Mr. Yoshijiro Sakagami
President, Rinkai Construction Co., Ltd.
2-3-8, Shiba, Minato-ku, Tokyo 105
Tel: 03-3453-4111
Mr. Tadahiko Sakamoto
President, Japan Dam Engineering Center
2-4-5, Azabudai, Minato-ku, Tokyo 110
Tel: 03-3433-7811
Prof Yasushi Sasaki
Professor, Department of Civil and
Environmental Engineering
Hiroshima University
1-4-1, Kagamiyama, Higashihiroshima-shi,
Hiroshima-ken 739
Tel: 0824-24-7783
Fax: 0824-24-7783
E-mail: [email protected]
Dr. Yukihiko Sumiyoshi
Executive Counselor, Nippon Steel Co., Ltd.
2-6-3, Ohte-machi, Chiyoda-ku, Tokyo100-71
Tel: 03-3275-5868
Mr. Jiro Taguchi
President, Construction Research Institute
11-8, Ohdenma-cho, Nihonbashi, Chuo-ku,
Tokyo 103-0011
Tel: 03-3663-2411
Fax: 03-3633-2417
Dr. Hiroshi Takahashi
Adviser, Engineering Department
Sato Kogyo Co., Ltd.
4-12-20, Nihonbashihon-cho, Cyuo-ku, Tokyo
103
Tel: 03-3661-2296
Dr. Masateru Tominaga
President, Public Works Research Center
1-6-4, Taito, Taito-ku, Tokyo 110
Tel: 03-3835-3609
Dr. Hajime Tsuchida
Executive Counselor, Nippon Steel Co., Ltd.
2-6-3, Ohte-machi, Chiyoda-ku, Tokyo
100-71
Tel: 03-3275-5894
xLviii

Mr. Seizo Tsuji
Adviser, Road Management Technology
Center
9-9, Hisamatsu-cho, Nihonbashi, Chuo-ku,
Tokyo 103-0005
Tel: 03-5695-2711
Fax: 03-5695-2715
Prof. Makoto Watabe
Professor, Faculty ofEnvironmental
Information
Keio University
5322, Endo, Fujisawa-shi, Kanagawa-ken 252
Tel: 0466-47-5111
Fax: 0466-47-5041
xLix


UNITED STATES-SIDE MEMBERSHIP: PANEL ON WIND AND SEISMIC EFFECTS
Dr. Richard N. Wright
Chairman, U.S. -side Panel
Director, Building and Fire Research
Laboratory
National Institute of Standards and
Technology
U.S. Department of Commerce
Gaithersburg, MD 20899
301-975-5900 FAX: 301-975-4032
E-mail: [email protected]
Mr. Noel J. Raufaste
Secretary-General, U.S. -side Panel
Head, Cooperative Research Programs
Building and Fire Research Laboratory
National Institute of Standards and
Technology
U.S. Department of CommerceGaithersburg, MD 20899
301-975-5905 FAX: 301-975-4032
E-mail: [email protected]
Dr. Daniel P. Abrams
Director, Md-America Earthquake Center
Hanson Engineers Professor of Civil
Engineering
University of Illinois
1241 Newmark Laboratory
205 North Mathews Avenue
Urbana, XL 61801
244-6302 FAX: 217-333-3821
E-mail: [email protected]
Dr. Kharaiti L. Abrol
Principal Structural Engineering Consultant
Room 475
Department of Veterans Affairs
810 Vermont Avenue, NWWashington, DC 20420
202-565-5579 FAX: 202-565-5478
E-mail: abrkha@hq, med.va.gov
Dr. John AkeGeophysicist
Seismotectonics and Geophysics Section
Code D-8330
P.O. Box 25007
Bureau ofReclamation
U.S. Department of the Interior
Denver, CO 80225
303-236-4195 x276 FAX: 303-236-9127
E-mail: [email protected]
Mr. John Baals
Seismic Safety Coordinator
P.O. Box 25007 (D-8110)
Bureau ofReclamation
U.S. Department of the Interior
Denver, CO 80225
303-236-3999 x534 FAX: 303-236-9099
E-mail: [email protected]
Dr. Celso S. Barrientos
Supervisory Physical Scientist
National Environmental Satellite Data
Information Service - Code E/RA28National Oceanic and Atmospheric
Administration
U.S. Department ofCommerce5200 Auth Road
Camp Springs, MD 20746
301-763-8102 FAX: 301-763-8020
E-mail: [email protected]
Dr. Eddie N. Bernard
Director, Pacific Marine Environmental
Laboratory
National Oceanic and Atmospheric
Administration
U.S. Department ofCommerce
7600 Sand Point Way, NEBINC15700/Building3
Seattle, WA 98 11 5-0070
206-526-6800 FAX: 206-526-6815
E-mail: [email protected]
Li
Mr. Mike Blackford
lOC-NWS/INTERNALTsunami Information Center
737 Bishop Street, Suite 2200
Honolulu, HI 96813-3213
808-689-8207x301 FAX: 808-689-4543
E-mail: [email protected]
Dr. David M. Boore
U.S. Geological Survey
345 Middlefield Road MS 977
Menlo Park, CA 94025
650-329-5616 FAX: 650-329-5163
E-mail: [email protected]
Dr. Roger D. Borcherdt
Branch of Seismology
U.S. Geological Survey
U.S. Department of the Interior
345 Middlefield Road, MS 977
Menlo Park, CA 94025
650-329-5619 FAX: 650-329-5163
E-mail: [email protected]
Dr. Mehmet K. Celebi
Research Civil Engineer
Branch ofEarthquake and Geomagnetic
Information
U.S. Geological Survey
U.S. Department of the Interior
345 Middlefield Road, MS 977
Menlo Park, CA 94025
650-329-5623 FAX: 650-329-5163
E-mail: [email protected]
Mr. Harish Chander
U.S. Dept. Of Energy (EH-31),
CXXI, Room 2016(GTN)19901 Germantown Road
Germantown, MD 20874-1290
301-903-6681 FAX: 301-903-8693
E-mail: [email protected]
Dr. Ken P. Chong
Program Director, Mechanical & Structural
Systems
National Science Foundation
4201 Wilson Boulevard - Room 545
Arlington, VA 22230
703-306-1361 FAX: 703-306-0291
E-mail: kchong@nsfgov
Dr. Riley Chung
Group Leader, Earthquake Engineering
Structures Division
Building and Fire Research Laboratory
National Institute of Standards and
Technology
U.S. Department of Commerce
Gaithersburg, MD 20899
301-975-6062 FAX: 301-869-6275
E-mail: riley.chung@. nist.gov
Mr. James D. Cooper
Chief, Structures Division, HNR-10Federal Highway Administration
U.S. Department of Transportation
6300 Georgetown Pike
McLean, VA 22101
703-285-2060 FAX: 703-285-2766
E-mail: [email protected]
Mr. William Freeborne
Housing and Urban Development
Room 8132
45 1 Seventh Street, SWWashington, DC 20410
202-708-4370 xl40 FAX:202-708-5873
E-mail: [email protected]
Mr. Joseph H. Golden
NOAA/OAR/USWRP1315 East-West Highway
Room 11554
Silver Spring, MD 20910
301-713-0460, ext. 123 FAX: 301-713-1459
202-482-1584
E-mail: [email protected]
Lii
Mr. Peter E. Gurvin
Director, Building Design and Engineering
Division
Foreign Building Operations
Building SA-6, Room 335
U.S. Department of State
Washington, DC 20520
703-875-6117 FAX: 703-875-6204
E-mail: [email protected]
Dr. Robert L. Hall
Chief, Structural Analysis Group
U.S. Army Engineer Waterways Experiment
Station
3909 Halls Ferry Road
Vicksburg, MS 39180-6199
601-634-2567 FAX: 601-634-3412
E-mail: [email protected]
Dr. Walter W. Hays
Earthquake Hazards Reduction Program
U.S. Geological Survey
905 National Center
12201 Sunrise Valley Drive
Reston, VA 20192
703-648-6711 FAX: 703-648-6747
E-mail: [email protected]
Dr. Allen M. Hittelman
Chief, Solid Earth Geophysics Division
E/GCl, National Geophysical Data Center
NOAA, NESDIS325 Broadway
Boulder, CO 80303-3328
303-497-6591 FAX: 303-497-6513
E-mail: [email protected]
Mr. Larry C. Hultengren
Senior Structural Engineer
Office of Civil/Structural Engineering
Foreign Building Operations
Building SA-6, Room 346
U.S. Department of State
Washington, DC 20520
703-875-6194 FAX: 703-875-6204
Dr. Mary Ellen Hynes
Chief, Earthquake Engineering and
Geophysics Branch
Geotechnical Laboratory
USACE-CEWES-GG-H3909 Halls Ferry RoadU.S. Army Waterways Experiment Station
Vicksburg, MS 39180
601-634-2280
E-mail: [email protected]
Dr. William B. Joyner
Geophysicist
Branch of Seismology
U.S. Geological Survey
U.S. Department of the Interior
345 Middlefield Road, MS 977
Menlo Park, CA 94025
650-329-5640 FAX: 650-329-5163
E-mail: [email protected]
Mr. Roger M. Kenneally
Structural Engineer
Structural and Seismic Engineering Branch
Mail Stop TlO-Ll
U.S. Nuclear Regulatory Commission
Washington, DC 20555
301-415-6303 FAX: 301-415-5074
E-mail: [email protected]
Dr. George Lee
Director, Center for Advanced Technologies
in Earthquake Loss Reduction
State University ofNew York at Buffalo
Red Jacket Quadrangle
Buffalo, NY 14261
716-645-3391 FAX: 716-645-3399
E-mail: [email protected]
Liii
Dr. H.S. LewStnjctures Division
Building and Fire Research Laboratory
National Institute of Standards and
Technology
U.S. Department of Commerce
Gaithersburg, MD 20899
301-975-6061 FAX: 301-869-6275
E-mail: [email protected]
Dr. Shih-Chi Liu
Program Director, Structural Systems
Division of Biological and Critical Systems
National Science Foundation
4201 Wilson Boulevard - Room 545
Arlington, VA 22230
703-306-1362 FAX: 703-306-0291
E-mail: sliu@nsfgov
Dr. Josephine Malilay
Disaster Assessment and Epidemiology
Section
National Center for Environmental Health
F-46 Center for Disease Control and
Prevention
4770 Buford Highway, NEAtlanta, GA 30341
770-488-7295 FAX: 770-488-7335
E-mail: [email protected]
Dr. Francis G. McLeanValue Engineering Program Manager
Code D-8 170
P.O. Box 25007
Bureau of Reclamation
U.S. Department of the Interior
Denver, CO 80225
303-445-3091 FAX: 303-6475
E-mail: [email protected]
Dr. Raymond E. Meyer
Department of State
SA14/Room 1705
USAIDAVashington, DC 20523-1443
202-712-1078 FAX: 202-216-3707
E-mail: [email protected]
Dr. Jack Moehle
Director, Pacific Earthquake Engineering
Research Center
University of California Berkeley
721 Davis Hall
Berkeley, CA 94720-1710
510-231-9554
E-mail: [email protected]
Mr. Ugo Morelli
Policy Manager
Federal Emergency Management Agency
500 C Street, SWWashington, DC 20472
202-646-2810 FAX: 202-646-2577
E-mail: [email protected]
Dr. Stuart Nishenko
Federal Emergency Management Agency
500 C Street, SWWashington, D.C. 20472
202-646-3945 FAX: 202-646-4596
E-mail: [email protected]
Mr. Howard D. Nickerson
Earthquake Engineering and Weapons
Specialist
Naval Facilities Engineering CommandHoffman Building #2, Room 12S63, Code
04B2
200 Stovall Street
Alexandria, VA 22332
202-433-8599 FAX: 202-433-8777
E-mail : howard . d . nickerson@esc6 1@navfac
nfesc
Liv
Mr. Tom Post
Chief, Earthquake Engineering Division
California Department of Transportation
(CALTRANS)P.O. Box 942873
Sacramento, CA 95814
916-227-8728 FAX: 916-227-8898
E-mail: [email protected]
Dr. William E. Roper
Director, U.S. Army Topographic Engineering
Center
7701 Telegraph Road
Alexandria, VA 22315-3864
703-428-6600 FAX: 703-428-8154
E-mail: [email protected]
Dr. Charles E. Smith
Research Program Manager
Offshore Minerals Management
Technology Assessment and Research Branch
Minerals Management Service
U.S. Department of the Interior
381 Elden Street, MS 4800
Herndon, VA 20170-4817
703-787-1561 FAX: 703-787-1555
E-mail: [email protected]
Dr. T. T. Soong
Deputy Director, Center for Advanced
Technologies in Earthquake Loss Reduction
State University ofNew York at Buffalo
Red Jacket Quadrangle
Buffalo, NY 14261
Mr. Stanley Strickland
Chief, Air Base Systems Branch
Stop 37, WL/FIVC/OL, Bldg. 1120
139 Barnes Drive, STE 2
Tyndall AFB, FL 2403-6001
904-283-3709 FAX: 904-283-3722
E-mail: [email protected]
Dr. Phillip Yen"Federal Highway Administration
6300 Georgetown Pike
McLean, VA 22101
703-285-2315 FAX: 703-285-2766
E-mail: [email protected]
Lv
ALTERNATE MEMBERS
Dr. Clifford J. Astill
Program Director
Division of Biological and Critical Systems
National Science Foundation
4201 Wilson Boulevard - Room 545
Arlington, VA 22230
703-306-1361 FAX: 703-306-0291
E-mail: [email protected]
Mr. Michael Changery
Chief, Global Analysis Branch
National Climatic Data Center
National Oceanic and Atmospheric
Administration
U. S. Department of CommerceFederal Building
Ashville, NC 28801
704-271-4765 FAX: 704-271-4246
E-mail: [email protected]
Dr. C.Y. Chen
Senior Civil/Geotechnical Engineer
Office of Foreign Buildings
Department of State
Code SA-6, Rm. 347
Washington, DC 20520
703-875-6207 FAX: 703-875-6204
E-mail: [email protected]
Mr. Vincent P. Chiarito
Research Structural Engineer
Structural Mechanics Division
Structures Laboratory
U.S. Army Engineer Waterways Experiment
Station
3909 Halls Ferry RoadVicksburg, MS 39180-6199
601-634-2714 FAX: 601-634-3412
Dr. James F. Costello
Senior Structural Engineer
Structural and Geological Engineering Branch
Office ofNuclear Regulatory Research
U.S. Nuclear Regulatory Commission
Mail Stop TlO-Ll
Washington, DC 20555
301-415-6009 FAX; 301-415-5074
E-mail:[email protected]
Mr. Lucian G. Guthrie, P.E.
Structures Branch, Eng. Div.
U.S. Army Corps of Engrs.
UQUSACE (CECW-ED)Washington, D.C. 20314-1000
202-761-8673 FAX: 202-761-4716
E-mail: civil_works.engl_j30Stguthrie(Lucian
Guthrie)
Dr. James R. Houston
Director, Coastal Engineering Research
Center
U.S. Army Engineer Waterways Experiment
StationAVESCV-Z
3909 Halls Ferry Road
Vicksburg, MS 39180-6199
601-634-2000 FAX: 601-634-2055
E-mail: houston@coafsl .wes.army.mil
Mr. James Lander
Geophysicist
Cooperative Institute for Research in
Environmental Sciences
University of Colorado
Campus Box 449, Room 152 RL33100 Marine Street
Boulder, CO 80309
303-497-6446 FAX: 303-497-6513
E-mail: [email protected]
Lvi

I
I
Mr. Tingley K. LewResearch Structural Engineer
Structures Division
Naval Facilities Engineering Service Center -
Code C621110 23rd Ave.
Port Hueneme, CA 93043-4370
805-982-1234 FAX: 805-982-1418
E-mail: [email protected]
Mr. Michael Mahoney
Physical Scientist
Federal Emergency Management Agency
500 C Street, SWWashington, DC 20472
202-646-2794 FAX: 202-646-4387
E-mail: [email protected]
Dr. Martin C. Miller
Chief, Coastal Oceanography Branch
USAE, Waterways Experiment Station
Coastal and Hydraulics Laboratory (CEWES-CR-0)
3909 Halls Ferry Road
Vicksburg, MS 39180
601-634-3999 FAX: 601-634-4314
E-mail: [email protected]
Dr. Erdal Safak
Research Structural Engineer
U.S. Geological Survey
Box 25046, MS 966
Denver Federal Center
Denver, CO 80225
303-273-8593 FAX: 303-273-8600
E-mail: [email protected]
Dr. John B. Scalzi
Program Director, Structures and Building
Systems
National Science Foundation
4201 Wilson Blvd. - Room 545
ArHngton, VA 22230
703-306-1361 FAX:703-306-0291
E-mail: jscalzi@nsfgov
i
Lvii
1,


PANEL TASK COMMITTEEMEMBERS

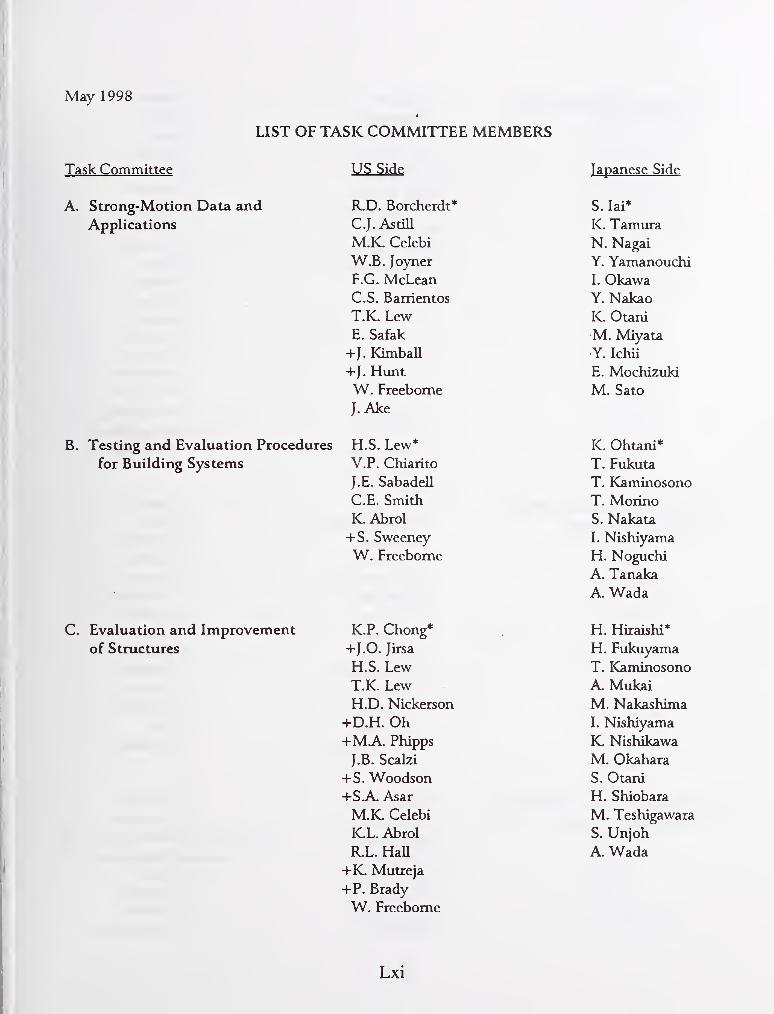
May 1998
LIST OF TASK COMMITTEE MEMBERS
Task Committee US Side
A. Strong-Motion Data andApplications
R.D. Borcherdt*
C.J. Astill
M.K. Celebi
W.B. Joyner
F.G. McLeanC.S. Barrientos
T.K. LewE. Safak
+J. KimbaU
+J. HuntW. Freebome
J.Ake
B. Testing and Evaluation Procedures
for Building Systems
H.S. Lew*
V.P. Chiarito
J.E. Sabadell
C.E. Smith
K. Abrol
+ S. Sweeney
W. Freebome
C. Evaluation and Improvement K.P. Chong*
of Structures +J.O. Jirsa
H.S. LewT.K. LewH.D. Nickerson
+D.H. Oh+MA. Phipps
J.B. Scalzi
+ S. Woodson+S.A. Asar
M.K Celebi
KL. Abrol
R.L. Hall
+K. Mutreja
+P. Brady
W. Freebome
Japanese Side
S. lai*
K. TamuraN. Nagai
Y. Yamanouchi
I. OkawaY. NakaoK. Otani
M. Miyata
Y. Ichii
E. Mochizuki
M. Sato
K. Ohtani*
T. Fukuta
T. Kaminosono
T. Morino
S. Nakata
I. Nishiyama
H. Noguchi
A. Tanaka
A. Wada
H. Hiraishi*
H. Fukuyama
T. Kaminosono
A. MukaiM. Nakashima
I. Nishiyama
K Nishikawa
M. Okahara
S. Otani
H. Shiobara
M. Teshigawara
S. Unjoh
A. Wada
Lxi
D. Earthquake Engineering for
DamsR. HaU*W.E. Roper
F.G. McLeanL.G. Guthrie
+R. Davidson
+M.E. Hynes
A.G. Franklin
+R. Navidi
+L. Von Thun+W. Allerton
T. Sasaki*
T. Fujino
Y. lida
J. Inomata
T. Iwashita
J. Kashiwai
I. NagayamaS. NakamuraT. OhmachiY. OhneT. Sasaki
S. Takasu
J. TamuraM. Toyota
T. Uesaka
Y. Wakisaka
K. Watanabe
H. WatanabeA. Yamagichi
Y. Yamaguchi
E. Design for Wind and WindHazard Mitigation
J. Golden*
+B. Bienkiewicz
+H. Bosch
+G. Chiu
W. Freebome
4-A. ICareem
H.S. Lew+K. Mehta
+D. Reed
+T. Reinhold
C. Smith
+P. Tertell
A. Chiu
M. Mahoney
T. Okada*
H. Sato*
N. Furuya
H. Kikitsu
K. Kamura
N. Kinoshita
T. Mabuchi
G. Naito
H. Shirato
T. Tamura
Y. TamuraY. Uematsu
S.Yagi
H. Yamada
F. Disaster Prevention Methodsfor Lifeline Systems
R.M. Chung*
C.J. Astill
M.K. Celebi
J.D. Cooper
+G. Al-Chaar
T.K. Lew
J.B. Scalzi
+ S. Wu
M Yasuda*
M. HamadaK. Honda
J. Hoshikuma
Y. ICajiya
M. HamadaK. Honda
J. Hoshiktmia
Lxii

+S. Wu+ S. Sommer
Y. ICajiya
H. ICameda
M. Kaneko
T. ICatayama
A. Kinoshita
O. Matsuo
K. MiyamotoN. OgawaM. Ozaki
K. Sasabi
K. Shimamura
S. Takada
K. Tamura
J. TohmaS. Unjoh
T. Uwabe
G. Structural Control andIntelligent Material
Systems
S.C. Liu*
V.P. Chiarito
K.P. Chong
+J.R. Hayes
L.C. Hultengren
G. Lee
S. Unjoh*
Y. Adachi
IC. Asano
Y. Fujino
H. Fukuyama
Y. Goto
H. lemura
N. Inoue
Y. Inoue
T. Ishimaru
K. Kawashima
M. Kitazawa
H. Kosaka
Y. Makiguchi
C. MinowaT. Moriya
A. Nishitani
H. Okada
S. OkamotoA. OgawaM. Sato
H. Soil Behavior and Stability
During Earthquakes
M.E. Hynes*
CJ. Astill
R.D. Borcherdt
C.Y. ChenE.G. McLeanC.E. Smith
O. Matsuo*
J. Fukui
S. lai
M. liba
H. Kobayashi
J. ICoseki
Lxiii
R.M. Chung+M.E. Hynes
+J.P. Koester
+R.H. Ledbetter
I. Storm Surge and Tsunami M.Blackford*
CJ.AstiU
C.S. Barrientos
' > E.N. Bernard
jijribk J. Lander
. W.E. R£.per
A.M. Hittelman
J. Wind and Earthquake Engineering J.D. Cooper*
for Transportation Systems J.B. Scalzi
H.S.Lewr J.B. Scalzi
P. Yen
+H.R. Bosch
C. Minowa
J. Nishikawa
M. OkamuraT. Sugano
H. Suzuki
K. TamuraI. Tohata
J. TohmaY. Yamaguchi
M. Yasuda
S. Yasuda
H. Yoshida
K. Zen
S. Sato*
S. AkedaT. Goto
S. Iwasaki
K. Kawata
T. IConishi
K. MinamiT. Nagai
T. NakayamaM. OkadaT. Sasajima
IC Satake
N. Shuto
T. Yamashita
K. Nishikawa*
Y. Fujino
N. Furuya
J. Fukui
T. Inatomi
M. Ishida
K. ICawashima
Y. Kimura
M. Kitazawa
Y. NakaoH. Kosaka
T. Moritani
J. Murakoshi
A. OgawaK. Ogiwara
M. Okahara
H. Sato
Lxiv

M. Sato
Y. Tanaka
T. Terayama
K. TamuraS. Unjoh
M. Yasuda
K. Wind and Earthquake Engineering
for Offshore and Coastal Facilities
C.E. Smith*
C.S. Barrientos
W.E. Roper
J.E. SabadeU
+M.C. Miller
M.K. Celebi
T. Uwabe*
J. Fukui
S. lai
M. KazamaS. NodaA. NozuM. Okada
H. Shiojiri
T. Sugano
H. Tsuchida
Y. Yoshida
* Chairman
+ TC Members (not Panel Members)
Lxv


RESOLUTIONS

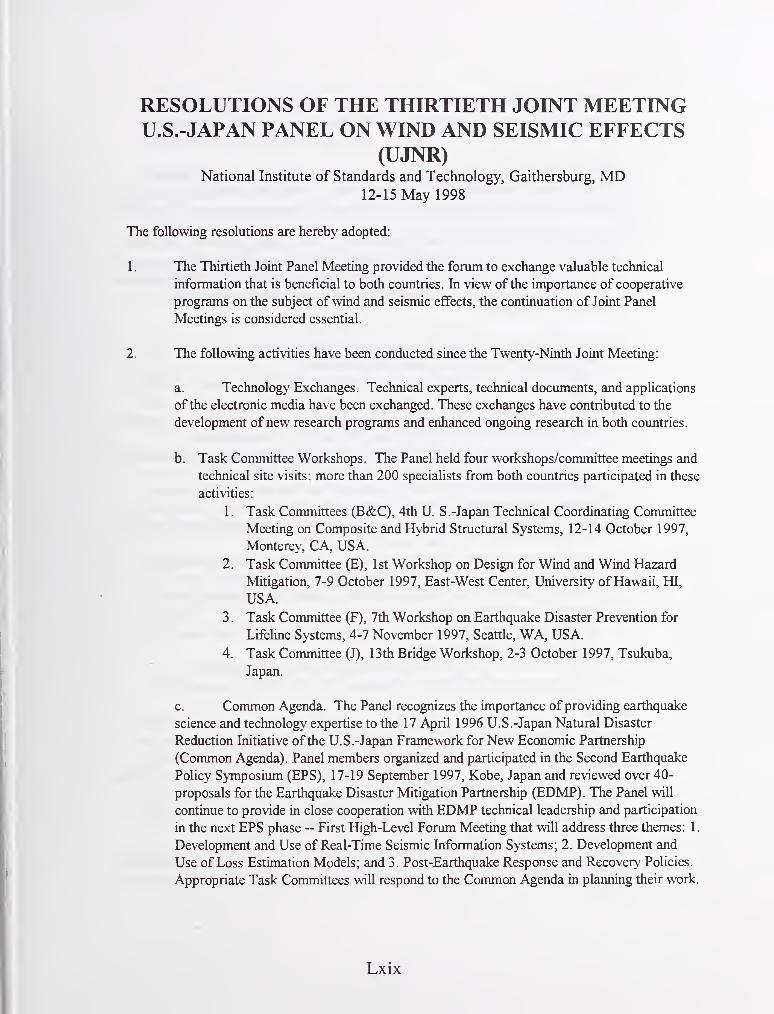
RESOLUTIONS OF THE THIRTIETH JOINT MEETINGU.S.-JAPAN PANEL ON WIND AND SEISMIC EFFECTS
(UJNR)National Institute of Standards and Technology, Gaithersburg, MD
12-15 May 1998
The following resolutions are hereby adopted:
1. The Thirtieth Joint Panel Meeting provided the forum to exchange valuable technical
information that is beneficial to both countries. In view of the importance of cooperative
programs on the subject of wind and seismic effects, the continuation of Joint Panel
Meetings is considered essential.
2. The following activities have been conducted since the Twenty-Ninth Joint Meeting:
a. Technology Exchanges. Technical experts, technical documents, and applications
of the electronic media have been exchanged. These exchanges have contributed to the
development ofnew research programs and enhanced ongoing research in both countries.
b. Task Committee Workshops. The Panel held four workshops/committee meetings and
technical site visits; more than 200 specialists fi^om both countries participated in these
activities:
1 . Task Committees (B&C), 4th U. S.-Japan Technical Coordinating Committee
Meeting on Composite and Hybrid Structural Systems, 12-14 October 1997,
Monterey, CA, USA.
2. Task Committee (E), 1st Workshop on Design for Wind and Wind Hazard
Mitigation, 7-9 October 1997, East-West Center, University ofHawaii, HI,
USA.
3 . Task Committee (F), 7th Workshop on Earthquake Disaster Prevention for
Lifeline Systems, 4-7 November 1997, Seattle, WA, USA.
4. Task Committee (J), 13th Bridge Workshop, 2-3 October 1997, Tsukuba,
Japan.
c. Common Agenda. The Panel recognizes the importance of providing earthquake
science and technology expertise to the 17 April 1996 U.S. -Japan Natural Disaster
Reduction Initiative of the U.S.-Japan Framework for New Economic Partnership
(Common Agenda). Panel members organized and participated in the Second Earthquake
Policy Symposium (EPS), 17-19 September 1997, Kobe, Japan and reviewed over 40-
proposals for the Earthquake Disaster Mitigation Partnership (EDMP). The Panel will
continue to provide in close cooperation with EDMP technical leadership and participation
in the next EPS phase ~ First High-Level Forum Meeting that will address three themes: 1.
Development and Use of Real-Time Seismic Information Systems; 2. Development and
Use of Loss Estimation Models; and 3. Post-Earthquake Response and Recovery Policies.
Appropriate Task Committees will respond to the Common Agenda in planning their work.
Lxix
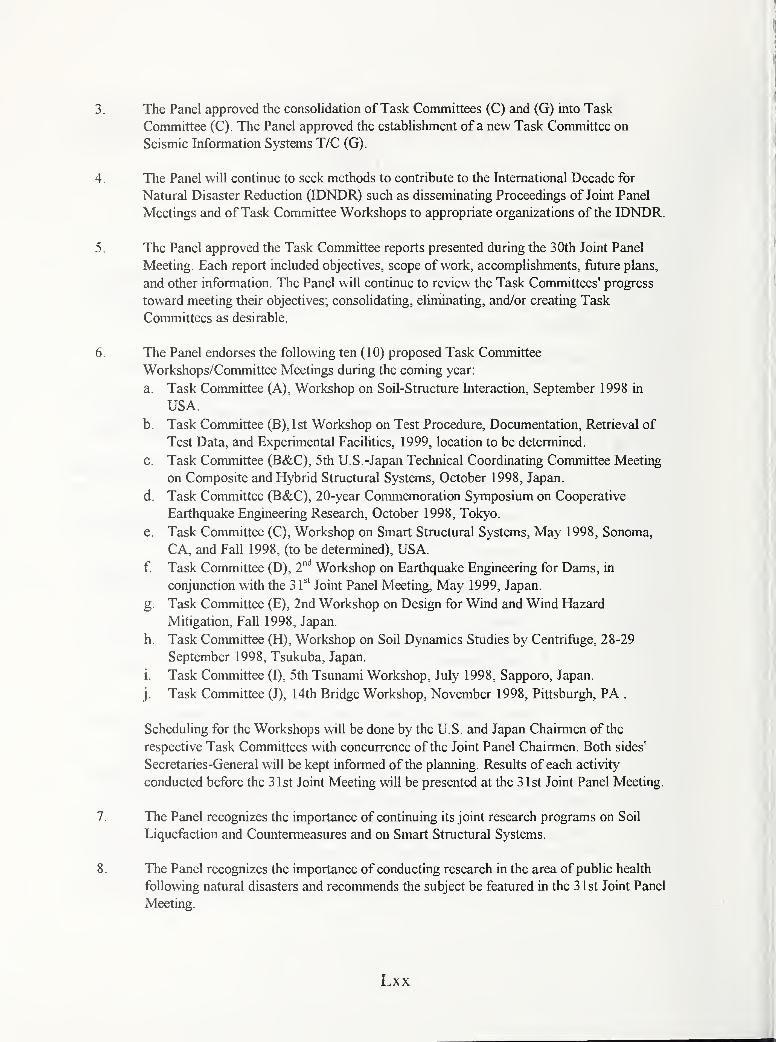
The Panel approved the consoUdation of Task Committees (C) and (G) into Task
Committee (C). The Panel approved the establishment of a new Task Committee on
Seismic Information Systems T/C (G).
The Panel will continue to seek methods to contribute to the International Decade for
Natural Disaster Reduction (IDNDR) such as disseminating Proceedings of Joint Panel
Meetings and of Task Committee Workshops to appropriate organizations of the IDNDR.
The Panel approved the Task Committee reports presented during the 30th Joint Panel
Meeting. Each report included objectives, scope of work, accomplishments, future plans,
and other information. The Panel will continue to review the Task Committees' progress
toward meeting their objectives; consolidating, eliminating, and/or creating Task
Committees as desirable.
The Panel endorses the following ten (10) proposed Task Committee
Workshops/Committee Meetings during the coming year:
a. Task Committee (A), Workshop on Soil-Structure Interaction, September 1998 in
USA.
b. Task Committee (B),lst Workshop on Test Procedure, Documentation, Retrieval of
Test Data, and Experimental Facilities, 1999, location to be determined.
C. Task Committee (B&C), 5th U.S. -Japan Technical Coordinating Committee Meeting
on Composite and Hybrid Structural Systems, October 1998, Japan.
d. Task Committee (B&C), 20-year Commemoration Symposium on Cooperative
Earthquake Engineering Research, October 1998, Tokyo.
e. Task Committee (C), Workshop on Smart Structural Systems, May 1998, Sonoma,
CA, and Fall 1998, (to be determined), USA.
f. Task Committee (D), 2"^* Workshop on Earthquake Engineering for Dams, in
conjunction with the 3 T' Joint Panel Meeting, May 1999, Japan.
g. Task Committee (E), 2nd Workshop on Design for Wind and Wind Hazard
Mitigation, Fall 1998, Japan.
h. Task Committee (H), Workshop on Soil Dynamics Studies by Centrifuge, 28-29
September 1998, Tsukuba, Japan.
i. Task Committee (I), 5th Tsunami Workshop, July 1998, Sapporo, Japan.
j. Task Committee (J), 14th Bridge Workshop, November 1998, Pittsburgh, PA .
Schedulmg for the Workshops will be done by the U.S. and Japan Chairmen of the
respective Task Committees with concurrence of the Joint Panel Chairmen. Both sides'
Secretaries-General will be kept informed of the planning. Results of each activity
conducted before the 3 1st Joint Meeting will be presented at the 3 1st Joint Panel Meeting.
The Panel recognizes the importance of continuing its joint research programs on Soil
Liquefaction and Countermeasures and on Smart Structural Systems.
The Panel recognizes the importance of conducting research in the area of public health
following natural disasters and recommends the subject be featured in the 31st Joint Panel
Meeting.
Lxx
9. The Panel will seek methods to contribute to the International Organization for
Standardization (ISO) through participation of its members and related agencies in
appropriate ISO Technical Committees.
10. The Panel published its fifth newsletter issue, Wind and Seismic Effects, Winter 1998.
The newsletter featured articles on the 29th Joint Panel Meeting; the 2nd U.S.-Japan
Earthquake Policy Symposium; the 1st U.S.-Japan Workshop on Design for Wind and
Wind Hazard Mitigation; highlights ofnew Japanese laboratory facilities following the
Kobe Earthquake; and a highlight of the National Research Institute for Earth Science
and Disaster Prevention and the U.S. Geological Survey. The Panel endorses continuing
the publication of the Panel's newsletter. The U.S.-side will publish the sixth newsletter
during the winter of 1998-99.
11. The National Institute of Standards and Technology (NIST) will maintain the Panel's
Web Site on an interim basis. The five Panel newsletters were added to the Web Site.
The Panel encourages all members from both sides to use electronic media, as much as
possible, in communicating Panel findings and summaries of its activities. The Web Site
URL address is: http://www.bfrl.nist.gov/info/ujnr/ujnrl.html.
12. The Panel recognizes the importance of continued exchange of personnel, technical
information, research results, and recorded data that lead to mitigating losses from sfrong
winds and earthquakes. The Panel also recognizes the importance of using available
large-scale testing facilities and other complementary capabilities in both countries.
Thus, these activities should be continued, sfrengthened, and expanded. The Panel will
provide official endorsement to facilitate these exchanges.
13. Thirty-First Joint Panel Meeting of the UJNR Panel on Wind and Seismic Effects will be
held at the Public Works Research Institute, Tsukuba, Japan in May 1999. Specific dates,
program, and itinerary will be proposed by the Japan-side with concurrence of the U.S.-
side Panel.
Lxxi


SPECIAL SESSION in CELEBRATIONof the PANEL'S 30'" ANNIVERSARY

Natural Disasters and Protective Measures in Japan
by
Yasutake Inoue*
ABSTRACT
As a country that suffers frequent natural
disasters, Japan applies lessons learned from
these experiences to the tasks of providing
disaster protection facilities and improving the
disaster resistance of infrastructures, but the
Hanshin - Awaji Earthquake Disaster (January
1995) taught that because it is difficuh to
prevent all disasters from occurring, it is
essential to accept that disasters will occur and
to provide crisis management type disaster
protection measures that minimize the damage
that they cause. This report describes measures
and technological research undertaken in order
to supplement existing hardware measures
involving the construction of disaster protection
facilities with new software measures: those
intended to provide crisis management
capabilities.
Key words; Natural Disaster, Crisis
Management, Disaster Protection Measure,
Minimization of Damage, Seismic Safety Level,
Seismic Information System.
1. INTRODUCTION
Hardly a year passes without a disaster
occurring somewhere in Japan as a consequence
of harsh natural conditions that make it one of
the world's most disaster prone nations along
with the high concentration of land use in a few
small regions of the country. This report
introduces examples of some recent disasters. It
also discusses issues that construction
administrators must address in response to the
Hanshin - Awaji Earthquake Disaster (January
1995), and topics that will be the object of future
technological research as an example of
earthquake resistance measures.
2. NATURAL CONDITIONS, NATIONALLAND USE PATTERNS AND
NATURAL DISASTERS IN JAPAN
(1) Natural Conditions and National Land Use
Patterns in Japan
Japan is a nation with many hills and
mountains and generally precipitous topography,
is drained by rivers that are shorter and steeper
than those in other nations, and has an extremely
long coastline in relation to its total land area.
And geographically, it is part of the circum-pan
Pacific volcanic and earthquake zones and one
of the most volcanic and earthquake activity
prone nations in the world. Its geology features
large faults and fracture zones and many places
with weak geological structures. Climatic
features of Japan include its position in the path
of numerous typhoons and heavy winter snow
accumulation in large areas of the country.
In addition to the harsh topographical,
geographical, geological, and meteorological
natural conditions found in Japan, about 50% of
its population and 75% of its total productive
activities are concentrated in inundation zones
(regions lower than the river water level during
the flood period) on alluvial planes covering no
more than about 10% of the total national land.
On top of this, advancing urbanization has been
accompanied by the growing residential use of
regions consisting of low swampy land, alluvial
fans, precipitous slopes, and other ground with a
high latent risk of natural disasters.
In addition to these natural conditions and
this pattern of national land use, hardly a year
passes without a natural disaster occurring
somewhere in Japan as a result of typhoons.
* Director-General of Public Works Research Institute,
Ministry of Construction, Asahi 1, Tsukuba-shi,
Ibaraki-ken, 305-0804 Japan
3
extremely heavy rainfall, earthquakes, or
volcanic eruptions.
(2) Natural Disasters
Figure 1 shows the numbers of fatalities
and missing persons caused by natural disasters
in recent years organized by the cause of the
disasters. It reveals that frequent storm and flood
damage caused by typhoons and heavy rainfalls
are the cause of fatalities etc. almost every year,
and that many people died or disappeared as a
result of the Hokkaido Nansei-oki Earthquake
(1993) and the Hanshin - Awaji Earthquake
Disaster (Hyogo-ken Nanbu Earthquake: 1995).
Table 1 presents representative examples
of each of the wide variety of disasters that
occur in Japan.
3. LESSONS TAUGHT BY THE HANSHIN -
AWAJI EARTHQUAKE DISASTER
To prepare for natural disasters that occur
almost every year, we have systematically and
continually carried out river improvement, damconstruction, coastline preservation, landslide
disaster prevention, road disaster prevention,
and urban disaster protection projects in an
effort to make Japan a safer place to live. To
take changes to bridge technology standards as
an example of earthquake resistance measures,
as shown in Table 2, the Kanto Earthquake was
followed by the introduction of design
accounting for earthquakes so that it would be
possible to design bridges able to withstand a
similar earthquake. These standards were
reassessed again following the later Niigata
Earthquake and Miyagi-ken-oki Earthquake. In
this way, we have continually taken advantage
of our experiences with natural disasters to
provide the capacity required to protect bridges
from their effects.
But the Hanshin - Awaji Earthquake
Disaster that struck the Kinki Region of Japan, a
part of the country spared serious earthquakes
for many decades and one believed to be
relatively safe, resulted in damage on a scale
that exceeded our expectations. By starting fires
in districts with highly concentrated woodenhousing and by cutting off lines supplying
essential services, it dealt a severe blow to the
lives of the residents of the disaster region. It
also cut traffic networks, with severe
repercussions on productive activities both
within and outside of Japan.
These events have taught us not only that
present science can not necessarily be used to
predict the exact time and location of a powerful
earthquake, particularly a shallow intraplate
earthquake under the land, but that the power of
an earthquake can exceed any experienced in the
past and that changes both in urban
environments and in transportation and other
features of the socioeconomic environments
both within and outside of Japan mean there is a
risk that a powerful earthquake can inflict
terrible harm on human society.
4. ISSUES IN FUTURE CONSTRUCTIONADMINISTRATION
With the "creation of national land where
people can be safe and secure" as one of the
principal themes of construction administration
in Japan, we have continually striven to reduce
nature's ferocity by, for example, improving
flood control and erosion prevention measures
along with urban disaster protection measures,
and strengthening the earthquake resistance of
public works structures, homes, and buildings.
But the Hanshin - Awaji Earthquake Disaster
has taught us that in addition to improving
disaster prevenfion facilities intended to keep
such disasters from occurring, it is also
important that we accept that it is impossible to
prevent all disasters, and assuming that they will
eventually occur, prepare for them by providing
measures to minimize the damage they inflict.
So as described below, it is essential that
hardware measures be accompanied by efforts to
create crisis management type disaster
protection measures: software measures such as
the provision of systems to provide information
concerning disasters and strengthened
coordination between concerned administrative
bodies.
(1) Establishment of Regionally Managed Crisis
Management Systems
4
To minimize the damage that disasters
cause, the provision of disaster prevention
facilities will be accompanied by risk
management measures implemented at normal
times in preparation for disasters: the
clarification of the distribution of roles between
concerned organizations, private companies, and
residents (regional government bodies, fire
fighting and flood response teams), and the
complete distribution of hazard maps (Figure 2)
etc. In addition, crisis management measures
including the distribution of disaster information
and the implementation by volunteers and others
of various support activities will be carried out
to reduce the damage after a disaster occurs.
(2) Switch-over to Facility Improvement for
Damage Reduction
Taking levees as an example of this
change in the basic concept guiding disaster
protection facility provision, rather than being
considered to be structures that must prevent
flooding from ever occurring, it will be assumed
that disasters are inevitable and levees will be
treated as structures intended to minimize
damage by, for example, emphasizing the
prevention of extremely severe damage when a
levee does break.
And past hardware measures to prevent
landslides and debris flows that cause frequent
fatal disasters, will be supplemented by software
measures: providing belts of trees as buffer
zones, strengthening regulations governing risk
areas, and so on (Figure 3).
(3) Provision of Comprehensive Disaster
Protection Measures for Urban Areas
With a large proportion of Japanese
population and assets and most of its economic
and social activities concentrated in its cities, in
order to prevent the paralysis of the economic
and public functions of the country, and to
improve safety during large scale disasters,
comprehensive large scale damage prevention
measures will be undertaken by both the
hardware and software sides: reinforcing the
disaster resistance of housing and infrastructures
and improving over-concentrated urban districts.
And to permit the rapid and smooth
restoration of the daily lives of the people along
with economic and public life following a
disaster, emergency roadways to replace wide
area arterial roads, wide area disaster protection
bases, emergency transport routes, etc. will be
provided at the same time as multiutility tunnels
are constructed to improve the disaster
resistance of lifelines used to supply city
dwellers with essential services (Figure 4).
5. TOPICS FOR FUTURE TECHNOLOGICALRESEARCH
To minimize the damage caused by natural
disasters, research on a number of technologies
must be undertaken. This section of this report
describes a number of technological research
areas related to protection from earthquake
disaster. The concepts on which this selection is
based also apply to other types of disasters.
(1) Improving the Earthquake Resistance of
Structures
The most basic category of technological
research that is required is the search for ways to
improve the earthquake resistance of civil
infrastructures. Large scale centriftige and large
scale three-dimensional shaking table
(Photograph 1 ) that have been recently installed
will be used to conduct research into seismic
design and retrofit technology.
(2) Earthquake Disaster Loss Estimation
Methodology
In order to more efficiently conduct
projects to increase the earthquake resistance of
civil infrastructures, research will be conducted
to find ways to quantitatively assess the loss
caused by credible earthquakes and the effects
of earthquake resistance improvement projects.
These will enable to set the seismic safety level
rationally, and to prioritize economical projects
based on the cost - benefits analysis (Figure 5).
(3) Coordination of Seismic Safety Levels of
Urban Infrastructures
Research to achieve coordination of
seismic safety levels for the various kinds of
infrastructures that constitute an urban area will
5
be carried out. The results will, by reflecting the
role of infrastructures in each region and the
effects of earthquake resistance improvement
projects, enable to improve the seismic safety of
overall cities (Photograph 2).
(4) Seismic Information Systems
In addition to providing structures with
appropriate earthquake resistance, it is necessary
to develop technology needed to implement
efficient crisis management. Research to
develop seismic information systems including
early damage estimation technology, damage
monitoring technology, and data communication
technology will allow facility managers to take
effective emergency action such as the
temporary repair works on arterial roads
immediately after the disaster (Figure 6).
6. SUMMARY
At the same time as the needs for
infrastructures are diversifying, finding ways to
skillfully utilize the nation's resources including
Its limited budget, housing stock, and
infrastructures stock, has become a serious
problem in the face of severe financial
conditions, the aging of the population, the
falling birth rate, the growing value attached to
the natural environment and to the global
environment, and other problems. In the future,
the provision of hardware, new protective
structures and the like, is sure to take longer
than it does now, and it will be essential to adopt
comprehensive measures that emphasize the
software approach. This is a switch from
"national land construction" to "national land
management (improvement, use, preservation)."
It will also be necessary to introduce more and
better software measures to deal with the threat
of natural disasters.
REFERENCES
1) Ministry of Construction ; Construction
White Paper, 1995
2) National Land Agency : Disaster Prevention
White Paper,1993,1994,1997
6
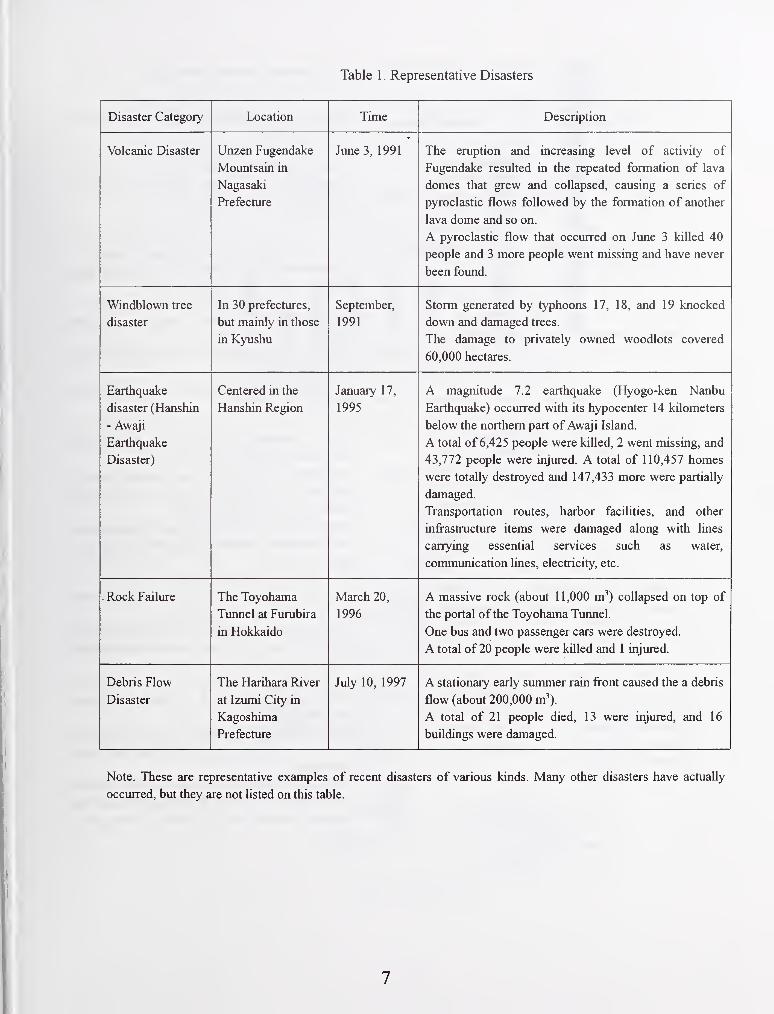
Table 1 . Representative Disasters
Disaster Category Location Time Description
Volcanic Disaster Unzen Fugendake
Mountsatn in
Nagasaki
Prefecture
June 3, 1991 The eruption and increasing level of activity of
Fugendake resulted in the repeated fonnation of lava
domes that srew and collansed causms a series of
pyroclastic flows followed by the formation of another
lava dome and so on.
A pyroclastic flow that occurred on June 3 killed 40
people and 3 more people went missing and have never
1-i^£kti Tr\iin/iUCCil lUUIiU.
Windblown tree
disaster
In 30 prefectures,
but mainly in those
in Kyushu
September,
1991
Storm generated by typhoons 17, 18, and 19 knocked
down and damaged trees.
The damage to privately owned woodlots covered
60,000 hectares.
Earthquake
disaster (Hanshin
- Awaji
Earthquake
Disaster)
Centered in the
Hanshin Region
January 17,
1995
A magnitude 7.2 earthquake (Hyogo-ken Nanbu
Earthquake) occurred with its hypocenter 14 kilometers
below the northern part of Awaji Island.
A total of 6,425 people were killed, 2 went missing, and
43,772 people were injured. A total of 110,457 homes
wf*rf^ tntflllv dpQtrovpH ;)tirl 147 mnrf* wf^rf* nartiallv
damaged.
Transportation routes, harbor facilities, and other
infrastructure items were damaged along with lines
carrying essential services such as water,
rnmtniinipafinn linpQ f^lppfripitv f*tpwvjiiiiiiuiijwciiiv.'ii iiiiwo, ^i&^ii i^iiy, wLw.
- Rock Failure The Toyohama
Tunnel at Furubira
in Hokkaido
March 20,
1996
A massive rock (about 1 1 ,000 m') collapsed on top of
the portal of the Toyohama Tunnel.
One bus and two passenger cars were destroyed.
A tnffil of 90 npnnip wpfp killpH ^nd 1 iniiirpH
Debris Flow
Disaster
The Harihara River
at Izumi City in
Kagoshima
Prefecture
July 10, 1997 A stationary early summer rain front caused the a debris
flow (about 200,000 m').
A total of 21 people died, 13 were injured, and 16
buildings were damaged.
Note. These are representative examples of recent disasters of various kinds. Many other disasters have actually
occurred, but they are not hsted on this table.
7
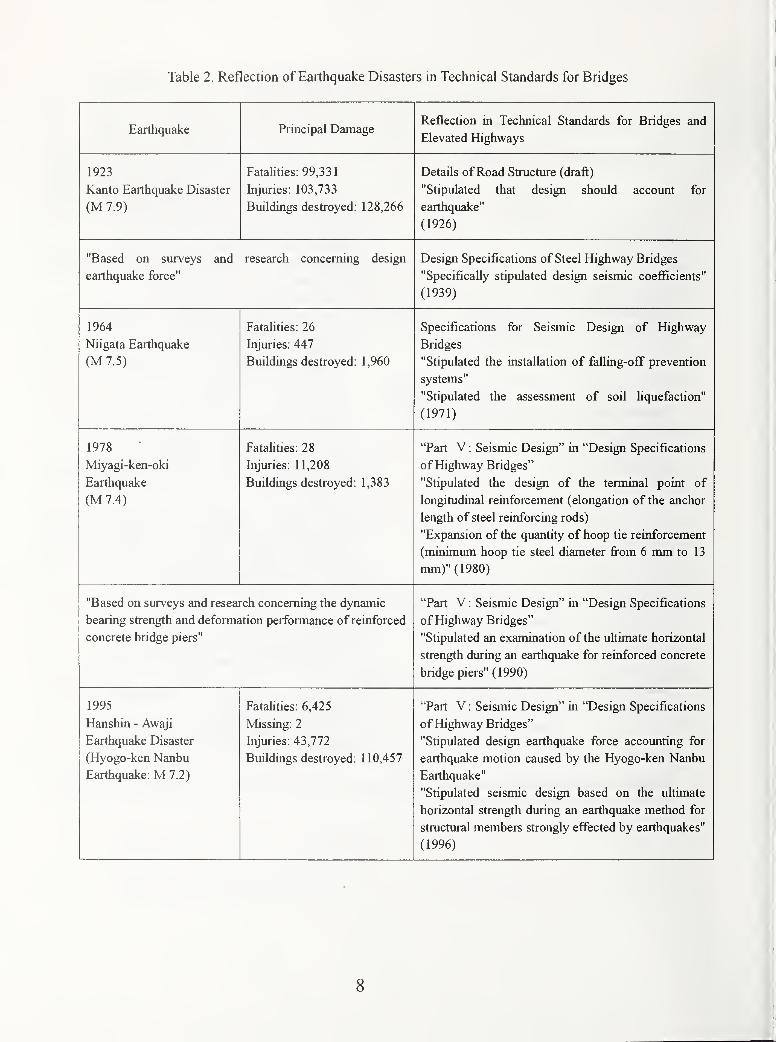
Table 2. Reflection of Earthquake Disasters in Technical Standards for Bridges
Earthquake Principal DamageReflection in Technical Standards for Bridges and
Elevated Highways
1923
Kanto Earthquake Disaster
(M 7.9)
Fatalities: 99,331
Injuries: 103,733
Buildings destroyed: 128,266
Details ofRoad Structure (draft)
"Stipulated that design should account for
earthquake"
(1926)
"Based on surveys and research concerning design
earthquake force"
Design Specifications of Steel Highway Bridges
"Specifically stipulated design seismic coefficients"
(1939)
1964
Niigata Earthquake
(M 7.5)
Fatalities: 26
Injuries: 447
Buildings destroyed: 1,960
Specifications for Seismic Design of Highway
Bridges
"Stipulated the installation of falling-ofif prevention
systems"
"Stipulated the assessment of soil liquefaction"
(1971)
1978
Miyagi-ken-oki
Earthquake
(M 7.4)
Fatalities: 28
Injuries: 11,208
Buildings destroyed: 1,383
"Part V : Seismic Design" in "Design Specifications
of Highway Bridges"
"Stipulated the design of the terminal point of
longitudinal reinforcement (elongation of the anchor
length of steel reinforcing rods)
"Expansion of the quantity of hoop tie reinforcement
(minimum hoop tie steel diameter from 6 mm to 13
mm)" (1980)
"Based on surveys and research concerning the dynamic
bearing strength and defonnation performance of reinforced
concrete bridge piers"
"Part V : Seismic Design" in "Design Specifications
of Highway Bridges"
"Stipulated an examination of the ultimate horizontal
strength during an earthquake for reinforced concrete
bridge piers" (1990)
1995
Hanshin - Awaji
Earthquake Disaster
(Hyogo-ken Nanbu
Earthquake: M 7.2)
Fatalities: 6,425
Missing: 2
Injuries: 43,772
Buildings destroyed: 110,457
"Part V : Seismic Design" in "Design Specifications
of Highway Bridges"
"Stipulated design earthquake force accounting for
eannquaKe motion causeu oy me nyogo-Ken iNanou
Earthquake"
"Stipulated seismic design based on the ultimate
horizontal strength during an earthquake method for
structural members strongly effected by earthquakes"
(1996)
8
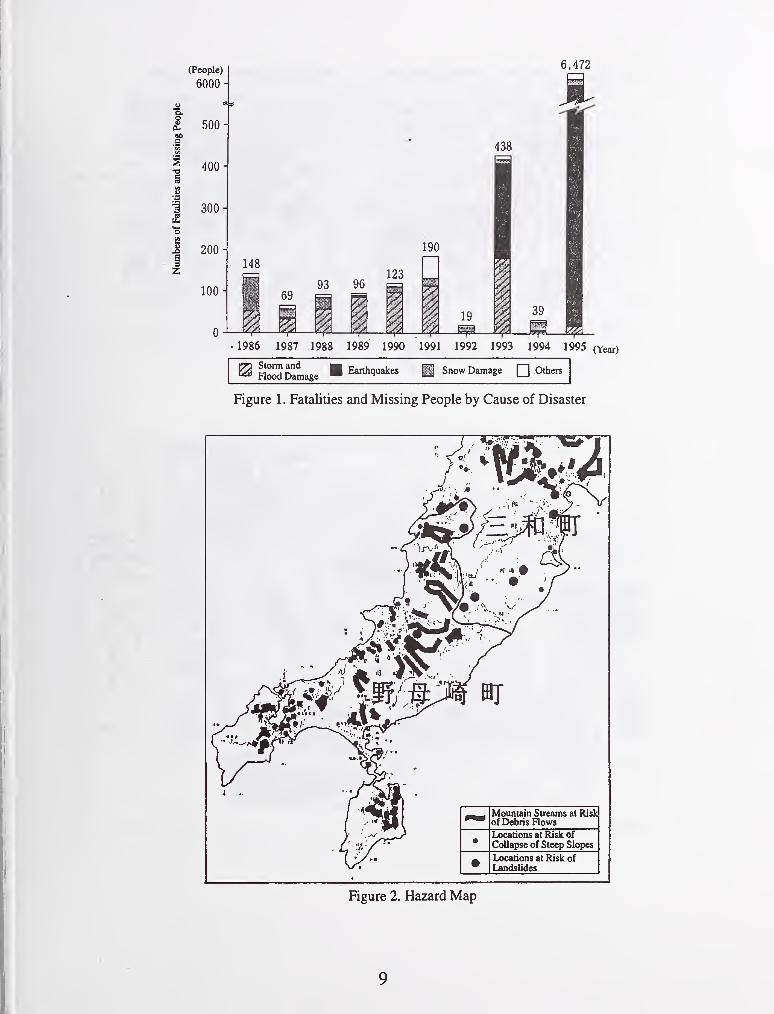
(People)
6000
.a
a1
•s
iSu.o
Z
500 -
400 -
300 -
200
100
0
148
6993 96
123
^ ^ ^
190
438
19 i
6,472
39
1986 1987 1988 1989 1990 1991 1992 1993 1994 1995 (Year)
Storm and
Flood DamageEarthquakes Snow Damage Q Others
Figure 1 . Fatalities and Missing People by Cause of Disaster
Mountain Streams at Riskof E>ebris Rows
•Locations at Risk of
Collapse of Steep Slopes
• Locations at Risk ofLandslides
Figure 2. Hazard Map
9
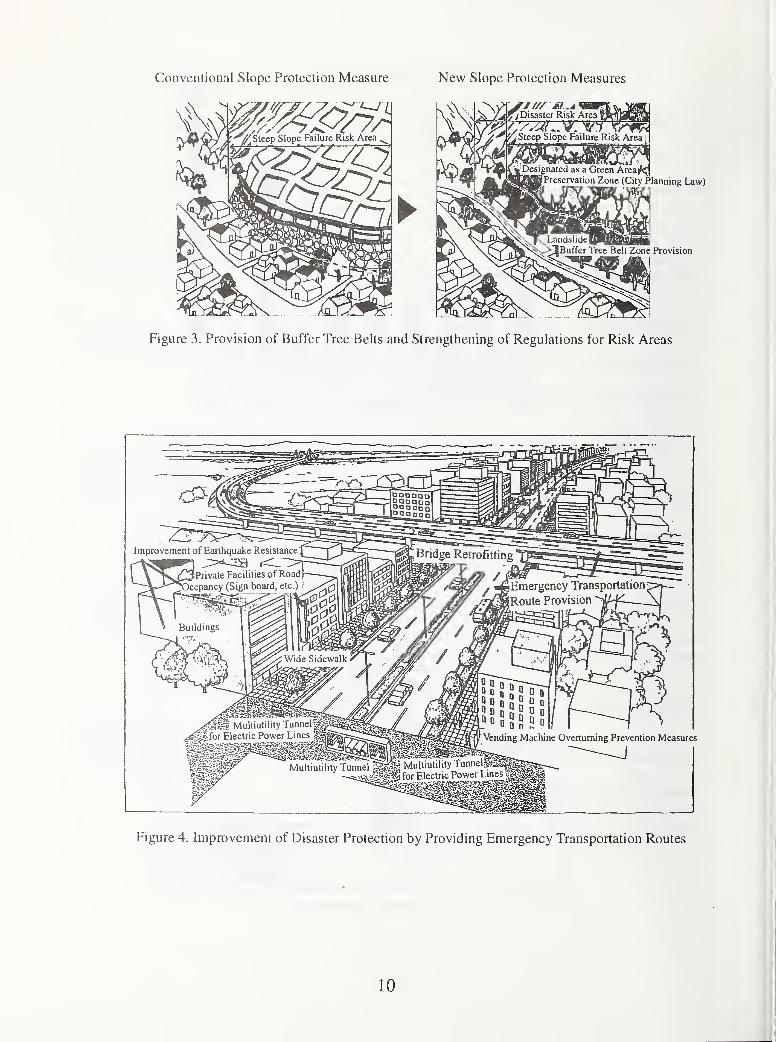
Conventional Slope Protection Measure New Slope Protection Measures
^ r^--^SteepSlope Failure Risk_Area .
\ ^Disaster Risk Area E
C)Lj ^ioSteen Slonft Failure Risk Arpji I I
I^Designated as a Green .
(Preservation Zone (City Planning Law)
Landslide!
Buffer Tree Belt Zone Provision
Figure 3. Provision of Buffer Tree Belts and Strengthening of Regulations for Risk Areas
Improvement of Earthquake Resistance
Jprivate Facilities of Road
fOccpancy (Sign board, etc.) '
'Bridge Retrofitting
'
/fiEmergency Transportation
j
KRoute Provision
'
/
Wide Sidewalk <
^^m. MultiutilityTunnel^^^^^^,,^^^#gfor Electric Power Lines ^^E^^^^^sbwj
Multiutihty Tunnel 5^:^ Multiutil.ty Tunne Pis^-v.vv^^C^^ for Electric Power Lines 'j^^^
D D
Vending Machine Overturning Prevention Measures
Figure 4. Improvement of Disaster Protection by Providnig Emergency Transportation Routes
10

Embankment Production Facilities^ Bridge
NormalConditions
Highway NetworkData
Socio-EconomicData
turned
Damagebefore EQ
Feedback
Initialization]
Planner
Restoration\
ActualDamageafter EQ
J
Loss Estimation
Priority for
Retrofitting/Restoration
Time-History ofEarthqual<e Effects
Feedback
Figure 5. Loss Estimation for Pre-/Post Earthquake Risk Management
Accelerometer Network
20-40km along Highway
Microwave CommunicationNetwork
fS3''''^ork Office
Accelerometer
Accelerometer "^^^^ Office Regional Bureau
Real-time DamageEstimation System
Headquarter
Figure 6. Earthquake Disaster Information System
11
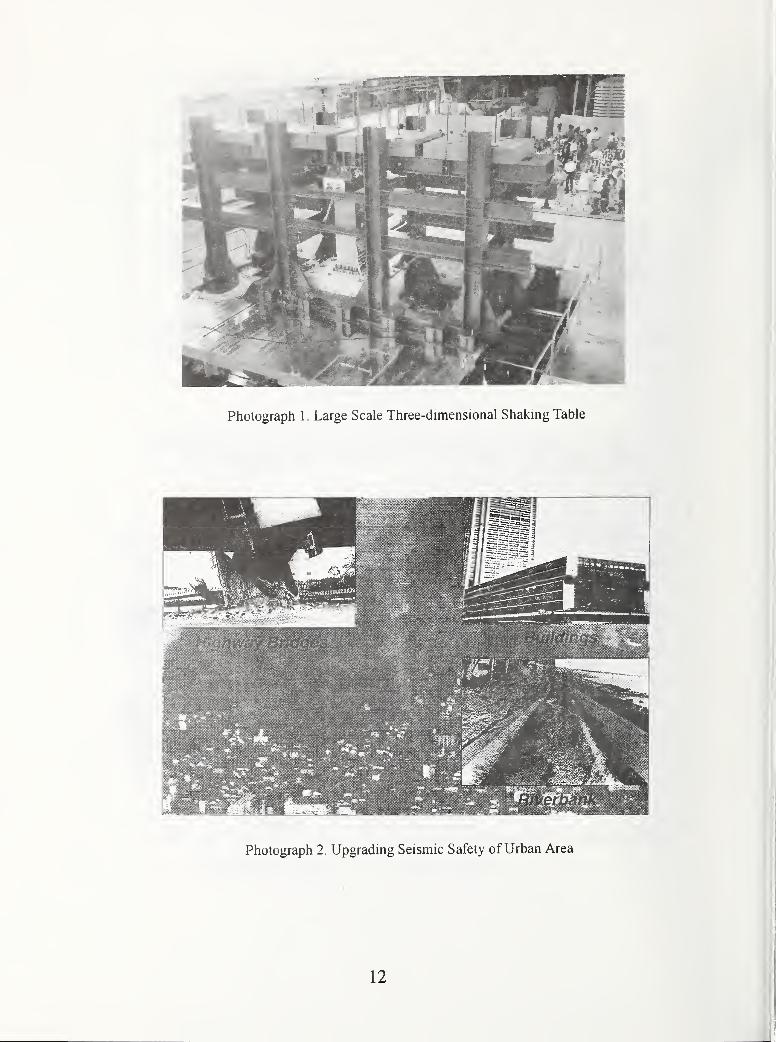
Photograph 1. Large Scale Three-dimensional Shaking Table
Photograph 2. Upgrading Seismic Safety ofUrban Area
12
Completing Our Panel's Work
by•
Richard N. Wright^
ABSTRACT
Our 30th Joint Meeting provides an
opportunity to reflect on our work and
accompHshments and estabhsh our view for
the future of our U.S./Japan Panel on Wind
and Seismic Effects. The Panel has helped
us, in the United States, in Japan, and in the
world, to: (1) focus, coordinate and amplify
efforts of government, academia and
industry to better understand extreme wind
and earthquake phenomena, and (2) increase
the resistance of our built environment and
society to their destructive effects. Is it not
time to commit ourselves to the solution of
the problem of destructive winds and
earthquakes? Can we make it the objective
for the next 20 years of the Panel to work
together, with the international wind and
earthquake communities, to provide: (1) the
knowledge of extreme wind and earthquake
phenomena; (2) the practices for planning,
design, construction, operation,
maintenance, and rehabilitation of our built
environment; and (3) the incentives for
societal actions to apply the practices that
together will end the threat of wind and
earthquake disasters?
KEY WORDS: Disaster Mitigation;
Earthquakes; Earthquake Engineering; Earth
Science; Japan; Meteorology; Seismology;
Social Science; United States; WindEngineering
1. INTRODUCTION
Our 30th Joint Meeting provides an
opportunity to reflect on our work and
' Director, Building and Fire Research Laboratory
National Institute of Standards and Technology
accomplishments and establish our view for
the future of our U.S./Japan Panel on Windand Seismic Effects. It is a wonderful
opportunity, while the founders of the Panel
can still be with us, to note how the Panel
has helped us, in the United States, in Japan,
and in the world, to: (1) focus, coordinate
and amplify efforts of government,
academia and industry to better understand
extreme wind and earthquake phenomena,
and (2) increase the resistance of our built
environment and society to their destructive
effects.
Moreover, we have the opportunity to
define our objectives for future Panel
collaborations. Therefore, I wish to build
on the thoughts of Dr. Tsuneo Katayama,
Director General of the National Research
Institute for Earth Science and Disaster
Prevention, at the 29th Joint Meeting and at
the Second U.S./Japan Earthquake Policy
Symposium: Is it not time to commitourselves to the solution of the problem of
destructive winds and earthquakes? Can
we make it the objective for the next 20
years of the Panel to work together, with the
international wind and earthquake
communities, to provide: (1) the knowledge
of extreme wind and earthquake
phenomena; (2) the practices for
planning, design, construction, operation,
maintenance, and rehabilitation of our
built environment; and (3) the incentives
for societal actions to apply the practices
that together will end the threat of wind
and earthquake disasters?
13

The appendix to this paper is an excellent
summary of the activities and
accomplishments of the Panel prepared by
our U.S.-side Secretary General, Noel
Raufaste. In the following paragraphs, I
draw upon the facts from this summary to
show that we have established a sound basis
for committing ourselves to Completing Our
Panel's Work and solving the problem of
destructive winds and earthquakes.
Our Panel was established in 1969 to
encourage, develop and implement the
exchange of wind and seismic technologies;
develop stronger links between the two
countries; conduct joint research and
cooperative programs; and exchange guest
researchers and equipment. Now, we are
holding our 30th joint meeting, and have
established an active family of task
committees that have held more than 60
workshops and conferences, have published
more than 1 700 papers, and exchanged over
200 guest researchers. These activities, our
collaborative investigations of effects of
U.S. and Japanese extreme winds and
earthquakes and our 9 Cooperative Research
Programs have resulted in knowledge and
recommended practices used in the United
States, Japan and other nations to reduce our
vulnerability.
2. CHALLENGE TO THE PANEL
Our work is gaining new scope. We are
beginning to address public health issues to
understand how wind and seismic effects
threaten illnesses and injuries and to define
countermeasures. We are beginning to
address emergency information services to
adapt information and communication
technologies to assist: (1) emergency
managers in search and rescue and in
avoidance of secondary damages such as
post-earthquake fires; (2) scientists and
engineers in understanding wind,
earthquake and fire phenomena, and the
performance of the built environment and
political and economic systems; and (3) the
public and private sectors in recovery from
the damages. We are increasingly invol-
ving leaders from industry and universities
in the work of the Panel. This scope allows
us to coordinate and focus public, private
and academic R&D, in the U.S. and Japan,
to provide the knowledge and recommended
practices needed to reduce our vulnerability.
We have not yet developed cooperative
activities aimed at defining and imple-
menting the incentives needed by all levels
of government, property owners, and the
general public to apply the recommended
practices systematically and economically
to end the threat of wind and earthquake
disasters. If this proposal for Completing
Our Panel's Work is endorsed by the Panel,
we will have to give substantial future
attention to incentives for mitigation of
wind and seismic effects. Our strategy for
20 years work would involve continued and
sfrengthened collaborations to:
• Exploit the opportunities provided by
wind and seismic disasters to gain
knowledge and public and private
policy support for mitigation.
• Improve knowledge of the destructive
environments arising from extreme
winds, earthquakes and post-event fires,
the response of the built environment,
and societal response during emergency
and recovery periods.
• Develop cost effective recommended
practices for planning, design,
construction, and rehabilitation of the
built environment.
• Develop cost effective recommended
practices for emergency services and
recovery.
• Develop incentives for public and
private sector actions to implement
recommended practices to end the threat
of wind and earthquake disasters.
14
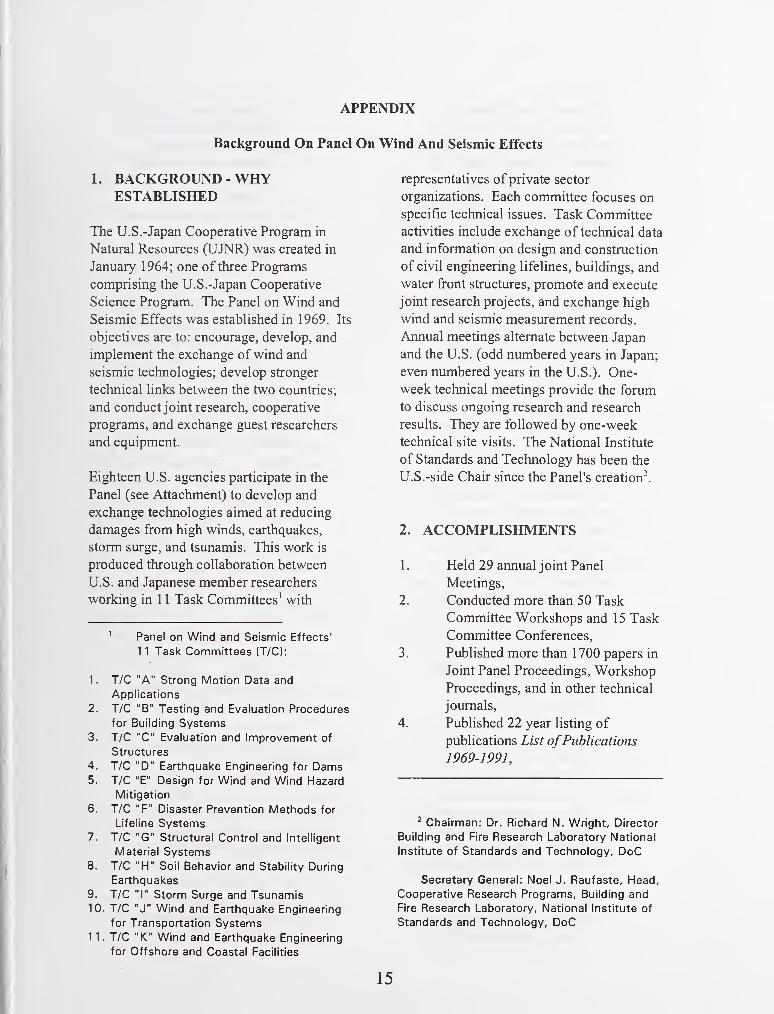
APPENDIX
Background On Panel On Wind And Seismic Effects
1. BACKGROUND - WHYESTABLISHED
The U.S.-Japan Cooperative Program in
Natural Resources (UJNR) was created in
January 1964; one of three Programs
comprising the U.S.-Japan Cooperative
Science Program. The Panel on Wind and
Seismic Effects was established in 1969. Its
objectives are to: encourage, develop, and
implement the exchange of wind and
seismic technologies; develop stronger
technical links between the two countries;
and conduct joint research, cooperative
programs, and exchange guest researchers
and equipment.
Eighteen U.S. agencies participate in the
Panel (see Attachment) to develop and
exchange technologies aimed at reducing
damages from high winds, earthquakes,
storm surge, and tsunamis. This work is
produced through collaboration between
U.S. and Japanese member researchers
working in 1 1 Task Committees' with
^ Panel on Wind and Seismic Effects'
1 1 Task Committees (T/C):
1 . T/C "A" Strong Motion Data and
Applications
2. T/C °B" Testing and Evaluation Procedures
for Building Systems3. T/C "C" Evaluation and Improvement of
Structures
4. T/C "D" Earthquake Engineering for Dams5. T/C "E" Design for Wind and Wind Hazard
Mitigation
6. T/C "F" Disaster Prevention Methods for
Lifeline Systems7. T/C "G" Structural Control and Intelligent
Material Systems8. T/C "H" Soil Behavior and Stability During
Earthquakes
9. T/C "I" Storm Surge and Tsunamis10. T/C "J" Wind and Earthquake Engineering
for Transportation Systems1 1. T/C "K" Wind and Earthquake Engineering
for Offshore and Coastal Facilities
representatives of private sector
organizations. Each committee focuses on
specific technical issues. Task Committee
activities include exchange of technical data
and information on design and construction
of civil engineering lifelines, buildings, and
water front structures, promote and execute
joint research projects, and exchange high
wind and seismic measurement records.
Annual meetings alternate between Japan
and the U.S. (odd numbered years in Japan;
even numbered years in the U.S.). One-
week technical meetings provide the forum
to discuss ongoing research and research
results. They are followed by one-weektechnical site visits. The National Institute
of Standards and Technology has been the
U.S.-side Chair since the Panel's creation^.
2. ACCOMPLISHMENTS
1 . Held 29 annual joint Panel
Meetings,
2. Conducted more than 50 Task
Committee Workshops and 15 Task
Committee Conferences,
3. Published more than 1700 papers in
Joint Panel Proceedings, Workshop
Proceedings, and in other technical
journals,
4. Published 22 year listing of
publications List ofPublications
1969-1991,
^ Chairman: Dr. Richard N. Wright, Director
Building and Fire Research Laboratory National
Institute of Standards and Technology, DoC
Secretary General: Noel J. Raufaste, Head,
Cooperative Research Programs, Building and
Fire Research Laboratory, National Institute of
Standards and Technology, DoC
15
5. Exchanged over 200 guest
researchers who performed short
and long term joint cooperative
research assignments that have
enhanced host and supply
laboratory's research mission and
contributed to improved structural
standards and building codes,
6. Annually visit more than 10 major
public works construction projects
that are using innovative civil
engineering techniques and research
laboratories having unique test and
measurement capabilities that
enhance the joint Panel's
understanding of research, design,
and construction procedures used by
both countries,
7. Performed joint post disaster
surveys and made entrees for
counterpart panel members to
participate in post disaster studies of
the performance of constructed
facilities exposed to wind,
earthquake, and tsunamis; results
are shared with the professional
community which contribute to
improved knowledge and practice
for disaster resistant constructed
facilities,
8. Conducted specialty symposia, e.g.,
• a two-day symposium on
Hurricane Hugo, Charleston
S.C., 1990 (22nd Joint
Meeting);
• a one-day international
symposium on IDNDR in Gifu,
Japan, 1991 (23rd Joint
Meeting);
• a mini-symposium during
technical site visits at Lehigh
University ATLSS Facility, at
New Orleans Corps of
Engineers Facility, and at LBL,
1992 (24th Joint Meeting);
• 25th Panel Anniversary
Symposium, IDNDR focus on
lessons learned in post disaster
investigations, Tokyo, 1993;
• a mini-symposium during
technical site visits at
Waterways Experiment Station,
Vicksburg, MI, 1994 (26th Joint
Meeting);
• a mini symposium during site
visits at University of
Minnesota's Wind Tunnel
Facility and at the Department
of Geology and Mineral
Industries, Portland, Oregon,
1996 (28th Joint Meeting)
.
Each event has advanced
technology transfer to participants
and stimulated greater attention to
promoting disaster mitigation
programs.
9. Translated into English two
Ministry of Construction reports,
Manualfor Repair Methods ofCivil
Engineering Structures Damaged by
Earthquakes and 2-volume Base
Isolation Systemsfor Buildings;
publications distributed to U.S. civil
engineering community as
improved practices,
10. Shared technical information during
Joint Panel Meetings, Task
Committee Workshops, and during
routine correspondence between
U.S. and counterpart Japanese
researchers that improved
researchers abilities to perform
mission research.
3. COOPERATIVE RESEARCHPROGRAMS
Completed seven Cooperative Research
Programs; two on-going Programs.
Accomplishments have improved design
and construction practices for both
countries.
1. Reinforced Concrete Structures
(1979-1987), accomplishments
include testing six-story full scale
16
buildings which led to improve
seismic design methods of
reinforced concrete buildings.
2. Lifeline Facilities (1982-1989);
accomplishments included
development of improved seismic
design methods of bridge columns.
3. In-situ Testing Methods for Soil
Liquefaction (1983-1986);
accomplishments include
development of rationale for
Standard Penetration Test (SPT)
data based on energy ratio.
4. Masonry Structures (1984-1988);
accomplishments include
development of strength-based
design guidelines for reinforced
masonry buildings.
5. Steel Structures (1985-1987);
accomplishments include testing of
a full-scale five-story building to
confirm prediction of performance
based on components and
subassemblages.
6. Hybrid Control (1990-1994);
accomplishments include
development of hybrid control
algorithms that require less energy
for controlling bridge response.
7. Precast Seismic Structural Systems
(1991-1992); accomplishments
include development of strength-
based design guidelines.
8. Seismic Performance of Composite
and Hybrid Structures (1993-).
9. Research on Countermeasures for
Soil Liquefaction (1994-).
4. TYPES OF EXCHANGES
Guest research exchanges advanced state of
technology in areas of steel, concrete, and
masonry structures under seismic forces;
developed techniques to analyze risks from
liquefaction; modeled water seepage in damfoundations; performed comparative
analyses of seismic design of U.S. and
Japanese bridges.
5. BENEFITS
The Panel's activities resulted in improved
building and bridge standards and codes and
design and construction practices for
constructed facilities in both countries, for
example:
1 . created and exchanged digitized
earthquake records used as the basis
of design and research for Japan and
the United States.
2. transferred earthquake engineering
information and strong-motion
measurement techniques for use by
seismically active countries, e.g.,
Australia, Canada, Italy, Mexico,
Peru, Taiwan, Turkey, and North
Africa;
3. produced data that advanced retrofit
techniques for bridge structures;
4. developed field test data for use in
aerodynamic retrofit of bridge
structures;
5. produced full-scale test data that
advanced seismic design standards
for buildings;
6. advanced technology for repairing
and strengthening reinforced
concrete, steel, and masonry
structures;
7. improved in-situ measurement
methods for soil liquefaction and
stability under seismic loads;
8. created a database comparing
Japanese and U.S. standard
penetration tests to improve
prediction of soil liquefaction;
9. created database on storm surge and
tsunamis and verified mathematical
models of tsunami and storm surge
warning systems;
10. established a library resource of
current research on wind and
earthquake engineering and on
storm surge and tsunamis;
1 1 . published proceedings of Panel
meetings. Task Committee
Workshops, and special
publications such as List of Panel
Publications and translated two-
volume series on earthquake 2.
resistant construction using base
isolation systems;
12. gained better knowledge of both 3,
countries research, design and
construction capabilities from in-
depth visits to host country's
laboratories and building and public
works projects. Results of such
visits contribute to creation ofnewTask Committees, agendas for Joint
Panel meetings and task committee 4.
workshops, special visits of U.S.-
Japan researchers, and joint
collaborative research.
6. FUTURE PLANS 5.
The Panel is plaiming:
1 . its 30th Joint Meeting to be
conducted at NIST, Gaithersburg,
MD in May 1998.
to conduct four Task Committee
workshops before the 30th Joint
Panel Meeting.
participation in appropriate research
projects of the U.S.-Japan
Earthquake Disaster Mitigation
Partnership of the April 17, 1996
Agreement, U.S.-Japan CommonAgenda. Appropriate Task
Committees will respond to the
Partnership in planning its work,
to publish its 5th newsletter for
disseminating Panel's activities to
peers and to decisionmakers at
Government laboratories and
agencies involved in construction,
a Panel Home Page to electronically
disseminate Panel information
worldwide. The effort will build on
current Panel descriptions.
18
ATTACHMENT
U.S. Members — Panel on Wind and Seismic Effects
Department of Commerce National Institute of Standards and Technology
National Oceanic and Atmospheric Administration
Department of Energy
Department of Health and Human Services
Center for Disease Control and Prevention
Department of Housing and Urban Development
Department of Interior Bureau of Reclamation
U.S. Geological Survey
Minerals Management Service
Department of State Office of Foreign Building Operations
Agency for International Development
Department of Transportation Federal Highway Administration
Department of Veterans Affairs
Department of the Army Corps of Engineers
Department ofNavy Naval Civil Engineering Laboratory
Department of Air Force Civil Engineering Support Agency
Federal Emergency Management Agency
National Science Foundation
Nuclear Regulatory Commission
California Department of Transportation
NSF Earthquake Eng. Centers Center for Advanced Technologies in Earthquake Loss
Reduction, State University ofNew York, Buffalo
Pacific Earthquake Engineering Research Center,
University of California, Berkeley
Mid-America Earthquake Center, University of Illinois,
Urbana-Champaign
19

i
STORM SURGE and TSUNAMIS

TSUNAMI AND STORM SURGE CHARACTERISTICS BASED ON LONG-TERMTIDE OBSERVATIONS
by
Toshihiko NAGAI". Kazuteru SUGAHARA". Hiroshi WATANABE".Koji KAWAGUCHI''. Masahiro MIHARA''. and Katsumi TAKASHIMA'
ABSTRACT
Based on the 38-year tide observation
records digitized every hour between 1958
and 1995, long waves-characteristics
including Tsunamis and Storm surges were
investigated. Long-waves with double
amplitudes greater than 15cm were observed
for 180 cases during the 38 years including
4 tsunamis.
Key Words: Tide Observation.
Long Waves,
Tsunami
1. INTRODUCTION
This paper presents the analysis of
observed long-term tide data ; to clarify
profiles of long-waves including tsunamis
and storm surges. (Nagai. et. al. , 1996)
2. TIDE OBSERVATIONS AND DATA ANALYSIS
38 years of tide data, between 1958 and
1995, obtained at the Kurihama-Tide-Station
were analysed. The station is located at the
entrance of the Tokyo-Bay (N35'' 13' 28".
E139° 43' 27"). and employs the Fuse type
tide gauge with a well. Figure 1 and 2 shows
location of the tide station. Photo 1 shows
the Fuse type tide gauge. The tide well is
connected to the sea with a tube as the
Figure 3 shows. The tube of the diameter
131mm works as a low-pass-filter by omitting
the high frequency sea level fluctuations
caused by wind waves.
Observed data were recorded on an
analog recorder for the entire observation
term. All the data were digitized every hour
in order to calculate the mean sea level and
the harmonic components.
3. LONG-WAVE RECORDS
Figure 4 shows the observed long-waves
with the heights (double amplitude) greater
than 15cm. Among these 180 cases, 4 casese
were tsunamis, andthe others were caused by
weather disturbances. Table 1 shows joint
distribution between double amplitudes and
periods of the observed long waves. Observed
periods were either between 2-3 minutes or
15-20 minutes, which corresponds to the
local topographical resonance periods of the
two different modes, except the 1960-Chile-
Tsunami event with periods of around 80
minutes.
1) Hydraulic Engineering Division.
Port and Harbour Research Institute,
Ministry of Transport
3-1-1. Nagase. Yokosuka 239-0026, Japan
TEL:+81-468-44-5017 FAX:+81-468-42-5246
2) ECOH Co.
2-6-4. Kita-Ueno. Taito. Tokyo 110-0014.
Japan
TEL:+81-3-5828-2185 FAX:+81-3-5828-2176
3) Coastal Ocean Research Co.
3-21-1. Shimo-Ochiai. Shinjuku-ku, Tokyo
161-0033. Japan
TEL:+81-3-3950-3740 FAX:+81-3-3951-9171
23
4. THE 1960-CHILE-TSUNAMI PROFILES
Figure 5 shows the observed 1960-Chile-
Tsunami profiles by digitizing with a
shorter interval, every 36s. The lower
figure shows the observed water surface
level with astronomical tides, while the
upper figure shows the tsunami profiles by
omitting lower frequency astronomical tide
components. The marks ®, (2), (3). (3), and®',
.(3)'
.(3)'
,©
.©
.®'
.®' mean the data
terms for frequency spectra analysis.
Frequency spectra analysis was
conducted with different record lengths 1024.
2048. 4096. and 8192 data points, which
corresponds to the sampling length of lOh.
20h. 40h. and 80h. respectively, as the
Figure 6 shows. The results showed that the
peak frequency of the tsunami was 0. 0002Hz,
and the second peak was at 0. OOlHz. This
second peak corresponded to the local
topographic resonance frequency. The ratio
of the second peak and the first peak
increased with time. The results of this
study provided more detailed tsunami spectra
information than the previous study
conducted in I960' s. (Hatori, 1969)
5. THE 1996-IRIANJAYA-TSUNAMI PROFILES
The frequency response of the well,
connected with a tube to the sea water, was
investigated at the occasion of the 1996
1 r ian jaya-Tsunami event by comparing the
tide gauge data with the ultra-sonic direct
sea surface elevation data. Photo 2 shows
the Ultra-sonic direct sea surface measure-
ment equipment.
Figure 7 is the tsunami profiles
including the NOWPHAS offshore wave gauges
continuous records (Nagai et.al. 1994), the
low-pass-filtered Fuse type tide gauge
records, and the ultra-sonic direct sea
surface elevation records. The NOWPHAS
offshore wave gauge is located 50km off the
24
tide station near the Izu-Ohshima Island.
( water depth 50m,N 34° 40' 23". E 139° 27' 19"
)
Figure 8 shows the results of the
spectra analysis of the three records of the
Figure 7. The peak frequency of the tsunami
was 0. OOlHz, near to the local topographic
resonance frequency. The responce function
indicates that the tsunami was amplified in
the Kurihama Bay due to the topographic
resonance. Figure 8 also proves that for
longer period waves, greater than 5 minute
periods, ratio is almost 1.0 between the two
records of the low-pass-filtered Fuse type
one and the direct sea surface elevation one.
5. STORM SURGE RECORDS
Harmonic analysis was conducted for
every year from the hourly based observed
data, and the 28 components' amplitudes and
phases were obtained. Table 2 shows the
results of the 4 principal components of M2
(period of 12.42h), S2(12h), Kl(23. 934h).
and 01(25. 819h). ZO values defined as the
sum of the amplitudes of the 4 components
are also shown.
In addition to the each year's
calculated 4 components and the ZO value,
maximum, minimum, and average amplitudes and
the standard deviation (S. D. ) are shown in
Table 2. The 4 components' amplitudes
fluctuations were small with the standard
deviation less than 1%. Nevertheless,
amplitudes of the longer period components
such as Sa(lyear) and SSa(0. 5year), showed
much larger fluctuations.
Astronomical tide was calculated from
the 28 harmonic tide components' amplitudes
and phases, and storm surge ( meteorological
tide ) level was obtained as the diference
between the observed tide and calculated one.
Table 3 shows the records of the 40 highest
storm surges during the 38 years with the
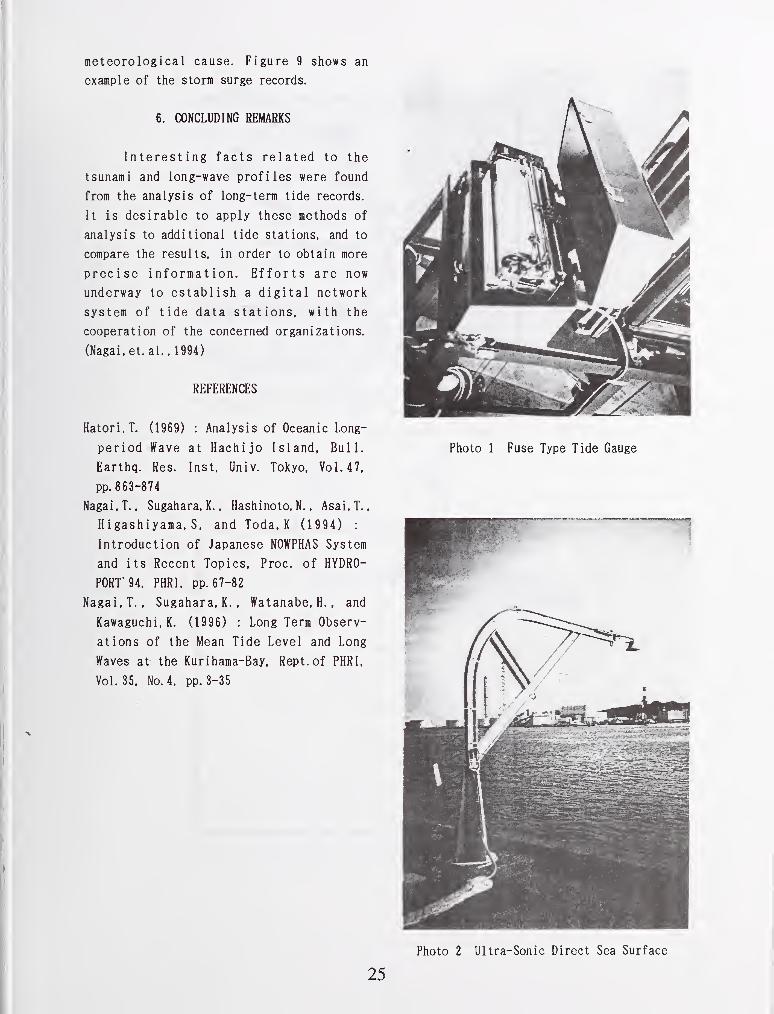
meteorological cause. Figure 9 shows an
example of the storm surge records.
6. CONCLUDING REMARKS
Interesting facts related to the
tsunami and long-wave profiles were found
from the analysis of long-term tide records.
It is desirable to apply these methods of
analysis to additional tide stations, and to
compare the results, in order to obtain more
precise information. Efforts are now
underway to establish a digital network
system of tide data stations, with the
cooperation of the concerned organizations.
(Nagai, et. al. , 1994)
REFERENCES
Hatori.T. (1969) : Analysis of Oceanic Long-
period Wave at Hachijo Island, Bull.
Earthq. Res. Inst, Univ. Tokyo. Vol.47,
pp. 863-874
Nagai, T., Sugahara, K. , Hashinoto, N. , Asai,T.
.
Higashiyama, S, and Toda. K (1994) :
Introduction of Japanese NOWPHAS System
and its Recent Topics, Proc. of HYDRO-
PORT" 94, PHRI. pp. 67-82
Nagai, T.. Sugahara, K. . Watanabe, H. , and
Kawaguchi,K. (1996) : Long Term Observ-
ations of the Mean Tide Level and Long
Waves at the Kurihama-Bay, Rept. of PHRI,
Vol.35, No. 4, pp. 3-35
Photo 1 Fuse Type Tide Gauge
Photo 2 Ultra-Sonic Direct Sea Surface
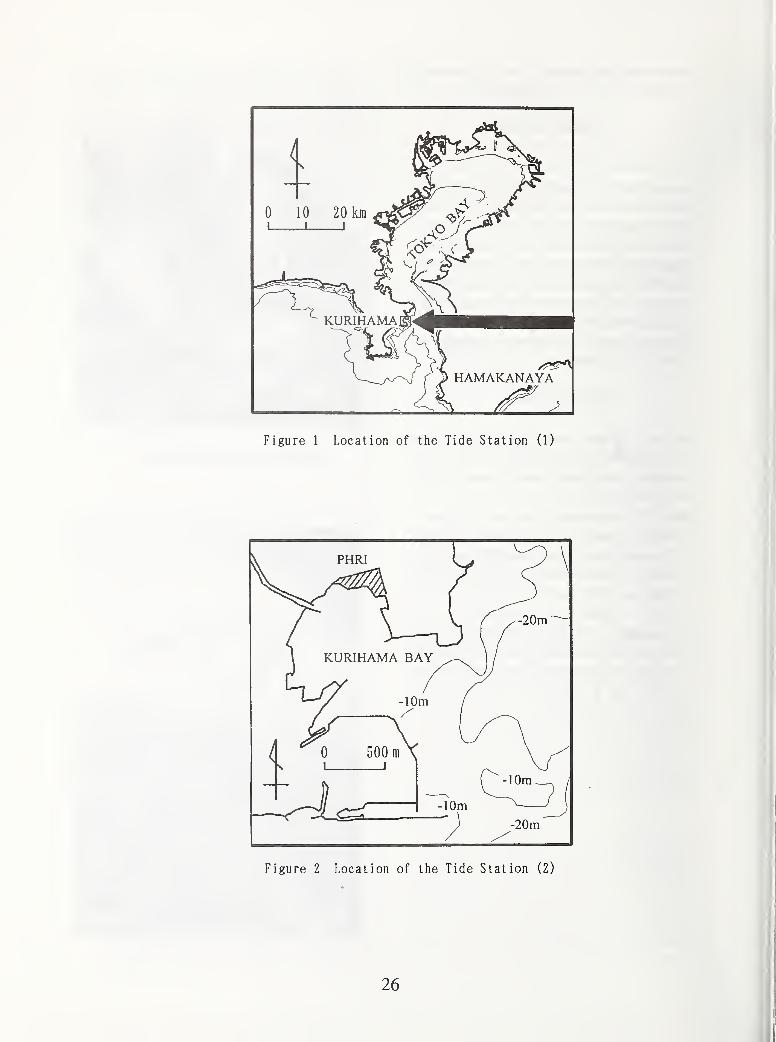
Figure 1 Location of the Tide Station (1)
I
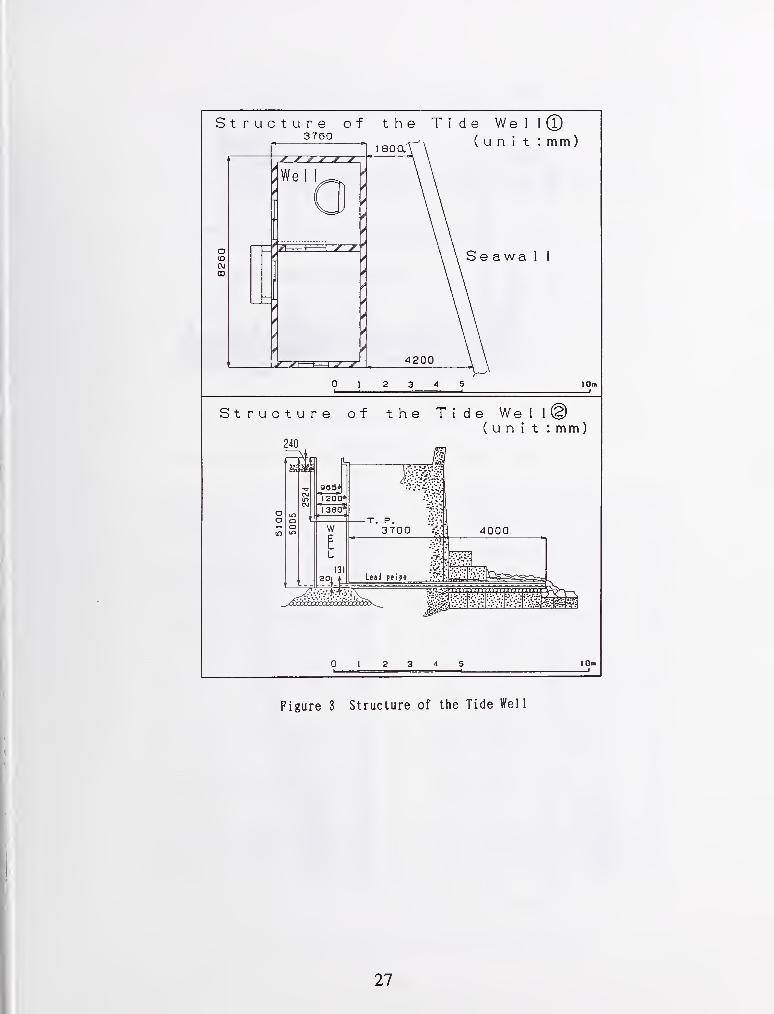
Structure of the Tide Well(l)
0 1 2 3 4 5 lOn
Structure of the Tide Weil©(unit: mm
)
lOm
Figure 3 Structure of the Tide Well
27
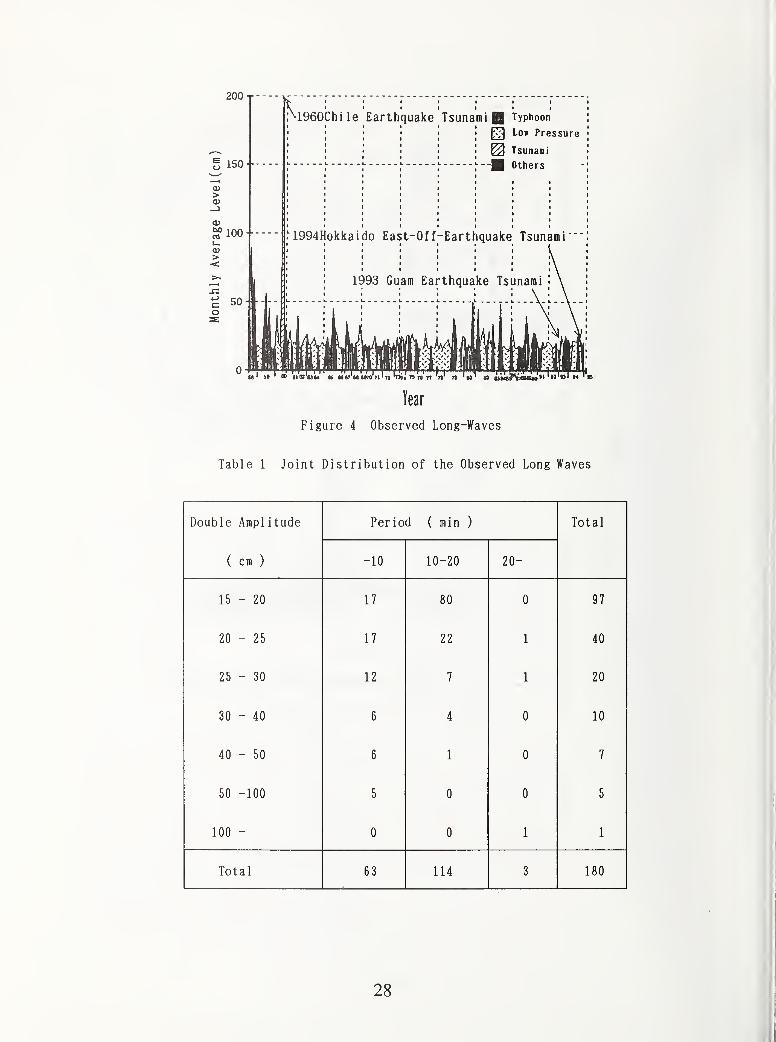
200 T
>
<V
^100 +
>-<
1^'
co
50-
1960Chile Earthquake
1994Hokkaido East-Off
Tsunami Typhoon
Low Pressure
Tsunani
Others
Earthquake Tsunami
1993 Guam Earthquake Tsunami
inn n n n 'lo' a fst»f^tmm»o"
year
Figure 4 Observed Long-Waves
Table 1 Joint Distribution of the Observed Long Waves
Double Ampl itude
( cm )
Period ( min ) Total
-10 10-20 20-
15 - 20 17 80 0 97
20 - 25 17 22 1 40
25 - 30 12 7 1 20
30 - 40 6 4 0 10
40 - 50 6 1 0 7
50 -100 5 0 0 5
100 -0 0 1 1
Total 63 114 3 180
28
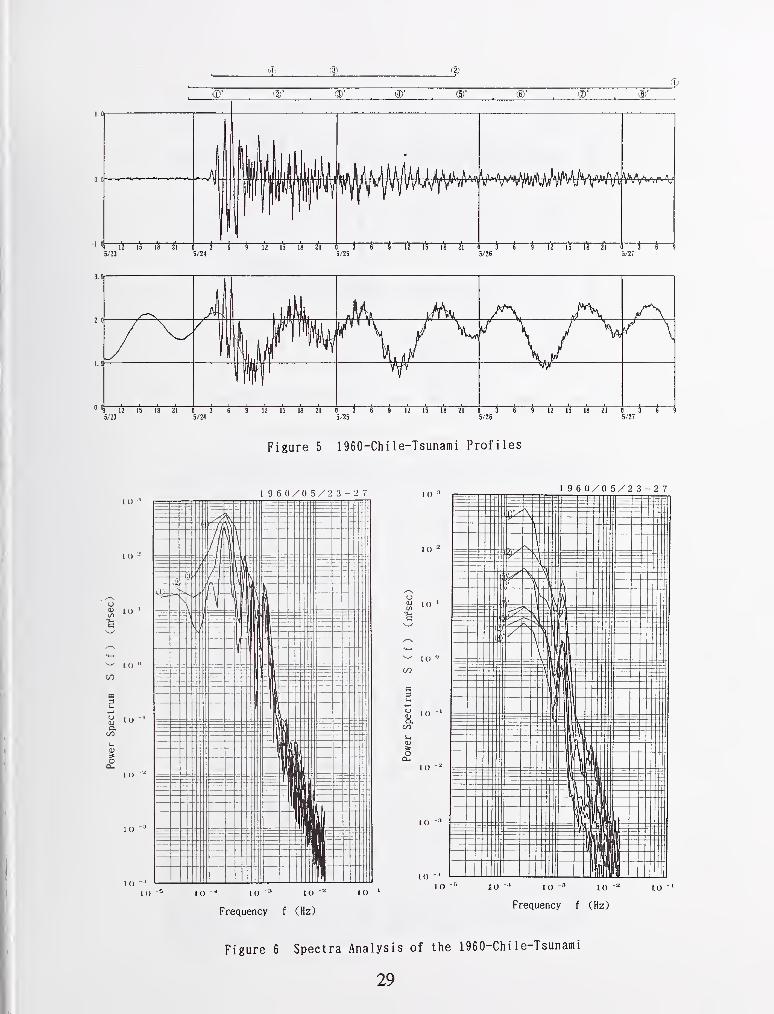
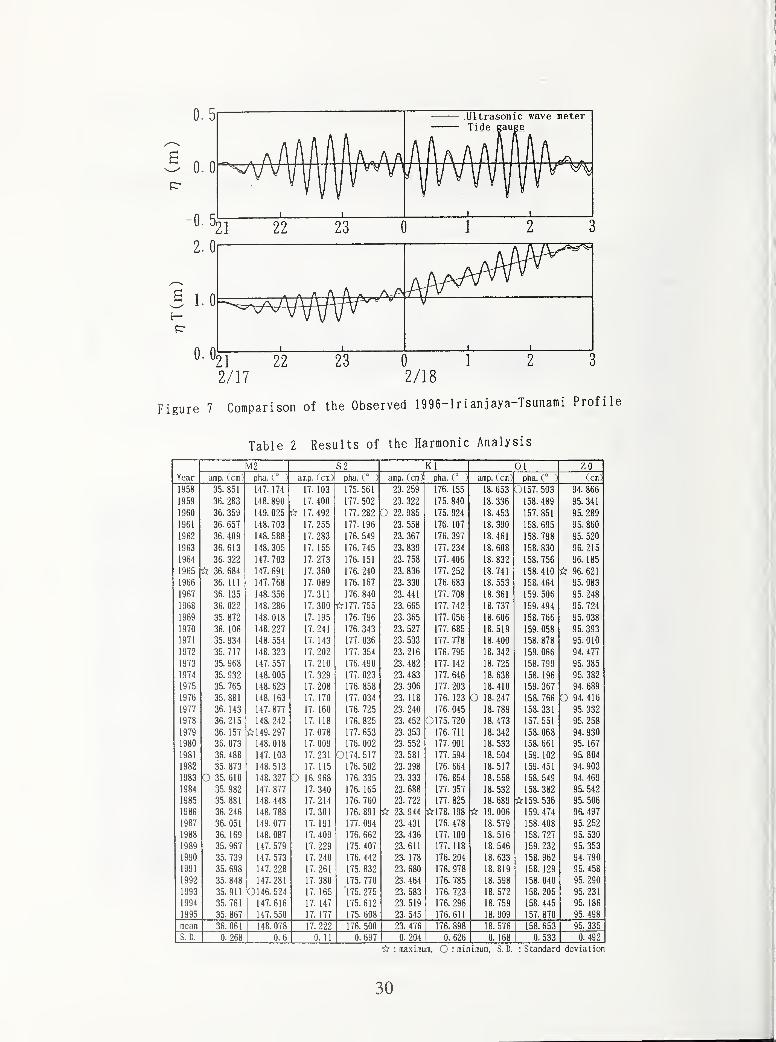
^ 0.0
-0.5:
2.
0
1.0
0.0
Ultrasonic wave meterTide Eauge
1 1 1 I
21 22 23
pr
1 1
'21 22
2/17
23
2/18
Figure 7 Comparison of the Observed 1996-Irianjaya-Tsunami Profile
Table 2 Results of the Harmonic Analysis
M2 S2 Kl 01 ZOYear amp. (cm) pha. (° ) amp. (cm) pha. (° ) amp. (on) pha. (°
) amp. (cm) pha. C ) (cm)
1958 35. 851 147. 174 17. 103 175. 561 23. 259 176. 155 18. 653 0157. 503 94. 866
1959 36. 283 148. 890 17. 400 177. 502 23. 322 175. 840 18. 336 158.489 95. 341
1960 36. 359 149. 025 ti 17.492 177. 282 O 22. 985 175. 924 18.453 157. 851 95. 289
1961 36. 657 148. 703 17. 255 177. 196 23. 558 176. 107 18. 390 158. 695 95. 860
1962 36. 409 148. 588 17. 283 176. 549 23. 367 176. 397 18.461 158. 798 95. 520
1963 36.613 148. 305 17. 155 176. 745 23. 839 177. 234 18. 608 158. 830 96.215
1964 36. 322 147. 703 17. 273 176. 151 23. 758 177. 406 18. 832 158. 756 96. 185
1965 t: 36. 684 147. 691 17. 360 176. 240 23. 836 177. 252 18. 741 158.410 96.621
1966 36. Ill 147. 768 17.089 176. 167 23. 330 176. 683 18. 553 158.464 95. 083
1967 36. 135 148. 356 17.311 176. 840 23. 441 177. 708 18. 361 159. 506 95. 248
1968 36. 022 148. 286 17. 300 irl77. 755 23. 665 177. 742 18. 737 159.494 95. 724
1969 35. 872 148.018 17. 195 176. 796 23. 365 177. 056 18. 606 158. 766 95. 038
1970 36. 106 148. 227 17. 241 176. 343 23. 527 177. 685 18.519 159.058 95. 393
1971 35. 934 148. 554 17. 143 177. 036 23. 533 177. 778 18.400 158. 878 95.010
1972 35.717 148. 323 17. 202 177. 354 23.216 176. 795 18. 342 159.066 94. 477
1973 35. 968 147.557 17.210 176. 490 23. 482 177. 142 18. 725 158. 799 95. 385
1974 35. 932 148.005 17. 329 177. 023 23. 483 177. 646 18. 638 158. 196 95. 382
1975 35. 765 148. 623 17. 208 176. 858 23. 306 177. 203 18.410 159. 367 94. 689
1976 35. 881 148. 163 17. 170 177. 034 23. 118 176. 123 O 18.247 158. 766 O 94.416
1977 36. 143 147. 877 17. 160 176. 725 23. 240 176. 045 18. 789 158. 331 95. 332
1978 36.215 148. 242 17. 118 176. 825 23. 452 0175. 720 18.473 157. 551 95. 258
1979 36. 157 5^149. 297 17. 078 177. 653 23. 353 176.711 18. 342 158. 068 94. 930
1980 36. 073 148.018 17. 009 176. 002 23. 552 177. 001 18. 533 158. 661 95. 167
1931 36. 488 147. 103 17. 231 0174. 517 23. 581 177. 594 18. 504 159. 102 95. 804
1982 35. 873 148.513 17. 115 176. 502 23. 398 176. 664 18.517 159.451 94. 903
1983 0 35.610 148. 327 0 16.968 176. 335 23. 333 176. 854 18. 558 158. 549 94. 469
1984 35. 982 147. 877 17. 340 176. 165 23. 688 177. 357 18. 532 158.382 95. 542
1985 35. 881 148.448 17.214 176. 760 23. 722 177. 825 18. 689 159. 536 95. 506
1986 36. 246 148. 788 17. 301 176. 891 i: 23. 944 irl78. 198 ir 19.006 159.474 96. 497
1987 36. 051 149. 077 17. 191 177. 094 23. 431 176. 478 18. 579 158.408 95. 252
1988 36. 169 148.087 17.409 176. 662 23. 436 177. 100 18.516 158. 727 95. 530
1989 35. 967 147. 579 17. 229 175. 407 23.611 177. 118 18. 546 159.232 95. 353
1990 35. 739 147. 573 17. 240 176. 442 23. 178 176. 204 18. 633 158. 962 94. 790
1991 35. 698 147. 228 17.261 175. 832 23. 680 176. 978 18.819 158. 129 95. 458
1992 35. 848 147. 281 17. 380 175. 770 23. 464 176. 785 18. 598 158. 040 95. 290
1993 35.911 0146.524 17. 165 175. 275 23. 583 176. 723 18. 572 158. 205 95. 231
1994 35. 761 147.616 17. 147 175.612 23.519 176. 296 18. 759 158. 445 95. 186
1995 35. 867 147. 550 17. 177 175. 608 23. 545 176.611 18. 909 157.870 95. 498
mean 36. 061 148.078 17. 222 176. 500 23. 476 176. 898 18. 576 158. 653 95. 335
S.D. 0. 268 0.6 0. 11 0. 697 0. 204 0. 626 0. 168 0. 533 0.492
ii : ma.Kiraum. O : minimum. S. D. : Standard deviation
30
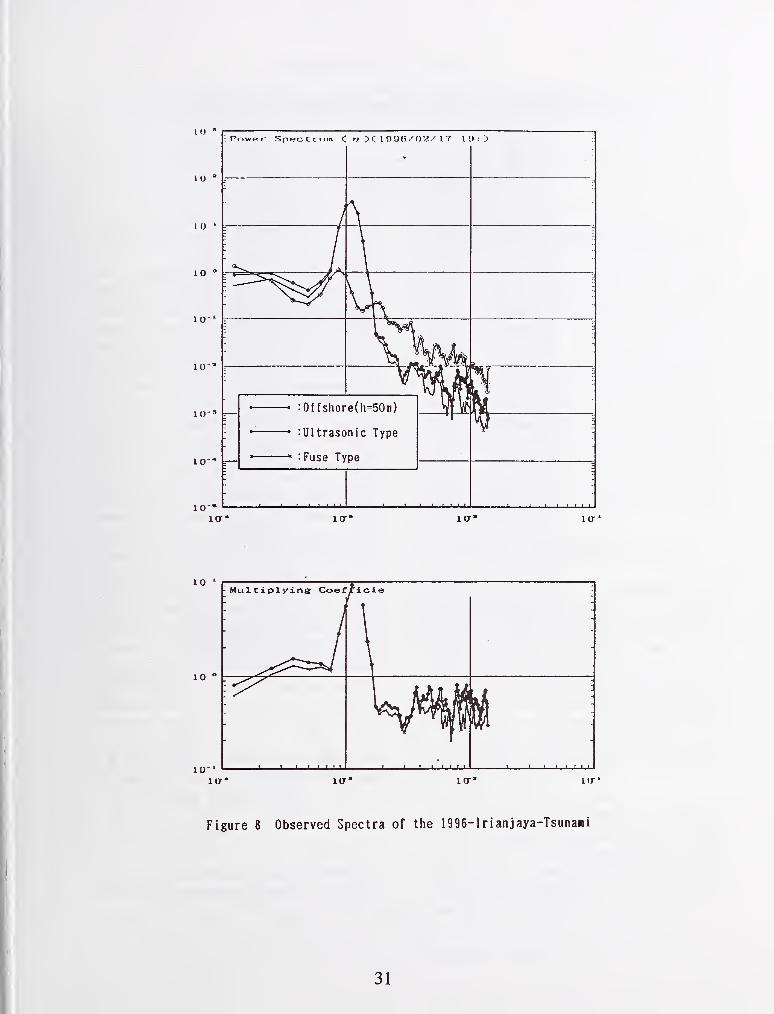
31
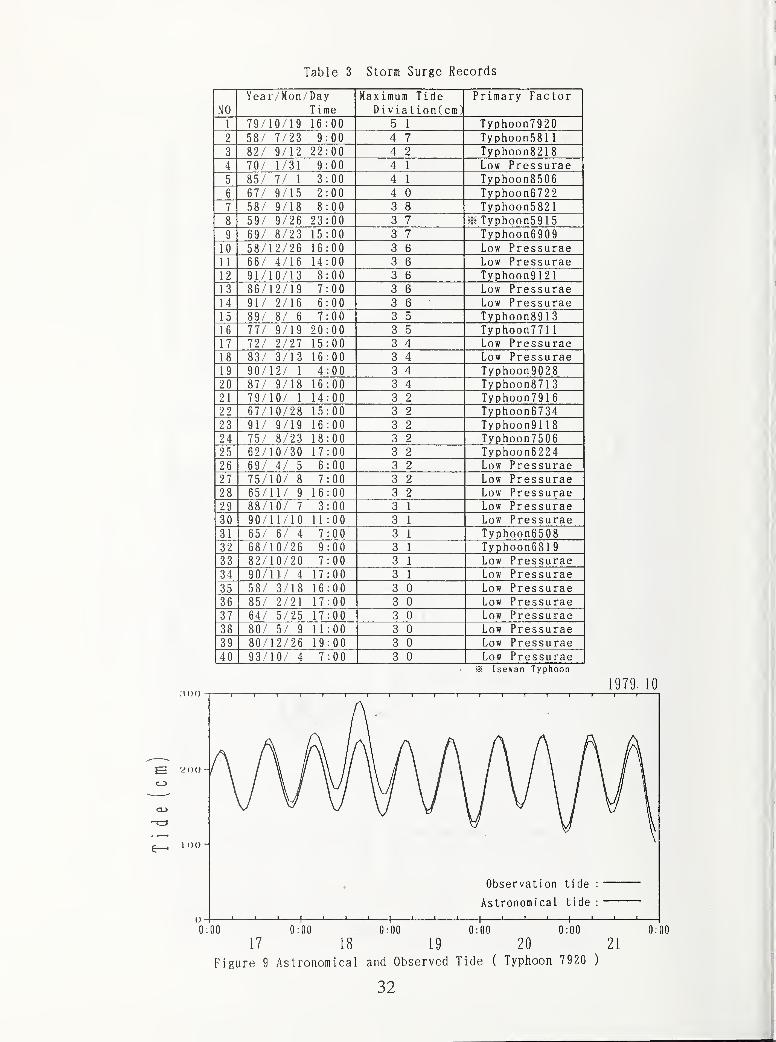
Table 3 Storm Surge Records
Year/Mon/DayTime
n d A 1 111 U III 1 i U C
U L V i d L i U 11 V, U 111 ^
rlilllaiy rdCLUI
1
I7 Q / 1 n / 1 Q 1 fi(9/1U/19 10. u u
0L
CO/ 7/OQ Q0 0/ 1/6,0 9 n nu u A 71 y p noo n J o 1 1
q 99/ Q/19 99oZ/ 9/lZ ^Z u u A 9 Tunhnnn ft 9 1 ft
A4 7 n / 1 / "} 1 Q
I U / 1 / 0 i 9 u u
c0
Q c: / 7 / 1 Q00 / / / 1 0 u u A 1 T\/r\Vir»r\n ft ^Ofi1 y piiuuuojuu
c0
C 7 / ft / 1 C 9b / / 9/ 1 D Z U U A n Ti7nKr\r\nfi799lypnoonoiii
7 00/ 9/ lo 0 U U o o Ti7nhr\nnt^ft9 1
Q0 59/ 9/zb 66 0 0 Q 7O 1 ^ Typhoon5915Q b9/ o/z3 10 A A
0 0 Q 7 lypnoonDyuyi U 58/12/26 16
A A00 6 D Low Pressurae
1 1
1 1 bb/ 4/ lb 14 uu o cO D Low Pressurae1 01 L 91/10/13 8
A A00 o b 1 ypnoony iL\
1 Q 86/12/19 7 00 O D Low Pressurae1 A1
4
91/ 2/16 6 00 o b Low Pressurae1 C1
5
89/ 8/6 7 00 6 o 1 ypnoono9 1 o
1 bT'T / A/tA Art77/ 9/19 20 00 O 0 Typhoon77 1
1
1 /
TA/ A/A'7 ir72/ 2/27 15 0 0
O Ao 4 Low Pressurae1 01 0
AA / A/1A IP83/ 3/13 16 00 o 4 Low Pressurae
1 f\1 9
AA/1A/ 1 i
90/12/ 1 4 00 6 4 1 ypnoon9UZoo n20
AT/ A/1A 1A87/ 9/18 16 00 d 4 1 y pnoono / 1
J
L 1 79/10/ 1 14 00 o oO Z i ypnoon / y 1
b
0 0 AT/IA/AA 1C67/10/28 15 00 o oo ^ lypnoonb / o4O 0 A1/ A/1A IP
91/ 9/19 16 00 o o1 ypnoon9 lib
0 A 1 C / A/OA in75/ 8/23 18 00 o o
1 ypnoon / 0 0 b
0 c60PA/IA/AA IT62/10/30 17 00 o od I lypnoonbZZ4
2dPA/ i / r p69/ 4/5 6
A A00 Q O Low Pressurae
0 7z /
TC/IA/ O T75/10/ 8 7A A00 o oo Z Low Pressurae
0 0 (?C/11/ A 1Cbo/ 1 1 / 9 1 fa
A A0 0 d I Low Pressurae
0 0Z 9oo/ir\/ 7 o88/ 10/ 7 6
A AU 0 Low Pressurae
0 U 90/11/10 11A AU 0 Low Pressurae
Q 10 1 bo/ b/ 4 /
A A0 u Typhoon65 0 8
0 Z fiQ/in/9fi QDO/IU/ZD 9 u u iypnoonDoi9Q Q0 0 82/10/20 7 •00 Low Pressurae0 4 90/11/ 4 17 :00 1 I rwii PT*ACClIT"aAL/Un riCOoUidC35 58/ 3/18 16 :00 3 0 Low Pressurae36 85/ 2/21 17 :00 3 0 Low Pressurae37 64/ 5/25 17 :00 3 0 Low Pressurae38 80/ 5/ 9 11 :00 3 0 Low Pressurae39 80/12/26 19 :00 3 0 Low Pressurae40 93/10/ 4 7 :00 3 0 Low Pressurae
?S i sewan -Typhoon
1979. LO•100 -1
1 1 1 r 1 1 1 1 1 1 1 1 1 1 1 1 1 1 1
10 0-
Observation tide
Astronomical tide
_1 I L. _1 ' I I 1 I
fl;flO fl:flO 0:00 0:00 0:00
[7 L8 19 20 21
Figure 9 Astronomical and Observed Tide ( Typhoon 7920 )
32
International Responses to Pacific Tsunami Warnings and Watches
by
Michael E. Blackford
ABSTRACT
The Pacific Tsunami Warning Center has
issued thirteen warnings to the participants in
the Tsunami Warning System in the Pacific
since the beginning ofthe International Decade
for Natural Disaster Reduction. The average
time for the dissemination of these warnings
has been about 55 minutes. In most cases
tsunami destruction has been confined to
localities that are within one hour's tsunami
travel time fi^om the source. While the
Warning Center's warnings may not reach
those most affected by reecent tsunamis, the
information is nevertheless of great value to
those emergency managers fiirther down
stream of the spreading tsunami. Anexamination of the warning process indicates
the need for more feedback from the
participants receiving the warnings regarding
the applicability of the information to their
needs and, if they are affected by the tsunami,
a timely summary of these affects that can be
used to ascertain the severity of the tsunami.
The study also points up the critical need for
independently fijnctioning regional tsunami
warning centers.
KEYWORDS: destructive tsunamis,
emergency managers, feedback, response,
tsunami warning, tsunami watch
1. INTRODUCTION:
Since the beginning of the International
Decade for Natural Disaster Reduction
(IDNDR) the Pacific Tsunami Warning Center
(PTWC), acting as the Operations Center for
the Tsunami Warning System in the Pacific
(TWSP), issued 13 warnings for earthquakes
that were believed to have the potential to
generate tsunamis. These events are
summarized in Table 1 . It was further believed
that these tsunamis could be destructive in the
Pacific beyond the earthquake macroseismic
area. In nearly every case the tsunamis that
were generated proved to be either
non-destructive or non-existent in the far field.
All 13 earthquakes for which warnings were
issued resulted in at least a local tsunami.
Some of these caused significant loss of life
and property damage.
2. TSUNAMI WARNING ISSUANCE
The average time from earthquake origin time
to the issuance of a warning for these events is
fifty-five minutes. Information on the timing
of warnings issued is found in Table 2. The
issuance time ranges from 34 minutes to 92
minutes after the origin time. This range is
affected by two factors: an organizational
relationship with a regional warning center
responsible for issuing tsunami warnings to the
northeast Pacific region within 1 5 minutes and
International Tsunami Information Center,
IOC-US National Weather Service, Pacific
Region, National Oceanographic and
Atmospheric Administration (NOAA),
Honolulu, Hawaii 968 1
3
33
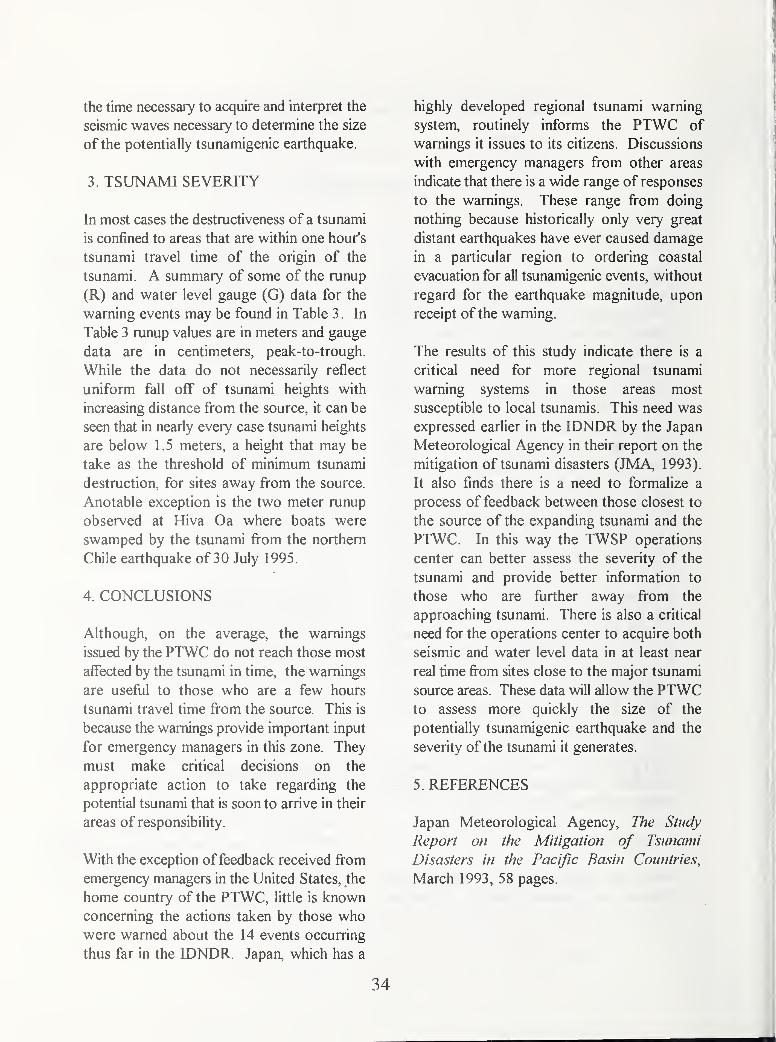
the time necessary to acquire and interpret the
seismic waves necessary to determine the size
of the potentially tsunamigenic earthquake.
3. TSUNAMI SEVERITY
In most cases the destructiveness of a tsunami
is confined to areas that are within one hour's
tsunami travel time of the origin of the
tsunami. A summary of some of the runup
(R) and water level gauge (G) data for the
warning events may be found in Table 3. In
Table 3 runup values are in meters and gauge
data are in centimeters, peak-to-trough.
While the data do not necessarily reflect
uniform fall off of tsunami heights with
increasing distance from the source, it can be
seen that in nearly every case tsunami heights
are below 1.5 meters, a height that may be
take as the threshold of minimum tsunami
destruction, for sites away from the source.
Anotable exception is the two meter runup
observed at Hiva Oa where boats were
swamped by the tsunami from the northern
Chile earthquake of 30 July 1995.
4. CONCLUSIONS
Although, on the average, the warnings
issued by the PTWC do not reach those most
affected by the tsunami in time, the warnings
are useful to those who are a few hours
tsunami travel time from the source. This is
because the warnings provide important input
for emergency managers in this zone. They
must make critical decisions on the
appropriate action to take regarding the
potential tsunami that is soon to arrive in their
areas of responsibility.
With the exception offeedback received from
emergency managers in the United States, the
home country of the PTWC, little is knownconcerning the actions taken by those whowere warned about the 14 events occurring
thus far in the IDNDR. Japan, which has a
highly developed regional tsunami warning
system, routinely informs the PTWC of
warnings it issues to its citizens. Discussions
with emergency managers from other areas
indicate that there is a wide range of responses
to the warnings. These range from doing
nothing because historically only very great
distant earthquakes have ever caused damage
in a particular region to ordering coastal
evacuation for all tsunamigenic events, without
regard for the earthquake magnitude, upon
receipt of the warning.
The results of this study indicate there is a
critical need for more regional tsunami
warning systems in those areas most
susceptible to local tsunamis. This need was
expressed earlier in the IDNDR by the Japan
Meteorological Agency in their report on the
mitigation of tsunami disasters (JMA, 1993).
It also finds there is a need to formalize a
process of feedback between those closest to
the source of the expanding tsunami and the
PTWC. In this way the TWSP operations
center can better assess the severity of the
tsunami and provide better information to
those who are fiirther away from the
approaching tsunami. There is also a critical
need for the operations center to acquire both
seismic and water level data in at least near
real time fi"om sites close to the major tsunami
source areas. These data will allow the PTWCto assess more quickly the size of the
potentially tsunamigenic earthquake and the
severity of the tsunami it generates.
5. REFERENCES
Japan Meteorological Agency, The Study
Report on the Mitigation of Tsunami
Disasters in the Pacific Basin Countries,
March 1993, 58 pages.
34
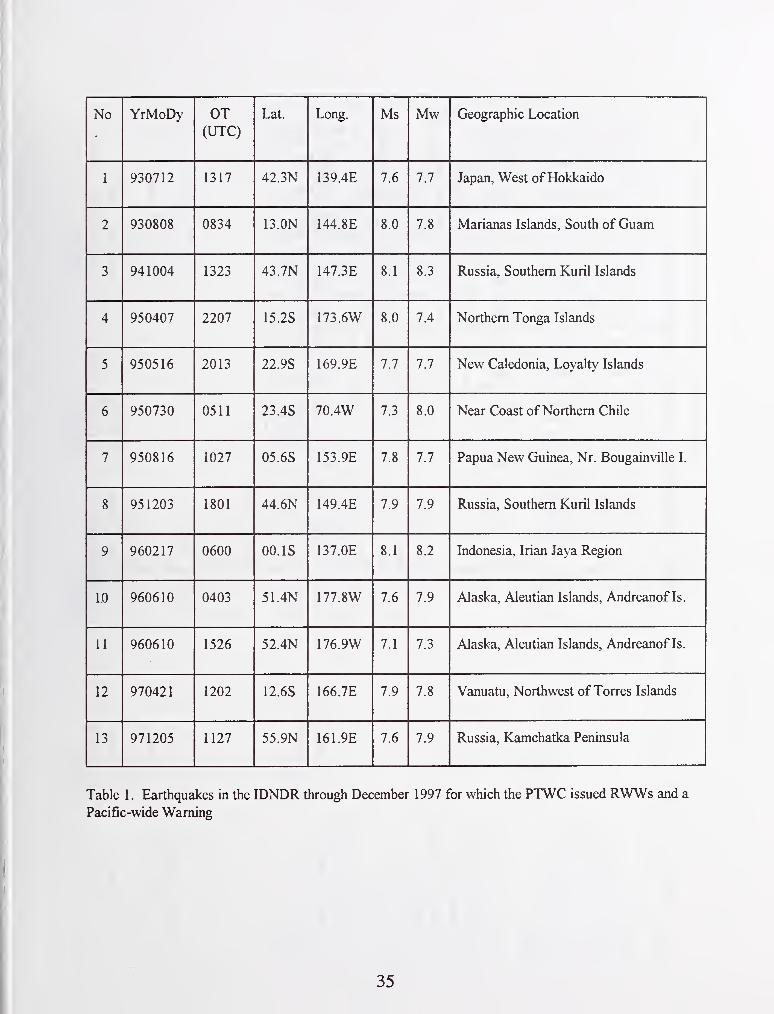
"KTNo YrMoDy OT(UTC)
Lat.TLong. Ms Mw Creographic Location
1 930712 1317 42.3N 139.4E 7.6 7.7 Japan, West of Hokkaido
2 930808 0834 13.0N 144.8E 8.0 7.8 Marianas Islands, South of Guam
3 941004 1323 43.7N 147.3E 8.1 8.3 Russia, Southern Kuril Islands
4 950407 2207 15.2S 173.6W 8.0 7.4 Northern Tonga Islands
5 950516 2013 22.9S 169.9E 7.7 7.7 New Caledonia, Loyalty Islands
6 950730 0511 23 .4S 70.4W 7.3 8.0 Near Coast ofNorthern Chile
7 950816 1027 05.6S 153.9E 7.8 7.7 Papua New Guinea, Nr. Bougainville I.
8 951203 1801 44.6N 149.4E 7.9 7.9 Russia, Southern Kuril Islands
9 960217 0600 OO.IS 137.0E 8.1 8.2 Indonesia, Irian Jaya Region
1.0 960610 0403 51.4N 177.8W 7.6 7.9 Alaska, Aleutian Islands, Andreanof Is.
11 960610 1526 52.4N 176.9W 7.1 7.3 Alaska, Aleutian Islands, Andreanof Is.
12 970421 1202 12.6S 166.7E 7.9 7.8 Vanuatu, Northwest of Torres Islands
13 971205 1127 55.9N 161.9E 7.6 7.9 Russia, Kamchatka Peninsula
Table 1 . Earthquakes in the IDNDR through December 1997 for which the PTWC issued RWWs and a
Pacific-wide Warning
35
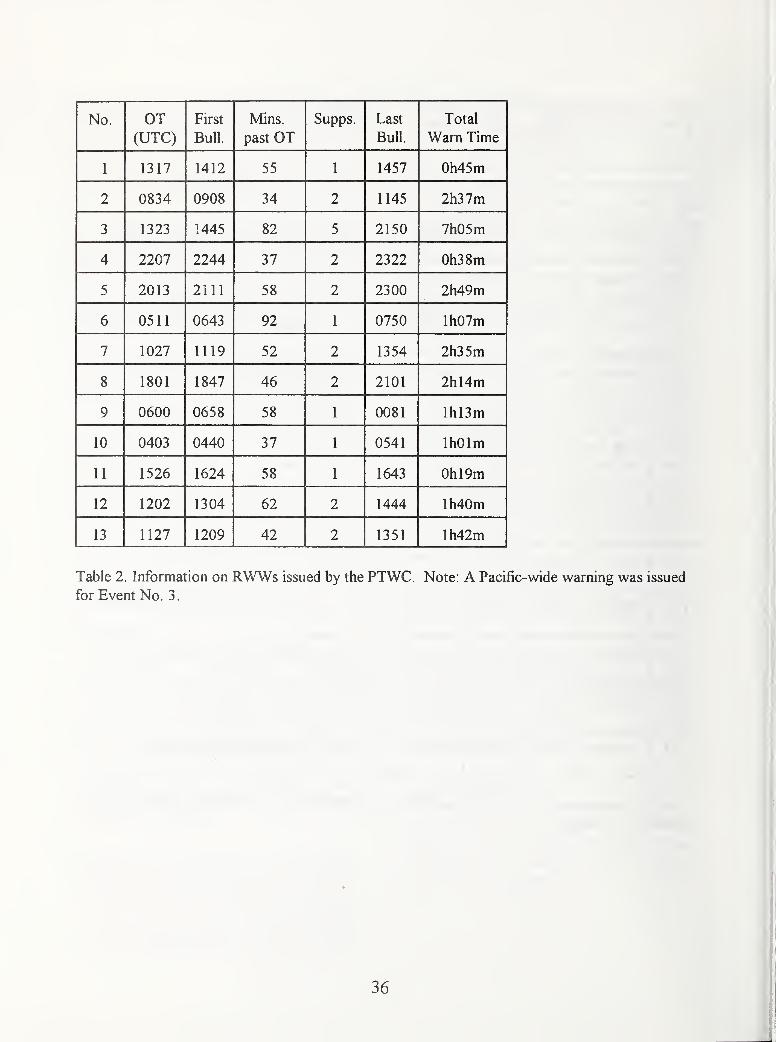
No. OT(UTC)
First
Bull.
Mins.
past OTSupps. Last
Bull.
Total
Warn Time
1 1317 1412 55 1 1457 Oh45m
2 0834 0908 34 2 1145 2h37m
3 1323 1445 82 5 2150 7h05m
4 2207 2244 37 2 2322 Oh38m
5 2013 2111 58 ^ 2300 2h49m
6 0511 0643 92 1 0750 lh07m
7 1027 1119 52 2 1354 2h35m
8 1801 1847 46 2 2101 2hl4m
9 0600 0658 58 1 0081 lhl3m
10 0403 0440 37 1 0541 IhOlm
11 1526 1624 58 1 1643 Oh19m
12 1202 1304 62 2 1444 lh40m
13 1127 1209 42 2 1351 lh42m
Table 2. Information on RWWs issued by the PTWC. Note: A Pacific-wide warning was issued
for Event No. 3.
36

inoinOS
>
o
oo o
o
Oh
O00
a*o
O£
oouaoco
Si a. o «e
Uh < H Cii
'O
8 8 8 8sooOS
T3 O
«$
IT)
o oVO 00 CO
C 3a> (L>
o —a
o o ooo o
etS
X3 00
o ^o ^X £o o
oo
O00es
o 0)op 3
oo^O
OON
•n
?3
i
0)
"2 3V3
C
o2 ^
oXVO
v6
o
N3;^
oo
c•2o
(N OSO m
3
CoX «j X
C0
O ^ao -eO
2 ^
CO
o E00 vCO JZ
^ O 00
osioooooaoooO
r- U2
OS
Vi1—1 3.£ eC 3 CO
O ^ ~
CO
CO
K/i CQ u 3 ^00 00 so OS OS
Ssp — ^o o o o
omOn
•c O
t« CO
O o
— o
e« 3
^ o
3CO O55
3 W
•coSo
m (N —O O O0^ cd,
NO
00OmOS
O
•I K
o o
O^ c=Oh .£
3 «i
I i
«Ai Oo o
c
O
oOS
CO
E
— o00000
3C/3
CoKNO
CO
CO
ISCO . _r
O ^r= CO
X
O O
.52 COCO ^CO CO
t5>rs Oo o
3in
Co
so
On r-
o o
c«
<o
CO
iCO
U
CO
cS
DC
_ I> On (N a* Z
O00 ^CO >a,
^
o00CO
o
;= tL*
1/5
CO
OJ(1>
0)
t >
m (N O OS
o o o 8 2
oCN
Os o
oos
N
Ua4->
cCO00
2
3 CO
^ E
NOoNOOS
CO
CO
O
CD>c/i
Co
CO
3 +-'
OX3 O
.ti 3 CO
IIICO «J C
ic
C/3
s
o
o00
IO>
Ui
•a
Vi
S
a.3c
CO
H
37

EARTHQUAKE ENGINEERING

Real-time Hybrid Vibration Experiments with a 2-Degrees-of-Freedom Model
by
Keiichi TAMURA'^and Hiroshi KOBAYASHI'^
ABSTRACT
The real-time hybrid vibration experiment is a
new concept experiment combining shaking table
test and numerical response analysis in real-time.
Real-time hybrid vibration experiments were
conducted with a 2 degrees-of-freedom model.
Results of experiments were compared with those
of conventional shaking table tests, and the
validity of real-time hybrid vibration experiment
is demonstrated.
Key words: real-time hybrid vibration
experiment, shaking table test, pseudo dynamic
experiment, actuator delay compensation
1, INTRODUCTION
Most of the conventional hybrid experiments are
pseudo dynamic experiments with an expanded
time axis due to limitations of devices, e.g.,
capability of computation and compensation for
actuator delay, and few precedents exist for
hybrid vibration experiments using shaking tables.
Differing from those conventional techniques, the
real-time hybrid vibration experiment is a new
concept experiment combining shaking table test
and numerical response analysis in real-time.
We have developed a real-time hybrid experiment
system at the Public Works Research Institute
after the 1995 Kobe Earthquake. Presented are
the results of real-time hybrid vibration
experiments with a 2 degrees-of-freedom model.
Results are compared with those of shaking table
tests and the validity of real-time hybrid vibration
experiment is demonstrated.
2. OVERVIEW OF REAL-TIME HYBRIDVIBRATION EXPERIMENT
As Figure-1 shows, in the real-time hybrid
vibration experiment, an original structure is
divided into two parts. One is an actual model
specimen of original structure. This specimen is
usually taken as a part of structure whose seismic
behavior is unknown or complicated. The other is
a numerical model for vibration response analysis.
This model represents a part of structure whose
seismic behavior can be evaluated by numerical
analysis.
The numerical model consists of structural
elements (mass, damping and stiffness matrices),
external force, which is calculated from the
acceleration of shaking table, and reaction force
1)Head, Ground Vibration Division, Earthquake
Disaster Prevention Research Canter, Public
Works Research Institute, Ministry of
Construction, Asahi 1, Tsukuba-shi, Ibaraki-
ken, 305-0804, Japan.
2)Research Engineer, ditto.
41
generated at the boundary of the actual and
numerical models. In the numerical analysis, the
external and reaction forces are inputted, and the
displacement of the actual model for the next
time step is calculated. This displacement is
realized by actuators. Then, the external and
reaction forces are measured and taken into
numerical analysis. Iterating these procedures, the
seismic behavior of original structure can be
accurately simulated.
3. FEATURES OF REAL-TIME HYBRIDVIBRATION EXPERIMENT
Time Interval of Experiment
It takes short time from measuring reaction
force to generating actuator signal for the next
time step^'. A central difference method is
employed for numerical analysis. Time
required for one cycle process is 2.08ms.
Actuator Delay Compensation
Since the response delay is inevitable with a
hydraulic actuator, a compensation technique is
adopted. This technique predicts the
displacement of an actuator at the time after
acutuator delay <5t^\ A schematic illustration
of compensation process is presented in
Figure-2, in which the predicted displacement
x" is estimated from the calculated
displacement Xj using an nth-order polynomial
equation (1):
3
x"^T apcj (1)i=0 ^ ^
where
ao=4, aj=-6, a2=4, a^--l
The predicted displacement is modified so that
the resulting displacement becomes equal to
the calculated one.
4. HYBRID VIBRATION EXPERIMENTSWITH A 2-DEGREES-OF-FREEDOM
MODEL
In order to demonstrate the validity of real-time
hybrid vibration experiment, both real-time
hybrid vibration experiments and conventional
experiments with a whole structure model were
conducted, and the results were compared.
The original structure for experiment is a 2
storied slab model supported by rubber bearings.
Its conceptual view is presented in Figure-L The
slab part consists of H-shaped beams and infilled
concrete. An advantage of rubber bearing is large
bearing capacity and low rigidity. Using rubber
bearings and heavy slabs makes it possible to
prolong the natural period of test specimen,
which is favorable for experiment. This test
specimen basically represents a linear structure,
however, nonlinear behavior of structure is also
represented by installing a viscous damper
between upper and lower slabs or between the
shaking table and the lower slab.
Test cases of hybrid vibration experiments are
listed in Table-L In the hybrid vibration
experiments, the mass, stiffness and damping of
the upper level and the mass of the lower level
were numerically modeled, as shown in Figure-1.
Pseudo dynamic experiments with 50 times
extended time axis were carried out to
demonstrate the effects of experimental time axis
on damping force estimation, which generally
depends on velocity. Besides those hybrid
vibration experiments, conventional experiments
with the whole structure were also conducted, and
the results of hybrid vibration experiments and
conventional experiments were compared.
Input motions employed for experiments were
five cycles of sinusoidal wave with the frequency
42
of 1.7Hz, which corresponds to the fundamental
natural frequency of the whole structure, and the
strong ground motion recorded at Kobe Maritime
Observatory, Japan Meteorological Agency,
during the 1995 Kobe Earthquake. The maximum .
peak acceleration was variously changed in
experiments.
5. NUMERICAL MODELS FOR HYBRIDVIBRATION EXPERIMENTS
5.1 Linear structure (Cases 1 and 2)
The equation of motion for numerical analysis
is described by
Mx +Cx+Kx=p+g^j2)
where
M: Mass matrix
C: Damping matrix
K: Stiffness matrix
x: Relative displacement vector
p: external force (seismic response)
vector
q: reaction force vector
The mass, damping and stiffness were
determined as follows:
Mass
Mass of slabs and rubber bearings were
considered.
Damping
The damping matrix was estimated from the
damping ratio to the critical /z=0.()26, which
was obtained by free vibration tests, and the
relationship C= j3 ^2hl co).
Stiffness
The relationship between load and
displacement was obtained by forced vibration
tests, where the frequency was set as 0.1 Hz and
1.7Hz. The result is shown in Figure-3. Since
the maximum peak displacement of the upper
slab in experiments with the whole strucure
was 20-30mm, the stiffness coefficient was
determined as 2.6 X lO^N/m.
5.2 Upper nonlinear structure (Cases 3 and 4)
Mass
Same as 5.1.
Damping and Stiffness
The damping and stiffness matrices can not be
developed by usual matrix operation, when
nonlinearity exists. In the present study, the
reaction force vector q was divided into a
irneaT pmt qj^-Kx) ^md "noTniineaT part q2 as
shown in Figire-4. qj and ^2 can be estimated
from measuring reaction force and nonlinear
calculation, respectively. Since the damping
force generally depends on velocity, the
relationship between force and velocity was
estimated from the forced vibration tests of
dampers, which is shown in Figure-5. Figure-6
presents the relationship between the damping
force and velocity. As seen from this figure,
this damper generates force almost proposional
to the velocity for the pull-side, and small and
velocity independent force for the push-side.
5.3 Lower nonlinear structure (Cases 5 to 8)
Same as 5.1.
6. EXPERIMENT RESULTS
Figure-7 compares displacement time histories of
the lower slab for hybrid vibration experiments
and conventional shaking table tests with the
whole structure, where the results of pseudo
dynamic hybrid experiments are plotted with the
actual time axis. The cross-correlation
coefficients between hybrid vibration
43

experiments and conventional shaking table tests
are calculated for displacements and shown in
Table-2. The following points may be deduced
from the experiment results.
(1)The real-time hybrid vibration experiment
well reproduces the seismic behavior of the 2-
degrees-of-freedom structure for both linear
and nonlinear cases.
(2)The pseudo dynamic hybrid experiment yields
excessive response and inappropriate response
period. This may be attributed to the fact that
pseudo dynamic experiment can not properly
reproduce the damping force, which is
generally proportional to velocity.
(3)The cross-correlation coefficients between the
calculated and resulting displacements in
hybrid vibration experiments show very high
values, such as higher than 0.99, for all cases,
which indicates that actuator delay
compemsation successfully works.
(4)Causes of slight error between real-time
hybrid vibration experiments and conventional
shaking table tests may exist in:
a. Effects of noise associated with measuring
instruments.
b. Effects of high-frequency forced vibration
of shaking table caused by actuators for
hybrid vibration experiment.
c. Slight difference of input motions for real-
time hybrid vibration experiments and
conventional shaking table tests.
d. Error in establishing parameters for
numerical analysis model.
7. CONCLUSIONS
The main conclusions of the present study may
be summarized as follows:
1) The technique employed in this study to
compensate actuator delay has sufficient
accuracy.
2) The real-time hybrid vibration experiment
well reproduces seismic behavior of the 2
degrees-of-freedom model and the validity
of experiment is confirmed.
REFERENCES
1)Kazuhiro UMEKITA, et al.. Development of C
Language Library for Super Real-Time
Controller (SRC) for Real-Time Hybrid
Seismic Testing System with Three-
dimensional-in-plane Excitation, 40th Japan
Joint Automatic Control Conference, 1997 (in
Japanese)
2)Toshihiko HORIUCHI, Masaki NAKAGAWA,Masaharu SUGANO and Takao KONNO,Development of a Real-Time Hybrid
Experimental System with Actuator Delay
Compensation, Eleventh World Conference on
Earthquake Engineering, 1996
44
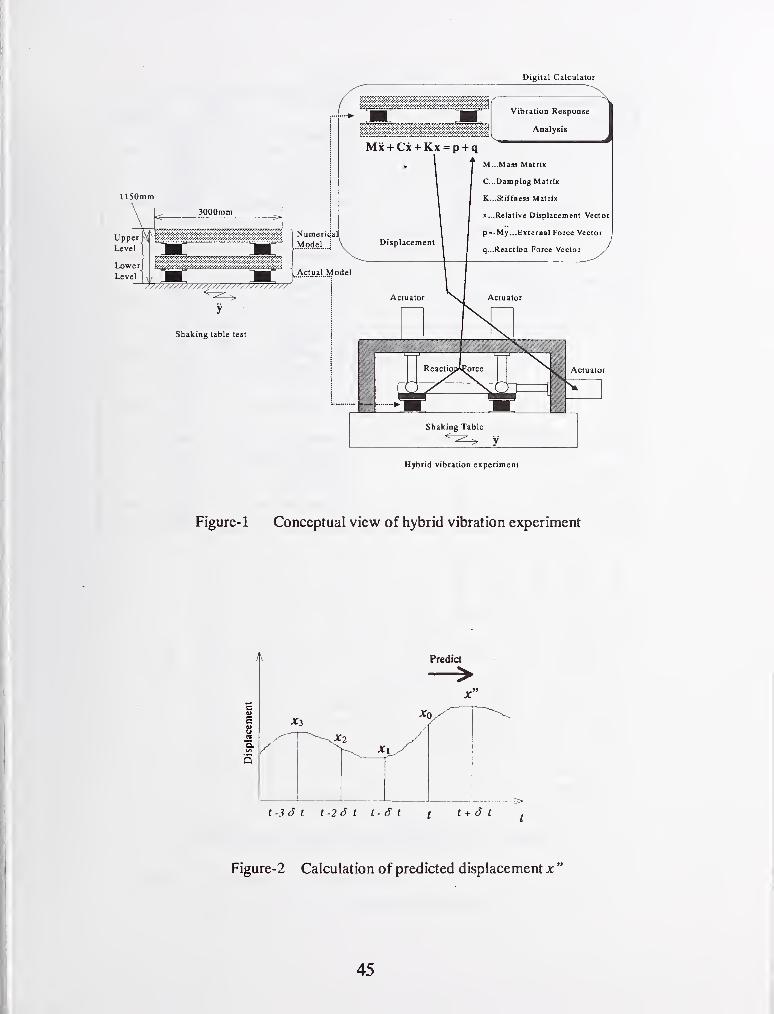
Figure-1 Conceptual view of hybrid vibration experiment
Predict
X3
t-3(^ t t-2S t t-d t t t+d t
Figure-2 Calculation of predicted displacement x
'
45
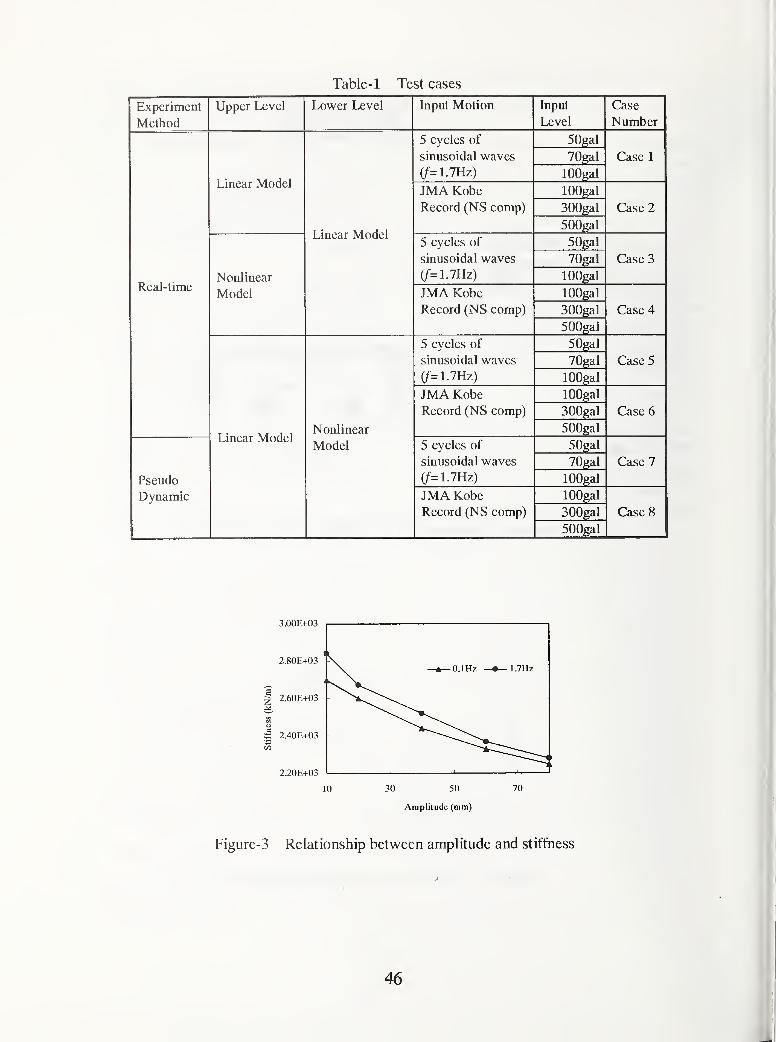
Table- 1 Test cases
Experiment
Method
Upper Level Lower Level Input Motion Input
Level
Case
Number
Real-time
Linear Model
Linear Model
5 cycles ot
sinusoidal waves
(f=L7Hz)
cr\ 15Ugal
70gal
lOOgal
Case 1
JMA Kobe
Record (NS comp)
1 r\r\ 1lOOgal
300gal
SOOgal
Case 2
Nonlinear
Model
5 cycles ot
sinusoidal waves
(/•=L7Hz)
SOgal
70gal
lOOgal
Case 3
JMA Kobe
Record (NS comp)
lOOgal
BOOgal
SOOgal
Case 4
Linear ModelNonlinear
Model
5 cycles of
sinusoidal waves
(/= 1.7Hz)
SOgal
70gal
lOOgal
Case 5
JMA Kobe
Record (NS comp)
lOOgal
300gal
SOOgal
Case 6
Pseudo
Dynamic
5 cycles of
sinusoidal waves
if^lJHz)
jugai
70gal
lOOgal
Case 7
JMA Kobe
Record (NS comp)
lOOgal
300gal
SOOgal
Cases
3.00E+l)3
220E+03 I ' ' ^
10 30 50 70
Amplitude (mm)
Figure-3 Relationship between amplitude and stiffoess
46
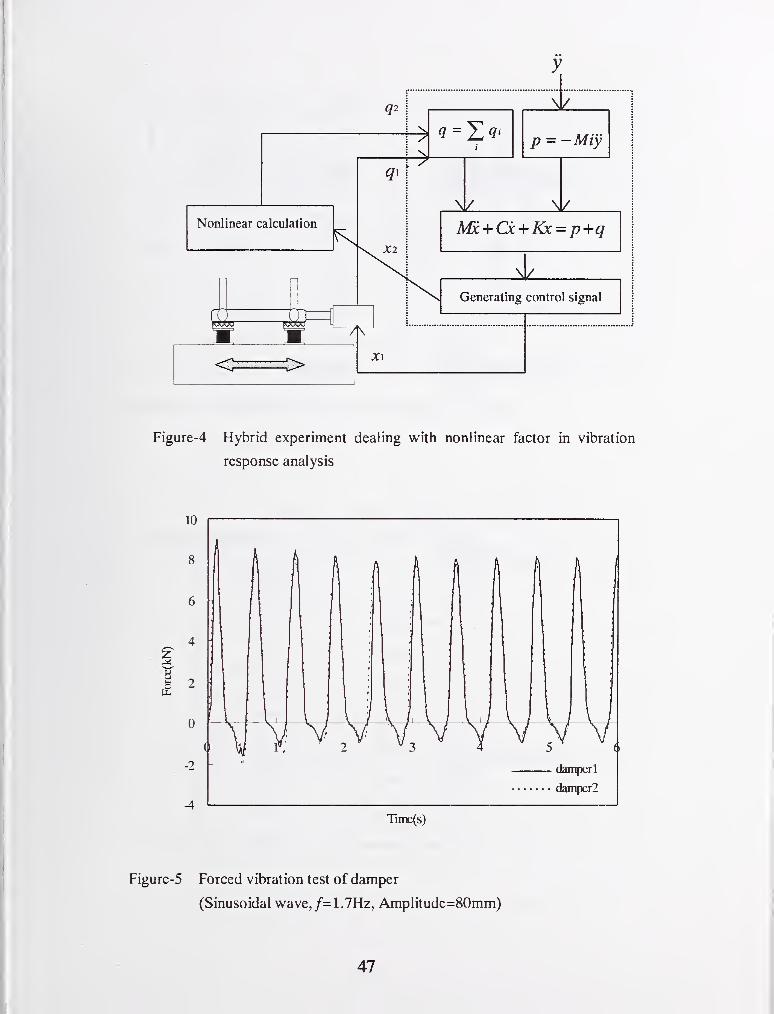
Nonlinear calculation
q2
^1
p = - Miy
Figure-4 Hybrid experiment dealing with nonlinear factor in vibration
response analysis
Tinie(s)
Figure-5 Forced vibration test of damper
(Sinusoidal wave,/=1.7Hz, Amplitude=80mm)
47
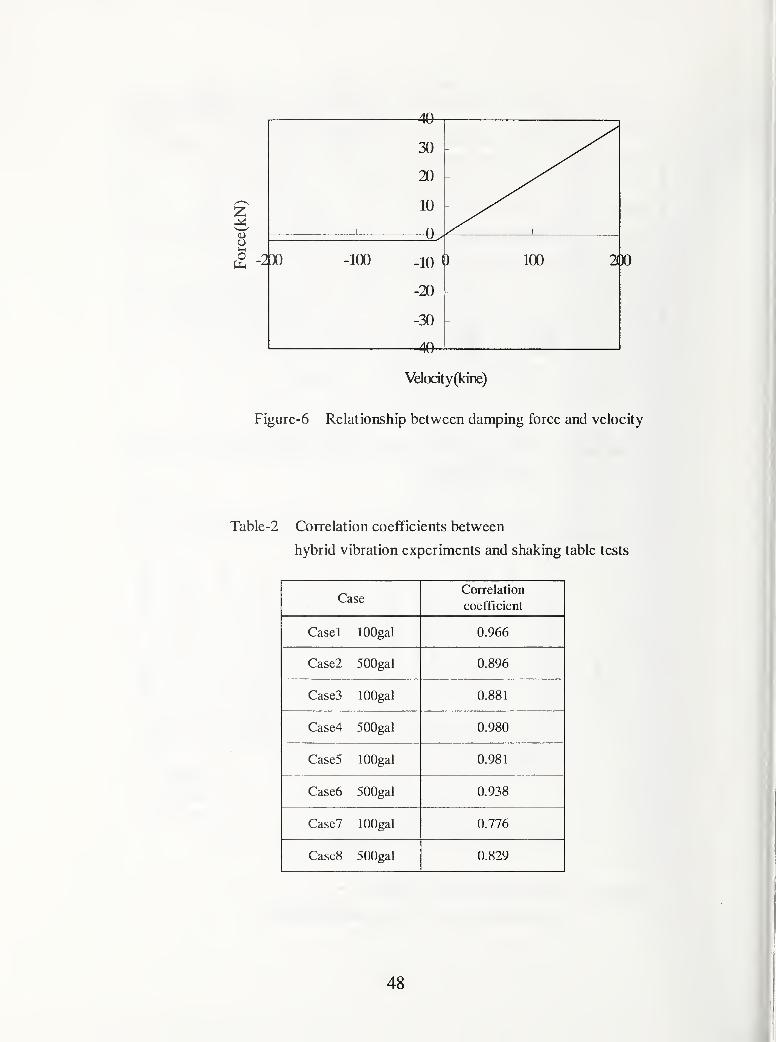
Table-2 Correlation coefficients between
hybrid vibration experiments and shaking table tests
CaseCorrelation
coefficient
Casel lOOgal 0.966
Case! SOOgal 0.896
Cases lOOgal 0.881
Case4 SOOgal 0.980
Cases lOOgal 0.981
Case6 SOOgal 0.938
CaseV lOOgal 0.776
Cases SOOgal 0.829
48
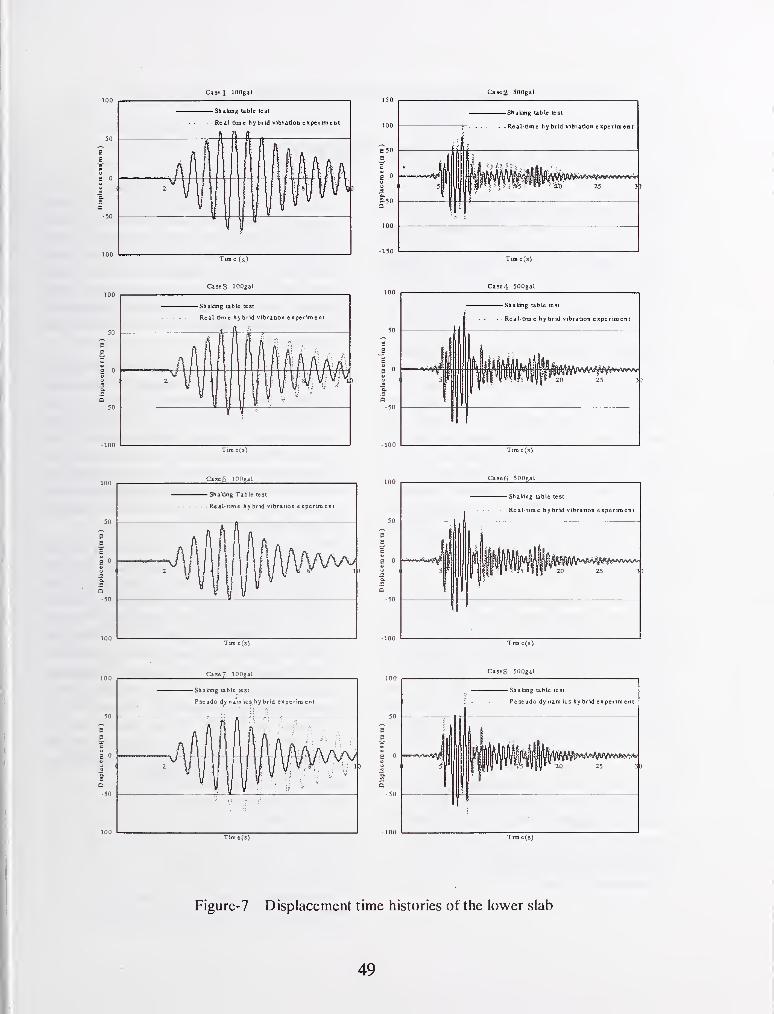
Casel lOOgal Ca3c2 SOOgal
Time (s)
Cases lOOgal Ca3e4 SOOgal
-Shakhig ubie test
Real-bme hybrid vibration experiment
-Shaking table test
' Real-tim e hy brid vibration e xpeiini e nt
Tirn e(s) Tim e(3)
Cases lOOgal CaseG 50Qgal
-Shaking table test
Re al-tim e hy brid vibration e xper im ent
Tim e(3) Tim e(3)
Case? lOOgal Cases SnOgal
-Shaking table test
Pseudo dy na-ni ics.hy brid experiment
E 0
Figure-7 Displacement time histories of the lower slab
49
A Vision for the Future of Strong-Motion Recording
Roger D. Borcherdt
ABSTRACT
Strong-motion recordings of shaking are the basis
for earthquake resistant design, construction, and
retrofit practices worldwide. They provide
critical quantitative measurements of damaging
earthquakes in urban environments needed for
mitigation of fiiture earthquake losses. The
present critical lack of strong-motion information
emphasizes that urgent action is required to
significantly increase resources to adequately
record fiiture damaging earthquakes. Recent
estimates for the US suggest that an urgent need
to record the next major earthquake adequately
throughout stricken urban areas requires that
instrumentation and recording efforts be
increased by nearly 20 times within the next five
to ten years (Stepp, 1997; Borcherdt, et al.,
1997). Justification for this dramatic increase as
prepared by the "Committee for the Future of the
US National Strong-Motion Program"
(Borcherdt, ed., 1997) is summarized here.
1. INTRODUCTION
Staggering losses fi'om recent earthquakes
impacting Northridge, California ($15 to $25
billion, 64 lives) and Kobe, Japan (> $100 bilHon
and 5500 lives) clearly demonstrate the potential
impact of moderate to large earthquakes on
modem urbanized societies. If a major
earthquake impacted some densely urbanized
areas of the United States in the near fiiture, life
and economic losses are estimated to be at least
KEYWORDS: Strong-motion recording, Public
Earthquake Safety, Earthquake hazards
reduction. Emergency response. Strong motion.
twice as large. If these same earthquakes were to
impact the areas in thirty to fifty years without
any major changes in earthquake safety, losses
could reach tens of trillions of dollars due to
increased urbanization with inadequate safety
standards. These tremendous potential losses
with catastrophic and global consequences argue
strongly for dramatically accelerated programs to
improve public earthquake ^ety as quickly as
resources permit.
Reduction of hfe and property losses to low and
manageable levels requires significant
improvements in both Hazard Mitigation and
Emergency Response. Quantitative
measurements of strong shaking referred to as
"strong-motion recordings" are the critical and
presently scarce element essential for significant
progress in both areas. Modem technology
offers important new opportunities to acquire
these recordings.
This paper provides a brief summary of the
justification for the need to significantly increase
strong-motion observation for public safety. The
application of the limited existing set of strong-
motion information to earthquake hazard
mitigation worldwide suggests that arguments for
additional information need to be considered in
international forums. This summary is presented
here to fiirther evaluate the need for strong-
motion observation worldwide. The summary is
presented as a series of answers to specific
questions prepared by the "Committee for the
Future of the US National Strong-Motion
Program", (Borcherdt, ed., 1997).
* United States Geological Survey
Menlo Park, CA 94025
50
2. How significant is the earthquake threat to
public safety?
• Staggering losses from recent earthquakes
impacting Northridge, California ($15 to $25
billion, 64 lives) and Kobe, Japan (> $100
billion and 5500 lives) clearly demonstrate the
potential impact of moderate earthquakes on
modem urbanized societies.
• Dramatic increases in urbanization based on
inadequate safety standards imply that costs
in lives and property from a ftiture major
earthquake in the United States could exceed
$200 billion dollars, cause several thousand
deaths, and significantly impact the global
economy.
3. What are strong-motion recordings?
• Strong-motion recordings are on-scale
recordings of the main damaging earthquake
at locations of most significance for public
earthquake safety.
• Strong-motion recordings are recordings of
the main shock, often on or near structures in
densely urbanized environments, within 20 kmof the earthquake-rupture zone for sites on
rock and within about 100 km for sites on soft
soils. Recordings of motions at levels
sufficient to cause damage at sites at greater
distances also are of interest for earthquake
engineering in areas likely to be affected by
large subduction zone earthquakes or in areas
with exceptionally low attenuation rates.
4. Why are strong-motion recordings criticalfor
significant improvements in public safety?
• Public safety requires that man-made
structures resist strong, earthquake-induced
shaking.
• Strong-motion recordings are the quantitative
in-situ measurement of shaking and the
resultant dynamic performance of structures
needed to build and strengthen the built
environment to resist future earthquakes.
• Strong-motion recordings are the basis for all
current earthquake-resistant design,
construction, and retrofit codes and practice.
• Strong-motion recordings are the basis for a
significant proportion of the research products
produced for purposes of earthquake hazard
reduction.
• Strong-motion recordings are necessary for
real-time damage assessment and emergency
V response in densely urbanized areas as both
efforts require dense sets of on-scale
measurements of damaging levels of shaking
on and near structures in earthquake stricken
areas.
• The present scarcity of quantitative
measurements of ground shaking and its
damaging effects on the built environment is a
major obstacle to reducing fiiture losses of
life and property to manageable levels.
5. Why is the present set of US strong-motion
recordings inadequate?
• No recordings exist of any major (Mw> 7.5)
US earthquake at locations experiencing
damaging levels of shaking.
• No recordings of any high-rise, steel-
moment-frame building within 20 km of a
moderate to large (Mw> 6.5) US earthquake
exist.
• No recordings exist in the US of any critical
lifeline at damaging levels of motion, such as
the six major bridges crossing the San
Francisco Bay that are being presently
retrofitted, based on as yet undocumented
levels ofground shaking.
• Few (<10) recordings of the dynamic
response of soft soils exist, yet billions of
dollars of bridges, buildings, pipelines, and
highways are being built on such deposits
each year.
• Few (<10) recordings exist of large sudden
coherent pulses of motion ("fault fling" or
"killer pulses") that occur near the fault
rupture and are expected to cause
catastrophic losses for cites s" Sa as Hayward,
Oakland and Berkeley, CA.
• Few recordings of most modem stmctures in
their in-situ environment have been obtained
of actual damaging levels of earthquake
loading.
51
6. Why is a thorough set of strong-motion
recordings of the next damaging earthquake an
urgent national need?
• Billions of dollars are being expended each
year to build and strengthen the built
environment based in many cases on as yet
undocumented strong ground shaking and
structural performance levels.
• If thorough sets of strong-motion recordings
of the next major earthquake are not obtained
on and near structures in the stricken areas,
then another important infrequent opportunity
will be missed.
• Present expenditures based on a totally
inadequate database will continue and the
catastrophic costs of future earthquakes will
increase exponentially with time as
urbanization increases.
• The high likelihood for a major damaging
earthquake to strike areas such as the San
Francisco Bay region within the next five
years, implies an urgent effort is required to
acquire and install the necessary resources to
prevent another major missed opportunity.
7. What resources are required to provide an
adequate set ofstrong-motion recordings of the
next major earthquake in the coterminous
United States?
• Recent consensus of a national workshop
(Stepp, 1997) implies a dramatic increase in
resources (funding and people) is needed to
ensure that critically needed instrumentation
(20,000 stations) is operational by the year
2005.
• Estimates derived on the basis of recent
National Seismic Hazard Maps (Frankel, et
al,, 1996) and estimates of population
exposure imply that instrumentation at about
20,000 sites is needed with 7,000 for ground-
motion, 7,000 for buildings, 3,000 for
lifelines, such as bridges and pipelines, and
3,000 for critical facilities necessary for
emergency response and near-real time
disaster assessment (Borcherdt, 1997a,
1997b, Borcherdt, et al., 1997).
8. What resources are required to record a
specific earthquake in one ofthe areas with high
population exposure to damaging ground
motions?
• Estimates of the density and location of
strong-motion stations needed to record a
specific earthquake can be developed for each
urban area using modem GIS technology,
regional estimates of ground shaking,
inventories of the built environment, and
modem methods to predict resultant
earthquake losses.
• Application of the procedures to the San
Francisco Bay Region for a repeat of the
1906 earthquake (Mw 7.7) provides
significant insight for strong-motion planning
purposes.
• Estimated losses for a repeat of the 1906
earthquake are expected to exceed $200
billion with more than 5000 deaths (RMS,inc., 1995).
• 140- 180 ground-motion stations are needed
in the city of San Francisco with a spacing of
no more than a few blocks in the heavily
impacted financial district.
• Superposition of the built environment on
predicted ground shaking maps shows that in
the southern San Francisco Bay region 45%of the 1079 bridges, 69% of the 16 airports,
22% of the 233 hazardous material sites, 48%of the 99 medical facilities, and 48% of the
801 schools are located in areas expected to
experience damaging levels of shaking that
exceed 0.6 g in spectral response acceleration
at 1.0 second.
• Superposition of the transportation fecilities
on a site class map based on the 1994
Recommend Building Code provisions shows
that 69% of the bridges, 57% of the
highways, and 100% of the railways are
located on either stiff clays and sandy soils or
on soft clays with a high to very high
amplification capability and moderate-to-high
liquefaction susceptibility.
• The large percentages of important stmctures
(~ 990) and buildings (>3000) located in
areas of potentially damaging ground shaking
52
suggest that more than 4000 sites in the SF
Bay region need to be considered for
instrumentation.
• If only 10 percent of especially vulnerable
structures in the southern SF bay region are
instrumented, then at least 400
instrumentation arrays on and near structures
are needed.
• Instrumentation estimates show that the
present level of strong-motion instrumentation
in the densely urbanized areas of the San
Francisco Bay Region is woefully inadequate
to document the ground shaking and the
resultant seismic performance of the built
environment to a repeat of the 1906
earthquake.
9. What proportion of strong-motion stations
should be equipped with real time
telecommunication for purposes of disaster
assessment and emergency response?
• Modem instrumentation with
telecommunication capabilities permits areas
of strongest shaking and the performance of
structures to be quickly assessed (Nigbor,
1997). Instruments on structures such as
major buildings, hospitals, schools, bridges,
freeway overpasses, dams etc. permit rapid
assessment of probable damage state, efficient
dispatch and routing of emergency response
resources, and efficient prevention of
additional disaster. Several important
examples illustrating the application of
modem technology to Disaster Reduction nowexist in Japan.
• Preliminary estimates on the basis of
estimated shaking levels suggest that some
50-85% of the strong-motion instmmentation
installed for ground-motion measurement
purposes in cells of highest population
exposure should be equipped with near-real
time communication capabilities for at least
some channels.
• Considerations based on the geographic
distribution of the built environment for the
southem San Francisco suggest some 25 to 50
percent of instmmented stmctures should also
be equipped with telecommunication for a few
data channels to assess the damage state of
the stmctures in near-real time.
10. CONCLUSION
•Strong-motion recordings of shaking are the basis
of earthquake resistant design, constmction, and
retrofit practice. For many issues important in
earthquake safety, advances will not occur until a
major earthquake provides new strong-motion
data. It is vital that we plan wisely to obtain the
greatest possible return from the next earthquake,
so that societies will not be forced to wait for
another disaster before acquiring the needed data
to resolve important safety issues.
11. ACKNOWLEDGMENTS
The summary presented here was prepared by the
"Committee for the Future of the US National
Strong-Motion Program" comprised of B. Bolt,
C. B. Crouse, G. Hart, K. Jacob, T. Shakal, C.
Stepp and USGS Members H. Benz, R.
Borcherdt (Chair), M. Celebi, A. Frankel, W.Joyner, E.V. Leyendecker, D. Oppenheimer, R.
Porcella, C. Stephens, and D. Wald.
12. REFERENCES CITED
Borcherdt, R. D., 1997a, US National Strong
Motion Program, in Proceedings, Workshop,
Vision 2005: An Action Plan for Strong
Motion Programs to Mitigate Earthquake
Losses in Urbanized Areas, C. Stepp, editor.
Committee for the Advancement of Strong
Motion Programs, Monterey, CA, April,
1997, 81-85.
Borcherdt, R. D., 1997b, Earthquake ground-
motion measurement for public safety.
Proceedings, 29th Joint Meeting UJNR Panel
on Wind and Seismic Effects, Tsukuba,
Japan, May 1997.
Borcherdt, R. D. ed., 1997, Vision for the fiiture
of the US National Strong-Motion Program,
The committee for the fiiture of the USNational Strong Motion Program, USGeological Survey Open File Rept. 97 - 530
B, 47p.
Borcherdt, R. D., Frankel, A., Joyner, W.B, and
Bouabid, J., 1997, Vision 2005 for
53
earthquake strong ground-motion
measurement in the United States, in
Proceedings, Workshop, Vision 2005: AnAction Plan for Strong Motion Programs to
Mitigate Earthquake Losses in Urbanized
Areas, C. Stepp, editor. Committee for the
Advancement of Strong Motion Programs,
Monterey, CA, April, 1997, 112-130.
Frankel, A., Mueller, C, Bamhard, T., Perkins,
D., Leyendecker, E.V., Dickman, N.,
Hanson, S., and Hopper, M., 1996, National
Seismic Hazard Maps, June 1996,
Documentation, http://gldage.cr.usgs.gov/
eq/hazmapsdoc/junecover .shtml.
Nigbor, R.L., 1997, Present and future needs for
strong-motion information. Proceedings,
Vision 2005: An Action Plan for Strong-
motion Programs to Mitigate Earthquake
Losses in Urbanized Areas, C. Stepp, editor.
Committee for the Advancement of Strong
Motion Programs, National Science
Foundation, Monterey, CA, April 1997.
Stepp, C. J., 1997, Proceedings, Vision 2005:
An Action Plan for Strong-motion Programs
to Mitigate Earthquake Losses in Urbanized
Areas, Committee for the Advancement of
Strong Motion Programs, National Science
Foundation, Monterey, CA, April 1997.
54

Project on 3-D Full Scale Earthquake Testing Facility
- First Report -
Keiichi OHTANI'\ Tsuneo Katayama^^ Heki Shibata^'
ABSTRACT
The Hanshin-Awaji Earthquake (Hyogoken-
Nanbu Earthquake, January 17, 1995) clearly
demonstrated that the occurrence of very
strong ground motion in the area near to the
seismic fault is capable of causing severe
structural damage beyond general estimation.
It has emphasized the importance of earthquake
engineering research into why and how
structures collapse in real earthquake
conditions and these processes are reproduced
numerically. Considering the lessons learnt
from recent earthquake disasters, NIED plan to
construct a "3-D Full Scale Earthquake Testing
Facility," which will be able to simulate the
process of destruction of structures. This
facility will be a central tool in a new concept of
research bases for earthquake disaster
prevention. NIED was conducted the research
and development of core technology such as the
big and high performance hydraulic actuators,
which have a long displacement and high
velocity, and high performance three
dimensional link joint since 1995 by the 4 year
project We constructed the prototype shaking
table systems and confirmed the performance
tests. NIED will begin the design and
construction of this new facility in fiscal year
1998. This paper summarizes the fundamental
concept of the facility and the result of R&D of
core technology.
Key Words: Earthquake Disaster,
High-performance actuator,
3-dimensional earthquake motion,
Shaking Table,
Structural damages.
1. INTRODUCTION
The Hanshin-Awaji Earthquake gave a great
impact to our society. More than 6,400 people
lost their lives and a lot of structures, such as
roads, railway bridges, buildings and other
structures, suffered unexpectedly serious
damages by this event This earthquake event
was made clear that our society, which is
consisted the advanced, complexes facilities and
concentrated population and city functions, has a
over-expected weakness against natural
disasters. The many major cities in Japan
located a high potential area for earthquake
hazard. Therefore, from this condition, it is
pointed out that big hazard by a future
earthquake at such big cities will affect the
worldwide economic impact based on the border
less, globalization, economic condition. And,
Director, Disaster Prevention Research Division, National Research Institute for Earth Science and Disaster Prevention
(NIED), Science and Technology Agency (STA)^' Dirertor-General, NIED.STA^' Guest Research Fellow, NIED, STA, Prof. Emeritus, Univ. of Tokyo
55
the high potential area of earthquake hazard are
also located the many countries, such as United
State and Asian region. The progress of
research for earthquake disaster mitigation is
very important them to prove world widely. It
is the urgent subject to decrease the potential of
earthquake hazard risk by the effective and
economical technology and measures based on
the appropriate engineering and scientific
knowledge.
Based on these condition, National Research
Institute foe Earth Science and Disaster
Prevention (NIED) has planned to construct a
"3-D Full Scale Earthquake Testing Facility."
NIED was conducting the research and
development of core technology since 1995 and
will start the design and construction works of
this new facility in fiscal year 1998.
This paper summarizes the fundamental
concepts of this facility and the current results
of research and development of the core
technology.
2. BACKGROUND
STA was enforced several actions relating
with the promotion of research and
development for earthquake disaster prevention
since the occurrence of Hanshin-Awaji
earthquake.
2.1. Basic plan for research and development on
disaster prevention
The promotion of research and development
of disaster prevention in Japan accelerated of
the clutch based on the "Basic Plan for
Research and Development on Disaster
Prevention" reported by the Prime Minister's
Council of Science and Technology, and finally
approved by the Prime Minister on December
1993.
2.2. Investigative committee for promoting
earthquake disaster prevention
Given this Basic Plan, and in light of the
lessons learnt from the recent earthquake
devastation, an "Investigative Committee for
Promoting Earthquake Disaster Prevention
(Chairman: Prof. Shigeru Ito, Keio University)"
was set up within the Research and
Development Bureau, Science and Technology
Agency (STA) in March 1995. This committee
was investigated the research and development
issues that need to be accelerated in disaster
prevention related science and technology.
The mandate of this committee was to quickly
propose the research and development issues
that need to be addressed, after which, on May
31, 1995, they published a report entitled
"Policies for Accelerating Earthquake Disaster
Prevention Based on the Experience of Great
Hanshin-Awaji Earthquake and the Other
Destructive Earthquakes."
This report produced the following four
research and development issues for urgent
attention:
1) Research and development into earthquake
disaster prevention by appraisal methods that
would act as a comprehensive basis for
accelerating earthquake disaster prevention,
2) Research and development into information
about earthquake disaster prevention and how
to support the daily existence of the people,
3) Research and development into the
strengthening of urban environment against
earthquake.
56
4) Research and development into the
maintenance of daily order and social activities
during an earthquake.
2.3. Committee to examine the research bases
for earthquake disaster prevention
Based on the lessons learnt from Hanshin-
Awaji earthquake, the various research
institutions, such as governmental, academic
and private sectors, were conducting the
research work for earthquake disaster
prevention. Furthermore, the existing
research institutions are encouraged the
expansion, reinforcement and arrangement of
organization for it's research potentials. But,
we strongly recognized that the difficult
problem, which is requested from the
experience of Hanshin-Awaji earthquake to the
science and technology of earthquake disaster
prevention, was raised. For answer to this
problem, we think to build up the new type
research organization.
Based on this recognition, STA established a
"Committee to examine Earthquake Disaster
Research Bases (Chairman: Prof. Tuneo Okada,
Shibaura Institute of Technology)" in November
1995. This committee published the report
entitled "Promotion of Effective Improvement
of Research Bases for Earthquake Disaster
Prevention based on Consideration of Hanshin-
Awaji Earthquake" in May 1996.
The following research needs were realized
with the chain of comprehensive research to
aim the mitigation of earthquake disasters in
and around the urban areas;
1) The research and development required the
arrangement of new large-scale experimental
facilities,
2) The research and development by the fluid
organization, such as participation of
researchers from many research fields and
different countries,
3) The comprehensive research and
development for earthquake disaster
prevention based on the non-physical aspects.
From these research needs, the committee
recognized of new research bases for
earthquake disaster prevention. The concepts
for this research base were stated clearly the
following five items;
1) By the basic consideration is sitting on the
protection of human lives, this bases will be
functioned the progress of cooperation,
exchange and mutual comprehension with
various fields of researchers, such as
engineering, science, humanity-social science,
information technology, medical science and
other sciences,
2) The research subjects, which is difficult to
conduct the fixed research organization, will
promote by the fluid organization systems,
3) By the arrangement the common-use
research facilities, the new research
organization and personnel structures will
arrange for the response the wide research
needs from wide areas of research field and
existing organizations,
4) To construct the bases of international
research exchange for the focus to the Asia
and Pacific region,
5) The bases will contribute the effective
transmission of the experience of the
Hanshin-Awaji earthquake to the future
generation and the comprehension and
support by the pubhc for the research of
disaster prevention.
57
Considering these concepts, the committee
proposed the construction (arrangement) of new
research bases for earthquake disaster
prevention. The committee's report
suggested the need in future comprehensive
research to reduce earthquake damage mainly
of urban area. As part of such research, the
report indicated the need to establish a new
research base with subjects of (1)
comprehensive anti-seismic, base-isolation and
response-control systems, (2) relation between
active faults and earthquake disaster prevention,
(3) comprehensive earthquake information.
The report insisted upon the significance of
further increasing the promotion of science and
technology' for earthquake disaster prevention.
2.4. Discussion at the Council for
Aeronautics, Electronics and Other
Advanced Technology
At the latest stage of discussion at the
Committee to examine the Research Bases for
Earthquake Disaster Prevention, STA
recognized to need the wider discussion with
the persons from various fields. The Minister
of State for Science and Technology was refer to
the Council for Aeronautics, Electronics and
Other Advanced Technology, which is the one
refer organization of the Minister, for the
discussion of the effective arrangement of
research bases for earthquake disaster
prevention at March 29, 1996. The Council
was requested the charge of discussion to the
Sub-committee for Earth Science. The sub-
committee was established the Sectional
Committee for Research Bases of Earthquake
Disaster Prevention (Chairman: Prof. Tuneo
Okada, Shibaura Institute of Technology). And,
following three working groups were
established under this sectional committee for
the concrete discussion. (1) Working Group
on Research Bases (Chairman: Prof. Hiroyuki
Kameda, Kyoto University), (2) Working Group
on the Objective Earthquake (Chairman: Prof.
Syunsuke Otani, University of Tokyo), (3)
Working Group on Large-Scale Three-
Dimensional Earthquake Simulator Facility
(Chairman: Prof. Emeritus Heki Shibata,
University of Tokyo),
After the total 30 meeting at the council,
subcommittee, sectional committee and
working groups, the Council was reported to the
Minister at September 3, 1997.
The report was clearly pointed out the
arrangement of large-scale three-dimensional
earthquake simulator facility as the core facihty
of the research bases for earthquake disaster
prevention.
3. PROJECT ON 3-D FULL SCALE
EARTHQUAKE TESTING FACILITY
NIED initiated the project on the large-scale
3-dimensional earthquake simulator facility just
after the occurrence of Hanshin-Awaji
earthquake. The research and development
for core technology for this facility was
conducting since 1995.
At the initiated stage, we named the "Large-
Scale 3-Dimensional Earthquake Simulator
Facihty." But, at this moment, we renamed to
the "3-D Full Scale Earthquake Testing
Facility."
The fundamental concepts of this project
based on the report by the Council for
Aeronautics, Electronics and Other Advanced
Technology.
58

3.1. Position to the project
This facility will construct as the core facility
of the research bases for earthquake disaster
prevention. Therefore, we need to clear the
positions of this facility.
1) Position of earthquake simulator for the main
element of development of the "Time-Space
Domain Simulation System for Earthquake
Disaster."
By the accumulation of the failure testing
result for different type of structures, it will be
possible to make a rapid progress the
usefulness of numerical shaking table. This
progress will connect the development of the
"time-space domain simulation system for
earthquake disaster prevention." This
simulation system is imaged to the total
simulation system of the sequence of
earthquake disaster, such as where and how
large earthquake occur, what kind of damage
occur and propagate and other related events.
2) Position of the clearly understanding of
failure mechanism of structures.
During the Hanshin-Awaji earthquake, the
structures were suffered over-expected
damage and failures. Therefore, it is
necessary to arrange the high performance
"earthquake simulator for the understanding of
failure process of structures during
earthquake.
3) Position of the response mechanism for the
request from major subject of earthquake
engineering.
To apply the experience of structure damage
and failures learnt from Hanshin-Awaji
earthquake and other recent destructive
earthquakes, and to create the safer city and
society against earthquake, it is necessary to
test the following items;
[1] Development and verification of new design
and construction technology for the building
structures,
[2] Development and verification of new design
and construction technology for the civil work
structures,
[3] Development and verification of new design
and construction technology for the
structures sited on different soil conditions,
[4] Verification of development, adaptability and
safety of base-isolation system and response
control technology
[5] Verification of advancement of seismic
performance and safety of the importance
industrial facilities and equipment, such as to
keep the social functions and to prevent
disaster propagation.
3.2. Requested fundamental performance
This facility is requested the realization with
fundamental performance as follows;
1)To be able to perform the failure test
It is necessary to have a performance of
reproduce of failure phenomena by the long-
period pulse waves (killer pulse), which was
the one characteristics of Hanshin-Awaji
earthquake motions.
2)To be able to produce the three-dimensional
movements
It is necessary to perfectly reproduce the 3-
dimensional strong motions of Hanshin-Awaji
earthquake, including the displacement and
velocity. This performance will set up to the
minimum requirement.
3)To be able to test for the real-size structures
Many phenomena of structural failure were
occurred at only the real size structures. For
the detailed understanding of such phenomena,
it is necessary to conduct the test for the real
59

size structural specimen. Therefore, it is
necessary to have the sufficient specification
of maximum model weight, allowable over-
turning moment capacity and others for the
test of large-size specimen.
3.3. Major specification
Sufficient information needs to be gathered
on how structures and foundations behave, and
whether or not they are destroyed, during a
major earthquake. The importance of
promoting the strengthening and rationalization
of earthquake-proof structural design is just one
of the lessons learnt from the Hanshin-Awaji
earthquake. Because earthquake vibrations
involve three-dimensional movement, it is
necessary' to set up a three-dimensional
earthquake simulator facility to accurately
reproduce earthquake motions. More than 30
three-dimensional shaking table have already
built throughout the world, but they are all only
small- or medium-sized devices. To perform
tests on real-size objects or large-scale models
of test structures and foundations, it is desirable
to have the large-scale 3-dimensional shaking
table. If large-scale 3-dimensional shaking
table was available, tests could be performed to
shed new light on the mechanism of dynamic
failure using real-size structures as test objects
and on the mechanism that destroys submerged
structures when soil hquefaction. If a stage
reached whereby design based on such
discovery can be performed, this will contribute
immensely to reducing earthquake disaster.
1) The main specification is shown in Table 1.
The actuator performance for three axes, (X,
Y (horizontal axis) and Z (vertical axis)), are
shown in Fig. 1 to Fig. 3, respectively. The
table size and maximum test model weight
are the largest specification of the world.
These specification was determined for the
conducting to the almost real-size 4 story, 2
X 3 span reinforced concrete buildings and
the real-size reinforced concrete bridge
columns.
2) The driving method is choose the
accumulator charge and electro-hydraulic
servo control system, which is very common
method to make the earthquake simulator.
3) The maximum acceleration of shaking table is
determined by the model weight At the
maximum test model weight, maximum
accelerations for horizontal axis are limited to
0.9 G. This value was determined by the
reproduce of ground surface earthquake
motions, not reproduce the response
movement of structures, which is the basic
conception of this facihty.
4) The maximum velocity and maximum
displacement are set up to the maximum
value of future imaged earthquake motions.
5) The maximum overturning moment is set to
perform the real-size subjects.
We will construct several buildings, such as
the control and measurement building, testing
building, oil source building and others. The
layout of the facility is shown in Fig. 4.
3.4. Construction site and time schedule
The government of Hyogo prefecture will
develop the Miki Memorial Park of Hanshin-
Awaji earthquake at the city of Miki. This park
have been functioned three zones, such as
athletic park zone, citizen recreation zone and
disaster prevention zone. This facility will
construct as the core facifity of disaster
prevention zone. For this zone, the disaster
prevention center of Hyogo prefecture, school
60
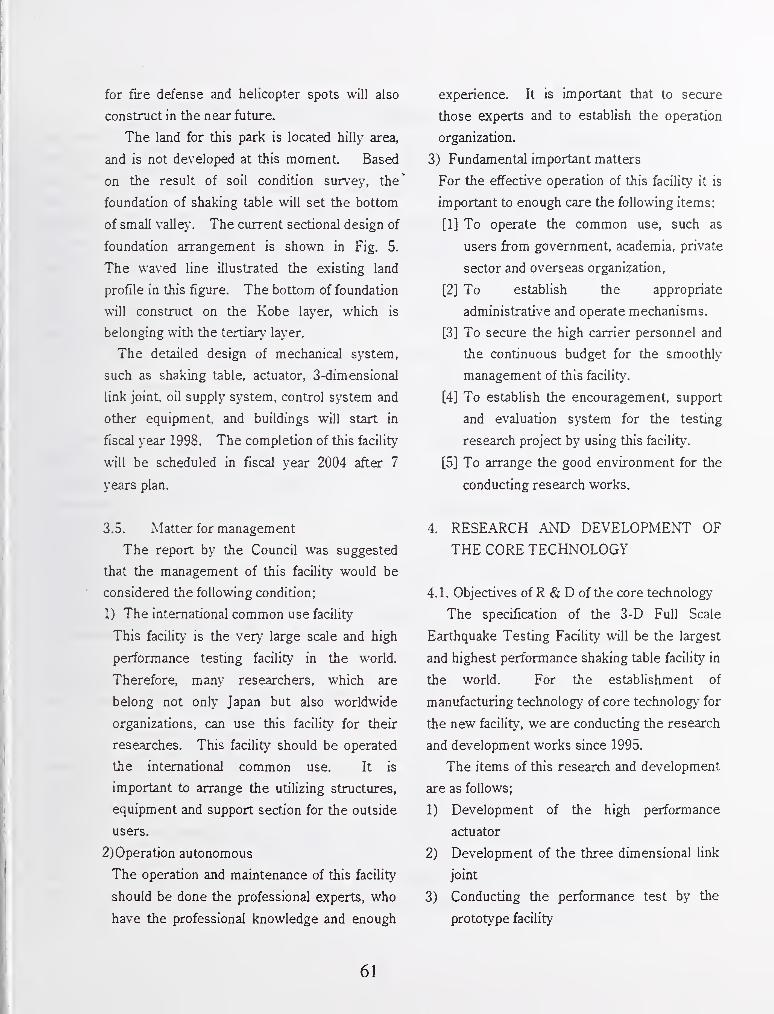
for fire defense and helicopter spots will also
construct in the near future.
The land for this park is located hilly area,
and is not developed at this moment. Based
on the result of soil condition survey, the*
foundation of shaking table will set the bottom
of small valley. The current sectional design of
foundation arrangement is shown in Fig. 5.
The waved line illustrated the existing land
profile in this figure. The bottom of foundation
will construct on the Kobe layer, which is
belonging with the tertiary layer.
The detailed design of mechanical system,
such as shaking table, actuator, 3-dimensional
link joint, oil supply system, control system and
other equipment, and buildings will start in
fiscal year 1998. The completion of this faciUty
will be scheduled in fiscal year 2004 after 7
years plan.
3.5. Matter for management
The report by the Council was suggested
that the management of this facility would be
considered the following condition;
1) The international common use facility
This facility is the very large scale and high
performance testing facility in the world.
Therefore, many researchers, which are
belong not only Japan but also worldwide
organizations, can use this facility for their
researches. This facility should be operated
the international common use. It is
important to arrange the utilizing structures,
equipment and support section for the outside
users.
2)Operation autonomous
The operation and maintenance of this facility
should be done the professional experts, who
have the professional knowledge and enough
experience. It is important that to secure
those experts and to establish the operation
organization.
3) Fundamental important matters
For the effective operation of this facility it is
important to enough care the following items;
[1] To operate the common use, such as
users from government, academia, private
sector and overseas organization,
[2] To establish the appropriate
administrative and operate mechanisms.
[3] To secure the high carrier personnel and
the continuous budget for the smoothly
management of this facility.
[4] To establish the encouragement, support
and evaluation system for the testing
research project by using this facility.
[5] To arrange the good environment for the
conducting research works.
4. RESEARCH AND DEVELOPMENT OF
THE CORE TECHNOLOGY
4.L Objectives of R & D of the core technology-
The specification of the 3-D Full Scale
Earthquake Testing Facility will be the largest
and highest performance shaking table facility in
the world. For the establishment of
manufacturing technology of core technology for
the new facility, we are conducting the research
and development works since 1995.
The items of this research and development
are as follows;
1) Development of the high performance
actuator
2) Development of the three dimensional link
joint
3) Conducting the performance test by the
prototype facility
61
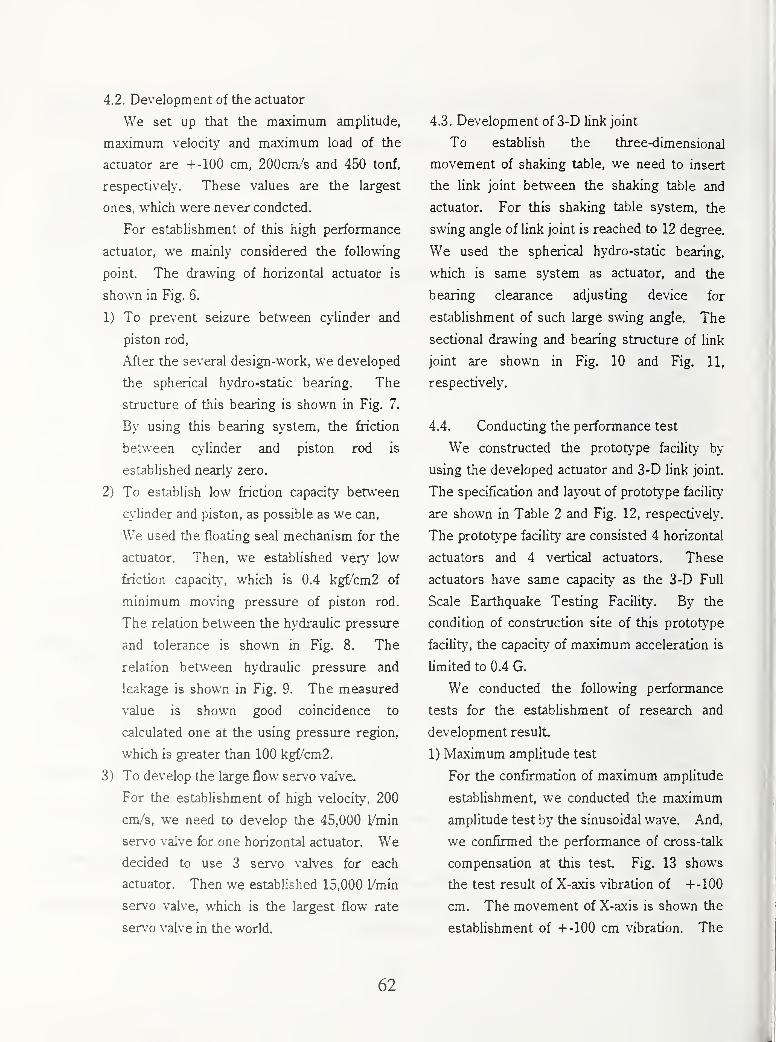
4.2. Development of the actuator
We set up that the maximum amplitude,
maximum velocity and maximum load of the
actuator are +-100 cm, 200cm/s and 450 tonf,
respectively. These values are the largest
ones, which were never condcted.
For establishment of this high performance
actuator, we mainly considered the following
point. The drawing of horizontal actuator is
shown in Fig. 5.
1) To prevent seizure between cylinder and
piston rod,
After the several design-work, we developed
the spherical hydro-static bearing. The
structure of this bearing is shown in Fig. 7.
By using this bearing system, the friction
between cylinder and piston rod is
established nearly zero.
2) To establish low friction capacity betv,-een
cylinder and piston, as possible as we can,
We used the floating seal mechanism for the
actuator. Then, we established very low
friction capacity, which is 0.4 kgf/cm2 of
minimum moving pressure of piston rod.
The relation between the hydraulic pressure
and tolerance is shown in Fig. 8. The
relation between hydraulic pressure and
leakage is shown in Fig. 9. The measured
value is shown good coincidence to
calculated one at the using pressure region,
which is greater than 100 kgf/cm2.
3) To develop the large flow servo valve.
For the estabUshment of high velocity, 200
cm/s, we need to develop the 45,000 1/min
servo valve for one horizontal actuator. Wedecided to use 3 servo valves for each
actuator. Then we established 15,000 I/min
servo valve, which is the largest flow rate
servo valve in the world.
4.3. Development of 3-D link joint
To estabhsh the three-dimensional
movement of shaking table, we need to insert
the link joint between the shaking table and
actuator. For this shaking table system, the
swing angle of link joint is reached to 12 degree.
We used the spherical hydro-static bearing,
which is same system as actuator, and the
bearing clearance adjusting device for
establishment of such large swing angle. The
sectional drawing and bearing structure of link
joint are shown in Fig. 10 and Fig. 11,
respectively.
4.4. Conducting the performance test
We constructed the prototype facility by
using the developed actuator and 3-D link joint.
The specification and layout of prototype facility
are shown in Table 2 and Fig. 12, respectively.
The prototype facility are consisted 4 horizontal
actuators and 4 vertical actuators. These
actuators have same capacity as the 3-D Full
Scale Earthquake Testing Facihty. By the
condition of construction site of this prototype
facihty, the capacity of maximum acceleration is
hmited to 0.4 G.
We conducted the following performance
tests for the estabhshment of research and
development result
1) Maximum amplitude test
For the confirmation of maximum amplitude
estabhshment, we conducted the maximum
amplitude test by the sinusoidal wave. And,
we confu-med the performance of cross-talk
compensation at this test Fig. 13 shows
the test result of X-axis vibration of +-100
cm. The movement of X-axis is shown the
estabhshment of -I- -100 cm vibration. The
62
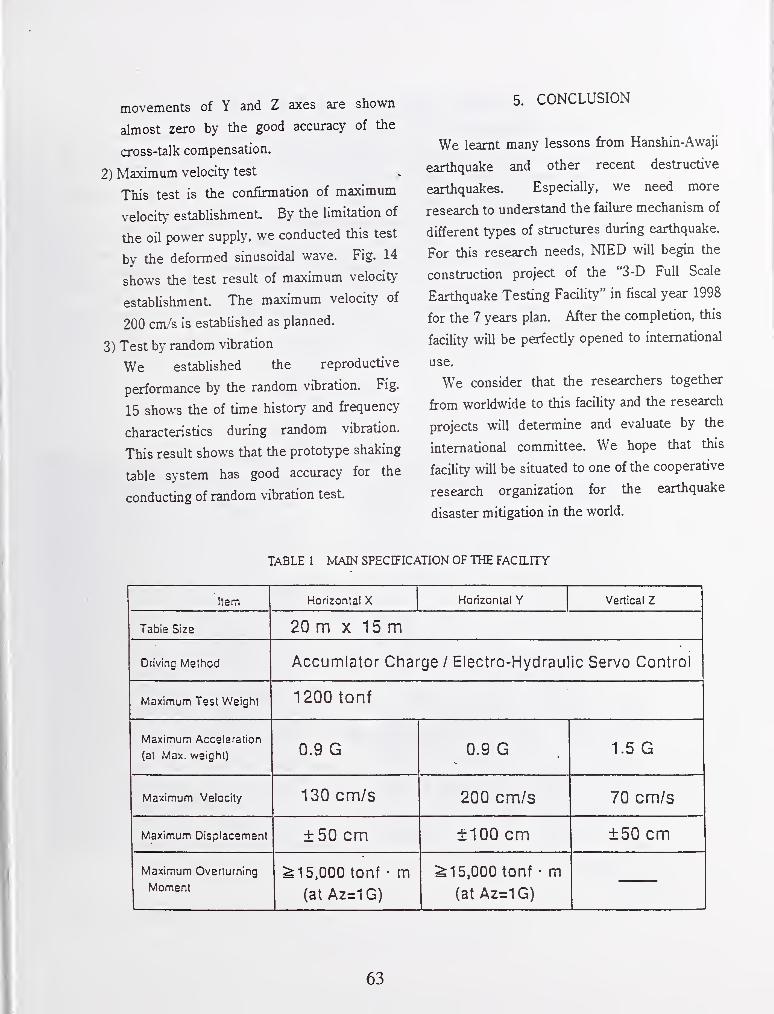
movements of Y and Z axes are shown
almost zero by the good accuracy of the
cross-talk compensation.
2) Maximum velocity test
This test is the confirmation of maximum
velocity establishment By the limitation of
the oil power supply, we conducted this test
by the deformed sinusoidal wave. Fig. 14
shows the test result of maximum velocity
establishment The maximum velocity of
200 cm/s is established as planned.
3) Test by random vibration
We established the reproductive
performance by the random vibration. Fig.
15 shows the of time history and frequency
characteristics during random vibration.
This result shows that the prototype shaking
table system has good accuracy for the
conducting of random vibration test
TABLE 1 MAIN SPECIFICAnON OF THE FACILITY
Item Horizontal X Horizontal Y Vertical Z
Tabie Size 20 m X 15m
Driving Melhod Accumlator Charge / Electro-Hydraulic Servo Control
Maximum Test Weight 1200 tonf
Maximum Acceleration
(at Max. weight) 0.9 G 0.9 G 1.5 G
Maximum Velocity 130 cm/s 200 cm/s 70 cm/s
Maximum Displacement ±50 cm ±100 cm ±50 cm
Maximum Overturning
Moment^15,000 tonf • m
(at Az=1G)
^15,000 tonf • m(at Az=1G)
63
5. CONCLUSION
We learnt many lessons from Hanshin-Awaji
earthquake and other recent destructive
earthquakes. Especially, we need more
research to understand the failure mechanism of
different types of structures during earthquake.
For this research needs, NIED will begin the
construction project of the "3-D Full Scale
Earthquake Testing FaciUty" in fiscal year 1998
for the 7 years plan. After the completion, this
facility will be perfectly opened to international
use.
We consider that the researchers together
from worldwide to this facility and the research
projects will determine and evaluate by the
international committee. We hope that this
facility will be situated to one of the cooperative
research organization for the earthquake
disaster mitigation in the world.
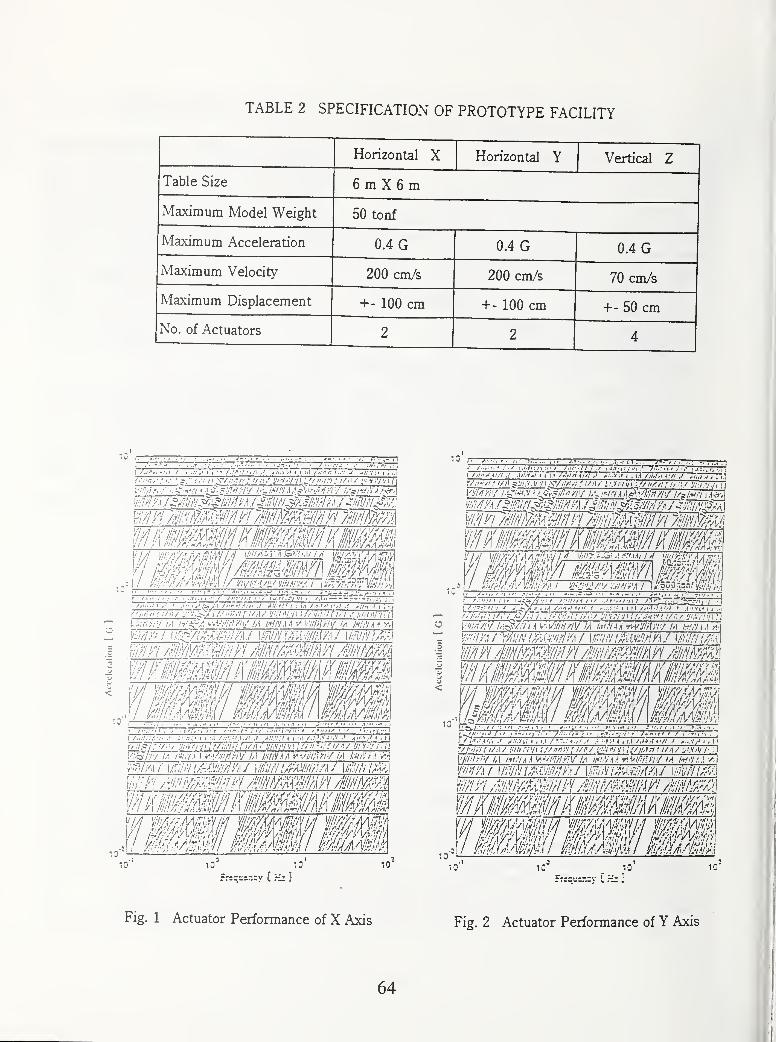
TABLE 2 SPECIFICATION OF PROTOTYPE FACILITY
Horizontal X Horizontal Y Vertical Z
J. dUlC OlZc 6 m X 6 m
Maximum Model Weight 50 tonf
Maximum Acceleration 0.4 G 0.4 G 0.4 G
Maximum Velocity 200 cm/s 200 cm/s 70 cm/s
Maximum Displacement +- 100 cm +- 100 cm +- 50 cm
No. of Actuators 2 2 4
10 r.—rr-TT-
3
. 1,1.1 /v.;;ri,,v,r .// .'.'7 J i 1,1 /.l.Kill/l >t i |.
;',v,v,7,./ ,'///!/ uh'iri'j'. urirj'n ;
.1:1 *-•'/,'////;/ 1/ //i /vY/i/.i/i r.t'i'/;;//V /A
1/ ki'k^'K
10 10 10'
I /.-l-'r' 'l/l ,1 .U:,i.l I I I.I Al/I ,1 ,,..7 •< I I |.< < V/ ,1 ^ii, ; ,< J , ij
limmmMmMMm.
WMimBiMMmmiMiimk
r/l":yi n/:\/ 'jh-nvn :.'/ :itr: ^ i/n/ f/'/\ ;///,',r,7i- //;\/ ;'.y/i//i ,'i
Vlil'l'.-N lA /.'l',y,^.^ ^^'irirlrVf'lA \ r.UI;'nH</ lA vA
Fig. 1 Actuator Performance of X Axis Fig. 2 Actuator Performance of Y Axis
64
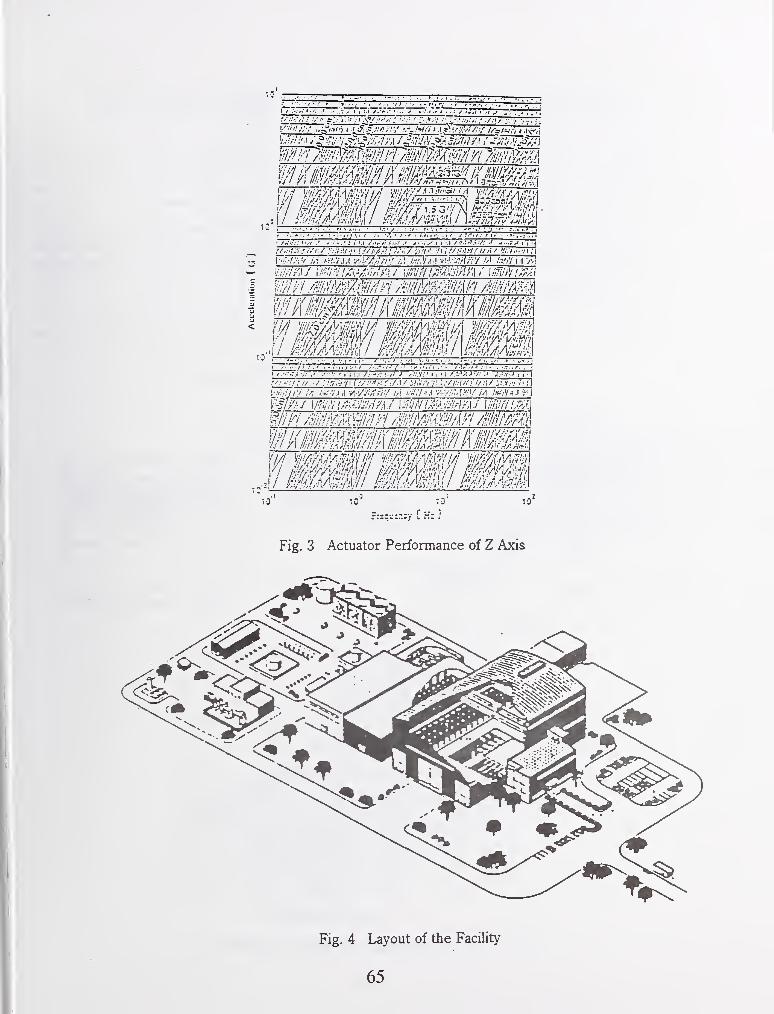
Fig. 4 Layout of the Facility
65
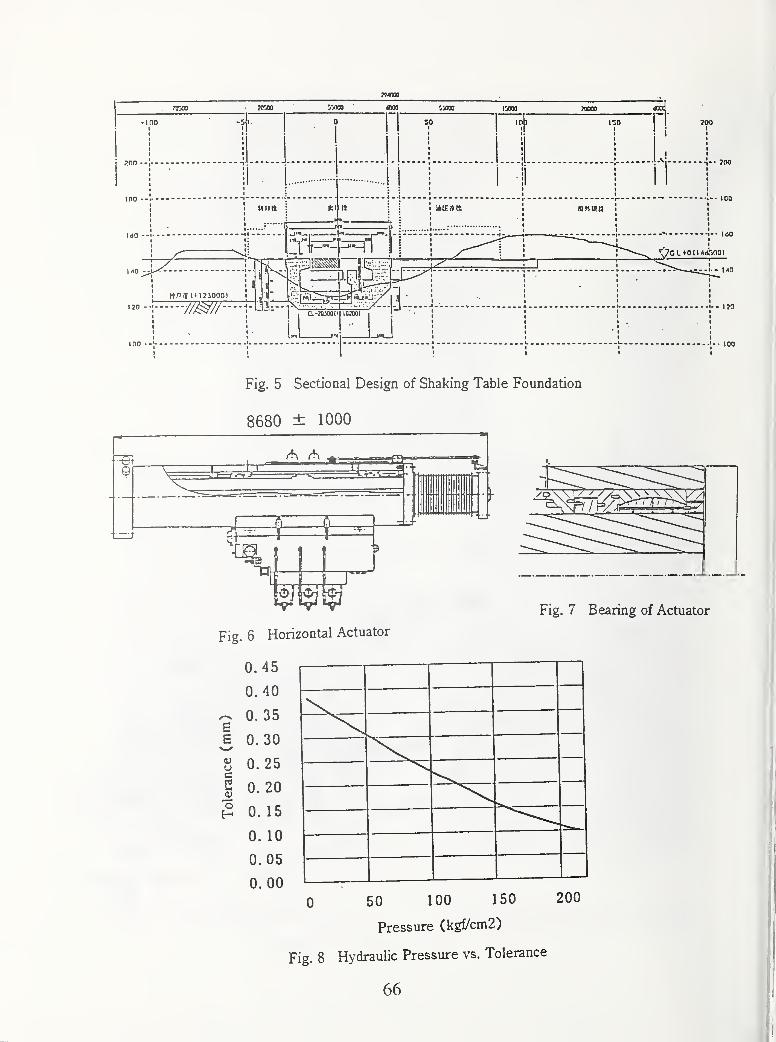
u
a-TOMOII
J
Fig. 5 Sectional Design of Shaking Table Foundation
8680 ± 1000
Fig. 7 Bearing of Actuator
50 100 150
Pressure (kgl/cm2)
Fig. 8 Hydraulic Pressure vs. Tolerance
66
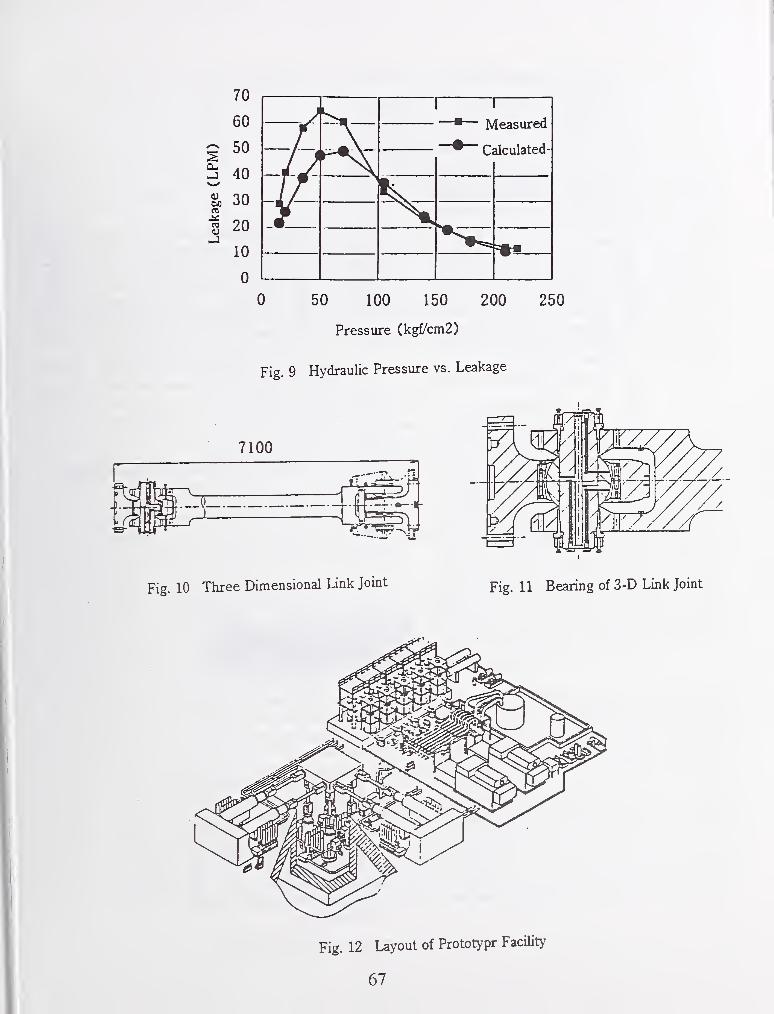
Pressure (kgf/cm2)
Fig. 9 Hydraulic Pressure vs. Leakage
Fig. 12 Layout of Prototypr Facility
67
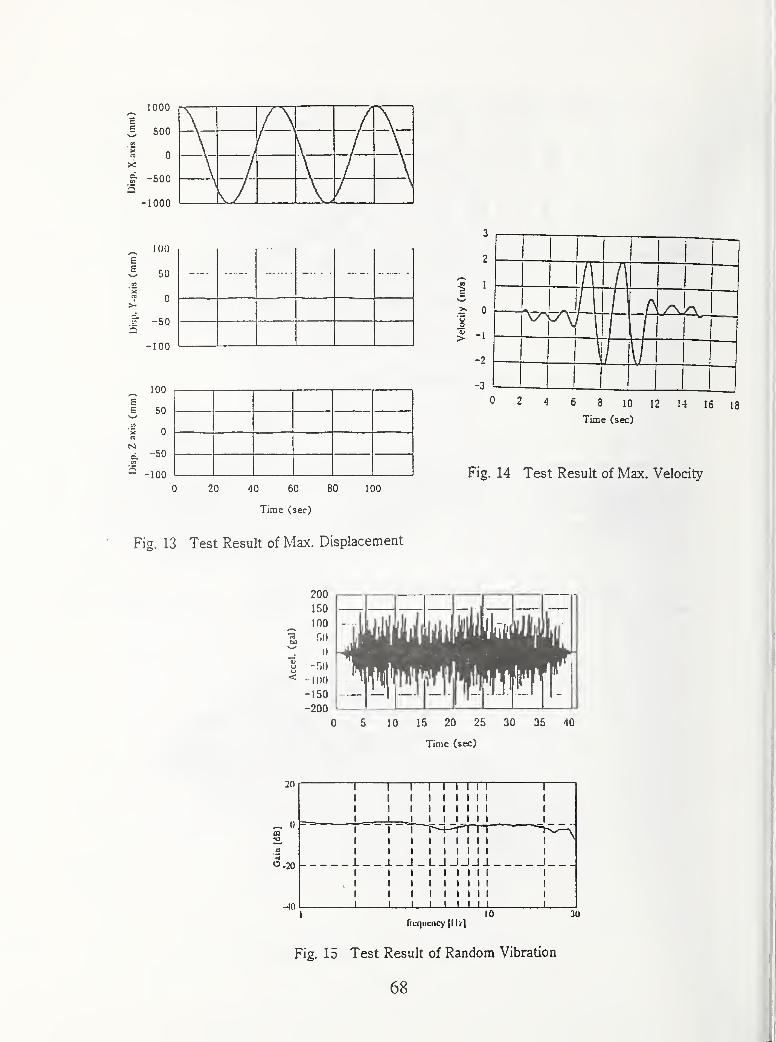
1000/—«
cc 500a)
a 0><
wc n A-5UU
Q-1000
1 00
1E
50m
0>•
c.-50
a-100
100
50
0
c.-50
CO
-100
20 -10 60 80
Time (sec)
100
Fig, 14 Test Result of Max. Velocity
Fig. 13 Test Result of Max. Displacement
10 15 20 25 30 35
Time (sec)
20
ffl
-10
1__1_J_ L J
TTTI I I
I I I
I I I
TTI I I
I I I
J J J_lI I I
I I I
I I I
I 1 I
I
0ricqtiency (I I/]
Fig. 15 Test Result of Random Vibration
68
30

Strong Motion from Surface Waves in Deep Sedimentary Basins
by
William B. Joyner'
ABSTRACT
It is widely recognized that long-period surface
waves generated by conversion of body waves
at the boundaries of deep sedimentary basins
make an important contribution to strong
ground motion. The factors controlling the
amplitude of such motion, however, are not
widely understood. Compared to the body
wave, the velocity of the surface wave is muchless, and, as a result, the curvature of the
wavefront and the geometric spreading are
much less. The surface wave behaves
approximately as if it were generated by a line
source m a two-dimensional medium. On the
other hand the low-Q basin sediments produce
significant anelastic attenuation, even at
relatively long periods. A study of
pseudovelocity response spectra of records of
the 1971 San Fernando and 1994 Northridge
earthquakes at sites in the Los Angeles Basin
shows that late-arriving surface waves with
group velocities of about 1 km/sec dominate the
ground motion for periods of 3 sec and longer.
The rate of amplitude decay for these waves is
less than for the body waves and depends
significantly on penod, with smaller decay for
longer periods. The amplitude can be modeled
by anelastic attenuation with decay proportional
to the exponential of distance multiplied by an
attenuation coefficient. Methods for estimating
the response spectral amplitudes for these waves
in future earthquakes are presented based on
either the San Fernando or Northridge data. The
response spectral amplitude of surface waves
fi-om the Northridge earthquake is less than
from the San Fernando earthquake by factors as
large as four. The surpnsingly large difference
between the San Fernando and Northridge
earthquakes can be explained, at least in part, by
directivity. Estimates of response values in
future earthquakes based on the two different
data sets give a sense of the range of
possibilities. These estimates are based on data
from the Los Angeles Basin, but, in the absence
of other data, they could be applied to sites in
other deep Quaternary basins. The results
presented in this paper indicate that inclusion of
anelastic attenuation may be essential in
modeling ground motion in deep sedimentary
basins. Future progress in understanding strong
motion from basin surface waves calls for
attention to faithful recording of the long-period
components of ground motion and to recording
motion for times long enough to include the
late-arriving surface waves.
1. INTRODUCTION
The importance of surface waves for long-
period strong earthquake ground motion has
long been recognized. Hanks (197^) examined
displacement time series obtained by double
integration of accelerometer records from the
1971 San Fernando, California, earthquake and
showed that surface waves were a significant
component of the long-period motion. Surface
waves in the San Fernando earthquake were also
studied by Lui and Heaton (1984) and by Vidale
and Helmberger (1988) who showed that the
surface waves were generated by conversion
from body waves at the margins of deep
sedimentary basins.
The factors controlling the amplitude of surface
waves generated by conversion of body waves
at basin margins are not widely understood.
The amplitude of surface waves is commonlysaid to decay as the one-half power of distance.
That statement is only true for laterally
homogeneous media and then only in the
frequency domain. The decay in the time
domain is greater because of dispersion. With
' U.S. Geological Survey, 345 Middlefield Road MS 977,
Menio Park, CA 94025
69
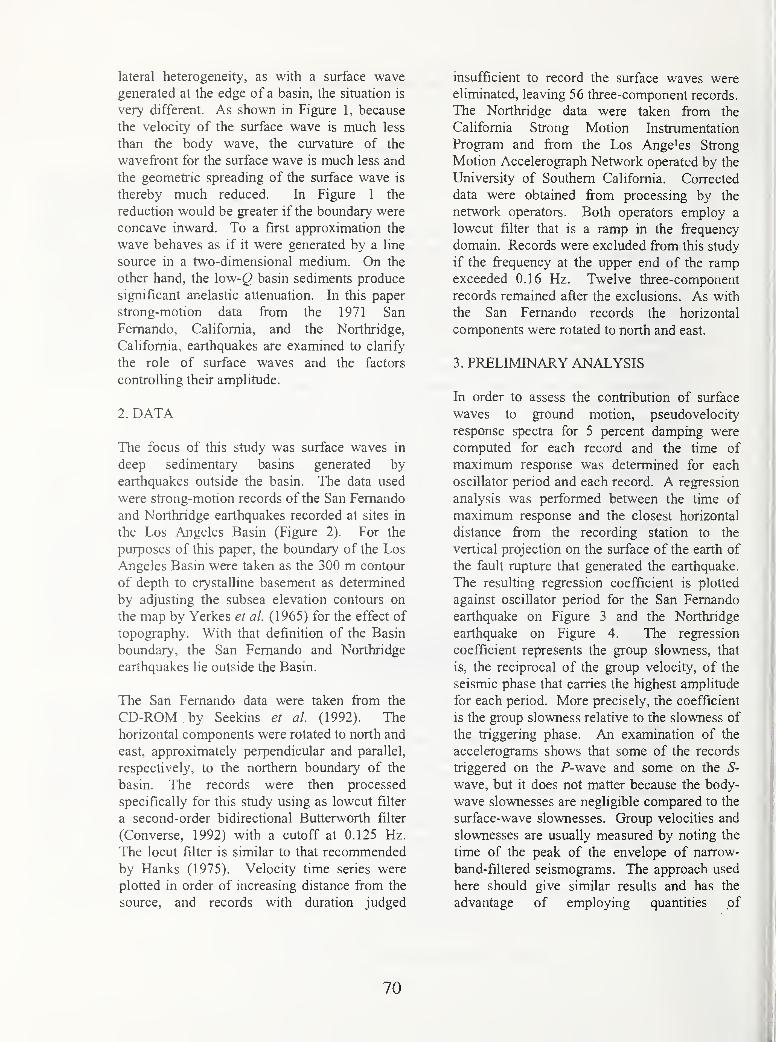
lateral heterogeneity, as with a surface wave
generated at the edge of a basin, the situation is
very different. As shown in Figure 1, because
the velocity of the surface wave is much less
than the body wave, the curvature of the
wavefront for the surface wave is much less and
the geometric spreadmg of the surface wave is
thereby much reduced. In Figure 1 the
reduction would be greater if the boundary were
concave inward. To a first approximation the
wave behaves as if it were generated by a line
source m a two-dimensional medium. On the
other hand, the low-^ basin sediments produce
significant anelastic attenuation. In this paper
strong-motion data from the 1971 San
Fernando, California, and the Northridge,
California, earthquakes are examined to clarify
the role of surface waves and the factors
controlling their amplitude.
2. DATA
The focus of this study was surface waves in
deep sedimentary basins generated by
earthquakes outside the basin. The data used
were strong-motion records of the San Fernando
and Northridge earthquakes recorded at sites in
the Los Angeles Basin (Figure 2). For the
purposes of this paper, the boundary of the Los
Angeles Basin were taken as the 300 m contour
of depth to crystalline basement as determined
by adjusting the subsea elevation contours on
the map by Yerkes et al. (1965) for the effect of
topography. With that definition of the Basin
boundary, the San Fernando and Northridge
earthquakes lie outside the Basm.
The San Fernando data were taken from the
CD-ROM by Seekms et al. (1992). The
horizontal components were rotated to north and
east, approximately perpendicular and parallel,
respectively, to the northern boundary of the
basm. The records were then processed
specifically for this study using as lowcut filter
a second-order bidirectional Butterworth filter
(Converse, 1992) with a cutoff at 0.125 Hz.
The locut filter is similar to that recommended
by Hanks (1975). Velocity time series were
plotted in order of increasing distance from the
source, and records with duration judged
insufficient to record the surface waves were
eliminated, leaving 56 three-component records.
The Northridge data were taken from the
California Sfrong Motion Instrumentation
Program and from the Los Angeles Sfrong
Motion Accelerograph Network operated by the
University of Southern California. Corrected
data were obtained from processing by the
network operators. Both operators employ a
lowcut filter that is a ramp in the frequency
domain. Records were excluded from this study
if the frequency at the upper end of the rampexceeded 0.16 Hz. Twelve three-component
records remained after the exclusions. As with
the San Fernando records the horizontal
components were rotated to north and east.
3. PRELIMINARY ANALYSIS
In order to assess the contribution of surface
waves to ground motion, pseudovelocity
response specfra for 5 percent damping were
computed for each record and the time of
maximum response was determined for each
oscillator period and each record. A regression
analysis was performed between the time of
maximum response and the closest horizontal
distance from the recording station to the
vertical projection on the surface of the earth of
the fault rupture that generated the earthquake.
The resulting regression coefficient is plotted
against oscillator period for the San Fernando
earthquake on Figure 3 and the Northndge
earthquake on Figure 4. The regression
coefficient represents the group slowness, that
is, the reciprocal of the group velocity, of the
seismic phase that carries the highest amplitude
for each period. More precisely, the coefficient
is the group slowness relative to the slowness of
the tnggering phase. An examination of the
accelerograms shows that some of the records
triggered on the P-wave and some on the S-
wave, but it does not matter because the body-
wave slownesses are negligible compared to the
surface-wave slownesses. Group velocities and
slownesses are usually measured by noting the
time of the peak of the envelope of narrow-
band-filtered seismograms. The approach used
here should give similar results and has the
advantage of employing quantities of
70
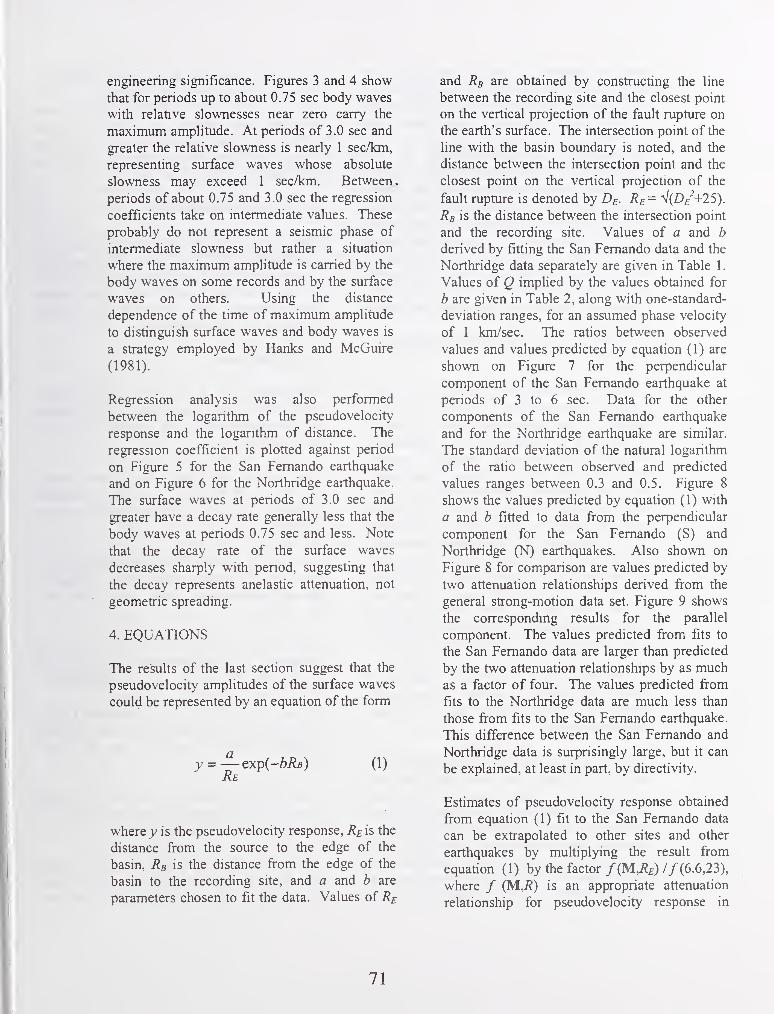
engineering significance. Figures 3 and 4 show
that for periods up to about 0.75 sec body waves
with relative slownesses near zero carry the
maximum amplitude. At periods of 3.0 sec and
greater the relative slowness is nearly 1 sec/km,
representing surface waves whose absolute
slowness may exceed 1 sec/km. Between,
periods of about 0.75 and 3.0 sec the regression
coefficients take on intermediate values. These
probably do not represent a seismic phase of
intermediate slowness but rather a situation
where the maximum amplitude is carried by the
body waves on some records and by the surface
waves on others. Using the distance
dependence of the time of maximum amplitude
to distinguish surface waves and body waves is
a strategy employed by Hanks and McGuire
(1981).
Regression analysis was also performed
between the logarithm of the pseudovelocity
response and the logarithm of distance. The
regression coefficient is plotted against period
on Figure 5 for the San Fernando earthquake
and on Figure 6 for the Northridge earthquake.
The surface waves at periods of 3.0 sec and
greater have a decay rate generally less that the
body waves at periods 0.75 sec and less. Note
that the decay rate of the surface waves
decreases sharply with period, suggesting that
the decay represents anelastic attenuation, not
geometric spreading.
4. EQUATIONS
The results of the last section suggest that the
pseudovelocity amplitudes of the surface waves
could be represented by an equation of the form
y = —exp{-bRB) (1)
Re
where y is the pseudovelocity response, Re is the
distance from the source to the edge of the
basm, Rb is the distance from the edge of the
basin to the recording site, and a and b are
parameters chosen to fit the data. Values of Re
and Rb are obtained by constructing the line
between the recording site and the closest point
on the vertical projection of the fault rupture on
the earth's surface. The intersection point of the
line with the basin boundary is noted, and the
distance between the intersection point and the
closest point on the vertical projection of the
fault rupture is denoted by De- Re= V(D/+25).
Rb is the distance between the intersection point
and the recording site. Values of a and b
derived by fitting the San Fernando data and the
Northridge data separately are given in Table 1
.
Values of Q implied by the values obtained for
b are given in Table 2, along with one-standard-
deviation ranges, for an assumed phase velocity
of 1 km/sec. The ratios between observed
values and values predicted by equation (1) are
shown on Figure 7 for the perpendicular
component of the San Fernando earthquake at
periods of 3 to 6 sec. Data for the other
components of the San Fernando earthquake
and for the Northridge earthquake are similar.
The standard deviation of the natural logarithm
of the ratio between observed and predicted
values ranges between 0.3 and 0.5. Figure 8
shows the values predicted by equation (1) with
a and b fitted to data from the perpendicular
component for the San Fernando (S) and
Northridge (N) earthquakes. Also shown on
Figure 8 for comparison are values predicted by
two attenuation relationships derived from the
general strong-motion data set. Figure 9 shows
the corresponding results for the parallel
component. The values predicted from fits to
the San Fernando data are larger than predicted
by the two attenuation relationships by as muchas a factor of four. The values predicted from
fits to the Northridge data are much less than
those from fits to the San Fernando earthquake.
This difference between the San Fernando and
Northridge data is surprisingly large, but it can
be explained, at least m part, by directivity.
Estimates of pseudovelocity response obtained
from equation (1) fit to the San Fernando data
can be exfrapolated to other sites and other
earthquakes by multiplying the result from
equation (1) by the factor /(M,/?^) 7/(6.6,23),
where / (M,R) is an appropriate attenuation
relationship for pseudovelocity response in
71
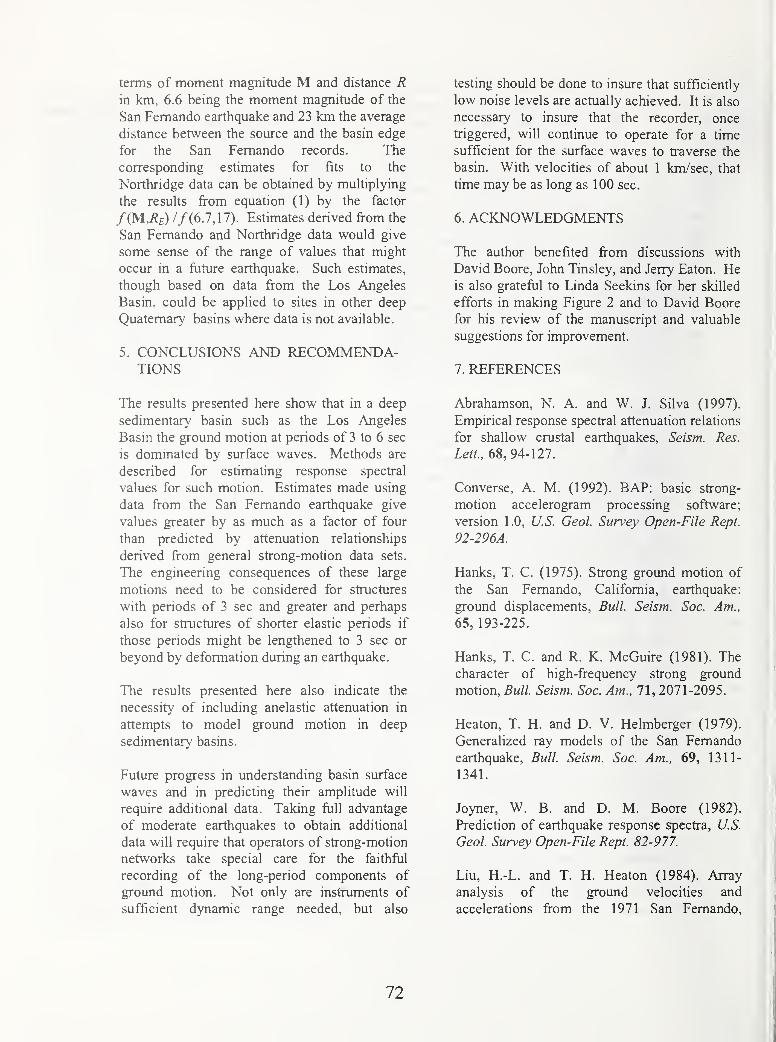
terms of moment magnitude M and distance Rin km, 6.6 being the moment magnitude of the
San Fernando earthquake and 23 km the average
distance between the source and the basin edge
for the San Fernando records. The
corresponding estimates for fits to the
Northridge data can be obtained by multiplying
the results from equation (1) by the factor
/(MMe) //(6.7,17). Estimates derived from the
San Femando and Northridge data would give
some sense of the range of values that might
occur in a future earthquake. Such estimates,
though based on data from the Los Angeles
Basin, could be applied to sites in other deep
Quaternary basins where data is not available.
5. CONCLUSIONS AND RECOMMENDA-TIONS
The results presented here show that m a deep
sedimentary basin such as the Los Angeles
Basin the ground motion at periods of 3 to 6 sec
is dominated by surface waves. Methods are
described for estimating response spectral
values for such motion. Estimates made using
data from the San Femando earthquake give
values greater by as much as a factor of four
than predicted by attenuation relationships
derived from general strong-motion data sets.
The engineering consequences of these large
motions need to be considered for structures
with penods of 3 sec and greater and perhaps
also for structures of shorter elastic periods if
those periods might be lengthened to 3 sec or
beyond by deformation during an earthquake.
The results presented here also indicate the
necessity of including anelastic attenuation in
attempts to model ground motion in deep
sedimentary basins.
Future progress in understanding basin surface
waves and in predicting their amplitude will
require additional data. Taking full advantage
of moderate earthquakes to obtain additional
data will require that operators of strong-motion
networks take special care for the faithful
recording of the long-period components of
ground motion. Not only are instruments of
sufficient dynamic range needed, but also
testing should be done to insure that sufficiently
low noise levels are actually achieved. It is also
necessary to insure that the recorder, once
triggered, will continue to operate for a time
sufficient for the surface waves to traverse the
basin. With velocities of about 1 km/sec, that
time may be as long as 100 sec.
6. ACKNOWLEDGMENTS
The author benefited from discussions with
David Boore, John Tinsley, and Jerry Eaton. Heis also grateful to Linda Seekins for her skilled
efforts in making Figure 2 and to David Boore
for his review of the manuscript and valuable
suggestions for improvement.
7. REFERENCES
Abrahamson, N. A. and W. J. Silva (1997).
Empirical response spectral attenuation relations
for shallow crustal earthquakes. Seism. Res.
Lett., 68, 94-127.
Converse, A. M. (1992). BAP: basic strong-
motion accelerogram processing software;
version 1 .0, U.S. Geol. Survey Open-File Rept.
92-296A.
Hanks, T. C. (1975). Strong ground motion of
the San Femando, Califomia, earthquake:
ground displacements, Bull. Seism. Soc. Am.,
65, 193-225.
Hanks, T. C. and R. K. McGuire (1981). The
character of high-frequency strong ground
motion. Bull. Seism. Soc. Am., 71, 2071-2095.
Heaton, T. H. and D. V. Helmberger (1979).
Generalized ray models of the San Femando
earthquake, Bull. Seism. Soc. Am., 69, 1311-
1341.
Joyner, W. B. and D. M. Boore (1982).
Prediction of earthquake response spectra, U.S.
Geol. Survey Open-File Rept. 82-977.
Liu, H.-L. and T. H. Heaton (1984). Array
analysis of the ground velocities and
accelerations from the 1971 San Femando,
72

California, earthquake, Bull. Seism. Soc. Am.,
74, 1951-1968.
Seekins, L. C, A. G. Brady, C. Carpenter, and
N. Brown (1992). Digitized strong-motion
accelerograms of North and Central American
earthquakes 1933-1986, U.S. Geol. Survey
Digital Data Series DDS- 7.
Vidale, J. E. and D. V. Helmberger (1988).
Elastic finite-difference modeling of the 1971
San Femando, California earthquake, Bull.
Seism. Soc. Am., 78, 122-141.
Yerkes, R. F., T. H. McCulloh, J. E.
Schoellhamer, and J. G. Vedder (1965).
Geology of the Los Angeles Basin California -
an introduction, U.S. Geol. Survey Prof. Paper420-A, 57 p.
73
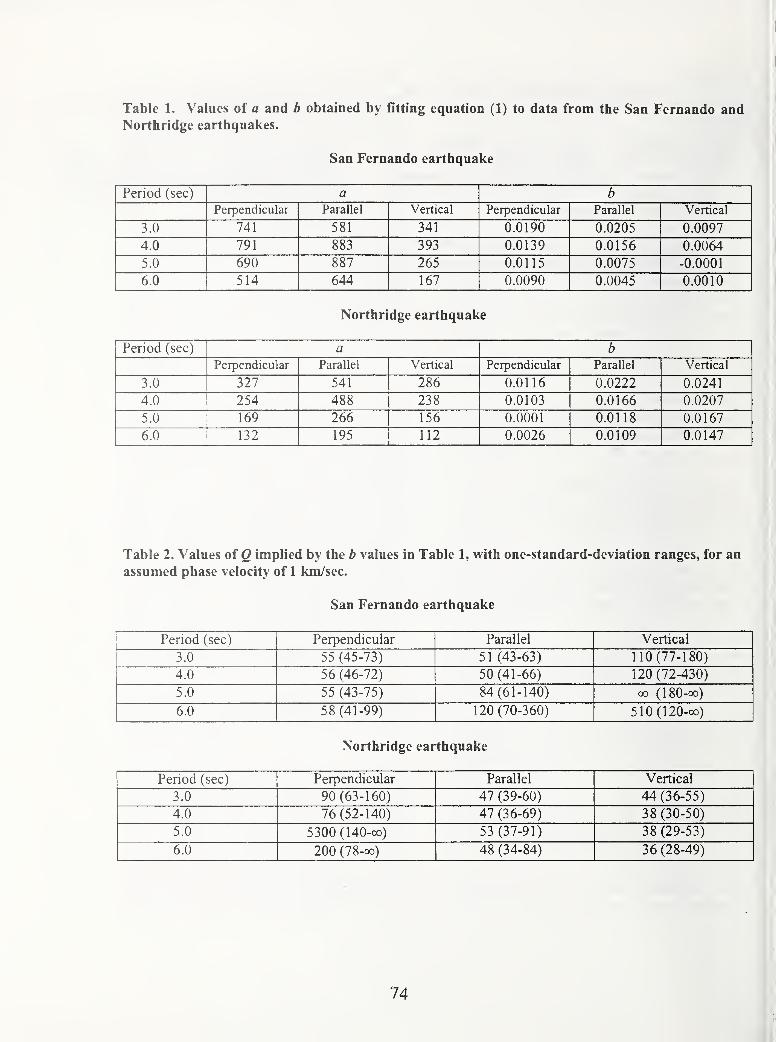
Table 1. Values of a and b obtained by fitting equation (1) to data from the San Fernando andNorthridge earthquakes.
San Fernando earthquake
Period (sec) a b
Perpendicular Parallel Vertical Perpendicular Parallel Vertical
3.0 741 581 341 0.0190 0.0205 0.0097
4.0 791 883 393 0.0139 0.0156 0.0064
5.0 690 887 265 0.0115 0.0075 -0.0001
6.0 514 644 167 0.0090 0.0045 0.0010
Northridge earthquake
Period (sec) a b
Perpendicular Parallel Vertical Perpendicular Parallel Vertical
3.0 327 541 286 0.0116 0.0222 0.0241
4.0 254 488 238 0.0103 0.0166 0.0207
5.0 169 266 156 0.0001 0.0118 0.0167
6.0 132 195 112 0.0026 0.0109 0.0147
Table 2. Values of Q implied by the b values in Table 1, with one-standard-deviation ranges, for an
assumed phase velocity of 1 km/sec.
San Fernando earthquake
Period (sec) Perpendicular Parallel Vertical
3.0 55 (45-73) 51 (43-63) 110(77-180)
4.0 56 (46-72) 50 (41-66) 120 (72-430)
5.0 55 (43-75) 84 (61-140) 00 (180-00)
6.0 58 (41-99) 120(70-360) 510 (120-00)
Northridge earthquake
Period (sec) Perpendicular Parallel Vertical
3.0 90 (63-160) 47 (39-60) 44 (36-55)
4.0 76(52-140) 47 (36-69) 38 (30-50)
5.0 5300 (140-00) 53 (37-91) 38 (29-53)
6.0 200 (78-aD) 48 (34-84) 36 (28-49)
74

I
Figure 1. Schematic plan view of the wavefronts for an S wave from a point source converting to a
surface wave at the edge of a basin. The phase velocity of the surface wave is one-third the S wavevelocity.
r
75
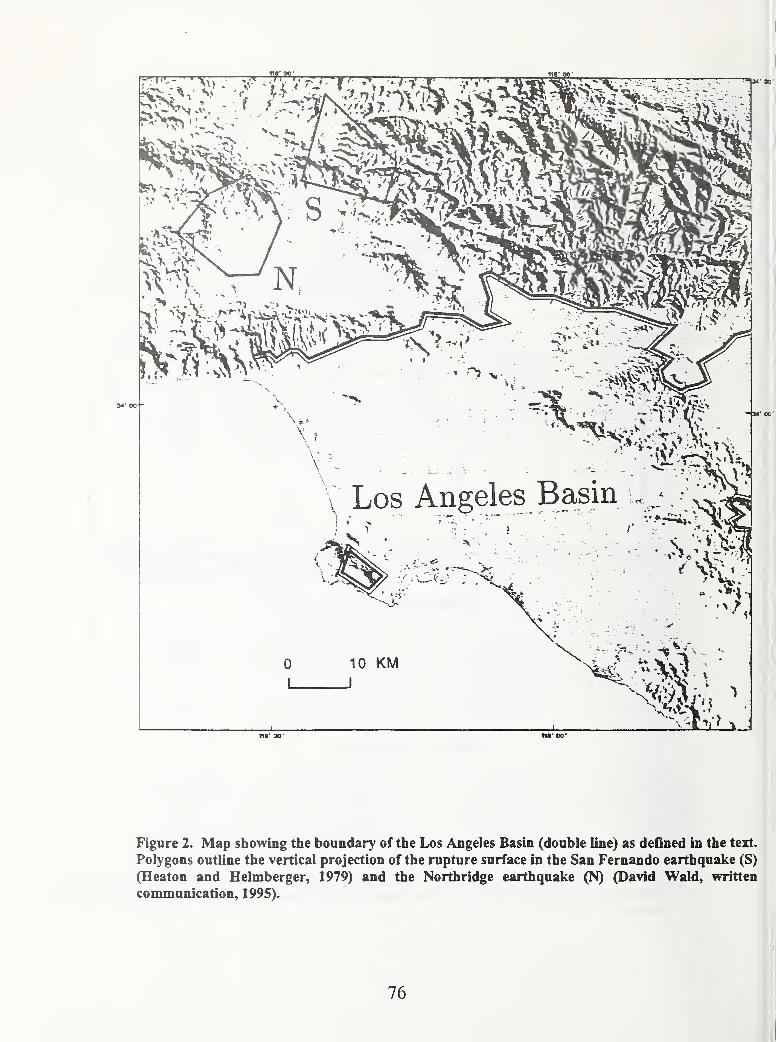
!!«•»• WOO-
Figure 2. Map showing the boundary of the Los Angeles Basin (double line) as defined in the text.
Polygons outline the vertical projection of the rupture surface in the San Fernando earthquake (S)
(Heaton and Helmberger, 1979) and the Northridge earthquake (N) (David Wald, written
communication, 1995).
76

PERPENDICULAR SAN FERNANDO EARTHQUAKE1 1 1 1—I—I—n—i 1 1 1
1 I I I
2
^1 h
1-
ZUJ
Oo
<
IIII
1 1 1
1
_1 I I 1 L. _i I I 1 1 1—1—
L
0.1 1 .0
PERIOD (S)
10.0
PARALLEL
2
zUi
oLLU.UJooX 0^
»-
-T 1 1 1—T-l-j-
X X
I • 1 l—l—1—L.
0.1 1.0
PERIOD (S)
10.0
VERTICALr
1 1 1—I—I I I I
' 1 1 1—I—r-r-r-
2it:
O
UJ
OoX 0'
<2
II ill I
I I—I—i-i-
0 1 1.0 10.0
PERIOD (S)
Figure 3. Regression coefficient between the time of maximum pseudovelocity response and closest
horizontal distance to the vertical projection of the fault rupture for records from the San
Fernando earthquake. The bars show the one-standard-error range for the coefficient.
77
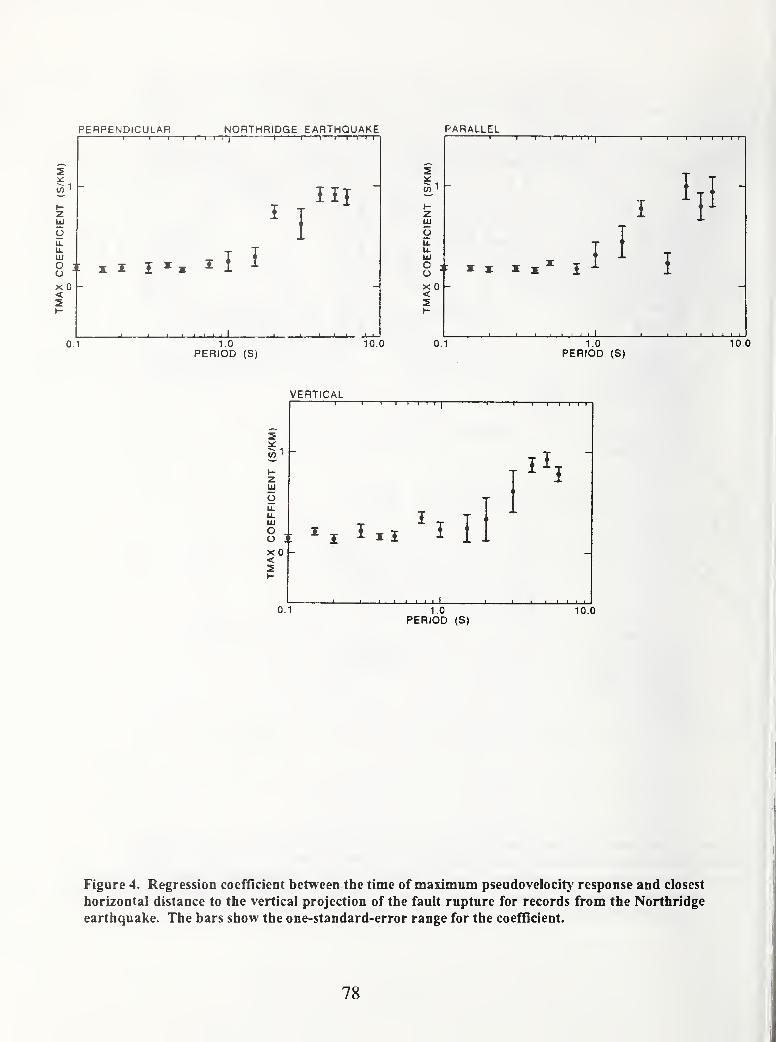
PERPENDICULAR NORTHRIDGE EARTHQUAKE1 1 1 1 1 1—TT--1 1 1 1—I—I—
r
Kill
HI
-I J I I
1.0
PERIOD (S)
10.0
PARALLEL
z
ou.u.UJ
oo •
X 0<
-I 1 r- -1 1 1 1—I—I—n-
III
II
I
0.1_J 1_J L-l_
1.0PERIOD (S)
10.0
VERTICAL
zUJ
o
UJ
O ..o XX 0<
-J 1 I I J '
-I—I—I—I I I
ll
1
i
-1 ' ' I—I L_L.
0.1 1.0
PERIOD (S)10.0
Figure 4. Regression coefficient between the time of maximum pseudovelocity response and closest
horizontal distance to the vertical projection of the fault rupture for records from the Northridge
earthquake. The bars show the one-standard-error range for the coefficient.
78
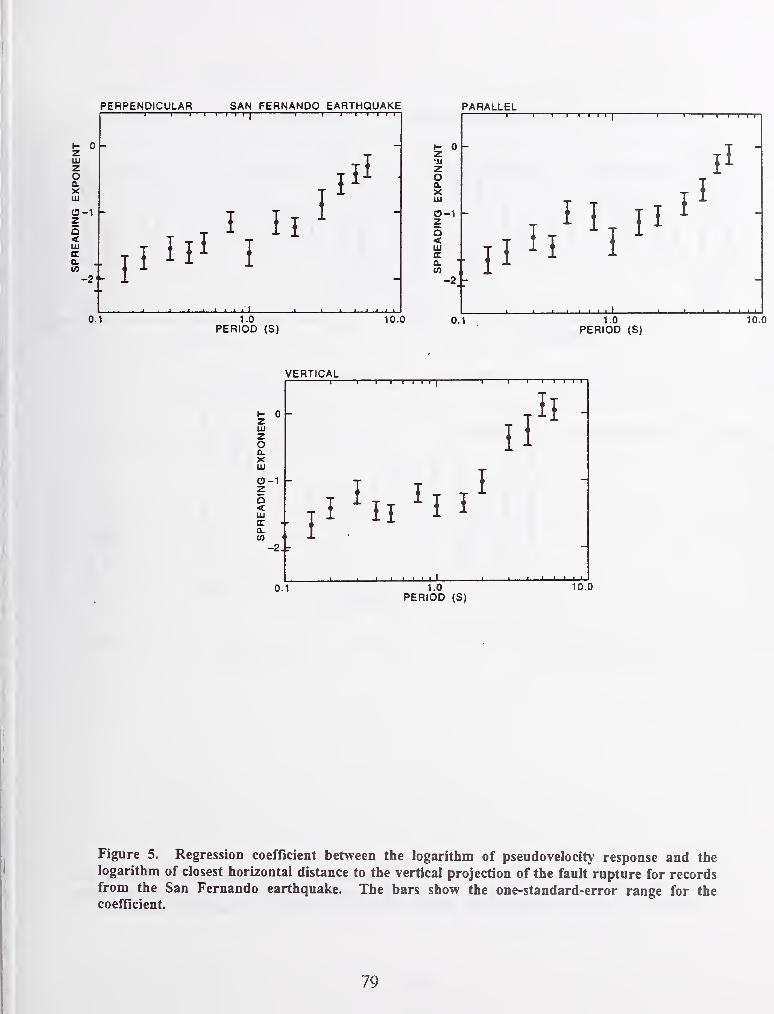
PERPENDICULAR SAN FERNANDO EARTHQUAKET 1 1 1—I [ I
PARALLEL
1.0PERIOD (S)
t- 0z•.u
zo0.XlU
0-1zo<UJITa.fii
-2
I I r—r-I I 1—I—I—
r
ji n i
I
10.0 0.1 1.0PERIOD (S)
VERTICAL
zlUzoa.XlU
0-1za<LUCCQ.(0
-2.r
T 1 1 1—r—I I I
I-I 1 1 1
1 T I I
ll
:: I
' u0.1 1.0
PERIOD (S)
10.0
Figure 5. Regression coefficient between the logarithm of pseudovelocity response and thelogarithm of closest horizontal distance to the vertical projection of the fault rupture for recordsfrom the San Fernando earthquake. The bars show the one-standard-error range for thecoefficient.
79
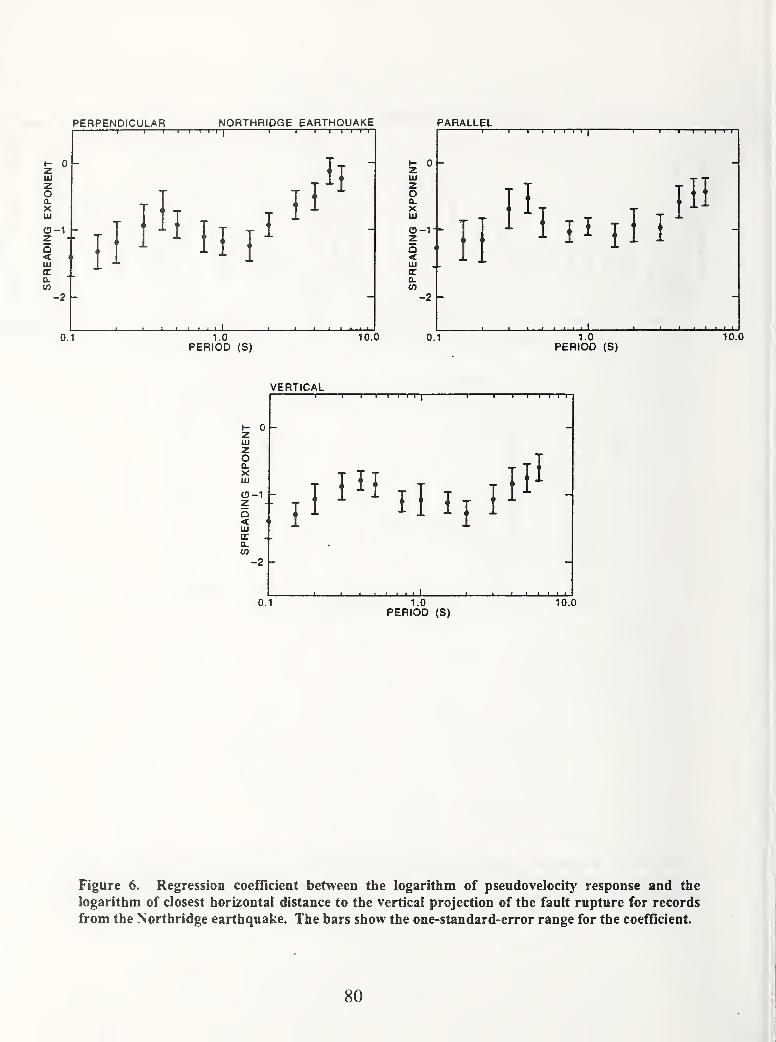
PERPENDICULAR NORTHRIDGE EARTHQUAKE1 1 1 1—I—I—
r
ZUJzoa.XUJ
0-1zo<UJ
a«-2
-1 1 1—I—I—n-
J
0.1_l I I L.
1.0PERIOD (S)
10.0
PARALLEL1 1 1 1—I—I—r—r-
ZUJzoCLXUJ
0-1zo<UJocQ.(0
-2 -
0.1
I I—I—I
—
r-r
-I ' _l I ' LU-1.0
PERIOD (S)10,0
VERTICAL
ZUJzoQ.XUJ
CD-Izo<UJ(EQ.in
-2
-I r—1—I—I—I I
I
0.1
' .III I II I I ' '
1.0PERIOD (S)
10.0
Figure 6. Regression coefTicient between the logarithm of pseudovelocity response and the
logarithm of closest horizontal distance to the vertical projection of the fault rupture for records
from the Northridge earthquake. The bars show the one-standard-error range for the coefficient.
80
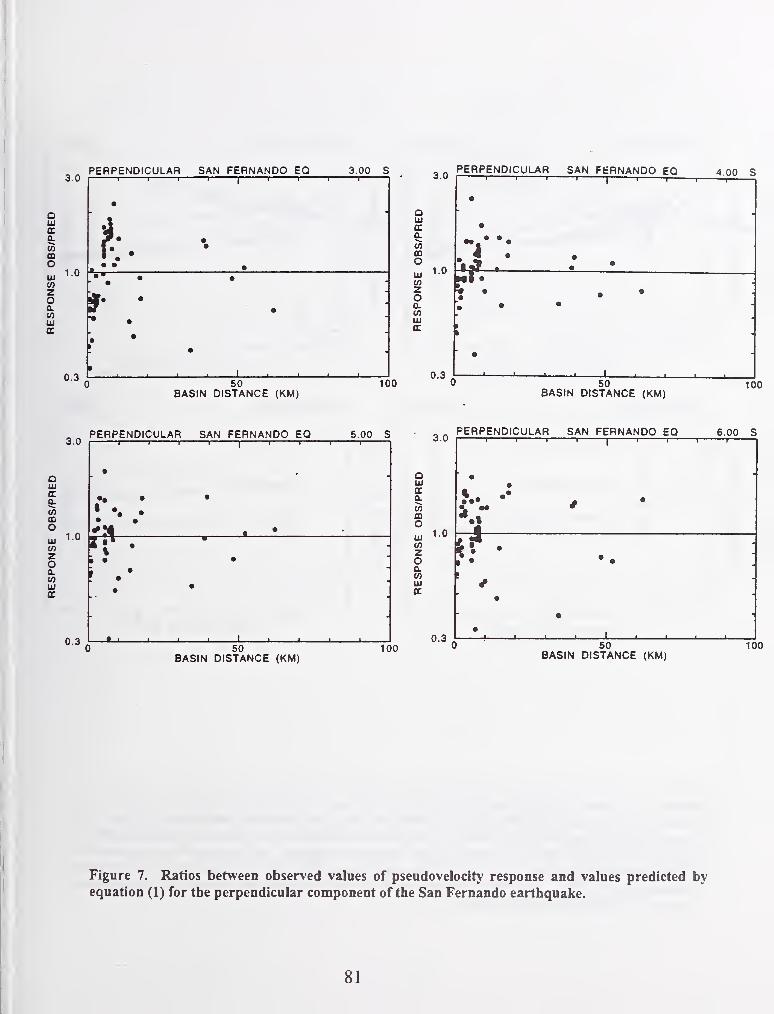
PERPENDICULAR SAN FERNANDO EQ3.0 I
1 1 1 1 1 1 1 r3.00 S
BASIN DISTANCE (KM)
PERPENDICULAR SAN FERNANDO EQ
100
5.00 S
100
3.0
OUJoc
COCDOUJ(AzoQ.(nUJoc
1.0
0.3
3.0
PERPENDICULAR SAN FERNANDO EQ 4.00 S1 ' r-
•• • • •
4 :
aUJa.
CDOUJCOzoQ.(fl
Ula
1.0
0.3
BASIN DISTANCE (KM)50
BASIN DISTANCE (KM)
J 50 100BASIN DISTANCE (KM)
PERPENDICULAR SAN FERNANDO EQ 6.00 Sr
•
11
—1
1 1 1 1
'
•
••
/ •
u -
it •
• •
•
•
•L_ 1 1 1 1 1 1 1 I
100
Figure 7, Ratios between observed values of pseudovelocity response and values predicted byequation (1) for the perpendicular component of the San Fernando earthquake.
81
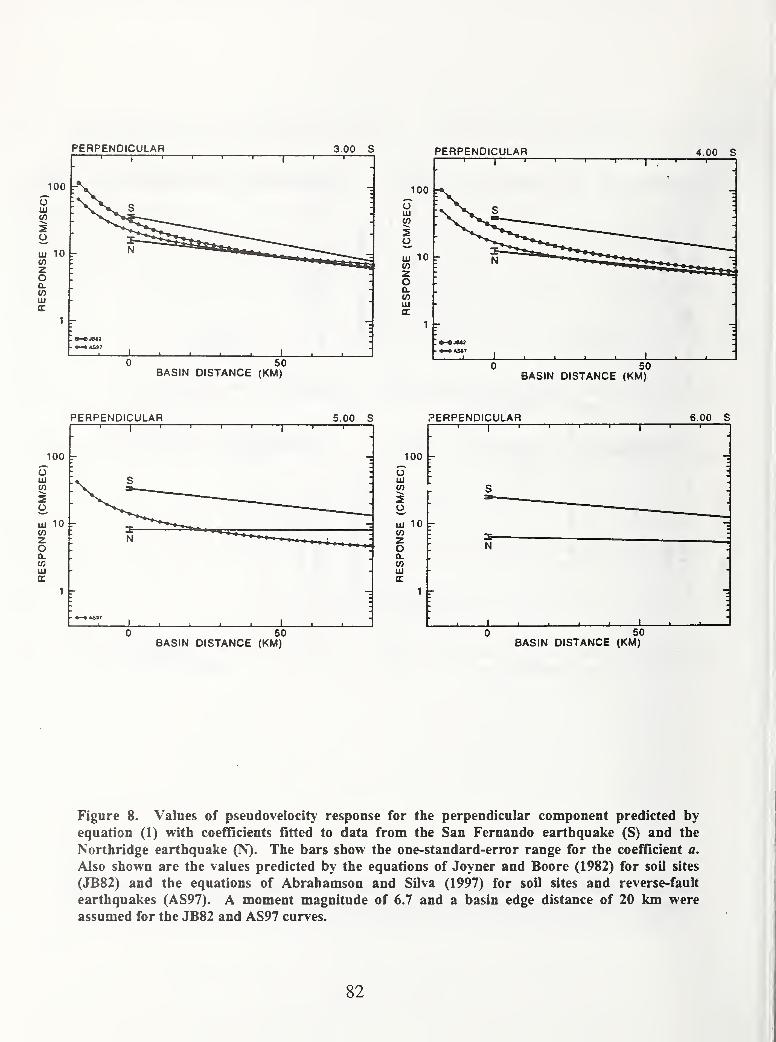
PERPENDICULAR 5.00 S PERPENDICULAR 6.00 S
0 50 0 50BASIN DISTANCE (KM) BASIN DISTANCE (KM)
Figure 8. Values of pseudovelocity response for the perpendicular component predicted by
equation (1) with coefficients fitted to data from the San Fernando earthquake (S) and the
Northridge earthquake (N). The bars show the one-standard-error range for the coefficient a.
Also shown are the values predicted by the equations of Joyner and Boore (1982) for soil sites
(JB82) and the equations of Abrahamson and Silva (1997) for soil sites and reverse-fault
earthquakes (AS97). A moment magnitude of 6.7 and a basin edge distance of 20 km were
assumed for the JB82 and AS97 curves.
82

PARALLEL 3.00 S PARALLEL 4.00 S
BASIN DISTANCE (KM) BASIN DISTANCE (KM)
PARALLEL 5.00 S PARALLEL
BASIN DISTANCE (KM) BASIN DISTANCE (KM)
Figure 9. Values of pseudovelocity response for the parallel component predicted by equation (1)
with coeflicients fitted to data from the San Fernando earthquake (S) and the Northridge
earthquake (N)- The bars show the one-standard-error range for the coefficient a. Also shown are
the values predicted by the equations of Joyner and Boore (1982) for soil sites (JB82) and the
equations of Abrahamson and Silva (1997) for soil sites and reverse-fault earthquakes (AS97). Amoment magnitude of 6.7 and a basin edge distance of 20 km were assumed for the JB82 and AS97curves.
83
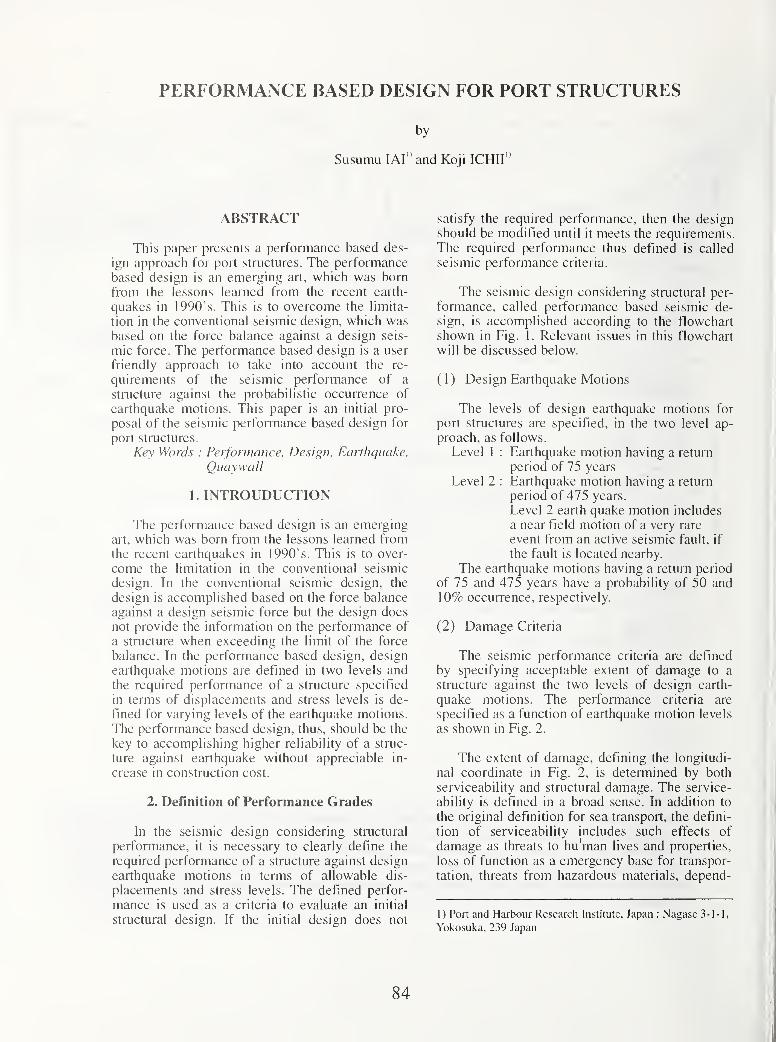
PERFORMANCE BASED DESIGN FOR PORT STRUCTURES
by
Susumu lAl" and Koji ICHIl"
ABSTRACT
This paper presents a performance based des-
ign approach for port structures. The performance
based design is an emerging art, which was born
from the lessons learned from the recent earth-
quakes in 1990's. This is to overcome the limita-
tion in the conventional seismic design, which wasbased on the force balance against a design seis-
mic force. The performance based design is a user
friendly approach to take into account the re-
quirements of the seismic performance of a
structure against the probabilistic occurrence of
earthquake motions. This paper is an initial pro-
posal of the seismic performance based design for
port stmctures.
Key Words : Performance, Design, Earthquake,
Quaywall
1. INTROUDUCTION
The performance based design is an emergingart, which was born from the lessons learned fromthe recent earthquakes in 1990's. This is to over-
come the limitation in the conventional seismic
design. In the conventional seismic design, the
design is accomplished based on the force balance
against a design seismic force but the design does
not provide the information on the performance of
a structure when exceeding the limit of the force
balance. In the performance based design, design
earthquake motions are defined in two levels and
the required performance of a structure specified
in terms of displacements and stress levels is de-
fined for varying levels of the earthquake motions.
The performance based design, thus, should be the
key to accomplishing higher reliability of a struc-
ture against earthquake without appreciable in-
crease in construction cost.
2. Definition of Performance Grades
In the seismic design considering structural
performance, it is necessary to clearly define the
required performance of a structure against design
earthquake motions in terms of allowable dis-
placements and stress levels. The defined perfor-
mance is used as a criteria to evaluate an initial
structural design. If the initial design does not
satisfy the required performance, then the design
should be modified until it meets the requirements.
The required performance thus defined is called
seismic performance criteria.
The seismic design considering structural per-
formance, called performance based seismic de-
sign, is accomplished according to the flowchart
shown in Fig. 1 . Relevant issues in this flowchart
will be discussed below.
(1) Design Earthquake Motions
The levels of design earthquake motions for
port structures are specified, in the two level ap-
proach, as follows.
Level 1 : Earthquake motion having a return
period of 75 years
Level 2 : Earthquake motion having a return
period of 475 years.
Level 2 earth quake motion includes
a near field motion of a very rare
event from an active seismic fault, if
the fault is located nearby.
The earthquake motions having a return period
of 75 and 475 years have a probability of 50 and10% occurrence, respectively.
(2) Damage Criteria
The seismic performance criteria are defined
by specifying acceptable extent of damage to a
structure against the two levels of design earth-
quake motions. The performance criteria are
specified as a function of earthquake motion levels
as shown in Fig. 2.
The extent of damage, defining the longitudi-
nal coordinate in Fig. 2, is determined by both
serviceability and structural damage. The service-
ability is defined in a broad sense. In addition to
the original definition for sea transport, the defini-
tion of serviceability includes such effects of
damage as threats to hu'man lives and properties,
loss of function as a emergency base for transpor-
tation, threats from hazardous materials, depend-
1) Port and Harbour Research Institute, Japan : Nagase 3-1-1,
Yokosuka, 239 Japan
84

ing on the functions of port structures. The struc-
tural damage depends on a structural type; i.e. the
extent of structural damage to a gravity quaywall
is mainly specified by displacements and tilting
while that to a sheet pile quaywall is mainly speci-
fied by stress states in the structure. The ac-
ceptable extent of damage thus depends on both
function and type of a structure.
The extent of damage shown in Fig.2 is
specified in the most general qualitative terms into
three degrees. More specific descriptions for the
extent of damage is defmed in Table 1 with re-
spect to the serviceability and the structural dam-age. The most specific and quantitative damagecriteria will be described in 3 and 4 for each type
of structures.
(3) Performance Grades
The damage criteria defined by three degrees
described above permits to define the performance
criteria as shown in Fig. 2. As shown in this figure,
the performance grades are specified in four
grades, XS, XA, XB and XC, as follows.
Grade XS : The extent of damage remains
degree I for Level 2 motion.
Grade XA : The extent of damage remains
degree I for Level 1 motion and
degree II for Level 2 motion.
Grade XB : The extent of damage remains
degree I for Level 1 motion and
degree III for Level 2 motion.
Grade XC : The extent of damage remains
degree II for Level 1 motion.
Collapse of structure, if occurs at
Level 2 motion, does not have
threats to the surrounding.
(4) Importance of Structure and Performance
Grades
The performance grades defined above closely
relate to the importance of structures. A structure
with higher importance requires a higher perfor-
mance grade. The importance of port structures is
generally measured by the seismic effects on
serviceability (in a broad sense) and structural
damage. For example, the importance of port
structures specified in the current Japanese design
code" are categorized into four classes as shownin Table 2. These classes of importance approxi-
mately corresponds to the required performance
grades as shown in Table 3.
3. Damage Criteria for Gravity Quaywall
In the performance based design, the ac-
ceptable extent of damage, i.e. the damage criteria,
should be clearly specified based on the function
and seismic response of a structure. The damagecriteria should be generally established by a groupof design engineers with assistance and advice
from the user and owner of the structure/facility.
The guidelines for establishing the damagecriteria for typical port structures will be shown in
3 and 4. These guidelines are for the most general
case, considering a general purpose quay wall
where the seismic damage poses no threats to
human lives, no hazardous material is handled,
without a movable crane, and the sea space in
front of the quay wall is unlimited. Additional
guidelines are offered in 5 for the quay walls
having container and other movable cranes.
(1) Seismic response of gravity quaywall
A gravity quaywall is made of a caisson or
other gravity wall put on seabed, and maintains its
stability by the friction at the bottom of the wall
against the earth pressures from the backfill soil
behind the wall. Typical failure modes duringearthquakes are seaward displacements and tilting
as shown in Fig. 3(a) for a firm foundation. For a
loosely deposited sandy foundation, the failure
modes involve overall deformation of the founda-tion beneath the wall, resulting in large seawarddisplacement, tilting and settlements. A wall with
a smaller width to height ratio exhibits tilting
mode rather than horizontal displacements. A wall
designed with a seismic coefficient of 0.15 in the
pseudo static approach is on the border line for
exhibiting tilting mode and horizontal displace-
ments.
Large horizontal displacements and settle-
ments of a gravity quaywall do not significantly
reduce the residual state of stability, and are con-
sidered generally acceptable for structural damage.Tilting of the wall, however, significantly reduce
the residual stability, thus providing restrictive
conditions for structural damage criteria. The past
case histories^' show overturning/collapse of cel-
lular block and cantilever types. These types of
gravity walls need a careful consideration in
specifying damage criteria regarding overturn-
ing/collapse.
(2) Items specifying damage criteria for gravity
quaywall
Seismic performance of a gravity quaywall is
specified based on the serviceability in safe
mooring, safe operation of wheeled vehicles andcargo handling, flooding, and the structural dam-
85
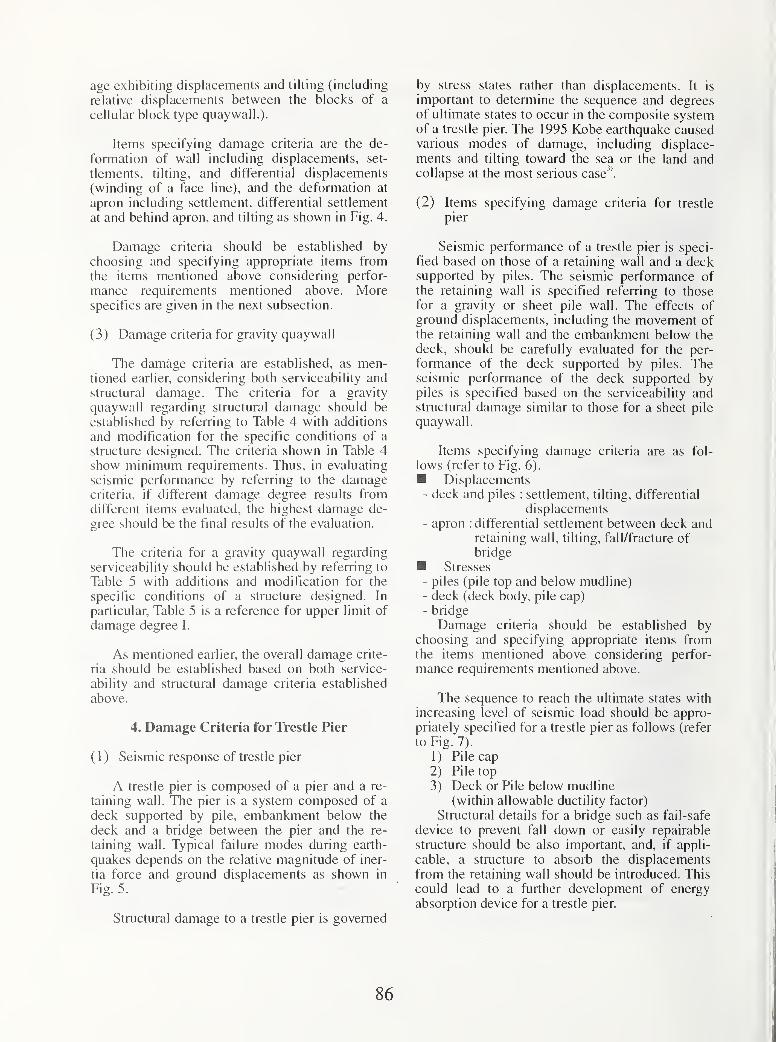
age exhibiting displacements and tilting (including
relative displacements between the blocks of a
cellular block type quaywall.)-
Items specifying damage criteria are the de-
formation of wall including displacements, set-
tlements, tilting, and differential displacements
(winding of a face line), and the deformation at
apron including settlement, differential settlement
at and behind apron, and tilting as shown in Fig. 4.
Damage criteria should be established by
choosing and specifying appropriate items fromthe items mentioned above considering perfor-
mance requirements mentioned above. Morespecifics are given in the next subsection.
(3) Damage criteria for gravity quaywall
The damage criteria are established, as men-tioned earlier, considering both serviceability and
structural damage. The criteria for a gravity
quaywall regarding structural damage should be
established by referring to Table 4 with additions
and modification for the specific conditions of a
structure designed. The criteria shown in Table 4
show minimum requirements. Thus, in evaluating
seismic performance by referring to the damagecriteria, if different damage degree results fromdifferent items evaluated, the highest damage de-
gree should be the final results of the evaluation.
The criteria for a gravity quaywall regarding
serviceability should be established by referring to
Table 5 with additions and modification for the
specific conditions of a structure designed. In
particular. Table 5 is a reference for upper limit of
damage degree I.
As mentioned earlier, the overall damage crite-
ria should be established based on both service-
ability and structural damage criteria established
above.
4. Damage Criteria for IVestle Pier
( 1 ) Seismic response of trestle pier
A trestle pier is composed of a pier and a re-
taining wall. The pier is a system composed of a
deck supported by pile, embankment below the
deck and a bridge between the pier and the re-
taining wall. Typical failure modes during earth-
quakes depends on the relative magnitude of iner-
tia force and ground displacements as shown in
Fig. 5.
Structural damage to a trestle pier is governed
by stress states rather than displacements. It is
important to determine the sequence and degreesof ultimate states to occur in the composite systemof a trestle pier. The 1995 Kobe earthquake causedvarious modes of damage, including displace-
ments and tilting toward the sea or the land andcollapse at the most serious case
(2) Items specifying damage criteria for trestle
pier
Seismic performance of a trestle pier is speci-
fied based on those of a retaining wall and a decksupported by piles. The seismic performance of
the retaining wall is specified referring to those
for a gravity or sheet pile wall. The effects ofground displacements, including the movement ofthe retaining wall and the embankment below the
deck, should be carefully evaluated for the per-
formance of the deck supported by piles. Theseismic performance of the deck supported bypiles is specified based on the serviceability andstructural damage similar to those for a sheet pile
quaywall.
Items specifying damage criteria are as fol-
lows (refer to Fig. 6).
Displacements- deck and piles : settlement, tilting, differential
displacements- apron : differential settlement between deck and
retaining wall, tilting, fall/fracture of
bridge
Stresses
- piles (pile top and below mudline)- deck (deck body, pile cap)- bridge
Damage criteria should be established bychoosing and specifying appropriate items fromthe items mentioned above considering perfor-
mance requirements mentioned above.
The sequence to reach the ultimate states with
increasing level of seismic load should be appro-
priately specified for a trestle pier as follows (refer
to Fig. 7).
1) Pile cap
2) Pile top
3) Deck or Pile below mudline(within allowable ductility factor)
Structural details for a bridge such as fail-safe
device to prevent fall down or easily repairable
structure should be also important, and, if appli-
cable, a structure to absorb the displacements
from the retaining wall should be introduced. This
could lead to a further development of energy
absorption device for a trestle pier.
86
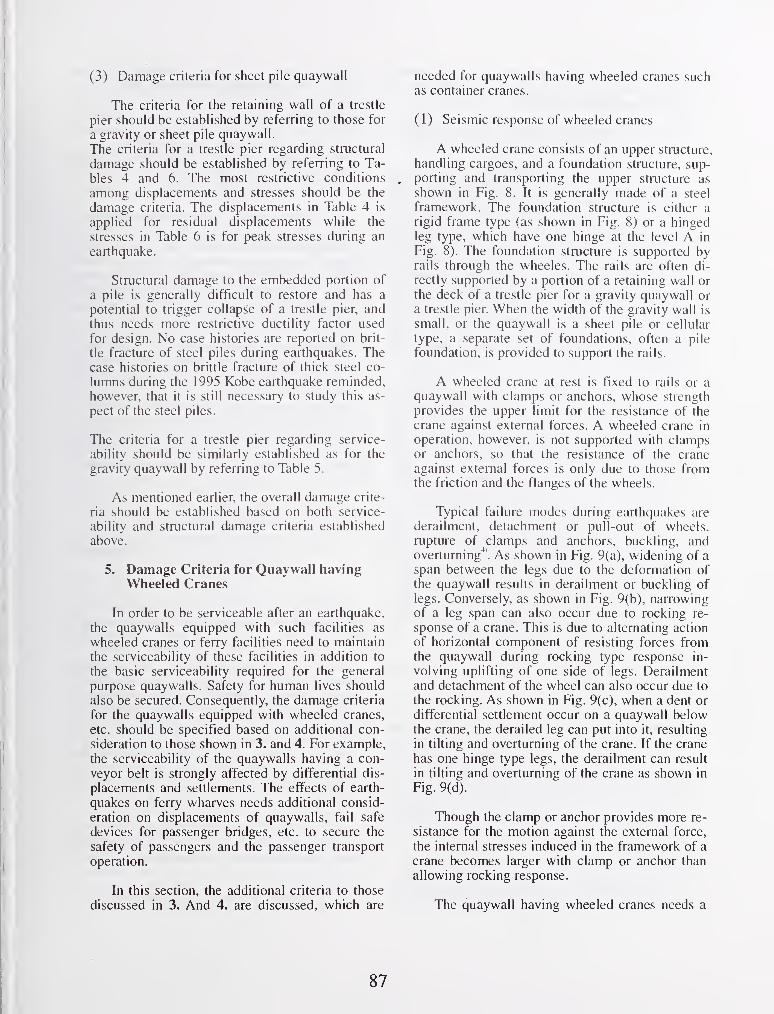
(3) Damage criteria for sheet pile quaywall
The criteria for the retaining wall of a trestle
pier should be established by referring to those for
a gravity or sheet pile quaywall.
The criteria for a trestle pier regarding structural
damage should be established by referring to Ta-
bles 4 and 6. The most restrictive conditions
among displacements and stresses should be the
damage criteria. The displacements in Table 4 is
applied for residual displacements while the
stresses in Table 6 is for peak stresses during an
earthquake.
Structural damage to the embedded portion of
a pile is generally difficult to restore and has a
potential to trigger collapse of a trestle pier, and
thus needs more restrictive ductility factor used
for design. No case histories are reported on brit-
tle fracture of steel piles during earthquakes. Thecase histories on brittle fracture of thick steel co-
lumns during the 1995 Kobe earthquake reminded,
however, that it is still necessary to study this as-
pect of the steel piles.
The criteria for a trestle pier regarding service-
ability should be similarly established as for the
gravity quaywall by referring to Table 5.
As mentioned earlier, the overall damage crite-
ria should be established based on both service-
ability and structural damage criteria established
above.
5. Damage Criteria for Quaywall havingWheeled Cranes
In order to be serviceable after an earthquake,
the quaywalls equipped with such facilities as
wheeled cranes or ferry facilities need to maintain
the serviceability of these facilities in addition to
the basic serviceability required for the general
purpose quaywalls. Safety for human lives should
also be secured. Consequently, the damage criteria
for the quaywalls equipped with wheeled cranes,
etc. should be specified based on additional con-
sideration to those shown in 3. and 4. For example,
the serviceability of the quaywalls having a con-
veyor belt is strongly affected by differential dis-
placements and settlements. The effects of earth-
quakes on ferry wharves needs additional consid-
eration on displacements of quaywalls, fail safe
devices for passenger bridges, etc. to secure the
safety of passengers and the passenger transport
operation.
In this section, the additional criteria to those
discussed in 3. And 4. are discussed, which are
needed for quaywalls having wheeled cranes suchas container cranes.
(1) Seismic response of wheeled cranes
A wheeled crane consists of an upper structure,
handling cargoes, and a foundation stracture, sup-
porting and transporting the upper structure as
shown in Fig. 8. It is generally made of a steel
framework. The foundation structure is either a
rigid frame type (as shown in Fig. 8) or a hingedleg type, which have one hinge at the level A in
Fig. 8). The foundation structure is supported byrails through the wheeles. The rails are often di-
rectly supported by a portion of a retaining wall or
the deck of a trestle pier for a gravity quaywall or
a trestle pier. When the width of the gravity wall is
small, or the quaywall is a sheet pile or cellular
type, a separate set of foundations, often a pile
foundation, is provided to support the rails.
A wheeled crane at rest is fixed to rails or a
quaywall with clamps or anchors, whose strength
provides the upper limit for the resistance of the
crane against external forces. A wheeled crane in
operation, however, is not supported with clampsor anchors, so that the resistance of the crane
against external forces is only due to those fromthe friction and the flanges of the wheels.
Typical failure modes during earthquakes are
derailment, detachment or pull-out of wheels,
rupture of clamps and anchors, buckling, andoverturning^'. As shown in Fig. 9(a), widening of a
span between the legs due to the deformation of
the quaywall results in derailment or buckling of
legs. Conversely, as shown in Fig. 9(b), narrowingof a leg span can also occur due to rocking re-
sponse of a crane. This is due to alternating action
of horizontal component of resisting forces fromthe quaywall during rocking type response in-
volving uplifting of one side of legs. Derailment
and detachment of the wheel can also occur due to
the rocking. As shown in Fig. 9(c), when a dent or
differential settlement occur on a quaywall belowthe crane, the derailed leg can put into it, resulting
in tilting and overturning of the crane. If the crane
has one hinge type legs, the derailment can result
in tilting and overturning of the crane as shown in
Fig. 9(d).
Though the clamp or anchor provides more re-
sistance for the motion against the external force,
the internal stresses induced in the framework of a
crane becomes larger with clamp or anchor than
allowing rocking response.
The quaywall having wheeled cranes needs a
87
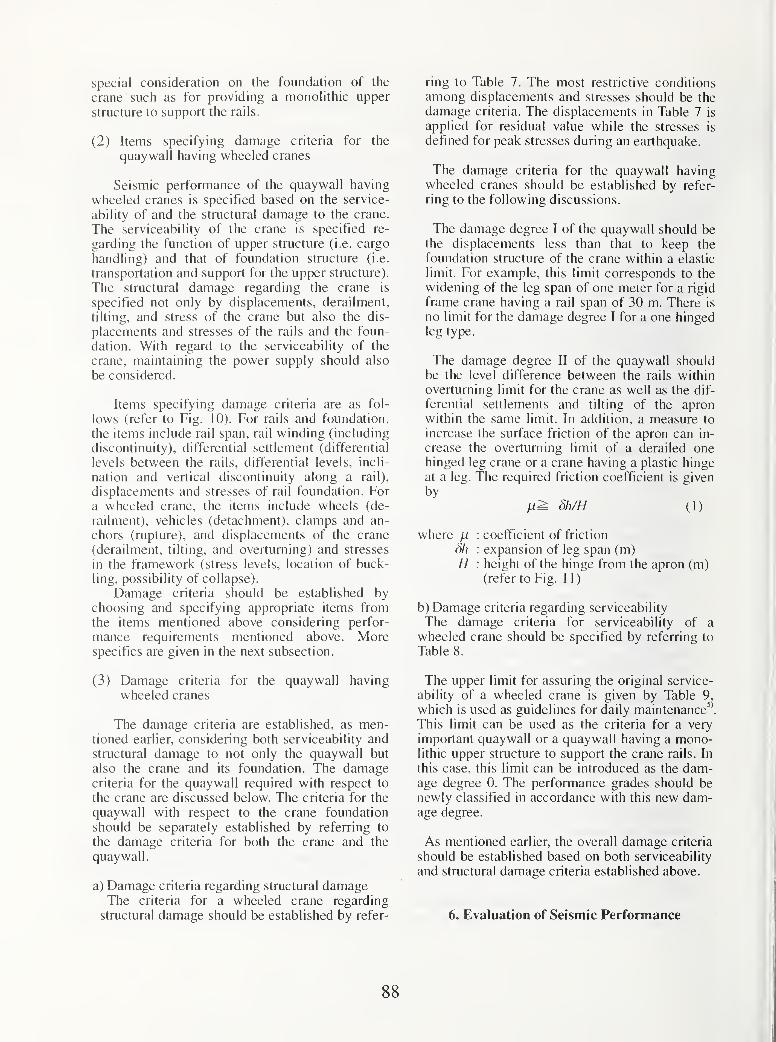
special consideration on the foundation of the
crane such as for providing a monolithic upper
structure to support the rails.
(2) Items specifying damage criteria for the
quaywall having wheeled cranes
Seismic performance of the quaywall having
wheeled cranes is specified based on the service-
ability of and the structural damage to the crane.
The serviceability of the crane is specified re-
garding the function of upper structure (i.e. cargo
handling) and that of foundation structure (i.e.
transportation and support for the upper structure).
The structural damage regarding the crane is
specified not only by displacements, derailment,
tilting, and stress of the crane but also the dis-
placements and stresses of the rails and the foun-
dation. With regard to the serviceability of the
crane, maintaining the power supply should also
be considered.
Items specifying damage criteria are as fol-
lows (refer to Fig. 10). For rails and foundation,
the items include rail span, rail winding (including
discontinuity), differential settlement (differential
levels between the rails, differential levels, incli-
nation and vertical discontinuity along a rail),
displacements and stresses of rail foundation. For
a wheeled crane, the items include wheels (de-
railment), vehicles (detachment), clamps and an-
chors (rupture), and displacements of the crane
(derailment, tilting, and overturning) and stresses
in the framework (stress levels, location of buck-
ling, possibility of collapse).
Damage criteria should be established by
choosing and specifying appropriate items fromthe items mentioned above considering perfor-
mance requirements mentioned above. Morespecifics are given in the next subsection.
(3) Damage criteria for the quaywall having
wheeled cranes
The damage criteria are established, as men-tioned earlier, considering both serviceability andstructural damage to not only the quaywall but
also the crane and its foundation. The damagecriteria for the quaywall required with respect to
the crane are discussed below. The criteria for the
quaywall with respect to the crane foundation
should be separately established by referring to
the damage criteria for both the crane and the
quaywall.
a) Damage criteria regarding structural damageThe criteria for a wheeled crane regarding
structural damage should be established by refer-
ring to Table 7. The most restrictive conditions
among displacements and stresses should be the
damage criteria. The displacements in Table 7 is
applied for residual value while the stresses is
defined for peak stresses during an earthquake.
The damage criteria for the quaywall havingwheeled cranes should be established by refer-
ring to the following discussions.
The damage degree I of the quaywall should bethe displacements less than that to keep the
foundation structure of the crane within a elastic
limit. For example, this limit corresponds to the
widening of the leg span of one meter for a rigid
frame crane having a rail span of 30 m. There is
no limit for the damage degree I for a one hingedleg type.
The damage degree II of the quaywall should
be the level difference between the rails within
overturning limit for the crane as well as the dif-
ferential settlements and tilting of the apronwithin the same limit. In addition, a measure to
increase the surface friction of the apron can in-
crease the overturning limit of a derailed onehinged leg crane or a crane having a plastic hinge
at a leg. The required friction coefficient is given
by
Ai^ 5h/H (1)
where }A : coefficient of friction
dh : expansion of leg span (m)H : height of the hinge from the apron (m)
(refer to Fig. 1 1)
b) Damage criteria regarding serviceability
The damage criteria for serviceability of a
wheeled crane should be specified by referring to
Table 8.
The upper limit for assuring the original service-
ability of a wheeled crane is given by Table 9,
which is used as guidelines for daily maintenance".
This limit can be used as the criteria for a very
important quaywall or a quaywall having a mono-lithic upper structure to support the crane rails. In
this case, this limit can be introduced as the dam-age degree 0. The performance grades should benewly classified in accordance with this new dam-age degree.
As mentioned earlier, the overall damage criteria
should be established based on both serviceability
and structural damage criteria established above.
6. Evaluation of Seismic Performance
88
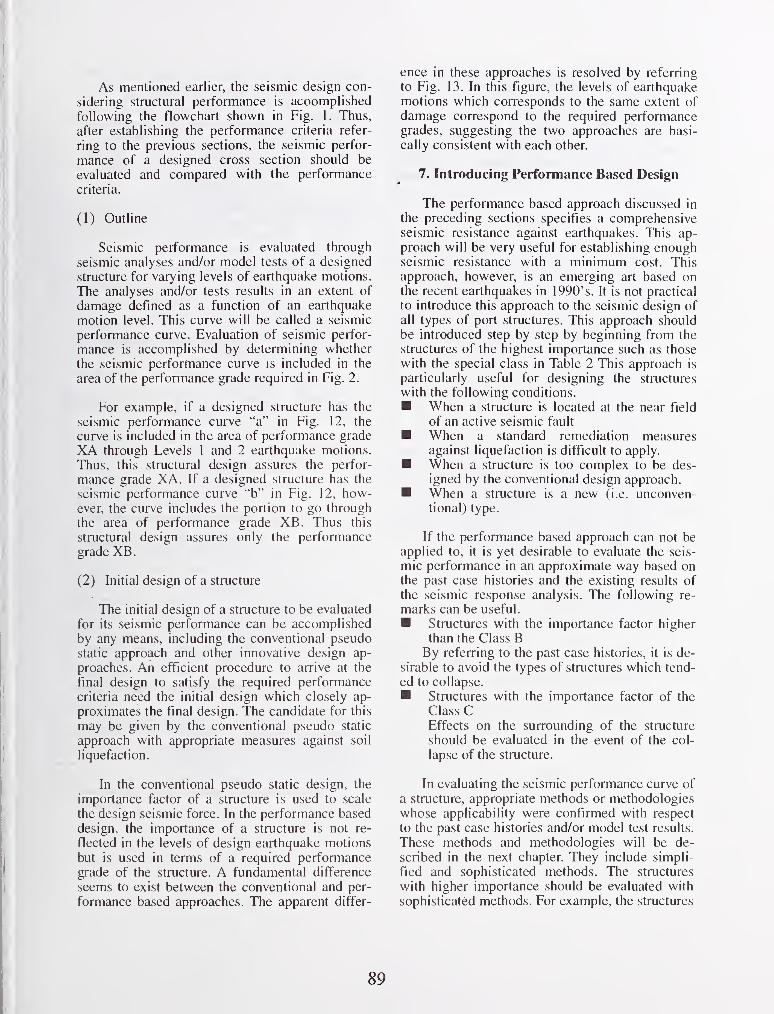
As mentioned earlier, the seismic design con-
sidering structural performance is acoomplished
following the flowchart shown in Fig. 1. Thus,
after establishing the performance criteria refer-
ring to the previous sections, the seismic perfor-
mance of a designed cross section should be
evaluated and compared with the performance
criteria.
(1) Outline
Seismic performance is evaluated through
seismic analyses and/or model tests of a designed
structure for varying levels of earthquake motions.
The analyses and/or tests results in an extent of
damage defined as a function of an earthquake
motion level. This curve will be called a seismic
performance curve. Evaluation of seismic perfor-
mance is accomplished by determining whether
the seismic performance curve is included in the
area of the performance grade required in Fig. 2.
For example, if a designed structure has the
seismic performance curve "a" in Fig. 12, the
curve is included in the area of performance grade
XA through Levels 1 and 2 earthquake motions.
Thus, this structural design assures the perfor-
mance grade XA. If a designed structure has the
seismic performance curve "b" in Fig. 12, how-ever, the curve includes the portion to go through
the area of performance grade XB. Thus this
structural design assures only the performance
grade XB.
(2) Initial design of a structure
The initial design of a structure to be evaluated
for its seismic performance can be accomplished
by any means, including the conventional pseudo
static approach and other innovative design ap-
proaches. An efficient procedure to arrive at the
final design to satisfy the required performance
criteria need the initial design which closely ap-
proximates the final design. The candidate for this
may be given by the conventional pseudo static
approach with appropriate measures against soil
liquefacfion.
In the conventional pseudo static design, the
importance factor of a structure is used to scale
the design seismic force. In the performance based
design, the importance of a structure is not re-
flected in the levels of design earthquake motions
but is used in terms of a required performance
grade of the structure. A fundamental difference
seems to exist between the conventional and per-
formance based approaches. The apparent differ-
ence in these approaches is resolved by referring
to Fig. 13. In this figure, the levels of earthquake
motions which corresponds to the same extent of
damage correspond to the required performancegrades, suggesting the two approaches are basi-
cally consistent with each other.
7. Introducing Performance Based Design
The performance based approach discussed in
the preceding sections specifies a comprehensiveseismic resistance against earthquakes. This ap-
proach will be very useful for establishing enoughseismic resistance with a minimum cost. This
approach, however, is an emerging art based onthe recent earthquakes in 1990's. It is not practical
to introduce this approach to the seismic design of
all types of port structures. This approach should
be introduced step by step by beginning from the
structures of the highest importance such as those
with the special class in Table 2 This approach is
particularly useful for designing the structures
with the following conditions.
When a structure is located at the near field
of an active seismic fault
When a standard remediation measuresagainst liquefaction is difficult to apply.
When a structure is too complex to be des-
igned by the conventional design approach.
When a structure is a new (i.e. unconven-tional) type.
If the performance based approach can not be
applied to, it is yet desirable to evaluate the seis-
mic performance in an approximate way based onthe past case histories and the existing results of
the seismic response analysis. The following re-
marks can be useful.
Structures with the importance factor higher
than the Class BBy referring to the past case histories, it is de-
sirable to avoid the types of structures which tend-
ed to collapse.
Structures with the importance factor of the
Class CEffects on the surrounding of the structure
should be evaluated in the event of the col-
lapse of the structure.
In evaluating the seismic performance curve of
a structure, appropriate methods or methodologies
whose applicability were confirmed with respect
to the past case histories and/or model test results.
These methods and methodologies will be de-
scribed in the next chapter. They include simpli-
fied and sophisticated methods. The structures
with higher importance should be evaluated with
sophisticated methods. For example, the structures
89
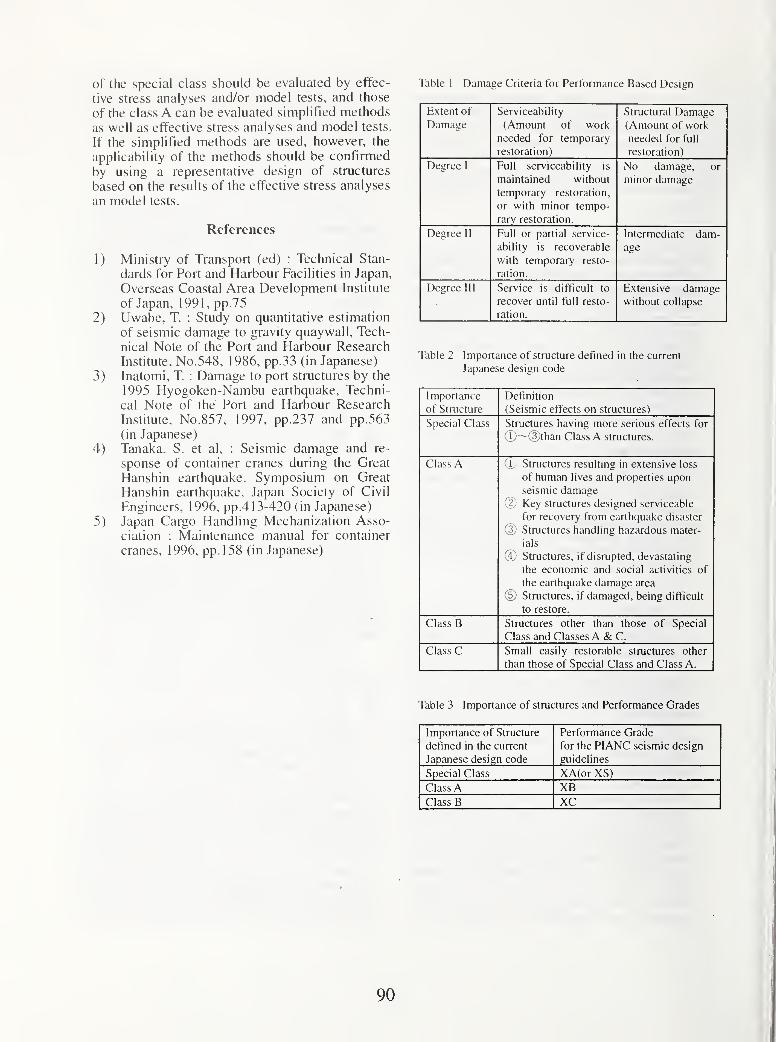
of the special class should be evaluated by effec-
tive stress analyses and/or mode! tests, and those
of the class A can be evaluated simplified methods
as well as effective stress analyses and model tests.
If the simplified methods are used, however, the
applicability of the methods should be confirmed
by using a representative design of structures
based on the results of the effective stress analyses
an model tests.
References
1) Ministry of Transport (ed) : Technical Stan-
dards for Port and Harbour Facilities in Japan,
Overseas Coastal Area Development Institute
of Japan, 1991, pp.75
2) Uwabe, T. : Study on quantitative estimation
of seismic damage to gravity quaywall. Tech-
nical Note of the Port and Harbour Research
Institute, No. 548, 1986, pp.33 (in Japanese)
3) Inatomi, T. : Damage to port structures by the
1995 Hyogoken-Nambu earthquake. Techni-
cal Note of the Port and Harbour Research
Institute, No. 857, 1997, pp.237 and pp.563(in Japanese)
4) Tanaka, S. et al, : Seismic damage and re-
sponse of container cranes during the Great
Hanshin earthquake. Symposium on Great
Hanshin earthquake, Japan Society of Civil
Engineers, 1996, pp.4 13-420 (in Japanese)
5) Japan Cargo Handling Mechanization Asso-
ciation : Maintenance manual for container
cranes, 1996, pp.158 (in Japanese)
Table 1 Damage Criteria for Performance Based Design
Extent of
DamageServiceability
(Amount of work
needed for temporary
restoration)
Structural Damage(Amount of work
needed for full
restoration)
Degree 1 Full serviceability is
maintained without
temporary restoration,
or with minor tempo-
rary restoration.
No damage, or
minor damage
Degree II Full or partial service-
ability is recoverable
with temporary resto-
ration.
Intermediate dam-age
Degree III Service is difficult to
recover until full resto-
ration.
Extensive damagewithout collapse
Table 2 Importance of structure defined in the current
Japanese design code
Importance
of Structure
Definition
(Seismic effects on structures)
Special Class Structures having more serious effects for
(T)~~®than Class A structures.
Class A (£) Structures resulting in extensive loss
of human lives and properties upon
seismic damage(2) Key structures designed serviceable
for recovery from earthquake disaster
(?) Structures handling hazardous mater-
ials
® Structures, if disrupted, devastating
the economic and social activities of
the earthquake damage area
(5) Structures, if damaged, being difficult
to restore.
Class B Structures other than those of Special
Class and Classes A & C.
Class C Small easily restorable structures other
than those of Special Class and Class A.
Table 3 Importance of structures and Performance Grades
Importance of Structure
defined in the current
Japanese design code
Performance Grade
for the PIANC seismic design
guidelines
Special Class XA(orXS)Class A XBClass B XC
90
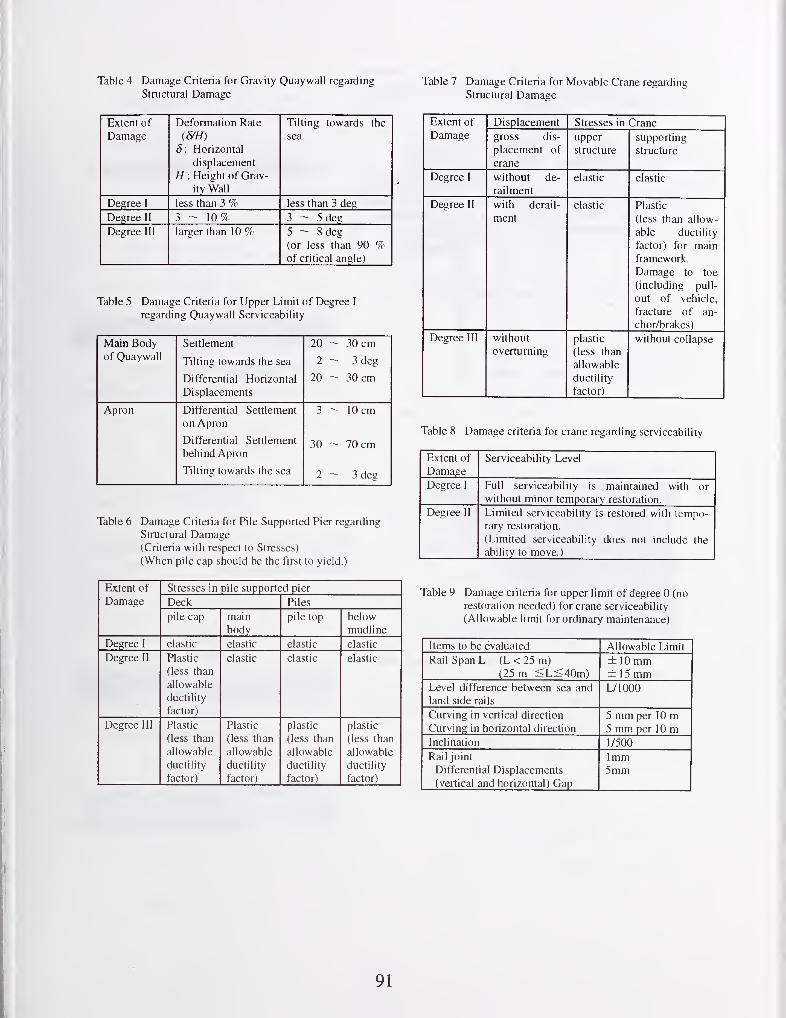
Table 4 Damage Criteria for Gravity Quaywall regarding
Structural Damage
Extent of
DamageDeformation Rate
^ ' Horiyontnl
displacement
H : Height of Grav-
ity Wall
Tilting towards the
sea
Degree I less than 3 7r less than 3 deg
Degree 11 3 - 10% 3 - 5deg
Degree ill larger than 10 % 5 - 8 deg
(or less than 90 %of critical angle)
Table 5 Damage Criteria for Upper Limit of Degree I
regarding Quaywall Serviceability
Main Body
of Quaywall
Settlement
Tilting towards the sea
Differential Horizontal
Displacements
20 - 30 cm
2 - 3 deg
20 - 30 cm
Apron Differential Settlement
on Apron
Differential Settlement
behind Apron
Tilting towards the sea
3 - 10 cm
30 - 70 cm
2 - 3 deg
Table 6 Damage Criteria for Pile Supported Pier regarding
Structural Damage(Criteria with respect to Stresses)
(When pile cap should be the first to yield.)
Extent of Stresses in pile supported pier
Damage Deck Piles
pile cap main
body
pile top below
mudline
Degree 1 elastic elastic elastic elastic
Degree IL Plastic
(less than
allowable
ductility
factor)
elastic elastic elastic
Degree III Plastic Plastic plastic plastic
(less than (less than (less than (less than
allowable allowable allowable allowable
ductility ductility ductility ductility
factor) factor) factor) factor)
Table 7 Damage Criteria for Movable Crane regarding
Structural Damage
Extent of
DamageDisplacement Stresses in Crane
gross dis-
placement of
crane
upper
structure
supporting
structure
Degree I without de-
railment
elastic elastic
Degree II with derail-
ment
elastic Plastic
(less than allow-
able ductility
factor) for main
framework.
Damage to toe
(including pull-
out of vehicle,
fracture of an-
chor/brakes)
Degree III without
overturning
plastic
(less than
allowable
ductility
factor)
without collapse
Table 8 Damage criteria for crane regarding serviceability
Extent of
DamageServiceability Level
Degree I Full serviceability is maintained with or
without minor temporary restoration.
Degree 11 Limited serviceability is restored with tempo-
rary restoration.
(Limited serviceability does not include the
ability to move.)
Table 9 Damage criteria for upper limit of degree 0 (no
restoration needed) for crane serviceability
(Allowable limit for ordinary maintenance)
Items to be evaluated Allowable Limit
Rail Span L (L < 25 m)(25 m ^L^40m)
±10 mm± 15 mm
Level difference between sea and
land side rails
L/1000
Curving in vertical direction
Curving in horizontal direction
5 mm per 10 m5 mm per 10 m
Inclination 1/500
Rail joint
Differential Displacements
(vertical and horizontal) Gap
1mm5mm
91
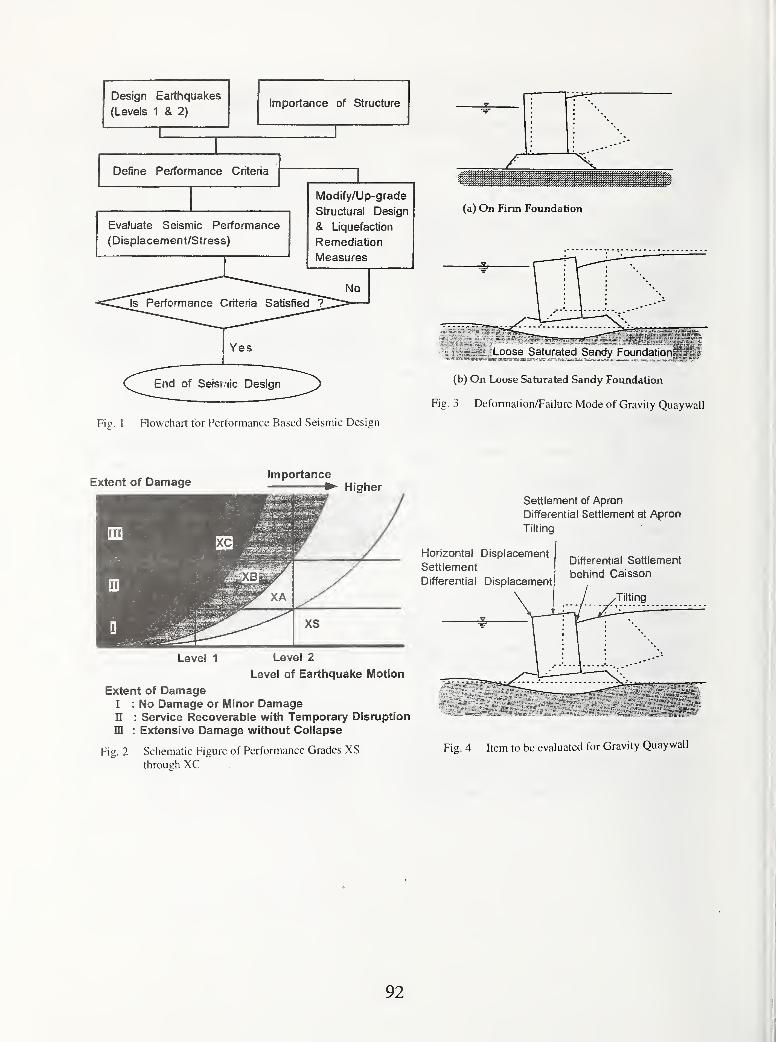
Design Earthquakes
(Levels 1 & 2)
1
Importance of Structure
Define Performance Criteria
Evaluate Seismic Performance
(Displacement/Stress)
Modify/Up-grade
Structural Design
& Liquefaction
Remediation
Measures
End of Seismic Design
Fig. 1 Flowchart for Performance Based Seismic Design
(a) On Firm Foundation
•: Loose Saturated Sandy Foundation^^l
(b) On Loose Saturated Sandy Foundation
Fig. 3 Deformation/Failure Mode of Gravity Quaywall
Extent of DamageImportance
Higher
Settlement of Apron
Differential Settlement at Apron
Tilting
Horizontal Displacement
Settlement
Differential Displacement
Differential Settlement' behind Caisson
Level 1 Level 2
Level of Earthquake Motion
Extent of DamageI : No Damage or Minor DamageIT : Service Recoverable with Temporary Disruption
in : Extensive Damage without Collapse
Fig. 2 Schematic Figure of Performance Grades XS
through XCFig. 4 Item to be evaluated for Gravity Quaywall
92
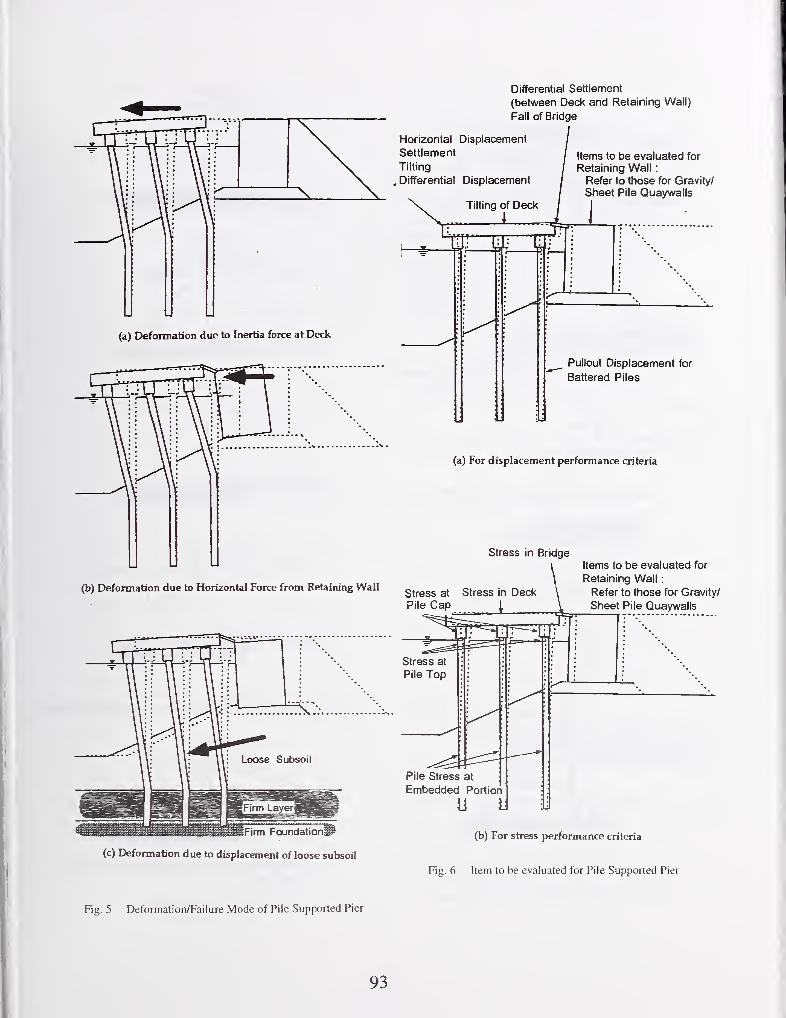
Differential Settlement
(between Deck and Retaining Wall)
Fall of Bridge
Horizontal Displacement
Settlement
Tilting
, Differential Displacement
Items to be evaluated for
Retaining Wall
:
Refer to those for Gravity/
Sheet Pile Quaywalls
(a) Deformation due to Inertia force at Deck
Pullout Displacement for
Battered Piles
(a) For displacement performance criteria
Stress in Bridge
(b) Deformation due to Horizontal Force from Retaining WallStress at Stress in DeckPile Cap ^ 1
Items to be evaluated for
Retaining Wall
:
Refer to those for Gravity/
Sheet Pile Quaywalls
iPirm Foundation^
(c) Deformation due to displacement of loose subsoil
(b) For stress performance criteria
Fig. 6 Item to be evaluated for Pile Supported Pier
Fig. 5 Deformation/Failure Mode of Pile Supported Pier
93

.©Yielding at Deck
©Yielding at i
Pile Cap-^r:;:^^
©Yielding at
Pile Top
©Yielding at
Embedded Portion
u y
Fig. 7 Acceptable Order of Yielding for Pile Supported Pier
/ 1girder upper structure
\brace
supporting structureseaside L
leg1
landside
leg
vehicle
& rail
Fig. 8 Schematic figure of Movable Crane
(b) Narrowing Span between the Legs due to Rocking Motion
(a) Widening of Span between the Legs^
Fig. 9 Deformation Mode of Movable Crane
(c) Tilting of Crane due to Differential Settiement of
Foundation
Fig. 9 (Continued)
94
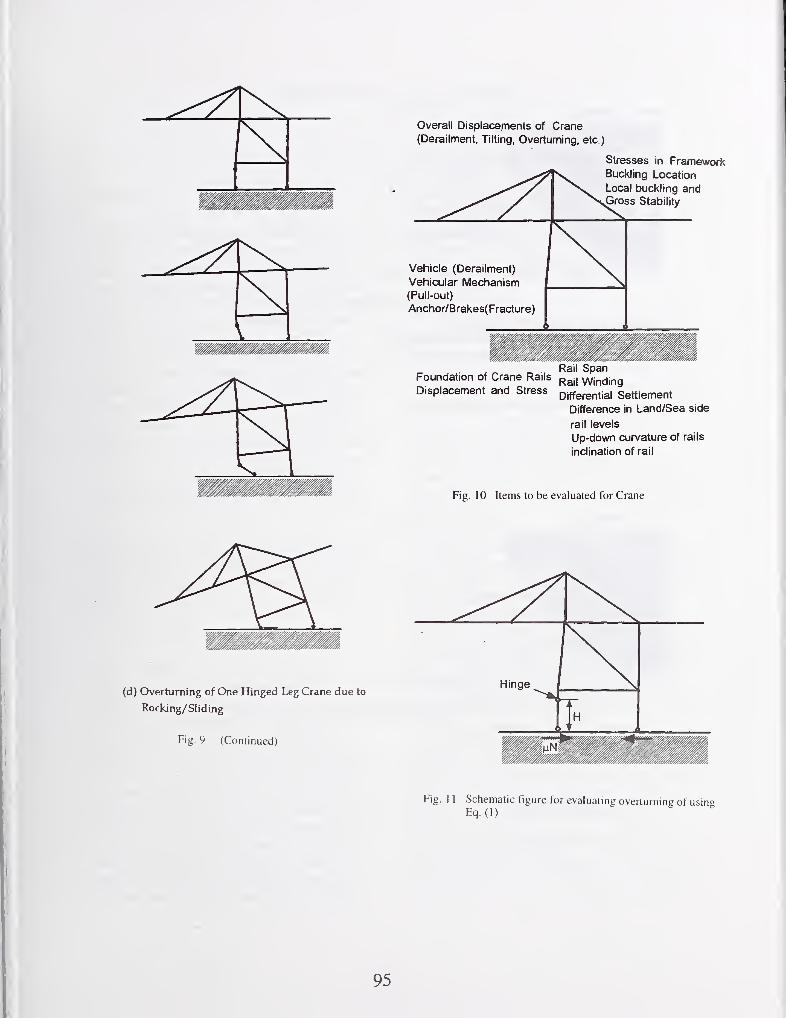
Overall DIsplacernents of Crane(Derailment, Tilting, Overturning, etc.)
Stresses in FrameworkBuckling Location
Local buckling andGross Stability
Vehicle (Derailment)
Vehicular Mechanism(Pull-out)
Anchor/Brakes( Fracture)
Foundation of Crane RailsRail Span
Rail WindingDisplacement and Stress
Differential Settlement
Difference in Land/Sea side
rail levels
Up-down curvature of rails
inclination of rail
Fig. 10 Items to be evaluated for Crane
(d) Overturning of One Hinged Leg Crane due to
Rocking/Sliding
Fig. 9 (Continued)
Hinge|
H
Fig, 1 1 Schematic figure for evaluating overturning of usingEq. (1)
95

structure bStructure a
Extent of Damage
Level 1 Level 2
Level of Earthquake Motion
Examples of Seismic PerformanceStructure a : Satisfy Performance Grade XAStructure b : Satisfy Performance Grade XB
Fig. 1 2 Examples of Seismic Performance
Levels of Earthquake Motiondepending on Performance Gradesfor Equal Damage Extent
Fig. 1 3 Levels of Earthquake Motion depending on
Performance Grades
96

Analysis of Sea-Floor Earthquake Data
by
Charles E. Smith' and David M. Boore^
ABSTRACT
The Minerals Management Service (MMS), in
cooperation with several oil and gas companies,
installed a seismometer network on the ocean
floor in the Santa Barbara Channel off the coast
of southern California. The program was called
SEMS, for the Seafloor Earthquake Measurement
System. The purpose of the program was to
characterize the nature of the response of
earthquake ground motions for use in the design
and reassessment of offshore platforms used in
petroleum drilling and production. The United
States Geological Survey (USGS) was given a
contract to provide seismological analysis of data
obtained from the SEMS program and compared
it to data from earthquakes measured onshore.
This paper provides an overview of the work by
the USGS on this initivative.
KEYWORDS: earthquake ground motions,
offshore platforms, seafloor seismic
measurements, seismological analyses, seismic-
hazard uncertainties.
1. INTRODUCTION
A major effort was undertaken by both the
Goverrunent and the oil and gas industry to
obtain records of earthquake seafloor motions for
the design of new platforms or in the reassess-
ment of the integrity of existing offshore
facilities. The prime goal of the program was to
obtain data that might help answer the question
of whether ground motions at offshore sites are
significantly different than those at onshore sites;
if this is true, then the decision of using onshore
motions as the basis for the seismic design or
reassessment of offshore platforms should be
reevaluated. This paper provides an overview of
the more detailed analysis presented in Boore
' (1997), Boore and Smith (1998) and Boore
(1998) of earthquake data obtained from seafloor
seismic motions measured from the SEMSprogram.
2. SHORT HISTORY OF SEMS.
To obtain creatable data on the response of the
seafloor to earthquake-induced ground shaking,
the Sandia National Laboratory was
commissioned, with funding by the MMS and
several major oil companies, to develop, deploy,
and recover data from instruments placed on the
seafloor. A complete history of the SEMSprogram is contained in Reece, et. al (1991),
Steefe and Engi (1987), Smith (1991), and
Platzbecker (1997 ). A brief synopsis of the
SEMS project is provided as background for this
paper.
The SEMS program was developed in a number
of stages beginning some 20 years ago. These are
usually referred to as SEMS I, SEMS II, SEMSIII, and SEMS IV (in this paper standard
numbers are used rather than Roman numerals;
thus SEMS 1, SEMS 2, SEMS 3, and SEMS 4 or
more briefly, SI, S2, S3 and S4). The programs
were very unique in that all stages of the SEMSproject used digital reading of seafloor
accelerations. Data were analyzed from SI, S2,
and S4.
SEMSl: In 1978, a 3-axis accelerometer was
embedded several meters below the seafloor, and
the output from the accelerometer was fed to a
self-contained instrument package resting on
1 Research Program Manager, Minerals Management
Service, Hemdon, VA 20170
2 Senior Geophysicist, U. S. Geological Survey, Menlo
Park, CA 94025
97
the seafloor. This package digitized the input at
a rate of 100 samples per sec and stored the data
onboard. Data recovery was via an acoustic
uplink to a ship deployed specifically for data
recovery. The SEMS was installed at several
offshore locations and at one onshore location.
Data were analyzed from the onshore location
(SIVC) and a nearby offshore location (SIHN)
near platform Henry in the Santa Barbara
channel (See table 1 for station information, and
table 2 for earthquake information).
SEMS2: In 1985, the system was redesigned to
have a longer system life, and was deployed near
platforms Elly and Ellen, off Long Beach. In
other respects, the system was similar to that of
SEMS 1 (a triggered system with data storage in a
unit on the seafloor, using an acoustic uplink
from data retrieval). The notation "S2LB" was
used for this system. Data were analyzed for two
earthquakes occuring in 1986, the North Palm
Springs and the Oceanside earthquakes.
SEMS3: In 1989, the system was again
redesigned, using better batteries, electronics,
and triggering algorithm. The result was a
longer-life, more sensitive system with fewer
false triggers. A major improvement is in using
data from horizontal as well as the vertical
component in the triggering algorithm (the
SEMSl and SEMS2 units used only vertical
component, which, generally has anomalously
low amplitudes of motion). The system was
deployed at two locations, one near the SEMS2package off Long Beach (S2LB), and another off
of Point Pedemales, near platform Irene (S2IR).
This latter site used a datalogger onboard the
platform, connected via a cable to the sensor,
which was embedded in the seafloor. Apparently
the hole did not slump in, and this, combined
with cable drag due to strong currents, limited
the usefulness of this installation. The only data
from a SEMS3 unit used in this paper are that
from the 1990 Upland earthquake recorded on
S3LB (the recordings for this event, however, are
very high quality and useful; they have a long
enough duration and a good enough signal-to-
noise ratio to record late arriving long-period
surface waves.) Unfortunately, recordings of the
1992 Landers earthquake and aftershocks were
lost because the seafloor data acquisition system
had been dragged away, apparently by a
fisherman's net. This is very unfortunate because
the earthquake was one of the largest to have
struck southern California since 1952. The long-
period motions of most concern to platform
design were very strong for that earthquake and,
as a result, they were well recorded on
conventional strong-motion instruments onshore,
thus providing an excellent set of onshore
motions against which to check the offshore
motions (this has been a problem with most of
the SEMS recordings: the earthquakes were far
enough away and of low enough magnitude that
conventional onshore strong-motion recorders
either did not trigger or did not record signals
that could yield reliable long-period information;
in constrast, the SEMS unit can faithfully record
these weak motions).
SEMS4: To address the problem of data
recovery from stand-alone sea-floor installations,
it was decided to deploy a new system in 1995,
SEMS4, using a commercial 24-bit datalogger on
a platform, with a cable connecting the sensors to
the datalogger. The dataloggers also have a dial-
up capability, making it possible to interrogate
the units remotely. The loggers are being run at
20 samples per sec. The sensors are force
balance accelerometers, almost flat to
acceleration between 0.4 and 1500 Hz (the
response at 1 Hz is nominally down by 3 db
relative to the 100 Hz response); the low
frequency rolloffs starts at about 0.4 Hz. Three
systems have been deployed, near platforms
Eureks (S3EU), Grace (S4GR), and Irene (S4IR).
Records of earthquakes in 1995 and 1997,
recorded by S4GR and S4IR, are analyzed in this
report. The SEMS4 instruments have been turned
over to the California Strong-Motion Program of
the California Division of Mines and Geology,
who will operate the stations and collect and
disseminate the data. See figure 1 for the layout
of the SEMS4 instrument array.
98
3. ANALYSIS OF DATA
Because of the lack of onshore data for distances
comparable to those from the source to the
SEMS sites, the empirical interpretation of the
data focused on the ratio of response spectra for
the vertical and horizontal components (V/H) as
a function of period. Comparisons to the few
available ratios and to the ratios derived from
regression analysis of strong motion data clearly
show the offshore ground motions to have
anomalously low ratios for short-period response.
Some evidence is presented that the anomalous
V/H at shore periods is due to very low values
for the vertical component. The differences
between the average onshore and offshore ratios
become smaller as the period increases, but still
persist at periods as long as 2 sec. A preliminary
study suggests that the differences at the longer
periods are more a function of the average shear-
wave velocities under the site than to whether the
site is offshore or onshore.
To augment the data, theoretical calculations
were performed of wave propagation in earth
models simulating the offshore environment.
Comparisons of observed and theoretical V/H for
fouier spectral amplitudes are in reasonable
agreement. The theoretical calculations show
that the water layer makes almost no difference
to the horizontal components of the motion,
although it does influence the vertical
components of the S-wave portion of the ground
motion at frequencies related to the depth of
water (around 6 Hz for depths of 60 to 70 M); the
effect is negligible for periods near the resonant
period of a platform (generally between 1.5 and
4.0 sees). This is not to say that the water is not
an important factor, for it does allow relatively
low shear-wave velocities to exist over wide
regions. There are onshore locations with
comparably low velocities, but they are
sometimes fairly restricted in spatial extent.
Because of limited recording duration for some
of the events, the study was restricted to ground
motions less than a 2-sec. period. Recordings for
one event, however, were of long enough
duration to capture clear long-period (near 6 sec),
large amplitude waves, probably surface waves
traveling through the Los Angeles basin. Achoice of an upper limit of a 2 sec period
effectively eliminates these surface waves from
our analysis.
4. SUMMARY OF ACCELEROGRAMS USED
The data used in this report included the largest
events recorded on the SEMS units. The stations
from which data were obtained are listed in table
1, which contains a short summary of basic
information for each station; geotechnical
information, and estimates of shear-wave
velocity for the sites are discussed in a later
section. The earthquakes used are summarized in
table 2, and table 3, containing event-to-station
distances, and is a convenient summary of which
station recorded which earthquakes. Tables
containing more details about events and stations
are contained in Boore ( 1 997). A map showing
the locations of the recording stations and earth-
quakes is given in -igure 2.
With one exception, each earthquake was
recorded on only one of the offshore SEMSstations. The exception is the first Simi Valley,
1997 aftershock of the 1994 Northridge
earthquake. This event was recorded on two
SEMS4 stations: S4GR and S4IR. The lack of
multiple offshore recordings for a given event
limits, to an extent, the interpretation of the data.
A more important limitation than the lack of
multiple offshore recordings is the relative
scarcity of onshore data at sites near the offshore
sites (by near, we mean along the same general
azimuth from the earthquake to the SEMS site,
and at distances as close to the SEMS site as the
coastal configuration allows; for the earthquakes
listed in table 3, there are generally numerous
recordings of ground motions but at epicentral
distances much smaller than the epicentral
distances to the SEMS stations). As tables 2 and
3 show, most of the SEMS records were obtained
99
from moderate-size earthquakes at distances in
excess of 70 km. The standard analog, onshore
accelerographs do not have the sensitivity to
provide digitizable data at these distances for the
earthquakes recorded on the SEMS sites. The
only earthquake for which we were able to obtain
onshore and offshore data is the Santa Barbara
Island 1981 earthquake, which was recorded on
three onshore stations, one of which was a SEMSunit installed onshore near the Vic Trace
Reservoir. The other two recordings, SC38 and
SC51, were obtained on standard analog
accelerometers maintained by the University of
Southern California (USC).
Several sites recorded different earthquakes, thus
allowing a check on the stability of the ratio of
motions for the vertical and horizontal
components. These sites include S2EE, with
two recordings, S4GR, with three recordings, and
S4IR, with two recordings. In addition, sites
S2EE and S3EE were close to one another, so if
counted as one site, three recordings are available
for these sites.
5. V/H-OBSERVATIONS
Visually, the accelerograms recorded on the
SEMS units look much like those from onshore
sites. As an example, figure 3a shows the three
components of motion for the 1990 Upland
earthquake; because the units have pre-event
buffers, the initial P-wave motion has been
captured (unlike the records from analog
accelerographs), and the P-wave is followed by a
clear S arrival, which is followed by a slowly
decaying coda or tail. The vertical component is
small relative to horizontal components, but it is
possible to fmd onshore records with comparable
relations between the components.
The acceleration, velocity, and displacement time
series for the 1990 Upland SEMS recording are
also shown in figure 3. The acceleration traces
are largest near the beginning of the record, and
they decay to small motions at the time of arrival
of the large amplitude long-period waves. The
outstanding features of these figures are the late
arriving, long-period (= 6 sec) motions on all
three components. These motions are not
unexpected, for the travel path (Figure 2)
traverses the Los Angeles basin, and the waves
resemble the surface waves that have been
observed to propagate in the basin. In
seismological terms, the peak accelerations are
probably carried by body waves, while the long-
period arrivals are surface waves.
The main goal of the SEMS program was to
study the similarties and differences of ground
motions on the seafloor to those onshore.
Because the earthquakes recorded at the SEMSsites were generally not recorded at nearby
onshore sites, it is difficult to make a direct
assessment of the agreement between onshore
and offshore motions; ground motions depend on
many variables, such as earthquake size and type
of faulting, distance from the source, propagation
path, and local site geology, and a comparison of
only a few recordings is worthless unless
adequate corrections can be made to remove
these influences on the amplitudes of the
motions. The ratio of vertical to horizontqal
motions (V/H), however, might be expected to
remove all but the effect of local geology, at least
to first order. By comparing ratios, it would then
be possible to compare a few onshore and
offshore recordings to see if they were
comparable or not. This technique was
performed in the study. The study also compared
the ratios from offshore recordings with those
predicted from regression analyses based on
hundreds of onshore recordings from manyearthquakes; this provides a measure of
comparison that represents the average ratio for a
typical site and earthquake of a specified
magnitude and distance. In addition, the study
compared the average V/H for offshore SEMSsites to the V/H from a few onshore recordings
for which the shear-wave velocities beneath the
recording sites are similar to the velocities we
estimate to exist beneath the SEMS offshore
sites.
100
Several events were recorded at the same station
(table 3). It is interesting to compare V/H for
the multiple earthquakes at a given site to assess
the stability of the ratio. Similar ratios for
different events might suggest that the ratio is
strongly controlled by local site conditions,
particularly if the events are different magnitude
and have different travel paths to the site.
Figures 4 and 5 show such comparisons for
fourier amplitude spectra and response spectra.
We have treated S2EE and S3EE as one site. In
these figures, the geometric average of the two
horizontal components has been used for the
denominator. There is a general trend for the
ratios to increase with period, and there is more
scatter at short periods than at long periods. The
first impression is that there is considerable
scatter in the ratios, particularly at short periods.
Careful inspection of the figures, however, shows
that generally the ratios of V/H from different
earthquakes recorded at individual sites are
similar to one another; the large scatter is
primarily due to site-to-site variations in the ratio
(in particular, compare the S2EE and S3EE to
S4IR).
The results are first presented from recordings of
the 1981 Santa Barbara Island earthquake, which
was recorded on an offshore station and several
onshore stations. The ratios of 5 percent
damped response spectra are shown in figure 6,
in which it is clear that the offshore recording
(SIHN) has a much different V/H than for the
onshore recordings. The difference is largest at
short periods and tends to decrease at long
periods. The regression-based ratios are in
much better agreement with the onshore ratios
than with the offshore ratio. It was judged that
with the possible exception of SC38, the onshore
sites are underlain by materials with higher
shear-wave velocities than the offshore site
(SC38 is described to be on dune sand in
Anderson et al. , 1981, whereas SIVC and SC51
are on marine terrace deposits), and, therefore,
one would expect the spectral ratios for the
onshore sites to be more similar to the ratios
from regression-based results than for the
offshore site.
A comparison between the regression-based
onshore results and the average of the SEMSoffshore results is shown in figure 7. For the
sake of clarity, the offshore ratios have been
combined into a single average, in spite of the
site-to-site differences demonstrated earlier; this
will make no difference in the overall
comparison of observed offshore and onshore
V/H ratios. The distance at which the AS97relations were evaluated was 120 km, which is
close to the geometric mean distance of 1 13 kmfor the events used in forming the ratio. The
regression-based results for C97 were evaluated
at the greatest distance-60 km-for which two
equations are valid. Also included in the
comparison in figure 7 are results from analyses
of specific earthquakes (Loma Prieta 1989 and
Northridge 1994), as well as results from the
SMARTl array in Taiwan. In general, the
onshore results are above the SEMS offshore
results, and the difference is largest at short
periods.
The large difference between average onshore
sites and the SEMS offshore recordings at short
periods is consistent with the fundings of Sleefe
(1990), who made scatter plots of peak
accelerations, with horizontal components on one
axis and vertical components on the other.
Using differenet symbols for offshore and
onshore recordings, he clearly found two
populations separated in the same sense as we
found for response spectra. In addition. Smith
( 1 990) found that V/H for peak acceleration and
peak velocity from offshore sites was smaller
than for onshore sites, again in qualitative
agreement with the findings from the spectral
ratios.
6. PEAK MOTIONS AS A FUNCTION OFDISTANCE
The previous figures show a clear difference in
V/H at short periods between the offshore and
onshore recordings. Is this due to onshore vs.
101
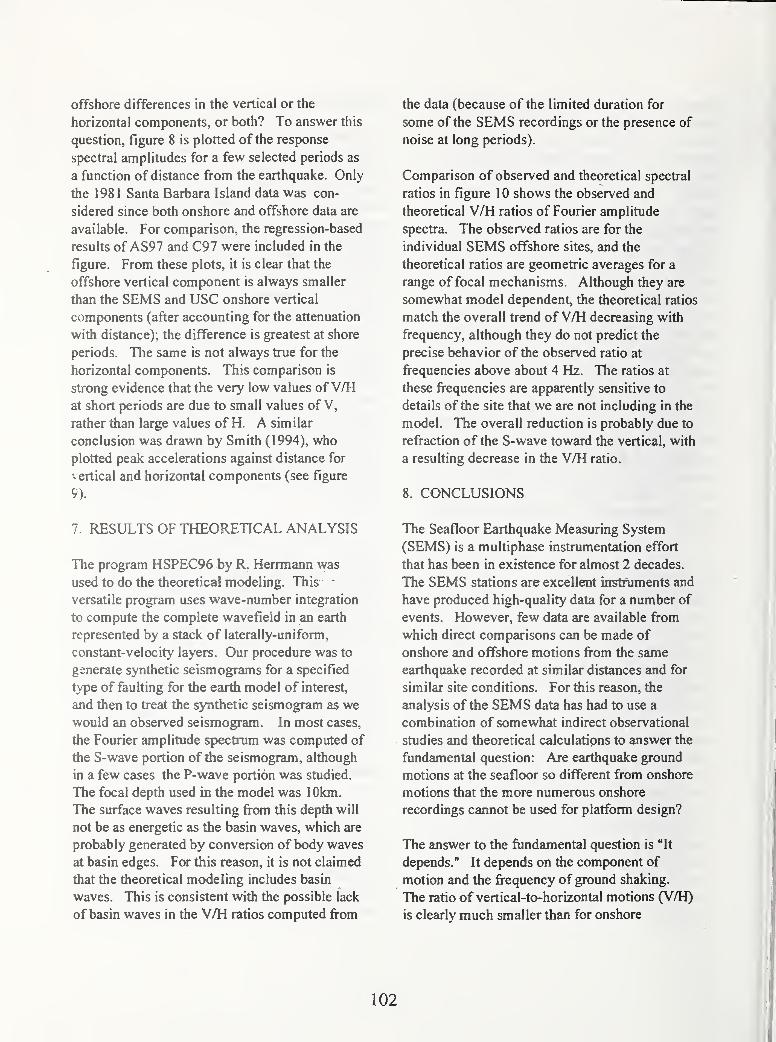
offshore differences in the vertical or the
horizontal components, or both? To answer this
question, figure 8 is plotted of the response
spectral amplitudes for a few selected periods as
a function of distance from the earthquake. Only
the 1981 Santa Barbara Island data was con-
sidered since both onshore and offshore data are
available. For comparison, the regression-based
results of AS97 and C97 were included in the
figure. From these plots, it is clear that the
offshore vertical component is always smaller
than the SEMS and USC onshore vertical
components (after accounting for the attenuation
with distance); the difference is greatest at shore
periods. The same is not always true for the
horizontal components. This comparison is
strong evidence that the very low values of V/H
at short periods are due to small values of V,
rather than large values of H. A similar
conclusion was drawn by Smith (1994), whoplotted peak accelerations against distance for
vertical and horizontal components (see figure
9).
7. RESULTS OF THEORETICAL ANALYSIS
The program HSPEC96 by R. Herrmann was
used to do the theoretical modeling. This
versatile program uses wave-number integration
to compute the complete wavefield in an earth
represented by a stack of laterally-uniform,
constant-velocity layers. Our procedure was to
generate synthetic seismograms for a specified
type of faulting for the earth model of interest,
and then to treat the synthetic seismogram as wewould an observed seismogram. In most cases,
the Fourier amplitude spectrum was computed of
the S-wave portion of the seismogram, although
in a few cases the P-wave portion was studied.
The focal depth used in the model was 10km.
The surface waves resulting from this depth will
not be as energetic as the basin waves, which are
probably generated by conversion of body waves
at basin edges. For this reason, it is not claimed
that the theoretical modeling includes basin
waves. This is consistent with the possible lack
of basin waves in the V/H ratios computed from
the data (because of the limited duration for
some of the SEMS recordings or the presence of
noise at long periods).
Comparison of observed and theoretical spectral
ratios in figure 1 0 shows the observed and
theoretical V/H ratios of Fourier amplitude
spectra. The observed ratios are for the
individual SEMS offshore sites, and the
theoretical ratios are geometric averages for a
range of focal mechanisms. Although they are
somewhat model dependent, the theoretical ratios
match the overall trend ofV/H decreasing with
frequency, although they do not predict the
precise behavior of the observed ratio at
frequencies above about 4 Hz. The ratios at
these frequencies are apparently sensitive to
details of the site that we are not including in the
model. The overall reduction is probably due to
refraction of the S-wave toward the vertical, with
a resulting decrease in the V/H ratio.
8. CONCLUSIONS
The Seafloor Earthquake Measuring System
(SEMS) is a multiphase instrumentation effort
that has been in existence for almost 2 decades.
The SEMS stations are excellent instniments and
have produced high-quality data for a number of
events. However, few data are available from
which direct comparisons can be made of
onshore and offshore motions from the same
earthquake recorded at similar distances and for
similar site conditions. For this reason, the
analysis of the SEMS data has had to use a
combination of somewhat indirect observational
studies and theoretical calculatipns to answer the
ftindamental question: Are earthquake ground
motions at the seafloor so different from onshore
motions that the more numerous onshore
recordings caimot be used for platform design?
The answer to the ftindamental question is "It
depends." It de[>ends on the component of
motion and the frequency of ground shaking.
The ratio of vertical-to-horizontal motions (V/H)
is clearly much smaller than for onshore
102

recordings at relatively high frequencies (above
about 3 Hz). Studies of the vertical and
horizontal motions separately suggest that the
anomaly lies with the vertical motions.
Theoretical studies show that the reduction of
vertical motions can be produced by interactions
of S-waves in the solid materials below the
seafloor and P-waves in the water layer. These
interactions are most important at the resonant
frequencies of vertically propagating acoustic
waves in the water layer. A reduced vertical
component can also be produced by refraction of
an incoming wave toward the vertical, such as
will occur for shear-wave velocities that decrease
towards the Earth's surface. V/H computed
from a few onshore sites with shear-wave
velocity versus depth similar to that estimated to
be beneath the SEMS offshore stations are much
different at high frequencies than the ratios from
the SEMS stations, suggesting that simple
up - ard-refraction plays a small role in the
dif erence between onshore and offshore motions
ai ; .e higher frequencies.
Thv water layer indirectly influences motions by
allowing low-velocity sediments to exist over a
widespread area, and by increasing the pore
pre. sure in the sediments, which will reduce the
velocity in sands and silts.
As noted before, it is easy to get caught up in the
complexities at high frequencies, which reflect
the water layer as well as local shear-wave
velocities. Although some parts of offshore
platform systems are sensitive to high-frequency,
vertical component waves (e.g., Smith, 1994,
Brady, 1993), the motions are mudline motions
and are far from the horizontal resonance
frequencies of most offshore platforms. Moreimportantly, for design and analysis of platforms,
may be periods of motion longer than 1 second.
Particularly useful recordings for the study of
long-period motions were made at a SEMS site
offshore Long Beach. Comparisons of response
spectra obtained from the SEMS instruments
with onshore empirical and theoretical
calculations, as well as time-domain comparisons
with onshore waves that have traveled through
the Los Angeles basin, suggest that the seafloor
motions at the SEMS site are significantly
influenced by late arriving, large amplitude
- surface waves ("basin waves") at long periods.
These waves may be niore important for platform
analysis and design than the higher frequency
waves that are influenced by the water layer. In
this sense, the travel path may be more important
than the local site conditions.
9. REFERENCES
Boore, D.M. ( 1 997). Analysis ofEarthquake
Recordings Obtainedfrom the Seafloor
Earthquake Measurement System (SEMS)
Instruments Deployed offthe Coast ofSouthern
California, U. S. Geol. Surv. Open-File Rept. 97-
733, 242 p.
Boore, D. M. (1998). Basin Waves on A Sea-
Floor Recording Near Long Beach, California
from the 1990 Upland Earthquake: Implications
for Ground Motionsfrom a Larger Earthquake :
Bull. Seism. Soc. Am. (submitted for
publication).
Boore, D. M. and Smith, C. E. (1998). Analysis
ofEarthquake Recordings Obtainedfrom the
Seafloor: Earthquake Measurement (SEMS)
Instrument Deployed offthe Coast ofSouthern
California, Bull. Seism. Soc. AM 89 (submitted
for publications).
Brady, A. G. ( 1 993). Offshore Strong Ground
Motion and Onshore Surrogates, Proceedings,
International Workshop on Wind and Earthquake
Engineering for Offshore and Coastal Facilities,
Yokosuka, Japan, May 12-14.
Reece, E. W., D. E. Ryerson, and R. L. McNeill
(1981). Long-Term Measurements ofGroimd
Motions Offshore, International Conference. OnRecent Advances in Geotechnical Earthquake
103
Engineering and Soil Dynamics, St. Louis,
Missouri, April 26-May 3, 1981, Vol I, 377-380.
Steefe, G. E. ( 1 990). The long-Term
Measurement ofStrong-Motion Earthquakes
Offshore Southern California, Proceedings
Offshore Technology Conference OTC 6336,
561-568.
Sleefe, G. E. and D. Engi (1987). Seafloor
Responsefor two Southern California
Earthquakes, Proceedings 1987 Spring Conf OnExper. Mech., Houston, Texas, June 14-19, 1987,
and Sandia report SAND86-2441C.
Smith, C. E. (1990). Seismic Design
Considerationsfor Offshore Oil and Gas
Structures, Proceedings 21" Joint Meeting ofthe
U.S. - Japan Cooperative Program in Natural
Resources: Panel on Wind and Seismic Effects,
NIST SP 776.
Smith, C. E. ( 1 99 1 ). Seafloor Seismic Network
Offshore Southern California, Proceedings 23"*
Joint Meeting of the U. S. - Japan Cooperative
Program in Natural Resources: Panel on Wind
and Seismic Effects.
Smith, C. E. (1994). Dynamic Response of
Offshore Steel-Jacket Platforms Subject to
Measured Seafloor Seismic Ground Motions,
D. Sc. thesis. Graduate School of Engineering
and Applied Science, George Washington
University, 323 pp.
Ehasz, J. P., Franco, R. J., and Platzbecker, M. R.
( 1 997). Seafloor Earthquake Measurement
System - SEMS4, Sandia National Laboratories,
SAND97 - 1630, Albuquarque, New Nexico,
70pp.
104
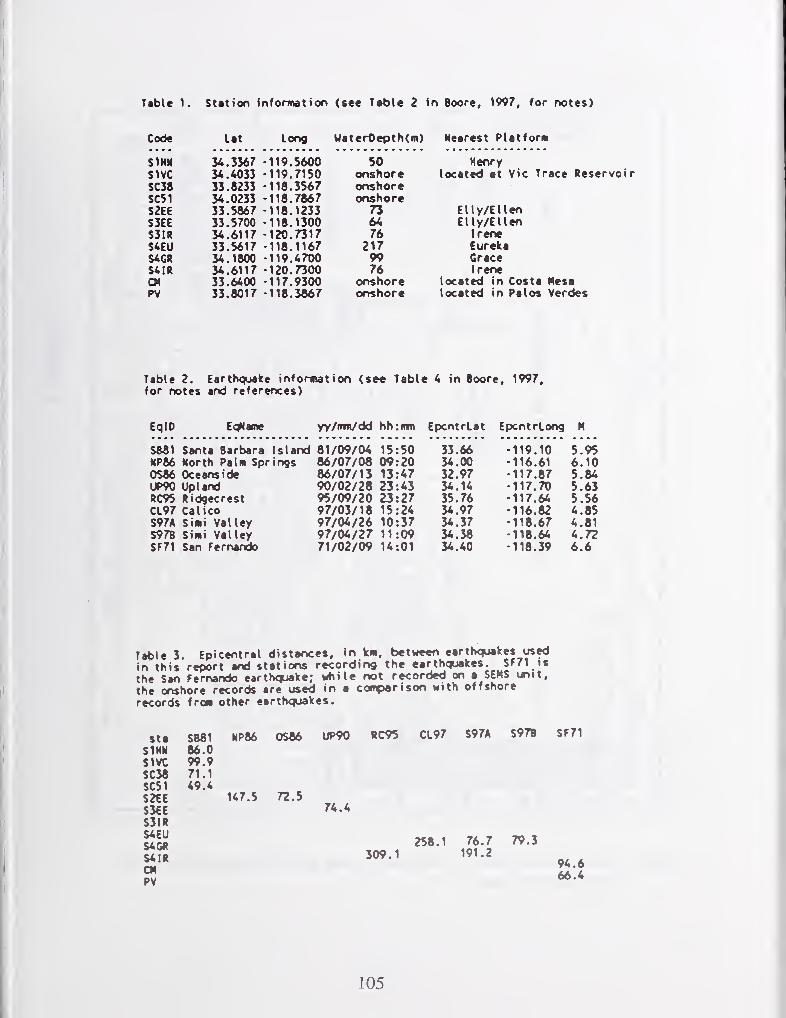
Table 1. Station Information (see Tabte 2 in Boore, 1997, for notes)
Code L«t Long UaterOepth(m) Nearest Platform
SIHM 34.3367 •119.5600 50 HenryS1VC 34.4033 -119.7150 onshore located at Vic Trace ReservoirSC38 33.8233 -118.3567 onshoreSCSI 34.0233 •118.7867 onshoreS2EE 33.5867 •118.1233 73 Elly/EllenS3EE 33.5700 -118.1300 64 Elly/EllenS3IR 34.6117 •120.7317 76 IreneS4EU 33.5617 •118.1167 217 EurekaS4GR 34.1800 •119.4700 99 GraceS4IR 54.6117 •120.7300 76 IreneCM 33.6400 -117.9300 onshore located in Costa MesaPV 33.8017 •118.3867 onshore located in Palos Verdes
Table 2. Earthquake information (see Table 4 in Boore, 1997,for notes and references)
EqlD E<^aine yy/nw/dd hh:mm EpcntrLat EpcntrLong M
S881 Santa Barbara Island 81/09/04 15:50 33.66 -119.10 5.95NP86 North Pain Springs 86/07/08 09:20 34.00 •116.61 6.100$86 Oceans ide 86/07/13 13:47 32.97 -117.87 5.84UP90 Upland 90/02/28 23:43 34.14 -117.70 5.63RC95 Ridgecrest 95/09/20 23:27 35.76 •117.64 5.56CL97 Calico 97/03/18 15:24 34.97 •116.82 4.85S97A Siai Valley 97/04/26 10:37 34.37 -118.67 4.81S97B Sini Valley 97/04/27 11:09 34.38 •118.64 4.72SF71 San Fernando 71/02/09 14:01 34.40 •118.39 6.6
Table 3. Epicentral distances, in km, between ear th<^ke$ used
in this report and stations recording the earth<^kes. SF71 is
the San Fernando earthquake; while not recorded on • SEMS vx>it,
the onshore records are used in • coirparison with offshore
records from other earthc^iakes.
sta SB81 NP86 0S86 UP90 RC95 CL97 S97A S97B SF71
SIHN 86.0S1VC 99.9SC38 71.1
SC51 49.4S2EE 147.5 72.5
SSEE 74.4
S3IRS4EUS4GRS4IRCMPV
258.1 76.7 79.3
309.1 191.294.666.4
105
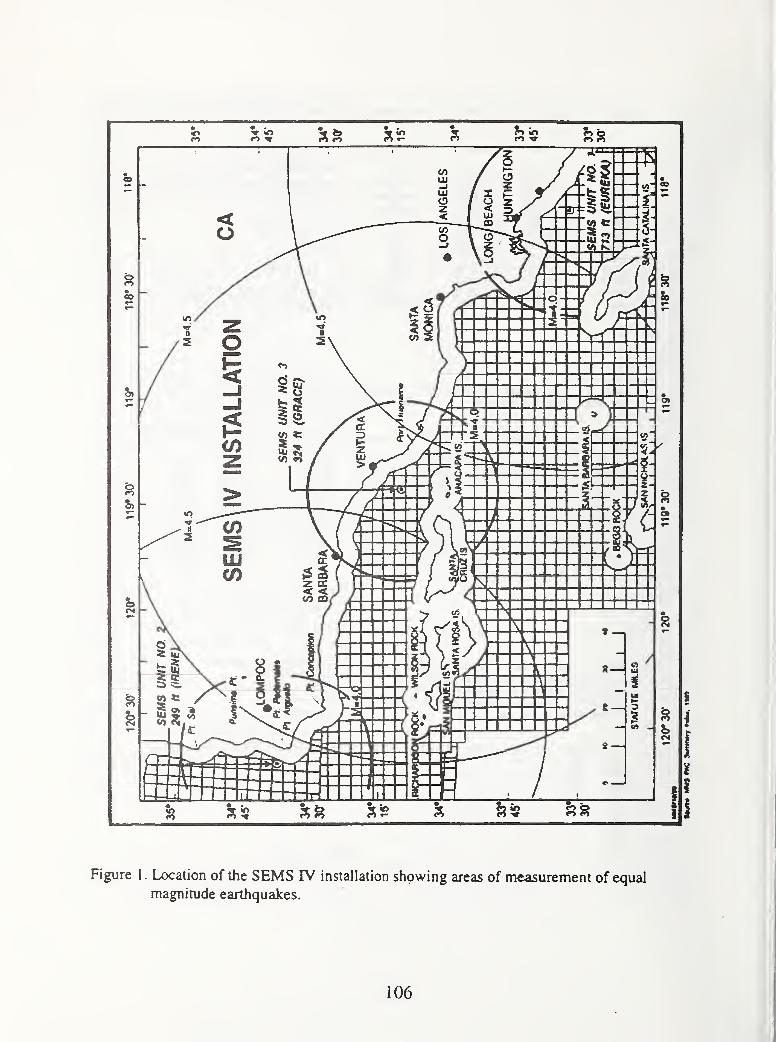
Figure I. Location of the SEMS FV installation showing areas of measurement of equal
magnitude earthquakes.
106
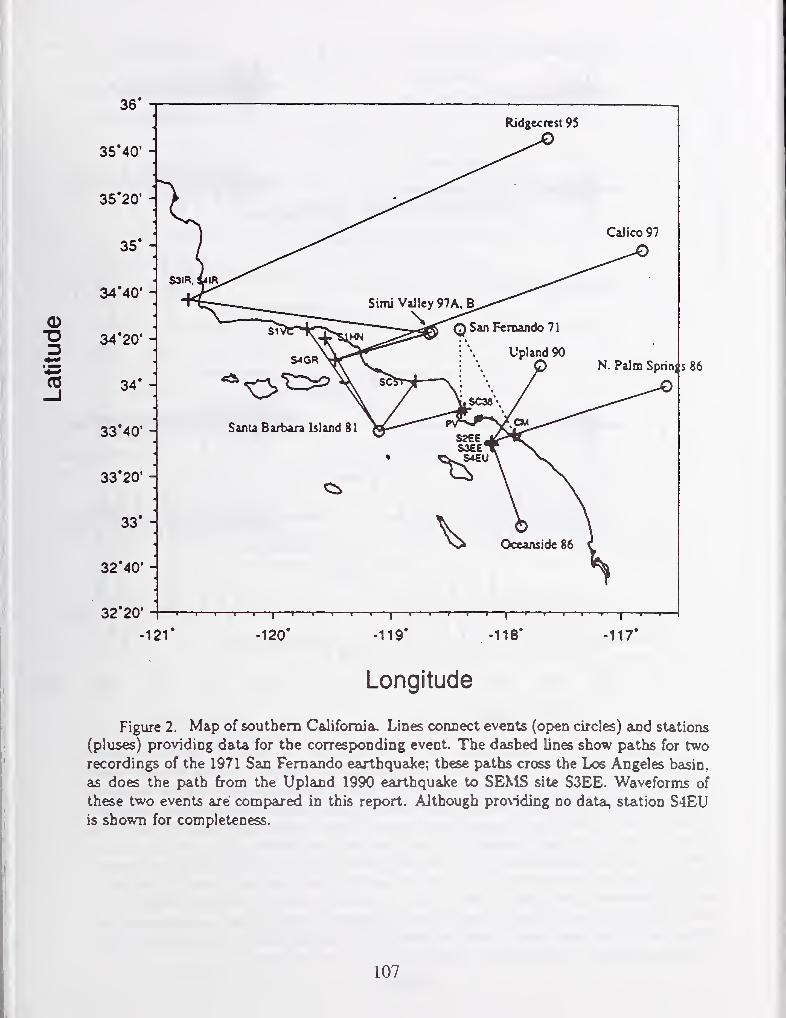
-121* -120* -119* -118* -117*
Longitude
Figure 2. Map of southern California, Lines connect events (open circles) and stations
(pluses) providing data for the corresponding event. The dashed lines show paths for two
recordings of the 1971 San Fernando earthquake; these paths cross the Los Angeles basin,
as does the path from the Upland 1990 earthquake to SEMS site S3EE. Waveforms of
these two events are compared in this report. Although pro\iding no data, station S4EUis shown for completeness.
107
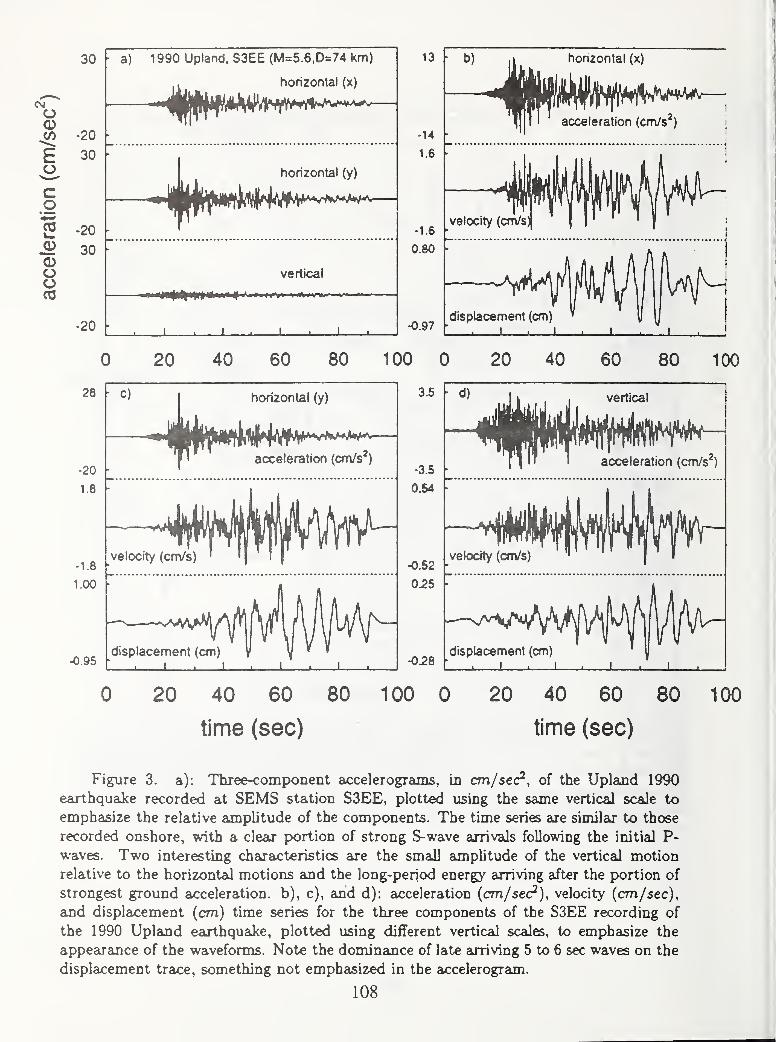
O
E
c
CO
Q)
CDOOCC
30
-20
30
-20
30
-20
28
a) 1990 Upland. S3EE (M=5.6,D=74 km)
horizontal (x)
-20
1.8
-1.8
1.00
-0.95
horizontal (y)
vertical
_L _L
13
•14
1.6
-1.6
0.80
-0.97
horizontal (x)
acceleration (cm/s^) i
20 40 60 80 100 0 20 40 60 80 100
^)1 horizontal (y)
Ti acceleration (cm/s^)
velocity (crn/s) ' '| '1
-—-'Avy^/yldisplacennent (cm) y \I.I.I
1 1 1
3.5
-3.5
-0.52
-028
1vertical
1 1 acceleration (cm/s^)
velocity {cm/s
displacement (cm)I.I.I. 1
0 20 40 60 80 100 0 20 40 60 80 100
time (sec) time (sec)
Figure 3. a): Three-component accelerograms, in cm/sec^, of the Upland 1990
earthquake recorded at SEMS station S3EE, plotted using the same vertical scale to
emphasize the relative amplitude of the components. The time series are similax to those
recorded onshore, with a clear p>ortion of strong S-wave arrivals following the initial P-
waves. Two interesting characteristics are the small amplitude of the vertical motion
relative to the horizontal motions aind the long-period energy arriving after the portion of
strongest ground acceleration, b), c), and d): acceleration {cm/sec?), velocity {cm/sec),
and displacement (cm) time series for the three components of the S3EE recording of
the 1990 Upland earthquake, plotted using different vertical scales, to emphasize the
appearance of the waveforms. Note the dominance of late arriving 5 to 6 sec waves on the
displacement trace, something not emphasized in the accelerogram.
108
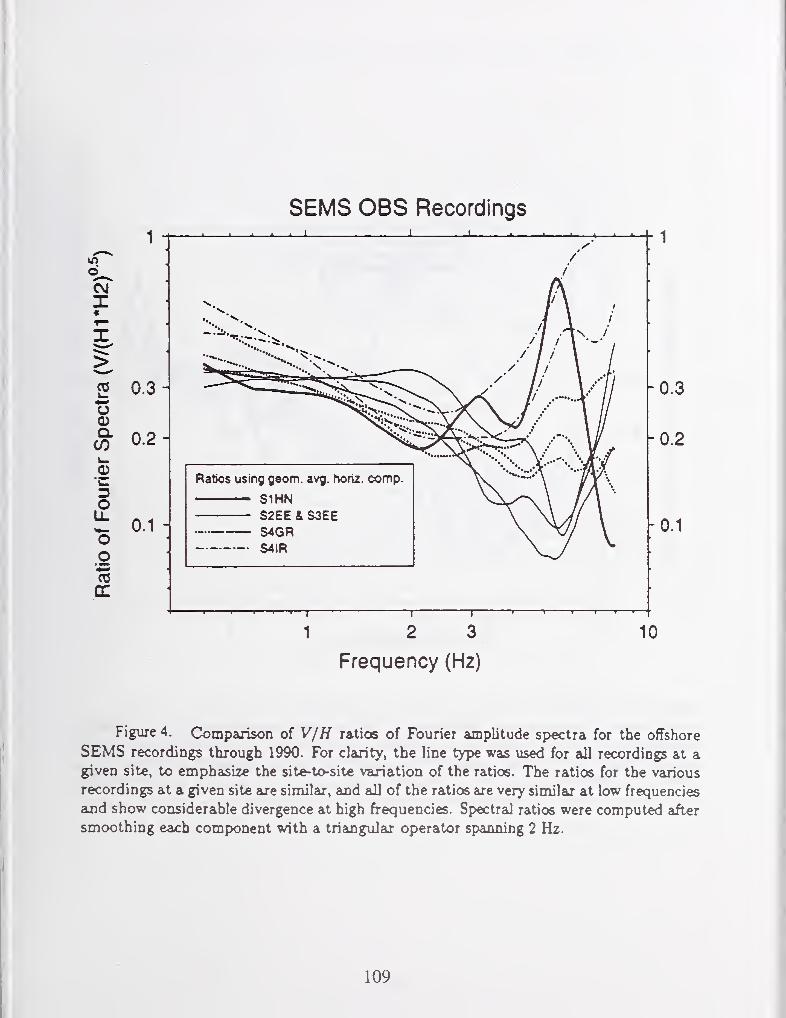
SEMS OBS Recordings
Frequency (Hz)
Figure 4. Comparison of V/H ratios of Fourier amplitude spectra for the offshore
SEMS recordings through 1990. For clarity, the line type was used for all recordings at agiven site, to emphasize the site-to-site variation of the ratios. The ratios for the various
recordings at a given site are similar, and all of the ratios are very similar at low frequencies
ajid show considerable divergence at high frequencies. Spectral ratios were computed after
smoothing each component with a triangular operator spanning 2 Hz.
109
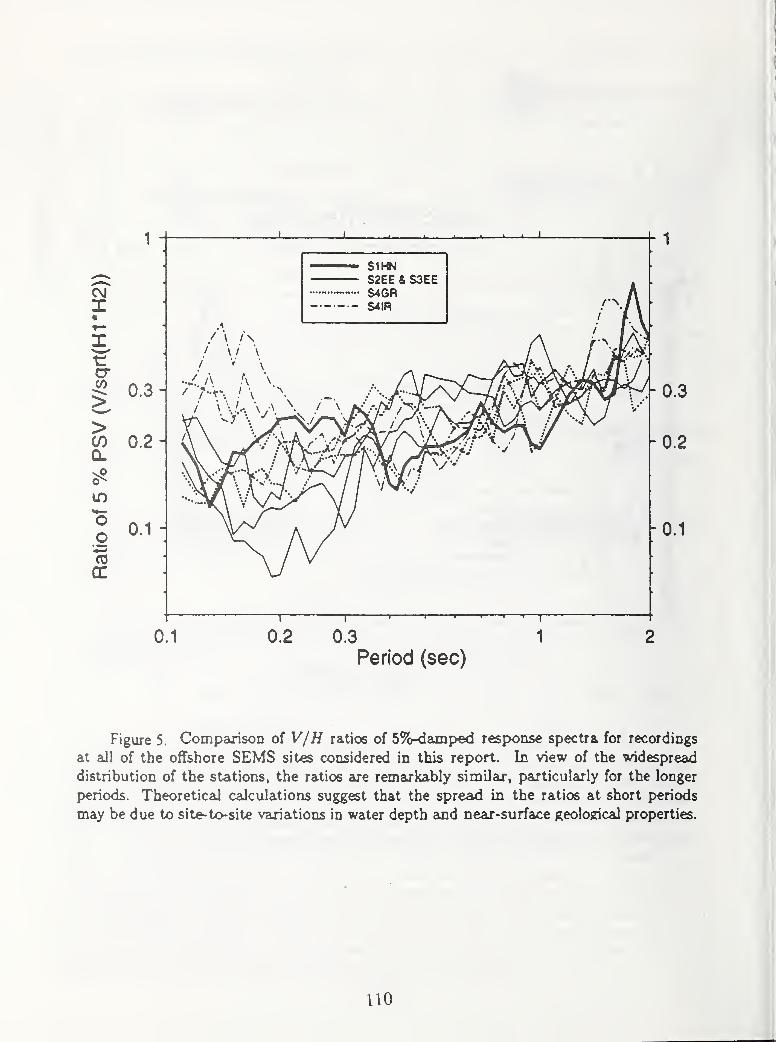
0.1 0.2 0.3 1 2
Period (sec)
Figure 5. Comparison of V/H ratios of 5%-damf>ed resi>onse spectra for recordings
at all of the offshore SEMS sites considered in this report. In view of the widespread
distribution of the stations, the ratios are remarkably similar, particularly for the longer
p>€riods. Theoretical calculations suggest that the spread in the ratios at short periods
may be due to site-to-site variations in water depth and neax-surface geological properties.
110
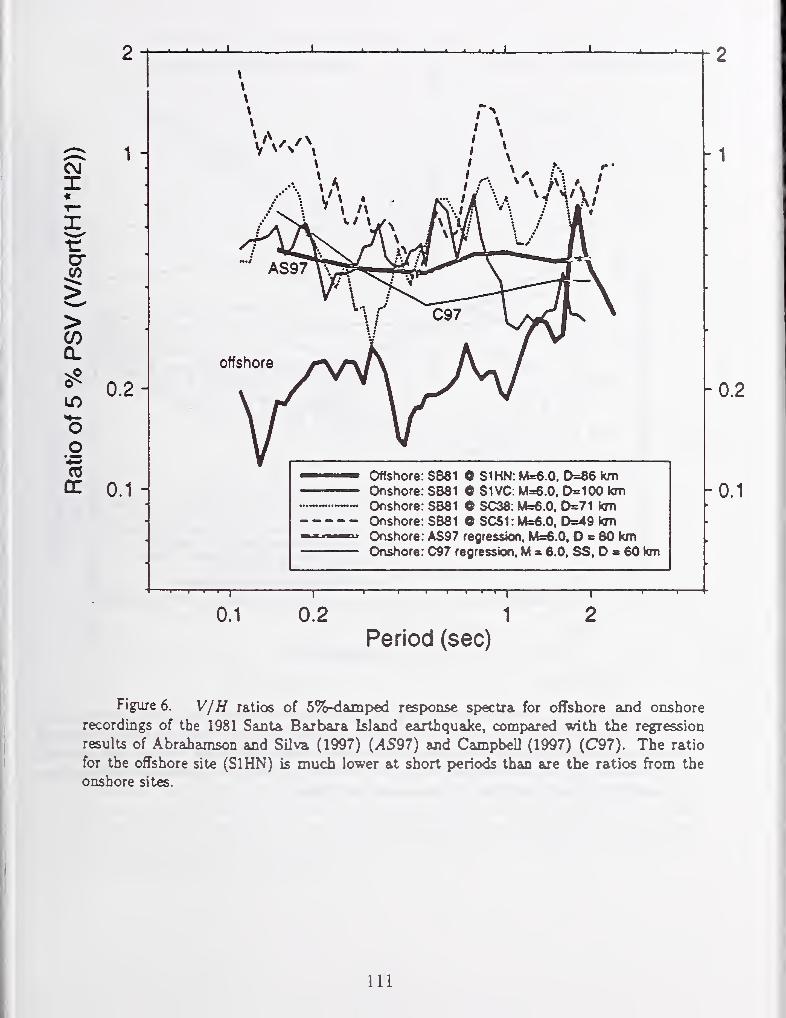
1-
0.2-
0.1 -
offshore
Offshore: SB81 O SIHN: M=6.0. D=86 kmOnshore: SB81 C S1VC: M=6.0. D=100 kmOnshore: SB81 O SC38: M=6.0. 0=^71 kmOnshore: SB81 C SCSI: M=6.0. D=49 kmOnshore: AS97 regression, M=:6.0, O « 80 kmOnshore: C97 regression, M x 6.0, SS, D « 60 km
"T I I (II
Period (sec)
20.1 0.2
Figure 6. V/H ratios of 5%-daLmped resp>ons€ spectra for ofTshore and onshore
recordings of the 1981 Santa. Barbara Island earthquake, compeared with the regression
results of Abrahamson and SUva (1997) (XS97) and Campbell (1997) (C97). The ratio
for the ofTshore site (SlHN) is much lower at short periods than are the ratios from the
onshore sites.
Ill
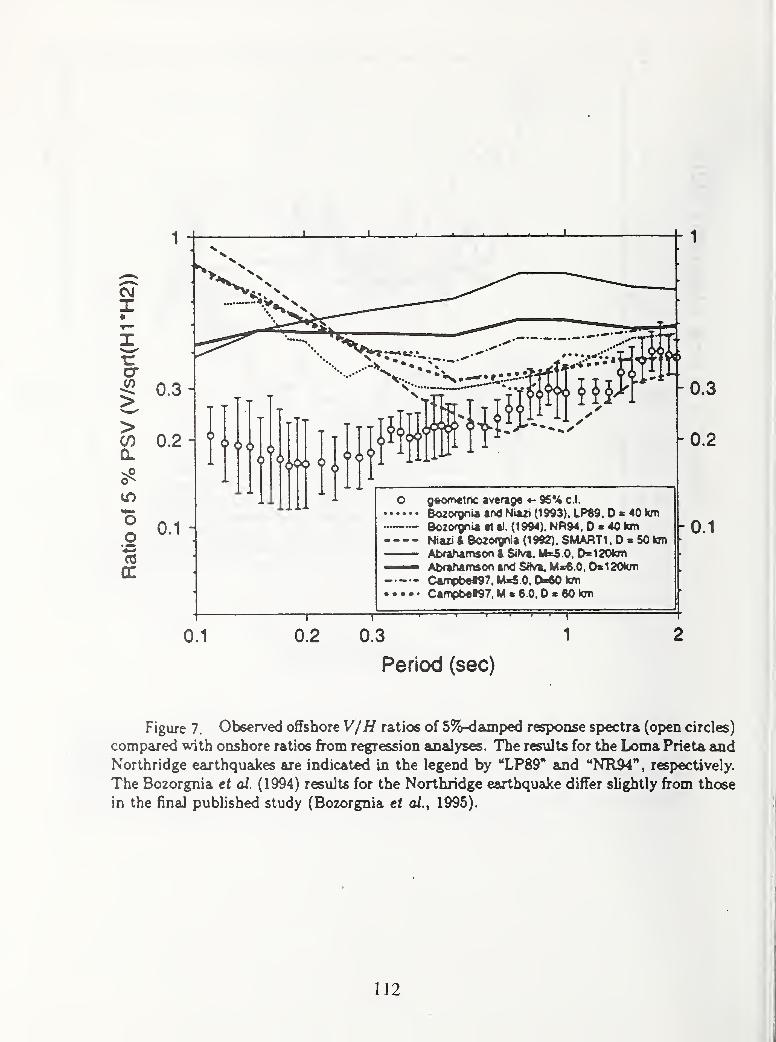
0.3
0.2
0.1 -
^^^^ '^N
•v^-^V?,^-1
Y s><i>
0.3
0.2
O geom«tric average 96% c.l.
Bo2<X9niaandNia2i(l993).LP89.0«40kmBozofgniaaial. (1»4).NR94.0«40l5mNiazi&Bo2orgnia(l992). SMARTl.D»50kmAt>aham$oo4Sitva,U«5.0. 0»120»OT
—— Abrahamson and Sitva, Mx6.0, 0«120kni
C*rTvbet97. MxS.0. 0«-«0 ton
• . . > . Campb«>97, M * 6 0, 0 * 60 ton
-0.1
I I I
0.1 0.2 0.3
Period (sec)
Figure 7. Observed offshore VjH ratios of 5%-damped response spectra (open circles)
compared with onshore ratios from regression analyses. The results for the Loma Prieta andNorthridge earthquakes are indicated in the legend by "LPSQ" and "NR94'', respectively.
The Bozorgnia ti oX. (1994) results for the Northridge earthquake differ slightly from those
in the final pubUshed study (Bozorgnia ti a/., 1995).
112
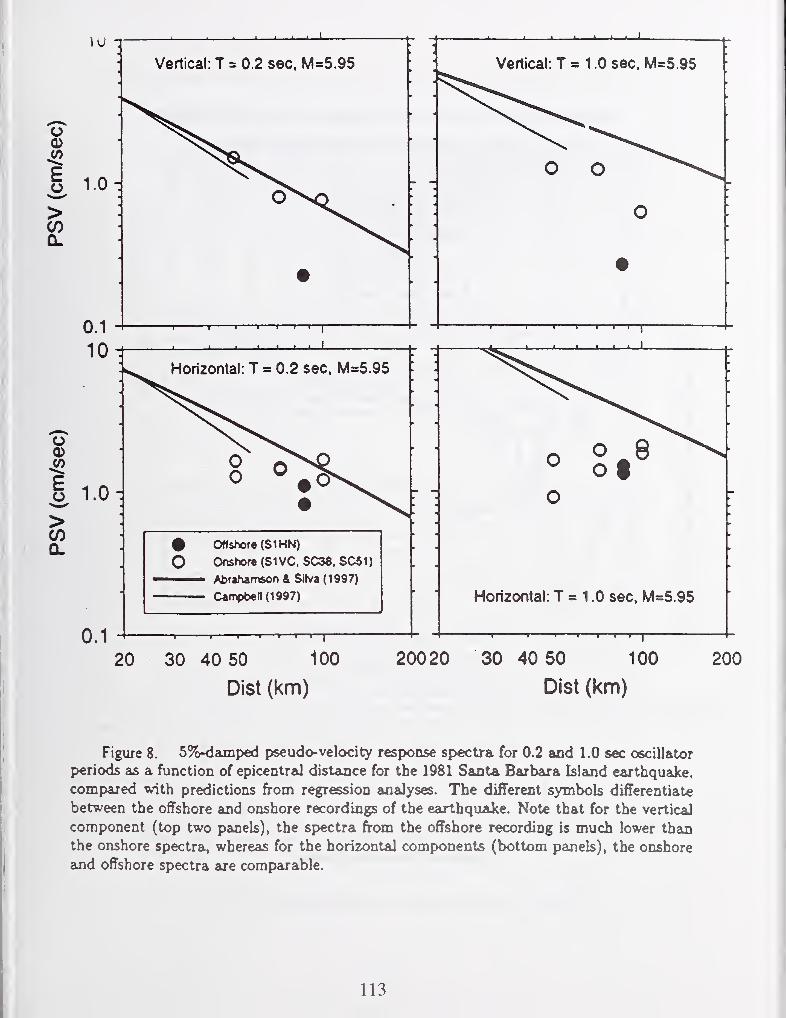
0.1
10
I I I T( 1 %
o
% 1.0
>CO0.
0.1
Horizontal: T = 0.2 sec, M=5.95
Offs^wre (SIHN)
Onshon (S1VC. SC38. SCSI)
Abrahamson & SiJva (1997)
Campben(l997)
I I I I I I—I—
p
20 30 40 50 100
Dist (km)
20020 30 40 50 100
Dist (km)
200
Figure 8. 5%-damped pseudo-velocity response spectra for 0.2 and 1.0 sec oscillator
periods as a function of epicentral distance for the 1981 Santa Barbara Island earthquake,
compared with predictions from regression analyses. The different symbols differentiate
between the offshore and onshore recordings of the earthquake. Note that for the vertical
component (top two pyanels), the sp>€ctra from the offshore recording is much lower than
the onshore spectra^ whereas for the horizontal components (bottom panels), the onshore
and offshore spectra are comparable.
113

O CKM -I . 1 . . 1 I I I I .1
0 to 20 30 40 SO eO 70 «3 90 100 110
EpicGntra/ distanco (mif&s)
Figure 9. Epicentral distance verus peak ground accelerations
114

10'
SEMS OBS Recordings and Theory
6
2o0)Q.C/)
3
&oo(0
10'^
10*
0.2
* I ... I
Geo<T^«tnc average of ratios at a givers station— S1HNS2ee4S3EES4GRS4IR
Theory: model 1
I II 1 1 1 1 •• I Theory: model 2
2
Frequency (Hz)
10^
:10"'
10 20
10*
Figure 10. V/H ratios of Fourier MnpUtude spectra of the S-wave portion of offshore
recordings, compared to theoretical predictions.
115
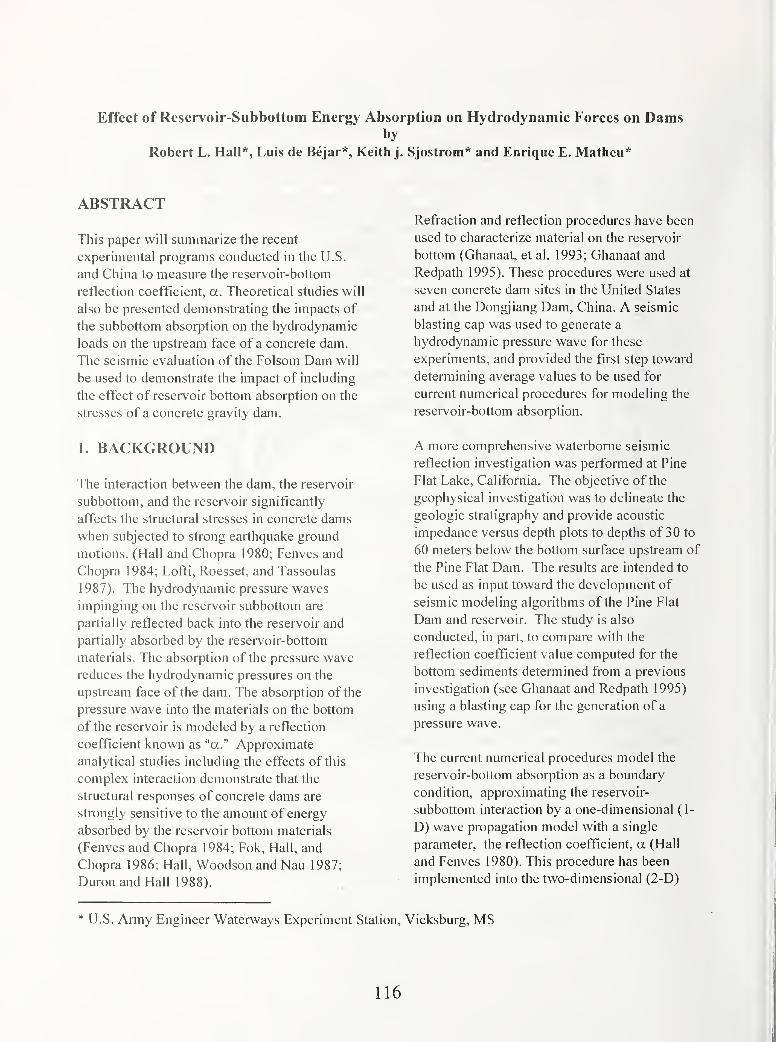
Effect of Reservoir-Subbottom Energy Absorption on Hydrodynamic Forces on Damsby
Robert L. Hall*, Luis de Bejar*, Keith j. Sjostrom* and Enrique E. Matheu*
ABSTRACT
This paper will summarize the recent
experimental programs conducted in the U.S.
and China to measure the reservoir-bottom
reflection coefficient, a. Theoretical studies will
also be presented demonstrating the impacts of
the subbottom absorption on the hydrodynamic
loads on the upstream face of a concrete dam.
The seismic evaluation of the Folsom Dam will
be used to demonstrate the impact of including
the effect of reservoir bottom absorption on the
stresses of a concrete gravity dam.
1. BACKGROUND
The interaction between the dam, the reservoir
subbottom, and the reservoir significantly
affects the structural stresses in concrete dams
when subjected to strong earthquake ground
motions. (Hall and Chopra 1980; Fenves and
Chopra 1984; Lofti, Roesset, and Tassoulas
1987). The hydrodynamic pressure waves
impinging on the reservoir subbottom are
partially reflected back into the reservoir and
partially absorbed by the reservoir-bottom
materials. The absorption of the pressure wave
reduces the hydrodynamic pressures on the
upstream face of the dam. The absorption of the
pressure wave into the materials on the bottom
of the reservoir is modeled by a reflection
coefficient known as "a." Approximate
analytical studies including the effects of this
complex interaction demonstrate that the
structural responses of concrete dams are
strongly sensitive to the amount of energy
absorbed by the reservoir bottom materials
(Fenves and Chopra 1984; Fok, Hall, and
Chopra 1986; Hall, Woodson and Nau 1987;
Duron and Hall 1988).
Refraction and reflection procedures have been
used to characterize material on the reservoir
bottom (Ghanaat, et al. 1993; Ghanaat and
Redpath 1995). These procedures were used at
seven concrete dam sites in the United States
and at the Dongjiang Dam, China. A seismic
blasting cap was used to generate a
hydrodynamic pressure wave for these
experiments, and provided the first step toward
determining average values to be used for
current numerical procedures for modeling the
reservoir-bottom absorption.
A more comprehensive waterbome seismic
reflection investigation was performed at Pine
Flat Lake, California. The objective of the
geophysical investigation was to delineate the
geologic stratigraphy and provide acoustic
impedance versus depth plots to depths of 30 to
60 meters below the bottom surface upstream of
the Pine Flat Dam. The results are intended to
be used as input toward the development of
seismic modeling algorithms of the Pine Flat
Dam and reservoir. The study is also
conducted, in part, to compare with the
reflection coefficient value computed for the
bottom sediments determined from a previous
investigation (see Ghanaat and Redpath 1995)
using a blasting cap for the generation of a
pressure wave.
The current numerical procedures model the
reservoir-bottom absorption as a boundary
condition, approximating the reservoir-
subbottom interaction by a one-dimensional (1-
D) wave propagation model with a single
parameter, the reflection coefficient, a (Hall
and Fenves 1980). This procedure has been
implemented into the two-dimensional (2-D)
* U.S. Army Engineer Waterways Experiment Station, Vicksburg, MS
116
code, EAGD (Fenves and Chopra 1984), for
concrete gravity dams and into a three-
dimensional (3-D) code, EACD, for arch dams
(Fok, Hall, and Chopra 1986). Numerical
procedures such as the Boundary Element
Method (de Bejar 1996) can be used to model
the reservoir-subbottom interaction, accounting
for the spatial variation of material properties.
Further, models will need to be developed to
accurately reproduce the measured response of
an actual concrete dam-reservoir-foundation
system.
2. MEASUREMENTS
Acoustic subbottom reflections are produced
when a source of acoustic energy is deployed
just below the water surface and fired. In a
homogeneous medium, the acoustic waves
extend uniformly in all directions from the
source in which the advancing wavefronts are
spherical surfaces centered at the source and
normal to the direction of propagation. Whenthe acoustic energy arrives at a boundary
between two materials of differing density and
elastic velocity, part of the energy will be
reflected back towards the surface and part
transmitted downward into the medium below.
Portions of the transmitted energy will also
undergo absorption or attenuation in the
material while the wavefront propagates through
to the next stratigraphic boundary.
The amplitudes of the incident, reflected, and
transmitted wave energies vary with respect to
the density and velocity of the materials through
which the wave energy is propagating. The
ratio between the amplitudes of incident and
reflected wave energy is called the reflection
coefficient (a) and is defined as:
a = ^Ai
where and ^/ are the amplitudes of the
reflected and incident wave energy, respectively
(Telford, et al. 1976). Reflected wave energies
are detected using hydrophones or piezoelectric
transducers which convert changes in water
pressure caused by the acoustic wavefronts into
electrical impulses. The electrical signals are
amplified, filtered, and recorded using a shallow
seismic, digital data acquisition system.
Two independent geophysical techniques for
determining a in-situ were used at seven
concrete dam sites in the United States and at
the Dongjiang Dam, China (Fig 1). The seismic
reflection technique measures the incident and
reflected shock waves generated by a blasting
cap on the reservoir bottom. The seismic
refraction technique measures the propagation
velocity of the pressure wave in the subbottom
materials by measuring the refracted waves and
then computing the ratio of the acoustic
impedances of the material. The refraction
experiments were based on a technique
developed by Hunter and PuUan (1990).
Blasting caps serve as the source for the
generation of a pressure wave for both types of
experiments. The a value is computed from the
ratio of the acoustic impedances of the
reservoir-bottom material and the water in the
reservoir (Ghanaat and Redpath 1995).
At the Dongjiang Dam, the reflection
experiments were conducted above a submerged
concrete cofferdam. The location of the
cofferdam was determined during the
processing of the experimental data when
construction drawing became available.
Analyses of the reflection experiments resulted
in a completed a value of 0.63 for the reservoir-
bottom sediments. This value was affected by
the cofferdam. The results from the seismic
refraction testing determined a to be 0.40 for
the reservoir-bottom sediments and 0.80 for the
granite rock (Ghanaat et al. 1993).
At the seven U.S. dam sites, the values of a for
the reservoir-subbottom material varied over a
range from -0.55 to 0.66. Pine Flat, Hoover,
and Folsom had negative a values. The negative
values are the result of the wave propagation
velocity through the reservoir-bottom material
being less than the propagation velocity through
water. This can occur when the density of the
material is less than that of water. This leads to
117

the conclusion that the reservoir-bottom
material may contain decaying organic material
which is producing gases in the material. Glen
Canyon had a low a values of 0.15. Monticello,
Morrow Point, and Crystal had a values greater
than 0.66. This study concluded that conducting
both refraction and reflection experiments is
essential for determining a (Ghanaat and
Redpath 1995).
A waterborne seismic reflection investigation
was also performed in Pine Flat Lake. This
study concentrated in the narrow neck of the
reservoir upstream of the dam structure. The
survey was conducted aboard the WESResearch Vessel (R/V) Waterways Explorer
with acoustic energy generated by two high-
resolution subbottom profiling systems. The
first system was operated at a frequency of 3.5
and 7.0 kHz and is typically called a 'pinger'
because of the audible noise it makes during
operation. The second system is a lower
frequency 'boomer' system and hydrophone
which has an output frequency range of 0.5 to
2.0 kHz to interrogate the subbottom sediment
structure. The higher operating frequency of the
'pinger' system allows greater resolution of the
bottom and subbottom stratigraphy than the
'boomer' or air gun systems but shallower
depths of energy penetration depending on the
characteristics of the subbottom material.
The pinger system consisted of a Datasonics
SBP-5000 subbottom profiling system. The
SBP-5000 transmitters were mounted within a
towfish rigidly attached to a telescoping arm
and deployed through the front deck of the
Waterways Explorer. The system allows the
transmission of variable-length acoustic pulses
(0.2 - 3 msec) over frequency ranges of 3.5, 7.0,
10.0 kHz. The transducers of both the source
and receiver were positioned 3 feet below the
water surface during data collection. For the
Pine Flat Lake study, the length of the pinger
pulse width at frequencies of 3.5 and 7.0 kHzwas set at 0.2 msec and is typically able to
resolve stratigraphic layers having thicknesses
greater than or equal to 0.6 meters. A total trace
length of 700 samples were digitally acquired
every 42 )usec which corresponds to a sampling
rate of 16 samples/|^sec. This sampling rate
provides an effective depth of subsurface
exploration of approximately 4.5 to 12.4 meters
below the bottom surface, depending on the
bottom and subbottom sediment characteristics.
The electro-mechanical source of the boomer
system is mounted on a sled and, along with the
hydrophone array, towed approximately 21.3
meters behind the R/V during the investigation.
The EG&G Models 23 1 and 232 sources were
operated in the frequency range of 0.5 to 2.0
kHz at an energy level of 300 joules. The
length of the boomer pulse width at the central
frequency of 1 .2 kHz is typically able to resolve
lithologic layers having thicknesses greater than
L5 meters. Under typical surveying conditions,
a total seismic trace length of 700 samples were
collected every 88 fisec (sampling rate = 8
samples/|isec), resulting in exploration depths in
excess of 30 meters below the bottom surface.
These detailed studies confirmed the existence
of negative values of a as reported by Ghanaat
and Redpath in their studies. This study also
provided the spacial variation of the reservoir-
bottom materials, as well as the depth, of
different subbottom material layers. As detailed
numerical procedures are developed, this
detailed description of the reservoir subbottom
may be needed.
3. THEORETICAL SUBBOTTOM-RESERVOIR-DAM INTERACTIONEFFECT
The effect of the interaction between the
absorptive boundary and the dam via the
pressure field transmitted by the fluid medium
becomes apparent by considering the simple
example in Figure 2. This 2-D model represents
the longitudinal section of a reservoir with
aspect ratio 3 (the ratio of the reservoir length to
the dam height, at full capacity). The water is
assumed impounded by a rigid boundary at the
far end of the reservoir, and the bottom is
characterized by a reflection coefficient typical
of a solid continuum [a s (0,1)].
118
The system is subjected to a steady-state
harmonic acceleration applied uniformly at the
rock base, with amplitude 0.30g (where g is the
acceleration of gravity), and frequency of 1.0
Hz. Figure 3 indicates the linear distribution of
the hydrostatic pressure on the upstream face of
the dam, normalized with respect to its value at
the bottom. By comparison, the corresponding
amplitude of the hydrodynamic pressure field
on this front wall is computed at six nodes
uniformly spaced along the wall height. These
hydrodynamic pressures were estimated using
Westergaard's approximation (Westergaard
1933) and appear in Figure 3 normalized with
respect to the corresponding hydrostatic
pressure at the point under consideration.
Notice that the maximum value of the
hydrostatic pressure on the wall takes place at
node 13, located at a distance of 0.40 H from the
bottom, where H is the dam height. At node 13,
the hydrostatic pressure is increased by a
hydrodynamic pressure with amplitude 33% of
the hydrostatic pressure at this node.
The effect of the dynamic interaction between
the flexible subbottom and the dam (H = 91 .4
meters) is considered at nodes 13, 17, and 21,
within the lower 40% of the wall height, where
the hydrodynamic contribution to the total
pressure field is significant. Figures 4, 5, and 6
show the normalized amplitudes of the
hydrodynamic pressure at the nodes in question.
The corresponding abscissas in these figures
are normalized with respect to the fundamental
natural frequency of the impounded water,
given by
(0, = -^ [Hz]AH
where C is the velocity of propagation of the
pressure waves in water. Multiple spectra
appear in each figure according to the value of
the parameter a. Physically, the two extremes
of the domain of a mean as follows: (a) a = 0
corresponds to an infinite water depth of the
reservoir, and (b) a = 1 .00 corresponds to a
rigid reservoir bottom. Intermediate values
correspond to different degrees of foundation
rock acoustic impedance. Notice the resonant
peaks at the natural frequencies of the
impounded water, which grow without bound
for a = 1 .00 (as in the case of a resonant elastic
system without damping). The elasticity of the
rock subbottom (assumed to extend to infinity)
' effectively acts within the dam-reservoir-
subbottom system as an energy-dissipating
mechanism.
Even a small amount of a-decrease from the
vicinity of a 8 (0.95,1 .00) serves as a powerful
moderator of maximum hydrodynamic
responses. For frequency components of the
excitation such that the ratio (oo/co]) smaller
than about 0.50, the effect ofa is negligible,
and the system response remains relatively
unaffected with respect to that for a rigid
bottom. For frequency components of the
excitation such that the ratio (co/coj) lies
between 0.50 and 0.80, the reduction in the
system response is of intermediate magnitude,
reaching up to 30% reduction at (oo/co j) = 0.80,
for a = 0.20, as compared to the corresponding
dynamic magnification for a =1.00. The most
dramatic attenuation of the system response
occurs for frequency contents in the range for
the ratio (co/coi) from 0.80 to about 1.00, where
the reduction reaches about 75% for a = 0.35,
for example, as compared to the dynamic
magnification corresponding to a in the vicinity
of 0.95 . For (co/o)i) > 1 .00, the effect of a on
the system response in inconclusive due to
oscillation according to the specific frequency
content of the excitation.
4. EVALUATION
A seismic evaluation of the Folsom Dam and
reservoir project has been performed (Hall,
Woodson, and Nau 1989). The structure is
located on the American River, 32 airline
kilometers northeast of the city of Sacramento.
The Folsom Project was designed and built by
the Corps of Engineers during the period from
1948 to 1956 under the authority of the Flood
Control Act of 1944 and the American River
Basin Development Act of 1949. In May 1956,
ownership was transferred to the U.S. Bureau of
119
Reclamation for operation and maintenance.
The concrete gravity section (Fig 7) of the damwas designed with pseudo-static acceleration of
0.05 g acting upstream. Based on their studies of
the horizonal ground acceleration recorded on
an array of accelerometers normal to the.
Imperial Valley fault during the Imperial Valley
earthquake of 1979, Bolt and Seed (1983)
recommend the following ground motions:
Peak horizontal ground acceleration = 0.35 g
Peak horizontal ground velocity = 0.20 m/sec
Bracketed duration (0.05 g) = 16 sec
The seismic analyses of the critical nonoverflow
monolith of the dam were conducted using the
2-D program, EACD-84 (Fenves and Chopra
1984). In this approach, the time history
response of the dam subjected to the specified
earthquake motions is determined with the
simultaneous effects of dam-water interaction,
dam-foundation rock interaction, and reservoir-
bottom absorption included. Water
compressibility is included in the analysis since
the earthquake response of the concrete dam can
be significantly affected by this factor. The
foundation rock supporting the dam is idealized
as a homogenous, isotropic, visco-elastic half
plane. The dam monolith is idealized with an
assemblage of four-node nonconforming planar
finite elements. Dissipation of strain energy in
the concrete is modeled with a constant
hysteretic damping factor. A viscous damping
ratio for all the natural vibration modes of the
concrete dam on a rigid foundation with no
reservoir corresponds to a constant hysteretic
damping factor of twice the viscous damping
ratio (Fenves and Chopra 1984).
The absorption nature of the reservoir
subbottom is characterized by the wave
reflection coefficient, a. The coefficient
represents the dissipation of hydrodynamic
pressure waves in the reservoir bottom and is
modeled approximately by a boundary condition
of the reservoir bottom which partially absorbs
incident hydrodynamic pressure waves (Fenves
and Chopra 1984). The wave reflection
coefficient is defined as the ratio of the
amplitude of the reflected hydrodynamic
pressure wave to the amplitude of the vertically
propagating pressure wave incident on the
reservoir bottom. The material at the bottom of
the reservoir determines the wave coefficient a,
in the following equation:
\-Ka =
\ + Kwhere
K - pc / Pf. Cf.
c = Velocity of pressure waves in water
p = Density of water
Or = V^r /Pr
- Young's modulus of reservoir bottom material
Pj. = Density of reservoir bottom material
For foundation rock module values of 40, 54.5,
and 76 x lO^N/m^, the above equation leads to
a values of 0.75, 0.79, and 0.82, respectively.
The pertinent stress analysis results are shown
in Table 1 . The greatest principal stresses occur
for the case in which the foundation modulus
and the reservoir-bottom coefficient are the
largest. For this set of parameters, a maximumprincipal stress of 6 x lO^N/m^ occurs on the
downstream face at an allocation of 22.5 meters
from the crest. This region corresponds to that at
which the vertical downstream face begins its
transition to an inclined surface. The stress of 6
X 10^ N/m2 is greater that the recommended
tensile strength of 5.8 x 10^ N/m^ for rich
concrete. To investigate the depth to which
possible cracking might penetrate, contours of
envelope values of maximum principal stresses
are shown in Fig 8. For the worse case, an area
approximately 0.6 meters in depth on the
downstream face is subjected to tensile stresses
exceeding 4.8 x 10^ N/m^, the least tensile
strength of the dam concrete. By including the
effects of the reservoir-bottom absorption, it is
reasonable to conclude that cracking will be
quite limited in extent and depth of penetration
into the monolith.
120
5. CONCLUSIONS
The effect of reservoir-subbottom energy
absorption of the hydrodynamic loads on
concrete dams subjected to large seismic ground
motions may be substantial, particularly for
excitation frequency contents in the range of
0.50< (co/coi) <1.00, where 00 1 is the
fundamental frequency of the impounded
reservoir. The measurement of the absorptive
nature of the reservoir subbottom can be
measured with different geophysical techniques.
These techniques range from simple blasting
cap techniques to very sophisticated waterbome
measuring equipment. Analytical procedures are
available from the simple 1-D wave propagation
models to nonlinear constitutive models of
partially saturated materials. What has not been
determined is the needed degree of
sophistication of the measurements or the
analytical models. Further research needs to be
performed to quantify the effect the spatial
variation of the subbottom materials, as well as
the geometry of the reservoir bottom, has on the
hydrodynamic loads. These results will
determine the needed parameters of an
engineering model for the reservoir subbottom
and the corresponding geophysical techniques.
6. AKNOWLEDGEMENTS
The research presented in this paper was
sponsored by^he Civil Works Direct-Allotted
EQEN Program. We appreciate the cooperation
of the authorities at the U. S. Army Engineer
Waterways Experiment Station and the Office,
Chief of Engineers, U. S. Army Corps of
Engineers, that permitted us to prepare and
present this paper for publication. Permission to
publish this paper was granted by the Chief of
Engineers.
7. REFERENCES
Hall, J. F., and Chopra, A. K. (1980). "Dynamic
response of embankment, concrete-gravity, and
arch dams including hydrodynamic interaction,"
Report No. UCB/EERC-80/39, Earthquake
Engineering Research Center, University of
California, Berkeley, CA.
Fenves, G., and Chopra, A. K. (1984). "EAGD-84: A computer program for earthquake analysis
of concrete gravity dams," Report No.
- UCB/EERC-84-1 1, Earthquake Engineering
Research Center, University of California,
Berkeley, CA.
Fok, K. L., Hall, J. F., and Chopra, A. K. (1986).
"EACD-3D: A computer program for three-
dimensional earthquake analysis of concrete
dams," Report No. UCB/EERC-86/09,
Earthquake Engineering Research Center,
University of California, Berkeley, CA.
Lotfi, v., Roesset, J. M., and Tassoulas, J. L.
(1986) . "A technique for the analysis of the
response of dams to earthquakes," Earthquake
Engineering and Structural Dynamics, Vol 15,
pp 463-490.
Hall, R. L., Woodson, S. C, and Nau, J. M.,
(1987) . "Seismic stability evaluation of Folsom
Dam and reservoir project," Technical Report
GL-87-14. U.S. Army Engineer Waterways
Experiment Station, Vicksburg, MS.
Duron, Z. H., and Hall, J. F. (1988).
"Experimental and finite element studies of the
forced vibration response of the Morrow Point
Dam," Journal ofEarthquake Engineering and
Structural Dynamics, Vol 16, pp 102 1-1039
Ghanatt, Y., Chen, H., Redpath, B. B., and
Clough, R. W. (1993). "Experimental study of
the Dongjiang Dam dam-water-foundation
interaction," Technical Report QS93-03. Report
to the National Science Foundation on Research
conducted under the U. S. - China Protocol for
Scientific and Technical Cooperation in
Earthquake Studies, Quest Structures,
Emeryville, CA.
Ghanaat, Y., and Redpath, B. B. (1995).
"Measurements of reservoir-bottom reflection
coefficient at seven concrete dam sites,"
Technical Report QS95-01, Report to the U.S.
121
Army Engineer Waterways Experiment Station
and the Bureau of Reclamation, Quest
Structures, Emeryville, CA.
Hunter, J.A., and Pullan, S.E. (1990). "A
vertical array method for shallow seismic
refraction survey of the Sea Floor," Geophysics,
Vol 55, No 1, pp 92-96.
de Bejar, L. A. (1996). "Subbottom absorption
coefficients for seismic analysis of concrete
dams," Proceedingsfrom the First U.S. - Japan
Workshop on Earthquake Engineeringfor
Dams, Vicksburg, MS.
Caulfield, D. C, Caulfield, D. D., and Yim, Y.
(1985). "Shallow subbottom impedance
structures using an iterative algorithm and
empirical constraints," Journal ofthe Canadian
Society ofExploration Geophysicists, 21(1),
pp7-14.
Caulfield, D. D., and Yim, Y. (1983).
"Prediction of shallow subbottom sediment
acoustic impedance while estimating absorption
and other losses," Journal ofthe Canadian
Society ofExploration Geophysicists, 1 9( 1 ),
pp44-50.
Hamilton, E. L. (1980). "Geoacoustic modeling
of the Sea Floor," Journal ofthe Acoustical
Society ofAmerica, 68(5), ppl313-1340.
McGee, R.G., Ballard, R.F. Jr., and Caulfield,
D.D. (1995). "A technique to assess the
characteristics of bottom and subbottom marine
sediments," Technical Report DRP-95-3, U.S.
Army Engineer Waterways Experiment Station,
Vicksburg, MS.
Telford, W.M., Geldart, L.P., Sheriff, R.E., and
Keys, D.A. (1976). Applied Geophysics.
Cambridge University Press, New York.
Westergaard, H.M. (1933). "Water pressures on
dams during earthquakes," Trans. ASCE (98),
pp 418-433.
122
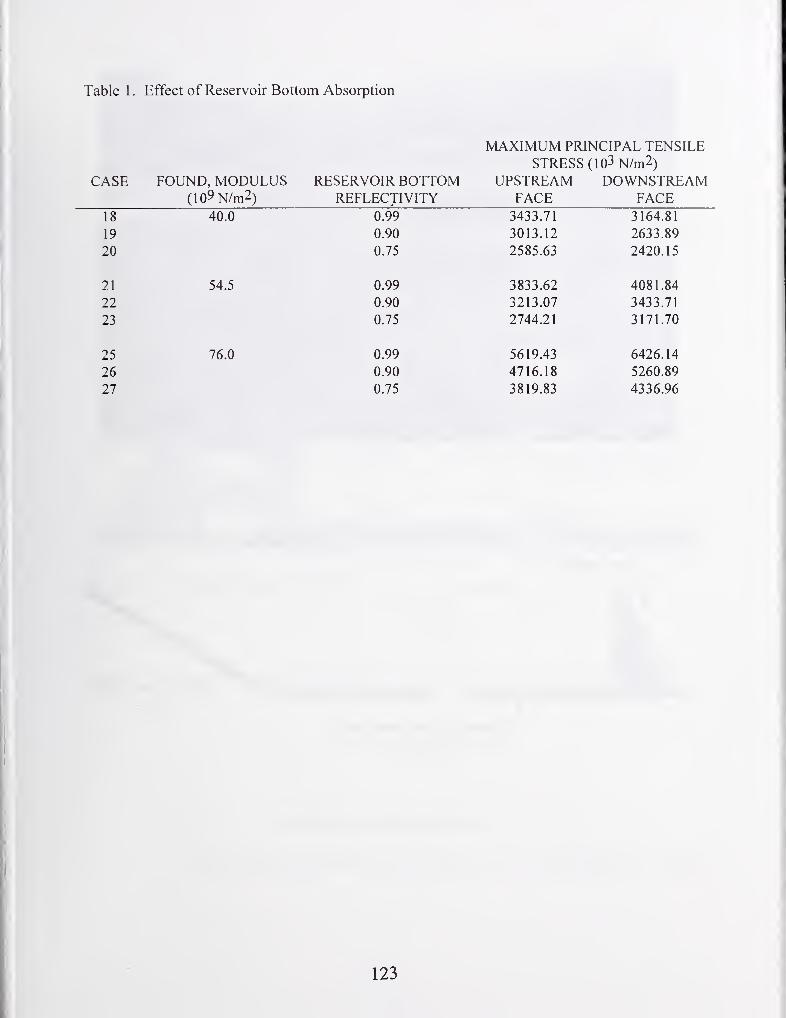
Table 1 . Effect of Reservoir Bottom Absorption
MAXIMUM PRINCIPAL TENSILESTRESS (103 N/m2)
CASE FOUND, MODULUS RESERVOIR BOTTOM UPSTREAM DOWNSTREAM(109 N/m2) REFLECTIVITY FACE FACE
18 40.0 0.99 3433.71 3164.81
19 0.90 3013.12 2633.89
20 0.75 2585.63 2420.15
21 54.5 0.99 3833.62 4081.84
22 0.90 3213.07 3433.71
23 0.75 2744.21 3171.70
25 76.0 0.99 5619.43 6426.14
26 0.90 4716.18 5260.89
27 0.75 3819.83 4336.96
123
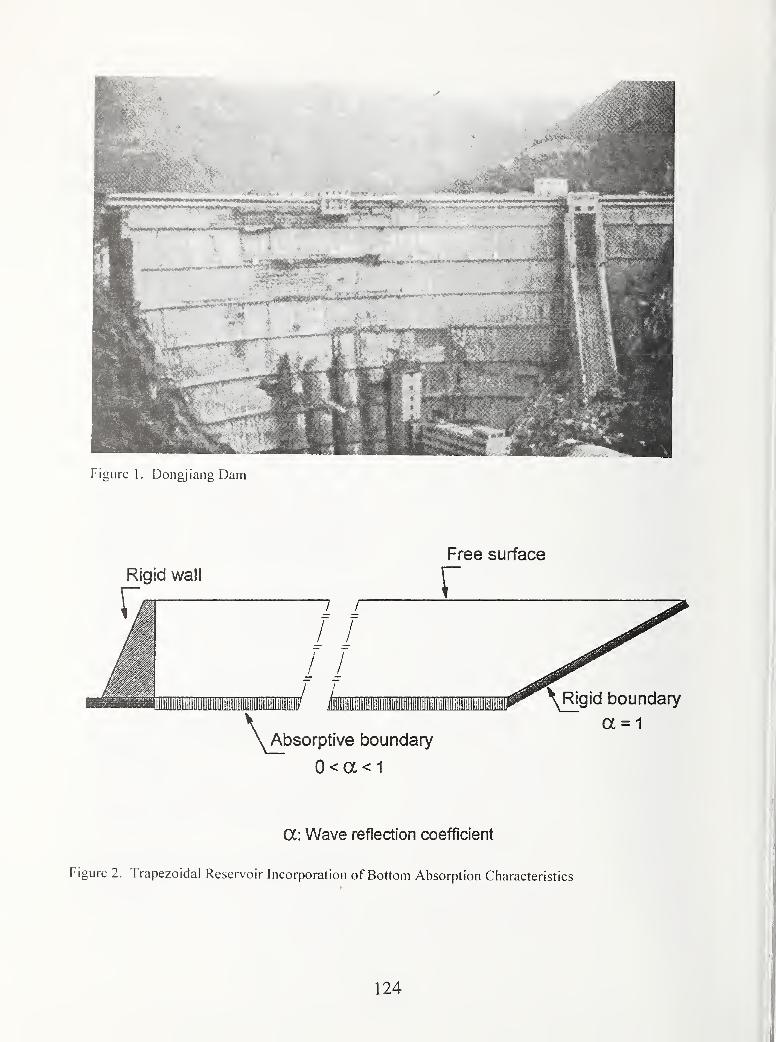
Figure 1. Dongjiang Dam
Free surface
0<a<1
a: Wave reflection coefficient
Figure 2. Trapezoidal Reservoir Incorporation of Bottom Absorption Characteristics
124

Maximum Ground Acceleration = 0.30g
Excitation Frequency = 1 Hz
Figure 3. Trapezoidal Reservoir - Front Wall
1
125
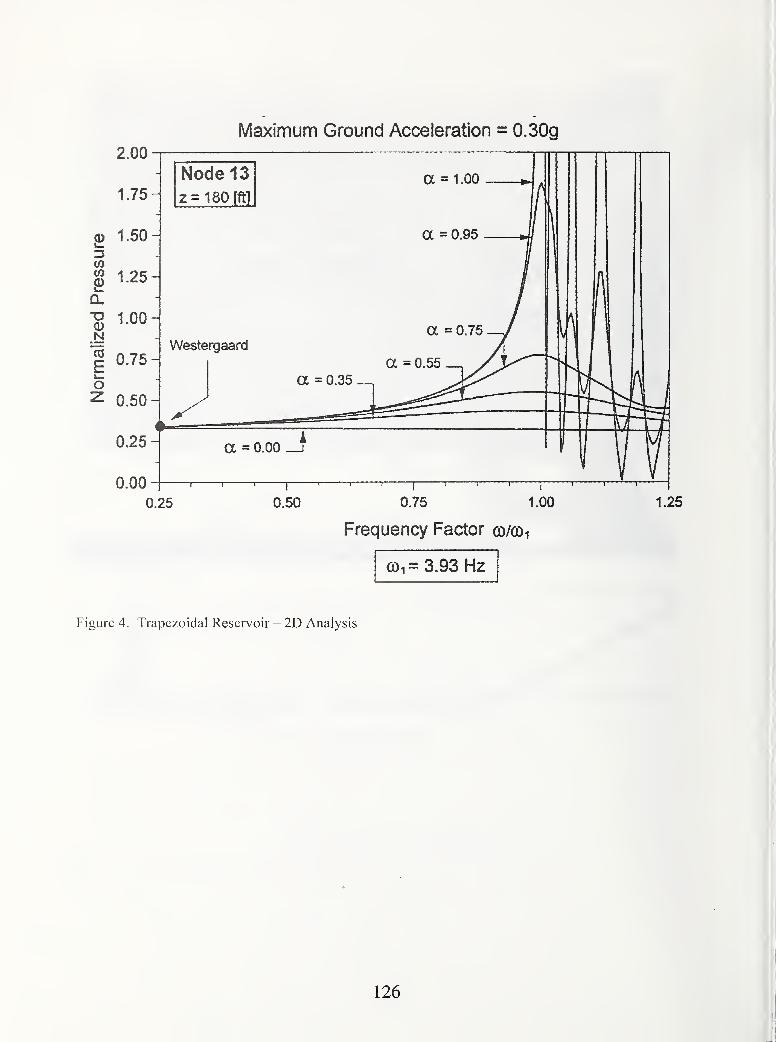
Maximum Ground Acceleration = 0.30g
0.25 0.50 0.75 1.00 1.25
Frequency Factor co/coi
CDi = 3.93 Hz
gure 4. Trapezoidal Reservoir - 2D Analysis
126
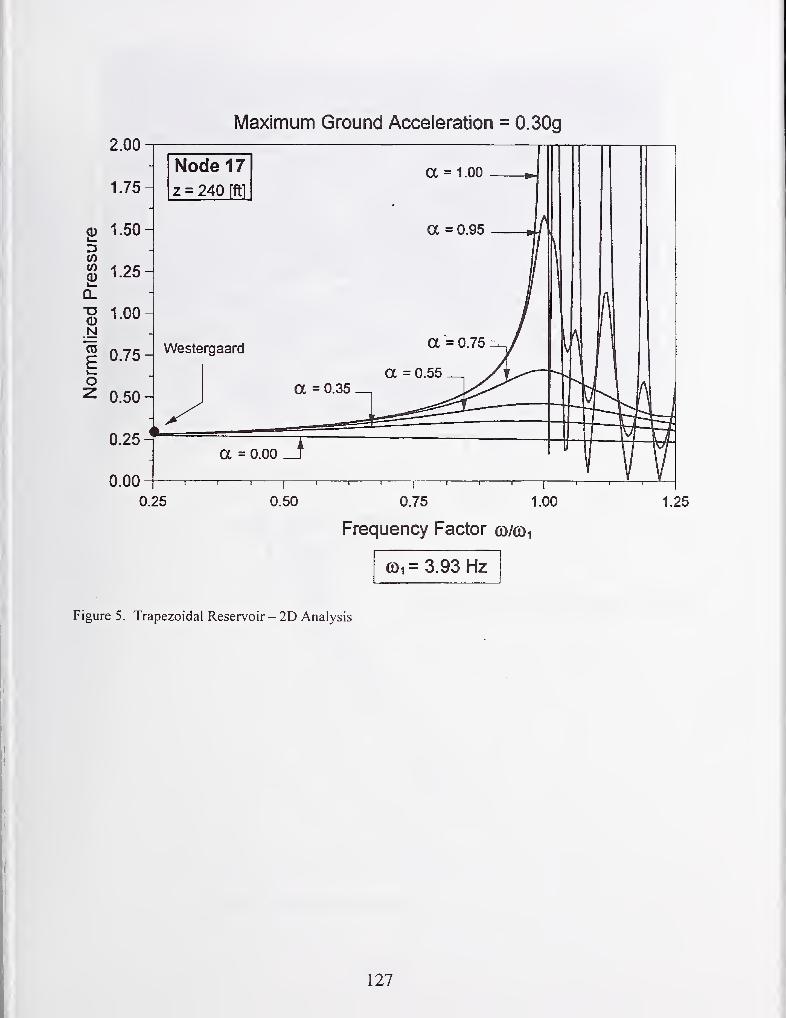
Maximum Ground Acceleration = 0.30g
0.25 0.50 0.75 1.00 1.25
Frequency Factor co/coi
©1 = 3.93 Hz
Figure 5. Trapezoidal Reservoir - 2D Analysis
127
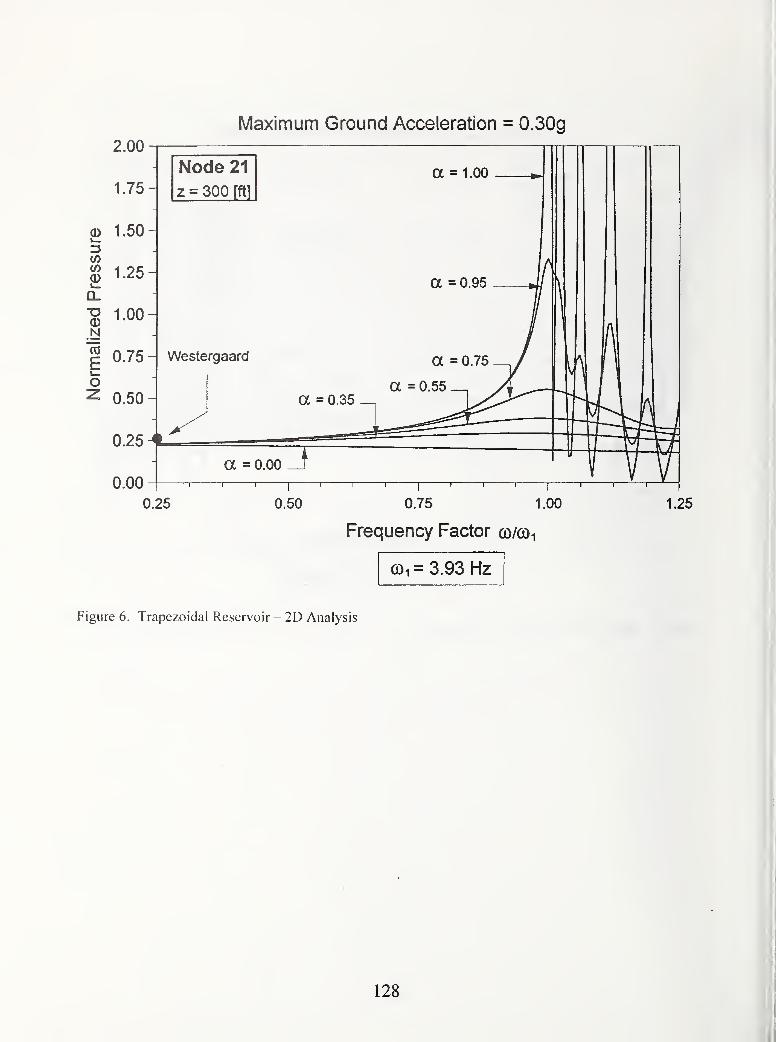
Maximum Ground Acceleration = 0.30g
2.00
1.75
<D 1.50-
u
1-25 H\
g 100N
Eo
0.75
0.50
0.25
Node 21
z = 300 fft]
Westergaard
0.00
a = 1.00
a = 0.00
—'
-1^
\
0.25 0.50
a = 0.35
Frequency Factor co/cOi
coi = 3.93 Hz
1.25
Figure 6. Trapezoidal Reservoir - 2D Analysis
128

Figure 8. Maximum Principal Stress
129
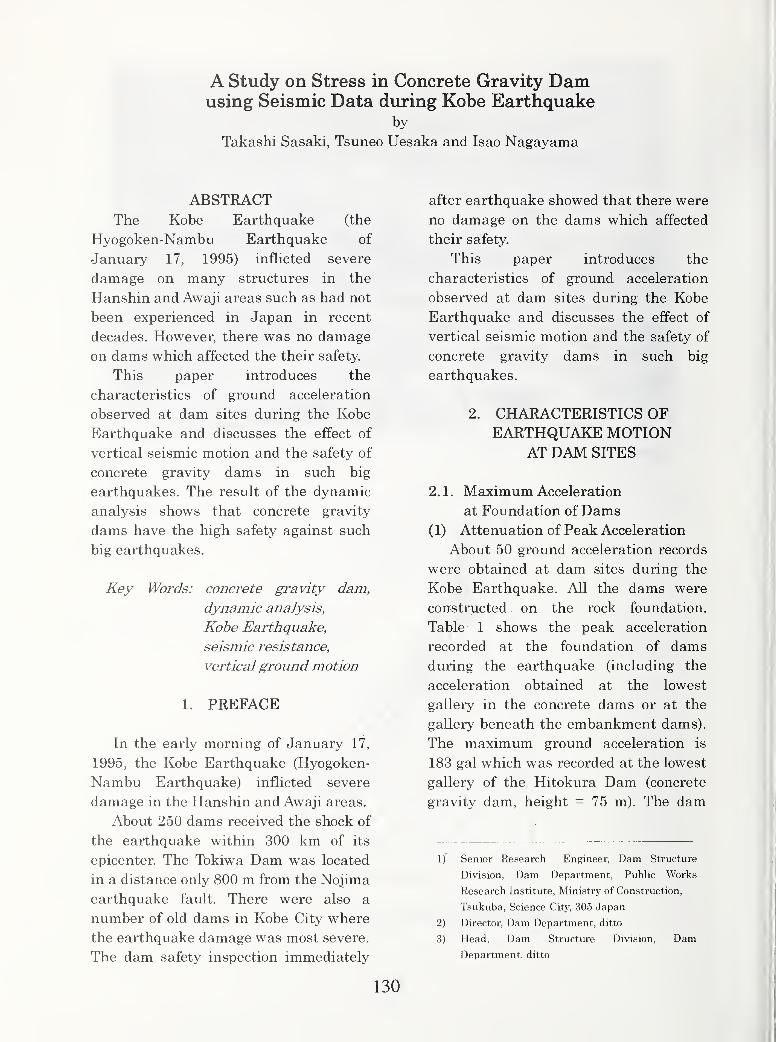
A Study on Stress in Concrete Gravity Damusing Seismic Data during Kobe Earthquake
by
Takashi Sasaki, Tsuneo Uesaka and Isao Nagayama
ABSTRACTThe Kobe Earthquake (the
Hyogoken-Nambu Earthquake of
January 17, 1995) inflicted severe
damage on many structures in the
Hanshin and Awaji areas such as had not
been experienced in Japan in recent
decades. However, there was no damage
on dams which affected the their safety.
This paper introduces the
characteristics of ground acceleration
observed at dam sites during the Kobe
Earthquake and discusses the effect of
vertical seismic motion and the safety of
concrete gravity dams in such big
earthquakes. The result of the dynamic
analysis shows that concrete gravity
dams have the high safety against such
big earthquakes.
Key Words: concrete gravity dam,
dynamic analysis,
Kobe Earthqualie,
seismic resistance,
verticalground motion
1. PREFACE
In the early morning of January 17,
1995, the Kobe Earthquake (Hyogoken-
Nambu Earthquake) inflicted severe
damage in the Hanshin and Awaji areas.
About 250 dams received the shock of
the earthquake within 300 km of its
epicenter. The Tokiwa Dam was located
in a distance only 800 m from the Nojima
earthquake fault. There were also a
number of old dams in Kobe City where
the earthquake damage was most severe.
The dam safety inspection immediately
after earthquake showed that there were
no damage on the dams which affected
their safety.
This paper introduces the
characteristics of ground acceleration
observed at dam sites during the Kobe
Earthquake and discusses the effect of
vertical seismic motion and the safety of
concrete gravity dams in such big
earthquakes.
2. CHARACTERISTICS OFEARTHQUAKE MOTION
AT DAM SITES
2. 1. Maximum Acceleration
at Foundation of Dams(1) Attenuation of Peak Acceleration
About 50 ground acceleration records
were obtained at dam sites during the
Kobe Earthquake. All the dams were
constructed on the rock foundation.
Table 1 shows the peak acceleration
recorded at the foundation of dams
during the earthquake (including the
acceleration obtained at the lowest
gallery in the concrete dams or at the
gallery beneath the embankment dams).
The maximum ground acceleration is
183 gal which was recorded at the lowest
gallery of the Hitokura Dam (concrete
gravity dam, height = 75 m). The dam
1) Senior Research Engineer, Dam Structure
Division, Dam Department, Public Works
Research Institute, Ministry of Construction,
Tsukuba, Science City, 305 Japan
2) Director, Dam Department, ditto
3) Head, Dam Structure Division, DamDepartment, ditto
130
was located in a distance of 47 km from
the epicenter or only 10 km from the
estimated earthquake source fault in the
ground. The location of the earthquake
source fault in the Kobe area was
estimated from the distribution of
aftershocks on January 17, while it
coincides with the Nojima fault in the
Awaji area.
The attenuation of the horizontal
peak acceleration of the foundation of
dams is shown in Figure 1, and the
attenuation of the vertical peak
acceleration in Figure 2. The envelopes
of the peak acceleration can be expressed
by a straight Hne in the semi-logarithm
plot. They are expressed as follow:
In Aft = In 217 - 0.0170 ZlnAv=\n 93- 0.0114 Z
where
AJi : horizontal peak acceleration (gal)
Av : vertical peak acceleration (gal)
L : distance from the earthquake
source fault (km)
From the figure and the above equation,
it can be estimated that the maximum of
horizontal peak acceleration induced at
the rock sites near the earthquake source
fault was about 220 gal.
(2) Horizontal Peak Acceleration versus
Vertical Peak Acceleration
Figure 3 shows the relationship
between the horizontal peak acceleration
and the vertical peak acceleration
observed at dam sites during the Kobe
Earthquake. The ratio of the vertical
peak acceleration to the horizontal peak
acceleration ranges from 1/3 to 1/1. This
ratio tends to decrease as the horizontal
peak acceleration increases.
2.2. Acceleration Response Spectrum
The response spectra of the
acceleration in the stream direction
(damping ratio of 10%) at 21 dam sites in
the Kobe Earthquake are shown in
Figure 4. Each spectrum is normahzed so
that the maximum ground acceleration
is equal to 1. The average value of the
normahzed response spectra is about 2
for the natural period ranging from 0. 1 to
0.6 seconds. The response spectra
decrease rapidly when the natural period
exceeds about 0.6 seconds.
3. EFFECT OF VERTICAL SEISMICMOTION
3.1. Model Concrete Gravity DamsThe concrete gravity dams used in the
analysis have the typical cross section
whose downstream slope is 0.8:1, and
whose upstream slope is vertical (0.0:1).
The height of the dams ranges from 25 mto 150 m. Figure 5 shows the finite
element model of the dam, and Table 2
shows the physical properties of the
material.
3.2. Methodology
The response spectrum method with
the modal analysis was used in the
analysis of dynamic stresses in dam body.
The first 6 modes of vibration were
considered. The damping ratio was
assumed 10 %. This value is based on the
results of behavior analysis of the
Hitokura Dam (height = 75 m), where
the acceleration of the foundation was
183 gal and the acceleration of the top
gallery (8 m lower than the crest of the
dam) was 482 gal in the Kobe
Earthquake. Figure 6 shows the result of
the analysis of the Hitokura Dam.
The effect of reservoir water was
accounted for as the added mass matrix
in the modal analysis. The added mass
matrix is calculated assuming that
reservoir water is incompressible.
3.3. Acceleration Records Used
in Analysis
Acceleration records (sets of
horizontal and vertical acceleration)
obtained at the foundations of 21 dam
131
sites. These records include data
measured in the bottom gallery in the
dam. Two types of acceleration were used
in this section. One is the acceleration
record which adjusted so that the
maximum value was 100 gal for both
horizontal and vertical acceleration. Andthe second is original acceleration record.
3.4. Results ofAnalysis
(1) Tensile Stress for Ground
Acceleration of lOOgal
Figure 7 shows the results of the
tensile stress at the heel of the dam for
the horizontal seismic motion and the
vertical seismic motion. The horizontal
motion and vertical motion are
separately applied to the dam. Figure 7
(a) is the results for the full reservoir,
and (b) is the results for the empty
reservoir. The symbols are the individual
result and the solid line indicate the
average value for each dam height.
These figures show the tensile stresses
at the heel of the dam for the horizontal
motion and the vertical motion are in
proportion to the dam height, and the
stresses for horizontal motions vary
more widely than the stresses for vertical
motions.
Figure 8 compares the results of the
tensile stress when the horizontal
seismic motion and the vertical seismic
motion are separately applied. Figure 8
(a) is the results for the full reservoir and
(b) is the results for the empty reservoir.
The figures show that the tensile stress
at the heel of the dam generated by the
vertical seismic motion is about 20% -
40% of the tensile stress generated by
the horizontal seismic motion in the case
of the full reservoir, and about 30 - 60%in the case of the empty reservoir. Andthe greater the tensile stress for the
horizontal seismic motion is, the smaller
the effect of the vertical seismic motion
becomes.
(2) Tensile Stress for Original Ground
Acceleration
Figure 9 compares the results of the
tensile stress at the heel of the damwhen the horizontal seismic motion and
the vertical seismic motion are
separately applied. Figure 9 (a) is the
results for the full reservoir and (b) is the
results for the empty reservoir.
When the tensile stress at the heel of
the dam generated by the horizontal
seismic motion become large, the tensile
stress generated by the vertical seismic
motion decrease to less than 10% of the
tensile stress generated by the horizontal
seismic motion in the case of the full
reservoir, and to less than 20% in the
case of the empty reservoir. In general
speaking, the time when the stress by
horizontal motion gets maximum value
and the time when the stress by vertical
motion gets maximum value do not
coincide. So, the above-mentioned
estimations are the upper limits of
effects of vertical ground motions. The
vertical ground motions, therefore, have
less effects in the actual situation.
4. EVALUATION OF SEISMICRESISTANCE OF CONCRETE
DAMS
4.1. Conditions for Analysis
The model concrete gravity dam and
the methodology used in this chapter is
the same in Chapter 3.
4.2. Acceleration Records Used
in Analysis
In Chapter 3, the effects of vertical
ground motions are very small especially
in the case of the full reservoir. So, only
horizontal ground motions are
considered in this chapter.
Two types of acceleration were used
in the analysis. At first, 21 original
acceleration records were used and the
132
results of the analysis were examined
with regard to the distance from the
earthquake source fault. Then, the
typical 4 acceleration records (ACC-1 to
ACC-4) which were observed at the damsites near the earthquake source fault
were used. In this case, the horizontal
peak acceleration was enlarged as muchas 220 gal. It is the estimated maximumacceleration in the Kobe Earthquake.
Figure 10 shows the response spectrum
of acceleration records ACC-1 to ACC-4(damping ratio = 10 %).
4.3. Results ofAnalysis
(1) Maximum Tensile Stress versus
Distance from Earthquake Source
Fault
The maximum tensile stress was
induced at the bottom portion of the
upstream face of the dams in all cases.
Figure 11 shows the maximum tensile
stress in the dams excluding static stress
with regard to the distance from the
earthquake source fault. The envelope is
almost in a straight hne, although the
maximum tensile stress has wide range
depending on the characteristics of the
acceleration records. Figure 12 shows the
maximum tensile stress in the dams
including static stress with regard to the
distance from the earthquake source
fault. It can be estimated from the
figures that the maximum tensile stress
induced in the dams near the earthquake
source fault is about 3.1 N/mm^ in 150m
high dams, 2.2 N/mm^ in 100 m high
dams and 0.4 N/mm ^ in 50 m high
dams.
(2) Maximum Tensile Stress for Ground
Acceleration of 220 gal
Figure 13 shows the maximumtensile stress in the dams of the different
height induced by the ground
acceleration of ACC-1 to ACC-4. The
stress includes the static stress in all
cases. The acceleration ACC-1 produces
the largest stress in higher dams, since
the dominant period of the acceleration
is close to the natural period of those
dams. On the contrary, the acceleration
ACC-4 produces the lowest stress in
higher dams, since the dominant period
of the acceleration is far from the natural
period of those dams.
The figure shows that the maximumtensile stress increases in proportion to
the height of the dam. The envelope is
expressed as:
o = 0.0226 H (at 220 gal)
or
a =(0.0129 a - 0.568) //"/lOO
where
o : maximum tensile stress (N/mm^)
a : maximum ground acceleration (gal)
H : height of dam (m)
It can be estimated from the figure or
the above equations that the maximumtensile stress by the ground acceleration
of 220 gal is about 3.4 N/mm^ even in
150 m dams. Since the dynamical stress
occurs instantaneously, it is considered
that dams can withstand such a level of
tensile stress.
5. CONCLUSION
The Kobe Earthquake inflicted severe
damage in the Hanshin and Awaji areas
such as had never been experienced in
Japan in recent decades. However, there
was no damage on the dams affecting
their safety.
This paper introduces the
characteristics of ground acceleration
observed at dam sites during the Kobe
Earthquake and discusses the effects of
vertical seismic motions on dam and the
safety of concrete gravity dams in such
big earthquakes. The results of the
analysis are as follows:
(1) It is estimated that the maximumpeak acceleration at rock sites induced
133
by the Kobe Earthquake was about 220
gal.
(2) The effect of the vertical seismic
motion on the stress of dam body is very
small as compared with the effect of the
horizontal seismic motion. The tendency
can be obvious when the stress by
horizontal seismic motion is large, and
the reservoir is full.
(3) It is estimated that the maximumtensile stress in the concrete gravity
dams induced by the earthquakes is:
a = 0.0226 (at 220 gal)
or
a =(0.0129 a -0.568)77/100
where
a : maximum tensile stress (N/mm^)
a : maximum ground acceleration (gal)
H : height of dam (m)
Therefore, the maximum tensile stress in
150 m high concrete gravity dams
induced by the ground acceleration of
220 gal is about 3.4 N/mm^ Since the
dynamical stress occurs instantaneously,
it is considered that dams can withstand
such a level of tensile stress. So, the
concrete gravity dams are safe in such
big earthquake as Kobe Earthquake.
REFERENCES(1) Committee on Evaluation of
Earthquake Resistance of Dams:
Report of Committee on Evaluation of
Earthquake Resistance of Dams,
November, 1995
(2) A. Nakamura, 1. Nagayama, T. Sasaki
and T. Iwashita: Safety of Damsduring Hyogoken-Nambu Earthquake
on January 17, 1995 in Japan,
IIWCEE, Acapulco, 1996
(3) I. Nagayama, S. Jikan: Study on
Dynamic Behavior of Concrete DamsDuring Earthquake with Hydro-
dynamic Interaction, Int. Symp. on
Earthquake & Dams, China, 1987
134I
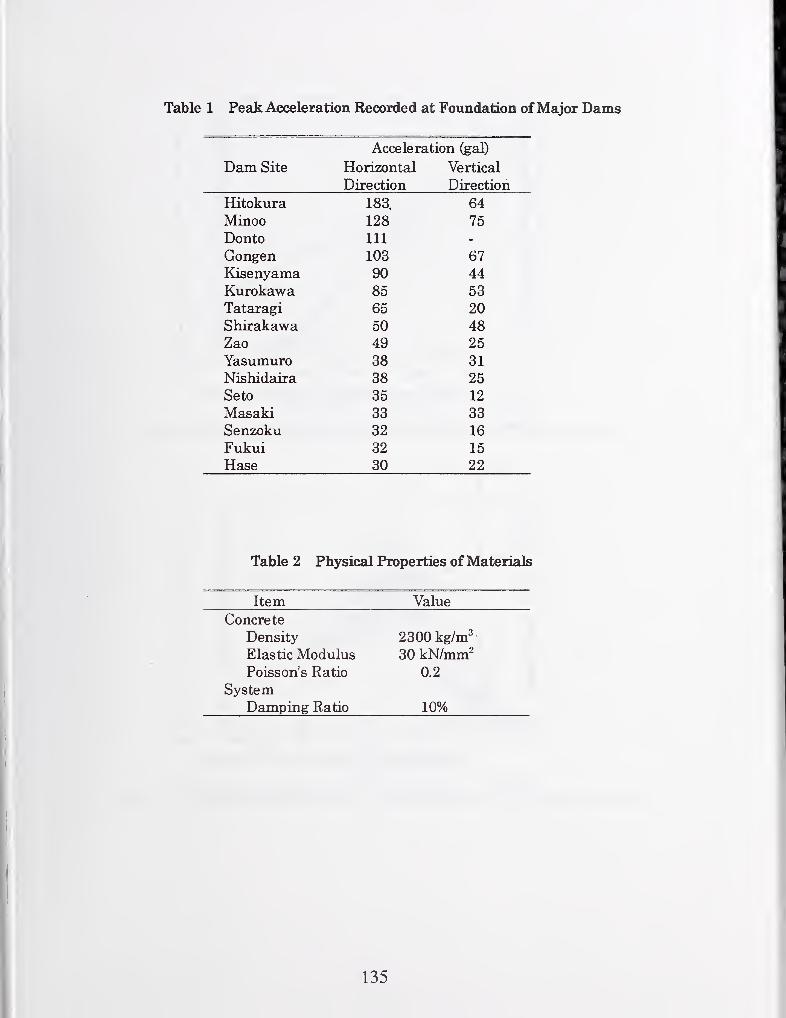
Table 1 Peak Acceleration Recorded at Foimdatioii ofMajor Dams
Acceleration (gal)
Dam Site Horizontal Vertical
Direction Direction
Hitokura 183. 64
Minoo 128 75
Donto 111 _
Gongen 103 67
Kisenyama 90 44
Kurokawa 85 53
Tataragi 65 20
Shirakawa 50 48
Zao 49 25
Yasumuro 38 31
Nishidaira 38 25
Seto 35 12
Masaki 33 33
Senzoku 32 16
Fukui 32 15
Hase 30 22
Table 2 Physical Properties of Materials
Item Value
Concrete
Density 2300 kg/m^
Elastic Modulus 30 kN/mm"Poisson's Ratio 0.2
SystemDamping Ratio 10%
135
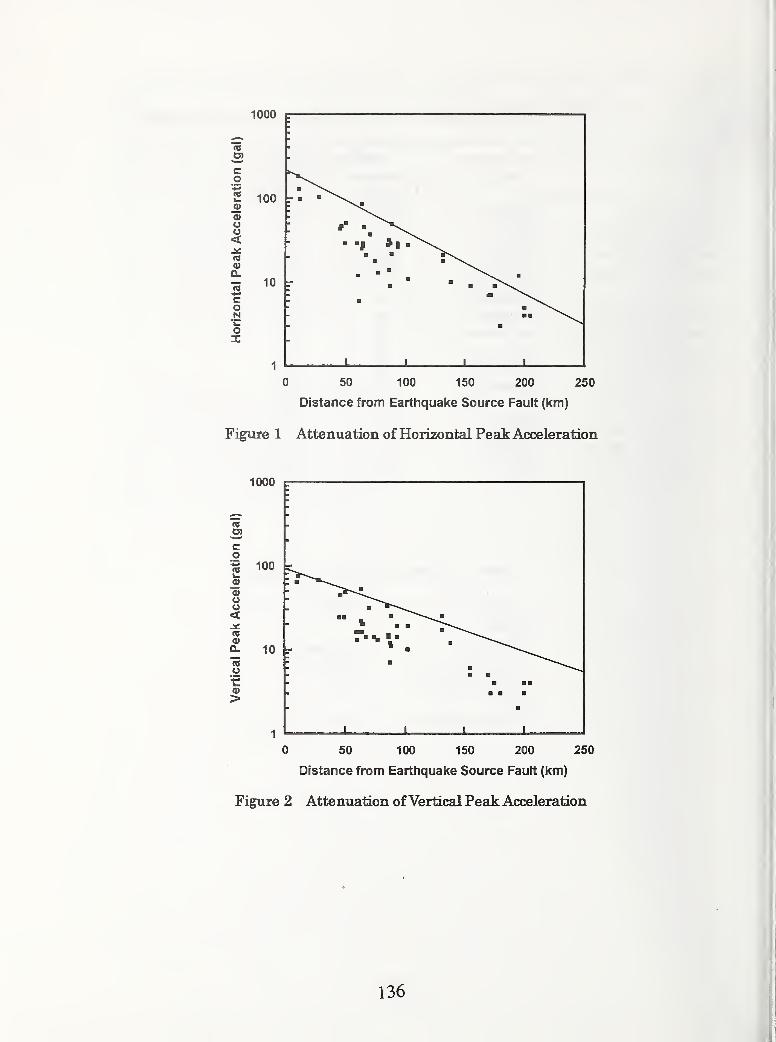
1000 p
0 50 100 150 200 250
Distance from Earthquake Source Fault (km)
Figure 1 Attenuation of Horizontal Peak Acceleration
1000
ca
c
I100
«0)uu<
<o
a. 10 r(0or>
0 50 100 150 200 250
Distance from Earthquake Source Fault (km)
Figure 2 Attenuation ofVertical Peak Acceleration
136
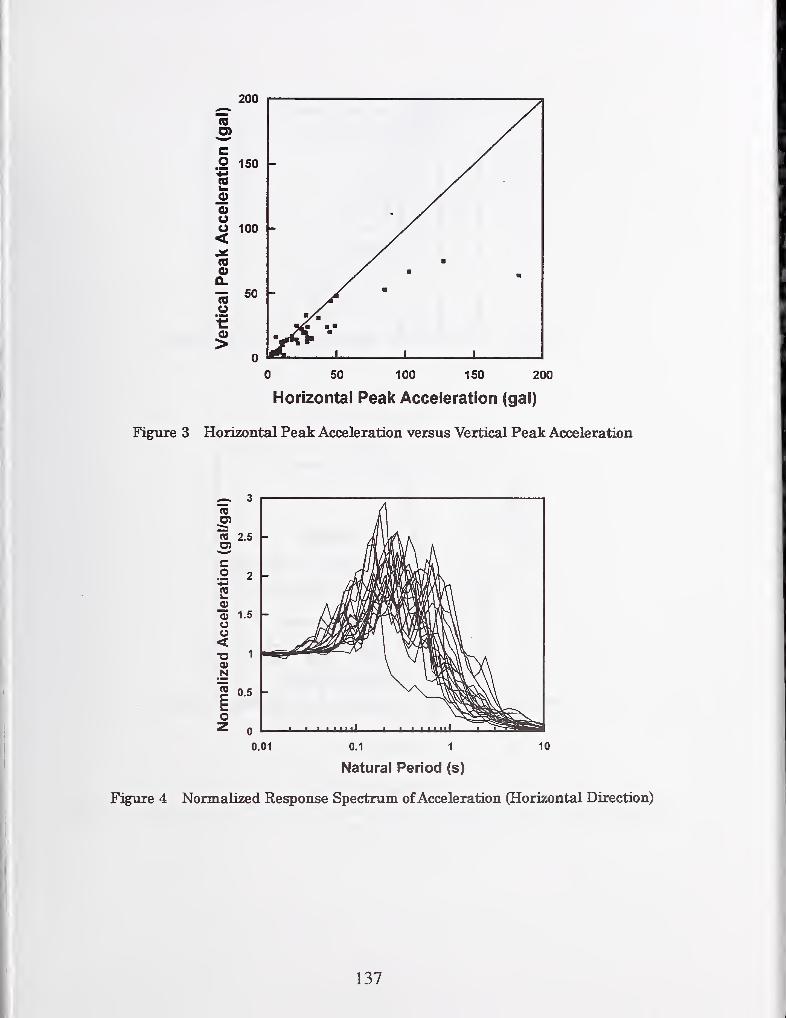
0 50 100 150
Horizontal Peak Acceleration (gal)
Figure 3 Horizontal Peak Acceleration versus Vertical Peak Acceleration
0.01 0.1 1 10
Natural Period (s)
Figure 4 Normalized Response Spectrum ofAcceleration (Horizontal Direction)
137
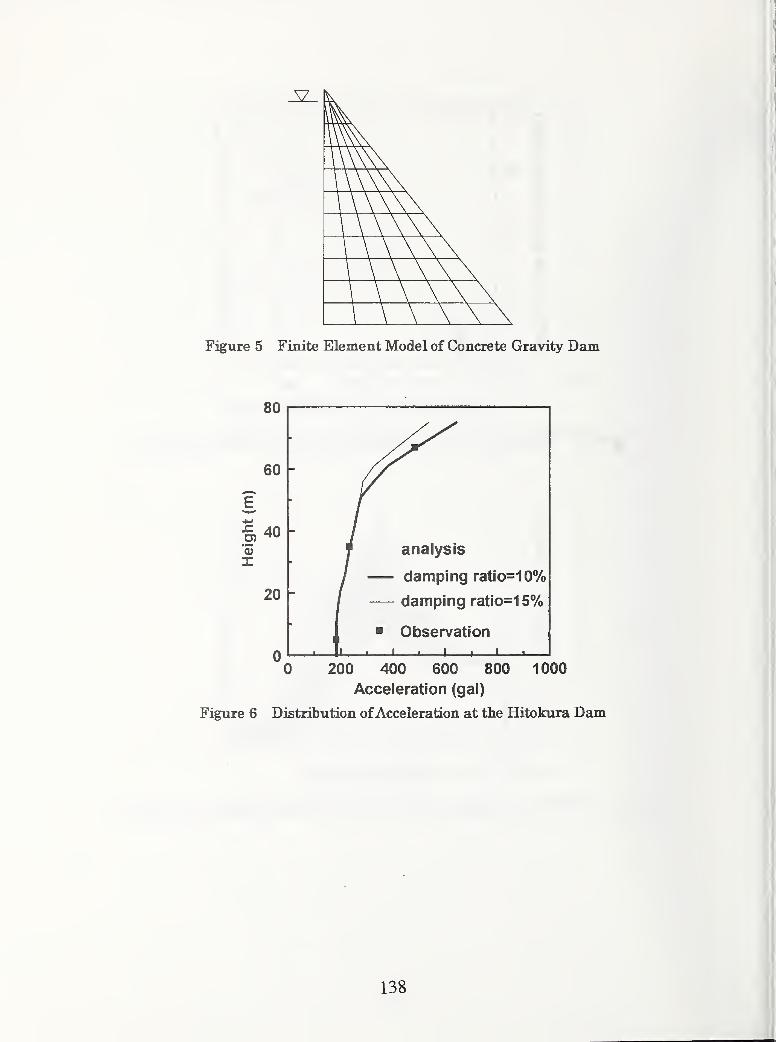
Figure 5 Finite Element Model of Concrete Gravity Dam
80
60 -
&400)
I
20
analysis
damping ratio=10%
— damping ratio=15%
Observation
0 200 400 600 800 1000
Acceleration (gal)
Figure 6 Distribution ofAcceleration at the Hitokura Dam
138

ns
o
CM
EEzMin
£(0
c0)I-
E3E
CO
1-
• Stress for Horizontal Seismic Motion
^ Stress for Vertical Seismic Motion
50 100
Height of Dam (m)
(a) FuU Reservoir
150
O)
• Stress for Horizontal Seismic Motion
^ Stress for Vertical Seismic Motion
M0)
c«I-
E
EX
50 100
Height of Dam (m)
150
(b) Empty Reservoir
Figure 7 Height ofDam versus Maximum Tensile Stresses for Horizontal Seismic Motion
and Vertical Seismic Motion
139
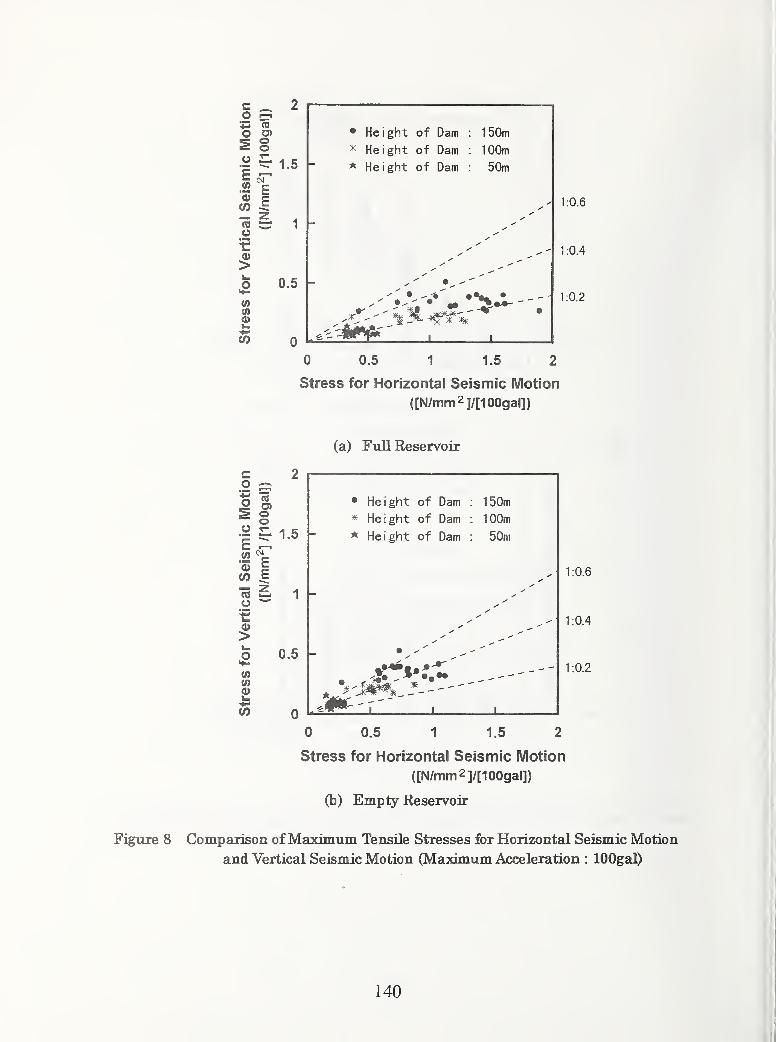
c ^.2 —o O)Sooo Zl
.£ £0) cW -5
1.5
O
ww0)
^ 1
0.5 -
to
* Height of Dam
* Height of Dam
* Height of Dam
150m
100m
50m
1:0.6
1:0.4
1:0.2
0 0.5 1 1.5 2
Stress for Horizontal Seismic Motion
([N/mm2]/[ioogal])
(a) Full Reservoir
c.2
o «O O)
^ §i ^ 1-5 hE —
>
« ^_
75^
or5i
^ 1-
0.5 -
(0(00)
4-1
CO
• Height of Dam
^ Height of Dam
* Height of Dam
150m
100m
50m
± ±
1:0.6
:0.4
:0.2
0 0.5 1 1.5 2
Stress for Horizontal Seismic Motion
([N/mm2]/[l00gal])
(b) Empty Reservoir
F^ure 8 Comparison ofMaximum Tensile Stresses for Horizontal Seismic Motion
and Vertical Seismic Motion (Maximum Acceleration : lOOgal)
140
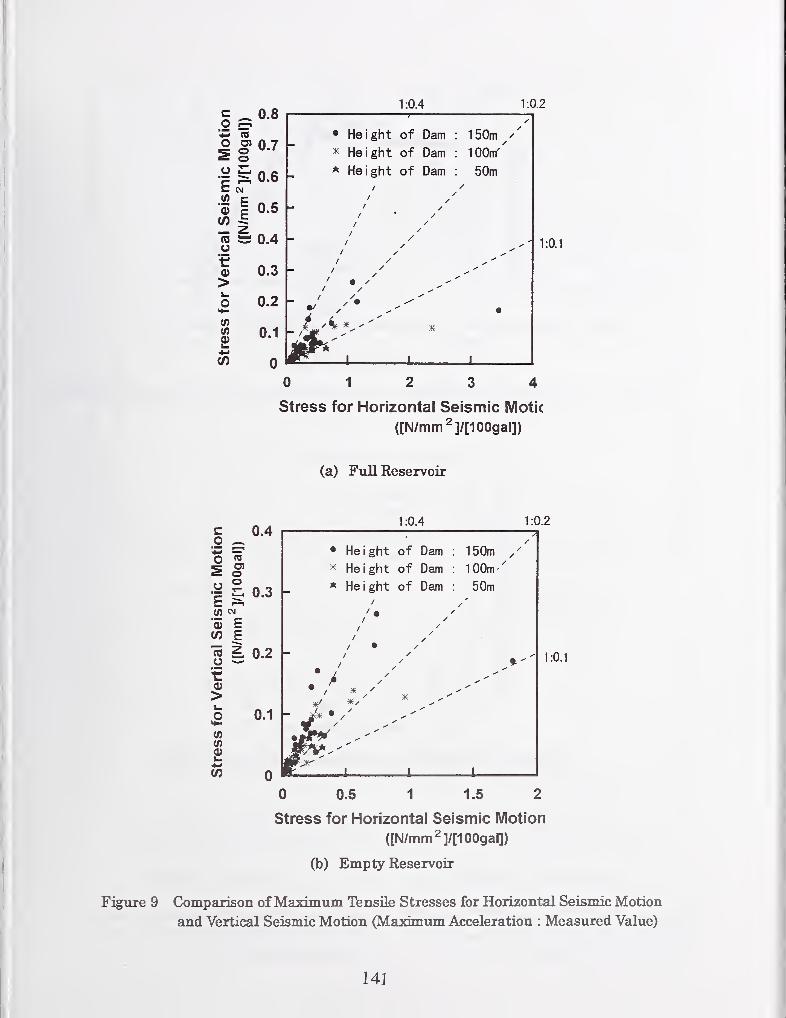
_ 0.8
O O)
^ ou ^
.12 E<D c(/) -5_ Zu
>
(0(0a>
0)
0.7
0.6
0.5
0.4
0.3
0.2
0.1
1:0.4
* Height of Dam
* Height of Dam
* Height of Dam
1:0.2
150m
lOOm-'
50m
J. J. J-
- 1:0.1
0 12 3 4
Stress for Horizontal Seismic Motic
([N/mm^]/[100gal])
(a) Full Reservoir
g ^o w2 o
0.41:0.4 1:0.2
I ^ 0-3
5 E(0 E
>
0)
£-t-l
CO
0.2
0.1 -
• He i ght of Dam
^ He i ght of Dam
* He i ght of Dam
150m
lOOm-^
50m
/
/ •
J.
1:0.1
0 0.5 1 1.5 2
Stress for Horizontal Seismic Motion
([N/mm2]/[100gal])
(b) Empty Reservoir
Figure 9 Comparison ofMaximum Tensile Stresses for Horizontal Seismic Motion
and Vertical Seismic Motion (Maximum Acceleration : Measured Value)
141

1000
Natural Period (s)
Figure 10 Modified Response Spectra ofFour Acceleration Records (Horizontal Direction)
0 50 100 150
Height of Dam (m)
Figure 13 Maximum Tensile Stress versus Height ofDams
142
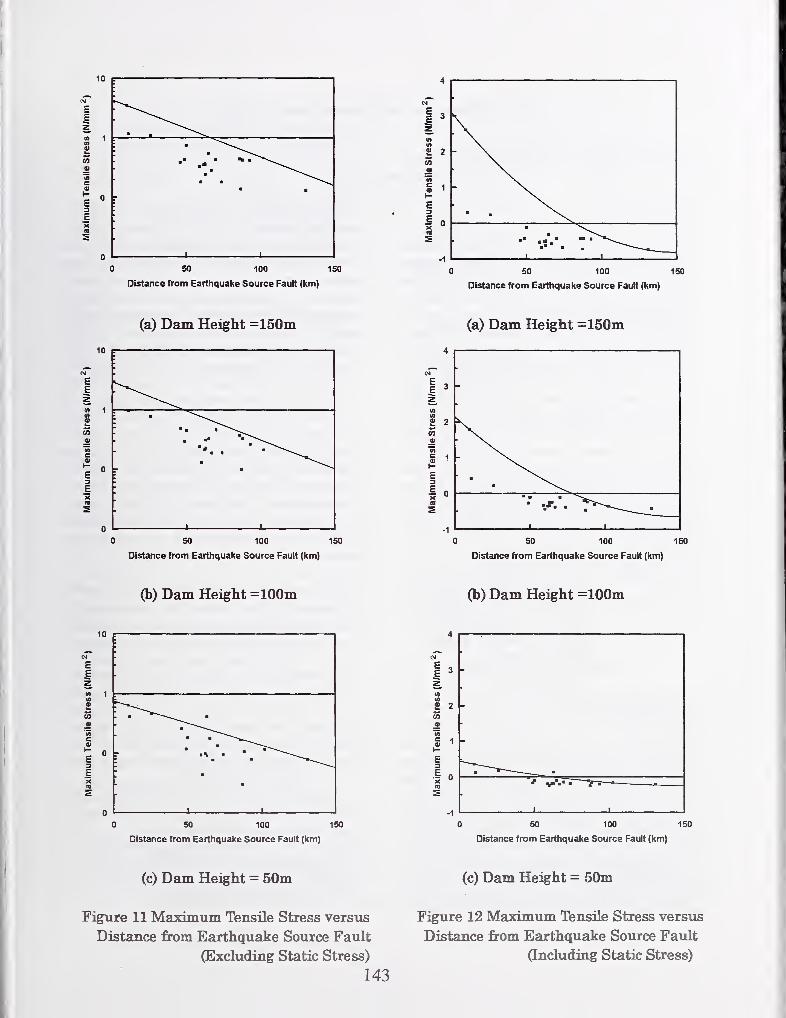
(b) Dam Height =100m
0 50 100 150
Distance from Earthquake Source Fault (km)
(b) Dam Height =100m
50 100 150
Distance from Earthquake Source Fault (km)
(c) Dam Height = 50m
Figure 11 Maximum Tensile Stress versus
Distance firom Earthquake Source Fault
(Excluding Static Stress)
(c) Dam Height = 50m
Figure 12 Maximum Tensile Stress versus
Distance from Earthquake Source Fault
(Including Static Stress)

Seismic Analysis of Hoover Dam
by
By Larry K. Nuss
ABSTRACT
Hoover Dam is a 221-m (727-foot) high concrete
thick-arch dam located on the border between
Arizona and Nevada about 58 km (36 miles) from
Las Vegas, Nevada. The postulated maximumcredible earthquake (MCE) for Hoover Dam is a
magnitude Ms 6.75 on the Mead Slope Fault. Initial
structural finite element analysis calculated stresses
larger than the tensile strength on the upper portions
of the dam. More sophisticated analysis followed
when additional data was obtained for material
properties and seismic loading. The first approach
was a linear-elastic analysis incorporating
foundation-structure interaction with mass in the
foundation. The second approach was a non-linear
analysis incorporating concrete cracking and
contraction joint interaction using smeared crack
techniques and kinematic stability analysis of the
top of the dam.
KEYWORDS: Hoover Dam; concrete arch dam;
nonlinear and linear dynamic
structural analysis; foundation
impedance; hydrodynamic
interaction, reservoir bottom
reflection coefficient;
EACD3D96; ANACAR
1. INTRODUCTION
Hoover Dam is a 221-m (727-foot) high concrete
thick-arch dam located on the border between
Arizona and Nevada about 58 km (36 miles) from
Las Vegas, Nevada. The dam was completed in
1935, has a crest length of 380 m (1244 feet), a
crest thickness of 14 m (45 feet), and a maximum
base width of 201 m (660 feet) (see figure 1). It is
the highest concrete dam in the United States, the
eighteenth highest dam in the world, and forms the
largest manmade reservoir in the United States
[USCOLD, 1995]. The postulated maximumcredible earthquake (MCE) for Hoover Dam is a
magnitude Ms 6.75 on the Mead Slope Fault, with
primarily normal fault rupture mechanism involving
rupture from 15 km (9.3 miles) depth to the surface
and 3 km (1.8 miles) closest surface approach to
the dam [O'Connell, 1996]. The probability of the
MCE is postulated to be as frequent as 1:10,000
years or as infrequent as 1:100,000 years. Initial
structural analysis using conventional linear-elastic
three-dimensional dynamic finite element methods,
assuming material properties and a massless
foundation, calculated stresses larger than the tensile
strength on the upper portions of the dam. These
results indicate concrete cracking occurs in the
upper 61 m (200 feet) of the dam. If the top 61 m(200 feet) of the dam failed during a seismic event,
the downstream consequences would be massive.
An estimated loss-of-life of 400 people and
damages not including losses from project benefits
totaling $ 1 7 billion (US) could occur.
More sophisticated analysis followed when
additional data was obtained for material properties
and seismic loading. Currently, there is no software
code available that incorporates all the important
aspects (hydrodynamic interaction, impedance of
dam-foundation interaction, contraction joint action,
or rigid block kinematic movements) associated
with a concrete dam for a complete structural
analysis. For this reason, various software
programs were run using the Hoover finite element
model and knowledge of the influence of each aspect
1 ) Submitted for presentation at the 30*^^ joint meeting
of the U.S-Japan Panel on Wind and Seismic Effects,
May 12-15, 1998, Gaithersburg, Maryland.
2) Larry K. Nuss, Senior Structural Engineer, Bureau
ofReclamation, Structural Analysis Group (D-81 10),
P.O. Box 25007, Denver, Colorado 80123,
(303) 445-323 1 ,[email protected] .
144
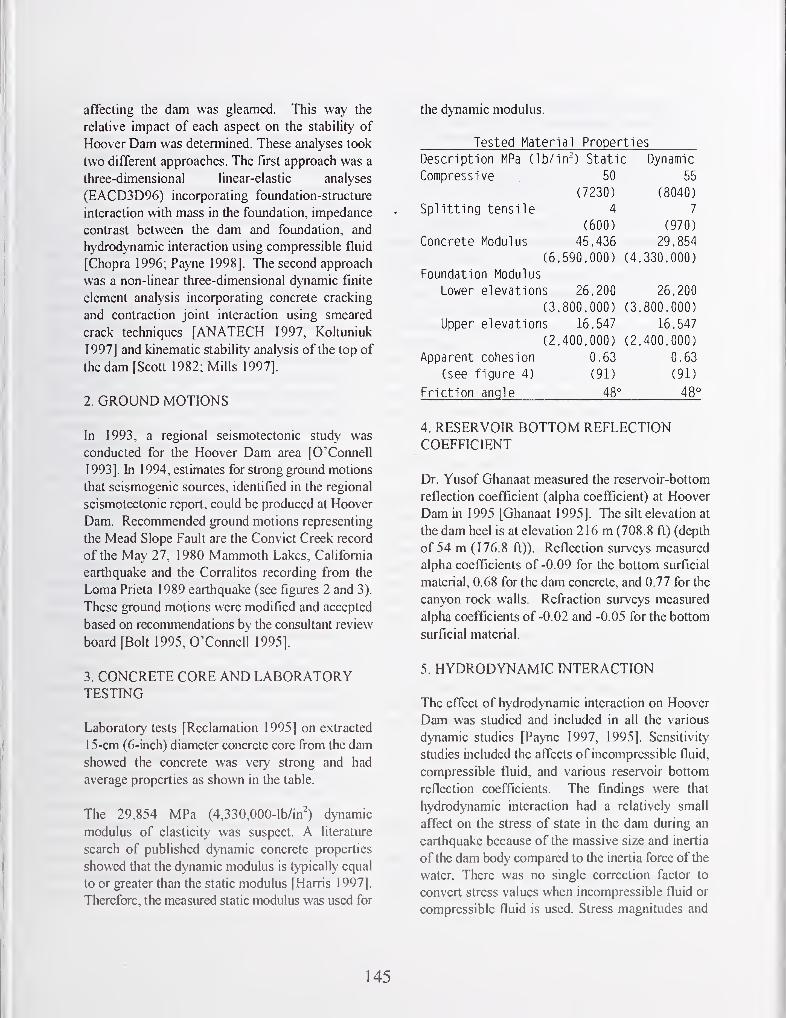
affecting the dam was gleamed. This way the
relative impact of each aspect on the stabiUty of
Hoover Dam was determined. These analyses took
two different approaches. The first approach was a
three-dimensional linear-elastic analyses
(EACD3D96) incorporating foundation-structure
interaction with mass in the foundation, impedance
contrast between the dam and foundation, and
hydrodynamic interaction using compressible fluid
[Chopra 1996; Payne 1998]. The second approach
was a non-linear three-dimensional dynamic finite
element analysis incorporating concrete cracking
and contraction joint interaction using smeared
crack techniques [ANATECH 1997, Koltuniuk
1997] and kinematic stability analysis of the top of
the dam [Scott 1982; Mills 1997].
2. GROUND MOTIONS
In 1993, a regional seismotectonic study was
conducted for the Hoover Dam area [O' Council
1993]. In 1994, estimates for strong ground motions
that seismogenic sources, identified in the regional
seismotectonic report, could be produced at Hoover
Dam. Recommended ground motions representing
the Mead Slope Fault are the Convict Creek record
of the May 27, 1980 Mammoth Lakes, California
earthquake and the Corralitos recording from the
Loma Prieta 1989 earthquake (see figures 2 and 3).
These ground motions were modified and accepted
based on recommendations by the consultant review
board [Bolt 1995, O'Connell 1995].
3. CONCRETE CORE AND LABORATORYTESTING
Laboratory tests [Reclamation 1995] on extracted
15-cm (6-inch) diameter concrete core from the dam
showed the concrete was very strong and had
average properties as shown in the table.
The 29,854 MPa (4,330,000-lb/in') dynamic
modulus of elasticity was suspect. A literature
search of published dynamic concrete properties
showed that the dynamic modulus is typically equal
to or greater than the static modulus [Harris 1997].
Therefore, the measured static modulus was used for
the dynamic modulus.
Tested Material Properties
Description MPa (Ib/in^) Static Dynamic
Compressive 50 55
(7230) (8040)
Splitting tensile 4 7
(600) (970)
Concrete Modulus 45.436 29.854
(6 590.000) (4 330.000)
Foundation Modulus
Lower elevations 26.200 26.200
(3 800.000) (3 800.000)
Upper elevations 16.547 16.547
(2.400.000) (2 400.000)
Apparent cohesion 0.63 0.63
(see figure 4) (91) (91)
Friction angle 48° 48°
4. RESERVOIR BOTTOM REFLECTIONCOEFFICIENT
Dr. Yusof Ghanaat measured the reservoir-bottom
reflection coefficient (alpha coefficient) at Hoover
Dam in 1995 [Ghanaat 1995]. The silt elevation at
the dam heel is at elevation 216 m (708.8 ft) (depth
of 54 m (176.8 ft)). Reflection surveys measured
alpha coefficients of -0.09 for the bottom surficial
material, 0.68 for the dam concrete, and 0.77 for the
canyon rock walls. Refraction surveys measured
alpha coefficients of -0.02 and -0.05 for the bottom
surficial material.
5. HYDRODYNAMIC INTERACTION
The effect of hydrodynamic interaction on Hoover
Dam was studied and included in all the various
dynamic studies [Payne 1997, 1995]. Sensitivity
studies included the affects of incompressible fluid,
compressible fluid, and various reservoir bottom
reflection coefficients. The findings were that
hydrodynamic interaction had a relatively small
affect on the stress of state in the dam during an
earthquake because of the massive size and inertia
of the dam body compared to the inertia force of the
water. There was no single correction factor to
convert stress values when incompressible fluid or
compressible fluid is used. Stress magnitudes and
145
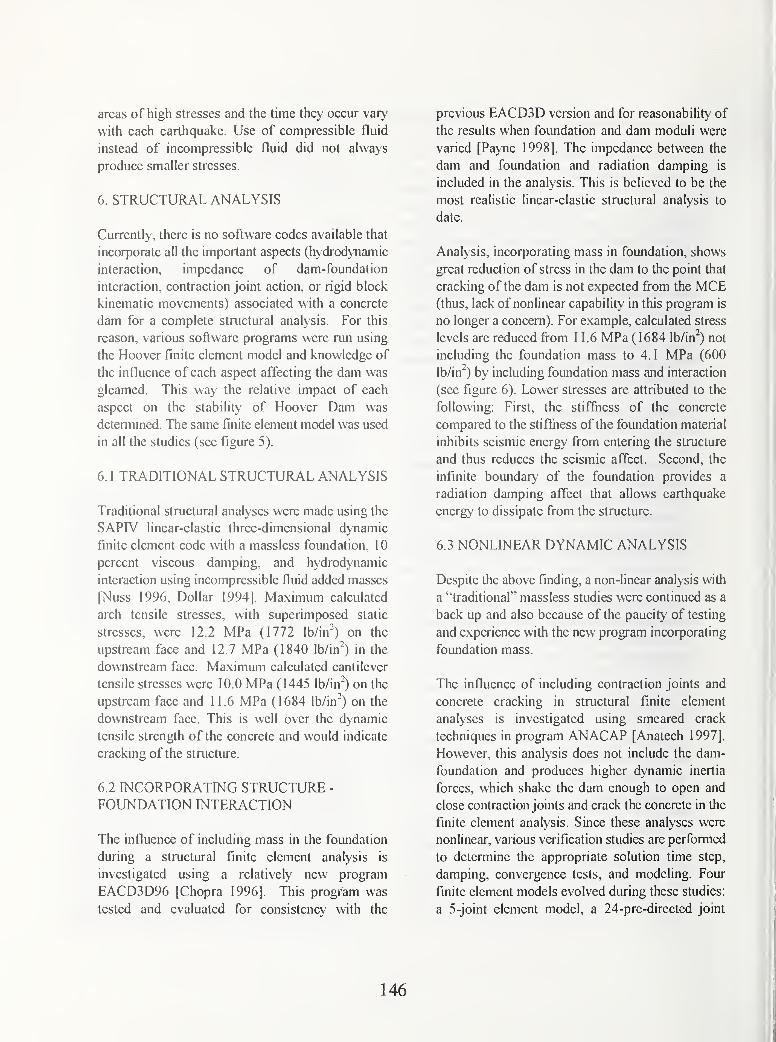
areas of high stresses and the time they occur vary
with each earthquake. Use of compressible fluid
instead of incompressible fluid did not always
produce smaller stresses.
6. STRUCTURAL ANALYSIS
Currently, there is no software codes available that
incorporate all the important aspects (hydrodynamic
interaction, impedance of dam-foundation
interaction, contraction joint action, or rigid block
kinematic movements) associated with a concrete
dam for a complete structural analysis. For this
reason, various software programs were run using
the Hoover finite element model and knowledge of
the influence of each aspect affecting the dam was
gleamed. This way the relative impact of each
aspect on the stability of Hoover Dam was
determined. The same finite element model was used
in all the studies (see figure 5).
6. 1 TRADITIONAL STRUCTURAL ANALYSIS
Traditional stnictural analyses were made using the
SAPIV linear-elastic three-dimensional dynamic
finite element code with a massless foundation, 10
percent viscous damping, and hydrodynamic
interaction using incompressible fluid added masses
[Nuss 1996, Dollar 1994]. Maximum calculated
arch tensile stresses, with superimposed static
stresses, were 12.2 MPa (1772 Ib/in"^) on the
upstream face and 12.7 MPa (1840 Ib/in^) in the
dovNTistream face. Maximum calculated cantilever
tensile stresses were 10.0 MPa (1445 lb/in") on the
upstream face and 1 1.6 MPa (1684 lb/in") on the
downstream face. This is well over the d>Tiamic
tensile strength of the concrete and would indicate
cracking of the structure.
6.2 INCORPORATING STRUCTURE -
FOUNDATION INTERACTION
The influence of including mass in the foundation
during a structural finite element analysis is
investigated using a relatively new program
EACD3D96 [Chopra 1996]. This progiam was
tested and evaluated for consistency with the
previous EACD3D version and for reasonability of
the results when foundation and dam moduli were
varied [Payne 1998]. The impedance between the
dam and foundation and radiation damping is
included in the analysis. This is believed to be the
most realistic linear-elastic structural analysis to
date.
Analysis, incorporating mass in foundation, shows
great reduction of stress in the dam to the point that
cracking of the dam is not expected from the MCE(thus, lack of nonlinear capability in this program is
no longer a concern). For example, calculated stress
levels are reduced from 1 1.6 MPa (1684 Ib/in^) not
including the foundation mass to 4.1 MPa (600
lb/in") by including foundation mass and interaction
(see figure 6). Lower stresses are attributed to the
following: First, the stiffness of the concrete
compared to the stiffhess of the foundation material
inhibits seismic energy from entering the structure
and thus reduces the seismic affect. Second, the
infinite boundary of the foundation provides a
radiation damping affect that allows earthquake
energy to dissipate from the structure.
6.3 NONLINEAR DYNAMIC ANALYSIS
Despite the above finding, a non-linear analysis with
a "traditional'' massless studies were continued as a
back up and also because of the paucity of testing
and experience with the new program incorporating
foundation mass.
The influence of including contraction joints and
concrete cracking in structural finite element
analyses is investigated using smeared crack
techniques in program ANACAP [Anatech 1997].
However, this analysis does not include the dam-
foundation and produces higher dynamic inertia
forces, which shake the dam enough to open and
close contraction joints and crack the concrete in the
finite element analysis. Since these analyses were
nonlinear, various verification studies are performed
to determine the appropriate solution time step,
damping, convergence tests, and modeling. Four
finite element models evolved during these studies:
a 5-joint element model, a 24-pre-directed joint
146

model, a 16-pre-directed joint model, and an 8-pre-
directed joint model [Koltuniuk 1997].
Using the Convict Creek ground motion, the
ANACAP analysis predicted horizontal cracking 46
m (150 feet) below the dam crest on the upstream
face, continuing through the dam in the downstream
direction, sloping upward toward the downstream
face (see figure 7). ANACAP indicated stability
and 3-cm (1.1-inch) movement of the dam
upstream. This cracking pattern forms concrete
blocks capable of sliding independently from the
dam body along the cracked basal plane and
bounded on the sides by vertical contraction joints.
Using the Corralitos ground motion, the calculated
cracking, which is significantly less, is located 82 m(270 feet) below the dam crest on the downstream
face, and does not progress through to the upstream
face. Therefore, fiirther stability analysis using this
earthquake record is not needed.
The capability of extracting an XYZ time history of
hydrod>'namic pressures at nodes on the upstream
face from EACD3D was developed which made it
possible to apply hydrodynamic forces to other
finite element codes. This allowed for the ability to
apply full compressible hydrodynamic forces
including reservoir bottom reflection effects to the
nonlinear ANACAP model of Hoover Dam.
Incorporating full hydrodynamic compressible fluid
effects in the nonlinear ANACAP model of Hoover
Dam showed cracking developed sooner, cracking
advanced at a slower rate, but the final cracking
pattern was very similar compared to the
incompressible fluid effect. Thus, use of full
hydrodynamic would not have changed results in
terms of preventing formation of a potential sliding
mass in the upper part of the dam.
6.4 KINEMATIC STABILITY OF THE TOP OFDAM
Kinematic studies were performed to investigate the
sliding stability of an independent concrete block
formed separate from the dam body bounded by
horizontal cracking and vertical contraction joints.
The computer program RIGID uses a Newmarkprocedure to determine movements of a rigid body
[Scott 1982]. Loads applied to the block were the
accelerations calculated in the concrete dam at 46 m(150 feet) from the crest, static reservoir loads, and
forces representing full hydrodynamic and reservoir
, boundary effects [Mills 1997] (see figure 8). The
maximum "expected" displacement if a "cracked
block" were to form in upper part of dam during the
earthquake is about 9 cm (3.5 inches) in the
upstream direction. Such small displacement would
not impair stability of the dam or result in reservoir
release because the dam is 30 m (100 feet) thick at
this depth arch action and the wedging provides side
restraint.
7. CONCLUSIONS
Based on structural analysis incorporating
foundation mass. Hoover Dam is predicted to
withstand shaking from the maximum credible
earthquake without significant cracking. This
improved performance over previous traditional
analyses is attributed to the impedance contrast
between the dam and foundation, which inhibits
earthquake energy from entering the structure.
Calculated stress levels during the maximumcredible earthquake are below the tensile strength of
the concrete when incorporating the impedance
between the dam and foundation.
Based on nonlinear structural analysis with a
massless foundation (performed in the event that the
impedance between the dam and foundation proves
to be inaccurate) concrete cracking at 46 m (150
feet) below the dam crest is indicated. However,
even if this cracking extends through the upstream
to downstream thickness of the dam, forming
independent blocks separate from the dam body, the
calculated block movements are on the order of a
few inches, which would not cause instabilities nor
an uncontrolled release of the reservoir.
The top of dam is considered stable for the post-
earthquake condition because of many positive
factors. The dam has 20-cm (8-inch) diameter
formed drains at 3-m (10-foot) centers cross-canyon
147

in the dam body to reduce uplift pressures from
infiltration of water along any upstream cracking.
Arch action is maintained during and after an
earthquake, which inhibits any downstream
movements. The top 46 m (150 feet) of the dam
resembles a gravity dam section with a downstream
slope of 0.7: 1 . This size gravity section is stable for
static loads without arch action. Calculated
eartliquake induced cracking is radial so arch action
is maintained. The horizontal basal plane formed by
cracking during an earthquake slope upward toward
the downstream face, which produces a stable slide
plane.
8. ACKNOWLEDGEMENTS
The author would like to thank the Consultant
Review Board: Ray Clougli, Bruce Bolt, and Alfred
Hendron; peer review members: Larry Von Thun
and Gregg Scott, team members: Terry Payne,
Barbara Mills-Bria, Roman Kollunuik, Dan
O'Conncll, Mike Romansk-y, Chuck Sullivan, Dave
Harris, and Jack Touseull; and other contributors
Dave Dollar, Yusof Ghanaat, Randy James, Anil
Chopra, Hanchen Tan, Jolin Hall, Greg Fenves, and
Ka-Lun Fok.
9. REFERENCES
Nuss, L.K., HVD-81 lO-MDA-97-1, ^'Executive
Summary ofthe Static and Dynamic Stability
Studiesfor Hoover Dam for the Modification
Decision Analysis''\ Bureau of Reclamation, May1998.
Payne, T.L., HVD-81 lO-MDA-97-2, "Ltnear-
Elastic Dynamic Structural Analysis Including
Mass in the Foundation for Hoover Dam^\
Bureau of Reclamation, April 1998.
Payne, T.L., HVD-8110-MDA-97-3, "Effects ofWater Compressibility on Dynamic Structural
Analysis for Hoover Dam'\ Bureau of
Reclamation, November 1997.
Koltuniuk, R.M., HVD-8 1 lO-MDA-97-4, ''Non-
linear Dynamic Structural Analysis ofHoover
Dam Including Modeling ofContraction Joint
Opening and Concrete Cracking", Bureau of
Reclamation, September 1997.
Mills, B.L., HVD-81 lO-MDA-97-5, ''Kinematic
Studies to Determine the Stability ofPostulated
Independent Concrete Blocks Indicated by the
Non-linear Analysis ofHoover Dam During
Seismic Loading'', Bureau of Reclamation,
December 1997.
Nuss, L.K., HVD-8 11 0-MDA-97-6,
"Orientationsfor the Modified Convict Creek
and Corralitos GroundMotions for use in the
Structural Analysis ofHoover Dam"", Bureau of
Reclamation, June 1996.
Payne, T.L., HVD-8 1 lO-MDA-97-7, "EACDFOK- A Modified Version ofEACD-SD to Obtain
Hydrodynamic Pressure Time Histories at Nodes
on the Upstream Face ofDams'", Bureau of
Reclamation, September 1997
Payne, T.L., HVD-8 11 0-MDA-97-8, "EACDFOK- Procedure and Verification for Incorporating
Full Hydrodynamic Interaction Other Finite
Element Codes'', Bureau of Reclamation, October
1997.
Payne, T.L., HWD-Sl lO-MDA-02-95 - "Influence
ofWater Compressibility - Dynamic Linear Elastic
Structural Analyses - Hoover Dam", Bureau of
Reclamation. September 10, 1995.
Anatech Corporation, "ANACAP - Concrete
Analysis Program" , Version 2.1e, 1997.
Scott, G., "RIGID - Dynamic Response ofJointed
Rock Masses",University of Colorado, 1982.
Chopra A. and Hanchen, T., •'EACD-3D-96: AComputer Program for Three-Dimensional
Analysis of Concrete Dams", University of
California, Berkeley, California, Report No.
UCB/SEMM-96/06, October 1996.
Chopra, A., Hall, J., and Fok, K.. "EACD-3D-A
148
Computer Programfor Three-Dimensional
Earthquake Analysis ofConcrete Dams'\
University of California, Berkeley, California,
Report No. UCB/EERC-86/09, July 1986.
O'Connell, R.H., "'Modified Convict Creek and
Corralitos Ground Motions for Hoover Dam -
Boulder Canyon Project, Arizona and Nevada'',
Bureau of Reclamation, Technical Memorandum
No. D8330-96-004, February 22, 1996.
O'Connell, D. and Ake, J., "'Ground Motion
Analysisfor Hoover Dam'\ Bureau of Reclamation,
Seismotectonic Report 94-1, January 1995.
O'Connell, D. and Anderson, L., "'Seismotectonic
Study of the Northern Lower Colorado River -
Arizona, California, and Nevada for Hoover,
Davis, and Parker Dams'\ Bureau of Reclamation,
Seismotectonic Report 93-4, April, 1993.
Harris, D., "Review of Hoover Dynamic Tests
Relative to Other Published Literature'", Bureau of
Reclamation, Materials Engineering and Research
Laboratory, March 20, 1997.
Bolt, B., Clough, R.. and Hendron, A., "Report ofBoard of Consultants on Hoover DamModification Decision Analysis, Boulder Canyon
Project, Nevada'\ August 1994, November, 1995,
and September 1997.
Bureau of Reclamation, "Results of Direct Shear
Tests on Concrete Core Specimens, Hoover Dam,
Boulder Canyon Project'', Earth Sciences and
Research Laboratory Referral Number 8340-96-03,
February 5, 1996.
Bureau of Reclamation, "Report ofMass Concrete
Core Testing - Hoover Dam - Boulder Canyon
Project", Materials Engineering Branch Referral
Memorandum No. 8180-95-003, November 27,
1995.
Project", Lower Colorado Regional Office, May 27,
1993.
Dollar, Dave, "Preliminary Analysis ofStructural
Engineering Issues Including Effects ofthe MCE- Hoover Dam", Bureau of Reclamation, May 13,
1994.
Ghanaat, Y. and Redpath, B., "Measurements ofReservoir-Bottom Refection Coefficient at Seven
Concrete Dams", Quest Structures, Orinda,
California, October 1995.
United States Committee On Large Dams, "U.S.
and World Dam, Hydropower, and Reservoir
Statistics", USCOLD Committee on Register of
Dams, 1995.
Bureau of Reclamation, "Arizona Abutment-
Geologic Field Data Report-Modification Decision
Analysis Study-Hoover Dam-Boulder Canyon
149
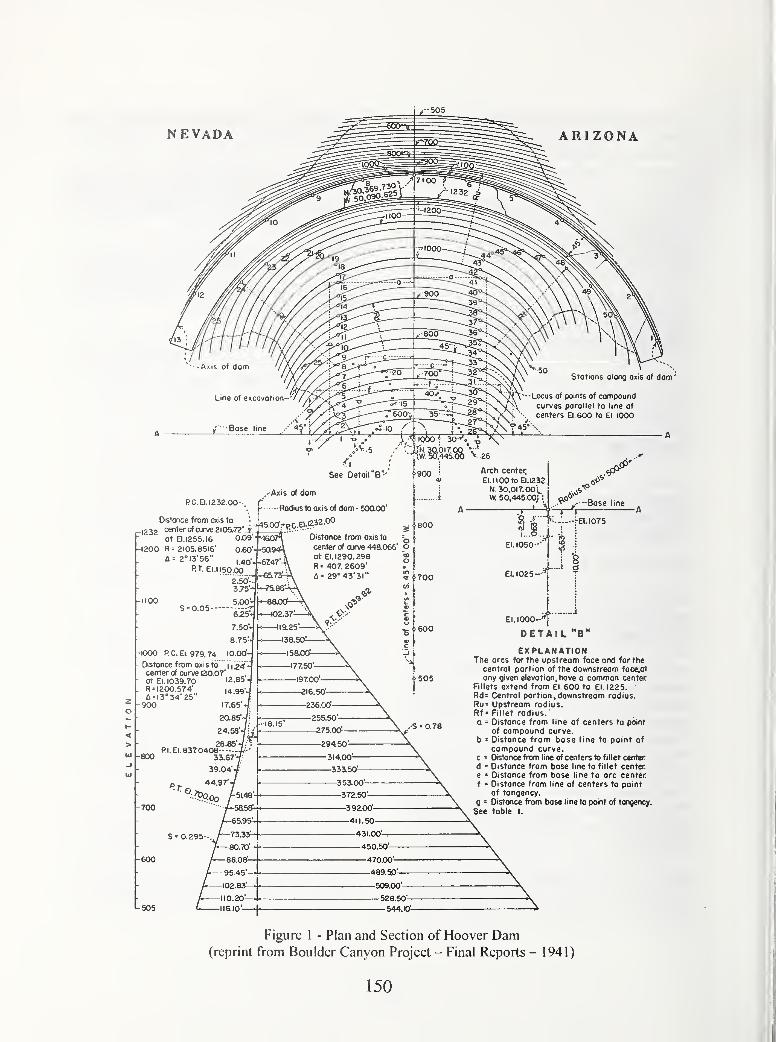
NEVADA ARI ZONA
ions olong oxis of dom'
Locus of points of compoundcurves poroilel to line of
centers El.600 to EI.IOOO
Base line
PC.EI.I232
Ostonce from oxis
1232at El. 1255. 16
1200 R= 2105.8516'
ii= 2* 13' 56"
.00-. f
.0 d
PT.EI.IISOXX)
2.50- t*^
See OetoirB"'
- Axis of dom
Rodius to oxis of dam - soaoo'
T45.0Cfrp.C.O:)25^-°°
Oistonce from oxis to
center of curve 44a066'ot El. 1290. 298R = 407. 2609'
t' 29*43'3I"
800
ilOO5 = 0.05
700
-600
1-505
V 26
Arch center,
El. 1100 to EI.I232
N 30,017. 00"t,W 50,445.00; !
••^ ..---Bose line
EI.I050-'
t \ ^rEI. 1075
i \
(0<ti :
EL 1025-^
HEI.IOOO-''
-KXX) R C. El. 979. 74
Distance from oxis to
center of curve 130.07'
at El. 1039.70R = I200 574'
a = l3°34' 25"
900
800
DETAIL "B"
EXPLANATIONThe ores for the upstreom foce ond for the
central portion of the downstreom foce.at
ony given elevotion, hove o common center
Fillets extend from El.600 to El. 1225.Rd= Centrol portion, downstreom rodius.
Ru= Upstreom radius.Rf = Fillet rodius.'
a = Distance from line of centers to point
of compound curve.Oistonce from bose line to point of
compound curve.Oistonce from line of centers to fillet center
Oistonce from bose line to fillet centerDistance from base line to ore centerDistance from line of centers to pointof tongency.
g = Distance from base line to point of tongency.
See table I.
Figure 1 - Plan and Section of Hoover Dam(reprint from Boulder Canyon Project - Final Reports 1941)
150

o MaxY =. 72 at 4 .26
UPSTREAM ACCELERATIONMinY = 74 at 4 . 36
—^ Wwv^LU
o MaxY =
1 . 0 2 . 0
. 43 at 4 .71
3.0 4.0 5,.0 6.0 7.0TIME - SECONDS
CROSS-CANYON ACCELERATION
a . 0
MinY =
9 . 0 10 . 0
. 47 at 4 . 65
0 1.0 2.0 3.0 4.0 '5.0 6.0 7.0 8 0 9 0 10TIME - SECONDS
VERTICAL ACCELERATIONMaxY= .34 at 4.32 MinY= -.24 at 4.38
OHO
< „.0
in Max Y=
1 .
0
'
. 0 3 . 0 4.0 5.0 5.0TIME - SECONDS
7.0
2.50 atACCELERATION RESPONSE SPECTRA (5% DAMPING). 15 MinY=
9 . 0 10 0
.03 at 2.3?
Figure 2 - Convict Creek Accelerograms And Acceleration Response Spectra
151
2 , 0
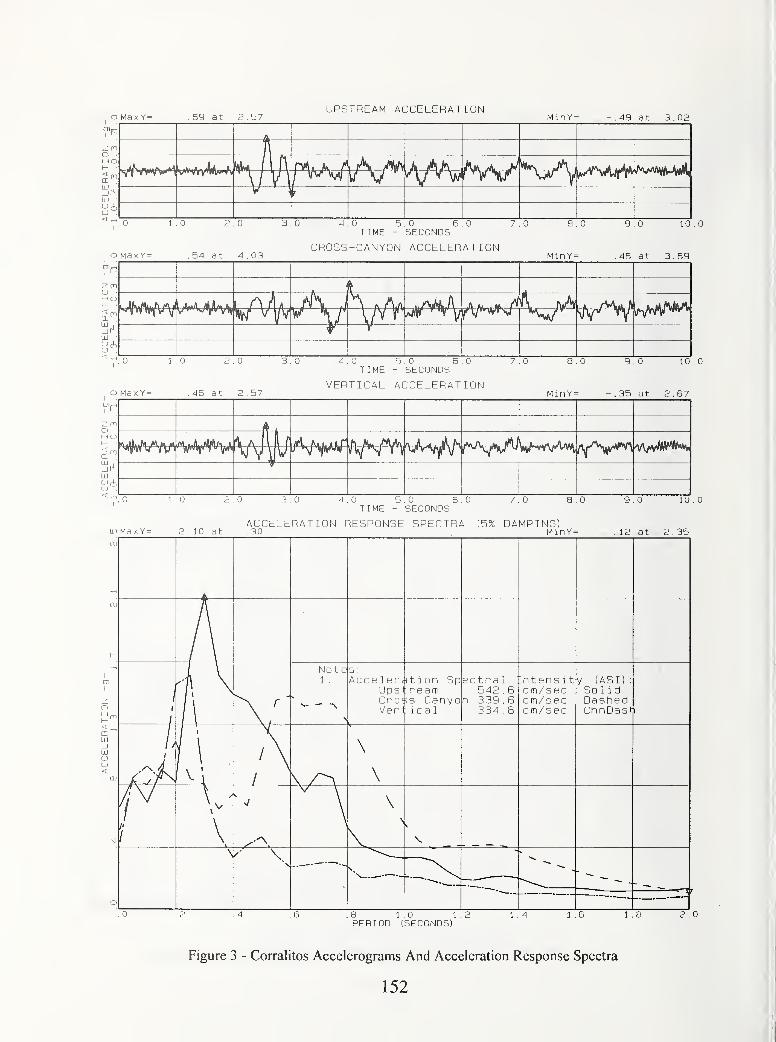
o Max Y = . 69 at 2 . 57UPSTREAM ACCELERATION
MinY = ,49 at 3.02
0 1
Ma.x Y =
0 2
.54 at
0
4 . 03
3 0 4
CROSS
0 5TIME -
-CANYON
0 6.0 7SECONDS
ACCELERATION
0 a
MinY =
0 9
-. 46
0 10
at 3.69
10.0
4.0 5.0 6.0TIME - SECONDS
ACCELERATION RESPONSE SPECTRA (5% DAMPING)inMaxY= 2.10 at .30
. MinY =
10.0
12 at 2.35
1
H^ r
'
Note1 .
— ^
5 '.
A c c: e 1 e r c
UpsiCno =
Ver
5t 1 on Sp; ream
Canyo: 1 c a 1
ectra 1 ;
542 . 6n 339.6
334 . 6
Intens i tcm/secc m/seccm/sec
y (ASI) :
Sol idDashedChnDasl-
1
1 /\S
^
\
\
11'
I \
\
'
.0 .8 1.0 1 . ,
PERIOD (SECONDS)1 . 4 1 .6 1 . 8 2 . 0
Figure 3 - Corralitos Accelerograms And Acceleration Response Spectra
152
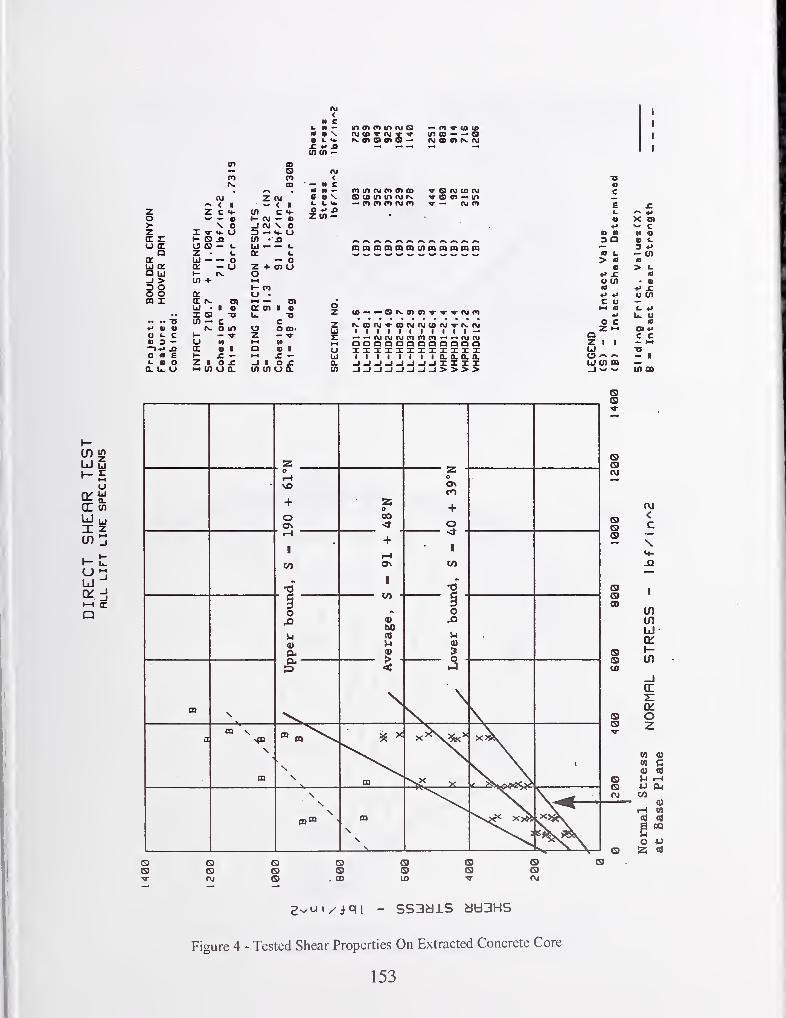
u u^-£
u
(E «i
U ujX z
U1-4 (E
Q
_
<_
z 2 c (J)
o e t- (M a>- \ o _l W \ oz I <•- u Z3 — u- u(c r 1- j> (n • JDU (E o s I. u — <.
Q z t. q: 1.
bJ o oU K q: o z + Ol oa ij t- o_i > Lft + >-i
3 O 1- mo o q: u •
m I cr m 1-1 — Olu 1 » q; o) 1 «X d •o u T3^ ..-a U) c c
*» n » o in o o 0D>O k c t- z• 3 — u M M"»•»> SI cc O 1 a O 1o a E (- X X(no z 1 o X _l 1 o XQ. L. U t—
4
o a. cn cn o Q.
nj<
H C>. M —
• \• >.•«-
X *• AWW —
<— » ca M -e • N
o az in —
ozzUJz*-i
ouOl
ru UJ <vi V in CD — — O
m Ul CM f) tn (D Q (vj u> (M(Ocommtvir^ tt o <n — tn
OQnoQCDOQCQcnoQnnpQcn
•o«c
a aX XI I
IMI I
(\l (MQ aX XI I
CDCMOJCOCXI^rvNI I I I I I I —aaaaaoaaxxxxxxxxI I I I Q. Q. Q. a.-I-I-I-JXXXX_i_i_i_i>>>>
2:0I-l
so
+oON
!2;0OO<!
oo\CO
+O
I-l
+
o\
1
>*
00
>per
bouri
/erage,
S
5wer
boui
CD N
<:
\
aca s
mNS
N.m
Ss\
DqCO s m\N ^*^^s^\
s
(M
(9
(SCD
(9CD
IS(9
E XL.
•1 X o)» c« « M O3 a a 1.
3 *>a L — cn> a a
o > i.
» X au U) • «ia V X*» *> o cnc oI-l a L. *t
U. Uo c az cn >a c cZ 1 1 — 1—
1
u u— 1Ul U) n_j w u) m
Q(S
QG)OJ
(9SS
S)(D 10
(S G)SOJ
(9
Figure 4 - Tested Shear Properties On Extracted Concrete Core
153
OJ<c
\
J3
mcnu»-
CE2:
Oz
CO 0)
CO
(l>
19 U r-l
(9 •U<M C/5
4)i-H CQ
Cd
gOQ
O 4J
(9 Cd

Figure 5 - Finite Element Model Of Hoover Dam And Foundation
154
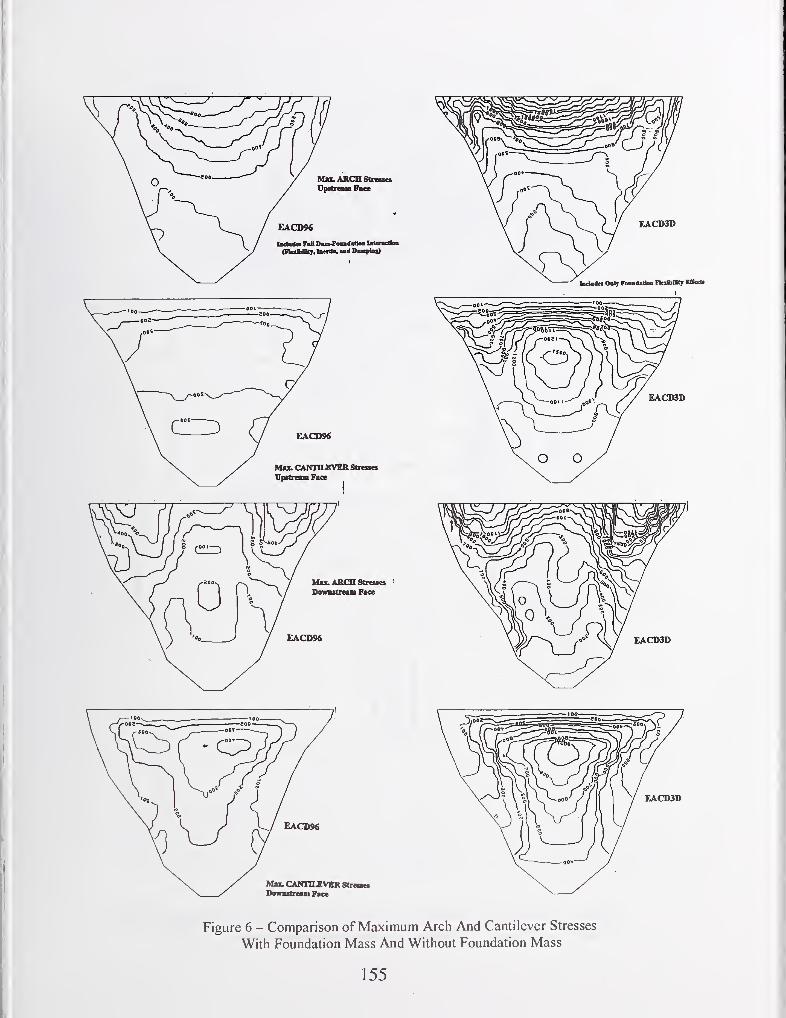
155
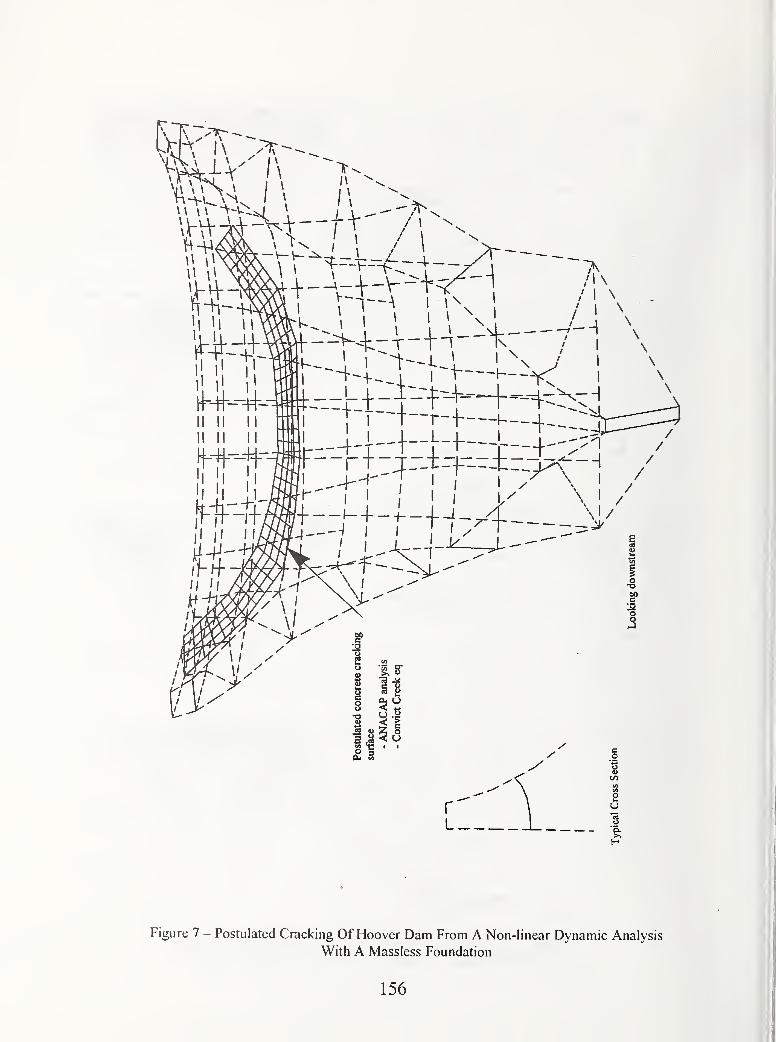
W
— i / ,
//
//
/
1//
o
u
s
o.
H
Figure 7 - Postulated Cracking Of Hoover Dam From A Non-linear Dynamic Analysis
With A Massless Foundation
156
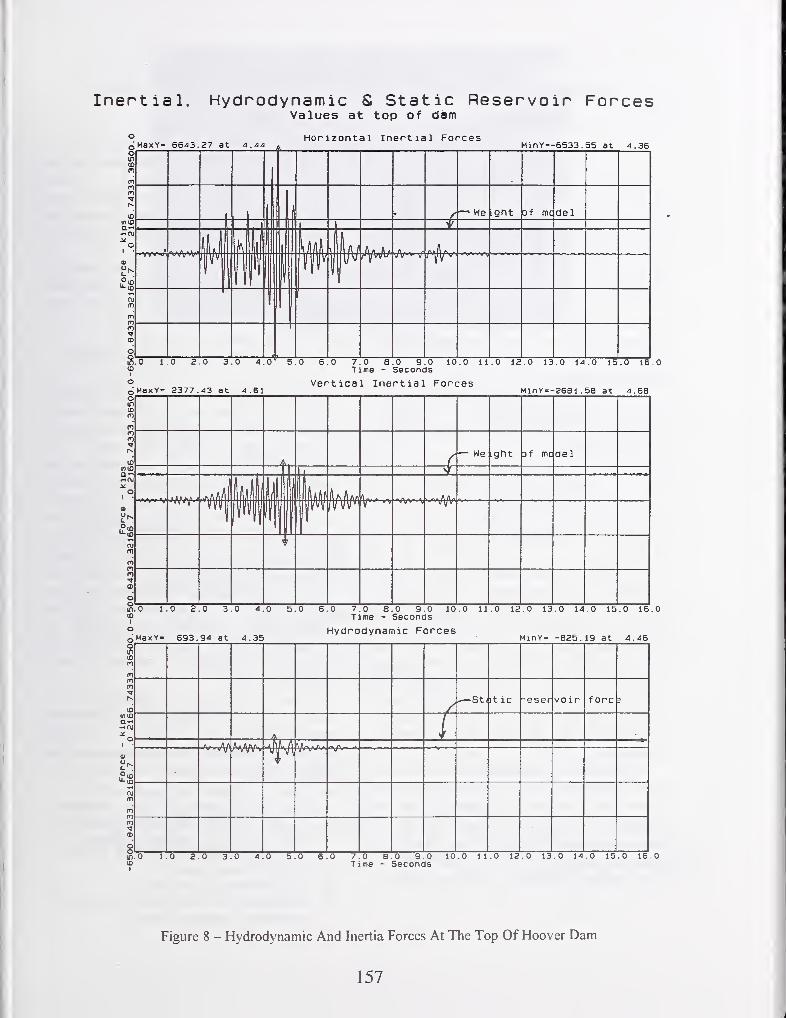
Inert ia 1, Hydnodynamic S Static Reservoir ForcesValues at top of dam
Horizontal Inertial Forces
— we .ght D f ma del
II 1 wIP1
.0 1
MaxY"=
0 2
^311 .
0 3
43 at
.0 A
4.61
5.0 6
ver
0 7T]
•tica
0 Bne -
1 Ine
0 9Seconc
rtial
0 10is
Fore
.0 11
res
.0 12 . 0 13
MinY--
.0 14
2681 .
. 0 15
5B at
. 0 15
4.68
— We ight f mc del
»—
in.OID
1.0 2.0 3.0 A.O 5.0 6.0 7.0 8.0 9.0Time - Seconds
10.0 11.0 12.0 13.0 14.0 15.0 16.0
693.94 at 4.35Hydrodynamic Forces
MinY- -625. 19 at 4.46
^St, it ic ^eser voir fore
^s^V—
*
ncD
lO.O(D
1.0 2.0 3.0 4.0 5.0 6.0 7.0 e .0 9.0Time - Seconds
10.0 11.0 12.0 13.0 14.0 15.0 16.0
Figure 8 - Hydrodynamic And Inertia Forces At The Top Of Hoover Dam
157
Development and Operation of Large Centrifuge at PWRIby
Osamu Matsuo'\ Tatsuya Tsutsumi^\ Mitsu Okamura^', Tetsuya Sasaki^^ and Kunio Nishi"^
ABSTRACTA large geotechnical centrifuge with a radius
of 6.6 m has been developed at Public Works
Research Institute in 1997. For the purpose of
the geotechnical earthquake studies, a powerful
electro-hydrauric shaking table designed to work
in the centrifuge has also been developed. This
shaking table provides 40G shaking acceleration
to a model of 1 ton, which acceleraton is
equivalent to the maximum ground acceleration
observed during the 1995 Hyogoken Nanbu
earthquake for a model at 50G centrifugal
acceleration field.
The centrifuge has been under extensive use to
investigate various geotechnical problem.
Results of centrifuge tests carried out so far are
briefly described.
Key Words: Geotechnical Centrifuge,
Shaking Table, Model test
Retaining Wall
1. INTRODUCTION
Public Works Research Institute (PWRI)
constructed first geotechnical centrifuge with a
radius of 1.25 m in 1961. With increasing
needs of geotechnical earthquake studies, the
second centrifuge with a radius of 2.0 m was
introduced in 1987 with a shaking table having a
capacity of 40* ton. This centrifuge has been
used to study various boundary value problems
including soil liquefaction, seismic slope stability,
soil improvement techniques, tunnel excavation,
and so on.
The Hyogoken Nanbu earthquake, January 17,
1995, that hit the densely populated area caused
devastating damages to human lives and
properties. It also demonstrated various
earthquake geotechnical problems. Immediately
after the quake, PWRI, the Ministry of
Construction headquarters and the Government
decided to construct a new centrifuge with a
shaker which can simulate strong ground motion
observed in the past earthquake. PWRIinitiated basic and detailed design works in May,
1995. Construction of the centrifuge and the
enclosure started in March, 1996 and completed
in March, 1997.
In this paper, notable features of the centrifuge
are described in detail and results of dynamic
centrifiige tests on retaining walls are also
discussed.
2. CENTRIFUGE SPECIFICATIONS
The centrifuge that has been newly installed at
PWRI is the largest centrifuge in Japan, with a
effective radius of 6.6m and maximum payload of
2.7 tons at up to 150G (400G • ton). Aphotograph and a schematic illustration of the
centrifuge are shown in Fig.l and 2, respectively.
Notable specifications are summarized in Table 1.
The main parts of the centrifuge are housed in an
underground reinforced concrete pit, 17.0 m in
diameter and 4.6 m deep. A pair of hydraulic
jacks is installed at one side of rotation arm.
When the platform swing up, these jacks push the
swing platform to sit on the end plate of the arm
so that strong earthquake motions can be
simulated by fixing the swing platform to the rigid
rotating arm. This is called "Touch-down System"
(Naguraetal. 1994).
In order to eliminate the imbalance moment
produced during spinning, a in-flight automatic
balancing system is equipped. In-flight
balancing is achieved by moving two balancing
weights on the rotation arm. When the balance
1) Head, Soil dynamics division. Earthquake
Disaster Prevention Research Center, Public
Work Research Institute, Ministry of
Construction, Tsukuba city 3050804, Japan
2) Research Engineer, ditto
3) Senior Research Engineer, ditto
4) Research Engineer, Technical Institute, Hazama
Corporation, Tsukuba city, Japan
158
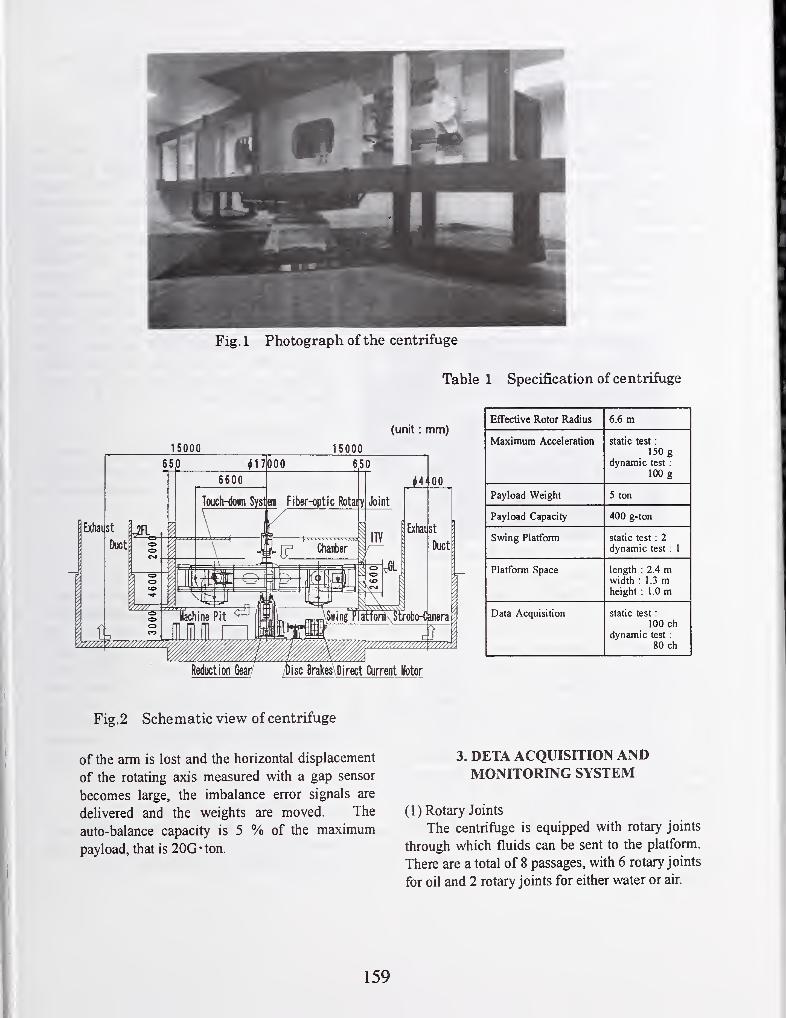
Fig. 1 Photograph of the centrifuge
Table 1 Specification of centrifuge
(unit : mm)
1 5000 1 5000
Effective Rotor Radius 6.6 m
Maximum Acceleration static test :
150 gdynamic test :
100 g
Payload Weight 5 ton
Payload Capacity 400 g-ton
Swing Platform static test : 2
dynamic test : 1
Platform Space length : 2.4 mwidth ; 1.3 mheight :1.0m
Data Acquisition static test :
100 ch
dynamic test :
80 ch
Fig.2 Schematic view of centrifuge
of the arm is lost and the horizontal displacement
of the rotating axis measured with a gap sensor
becomes large, the imbalance error signals are
delivered and the weights are moved. The
auto-balance capacity is 5 % of the maximum
payload, that is 20G-ton.
3. DETA ACQUISITION ANDMONITORING SYSTEM
(1) Rotary Joints
The centriftige is equipped with rotary joints
through which fluids can be sent to the platform.
There are a total of 8 passages, with 6 rotary joints
for oil and 2 rotary joints for either water or air.
159
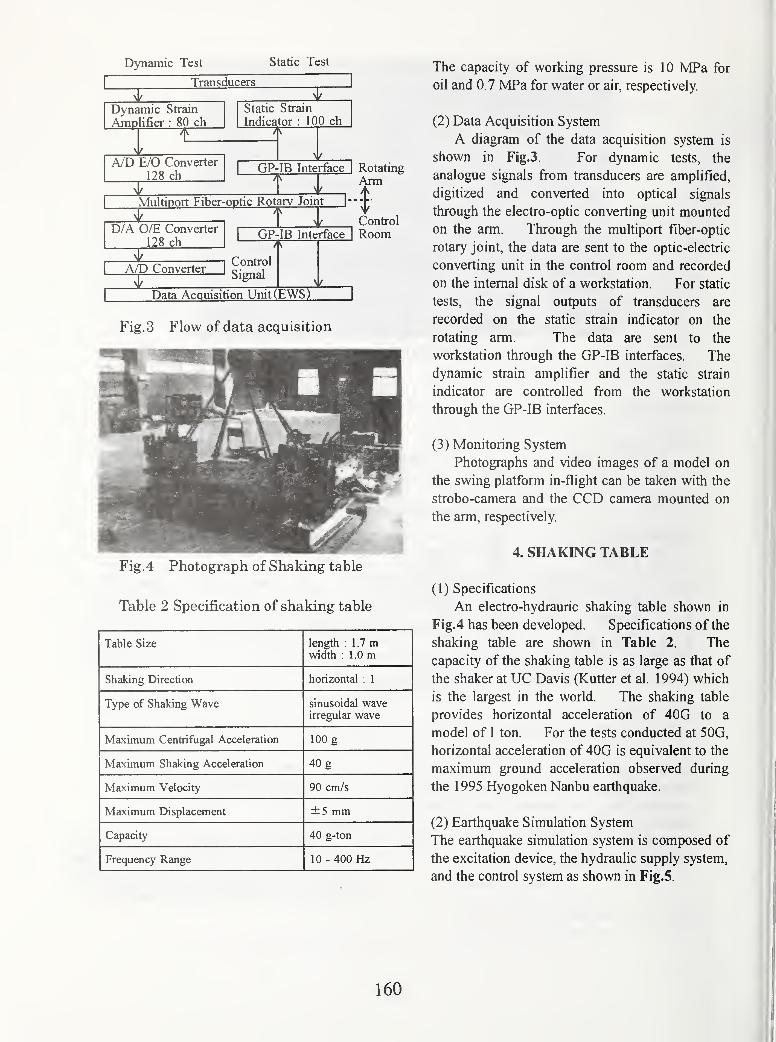
Dynamic Test Static Test
Transducers
Dynamic Strain
Amplifier : 80 ch
Static Strain
Indicator : 100 chTfv
A/D E/0 Converter
128 chGP-IB Interface I Rotating
Arm
Multiport Fiber-optic Rotary Joint
D/A 0/E Converter
128 ch
Control
GP-IB Interface I Room7K—
I A/p Converter ]
Control
Signal
Data Acquisition Unit(EWS)
Fig. 3 Flow of data acquisition
Fig.4 Photograph of Shaking table
Table 2 Specification of shaking table
Table Size length : 1.7 mwidth : 1.0 m
Shaking Direction horizontal : 1
Type of Shaking Wave sinusoidal waveirregular wave
Maximum Centrifugal Acceleration 100 g
Maximum Shaking Acceleration 40 g
Maximum Velocity 90 cm/s
Maximum Displacement ±5 mm
Capacity 40 g-ton
Frequency Range 10 - 400 Hz
The capacity of working pressure is 10 MPa for
oil and 0.7 MPa for water or air, respectively.
(2) Data Acquisition System
A diagram of the data acquisition system is
shown in Fig.3, For dynamic tests, the
analogue signals from transducers are amplified,
digitized and converted into optical signals
through the electro-optic converting unit mounted
on the arm. Through the multiport fiber-optic
rotary joint, the data are sent to the optic-electric
converting unit in the control room and recorded
on the internal disk of a workstation. For static
tests, the signal outputs of transducers are
recorded on the static strain indicator on the
rotating arm. The data are sent to the
workstation through the GP-IB interfaces. The
dynamic strain amplifier and the static strain
indicator are controlled from the workstation
through the GP-IB interfaces.
(3) Monitoring System
Photographs and video images of a model on
the swing platform in-flight can be taken with the
strobo-camera and the CCD camera mounted on
the arm, respectively.
4. SHAKING TABLE
(1) Specifications
An electro-hydrauric shaking table shown in
Fig,4 has been developed. Specifications of the
shaking table are shown in Table 2. The
capacity of the shaking table is as large as that of
the shaker at UC Davis (Kutter et al. 1994) which
is the largest in the world. The shaking table
provides horizontal acceleration of 40G to a
model of 1 ton. For the tests conducted at 50G,
horizontal acceleration of 40G is equivalent to the
maximum ground acceleration observed during
the 1995 Hyogoken Nanbu earthquake.
(2) Earthquake Simulation System
The earthquake simulation system is composed of
the excitation device, the hydraulic supply system,
and the control system as shown in Fig.5.
160
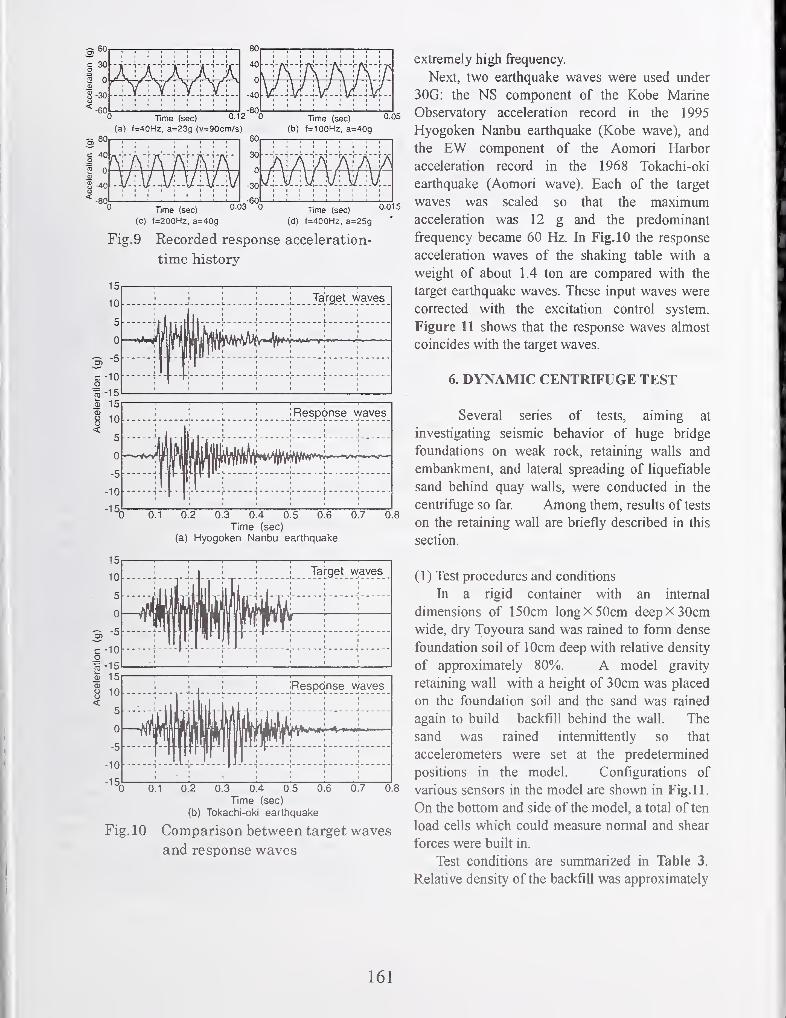
§60c 30g2 0
S-30o
0
-40
-80
- " T "At ~ An - - r yc
(a) f=40Hz, a=23g (v=90cm/s) (b) f=100Hz, a=40g
Time (sec) Time (sec)0.015
(c) f=200Hz, a=40g (d) f=400Hz, a=25g
Fig. 9 Recorcied response acceleration-
time history
10
5
0
-5
-10
-15,
0.1 0.2 0.3 0.4 0.5 0.6
Time (sec)
(a) Hyogoken Nanbu earthquake
0.7 0.8
' '
1 ' ' iRespdnse waves
0.1 0.2 0.6 0.70.3 0.4 0.5
Time (sec)
(b) Tokachi-oki earthquake
Fig. 10 Comparison between target waves
and response waves
0.8
extremely high frequency.
Next, two earthquake waves were used under
30G: the NS component of the Kobe Marine
Observatory acceleration record in the 1995
Hyogoken Nanbu earthquake (Kobe wave), and
the EW component of the Aomori Harbor
acceleration record in the 1968 Tokachi-oki
earthquake (Aomori wave). Each of the target
waves was scaled so that the maximumacceleration was 12 g and the predominant
frequency became 60 Hz. In Fig.10 the response
acceleration waves of the shaking table with a
weight of about 1.4 ton are compared with the
target earthquake waves. These input waves were
corrected with the excitation control system.
Figure 11 shows that the response waves almost
coincides with the target waves.
6. DYNAMIC CENTRIFUGE TEST
Several series of tests, aiming at
investigating seismic behavior of huge bridge
foundations on weak rock, retaining walls and
embankment, and lateral spreading of liquefiable
sand behind quay walls, were conducted in the
centrifuge so far. Among them, results of tests
on the retaining wall are briefly described in this
section.
(1) Test procedures and conditions
In a rigid container with an internal
dimensions of 150cm long X 50cm deep X 30cmwide, dry Toyoura sand was rained to form dense
foundation soil of 10cm deep with relative density
of approximately 80%. A model gravity
retaining wall with a height of 30cm was placed
on the foundation soil and the sand was rained
again to build backfill behind the wall. The
sand was rained intermittently so that
accelerometers were set at the predetermined
positions in the model. Configurations of
various sensors in the model are shown in Fig.ll.
On the bottom and side of the model, a total of ten
load cells which could measure normal and shear
forces were built in.
Test conditions are summarized in Table 3.
Relative density of the backfill was approximately
161
4
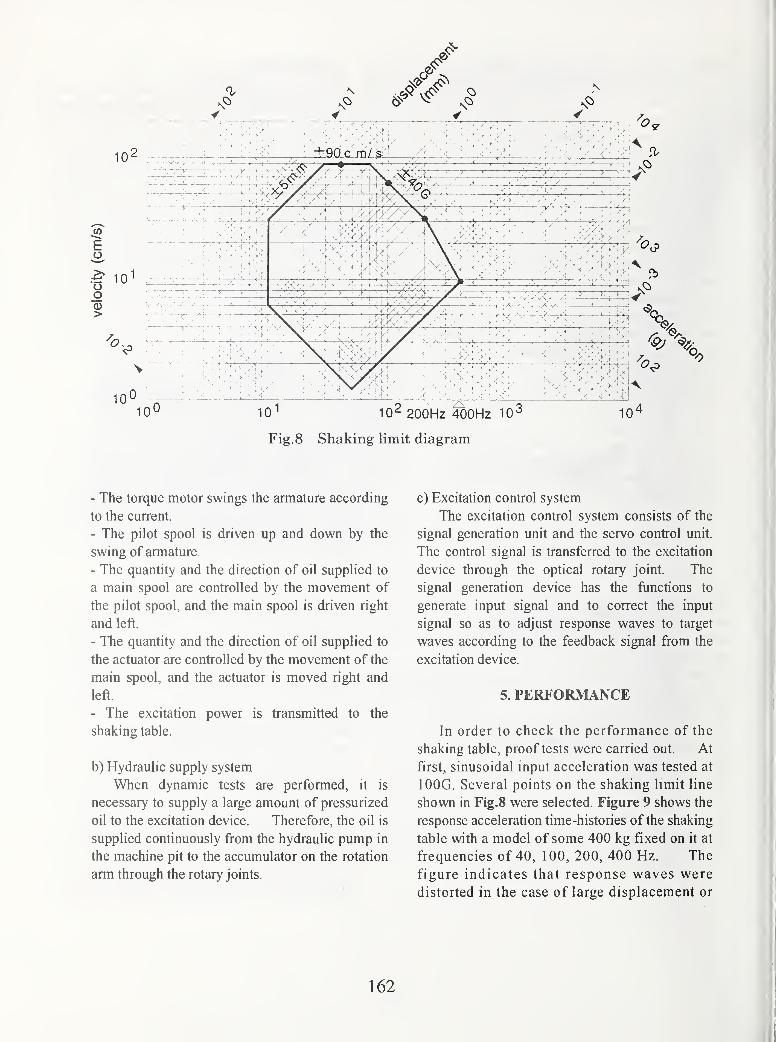
- The torque motor swings the armature according
to the current.
- The pilot spool is driven up and down by the
swing of armature.
- The quantity and the direction of oil supplied to
a main spool are controlled by the movement of
the pilot spool, and the main spool is driven right
and left.
- The quantity and the direction of oil supplied to
the actuator are controlled by the movement of the
main spool, and the actuator is moved right and
left.
- The excitation power is transmitted to the
shaking table.
b) Hydraulic supply system
When dynamic tests are performed, it is
necessary to supply a large amount of pressurized
oil to the excitation device. Therefore, the oil is
supplied continuously from the hydraulic pump in
the machine pit to the accumulator on the rotation
arm through the rotary joints.
c) Excitation control system
The excitation control system consists of the
signal generation unit and the servo control unit.
The control signal is transferred to the excitation
device through the optical rotary joint. The
signal generation device has the functions to
generate input signal and to correct the input
signal so as to adjust response waves to target
waves according to the feedback signal from the
excitation device.
5. PERFORMANCE
In order to check the performance of the
shaking table, proof tests were carried out. At
first, sinusoidal input acceleration was tested at
lOOG. Several points on the shaking limit line
shown in Fig.8 were selected. Figure 9 shows the
response acceleration time-histories of the shaking
table with a model of some 400 kg fixed on it at
frequencies of 40, 100, 200, 400 Hz. The
figure indicates that response waves were
distorted in the case of large displacement or
162
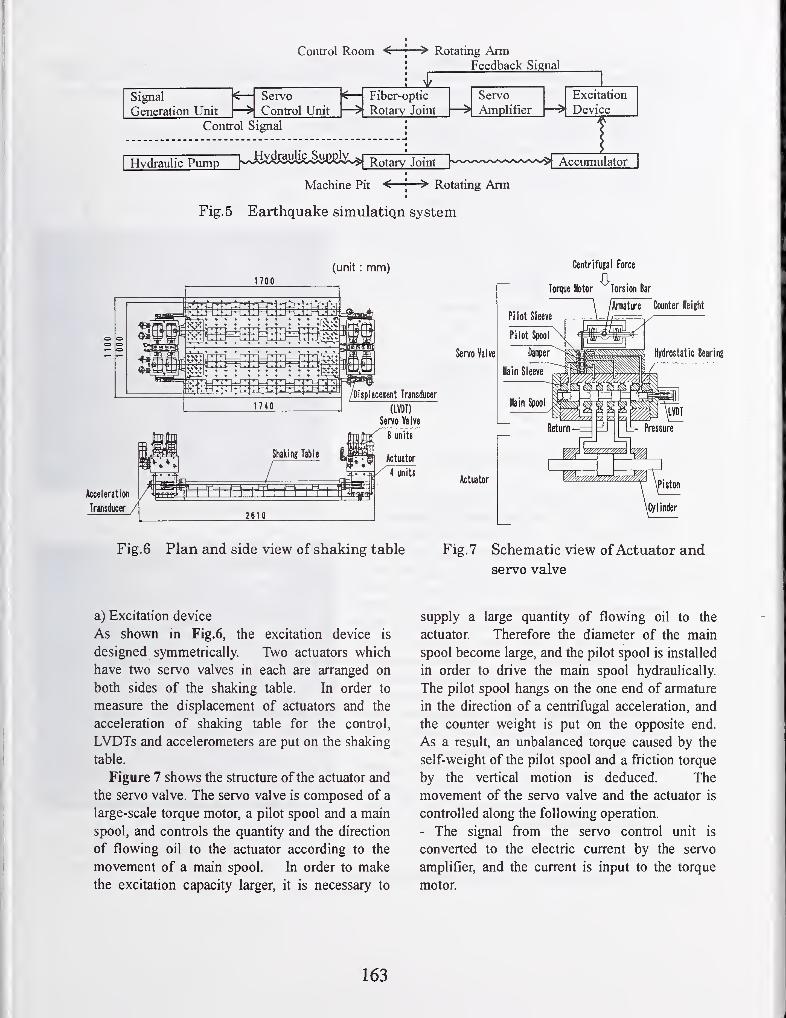
Control Room
Signal
Generation Unit
Servo
^ Control Unit
> Rotating ArmFeedback Signal
Fiber-optic
^ Rotary Joint
Control Signal
Hydraulic Supph
—
^
Servo
Amplifier
Excitation
Device
Hydraulic Pump ~[wxXxx.Sv^S/n/-B£S^^^ Rotary JointI
Machine Pit <—|
—
> Rotating Arm
I
Fig. 5 Earthquake simulatiqii system
(unit : mm)1700
1 740
^celeration
Transducer /
Shaking Table
/Dispiacenent Transducer
(LVDT)
Servo Valve
8 units
Actuator
A
2610
4 units
Centrifugal Force
Anuture Counter Reight
Servo Valve
Actuator
Fig. 6 Plan and side view of shaking table Fig. 7 Schematic view ofActuator and
servo valve
a) Excitation device
As shown in Fig.6, the excitation device is
designed symmetrically. Two actuators which
have two servo valves in each are arranged on
both sides of the shaking table. In order to
measure the displacement of actuators and the
acceleration of shaking table for the control,
LVDTs and accelerometers are put on the shaking
table.
Figure 7 shows the structure of the actuator and
the servo valve. The servo valve is composed of a
large-scale torque motor, a pilot spool and a main
spool, and controls the quantity and the direction
of flowing oil to the actuator according to the
movement of a main spool. In order to make
the excitation capacity larger, it is necessary to
supply a large quantity of flowing oil to the
actuator. Therefore the diameter of the main
spool become large, and the pilot spool is installed
in order to drive the main spool hydraulically.
The pilot spool hangs on the one end of armature
in the direction of a centrifugal acceleration, and
the counter weight is put on the opposite end.
As a result, an unbalanced torque caused by the
self-weight of the pilot spool and a friction torque
by the vertical motion is deduced. The
movement of the servo valve and the actuator is
controlled along the following operation.
- The signal from the servo control unit is
converted to the electric current by the servo
amplifier, and the current is input to the torque
motor.
163
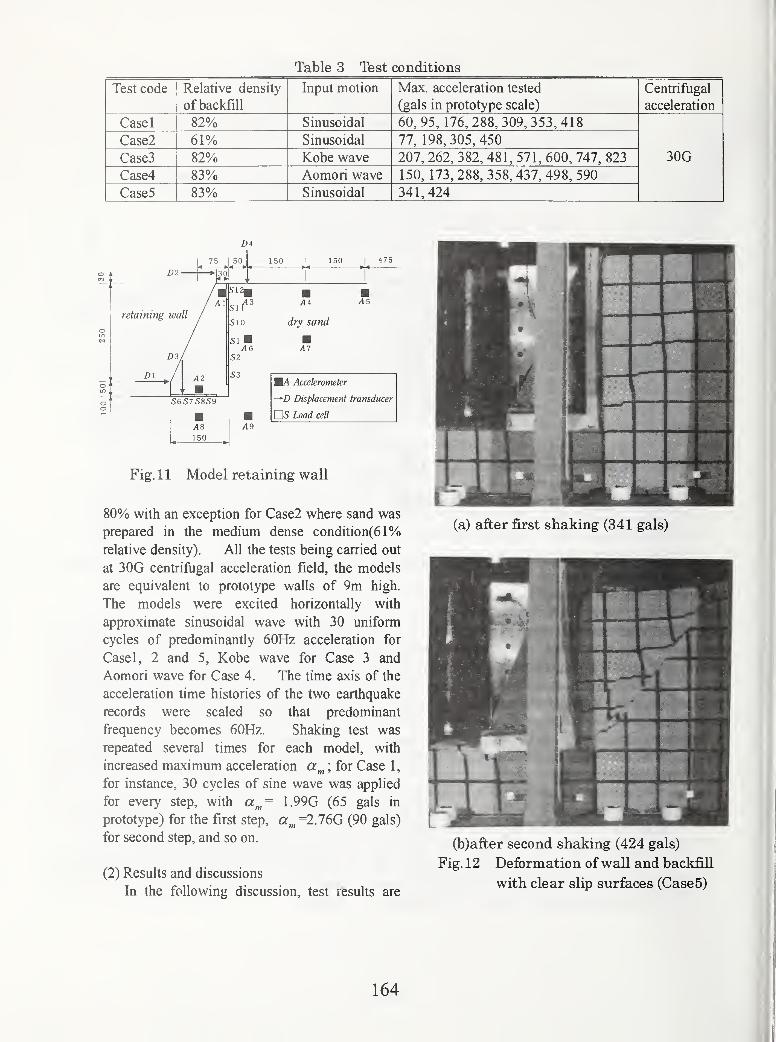
Table 3 Test conditions
iCbl LUUC rvcictii vc vj.ciioiij' TfiT^iit mntinnlllLfUl lilUlXUll \/fav fippplpratinn tpQtpH
(pal^ in nrototvnp ^ralp^
Centrifugal
acceleration
Casel 82% Sinusoidal 60, 95, 176, 288, 309, 353, 418
30GCase2 61% Sinusoidal 77, 198, 305,450
Case3 82% Kobe wave 207, 262, 382, 481, 571, 600, 747, 823
Case4 83% Aomori wave 150, 173, 288, 358, 437, 498, 590
CaseS 83% Sinusoidal 341,424
retaining wall
44
dry sand
A5
S6S75859
A8150
MA Accelerometer
Displacement transducer
OS Load cell
A9
Fig. 11 Model retaining wall
80% with an exception for Case2 where sand was
prepared in the medium dense condition(61%)
relative density). All the tests being carried out
at 30G centrifugal acceleration field, the models
are equivalent to prototype walls of 9m high.
The models were excited horizontally with
approximate sinusoidal wave with 30 uniform
cycles of predominantly 60Hz acceleration for
Casel, 2 and 5, Kobe wave for Case 3 and
Aomori wave for Case 4. The time axis of the
acceleration time histories of the two earthquake
records were scaled so that predominant
frequency becomes 60Hz. Shaking test was
repeated several times for each model, with
increased maximum acceleration ; for Case 1,
for instance, 30 cycles of sine wave was applied
for every step, with a^= 1.99G (65 gals in
prototype) for the first step, =2.760 (90 gals)
for second step, and so on.
(2) Results and discussions
In the following discussion, test results are
(a) after first shaking (341 gals)
(b)afiter second shaking (424 gals)
Fig. 12 Deformation of wall and backfill
with clear slip surfaces (CaseS)
164
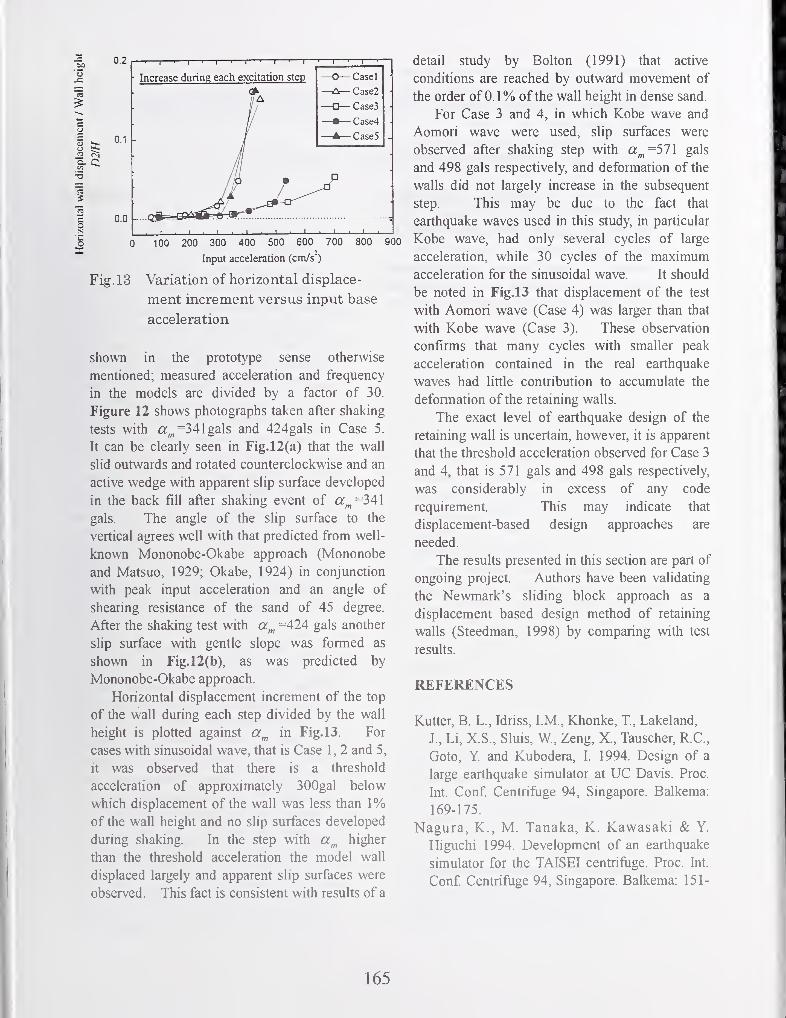
coN
0 100 200 300 400 500 600 700 800 900
Input acceleration (cm/s")
Fig. 13 Variation of horizontal displace-
ment increment versus input base
acceleration
shown in the prototype sense otherwise
mentioned; measured acceleration and frequency
in the models are divided by a factor of 30.
Figure 12 shows photographs taken after shaking
tests with a^=341gals and 424gals in Case 5.
It can be clearly seen in Fig.l2(a) that the wall
slid outwards and rotated counterclockwise and an
active wedge with apparent slip surface developed
in the back fill after shaking event of a^=341
gals. The angle of the slip surface to the
vertical agrees well with that predicted from well-
known Mononobe-Okabe approach (Mononobe
and Matsuo, 1929; Okabe, 1924) in conjunction
with peak input acceleration and an angle of
shearing resistance of the sand of 45 degree.
After the shaking test with =424 gals another
slip surface with gentle slope was formed as
shown in Fig. 12(b), as was predicted by
Mononobe-Okabe approach.
Horizontal displacement increment of the top
of the wall during each step divided by the wall
height is plotted against in Fig.l3. For
cases with sinusoidal wave, that is Case 1, 2 and 5,
it was observed that there is a threshold
acceleration of approximately 300gal below
which displacement of the wall was less than 1%of the wall height and no slip surfaces developed
during shaking. In the step with higher
than the threshold acceleration the model wall
displaced largely and apparent slip surfaces were
observed. This fact is consistent with results of a
detail study by Bolton (1991) that active
conditions are reached by outward movement of
the order of 0.1% of the wall height in dense sand.
For Case 3 and 4, in which Kobe wave and
Aomori wave were used, slip surfaces were
observed after shaking step with a^=571 gals
and 498 gals respectively, and deformation of the
walls did not largely increase in the subsequent
step. This may be due to the fact that
earthquake waves used in this study, in particular
Kobe wave, had only several cycles of large
acceleration, while 30 cycles of the maximumacceleration for the sinusoidal wave. It should
be noted in Fig.l3 that displacement of the test
with Aomori wave (Case 4) was larger than that
with Kobe wave (Case 3). These observation
confirms that many cycles with smaller peak
acceleration contained in the real earthquake
waves had little contribution to accumulate the
deformation of the retaining walls.
The exact level of earthquake design of the
retaining wall is uncertain, however, it is apparent
that the threshold acceleration observed for Case 3
and 4, that is 571 gals and 498 gals respectively,
was considerably in excess of any code
requirement. This may indicate that
displacement-based design approaches are
needed.
The results presented in this section are part of
ongoing project. Authors have been validating
the Newmark's sliding block approach as a
displacement based design method of retaining
walls (Steedman, 1998) by comparing with test
results.
REFERENCES
Kutter, B. L., Idriss, I.M., Khonke, T, Lakeland,
J., Li, X.S., Sluis, W., Zeng, X., Tauscher, R.C.,
Goto, Y. and Kubodera, I. 1994. Design of a
large earthquake simulator at UC Davis. Proc.
Int. Conf Centrifuge 94, Singapore. Balkema:
169-175.
Nagura, K., M. Tanaka, K. Kawasaki & Y.
Higuchi 1994. Development of an earthquake
simulator for the TAISEI centrifiige. Proc. Int.
Conf Centrifuge 94, Singapore. Balkema: 151-
165

156.
Mononobe N. and Matsuo H. 1929. On the
determination of earth pressure during
earthquakes, Proc World Engng. Congress,
Vol.9, pp. 177-185
Okabe S. 1924. General theory of earth pressure,
Journal of Japan Civil Engng Society, Vol.12,
No.l
Bolton M.D. 1991. Geotechnical stress analysis
for bridge abutment design. Contractor report
270, Transport and Road Research Laboratory,
Crowthome, Berks.
Steedman R.S. 1998. Seismic design of retaining
walls. Proc. Institution of Civil Engineers,
Geotechnical Engineering, Vol.131, pp. 12-22
166
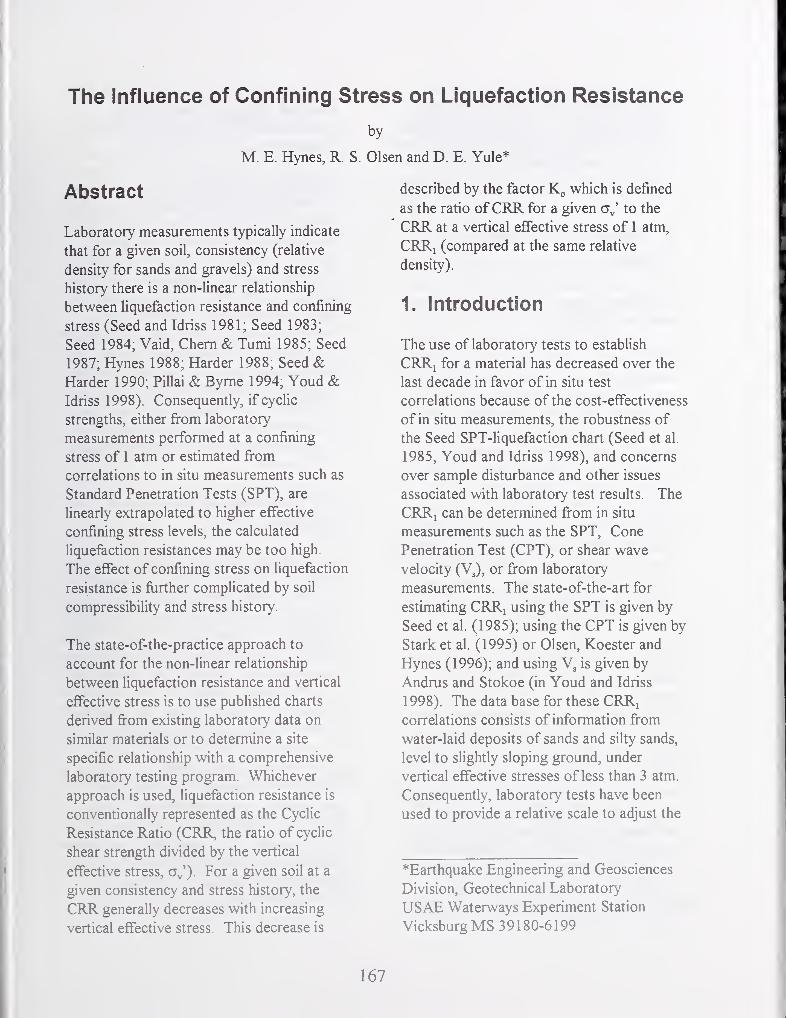
The Influence of Confining Stress on Liquefaction Resistance
by
M. E. Hynes, R. S. Olsen and D. E. Yule*
Abstract
Laboratory measurements typically indicate
that for a given soil, consistency (relative
density for sands and gravels) and stress
history there is a non-linear relationship
between liquefaction resistance and confining
stress (Seed and Idriss 1981; Seed 1983;
Seed 1984; Vaid, Chem & Tumi 1985; Seed
1987; Hynes 1988; Harder 1988; Seed &Harder 1990; Pillai & Byrne 1994; Youd &Idriss 1998). Consequently, if cyclic
strengths, either fi-om laboratory
measurements performed at a confining
stress of 1 atm or estimated fi^om
correlations to in situ measurements such as
Standard Penetration Tests (SPT), are
linearly extrapolated to higher effective
confining stress levels, the calculated
liquefaction resistances may be too high.
The effect of confining stress on liquefaction
resistance is farther complicated by soil
compressibility and stress history.
The state-of-the-practice approach to
account for the non-linear relationship
between liquefaction resistance and vertical
effective stress is to use published charts
derived from existing laboratory data on
similar materials or to determine a site
specific relationship with a comprehensive
laboratory testing program. Whichever
approach is used, liquefaction resistance is
conventionally represented as the Cyclic
Resistance Ratio (CRR, the ratio of cyclic
shear strength divided by the vertical
effective stress, ct^'). For a given soil at a
given consistency and stress history, the
CRR generally decreases with increasing
vertical effective stress. This decrease is
described by the factor K„ which is defined
as the ratio ofCRR for a given a^' to the
CRR at a vertical effective stress of 1 atm,
CRRi (compared at the same relative
density).
1. Introduction
The use of laboratory tests to establish
CRRi for a material has decreased over the
last decade in favor of in situ test
correlations because of the cost-effectiveness
of in situ measurements, the robustness of
the Seed SPT-liquefaction chart (Seed et al.
1985, Youd and Idriss 1998), and concerns
over sample disturbance and other issues
associated with laboratory test results. The
CRRi can be determined from in situ
measurements such as the SPT, Cone
Penetration Test (CPT), or shear wave
velocity (Vj), or from laboratory
measurements. The state-of-the-art for
estimating CRR^ using the SPT is given by
Seed et al. (1985); using the CPT is given by
Stark et al. (1995) or Olsen, Koester and
Hynes (1996); and using Vg is given by
Andrus and Stokoe (in Youd and Idriss
1998). The data base for these CRRicorrelations consists of information from
water-laid deposits of sands and silty sands,
level to slightly sloping ground, under
vertical effective stresses of less than 3 atm.
Consequently, laboratory tests have been
used to provide a relative scale to adjust the
*Earthquake Engineering and Geosciences
Division, Geotechnical Laboratory
USAE Waterways Experiment Station
VicksburgMS 39180-6199
167
CRRj values from in situ tests to higher
confining stress levels and non-level ground
stress conditions. The purpose of this study
was to review and report the current state of
knowledge with respect to the influence of
overburden stress on liquefaction resistance.
2. Historical Data and
Charts
Seed and Idriss (1981) to Seed and
Harder (1990)
Early tests on sands and silty sands indicated
considerable scatter in the values of K^,
.
These data, summarized in Figure 1 and
taken in part from Harder (1988), include
Sacramento River sand (Lee 1965),
Monterey No. 0 and Reid-Bedford sands
(Townsend and MuUuUs 1976), Upper and
Lower San Fernando Dams (Seed et al.
1973) and Fort Peck Dam (Marcuson and
Krinitzsky 1976). Superimposed on Figure 1
is an early relationship suggested by Seed
and Idriss (1981). As more data became
available, the chart was updated by Seed
(1984 and 1987), Harder (1988), and Seed
and Harder (1990), shown in Figure 3.
Upper and Lower San Fernando
Dams, Seed et al. (1973) and Seedet al. (1989)
Seed et al. (1973) and Seed et al. (1989)
report the results of cyclic triaxial tests on
undisturbed samples of silty sand and sandy
silt from the Upper and Lower San Fernando
Dams (USFD and LSFD). LSFD came
within inches of being overtopped after an
upstream slide developed in the dam as a
result of the 1971 San Fernando earthquake.
USFD settled 3 ft and moved about 5 ft
downstream, but did not fail; if it had failed,
the downstream dam would also have been
breached. This event resulted in the
evacuation of 80,000 people immediately
downstream of the two reservoirs.
Construction ofLSFD began in 1912, and
construction ofUSFD began in 1925. The
method of construction was hydraulic fill,
resuhing in an in situ relative density of
about 55 percent. Seed et al. (1973) and
Seed et al. (1989) observed that the cyclic
strength was about the same for the silty
sands and sandy silts; the method of
deposition resulted in a consistency that nowhad a uniform cyclic strength, although the
material type changed. Comparison of the
cyclic strength interpreted fi-om SPTcorrelations was very similar but slightly
greater than the strength determined from
the undisturbed specimens of the hydraulic
fill (Figure 4).
Fort Peck Dam, Marcuson andKrinitzsky (1976)
Marcuson and Krinitzsky (1976) report the
results of cyclic triaxial tests on undisturbed
and reconstituted (wet pluviation) samples of
hydraulic fill and foundation soils from Fort
Peck Dam. Construction of Fort Peck Dambegan in 1934. Relative densities determined
in the laboratory resulted in values of about
40 to 50 percent, rather than the 70 percent
average value indicated fi^om the Gibbs and
Holtz relationships for corresponding
blowcounts. Marcuson and Krinitzsky
(1976) made a comparison of the cyclic
strength of undisturbed and reconstituted
specimens at a confining stress of 8.3 psi
(0.57 atm). These data indicate that the
cyclic strength of the undisturbed specimens
was about 80 (foundation material) to 150
(shell material) percent greater than for
reconstituted specimens.
168
Sardis Dam, U.S. Army Engineer
District, Vicksburg (1985, 1988)
Sardis Dam is one of the three hydraulic fill
dams owned by the Corps ofEngineers.
Reevaluation of the seismic stability of Sardis
Dam began shortly after the near
catastrophic failure ofLSFD, in part because
of its proximity to the New Madrid fault
zone in Central U.S. Sardis Dam was
constructed in the late 1930's. Material
mixtures in the fill and foundation range from
sands to silts to high-water-content, low-
plasticity clays. The results of cyclic
laboratory tests, conducted over the course
of the reevaluation, were provided by U.S.
Army Engineer District, Vicksburg, for
inclusion in this study.
Olsen(1984)
Olsen (1984) generalized the data trends
fi-om the preliminary relationship by Seed
(1984), together with project data at WESinto the following expression: K^, = {a\)
^'
^
. Olsen (1984) reported that the stress
exponent, f,ranged fi^om 0.6 to 0.95 with
0.7 recommended for sands. This
recommendation is similar to the updated
Seed curves shown in Figure 2, and also
bounds the data fi^om Vaid and his
colleagues described next.
Vaid et al. (1985),
Vaid and Thomas (1994)
Cyclic strength, K„ for pluviated clean sands
Vaid et al. (1985) conducted cyclic triaxial
tests on two fine, clean sands, well rounded
Ottawa sand and an angular tailings material,
to investigate the effects of relative density,
compressibility, confining stress, and particle
angularity on cyclic strength. CRR for
confining stresses of 200, 800, 1600 and
2500 kPa were determined as a fianction of
consolidated relative density. The samples
were constructed by dry pluviation, and
vibrated to increase density.
Vaid et al. (1985) observed that there are
competing effects of increased confining
stress; one is densification due to the
compressibility of the material with
increasing confining stress which has the
effect of increasing CRR and the other is the
curvature in the cyclic strength envelope
which tends to decrease CRR as confining
stress increases. IfCRR values are
compared at the same consolidated relative
density, the data indicate a trend toward
convergence of the cyclic strength curves,
developed for different confining stresses, at
lower relative densities. These data imply
that Kg is approximately one for very loose
materials, and increases as relative density
increases. These data indicate that for
clean sands and silty sands have a limiting
value of about 0.6 at a confining stress of
about 8 atm. The cyclic triaxial test data
fi^om Vaid and Thomas (1994) on Fraser
River sand (dry pluviated and vibrated
specimens) follow a similar trend.
Stress focus plots of cyclic strength and CRRfor pluviated clean sands
Trends and deviations in geotechnical data
with confining stress are sometimes easier to
see when the data are plotted in log-log
plots. These log-log plots are termed stress
focus plots from Olsen (1994). If data fit as
a straight line on a log-log stress focus plot,
then that data is well fitted by a simple
exponential curve. Stress focus plots were
used in this study as a framework for
investigating confining stress effects on
cyclic strength and CRR. The Vaid et al.
(1985) and Vaid and Thomas (1994) data are
plotted on stress focus charts (log jo cyclic
169
strength plotted versus log lo effective
confining stress, atm) in Figure 5. This
figure shows that at confining stresses of 400
kPa and greater, the cyclic strength envelope
is well fitted with an exponential curve (plots
as a straight line on a log-log plot).
These data follow the stress focus concept,
namely that the cyclic strength curves for
different relative densities tend to converge
as confining stress increases. This point (or
zone) of convergence is termed the stress
focus. As shown by Olsen (1994), the
location of the stress focus is a function of
soil type and mineralogy. The slope of a line
in a stress focus plot corresponds to the
inverse of the exponent used by Olsen (1984)
to describe K,, : K„ = (a'J^
'^
. Consider
generalized stress focus cyclic strength lines
for a very loose, medium dense and dense
sand. As density increases, the cyclic
strength at a confining stress of 1 atm, CRRi,
increases. As density increases, the slope,
1/f , of the stress focus cyclic strength line
increases. The corresponding K^, curves are
determined as: K^, = {a\)^
"^ As density
increases, the exponent f decreases and K^,
decreases, resulting in a more severe
reduction to CRR.
Gravelly Soils, Hynes (1988 and 1996)
Hynes (1988) conducted 15-in. diameter
cyclic triaxial tests on moist tamped gravel
specimens from Mormon Island Auxiliary
Dam, constructed to relative densities of
about 40 and 64 percent. Similar tests were
conducted at WES on Ririe Dam gravels
(Sykora et al. 1991) compacted to a relative
density of about 45 percent, and Success
Dam gravels compacted to a relative density
of about 50 percent (U.S. Army Engineer
District, Sacramento 1996). Banerjee et al.
(1979) conducted tests on well-compacted
Oroville Dam gravels (relative density of
about 84 percent, 12-in. diameter, specimens
constructed in 6 layers with surface vibrator
applied for compaction). Cyclic strengths
for this study were compared at N = 10 load
cycles.
Hynes (1996) observed that the cycUc
strength envelopes for these gravels have an
upward turn at low confining stress, less than
3 atm. Hynes (1996) proposed that this
behavior is caused by a stress history that the
sample construction process builds into the
specimen, causing it to behave as an
overconsolidated (oc) soil; oc material has
greater axial and horizontal stiffiiess, is more
resistant to volume change, and thus is more
resistant to development of residual excess
pore pressures when subjected to cyclic
loading. In a stress focus chart, over-
consolidation is indicated by a steepening of
the cyclic strength line as confining stress
decreases. Over-consolidation results in
reduced values of .
The K„ values interpreted from the gravel
data depend upon how the CRR^ is estimated
(also the failure criterion used such as
maximum pore pressure response and cyclic
strain level, and membrane compliance
corrections applied). The most conservative
K(, values are obtained by straight-line
projection of the cyclic strength-effective
confining stress Mohr-Coulomb envelope to
estimate CRRj . The resulting K„ values for
Oroville gravels are : K„ 0.54 at 2 atm and
0.2 at 8 atm confining stress. The most
optimistic K„ values are obtained by ignoring
the apparent "overconsolidated" data at 2
atm, and then projecting the cyclic strength
envelope to the origin. This results in K^,
values of 0.50 at 8 atm and 0.44 at 14 atm
for Oroville gravels. The range ofK„
interpretations for the gravel data collected
in this study are plotted in Figure 6, with the
Seed and Harder (1990) curve for reference.
170
Except for the most optimistic
interpretations, these gravel data generally
plot below the data for clean and silty sands
(resulting in a more severe K„ reduction to
CRRi).
Byrne & Harder (1991), Pillai & Byrne
(1994) and Pillai & Stewart (1994)
Byrne and Harder (1991) selected K„ values
for clean sands from previous work to
develop a recommendation for the clean
sands and gravels present at Terzahgi Dam,
Canada. Their data set included the work by
Vaid and his colleagues at the University of
British Columbia at Vancouver (UBC), as
well as clean sand data from Seed and
Harder (1990). This clean sand curve is
plotted in Figure 7. Pillai and Byrne (1994)
estimated values for Duncan Damfoundation materials. At Duncan Dam, the
foundation contains a water-laid unit of very
fine sand (D50 = 0.2 mm) with 5 to 8 % fines
(typical gradations shown in Figure 1 la).
Foundation soils were frozen in situ to
extract high quality samples for laboratory
testing. Pillai and Byrne (1994) and Pillai
and Stewart (1994) report constant values of
CRR for confining stresses of 2 to 12 atm
from cyclic triaxial laboratory results, and
also constant values ofCRR for confining
stresses of 2 to 6 atm from cyclic simple
shear laboratory results. IfCRR is constant
regardless of confining stress (for a fixed
relative density), then is equal to one.
The in situ freezing procedure resulted in
undisturbed samples with a wider range of
void ratios and slightly lower average than
the values measured in situ by other means
(including gamma-gamma logging). Whenthese samples were reconsolidated to
effective confining stress levels of 2, 4 and 6
atm, they densified. The CRR values at 10
cycles correspond to a relative density of
about 55 percent, and indicate values of
about one.
For the liquefaction analysis of the fine sand
unit in the Duncan Dam foundation, CRRwas estimated to be constant with confining
stress in the fine sand, with CRR = 0. 12
(earthquake magnitude = 6.5). Pillai and
Byrne (1994) and Pillai and Stewart (1994)
state that the N-values measured in the unit
at various effective confining stress levels
(various overburden depths) were converted
to Nj 60 values using an energy correction
measured for the SPT equipment and Gibbs
and Holtz (1957) relative density
relationships to determine Nj for a given
relative density (known from the gamma-gamma logging and undisturbed samples).
CRRi values from Seed's liquefaction chart
(Seed et al. 1985) were inferred from the
Nj 60 values. K„ values were estimated as the
ratios ofCRR (equal to 0. 12) to CRRivalues. This procedure combines changes in
CRR due to confining stress with changes
due to densification, and requires
considerable confidence in the relationships
used to determine go for a given relative
density. However, in this case, the resulting
CRR is about the same as would be obtained
if densification effects are treated separately
and Cn and corrections are determined
for fixed values of relative density.
Gibbs and Holtz (1957) performed chamber
tests on a coarse sand (D50 =1.5 mm) with
zero fines and a fine sand (D50 = 0.3 mm)with 14 percent fines. Gibbs and Holtz
(1957) performed chamber tests on dry,
moist and saturated coarse sand specimens
and dry and saturated fine sand specimens.
They used confining stresses of 0 (self-
weight), 10, 20 and 40 psi (0, 0.68, 1.36 and
2.72 atm). For the Duncan Dam analysis, it
appears that Nj ^o values were linearly
interpolated from the measured value ofNj
60= 10 for the fine sand at 1 atm and D^ = 30

% , to the estimated value ofNj \9 at
= 65 %,using Gibbs and Ho'ltz (1957)
relationships as a guide.
Marcuson and Bieganousky (1976)
performed SPT chamber tests to determine
Cj^ corrections and relative density
relationships for fine to coarse sands with
low fines contents. They used two fine
sands, Reid-Bedford Model sand and Ottawa
sand, with gradations similar to Duncan
Dam. Marcuson and Bieganousky (1976)
used effective confining pressures of 10, 40
and 80 psi (0.68, 2.72 and 5.44 atm). Their
relationship between Nj go and D^ for fine,
submerged sand is similar to the Gibbs and
Holtz (1957) relationship for dry coarse
sand. The Marcuson and Bieganousky
(1976) data indicate that values decrease
(a more severe reduction from N to ) as
grain size and relative density decrease
(Hynes-Griffin and Franklin 1989).
Skempton (1986), Olsen (1994) and Olsen
and Mitchell (1995) provide summaries of
data and estimated corrections. The
potential range in values is large.
It is difficult to compare the K„ values from
the Duncan Dam study with other sources
since: a) the data reduction process couples
densification due to increased confining
stress with confining stress effects on cyclic
strength and penetration resistance; and b)
the resulting confining stress corrections are
highly site specific. In this case, the confining
stress and densification effects appear to
cancel each other, so CRR would be found
to be constant with depth using procedures
that treat densification and confining stress
separately.
Consensus K^, Curve (Harder 1996,
Youd and Idriss 1998)
The Kg correction was an issue discussed at
the Salt Lake City Workshop (Youd and
Idriss, editors, 1998). Published K„ trends
indicate a wide range of possible K„
relationships. After a presentation by Harder
(1996) and considerable discussion by the
participants, a consensus K„ relationship was
selected as the clean sand curve from Byrne
and Harder (1991, Figure 7). It roughly
corresponds to the average for all tested soil
types and relative density levels, and serves
as a lower bound for medium dense to loose
sands and silty sands. The data that support
the consensus curve correspond generally
to medium dense clean sands. The
consensus K„ curve may be unconservative
for gravelly soils or very dense soils, and
may be very conservative for loose sands and
silts.
Summary K^, Curves for Different Soil
Types
Clean Sands . The K^, data for clean sands
are grouped in Figure 8. The data fi"om Vaid
show a consistent trend that K„ decreases as
relative density increases for loose to
medium dense clean sands. However, the
CRRi values determined from the laboratory
tests are significantly less than would be
estimated for a clean sand at that relative
density based on blowcount correlations.
Gravels . The limited data for gravels
172
indicate lower values ofK„ than for sands
and silty sands. (A lower value ofK„ means
a more severe reduction in cyclic strength.)
However, the range of possible values of
is large, depending on the procedure used to
estimate CRRj . The K„ boundary for the
clean sand data is the upper bound for
interpretation of the gravel data. The K„
values are minimum when CRRi is estimated
from straight-line extrapolation in a shear
strength vs. confining stress plot, with
samples at lower confining stresses behaving
as overconsolidated material. The K„ values
are maximum when CRR^ is estimated from
straight-line extrapolation in a shear strength
vs. confining stress plot, ignoring
"overconsolidated" data.
Hydraulic Fill and Foundation Soils . The
and cyclic strength data for hydraulic fills are
shown in Figures 9 and 10. Data from loose
samples of silty sand formed by wet
pluviation (Fort Peck Dam shell and
foundation material) have values of about
0.9 to 0.95 at confining stresses of 6 to 8
atm. Values of K^, from tests on
undisturbed samples of hydraulic fill from
Sardis, USFD and LSFD generally plot
below the earlier Seed curves. The USFDdata form a lower bound to the data set
for hydraulic fill material. Figure 9 also
shows Kp data for silty, sandy foundation
soils (primarily alluvial) from Sardis, Fort
Peck, Arcadia and Enid Dams.
Soil Mixtures TSilty. Sandy Foundation
Soils).Figures 1 1 and 12 show K„ and
cyclic strength values from cyclic triaxial
tests on undisturbed samples of silt, carved
from block samples of the foundation
materials at Enid Dam. Also shown in these
figures are K„ values for foundation soils at
Arcadia Dam. The Arcadia samples were
undisturbed, thin-wall shelby tube samples.
For Enid silt, the maximum value ofK„
results from including densification of the
sample during consolidation. The minimum
value comes from comparing cyclic strengths
at a constant void ratio. The Enid and
Arcadia points plot close to the hydraulic fill
data from USFD, LSFD and Sardis Dam.
Consequently, the USFD data also form a
lower bound curve for silty, sandy
mixtures.
Stress History, Undisturbed samples,
Reconstructed Specimens and CRR^
Stress History Effects The database of cyclic
strength and K^, values assembled for this
study indicate that K^, is very sensitive to the
stress history ofthe soil. The effect of the in
situ stress history on cyclic strength can be
obscured due to sample disturbance unless
special measures, such as freezing (Singh et
al. 1982, Tani and Yasunaka 1988), are
taken to minimize disturbance.
Reconstruction of specimens in the
laboratory may introduce an artificial stress
history, as is caused by moist tamping, or
result in a near virgin state, as is the case
with wet or dry pluviation.
Undisturbed and Moist-Tamped Specimens
Increased cyclic strength caused by stress
history effects introduced during laboratory
construction of a specimen may not simulate
in situ conditions unless a similar stress
173
history exists in the field. Samples
constructed by moist tamping may
approximately simulate a stress history for
rolled-fill materials (which are known to
perform very well under cyclic loading, Seed
et al. 1977). However, for cohesionless
soils, high quality undisturbed samples
obtained by in situ fi-eezing are needed to
quantify past stress history effects on cyclic
strength and determine the appropriate K„
correction (Singh et al. 1982).
Undisturbed and Pluviated Specimens
Sample construction by wet or dry pluviation
may simulate deposition of hydraulic fill or
foundation deposits beneath a dam, typically
recent alluvium, colluvium or lacustrine
deposits. However, the in situ deposit may
have some stress history and aging effects
that are not simulated by freshly constructed
laboratory samples. These in situ stress
history and aging effects would be most
apparent at low levels of confining stress.
An elevated cyclic strength at low confining
stress leads to a more severe correction.
If high quality undisturbed samples are used
to determine cyclic strength as a fianction of
confining stress, as was the case for LSFDand USFD, then the cyclic strength may be
somewhat elevated at low confining stress
and the K^, correction less than one. If
recently constructed (pluviated) laboratory
tests are used for relative scaling of strength
to extend field correlations, then the K„
correction may be close to one, and cyclic
strength at high confining stresses may be
overestimated. This can be observed by
comparing the K„ correction for LSFD and
USFD with that for Fort Peck Dam.
CRRifrom Laboratory Tests Compared with
CRRifrom Penetration Tests Cyclic
strengths ofundisturbed samples correspond
fairly well with cyclic strengths inferred from
penetration tests (examples: USFD and
LSFD data; data from Japan on samples
excavated using in situ freezing reported in
Prakash and Dakoulas 1994). Cyclic
strengths of samples prepared by wet or dry
pluviation are generally much lower than
expected for a soil at that relative density
(examples: data from Vaid and others for
clean sands; comparison of cyclic strength of
reconstructed specimens and undisturbed
specimens from Fort Peck Dam). The cyclic
strength data for gravels (Folsom, Ririe and
Oroville Dams) were compared with an
estimated CRRi for soils at that relative
density. Estimation of CRRj from the
laboratory gravel data in stress focus plots
leads to values that are significantly less than
expected for a given relative density. This
underestimation of CRR^ can also be
observed in the Fraser River sand data; the
CRRi values from the laboratory tests on
freshly constructed pluviated specimens are
much less than would be expected for a
material at that relative density.
The data for freshly deposited materials (Fort
Peck Dam, Vaid) indicate a straight line
relationship on the stress focus plot but the
CRRi values are well below (80 to 150
percent too low for Fort Peck) those
expected for a material at that relative
density. Consequently, if specimens are
constructed by wet or dry pluviation, the
results should be similar to the observations
from Fort Peck and Vaid's work, and are not
174

necessarily representative of field conditions;
these results may also greatly overestimate
K(, . The Duncan Dam laboratory data
contradict this trend; these data were
obtained fi'om cyclic tests on undisturbed
samples of fine, clean sand that had been
frozen prior to sampling. The freezing
process has been shown to preserve stress
history effects on cycUc strength (Singh et al.
1982). The Duncan Dam laboratory data
indicate equal to one for confining
stresses ranging from 2 to 12 atm.
The stress focus theory described shows that
the cyclic strength envelopes for a given
gradation and mineralogy merge at very high
confining stress, regardless of stress history
and relative density. In the stress range of
interest for dams, however, cyclic strength
envelopes can be very sensitive to these
factors. The cyclic strength chart from Seed
et al. (1983) shows blowcount values at sites
that have and have not liquefied. For the
sites that did liquefy, the process of
liquefaction in the field may have the effect
of redepositing the affected soils, thus
erasing past stress history, and resulting in a
near virgin deposit. For the sites that did not
liquefy, the past stress history may be
preserved and possibly added to by the
earthquake shaking.
3. Conclusions
1 . Laboratory cyclic strength tests on
relatively loose soil samples reconstituted by
dry or wet pluviation result in high K^, values
(nearly linear strength envelope with
intercept near zero, little reduction in CRRas confining stress increases).
2. The CRRi values for reconstituted,
pluviated specimens are too low by about a
factor oftwo when compared to CRR^values from tests on high quality undisturbed
specimens.
3 . The CRRi values for reconstituted,
pluviated specimens are too low by about a
factor of two when compared to CRRjvalues estimated from penetration tests for
soils at about the same relative density as the
reconstituted specimens.
4. The Kg data base developed in this study
from laboratory tests on undisturbed samples
of fine sands, silts and silty sands, including
hydraulic fill and water-laid foundation
deposits, indicates values ranging from a
minimum of 0.55 to 0.45 (LSFD and USFD),
and a maximum of 1 to 0.9 (Duncan Dam)for confining stresses of4 to 6 atm.
5. Experience at USFD and LSFD indicates
that although material type is variable in
hydraulic fills, the method of deposition
results (for practical purposes) in a uniform
relative density and a uniform cyclic strength.
6. It is hypothesized that stress history
(including aging effects) is an important
factor in determining appropriate values for
K„ . Pluviation in the laboratory results in
near-virgin specimens, but the cyclic
strengths of these specimens does not
correspond to values from undisturbed
175

samples and inferred from penetration tests.
Moist-tamping results in specimens with
considerable stress history that may or may
not correspond well to field conditions.
7. Direct measurement of in the
laboratory will require testing high quality
undisturbed specimens. Pluviated,
reconstituted specimens may overestimate
Kg . Moist-tamped, reconstituted specimens
may underestimate K„ .
8. Stress Focus theory, originally developed
for interpreting CPT cone resistance, was
investigated as a framework for interpreting
the non-linear relationship between cyclic
strength and confining stress. The data
indicate a locus for a stress focus boundary
for liquefaction resistance which varies with
soil type. The stress focus format simplifies
the mechanics of relating CPT measurements
to soil properties.
4. Recommendations
1. Before conducting a costly, complex
laboratory testing program for site-specific
values ofK„,parametric dynamic analyses
and liquefaction evaluations should be
conducted to determine whether a detailed
laboratory testing program is warranted.
2. Initially, the analyses should consider the
most optimistic K„ values. If the dam or site
is judged unsafe with these values, remedial
construction is indicated.
3. If the dam is found to be safe, with
factors of safety against liquefaction greater
than 2, the analyses should then be
performed with the lower bound K^, values.
4. If the dam is still judged to be safe with
these values, for example with factors of
safety against liquefaction greater than 1.5,
then flirther laboratory testing or analysis
may be unnecessary to demonstrate adequate
seismic performance.
5. However, ifthe analyses (with the lower
bound K„ values) indicate factors of safety
less than 1.5, then a laboratory testing
program is recommended to quantify the
appropriate K„ relationships for this site.
5. References
Andrus, R. D. and Stokoe, K. H. 1996.
"Guidelines for Evaluation ofLiquefaction
Resistance Using Shear Wave Velocity," Salt
Lake City Workshop, NCEER.
Bieganousky, W.A. and Marcuson, W. F. Ill,
1976. "Liquefaction Potential ofDams and
Foundations, Report 1 : Laboratory Standard
Penetration Tests on Reid-Bedford Model
and Ottawa Sands," Research Report S-76-
2, USAEWES, Vicksburg, MS.
Bieganousky, W.A. and Marcuson, W. F. Ill,
1977. "Liquefaction Potential ofDams and
Foundations, Report 2: Laboratory Standard
Penetration Tests on Platte River Sand and
Standard Concrete Sand," Research Report
S-76-2, USAEWES Station, Vicksburg, MS.
176
FUGROInc 1980. "Cone Penetration
Testing of Arcadia Dam Site," Tulsa District
of the Corps of Engineers, Long Beach, CA.
Harder, L.F. 1988. "Use ofPenetration Tests
to determine the Cyclic loading Resistance of
Gravelly Soils during Earthquake Shaking",
PhD Dissertation, UC Berkeley.
Hynes, M.E. 1988. "Pore pressure charac-
terization of gravels under undrained cyclic
loading," PhD Dissertation, UC Berkeley.
Hynes, M.E. 1996. "Liquefaction Potential
of Gravels," Salt Lake City, NCEER
Hynes-GrifFm, M. E. and Franklin, A. G.
1989. "Overburden Correction in Gravels,"
Proceedings of the 20th Joint Meeting of the
UJNR Panel on Wind and Seismic Effects,
NIST SP 760, NIST, Gaithersburg, MD.
Gibbs, H. J. and Holtz, W. G, 1957.
"Research on determining the density of sand
by spoon penetration testing," Proceed-ings.
4th ISSMFE Conference . Vol. I.
Marcuson, W. F. Ill and Krinitzsky, E. L.
1976. "Dynamic Analysis of Fort Peck
Dam," Technical Report S-76-1,
USAEWES, Vicksburg, MS.
Olsen, R.S. 1984. "Liquefaction analysis
using the Cone Penetrometer Test (CPT),"
Proceedings of 8th World Conference on
Earthquake Engineering . San Francisco.
Olsen, R.S. 1994. "Normalization and
Prediction of Geotechnical Properties using
the Cone Penetrometer Test (CPT)," PhDDissertation, UC Berkeley.
Olsen R.S. and Mitchell J.K. 1995. "CPTstress normalization and prediction of soil
classification" Proceedings of International
Symposium on Cone Penetrometer Testing -
CPT'95 . October, Linkoping, Sweden.
Pillai, V.S, and Byrne, P.M. 1994."Effect of
overburden pressure on liquefaction
resistance of sands," Canadian Geotechnical
Journal . Vol. 31, pg 951-966.
Pillai, V.S, and Stewart, R. A. 1994.
"Evaluation of liquefaction potential of
foundation soils at Duncan Dam," Canadian
Geotechnical Journal . Vol. 31, pg 53-60.
Seed, H. B. and De Alba, P. 1986. "Use of
SPT and CPT tests for evaluating the
liquefaction resistance of soils," Proceedings
of the Specialty Conference on the Use of In
Situ Tests in Geotechnical Engineering .
Blacksburg, VA, ASCE Geotechnical
Special Publication No. 6, pp. 120-134.
Seed, H. B. and Idriss, I. M. 1981.
"Evaluation ofLiquefaction Potential of
Sand Deposits Based on Observations of
Performance in Previous Earthquakes,"
Proceedings of the ASCE National Fall
Convention . St. Louis, Session No. 24.
Seed, H.B. 1983. "Earthquake-Resistant
Design ofEarth Dams," Proceedings of
Symposium on Seismic Design ofEmbank-
ments and Caverns . May, ASCE pg 41-64.
177
Seed, H.B.1984, 1987. Pers. communication
Seed, H. B., Idriss, I. M. and Arango, T.
1983 . "Evaluation of Liquefaction Potential
Using Field Performance Data," Journal of
Geotechnical Engineering Division . ASCE,
Vol. 109, No. 3, March 1983, pp. 458-492.
Seed, R.B. and Harder, L.F. 1990. "SPT-
based analysis of cyclic pore pressure
generation and undrained strength" Proceed-
ings. H. B. Seed Memorial Symposium .
Bitech Publishers, Vol. 2, pg 351-376.
Singh, S., Seed, H.B. And Chan, C.K. 1982.
"Undisturbed sampling of saturated sands by
freezing." Journal of Geotechnical Engin-
eering . ASCE, New York, Vol. 108, No. 2.
Skempton, A. W. 1986. "Standard
Penetration Test Procedures and the Effects
in Sands of Overburden Pressure, Relative
Density, Particle Size, Aging and Overcon-
solidation," Geotechnique . Vol. 36, No. 3.
Stark, T. D , and Olson, S. M. 1995.
"Liquefaction Resistance using SPT and
Field Case Histories," Journal of
Geotechnical Engineering . ASCE, NewYork, Vol. 121, No. 12, pp 856-868.
Tani, S. And Yasunaka, M. 1988. "Effect
of sampling methods on liquefaction resis-
tance of loose sand," Proceedings, 9''' World
Conference on Earthquake Engineering,
Tokyo-Kyoto, Japan, Vol. Ill, pp 219-224.
Thomas, J. 1992. "Static, cyclic and post
liquefaction undrained behavior of Eraser
River Sand," MS Thesis, UBC, Canada.
U.S. Army Engineer District, Tulsa. 1982.
"Arcadia Lake, Deep Fork River,"
Supplement No. 1 to Design MemorandumNo. 9, "Embankment and Spillway."
U.S. Army Engineer District, Vicksburg.
1988. "The Sardis Earthquake Study,"
Supplement No. 1 to Design MemorandumNo. 5 (1985).
Vaid, Y.P., Chem, J.C. and Tumi, H. 1985.
"Confining pressure, grain angularity, and
liquefaction," Journal of Geotechnical En-
gineering . ASCE, October, Vol. Ill, No.
10.
Vaid, Y. P. and Thomas, J. 1994. "Post
liquefaction behavior of sand," Proceedings
of the 13th ISSMFE Conference. New Delhi
Vaid, Y. P. and Thomas, J. 1995.
"Liquefaction and post liquefaction behavior
of sand," Journal of Geotechnical
Engineering . ASCE, Vol. 121, No. 2.
Youd, L. and Idriss, I. M. editors. 1998.
"Workshop on Evaluation ofLiquefaction
Resistance," Proceedings, Salt Lake City,
sponsored by FHWA, NSF and WES, in
publication, NCEER, Buffalo, NY.
178
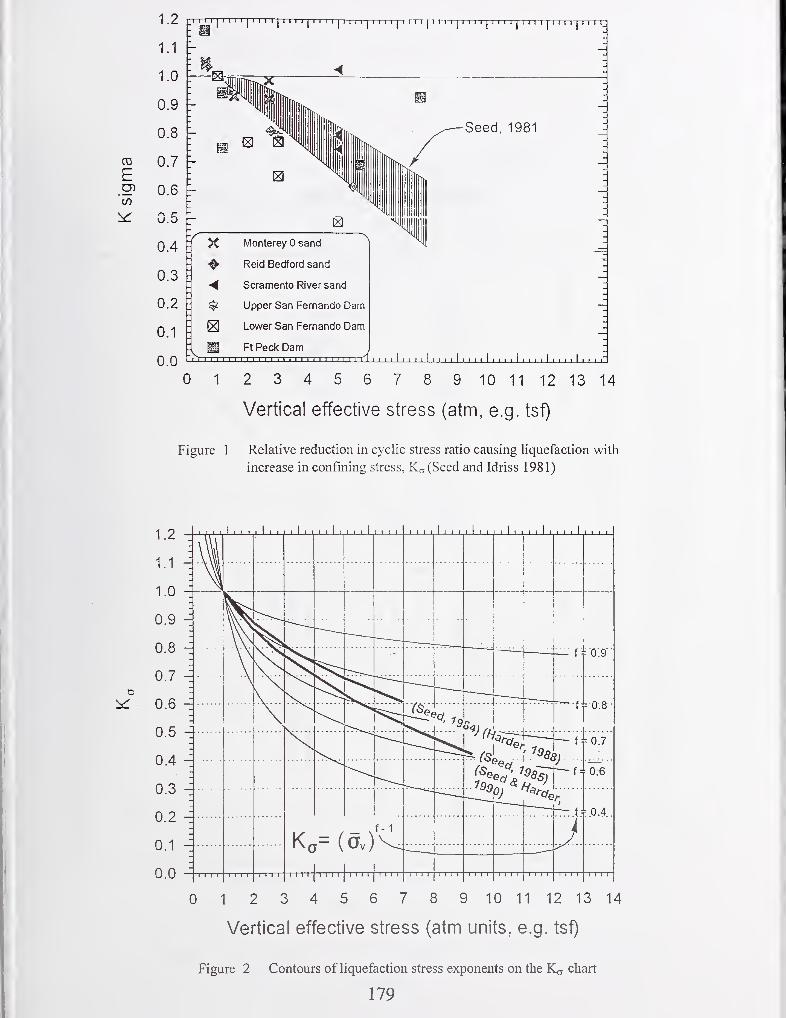
1.2 u
0 1 2 3 4 5 6 7 8 9 10 11 12 13 14
Vertical effective stress (atm, e.g. tsf)
Figure 1 Relative reduction in cyclic stress ratio causing liquefaction with
increase in confining stress, (Seed and Idriss 1981)
0 1 2 3 4 5 6 7 8 9 10 11 12 13 14
Vertical effective stress (atm units, e.g. tsf)
Figure 2 Contours of liquefaction stress exponents on the chart
179

180
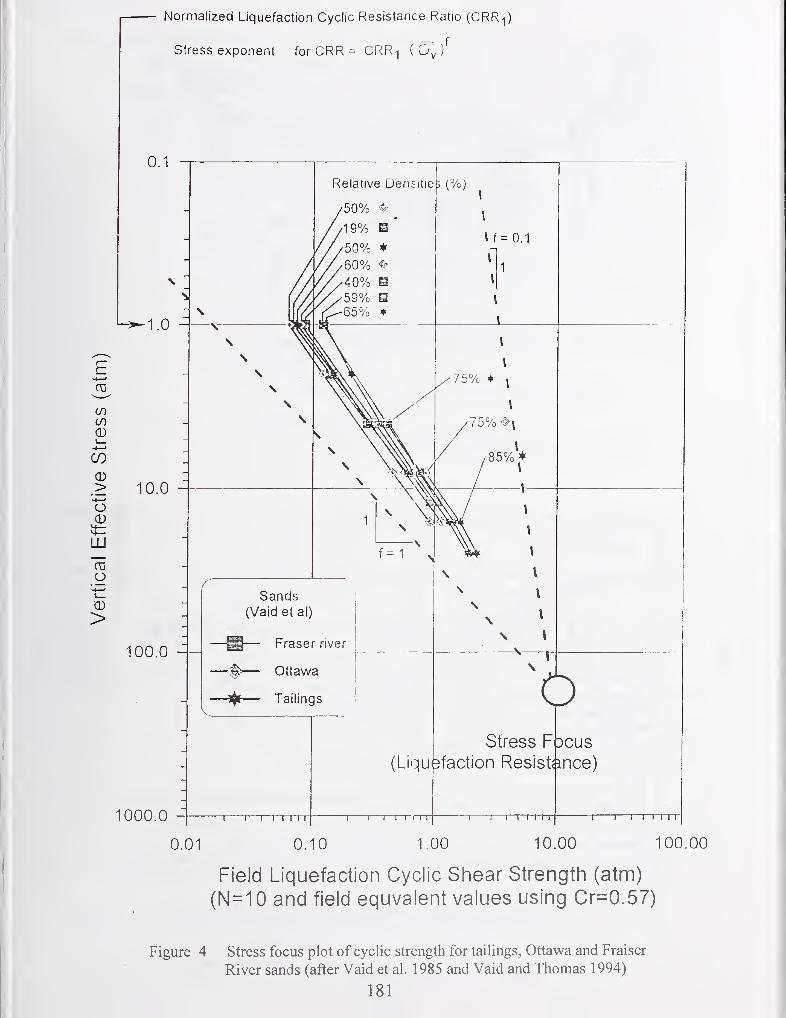
Normalized Liquefaction Cyclic Resistance Ratio (CRR-|)
Stress exponent forCRR= CRR-] ( C\, )^
E
S-(/5
(/)
0)
CO
CD>
(D
LU
"too
(D
>
10.0
1000.0
100.0 -
10.00 100.00
Field Liquefaction Cyclic Shear Strength (atm)
(N=10 and field equvalent values using Cr=0.57)
Figure 4 Stress focus plot of cyclic strength for tailings, Ottawa and Fraiser
River sands (after Vaid et al. 1985 and Vaid and Thomas 1994)
181
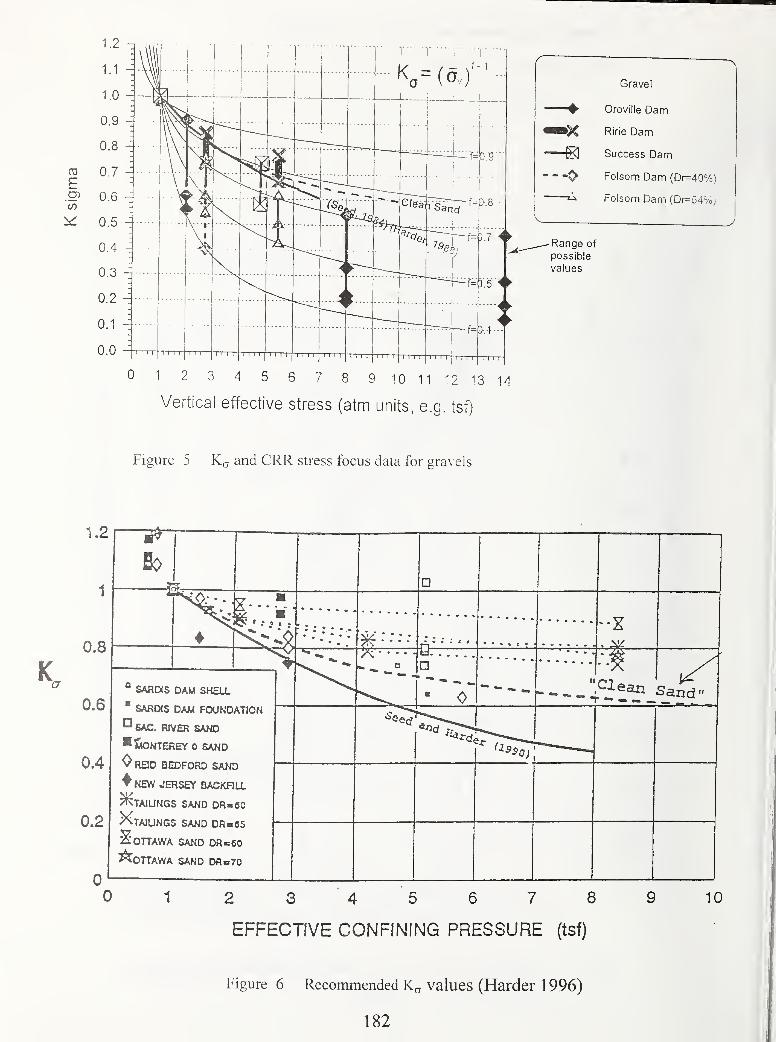
0 2 3 4 5 6 7 8 9 10 11 12 13 14
• Vertical effective stress (atm units, e.g. tsf)
Figure 5 Kcr and CRR stress focus data for gra\ els
° SARWS DAM SHELL
SARDIS DAM FOUNDATION
^ SAC. RIVER SAND
lioNTEREY 0 SAND
OrbD BEDFORD SAND
^ NEW JERSEY BACKHLL
^TAIUNGS SAND DR-60
XtAIUNGS sand DR-65
OTTAWA SAND DR-:60
3^0TTAWA SAND Dfl=70
1 2 3 4 5 6 7 8
EFFECTIVE CONFINING PRESSURE (tsf)
10
Figure 6 Recommended K^, values (Harder 1 996)
182
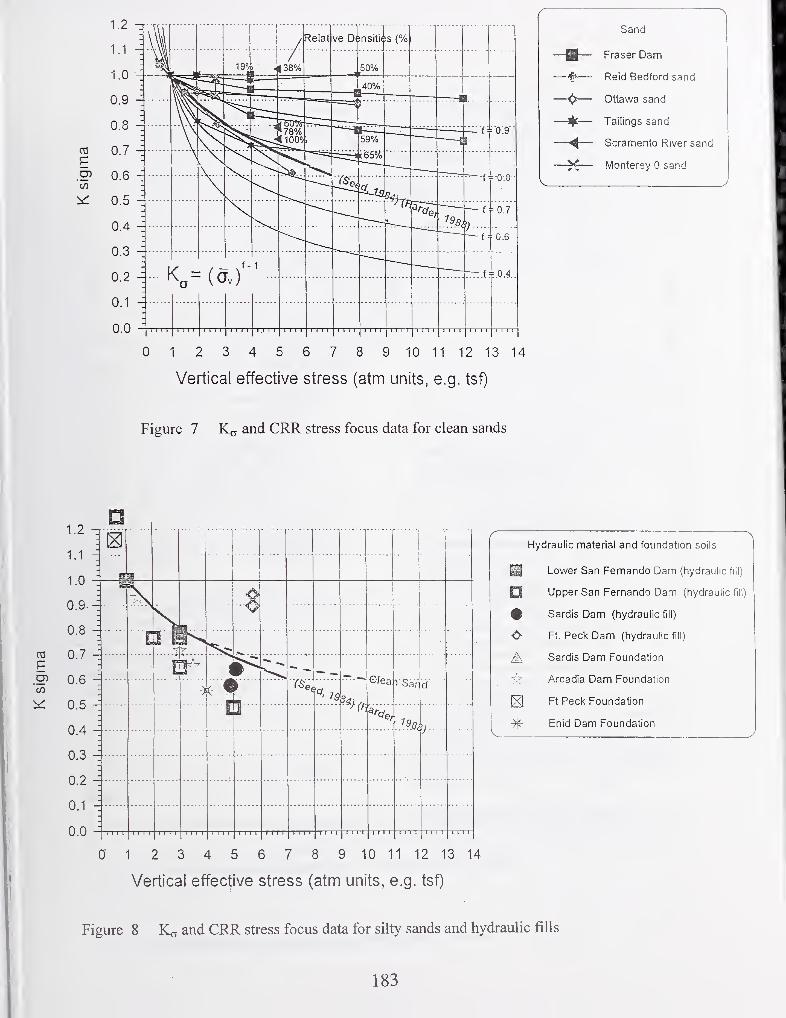
0 1 2 3 4 5 6 7 8 9 10 11 12 13 14
Vertical effective stress (atm units, e.g. tsf)
Figure 7 and CRR stress focus data for clean sands
t
i€/ea VSar d
< €
E
Hydraulic material and foundation soils
Lower San Fernando Dam (hydraulic fill)
Upper San Fernando Dam (hydraulic fill)
Sardis Dam (hydraulic fill)
Ft. Peck Dam (hydraulic fill)
Sardis Dam Foundation
Arcadia Dam Foundation
Ft Peck Foundation
Enid Dam Foundation
0 1 2 3 4 5 6 7 8 9 10 11 12 13 14
Vertical effective stress (atm units, e.g. tsf)
Figure 8 and CRR stress focus data for silty sands and hydraulic fills
183

0.1
1.0
10.0 —
100.0 --
1000.0
Osla source
Uppef San Femsndo D«m • 6<ed
— * Lake AfrcMrlicad dam -Seed
-0— Sards Dam - WES data
Fdjom 0am • Gravels - Hyn«
—H— RirteOam-WES
wB^^M CXmcan Dam • BChydro
San Joechln • G«<d
- (P - Fam«i«dam.E«edfl3M)
' A Lower San Fernando Dam- Seed
Dpper San Fernando Dam - Seed
Los Angles Dam- Seed
OrovlBe Dam • Seed
Rnopons Dam
IOttawa Sands - VaJd etc
—^— Ottawa Sands - Vald etc
-X— Taffinss Sand -Vftid etc
A TaJInjs Sands -Vald etc
Fraser Sand - VaJd etc
i\ Fraser Sand • Vald etc
-H- Arcadia Dam -WES
Phuicunhaphan,TsaI&TNer$(1932)
liquefactii
Stress
for sil
Probable zone for the Stress
Focus for dirty sands andsandy mixtures
Liquefaction Stresj
for sands andFocusgravels
"T 1 1—TT"
0.01 0.10 1.00 10.00
Lab determined liquefaction resistance strength (atm units)
for field conditions
(at N=15 cycles, and 5% DA strain)
Figure 9 Trends of liquefaction resistance in stress focus format
184
Evaluation of the Seismic Capacity Of
An Existing Thick Wall Reinforced Concrete Structure
Using Probabilistic Criteria
by
F. Loceffl G. Mertzl and G. Rawls^
ABSTRACT
A seismic qualification of a reinforced concrete
nuclear materials processing facility using
performance based acceptance criteria is
presented. Performance goals are defined in
terms of a minimum aimual seismic failure
frequency. Pushover analyses are used to
determine the building's ultimate capacity and
relate the capacity to roof drift and joint
rotation. Nonlinear dynamic analyses are used to
quantify the building's drift versus earthquake
magnitude using a suite of time histories
representing varying soil conditions and levels
of seismic hazard.
A probabilistic correlation between joint
rotation and damage state is developed from
experimental data. The results of the
deterministic pushover and nonlinear time
history analyses are evaluated statistically to
develop a probability of seismic failure or
fragility. The building fragility level is
convolved with the seismic hazard curve to
determine annual seismic failure frequency.
KEYWORDS
BUILDING; FRAGILITY, NONLINEAR;SEISMIC
1. INTRODUCTION
This paper discusses the seismic qualification of
an existing nuclear material processing facility.
This work was part of an effort to update the
facility safety analysis
Westinghouse Savannah River Company, Aiken SC 29808.
The material processing facility is a heavy
concrete structure that was built in the early
1950's. Radiation shielding was the primary
design consideration. Lateral load resistance
was given scant attention in 1950's vintage
design codes. This combination of factors
resulted in large, lightly reinforced concrete
sections which do not meet today's seismic
detailing requirements.
The safety analysis is updated to include our
current imderstanding of the seismic hazard at
the building site and the building's seismic
response. The current seismic design loading is
several times larger than the lateral loads
considered in the original design. When the
current seismic loads are combined with the lack
of current code detailing, the structure will not
meet a design-code seismic qualification.
An probabilistic evaluation methodology that
addresses the lightly reinforced concrete
buildings with 1950's detailing, typically found
in older facilities, is discussed in this paper.
Using this methodology, the authors have shown
that a nuclear material processing facility is
capable of surviving the postulated design basis
earthquake (DBE).
This paper emphasizes the probabilistic aspects
of this evaluation while a companion paper
(Mertz et al, 1998) emphasizes the analysis
methodology.
185
1 . 1 ACCEPTANCE CRITERIA
DOE Standard 1020 sets acceptance criteria for
DOE facilities based on performance goals. For
the structure discussed in this paper the
performance goal is an annual failure frequency
of 2x10"^. The standard allows considerable
latitude in evaluation methodology as long as
the specified performance goal for a given
category of structures, systems and components
(SSCs) are met. This latitude consists essentially
of three approaches to meet the performance
goals for the SSC.
• For a hazard probability specified for the
facility use, apply conservative
deterministic evaluation techniques based
on national consensus standards as
supplemented by DOE Standard 1020
requirements for the facility performance
goal.
• Achieve less than a 10% probability of
unacceptable performance of an SSCsubjected to a scaled design basis
earthquake (SDBE) that is 50% larger than
the DBE.
Demonstrate acceptable structural behavior
by showing that the building armual
probability of seismic failure is less than the
facility performance goal.
A key factor in the probabilistic approach is the
specification of an acceptance criteria, stated in
probabilistic terms, that conforms to the
performance goals in DOE Standard 1020.
The structure discussed in this paper consists of
a reinforced concrete frame with partially
developed joints. Failure for a specific joint is
defined, in this paper, as the reduction of
capacity below a nominal value. Frame failure is
conservatively assumed to occur when the first
joint fails. Thus, this probabilistic assessment
has a definite conservative bias. Identifying a
joint failure, as such, does not imply the failure
of the building frame. In fact, substantial
conservatism exists since a failure of the frame
cannot occur until a sufficient number ofjoints
sustain sufficient damage to cause a collapse
mechanism.
Using this definition of unacceptable structural
behavior, the evaluation methodology leads to
the calculation of the conditional probability of
seismic failure. This conditional failure
probability is measured against the acceptance
criteria in DOE Standard 1020.
1.2 ANALYSIS METHODOLOGY
There are several options available to evaluate
older existing facilities for seismic loads. The
choice should consider the in-situ building
condition, the level of seismic load, the effects
of foundation embedment, the functional
requirements, the level of acceptable damage,
the confinement requirements, and the
performance category of the facility. This paper
concentrates on the more rigorous approach to
demonstrate the capability of a facility to
withstand a postulated seismic event.
1.3 FACILITY DESCRIPTION
The material processing facility, designed and
constructed in the early 1950s, are reinforced-
concrete buildings. They are 66 ft high, 122 ft
wide (Figure 1) and consist of eighteen
segments, typically 43 ft long. One-inch
expansion joints separate the segments from
each other. The exterior walls range from 2.5 to
4.8 fit thick and support a haunched roof slab. Aframe structure is contained within the building.
The lower portion consists of continuous walls
and discrete columns while the upper portions
contain continuous walls. The specified design
strength of the concrete is 2,500 psi and Grade-
40 reinforcing steel was used. The structure is
supported on a 5-foot-thick reinforced-concrete
foundation mat. The total weight of a typical
segment is 24,800 kips.
Primary longitudinal (N-S) stiffiiess against
seismic loading comes from the 4 ft thick shear
walls while the transverse (E-W) stiffiiess is
provided by frame action of the reinforced-
concrete walls.
The original design was based on the Uniform
Building Code (UBC, 1946) with a 1951
Addenda and on the American Concrete
Institute (ACI) Code ACI 3 1 8-47. The design
focused on gravity loading with only a nominal
seismic lateral load applied statically to the
building structure. The exterior walls were
186
designed to resist a uniform external over-
pressure. This design condition resulted in
heavier reinforcement on the inside face of the
walls than on the outside face. Many of the
embedment and splice lengths of the reinforcing
steel do not satisfy current ACI specifications
Vkith some embedment lengths only 25 percent
of that required by the current code.
A typical joint that connects the roof to the
exterior wall is shown in Figure 2. This joint
was designed for gravity loads and the bottom
slab reinforcing is not fully anchored in the
wall. Seismic loads will cause load reversal,
putting the bottom bars in tension and the
capacity of this underdeveloped bar is reduced
due to bond slip. This joint is 43 feet long and
the geometry of the joint constrains the concrete
around the reinforcing bar.
2. DEVELOPMENT OF SEISMIC INPUT
The probabilistic structural analysis requires
that the median responses of the building be
determined. The building sits on a deep layered
site consisting of sands and clays over bedrock.
Bedrock is approximately 950 ft below free
field. Seismic motions were developed for: 1) an
evaluation basis earthquake (EBE) with 2000
year return period, and 2) a seismic margin
earthquake (SME) with a 10,000 year return
period. Both the EBE and SME ground motions
are defmed in the form of 5% damped rock-
outcrop response spectra. Eight acceleration
time histories were prepared; four compatible
with the EBE spectrum and four compatible
with the SME spectrum.
To consider the variabilities in the soil between
the free field and the bedrock each time history
was convolved through several soil columns, as
shown schematically in Figure 3. At the site,
there were four deep borings (s950 ft) to
bedrock, and five shallow borings, (=150 ft).
Each EBE and SME time history was convolved
through 20 soil columns that were formed by
combining each deep boring with all five
shallow borings, resulting in 80 time histories at
the base of the building.
The response spectra of the convolved time
histories are plotted at the elevation of the
basemat of the building and a mean spectrum
was calculated for both the EBE and the SMEmotions. To reduce the computational effort in
developing the building response, a subset of 1
1
out of 80 time histories were chosen for both the
EBE and SME events. These 1 1 time histories
were selected such that the mean of their
response spectra closely matches the mean of
the full suite of 80 time histories. Furthermore,
the 1 1 spectra are evenly spaced between the
maximum and minimum envelopes of the 80
spectra from the convolved time histories, and
have an equal probability of occurrence.
The median response spectra of these time
histories are shown in Figure 4 for the 2,000-
year and the 10,000-year events.
3. DETERMINISTIC BUILDINGRESPONSE
The building behavior was determined by
performing a static pushover analysis to
determine the structure's overall lateral load
resistance. Nonlinear dynamic analyses, using a
simplified dynamic model, were performed to
determine the seismic response.
3 . 1 STATIC PUSHOVER ANALYSIS
In the east-west direction, the structure consists
of a moment resisting lateral frame with a rigid
penthouse structure. A static pushover analysis
of the lateral load resisting frame is performed
to determine the building's lateral load capacity
and the relationship between displacement and
joint rotation.
Lumped nonlinear springs are located at critical
joints to represent, cracking of the gross section,
yielding of the longitudinal reinforcing and
bond slip due to inadequate development. In
partially developed joints, the members'
capacity is reduced by the ratio of the actual
development length to the code development
length.
A typical monotonic load-deformation curve or
backbone curve for the structure is shown in
Figure 5. The structure remains elastic below a
base shear of about 5% of the building weight.
Above this load, individual joints crack and
yield at different load levels, which gradually
soften the overall structural response. A plastic
collapse mechanism is nearly formed after six
187

inches of displacement. For displacements
beyond this point, the slight increase in capacity
due to strain hardening of the reinforcement is
nearly offset by the increasing P-A forces. The
ultimate capacity corresponds to about 1 1% of
the structure's weight.
3 .2 NONLINEAR DYNAMIC ANALYSIS
A fragility analysis for a reinforced-concrete
structure subjected to strong earthquake motions
requires realistic conceptual structural models
that consider changes in stiffiiess and material
properties, the variability of seismic source and
in-situ soil conditions. To adequately address
these parameters, numerous non-linear time
liistory analyses were performed. Since non-
linear time history analyses are numerically
intensive, reduced dynamic models are used to
perform the analyses.
The elastic response of the frame in Figure 1 is
dominated by the response of the first mode,
with roof drifts in-phase with joint rotations.
Thus, the structure is represented with a single-
degree-of-freedom (SDOF) model having an
equivalent elastic response as the fiill structural
model. The elastic natural frequency of the
structure is on the order of 1 to 1.3 Hz.
The nonlinear response of the SDOF model is
represented by the Takeda hysteresis model
(Takeda, 1970) that represents the
experimentally observed behavior of reinforced
concrete beams subject to cyclic loads. The 1
1
EBE and 1 1 SME ground motions are evaluated
using a SDOF model which represent the
nominal capacity of the building based on
'design' material properties. The range of roof
displacements, for the 1 1 representative 2,000
and 1 1 representative 10,000 year ground
motions is summarized in Table 1
.
The initial structural stiffiiess of the SDOFmodel was also perturbed to address the
uncertainty in natural frequency on response.
The range of roof displacements for the 1
1
representative ground motions with lower bound
(-30%), best estimate, and upper bound (+30%)stiffness is summarized in Table 2. This
structure is more sensitive to variations in soil
column than to variations of initial stiffiiess.
Table 1 Range Of Roof Displacements ForDifferent Earthquake Magnitudes and Soil
Columns
Ground # Minimum MaximumMotion
(in) (in)
EBE 33 1.30 2.78
SME 33 6.52 10.2
Table 2 Range Of Roof Displacements ForDifferent Earthquake Magnitudes, Soil
Columns, And Natural Frequencies
Ground
Motion
# Minimum
(in)
Maximum
(in)
EBE 33 1.30 2.78
SME 33 6.52 10.2
The 1 1 EBE ground motions were also
evaluated using a SDOF model that represented
the median building capacity to investigate the
change in response with capacity. The lateral
load capacity of the frame, calculated using
median material properties, is about 27% larger
than the lateral load capacity calculated using
material properties that are exceeded by 95% of
the test data. The influence of material strengths
on the range of seismic displacement, shown in
Table 3, is small because the structure is
responding in the displacement confrolled
region of the specfra.
Table 3 Range Of SME Roof DisplacementsFor Different Material Strengths
Material
Properties
# Minimum
(in)
Maximum
(in)
95%Exceedance
33 6.52 10.2
Median 33 7.21 10.1
Representative nonlinear MDOF were also
performed to validate the SDOF analyses. These
comparisons indicate that the SDOF mass
188
participation was overestimated and
consequently, the SDOF models tend to over-
predict the roof displacements.
4. PROBABILISTIC ANALYSIS
Ground motions and the resulting structural
drifts were developed in the proceeding
sections. Theses values are combined in this
section with the probability ofjoint failure to
determine the mean annual probability of
seismic failure which is compared to the
structures performance goal specified by DOEStandard 1020.
4. 1 PROBABILITY OF PARTIALLYDEVELOPED JOINT FAILURE
Rotations are imposed on the joints when a
frame drifts under seismic lateral loads. Joints
that do not meet the ACI 318-95, development
length requirements may not develop their full
yield moment. In this evaluation, the ACI bond
stress is used to limit the bending capacity
((() Mn), of a partially developed joint, by the
ratio of actual development length, to the ACIdevelopment length. The amount of bar slip at
the reduced moment is determined by the
rotation imposed on the joint and ultimately by
the lateral drift of the frame as shown in Figure
6. Failure is defined as the inability of a joint to
resist the reduced moment, at a given drift.
Typical confined bar pullout test results
(Eligehausen, 1983), are shown in Figure 7.
Monotonic tests indicate that for low
magnitudes of bond slip the bars have a muchlarger capacity than the ACI 3 18-95 code allows
and that the code bond capacity corresponds to
the capacity at large deformations. Cyclic tests
indicate that the capacity degrades with an
increasing number of cycles and the degradation
is more pronounced when cycled with larger
ranges of slip. After 10 cycles, the code capacity
is obtained when loading beyond the maximumpost-bond slip. This test data was reviewed and
judged that 13% and 75% of the specimen
would fail to maintain the ACI bond capacity at
peak slip ranges of 0.2 in and 0.36 in
respectively. A lognormal probability
distribution is fit to these two failure estimates
as shown in Figure 8.
Test of full scale joints with partially developed
bars, shown in Figure 9 (Beres, 1992, Aycardi,
1992), demonstrate that the joint is capable of
resisting considerable rotation at the reduced
bending moment (j) Mn l/lj. Joint rotations for
this data are converted to bar slip, ranked, and
used to validate the bar slip probability of
failure in Figure 8. Note that the bar slip in
Figure 6 is the product ofjoint rotation and the
distance between the neutral axis to the
reinforcing, d. A joint rotation of 0.02 radians of
the 24 inch deep test specimen, in Figure 9,
causes the same bond slip as a 0.01 radian
rotation on a section that is 48 inches thick.
Thus, allowable joint rotation limits should be
viewed v^th caution when evaluating thick
sections.
Individual joint rotations corresponding to each
increment of roof drift in the pushover analysis,
Figure 5, are converted into components of
bending rotation and bond slip. Bond slip failure
probabilities from Figure 8 are assigned to each
joint based on the computed bar slip. Bending
failure probabilities are also assigned using a
similar relationship and combined with the bond
slip failure probability. Bond slip dominated the
failure probabilities of this structure.
It was assumed that the loss of any critical
member in the load path could result in building
failure, Therefore, an envelope of the individual
critical member joint failure probabilities
represents the probability of structural failure,
and is shown in Figure 10. Parametric studies
indicate that this indetermanent structure can
survive the loss of a single critical joint with a
reduced lateral load capacity. As shovm above
the seismic drift is insensitive to lateral load
capacity because the building responds in the
displacement controlled region of the spectra.
Thus, the probability of structural failure, shown
in Figure 10, has a conservative bias.
For roof displacements less than 4 inches (0.5%
drift) the probability of failure is negligible
while a roof displacement of 5.8 inches (0.8%
drift) corresponds to a 50% probability of
failure. The probability of failure for the
structure is dominated by a joint on the exterior
frame that fails by bond slip.
189
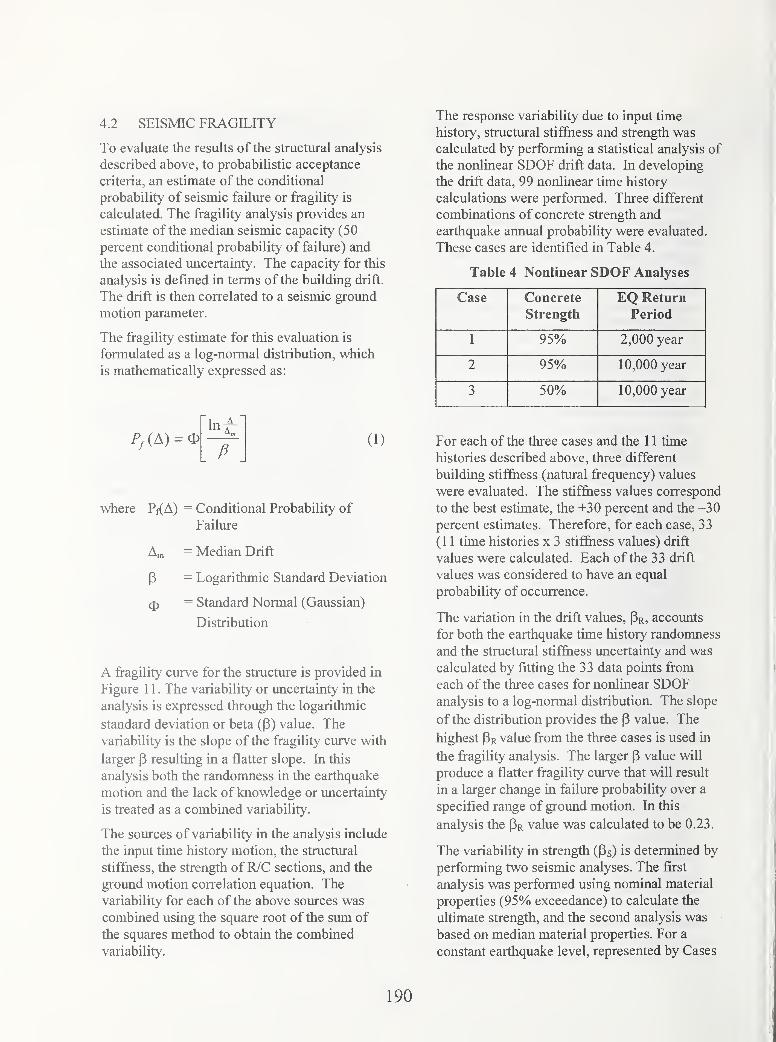
4.2 SEISMIC FRAGILITY
To evaluate the results of the structural analysis
described above, to probabilistic acceptance
criteria, an estimate of the conditional
probability of seismic failure or fragility is
calculated. The fragility analysis provides an
estimate of the median seismic capacity (50
percent conditional probability of failure) and
the associated uncertainty. The capacity for this
analysis is defined in terms of the building drift.
The drift is then correlated to a seismic ground
motion parameter.
The fragility estimate for this evaluation is
formulated as a log-normal distribution, which
is mathematically expressed as:
P,(A) = 0hi
P(1)
where Pf(A) = Conditional Probability of
Failure
Am = Median Drift
P = Logarithmic Standard Deviation
(J)= Standard Normal (Gaussian)
Distribution
A fragility curve for the structure is provided in
Figure 1 1 . The variability or uncertainty in the
analysis is expressed through the logarithmic
standard deviation or beta (P) value. The
variability is the slope of the fragility curve with
larger P resulting in a flatter slope. In this
analysis both the randomness in the earthquake
motion and the lack of knowledge or imcertainty
is treated as a combined variability.
The sources of variability in the analysis include
the input time history motion, the structural
stiffness, the strength of R/C sections, and the
ground motion correlation equation. The
variability for each of the above sources was
combined using the square root of the sum of
the squares method to obtain the combined
variability.
The response variability due to input time
history, structural stiffness and strength was
calculated by performing a statistical analysis of
the nonlinear SDOF drift data. In developing
the drift data, 99 nonlinear time history
calculations were performed. Three different
combinations of concrete strength and
earthquake annual probability were evaluated.
These cases are identified in Table 4.
Table 4 Nonlinear SDOF Analyses
Case Concrete
Strength
EQ Return
Period
1 95% 2,000 year
2 95% 10,000 year
3 50% 10,000 year
For each of the three cases and the 1 1 time
histories described above, three different
building stif&iess (natural frequency) values
were evaluated. The stiffiiess values correspond
to the best estimate, the +30 percent and the -30
percent estimates. Therefore, for each case, 33
(11 time histories x 3 stif&iess values) drift
values were calculated. Each of the 33 drift
values was considered to have an equal
probability of occurrence.
The variation in the drift values, Pr, accounts
for both the earthquake time history randomness
and the structural stiffiiess uncertainty and was
calculated by fitting the 33 data points from
each of the three cases for nonlinear SDOFanalysis to a log-normal disfribution. The slope
of the distribution provides the P value. The
highest Pr value from the three cases is used in
the fragility analysis. The larger P value will
produce a flatter fragility curve that will result
in a larger change in failure probability over a
specified range of ground motion. In this
analysis the Pr value was calculated to be 0.23.
The variability in sfrength (Ps) is determined by
performing two seismic analyses. The first
analysis was performed using nominal material
properties (95% exceedance) to calculate the
ultimate strength, and the second analysis was
based on median material properties. For a
constant earthquake level, represented by Cases
190

2 and 3 in Table 4, the variability in a fragility
analysis is measured by the change in building
response due to the change in ultimate strength.
The median drift values in cases 2 and 3 are the
same because the building is responding in the
displacement control region of the spectra.
Thus, the variability for this structure with
respect to strength is zero (Ps = 0).
The fragility level for a structure is correlated to
a ground motion parameter. Studies provided
by Sozen, (Gulkan, 1974), Iwan, (Iwan, 1980),
and Kennedy, (Kennedy, 1984), show that the
drift of nonlinear SDOF systems can be
reasonably correlated to the specfral
displacement by the equation
(2)
Where So (fe, Ag) is the input ground motion
specfral displacement at an effective frequency
fe and an effective damping Ae.
The data in this analysis provided a good
correlation between the average specfral
displacement ( 5"^ ) t^ken over a frequency
range from- 0.35-0.65 Hz at an effective damping
level of 10%. Therefore, the following equation
was used to represent the drift response (8r) in
terms of specfral displacement
(3)
A small level of variability in the ground motion
equation is addressed by assigning a beta value
(Peq) to the equation. Based on engineering
judgement Peq =0.05 was assigned to the
equation.
The median capacity of the structure is defined
as the lateral drift that results in a 50%probability of structural failure. To develop the
median capacity and the associated variability
the drift verses probability of failure data in
Figure 10 is fit to a log-normal distribution. The
log-normal fit of the data provides a median
drift capacity of 5.8 inches with an associated
variability on capacity Pc = 0.17. The median
capacity of 5.8 inches represents a 50 percent
probability of failure.
The variability for each individual source is
summarized in Table 5. These variabilities were
combined using square root of the sum of the
squares as the statistical method to determine a
composite variability. A composite variability
of 0.29 is calculated for this structure.
Table 5 Seismic Fragility
Variability Value
Response - Pr 0.23
Sfrength - ps 0.00
Equation - Peq 0.05
Capacity - Pc 0.17
Composite - P* 0.29
^P = Composite Variability =
Comparing Figure 10 with Figure 1 1, the
building median drift capacity of 5.8 inches and
its associated variability Pc of 0.17, as shown in
Figure 10, can be considered a lower bound
fragility curve because it does not contain all of
the sources of variability. The other sources of
variability including response, sfrength, and
ground motion correlation provide adjustments
that flatten the distribution, as shown in Figure
1 1 . The flattening of the fragility curve using
the composite beta value of 0.29 results in a
wider range on probability of failure verses
seismic input motion. Correlating the drift
response to the ground motion parameter
specfral displacement completes the final
seismic fragility for the structure. The seismic
fragility for this structure is expressed in term of
the specfral displacement by the equation:
(4)
191

Where So = Spectral displacement at a given
probability of failure
5"^ = Median spectral displacement
(5.8 inches)
P = Composite variability (.29)
X = The number of normal standard
deviations the given probability
is from the median.
4.3. ANNUAL PROBABILITY OF SEISMICFAILURE
The fragility curves were convolved
(integrated) with the site mean hazard curve to
obtain an estimate of the mean annual
probability of seismic failure. Equation 5, from
DOE Standard 1020, is a good approximation
for more formal numerical integration, was
used.
C(5)
50
SME
Where Pr = Mean armual probability of
seismic failure
C50 = Median spectral displacement
capacity
P = Composite logarithmic standard
deviation
SME = Median SME response
Hd = Annual probability of exceeding
the median SME
Kh = Slope parameter of the spectral
displacement hazard curve
This equation assumes that the fragility curve is
log-normal and that the hazard curve of average
spectral displacement can be approximated by a
straight line on a log-log plot. Values
summarized in Table 5 were used to calculate
the mean annual probability of failure. For the
structure evaluated in this analysis the meanarmual probability of seismic failure was
determined to be 1.8x10"'*, which is less than the
acceptance criteria performance goal of 2x10"''.
Thus, this structure meets the probabilistic
acceptance criteria specified in DOE Standard
1020.
5. CONCLUSIONS
A methodology to predict structural behavior in
older DOE reinforced concrete facilities was
implemented. This methodology can be used to
demonstrate seismic capability consistent with
the performance goals stated in DOE Standard
1020 when traditional deterministic methods
indicate deficient seismic designs. Adaptations
of the methodology can be used to meet
performance goals developed for other nuclear
and non-nuclear buildings.
Key to the development of realistic estimates of
the ultimate lateral load resisting capacities for
existing structures is the understanding of the
behavior of reinforced concrete joints with
partially developed bars. These joints do not
necessarily demonstrate brittle behavior and the
limited rotation capability of partially developed
joints can contribute significantly to the overall
ductility of the reinforced concrete frame.
Notv^dthstanding the ductility available whenestimating the limit state, significant damage in
the structure is expected to occur, thus newconstruction should fully develop bars.
This structure has an elastic frequency on the
order of 1 to 1.3 Hz, which increases further as
the lateral load increases. This high period
structure is displacement controlled thus
computed drifts are relatively insensitive to the
initial structural stiffiiess and capacity. The
drifts are a function of the low frequency
displacements in the ground motions.
6. ACKNOWLEDGMENTS
The information contained in this article was
developed during the course of work done under
Contract No. DE-AC09-89SR18035 with the
U.S. Department of Energy.
The analyses presented in this paper were
performed by the engineers in the Structural
Mechanics Section and the Site Geotechnical
Services Department of the Westinghouse
Savarmah River Company. The generous
192
guidance provided by Dr. Robert P. Kennedy,
Prof. Charles E. Miller, and Prof. Mehta Sozen
are gratefully acknowledged.
7. REFERENCES
American Concrete Institute, ACI-3 18-5 1,
Building Code Requirementsfor Reinforced
Concrete, 1951.
American Concrete Institute, ACI-3 18-95,
Building Code Requirementsfor Structural
Concrete and Commentary, 1995.
APPLIED TECHNOLOGY COUNCIL, ATC-19, "Structural Response Modification
Factors", 1995.
APPLIED TECHNOLOGY COUNCIL, FEMA273, "NEHRP Guidelines for the Seismic
Rehabilitation of Buildings", 1996.
APPLIED TECHNOLOGY COUNCIL, FEMA274, "NEHRP Commentary on the
Guidelines for the Seismic Rehabilitation of
Buildings", 1996.
Aycardi, A. E., Mander, J. B., and Reinhom, A.
M., "Seismic Resistance of Reinforced
Concrete Frame Structures Designed Only
for Gravity Loads: Part 11 - Experimental
Performance of Subassemblages, NCEER-92-0028, National Center for Earthquake
Engineering Research, December 1992.
Beres, A.,White, R., Gergely, P., "Seismic
Performance of Interior and Exterior Beam-to-Column Joints Related to Lightly
Rernforeed Concrete Frame Buildings:
Detailed Experimental Results", NCEER-92-0024, National Center for Earthquake
Engineering Research, September 1992
DOE-STD- 1020-94, "Natural Phenomena
Hazards Design and Evaluation Criteria for
Department of Energy Facilities", April
1994.
Eligehausen, R., Popov, E. P., Bectero, V. V.,
"Local Bond Stress-Slip Relationships of
Deformed Bars Under Generalized
Excitations," Report UCB/EERC-83/23,
October 1983.
Gulkan, P. and Sozen, M.A., "Inelastic
Responses of Reinforced Concrete
Structures to Earthquake Motions," ACIJournal, Vol. 71, No. 12, December, 1974.
International Conference of Building Officials,
Uniform Building Code, 1994.
Iwan, W. D., "Estimating Inelastic Response
Spectra from Elastic Spectra", Earthquake
Engineering & Structural Dynamics, Vol. 8,
1980.
Kennedy, R.P., et.al. "Engineering
Characterization of Ground Motion - Task I:
Effects of Characteristics of Free-Field
Motion on Structural Response,"
NUREG/CR-3805, Vol. 1, U.S. Nuclear
Regulatory Commission, 1984.
Mertz, G., Loceff, F., Houston, T., Rawls, G.,
and Mulliken, J., "Performance Based
Seismic Qualification of Reinforced
Concrete Nuclear Materials Processing
Facilities", 6'^ National Conference on
Earthquake Engineering, Seattle, May,
1998.
Takeda, T., Sozen, M. A., and Nielson, N. N.,
"Reinforced Concrete Response to
Simulated Earthquakes", ASCE Journal of
the Structural Division, Vol. 96, No. ST 12.,
1970
193
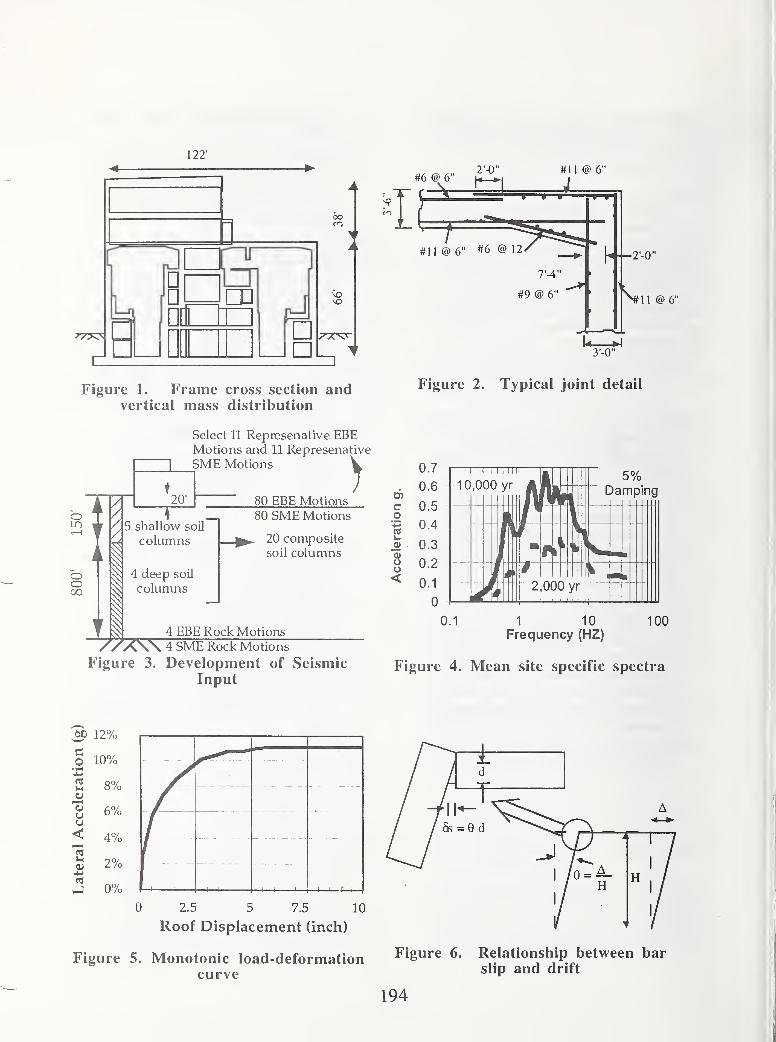
122'
cz
oo
Figure 1. Frame cross section andvertical mass distribution
#6 @ 62'-0" #11 @ 6"
#1 1 @ 6" #6 @ 12-
7'4"
#9 @ 6"
-2-0"
1 1 @ 6"
3'-0"
Figure 2. Typical joint detail
o
oooo
Select 11 Represenative EBEMotions and 11 Represenative
SME Motions
t.
A M I .20' I
w / 5 shallow SOU
T columnsi\ i
/ 5 shallow SOU
^ columns
1\^ 4 deep soU
^ columns
I
80 EBE Motions80 SME Motions
. 20 compositesoil columns
4 EBE Rock Motionsy/XW 4 SME Rock Motions
Figure 3. Development of SeismicInput
CoTO
8o<
5%Damping
0.1 1 10Frequency (HZ)
100
Figure 4. Mean site specific spectra
^ 12%
O 10%
rj
uu
rj
i-J
2.5 5 7.5 10
Roof Displacement (inch)
Figure 5. Monotonic load-deformationcurve
Figure 6. Relationship between barslip and drift
194
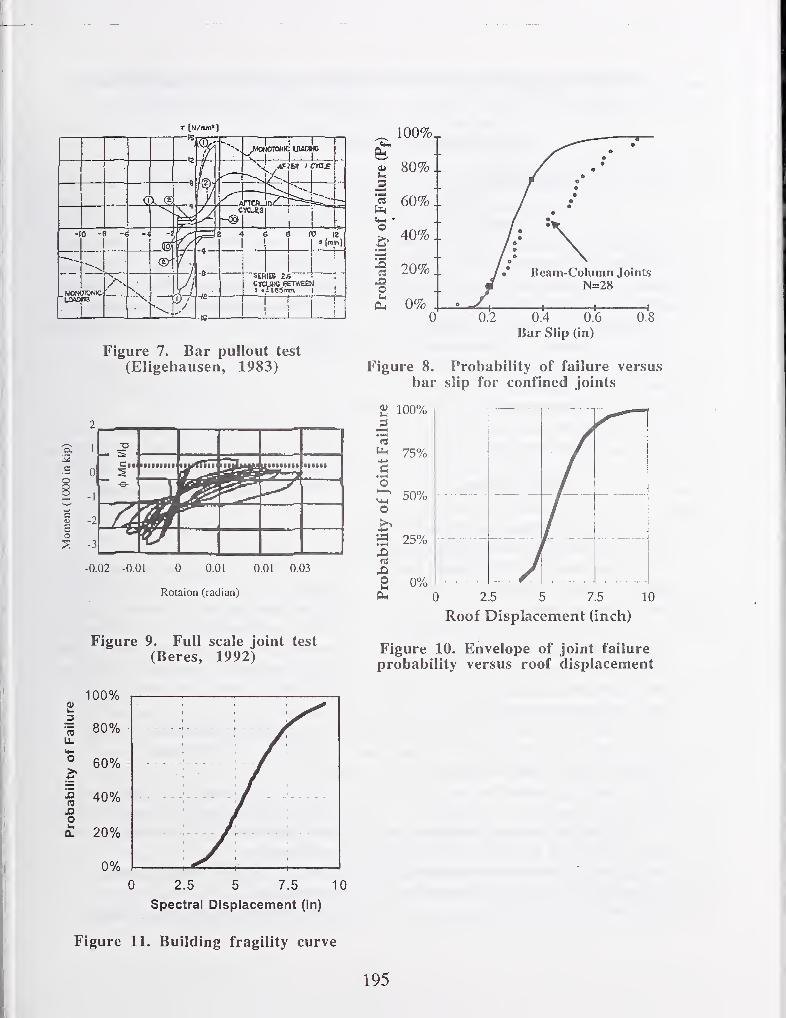
T [N/cim«)
Figure 7. Bar pullout test
(Eligehausen, 1983)
-0.02 -0.01 0 0.01 0.01 0.03
Rotaion (radian)
Figure 9. Full scale joint test
(Beres, 1992)
100%I 1
| 80% \
\ 60% /1 40% :/----:
o /£ 20% /r -
0% I'^-^^—^ \
0 2.5 5 7.5 10
Spectral Displacement (in)
Figure 11. Building fragility curve
Bar Slip (in)
Figure 8. Probability of failure versus
bar slip for confined joints
Roof Displacement (inch)
Figure 10. Envelope of joint failure
probability versus roof displacement
195

Development of an Analysis of Stmctural Steel Fracture and Development of Technical Solutions
Hiroyuki Yamanouchi ',Akiyc
ABSTRACT
This paper presents the outline of a
comprehensive technology development project by
the Ministry of Construction, Jqjan, in which an
analysis of structural steel fiacture and technical
solutions should be developed. Material properties
and welding effects on steel fracture, fabricating and
fracture of connections and collapse mechanism and
fracture of steel structures are now being investigated.
Key Words: Steel Fracture
Materialproperties
Welding
Collapse mechanism
1. INTRODUCTION
In the extremely strong earthquake that
struck Kobe and other parts of southern Hyogo
Prefecture on January 17, 1995, structural steel in
high-rise buildings and elsewhere was found to have
snapped like sticks ofchalk.
Presently, the approach to construction of
buildings and other structures using steel materials has
two facets: elastic design to resist ordinary loads and
small or medium-strength earthquakes by ensuring
that no residual deformation will result from small-to-
medium stresses to structural steel; and plastic design
to ensure that in the event of a major earthquake,
inelastic deformation of structural steel will dissipate
enough energy to prevent the entire structure's
collapse.
In the Kobe earthquake, however, structural
steel materials broke before they could dissipate
energy through inelastic deformation, suggesting that
a force smaller than the design force was able to
destroy them.
Mukai ^ and Takashi Hasegawa ^
This is why studies will analyze these
phenomena and devise ways to analyze, investigate,
and develop effective remedies.
This project initiated in April, 1996 and will
be finished in March, 1999. In this project.
Building Research Institute (BRI) is responsible for
organizing and implementing the development of the
analysis and solutions of steel members, welding and
building structures.
2. FINAL GOAL
Our final goals are to clarify the demand for
structural steel, to develop the guideline on welding
procedures and to propose the design method for
avoiding the brittle fracture of steel structures.
3. ORGANIZATION
BRI is carrying out the project as a
cooperative research with The Kozai Club (KC).
We have three sub-committees as shown in Fig. 1 . In
addition, we are carrying out Research for
Innovation(RFI) and US-Japan Cooperative Research
as part of this project. In the following chapters, the
outline ofthese activities will be introduced.
4. WELDING AND FRACTURE OF
MATERIALS
In this sub-committee, five subjects are
1) Director, Codes and Evaluation Research Centa, Building
Research Institute, Ministiy of Construction, Tachihara 1, Tsukuba,
Ibaraki, 305-0802 Japan
2) Head of Aerodynamics Division, Department of Structural
Engineering, ditto
3) Research Engineer ofStructural Dynamics Division, ditto
196
being investigated to clarify the material properties
and welding effects on steel fracture. Those subjects
are as follows:
(1) Effect ofSize
Experimental variables are plate thickness
(25mni, 40mm, 100mm) and toughness of steel plates
(low tou^iness, high tou^iness).
(2) Effect ofwelding
Experimental variables are heat input (CO2:
40 kJ/cm, ES: 800 kJ/cm) and toughness of steel
plates (low toughness, high toughness).
(3) Effect ofImpact
Ejq)erimental variable is loading rates
(Static, 1 m/sec, 3 m/sec, 10 m/sec).
(4) Effect ofAmplitude
Experimental variable is displacement
amplitudes (monotonic, ±2 8 p, ±4 5 p, ±8 d p).
(5) Effect ofTime
Experimental variable is the time of load
duration (10 seconds, 5 minutes, 2.5 hours).
These subjects have been examined by
beam bending tests; experiments with low toughness
steel are almost completed
5. FABRICATING AND FRACTURE OFCONNECTIONS
The objectives ofthis sub-committee are to
analyze the factors of brittie fracture observed in the
welded connection and to verify reliable measures for
the new-generation steel, tiie fabrication procedures,
in-process inspection of tfie construction of new
buildings. The final goals of this sub-committee are
to clarify the phenomenon of beam-to-column
connections, truss connections, etc., to develop
guidelines on the fabrication procedures for improving
the seismic performance, to assess the economic,
social and political costs of implementing the
recommendations in details of connections for more
reliable inelastic action and to revise All's Standard
for the Ultrasonic Inspection ofWeld Defects in Steel
Structures. There are four woridng groups in this
sub-committee.
(1) Data Analysis
In tills woridng group, to investigate the
steel properties for building structures, fracture data
base is under construction.
(2) Fundamental Study
In order to evaluate the material properties
of steels prepared for fiill scale tests and to study the
welding effects on material properties, material tests
were conducted. Those were tensile tests, hardness
tests, charpy impact tests, fracture toughness tests, eto.
(3) Full Scale Connection Test
To investigate the relationship between the
plastic deformation capacity of beam-to-column
connection and the toughness of materials/connection
details/fabrication level, cyclic loading tests of beam-
to-column connection have been conducted. The
parameters are toughness of steel materials (low
toughness/high toughness), connection details
(conventional type/revised type), welding condition
(normal heat input/high heat input), loading speed
(static/dynamic) and slab contribution.
(4) Strain Rate/ Weld Defects Test
Butt welded joints and T weld joints with
low toughness steel have been tested, to investigate
the strain rate and weld defects on the
strength/fracture ofbeam-to-column connection.
6. COLLAPSE MECHANISM AND FRACTURE
OF STEEL FRAMES
The main objective ofthis sub-committee is
to determine the required plastic deformation capacity
of members in steel rigid frames subjected to
earthquakes. It is presumed that the required plastic
deformation edacity of steel members depends on the
ultimate resistance of the frames, the formation of
mechanism, tiie intensify of the input earthquake
ground motions, and so on. In order to accomplish
this objective, the following studies are now well
197
underway in this subcommittee.
(1) Earthquake response analysis ofthe frames having
brittle fracture at beam-ends
The earthquake response analyses of the 9-
story 3-bay planar frame with brittle fracture were
performed in order to investigate the effect of brittle
fractures at beam-ends on seismic response of steel
rigid frames.
Fig 2 shows the hysteresis model of plastic
hinges at beam-ends assumed in the analysis model.
The most important parameter of this analysis is the
plastic rotation capacity ( ^ f) of the hinges. In this
model frame, the plastic rotation capacity {6 f) ofthe
hinges at beam-ends was assumed to be 0, 0.005, 0.01,
0.02rad.. Fig 3 demonstrates an example of the
analysis results in terms of maximum interstoiy drift
angles in each story. In case of ^ f = 0.01, the
maximum interstoiy drift angle of the frame against
the Kobe earthquake ground motion is larger than that
against the other earthquake ground motions.
(2) Simplified Response Prediction Models
In this sub-committee, the simplified fish
bone model were developed to predict the seismic
behavior ofthe frames. The predictions by using the
fish bone model were compared to the results by using
the frame model for verifying the predictability ofthe
fish bone model.
(3) Column Overdesign Factor (COF) for Ensuring
Beam-Collapse Mechanism in Earthquake Response
The objectives ofthis analysis is as follows;
1) To determine the COF needed for ensuring beam-
collapse mechanism
2) To investigate plastic rotation expected to columns
ifthe COF smaller than 1
From the results of the earthquake response
analysis using the fish bone model, following the
results were obtained.
1) Even if column yielding is permitted, overall
behavior ( including max. overall drift angle, max.
stoiy drift angle, max. beam rotation ) remains
relatively unchanged as long as the COF ^1.1.
2) For the case where the max. velocity of input EQ is
0.5 m/sec, max. column plastic rotation was smaller
than O.Olrad. (3-story model) and 0.005rad. (6 and 9
story models) when the COF ^1.1.
(4) Experimental Study on Inelastic Behavior of Joint
Panel Zone
This study was conducted to investigate the
elastic-plastic behavior of joint panel zone and to
propose the adequate guide on strength and rigidity.
The following three series of tests were carried out in
this study.
Series 1: Test on the beam to SHS ( square hollow
section ) column connections subjected to diagonal
bending moment ( see Fig. 4)
Series 2: Test on the effect of manufacturing process
ofSHS column
Series 3: Test on the H-shaped column connections
(5) Model Building Studies
The objectives of this study is to investigate
the seismic performance of U.S. steel perimeter
fimnes and Japanese spatial moment resisting frames.
For this purpose, the SAC theme structures have been
redesigned by Japanese seismic code under similar
soil and hazard conditions as spatial moment resisting
fi^es using box columns.
A comparison between nonlinear responses
of U.S. perimeter(SAC3-LA) and of redesigned
Japanese spatial moment resisting frames(BRBA,
BRDB) is performed. From the results of the
earthquake response analysis, a clear difference in
seismic performance of U.S. frames and Japanese
fimies in terms of interstoiy drift angles, cumulative
plastic rotations( Tj +) was found, (see Table 1, Fig. 5,
Fig.6 and Fig.7)
7. RESEARCH FOR INNOVATION
We have just started the research on the
198
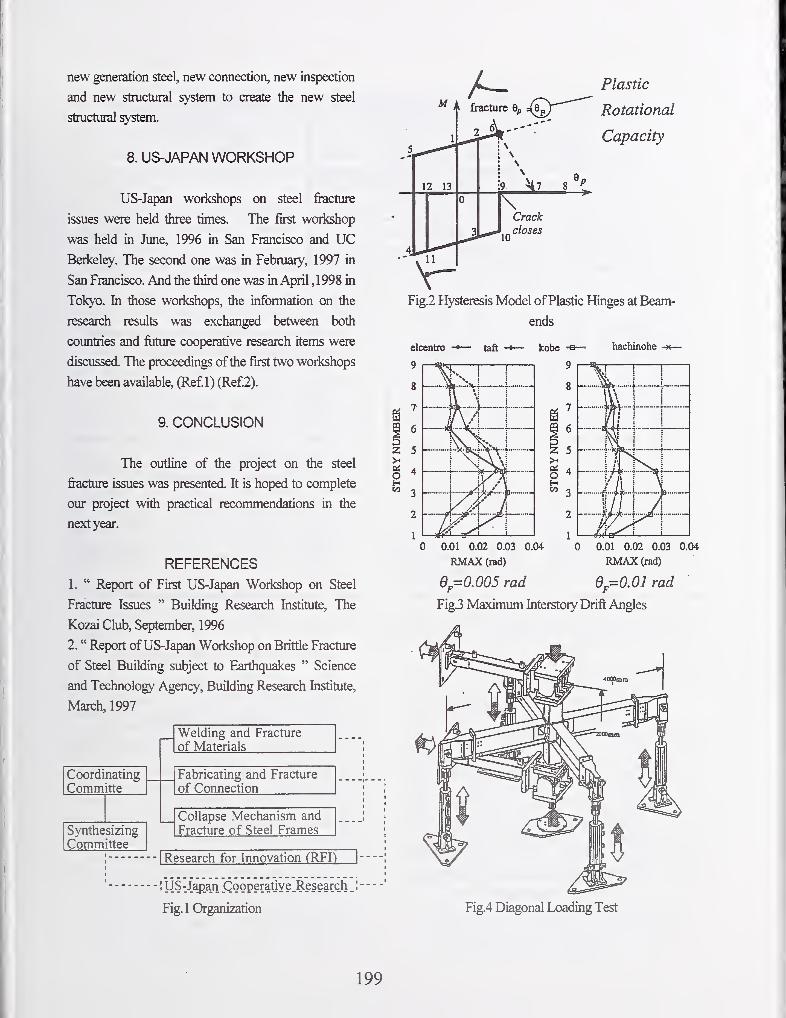
new generation steel, new connection, new inspection
and new structural system to create the new steel
structural system.
8. US-JAPAN WORKSHOP
US-Japan woitehops on steel fiacture
issues were held three times. The first woiicshop
was held in June, 1996 in San Francisco and UCBericeley. The second one was in Februaiy, 1997 in
San Francisco. And the third one was in April ,1998 in
Tol^o. In those workshops, the information on tfie
research results was exchanged between both
countries and future cooperative research items were
discussed. The proceedings ofthe first two woricshops
have been available, (Ref 1) (Ref2).
9. CONCLUSION
The outline of the project on the steel
fracture issues was presented. It is hoped to complete
our project with practical recommendations in the
next year.
REFERENCES1. " Report of First US-Japan Woricshop on Steel
Fracture Issues " Building Research Institute, The
Kozai Club, September, 1996
2. " Report ofUS-Japan Workshop on Brittle Fracture
of Steel Building subject to Earthquakes " Science
and Technology Agency, Building Research Institute,
March, 1997
Coordinating
Committe
Synthesizing
Committee
Welding and Fracture
of Materials
Fabricating and Fracture
of Connection
Collapse Mechanism and
Fracture of Steel Frames
•
\ Research for Innovation (RFD I
•
'< US-Japan Cooperative.Research . ;
Fig.l Organization
Plastic
Rotational
Capacity
Fig.2 Hysteresis Model ofPlastic Hinges at Beam-
elcentro
9
taft hachinohe
!
v\ ^
L _i
// \'*^'
on
00
0 0.01 0.02 0.03 0.04
RMAX(rad)
6 =0.005 radF
0 0.01 0.02 0.03 0.04
RMAX (rad)
6=0.01 radF
Fig.3 Maximum Interstory Drift Angles
Fig.4 Diagonal Loading Test
199
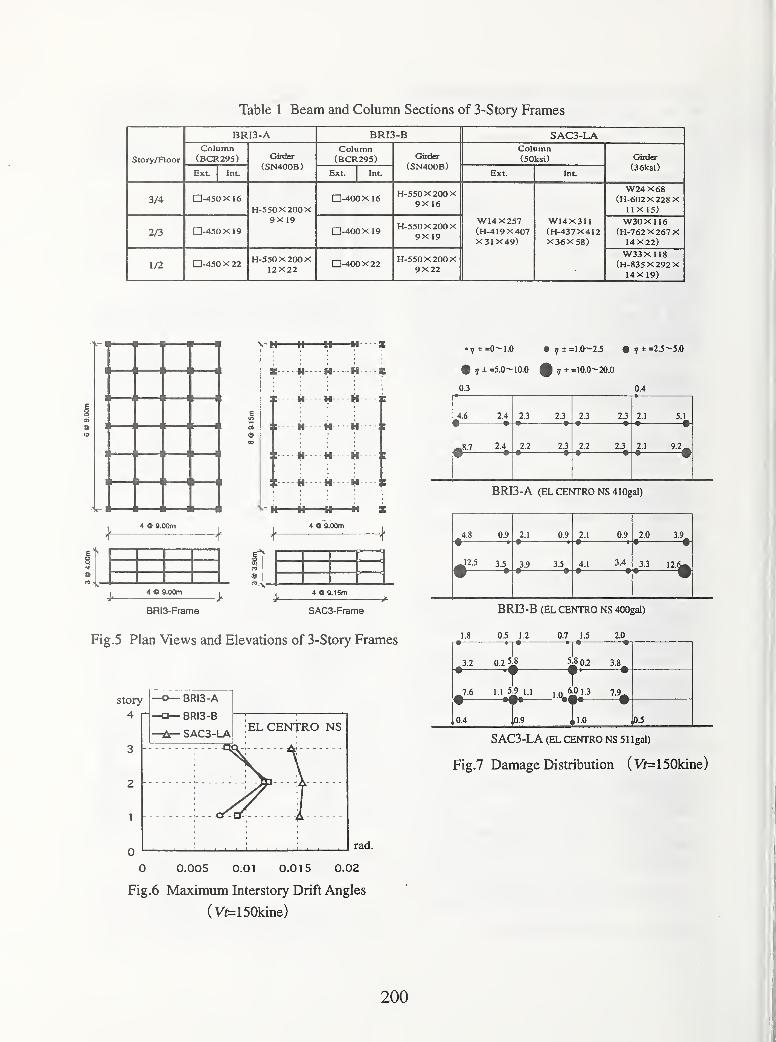
Table 1 Beam and Column Sections of 3-Story Frames
Story/Floor
BRI3-A BRI3-B SAC3-LAColumn(BCR295) Girder
(SN400B)
Column(BCR295) Gilder
(SN400B)
Column(SOksi) Girder
(36ksi)Ext. Int. Ext. Int. Ext. Int.
3/4 -450X 16
H-550X200X9X 19
-400X 16H-550 X 200 X
9X 16
W14X257(H-419X407X31 X49)
W14X3U(H-437X412X 36X58)
W24X68(H-602X228XIIX 15)
2/3 -450XI9 -400X 19H-550X 200
X
9X 19
W30X116(H-762 X 267 X14X22)
1/2 -450 X 22H-550X200X
12X22-400 X 22
H-550 X 200 X9X22
W33X 118
(H-835X292X14X19)
VM H H M S
* M H H
M M H
H H
-H-
VH H H M
,4 O ~9.00m
4 C 9.00fn
BRI3-Frame SAC3-Frame
Fig.5 Plan Views and Elevations of 3-Story Frames
story
4 r1
-o— BRI3-A
-o— BRI3-B
-A- SAC3-LA:ELCENTRO NS
rad.
0 0.005 0.01 0.015 0.02
Fig.6 Maximum Interstory Drift Angles
(Vt^lSOkine)
• 7 ± =0-1.0 • 7± ==1.0- 2.5 • 7 ± =23-5.0
0.3
=5.0- 10.0 =10.0-20.0
0.4
4.6 2.4 2.3 2.3 2.3 2.3 2.1 5.1• •- •
—
•
2.4 2.2 2.3 2.2 2.3 2.1• •- •
—
•- •
BRI3-A (EL CENTRO NS 410gal)
4.8 0.9 2.1 0.9 2.1 0.9 2.0« •
—
-«
—
•
3.5 3.5 4.1 3.4 3.3 12.^• •
—
• •
BRI3-B (EL CENTRO NS 400gal)
1.8 0.5 1.2 0.7 15 2.01 r-r* T* •
3.2 0.2 5^
T T5;? 0.2 3.8,
SAC3-LA (EL CENTRO NS 51 Igal)
Fig.7 Damage Distribution ( Vir=150kine)
200
Design Guidelines for the Seismic Modification of Welded Steel Moment Frame Buildings
by
John L. Gross, Ph.D., P.E.^
ABSTRACT
Prompted by the widespread damage to welded
beam-to-column connections as a result of the
1994 Northridge earthquake, the National
Institute of Standards and Technology (NIST)
initiated a study to determine the efficacy of
various techniques for the modification of
existing welded steel moment frame con-
nections to improve their seismic performance.
Problems associated with retrofitting of
existing WSMF buildings are discussed and the
alternative strategies selected for study are
described. Results of 18 full-scale tests of two-
sided (interior) connections, some having a
lightweight concrete slab on metal deck, are
presented. Design guidelines, based on the
experimental results, have been written in
cooperation with the American Institute of
Steel Construction (AISC) and are described.
KEYWORDS: buildings; connections; design;
earthquake engineering; frames; rehabilitation;
steel
1. INTRODUCTION
The January 17, 1994 Northridge earthquake
caused significant unexpected damage to
welded steel moment frame (WSMF)construction. In particular brittle fractures in
the beam-to-column moment connections were
found in over 100 buildings (Youssef et al.
1995). In some instances the beam flange-to-
column flange welds fractured completely
resulting in greatly reduced moment resistance
at the connection. Fortunately, no members or
buildings collapsed as a result of the connection
failures and no lives were lost. Nevertheless,
the widespread occurrence of these connection
failures is indicative of basic deficiencies in
welded steel moment frame design and
construction practice prior to the 1994
Northridge earthquake. Indeed, the beam-to-
column connection detail in common use at the
time of the Northridge earthquake was deleted
in an emergency code change ("ICBO Board"
1994). There is concern that existing structures
incorporating these pre-Northridge welded
moment connections may not provide the
desired level of seismic performance in a major
earthquake. The work described in this paper
addresses the design of modifications to the
WSMF connections to provide improved
seismic performance.
1.1 Background
In the United States, seismic design of WSMFconstruction is based on the assumption that, in
a severe earthquake, frame members will yield
in a ductile fashion thereby dissipating energy.
The welds and bolts that connect the frame
members, being considerably less ductile, must
be designed so as not to fracture (SEAOC1990). The beam-to-column moment con-
nections should be designed, therefore, for
either the strength of the beam in flexure or the
moment corresponding to the joint panel zone
shear strength.
The Uniform Building Code, or UBC GCBO1994), is adopted by nearly all California
jurisdictions as the standard for seismic design.
From 1988 to 1994 the UBC prescribed a
beam-to-column connection that was deemed to
satisfy the above strength requirements. This
"prescribed" detail required that the beam
flanges be welded to the column using
complete joint penetration (CJP) groove welds.
Building and Fire Research Laboratory
National Institute of Standards and Technology
Gaithersburg, Maryland 20899 USA
201
The beam web connection was made by either
welding directly to the column or by bolting to
a shear tab which in turn was welded to the
column. A version of this prescribed detail is
shown in Figure 1. Although this connection
detail was first prescribed by the UBC in 1988,
it has been widely used since the early 1970's.
In general, fractures of these "prescribed"
moment connections were found to initiate at
the root of the beam flange CJP weld and
propagate through either the beam flange, the
column flange, or the weld itself. In some
instances, fracture extended through the
column flange and into the column web. The
steel backing, which was generally left in
place, produced a mechanical notch at the weld
root. Fractures often initiated from weld
defects in the root pass which were contiguous
with the notch introduced by the weld backing.
A schematic of a typical fracture path is shown
in Figure 2. A fracture analysis, based upon
measured material properties and measured
weld defect sizes (Kaufmann et al. 1997),
revealed that cleavage fracture would occur at
stress levels roughly equal to the nominal yield
strength of the beam.
1.2 Connection Failures
Brittle fracture will occur when the applied
stress intensity, which can be computed from
the applied stress and the size and character of
the initiating defect, exceeds the critical stress
intensity for the material. The critical stress
intensity is in turn a function of the fracture
toughness of the material. In the fractures that
occurred in WSMF construction as a result of
the Northridge earthquake, several contributing
factors were observed which relate to the
fracture toughness of the materials, size and
location of defects, and magnitude of applied
stress. These factors are discussed here.
The self-shielded flux cored arc welding
(FCAW-SS) process is widely used for the CJP
flange welds in WSMF construction. The
E70T-4 electrode in common use prior to the
Northridge earthquake, is not rated for notch
toughness and has been found to have very low
Charpy V-notch (CVN) toughness, frequently
on the order of 7 J at 20° C (Kaufmann et al.
1997).
The practice of leaving the steel backing in
place introduces a mechanical notch at the root
of the flange weld joint as shown in Figure 2.
Also, weld defects in the root pass, being
difficult to detect using ultrasonic inspection,
may not have, been rejected by the inspectors
and therefore were not repaired. Further, the
use of "end dams" in lieu of weld tabs was
widespread.
The weld joining the beam flange to the face of
the relatively thick column flanges is highly
restrained. This restraint inhibits yielding and
results in somewhat more brittle behavior.
Further, the stress across a beam flange
connected to a wide flange column section is
not uniform but rather is higher at the center of
the flange and lower at the flange tips. Also,
when the beam web connection is bolted rather
than welded, the moment is carried principally
by the beam flanges. Finally, the actual yield
strength of a steel member may exceed the
nominal yield strength by a considerable
amount. Since seismic design of moment
frames relies on beam members reaching their
plastic moment capacity, an increase in the
yield strength translates to increased demands
on the CJP flange weld.
Modifications to pre-Northridge WSMFconnections to achieve improved seismic
performance seek to reduce or eliminate some
of the factors which contribute to brittle
fracture mentioned above. Methods of
achieving improved seismic performance are
addressed next.
2. IMPROVING SEISMIC PERFORMANCE
There are several approaches to minimizing the
potential for fracture including, 1) strengthen-
ing the connection thereby reducing the beam
flange stress at the column face, 2) limiting the
beam moment at the column face, or 3)
202
increasing the fracture resistance of welds.
Any of these basic approaches, or a
combination of them, may be used. This paper
presents three connection modification
methods: welded haunch, bolted bracket, and
reduced beam section. The first two of these
modification methods employ the approach of
strengthening the connection and thereby
forcing inelastic action to take place in the
beam section away from the face of the column
and the CJP flange welds. The third method
seeks to limit the moment at the column face by
reducing the beam section at some distance
from the column thereby introducing a
structural "fuse."
2.1 Reduced Beam Section
The reduced beam section (or RBS) technique
is illustrated in Figure 3. As shown, the beam
flange is reduced in cross section thereby
weakening the beam in flexure. Various
profiles have been tried for the reduced beam
section but only the circular cut is considered
here. The intent is to force a plastic hinge to
form in the reduced section. By introducing a
structural "fuse" in the reduced section, the
force demand that can be transmitted to the
CJP flange welds is also reduced. The
reduction in beam strength is acceptable in
most cases since drift requirements frequently
govern moment frame design and the members
are larger than needed to satisfy strength
requirements. The RBS technique applied to
the bottom flange only tends to reduce the
overall frame stiffness on the order of 5%.This technique has been shown to be promising
in tests intended for new construction.
The RBS plays a role quite similar to that of
connection reinforcement schemes such as
cover plates. Both the RBS and connection
reinforcement move the plastic hinge away
from the face of the column and reduce stress
levels in the vicinity of the CJP flange welds.
Connection reinforcement often requires welds
that are difficult and costly to make and
inspect. These problems are lessened with the
RBS, which is somewhat easier to construct.
On the other hand, a greater degree of stress
reduction can be achieved with connection
reinforcement. With the RBS, there is a
practical limit to the amount of flange material
that can be removed and consequently, there is
a limit to the degree of stress reduction that can
be achieved with the RBS.
The reduced beam section appears attractive for
the modification of existing connections
because of its relative simplicity, and because it
does not increase demands on the column and
panel zone. For new construction, RBS cuts are
typically provided in both the top and bottom
beam flanges. However, when modifying
existing connections, making an RBS cut in the
top flange may prove difficult due to the
presence of a concrete floor slab.
Consequently, in this study addressing the
modification of existing connections, the RBScut is provided in the bottom flange only.
2.2 Welded Haunch
Welding a tapered haunch to the beam bottom
flange (see Figure 4) has been shown to be
very effective for enhancing the cyclic
performance of damaged moment connections
(SAC 1996) or connections for new
construction (Noel and Uang 1996). The
cyclic performance can be further improved
when haunches are welded to both top and
bottom flanges of the beam (SAC 1996)
although such a scheme requires the removal of
the concrete floor slab in existing buildings.
Reinforcing the beam with a welded haunch
can be viewed as a means of increasing the
section modulus of the beam at the face of
column. However, a more appropriate
approach is to treat the flange of the welded
haunch as a diagonal strut. This strut action
drastically changes the force transfer
mechanism of this type of connection and can
be shown to greatly reduce the stress in the
beam flange welds.
The tapered haunch is usually cut from a
structural tee or wide flange section although it
could be fabricated from plate. The haunch
203

web is fillet welded to the beam and column
flanges. The haunch flange is then groove
welded to the beam and column flanges (see
Figure 4).
2.3 Bolted Bracket
The bolted bracket is an alternative to the
welded haunch and has the added advantage
that no field welding is required. Rather, high
strength bolts are used to attach a welded steel
bracket, fabricated from plate, to both the beam
and column as shown in Figure 5. Installation
of the bolted bracket eliminates the problem
associated with welding such as venting of
welding fiimes, supply of fresh air, and the
need for fire protection.
As with the welded haunch, the bolted bracket
forces inelastic action in the beam outside the
reinforced region. Tests have shown this to be
an effective repair and modification technique
producing a rigid connection with stable
hysteresis loops and high ductility (Kasai et al.
1997).
Various types of bolted bracket have been
developed. The haunch bracket (Figure 5)
consists of a shop-welded horizontal leg,
vertical leg and vertical stiffener. The two legs
are bolted to the beam and column flanges. Anangle bracket (not shown), cut from a relatively
heavy wide flange section, has been used for
the top flange where it is desirable to conceal
the modification within the concrete slab.
3. EXPERIMENTAL PROGRAM
The modification of pre-Northridge momentconnections differs from new construction in
two significant ways:
1) Existing welds are generally of low
toughness E70T-4 weld metal with steel
backing left in place and their removal and
replacement using improved welding practices
and tougher filler metal is both difficult and
expensive, and
2) Access to the connection may be limited,
especially by the presence of a concrete floor
slab which may limit or preclude any
modifications to the top flange.
With these limitations in mind, the National
Institute of Standards and Technology (NIST)
initiated an experimental program for the
express purpose of determining the connection
performance for various levels of connection
modification. As such, initial tests were
conducted on specimens that typically involved
modifications only to the bottom flange. Based
on successes and failures, additional remedial
measures were applied until acceptable
performance levels were obtained.
The NIST experimental program was designed
to complement other test programs that had
been completed or were in progress. In the
majority of the tests conducted prior to NISTinvolvement, the test specimens consisted of
bare steel frame subassemblages representing
one-sided (exterior) connections. The NIST
program sought to obtain data on interior, or
two-sided, cormections to determine if such
connections perform as well as one-sided
connections. Additionally, the presence of a
concrete slab, whether designed to act
compositely or not, tends to shift the elastic
neutral axis of the beam upward thereby
increasing tensile flexural strains at the bottom
beam flange weld as compared to those in a
bare steel frame. To address this issue, some
NIST tests included a steel deck-supported
lightweight concrete slab. The concrete slab
was not designed for composite action,
however, shear studs designed to transfer
lateral forces into the moment frame force the
slab to act compositely with the steel beam.
Beam secfions used in the NIST experimental
program were selected to conform to those
used in the SAC Phase 1 test program (SAC
1996). Two-sided connecfions, however,
required larger columns than those used in the
SAC tests to accommodate the unbalanced
beam moments. Columns were selected so as
to not require the addition of column web
stiffening, commonly referred to as "doubler
plates." The columns selected also did not
204
require continuity plates as would be consistent
with practice in the early 1980's. The two test
specimen sizes consisted of the following beam
and column sections, respectively: W30x99,
W12x279 and W36xl50, W14x426.
The NIST experimental program involved the
testing of 18 full-size beam-to-column
connections which had been modified using the
techniques described herein. One specimen
was repaired and re-tested. A diagram of the
test specimens and representative test apparatus
is shown in Figure 6. The tests were
conducted at the University of Texas at Austin,
the University of California, San Diego and
Lehigh University's ATLSS Research Center.
4. EXPERIMENTAL RESULTS
The objective of modifying moment connec-
tions in existing buildings is to improve their
performance in future earthquakes. Exper-
imental results indicate that the modified
connections are generally capable of developing
at least 0.02 radian of plastic rotation. A plot
of the moment at the face of the column versus
total plastic rotation for a representative haunch
modification with concrete slab is shown in
Fig. 7. While not meeting new construction
standards, these modified connections will
provide a significant improvement in
performance compared to existing pre-
Northridge connections. The use of these
modified connections should reduce potential
economic losses and mitigate safety concerns
for existing WSMFs in future earthquakes. Aminimum plastic rotation of 0.02 radian
provides a reasonable and realistic basis for the
seismic rehabilitation of a wide variety of
ordinary buildings constructed with WSMFs.
4.1 RBS Results
The experimental data indicate that the addition
of the beam flange cutout, by itself, is not
sufficient to significantly improve connection
performance. In all cases in which the low
toughness beam flange groove welds were not
replaced, the welds fractured at low levels of
plastic rotation indicating that additional
measures would be required to significantly
improve performance. Better performance was
achieved by not only providing a flange cutout,
but also by replacing the existing top and
bottom beam flange groove welds with a higher
. toughness weld metal. Tests indicated that this
level of modification permits the development
of plastic rotations on the order of 0.02 radian
to 0.025 radian.
4.2 Welded Haunch Results
For both sets of member sizes tested, the test
data show that, when the beam top flange
groove welded joint was left in its pre-
Northridge condition, the welded haunch
modification outperformed the RBSmodification. Of the three sets of bare steel
specimens tested, five beams experienced
welded fracture at the top flange. Two-thirds
of the beams, however, were able to develop
plastic rotations of at least 0.025 radian. Whenthe concrete slab was present, none of the
beams experienced weld fracture and the plastic
rotation achieved for the six beams tested
varied from 0.028 radian to 0.031 radian, more
than adequate for modification purposes.
4.3 Bolted Bracket Results
For the bolted bracket tests, four specimens
showed early fracture of the top flange weld
when the top flange connection was not
modified. When a stiff double angle was
bolted to the top flange and column face, the
top flange did not fracture and the connections
were able to develop 0.05 radian plastic
rotation. The addition of a top angle, however,
necessitates the removal of a portion of the
concrete slab.
5. DESIGN GUIDELINES
Based on the results of 18 tests conducted
under the program described herein, design
guidelines have been developed which allow
the proportioning and detailing of the three
modification techniques described above. The
205
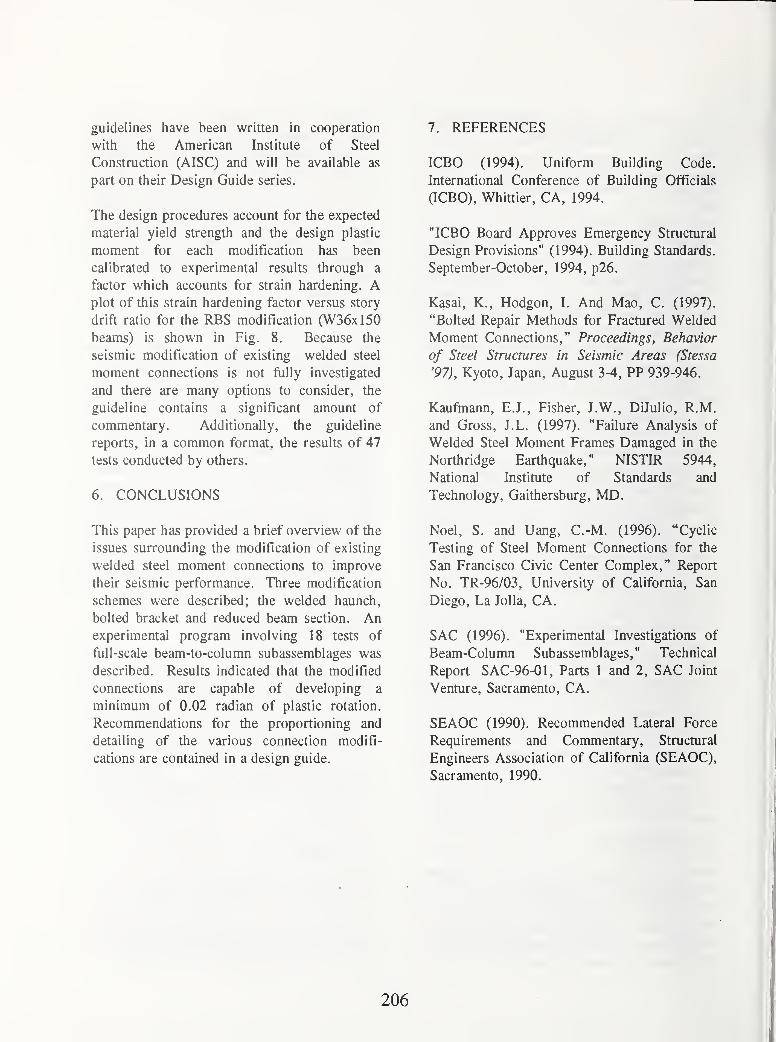
guidelines have been written in cooperation
with the American Institute of Steel
Construction (AISC) and will be available as
part on their Design Guide series.
The design procedures account for the expected
material yield strength and the design plastic
moment for each modification has been
calibrated to experimental results through a
factor which accounts for strain hardening. Aplot of this strain hardening factor versus story
drift ratio for the RBS modification (W36xl50
beams) is shown in Fig. 8. Because the
seismic modification of existing welded steel
moment connections is not fully investigated
and there are many options to consider, the
guideline contains a significant amount of
commentary. Additionally, the guideline
reports, in a common format, the results of 47
tests conducted by others.
6. CONCLUSIONS
This paper has provided a brief overview of the
issues surrounding the modification of existing
welded steel moment connections to improve
their seismic performance. Three modification
schemes were described; the welded haunch,
bolted bracket and reduced beam section. Anexperimental program involving 18 tests of
full-scale beam-to-column subassemblages was
described. Results indicated that the modified
connections are capable of developing a
minimum of 0.02 radian of plastic rotation.
Recommendations for the proportioning and
detailing of the various connection modifi-
cations are contained in a design guide.
7. REFERENCES
ICBO (1994). Uniform Building Code.
International Conference of Building Officials
aCBO), Whittier, CA, 1994.
"ICBO Board Approves Emergency Structural
Design Provisions" (1994). Building Standards.
September-October, 1994, p26.
Kasai, K., Hodgon, I. And Mao, C. (1997).
"Bolted Repair Methods for Fractured Welded
Moment Connections," Proceedings, Behavior
of Steel Structures in Seismic Areas (Stessa
'97), Kyoto, Japan, August 3-4, PP 939-946.
Kaufmann, E.J., Fisher, J.W., DiJulio, R.M.
and Gross, J.L. (1997). "Failure Analysis of
Welded Steel Moment Frames Damaged in the
Northridge Earthquake," NISTIR 5944,
National Institute of Standards and
Technology, Gaithersburg, MD.
Noel, S. and Uang, C.-M. (1996). "Cyclic
Testing of Steel Moment Connections for the
San Francisco Civic Center Complex," Report
No. TR-96/03, University of California, San
Diego, La Jolla, CA.
SAC (1996). "Experimental Investigations of
Beam-Column Subassemblages," Technical
Report SAC-96-01, Parts 1 and 2, SAC Joint
Venture, Sacramento, CA.
SEAOC (1990). Recommended Lateral Force
Requirements and Commentary, Structural
Engineers Association of California (SEAOC),
Sacramento, 1990.
206
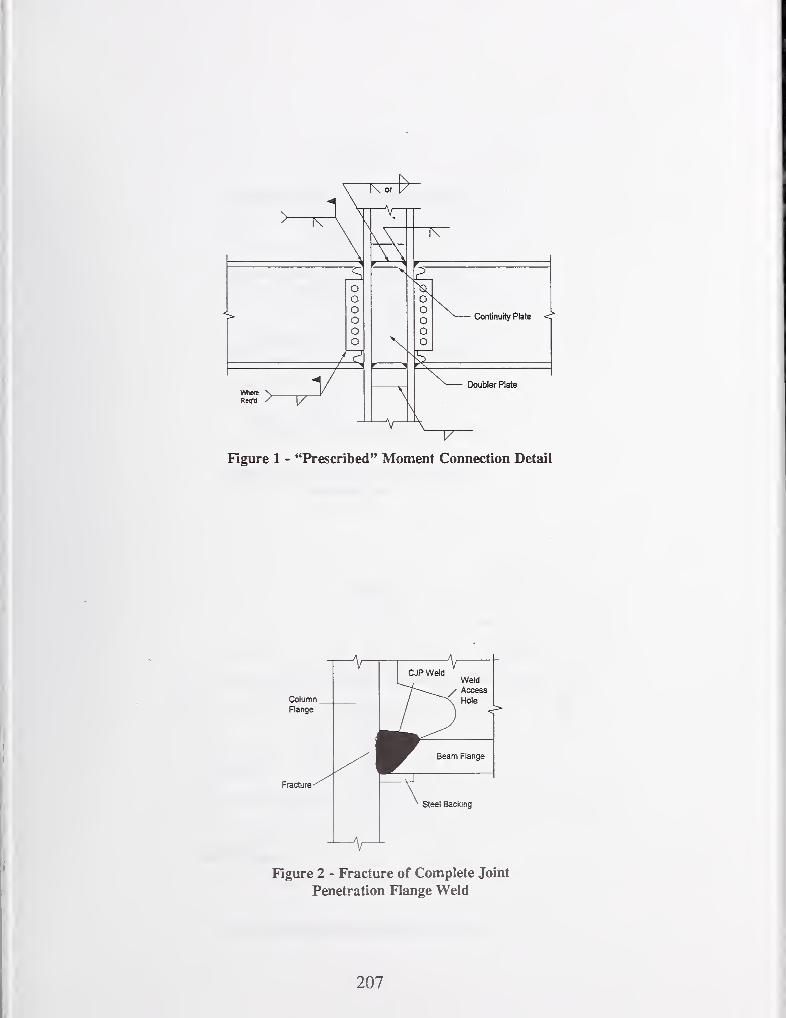
Figure 1 - "Prescribed" Moment Connection Detail
Figure 2 - Fracture of Complete Joint
Penetration Flange Weld
207
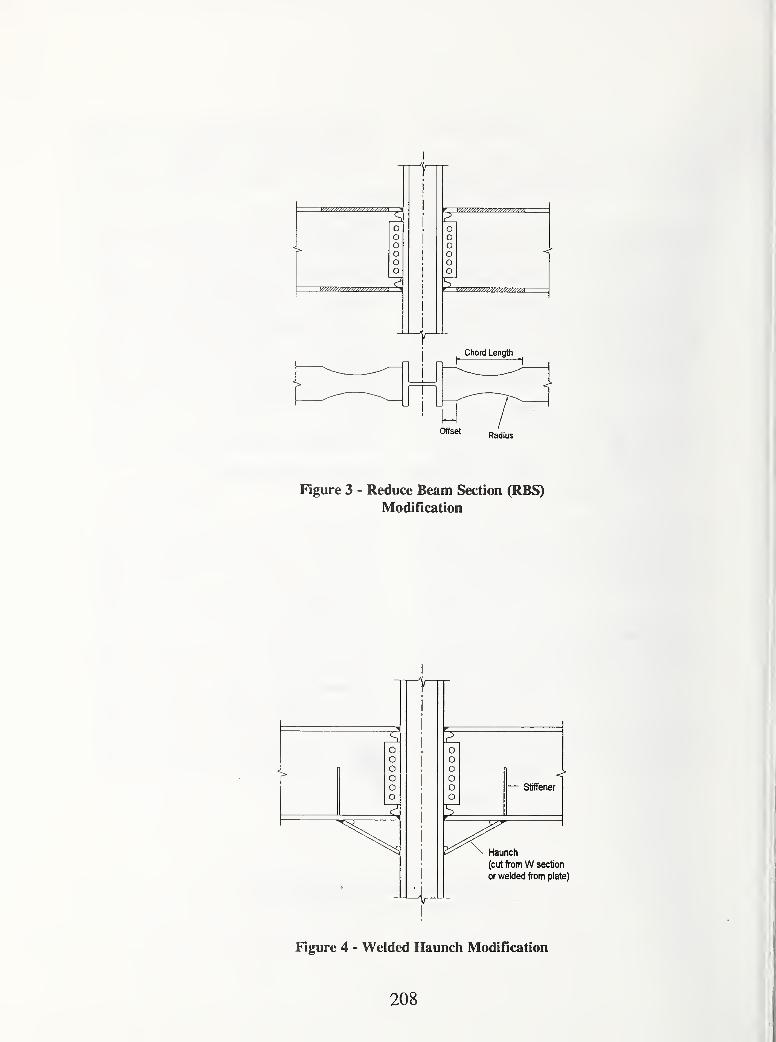
Figure 3 - Reduce Beam Section (RBS)
Modification
<Stiffener
Haunch
(cut from W section
or welded from plate)
Figure 4 - Welded Haunch Modiflcation
208
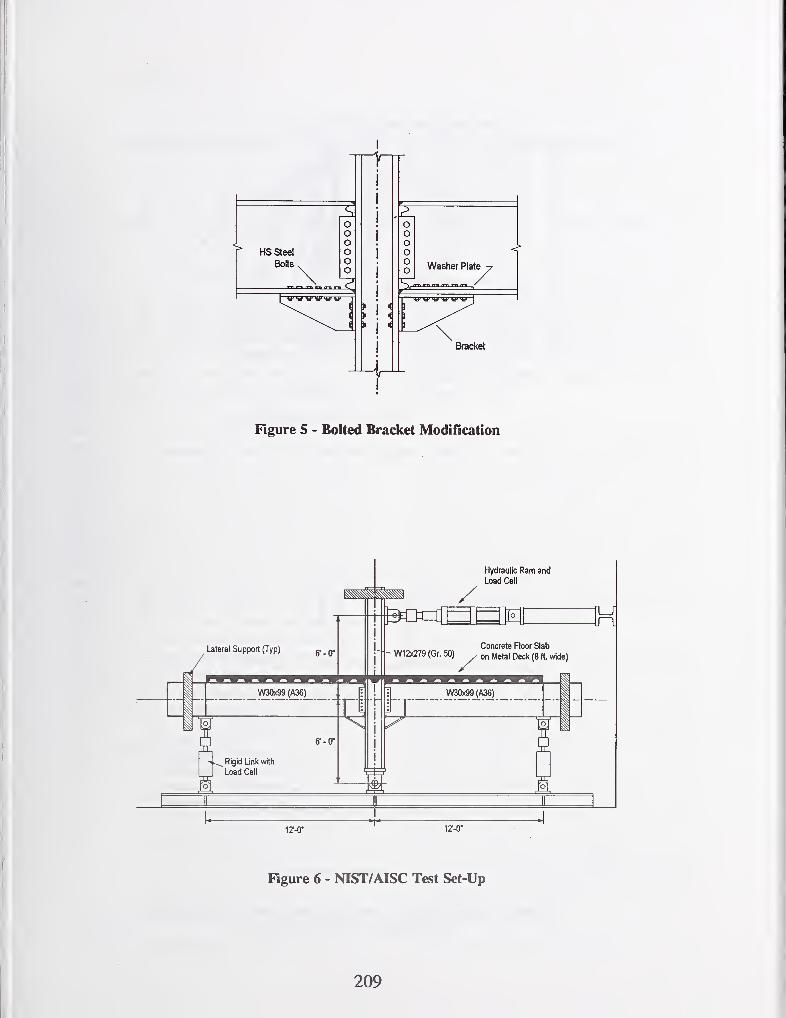
I
T
Figure 5 - Bolted Bracket Modification
1
Lateral Support (Typ) g. _
W30x99(A36)
Rigid Linl< with~Load Cell
Hydraulic Ram and
Load Cell
Concrete Floor SlabW12x279 (Gr. 50) , Metal Deck (8 ft wide)
W3Qx99{A36)
l^-O"
Figure 6 - NIST/AISC Test Set-Up
209
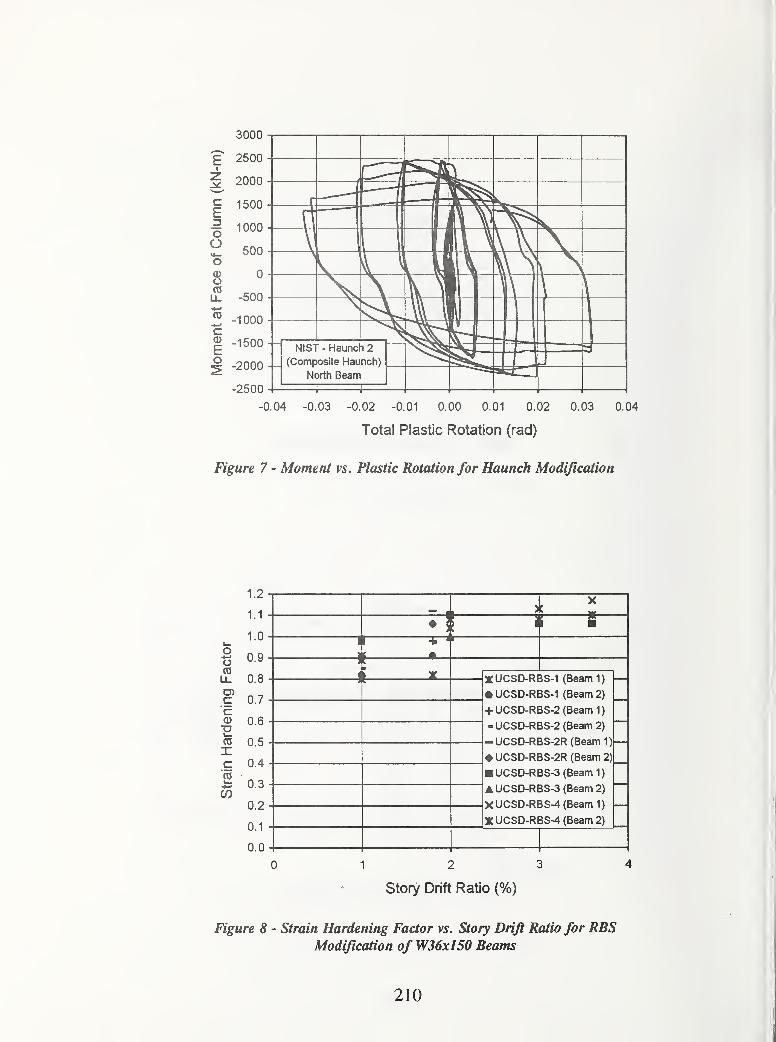
3000
-0.04 -0.03 -0.02 -0.01 0.00 0.01 0.02 0.03 0.04
Total Plastic Rotation (rad)
Figure 7 - Moment vs. Plastic Rotation for Haunch Modification
)
Xc
\i i
11 ^ «
JK UCSD-RBS-1 (Beam 1)
• UCSD-RBS-1 (Beam 2)
+ UCSD-RBS-2(Beam 1)
-UCSD-RBS-2 (Beam 2)
-UCSD-RBS-2R (Beami)
UCSD-RBS-2R (Beam 2)
UCSD-RBS-3 (Beami)
UCSD-RBS-3 (Beam 2)
XUCSD-RBS-4 (Beam 1)
XUCSD-RBS-4 (Beam 2)
story Drift Ratio (%)
Figure 8 - Strain Hardening Factor vs. Story Drift Ratio /or RBSModification of W36xl50 Beams
210
DRAFT MANUAL FORSEISMIC ISOLATION DESIGN OF UNDERGROUND STRUCTURES
by
Shigeki UNJOH", Jun-ichi HOSHIKUMA", Kazuhiro NAGAYA'' and Kazuhiko MURAl'^
ABSTRACT
Public Works Research Institute has conducted
3-year joint research program on seismic
isolation systems for underground structures to
improve the structural performance and the
safety during earthquakes. This project has
been made through the joint research program
between Public Works Research Institute,
Public Works Research Center and 17 private
companies. Developed seismic isolation
systems for the underground structures are
made by constructing the isolation materials
with low-shear modulus around the
underground structures to absorb the effect of
ground deformation. Five kinds of seismic
isolation materials have been developed and the
analysis and design methods for the
underground structures with the seismic
isolation systems have been also studied and
developed. The final 'accomplishment is
complied as a "Draft Manual for Seismic
Isolation Design of Underground Structures" in
March 1998.
KEY WORDS : Seismic Design
Underground Structure
Seismic Isolation
Seismic Isolation Material
Seismic Isolation Design
Design Manual
1. INTRODUCTION
Underground structures such as tunnels and
pipelines are generally affected by the
displacement and deformation of the
surrounding ground during earthquakes. In
general, therefore, the underground structures
are less influenced by the effect of earthquakes
than the structures on the ground in which the
earthquake response is amplified through the
structures.
On the other hand, the underground has
recently been starting to be developed and to
be densely used especially in urban areas. The
underground structures are often required to be
constructed at the sites where the effect of
earthquake becomes critical in the design, such
as the sites with soft soil conditions, the sites
where the ground condition is drastically
changing, and the sites where structures with
different vibrational characteristics are
constructed closely or jointly.
During the 1995 Hyogo-ken-nanbu Earthquake,
the damage to the underground structures were
relatively slight comparing the structures on the
ground such as buildings and bridges.
However, some of the underground structures
such as subway station were damaged
destructively. At the Daikai-Station of the
Kobe High Speed Train, the RC columns were
failed in shear and the upper slab was settled.
1) Head, Earthquake Engineering Division,
Earthquake Disaster Prevention Research
Center, Public Works Research Institute,
Ministry of Construction, Tsukuba-shi,
Ibaraki-ken, 305, Japan
2) Research Engineer, ditto
3) Visiting Research Engineer, ditto
211
The damage to sewage systems such as cracks
and dislodgement of pipes were also found.
The Public Works Research Institute has been
studied and developed the seismic isolation
systems for the underground structures to
improve the seismic performance and the safety
by constructing the isolation materials with
low-shear modulus surrounding the
underground structures. The isolation materials
absorb the deformation of the ground during
the earthquakes. This study was made through
the joint research program between Public
Works Research Institute, Public Works
Research Center, and 17 private companies
including material makers, general contractors,
design consulting firms.
In the Joint research program, major objectives
of the research and development are as follows:
1) Development of Isolation Materials
Applicable for the Seismic Isolation
Systems
2) Construction Methods of Seismic Isolation
Materials
3) Design Methods for Underground
Structures with Seismic Isolation Systems
The final accomplishments of the research and
development is compiled as the "Draft Manual
of Seismic isolation design for Underground
Structures" in March 1998.
This paper presents the concept of the seismic
isolation systems for the underground
structures and the outline of the draft design
manual.
2. SEISMIC ISOLATION SYSTEMS FORUNDERGROUND STRUCTURES
2.1 Concept of Seismic Isolation Systems
In general, underground structures are
subjected to the deformation through the
interaction between the ground and the
structures. Therefore, when the stiffness of the
structures are increased, the flexibility of the
structures is decreased then the section force
developed against the same deformation is
increased. Hence, the design to increase the
section or number of reinforcing bars to ensure
the earthquake force developed like usual
structures is not effective in general. In this
case, it is effective to isolate the structures
from the deformation of the ground.
There are several ways to decrease the effect of
ground deformation to be transmit to the
underground structures. Major ways are the
followings :
1) To make the underground structures
flexible by decreasing the stiffness
2) To decrease the effect of ground
deformation to be transmitted to the
underground structures
The usual way, which has been employed for
actual submerged turmels and shield tunnels
and common utility ducts, is the above 1)
using flexible joints. When the stiffness of the
joints are decreased, the ground deformation is
absorbed at the joints and the section force of
the structures is decreased. However, when the
displacement developed at the joints becomes
excessive, there are cases in which such
excessive displacement is not acceptable or the
special water-proof joints are required
depending on the performance level required to
the structures during large earthquakes.
On the other hand, the above 2) includes the
methods in which the seismic isolation layer
consisted of the materials with low shear
modulus comparing the surrounding soils are
constructed around the structures as shown in
Fig.l. Since the shear deformation of the
ground is absorbed by the seismic isolation
layer, the excessive displacement, which may
be developed at the specific joints, is prevented
by this methods. Furthermore, since the ground
deformation is absorbed, the isolation layer is
212

effective to earthquake ground deformation
both in the longitudinal and transverse
directions.
Here, the method to decrease the effect of
earthquakes by constructing the seismic
isolation layer around the underground
structures is defined as "Seismic Isolation
Systems for Underground Structures".
2.2 Application of Seismic Isolation Systems
Th effect of earthquake is generally large for
the underground structures under the following
conditions based on the past earthquake
damage experiences.
1) Boundary section where the ground
conditions are critically changed
The effect of earthquakes on the underground
structures becomes large at the sites where the
ground condition is changing from stiff ground
to soft ground, or from cut ground to
embanked ground. The deformation and the
strain is concentrated at the boundary of the
such sections with the change of ground
conditions.
2) Connection section of two different
structures
The deformation is concentrated at the
connection section between shaft and tunnels,
or junction sections, by the difference of the
vibrational characteristics of two adjacent
structures.
Therefore, the application of the seismic
isolation systems is effective such boundary
sections with different ground conditions or
different structural conditions as shown in
Fig.2. The concentration of the deformation
and the strain is absorbed by the seismic
isolation layer and the seismic performance of
the underground structures can be improved.
Also, the transmission of shear deformation can
be decreased by the seismic isolation layer, the
effect of earthquakes is decreased for the
transverse direction of the structures with wide
section in which the surrounding shear stress is
critical in the seismic design.
Furthermore, when it is required to prevent
water from coming in the structure depending
on the required performance of the structures,
the application of the seismic isolation layer
with a water-proof function is effective both
for the increase of the earthquake resistant
performance and the water-proof performance.
2.3 Seismic Isolation Materials
Seismic isolation materials applicable to the
underground structures are required to have the
performances of seismic isolation functions and
the function as the backfill materials. The
development of the seismic isolation materials
have been made for the shield-driving tunnels
and the open-cut type tunnels. The required
performances are as follows:
1) Low shear modulus and high shear
deformability
2) High durability, long-term stability, and
small volumetric changes
3) High constructionablity (for example for
shield-driving tunnels : transportability by
pumping in a liquid state and high
filling-up performance
4) Watertightness
5) No dilution by ground water
6) No contaminants
Based on the above required performances, in
the joint research program, 5 kinds of the
seismic isolation materials were developed as
shown in Table 1. The material characteristics
including mechanical one, such as shear
modulus, durability, watertightness, creep, and
constructionablity were tasted using developed
materials.
Fig3 shows examples of the mechanical
properties of the developed materials obtained
through the hollow cylindrical cyclic shear
213
tests. The all materials were tested by the same
testing methods.
To simulate the actual condition in the tests,
the surface soil layer with about 3m are
assumed for the open-cut type tunnels. And for
the shield driving tunnels, the surface layer
with about 20 m was assumed. Then the
confined pressures were selected as 0.5, 1.5
and 3.5 kgf/cm^ The cyclic loading rate is
assumed as 1 Hz considering the natural period
of the surface layer. The strain range tested
was assumed up to 10% considering the large
deformation during the large earthquakes based
on the analytical results.
Fig3 shows that the shear modulus and
damping ratio for Urethan-based material,
Silicon-based material and Liquid Rubber
material are almost constant in the range of the
strain tested. And the confinement dependency
was not found.
On the other hand, Asphalt-based material has
the strain dependency in which when the strain
increases the shear modulus decreases and the
damping increases. The confinement
dependency is found at the small strain range
but is not remarkable.
For Precast Rubber Panel, the strain
dependency and confinement dependency are
found. Since the precast rubber panel is made
by binding the rubber tips by resin, the precast
rubber panel has the void inside the panel. The
strain dependency is developed by the resin
characteristics is changed in the high strain
range then the shear modulus decreases.
Seismic isolation design of the underground
structures has to be made based on the material
characteristics as above mentioned. Some
materials have other dynamic characteristics
such as velocity dependency. They are also
obtained through the necessary tests.
2.4 Construction Methods
Fig.4 shows the outline of the construction
methods of seismic isolation materials. For the
shield-driving tunnels, the same construction
methods of the backfill to the tale void is
applicable. The materials are injected to the
tale void from the inside of the tunnels and the
seismic isolation layer has constructed around
the structures. To prevent the inflow of the
isolation materials toward the shield machine
and to construct seismic isolation layer
certainly in the tale void, the shield machine
requires the inflow prevention devices but not
important remodeling. For the open-cut type
tunnels, the seismic isolation layer can be
constructed with the construction of the
tunnels. In the joint research project, both
construction methods are verified through the
construction tests of the seismic isolation layer.
3. VERIFICATION TESTS OF THEEFFECTIVENESS OF SEISMICISOLATION SYSTEMS
3.1 Test Models
To verify the effectiveness of the seismic
isolation systems, the model tests were made
using large shake table at the Public Works
research Institute.
Fig. 5 shows the scale of the model. Tunnel is
assumed to be constructed at the change
section of ground conditions. The tunnel was
the almost 1/70 size of actual structures with a
diameter of 70mm and the thickness of 2mm.
The ground was made of Silicon where the soft
soil was assumed to have the shear modulus of
lkgfi'cm\ and the stiff soil was assumed to
have the 20kgf/cm\ Seismic isolation layer was
assumed to have the thickness 10mm and the
shear modulus of 0.05kgf/cm\
The model was subjected to the sinusoidal
ground motion and the random earthquake
214
ground motion. Since the natural frequency of
the model was 6.5Hz, the sinusoidal wave with
the natural frequency of the ground was input
to the shake table.
3.2 Test Results
Fig. 6 shows the typical test results. In the'
right side section where the ground condition is
changed, the seismic isolation layer is
constructed. The strain in the tunnels in the
longitudinal direction developed at the change
section of the ground conditions was decreased
by 30% by employing the isolation layers. This
was the aknost expected effectiveness through
the analysis.
4. DRAFT MANUAL FOR SEISMICISOLATION DESIGN OFUNDERGROUND STRUCTURES
4.1 Table of Contents
The draft manual consists of 9 chapters, 4
design examples and the 12 reference
materials. The table of contents is as follows.
1. General
1.1 Scope
1.2 Definition of Terms
1.3 Symbols
2. Basic Principle of Seismic Isolation Design
for Underground Structures
3. Design Earthquake Ground Motion and
Design Ground Displacement
3.1 General
3.2 Design Ground Displacement during
Earthquakes
3.3 Dynamic Soil Properties
3.4 Design Earthquake Response Spectrum
3.5 Input Ground Motion for Dynamic
Analysis
4. Seismic Design of Underground Structures
in Transverse Direction
4.1 General
4.2 Horizontal Ground Displacement during
Earthquakes
4.3 Static Analysis Methods of
Underground Structures in Transverse
Direction
4.3.1 General
4.3.2 Response Inertia Force Methods
4.4.3 Other Static Analysis Methods
4.4 Model of Underground Structures in
Transverse Direction
4.4.1 Model of Shield Driving Tunnel
4.4.2 Model of Open-Cut Type Tunnel
4.5 Evaluation of Safety
4.6 Check of Safety by Dynamic analysis
Methods
4.6.1 General
4.6.2 Analytical Model
4.6.3 Evaluation of Safety
5. Seismic Design of Underground Structures
in Longitudinal Direction
5.1 General
5.2 Horizontal Ground Displacement during
Earthquake
5.3 Static Analysis Methods of
Underground Structures in Longitudinal
Direction
5.3.1 General
5.3.2 Analysis Methods using
Beam-Mass Model
5.3.3 Analysis Methods using
Axisymnmentrilc Model
5.3.4 Analysis Methods using Simplified
3-Dimensional FEM Model
5.3.5 Analysis Methods using
3-Dimensional FEM Model
5.4 Model of Underground Structures in
Transverse Direction
5.4.1 Model of Shield Driven Tunnel
5.4.2 Model of Open-Cut Type Tunnel
5.5 Evaluation of Safety
5.6 Check of Safety by Dynamic analysis
Methods
5.6.1 General
5.6.2 Analytical Model
5.6.3 Evaluation of Safety
6. Seismic Design of Connection Section
between Shaft and Tunnel
215

6.1 General
6.2 Horizontal Ground Displacement during
Earthquake
6.3 Static Analysis Methods of Connection
Section between Underground
Structures
6.4 Model of Shaft and Underground
Structures
6.5 Evaluation of Safety
7. Design of Isolation Material and the
Material Properties
7.1 General
7.2 Asphalt-based Material
7.2.1 General
7.2.2 Material Properties
7.3 Urethan-based Material
7.3.1 General
7.3.2 Material Properties
7.4 Silicon-based Material
7.4.1 General
7.4.2 Material Properties
7.5 Liquid Rubber Material
7.5.1 General
7.5.2 Material Properties
7.6 Precast Rubber Panel Material
7.6.1 General
7.6.2 Material Properties
8. Design of Seismically Isolated Tunnels
against Usual Loads
Design Examples
1. Design Example of Open-Cut Type Tuimel
in Transverse Direction
2. Design Example of Shield-driving Tunnel
which is constructed at Changing Site of
Ground Condition
3. Design Example of Shield-driving Tunnel
which is constructed under the Retaining
Caisson
4. Design Example of Connecting Section
between Shaft and Tunnel
Reference Materials
1. Mechanical Properties of Isolation Materials
2. Construction Methods of Shield Tunnels
with Isolation Design
3. Construction Methods of Open-Cut Type
Tunnels with Isolation Design
4. Applicability of Seismic Isolation Design for
Longitudinal Direction of Underground
Structures
5. Applicability of Seismic Isolation Design for
Transverse Direction of Open-Cut Type
Turmels
6. Applicability of Seismic Isolation Design for
Transverse Direction of Shield driving
Tunnels
7. Applicability of Seismic Isolation Design for
Connection section between Shaft and
Tunnels
8. Applicability of Analysis Methods in
Longitudinal Direction of Underground
Structures with Isolation Design
9. Applicability of Analysis Methods in
Transverse Direction of Underground
Structures with Isolation Design
10. Analysis Examples of Settlement of
Surrounding Soils around Underground
Structures with Isolation design
11. Verification Tests Results of Effectiveness
of Seismic Isolation Design of Underground
Structures
12. Verification Tests Results of Effectiveness
of Seismic Isolation design of Underground
Structures
4.2 Basic Principle of Seismic Isolation
Design
In the draft design manual, the basic principle
of the seismic isolation design is specified as
follows:
(1) The objective of the seismic isolation
design for the underground structures is to
decrease the section forces developed during
earthquakes
(2) The thickness and the length of the
isolation layer shall be designed so as to get
the effective isolation function.
(3) When the seismic isolation systems are
employed, the stability during the construction
216
and the stability against the usual loads shall be
verified.
(4) In the seismic isolation design, the two type
of earthquake ground motion shall be taken
into account. They are the earthquake ground
motion with high probability to occur during
the lifetime of the structures and the
earthquakes ground motion with strong
intensity and the low probability to occur
during the lifetime of the structures. Against
these two types of earthquake ground motions,
the underground structures shall be designed to
insure the seismic performance level depending
on the structural characteristics, purposes of
use, importance, etc.
(5) Seismic isolation systems are applied both
for the transverse and longitudinal directions of
the underground structures. In the transverse
direction, the earthquake response is analyzed
by using Finite Element Method (FEM) model
where the inertia force of ground is applied to
the model. In the longitudinal direction, the
earthquake response is analyzed using
beam-spring model where the deformation of
the ground applied is analyzed through the
dynamic analysis of the ground. In the analysis
of the connection of the shaft and the tunnels,
the beam-spring model or axisymmetric FEMmodel. The properties of soils and structures
shall be given appropriately depending on the
response level.
(6) In the design of the underground structures
with complicated vibrational characteristics
during earthquakes, the safety shall be check
by using detailed model and analysis methods.
(7) Isolation materials shall be selected
considering the constructionablity,
watertightness, durability, material properties,
etc., and shall be used in the reliable range of
the material properties.
5. CONCLUDING REMARKS
The preceding pages presented an outline of
3-year joint research program on seismic
isolation systems for underground structures to
improve the structural performance and the
safety during earthquakes. There is an idea of
the seismic isolation system for the
underground structures long time ago, but the
isolation materials and the construction
methods applicable for the systems had not yet
been developed. Through the joint research
program, 5 kinds of seismic isolation materials
have been developed and the analysis and
design methods for the underground structures
with the seismic isolation systems have been
also studied and developed. The final
accomplishment is complied as a "Draft
Manual for Seismic Isolation Design of
Underground Structures". Since the draft
manual is now under printing, it will be
available in around June.
This research is one of the first steps to realize
a new earthquake resistant structure. We are
planning to study furthermore about the
practical application of the isolation systems
and the verification tests using full-scale
structures should be studied.
ACKNOWLEDGMENTS
This study was made the joint research
program between Public Works Research
Institute, Public Works Research Center and 17
private firms. The authors thank all members
of the joint research program who have
conducted research and development eagerly.
In particular, Mr. Isao TAKATORI, Director of
the Public Works Research Center and Dr.
Takeyasu SUZUKI, Kumagai-gumiCooperation for their faithful contribution to
the joint research program.
REFERENCES
1) Public Works Research Institute : Report of
The Disaster Caused by the 1995
Hyogo-ken Nanbu Earthquake, Journal of
217

Research, Public Works Research Institute,
Vol.33, March 1997 (in English)
2) Public Works Research Institute, Public
Works Research Center, 17 Private Firms :
Report of The Joint Research on Seismic
Isolation Design of Underground Structures
Vol.1 and Vol.2, Joint Research Report,
No. 154 and 192, November 1996 and
December 1997, (In Japanese)
3) Public Works Research Institute, Public
Works Research Center, 17 Private Firms :
Report of The Joint Research on Seismic
Isolation Design of Underground
Structures, - Draft Manual for Seismic
Isolation design of Underground Structures
-, Joint Research Report, March 1998
(Under Printing)
4) Unjoh, S., Hoshikuma, J., Nagaya. K, and
Murai, K: Development of Seismic
Isolation Systems for Underground
Structures and the Mechanisms of Seismic
Isolation, 7th US-Japan Workshop on
Earthquake Disaster Prevention for Lifeline
Systems, November 4-7, 1997, Seattle,
Washington
5) Suzuki, T, and Tanaka, T : Research and :
Development on the Seismic Isolation
Systems applied to Urban Tunnels (Part-1:
Development of Seismic Isolation Materials
and Construction Methods), 7th US-Japan
Workshop on Earthquake Disaster
Prevention for Lifeline Systems, November
4-7, 1997, Seattle, Washington
6) Tanaka, T, and Suzuki, T : Research and :
Development on the Seismic Isolation
Systems applied to Urban Tunnels (Part-1:
Effects of Seismic Isolation and Seismic
design), 7th US-Japan Workshop on
Earthquake Disaster Prevention for Lifeline
Systems, November 4-7, 1997, Seattle,
Washington
218

Table 1 Seismic Isolation Materials Developed
Construction Methods Isolation Material Material Contents
Shield Driv ing Tunnel Asphalt-based MaterialAsphalt and portland cement with
high-water absorbing polymer
Urcthan-basod Material Urethan with fly ash and pcMyor
Silicon-based Material Silicon oil and fly ash with polyether
Open-Cut Type Tunnel Liquid Rubber MaterialPolybutadiene-type liquid rubber with
polyisocyanate
Precast Rubber PanelRubber tips made of shredded tires with
urethan polymer resin
Fig.l Concept of Seismic Isolation Systems for Underground Structures
219
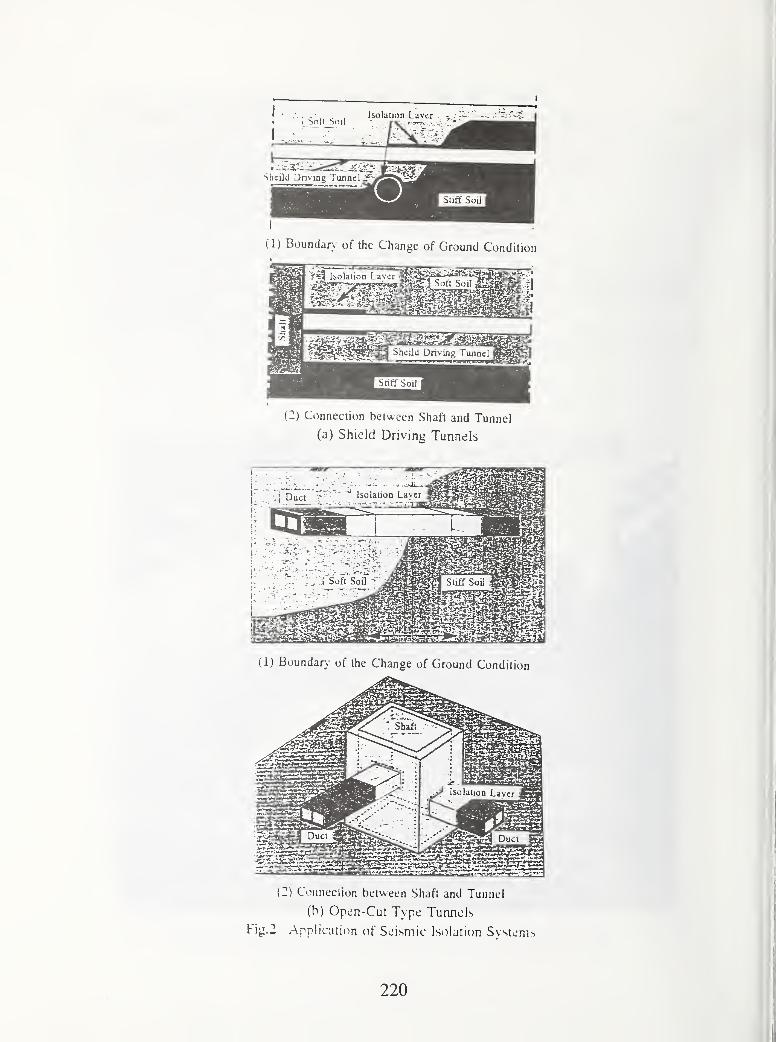
(1) Boundan, of the Change of Ground Condition
(2) Connection between Shaft and Tunnel
(a) Shield Driving Tunnels
(1) Boundary of the Change of Ground Condition
220
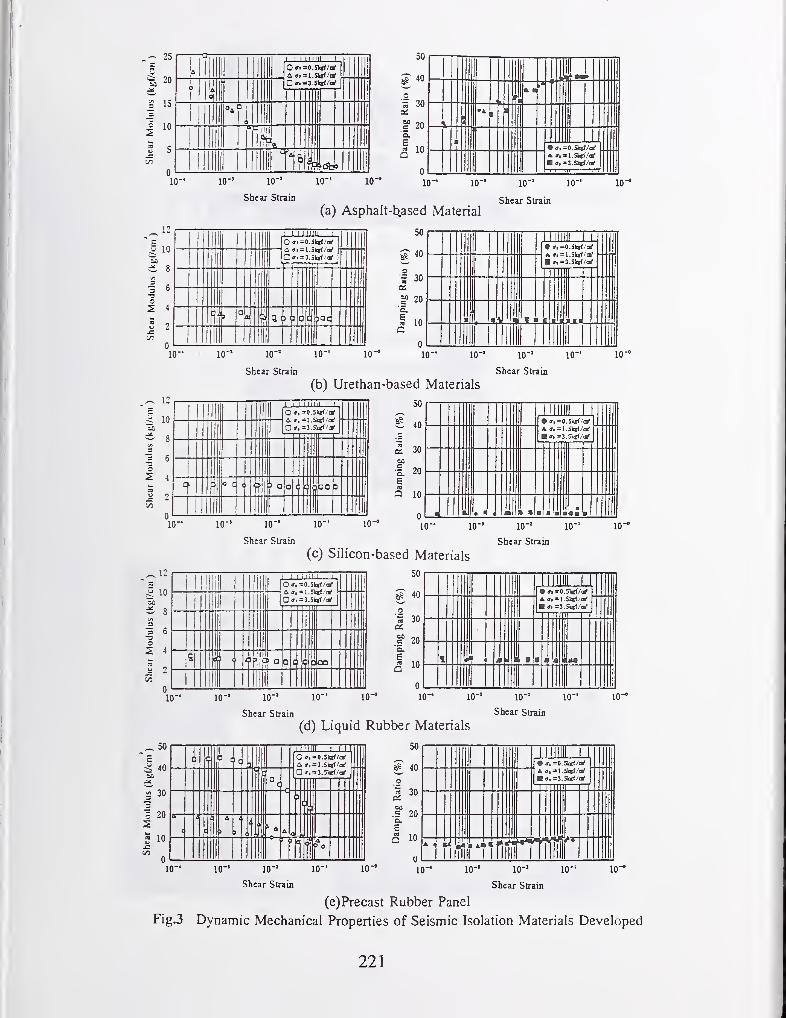
25
'J
'Si20
15
aiU
5
0
lo-"
10"
10-'
^ 50
J 40so
30
o 20
H 10
0,0
50
40
5 30as
20
10
10-' 10-'
Shear Strain
10- 10- 10-
(a) Asphalt-b,ased Material
10-' 10-'
Shear Strain
10-
,1 I I I I I
. = l.Sk»f/^
ac
50
40
.230
c 20
'a.
E10«
G0
Jl• .r, =O.Ski</i^
A 7. = l.SI«(/a'
1 » r10-' 10-'
Shear Strain
10- 10- 10- 10- 10-'
Shear Strain
10"
ft? o
O », =O.Sk»</ai'
a », = I.5k»</c»'
JO
(b) Urethan-based Materials
50
40
30
20
10
so
e
Q
A », = 1.5k»f/(«'
=3.51n</ii'
10- 10-'
Shear Strain
10- 10- 10- 10-
(c) SOicon-based Materials
10-'
Shear Strain
10-
0». =0.5ki</M'I
OQO
50
^ 40
o5 30a:
aa20
a.E
10
rt»
>
10- 10-'
Shear Strain
10- 10- 10- 10-
(d) Liquid Rubber Materials
10-'
Shear Strain
10-
50
40
« 30a:
Olic 20'5.
Efid
Q 10
U
1 Aiifl^^''^
• >, =l>.SI«</c^
A », = 1.5kt'/irf
10- 10- 10- 10-10" 10- 10- 10- 10- 10-
Shear Strain Shear Strain
(e)Precast Rubber Panel
Fig.3 Dynamic Mechanical Properties of Seismic Isolation Materials Developed
221
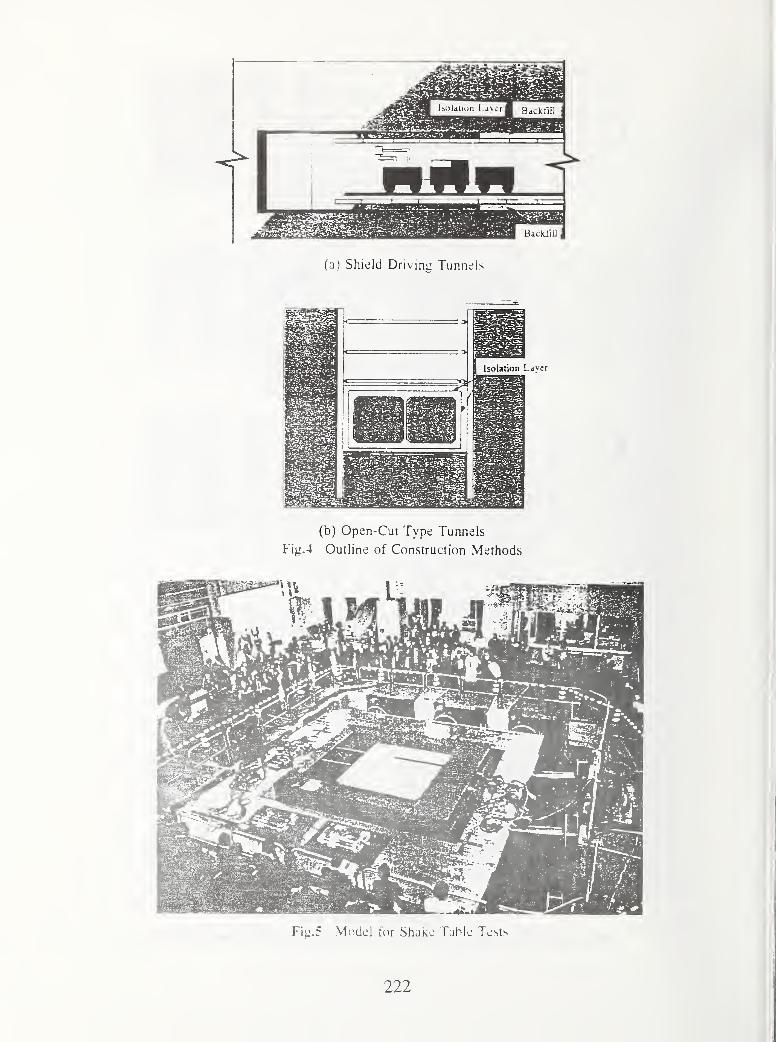
(a) Shield Drivinii Tunnels
Fiy.5 Model for Shake Table Tests
222

3000
2000
1000
-1000
-2000
-3000
With Isolation
Without Isolation
1
mm
—*, \
•••.X
\ i
\!
Soft Soil Sriff SoU
;
'
i
'
\
Isolation Length
11 1
100 200 300
Distance (cm)
400 500
(a) Strain Distribution in Tunnel Model in The Longitudinal Direction
(Sinusoidal Input : 6.5Hz, 150gal)
2500
2000
'o^ 1500
•| 1000
^ 500
•i 0
^ -500
- -1000
'^ -1500
-2000
-2500
' With Isolation
' Without Isolation
n I. T .1 * A ^ A .'. A « A ,'t f.
V ¥ •.' V V -J V V V V v' V S
0.5 1 1.5
Time (s)
(b) Strain Response
(Sinusoidal Input : 6.5Hz, 150gal)
0.5 2 2JS 3
Time (s)
(c) Strain Response (Earthquake Wave)
Fig.6 Test Results of Shake Table Tests
V V
2.5
223
Comparison between the affected populations of indirect health effects
after the 1995 Great Hanshin-Awaji earthquake
by
Keiko Ogawai>, Ichiro Tsuji^), Shigeru Hisamichi^)
Keishi Shiono^)
ABSTRACT_
Indirect health effects (any kinds of
health outcomes, not directly caused by
the structural damages ) after the
earthquake have come to be the issue
after the fatal earthquakes such as the
1995 Great Hanshin-Awaji earthquake.
The investigations about the mortality
and morbidity due to both direct andindirect health effects at the communitylevel are required to identify the mosteffective countermeasures in the pre-
impact and post impact phase.
As an example of indirect health
effects, age-adjusted death rates of
acute myocardial infarction were
compared among several affected
regions. In Nada, Higashi-Nada,
Hyogo, Nagata districts in Kobe City weobserved the sharp increase in the
average death rates between Januaryand March, 1995 in comparison with
1994 and 1996. Outside of Kobe City,
the similar increase was observed in
Amagasaki and Tsuna. The different
patterns in the increase of rates
between January and March, 1995 are
suggestive of the multiple risk factors.
The further investigation is required to
identify the environmental factors
(structural and non-structural) to
reduce the total health outcomes.
KEYWORDS:indirect health effects
age-adjusted death rate
acute myocardial infarction
1. INTRODUCTION
The first step in preventing adverse
health outcomes would be to identify
the risk factors and to establish the
effective measures in adverse. There
have been numerous reports regarding
the human casualties directly caused by
structural damage after the earthquake
(Glass, 1977; de Bruycker, 1985; Coburn,
1987; Jones, 1990; Noji, 1990; Shiono,
1991b). Not only the death andinjuries caused by the structural
damages but also indirect health effects
have also been reported
1)Department of Public Health, TohokuUniversity School of Medicine, Miyagi,
Japan
2) Nagaoka Technology College, Niigata,
Japan(Logue,1978; 1979; 1980; 1981a; 1981b).
224
For instance, it has been reported that
the incidence of coronary heart disease
increased after the disasters
(Trichopoulos, 1983; Katsouyanni, 1986;
Suzuki, 1995; Leor, 1996).
Nevertheless, there are very few studies
to describe the indirect health effects
after the earthquake at the population
level (Kloner, 1997).
Indirect health effects after the
earthquake in this paper refers to as all
the medical health consequences not
directly caused by the structural
damages. Description of the magnitudeof indirect health effects andidentification of their risk factors wouldlead us to better implementation of
preventive measures after the disasters.
For this purpose, we compared age-
adjusted death rate of acute myocardial
infarction (AMI) in Kobe and seven
other cities in Hyogo Prefecture before
and after the Great Hanshin-Awaji
Earthquake.
2. SUBJECTS AND METHOD
The Great Hanshin-Awaji
Earthquake hit the southern part of
Hyogo Prefecture on 17 January, 1995.
The epicenter was reported to be located
on the northern tip of Awaji island.
The magnitude was given at 7.2 on the
Japan Meteorological Agency. Weobtained all death certification data
(n=127,474) at Hyogo Prefecture
between 1994 and 1996 from the Vital
Statistics Recording Office, Ministry of
Health and Welfare, Japan. The data
included data of death, age of death, sex,
area code, date of death for each
decedent, but did not include personal
name or other identifier. We classified
cause of death according to
International Classification of Diseases,9th Revision aCD-9) for 1994 and 10^^
Revision aCD-10) for 1995 and 1996.
Age-adjusted death rates of AMI, as
standardized to the model population of
Japan in 1985, by month werecalculated in all nine districts within
Kobe City and seven cities in southern
part at Hyogo Prefecture (Amagasaki,
Nishinomiya, Sumoto, Ashiya, Itami,
Takarazuka and Tsuna).
3. RESULT
Fig. 1 shows the age-adjusted death
rate ofAMI by month. Monthly trends
of the age-adjusted death rate of AMIcould be classified into two different
patterns. One example was presented
in Fig. lA. It was the result in Nadadistrict, Kobe City. Notable increase
in the age-adjusted death rate wasobserved only in January, February andMarch, 1995. The other pattern waspresented in Fig. IB; Kita district, KobeCity. The death rates did not increase
in January, February and March, 1995.
Fig. 2 summarizes the age-adjusted
death rates of AMI at each region
between January and March in 1994,
1995 and 1996, respectively. Wecompared the average rates betweenJanuary and March in each year. Thenotable increase in the average death
rate was observed in some regions such
as East Nada, Nada, Hyogo and Nagatadistricts among Kobe City andAmagasaki and Tsuna. We could not
observe uniform trend between menand female in each region.
Fig. 3 showed different patterns of the
monthly trend of age-adjusted death
rates of AMI from January to March,
1995. The peak in the death rates in
225

Nagata district in men and women wasobserved in January. ,0n the other
hand, the peak in the death rates in
Nada district was observed on February,
one month later. In case of Ashiya in
men, the peak was observed in March.
The death rates in men in Tsunashowed two peaks in January andMarch. The trend in the death rates in
Ashiya and Tsuna was different
between men and women.Table 1 showed the actual number of
death of AMI according to the 17
regions. We compared the total
number of death between January andMarch in each year. The number of
death of AMI in 1995 was more than
twice as that of 1994.
4. DISCUSSION
Our population based study showedexcess mortality ofAMI in some regions
after Great Hanshin-Awaji earthquake.
The pattern of the increase in death
rates were different among the affected
regions. Fig. 2 suggests us the need to
measure the risk factors at the regional
level for the causing inference. Thedifferent trend in death rates for the
early recovery stage as shown in Fig. 3
are suggestive of the multiple risk
factors to AMI.Several cases reports about the
increase in the incidence of ischemic
heart diseases after the disasters have
been reported (Faich, 1979; Trevisan,
1992). Although the mechanisms to
increase the mortality and morbidity of
cardiovascular diseases have still to be
clarified, the stresses in the post-
disaster period could be considered as a
possible explanation (Bertazzi, 1989;
Willich, 1993).
The following three points are
possible explanation of the increase in
death rates between January andMarch, 1995.
One possibility is due to the change of
the classification of cause of death,
namely fi-om ICD-9 to ICD-10. It wasrecommended that we should put the
exact cause of death on "heart failure"
cases. This recommendation could
possibly increase the death rate of AMI.The increase of death rates in our study,
however, was limited between Januaryand March, 1995. Therefore the
monthly trend observed in our study
could not be explained by the change of
the classification.
The second possibility is due to the
deterioration of hospital services by the
structural and non-structural elements
in the damage by the seismic activities
with the same of the incidence of death
rates. The increase of death rates
could be explained by the increase of
fatal rate. We are analyzing the
relationship between the function loss
in the hospital and prognosis of AMIpatients.
The third possibility is the increase of
the incidence of AMI. Actually the
number of death of AMI from January
to March, 1995 became the double of
that of the same term, 1994.
Considering the magnitude, the
possibility cannot be denied.
Identification of the risk factors is
mostly required. For this purpose, weare measuring "the inconvenience of
daily life due to lifeline disruption" to
analyze the relationships between them(Shiono,1989; 1991a).
The further research will be required
to identify the additional possible
environmental factors to influence the
226

overall health outcomes on the affected
populations.
5. CONCLUSION
The epidemiological research at the
population level is essential to identify
the risk factors for the health
consequences after the catastrophic
disasters which need the external
assistance. The public health
approach should be defined on the
investigation about the magnitude of
health outcomes on the affected
population.
6. ACKNOWLEDGMENT
This study was supported in part byGrants-in-Aid for Scientific Research on
Priority Areas from the Ministry of
Education, Science and Culture of
Japan (Grant No. 09234102).
REFERENCES
Bertazzi P.A. et al.(1989) .Ten-year
mortality study of the population
involved in the Seveso incident in 1976.
Am J Epidemiol 129, 1187-1200
Coburn A.W. et al (1987) .Factors
affecting fatalities and injury in
earthquakes. Internal report,
Engineering seismology andearthquake disaster prevention
planning. Hokkaido, Japan, HokkaidoUniversity, 1-80
de Bruycker, M. et al (1985) .The 1980
Earthquake in Southern Italy:
Morbidity and Mortality. Int JEpidemiol 14, 113-117
Faich G. and Rose R.(1979). BHzzardMorbidity and Mortality: RhodeIsland, 1978.
Am J PubUc Health 69, 1050-1052
Glass R.I. et al (1977). Earthquakeinjuries related to housing in a
Guatemala village. Science 197, 638-664
Jones N.P. et al (1990). Considerations
in the epidemiology of earthquake
injuries. Earthquake Spectra. Vol 6,
No.3, 507-528
Jones N.P. et al (1994) .Risk factors for
casualty in earthquake: The application
of epidemiologic principles to structural
engineering. Structural Safety 13, 177-
200
Katsouyanni K. et al (1986).
Earthquake-related stress and cardiac
mortality: Int J Epidemiol 15, 326-330
Kloner R.A. et al (1997). Population-
based analysis of the effect of the
Northridge Earthquake on cardiac
death in Los Angeles County, California.
Am J Coll Cardiol 30 (5), 1174-80
Leor J. et al (1996). Sudden cardiac
death triggered by an earthquake. N.
Engl. J. Med. 34, 413-9
Logue J.N. (1978) .Long-term effects of
a major natural disaster: The Hurricane
Agnes flood in the Wyoming Valley of
Pennsylvania, June, 1972. Doctoral
Dissertation, Columbia University
Faculty of Medicine, School of Public
Health, Division of Epidemiology, NewYork
227
Logue J.N. et al (1979). Emotional andphysical distress following Hurricane
Agnes in Wyoming Valley of
Pennsylvania. Public Health Reports 94,
495-502
Logue J.N ., Hansen H. (1980). A case-
control study of hypertensive women in
a post-disaster community. Journal of
Human Stress 6 (2), 28-34
Logue J.N. et al (1981a). Someindications of long term health effects of
a natural disaster in American Society.
Public Health Reports 96 (1), 67-79
Logue J.N., et al (1981b). Research
issues and directions in the
Epidemiology of health effects of
disasters. Epidemiologic Reviews 3,
140-162
Meisel S.R. et al (1991). Effects of Iraqui
missile war on incidence of acute
myocardial infarction and sudden death
in Israeli civilians. Lancet 338, 660-61
Noji E.K. et al (1990). The 1988
earthquake in Soviet Armenia: a case
study. Annals of Emergency Medicine
19, 891-897
Shiono K. , Shumuta Y. (1991a).
Inconvenience in resident's daily living
activities from post-earthquake
suspension of utility services, part 2.
Procedure for estimation.
Comprehensive Urban Studies No. 41,
37-46
Shiono K. et al (1991b). Post-event rapid
estimation of earthquake fatalities for
the management of rescue activity.
Comprehensive Urban Studies No. 44,
61-106
Suzuki S. et al (1995). Hanshin-Awaji
earthquake and acute myocardial
infarction. I^ancet, 345, 981
Trevisan M. et al (1992). Earthquakeand Coronary Heart Disease Risk
Factors: A Longitudinal Study. Am JEpidemiol 135, 632-7
Trichopoulos D. et al (1983).
Psychological stress and fatal heart
attack; the Athens (1981) earthquake
natural experiment. Lancet 1, 441-3
Willich S.N. et al (1993). Sudden cardiac
death:support for a role of triggering in
causation. Circulation 87, 1442-50
Shiono K. (1989). Inconvenience in
resident's daily living activities from
post-earthquake suspension of utility
services. Comprehensive Urban Studies
No. 38,
149-167
228
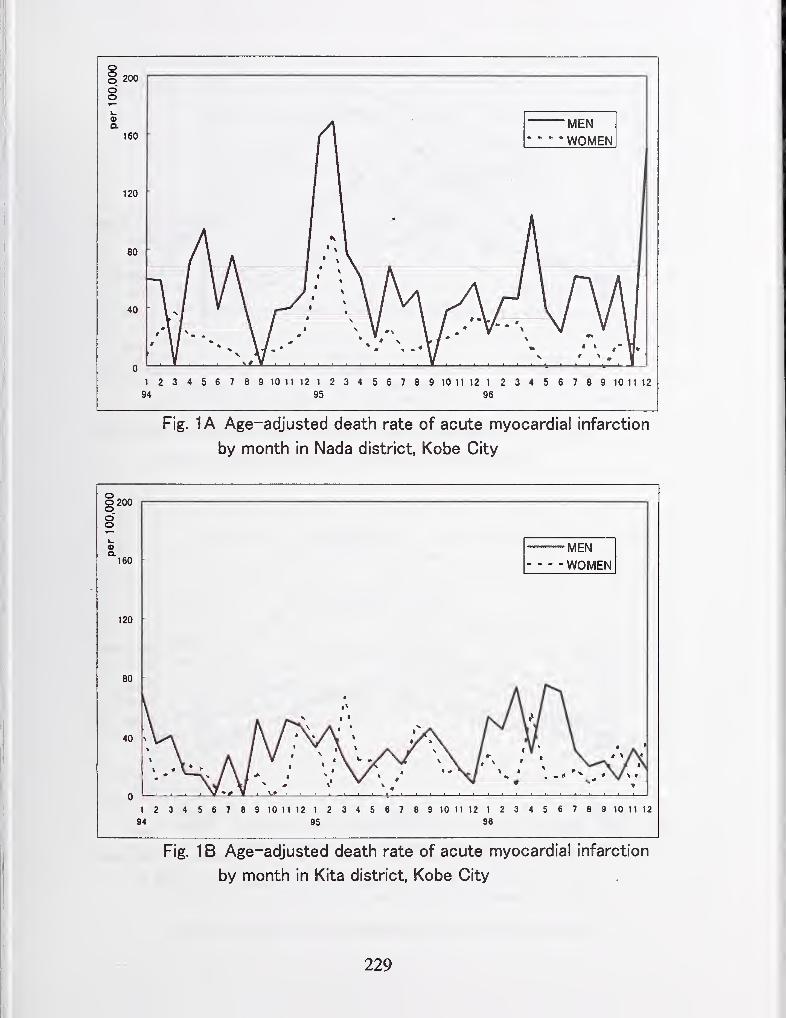
o§ 200
oo
1 234567 89 10 11 12 1 23456789 10 11 12 1 23456789 10 11 12
94 95 96
Fig. 1A Age-adjusted death rate of acute myocardial infarction
by month in Nada district, Kobe City
-MEN- WOMEN
oO200oo"o
oQ.
160
120 -
229
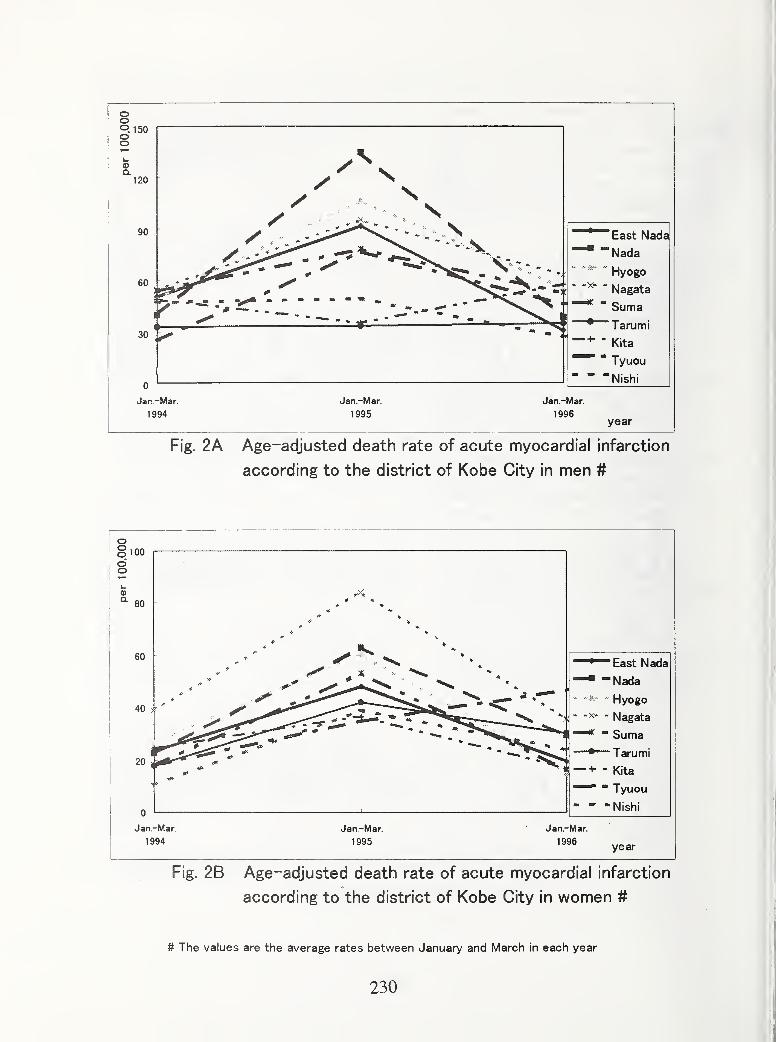
oo<=> 150oo
Jan-Mar. Jan-Mar. Jan.-Mar.
1994 1995 1996year
Fig. 2A Age-adjusted death rate of acute myocardial infarction
according to the district of Kobe City in men #
ooloooo
80
""East Nada
""Nada
Hyogo,- -X- * Nagata
" Suma' —•- Tarumi
!
— - Kita
" Tyuou
"Nishi
Jan.-Mar.
1994
Jan.-Mar.
1995
Jan.-Mar.
1996year
Fig. 2B Age-adjusted death rate of acute myocardial infarction
according to the district of Kobe City in women #
# The values are the average rates between January and March in each year
230
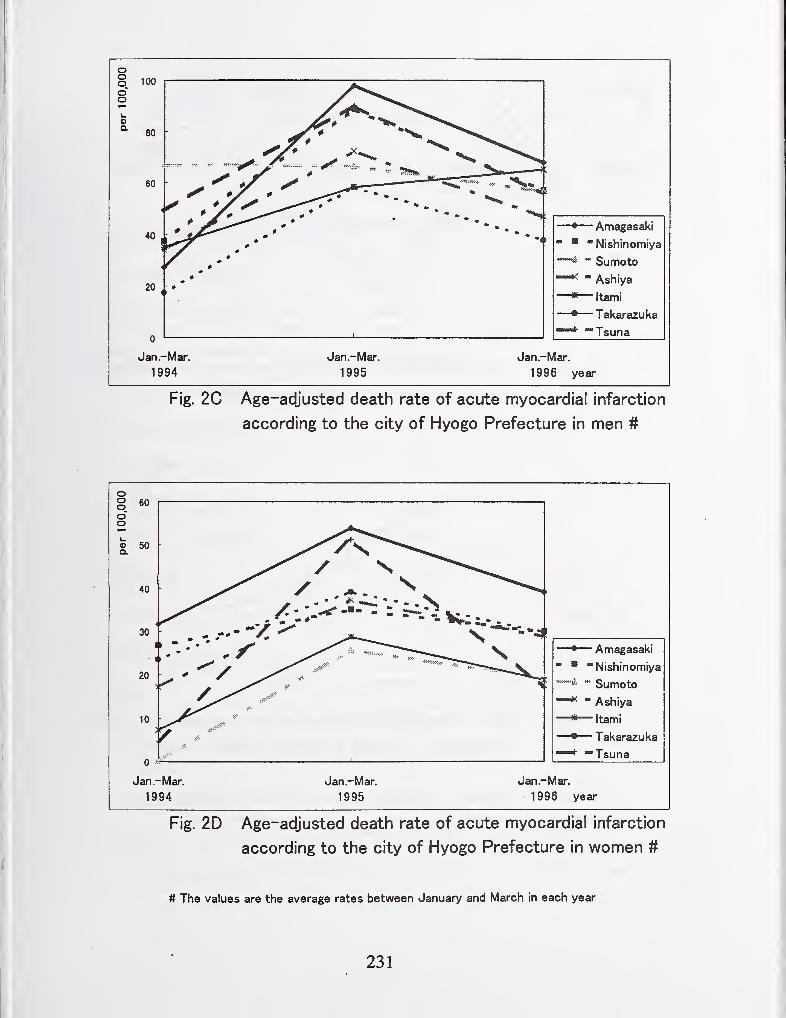
o§ 100
o"o
a.
20
—»- Amagasakim m "Nishinomiya
*" SumotB
' Ashiya
— Itami
— Takarazuka
"Tsuna
Jan -Mar.
1994
Jan -Mar.
1995
Jan.-Mar.
1996 year
Fig. 2C Age-adjusted death rate of acute myocardial infarction
according to the city of Hyogo Prefecture in men #
— Amagasaki
"Nishinomiya
Sumoto
Ashiya
Itami
Takarazuka
"Tsuna
Jan.-Mar.
1995
Jan.-Mar.
1996 year
Fig. 2D Age-adjusted death rate of acute myocardial infarction
according to the city of Hyogo Prefecture in women #
# The values are the average rates between January and March in each year
231
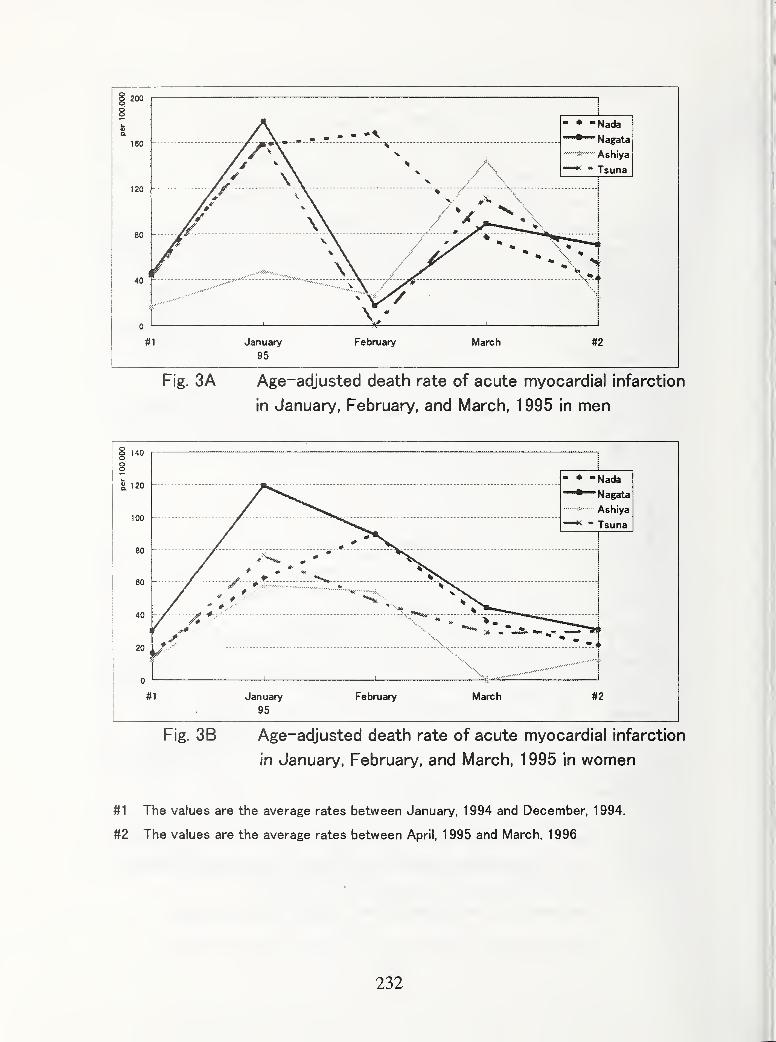
200
#1 January February March
95
Fig. 3A Age-adjusted death rate of acute myocardial infarction
in January, February, and March, 1995 in men
#1 The values are the average rates between January, 1994 and December, 1994.
#2 The values are the average rates between April, 1 995 and March, 1 996
232
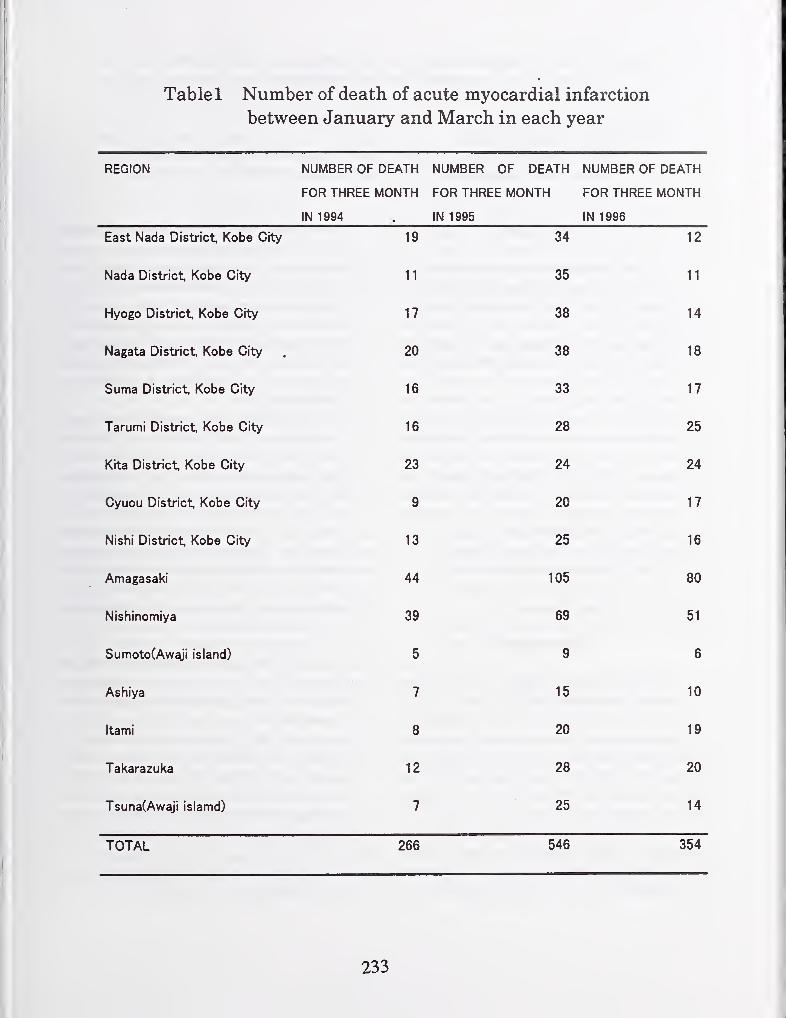
Table 1 Number of death of acute myocardial infarction
between January and March in each year
REGION NUMBER OF DEATH NUMBER OF DEATH NUMBER OF DEATH
FOR THREE MONTH FOR THREE MONTH FOR THREE MONTH
IN 1994 . IN 1995 IN 1996
East Nada District Kobe City 19 34 12
Nada District, Kobe City 11 35 11
Hyogo District Kobe City 17 38 14
Nagata District Kobe City 20 38 18
Suma District Kobe City 16 33 17
Tarumi District Kobe City 16 28 25
Kita District Kobe City 23 24 24
Cyuou District Kobe City 9 20 17
Nishi District Kobe City 13 25 16
Amagasaki 44 105 80
Nishinomiya 39 69 51
Sumoto(Awaji island) 0 b
Ashiya 7 15 10
Itami 8 20 19
Takarazuka 12 28 20
Tsuna(Awaji islamd) 7 25 14
TOTAL 266 546 354
233
New Framework for Performance Based Design of Building Structures
-Design Flow and Social System-
by
Hisahiro HIRAISHI", Masaomi TESHIGAWARA", Hiroshi FUKUYAMA", Taiki SAITO",
Wataru GOJO", Hideo FUJITANI", Yuji OHASHI", Izuru OKAWA", Hisashi OKADA"
ABSTRUCT
This paper introduces the outline of the new
structural engineering framework and social
system for the performance-based design of
building stmctures proposed under the 3-year
Comprehensive Research and Development
Project on "Development of a New Engineering
Framework for Building Structures" was
launched in fiscal 1995. In the project, the
clarification of target performance, the evaluation
of performance and the indication of performance,
are emphasized as the main three elements of this
framework. The implementation of the proposed
framework is also expected to promote
engineering innovation, the progress in building
engineering, and globalization.
Key Words :Performance-based Design,
Performance Evaluation,
Target Performance Level,
Social System
1. INTRODUCTION
The present structural design framework
prescribes the design load and external force, as
well as the allowable stress and deformation, but
does not specify the performance requirements
explicitly. Only detailed calculation methods are
specified without clear indication of target
performance and building performances (Figure
1).
As a result of that, the present framework
cannot explain explicitly the real building
performance and is becoming increasingly
inappropriate for new technologies and
performance indication. Then it has been needed
to establish a new "performance-based structural
design framework". This framework would also
encourage the communication between
consumers and engineers in order to make a
consensus on building structural performance,
and the application of new materials and new
technologies, by its rational performance
requirements and its flexibility in evaluation of
performance.
To establish such a performance-based
framework, a 3-year Comprehensive Research
and Development project on "Development of a
New Engineering Framework for Building
Stmctures (referred to below as Comprehensive
R&D Project)" was launched in fiscal 1995. The
concept of the performance-based stmctural
design has been discussed in the technical
coordinating committee of the project (Chairman:
Prof Dr. Tsuneo OKADA). Three sub-
committees are organized under the technical
coordinating committee.
This paper introduces the outline of the
concept and the framework of Performance Based
Design (P.B.D.) with the structural performance
evaluation system discussed in the "Performance
Evaluation" sub-committee (Chairman: Prof. Dr.
Hiroshi AKIYAMA), the target performance of
buildings stmctures and their levels from various
point of view in "Target Performance Level" sub-
committee (Chairman: Prof Dr. Yoshitsugu
AOKI), and the social background and supporting
systems should be to conduct P.B.D. practice
1) Building Research histitute. Ministry of
Constmction, 1 Tatehara, Tsukuba, Ibaraki,
305-0802, Japan
234

smoothly in the market in the "Social System sub-
committee (Chairman: Dr. Katsumi YANO)".
This paper introduces the outline of the
performance based structural framework in a
stage of research. So, this framework should be
reconsidered in adopting into the regulation or
code, for example Building Standard Law.
2. OBJECTTVTS
The primar}' objective of the new
framework is to create an system in which the
performance of buildings is clearly indicated and
"consumers" (owners and users) are well
informed of how their buildings perform and how
much it costs to attain the performance (design,
supervision and construction costs). The new
framework would also bring about other benefits,
such as progress in building engineering and
design techniques, greater flexibility in design,
and closer intemational cooperation. It is
important to clarify target performance and verify
by the rational performance evaluation method, so
that the building performance satisfies the target
performance initially clarified.
Such an approach allows more flexibility in
choosing design techniques and calculation
methods, because it aims to understand
performance requirements, and to clarify the
target performance and evaluate the building
performance rationally.
Next, it is important for engineers to explain
the building structural performance to owners,
users, and the pubhc. hi the process of decision of
target performance, engineers are expected to
communicate with owners, in order to understand
the requirements of owners, and to make advices
to them from the engineering and public point of
view. Then, users and the pubhc are able to
understand the building performance.
Moreover, it is also important that the
building strucmral performance will be one of the
most important measures for consumers to defme
the building value. As a result of that, the concept
of cost-performance is treated in structural
engineering by the new framework with a
performance-based approach.
3. CONCEPT OF THE NEWPERFORMANCE-BASED DESIGN
FRAMEWORKFigure 2 shows a flow of the new
performance-based structural framework
proposed by the Project (referred to below as the
"new framework"). The new framework
consists of three key procedures: "clarification of
target performance", "evaluation of performance"
and "indication of performance".
At the first stage of (frame- 1), "Basic
Strucmral Performances" which are primarily
required for the building structures are estabhshed.
Safety, Reparability and Ser\'iceability are
itemized as the Basic Strucmral Performance.
hi the second stage, "Basic Strucmral
Performances" which are described as the "Limit
States" for each "Performance Evaluation Item"
in general expression in the frame-3. The types
of loads or extemal forces and their magnimde in
the frame-2 are set along with setting of the
frame-3 . Performance levels ofeach performance
evaluation item should be defmed by the
relationships between the magnitude of loads and
extemal forces which affects to the structure, and
the limit states that the structure should be in.
The performances evaluated in the frame-4
of each evaluation items should be indicated
clearly in the frame-5.
4. CLARIFICATION OF TARGETPERFORMANCE
In principle, the target performance of a
building is clarified how the building should
perform according to each performance
evaluation items, i.e. the state of the stmcmral
frame and each building elements under assumed
loads and extemal forces. To do so, it is
necessary to study the performance requirements
for the building (items and levels of the
performance required).
235
First of all, a building is required to have
public functions. Buildings have certain meanings
in the society and have to be suitable for the
general public, or society. The minimum
requirements of building performance are defined
in the code. Building is required to have
functions specific to its usage. In other words, a
building should fulfill essential functions that can
be understood with its context in the public.
Next, there are needs or requirements of
building owners and users. Any owner or user has
some ideas of the building performance they
require, however vague they might be, based on
the information available to them. These
requirements might be classified into those
required generally by owners and users and those
specifics to each case.
On the other hand, the engineering
performance of a building has been based on the
judgements of the experts in structural
engineering, based on empirical records of
damages caused by loads and external forces of
past earthquakes and other events. In recent
years, however, explicit methods of making such
expert judgement have been developed.
By using available methods, structural
engineers will specify the target performance of
each building that would reflect the requirements
of lay "consumers".
4.1 Basic Structural Performance
Three basic structural performances, Safety,
Reparability and Serviceability are itemized. Each
of them corresponds to security of human lives,
security of property from the viewpoint of
easiness to repair, and security of serviceability,
respectively. Table 1 describes the objectives
and the contents to evaluate these basic structural
performances.
4.2 Performance Evaluation Items and Limit
States
The combination of basic structural
performances and the objects to be evaluated are
defined as Performance Evaluation Items.
Limit state for each performance evaluation item
is listed in general expression in Table 2. In the
left column of Table 2, the objects to be evaluate
are enumerated. These are structural frame,
structural member, non-structural member,
equipment/machine, fixture, furniture and soil.
Structural member and non-structural member
might be arrange into one term as building
members.
For example, safety limit state of structural
frame is defined as that the destruction directly
affects human life should be avoided. And in
the safety limit of the building member, it is
defined that falling out or scattering of building
members that directly affects human life should
be avoided. Safety limit state for safety
performance, reparability limit state for
reparability performance, and serviceability limit
state for serviceability performance are set.
4.3 Types and Magnitude of Loads and
External Forces
Usual loads (such as dead or live loads,
buoyancy, negative friction, soil pressure, water
pressure etc.), unusual loads of snow, wind,
earthquake, other forces such as temperature
stress, special soil or water pressure etc. should be
considered. The magnitude of loads and
external forces and their combination might be set
corresponding to the three basic performances
level; considering social situation, and frequency
of occurrence.
The idea of design earthquake load in that scheme
is introduced in Appendix I.
4.4 Performance Level
Performance levels of each performance
evaluation item will be indicated by the
relationships between the magnitude of loads and
external forces which affects to the structure, and
the limit states which the structure should be in.
Performance levels themselves can be
determined by designer and owner as the distance
from empirical reference level such as code
requirement, or a reliability method, etc.
236

Some issues which need to be considered in
determining the performance level of buildings
are discussed in Appendix n.
5. DESIGN AS A SOLUTION TO FULFILL
THE TARGET PERFORMANCE
Structural design is carried out to attain the
target performance. Note that a structure
means the structural system as a whole here,
which involves not only the structural frame but
also every building element including interior and
exterior members, equipment, devices,
furnishings and grounds.
The structural engineers practice their
philosophy in developing a structural system that
realizes the target performance. For example,
several solutions may be possible when trying to
attain the target performance of a structural frame
to resist earthquakes; the engineers can either
design the structural frame to bear the seismic
forces and energies on its own, or use some
devices to control the responses. In either way,
detailed measures are developed through studies.
The new framework will thus encourage
technological innovation, such as the
development of new structural frames or new
devices. This will eventually motivate the
structural engineers to embrace technological
development.
After determining the details, the structural
engineers prepares drawings and specifications,
on which construction works are to be based.
6. EVALUATION OF PERFORMANCE
"Evaluation of Performance" is conducted in
the third stage according to the "Principle of
Performance Evaluation"; the response value
should not exceed the limit value to satisfy the
performance level. The performance level is
represented by engineering expression in this
stage.
Some definite evaluation methods will be
developed in accordance with this flow to realize
"The Principle of Performance Evaluation."
The performance level is represented by
engineering expression in this stage.
"Evaluation of Performance" is conducted
according to the following steps.
1) Quantitative determination of the magnitude of
loads and external forces
Magnitude of loads and external forces are
determined in accordance with reliable materials
relating to the background and the setting method.
2) Set the type of engineering value used for the
response value and limit value
Suitable types of engineering value for
response value and limit value should be
determined for performance evaluation. Not
only force, but displacement, velocity, and
acceleration, energy, etc. can be selected for
evaluating the structural performance. It means
that the structural performances are defined by
engineering terminologies.
3) Establishment or calculation of the limit value
The limit value which satisfies the limit state
should be established (calculated or judged)
according to the items describing the quantitative
determination method of limit states values.
4) Calculation of the response value
The response value should be calculated by
the suitable analytical method.
5) Comparison of the response value with the
limit value
The response value should be compared
with the limit value and confirm the performance
level.
Practical methods for evaluating the
structural performance and designing are
necessary to be developed in accordance with this
"Principle of Performance Evaluation" flow.
The principle of performance evaluation should
promote the renewal of the conventional
evaluation method, following to the development
of social fulfillment and the advancement of
evaluation technology. Accordingly, detailed
performance evaluation or design methods
established by current knowledge are only
exemplified in order to renew easily or select
237
practically.
7. INDICATION OF PERFORMANCE
The evaluated performance should be
indicated for each performance evaluation items.
For example, destruction of structural frame
which affects human lives directly by O O(loads or external forces) will almost be avoided.
Probability for satisfying the basic performances
may also be indicated.
This ultimately serves as a bridge between
the engineers and society, i.e. consumers (owners,
users and the public) of buildings. Easily,
indication of building performance will become
one of the key roles of structural engineer. This
new responsibility will eventually give a
recognized social status to the profession that
society can rely on. The recognized stractural
engineers would be those who can clearly explain
to the public how the buildings' performance was
achieved at reasonable cost.
By the new framework, the performance
required by the public for building structures is
translated into the target performance by the
structural designer in the technological domain.
The engineers work to achieve this target
performance and then announces the actual
performance to the public.
8. SOCIAL SYSTEM
In order to make buildings actually
performance-based-designed and the objective of
this Project fulfilled, new "Social System" has to
be developed, which is composed of various
supporting devices for P.B.D. practice like social
codes/rales, institutions, technical tools,
information systems, etc. The outline of the new
Social System and its necessary elements are as
follows:
(1) Process of P.B.D.
P.B.D. can be assumed to be conversion between
three phases of information related to stractural
performance: "Design Brief, identifying clients'
needs and other requirements for the project",
"Design Criteria, specifying target performance
for the project" and "Design Solutions, verified to
comply with the Design Criteria". P.B.D. is
carried out through the following process:
a) Identifying needs about expected performance
through appropriate communication between the
structural engineer and the client (consequently
supporting the clients to develop the Design
Brief)
b) Developing the Design Criteria including the
structural design policy, target performance and
verification methods
c) Obtaining the approval for the Design Criteria
from the client
d) Developing the Design Solutions (i.e. repeating
cycles of preparative design and its verification of
conformity to the target performance)
e) Presenting verified performance of the Design
Solutions to the client
f) Delivering Design Solutions and other
necessary information (e.g. construction methods,
quality control conditions, supervision methods,
etc.) to the production/construction stage
(2) Need for functions of the new Social System
The following four functions are to be attained by
the new Social System:
— Functions mainly beneficial to clients —a) To support clients to concretize their needs
based on correct understanding of structural
performance
b) To ensure sufficient reliability of conversion of
clients' needs into target performance
c) To ensure sufficient reliability of conversion of
target performance into performance of Design
Solutions
— Function mainly beneficial to engineers —d) To prepare appropriate environment for those
who intend to implement the P.B.D. practice
(3) Framework for the elements of the new Social
System
To fulfill the four expected functions, the
framework of the Social System should be as
238
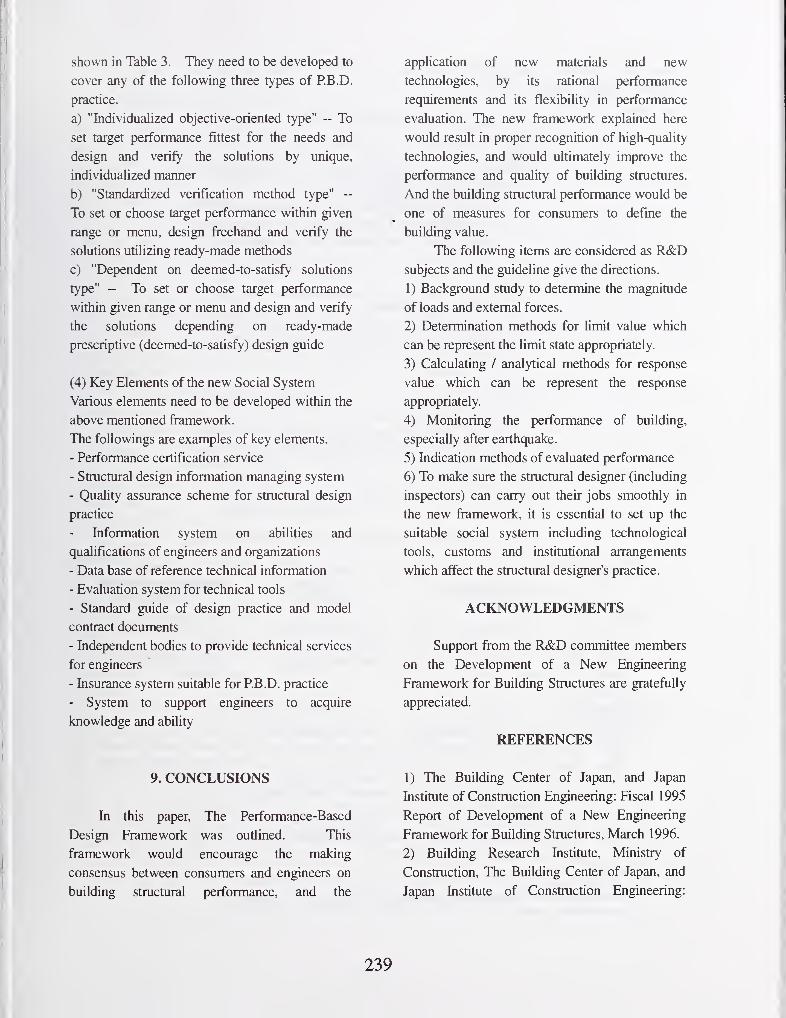
shown in Table 3. They need to be developed to
cover any of the following three types of P.B.D.
practice.
a) "Individualized objective-oriented type" — To
set target performance fittest for the needs and
design and verify the solutions by unique,
individualized manner
b) "Standardized verification method type" —
To set or choose target performance within given
range or menu, design freehand and verify the
solutions utilizing ready-made methods
c) "Dependent on deemed-to-satisfy solutions
type" ~ To set or choose target performance
within given range or menu and design and verify
the solutions depending on ready-made
prescriptive (deemed-to-satisfy) design guide
(4) Key Elements of the new Social System
Various elements need to be developed within the
above mentioned framework.
The followings are examples of key elements.
- Performance certification service
- Structural design information managing system
- Quality assurance scheme for structural design
practice
Information system on abilities and
qualifications of engineers and organizations
- Data base of reference technical information
- Evaluation system for technical tools
- Standard guide of design practice and model
contract documents
- Independent bodies to provide technical services
for engineers
- Insurance system suitable for P.B.D. practice
- System to support engineers to acquire
knowledge and ability
9. CONCLUSIONS
In this paper. The Performance-Based
Design Framework was outlined. This
framework would encourage the making
consensus between consumers and engineers on
building structural performance, and the
apphcation of new materials and new
technologies, by its rational performance
requirements and its flexibility in performance
evaluation. The new framework explained here
would resuh in proper recognition of high-quality
technologies, and would ultimately improve the
performance and quality of building structures.
And the building structural performance would be
one of measures for consumers to define the
building value.
The following items are considered as R&Dsubjects and the guideline give the directions.
1) Background study to determine the magnitude
of loads and external forces.
2) Determination methods for limit value which
can be represent the limit state appropriately.
3) Calculating / analytical methods for response
value which can be represent the response
appropriately.
4) Monitoring the performance of building,
especially after earthquake.
5) Indication methods of evaluated performance
6) To make sure the structural designer (including
inspectors) can carry out their jobs smoothly in
the new framework, it is essential to set up the
suitable social system including technological
tools, customs and institutional arrangements
which affect the structural designer's practice.
ACKNOWLEDGMENTS
Support from the R&D committee members
on the Development of a New Engineering
Framework for Building Structures are gratefully
appreciated.
REFERENCES
1) The Building Center of Japan, and Japan
Institute of Construction Engineering: Fiscal 1995
Report of Development of a New Engineering
Framework for Building Structures, March 1996.
2) Building Research Instimte, Ministry of
Construction, The Building Center of Japan, and
Japan Institute of Construction Engineering:
239
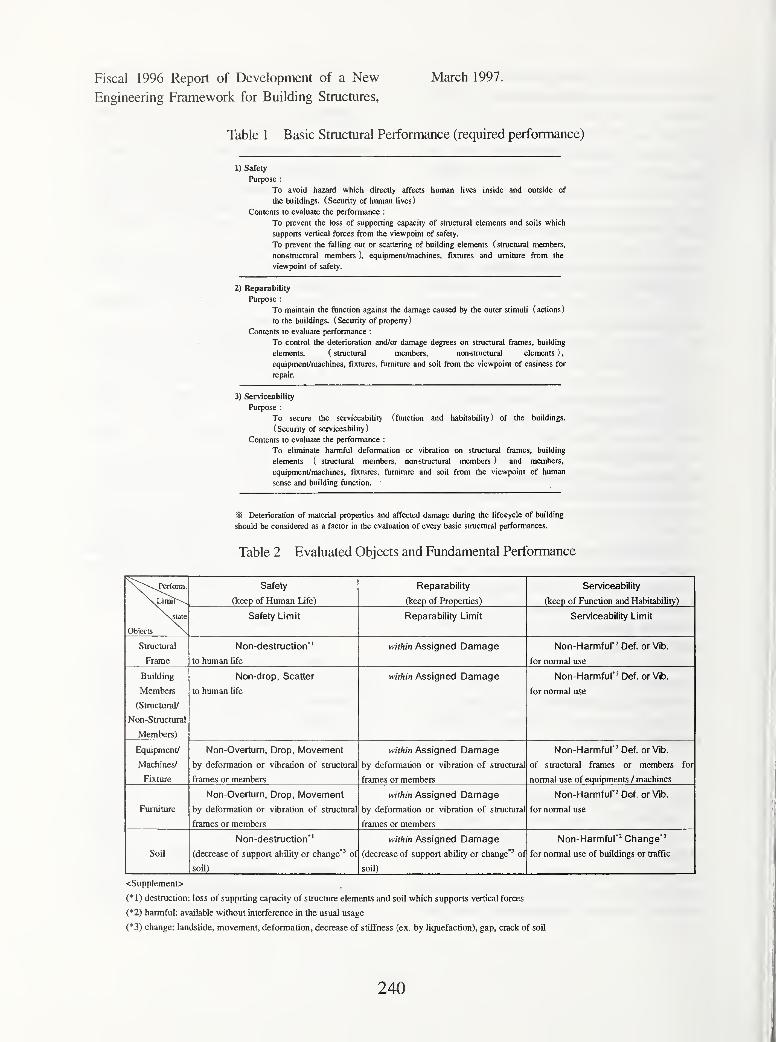
Fiscal 1996 Report of Development of a New March 1997.
Engineering Framework for Building Structures,
Table 1 Basic Structural Performance (required performance)
1) Safety
Purpose :
To avoid hazard which directly affects human lives inside and outside of
the buildings. ( Security of human lives
)
Contents to evaluate the performance :
To prevent the loss of supporting capacity of structural elements and soils which
supports vertical forces from the viewpoint of safety.
To prevent the falling out or scattering of building elements ( structural members,
nonstructural members ), equipment/machines, fixtures and umiture from the
viewpoint of safety.
2) Reparability
Purpose :
To maintain the function against the damage caused by the outer stimuli (actions)
to the buildings. (Security of property)
Contents to evaluate performance :
To control the deterioration and/or damage degrees on structural frames, building
elements. ( structural members, nonstructural elements )
,
equipment/machines, fixtures, furniture and soil from the viewpoint of easiness for
repair.
3) Serviceability
Purpose :
To secure the serviceability (fiinction and habitability ) of the buildings.
(Security of serviceability)
Contents to evaluate the performance :
To eliminate harmful deformation or vibration on structural frames, building
elements ( structural members, nonstructural members ) and members,
equipment/machines, fixtures, furniture and soil from the viewpoint of human
sense and building function.
Deterioration of material properties and affected damage during the lifecycle of building
should be considered as a factor in the evaluation of every basic strucniral performances.
Table 2 Evaluated Objects and Fundamental Performance
\y\Perform.
\^imit~^
\state
Objects \,
Safety
(keep of Human Life)
Reparability
(keep of Properties)
Serviceability
(keep of Function and Habitability)
Safety Limit Reparability Limit Serviceability Limit
Structural
Frame
Non-destruction*'
to human life
within Assigned Damage Non-Harmful*' Def. or Vib.
for normal use
Building
Members
(Structural/
Non-Structural
Members)
Non-drop, Scatter
to human life
within Assigned Damage Non-Harmful*' Def. or Vib.
for normal use
Equipment/
Machines/
Fixture
Non-Overturn, Drop, Movement
by deformation or vibration of structural
frames or memt)ers
within Assigned Damage
by deformation or vibration of strucmral
frames or members
Non-Harmful*' Def. or Vib.
of structural frames or members for
normal use of equipments / machines
Furniture
Non-Overturn, Drop, Movement
by deformation or vibration of structural
frames or members
within Assigned Damage
by deformation or vibration of structural
frames or members
Non-Harmful*' Def. or Vib.
for normal use
Soil
Non-destruction*'
(decrease of support ability or change*' of
soil)
within Assigned Damage
(decrease of support ability or change*' of
soil)
Non-Harmful*' Change*'
for normal use of buildings or traffic
<Supplement>
(*1) destruction: loss of supprting capacity of structure elements and soil which supports vertical forces
(*2) harmful: available without interference in the usual usage
(*3) change: landslide, movement, deformation, decrease of stiffness (ex. by liquefaction), gap, crack of soil
240
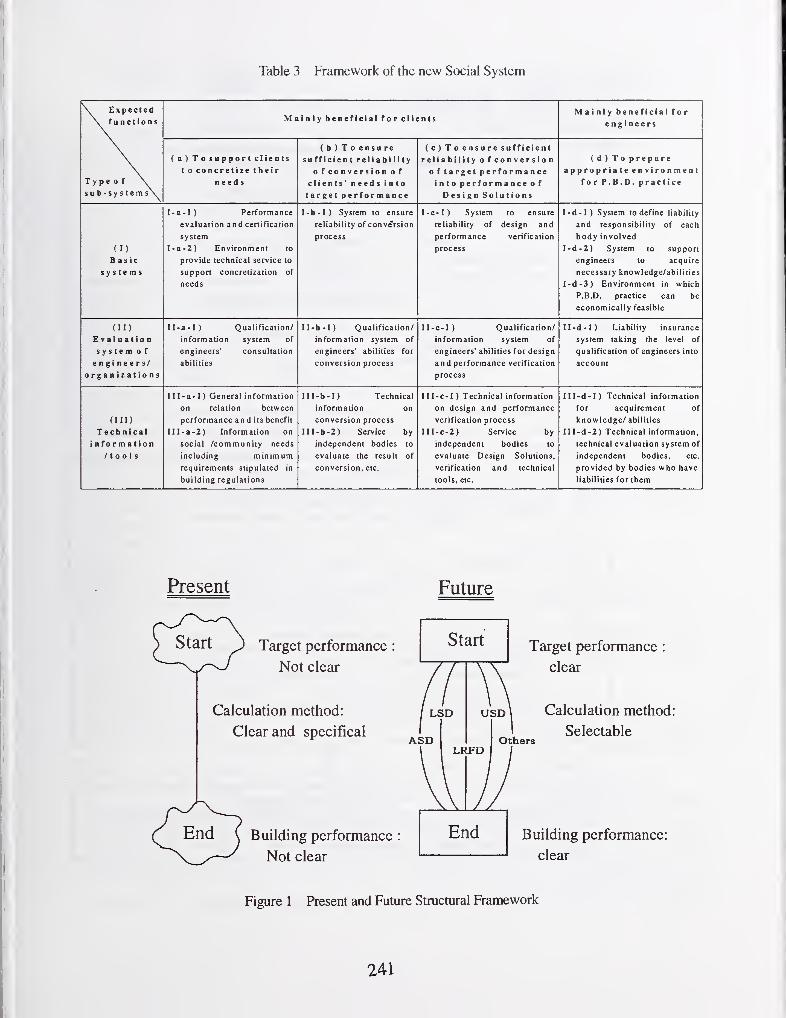
Table 3 Framework of the new Social System
\ Expected\. Tu actions
Type o f \sub-system s\
Mainly beneficial for clientsMainly beneficial for
engineers
(a ) To supportclientst 0 concretize their
needs
(b) To ensuresufficient reliability
ofconversionofclients' needs into
target performance
(c) To ensure sufficient
reliability of conversionoftarget performanceinto performance o f
Design Solutions
(d)Toprepareappropriate environment
for P.B.D. practice
(I)
Basic
systems
I • a - 1 ) Performance
evaluation and certification
system
I-a-2) Environment to
provide technical service to
support concretization of
needs
I-b-1) System to ensure
reliability of conversion
process
I-c-1) System to ensure
reliability of design and
performance verification
process
I-d-1) System to define liability
and responsibility of each
body involved
l-d-2) System to support
engineers to acquire
necessary knowledge/abilities
I-d-3) Environment in which
P.B.D. practice can be
economically feasible
(II)
Evaluationsystem o f
engineers/organizations
II-a-1) Qualification/
information system of
engineers' consultation
abilities
Il-b-I) Qualification/
information system of
engineers' abilities for
conversion process
II-c-1) Qualification/
information system of
engineers' abilities for design
and performance verification
process
ll-d-I) Liability insurance
system taking the level of
qualification of engineers into
account
(III)
Technicalinformation
/tools
III-a-1) General information
on relation between
performance and its benefit
III-a-2) Information on
social /community needs
including minimum
requirements stipulated in
building regulations
III-b-1) Technical
information on
conversion process
III-b-2) Service by
independent bodies to
evaluate the result of
conversion, etc.
III-c-1) Technical information
on design and performance
verification process
III-c-2) Service by
independent bodies to
evaluate Design Solutions,
verification and technical
tools, etc.
III-d-1) Technical information
for acquirement of
knowledge/ abilities
III-d-2) Technical information,
technical evaluation system of
independent bodies, etc.
provided by bodies who have
liabilities for them
Present Future
^ Start ) Target performance :
Not clear
Calculation method:
Clear and specifical
Q End ( Building performance :
^\_^-—^ Not clear
Start
LSD
ASD
Target performance
clear
usd\ Calculation method:
Selectable
LRFDOthers
End Building performance:
clear
Figure 1 Present and Future Structural Framework
241

Owners,Users
and the PublicPerformance Requirements
IClarification of Target Performance(frame-1)
Basic Structural Performance
Safety, Reparability, Serviceability
(TabIe-1)
IPerformance Evaluation Items
(frame-2) (frame-3)
Types and Magnitude ofLimit StateLoads and External Forces < >
Performance (TabIe-2)
Level
(frame-4)
Evaluation of Performance
Principle of Performance Evaluation
Response value should not exceed limit value to satisfy performance level
Response value Limit vadue
Evaluation Method1) Quantitative determination of the magnitude of loads and external forces
2) Set the type of engineering value used for the response value and limit value
3) Establishment or calculation of the limit value
4) Calculation of the response value
5) Comparison of the response value with limit value
(frame-5)
Indication of performanceBuilding performance should be indicated for each performance evaluation items
ex.) Destruction of structural frame which affects human lives directly does not
occur underoo (loads or external forces).
Figure 2 Evaluation system of Structural Performance
242
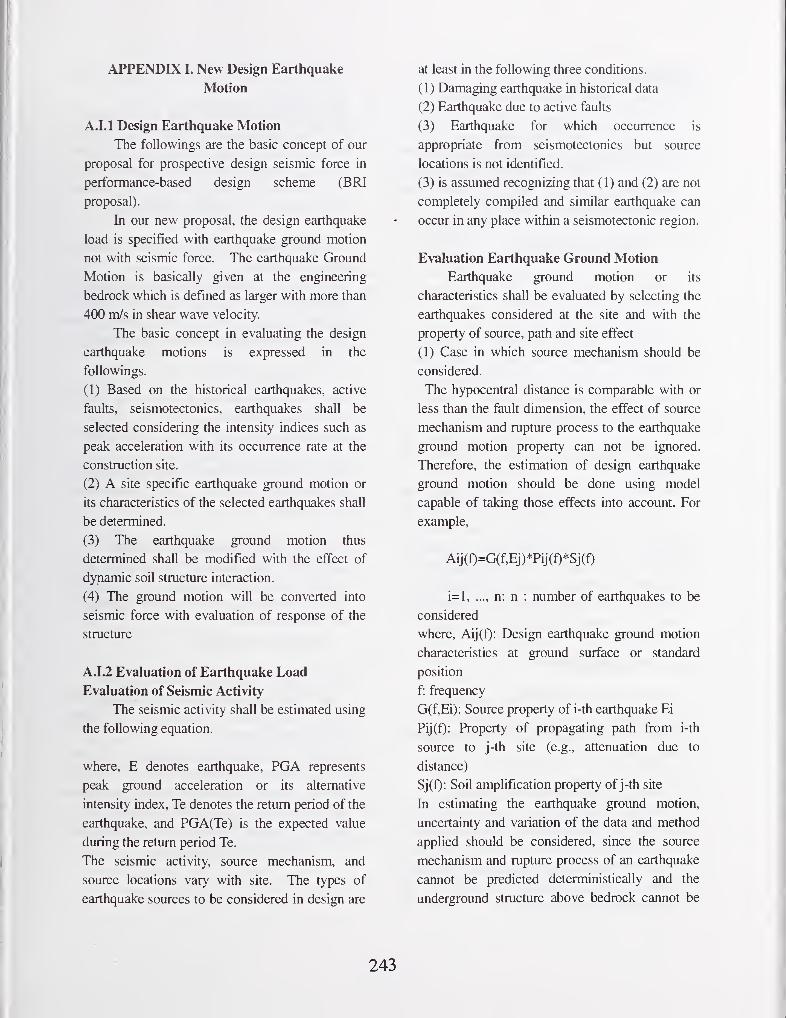
APPENDIX I. New Design Earthquake
Motion
A.I.1 Design Earthquake Motion
The followings are the basic concept of our
proposal for prospective design seismic force in
performance-based design scheme (BRI
proposal).
In our new proposal, the design earthquake
load is specified with earthquake ground motion
not with seismic force. The earthquake Ground
Motion is basically given at the engineering
bedrock which is defined as larger with more than
400 m/s in shear wave velocity.
The basic concept in evaluating the design
earthquake motions is expressed in the
followings.
(1) Based on the historical earthquakes, active
faults, seismotectonics, earthquakes shall be
selected considering the intensity indices such as
peak acceleration with its occurrence rate at the
construction site.
(2) A site specific earthquake ground motion or
its characteristics of the selected earthquakes shall
be deterrruned.
(3) The earthquake ground motion thus
determined shall be modified with the effect of
dynamic soil structure interaction.
(4) The ground motion will be converted into
seismic force with evaluation of response of the
strucmre
A.I.2 Evaluation of Earthquake Load
Evaluation of Seismic Activity
The seismic activity shall be estimated using
the following equation.
where, E denotes earthquake, PGA represents
peak ground acceleration or its alternative
intensity index, Te denotes the return period of the
earthquake, and PGA(Te) is the expected value
during the return period Te.
The seismic activity, source mechanism, and
source locations vary with site. The types of
earthquake sources to be considered in design are
at least in the following three conditions.
(1) Damaging earthquake in historical data
(2) Earthquake due to active faults
(3) Earthquake for which occurrence is
appropriate from seismotectonics but source
locations is not identified.
(3) is assumed recognizing that (1) and (2) are not
completely compiled and similar earthquake can
occur in any place within a seismotectonic region.
Evaluation Earthquake Ground Motion
Earthquake ground motion or its
characteristics shall be evaluated by selecting the
earthquakes considered at the site and with the
property of source, path and site effect
(1) Case in which source mechanism should be
considered.
The hypocentral distance is comparable with or
less than the fault dimension, the effect of source
mechanism and rupture process to the earthquake
ground motion property can not be ignored.
Therefore, the estimation of design earthquake
ground motion should be done using model
capable of taking those effects into account. For
example,
Aij(f)=G(f,Ej)*Pij(0*Sj(f)
i=l, n: n : number of earthquakes to be
considered
where, Aij(f): Design earthquake ground motion
characteristics at ground surface or standard
position
f: frequency
G(f,Ei): Source property of i-th earthquake Ei
Pij(f): Property of propagating path from i-th
source to j-th site (e.g., attenuation due to
distance)
Sj(f): Soil amplification property of j-th site
hi estimating the earthquake ground motion,
uncertainty and variation of the data and method
applied should be considered, since the source
mechanism and rupture process of an earthquake
cannot be predicted deterministically and the
underground structure above bedrock cannot be
243

investigated thoroughly.
(2) Case in which source mechanism need not be
considered
The effect of minute variation in source
mechanism on ground motion in case that the
hypocentral distance is larger than the source
dimension, is generally small. Therefore, the
following equation can be used.
Aij(f)=GPij(M,D,f)*Sj(f)
where,
GPij(M,D,f): spectrum at bedrock
D: distance from source to site
GPij(M,D,f) can be estimated by the M-Aregressive equation. The long-period property
ascribed to deep underground structure above
seismic bedrock shall be considered when it is
appropriate to incorporate.
A.I.2.1 Estimation of Site Amplification
Property
Site amplification property for i-th site Sj(f) shall
be estimated with the amplification due to the
surface soil above bedrock, the correction
coefficient for topographical irregularity.
However, earthquake response analysis is
preferable for excessive irregular topography or in
case soil amplification changes due to nonlinear
response of soils.
Sj(f)-Slj(f)*S2j(f)
where, Slj(f): Amplification coefficient for
surface soil
S2j(f): Correction coefficient for topographical
irregularity
( 1 ) Amplification coefficient for surface soil
When the surface soil is almost horizontally
layered and the influence of excess pore water
pressure is ignored, the amplification coefficient
can be estimated with the predominant frequency
of shear wave propagating vertically in the
horizontally layered structure.
(2) Correction coefficient due to topographical
irregularity
The correction coefficient due to topographical
irregularity is use for considering the influence of
irregular surface land form or non-horizontal
layers. Therefore, in case that the surface soil is
almost horizontally layered and then the influence
can be ignored, the coefficient shall be one.
A.I.2.2 Evaluation of Dynamic Soil Structure
Interaction Effect
The effect of dynamic soil structure interaction
shall be considered since the soils supporting the
foundation is not rigid. The inclusion of he
effect in input earthquake motion means that the
Cijk(f)=Aij(f)*Ik(f)
where, Cijk(f): design earthquake ground motion
at building foundation
Ik(f): Correction coefficient of the effect of
dynamic soil structure interaction
However, when the excessive nonlinearity in soil
and foundation is expected, a more realistic model
should be used.
A.I.2.3 Evaluation of Earthquake Load
Earthquake load equivalent to effective input
motion in fixed base condition or equivalent
design earthquake load index can be obtained by
the following formula
Dijkl(f)=Cijk(f)*Bl(f)
where, Dijkl(f): Design earthquake load index
Bl(f): Coefficient to translate to earthquake load
such as story shear force coefficient considering
the structural property.
However, since the design earthquake load index
is an average or overall intensity index, it may not
be able to grasp the destructiveness of the design
motion. In such case, a specific method such as
dynamic analysis procedure using earthquake
motion time history shall be used.
244
APPENDIX n. Performance Level
There are many issues which need to be
considered in determining the performance levels of
buildings. Some of the these issues are listed
below and discussed in the sections to follow.
(1) Performance Level of Existing Buildings
(2) Acceptable Risk Level
(3) Minimum Cost Level
(1) Performance Level of Existing Buildings
The current building code in Japan provides
design and analysis procedures to achieve the
primary design objectives such as the life safety
under a large (severe) earthquake. Even the
current code doesn't describe the level of safety
explicitly, it has been accepted in the society by
revising its context reflecting the building damage
by past earthquakes. Therefore, it is quite
reasonable to determine the target performance level
of buildings in a new design procedure by referring
to the performance level of existing buildings which
were designed in accordance with the current code.
The performance level should be examined
under consideration of the possibility of fliture
earthquake damage. Since there is large uncertainty
in estimating future earthquake loads, the seismic
safety of existing buildings should be examined in
terms of probabilistic measures such as the
reliability index /? in a building life time.
Model of buildings
Two typical buildings designed in accordance with
the current design code are selected as the
representatives of existing buildings; one is an 8-
story reinforced concrete building and the other is a
6-story steel building. Constmction sites are
assumed to be in Tokyo and Osaka, Japan. Since
the design seismic zone factor is the same for both
sites (Z =1.0), the design shear forces are identical
for both buildings. The uncertainties associated
with structural properties are assumed to be
negligible comparing the uncertainties of earthquake
loads, and not considered in this study.
- Model of earthquake ground motions
Input earthquake ground motions are
simulated referring to the guideline,
"Recommendations for Loads on Buildings,"
published by the AU (Architectural Institute of
Japan) in 1993. This study assumes that the
maximum earthquake acceleration and the ground
amplification factor are random variables. - Seismic
reliability estimate
Sample input ground motions are generated
and the nonlinear response analyses of the designed
buildings are carried out. From the relation
between the input scale and the maximum story drift
ratio, the reliability index /? is evaluated as a
function of the design criterion.
Figure A.II.l shows the relation between the
maximum drift ratio Y and the safety index /? for
the reinforced concrete building and the steel
building, respectively . As shown in the figures, the
reliability index /? of Tokyo site is generally
smaller than those of Osaka site. The difference of
the safety indices between RC building and Steel
buildings in the same site is not so large.
From the calculated results, the performance of
the buildings and its reliability index could be
approximately summarized in Table A.II. 1
.
Table A.n.l
Example of Reliability Index for RC Buildings
Performance items /?*
Concrete crack /?= 0
Failure of secondary elements /?= 1.0
Failure of stmctural elements /5= 2.0
Collapse of building /?= 3.0
* reterence penod IS 50 years
(2) Acceptable Risk Level
In daily life, we usually neglect the very small
risk such as the risk of being hit by a comet,
however, the risk of being hit by a car may not be
considered negligible. If we reduce the strength of
a building, the risk associated with earthquake-
induced building damage may increase. So, the
question is how large risk people may think
acceptable, and what level of safety should be
assigned to building stmctures.
We call the potential risk in daily life, such as
245
the risk by disease, traffic accident, etc., as
"background risk," and gathered statistical data of
such risks from various sources. Obtained data are
summarized into a risk database where the data of
death of people are categorized by the type of causes,
years, etc. The annual death ratios (=risks) in
Japan by different causes are summarized in Table
A.n.2.
Table A.n.2
Examples of Annual Risk in Japan
Risk items Annual risk
Fire lO-'tolO"'
Earthquake lO-^tolO"^
Suicide lO'^
Traffic accident 10"^
Disease 10"^ to 10"^
In case of earthquakes, the death ratio was evaluated
by taking moving average with twenty year intervals,
and it shows some fluctuation between the range of
10"^ and 10"^. Some people reports that people will
neglect the event which annual occurrence ratio is
below 10'^, however, when we think about the huge
disaster at the Great Hanshin-Awaji earthquakes, it
is clear that the frequency of event is not only a
measure to judge its acceptability. The impact of
the event to the society should be discussed together.
Figure A.II.2 is a schematic figure showing the
relation between the frequency of the risk events and
their social impact, and the boundary of acceptable
region may be drawn in this figure.
(3) Minimum Cost Level
Total cost of a building in its lifetime is
generally modeled by the following equation:
C,o,ai = C,„,(R) + C,<R)P,<R)
where, R is the design parameter of the building to
represent its resistance, C,o(ai is the total cost, is
the initial cost for construction, Cf is the damage cost,
and Pf is the probability of the occurrence of such
damage. In this study, the damage cost Cf is
assumed to consist of three different components.
where, C^p is the cost for repairing the building
damage, C|os is the cost associated with the loss of
contents, and C^p^ is the cost considering the
secondary damage such as the loss of business. The
initial cost, Cjnj, is assumed to be a simple function
of the parameter R, and the damage costs, Crep, C|os
and Cspd, are modeled as functions of the maximum
story drift ratio. Figure A.II.3 shows the analytical
flow to obtain the total cost by the Monte-Carlo
simulations.
The optimum design parameter to minimize
total cost are evaluated for various types of
buildings. Table A.n.3 shows the results of for the
buildings in Tokyo. In case of the private house
and the office building, the minimum cost levels are
found to be less than the level of current code
requirement, however, in case of the school building
and the hospital building, the minimum cost levels
are much larger than the current design level
because of the large cost of damage to their
functions. These results suggest the necessity of
higher performance levels of such public buildings
more than the code requirement levels of general
buildings.
Table A.n.3
Examples of Minimum Cost Design Levels
Building type Minimum cost level*
Private house 92
Office 98
School 120
Hospital 200
* current design level =100
It is very sensitive issue to include the loss of
human life into the calculation of damage costs.
Of course, it may be possible to consider the loss of
human life as the price of life insurance or cost for
compensation, etc., however, it doesn't mean that the
human life is equal to such costs. Therefore, we
didn't include the loss of human life into the above
cost calculations. Multiple design criteria including
costs and human life in different axes should be
discussed.
246

3
% 1
RC Building
Osaka; ^.^^r"^^
', \^dr^ L
Tokyo
1 /'' / '
1 /—1
1/200 1/100 1/50
Maximum Story Drift Ratio Y0 1/200 1/100 1/50
Maximum Story Drift Ratio Y
Figure A. II .1 Relation between the maximum story drift Y and the reliability index )3 in 50 years
Social Impact
10 10 ^ 10
Figure A. 11 .2 Concept of Acceptable Risk
Risk Level
Max.Acc.
of Earthquake
Design Base
Shear
\^ Response Evaluation
—
>
Max. Drift Ratio: Z Damage
Index: D^
Initial : Cini
Repair: Crep
Contents: Clos —>| Total Cost: Ctotal
Spreading: Cspd
Figure A. E .3 The Analytical Flow to Obtain the Total Cost by the Monte-Carlo Simulations
247
Highway Bridge Seismic Design:
How Current Research May Affect Future Design Practice
by
Ian M. Friedland^ W. Phillip Yen^ Ronald L. Mayes^ and John O'Fallon^
ABSTRACT
Under a program sponsored by the Federal
Highway Administration, the National Cen-
ter for Earthquake Engineering Research is
conducting a research program on newhighway structure design and construction
which has among its objectives studies on
the seismic vulnerability of tunnels,
retaining structures and bridges and the
development of technical information on
which, in the case of bridges, revisions can
be made to current national design
specifications. As a wrap-up to the pro-
gram, research results are being reviewed
and assessed in order to determine the
impact that their results may have on the
future development of a consistent seismic
design specification for highway structures.
This paper summarizes some of the
important results of the research conducted
under the program and discusses issues
resulting from this impact assessment task
with respect to expected effects on future
design practice.
KEYWORDS: bridges, codes, criteria,
design, earthquake, highways, retaining
structures, specifications, structures, tunnels
1. INTRODUCTION
1 . 1 Background
The loss of life and extensive property
damage suffered during the 1989 LomaPrieta, 1994 Northridge and 1995 Kobeearthquakes emphasized the need for
research to provide new procedures and
specifications for constructing earthquake-
resistant bridges and highways. In
recognition of this need, the Federal
Highway Administration (FHWA) initiated
a comprehensive Seismic Research Program
for bridges and highways in the fall of 1992.
This program is being conducted by the
National Center for Earthquake Engineering
Research (NCEER) in cooperation with
agencies participating in the Federally-
sponsored National Earthquake Hazards
Reduction Program.
The research being conducted by NCEERconsists of two separate FHWA-sponsoredprojects. Both projects involve research
studies on the seismic vulnerability of
highway construction in the U.S. including
bridges, tunnels, retaining structures, slopes
and embankments, culverts and pavements.
One project focuses on existing transpor-
tation infrastructure while the other is
concerned with new highway construction.
The motivation for these studies comes from
the fact that the present guidelines for
seismic design and retrofit of highway
bridges are 10-15 years old, and that there
are no national seismic design or retrofit
standards for the other components of
typical highway systems. In addition, recent
' National Center for Earthquake Engineering
Research, State University ofNew York at Buffalo,
102 Red Jacket Quadrangle, Buffalo, NY 14261-
0025^ Federal Highway Administration HNR-10, Tumer-
Fairbank Highway Research Center, 6300
Georgetown Pike, McLean, VA 22101^ Dynamic Isolation Systems, 3470 Mt. Diablo
Boulevard, Suite A200, Lafayette, CA 94549
248
experience in California, Costa Rica, the
Philippines, and Japan has provided newinsight into bridge and highway response
during earthquakes.
Significant progress has also been made in
understanding the seismic risk of the U.S., in
geotechnical engineering terms and in
seismic resistant design, such that a
comprehensive review of design and retrofit
philosophies and procedures can now be
undertaken. However, although much has
been learned, there are still many gaps in
basic knowledge. Furthermore, not all
existing knowledge can be immediately
applied to the highway arena and fiirther
studies are required to facilitate the transfer
of this technology.
As a result, the FHWA initiated the two
major studies comprising the NCEERHighway Project; one on existing
transportation infi-astructure and the second
on new design and construction. Research
on these projects was initiated by NCEER in
mid- 1993 and has a national focus. It is
intended to address differences in seismicity,
bridge types, and typical design details
between eastern and central U.S. bridges and
those which have been studied in California.
Furthermore, unlike the western U.S., design
and retrofit strategies for the eastern and
central U.S. need to reflect the probability
that an earthquake significantly larger than
the design earthquake can occur.
1.2 FHWA Research for New Highway
Structure Design and Construction
The FHWA program on new highway
structure design and construction (officially
known as the FHWA Seismic Research
Program) has among its objectives studies
on the seismic vulnerability of tunnels,
retaining structures and bridges and the
development of technical information on
which, in the case of bridges, revisions can
be made to the current national design
specifications. This research has national
applicability, but in view of the relatively
advanced state-of-practice on the West
Coast, is focussing on low-to-moderate
seismic zones. The program includes both
analytical and experimental studies, with a
focus on the following technical areas:
• seismic hazard exposure and ground
motion input for the U.S. highway
system;
• foundation design and soil behavior
• structural issues of importance, response
and analysis;
• design issues and details; and
• design criteria review.
As a wap-up to the program, a final task is
being conducted which is providing a review
of the results obtained from each of the
studies conducted under the program, in
order to assess the impact that their results
may have on the future development of a
consistent seismic design specification for
highway structures.
The purpose of this paper is to summarize
some of the important results of the research
conducted under the program and to discuss
issues resulting from the wrap-up impact
assessment task, with respect to their
expected effects on future design practice.
2. SEISMIC HAZARD EXPOSUREAND GROUND MOTION INPUT
The research in the area of seismic hazard
exposure has focused on the evaluation of
alternative approaches for portraying and
representing the national seismic hazard
exposure in the U.S., quantifying and
developing an understanding of the effects
of spatial variation of ground motion on
highway structure performance, and the
249
development of inelastic design spectra for
assessing inelastic deformation demands.
2.1 Representation of Seismic Hazard
Exposure
Research in the area of seismic hazard
exposure representation was conducted in
order to:
• explore a number of important issues
involved in national representations of
seismic ground motions for design of
highway facilities;
• recommend future directions for
national seismic ground motion
representation, especially for use in
nationally applicable guidelines and
specifications such as the AASHTOseismic design provisions for bridges;
and
• identify areas where further
development and/or research are needed
to define ground motion representation
for guidelines and specifications.
The ground motion issues that have emerged
in recent years as potentially important to
highway facilities design and that were
considered in this work included
consideration of:
(a) Should new (1996) USGS maps
provide a basis for the national seismic
hazard portrayal of highway facilities?
If so, how should they be implemented
in terms of design values?
(b) Should energy or duration be used in a
design procedure?
(c) How should site effects be character-
ized for design?
(d) Should vertical ground motions be
specified for design?
(e) Should near-source ground motions be
specified for design?
The following summarize the key elements
of each issue and conclusions of the
research.
(a) New USGS maps - In 1996, the U.S.
Geological Survey (USGS) developed newseismic ground shaking maps for the
contiguous U.S. These maps depict contours
of peak ground acceleration (PGA) and
spectral accelerations (SA) at 0.2, 0.3, and
1.0 second (for 5% damping) of ground
motions on rock for probabilities of
exceedance (PE) of 10%, 5%, and 2% in 50
years, corresponding to return periods of
approximately 500, 1000, and 2500 years,
respectively.
The research considered whether the newUSGS maps should replace or update the
maps currently in AASHTO, which were
developed by the USGS in 1990. The key
issue regarding whether the new USGSmaps should provide a basis for the national
seismic hazard portrayal for highway
facilities is the degree to which they provide
a scientifically improved representation of
seismic ground motion. Based on an
analysis of the process of developing the
maps, the inputs to the mapping, and the
resulting map values, it was concluded that
these new maps represent a major step
forward in the characterization of national
seismic ground motion. The maps are in
substantially better agreement with current
scientific understanding of seismic sources
and ground motion attenuation throughout
the U.S. than the current AASHTO maps. It
was therefore concluded that the new USGSmaps should provide the basis for a newnational seismic hazard portrayal for
highway facilities.
The issue of an appropriate probability level
or return period for design ground motions
based on the new USGS maps was also
examined. Analyses were presented
250
showing the effect of probabiHty level or
return period on ground motions and
comparisons of ground motions from the
new USGS maps and the current AASHTOmaps. It was recommended that for design
of highway facilities against collapse,
consideration should be given to adopting
probability levels for design ground motions
that are lower than the 10% probability of
exceedance in 50 years that is currently in
AASHTO. This is consistent with proposed
revisions to the 1 997 NEHRP provisions for
buildings, in which the new USGS maps for
a probability of exceedance of 2% in 50
years have been adopted as a collapse-
prevention design basis.
(b) Consideration of energy or duration - At
the present time, the energy or duration of
ground motions is not explicitly recognized
in the design process for bridges or
buildings, yet many engineers are of the
opinion that the performance of a structure
may be importantly affected by these
parameters, in addition to the response
spectral characteristics of the ground
motion. As a result, it was concluded that
some measure of the energy of ground
motions is important to the response of a
bridge, but, at present, there is no accepted
design procedure to account for energy.
Research in this area should be continued to
develop energy-based design methods that
can supplement current elastic-response-
spectrum-based design methods. It was also
concluded that energy rather than duration is
the fundamental parameter affecting
structural behavior.
(c) Characterization of site effects - At a
Site Effects Workshop held in 1992 at the
University of Southern California (USC), a
revised quantification of site effects on
response spectra and revised definitions of
site categories were proposed.
Subsequently, these revised site factors and
site categories were adopted into the 1994
NEHRP provisions and the 1997 Uniform
Building Code (UBC). Since the
development of these revised site factors,
two significant earthquakes occurred (the
1994 Northridge and 1995 Kobeearthquakes) which provided substantial
additional data for evaluating site effects on
ground motions, and research using these
data has been conducted.
The site factors and site categories in the
current AASHTO specifications are those
that were superseded by the USC Workshop
recommendations in the NEHRP Provisions
and the UBC. Under this research, the
question was whether the USC Workshop
recommendations should be utilized in
characterizing ground motions for highway
facilities design and whether they should be
modified to reflect new data and newknowledge since the 1992 Workshop. The
most significant differences in the USCWorkshop recommendations and the
previous site factors (those currently in
AASHTO) are: (l)the revised site factors
include separate sets of factors for the short-
period and long-period parts of the response
spectrum, whereas the previous site factors
were only for the long-period part; (2) the
revised site factors are dependent on rather
than independent of intensity of ground
shaking, reflecting soil nonlinear response;
and (3) the revised site factors are larger
(i.e., show a greater soil response
ampliflcation) than the previous factors at
low levels of shaking, as appropriate to the
lower-seismicity regions in the U.S.
It was found that the post-Northridge and
post-Kobe earthquake research conducted to
date generally was supportive of the site
factors derived in the 1992 USC Workshop,
although revisions to these factors might be
considered as further research on site effects
is completed. It was therefore recom-
251
mended that the factors developed at the
use Workshop and adopted by the NEHRPProvisions and the UBC be proposed as part
of a new national representation of seismic
ground motion for highway facilities design.
(d) Vertical ground motions - At present,
the AASHTO specifications do not contain
explicit requirements to design for vertical
accelerations. Ground motion data from
many earthquakes in the past 20 years have
shown that, in the near-source region, very
high short-period vertical spectral
accelerations can occur. For near-source
moderate-to-large magnitude earthquakes,
the rule-of-thumb ratio of 2/3 between
vertical and horizontal spectra is a poor
descriptor of vertical ground motions. At
short periods, the vertical-to-horizontal
spectral ratios can substantially exceed
unity, whereas at long periods, a ratio of
two-thirds may be conservative. It was
demonstrated that our current understanding
and ability to characterize near-source
vertical ground motions is good, especially
in the western U.S. where the near-source
region is better defined (i.e., near mappedactive faults). It was also demonstrated that
high vertical accelerations as may be
experienced in the near-source region can
significantly impact bridge response and
design requirements in some cases. On the
basis of these findings, it was concluded that
vertical ground motions should be
considered in bridge design in higher
seismic zones for certain types of bridge
construction. It was recommended that
specific design criteria and procedures be
developed for certain bridge types.
(e) Near-source ground motions - The
characteristics of near-source horizontal
ground motions and the effects of near-
source ground motions on bridge response
were examined. As the distance to an
earthquake source decreases, the intensity of
ground motions increases, and this increase
in ground motion intensity is incorporated in
new USGS maps. However, in addition to
their higher intensity, near-source ground
motions have certain unique characteristics
that are not found at greater distances. The
most significant characteristic appears to be
a large pulse of long-period ground motions
when an earthquake rupture propagates
toward a site. Furthermore, this pulse is
larger in the direction perpendicular to the
strike of the fault than in the direction
parallel to the strike. This characteristic of
near-source ground motions has been
observed in many earthquakes, including
most recently in the Northridge and Kobeearthquakes. Preliminary analyses of bridge
response indicate that near-source ground
motions may impose unusually large
displacement demands on bridge structures.
It was therefore concluded that traditional
ground motion characterizations (i.e.,
response spectra) may not be adequate in
describing near-source ground motions,
because the pulsive character of these
motions may be more damaging than
indicated by the response spectra of the
motions. Recommendations include the
need for additional research to evaluate
more fiilly the effects of near-source ground
motions on bridge response and to
incorporate these effects in code design
procedures. Until adequate procedures are
developed, consideration should be given to
evaluating bridge response using site-
specific analyses with representative near-
source acceleration time histories.
2.2 Spatial Variation of Ground Motion
The objective of the research in this area
was to develop procedures for determining
spectrum compatible time histories that
adequately represent spatial variations in
ground motion including the effects of
different soil conditions. The procedures
252
were then used to examine the effects of
spatial variabiHty on critical response
quantities for typical structures.
The methodology used a spectral
representation to simulate stochastic vector
processes having components corresponding
to different locations on the ground surface.
An interative scheme was used to generate
time histories compatible with prescribed
response spectra, coherency, and duration of
motion. Analysis results for eight example
bridges were tabulated, showing the relative
ductility demand ratio for column flexure
due to seismic wave propagation spatial
effects. In general, there was about a 10%maximum increase when using linear
analysis, and a 25% maximum increase
when using non-linear analysis for bridges
up to 1000 feet in length. Results were also
tabulated for relative opening and closing at
expansion joints for bridges with
superstructure hinges. In general, the
relative joint opening movement was up to
two times when using either linear or non-
linear analysis for bridges up to 1 000 feet in
length.
Potential future code impacts resulting from
this work are as follows:
• For right bridges under 1000 feet in
length with at least two spans and
uniform soil conditions, the use of
synchronous support ground motions
may be recommended. If a conservative
approach is desired, the seismic response
coefficient could be increased by 10% or
the R-factor could be decreased by 20%.
• For bridges over 1000 feet in length,
with supports on different local soil
conditions or with high skews, the use of
time history analyses involving
asynchronous support ground motions
may be advisable. In so doing, a number
of scenario earthquakes and several
different values of wave velocity should
be investigated. It is important to note,
however, that these results are
preliminary and have not been
independently validated as yet.
The implementation of time history analyses
• may significantly increase overall design
cost for complicated bridges. However, it is
expected that overall structural performance
would also be significantly improved by the
ability to account for differing soil
conditions.
2.3 Inelastic Design Spectrum
The research in this area had the objective of
developing inelastic response spectrum
which would allow designers to assess the
inelastic deformation demands, ultimately
leading to improved seismic performance
for new bridge construction. The spectrum
are being derived for nationwide use,
accommodating different seismic environ-
ments and site soil conditions. They are also
being developed for design applications, by
accounting for scattering and variabilities
that exist in real earthquake ground motions
and for non-linear structural response.
Under the current program, the research has
not progressed to the point where its results
are ready for implementation. Whencomplete, it is likely to have a major impact
on seismic design code requirements for
bridges, as inelastic spectra will be one of
the key elements in a displacement-based or
energy-based design procedure. Future
work in this area should include procedures
for determining inelastic spectra at a specific
site. The current state of research provides
an approximate method that starts with an
elastic spectrum rather than time history; as
time histories for the eastern U.S. are
currently lacking, this approach will have an
obvious appeal.
253
3. FOUNDATION DESIGN AND SOILBEHAVIOR
Research tasks in this area investigated and
improved criteria for the design and analysis
of major foundation elements including
abutments, retaining walls, pile and spread
footings, and drilled shafts. In addition,
work was performed on soil liquefaction and
lateral spread identification and mitigation.
3.1 Abutments and Retaining Walls
Research on bridge abutments and retaining
walls focused on modeling alternatives,
clarifying the process of design for service
loads versus seismic loading, and providing
simplified approaches for design that
incorporate key issues affecting seismic
response. The research also attempted to
provide a new procedure for determining the
seismic displacements of abutments and
retaining walls founded on spread footings,
which differ from current procedures by
addressing mixed-mode behavior (i.e.,
including rotation due to bearing capacity
movement and sliding response). Both
experimental and analytical studies were
conducted; the experimental studies
included sand-box experiments on a shaking
table and centrifuge models. Results of this
research included:
• Development of a simplified procedure
for estimating abutment stiffness. A key
element of this approach is determining
the portion of the wall that can be relied
on to mobilize backfill resistance.
• Extending current AASHTO design
procedures to the more general case of
translation and rotation of walls and
abutments. The results are presented in
a manner that will allow the methods to
be easily introduced into a future code
revision. The new procedures will be of
greatest use for free-standing gravity
walls and for active mode abutment and
wall movements.
• Consideration of passive loading
conditions for walls and abutments.
Current AASHTO provisions only
address active loading conditions. Since
passive loading can result in forces that
are up to 30 times those for active
conditions, there is a strong possibility
that many bridges will not develop
passive resistance without abutment
damage.
3.2 Pile and Spread Footings and Pile
Groups
Studies on pile footings, spread footings and
pile groups included experimental and
analytical research tasks which were
intended to: provide improved
understanding of the lateral response of pile-
cap foundations; evaluate the influence of
modeling parameters on estimated
displacement and force demands;
recommend methods for characterizing the
stiffness of pile footings; quantify the
importance of radiation damping and
kinematic interaction on response; and
evaluate conditions under which uplift
becomes significant and how best to model
uplift in a design procedure. Results from
these studies included the following:
• For pile-cap systems, the research
demonstrated that design procedures
should use simple additions for the
contribution from the base, side and
active/passive ends when estimating the
lateral capacity of embedded spread
footings in dense sand, along with elastic
solutions with an equivalent linear soil
shear modulus at shallow depths to
estimate the secant stiffness of the
footing. This effectively confirms that
existing procedures can be used to obtain
reasonable approximations of pile-cap
254

foundation response, as long as
consideration is given to the levels of
deformation and embedment for the
system.
• Axial and lateral loading response and
stiffiiess characteristics are important
parameters for the design of single piles
and pile groups, although such
information is not currently addressed in
the AASHTO provisions. Axial
response often controls rocking response
of a pile group. New procedures and
simplified stiffness charts are provided
for determining the lateral load-
deflection characteristics of single piles
and groups.
• Nonlinear load-deflection analyses
illustrate the sensitivity of results to
uncertainties in p-y stiffness, gapping,
pile-head fixity, bending stiffness
parameters, and embedment effects. The
analyses have demonstrated that load-
deformation response is more affected
by input variations than by the momentwithin the pile.
• For spread footings without uplift, the
- research demonstrated that (a) ignoring
soil-structure interaction reduces the
fiindamental period of the system,
resulting in higher accelerations; (b)
increasing the effectiveness of
embedment increases radiation damping
and reduces the fundamental period of
the system; and (c) neglecting radiation
damping has only a minor effect on the
system. Uplift of the spread footing
results in a softer mode of vibration for
the system, with increasing fundamental
period as the amount of uplift increases.
3.3 Drilled Shafts
Research on drilled shafts was conducted in
order to provide information on the
influence of modeling procedures on the
response of the structure, evaluate the
effects of modeling on estimated
displacement and force demands on the
foundation, and to summarize methods for
characterizing the response of drilled shaft
foundations, including their limitations.
Results of this work included the following:
• Foundation stiffness has been shown as a
key parameter and contributor to the
dynamic response of the structure,
necessitating realistic estimates and
appropriate integration into a detailed
structural analysis. The response of a
soil-foundation system to load is
nonlinear; however, for practical
purposes, an equivalent linear
representation is normally used.
• Guidance is provided on the
development of equivalent linear and
nonlinear stiffness values, and the
importance and sensitivity of foundation
geometry and boundary conditions at the
shaft head are identified. A key
conclusion is that realistic representation
of pile-head fixity can lead to a muchmore economical design.
• The p-y approach is recognized as the
most common method of analyzing the
nonlinear response of the shaft to lateral
load. Parameters that must be
considered include the effects of soil
property variation, degradation effects,
embedment, gapping, and scour effects.
3.4 Liquefaction Processes and Lique-
faction Mitigation Methodologies
A significant amount of research has been
conducted under the NCEER Highway
Project on liquefaction processes, screening
for liquefaction potential, and the
development and/or improvement of
liquefaction mitigation methodologies.
Much of this work was conducted under the
companion FHWA project on seismic
vulnerability of existing transportation
255
infrastructure, but all of it is appropriate for
either new design or existing construction
evaluation. Among the major studies
conducted under this project was a review,
synthesis, and improvement to recent
developments in simplified procedures for
evaluating the liquefaction resistance of
soils, and the compilation and evaluation of
case studies and procedures for ground
liquefaction mitigation. Results of this
research included:
• Identification of a consensus simplified
procedure for evaluating liquefaction
resistance. Minor modifications for the
determination of the stress reduction
factor used in the calculation of the
cyclic stress ratio were recommended,
which allow the stress reduction factor to
be calculated to depths greater than 30
meters.
• Identification of the latest procedures for
determining cyclic resistance ratios
(CRR) using cone penetration test (CPT)
procedures. One of the primary
advantages of CPT is the consistency
and repeatability of the method. Plots
for determining the liquefaction
resistance directly from CPT data, rather
than converting to an equivalent
standard penetration test (SPT) N-value,
are presented. Procedures are also
provided for correcting CPT data based
on overburden pressures, fines contents,
and for thin layers.
• Plots for determining CRR from shear
wave velocity data have been prepared,
and procedures for correcting shear
wave velocity data due to overburden
stress and fines content are explicitly
given.
• Methods which have been employed
successfully for liquefaction mitigation
include deep dynamic compaction, deep
vibratory densification, gravel drains,
permeation grouting, replacement
grouting, soil mixing, and micro
blasting. Parameters and limitations for
each of these approaches are
summarized, including typical treatment
depths and applicable soil types.
• Flow charts for assessing ground
deformations for pre- and post-treatment
conditions were developed. These are
accompanied by recommendations for
preferred ground improvements methods
based on differing site conditions.
4. STRUCTURAL IMPORTANCE,ANALYSIS, AND RESPONSE
Several studies were conducted in order to
provide a definition of structural importance,
which is necessary in the development of
design and performance criteria, and to
evaluate methods of analysis and structural
response. These studies also provided a
synthesis of current systems and details
commonly used to provide acceptable
seismic performance in various states and
regions. Among the findings of these
studies were the following:
• Provisions employed by the California
Department of Transportation (Caltrans)
were generally more rigorous than those
used by the majority of states (who
primarily used current AASHTOprovisions). However, adoption of
Caltrans' design provisions nationwide
would likely complicate designs and add
to construction cost; this may be
unjustified for many low-to-moderate
seismic hazard states. In addition, if
Caltrans' experience is to be adapted
nationally, some adjustments are
required in order to accommodate bridge
types and details commonly used
elsewhere.
• Studies that were conducted on the
application of advanced modeling
methods for concrete bridge components
256
provided a computer program which
determines moment-curvature and force-
deflection characteristics for reinforced
concrete columns; excellent correlation
was obtained between analytical and
experimental test results for these
components.
• A refmed model to simulate the
hysteretic behavior of confined and
unconfined concrete in both cyclic
compression and tension was developed.
The model includes consideration of the
nature of degradation within partial
hysteresis looping and the transition
between opening and closing cracks.
• A study on energy and fatigue demands
on bridge columns resulted in design
recommendations for the assessment of
fatigue failure in reinforcing steel, based
on the results of nonlinear dynamic
analyses. This methodology
incorporates traditional strength and
ductility considerations with the fatigue
demands. Based on parametric studies,
it was concluded that low cycle fatigue
demand is both earthquake and
hysteretic model dependent.
• Based on an examination of existing and
proposed methods for quantifying bridge
importance, a specific method was
selected and tested against a database of
bridge information commonly available
within the FHWA's National Bridge
Inventory. One limitation of the study is
that it deliberately avoided addressing
political and economic issues related to
bridge seismic design criteria and
highway network considerations.
• Following the Northridge earthquake,
concerns were raised as to the role
vertical accelerations may have played
in causing damage to one or more
bridges. In a study conducted to
investigate the effects of vertical
acceleration on bridge response,
preliminary results indicate that vertical
components of ground motion could
have a significant effect on bridge
response for structures within 10 km of
the fault, and even within 20-30 km for
certain conditions. The results of this
study will be controversial whenpublicized; however, a far too limited
study was conducted (only six example
bridges were analyzed) in order to
provide definitive guidance at this time.
• In a study which investigated the
applicability of simplified analysis
methods to various types and
configurations of bridges, a number of
design and analysis limitations were
identified. Parameters evaluated
included curvature, span length ratio,
pier height, skew and span connectivity.
Based on the analyses, a definition for
"regular" bridges and for which
simplified methods are appropriate was
developed. In general, regular bridges
must have three or fewer spans, variation
of mass distribution between adjacent
spans varying by less than 50%, a
maximum ratio between adjacent pier
stiffnesses in the longitudinal and
transverse directions not greater than
4.0, and a subtended angle in plan not
greater than 90°.
5. STRUCTURAL DESIGN ISSUESAND DETAILS
A number of studies were conducted in
order to improve design procedures and
structural detailing for highway structures,
but the focus was primarily on bridges; one
study also examined movement detailing for
tunnels. These studies looked at issues of
capacity detailing for ductility, elastic
behavior, and movements. Among the
results of this research were the following:
• A design concept termed DamageAvoidance Design (DAD) was
257
developed which attempts to avoid
plastic hinging in columns, thereby
avoiding loss of service for important
bridges following a major earthquake.
The concept evaluated details which
provide for rocking of columns and
piers, which rotate about their ends but
are restrained from collapse through
gravity and the optional use of central
unbonded post tensioning in the column
core.
A second design concept termed Control
and Repairability of Damage (CARD)was also developed, which provided
structural and construction details for
reinforced concrete columns that provide
replaceable or renewable sacrificial
plastic hinge zone components. In this
concept, the hinge zones are deliberately
weakened and regions outside the hinge
zones are detailed to be stronger than the
sacrificial (fuse) zone; the remaining
elements of the structure then remain
elastic during strong earthquakes.
In a study on transverse reinforcing
requirements for concrete bridge
columns and pier walls, it was found that
the current AASHTO requirements
could be lowered by up to 50% while
still achieving displacement ductilities of
4 to 7 for bridges in low to moderate
seismic zones. An important aspect of
this work though was that the end
anchorages for transverse steel hoops
must be maintained for the reinforcing to
be effective; 90° bends on J-hooks were
found to be inadequate.
Research was conducted on momentoverstrength capacity in reinforced
concrete bridge columns, and a
simplified method for determining
colunrn overstrength was developed.
The upper-bound overstrength factors
developed in this task validate
prescriptive overstrength factors
recommended in ATC-32, but also
indicate that some factors in current
Caltrans and AASHTO provisions maybe too low.
• A synthesis was conducted on details
commonly used to accommodate
expected movements on bridges and
retaining walls in the eastern and
western U.S. Based on the synthesis,
design and detailing recommendations
were made in order to provided the basis
for improved bridge design standards.
The specific elements considered in this
effort included restraining devices,
sacrificial elements, passive energy
dissipation devices, and isolation
bearings. A similar effort wasconducted on movement criteria and
detailing for tunnels.
• For steel superstructures, a number of
issues were considered, including
ductility based on cross-section
configuration, applicability of
eccentrically-braced frames, details
which allow for easy repair of steel
sections following a moderate to large
earthquake, anchor bolt performance
under lateral uplift loads, and
economical moment connection details
between steel superstructures and
concrete substructures.
6. CONCLUSIONS
As a result of a research program sponsored
by the Federal Highway Administration,
researchers working for the National Center
for Earthquake Engineering Research have
developed a number of analytical tools,
methods of analysis, structural design
details, and specification recommendations
appropriate for seismic design of highway
system structures. The primary focus of this
work has been on highway bridges, but
some research on tunnels and retaining
structures was also performed. The program
has also resulted in recommendations
258

regarding the representation of seismic
hazard in future design codes, the
performance and improvement of soils
under seismic shaking, and an improved
understanding of the behavior of structural
systems and components under seismically-
induced forces and displacements. In
addition, it is likely that additional
recommendations regarding the use of a
performance-based design philosophy and
dual-level design and performance criteria
will be made to AASHTO as a result of this
work.
The results of this program will likely be
considered and incorporated into an effort
soon to be initiated under the AASHTO-sponsored National Cooperative Highway
Research Program (NCHRP). NCHRPProject 12-49 will start in the summer of
1998 and has as its objective the
development of the next generation of
seismic design specifications for the
AASHTO Load and Resistance Factor
Design Specifications. Analysis tools and
design details will be disseminated to the
practicing engineering community and are
also expected to impact future highway
structure design practice.
• 7. ACKNOWLEDGMENTS
Dr. George C. Lee is the principal
investigator on the NCEER HighwayProject. The authors would like to
acknowledge Dr. Lee's guidance and
direction on this project. In addition, the
Impact Assessment task conducted under the
project is managed by the Applied
Technology Council, with Mr. Christopher
Rojahn as task principal investigator. Task
participants include Donald Anderson, John
Clark, C. Stewart Gloyd, Richard V. Nutt,
and Maurice Power; much of the summaryinformation reported in this paper was
extracted from their task reports.
259
DEVELOPMENT OFPERFORMANCE-BASED BUILDING CODE IN JAPAN
-FRAMEWORK OF SEISMIC AND STRUCTURAL PROVISIONS -
By
HIRAISHI Hisahiroi), MIDORIKAWA Mitsumasa^),
TESHIGAWARA Masaomi^), andGOJO Wataru'^)
ABSTRACT
On February of 1996, it wasofficially announced by the Ministry of
Construction that the Building Standard Lawof Japan should be revised into that based on
performance. The building code in Japan
will be changed from current prescriptive type
into performance-based type in a few years.
In responding this announcement, the
performance -based building code is nowunder development at the Building Research
Institute (BRI).
In this paper, presented is the
framework and concepts of the performance-
based seismic and structural provisions in
Japan proposed by BRI. In the principles of
structural safety, the required performance
and loads/forces levels are clearly defined.
There are four routes in verification
procedures and associated structural
specifications following the principles of
structural safety; proposed route, conventional
route, small building route requiring no
calculation, and other route including
alternative verification procedures, deemed-
to-satisfy provisions, and expert judgments.
Seismic effects to buildings are considered on
the basis of basic seismic design spectrum
defined at the engineering bedrock under
surface soil layers.
There are three levels in the
objectives and requirements to building
structures and loads/forces levels. Theobjectives are life safety, damage prevention.
and continuous normal operation of a building.
The principle of verification procedures is
that the predicted response values should not
exceed the estimated limit values.
The newly proposed verification
procedure for major earthquakes is illustrated,
as all others remain basically the same as
those actually in use. There are indeed
various analytical methods for predicting the
response of structures subjected to earthquake
excitations. The one which is shown here is
based on the equivalent single-de^ee -of-
ficedom system and response spectrum
method.
KEY WORDS: performance-based building
code, seismic and structural provisions,
required performance level, verification
procedures.
1. INTRODUCTION
The need for the development of
performance -based standards is a logical
consequence of the rapid economic growth of
Japan, which is strongly affected by the
1) Director, Structural Engineering Dept.,
Building Research Institute, Ministry of
Construction, 1 Tachihara, Tsukuba, Ibaraki,
305-0802 Japan.
2) Research Director for International Codes
and Standards, BRI, MOC.3) Head, Structure Div., BRI, MOC.4) Head, Building Economy Div., BRI, MOC.
260

international economic progress.
In 1995, World Trade Organization
(WTO) initiated first the idea of performance-
based standards, which was concluded in the
form of the Agreement on Technical Barriers
to Trade (TBT). This agreement calls for an
obedience wUl towards the guidelines and
recommendations issued by the International
Standards and International Standardization
Institutions. Furthermore, International
Organization for Standardization (ISO) is
strongly promoting the revision of the current
international standards on the basis of
performance principles.
According to U.S.-Japan FrameworkTalks on Bilateral Trade, the American side
has requested that the deregulation poHcy for
restructuring the Japanese administration
should be extended to the building industry as
well, where the review of Building Standard
Regulations and reduction of construction
cost for housing are required.
Reflecting this developments, on
February in 1996 it was ofiicially announced
by the Ministry of Construction authorities
that the Building Standard Law of Japan
should be revised on the basis of performance
principles. Very recently, in the Building
Council report of March 24, 1997, entitled
"For a New Building Administration
Framework, which could cope with the
economic & social changes and their
prospects in the 21st century", it was clearly
stated that in order to compile a highly
flexible New Building Standard Law, the
current provisions must be revised into those
based on performance. That served as a
basis for the compilation of "Guidelines for
the Performance-based Building Code".
2. PERFORMANCE-BASEDBUILDING CODE
Unlike the in-current-use
conventional Building Code, the
Performance-Based Building Code prescribes
clearly the type and the level of the required
performance for a given building structure.
In other words, for the precisely determined
response of the structure subjected to assumedloads and forces, it prescribes the verification
procedures to be used for the estimation of
structure's conformity with the required
structural safety.
However, even in the case of the
performance-based provisions, the
prescription of a minimum required level is
necessary, being this the same as in the
•current Building Code Provisions. In this
sense, the performance-based code is different
form the performance-based design, which
has been a current topic among structural
engineers. The latter deals with a design
procedure which is based on a clearly defined
target performance for the structure
considered, normally being prescribed higher
than the minimum required performance level.
Basically, the performance-based design is
the structural design on the basis of
consultation between the structural engineer
and the owner of the building.
In this paper are presented the
framework and the conception of the
Performance-Based Structural Code, which is
now under development at Building Research
Institute (BRI) in Japan. The main aspects
considered here are the conceptual framework
of the Structural Code; the level and
conception of the earthquake, wind, snow and
live forces^loads; required structural
performance against each force s/loads and the
verification procedures to be used for the
estimation of structure's conformity with the
required performance level.
It should be noticed here that
presented in this paper is just the state-of-the-
art and up-to-now level of development of the
Performance-Based Structural Provisions at
BRI in Japan. It should not be considered as
a fiilly completed version, ready to be
presented for the final official approval.
3. CONCEPTUALFRAMEWORK OFPERFORMANCE-BASEDSTRUCTURAL CODE
The conceptual framework of
Performance-Based Structural Code proposed
261
by BRI is shown in Fig. 1. Following the
principles of structural safety, the verification
procedures to be used for the estimation of
structure's conformity with the required
performance level are roughly classified as
(see Fig. 1):
a. Proposed route
b. Conventional route
c. Small building route, and
d. Others
The proposed route represents a newverification procedure to be used instead of
the current one, which is based on the
calculation of allowable stress and estimation
of ultimate capacity for lateral load. It
considers the effects of major earthquakes as
well as other forces and loads. The other
effects which are not considered in the
structural calculations, such as construction
quality, durability, quality of construction
materials, and nonstructural elements, are
covered by structural specifications. In
essence, by using this procedure it is possible
to evaluate and verify the structural
performance possessed by a designed
structure, regardless of the design method
used. It is just a verification procedure
which verifies whether or not the prescribed
performance objectives are met.
Accordingly, for structural specifications as
weU the minimum required supplementary
specifications are prescribed.
The second route represents the
conventional verification procedure now in
use, adopted as the standard structural
calculation method. It can be supplemented
with additional provisions in addition to those
of the first route described above. However,
if the principles of performance-based
provisions are to be followed, it should be
noticed that the obviously unnecessary parts
to be considered by structural calculations are
eliminated. To this extent, the second route
can be considered as a kind of deemed-to-
satisfy verification procedure.
The third route applies to small
buildings. This route does not require
structural calculations and is considered to be
deemed-to-satisfy provisions. It prescribes
only conventional-based structural
specifications. Through this route, is
attempted to make as clear as possible the
details of each structural specification. In
case of a possible structural calculation
alternative, special clauses which allow for
the implementation of newly developed
materials, design methods and construction
methods are provided.
In the fourth route are included all
other alternative verification procedures and
deemed-to-satisfy provisions, such as those
developed and certified by private institutions
as well as those requiring expert judgments.
The types of loads and forces
considered in the newly proposed verification
procedure remain almost the same with those
currently in use. However, for the case of
earthquake effects only, new earthquake
motion provisions are prepared to replace the
current earthquake force provisions.
In a definite proposal, the earthquake
motion response spectra at the engineering
bedrock, assumed to be the stratum having
shear wave velocity in the range of several
hundreds m/s, is considered as the basic
design spectra. On the basis of this
conception for the earthquake input motion, it
is possible that earthquake effects be not only
accounted rationally through the
incorporation of influence of local soil
conditions on ground motion characteristics at
the free surface but also conveniently
incorporated in the newly developed design
procedures of seismically isolated and
response controlled structures. Furthermore,
it is anticipated that the future proposals
expected for the verification and design
procedures be suitably implemented.
4. REQUIRED PERFORMANCE LEVELFOR BUILDING STRUCTURES
An outline of requirements for
building structures and loads/forces levels is
shown in Table 1 . In the vertical column on
the left hand side of the table are shown the
requirements for building structures, while in
the rest of the table are shown the main types
262
of loads^forces to be considered and their
corresponding levels for each of the
requirements assigned for building structures.
Undoubtedly, the loads/forces shown in Table
1 are to be combined according to specified
rules.
As it is shown in Table 1,
requirements for building structures are
classified in three categories, which are
explained below.
4.1 Life Safety
The essential purpose of this
requirement is the safety of life. It should be
expected that under the action of loads/forces
taken into consideration, the building should
not experience any story collapse. In other
words, it is required that the situation of not
providing sufficient space for possible
survival of building occupants should not be
experienced.
4.2 Damage Prevention
The aim of this requirement is
damage prevention. Under this provision, it
is required first that after the action of the
loads'forces taken into consideration, no
structural damage which could threaten the
structural safety of the building will take
place. Furthermore, it is required that no
other kind of damage which causes in the
building structure a situation which does not
comply with other requirements of the
Building Standard Law should be experienced.
The above mentioned requirement for no
structural damage which could threaten the
safety of the structure means that the
structural safety performance required by
Section 4.1 should be preserved. The second
requirement related to other kind of damagemeans that the provisions of Building
Standard Law concerning fire safety should
be satisfied. It should be mentioned here
that, the requirements for Damage Prevention
described in this section are included in the
Life Safety requirements as well.
4.3 Continuous Normal Opo'ation
The purpose of this requirement is
the assurance of continuous normal operation
of the building structure. It aims at avoiding
the harmful deformations and vibrations in
structural fi-ames, members, interior and
exterior finishing materials of the building
structure while subjected to loads/forces taken
into account. The above mentioned harmful
deformations and vibrations are assumed to
be those related to dead, live and snow loads
acting for a relatively long time on the
structure causing thus excessive deformations
in slabs and beams, and consequently
discomfort to the occupants or difficulties in
the operation of the building. The details for
the requirements concerning the discomfort to
the occupants or difficulties in the operation
are not yet clearly formulated. Therefore a
further investigation is necessary. It should
be mentioned here again that, the
requirements for Continuous NormalOperation described in this section are
included in the Life Safety requirements and
Damage Prevention requirements as well.
For each of the three categories of
requirements for building structures described
above are assumed the following levels of
loads/forces:
4.4 Maximum Probable Event LevelThis level of loads^forces
corresponds to the category of requirements
in Section 4.1 for building structures and is
assumed to produce the maximum possible
effects on the structural safety of a building to
be constructed at a given site. Themaximum possible earthquake motion level is
determined on the basis of historical
earthquake data, recorded strong ground
motions in the past, seismic and geologic
tectonic structures, active faults, and others.
This earthquake motion level corresponds
nearly to that of highest earthquake forces
used in the current seismic design practice,
representing the horizontal earthquake forces
induced in the building structures in case of
major seismic events. Wind forces and
snow loads are determined on the basis of a
263
100-500 year return period. This level is
somewhat higher than the current one used in
the actual design practice.
4.5 Once-in-a-Lifetime Event Level
This level of loads/forces
corresponds to the category of requirements
in Section 4.2 for building structures and is
assumed to be experienced more than once
during the Hfetime of the building. Strictly
speaking, earthquake, wind and snow are
natural phenomena with different probability
of occurrence and normally for each of themshould be assumed different return period.
Therefore a return period interval of 30-50
years is supposed to cover all these three
natural events. This level of earthquake
motion corresponds nearly to the middle level
earthquake forces used in the current seismic
design practice, representing the horizontal
earthquake forces induced in the building
structures in case of moderate earthquakes.
The levels of wind forces and snow loads are
nearly the same with those being actually
used in the current design practice.
4.6 Ordinary Event Level
This level of loads/forces
corresponds to the category of requirements
in Section 4.3 for building structures and is
normally assumed to be experienced several
times during the lifetime of the building.
For the case of snow loads it is roughly
assumed a return period of 3-5 years. This
level is not clearly prescribed even in the
current provisions. Therefore a further
careful investigation is needed for it.
Finally, the way the live loads will
be treated in accordance with building
structures requirements is still under
investigation. Because of its totally different
character compared to earthquake, wind and
snow loads/forces, known as natural
phenomena of temporary effects, it is
considered that the live loads could be better
prescribed through two separate options:
extraordinary and ordinary options.
5. VERIFICATION PROCEDURES FORA REQUIRED PERFORMANCE LEVEL
Various response and limit values
are considered for use in proposed
verification procedures, in accordance with
each of the requirements prescribed for
building structures. A representative
example of this arrangement is shown in
Table 2. The principle of verification
procedures is that the predicted response
values due to the action of forces/loads onbuilding structures should not exceed the
estimated limit values. Fundamentals of
proposed verification procedures
corresponding to each level of earthquake,
wind and snow loads/forces are described
below.
5.1 Vaification Procedures Correspondingto Maximum Probable Event Level
In case of earthquakes, the maximumdisplacement response of the building
structure subjected to strong ground motions
should be smaller than the displacement Umit.
While in case of wind and snow, it is required
that the maximum stresses developed in the
structure should be smaller than the stress
limits. In defining displacement and stress
limits for earthquake motion and wind forces
respectively, it may be necessary to consider
the effects of repeating cycles in the plastic
region of the response as well. However,
fixing some stress limit values for the case of
wind forces is very difficult at the moment,
because the actual design of building
structures against wind forces in general do
not account yet for the inelastic behavior.
Concerning the analytical methods to be used
for predicting structural response, it is noted
that they should not be necessarily the same
as the current ones. Accordingly, in the
newly proposed verification procedures, it is
expected that analytical methods to be used
for the case of earthquake excitations and that
of wind/snow forces/loads be different. In
the former case it is expected to apply
Equivalent Single Degree of Freedom System
264
and Response Spectrum Method, while in the
latter one Static Elasto-Plastic Analysis.
5.2 Verification Procedures Corresponding
to Once-in-a-Lifetime Event Level
For this level of earthquake, wind
and snow loads/forces it is required to be
confirmed whether the stresses taking place at
each structural element satisfy the condition
of being smaller than the Hmit stress. The
limit stress mentioned here impUes that the
whole structure behaves generally within the
elastic range. In case of snow loads, it is
additionally required that the creep effect be
taken into account in defining Umit stress
values. In any case, the fundamental
conceptions of the current and newly
proposed verification procedures are not
much different. Therefore, it is expected
that the actual static elastic analysis be of
further use.
5.3 Verification Procedures Corresponding
to Ordinary Event LevelActually, the verification for this
level of loads/forces is not definitely required.
Only in case of special need or situation, the
necessary performance is examined in the
current design process. Displacement, stress
and acceleration Umit values are used in the
verification procedures of this level.
Defming these Umit values seems to be a
rather difficult issue which indispensably
needs a careful investigation.
The verification procedures for Uveloads are expected to be almost the same as
those being used in the current practice.
Moreover, from Table 2 it can be noticed that
no description on foundations and soils are
given. This subject is also under
investigation.
Besides the Umit values defined on
the basis of the requirements for building
structures as it is shown in Table 2, other
displacement-, stress- or acceleration-related
Umit values, defined on the basis of the
requirements for architectural, mechanical
and electrical elements permanently attached
to buildings, are considered in certain cases if
necessary. On this point, a special
investigation is needed.
As it was mentioned above,
excluding the newly proposed verification
procedure for maximum probable earthquake
events, all others remain basically the same as
those actually in use. Therefore, hereafter
the focus is put on the proposed verification
procedure for the case of earthquake
excitations. A flow chart of this procedure is
illustrated in Fig. 2. There are indeed
various analytical methods for predicting the
response of structures subjected to earthquake
excitations. The one which is shown here is
based on the equivalent single -degree -of-
freedom system and response spectrum
method.
5.4 Proposed Verification Procedurefor the Case of Majw Earthquakes
According to this procedure the steps
to be followed are:
I. Determine the Umit displacement of the
structure.
II. Determine the hysteretic characteristic,
equivalent stiffness and equivalent
damping ratio of the structure.
i) Model the structure as a simplified
equivalent single-degree-of-freedom
system (ESDOFS) and establish its
force-displacement curve (see Fig. 2a).
U) Assume now that the Umit displacement
determined in step I corresponds to the
above mentioned ESDOFS.iii) Determine the equivalent stifl&iess in
accordance with the limit displacement.
iv) Determine the equivalent damping ratio
on the basis of viscous damping ratio,
hysteretic dissipation energy and elastic
strain energy of the structure (see Fig.
2b).
III. Determine the response spectra to be used
in the verification procedure.
i) For a given basic design spectrum at the
engineering bedrock level, draw up the
free-field site-dependent acceleration
(Sa) and displacement response spectra
(Sd), for different damping levels.
265
ii) In the estimation of free-field site-
dependent acceleration and displacement
response (step i) above), consider the
strain-dependent soil deposit
characteristics.
iii) In case of need, present graphically the
relation of Sa-Sd, for different dampinglevels.
IV. Examine the safety of the structure.
In this final step, it is verified whether the
response values predicted on the basis of
the response spectra determined according
to the step III satisfy the condition of
being smaller than the limit values
estimated on the basis of step II (see Fig.
2c).
The verification procedure presented
above is in essence a blend of equivalent
single-degree-of-freedom modeling of
structures with the site-dependent response
spectrum concept, which makes possible the
prediction of maximum structural response in
case of major earthquakes as well as the
confirmation whether the predicted response
values are smaller than the limit ones.
Moreover, it is also noted that the soil-
structure interaction effects should basically
be considered. The factor of structural
characteristics Ds, used in the current practice
for verifying the ultimate capacity of the
structure to resist lateral loads, is determined
on the basis of the concept that the structural
strength necessary to keep the displacement
response during earthquakes smaller than the
limit displacement, estimated on the basis of
plastic deformation capacity of the structural
members, should be guaranteed.
From the above discussion, it can be
concluded that the newly proposed
verification procedure is just the process to
estimate the Ds values. The difference lies
on the fact that the proposed procedure does
not go up to the calculation of the Ds values.
It ends just before this step.
In order to determine the limit
displacement of the structure, a specific
displaced mode is necessary to be assumed in
advance for its inelastic response (see Fig. 2a).
Basically, any predominant or possible to be
experienced displaced mode of the structure
subjected to earthquake forces can be applied.
The predominant or possible to be
experienced displaced mode implies any of
the failure modes observed during the major
earthquakes such as beam failure mode, story
failure mode or any other definite failure
mode. Furthermore, precisely determined
characteristics of structural materials should
also be provided.
In the illustration presented above
for the proposed verification procedure the
limit value referred to is the maximumdisplacement. Nevertheless, besides
displacement any other measures can be used,
for example energy. In this case, both the
response and limit values should be expressed
in terms of energy.
The application of the proposed
verification procedure for building structures
where torsional vibration effects are
predominant requires a further detailed
investigation.
Finally, a more appropriate
consideration of the loading duration time and
material properties in the current verification
procedure based on the allowable stress
concept is under investigation.
6. FUTURE SCOPE
Having established the fundamental
principles for the revision of the current
Building Standard Law of Japan does not
mean that everything is done. The
framework and concepts of performance-
based building provisions presented in this
paper constitute just the beginning of an
enormous task to be done in the future. In
order to realize the intentions of performance-
based standards, directed towards the
expansion of free initiative, the promotion of
new technologies, and the activation of
market competition, as well as the verification
of the designed performance level in
constructed building structures, the
establishment of building related institutions
is needed. For this purpose. The Building
266
Council is appealing for the openness of
private institutions towards building
verification procedures and inspection.
Expanding the role of private institutions in
the verification/inspection system is also a
ver>' important condition for the
implementation of performance-based
provisions. Consequently, for a successful
operation of this verification/inspection
system, high level of competence, organizing
ability and responsibilit}^ are required.
Furthermore, the emphasis should
not be given only to the performance-based
provisions. In order to widen the use of
recently emerged performance-based design,
it is necessary to further intensify the efforts
towards a marketable performance. In this
sense, the popularization of performance
indication system proposals is desired.
7. CONCLUDING REMARKS
In this paper, presented is the state of
the art of the Performance-Based Building
Code of Japan, currently under development
at the Building Research Institute. In
essence, performance -based provisions intend
to provide as clearly as possible answers to
the frequently raised questions: for what
purpose, towards what objective, and for what
conditions. The greatest advantage of this
new approach lies on the fact that it focuses
primarily on the achievement of the
prescribed objectives, regardless of the
methodology used. As a result, while
promoting technical development, it maybecome possible some time in the future that
the owner himself to select the desired
performance of the building. On the other
hand, due to the long time and high cost
required for its implementation, it mayhappen that the performance-based approach
results in a complicated verification procedure,
pointing out thus the need for a much more
careful judgment in selecting between
specification-based or performance -based
provisions. There are still many issues to be
considered in the future and in dealing with
them it should be kept always in mind the
purpose that the performance-based concept is
to be applied.
ACKNOWLEDGMENT
This manuscript was stimulated by the
authors' participation as members of the
"Task Committee to Draft Performance-Based
Building Provisions", where they have shared
their opinions with other members. Theywould Uke to express their gratitude towards
all of them.
REFERENCES
1) BRI: Towards performance-based
standards, BRI-H9 Autumn Seminar Notes,
Building Research Institute, Ministry of
Construction, November, 1997 (in Japanese).
2) BCR: For a New Building Administration
Framework, which could cope with the
economic & social changes and their
prospects in the 21st century. Building
Council Report, March, 1997 (in Japanese).
3) IS0/IEC Directives - Part 2: Methodology
for the development ofinternational standards,
1992.
4) BCJ: Structural provisions for buildings,
Commentary on Building Standard Law, The
Building Center of Japan, 1997 (in Japanese).
5) AIJ: Recommendations for loads on
buildings. Architectural Institute of Japan,
1996.
6) ISO 6240: Performance standards in
building - Contents andpresentation, 1980.
7) ISO 6241: Performance standards in
building - Principles for their presentation
andfactors to be considered, 1984.
8) ISO 7162: Performance standards in
building - Contents and format of standards
for evaluation ofpresentation, 1992.
267
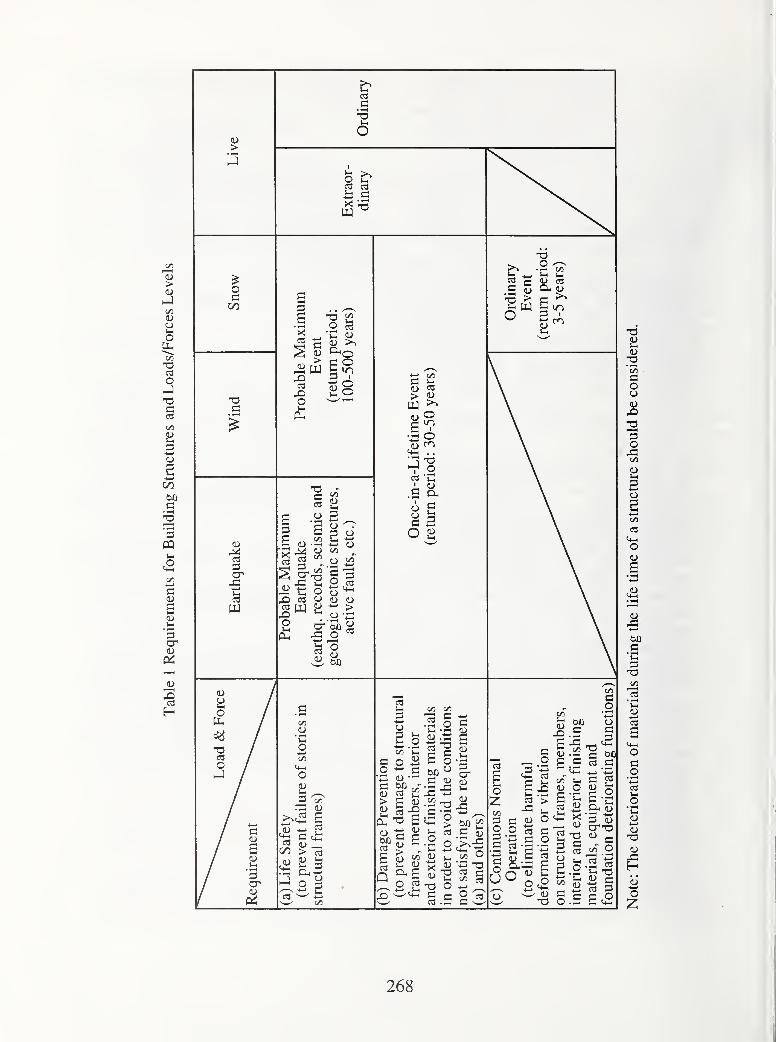
(U>
c
J-H
o
oc
73c
Hi
cr
O
o ^
c o
2^8
c03
3 B
S 03 <^
1 1-C o
X) 03 Oo3 djX) '-'
O o
'o(Ut>0
03
<u
-a
C 5^ 03
o a I
(V) c3
'3 ^' .2cd
.S Cl,
(U g
O ^
C/3
oI—
'
o
3 1«
^ 03
03 S^ > 3
3 o ^
3 o
C/5 Vh
6 §
33o c
Q
l-H
3cr(US-(
<U
o>cd
•5 O >^-t3
O 03
3 ^
S3T3 O§3
303 C
Is
268
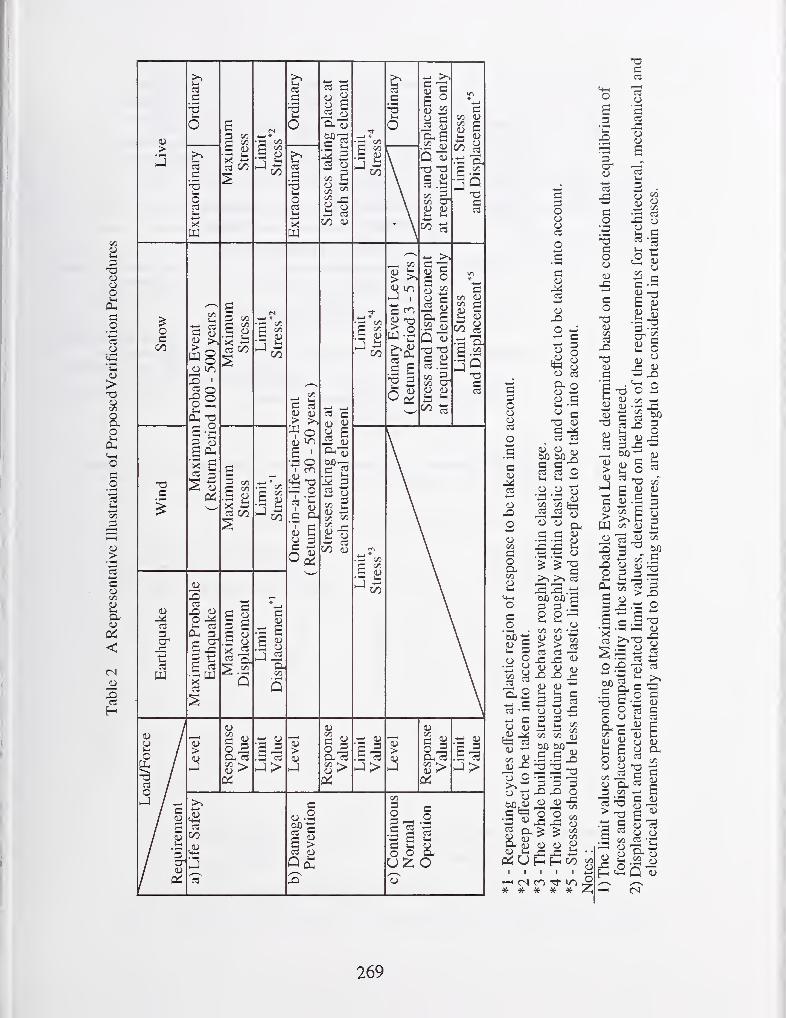
(U>
oc00
ipq
oo
l-c
c
o
^80) in
isi-i
£§S a-
cu3
S 0)
O- 3
I3 tU
>
3 c/2
3SC/3— 2
3 c/3
C3 00
cr.3(U
j2 a.
o ^Cu
(U ^
<U
00
00
00
c
CM
g _3.3 13
4-1
00
Si--
c3
O
c
o
W
C/3
(U mS '
- 2
^ 2
£
^ 5
>
5 >-i
2 o
00 <u
- (U
.£ 2^ 3
SC/2
00 2
00
.3
00
c/3
00
a _33 13
c
t3
> >Ju in1—1
I
c <^
.£ e
c
£
(U
(U
Q 13
oo
c1/3 3<U 3
00_^
•3
Is-a3
3c/3 <UV3 3(1) 3
33|3
T33?3
c/3
3O
§ o
3Oc«
ci,
3 3
H H
T33c3
5 S"^. ^
5 :S ^ ^
2:213fc«
269
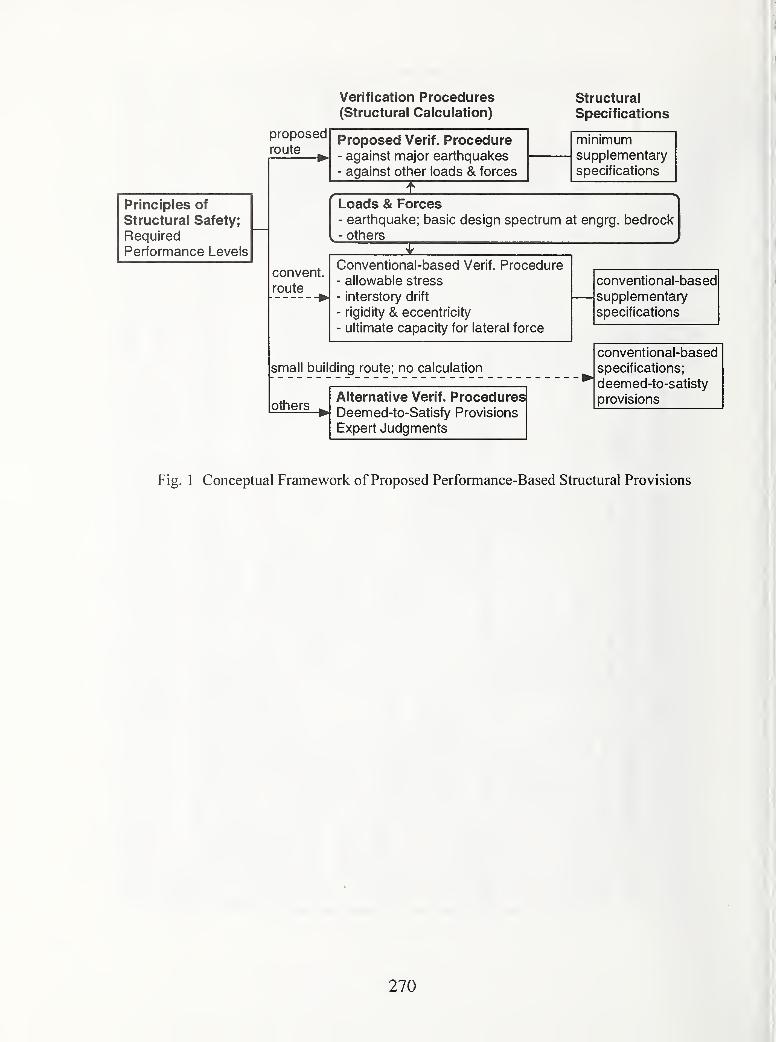
Verification Procedures(Structural Calculation)
Structural
Specifications
proposed
route ^
Principles of
Structural Safety;
Required
Performance Levels
Proposed Verif. Procedure- against major eartlnqual<es
- against other loads & forces
minimumsupplementary
specifications
convent,
route
Loads & Forces- earthquake; basic design spectrum at engrg. bedrock- others
Conventional-based Verif. Procedure- allowable stress
- interstory drift
- rigidity & eccentricity
- ultimate capacity for lateral force
conventional-based
supplementary
specifications
small building route; no calculation
othersAlternative Verif. ProceduresDeemed-to-Satisfy Provisions
Expert Judgments
conventional-based
specifications;
deemed-to-satisty
provisions
Fig. 1 Conceptual Framework of Proposed Performance-Based Structural Provisions
270
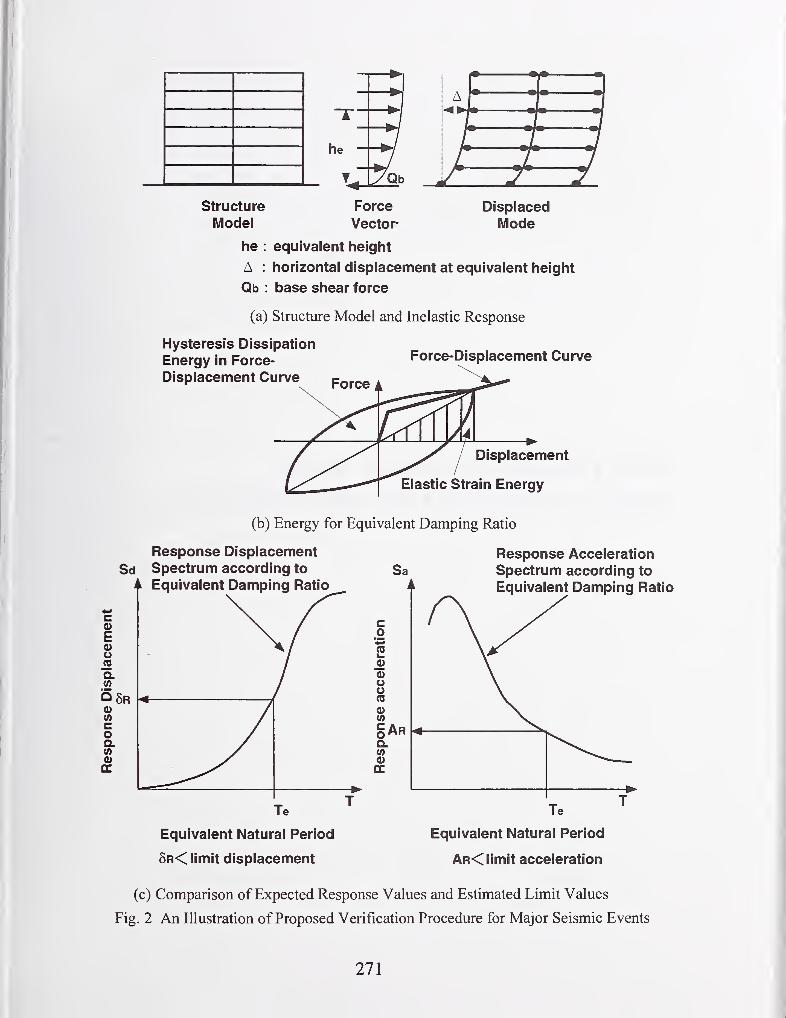
structure
ModelForce
VectorDisplaced
Mode
he : equivalent height
A : horizontal displacement at equivalent height
Qb : base shear force
Hysteresis Dissipation
Energy in Force-
Displacement Curve
(a) Structure Model and Inelastic Response
Force-Displacement Curve
Displacement
Elastic Strain Energy
(b) Energy for Equivalent Damping Ratio
Response Displacement
Sd Spectrum according to
i Equivalent Damping Ratio
Response Acceleration
Spectrum according to
Equivalent Damping Ratio
Equivalent Natural Period
6r< limit displacement
Equivalent Natural Period
Ar< limit acceleration
(c) Comparison of Expected Response Values and Estimated Limit Values
Fig. 2 An Illustration of Proposed Verification Procedure for Major Seismic Events
271


I
REAL TIME INFORMATIONACQUISITION and DISSEMINATION
273

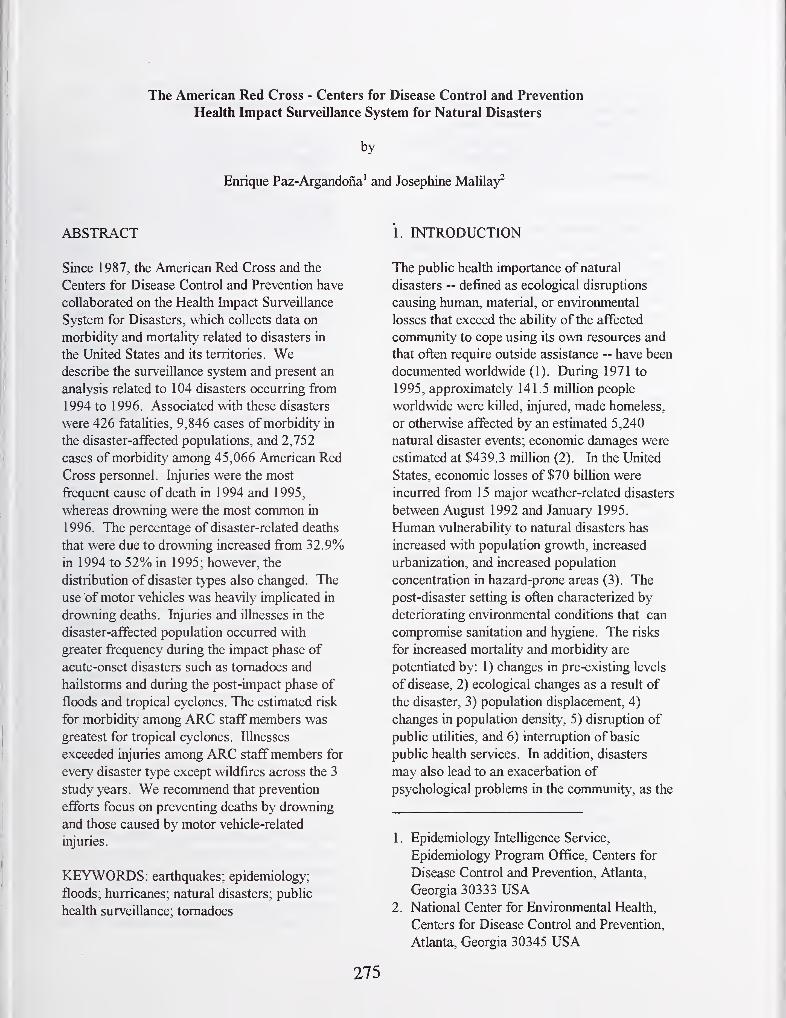
The American Red Cross - Centers for Disease Control and Prevention
Health Impact Surveillance System for Natural Disasters
Enrique Paz-Argandona and Josephine Malilay^
ABSTRACT
Since 1987, the American Red Cross and the
Centers for Disease Control and Prevention have
collaborated on the Health Impact Surveillance
System for Disasters, which collects data on
morbidity and mortality related to disasters in
the United States and its territories. Wedescribe the surveillance system and present an
analysis related to 104 disasters occurring from
1994 to 1996. Associated with these disasters
were 426 fatalities, 9,846 cases of morbidity in
the disaster-affected populations, and 2,752
cases of morbidity among 45,066 American Red
Cross personnel. Injuries were the most
frequent cause of death in 1994 and 1995,
whereas drowning were the most common in
1996. The percentage of disaster-related deaths
that were due to drowning increased from 32.9%
in 1994 to 52% in 1995; however, the
distribution of disaster types also changed. The
use of motor vehicles was heavily implicated in
drowning deaths. Injuries and illnesses in the
disaster-affected population occurred with
greater frequency during the impact phase of
acute-onset disasters such as tornadoes and
hailstorms and during the post-impact phase of
floods and tropical cyclones. The estimated risk
for morbidity among ARC staff members was
greatest for tropical cyclones. Illnesses
exceeded injuries among ARC staffmembers for
every disaster type except wildfires across the 3
study years. We recommend that prevention
efforts focus on preventing deaths by drowning
and those caused by motor vehicle-related
injuries.
KEYWORDS: earthquakes; epidemiology;
floods; hurricanes; natural disasters; public
health surveillance; tornadoes
I. INTRODUCTION
The public health importance of natural
disasters ~ defined as ecological disruptions
causing human, material, or environmental
losses that exceed the ability of the affected
community to cope using its own resources and
that often require outside assistance ~ have been
documented worldwide (1). During 1971 to
1995, approximately 141.5 million people
worldwide were killed, injured, made homeless,
or otherwise affected by an estimated 5,240
natural disaster events; economic damages were
estimated at $439.3 miUion (2). In the United
States, economic losses of $70 billion were
incurred from 15 major weather-related disasters
between August 1992 and January 1995.
Human vulnerability to natural disasters has
increased with population growth, increased
urbanization, and increased population
concentration in hazard-prone areas (3). The
post-disaster setting is often characterized by
deteriorating environmental conditions that can
compromise sanitation and hygiene. The risks
for increased mortality and morbidity are
potentiated by: 1) changes in pre-existing levels
of disease, 2) ecological changes as a result of
the disaster, 3) population displacement, 4)
changes in population density, 5) disruption of
public utilities, and 6) interruption of basic
public health services. In addition, disasters
may also lead to an exacerbation of
psychological problems in the community, as the
1. Epidemiology Intelligence Service,
Epidemiology Program Office, Centers for
Disease Control and Prevention, Atlanta,
Georgia 30333 USA2. National Center for Environmental Health,
Centers for Disease Control and Prevention,
Atlanta, Georgia 30345 USA
by
275
normal routines of people are disrupted.
Common health hazards after disasters have
been 1) exacerbation of chronic illness; 2)
psychological effects; 3) a lack of food, water,
and shelter resulting from population
displacement; and 4) climatic exposure (4).
Responding to natural disasters in a timely and
appropriate manner requires epidemiologic tools
that can rapidly provide information upon which
public health decisions may be made. These
tools may be used to control epidemics; monitor
rates of preventable deaths, illness, and injuries;
monitor health care needs among the affected
population; and identify appropriate
interventions.
A commonly used epidemiologic tool following
a disaster is surveillance. Surveillance is the
ongoing and systematic collection, analysis, and
interpretation of outcome-specific data for use in
planning, implementing and evaluating public
health practice (5). Data from surveillance
systems are used both to determine the need for
public health action and to assess the
effectiveness of programs.
In the post-disaster setting, surveillance provides
information that can serve as the basis for action
during the immediate disaster and also for
planning of future activities. Such information
is used to answer the following questions (6):
• What problems are occurring? Why are
they occurring?
• Where are problems occurring?
• Who is affected?
• What problems are causing the greatest
morbidity and mortality?
• What problems are increasing or
decreasing?
• What problems will subside on their
own? When?• What problems will increase if
unattended?
• What relief resources are available?
• What relief activities are in progress?
• Are relief activities meeting relief
needs?
• What additional information is needed
for decision-making?
Such systems for collecting the above
information must be flexible to changes in the
definitions of health outcomes; acceptable to
users ofthe data; sensitive and specific for
capturing valid and reliable information; timely
in collection, analysis, and response; accurate,
representative, and ethical (7).
2. BACKGROUND
To improve the reporting of health events related
to disasters ~ defined as any death, injury, or
illness occurring during the pre-impact, impact,
or post-impact phase of a disaster ~ the
American Red Cross (ARC) and the Centers for
Disease Control and Prevention (CDC)developed the Health Impact Surveillance
System for Natural Disasters (HISSD) under a
memorandum of agreement in 1986. The
objectives ofHISSD were:
• To estimate the magnitude of morbidity
and mortality associated with major
disasters in the United States and its
territories.
• To characterize the impact of each
disaster type.
• To identify risk factors for disaster-
related injury, ilbiess, or death among
disaster-affected populations.
• To monitor health and identify risk
factors for injury and illness among
ARC personnel involved in relief
operations.
• To stimulate epidemiological research
aimed at preventing or mitigating
morbidity and mortality associated with
disasters.
The role ofthe ARC in this surveillance system
is to determine the need for emergency and
preventive health services by documenting the
number of deaths, illnesses, and missing persons
related to a disaster event (defined as disasters
costing $50,000 or more for ARC operations).
The role ofCDC is to analyze the data collected
276
by the ARC, to assess the adverse health effect
of the disaster event, and to advise the ARC on
response and prevention.
From 1988 to 1993, the ARC summarized and
forwarded disaster-related morbidity and
mortahty statistics to CDC for compilation (8,
9). In 1996, CDC conducted a survey to assess
the usefiibiess of the system, improved collection
instruments, field-tested new forms, and
evaluated the flow of information from ARCservice centers and shelters, to its headquarters,
and finally to CDC (10, 11).
3. COMPONENTS AND OPERATION OFTHE SYSTEM
The population under surveillance is the entire
population in the disaster area, who seek
assistance in ARC shelters or service centers,
including the ARC staff members who are paid
employees or volunteers for relief operations.
Information about deaths is population-based
and is collected by ARC volunteers and nurses
who quer>' their clientele, local hospitals,
doctors' offices, medical examiners or coroners,
and local authorities, such as sheriffs' offices.
Information about injuries and ilbiesses is
provided by the ARC health services based on
visits for these services. The flow of health
information is generated and processed in ARCfield disaster-relief facilities. From these field
facilities, the flow of the mortality and morbidity
data is traced through the field operations
headquarters to the ARC national office, and
finally to CDC (see Figure 1 .)
Such information is organized by year to
mclude:
• The number of fatalities, injuries, and
illnesses per individual event.
• The number of fatalities, injuries, and
illnesses by type of disaster.
• The geographic location at which these
health conditions occurred.
• Demographic information on individual
clients, including decedents.
• Causes of injuries, illnesses, and
deaths.
• Descriptions of circumstances in which
individual cases of injuries, illnesses,
and deaths occurred.
• The number ofARC volunteers and
staffwho are injured, ill, or die during
relief operations.
The results of the analysis are presented in a
preliminary report to the ARC and CDC. Afinal report is subsequently produced and
disseminated to the disaster community (12).
The reports serve the following objectives:
• To recommend ways of preventing
deaths in fiature natural disasters based
on the systematic description of past
events.
• To describe disaster-related morbidity in
the disaster-affected population and
among ARC staff members.
• To provide the descriptive epidemiology
needed to generate hypotheses for
fiirther analytic studies.
• To evaluate the surveillance system's
performance for the years under study
and to recommend ways of improving
the system.
4. ANALYSES FROM THESURVEILLANCE SYSTEM
In this section, we present surveillance data from
the years 1994, 1995 and 1996.The number of
disaster events by natural hazard, state, and year
when the event occurred are shown in Figures 2-
4.
4.1 Mortality Results
4.1.1 Causes of death
A larger number and greater variety of disasters
occurred in 1995 and 1996 than in 1994, but
fewer fatalities were associated with these
disasters. The Northridge earthquake was
perhaps the most severe disaster of 1994 and
accounted for the largest number of fatalities.
Injuries and drowning remained the leading
277
causes of death across the 3 study years.
Injuries were the leading cause of death in 1994
and 1995 and accounted for most of the deaths
associated with earthquakes and tornadoes.
Crushing injuries and unspecified multiple
injuries were the leading causes of death in all 3
years. Motor vehicle-related injuries may have
been under represented.
The proportion of deaths by drowning increased
across the study years, accounting for 32.9%,
43.4%, and 52.3% of all deaths in 1994, 1995,
and 1996, respectively. The use of a motor
vehicle was heavily implicated in disasters
associated with drowning, such as floods, flash
floods, and Tropical Storm Alberto. The results
are consistent with the use of a motor vehicle
being a risk factor for death by drowning.
Whether these motor vehicle deaths were
entirely preventable is unknown, but at least
eight of the deaths were known to have occurred
during floods when drivers ignored "road
closed" signs or when "road closed" signs were
not used properly. Other deaths by tree fall
injuries and structural collapse of roadways
could have been prevented if drivers stayed off
roads during tropical cyclones and floods.
These deaths point to the need for better
communication of prevention messages.
Heart attacks were the third most fi-equent
cause of death in the earthquake year, 1994, but
were not as fi'equent in other disaster years
except during the clean-up phase of tropical
cyclones and floods in 1996. These findings
point to the need for hospitals to be ready to
treat patients who have heart attacks
precipitated by earthquakes, tropical cyclones,
or floods. The proper operation of backup
electrical power in hospitals during and after an
earthquake is important in critical care facilities;
three fatalities were associated with failure of
mechanical ventilators. Fires resulting from
candles and stoves being lit during power
outages were a preventable cause of death.
4.1.2 Demographic characteristics
During studied years, more men than women
have died fi-om disaster-related causes. The
number of deaths among men consistently
exceeded the number among women in every
phase of tropical cyclones, and male sex is a
risk factor for death during these events. It maybe that men are more likely than women to be
engaged in high-risk clean-up activities, such as
cutting tree limbs, or that men are more likely to
engage in risk-taking behaviors that involve
motor vehicles. Men may also be more likely to
be exposed to risks as a result of employment on
power crews and other occupationally related
activities.
The consistent finding across 3 years that more
than half of deaths occurred in persons 60 years
or older during disasters indicated the greater
physical vuhierability of this population. The
results may demonstrate the need for preventive
messages, improved evacuation efforts, and an
identification of risk factors among older people.
4.1.3 Place of death and place of injury
For the 3 years studied, most deaths occurred
outdoors, in single-family homes, or in motor
vehicles. The distribution of place of injury was
not consistent over the 3 years, mainly because
the data were skewed by the 1994 Northridge
earthquake, in which fatal injuries occurred
mainly in multi-family dwellings, and by a
church roof collapse in the same year, in which
a number of fatal injuries also occurred.
The two fatalities among ARC staffmembers
were due to cardiovascular events. Further
circumstances are unknown; the deaths may
have been brought on by the physical activity
associated with disaster relief.
4.2 Morbidity Results
Morbidity occurred more fi-equently during the
post-impact phase of floods and tropical
cyclones than during the impact phase, a pattern
also noted in previous years (8, 9). In contrast,
in disasters with sudden acute onset, such as
tornadoes, morbidity was more likely to occur
during the impact phase. Our finding that
278
illnesses were more common than injuries
among field personnel may be somewhat usefiil
in planning health assistance to staff members,
but further study of disaster-related morbidity is
necessary'.
5. DISCUSSION
The ARC-CDC Health Impact Surveillance
System is the only known surveillance system in
the U.S. that systematically collects morbidity
and mortality data related specifically to natural
and technological disasters. As the nation's
designated relief agency, the ARC is in a unique
position to collect data as disaster-relief
operations are conducted. The surveillance
information helps the ARC to target resources
for future disaster assistance, and it helps CDC,as the nation's prevention agency, to better
focus prevention efforts. The system also
collects valuable information on the
circumstances of each case of illness, injury, or
death among personnel specifically trained in
disaster relief
Like most surveillance systems, the ARC-CDCHealth Impact Surveillance System has
limitations that analysts should keep in mind
when interpreting the data. For example, as
with most surveillance systems, a number of
limitations arose with interpretation of the data.
Whereas the difference between disaster
categories such as "earthquake" and "tornado"is
straightforward, the difference between others,
such as floods vs flash flood, may be more
difficult to distinguish. There also may be
additional floods with tornadoes that were not
characterized as such. Because of this lack of
standard definitions for disaster types, the
analysis of mortality and morbidity within
disaster types is most useful for those categories
that are clearly distinct fi^om one another, such
as earthquakes and hurricanes.
Another limitation is that the accuracy of
whether a fatality was truly disaster-related was
a fiinction of how well the circumstances of the
fatality were described. Responses varied
widely from a few words ( e.g., "died by
drowning") to detailed descriptions providing all
circumstances, including the date, time, and
location of death, and details regarding events
leading up to the death. Some deaths recorded
by the system and included in the analysis were
probably not actually disaster-related, and
other deaths may have been indirectly related to
disasters even though they are not classified as
such because of a lack of detail provided.
Particularly suspect are deaths by chronic
disease processes or because of pre-existing
medical conditions, which may or may not have
occurred in the absence of the disaster.
As with disaster-relatedness, the determination
of whether a death occurred before or after
impact or whether it was related to a secondary
disaster was largely a function of the level of
detail provided in the form. As a result, there
may be significant under reporting of deaths
related to a secondary disaster and of deaths
occurring during the pre- and post-impact
periods, as well as an over estimate of the
number of deaths that occurred during the
impact phase.
A fourth limitation is that even though the
system asks that the cause of death be
ascertained from the death certificates of the
victims, many fatality forms list the information
source as nonmedical, such as the police or a
family member. Furthermore, many deaths are
listed with a circumstantial rather than a medical
cause, such as "car accident." Conversely,
injuries sustained in car accidents may not be
noted as such, and there is likely to be some
overlap between the injury and the motor vehicle
categories. The causes of death presented in this
report should therefore be interpreted as broad
categories describing a general circumstance of
death rather than specific physiological events.
The consistent difficulties with morbidity reports
described above, have led to the development of
a new form on which to report morbidity. This
form provides information individually rather
than as an aggregate tally. The new form will
improve the quality of data by providing pre-
existing categories of injuries and illnesses, as
279
well as by prompting for the location, time, and
circumstances of the injuries. After 1997, the
year in which this form was first implemented,
an improved analysis of the morbidity
associated with disasters will be possible.
6. RECOMMENDATIONS FOR THEPREVENTION OF DISASTER-RELATEDMORTALITY AND MORBIDITY
In addition to pointing to the need for improved
weather forecasting and for dissemination of
weather information to at-risk populations, the
above analysis indicates that the following could
help reduce disaster-related mortality and
morbidity in disaster-affected communities.
• Make the avoidance of deaths in motor
vehicles during flooding or heavy rains
a major focus of prevention efforts. The
National Weather Service,
meteorologists, and local emergency
management authorities should
coordinate their announcement of
warnings and establish safe detour
routes in communities affected by
severe flooding. During a flood watch,
for example, public advisories should be
broadcast to caution people to observe
existing barricades and avoid routes that
authorities have declared unsafe.
Moreover, people in cars should be
advised not to attempt to outrun the
flood, but to seek shelter in a nearby
pubhc building.
• Make the prevention of deaths and
injuries following the impact of a
tropical cyclone a major focus of
disaster-related health education.
Health education should emphasize
tree-cutting safety, power-line safety,
the avoidance of candles as a light
supply following power outages, and
the proper use and ventilation of
generators.
major focus of prevention efforts. In
educational campaigns, people in the
community should be encouraged to
keep in touch as much as possible with
elderly neighbors and family members
over the course of a disaster so that
they can provide assistance when
necessary.
• Focus disaster-response plans for acute-
onset disasters on mass-casualty
preparedness and the immediate care of
victims under disaster conditions (e.g.,
search and rescue, triage, and
transportation). Large numbers of
casualties may be expected during the
impact phase of tornadoes and
earthquakes. The hospital deaths
associated with power loss following the
Northridge earthquake demonstrate the
need for constant vigilance.
7. CONCLUSIONS
The Health Impact Surveillance System for
Disasters provides a basis for case definitions of
injuries and illnesses associated with disasters;
documents disaster-related mortality and
morbidity; and provides data with which to
perform cost analyses. Further improvements
include a revision of the ARC's data collection
training manual and in procedures used by with
ARC staff, implementation of standardized case
definitions for injuries and illnesses under
International Classification of Diseases-9
coding, computerization ofthe ARC field
collection, and the Centers for Disease Control
collaboration with the ARC to gather
information from emergency rooms and other
health providers in disaster sites.
8. REFERENCES
1. Gunn SWA. Multilingual dictionary of
disaster medicine and international
relief. Dordrecht, The Netherlands;
Kluwer Academic Pubhshers, 1990.
Make the avoidance of deaths and
injuries among people 60 and over a 2. International Federation of Red Cross
280

and Red Crescent Societies. World
disasters report 1997. Oxford, UK:
Oxford University Press, 1997.
3. U.S. Federal Subcommittee on Natural
Disaster Reduction (SNDR). Natural
disaster reduction: a plan for the nation.
Washington, DC: SNDR 1996.
4. Western KA. Epidemiologic
surveillance after natural disaster.
Scientific Publication No. 420.
Washington, DC: Pan American Health
Organization, 1982.
5. Thacker SB, Berkehnan RL. Public
health surveillance in the United States.
Epidemiol Rev 1988;10:164-90.
6. Sidel VW, Onel E, Geiger HJ, Leaning
J, Foege WH. Public health responses
to natural and human-made disasters.
In: Maxcy, Rosenau, Last, eds. Public
Health & Preventive Medicine, 13**^ ed.
CT: Appleton & Lange, 1992: 1 173-86.
7. Centers for Disease Control and
Prevention. Guidelines for evaluating
surveillance systems. MMWR MorbMortal Wkly Rep 1988;37, No. S-5.
8. Duclos P. American Red Cross disaster
database collaborative project:
surveillance system for natural disasters
using American Red Cross records.
Atlanta, GA: Centers for Disease
Control and Prevention, 1988.
9. Quenemoen L. Evaluation of the health
impact surveillance system for disasters.
Atlanta, GA: Centers for Disease
Control and Prevention, 1993.
10. Fiedler L, Malilay J. A formative
evaluation of the health impact
surveillance for natural disasters. Areport to the American Red Cross.
Atlanta, GA: National Center for
Environmental Health, Centers for
Disease Control and Prevention, 1996.
IL Paz E, Gorjaric M, Gunderson E. Afield evaluation of the health impact
surveillance for disasters. A report to
the American Red Cross. Atlanta GA:
National Center for Environmental
Health, Centers for Disease Control and
Prevention, 1996.
12. Paz E, Hall SA, MaHlay J. American
Red Cross—Centers for Disease Control
and Prevention health impact
surveillance system for disasters. Areport to the American Red Cross for
years 1994, 1995, 1996. Atlanta, GA:
National Center for Environmental
Health, Centers for Disease Control and
Prevention, 1997.
281
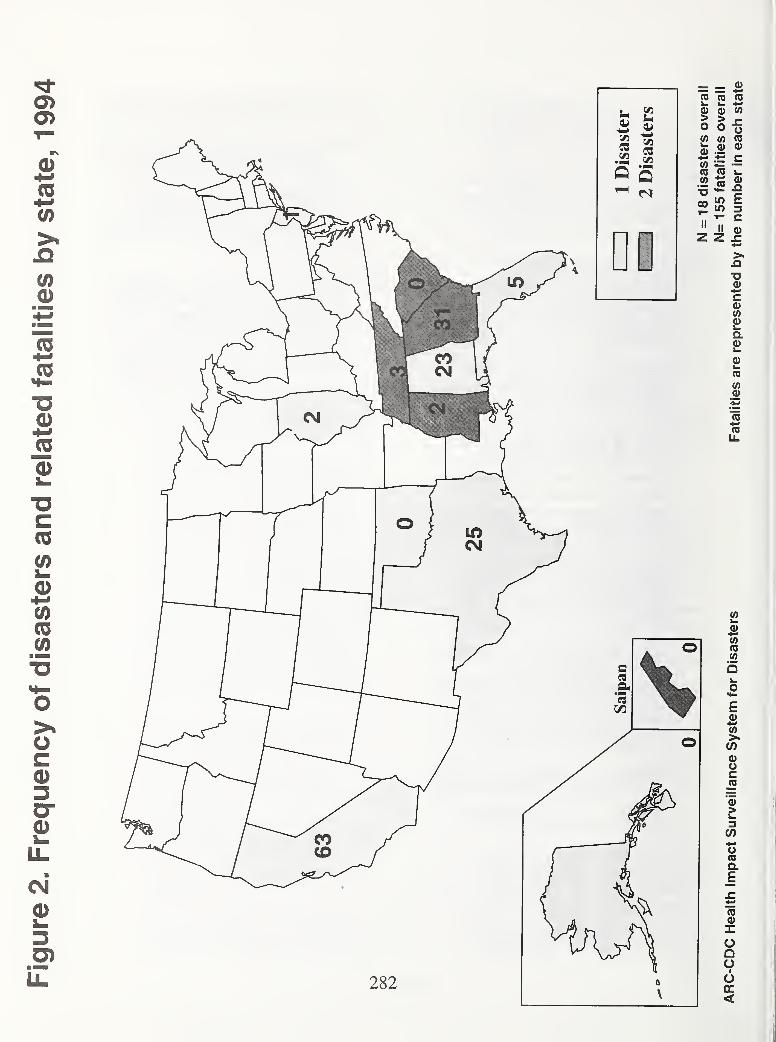
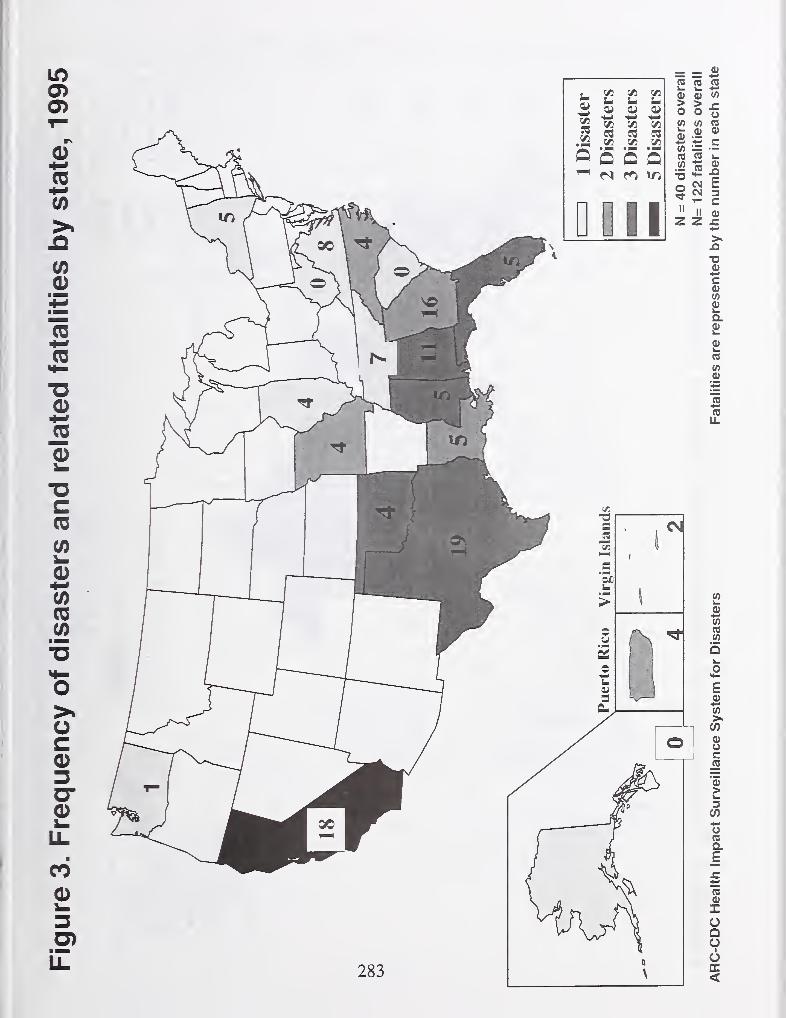
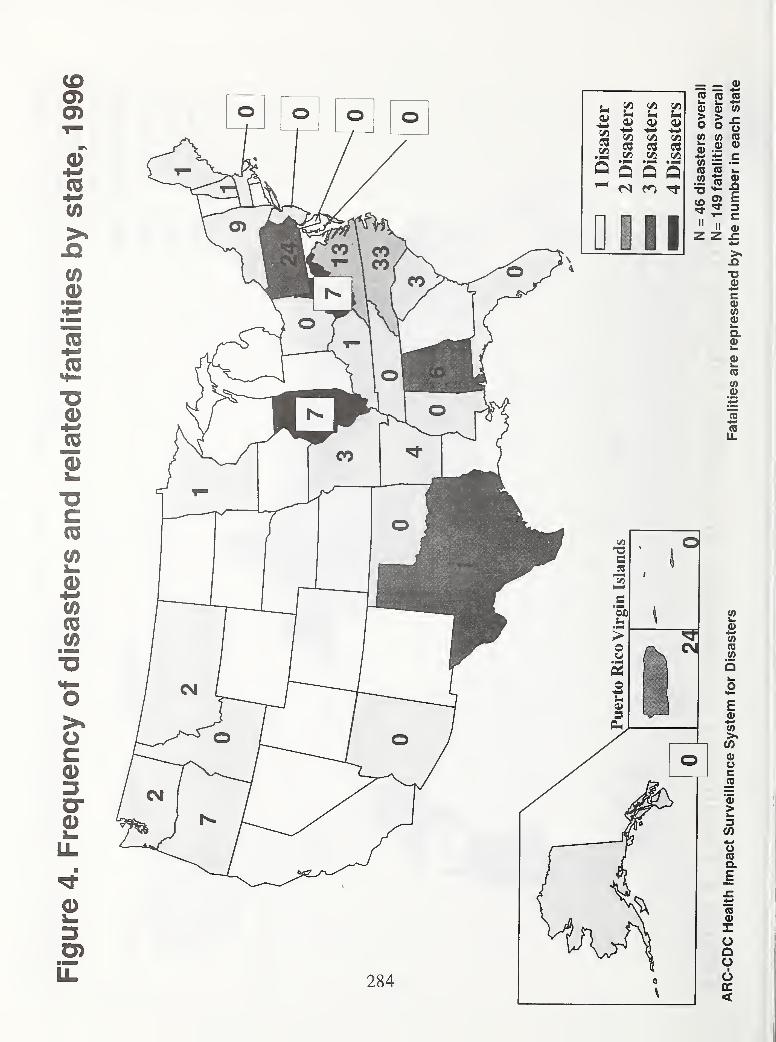
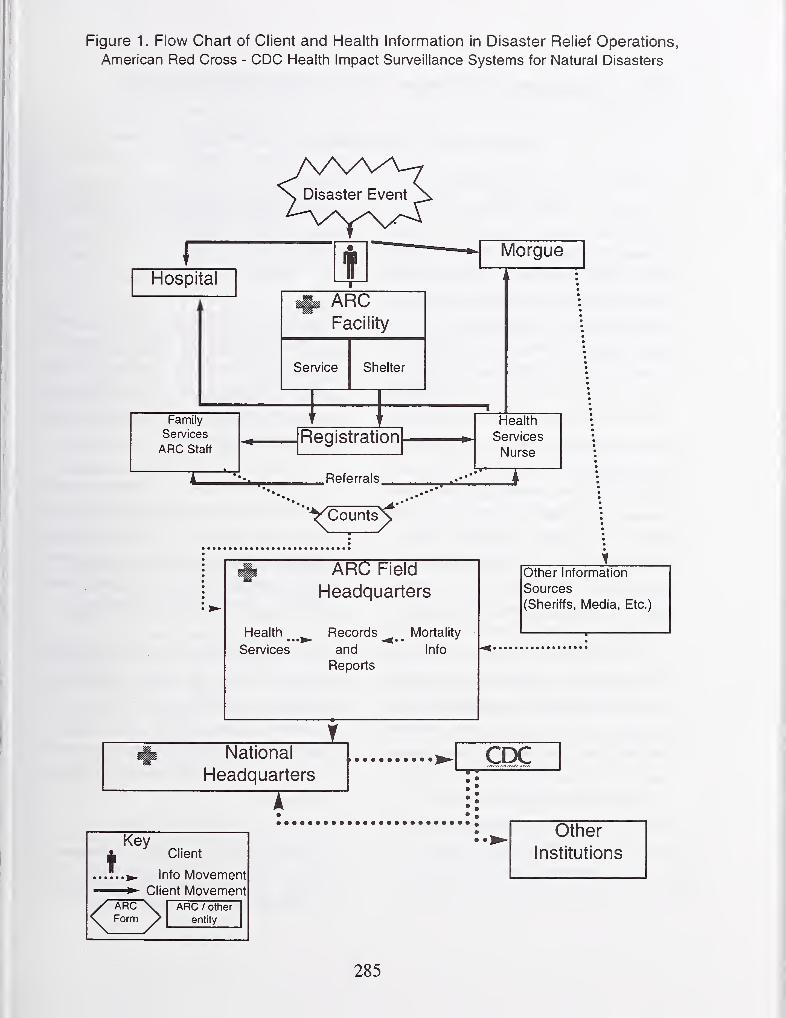
Figure 1. Flow Chart of Client and Health Information in Disaster Relief Operations,
American Red Cross - CDC Health Impact Surveillance Systems for Natural Disasters
Morgue
ARCFacility
Service
Family
Services
ARC Staff
Shelter
Registration
Health
Services
Nurse
.Referrals.
''
^Counts^'
Health
Services
ARC Field
Headquarters
Records Mortality
and Info
Reports
T^ National
Headquarters
other Information
Sources
(Sheriffs, Media, Etc.
CDC
t
KeyClient
<
Info Movement- Client Movement
ARCForm
ARC / other
entity
Other
Institutions
285
Development of the Disaster Information System(DIS/Earthquakes)
by
Kazuo Okayama'', Takaharii Kiriyama^', Seishi Yabiiuchi^'
ABSTRACT
Utilizing the experiences oF the Great Hanshin-
Awaji Harthquake, the National Land Agency has
been piomoting the development of the Disastei
Infoimation System (DIS/Karthquakes) which uses
the Geographic Information System (GIS). This
system is expected to provide quick and appropriate
decision making in all three phases, "preparation",
"'emergency measures" and "recovery/rehabilitation".
Since April 1996, the National Land Agency has
been opcratit)g the Early Estimation Systetn
which automatically estimates the scale of flamage
causcti by an caithquakc using the very limitetl
inforn)atioii available immediately after an
earthquake occurs. 'Junently, the agency is
pursuing the development of an [*mergency
Measures Support System (EMS), which will
consolidate and share infonnation through the
constniction of an on-line network linked with other
disaster-prevention organizations, and utilize such
information in support of emergency measures such
as rescue and medical care, emergency
transportation, evacuation, lifelines, and volunteers..
Key Words : Disaster Prevention Information
Geographic Information System(GIS),
Early Estimation ofDamage
i Support ofEmergency Measure
1 OVERALL GONCEPT AND STATUS OF
DEVELOPMEN T OF THE DIS
L] Background
The (}reat Hanshin-Awaji Earthquake, which
occurred right under the city ofKobe on January 1 7,
1995, again showed the importance of rapid
response activities by the national government,
particularly the importance of estimating damage
immediately after an earthquake.
If organizations concerned with disaster prevention,
have numerical map and geogiaphical location data
and a system that combines this data for quick and
efficient application, they should be able to quickly
detemiine the state of damage, and support rescue
and recovery activities quickly and effectively.
The difficulty encountered in collecting appropriate
infonnation after the Great Hanshin-Awaji
Earthquake reemphasized the importance of
information. How to collect, put in order and
analyze information efficiently have become major
factors in recognizing the necessity of building a
new system.
1)Director, Earthquake Disaster Countermeasures
Division, Disaster Prevention Bureau, National Land
Agency, 1-2-2 Kasumigaseki Chiyoda-ward, 100 Japan,
2)Deputy Director, 3)Former Deputy Director
286
The new basic plan of disaster prevention which
was amended in July 1995 considers the importance
of information in the following three stages:
prevention, emergency measures and
recovery/rehabilitation. It shall promote the
construction of geographic information systems to
support the realization of disaster-preventive
measures.. It also states that the on-line database
network, shall be construct.
Based on this experience, the National Land Agency
has been promoting preparation of a Disaster
Information System by utilizing Geographic
Information System (GIS) that manages information
on topography, ground conditions, population,
building stock, disaster response facilities, etc.,
connected to digital maps on a computer.
1 .2 Overall concept
In order to develop the DIS, the National Land
Agency is examining ways in which the Geographic
Information System (GIS) is being used/utilized
domestically and abroad in relation to disaster
prevention. It has established committees and
coordinating groups composed of academic experts
on disaster prevention and systems development,
and of persons from related agencies, incorporating
the views of such groups into its development ofthe
system.
As shown in Figure 1, the DIS focuses on three
stages of an earthquake disaster. They are
emergency period, recovery/rehabilitation period,
and preparation period for the next disaster. This
system is expected to effectively support quick and
appropriate decision making by the organizations
concerned.
The DIS includes plans for the preparation of a
"Map and Disaster Prevention Information Data
Base" containing map data and other information
relating to government agencies, public facilities,
roads, disaster prevention facilities, etc. Through a
network, the system will tie in such information as
post-earthquake damage, the status of emergency
measures, and the state of reconstruction of public
facilities, lifelines, etc. to digitalized maps on the
computer.
As part of its effort to support post-disaster
responses, the agency is also developing an Early
Estimation System (EES), which aims to provide
approximate estimates of the scale of damage in the
immediate aftermath of a disaster, under conditions
of limited information; and an Emergency Measures
Support System (EMS), which aims to support a
variety ofemergency measures (details to follow).
As time passes, recovery/rehabilitation measures
become more important, and here comes the
Recovery/Rehabilitation Measures Support System,
which provides information to support the
establishment of recovery and rehabilitation plans at
various levels, and to help manage their progress.
While the above deals with responses after a disaster,
the agency is also considering utilizing its resources
at the stage of "preparations for disaster." Such
resources include its Map and Disaster Prevention
287
Information Data Base, which has accumulated over
the course of developing the systems, and the know-
how that the agency has developed in the past,
including its methods of estimating earthquake
damage.
By utilizing data bases that have been developed
beforehand, the Earthquake Damage Estimation
System estimates damage caused by hypothetical
earthquakes, and, on the basis of such estimates,
supports efforts to propose disaster-prevention and
emergency-response measures. The Support
System for the Improvement and Planning of
Earthquake-related Disaster Prevention Facilities
estimates the number of disaster prevention facilities
needed, assists in the selection of possible sites, and
forecasts the impact that such facilities would have,
thus supporting the planning of appropriate
earthquake-related disaster prevention facilities.
1 .3 Status ofdevelopment
The National Land Agency has been working on the
development of such systems since fiscal 1995.
For its Map and Disaster Prevention Information
Data Base, it has developed digital maps on a scale
of 1/25,000 and 1/2,500, and, as shown in Table 1,
has prepared data linked to these maps on natural
conditions, such as topography and geology, social
conditions such as population, public works
facilities, lifelines and disaster prevention facilities.
With regard to its comprehensive systems, the
agency has been operating the EES since April 1996,
and is currently pursuing the development of the
EMS, which will create a network linking various
disaster prevention-related agencies, and will
consolidate, organize and analyze the information
provided by such agencies in support of emergency
measures.
2. THE EARLY ESTIMATION SYSTEM (EES)
2 . 1 The aims ofEES development
The EES provides quick estimates of the
approximate scale of damage caused by an
earthquake under conditions of limited information
immediately after the disaster. The system has
been designed to provide information that will
contribute to prompt and appropriate judgments
relating to emergency measures.
In Japan, past records on earthquakes and
earthquake damage are available, making it possible,
to a certain extent, to organize a coherent picture of
the relationship between earthquakes and the
damage caused by them in different areas. By
applying to such records analytical methods newly
obtained in recent years, it has become possible to
estimate injury and loss ofhuman life resulting from
buildings that are destroyed by earthquakes.
The EES is equipped with forecasting tools that
utilize such know-how, as well as with a data base
containing information on topography, ground
conditions, buildings, population, etc. for the entire
country. The system is also characterized by its
ability to receive in real time data from
288
seismographs installed in approximately 1200
locations around the country by both the
Meteorological Agency and local governments, and
to use such data on seismic intensity in its estimates.
The EES is also connected to the Meteorological
Agency's Comprehensive Observation System for
Seismological Activity, which enables it to
immediately use seismic data that has been collected
by the Meteorological Agency. Based on this data,
the system estimates the distribution of seismic
intensity for each mesh (approximately 1 square km)
in the country, and the damage to buildings and the
casualties due to building damage (Figure 2).
2.2 Verification of estimates and results of system
operation
hi a simulated response to the Great Hanshin-Awaji
Earthquake, the system produced estimates within
roughly five minutes of its receipt of data fi"om the
Meteorological Agency. The system's estimate
was that the earthquake destroyed approximately
100,000 buildings, and that damage resulted in
casualties (deaths) to about 4,000 people. Thus, it
was generally capable of assessing the scale of
earthquake damage immediately after the disaster
struck.
From the time the system went into operation in
April 1996 through the end of March 1998, it has
recorded 69 earthquakes with seismic intensities
above 4, of which five have registered readings
higher than 5. hi the largest of these earthquakes,
which occurred on May 13, 1997 in the Satsuma
region of Kagoshima Prefecture, the system
recorded a maximum seismic intensity of "weak 6,"
and estimated destruction to 832 buildings and
resultant human casualties (deaths) of 15 (Figure 3).
Although this exceeded the actually reported
damage of 77 buildings totally or partially destroyed
and one person seriously injured, it roughly
expressed the scale of the largest earthquake disaster
of the past two years. Because the system tends to
estimate on the high side for earthquakes ofthis size,
there is a need to consider making further
improvements hereafter. However, when
assessments of damage based on reports from the
scene require time, the system permits a quick, albeit
rough, grasp of the scale of damage caused by an
earthquake, and in this way has contributed
substantially to the material available for the
government to make judgements on initial response
activities.
Since September 1997, as a result of having added
new forecasting categories, including the number of
persons seriously injured, the number in critical
condition, and the number evacuated, the system's
information is being used by related agencies in
preparing emergency response activities. Hereafter,
the agency plans to encourage the use of the system
for speedier launches of response activity, and as
preliminary information for the EMS, which is now
under development.
3 . THE EMERGENCY MEASURES SUPPORT
SYSTEM (EMS)
3 . 1 The aims ofthe EMS development
289
The EMS establishes a mechanism for organizing
and sharing information through the GIS on damage
sustained in a disaster and on the status of
preparations and actions relating to various
emergency measures. This is information that
must be shared, and which the system provides by
organizing information that is available from related
agencies, and other information required for the
adoption of emergency measures. The system
constructs a data network that links related agencies
through use of data processing and
telecommunications methods.
Under the EMS, the agency will develop a system
that takes such shared information and generates
from it usefijl, value-added information that can be
utilized in the formulation of emergency measures,
ranging from rescue and medical care to emergency
transportation, evacuation, lifelines, and volunteer-
related activities.
3.2 The construction of networks linked with
related agencies
By constructing an on-line network that ties the DIS
to the various disaster-prevention information
systems owned by related agencies, it will become
possible to share data bases and to exchange
information among related agencies. With ample
consideration given to needs for safety during
disasters, the agency will utilize the Central Disaster
Prevention Radio Network as its means of
telecommunications, a system being developed to
link related agencies.
By overlapping onto digitalized maps information
gathered from related agencies and previously
established data bases of disaster prevention-related
information, and, moreover, by organizing such
information onto reports and providing it to related
agencies as effective, added-value information
aiding various emergency measures, the EMS
fosters the following kinds of objectives and makes
it possible for the government to execute prompt and
appropriate emergency measures, together.(Figure
4):
• the sharing ofvarious kinds of information;
• coordination with related agencies;
• greater efficiency in analyzing and organizing
data.
3 .3 Applications ofthe EMS
The EMS will be systematically developed with a
focus on the following kinds of applications, which
consolidate onto the GIS the information and
knowledge that has been gathered regarding the
emergency measures that will be required
immediately after earthquakes.
* Support system for rescue and medical care
To support the dispatching of rescue and
emergency medical teams, the fransporting of
injured or sick persons outside the disaster area,
and the transporting of medical supplies, etc.
* Support system for emergency transportation
To support emergency transportation activity
290
for food, water and other material.
* Support system for evacuation
To support evacuation measures, such as the
appropriate accommodation of large numbers
ofevacuees during extensive disasters.
* Support system for lifelines
To support the utility industry and others in
their efforts, so as to foster the effective and
concentrated restoration of lifeline functions.
* Support system for volunteers
To support an efficient and appropriate
deployment of volunteers.
These systems are being methodically developed,
beginning with those for which mechanisms of
information distribution etc. have been established.
4. FUTURE OUTLOOK
In this way, the DIS is being built through the
methodical development of systems appropriate for
each stage. To utilize the DIS even more
effectively, however, there is a need to reinforce its
ability to distribute information—to coordinate with
related agencies and the media, to release public
information to businesses, residents, etc.—and to
dynamically introduce new technologies.
First, in terms of strengthening coordination with
related agencies, there is the need to go beyond the
establishment of mechanisms for the sharing of
disaster prevention information during disasters, and
to work toward increased coordination aimed at
enhancing the sharing and maintenance of
information during ordinary times as well. There
is also the need to foster use of data bases in
everyday operations and to use the system in
training activity and in programs aimed at
' developing disaster-prevention specialists.
Moreover, as a step toward closer coordination with
local governments, the further sharing of data bases
should be encouraged between such govemments
and the departments and bureaus possessing map
information and data bases on houses etc.
By appropriately providing businesses, residents and
others with information organized according to
objectives of utilization, the effectiveness of disaster
prevention measures is strengthened. Conversely,
it would also be possible to consider a system of
information gathering that utilizes the Internet and
other means to collect such information from
businesses and residents.
Among the new technologies that will be considered
as a part of fostering more sophisticated uses of the
DIS are those aimed at securing methods of data
transmission, including the Central Disaster
Prevention Radio Network, the telecommunications
systems of other agencies, satellite
telecommunications, the Internet, and so on.
Among the possible methods of gathering
information from disaster areas is the utilization of
remote sensing technology which would allow the
assessment of scale of damage over wide areas and
mobile terminals. Mobile terminals can also be
291
utilized as a mechanism for providing appropriate
information from the DIS to disaster sites.
To supplement the development of the GIS data
base, efforts should be made to utilize the digital
maps and disaster-prevention information that are
being developed by the private sector, as well as
satellite photography. In addition, to foster more
sophisticated uses of the GIS, efforts to promote the
utilization of car navigation technology should be
considered.
Making the DIS easier to use is also an issue that
needs to be dealt with hereafter, and in this regard
efforts should be made to improve display methods
through such means as adopting three-dimensional
display technology, utilizing more versatile
visualization technology, and so on. Also, it will
be necessary to provide better methods of checking
the system and the disaster prevention structure and
of providing better ways of enhancing their
utilization.
While always considering systematic and
technological improvements, the agency will
develop the DIS in stages, coordinating its efforts
more and more closely with other agencies. The
aim will be to develop a system that supports
disaster prevention measures that utilize information
in the most effective way possible.
292
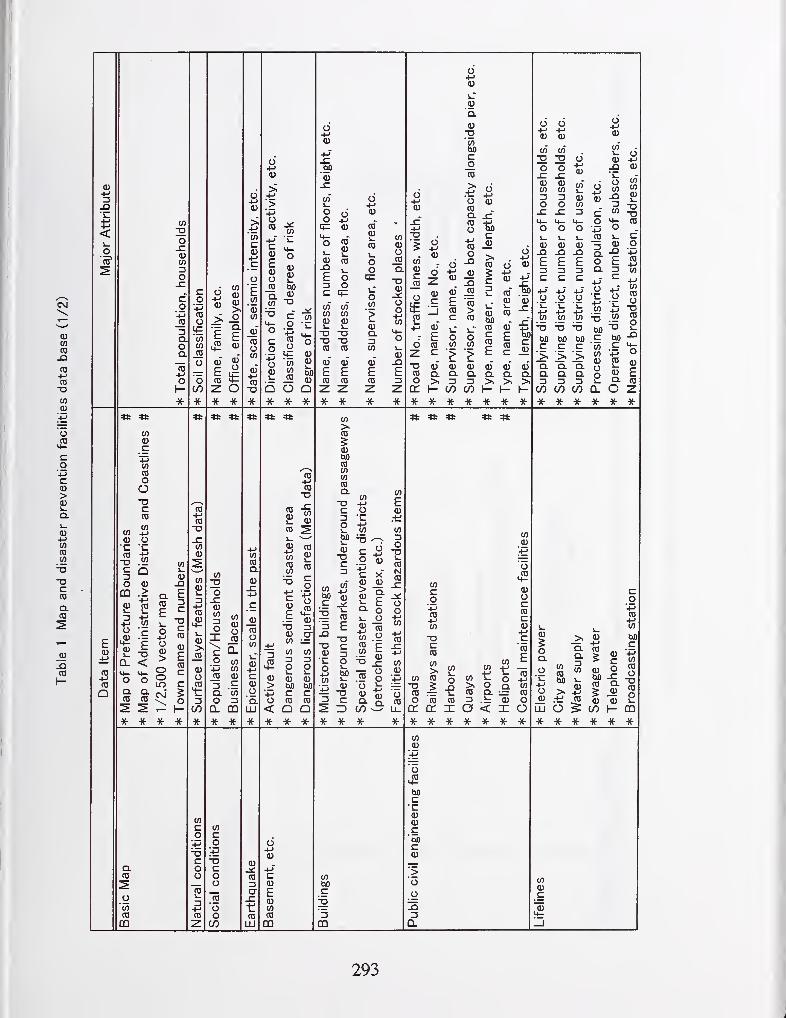
1
1
E -
2 O
bfl
i s °
o wSi
Q) Wtj£
Q O Q-X-
+J(D
1-
o oo -l->
<D
4-o CVJ
<Ui_ i_<u CO
quior
ocw" COCO (/)
(U (Di_ i_o Do -QCO 00
<U
E ECD CO
zX-
ooq=
Ow
0)Q.3W
(U
ECO
oJOCI
aoo
o+J
r 6
g E_j ^
E oCD tf>
^. 'E
Q.>
o0)
'q.
0)-a"w
c_oCD
^ 6.T= +->
o <uCO
S toc0)
COo
JD
CD>CD
>CD O
C CD
L.
(U CDtuO -
CO CD
S E
Q.3CO
(U 0} 0}Q. Q. Q.
>C/D h- h-
* * -X-
o o-M -H0) <u
ox:0)(0
o
oC/)
CO
O O O JD O
4) (1)
-Q JDE E3 3C C+J -I-'
O O
bO bOC C
!>Q.
Q. Q.3 3
C/) CO
JO3Q.OQ.
O+->
(D
COCO
Vi_
"DT3CD
Co
•cog+-' Cto ^— CO <D
Oc bO
D OCOCO
<U 03 (0
t: Q- CO
1 O•X- -X- ^ -X- ^ )(
CO
Q
CO
0)
_c
CO
CO
oOTJCCO
CO ^0) o
-s ^
i ^o <u
QD >
(D CD
3 4J
CO
ECO
TJQ- <I- <+-
o oQ. Q.CO (0
OoCD
>ooLOCN
(D
CO+J COCO 0)
•X- -X- * *Q. m•X- *
^ 5
.E (uO 3(U D"(O
to CO
3 3O Oi_ i_
CD CDbO bOC CCD CD
Q Q
CO
>CO
(DbOCDCOCOCOa
c3obOi_
(U
T3c3
COfcuO %
*t *t *t:
CD
Eoc3O
CO
Cg
-t-j
c>(D
(D+JCOCDto
O b —bOi_
<u
-oc3
* -x- -x-
CD
O(DQ.C/D
X- -X- -X-
toco
-!->
CD+JCO
DcCD
CO>to CO oto := i_
O CD CO
COCO
t> O Q.CO Q. ~3 .b CD
to
to t
cr cc X o < X* -x- * -x- -x- ^e-
o >^ ^^ .-t: CO 5LU o 5 (/)
Q. CD
CO (D^ bO
to
CD
bOc
° s
CD 1-
4f -x- * -x-
o<D
+->"
C toCD bO
E c(D |gCOCD
'5
QQ GQ
o45bOc
'i.
ID
(D
C"boc0)
>ooIB3CL
293
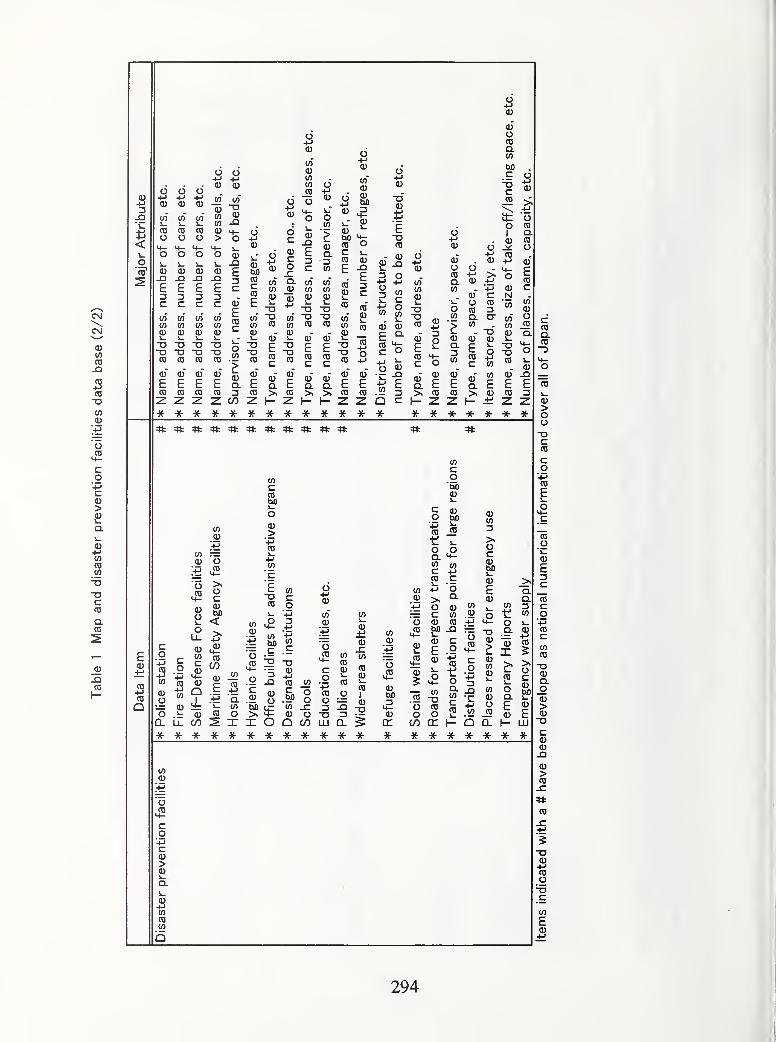
3
o o o
ECWw<Di_aoCD
ECO
CD
E
C
cn
CDi_
-a-am
ECD
Oi
EctoC/5
<Di_oaCD
CD
ECD
o o+-' 4->
W 2J<n -Q
> OO 0)
E i
V)0)cnCO_CD
O (U O
O+->
(U
CO(U(UbO
cu
CO
(Ui_aDCD
ECD
hjo
W CD
o
1 =2 c
oCfl s- ^
0 CD OQ- £ ^3 CD 0)
W Ea
ow
CDQ.
CD
(f)
CO
0i_
-o
CD
cd"
ECDc
COCOCD
Eccd'
cu
"I
DCD
t Q.CD >Z I-
^ CD CU ^ ^(D > > CD CD
Ot->
-dCD
EoCD
- <D0) ^
O^
E ^+-' o</) CO. i_
(U CD
E ^c o
o <iJ
c -Q+-' E
Q c
OCDQ.CO
bOcT3C-is >
o+JCD
CO(0
0
CD 4-C O
Q. t> CD
O+J<D
cd"
OCDQ.CO
O(U
(DOCDQ.CO
OI
_^CD
^ E
cCD
-aCD
0)N"co
co"
CO0)i_
aCD
oCDaCD
o
ECD
Cco"
ooJDQ.
CCDaCD
0 CO 0E ^ E ECD > 0 CD
0
E3
* ¥ ¥ -ii- * ^ *0>OoocCD
co4-»
(0
EI-
"coo'i-
0E3C"cocg+jCOcCOCD
-a0Q.o0>0
00JD
0>(0
(0
CD
Q
toC(QbO
CO—
0 o
o
co+->
CD+JCO
0o ^:= 0 a:O 0
o o5
CD 0m '—
'
C/D
4?
>oc0tuO
< CO
> 0+:!
CD oC/3 >20 CO oE CO
+-> 'c+J 'q 0
COCD o >X X
X-
aCD
4- +j
CO'+-"
bo wc .E
!5 -a•-0)
o.CD to
2 -D CD CO
C "O0oit
CD OO.5P o o 1^
CO
03 J3
O -O 3O) LU CL
to
0+-> to
"o 0
CD0COI
0o0bO34-0
(0co'm0
0bO
CD J5t: ^o ,oQ. •^-
cn COC +JCD ci3 O>oc0 CD
CO .2
bO ^0 0
COo
1 ^H .2
1 ^c
0CO
3>oc0bO
0E0
u- o-o .9-
C X0to
0
CO
>oc0hO
"O CD ^ +^ " E ''^
o o 2 .i2 J5 0 ECO cr I- Q CL I- LLi
-x- -x- *
a0+jCOo
_c
(0
E0
294
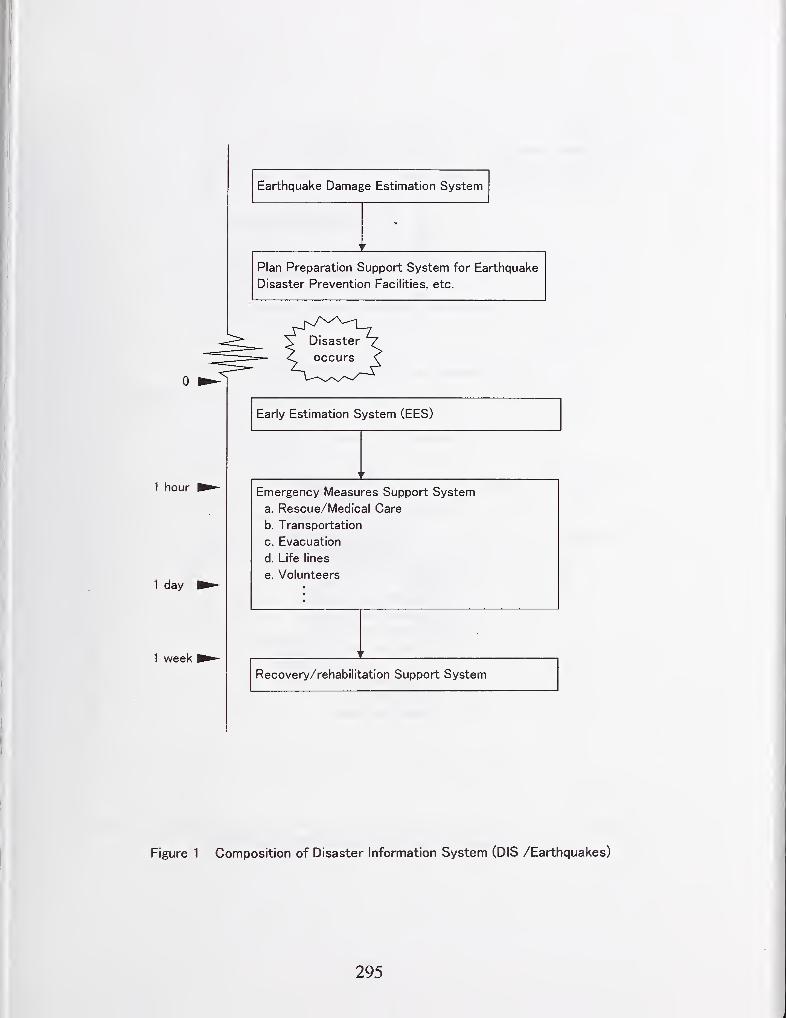
1 hour
1 day
1 week
Earthquake Damage Estimation System
f
Plan Preparation Support System for Earthquake
Disaster Prevention Facilities, etc.
Early Estimation System (EES)
r
Emergency Measures Support System
a. Rescue/Medical Care
b. Transportation
c. Evacuation
d. Life lines
e. Volunteers
r
Recovery/rehabilitation Support System
Figure 1 Composition of Disaster Information System (DIS /Earthquakes)
295
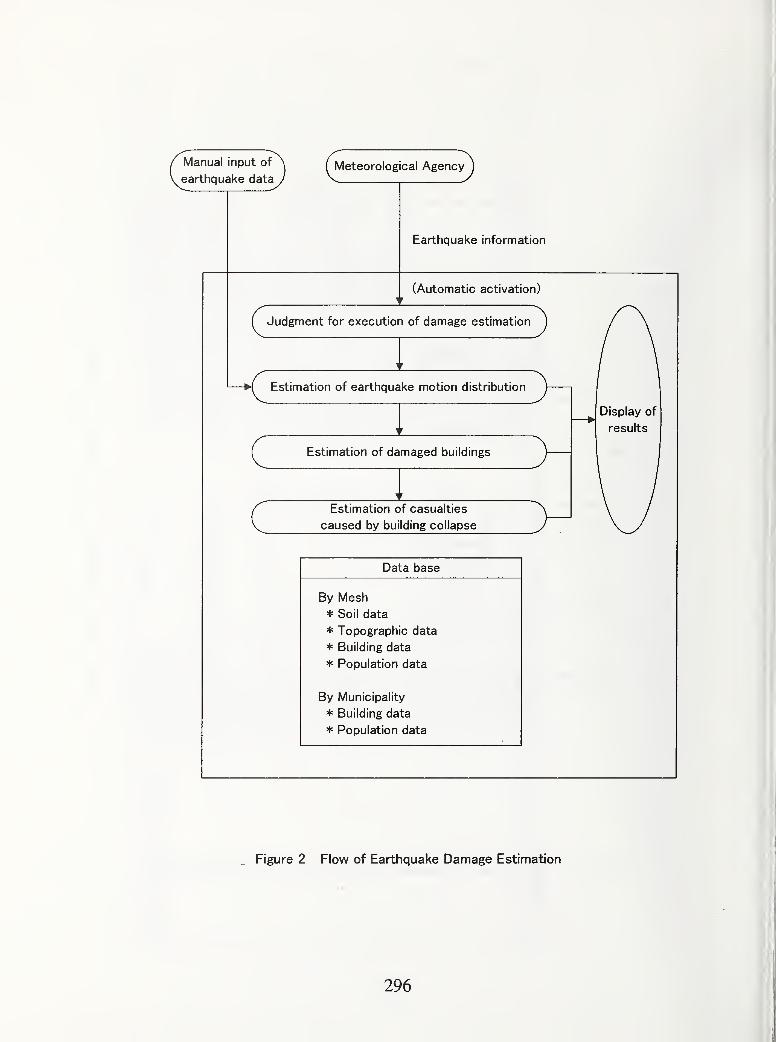
f Manual input of \V earthquake dataJ
^Meteorological Agency
Earthquake information
(Automatic activation)
Judgment for execution of damage estimation^
W Estimation of earthquake motion distribution
Estimation of damaged buildings
Estimation of casualties
caused by building collapse
Display of
results
Data base
By Mesh* Soil data
* Topographic data
* Building data
* Population data
By Municipality
* Building data
* Population data
Figure 2 Flow of Earthquake Damage Estimation
296
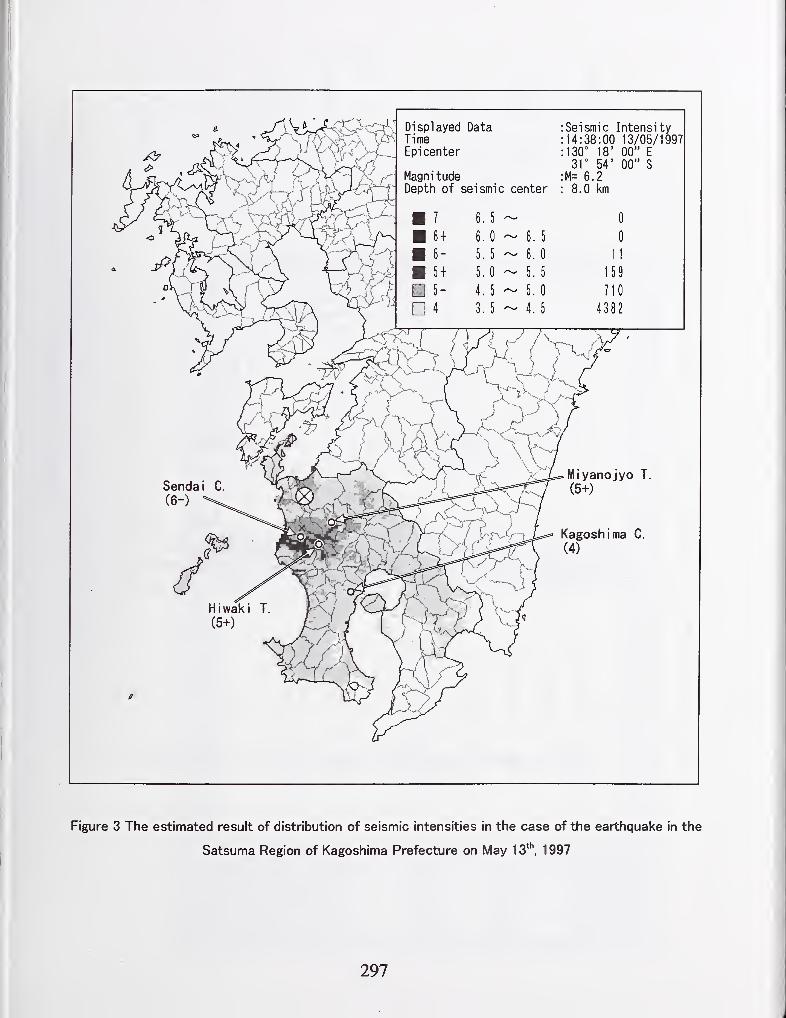
Displayed Data : Seismic IntensityTime : 14:38:00 13/05/1997Epicenter •130° 18' 00" E
31° 54' 00" S
Magnitude :M= 6.2Depth of seismic ft n Urn
1 6. 5' 0
6 + 6, 0'- 6, 5 0
6- 5. 5'- 6. 0 11
5 + 5. 0'- 5. 5 159
4. 5'- 5. 0 710
n 4 3. 5'- 4. 5 4 3 8 2
Miyanojyo T.
(5+)
Kagoshima C.
(4)
Figure 3 The estimated result of distribution of seismic intensities in the case of the earthquake in the
Satsuma Region of Kagoshima Prefecture on May 13'^, 1997
297
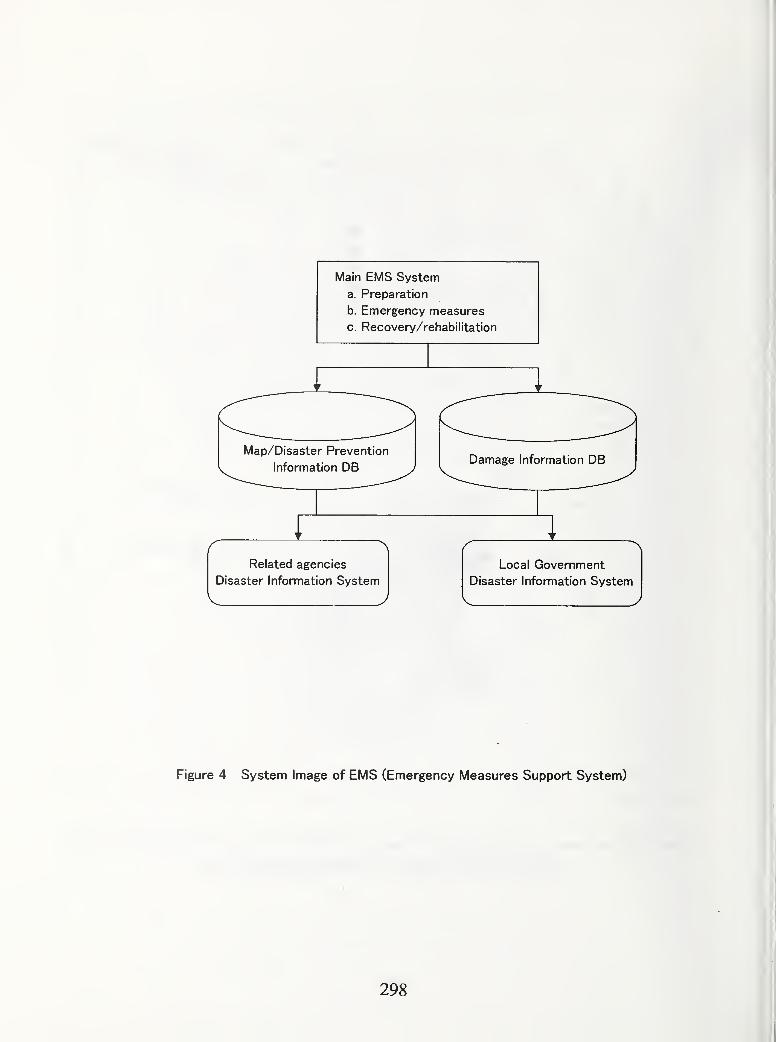
Main EMS System
a. Preparation
b. Emergency measures
c. Recovery/rehabilitation
Map/Disaster Prevention
Information DBDamage Information DB
Related agencies
Disaster Information System
Local Government
Disaster Information System
ure 4 System Image of EMS (Emergency Measures Support System)
298
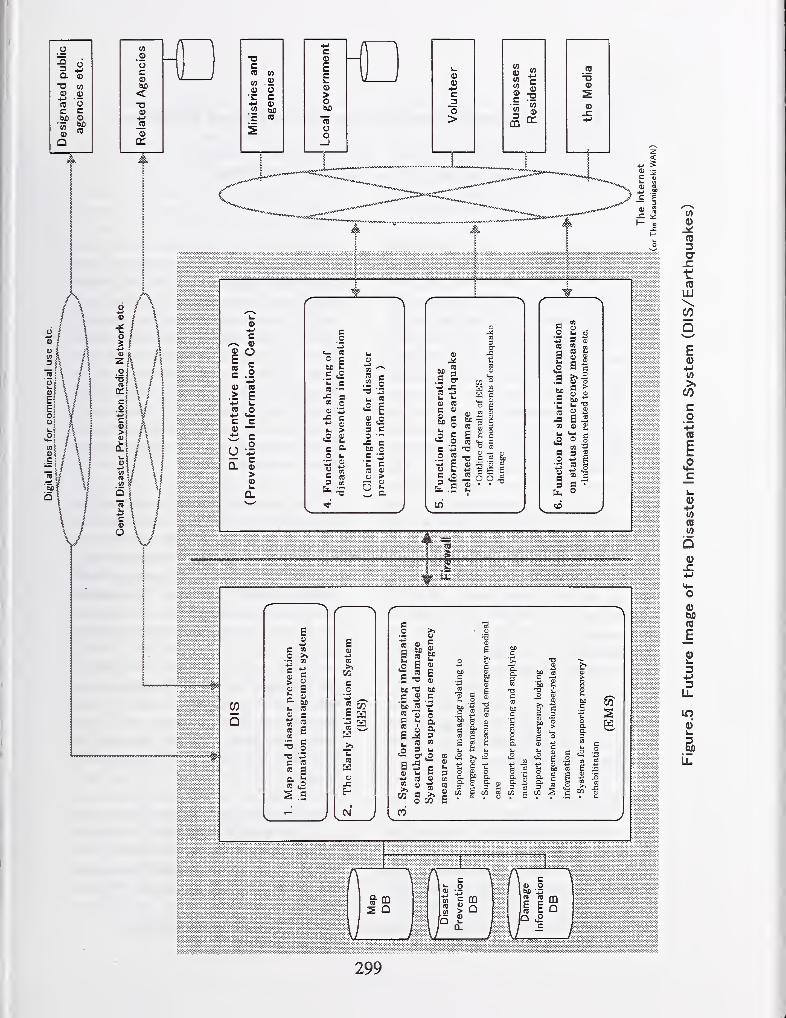
(A
V
(0
cr
t:(Q
LU\CO
Q
Eo-M(A
>
Co
(0
E
c
re
E
2!
+j13
LL
in
si
buo
299
Recent FEMA Activities in Earttiquake Risk Analysis and Mitigation
by
Stuart Nishenko, Claire Drury and Jeff Milheizler^
ABSTRACT
The Federal Emergency Management
Agency (FEMA), in collaboration with
the National Institute of Building
Sciences (NIBS), released the HAZUSearthquake loss estimation methodology
in 1997. This methodology assists state
and local emergency managers in
estimating seismic risk to their
jurisdictions in order to focus planning
and mitigation strategies. The
methodology also provides the capabihty
to conduct post-earthquake loss
estimation for emergency response, and
provides a nationally consistent exposure
and inventory database to compare
seismic risk across multiple regions
throughout the United States. HAZUS-related research and outreach activities
are summarized, as well as plans for the
development and release of wind and
flood loss estimation modules.
KEYWORDS: earthquake
modeling; geographic information
systems; HAZUS; loss estimation;
mitigation; Project Impact.
1. INTRODUCTION
The recent Northridge, California and
Kobe, Japan earthquakes were wake up
calls for the earthquake community.
These events raised awareness about the
damage potential of a moderate-sized
earthquake striking close to an urban
center, and demonstrated that high risk
could be present in areas of low seismic
hazard. Many questions were raised
about the earthquake problem in the
United States - were seismic policies
focused on regions of high risk or high
hazard? Did cities like Boston or NewYork have a high enough risk to
experience a disaster like Kobe, despite
their low seismic hazard?
In the past, much of the perception of
the 'earthquake problem' was based on
an understanding of the earthquake
hazard - the location of faults, geology,
and the distribution of strong ground
motion in space and time - instead of
earthquake risk, which is a product of
the hazard, the population and building
exposure, and the vulnerability. Policy,
land use, and development decisions at
the Federal, state, and local level are
risk-based decisions and need
appropriate inputs. Areas of high
earthquake risk may not always be
coincident with areas of high earthquake
hazard.
Detailed information is available about
the earthquake hazard in different
regions of the United States through the
efforts of the US Geological Survey and
the National Earthquake Hazards
Program Policy and Assessment Branch, Program Assessment and Outreach Division, Mitigation
Directorate, Federal Emergency Management Agency, Washington DC 20472
300

Reduction Program. There are few
corresponding risk maps, however, that
could be used for risk-based earthquake
planning and mitigation. Most of the
general understanding about risk is
restricted to property damage, insured
losses, and casualties related to specific
scenario events or regional probabilistic
loss studies (NRC,1989; NIBS, 1994).
Until recently, there was no nationally
consistent earthquake loss estimation
methodology for the United States.
Without such a standardized technology,
it was infeasible to compare levels of
damage or losses between regions.
In support of the National Mitigation
Strategy, FEMA has developed a
standardized earthquake loss estimation
methodology, HAZUS (Hazards United
States) that uses a nationally consistent
hazard, exposure, and inventory database
to estimate earthquake losses throughout
the United States. HAZUS provides
local, state, and regional emergency
management officials with the tools
necessary to plan and stimulate efforts to
reduce risk fi^om earthquakes and to
prepare for emergency response and
recovery following an earthquake.
HAZUS is built on an integrated
geographic information system (GIS)
platform that rapidly produces regional
profiles and estimates of earthquake loss.
HAZUS is currently available in both
Maplnfo and ArcView versions. The
methodology has been tested against the
experience fi^om several past earthquakes
and against the judgment of experts, and
has been judged capable of producing
results that are credible for the intended
purpose. Additionally, a series of pilot
studies were conducted in Portland, ORand Boston, MA. Detailed descriptions
of the HAZUS methodology can be
found in the HAZUS Users Manual and
Technical Manuals (NIBS, 1997a,b). Aseries of articles in the special issue of
Earthquake Spectra on Loss Estimation
(Brookshire et al., 1997; Kircher et al.,
1997a,b; Whitman et al., 1997) provide
additional information.
Jamieson and Milheizler (1997)
reviewed the development of the
HAZUS methodology and provided a
description of the individual modules
(Potential Earth Science Hazards,
Inventory, Direct Damage, Induced
Damage, Direct Loss, and Indirect Loss)
that comprise the HAZUS methodology.
This article summarizes research and
outreach activities in the United States
since the release of HAZUS in 1997 and
discusses plans for the development of
wind and flood loss modules.
2. CURRENT HAZUS ACTIVITIES
2.1 National Activities
2.1.1 Proj ect Impact
FEMA's Disaster Resistant Communityinitiative. Project Impact, utilizes a 4-
step approach to creating safer
communities - forming partnerships,
assessing risk, prioritizing mitigation
needs, and communication with the
community. Examination of the
community's risk for natural disasters
and identification of its vulnerabilities to
those risks are essential to successful
mitigation. HAZUS inventory data is
being used for the analysis of several
different hazards, including earthquake,
flood, wind, and wildfire, to produce a
Community Profile for Project Impact
communities. The HAZUS loss
301
estimation methodology is being used to
estimate earthquake losses in areas with
an earthquake risk. Two Project Impact
communities with significant exposure
to earthquakes are Oakland, CA and
Seattle, WA. The other hazards are
being examined by overlaying the
HAZUS inventory with hazard layers
and using GIS capabilities to
approximate exposure and potential
losses. These multi-hazard data layers
are available with HAZUS on
supplemental CD-ROM's. In addition,
FEMA plans to provide each Project
Impact community with HAZUSsoftware and assistance as needed to use
HAZUS to conduct baseline earthquake
risk analyses to facilitate mitigation
planning.
2.1.2 Annualized Earthquake Loss
Since HAZUS is a standardized
methodology with a nationally consistent
inventory, it provides the perfect
platform to assess and compare seismic
risk across multiple regions throughout
the continental United States. This
analysis compares earthquake risk in
terms of average annualized losses
(AAL), which is the average loss over
different return periods, normalized
annually. These loss estimates help to
compare the average level of risk
between regions. Risk management
decisions also need to account for the
exposure of the region in addition to the
absolute level of loss. A new index has
been developed, the annualized loss ratio
(ALR), which is the ratio of average
annual loss to exposure. This index
provides a measure of relative risk and
can be used to compare risk across
different geopolitical units such as
census tracts, metropolitan areas,
counties, or states.
2.1.3 Training
Regularly scheduled training classes
have been held at contractor facilities in
Menlo Park, CA and FEMA's National
Emergency Training Center in
Emmitsburg, MD. These classes provide
3 1/2 days of in-depth training on
HAZUS and GIS. In 1997 and 1998,
over 100 users have been trained in
HAZUS. These users include
emergency managers, planners,
geologists, GIS analysts and others from
45 states, three territories, local
governments, the Red Cross, the three
regional earthquake consortia, and
FEMA personnel.
2.1.4 Technical Support
Technical support is being provided to
HAZUS users via phone, fax, and e-
mail. FEMA is also developing a
HAZUS homepage, which will describe
current HAZUS developments and
applications nationwide, and provide a
network for HAZUS users. The HAZUShome page is located in the Mitigation
section of the FEMA Internet site
(http ://www .fema.gov) .
2.2 Regional Activities
In addition to national scale studies,
HAZUS is being used by state and local
officials for earthquake response and
recovery planning, and to investigate
mitigation alternatives. Results of an
initial survey (Anagnos et al., 1998)
conducted after the first release of
HAZUS to state emergency managers
indicated at that time that users had
conducted analyses using the default
inventory data included with the
methodology. The survey also showed
302
that users are now beginning to
undertake the task of refining existing
inventories and collecting more detailed
local data for incorporation into HAZUSto improve loss estimates.
2.2.1 Western United States
Throughout California, the HAZUSmethodology is being used to estimate
levels of ground motion for specific fault
systems (e.g., the San Andreas Fault
near Parkfield; the northern Hayward
Fault near Berkley, as well as the
Rodgers Creek and San Jacinto Faults).
These estimates have been used to
develop emergency response plans and
to conduct response exercises in both
northern and southern California.
FEMA Region 9 is engaged in
developing a San Francisco Bay Area
HAZUS users group that would enable
widespread public and private sector
participation. The goal of this group is to
improve preparedness for the next major
earthquake in the Bay area.
In the state of Washington, initial
HAZUS projects in Seattle are focusing
on transportation systems. Additionally,
a volcano hazards database for Mt.
Rainier and other Cascades volcanoes is
being developed for use with the
HAZUS inventory information to
identify the exposure of communities to
mudflows and other volcanic hazards.
Shortly after the release of HAZUS in
the spring of 1997, the Portland METROEmergency Planning Program used
HAZUS analysis and maps generated by
HAZUS to facilitate discussions of
earthquake hazard mitigation measures
at a workshop attended by
representatives of the business, utilities,
and public sectors of the cormnunity.
2.2.2 Central United States
In Kentucky, Alabama, Tennessee, and
Indiana efforts are underway, typically
'in cooperation with state university
systems, to refine the existing default
data and to incorporate inventory data
fi*om state and local sources.
Largely due to the efforts of the Central
United States Earthquake Consortium
(CUSEC), HAZUS has played a
significant role in the Southwestern
Indiana Disaster Recovery Business
Alliance and the Southwestern Indiana
Disaster Resistant Community Initiative.
Both groups are working to coordinate
and guide long-term planning and
implementation of regional efforts to
reduce vulnerability to earthquakes,
floods, and other natural disasters. Theyare developing a HAZUS demonstration
project that will emphasize training,
team building, data inventory, strategy
development, and program review at the
community level. The Central USEarthquake Consortium is documenting
this demonstration project for the benefit
of other Central US communities.
2.2.3 Eastern United States
A compilation of detailed geologic
information is currently underway in the
New York City metropolitan area to
better define seismic site response.
Additionally, inventory collection
programs are underway to upgrade the
default HAZUS inventory data and
prepare for the multi-hazard version of
HAZUS. The formation of the NewYork City Metropolitan Area Loss
Reduction Consortium in 1998 will
303

provide technical assistance for the
development and implementation of
mitigation and loss reduction strategies.
The Northeast States Emergency
Consortium (NESEC) has developed an
automated default Report Format to
assist in developing HAZUS reports at
the state, county, and community level.
Vermont has been active in mapping
earthquake hazards in 'soft' soils and
will use this information to develop
appropriate mitigation activities in
vulnerable areas.
Additional inventory collection efforts
are underway in New Hampshire, where
an innovative program is using
Americorps volunteers to collect site-
specific, all-hazards inventory data for
incorporation into HAZUS.
North and South Carolina are working
with HAZUS to refme the default
inventory databases and are learning to
use HAZUS products.
3 . FUTURE HAZUS ACTIVITIES
3.1 Multi-Hazard Loss Estimation
FEMA and NIBS are currently in the
process of expanding the capabilities of
HAZUS to make it a multi-hazard loss
estimation methodology. Flood and wind
loss modules are under development and
will be integrated into HAZUS in
approximately two years. Flood and
Wind committees were created to
oversee the development of these two
modules. Each is comprised of memberswith experience and expertise in the
flood and wind fields. Dr. Joseph
Minor, University of Missouri-Rolla,
chairs the nine-member Wind
committee; and Mr. Douglas Plasencia,
Kimley-Hom and Associates, chairs the
eleven-member Flood committee.
A key element in the development of
these modules is to have users provide
input throughout the process. Users'
Workshops are scheduled for both the
Flood and Wind Modules. These will be
attended by a wide variety of potential
users, including emergency managers,
floodplain managers, state and local
representatives, and others. The
outcome of these workshops will be a
Users' Requirements Report that will be
furnished to the development contractor
to ensure that the end product meets the
needs of potential users.
2.3 International Loss Estimation
The United States-Japan CommonAgenda for Cooperation in the Global
Perspective has identified real-time
seismic information systems and
earthquake loss estimation
methodologies as topics for discussion at
the 1'^ High-Level US - Japan
Earthquake Policy Cooperation Forum.
The creation of the Seismic Information
Systems Task Committee, as part of the
US-Japan Panel on Wind and Seismic
Effects, is an opportunity to foster
cooperation between US and Japanese
researchers and policy makers. The Task
Committee will provide technical
support to the Common Agenda, and
will act as a forum for identifying,
developing, and reviewing data systems
and methodologies involved with
seismic information systems, earthquake
loss estimation, geospatial and
topographic information systems, and
early seismic warning systems.
304
4. CONCLUSIONS
The introduction of HAZUS in the
United States has sparked interest and
activity in earthquake loss estimation at
the Federal, state, and local level. Loss
estimation also provides a unique
opportunity for international
collaboration and partnership. Inquiries
about HAZUS and earthquake loss
estimation in general from China, Japan,
Latin America and Russia demonstrates
the common challenges that we all face
with respect to natural disasters and the
willingness to work together to create
safer communities for the future.
5. REFERENCES
Anagnos, T., Lawson, R. S., Schneider,
P., and Drury, C, 1998, Initial
Problems and Successes in
Implementing the HAZUS Loss
Estimation Methodology Throughout
the United States, in Proc. 6th
National Conference Earthquake
Engineering, Seattle, WA.
Brookshire, D., Chang, S. E., Cochrane,
H., Olson, R., Rose, A., and Steenson,
J., 1997, Direct and Indirect
Economic Losses from Earthquake
Damage, Earthquake Spectra, 13,
683-701.
Jamieson, G., and Milheizler, J., 1997,
The Use of GIS in Loss Estimation
and Risk Assessment, Proc. 29"^ Joint
Meeting of the US-Japan Panel on
Wind and Seismic Effects, UJNR,
May 13-16, 1997 Tsukuba, Japan.
Kircher, C, Nassar, A. A., Kustu, O.,
and Holmes, W., 1997a,
Development of Building DamageFunctions for Earthquake Loss
Estimation, Earthquake Spectra, 13,
663-682.
Kircher, C, Reitherman, R. K.,
Whitman, R. V., and Arnold, C,1997b, Estimation of Earthquake
Losses to Buildings, Earthquake
Spectra, 13, 703-720.
National Institute of Building Sciences,
1997a, HAZUS Technical Manual, 3
vol., Washington DC
National Institute of Building Sciences,
1997b, HAZUS97 Users Manual,
Washington DC
National Institute of Building Sciences,
1994, Assessment of State-of-the Art
Earthquake Loss Estimation
Methodologies, FEMA 249,
Washington DC 300 pp.
National Research Council, 1989,
Estimating Losses from Future
Earthquakes, FEMA- 177,
Washington DC 23 1 pp.
Whitman, R. V., Anagnos, T., Kircher,
C. A., Lagorio, H. J., Lawson, R. S.,
and Schneider, P., 1997,
Development of a National
Earthquake Loss Estimation
Methodology, Earthquake Spectra,
13, 643-661.
305
SEISMIC INFORMATION SYSTEM FOR CIVIL INFRASTRUCTURES
by
SUGITA Hideki NOZAKI Tomofumi'>
ABSTRACT
This paper describes comprehensive
image of the seismic information system (SIS).
Two points are included in the paper: i.g., a new
system architecture to realize SIS with
systematic control, possibility of extension and
the independence of the subsystems, and several
element technologies applicable to the
subsystems of SIS. The proposed concept does
not only concentrate on the technologies of the
supply-side, but also the philosophy and the
technologies that is "objective oriented." As the
counter-earthquake activity system is
responsible many complex jobs at a time, and as
the information technologies is becoming highly
technical, the concept introduced here is very
much help for the personnel of the counter-
earthquake activity system.
Key Words: Counter-earthquake activity system,
Information system, New technology
andphilosophy
1. INTRODUCTION
Since the Hyogo-ken Nanbu Earth-
quake, which revealed the necessity for quickly
monitoring damage, communicating information,
and making decisions, many organizations have
constructed various systems to deal with
earthquake information, which are listed in
Table 1-1 . Their principal functions are to:
1) monitor, collect, and adequately display
accelerograph measurements and data from
other organizations and systems
(observation and collection),
2) estimate the damage to facilities and injury
to people by the earthquake and consequent
fires, from the data collected {damage
estimation),
3) take emergency measures based on the data
collected, and the estimated damage, such
as immediate suspension of facility
functions and warnings to users {emergency
response support), and
4) support the decision making processes by
presenting instructions given in emergency
manuals and proposing optimum strategies
{counter-earthquake system support).
So far, most of these systems are
developed for use within the organization.
Although each system remotely accelerographs,
collects and communicates information through
the network, and exchanges data between its
submodules constructed for each function, it has
its own independent database. When users
encounter the occasion to exchange data
between systems, they must conduct a series of
complicated operations and must know the
1) Head, Earthquake Disaster Prevention Technology
Division, Earthquaice Disaster Prevention Research
Center, Public Works Research Institute, Ministry of
Construction, Tsukuba, Ibaraki, 305-0804 Japan
2) Senior Research Engineer, ditto
306
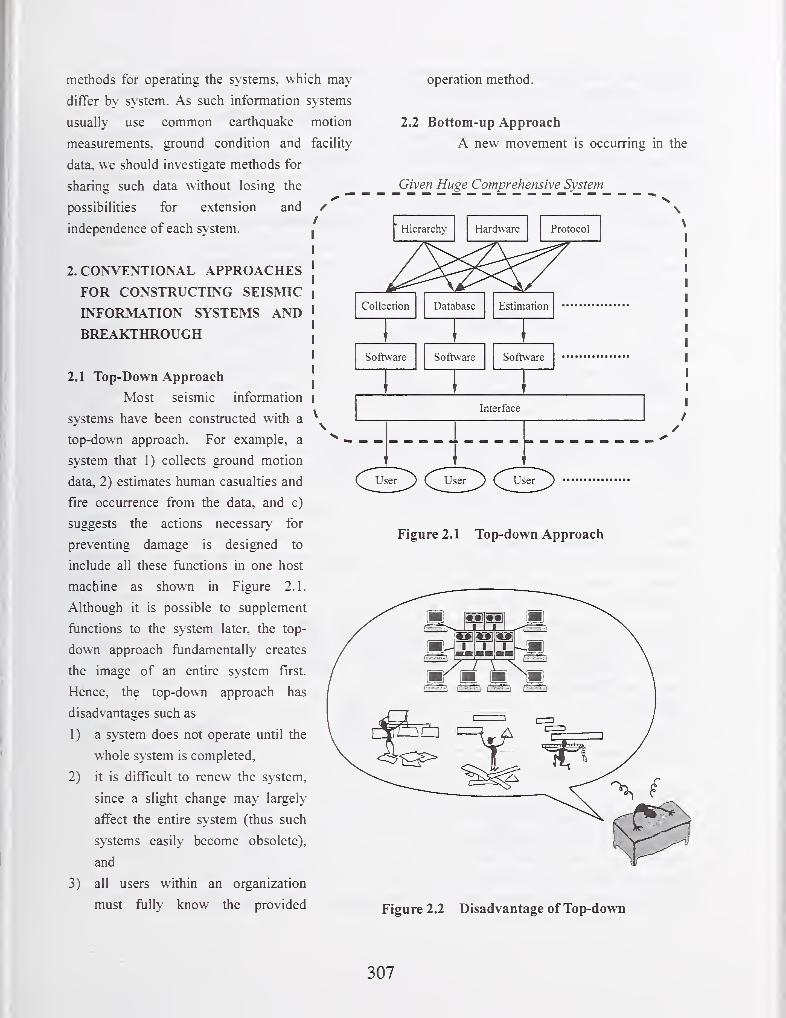
methods for operating the systems, which may
differ by system. As such information systems
usualK use common earthquake motion
measurements, ground condition and facilit\'
data, we should investigate methods for
sharing such data without losing the
possibilities for extension and /
independence of each system.
2. CONVENTIONAL APPROACHES
FOR CONSTRUCTING SEISMIC
INFORMATION SYSTEMS ANDBREAKTHROUGH
2.1 Top-Down Approach
Most seismic information
systems have been constructed with a
top-down approach. For example, a
system that 1) collects ground motion
data, 2) estimates human casualties and
fire occurrence from the data, and c)
suggests the actions necessary' for
preventing damage is designed to
include all these fiinctions in one host
machine as shown in Figure 2.1.
Although it is possible to supplement
functions to the system later, the top-
down approach fiindamentally creates
the image of an entire system first.
Hence, the top-down approach has
disadvantages such as
1) a system does not operate until the
whole system is completed,
2) it is difficult to renew the system,
since a slight change may largely
affect the entire system (thus such
systems easily become obsolete),
and
3) all users within an organization
must fully know the provided
operation method.
2.2 Bottom-up Approach
A new movement is occurring in the
Given Huge Comprehensive System
Interface
(^User^ (^User^ User
Figure 2.1 Top-down Approach
Figure 2.2 Disadvantage of Top-down
307
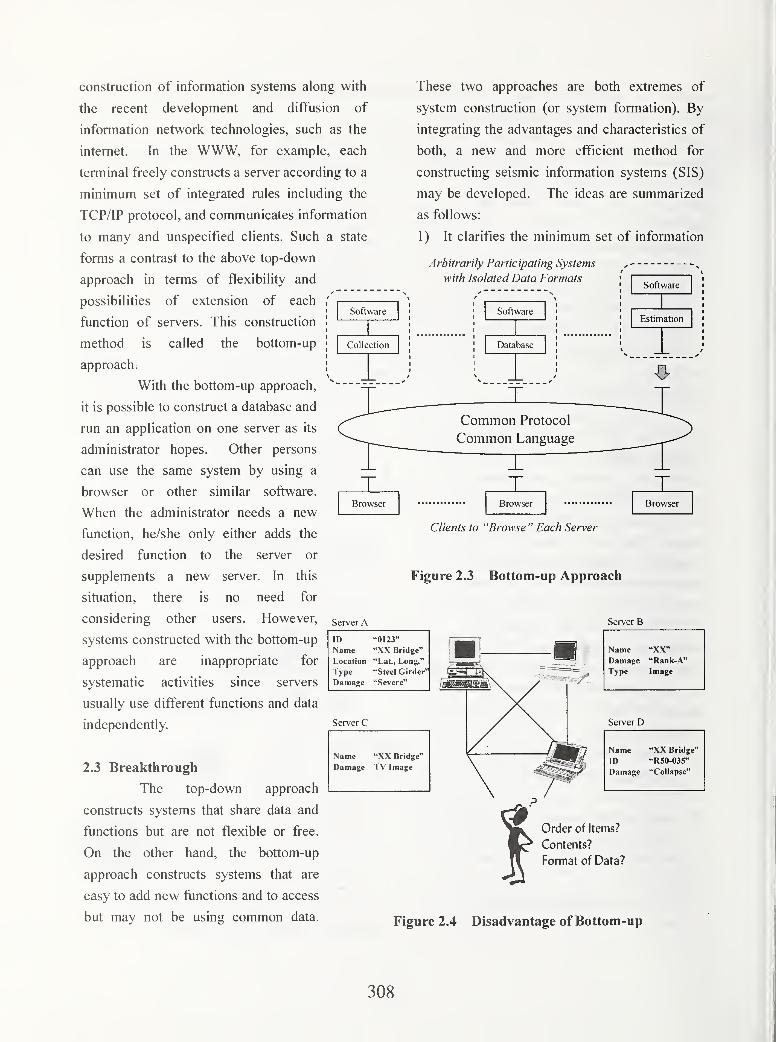
2.3 Breakthrough
The top-down approach
constructs systems that share data and
functions but are not flexible or free.
On the other hand, the bottom-up
approach constructs systems that are
easy to add new functions and to access
but may not be using common data.
construction of information systems along with
the recent development and diffusion of
information network technologies, such as the
internet. In the WWW, for example, each
terminal freely constructs a server according to a
minimum set of integrated rules including the
TCP/IP protocol, and communicates information
to many and unspecified clients. Such a state
forms a contrast to the above top-down
approach in terms of flexibility and
possibilities of extension of each
function of servers. This construction
method is called the bottom-up
approach.
With the bottom-up approach,
it is possible to construct a database and
run an application on one server as its
administrator hopes. Other persons
can use the same system by using a
browser or other similar software.
When the administrator needs a new
function, he/she only either adds the
desired function to the server or
supplements a new server. In this
situation, there is no need for
considering other users. However,
systems constructed with the bottom-up
approach are inappropriate for
systematic activities since servers
usually use different functions and data
independently.
These two approaches are both extremes of
system construction (or system formation). By
integrating the advantages and characteristics of
both, a new and more efficient method for
constructing seismic information systems (SIS)
may be developed. The ideas are summarized
as follows:
1) It clarifies the minimum set of information
Arbitrarily Participating Systems
with Isolated Data Formats
Software
Collection
Software
Database
Software
Estimation
"1
Common Protocol
Common Language
I
Browser
Clients to "Browse " Each Server
Figure 2.3 Bottom-up Approach
Server A Server B
ID "0123"
Name "XX Bridge"
Location "Lat,, Long."
Type "Steel Girder"
Damage "Severe"
Server C
Name "XX Bridge"
Damage TV Image
Name "XX"Damage "Rank-A"
Type Image
Server D
Name "XX Bridge"
ID "R50-035"
Damage "Collapse"
Order of Items?
Contents?
Format of Data?
Figure 2.4 Disadvantage of Bottom-up
308
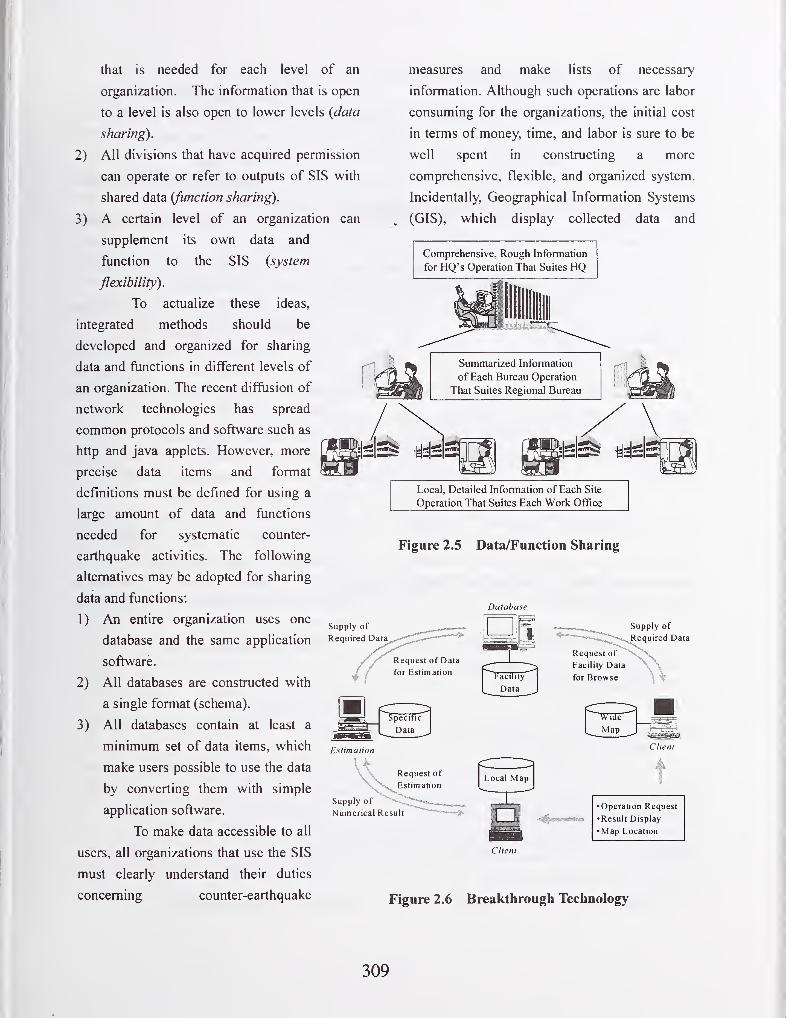
that is needed for each level of an
organization. The information that is open
to a level is also open to lower levels {data
sharing).
2) All divisions that have acquired permission
can operate or refer to outputs of SIS with
shared data (function sharing).
3) A certain level of an organization can
supplement its own data and
function to the SIS {system
flexibility).
To actualize these ideas,
integrated methods should be
developed and organized for sharing
data and functions in different levels of
an organization. The recent diffusion of
network technologies has spread
common protocols and software such as
http and Java applets. However, more
precise data items and format
definitions must be defined for using a
large amount of data and functions
needed for systematic counter-
earthquake activities. The following
alternatives may be adopted for sharing
data and functions:
1) An entire organization uses one
database and the same application
software.
2) All databases are constructed with
a single format (schema).
3) All databases contain at least a
minimum set of data items, which
make users possible to use the data
by converting them with simple
application software.
To make data accessible to all
users, all organizations that use the SIS
must clearly understand their duties
concerning counter-earthquake
measures and make lists of necessary
information. Although such operations are labor
consuming for the organizations, the initial cost
in terms of money, time, and labor is sure to be
well spent in constructing a more
comprehensive, flexible, and organized system.
Incidentally, Geographical Information Systems
(GIS), which display collected data and
Comprehensive, Rough Information
for HQ's Operation That Suites HQ
Summarized Information
of Each Bureau Operation
That Suites Regional Bureau
°JDII
Local. Detailed Information of Each Site
Operation That Suites Each Work Office
Figure 2.5 Data/Function Sharing
Database
Supply of
Require
Supply of
Required Data
Supply of
Numerical Result•Operation Request
•Result Display
•Map Location
Clieni
Figure 2.6 Breakthrough Technology
309

Table 2.1 A&D of Respective Approach
Top-down Bottom-up Breakthrough
Development/ Imp
rovement Speedslow rapid
comparat i ve1
y
rap i d
Poss i b i 1 i ty of
Extens i onsma 1 1 large
comparatively
1 arge
Independence of
SubsystemsAlmost none
Almost
i ndependent
1 ndependent
under some
contro
1
Physical Cost
in DevelopmentQu i te much Sma 1 1 Not much
Labor Cost
Large when
study i ng
manipulation
Responsibi 1 ity
of each server
admi n i strator
Initial
coord i nat i on
is required
Uniformity of
DataSecured
Difficult to
estab 1 i sh
Secured when
necessary
Systemat i c
Development and
use
Strict Chaot i c Pract i ca
1
estimations on maps, will be independent from
the collecting and estimating procedures. In
the approach introduced here, data interfaces can
be jointly used even when GIS applications/data
are different.
The advantages and the disadvantages
are summarized on Table 2.1. According to this,
strict coherence of the top-down approach, the
incoherence of the bottom-up approach and the
advantages of the proposed approach against
others are clearly depicted.
3. FUNCTIONS, TECHNOLOGIES,
APPLICATIONS OF SEISMIC
INFORMATION SYSTEMS
3.1 Functions to be Included in
Seismic Information Systems
This section summarizes
functions to be included in SIS of
organizations that administer civil
infrastructures, such as the Ministry of
Construction. The following functions
are proposed to be included in SIS.
(a) Evaluation of counter-earthquake
AND
GUl/GSI
projects
SIS should help determine the priority
of reinforcing projects, based on their
influence over emergency activities and
economic damage.
(b) Evaluation of counter-earthquake
activity systems
SIS should help evaluate the speed and
accuracy for collecting and
communicating information of counter-
earthquake activity systems.
(c) Monitoring. collection and
estimation of earthquake data
SIS should collect characteristic values
and wave data that are monitored and
calculated by accelerographs and should
estimate epicenters, etc.
(d) Support of anti-seismic activities
SIS should spontaneously inform of earthquakes,
display manuals for emergency activities.
(e) Detection of facility damage
SIS should directly detect and communicate
damage to public facilities by censors and so on.
(f) Real-time estimation of damage
SIS should quickly estimate the damage to
facilities based on earthquake information and
ground and structure data.
(g) Collection of inspection data
Pre-earthquake Project Assessment —
Earthquake Countermeasure System Efficiency Assessment DB
Earthquake Monitoring & Estimation
Earthquake Countermeasure Support — DB
Facility Damage Detection and Collection
Real-time Damage Estimation —
Inspection Data Collection
DB
DB
DB
DB
DB
DB
DB
CommonDB
Figure 3.1 Functions of SIS
310

SIS should record and communicate actual
inspection data collected at the sites.
(h) Display of maps, images, and animated
pictures
SIS should have the interfaces to refer and input
information appropriately.
(i) Communication of information
(sound, images, animated pictures, and
data^
SIS should transmit data through public
and private telephone lines, facsimiles,
internets, intranets, extranets, etc.
The following sections outline
several technologies and systems that
the Public Works Research Institute
(PWRI) is developing. These
fiinctions, which are now independently
studied, may be integrated into
subsystems by coordinating data and by
refining each function.
the category (f) 'real-time estimation of damage.'
Example displays of the system for maximum
acceleration, estimated liquefaction risk, and
estimated damage to facilities are shown in
Figures 3.2 to 3.4. The system is also installed
with a multiple-address device, which
7WW£> fcr<y> ttrt<sj> r~vu> si+lity
IdI»I
•1 I'l
r mx "{>»xl»J!l5 r sili • • • O C--23 --eo
3 • •so --400 400—
3.2 Accelerograph Network and
Urgent Damage Estimation
System
The Ministry of Construction
has installed approximately 800 online
accelerographs throughout Japan
(accelerograph network) to help urgent
inspection of its facilities, such as
highways and river facilities, after
earthquakes. This accelerograph \'
network falls in the category (c)
'monitoring and collection of
earthquake data' of Section 3.1. PWRI
collects seismic information
experimentally from approximately 100
accelerographs in the Kanto Area, and
is developing a system for estimating
liquefaction risks and bridge damage in
this area. This system corresponds to
Figure 3.2 Estimation of Max. Acc.
iMwD itTH^ mnvo T-^to sw-i*c)
-lol"!
Figure 3.3 Estimation of Liquefaction Risk
311
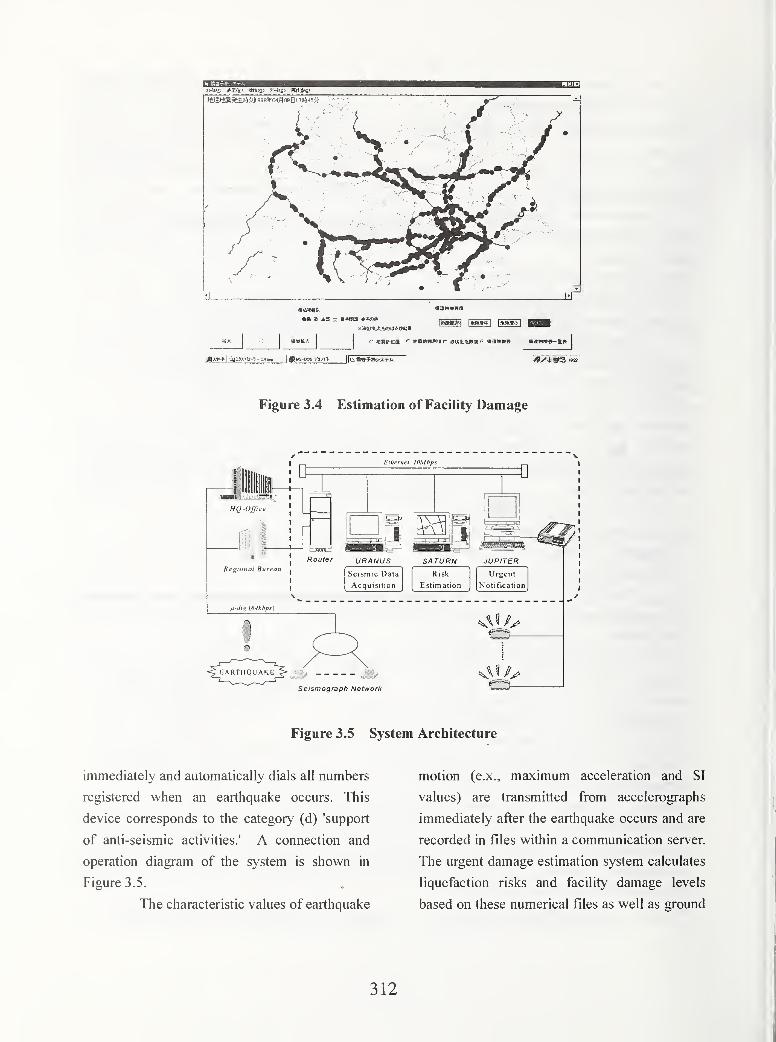
jt/mp «to^i t»rt<a) r-iisii «+fi*c»
Figure 3.4 Estimation of Facility Damage
Elhernet 10Mbps
Seismograph Network
Figure 3.5 System Architecture
immediately and automatically dials all numbers
registered when an earthquake occurs. This
device corresponds to the category (d) 'support
of anti-seismic activities.' A connection and
operation diagram of the system is shown in
Figure 3.5.
The characteristic values of earthquake
motion (e.x., maximum acceleration and SI
values) are transmitted from accelerographs
immediately after the earthquake occurs and are
recorded in files within a communication server.
The urgent damage estimation system calculates
liquefaction risks and facility damage levels
based on these numerical files as well as ground
312
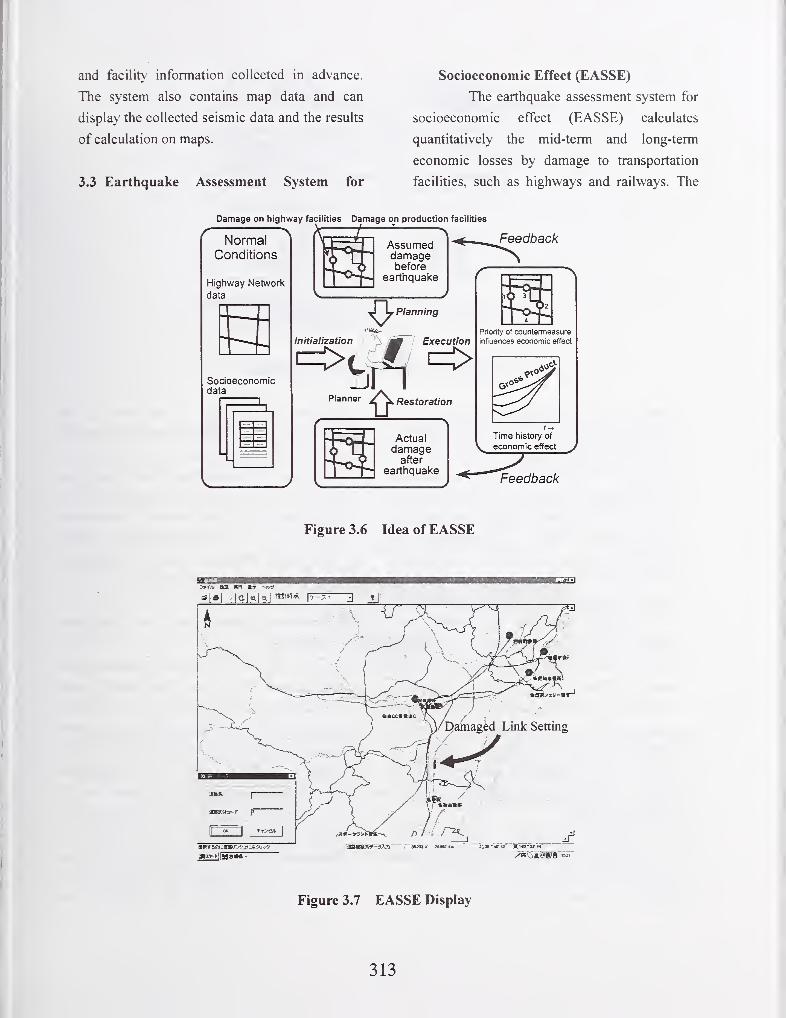
and facility information collected in advance.
The system also contains map data and can
display the collected seismic data and the results
of calculation on maps.
3.3 Earthquake Assessment System for
Socioeconomic Effect (EASSE)
The earthquake assessment system for
socioeconomic effect (EASSE) calculates
quantitatively the mid-term and long-term
economic losses by damage to transportation
facilities, such as highways and railways. The
Damage on highway faculties Damage on production facilities
NormalConditions
Highway Network
data
Socioeconomicdata
Assumeddamagebefore
earthquake
Feedback
Planning
Initialization Execution
Planner^ Restoration
Priority of countermeasure
irifiuerices economic effect
Time history of
economic effect
Figure 3.6 Idea of EASSE
Figure 3.7 EASSE Display
313
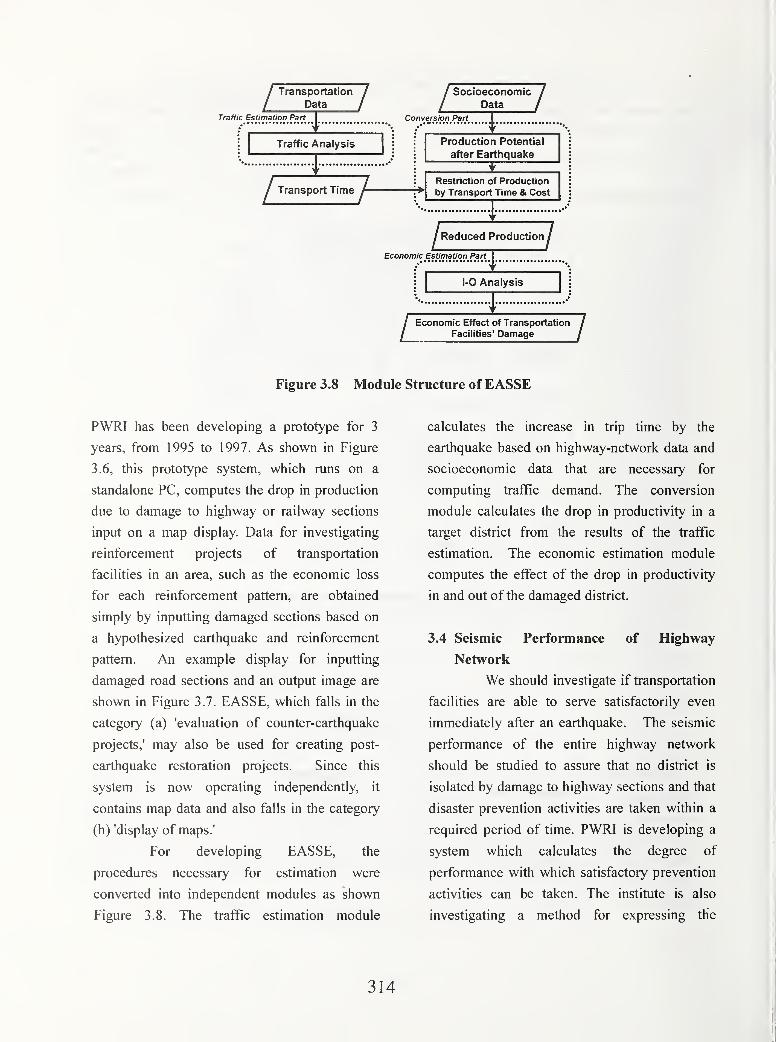
LTransportation
Data
Traffic Estimation Part7 L
Traffic Analysis
I Transport Time"^
SocioeconomData
Conversion Part
Production Potential
after Earthquake
Restriction of Production
by Transport Time & Cost
Reduced Production
Economic Estimation Part1
1-0 Analysis
7Economic Effect of Transportation
Facilities' Damage
Figure 3.8 Module Structure of EASSE
PWRI has been developing a prototype for 3
years, from 1995 to 1997. As shown in Figure
3.6, this prototype system, which runs on a
standalone PC, computes the drop in production
due to damage to highway or railway sections
input on a map display. Data for investigating
reinforcement projects of transportation
facilities in an area, such as the economic loss
for each reinforcement pattern, are obtained
simply by inputting damaged sections based on
a hypothesized earthquake and reinforcement
pattern. An example display for inputting
damaged road sections and an output image are
shown in Figure 3.7. EASSE, which falls in the
category (a) 'evaluation of counter-earthquake
projects,' may also be used for creating post-
earthquake restoration projects. Since this
system is now operating independently, it
contains map data and also falls in the category
(h) 'display of maps.'
For developing EASSE, the
procedures necessary for estimation were
converted into independent modules as shown
Figure 3.8. The traffic estimation module
calculates the increase in trip time by the
earthquake based on highway-network data and
socioeconomic data that are necessary for
computing traffic demand. The conversion
module calculates the drop in productivity in a
target district from the results of the traffic
estimation. The economic estimation module
computes the effect of the drop in productivity
in and out of the damaged district.
3.4 Seismic Performance of Highway
Network
We should investigate if transportation
facilities are able to serve satisfactorily even
immediately after an earthquake. The seismic
performance of the entire highway network
should be studied to assure that no district is
isolated by damage to highway sections and that
disaster prevention activities are taken within a
required period of time. PWRI is developing a
system which calculates the degree of
performance with which satisfactory prevention
activities can be taken. The institute is also
investigating a method for expressing the
314

Seismic Performance of Total Network?Priority of Links in Terms of Seismic Performance?
Figure 3.9 Network Seismic Performance
Highway Network Given Link Damage
Link I
Link 2 s
Counter-disaster ODBackground OD
I I
Link n
Network
Seismic Performance
Evaluation
Seismic Performance
Index
Network
Seismic Performance
4>
Importance of Vulnerable Link
,
(Priority)
Decision Making for
Counter-earthquake Plan
Figure 3.10 Flow of Calculation
importance of a damaged section quantitatively.
Like EASSE, this system corresponds to the
category (a) 'evaluation of anti-seismic projects.'
This system evaluates the seismic
performance of the entire network and the
importance of damaged sections when an
earthquake disconnects the link of the network.
The seismic performance of the network is
calculated by computing the sum of disaster
prevention activities' effects, which are
determined based on the trip times of traffics in
the network after the earthquake. A method is
also investigated for calculating importance
indices of network sections using the network
seismic performance indices above.
315
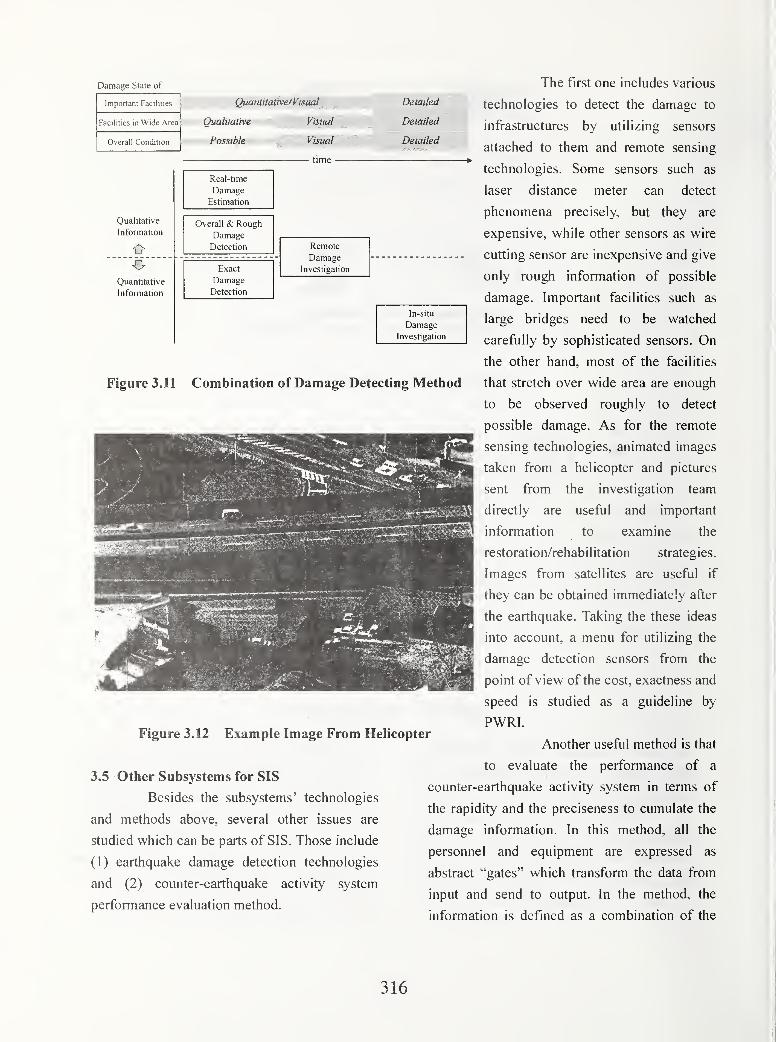
Damage State of
Important Facilities Qmniitative/Visual Detailed
Facilities in Wide Area
Overall Condition
Qualitative Visual
Possible Visual
Detailed
Detailed
time
Qualitative
Infonnation
Quantitative
Infonnation
Real-time
Damage
Estimation
Overall & Rough
Damage
Detection
Exact
Damage
Detection
Remote
Damage
Investigation
In-situ
DamageInvestigation
Figure 3.11 Combination of Damage Detecting Method
Figure 3.12 Example Image From Helicopter
3.5 Other Subsystems for SIS
Besides the subsystems' technologies
and methods above, several other issues are
studied which can be parts of SIS. Those include
(1) earthquake damage detection technologies
and (2) counter-earthquake activity system
performance evaluation method.
The first one includes various
technologies to detect the damage to
infrastructures by utilizing sensors
attached to them and remote sensing
technologies. Some sensors such as
laser distance meter can detect
phenomena precisely, but they are
expensive, while other sensors as wire
cutting sensor are inexpensive and give
only rough information of possible
damage. Important facilities such as
large bridges need to be watched
carefully by sophisticated sensors. On
the other hand, most of the facilities
that stretch over wide area are enough
to be observed roughly to detect
possible damage. As for the remote
sensing technologies, animated images
taken from a helicopter and pictures
sent from the investigation team
directly are useful and important
information to examine the
restoration/rehabilitation strategies.
Images from satellites are useful if
they can be obtained immediately after
the earthquake. Taking the these ideas
into account, a menu for utilizing the
damage detection sensors from the
point of view of the cost, exactness and
speed is studied as a guideline by
PWRI.
Another useful method is that
to evaluate the performance of a
counter-earthquake activity system in terms of
the rapidity and the preciseness to cumulate the
damage information. In this method, all the
personnel and equipment are expressed as
abstract "gates" which transform the data from
input and send to output. In the method, the
information is defined as a combination of the
316
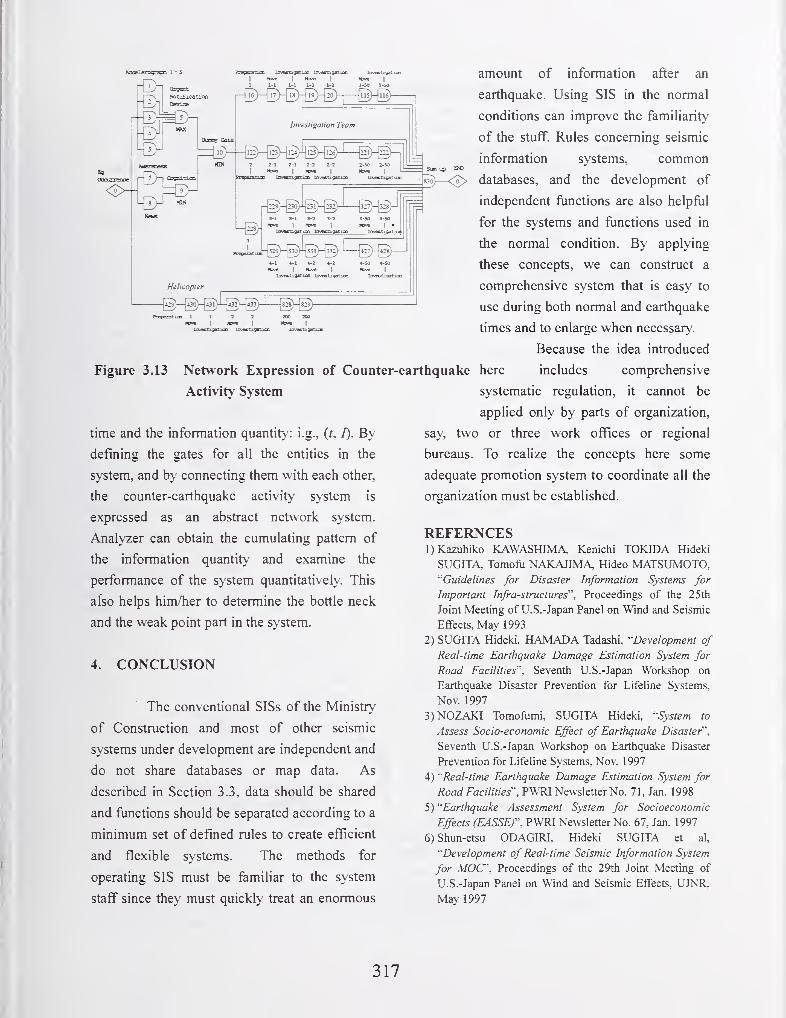
amount of information after an
earthquake. Using SIS in the normal
conditions can improve the familiarit\'
of the stuff. Rules concerning seismic
information systems, common
databases, and the development of
independent ftinctions are also helpful
for the systems and functions used in
the normal condition. By applying
these concepts, we can construct a
comprehensive system that is easy to
use during both normal and earthquake
times and to enlarge when necessary.
Because the idea introduced
Figure 3.13 Network Expression of Counter-earthquake here includes comprehensive
Activity System
time and the information quantit>': i.g., {t, I). By
defining the gates for all the entities in the
system, and b>' connecting them with each other,
the counter-earthquake activity system is
expressed as an abstract network system.
Analyzer can obtain the cumulating pattern of
the information quantity and examine the
performance of the system quantitatively. This
also helps him/her to determine the bottle neck
and the weak point part in the system.
4. CONCLUSION
The conventional SISs of the Ministry
of Construction and most of other seismic
systems under development are independent and
do not share databases or map data. As
described in Section 3.3, data should be shared
and functions should be separated according to a
minimum set of defined rules to create efficient
and flexible systems. The methods for
operating SIS must be familiar to the system
staff since they must quickly treat an enormous
systematic regulation, it cannot be
applied only by parts of organization,
say, two or three work offices or regional
bureaus. To realize the concepts here some
adequate promotion system to coordinate all the
organization must be established.
REFERNCES1) Kazuhiko KAWASHIMA. Kenichi TOKIDA Hideki
SUGITA. Tomofu NAKAJIMA, Hideo MATSUMOTO,''Guidelines for Disaster Information Systems for
Important Infra-structures". Proceedings of tlie 25th
Joint Meeting of U.S.-Japan Panel on Wind and Seismic
Effects. May 1993
2) SUGITA Hideki. HAMADA Tadashi. "Development of
Real-time Earthquake Damage Estimation System for
Road Facilities'', Seventh U.S.-Japan Workshop on
Earthquake Disaster Prevention for Lifeline Systems,
Nov. 1997
3) N0ZAKI Tomofumi, SUGITA Hideki, "System to
Assess Socio-economic Effect of Earthquake Disaster'',
Seventh U.S.-Japan Workshop on Earthquake Disaster
Prevention for Lifeline Systems. Nov. 1997
4) "Real-time Eartliquake Damage Estimation System for
Road Facilities", PWRI Newsletter No. 7L Jan. 1998
5) "Earthquake Assessment System for Socioeconomic
Effects fEASSEr. PWRI Newsletter No. 61, Jan. 1997
6) Shun-etsu ODAGIRI. Hideki SUGITA et al,
"Development of Real-time Seismic Information System
for MOC, Proceedings of the 29th Joint Meeting of
U.S.-Japan Panel on Wind and Seismic Effects, UJNR.
May 1997
317
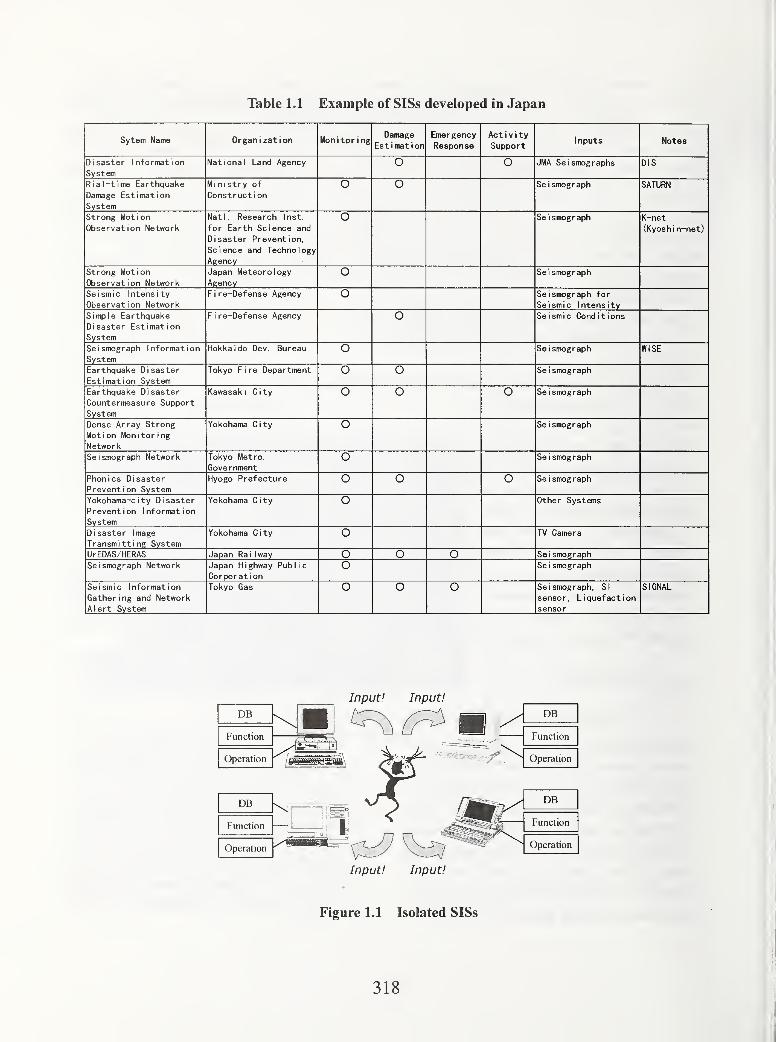
Table 1.1 Example of SISs developed in Japan
Sytem Name Organ i zat ion Monitor i ngDamage
Estimation
EmergencyResponse
Act i V i ty
Supportt nputs Notes
Disaster Information
System
Nat i ona 1 Land Agency o o JMA Seismographs DIS
Rial-time Earthquake
Damage Estimation
System
Ministry of
Constructiono o Se i smograph SATURN
Strong Mot i on
Observation Network
Natl. Research Inst,
for Earth Science and
Disaster Prevention,
Science and Technology
Agency
o Se i smograph K"net
(Kyosh in-net)
Strong Motion
Observation Network
Japan Meteorology
AgencyO Se i smograph
Se 1 sm 1 c 1 ntens i tyObservation Network
F i re—Defense Agency o Se 1 smograph for
Seismic Intensity
Simple Earthquake
Disaster Estimation
System
Fire-Defense Agency O Seismic Conditions
Se 1 smograph 1 nformat i on
SystemHokka 1 do Dev Bureau o WISE
Earthquake D i saster
Estimation System
Tokyo F 1 re Department o o
Earthquake Disaster
System
Kawasaki City o o O Se i smograph
Dens© Arr3y Strong
Mot 1 on Mod
i
tor i ngNetwork
1 <_'r\L'i idirid \j I Ly Se 1 smograph
S© 1 smo^rsph Network
Government
Phonics Disaster
Prevention SystemHyogo Prefecture o o O Se i smograph
Yokohama-city Disaster
Prevention Information
System
Yokohama City o Other Systems
Disaster Image
Transmitting SystemYokohama City o TV Camera
UrEDAS/HERAS Japan Ra i Iway o o O Se i smograph
Seismograph Network Japan Highway Public
Corporat i ono Se i smograph
Seismic Information
Gathering and Network
Alert System
Tokyo Gas o o O Seismograph, SI
sensor. Liquefaction
sensor
SIGNAL
Input! Input!
Input! Input!
Figure 1.1 Isolated SISs
318
New Developments in Seismic Risk Analysis for Highway Systems
by
Stuart D. Wemerl, Craig E. Taylor^, James E. Moore II^,
John B. Mander^, John B. Jemigan^, and Howard H. M. Hwang^
ABSTRACT
This paper summarizes current research to
develop a new seismic risk analysis (SRA)
procedure for highway and roadway systems.
The procedure synthesizes geoseismic,
engineering, network, and economic models to
assess earthquake effects on system-wide traffic
flows and travel times. The SRA results
provide an improved basis for prioritizing
highway components for seismic retrofit, and
for defining seismic performance requirements
for these components.
KEY WORDS: earthquake, seismic, risk,
highways, roadways, bridges, hazards, system,
network
1. INTRODUCTION
Past experience has shown that earthquake
damage to highway components (e.g., bridges,
roadways, tunnels, retaining walls, etc.) can
severely disrupt traffic flows and this, in turn,
can impact the economy of the region as well as
post-earthquake emergency response and
recovery. Furthermore, the extent of these
impacts will depend not only on the seismic
response characteristics of the individual
components, but also on the characteristics of
the highway system that contains these
components. System characteristics that will
affect post-earthquake traffic flows include: (a)
the highway system network configuration; (b)
• locations, redundancies, and traffic capacities
and volumes of the system's links between key
origins and destinations; and (c) component
locations within these links (e.g., Moore et al,
1997).
From this, it is evident that earthquake damage
to certain components (e.g., those along
important and non-redundant links within the
system) will have a greater impact on the
system performance (e.g., traffic flows) than
will other components. Unfortunately, such
system issues are typically ignored whenspecifying seismic performance requirements
and design criteria for new and existing
components; i.e., each component is usually
treated as an individual entity only, without
regard to how its damage may impact highway
system performance. Furthermore, current
criteria for prioritizing bridges for seismic
retrofit represent the importance of the bridge as
a traffic-carrying entity only by using average
daily traffic count, detour length, and route type
as parameters in the prioritization process.
These criteria do not account for the systemic
effects associated with the loss of a given
bridge, or for combinatorial effects associated
with the loss of other bridges in the highway
system. However, consideration of these
systemic and combinatorial effects can provide
a much more rational basis for establishing
seismic retrofit priorities and performance
requirements for highway components.
1 Seismic Systems & Engineering Consultants, 8601 Skyline Blvd., Oakland CA 9461
1
^Natural Hazards Management Inc., 5402 Via del Valle, Torrance CA 90505
^University of Southern California, 3518 Trousdale Parkway, Los Angeles CA 90089
4 State University ofNew York at Buffalo, 230 Ketter Hall, Buffalo NY 14260
5 Ellers, Oakley, Chester, & Rike, 5100 Poplar Avenue, Suite 1600, Memphis TN 38137
6 University of Memphis, 3890 Central Avenue, Memphis TN 38152
319

In recognition of these issues, the National
Center for Earthquake Engineering Research
(NCEER) has included system seismic risk
analysis (SKA) in its current six-year seismic
research project entitled "Seismic Vulnerability
of Existing Highway Construction." This paper
describes the SRA research being conducted
under the NCEER project including: (a) a new
SRA procedure that has been developed under
the project; (b) an initial demonstration
application of the procedure to the Memphis
Tennessee highway system; (c) current research
to further develop the procedure; and (d) the
applicability of the procedure for real-time post-
earthquake loss estimation.
2. SEISMIC RISK ANALYSIS PROCEDURE
2.1 General Description
The highway system SRA procedure is shown in
Figure 1. It can be carried out for any number
of scenario earthquakes and simulations, in
which a "simulation" is defined as a complete
set of system SRA results for one particular set
of input parameters and model uncertainty
parameters. The model and input parameters
for one simulation may differ from those for
other simulations because of random and
systematic uncertainties (Werner et al., 1996).
For each earthquake and simulation, this multi-
disciplinary procedure uses geoseismic,
geotechnical and structural engineering,
transportation network analysis, and economic
evaluation models to estimate: (a) earthquake
effects on system-wide traffic flows (e.g., travel
times, paths, and distances); (b) economic
impacts of highway system damage (e.g., repair
costs and costs of travel time delays); and (c)
post-earthquake traffic flows along vital
roadways (to facilitate emergency response
planning). Key to this procedure is a modular
GIS data base that contains the data and models
needed to implement the system SRA.
This SRA procedure has several desirable
features. First, it has a GIS framework, to
enhance data management, analysis efficiency.
and display of analysis results. Second, the GISdata base is modular, to facilitate the
incorporation of improved data and models
from future research efforts. Third, the
procedure can develop aggregate SRA results
that are either deterministic (consisting of a
single simulation for one or a few scenario
earthquakes) or probabilistic (consisting of
many simulations and scenario earthquakes).
This range of results facilitates the usefulness of
SRA for a variety of applications (e.g., seismic
retrofit prioritization and criteria, emergency
response planning, planning of system
expansions or enhancements, etc.). Finally, the
procedure uses rapid engineering and network
analysis procedures, to enhance its future use as
a real-time predictor of system states and traffic
impacts shortly after an actual earthquake.
2.2 GIS Data Base
The GIS data base consists of four modules with
data and models that characterize the system,
seismic hazards, component vulnerabilities, and
economic impacts of highway system damage.
To facilitate analysis efficiency, these modules
are pre-processors to the four-step SRAprocedure shown in Figure 1
.
2.2.1 System Module
The system module contains the following
information to characterize the highway system,
as provided by transportation and urban
planning specialists:
System Data - including: (a) system network
configuration linkages, and component types
and locations; (b) numbers of lanes, traffic
flows, capacities, and congestion functions for
each roadway link; (c) origin-destination zone
locations and trip tables; and (d) any special
system characteristics, such as certain roadways
being critical for emergency response or
national defense.
Trajfic Management - including measures by
transportation authorities for modifying the
system to ease post-earthquake traffic flows
320

(e.g., detour routes, modifications of roadways
from two-way to one-way traffic, etc.)
Transportation Network Analysis Procedures -
to estimate post-earthquake traffic flows for
each simulation and scenario earthquake.
2.2.2 Hazards Module.
The hazards module contains input data and
models provided by geologists and geotechnical
engineers for characterizing system-wide
ground motion, liquefaction, landslide, and
surface fault rupture hazards. Input data
include: (a) the ensemble of scenario earthquake
events developed during the initialization phase
of the SRA (Sec. 3.1); (b) locations and
topographic data for slopes within the system
that could be prone to landslide; and (c) local
soil conditions throughout the system, as needed
to estimate local geologic effects on ground
shaking and the potential for liquefaction and
landslide. Models contained in the hazards
module will estimate: (d) the attenuation of rock
motions with increasing distance from the
earthquake source, for a range of earthquake
magnitudes; (e) the effects of local soil
conditions on the motions at the ground surface;
and (f) permanent ground displacements due to
earthquake-induced landslide, liquefaction, and
surface fault rupture. A deterministic
representation of hazards models will use mean
values of these quantities. A probabilistic
representation will use probability distributions
to account for uncertainties in the seismologic,
geologic, and soil input parameters and in the
hazard evaluation models.
2.2.3 Component Module
The component module contains input data and
models provided by structural and construction
engineers to characterize each component in
terms of a "loss model" and a "functionality
model". The loss model represents the
component's direct losses (i.e., repair costs),
and the functionality model represents its
"traffic states" (i.e., whether the component will
be partially or completely closed to traffic
during the repair of the earthquake damage, the
durations of these closures, and speed limits for
traffic along the component during repair). Both
models are a function of the level of ground
shaking at the component's site, as well as the
level of permanent ground displacement due to
liquefaction, landslide, or surface fauh rupture.
The models for each component are developed' by evaluating: (a) its seismic response to each
designated level of ground shaking and
permanent ground displacement; (b) its
"damage state", (i.e., the degree, type, and
locations of any earthquake damage to the
component); (c) its damage repair procedures;
and, from this (d) its traffic states at various
times after the earthquake (to reflect the rate of
traffic restoration as repairs proceed).
After each component's traffic states are
obtained, they are incorporated into the highway
system network model to obtain the overall
"system state", i.e., the ability of each link in the
system to carry traffic at various times after the
earthquake (in terms of number of open lanes,
speed limits, etc.). These system states will
reflect the effect of each component's damage
state on adjacent and underlying roadways.
This, of course, will also depend on the location
of the component within the overall system, as
well as system network characteristics.
A deterministic representation of loss and
functionality models will use mean values of the
component repair costs and traffic states. Aprobabilistic representation will use probability
distributions to account for uncertainties in the
evaluation of the component seismic response,
and in the estimation of the resulting repair
costs and traffic states.
2.2.4 Socio-Economic Module
The socio-economic module contains models
and data for evaluating broader social and
economic impacts of earthquake-induced traffic
flow disruptions. These impacts can include
indirect dollar losses (e.g., to commuters and
businesses), effects on emergency response
(e.g., reduced access to medical, police, fire-
321
fighting, airport, government centers, etc.), and
societal effects (e.g., reduced access to
residential areas, shopping areas, etc.). This
module is developed by transportation
specialists, urban planners, and economists.
3. ANALYSIS PROCEDURE
3.1 Step 1 : Initialization of Analysis
The initialization of the SRA (Step 1) contains
two parts. First, regional earthquake source
models are used to define an ensemble of
scenario earthquakes, in which each earthquake
is most commonly defined in terms of its
magnitude, location, and frequency of
occurrence. Uncertainties in defining the values
of the various earthquake input parameters mayalso be modeled at this stage. The second part
of Step 1 establishes the total number of
simulations for each scenario earthquake, as
further described in Werner et al. (1996).
3.2 Step 2: Development of Each Simulation
for Each Scenario Earthquake
Under Step 2, the following evaluations are
carried out to develop each of the simulations
for each scenario earthquake:
Hazard Evaluation. First, the data and models
contained in the hazards module are used to
estimate the earthquake ground motions and
geologic hazards throughout the system.
Direct Loss and System State Evaluation. Once
the hazards are estimated, the data and models
from the component module are used to
evaluate direct losses and system states (defined
at various times after the earthquake).
Trajfic Flow Evaluation. The system data and
transportation network analysis procedure from
the system module are applied to the pre-
earthquake system and post-earthquake system
states, to assess earthquake effects on system-
wide travel times, travel distances, and travel
paths, as well as traffic flows along roadways
vital to emergency response.
Socio-Economic Impact Evaluation. Once the
earthquake effects on traffic flows within the
system are evaluated, the data and models from
the socio-economic module are used to evaluate
impacts of the impeded traffic flows in terms of:
(a) indirect dollar losses; and (b) reduced access
to and from emergency response centers.
3.3 Step 3: Incrementation of Simulations and
Scenario Earthquakes
Under Step 3, the evaluations from Step 2 are
repeated, in order to develop multiple
simulations for multiple scenario earthquakes (if
the SRA is to be probabilistic).
3.4 Step 4: Aggregate System Analysis Results
This final step in the SRA process is carried out
after the system analyses for all simulations and
scenario earthquakes have been completed. In
this step, the results from all simulations and
earthquakes are aggregated and displayed.
Depending on user needs, these aggregations
could focus on the seismic risks associated with
the total system or with individual components.
Furthermore, the system or component results
could be provided: (a) for individual
simulations, which is termed a seismic
vulnerability analysis, and/or (b) for the broader
(probabilistic) range of simulations, leading
either to loss statistics (e.g., average annualized
loss) or to loss distributions that show the
severity of earthquake-induced system losses for
different probability levels^. For research
purposes, the impacts of incorporating
uncertainties . into the SRA will be of
considerable interest. For other purposes, such
as the planning of seismic strengthening
programs for existing highway systems, outputs
can be adapted and/or simplified to meet the
particular requirements of each user audience.
^The "loss" can be defined in several ways, such
as direct repair cost, travel time delays due to
earthquake damage (between certain key origin-
destination zones or aggregated over all zones),
indirect losses due to travel time delays, or other
adverse consequences.
322
4. DEMONSTRATION ANALYSIS
4.1 Objective and Scope
Early in the NCEER Highway Project, the SRAprocedure was used with then-available data and
models to carry out a demonstration SRA of the
Memphis, Tennessee highway-roadway system
(Fig. 2). The objective of the analysis was to: (a)
illustrate the application of the SRA procedure,
and the types of results that can be obtained; and
(b) provide a basis for identifying and
prioritizing research needs to improve the
procedure. Because of limitations in many of
the then-available data and models, the results
from this SRA are preliminary. Nevertheless, it
is of interest to briefly summarize this SRA, in
order to illustrate the applicability of the
procedure. This SRA application is described in
more detail by Werner and Taylor (1995).
4.2 Assumptions
The Memphis highway-roadway system is
shown in Figure 2. This demonstration SRAconsisted of deterministic analysis of the
response of this system to four different
earthquake events (Fig. 3a). This paper presents
results from one of these earthquakes, termed
Earthquake D, which has a moment magnitude
of 5.5 and is centered about 35 km to the north
of the northern segment of the beltway that
surrounds the city of Memphis. Assumptions
for this SRA are summarized below.
4.2.1 System Input Data
The system's network configuration was
obtained from the University of Memphis.
Traffic data, roadway traffic capacities, and 0-Dzones within the system were provided by the
Memphis and Shelby County Office of Planning
and Development (OPD). The traffic flow data
were from their 1988 traffic forecasting model.
4.2.2 Network Analysis Procedure
The MINUTP traffic forecasting software
(Comsis, 1994) was used to analyze pre- and
post-earthquake traffic flows. This software
was chosen because it is used at the Memphis-Shelby County OPD, and all regional traffic
data were available in the input format for this
software. MINUTP is based on the UrbanTransportation Planning System (UTPS), which
was developed over two decades ago by the
• U.S. Dept. of Transportation (see Sec. 5.5.1).
Also, the then-available version of MINUTPwas not GIS-compatible, which increased the
effort needed for our system analysis.
4.2.2 Seismic Hazards
The system-wide ground shaking due to
Earthquake D was represented in terms of peak
ground acceleration (PGA), and was based on
soil conditions obtained from prior local
geologic mapping by the University of Memphis(Fig. 3b). The PGA at each bridge site was
estimated by: (a) computing site-specific
bedrock accelerations by using an early version
of the Hwang and Huo (1997) attenuation
equation; and (b) applying the Martin and
Dobry (1994) soil amplification factors to these
rock accelerations, to obtain corresponding
ground surface PGAs that include effects of
local soil conditions (Fig. 4).
4.2.3 Bridge Loss Models
Loss models previously developed under the
ATC-25 project for conventional highway
bridges were used to estimate direct losses for
each bridge in the system due to each
earthquake (ATC, 1991). In these models, the
direct losses depend only on whether the bridge
has simple spans or is continuous/monolithic;
i.e., other bridge structural attributes that could
impact seismic performance are not considered.
4.2.4 Bridge Functionality Models
Functionality models for this demonstration
SRA represented bridge traffic states as the
number of lanes open at discrete times after an
earthquake, as a function of PGA and the
original number of lanes along the bridge. They
were developed by modifying ATC-25 bridge
323

restoration models based on prior observations
of the seismic performance and repair and
reconstruction processes for California bridges
during the Loma Prieta and Northridge
Earthquakes (Werner and Taylor, 1995). Twodifferent models were developed in accordance
with the ATC-25 conventional highway bridge
designations — one for simple-span bridges and
one for continuous bridges. In addition, to
illustrate effects of bridge damage repair rates
on post-earthquake system performance,
functionality models were developed for two
discrete times — three days and six months after
the earthquake.
4.2.5 Economic Model
Studies of economic impacts of earthquake-
induced highway system damage have shown
that indirect dollar losses due to such damage
can far exceed the direct losses for repair of the
damage (e.g., Gordon and Richardson, 1996).
However, methods for estimating such impacts
for future earthquakes are not yet well
developed. Therefore, for this demonstration
SRA, a simplified procedure from BAA (1994)
was used to estimate costs due to deterioration
in commute time only. These cost estimates are
based on vehicle-hours of delay (as obtained
from the MINUTP system analyses),
corresponding person-hours of delay (based on
an assumed average vehicle occupancy rate of
1.4 persons/vehicle), truck-hours of delay
(assuming 30 percent of the vehicles are trucks),
and excess fuel costs due to travel time delays.
4.3 RESULTS
4.3.1 Direct Losses
In accordance with the ATC-25 model used in
this demonstration SRA, direct losses due to
damage to the system's bridges are represented
as a damage ratio, DMG (%), which is defined
as the ratio of the repair cost for each bridge to
its total replacement cost. For Earthquake D,
the average damage ratio (averaged over all of
the 286 bridges in the system) was 37.4%.
4.3.2 Travel Times and Distances
System State Results. Figure 5 shows the pre-
earthquake system state and post-earthquake
system states at times of three days and six
months after Earthquake D. This figure
indicates that, although Earthquake D has only a
moderate magnitude (Mw = 5.5), its proximity
to the northern segment of the Memphishighway system causes extensive roadway
closures in that segment, with lesser impacts on
other segments of the system.
Total System-Wide Travel Times. Table 1
contains the total pre- and post-earthquake
travel times and distances for the Memphishighway system. This table shows that the
modified system states due to Earthquake Dresult in a total system-wide travel time three
days after the earthquake that is nearly 34
percent longer than the pre-earthquake values.
At six months after the earthquake, the bridge
repairs within that time have reduced the total
travel time; however it is still nearly 20 percent
longer than the pre-earthquake value.
Total System-Wide Travel Distances. Table 1
shows that the total system-wide travel
distances at times of three days and six months
after the occurrence of Earthquake D are not
sensitive to the modified system states. This
trend may be due to the significant loss of
service along the faster but less direct highway
segments at the north and northeastern portions
of the beltway, because of the many damaged
bridges along those segments. As a result,
drivers would be forced to use ground surface
routes with fewer damaged bridges that are
shorter but slower than the beltway routes.
0-D Zone Travel Times. Table 2 shows that, at
a time of three days after the earthquake, the
travel times between the 0-D zones listed in the
table are, on the average, nearly 16 percent
larger than those for the pre-earthquake system.
The travel time increases are largest for
northernmost of the highlighted zones, which
are at Shelby Farms (Zones 249 and 252),
Bartlett (Zone 264), and the Covington Pike
324
(Zone 274). This is because, as previously
noted, it is this section of the Memphis area
highway and roadway system that is most
severely damaged. At a time of 6 months after
the earthquake, Table 2 shows that the travel
times to and from these zones have been
reduced substantially, and are now only 5.3
percent larger than the pre-earthquake values.
O-D Zone Travel Distances. The travel
distances to and from the O-D zones listed in
Table 2 are insensitive to system damage from
Earthquake D (Werner and Taylor, 1995).
Economic Impacts. Estimates of economic
impacts for times of both three days and six
months after the earthquake are shown in Table
3. They are based on total system-wide travel
time delays per 24-hour day of 126,000 vehicle-
hours and 73,000 vehicle-hours at times of three
days and six months after the earthquake
respectively (as previously shown in Table 1).
From this, the BAA (1994) cost estimation
procedure leads to a total cost per day of the
earthquake-induced time delays of $1.6 million
at three days after the earthquake, and $930
thousand at six months after the earthquake.
We then estimated the total time delay costs
over a one-year time period after Earthquake D,
by assuming an average daily time-delay cost
for the year of $930 thousand (which
corresponds to the above daily cost at a time of
six months after the earthquake). From this, the
total cost of the system-wide time delays over
this one-year time period was computed to be
365 days x $930,000 = $340 x 106.
5.0 NEW DEVELOPMENTS
Since the above demonstration SRA was carried
out, there have been significant ftirther
developments and improvements to the
procedure. The improved procedure will be
used in a re-analysis of the seismic risks to the
Memphis highway-roadway system that is
planned later during this year (1998). This
analysis will be probabilistic, using multiple
scenario earthquakes and simulations.
The new developments to the SRA procedure
have focused on the establishment of improved
models for: (a) multiple scenario earthquakes;
(b) ground shaking and liquefaction hazards; (c)
bridge vulnerability modeling; and (d)
transportation network analysis. These newdevelopments are summarized in the remainder
. of this section.
5.1 Scenario Earthquakes
In a SRA of a system with spatially dispersed
components, individual scenarios are required to
evaluate correlation effects of earthquakes, i.e.,
the simultaneous effects (including systemic
consequences of damages) of individual
earthquakes on components located at diverse
sites. Scenario earthquake models for our SRAprocedure for highway systems are based on an
adaptation of work by Frankel et al. (1996) for
the Central and Eastern United States (CEUS),
as part of the United States Geological Survey
(USGS) National Hazard Mapping Program.
The Frankel et al. work for the CEUS uses four
different spatially smoothed models based on
historical seismicity data, plus a special model
for the New Madrid Seismic Zone (NMSZ).
Our adaptation of these models is summarized
in Sections 5.1.1 and 5.1.2.
5.1.1 Historical Seismicity Models
For developing scenario earthquakes for our
SRA of the Memphis highway-roadway system,
we have defined a large seismicity zone around
Memphis that extends from 88.0 to 92.0 degrees
longitude and from 34.0 to 38.0 degrees latitude.
This zone has been divided into small
microzones, with dimensions of about 11.1 kmin both length and width.
Three different models are weighted to establish
the earthquake activity within each microzone,
based on historical seismicity data from a USGScatalogue that is an updated and improved
version of the Seeber-Armbruster (1991)
earthquake catalogue. These models are
developed from earthquakes with the following
325
magnitude cutoffs and completeness times: (1)
magnitude 3+ earthquakes since 1924; (2)
magnitude 4+ earthquakes since 1860; and (3)
magnitude 5+ earthquakes since 1700. In
addition, Frankel et al. include a fourth model
(Model 4) that is a large background seismicity
model that applies to the entire seismicity zone,
and is weighted with the above three models to
establish earthquake activities.
The number of earthquakes shown in the USGScatalog to exceed the respective minimum
magnitude of Models 1 through 3 respectively is
counted and, based on the starting and end date
of the model (e.g., 71 years for Model 1), is
converted to a frequency of occurrence. Then,
to account for uncertainties in the locations of
these earthquakes, a relatively flat gaussian
model is applied that redistributes and smooths
the earthquake locations among the microzones
Given this redistribution of earthquake
occurrences for each of Models 1-3, and
assuming a threshold magnitude of 5.0 for the
onset of earthquake damage, a "b" value of 0.95
in the Richter magnitude-frequency relationship
is assumed (derived elsewhere) to estimate the
frequency of occurrence of earthquakes with
magnitude > 5.0 in each microzone (for each of
these models). For Model 4, a uniform
distribution is used to allocate potential
earthquakes with magnitudes > 5.0 among all of
the microzones.
Based on a method of adaptive weighting, we
followed Frankel et al. in combining the four
above-mentioned models in order to derive
frequencies of occurrence of earthquakes of
magnitude > 5.0 in each microzone. Next, we
summed these frequencies to -determine the
corresponding frequency of occurrence within
the overall seismicity zone. Using this
frequency and the frequencies in each
microzone, we then developed a conditional
cumulative probability matrix for the overall
seismicity zone. This two-column matrix
contains microzones (numbered) in one column,
and cumulative conditional probabilities (from 0
to 1) in the other column. In addition, we used a
Poisson model to convert the frequency of
occurrence of earthquakes with magnitudes >
5.0 in the overall seismicity zone to a
corresponding probability of occurrence.
At this stage, a natural way to develop these
scenarios for purposes of analyzing system
performance and for eventually compiling
information on loss distributions and their
variability over a time dimension is to employ a
"walk-through" analysis. (Daykin et al., 1994).
The first step in such an analysis is to select an
appropriate time frame over which the analysis
would be carried out (e.g., one or more time
frames of 10 years, 50 years, 100 years, etc.).
Then, for each year in each time frame (starting
with Year 1 and then repeating the process for
each successive year), successive uniform
random number generators are applied with the
appropriate cumulative conditional probability
distribution to evaluate: (a) whether or not at
least one earthquake of magnitude >5.0 has
occurred somewhere in the large seismicity
zone during the year; (b) if so, whether or not a
second earthquake has occurred in the zone
during the year; and (c) for each earthquake that
has occurred in the zone during the year, the
microzone where the earthquake is located. Wealso use a random generation technique to
estimate the earthquake magnitude, with the
likelihood of diverse magnitude levels assumed
to be represented by a Richter (lognormal)
magnitude-recurrence relationship.
5.1.2 New Madrid Fault Zone
For modeling the New Madrid fault zone while
the Frankel et al, approach was undergoing
modifications, we have initially followed earlier
USGS procedures described by Leyendecker et
al. (1995). In this, we have: (a) modified the
Der Kiureghian et al. (1977) approach to
distribute earthquake occurrences within the
fault zone; (b) applied estimates of the
frequency of occurrence for earthquakes in the
zone based on the Frankel et. al. approach and
other relevant studies, and converted these to
probabilities of occurrence using a Poisson
326
model; and (c) postulated that the fault zone is
comprised of four parallel linear faults.
Following this, a walk-through analysis is used
to develop a random sequence of earthquakes
occurring within the zone during the time period
of interest. To illustrate, let us assume that the
probability of occurrence of an earthquake with
a given magnitude (say magnitude 8.0) within
the New Madrid fault zone is 0.002. From this,
the walk-through process for each year involves
the use of successive random number generators
to indicate: (a) whether an earthquake of this
magnitude has occurred within the fault zone;
and (b) if so, which of the four fault traces is the
source of the earthquake. Then, subsequent
steps involve: (c) estimation of the rupture
length along the fault trace, using the Wells-
Coppersmith (1994) relationship between
rupture length and earthquake magnitude and
including a normally distributed uncertainty
factor (in log space) with a standard deviation of
0.22; and (d) estimation of the location of the
rupture length within the overall fault trace, by
using a polar method to generate a normally
distributed uncertainty factor in log space (Law
andKelton, 1991)8.
The results of this walk-through analysis of
earthquakes occurring within the New Madrid
fault zone are combined with the results of the
walk-though analysis of potential earthquakes
from the historical seismicity models (Sec.
5.1.1) to estimate the total earthquake activity
during each year of the time frame of interest.
5.1.3 Current Status
The above approach has been used to develop
an initial set of scenario earthquakes for the
Memphis area. The modeling assumptions
leading to these earthquakes are now being
^In this, the difference between the rupture
length and the total length of the fault is
computed, and a uniform random number
generator is used to indicate where the fault
rupture is initiated relative to one end of the
fault trace.
reviewed, prior to our developing a final set of
scenario earthquakes for our forthcoming SRAof the Memphis highway-roadway system.
5.2 Ground Motion Hazards
The ground motion hazards for our updated
SRA of the Memphis highway-roadway system
will be represented as five-percent damped
ground response spectra at the ground surface.
The estimation of these spectra for a particular
site will involve: (a) use of a rock motion
attenuation relationship to estimate spectral
amplitudes of rock motions; and (b) application
of soil amplification factors to these rock
motion spectra, to develop corresponding
spectra of motions at the ground surface that
incorporate effects of local soil conditions.
For our SRA of the Memphis highway-roadway
system, we will be using: (a) the Hwang and
Huo (1997) rock motion attenuation
relationships for peak acceleration and for
spectral accelerations over a wide range of
natural periods; and (b) the Hwang et al. (1997)
soil amplification factors for NEHRP site
classifications A through E. These procedures
have the following benefits: (a) they are
internally consistent, i.e., they are intended for
use together to compute ground surface peak
accelerations and spectral accelerations (as the
product of the Hwang and Huo rock motions
and the Hwang et al. soil amplification factors);
(b) they specifically focus on anticipated CEUSground shaking characteristics; (c) the Hwangand Huo rock motion attenuation relationships
compare well with other well-established
relationships for the CEUS; (d) the Hwang et al.
soil amplification factors are developed from
state-of-the-practice analytical procedures; and
(e) effects of uncertainties in various input
parameters are considered.
5.3 Liquefaction Hazards
The treatment of liquefaction hazards within the
multi-scenario framework of the SRA procedure
involves the following steps: (a) compilation of
soils data for the region; (b) for a given scenario
327
earthquake and simulation, evaluation of the
potential for liquefaction throughout the
highway-roadway system, including estimation
of permanent ground displacements; and (c)
estimation of traffic states at bridges and along
roadways within the system due to these ground
displacements. Our plans for carrying out these
steps in our SRA of the Memphis highway-
roadway system are summarized below.
5.3.1 Soils Data
Under a prior project carried out at the Center
for Earthquake Research and Information
(CERI) of the University of Memphis, data from
8,500 boring logs throughout Shelby County
were compiled by Ng et al. (1989). Ng et al.
then divided the county into a series of cells
with dimensions of about 2,500 ft. by 3,000 ft.,
and used the data from the boring logs to
develop the following information for those
cells where boring logs were available: (a)
estimated average values SPT blowcounts,
natural soil density, and unconfmed
compressive strength for each soil layer, as well
as ground surface elevation, and groundwater
level; and (b) development of a representative
soil log for the cell. A GIS data base containing
these data has been made available by CERI for
use in our SRA of the Memphis highway-
roadway system. For those cells, where no data
were available, soil properties have recently
been estimated using data from the nearest cells
with soils of the same geologic unit (Hwang and
Lin, 1997). It is noted that CERI is currently
updating this data base; however this updated
data base will not be completed and available
for use until early 1999.
5.3.2 Hazard Evaluation Procedure
Evaluation of the potential for liquefaction
hazards to the Memphis highway-roadway system for
a given scenario earthquake event will be carried out
only for those cells that contain bridges and/or
roadways within the system. This evaluation will
consist of the following steps, which generally follow
the approach by Youd and Gummow ( 1 995):
Initial Screening. An initial screening of soils and
geologic will be carried out to initially establish which
cells in the system have a low potential for
liquefaction and therefore can be eliminated from
further analysis. Our initial screening efforts will be
guided by prior liquefaction evaluations of the
Memphis area by Hwang and Lin (1997) for
earthquakes of magnitudes 6.5, 7.0, and 7.5 centered
in Marked Tree, Arkansas.
Further Screening. For those cells shown by the
initial screening to have a potential for liquefaction,
further screening will be carried out through very
simplified and conservative assessment of the range
of possible ground shaking hazards in the cell due to
the various scenario earthquakes for the SRA, in order
to eliminate additional cells shown by this fiirther
screening to have a low liquefaction potential.
Seed-Idriss Procedure. For those cells that are still
shown to have a potential for liquefaction, the Seed-
Idriss (1982) procedure will be used for a final
evaluation of liquefaction potential.
Permanent Ground Displacement For the cells
shown from the above steps to have potentially
liquefiable soils, permanent ground displacements
will be estimated as follows: (a) for bridge or roadway
sites with gently sloping ground or a free face
condition, the Bartlett-Youd (1995) procedure will be
used to estimate lateral spread displacements; and (b)
the Tokimatsu-Seed (1987) procedure will be used to
estimate vertical settlements.
5.3.3 Liquefaction Effects on Traffic States
Estimation of the effects of liquefaction on traffic
states along the bridges and roadways within the
Memphis highway-roadway system will be based on
analysis of: (a) empirical data compiled by Youd
(1997) that describes bridge damage modes due to
liquefaction-induced ground displacement for 116
bridges during earthquakes in the United States, Costa
Rica, and Japan; and (b) liquefaction maps for the San
Francisco Bay Area due to the 1989 Loma Prieta
Earthquake that are now being completed at the
USGS; and (c) a data base of liquefaction-induced
road closures in the Bay Area following the Loma
Prieta Earthquake (ABAG, 1997).
328
5.4 Bridge Modeling
5.4.1 Background
Essential to the SRA process is the incorporation
of models for estimating bridge damage states
and traffic states. This section describes
candidate bridge models now under development.
Damage-state modeling of individual bridges can
be carried out using conventional structural
analysis tools that employ either the
Capacity/Demand or Lateral Strength (pushover)
methods of analysis, as described in the FHWA(1995) Retrofit Manual. However, application of
these methods would lead to an intractable task if
applied to each of the large number of bridges
that will comprise a highway-roadway system.
Therefore, any analysis tools that are used for
bridge damage-state modeling for highway
system SRA must be rapid and efficient to
implement. In addition, to increase efficiency of
the damage-state modeling process, we are
exploring the feasibility of developing damage-
state models for bridge groups rather than
individual bridges (where each group would
consist of bridges with certain similar attributes
important to seismic response). To enhance
analysis efficiency, the damage-state models (for
individual bridges or groups) will be developed in
a pre-processor to the main SRA procedure
As an option to the use of analytical models, an
alternative damage-state modeling approach is
the use of empirical models developed from
experiential observations. However, the principal
problems with such models are: (a) they use
vague damage descriptors such as "slight",
"moderate" or "extensive" that neither account
for the post-earthquake serviceability of bridges
nor provide a clear basis for estimating post-
earthquake repair costs and traffic states; and (b)
they are mostly based on California bridges,
whose structural characteristics are often very
different from those for the stock of bridges
found elsewhere in the United States. These two
reasons negate the use of empirical modeling
techniques by themselves. However, empirical
observations of the actual performance of bridges
during past earthquakes will, of course, provide a
valuable basis for validating analytical bridge
damage state models that are developed.
For these reasons, it is our view that analytical
procedures are the methods of choice for
developing bridge damage-state models for
highway system SRA. In this, alternative models
•with differing degrees of refinement will be
incorporated into the component module, in
which the selection of one of these models for a
particular SRA application would depend on such
factors as available bridge data, bridge
characteristics, etc. Results from these models
will then be used with expert-opinion and
empirical information in order to estimate bridge
traffic states due to each damage state.
With this as background, the remainder of this
section is organized into three main parts.
Section 5.4.2 describe one damage-state
modeling approach that is being developed
specifically for use with highway-roadway
system SRA ~ the "rapid-pushover" method by
Mander and Dutta (1997). Following this,
Section 5.4.3 summarizes other candidate
damage-state modeling methods that are being
developed under the NCEER Highway Project or
other research programs. Finally, Section 5.4.4
summarizes our plans for developing bridge and
roadway traffic states, once the damage states are
established.
5.4.2 Rapid-Pushover Method
The rapid-pushover method (Mander and Dutta,
1997) is a new non-linear static (pushover)
procedure for rapid estimation of bridge damage
states. It accounts for the contributions of the
piers and the arching (3D) action of the deck to
the total base-shear capacity of the bridge system.
Deck Contribution. The contribution of the deck
to the bridge system's total base shear capacity
has been systematically overlooked in most
capacity analyses. This contribution is due to the
resistance of the deck resulting from plastic
moments that are mobilized by the bearings
working as a group. This action occurs because,
as the deck rotates, there also occurs some lateral
329
displacement which is resisted by frictional
forces arising in each bearing. Mander and
Dutta (1997) have evaluated this effect for
bridges with multiple simply-supported spans and
with continuous spans. For these cases, a plastic
mechanism analysis is used to establish the deck
capacity as the lowest capacity of all possible
postulated failure mechanisms. These failure
mechanisms incorporate the geometry of the deck
spans, the relative flexibility of the pier bents, and
resistance and the capacities of the bearings.
Pier Contribution. Under longitudinal or
transverse excitation, a bridge pier is presumed to
display a marked degradation of strength capacity
as the earthquake shaking proceeds. The
magnitude and rate of the strength decay will
depend upon the design details at or near the
potential plastic hinge zones ~ particularly
connection details such as lap splices and
anchorage zones - and the shear capacity of the
columns and the column-to-cap connections.
Although sophisticated energy-based evaluation
techniques are available for evaluating these
sources of strength decay, a more simplified
displacement-based method of analysis is instead
proposed, in order to increase the speed and
efficiency of the evaluation process. This method
uses a simplified strength decay model for the
bridge pier, in which the total pier capacity is
assumed to consist of: (a) diagonal strut (or arch)
action which constitutes the concrete resistance;
and (b) resistance contributions arising from the
longitudinal and transverse reinforcing steel.
Mander and Dutta (1997) suggest that these
contributions to the pier capacity can be simply
expressed in terms of geometric factors alone,
many of which may be obtained (or inferred)
from existing Bridge Management System data
bases.
Discussion of Rapid-Pushover Method. This
method is a rapid yet technically rational
approach for developing bridge capacity spectra.
Furthermore, the capacity spectra include various
displacement thresholds that each represent the
onset of a new damage state. Each of these
damage states are physically defined so as to
facilitate their interpretation during subsequent
estimation of bridge traffic states. For example.
depending on a bridge's geometry and detailing,
various damage states may be defined in terms
of: (a) first yield; (b) the onset of cracking and
spalling; (c) loss of anchorage; (d) concrete
failure; (e) pier damage or collapse, due to such
causes as splices in plastic hinge zones or
inadequate transverse or longitudinal
reinforcement; (f) deck unseating; (g) bearing
failure; and (h) abutment backwall failure. In
addition, although the rapid pushover method has
been formulated as a deterministic approach,
procedures are being studied that would extend it
to be probabilistic as well, in which model and
material property uncertainties are represented.
Capacity-Demand Resolution. Once the capacity
spectrum is developed, a capacity-demand
analysis is carried out to determine each bridge's
damage state for a given scenario earthquake and
simulation. The first step in this process is to
establish the demand spectrum at the bridge site
by adjusting the five-percent damped site-specific
ground-response spectrum at each bridge site to
account for increased effective damping due to
increased yielding and damage to the bridge as
the level of displacement increases. Then, the
damage state for the given scenario earthquake
and simulation is taken to correspond to that
damage state within which the demand and
capacity spectra intersect. This is determined
analytically by computing the difference between
demand vs. capacity base shear coefficients at
displacement levels that represent the onset of
each successive damage state, and then
identifying the damage state where the sign of the
difference first changes.
Current Status. Although the basic framework of
the rapid-pushover method is established, it is
still under development to incorporate such
phenomena as effects of bridge skew, foundation
damage modes, etc. In addition, the method is
currently being validated through its application
to actual bridges that have been subjected to
earthquake shaking and have well-established
seismic response characteristics. It is noted that a
simplified version of the rapid-pushover method
is currently under development for enhancing the
transportation lifeline module in HAZUS (Basoz
and Mander, 1998).
330
5.4.3 Other Damage State Models
This section briefly summarizes other candidate
bridge damage state models. One model is being
developed specifically for application to the
large Mississippi River crossings in Memphis
(Liu, 1997). The other models are presented as
possible options or supplements to the rapid
pushover method. These mclude modeling
procedures currently being developed by Jemigan
and Hwang (1997) and by Shinozuka (1998).
Major Bridges. The rapid-pushover method and
the other bridge modeling methods described
below would be applied to all bridges in the
Memphis highway-roadway system, except the
two large steel bridges that cross the Mississippi
River along Interstate Highways 40 and 55. For
these major bridges, capacity spectra will be
developed from results of a prior detailed seismic
vulnerability analysis of the Interstate 40 river
crossing, and from an approximate assessment of
the Interstate 55 river crossmg, which has not yet
been subjected to a detailed seismic vulnerability
evaluation (Liu, 1997).
Jemigan and Hwang (1997). In an ongoing
study to develop damage state fragility curves for
the 452 bridges within the highway-roadway
system in Memphis and Shelby County,
Tennessee, Jemigan and Hwang (1997) are
applying the capacity-demand method described
in the FITWA (1995) seismic retrofit manual.
This study has consisted of the development of a
GIS data base of structural attributes for these
bridges, a grouping of bridges according to
superstructure and substructure characteristics,
and the development of fragility curves for each
grouping that establish the probability of
achieving none/minor, repairable, or significant
damage as a function of peak ground acceleration
(ATC, 1996). Dynamic analysis is used to
develop the demands for bridges within each
group, whose attributes are selected from random
sampling of the range of attributes for that group.
To date (April 1998), fragility curves have been
developed for most of the bridge groups defined
for the Memphis and Shelby County bridges.
Shinozuka (1997). Another damage state
modeling approach is being developed under the
NCEER Highway Project by Shinozuka (1997).
This approach will establish bridge damage state
fragility curves through the use of numerical
simulation based on rigorous dynamic analysis,
in conjunction with professional judgment and
quasi-static and design-code type analysis. The
approach will be validated through comparisons
of analytical predictions against observed
performance of bridges during past earthquakes.
5.4.4 Traffic States
The final step in this bridge modeling process is
the establishment of fraffic states along the
roadways at each end of the bridge, and also
along roadways that pass beneath, above, or
adjacent to the bridge. These traffic states
represent the ability of the various roadways to
carry fraffic, in terms of the number of lanes that
remain open to fraffic and possibly any reduction
in speed limit as well. Once they are established
for a given scenario earthquake and simulation,
they are incorporated into a system network
model to establish overall post-earthquake system
states (to which fransportation network analysis
procedures are applied to estimate earthquake
effects on system-wide traffic flows). Therefore,
the estimation of traffic states from the bridge
damage states is a key step in the overall system
SRA process.
These traffic states will vary with time after the
earthquake, to reflect the estimated rate and type
of post-earthquake repair of the bridge. This rate
of repair will, in turn, depend not only on the type
and extent of damage to the bridge, but also on
construction practices within the region of the
country that contains the highway system being
analyzed. To account for these variables when
establishing improved bridge models for the
planned re-analysis of the Memphis highway
system, an expert opinion approach is being
developed that will involve: (a) establishing each
possible damage state for the various bridges in
the system; (b) having experienced bridge
engineers from the Memphis area and the
Tennessee Department of Transportation review
these damage states and provide their opinion as
331

to the costs, types, durations, and traffic impacts
associated with the repair process for each
damage state; (c) interpreting these estimates
using bridge repair cost and functionaUty data
from past earthquakes (in Cahfornia and
elsewhere); (d) from this, estabhshing models
that provide repair costs and traffic states (at
various times after the earthquake) for each
bridge damage state; and (e) incorporating these
models into the component module for the SRAprocedure, for use during our subsequent SRA for
the Memphis highway-roadway system.
5.5 Transportation Network Analysis Procedure
5.5.1 Background
As previously noted, the network analysis
portion of our prior demonstration SRA of the
Memphis highway system relied on MINUTP ~
a standard program that implements Urban
Transportation Planning System (UTPS)
algorithms (Werner et al., 1996). Experience
from that analysis showed that data preparation
and implementation of MINUTP was
unacceptably time consuming - partially due to
the fact that MINUTP was not GIS-compatible.
Also, although UTPS models and their
derivatives are standard planning tools in cities
receiving Federal support for local
transportation projects, such models have the
following deficiencies for SRA applications: (a)
consideration of an adequate level of detail for
representing the region served by the system
(i.e., region boundaries, 0-D zones, and the
system network structure) is costly; (b) loss-of-
service measures developed from UTPSnetwork assignment models are inconsistent
with loss-of-service measures from other UTPSmodels; (c) behavioral shifts due to major
disasters such as large earthquakes are difficult
to represent; and (d) the UTPS procedure has
little capacity for considering time dependence
of system performance characteristics.
In view of this, it became clear that an
alternative transportation network analysis
procedure was needed that: (a) provides a
capacity for more rapid estimation of network
flows; (b) represents the latest well-developed
technology and circumvents technical
limitations of the UTPS algorithms; (c) is
compatible with the GIS-based framework of
our current SRA procedure; and (d) provides a
capability for using transportation system input
data typically available from Metropolitan
Planning Organizations (MPOs).
We have found that a new Associative Memory(AM) procedure for rapid estimation of traffic
flows that was developed at the University of
Southern California (USC) best meets the above
objectives (e.g., Moore et al., 1997). The
objective of this AM work has been to provide
rapid and dependable estimates of flows in
congested networks, given changes in link
configuration due to earthquake damage, and to
attach these changes to the decision-making
procedures used to prioritize bridges for seismic
retrofit. Such a procedure articulates well with
existing efforts in the field, because these flow
estimates are input to both total transportation
system cost and accessibility measures.
5.5.2 Overview ofAM Procedure
The AM procedure is derived from the artificial
intelligence field to predict changes in highway
system flows. These predictions are based on
good approximate solutions to constrained
optimization problems that represent the
economic determinants of network flows. As
such, the AM procedure has the capability to
determine changes in the system's total
commuting time due to changes in the highway
system network. To illustrate, if one link of a
freeway is being considered for retrofit, the
change in the total system commuting time due
to removal of this link is calculated by the
following steps: (a) identification of equilibrium
flows and commuting times for each link in the
intact (pre-earthquake) network; (b) calculation
of total system commuting times by summing
the commuting times for all links; (c) removal
of the link from the highway system, simulating
closure due to earthquake damage; and (d)
determination of the change in total system
commuting time due to the link's removal.
332
5.5.3 Development ofAM Matrix
The AM procedure focuses on the development
of an AM matrix that is used to map given sets
of system network configurations (stimulus) to
lead to corresponding traffic flows (response).
The AM matrix is developed from the following
steps:
Step 1. Training and Test Cases. Standard
numerical analysis is used to develop an
ensemble of user equilibrium traffic flows for
various network configurations, all of which
represent the same general type of network and
traffic flow characteristics. Most of these
solutions are designated as training cases, with
the remainder designated as test cases. These
flows are computed for each link in the system
in terms of equivalent passenger-car-units per
hour.
Step 2, AM Training. The training cases from
Step 1 are used to train the AM; i.e., to
determine the elements of the AM matrix that
minimize the mean-square difference between
the true user equilibrium traffic flows for all
training cases and the estimated flows using the
AM matrix.
Step 3. AM Testing. The basic premise of this
approach is that the AM matrix will provide a
good estimate of traffic flows from other
network configurations that represent similar
conditions to those of the training cases, but
have not been included in these cases. To check
this, the AM matrix is used to predict traffic
flows for each test case from Step 1, and these
predicted flows are compared to the actual flows
for the test cases as obtained during that step.
Step 4. AM Refinement. From past experience,
Step 3 will usually lead to excellent
comparisons between predicted and actual
traffic flows if an adequate number of training
cases has been selected. However, if needed,
additional training and test cases can be
developed in Step 1 and used to further refine
the AM matrix and the accuracy of its traffic
flow predictions.
5.5.4 Current Status
We are programming the AM procedure for
rapid estimation of traffic flows developed at
the University of Southern for incorporation
into the SRA methodology. In addition, wehave compiled network data for the Memphishighway-roadway system for an updated SRA
* of this system.
Our programming of the AM procedure
considers that the procedure has two sub-
modules — the training and stimulus-response
sub-modules. The training sub-module solves
conventional user-equilibrium flow problems
given different configurations for the Memphisnetwork. The stimulus-response sub-module
constructs an AM matrix that best fits these user
equilibrium inputs (network configurations) and
outputs (traffic flows). In this way, the exact
user-equilibrium solutions "train" the AM,which then can be used to obtain very rapid
estimates of traffic flows for other network
configurations not included in the training sub-
module. These AMs have been shown to
provide good approximations of user-
equilibrium flows associated with new network
configurations, including networks in which
capacity has been lost.
Creation of training data is a pre-processing
step, but users of the SRA methodology will
also have the opportunity use the training sub-
module to solve for exact user-equilibrium
flows for various post-earthquake network
configurations. Regardless of why users might
elect to solve these flow problems exactly, the
results of the analysis can usually be added to
the training data provided to the stimulus-
response sub-module.
We have programmed user-equilibrium traffic-
assignment and the generalized inverse-matrix
modules in the C programming language,
specifically Watcom C/C++ VI 1.0. These sub-
modules must be integrated into one model to
be tested and applied. We are nowprogramming an integrated analysis
environment that contains a transportation data-
333
base management system, training module,
stimulus-response module, and output
generation module.
We have also been working with the Memphis
and Shelby County Office of Planning and
Development (OPD), who is the MPO for the
Memphis region, to compile network input data
for use in our forthcoming SRA of the Memphis
highway-roadway system. The data for this
system is based on OPD's most recent (1995)
MINUTP model. These network data includes
665 origin-destination zones and associated trip
tables, 3,853 nodes and their attributes, and
9,716 directional links and their attributes.
These data have now been incorporated into the
GIS data base for our Memphis system SRA.
6.0 REAL-TIME APPLICATIONS
Research is being carried out by earthquake
scientists and engineers to develop procedures
for estimation of seismic effects in real time.
Such procedures facilitate rapid emergency-
response decision making by using scientific
and engineering monitoring systems and models
for seismic data collection, analysis, initial real
time prediciton of seismic effects, and updating
of real-time predictions as new earthquake data
becomes available (e.g., Eguchi et al., 1997;
Taylor etal., 1998).
The highway system SRA procedure described
in this paper features is well suited for real-time
prediction of highway system seismic
performance. Particular benefits of the
procedure for such applications include its use
of GIS-based modules with rapid procedures
for: (a) predicting seismic hazards, component
performance, and system-wide traffic flows; and
(b) display of prediction results.
We envision that the use of the SRA procedure
for real-time predictions of highway system
seismic performance would require the
following pre-earthquake steps, as a unified
effort of regional government officials,
emergency response planners, earthquake
engineers, and transportation specialists.
System Inventory. Engineers and planners
should: (a) identify the extent of the highway-
roadway system to be analyzed; (b) compile
relevant data for the system, including network,
traffic, component, and origin-destination zone
data as described earlier in this paper; and (c)
identify locations and access routes for key
emergency response/recovery facilities.
Real Time Information Needs. Government and
emergency response planning officials should
identify their particular post-earthquake
information needs from the results of the real-
time application of the SRA procedure. This
could include information on: (a) locations of
earthquake damage to the highway-roadway
system; (b) impacts of this system on traffic
flows, including alternative routes that would be
taken by users immediately after the earthquake;
(c) accessibility to and from hospitals, police
and fire departments, airports, and other key
emergency response centers; and (d) the
effectiveness of alternative short-term traffic
management procedures in reducing post-
earthquake traffic congestion and improving
access to emergency response facilities.
SRA Module Development. After the above
steps have been carried out, systems and
engineering information needed to rapidly carry
out highway-roadway system SRAs in real time
can be developed within the GIS-based SRApreprocessor modules. This would include
development and incorporation of: (a) models
for estimating seismic hazards throughout the
system that are based on regional seismologic
and geologic characteristics; (b) vulnerability
and fragility models for characterizing damage
states and traffic states of the bridges and other
components that comprise the system; and (c)
an AM matrix for estimating traffic flows for
the highway-roadway system and its range of
potential post-earthquake system states.
Integration into Real-Time Earthquake DamageAssessment System. We envision that this
highway-roadway system performance
predictions would be part of a larger real-time
earthquake damage assessment system that
334
would be in place for the region. Accordingly,
the predictions developed in the previous step,
together with the SRA procedure itself, should
be integrated into this real-time system, so that
information on future earthquake magnitudes
and locations can be readily accessed for rapid
estimation of post-earthquake system
performance and losses.
6.0 CONCLUDING COMMENTS
This paper has described a new SRA procedure
for highway systems. A demonstration
application of the procedure to the Memphis
highway system has provided preliminary
results that show the type of information that
can be obtained using SRA. Significant
research has been carried out that will
dramatically improve the reliability of the
system performance resuhs obtained using the
SRA procedure.
SRA can enhance the prioritization, planning,
and implementation of seismic risk reduction
for highway systems. Its principal benefit is its
ability to directly represent seismic performance
of highway systems - in terms of post-
earthquake traffic flow - and to represent
systemic effects associated with the damage to
various highway components. This information
will provide a much improved basis for
decision-making pertaining to such issues as
prioritizing various components for seismic
strengthening, establishing component seismic
performance and design criteria, and justifying
funding for seismic retrofit or other seismic risk
reduction measures. In addition, because the
SRA procedure uses rapid GIS-based methods
for estimating seismic performance of highway-
roadway systems, it can be readily adapted to
real-time prediction applications.
ACKNOWLEDGEMENTS
This research is being funded by the National
Center for Earthquake Engineering Research
(NCEER) under their Highway Project. This
financial support is gratefully acknowledged.
The authors also wish to acknowledge: (a) Dr.
Ian Buckle and Mr. Ian Friedland of NCEERand Prof Masanobu Shinozuka of the
University of Southern California, for their
encouragement and helpful suggestions; (b) Mr.
Jon Walton, for his programming and GISsupport; (c) Messrs. Clark Odor and Esther
Anderson of the Memphis and Shelby County
OPD, for providing system, traffic, and trip-
- table data for the Memphis area highway-
roadway system; and (d) Mr. Edward
Wasserman and his staff at the Tennessee
Department of Transportation in Nashville,
Tennessee, for providing valuable bridge data,
drawings, and reports from their files.
7.0 REFERENCES
Applied Technology Council (ATC) (1991)
ATC-25 — Seismic Vulnerability and Impact of
Disruption of Lifelines in the Conterminous
United States, Redwood City CA.
Applied Technology Council (ATC) (1996).
ATC-32 -- Improved Seismic Design Criteriafor
California Bridges: Provisional
Recommendations, Redwood City CA.
Association of Bay Area Governments (ABAG)(1997). Riding Out Future Quakes: Pre-
Earthquake Planning for Post-Earthquake
Transportation System Recovery in the San
Francisco Bay Region, Oakland CA, October.
Bartlett, S.F. and Youd, T.L. (1995). "Empirical
Prediction of Liquefaction-Induced Lateral
Spread" Journal of Geotechnical Engineering
ASCE, 121(4), April, pp 316-329.
Barton-Aschman Associates (BAA) (1994).
Interstate 10 Recovery Report — Northridge
Earthquake Recovery California Department of
Transportation, District 7, Office of Operations,
Los Angeles CA. September 15.
Basoz, N. and Mander, J. (1998). Enhancement
of the Highway Transportation Lifeline Module
in HAZUS, Draft Report to National Institute of
Building Sciences, Washington D.C., April 3.
335

Comsis Corporation (1994). MINUTP Technical
Users Manual Silver Springs MD, July.
Daykin, C. D., Pentikainen, T., and Pesonen, M.
( 1 994) . Practical Risk Theoryfor Actuaries,
London: Chapman & Hall.
Der Kiureghian, A. and A. H-S. Ang, 1977, "A
Fault Rupture Model for Seismic Risk
Analysis," Bulletin ofthe Seismological Society
ofAmerica, 64( 4), pp 1 173-1 194, August.
Eguchi, R.T., Goltz, J.D., Seligson, H.A.,
Flores, P.J., Blais, N.C., Heaton, T.H., and
Bortugno, E. (1997). "Real-Time Loss
Estimation as Emergency Response Decision
Support System: The Early Post-Earthquake
Damage Assessment Tool", Earthquake
Spectra, 13( 4), November, pp 815-832.
Federal Highway Administration (FHWA)(1995) . Seismic Retrofitting Manual for
Highway Bridges, Publication No. FHWA-RD-94-052, Turner-Fairbank Highway Research
Center, McLean VA, May.
Frankel, A., Mueller, C, Barnhard, T., Perkins,
D., Leyendecker, E.V., Dickman, N., Hanson,
S., and Hopper, M. (1996). National Seismic
Hazard Maps, June 1996 Documentation,
Preliminary Report prepared at U.S. Geological
Survey, Denver CO, July 19.
Gordon, P., Richardson, H.W., and Davis, B.
(1996) . Transport-Related Business Interruption
Impacts of the Northridge Earthquake Lusk
Center Research Institute, University of
Southern California, Los Angeles CA, March.
Hwang, H.H.M. and Huo, J-R. (1997).
"Attenuation Relations of Ground Motion for
Rock and Soil Sites in Eastern United States",
Soil Dynamics and Earthquake Engineering,
Vol. 16, pp 363-372.
Hwang, H.H.M. and Lin, H. (1997). GIS-Based
Evaluation of Seismic Performance of Water
Delivery Systems, University of Memphis,
Memphis TN, February 10.
Hwang, H.H.M., Lin, H., and Huo, J-R. (1997).
"Site Coefficients for Design of Buildings in
Eastern United States", Soil Dynamics andEarthquake Engineering, Vol. 16, pp 29-40.
Jernigan, J.B. and Hwang, H.H. (1997).
Inventory and Fragility Analysis of MemphisBridges, Center for Earthquake Research and
Information, University of Memphis, MemphisTN, September 15.
Law, A.M. and Kelton, W.D. (1991). Simulation
Modeling & Analysis, New York: McGraw-Hill, Inc., New York NY.
Leyendecker, E. V., D. M. Perkins, S. T.
Algermissen, P. C. Thenhaus, and S. L. Hanson,
(1995). USGS Spectral Response Maps and
their Relationship with Seismic Design Forces
in Building Codes, Open-File Report 95-596,
U.S. Geological Survey, Denver CO.
Liu, W.D. (1997). "Major Bridge Damage State
Modeling", Year 5 Research Plan, NCEERHighway Project, National Center for
Earthquake Engineering Research, Buffalo NY,October 3
.
Mander, J.B. and Dutta, A. (1997). "A Simple
Pushover Method for Rapid Evaluation of
Bridge Capacity", NCEER Bridge Damage-
State Modeling Workshop, San Francisco CA,
August 6-7.
Martin, G.R. and Dobry, R. (1994).
"Earthquake Site Response and Seismic Code
Provisions" NCEER Bulletin, 8( 4), pp 1-6.
Moore, J.E. II, Kim, G., Xu, R., Cho, S., Hu, H-
H, and Xu, R. (1997). Evaluating System
ATMIS Technologies via Rapid Estimation of
Network Flows: Final Report, California PATHReport UCB-ITS-PRR-97-54, December.
Ng, K.W., Chang, T.S., and Hwang, H.H.M.
(1989). Subsurface Conditions of Memphis and
Shelby County, Report NCEER-89-0021,
National Center for Earthquake Engineering
Research, Buffalo NY, July 26.
336
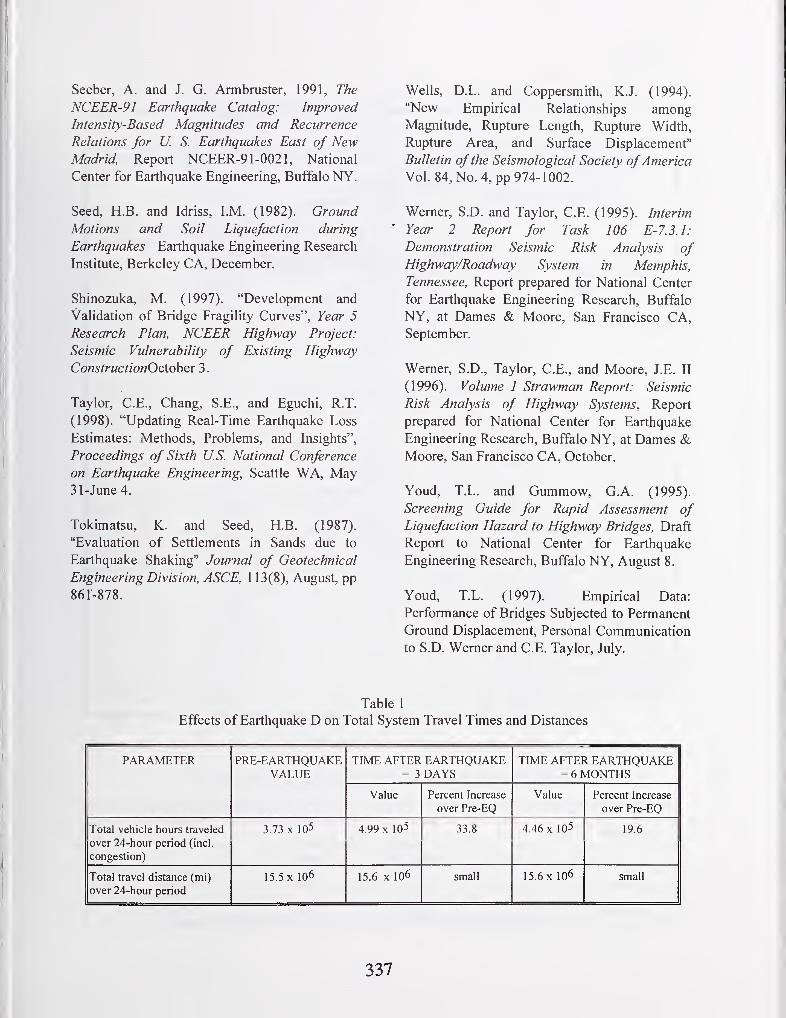
Seeber, A. and J. G. Armbruster, 1991, The
NCEER-91 Earthquake Catalog: Improved
Intensity-Based Magnitudes and Recurrence
Relations for U. S. Earthquakes East of NewMadrid, Report NCEER-91 -0021, National
Center for Earthquake Engineering, Buffalo NY.
Seed, H.B. and Idriss, I.M. (1982). Ground
Motions and Soil Liquefaction during
Earthquakes Earthquake Engineering Research
Institute, Berkeley CA, December.
Shinozuka, M. (1997). "Development and
Validation of Bridge Fragility Curves", Year 5
Research Plan, NCEER Highway Project:
Seismic Vulnerability of Existing Highway
ConstructionOctoher 3
.
Taylor, C.E., Chang, S.E., and Eguchi, R.T.
(1998). "Updating Real-Time Earthquake Loss
Estimates: Methods, Problems, and Insights",
Proceedings of Sixth U.S. National Conference
on Earthquake Engineering, Seattle WA, May31 -June 4.
Tokimatsu, K. and Seed, H.B. (1987).
"Evaluation of Settlements in Sands due to
Earthquake Shaking" Journal of Geotechnical
Engineering Division, ASCE, 1 13(8), August, pp861-878.
Wells, D.L. and Coppersmith, K.J. (1994).
"New Empirical Relationships amongMagnitude, Rupture Length, Rupture Width,
Rupture Area, and Surface Displacement"
Bulletin ofthe Seismological Society ofAmerica
Vol. 84, No. 4, pp 974-1002.
Werner, S.D. and Taylor, C.E. (1995). Interim' Year 2 Report for Task 106 E-7.3.I:
Demonstration Seismic Risk Analysis ofHighway/Roadway System in Memphis,
Tennessee, Report prepared for National Center
for Earthquake Engineering Research, Buffalo
NY, at Dames & Moore, San Francisco CA,September.
Werner, S.D., Taylor, C.E., and Moore, J.E. II
(1996). Volume I Strawman Report: Seismic
Risk Analysis of Highway Systems, Report
prepared for National Center for Earthquake
Engineering Research, Buffalo NY, at Dames &Moore, San Francisco CA, October.
Youd, T.L. and Gummow, G.A. (1995).
Screening Guide for Rapid Assessment of
Liquefaction Hazard to Highway Bridges, Draft
Report to National Center for Earthquake
Engineering Research, Buffalo NY, August 8.
Youd, T.L. (1997). Empirical Data:
Performance of Bridges Subjected to Permanent
Ground Displacement, Personal Communication
to S.D. Werner and C.E. Taylor, July.
Table 1
Effects of Earthquake D on Total System Travel Times and Distances
PARAMETER PRE-EARTHQUAKEVALUE
TIME AFTER EARTHQUAKE= 3 DAYS
TIME AFTER EARTHQUAKE= 6 MONTHS
Value Percent Increase
over Pre-EQ
Value Percent Increase
over Pre-EQ
Total vehicle hours traveled
over 24-hour period (incl.
congestion)
3.73 X 10⁵ 4.99 X 10⁵ 33.8 4.46 X 10⁵ 19.6
Total travel distance (mi)
over 24-hour period
15.5 X 10⁶ 15.6 X 10⁶ small 15.6 X I06 small
337
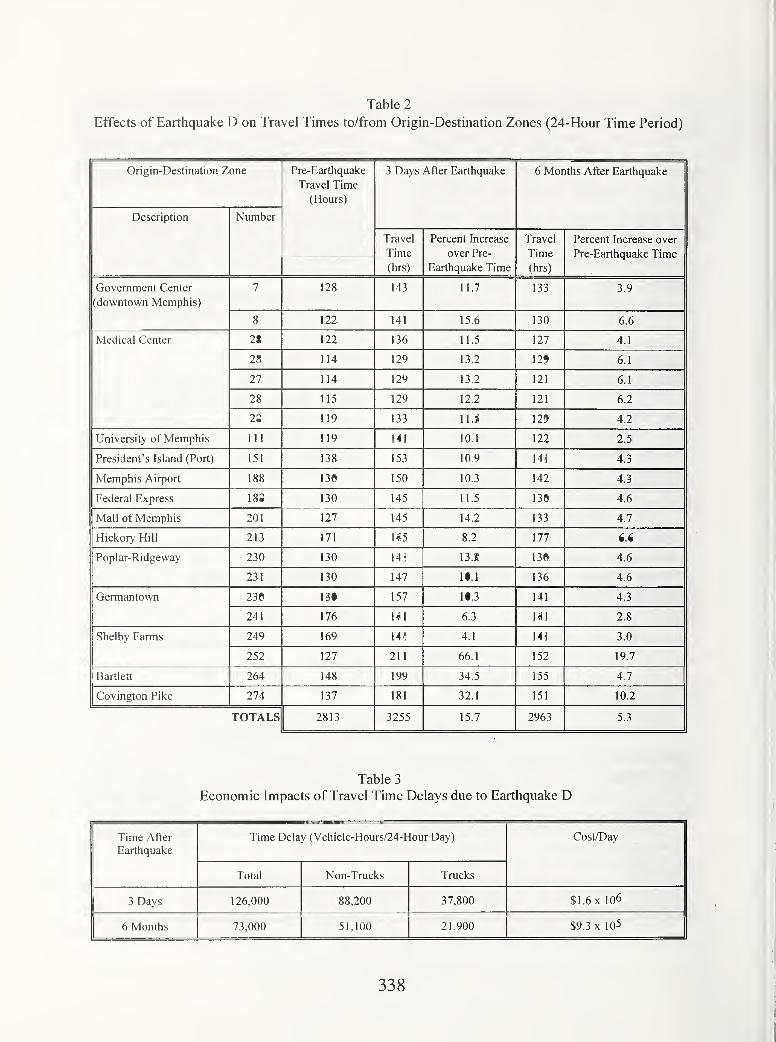
Table 2
Effects of Earthquake D on Travel Times to/from Origin-Destination Zones (24-Hour Time Period)
Origin-Destination Zone I 1^ L^di iiiuuai^.^
Travel Time
(Hours)
3 Days After Earthquake 6 Months After Earthquake
Description Number
Travel
Time
(hrs)
Percent Increase
over Pre-
Earthquake Time
Travel
Time
(hrs)
Percent Increase over
Pre-Earthquake Time
Government Center
(downtown Memphis)
7 128 143 11.7 133 3.9
o 122 141 15.6 130 6.6
Medical Center 122 136 1 1.5 127 4.1
ZD 114 129 13.2 121 6.1
"77Z / 114 129 13.2 121 6.1
zo 115 129 12.2 121 6.2
119 133 1 1.8 124 4.2
University of Memphis 1 1 I111 119 131 10.1 122 2.5
President's Island (Port) 1 J 1 138 153 10.9 144 4.3
Memphis Airport 1 oo 136 150 10.3 142 4.4
Federal Express 1 SQ 130 145 11.5 136 4.6
Mall of Memphis 201 127 145 14.2 133 4.7
Hickory Hill 213 171 185 8.2 177 3.5
Poplar-Ridgeway 230 130 148 13.0 136 4.6
231 1 JU 147 13.1 136 4.6
Germantown 236 141 157 11.3 147 4.3
241 176 187 6.3 181 2.8
Shelby Farms 249 169 176 4.1 174 3.0
252 127 211 66.1 152 19.7
Bartlett 264 148 199 34.5 155 4.7
Covington Pike 274 137 181 32.1 151 10.2
TOTALS 2813 3255 15.7 2963 5.3
Table 3
Economic Impacts of Travel Time Delays due to Earthquake D
Time After
Earthquake
Time Delay (Vehicle-Hours/24-Hour Day) Cost/Day
Total Non-Trucks Trucks
3 Days 126,000 88,200 37,800 $1.6 X 10⁶
6 Months 73,000 51,100 21,900 $9.3 X 10⁵
338
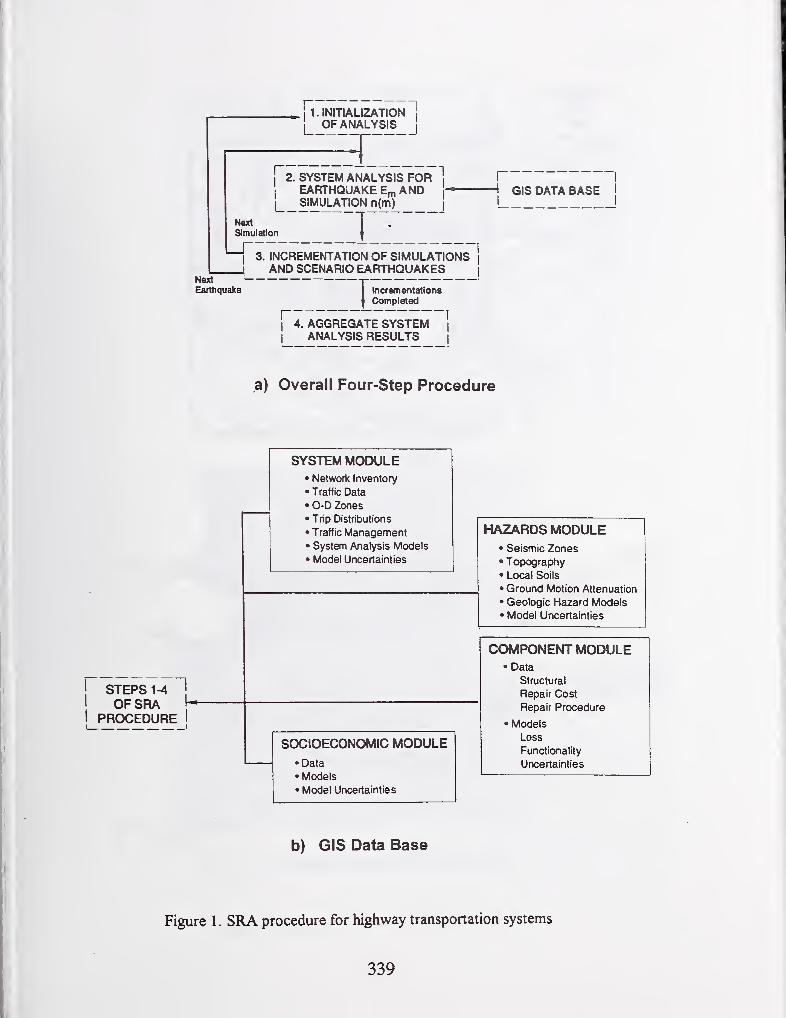
\~2. SYSTEM ANALYSIS FOR 1
IEARTHQUAKE E^, AND r
r"GIS DATA BASE
Next
Simulation
SIMULATION n(m)
3. INCREMENTATION OF SIMULATIONSAND SCENARIO EARTHQUAKES
Next
Earthqualo
J'Incrementations
Completed
^ 4. AGGREGATE SYSTEM i
ANALYSIS RESULTS i
a) Overall Four-Step Procedure
STEPS 1-4 ^OFSRA H
PROCEDURE I
SYSTEM MODULE• Network Inventory
• Traffic Data
• O-D Zones
• Trip Distributions
• Traffic Management• System Analysis Models
• Model Uncertainties
HAZARDS MODULE• Seismic Zones• Topography• Local Soils
• Ground Motion Attenuation
• Geologic Hazard Models• Model Uncertainties
SOCIOECONOMIC MODULE•Data• Models
• Model Uncertainties
COMPONENT MODULE•Data
Structural
Repair Cost
Repair Procedure
• Models
Loss
Functionality
Uncertainties
b) GIS Data Base
Figure 1 . SRA procedure for highway transportation systems
339
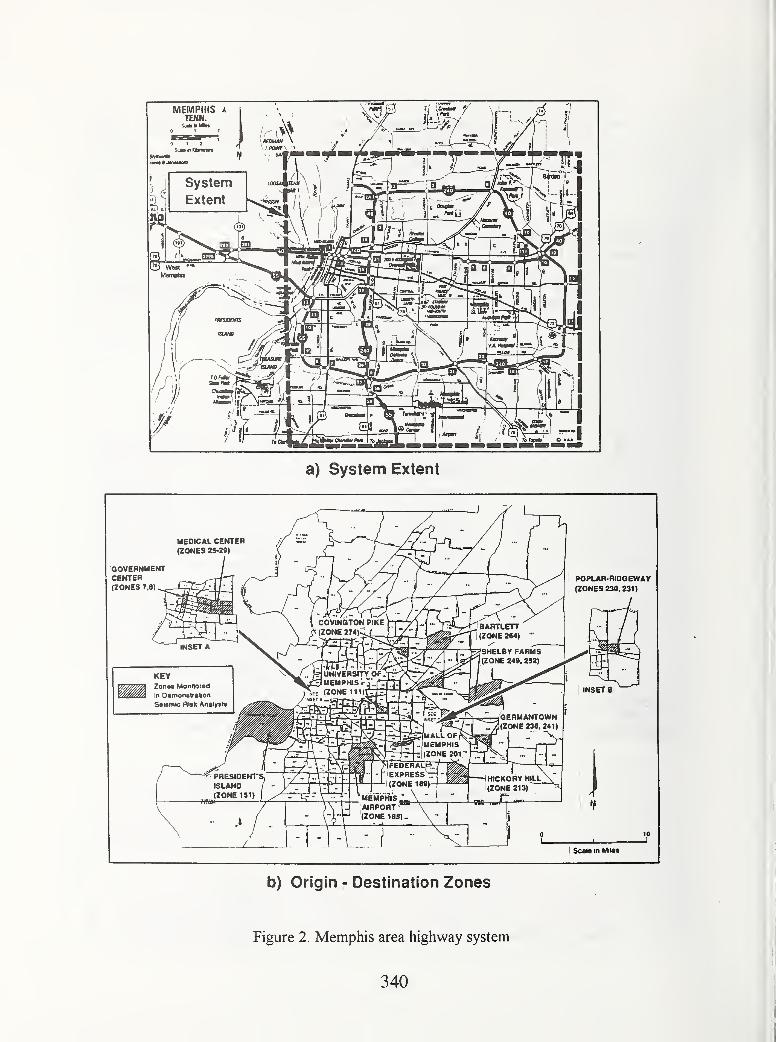
b) Origin - Destination Zones
Figure 2. Memphis area highway system
340
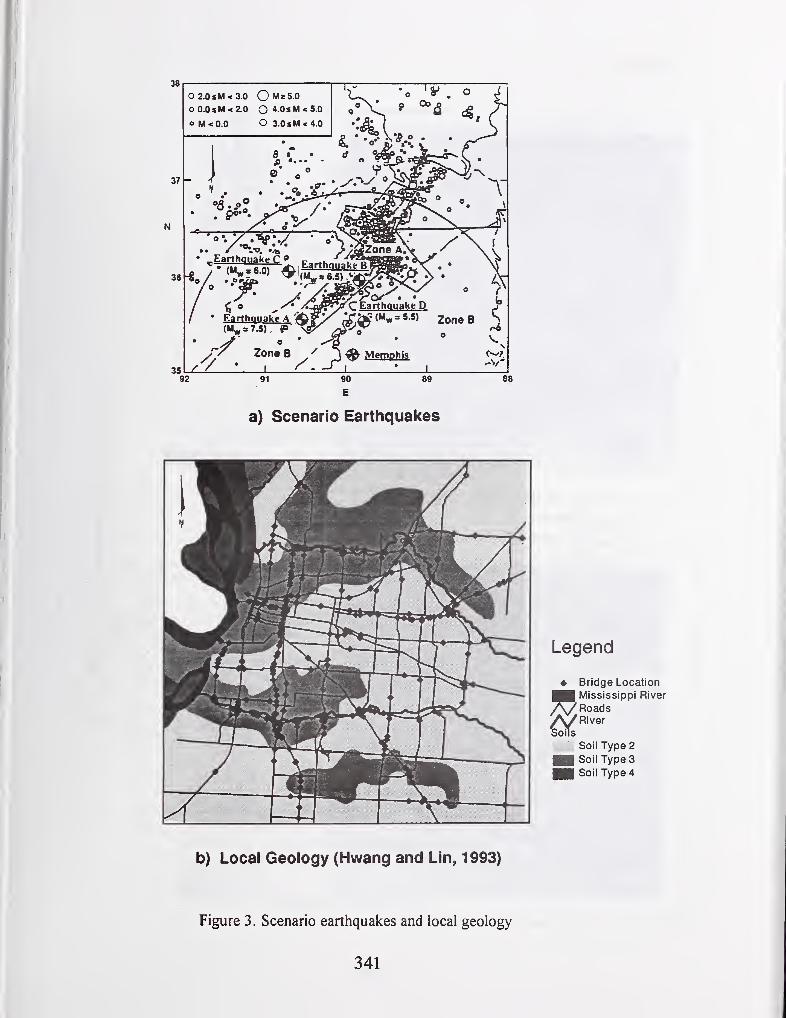
38
O2.0*M<3.0 OMsS.OoO.OsM<^0 O't.0sM<S.0
o M<0.0 O 3.0sM<4.0
a) Scenario Earthquakes
Legend
Bridge Location
Mississippi River
RoadsRiver
Soils
Soil Type 2
mm Soil Type 3I Soil Type 4
b) Local Geology (Hwang and Lin, 1993)
Figure 3. Scenario earthquakes and local geology
341
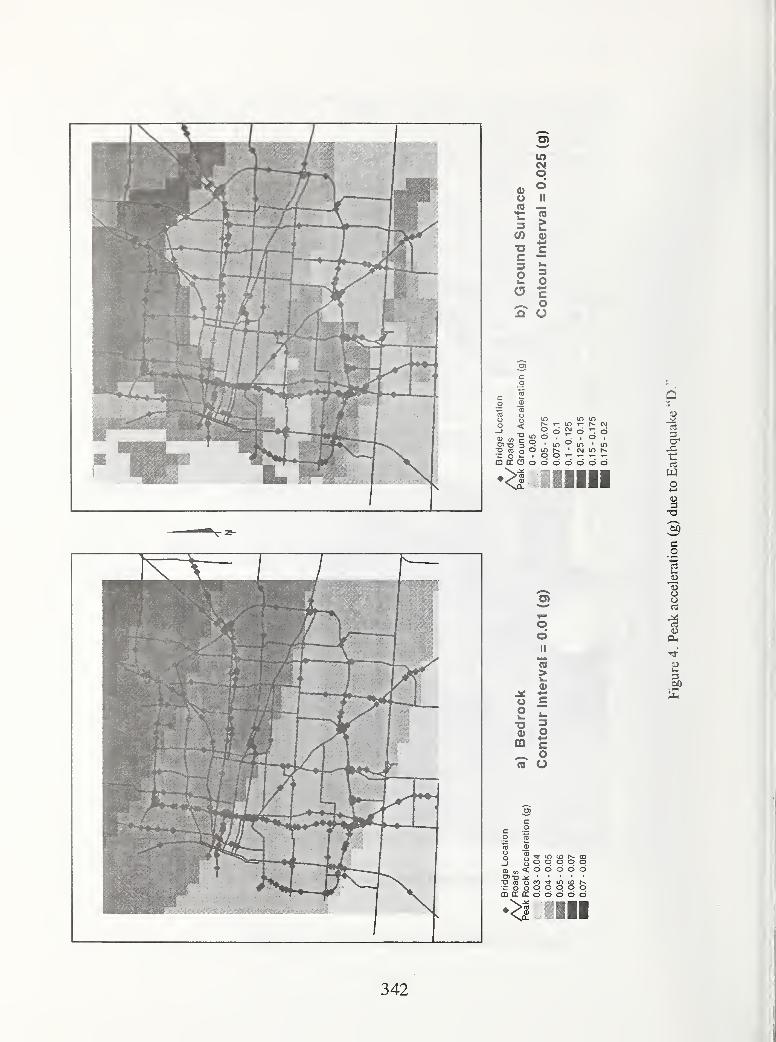
nil
aCT_C
kS
Wo!->
(U3-O
'So
2odII
>0)
uoo
^ o(0 O
3o
in CD 1^ 03o o o o oo „ < o o o oo <o o n "J LO CO~ o o o o o oCO DC DC o O o O
co
13oo
DS-i
300
342
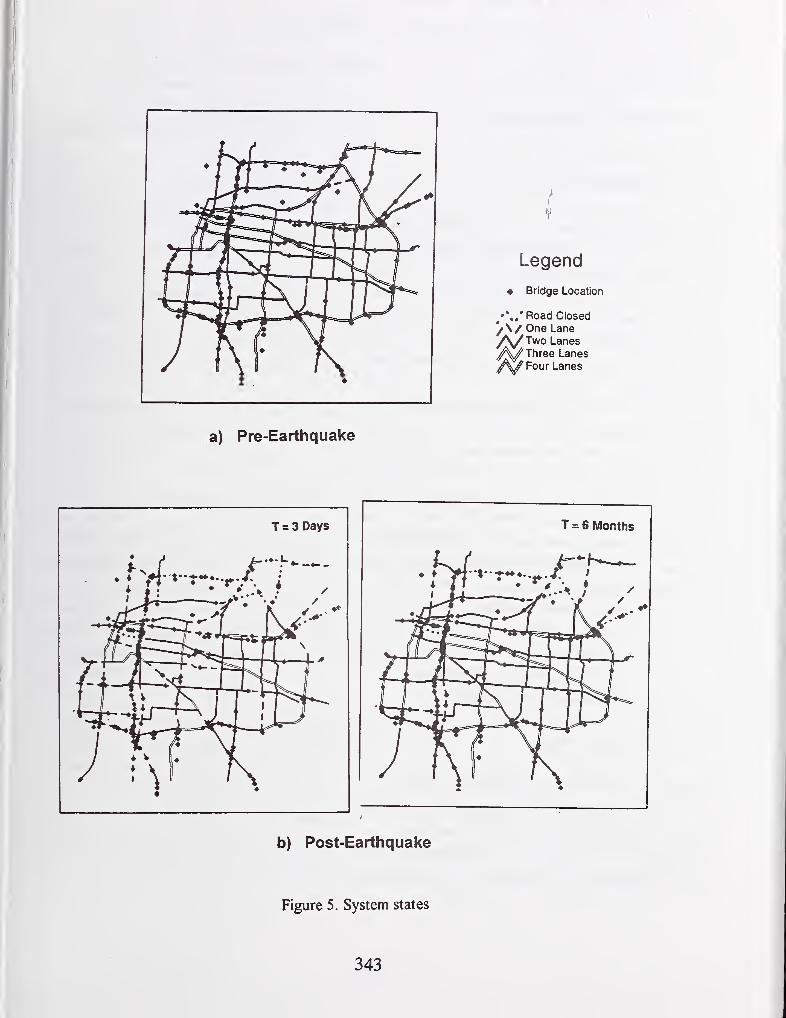
\
Legend
Bridge Location
Road Closed
/\/ One Lane/\yTwo Lanes
Three Lanes* Four Lanes
a) Pre-Earthquake
b) Post-Earthquake
Figure 5. System states
343
" IJ) e: "v^ a s t ^a. t i r 1 cg^ N -t: w C3 k: Jl 11
€5 1:1 d_ s vj 1 a J i3i ]^ C-3L 11"
M 3_ T_J X. c£i
Professor of Keio University (Chairman of the Above Committee)
Makoto WATABE
Director of The Devastating Preventive Network of Yokosuka City
Satomi HIROKAWA
Th.is paper presents about the report
of devastating network in Miura penin
sula near Toky o . 1 9 9 5 , January . 1 7 , eary
in the morning ,Kobe Earthquake damag
ed many people in Japan. At this eart
hquake , informations were very poor. Si
nee then various cities had committee
s to modify these situations . Yokosuka
City and NTT (Nipon Telephone and Tel
egram) (Chairman was myself) started th
e committee in the same year of March
1 . They were using the ordinary malti
media because of difficalties of usin
g extra methods (like the battery not
working) when devastating earthquake
comes. By 2 years, we could finish bas
ic ideas and the now were realizing.
Key Words : Yokosuka City
Mult imedia
Information network
Application software
Devastating network
1 INTRODUCTION
1995 January 17 eary in the morning,
we had Kobe-Awaji devastating earth
quake, and Japanese people had the big
damages. The cities of Japanese at t
hat time, should consider the mformat
ion ::;y stftins ,iiiipotan n to inior ia
th^ camuges of, for -.nr^tance , p
c^'yple 111 the damaged areas fro
Hi ;,he cities or firefightinq o
t Sices of the cities. Fort una
t
if:iy , Yokosuka City was quite ea
gar f <:r i^.f orniat ion systems of
jiatural disastir^r. Especially
•"he r '-servat ion of drikiuq wat
e r , trie 7 must: carry it iroru bag
ami River, f..ir from Yok;'.suka , so
tney form nne ranks of water
before Kobe Earthquake.
2 DEVASTATING NETV^OT^K
D eV c; s t. a t i ng : ; e r w o r k was u s e r u
1 , of course, at natuur al disas
r. e r e v en t: s , b c r. even o r d i 1 1 a 1 1 y
times usiiig multimedia ijiforma
tion and correspondent network
s,and information between rei
a ted organizations are vei'v im
portant . These are the basic i
deas of " devastating network ".S
afeties of the people in the d
istricts and better services o
f administrations will be also
important . The above network s
ystems are used for vordmally
time, for the information ser
344

vices , ed'jcat ion infomation ' s common u
se and for information between admini
stration offices. At devastating time,
to chenge application software , using
the same tools of ordinally time, info
rmation of damages degrees, of accumil
ation, of good tim.ing about the loss
of the people, the common knowledge ab
out the devastating information for e
ach information offices are necessary
. Uses of devastating iietwork,on ordi
nal times, were not only the effectiv
e uses of devastating ne^twork in ordi
nal times but devastating network sys
terns must be used ordinal daily beca
use on devastating times, the ordinaly
people , som.etimes , could - not use specia
1 devastating network or devastating
netv/ork was broken arid the poeple cou
Id iiOt realize it until they start to
use or the batteries of devastating
network were run out.
The reason of maltimedia for devasra
ting network were the following;
combinations of variouse information
of pi-ctures,of places, of voices and 1
etters to understand easily the damiag
ed degrees by coming devastation will
be especially i:iecessary at devastati
ng t imies .
3 MIIIRA PENINSULA City (Yokosuka City
) MADE A COMMITTEE FOR DEVASTATIG NET
WORK - ^
Not only peninsula's closed situatio
ns but also this peninsula area are c
ailed "Tanito" (valley and door), mixed
with vallies and hi lis, and when deva
stating earthquake comes, m the above
areas are qute difficult to
inform their damages to thei
r area or near areas . Actuall
y,some places of firfighting
radios and potable telephone
s could not communicate each
other (PHS:portable telephon
e became better communicatio
ns recently) .Yokosuka City w
as eager about devastating n
etwork since long time ago,
a
nd drinking water were store
d in the water tanks, for ins
tance under the parks becaus
e drinking water were brough
t from Sagami River by the s
teel pipes as already writte
n before . Beside the above, th
ey are promoted to prepare m
achine mater ials , food and me
dicines . However the method o
f inf ormat ion , between firefi
ghting offices or cities dev
astating network radios and
general telephones could onl
y use . Cor responcpondent meth
od between self defense armi
es, polices and medical offic
es are known to be only by t
elephones . These the above re
sons became to start the com
mittee of devastating networ
k. Beside the above items, NTT
s roles could not be missed.
In Yokosoka City, NTT may hav
e rsearch office soon, and so
meny people of NTT live in
Miura peninsula area. So NTT
plans the similar devastatin
g netwok with Yokosuka City.
345
Aiid tnis was the one of the reasons >/
hy Yokosuka City made the committee o
f devastating network.
4 CONSIDERATION AND PROCESS
Almost all cities of Miura peninsula
h.ave similar conditions , so other tha
n Yokosuka City, 3 cities, 1 town, NTT a
nd Kanagawa prefecture office joined
together for this commit tee . And self
defend army of f ices , mar ine security
of f ices,polices , medical offices and
lifeline business groups (all together
33 offices) joined together. 2 years 1
on.g , com.mi ttee started from March 1 th
e same year of Kobe-Awaji devastating
earthquake . In year of 1995,11 times o
f meet ings (considerations : 3 times org
anizer meetings: 4 times top committe
e:4 times) and 4 5 times of person ^ s h
earings were held to find out the rea
1 problems. And basic concepts were de
termined
.
Through these meet ings , each related
offices discussed and concidered the
real necessary information , stiles of
these information and what the real u
seful information will be. Finally, Oc
tober 26 of nhe same year , H""ARCSJ (Aid
For District Devastating Network) wer
e made as the result for the rocal de
vastating network.
The second year of devastating netwo
rk commi ttee , dependig upon basic cone
epts , realized devastatiJig network, dis
cussed the specifications of devastat
ing network. 11 times of meetings and
all together 4 1 times of liearings wer
e done. The specifications of necessar
y functions and practical us
es of this function were se
ttled,and concluded the 2 ye
ars project. By this devastat
ing network project, the trus
t each others of the related
offices were much more inc
reased. After this , committee
of devastating network, at Mi
ura peniunsula area,meny off
ices got together to do the
training of devastating netw
ok. In that sense, the new con
nections of each others will
be made.
The second years of this pr
oject,1996 April, 4 cities an
i d 1 town , collected together
1 the policies of the common p
urpose and once again get to
gether to fix the satellite
telephones , that were establi
shed in prefecture's office
I
and polices offices so that
' at anytimes they can contact
jwith each other. Upon the ab
ove ideas , communications net
work by the real multimedia
'will be prepared. The later o
I f the second years , depending
upon the final results, star
ted the real devastating net
work.
The research people of NTT'
s developed application soft
ware and Miura peninsula are
became the fields and by ma
ny people of the related joi
ned together for the experie
I nces of application software
346
s. Points of this development were the
use of the standard communication sy-
stem, at the same time, to many address
, the communication traffic were flow
n about and treated them with composu
re.Hardwear to load the software were
made by Yukosuka City with some assis
tance from the administration of trad
es and industries . Using LAN and sarve
rs of Yokosuka City and of their educ
ation study offices, the communication
circuits and for the edge PC will be
maintenanced after 1997.
At August 31 1997, using the studied
facilities , the exercise was performed
by Yokosuka City. The information of d
evastating network was to the main me
asure office and we stayed there to e
stimate the results. the main measure
office necessaryly chenged some syste
m and brought the new portable termin
ations with staffs of f ierf ighting , to
exercise to send multimedia informat
ion to that main measure office throu
gh pictures, GPS data , voices and lett
er s .
5 FUTURE
The brushup of examined systems and
prepare the real system will be neces
sary to improve these systems . Through
these improvement , finally the wonderf
ul systems will be made.
The practical use of the regulations
will be sometimes quite difficult, so
the through experiment system , hear ing
s will be expected and the practical
rules and systems will be obtained th
rough the forms of frulesj.
The costs of correspondent
maintenances were not cheap,
so ordinal correspondent inf
ormation systems were used,W
e would like to use the excl
usive correspondent safe sys
tems in the future.
347
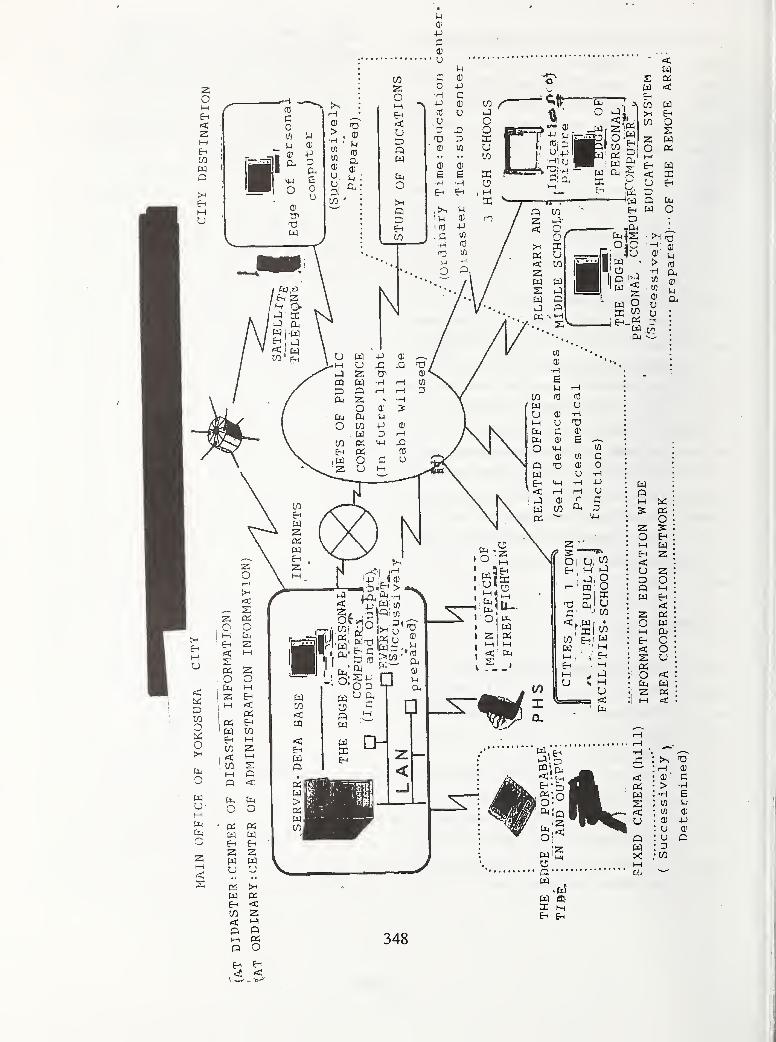
4J
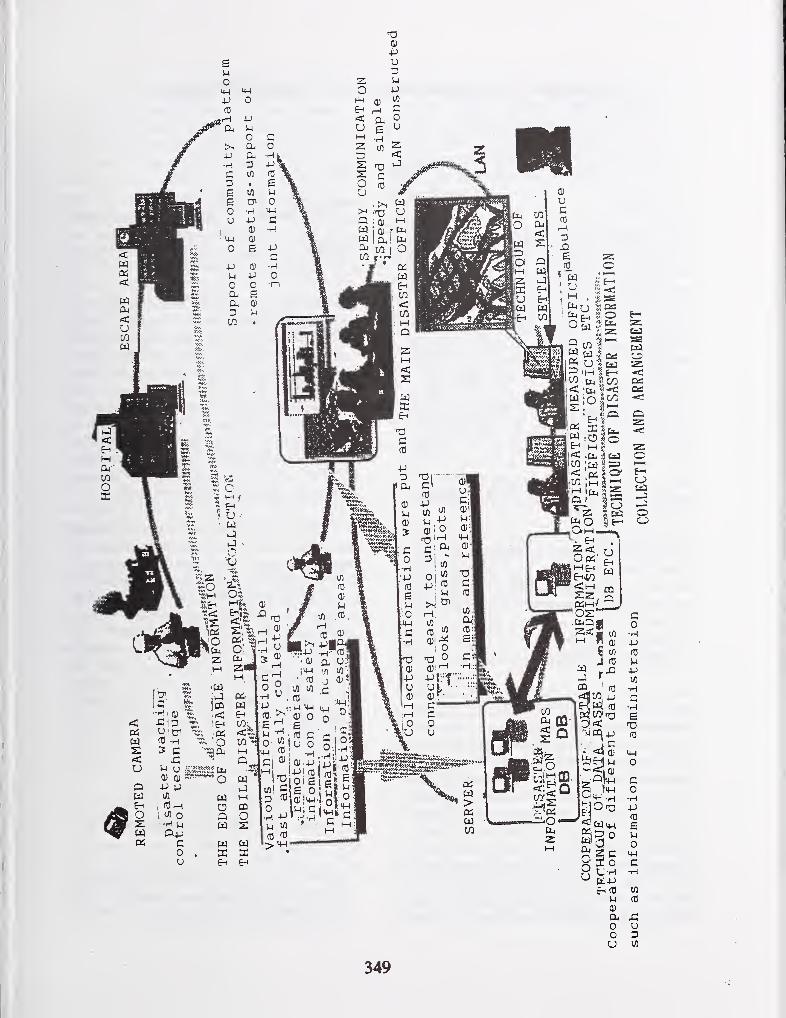
349
Geospatial Analysis Support to Natural Disasters
By
William E. Roper
'
ABSTRACT
Natural disasters have a major impact, globally
and within the United States (U.S.) causing injury
and loss of life, as well as economic losses. To
better address disaster response needs, a task force
has been established to leverage technological
capabilities to improve disaster management.
Geospatial analysis is one of these important
capabilities. A cross section of geospatial
technologies applicable to disaster management
are presented. These include: 3-D visualization,
hyperspectral imagery, use of spectral libraries,
digital multispectral video, fluorescence, radar
imaging systems, photogeologic analysis, shaded
relief imagery, differential global positioning
system, and geographic information systems. Asample of satellite and sensor systems currently
available is presented.
KEYWORDS: disaster management; mapping;
hyperspectral; geospatial; spectral library; radar
imaging; fluorescence; GIS; photogeologic
analysis; GPS; satellite sensors; shaded relief; 3-D
fly through.
1. INTRODUCTION
Natural disasters are a constant threat to mankind
on a global scale. Global disaster costs are
continuing to rise. Annual global economic costs
related to disaster events average $440 billion per
year (World Disaster Report, 1996) with floods
being the major cause (Figure 1). In the U.S., the
number of lives lost due to natural disasters has
been decreasing over the last several decades,
largely because of advances in disaster indication
and warning capabilities. In terms of damage to
property, however, the trend is reversed. For the
period 1992-1996, the average cost of natural
disasters in the U.S. has been $54.3 billion, with
hurricanes and earthquakes tied as the leading
cause (Figure 2). These rising costs are the
combined result of increased urbanization,
particularly in high-risk coastal areas, and the
increased complexity and size of our
infrastructure.
The loss of life and property continues to rise in
many regions of the world because of these
events. One example is the Bangladesh weather
event of 1970, when a tropical cyclone slammed
into its delta region killing 300,000 people (Tobin
and Montz, 1997). The crop losses were
estimated at $63 million, and more than 280,000
cattle were drown (Burton, Kates, and White,
1993). The rich delta soil is an agricultural
resource that still draws people to settle there,
therefore a recurrence of this type of weather
event could likely pose a similar disaster.
This paper will focus on geospatial analysis and
some of the specific developments in this rapidly
changing area that can assist the disaster manager.
There has been significant capability growth in
the geospatial areas of remote sensing, spectral
analysis, global positioning systems (GPS),
geographic information systems (GIS), and
modeling and simulation techniques (Roper,
1997). Each adds important value in
characterizing infrastructure, risk areas, disaster
zones, and control points that are essential to
rapid deployment of scarce resources in the most
effective manner.
2. GLOBAL DISASTERINFORMATION NETWORK
In February 1997, Vice President Albert Gore sent
a letter to key Federal departments and agencies
' Director, U.S. Army Topographic Engineering
Center, 7701 Telegraph Road, Alexandria, VA22315-3864, www.tec.army.mil
350
requesting that senior officials discuss the
feasibihty of establishing a global disaster
information network. In response to this request,
a Disaster Information Task Force was established
to evaluate the needs and issues, examine the
feasibility, and outline a phased, integrated
approach to address this important global need
(Disaster Information Task Force Report, 1997).
There has been considerable effort expended in
developing and coordinating activities in the U.S.
Federal government over the last 1 1/2 years
relating to the Global Disaster Information
Network (GDIN). Some of the initial Geospatial-
related efforts focused on the integration of
archival and real-time data sets, and the
adaptation of new and emerging technologies.
Ongoing activities of the Disaster Information
Task Force related to geospatial technology
include directed technology support, information
integration, and modeling technologies for
disaster effects. The specific recommendation for
the directed technology area includes
development of approaches to integrate new and
emerging tools and technologies for modeling,
simulation, data fiision, etc., for use by disaster
managers and planners.
It is important to consider the application of
geospatial data and analysis across the
comprehensive Disaster Management Cycle. This
basic four-phased fi-amework of mitigation,
preparedness, response, and recovery, when
integrated with GDIN capabilities, can be a strong
supplement to current disaster support functions
(Figure 3). Geospatial information can make a
critical contribution to the disaster management
community through enhancing the definition,
identification, accuracy, and availability of
essential information for community resilience.
3. GEOSPATIAL RESEARCHCOMMUNITY INVOLVEMENT
The flow of disaster related information can be
conceptually shown as a seven step process as
shown in Figure 4. The geospatial research
community may have a role in each of these steps,
depending on the particular disaster situation.
This could include assistance in defining the
problem through current image analysis.
Assistance in determining collection and analysis
methodologies assists in defining the requirement.
A key area of support is providing supporting
data in the form of maps, imagery, and spectral
information.
An even more important support area is data
exploitation. This includes the processing of
digital data, image integration, feature
classification and attribution, classification
output, accuracy assessments, and post-processing
operations. It is the most technically challenging
step in the process. The decision support phase
includes geospatial visualization, merged data
analysis, and specialized decision support
products. This involves the synthesis of data
types in order is generate data layers (such as,
soils, vegetation, terrain) along with models and
simulation techniques that use the various data
layers.
It is during this phase that the concept of virtual
forums could take place. These forums would
allow expert input from multiple locations to be
jointly focused on problem solving for the disaster
situation. Within the geospatial community this
could include virtual fly-through support showing
the impacts of possible decisions on the natural
environment, the built environment, and on the
population, including those with special needs. It
also could include analysis of changing situational
information, and image-based change detection
and analysis.
In the final two phases, tailored map products and
GIS overlay information can be used as integral
parts of directives and guidance to disaster
mangers in the field. These specific products
could be maps delineating evacuation routes, area
identification for damage assessments, or point
locations for water distribution.
The geospatial research community has typically
been interdisciplinary, including the natural
sciences, engineering, architecture, land use
planning, photogrametry, etc. However, in the
disaster management arena, broader
351
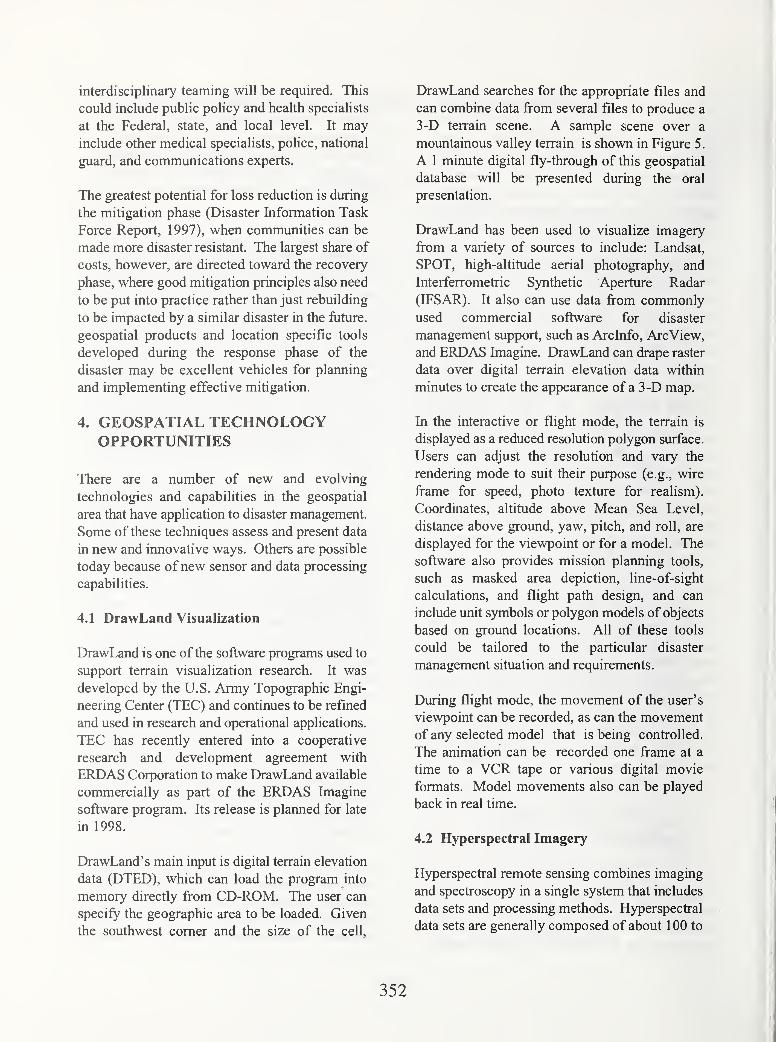
interdisciplinary teaming will be required. This
could include public policy and health specialists
at the Federal, state, and local level. It mayinclude other medical specialists, police, national
guard, and communications experts.
The greatest potential for loss reduction is during
the mitigation phase (Disaster Information Task
Force Report, 1997), when communities can be
made more disaster resistant. The largest share of
costs, however, are directed toward the recovery
phase, where good mitigation principles also need
to be put into practice rather than just rebuilding
to be impacted by a similar disaster in the future,
geospatial products and location specific tools
developed during the response phase of the
disaster may be excellent vehicles for planning
and implementing effective mitigation.
4. GEOSPATIAL TECHNOLOGYOPPORTUNITIES
There are a number of new and evolving
technologies and capabilities in the geospatial
area that have application to disaster management.
Some of these techniques assess and present data
in new and innovative ways. Others are possible
today because ofnew sensor and data processing
capabilities.
4.1 DrawLand Visualization
DrawLand is one of the software programs used to
support terrain visualization research. It was
developed by the U.S. Army Topographic Engi-
neering Center (TEC) and continues to be refined
and used in research and operational applications.
TEC has recently entered into a cooperative
research and development agreement with
ERDAS Corporation to make DrawLand available
commercially as part of the ERDAS Imagine
software program. Its release is planned for late
in 1998.
DrawLand 's main input is digital terrain elevation
data (DTED), which can load the program into
memory directly from CD-ROM. The user can
specify the geographic area to be loaded. Given
the southwest comer and the size of the cell,
DrawLand searches for the appropriate files and
can combine data from several files to produce a
3-D terrain scene. A sample scene over a
mountainous valley terrain is shown in Figure 5.
A 1 minute digital fly-through of this geospatial
database will be presented during the oral
presentation.
DrawLand has been used to visualize imagery
from a variety of sources to include: Landsat,
SPOT, high-altitude aerial photography, and
Interferrometric Synthetic Aperture Radar
(IFSAR). It also can use data from commonlyused commercial software for disaster
management support, such as Arclnfo, ArcView,
and ERDAS Imagine. DrawLand can drape raster
data over digital terrain elevation data within
minutes to create the appearance of a 3-D map.
In the interactive or flight mode, the terrain is
displayed as a reduced resolution polygon surface.
Users can adjust the resolution and vary the
rendering mode to suit their purpose (e.g., wire
fi"ame for speed, photo texture for realism).
Coordinates, altitude above Mean Sea Level,
distance above ground, yaw, pitch, and roll, are
displayed for the viewpoint or for a model. The
software also provides mission planning tools,
such as masked area depiction, line-of-sight
calculations, and flight path design, and can
include unit symbols or polygon models of objects
based on ground locations. All of these tools
could be tailored to the particular disaster
management situation and requirements.
During flight mode, the movement of the user's
viewpoint can be recorded, as can the movement
of any selected model that is being controlled.
The animation can be recorded one frame at a
time to a VCR tape or various digital movie
formats. Model movements also can be played
back in real time.
4.2 Hyperspectral Imagery
Hyperspectral remote sensing combines imaging
and spectroscopy in a single system that includes
data sets and processing methods. Hyperspectral
data sets are generally composed of about 100 to
352
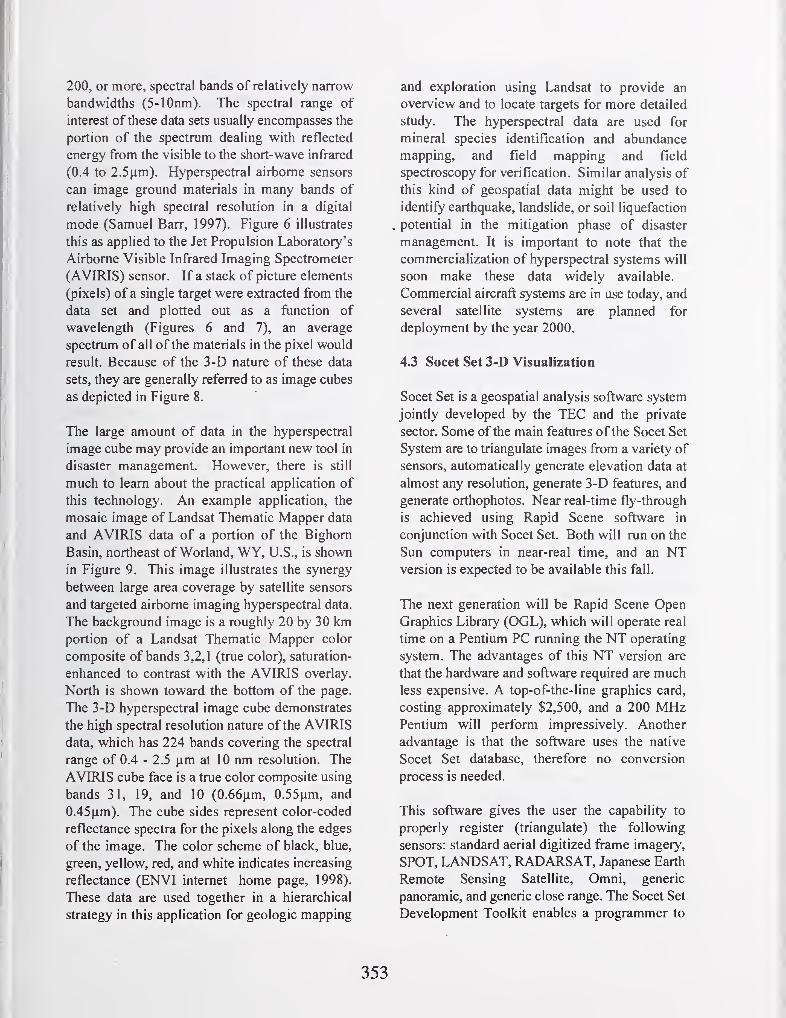
200, or more, spectral bands of relatively narrow
bandwidths (5-lOnm). The spectral range of
interest of these data sets usually encompasses the
portion of the spectrum dealing with reflected
energy from the visible to the short-wave infrared
(0.4 to 2.5^m). Hyperspectral airborne sensors
can image ground materials in many bands of
relatively high spectral resolution in a digital
mode (Samuel Barr, 1997). Figure 6 illustrates
this as applied to the Jet Propulsion Laboratory's
Airborne Visible Infrared Imaging Spectrometer
(AVIRIS) sensor. If a stack of picture elements
(pixels) of a single target were extracted from the
data set and plotted out as a function of
wavelength (Figures 6 and 7), an average
spectrum of all of the materials in the pixel would
result. Because of the 3-D nature of these data
sets, they are generally referred to as image cubes
as depicted in Figure 8.
The large amount of data in the hyperspectral
image cube may provide an important new tool in
disaster management. However, there is still
much to learn about the practical application of
this technology. An example application, the
mosaic image of Landsat Thematic Mapper data
and AVIRIS data of a portion of the Bighorn
Basin, northeast of Worland, WY, U.S., is shown
in Figure 9. This image illustrates the synergy
between large area coverage by satellite sensors
and targeted airborne imaging hyperspectral data.
The background image is a roughly 20 by 30 kmportion of a Landsat Thematic Mapper color
composite of bands 3,2,1 (true color), saturation-
enhanced to contrast with the AVIRIS overlay.
North is shown toward the bottom of the page.
The 3-D hyperspectral image cube demonstrates
the high spectral resolution nature of the AVIRIS
data, which has 224 bands covering the spectral
range of 0.4 - 2.5 ^m at 10 nm resolution. The
AVIRIS cube face is a true color composite using
bands 31, 19, and 10 (0.66nm, 0.55^m, and
0.45 ^m). The cube sides represent color-coded
reflectance spectra for the pixels along the edges
of the image. The color scheme of black, blue,
green, yellow, red, and white indicates increasing
reflectance (ENVI internet home page, 1998).
These data are used together in a hierarchical
strategy in this application for geologic mapping
and exploration using Landsat to provide an
overview and to locate targets for more detailed
study. The hyperspectral data are used for
mineral species identification and abundance
mapping, and field mapping and field
spectroscopy for verification. Similar analysis of
this kind of geospatial data might be used to
identify earthquake, landslide, or soil liquefaction
. potential in the mitigation phase of disaster
management. It is important to note that the
commercialization of hyperspectral systems will
soon make these data widely available.
Commercial aircraft systems are in use today, and
several satellite systems are planned for
deployment by the year 2000.
4.3 Socet Set 3-D Visualization
Socet Set is a geospatial analysis software system
jointly developed by the TEC and the private
sector. Some of the main features of the Socet Set
System are to triangulate images from a variety of
sensors, automatically generate elevation data at
almost any resolution, generate 3-D features, and
generate orthophotos. Near real-time fly-through
is achieved using Rapid Scene software in
conjunction with Socet Set. Both will run on the
Sun computers in near-real time, and an NTversion is expected to be available this fall.
The next generation will be Rapid Scene OpenGraphics Library (OGL), which will operate real
time on a Pentium PC running the NT operating
system. The advantages of this NT version are
that the hardware and software required are muchless expensive. A top-of-the-line graphics card,
costing approximately $2,500, and a 200 MHzPentium will perform impressively. Another
advantage is that the software uses the native
Socet Set database, therefore no conversion
process is needed.
This software gives the user the capability to
properly register (triangulate) the following
sensors: standard aerial digitized frame imagery,
SPOT, LANDSAT, RADARSAT, Japanese Earth
Remote Sensing Satellite, Omni, generic
panoramic, and generic close range. The Socet Set
Development Toolkit enables a programmer to
353

insert additional math models into the software to
perform registration in conjunction with other
sensors.
Whenever stereo imagery is available for the
above sensors, one can generate high-resolution
elevation data using the Automatic Terrain
Extraction (ATE) module of the Socet Set
software. Thus, it is possible to generate data that
has a post spacing of Im, if so desired. The
horizontal and vertical accuracy of this data
depends on a number of factors, such as the
resolution of the imagery, the type of control
points used, and the convergence angle of the
stereo images. Further applications, such as
terrain shaded relief images, and line of sight
analysis, can be done within Socet Set. The line
of sight capability provided within Socet Set also
integrates buildings and trees into the analysis (if
constructed in the feature extraction module
described below).
Where the elevation data generated using
automatic terrain extraction does not meet quality
control criteria, a full suite of interactive editing
tools is available to manually update the data.
Typically this may be required over features such
as lakes where there is little contrast in the
imagery for the automatic correlation process to
perform efficiently.
Another key capability is the ability to create
digital orthophotos where the displacement is
accounted for because of terrain relief This in
turn can be made into a map substitute with grid
lines and feature annotation overlain for quick
updates of maps in emergency situations.
The Feature Extraction module enables the user
to collect arial, line, and point features while in a
3-D stereo environment. Thus, a true coordinate
exists for every point digitized. The feature
extraction tool also allows the construction of
3-D wire frame models that high resolution
simulator fly-through packages depend on to
make the generated scenes appear realistic. The
wire frames can be exported into several other
software packages for further exploitation.
A module called Image Perspective
Transformation (IPT) is available, which renders
high resolution fly-throughs in non-real time.
Although this is not a real-time interactive fly-
through capability, several features are still
unique on this module. The software allows the
user to texture the rendered scenes from multiple
images that are registered in an automated
fashion. Thus, a building can have texture on four
sides and the roof from five different images, and
the user does not have to manually register each
image. Since the images have already been tied to
the ground, and with each other photogram-
metrically, all of the image texture from all of the
images will correctly cover the appropriate
building face as shown in Figure 10 (a 1 minute
dynamic fly-through was shown in the oral
presentation).
As mentioned previously, Socet Set is one of the
premier database development tools for
constructing high resolution fly-throughs. All of
the above tools give the user the ability to put
together, from two or more images, a complete,
accurate database. The interface with the Evans
and Sutherland, Inc., simulator databases is a final
important step in allowing the database to
maintain its integrity. Typically, in the translation
of data from one software package to the next,
important attributes are lost or altered, decreasing
the accuracy and usefulness of the database.
The applications of these tools are numerous.
TEC has done work to help locate where World
War I-era munitions were buried in the Spring
Valley neighborhood of Washington, D.C., by
triangulating images taken in the 1920s with
modem imagery. This gave analysts the ability to
precisely locate where potential burial locations
existed in a modem coordinate system.
For disaster assistance Socet Set can create high
resolution data sets from a wide variety of image
sources. Using Rapid Scene with Socet Set, 3-D
depictions of the terrain and building features can
be created. The disaster manager could virtually
walk into the situation to conduct assessments and
planning activities.
354
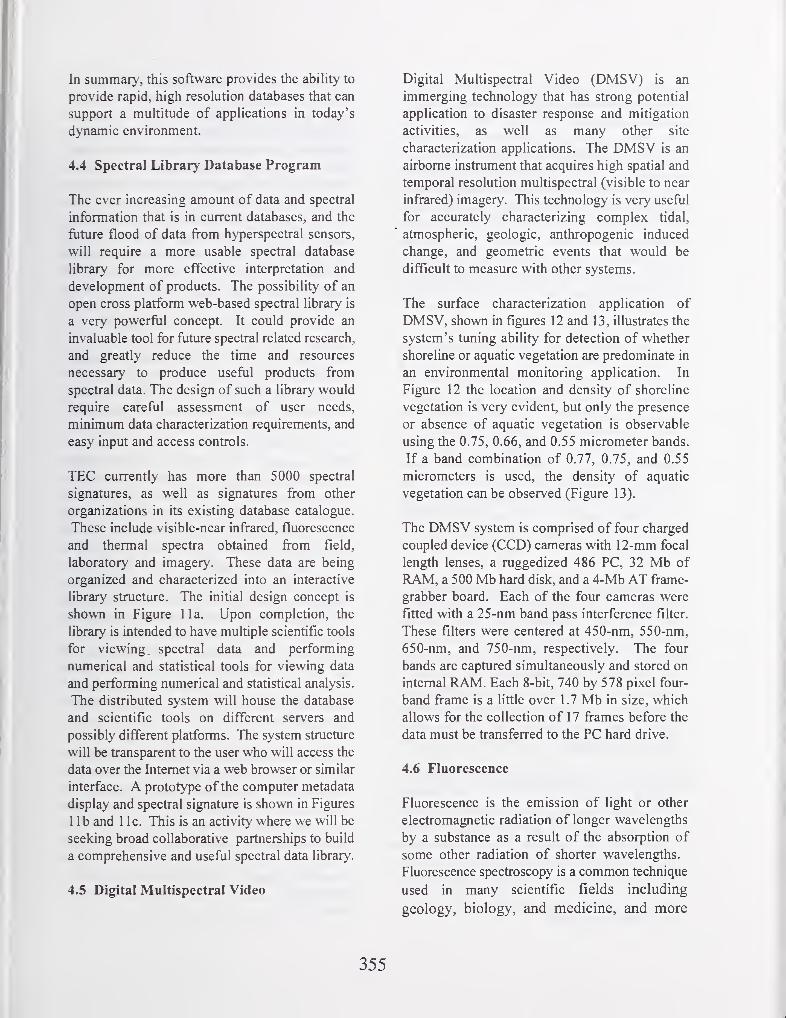
In summary, this software provides the ability to
provide rapid, high resolution databases that can
support a multitude of applications in today's
d>Tiamic environment.
4.4 Spectral Library Database Program
The ever increasing amount of data and spectral
information that is in current databases, and the
future flood of data from hyperspectral sensors,
will require a more usable spectral database
library for more effective interpretation and
development of products. The possibility of an
open cross platform web-based spectral library is
a very powerftil concept. It could provide an
invaluable tool for future spectral related research,
and greatly reduce the time and resources
necessary to produce useful products from
spectral data. The design of such a library would
require careful assessment of user needs,
minimum data characterization requirements, and
easy input and access controls.
TEC currently has more than 5000 spectral
signatures, as well as signatures from other
organizations in its existing database catalogue.
These include visible-near infrared, fluorescence
and thermal spectra obtained from field,
laboratory and imagery. These data are being
organized and characterized into an interactive
library structure. The initial design concept is
shown in Figure 11a. Upon completion, the
library is intended to have multiple scientific tools
for viewing spectral data and performing
numerical and statistical tools for viewing data
and performing numerical and statistical analysis.
The distributed system will house the database
and scientific tools on different servers and
possibly different platforms. The system structure
will be transparent to the user who will access the
data over the Internet via a web browser or similar
interface. A prototype of the computer metadata
display and spectral signature is shown in Figures
lib and 1 Ic. This is an activity where we will be
seeking broad collaborative partnerships to build
a comprehensive and useful spectral data library.
4.5 Digital Multispectral Video
Digital Multispectral Video (DMSV) is an
immerging technology that has strong potential
application to disaster response and mitigation
activities, as well as many other site
characterization applications. The DMSV is an
airborne instrument that acquires high spatial and
temporal resolution multispectral (visible to near
infrared) imagery. This technology is very useful
for accurately characterizing complex tidal,
' atmospheric, geologic, anthropogenic induced
change, and geometric events that would be
difficult to measure with other systems.
The surface characterization application of
DMSV, shown in figures 12 and 13, illustrates the
system's tuning ability for detection of whether
shoreline or aquatic vegetation are predominate in
an environmental monitoring application. In
Figure 12 the location and density of shoreline
vegetation is very evident, but only the presence
or absence of aquatic vegetation is observable
using the 0.75, 0.66, and 0.55 micrometer bands.
If a band combination of 0.77, 0.75, and 0.55
micrometers is used, the density of aquatic
vegetation can be observed (Figure 13).
The DMSV system is comprised of four charged
coupled device (CCD) cameras with 12-mm focal
length lenses, a ruggedized 486 PC, 32 Mb of
RAM, a 500 Mb hard disk, and a 4-Mb AT frame-
grabber board. Each of the four cameras were
fitted with a 25-nm band pass interference filter.
These filters were centered at 450-nm, 550-nm,
650-nm, and 750-nm, respectively. The four
bands are captured simultaneously and stored on
internal RAM. Each 8-bit, 740 by 578 pixel four-
band frame is a little over 1.7 Mb in size, which
allows for the collection of 17 frames before the
data must be transferred to the PC hard drive.
4.6 Fluorescence
Fluorescence is the emission of light or other
electromagnetic radiation of longer wavelengths
by a substance as a result of the absorption of
some other radiation of shorter wavelengths.
Fluorescence spectroscopy is a common technique
used in many scientific fields including
geology, biology, and medicine, and more
355
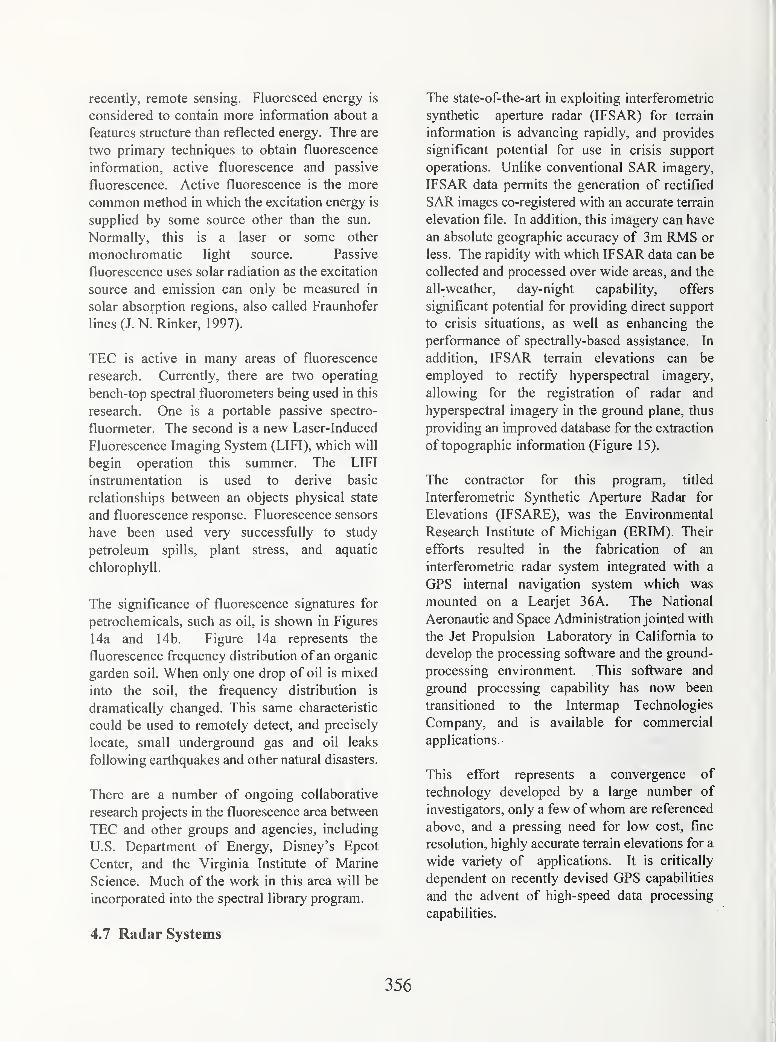
recently, remote sensing. Fluoresced energy is
considered to contain more information about a
features structure than reflected energy. Thre are
two primary techniques to obtain fluorescence
information, active fluorescence and passive
fluorescence. Active fluorescence is the more
common method in which the excitation energy is
supplied by some source other than the sun.
Normally, this is a laser or some other
monochromatic light source. Passive
fluorescence uses solar radiation as the excitation
source and emission can only be measured in
solar absorption regions, also called Fraunhofer
lines(J.N. Rinker, 1997).
TEC is active in many areas of fluorescence
research. Currently, there are two operating
bench-top spectral fluorometers being used in this
research. One is a portable passive spectro-
fluormeter. The second is a new Laser-Induced
Fluorescence Imaging System (LIFI), which will
begin operation this summer. The LIFI
instrumentation is used to derive basic
relationships between an objects physical state
and fluorescence response. Fluorescence sensors
have been used very successfully to study
petroleum spills, plant stress, and aquatic
chlorophyll.
The significance of fluorescence signatures for
petrochemicals, such as oil, is shown in Figures
14a and 14b. Figure 14a represents the
fluorescence frequency distribution of an organic
garden soil. When only one drop of oil is mixed
into the soil, the frequency distribution is
dramatically changed. This same characteristic
could be used to remotely detect, and precisely
locate, small underground gas and oil leaks
following earthquakes and other natural disasters.
There are a number of ongoing collaborative
research projects in the fluorescence area between
TEC and other groups and agencies, including
U.S. Department of Energy, Disney's Epcot
Center, and the Virginia Institute of Marine
Science. Much of the work in this area will be
incorporated into the spectral library program.
4.7 Radar Systems
The state-of-the-art in exploiting interferometric
synthetic aperture radar (IFSAR) for terrain
information is advancing rapidly, and provides
significant potential for use in crisis support
operations. Unlike conventional SAR imagery,
IFSAR data permits the generation of rectified
SAR images co-registered with an accurate terrain
elevation file. In addition, this imagery can have
an absolute geographic accuracy of 3m RMS or
less. The rapidity with which IFSAR data can be
collected and processed over wide areas, and the
all-weather, day-night capability, offers
significant potential for providing direct support
to crisis situations, as well as enhancing the
performance of spectrally-based assistance. In
addition, IFSAR terrain elevations can be
employed to rectify hyperspectral imagery,
allowing for the registration of radar and
hyperspectral imagery in the ground plane, thus
providing an improved database for the extraction
of topographic information (Figure 15).
The contractor for this program, titled
Interferometric Synthetic Aperture Radar for
Elevations (IFSARE), was the Environmental
Research Institute of Michigan (ERIM). Their
efforts resulted in the fabrication of an
interferometric radar system integrated with a
GPS internal navigation system which was
mounted on a Learjet 36A. The National
Aeronautic and Space Administration jointed with
the Jet Propulsion Laboratory in California to
develop the processing software and the ground-
processing environment. This software and
ground processing capability has now been
transitioned to the Intermap Technologies
Company, and is available for commercial
applications.
This effort represents a convergence of
technology developed by a large number of
investigators, only a few ofwhom are referenced
above, and a pressing need for low cost, fine
resolution, highly accurate terrain elevations for a
wide variety of applications. It is critically
dependent on recently devised GPS capabilities
and the advent of high-speed data processing
capabilities.
356
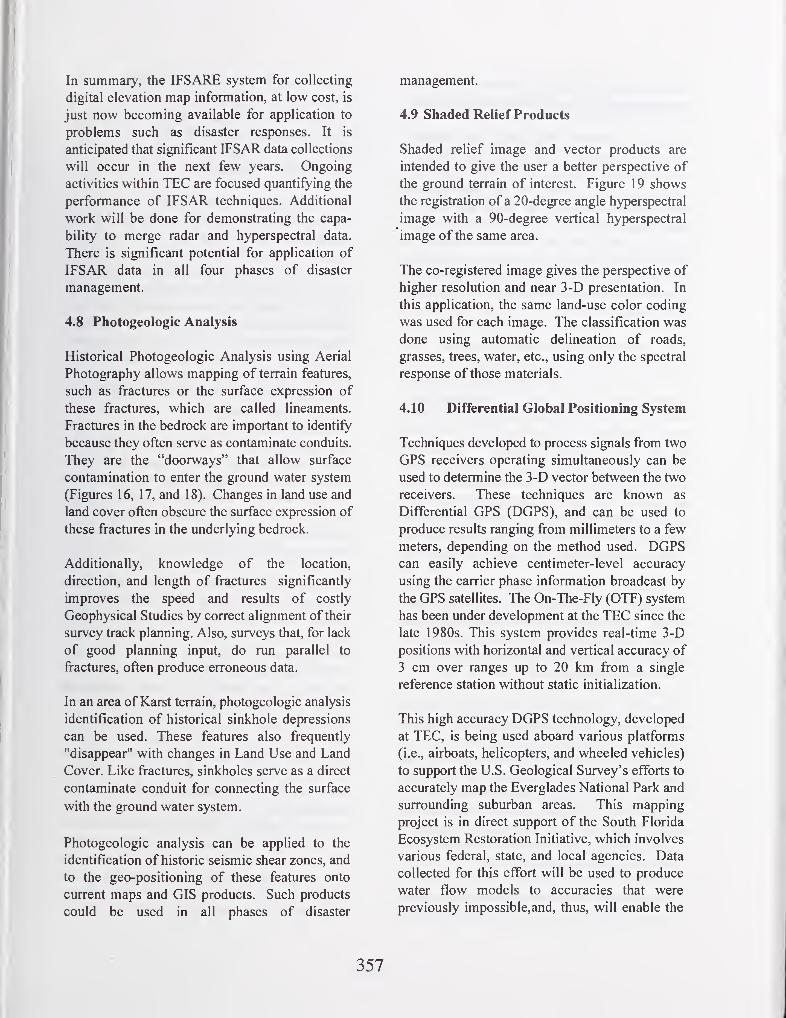
In summary, the IFSARE system for collecting
digital elevation map information, at low cost, is
just now becoming available for application to
problems such as disaster responses. It is
anticipated that significant IFSAR data collections
will occur in the next few years. Ongoing
activities within TEC are focused quantifying the
performance of IFSAR techniques. Additional
work will be done for demonstrating the capa-
bility to merge radar and hyperspectral data.
There is significant potential for application of
IFSAR data in all four phases of disaster
management.
4.8 Photogeologic Analysis
Historical Photogeologic Analysis using Aerial
Photography allows mapping of terrain features,
such as fractures or the surface expression of
these fractures, which are called lineaments.
Fractures in the bedrock are important to identify
because they often serve as contaminate conduits.
They are the "doorways" that allow surface
contamination to enter the ground water system
(Figures 16, 17, and 18). Changes in land use and
land cover often obscure the surface expression of
these fractures in the underlying bedrock.
Additionally, knowledge of the location,
direction, and length of fractures significantly
improves the speed and results of costly
Geophysical Studies by correct alignment of their
survey track planning. Also, surveys that, for lack
of good planning input, do run parallel to
fractures, often produce erroneous data.
In an area of Karst terrain, photogeologic analysis
identification of historical sinkhole depressions
can be used. These features also frequently
"disappear" with changes in Land Use and Land
Cover. Like fractures, sinkholes serve as a direct
contaminate conduit for connecting the surface
with the ground water system.
Photogeologic analysis can be applied to the
identification of historic seismic shear zones, and
to the geo-positioning of these features onto
current maps and GIS products. Such products
could be used in all phases of disaster
management.
4.9 Shaded Relief Products
Shaded relief image and vector products are
intended to give the user a better perspective of
the ground terrain of interest. Figure 19 shows
the registration of a 20-degree angle hyperspectral
image with a 90-degree vertical hyperspectral
image of the same area.
The co-registered image gives the perspective of
higher resolution and near 3-D presentation. In
this application, the same land-use color coding
was used for each image. The classification was
done using automatic delineation of roads,
grasses, trees, water, etc., using only the spectral
response of those materials.
4.10 Differential Global Positioning System
Techniques developed to process signals from two
GPS receivers operating simultaneously can be
used to determine the 3-D vector between the two
receivers. These techniques are known as
Differential GPS (DGPS), and can be used to
produce results ranging from millimeters to a few
meters, depending on the method used. DGPScan easily achieve centimeter-level accuracy
using the carrier phase information broadcast by
the GPS satellites. The On-The-Fly (OTF) system
has been under development at the TEC since the
late 1980s. This system provides real-time 3-D
positions with horizontal and vertical accuracy of
3 cm over ranges up to 20 km from a single
reference station without static initialization.
This high accuracy DGPS technology, developed
at TEC, is being used aboard various platforms
(i.e., airboats, helicopters, and wheeled vehicles)
to support the U.S. Geological Survey's efforts to
accurately map the Everglades National Park and
surrounding suburban areas. This mapping
project is in direct support of the South Florida
Ecosystem Restoration Initiative, which involves
various federal, state, and local agencies. Data
collected for this effort will be used to produce
water flow models to accuracies that were
previously impossible,and, thus, will enable the
357
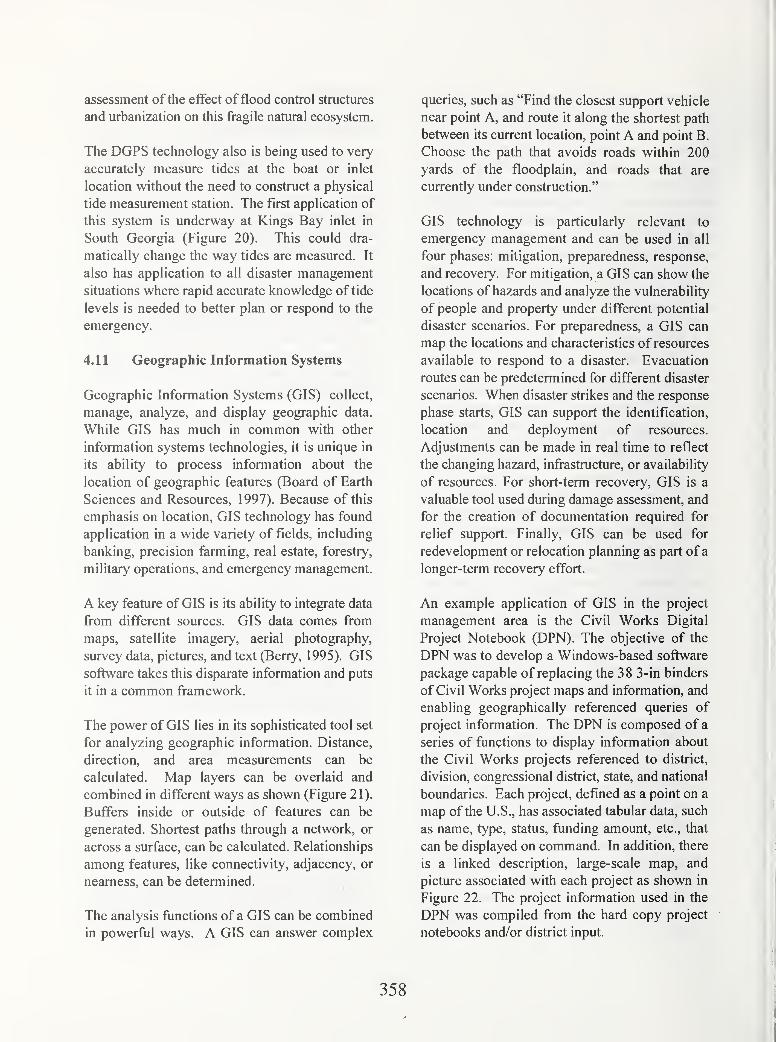
assessment ofthe effect of flood control structures
and urbanization on this fragile natural ecosystem.
The DGPS technology also is being used to very
accurately measure tides at the boat or inlet
location without the need to construct a physical
tide measurement station. The first application of
this system is underway at Kings Bay inlet in
South Georgia (Figure 20). This could dra-
matically change the way tides are measured. It
also has application to all disaster management
situations where rapid accurate knowledge of tide
levels is needed to better plan or respond to the
emergency.
4.11 Geographic Information Systems
Geographic Information Systems (GIS) collect,
manage, analyze, and display geographic data.
While GIS has much in common with other
information systems technologies, it is unique in
its ability to process information about the
location of geographic features (Board of Earth
Sciences and Resources, 1997). Because of this
emphasis on location, GIS technology has found
application in a wide variety of fields, including
banking, precision farming, real estate, forestry,
military operations, and emergency management.
A key feature of GIS is its ability to integrate data
from different sources. GIS data comes from
maps, satellite imagery, aerial photography,
survey data, pictures, and text (Berry, 1995). GIS
software takes this disparate information and puts
it in a common framework.
The power of GIS lies in its sophisticated tool set
for analyzing geographic information. Distance,
direction, and area measurements can be
calculated. Map layers can be overlaid and
combined in different ways as shown (Figure 21).
Buffers inside or outside of features can be
generated. Shortest paths through a network, or
across a surface, can be calculated. Relationships
among features, like connectivity, adjacency, or
nearness, can be determined.
The analysis functions of a GIS can be combined
in powerful ways. A GIS can answer complex
queries, such as "Find the closest support vehicle
near point A, and route it along the shortest path
between its current location, point A and point B.
Choose the path that avoids roads within 200
yards of the floodplain, and roads that are
currently under construction."
GIS technology is particularly relevant to
emergency management and can be used in all
four phases: mitigation, preparedness, response,
and recovery. For mitigation, a GIS can show the
locations of hazards and analyze the vulnerability
of people and property under different potential
disaster scenarios. For preparedness, a GIS can
map the locations and characteristics of resources
available to respond to a disaster. Evacuation
routes can be predetermined for different disaster
scenarios. When disaster strikes and the response
phase starts, GIS can support the identification,
location and deployment of resources.
Adjustments can be made in real time to reflect
the changing hazard, infrastructure, or availability
of resources. For short-term recovery, GIS is a
valuable tool used during damage assessment, and
for the creation of documentation required for
relief support. Finally, GIS can be used for
redevelopment or relocation planning as part of a
longer-term recovery effort.
An example application of GIS in the project
management area is the Civil Works Digital
Project Notebook (DPN). The objective of the
DPN was to develop a Windows-based software
package capable of replacing the 38 3-in binders
of Civil Works project maps and information, and
enabling geographically referenced queries of
project information. The DPN is composed of a
series of functions to display information about
the Civil Works projects referenced to district,
division, congressional district, state, and national
boundaries. Each project, defined as a point on a
map of the U.S., has associated tabular data, such
as name, type, status, funding amount, etc., that
can be displayed on command. In addition, there
is a linked description, large-scale map, and
picture associated with each project as shown in
Figure 22. The project information used in the
DPN was compiled from the hard copy project
notebooks and/or district input.
358
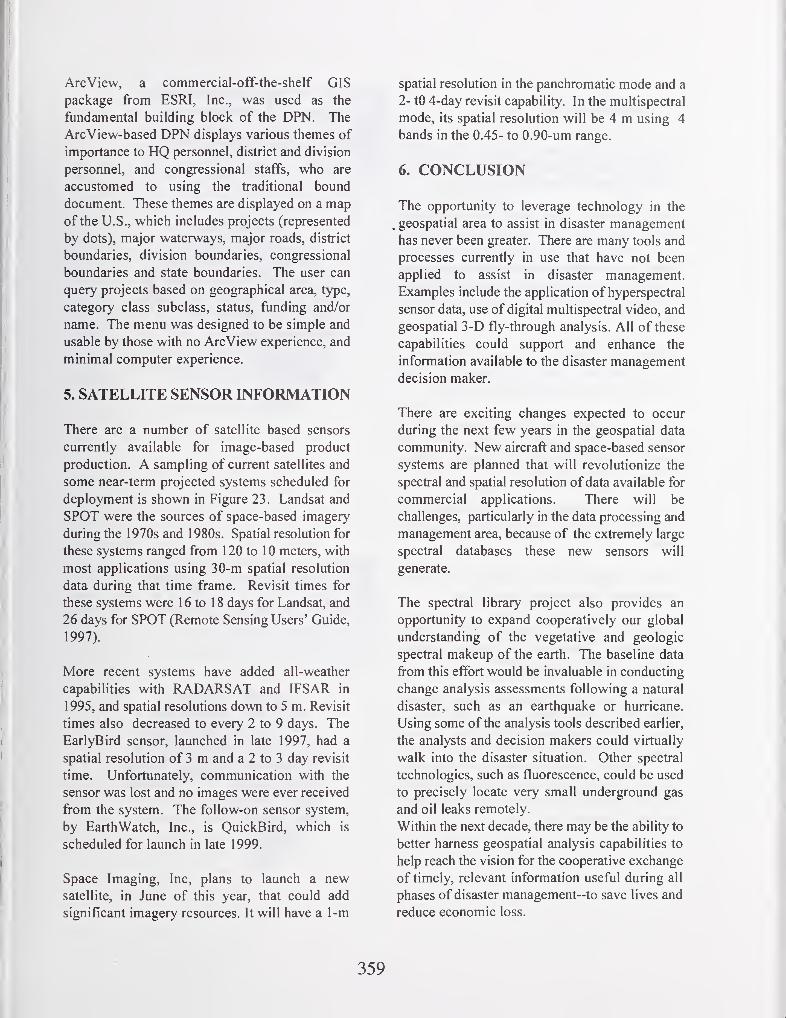
ArcView, a commercial-off-the-shelf GIS
package from ESRI, Inc., was used as the
fundamental building block of the DPN. The
ArcView-based DPN displays various themes of
importance to HQ personnel, district and division
personnel, and congressional staffs, who are
accustomed to using the traditional bound
document. These themes are displayed on a mapof the U.S., which includes projects (represented
by dots), major waterways, major roads, district
boundaries, division boundaries, congressional
boundaries and state boundaries. The user can
query projects based on geographical area, type,
category class subclass, status, funding and/or
name. The menu was designed to be simple and
usable by those with no ArcView experience, and
minimal computer experience.
5. SATELLITE SENSOR INFORMATION
There are a number of satellite based sensors
currently available for image-based product
production. A sampling of current satellites and
some near-term projected systems scheduled for
deployment is shown in Figure 23. Landsat and
SPOT were the sources of space-based imagery
during the 1970s and 1980s. Spatial resolution for
these systems ranged from 120 to 10 meters, with
most applications using 30-m spatial resolution
data during that time frame. Revisit times for
these systems were 16 to 18 days for Landsat, and
26 days for SPOT (Remote Sensing Users' Guide,
1997).
More recent systems have added all-weather
capabilities with RADARSAT and IFSAR in
1995, and spatial resolutions down to 5 m. Revisit
times also decreased to every 2 to 9 days. The
EarlyBird sensor, launched in late 1997, had a
spatial resolution of 3 m and a 2 to 3 day revisit
time. Unfortunately, communication with the
sensor was lost and no images were ever received
from the system. The follow-on sensor system,
by EarthWatch, Inc., is QuickBird, which is
scheduled for launch in late 1999.
Space Imaging, Inc, plans to launch a newsatellite, in June of this year, that could add
significant imagery resources. It will have a 1-m
spatial resolution in the panchromatic mode and a
2- to 4-day revisit capability. In the multispectral
mode, its spatial resolution will be 4 m using 4
bands in the 0.45- to 0.90-um range.
6. CONCLUSION
The opportunity to leverage technology in the
. geospatial area to assist in disaster managementhas never been greater. There are many tools and
processes currently in use that have not been
applied to assist in disaster management.
Examples include the application of hyperspectral
sensor data, use of digital multispectral video, and
geospatial 3-D fly-through analysis. All of these
capabilities could support and enhance the
information available to the disaster management
decision maker.
There are exciting changes expected to occur
during the next few years in the geospatial data
community. New aircraft and space-based sensor
systems are planned that will revolutionize the
spectral and spatial resolution of data available for
commercial applications. There will be
challenges, particularly in the data processing and
management area, because of the extremely large
spectral databases these new sensors will
generate.
The spectral library project also provides an
opportunity to expand cooperatively our global
understanding of the vegetative and geologic
spectral makeup of the earth. The baseline data
from this effort would be invaluable in conducting
change analysis assessments following a natural
disaster, such as an earthquake or hurricane.
Using some of the analysis tools described earlier,
the analysts and decision makers could virtually
walk into the disaster situation. Other spectral
technologies, such as fluorescence, could be used
to precisely locate very small underground gas
and oil leaks remotely.
Within the next decade, there may be the ability to
better harness geospatial analysis capabilities to
help reach the vision for the cooperative exchange
of timely, relevant information useful during all
phases of disaster management—to save lives and
reduce economic loss.
359

7. REFERENCES
Barr, Samuel, Hyperspectral Imagery Exploitation
Tutorial, International Symposium on Spectral
Sensing Research, San Diego, CA, 1997.
Berry, Joseph K., Spatial Reasoning for Effective
GIS, Fort Collins, CO, GIS World Books, 1995.
Board on Earth Sciences and Resources,
Rediscovering Geography, National Research
Council, National Academy Press, Washington,
D.C., 1997.
Burton, Ian, Robert W. Kates, and Gilbert F.
White, The Environment as Hazard, 2d Edition,
New York, NY: The Guilford Press, 1993.
Disaster Information Task Force Report,
Harnessing Information and Technology for
Disaster Management, Global Disaster
Information Network, 1997.
ENVI Inc., AVIRIS Image of Big Horn Basin,
Wyoming, http://www.envi-sw.com/images/asprs ,
1998.
Remote Sensing Users' Guide, U.S. ArmyTopographic Engineering Center, 1997.
Rinker, J.N., Spectral Remote Sensing Tutorial,
International Symposium on Spectral Sensing
Research, San Diego, CA, 1994.
Roper, William E., Challenges in Spectral Sensing
Research; Observations to Information,
International Symposium on Spectral Sensing
Research, San Diego, CA, 1997.
Tobin, Graham A., and Burrell E. Montz, Natural
Hazards: Explanation and Integration, New York,
NY: The Guilford Press, 1997.
360
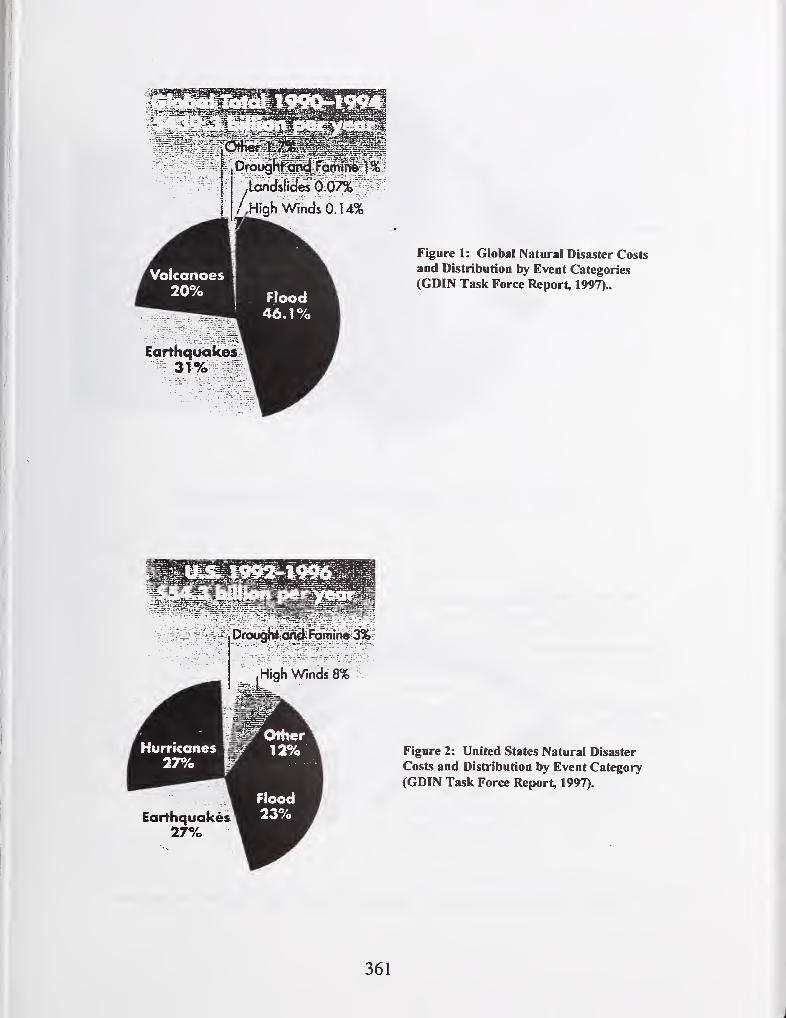
Figure 1: Global Natural Disaster Costsand Distribution by Event Categories
(GDIN Task Force Report, 1997)..
Figure 2: United States Natural Disaster
Costs and Distribution by Event Category
(GDIN Task Force Report, 1997).
361
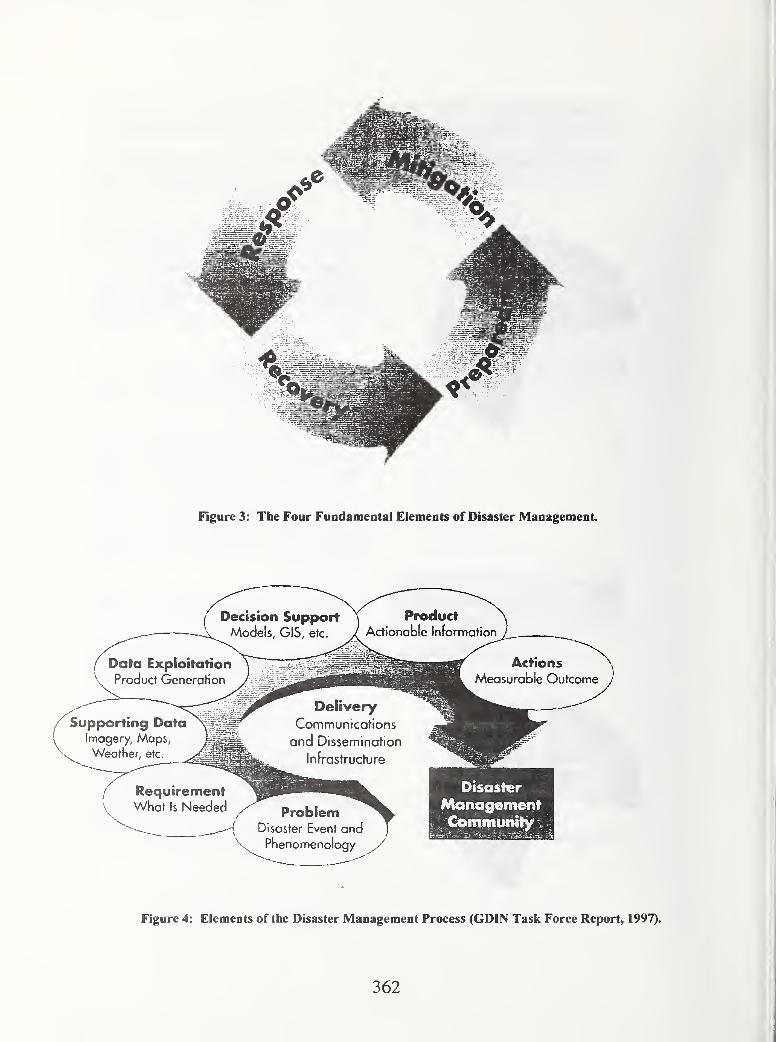
Figure 3: The Four Fundamental Elements of Disaster Management
Decision SupportModels, GIS, etc.
( Data Exploitation
V Product Generation
ActionsMeasurable Outcome Jy
/ Supporting Data\ Imagery, Maps,
Weather, etc.
RequirementWhat Is Needed Problem
( Disaster Event and\^^^^Phenomenology
Disaster
Managemefifr;|C0n!|)«l«wj^
Figure 4: Elements of the Disaster Management Process (GDIN Task Force Report, 1997).
362

Figure 5: Image of River Valley
used in DrawLand Fly-Through.
Figured: Data Collection
niustration of the AVIRISHyperspectral System.
224 Spectral
Bands
i
Single Pixel
20 n X 20 m
224 Images
Taker Simjitaneously
In Adjacent Spectrai
Bands, Innerently
Registered
363
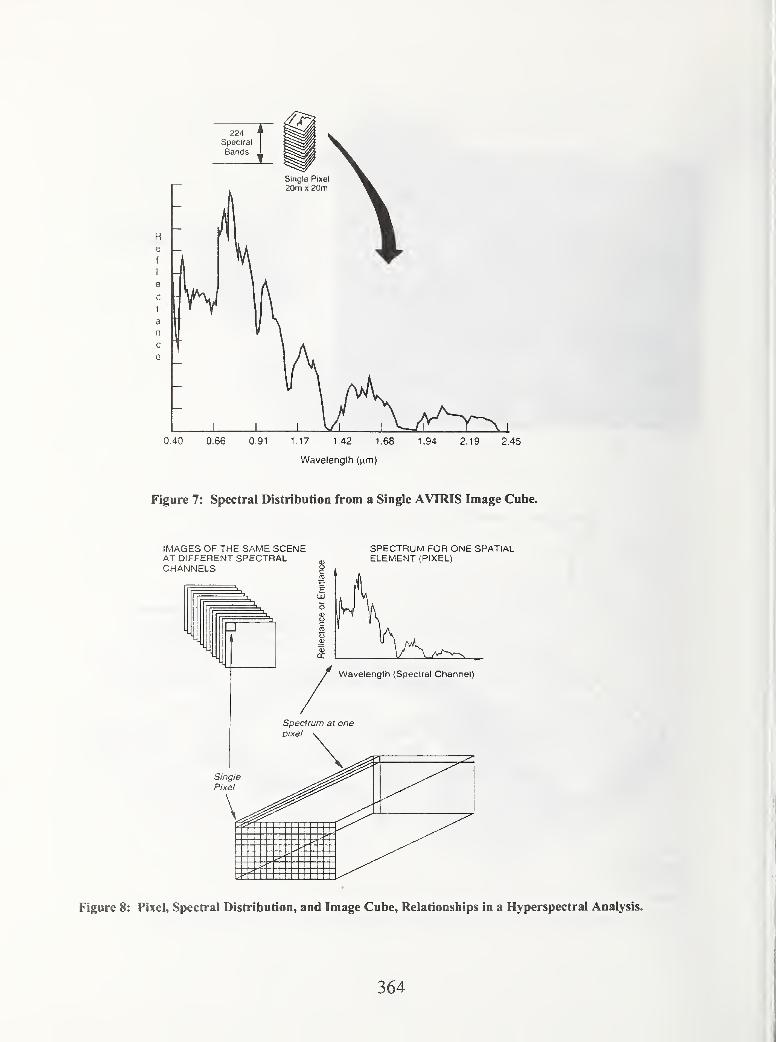
0.40 0.66 0.91 1.17 1.42 1.68 1.94 2.19 2.45
Wavelength (nm)
Figure 7: Spectral Distribution from a Single AVIRIS Image Cube.
Figure 8: Pixel, Spectral Distribution, and Image Cube, Relationships in a Hyperspectral Analysis.
364
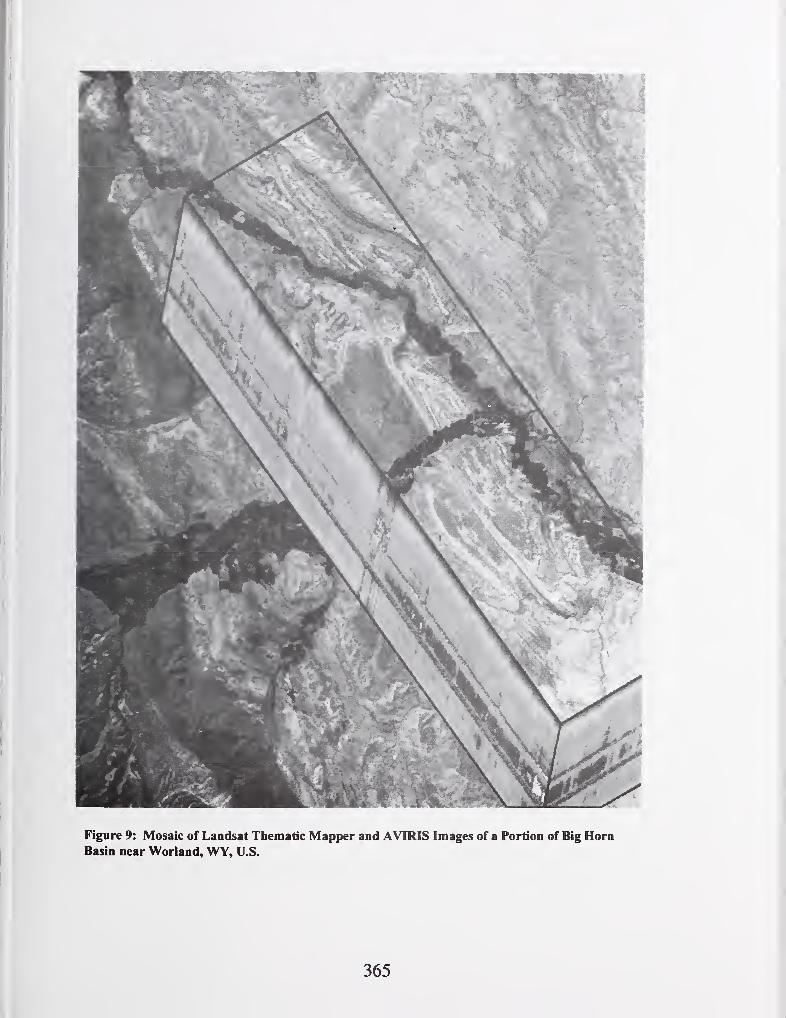
365
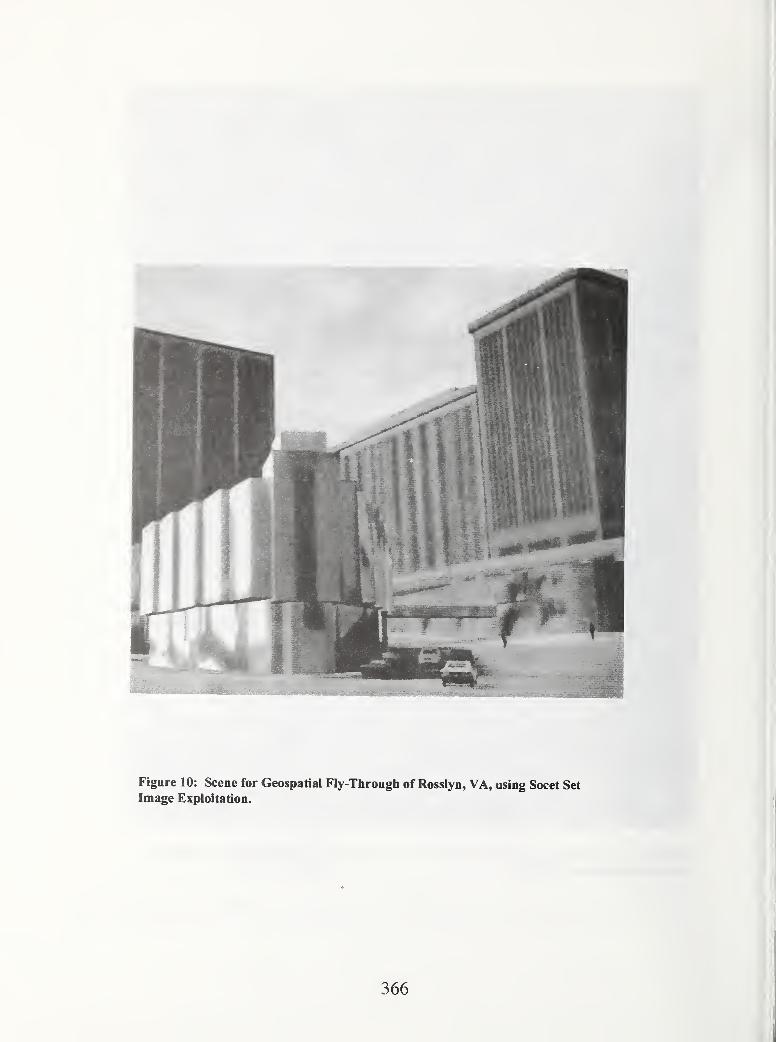
Figure 10: Scene for Geospatial Fly-Through of Rosslyn, VA, using Socet Set
Image Exploitation.
366
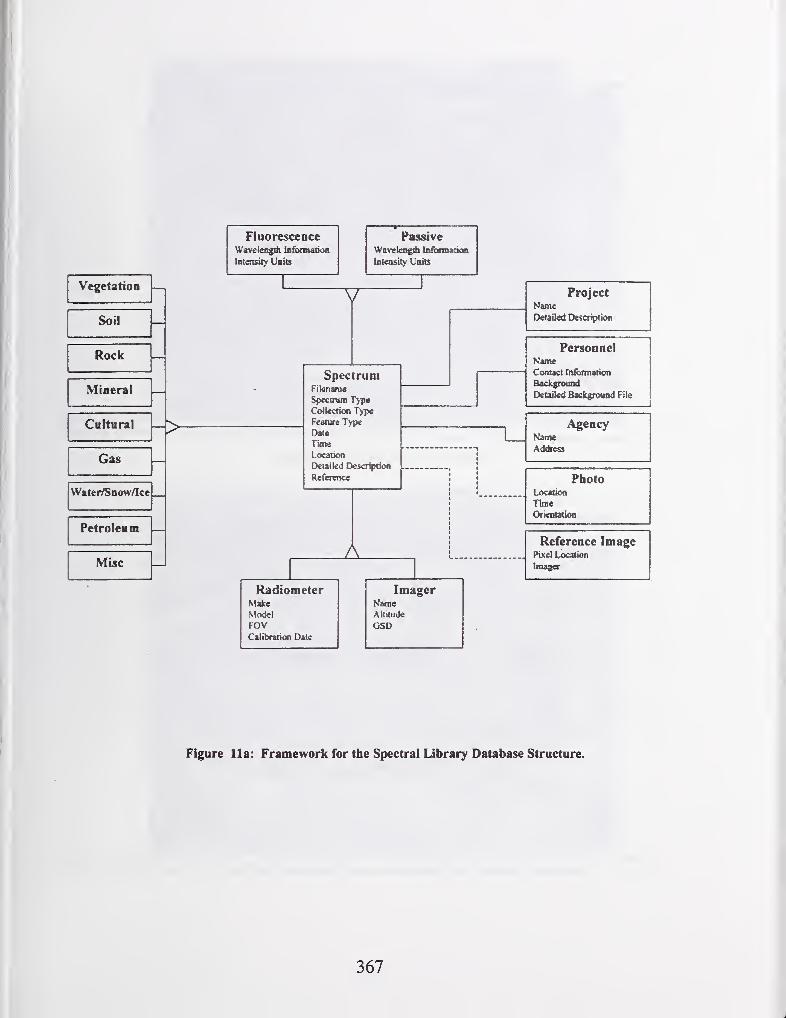
Vegetation
FluorescenceWaveleaglli lo&niiatica
Intensity Units
PassiveWavelcnglfa tnibnBatjoa
(ii(«A$i(y Units
Soil
Rock _
Mineral —
Caftural
Gas
W»ter/Snow/Ice
Petroleam
Misc —
V
>
SpectramFilename
Spectrunt Type
Cottection Type
Feature Type
0«t«
Time
Location
Detailed Descriptioa
Reference
ProjectNameDetailed Deso^ioa
PersonnelNameContact tnfoftnation
Background
Detaikd Baekgrouod File
AgencyNameAddresi
ARadiometer
Malce
Model
FOVCalibration Date
ImagerNameAltitude
GSD
PhotoLocatkM
rimeOrtentation
Reference Image?\xti Location
Imager
Figure 11a: Framework for the Spectral Library Database Structure.
367
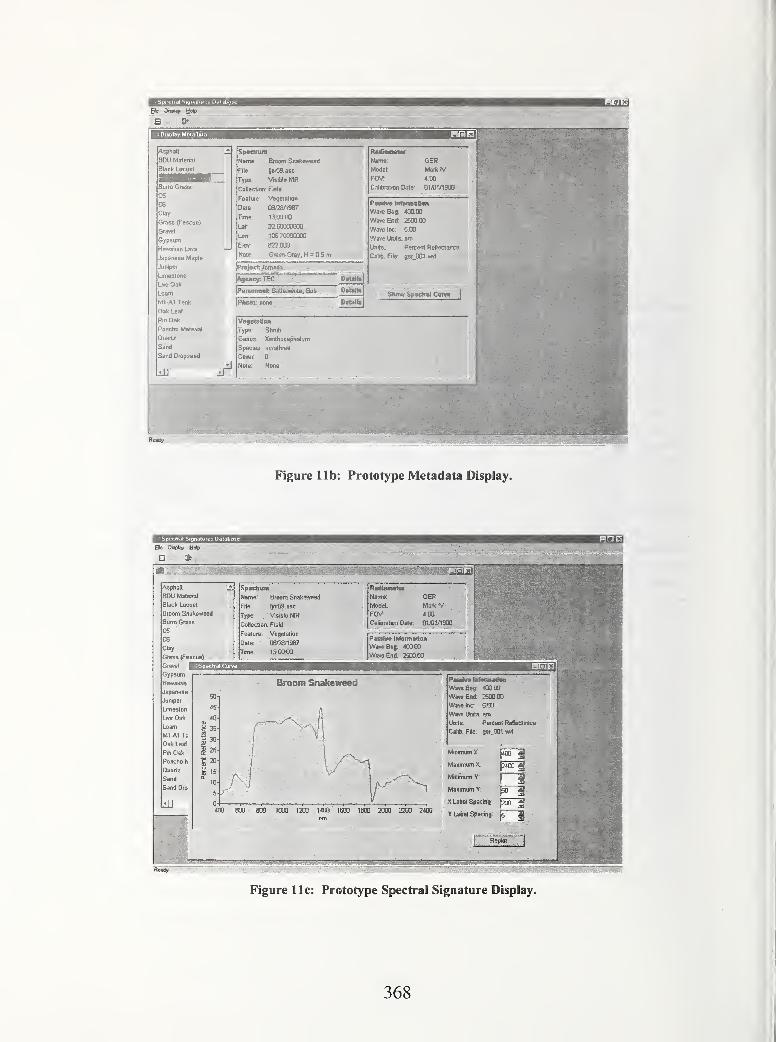
Efc Dirohp a*5 >
Asphalt
BDU Matetial
Black Locust
Burro Grass
C5
C6
Clay
Grass (Fescue)
Gypsum
Hawaiian Lava
Japanese Maple
Juniper
Limestone
UveOalf
Loam
M1-A1 Tank
Oak Leaf
Pin Oak
Poncho Material
Quartz
Sand
Sand OropsBed
ill
Spactfum
Name: BraOin Snakeweed
Filt IjOiSS.asc
Typt Vitible NIR
Collection: Field
Faalwe Vegetation
Dale 0808^967
Time: 13.00:00
Lat: 32.60000000
Lon- 106 70000000
Elev: 822.000
Note: GiseivGrey. H = 0 5 m
jProjscfc jQfitc-
jAgsnqr. TEC
\Penonneii Saiiorwhiis. 3o!> OetaJj«|
jPhoto: none DetaHsl
RarfMniwIar
Name: GERMoiiel: Matte IV
FOV: 4.00
Cal*ralmn Date: 01/01^900
Pmatm bifDrmafian
WavaBeg: 400.00
WaveEnif: 260000
Wave Inc: 5.00
Wave Unds. nmUnrts- Pertenl Refiectjnce
Calib, Fi!8 garjm .vnl
Show Spacttai Curve
Type: Shnjb
Genus: Xa-ittiocephaium
Species: soraltirae
Cover 0
Note' None
liiMiifi^^
Figure lib: Prototype Metadata Display.
£fc Dl>pl« H*B ^m
Asphalt
BDU Material
Black Locust
Bioom Snakeweed
Surto Grass
C5
C8
Day
Grass (Fescuel.
Gtavel
Gypsum
Name: Groom 5i>3k?>^ed
Fila: IjoiSS asc
Type Visible NIB
Collection: Field
Feature: Vegetation
Dale, oa^ge?Time: 13:00:00
Radlsmattf
Name:
ivlodel:
FOVCalibration Date:
GERMark
4.00
01/01/1900
Pmihm InfomiaUoH
Wave Bog: 400 00
Wave End; 2500.00
Broom Snakeweed
^1 Maximum X
Minirnum Y:
Manimum Y:
X Label Spacing-
000 1200 1400 1600 1S0O 2000 2200 2400
Wave Beg: 4CD.X
Wave End: 2600.00
Wave he: 5.m
Wave ijnits: nmUnits: Percent Retlactance
Calib. File: get.OOI.wvl
Y Label Spacing: p 3
[ Reploi~_"j|
Figure 11c: Prototype Spectral Signature Display.
368
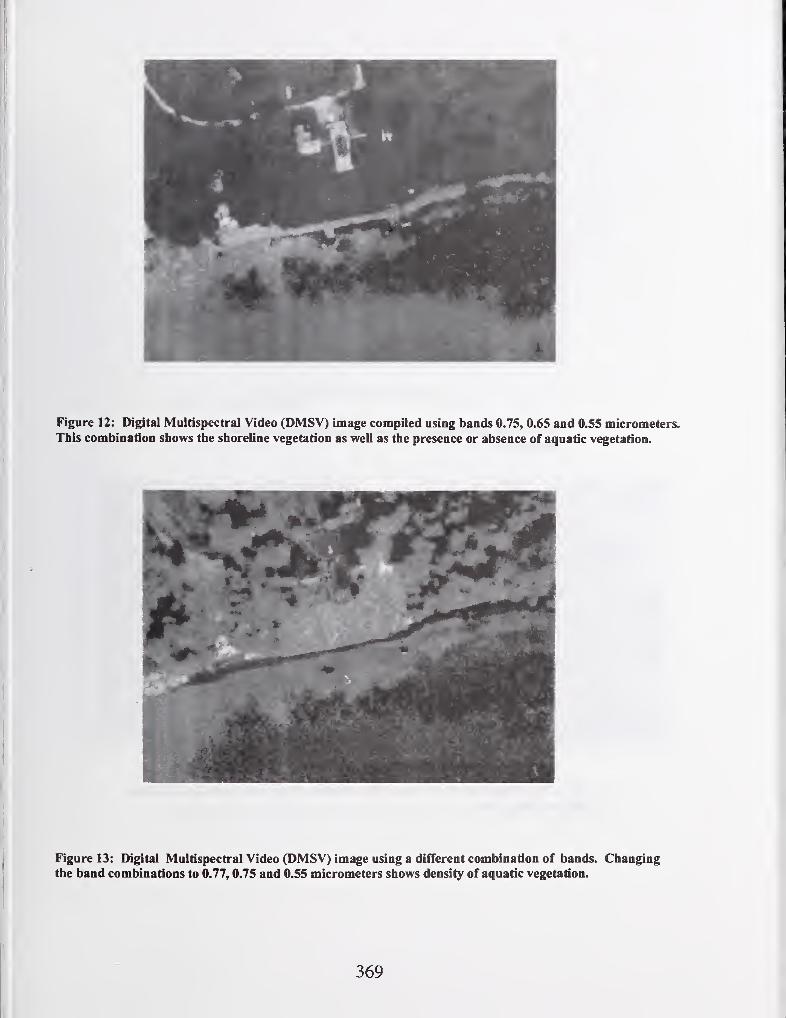
Figure 12: Digital Multispectral Video (DMSV) image compiled using bands 0.75, 0.65 and 0.55 micrometers.
This combination shows the shoreline vegetation as well as the presence or absence of aquatic vegetation.
Figure 13: Digital Multispectral Video (DMSV) image using a difTerent combination of bands. Changingthe band combinations to 0.77, 0.75 and 0.55 micrometers shows density of aquatic vegetation.
369
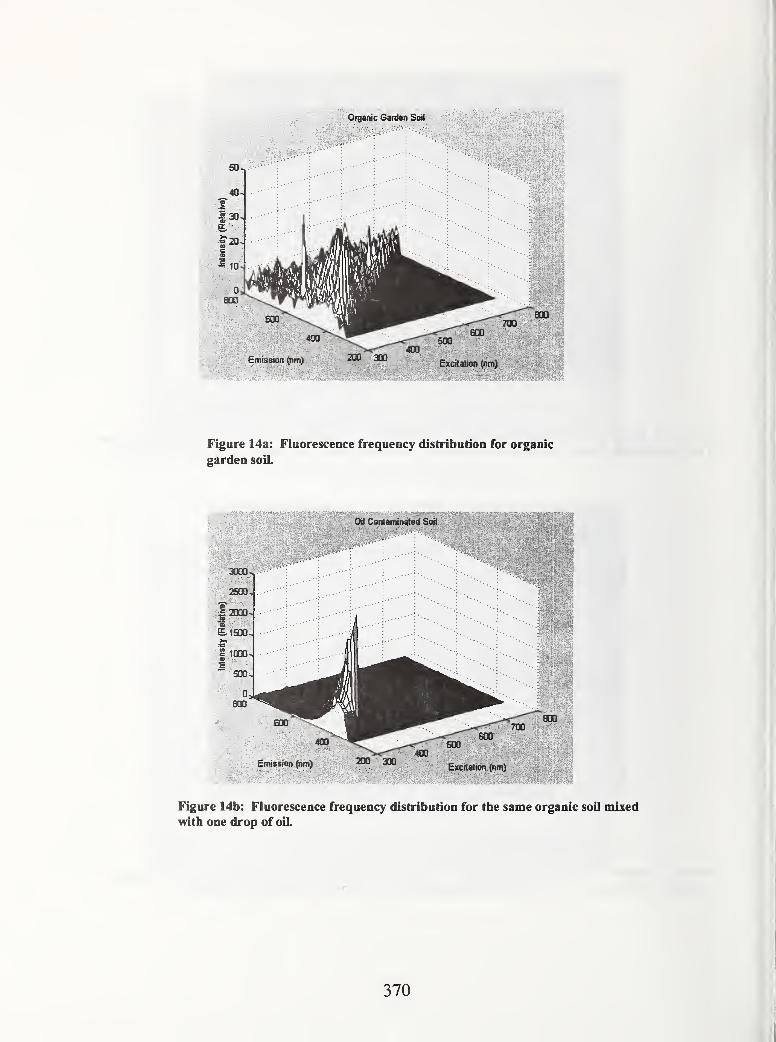
Organic Garden Soil
Emission (nm) 2CB 3tBExcitation (nm)
Figure 14a: Fluorescence frequency distribution for organic
garden soiL
Emission (nm) 2Q0 300Excitation (nm)
Figure 14b: Fluorescence frequency distribution for the same organic soil mixed
with one drop of oiL
370
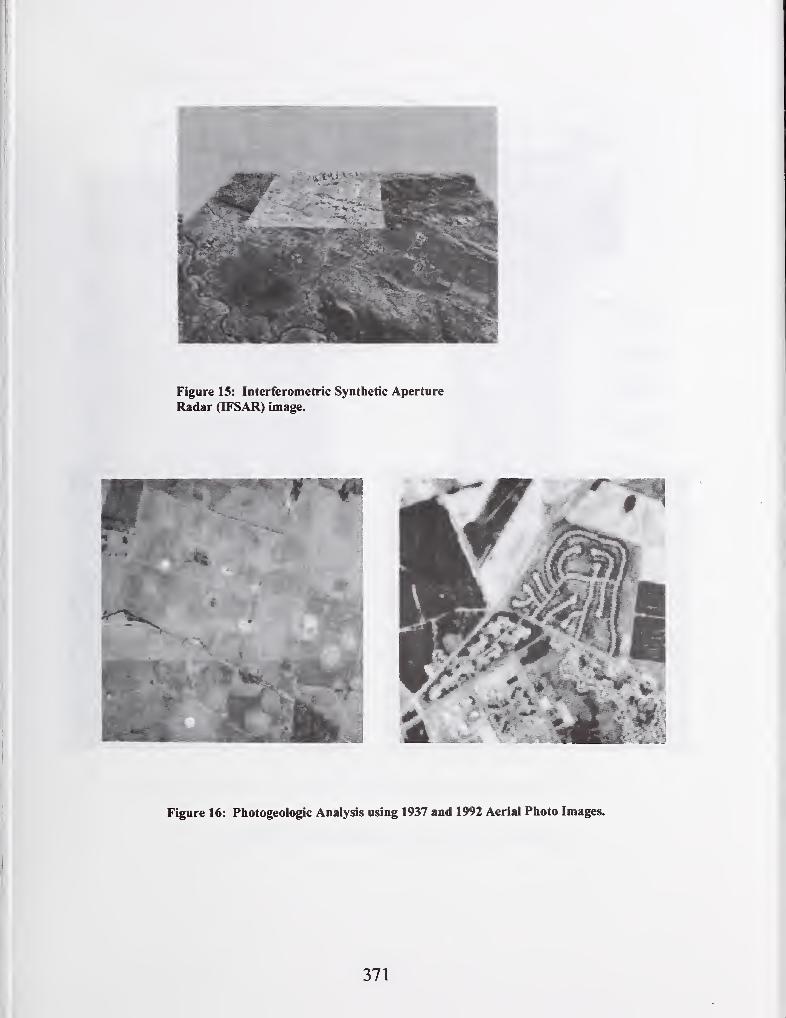
Figure 15: Interferometric Synthetic Aperture
Radar (IFSAR) image.
Figure 16: Photogeologic Analysis using 1937 and 1992 Aerial Photo Images.
371
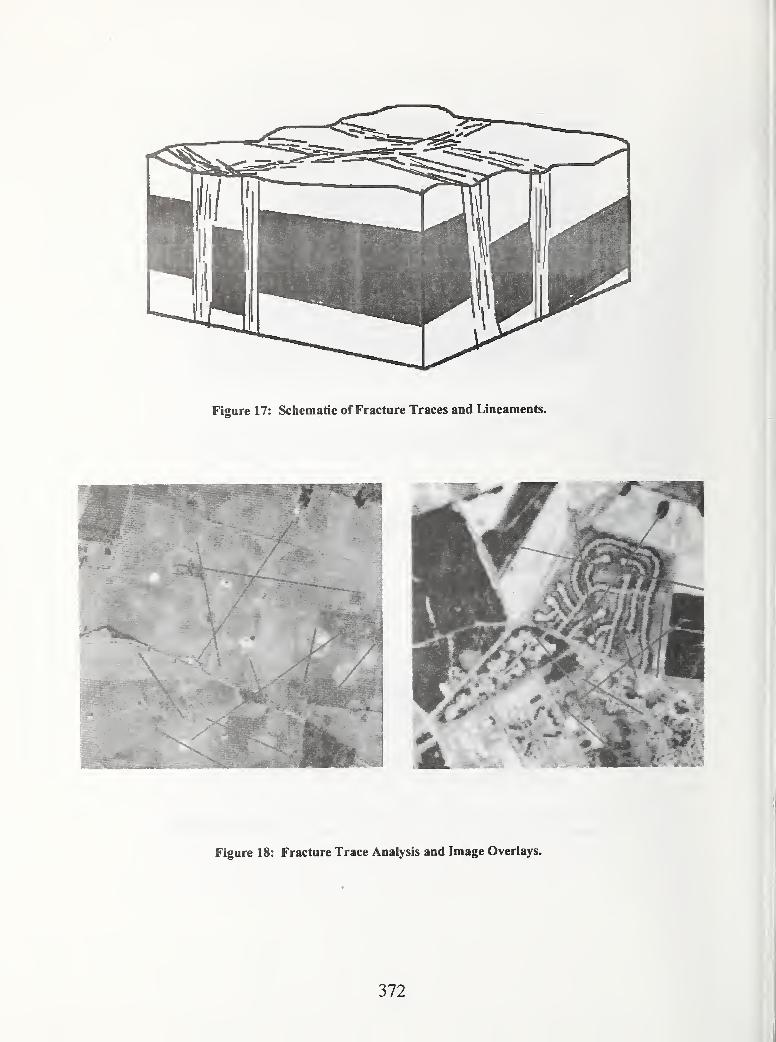
Figure 18: Fracture Trace Analysis and Image Overlays.
372

Figure 19: Comparison of a shaded relief image and a 2D land use image.
373

Figure 20: Differential Global Positioning System (GPS) application for
precise tide level measurement using the Nav-Star Satellite Constellation.
Figure 21: Geographic Information System (GIS) Data Layers.
374
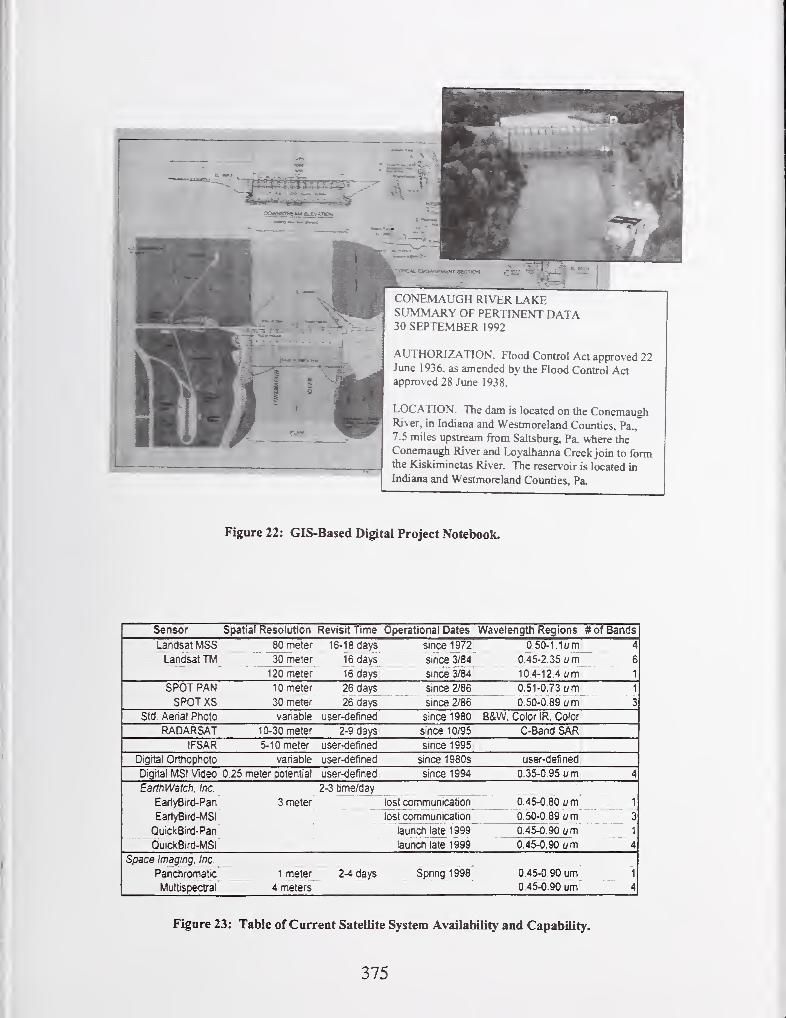
CONEMAUGH RIVER LAKESUMMARY OF PERTINENT DATA30 SEPTEMBER 1992
AUTHORIZATION. Flood Control Act approved 22June 1936. as amended by the Flood Control Actapproved 28 June 1938.
LOCATION. The dam is located on the ConemaughRiver, in Indiana and Westmoreland Counties, Pa.,
7.5 miles upstream fktm Saltsburg, Pa. where the
Conemaugh River and Loyalhanna Creek join to formthe Kiskiminetas River. The reservoir is located in
Indiana and Westmoreland Counties, Pa
Figure 22: GIS-Based Digital Project Notebook.
Sensor Spatial Resolution Revisit Time Operational Dates Wavelength Regions # of Bands
Landsat MSS 80 meter 16-18 days since 1 972 0.50-1.lum 4
LandsatTM 30 meter 16 days since 3/84 0.45-2.35 um: 6
120 meter 16 days since 3/84 10.4-12.4 t/m 1
SPOT PAN 1 0 meter 26 days since 2/86 0.51-0.73 um 1
SPOT XS 30 meter 26 days since 2/86 0.50-0.89 urn 3
Std Aenal Photo vanable user-defined since 1980 B&W, Color IR. Color
RADARSAT 10-30 meter 2-9 days since 1 0/95 C-Band SARIFSAR 5-10 meter user-defined since 1995
Digital Orthophoto vanable user-defined since 1980s user-defined
Digital MSI Video 0 25 meter potential user-defined since 1994 0.35-0.95 urn 4
EarthWatch. Inc. 2-3 time/day
EarlyBird-Pan 3 meter lost communication 0.45-0.80 urn 1
EartyBird-MSI lost communication 0.50-0.89 urn 3
QuickBird-Pan launch late 1999 0.45-0.90 urn 1
QuickBird-MSI launch late 1999 0.45-0.90 urn 4
Space Imaging. Inc.
Panctiromatic 1 meter 2-4 days Spring 1998 0.45-0.90 um 1
Multispectrai 4 meters 0,45-0.90 um" 4
Figure 23: Table of Current Satellite System Availability and Capability.
375

}
I

WIND ENGINEERING

Analysis of Wind and Wind Effects Re\isited - A Case Study
of Deer Isle-Sedg^ick Bridge
by
D. W. Marsh-, B. Bienkievdcz^, andH. R. Bosch-'
ABSTRACT
In 1980 the Federal Hidiway Admin istraiion began
a detailed study of the viind-iaduced oscnianons of
the Deer Isle-Sedg%^ick Bridge. The bridge is
instrumented \sith an array of anemometers and
accelerometers which measure wind \-elocit\- and
bridge response. The present study analyzes the
\^-ind-uiduced motion of the bridge to determine
fiindamental frequencies and mode shapes. It
introduces Proper Orthogonal Decomposition
(POD) as a technique for determining primary-
frequencies and mode shapes and compares the
results to those obtained using spectral analysis
exclusiveh-. It unhzes v."a\ elet transform (WT)
analy sis to m\ estigate energy content of temporal
flow events and peaks of the bridge deck response
Both the POD and techniques are found to be
usefiil m analy sis of wind f[o\y and ^^md-mduced
response of the bridge deck.
KE\'AVORDS: wind, proper orthogonal
decomposition, ^\-a^-elet analysis, bridge response-
field measurements, aerodynamic response.
1. INTRODUCTION
The Deer Isle-Sedg\\ick Bridge (DISB) is a long-
span suspension bridge similar in cross-section to
the old Tacoma Narrows Bridge, which feiled
catastrophically in 1940 due to \\-md-mduced
structural \-ibration. The feilure of the Tacoma
Narrows Bridge made e\ident the need for detailed
analysis of the dynamic beha^ior of long-span
bridges subjected to wind loadmg. The DISB s
design was augmented with many structural
modifications to minimize wind-induced oscillations,
but significant response is still obsen ed. In 1980,
the Federal Highway Admmistration (FHW'Al
began a detailed study of the wind-induced motion
of the DISB The present paper describes analy sis
ofthe FHW'A da.ta to esiabiish wind chara.c:er.sr:cs
atthe bridge site and to determine mode shapes anc
natural frequencies of bridge :scilla:icn. Ii
introduces new tools for -wind and bridge response
data analysis: the Proper Orthogonal
Decomposmon iPODi and \^'a%"elet Transfoim
iA\T) analysis. The POD :s sh:-- to re ere:-\-e
m determining Mbranonai cnaracier.iiics oi the
bridge. The is employ-ed in analy-sis of the
bridge peak response.
2. BACKGROL"^'D
2
.
1 Com-entional Analysis
Com-entional analy-sis of v»ind and \'.ina ^:OwCed
effects on bridges, buildings and other structures is
frequentiy earned our m frequency domain, using
spectral approach.
2.1.1 Wind Field
W'md flow m the annosphenc bo^ondaiy Layer is
usually described for wind componenis m three
orthogonal directions; along-\%-md. lateral, and
\-emcal. The charactensncs of flucnianons of
these components are typically specified by power
spectra, which are compared \\Tth empirical
' Dept. of Cnil Engmeenng. Colorado Stare
Um%-ersity. Fon CoUins. Co S C'5 2 3- 1 3 "2
.
" Tumer-Fairbank High\'»iay Research Center.
Federal Highway- Administration. McLean. \'A
::i:'l-::^6 (on leave from Dep: of Civil
Engmeermg. Colorado State Lm\ersii>. Fon
Colhns. CO 80523-13":)
Tumer-Fairbank Highway^ Research Center.
Federal Highway Administration, McLean, \'A
22101-2296.
379
spectral formulas based on field measurements. Anumber of such formulas have been proposed. The
spectral models recommended by Kaimal, Harris,
and Lumley and Panofsky, Simiu and Scanlan
(1996), are considered in this paper.
2.1.2 Bridge Response
Fundamental frequencies of oscillation of lightly
damped structures can be determined from spectral
analysis of response measurements. The peaks in
the autospectra of the response are either due to
peaks in the excitation spectra or normal mode
oscillations. The cause of such peaks can be
determined by analyzing the phase information of
the cross-spectra between measurements at different
points on the structure. In case of a bridge deck,
vertical (bending) and torsional modes can be
distinguished by analyzing the cross-spectrum
between measurements at two laterally spaced
points on the structure. The measurements m phase
indicate a vertical mode, while measurements that
are 180 degrees out of phase indicate a torsional
mode.
The ftmdamental modes of oscillation of a lightly
damped structure can be defined using the
autospectra of response measurements taken at
different points on the structure. For a given natural
frequency, the square root of the autospectral value
at this frequency gives the magnitude ofthe ordinate
of the mode shape at a considered location. The
sign of this modal value is determmed with respect
to a reference pomt usmg the phase mformation
from the cross-spectrum between the measurements
at the reference point and the selected location.
The coherence fiinction provides important
information for determining fiindamental frequencies
and modal shapes. It can be used to estimate the
random errors in the phase values and thereby
establish the statistical significance of the phase
information. In general, the autospectral values
should be used to determine the fiandamental mode
shapes only if the cross-spectra between the
considered locations produce near unity coherence
and near 0 or 1 80 degrees phase, Bendat and Piersol
(1993).
2.2 Proper Orthogonal Decomposition
Proper Orthogonal Decomposition, also called the
Karhunen-Loeve expansion, is a mathematical
technique to establish deterministic spatial fiinction
that is best correlated with a given random field.
This is accomplished by finding the fiinction ofthe
largest projection (in the mean-square sense) on the
field. The procedure leads to an eigenvalue
problem involving spatial covariance.
The simplest implementation of the POD is for
variables measured at umformly spaced locations.
In this case the POD for a variable r reduces to the
following (discrete) eigenvalue problem
[i^]=i{<i)}
where is the space covariance of the random
variable r, A is the eigenvalue, and {€>) is the
eigenvector (eigenmode). The eigenvectors are
used in a series expansion of the variable r,
where the principal coordinates q^it) can be
computed (in a discrete form) as follows
qn{t) =
' J
Each principal coordinate q„(t) corresponds to a
specific eigenvector 0„ , which in turn represents
n-ih modal shape of the variable r.
It is shown that the spatial distribution of the
variance of r can be written in terms of the
eigenvalues and eigenvectors
It follows that the relative magnitude of the
380
eigenvalue indicates contribution of a particular
mode to the random field r.
In this study, the POD is employed to determine the
eigenmodes and principal coordinates of approach
wind flow and the natural fi^equencies as well as
normal modes ofthe bridge deck oscillation. These
quantities are then compared with the results
obtained using spectral analysis.
2.3 Wavelet Transform Analysis
Conventional spectral analysis is based on Fourier
Transform (FT), which is of a global nature. In the
process, time localization of occurrence of extreme
values of a given signal, such as peaks of wind
speed and/or wind-induced bridge response, is lost.
In addition, the standard FT is only applicable for
stationary data. This limitation is to some extent
overcome by a modified FT, the Short Time Fourier
Transform (STFT). In this approach, short
fractions of the original data record, resulting from
application of fixed-duration filtering window, are
used in the FT and a time-frequency decomposition
of the original signal is obtained. However, the
STFT has a number of shortcomings. The most
critical is a limited frequency resolution.
Limitations of the FT and STFT are overcome by
the Wavelet Transform (WT). Instead of using a
window of a fixed time duration, the base functions
of span dependent on time-scale (or frequency) of
interest, are employed. Typically, these fimctions
have a wavy nature and their duration is finite.
These "small waves" are labeled wavelets. This is
in contrast to harmonic (sine and cosine) waves of
infinite span, employed in the FT. The WT base
fimctions are obtained by dilatation (stretching or
compressing) of a reference function, called the
mother wavelet. A number of the mother wavelet
fimctions have been developed. One ofthe fimctions
- the Mexican hat wavelet- is employed in analysis
presented m this paper.
The WT unfolds the signal as a time-frequency (or
time-scale) fimction represented by wavelet
coefficients. It leads to a good time-frequency
resolution for both short and long-duration
components ofthe signal. The parameter similar to
the autospectrum (calculated for example using
the STFT), the wavelet modulus or its square, can
be computed. It is typically plotted as a fianction
of time and frequency (or scale) and such
representation of the WT results is called a
scalogram. The volume enclosed by the surface of
the scalogram is directly related to the energy of
the signal, just as the volume under the STFTautospectrum and the area enclosed by the
conventional FT autospectrum, correspond to the
variance of the analyzed signal.
The real, continuous WT is defined by the
following transform pair
X{aJ)=\x{u)i//a,{u)du
x{t) = "t;J J
X(a,u)i//^^{u)—dadu
where
1 U - t
y/.{u) = -1=11/ {)
^la a
and
il/(u) = mother wavelet fimction,
a = scale parameter,
t = time instant,
x(t) = original signal,
X(a, t) = wavelet transform, and
C = normalization constant.
The choice of the mother wavelet depends on the
intended use. The 'Mexican Hat" wavelet fimction
was used in the analysis presented herein.
3. FIELD CONFIGURATION
3.1 Deer Isle-Sedgwick Bridge
The Deer Isle-Sedgwick Bridge (DISB) is a long-
span, girder-stiffened suspension bridge, on the
Atlantic coast of Maine, which connects the
381
mainland at Sedgwick with Deer Isle , in the NE-
SW direction. It was constructed in 1938 and
opened to traffic in 1939. Its main span is 1080 feet
long, while the two side spans are 484 feet in length.
In addition, there is a 100-foot long approach span
on each end giving a total bridge length of2248 feet.
The 20-feet wide deck carries two traffic lanes and
it has an H-type cross-section, similar to that ofthe
old Tacoma Narrows Bridge. Originally, the deck
was supported only with vertical hangers from the
main cables. Later, cable stays, traverse bracing,
and cable ties were added to increase the bridge
resistance to wind. Although these modifications
were effective in attenuating wind-induced bridge
oscillations, instances of excessive response
attributed to wind are still observed. As a result, the
bridge continues to be the subject of an ongoing
field measurement program carried out by FHWA,in collaboration with the State of Maine.
3.2 Instrumentation
The bridge is instrumented with an array of
anemometers and accelerometers to momtor the
wind speed and bridge accelerations, see Figure 1
.
There are six tri-axis Gill anemometers mounted on
outriggers which extend 12 feet from the side and 3
feet above the deck. In addition, two skyvane
anemometers are mounted on the east tower. One is
located 18 feet above the tower top, while the
remaining anemometer is at the tower base,
approximately 33 feet above the water surface. The
anemometers provide information on three
components ofthe wind velocity: horizontal normal
to the deck, horizontal along the deck, and vertical,
see Figure 1
.
Six pairs of single-axis servoaccelerometers are
distributed along the span of the bridge, with four
pairs of accelerometers on the main span and two
pairs of accelerometers on the North side span, see
Figure 1 . Three additional accelerometers are used
to measure the motion of one of the bridge towers.
Signals from pairs of the accelerometers on the
deck are combined to monitor the torsional and
vertical (heaving) motion of the deck, while the
response in torsion, bending, and sway is extracted
for the tower. Readings from the anemometers and
accelerometers are acquired nearly simultaneously.
with a sampling rate of approximately 20 samples
per second and a typical record length of 10
minutes.
4. DATA ANALYSIS
4. 1 Conventional Data Analysis
4.1.1 Wind Field
The wind data were broken into 4096-data point
records, of approximately 205-second length.
Typically three such records were employed in
spectral and cross-spectral analysis, which
included ensemble averaging. The spectra were
corrected for the frequency response of the
anemometers, using approach proposed by
McMichael and Cleveland (1978). Representative
normal to the deck horizontal and vertical velocity
spectra (uncorrected and corrected for the
frequency response ofthe anemometers) are shown
in Figure 2. They are compared with empirical
wind spectra models proposed by Harris, Kaimal,
and Lumley and Panofsky, Simiu and Scanlan
(1996).
4.1.2 Bridge Deck Response
Since the analyzed data was dominated by the
response in vertical (heave) direction, the results
presented herein are limited to this direction.
Representative autospectra of the deck vertical
motion are depicted in Figure 3, while the natural
frequencies and-mo^al shapes, determined from the
spectral/cross-spectral analysis are shown in
Figure 4. A comparison ofthe natural frequencies
for the three vertical modes is presented in Table 1
.
A very good agreement with the results reported by
Kumarasena et al.( 1991) can be observed.
4.2 Proper Orthogonal Decomposition
4.2.1 Wind Field
As mentioned earlier, the POD analysis is
sigmficantly simplified when the data is specified
at (spatially) uniformly distributed locations. From
the data set defined by anemometer locations mFigure 1, approximately equally spaced
382

anemometers 2, 5, and 6 were selected for the PODcalculations. Representative results are shown in
Figures 5 and 6, where the convergence of the
reconstructions of the horizontal (normal to the
deck) and vertical velocity components near the deck
mid-span (anemometer location 5) are presented. It
can be seen that the reconstruction involving only
one POD mode was sufficient to fiiUy recover the
original time series of the vertical velocity
component. Similar conclusions were found for the
remaining anemometer locations.
4.2.2 Bridge Deck Response
The POD analysis of the bridge response was
carried out for accelerometer data at locations 7
through 12. The signals from three pairs of the
accelerometers (7-8, 9-10, andIl-12) were
combined to obtain vertical and torsional
accelerations at three, equally spaced bridge deck
locations (quarter-span, half-span, and three-
quarter-span), respectively. These six quantities
(vertical and torsional accelerations at three
locations) were used to calculate the space
covariance matrix [R^], ofthe dimension six-by-six.
Next, six eigenvalues, eigenmodes and principal
components of the bridge accelerations were
computed. Each eigenmode was arranged into two
parts:. (1) associated with the vertical degree of
freedom and (2) associated the torsional motion. In
this format the six vertical-torsional pairs of the
modes are depicted in Figure 7, together with the
corresponding six eigenvalues. The modes are
arranged in a descending order of the eigenvalues.
It can be seen that the first three modes are
essentially vertical, while the remaining three modes
are torsional. Included also in Figure 7 are power
autospectra ofthe six principal coordinates The
frequency of the dominant spectral peak is marked
for the first four modes. It can be seen that the
(three) POD vertical modes in Figure 7 closely
resemble the natural modes obtained from spectral
analysis. Also a comparison of the natural
frequencies in Table 1 and spectra in Figure 7,
shows that the spectral peak frequencies in Figure
7 are equal to the natural frequencies in Table 1.
When the POD modes are ordered according to a
descending magnitude of the spectral peak
frequencies in Figure 7, then there exists one-to-one
equivalency between the POD results and the
natural modes and frequencies resulting from
conventional spectral analysis.
The last three modes in Figure 7 are torsional. As
is indicated by the spectra of the principal
coordinates associated with these modes, their
participation in the bridge deck response is
significantly smaller than that for the vertical
modes. Mainly due to this fact, extraction of
torsional modes was difficult using spectral
analysis. It follows that this limitation is overcome
when POD approach is employed.
Further analysis, not presented herein, shows that
regardless ofnature ofthe acceleration signals and
the level of participation of natural modes in the
structural response, the POD always leads to a set
of the natural frequencies and structural modes.
However, this approach has also a drawback. The
number of modal contributions possible to be
detected using the POD can not exceed the number
of input signals used in analysis. Ifthe number of
the data channels is higher than the number of
expected significant modes, this may not be a
problem. Effort to apply the POD results to aid
determination of the modal structural damping is
currently underway.
4.3 Wavelet Transform Analysis
Wavelet transform (WT) analysis was used in this
study to investigate frequency content of(temporal)
peaks of the wind field and bridge deck response.
Scalograms involvingWT modulus were employed
in the study. Also the wavelet coefficients were
used in (wavelet) filtering and reconstruction ofthe
analyzed signals.
4.3 .1 Wind Field
Representative results ofWT analysis ofwind field
are shown in Figure 8, for the anemometer near the
deck mid-span, anemometer 5 in Figure 1. Afraction of the record of the horizontal (normal to
the deck) velocity component and plot of the
corresponding WT modulus are depicted. The
time series in the figure is centered at the time
instant of occurrence of the peak vertical
383
acceleration at the center of the deck. This
scalogram highhghts discontinuities in the wind
velocity signal and reveals the spectral content of
the wind velocity peaks. Significant contributions
reaching down to 0. 18 Hz, at several time instants,
are exhibited.
4 .3 .2 Bridge Deck Response
Figures 9 and 10 show representative results ofWTanalysis of the bridge deck response. A fraction of
the time series of the deck response a the mid-span
location (accelerometers 9-10, Figure 1) is shown in
Figure 9, together with its WT scalogram. The
scalogram indicates a slightly modulated harmonic
signal, with maxima at approximately 0.7 Hz. Acloser examination of the numerical values of the
WT modulus shows that the peaks actually occur at
the frequency of 0.698 Hz. This is in a close
agreement with the POD results in Figure 7, where
a dominant participation ( in the vertical motion) by
the mode with the natural fi^equency of 0.698 Hz is
apparent. Compare also spectral results in Figure 3
.
Application oftheWT results in decomposition and
reconstruction of the bridge response time series is
illustrated in Figure 10. The original signal (upper
plot), the signal contribution at the fi'equency of
0.698 Hz (middle graph), and the signal
reconstructed using the WT results (lower plot) are
shown. It can be seen that indeed the 0.698 Hz-
component ofthe signal is dominant (middle graph)
and that the original signal can be reconstructed
from the WT results.
It has been shown elsewhere, Bienkiewicz and Ham(1997), that the cross-wavelet analysis of the
approach wind and wind-induced loading mayprovide useful physical insight, not available using
traditional (e.g. FT based) techniques.
5 CONCLUDING REMARKS
The Deer Isle-Sedgwick Bridge data displays
motion dominated by vertical modes of oscillation.
Bridge response in the first three vertical modes was
identified using traditional spectral approach.
Compatible results were obtained using the PODanalysis. In addition, by application of the POD it
was possible to identify modes of vibration not
clearly apparent from FT spectral analysis.
Wavelet transform was found useful in time-
frequency analysis of extreme wind speed and
bridge response. It made possible determining
energy content of both the peak wind speed and
bridge deck acceleration.
Further investigation is needed to fully evaluate the
potential of application of the proper orthogonal
decomposition and wavelet transform, as well as
other novel techniques, in study ofwind effects on
long-span bridges and other wind-prone structures.
6. REFERENCES
Bendat, J. S., and Piersol, A. G. (1993)
Engineering Applications of Correlation and
Spectral Analysis , John Wiley and Sons, Inc.
Bienkiewicz, B. and Ham, H. J. (1997), Wavelet
Study of Approach-Wind Velocity and Building
Pressure," Journal of Wind Engineering and
Industrial Aerodynamics, Vol. 69-71, pp. 671-683.
Bienkiewicz, B., Ham, H. J. , and Sun, Y. (1993)
"Proper Orthogonal Decomposition of Roof
Pressure," Journal of Wind Engineering and
Industrial Aerodynamics, Vol. 50, pp. 193-202.
Bosch, H. R, and Miklofsky, H. A. (1993)
"Monitoring the Aerodynamic Performance of a
Suspension Bridge," Proceedings of the 7* U.S.
National Conference on Wind Engineering, Los
Angeles, CA, Vol. I, pp. 125-134.
Kumarasena, T., Scanlan, R. H., and Morris, G. R.
(1989) "Deer Isle Bridge: Field and Computed
Results," Journal of Structural Engineering, Proc.
ASCE, Vol. 115, No. 9, pp. 2323-2328.
Kumarasena, T., Scanlan, R. H., and Ehsan, F.
(1991) "Wind-Induced Motions of Deer Isle
Bridge," Journal of Structural Engineering, Proc.
ASCE, Vol. 117, No. 11, pp. 3356-3374.
McMichael, J. M. and Cleveland, W. G. (1978)
"Characteristics of Helicoid Anemometers,"
NBSIR 78-1505, National Bureau of Standards,
384

Washington, D.C., 1978.
Simiu, E. and Scanlan, R. H. (1996), Wind Effects
on Structures, 3'^'* Edition, John Wiley and Sons, Inc.
Table . 1 Natural Frequencies ofDeer Isle-Sedgwick Bridge
Vertical Mode Spectral Analysis
[Kumarasena et al.]
POD Analysis
[Present Study]
V Symmetric 0.28 Hz 0.308 Hz
Anti-symmetric 0.49 Hz 0.508 Hz
2"'* Symmetric 0.68 Hz 0.698 Hz
Figure 1. Deer Isle - Sedgwick Bridge ~ Instrumentation Layout
385
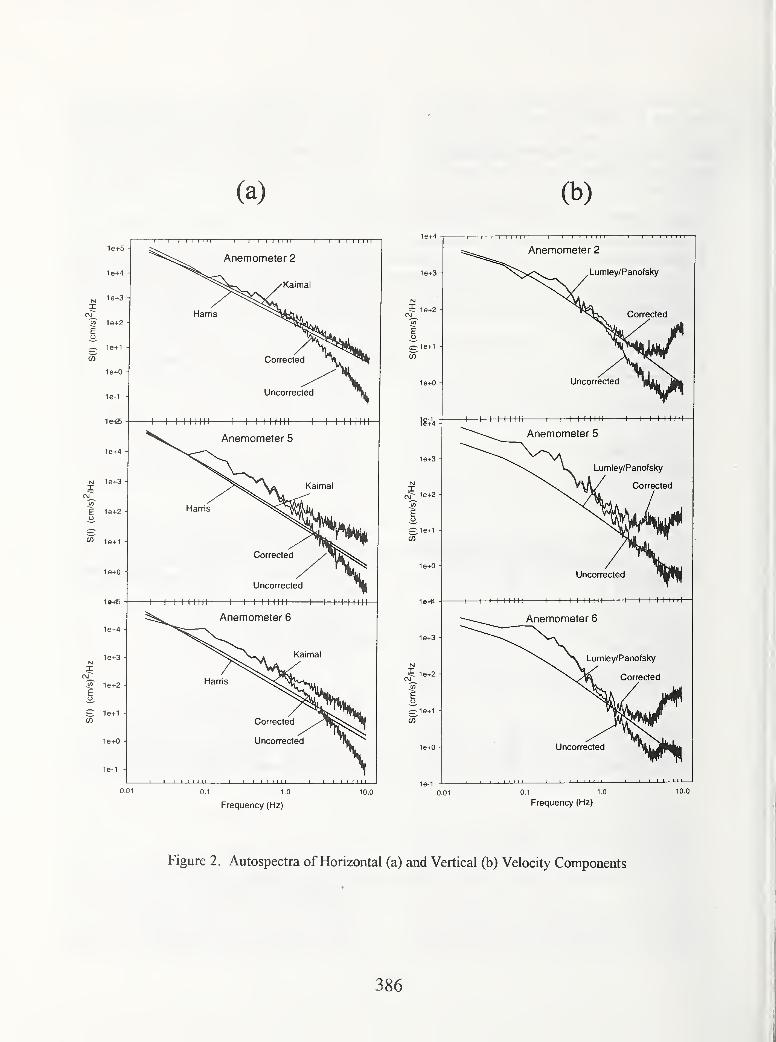
Figure 2. Autospectra of Horizontal (a) and Vertical (b) Velocity Components
386
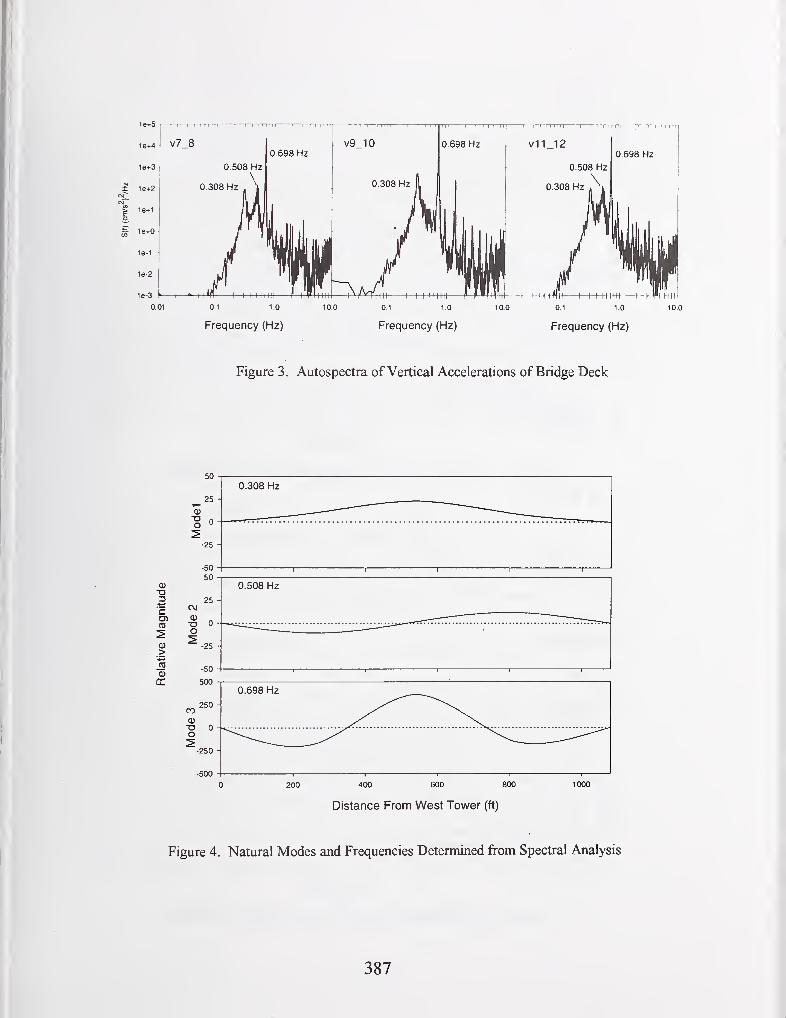
1e+5
0.01 0.1 1.0 10.0 0.1 1.0 10.0 0.1 1.0 10.0
Frequency (Hz) Frequency (Hz) Frequency (Hz)
Figure 3. Autospectra of Vertical Accelerations of Bridge Deck
Figure 4. Natural Modes and Frequencies Determined from Spectral Analysis
387
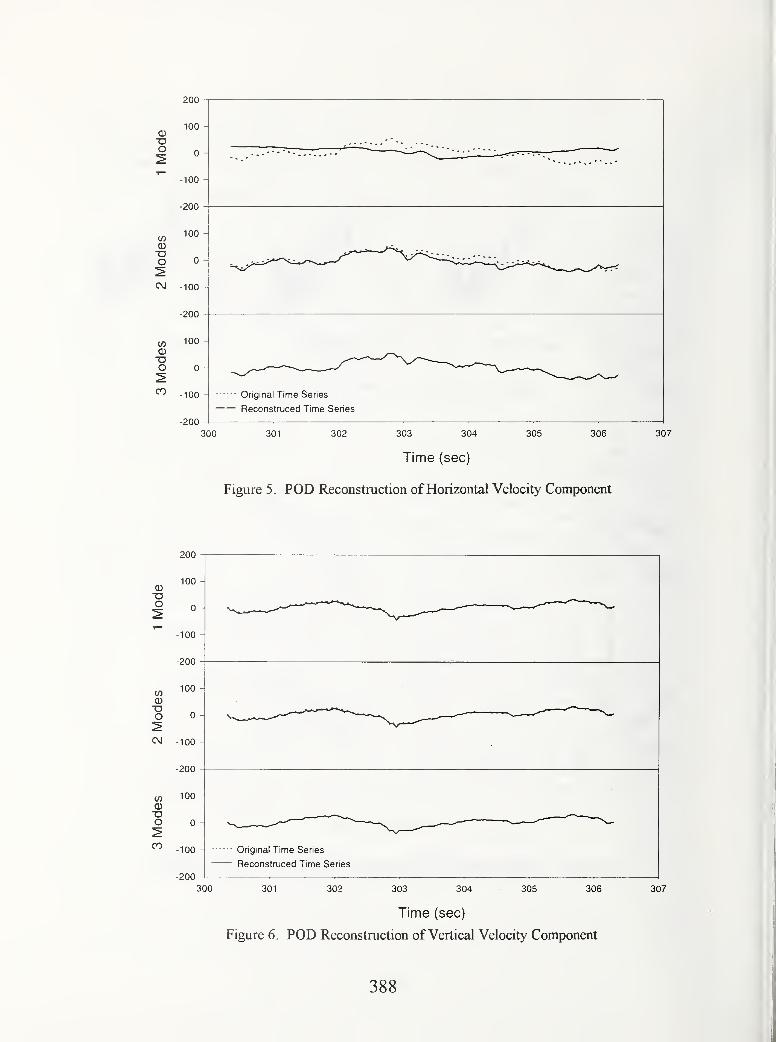
200
100
0
-100
-200
100
0
-100 -1
-200
100 -
0 -
-100 -
-200
300
Original Time Series
Reconstruced Time Series
301 302 305 306303 304
Time (sec)
Figure 5. POD Reconstruction of Horizontal Velocity Component
307
200
100 -
0 -
100
200
100
0 -
100 -
200
100 -
0 -
100 -
200
Original Time Senes
Reconstruced Time Series
300 301 302 303 304 305 306 307
Time (sec)
Figure 6. POD Reconstruction of Vertical Velocity Component
388
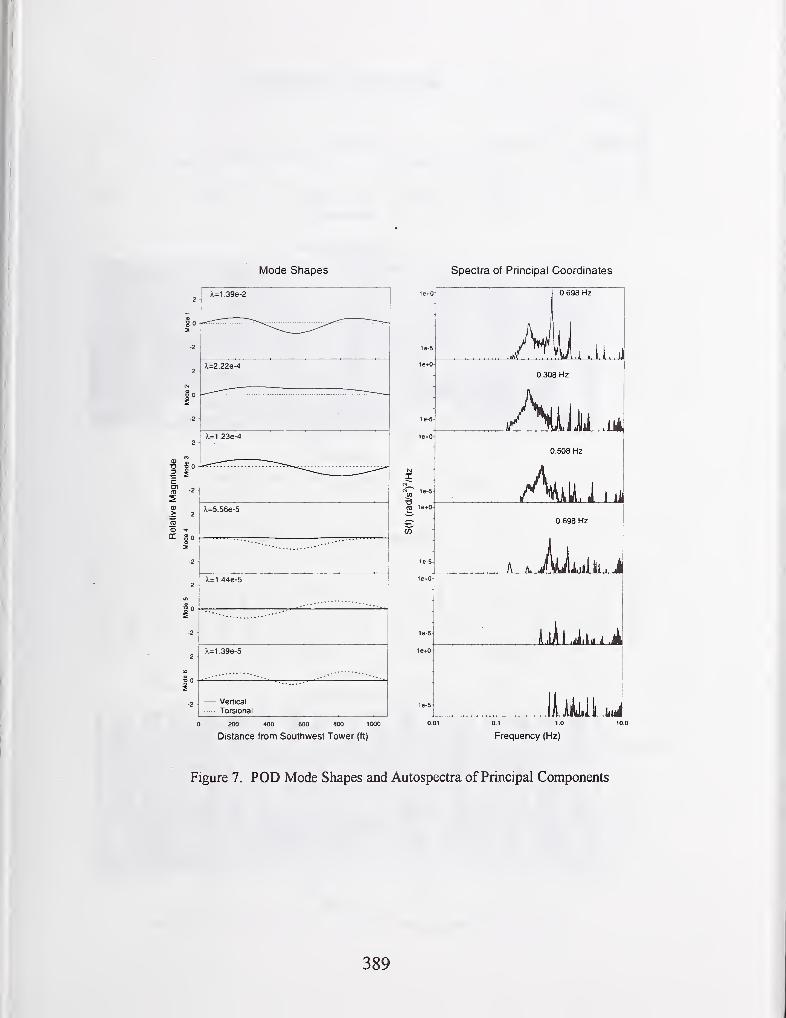
Mode Shapes Spectra of Principal Coordinates
X^1.39e-2
X=1 .236-4
X=5.56e-5
X=1.44e-5
X=1.39e-5
— Vertical
Torsional
0 200 400 600 800 1000
Distance from Southwest Tower (tt)
1e-S
1e+0
10-5
le+0
1e-5
\e*0
iJ4
0.508 Hz
ILL0.698 Hz
A. .jliilli 111
01 10
Frequency (Hz)
Figure 7. POD Mode Shapes and Autospectra of Principal Components
389

^1200CO
1
!JlOOOoo(D
^ 800
Normal Velocity - Anemometer 5
295 300 305time (sec)
Wavelet Modulus
310
295 300 305time (sec)
Figure 8. WT Spectrogram ofNormal Velocity
310
315
315
50
Vertical Acceleration - V9-10
295 300 305time (sec)
Wavelet Modulus
310 315
295 300 305time (sec)
310 315
Figure 9. WT Spectrogram of Vertical Acceleration at Deck Mid-Span
390
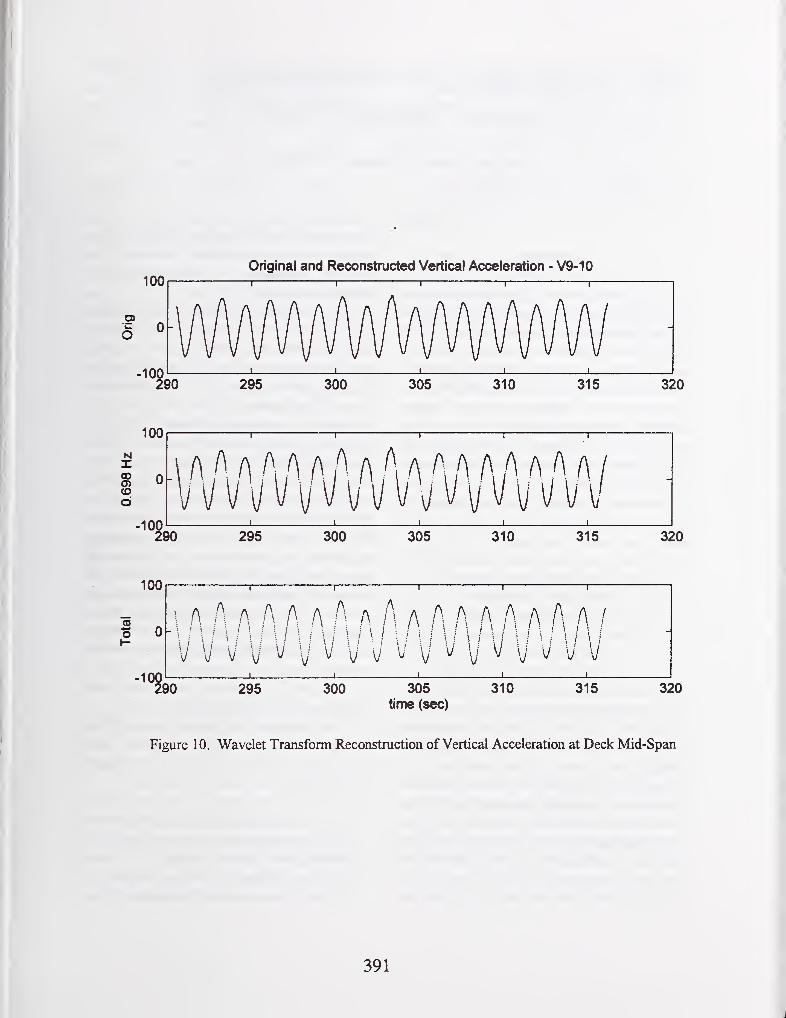
Figure 10. Wavelet Transform Reconstruction of Vertical Acceleration at Deck Mid-Span
391
Next Generation Trans-Strait Road Projects and
the State of Technology Development
by
Michio Okahara , Masahiro Nishitani
ABSTRACT
Super long-span bridges between 20 and
30% greater than the Akashi Kaikyo Bridge
need to be constructed in order to create new
traffic axes to enliven and stimulate outlying
regions of Japan for the 21st century. Studies
have been undertaken to develop ways to
construct super long-span bridges more
economically and rationally. As the results,
new types of structures, new concepts of
designs, and innovative execution technologies
have been introduced, permitting the
construction of super long-span bridges at
much lower cost than by simply extending and
applying existing technologies.
Key Words : Trans-Strait Road Projects
Super Long-Span Bridges
:New Types ofStructures
New Concepts ofDesigns
1. INTRODUCTION
'^ The Akashi Kaikyo Bridge, the longest
one among not only bridges between Honshu
and Shikoku but also all bridges in the world,
opened on April 5, 1998. When the Kurushima
Bridges and Tatara Bridge will open as
scheduled in the spring of 1999, Honshu and
Shikoku will be linked completely by the three
routes as envisioned in the original plans.
New traffic axes are being advocated as
the key to making effective use of the limited
land area of Japan to provide this country with
a more balanced national land structure for the
21st century. And the lessons learned by the
Hyogo-ken Nanbu Earthquake have shown us
that the redundancy in infrastructures is
extremely important.
For such backgrounds, new traffic axes
to play a key role in creating newly defined
multi national land axes to enliven and
stimulate outlying regions of Japan occupy the
following position in the "New Comprehensive
National Development Plans" authorized by
the Japanese Government in March, 1998. The
Tokyo Bay Mouth Road, Ise Bay Mouth Road,
Kitan Strait Road, Kanmon Strait Road, Hoyo
Strait Road and Shimabara-Amakusa-
Nagashima Bridges projects, that should be
implemented with close attention paid to cost-
benefits effects and other related conditions,
are planned to promote the development of
new technologies including those that reduce
the cost of long-span bridges construction, to
protect their surrounding environments, and to
stimulate outlying regions by promoting
increased cooperation and interaction among
regions.
Figure 1.1 presents trans-strait road
projects now at the concept stage.
To complete the Akashi Kaikyo Bridge
and other Honshu-Shikoku Bridges, new
technologies of various kinds were developed,
permitting the construction of safe and
1) Director, Structure and Bridge Department,
Public Works Research Institute, Ministry of
Construction, Tsukuba, JAPAN
2) Advisory Engineer for Bridge, Planning and
Research Administration Department, ditto
392
reliable long-span suspension bridges in the
2,000m class. It will be necessary to apply even
more advanced versions of these technologies
in order to construct the next generation
projects.
But the meteorological and
oceanographic conditions in terms of
topography, geology, water depth, wind speed
and so on at the planned sites of future projects
are expected to be severer than those at the
Seto Inland Sea area where the Honshu-
Shikoku bridges were constructed. Since the
straits to be crossed will be wider and deeper,
planned bridges will require superstructures
with longer spans and substructures
appropriate for deeper water. Faced to the
Pacific Ocean, they will be vulnerable to the
effects of typhoons and ocean waves. They
must also be constructed in earthquake prone
area. Considering these conditions, it has been
concluded that super long-span bridges
constructed as the part of future projects will
be between 20 and 30% longer than the Akashi
Kaikyo Bridge. It is believed that it would be
technically possible to use the same technology
applied to the construction of the Honshu-
Shikoku bridges to build bridges greater than
ever before, but to build them more
economically and rationally, newer
technologies must be developed.
2. OUTLINES OFTRANS-STRAIT ROAD PROJECTS
Three trans-strait road projects, namely
the Tokyo Bay Mouth Road, Ise Bay Mouth
Road, and Kitan Strait Road, are introduced
below.
2. 1 Tokyo Bay Mouth Road
The Tokyo Bay Mouth Road is about
20km long trans-strait road (marine section :
about 10 to 15km) crossing the Uraga Strait to
link the Yokosuka-shi in Kanagawa-ken with
the Futtsu-shi in Chiba-ken.
The Uraga Strait is an international
navigation channel (channel width : 1,750m)
where ships converge. The Tokyo Bay Mouth
Road will be constructed close to the location
of the epicenter of the Great Kanto Earthquake
of 1923.
The bridge now under consideration is a
long-span suspension bridge with a center span
length of 2,250m.
2.2 Ise Bay Mouth Road
The Ise Bay Mouth Road is about 90km
long trans-strait road (marine section : about
20km) crossing the Ise Bay Mouth from Irago
Cape at the tip of the Atsumi Peninsula in
Aichi-ken to the Shima Peninsula in Mie-ken.
The Ise Bay Mouth is a strait designated
as an international navigation channel (channel
width 1,200m). Plate boundary-type
earthquakes of Magnitude 8 class occurred
near the planned site around 1945, and there is
a fear of the Tokai earthquake near the route.
The plan now under consideration
hypothesizes a long-span suspension bridge
with a center span length of 2,000m.
2.3 Kitan Strait Road
The Kitan Strait Road is a trans-strait
road with a length of about 40km (marine
section : about 11km) linking the Wakayama-
shi in Wakayama-ken with the Sumoto-shi in
Hyogo-ken.
The Kitan Strait Road locates parallel to
the Median Tectonic Line where the high level
of activity is forecast and close to the
epicenters of the Nankai Earthquake and other
plate boundary-type earthquakes.
The study underway in preparation for
the construction of the bridge over the Kitan
Strait hypothesizes a long-span suspension
bridge with a center span length of 2,700m.
Figure 2.1 shows the planned route and Figure
2.2 shows the Kitan Strait Bridge.
393
3. INTRODUCTION TO NEWTECHNOLOGICAL DEVELOPMENTS
3.1 Introduction to New Technological
Developments
Priority and preferential studies of
technologies believed to have the potential to
contribute to the shortening of construction
period and reduction of construction cost are
now in progress.
The major technological developments
that have been promoted are broadly
categorized into three groups : 1) new types of
structures, 2) new concepts of designs, and 3)
innovative execution methods. An outline of
these technological developments is presented
in Table 3.1.
3.2 New Types of Structures
(1) Girder Sections with Lower Cost and Better
Aerodynamic Stability
It is vital to guarantee that super long-
span suspension bridges remain stable during
strong wind conditions. Methods of
guaranteeing aerodynamic stability include
increasing the stiffness of stiffening girders
and devising innovative new girder sections.
For the Akashi Kaikyo Bridge, a truss
type stiffening girder already used in earlier
bridges has been adopted. And because of their
small center span lengths of about 1,000m,
single box type stiffening girders have been
used for the Kurushima Bridges.
Problems that must be overcome to
construct super long-span suspension bridges
with a center span length greater than 2,000m
include 1) the steel weight increase caused by
measures to increase the stiffness of the
stiffening girders and 2) the truss girders are
vulnerable to the effects of wind by the high
drag force. To overcome these problems,
studies now in progress are focused on the use
of slotted box girders and single box girders on
two premises: 1) the use of box girders will
improve the wind resistance, improving the
vibration properties and aerodynamic
properties and 2) it is possible to construct a
superstructure using the hoisting erection
method that raises the box girder blocks
directly from the sea surface at the erecting
location.
(2) Underwater Foundations with Lower Cost
and Better Earthquake Resistance
Comparisons of the planned sites of
future projects with those of the Honshu-
Shikoku Bridges reveal that 1) the former tend
to be closer to the epicenters of large scale
earthquakes, 2) their foundations must be
constructed in deeper water, 3) and the
properties of the bearing ground supporting
their foundations are worse than in the case of
earlier bridges. It will, therefore, be necessary
to develop underwater main tower foundation
types that are of more highly earthquake
resistance and more economical and rational to
construct than existing cylindrical solid
foundations (the main tower foundations of the
Akashi Kaikyo Bridge for example).
Studies to meet these needs are based on
the twin-shaft type foundation shown in Figure
3.1. The benefits of this type include 1) lower
concrete volume that reduces construction cost
and shortens construction period, 2) the light
weight that allows its use on relatively softer
ground, and 3) the light weight and lower
center of the gravity for superior earthquake
resistance. It is essential that future projects be
preceded by studies to determine the shape
most appropriate for each project considering
design and construction conditions such as the
water depth, geology and so on at the planned
sites.
3.3 New Concepts of Designs
(1) Wind Resistant Design
While the Honshu-Shikoku Bridges were
being designed, a number of wind resistant
design methods for long-span bridges were
studied and tested experimentally to improve
394
design precision. The knowledges obtained
from the results of the full model wind tunnel
studies conducted to study the aerodynamic
stability of the Akashi Kaikyo Bridge in
particular has been applied to propose a
number of new concepts that may be
incorporated into wind resistant design of
future super long-span bridges.
[1] Review of Wind Fluctuation Characteristics
As the span length of bridges increases,
the cross section of girders will be determined
in accordance with wind load. It is, therefore,
possible to create more economical and
rational designs by improving the precision of
wind load calculations.
Wind load is calculated by increasing the
static load calculated from mean wind speed
accounting for the effect of wind fluctuation.
The results of the full model wind tunnel tests
of the Akashi Kaikyo Bridge and observations
of natural winds have confirmed that it is
possible to achieve a relative reduction of the
effect of wind fluctuation acting on the girder
of a long-span suspension bridge. In other
words, the wind load used to design super
long-span suspension bridges can be lower
than that calculated based on conventional
standards.
[2] Development of Flutter Analysis
Aerodynamic stability of long-span
suspension bridges has been studied based on
wind tunnel tests in use of a section model
supported by spring, but it is now known that
since the span of bridges has increased, it is
impossible to fully reproduce their behavior
using a section model. For this reason, the
wind resistant design for the Akashi Kaikyo
Bridge involved the clarification of
aerodynamic stability by conducting the wind
tunnel tests using the 40m long full model to
reproduce the complex vibration properties of
the real bridge. The findings of this studies
have permitted the development of a flutter
analysis to be used to precisely clarify the
aerodynamic stability of a long-span bridge.
(2) Seismic Design
It has been pointed out that future
projects sites are close to the epicenters of
large scale plate boundary-type earthquakes
and the existence of active faults in the vicinity.
It is, therefore, necessary to adopt appropriate
design earthquake ground motions and
corresponding analytical methods so that it will
be possible to practice economical and rational
design and will guarantee the aseismicity of the
structures.
[1] Basic Concepts of Seismic Design
As a basis of seismic design, the design
earthquake ground motions and the
corresponding safety levels of structures will
be considered at two stages. At Level- 1 (LI),
"damages which destroy transportation
functions shall be prevented for moderate
ground motions induced in the earthquakes
with high probability to occur within the life
time of structures". At Level-2 (L2),
"recoverable functional damages shall be
allowed, but collapses shall be prevented for
extreme ground motions induced in the
earthquakes with low probability to occur at
future projects sites."
[2] Input Design Earthquake Ground Motions
The input design earthquake ground
motion used for LI design is evaluated by
statistically analyzing past earthquakes within
300km of the center of future projects sites to
hypothesize ground motion with return period
of 150 years.
The input design earthquake ground
motion used for L2 design is evaluated on the
hypothesis that either large scale plate
boundary-type earthquakes or inland intra-plate
earthquakes caused by active faults will occur
relatively close to future projects sites. This
ground motion is evaluated in some ways : 1)
attenuation equations, 2) fault rupture process
models, 3) recorded strong ground motion at
near field of large scale earthquakes.
[3] Seismic Design Methods of Foundations
The seismic design of foundations is
395
conventionally done based on the response
spectrum method : the use of a rigid body using
a two-degree-of-freedom model that represents
soil stiffness as a linear spring. But because it
is clear that during a large scale earthquake, the
stiffness and damping properties of
surrounding soils produce nonlinear behaviors,
the LI seismic design method that accounts for
these properties has been developed. It is,
therefore, now possible to perform high
precision rational seismic design of
foundations.
The check of the stability of foundations
against L2 ground motion is made by elasto-
plastic FEM time history response analyses. In
the analyses, the nonlinear stress-strain relation
of surrounding soils is modeled as the modified
Ramberg-Osgood model, and a model that can
represent the characteristics of the separation
between a foundation and ground is used. The
properties of ground are analyzed in detail by
this method.
(3) Design of Superstructures
In superstructure design standards of the
Honshu-Shikoku Bridges, provisions
contributing substantially to lower construction
cost and shorter construction period have been
reviewed.
[1] Allowable Stress of Main Cables
Because the weight of main cables in a
super long-span suspension bridge with a span
length exceeding 2,000m will account for
between 20 and 30% of the steel weight of the
bridge, and lowering the weight of main cables
will make a large contribution to lowering
construction cost and shortening construction
period.
The design of main cables in the
Honshu-Shikoku Bridges were adopted as the
allowable stress of 56kgf/mm^ for the
Innoshima Bridge (completed in 1983) and
64kgf/mm^ for the Seto-Ohashi Bridge
(completed in 1988). In the design of the
Akashi Kaikyo Bridge, because the cable
strands material was improved to increase the
tensile strength from 160kgf/mm^ to
1 80kgf/mm^, the allowable stress was raised to
82kgf/mml
In the design of super long-span
suspension bridges, it was found that the
allowable stress of main cables could be set at
lOOkgf/cm^ on such grounds as, 1) the quality
of high strength strands material will stabilize,
2) bridge erection will have high precision, 3)
corrosion prevention technologies will be sure
to have improved, and 4) there will be leeway
considering the safety balance of an entire
suspension bridge system.
A comparison of the allowable stress of
main cables with a case where it would be
identical to that of the main cables of the
Akashi Kaikyo Bridge (82kgf/mm^) reveals
that the weight of main cables can be lowered
by about 40%.
[2] Methods of Live Loading
The design live load of super long-span
suspension bridges is based on a calculation
method that reduces live load according to the
span in the same way as the design of the
Honshu-Shikoku Bridges. And the method of
loading only a traffic lane width instead of
loading a carriage way width is adopted to
account for the real situation of motor vehicle
traffic.
Main towers have conventionally been
designed by performing influence line loading :
loading live load in a loading range that
represents the severest possible conditions on
the design section. But because it is highly
unlikely for such loading conditions to actually
occur, it is clearly possible to increase the
allowable stress.
(4) Design of Substructures
Because the selection of the bearing
layer to support a foundation is governed to a
great degree by the dimensions of a foundation,
the quantity of soils to be excavated to reach
the bearing layer, etc., this is an important
396
matter in determining the construction cost and
period. To practice an economical and rational
design, the bearing capacity of ground and
deformation of a foundation must be precisely
calculated and reflected in the design.
Accordingly, the method involving the
clarification of the on-site ground properties
through geological explorations and laboratory
tests, the precise modeling of the results, and
FEM analyses accounting for these ground
properties have been developed. Specifically,
1) the geological properties of ground are
clarified by acoustic explorations, boring
explorations, or borehole loggings at the site,
2) the undisturbed specimens obtained by
boring are used to clarify the deformation
properties of ground from a minute strain level
to a failure range, and 3) the nonlinear
properties of ground are modeled and analyzed
based on the results of the first two steps.
3.4 Innovative Execution Methods
(1) Execution Methods of Superstructures
Execution methods of superstructures
have been introduced existing execution
methods from other countries. Examples
include 1) the use of tension bolts to assembly
tower shaft joints, 2) the use of the hoisting
erection method to install girder blocks, and 3)
finishing tower bases with grouting. Other
methods under consideration are the systematic
overlapping of work steps by, for example,
simultaneously erecting hanger ropes and
girders, a main cable erection method that does
not require catwalks, and more economical use
of tower erection cranes.
(2) Execution Methods of Substructures
Maritime conditions will be particularly
severe at the sites of future projects ; ones to be
constructed facing the Ocean where they will
be exposed to the effects of typhoons and
ocean waves. Execution methods that minimize
the effects of the maritime conditions at the
sites in order to improve working days ratio
under these severe conditions now being
studied include the use of semi-submersible
pontoons immune to the effects of waves, the
prefabrication of caissons and other steel
members, and so on.
3.5 Effect ofNew Technological Developments
A comparison of the results of the trial
design performed using newly developed
technologies with that based on existing
technologies has confirmed that new
technological developments have been
effective.
Table 3.2 presents the comparison of the
results for the Tokyo Bay Mouth Bridge. It
indicates that it is possible to reduce
construction cost roughly by 30 to 50% in case
developing new technologies are utilized. The
factors for this reduction are presented below.
But assuming that the factors overlap, the
percentages representing the contributions of
each new technology to the reduction of
construction cost are just rough yardsticks.
1) Developments of new types structures
(about 25%)- Adoption of a slotted box girder (with an
open grating)
- Adoption of a twin-shaft type foundation
2) Introduction of new concepts designs
(about 10%)
- Reduction of wind load
- Classification of design earthquake ground
motions at two stages
- Review of safety factors
- Appropriate evaluations of bearing capacity
of ground
3) Innovative execution methods
(about 5%)- Review of fabrication precision and
introduction of overlapping execution works
- Improvement of submarine drilling and
working days ratio
The developments of new types
structures contribute greatly to the construction
cost reduction.
397
4. SPECIFIC EXAMPLES OFNEW TYPES STRUCTURES
4.1 New Types of Superstructures
(1) Slotted Box Girders
[1] Development of girders with better
aerodynamic stability
A slotted box girder has an opening at
the center of girder. Section models premised
on a center span length of 3,000m with two
side spans of 1,500m have been used for wind
tunnel tests to study the relationship of the
flutter onset wind speed with the opening
pattern, opening width and aerodynamic
appendages.
The results have revealed the following
facts.
1) Aerodynamic stability is improved by
providing an opening at the center of girder,
and the larger the width, the better
aerodynamic stability.
2) It is possible to improve aerodynamic
stability by installing center barriers in the
center of the opening.
3) It is possible to improve aerodynamic
stability by installing guide vanes at the end of
girder.
4) Guard rails contribute to improved
aerodynamic stability and it is possible to
improve aerodynamic stability during negative
angle of attack by installing under barriers at
the bottom of girder to create vertically
symmetrical cross sections.
Figure 4.1 shows a cross section
proposed based on the results of the wind
tunnel tests.
[2] Developments of girders with lower cost
The central part of a slotted box girder
must be provided with an opening as a wind
resistance measure (the solidity factor of the
opening is about 50%). But it is more
economical and rational to provide the
necessary opening width by installing an open
grating to permit motor vehicles to drive on the
top of the open grating than to provide the
width of traffic lanes on the top of box girder.
The girder with an open grating sharply cuts
construction cost and shortens construction
period. Specifically, 1) a main tower interval
need not be expanded, 2) a foundation width
need not be increased, and 3) the steel weight
of a super long girder can be reduced.
The number of traffic lanes of future
projects is assumed to be four lanes. In this
case the central two lanes will have to be
located on the open grating. The adoption of a
slotted box girder will also permit stage
construction, as the first two lanes are opened
on the top of box girder and two more lanes are
added later after an open grating has been
installed.
In Japan, open gratings have been
installed on some long-span bridges, such as
the Seto-ohashi Bridge and the Akashi Kaikyo
Bridge. But because they were introduced to
guarantee aerodynamic stability, they were
installed on parts of these bridges that normally
load no traffic such as the central strip and road
shoulder. They have never been used to form a
roadway. Table 4. 1 presents some examples of
their use as a roadway in foreign countries.
Photograph 4.1 shows the open grating of the
Mackinac Bridge in the United States. It has
not been replaced during the forty years since it
was constructed.
At the PWRI, driving tests are planned to
confirm the running safety of motor vehicles to
travel at high speed on open gratings. The tests
will be carried out to study 1) skid resistance
on open gratings, 2) running safety when road
surface conditions differ between the left and
right wheels of motor vehicles (when changing
lanes for example), 3) human engineering
verification during driving on them (riding
comfort, uneasiness experienced by drivers and
so on), and 4) traffic management measures
(speed limits and so on), etc.
Skid resistant tests are now underway
(Photographs 4.2 and 4.3). The tests are being
398
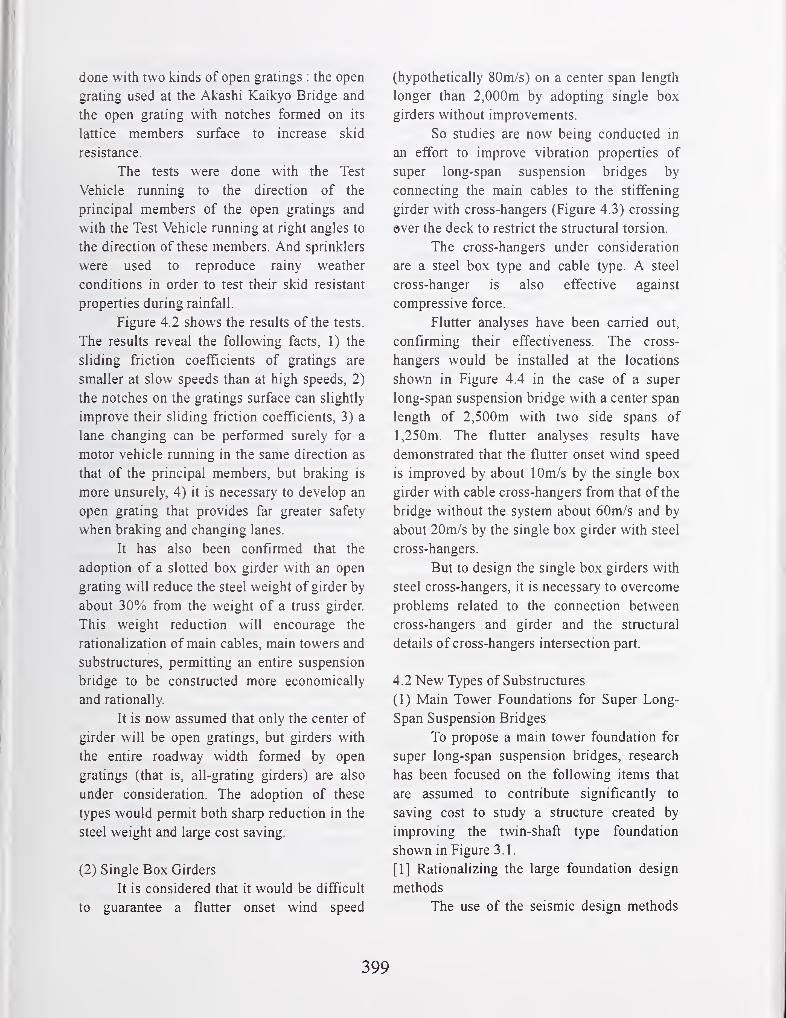
done with two kinds of open gratings : the open
grating used at the Akashi Kaikyo Bridge and
the open grating with notches formed on its
lattice members surface to increase skid
resistance.
The tests were done with the Test
Vehicle running to the direction of the
principal members of the open gratmgs and
with the Test Vehicle running at right angles to
the direction of these members. And sprinklers
were used to reproduce rainy weather
conditions m order to test their skid resistant
properties during rainfall.
Figure 4.2 shows the results of the tests.
The results reveal the following facts, 1) the
sliding friction coefficients of gratings are
smaller at slow speeds than at high speeds, 2)
the notches on the gratings surface can slightly
improve their sliding friction coefficients, 3) a
lane changing can be performed surely for a
motor vehicle running in the same direction as
that of the principal members, but braking is
more unsurely, 4) it is necessary to develop an
open grating that provides far greater safety
when braking and changing lanes.
It has also been confirmed that the
adoption of a slotted box girder with an open
grating will reduce the steel weight of girder by
about 30% from the weight of a truss girder.
This weight reduction will encourage the
rationalization of main cables, main towers and
substructures, permitting an entire suspension
bridge to be constructed more economically
and rationally.
It IS now assumed that only the center of
girder will be open gratings, but girders with
the entire roadway width formed by open
gratings (that is, all-grating girders) are also
under consideration. The adoption of these
types would permit both sharp reduction in the
steel weight and large cost saving.
(2) Single Box Girders
It is considered that it would be difficult
to guarantee a flutter onset wind speed
(hypothetically 80m/s) on a center span length
longer than 2,000m by adopting single box
girders without improvements.
So studies are now being conducted in
an effort to improve vibration properties of
super long-span suspension bridges by
connecting the main cables to the stiffening
girder with cross-hangers (Figure 4.3) crossing
ever the deck to restrict the structural torsion.
The cross-hangers under consideration
are a steel box type and cable type. A steel
cross-hanger is also effective against
compressive force.
Flutter analyses have been carried out,
confirming their effectiveness. The cross-
hangers would be installed at the locations
shown in Figure 4.4 in the case of a super
long-span suspension bridge with a center span
length of 2,500m with two side spans of
1,250m. The flutter analyses results have
demonstrated that the flutter onset wind speed
is improved by about lOm/s by the single box
girder with cable cross-hangers from that of the
bridge without the system about 60m/s and by
about 20m/s by the single box girder with steel
cross-hangers.
But to design the single box girders with
steel cross-hangers, it is necessary to overcome
problems related to the connection between
cross-hangers and girder and the structural
details of cross-hangers intersection part.
4.2 New Types of Substructures
(1) Main Tower Foundations for Super Long-
Span Suspension Bridges
To propose a main tower foundation for
super long-span suspension bridges, research
has been focused on the following items that
are assumed to contribute significantly to
saving cost to study a structure created by
improving the twin-shaft type foundation
shown in Figure 3.1.
[1] Rationalizing the large foundation design
methods
The use of the seismic design methods
399
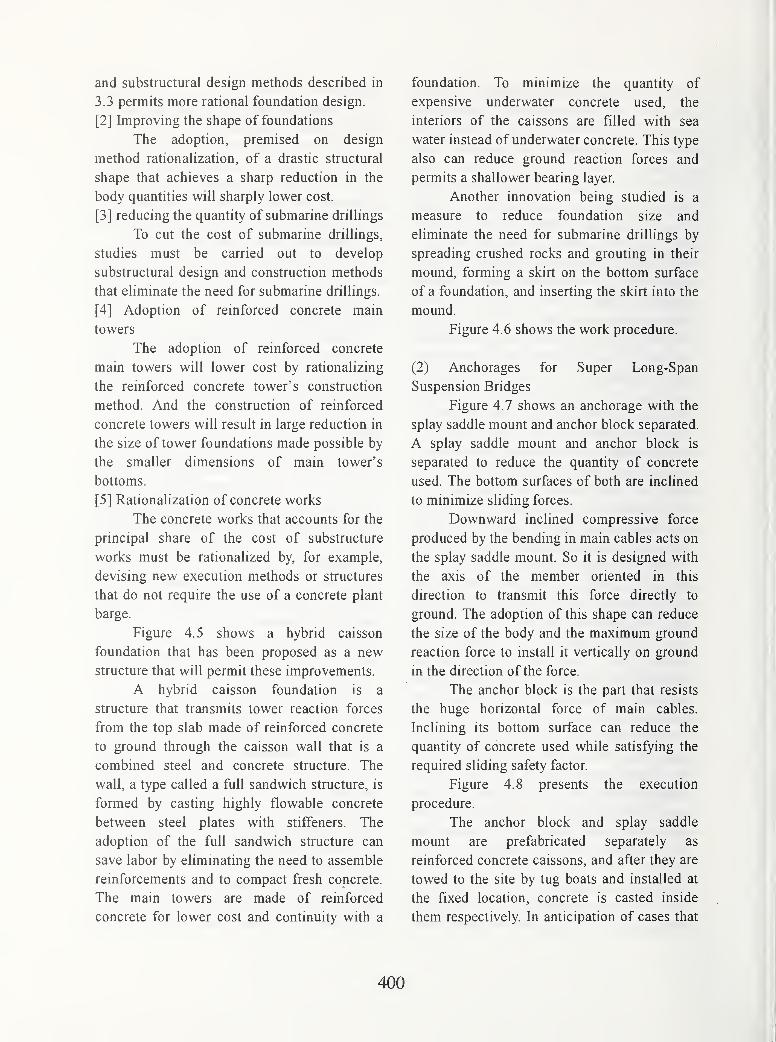
and substructural design methods described in
3.3 permits more rational foundation design.
[2] Improving the shape of foundations
The adoption, premised on design
method rationalization, of a drastic structural
shape that achieves a sharp reduction in the
body quantities will sharply lower cost.
[3] reducing the quantity of submarine drillings
To cut the cost of submarine drillings,
studies must be carried out to develop
substructural design and construction methods
that eliminate the need for submarine drillings.
[4] Adoption of reinforced concrete main
towers
The adoption of reinforced concrete
main towers will lower cost by rationalizing
the reinforced concrete tower's construction
method. And the construction of reinforced
concrete towers will result in large reduction in
the size of tower foundations made possible by
the smaller dimensions of main tower's
bottoms.
[5] Rationalization of concrete works
The concrete works that accounts for the
principal share of the cost of substructure
works must be rationalized by, for example,
devising new execution methods or structures
that do not require the use of a concrete plant
barge.
Figure 4.5 shows a hybrid caisson
foundation that has been proposed as a new
structure that will permit these improvements.
A hybrid caisson foundation is a
structure that transmits tower reaction forces
from the top slab made of reinforced concrete
to ground through the caisson wall that is a
combined steel and concrete structure. The
wall, a type called a full sandwich structure, is
formed by casting highly flowable concrete
between steel plates with stiffeners. The
adoption of the full sandwich structure can
save labor by eliminating the need to assemble
reinforcements and to compact fresh concrete.
The main towers are made of reinforced
concrete for lower cost and continuity with a
foundation. To minimize the quantity of
expensive underwater concrete used, the
interiors of the caissons are filled with sea
water instead of underwater concrete. This type
also can reduce ground reaction forces and
permits a shallower bearing layer.
Another innovation being studied is a
measure to reduce foundation size and
eliminate the need for submarine drillings by
spreading crushed rocks and grouting in their
mound, forming a skirt on the bottom surface
of a foundation, and inserting the skirt into the
mound.
Figure 4.6 shows the work procedure.
(2) Anchorages for Super Long-Span
Suspension Bridges
Figure 4.7 shows an anchorage with the
splay saddle mount and anchor block separated.
A splay saddle mount and anchor block is
separated to reduce the quantity of concrete
used. The bottom surfaces of both are inclined
to minimize sliding forces.
Downward inclined compressive force
produced by the bending in main cables acts on
the splay saddle mount. So it is designed with
the axis of the member oriented in this
direction to transmit this force directly to
ground. The adoption of this shape can reduce
the size of the body and the maximum ground
reaction force to install it vertically on ground
in the direction of the force.
The anchor block is the part that resists
the huge horizontal force of main cables.
Inclining its bottom surface can reduce the
quantity of concrete used while satisfying the
required sliding safety factor.
Figure 4.8 presents the execution
procedure.
The anchor block and splay saddle
mount are prefabricated separately as
reinforced concrete caissons, and after they are
towed to the site by tug boats and installed at
the fixed location, concrete is casted inside
them respectively. In anticipation of cases that
400

the reinforced concrete caisson of the anchor
block will be too heavy to be executed while
floating and setting, a method of dividing the
anchor block in some parts then joining them
on the water is under study.
Technical issues that must be resolved
for this anchorage type include preliminary
submarine drillings, inclining of the bottom
surface related to concrete works, and others.
5. CONCLUSIONS
The studies have shown that new
technologies such as developments of new
types structures, introduction of new concepts
designs and innovative execution methods will
permit the construction of super long-span
bridges at much lower cost than if existing
technologies were applied.
Further studies of new structures, design
methods, and execution methods are necessary
in order to achieve even lower construction
cost and shorter construction period.
And for each project, the investigations
of natural conditions at the planned sites will
be continued and reinforced. Then based on
their results, the studies will be made to make
the design and construction plans more
economical and rational in the view of the
unique local situations.
ACKNOWLEDGEMENTS
The Ministry of Construction has
established the Investigation Committee on
Trans-Strait Road Projects to efficiently
conduct surveys of super long-span bridges in
conception with the trans-strait road projects.
Some of the newly developed technologies
introduced in this report have argued in the
Committee.
We sincerely thank Dr.Yoshida
(Chairman : President of Honshu-Shikoku
Bridges Engineering Co. Ltd.) and all of the
Committee members for their encouraging
guidance.
REFERENCES
Public Works Research Institute, "Report
of the Investigation Committee on Trans-Strait
Road Projects in Japan", August 1993 (in
Japanese)
Public Works Research Institute, "Report
of the Investigation Committee on Trans-Strait
Road Projects in Japan", March 1996 (in
Japanese)
Table 4. 1 Suspension Bridges with Open Grating Used as Roadway
Bridge Country Center Span Year Location of Purpose
Length(m) Completed Open Grating
New Tacoma Br. US 853 1948 Lane boundaries Aerodynamic stabilization
Mackinac Br. US 1,158 1957 Sidewalks, inside lanes Aerodynamic stabilization
Salazar Br. Portugal 1,013 1966 Inside lanes Aerodynamic stabilization
Angostura Br. Venezuela 712 1967 Inside lanes Weight reduction
Aerodynamic stabilization
401
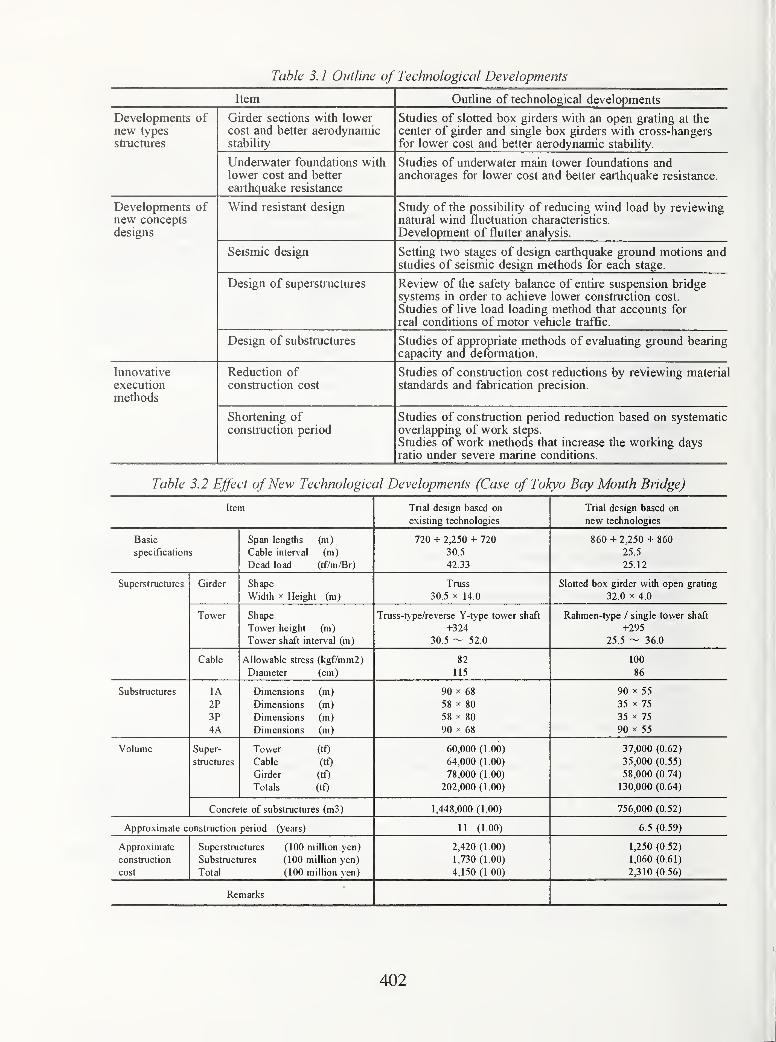
Table 3. 1 Outline of Technological Developments
Item Outline of technological developments
Developments ofnew types
structures
Girder sections with lowercost and better aerodynainic
stability
Studies of slotted box girders with an open grating at the
center of girder and single box girders with cross-hangersfor lower cost and better aerodynamic stability.
Underwater foundations with
lower cost and better
earthquake resistance
Studies of underwater main tower foundations andanchorages for lower cost and better earthquake resistance.
Developments ofnew concepts
designs
Wind resistant design Study of the possibility of reducing wind load by reviewingnatural wind fluctuation characteristics.
Development of flutter analysis.
Seismic design Setting two stages of design earthquake ground motions andstudies of seismic design methods for each stage.
Design of superstructures Review of the safety balance of entire suspension bridge
systems in order to achieve lower construction cost.
Studies of live load loadmg method that accounts for
real conditions of motor vehicle traffic.
Design of substructures Studies of appropriate methods of evaluating ground bearingcapacity and deformation.
Innovative
execution
methods
Reduction ofconstruction cost
Studies of construction cost reductions by reviewing material
standards and fabrication precision.
Shortening ofconstraction period
Studies of construction period reduction based on systematic
overlapping of work steps.
Studies of work methods that increase the working daysratio under severe marine conditions.
Table 3.2 Effect ofNew Technological Developments (Case of Tokyo Bay Mouth Bridge)
Item Tnal design based on Trial design based on
existing technologies new technologies
Basic Span lengths (m) 720 + 2,250 + 720 860 + 2,250 + 860
specification s Cable interval (m) 30.5 25,5
Dead load (tf/m/Br) 42,33 25,12
Superstructures Girder Shape Truss Slotted box girder with open grating
Width X Height (m) 30.5 X 14,0 32.0 X 4.0
Tower Shape Truss-type/reverse Y-type tower shaft Rahmen-type / single tower shaft
Tower height (m) +324 +295
Tower shaft interval (m) 30,5 - 52,0 25.5 - 36,0
Cable Allowable stress (kgf/mmZ) 82 100
Diameter (cm) 115 86
Substructures lA Dimensions (m) 90 X 68 90 X 55
2P Dimensions (m) 58 X 80 35 X 75
3P Dimensions (m) 58 X 80 35 X 75
4A Dimensions (m) 90 X 68 90 X 55
Volume Super- Tower (tO 60,000 (1,00) 37,000 (0,62)
structures Cable (tf) 64,000 (1,00) 35,000 (0,55)
Girder (tf) 78,000 (1,00) 58,000 (0,74)
Totals (tf) 202,000 (1,00) 130,000 (0,64)
Concrete of substructures (m3) 1,448,000 (1.00) 756,000 (0.52)
Approximate construction period (years) 11 (1,00) 6,5 (0,59)
Approximate Superstructures (100 million yen) 2,420 (1,00) 1,250 (0,52)
construction Substructures (100 million yen) 1,730 (1,00) 1,060 (0,61)
cost Total (100 million yen) 4,150 (1 00) 2,310 (0,56)
Remarks
402
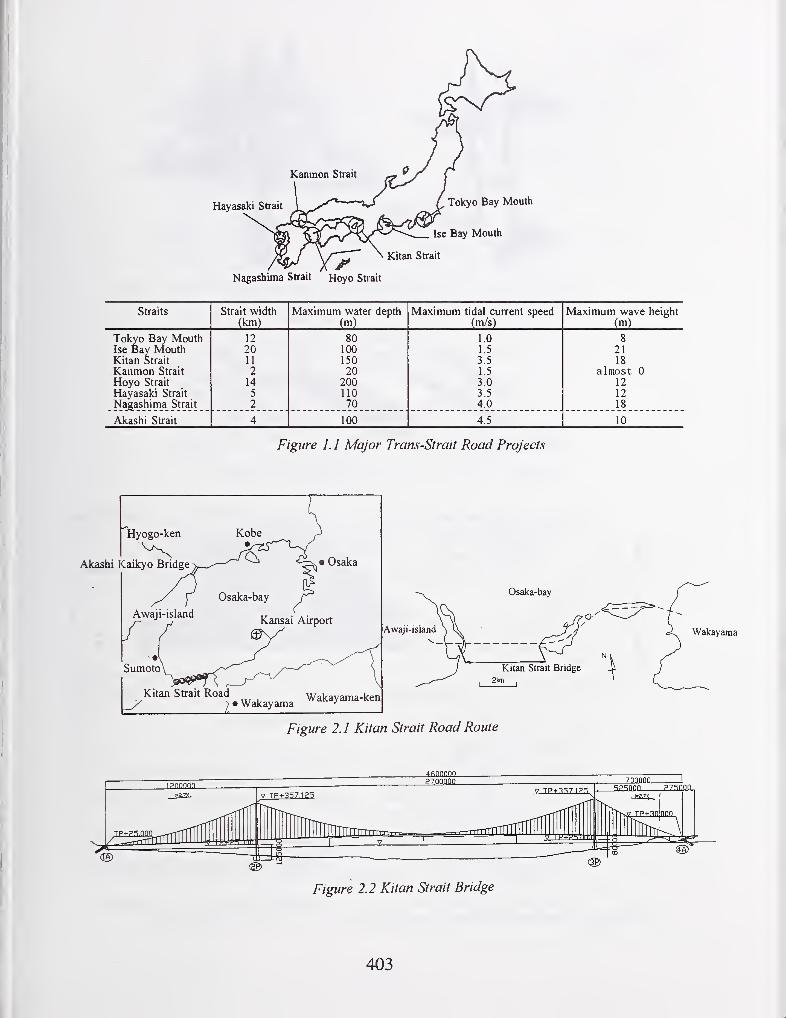
Hayasaki Strait
Nagashiina Strait Hoyo Strait
Tokyo Bay Mouth
Ise Bay Mouth
Kitan Strait
Straits Strait width(km)
Maximum water depth(m)
Maximum tidal current speed(m/s)
Maximum wave height
(m)
Tokyo Bay MouthIse Bay Mouth
12 80 1.0 8
20 100 15 21Kitan Strait 11 150 3.5 18Kanmon Strait 2 20 1.5 almost 0Hoyo Strait 14 200 3.0 12Hayasaki Strait 5 110 3.5 12Nagashima Strait 2 70 4.0 18
Akashi Strait 4 100 4.5 10
Figure 1. 1 Major Trans-Strait Road Projects
Hyogo-ken
Akashi Kaikyo Bridge
Awaji-island
Osaka
Osaka-bay
Kansai Airport
Kitan Strait Road) • Wakayama
Wakayama-ken
Awaji-island Wakayama
Figure 2.1 Kitan Strait Road Route
Figure 2.2 Kitan Strait Bridge
403
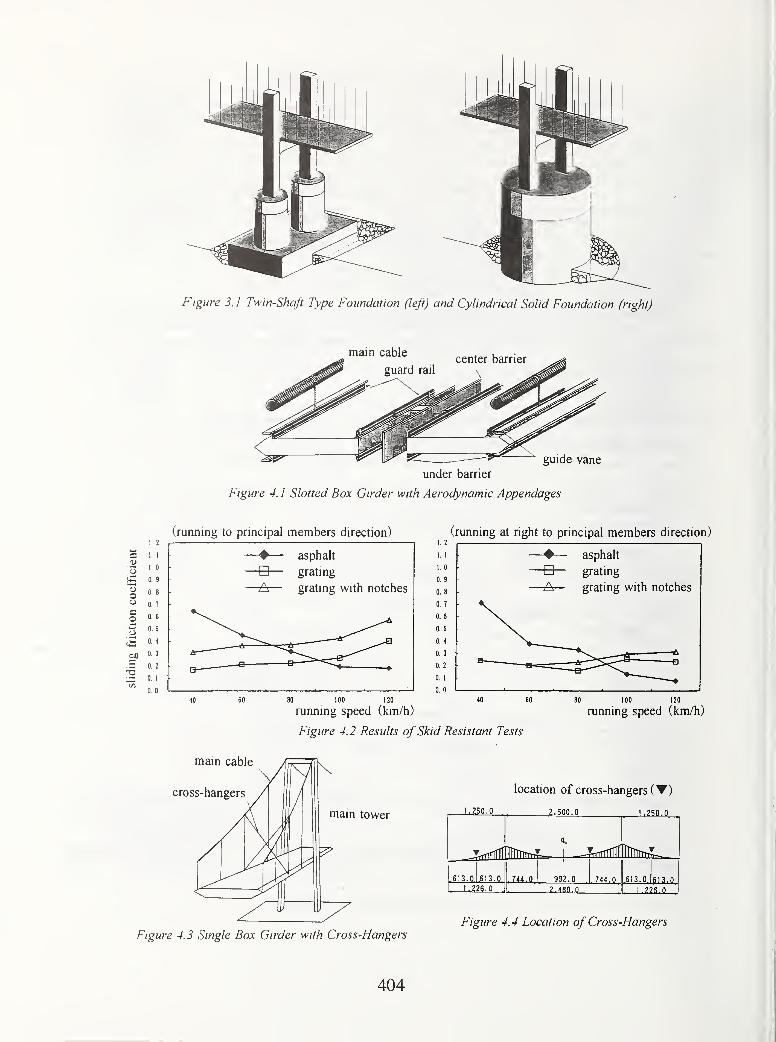
Figure 3. 1 Twin-Shaft Type Foundation (left) and Cylindrical Solid Foundation (right)
main cablecenter barrier
guide vane
under barrier
Figure 4.1 Slotted Box Girder with Aerodynamic Appendages
(running to principal members direction) (running at right to principal members direction)
ooco
OX)
c
100 120
running speed (km/h)
Figure 4.2 Results of Skid Resistant Tests
80 100 izo
running speed (km/h)
main cable
cross-hangers
Figure 4.3 Single Box Girder with Cross-Hangers
location of cross-hangers (T)
^TTtrmJL 1 ^SrTTTlTlllTllTTTTT^
.613.0 613.0 744.0 992.0 744.0 613.0 613.0.
. 1.226.0 2.480.0,
1.776.0
Figure 4. 4 Location of Cross-Hangers
404
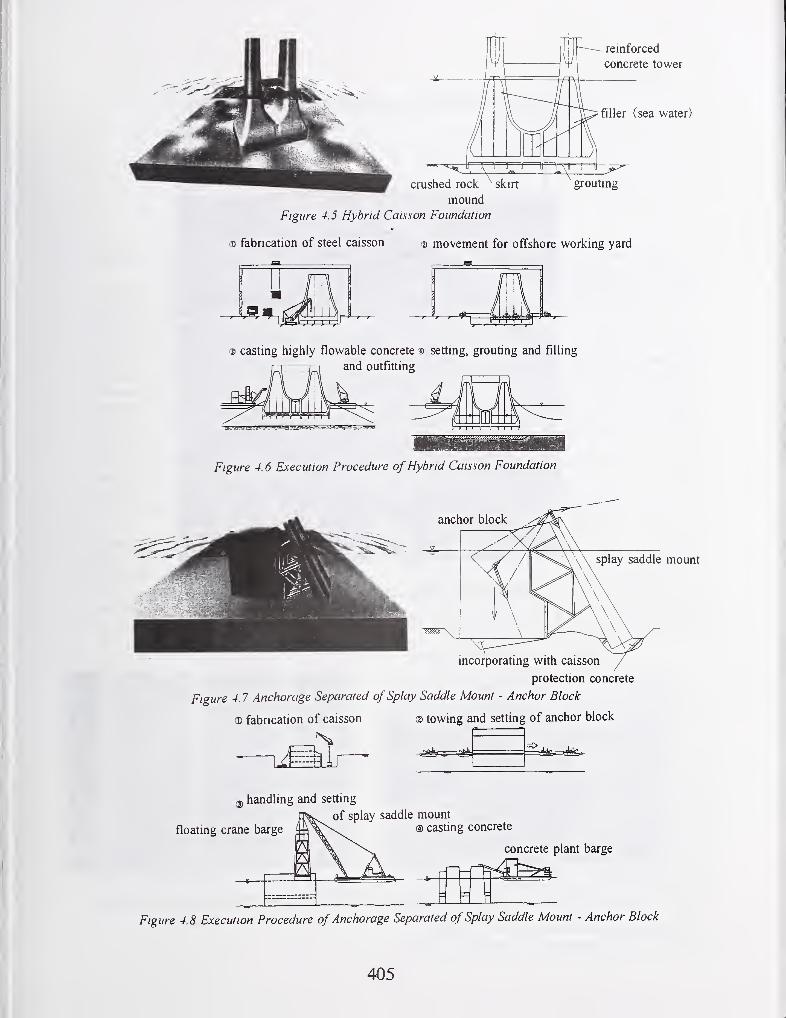
crushed rock skirt
mound
Figure 4.5 Hybrid Caisson Foundation
reinforced
concrete tower
filler (sea water)
grouting
® fabrication of steel caisson o movement for offshore working yard
D casting highly flowable concrete d setting, grouting and filling
and outfitting
I I I
—
^—u I 1
Figure 4.6 Execution Procedure of Hybrid Caisson Foundation
splay saddle mount
incorporating with caisson
protection concrete
Figure 4.7 Anchorage Separated of Splay Saddle Mount - Anchor Block
® fabrication of caisson @ towing and setting of anchor block
"I
handling and setting
of splay saddle mount
floating crane barge ® casting concrete
concrete plant barge
Figure 4.8 Execution Procedure of Anchorage Separated of Splay Saddle Mount - Anchor Block
405
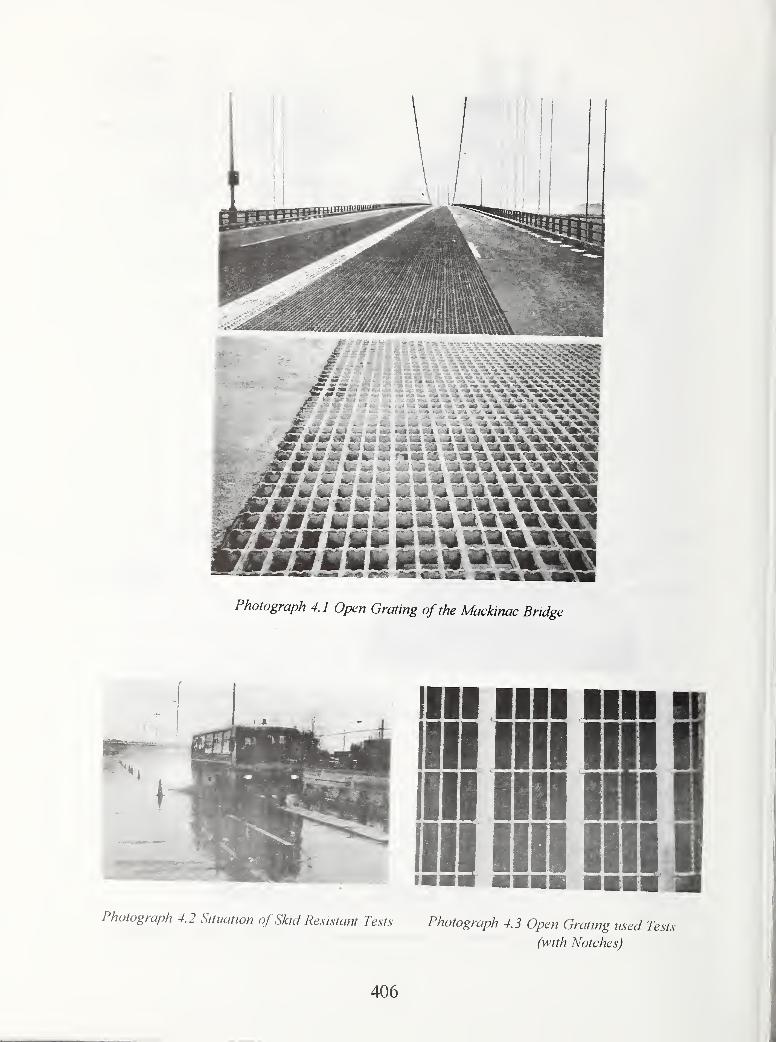
Photograph 4.1 Open Grating of the Mackinac Bridge
Photograph 4.2 Situation ofSkid Resistant Tests Photograph 4.3 Open Grating used Tests
(with Notches)
New Hurricane Wind Structures and Wind Speed Measurements
by
Peter G. Black^and
Frank D. Marks, Jr.*
ABSTRACT
A major source of difficulty in past efforts to
predict TC intensity, wind fields, and storm
surge at landfall has been the inability to
measure the surface wind field directly and the
inability to predict how it changes in response to
external and internal forcing. A synthesis ofpast
observations of gust factors in hurricanes, in
addition to new GPS dropsonde observations,
have made it possible to estimate peak gust, 1-
min and 10-min sustained mean windfields at
thelO-M level. Significant departures fi-om the
traditional log law have been found. Recently,
multiple low-level wind maxima were observed
in eyewall observations fi-om GPS dropsondes.
Recent Observations of eyewall mesovortices
have made it possible to observe the structure
and characteristics of these features as they
make landfall. They have been found to be
associated with strong convection in the eyewall
at a time when rapid strengthening is occurring.
This can produce short periods of intense winds
at considerably larger distances inland than is
normally expected for landfalling hurricanes.
KEYWORDS:
boundary layer; eyewall; gust factor; hurricane;
mesocyclone; mesovortex; satellite; radar;
tropical cyclone; typhoon.
1. INTRODUCTION
It is an important international priority to
improve the forecasts of surface wind field,
intensity, structure and storm surge in
landfalling tropical cyclones (TC) in order to
successfully mitigate the detrimental physical
impacts associated with these storms. Coastal
population growth in the U.S. of 4-5% yr', is
outpacing the historic 1-2% yr' rate ofimprovement in official hurricane track
predictions. While specific track prediction
models have indicated a 15-20% improvementover the past 2-3 years, very little skill has beenshown in the prediction of intensity change or
wind field distribution (Neumann et al 1997).
For this reason, the average length of coastline
warned per storm, about 570 km, has not
changed much over the past decade, nor has the
average overwaming percentage, about 75%.However, the average preparation costs haveincreased eight-fold in the past 7 years from
$50M storm ' in 1989 (Sheets 1990) to an
estimated $300M storm ' in 1996, or about $1Mnm ' of coastline warned (Jarrell et al 1992;
Neumann et al 1997). The increasing potential
for severe loss of life as coastal populations soar,
and potential monetary losses of tens of billions
of dollars requires that greater effort be directed
to understanding all physical processes whichplay an important role in modulating TC windfields and storm surge at landfall.
A major source of difficulty in past predictions
of TC intensity, wind fields, and storm surge at
landfall has been the inability to measure the
surface wind field directly and the inability to
predict how it changes in response to external
and internal forcing. The surface wind field
must presently be estimated from a synthesis of
scattered surface ship and/or buoy observations
and aircraft measurements at 1.5 km to 3.0 kmaltitude (Powell 1980; Powell et al 1996; Powell
and Houston 1996). This task is complicated by
variations with height of the storm's structure,
such as the change with height of storm-relative
flow due to environmental wind shear and to the
variable outward tilt of the wind maximum with
height.
1 NOAA/AOML, Hurricane Research Division,
4301 Rickenbacker Causeway, Miami, FL 33149
407
Numerous studies of TC structure have beenmade previously using various combinations of
remote sensing and in situ data. Numerousstudies of TCs have been made concentrating onNOAA aircraft data, ground based radar andsurface damage reports, e.g., Willoughby andBlack (1996) and Black and Marks (1991).
Based on NOAA aircraft observations, eyewall
mesovortices and attendant supercell convection
were associated with intense turbulence, vertical
air motions in excess of 20 m s ' at cloud base
and momentary loss of aircraft control during
low-level penetrations in rapidly developingHurricanes Gladys (1975) and Hugo (1989).
Vorticity perturbations were deduced withmagnitudes on the order of Midwestthunderstorm mesocylones. Land based radar
observations and damage surveys after
Hurricane Andrew (1992) suggested that
enhanced swirling motion associated with
convectively initiated eyewall mesovortices mayhave been responsible for the intense inland
wind damage associated with landfall in SouthFlorida (Wakimoto and Black 1994; Willoughbyand Black 1996). Convective perturbations
along the inner edge of the outer eyewall of
Typhoon Paka (1997) led to three distinct
destructive wind surges over the northern half of
Guam.
An in-depth examination of 3-5 s gust factors at
10-m level derived from a number of sources
suggest that separate populations of gust factors
are associated with mid-latitude storms, over-
water and over-land TC conditions. The meanover-water gust factors for 1-min, 10-min and30-min measurement duration in TCs werefound to be 1.23, 1.40 and 1.48, respectively.
The ratio of average maximum wind estimates in
West Pacific TCs from the post- 1970 data set
over those from the pre- 1970 data set, is foundto be about the same as the ratio between flight-
level (cloud base) winds and surface winds, an
average of 0.8 (Powell, 1980). Recent GlobalPositioning System (GPS) dropsonde (GPSsonde) data in the eyewalls of HurricanesGuillermo (1997) and Erika (1997) in 1997suggest that different ratios may apply in the TCouter region beyond the eyewall than in the
eyewall itself. The difference in wind estimates
between the two time periods in the westernPacific may be due to the failure to take into
account the decrease of the wind with height in
the boundary layer of the TC for the pre- 1970era observations.
Black (1993) suggested that the TC gust factor
increased with height at the same rate that the
mean wind decreases with height in the TCatmospheric boundary layer (ABL), implyingthat convection conserves momentum in the
ABL, maintaining a nearly constant peak gust
wind speed with height. The recent Guillermoand Erika GPS sonde data have shown that the
vertical structure in the ABL is much morecomplex than previously thought containingmultiple wind maxima. Multiple wind maxima in
the ABL was first observed by Wilson (1979)with instrumented tower observations.
2. EYEWALL MESOVORTEX STRUCTURE
In Hurricane Andrew (1992), an eyewallreplacement cycle developed as the storm movedacross the Gulf Stream. The Miami WSR-57radar was able to observe the dissipation of the
old eyewall over the Bahamas simultaneouslywith its replacement by a larger eyewall. A slow
contraction of the new eyewall followed and twocenters of convective activity formed in the
eyewall and rotated around the eye. As the stormapproached Miami, two distinct cyclonic meso-vortices could be seen adjacent to the convective
centers of action on opposite sides of the
eyewall, which rotated about a common center in
the middle of the eye. The presence of twomeso-vortices indicated a predominance of wavenumber-2 asymmetric structure. However, as the
eyewall approached the coast and came into viewof the Tampa WSR-57 radar, as well as the
Melbourne WSR-88D radar, a transition wasobserved from a rotating wave number-2asymmetric flow to a fixed wave number-
1
asymmetric flow relative to the translating center,
even as the intense winds destroyed the MiamiWSR-57 radar.
The Tampa WSR-57 radar, which was being
recorded digitally by a team from the Hurricane
Research Division, scanned the eyewall at 30-s
intervals, covering an altitude band of 3-8 km.The WSR-57 revealed that a series of 7 intense
raincells developed in the north portion of the
eyewall as it made contact with the coast, movedacross south Dade County and dissipated in the
south portion of the eyewall, south of
Homestead, PL, during the 45 min required for
the eyewall to move ashore. Development of the
intense raincells, which began as the eyewall
made contact with the coast, continued at
intervals of 3- to 7-min, and ended once the
eyewall was completely over land. Each had a
408
life cycle of 8-15 min growing in intensity from
30 dBZ (-10 mm h ') to 50 dBZ (150 mm h ').
The rapid growth in cell intensity impliedintense updrafts within the cells. These updrafts,
imbedded within the background TC-scalevorticity, enhances the vorticity locally on the
scale of the updraft by means of vortex tube
stretching and tilting of horizontal vorticity into
the vertical. Thus, meso-vortices, similar to that
associated with the tornado cyclone in rotating •
severe thunderstorm cells, were probablyproduced in Andrew's eyewall in association with
each intense raincell.
Through the process of geostrophic adjustment,
the pressure field adjusts rapidly to perturbations
in the wind field on the mesoscale which are
larger than the Rossby radius of deformation(on the order of 10 km for TC eyewalls). Hence,as the perturbation vortex grows with the
raincell, an accompanying pressure perturbation
develops near the inner edge of the eyewall,where the updraft is located. Anecdotal evidencefor the existence of this pressure perturbation
was obtained from two sources. First, by pureserendipity, the NOAA-11 polar-orbitingspacecraft passed over South Florida at a timeexactly midway through the raincell production
process as the eyewall was moving onshore. The1-km resolution infrared image (not shown)revealed a "hot spot" in the image, not in the
center of the eye, as normally expected, butoffset from the center immediately adjacent to
the eyewall convection. The secondserendipitous observation was made by a private
citizen, who observed their minimum pressure
reading for the storm from a home barometer,
later calibrated, which was situated exactly within
the warmest pixel of the image and within 3 minof the satellite image time. Four additional
private pressure observations in the nearby area
confirmed the existence of a pressureperturbation along the edge of the eyewall that
was 9 hPa lower than the minimum pressure in
the center of the eye observed by Air Forcereconnaissance aircraft at nearly the same time.
Such a mesovortex was actually penetrated byresearch aircraft at low altitude (300 m) in
Hurricane Hugo (1989), obtaining detailed
flight-level measurements. The Hugo aircraft
flight revealed a classic meso-vortex signature
with a wind speed perturbation of 30 m s ' and a
pressure perturbation of 13 hPa and was tracked
for 5 revolutions about the eye center during a
1.5 h period as 5 separate cells developed anddecayed, an almost identical scenario to Andrew.
An eyewall mesovortex was first photographedfrom above by a U-2 aircraft in Typhoon Ida
(1958) (Fletcher et al 1961). The eyewallactually folds into the eye as it attempts to
partially wrap around the meso vortex in Ida.
Both Ida and Hugo shared a commoncharacteristic with Andrew in that they were bothvery intense and deepening rapidly. One mightconclude that meso-vortices and their attendant
enhanced and streaky surface winds are a
characteristic of intense, deepening storms, andthat, should this occur as landfall approaches,then intense inland wind damage is to beexpected.
2.1 Hurricane Hugo
On 15 September 1989, a NOAA WP-3D madethe first aircraft penetration into Hurricane Hugoat an altitude of 450 m when it was -500 kmnortheast of Barbados. The aircraft encounteredintense turbulence and suffered the loss of anengine. Data from this aircraft showed that it
penetrated a mesoscale vortex imbedded in the
inner edge of the eyewall adjacent to intense
convection.
The mesovortex had a diameter of 1 km at 500m altitude which is a factor of 10 smaller than
the eye diameter. This is about the same ratio as
suction vortex size to its parent tornado (Fujita,
1971). The 1 km is also 10 times smaller than a
tornado's parent mesocyclone and about 5 times
larger than a tornado. The wind and pressure
perturbations about a linear pressure and windspeed profile are 30 m s ' and 12 hPa,respectively, The former is about a factor of 3
smaller than the eyewall maximum winds. In
contrast, suction vortex winds are about a factor
of 2 greater than tornado rotational winds (Fujita
1971). The perturbation vorticity is -10' s ', an
order of magnitude greater than eyewall or
mesocyclone vorticity and about the same as
tornado vorticity.
During 14 subsequent orbits of the eye the
aircraft penetrated the vortex on nine different
occasions with diameters of 1-2 km. The vortex
penetrations, at gradually increasing altitude,
showed that the vortex's maximum strength andsmallest diameter appeared to be at cloud baseand broadened with height. The vortex rotated
around the center of circulation with a period of
19 min, implying a translation speed of 30 m s '.
This was the first time that an aircraft hadpenetrated such a phenomena in a TC, although
vortices of this type have been observed, and are
probably more common than previously
409
believed (e.g., Fletcher et al 1961; Marks and
Houze 1984; Muramatsu 1986; Bluestein and
Marks 1987).
2.2 Hurricane Luis
During the daylight hours of 6 September 1995,
1-km resolution GOES-9 1-min interval images
and GOES-8/9 15-min stereo images wereobtained over Hurricane Luis. These data were
concurrent with NOAA WP-3D one-minhorizontal and vertical airborne radar scans.
These observations revealed a series of 8
cycloidal loops. The low-level center is indicated
by the primary low-cloud swirl, while the upper-
level center is indicated by the center of the
cirrus cloud rim and the infrared maximumtemperature. Secondary low-cloud swirls
appeared to rotate around the primary swirl. Thecycloidal loops had an average period of 90 minand an average diameter of 20 km. The upper
eye diameter averaged 60 km, while the low-
level diameter averaged 40 km. The upper-level
center was displaced to the east-southeast of the
primary low-cloud swirl by an average of 25
km. Overshooting convective turret clusters wereobserved in the eyewall with similar 90-minperiods and duration averaging 20 min.
One event, corresponding to the first WP-3D eye
penetration, was analyzed in detail using the
radar and one-min GOES-9 data. Several
minutes after rapid increase in radar reflectivity
occurred in the northeast eyewall sector, a cluster
of overshooting turrets was observed emergingabove the cirrus shield in the north eyewall
sector. The cluster continued to bubble as the
turret and reflectivity maximum rotated around
to the west eyewall sector. Strong evidence of
cyclonic rotation of the turret elements wasobserved during the peak overshoot period.
Simultaneously, the GOES-8/9 stereo imagery
revealed that thin cirrus elements at the upper
edge of the eyewall were being entrained into
the eye as they descended toward the primary
low-level center adjacent to the overshooting
turret cluster. During this period, the low-level
center was migrating toward the eyewall sector
where the turret cluster was observed.
2.3 Synopsis
Features observed here are very similar to those
encountered during a NOAA WP-3D flight into
Hurricane Hugo (1989) (Black and Marks1991). The storm structure was somewhatdifferent in that case with a smaller eye than
Luis, but the intense convection was clearly
associated with a mesovortex which wasseparable from the intense background vortex
circulation. The mesovortex had perturbation
pressure on order of 15 hPa and windperturbation on order 30 m s '. Vertical
reflectivity structure was similar to that in Luis
with intense cores sloping outward andupstream.
The mesovortex in Luis never penetrated to lowlevels, and did not appear to be as strong.
However, the 6 revolutions about the eyewall in
Hugo were very similar to the 8 loops observed
for Luis. Only the revolution period was longer
for Luis (90 min) compared to Hugo's (20 min)
due to the larger eye diameter (60 km vs. 14 kmrespectively). A schematic composite of the flow
fields, depicted in Fig. 1, illustrates how the
mesovortex flow is superimposed upon the TC-scale flow.
3. RECENT ABL OBSERVATIONS INHURRICANES GUILLERMO AND ERIKA(1997)
The successful deployment of the new GPSsondes with reliable wind, temperature, humidity
and pressure measurements every 0.5 s to within
less than 10 m of the surface were made for the
first time from the NOAA WP-3D andGulfstream IV (G-IV) aircraft in the inner core
of eastern Pacific Hurricane Guillermo (1997).
Additional drops were made on three days in
Atlantic Hurricane Erika (1997).
Preliminary analysis of a few of the eyewall
soundings have revealed several new and
unusual ABL structures. Figure 2 shows three
normalized eyewall ABL soundings of potential
temperature (0), specific humidity (q) and wind
speed (WS) from Hurricanes Guillermo and
Erika The vertical coordinate is normalized by
the depth of the ABL, defined as the depth of
the constant 6 layer (-300 m). These eyewall
soundings indicate three consistent low-level
wind maxima at approximately 0.7 normalized
height units (-200 m), at 1.4 units (-400 m),
and at 2.5 units (-750 m). The lowest windmaximum appears just above the top of a
constant-q layer, whose depth is shallower than
the constant-9 layer. The other two wind maximaoccur at and just above the constant-9 layer.
These soundings are typical of other eyewall
soundings that show multiple wind maxima in
the ABL and exhibit a shallow constant-q layer.
The latter corresponds with a layer of nearly
410

constant wind direction (not shown), and may be
representative of the surface layer. These windobservations are consistent with Australian tower
observations in the inner, high-wind core of TCfirst reported by Wilson (1979) and recently
discussed by Kepert and Holland (1997). Thesedata showed a low level wind maximumconsistently at the 60-m level, as well as a windmaximum near the top of the 400-m tower.
The observation of a thin layer of elevated
specific humidity in the high wind region
beneath the eyewall is very suggestive of a spray
layer which may enhance evaporation in the
>90% relative humidity air. The existence of a
wind maximum above this layer indicates that
upward vapor fluxes in the ABL may becontrolled more by shear-induced turbulence at
the top of the high specific humidity layer than
by direct flux from the sea. Sea spray processes
such as discussed by Fairall et al (1994) maybecome important. Additional analysis of this
revolutionary new data source should lead to
profound new insights into the workings of the
TC eyewall ABL.
4. CONCLUSIONS
A unique combination of 1-min interval super-
rapid-scan GOES-9 images and NOAA aircraft
data provides unprecedented insights into the
dynamics of eyewall convective outbreaks, eyemotion, and low-level cloud motion in the eye.
The mesovortices observed in concurrentGOES/Aircraft 1-min animations appear to besimilar to features of eyewall mesovorticesobserved by the flights into Gladys (1975) andHugo (1989) and to observations in Andrew(1992). It is hypothesized that the mesoscalevortices are advected by the TC-scale vortex
causing significantly higher winds in regions
where the wind velocities of the two vortices are
near their maxima and in the same direction.
The insights gained from this work havepotentially far reaching implications as to an
improved understanding of the track andintensity fluctuations associated with these
features and to strategies for mitigating attendant
damages at landfall.
5. REFERENCES
Black, P.G., 1993: Evolution of maximum windestimates in typhoons. Tropical Cyclone
Disasters, J. Lighthill and Z. Zhemin, eds.,
Peking University Press, Beijing, PRC, 104- 11
5
Black, P. G. and F. D. Marks, Jr., 1991: Thestructure of an eyewall meso-vortex in HurricaneHugo (1989). Proc. 19th Conference onHurricanes and Tropical Meteorology, AMS,Miami, FL, 579-582.
• Black, P. G. and L.K. Shay, 1998: Observationsof tropical cyclone intensity change due to air-
sea interactions. Proc. Symposium on Tropical
Cyclone Intensity Change, Phoenix, AZ, AMS,161-168.
Bluestein, H.B., and F.D. Marks, 1987; On the
structure of the eyewall of Hurricane Diana(1984): Comparison of radar and visual
characteristics. Mon. Wea. Rev., 115, 2542-2552.
Fairall, C. W., J. D. Kepert and G. J. Holland,
1994: The effect of sea spray on surface energytransports over the ocean. The GlobalAtmosphere and Ocean System, 2, 121-142.
Fletcher, R.D., J.R. Smith, and R.C. Bundgaard,1961: Superior photographic reconnaissance of
tropical cyclones. Weatherwise, 14, 102-109.
Fujita, T. T., 1971: Proposed mechanism of
suction spots accompanied by tornadoes. Proc.
7th Conference on Severe Local Storms, AMS,Kansas City, MO, 208-213.
Hasler, A.F., P.G. Black, V.M. Karyampudi, M.Jentoft-Nilsen, K. Palaniappan, D. Chesters,
1997: Synthesis of eyewall mesovortex andsupercell convective structure in Hurricane Luis
with GOES 8/9 stereo, concurrent 1-min GOES-9 and NOAA airborne radar observations. Proc.
22nd Conference on Hurricanes and Tropical
Meteorology, AMS, Ft. Collins, CO, 201-202.
Jarrell, J. D., P. J. Hebert and M. Mayfield, 1992:
Hurricane experience levels of coastal countypopulations from Texas to Maine. NOAA Tech.
Memo. NWS NHC-46, 152 pp.
Kepert, J. D. and G. J. Holland, 1997: TheNorthwest Cape tropical cyclone boundary layer
monitoring station. Proc. 22nd Conference onHurricanes and Tropical Meteorology, AMS, Ft.
Collins, CO, 82-83.
Marks, F.D., and R.A. Houze, 1984: Airborne
Doppler radar observations in Hurricane Debby.Bull. Amer. Meteor. Soc, 65, 569-582.
411

Muramatsu, T., 1986: The structure of
polygonal eye of a typhoon. J. Met. Soc. ofJapan, 64, 913-921.
Neumann, C, H. Nicholson, C. Guard, 1997:
National Plan for Tropical Cyclone Researchand Reconnaissance (1997-2002), FCM-P25-1997, Office of the Federal Coordinator for
Meteorological Services and SupportingResearch.
Powell, M. D., 1980: Evaluations of diagnostic
marine boundary layer models applied to
hurricanes. Mon. Wea. Rev., 108, 757-766.
Powell, M. D., S. H. Houston and T. A.Reinhold, 1996: Hurricane Andrew's landfall in
South Florida. Part I: Standardizingmeasurements for documentation of surface
wind fields. Wea. and Forecasting, 11,304-327.
Powell, M. D. and S. H. Houston, 1996:
Hurricane Andrew's landfall in South Florida.
Part II: Surface wind fields and potential real-
time applications. Wea. and Forecasting, 11,
329-349
Sheets, R. H., 1990: The National HurricaneCenter, past, present and future. Wea. andForecasting, 5, 185-232.
Wakimoto, R., and P.G. Black, 1994: DamageSurvey of Hurricane Andrew and Its
Relationship to the Eyewall. Bull. Amer. Meteor.
Soc, 15, 2, 189-200.
Willoughby, H.E., and P.G. Black, 1996:Hurricane Andrew in Florida: Dynamics of a
Disaster. Bull. Amer. Meteor. Soc, 77, 543-549.
Wilson, K. J., 1979: Characteristics of the
subcloud layer wind structure in tropical
cyclones. International Conference on Tropical
Cyclones, Perth, Australia.
412
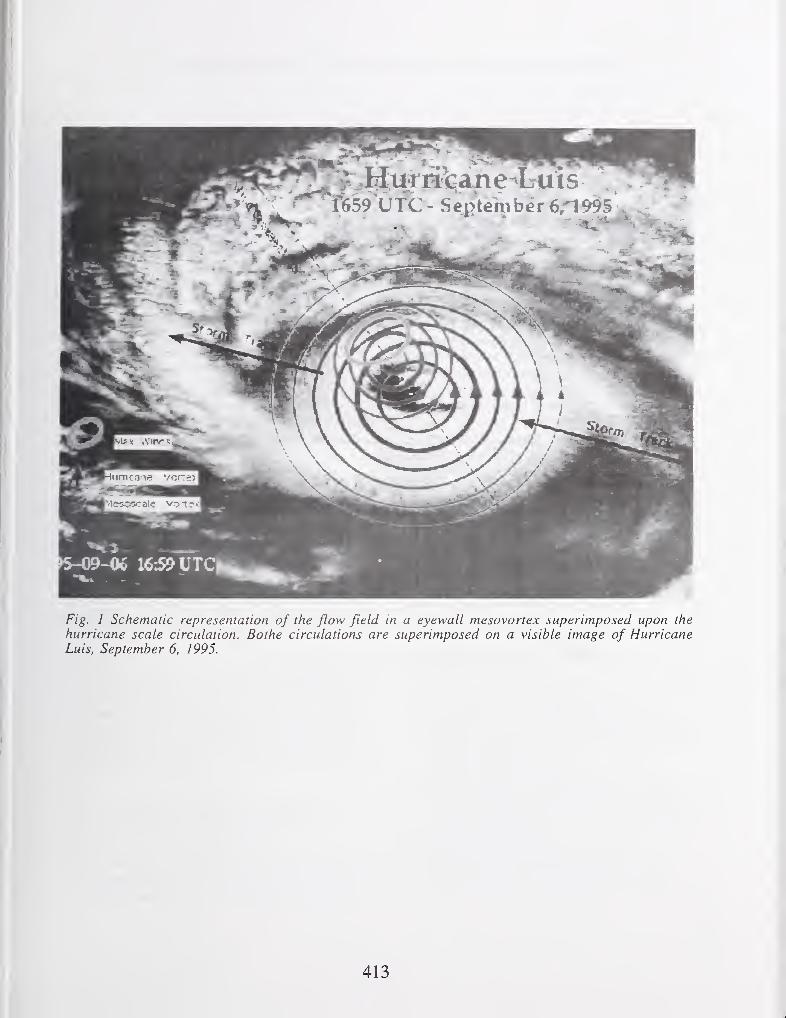
Fig. 1 Schematic representation of the flow field in a eyewall mesovortex superimposed upon the
hurricane scale circulation. Bothe circulations are superimposed on a visible image of HurricaneLuis, September 6, 1995.
413

e(K)303 313 323 343
20.0 30.0 40.0 50.0
Wind Speed (m s"^) and q (g kg"^)
70.0
Fig. 2. GPS dropsonde profiles of specific humidity (q g kg'^), potential temperature (6 °C) and wind
speed (WS m s'^) for three typical profdes in the eyewall of Hurricanes Guillermo (thick solid lines)
and Erika (thin dashed lines). Vertical coordinate is normalized by the depth of the ABL defined as
the depth of the constant q layer (-300 m).
414
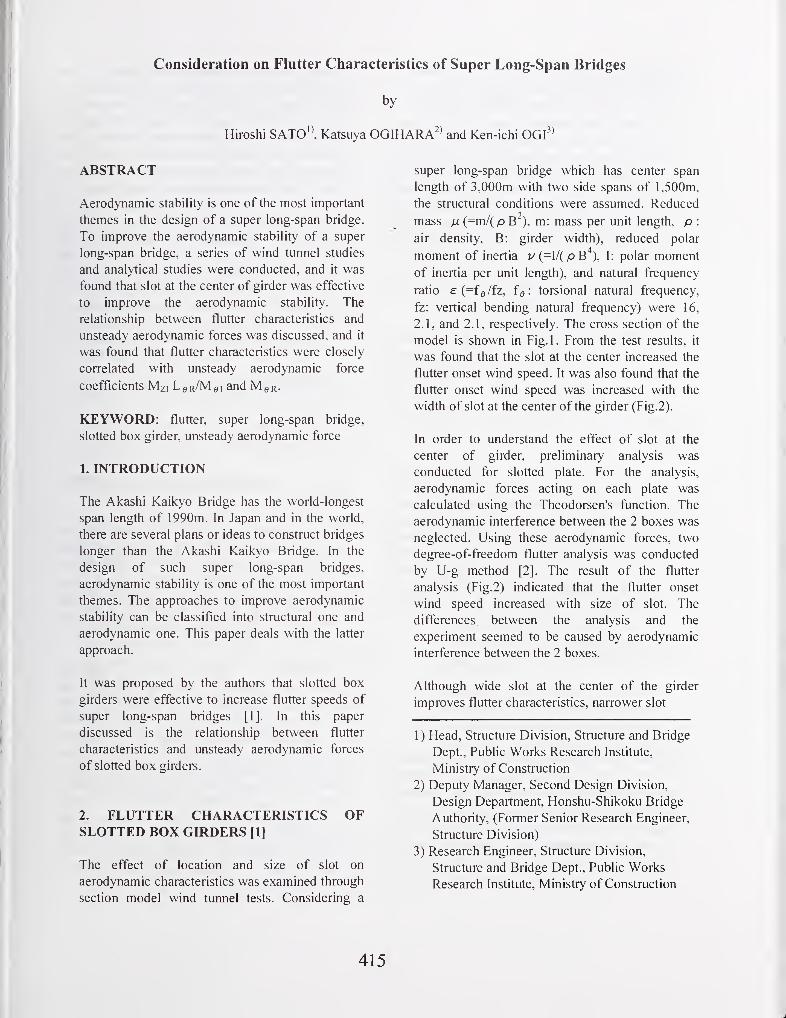
Consideration on Flutter Characteristics of Super Long-Span Bridges
by
Hiroshi SATO", Katsuya OGIHARA"^ and Ken-ichi OGI
ABSTRACT
Aerodynamic stability is one of the most important
themes in the design of a super long-span bridge.
To improve the aerodynamic stability of a super
long-span bridge, a series of wind tunnel studies
and analytical studies were conducted, and it was
found that slot at the center of girder was effective
to improve the aerodynamic stability. The
relationship between flutter characteristics and
unsteady aerodynamic forces was discussed, and it
was found that flutter characteristics were closely
correlated with unsteady aerodynamic force
coefficients Mzi LeR/Mgi and Mqr.
KEYWORD: flutter, super long-span bridge,
slotted box girder, unsteady aerodynamic force
1. INTRODUCTION
The Akashi Kaikyo Bridge has the world-longest
span length of 1990m. In Japan and in the world,
there are several plans or ideas to construct bridges
longer than the Akashi Kaikyo Bridge. In the
design of such super long-span bridges,
aerodynamic stability is one of the most important
themes. The approaches to improve aerodynamic
stability can be classified into structural one and
aerodynamic one. This paper deals with the latter
approach.
It was proposed by the authors that slotted box
girders were effective to increase flutter speeds of
super long-span bridges [1]. In this paper
discussed is the relationship between flutter
characteristics and unsteady aerodynamic forces
of slotted box girders.
2. FLUTTER CHARACTERISTICS OFSLOTTED BOX GIRDERS [1]
The effect of location and size of slot on
aerodynamic characteristics was examined through
section model wind tunnel tests. Considering a
super long-span bridge which has center span
length of 3,000m with two side spans of 1,500m,
the structural conditions were assumed. Reduced
mass n (=m/( p B'^), m: mass per unit length, p :
air density, B: girder width), reduced polar
moment of inertia v (=I/( p B''), I: polar moment
of inertia per unit length), and natural frequency
ratio £(=f9/fz, f^: torsional natural frequency,
fz: vertical bending natural frequency) were 16,
2.1, and 2.1, respectively. The cross section of the
model is shown in Fig.l. From the test results, it
was found that the slot at the center increased the
flutter onset wind speed. It was also found that the
flutter onset wind speed was increased with the
width of slot at the center of the girder (Fig.2).
In order to understand the effect of slot at the
center of girder, preliminary analysis was
conducted for slotted plate. For the analysis,
aerodynamic forces acting on each plate was
calculated using the Theodorsen's function. The
aerodynamic interference between the 2 boxes was
neglected. Using these aerodynamic forces, two
degree-of-freedom flutter analysis was conducted
by U-g method [2]. The result of the flutter
analysis (Fig.2) indicated that the flutter onset
wind speed increased with size of slot. The
differences, between the analysis and the
experiment seemed to be caused by aerodynamic
interference between the 2 boxes.
Although wide slot at the center of the girder
improves flutter characteristics, narrower slot
1 ) Head, Structure Division, Structure and Bridge
Dept., Public Works Research Institute,
Ministry of Construction
2) Deputy Manager, Second Design Division,
Design Department, Honshu-Shikoku Bridge
Authority, (Former Senior Research Engineer,
Structure Division)
3) Research Engineer, Structure Division,
Structure and Bridge Dept., Public Works
Research Institute, Ministry of Construction
415
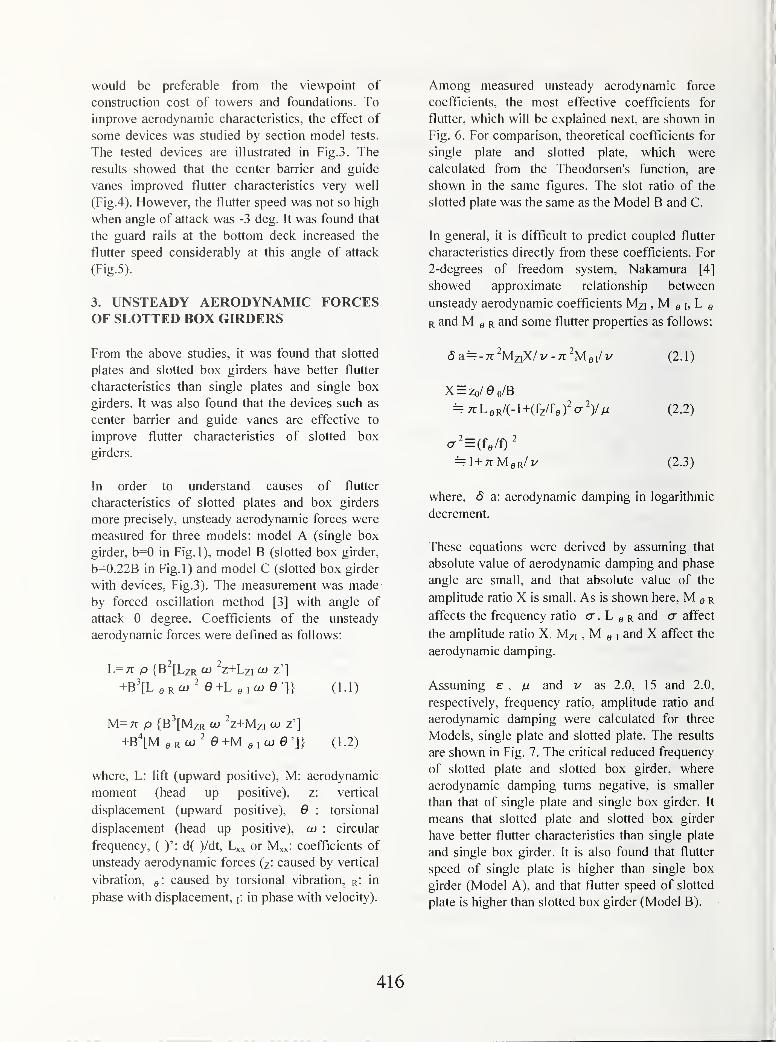
would be preferable from the viewpoint of
construction cost of towers and foundations. To
improve aerodynamic characteristics, the effect of
some devices was studied by section model tests.
The tested devices are illustrated in Fig. 3. The
results showed that the center barrier and guide
vanes improved flutter characteristics very well
(Fig.4). However, the flutter speed was not so high
when angle of attack was -3 deg. It was found that
the guard rails at the bottom deck increased the
flutter speed considerably at this angle of attack
(Fig.5).
3. UNSTEADY AERODYNAMIC FORCESOF SLOTTED BOX GIRDERS
From the above studies, it was found that slotted
plates and slotted box girders have better flutter
characteristics than single plates and single box
girders. It was also found that the devices such as
center barrier and guide vanes are effective to
improve flutter characteristics of slotted box
girders.
In order to understand causes of flutter
characteristics of slotted plates and box girders
more precisely, unsteady aerodynamic forces were
measured for three models: model A (single box
girder, b=0 in Fig.l), model B (slotted box girder,
b=0.22B in Fig.l) and model C (slotted box girder
with devices, Fig.3). The measurement was made
by forced oscillation method [3] with angle of
attack 0 degree. Coefficients of the unsteady
aerodynamic forces were defined as follows:
L=7r p {B [LzR CO ~z+Lz] OJ z']
+BUeR"j'0+Lei^^0"]} (l-O
M=7r p {B^[MzR w ^z+Mzi cu z']
+B^[M eROJ ^ 0+M eicu 0']} (1.2)
where, L: lift (upward positive), M: aerodynamic
moment (head up positive), z: vertical
displacement (upward positive), 6 : torsional
displacement (head up positive), co : circular
frequency, ( )': d( )/dt, L^x or Mxx: coefficients of
unsteady aerodynamic forces (z- caused by vertical
vibration, g-. caused by torsional vibration, r: in
phase with displacement, i: in phase with velocity).
Among measured unsteady aerodynamic force
coefficients, the most effective coefficients for
flutter, which will be explained next, are shown in
Fig. 6. For comparison, theoretical coefficients for
single plate and slotted plate, which were
calculated from the Theodorsen's function, are
shown in the same figures. The slot ratio of the
slotted plate was the same as the Model B and C.
In general, it is difficult to predict coupled flutter
characteristics directly from these coefficients. For
2-degrees of freedom system, Nakamura [4]
showed approximate relationship between
unsteady aerodynamic coefficients Mzi , M g i,L 9
R and M 0 R and some flutter properties as follows:
(5a=-7r^MziX/j/-7r-Mei/v (2.1)
X = Zo/0o/B
^KLeR/i-\+{fz/fefcr')/n (2.2)
= l + 7rMeR/v (2.3)
where, 6 a: aerodynamic damping in logarithmic
decrement.
These equations were derived by assuming that
absolute value of aerodynamic damping and phase
angle are small, and that absolute value of the
amplitude ratio X is small. As is shown here, M g r
affects the frequency ratio cr . L g r and a affect
the amplitude ratio X. Mzi , M g 1 and X affect the
aerodynamic damping.
Assuming s , ju and v as 2.0, 15 and 2.0,
respectively, frequency ratio, amplitude ratio and
aerodynamic damping were calculated for three
Models, single plate and slotted plate. The results
are shown in Fig. 7. The critical reduced frequency
of slotted plate and slotted box girder, where
aerodynamic damping turns negative, is smaller
than that of single plate and single box girder. It
means that slotted plate and slotted box girder
have better flutter characteristics than single plate
and single box girder. It is also found that flutter
speed of single plate is higher than single box
girder (Model A), and that flutter speed of slotted
plate is higher than slotted box girder (Model B).
416

Comparing unsteady aerodynamic force
coefficients of single plate and single box girder
(Model A), it is found that they are almost
identical except for M ^ i.Since M g i
produces
positive aerodynamic damping as can be seen in
eq.(2.1) and Fig. 6, it is found that the difference
of Mel explains the different flutter speeds of
single plate and single box girder (Model A). In a
similar way, it is found that the difference of M^i
explains the different flutter speeds of slotted plate
and slotted box girder (Model B), because Mzi
produces negative aerodynamic damping.
Therefore. Nakamura's equations are effective to
explain flutter characteristics. However, flutter
characteristics such that slotted plate and slotted
box girder have better flutter characteristics than
single plate and single box girder, can not be
explained directly from these equations.
4. INEQUALITY FOR FLUTTER ONSET
If onset of flutter is deflned as d a^O, simpler
inequality for onset of flutter can be derived from
(2.1)-(2.3) as follows:
aMz, LgR/Mei+ySMeR^l (3.1)
a=(e'/ie'-mn/u) (3.2)
0=(\/(e--m7t/v) (3.3)
The left hand side of inequality (3.1) was
calculated for the Models A, B and C using
measured unsteady aerodynamic forces, as well as
for single plate and slotted plate using the
Theodorsen's function, e, /j. and v were
assumed as 2.0, 15 and 2.0, respectively. The
results are shown in Fig.8. The slotted box girders
and slotted plate show higher flutter speed than the
single box girder or single plate. Since the first
term of the left hand side of inequality (3.1) is
much larger than the second term, it can be said
that this higher flutter speed was caused mainly by
the property of M^i Lg^/Mgi.
In Fig.8, reduced flutter speed U/(fB) of slotted
box girder with devices is almost identical with
that of slotted box girder. In Fig.9, the results are
plotted with f^B/U. Flutter speed of slotted box
girder with devices is higher than that without
devices. It means that the effect of devices came
from small value of Mqr, which affected apparent
frequency in wind.
5. CONCLUSION
Slotted box girders have good flutter
characteristics, and they can be improved by some
devices like center barrier and guide vane. In this
paper, the relationship between flutter
characteristics and unsteady aerodynamic forces
of the slotted box girders was discussed. The main
findings are as follows:
(1) Flutter characteristics of single plate, slotted
plate, single box girder and slotted box girder can
be explained by their unsteady aerodynamic forces
through Nakamura's equations and the following
inequality for flutter onset:
orMziLeR/Mgi+ySMeR^l
(2) The higher flutter speed of slotted box girders
and slotted plate than the single box girder or
single plate was caused mainly by property of Mzi
LeR/Mei.
(3) The effect of the devices like center barrier and
guide vane came from small value of Mqr, which
affected apparent frequency in wind.
REFERENCES
[1] Sato H. and Ogihara K, Aerodynamic
characteristics of slotted box girders.
Proceedings of the 28th Joint Meeting of the
Panel on Wind and Seismic Effects, UJNR,
1996
[2] Washizu K., "Aeroelasticity", Kyouritsu
Shuppan, Tokyo, 1957 (in Japanese).
[3] Okubo, T., Narita N. and Yokoyama K., Some
approaches for improving wind stability of
cable-stayed girder bridges, Proc. of the 4th
International Conference on Wind Effects on
Buildings and Structures, 1975
[4] Nakamura, Y., An analysis of binary flutter of
bridge deck sections, J. of Sound and
Vibration, 57(4), 1978
417

B
0.05 IB
< 2 cl=B/17
Fig.l Cross Section of Slotted Girder
25
ffl
3-a
20'
15
§ 10'
1•5 .
0.0 0.1
Analysis
^ Experiment
0.2 0.3
Slot Ratio b/B
0.4 0.5
Fig.2 Flutter Onset Speed and Slot Ratio
Guard Rails
Center Barrier Guide Vane
Guard Rails
b-0.22B
5 d=B/17
0.051B
B
Fig.3 Slotted Box Girder with Devices
418
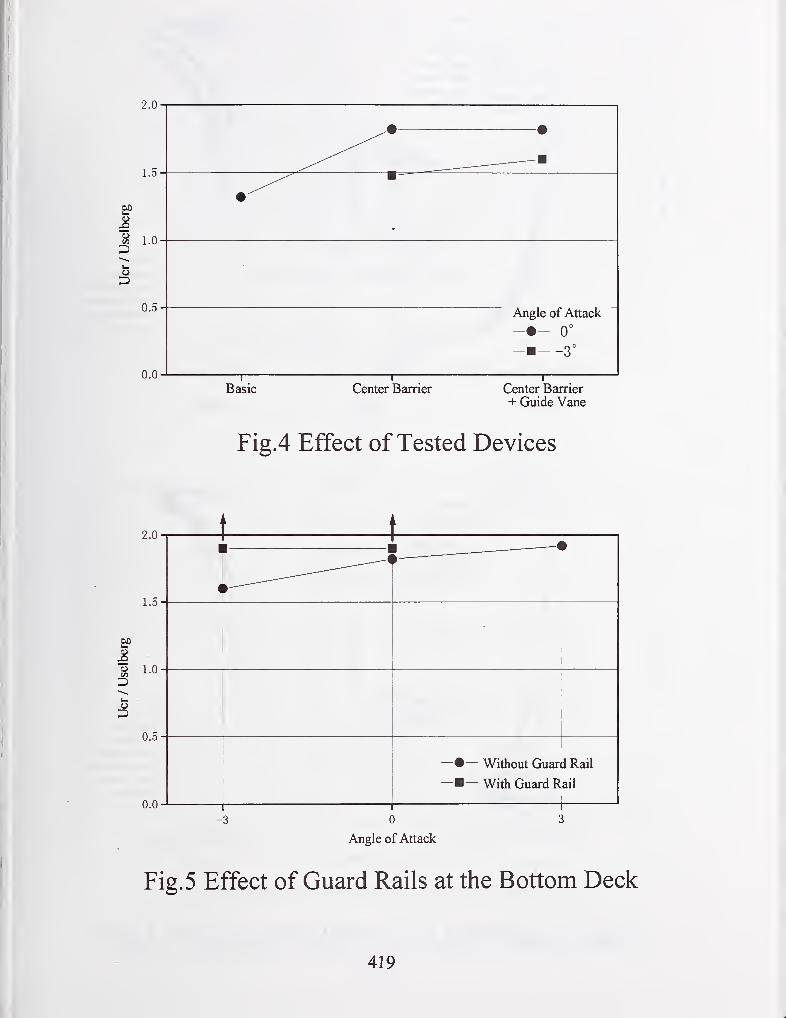
2.0-
1.5-
^# •
— "
Angle of Attack
-•- 0°
---3°
5
0.5
0.0'
Basic Center Barrier Center Barrier
+ Guide Vane
Fig.4 Effect of Tested Devices
2.0-
1.5-
EP
Sil.O'
k. -
uD
0.5-
0.0'
-3
1
1
1 1 1^< \
>
—•— Without Guar(
—— With Guard R. .. —
i
IRail
ail
Angle of Attack
Fig.5 Effect of Guard Rails at the Bottom Deck
419
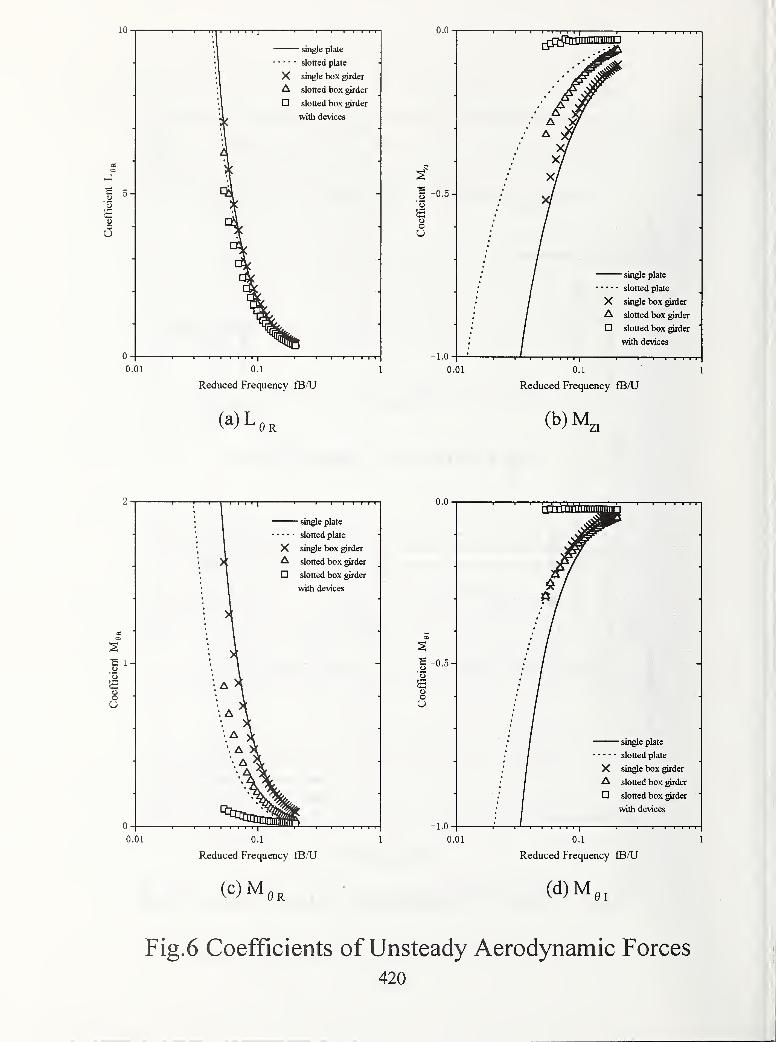
0.01
Reduced Frequency fB/U
(c)M,
0.01
single plate
- • slotted plate
X single box girder
A slotted bos girder
slotted box girder
with devices
0.1
Reduced Frequency fBAJ
0R (d)M
Fig.6 Coefficients of Unsteady Aerodynamic Forces
420
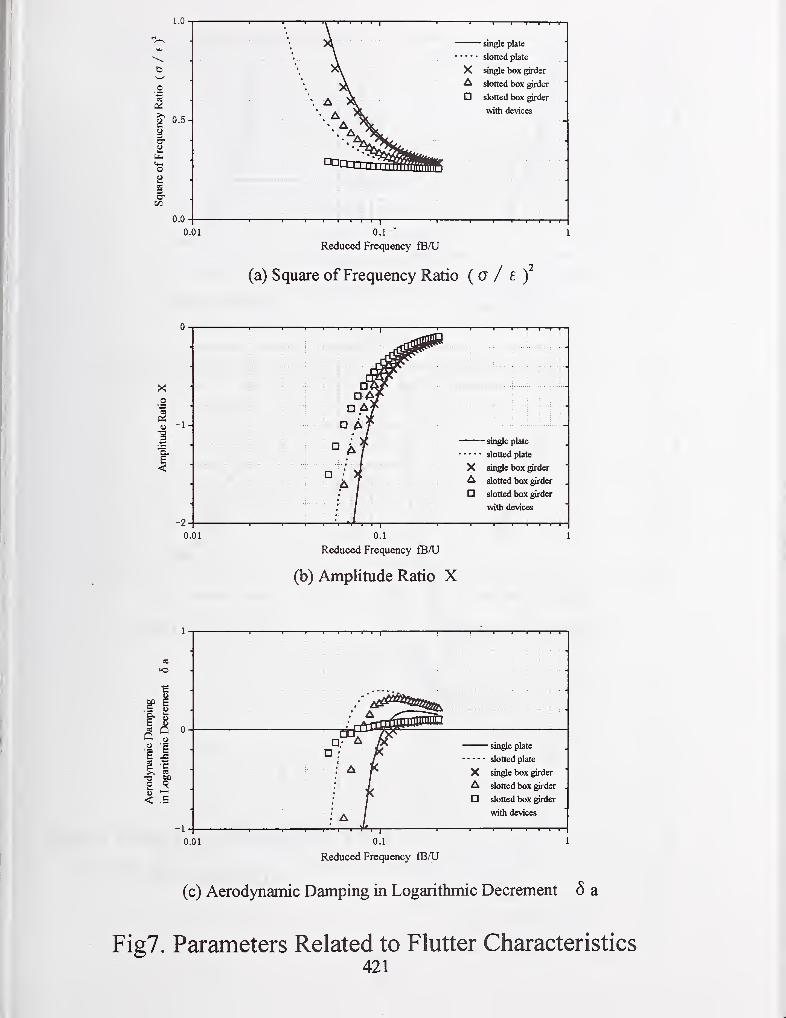
c
.S 4>
c Si
< =
0.01
Reduced Frequency fB/U
X
- single plate
sloned plate
single box girder
slotted box girder .
slotted box girder
with devices
(c) Aerodynamic Damping in Logarithmic Decrement 8 a
Fig7. Parameters Related to Flutter Characteristics421
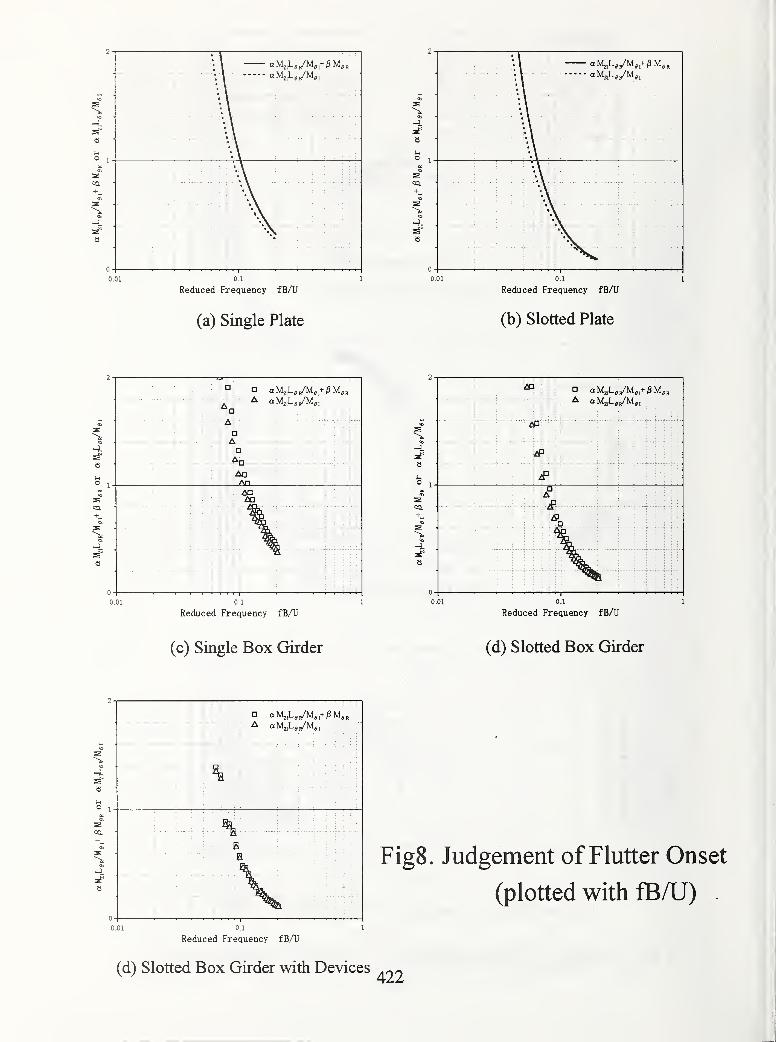
a
_!
a
[3 a
a01*
SI
R
CA
\
Ah
CoAn/£}
Reduced Frequency fB/U
(c) Single Box Girder
a
a
aA a
01* ^1^0 R
if
t!
Afi
i
Reduced Frequency fB/U
(d) Slotted Box Girder
a
a
Fig8. Judgement of Flutter Onset
(plotted with ffi/U) .
Reduced Frequency fB/U
(d) Slotted Box Girder with Devices
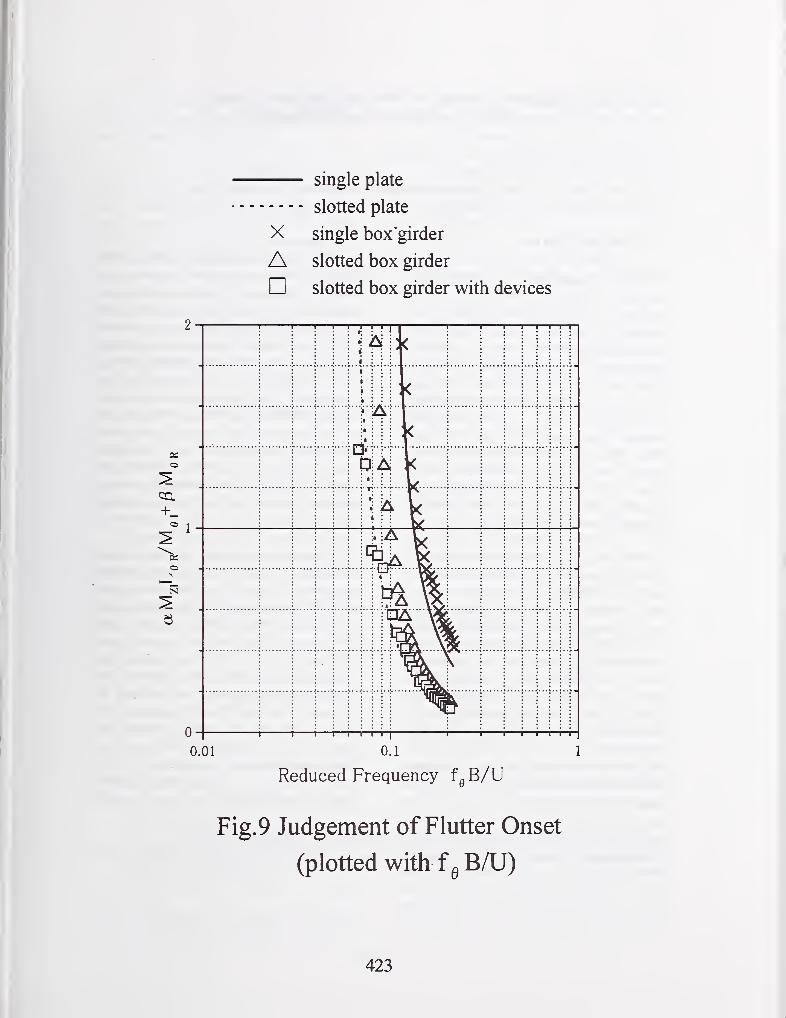
single plate
slotted plate
X single box girder
A slotted box girder
slotted box girder with devices
0.01 0.1 1
Reduced Frequency f^B/U
Fig.9 Judgement of Flutter Onset
(plotted with f^B/U)
423
structural Control for Wind and Earthquake Loads:
NSF'S Coordinated Research Program
by
M. P. Singh' and T. T. Soong^
1. INTRODUCTION
Civil engineering structures are
commonly designed for their strength and
stability. The structural systems are
analyzed to calculated forces in various
load-carrying elements such as beams,
columns, etc. These elements are then
proportioned such that they can withstand
the calculated forces without overstressing
or instability failures. Since elastically
designed structures could be bulky and
costly, they are allowed to yield, at least for
extreme loads such as earthquakes. Such
designs, therefore, admit the possibility of
structural damage of the load carrying
elements in an extreme event.
In the last two decades, there has been a
growing interest to find ways to reduce or
control the effect of the extreme events.
The earthquake-induced effects on
structures can be reduced either by filtering
or absorbing the damaging energy
transmitted to a structure. A significant
amount of research has been done to
develop base isolation methods that
primarily filter out the damaging energy
from reaching the superstructure. The base
isolators increase the fundamental period of
the system such that combined structure
isolator systems shifts into the lower
response spectrum range.
The energy dissipaters or energy sinks,
placed at suitable locations in structures,
have also been used for reducing dynamic
response. The energy dissipater that have
been recently considered for earthquake
applications are the viscous, viscoelastic,
and friction dampers, and yielding devices
that add damping and stiffness (ADAS) to
the system. These devices absorb vibration
energy that otherwise would have gone to
deform and possibly damage the structural
elements. These devises can be designed
such that they are disposable. That is, an
overly deformed or damaged energy
dissipater can be replaced with new ones
after a strong event, if considered necessary.
The aforementioned approaches are
commonly referred to as passive control
approaches, as the devices cone into action
only after the structure has responded to the
external disturbance. The reliability and
usefulness of these methods is now quite
well established in structural engineering
community. As such, these methods are
being increasingly used in practice in
buildings in seismically active regions. The
National Science Foundation (NSF) has
played a major role in the development of
these passive control approaches; it has
made it possible to bring these useful
concepts to fruition and to implementation
' Professor, Dept. of Eng. Science and Mechanics, Virginia Tech, Blacksburg, VA 24060^ Samuel Capen Professor, Dept. of Civil Engineering, State Univ. ofNew York at Buffalo, Buffalo, NY14260
424

stage by providing continuous funding to
research projects dealing with this topic
over the past twenty five years.
Along with the development of passive
devices, the research community has also
been exploring the development of the
active control methods. In the active
methods, the external forces are applied to
control the response. The application of
forces through tendons or other forms of
actuators have been examined. When,
where, and how much the forces should be
applied is decided according to a suitable
algorithm based on the measurements made
on the response of the structure, and
sometimes also on the external excitation.
Each control system consists of three basic
components: (a) a sensing system, (b) a
decision making unit, which determines the
necessary control actions required to
achieve the desired control objectives, and
(c) an actuation system that apply control
forces determined by the algorithm.
Although the active control methods
have been used in electrical, mechanical and
aerospace engineering, these methods are
not directly usable with civil engineering
structures as these structures have their
unique set of challenges and different
design issues. The reasons for this are:
(1) Civil structures are massive systems,
and therefore the required control force
and power can be several orders of
magnitude higher than those required
for mechanical systems.
(2) The civil structures also have large
degrees of freedom.
(3) Civil structures and loading on them
have larger uncertainties levels. Thus
control robustness is an important issue.
(4) The control system must be extremely
reliable, as life safety is one of the
primary design criteria for civil
structures.
(5) The fimctionality control of distributed
civil infi-astructure system has no
parallel in the mechanical systems, and
these will require different innovative
control concepts.
(6) The problem of control of existing
structures pose a different set of
problems with various constrains,
requiring significantly different control
solutions
2. STRUCTURAL CONTROLRESEARCH PROGRAM OF NSF
Realizing the potential of the newtechnology, the National Science
Foundation actively sought community
opinion through following national and
international workshops and panel to start a
new research program.
(1) U.S. Panel on Structural Control
Research, established in 1989 under
the direction of Professor George
Housner.
(2) International Workshop on Intelligent
Structures, Taipeh, Taiwan, July 1990.
(3) Joint NSF-EPRI Workshop on
Research Needs in Intelligent Control
Systems, Oct. 1990.
(4) U.S. National Workshop on Structural
Control Research, University of
Southern California, Los Angles, Oct.
1990.
(5) Workshop on Sensors and Signal
Processing for Structural Control,
Washington, DC, Feb. 1991.
These forums provided the intellectual
framework to start a new research initiative
entitled Program on Structural Control for
Safety, Performance, and Hazard Mitigation
by the NSF in 1992 (Ref. 4). The program
was initiated for five years. The broad
objectives of the program were to foster, on
a coordinated basis, multi-disciplinary
research and development of passive, active
and hybrid control technology for
application to buildings and civil
infi-astructure systems subjected to dynamic
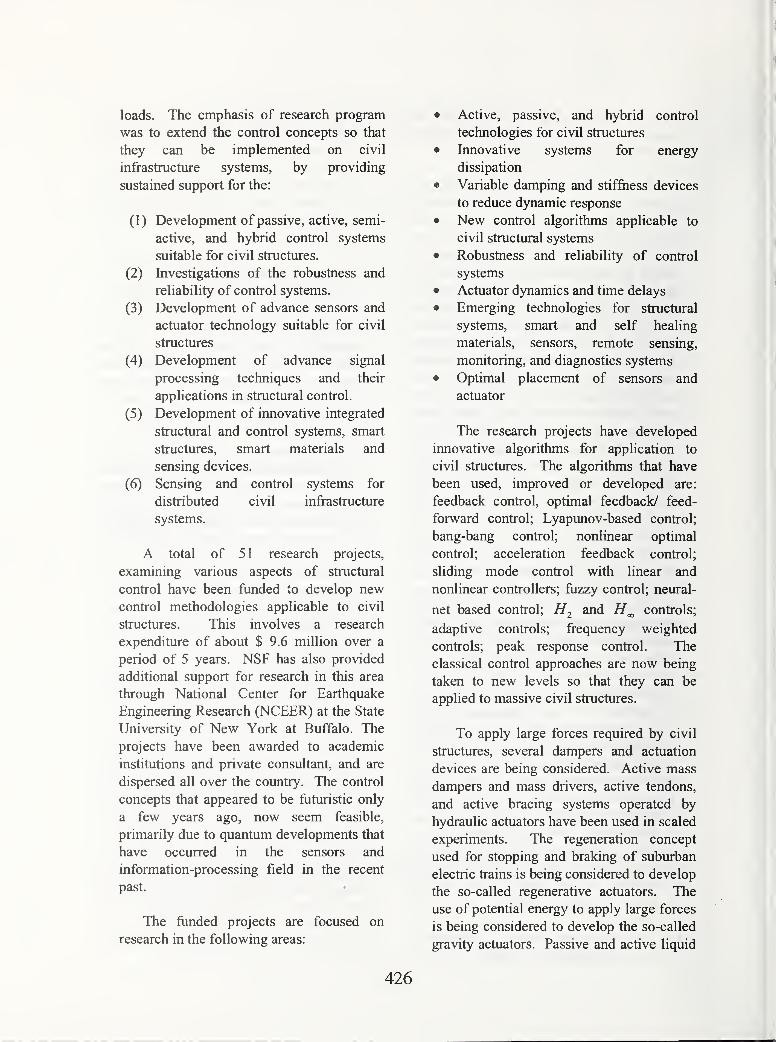
loads. The emphasis of research program
was to extend the control concepts so that
they can be implemented on civil
infrastructure systems, by providing
sustained support for the:
(1) Development of passive, active, semi-
active, and hybrid control systems
suitable for civil structures.
(2) Investigations of the robustness and
reliability of control systems.
(3) Development of advance sensors and
actuator technology suitable for civil
structures
(4) Development of advance signal
processing techniques and their
applications in structural control.
(5) Development of innovative integrated
structural and control systems, smart
structures, smart materials and
sensing devices.
(6) Sensing and control systems for
distributed civil infrastructure
systems.
A total of 51 research projects,
examining various aspects of structural
control have been funded to develop newcontrol methodologies applicable to civil
structures. This involves a research
expenditure of about $ 9.6 million over a
period of 5 years. NSF has also provided
additional support for research in this area
through National Center for Earthquake
Engineering Research (NCEER) at the State
University of New York at Buffalo. The
projects have been awarded to academic
institutions and private consultant, and are
dispersed all over the country. The control
concepts that appeared to be futuristic only
a few years ago, now seem feasible,
primarily due to quantum developments that
have occurred in the sensors and
information-processing field in the recent
past.
The funded projects are focused on
research in the following areas:
• Active, passive, and hybrid control
technologies for civil structures
• Innovative systems for energy
dissipation
• Variable damping and stif&iess devices
to reduce dynamic response
• New control algorithms applicable to
civil structural systems
• Robustness and reliability of control
systems
• Actuator dynamics and time delays
• Emerging technologies for structural
systems, smart and self healing
materials, sensors, remote sensing,
monitoring, and diagnostics systems
• Optimal placement of sensors and
actuator
The research projects have developed
innovative algorithms for application to
civil structures. The algorithms that have
been used, improved or developed are:
feedback control, optimal feedback/ feed-
forward control; Lyapunov-based control;
bang-bang control; nonlinear optimal
control; acceleration feedback control;
sliding mode control with linear and
nonlinear controllers; fuzzy control; neural-
net based control; and controls;
adaptive controls; frequency weighted
controls; peak response confrol. The
classical control approaches are now being
taken to new levels so that they can be
applied to massive civil structures.
To apply large forces required by civil
structures, several dampers and actuation
devices are being considered. Active mass
dampers and mass drivers, active tendons,
and active bracing systems operated by
hydraulic actuators have been used in scaled
experiments. The regeneration concept
used for stopping and braking of suburban
electric trains is being considered to develop
the so-called regenerative actuators. The
use of potential energy to apply large forces
is being considered to develop the so-called
gravity actuators. Passive and active liquid
426
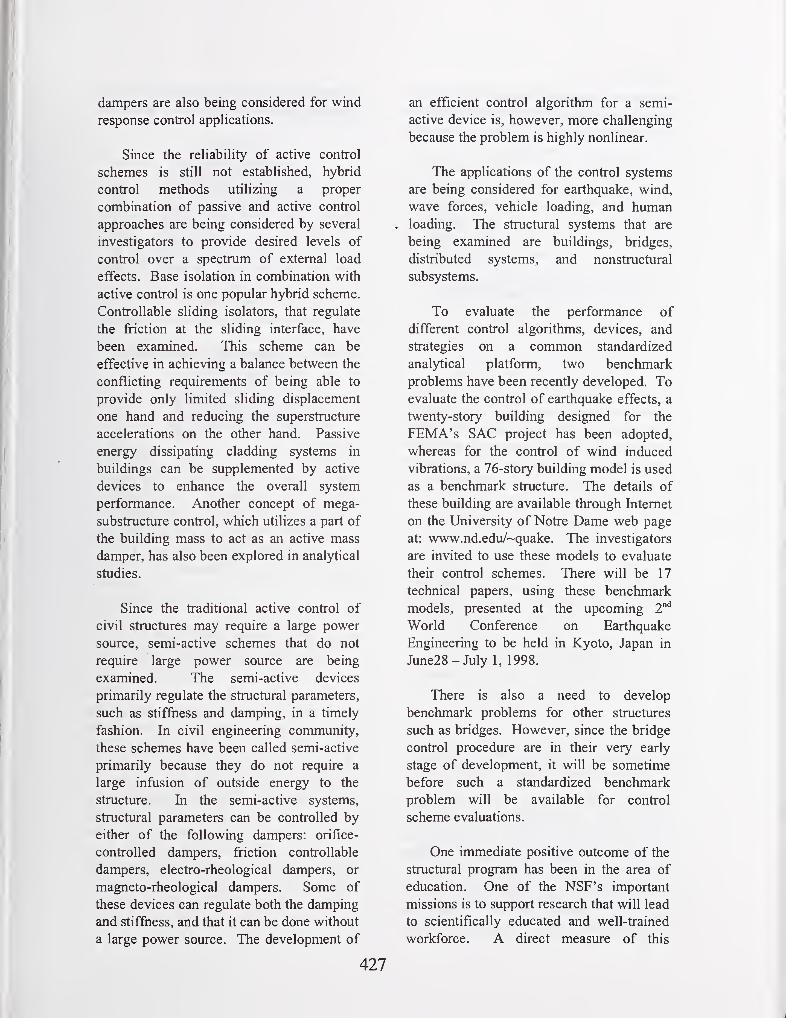
dampers are also being considered for wind
response control applications.
Since the reliability of active control
schemes is still not established, hybrid
control methods utilizing a proper
combination of passive and active control
approaches are being considered by several
investigators to provide desired levels of
control over a spectrum of external load
effects. Base isolation in combination with
active control is one popular hybrid scheme.
Controllable sliding isolators, that regulate
the friction at the sliding interface, have
been examined. This scheme can be
effective in achieving a balance between the
conflicting requirements of being able to
provide only limited sliding displacement
one hand and reducing the superstructure
accelerations on the other hand. Passive
energy dissipating cladding systems in
buildings can be supplemented by active
devices to enhance the overall system
performance. Another concept of mega-
substructure control, which utilizes a part of
the building mass to act as an active mass
damper, has also been explored in analytical
studies.
Since the traditional active control of
civil structures may require a large power
source, semi-active schemes that do not
require large power source are being
examined. The semi-active devices
primarily regulate the structural parameters,
such as stiffness and damping, in a timely
fashion. In civil engineering community,
these schemes have been called semi-active
primarily because they do not require a
large infusion of outside energy to the
structure. In the semi-active systems,
structural parameters can be controlled by
either of the following dampers: orifice-
controlled dampers, friction controllable
dampers, electro-rheological dampers, or
magneto-rheological dampers. Some of
these devices can regulate both the damping
and stiffness, and that it can be done without
a large power source. The development of
an efficient control algorithm for a semi-
active device is, however, more challenging
because the problem is highly nonlinear.
The applications of the control systems
are being considered for earthquake, wind,
wave forces, vehicle loading, and human. loading. The structural systems that are
being examined are buildings, bridges,
distributed systems, and nonstructural
subsystems.
To evaluate the performance of
different control algorithms, devices, and
strategies on a common standardized
analytical platform, two benchmark
problems have been recently developed. Toevaluate the control of earthquake effects, a
twenty-story building designed for the
FEMA's SAC project has been adopted,
whereas for the control of wind induced
vibrations, a 76-story building model is used
as a benchmark structure. The details of
these building are available through Internet
on the University of Notre Dame web page
at: www.nd.edu/~quake. The investigators
are invited to use these models to evaluate
their control schemes. There will be 17
technical papers, using these benchmark
models, presented at the upcoming
World Conference on Earthquake
Engineering to be held in Kyoto, Japan in
June28-July 1, 1998.
There is also a need to develop
benchmark problems for other structures
such as bridges. However, since the bridge
control procedure are in their very early
stage of development, it will be sometime
before such a standardized benchmark
problem will be available for control
scheme evaluations.
One immediate positive outcome of the
structural program has been in the area of
education. One of the NSF's important
missions is to support research that will lead
to scientifically educated and well-trained
workforce. A direct measure of this
427
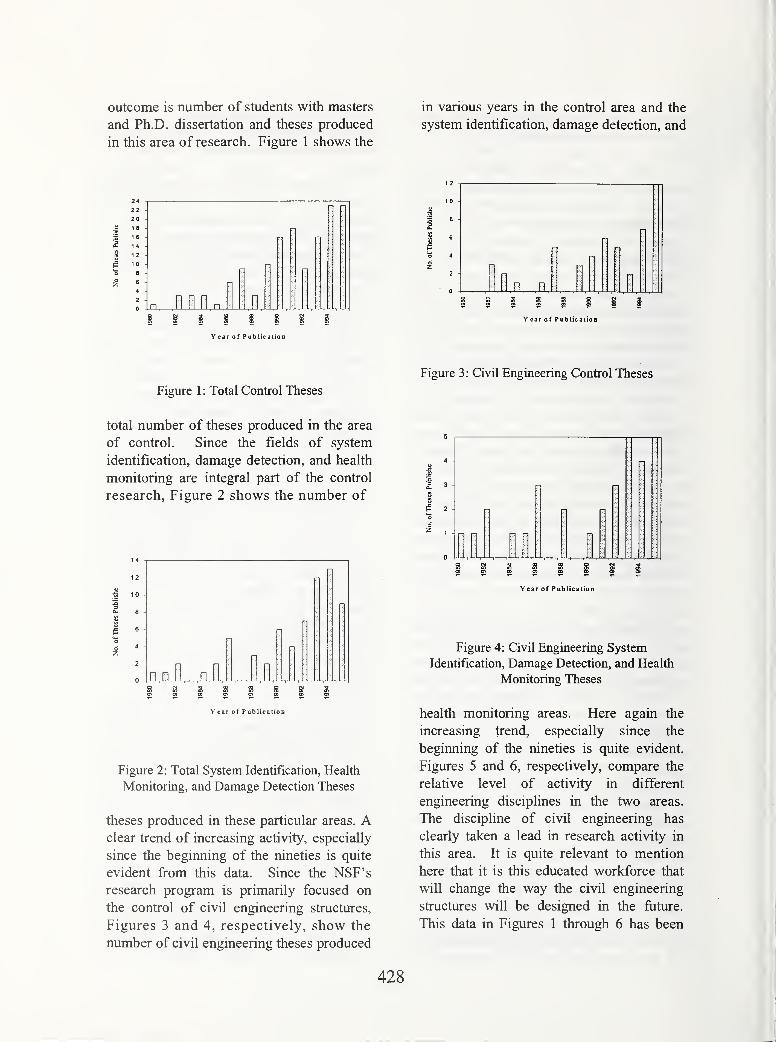
outcome is number of students with masters
and Ph.D. dissertation and theses produced
in this area of research. Figure 1 shows the
in various years in the control area and the
system identification, damage detection, and
Year o f P ab lica tion
Year of Publication
Figure 3: Civil Engineering Control Theses
Figure 1 : Total Control Theses
total number of theses produced in the area
of control. Since the fields of system
identification, damage detection, and health
monitoring are integral part of the control
research, Figure 2 shows the number of
nn
Year of Publication
Figure 2: Total System Identification, Health
Monitoring, and Damage Detection Theses
theses produced in these particular areas. Aclear trend of increasing activity, especially
since the beginning of the nineties is quite
evident fi^om this data. Since the NSF's
research program is primarily focused on
the control of civil engineermg structures.
Figures 3 and 4, respectively, show the
number of civil engineering theses produced
fS 2
Y ear of Publication
Figure 4: Civil Engineering System
Identification, Damage Detection, and Health
Monitoring Theses
health monitoring areas. Here again the
increasing trend, especially since the
beginning of the nineties is quite evident.
Figures 5 and 6, respectively, compare the
relative level of activity in different
engineering disciplines in the two areas.
The discipline of civil engineering has
clearly taken a lead in research activity in
this area. It is quite relevant to mention
here that it is this educated workforce that
will change the way the civil engineering
structures will be designed in the future.
This data in Figures 1 through 6 has been
428
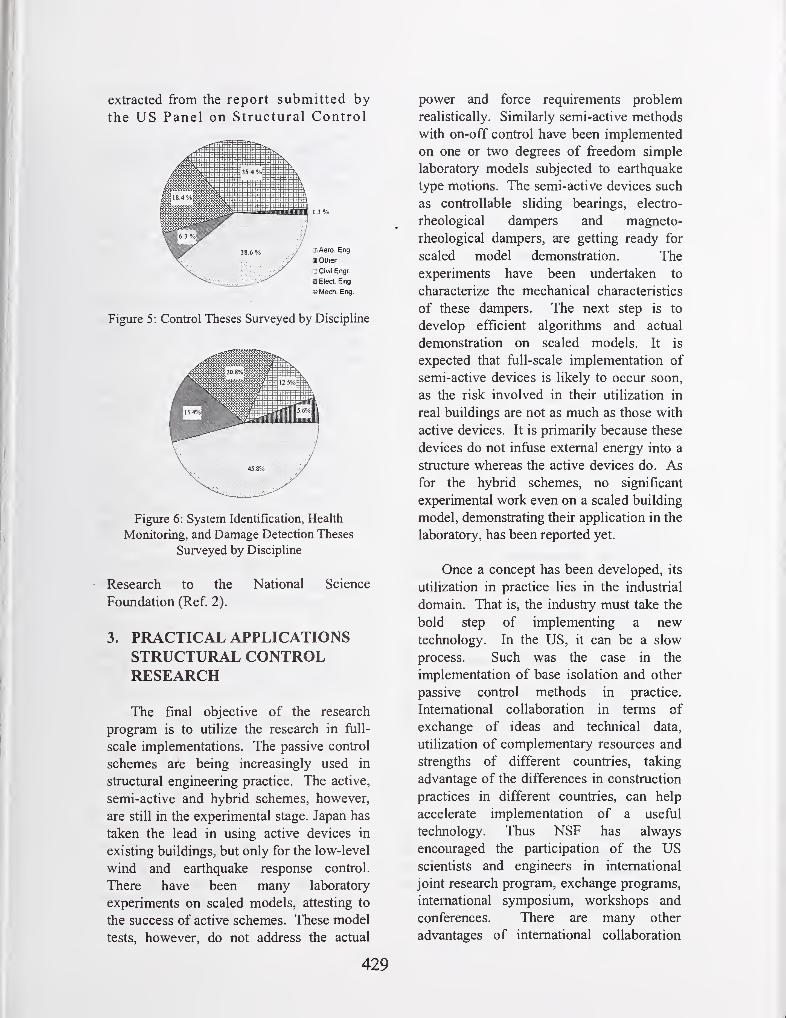
extracted from the report submitted by
the US Panel on Structural Control
BMech. Eng.
Figure 5: Control Theses Surveyed by Discipline
ta
Figure 6: System Identification, Health
Monitoring, and Damage Detection Theses
Surveyed by Discipline
Research to the National Science
Foundation (Ref. 2).
3. PRACTICAL APPLICATIONSSTRUCTURAL CONTROLRESEARCH
The final objective of the research
program is to utilize the research in full-
scale implementations. The passive control
schemes are being increasingly used in
structural engineering practice. The active,
semi-active and hybrid schemes, however,
are still in the experimental stage. Japan has
taken the lead in using active devices in
existing buildings, but only for the low-level
wind and earthquake response control.
There have been many laboratory
experiments on scaled models, attesting to
the success of active schemes. These model
tests, however, do not address the actual
power and force requirements problem
realistically. Similarly semi-active methods
with on-off control have been implemented
on one or two degrees of freedom simple
laboratory models subjected to earthquake
type motions. The semi-active devices such
as controllable sliding bearings, electro-
rheological dampers and magneto-
rheological dampers, are getting ready for
scaled model demonstration. The
experiments have been undertaken to
characterize the mechanical characteristics
of these dampers. The next step is to
develop efficient algorithms and actual
demonstration on scaled models. It is
expected that full-scale implementation of
semi-active devices is likely to occur soon,
as the risk involved in their utilization in
real buildings are not as much as those with
active devices. It is primarily because these
devices do not infrise external energy into a
structure whereas the active devices do. As
for the hybrid schemes, no significant
experimental work even on a scaled building
model, demonstrating their application in the
laboratory, has been reported yet.
Once a concept has been developed, its
utilization in practice lies in the industrial
domain. That is, the industry must take the
bold step of implementing a newtechnology. In the US, it can be a slow
process. Such was the case in the
implementation of base isolation and other
passive control methods in practice.
International collaboration in terms of
exchange of ideas and technical data,
utilization of complementary resources and
strengths of different countries, taking
advantage of the differences in construction
practices in different countries, can help
accelerate implementation of a useful
technology. Thus NSF has always
encouraged the participation of the USscientists and engineers in international
joint research program, exchange programs,
international symposium, workshops and
conferences. There are many other
advantages of international collaboration
429

such as the (1) eUmination of dupHcation,
(2) better identification of research needs,
(3) creation and effective utiHzation of
international test beds, (4) improvement of
research skills, (5) better educational and
exchange opportunities, (6) increased
visibility and awareness of earthquake
engineering in the general public, and (7)
strengthening of research and educational
infrastructure for the future.
4. FUTURE RESEARCH NEEDS IN
STRUCTURAL CONTROL
Based on a careful assessment of the
current research activities in the US and
other countries, and the input received from
the researchers involved in the structural
control program through various workshops
and meetings, the following six broad areas
have been identified for future research
endeavors:
1. Research in passive, active, semi-active
and hybrid control with emphasis on
nonlinear systems, nonlinear confrol,
nonlinear identification, predictive and
adaptive control, actuator saturation,
actuator and sensor and malfunction,
application to sfrong seismic inputs,
especially vertical components.
2. Research on control of large dispersed
and distributed parameter systems
(lifelines) with special emphasis on
intelligent sensors and fore-warning
systems, information processing and
decision making systems.
3. Research on high performance,
innovative, and intelligent materials
4. Research on system integration with
emphasis on hardware/software
integration, integrated design of
structure-control system, optimal sensor
and actuator locations, reliability cost-
benefit considerations, and integration of
health monitoring systems.
5. Control system evaluation through
analytical and experimental benchmark
studies.
6. Education and technology transfer
involving training of graduate students,
practitioners, and development of design
guidelines and code provisions
More details of these broad research areas
and the genesis of their development are
provided in the reports of the following
workshops/meetings
.
1 . Joint US-Japan Workshop on Mitigation
of Urban Disasters: Cooperative
Research on Structural Control, Kyoto,
Japan, March 14-15, 1996
2. "Fourth Coordination Meeting for NSFResearch Program on Structural
Control," University of Nofre Dame,
South Bend, Indiana, October, 4-5, 1996
3. Second International Workshop on
Structural Control, Hong Kong,
December, 18-21, 1996
4. Fifth Coordination Meeting for NSFResearch Program on Structural
Control," University of Nevada, Reno,
Nevada, August, 18-19, 1997 (Ref. 5)
5. FUTURE PROGRAMS INHAZARD MITIGATION
The NSF is developing a new Major
Research Equipment Program that is
intimately related to the area of structural
control in hazard mitigation. The program
is still in the planning stage. It has also
been referred to as the National Network for
High Performance Seismic Simulation
(NHPS) program. The program is proposed
to respond to the need for an integrated
430
network of experimental research facilities
and a new research environment. It is
expected to advance the scientific
understanding of the impacts of
earthquakes. It will help mitigate the effect
of disasters attributable to a lack of
knowledge about the behavior of
engineering materials, soils, and
construction during earthquakes. The
network will include advanced-design
earthquake simulation facilities, large scale
testing systems, and field facilities. It will
provide a means for the rapid exchange of
ideas and information, and offer immediate
access to research data generated anywhere
in the network. It will also serve as a forum
for bringing researchers and practitioners
together to share their expertise with
students and professionals engaged in
earthquake engineering. It will create an
environment where students are learning
through research that is supported by the
latest experimental and communication
technologies. It is expected to enhance the
synergy and vitality in earthquake
engineering.
The objective of NHPS is to advance
scientific knowledge, avoid future
catastrophes, and protect the populace, built
environment and economy in future
earthquakes. NHPS will consist of three
special purpose (new and enhanced)
laboratories to simulate earthquake
generated actions on structures and to
monitor the motions and response of the
built environment during such motions or
during actual earthquakes. NHPS will
include the following new or enhanced
equipment and facilities.
• Advanced-design earthquake simulation
facilities. To meet the challenge of
high-intensity ground motion
parameters stipulated by the 1994 Los
Angeles and 1995 Kobe events, this
NHPS component will include newadvanced-design earthquake simulation
systems for structural testing and
development of ''on-board" shaking
units in centrifuges for soil testing.
Similarly, the complexities of Tsunami
waves and their effects on shorelines
and coastal facilities will be studied
using an advanced wave generator
mounted in a large wave tank.
• Large-scale testing system. Failures of
structural steel elements in the Los
Angeles and Kobe earthquakes have
created an exigency for testing
structural elements, assemblies of
elements, and response modification
devices in full scale. These elements
exhibit complex nonlinear behavior and
require the development of large-scale
actuators and improvement of existing
capabilities for combined vertical and
lateral loading of test specimens.
• Field simulation and laboratories. This
component ofNHPS will comprise field
testing installations and mobile
laboratory units to monitor the behavior
of constructed facilities before, during
and after an earthquake. It is needed in
order to accumulate behavioral data that
cannot be obtained in the laboratory
because of difficulties in replicating the
structure replete with complications
introduced by site, construction, and
architectural effects.
This program when implemented will have
far reaching effect in the development and
implementation of the structural and
systems control methods.
6. CONCLUDING REMARKS
The paper describes the development of
the NSF's Program on Structural Control.
NSF views the research on structural control
as an important means for natural hazard
reduction. NSF has invested significant
resources to initiate this program by funding
51 research projects with a research
expenditure of $9.6 millions. Some of these
431
projects are still continuing. The
researchers are involved in solving several
issues related to the control of civil
engineering structures. They are developing
new algorithms, actuation devices,
materials, and new control concepts.
Although the five-year program is formally
over, the NSF's support of the research
activities in this promising area has
continued.
The active and semi-active control
technologies, however, are not quite ready
for implementation in practice. The
requirements of large control forces and
large external power source are serious
impediments in the application of active
control. In this respect, the semi-active
schemes seem to be more promising for
their application to civil structures, as they
do not need a large power source. However,
these schemes are still in the laboratory-
testing phase.
The NSF and the structural control
research community consider the
coordinated international collaboration and
active industrial participation very
important component of the program for a
successful utilization of this technology.
7. ACKNOWLEDGEMENTS
The writers have had the opportunity of
coordinating the research activities of the
NSF's program of research on structural
control. Their views on the program, gained
through this coordination, are reflected in
this paper. The writers acknowledge the
help and information they have received
from different sources, including the NSFProgram Directors S. C. Liu and E. J,
Sabadell, and Prof. Sami Masri of the
University of Southern California.
However, the opinions, interpretations, and
views presented in the paper are entirely
those of the writers, and not of the NSFProgram Directors or the National Science
Foundation.
8. REFERENCES
1. Chong, K. P., Liu, S. C, and Li, J. C,Editors, "Intelligent Structures", (1990),
Elsevier Applied Science, London and
New York, 460 pp.
2. Housner, G. W., Masri, S. F., Singh, M.
P., and Soong, T. T., " Structural
Control Research: Future Horizons of
the General Field of Structural Control",
Report by U.S. Panel on Structural
Control submitted to National Science
Foundation, August 1997.
3. Liu, S.C., Chong, K. P., and Singh, M.
P., "Civil Infrastructure Systems
Research: Hazard Mitigation and
Intelligent Material Systems", J. of
Smart Materials and Sfr, 3 (1994),
A169-174
4. National Science Foundation,
"Structural Confrol Inititative", NSF 91-
62, Arlington, VA, 1991
5. Soong, T. T. and Singh, M. P., "Fifth
Coordination Meeting Report for NSFResearch Program on Structural
Confrol", University at Buffalo, School
of Engineering and Applied Sciences,
State University of New York at
Buffalo, NY, October 15, 1997
432
Wind and Seismic Research for Improved Engineering Consensus
Standards and Housing Construction
by
Jay H. Crandell'and William Freebome^
ABSTRACT
This paper provides an overview of recent
engineering research that has resulted in
improved engineering standards, design methods,
and building codes for the construction of
housing and other t\pes of buildings in the United
States. The engineering advancements include
the development of a new hurricane wind map,
new load and directionalit>' factors for wind, and
a new method of analyzing wood-frame shear
walls.
KEYWORDS.
Houses, Engineering, Research, Wind, Seismic,
Consensus Standards, Building Codes
1. INTRODUCTION
Housing construction in the United States has
become subject to increased scrutiny with respect
to its performance in high wind and earthquake
risk regions. As a result of this scrutiny the need
for affordable and simple construction methods
has been challenge by the need to improve the
safety of these buildings. The focus of this
summary paper is to give a broad overview of
recent efforts to improve the safet>' of residential
buildings while maintaining affordability and
simplicity of construction methods or regulations.
Over the past two years, the National Association
of Home Builders and the U.S. Department of
Housing and Urban Development have joined in
a multi-year cooperative program to address the
safety and affordability of future housing in the
United States. The title of the program is
Housing Affordability Through Design
Efficiency (HATDE). The program is under the
management of the NAHB Research Center, Inc.
Other partners have included State Farm
Insurance Companies, Applied Research
Associates, Virginia Polytechnic Institute and
State University, Johns Hopkins University,
Clemson University, and Andersen Corporation.
The program has extended recent research funded
by other institutions such as the National Science
Foundation and the U.S. Department of
Agriculture to applications related to efficient
design of residential buildings and other types of
structures.
2. OVERVIEW OF THE HATDE PROGRAM
The objective of the HATDE program is simply
stated as follows:
"To conduct practical research activities which
support the development and implementation of
innovative and efficient engineering principles
and construction practices in support of
reasonably affordable and safe housing in all
hazard conditions in the United States."
To meet this objective a comprehensive research
agenda was developed and continues to be
subject to review and input from a broad-based
research coordination group. The research
program and agenda encompasses the following
major elements:
'NAHB Research Center, Inc., 400 Prince
George's Boulevard, Upper Marlboro, MD207,74-8731.
^U.S. Department of Housing and Urban
Development, 451 Seventh Street, SW,
Washington, D.C. 20410.
433
Coordination 3 STRUCTURAL LOADS (WIND)
Research Coordination Group (90
representatives)
Peer Review Group (6 experts in
engineering, architecture, and housing)
• Research Areas
Loads
Resistance (Strength)
Performance Assessment
Quahty/Defects Analysis
• Dissemination
Buildmg Codes
Engineering Standards
Education & Demonstration
Pubhcation/Reports/Articles
The research coordination effort serves several
purposes including identification and
prioritization of research needs, dissemination of
research findings, coordination with similar
research programs and initiatives, and
development of partnerships. Research activities
are selected fi-om the research agenda based on
priority and fianding availability among the
collaborators. A smaller peer review group
assists in the direction of program funding and
critical review of research activities, plans,
results, and proposed applications. The program
is specifically designed to address research needs
in a manner that will have the most immediate
and effective impacts on improving residential
construction and design practices. The
underlying principle is that more efficient
engineering approaches will result in improved
performance of homes (relative to current day
practices) without adversely impacting the cost of
construction or housing affordability.
The remainder of this paper will present the key
research and dissemination activities
accomplished to date in the HATDE program.
A major emphasis in the formation of the
HATDE program was related to wind loads,
particularly in hurricane prone regions. This
emphasis was associated with the construction
cost impacts realized when homes were subject to
engineered design using existing engineering load
standards such as the American Society of Civil
Engineer's standard Minimum Design Loads for
Buildmgs and Other Structures (ASCE 7)[1].
Because of this concern two projects were
directed toward research needs which would
improve the accuracy of this wind load standard
when applied to homes and other structures.
The first project focused on the development of a
hurricane coast wind map that utilized the latest
advancements in hurricane wind field and risk
modeling [2] [3]. Using these models which were
validated by data from numerous actual
hurricane events, Applied Research Associates
(Raleigh, NC) produced a new generation design
wind map for the hurricane coast regions of the
United States. The map shown in Figure 1 is
essentially the same map that is now being
considered for approval in the ASCE 7 consensus
standard. It is important to note that the new
map results in a faster degradation of hurricane
wind contours over land. This shift of the wind
contours toward the coast is a result of the more
accurate hurricane wind field modeling.
The second project related to wind loads re-
evaluated the wind load factor for probability-
based design formats such as Load and
Resistance Factor Design (LRFD). LRFD load
combinations are supported in the ASCE 7
standard and they are advancing in application to
residential construction with the advent of LRFDprovisions for wood construction [4]. The load
factor study included a delphi process of wind
engineering experts in the United States to help
identify the latest knowledge regarding the
stochastic parameters related to wind loads. Also
included in this work was the investigation of a
wind directionality factor that adjusts wind loads
to account for the probability that wind will not
always come fi"om a direction that produces the
434

worst-case wind effect on any particular
structure or its components.
As a result of this work a new wind load factor
and a separate directionality factor is being
proposed for inclusion in the next version of the
ASCE 7 consensus standard. The previous wind
load factor of 1.3 included a 0.85 factor
adjustment for directionality. By removing the
0.85 directionality factor, the wind load factor
would numerically change to 1.5 (1.3/0.85 =
1.5). This change was also supported by the re-
analysis of the wind load factor using the delphi
results and principles of uncertainty [5]. The
directionality factor is then treated as an
adjustment parameter (depending on shape of the
structure) when calculating the nominal (50-year
return period) wind load. Based on this work, a
possible representation of a wind load
combination and the wind velocity pressure
equation might be as follows:
0.9D + 1.5W
q= 0.613K,K,iKy
I
where,
P = dead load
W = wind load
q = wind velocity pressure (N/m^)
Kz = exposure coefficient
Kzt = topographic factor
Kd = directionality factor of 0.85
V = nominal design wind speed (m/s)
I - building importance factor
Other research has shown that the load factor
should be higher for hurricane prone regions.
The final outcome of these changes will be
forthcoming through the ASCE 7 consensus
standard balloting process.
4. STRUCTURAL RESISTANCE
A major ^ocus in the area of seismif' design and
wind resiiiance wood-fi'ame home^ ;\as bee i in
the area of wall braciiig or the lateral force
resisting system (LFRS). Ti.. major components
of the LFRS of a home are light-frame shear
walls with wood structural panels. Of course,
the performance of these walls is dependent on
the manner of restraining the walls against
rotation. Common practice is to include hold-
down brackets and special metal connectors to
transfer overturning loads to the building
foundation. Other fasteners, including nails,
anchor bolts, and shear plates, transfer shear
loads collected by horizontal diaphragms (floors
and roofs) to the shear walls. Similarly, the base
of the shear wall is connected to the walls or
foundations below. While this scheme provides a
reasonably simple method of engineering
analysis, it is not the most efficient practice for
relatively light residential buildings such as
single-family detached homes.
To improve the efficiency of designing the LFRSof homes, a shear wall research project was
initiated in the HATDE program. The project
was designed to build on previous research on the
perforated shear wall method [6]. By this
method, an engineer may readily and accurately
determine the strength of a fiilly-sheathed wall
with openings, and hold-downs are only required
at the ends of the walls. While resulting in a
moderate reduction in capacity compared to a
wall with hold-downs restraining each fiill-height
segment, it provides sufficient strength for many
light-fi^ame residential construction applications,
even in high wind and seismic conditions. The
perforated shear wall method was first developed
by researchers in Japan over 20 years ago [7]
.
The HATDE program expanded the work to
include investigation of perforated walls with fiill
restraint of each segment and with no restraint
other than conventional anchor bolts through the
sill plates. These tests included numerous
opening configurations in walls that were 12.2 m(40 ft) long. Both cyclic and monotonic loading
conditions were investigated [8] [9]. Finally, four
walls of a 3.7m (12 ft) length with comer
fi-aming and no hold-down restraints were
subjected to the cyclic loading test r-otocol [10].
The unit shear strength obtained thes tests
was more than 85 peri, nt of that achieved with
the fiilly restrained walls previously tested. This
435
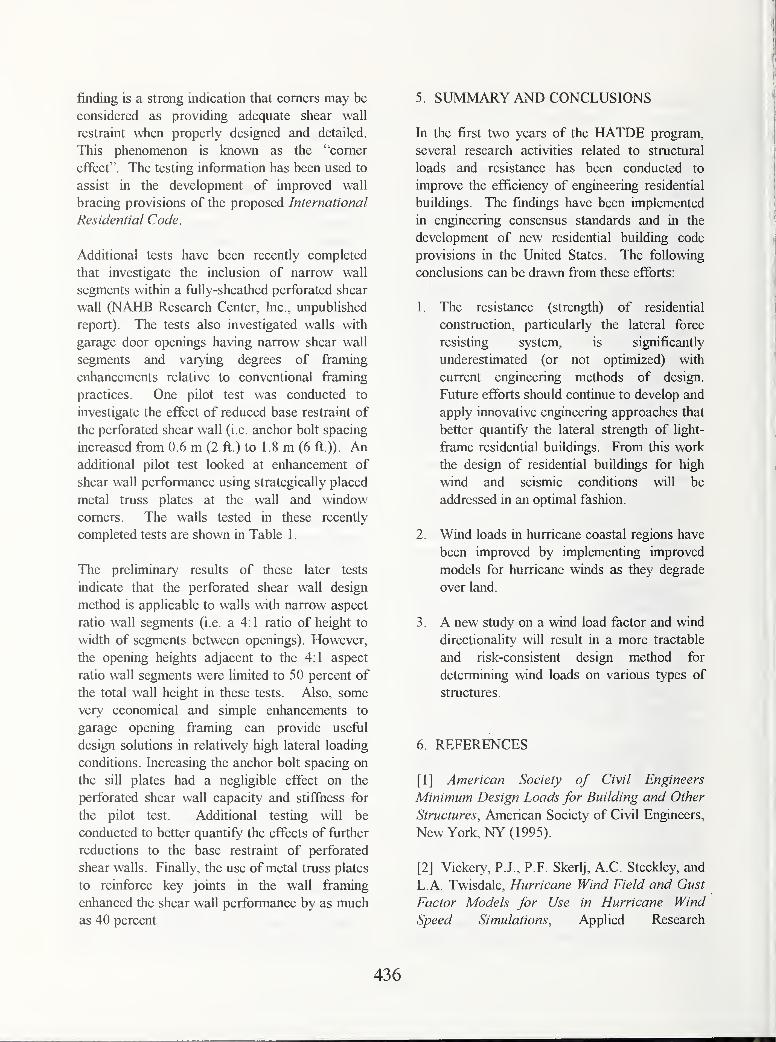
finding is a strong indication that comers may be
considered as providing adequate shear wall
restraint when properly designed and detailed.
This phenomenon is known as the "comer
effect". The testing information has been used to
assist in the development of improved wall
bracing provisions of the proposed International
Residential Code.
Additional tests have been recently completed
that investigate the inclusion of narrow wall
segments within a fiilly-sheathed perforated shear
wall (NAHB Research Center, Inc., unpublished
report). The tests also investigated walls with
garage door openings having narrow shear wall
segments and varying degrees of framing
enhancements relative to conventional framing
practices. One pilot test was conducted to
investigate the effect of reduced base restraint of
the perforated shear wall (i.e. anchor bolt spacing
increased from 0.6 m (2 fl.) to 1.8 m (6 ft.)). Anadditional pilot test looked at enhancement of
shear wall performance using strategically placed
metal tmss plates at the wall and window
comers. The walls tested in these recently
completed tests are shown in Table 1
.
The preliminary results of these later tests
indicate that the perforated shear wall design
method is applicable to walls with narrow aspect
ratio wall segments (i.e. a 4:1 ratio of height to
width of segments between openings). However,
the opening heights adjacent to the 4:1 aspect
ratio wall segments were limited to 50 percent of
the total wall height in these tests. Also, some
very economical and simple enhancements to
garage opening framing can provide useful
design solutions in relatively high lateral loading
conditions. Increasing the anchor bolt spacing on
the sill plates had a negligible effect on the
perforated shear wall capacity and stiffiiess for
the pilot test. Additional testing will be
conducted to better quantify the effects of further
reductions to the base restraint of perforated
shear walls. Finally, the use of metal tmss plates
to reinforce key joints in the wall framing
enhanced the shear wall performance by as much
as 40 percent
5 SUMMARY AND CONCLUSIONS
In the first two years of the HATDE program,
several research activities related to stmctural
loads and resistance has been conducted to
improve the efficiency of engineering residential
buildings. The findings have been implemented
in engineering consensus standards and in the
development of new residential building code
provisions in the United States. The following
conclusions can be drawn from these efforts:
1. The resistance (strength) of residential
constmction, particularly the lateral force
resisting system, is significantly
underestimated (or not optimized) with
current engineering methods of design.
Future efforts should continue to develop and
apply innovative engineering approaches that
better quantify the lateral strength of light-
frame residential buildings. From this work
the design of residential buildings for high
wind and seismic conditions will be
addressed in an optimal fashion.
2. Wind loads in hurricane coastal regions have
been improved by implementing improved
models for hurricane winds as they degrade
over land.
3 . A new study on a wind load factor and wind
directionality will result in a more tractable
and risk-consistent design method for
determining wind loads on various types of
stmctures.
6. REFERENCES
[I] American Society of Civil Engineers
Minimum Design Loads for Building and Other
Structures, American Society of Civil Engineers,
New York, NY (1995).
[2] Vickery, P.J., P.F. Skerlj, A.C. Steckley, and
L.A. Twisdale, Hurricane Wind Field and Gust
Factor Models for Use in Hurricane Wind
Speed Simulations, Applied Research
436
Associates, Raleigh, NC (1997) pending
publication.
[3] Vickery, P.J., P.F. Skerlj, and L.A.
Twisdale, Simulation of Hurricane Risk in the
United States Using an Empirical Storm Track
Modeling Technique, Applied Research
Associates, Raleigh, NC (1997) pending
publication.
[4] Load and Resistance Factor Design Manual
for Engineered Wood Construction, American
Forest & Paper Association, American WoodCouncil, Washington, DC, (1996).
[5] EUingwood, B. and P. Beraki, Wind Load
Statistics for Probability-Based Design,
prepared for the U.S. Department of Housing and
Urban Development, the National Association of
Home Builders, and the NAHB Research Center,
Inc. by Johns Hopkins University, Baltimore,
MD, October 1 997 (pending journal publication;
available through NTIS).
[6] Dolan, J. and Johnson, A, Monotonic Tests
of Long Shear Walls with Openings, prepared
for the American Forest and Paper Association
by Virginia Polytechnic Institute and State
University, 1996.
[7] Sugiyama, H. and Matsumoto, T., Empirical
Equations for the Estimation of Racking
Strength ofa Plywood Sheathed Shear Wall with
Openings, Summary of Technical Papers Annual
Meetings, Trans, of A. I. J., 1994.
[8] Dolan, J. and Heine, C, Monotonic Tests of
Wood Frame Shear Walls with Various
Openings and Base Restraint Configurations,
Prepared for the NAHB Research Center, Inc. by
Virginia Polytechnic Institute and State
University, 1997.
[9] Dolan, J. and Heine, C, Sequential Phased
Displacement Cyclic Tests of Wood Frame
Shear Walls with Various Openings and Base
Restraint Configurations, Prepared for the
NAHB Research Center Inc. by Virginia
Polytechnic Institute and State University, 1997.
[10] Dolan, J. and Heine, C, Sequential Phased
Displacement Tests of Wood Framed Shear
Walls with Corners, Prepared for the NAHBResearch Center Inc. by Virginia Polytechnic
Institute and State University, 1997.
437
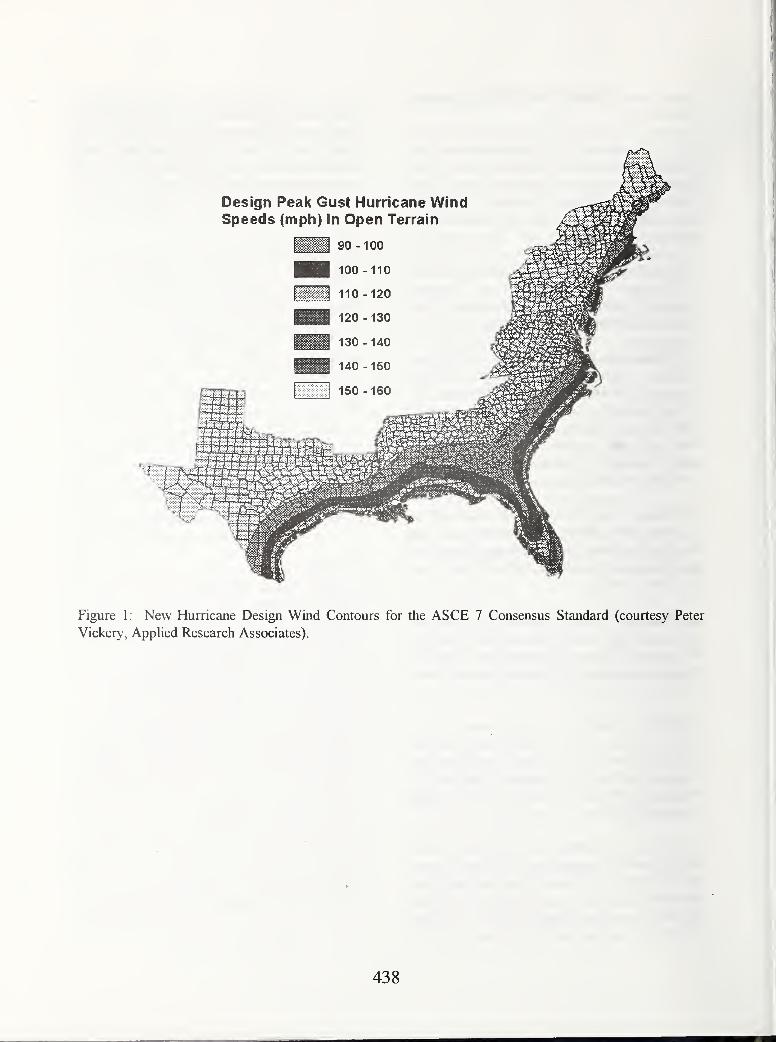
Figure 1: New Hurricane Design Wind Contours for the ASCE 7 Consensus Standard (courtesy Peter
Vickery, Applied Research Associates).
438
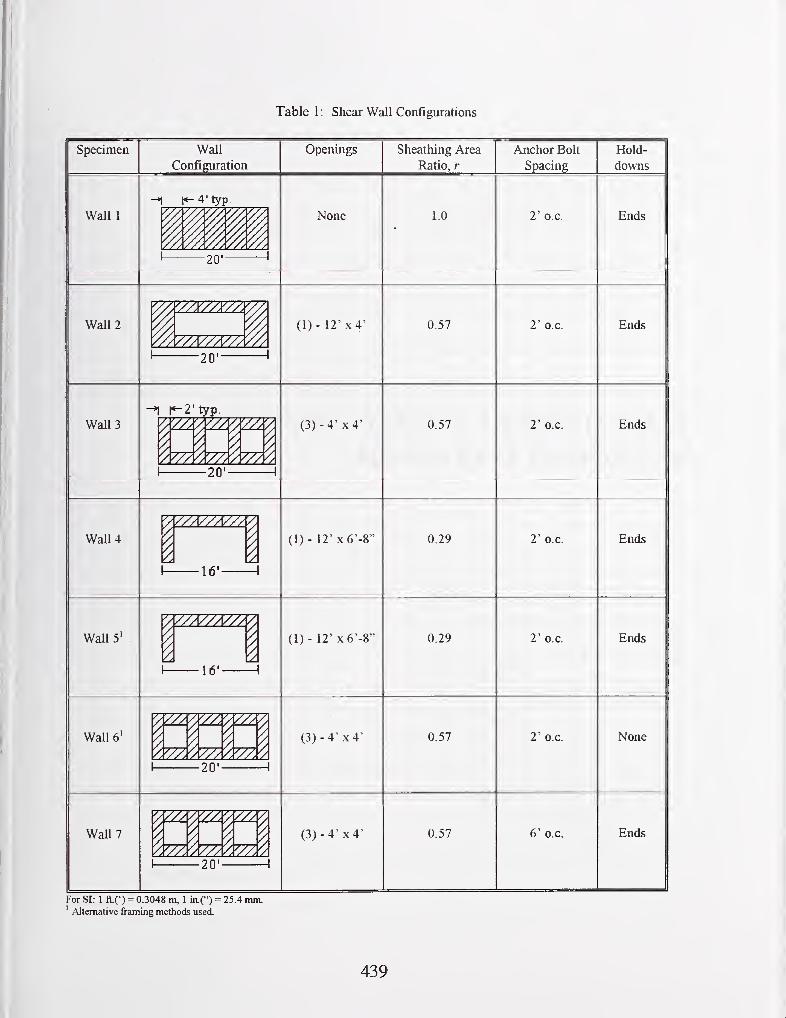
Table 1 : Shear Wall Configurations
Specimen Wall
Configuration
Openings Sheathing Area
Ratio, r
Anchor Bolt
Spacing
Wall 1 None 1.0 2' o.c.
Wall 2
'A//A//A//A20'
(1) - 12' X 4' 0.57 2' o.c.
1 r-2'typ.
Wall 3 (3)-4' x4' 0.57
20'
2' o.c.
Wall 4
16'-
(1) - 12' x6'-8" 0.29 2' o.c.
Walls'
Id'
(1)- 12' x6'-8'^ 0.29 2' o.c.
Wall 6'(3) -4' x4' 0.57
20' -I
2' o.c.
Wall 7
y777//77A20'-
(3) -4' x4' 0.57 6' o.c.
For SI: 1 ft.(') = 0.3048 m, 1 in.(") = 25.4 mm.' Alternative framing methods used.
439


SUMMARY ofJOINT COOPERATIVERESEARCH PROGRAMS

U.S.-Japan Cooperative Earthquake Engineering Research Programon Composite and Hybrid Structures
- Current Status of Japan Side Research -
by
Isao Nishiyama *1, Hiroyuki Yamanouchi *2 and Hisahiro Hiraishi *3
ABSTRACT
The U.S.-Japan Cooperative EarthquakeEngineering Research Program started in 1979following the recommendations as outlined in the
final report of the U.S.-Japan Planning Groupfor the program (Ref.l). The overall objective of
the total program is to improve seismic safety
practices in both countries through cooperative
studies to determine the relationship among full-
scale tests, small-scale tests, component tests, andrelated analytical and design implication studies.
A five-year research program on Composite andHybrid Structures was recommended to start in
1993 fiscal as the Phase 5 based on a number of
technical meetings between the U.S. and Japan
(Ref.2).
Because of diverse and broad scope of the
subject area, the research program was organized
into the following four groups: Concrete Filled
Tube Column Systems; Reinforced Concrete
(RC) and Steel Reinforced Concrete (SRC)Column Systems; RC / SRC Wall Systems; andNew Materials, Elements and Systems. In
addition to the objectives of the total program,Phase 5 aimed at (1) developing design
guidelines (for a unified code development) for
typical composite and hybrid structures, and (2)
developing new and innovative compositestructural elements and hybrid systems using
advanced new materials and / or devices.
Japan side has just completed his assignment ofthe cooperative research work in the fiscal yearof 1997. This report presents the outlines of the
research conducted during five years and the
general contents of the proposed draft guidelines.
KEYWORDS:composite and hybrid structures; concrete
filled tube column systems; reinforced concrete
and steel reinforced concrete column systems;
RC/SRC wall systems; new materials, elements
and systems; outline of research results;
proposed draft guidelines.
1. RESEARCH RESULTS ON CFT
1 . 1 Basic Research Plan
There are many experimental and analytical
studies on concrete filled tube column (CFT)
systems which are reported in technical journals.
First, the strength and ductility of the CFTsystems are predicted by processing these existing
data. Secondly, the effectiveness of these
predictions is verified by supplementary
experimental studies. As the materials' strengths
in use are quickly increasing, wide range of
structural steel strength and concrete strength are
considered to verify the applicability of the
predictions. Finally, draft design guidelines are
developed.
1.2 Research Items and Results
(1) Database
Test data of CFT columns and beam-columnswere collected from the Japanese literature
published in 1971 through 1995, and a database
was developed. A total of 786 test data (test
specimens) were found: 501 square CFT and 285
circular CFT. A database for the tests of
connections between CFT column and steel beamwas also prepared. Column bases and connections
between CFT frame and brace are also important
structural elements of CFT system, but however
very few test data were available so far in Japan.
* 1 Head, Housing Construction Division,
Production Engineering Department,Building Research Institute (BRI), Ministry
of Construction (MOC), Tachihara-1,
Tsukuba, Ibaraki, 305-0802, Japan.* 2 Director, Codes and Evaluation Research
Center, BRI, MOC.* 3 Director, Structural Engineering
Department, BRI, MOC.
443
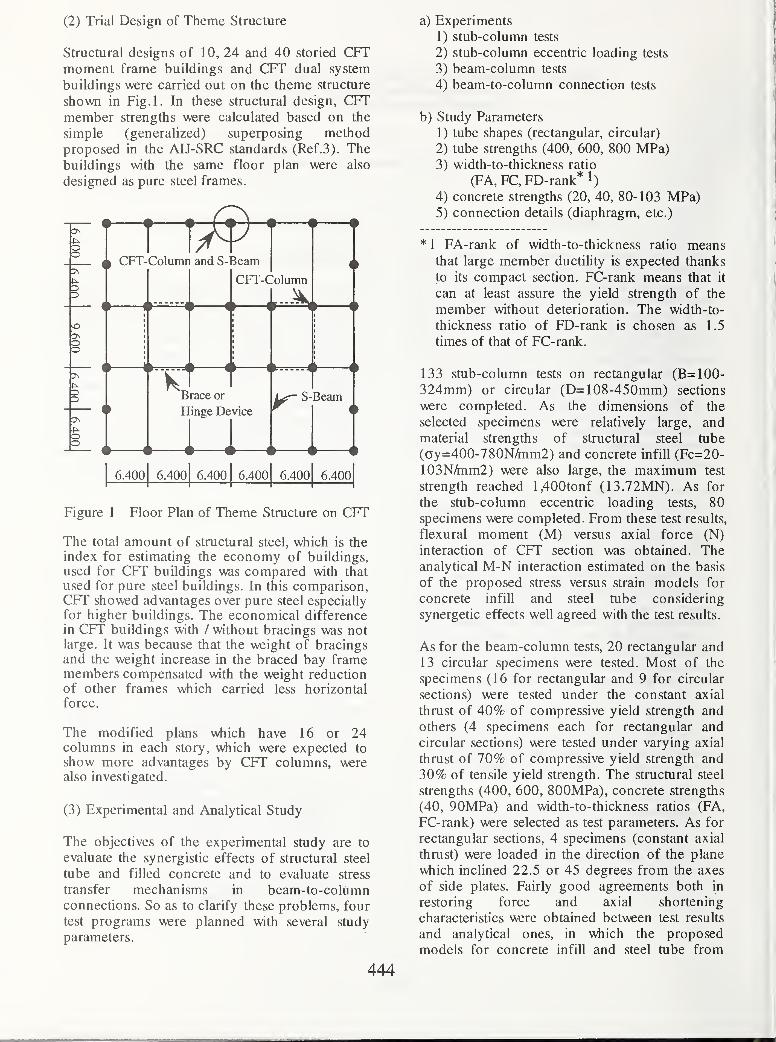
(2) Trial Design of Theme Structure
Structural designs of 10, 24 and 40 storied CFTmoment frame buildings and CFT dual system
buildings were carried out on the theme structure
shown in Fig.l. In these structural design, CFTmember strengths were calculated based on the
simple (generalized) superposing methodproposed in the AIJ-SRC standards (Ref.3). Thebuildings with the same floor plan were also
designed as pure steel frames.
oo
DZ>
i
> CFT-
i i
Columr and S- 3eam
CFT-C
> 4
'olumn
I •
oo
t 1
i ii
t—
^
\ 4 \ 4
\ 4
\
1^
asH
\ 4
race or
inge Device
1 4>
Beam
> 4
6.400
t i
6.400
\ 4
6.400
\ 4
6.400
\ 4
6.400
\ •
6.400
1
Figure 1 Floor Plan of Theme Structure on CFT
The total amount of structural steel, which is the
index for estimating the economy of buildings,
used for CFT buildings was compared with that
used for pure steel buildings. In this comparison,CFT showed advantages over pure steel especially
for higher buildings. The economical difference
in CFT buildings with / without bracings was notlarge. It was because that the weight of bracingsand the weight increase in the braced bay framemembers compensated with the weight reduction
of other frames which carried less horizontal
force. -
The modified plans which have 16 or 24columns in each story, wdiich were expected to
show more advantages by CFT columns, werealso investigated.
(3) Experimental and Analytical Study
The objectives of the experimental study are to
evaluate the synergistic effects of structural steel
tube and filled concrete and to evaluate stress
transfer mechanisms in beam-to-columnconnections. So as to clarify these problems, four
test programs were planned with several study
parameters.
a) Experiments
1) stub-column tests
2) stub-column eccentric loading tests
3) beam-column tests
4) beam-to-column connection tests
b) Study Parameters
1) tube shapes (rectangular, circular)
2) tube strengths (400, 600, 800 MPa)3) width-to-thickness ratio
(FA, EC, FD-rank* 1)
4) concrete strengths (20, 40, 80-103 MPa)5) connection details (diaphragm, etc.)
* 1 FA-rank of width-to-thickness ratio meansthat large member ductility is expected thanks
to its compact section. EC-rank means that it
can at least assure the yield strength of the
member without deterioration. The width-to-
thickness ratio of FD-rank is chosen as 1.5
times of that of EC-rank.
133 stub-column tests on rectangular (B=100-324mm) or circular (D=108-450mm) sections
were completed. As the dimensions of the
selected specimens were relatively large, and
material strengths of structural steel tube
(oy=400-780N/mm2) and concrete infill (Fc=20-
103NATnim2) were also large, the maximum test
strength reached l,400tonf (13.72MN). As for
the stub-column eccentric loading tests, 80specimens were completed. From these test results,
flexural moment (M) versus axial force (N)
interaction of CFT section was obtained. Theanalytical M-N interaction estimated on the basis
of the proposed stress versus strain models for
concrete infill and steel tube considering
synergetic effects well agreed with the test results.
As for the beam-column tests, 20 rectangular and
13 circular specimens were tested. Most of the
specimens (16 for rectangular and 9 for circular
sections) were tested under the constant axial
thrust of 40% of compressive yield strength and
others (4 specimens each for rectangular and
circular sections) were tested under varying axial
thrust of 70% of compressive yield strength and
30% of tensile yield strength. The structural steel
strengths (400, 600, 800MPa), concrete strengths
(40, 90MPa) and width-to-thickness ratios (FA,
EC-rank) were selected as test parameters. As for
rectangular sections, 4 specimens (constant axial
thrust) were loaded in the direction of the plane
which inclined 22.5 or 45 degrees from the axes
of side plates. Fairly good agreements both in
restoring force and axial shortening
characteristics were obtained between test results
and analytical ones, in wtiich the proposed
models for concrete infill and steel tube from
444
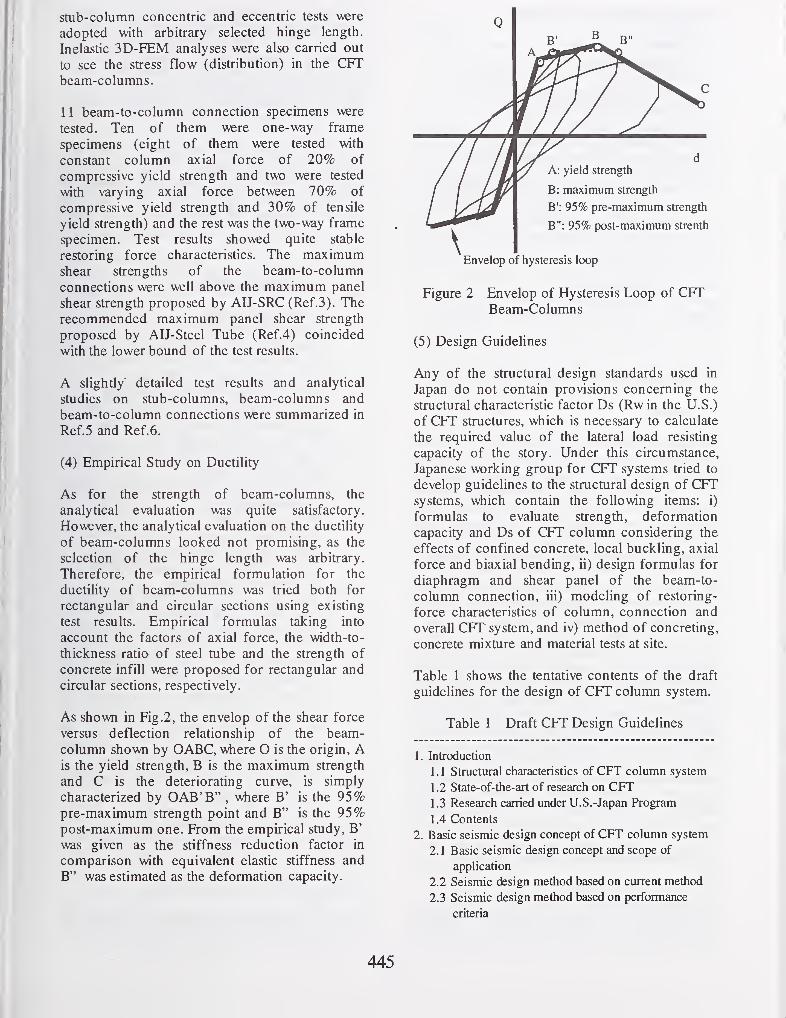
stub-column concentric and eccentric tests were
adopted with arbitrary selected hinge length.
Inelastic 3D-FEM analyses were also carried out
to see the stress flow (distribution) in the CFTbeam-columns.
1 1 beam-to-column connection specimens were
tested. Ten of them were one-way frame
specimens (eight of them were tested with
constant column axial force of 20% of
compressive yield strength and two were tested
with varying axial force between 70% of
compressive yield strength and 30% of tensile
yield strength) and the rest was the two-way frame
specimen. Test results showed quite stable
restoring force characteristics. The maximumshear strengths of the beam-to-column
connections were well above the maximum panel
shear strength proposed by AIJ-SRC (Ref.3). Therecommended maximum panel shear strength
proposed by AlJ-Steel Tube (Ref.4) coincided
with the lower bound of the test results.
A slightly' detailed test results and analytical
studies on stub-columns, beam-columns and
beam-to-column connections were summarized in
Ref.5 and Ref.6.
(4) Empirical Study on Ductility
As for the strength of beam-columns, the
analytical evaluation was quite satisfactory.
However, the analytical evaluation on the ductility
of beam-columns looked not promising, as the
selection of the hinge length was arbitrary.
Therefore, the empirical formulation for the
ductility of beam-columns was tried both for
rectangular and circular sections using existing
test results. Empirical formulas taking into
account the factors of axial force, the width-to-
thickness ratio of steel tube and the strength of
concrete infill were proposed for rectangular and
circular sections, respectively.
As shown in Fig. 2, the envelop of the shear force
versus deflection relationship of the beam-column shown by OABC, where O is the origin, Ais the yield strength, B is the maximum strength
and C is the deteriorating curve, is simply
characterized by OAB'B" , where B' is the 95%pre-maximum strength point and B" is the 95%post-maximum one. From the empirical study, B'
was given as the stiffness reduction factor in
comparison with equivalent elastic stiffness and
B" was estimated as the deformation capacity.
Envelop of hysteresis loop
Figure 2 Envelop of Hysteresis Loop of CFTBeam-Columns
(5) Design Guidelines
Any of the structural design standards used in
Japan do not contain provisions concerning the
structural characteristic factor Ds (Rw in the U.S.)
of CFT structures, which is necessary to calculate
the required value of the lateral load resisting
capacity of the story. Under this circumstance,
Japanese working group for CFT systems tried to
develop guidelines to the structural design of CFTsystems, which contain the following items: i)
formulas to evaluate strength, deformation
capacity and Ds of CFT column considering the
effects of confined concrete, local buckling, axial
force and biaxial bending, ii) design formulas for
diaphragm and shear panel of the beam-to-
column connection, iii) modeling of restoring-
force characteristics of column, connection and
overall CFT system, and iv) method of concreting,
concrete mixture and material tests at site.
Table 1 shows the tentative contents of the draft
guidelines for the design of CFT column system.
Table 1 Draft CFT Design Guidelines
1. Introduction
1 . 1 Structural characteristics of CFT column system
1.2 State-of-the-art of research on CFT1.3 Research carried under U.S.-Japan Program
1.4 Contents
2. Basic seismic design concept of CFT column system
2. 1 Basic seismic design concept and scope of
application
2.2 Seismic design method based on current method
2.3 Seismic design method based on performance
criteria
445
3. Behavior and design of CFT member
3.1 General
3.2 Behavior of CFT short column under concentric
compression force
3.3 Behavior of CFT short column under combined
compression force and bending moment
3.4 Behavior of CFT beam-column
3.5 Design of CFT column
4. Behavior and design of CFT joints
4. 1 Behavior of CFT column to steel beam
connection panel
4.2 Design of CFT column to steel beam connection
4.3 Design of brace connection
4.4 Design of CFT column bases
5. Construction of CFT column system
5.1 Steel tube
5.2 Concrete infill
6. Example of trial design
Appendix 1 . Trial design of CFT column system
Appendix 2. Test specimens carried under U.S.-Japan
Program
2. RESEARCH RESULTS ON RCS
2.1 General
In Japan, a great number of beam-to-column sub-
assemblage tests on RCS (reinforced concrete
column and structural steel beam) systems have
been conducted. However, the variations of the
joint details are quite wide and so the test results
have not been thoroughly investigated yet.
Therefore, these existing test results are first
compiled in a common format as a database.
Then, the joint panel shear strength and ductility
are investigated. In this consideration, the joint
details are classified into through column type
and through beam type.
As the existing test data are partial to interior
through beam type joints, necessary exterior joint
tests and through column type joint tests are
planned. A basic study to investigate the stress
transfer in the joint is also planned. In Japan, two-
way frame system is more common, so 3D joint
tests are planned. Frame test is also planned so as
to increase the accuracy of the evaluation of the
strength and ductility. Inelastic 3D finite element
analyses are also planned to more precisely
understand the behavior of the joints. Finally,
draft design guidelines is developed.
2.2 Research Items And Results
(1) Review and Database
A total of 436 experimental data was included
into a database, in which the information of about
160 items such as generals, the details of columns,
beams and joints, experimental results and so onis written for each test. The collected test data are
sort into 17 typical details for through beam type
joints and 13 for through column type joints
based on the types of reinforcing details. Thedata are also classified into 1) panel shear yielded
data and 2) others.
Panel shear yielded data vwere used to verify the
accuracy of the existing design formulas
(maximum strength) for each typical details of
the RCS connections. Adding the test data
produced by the U.S.-Japan program, a better
panel shear strength design formula was proposed
by Eq.l.
Qp=Qw-hQf+Qh+Qc (1)
where,
Qw=C 1 *Aw*sxwyQf=0.5*Af*sTfyQh=0.25*Pw*(ywy*Bc*mcdQc=0.4*C2*C3*Bc*Dc*0.1*cob*j6Aw: sectional area of web plate
sxwy: shear yield stress of web plate
Af: sectional area of web of cover plate
sxfy: shear yield stress of cover plate
Pw: shear reinforcement ratio
(jwy: yield stress of shear reinforcement
Be: width of columnmcd: central distance between external
reinforcements
Be: column width
Dc: column depth
cab: concrete compressive strength
j6: joint panel shape factor (=3 for +, 2
for T, and 1 for L joints)
CI: 0.8 for without FBP (face bearing
plate) and 0.9 for with FBPC2: 0.8 for without FBP and cover plate;
1.0 for with FBP or cover plate
(prototype); 1.1 for prototype with
extended FBP, or with outer side small
column, or with inner side band plate; 1.5
for prototype with outer side band plate
or with FBP -i- vertical rebar, or for
diagonal stiffener; 1.6 for diagonal
stiffener -i- wide FBP, or diaphragm.
C3: 0.9 for without transverse beam and
1.0 for with transverse beam.
The displacement information was used to
estimate the shear force versus shear deformation
relation of the joint panel.
(2) Trial Design of Theme Structure
6 and 12 story building frames were designed bythe current Japanese design standards (Ref.3 &

Ref.7), wdiose floor plan is identical to Fig.l. The
allowable stress design method was used with the
static lateral forces corresponding to the base
shear force coefficients of 0.918 and 0.133 for
the 6 and 12 story buildings, respectively. Timehistory analyses using the equivalent multi-mass
shear system for four recorded ground motions
with 50 cm/sec of velocity amplitude were also
conducted in which the hysteresis model was
assumed by normal tri-linear with the monotonic
envelop obtained by static pushover analysis. Themaximum story drift and the maximum ductility
ratio of the designed building frames were
studied.
The designed buildings are also utilized to further
investigate the realization of the proposed design
guidelines from the practical view points.
(3) Beam-To-Column Connection
a) Stress Transfer Mechanism Study
The shear strength of the joint panel is thought to
be estimated as the sum of the shear strengths of
inner concrete, outer concrete, web of the
structural steel and hoops. However, the
contribution of outer concrete on the shear
strength is quite doubtful as it is not known howthe shear stress is transferred between inner and
outer parts. So as to make clear the stress transfer
mechanism, several sophisticated experiments
were carried out.
b) Through Column Type Joint Tests
Ten specimens for interior beam-to-columnconnections were tested. In these tests, the effects
of vertical stiffeners and the cover plates were
investigated. These test results were useful for
developing design formula for panel shear
strength. The detailed test results are shown in
Ref.8.
c) T- and L-Shaped Joint Tests
Fifteen beam-to-column connection specimens
were tested to make clear the effects of the
geometry (cruciform, T and L) of the joints. Here,
the joint details of the through beam type with
FBP, extended FBP, cover plate and band plate
are all included. The through column type is also
considered. Through these experiments and 3D-FEM analyses, the shape factors for cruciform
shaped joint, T-shaped one and L-shaped one are
evaluated as 3.0, 2.4 and 1.4, respectively.
However, in the proposed design guideHnes, the
traditional shape factors as 3.0, 2.0 and 1.0 are
adopted for practical simplification with safer side
decision. The detailed test results are shown in
Ref.8.
d) 3D Joint Tests
So as to see the inelastic behavior of beam-to-
column connections under two directional
loading, four 3D joint test specimens were
constructed. Three of them are through columntype with the identical shape and one is through
beam type. One of the three identical through
column joints was loaded in the direction of the
frame (beam) in an ordinary manner. Second one
was loaded in the direction of 45 degrees with
respect to the axis of the frame. The third one was
loaded following a circle shaped orbit. Thestrength and restoring force characteristics of the
first and second specimens were quite resemble
each other and the effect of loading direction can
be considered negligible. However, the circle
orbit loading largely reduced the strength. This
effect was not included in the proposed design
guidelines, which will be the future problem. Thedetailed test results are presented in Ref.9.
(4) Frame Test
So as to understand the overall inelastic behavior
and required ductility in each structural elements
of RCS frame, a two story (1.35m in story height)
and two bay (2.1m in beam span) frame
specimen was tested. The frame was designed as
weak joint panel. The test results showed fairly
good ductility, but the hysteresis loop showedpinched.
(5) 3D-FEM Analyses
Elastic and inelastic behavioral characteristics of
bond and friction between concrete and steel were
investigated by fundamental experiments. Thetest results were reflected to modify the
constitutive models for the inelastic 3D-reMprogram. Analytically obtained monotonic load
versus deflection relationships were comparedwith the envelops of the cyclic behaviors of
beam-to-column connections with excellent
agreements, v^ich verified the effectiveness of
3D-FEM analyses. The 3D-FEM analyses also
gave us better understanding of the stress
distribution in the beam-to-column connection.
This analytical method was also applied to 3D-joint test and frame test and fairly good results
were obtained. The detailed analytical results are
shown in Ref.8.
3D-FEM analyses will be continued to
complement data on the structural performance
of RCS connections out of the extent of test data
447

and to further improve the shear design formulas
of RCS connections.
(6) Equivalent Damping of Joints and Frames
Equivalent viscous damping of 15 beam-to-
column connections and 4 frames was calculated
at each displacement amplitudes. The estimated
damping was summarized as follows; i) Beamhinging specimens showed the largest damping
and it reached 40% at the large displacement
amplitude, ii) Column failure or bearing failure
specimens showed the least damping and it was
about 10% even at the large displacement,
amplitude, iii) Joint panel shear yielding
specimens showed intermediate damping between
10-20% and the cover plate improved the energy
dissipation capacity.
(7) Draft RCS Design Guidelines
In recent years, a large number of RCSconnection details have been developed and
applied to the real construction practices.
However, many of the new connection details and
systems developed are not covered by the existing
standards, and thus the establishment of original
design procedures for RCS connections and
systems are urgently needed in Japan.
Japanese working group for RCS systems
developed draft design guidelines for RCSsystems, which contained the following items: i)
formula to evaluate panel shear strength, ii) yield
mechanisms to be recommended and how to
realize the intended mechanism, iii) modeling of
restoring force characteristics of beam-to-columnconnections, and iv) fabrication and construction
method.
Table 2 shows the tentative contents of the draft
guidelines for the design of RCS system.
Table 2 RCS Draft Guidelines
Preface
Part 1 : Draft design guidelines
1. General
1.1 Scope of application
1.2 Terminology
1.3 Notations
1.4 Related codes and standards
2. Materials
2.1 Kind and quality of materials
2.2 Material constant
2.3 Allowable stress and material strength
3. Structural design
3.1 Fundamentals for structural planning
3.2 Fundamentals for panel design and details
3.3 Design methods
3.4 Method based on current practice
3.5 Method based on performance criteria
3.6 Design example
4. Fabrication and ConstrucUon
5. Example of Construction
Part 2: Technical Information
1. Database
1.1 Infroduction
1 .2 Profile of database
1.3 Investigation of existing shear strength design
formulas
1.4 Proposed design formula
1.5 Proposed skeleton model
2. Experimental and Analytical Results done by U.S.-
Japan Program
2.1 Stress transfer in the joint panel
2.2 Behavior of through beam type joint
2.3 Behavior of interior through column type joint
2.4 Behavior of exterior joint
2.5 Behavior of 3D joint
2.6 Behavior of frame
2.7 Inelastic 3D-FEM analysis
2.8 Equivalent damping of RCS joints and frame
3. RESEARCH ON HWS
3.1 General
The structural system of core wall with exterior
steel frame is not common in Japan and its design
method is not established yet. So, six, twelve and
twenty-four storied theme structures were
preliminary designed. According to the
preliminary design, six storied model was
considered to be designed just depending on the
large shear strength of walls. Twenty-four storied
model needed hat truss (and belt truss) to reduce
large overturning moment induced at the foot of
the coupled shear walls, wiiich made the
development of general design procedure rather
difficult. Therefore, twelve storied theme structure
was first selected and the design problem was
picked up. Then, the design implication is
expanded into much higher or lower systems.
The rationality of the designed system is verified
through the analytical and experimental studies.
3.2 Research Items And Results
(1) Trial Design of Theme Structure
First, twelve story model building (see Fig. 3) was
designed on the basis of the general design
concept (Ref.7). The strength of the designed
building was too large to be investigated as the
target strucmre to be developed. Then, the
building was revised considering the design

concept for the coupled-shear wall in NewZealand (Ref.lO). In New Zealand practice,
earthquake load is distributed to each wall
according to the overturning moment ratio
carried by boundary beams. As the building still
had large overstrength, the reinforcements in the
core walls were intentionally reduced to reach
reasonable strength level, 35 percent as the base
shear coefficient. The final designed building was
investigated whether it performed well or not
under the seismic effects through the dynamic
inelastic analyses using fish-bone model or frame
model.
6.4001
6.400| 6.400|
6.4001
6.40o| 6.40o|
Figure 3 Floor Plan of Theme Structure onHWS
(2) Coupled-Shear Wall Test
One-third scale model of 12 storied coupled-
shear wall test was carried out. During the test, the
forces acting in each member was measured so as
to understand the force re-distribution in the
coupled-shear walls and boundary beams for
design purpose. For this purpose, load cells were
installed into all boundary beams. The coupled-
shear walls showed very stable hysteresis loops
until 1/67 radian in drift index. From the readings
of the load cells, it was observed that the
boundary beams act like wedges inserted between
walls after they cracked and expanded in length.
These test results were investigated by FEM and
MS (multi spring) model analyses. The detailed
test results and some analytical studies were
discussed in Ref.ll and Ref.l2.
(3) T- and L-Shape Shear Wall Test
To understand the stiffness, strength anddeformability of 3D- wall is essential for the
design implication to HWS systems. Three one-
third scale T-shaped shear wall specimens without
boundary columns, which represented the walls of
the lowest story of the 12 storied prototype HWSsystem, were conducted. In these tests, the shear
force and flexural moment with different
moment-to-shear ratios were applied with varying
axial forces.
Large axial force was expected at the corner of
the 3D-wall of lowest story wdien two directional
seismic force affected on the HWS system. Then,
the ductility of the corner part of the wall
depended much on its confinement. Therefore,
four L-shaped shear walls varying their
confinement level were tested with large axial
force. These test data were utilized to develop
hysteresis model of 3D-walls.
The detailed test results were discussed in Ref.l3.
(4) Theoretical Study
Theoretical investigation was carried on the
dynamic behavior of 3D HWS under the bi-
directional earthquake motion, in order to
establish a rational mathematical model in view of
the experimental results, and the fluctuation of
shear forces acting on dynamically-behavingrigid walls and flexible steel frames, to determinethe design shear force for HWS.
(5) Literature Survey
About eighty papers on boundary beams andthirty papers on RC wall to steel beamconnections were surveyed. As for the inelastic
behavior of the boundary beams, the past
analytical and experimental information wasconsidered to be enough for design purpose. Onthe other hand as for the RC wall to steel beamconnections, the isolated joint strength tests werefound in the reports and no sub-assemblage tests
were found. From this viewpoint, someverification test might be necessary for RC wall to
steel beam connection. However, as the flexural
stiffness of the steel beam with long span was very
small and the rotational deformability of the joint
itself was not so large, the experiment was not
carried out.
(6) Design Guidelines
Seismic performance of each member in HWSdiffers significantly. Coupled walls and link
beams may be damaged within a relatively small
drift, while exterior steel frames will remain elastic
at the limit drift of the walls. Design guidelines
for HWS system should consider these different
performance of each structural element. It is also
indicated that the following items are important in
449
the design of HWS, in addition to the design
methodology of the coupled shear walls and link
beams: design for diagonal loading, soil spring
effect, seismic use of perimeter steel frame,
confinement of compression wall, and method of
energy dissipation.
Table 3 shows the tentative contents of the draft
guidelines for the design of HWS system. Thedetailed explanation of the design concept is
presented in Ref.l3.
Table 3 HWS Draft Guidelines
Introduction
1 . Scope of Application
1.1 Structural components
1.2 Scale and geometry of building
1.3 Materials
2. Target Performance in Seismic Design
2.1 Establishment of target performance
2.2 Confirmation of target performance
3. Check of Target Performance
3.1 Input ground motion
3.2 Analytical methods
3.3 Check of design criteria
4. Check of member performance
4. 1 Fundamentals for member performance
4.2 Walls
4.3 Boundary beams
4.4 Exterior frames
4.5 Steel beam to core wall connections
4.6 Foundations
Appendix 1 . Design examples
Appendix 2. References, Test report and Other
Appendix 3. Examples of Dynamic Analyses
4. RESEARCH RESULTS ON RFI
4.1 Feasibility Study
Following items were discussed as possible
research topics: Fiber reinforced plastics (FRP),
high-performance concrete (HPC), intelligent
material, prestressed steel member, hinge device,
mega-structure system, recycle element, fire-
proofing material for CFT, and high-performance
steel. Some hearing-type meetings with material
manufacturers and general contractors were
conducted with a view to study a possibility of
above items as research topics of RFI, and FRPand HPC were selected for feasibility studies oneffective use.
4.2 Research on FRP
The research program on effective utilization of
FRP materials for composite and hybrid
450
structures contained three research items as
follows. These items were selected through the
feasibility study on effective utilization of FRP.
a) Development of the evaluation method for
high-performance FRP-RC panels.
b) Development of the effective repair and / or
strengthening method by using FRP for
existing RC members.
c) Feasibility study on the effective utilization of
FRP to the electrical facilities.
The behaviors of FRP-RC panels of flat- and
tube-types reinforced by 2-dimensional FRPreinforcements, under axial tension and
compression, in-place flexure and shear and out-
of-plane flexure were experimentally investigated.
The flexural and shear behaviors andconfinement of concrete of RC columns wiiich
were wrapped by FRP strand or FRP sheet / tape
with resin for repairing and / or strengthening
were also investigated. The application of FRP to
the electrical facilities such as a power station, andstructures that had to be sheltered from electrical
noise was studied from the literature survey.
4.3 Research on HPC
There are few cooperative research between
concrete makers and structural designers in Japan.
The makers have many technologies but they
don't know how to use it. On the other hands,
designers have a few information about newtechnologies of concrete. But they have manyhints about the idea of future concrete.
The main objective is to exchange the
information of makers and structural designers to
discuss about how to use effectively the concrete
materials to the structural members and how will
be the future concrete. Through the discussions,
the following two topics were depicted.
a) Light weight concrete with high strength ofwhich the specific gravity is imaged to beabout 1.2 and 1.6, and the compressive
strength of 30 and 60 MPa, respectively
b) Advanced concrete with high tensile strength
and ductility of which the tensile strength is
imaged from 30 to 200 MPa, and the tensile
ductility from 1 to 10 %.
As for the light weight concrete, two kinds of
imaged concrete were realized and several
fundamental tests on bond strength and
compressive strength were carried out.

As for the high tensile strength concrete, various
types of fibers with mortal were tested and someof them showed high tensile strength and goodcompressive ductility. However, it was made clear
that such performance was quite sensitive to the
kind of fibers.
4.4 Technical Information
The research results can not be summarized as
design guidelines but they can be used as
technical information. Design guidelines will
contain the items concerning the design,
fabrication, construction and application of the
advanced materials mentioned above, that is,
FRP-RC panel element, I^RP strand and sheet /
tape for repairing and strengthening of existing
RC members, FRP for electrical facilities, light
weight concrete with high strength and concrete
with high tensile strength and ductility.
5. SUMMARY
U.S.-Japan Cooperative Earthquake EngineeringResearch on Composite and Hybrid Structures
initiated in 1993 fiscal as a five year programcame to the final stage. This paper presents the
outlines of the research results conducted duringthis five years and the general contents of the
proposed draft guidelines by Japan side.
Research results by the U.S. side vjhich will comeout in other two or three years shall be reflected
to improve the design guidelines presented in this
paper.
ACKNOWLEDGMENTS
The authors wish to express their great thanks to
the Members of Japan Technical CoordinatingCommittee for their useful comments andsuggestions to the development of design
guidelines and / or technical information on CFT,RCS, HWS and RFI.
REFERENCES
1. "Recommendations for a U.S.-Japan
Cooperative Research Program utilizing
Large-Scale Testing Facilities", Report No.UCB/EERC 79-26, 1979.9.
2. "Recommendation for U.S.-Japan CooperativeResearch Program -Phase 5 Composite andHybrid Structures", Report No. UMCEE 92-29,
1992.11.3. " Standards for Structural Calculation of Steel
Reinforced Concrete Structures,"
Architectural Institute of Japan, 1987 revision.
4. " Recommendations for the Design andFabrication of Tubular Structures in Steel,"
Architectural Institute of Japan, 1990 revision.
5. S. Morino, "An overview of U.S.-Japan
Cooperative Earthquake Research Program on
CFT column systems," SEWC'98, July 19-23,1998.
6. K. Sakino et al., " Experimental studies anddesign recommendations on concrete filled
steel tubular columns -U.S.-Japan Cooperative
Earthquake Research Program-," SEWC'98,July 19-23, 1998.
7. " Structural Provisions for Buildings,"
Building Center of Japan, 1994.9. (in
Japanese)
8. H. Noguchi et al., " Shear strength of beam-to-column connections in RCS system,"
SEWC'98, July 19-23, 1998.
9. 1. Nishiyama et al., " Bi-directional seismic
response of reinforced concrete column andstructural steel beam subassemblages,"
SEWC'98, July 19-23, 1998.
10. T. Paulay and M. J. N. Priestley, " Seismic
Design of Reinforced Concrete and MasonryBuildings," John Wiley & Sons, Inc.
11. M. Teshigawara et al., " Seismic test on 12-
story coupled shear wall with flange walls,"
SEWC'98, July 19-23, 1998.
12. M. Teshigawara et al., "Energy absorption
mechanism and the fluctuation of shear force
in the coupled shear walls," SEWC'98, July
19-23, 1998.
13. T. Kabeyasawa et al., "Displacement-BasedDesign of Hybrid Core Wall System,"SEWC'98, July 19-23, 1998.
451
U.S.-Japan Cooperative Earthquake Research Programon Composite and Hybrid Structures -
U.S.-side Progress
by
Subhash C. Goell
ABSTRACT
A five-year research program on Compositeand Hybrid Structures as Phase 5 of the U.S.-
Japan Cooperative Earthquake ResearchProgram was recommended to be initiated in
1993 in both countries. The research work in
Japan started in fiscal year 1993. However,fuller participation of researchers on bothsides started in early summer 1995. Thesponsorship of the program is by the National
Science Foundation in the U.S. and by the
Ministry of Construction along with a numberof industry groups in Japan. This paperpresents a brief status report of the programand research progress made to date on the
U.S. side. Because of diverse and broad scopeof the subject area, the research program is
organized into the following four groups:
Concrete Filled Tube Column Systems (CFT);
Reinforced Concrete (RC) and Steel
Reinforced Concrete (SRC) Column Systems(RCS); and RC/SRC Wall Systems (HWS); NewMaterials, Elements and Systems (RFI). Atheme structure with well selected layout,
geometry and design loads for the research is
also presented, which provides a commonfocus for various systems to be studied, andalso a common prototype structure fromwhich the components and sub-assemblagesare drawn.
Key Words:Concrete Filled Steel Tube;RC Column with Steel Girder;
RCS Core Wall with Exterior Steel Frame;New Materials Elements and Systems.
1 . INTRODUCTION
The U.S.-Japan Cooperative EarthquakeResearch Program began in 1979 under the
auspices of the UJNR Panel on Wind andSeismic Effects. The overall objective of the
total program is to improve seismic safety
practices in both countries throughcooperative studies to determine the
relationship among full-scale tests, small-scale
tests, component tests, and related analytical
and design implication studies. First fourphases of the program have been ReinforcedConcrete (RC) Structures, Steel Structures,
Masonry Structures, and Precast ConcreteStructures. Research on Mixed Steel/RC
Structures was identified as an important phaseof the program as recommended in the
planning group report.
It is widely recognized that innovative uses oftwo or more different materials in a structure
leads to more efficient system for resisting
seismic forces. During the past ten years the
use of composite and hybrid structures has
increased in the U.S. and Japan. In spite of
some research and development work byJapanese construction companies, not enoughis known at present regarding their seismic
behavior or performance. Design proceduresand codes for use in typical design offices are
not well developed at present.
Considering the importance of developing
design guidelines (a unified codedevelopment) for typical composite andhybrid structures that are used in current
practice, and of developing new and innovative
composite structural elements and hybridsystems using advanced new materials and/or
devices, a five-year research program onComposite and Hybrid Structures was
recommended as the fifth phase of the
ongoing U.S.-Japan Cooperative EarthquakeResearch Program. The recommendationswere based on a number of technical meetings
of the U.S. and Japan Planning Groups andfinally a Joint Planning Group Workshop held
in Berkeley on September 10-12, 1992 (Ref.
1).
Because of diverse and broad scope of the
subject area, the research program is organized
into the following four groups: Concrete Filled
Tube Column Systems (CFT); RC/Steel
Reinforced Concrete Column Systems (RCS);
1 Professor, Dept. of Civil and EnvironmentalEngrg., University of Michigan, Ann Arbor,
MI 48109-2125, USA
452
and RQSRC Wall Systems (HWS); NewMaterials, Elements and Systems (RFI). Atheme structure provides a common focus ofthe program to facilitate cross comparisonbetween various system types identified and to
derive structural elements and sub-assemblages
for detailed studies.
2. PROGRAM MANAGEMENT,COORDINATION AND CURRENTSTATUS
The research program is planned for a periodof five years in both countries, and fundinghas been provided accordingly. Researchwork on the Japanese side started in the spring
of 1993. However, fuller participation andcoordination of research work on both sides
started in early summer 1995 when the first
group of U.S. research projects were awarded.Cooperation and coordination of work by all
participants are most essential to successful
completion of this program. Variouscommittees have been formed for this
purpose. A Joint Technical Sub-Committee(JTSC) in each of the four components of the
research program provides technical advice
and coordination. Each JTSC has a co-chairman from each side with membershipincluding all researchers in that area. Thesegroups meet as often as needed. All
participants and institutions are also part of the
bigger Joint Technical CoordinatingCommittee (JTCC) to review progress anddiscuss scientific and technical issues on a
common basis. This committee meets once a
year. The last (fourth) JTCC meeting was held
in Monterey, California, in October 1997. Thefifth JTCC meeting is scheduled to be held in
fall 1998 soon after the award of fourth yearU.S. research projects which is expected in
April-May 1998. A smaller group called Joint
Steering Committee (JSC), which consists ofkey representatives from the JTCC, oversees
the entire program and provides guidance onissues that are common to the fourcomponents of the program. The overall
program has a technical coordinator and a co-
chairman from each side.
In addition to sharing of technical information
and ideas among researchers, exchange of
personnel involved is strongly encouraged.This is happening more now as the research
program has gotten into its advance stage.
Active participation of practitioners andvarious industry representatives in planning,
coordination and execution of the research
work is also a strong feature of this program.
3. PROGRAM OBJECTIVES
Since the subject area of the Composite andHybrid Structures is diverse and broad, the
research program was organized into the
following four groups: CFT Column Systems;
RaSRC Column Systems; and RQSRC Wall
Systems; New Materials, Elements andSystems. The first three groups aim at
developing practical design guidelines (a
unified code development) for typical
composite and hybrid structures currently
used. The last group aims at developing newand innovative composite structural elementsand hybrid systems using advanced newmaterials and/or devices.
4. THEME STRUCTURE
The theme structure provides a commonfocus and a strong link between various
components of the research program, facilitate
cross comparisons between various systems to
be studied, and also provides a commonprototype structure from which the structural
elements and sub-assemblages for detailed
studies are drawn. The following criteria were
used for selection of the theme structure:
- The building plan was selected so as to
reflect the benefits that the hybrid structures
provide over non-hybrid structures.
- The basic plan is common to various types
of hybrid structures. The number of stories
and the make-up and combination ofstructural components and details can bevaried.
- Rules to determine dead load, live load andseismic forces to be used in design
simulation are common in the U.S. andJapan Groups.
5. RESEARCH ON CFT SYSTEMS
A number of research projects were fundedduring the first two years. These projects
focused on the behavior of CFT column-to-WF beam moment connections. The specimens
are nearly full size and include circular andsquare tube sections for columns. Theconnection details include the use of
diaphragms, shear studs, welds, and bolts. Themain variables are the connection details to
transfer beam forces into the column. Theobjectives are:
453

1) To determine the force transfer
mechanism, examine the effects of various
connection details on this mechanism, and onthe connection strength, stiffness and ductility
under cyclic loading.
2) Develop and evaluate practical andeconomical connection details for seismic
resistance.
3) Formulate practical design guidelines.
Some testing work also includes study ofbeam-columns under combined axial force
and bending. Analytical studies accompanythe experimental work. The analytical modelsinclude complex finite element formulationsin an effort to develop simpler empirical ormechanics based models for practical designwork. Analytical work is also aiming at
studying the bond and shrinkage effects, andconfinement effects in CFT memberssubjected to different load conditions.
6. RESEARCH ON RCS SYSTEMS
RCS structures in the U.S. generally consist ofcolumns made of light steel shapes encased in
RC. The light steel shape provides ease oferection and connection to the steel beam.Currently, there are seven active projects in the
U.S., that are related to RCS structures. Theprojects include preparation of database onconnections, testing of exterior and interior
beam-to-column connections with and withoutfloor slab, composite frames with partially
restrained connections, and use of highstrength steel and concrete. The joint detail
variables include: lateral ties, beam bearingplates, use of PRC in place of stirrups.
Analytical studies focus on modeling the
connection and frame behavior to addresspractical analysis and design issues.
7. RESEARCH ON HWS SYSTEMS
In one research project on seismic behavior ofsteel/composite coupling beams and their
connections to the RC shear wall has beenstudied experimentally and analytically. Fourone-third scale specimens were tested whichrepresented a portion of the wall and one halflength of the coupling beam from a 20 story
theme structure. The effect of concreteencasement of the steel beam and details of the
connection in the embedded portion havebeen studied. Two more research projects
were started in the second year which deal with
studies of composite SRC shear walls with steel
boundary elements, and steel frames with RCcast-in-place in-fill walls.
8. RESEARCH ON NEW MATERIALS,ELEMENTS AND SYSTEMS (RFI)
The research work in this group aims at
developing and application of new andadvanced materials in innovative compositestructural elements and systems (Research ForInnovation - RFI). Thus, the studies in this
group are more of feasibility type than those
in the previous three groups where the
objectives are to develop detailed guidelines
for practical design work.
Significant amount of research work has beendevoted to advanced cementitious and plastic
composite materials. Albeit, the available
information needs to be expanded to
application in seismic load conditions. In twoprojects under this program, work is in
progress on developing innovative compositesystems consisting of steel and fiber reinforced
concrete (FRC). The structural elements are
made of selective combinations of FRC andsteel members. The combinations under study
include: FRC-encased open web steel joists,
and high performance FRC core encased in
slurry infiltrated mat concrete (SIMCON)shells for reinforcement as well as stay-in-
place form work. In another project
application of fiber reinforced concrete in the
joint regions of RCS systems is being studied.
Work is also in progress on further
development of Engineered Cementitious
Composite (ECC) materials and their selective
use in structural elements, such as columnswith large ductility demands.
9. CONCLUDING REMARKS
A brief overview of the progress of U.S.-Japan
Cooperative Earthquake Research Program onComposite and Hybrid Structures has beenpresented in this paper. This five-year
program started in 1993 in Japan and in 1995in the U.S. The two year time lag is beingtaken as an opportunity to plan the future
research work in a more careful and useful
manner in order to derive the most benefit
from the work that has already beencompleted on both sides. The overall
coordination efforts, cooperation andexchange of information have been excellent.
More active exchange of research personnel is
currently occurring in this program. At least
454
four or five researchers from each side haveparticipated for short and long term durations.
More details on the current status andtechnical progress made in this program canbe found in the minutes of the last (fourth)
JTCC meeting (Ref. 2). A listing of the general
recommendations from that meeting is given
in the Appendix of this paper. A www site has
also been established which contains updatedinformation on the overall status of this
program as well as summary of results andfindings from individual research projects
(www.eerc.berkeley.edu/usjhcs).
10. REFERENCES
1. "Recommendation for U.S.-JapanCooperative Research Program - Phase 5
Composite and Hybrid Structures," ReportNo. UMCEE 92-29, Department of Civil
and Environmental Engineering, TheUniversity of Michigan, Ann Arbor, MI,48109-2125, November 1992.
2. "Summary, Resolutions andReconmiendations of the Fourth Joint
Technical Coordinating CommitteeMeeting," Report No. UMCEE 98-03,
Department of Civil and EnvironmentalEngineering, The University of Michigan,Ann Arbor, MI, 48109-2125, January1998.
11. APPENDIX
General Reconmiendations from the 4th JTCCmeeting:
1. Exchange of researchers, and research data
(e.g., via www) on both sides should becontinued at an increased level.
2. Close cooperation and collaborative
research effort on both sides should becontinued till the end of the five year
program of both countries.
3. Scope of this program may be expandedto include more thorough examination of
promising innovative technologies andmaterials (such as those explored in the
RFI Program) applied to repair andupgrading of existing structures,
application to infrastructure systems, andso on.
4. Efforts to synthesize and interpret
knowledge gained in the program, and to
disseminate this knowledge anddesign/analysis methodologies to the
design profession and industry should beaccelerated.
5. Consideration should be given to performtesting work on carefully selected full
frames in possible cooperation with other
research programs.
6. Material manufacturers, construction andother industrial organizations should
continue to actively support the research
program.
7. Each JTSC should meet as needed to
achieve good coherence in the cooperative
research work.
8. Each JTSC should study development of
performance criteria as related to design
guidelines to be developed in eachcountry.
9. Use of common set of ground motions is
encouraged to permit more direct
comparison of dynamic analysis results.
10. The funding agencies in both countries
should maintain proper balance of
research effort among the four areas of the
program consistent with the research
needs.
1 1 . Funding should be provided for joint
coordinated publication of research workwith practical implications.
12. The 5th JTCC meeting should be held in
early fall of 1998 at a place to be hosted
by the Japan side.
455


MANUSCRIPT PRESENTEDat MINI-SYMPOSIUM

Development of New High Bridge Piers Containing Spiral Reinforcement
by
Okahara Michio ", Fukui Jiro Adachi Takuya Okoshi Moriyuki ^\ Koga Yasuyuki
ABSTRACT
The construction of expressway and other
arterial roads in Japan is shifting from those
running the length of the Japanese Archipelago
to roads across its islands, a change in
emphasis that has increased the number of
roads constructed through mountainous regions
of the country. Recent years, a strong demand
for the preservation of natural environments
has been accompanied by the need for bridge
construction methods that have minimal effects
on nature. To meet this new requirement, high
bridge piers must be constructed.
In response to these circumstances,
rationalize execution and to develop the 3H
(Hybrid Hollow High Pier) Method: a new
high bridge pier structure that is both
economical and provides earthquake resistance.
Kye Words: High Pier
Spiral Reinforcement
Development of Construction
Performance Confirmation Tests
1. INTRODUCTION
The construction of expressway and other
arterial roads in Japan is shifting from those
running the length of the Japanese Archipelago
to roads across its islands, a change in
emphasis that has increased the number of
roads constructed through mountainous regions
of the country. Past roads through mountainous
areas included many sections constructed by
means of large scale cutting and embankment
work. But in recent years, a strong demand for
the preservation of natural environments has
been accompanied by the need for bridge
construction methods that have minimal effects
on nature. To meet this new requirement, high
bridge piers must be constructed. And the work
performed to construct bridge piers must
include environmental measures such as cutting
less soil and reducing the size of execution
yards. It is also necessary to reduce labor
requirements and the quantity of work
performed to deal with both a shortage of and
an increase in the average age of skilled
construction workers.
During the Hyogo-ken Nanbu Earthquake of
1995, road bridges that play important roles as
evacuation routes and emergency transportation
arteries, were destroyed with serious effects on
the life of local society. It is now essential to
develop new kinds of bridge piers that provide
earthquake resistance superior to that of
conventional reinforced concrete bridge piers.
In response to these circumstances, the
Public Works Research Institute of the
1 ) Director, Structure and Bridge Department,
Public Works Research Institute, Ministry of
Construction
Tsukuba Science City, 305-0804,Japan
2) Head, Foundation Engineering Division,
Structure and Bridge Department, Public
Works Research Institute, Ministry ofConstruction
ditto
3) Researcher, Foundation EngineeringDivision, Structure and Bridge Department,
Public Works Research Institute, Ministry of
Construction
ditto
4) Director, Research Section 3, AdvancedConstruction Technology Center,
Tokyo-to, 1 12-00 12,Japan
459
Ministry of Construction has worked in
cooperation with the Advanced Technical
Center, and private companies to rationalize
execution and to develop the 3H (Hybrid
Hollow High Pier) Method: a new high
bridge pier structure that is both economical
and provides earthquake resistance.
2. OUTLINE OF THE 3H METHOD
2.1 Present Problems and Development Goals
Most high bridge piers now designed and
constructed are reinforced concrete bridge
piers. Extremely large quantities of steel
reinforcing material is used in order to
minimize their cross section dimensions. The
revision to the Road Bridge Guidelines
completed in 1996 stipulates that bridge piers
shall be provided with sufficient stiffness by
installing highly concentrated hoop ties and
intermediate hoop ties. This has made
execution of bridge piers extremely difficult,
resulting in many problems related to
construction periods and costs. It is also
necessary to guarantee safe execution at high
work locations.
In response, technical development has been
undertaken in an effort to improve high bridge
piers by
( 1 ) increasing execution efficiency,
(2) improving bridge pier earthquake
resistance,
(3) preserving the environment,
(4) cutting costs, and
(5) improving the quality and appearance of
the work.
2.2 Structure of a 3H Method Bridge Pier
Figure 1 through Figure 4 present an outline of
the structure of 3H Method bridge piers.
The most important distinguishing feature of
the structure of a 3H Method bridge pier is the
fact that part of the axial direction reinforcing
rods installed with the conventional method are
replaced with steel (H-steel or steel pipes) .
As Figure 3 and Figure 4 show, the
intermediate hoop ties are replaced with spiral
reinforcement. This spiral reinforcement forms
a spiral column consisting of the steel and
axial direction reinforcement surrounding it.
Figures 5 and 6 show spiral columns. These
are installed around the full circumference of
the bridge pier section to form the bridge pier
column. Because this is a steel - reinforced
concrete structure that includes steel material,
its buckling load carrying capacity is greater
than that of a reinforced concrete structure.
This permits a reduction in the decline in its
bearing strength after maximum load during
bending behavior. And by closing the axial
direction reinforcement, the spiral
reinforcement confines the buckling of the steel
reinforcement generated during large
deformation of the bridge pier. This provides
the same function as intermediate hoop ties.
These features improve the toughness of bridge
piers. It is also possible to construct bridge
piers with far greater earthquake resistance
than that of conventional bridge piers.
2.3 3H Method Execution Procedure
The 3H method execution has been
developed basically by effectively combining
existing technologies. It is also more rational
than past methods of constructing bridge piers.
It is extremely important, however, to make
sure that the initial assembly of the spiral
columns is performed precisely. And to reduce
labor, the spiral columns must be as long as
possible. Depending on the bridge pier height
and other construction conditions, appropriate
measures must be take to prevent vibration,
oscillation, etc. of the spiral columns during
execution.
Execution methods can be broadly
categorized into the following two methods
460
depending upon the type of forms used.
2.3.1 Execution Method Using Precast Forms
This execution method is used mainly to
build high bridge piers with a height ranging
from 30 to 60 meters. Because precast forms
are used on the inside and outside surfaces of
the bridge pier, it is the best method from the
viewpoint of execution properties, quality, and
appearance.
The execution is performed by first
installing the spiral columns, assembling the
precast forms into appropriate units on land,
using a crane to lower the units into place, then
anchoring them. Finally, the spaces between
the precast forms are filled with secondary
concrete.
2.3.2 Execution Method Using Movable Forms
This execution method is used mainly to
construct bridge piers higher than 50 meters in
height. The use of large movable forms permits
improved execution properties and shorter
work periods.
With this method, the spiral columns and
hoop ties are installed, then jacks are used to
simultaneously or alternately raise the forms
and the scaffolding in order to construct the
bridge piers.
2.4 Special Features of the 3H Method
The following are the special features of the
structure and the execution method described
above.
( 1 ) More Efficient Execution
- Replacing part of the axial direction
reinforcement with H-shaped steel, steel pipes,
or other steel material sharply reduces the
quantity of complex reinforcing work that is
necessary. This can bring substantial
improvements in execution efficiency and
speed up the execution.
- The use of spiral columns can eliminate the
work required to install intermediate hoop ties.
- The use of precast forms or large movable
forms also contributes to more efficient
execution.
(2) Improving Earthquake Resistance
It is a steel - reinforced concrete structure built
by replacing part of the axial direction
reinforcement with H-shaped steel or steel
pipes to provide buckling load carrying
capacity and toughness superior to that possible
with a reinforced concrete structure.
(3) Environmental Protection
- The use of precast forms or large movable
forms can reduce the quantity of natural
resources consumed.
- The method can reduce the size of execution
yards, mitigating the effects of the work on the
surrounding environment.
(4) Cost Reductions
- More efficient execution shortens
construction periods, lowering costs.
( 5 ) Improved Quality and Appearance
- The use of factory made or processed
structural members contributes to more
dependable quality and more attractive bridges.
3. PERFORMANCE CONFIRMATIONTESTS CONDUCTED TO DEVELOP NEWTECHNOLOGY
In order to develop the 3H Method, it was
necessary to accurately clarify previously
unknown dynamic properties and their
behavior. The authors have performed element
tests of several kinds. These tests have
confirmed that the 3H Method has properties
equal or superior to those of the conventional
method.
And loading tests of conventional reinforced
concrete structures and structures made using
the 3H method were performed with models
1/4 the size of real bridge piers.
The remainder of Section 3. describes the tests
and their results.
461
3.1 Column Specimens
3.1.1 Outline of the Test
The specimens modeled part of the hollow
cross section of bridge piers. With dimensions
of 1,600 X 450 X 1,700, they were about 1/2
the size of those of an actual bridge. The test
cases are shown in Table 1 and outlines of the
specimens are shown in Figure 7. Case 1
( standard specimen) represented a
conventional reinforced concrete structure;
Cases 2 through 7 represented steel -
reinforced concrete structures made using
H-shaped steel; Cases 8 and 9 represented steel
- reinforced concrete piers made using steel
pipes; and Case 10 represented a reinforced
concrete bridge pier made using spiral
reinforcement. Cases 2 through 9 were tested
by varying factors such as the pitch of the
spiral reinforcement, the intervals between the
columns, and the axial direction reinforcement
ratio (percentage of the total steel cross
section area accounted for by the axial
direction reinforcing steel area) , the hoop tie
pitch, etc. The total steel material section areas
in the steel - reinforced concrete structures and
the reinforced concrete structures were almost
identical and the axial direction reinforcement
ratio in the steel - reinforced concrete structure
was about 10%.
The tests were performed by monotonically
increasing the vertical load and measuring the
displacement of the specimens in the height
direction and the strain etc. of the steel
reinforcement.
3.1.2 Test Results
Fracturing of the specimens in every case
occurred in the form of cracking of the
concrete surface in the loading direction at the
ends and in the middle of the specimens. As
the load increased, the centers of the specimens
bulged out at right angles to the loading
direction. Afterwards, the protective concrete
covering peeled off, and the testing ended
when the axial direction reinforcement buckled.
Photographs 1 and 2 show the way that the
H-shaped steel and steel pipes fractured.
Table 2 summarizes the test results. The
strength ratio ( P / a ) that clarifies the
bearing strength in each case compared the
maximum stress found from the maximum load
and the concrete strength of the test pieces.
The following information is revealed by this
Strength ratio.
( 1 ) In Case 2 through Case 4, the confining
effects of the spiral reinforcement provided
maximum stress almost equal to that in Case 1
where intermediate hoop ties were used. And
only slight differences were observed in the
maximum stress and strength ratio as a result
of the pitch of the spiral reinforcement.
(2) Case 3 and Case 5 reveal that the
intervals between columns has almost no effect
on the maximum stress.
(3) Case 3 and Case 7 reveal that as the
interval between the hoop ties is increased, the
maximum stress declines by about 30%.
Figure 8 shows the strain of the spiral
reinforcement at about the center of the Case 2
specimen. Up to maximum load, the strain in
the middle (S12, S12) was highest. But the
strain of the spiral reinforcement at that time
ranged from 1,000 to 1,500 /z , which was less
than the yield strain (between 1/7 and 1/5 of
approximately 7,300 jU ) • At the stage where
the continued loading had reduced the load to
about 80% of the maximum load, the strain of
the spiral material in a part corresponding to
the intermediate hoop ties (S2, S7, SI 5)
abruptly increased. This spiral reinforcement
displays behavior typical of intermediate hoop
ties.
Figures 9 and 10 show the displacement at
right angles to the load direction in the center
of the specimens. In Case 2 and Case 3,
462
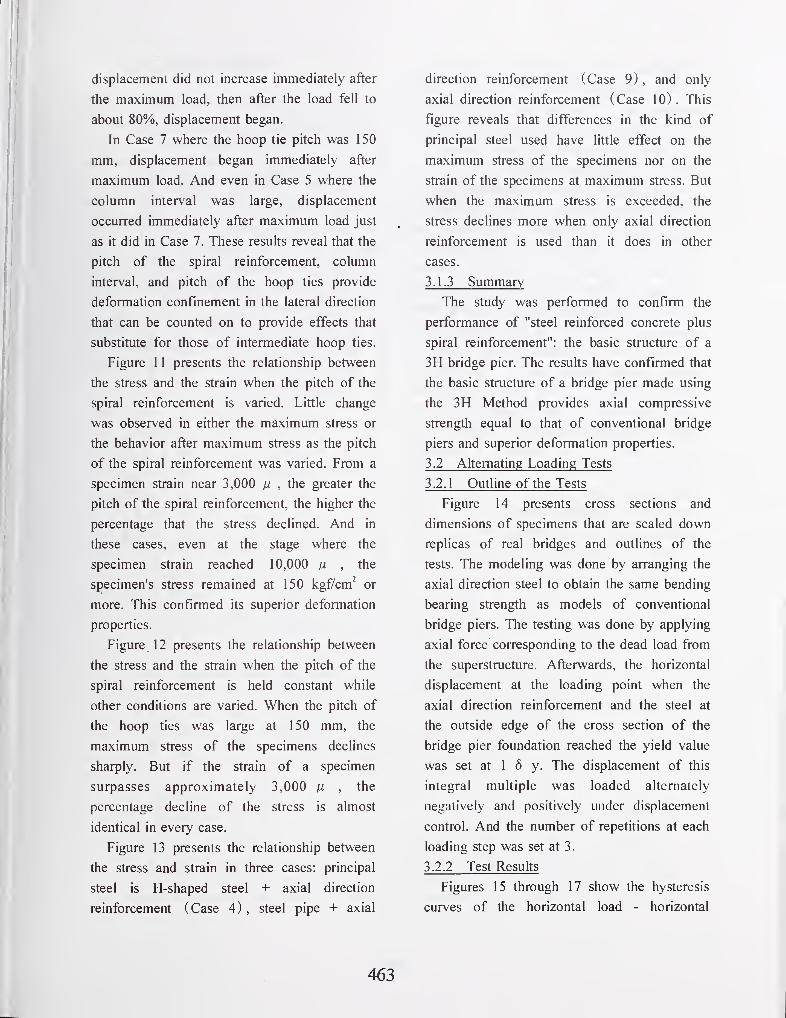
displacement did not increase immediately after
the maximum load, then after the load fell to
about 80%, displacement began.
In Case 7 where the hoop tie pitch was 150
mm, displacement began immediately after
maximum load. And even in Case 5 where the
column interval was large, displacement
occurred immediately after maximum load just
as it did in Case 7. These results reveal that the
pitch of the spiral reinforcement, column
interval, and pitch of the hoop ties provide
deformation confinement in the lateral direction
that can be counted on to provide effects that
substitute for those of intermediate hoop ties.
Figure 1 1 presents the relationship between
the stress and the strain when the pitch of the
spiral reinforcement is varied. Little change
was observed in either the maximum stress or
the behavior after maximum stress as the pitch
of the spiral reinforcement was varied. From a
specimen strain near 3,000 fj. , the greater the
pitch of the spiral reinforcement, the higher the
percentage that the stress declined. And in
these cases, even at the stage where the
specimen strain reached 10,000 yU , the
specimen's stress remained at 150 kgf/cm^ or
more. This confirmed its superior deformation
properties.
Figure 12 presents the relationship between
the stress and the strain when the pitch of the
spiral reinforcement is held constant while
other conditions are varied. When the pitch of
the hoop ties was large at 150 mm, the
maximum stress of the specimens declines
sharply. But if the strain of a specimen
surpasses approximately 3,000 ix , the
percentage decline of the stress is almost
identical in every case.
Figure 13 presents the relationship between
the stress and strain in three cases: principal
steel is H-shaped steel + axial direction
reinforcement (Case 4) , steel pipe + axial
direction reinforcement (Case 9) , and only
axial direction reinforcement (Case 10) . This
figure reveals that differences in the kind of
principal steel used have little effect on the
maximum stress of the specimens nor on the
strain of the specimens at maximum stress. But
when the maximum stress is exceeded, the
stress declines more when only axial direction
reinforcement is used than it does in other
cases.
3.1.3 Summary
The study was performed to confirm the
performance of "steel reinforced concrete plus
spiral reinforcement": the basic structure of a
3H bridge pier. The results have confirmed that
the basic structure of a bridge pier made using
the 3H Method provides axial compressive
strength equal to that of conventional bridge
piers and superior deformation properties.
3.2 Alternating Loading Tests
3.2.1 Outline of the Tests
Figure 14 presents cross sections and
dimensions of specimens that are scaled down
replicas of real bridges and outlines of the
tests. The modeling was done by arranging the
axial direction steel to obtain the same bending
bearing strength as models of conventional
bridge piers. The testing was done by applying
axial force corresponding to the dead load from
the superstructure. Afterwards, the horizontal
displacement at the loading point when the
axial direction reinforcement and the steel at
the outside edge of the cross section of the
bridge pier foundation reached the yield value
was set at 1 6 y. The displacement of this
integral multiple was loaded alternately
negatively and positively under displacement
control. And the number of repetitions at each
loading step was set at 3.
3.2.2 Test Results
Figures 15 through 17 show the hysteresis
curves of the horizontal load - horizontal
463
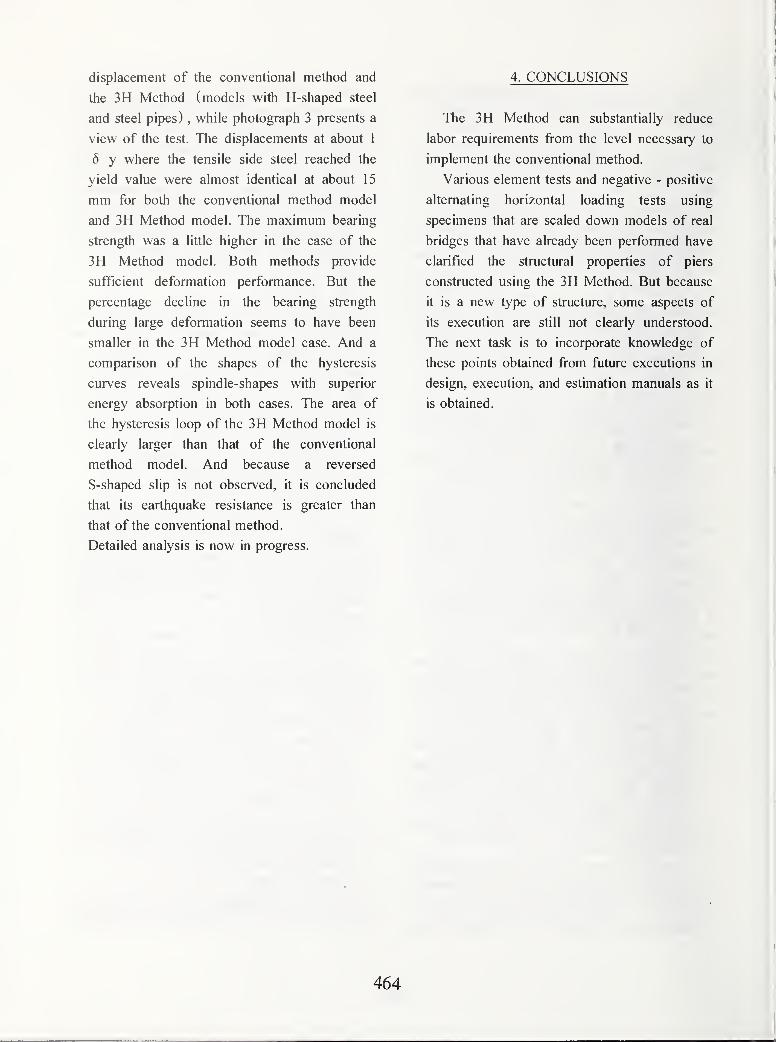
displacement of the conventional method and
the 3H Method (models with H-shaped steel
and steel pipes) , while photograph 3 presents a
view of the test. The displacements at about 1
6 y where the tensile side steel reached the
yield value were almost identical at about 15
mm for both the conventional method model
and 3H Method model. The maximum bearing
strength was a little higher in the case of the
3H Method model. Both methods provide
sufficient deformation performance. But the
percentage decline in the bearing strength
during large deformation seems to have been
smaller in the 3H Method model case. And a
comparison of the shapes of the hysteresis
curves reveals spindle-shapes with superior
energy absorption in both cases. The area of
the hysteresis loop of the 3H Method model is
clearly larger than that of the conventional
method model. And because a reversed
S-shaped slip is not observed, it is concluded
that its earthquake resistance is greater than
that of the conventional method.
Detailed analysis is now in progress.
4. CONCLUSIONS
The 3H Method can substantially reduce
labor requirements from the level necessary to
implement the conventional method.
Various element tests and negative - positive
alternating horizontal loading tests using
specimens that are scaled down models of real
bridges that have already been performed have
clarified the structural properties of piers
constructed using the 3H Method. But because
it is a new type of structure, some aspects of
its execution are still not clearly understood.
The next task is to incorporate knowledge of
these points obtained from future executions in
design, execution, and estimation manuals as it
is obtained.
464

li
U
t-
c
3 CO
E
5
^ t3 E
o «
§ =
z ^ ~« c «
(1>
O 3
_ ECO <U
< a
a:
1—3
C/3
O
oo oo
oo
-e-
o5
X
Q
oo
o5
00
a.
<N
-e-
o.
02
c
6B
E
«3 ^
—
ocoO
« EGO 55
e <
c« ECO Oou<^ CO
CO ^> c5 .2
T3toO-J
E3EXCO
o
o 00 OS
00
(N
O VO o(N
ONOS00
000000
oOs
ONOON
ooo
NO
NO00
ON(N
NO1^
NO Ov
OO On(NO
XI
n.
CO
U
465

Figure 1. Precast Form Structure
Figure 2. Movable Form Structure
466

H-s:laped Steel
Spiral Reinforcement
Axial direction
;Reinforcement
1^1
Figure 3. H-shaped Steel Type Figure 4. Steel Tube Type
f ^
H H H H
H H H H
mra'
Spiral Reinforcement
H-shaped Steel
Figure 5. H-shaped Steel Type Arrangement Diagram
oo
o o o o o
o o o o o
o0'"
o
Spiral Reinforcement
Steel Pipe
Figure 6. Steel Tube Type Arrangement Diagram
467
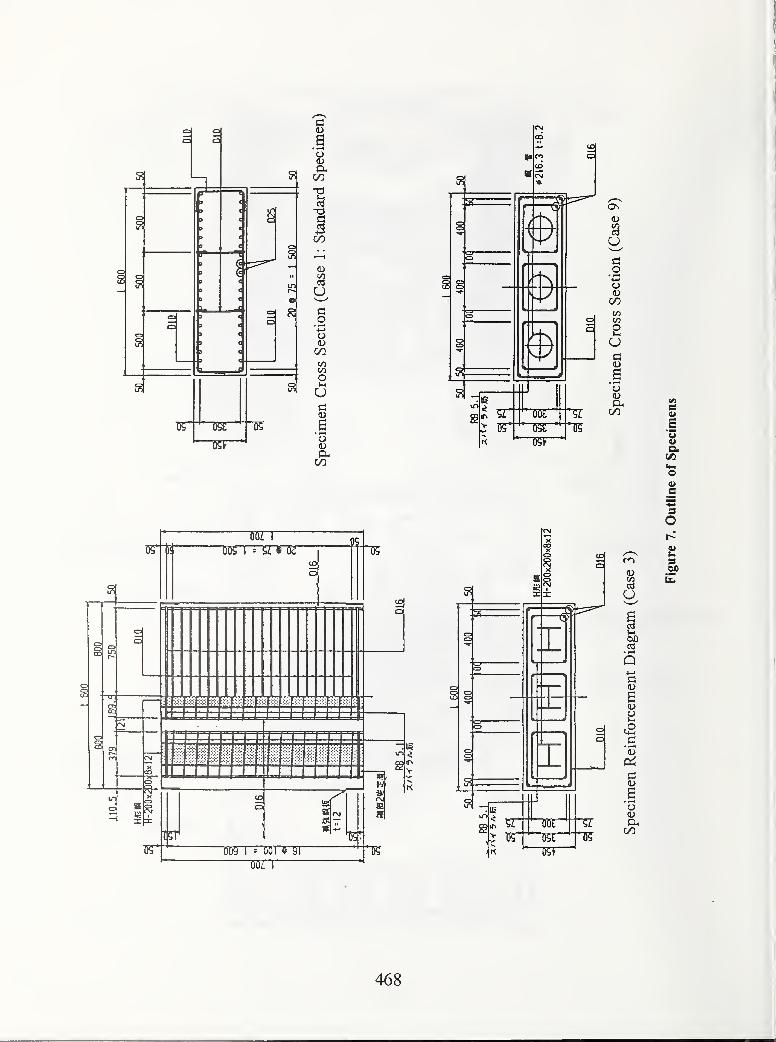
SI 5^
T55r
s
o
00
00
U
_o
to(/)
Ol-H
ua
.§oa,C/)
OS
<UCOc«
_o'+-•
o0)
COCOCOOi-i
c
ao0)
00 ea>
E*3
Q.
"TO"
OK I = fi K
X
i
001 6 91
IS
1?
-16u-> ^
si
aXX
(C
"DDT
T55
CO
(30
5 ^
u
00
k.
3CD
468
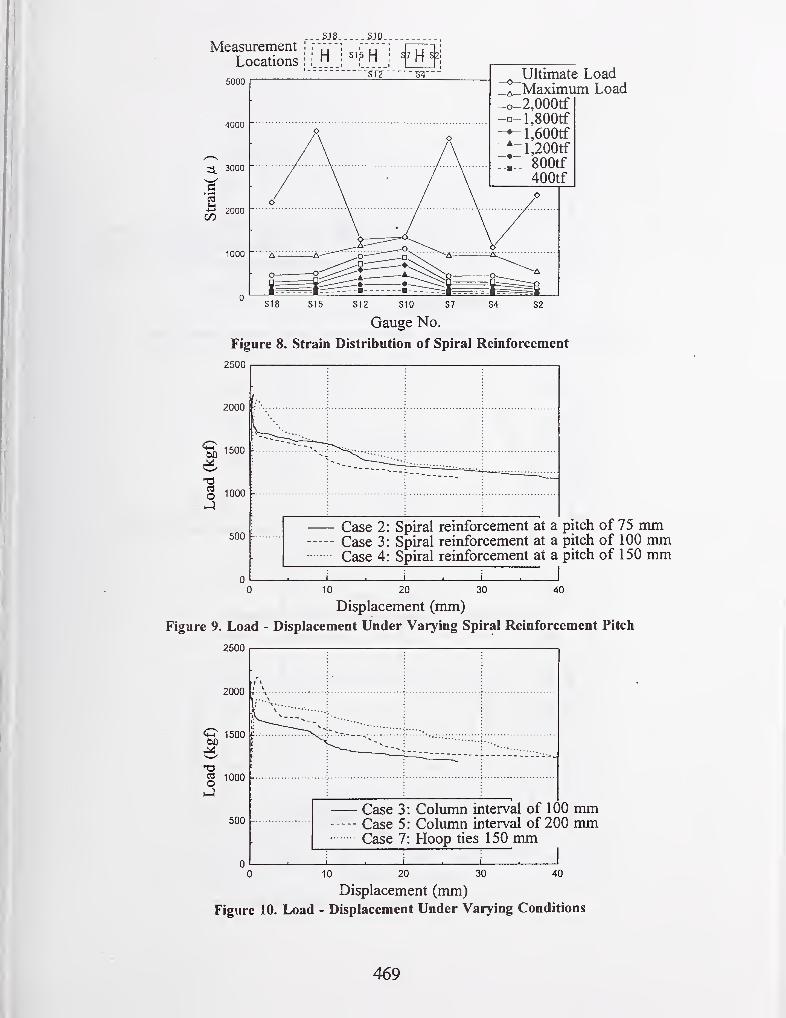
MeasurementLocations
.5J8 5J0.
i H i
sip H i
S7 H S2
5000"Sf? -s^- Ultimate Load
^_Maximum Load-o-2,000tf--l,800tf-^l,600tf
l,200tf
800tf400tf
(30
S18 S15 S12 S10 S7 S4 S2
Gauge No.
Figure 8. Strain Distribution of Spiral Reinforcement
2500
2000
1500
-a
§ 1000
500Case 2: Spiral reinforcement at a pitch of 75 mmCase 3: Spiral reinforcement at a pitch of 100 mmCase 4: Spiral reinforcement at a pitch of 150 mm
0 10 20 30 40
Displacement (mm)
Figure 9. Load - Displacement Under Varying Spiral Reinforcement Pitch
2500
2000
150000
5 1000o
500Case 3: Column interval of 100 mmCase 5: Column interval of 200 mmCase 7: Hoop ties 150 mm
30 400 10 20
Displacement (mm)
Figure 10. Load - Displacement Under Varying Conditions
469

300
250
00^ 200 -
V)CO0)
tiCO
c<u
Bo
150
100
50
Case 2: Spiral reinforcement at a pitch of 75 mmCase 3: Spiral reinforcement at a pitch of 100 mmCase 4: Spiral reinforcement at a pitch of 150 nmi
2000 4000 6000
Specimen Strain ( /z
)
8000 10000
Figure 11. Stress - Strain Caused Under Varying Spiral Reinforcement Pitch
300
Case 3:
Case 5: Column interval of 200 liim
Case 6: Principal reinforcement ratio of 40%Case 7: Hoop ties: 150 mm
2000 10000
Specimen Strain ( /x )
Figure 12. Stress - Strain Under Varying Conditions
300
0 I . i . 1 i 1 i 1 • 1
0 2000 4000 6000 8000 10000
Specimen Strain (
)
Figure 13. Stress - Strain Under Varying Principal Steel
470
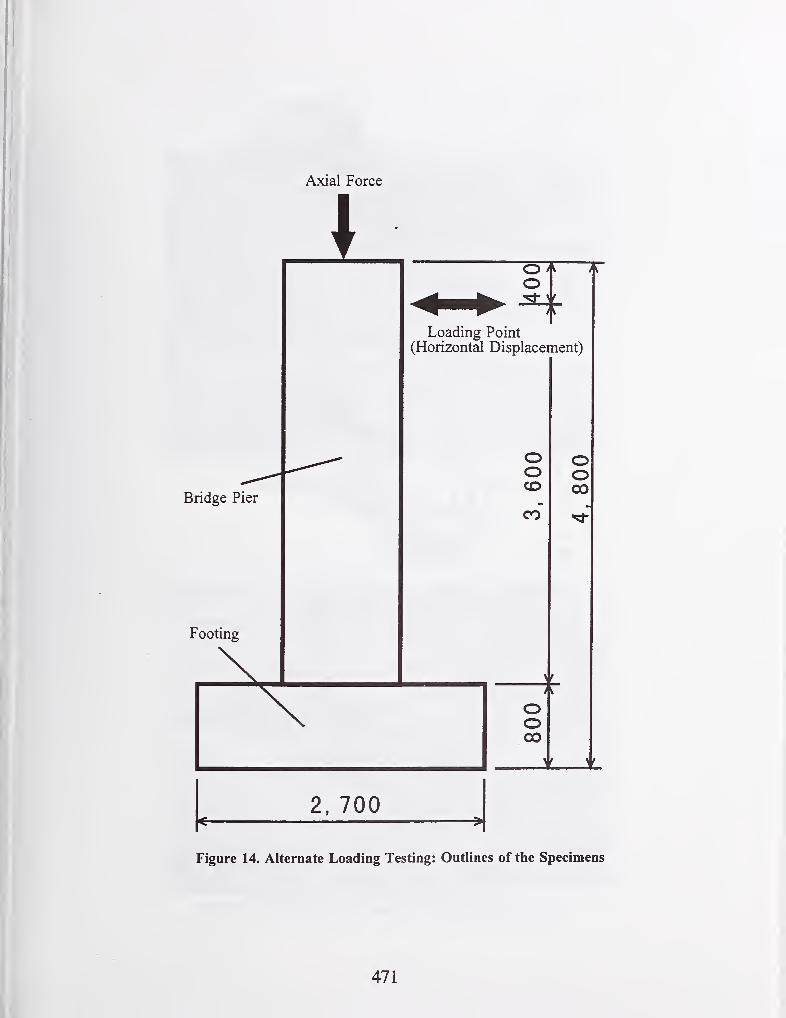
Axial Force
Bridge Pier
Footing
OO
Loading Point(Horizontal Displacement)
OOCO
CO
oo00
oo00
2, 700
Figure 14. Alternate Loading Testing: Outlines of the Specimens
471
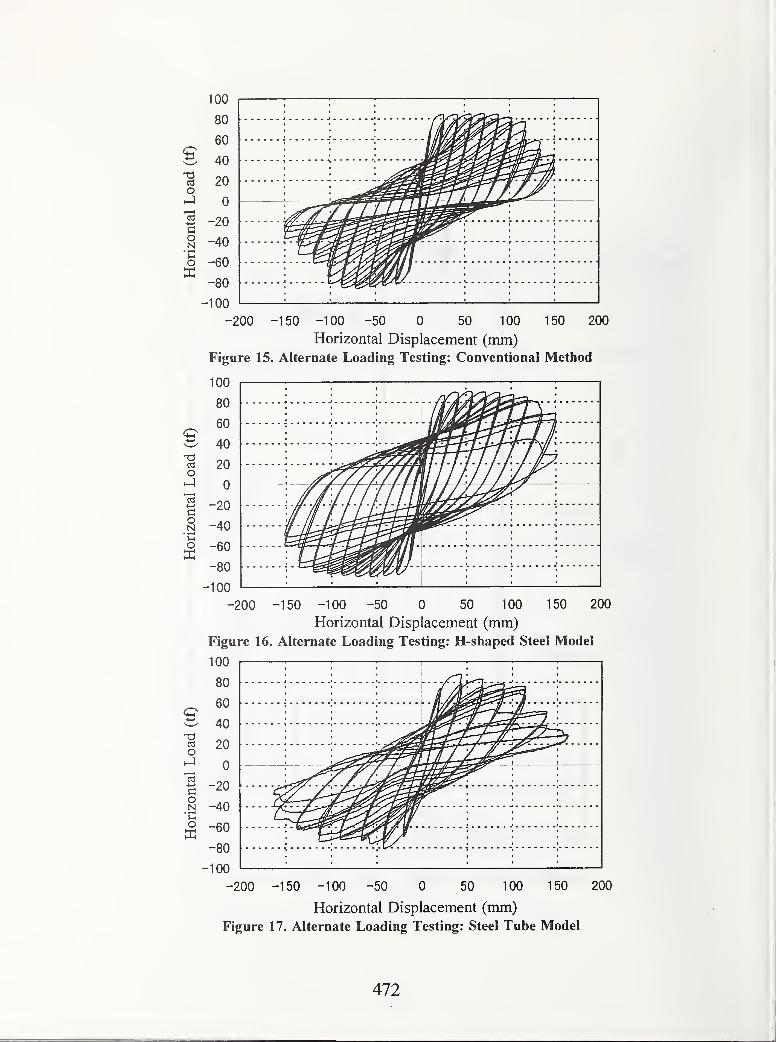
100
-100 "• • • —• '
-200 -150 -100 -50 0 50 100 150 200
Horizontal Displacement (mm)Figure 15. Alternate Loading Testing: Conventional Method
100I
-200 -150 -100 -50 0 50 100 150 200
Horizontal Displacement (mm)Figure 16. Alternate Loading Testing: H-shaped Steel Model
100I
1
1
-100 '' '
-200 -150 -100 -50 0 50 100 150 200
Horizontal Displacement (mm)
Figure 17. Alternate Loading Testing: Steel Tube Model
472
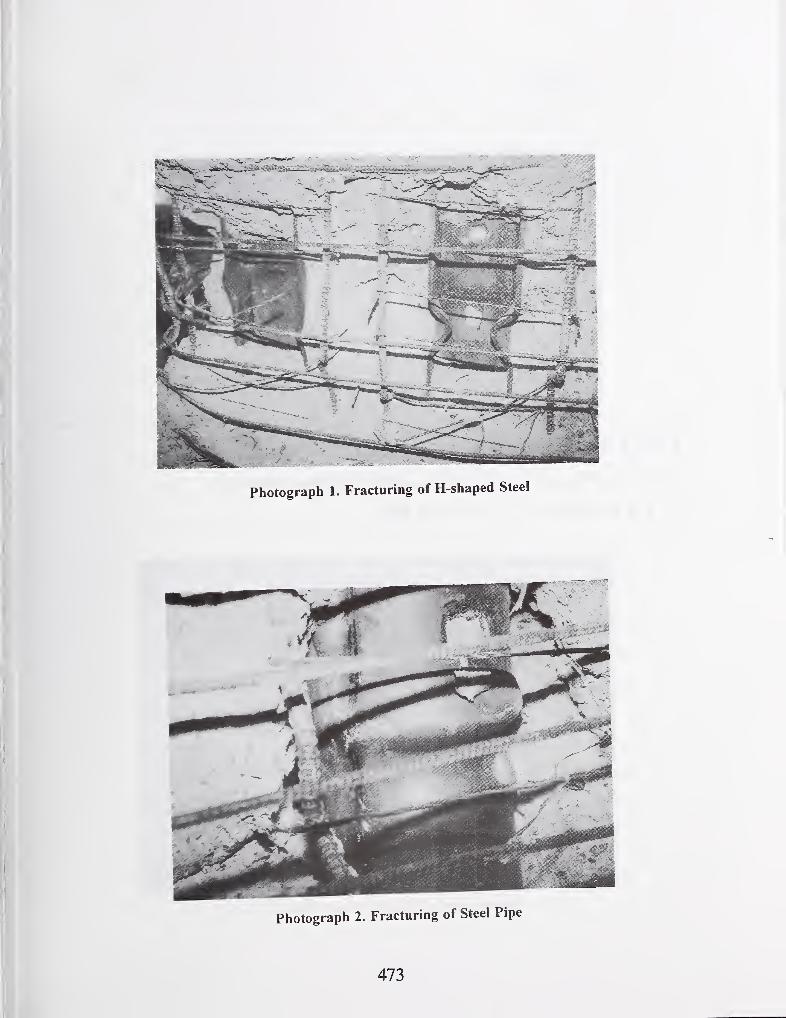
Photograph 1. Fracturing of H-shaped Steel
Photograph 2. Fracturing of Steel Pipe
473
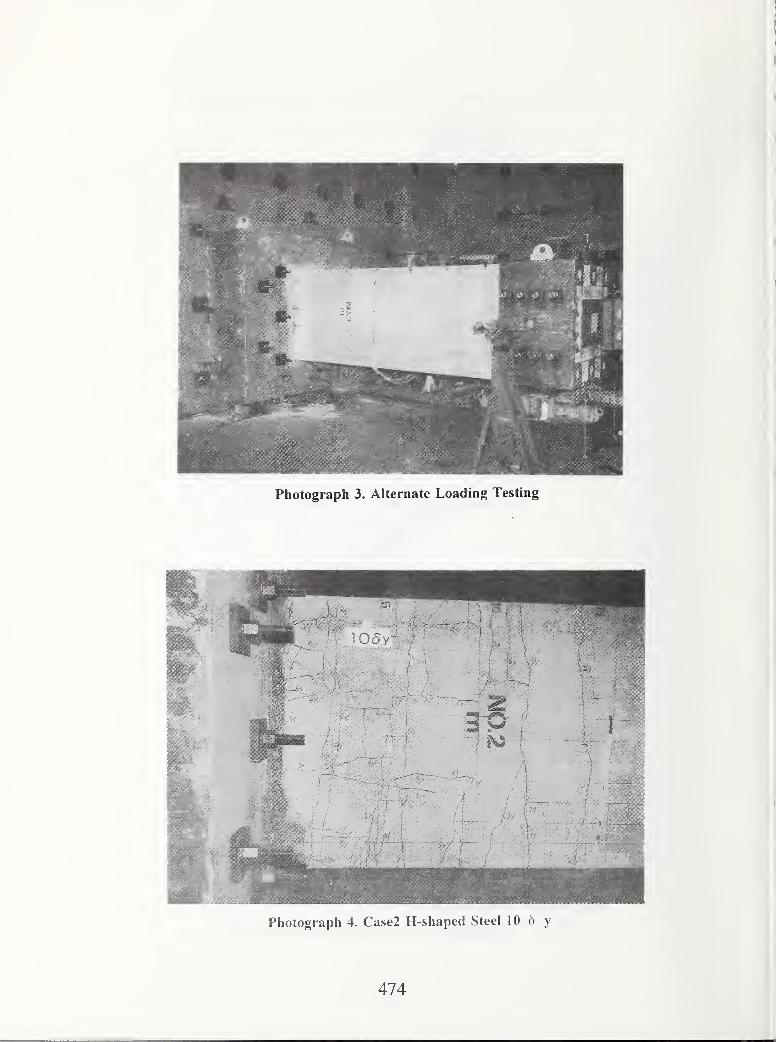
Photograph 3. Alternate Loading Testing
Photograph 4. Case2 H-shaped Steel 10 6 y
474

MANUSCRIPTS AUTHORED for
PANEL MEETING but NOTPRESENTED ORALLY

I
I
\
I

SHAKINGTABLE TESTONBASE ISOLATEDHOUSEMODELby
Hiroyuki Yamanouchi ' Mitsumasa Midorikawa^' and Masanori
ABSTRACT
Base isolation is very eflfective on keeping
safely during earthquakes(reduction of acceleration
reqxmse at floors and inte-story drifts ofstmcture, etc.).
In case of houses, it is diflBcult to elongate a period of
building by laminated mbber bearing isolators because
of tile light weight of building. In addition to rubb^
bearing devices, sliding and rolling type devices are
needed to be developed or applied. In this paper, the
effects of base isolation on response of houses and
mechanical characteristics of various kinds of seismic
isolators will be discussed. Shaking table tests of base
isolated house models were carried out. Various kinds
of isolators, such as mbber,
sliding , and rolling
bearings were tested. The effect ofthese isolators on the
regxMise of a superstmcture during earthquakes has
been demonstrated, through the comparison with
response for a non-isolated house. It is shown that the
reqxsnse of houses is remaikably depaident on
diaractaistics ofisolators.
Key words : Base Isolation,
House,
Shaking Table Test,
Earthquake Response,
Effect ofIsolation
1. INTRODUCTION
Many stmctures suffered from tiie 1995
Hyogoken-Nanbu Earthquake. Some at buildings have
collapse of 1st or intermediate stories". Engineers and
researchers recognized the necessity for
countermeasures against earthquakes. Since the
earthquake occurred in the gray dawn (5.45am) , there
were many persons v^di were dead and injured at
their houses.
Two buildings with base isolation were
constructed in Kobe City. The observed earthquake
motion in the buildings showed the effect of base
isolation on reduction ofacceleration response After
the earthquake, many low- and medium-rise buildings
with isolators have been designed and constmcted. But
base isolation of individual houses has not become
popular.
Base isolation is very effective on keeping safety
during earthquake(reduction ofacceleration response, at
floors and inter-story drift response, and protection from
overturning of fijmiture, etc.). In order to promote
constmction ofbase isolated houses and development of
isolator devices for houses, required performance for
base isolated houses has to be clarified. Building
Research Institute has a project on this theme in
collaboration with house builders and isolator device
conpanies ^\
Base isolated buildings in Japan and current
issues for spreading base isolated houses are
summarized, and shaking table test results of base
isolated house models are discussed. Various kinds of
isolators, such as mbber, sliding , and rolling bearings
were tested.
2. RECENTTENDENCYOF BASEISOLATED BUILDINGS IN JAPAN
Figure 1 illustrates the number of base isolated
1) Director, Codes and Evaluation Research Center,
Building Research Institute, Ministry of Constmction,
1, Tatehara, Tsukuba-shi, Ibaraki-Ken, 305-0802,
J^jan
2)Associate Director for International Codes and
Standards, Codes and Evaluation Research Center,
ditto
3)Head, Geotechnical Division, Department of
Stmctural Engineering , ditto
477
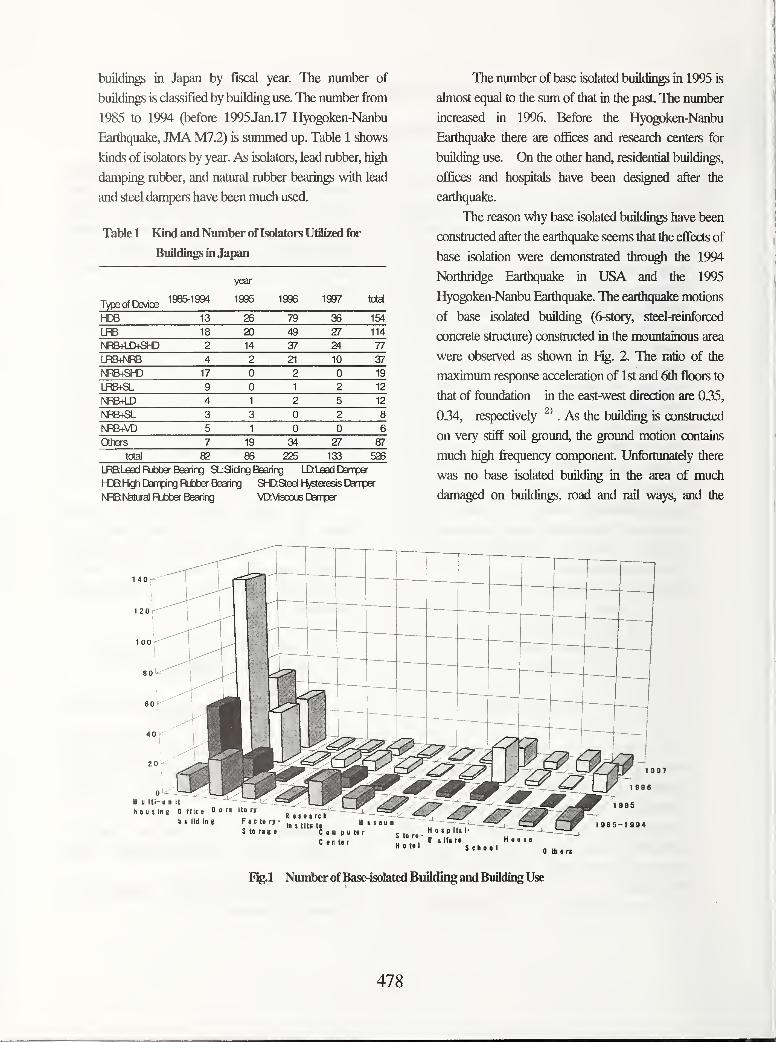
building? in Japan by fiscal year. The number of
buildings is classified by building use. The number fi^om
1985 to 1994 (before 1995Jan.l7 Hyogoken-Nanbu
Earthquake, JMA M7.2) is summed up. Table 1 shows
kinds of isolators by year. As isolators, lead mbber, high
damping mbber, and natural mbber bearings with lead
and steel dampers have been much used.
Table 1 Kind and Number ofIsolators Utilized for
Buildings inJapan
year
Typeof Dafloe1985-1994 1995 1996 1997 total
hCB 13 26 79 36 154
LRB 18 20 49 27 114
2 14 37 24 77
LFB+^FB 4 2 21 10 37
NFBt^ 17 0 2 0 19
LRB+SL 9 0 1 2 12
NRB+LD 4 1 2 5 12
NFB+SL 3 3 0 2 8
MRB+-VD 5 1 0 0 6
Others 7 19 34 27 87
total 82 86 225 133 526
LRBl^ad RlDter Bearing SLSidng Bearing LDLead C3afTper
hDBHgh Dannping Rtber Bearing Sl-DSteel Hysteresis Damper
NRBNatLral Riber Bearing VDViscxxB Danrper
The number of base isolated buildings in 1995 is
almost equal to the sum of that in the past The number
increased in 1996. Before the Hyogoken-Nanbu
Earthquake there are ofiBces and reseaidi centers for
building use. On the other hand, residential buildings,
offices and hospitals have been designed after the
earthquake.
The reason why base isolated buildings have been
constmcted after the earthquake seems that the effects of
base isolation were demonstrated through the 1994
Northridge Earthquake in USA and the 1995
Hyogoken-Nanbu Earthquake. The earthquake motions
of base isolated building (6-stoiy, steel-rcinforced
concrete stmcture) constmcted in the mountainous area
were observed as shown in Fig. 2. Hie ratio of the
maximum response acceleration of 1st and 6th floors to
that of foundation in the east-west directicHi are 035,
034, respectively ^'. As the building is constmcted
on very stiff soil ground, the ground motion contains
much high frequency component Unfortunately there
was no base isolated building in the area of much
damaged on building;s, road and rail ways, and the
y u Iti- u n it
housing 0 ffic. Don ilo ry
building F.clory ,„,„,„„ y usouiS to ri g e C 0 p u to r
C e n te r
1 095
1 985-1 994
^ '° " I 1 Ifi ro H 0 u I 0HolBl School
0 th • ri
Fig.1 Number ofBase-isolated Building and Building Use
478
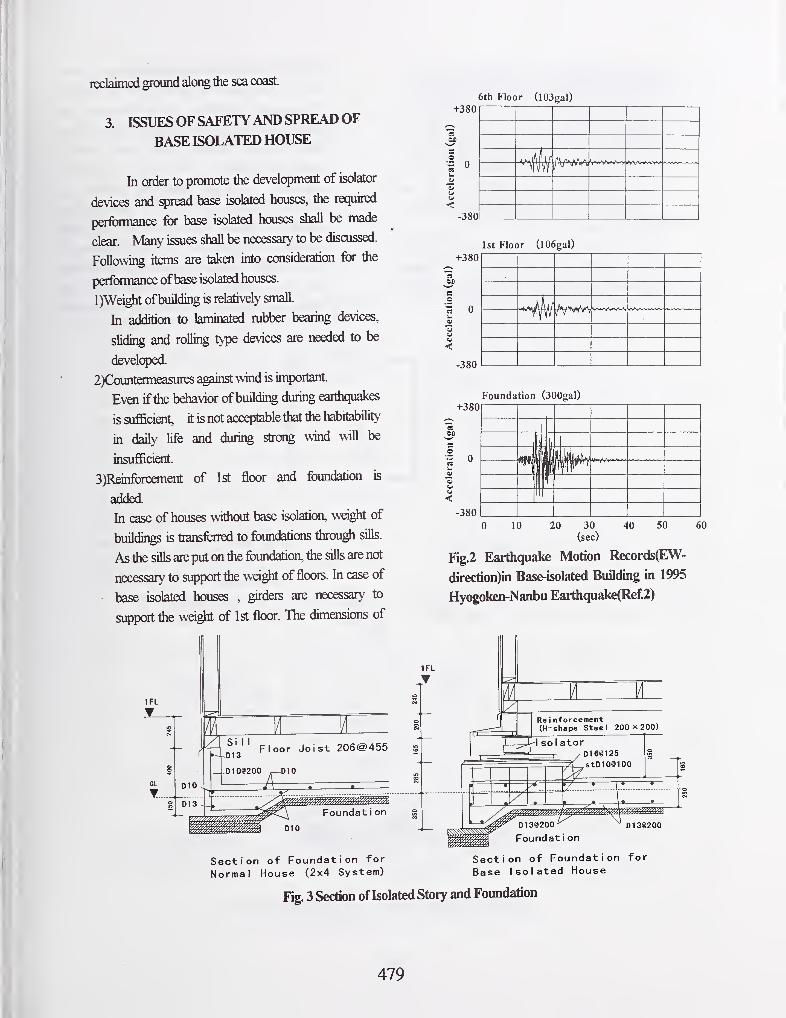
reclaimed ground along the sea coast
3. ISSUES OF SAFETYAND SPREAD OF
BASE ISOLATEDHOUSE
In order to promote the developmoTt of isolator
devices and spread base isolated houses, the required
performance for base isolated houses shall be made
clear. Many issues shall be necessary to be discussed.
Following itans are taken into consideration for the
performance ofbase isolated houses.
1)Weight ofbuilding is relatively small.
In addition to laminated mbber bearing devices,
sliding and rolling type devices are needed to be
developed.
2)Countameasures afflinst wind is important.
Evai ifthe bdiavior ofbuilding during earthquakes
is sufficient, itisnotaccqjtablethatthehabitability
in daily life and during strong wind will be
insufficient.
3)Reinforcement of 1st floor and foundation is
added.
In case of houses without base isolation, wei^ of
buildings is transferred to foundations through siUs.
As the siUs are put on the foundation, the sills are not
necessary to support the weight of floors. In case of
base isolated houses ,girders are necessary to
siqjpat tiie weight of 1st floor. The dimensions of
Section of Foundation for
Normal House (2x4 System)
+380
0
6th Floor (I03gal)
-380
1st Floor (I06gal)
+380
OA
e
^ 0
-380
+380Foundation (300gal)
Fig.2 Earthquake Motion Records(EW-
direction)in Base-isolated Building in 1995
Hyogoken-Nanbu Earthquake(Ref.2)
Re i nforcement(H-shape Steel 200x200)
'1<-! so 1 ator
1 D16@125
• V *\• •
•
D13@200
Foundat i on
Section of Foundation for
Base Isolated House
Fig. 3 Section ofIsolated Story and Foundation
479
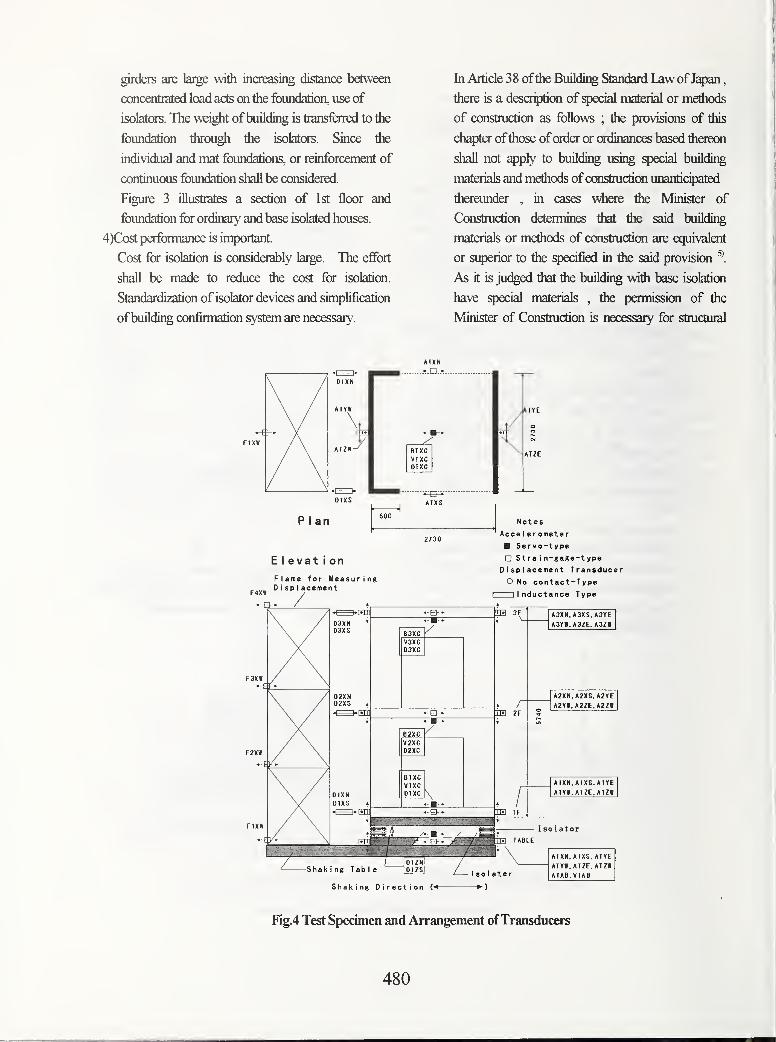
girders are large with increasing distance between
concentrated load acts on the foundation, use of
isolators. The weight ofbuilding is transferred to the
foundation through the isolators. Since the
individual and mat foundations, or reinforcement of
continuous foundation shall be considered.
Figure 3 illustrates a section of 1st floor and
foundation for ordinary and base isolated houses.
4)Cost performance is important.
Cost for isolation is considerably large. The effort
shall be made to reduce the cost for isolation.
Standardisation of isolator devices and simplification
ofbuilding confirmation system are necessary.
In Article 38 ofthe Building Standard Law ofJapan
,
there is a descrqrtion of speaai material or methods
of construction as follows ; the provisions of this
chapter ofthose oforder or ordinances based thereon
shall not apply to building using spedai building
materials and methods ofCOTStmcticm unanticipated
thereunder , in cases where the Minister of
Constmction determines that the said building
materials or methods of ccHistmction are equivalent
or siqjerior to the specified in the said provision ^.
As it is judged that the building with base isolation
have special materials , the pamission of the
Minister of Constmction is necessary for stmctural
P I an
ElevationFlame for MeasuringD I sp I acement
Note s
Acce I e r ©meter
Servo-type
Strain-gage-type
Displacement Transducer
O No contact-Type
Inductance Type
Shaking Direction (
Fig.4 Test Specimen and Arrangement ofTransducers
480
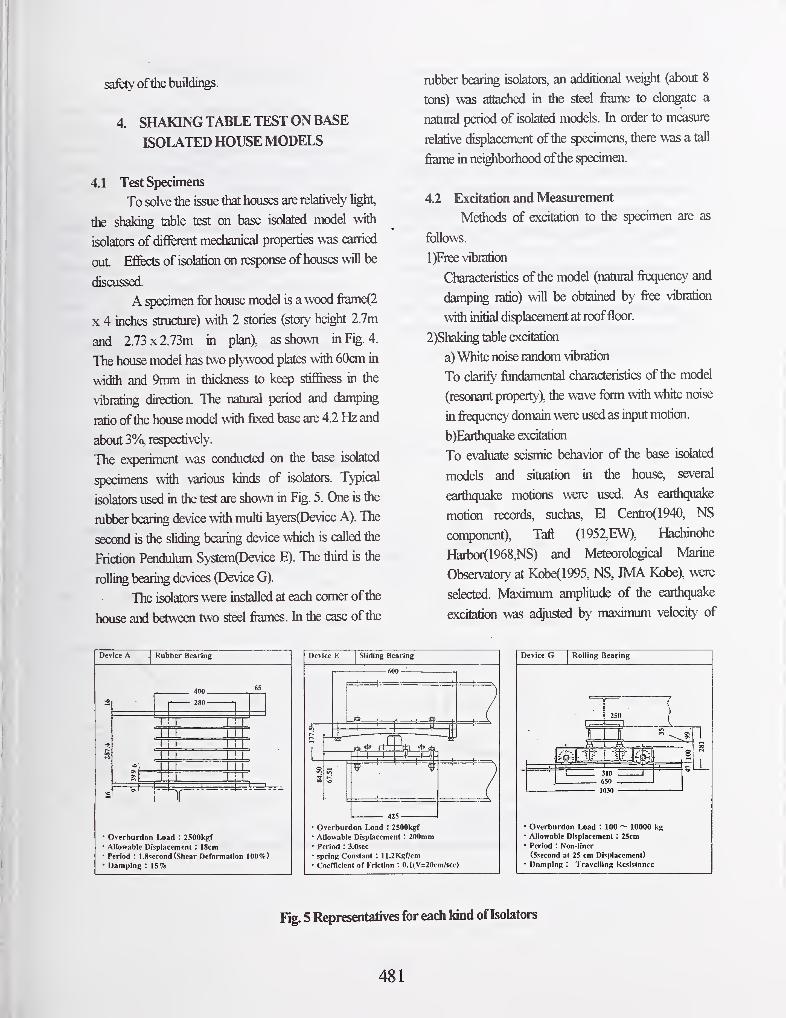
safety oftiie buildings.
4. SHAKING TABLE TEST ON BASE
ISOLATED HOUSEMODELS
4.1 Test Specimens
To solve the issue that houses are relatively light,
the shaking table test on base isolated model with
isolators of different medianical properties was carried
out Effects of isolation on response ofhouses will be
discussed.
A specimen for house model is a wood fiame(2
X 4 inches stmcture) with 2 stories (story height 2.7m
and 2.73 X 2.73m in plan), as shown in Fig. 4.
The house model has two plywood plates with 60cm in
width and 9mm in tiiickness to keep stiflfiiess in the
vibrating direction. The natural period and damping
ratio ofthe house model with fixed base are 4.2 Hz and
about 3%, respectively.
The e?q)eriment was conducted on tiie base isolated
specimais with various kinds of isolators. Typical
isolators used in the test are shown in Fig. 5. One is the
mbber bearing device with muM layers(E)evice A). The
second is the sliding bearing device which is called the
Friction Pendulum System(Device E). The third is the
rolling bearing devices (Device G).
The isolators were installed at each comer ofthe
house and betweoi two steel flames. In the case ofthe
mbber bearing isolators, an additional weight (about 8
tons) was attached in the steel flame to elongate a
natural period of isolated models. In order to measure
relative displacement ofthe specimens, there was a tall
flame in neighboihood ofthe specimen.
4.2 Excitation and Measurement
Methods of excitation to the specimen are as
follows.
1)Free vibration
Characteristics of the model (natural fluency and
danping ratio) will be obtained by free vibration
with initial displacement at rooffloor.
2)Shaking table excitation
a)White noise random vibration
To clarify fiindamental characteristics of the model
(resonant property), the wave form with white noise
in fiiequaicy domain were used as input motion.
b)Earlhquake excitation
To evaluate seismic behavior of the base isolated
models and situation in the house, several
earthquake motions were used. As earthquake
motion records, suchas. El Centro(1940, NS
component), Taft (1952,EW), Hachinohe
Harbor<1968,NS) and Meteorological Marine
Observatory at Kobe(1995, NS, JMA Kobe), were
selected. Maximum anplitude of the earfliquake
excitation was adjusted by maximum velocity of
Device A J Rubber Bearing
400.
280-
Overburden Load : 2500kgf' Allowable Displacement : 18cm• Period : I.Ssecond (Shear Dernrmation 100%)• Damiiing : 15%
Device E Sliding Bearing
' Overburdon Load : 2500kgf' Allowable Displacement : 200mm• Period : 3.0sec
' spring Constant : 11.2Kgf/cm
• Coefficient of Friction : O.I(V=20cm/scc)
Device G Rolling Bearing
Overburdon Load : 100 ~ 10000 kgAllowable Displacement : 25cmPeriod : Non-liner
(Ssecond at 25 cm Displacement)
Damping : Trnvclling Resistance
Fig. 5 Representatives for each kind ofIsolators
481
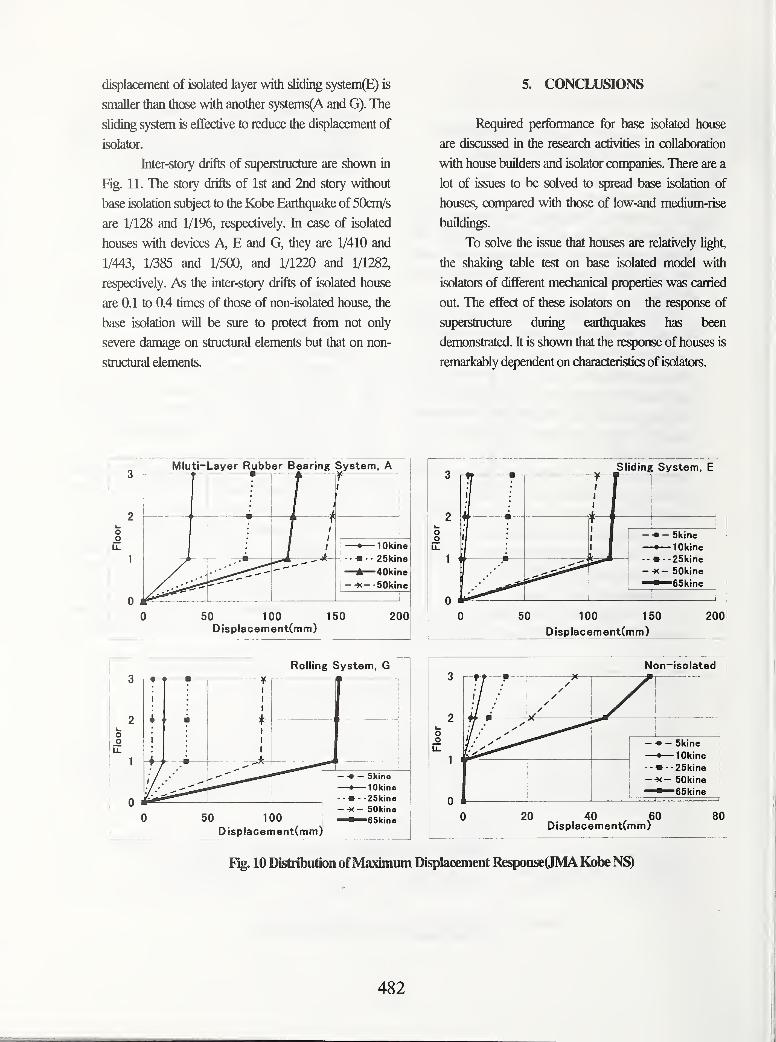
displacement of isolated layer with sliding system(E) is
smaller than those with another systems(A and G). The
sliding system is effective to reduce the displacement of
isolator.
Inter-story drifts of superstmcture are shown in
Fig. 11. The story drifts of 1st and 2nd story without
base isolation subject to the Kobe Earthquake of 50cm/s
are 1/128 and 1/196, respectively. In case of isolated
houses v^th devices A, E and G, they are 1/410 and
1/443, 1/385 and 1/500, and 1/1220 and 1/1282,
respectively. As the inter-story drifts of isolated house
are 0.1 to 0.4 times of those of non-isolated house, the
base isolation will be sure to protect from not only
severe damage on stmctural elements but that on non-
stmctural elements.
5. CONCLUSIONS
Required performance for base isolated house
are discussed in the researdi activities in collaboration
with house builders and isolator corrq)ames. There are a
lot of issues to be solved to ^Tread base isolation of
houses, compared with those of low-and medium-rise
buildings.
To solve the issue that houses are relatively light,
the shaking table test on base isolated model with
isolators of different medianical properties was carried
out. The effect of these isolators on the response of
superstmcture during earthquakes has been
demonstrated. It is shown that the response of houses is
remarkably dependent on diaractmstics of isolators.
Mluti-Layer Rubber Bearing System, A Sliding System, E
# •
m t1
1
1
;
-
•
1
1
1
1
11
- -• — Skine
— lOkine
• --25kine
K- SOkine
6Skine
^1 _1
1—
1
1
50 100 150
Displacement(mm)
200i
Rolling System, G
o
u.
50 100L
Displacement(mm)
--•--25kino- -K - SOkine
^^^"65kine 20 40
Non-isolated
i i
/
!/' ^^^^^^^
^
Skine—•— lOkine- - • - -2Skine
SOkine
eSkine
Displacement(mm).60 80
Fig. 10 Distribution ofMaximum Displacement Response(JMA Kobe N!S)
482
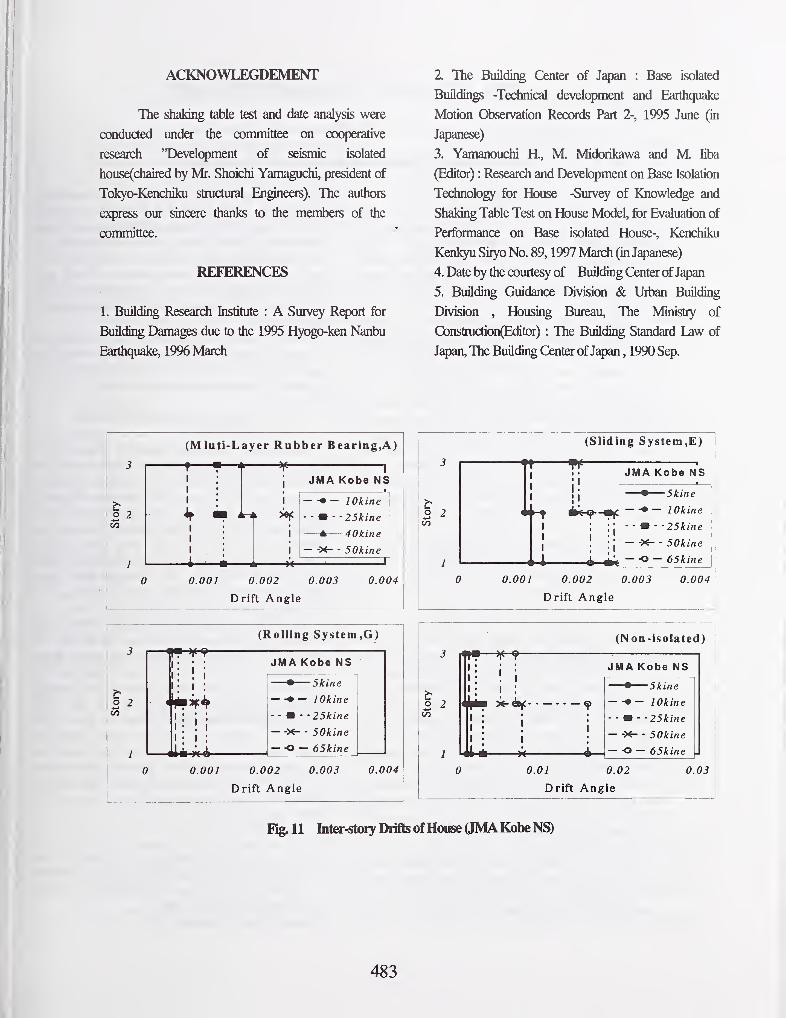
ACKNOWLEGDEMENT
The shaking table test and date analysis were
conducted under the committee on cooperative
researdi "Development of seismic isolated
house(diaired by Mr. Shoichi Yamagudii, president of
Tokyo-Kendiiku stmctural Bigineers). The authors
express our sincere thanks to the members of the
committee.
REFERENCES
1. Building Researdi Institute : A Survey Report for
Building Damages due to the 1995 Hyo^-ken Nanbu
Earthquake, 1996 Mardi
2. The Building Center of Japan : Base isolated
Buildings -Technical development and Earthquake
Motion Observation Records Part 2-, 1995 June (in
Japanese)
3. Yamanoudii H., M. Midorikawa and M. liba
(Editor) : Researdi and Development on Base Isolation
Technology for House -Survey of Knowledge and
Shaking Table Test on House Model, for Evaluation of
Performance on Base isolated House-, Kenchiku
Kenl^ Siryo No. 89, 1997 March (in J^anese)
4. Date by the courtesy of Building Center ofJapan
5. Building Guidance Division & Urban Building
Division,
Housing Bureau, The Ministry of
Conslruction(Editor) : The Building Standard Law of
Japan, The Building Center ofJapan , 1990 Sep.
i2
(Mluti-Layer Rubber Bearing,A)
¥I
JMA Kobe NS
— -• — lOkine
- - • - - 25kine
40kineA— -X- - SOkine
0.001 0.002 0.003
Drift Angle
0.004
(Rolling System.G)
JMA Kobe NS
• Skine
— -— lOkine
— - • - - 25kine
— -X- - SOkine
— -O — 65kine
0.001 0.002 0.003
Drift Angle
0.004
1^C/3
2 2C/3
(Sliding System,E)
JMA Kobe NS
I
II
' — Skine
i^f^-^- -•- lOkineI
- - • - - 25kine
— -X- - SOkine
^ ^1 — O — 6Skine
0.001 0.002 0.003
Drift Angle
0.004
(Non-isolated)
>t-4»|(
i
H—'
JMA Kobe NS
9
I
-i-
Skine
• — lOkine
25kine
— -X- - SOkine
— -o — 6Skine
0.01 0.02
Drift Angle
0.03
Pig. 11 Inter-stoiy Drifts ofHouse (JMA Kobe NS)
483
Dense Strong Motion Instrument Array in Sendai
by
Izuru Okawa'\ Toshihide Kashima^^ and Shin Koyama^^
ABSTRACT
This paper describes an on-going earthquake
observation project in Sendai, Japan. Theobservation system includes 1 1 observation sites
and a control center. A number of records with
intermediate amplitudes have been obtained to
this date.
In this report, the earthquake observation
system is introduced at first. The description
includes the outline of the geological condition of
the Sendai area, the objective area of the
observation, the surface geology of the 1
1
observation sites from the investigation in sites,
and the recorded data until the project started.
During the period, the seismic activity of the area
was not so high. Therefore, the amplitudes of
acceleration records are not large enough to be
called "strong motion". However, these data are
essential for the purpose to examine the dynamic
amplification property of the surface soils.
Key words: Instrument Array, Local Site Effect,
Strong Earthquake Motion,
Surface Geology
1. INTRODUCTION
It has often been said that the damage to
structures during earthquake is more or less
associated with the subsoil conditions on which
they stood. It means that characteristics of
earthquake ground motions at ground surface
greatly reflect the dynamic properties of
underlying soils. However, the dynamic property
varies with surficial geology such as irregularity
and inhomogeneity of soil deposits.
The Building Research Institute (BRI) started
the earthquake observation program 40 years ago,
when the development of the recording system
and analysis programs was underway.
In 1983, BRI started to install instruments in
Sendai City area to accumulate earthquake
records focusing on the effect of surface geology
on seismic motion with a long-term vision of re-
establishing the methodology to specify design
input motions for buildings'^ Private companies
(16 general contractors and a group of design
firms) cooperatively meiged this project from
1987. At the end of the fiscal year of 1989, the
recording system was completed, consisting of 1
1
sites including outcrop rock, reclaimed land, soft
soil ground around which considerable damagewas found during the 1978 Miyagi-ken-oki
earthquake^^
This report introduces the earthquake
recording system and results of analyses of the
recorded motions. In addition, other observation
projects operated by BRI are introduced.
2. ARRAY CONFIGURATION
The Sendai area is assigned as one of sites
with the highest priority in Japan for the
deployment of strong motion instrument arrays.
The array system of our project consists of eleven
sites as shown in Fig. 1, with spacing of 3 to 4
kilometers on the E-W line passing through the
center of the city, and the N-S line passing
through Nigatake and Oroshimachi. These areas,
i.e., around Nigatake and Oroshimachi, also
suffered severe structural damage during the
1978 Miyagi-ken-oki earthquake.
Four of the sites, SHIR, OKIN, TRMA and
NAKA, are located where the thickness of
alluvium is 60 to 80 meters. A fault, Rifu-
Nagamachi tectonic line, is also the line of
separation of the two zones. Most of the damage
occurred on the eastern side during the 1978
Miyagi-ken-oki earthquake. Table I shows the
installation depths of accelerometers, and the
shear wave velocity of the layer in which the
lowermost accelerometer is placed. Also shown
in Table 1 is the soil classification, specified in
the Building Standard Law of Japan, for each of
the observation sites.
1 ) Head, International Institute of Seismology and
Earthquake Engineering (USEE), Building Research
Institute (BRI), Ministry of Construction, Tsukuba
Science City, 305-0802, Japan
2) Senior Research Engineer, ditto
484
3. OBSERVATION SYSTEM ground divided by one at the lowermost point.
Each site has three accelerometers arranged
vertically. One on the surface, one at 20 to 30 munderground with a shear wave velocity of 300 to
400 m/s, and one on the base layer having a shear
wave velocity of 700 to 800 m/s and underlying
at depth of 50 to 80m in the area. A controlling
and monitoring center is located at BRI in
Tsukuba and is connected to a sub-controlling-
center in Sendai via public telephone line. Thesub-controlling-center is facilitated in the
building of the Local Headquarters of Ministry of
Construction for the Tohoku (northeastern)
district of Japan in Sendai. The sub-controlling-
center is further connected to all observation sites
via exclusive telephone lines. Figure 2 shows a
block diagram of the entire system.
The array observation system consists
essentially of three accelerometers, an amplifier,
an A-D converter, a pre-event memory, a digital
magnetic tape recorder, and a clock. In order to
obtain both a large dynamic range and a high
resolution in recording, a digital system is used.
Specifications of the array observation system are
shown in Table 2.
4. OBSERVED EARTHQUAKES
Table 3 lists acceleration records are used in
this report. The JMA (Japan Meteorological
Agency) Seismic Intensities for those
earthquakes were 3 or above at Sendai. The JMAmagnitudes of earthquakes ranged from 4.1 to 8.1
and epicentral distances extended to 800 km. Themaximum acceleration was 106 cm/s^ on the
ground surface at NAGA site.
5. CHARACTERISTICS OFEARTHQUAKE MOTIONS
In this chapter, the geological condition and
configuration of accelerometers are outlined for
each site. And then amplification effect of subsoil
is discussed through the comparison of spectral
ratios between observational results and
analytical ones. Fourier spectral ratios in the E-Wdirection and theoretical transfer functions of SH-
wave with damping ratios of 5 % and 10 % for
each site is shown in Figs. 3 to 13. All Fourier
spectra are smoothed using the Parzen windowwith a width of 0.2 Hz. Fourier spectral ratio is
obtained from a spectrum of the record on the
(1) MIYA site (Miyagino)
This site is classified as lowland, close to the
border between the hill. The Tertiary Pliocene
layer is found at 26 meters below the surface.
The degree of compaction of the Tertiary layer is
lower at the upper layer, which changes to sand.
. The compaction for the lower layers is high. Thesand-gravel layer, found at the upper part of the
Tertiary, contains clay, and is firm.
Fourier spectral ratios in the E-W direction are
shown in Fig. 3. The broken line and the dotted
line indicate transfer functions of SH-wave with
damping ratios of 5 % and 10 %, respectively.
Large amplification can be observed in the
frequency rage near 2.4 Hz on both of observed
and theoretical results.
(2) NAKA site (Nakano)This site lies on the basin of Nanakita-gawa
River. The Tertiary layer is found approximately
58 meters below the surface. Thick alluvia layer
lies above the layer. This site belongs to the soft
soil category. The Tertiary pelite or tuff deposit is
fairly firm but fragile against a light hammerblow. The upper layer is rather loose, but the
lower is fairly firm.
Fourier spectral ratios of observed records and
theoretical transfer function are drawn in Fig. 4.
Shapes of both results are in full accord with each
other and peak at a frequency of 1 .3 Hz.
(3) TAMA site (Tamagawa)This site is on the Tertiary rock formation
except for the thin fill layer on the surface. Therock consists mainly of tuff and sand. The upper
portion of the rock is loose, the lower is
extremely firm. TAMA site can be the reference
site to discuss amplification effect of surface
geology at other sites.
Figure 5 shows spectral ratios and theoretical
transfer functions. Peaks of spectral ratios appear
at a frequency of 7.5 Hz. However, these are not
so high as theoretical peaks.
(4) ORID site (Oridate)
This site consists mainly of relatively soft
pelite or tuff. The lower part of the layer is
andesite with upper part of andesite being
weathered and fragile. The layer at more than 70
meters below the surface is fairy firm.
Through the comparison between observed
485
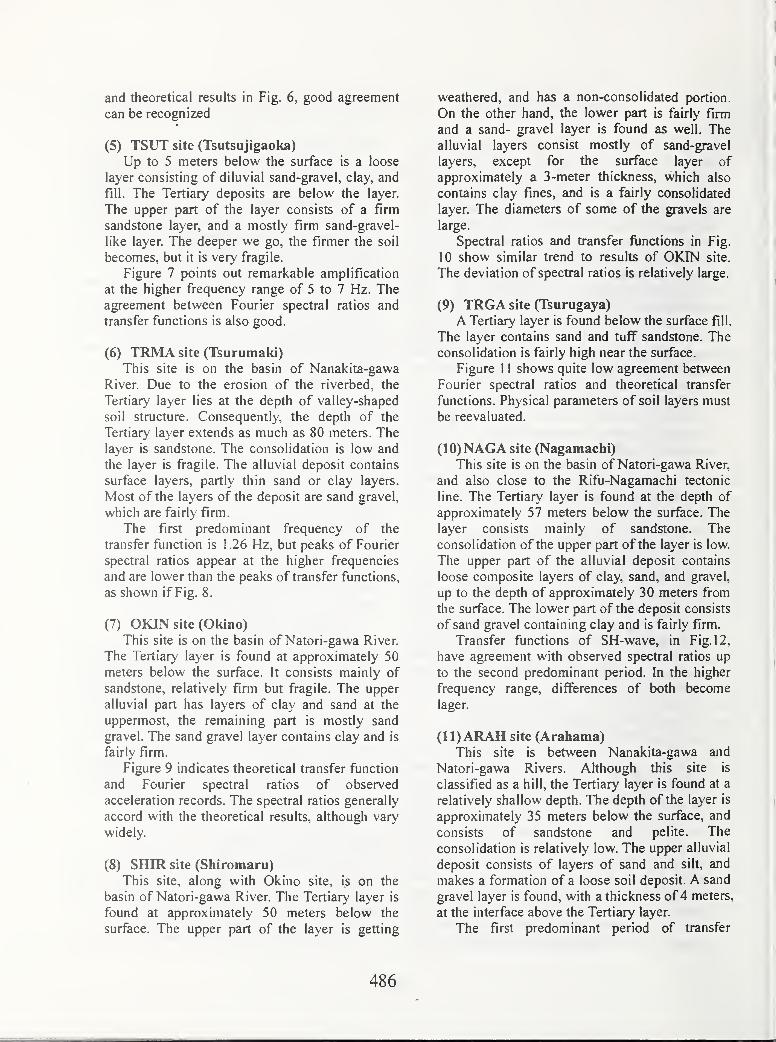
and theoretical results in Fig. 6, good agreement
can be recognized
(5) TSUT site (Tsutsujigaoka)
Up to 5 meters below the surface is a loose
layer consisting of diluvial sand-gravel, clay, and
fill. The Tertiary deposits are below the layer.
The upper part of the layer consists of a firm
sandstone layer, and a mostly firm sand-gravel-
like layer. The deeper we go, the firmer the soil
becomes, but it is very fragile.
Figure 7 points out remarkable amplification
at the higher frequency range of 5 to 7 Hz. Theagreement between Fourier spectral ratios and
transfer functions is also good.
(6) TRMA site (Tsurumaki)
This site is on the basin of Nanakita-gawa
River. Due to the erosion of the riverbed, the
Tertiary layer lies at the depth of valley-shaped
soil structure. Consequently, the depth of the
Tertiary layer extends as much as 80 meters. Thelayer is sandstone. The consolidation is low and
the layer is fragile. The alluvial deposit contains
surface layers, partly thin sand or clay layers.
Most of the layers of the deposit are sand gravel,
which are fairly firm.
The first predominant frequency of the
transfer function is 1 .26 Hz, but peaks of Fourier
spectral ratios appear at the higher frequencies
and are lower than the peaks of transfer functions,
as shown if Fig. 8.
(7) OKIN site (Okino)
This site is on the basin of Natori-gawa River.
The Tertiary layer is found at approximately 50
meters below the surface. It consists mainly of
sandstone, relatively firm but fragile. The upper
alluvial part has layers of clay and sand at the
uppermost, the remaining part is mostly sand
gravel. The sand gravel layer contains clay and is
fairly firm.
Figure 9 indicates theoretical transfer function
and Fourier spectral ratios of observed
acceleration records. The spectral ratios generally
accord with the theoretical results, although vary
widely.
(8) SHIR site (Shiromaru)
This site, along with Okino site, is on the
basin of Natori-gawa River. The Tertiary layer is
found at approximately 50 meters below the
surface. The upper part of the layer is getting
weathered, and has a non-consolidated portion.
On the other hand, the lower part is fairly firm
and a sand- gravel layer is found as well. Thealluvial layers consist mostly of sand-gravel
layers, except for the surface layer of
approximately a 3-meter thickness, which also
contains clay fines, and is a fairly consolidated
layer. The diameters of some of the gravels are
large.
Spectral ratios and transfer functions in Fig.
10 show similar trend to results of OKIN site.
The deviation of spectral ratios is relatively large.
(9) TRGA site (Tsurugaya)
A Tertiary layer is found below the surface fill.
The layer contains sand and tuff sandstone. The
consolidation is fairly high near the surface.
Figure 1 1 shows quite low agreement between
Fourier spectral ratios and theoretical transfer
functions. Physical parameters of soil layers must
be reevaluated.
(10)NAGA site (Nagamachi)This site is on the basin of Natori-gawa River,
and also close to the Rifu-Nagamachi tectonic
line. The Tertiary layer is found at the depth of
approximately 57 meters below the surface. The
layer consists mainly of sandstone. The
consolidation of the upper part of the layer is low.
The upper part of the alluvial deposit contains
loose composite layers of clay, sand, and gravel,
up to the depth of approximately 30 meters from
the surface. The lower part of the deposit consists
of sand gravel containing clay and is fairly firm.
Transfer functions of SH-wave, in Fig. 12,
have agreement with observed spectral ratios up
to the second predominant period. In the higher
frequency range, differences of both become
lager.
(11)ARAH site (Arahama)This site is between Nanakita-gawa and
Natori-gawa Rivers. Although this site is
classified as a hill, the Tertiary layer is found at a
relatively shallow depth. The depth of the layer is
approximately 35 meters below the surface, and
consists of sandstone and pelite. The
consolidation is relatively low. The upper alluvial
deposit consists of layers of sand and silt, and
makes a formation of a loose soil deposit. A sand
gravel layer is found, with a thickness of 4 meters,
at the interface above the Tertiary layer.
The first predominant period of transfer
486
functions is 1.22 Hz as shown in Fig. 13. This is
the softest ground condition in our observation
sites. Although number of records is few, a
degree of accordance is satisfactory.
6. OTHER PROJECTS OF BRI
BRI is carrying out earthquake motion
observation projects not only in Sendai but also
all over Japan. We are briefly introducing other
project in this chapter.
(1) Nationwide Strong Motion Observation
BRI has installed strong-motion instruments
in major cities throughout Japan. There are now47 observation sites in operation using the digital
strong-motion instrument. The objects of
observation are mainly buildings, and the
measuring point is usually placed both on the top
and in the foundations of the building. Every
observation site is connected to BRI via
telephone line in order to mitigate maintenance
work and to collect data immediately.
The obser\'ation network has obtained manynoteworthy records. For example, in the 1993
Kushiro-oki (Off Kushiro) Earthquake, 711 gal
was recorded as the peak acceleration on the
ground surface at Kushiro Local Meteorological
Observatory. Also, in the 1994 Sanriku-haruka-
oki (Far off Sanriku) Earthquake, an enormous
acceleration record was obtained in the building
next to the severely damaged old Hachinohe
municipal office building.
(2) Strong-Motion Instrument Network in the
Metropolitan AreaThe 1995 Hyogo-ken-nanbu Earthquake
(Kobe Earthquake) awakened us again to the
importance of disaster prevention measures for
large-scale urban areas. It is important to predict
the probability of a future earthquake and its
impact, and make as many preparations as
possible in anticipation of such an event. It is also
very essential to grasp the damage situation
immediately to put in effect the necessary
countermeasures. BRI has established twenty
new observation sites placed radially in the
Tokyo metropolitan area. This project aims to
investigate the characteristics of the seismic
motion affecting the whole Kanto Plain through
observation records. The system immediately
collects information on the seismic intensity at
the time of an earthquake occurrence.
(3) Strong-motion observation at Annex, BRIThe project to observe the complicated
behavior of the building and the effect of the soil-
structure interaction during earthquakes has been
started with the construction of the Urban
Disaster Mitigation Research Center (Annex)
building in BRI recently. The amplification
process by the ground surface layers and the
three-dimensional behavior of the buildings are
recorded using twenty-two accelerometers placed
in and around the annex and main buildings.
7. CONCLUSIONS
The earthquake observation project with
dense accelerometer array configuration is nowunder way. High quality records are being
accumulated year by year. We are ready to makethese data open to the public via the Internet,
hoping the research of ground motion prediction
becomes more active and the seismic design
methodology for buildings is more upgraded in
the future.
The earthquake records used in this study
have been obtained in the Dense Strong Motion
Earthquake Seismometer Array Observation
Project which has been implemented as a
cooperative research project between Building
Research Institute (BRI), Ministry of
Construction and the Association for Promotion
of Building Research (KKSK). For the
implementation of the project, the steering
committee for Dense Strong Motion Earthquake
Seismometer Array Observation, which consists
of 18 organizations (i.e., BRI, 16 general
contractors and a union of design office firms), is
organized by KKSK.
REFERENCES
1) Kitagawa Y., et al., "Dense Array Observation
and Analysis of Strong Ground Motions at
Sites with Different Geological Conditions in
Sendai", BRI Research Paper No. 139,
Building Research Institute, July 1994
2) Building Research Institute, "Report on the
Damage by 1978 Ofif-Miyagi Prefecture
Earthquake" (in Japanese), Research Report
ofBRI,No.86, pp.75-81, 1978.
487
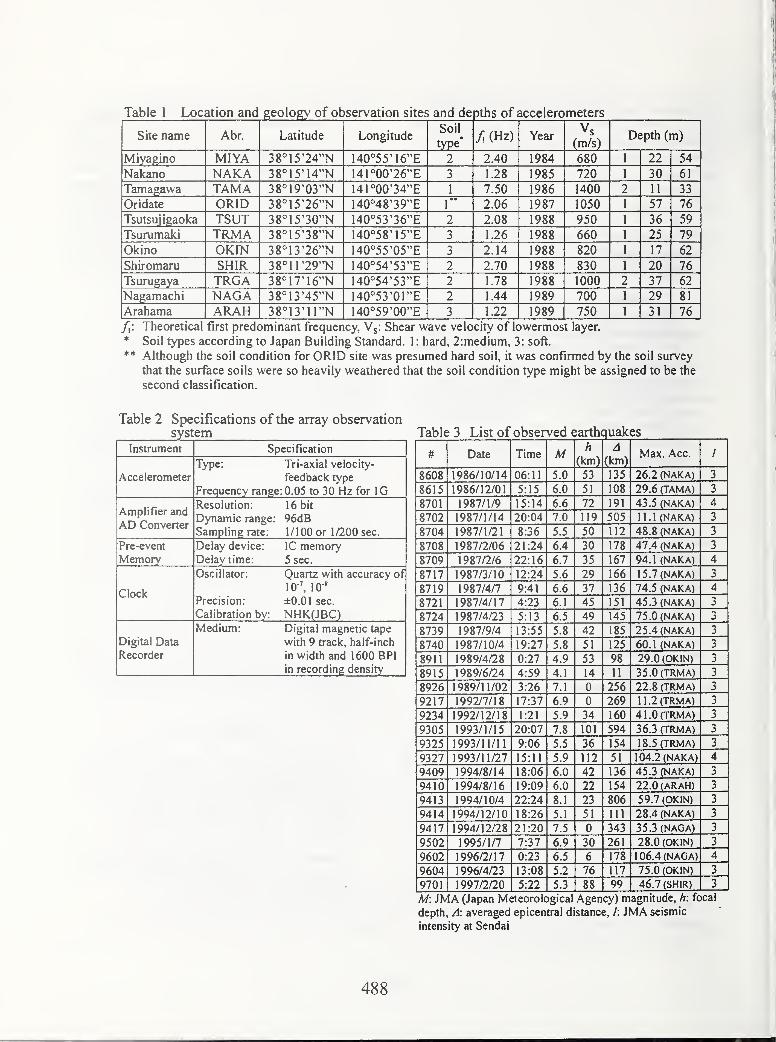
Table 1 Location and geology of observation sites and depths of accelerometers
Site name Abr. I atitude 1—'V 1 1g 1 1UUVSoil
type*Year
Vs(m/s)
Depth (m)
Miyagino MIYA 38°15'24"N 140°55'16"E 2 2.40 1984 680 1 22 54
Nakano NAKA 38°15'14"N 14I°00'26"E 3 1.28 1985 720 30 61
Tamagawa TAMA 38°19'03"N 141°00'34"E 1 7.50 1986 1400 11 33
Oridate GRID 38°15'26"'N 140°48'39"E \" 2.06 1987 1050 57 76
Tsutsujigaoka TSUT 38°15'30"N 140°53'36"E 2 2.08 1988 950 36 59
Tsurumaki TRMA 38°15'38"N 140°58'15"E 3 1.26 1988 660 25 79
Okino OKIN 38°13'26"N 140°55'05"E 3 2.14 1988 820 17 62
Shiromaru SHIR 38°11'29"N 140°54'53"E 2 2.70 1988 830 20 76
Tsurugaya TRGA 38°17'16""N 140°54'53"E 2 1.78 1988 1000 37 62
Nagamachi NAGA 38°13'45"N ]40°53'01"E 2 1.44 1989 700 29 81
Arahama ARAH 38°13'11"N 140°59'00"E 3 1.22 1989 750 31 76
f{. Theoretical first predominant frequency, Vg: Shear wave velocity of lowermost layer.
* Soil types according to Japan Building Standard. 1 ; hard, 2:medium, 3: soft.
** Although the soil condition for GRID site was presumed hard soil, it was confirmed by the soil survey
that the surface soils were so heavily weathered that the soil condition type might be assigned to be the
second classification.
Table 2 Specifications of the array observation
Instrument Specification
Acceierometer
Type: Tri-axial velocity-
feedback type
Frequency range: 0.05 to 30 Hz for IG
Amplifier and
AD Converter
Resolution: 16 bit
Dynamic range: 96dBSampling rate: 1/100 or 1/200 sec.
Pre-event
MemoryDelay device: IC memoryDelay time: 5 sec.
Clock
Oscillator: Quartz with accuracy of
W\ 10-'
Precision: ±0.01 sec.
Calibration by: NHK(JBC)
Digital Data
Recorder
Medium: Digital magnetic tape
with 9 track, half-inch
in width and 1600 BPI
in recording density
Table 3 List of observed earthquakes
uw Date Time A4M h
(km) (km)Max. Acc.
8608 1986/10/14 06:11 5.0 53 135 26.2 (NAKA) 3
8615 1986/12/01 5:15 6.0 51 108 29.6 (TAMA) 3
8701 1987/1/9 15:14 6.6 72 191 43.5 (NAKA) 4
8702 1987/1/14 20:04 7.0 119 505 11.1 (NAKA) 3
8704 1987/1/21 8:36 5.5 50 112 48.8 (NAKA) 3
8708 1987/2/06 21:24 6.4 30 178 47.4 (NAKA) 3
8709 1987/2/6 22:16 6.7 35 167 94.1 (NAKA) 4
8717 1987/3/10 12:24 5.6 29 166 15.7 (NAKA) 3
8719 1987/4/7 9:41 6.6 37 136 74.5 (NAKA) 4
8721 1987/4/17 4:23 6.1 45 151 45.3 (NAKA) 3
8724 1987/4/23 5:13 6.5 49 145 75.0 (NAKA)
8739 1987/9/4 13:55 5.8 42 185 25.4 (NAKA) 3
8740 1987/10/4 19:27 5.8 51 125 60.1 (NAKA) 3
8911 1989/4/28 0:27 4.9 53 98 29.0 (OKIN) 3
8915 1989/6/24 4:59 4.1 14 11 35.0 (TRMA) 3
8926 1989/11/02 3:26 7.1 0 256 22.8 (TRMA) 3
9217 1992/7/18 17:37 6.9 0 269 1 1 .2 (TRMA) 3
9234 1992/12/18 1:21 5.9 34 160 41.0 (TRMA) 3
9305 1993/1/15 20:07 7.8 101 594 36.3 (TRMA) 3
9325 1993/11/11 9:06 5.5 36 154 18.5 (TRMA) 3
9327 1993/11/27 15:11 5.9 112 51 104.2 (NAKA) 4
9409 1994/8/14 18:06 6.0 42 136 45.3 (NAKA) 3
9410 1994/8/16 19:09 6.0 22 154 22.0 (ARAH) 3
9413 1994/10/4 22:24 8.1 23 806 59.7 (OKIN) 3
9414 1994/12/10 18:26 5.1 51 111 28.4 (NAKA) 3
9417 1994/12/28 21:20 7.5 0 343 35.3 (NAGA) 3
9502 1995/1/7 7:37 6.9 30 261 28.0 (OKIN) 3
9602 1996/2/17 0:23 6.5 6 178 1 06.4 (NAGA) 4
9604 1996/4/23 13:08 5.2 76 117 75.0 (OKIN) 3
9701 1997/2/20 5:22 5.3 88 99 46.7 (SHIR) 3
M: JMA (Japan Meteorological Agency) magnitude, h: focal
depth. A: averaged epicentral distance, /: JMA seismic
intensity at Sendai
488
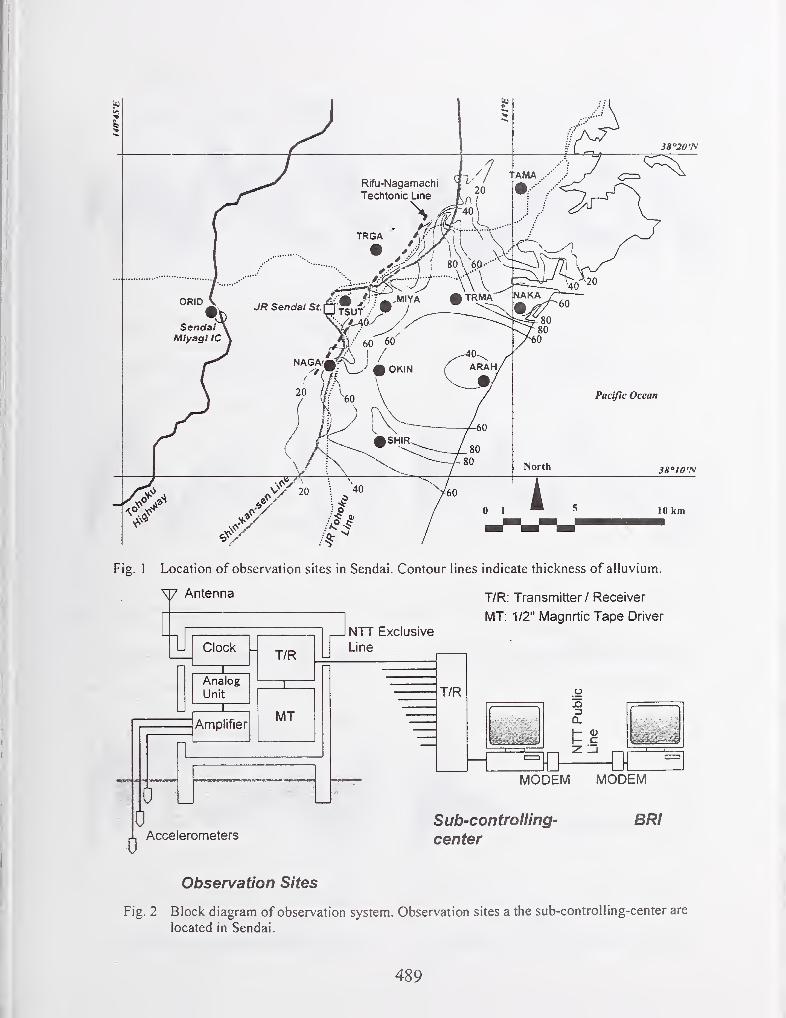
3S°20'N
10 km
Fig. 1 Location of observation sites in Sendai. Contour lines indicate thickness of alluvium.
V Antenna T/r. Transmitter / Receiver
I
MT; 1/2" Magnrtic Tape Driver
Clock -
Analog
Unit
T/R
I NTT Exclusive
Line
D
AmplifierMT
T/R
Q.
0
0Accelerometers
Sub-controlling
center
MODEM MODEM
BRI
Observation Sites
Fig. 2 Block diagram of observation system. Observation sites a the sub-controlling-center are
located in Sendai.
489

MIYA E-W
0.2-1— ^ . . , 1
0.5 1 5 10
Frequency (Hz)
Fig. 3 Fourier spectral ratio at MIYA site
0.5
0.2-^ —.
. _l0.5 1 5 10
Frequency (Hz)
Fig. 4 Fourier spectral ratio at NAKA site
TAMA E-W
0.2-1. I
0.5 1 5 10
Frequency (Hz)
Fig. 5 Fourier spectral ratio at TAMA site
490
ORID E-W
0.5 1 5 10
Frequency (Hz)
Fig. 6 Fourier spectral ratio at ORID site
0.5-
0.2 I < 1
0.5 i 5 10
Frequency (Hz)
Fig. 7 Fourier spectral ratio at TSUT site
TRMA E-W
0.5 I 5 10
Frequency (Hz)
Fig. 8 Fourier spectral ratio at TRMA site

OKIN E-W NAGA E-W
Frequency (Hz)
Fig. 9 Fourier spectral ratio at OKIN site
SHIR E-W
Frequency (Hz)
Fig. \0 Fourier spectral ratio at SHIR site
TRGA E-W
Frequency (Hz)
Fig. 1 1 Fourier spectral ratio at TRGA site
Frequency (Hz)
Fig. 12 Fourier spectral ratio at NAGA site
ARAH E-W20
10
5
c
1-
0.5
0.2
A
/ii ftm i
i\W / .1Wr^ / 1
0.5 1 5
Frequency (Hz)
Fig. 13 Fourier spectral ratio at ARAH site
10
491
Deposition of Oil spilled from A Russian Tanker on Coasts
by
Fuminori Kato" and Shinji Sato^'
ABSTRACTHeavy oil spilled from a Russian tanker
deposited on coasts facing the Japan Sea in
January 1997. Especially, coasts in Fukui
Prefecture and Ishikawa Prefecture were
attacked by disastrous oil deposition. On the
basis of detailed field reconnaissance, the
behavior of deposited oil was described for
sandy beaches, pebble beaches and rocky coasts.
Impacts of oil deposition on coastal
environment were also estimated.
Key Words :Coastal Environment,
Oil Deposition, Oil Spill,
Winter Storm
1 . INTRODUCTIONThe Russian tanker "Nakhodka" sank in
the Japan Sea off Oki Islands on January 2,
1997. Huge amount of 6,240 kl heavy oil was
spilled from the tanker. The amount ranks with
the worst oil spill accident in Japan, that is, the
accident at Mizushima oil plant of Mitsubishi
Petroleum Corporation in 1971 in which 7,500
- 9,500 kl of C heavy oil was spilled. The spilled
oil from the Russian tanker polluted the coasts
facing the Japan Sea from Yamagata Prefecture
to Shimane Prefecture. Deposited oil on coasts
was removed with the help of many volunteers.
Oil removal activities were performed under
severe weather conditions and greatly
influenced by winter storms. Since the long-
term impacts of oil deposition on coastal
environments were anticipated, field
observation was conducted on the behavior of
the deposited oil on coasts and its impact on
coastal environments.
2. MOVEMENT OF SPILLED OIL ANDEFFORTS FOR RECOVERY
The oil spill accident occurred when the
Russian tanker "Nakhodka" was traveling in
the Japan Sea from Shanghai to Petropavlovsk
in the Kamchatka Peninsula, Russia. The tanker
was carrying 19,000 kl of C heavy oil. OnJanuary 2, 1997, the tanker was accidentally
broken into two pieces by storm off Oki Islands.
The bow drifted in Japan Sea and the rest of the
body sank onto the sea bottom of 2,500 m depth.
A total amount of 6,240 kl of oil was spilled
from the two pieces of the tanker. Part of the
oil deposited the coasts facing the Japan Sea
from Yamagata Prefecture to ShimanePrefecture.
After drifting on the sea surface, the bow
stranded on the coast of Mikuni Town, Ishiwaka
Prefecture, on January 7. Photo 1 illustrates the
stranded bow and deposited sludge-like oil on
the coast. In the town, oil deposited on the beach
intermittently for about two months from the
accident. Sludge-like oil drifted toward the
coast in the beginning of the time. About one
month after the first oil deposition, only oil
grain deposited on the beach. Oil in the stranded
bow was completely removed on February 25,
but oil grain occasionally deposited on the coast
even after that.
Figure 1 shows the date of the first oil
arrival on the coast and the total amount of
removed oil. From Kaga Coast in Ishikawa
Prefecture to Tottori Coast, the first arrival date
was January 7-9. As the spilled oil was
transported by the strong Tsushima currents and
wind-driven currents, the arrival of oil delayed
1) Research Engineer, Coast Division, River
Department, Public Works Research Institute,
Ministry of Construction, Tsuktiba, 305-0804 Japan
2) Head, Coast Division, ditto
492
on the northern coasts.
The amount of oil deposited on the coasts
was not estimated, however, it can be inferred
from the amount of oil removed by March 28
which includes not only oil but also sand, gravel
and sea water. The total amount of removed oil
was 38,000 kl. The removed oil in Fukui
Prefecture was about 18,000 kl, and that in
Ishikawa Prefecture was about 13,000 kl. The
total amount of oil removal was especially large
in the area around Mikuni Town, eastern part
of Wakasa Bay, and northern part of outer side
of Noto Peninsula.
Figure 2 shows the temporal variation of
significant wave height and average wind
velocity recorded at Tokumitsu oceanographic
observation station in Mattou City, Ishikawa
Prefecture (see Fig.l). A ultrasonic-type wave
gage is fixed on the sea bottom at the point of
15 m depth, 1,500 m off the coast. A wind meter
is installed at about 15 m above the ground.
Significant wave height in January and February
1997 was mostly over 1 m, sometimes exceeded
the highest significant wave height 4.93 mbetween 1988 and 1996. Wind speed in the
period was frequently over 10 m/s. Prevailing
wind direction was from northwest. Such winter
storm made oil removal quite difficult.
Oil removal works on the beach was
started immediately after the first oil arrival.
The total amount of oil removal in Mikuni Townreached 2,170 kl by January 20 and 2,520 kl by
March 28. It included sand, gravel and sea water
which were collected with oil. At a gravel beach
in Mikuni Town, pebbles were wiped out with
a piece of cloth steeped by kerosene in March.
In Hamaji Coast, a sandy beach in the town,
thorough oil removal was conducted even after
oil removal on the surface. The removal of oil
from the sand layer was conducted by two ways;
one was sand sieving by hand and the other was
pushing out oil-mixed sand into the sea
expecting for the stir by waves.
3. FIELD RECONNAISSANCE ONREMAINED OIL
Field reconnaissances on remained oil
were conducted several times on coasts in
Fukui, Ishikawa and Kyoto Prefectures. The
result shows sediments in the coast influenced
oil deposition.
On sandy beach. Sand accretion after the
011 deposition resulted in the confinement of oil
in sand. Photo 2 illustrates typical oil deposition
on sandy beach. Lumps of oil were scattered
on the surface. In order to investigate the
presence of oil underground, sand in an area of
12 m by 1.5 m was excavated to the depth of
1.5 m. Figure 3 and Photo 3 illustrate an oil layer
in the ground of Hamaji Coast, Mikuni Town,
Fukui Prefecture, observed on February 6, 1997.
Depth of the layer was over 1 m. Oil
concentration in the layer was 20,000 mg/kg (oil
weight per 1 kg of sand). Since there were no
traces of oil penetration above the underground
oil layer, it was considered that the oil was
remained underground owing to the rapid
accretion of sand.
On gravel beach, oil penetrated into the
void space among the gravels. Photo 4 shows
oil in the space among gravels near the stranded
bow. The gravels were coated thickly by oil.
Photo 5 illustrates a gravel beach adjacent to
Hamaji Coast on the other side of Imazu River,
observed on June 11, 1997. There were gravels
covered with oil on the surface. Figure 4 shows
oil concentration in sediments was 72.7-415 mg/
kg in 50-70 cm depth, 15 mg/kg in 90-100 cm,
0 mg/kg in 130-150cm on March 6. The
thickness of the gravel layer was up to Im. The
deeper part is consisted of only sand. This
means that oil has penetrated into the border of
the sand layer.
On rocky coast, oil has filled rock cracks.
Photo 5 and 6 illustrates oil deposition on rocky
coast in Shiga Town, Ishikawa Prefecture.
Deposited oil was seen in rock cracks even in
splash zone.
4. IMPACT OF REMAINED OIL ONCOASTAL ENVIRONMENTS
(1) Remained Oil on Coasts
Oil deposition on coasts have a serious
impact on coastal environments. Field
493
observation of the impact was conducted in
Mikuni Town.
Figure 5 shows oil concentration in
seawater taken at Hamaji Coast. Line 1 is across
the zone in which detached breakwaters is built.
Line 2 is out of the zone. Onshore point is 50 moff the coastal line. Offshore point is 150 m off
the coastal line. Oil was detected on February
2, February 25, June 11 and November 21, 1997.
It shows oil was detected intermittently.
Leveling on the beach for sea bathing may push
sand into sea on June 11. Oil in sand on the
beach can be washed away by big waves.
Figure 6 shows oil concentration in sand
on the beach of Hamaji Coast. Although sand
on the surface has contained oil by March, it
has rarely contained oil since May. On the other
hand, oil was detected in the ground even in
November. It indicates that oil is scattered in
the ground of the sandy beach although oil on
the surface has been removed by removal
activities.
Figure 7 shows oil concentration in
marine sediments on Hamaji Coast. Oil in
marine sediments was detected only on
February 25. It indicates oil-mixed sand maydeposit on the sea bottom.
(2) Impact on Coastal Organisms
Observation of macrobenthos on the
beach was conducted at Hamaji Coast. Species
and number of macrobenthos in 30 cm square,
30cm in depth, was measured. Table 1 shows
the result. Macrobenthos were found to be rare
before the end of February. Species and the
number of macrobenthos increased after March.
It is considered that macrobenthos will not be
present in surface sediments during winter since
vigorous sediment movement will occur under
winter storms. It is still uncertain whether the
variation of macrobenthos was due to seasonal
change or due to the impact of oil deposition.
Observation of macrobenthos in marine
sediments was conducted at Hamaji Coast.
Table 2 shows species and number of the
macrobenthos. There were few macrobenthos
on the sea bottom in the beginning of February
as well as on the beach. The same reason can
be considered. Impact of oil deposition is also
unknown.
Observation of sessile creatures was
conducted on a gravel coast and a rocky coast
in Mikuni Town. Species and number of sessile
creatures in 30 cm square was measured. Table
3 shows the result. No significant changes in
their species and number are recognized.
Creatures of low activity have never been
observed between 1 month and 1 1 months after
the first oil arrival. To conclude, impact of oil
deposition on sessile creatures was not
recognized.
Observation of seaweeds was conducted
on the same coasts as sessile creatures
observation. Species and weight of seaweeds
in 30 cm square was measured. Table 4 shows
the result. Extreme changes in their species is
not recognized. It indicates seaweeds was not
influenced by oil deposition so much.
Totally speaking, impacts of oil
deposition on coastal environments have not
been clearly detected yet. Further monitoring
survey will be necessary for a few years.
(3) Impact on Beach Utilization
Inquiry from the sea bathing people on
the beaches in Fukui Prefecture and Ishikawa
Prefecture was conducted on August 8-9. The
result shows that they had no reluctancy for past
oil deposition.
Laboratory experiments on remained oil
recognition were conducted. The result suggests
the guideline for recreational beaches, that is,
there should be no visible oil on the surface and
oil concentration in sand should be less than 20
mg/kg.
5. Conclusion
Field surveys were conducted in order to
understand the effects of vast deposition of
spilled oil on coastal environments. Main
conclusions are summarized as follows:
(1) The behavior of deposited oil on
coasts varied among sandy beach, pebble beach
and rocky coast.
(2) Further long-time monitoring will be
necessary to understand the impacts on
ecological system.
494
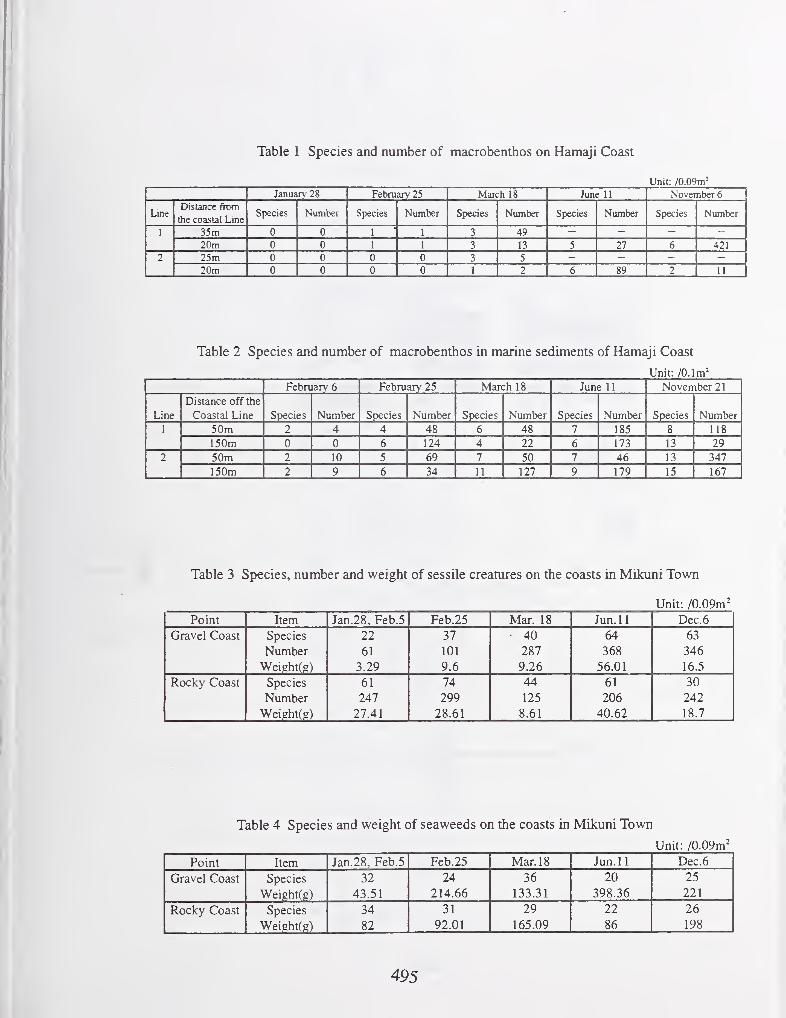
Table 1 Species and number of macrobenthos on Hamaji Coast
Unit: /0.09in^
January' 28 February 25 March 18 June 11 November 6
LineDistance from
the coastal LineSpecies Number Species Number Species Number Species Number Species Number
1 35m 0 0 1 1 3 49
20m 0 0 1 1 3 13 5 27 6 421
2 25m 0 0 0 0 3 5
20m 0 0 0 0 1 2 6 89 2 11
Table 2 Species and number of macrobenthos in marine sediments of Hamaji Coast
Unit: /0.1m'
February 6 February 25 March 18 June 1
1
November 21
Line
Distance off the
Coastal Line Species Number Species Number Species Number Species Number Species Number
1 50m 2 4 4 48 6 48 7 185 8 118
150m 0 0 6 124 4 22 6 173 13 29
2 50m 2 10 5 69 7 50 7 46 13 347
150m 2 9 6 34 11 127 9 179 15 167
Table 3 Species, number and weight of sessile creatures on the coasts in Mikuni Town
Unit: /0.09m'
Point Item Jan.28, Feb.5 Feb.25 Mar. 18 Jun.ll Dec.6
Gravel Coast Species 22 37 40 64 63
Number 61 101 287 368 346
Weight(g) 3.29 9.6 9.26 56.01 16.5
Rocky Coast Species 61 74 44 61 30
Number 247 299 125 206 242
Weightfg) 27.41 28.61 8.61 40.62 18.7
Table 4 Species and weight of seaweeds on the coasts in Mikuni Town
Unit: /0.09m^
Point Item Jan.28, Feb.5 Feb.25 Mar. 18 Jun.ll Dec.6
Gravel Coast Species 32 24 36 20 25
Weight(g) 43.51 214.66 133.31 398.36 221
Rocky Coast Species 34 31 29 22 26
Weight(g) 82 92.01 165.09 86 198
495

Fukui Prefecture 17,864kl
Li_j I
0 25 50 100km
Fig.l The first oil arrival date and the total amount of removed oil by March 28, 1997.
496
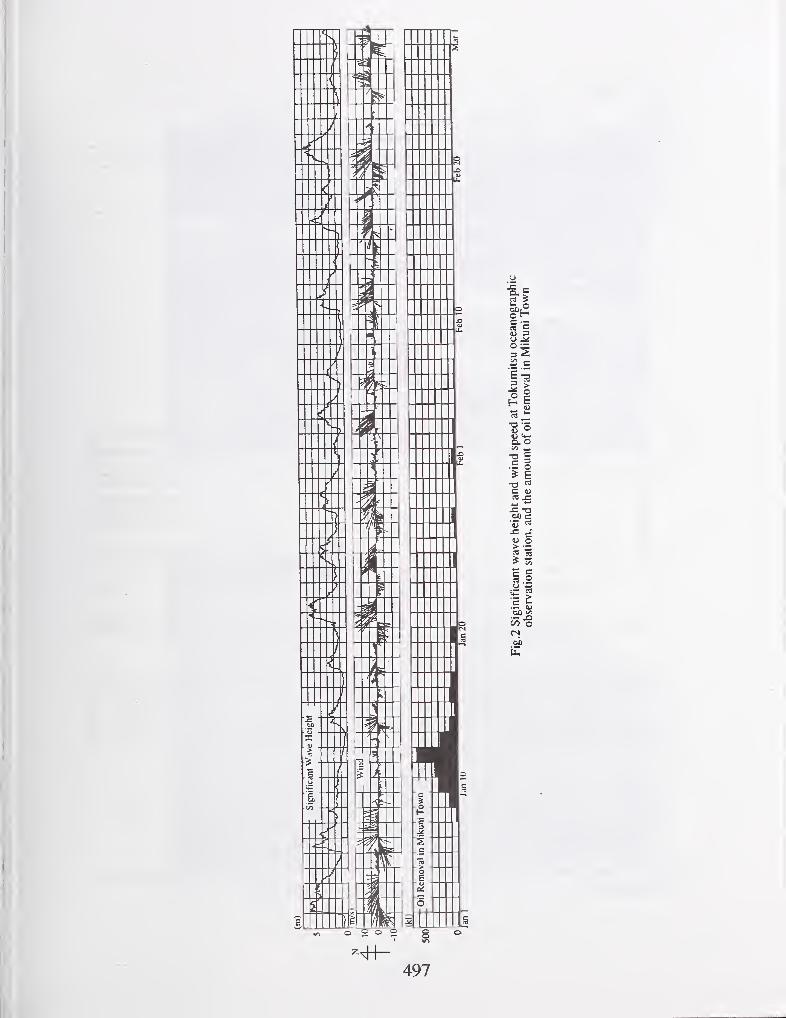
497
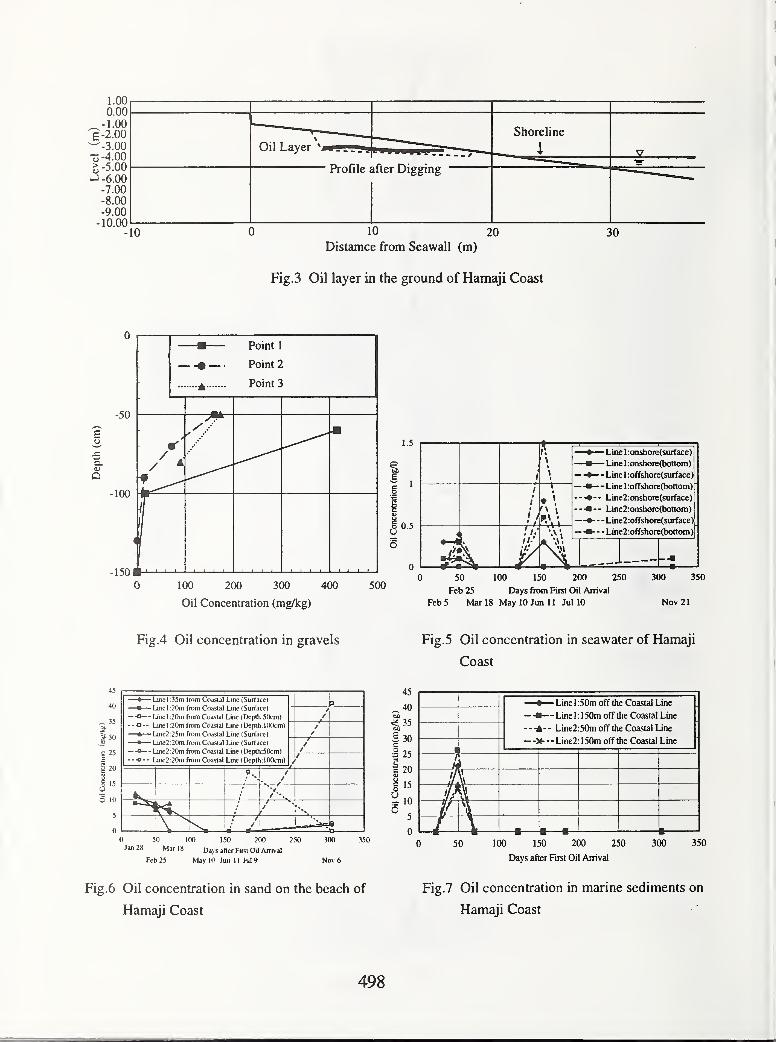
1.00
0.00
_-1.00E-2.00^-3.0013-4.00g-5.00-1-6.00
-7.00
-8.00
-9.00
-10.00-10 10 20
Distamce from Seawall (m)
Fig.3 Oil layer in the ground of Hamaji Coast
30
a.
Point 1—
—
—•— • Point 2
A Point 3
1.5
aE
5 0.5U
100 200 300 400
Oil Concentration (mg/kg)
500
'/-I//•'
—t—
\
• Line 1 :oiishoie(surface)
Line 1 :onshore(bottom)
--— - Line 1 ;offshore{surface)
• — Line 1 :offshore(bottom)
Line2:onshore(suiface)
Line2:onshore(bottoni)
------ Line2:offshore(surface)
--— Line2:offshore(bottom)
50 100 150 200 250 300 350
Feb 25 Days from First Oil Arrival
Feb 5 Maris May 10 Jun 11 Jul 10 Nov 21
Fig.4 Oil concentration in gravels Fig.5 Oil concentration in seawater of Hamaji
Coast
45
40
_ 35
"I 30
1 15u6 10
5
0
—•— Lmel;?5ni fmm Coaslal Line (Surtatc)—•— Line! :2()m from Coastal Line (Surface)
— — Line 1 ;20m from Coastal Line (Deplh:50L-m)
--•0-- Unci :20m from Coastal Line (Depth: UKtem)
—A— ljne2:25m from Coastal Line (Surface)—•— Une2:20m from Coastal Line (Surface)
— -«— Une2:20m from Coastal Line (Deplh SOcm)-0-- Line2:20m from Coastal Line (Depth: lOOcm)
P/
//—
//—/
//
>
/
//
• /
/ -.
4—,/ *.
/•
m1D
50 100 150 2(X1
I Mar 18 pa^^ jfler First Oil Arrival
Feb 25 May HI Jun II Jul 9
Fig.6 Oil concentration in sand on the beach of
Hamaji Coast
45
40
§> 35
E"c
30
o25
c 20(Uuco 15
O10
65
50 100 150 200 250
Days after First Oil Arrival
300
>— Line 1 :50m off the Coastal Line
1— - Line 1 ; 1 50m off the Coastal Line
i" Line2:50m off the Coastal Line
—
)
«---Line2:150m otlihe Coastal Line
!
(i
Si*>!
n\
—
m-^ 1
350
Fig.7 Oil concentration in marine sediments on
Hamaji Coast
498
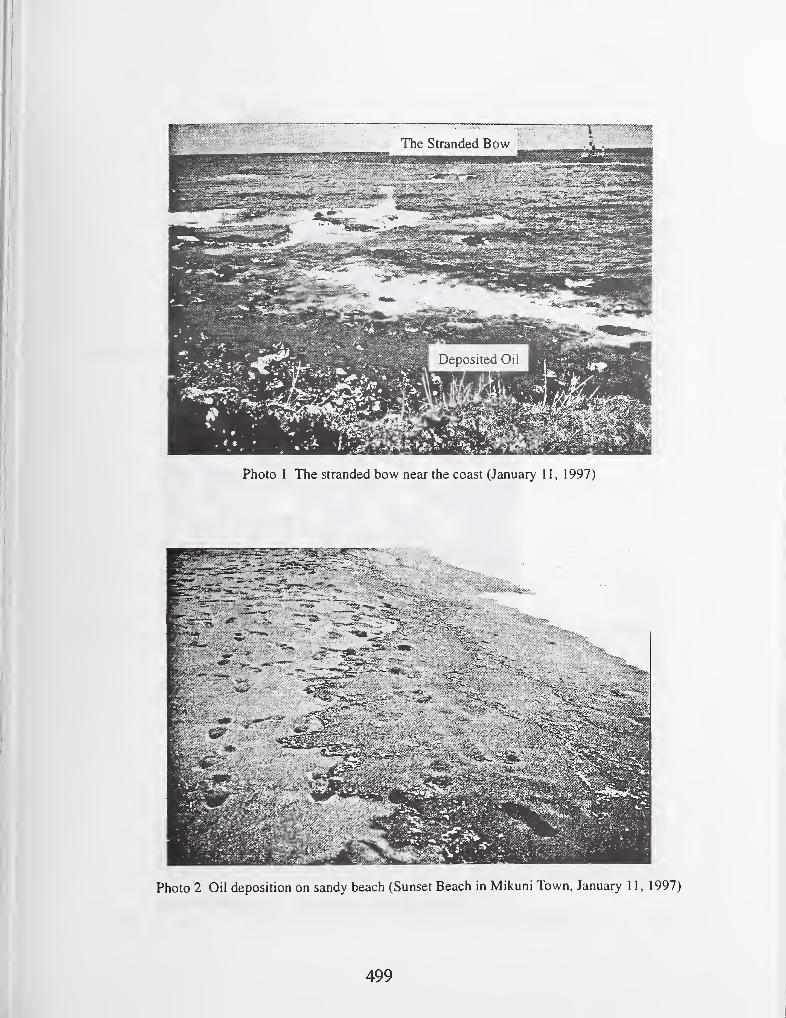
I
Photo 1 The stranded bow near the coast (January 11, 1997)
Photo 2 Oil deposition on sandy beach (Sunset Beach in Mikuni Town, January 11, 1997)
499
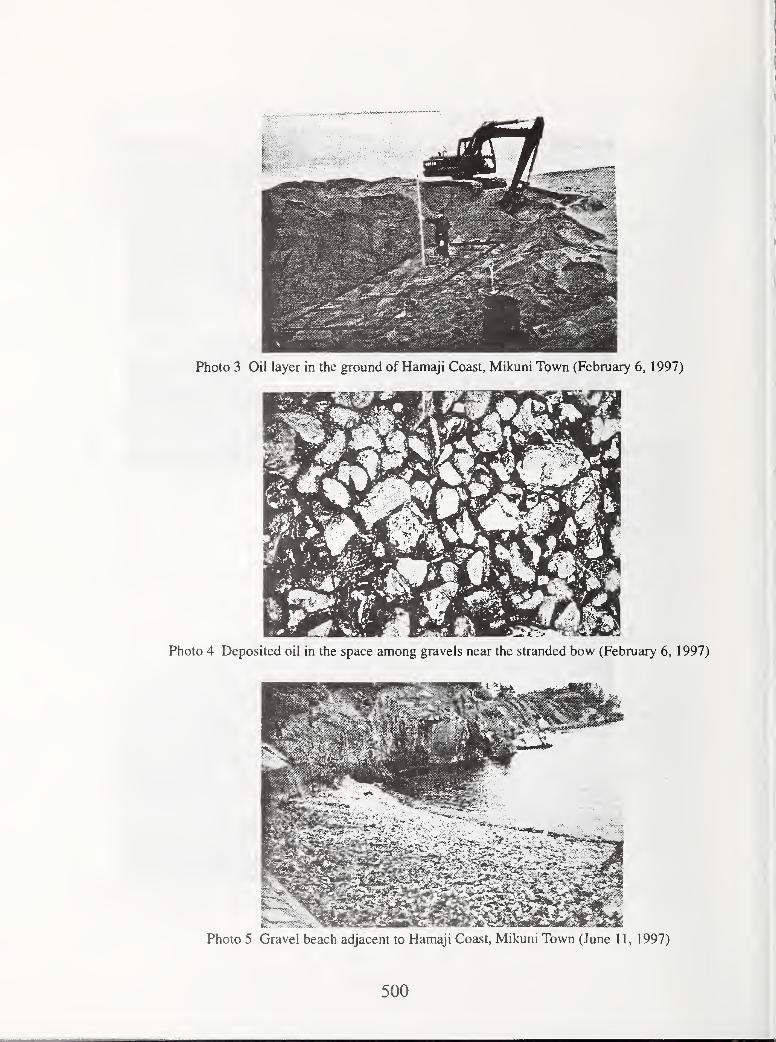
Photo 3 Oil layer in the ground of Hamaji Coast, Mikuni Town (February 6, 1 997)
Photo 5 Gravel beach adjacent to Hamaji Coast, Mikuni Town (June 1 1 , 1997)
500

Photo 6 Rocky coast in Shiga Town, Ishikawa Prefecture (February 10, 1997)
Photo 7 Oil deposition around a tide pool (February 10, 1997)
501
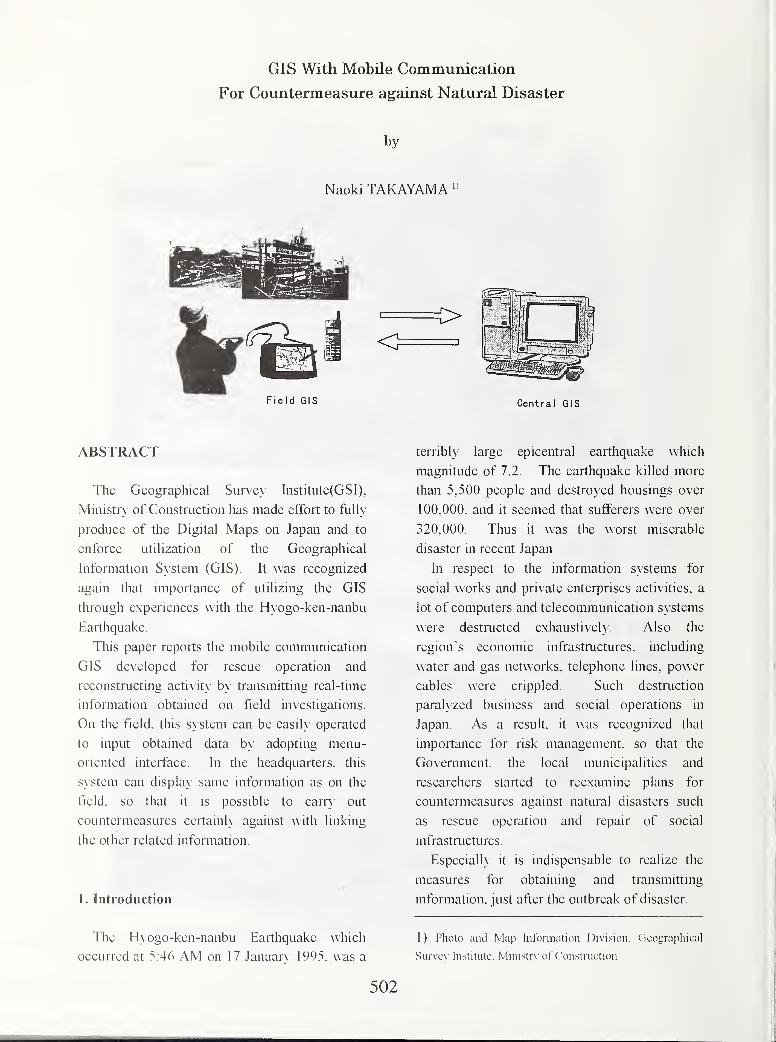
GIS With Mobile Communication
For Countermeasure against Natural Disaster
by
Naoki TAKAYAMA "
Field GIS Central GIS
ABSTRACT
The Geographical Sun/ey Institute(GSI).
Ministry of Constmction has made effort to fiilly
produce of the Digital Maps on Japan and to
enforce utilization of the Geographical
Information S>'stem (GIS). It was recognized
again that importance of utilizing the GIS
through experiences with the H} ogo-ken-nanbu
Earthquake.
This paper reports the mobile communication
GIS developed for rescue operation and
reconstructing activity by transmitting real-time
information obtained on field investigations.
On the field, this s\stem can be easil\' operated
to input obtained data by adopting menu-
oriented interface. In the headquarters, this
system can displa> same information as on the
field, so that it is possible to carr> out
countcrmeasures certainh against with linking
the other related information.
1. Introduction
The Hyogo-ken-nanbu Earthquake which
occurred at 5:46 AM on 17 Januap> \995. was a
terribly large epicentral earthquake which
magnitude of 7.2. The earthquake killed more
than 5,500 people and destroyed housings over
100,000. and it seemed that sufferers were over
320.000. Thus it was the worst miserable
disaster in recent Japan
In respect to the infomiation systems for
social works and private enterprises activities, a
lot of computers and telecommunication systems
were destnicted exliaustively. Also the
region's economic infrastmctures. including
water and gas networks, telephone lines, power
cables were crippled. Such destaiction
paralyzed business and social operations in
Japan. As a result, it v\as recognized that
importance for risk management, so that the
Government, the local municipalities and
researchers started to reexamine plans for
countcrmeasures against natural disasters such
as rescue operation and repair of social
infrastructures.
Especialh it is indispensable to realize the
measures for obtaining and transmitting
information, just after the outbreak of disaster.
I) Pliolo iind Map liironiiation l)i\'i,sion. Clcograjihical
Sur\'c\ Insliliitc. Mini.slrx DrCoiislriiction
502
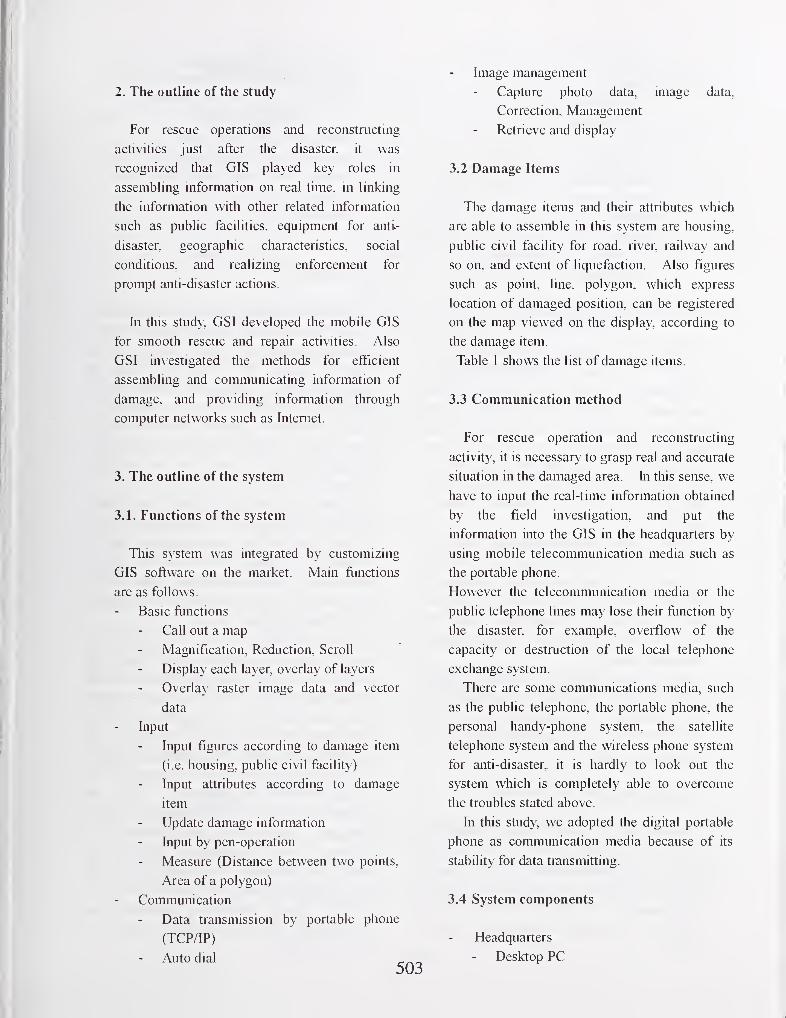
2. The outline of the study
For rescue operations and reconstructing
activities just after the disaster, it was
recognized that GIS played key roles in
assembling information on real time, in linking
the information with other related information
such as public facilities, equipment for ant>
disaster, geographic characteristics, social
conditions, and realizing enforcement for
prompt anti-disaster actions.
In this stud}. GSI developed the mobile GIS
for smooth rescue and repair activities Also
GSI in\estigated the methods for efficient
assembling and communicating information of
damage, and providing information through
computer networks such as Internet.
3. The outline of the system
3.1. Functions of the system
Tliis system was integrated by customizing
GIS software on the market. Main fijiictions
are as follows.
Basic functions
Call out a map
Magnification. Reduction. Scroll
Display each layer, overlay of layers
Overla}' raster image data and vector
data
Input
Input figures according to damage item
(i.e. housing, public civil facility)
Input attributes according to damage
item
Update damage information
Input by pen-operation
Measure (Distance between two points,
Area of a polygon)
Communication
Data transmission by portable phone
(TCP/IP)
Auto dial
Image management
Capture photo data, image data.
Correction, Management
Retrieve and display
3.2 Damage Items
The damage items and their attributes which
are able to assemble in this system are housing,
public civil facility for road, river, railway and
so on. and extent of liquefaction. Also figures
such as point, line, polygon, v/hich express
location of damaged position, can be registered
on the map viewed on the display, according to
the damage item.
Table 1 shows the list of damage items.
3.3 Communication method
For rescue operation and reconstructing
activity, it is necessar}' to grasp real and accurate
situation in the damaged area. In this sense, we
have to input the real-time information obtained
by the field investigation, and put the
information into the GIS in the headquarters by
using mobile telecommunication media such as
the portable phone.
However the telecommunication media or the
public telephone lines may lose their function by
the disaster, for example, overflow of the
capacity or destruction of the local telephone
exchange system.
There are some communications media, such
as the public telephone, the portable phone, the
personal handy-phone system, the satellite
telephone system and the wireless phone system
for anti-disaster, it is hardly to look out the
system which is completely able to overcome
the troubles stated above.
In this study, we adopted the digital portable
phone as communication media because of its
stability for data transmitting.
3.4 System components
Headquarters
- Desktop PC
Modem
Software
WindowsNT
GIS software
Field system
Pen computer
Portable phone
Digital Camera
Modem
Software
Wmdows for PenComputing
FieldNotes
3.5 Effect for systematization
Tlius far. when a disaster occurred, officials in
charge of anti-disaster assembled information on
the damaged area, and they brought it to the
headquarters themselves, or reported it b\ using
the public telephone or the wireless phone
system for anti-disaster. In this case, so that
the subjectivity of the officials could influence
the quality of information, the reliability of
information might be sometimes doubtftil
slightly.
If the mobile communication GIS for rescue
operation and reconstmcting activity is used, it
is possible to transmit pictures of the damaged
situation from the field promptly. The facts
such as pictures are effective to grasp the
damaged situation and to take countermeasures
against the disaster.
On the other hand, to be shared common
information by the headquarters and the field, is
also effective for managing real time
information and providing information to the
related organizations.
3.6 Applicable fields of this system
In this study, it is considered the feasibility of
the mobile communication GIS with a portable
phone. As an application for the other field, it
seems to be used for the support system on the
field research.
The major applicable businesses are as
follows.
Update topographic map data
Basic investigation for the City Planning
(land use survey, research of housings)
Confirmation of building houses (Field
investigation for comparison)
Investigation of fixed property', building site
Investigation of possessions on the roads
Welfare
Marketing
4. Conclusion
In this study, the mobile communication GIS
was developed in order to enforce smooth rescue
operation and reconstmcting activity at the
disaster, through the experience from the
Hyogo-ken-nanbu earthquake. This system
was just developed as a prototype system,
improvement of the ftinctions will be needed for
practical use. Also it is necessary to establish
organizations and liaisons for utilizing the
system.
On the other hand, it is prerequisite to settle
the main computer at the headquarters. Hence
it is also needed the risk management such as
aseismatic staicturing of the building of the
headquarters. countermeasures for fire,
prevention for falling down of the computers,
and backup of the data.
Concerning to the risk management for
computer systems, there are some manuals, for
example, the security management guideline for
the computer system, or the guideline for system
inspection, and based on such guidelines many
kinds of countermeasures have been taken. In
spite of these measures, the unexpected damages
of the computer system were recognized at the
Hyogo-ken-nanbu earthquake. Thus the
reexamine of the risk management is quite
necessar}'. To avoid ftinctional disorder of the
computer aided anti-disaster system b}'
hazardous earthquake, it is strongly expected
that ftirther strengthen the countermeasure for
security, through researching, analyzing and
investigating of the computer system in
damaged situation.

ITEMSymbol CONTENT OF ATTRIBUTES
(selecting on menu window)type image color
Housepoint
polygon
red
Situation : completely destroyed, partial destroyed, slightly
M Restoring condition : pulled down, rebuilding, repairing,
other
Comment
Road
point
line
polygon
gray
Place : roadway, vsidewalk, median, slope, side ditch,
bridge, tunnel, other institutions, other
Situation : depression, upheaval, clack, collapse, other
Quantities : meter, square meters
Comment
River
point
line
polygon
blue
Plripp levpp rivpr pour^p wntpr ^Mtp lirirrMfP nonrl
other
Damage : collapse, flooding, ravage of institution, other
Quantities : meter, square meters
( ^om TTipn t
RciilroHcl
line
olive
-
green
PIhpp ' TMil ovpyhpMfl wirp station hiiilrlin*^'" ^^'ava^^p
railroad bridge, other
Situation : depression, upheaval, collapse, cul off, other
Quantities : meter, square meters
Comment
Water pipe
point
line
light
blue(/omment
Sewerpoint
1
line
Ixf brown Comment
Gas pipe
point
line
purple Comment
rjiecii ic
power
point
line
green
Place : electric light pole, overhead wire, underground
interconnection system, other
Comment
Telephone
point
line' NTT^
yellowDamage : telephone pole, overhead wire, underground, other
Comment
Liquefaction polygonnavy-
blueComment
Other
point
line
P'JJ^yg'jn
black Comment
Place ofr> i" fry o 1"^ r\\T]JllUl.UgI dLlJliy
point
line
imagepink
Number oi photograph (input by lUkey)
Comment
Note image black
Table 1 The Item List of Collecting Damage Information
505
Aerodynamic databases and electronic standards for wind loads:
A pilot application
by
Timothy Whalen' ^ Emil Simiu', Gilliam Hams^ Jason Lin'*, and David Surry"*
ABSTRACT
As part of ongoing National Institute of Standards
and Technology research on the development of a
new generation of standard provisions for wind
loads, we present results of a pilot project on the
use of large aerodynamic databases for the
improved estimation of wind-induced bending
moments and shear forces in low-rise building
frames. We use records of wind pressure time
histories measured at a large number of taps on the
building surface in the Boundary Layer Wind
Tunnel of the University of Western Ontario. Time
histories of moments and shear forces in a frame
are obtained by adding pressures at all taps
tributary to that frame multiplied by the respective
tributary areas and influence coefficients. The
latter were obtained from frame designs provided
by CECO Building Systems. We compare results
obtained by using the pressure time history records
with results based on ASCE 7 standard provisions.
The comparison shows clearly that provisons
which use aerodynamic databases containing the
type of data described in this work can result in
designs that are significantly more risk-consistent
as well as both safer and more economical than
designs based on conventional standard provisions.
We oudine future research on improved design
methodologies made possible by our proposed
approach to wind loading standardization. Finally,
the proposed methodologies may be used for
damage assessment for insurance purposes.
KEYWORDS: Building technology;
aerodynamics; codes and standards; databases;
risk; structural engineering; wind engineering.
1. INTRODUCTION
Conventional standard provisions for wind loads
reflect two conflicting needs: (1) to asssure that
they are risk-consistent, the provisions should
reflect the information on which they are based as
completely and realistically as possible; and (2)
conventional standards have limitations that
impose reductive formats and simplifications, with
consequent loss of information and risk-
consistency.
Owing to current information storage and
computational capabilities standard provisions
need no longer be based on reductive ~ and
distorting — tables and plots. It is now practical to
develop user-friendly standard provisions that
incorporate large amounts of useful information
[1,2]. In this paper we present results that illustrate
aspects of the development and advantages of such
provisions in the specific case of low-rise building
frames.
In Section 2 we describe (1) the geometry of the
buildings chosen as our test cases, (2) the design
criteria for the frames, and (3) basic information on
the frames, which were designed by CECOBuilding Systems. In Section 3 we briefly describe
the wind tunnel tests performed at the Boundary
Layer Wind Tunnel Laboratory of the University
of Western Ontario (BLWTL) [3]. In Section 4 wedescribe the procedure used to calculate wind-
induced internal forces (i.e., bending moments,
shear forces and axial forces).
'Building and Fire Research Laboratory, National
Institute of Standards and Technology,
Gaithersburg, MD 20899
^Present address: School of Civil Engineering,
Purdue University, West Lafayette, IN 47907
^CECO Building Systems, Columbus, MS 39703
"Boundary Layer Wind Tunnel Laboratory,
University of Western Ontario, London, Ont.,
Canada N6A 5B9
506
using: (1) the ASCE 7-93 Standard provisions on
wind loads [4], and (2) time-dependent loads
based on the wind tunnel measurements. In
Section 5 we present and discuss our results. In
Section 6 we discuss the vast potential for
improving both the safety and economy of
structural designs offered by the approach
described in this paper, and future research
aimed at realizing that potential.
2. BUILDING GEOMETRIES, DESIGNCRITERIA, AND FRAMES
The buildings studied in this pilot project are
rectangular in plan with dimensions 61 m (200
ft)x 30.5 m (100 ft), and have gable roofs with
1/24 slopes and ridge parallel to the long
dimension. For the fu:st set the eave height is H=6.1 m (20 ft); for the second set it is H=9.75 m(32 ft). Each set consists of four buildings with
identical geometry. Two of the four buildings are
located near Miami, Florida. The other two are
located near Charleston, S.C. For each of these
locations one building is in open terrain and one
is in suburban terrain. All buildings are located at
13 km (8 miles) inland from the coastiine and are
assumed to be Category 1 [4].
The frames were designed by CECO Building
Systems in accordance with Metal Buildings
Manufacturers Association (MBMA) current
practices, which are based on the the ASCE 7-93
Standard and the 1989 AISC Design Manual
(Allowable Stress Design). The configuration of
the frames is shown in Fig. 1. For the direction
normal to the ridge, the main wind load resisting
systems consist of 2 end frames and 7 interior
frames. The distance between interior frames is
7.62 m (25 ft) center to center. The end frames
are equally spaced from the respective
neighboring interior frame. The frame
dimensions and the cross-sectional dimensions of
the webs and flanges are identical for all frames
of a given building. We refer to the Miami (M)
building with H= 6.1 m (20 ft) in suburban (S)
terrain as MS20. The other buildings are
designated MS32, CS20, CS32, and MO20,M032, CO20, C032 (C designates Charleston;
O designates open terrain).
3. WIND TUNNEL TESTS
Building models were tested at 1:200 and 1:100
scales for suburban terrain and 1:200 scale for
open terrain. Pressure taps were installed at
about 500 locations for the buildings with
H=9.75 m and 440 locations for the buildings
with H=6.1 m. The tap locations are shown in
Fig. 2. Pressure time histories were measured
for each of 37 wind directions between 0° and
180° at 5° intervals. Pressure coefficients Cp
obtained from the pressure measurements were
referenced to the experimental dynamic pressures
at the eave height H. The approximate wind
tunnel mean flow speeds Vh(H) at the model eave
height H correspond to the full-scale hourly
speeds listed in Table 1
.
In this paper we consider only the 1:200 model
tests. The characteristics of the wind tunnel flows
conform to standard representations of
atmospheric boundary-layer flows over open and
suburban terrain - see [3] for details.
The time series were sampled at 400 Hz for 60
s. The processed time series were corrected for
residual non-simultaneity, and digitally low-pass
filtered at 150 Hz. The resolution for the
pressure coefficients is about 0.01. The data were
archived onto 8 mm cassette tapes. Each tape
contains two directories. Each directory contains
all the data for one building with specified eave
height in one type of terrain. The size of a
directory is about 2 GigaBytes whenuncompressed and about 600 MegaBytes whencompressed. For details on the data file structure
and on restoring data from tapes see [3].
4. WIND-INDUCED INTERNAL FORCES
Wind-induced internal forces were obtained for
two types of wmd loadings: (1) the wind loading
specified by the ASCE 7-93 Standard and (2) the
wind loading obtained from the wind tunnel data.
The ASCE loading is based on wind speeds
estimated without regard for direction. For
507
consistency our estimates of the wind loading
obtained from wind tunnel tests are based on
similar estimates of the wind speeds. The
pressures are
p(t)=0.613Cp(t) V„2(H) (N/n?) (1)
Vh(H) = 1.046(K,)"2Vc, (2)
where Cp is the pressure coefficient as
determined from the wind tunnel tests, 1.046 is
the importance factor for Category 1 buildings
located at 13 km (8 miles) from the coastline
(Table 5 of [4]), H is the eave height in meters,
Vj/H) is the mean hourly speed at elevation H, Vis the basic wind speed in m/s (V=42.5 m/s (95
mph) for Charleston and 49.6 m/s (ill mph) for
Miami -- see Fig. 1 of [4]), is an exposure
coefficient whose square root transforms the
fastest-mile wind speed at 10 m elevation over
open terrain into the fastest-mile wind speed at
elevation H over the specified type of terrain (for
H=6.1 m (20 ft), K,=0.87 for open terrain and
K2= 0.42 for suburban terrain; for H = 9.75 m(32 ft), K,=0.996 for open terrain and K,=0.514
for suburban terrain - see Table 6 of [4]), and c
is a coefficient that transforms fastest-mile wind
speeds to mean hourly speeds (c~ 1/1.30 for
Charleston and c~ 1/1.31 for Miami ~ see Sect.
6.5.2.2 and Fig. C5 of the Commentary in [4]).
The internal forces were obtained by summing up
the pressures at all taps contributing to the
loading of a frame times the respective tributary
area and influence coefficient. The influence
coefficients were calculated using standard linear
analysis techniques, and accounted for the
position of the tap with respect to the frame. It
was assumed that the load associated with any
given tap is transmitted to the frame by simply
supported girts or purlins, and that there is no
load redistribution among the frames. For the
loading based on wind-tunnel results this
procedure yielded time histories of the internal
forces being sought, from which r.m.s. values of
the internal forces were obtained. The internal
force corresponding to a nominal one-hour
loading is defined as the mean value plus the
r.m.s. value times the peak factor
kpk= (2 In 3600vp)>'2 -h 0.577/(2 In 3600v p) "\3)
[5], where Vp is the mean zero upcrossing rate of
the fluctuating part (excluding the mean) of the
internal force for the prototype. The rate Vp is
obtained from its model counterpart by equating
reduced frequencies for the model and prototype.
This yields v,/Vp ={[Vh(H)]J[Vh(H)]p}(Dp/DJ,
where the subscripts p and m indicate model and
prototype, respectively, and D^/D^ is the
reciprocal of the model scale. The speed (H)
for the model is taken from Table 1. It is
assumed that the wind speed specified by the
ASCE 7-93 Standard can blow from any
direction.
5. RESULTS
For 6 cross-sections shown in Fig. 1, Table 2
lists the ratio between the worst case bending
moments induced by the time-dependent load
modeled on the basis of the wmd tunnel tests (for
brevity, we will refer to this load as the actual
loading) and their counterpart worst case bending
moments induced by ASCE Standard 7-93 loads.
In both cases the respective most unfavorable
wind loading conditions were assumed. If the
loading specified by the Standard were "on
target", i.e., if it reflected consistently the actual
loading, then all entries in Table 2 would be
unity. Such consistency is impossible owing to
the constraints imposed on the volume of
information that can be conveyed in
conventional standard provisions. Given those
constraints the ASCE 7-93 Standard writers
attempted to specify information as consistently
as possible. However, we note that for any given
frame the ratios of Table 2, instead of being
unity, differ significantly and nonuniformly from
unity in most cases. For example, for the frames
of building CS20, the ratios vary from a
minimum of 0.5 to a maximum of 0.82. This
means that some cross-sections will be more
over-designed than others. The sections that are
the most over-designed contribute litfle to the
overall safety of the frame. The statement can
508
therefore be made ~ conditional on the strength
having a given value — that the least over-
designed cross-section would fail if a sufficiently
powerful storm occurred, with the additional
strength reserve of the more over-designed cross-
sections being wasted. The ratio between the
maximum and the minimum entry for a given
type of frame is denoted by rf , and is a measure
of the inconsistency of the design over the cross-
sections listed in Table 2 for that type of frame.
We also list in Table 2 the ratio, denoted by ri^f
between the maximum to the minimum entry
across types of frames for cross-sections #2, #4,
and # 6 (these sections are the section at the
frame knee, girder pinch, and ridge line, where
comparisons between frame types are
meaningful). The ratio r,^ is a measure of the
extent to which the influence lines of the frames
affect the capability of the conventional standard
provisions to reflect the actual moments
occurring in the frames. This capability is
affected by the fact that the standard provisons
were based on one specific type of influence
lines. Inconsistencies between effects of loads in
conventional standard provisions and effects of
actual loads inevitably arise should the design of
the frames deviate from the design assumed in
development of the conventional standard
provisions. It can be seen in Table 2 that i^^ can
be as large as 1.52. (We also note that the ASCEstandard does not differentiate betwen loads on
two-hinged and three-hinged frames, even though
the respective influence lines are significantly
different. Nor does the ASCE 7 standard make
allowance for the distance between frames, even
though owing to the fluctuating nature of the
loads this distance can affect significantly the
magnimde of the internal forces.)
The adoption of standard provisions that use
large aerodynamic databases would result in
moment and shear diagrams allowing the designs
would be risk-consistent both within a frame and
across different frames. The waste inherent in
non-uniformities within a frame would therefore
be eliminated. For example, for frame CS32, the
design would be safer if instead of the ratio 1.00
(for cross-section #6), the ratio 0.9 were used.
and it would also be more economical if the
ratios 0.65, 0.67, 0.74, 0.58, and 0.87 were to
be changed to the ratio 0.9.
Design technology has progressed to the point
where designers can achieve designs with stresses
that are within a few percentage points of the
stresses induced by the standard loads. However,
this close match provides only the illusion of
good design, since the designer is deprived by
conventional standard provisions of the
knowledge of the actual loads and the associated
actual stresses. A standard using large
aerodynamic databases would allow the designer
to design for the best available loading
information that can be produced in the present
state of the art, without the significant artificial
distortions due to the conventional standards'
antiquated way of conveying loading information.
Since the present investigation is exploratory, weconsidered only wind directions 0°, 30°, 60°,
90°, and 120°. In a forthcoming report all 37
wind directions will be considered. Preliminary
searches have indicated that consideration of the
results for all 37 directions will leave Table 2
essentially unchanged.
6. FUTURE RESEARCH
As already indicated, the aim of this paper is to
present a pilot study. An exhaustive investigation
along the lines presented in this paper is planned,
however, which will include consideration of all
wind directions. It will also consider the effects
of wind directionality, which we assumed here to
be characterized by a circular extreme wind
rosette. This assumption is used in the ASCE 7-
93 Standard, but it is fact not necessarily
warranted, as shown by the example of the wind
rosette of Fig. 3 (milepost 1950, near Charleston,
see [6]). We plan to investigate the effect of
modeling scale using the results obtained in the
wind tunnel for 1:100 models. Instead of
estimating moments for a few selected sections,
we plan to produce full moment and shear force
diagrams for the entire frames. It is conceivable
that automated production will render desirable in
509

the future designs that may be somewhat different
for the various frames of a given building.
Moment and shear force diagrams corresponding
to various mean recurrence intervals can be
produced for each of those individual frames,
giving the designer the option of considering the
possibility of reducing the amount of material for
some frames, if this is warranted by the moment
and shear force diagrams.
We also plan to study the possibility of automated
iterative designs, starting with a design based, for
example, on conventional standard provisions,
refining the design on the basis of moment and
shear diagrams based on acuial wind loads,
recalculating the moments and shears based on
the influence lines of the new frame, until a
satisfactory convergence is achieved. Only then
will designs accommodating calculated stresses to
within a few percentage points make sense, that
is, offer the substance rather than the illusion of
good engineering design. We note that
anticipated progress in Computational Fluid
Dynamics might allow the entire load definition
process to be computerized in the future, at least
for certain applications. Finally, we note that the
power of the computer and the availability of
databases for time histories of wind pressures
make it possible for researchers and designers to
study the plastic behavior of frames in the time
domain on the basis of realistic fluctuating wind
loads. Plastic designs are currently viewed by the
industry as uneconomical, and allowable stress
designs are used instead, but further research
made possible by the availability of appropriate
databases containing aerodynamic pressure time
histories will enable research to be conducted that
might lead to a change of current design
philosophy.
7. REFERENCES
1. Simiu, E. and Stathopoulos, T. (1997),
"Codification of wind loads on buildings using
bluff body aerodynamics and climatological data
bases," J. Wind Eng. Ind. Aerodyn. (in press).
2. Simiu, E., Garrett, J.H., and Reed, K.A.
(1993), "Development of Computer-based
Models of Standards and Attendant Knowledge-
base and Procedural Systems," in Struct. Eng. In
Natural Hazards Mitigation, Structures Congress,
Irvine, Calif., American Society of Civil
Engineers, New York.
3. Lin, J. and Surry, D. (1997), Simultaneous
Time Series of Pressures on the Envelope of TwoLarge Low-rise Buildings, BLWT-SS7-1997,
Boundary-Layer Wind Tunnel Laboratory, The
Univ. of Western Ontario, London, Ontario,
Canada.
4. ASCE Standard 7-93 (1993), American
Society of Civil Engineers, New York.
5. Davenport, A.G. (1964), "Note on the
Distribution of the Largest Values of a RandomFunction with Application to Gust Loading,
J. Inst. Civ. Eng. 24, 187-196.
6. Simiu, E. and Scanlan, R.H. (1996), Wind
Effects on Structures: Fundamentals and
Applications to Design,3Td Ed., Wiley-
Interscience, New York.
510
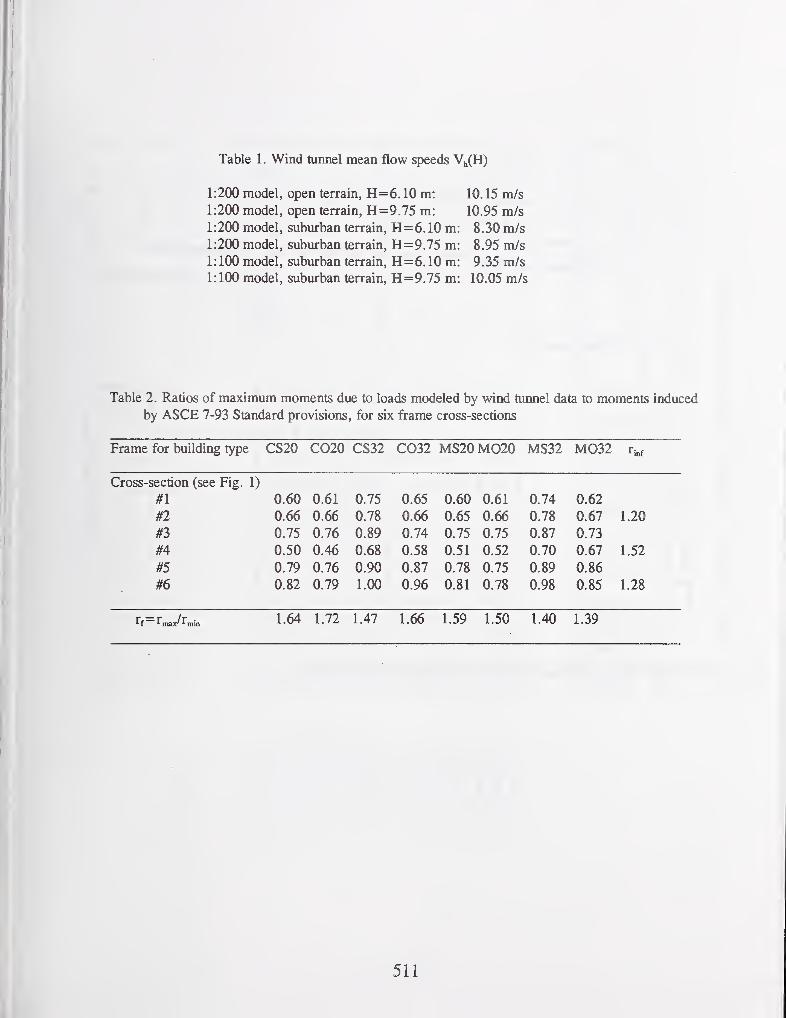
Table 1. Wind tunnel mean flow speeds Vh(H)
1:200 model, open terrain, H=6. 10 m: 10. 15 m/s
1:200 model, open terrain, H=9.75 ra: 10.95 m/s
1:200 model, suburban terrain, H=6. 10 m: 8.30 m/s
1:200 model, suburban terrain, H=9.75 m: 8.95 m/s
1: 100 model, suburban terrain, H=6. 10 m: 9.35 m/s
1:100 model, suburban terrain, H=9.75 m: 10.05 m/s
Table 2. Ratios of maximum moments due to loads modeled by wind tunnel data to moments induced
by ASCE 7-93 Standard provisions, for six frame cross-sections
Frame for building type CS20 CO20 CS32 C032 MS20MO20 MS32 M032 r^
Cross-section (see Fig. 1)
#1 0.60 0.61 0.75 0.65 0.60 0.61 0.74 0.62
#2 0.66 0.66 0.78 0.66 0.65 0.66 0.78 0.67 1.20
#3 0.75 0.76 0.89 0.74 0.75 0.75 0.87 0.73
#4 0.50 0.46 0.68 0.58 0.51 0.52 0.70 0.67 1.52
#5 0.79 0.76 0.90 0.87 0.78 0.75 0.89 0.86
#6 0.82 0.79 1.00 0.96 0.81 0.78 0.98 0.85 1.28
rf=r^/r^ 1.64 1.72 1.47 1.66 1.59 1.50 1.40 1.39
511
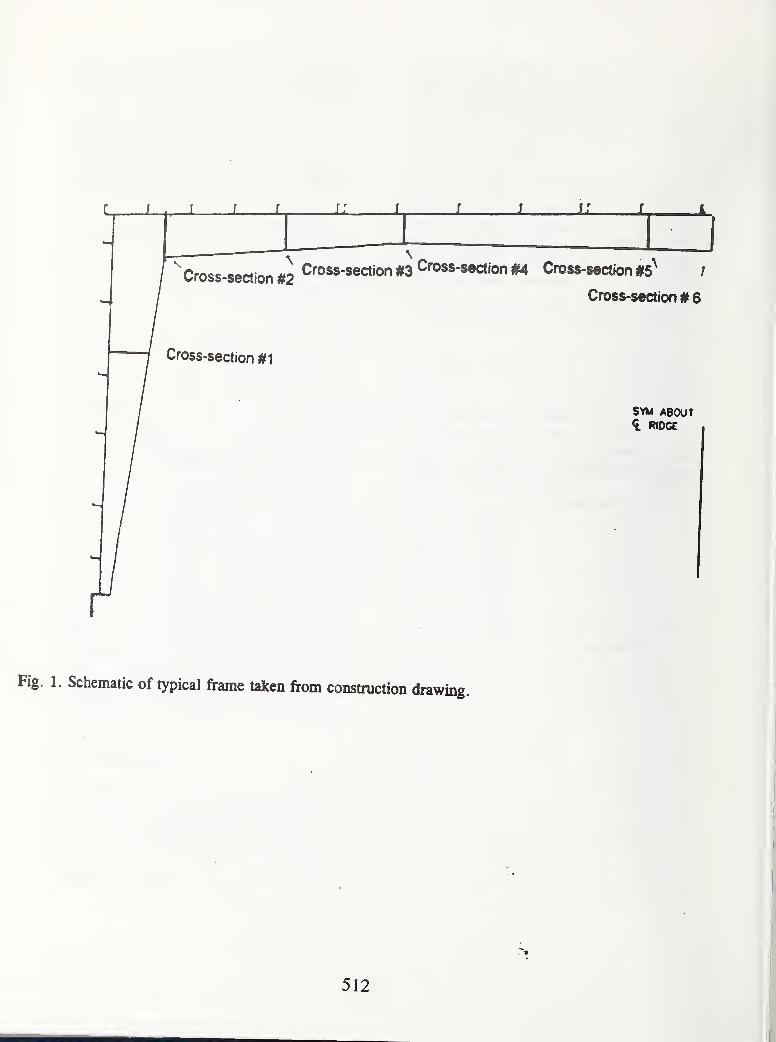
Cross-section #2]i Cross-section #3 Cross-section #4 Cross-section #5^
Cross-section # 6
Cross-section #1
SYM ABOUT^ RIOCE
Fig. 1. Schematic of typical frame taken from construction drawing.
512
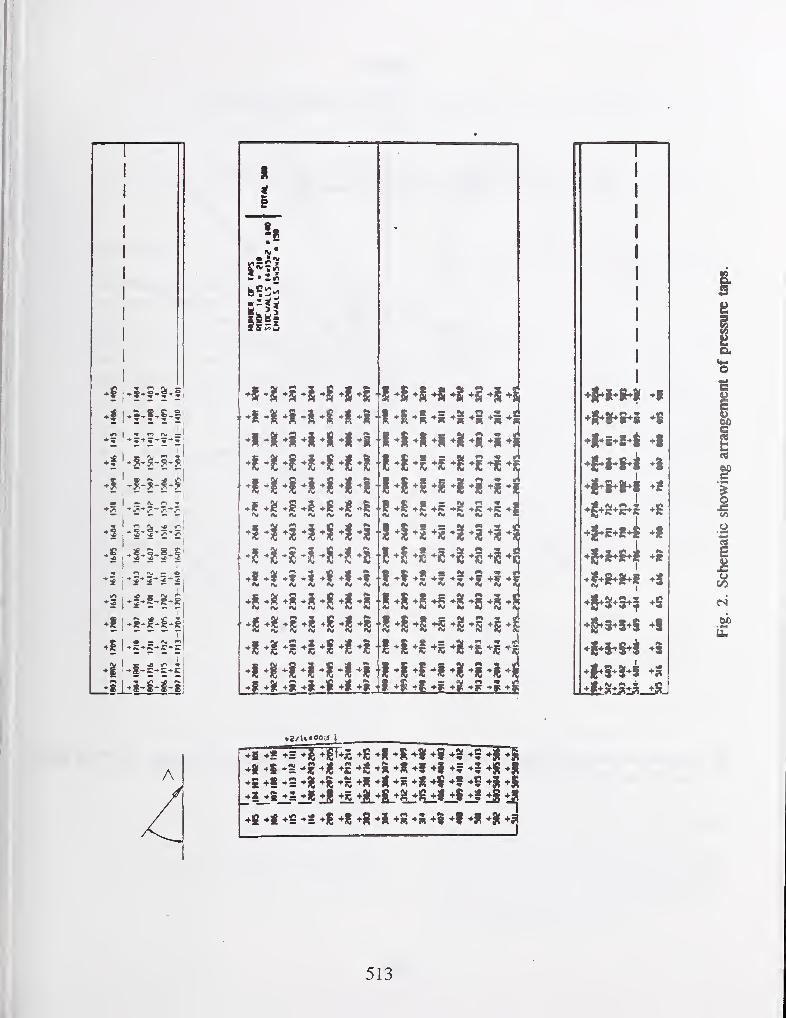
-1
^ ^
1 — ft. m 1
~ " ~
1' 2 S( £ C
*i2 ^ ^ '
m3
*i• — ^_ ! _
s ^ in w
•81
*S *5 *J -^S *J *8
*i *g
i( i I « I «
*i *i *t *l
*l *l *l *i *t *i
*g ^5 ^1 *g ^1f\j i\j t\t r\j f\d es^
*l *2 *i *i
^J! *i *l *i *i
*i .1 .1fti «U A< <W
i *i *i
I *l *S *l
I -Ig -I
^ 1^ ^
*S *5fw Aj
+S *sn< <vj «\j
*i5 +8! +15r\t t\i
-I *l
I I *s
I I I *i
I *J *lc *f *l
! I ! i I
*i -^5Al <W <Vl <W <M
! *i *t *l *3I
I *i +c *5!
I ^1 ^1 ^3!Hi fSd H »i
i *S *5 *s *2
S *S *S *s *S
I +1 *l +1
^I ^1 ^1
*m
£JJL.
I3
ao
60
60e
o
R3
60
*fi +f *5 -^gf*i5 *I6 *i ^Ji **^^i^F*rT^*1 ^1 *S ^1 *2 ^2 ^Si +f +1 +5 42 +S +11
*E *1 -S ^% *S ^% +fi -^S +5 -^J *li
48 4| +8 +H +S *5 -^5 "^f -^Sl *S?
513
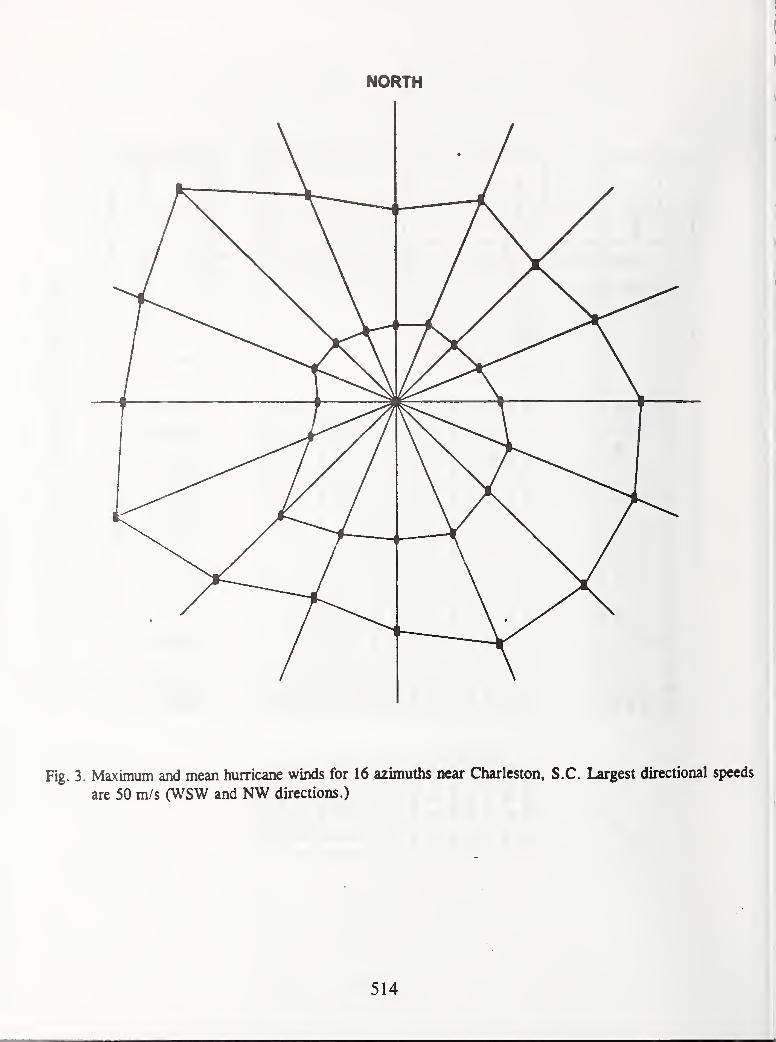
NORTH
514

GPS MONITORING OF STRUCTURES: RECENT ADVANCES
by
Mehmet gelebi', WiU Prescott^ Ross Stein', Ken Hudnut^ Jeff Behr' and Steve Wilson^
ABSTRACT
Relative displacements used to assess stress
and drift conditions of structures are difficult
to measure directly. Accelerometers are the
most common instruments used to monitor
structural systems during earthquakes or
strong winds, but to arrive at displacements
requires processing including double
integration. In most cases, such processing
does not take place in real-time or near real-
time because of requisite steps including
choice of filters for signal processing. These
choices could introduce errors at periods
relevant to structural response. However,
recent advances in Global Positioning
System (GPS) technology recording at 10
samples per second (sps) allows reliable
monitoring of long-period structures such as
suspension or cable-stayed bridges and taU
buildings. GPS units with a capability of
resolving motion at the centimeter level (± 1
cm for horizontal, ± 2 cm for vertical
accuracy) with sampling rates of 10 sps are
now available from several manufacturers.
The majority of tall buUdings (20-40 stories
or more) are flexible steel framed structures
whose fundamental period (T, in seconds)
can be estimated with the empirical formula
T = 0. 1 N, where N is the number of stories
of a building. Thus, the frequencies
corresponding to the fundamental periods of
most buildings over 20 stories are 10-20
times the Nyquist frequency of the sampling,
which is sufficient to assess accurately its
average drift ratio^. With this method,
displacement is measured directly in real-
time.
In this paper, we discuss the scientific
justification and feasibility of using GPStechnology to monitor long-period
structures. We describe an experiment
simulating the response of a tall building.
The results indicate that sampling at 10 sps
provides a clear and accurate response
history from which drift ratios and dynamic
characteristics of the specimen can be
derived. The paper discusses in detail howdata recorded from tall buildings monitored
with GPS units can be used by engineers and
building owners or managers to assess the
building performance during extreme
' U.S. Geological Survey, MS977, 345
Middlefield Rd., Menlo Park, Ca. 940252 U.S. Geological Survey, 525 S. WUsonAve., Pasadena, CA 91106
^SCIGN, 525 S. Wilson Ave., Pasadena, Ca.
91106^ Leica GPS, 23868 Hawthorne Blvd.,
Torrence, CA., 90505
^ Drift ratio is the relative displacement of
two consecutive floors divided by the height
of the floor. In this case, we are defining
average drift ratio between the roof level and
the ground level as the relative displacement
between those two levels divided by the
height between the two levels.
515
motions caused by earthquakes and strong
winds, by establishing threshold
displacements or drift ratios and identifying
changing dynamic characteristics. Such
information can then be used to secure public
safety and/or take steps to improve the
performance of the building.
KEYWORDS: global positioning system,
building, bridge, monitoring, long-period,
structural response, frequency
1. INTRODUCTION
Seismic monitoring of structural systems
constitutes an integral part of National
Earthquake Hazard Reduction Program. In
general, until recently, monitoring the
response of structural systems for the
purpose of assessment and mitigation of
earthquakes (and also severe winds) has
relied on measuring shaking response by
deploying accelerometers throughout a
particular structure of interest to the
scientific and engineering community. In
contrast, there are no efficient or feasible
methods to measure displacements during an
earthquake or severe wind. Recordings of
the acceleration response of structures have
served us well. Studies conducted on such
records have been useful in assessing
design/analyses procedures, improving code
provisions and in correlating the response
with damage.
Since the Ms=6.7 Northridge (17 January
1994) and Ms=6.8 Kobe (17 January 1995)
earthquakes, drift studies and assessment of
susceptibility to damage of tail buUdings
have become important issues - particularly
because so many steel framed buildings were
damaged, some severely and some lightly. In
the Los Angeles area, for example, following
the Northridge event, several hundred steel-
framed buildings had to be examined,
assessed, repaired and/or retrofitted. Only
three of these buildings were mstrumented
prior to the event, providing some limited
acceleration response data to be used for
interpretation of the widespread damage.
Additional data, if available in real-time or
near real-time could have been very usefiil
for studies and design of repair and
retrofitting projects that followed. Therefore
there is a great need for better monitoring of
tali buildings.
Relative displacements, which are key to
assessing drift and stress conditions of
structures, are difficult to measure directly.
On the other hand, measuring acceleration
response requires a double integration
process to arrive at displacements. The
integration process is not readily automated
because of the nature of signal processing ~
which (a) requires selection of filters and
baseUne correction (the constants of
integration), and (b) often requires
substantial judgement when anomalies exist
in the records. Consequently, this process
can lead to errors in the calculation of
velocities and displacements. This problem is
more acute for permanent displacements.
Accelerometer measurements cannot be used
to recover the permanent displacements at
the centimeter level; and even if they were, it
is questionable if it can be done so in real-
time. To the authors' best knowledge, such
comparisons have not been made. That is,
the level of accuracy of displacements
calculated from accelerations has not been
widely verified by observations (e.g. some
shake table tests performed to compare the
performances of accelerometers and
accelerographs have not been directed to
check displacements).
516

As an alternative method of measuring
relative displacements while monitoring
structural systems, we introduce GPStechnology. In general, GPS monitoring
systems are used for other purposes because
of the sampling rates used (e.g.. 1 sample per
hour, day etc). A few such applications
including those for structural systems are
summarized in Appendix A. However, the
technology has advanced to such a stage that
it is now possible to record at 10 sps. This
provides a great opportunity to monitor
long-period structures reliably (e.g. tall
buildings that are 20-40 stories or more).
The majority of the tail buildings are flexible
steel framed structures. The fundamental
period of such a flexible framed building can
be estimated with the empirical formula^: T =
0.1 N, where N is the number of stories of
the buUding. This means that at least 20 - 40
data points will be recorded for one cycle of
motion of a 20 - 40 story building vibrating
at the fundamental period. This provides
sufficient accuracy to assess the average drift
ratio of a building. Such information can be
very useful in assessing the damage to a
building. In addition, the main value in using
GPS technology to assess the condition of a
building is that the displacement
measurements can be made directly in real-
time and with sufficient precision. As
discussed later, we have made preliminary
tests to prove the technical feasibility of the
application of GPS to monitoring structures.
There is great potential for the development
of the application of GPS technology to
* For most flexible buildings, the fundamental period
(T) is approximated by O.IN, where N is the number
of floors of a building (even though the fimdamental
period can vary between [0.05-0. 15]N depending on
the flexibility of the building). Therefore, to simulate
a 40-story building, we set the period (frequency)
equal to 4 s (0.25 Hz) and proportioned the length,
width and thickness of the cantilever.
monitor long-period structures during
earthquakes. The application can also be
extended to monitoring wind-induced
deformation of tall buUdings, long-span
suspension and cable-stayed bridges and tall
chimneys. Furthermore, with future advances
in GPS technology and improvements in
sampling capability (e.g. higher than 10 sps),
it will be possible to monitor short-period
structures as well. The current technologies
do not readily lend themselves to automated,
real-time applications. Additionally, direct
measurements of displacements wiU enable
us to reliably detect structural movement
caused by failure of the ground under the
structure (e.g. liquefaction).
2. TECHNICAL JUSTIHCATION
2, 1 Model Tests Simulating A Tall Building
To investigate the feasibility of using GPStechnology to monitor tall buildings (and
other long-period structures), we conducted
2 experiments. Figure 1 depicts a photo and
the overall set-up for a simple experiment
designed by selecting a standard stock steel
bar to simulate a 30-40 story flexible
building. We selected the length, thickness
and width of the two bar specimens to yield
a fundamental period of approximately 4
seconds in the weak direction. To make
things simple, we purposefully selected the
width and thickness of each of two bars
with an extremely weaker axis in one
direction. The width was varied to show the
sensitivity of measurements during vibration
and at 10 Hz sampling rate. Each bar was
fixed at the base and the GPS unit was
attached at its tip. By providing an initial
displacement, each bar was set into free
vibration and its motion was recorded.
Results are summarized in Table 1. Figure 2
shows the particle motion and time-history
517
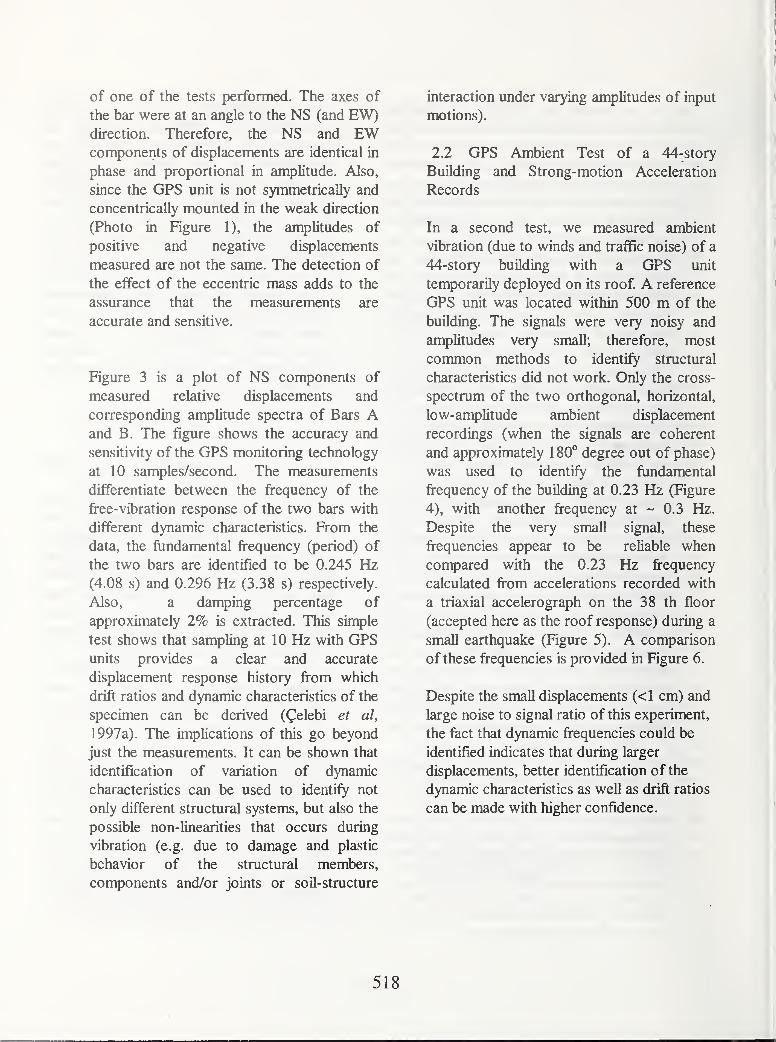
of one of the tests performed. The axes of
the bar were at an angle to the NS (and EW)direction. Therefore, the NS and EWcomponents of displacements are identical in
phase and proportional in amphtude. Also,
since the GPS unit is not symmetrically and
concentrically mounted in the weak direction
(Photo in Figure 1), the amplitudes of
positive and negative displacements
measured are not the same. The detection of
the effect of the eccentric mass adds to the
assurance that the measurements are
accurate and sensitive.
Figure 3 is a plot of NS components of
measured relative displacements and
corresponding amplitude spectra of Bars Aand B. The figure shows the accuracy and
sensitivity of the GPS monitoring technology
at 10 samples/second. The measurements
differentiate between the frequency of the
free-vibration response of the two bars with
different dynamic characteristics. From the
data, the fundamental frequency (period) of
the two bars are identified to be 0.245 Hz(4.08 s) and 0.296 Hz (3.38 s) respectively.
Also, a damping percentage of
approximately 2% is extracted. This simple
test shows that sampling at 10 Hz with GPSunits provides a clear and accurate
displacement response history from which
drift ratios and dynamic characteristics of the
specimen can be derived (^elebi et al,
1997a). The implications of this go beyond
just the measurements. It can be shown that
identification of variation of dynamic
characteristics can be used to identify not
only different structural systems, but also the
possible non-Unearities that occurs during
vibration (e.g. due to damage and plastic
behavior of the structural members,
components and/or joints or soil-structure
interaction under varying amplitudes of input
motions).
2.2 GPS Ambient Test of a 44-story
Building and Strong-motion Acceleration
Records
In a second test, we measured ambient
vibration (due to winds and traffic noise) of a
44-story building with a GPS unit
temporarily deployed on its roof. A reference
GPS unit was located within 500 m of the
building. The signals were very noisy and
amplitudes very small; therefore, most
common methods to identify structural
characteristics did not work. Only the cross-
spectrum of the two orthogonal, horizontal,
low-amplitude ambient displacement
recordings (when the signals are coherent
and approximately 180° degree out of phase)
was used to identify the fundamental
frequency of the building at 0.23 Hz (Figure
4), with another frequency at ~ 0.3 Hz.
Despite the very small signal, these
frequencies appear to be reliable when
compared with the 0.23 Hz frequency
calculated from accelerations recorded with
a triaxial accelerograph on the 38 th floor
(accepted here as the roof response) during a
small earthquake (Figure 5). A comparison
of these frequencies is provided in Figure 6.
Despite the small displacements (<1 cm) and
large noise to signal ratio of this experiment,
the fact that dynamic frequencies could be
identified indicates that during larger
displacements, better identification of the
dynamic characteristics as well as drift ratios
can be made with higher confidence.
518
3. LOOKING TO THE FUTURE:REAL TIME MONITORING
We are developing a real-time structural
monitoring technique using GPS. Our
approach in developing this application is as
follows:
• We are planning to deploy GPS units on
one or more tall buildings that are
already instrumented with
accelerometers. This will facilitate
comparison of absolute and relative
displacements. The GPS units will be
configured to provide data to indicate the
real-time average drift ratio and changes
in the dynamic characteristics of the tall
building. This information can be madeavailable to building managers (or
interested parties) in real-time or
whenever a predetermined displacement
threshold is reached. The building
managers can assess the response of the
buildings according to (a) different
threshold displacements (e.g. A, B and Cas shown in Figure 7), (b) drift ratios, or
(c) changing dynamic characteristics. If
a situation is serious, the management
can make decisions to evacuate the
building for additional inspection.
Therefore, one by-product of the effort
would be to secure the safety of the
occupants and significant contents of the
building. Thus, a real-time structural
health monitoring environment will be
created. At least 3 GPS units per building
are required to monitor a tall building.
Two of the units should be deployed on
the roof to detect translational and
torsional response of the building. The
third unit will serve as a reference ground
station to evaluate relative displacement.
This also needs a site with excellent sky
visibility.
• Similar deployments are being planned
for other types of long-period structures.
One project in development at this time
is for deploying GPS units on one of the
long-period suspension bridges such as
the Golden Gate Bridge and Bay Bridge
(San Francisco) or Vincent-Thomas
Bridge (Los Angeles). As in the case of
tall buildings, changes in dynamic
characteristics after the displacements at
critical locations of a bridge have
exceeded predetermined thresholds can
be calculated in near real-time (Figure 8).
When warranted, the management can
make decisions to inspect the bridge (e.g.
decisions can be made to stop the traffic,
thus securing the bridge safety, which is
one of the objectives of lifeline
earthquake engineering). With the GPStechnology, we can furnish time-
dependent displacements for the relative
movements of critical locations of
structures. For example, for the bridges,
GPS units placed at pre-selected
locations of bridge elements can indicate,
in real-time, the amplitude of the
displacements of the decks and towers,
as well as movements of key bridge
elements relative to local bedrock
reference points. Thus, movements of the
piers relative to the abutments, the top of
a tower with respect to its base, or the
span with respect to the ground, can be
made at a centimeter-level of precision,
in real-time. We will recover both the
dynamic motions that accompany the
earthquake, as well as the static or
permanent displacements experienced by
the bridge once the shaking has stopped.
Such permanent displacements affect the
state of stress of a bridge, and provide
evidence for distortion or failure of
bridge elements or subsidence of piers
519
due to ground compaction induced by
earthquake shaking.
• Requisite software is being developed to
assess and mitigate the two natural
hazards (earthquake and severe wind)
affecting the structures by using the
displacements measured by the GPSunits.
• The collected information on the
response of the structure during strong
motion events (or strong winds) can be
used to make decisions for fijrther
evaluation of the susceptibility to damage
of the structure and future repair/retrofit
schemes may be developed.
• The recorded data can be used to analyze
the performance of the structure and
such results can be used to improve
future analyses/design procedures.
• The data collected will also be used to
assess long-term displacements of critical
locations of structural systems (e.g.
permanent displacements, settlement of
foundations, long-term deformations due
to change of temperature and the plate
tectonic deformation spanning the San
Francisco Bay and parts of the Los
Angeles Basin) and to develop
methodologies on how the findings can
be incorporated into useful practical
design procedures.
4. CONCLUSIONS:
It is shown in this paper that recent advances
in sampling rates of GPS technology allows
real-time monitoring of long-period
structures such as tall buUdings and long-
span bridges. The advantage is that relative
displacements can be measured in real-time
and with sufficient accuracy. The technical
feasibility is illustrated through two tests
conducted on two vertically cantilevered bars
that simulated tall buildings and ambient test
of a 44-story building. Both approaches
show that GPS monitoring of long-period
structures provide sufficiently accurate
measurements of relative displacements and
that dynamic characteristics of the vibrating
systems can be accurately identified. This
capability can be very useful to be used for
structural health monitoring purposes.
Procedures and software are being
developed to permanently deploy GPS units
on tall buildings and suspension bridges.
5. REFERENCES:
^elebi, M., Presscott, W., Stein, R., Hudnut,
K., and Wilson, S., 1997, Application ofGPSin Monitoring TaU Buildings in Seismic Areas,
Abstract, AGU Meeting, San Francisco, Ca.
Dec. 1997
gelebi, M, 1998, GPS and/or strong and
weak motion structural response
measurements - Case studies. Structural
Engineers World Congress (SEWC), San
Francisco, Ca., July 1998 (paper submitted).
Hodgkinson, K. M., R. S. Stein, K. W.Hudnut, J. Satalich, and J. H. Richards,
Damage and restoration of geodetic
infrastructure caused by the 1994
Northridge, California, earthquake, U.S.
Geol. Surv. Open File Rep., 96-517, 1-70,
1996.
Hudnut, K. W., Z. Shen, M. Murray, S.
McClusky, R. King, T. Herring, B. Hager,
Y. Feng, P. Fang, A. Donnellan, and Y.
Bock, Coseismic displacements of the 1994
520
Northridge, California, earthquake. Bull.
Seis. Soc. Amer., 86, S19-S36, 1996.
Hudnut, K., 1996, Continuous GPSmonitoring of dam deformation, EOS, no.
46, pp. F139 (abstract).
Hudnut, K.W., and Behr, J., 1998,
Continuous GPS monitoring of deformation
of Pacoima Dam, Ca., (paper in preparation).
King, N. E., H. Johnson, W. H. Prescott, M.
H. Murray, J. L. Svarc, R. Clymer, and B.
Romanowicz, 1996, Estimates of GPS and
monument noise from the Bay Area Regional
Deformation (BARD) permanent array:
EOS, Transactions, American Geophysical
Union, v. 77, p. 153.
King, N. E., M. H. Murray, and W. H.
Prescott, 1994, The Bay Area Regional
Deformation (BARD) permanent GPS array
(Abs.): EOS, Transactions, American
Geophysical Union, v. 75, p. 470.
King, N. E., J. L. Svarc, E. B. Fogehnan, W.
K. Gross, K. W. Clark, G. D. Hamilton, C.
H. Stiffler, and J. M. Sutton, 1995,
Continuous GPS observations across the
Hayward fault, California, 1991-1994: J..
Geophys. Res., v. 100, p. 20,271-20,284.
Prescott, W. H., 1996, Will a continuous
GPS array for L.A. help earthquake hazard
assessment?: EOS, Transactions, American
Geophysical Union, v. 77, p. 417.
Stein, R. S., K. W. Hudnut, J. Satalich, and
K. M. Hodgkinson, Monitoring seismic
damage to bridges and highways with GPS:
Insights from the 1994 Northridge
earthquake, in Natl. Seismic Confr. on
Bridges and Highways, (pp. 347-360),
Sacramento, Fed. Highway Admin, and
Calif. Dept. of Transportation, 1997.
Stein, R. S., G. A. Marshall, and M. H.
Murray, Permanent ground movement
associated with the 1992 M=7 Cape
Mendocino, California, earthquake:
Implications for damage to infrastructure and
hazards to navigation, U.S. Geol. Surv.
Open-FUe Rep., 93-383, 36 p., 1993.
521
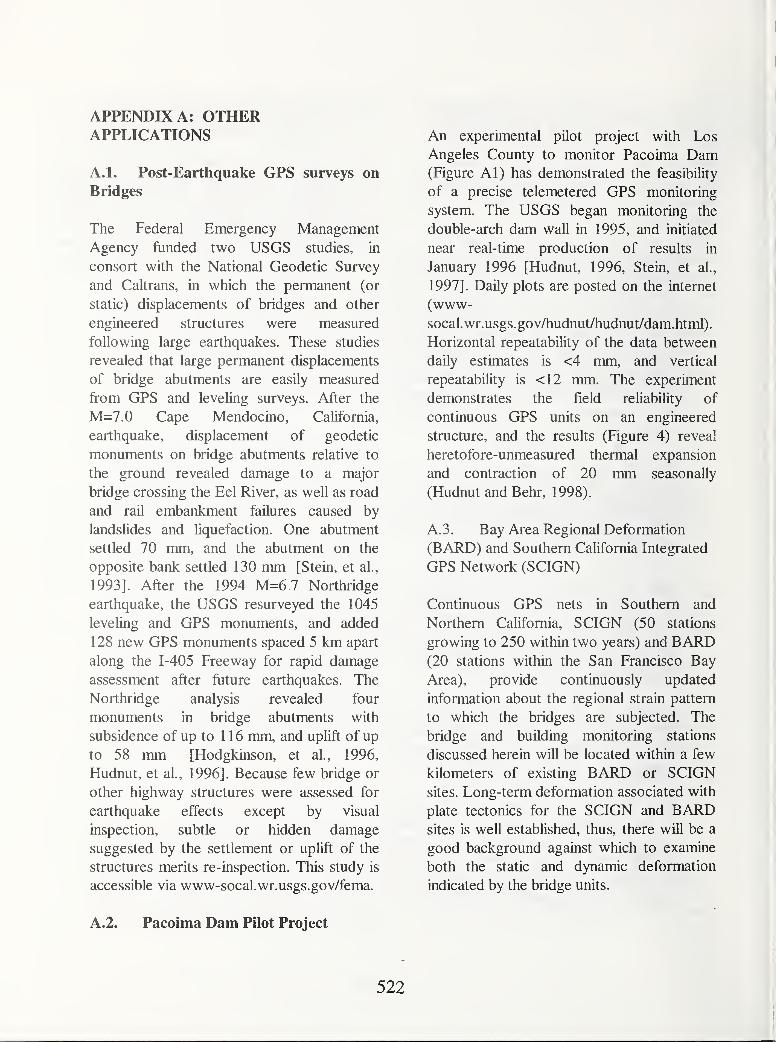
APPENDIX A: OTHERAPPLICATIONS
A.l. Post-Earthquake GPS surveys on
Bridges
The Federal Emergency Management
Agency funded two USGS studies, in
consort with the National Geodetic Survey
and Caltrans, in which the permanent (or
static) displacements of bridges and other
engineered structures were measured
following large earthquakes. These studies
revealed that large permanent displacements
of bridge abutments are easily measured
from GPS and leveling surveys. After the
M=7.0 Cape Mendocino, California,
earthquake, displacement of geodetic
monuments on bridge abutments relative to
the ground revealed damage to a major
bridge crossing the Eel River, as well as road
and rail embankment failures caused by
landslides and liquefaction. One abutment
settled 70 mm, and the abutment on the
opposite bank settled 130 mm [Stein, et al.,
1993]. After the 1994 M=6J Northridge
earthquake, the USGS resurveyed the 1045
leveling and GPS monuments, and added
128 new GPS monuments spaced 5 km apart
along the 1-405 Freeway for rapid damage
assessment after future earthquakes. The
Northridge analysis revealed four
monuments in bridge abutments with
subsidence of up to 116 mm, and uplift of up
to 58 mm [Hodgkinson, et al., 1996,
Hudnut, et al., 1996]. Because few bridge or
other highway structures were assessed for
earthquake effects except by visual
inspection, subtle or hidden damage
suggested by the settlement or uplift of the
structures merits re-inspection. This study is
accessible via www-socal.wr.usgs.gov/fema.
A.2. Pacoima Dam Pilot Project
An experimental pilot project with Los
Angeles County to monitor Pacoima Dam(Figure Al) has demonstrated the feasibility
of a precise telemetered GPS monitoring
system. The USGS began monitoring the
double-arch dam wall in 1995, and initiated
near real-time production of results in
January 1996 [Hudnut, 1996, Stein, et al.,
1997]. Daily plots are posted on the internet
(www-socal.wr.usgs.gov/hudnut/hudnut/dam.html).
Horizontal repeatability of the data between
daily estimates is <4 mm, and vertical
repeatability is <12 mm. The experiment
demonstrates the field reliability of
continuous GPS units on an engineered
structure, and the results (Figure 4) reveal
heretofore-unmeasured thermal expansion
and contraction of 20 mm seasonally
(Hudnut and Behr, 1998).
A. 3. Bay Area Regional Deformation
(BARD) and Southern California Integrated
GPS Network (SCIGN)
Continuous GPS nets in Southern and
Northern California, SCIGN (50 stations
growing to 250 within two years) and BARD(20 stations within the San Francisco Bay
Area), provide continuously updated
information about the regional strain pattern
to which the bridges are subjected. The
bridge and building monitoring stations
discussed herein wiU be located within a few
kilometers of existing BARD or SCIGNsites. Long-term deformation associated with
plate tectonics for the SCIGN and BARDsites is well established, thus, there wiU be a
good background against which to examine
both the static and dynamic deformation
indicated by the bridge units.
522
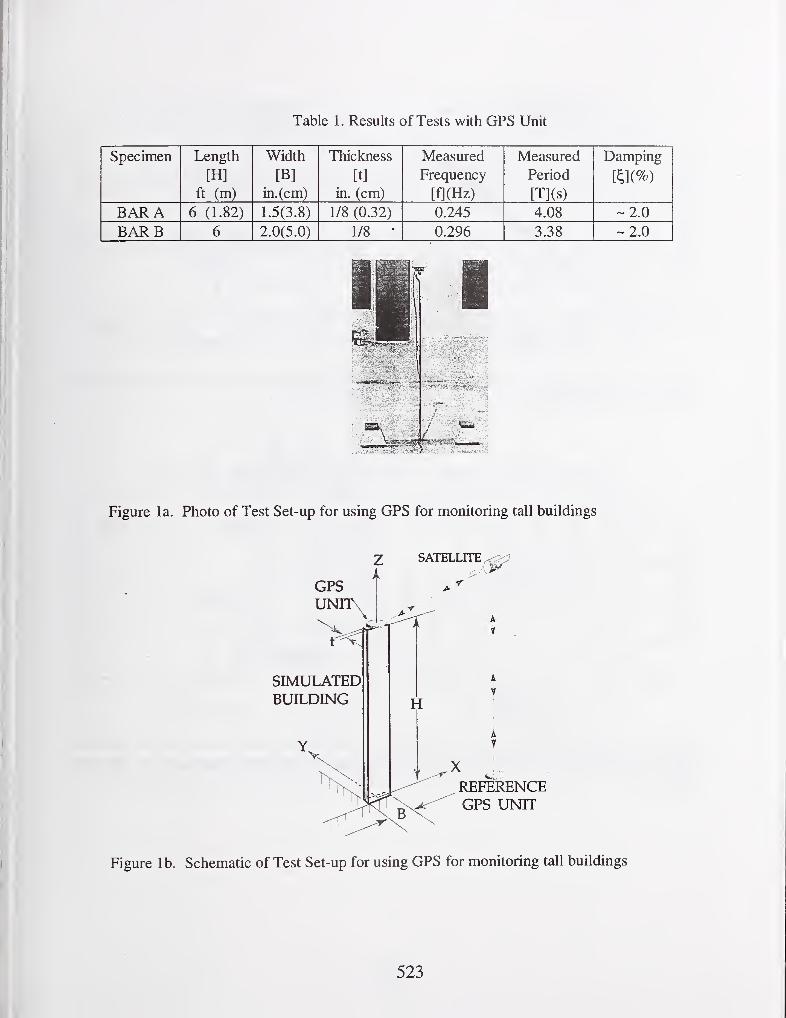
Table 1. Results of Tests with GPS Unit
Specimen Length
[H]
ft (m)
Width
[B]
in. (cm)
Thickness
[t]
in. (cm)
Measured
Frequency
mmMeasured
Period
[T](s)
Damping
m%)
BAR A 6 (1.82) 1.5(3.8) 1/8 (0.32) 0.245 4.08 -2.0
BARB 6 2.0(5.0) 1/8•
0.296 3.38 ~ 2.0
Figure la. Photo of Test Set-up for using GPS for monitoring tall buildings
GPS
SIMULATEDBUILDING
2 SATELLITE
H
X
B
REFERENCEGPS UNIT
Figure lb. Schematic of Test Set-up for using GPS for monitoring tall buildings
523
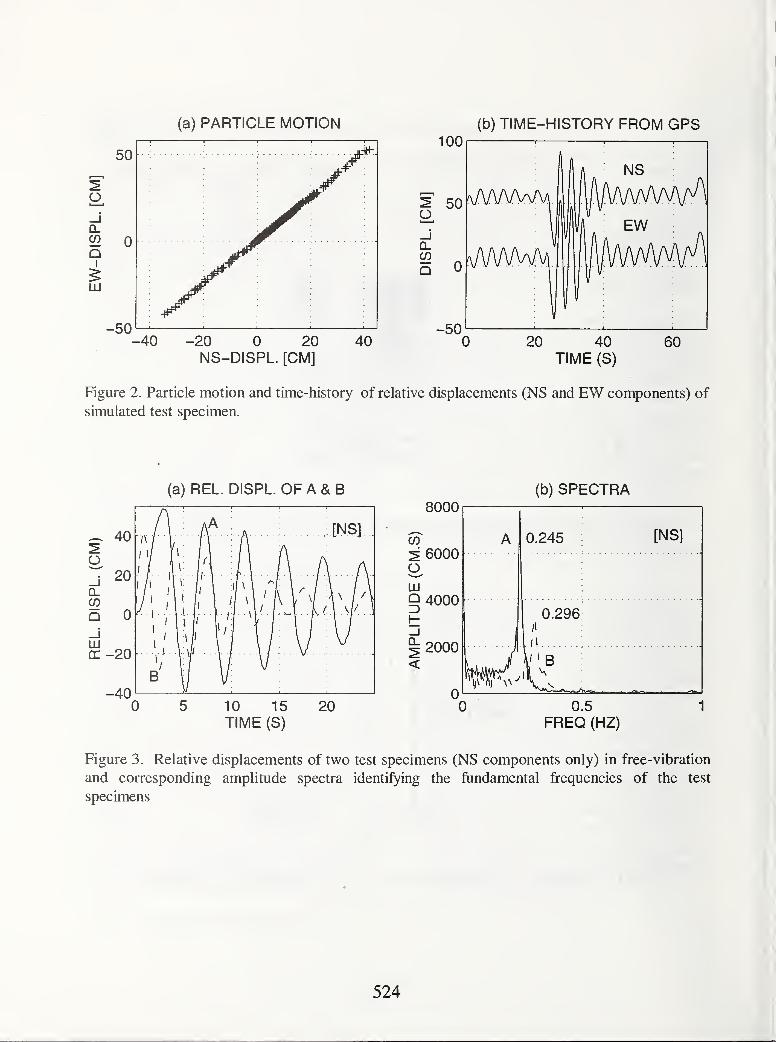
(a) PARTICLE MOTION (b) TIME-HISTORY FROM GPS
-40 -20 0 20NS-DISPL. [CM]
100
20 40TIME (S)
Figure 2. Particle motion and time-history of relative displacements (NS and EW components) of
simulated test specimen.
(a) REL. DISPL OF A & B
O40
20CLCO
Q 0
LUCC -20
-40
[NS].
'/
ft
y, /\
^
\^
( ''V/
]
B I Va.
0 10 15
TIME (S)
20
(b) SPECTRA8000
_ 6000OLLI
§ 4000
_l
^ 2000
0
A 0.245 [NS]
0.296/I
II
\|>B
0.5
FREQ (HZ)
Figure 3. Relative displacements of two test specimens (NS components only) in free-vibration
and corresponding amplitude spectra identifying the fundamental frequencies of the test
specimens
524

(b) 44-STORY BLDG
UJQd<
150
100
50
0
^ -50
X -100
-150
0.5
FREQ (HZ)
V
1
1 vjV-
0.5
FREQ (HZ)
150
100
50
0
-50
-100
-150
1
Figure 4. Ambient test of a 44-story building with GPS technology: Cross-spectrum (left-solid),
coherence (left-dashed) and phase-angle (right) of two orthogonal horizontal motions.
(a) ROOF: RECORDED (b) ROOF: SPECTRUM
10 20TIME (S)
(c) ROOF: RECORDED
0.5 1 1.5
FREQ (HZ)
(d) ROOF: SPECTRUM
1000
oLUG3
500
Q.
<
0.23
10 20TIME (S)
0.5 1 1.5
FREQ (HZ)
Figure 5. Recorded roof (38'*' floor accepted in lieu of roof) accelerations of a 44-story building
and displacements (derived by double integration) and amplitude spectrum.
525
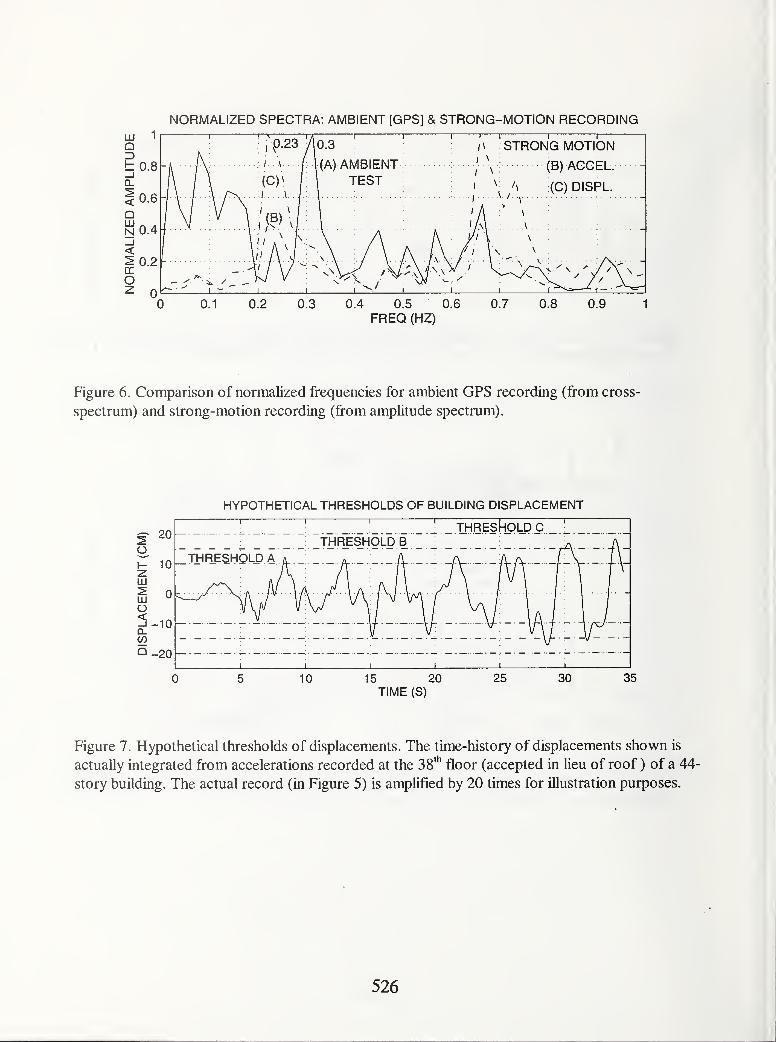
Figure 6. Comparison of normalized frequencies for ambient GPS recording (from cross-
spectrum) and strong-motion recording (from amplitude spectrum).
HYPOTHETICAL THRESHOLDS OF BUILDING DISPLACEMENT
O
O
20
1
' THRESHOLD CTHRESHOLD B
1
10 _ THRESHOLD A a.
_
0
10
201 1 1 1 1
0 5 10 15 20 25 30 35TIME (S)
Figure 7. Hypothetical thresholds of displacements. The time-history of displacements shown is
actually integrated from accelerations recorded at the 38"" floor (accepted in lieu of roof ) of a 44-
story building. The actual record (in Figure 5) is amplified by 20 times for illustration purposes.
526
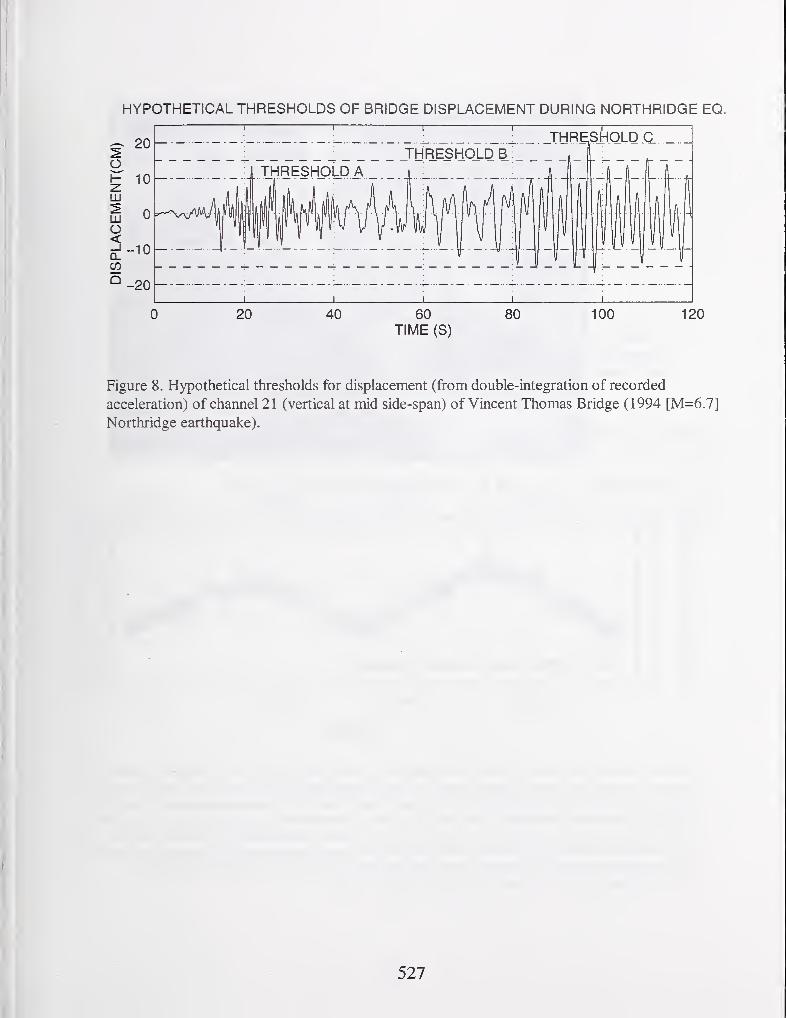
HYPOTHETICAL THRESHOLDS OF BRIDGE DISPLACEMENT DURING NORTHRIDGE EQ.
TIME (S)
Figure 8. Hypothetical thresholds for displacement (from double-integration of recorded
acceleration) of channel 21 (vertical at mid side-span) of Vincent Thomas Bridge (1994 [M=6.7]
Northridge earthquake).
527
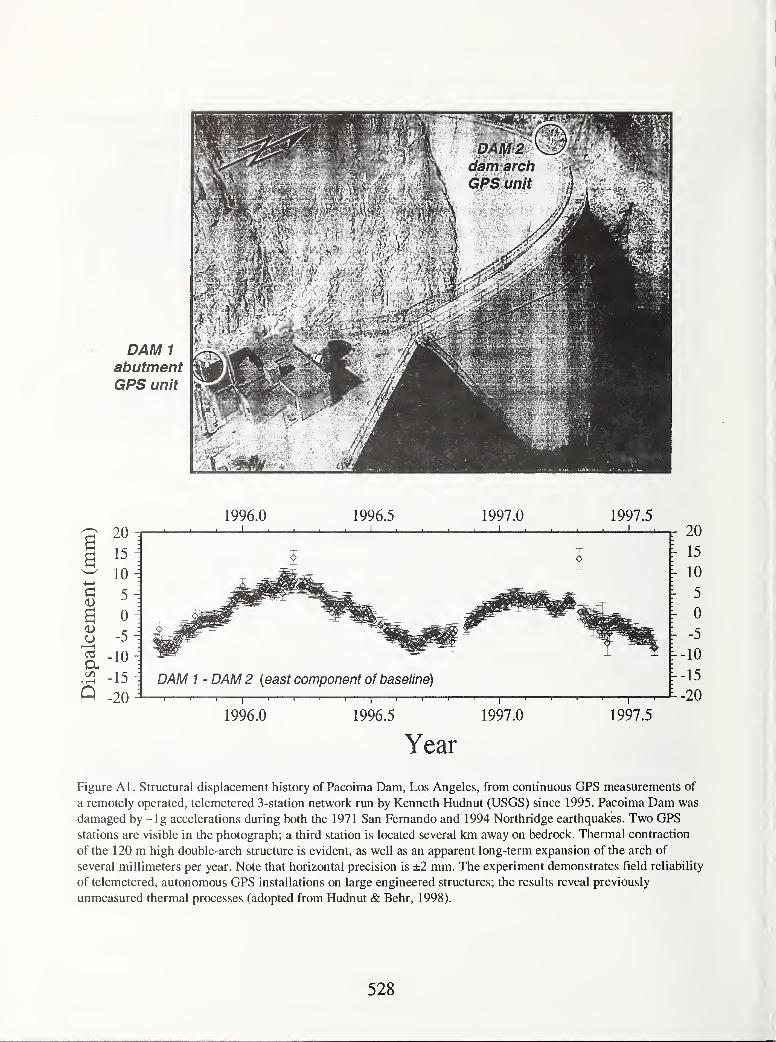
Figure Al. Structural displacement history of Pacoima Dam, Los Angeles, from continuous GPS measurements of
a remotely operated, telemetered 3-station network run by Kenneth Hudnut (USGS) since 1995. Pacoima Dam was
damaged by ~lg accelerations during both the 1971 San Fernando and 1994 Northridge earthquakes. Two GPSstations are visible in the photograph; a third station is located several km away on bedrock. Thermal contraction
of the 120 m high double-arch structure is evident, as well as an apparent long-term expansion of the arch of
several millimeters per year. Note that horizontal precision is ±2 mm. The experiment demonstrates field reliability
of telemetered, autonomous GPS installations on large engineered structures; the results reveal previously
unmeasured thermal processes (adopted from Hudnut & Behr, 1998).
528

APPENDIX
TASK COMMITTEE A-K REPORTSAND NEW T/C ON SEISMIC INFORMATION SYSTEMS

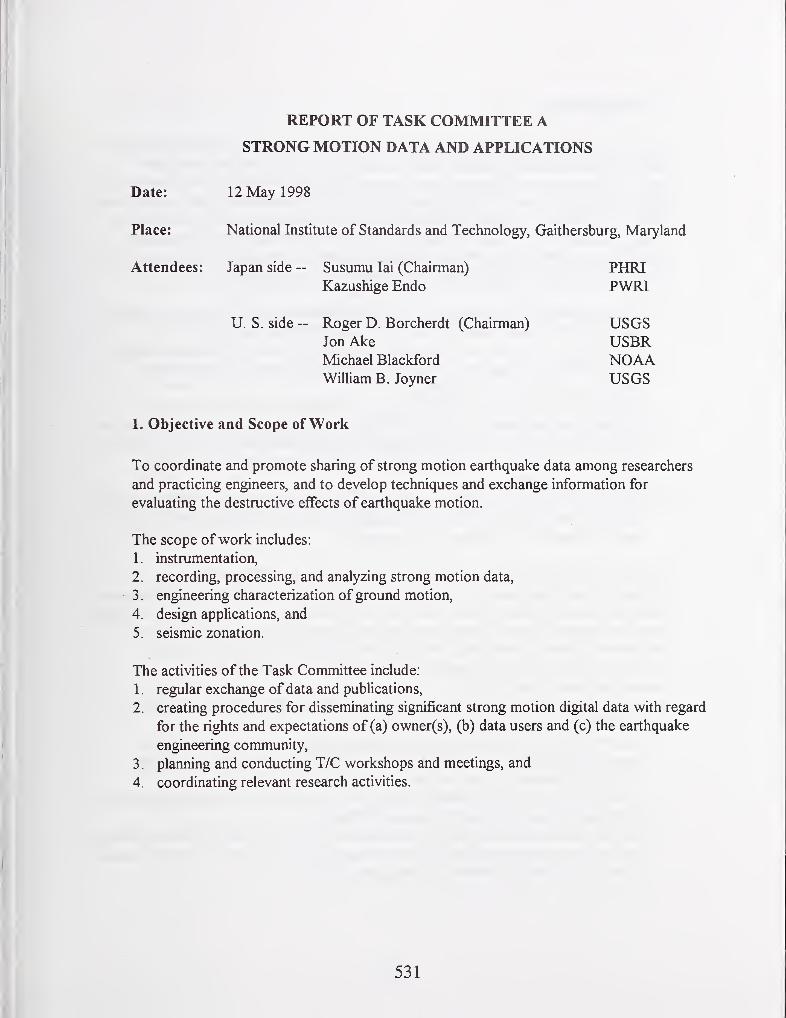
REPORT OF TASK COMMITTEE A
STRONG MOTION DATA AND APPLICATIONS
Date: 12 May 1998
Place: National Institute of Standards and Technology, Gaithersburg, Maryland
Attendees: Japan side Susumu lai (Chairman)
Kazushige EndoPHRIPWRI
U. S. side Roger D. Borcherdt (Chairman)
Jon AkeMichael Blackford
William B. Joyner
USGSUSBRNOAAUSGS
1. Objective and Scope of Work
To coordinate and promote sharing of strong motion earthquake data among researchers
and practicing engineers, and to develop techniques and exchange information for
evaluating the destructive effects of earthquake motion.
The scope ofwork includes:
1. instrumentation,
2. recording, processing, and analyzing strong motion data,
3 . engineering characterization ofground motion,
4. design applications, and
5 . seismic zonation.
The activities of the Task Committee include:
1 . regular exchange of data and publications,
2. creating procedures for disseminating significant strong motion digital data with regard
for the rights and expectations of (a) owner(s), (b) data users and (c) the earthquake
engineering community,
3. planning and conducting T/C workshops and meetings, and
4. coordinating relevant research activities.
531
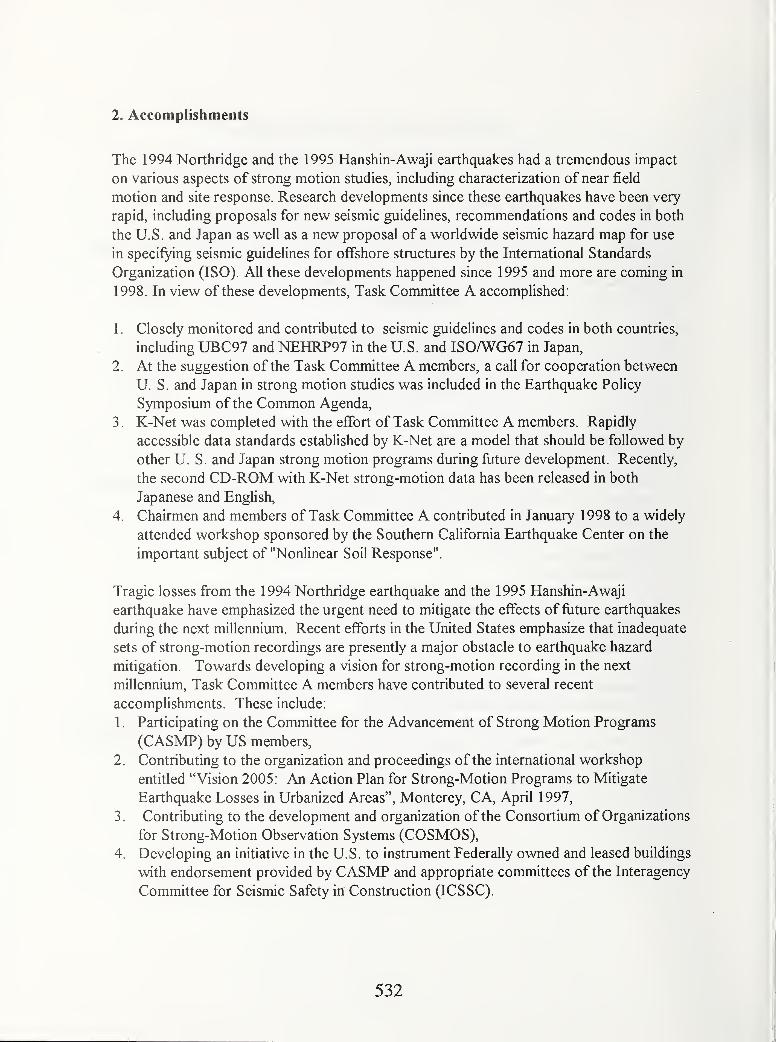
2. Accomplishments
The 1994 Northridge and the 1995 Hanshin-Awaji earthquakes had a tremendous impact
on various aspects of strong motion studies, including characterization of near field
motion and site response. Research developments since these earthquakes have been very
rapid, including proposals for new seismic guidelines, recommendations and codes in both
the U.S. and Japan as well as a new proposal of a worldwide seismic hazard map for use
in specifying seismic guidelines for offshore structures by the International Standards
Organization (ISO). All these developments happened since 1995 and more are coming in
1998. In view of these developments. Task Committee A accomplished:
1. Closely monitored and contributed to seismic guidelines and codes in both countries,
including UBC97 and NEHRP97 in the U.S. and ISOAVG67 in Japan,
2. At the suggestion of the Task Committee A members, a call for cooperation between
U. S. and Japan in strong motion studies was included in the Earthquake PoUcy
Symposium of the Common Agenda,
3. K-Net was completed with the effort of Task Committee A members. Rapidly
accessible data standards established by K-Net are a model that should be followed by
other U. S and Japan strong motion programs during future development. Recently,
the second CD-ROM with K-Net strong-motion data has been released in both
Japanese and English,
4. Chairmen and members of Task Committee A contributed in January 1998 to a widely
attended workshop sponsored by the Southern California Earthquake Center on the
important subject of "Nonlinear Soil Response".
Tragic losses fi^om the 1994 Northridge earthquake and the 1995 Hanshin-Awaji
earthquake have emphasized the urgent need to mitigate the effects of future earthquakes
during the next millennium. Recent efforts in the United States emphasize that inadequate
sets of strong-motion recordings are presently a major obstacle to earthquake hazard
mitigation. Towards developing a vision for strong-motion recording in the next
millennium. Task Committee A members have contributed to several recent
accomplishments. These include:
1 . Participating on the Committee for the Advancement of Strong Motion Programs
(CASMP) by US members,
2. Contributing to the organization and proceedings of the international workshop
entitled "Vision 2005: An Action Plan for Strong-Motion Programs to Mitigate
Earthquake Losses in Urbanized Areas", Monterey, CA, April 1997,
3. Contributing to the development and organization of the Consortium of Organizations
for Strong-Motion Observation Systems (COSMOS),4. Developing an initiative in the U.S. to instrument Federally owned and leased buildings
with endorsement provided by CASMP and appropriate committees of the Interagency
Committee for Seismic Safety in Construction (ICSSC).
532
3. Future Plans
Future plans include:
1. Planning a Task Committee workshop on Soil-structure Interaction (Chairmen: Celebi
and Okawa, September 1998 in U. S.).
2. Hosting a new workshop in December 1998 on strong motion studies, which could be
held in conjunction with ESG 98 (Effect of Surface Geology), to review and integrate,
where possible, the most recent developments since the 1996 workshop.
3. Coordinating, where appropriate, ongoing U.S. and Japan developments in strong-
motion-recording and data-dissemination programs, in conjunction with activities of
recently established committees such as CASMP and organizations such as COSMOS.4. Develop recommendations for Common Agenda, possibly in a workshop, regarding
U.S. and Japan needs for strong-motion measurement in densely urbanized areas to
significantly improve public earthquake safety.
5. Coordinating, where appropriate, ongoing developments in seismic hazard mapping
and seismic codes for generalization and worldwide use.
6. Recognizing the developing emphasis in the engineering and emergency response
communities on near-real time data availability, TC/A will continue to promote and
exchange new developments in real-time data acquisition, processing, and notification.
This activity will be in conjunction with the proposed TC on Seismic Information
Systems.
7. Pursuing the idea of establishing a WWW page, which provides links to home pages of
participating strong-motion organizations in conjunction with other UJNRWWWactivities.
533
REPORT OF TASK COMMITTEE BTESTING AND EVALUATION PROCEDURES FOR BUILDING SYSTEMS
Date: 12 May 1998
Place: National Institute of Standards and Technology, Gaithersburg, MD, U.S.A
Attendees: U. S. Side H. S. Lew (Chairman) NISIDaniel Abrams MAE Center
Japan Side — Keiichi Ohtani (Chairman) NIEDMakoto Watabe Keio University
1. Objective and Scope ofWork
The objective of the Task Committee is to develop and recommend rational test
procedures and to collect performance data of dynamic response of structures through
both laboratory testing of prototype structures and field testing of structures in-situ.
The scope ofwork includes:
1 Plans and conducts workshops and joint meetings to identify research topics and
develops joint research programs.
2. Coordinates research projects carried out by various laboratories in the U. S. and
Japan. Facilitates publication of research results and implementation of findings in
codes and standards.
3. Facilitates exchange of research personnel, technical information and available testing
facilities.
4. Develops uniform testing procedures including test loading history for case of
comparison of results of tests carried out by various researchers, and for establishment
of data base.
5. Develops guidelines for interpretation of test results in consideration for design of
structures.
6. Develops methodology for evaluation and interpretation of physical test results.
2. Accomplishments
1. The third phase of the U. S. Precast Seismic Structural Systems Program (PRESSS)
was initiated in 1 995 Studies, including the testing of a full scale, five story frame
534
structure are in progress. Large-scale frame testing will be carried out at the
University of California - San Diego.
2. In Japan, a 3 -year program on the development of design guidelines for
precast/prestressed buildings has been underway for the past two years and will be
completed in 1998.
3. The research program on Composite and Hybrid Structures (CHS) in Japan was
completed in early 1998. Experimental and analytical work was carried out jointly. The
Building Research Institute, several universities and construction companies, and the
Japan Structural Consultant Association undertook an applications study for
implementing research results into practice.
4. The research program on CHS in the U.S. was initiated in 1995 under the sponsorship
of the National Science Foundation. Over 16 research projects are in progress.
Additional projects on composite wall systems are being initiated.
5. The Fourth U.S. -Japan Joint Technical Coordinating Committee (JTCC) meeting on
CHS was held in October 1997 in Monterey, CA. Both sides agreed to continue to
coordinate efforts in the development of design guidelines and to transfer technology
to the design profession.
6. The 6* U.S.-Japan Cooperative Research on "Smart Structural Systems" (Auto-
Adoptive Media) was initiated in 1998.
3. Future Plans
1 . The Fifth U. S. -Japan Joint Technical Coordinating Committee Meeting on CHS will
be held in October 1998 in Japan, in conjunction with an International Symposium to
commemorate the 20'*' Anniversary ofU.S. -Japan Cooperative Research.
2. Several TCC meetings will be scheduled in respective countries in the coming year.
3 . In support of the International Decade for Natural Disaster Reduction (IDNDR)
Program, techniques will be explored to disseminate findings of completed joint
research projects to countries with high seismic risks.
4. A joint workshop on Test Procedure, Documentation, Retrieval of Test Data, and
Experimental Facilities will be held to maximize the usefulness of research data. The
date and location will be established prior to the 3 Joint Panel Meeting.
5. Future plans for U.S.-Japan cooperative programs shall consider existing and planned
experimental research programs of the three new NSF earthquake engineering research
centers.
535

REPORT OF TASK COMMITTEE C
DESIGN, EVALUATION AND IMPROVEMENT OF STRUCTURES
Date: 12 May 1998
Place: National Institute of Standards and Technology, Gaithersburg, MD, USA
Attendees: U.S.-side-- Shi-Chi Liu (Acting Chairman)
Noel Raufaste
Lawrence Hultengren
NSFNISIDOS
Japan-side- Hisahiro Hiraishi (Chairman)
Jun-ichi Hoshikuma
Michio Okahara
Takao Masui
Akiyoshi Mukai
BRIPWRIPWRINLABRI
1. Objective and Scope of Work
The objective of Task Committee (C) is to develop disaster mitigation guidelines and
programs that will improve the performance ofnew structures and the capacity of existing
structures in resisting wind and seismic forces. To establish adequate evaluation of
performance, each country will coordinate the development of condition assessment,
screening, structural analysis, and design methodologies. Enhance performance can be
obtained by the intelligent renewal, repair, and retrofit of existing buildings and other
structures. Certain structures will be analyzed and instrumented and then evaluated after
disasters. Also, effective use of new advanced materials, smart materials, and structural
systems associated with appropriate design methods, will provide structural performance
in the life cycle.
The scope ofwork includes:
1. Exchanging information, planning and hosting workshops on new design technologies,
evaluation technologies, and repair and retrofit techniques.
2. Studying new materials and methods for repairing and retrofitting existing structures
and for new construction.
3 . Developing a uniform system for screening and analyzing wind and seismic resistance
capacity of structures in each country.
4. Evaluating, composite/hybrid building structures and smart structural systems and
providing documentation for post-disaster evaluation of performance.
5. Developing reliable condition assessment systems for new and existing structures.
536
6. Coordinating research projects in the U.S. and Japan to minimize duplication and
maximize benefits.
2. Accomplishments
1. Conducted the fourth U.S.-Japan Technical Coordinating Committee Meeting on
Composite and Hybrid Structural Systenis, Monterey, CA, USA, during 12-14
October 1997.
2. In the field of hybrid structural systems. Dr. H. Kuramoto, BRI, completed a one-year
(October 1996-September 1997) research assignment at Cornell University, and Prof
R. Frosh, Purdue University, visited BRI in March 1998 to discuss the 6'^ U.S.-Japan
Cooperative Research Program on Smart Structural Systems.
3. Initiated Phase 6 of the U.S.-Japan Cooperative Research Program on "Auto-Adaptive
Media (Smart Structural Systems).
3. Future Plans
The following activities are planned for T/C (C):
1. Conduct the 5*^ U.S. -Japan Technical Coordinating Committee Meeting on Composite
and Hybrid Structural Systems, October 1998, Japan.
2. Conduct Workshops on Auto-Adaptive Media (Smart Structural Systems), in May at
Sonoma, CA, and Fall (to be determined), USA, 1998.
3 . Conduct a 20-year commemoration symposium on Cooperative Earthquake
Engineering Research, October 1998, Tokyo.
4. Continue the 6th U.S.-Japan Cooperative Research Project on Auto-Adaptive Media
(Smart Structural Systems).
5. Develop a reliable methodology for screening and analyzing wind and seismic resistant
capacity, and advanced instrumentation technology and expert systems to provide
condition assessment of existing structures.
6. Compile a database of advance materials/systems that have potential for improving
structural performance ofnew construction, and for use in rehabilitating and
strengthening existing buildings.
7. Investigate new design methodologies based on required structural performance using
advanced materials and systems.
537
8. Continue to encourage participants by private industry, consulting engineers,
universities, national and local government agencies involved in instrumentation,
evaluation, condition assessment, and retrofit and strengthening of existing buildings,
for seismic and wind resistance.
4. Other Activities
The following activities support the work of T/C (C):
1 . U.S. research sponsored by NSF, Corps ofEngineers, NIST and FWHA have
developed reports on seismic rehabilitation and retrofit strategies, including innovative
techniques for strengthening existing buildings and bridges.
2. Continue development ofNSF's Civil Infrastructure Systems Research Program,
including strong emphasis on evaluation and improvement of structures.
3 . Continue to encourage conduct of research in the area of retrofit and repair of
buildings and structures.
5. Develop and Harmonize T/Cs C & G
The consolidation of the T/Cs (C&G) was proposed at the U.S. -side Domestic Panel
Meeting of September 1997 and was approved by both sides at their respective Domestic
Panel Meetings, December 1997. T/C (C) requests approval from the flill Panel at the 30*^
Joint Panel Meeting ofMay 1998 to consolidate T/Cs (C&G) into a new T/C (C). The
revised name and proposed mission will be proposed by the respective T/C Chairs at both
sides Fall 1998 Domestic Meetings. Suggested new T/C titles were:
1 . High Performance Structural Systems and Auto-Adaptive Media.
2. High Performance Systems: Design, Repair, Evaluation, and Auto-Adaptive Media.
Suggested objective and scope ofwork and the future plans of the renewal Task
Committee (C) are as follows:
1 . Exchange information, and plan and conduct workshops on new design technologies,
evaluation technologies, repair and retrofit techniques.
2. Study advanced materials and methods for new construction and for repairing and
retrofitting existing structures.
3. Develop reliable condition assessment systems for new, existing and damaged
structures.
4. Develop and Harmonize performance based structural design developed in each
country.
538

Coordinate research projects on design, evaluation and improvement of structures
the U.S. and Japan to minimize duplication and maximize benefits.
539
REPORT OF TASK COMMITTEE D
EARTHQUAKE ENGINEERING FOR DAMS
Date: 12 May 1998
Place: National Institute of Standards and Technology, Gaithersburg, MD, USA
Attendees: U.S. -side- Robert Hall (Chairman) USAEUSAEUSAEUSERUSSR
Joseph Koester
William Roper
Larry Nuss
Frank McLean
Japan-side- Takashi Sasaki (Acting-Chairman)
Mitsu Okamura
Hideki Sugita
PWRIPWRIPWRI
1. Objective and Scope of Work
To develop technical insights into better understanding of the response of dams to seismic
effects, the T/C will plan, promote, and develop research initiatives to assist in assuring
seismic safety and economical protective countermeasure against earthquake loading for
these structures.
The scope ofwork includes:
1. Methods of analysis for seismic design of dams including outlet works. Comparison of
design methods and criteria between U.S. and Japan. Development of "Design
Earthquake Ground Motions" for analysis and evaluation of dams. Assessment of
investigation and dynamic analysis methods as tools (modeling, calculation codes).
2. Dynamic characteristics of dam construction materials and site conditions. Strength
and deformation characteristics during earthquakes (concrete, soil and rock).
3. Analysis of observed behavior of dams and outlet works during earthquakes.
Investigation of the mechanism of damages due to earthquake loading. Application of
the analysis of the observed behavior during earthquake to the earthquake-resistant
design.
2. Accomplishments
540

1 . T/C (D) conducted the First U. S.-Japan Workshop on Advanced Research on
Earthquake Engineering for Dams at the Waterways Experiment Station in Vicksburg,
Mississippi, USA, on 12-14 November, 1996.
2. Articles related to the first Workshop were printed in the Panel's Technical Bulletin
Winds and Seismic Effects, Issue 4, and in the PWRI Newsletter, No. 68.
3. In the field of seismic design for concrete dams, Mr. Takashi Sasaki, PWRI, started a
one-year (December 1997-December 1998) research at University of California,
Berkeley.
4. Some members of T/C (D) ofU.S. and Japan sides participated in the 4* International
Conference on Case Histories in Geomechanical Engineering in St. Louis, Missouri,
USA on 9-12 March 1998, and exchanged the latest results of research/investigation
and the newest technical information about dam earthquake engineering.
3. Future Plans
1 . Exchange of the results of research/investigation and technical information about damearthquake engineering is encouraged, and feasibility ofjoint research and
investigation is in continuous consideration.
2. Exchange visits to the institutes concerned, of scientists and engineers between U.S.
and Japan, is to be extended for the effective communications.
3. The proceedings of the first Workshop will be published and distributed to the T/C
members and Panel Secretariats.
4. In the field of seismic design for embankment dams, Mr. Tomoya Iwashita, PWRI, will
start a one-year (August 1998-August 1999) research at University of California,
Berkeley.
5. T/C (D) will hold the Second Workshop at the Public Works Research Institute,
Tsukuba, Japan, or at another location in Japan that would enhance field observation
opportunities in conjunction with the 3 T' Joint Panel Meeting in 1999.
6. Update the Task Committee membership.
541
REPORT OF TASK COMMITTEE E
DESIGN FOR WIND AND WIND HAZARD MITIGATION
Date: 12 May 1998
Place: National Institute of Standards and Technology, Gaithersburg, MD, USA
Attendees: U.S. -side-- Joseph Golden (Chairman) NCAABogusz Bienkiewicz CSU/FHWAArt Chiu University ofHawaii at ManoaHarold Bosch FHWA
Japan-side — Hiroshi Sato (Co-Chairman) PWRIShigetoshi Kobayashi PWRC
1, Objective and Scope ofWork
To exchange technical information and to jointly plan, promote and foster research and
dissemination, to improve understanding ofwind and its effects on structures, establish
more rational wind resistant design methods for structures, and to contribute to wind
hazard mitigation.
The scope ofwork includes:
1 . Characterization of strong wind, especially boundary layer extreme winds.
2. Wind effects (wind loading on and wind-induced response of structures).
3 . Experimental and analytical methods to predict wind and its effects.
4. Damage and risk assessment.
5 . Wind hazard assessments and wind hazard mitigation.
2. Accomplishments
Held the first joint Workshop on Design for Wind and Wind hazard Mitigation at the East-
West Center at the University ofHawaii on October 7-9, 1997. Seven Japan-side
members and ten U.S. -side members participated in the Workshop. After presenting
recent research results, the participants discussed potential research topics that could be
pursued in a collaborative program. Many of the participants visited the NOAA Tsunami
Warning Center and the National Weather Service Office on Oahu; and some also visited
the NOAA Mauna Loa Observatory on Hawaii following the Workshop. The proceedings
of the Workshop will be published by the U.S. -side, and distributed to all the Task
Committee members.
542
3. Future Plans
1. Hold the second joint workshop in Japan in the autumn of 1998, possibly November.
2. Pursue the possibility of collaborative research on the topics recommended at the first
workshop. PWRI and the University ofWashington are discussing possible
collaborative research on "Development o^Prediction Methods for Wind Response of
Long Span Bridges."
3. Exchange technical information on the following subjects:
a) Topographical effects on wind and the use of field measurements, numerical
models and geographic information systems (GIS) to study these effects.
b) Control of wind-induced response of structures.
c) Computational fluid dynamics and wind tunnel tests.
d) Prediction of wind-induced response of full-scale structures.
e) Investigation of wind hazards, including post-storm damage assessment
methodologies.
f) Wind resistant design codes, standards and recommendations.
543
REPORT OF TASK COMMITTEE FDISASTER PREVENTION METHODS FOR LIFELINE SYSTEMS
Date : 12 May 1998
Place : National Institute of Standards and Technology, Gaithersburg, MD, USA
Attendees : U.S. -side
-
Riley Chung (Chairman)
Ronald Andrus
Josephine Malilay
PhilHp Yen
NISTNISTCDCFHWA
Japan-side Keiichi Tamura (Acting-Chairman)
Takaharu Kiriyama
Keiko Ogawa
PWRINLATohoku University
1. Objectives and Scope ofWork
To improve the performance oflifeline systems during earthquakes and extreme winds, and to promote the
development and implementation oftechnical and non-technical countermeasures, including the capability in
damage estimation techniques and inspection procedures, through:
1 . Planning and conducting workshops.
2. Facilitating exchange oftechnical information and personnel.
3 . Promoting development of design guidelines and standards.
2. Accomplishments
1 . Members ofthis T/C participated in the planning ofthe second earthquake policy symposium held in
Kobe, Japan in September 1997. The symposium was led by the US. Federal Emergency Management
Agency and the National Land Agency ofJapan, under the U. S .-Japan Natural Disaster Reduction
Initiative ofthe U.S.-Japan Framework forNew Economic Partnership (Common Agenda).
2. Task Committee (F) held the Seventh Joint Workshop on Disaster Prevention for Lifeline Systems on
November 4 through 7, 1997, in Seattle, Washington. The workshop was co-sponsored by the Public
Works Research Institute ofJapan and the National Science Foundation and the National Institute of
Standards and Technology ofthe United States. Forty-five experts, representing government, academia,
industry and private practice, participated in the workshop. Thirty papers were presented, many ofthem
focused on the results ofthe studies ofthe two most recent devastating earthquakes; the 1994 Northridge
earthquake in California and the 1995 Kobe earthquake in Japan.
3 . Under the auspices ofTask Committees (F&H), Dr. Ronald D. Andrus, an NIST researcher in
geotechnical earthquake engineering, had a successfiil visit in December 1997 to PWRI, PHRI, and other
544

universities and private companies. The purpose ofhis visit was to collect additional information on shear
wave velocities at sites where liquefaction has happened or not happened during past earthquakes in Japan
and to explore the use ofshear wave velocities for evaluating liquefaction potential for lifeline systems.
3. Future Plans
1 . Encourage collaborative research and development in areas such as: performance prediction and post-
earthquake damage assessment oflifeline systems; systems approach to lifeline performance; soil-structure
interaction; and cost-effective ground improvement techniques and other countermeasures for lifeline
facilities.
2. Encourage and strengthen current efforts in both countries for developing seismic design guidelines and
standards for lifeline systems. ExistingUJNR channels should beMy utilized to facilitate the exchange of
relevant information concerning the development ofguidelines and standards. Possible collaboration of
developing guidelines and standards for lifeline systems should be pursued.
3 . Initiate cooperative efforts, including development ofa database, between lifeline engineering and public
health to assess consequences due to the disruption oflifeline systems.
4 . Hold the Eighth Joint Workshop on Disaster Prevention for Lifeline Systems in the Fall of 1999 in Japan.
Specific location, time, and theme ofthe workshop will be determined through correspondence between
the co-chairs ofthis task committee.
545

REPORT OF TASK COMMITTEE GSTRUCTURAL CONTROL AND INTELLIGENT MATERIAL SYSTEMS
Date: 12 May 1998
Place: National Institute of Standards and Technology, Gaithersburg, MD, USA
Attendees: U.S. -side - Shi-Chi Liu (Chairman)
Noel Raufaste
Lawrence Hultengren
NSFNISTDOS
Japan-side Jun-ichi Hoshikuma (Acting-Chairman) PWRIBRIPWRINLABRI
Hisahiro Hiraishi
Michio Okahara
Takao Masui
Akiyoshi Mukai
1. Objective and Scope of Work
1 . Develop research plans in control of equipment and structures and in high performance
structural and material systems;
2. Implement control techniques for motion reduction and modification;
3. Implement use of advanced materials in actual design and construction of buildings
and other infrastructure systems under seismic or wind environments;
4. Promote U.S. -Japan cooperation in structural control and intelligent material systems
research;
5. Bring together governmental, academic, and industrial participants in joint pursuit of
these efforts; and
6. Contribute to IDNDR by organizing joint research and other technical activities in
stmctural and intelligent material systems research based on international cooperation.
T/C (G) works closely with other organizations to provide the leadership in this emerging
research by facilitating the exchange of data and information through UJNR mechanisms.
The scope ofwork includes:
1. Providing technical assistance, consultation and coordination ofUJNR affiliated
research organization in the initiation, development, and execute their programs in
research areas.
2. Promoting joint government-university-industry collaborative efforts to facilitate
technology transfer and practical implementation.
546
3. Sponsoring and conducting interdisciplinary workshops and meetings to identify key
area of research and opportunities for cooperation, and to stimulate public awareness
and interest in this field of research.
4. Developing promotional and demonstrative activities to stimulate public awareness
and interest in this field of research.
5. Providing information usefiil for the establishment of performance standards, design
and also retrofit/rehabilitation of existing structures.
6. Promoting research in intelligent material systems, sensors, actuators, optional control
system design, and encourage laboratory and field experiments of prototype and fiall-
scale structures.
2. Accomplishments
1 . In 1998, a five-year U.S. -Japan Cooperative Research Program on Urban Earthquake
Disaster Mitigation between NSF and Monbusho (Ministry ofEducation) was initiated
under U.S.-Japan Common Agenda.
2. Phase 6 of the U.S. -Japan Cooperative Research Program on "Auto-Adaptive Media"
(Smart Structural Systems) was initiated in 1998.
3. Future Plans
1 . To implement Phase 6 of the above U. S.-Japan Cooperative Research Program on
Auto-Adaptive Media.
2. Task Committee (G) confirmed its agreement to consolidate with T/C (C) into a new
T/C (C). The activities of T/C (G) will be continued in the new T/C (C) and in T/C
(J)-
4. Develop and Harmonize T/Cs C&G
The consolidation of the T/Cs (C&G) was proposed at the U.S. -side Domestic Panel
Meeting of September 1997, and was approved by both sides at their respective Domestic
Panel Meetings, December 1997. T/C (G) requests approval, from the fijU Panel at the
30"^ Joint Panel Meeting ofMay 1998, to consolidate T/Cs (C&G) into a new T/C (C).
The revised name and proposed mission will be proposed by the respective T/C Chairs at
both sides' Fall 1998 Domestic Meetings. Suggested new T/C titles were:
1 . High Performance Structural Systems and Auto-Adaptive Media
2. High Performance Systems: Design, Repair, Evaluation, and Adaptive Media.
Suggested objective and scope ofwork and the fiiture plans of the consolidated T/C (C)
are as follows:
1 . Exchange information, and plan and conduct workshops on new design technologies,
evaluation technologies, repair and retrofit techniques.
547

2. Study advanced materials and methods for new construction and for repairing and
retrofitting existing structures.
3 . Develop reliable condition assessment systems for new, existing and damaged
structures.
4. Develop and Harmonize performance based structural design developed in each
country.
5. Coordinate research projects on design, evaluation, and improvement of structures in
the U.S. and Japan to minimize duplication and maximize benefits.
548
REPORT OF TASK COMMITTEE HSOIL BEHAVIOR AND STABILITY DURING EARTHQUAKES
Date: 13 May 1998
Place: National Institute of Standards and Technology, Gaithersburg, MD, USA
Attendees: U.S. -side - Joseph P. Koester (Acting-Chairman)WESJon AkeLarry Nuss
Ronald Andrus
Frank McLeanWilliam Joyner
USERUSERNISIUSERUSGS
Japan-side Mitsu Okamura (Acting-Chairman)
Takashi Sasaki
PWRIPWRI
1. Objective and Scope ofWork
Government agencies responsible for public works must assure seismic safety and provide
economical protection against earthquake hazards.
The objective of the Task Committee (H) is to assist in meeting these needs by enhancing
the availability of technology for predicting the dynamic behavior of soils, foundations and
earth structures, and analyzing dynamic soil/structure interaction to assure their safe
performance during earthquakes.
In accordance with the objective, the scope ofwork includes:
1 . Exchange information on technological developments, state-of-the-art and practice
related to soil behavior and stability during earthquakes.
2. Exchange information and technical data relating to field performance, research, and
methods of practice.
3 . Plan and conduct programs of cooperative research and/or workshops in coordination
with the proposed or on-going programs.
4. Make other efforts needed including exchange of researchers between U.S. and
Japanese research institutions, and publication of research results and recommended
practice.
2. Accomplishments
549
1 . The National Research Institute for Earth Science and Disaster Prevention (NIED),
the Building Research Institute (BRI), and Wayne State University (WSU), have
continued to work in their cooperative research program "Physical and Numerical
Simulation of Structural Damages Due to Liquefaction and Development of
Countermeasure Techniques," 1994-1998.
2. Port and Harbor Research Institute (PHRI), Colorado School ofMines and the
Lovelace Institutes (Albuquerque, NM) have continued joint research on application
ofthe Nuclear Magnetic Resonance Imaging (NMRI) method to the study of soil
behavior and stability during earthquakes.
3. Under the auspices of Task Committees (F&H), Dr. Ronald R. Andrus, a NISTresearcher in geotechnical engineering, had a successful visit to PWRI, PHRI, several
universities, and private companies in December 1997. The purpose of his visit was to
collect data on shear wave velocities at sites where liquefaction was observed and not
observed, and to explore the use of shear wave velocities at sites for use in evaluating
liquefaction potential for lifeline systems.
3. Future Plans
1 . Task Committee (H) plans to hold a workshop on the Use of Centrifuge Modeling for
Research into Soil Behavior and Stability During Earthquakes 28-29 September 1998,
Tsukuba, Japan. It will be held just after the International Conference CENTRIFUGE'98 in Tokyo, organized by Japanese Geotechnical Society and International Society
for Soil Mechanics and Geotechnical Engineering (ISSMGE).
2. Continue collaborations on liquefaction prediction based on field performance data and
shear wave velocity measurements.
4. Other Activities
The Japanese Geotechnical Society has published a Handbook on Liquefaction
remediation. English translation and editing of the draft was completed with the assistance
ofPanel members.
550
REPORT OF TASK COMMITTEE I
STORM SURGE AND TSUNAMIS
Date: 13 May 1998
Place: National Institute of Standards and Technology, Gaithersburg, MD, USA
Attendees: U.S. -side - Michael Blackford (Chairman) NCAA
Japan-side Shigetoshi Kobayashi (Acting-Chairman) PWRCKeiichi Tamura PWRI
1. Objective and Scope of Work
The objective of this Task Committee is to mitigate damage from storm surge and tsunami
through cooperative research and shared technology and information. The primary cause
of storm surge is considered to be tropical cyclones (hurricane, typhoons). The primary
cause of tsunamis is considered to be sudden sea floor deformation due to earthquakes,
volcanic activity and landslides. Both hazards may cause disasters along coastal regions.
The scope of this T/C is as follows:
1 . Exchange resuhs of research on storm surge and tsunami occurrence, generation,
.propagation, and coastal effects. This includes observations on historical, current, and
theoretical tsunamis. Of particular interest is the eflFort by U.S. and Japan to acquire
deep ocean tsunami measurements.
2. Exchange results and status of storm surge and tsunami mitigation activities including
analysis of the problem, planning, warning and engineering approaches.
3 . Exchange information on development oftechnologies such as computer programs to
predict travel times, land-fall locations, inundation and run-up heights, and wave
characteristics, improved instrumentation, and use of satellite communication for
detection and warning.
4. Facilitate dissemination through exchanges of literature, technical reports at joint
meetings, special workshops, joint projects, and direct interaction among participants.
The storm surge research community which fiinctions through many related societies
and international organizations, defines and stimulates work in the field. The Task
Committee, through its meetings and workshops, encourages exchanges of ideas and
joint study by U.S. and Japanese investigators oftsunami events throughout the world.
551
2. Accomplishments
1 . The Task Committee agreed to support the improvement of the gridded bathymetry
and coastal-topography data initiated by International Tsunami Commission.
2. The Task Committee exchanged ideas on large-scale laboratory experiments on
tsunami run-up.
3 . Deep ocean tsunami detection systems were deployed off the coasts of Alaska and
Washington by the U.S. NOAA's Pacific Marine Environmental Laboratory (PMEL)during the summer of 1997. These instruments initially functioned well, however
winter storms proved it will be necessary to modify the communication system.
3. Future Plans
1. The 5* Storm Surge and Tsunami Workshop will be held in Sapporo, Japan, in July
1998.
2. Modified deep ocean detection systems will be redeployed during the summer of 1998
by PMEL.
552

REPORT OF TASK COMMITTEE J
WIND AND EARTHQUAKE ENGINEERINGFOR TRANSPORTATION SYSTEMS
Date: 13 May 1998
Place: National Institute of Standards and Technology, Gaithersburg, MD, USA
Attendees: U.S.-side- Dr. Phillip Yen (Acting-Chair) FHWADr. Daniel Abrams MAECDr. Bogusz Bienkiewicz CSUDr. Arthur Chiu University ofHawaii at ManoaDr. Joseph Golden NOAA
Japan-side ~ Dr. Michio Okahara (Acting-Chair) PWRIDr. Hiroshi Sato PWRIDr. Jun-ichi Hoshikuma PWRIDr. Hisahiro Hiraishi BRI
1. Objectives and Scope of Work
1. Plan, promote, and foster research on the behavior of highway bridges when subjected
to wind and seismic forces, and
2. Disseminate research results and provide specifications and guidelines based on the
Task Committee's findings. Surface transportation systems play a vital role in the
movement of goods and people. Highway bridges are especially influenced by the
forces ofwind and earthquakes because of their open exposure to those forces.
The scope ofwork includes:
1 . Researches on highway bridges without limitation on their size and function.
2. Investigations existing and new bridge designs.
3. The behavior ofwhole bridge systems and/or single components of a bridge.
2. Accomplishments
The 13th U.S. -Japan Bridge Engineering Workshop was held during 2-3 October 1997, in
Tsukuba, Japan. The workshop was attended by 19 U.S. and 58 Japanese participants.
The proceedings of the workshop has been published and will be distributed.
3. Future Plans
553

1. The 14th U.S. -Japan Bridge Engineering Workshop will be held during the Fall of
1998, in Pittsburgh, Pennsylvania, USA.
2. Continue to investigate and exchange technical information on improved seismic
retrofit and strengthening procedures for highway bridges based on experimental,
analytical, and field studies. This exchange should include information on maintenance
of existing bridges.
3. Continue to conduct cooperative research on the seismic performance of bridge piers
and columns experimentally and analytically, and encourage research on seismic
isolation and hybrid control of bridges.
4. Continue the coordinated research study to compare the seismic design criteria for
bridges in Japan and the U. S. and discuss the method and analysis procedures for
bridge column design. Continue to exchange information on the application of the limit
state design method.
5. Encourage a research study on seismic, aeroelastic, and aerodynamic response of long
span bridges such as cable-supported bridges with emphasis on behavior of composite
materials, cable inspection, vibration control, and corrosion protection.
6. Encourage a coordinated research study on seismic response and control, system
identification techniques, nondestructive evaluation of bridge structures, use and
performance of structural materials including new materials, and performance of
jointless bridges.
7. Dr. Jun-ichi Hoshikuma, Research Engineer ofEarthquake Engineering Division,
PWRI started his one-year guest research assignment on seismic design of bridges at
UCSD from March, 1998.
554
REPORT OF TASK COMMITTEE KWIND AND EARTHQUAKE ENGINEERING FOR OFFSHORE
AND COASTAL FACILITIES
Date: 13 May 1998
Place: National Institute of Standards and Technology, Gaithersburg, MD, USA
Attendees: U.S. -side - Charles Smith (Chairman)
Martin Eskijian
MMSCSLC
Japan-side Susumu lai (Acting-Chairman)
Akiyoshi Mukai
PHRIBRI
1. Objective and Scope of Work
To develop technical insights necessary to mitigate damage to offshore and coastal
facilities due to extreme wind and seismic effects. The Task Committee will plan, promote
and develop research initiatives to meet this objective and will disseminate the results of
their research for incorporation into future specification or design guidelines. Criteria for
the design of offshore and coastal facilities may differ greatly fi^om their onshore
counterparts. These differences can arise due to their unique design or mass distribution,
to the fluid/structure or wind/structure interaction, to the placement of foundation
elements in or on soft, fiiUy saturated soils that can be subject to large hydrodynamic
pressures, and to the lack of specific environmental data or engineering experience that
has been developed for most onshore sites.
The scope of work includes:
1 . Sponsoring and conducting workshops and meetings to identify key areas of research,
opportunities for cooperation, and the exchange of knowledge.
2. Predicting strong ground motions for offshore and coastal sites including assessing the
effects of basin geometry, linear, and nonlinear local geological effects using actual
seafloor response measurements.
3. Determining the dynamic response and the interaction of structure/foundation/soil
systems to seabed motions and/or extreme wind forces.
4. Assessing the dynamic response and behavior of various operational facilities mounted
on offshore and coastal structures.
5. Developing assessment methodologies for earthquakes and other characteristics of
potential seismic sources (e.g. faults) for offshore and coastal sites in regards to how
these conditions relate to structural design criteria.
555
6. Promoting the implementation ofnew research results into current design and
construction processes.
7. Developing research efforts to include laboratory and field programs to obtain data on
the response of offshore and coastal facilities to extreme wind and seismic forces.
8. Creating performance standards, design specifications, guidelines, and code
recommendations for applications to new construction as well as remedial action for
existing facilities.
2. Accomplishments
1. Members of Task Committee (K) helped to organize and participated in the workshop,
"Earthquake Criteria Workshop- Recent Development in Seismic Hazard and Risk
Assessment for Port, Harbor, and Offshore Structures," held concurrently with the
International Offshore Mechanics and Arctic Engineering (OMAE 1 997) Conference
in Yokohama, Japan on April 17, 1997.
2. Task Committee (K) held initial planning phase to conduct a third international
workshop. The theme of this workshop will focus on seismic, wind, and hazard
mitigation techniques for offshore and coastal facilities. It is to be held in Japan in late
1999 or early 2000.
3. Future Plans
1 . Develop workshop agenda of the third U.S.-Japan Workshop on Wind and
Earthquake Engineering for Offshore and Coastal Facilities.
2. Coordinate, where possible, on-going research on wind and earthquake engineering
for offshore and coastal facilities of interest to the members of the Task Committee.
This includes sharing of research reports and publications where possible.
3. Since tsunamis have been less severe in the U.S. than in Japan, the U.S. has fewer
researchers in this specialty. The Task Committee, through its meetings and
workshops, encourages exchanges of ideas and joint study by U.S. and Japanese
investigators of tsunami events throughout the world.
4. Task Committee (K) will work within the framework of the U.S. -Japan CommonAgenda Program focusing on the issue of acceptable seismic risk guidelines for ports
and harbors.
5. Task Committee (K) will coordinate activities with the Pacific Earthquake Engineering
Research (PEER) Program on ports and harbors centered at the University of
Southern California.
556
REPORT OF NEW TASK COMMITTEESEISMIC INFORMATION SYSTEMS
Date: 13 May 1998
Place: National Institute of Standards and Technology, Gaithersburg, MD, USA
Attendees: U.S.-side- Dr. Stuart Nishenkb (Co-chairman) FEMADr. William Roper (Co-chairman) USACEDr. Roger Borcherdt USGSDr. Mehmet Celebi USGSDr. Josephine Malilay CDCMr. Noel Raufaste NISI
Japan-side ~ Mr. Takaharu Kiriyama (Co-chairman) NLADr. Hideki Sugita (Co-chairman) PWRIMr. Takao Masui NLADr. Makoto Watabe Keio University
Mr. Keiichi Ohtani NIEDDr. Keiko Ogawa Tohoku University
1. Objective and Scope ofWork
The objective of this Task Committee is to improve understanding of earthquakes and
their societal impacts using seismic information systems (SIS), loss estimation
methodologies and computational models that describe the effects of seismic loading on
the built environment. The Task Committee will foster cooperation between the US and
II Japan policy and research community. It will be a principal Panel technical resource to the
Earthquake PoUcy Cooperation under the US-Japan Common Agenda.
The Task Committee will serve as a forum for exchanging information between the two
nations on identifying, developing, and reviewing data, systems, and methodologies
involved in SIS, earthquake loss estimation, geospatial and topographic information
systems, real-time seismic warning systems, and their application to earthquake disaster
mitigation, preparedness, emergency response, and recovery. The Task Committee also
will review various disaster information networks like the Global Disaster Information
Network (GDIN) and assess their applicability.
The scope ofwork for this Task Committee is as follows:
A. Plan and conduct T/C workshops and joint meetings to identify research topics and develop
joint research programs.
B. Review the principles, objectives, structure and uses of existing SIS systems, loss estimation
methodologies and real-time earthquake warning systems.
557
C. Review existing Geographic Information Systems (GIS), identify data structures and
operations required for successful integration into SIS. Results of this review may identify
applications to other natural disaster phenomena such as wind, storm surge, tsunami, and
flooding. If applicable, additional modules will be addressed in the future to be incorporated
into the system.
D. Facilitate the exchange of policy and research persormel, technical information, and data.
E. Assist in the coordination of policy initiatives and research projects in the US and Japan to
minimize duplication and maximize the benefits of bringing together government, academic,
and private sector participants in these efforts.
F. Facilitate the publication and distribution of earthquake policy and research results related to
SIS and the implementation of these findings in guidelines, codes, and standards
G. Provide technical assistance, consultation, and coordination of the Panel's affiliated research
organizations to support related work identified by the Common Agenda's Earthquake Policy
High Level Forum.
H. Facilitate the exchange of information between U S and Japan policy makers to promote the
application of SIS.
I. Develop promotional and demonstrative activities to stimulate public awareness and interest in
these emerging technologies.
J. Disseminate the knowledge gained from this US-Japan cooperation to other nations.
K. This Task Committee will cooperate with the UJNR Panels on Earthquake Research and on
Fire Research and Safety to identify specific tasks of mutual interest.
L. L. This Task Committee will promote and exchange new developments in real-time data
acquisition, processing, and notification in conjunction with T/C (A).
2. Meeting Accomplishments
A. Tasks concerned with the establishment of this Task Committee have been completed,
including definition of the committee objectives and scope of work, establishment of
the initial membership, and development of fliture plans.
B. Committee Membership is proposed for government participants and candidate non-
government participants are indicated.
Government Membership
U.S.-side- Dr. Stuart Nishenko (Co-chairman) FEMADr. William Roper (Co-chairman) CORPSDr. Harley Benz USGSDr. Roger Borcherdt USGS
558
Dr. Mehmet Celebi USGSDr. William Ellsworth USGSMr. Richard Eisner State of California, OESDr. Walter Hays USGSDr. H. S. Lew NISTDr. Peter Ward USGS
Japan-side -- Mr. Kazuo Okayama (Co-chairman) NLADr. Hideki Sugita (Co-chairman) PWRIMr. Akira Kinoshita GSIMr. Hiroshi Masaharu GSIMr. Akira Nagai JMAMr. A. Ito MRIDr. Hiroyuki Yamanouchi BRIMr. Tomofiimi Nozaki PWRIMr. Toshiaki Yokoi BRIDr. Izuru Okawa BRIMr. Atsushi Nozu PHRIDr. Keiichi Ohtani NIED
Proposed Non-Government Membership
U.S.-side ~ Dr. Scott LawsonDr. James Goltz
Mr. Ron Eguchi
Dr. David Simpson
Dr. Tim Ahern
Japan-side ~ Mr. Yoshiyuki Murayama Tohoku University
Dr. Keiko Ogawa Tohoku University
3. Future Plans
Plan and hold a joint workshop. The proposed time of the workshop is summer to autumn
of 1999. Further discussions on the time, theme, location of the workshop will take place
over the next several months. This workshop would review national policies and
programs on earthquakes, use of real-time warning and notification systems, use of remote
sensing and geospatial sensors and analysis technology applications, use of real-time and
near-real time strong motion measurement, damage assessment and emergency response
systems, use of earthquake loss-estimation methodologies and emergency response
models.
A. Review current real-time and near real-time earthquake warning/notification
systems in the US and Japan, e.g.
CUBE/TriNet in Southern California (USGS, CDMG, Caltech)
RMSCaltech
EQEIRIS
IRIS
559
REDI in Northern California (UC, Berkeley)
SCIGN (USGS, SCEC)ODIN (US govt.)
MOC-Net (MOC)JMA net (JMA)
B. Review real time and near real-time earthquake strong motion measurement,
damage assessment and emergency response systems in the US and Japan, e.g.
Health Impact Surveillance System for Natural Disasters (ARC-CDC)California Strong Motion Instrumentation Program (CDMG)US National Strong Motion Program (USGS)
- GPS-LPS (USGS)
Kyoshin net (NED)SIGNAL (Tokyo Gas)
SATURN (PWRI)
UrEDAS(JR)
C. Review earthquake loss estimation methodologies and emergency response
models, e.g.
HAZUS (FEMA)EPEDAT (EQE)
Early Estimation System (NLA)
Loss Estimation Model
Fire and Disaster Management Agency model (FDMA)Local government models
560 "i^V.S. GOVERMENT PRINTING OFFICE: 1998 -433-235/93227
Technical Publications
Periodical
Journal of Research of the National Institute of Standards and Technology—Reports NIST research
and development in those disciplines of the physical and engineering sciences in which the Institute is
active. These include physics, chemistry, engineering, mathematics, and computer sciences. Papers cover a
broad range of subjects, with major emphasis on measurement methodology and the basic technology
underlying standardization. Also included from time to time are survey articles on topics closely related to
the Institute's technical and scientific programs. Issued six times a year.
Nonperiodicals
Monographs—Major contributions to the technical literature on various subjects related to the
Institute's scientific and technical activities.
Handbooks—Recommended codes of engineering and industrial practice (including safety codes) devel-
oped in cooperation with interested industries, professional organizations, and regulatory bodies.
Special Publications—Include proceedings of conferences sponsored by NIST, NIST annual reports, and
other special publications appropriate to this grouping such as wall charts, pocket cards, and bibliographies.
National Standard Reference Data Series—Provides quantitative data on the physical and chemical
properties of materials, compiled from the world's literature and critically evaluated. Developed under a
worldwide program coordinated by NIST under the authority of die National Standard Data Act (Public
Law 90-396). NOTE: The Journal of Physical and Chemical Reference Data (JPCRD) is published
bimonthly for NIST by the American Chemical Society (ACS) and the American Institute of Physics (AIP).
Subscriptions, reprints, and supplements are available from ACS, 1155 Sixteenth St., NW, Washington, DC20056.
Building Science Series—Disseminates technical information developed at the Institute on building
materials, components, systems, and whole structures. The series presents research results, test methods, and
performance criteria related to the structural and environmental functions and the durability and safety
characteristics of building elements and systems.
Tectinical Notes—Studies or reports which are complete in themselves but restrictive in their treatment of
a subject. Analogous to monographs but not so comprehensive in scope or definitive in treatment of the
subject area. Often serve as a vehicle for final reports of work performed at NIST under the sponsorship of
other government agencies.
Voluntary Product Standards—Developed under procedures published by the Department of Commercein Part 10, Title 15, of the Code of Federal Regulations. The standards establish nationally recognized
requirements for products, and provide all concerned interests with a basis for common understanding of
the characteristics of the products. NIST administers this program in support of the efforts of private-sector
standardizing organizations.
Order the following NIST publications—FIPS and NISTIRs—from the National Technical Information
Service, Springfield, VA 22161.
Federal Information Processing Standards Publications (FIPS PUB)—Publications in this series
collectively constitute the Federal Information Processing Standards Register. The Register serves as the
official source of information in the Federal Government regarding standards issued by NIST pursuant to
the Federal Property and Administrative Services Act of 1949 as amended. Public Law 89-306 (79 Stat.
1127), and as implemented by Executive Order 11717 (38 FR 12315, dated May 11, 1973) and Part 6 of
Title 15 CFR (Code of Federal Regulations).
NIST Interagency or Internal Reports (NISTIR)—The series includes interim or final reports on work
performed by NIST for outside sponsors (both government and nongovernment). In general, initial
distribution is handled by the sponsor; public distribution is handled by sales through the National Technical
Information Service, Springfield, VA 22161, in hard copy, electronic media, or microfiche form. NISTIR's
may also report results of NIST projects of transitory or limited interest, including those that will be
published subsequently in more comprehensive form.

uua>
Emo ard
•ocOS
O 00wC oa» BE a
. o
8o00o
O ^ 3 fi-
^ DO >-
So O £