Wildfowl 62
237
Wildfowl 62 Editor Eileen C. Rees Associate Editor Anthony D. Fox Published by Wildfowl & Wetlands Trust Slimbridge, Gloucestershire GL2 7BT, UK Registered Charity No. 1030884
-
Upload
khangminh22 -
Category
Documents
-
view
3 -
download
0
Transcript of Wildfowl 62
Wildfowl 62
EditorEileen C. Rees
Associate EditorAnthony D. Fox
Published by
Wildfowl & Wetlands TrustSlimbridge, Gloucestershire
GL2 7BT, UK
Registered Charity No. 1030884
Cover photograph: Steller’s Eiders Polysticta stelleri, by Harri Taavetti.
Cover design by Paul Marshall
Published by the Wildfowl & Wetlands Trust, Slimbridge, Gloucestershire GL2 7BT, UK
Wildfowl is available by subscription from the above address. For further information call+44 (0)1453 891900 (extension 257), or e-mail [email protected]
ISBN 0 900806 61 3
Printed on FSC compliant paper by MPG Biddles
Prof Jeff BlackDepartment of WildlifeHumboldt State UniversityArcata, California 95521, USA.
Assoc Prof Bruce D. DuggerDepartment of Fisheries & WildlifeOregon State University104 Nash Hall, Corvallis, OR 97331, USA.
Prof Andy J. GreenWetland Ecology DepartmentDoñana Biological Station-CSICC/ Américo Vespucio s/n41092 Sevilla, Spain.
Dr Matthieu GuillemainOffice National de la Chasse et de la Faune
SauvageLa Tour du ValatLe Sambuc, 13200 Arles, France.
Dr David RoshierCentre for Integrative EcologySchool of Life & Environmental SciencesDeakin University, Waurn Ponds CampusGeelong, Victoria 3220, Australia.
Wildfowl
Editor
Dr Eileen C. ReesWildfowl & Wetlands Trust
Slimbridge, Gloucestershire GL2 7BT, UK.
Associate Editor
Prof Anthony D. FoxDepartment of Bioscience, Aarhus University
Kalø, Grenåvej 14, DK-8410 Rønde, Denmark.
Editorial Board

Contents
Editorial 1
Review Papers
A merganser at Auckland Islands, New Zealand 3M. Williams
Impacts of wind farms on swans and geese: a review 37E.C. Rees
Standard Papers
Population size and breeding success of Icelandic Whooper Swans Cygnus cygnus: 73results of the 2010 international censusC. Hall, J.R. Glanville, H. Boland, Ó. Einarsson, G. McElwaine, C.A. Holt, C.J. Spray &E.C. Rees
Habitat use, disturbance and collision risks for Bewick’s Swans Cygnus columbianus 97bewickii wintering near a wind farm in the NetherlandsR.C. Fijn, K.L. Krijgsveld, W. Tijsen, H.A.M. Prinsen & S. Dirksen
Limits of grazing area use by feral Greylag Geese Anser anser during moult 117K. Schwarz & F. Woog
Egyptian Goose Alopochen aegyptiaca: an introduced species spreading in and from the 128NetherlandsA. Gyimesi & R. Lensink
Evidence for Mallard Anas platyrhynchos and American Black Duck Anas rubripes 146competition in western New Brunswick, Canada M.J. Petrie, R.D. Drobney, D.T. Sears & L.M. Armstrong
Measurements and movements of Madagascar Teal Anas bernieri captured and ringed 165at Lake Antsamaka in central-western MadagascarF. Razafindrajao, H.G. Young & A.I. Bin Aboudou
Captive breeding and release diminishes genetic diversity in Brown Teal Anas chlorotis, 176an endangered New Zealand duckG.M. Bowker-Wright, B.D. Bell, P.A. Ritchie & M. Williams
Feeding environments of New Zealand’s extinct merganser revealed by stable 190isotope analyses M. Williams, R.N. Holdaway & K.M. Rogers
Direct and indirect evidence that productivity of Snowy Plovers Charadrius nivosus 204varies with occurrence of a nest predatorN.S. Burrell & M.A. Colwell
Short Communications
Ducks foraging on swan faeces 224T. Shimada
Announcements
The 9th Conference of the European Ornithologists’ Union: August 2013 228
Wildfowl: Instructions for Authors 229
To subscribe to Wildfowl, or to purchase back numbers, please contact Mrs Margaret (“Maggie”) Sage at the Wildfowl & Wetlands Trust, Slimbridge,
Gloucester GL2 7BT, UK, telephone +44 (0) 1453 891257 or send an e-mail to [email protected].

Wildfowl 62: Editorial
This edition of Wildfowl is of particular interest for the new information provided on twoendangered species – Madagascar Teal Anas bernieri and Brown Teal Anas chlorotis – and on theAuckland Islands Merganser Mergus australis which became extinct in 1902. The twomerganser papers are particularly evocative; scrupulous attention to detail in a review ofwritten records, use of modern techniques (stable isotope analysis) which throws further light on the birds’ feeding habitat, and the author’s biological insight into these birdsthroughout, helps to illustrate the distribution and habits of a species no longer with us. It is also touching that the review paper is dedicated to Janet Kear. She was remarkable not only for her pioneering studies of wildfowl and her work with waterbird conservation, but she inspired a generation of researchers and aviculturists, and for manyyears served as an eminent Editor of this journal. The Auckland Islands Merganser was aspecial interest of hers, and it is therefore hugely appropriate that these papers appear inWildfowl.
In addition to the work on endangered and extinct species, I am very pleased to see thepublication of a detailed paper on the effects of a wind farm on Bewick’s Swans Cygnus
columbianus bewickii wintering at Polder Wieringermeer in the Netherlands. Detailed post-construction studies of this kind are essential for assessing the effects of wind farmdevelopments on waterbird populations. The journal also includes informative papers on,inter alia, the growth in numbers of Egyptian Geese Alopochen aegyptiaca in the Netherland, thelatest population estimate for the Icelandic Whooper Swan Cygnus cygnus population andpotential competition between Mallard Anas platyrhynchos and Black Duck Anas rubripes in NewBrunswick. The threatened species focus also extended to North America, with a studyproviding evidence for the predation of Snowy Plover Charadrius nivosus eggs by CommonRavens Corvus corax. Insight into a more familiar species is provided through an assessmentof whether feral Greylag Goose Anser anser feeding distribution in Stuttgart, Germany, isinfluenced by their being flightless during moult.
During the course of the year, scanning the Wildfowl back catalogue was taken forwardspeedily and effectively by Christine Orchard, and most papers published in the journal overthe years are now in electronic (pdf) format. These are not yet readily available as some of thefiles are quite large (> 7 MB), but plans are underway to use OCR (optical characterrecognition) software to reduce file size, make the papers searchable, and ultimately to addthem to the Wildfowl pages of the WWT website.
I remain indebted to Tony Fox for his time, effort and invaluable comments as AssociateEditor for Wildfowl, and to Editorial Board members – Jeff Black, Bruce Dugger, AndyGreen, Matt Guillemain and David Roshier – for continuing to provide the advice andsupport essential for maintaining the standards and interest of the journal. I thank thereferees for their valuable comments on the papers, and Ellen Matthews (EM Typesetting)and the staff at MPG Biddles (which recently acquired the Cambridge University Press
1
© Wildfowl & Wetlands Trust Wildfowl (2012) 62: 1–2

printing presses) for taking the papers forward to publication. My colleagues Maggie Sage,Linda Dickenson and Jane Gawthorne provided helpful support throughout, including in thedistribution of Wildfowl 62.
Eileen Rees
Editor: WildfowlWWT Martin Mere
2
© Wildfowl & Wetlands Trust Wildfowl (2012) 62: 1–2
Photograph: Janet Kear during her time as Director of Centres at WWT andEditor of Wildfowl, by David Platt.
3
© Wildfowl & Wetlands Trust Wildfowl (2012) 62: 3–36
A merganser at Auckland Islands, New Zealand
MURRAY WILLIAMS
School of Biological Sciences, Victoria University, P.O. Box 600, Wellington, New Zealand.E-mail: [email protected]
Dedicated to the late Janet Kear, a friend and colleague from afar, whose lifetime work
enriched our knowledge and enjoyment of the world’s waterfowl.
Abstract
The last population of the merganser Mergus australis persisted at Auckland Islands inNew Zealand’s Subantarctic until its extermination by specimen collectors in 1902. Itis now represented by four duckling specimens, 23 skins of immatures and adults,three skeletons, and a partial cadaver stored in 11 museums. It was the smallestknown Mergus, the males weighing c. 660 g and showing little plumage dimorphismfrom the smaller (c. 530 g) females. Only five published accounts report first-handobservations of its ecology, breeding or distribution. Most likely it occurred as year-round territorial pairs in the larger streams and along the coastal edge at the heads ofAuckland Island’s eastern inlets and in Carnley Harbour and fed on both marine andfresh water foods. Its population probably never exceeded 20–30 pairs. The scantrecords suggest it had a typical summer breeding season. Although its keel area andwing skeleton were reduced relative to its sternum length it was well capable offlapping flight.
Key words: Auckland Islands, Auckland Islands Merganser, Mergus australis.
A merganser (Family Anatidae, TribeMergini) once inhabited the AucklandIslands archipelago, 450 km south of NewZealand in the subantarctic Southern Ocean(Fig. 1). When Polynesians first settled New Zealand in the late 13th Century,mergansers were also present in NewZealand (North, South and Stewart Islands)and at Chatham Island 800 km to NewZealand’s east (Holdaway et al. 2001; Worthy& Holdaway 2002). It was from AucklandIslands that the first specimen, in 1840(Hombron & Jacquinot 1841), and the last,
in 1902 (Alexander 1902; Ogilvie-Grant1905) was obtained, Polynesians havingearlier extirpated the New Zealand and Chatham Island populations. Thisbiogeographic oddity, a merganser in New Zealand’s waters, is today representedby 27 skins and bones thereof fromAuckland Islands (Kear & Scarlett 1970;Kear 2005a) and a small but increasingcollection of bones from midden andnatural deposits from the other twopopulations (Worthy 1998a,b, 2004; Millener1999).

4 A merganser at Auckland Islands
© Wildfowl & Wetlands Trust Wildfowl (2012) 62: 3–36
Figure 1. The Auckland Islands showing locations referred to in the text. 1= Magnetic Bay, 2 =Maclaren Bay.

A merganser at Auckland Islands 5
© Wildfowl & Wetlands Trust Wildfowl (2012) 62: 3–36
In this paper I review, and whereappropriate reappraise, existing knowledgeof Mergus australis at Auckland Islands, a birdcommonly referred to as Auckland Island(s)Merganser (e.g. Buller 1882, 1905; Hutton &Drummond 1905; Kear & Scarlett 1970;Kear 2005a; Young & Kear 2006) but also asSouthern Merganser (Tennyson &Martinson 2006) and New ZealandMerganser (Gill 2010). Scattered historicalaccounts and documentation of thismerganser were assembled by Kear &Scarlett (1970) to provide a first synthesis.Livezey (1989) added an appraisal of itsphylogenetic relationships and of itsflightedness. These two publicationsprovide the only substantive accounts of M.
australis to date and have been the sourcesfor all subsequent accounts (e.g. Marchant &Higgins 1990; Kear 2005a; Tennyson &Martinson 2006), much as Buller’s (1905)account was the source for early treatises(e.g. Phillips 1926; Mathews 1936; Delacour1959).
Since Kear & Scarlett’s synthesis, afurther skin has been reported in a museumcollection (Sigwart et al. 2004, 2005), apartial skeleton reported (but erroneouslyidentified; see Appendix 1) from Lyon,France (Wood et al. 1982), bones attributedto mergansers have been located at furthersites on New Zealand’s main islands(Worthy 1998a,b, 2004; Worthy & Holdaway2002), and the smaller sizes of bones found in abundance in a cave on ChathamIsland prompted Millener (1999) to suggestthey may constitute a separate taxon.Morphometric distinctions between thethree New Zealand Merganser populationsawait appraisal.
Description of plumage and soft parts
Kear & Scarlett (1970) described theplumages and soft parts of the adult,immature and duckling. The adultdescription was compiled from the authors’examinations of three skins in CanterburyMuseum, Christchurch, New Zealand (CM)(see Appendix 1), six skins in the (British)Natural History Museum, Tring, England(NHM), and one skin in the CambridgeUniversity Museum, Cambridge, England (J. Kear pers. comm.).
Their description was warranted becausethe original description (Hombron &Jacquinot 1841) had not been referred to inany publication other than in passing by vonHugel (1875), and most subsequentdescriptions, commencing with Buller (1882,1905), have been incremental modificationsand abbreviations either of von Hugel’s or of Buller’s and have ignored Mathews’ (1936) substantive re-description (based onspecimens NHM 1901.10.21.57 and NHM1901.10.21.58). Similarly, minor changesfrom the initial depiction (Hombron &Jacquinot 1853) have resulted in portrayalswith plumage and soft part colourations thatdiffer from original descriptions (e.g. Mathews1936; Shirihai & Jarrett 2002; del Hoyo et al.
2002; Tennyson & Martinson 2006), and inthe idiom of merganser species familiar tothe artists (e.g. Fleming 1982). Some are morefanciful (e.g. Flannery & Schouten 2001).Depictions based on freshly collectedspecimens (e.g. Hombron & Jacquinot 1853;Buller 1905; Fleming 1982) best capture softpart and head colouration. A composite ofsome historic and contemporary illustrationsis presented in Colour Plate 1.

6 A merganser at Auckland Islands
© Wildfowl & Wetlands Trust Wildfowl (2012) 62: 3–36
Colour plate 1. Historic and contemporary depictions of Mergus australis from: a) Hombron &Jacquinot 1853; b) Buller 1905; c) Fleming 1982; d) Mathews 1936; e) Shirihai & Jarrett 2002; f) Tennyson & Martinson 2006; g) photograph of Otago Museum mount AV1110 (Rod Morris).

A merganser at Auckland Islands 7
© Wildfowl & Wetlands Trust Wildfowl (2012) 62: 3–36
Kear & Scarlett (1970) did notdiscriminate the ages of the specimens theyexamined and, because some were newly-fledged young, their account is amended inthe descriptions below.
Adult
Sexes alike but males are larger and have alonger head crest. Head, crest and neck darkbrown, chin and throat a lighter brown.Crown and throat more rust-brown in male.Mantle, scapulars, back, rump and tail verydark brownish-black. Rust colouration ofthroat may descend onto upper breast(further in the male than female; Hutton1901a). Entire ventral surface a dull greyliberally streaked brown to present anoverall browny-mottled appearance (malespaler on abdomen; Hutton 1901a); flanksare uniform dark brown. Wing coverts slategrey, like the sides of the breast, with thelower row darker and banded white. Middlesecondaries white on the outer web andblack on the inner web and tips. Primariesand inner secondaries blackish. Males havewhite sub-terminally on the outer web of3–4 greater coverts to give the impressionthey have two white wing bars (Falla 1970).Underwing mottled and axillaries white.
Iris dark brown, culmen and tip of lowermandible black; cutting edge of uppermandible and rest of lower mandibleyellowish-orange; legs and feet orange;webs, joints and soles dusky. Thisdescription of eye and soft parts is aswritten in F.W. Hutton’s hand on the label of an adult female specimen (NHM1901.10.21.58) and it is repeated on the labelof the companion male specimen NHM1901.10.21.57 (Appendix 1). The label to
specimen NHM 1904.8.4.1, a femalecollected in July 1901 (mid winter), reads“Iris brown. Bill black on top, redunderneath. Legs and feet light red”.
Immature
This description is of birds newly-fledgedand identified as such by a terminal notch inthe rectrices or the persistence of the downfeather stalk extending from the tip of therachis (Larson & Taber 1980).
Sexes alike. Uniformly dark brownish-black on head, neck and throat. Entiredorsal surface, including rump and upperwing, dark grey. Entire ventral surfaceheavily mottled grey-brown. Developinghead crest apparent.
Two specimens collected in July 1901(NHM 1904.8.4.1; NHM 1902.8.6.1) whoserectrices have terminal notches, show amuch darker dorsal surface, obvious rufouson head and throat and conspicuouslyelongated crest feathers. I interpret these ashaving undergone a post-juvenile bodymoult.
The dried legs of immature specimensindicate they were a reddish colour.
Duckling
Description taken from specimen CMAV1581 (Appendix 1). Dark brown-blackabove with only a trace of pale wing,scapular and dorsal rump spots. Chin, throatand upper breast rusty brown with a spot ofchestnut beneath the eye (this chestnut mayrepresent fading of a darker plumage).Remaining underparts yellowish-white. Bill,legs and feet dark olive-brown.
These descriptions indicate that M.
australis, like the Brazilian Merganser Mergus
8 A merganser at Auckland Islands
© Wildfowl & Wetlands Trust Wildfowl (2012) 62: 3–36
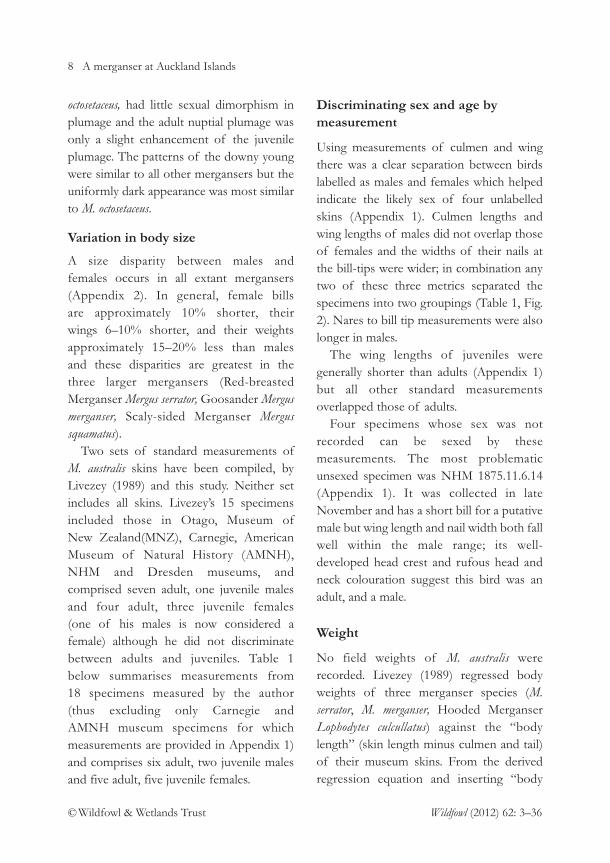
octosetaceus, had little sexual dimorphism inplumage and the adult nuptial plumage wasonly a slight enhancement of the juvenileplumage. The patterns of the downy youngwere similar to all other mergansers but theuniformly dark appearance was most similarto M. octosetaceus.
Variation in body size
A size disparity between males and females occurs in all extant mergansers(Appendix 2). In general, female billsare approximately 10% shorter, their wings 6–10% shorter, and their weightsapproximately 15–20% less than males and these disparities are greatest in the three larger mergansers (Red-breastedMerganser Mergus serrator, Goosander Mergus
merganser, Scaly-sided Merganser Mergus
squamatus). Two sets of standard measurements of
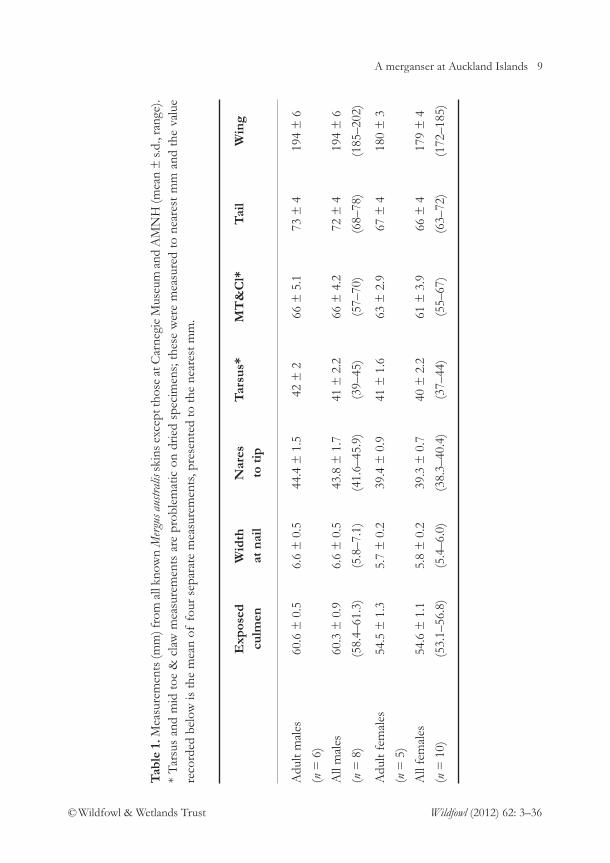
M. australis skins have been compiled, byLivezey (1989) and this study. Neither setincludes all skins. Livezey’s 15 specimensincluded those in Otago, Museum of New Zealand(MNZ), Carnegie, AmericanMuseum of Natural History (AMNH),NHM and Dresden museums, andcomprised seven adult, one juvenile malesand four adult, three juvenile females (one of his males is now considered afemale) although he did not discriminatebetween adults and juveniles. Table 1 below summarises measurements from 18 specimens measured by the author (thus excluding only Carnegie and AMNH museum specimens for whichmeasurements are provided in Appendix 1)and comprises six adult, two juvenile malesand five adult, five juvenile females.
Discriminating sex and age bymeasurement
Using measurements of culmen and wingthere was a clear separation between birdslabelled as males and females which helpedindicate the likely sex of four unlabelledskins (Appendix 1). Culmen lengths andwing lengths of males did not overlap thoseof females and the widths of their nails atthe bill-tips were wider; in combination anytwo of these three metrics separated thespecimens into two groupings (Table 1, Fig.2). Nares to bill tip measurements were alsolonger in males.
The wing lengths of juveniles weregenerally shorter than adults (Appendix 1)but all other standard measurementsoverlapped those of adults.
Four specimens whose sex was notrecorded can be sexed by thesemeasurements. The most problematicunsexed specimen was NHM 1875.11.6.14(Appendix 1). It was collected in lateNovember and has a short bill for a putativemale but wing length and nail width both fallwell within the male range; its well-developed head crest and rufous head andneck colouration suggest this bird was anadult, and a male.
Weight
No field weights of M. australis wererecorded. Livezey (1989) regressed bodyweights of three merganser species (M.
serrator, M. merganser, Hooded MerganserLophodytes culcullatus) against the “bodylength” (skin length minus culmen and tail)of their museum skins. From the derivedregression equation and inserting “body
A merganser at Auckland Islands 9
© Wildfowl & Wetlands Trust Wildfowl (2012) 62: 3–36
Tab
le 1
. Mea
sure
men
ts (m
m) f
rom
all
know
n M
ergu
s au
stra
lissk
ins
exce
pt th
ose
at C
arne
gie
Mus
eum
and
AM
NH
(mea
n ±
s.d.
, ran
ge).
* T
arsu
s an
d m
id t
oe &
cla
w m
easu
rem
ents
are
pro
blem
atic
on
drie
d sp
ecim
ens;
the
se w
ere
mea
sure
d to
nea
rest
mm
and
the
val
uere
cord
ed b
elow
is th
e m
ean
of f
our
sepa
rate
mea
sure
men
ts, p
rese
nted
to th
e ne
ares
t mm
.
Exp
osed
W
idth
N
ares
T
arsu
s*M
T&
Cl*
Tai
lW
ing
culm
enat
nai
lto
tip
Adu
lt m
ales
60
.6 ±
0.5
6.6
± 0
.544
.4 ±
1.5
42 ±
266
± 5
.173
± 4
194
± 6
(n=
6)
All
mal
es
60.3
± 0
.96.
6 ±
0.5
43.8
± 1
.741
± 2
.266
± 4
.272
± 4
194
± 6
(n=
8)
(58.
4–61
.3)
(5.8
–7.1
)(4
1.6–
45.9
)(3
9–45
)(5
7–70
)(6
8–78
)(1
85–2
02)
Adu
lt fe
mal
es
54.5
± 1
.35.
7 ±
0.2
39.4
± 0
.941
± 1
.663
± 2
.967
± 4
180
± 3
(n=
5)
All
fem
ales
54
.6 ±
1.1
5.8
± 0
.239
.3 ±
0.7
40 ±
2.2
61 ±
3.9
66 ±
417
9 ±
4
(n=
10)
(53.
1–56
.8)
(5.4
–6.0
)(3
8.3–
40.4
)(3
7–44
)(5
5–67
)(6
3–72
)(1
72–1
85)

10 A merganser at Auckland Islands
© Wildfowl & Wetlands Trust Wildfowl (2012) 62: 3–36
lengths” of M. australis and M. octosetaceus
skins, he deduced a weight of 898 g for M. australis and 983 g for M. octosetaceus. Field weights for M. octosetaceus are now
known (Appendix 2) and Livezey’sestimated weight was approximately 20%too high (assuming it was for a male).Furthermore, 898 g for M. australis seemsespecially generous for what is undoubtedlya small merganser.
Across all extant mergansers, mean winglength and mean weight (of both sexes;Appendix 2) are strongly correlated (R2 =0.95, P < 0.001; Fig. 3). Using the regressionequation (length = 0.095 * weight + 133)and the mean values of wing lengths ofadult M. australis (Table 1) males may haveweighed c. 660 g and females c. 530 g. Usingthe extremes of the range of adult wingmeasurements, the range of male weightsmay have been 550–800 g and females460–620 g. These estimates imply a sexualsize dimorphism similar to most othermergansers (Appendix 2).
Livezey (1989) suggested the wing lengthsof M. australis were disproportionatelyshorter than those of other mergansersrelative to their “body length”. If so,estimated weights above will be conservative.However, as demonstrated later (see Flight)wing length is correlated with keel areawhich in turn reflects pectoral muscle mass,a major determinant of body weight. M.
australis was capable of flight and winglength should still reflect weight in a waysimilar to other mergansers.
Using Livezey’s “body length” for fivemerganser species (his Table 2) and relatingthem to the mean weights given inAppendix 2 produced a weaker correlation(R2 = 0.74, P = 0.05) than the wing length :weight relationship above. Nevertheless,inserting Livezey’s “body lengths” for M.
australis into the equation describing the
Figure 2. Scatterplot of wing and culmenlengths of Mergus australis museum specimens.Specimens labelled as males (◆), as females (●)and those unsexed (unfilled symbols) andindicating the sex now assigned to them.
Figure 3. Relationship between mean winglengths and mean weights for males and femalesof all extant merganser species. Data fromAppendix 2. Regression equation is y = 0.095x +133 (R2 = 0.95, n = 12).

A merganser at Auckland Islands 11
© Wildfowl & Wetlands Trust Wildfowl (2012) 62: 3–36
Colour plate 2. Auckland Island landscapes and locations (2, 4) from which mergansers were collected.1 = Carnley Harbour viewed from Adams Island; 2 = Maclaren Bay on Adams Island; 3 = stream athead of Magnetic Bay and typical of other streams on Adams Island; 4 = shoreline at head of WaterfallInlet; 5 = Hanfield Inlet south branch; 6 = head of Musgrave Inlet; 7 = stream at head of Norman Inletand typical of streams in most eastern inlets. (Photographs: K. Walker and G. Walls).
1
2 3
4 5
6 7

12 A merganser at Auckland Islands
© Wildfowl & Wetlands Trust Wildfowl (2012) 62: 3–36
average relationship (length = 0.168 *weight + 348.5) derives a mean weight of835 g for males and 757 g for females. Sucha mean estimate remains too high, especiallyrelative to known weights of M. octocetaseus,and indicates that “body length” of museumspecimens is an unreliable measure ofmerganser size.
The estimated weights for M. australis
seem appropriate when specimen skins andmounts are compared with the two smallestmergansers (Hooded Merganser and SmewMergellus albellus) and with other NewZealand waterbirds of 500–700 g weight (e.g.Auckland Island Teal Anas aucklandica,Brown Teal A. chlorotis and Little ShagPhalacrocorax melanoleucos; see Marchant &Higgins 1990). Worthy (2004) noted thathumerus, ulna and tarsometatarsus bones ofM. australis were similar in size to, and readilyconfused with, those of Brown Teal, andthat their carpometacarpi and scapulaeapproximated those of New Zealand ScaupAythya novaeseelandiae, both species in the500–700 g weight range.
Distribution and possible populationsize
Specimens were collected in Waterfall Inlet(Reischek 1889; Wilson 1959), McLennanInlet (specimen NHM1901.10.21.57 label),Norman Inlet (Hutton 1901a) and CarnleyHarbour (Maclaren or Magnetic Bay, AdamsIsland; Chapman 1891), possibly in PortRoss (Hombron & Jacquinot 1841), and atunspecified locations in Carnley Harbour(Alexander 1902, Fig. 1, Colour plate 2,Appendix 1). McCormick (1884) reportedmerganser present in Laurie Harbour at thehead of Port Ross in 1840.
The absence of records from AucklandIsland’s other eastern inlets does not implythat suitable habitat elsewhere was lacking.The short and steep streams flowing intoWaterfall, McLennan and Norman Inlets arereplicated elsewhere (e.g. Hanfield Inlet andbays within Carnley Harbour) while at theheads of other inlets are larger streamsflowing along flat valley floors (e.g. Deepand Chambers Inlets) and in two of which(Musgrave and Granger Inlets) are smalllakes.
On riverine breeding habitat, othermerganser species are generally dispersed atvery low densities (< 0.2 pairs/km; speciesaccounts in Kear 2005b). Most observationsof their feeding are as pursuit feeders,chasing small fish prey underwater but theyalso grovel among stones and rocks inshallow water where snails and benthicinvertebrates are captured (Hughes & Green2005).
Auckland Island would have offeredmergansers sheltered habitat only on itsprotected eastern side where, along its 42km length, are 13 deep inlets (Fig. 1, Colourplate 2). At its southern end the drownedcaldera of Carnley Harbour is flanked byAdams Island and within these confinedwaters lie 12–14 smaller bays into whichshort streams tumble from the steepsurrounding hillsides (Fig 1, Colour plate 2);at least one, Maclaren or Magnetic Bay,provided habitat for a merganser pair andyoung (Chapman 1891).
A likely year-round territorial habit akinto M. octosetaceus suggests the head of eachinlet or bay would probably have beenoccupied by just a single pair. Although insome larger inlets (e.g. Deep Inlet and
A merganser at Auckland Islands 13
© Wildfowl & Wetlands Trust Wildfowl (2012) 62: 3–36
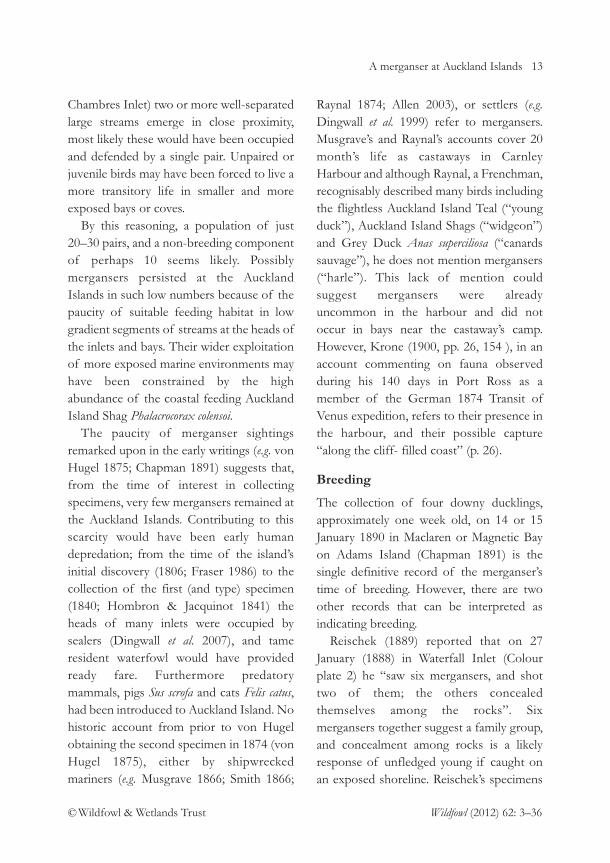
Chambres Inlet) two or more well-separatedlarge streams emerge in close proximity,most likely these would have been occupiedand defended by a single pair. Unpaired orjuvenile birds may have been forced to live amore transitory life in smaller and moreexposed bays or coves.
By this reasoning, a population of just20–30 pairs, and a non-breeding componentof perhaps 10 seems likely. Possiblymergansers persisted at the AucklandIslands in such low numbers because of thepaucity of suitable feeding habitat in lowgradient segments of streams at the heads ofthe inlets and bays. Their wider exploitationof more exposed marine environments mayhave been constrained by the highabundance of the coastal feeding AucklandIsland Shag Phalacrocorax colensoi.
The paucity of merganser sightingsremarked upon in the early writings (e.g. vonHugel 1875; Chapman 1891) suggests that,from the time of interest in collectingspecimens, very few mergansers remained atthe Auckland Islands. Contributing to thisscarcity would have been early humandepredation; from the time of the island’sinitial discovery (1806; Fraser 1986) to thecollection of the first (and type) specimen(1840; Hombron & Jacquinot 1841) theheads of many inlets were occupied bysealers (Dingwall et al. 2007), and tameresident waterfowl would have providedready fare. Furthermore predatorymammals, pigs Sus scrofa and cats Felis catus,had been introduced to Auckland Island. Nohistoric account from prior to von Hugelobtaining the second specimen in 1874 (vonHugel 1875), either by shipwreckedmariners (e.g. Musgrave 1866; Smith 1866;
Raynal 1874; Allen 2003), or settlers (e.g.Dingwall et al. 1999) refer to mergansers.Musgrave’s and Raynal’s accounts cover 20month’s life as castaways in CarnleyHarbour and although Raynal, a Frenchman,recognisably described many birds includingthe flightless Auckland Island Teal (“youngduck”), Auckland Island Shags (“widgeon”)and Grey Duck Anas superciliosa (“canardssauvage”), he does not mention mergansers(“harle”). This lack of mention couldsuggest mergansers were alreadyuncommon in the harbour and did notoccur in bays near the castaway’s camp.However, Krone (1900, pp. 26, 154 ), in anaccount commenting on fauna observedduring his 140 days in Port Ross as amember of the German 1874 Transit ofVenus expedition, refers to their presence inthe harbour, and their possible capture“along the cliff- filled coast” (p. 26).
Breeding
The collection of four downy ducklings,approximately one week old, on 14 or 15January 1890 in Maclaren or Magnetic Bayon Adams Island (Chapman 1891) is thesingle definitive record of the merganser’stime of breeding. However, there are twoother records that can be interpreted asindicating breeding.
Reischek (1889) reported that on 27January (1888) in Waterfall Inlet (Colourplate 2) he “saw six mergansers, and shottwo of them; the others concealedthemselves among the rocks”. Sixmergansers together suggest a family group,and concealment among rocks is a likelyresponse of unfledged young if caught onan exposed shoreline. Reischek’s specimens

14 A merganser at Auckland Islands
© Wildfowl & Wetlands Trust Wildfowl (2012) 62: 3–36
were both adults (now in Vienna Museum,Austria; Appendix 1) and, because he didnot indicate the others to have beenconspicuously different, most likely theywere near-fledged young.
New Zealand’s then Governor-General,Lord Ranfurly, obtained four merganserspecimens in early January 1901 (Alexander1901). Two adult specimens, now in theNatural History Museum at Tring, wereobtained on 5 January 1901 and two otherspecimens were probably collected on thator the following day – AV2944 (now inCanterbury Museum, Christchurch) andNMINH 1904.559.1 (now in NationalMuseum of Ireland, Natural History,Dublin; Appendix 1). Both latter specimenshave identical characteristics of newly-fledged birds, their tail feathers carryingdown stalks, their primaries unfrayed andunworn compared to those of adult birds,and they have immature plumage andcolouration. Possibly they were newly-fledged siblings and collected togetheralthough there are no records to confirmthis.
These observations, of newly-hatchedand almost-fledged young in January, implya late October–November laying period.Other merganser species, none of whichbreed in their first year, lay eggs at 1.5–2 dayintervals mostly in hole nests, incubate forabout four weeks, and take 60–70 days tofledge their young (Cramp & Simmons1977; species accounts in Kear 2005b).
That nesting sometimes was moreprotracted is indicated by a letter (dated 16May 1895) from S.V. Dannefaerd (a NewZealand specimen collector/dealer) toWalter Rothschild at Tring (O’Rourke 1997)
in which he referred to a female specimencollected in February containing an egg(specimen AMNH 734365; Appendix 1).Perhaps the merganser had a similarbreeding period to Auckland Island Tealwhose late re-nesting attempts can extendinto January and February and whoseducklings can sometimes be observed inMarch and early April (Williams 1995).
Both Chapman (1891) and Reischek(1889) provide evidence of brood size, onesoon after hatching and the other nearfledging, and both are of four young.Neither can be interpreted as clutch sizeother than as a minimum. Other merganserslay clutches of 8–10 eggs (species accountsin Kear 2005b).
Krone (1900, p. 154) provides anenigmatic reference to the merganser’schoice of nesting site. Translated from hisaccount, which was presented in poeticform …. “We liked the meat of the hunted
cormorants, tasting just like geese and ducks, with
lemon yellow fat, also the rare Sage taucher
(merganser), also called Entensager, with serrated
duck beak, which is on the side sharply notched, to
hold the fish which they catch while diving – those
nest, always rare, on top of the steep cliff, facing
north or north east, above the wild surf, around the
big cliff gate (cave?), where they live together with the
cormorants and also with the penguins, related
through kinship.”
Social structure
Observations of mergansers at AucklandIslands have been reported from October(Wilson 1959), late November (McCormick1884) and January–February (Chapman1891; Reischek 1889; Alexander 1901, 1902;Hutton 1901a,b). Specimens were collected

A merganser at Auckland Islands 15
© Wildfowl & Wetlands Trust Wildfowl (2012) 62: 3–36
at other times (November, March, July;Appendix 1) but I have not found notesassociated with these that shed light on thebirds’ habits at these times.
There are no records of mergansershaving been encountered other than assingles, as pairs, or as pairs with young;Reischek’s (1889) encounter with sixmergansers is interpreted as a family group.Wilson’s encounter, when he shot a pair in astream away from the coast (Falla 1970), isthe only one that immediately precedes theassumed breeding period, and has the pairtogether.
All northern hemisphere mergansers aregregarious during winter and duringmigration and form monogamous pairbonds on breeding habitat. The females ofsome species have been recorded at thesame breeding sites in consecutive years(species accounts in Kear 2005b). BrazilianMergansers are dispersed as pairs on well-defended river territories year round(Silveira & Bartmann 2001) and a similarsocial dispersion seems likely for M. australis.
Foods and feeding habitat
There are two records of food taken byAuckland Island’s mergansers.
A specimen shot in 1901 (NHM1901.21.57) at Adams Island’s Maclaren/Magnetic Bay had a 90 mm (“3.5 in”) KoaroGalaxias brevipinnis in its bill (Hutton 1901b).Although described by Hutton as a marinespecies, this is, like all Galaxias sp., afreshwater inhabitant and most likely themerganser would have caught it in the lowerreaches of the bay’s stream to which therewould have been easy access from theshoreline for Hutton and his hunters.
Kear and Scarlett (1970) reported the gutcontents of a preserved cadaver (NHMA/1999.1.124) as containing “macerated fishbones, mandibles of an errant polychaete andan unidentified gastropod”. They added that“the presence of the polychaete tends tosuggest a brackish water environment”.
Some treatises (e.g. Phillips 1926;Delacour 1959; Greenway 1967) havereported M. australis taking freshwatershrimps, an observation attributed to Waite(1909) but Waite says no such thing.
There are no accounts of mergansersfeeding at the Auckland Islands and fewaccounts from which their feeding habitatcan be discerned with certainty. Reischek(1889) observed his group of six feedingamong rocks on the shoreline of WaterfallInlet (Colour plate 2); Waite (1909) quotesCapt. J. Bollons, master of the governmentships regularly visiting the Subantarcticislands, as not having seen the bird on thecoasts, but having found it at the heads ofestuaries and especially on the island’swatercourses “picking about in the creeks”;and Falla (1970) reports R.A. Wilson, thecollector of two specimens in 1891, ashaving encountered his quarry up the streambed some distance from the coast and in adeep pool where the stream was partlydammed on a rocky terrace.
Despite many streams on Auckland andAdams Islands being short and steep,Galaxias brevipinnis is common in all, andespecially so where the streams’ gradientsflatten prior to flowing into the sea (M.Williams pers. obs.). These lower reacheswould have offered suitable, albeit limited,feeding sites for mergansers in fresh water.However, given that human access up

16 A merganser at Auckland Islands
© Wildfowl & Wetlands Trust Wildfowl (2012) 62: 3–36
streams from the coastline is extremelydifficult, it is not surprising that themerganser specimens were mostly seen andtaken at the head of the bays, either in astream’s lower reaches or at the coastal edge(Colour plate 2).
Williams et al. (2012) examined stableisotopes of C and N in feathers and claws ofsome museum specimens. They concludedsome of the birds sampled were feedingmostly on marine-sourced prey at the timeof growing their feathers while others hadincluded fresh water-sourced prey. However,they found no evidence of an exclusivelyfresh water feeding habit; feathers from oneof Wilson’s specimens collected from astream provided evidence of a mixed-sourcediet.
Flight
M. australis was not flightless despite itsdepictions with short wings suggestingotherwise (e.g. Buller 1905; Fleming 1982).Ogilvie-Grant (1905) quotes F. W. Hutton’scomment that the merganser “flies well”.Elsewhere, Hutton reported that “an olddrake merganser flew out from the shore tothe steamer where it was anchored close infor the evening. It settled on the waterwithin a few yards of the vessel and swamcalmly about quacking like a duck” (Hutton& Drummond 1905).
Livezey (1989) suggested M. australis
approached the threshold of flightlessness,a conclusion derived from his estimates of both body weight and wing area and the assumption that wing loading (wingarea/weight) is a measure of flying ability.The latter is not so for flapping flight(Pennycuick 2008).
Livezey (1989) also identified M. australis
as having a “weakly keeled” sternum and“disproportionately short mid-wingelements”. The latter conclusion arose fromhis observation that the length of the wingskeleton was similar to that of HoodedMerganser, which he concluded was asmaller bird.
Relative to its sternum length, M. australis
had a reduced keel. The keel area of all fivespecimens examined lie beyond the 50%prediction interval of a regression equationdescribing the average relationship betweenkeel area and sternum length for four extantmerganser species combined (see Fig. 4 inAppendix 3). On average, the keel area was79% (75–84%; geometric mean and range)of that predicted by the regression equation.This implies a relative reduction in pectoralmuscle mass, and of weight.
Similarly, relative to its sternum length, M.
australis had shortened wing bones (humerus+ ulna). The wing bone lengths of all threespecimens examined lie beyond the 50%prediction interval of the regressionequation describing the average relationshipbetween wing bone length and sternumlength for four extant merganser speciescombined (see Fig. 5 in Appendix 3). Thecombined lengths of the two wing bones ofM. australis were 91% (89–93%; geometricmean and range) of that predicted by theregression equation.
Does having a reduced keel (and thusreduced pectoral muscle mass) and reducedwing bone length necessarily mean reducedflying ability? Pennycuick (2008) provides amodel (PROGRAM Flight 1.22) fordetermining the merganser’s likely flightcharacteristics (Table 2).

A merganser at Auckland Islands 17
© Wildfowl & Wetlands Trust Wildfowl (2012) 62: 3–36
In simulations of M. australis, pectoralmuscle mass as a percentage of total bodymass was varied between the default value of17% and 12% (to reflect the reduction inkeel area), and body weight and wing spanwere also varied within the range ofestimates and measurements obtained. Evenwhen the most extreme values of maximumcalculated weight (from Fig. 3), shortestwing length (Table 1) and 12% pectoralmuscle mass were included together in asimulation the results suggest M. australis
had similar flight characteristics to manyother waterfowl (Table 2) and flew with therapid wing beat typical of the two smallermergansers (Hooded Merganser, Smew).The work required to maintain level flight atminimum power speed was about the sameper unit weight of muscle as for a MallardAnas platyrhynchos (Williamson et al. 2001;Pennycuick 2008).
Extinction
The merganser is the only bird known tohave become extinct at the Auckland Islands following the islands’ discovery by Europeans in 1806, after which people, predators and specimen collectorsarrived.
Human occupation of the islands wasbrief and localised. Sealers were the earliestresidents, establishing camps at the heads ofseveral bays and inlets (Dingwall et al. 2007);tame waterfowl would almost certainly havebeen included in their fare. Maori andEuropean settlement persisted for about a decade (1842–1854) in the Port Ross area (Fraser 1986) and presumably localwaterfowl would have supplemented theresidents’ diets also.
The scale of successful alien animalintroductions to Auckland Islands is modestby comparison to other islands in the NewZealand region (King 2006). While no ratRattus sp. colonised any of the AucklandIslands and no alien mammals were releasedonto Adams Island, mice Mus musculus, goatsCapra hircus, cats and pigs became wellestablished on Auckland Island. Pigs,already numerous about Port Ross by 1840(McCormick 1884), and cats have impactedmany seabird colonies on Auckland Islandand now restrict some petrel species tobreeding only on the smaller and predator-free islands (Taylor 2000), just as they haveAuckland Island Teal. Undoubtedly cats andpigs would have preyed upon any mergansernesting in an exposed site.
A third and final influence on themerganser’s extinction was specimencollecting (see Appendix 1). Eighteen of the23 skins of adults and fledglings now in the world’s museums were collected duringthe 14 year period 1888–1902. More were undoubtedly collected but havesubsequently disappeared, e.g. one ofWilson’s pair from 1891, the 1882 ColonialMuseum specimen (Appendix 1), and othersthat were collected for private dealers andcollectors (including S.V. Dannefaerd, H.H.Travers and W.L. Buller) by crew of thegovernment vessels Hinemoa and Tutanekai
during twice-yearly visits to the islands.Buller’s (1892) insistence that “specimens
of this interesting form in the adult stageshould be obtained for our museums beforeit is too late” clearly found willing listenersand established willing buyers. For example,Ogilvie-Grant (1905) chronicles how, whenat port in Bluff prior to Ranfurly’s 1901

18 A merganser at Auckland Islands
© Wildfowl & Wetlands Trust Wildfowl (2012) 62: 3–36
Tab
le 2
. Res
ults
of
sim
ulat
ions
usi
ng P
RO
GR
AM
Flig
ht 1
.22
(Pen
nycu
ick
2008
) exa
min
ing
the
flig
ht c
hara
cter
istic
s of
M. a
ustr
alis
and
sele
cted
oth
er m
erga
nser
s an
d w
ater
fow
l.
Spec
ies
Wei
ght
Win
g 1 V
mp
=
2 Spe
cifi
c 3 W
ingb
eat
Sour
ce; n
otes
(sex
)(k
g)sp
an
min
imum
w
ork
at
freq
uenc
y (m
)po
wer
V
mp
(Hz)
spee
d (J
/kg
)(m
/s)
M.
serr
ator
(F)
0.90
80.
8614
.810
.67.
61Pe
nnyc
uick
200
8: P
rogr
am F
light
1.2
2
M.
aust
ralis
(M)4
0.70
0.70
015
.010
.41
9.43
17%
pec
tora
l mus
cle
mas
s
M.
aust
ralis
(M)
0.70
0.70
015
.015
.59.
4312
% p
ecto
ral m
uscl
e m
ass
M.
aust
ralis
(M)
0.76
0.67
815
.710
.810
.1M
axim
um c
alcu
late
d w
eigh
t, sh
orte
st
mal
e w
ing,
17%
mus
cle
mas
s
M.
aust
ralis
(M)
0.76
0.67
815
.716
.210
.1M
axim
um c
alcu
late
d w
eigh
t, sh
orte
st
mal
e w
ing,
12%
mus
cle
mas
s
M.
aust
ralis
(F)5
0.55
0.65
814
.39.
469.
5317
% p
ecto
ral m
uscl
e m
ass
M.
aust
ralis
(F)
0.55
0.65
814
.314
.19.
5312
% p
ecto
ral m
uscl
e m
ass
M.
aust
ralis
(F)
0.63
0.65
215
.09.
9710
.2M
axim
um c
alcu
late
d w
eigh
t, sh
orte
st
fem
ale
win
g, 1
7% m
uscl
e m
ass
M.
aust
ralis
(F)
0.63
0.65
215
.014
.910
.2M
axim
um c
alcu
late
d w
eigh
t, sh
orte
st
fem
ale
win
g, 1
2% m
uscl
e m
ass

A merganser at Auckland Islands 19
© Wildfowl & Wetlands Trust Wildfowl (2012) 62: 3–36
L.
cucu
llatu
s(J
M)6
0.59
0.61
15.2
9.94
11.0
capt
ive
L.
cucu
llatu
s(M
)0.
680.
6315
.710
.910
.4M
ean
mal
e w
t, m
id r
ange
of
win
gspa
n
from
Cra
mp
& S
imm
ons
(197
7)
M.
albe
llus
(JM
)60.
580.
5715
.612
.111
.4ca
ptiv
e
M.
albe
llus
(M)
0.65
0.62
15.6
10.9
10.4
Mea
n m
ale
wt,
mid
ran
ge o
f w
ings
pan
from
Cra
mp
& S
imm
ons
(197
7)
Ana
s pl
atyr
hync
hos
1.09
0.88
515
.514
.37.
14Pe
nnyc
uick
200
8: P
rogr
am F
light
1.2
2
A.
pene
lope
0.81
0.84
214
.411
.77.
16Pe
nnyc
uick
200
8: P
rogr
am F
light
1.2
2
1 V
mp
= m
inim
um p
ower
spe
ed, t
he v
eloc
ity a
t w
hich
the
pow
er r
equi
red
to f
ly is
less
tha
n at
eith
er s
low
er o
r fa
ster
spe
eds.
If t
hem
uscl
es c
anno
t pr
oduc
e th
is l
evel
of
pow
er, t
hen
the
bird
can
not
fly h
oriz
onta
lly, a
nd i
f th
e he
art
and
lung
s ca
nnot
sus
tain
the
min
imum
pow
er a
erob
ical
ly, th
en it
can
onl
y fly
in s
hort
bur
sts,
if a
t all
(fro
m P
enny
cuic
k 20
08: C
hapt
er 1
).2
Spec
ific
wor
k at
Vm
p=
the
wor
k do
ne in
eac
h co
ntra
ctio
n by
uni
t mas
s of
mus
cle
whe
n fl
ying
leve
l at V
mp.
3 W
ingb
eat f
requ
ency
= w
ingb
eat f
requ
ency
exp
ecte
d in
leve
l flig
ht a
t Vm
p.4
All
M.
aust
ralis
mal
e si
mul
atio
ns b
ased
on
estim
ated
bod
y w
eigh
t (F
ig. 3
), an
d w
ings
pan
(dis
tanc
e be
twee
n gl
enoi
d fo
ssae
(54
mm
)fr
om N
HM
A/1
999.
1.12
4, h
umer
us +
uln
a le
ngth
(128
mm
) fro
m N
HM
190
4.8.
4.3,
mea
n ad
ult w
ing
leng
th (1
94 m
m),
aspe
ct r
atio
9).
5 A
ll M
. au
stra
lisfe
mal
e si
mul
atio
ns b
ased
on
estim
ated
bod
y w
eigh
t (Fi
g. 3
), an
d w
ings
pan
(est
imat
ed d
ista
nce
betw
een
glen
oid
foss
ae(5
0 m
m),
hum
erus
+ u
lna
leng
th (1
24 m
m) f
rom
NH
M 1
904.
8.4.
4, m
ean
adul
t win
g le
ngth
(180
mm
), as
pect
rat
io 9
).6
Fled
ged
juve
nile
mal
e in
cap
tivity
, Wild
fow
l & W
etla
nds
Trus
t, Sl
imbr
idge
, UK
.

20 A merganser at Auckland Islands
© Wildfowl & Wetlands Trust Wildfowl (2012) 62: 3–36
collecting trip on Hinemoa, a bystanderoffered the ship’s crew £3 10s for anymerganser skin from the island. Ranfurly’svery deliberate pursuit of mergansers inevery inlet of Auckland Island for theBritish Museum (Alexander 1901, 1902;Ogilvie-Grant 1905) yielded the last ninespecimens in 1901–1902. None was seensubsequently despite a determined search bymembers of a 1907 scientific expedition tothe islands (Waite 1909). It is hard not toconclude that a naturally small merganserpopulation, already depleted by early humanoccupants and under pressure from two newmammalian predators, was tipped intopremature extinction by rapacious collecting.
Overview
The persistence of a small and isolatedpopulation of mergansers at AucklandIslands at the time of European arrival inNew Zealand provided a brief glimpse of aspecies that had already disappearedeverywhere else.
This small fish-eating duck, the smallestMergus, might be expected to show hints ofthe ‘islandisation’ conspicuous amongwaterfowl, and especially Anas ducks, onremote islands (Lack 1970; Weller 1980).These effects include reduction in body size,lower clutch sizes, larger eggs relative tobody size, reduced flight capability, year-round territoriality, increased terrestrialhabit, enhanced sexual size dimorphism andreduced plumage dimorphism, most ofwhich may be viewed as energetic responsesto limited but spatially predictable food onsmall islands (McNabb 1994a,b).
Breeding characteristics of mergansers atAuckland Islands may never be resolved but
if mergansers had been long-establishedresidents of Auckland Island a smallerclutch size than other merganser species isalmost certain (Lack 1970; Weller 1980;Rohwer 1988). Perhaps Chapman’s (1891)observation of four new hatchlings isindicative. A reduction of body massrelative to its New Zealand progenitor isalso possible if the founders responded totheir isolation in a manner similar to theantecedents of Auckland Island Teal(Williams et al. 1991). The reduction inpectoral muscle mass which a reduced keelarea implies and the apparent shortening of wing bones are indicators of thisresponse. Still to be resolved, however, iswhether Auckland Islands’ mergansers weresmaller ‘island’ derivatives of those onmainland New Zealand or whether allmergansers in the New Zealand region were small derivatives of a larger commonfounder.
The Auckland Islands archipelago is sucha small and restricted locality that it isdifficult to interpret many of the snippets ofmerganser ecology assembled by Kear &Scarlett (1970) and in this presentation. Thiswas a more widely distributed bird whosebones have been recovered in naturaldeposits and middens on New Zealand’smain islands (from northern North Island toStewart Island) and on Chatham Island(Millener 1999; Worthy 1998b; Worthy &Holdaway 2002). Although eight of thepresent nine sites at which Mergus boneshave been found on New Zealand arecoastal this does not necessarily imply themerganser was a marine or coastal species.To date, only two inland lacustrine sites haveyielded Holocene avifaunal remains –

A merganser at Auckland Islands 21
© Wildfowl & Wetlands Trust Wildfowl (2012) 62: 3–36
Pyramid Valley in North Canterbury fromwhich no fish-eating birds were recovered(Holdaway & Worthy 1997), and LakePoukawa in inland Hawkes Bay whereMergus and almost all other Holocenewaterfowl and water-dependent birds werepresent (Worthy 2004). M. australis may havehad a wider distribution which the few fossilsites under-represents and plausibly mayhave been a bird of New Zealand lakes andrivers, a habitat like that of most extantmergansers. The coastal edge habitat ofmergansers at Auckland Islands may bemore an example of a broader island nichethan one confirming a ubiquitous habitatchoice.
Acknowledgements
I greatly appreciated the assistance ofcurators of bird collections at NaturalHistory Museum, Tring (Mark Adams,Joanna Cooper), Dublin Museum ofNatural History (Nigel Monoghan),Cambridge University Zoology Museum(Michael Brooke), NaturhistorichesMuseum in Vienna (Ernst Bauernfeind),Staatliches Museum fur Tierkunde inDresden (Michael Packert), MuseumNationale d’Histoire Naturelle, Paris (AnnePreviato), Canterbury Museum (PaulScofield) and Museum of New Zealand(Colin Miskelly, Alan Tennyson). A specialthanks to Mark Adams for indulging myrepeat visits to his collection. I am alsograteful to Steve Rogers at CarnegieMuseum of Natural History, Pittsburgh andMary LeCroy at American Museum ofNatural History, New York for measuringtheir merganser specimens for me. How sadit was that my attempted communication
with the late Bradley Livezey coincided withhis most untimely death; I acknowledge thestimulus and insights provided by his 1989paper.
Part of this script was researched andcompiled while visiting the Wildfowl &Wetlands Trust, Slimbridge. I thank WWTstaff for their hospitality and for providinginformation on wing characteristics of othermergansers. Colin Pennycuick’s advice as I attempted to unravel the flightcharacteristics of M. australis was greatlyappreciated.
I thank: Livia Lins for providingunpublished field weights for BrazilianMerganser; Leigh Bull for initialmeasurements of the Paris type specimen;Dr Christiane Mortelier for consultingRaynal’s original French language text Les
Naufragés des Iles Auckland for me; ColinMiskelly for helpful comments on historicevents and activities at the Auckland Islands;Elliot Dawson, for comments andcorrections of my penultimate draft and foridentifying mergansers within Krone’sGerman language narrative; Doris Zuur fortranslating Krone’s text; Stephen Hartleyand Kevin Burns for statistical advice; TaneWilliams for compilation of Colour plate 1and Chris Edkins for drafting Figure 1; BrettJarrett, Rod Morris, Geoff Walls, KathWalker and Museum of New Zealand forpermission to reproduce their illustrations,photographs and images over which theyhold copyright; and Wildfowl editor EileenRees and associate editor Tony Fox for theirpatience and editorial craft.
Finally, no review of Auckland Island’smerganser is possible without acknowledging the initial detective work, and the abiding
22 A merganser at Auckland Islands
© Wildfowl & Wetlands Trust Wildfowl (2012) 62: 3–36
interest, of the late Janet Kear. Her first visitto New Zealand in 1968 where I wasassigned to “take her to the field and showher Blue Ducks Hymenolaimus malacorhynchos
and Brown Teal till her heart’s content” wasto my very great fortune. It was a pleasure toenjoy her friendship, and her support and interest thereafter in my research and in New Zealand’s waterfowl. A greatlyappreciated friend and colleague across theseas whose exhortation for this revision,alas, has been responded to belatedly.
References
Alexander, D. 1901. Cruise of the Hinemoa to thesouthern islands December 1900–January1901. Manuscript MSY-4600, AlexanderTurnbull Library (National Library of NewZealand), Wellington, New Zealand.
Alexander, D. 1902. Cruise of the Tutanekai tothe southern islands December 1901–January 1902. Manuscript MSY-4600,Alexander Turnbull Library (National Libraryof New Zealand), Wellington, New Zealand.
Allen, M.F. 2003. Wake of the Invercauld. Exile,Auckland, New Zealand.
Bartle, J.A. & Tennyson, A.J.D. 2009. History ofWalter Buller’s collections of New Zealandbirds. Tuhinga 20: 81–136.
Buller, W.L. 1882. Manual of the Birds of New
Zealand. Government Printer, Wellington,New Zealand.
Buller, W.L. 1892. Further notes andobservations on certain species of NewZealand birds (with exhibits). Transactions of
the New Zealand Institute 24: 75–91.Buller, W.L. 1895. Notes on New Zealand
ornithology, with an exhibition of specimens. Transactions of the New Zealand Institute 28:326–358.
Buller, W.L. 1905. Supplement to the Birds of New
Zealand. Vol.2. The Author, London, UK.
Chapman, F.R. 1891. The outlying islands ofNew Zealand. Transactions of the New Zealand
Institute 23: 491–522.Cramp, S. & Simmons, K.E.L. (eds.) 1977.
Handbook of the Birds of Europe, the Middle
East and North Africa. Oxford UniversityPress, Oxford, UK.
Dawson, E.W. & Duerbeck, H.W. 2008. The
German Transit of Venus Expedition at the
Auckland Islands 1874–1875. The HuttonFoundation New Zealand Special Papers No.3. The Wallypug Press, Eastbourne, NewZealand. [Accessible from National Libraryof New Zealand, Wellington, New Zealand.]
Delacour, J. 1959. The Waterfowl of the World.Country Life, London, UK.
Dingwall, P.R., Fraser, C., Gregory, J.G. &Robertson, C.J.R. 1999. Enderby Settlement
Diaries: Records of a British Colony at the
Auckland Islands. Wordsell Press, Auckland,New Zealand.
Dingwall, P.R., Jones, K.L. & Egerton, R. 2007. InCare of the Southern Ocean. Monograph 27,New Zealand Archaeological Association,Dunedin, New Zealand.
Falla, R.A. 1970. Letter to Janet Kear. Falla papersMS-Papers 2366–333. National Library ofNew Zealand, Wellington, New Zealand.
Flannery, T. & Schouten, P. 2001. A Gap in
Nature: Discovering the World’s Extinct Animals.Text Publishing, Melbourne, Australia.
Fleming, C.A. 1982. George Edward Lodge: the
Unpublished New Zealand Bird Paintings. NovaPacifica/National Museum of New Zealand,Wellington, New Zealand.
Fraser, C. 1986. Beyond the Roaring Forties.Government Printer, Wellington, NewZealand.
Gill, B. (convener). 2010. Checklist of the Birds of
New Zealand. Te Papa Press, Wellington, NewZealand.
Greenway, J.C. 1967. Extinct and Vanishing Birds of
the World. Dover Publications, New York, USA.

A merganser at Auckland Islands 23
© Wildfowl & Wetlands Trust Wildfowl (2012) 62: 3–36
Holdaway, R.N. & Worthy, T.W. 1997. Areappraisal of the Late Quaternary fossilvertebrates of Pyramid Valley, NorthCanterbury, New Zealand. New Zealand
Journal of Zoology 24: 69–121.Holdaway, R.N., Worthy, T.H. & Tennyson,
A.J.D. 2001. A working list of breeding birdspecies of the New Zealand region at firsthuman contact. New Zealand Journal of Zoology
28: 119–187.Hombron, J.B. & Jacquinot, H. 1841. Oiseaux
noveau. Annales des Sciences Naturelles – Zoologie
(Paris) Ser. 2.16.Hombron, J.B. & Jacquinot, H. 1853. Voyage au
Pôle Sud. Zoologie. Vol. 3, Paris, France.Hoyo, J. del, Elliott, A. & Sargatal, J. 2002.
Handbook of the Birds of the World. Vol. 7. LynxEdicions, Barcelona, Spain.
Hugel, A. von. 1875. Letter. Ibis 5: 389–94.Hughes, B. & Green, A.J. 2005. Feeding ecology.
In J. Kear (ed.), Ducks, Geese and Swans of the
World, pp. 27–56. Oxford University Press,Oxford, UK.
Hutton, F.W. 1901a. Field notebook. Falla papersMS-Papers 2366–365, National Library ofNew Zealand, Wellington, New Zealand.
Hutton, F.W. 1901b. On a marine Galaxias fromthe Auckland Islands. Transactions of the New
Zealand Institute 34: 198–199.Hutton, F.W. & Drummond, J.M. 1905. The
Animals of New Zealand. Whitcombe &Tombs, Christchurch, New Zealand.
Kear, J. 2005a. Auckland Island Merganser. In J.Kear (ed.), Ducks, Geese and Swans of the World,
pp. 746–748. Oxford University Press,Oxford, UK.
Kear, J. (ed.) 2005b. Ducks, Geese and Swans of the
World. Oxford University Press, Oxford, UK. Kear, J. & Scarlett, R.J. 1970. The Auckland
Islands Merganser. Wildfowl 21:78–86.King, C.M. (ed.). 2006. The Handbook of New
Zealand Mammals. Oxford University Press,Melbourne, Australia.
Kortright, F.H. 1942. The Ducks, Geese and Swans
of North America. Stackpole, Harrisburg,USA.
Krone, H. 1900: Dichtungen von Hermann Krone.Zweiter Band. Welt-Reise. I. Die Auckland-
Inseln und Australien. Vater und Sohn auf der
Welt-Reise 1874, 1875, zur Beobachtung des
Venus-Durchgangs 1874 Dezember 9, Station
Auckland-Inseln. (Erste wissenschaftliche
Expedition des deutschen Reiches.) I. Die
Robinsonade auf den Auckland-Inseln. Australian.Zugleich als zweiter Band von Hermann Krone’s“Dichtungen.” Halle a. d. Saale: Commissions-Verlag von Otto Hendel. Pp XVI + 1–312.
Lack, D. 1970. The endemic ducks of remoteislands. Wildfowl 21:5–10.
Larson, J.S. & Taber, R.D. 1980. Criteria of sexand age. In S.D. Schemnitz (ed.). Wildlife
Management Techniques Manual, 4th edition, pp.143–202. The Wildlife Society, WashingtonDC, USA.
Livezey, B.C. 1989. Phylogenetic relationshipsand incipient flightlessness of the extinctAuckland Islands Merganser. Wilson Bulletin
101: 410–435.McCormick, R. 1884. Voyages of Discovery in the
Antarctic and the Arctic seas. Sampson, Low &Co., London, UK.
McNab, R. 1913. The Old Whaling Days: A History
of Southern New Zealand 1830–1840.
Whitcombe and Tombs, Wellington, NewZealand.
McNabb, B.K. 1994a. Energy conservation andthe evolution of flightlessness in birds. The
American Naturalist 144(4): 628–642.McNabb, B.K. 1994b. Resource use and the
survival of land and freshwater vertebrateson oceanic islands. The American Naturalist
144(4): 643–660. Marchant. S. & Higgins, P. (eds). 1990. Handbook
of Australian, New Zealand and Antarctic birds.Vol. 1, Part B. Oxford University Press,Melbourne, Australia.

24 A merganser at Auckland Islands
© Wildfowl & Wetlands Trust Wildfowl (2012) 62: 3–36
Mathews, G.M. 1936. A Supplement to the Birds of
Norfolk and Lord Howe Islands to Which is Added
Those Birds of New Zealand Not Figured by
Buller. Witherby, London, UK.Millener, P.R. 1999. The history of the Chatham
Island’s bird fauna of the last 7000 years – a chronicle of change and extinction.Proceedings of the 4th International meetingof the Society of Avian Paleontology and Evolution. Smithsonian Contributions to
Paleobiology 89: 85–109.Musgrave, T. 1866. Castaway on the Auckland Isles:
A Narrative of the Wreck of the “Grafton” and of
the Escape of the Crew after Twenty Months
Suffering. Lockwood & Co., London, UK.Ogilvie-Grant, W.R. 1905. On the birds procured
by the Earl of Ranfurly in New Zealand andthe adjacent islands. Ibis 8 (5): 543–602.
O’Rourke, R.B. (compiler). 1997. S. Dannefaerd,
Jeweller, Lapidary, and Curio Merchant. The
collections on & offshore: Auckland Institute &Museum, Canterbury Museum Christchurch,
Museum of Victoria Melbourne, Australian Museum
Sydney, Natural History Museum Tring, Bernice P.
Bishop Museum Honolulu. A chronological document
bank. Museum of New Zealand, Te PapaTongarewa, Wellington, New Zealand.
Pennycuick, C.J. 2008. Modelling the Flying Bird.
Academic Press/Elsevier Inc., London, UK.Phillips, J.C. 1926. A Natural History of the Ducks.
Houghton Mifflin, Boston, USA.Raynal, F.E. 1874. Wrecked on a Reef, or Twenty
Months Among the Auckland Isles. T. Nelson &Sons, London, UK.
Reischek, A. 1889. Notes on the islands to thesouth of New Zealand. Transactions of the New
Zealand Institute 21: 378–389.Reischek, A. (1930). Yesterdays in Maoriland: New
Zealand in the ‘Eighties. Wilson & Horton,Auckland. New Zealand.
Rohwer, F.C. 1988. Inter- and intraspecificrelationships between egg size and clutch sizein waterfowl. Auk 105: 161–176.
Rothschild, L.W. 1907. On extinct and vanishingbirds. Proceedings International Ornithological
Congress 4: 191–217.Salvadori, T. 1895. Catalogue of Birds in the British
Museum. Vol. 27. British Museum, London,UK.
Shirihai, H. & Jarrett, B. 2002. A Complete Guide to
Antarctic Wildlife: The Birds and Marine
Mammals of the Antarctic Continent and Southern
Ocean. Alula Press, Degerby, Finland.Sigwart, J.D., Callaghan, E., Colla, A., Dyke, G.J.,
McCaffrey, S.L. & Monoghan, N.T. 2004.Catalogue of Screamers, Ducks, Geese andSwans in the National Museum of Ireland(Aves: Anseriformes). http://www.ucd.ie/cobid/collections//anseriformes.pdf (viewed8 May 2012).
Sigwart, J.D., Callaghan, E., Colla, A., Dyke, G.J.,McCaffrey, S.L. & Monoghan, N.T. 2005.Belatedly hatching ornithology collections atthe National Museum of Ireland. Zoologische
Mededelingen Leiden 79: 19–28.Silveira, L.F. & Bartmann, W.D. 2001. Natural
history and conservation of BrazilianMerganser Mergus octosetaceus at Serra daCanastra National Park, Minas Gerais, Brazil.Bird Conservation International 11: 287–300.
Smith, A. 1866. The Castaways: A Narrative of the
Wreck and Sufferings of the Officers and Crew of the
Ship Invercauld of Aberdeen on the Auckland
Islands. Brown & Son, Glasgow, Scotland, UK.Solovieva, D., Shokhrin, V. 2008. Egg size,
weight, and fresh egg density of Scaly-sidedMerganser Mergus squamata in SouthPrimorye, Russia. Wildfowl 58: 106–111.
Taylor, G.A. 2000. Action Plan for Seabird
Conservation in New Zealand. Part A, Threatened
Seabirds. Threatened Species OccasionalPublication 16, Department of Conservation, Wellington, New Zealand.
Tennyson, A.J.D. & Martinson, P. 2006. Extinct
Birds of New Zealand. Te Papa Press,Wellington, New Zealand.

A merganser at Auckland Islands 25
© Wildfowl & Wetlands Trust Wildfowl (2012) 62: 3–36
Waite, R.E. (ed.). 1909. The Subantarctic Islands of
New Zealand. Volume 2. Philosophical Instituteof Canterbury, Wellington, New Zealand.
Weller, M. 1980. The Island Waterfowl. Iowa StateUniversity Press, Ames, USA.
Williams, G.R. & Weller, M.W. 1974.Unsuccessful search for the Auckland IslandMerganser (Mergus australis). Notornis 21(3):247–249.
Williams, M., McKinney, F. & Norman, F.I. 1991.Ecological and behavioural adaptations ofaustral teal to island life. Proceedings 20th
International Ornithological Congress : 876–884. Williams, M. 1995. Social structure, dispersion
and breeding of the Auckland Island Teal.Notornis 42: 219–262.
Williams, M., Holdaway, R.N. & Rogers, K.M.(2012). Feeding environments of NewZealand’s extinct merganser revealed bystable isotope analyses. Wildfowl 62: 190–203.
Williamson, M.R., Dial, K.P. & Biewener, A.A.2001. Pectoral muscle performance duringascending and slow level flight in MallardsAnas platyrhynchos. The Journal of Experimental
Biology 201: 495–507.Wilson, R.A. 1959. Bird Islands of New Zealand.
Whitcombe & Tombs, Christchurch, NewZealand.
Wood, D.S., Zusi, R.L. & Jenkinson, M.A. 1982.World Inventory of Avian Skeletal Specimens,
1982. American Ornithologists’ Union andOklahoma Biological Survey, Norman,Oklahoma, USA.
Worthy, T.H. 1998a. A remarkable fossil andarchaeological avifauna from Marfells Beach,Lake Grassmere, South Island, New Zealand.Records of the Canterbury Museum 12(1): 79–176.
Worthy, T.H. 1998b. Fossil avifaunas from Old Neck and Native Island, Stewart Island – Polynesian middens or natural sites? Records of the Canterbury Museum 12 (2):49–82.
Worthy, T.H. 2004. The Holocene fossilwaterfowl fauna of Lake Poukawa, NorthIsland, New Zealand. Tuhinga 15: 77–120.
Worthy, T.H. & Holdaway R.N. 2002. The Lost
World of the Moa: Prehistoric Life of New
Zealand. Indiana University Press, Indiana,USA and Canterbury University Press,Christchurch, New Zealand.
Young, H.G. & Kear, J. 2006. The rise and fall ofwildfowl of the western Indian Ocean andAustralasia. Bulletin British Ornithologists’ Club
126A: 25–39.
Appendix 1. Mergus australis specimens from Auckland Islands in museumcollections.
The late 19th century was a period of assiduouscollecting of New Zealand’s avifauna andspecimens from its remote islands, like theAuckland Islands, were especially prized. Thisdemand was driven by competition betweenImperial museums in Europe to assemblepremier collections of fauna, flora andanthropology from their nation’s colonies, byNew Zealand’s new Colonial Museum andprovincial museums in Auckland, Christchurchand Dunedin to do likewise, and by private
collectors, most notably Walter Rothschild ofTring, England.
Baron Anatole von Hugel (1875), a travellingUK-based aristocrat returned the firstmergansers to England having purchased hisspecimens from collectors in Invercargill. Heplaced one specimen each in the British Museumof Natural History and the Zoological Museumat Cambridge University. Hermann Krone,following participation in the German Transit ofVenus expedition to Auckland Island in 1874

26 A merganser at Auckland Islands
© Wildfowl & Wetlands Trust Wildfowl (2012) 62: 3–36
(Dawson & Duerbeck 2008) returned home witha pair of mergansers which he presented to theDresden Museum. Between 1877–1889 AndreasReischek assembled a prodigious collection of New Zealand’s birds for the K.k.Naturhistorisches Hofmuseum (laterNaturhistorisches Museum Wien) in Vienna(Reischek 1889, 1930) and was the first majorcollector to visit the Auckland Islands (in 1888)determined to secure a pair of mergansers.
Crew of government ships visiting the islandtwice yearly returned to port with bird specimensfor sale and some of their merganser specimensare included among the existing museumspecimens. Sir Walter Buller was a determinedacquirer of these for both his own collection andfor sale to Walter Rothschild (Bartle & Tennyson2009). Although Rothschild acquired many birdspecimens from other New Zealand collectors(e.g. Dannefaerd, Travers) he received all of hismergansers from Buller. Those specimens arenow in the AMNH collection (Bartle &Tennyson 2009).
A last and most determined field collector wasLord Ranfurly, Governor-General of New Zealand1897–1904, who collected a large number of NewZealand and Pacific birds at the request of theBritish Museum (Ogilvie-Grant 1905). He visitedAuckland Islands in January 1901 (on NZGSHinemoa) and January 1902 (on NZGS Tutanekai)(Alexander 1901, 1902), collecting four mergansersin 1901 (an adult pair going to the British Museumand a recent fledgling each to Dublin andCanterbury Museums) and another two birds in1902 (the fates of which remain uncertain). AtRanfurly’s request crew of the British naval vesselHMS Archer visiting Auckland Islands in July 1901 collected at least three other merganserspecimens which were eventually lodged in theBritish Museum (Ogilvie-Grant 1905). FollowingRanfurly’s 1902 collecting no live mergansers wereseen again despite earnest (Waite 1909) and forlorn(Williams & Weller 1978) searches.
Eleven museums, three in New Zealand, twoin USA, three in Europe, two in UK and one inIreland, hold between them four ducklingspecimens and 23 skins of immatures and adults.Near-complete skeletal remains of three birdsand a partial cadaver from another are held at theNatural History Museum, Tring, and sternumand pelvic bones from skins are in Otago andCanterbury Museums. No merganser bones haveyet been collected from natural deposits atAuckland Islands. The documented presence oftwo M. australis skulls in the Universitie d’LyonAnatomy Department collection, France (Woodet al. 1982) is a case of M. serrator skulls beingmisidentified and wrongly labelled (A. Previatopers. comm.).
Not all specimens apparently received bymuseums can now be accounted for. Forexample, Buller (1892) refers to the BritishMuseum then containing “a pair” but the currentcollection contains only one specimen pre-dating1892. Buller also refers to a specimen in bothOtago and the Colonial (= National) Museumcollections (the latter deposited in 1880–81;Evening Post 25 April 1882) but their currentcollections contain no mergansers of thatvintage. Mystery also surrounds the fate of bothbirds collected by Ranfurly in 1902, and of theskins of 2 skeletons and cadaver in the NMH (seebelow).
Listed below are details for each specimen, asoriginally provided by Kear & Scarlett (1970),with added comment and measurements (inmm). Measurements of tarsus (especially) andmid toe & claw on the dried specimens provedextremely problematic and rarely repeatable towithin 1 mm; the means of four measurementsare provided for each simply to indicate theirapproximate magnitude. Length of exposedculmen, width of bill at tip (widest part of nail),and wing length proved the most repeatable ofstandard measurements, the latter being ofunflattened wing feathers from the distal portion

A merganser at Auckland Islands 27
© Wildfowl & Wetlands Trust Wildfowl (2012) 62: 3–36
of the carpus to the tip of the longest primaryfeather (usually the second). Rectrices of allspecimens were examined for presence ofterminal down stalks to indicate a recent fledgling(Larson & Taber 1980).
Canterbury Museum, Christchurch,New Zealand
Skin. AV1580. Collection date recorded as May1894, collector not identified. Ex W.L. Bullercollection. Original label has sex as male,changed (by R.M. Scarlett) to female.Measurements: culmen 54.5, bill width at tip5.4, wing 178, tarsus 41, mid toe & claw 67,tail 63. Sex by measurement – female. Headcrest poorly developed.
Skin. AV1583. Ex E.F. Stead collection. Collectedby R.A. Wilson, 30 Oct 1891, probably atWaterfall Inlet (Wilson 1959). Unsexed.Measurements: culmen 61, bill width at tip6.9, wing 199, tarsus 44, tail 73. Sex bymeasurement – male. Adult.
Skin (mount). AV2944. Collected by LordRanfurly’s party 5 Jan 1901. Acquired by F.W.Hutton, Canterbury Museums’ curator ofthe time who accompanied Ranfurly onHinemoa and was later responsible fordespatching Ranfurly’s collection to theBritish Museum (Hutton 1901a; Ogilvie-Grant 1905). Labelled male. Measurements:culmen 55.8, bill width at tip 5.8, wing 177,tarsus 37, mid toe & claw 55, tail 62. Sex bymeasurement – female. Tips of its remigesand rectrices are unfrayed and the down stalkvisible at tip of at least 3 rectrices. Recentfledgling. Identical in plumage to NMINH1904.559.1 which was collected at the sametime.
Skin. AV 1581. Duckling. Ex W.L. Bullercollection. Downy, c. 1 week old. Kear &Scarlett (1970) suggest this to be one of theducklings collected by crew of NZGSHinemoa on or about 15 Jan. 1890 in
Maclaren/Magnetic Bay, Adams island(Chapman 1891). Chapman collected 2 ofthese for Otago Museum (Chapman 1891)(see specimens A51.51) and another ducklingfrom this brood is AMNH 744347, derivedfrom Buller’s collection (Buller 1892; Bartle& Tennyson 2009).
Bones. AV 1582. Head including part cranium,upper and lower mandibles and quadrate.Label states “from old skin skeletonised23/10/53 R.J.Scarlett. Length of culmen 5.3inches” Nares to tip 36.6 and comparablewith females NHM 1904.8.4.2 and NHM1904.8.4.4. No collection data or daterecorded.
Bones AV 5176. Pelvis, sternum and 3 caudalvertebrae. Label reads “sternum and pelvis ofmale (O.1224.3) now AV 5176, Auckland Is,Jan 1901.” Almost certainly from mountedspecimen AV2944 in which case it isincorrectly sexed. Sternum + keel length(ventral) 85.7, sternum length (visceral/dorsal) 71.1, sternum anterior width 41.9,sternum posterior width 47.3, keel area 6.01cm2, pelvis acetabulum width 28.6, pelvisposterior width 48.0. Measurementscomparable with those of females NHM1904.8.4.2 and NHM 1904.8.4.4.
Bones. AV 7157. L. corocoid, length 44.8. L.scapula. Both bones labelled “merganser”.No other data.
Otago Museum, Dunedin, New Zealand
Skin (mount). AV 1110 (formerly A51.50).Labelled as “collected 1890, ex F.R. Chapmancollection, sex female”. Kear & Scarlett(1970) suggest this specimen may have beencollected in January 1890 on Chapman’sjourney on NZGS Hinemoa but Chapman(1891) makes no such claim and specificallysays that the parents of the ducklingscollected then escaped. Rectrices still carryingthe down stalk. Recent fledgling.
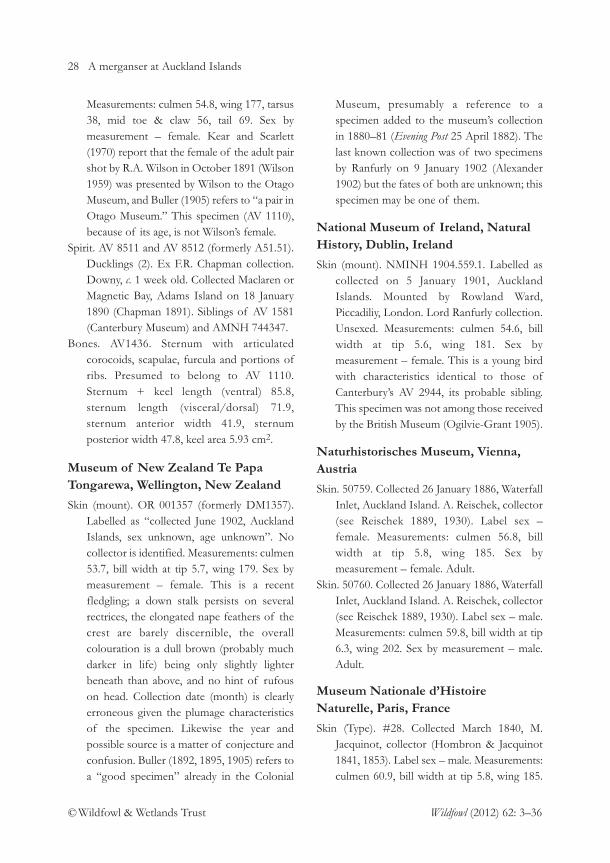
28 A merganser at Auckland Islands
© Wildfowl & Wetlands Trust Wildfowl (2012) 62: 3–36
Measurements: culmen 54.8, wing 177, tarsus38, mid toe & claw 56, tail 69. Sex bymeasurement – female. Kear and Scarlett(1970) report that the female of the adult pairshot by R.A. Wilson in October 1891 (Wilson1959) was presented by Wilson to the OtagoMuseum, and Buller (1905) refers to “a pair inOtago Museum.” This specimen (AV 1110),because of its age, is not Wilson’s female.
Spirit. AV 8511 and AV 8512 (formerly A51.51).Ducklings (2). Ex F.R. Chapman collection.Downy, c. 1 week old. Collected Maclaren orMagnetic Bay, Adams Island on 18 January1890 (Chapman 1891). Siblings of AV 1581(Canterbury Museum) and AMNH 744347.
Bones. AV1436. Sternum with articulatedcorocoids, scapulae, furcula and portions ofribs. Presumed to belong to AV 1110.Sternum + keel length (ventral) 85.8,sternum length (visceral/dorsal) 71.9,sternum anterior width 41.9, sternumposterior width 47.8, keel area 5.93 cm2.
Museum of New Zealand Te PapaTongarewa, Wellington, New Zealand
Skin (mount). OR 001357 (formerly DM1357).Labelled as “collected June 1902, AucklandIslands, sex unknown, age unknown”. Nocollector is identified. Measurements: culmen53.7, bill width at tip 5.7, wing 179. Sex bymeasurement – female. This is a recentfledgling; a down stalk persists on severalrectrices, the elongated nape feathers of thecrest are barely discernible, the overallcolouration is a dull brown (probably muchdarker in life) being only slightly lighterbeneath than above, and no hint of rufouson head. Collection date (month) is clearlyerroneous given the plumage characteristicsof the specimen. Likewise the year andpossible source is a matter of conjecture andconfusion. Buller (1892, 1895, 1905) refers toa “good specimen” already in the Colonial
Museum, presumably a reference to aspecimen added to the museum’s collectionin 1880–81 (Evening Post 25 April 1882). Thelast known collection was of two specimensby Ranfurly on 9 January 1902 (Alexander1902) but the fates of both are unknown; thisspecimen may be one of them.
National Museum of Ireland, NaturalHistory, Dublin, Ireland
Skin (mount). NMINH 1904.559.1. Labelled ascollected on 5 January 1901, AucklandIslands. Mounted by Rowland Ward,Piccadiliy, London. Lord Ranfurly collection.Unsexed. Measurements: culmen 54.6, billwidth at tip 5.6, wing 181. Sex bymeasurement – female. This is a young birdwith characteristics identical to those ofCanterbury’s AV 2944, its probable sibling.This specimen was not among those receivedby the British Museum (Ogilvie-Grant 1905).
Naturhistorisches Museum, Vienna,Austria
Skin. 50759. Collected 26 January 1886, WaterfallInlet, Auckland Island. A. Reischek, collector(see Reischek 1889, 1930). Label sex –female. Measurements: culmen 56.8, billwidth at tip 5.8, wing 185. Sex bymeasurement – female. Adult.
Skin. 50760. Collected 26 January 1886, WaterfallInlet, Auckland Island. A. Reischek, collector(see Reischek 1889, 1930). Label sex – male.Measurements: culmen 59.8, bill width at tip6.3, wing 202. Sex by measurement – male.Adult.
Museum Nationale d’HistoireNaturelle, Paris, France
Skin (Type). #28. Collected March 1840, M.Jacquinot, collector (Hombron & Jacquinot1841, 1853). Label sex – male. Measurements: culmen 60.9, bill width at tip 5.8, wing 185.

A merganser at Auckland Islands 29
© Wildfowl & Wetlands Trust Wildfowl (2012) 62: 3–36
Sex by measurement – male. Collectedduring Dumont D’Urville’s expedition toAuckland Islands 10–20 March 1840. Thecollection locality is presumed to be PortRoss because D’Urville’s two ships remainedanchored there and later in that yearMcCormick (1884) saw mergansers there.However D’Urville’s expedition scientistsvisited several of the island’s eastern inlets ona visiting Portugese whaler Speculacao (McNab1913).
Staatliches Museum fur Tierkunde,Dresden, Germany
Skin. C5730. Carnley Harbour, Auckland Island.1874. H. Krone presented. Label sex – male.Measurements: culmen 61.3, bill width at tip7.1, wing 194. Sex by measurement – male.The date and location cannot be verified.Kear & Scarlet (1970) list the specimen’sentry as “H. Krone bought and pres.”implying either its purchase by Krone or itspurchase from Krone. Hermann Krone wasa member of the five-month long 1874–75German Transit of Venus expedition basedat Terror Cove in Port Ross. Although theexpedition assembled a substantial naturalhistory collection, it did not include birds.The expedition members are not known tohave journeyed beyond Port Ross and theytravelled to and from Auckland Island on theAlexandrine directly to Melbourne, withoutcalling at any New Zealand port (ElliotDawson pers. comm.). However Krone(1900, pp. 24–26) lists seabirds at the islandincluding small penguins in Carnley Harbour,perhaps indicative of an otherwiseunrecorded visit.
Skin. C5731. Carnley Harbour, Auckland Island.1874. Label sex – female. Measurements:culmen 54.1, bill width at tip 6.0, wing 182.Sex by measurement – female. Comments asabove.
Zoology Museum, CambridgeUniversity, Cambridge, England
Skin. 12/Ana/38/a/1. Von Hugel collection.Label sex – male. Measurements: culmen60.7, bill width at tip 7.0, wing 192, tarsus 39,mid toe & claw 66, tail 73. Sex bymeasurement – male. Adult. Collection dateon label given as 11 Dec. 1874; von Hugel(1875) indicates he purchased this andanother specimen (BMNH 1875.11.6 14) inInvercargill, NZ and “the birds were killedthe latter end of November...”
Natural History Museum, Tring,England
Skin. 1875.11.6.14. Presented by von Hugel, oneof pair purchased in Invercargill (von Hugel1875). Label sex – unrecorded. Measurements: culmen 58.4, bill width at tip 6.3, wing 189,tarsus 38, mid toe & claw 67, tail 68. Sex bymeasurement – probably male. Measurements of bill and wing are smallest for any “male”measured. Its well-developed head crest andrufous colour of head and throat suggest itto be an adult.
Skin. 1901.10.21.57. McClennands (= McLennan) Inlet, Auckland Island. 4 January 1901.Presented by Earl of Ranfurly. Label sex –“male certain”. Label contains description ofsoft parts in hand of F. W. Hutton.Measurements: culmen 60.4, bill width at tip6.5, wing 188, tarsus 45, mid toe & claw 68,tail 70. Sex by measurement – male. Adult.
Skin. 1901.10.21.58. McClennands (= McLennan) Inlet, Auckland Island. 4 January 1901.Presented by Earl of Ranfurly. Label sex –“female certain”. Measurements: culmen53.9, bill width at tip 5.7, wing 181, tarsus 43,mid toe & claw 63mm, tail 72. Sex bymeasurement – female. Adult.
The collection date for the above 2 specimens isincorrect by one day. On 4 January 1901,

30 A merganser at Auckland Islands
© Wildfowl & Wetlands Trust Wildfowl (2012) 62: 3–36
Ranfurly’s party aboard NZGS Hinemoa spent allday in the Port Ross area of Auckland Island(Alexander 1901; Hutton 1901a). They journeyedto Carnley Harbour on 5 January visiting many ofthe eastern inlets, including Norman andMcLennan Inlets, along the way. Hutton (1901a)records one merganser being obtained inNorman Inlet but makes no reference to anybeing retrieved from McLennan Inlet. Hisnotebook entry for 5 January 1901 records“visited sounds on east coast” followed by adescription of a merganser’s bill, feet and eye anda reference to its short wings and “quacks like aduck”. His notebook entry for 6 January iswithout reference to location (but the party wasthen in Carnley Harbour; Alexander 1901) andcontains a description of a male merganser. Laterin his notebook he comments that “A full-grownmale flew from the shore to the Hinemoa andsettled in the water within gunshot of the vesselwhere it remained swimming about and quackinguntil shot from on board”. The 4 January 1901collection date appears to have arisen fromHutton’s notebook listing of small birdspecimens collected that day on Enderby Islandand the Port Ross shoreline and placed in anumbered specimen jar, to which he later added(in different pencil) “merganser australis 1 inNormans Inlet”. Two other mergansers (CM2944 and NMINH 1904.559.1.) are labelled ascollected on 5 January 1901.
Skin. 1904.8.4.1. Collector J.P. Rolleston, CarnleyHarbour, Auckland Island, 9 July 1901(Ogilvie-Grant 1905). Label records soft part colouration. Labelled sex – female.Measurements: culmen 53.1, bill width at tip 5.8, wing 177, tarsus (most removed from skin), mid toe & claw 60, tail 68. Sex by measurement – female. Rolleston,commanding officer of HMS Archer
responded to Ranfurly’s request and obtaineda range of bird specimens when patrolling
New Zealand’s Subantarctic islands. Culmenmeasurements are not reliable because therhampotheca has been soaked and liftedfrom the underlying bone, the entire skullremoved from the skin and retained as partof skeleton NHM 1904.8.4.2.
Skin. 1902.8.6.1. Collector Lt. Kennett Dixon,R.N. Auckland Island. No collection date.Labelled as male. Measurements: culmen60.4, bill width at tip 7.1, wing 197, tarsus 42, mid toe & claw 68, tail 78. Sex by measurement – male. Age uncertain.Collector was officer on HMS Archer whichvisited Auckland Island July 1901.
Skin. 1904.4.30.1. Collector Lt. A.J. Stewart, R.N.No further details. Presumed to have beencollected July 1901 during HMS Archer visitto Auckland Island. Measurements: culmen55.3, bill width at tip 6.0, wing 172, tarsus 41, mid toe & claw 63, tail 68. Sex by measurement – female. Falla (1970)considered this specimen to have“indeterminate” plumage and could be ayoung bird, which I confirm from thepresence of down stalks at the tips of therectrices.
Skeleton. 1904.8.4.2. Female. From skin1904.8.4.1 (Ogilvie-Grant 1905). Total skulllength 102.6, nares to bill tip 35.8, sternum +keel length (ventral) 87.4, sternum length(visceral) 71.7, sternum anterior width 42.5,keel area 5.45 cm2, pelvis acetabulum width28.7, pelvis posterior width 47.1, humerus67.8, ulna 54.7, femur 42.6, tibiotarsus 76.9,tarsus 40.4.
Skeleton. 1904.8.4.3. Label sex – male.Associated note reads “belongs to mountedspecimen standing up”. No such specimencan be traced. Total skull length 109.9, naresto bill tip 40.2, sternum + keel length(ventral) 94.8, sternum length (visceral/dorsal) 77.1, sternum anterior width 47.7,keel area 6.28 cm2, pelvis acetabulum width

A merganser at Auckland Islands 31
© Wildfowl & Wetlands Trust Wildfowl (2012) 62: 3–36
31.2, pelvis posterior width 49.9, humerus72.1, ulna 57.7, femur 45.4. Tibia and tarsuspresumably retained in the mount.
Skeleton. 1904.8.4.4. Label sex – female.Associated note reads “belongs to lyingmounted specimen”. No such specimen canbe traced. Total skull length 103.6, nares tobill tip 37.3, sternum + keel length (ventral)88.5, sternum length (visceral/dorsal) 72.3,sternum anterior width 43.1, keel area 5.60cm2, pelvis acetabulum width 29.0, pelvisposterior width 47.0, humerus 68.9, ulna55.0, femur 43.1, tibiotarsus 77.7, tarsus 41.2.
Ogilvie-Grant (1905) refers to skeletons “of an adult pair in the possession of Lord Ranfurly”;1904.8.4.3 and 1904.8.4.4 are presumably these.Since both retain complete skulls therhampothecae must have been removed from thebills, as for 1904.8.4.2. The whereabouts of themounts are unknown.
Spirit. A/1999.1.124. Cadaver of a male (basedon sternum-keel length) that was initiallylabelled as female but subsequently re-labelled as male. All musculature and entrailsremain but the gizzard has been opened andfood contents reported in Kear & Scarlett(1970). Associated original labels offer noindication of origin but one states “belongsto the one standing on/upright. Tibia andtarsus left with stuffed specimen”. Bodywidth at shoulder joint (glenoid fossae)54mm.
Ogilvie-Grant (1905) refers to the museumreceiving in the “ranfurly collection” 3 skins(1901.10.21.57, 1901.10.21.58, 1904.8.4.1) askeleton (1904.8.4.2) derived from one of theskins (1904.8.4.1), plus another two skeletons of“an adult pair in the possession of LordRanfurly”, which presumably are the two birds hecollected in Carnley Harbour on 9 January 1902
(Alexander 1902). The museum later received amale specimen (1902.8.6.1) followed by a femalespecimen (1904.4.30.1). Of the birds presently inthe NHM collection, the spirit specimen could bederived from either of the two male skins1902.8.6.1 or 1901.10.21.57. The reference to astanding mount could be a confusion should oneof these two birds have originally been mountedand later relaxed and turned into a skin, or itcould indicate the cadaver is not from anyspecimen now in the museum. In the latter case itwould represent another, presently unknown,male specimen.
Carnegie Museum, Pittsburgh, USA
Skin. 24509. Male. This was purchased in 1905with the “third Buller collection” (Bartle &Tennyson 2009; Appendix 5) and is thoughtto be the adult male mentioned in Buller(1905). A separate tag bears Buller’s no. 125.Bartle & Tennyson (2009) record collectiondate as 1894 and possibly supplied to Bullerby the collector A.W. Bethune. Measurements (supplied by S. Rogers, Carnegie Museum):culmen 53.8, nares to tip 40.1, bill width at tip5.3, wing 181. Sex by measurement – female.
American Museum of Natural History,New York, USA
Skin. 734364. Male. No other data. Original labelin the handwriting of commercial collectorS.V. Dannefaerd. Measurements (supplied byM. LeCroy, AMNH): culmen 61.5, bill widthat tip 5, wing 187. Sex by measurement –probably male.
Skin. 734365. Female. No other data.Dannefaerd’s label gives collection date as2/1895. Measurements (supplied by M.LeCroy, AMNH): culmen 60, nares to tip 40,bill width at tip 5, wing 178. Sex bymeasurement – female.
Skin. 734366. Labelled as female but a note byR.A. Falla dated 5 Aug. 1966 says “this is

32 A merganser at Auckland Islands
© Wildfowl & Wetlands Trust Wildfowl (2012) 62: 3–36
clearly a male”. Falla (1970) adds thisspecimen is “bigger than 734364”.Dannefaerd’s label gives collection date as2/1895. Measurements (supplied by M.LeCroy, AMNH): culmen 62, nares to tip 44,bill width at tip 5, wing 188. Sex bymeasurement – male.
Skin. 734367. Unsexed. December 1901 Traverscollection. Falla (1970) writes “seems to be amale, wing 192mm, bill only 58mm but wideand deep like 734366”. Measurements(supplied by M. LeCroy, AMNH): culmen
62, nares to tip 44, bill width at tip5.5, wing 188. Sex by measurement – male.
Skin. 744347. Duckling. Presumably one of thebrood of four collected by Chapman (1891).Others in Otago and Canterbury Museums.
These specimens were included in the AMNH’s1932 purchase of W.L. Rothschild’s collection atTring. According to Salvadori (1895) a male andfemale at Tring were immature birds in firstplumage. Rothschild (1907) mentioned fourspecimens at Tring, one mounted and three skins.
Appendix 2. Comparative measurements (mm) and weights (g) of mergansers. Meansare given ± s.d. with ranges in parentheses. Sources: 1 = Kear 2005b; 2 = Livezey 1989; 3 =Cramp & Simmons 1977; 4 = Kortright 1942; 5 = Solovieva & Shokhrin 2008; 6 = L. Lins(pers. comm.); 7 = this study.
Species Sex Culmen Tarsus Wing Weight
Mergus M 60.3 ± 0.97 42 ± 27 194 ± 67 550–7607
australis 59.6 ± 3.82 43.4 ± 1.72 185 ± 5.22 8982
F 54.6 ± 1.17 40 ± 27 179 ± 47 440–6307
55.0 ± 2.82 40.5 ± 1.22 175 ± 3.52 (80–83% of (91–93% of (93–94% of male weight)male size) male size)
Mergellus M 29.6 (27–32)3 34.0 (31–36)3 202 (197–208)3 652 (540–825)3
albellus F 26.8 (25–29)3 30.6 (29–32)3 184 (181–189)3 568 (515–630)3
(90% of male size) (91% of male size) (87% of male weight)
Lophodytes M 39.6 (37–41)1 32.4 (30–34)1 198 (191–207)1 680 (595–879)4
cucullatus 40.7 ± 1.22 33.6 ± 1.62 193 ± 4.22
F 38.3 (35–40)1 31.3 (30–33)1 185 (180–191)1 544 (453–652)4
39.0 ± 2.12 32.2 ± 1.12 183 ± 3.42 (= 80% of male weight)(96% of male) (93% of male) 6172
Mergus M 51.6 ± 1.52 44.4 ± 2.92 200.2 ± 4.42 8286
octosetaceus 983 (calculated)2
F 48.6 ± 0.92 40.8 ± 2.22 193.0 ± 3.92 7536
(94% of male size) (96% of male size) (91% of male weight)

A merganser at Auckland Islands 33
© Wildfowl & Wetlands Trust Wildfowl (2012) 62: 3–36
Contributed by Stephen Hartley, School ofBiological Sciences, Victoria University, P.O. Box600, Wellington, New Zealand.
To examine whether the keel of M. australis
was reduced and its wing short relative to itssternum length, linear regressions betweenloge(sternum length) and loge(keel area) andbetween loge(sternum length) and loge(wingbone length) were performed using data fromfour extant merganser species (Appendix 4). Theresults were back-transformed to the originalscale for graphical display. In fitting theregressions, individuals were consideredindependent data points. 50% predictionintervals were constructed around the fittedregression lines; the area within the 50%
prediction interval is expected to contain 50% ofall future points following the same relationshipused to build the model.
Data points for M. australis (Appendix 4) werethen compared to the inter-specific relationshipto determine whether they fell inside or outsidethe prediction interval more, or less, frequentlythan expected.
For the sternum – keel area relationship, allfive points for M. australis fell below the 50%prediction interval (Fig. 4). The probability of this occurring if M. australis follows the same relationship as the other mergansers is P = 0.0017 (0.5 * 0.254). For a given sternumlength, the keel area of M. australis was 0.792(0.753–0.839) [geometric mean and range]
Appendix 2 (continued)
Species Sex Culmen Tarsus Wing Weight
M. serrator M 59.2 (56–64)3 47.0 (44–50)3 247 (235–255)3 1,197 (947–1,350)3
58.1 ± 1.52 46.6 ± 1.62 236 ± 9.02 9842
F 52.1 (48–55)3 42.7(40–45)3 228 (216–239)3 984 (900–1,100)3
54.4 ± 2.62 45.1 ± 2.82 216 ± 9.12 (82% of male weight)(88–93% of (92% of male size)male size)
M. squamatus M 52–571 46–481 250–2651 1,232(1,125–1,400)1
55.6 ± 1.42 46.8 ± 0.72 249 ± 6.52 1,234(calculated)2
F ~451 – 220–2501 977 (930–1,070)5
50.5 ± 2.02 45.7 ± 2.32 235 ± 11.92 (79% of male weight)(91% of male size) (94% of male size)
M. merganser M 55.8 (52–60)3 51.7 (49–55)3 285 (275–295)3 1,709 (1,528–2,160)3
55.5 ± 3.62 51.9 ± 1.72 267 ± 5.52 1,3822
F 48.7 (44–52)3 47.4 (44–51)3 262 (255–270)3 1,232 (1,050–1,362)3
50.6 ± 2.32 46.7 ± 1.32 239 ± S 3.52 (72% of male weight)(87–91% of (90–92% of male size) male size)
Appendix 3: Sternum lengths, keel areas and wing bone (humerus + ulna) lengthsof mergansers.

34 A merganser at Auckland Islands
© Wildfowl & Wetlands Trust Wildfowl (2012) 62: 3–36
times that predicted by the inter-specificrelationship.
For the sternum – wing bone lengthrelationship, all three points for M. australis fellbelow the 50% prediction interval (Fig. 5). Theprobability of this occurring if M. australis
follows the same relationship as the othermergansers is P = 0.029 (0.5 * 0.252). For a givensternum length, the wing bones of M. australis
were 0.913 (0.892–0.925) [geometric mean andrange] times the length predicted by the inter-specific relationship of the other species.
Figure 4. Interspecific allometric relationship(excluding M. australis) between sternum lengthand keel area for four species of merganser (opensymbols) with 50% prediction interval (dashedline). loge(sternum) = –3.377 + 1.254*loge(keelarea), R2= 0.879, F1,31 = 224.2, P = 9.7*10–16.Data from Appendix 4.
Figure 5. Interspecific allometric relationship(excluding M. australis) between sternum lengthand wing bone length for four species ofmerganser (open symbols) with 50% predictioninterval (dashed line). loge(sternum) = 1.200 +0.862*loge(wing bone), R2= 0.920, F1,25 = 288.5,P = 3.1*10–15. Data from Appendix 4.

A merganser at Auckland Islands 35
© Wildfowl & Wetlands Trust Wildfowl (2012) 62: 3–36
Appendix 4. Sternum lengths, keel areas and wing bone (humerus, ulna) lengths of fourextant merganser species and M. australis. Specimens sourced from National Museum ofIreland, Dublin (NMINH), Natural History Museum, Tring (NHM), NaturhistorischesMuseum, Wien (Vienna), Staatliches Museum fur Tierkunde, Dresden (Dresden), MuseumNationale d’Histoire Naturelle, Paris (Paris), Otago Museum, Dunedin (Otago), CanterburyMuseum, Christchurch (CM).
Species & specimen Sex 1Sternum 2Keel Humerus Ulna identity length area length length
(mm) (cm2) (mm) (mm)
M. serrator
NMINH 1932.13.1 F 80.7 7.70 83.1 69.0
NHM1930.3.24.242 F 80.8 7.40 82.7 68.5
NHM 1997.78.1 F 79.2 7.69 81.5 64.7
NMINH 1927.6.1 M 88.6 9.81 91.1 76.2
NMINH 2004.79.26 M 93.3 10.90 87.6 72.2
NHM 1898.2.12.5 M 93.1 9.46 90.5 74.5
NHM 1930.3.24.633 M 88.1 10.20 90.3 73.7
Vienna 4456 F 83.5 7.71
Vienna 4827 M 90.9 8.76 89.3 73.1
Paris 1996/39 ? 80.7 7.25 80.2 66.0
M. merganser
NHM 1955.5.10 F 94.1 11.18 93.9 73.2
NHM 1866.12.30.5 F(?) 87.0 7.80 87.2 72.5
Dresden 3092 F 92.1 11.38 94.0
Dresden 3022 M 107.0 11.49
NHM 1930.3.24.239 M 103.6 11.90 98.2 81.6
NHM 1930.3.24.238 M 105.3 12.27 100.1 84.6
Vienna 2733 M? 108.2 12.75 104.0 87.2
M. albellus
NHM 1930.3.24.236 F 58.7 6.00 65.2 54.5
NHM s/1986.32.1 F 62.3 6.20 62.9 52.6
Dresden unnumbered F 60.7 6.22

36 A merganser at Auckland Islands
© Wildfowl & Wetlands Trust Wildfowl (2012) 62: 3–36
Appendix 4 (continued)
Species & specimen Sex 1Sternum 2Keel Humerus Ulna identity length area length length
(mm) (cm2) (mm) (mm)
NHM 1930.3.24.235 M 73.5 8.42 71.3 61.0
NHM 1930.3.24.237 M 71.3 7.50 68.9 58.2
Dresden barhmann 110 M 72.4 7.71 71.5
Vienna 8645 F 61.5 5.84 72.1 60.2
Paris 1977/1200 ? 73.0 7.60 69.4 58.1
Paris 1977/1199 ? 67.4 6.29 72.0 59.3
Paris 1997/679 ? 61.1 5.20 63.5 53.5
Paris 1921-203 ? 62.1 6.04
L. cucullatus
NHM 1986.60.8 M 70.3 8.38 69.1 55.6
NHM 1997.35.1 F 64.5 6.39 64.1 52.0
Vienna 4865 captive M 67.3 6.91 64.2 52.5
Vienna 2207 captive F 67.8 6.83 66.6 52.6
Vienna 4598 captive ? 66.3 6.46 64.0 51.7
M. australis
NHM1904.8.4.4 F 72.3 5.60 68.9 55.0
NHM1904.8.4.2 F 71.7 5.45 67.8 54.7
NHM 1904.8.4.3 M 77.1 6.18 72.1 57.7
CM 5176 F 71.1 6.01
Otago 1110 F 71.9 5.93
1 Sternum length is measured along the midline of its visceral (dorsal) surface.2 Keel area measured from a thin plasticine impression of the keel scanned against 1 mm grid
graph paper background.

37
© Wildfowl & Wetlands Trust Wildfowl (2012) 62: 37–72
Impacts of wind farms on swans and geese: a review
EILEEN C. REES
Wildfowl & Wetlands Trust, Martin Mere, Burscough, near Ormskirk, Lancashire L40 0TA, UK.E-mail: [email protected]
Abstract
This review considers data published on the effects of offshore and onshore windfarmson swans and geese and finds that the information available is patchy. Of 72 swans orgeese reported as collision victims at 46 wind farms, most (39 birds) were reported at 23wind farms in Germany where such data are collated. Post-construction monitoring wasundertaken for ≤ 1 year at 67% of 33 sites, making it difficult to test for cumulativeeffects or annual variation in collision rates. Site use by the birds was measured at onlynine of 46 wind farms where collisions by swans and geese were monitored or recorded.Displacement distances of feeding birds at wintering sites ranged from 100–600 m, butpreliminary evidence suggested that large-scale displacement also occurs, with fewerswans and geese returning to areas after wind farms were installed. Eight studies of flightbehaviour all reported changes in flight-lines for swans or geese initially seen headingtowards the turbines, at distances ranging from a few hundred metres to 5 km; 50–100%of individuals/groups avoided entering the area between turbines, but in some cases thesample sizes were small. Key knowledge gaps remain, including whether wind farminstallation has a consistently negative effect on the number of birds returning to awintering area; whether flight avoidance behaviour varies with weather conditions, windfarm size, habituation and the alignment of the turbines; provision of robust avoidancerate measures; and the extent to which serial wind farm development has a cumulativeimpact on specific swan and goose populations. It is therefore recommended that: 1)post-construction monitoring and dissemination of results be undertaken routinely, 2)the extent to which wind farms cause larger-scale displacement of birds from traditionalwintering areas be assessed more rigorously, 3) further detailed studies of flight-lines inthe vicinity of wind farms should be undertaken, both during migration and for birdscommuting between feeding areas and the roost, to provide a more rigorous assessmentof collision and avoidance rates for inclusion in collision risk models, and 4) thecombination of collision mortality and habitat loss at all wind farms in the species’ rangebe analysed in determining whether they have a significant effect on the population.
Key words: avoidance, collisions, displacement, offshore wind farms, terrestrial windfarms.

38 Swans, geese and wind farms
© Wildfowl & Wetlands Trust Wildfowl (2012) 62: 37–72
Wind farms have been installed increasinglyacross Europe during the late 20th and early 21st centuries, as governments seek to secure renewable energy supplies and reduce greenhouse gas emissions tocombat climate change. The EuropeanCommission’s Renewable Energy Roadmap(EU 2007) set a target of 20% of EU energyto be generated from renewable sources by2020 (EU 2008). Wind energy accounted for3.7% of EU electricity generation by early2008, and the European Commission’s goalof increasing that share to 12% by 2020 isregarded as achievable (European WindEnergy Association; EWEA 2008). Annualinstallations of wind power have increasedsteadily from 814 MW in 1995 to 93,957MW installed across Europe in 2011, withthe largest installed capacity in Germany,followed by Spain, Italy, France and the UK(EWEA 2012). Growth projections forwind-generated energy vary substantiallydepending on the analytical methods usedand the scope for technological progress(EWEA 2009), but current capacity isexpected to treble by 2020 (EWEA 2008).Within the UK, 348 wind farms (332onshore, 16 offshore) were operational byJuly 2012, generating > 7,000 MW of windpower, with a further 64 under construction,270 consented and 335 at the planningapplication stage (RenewableUK 2012).Planning applications for the large Round 3offshore wind farms proposed for Britishcoastal waters, and for further ScottishTerritorial Water sites, will be forthcomingfrom late 2012 onwards, with the firstRound 3 projects (if consented) operationalafter 2015.
The rapid development of renewable
energy has been a challenge forenvironmental conservation organisations.Increasing evidence shows climate changehaving deleterious effects on wildlife(Parmesan & Yohe 2003; Root et al. 2003;Thomas et al. 2004) yet injudicious locationof wind farms may have detrimental effectson some species, including birds (Langston& Pullan 2003; Barrios & Rodriguez 2004;Garthe & Hüppop 2004; Hötker et al. 2006;Sterner et al. 2007; Bright et al. 2008; EEA 2009). Adverse effects include directcollision mortality, habitat loss/degradation,displacement from feeding areas, barriereffects (birds flying around wind farms and thus potentially increasing energyexpenditure), and disturbance (see reviewsin Langston & Pullan 2003; Bright et al.2006; Drewitt & Langston 2006; Fox et al.2006; Inger et al. 2009). The risk of turbinecollisions varies across species (perhapsdependent on visual acuity and depthperception at the time; Martin 2011), andwind farm location, with potential for therebeing population-level effects in some cases(Bright et al. 2008), and raptors beingparticularly at risk of colliding with theturbines (Sterner et al. 2007; Carrete et al.2012).
Within the European Union, the planningapplication process for wind farmdevelopment requires wind farm companiesto undertake environmental impactassessments (EIAs) under the terms of theEU’s Environmental Impact AssessmentDirective 85/335/EEC (as amended byDirective 97/11/EC) to determine whetherthe installation would have a significanteffect on wildlife or other environmentalfeatures (Drewitt & Langston 2006). A

Swans, geese and wind farms 39
© Wildfowl & Wetlands Trust Wildfowl (2012) 62: 37–72
Strategic Environmental Assessment (SEA)is required for large scale developments orprogrammes under the SEA Directive 2001/42/EC, which integrates environmentalconsiderations in the development of plansand programmes and builds on project-levelEIAs by considering environmental issuesearlier in the planning process (Drewitt &Langston 2006). Where proposals pose athreat to the integrity of protected areas,such as those designated by governments asSpecial Protection Areas (SPAs) for birdsunder the EU Birds Directive, the legislationrequires that a Habitats RegulationAssessment (HRA) be undertaken. TheHRA first assesses the impacts of the plan,against the objectives for conserving sitesprotected under European legislation, byconsidering whether there is a “LikelySignificant Effect” (LSE) of the plan, eitheralone or in combination with other plans orprojects. If there is considered likely to be asignificant effect on the interests of theSPA, then the “Competent Authority” (e.g.the local council planning department forUK onshore sites; Marine Scotland/ScottishGovernment and the Marine ManagementOrganisation (MMO) for offshore sites inScottish territorial waters and in England) isrequired to undertake an “AppropriateAssessment” (AA) of a proposal, whichshould ascertain that there will be noadverse effects on the interests of the SPA before development can beconsented. The question of how to assessthe cumulative impacts on migratory birdpopulations of several wind farms beinginstalled along the migration routes has beenconsidered (de Lucas et al. 2007; Norman etal. 2007; Masden et al. 2010a) but has yet to
be fully resolved. Information on the totalnumber of wind farms along migrationroutes, and the cumulative effect of these onbirds migrating to or from key sites for thepopulation (i.e. SPAs and/or Ramsar sites),is still rarely (if ever) incorporated into AAsundertaken for new wind farm sites.
Although many wind farms are nowoperational or are currently underconstruction across Europe, and many moreare proposed, available information on theeffects of these developments is patchy. Areview of bird abundance data analysed to assess wind farm impacts at 19 sitesfound that although wind farms may have significant biological impacts,particularly for Anseriformes (wildfowl) andCharadriiformes (waders), the evidence-base remains poor, largely because manystudies are methodologically weak and ofshort duration (Stewart et al. 2007).Evidence is stronger for some avian speciesthan for others; for instance, for windturbines increasing raptor mortality (e.g.Thelander & Smallwood 2007; Dahl et al.2012) and displacing upland birds (Pearce-Higgins et al. 2008, 2009), with greaterdisplacement during construction thansubsequent operation for a number ofupland species (Pearce-Higgins et al. 2012).A spatially-explicit individual-based modelof a population of Hen Harriers Circus
cyanea on Orkney, which assessed thecombined effects of collision rate, habitatloss and displacement from wind turbines,found that the larger spatial responses toturbines were from those located close tonest sites (Masden 2010). Removal ofcollision mortality from this model showedthat the majority of population-level turbine

40 Swans, geese and wind farms
© Wildfowl & Wetlands Trust Wildfowl (2012) 62: 37–72
impacts were associated with direct andindirect habitat loss in this particularcircumstance, but few comparative studiesof this kind exist to gain insight into therelative impacts of turbines on avianpopulations. At offshore wind farms,assessments have focussed mainly on theirpossible impacts on seabird populations (e.g.Garthe & Hüppop 2004; Langston &Boggio 2011; Cook et al. 2012; Furness &Wade 2012; Langston & Teuten 2012),which is appropriate given that these birdsspend much of the year at sea, and trackingstudies have recently been undertaken toprovide detailed information on thepotential for offshore wind farms to affectgoose and swan populations at differentstages of their migration (Griffin et al. 2010,2011). But post-construction assessment ofhow wind farm development affects birdnumbers and distribution is still generallylacking, despite post-constructionmonitoring being required at some sites, and such information being extremelyuseful for informing environmental impactassessments at new developments.
This paper aims to collate and assesspublished information on the observedeffects of wind farms on swan and goosepopulations. As many of these populationsbreed at high latitudes, in areas currently notsubject to wind farm development, the studyfocuses on observations made in thewintering range and during spring andautumn migration. The three main hazardsthat turbines pose to the birds (after Fox et al. 2006): 1) displacement/habitat loss (e.g. reduced use of prime feeding areasfollowing construction of the turbines), 2)barrier effects (requiring a change in
migration routes or local flight-lines to avoidwind farms, potentially increasing energyexpenditure and disrupting links betweensites), and 3) collision mortality (Desholm etal. 2006; Drewitt & Langston 2006) are allconsidered. Particular consideration is givento measures used to determine avoidancerates, which have been calculated as: 1) thenumber of birds changing their flight-lines toavoid a wind farm, and as 2) the number ofcollisions recorded for birds entering a windfarm (usually via carcass searches), as slightvariations in avoidance rate measures result insignificant variation in the bird mortalitypredictions made by wind turbine collisionrisk models (Chamberlain et al. 2006).Additionally the review aims to identify gapsin knowledge and to outline priorities forfuture assessment of the impacts of windfarm development on these species.
Methods
Detailed information on the responses ofgeese and swans to wind farms was obtainedby checking original sources for swan andgoose data in published reviews (includingBright et al. 2006, 2008; Drewitt & Langston2006; Fernley et al. 2006; Hötker et al. 2006;Pendlebury 2006; de Lucas et al. 2007), and by internet searches for more recentscientific papers and grey literature reports.Of 16 constructed offshore wind farms inthe UK, five are potentially on the flyways ofmigratory swans and geese (at Barrow, Lynn& Inner Dowsing, Robin Rigg, Scroby Sandsand Walney Island); websites for these fivesites were visited to check for informationon swan and goose passage movements inpost-construction monitoring reports. Birdcasualties attributable to wind farm collisions

Swans, geese and wind farms 41
© Wildfowl & Wetlands Trust Wildfowl (2012) 62: 37–72
in Germany have been collated by the StateOffice for Environment, Health andConsumer Protection of Brandenburg(LUGV) since 2002, and data recorded up toJuly 2012 were provided for this review(Staatlichen Vogelschutzwarte 2012 and T.Dürr pers. comm.). Observations reportedin the literature of cases where the turbinesdid or did not affect swans and geese weregrouped into the three main categoriesestablished as potentially influencing birdpopulations (i.e. displacement/habitat loss,barrier effects and collision mortality). Majorstudies of the effects of wind farms onwaterbirds along the Baltic coast, such asPettersson (2005) and Petersen et al. (2006)covered a range of species, particularlyCommon Eider Somateria mollissima; onlyobservations made of swans and geeseincluded in these studies are cited here.
For each of the wind farm studies, thenumber and alignment (linear/cluster) ofturbines in the wind farm, its constructiondate, the swan/goose species potentiallyaffected and the duration of post-construction monitoring was recorded.Methods were inspected to determine whichstudies rigorously assessed collision rates, asopposed to those where incidental collisionswere recorded during observations ofdisplacement and barrier effects. The formerincluded ground surveys made for anyturbine-related casualties (in the case ofonshore wind farms), or where videocameras using infrared sensing, or furtheranalysis of bird occurrences and flighttrajectories were used to detect collisions (forthe offshore sites). Thus cases where swansand geese were seen flying through a windfarm, but methods (e.g. aerial surveys or use
of radar) did not permit, or analyses did notinclude, an assessment of collision frequency(e.g. Petersen et al. 2006; Plonczkier & Simms2012), were omitted from the collision ratereview (but included in the barrier effectreview), as there was no evidence forcollision rates being low or zero. For studiesassessing barrier effects, the number of birdsflying towards the wind farm, the numberthat changed their flight-path and thedistance at which they did so was recorded.For those assessing displacement fromfeeding areas or roost sites, the distance towhich the birds approached the wind farmfootprint before and after construction wasassessed, and whether the study recordedany changes in the total number of swans orgeese staging or wintering in the vicinity (as abroader measure of displacement from thesite) was also considered.
Collisions with turbines
The literature review and LUGV data foundpost-construction monitoring whichreported or aimed to report on collision ratesfor swans and geese at 46 wind farm sites:three in Belgium, one in Bulgaria, 23 inGermany, six in the Netherlands, one inNorway, one in Poland, three in Spain, one inSweden (Skåne being treated as a single sitein the absence of information on individualwind farms in the county), two in the UKand five in the USA (Table 1, Appendix 1).Forty of these included carcass searches, and nine studies (at Sabinapolder,Waterkaaptocht and Energy Research Centre(ECN) in the Netherlands, at Hellrigg andBarrow Offshore in the UK, Saint Nikola inBulgaria, Fehmarn in Germany and atBuffalo Ridge (Minnesota) and Stateline

42 Swans, geese and wind farms
© Wildfowl & Wetlands Trust Wildfowl (2012) 62: 37–72
(Washington/Oregon) in the USA) usedradar or visual observations to record birdflights within the wind farm sites (Table 1).All were onshore sites except for BarrowOffshore Wind, UK, where observationswere made of Pink-footed Geese Anser
brachyrhynchus flying through the wind farm
from an observation point 7–9.7 km fromthe site. Whilst this may seem too far foraccurate collision rate assessment, it isincluded here as nine geese were seen bothentering and leaving the wind farm at rotor height in autumn 2007 (BarrowOffshore Wind 2008). The Staatlichen
Table 1. Summary of monitoring undertaken to determine swan and goose collisions withturbines (carcass searches and observed collisions) at wind farm sites, and the total numberof collisions recorded, based on data presented in Appendix 1. Carcass searches wereundertaken at all sites except for Barrow Offshore Wind, UK (where birds were observedentering and leaving the wind farm) and four sites in Germany where swans and geese werereported as accidental recoveries.
Country No. wind No. where No. with No. with No. where Total no.farms with monitoring flight obs. > 1 year monitoring swan or
post- duration (visual monitoring linked goose construction is known or radar) to bird collisions
reports on presence recordedcollisions
Belgium 3 3 0 3 0 4
Bulgaria 1 1 1 1 1 0
Germany 23 14 1 1 1 39
Netherlands 6 6 3 2 4 13*
Norway 1 1 0 1 0 4
Poland 1 0 ? ? ? 5
Spain 3 ? ? ? ? 3
Sweden 1 1 0 0 0 1
UK 2 2 2 0 2 0
USA 5 5 2 3 1 3
TOTAL 46 33 9 11 9 72
*Two additional birds recovered near a wind farm are omitted, on the basis that they’re notconsidered to be collision casualties.
Swans, geese and wind farms 43
© Wildfowl & Wetlands Trust Wildfowl (2012) 62: 37–72
Vogelschutzwarte (2012) data reported 39swan and goose casualties associated with 23wind farms in Germany collated over a 12-year period (2002–July 2012) for anestimated 26 monitoring years (mostly ≤ 1year of post-construction surveys per windfarm, including wind farms searched onlyonce; see Appendix 1): 16 Mute SwansCygnus olor, one Whooper Swan Cygnus cygnus,four swan sp., three goose sp., three GreylagGeese Anser anser, three White-frontedGeese Anser albifrons, three Bean Geese Anser
fabalis, and six Barnacle Geese Branta leucopsis.Two more geese (either Bean Geese orWhite-fronted Geese) were seen collidingwith a turbine at the Meyenburg wind farm,Germany, in October 2008 (in both cases theindividuals were at the end of a flock of c.100 geese passing through the site), but thesewere not included in the LNGV databasebecause only feathers were found thefollowing day (Honig pers. comm. inLanggemach & Dürr 2012). Overall, 34swans and 37 geese (including two domesticgeese) were recovered in the surveys acrossall countries. Two Bewick’s Swans foundnear the Waterkaaptocht & ECN wind farmswere not included in these totals because post
mortem examination found no evidence forthem being collision casualties (Fijn et al.2012).
Of the 46 wind farms considered, 32were known to have been in place for ≥ 5years. Exceptions were Schlalach, Germany(built in 2010), Hellrigg , UK (2011), SaintNikola, Bulgaria (2009) and 11 Germanwind farm sites where the construction datewas not reported (T. Dürr pers. comm.).The duration of post-construction surveysfor bird collisions was known for 33 sites,
with 22 (67%) being undertaken for ≤ 1 yearor winter to date, including four sites inGermany where collisions were reportedfollowing an accidental discovery ratherthan through frequent and systematicsurveys of the turbines (Table 1). Of theeleven longer-term (≥ 2 year) surveys, swansor geese were recovered at seven sites (3 inBelgium, 2 in the Netherlands, 1 in Norwayand 1 in the USA), but only the BuffaloRidge (USA), St Nikola (Bulgaria), Urk (Netherlands) and Sabinapolder(Netherlands) wind farms providedinformation on the number of swans orgeese in the study area. No swans or geesewere found in carcass searches at St Nikolaand Buffalo Ridge, but only a proportion ofthe turbines were checked in each case(Table 1) and variation in mortality fordifferent turbines within the same windfarm was found to be more than double thevariation among wind farms for raptors(Ferrer et al. 2012). Only nine of the studieswhich reported or aimed to record swan orgoose collisions (by carcass searches and/orflight observations) assessed in any detailwhether the wind farm was in an area usedregularly by these species, either as a stagingor wintering site (Saint Nikola, Fehmarn,Urk, Sabinapolder, Waterkaaptocht, ECN,Hellrigg and Buffalo Ridge) or on the birds’flight-path during migration (BarrowOffshore Wind, UK). Definite collisions (3Mute Swans at Urk, 6 Greylags and 1Canada Goose at Sabinapolder, and 6Barnacle Geese at Fehmarn, Germany) wererecorded at just three of these sites thoughthe extent to which Buffalo Ridge coincidedwith goose habitat or flight-lines wasunclear, and it would be difficult to
44 Swans, geese and wind farms
© Wildfowl & Wetlands Trust Wildfowl (2012) 62: 37–72
determine collision frequency at Barrowusing the methods reported there to date.
Bird monitoring data at the five sites inthe USA reviewed by Fernley et al. (2006)and by Pendlebury (2006), led to ScottishNatural Heritage (SNH) advising that 99%avoidance rates be used in collision riskmodels developed to determine the impactof wind farms on goose species (SNH2010). An accurate assessment of bird-useof these sites therefore is of particularimportance, because collisions would needto be linked to the likelihood of birds flyingthrough the array for determining the rate ofcollision with or avoidance of the turbines.At Buffalo Ridge, fortnightly bird countsand carcass searches were conducted forfour years post-construction, during whichthere were 909 observations of CanadaGeese Branta canadensis, 278 observations ofSnow Geese Anser caerulescens and 92observations of White-fronted Geese (thelatter in 1997 only; Appendix 1) seen flyingwithin the 354-turbine wind farm area –measured as being within 800 m of the array(Osborn et al. 2000; Johnson et al. 2000;Johnson et al. 2002a; Fernley et al. 2006).That no goose carcasses were found duringthe study is indicative of high avoidance bythe birds using this site but, as noted byFernley et al. (2006) corpse searches werenot complete, with only 21–91 of the 354Buffalo Ridge turbines searched each year(Johnson et al. 2000, 2002a). In such cases, itis important to ensure that the sample ofsearched turbines is not biased, particularlyas some turbines within a wind farm pose agreater risk to the birds than others (Ferreret al. 2012). Moreover, a test of searchefficiency for goose carcasses placed under
turbines in Scotland found that theproportion found during weekly searchesranged from 65% (assuming all missed geesehad been removed by foxes) to 96%, withthe most likely figure being 83% of geesepresent being found (Gill & Smith 2001).
There was little post-construction data ongoose-use at the other wind farm sitesconsidered in the USA. Pre-constructionbird counts made at the Klondike wind farm(Oregon) found that the use of the studyarea by waterbirds was low; the only speciesobserved was Canada Goose, with 43 flocks(4,845 individuals) seen flying over the studyarea in the year-long pre-constructionsurvey in 2001 (Johnson et al. 2002b). Gooseflights in the vicinity were not recordedpost-construction when monitoringfocussed on carcass searches, during whichtwo Canada Goose carcasses were found(Johnson et al. 2003); Pendlebury (2006)mentions a 1-year post-construction birdsurvey at Klondike, but the results of thisare not evident in the Johnson et al. (2003)report. At Nine Canyon (Washington), bird-use was likewise monitored only pre-construction; goose-use of the area at thetime is unclear, use by waterbirds appearedto be lower than at Buffalo Ridge, Klondikeand Stateline (Erickson et al. 2002), andpost-construction carcass searches wereagain undertaken without any reference tothe number of geese present in the areaduring the survey years (Erickson et al.
2003). At Top of Iowa, large numbers ofCanada Geese were reported to occur onmanaged habitat 1–5 km from the windfarm in autumn, but except for carcasssearches there were no detailed bird-useobservations recorded at the wind farm

Swans, geese and wind farms 45
© Wildfowl & Wetlands Trust Wildfowl (2012) 62: 37–72
Tab
le 2
.Num
ber
of g
eese
and
sw
ans
of d
iffer
ent s
peci
es r
ecor
ded
as w
ind
turb
ine
casu
altie
s in
diff
eren
t cou
ntrie
s.
Spec
ies
Bel
gium
Ger
man
yN
ethe
rlan
dsN
orw
ayP
olan
dSp
ain
Swed
enU
SAT
OT
AL
Mut
e Sw
an16
35
125
Who
oper
Sw
an1
12
Swan
sp.
44
Bea
n G
oose
33
Gre
ylag
Goo
se1
38
33
18
Whi
te-f
ront
ed G
oose
33
Can
ada
Goo
se1
34
Bre
nt G
oose
11
Bar
nacl
e G
oose
66
Dom
estic
Goo
se3
3
Goo
se s
p.3
3
TO
TA
L4
3913
45
31
372

46 Swans, geese and wind farms
© Wildfowl & Wetlands Trust Wildfowl (2012) 62: 37–72
(Fernley et al. 2006), and goose flight in thecollision-risk zone was said to be very rare(Jain 2005). Lastly, at Stateline, 11 groups ofCanada Geese (363 birds) were recordedwithin the wind farm during bird counts,and one Canada Goose carcass was found in6–7 searches made of the 454-turbine sitepost-construction in 2003 (Erickson et al.2004). Fernley et al. (2006) and Pendlebury(2006) both noted the gaps in the data andPendlebury (2006) went on to note that thestudies could not be used to provide reliableestimates of avoidance rates (which wereput at 96% for one site and > 99% for theother sites), but several years later this hasnot been re-evaluated with the benefit ofnew studies and 99% avoidance of windfarms by geese remains the recommendedvalue for inclusion in collision risk models.
Despite there being only one wind farmin Germany where carcass searches areknown to have continued for > 1 year, thenumber of swan and goose collisions withturbines in Germany (39 casualties) clearlyoutnumber those from all other countriesconsidered (33 casualties; Tables 1, 2). The most commonly reported species wasthe Mute Swan, with 16 recovered inGermany, five in Poland, three in theNetherlands and one in Sweden(Winkelman 1989; Ahlén 2002; Hötker et al. 2006; Rodziewicz 2009; StaatlichenVogelschutzwarte 2012), followed by theGreylag Goose (18 birds from differentparts of Europe) and the Barnacle Goose(six recovered in Germany; StaatlichenVogelschutzwarte 2012; Table 2), but innone of these cases was there any flightobservation data, for determining frequencyof bird-wind farm overlap, and thus
avoidance rates for birds flying across thesites. Carcass searches were made for only1–2 years at most sites (Table 1, Appendix1), so these figures represent c. 1 season’sadditional mortality at best, rather than anassessment of mortality rate since each ofthe wind farms was constructed.
Observed barrier effects
The review by Hötker et al. (2006) found thatseven of 127 wind farm studies (not allrelating to swans or geese) assessed andfound evidence for turbines having a barriereffect on goose movements duringmigration or whilst commuting more locally(e.g. between feeding and roosting sites), for:Bean Geese (1 study), White-fronted Geese(3), Greylag Geese (2) and Barnacle Geese(1). Single observations and extensiveinvestigations were combined, and a barriereffect was assumed in quantitative studies ifat least 5% of the individuals or flocksshowed a measurable reaction by changingtheir flight direction to go around or over awind farm (Hötker et al. 2006). Theseobservations were made during daylight asthere was insufficient information at the time(e.g. through radar studies) on the birds’flight-lines at night, when migration oftenoccurs.
Eight published studies of swan or gooseflight-lines in relation to wind farm locationprovided information on the birds’avoidance behaviour (Table 3). Of these,radar studies or a combination of radar andvisual observations were undertaken forBewick’s Swans at Waterkaaptocht and atECN, Netherlands (Fijn et al. 2007, 2012),Brent and Barnacle Geese at Olsäng,Sweden (Pettersson 2005), Barnacle Geese

Swans, geese and wind farms 47
© Wildfowl & Wetlands Trust Wildfowl (2012) 62: 37–72
at Utgrunden, Sweden (Pettersson 2005),Pink-footed Geese at Lynn & InnerDowsing, UK (Plonczkier & Simms 2012),and Greylag Geese at Horns Rev, Denmark(Petersen et al. 2006), with visualobservations made of Pink-footed Geese atBarrow Offshore, UK (BOWind 2008) andat Hellrigg, UK (Ecology Consulting 2012)(Table 3). All reported some changes inflight-lines for swans or geese initially seenheading towards the turbines, with 50–100%of individuals or groups avoiding enteringthe wind farm site (Table 3). Avoidancedistance varied from a few hundred metres(at Waterkaaptocht/ECN and at Hellriggwintering sites, where the birds werecommuting daily between feeding areas andthe roost) up to 5 km for birds observedduring migration (Table 3).
Desholm & Kahlert (2005) additionallyfound that the proportion of CommonEider and goose flocks entering the Nystedwind farm area decreased significantly from40.4% (n = 1,406 flocks) during pre-construction (2000–2002) to 8.9% (n = 779)during the first year of operation (2003), butwhether there was a difference in theproportion of geese compared with eidersentering the wind farm was not reported.Jain (2005) observed Canada Geese flying inbetween, around and above wind turbines atTop of Iowa, USA, but states that avianflight in the collision-risk zone was very rareacross seasons. A study of Red-breastedGeese Branta ruficollis, White-fronted Geeseand Greylag Geese at the Saint Nikola windfarm in Bulgaria reported on flight-lines andaltitude of flight, and noted from radar datathat 64% of the geese (n = 272,210 gooseflights detected in winter 2010/11) were at
rotor height (c. 50–150 m for this particularwind farm), with 1% of birds flying at belowrotor height (0–49 m) and 36% above theturbines (Zehtindjiev & Whitfield 2011), butit was unclear whether the birds adjustedtheir flight-lines to pass around or over thewind farm, and thus exhibit avoidancebehaviour.
Flight-lines might also shift at longerdistances following wind farm construction;for instance, Petterssen (2005) noted that,once the turbines had been erected at Olsängand Utgrunden, geese generally flew closerto the mainland (inside the line of theturbines), and Plonczkier & Simms (2012)likewise found that migrating Pink-footedGeese were more likely to fly inland of theLynn & Inner Dowsing turbines in the thirdwinter of their post-construction surveys.Earlier studies for other migratorywaterbirds have demonstrated that evenquite dramatic shifts in migration routes mayhave only small effects on total migrationdistance (Desholm 2003; Masden et al. 2009),but where birds show diurnal movements,such as between breeding colonies and foodprovisioning areas (Masden et al. 2010b) ornight roosts and daytime feeding areas, theenergetic consequences of avoidance couldbecome significant.
The radar studies were unable to providedata on collision rates for birds flying withinthe wind farms because of the difficulty offollowing individuals within flocks (and thusidentifying those that fail to leave the windfarm site) by radar. Visual observations offlight-lines made in conjunction with radar atWaterkaaptocht/ECN, Netherlands, andwithout radar at Barrow Offshore, UK andat Hellrigg, UK did not record any collisions,

48 Swans, geese and wind farms
© Wildfowl & Wetlands Trust Wildfowl (2012) 62: 37–72
Tab
le 3
.Rec
ords
of
swan
s an
d ge
ese
adju
stin
g th
eir f
light
-line
s to
avo
id w
ind
farm
s. O
bser
vatio
n m
etho
d: R
AD
= R
adar
; FL
= fl
ight
obse
rvat
ions
. R
efer
ence
s: 1
= F
ijn e
t al
.20
07;
2 =
Fijn
et
al.
2012
; 3
= B
OW
ind
2008
; 4
= E
colo
gy C
onsu
lting
201
2;
5 =
Plo
nczk
ier &
Sim
ms
2012
; 6 =
Chr
iste
nsen
et a
l. 20
04; 7
= P
eter
sen
et a
l. 20
06; 8
= P
ette
rsso
n 20
05. T
urbi
ne a
lignm
ent:
* =
line
aral
ignm
ent;
** =
turb
ines
in 2
line
s; *
** =
clu
ster
. Obs
erva
tion
met
hod:
RA
D =
Rad
ar; F
L =
flig
ht o
bser
vatio
ns.
Spec
ies
No.
flig
ht-
No.
flig
hts
%
Win
d fa
rm
Bui
ltN
o.
Obs
. A
void
ance
A
void
ance
D
urat
ion
Ref
.lin
es d
irec
tly
wit
hin
avoi
danc
ena
me/
turb
ines
met
hod
dim
ensi
on
dist
ance
of p
ost-
tow
ards
win
d fa
rmlo
cati
on(h
ub
(V =
ver
tica
l; co
nstr
ucti
on
win
d fa
rmhe
ight
m)
H =
hor
izon
tal)
mon
itor
ing
Bew
ick’
s Sw
an36
4 bi
rds
167
bird
s54
Wat
erka
apto
cht,
2003
8*
RA
D &
FL
HFe
w
3 da
ys
1, 2
Nth
s(7
8 m
)hu
ndre
d (w
inte
rm
etre
s20
06/0
7)
Bew
ick’
s Sw
an68
4 bi
rds
308
bird
s55
EC
N te
st-p
ark,
20
03–
9 **
RA
D &
FL
HFe
w
5 da
ys
1, 2
Nth
s20
06(9
0 m
)hu
ndre
d(w
inte
rm
etre
s20
06/0
7)
Pink
-foo
ted
503
bird
s9
98B
arro
w
2006
30**
* FL
1V
2–3
km21
day
s3
Goo
seO
ffsh
ore,
UK
(75
m)
(200
7)
Pink
-foo
ted
1,02
2 bi
rds
4 gr
oups
Unc
lear
Hel
lrigg
, UK
2011
4***
FLH
>20
0 m
38 h
4
Goo
sew
ithin
200
m(8
0 m
)(2
2.12
.11–
of tu
rbin
es09
.03.
12)
Who
oper
Sw
an0
grou
ps0
grou
ps–
Hel
lrigg
, UK
2011
4***
FLH
>20
0 m
4(8
0 m
)
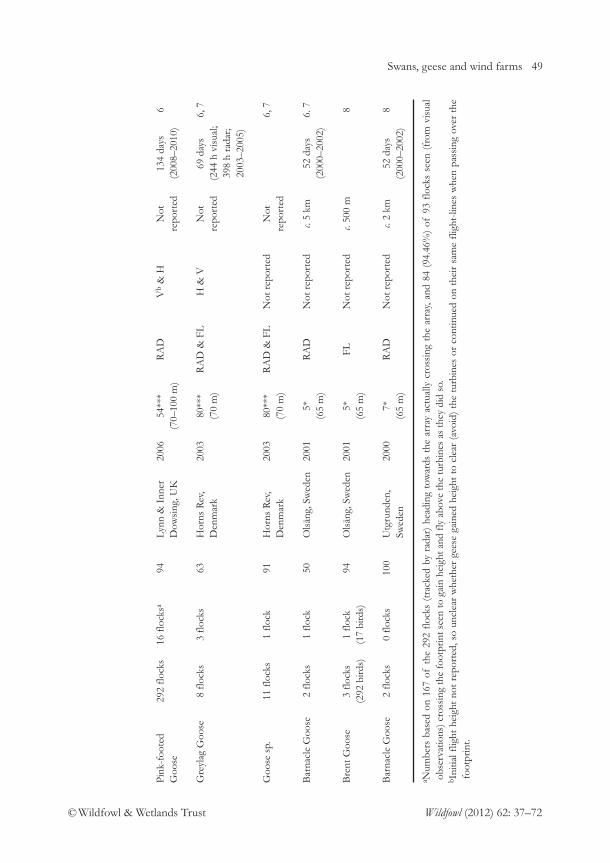
Swans, geese and wind farms 49
© Wildfowl & Wetlands Trust Wildfowl (2012) 62: 37–72
Pink
-foo
ted
292
floc
ks16
flo
cksa
94L
ynn
& I
nner
20
0654
***
RA
DV
b&
HN
ot
134
days
6
Goo
seD
owsi
ng, U
K(7
0–10
0 m
)re
port
ed(2
008–
2010
)
Gre
ylag
Goo
se8
floc
ks3
floc
ks63
Hor
ns R
ev,
2003
80**
*R
AD
& F
LH
& V
Not
69
day
s 6,
7D
enm
ark
(70
m)
repo
rted
(244
h v
isua
l;39
8 h
rada
r;20
03–2
005)
Goo
se s
p.11
flo
cks
1 fl
ock
91H
orns
Rev
, 20
0380
***
RA
D &
FL
Not
rep
orte
dN
ot
6, 7
Den
mar
k(7
0 m
)re
port
ed
Bar
nacl
e G
oose
2 fl
ocks
1 fl
ock
50O
lsän
g, S
wed
en20
015*
RA
DN
ot r
epor
ted
c. 5
km
52 d
ays
6. 7
(65
m)
(200
0–20
02)
Bre
nt G
oose
3 fl
ocks
1
floc
k 94
Ols
äng,
Sw
eden
2001
5*FL
Not
rep
orte
dc.
500
m8
(292
bird
s)(1
7 bi
rds)
(65
m)
Bar
nacl
e G
oose
2 fl
ocks
0 fl
ocks
100
Utg
rund
en,
2000
7*R
AD
Not
rep
orte
dc.
2 km
52 d
ays
8Sw
eden
(65
m)
(200
0–20
02)
a Num
bers
bas
ed o
n 16
7 of
the
292
flo
cks
(tra
cked
by
rada
r) h
eadi
ng t
owar
ds t
he a
rray
act
ually
cro
ssin
g th
e ar
ray,
and
84 (
94.4
6%)
of 9
3 fl
ocks
see
n (f
rom
vis
ual
obse
rvat
ions
) cro
ssin
g th
e fo
otpr
int s
een
to g
ain
heig
ht a
nd f
ly a
bove
the
turb
ines
as
they
did
so.
b I
nitia
l flig
ht h
eigh
t no
t re
port
ed, s
o un
clea
r w
heth
er g
eese
gai
ned
heig
ht t
o cl
ear
(avo
id)
the
turb
ines
or
cont
inue
d on
the
ir sa
me
flig
ht-li
nes
whe
n pa
ssin
g ov
er t
hefo
otpr
int.

50 Swans, geese and wind farms
© Wildfowl & Wetlands Trust Wildfowl (2012) 62: 37–72
but it seemed that the birds were flying ingood weather conditions: either conditionswere said to be good (Fijn et al. 2012), orgood visibility was required for theobservations to be made (Barrow OffshoreWind 2008), or conditions during vantagepoint (flight-line) observations were notrecorded (Ecology Consulting 2012).
None of the studies reported adverseweather conditions during observations.The effects of strong winds, heavyprecipitation or fog on the birds’ ability toavoid the wind farm or to negotiate theturbines if flying within the wind farmtherefore remains unclear, albeit that the lownumber of casualties reported from carcasssearches to date indicates that adverseweather may not increase the risk to swansand geese substantially at terrestrial sites.The six Barnacle Geese recorded as windturbine casualties in Germany were allfound under a single turbine the day afterfog and a storm, but it is not known whetherthe weather contributed to these collisions(T. Dürr, pers. comm.). Whether the size ofthe wind farm affects avoidance behaviour,with swans and geese being more likely to flyaround smaller wind farms but to passbetween the turbines for wind farmscovering a larger area should also beconsidered, as this is relevant to theconstruction of larger wind farm sites overthe next decade. The largest wind farmincluded in this review of observed barriereffects – the Horns Rev offshore wind farm in Denmark (80 turbines) – had arelatively high proportion (21%) of geesewhich were flying towards the wind farmcontinue through it (three of eight GreylagGoose flocks and one of 11 flocks of
unidentified goose species; Table 3), but thesample sizes are relatively small and thenumber of individual birds involved werenot recorded. Accumulated knowledge ofhow a range of individuals from differentspecies react to turbines are however helpful for populating models of avoidancebehaviour, which can be insightful forpredicting how geese and swans mayrespond to different sizes of wind farmsand specific turbine configurations (Masdenet al. 2012).
Displacement from feeding areas androost sites
Displacement of birds from feeding areasand roost sites is an important considerationbecause migratory swans and geese tend tocongregate at favoured (but frequentlyundesignated) feeding sites in winter, manyof which are associated with roost sites thathave been classified as Special ProtectionAreas (SPAs) under Article 4 of the BirdsDirective (EC Directive on theConservation of Wild Birds, 79/409/EEC)because of their importance for the species(Bright et al. 2008). Habitat quality in thenon-breeding season has been shown toinfluence the timing of bird migration(Marra et al. 1998; Gill et al. 2001;Stirnemann et al. 2012), body conditionduring spring migration (Bearhop et al. 2004)and breeding success (Ebbinge & Spaans1995; Madsen 1995; Norris et al. 2004; Ingeret al. 2010). Loss of feeding or roostinghabitats through disturbance ordisplacement by the turbines thereforecould affect the birds’ use of protected areasor result in them moving to suboptimal sites,with consequences for future survival and

Swans, geese and wind farms 51
© Wildfowl & Wetlands Trust Wildfowl (2012) 62: 37–72
productivity (Gill et al. 2001; Norris &Taylor 2006; Ratikainen et al. 2008).
Birds’ avoidance responses to wind farmsvary within and between species, but swansand geese are considered sensitive to thesedevelopments because they frequent openlandscapes (Hötker et al. 2006). The reviewby Hötker et al. (2006) indicated that theminimal distances to wind farms reportedwas 150 m (s.d. = 139 m, n = 8 studies) forswans and 373 m (s.d. = 226 m, n = 13) forgeese, with the minimal distances recordedfor geese during the non-breeding seasonranging from 50–850 m. Papers consideredin the current review likewise recordeddisplacement distances of 200–560 m forswans and 30–600 m for geese at terrestrialwind farms, and 2 km for one offshore site(Table 4), the latter estimated from mapsillustrating Mute Swan displacement (Figure51 in Petersen et al. 2006). For Pink-footedGeese, displacement was greater at windfarms where the turbines were arranged inclusters (200 m) than at linear or singleturbine sites (100 m) (Larsen & Madsen2000). Long-term post-construction studies,and thus information on whether birdsadapt to the change in landscape, are rare.An exception is that of Madsen &Boertmann (2008), who found not only thatPink-footed Geese grazed closer to windturbines c. 20 years after construction than10 years previously (Table 4), but that theextent to which they habituate to theturbines varied across sites. Observationsmade at two sites – the Klim Fjordholmeand Velling onshore wind farms in Denmark– indicated that the geese remained at agreater distance from the larger turbines(Madsen & Boertmann 2008), but more
studies of potential habituation to differenttypes of turbine are required to supportthese findings.
In addition to assessing the extent towhich birds approach turbines at a locallevel, whether the construction of windfarms influences the extent to which swansand geese winter in an area should beconsidered. In her pioneering study of birduse of fields around the Urk wind farm,which consisted of 25 turbines (hub height= 30 m) positioned along a dyke borderingLake IJsselmeer on the Noordoostpolder,the Netherlands, Winkelman (1989) foundthat, at the local level, Bewick’s, Whooperand Mute Swans were displaced to feedingareas 200–400 m from the wind farm sitepost-construction, with pooled data forBean Geese, White-fronted Geese andBarnacle Geese similarly suggesting200–400 m displacement, albeit that this wasa subjective assessment as the data did notpermit a meaningful comparison of pre-and post-construction distances for thegeese. Raw data indicated that more geesewere counted in the study area pre- thanpost-construction; for the three swanspecies (combined), mean numbers wererather similar in comparison with the rangeof counts recorded (Table 4), but asignificant negative impact was found forWhooper Swans in 1988/89, two years post-construction (Winkelman 1989). Goosecounts were presented in a different manner,but these too indicated that, whilst thenumber of Bean Geese in the area increasedsubstantially post-construction (mean values= 5,615 and 11,842, n = 10 years and 2 yearspre- and post-construction, respectively;111% increase), there was also a drop in

52 Swans, geese and wind farms
© Wildfowl & Wetlands Trust Wildfowl (2012) 62: 37–72
Tab
le 4
. Dis
plac
emen
t dis
tanc
es re
cord
ed fo
r sw
ans
and
gees
e, m
easu
red
as a
n ab
senc
e or
redu
ctio
n in
the
num
ber o
r den
sity
of
bird
sin
hab
itat n
ear
the
win
d fa
rm. O
bser
vatio
n m
etho
ds: A
S =
aer
ial s
urve
y; D
D =
dro
ppin
g de
nsiti
es; B
C =
bird
cou
nts.
Ref
eren
ces:
1=
Pet
erse
n et
al.
2006
; 2 =
Lar
sen
& M
adse
n 20
00; 3
= M
adse
n &
Boe
rtm
ann
2008
; 4 =
Kru
cken
berg
& J
aene
199
9; 5
= K
owal
lik20
02; 6
= T
. Dür
r pe
rs. c
omm
.; 7
= B
ioco
nsul
t &
Ars
u 20
10; 8
= H
andk
e et
al.
2004
; 9 =
Möc
kel &
Wie
sner
200
7; 1
0 =
Fijn
et a
l.
2012
; 11
= F
ijn e
t al
.20
07; 1
2 =
Win
kelm
an 1
989;
13
= E
colo
gica
l Con
sulti
ng 2
012.
* =
line
ar a
lignm
ent;
** =
tur
bine
s in
2 li
nes;
**
* =
clu
ster
.
Spec
ies
Win
d fa
rmN
o. t
urbi
nes
No.
bir
ds
No.
bir
ds
Obs
. D
ispl
acem
ent
Ref
s
(hub
hei
ght
m)
in v
icin
ity
(pre
-in
vic
init
y (p
ost-
met
hod
dist
ance
(m
)
cons
truc
tion
)co
nstr
ucti
on)
Mut
e Sw
anN
yste
d, D
enm
ark
72**
*8,
662–
10,6
042,
882–
3,47
8A
Sc.
2,00
0a1
(69
m)
Pink
-foo
oted
Gee
seK
lim F
jord
holm
e,
1–35
bN
ot r
epor
ted
Not
rep
orte
dD
Dc
100–
200d
2, 3
Den
mar
k(2
5–50
m)
Pink
-foo
ted
Goo
seT
horu
p, D
enm
ark
5*N
ot r
epor
ted
Not
rep
orte
dD
Dc
50–1
25d
3(3
1 m
)Pi
nk-f
oote
d G
oose
Vel
ling
Mae
rsk,
66
***
Not
rep
orte
dN
ot r
epor
ted
DD
c30
–100
d3
Den
mar
k(2
1–31
m)
Whi
te-f
ront
ed G
oose
Hol
tgas
te, G
erm
any
10*
Not
rep
orte
dN
ot r
epor
ted
BC
400–
600
4(5
0 m
)B
arna
cle
Goo
seIn
Ger
man
y??
????
DD
350–
600
5, 6
Gre
ylag
Goo
seFe
hmar
n, G
erm
any
Var
ious
????
BC
> 2
006,
7G
oose
sp.
Kru
mm
hörn
, Ger
man
y??
????
??30
0–40
0 6,
8G
reyl
ag G
oose
In B
rand
enbu
rg,
Var
ious
????
??25
06,
9G
erm
any
Bea
n G
oose
&In
Bra
nden
burg
, V
ario
us??
????
500
6, 9
Whi
te-f
ront
Goo
seG
erm
any

Swans, geese and wind farms 53
© Wildfowl & Wetlands Trust Wildfowl (2012) 62: 37–72
Bew
ick’
s Sw
anE
CN
test
-par
k,
9**
1,09
953
0B
C56
010
, 11
Nth
s(9
0 m
)B
ean
Gee
seE
CN
test
-par
k,
9**
5,84
01,
885
BC
464
11N
ths
(90
m)
Bea
n G
oose
Urk
, Nth
s25
*5,
615
11,8
42B
C20
0–40
0e12
(30
m)
Whi
te-f
ront
ed G
oose
Urk
, Nth
s25
*8,
570
7,69
7B
C20
0–40
0e12
(30
m)
Bar
nacl
e G
oose
Urk
, Nth
s25
*88
719
7B
C20
0–40
0e12
(30
m)
Mut
e Sw
anU
rk, N
ths
25*
129.
212
3.2
BC
200–
400f
12(3
0 m
)(±
54.
5; 8
1–24
6 )
(± 8
5.7;
16–
292)
Who
oper
Sw
anU
rk, N
ths
25*
102.
393
.3B
C20
0–40
0f12
(30
m)
(± 1
23.8
; 0–5
19)
(± 1
04.8
; 0–3
95)
Bew
ick’
s Sw
anU
rk, N
ths
25*
677.
261
4.9
BC
200–
400f
12(3
0 m
)(±
629
.7; 0
–2,3
12)
(± 7
16.9
; 0–2
,402
)Pi
nk-f
oote
d G
oose
Hel
lrigg
, UK
4***
3,
950
2,17
5B
C &
DD
>60
0g13
(80
m)
(270
–7,1
00)
(max
= 9
,320
)
a Dis
plac
emen
t of
Mut
e Sw
ans
on c
oast
al w
ater
s ne
ar th
e of
fsho
re w
ind
farm
; all
othe
r di
spla
cem
ent d
ista
nces
are
for
ons
hore
site
s.b T
otal
of
61 m
ostly
med
ium
-siz
ed w
ind
turb
ines
with
in t
he s
tudy
are
a in
rec
ent
year
s; a
ll w
ind
farm
s ≤
5 tu
bine
s (in
clud
ing
sing
le t
urbi
nes)
exc
ept
for
one
clus
ter
of 3
5 tu
rbin
es.
c Avo
idan
ce d
ista
nce
= p
oint
at w
hich
dro
ppin
g de
nsity
rea
ched
50%
of
the
max
imum
den
sity
alo
ng a
tran
sect
per
pend
icul
ar to
the
obje
ct.
d Med
ian
disp
lace
men
t dis
tanc
es; u
pper
val
ue r
ecor
ded
in 1
998–
2000
, upp
er v
alue
in 2
008.
e Poo
led
data
for
goo
se s
peci
es;
estim
ated
as
it w
as n
ot p
ossi
ble
to m
ake
a m
eani
ngfu
l co
mpa
rison
of
pre-
and
pos
t-co
nstr
uctio
n di
stan
ces
(Win
kelm
an 1
989)
.f P
oole
d da
ta f
or s
wan
spe
cies
.g G
eese
mos
tly 6
00–1
,500
m f
rom
tur
bine
s, bu
t on
e fl
ock
of 7
0 bi
rds
seen
with
in t
he w
ind
farm
site
dur
ing
surv
eys
mad
e in
the
pos
t-co
nstr
uctio
nw
inte
r (2
011/
12).

54 Swans, geese and wind farms
© Wildfowl & Wetlands Trust Wildfowl (2012) 62: 37–72
numbers of White-fronted Geese (8,570 vs.7,697; 10% decrease) and Barnacle Geese(887 vs. 197; 78% decrease) in the vicinity(from Table 18 in Winkelman 1989). Therewas an increase in the number of BeanGeese, stable numbers of White-frontedGeese and a decline in Barnacle Geeseacross the Noordoostpolder over the sameyears (mean annual totals =11,387 vs. 35,791for Bean Geese; 34,162 vs. 31,580 for White-fronted Geese; 6,211 vs. 2,807 for BarnacleGeese; from Winkelman 1989), but theproportion of Noordoostpolder geeserecorded in fields up to c. 3.5 km from windfarm was lower after than beforeconstruction for all three species (49% vs.33% for Bean Geese, 25% vs. 24% forWhite-fronted Geese and 14% vs. 7% forBarnacle Geese, pre- and post-constructionin each case).
Bird counts made at the Saint Nikolawind farm in Bulgaria found that numbersof geese were much lower in winter2010/11 (two years post-construction) than in 2008/09 (pre-construction) and2009/10 (Zehtindjiev & Whitfield 2011),but winter 2010/11 was relatively severe solonger-term monitoring is required todetermine whether there is any large-scaledisplacement of geese from the area.
In the only study which specificallyanalysed the proportion of birds winteringin the vicinity of a wind farm site before andafter construction, Fijn et al. (2012) likewisefound a significant drop, post-construction,in the proportion of wintering Bewick’sSwans using the area where wind turbineshad been installed in Polder Wieringermeer.Like Madsen & Boertman (2008), theyfound evidence for habituation, with swans
feeding closer to the turbines later in thestudy, but with fewer birds present in thestudy area (Fijn et al. 2012). Thus, althoughswans may be displaced by up to 600 mfrom field feeding areas, with larger-scaledisplacement (c. 2 km) in one case whereswans were feeding in coastal waters (Table4), whether the proportion of populationusing areas where wind farm developmenthas occurred diminishes post-construction,and the extent to which this is attributable todisplacement by the turbines still needs tobe addressed. This is also important fordetermining whether any mitigation plans(e.g. habitat management) in conjunctionwith wind farm development are likely to besuccessful. The potential for cumulativedisplacement impacts attributable to thearrangement of wind farms in thelandscape, through possible non-linearsynergistic effects with other wind farms orother landscape elements, also needs to beexplored (Larsen & Madsen 2000).
Gaps in knowledge
In addition to needing better linkage ofavoidance rates to the birds’ use of the site,and a robust assessment of whether windfarm installation results in fewer birdsreturning to a wintering area, outlinedabove, more specific information on howthe positioning and structure of wind farmsaffect the birds would be useful to ensurethat any impacts are kept to a minimum. Forinstance, turbines come in variable sizes, andmay be installed singly, linearly or as acluster, but there are few detailed studies ofthe effects of turbine height and alignmenton swans and geese. Larsen & Clausen(2002) initially suggested, from pre-

Swans, geese and wind farms 55
© Wildfowl & Wetlands Trust Wildfowl (2012) 62: 37–72
construction observations, that WhooperSwans might be more at risk from a park ofmedium-sized turbines than large turbinesas typical flight heights (mostly at 5–35 mwhen flying between feeding areas and theroost) would put them in the collision riskzone more often. On the other hand, birds(including swans and geese) may be morelikely to be displaced over longer distancesby larger turbines: Hötker et al. (2006)estimated from six studies included in theirreview that there was a 6.22 m increase inminimal distance between birds and a windfarm for every 1 m increase in tower height,though this change was not statisticallysignificant. The only studies which aimed totest the effects of turbine height on goosedistribution similarly found that geese areless tolerant of larger turbines, and may alsobe less likely to habituate to them (Larsen &Madsen 2000; Madsen & Boertmann 2008),but it should be noted that alignment is alsorelevant (with geese displaced further by acluster of turbines than single turbines orthose in a line; Larsen & Madsen 2000) andthe interactive effects of height andalignment has yet to be assessed. Morerecently, Krijgsveld et al. (2009) used radarand carcass searches to study the collisionrisk for birds with large modern turbines atthree wind farms in the Netherlands(Waterkaaptocht, Groettocht and JaapRodenburg), and found that the risk was c.threefold lower than for the smaller turbinesfor the species (not including swan andgeese) passing through the wind farm sites.They suggested that one possible reason forthis was that the increased height of theturbine allowed more birds to fly under therotors, and also proposed that the wider
spacing allowed more birds to pass betweenthe turbines. The relative costs and benefitsof potentially lower collision rates buthigher displacement distances for the largerwind farms therefore should be assessedmore rigorously for onshore sites.
The cumulative impact on migratory birdpopulations of several wind farms beinginstalled along the migration routes, orwithin a wintering area, is known to be anissue but has yet to be resolved. Writtenguidance has been produced to assist in theprocess of ornithological cumulative impactassessment (CIA) for offshore wind farms(since Norman et al. 2007), and Fox et al.(2006) emphasised the importance ofundertaking full Strategic EnvironmentalAssessments (SEAs) for offshore wind farmsites, not least to comply with Europeanlegislation. Masden et al. (2010a) went on toargue for the benefits of elevating CIA to astrategic level, as a component of spatiallyexplicit planning. Yet although there is anincreasing tendency for developers of thelarge offshore wind farms to take intoaccount other wind farms nationally,collision risk assessments for all wind farmsalong international migration routes, and thecumulative effect of these on birds migratingto/from key sites for the population (i.e.Special Protection Areas and/or Ramsarsites), are still rarely (if ever) incorporatedinto Appropriate Assessments undertakenfor new wind farm sites. For most Europeanand North American goose and swanpopulations, there is sufficient informationabout the precise migration routes, otherhazards encountered along these corridorsand the demographics of these populationsto be able to make preliminary assessments

56 Swans, geese and wind farms
© Wildfowl & Wetlands Trust Wildfowl (2012) 62: 37–72
of cumulative effects. Ultimately, thisknowledge should be used to support theconstruction of robust models of theirpopulation dynamics to establish the relativecosts of collision, barrier effects and habitatloss from each new wind farm proposal,based on existing sources of mortality andgiven current population trajectories.
Moreover, there has been a general lackof post-construction monitoring workundertaken, both for the early offshore sitesand for the numerous smaller terrestrialwind farms. For those studies that have beenundertaken, the collision rate anddisplacement data are not collated centrally,nor are they readily available in accessiblereports for assessing existing impacts. AScottish Wind Farm Bird Steering Group(SWBSG) has recently been formed, withthe aim of bringing together the onshorewind farm industry, government agenciesand conservation organisations to collateand analyse post-construction monitoringdata collected in Scotland, but this is not(yet) being extended across the UK. Even inGermany, where collision data has beencollated since 2002, in most casesmonitoring is undertaken and reported toLUGV for only one year post-construction.Developers are reluctant to undertake post-construction monitoring (particularly for > 1 year) because of the cost involved, andup to now it has not been an automaticrequirement of the planning process,although longer-term monitoring isrecommended by SNH (SNH 2009). Datatherefore are lacking for assessingcumulative impacts of existing wind farms,making it currently impossible to determinethe extent to which each new wind farm
would serially reduce the attractiveness of asite for swans and geese.
One drawback of undertaking post-construction monitoring for only one year isthat this reduces the scope for determiningthe effects of weather conditions and poorvisibility on the birds’ flight-lines and large-scale avoidance of wind farm sites. Becausewind speeds and birds’ airspeeds are often ofa similar magnitude, wind strength anddirection has a major influence on theorientation and energy expenditure ofmigrating birds, but the extent to which birdsare susceptible to wind drift appears to vary(e.g. Thorup et al. 2003; Green et al. 2004).Satellite-tracking and radar studies of swansand geese on migration indicate thatmigration routes may shift between years(Pettersson 2005; Griffin et al. 2011;Plonczkier & Simms 2012), and the extent towhich this varies with weather conditions(especially wind drift) has yet to bedetermined. Variation in wind conditions wasone explanation given for a lack ofcorrelation between raptor abundance andcollision rates at wind farms in Spain (Ferreret al. 2012). Radar studies have demonstratedthat birds continue to fly over or aroundwind farms after dark (Desholm & Kahlert2005; Fijn et al. 2012), but one study alsonoted that the proportion entering the windfarm is higher at night (Desholm & Kahlert2005). Whether familiarity with the windfarms will result in an increasing tendency forbirds to pass through rather than over oraround a site, the extent to which thisincreases their susceptibility to collisions withthe turbines, and the effects of poor visibility(including night-time flights and fog) on theirability to avoid the rotors on flying within a

Swans, geese and wind farms 57
© Wildfowl & Wetlands Trust Wildfowl (2012) 62: 37–72
wind farm has yet to be determined. Poorweather conditions, such as fog or low cloud,can affect visibility and studies of birdcollisions with other structures (e.g. powerlines) found that birds are much moresusceptible to flying accidents under suchcircumstances (Brown 1992; Drewitt &Langston 2008; Jenkins et al. 2010; Prinsen etal. 2011; Barrientos et al. 2012). Additionally,strong winds (especially tail- or cross-winds)blunt the fine motor control of flying birdsand consequently raise their susceptibility tocollision (Bevanger 1994 and Crowder &Rhodes 2001 in Jenkins et al. 2010). Althoughdifficult to assess, the frequency with whichswans and geese encounter adverse weatherduring migration, and the extent to whichthis puts them at risk of large-scale losses atwind farms (through reduced ability to avoidthe turbines), therefore should be consideredand included in collision risk models, perhapsas a stochastic event in the modelling process.Likewise, geese and swans migrate at highspeeds and at night (Griffin et al. 2010, 2011),so the ability of geese to avoid turbines underthese circumstances should be assessed atexisting wind farm sites, for instance bydeveloping techniques for detectingcollisions and measuring micro-avoidancerates within wind farms (Desholm et al. 2006;Collier et al. 2011).
Overview
Development of renewable energy hassubstantial benefits, notably reducing carbondioxide emissions and the provision of asecure local energy supply, with wind powerbecoming a major contributor to this fieldover the past two decades. It has long beenrecognised that collisions with and
displacement by the turbines could have asignificant negative effect on birds, but therate of wind farm development is still notmatched by publication of rigorous peer-reviewed reports or papers from studiesobserving, carefully analysing and accuratelyreporting these effects (Stewart et al. 2007;Natural England 2010; this study). Before-after-control-impact (BACI) studies of theeffects of wind farm development are not undertaken and reported routinely atonshore sites in the UK, despite these being recommended by statutory natureconservation bodies (e.g. Natural England2010), yet such information would beinvaluable for informing future wind farmdevelopment, including the preparation ofEIAs and advising on height, alignment, andthe effectiveness of mitigation programmessuch as (in the case of swans and geese)habitat management to provide the birds withalternative feeding areas for the life-time of the turbines. Where post-constructionsurveys have been undertaken to date, theyhave usually been of short duration (1 year,although SNH guidance is for longer periods;SNH 2009) and treated as confidential(therefore not readily available) by thedeveloper who commissioned the study.Moreover, except for the collation ofcollision data by LUGV in Germany and the new initiative (establishment of theSWBSG) in Scotland, there is no centralnational repository to assess whether post-construction surveys are being undertakenand reported appropriately, and to provide aninformation source to determine whether anysignificant impacts on birds (at thepopulation or local level) are being addressed.Yet centralised post-construction monitoring

58 Swans, geese and wind farms
© Wildfowl & Wetlands Trust Wildfowl (2012) 62: 37–72
data is crucial for determining actual impacts(as well as for validation and improvement ofmodelled predictions) and is required forcumulative impact assessments both for windfarm development along migration routes,and where turbines are installed in proximity to internationally important sites. Post-construction monitoring is undertaken moreroutinely for offshore wind farms, but againtends to be of short duration and not readilyaccessible, and within the UK the surveyshave focussed more on the potentialdisplacement of seabirds from feeding areas(which of course is an important issue) thanon collision rates and barrier effects for birdson migration.
A species-specific approach is required inassessing the potential impact of windfarms on birds because, as noted by Jenkinset al. (2010) susceptibility to collision varieswith morphology, as ocular structure andacuity affect a bird’s ability to see structuresand thus take evasive action (Bevanger 1994;Drewitt & Langston 2008), while size, massand wing structure influence the timerequired to make the necessary adjustments(Brown 1992; Bevanger 1994; Rubolini et al.2005). Reaction time is also affected byflight speed, which tends to be higher inheavy-bodied species, and a higher wingloading also reduces manoeuvrability(Bevanger 1994; Janss 2000). The highlysocial nature of swans and geese (whereparent-offspring bonds may persist formany years, e.g. Warren et al. 1993) are alsosignificant, since recent studies show thatsocial interactions have a significant, non-linear and potentially large effects oncollision risk (Croft et al. 2012). Hence,theoretically, relatively large, heavy and
socially interactive birds (e.g. swans andgeese) are more susceptible to collision thansmall, light and relatively large-winged birdswith acute vision (Jenkins et al. 2010), andbirds such as raptors which usepredominantly downward (lateral) vision areparticularly susceptible to collisions withturbines (Thelander & Smallwood 2007;Martin 2011; Dahl et al. 2012). Given ourrelatively weak ability to predict post-construction actual collision mortality (e.g.Ferrer et al. 2012) existing empirical andmechanistic methods of predicting collisionrisk at turbines should perhaps beaugmented (Tucker 1996; Sugimoto &Matsuda 2011). One approach would be to gather more information about theunderlying visual and behavioural processesof collision risk in particular species, inorder to populate individual-based or agent-based simulation models that may providemore powerful predictive tools tosupplement current approaches (e.g. Croft etal. 2012; Eichhorn et al. 2012).
This review found that 72 swans or geesewere reported as collision victims at 46 windfarms, but most (39 birds) were reported at23 German wind farms where such data arecollated, and even there only usually for c. 1year post-construction. Moreover, there wasa lack of linkage of collision rates with thebirds’ use of a site; whether or not swans orgeese occurred in the immediate area of thewind farm, or flew across/within the site,was considered at only nine of 46 windfarms where collisions by swans and geesewere monitored or recorded. Likewise,avoidance of turbines should be related towhether or not flights were initially in linewith the wind farm, rather than in relation to

Swans, geese and wind farms 59
© Wildfowl & Wetlands Trust Wildfowl (2012) 62: 37–72
all bird movements in the area, as includingthe latter artificially boosts sample sizes usedfor calculating avoidance rates. Sample sizesfor birds or flocks actually seen to changetheir flight-lines to avoid wind farms wereavailable for only eight studies (Table 3);these gave a wide range for the proportion ofbirds that ultimately passed through the windfarm (2– 46%, for sample sizes of <5 birdsor flocks) rather than going over or aroundthe site, with interactive effects of wind farmsize and visibility (day versus night-time flightsand weather conditions) on large-scaleavoidance yet to be assessed for swans andgeese. Yet such information is important forcollision risk models (Band et al. 2007; Band2012), as minor changes in avoidance ratescan have a major influence on the outcomeof (and confidence in) the models(Chamberlain et al. 2006). Swans and geesehave good eyesight and the review indicatesthat high levels of avoidance do occur. Butavoidance rates of 98% for Whooper Swansand 99% for geese currently advocated byScottish Natural Heritage for use forcollision risk models (SNH 2010) should berevisited and based on better observationaldata than those available from the reviews(Fernley et al. 2006; Pendlebury 2006) whichset the avoidance levels in the mid 2000s.Plans are underway to measure levels ofmicro-avoidance and collision rates byinstalling systems (using a variety of camerasand radar) within wind farms (Collier et al. 2011, 2012). Use of such technology wouldprovide a major advance for contributing tomodel development and validation, as well asfor determining whether wind farms arelikely to have significant effects on survivalrates for swan and goose populations.
This review has highlighted the relativelylittle attention paid in other studies to thepotential for large-scale displacement ofswans and geese from non-breeding feedingsites. Thus, although birds returning to anarea may approach on average to 100–600 mfrom the turbines, closer (40–100 m) wherehabituation occurs (Madsen & Boertmann2008), and were reported between turbinesin two studies (Madsen & Boertmann 2008;Ecology Consulting 2012), count dataprovided in other studies suggest that fewerbirds returned to study areas post-construction. In the one study that analysedthis (Fijn et al. 2012), reductions in numberswere significant. Swans and geese favouropen landscapes, and topographical featuressuch as trees and hedge lines are known tohave an adverse effect on site use (e.g.Madsen 1985). The combined effects oflandscape (power lines, wind breaks, roadsand settlements) caused an effective loss of68% of the field feeding areas (40 km2)available for Pink-footed Geese at KlimFjordholme (Denmark), with the presenceof 61 turbines (one farm of 35 turbines; theremainder of ≤5 turbines including singleturbines) resulting in the loss of 13% of theremaining area (Larsen & Madsen 2000).The potential for wind farm development to cause large-scale displacement of geese and swans from internationallyimportant wintering sites through habitatfragmentation and displacement frompreferred feeding areas therefore should beanalysed more rigorously and addressedmore carefully in the planning process. Thisshould include an assessment of small windturbines (SWT), which like larger turbines,vary in size and scale. The only study to date

60 Swans, geese and wind farms
© Wildfowl & Wetlands Trust Wildfowl (2012) 62: 37–72
aiming to quantify the effects of SWTs onbats and birds grouped three types of SWT(10 m high building-mounted, 6.5 m highfree-standing, and 18 m high free-standing;Minderman et al. 2012) and did not considerswans and geese.
Several recommendations emerge fromthe information gathered in this review.Firstly, although several authors haveemphasised in recent years the need forsystematic post-construction monitoring,and dissemination of the results of thesestudies (e.g. Fox et al. 2006; Drewitt &Langston 2006; Natural England 2010) thisinformation still seems to be lacking. Such monitoring programmes should beundertaken routinely, collated centrally, andadapted to quantify collision, barrier anddisplacement effects. Secondly, betterinformation is required about the extent oflarge-scale and local displacement of geeseand swans from feeding/drinking/roostingsites, and the effects of turbine number, sizeand alignment on such effective habitat loss.Thirdly, further detailed studies of the birds’flight-lines in the vicinity of wind farms arerequired, both during migration and forbirds commuting between feeding areas andthe roost, to provide a more rigorousassessment of collision and avoidance rates,and to quantify additional energy costs ofany avoidance behaviour during regular localflights. Finally, the combination of collisionmortality and habitat loss attributable towind farms across a species’ range should beanalysed to determine whether the currentsites and new developments will have asignificant effect on the population. Thedevelopment of new technology todetermine collision rates for birds entering
large wind farms should help to providemuch more accurate assessments of theconsequences of wind farm developmentfor swans, geese and other avian species.
Acknowledgements
This paper benefitted greatly by theinclusion of collision data from Germany,and I am indebted to Tobias Dürr both forkindly providing this information and foradvising me of German reports. Usefulinformation from Ruben Fijn, Robin Jones,Karen Krijgsveld, Ian Simms, Tim Youngsand Johanna Winkelman, and discussionswith Peter Cranswick, Anne Harrison andTim Mellings, helped to improve varioussections of the text. Sjoerd Dirksen, LarryGriffin, Geoff Hilton, Baz Hughes, CarlMitchell, Mark Trinder, Rowena Langstonand Christine Urquhart made helpfulcomments on a draft of the manuscript. Ithank Debbie Pain for the concept ofsummarising known effects of wind farmson swans and geese, which resulted in thisreview. Finally, I am particularly grateful toTony Fox for his numerous helpful ideasand edits in drafting and finalising the paper.
References
Ahlén, I. 2002. Fladdermöss och fåglar dödade avvindkraftverk. Fauna och flora 97: 14–21.
Band, W. 2012. Using a collision risk model to
assess bird collision risks for offshore windfarms.
Report to The Crown Estate (StrategicOrnithological Support Services); ProjectSOSS-02. British Trust for Ornithology,Thetford, UK.
Band, W., Madders, M. & Whitfield, D.P. 2007.Developing field and analytical methods toassess avian collision risk at wind farms. In M.de Lucas, G.F.E. Janss & M. Ferrer (eds.), Birds

Swans, geese and wind farms 61
© Wildfowl & Wetlands Trust Wildfowl (2012) 62: 37–72
and Wind Farms: Risk Assessment and Mitigation,pp. 259–275. Quercus, Madrid, Spain.
Barrientos, R., Ponce, C., Palacín, C., Martín,C.A., Martín, B. & Alonso, J.C. 2012. Wiremarking results in a small but significantreduction in avian mortality at power lines: aBACI designed study. PLoS ONE 7 (3):e32569. doi:10.1371/journal.pone.0032569.
Barrios, L. & Rodriguez, A. 2004. Behaviouraland environmental correlates of soaring-birdmortality at on-shore turbines. Journal of
Applied Ecology 41: 72–81.Barrow Offshore Wind Ltd. 2008. Barrow Offshore
Wind Farm. Post-Construction Monitoring Report,
15 January 2008. Barrow Offshore Wind Ltd.,c/o DONG Energy, Copenhagen, Denmark.
Bearhop, S., Hilton, G.M., Votier, S.C. &Waldron, S. 2004. Stable isotope ratiosindicate that body condition in migratingpasserines is influenced by winter habitat.Proceedings of the Royal Society of London (SeriesB) 271: S215–S221.
Bevanger, K.. 1994. Bird interactions with utilitystructures: collision and electrocution, causesand mitigating measures. Ibis 136: 412–425.
Bevanger, K., Berntsen, F., Clausen, S., Dahl,E.L., Flagstad, Ø. Follestad, A., Halley, D.,Hanssen, F., Hoel, P.L., Johnsen, L., Kvaløy,P., May, R., Nygård, T., Pedersen, H.C.,Reitan, O., Steinheim, Y. & Vang, R. 2009.Pre- and post-construction studies of conflicts between
birds and wind turbines in coastal Norway
(BirdWind). Progress Report 2009. NINAreport 505. 70 pp.
Bioconsult & Arsu. 2010. Zum Einfluss vonWindenergieanlagen auf den Vogelzug auf der Insel Fehmarn. GutachterlicheStellungnahme auf der Basis der Literaturund eigener Untersuchungen im Frühjahrund Herbst 2009. BioConsult, Husum,Germany and ARSU, Oldenburg, Germany.
Bright, J.A., Langston, R.H.W., Bullman, R.,Evans, R.J., Gardner, S., Pearce-Higgins, J. &
Wilson, E. 2006. Bird Sensitivity Map to provide
locational guidance for onshore wind farms in
Scotland. RSPB report, Sandy. 20 pp.Bright, J.A., Langston, R.H.W., Bullman, R.,
Evans, R.J., Gardner, S. & Pearce-Higgins, J.2008. Map of bird sensitivities to wind farmsin Scotland: A tool to aid planning andconservation. Biological Conservation 141:2342–2356.
Brown, W.M. 1992. Avian collisions with utility
structures: biological perspectives. In Proceedingsof the international workshop on avianinteractions with utility structures, pp. 12–13.APLIC/EPRI, Miami, USA.
Carrete, M., Sánchez-Zapata, J.A., Benítez, J.R.Lobón, M., Montoya, F. & Donázar, J.A.2012. Mortality at wind-farms is positivelyrelated to large-scale distribution andaggregation in griffon vultures. Biological
Conservation 145: 102–108.Chamberlain, D.E., Rehfisch, M.R., Fox, A.D.,
Desholm, M. & Anthony, S. 2006. The effectof avoidance rates on bird mortalitypredictions made by wind turbine collisionrisk models. Ibis 148: 198–202.
Christensen, T.K., Hounisen, J.P., Clausager, I.and Petersen, I.K. (2004). Visual and radar
observations of birds in relation to collision risk
at Horns Rev offshore wind farm, Annual status
report 2003. Report commissioned by ElsamEngineering A/S 2003. NERI report, Rønde,Denmark. 53pp.
Collier, M.P., Dirksen, S. & Krjgsveld, K.L. 2011.A review of methods to monitor collisions or micro-
avoidance of birds with offshore wind turbines. Part
1: review. Bureau Waardenburg bv Report No.11-078 to The Crown Estate (StrategicOrnithological Support Services); ProjectSOSS-03a. British Trust for Ornithology,Thetford, UK.
Collier, M.P., Dirksen, S. & Krjgsveld, K.L. 2012.A review of methods to monitor collisions or micro-
avoidance of birds with offshore wind turbines.

62 Swans, geese and wind farms
© Wildfowl & Wetlands Trust Wildfowl (2012) 62: 37–72
Part 2: feasibility study of systems to monitor
collisions. Bureau Waardenburg bv Report No.11-215 to The Crown Estate (StrategicOrnithological Support Services); ProjectSOSS-03a. British Trust for Ornithology,Thetford, UK.
Cook, A.S.C.P., Johnston, A., Wright, L.J. &Burton, N.H.K. 2012. A review of flight heights
and avoidance rates of birds in relation to offshore
wind farms. BTO Research Report to TheCrown Estate (Strategic OrnithologicalSupport Services); Project SOSS-02. BritishTrust for Ornithology, Thetford, UK.
Croft, S., Budgey, R., Pitchford, J.W. & Wood, A.J.2012. The influence of group size and social interactions on collision risk withobjects. Ecological Complexity 000: 000–000.doi:10.1016/j.ecocom.2012.06.002.
Crowder, M.R. & Rhodes, O.E. 2001. Aviancollisions with power lines: a review. In
Proceedings of a workshop on avianinteractions with utility and communicationsstructures, pp. 139–167. EPRI TechnicalReport No. 1006907, EPRI Charleston, USA.
Dahl, E. L., Bevanger, K., Nygård, T., Røskaft, E.& Stokke, B.G. 2012. Reduced breedingsuccess in white-tailed eagles at Smølawindfarm, western Norway, is caused bymortality and displacement. Biological
Conservation 145: 79–85.de Lucas, M., Janss, G.F.E. & Ferrer, M. 2007.
Birds and Wind Farms: Risk Assessment and
Mitigation. Quercus, Madrid, Spain.Desholm, M. 2003. How much do small-scaled
changes in flight direction increase overallmigration distance? Journal of Avian Biology
34: 155–158.Desholm, M. & Kahlert, J. 2005. Avian collision
risk at an offshore wind farm. Biology Letters
1: 296–298.Desholm, M., Fox, A.D., Beasley, P.D.L. &
Kahlert, J. 2006. Remote techniques forcounting and estimating the number of bird-
wind turbine collisions at sea: a review. Ibis
148: 76–89. Drewitt, A. & Langston, R.H.W. 2006. Assessing
the impacts of wind farms on birds. Ibis 148:29–42.
Drewitt, A.L. & Langston, R.H.W. 2008.Collision effects of wind-power generatorsand other obstacles on birds. Annals of the
New York Academy of Science 1134: 233–266.Ebbinge, B.S. & Spaans, B. 1995. The importance
of body reserves accumulated in springstaging areas in the temperate zone forbreeding in dark-bellied brent geese in thehigh arctic. Journal of Avian Biology 26:105–113.
Ecology Consulting 2012. Hellrigg Wind Farm:
Goose Refuge Monitoring Report. Winter 2011–12.
Ecology Consulting Report to RWE NpowerRenewables, Ecology Consulting, OldCassop, Durham.
Eichhorn, M., Johst, K., Seppelt, R. & Drechsler.M. 2012. Model-based estimation ofcollision risks of predatory birds with windturbines. Ecology and Society 17(2): 1.
Erickson, W., Johnson, G.D., Young, D.P.Jr.,Strickland, M.D., Good, R.E., Bourassa, M.& Bay, K. 2002. Synthesis and comparison of
baseline avian and bat use, raptor nesting and
mortality information from proposed and existing
wind developments. WEST, Inc. TechnicalReport for Bonneville Power Administration.WEST, Inc., Cheyenne, Wyoming, USA.
Erickson, W.P., Gritski, B. & Kronner, K. 2003.
Nine Canyon Wind Power Project Avian and Bat
Monitoring Report, September 2002–August 2003.WEST, Inc. and Northwest WildlifeConsultants, Inc. Technical Report to EnergyNorthwest and the Nine Canyon TechnicalAdvisory Committee. WEST, Inc., Cheyenne, Wyoming, USA.
Erickson, W.P., Jeffrey, J., Kronner, K. & Bay, K.2004. Stateline Wind Project Wildlife Monitoring
Final Report, July 2001–December 2003.

Swans, geese and wind farms 63
© Wildfowl & Wetlands Trust Wildfowl (2012) 62: 37–72
Western EcoSystems Technology, Inc. and Northwest Wildlife Consultants, Inc.Technical Report to FPL Energy, the Oregon Energy Facility Siting Council, and the Stateline Technical AdvisoryCommittee. http://www.west-inc.com/reports/swp_final_dec04.pdf.
European Union 2007. Renewable Energy Road Map. Renewable energies in the 21st
century: building a more sustainable future.Communication from the Commission ofthe European Communities to the Counciland the European Parliament. COM(2006)848 final. http://ec.europa.eu/energy/energy_policy/doc/03_renewable_energy_roadmap_en.pdf. (last accessed on10.11.2009).
European Union 2008. EU Renewable Energy
Directive 2008. Proposal for a Directive of theEuropean Parliament and of the Council onthe promotion and use of energy fromrenewable resources. COM (2008) 30 final.http://ec.europa.eu/energy/climate_actions/doc/2008_res_directive_en.pdf. (last accessed on 10.11.2009).
European Environment Agency 2009. Europe’s
onshore and offshore wind energy potential. An
assessment of environmental and economic
constraints. EEA Technical Report No.6/2009, European Environment Agency,Copenhagen, Denmark.
European Wind Energy Association 2008. Pure
Power – Wind Energy Scenarios up to 2030.
European Wind Energy Association,Brussels. Available at: http://www.ewea.org/fileadmin/ewea_documents/documents/publications/reports/purepower.pdf. (lastaccessed on 10.11.2009).
European Wind Energy Association 2012. Wind
in power. 2011 European Statistics. EuropeanWind Energy Association, Brussels. Available at: http://ewea.org/fileadmin/ewea_documents/documents/publications/
statistics/Stats_2011.pdf. (last accessed on31.08.2012).
Everaert J. 2008. Effecten van windturbines op de
fauna in Vlaanderen. Onderzoeksresultaten,
discussie en aanbevelingen. Rapporten van hetInstituut voor Natuur- en Bosonderzoek2008 (rapportnr. INBO.R.2008.44). Instituutvoor Natuur- en Bosonderzoek, Brussells,Belgium.
Fernley, J., Lowther, S. & Whitfield, P. 2006. A
review of goose collisions at operating wind farms and
estimation of the goose avoidance rate. NaturalResearch Ltd, West Coast Energy and HyderConsulting report. West Coast Energy, Mold,UK.
Ferrer, M., de Lucas, M., Janss, G.F.E., Casado,C., Muñoz, A.R., Bechard, M.J. & Calabuig,C.P., 2012. Weak relationship between riskassessment studies and recorded mortality in wind farms. Journal of Applied Ecology 49:38–46.
Fijn R.C., Krijgsveld K.L., Prinsen H.A.M.,Tijsen W. & Dirksen S. 2007. Effecten op
zwanen en ganzen van het ECN windturbine
testpark in de Wieringermeer. Aanvaringsrisico’s en
verstoring van foeragerende vogels. Report No. 07-094, Bureau Waardenburg, Culemborg, the Netherlands. www.buwa.nl/fileadmin/buwa_upload/Bureau_Waardenburg_rapporten/2007_Fijn_BW_ganzen_zwanen_ECN-testpark_klein.pdf.
Fijn, R.C., Krijgsveld K.L., Tijsen W., PrinsenH.A.M. & Dirksen S. 2012. Habitat use,disturbance and collision risks for Bewick’sSwans Cygnus columbianus wintering near awind farm in the Netherlands. Wildfowl 62:97–116.
Fox, A.D., Desholm, M., Kahlert, J., Christensen,T.K. & Petersen, I.K. 2006. Informationneeds to support environmental impactassessments of the effects of Europeanmarine offshore wind farms on birds. Ibis
148: 129–144.

64 Swans, geese and wind farms
© Wildfowl & Wetlands Trust Wildfowl (2012) 62: 37–72
Furness, B. & Wade, H. 2012. Vulnerability of
Scottish seabirds to offshore wind turbines.
MacArthur Green Ltd. report to MarineScotland, MacArthur Green, Glasgow, UK.
Garthe, S. & Hüppop, O. 2004. Scaling possibleadverse effects of marine wind farms on seabirds: developing and applying avulnerability index. Journal of Applied Ecology
41: 724–734.Gill, J.P. & Smith, T. 2001. Calibrated study of
wintering Pink-footed Goose potentialcollision victims and scavenging activity byfoxes at Dun Law wind farm 2000.Environmentally Sustainable Systems reportto CRE Energy Ltd. and Renewable EnergySystems Ltd., Environmentally SustainableSystems, Edinburgh, UK.
Gill, J.A., Norris, K., Potts, P.M., Gunnarsson, T.G., Atkinson, P.W. & Sutherland, W.J. 2001The buffer effect and large-scale populationregulation in migratory birds. Nature 412:436–438.
Green, M., Alerstam, T., Gudmundsson, G.A.,Hedenström, A. & Piersma, T. 2004. DoArctic waders use adaptive wind drift? Journal
of Avian Biology 35: 305–315.Griffin, L., Rees, E. & Hughes, B. 2010. The
migration of Whooper Swans in relation to offshore
wind farms. WWT Final Report to COWRIELtd., Wildfowl & Wetlands Trust, Slimbridge,UK.
Griffin, L., Rees, E. & Hughes, B. 2011. Migration
routes of Whooper Swans and geese in relation to wind
farm footprints: Final report. WWT report to theDepartment of Energy and Climate Change,Wildfowl & Wetlands Trust, Slimbridge, UK.
Handke, K.., Adena, J., Handke, P. & Sprötge, M. 2004. Räumliche Verteilung ausgewählterBrut- und Rastvogelarten in Bezug aufvorhandene Windenergieanlagen in einemBereich der küstennahen Krummhörn(Groothusen/Ostfriesland). Bremer Beitr.
Naturk. Naturschutz 7: 11-46
Hötker, H., Thomsen, K.-M. & Jeromin, H.2006. Impacts on Biodiversity of Exploitation of
Renewable Energy Sources: The Example of Birds
and Bats – Facts, Gaps in Knowledge, Demands for
Further Research, and Ornithological Guidelines
for the Development of Renewable Energy
Exploitation. Michael-Otto-Institut imNABU,Bergenhusen, Germany.
Inger, R., Harrison, X.A., Ruxton, G.D. Newton,J., Colhoun, K., Gudmundsson, G.A.,McElwaine, G., Pickford, M., Hodgson, D. &Bearhop, S. 2010. Carry-over effects revealreproductive costs in a long distance migrant.Journal Animal Ecology 79: 974–982.
Jain, A.A. 2005. Bird and bat behavior and mortality
at a northern Iowa windfarm. MSc thesis, IowaState University, Iowa, USA.
Janss, G.F.E. 2000. Avian mortality from powerlines: a morphologic approach of a species-specific mortality. Biological Conservation 95:353–359.
Jenkins, A.R., Smallie, J.J. & Diamond, M. 2010.Avian collisions with power lines: a globalreview of causes and mitigation with a South African perspective. Bird Conservation
International 20: 263–278.Johnson, G.D., Erickson, W.P., Strickland, M.D.,
Shepherd, M.F. & Shepherd, D.A. 2000.Avian monitoring at the Buffalo Ridge, Minnesota
wind resource area: results of a 4-year study.Western EcoSystems Technology Inc. reportto Northern States Power Company, WESTInc., Cheyenne, Wyoming, USA.
Johnson, G.D., Erickson, W.P., Strickland, M.D.,Shepherd, M.F., Shepherd, D.A. & Sarappo,S.A. 2002a. Collision mortality of local and migrant birds at a large scale wind-power development on Buffalo Ridge,Minnesota. Wildlife Society Bulletin 30:879–887.
Johnson, G.D., Erickson, W.P. & Bay, K. 2002b.Baseline ecological studies for the Klondike wind
project, Sherman County, Oregon. Western

Swans, geese and wind farms 65
© Wildfowl & Wetlands Trust Wildfowl (2012) 62: 37–72
Ecosystems Technology (WEST) Inc., andNorthwest Wildlife Consultants report toNorthwestern Wind Power. WEST Inc.,Cheyenne, Wyoming, USA.
Johnson, G.D., Erickson, W.P., White, J. &McKinney, R. 2003. Avian and bat mortality
during the first year of operation at the Klondike
Phase I wind project, Sherman County, Oregon.
Western Ecosystems Technology (WEST)Inc. report to Northwestern Wind Power.WEST Inc., Cheyenne, Wyoming, USA.
Kowallik, C. 2002. Auswirkungen vonWindenergieanlagen, Straßen und Gebäudenauf die Raumnutzung von Nonnengänsenund ein Prognose-Verfahren zurKonfliktbewertung. Dipl.-Arbeit Thesis,Universität Oldenburg, Oldenburg, Germany.
Krijgsveld, K.L. & Beuker, D. 2009.Vogelslachtoffers bij windpark Anna Vosdijk opTholen. Onderzoek naar aanvaringen ondertrekkende steltlopers en overwinterende smienten.Bureau Waardenburg report to Eneco NewEnergy. Bureau Waardenburg, Culemborg,the Netherlands.
Krijgsveld, K.L., Akershoek, K., Schenk, F., Dijk,F. & Dirksen, S. 2009. Collision risk of birdswith modern large wind turbines. Ardea 97:357–366.
Kruckenberg, H. & Jaene, J. 1999. Zum einflusseines Windparks auf die Verteilung weidenderBlässgänze im Rheiderland (Landkreis Leer, Niedersachsen). Natur und Landschaft 74:420–427.
Langgemach, T. & Dürr, T. 2012. Informationen
über Einflüsse der Windenergienutzung auf
Vögel. Stand 10.07.2012. Landesamt fürUmwelt, Gesundheit und Verbraucherschutz, Nennhausen/Buckow, Germany.
Langston, R.H.W. & Boggio, S. 2011. Foraging
ranges of Northern Gannets Morus bassanus inrelation to proposed offshore wind farms in the North
Sea. Royal Society for the Protection of Birdsreport to Hartley Anderson & Department
for Energy and Climate Change, RSPB,Sandy, UK.
Langston, R.H.W. & Pullan, J.D. 2003. Windfarms
and birds: an analysis of windfarms on birds, and
guidance on environmental assessment criteria and
site selection issues. RSPB⁄BirdLife Internationalreport to the Council of Europe (BernConvention). T-PVS⁄Inf (2003) 12.
Langston, R.H.W. & Teuten, E. 2012. Foragingranges of Northern Gannets Morus bassanus inrelation to proposed offshore wind farms in the UK:2011. Royal Society for the Protection ofBirds report to the Department for Energyand Climate Change. RSPB, Sandy, UK.
Larsen, J.K. & Clausen, P. 2002. Potential windpark impacts on whooper swans in winter:the risk of collision. Waterbirds 25 (SpecialPublication 1): 327–330.
Larsen, J.K. & Madsen, J. 2000. Effects of windturbines and other physical elements on field utilization by pink-footed geese (Anser
brachyrhynchus): a landscape perspective.Landscape Ecology 15: 755–764.
Madsen, J. 1985. Impact of disturbance on fieldutilization of pink-footed geese in WestJutland, Denmark. Biological Conservation 33:53–63.
Madsen, J. 1995. Impacts of disturbance onmigratory waterfowl. Ibis 137: 67–74.
Madsen, J. & Boertmann, D. 2008. Animalbehavioural adaptation to changing landscapes:spring-staging geese habituate to wind farms.Landscape Ecology 23: 1007–1011.
Marra, P.P., Hobson, K.A. & Holmes, R.T. 1998.Linking winter and summer events in amigratory bird by using stable-carbonisotopes. Science 282: 1884–1886.
Martin, G.R. 2011. Understanding bird collisionswith man-made objects: a sensory ecologyapproach. Ibis 153: 239–254.
Masden, E.A., Haydon, D.T., Fox, A.D., Furness,R.W., Bullman, R. & Desholm, M. 2009.Barriers to movement: impacts of wind
66 Swans, geese and wind farms
© Wildfowl & Wetlands Trust Wildfowl (2012) 62: 37–72
farms on migrating birds. ICES Journal of
Marine Science 66: 746–753.Masden, E.A. 2010. Assessing the cumulative
impacts of wind farms on birds: an individual-based model of hen harriers in Orkney. In
E.A. Masden (Ph.D. thesis), Assessing the
cumulative impacts of wind farms on birds. Chapter
6. University of Glasgow, Glasgow, UK.Masden, E.A., Fox, A.D., Furness, R.W., Bullman,
R. & Haydon, D.T. 2010a. Cumulative impactassessments and bird/wind farm interactions:developing a conceptual framework.Environmental Impact Assessment Review 30: 1–7.
Masden, E.A., Haydon, D.T., Fox, A.D. &Furness, R.W. 2010b. Barriers to movement:Modelling energetic costs of avoiding marinewind farms amongst breeding seabirds.Marine Pollution Bulletin 60: 1085–1091.
Masden, E.A., Reeve, R.E., Desholm, M., Fox,A.D., Furness, R.W. & Haydon, D.T. 2012.Assessing the impact of marine wind farmson birds through movement modelling.Journal of the Royal Society Interface 9:2120–2130.
Minderman, J., Pendlebury, C., Pearce-Higgins,J.W. & Park, K.J. 2012. Experimentalevidence for the effect of small wind turbineproximity and operation on bird and batactivity. PLoS ONE 7 (7), e 41177. Doi:10.1371/journal.pone.0041177.
Möckel, R. & Wiesner, T. 2007. Zur Wirkung vonWindkraftanlagen auf Brut- und Gastvögelin der Niederlausitz (Land Brandenburg).Arbeitsgemeinschaft Berlin-Brandenburgischer
Ornithologen 15 (Special Issue): 1–136.Musters, C.J.M., Noordervliet, M.A.W. & ter
Keurs, W.J. 1996. Bird casualties caused by awind energy project in an estuary. Bird Study
43: 124–126.Natural England 2010. Assessing the effects of
onshore wind farms on birds. Natural EnglandTechnical Information Note TIN069,Natural England, Sheffield, UK.
Norman, T.B., Buisson, R.S.K. & Askew, N.P.2007. Report on the COWRIE workshop on the
cumulative impact of offshore windfarms on birds.RPS report for the Collaborative OffshoreWind Research into the Environment(COWRIE Ltd.), COWRIE – CIBIRD-01-2007, UK.
Norris, D.R. & Taylor, C.M. 2006. Predicting the consequences of carry-over effects inmigratory animals. Biology Letters 2: 148–151.
Norris, D.R., Marra, P.P., Kurt Kyser, T. & Sherry, T.W. 2004. Tropical winter habitatlimits reproductive success on the temperatebreeding grounds in a migratory bird.Proceedings Royal Society B 271: 59–64.
Osborn, R.G., Higgins, K.F., Usgaard, R.E. &Dieter, C.D. 2000. Bird mortality associatedwith wind turbines at the Buffalo Ridge WindResource Area, Minnesota. American Midland
Naturalist 143: 41–52. Parmesan, C. & Yohe, G. 2003. A globally
coherent fingerprint of climate changeimpacts across natural systems. Nature 421:37–42.
Pearce-Higgins, J.W., Stephen, L., Langston,R.H.W. & Bright, J.A. 2008. Assessing thecumulative impacts of wind farms onpeatland birds: a case study of golden ploverPluvialis apricaria in Scotland. Mires and Peat 4:1–13.
Pearce-Higgins, J.W., Stephen, L., Langston,R.H.W., Bainbridge, I.P. & Bullman, R. 2009.The distribution of breeding birds aroundupland wind farms. Journal of Applied Ecology
46: 1323–1331.Pearce-Higgins, J.W., Stephen, L., Douse, A. &
Langston R.H.W. 2012. Greater impacts ofwind farms on bird populations duringconstruction than subsequent operation:results of a multi-site and multi-speciesanalysis. Journal of Applied Ecology 49: 386–394.
Pendlebury, C. 2006. An appraisal of “A review
of goose collisions at operating windfarms and

Swans, geese and wind farms 67
© Wildfowl & Wetlands Trust Wildfowl (2012) 62: 37–72
estimation of the goose avoidance rate” by Fernley, J.,
Lowther, S. and Whitfield, P., BTO ResearchReport No. 455, BTO Scotland, University of Stirling. http://www.snh.org.uk/pdfs/strategy/renewable/BTOResearch455.pdf
Petersen, I.K., Christensen, T.K., Kahlert, J.,Desholm, M. & Fox, A.D. 2006. Bird numbers
and distributions in the Horns Rev offshore wind
farm area. National Environment ResearchInstitute report for DONG Energy andVattenfall A/S, NERI, Ministry of theEnvironment, Denmark.
Pettersson, J. 2005. The impact of offshore wind farms
on bird life in Southern Kalmar Sound, Sweden.
A final report based on studies 1999–2003. Reportfrom Lund University to the Swedish EnergyAgency. Lund University, Lund, Sweden.
Plonczkier, P. & Simms, I.C. 2012. Radarmonitoring of migrating pink-footed geese:behavioural responses to offshore wind farmdevelopment. Journal Applied Ecology doi10.1111/j.1365-2664.2012.02181.x.
Prinsen, H.A.M., Boere, G.C., Píres, N. &Smallie, J.J. (Compilers) 2011. Review of the
conflict between migratory birds and electricity power
grids in the African-Eurasian region. AEWA/CMS report, Bonn, Germany.
Ratikainen, I.I., Gill, J.A., Gunnarsson, T.G.,Sutherland, W.J. & Kokko, H. 2008. Whendensity-dependence is not instantaneous:theoretical developments and managementimplications. Ecology Letters 11: 184–198.
RenewableUK 2012. Statistics. http://www.bwea.com/statistics. (last accessed on20.07.2012).
Rodziewicz, M. 2009. Monitoring powykonawczy
ptaków na farmie wiatrowej Kisielice-Łodygowo.
Raport 2009, stycze – grudzie . IberdrolaRenewables Polska Sp. zo.o., Jerzwałd, Poland.
Root, T.L., Price, J.T., Hall, K.R., Schneider, S.H., Rosenzweig, C. & Pounds, J.A. 2003.Fingerprints of global warming on wildanimals and plants. Nature 421: 57–60.
Rubolini, D., Gustin, M., Bogliani, G. &Garavaglia, R. 2005. Birds and powerlines inItaly: an assessment. Bird Conservation
International 15: 131–145.Scottish Natural Heritage 2009. Guidance on
methods for monitoring bird populations at onshore wind farms. SNH Guidance Note.http://www.snh.gov.uk/docs/C205417.pdf(accessed on 25.10.2012).
Scottish Natural Heritage 2010. Use of Avoidance
Rates in the SNH Wind Farm Collision Risk
Model. SNH Avoidance Rate Information & Guidance Note. http://www.snh.gov.uk/docs/B721137.pdf (last accessed on31.08.2012).
Staatlichen Vogelschutzwarte 2012. Vogelverluste an
Windenergieanlagen (Bird fatalities at wind turbines
in Europe). http://www.mugv.brandenburg.de/cmsdetail.php/bb2.c.451792.de.
Sterner, D., Orloff, S. & Spiegel, L. 2007. Windturbine collision research in the UnitedStates. In M. de Lucas, G.F.E. Janss & M. Ferrer (eds.), Birds and Wind Farms:
Risk Assessment and Mitigation, pp. 81–100.Quercus, Madrid, Spain.
Stirnemann, R.L., O’Halloran, J., Ridgeway, M. &Donnelly, A. 2012., Temperature-relatedincreases in grass growth and greatercompetition for food drive earliermigrational departure of wintering WhooperSwans. Ibis 154: 542–553.
Stewart, G.B., Pullin, A.S. & Coles, C.F. 2007. Poorevidence-base for assessment of windfarmimpacts on birds. Environmental Conservation
34: 1–11.Sugimoto, H. & Matsuda, H. 2011. Collision risk
of White-fronted geese with wind turbines.Ornithological Science 10: 61–71.
Thelander, C.G. & Smallwood, K.S. 2007. TheAltamont Pass Wind Resource Area’s effects on birds: a case history. In M. deLucas, G.F.E. Janss & M. Ferrer (eds.), Birds and Wind Farms: Risk Assessment and

68 Swans, geese and wind farms
© Wildfowl & Wetlands Trust Wildfowl (2012) 62: 37–72
Mitigation, pp. 25–46. Quercus, Madrid,Spain.
Thomas, C.D., Cameron, A., Green, R. E.,Bakkenes, M., Beaumont, L.J., Collingham,Y.C. & Erasmus, B.F.N. 2004. Extinction riskfrom climate change. Nature 427: 145–148.
Thorup, K., Alerstam, T., Hake, M. & Kjellén, N.2003. Bird orientation: compensation forwind drift in migrating raptors is age-dependent. Proceedings Royal Society London B
(Suppl.) 270: S8–S11. Tucker, V.A. 1996. A mathematical model of bird
collisions with wind turbine rotors Journal of
Solar Energy Engineering 118: 253–262. Veerbeek, R.G., Beuker, D., Hartman, J.C. &
Krijgsveld, K.L. 2012. Monitoring vogelsWindpark Sabinapolder. Onderzoek naaraanvaringsslachtoffers. Bureau Waardenburgreport to RWE Innogy WindpowerNetherlands. Bureau Waardenburg,Culemborg, the Netherlands.
Warren, S.M., Fox, A.D., Walsh, A.J. &O’Sullivan, P. 1993. Extended parent-offspring relationships amongst the Green -
Photograph: Bewick’s Swans at the ECN wind farm, the Netherlands, by Wim Tijsen.
land White-fronted Goose (Anser albifrons
flavirostris). Auk 110: 145–148.Winkelman, J.E. 1989. Vogels en het windpark nabij
Urk (NOP): aanvaringsslachtoffers en verstoring
van pleisterende eenden ganzen en zwanen. [Birds
and the wind park near Urk: collision victims
and disturbance of ducks, geese and swans.]
RIN-report 89/15. Rijksinstituut voorNatuurbeheer, Arnhem, the Netherlands. [InDutch with English summary.]
Zehtindjiev, P. & Whitfield, D.P. 2010. Monitoring
of wintering geese in the AES Geo Energy Wind
Park “Sveti Nikola” territory and the Kaliakra
region in winter 2009/2010. BulgarianAcademy of Sciences and Natural ResearchLtd. report to AES Geo Energy OOD, Sofia,Bulgaria.
Zehtindjiev, P. & Whitfield, D.P. 2011. Monitoring
of wintering geese in the AES Geo Energy Wind
Park “Sveti Nikola” territory and the Kaliakra
region in winter 2010/2011. BulgarianAcademy of Sciences and Natural ResearchLtd. report to AES Geo Energy OOD, Sofia,Bulgaria.

Swans, geese and wind farms 69
© Wildfowl & Wetlands Trust Wildfowl (2012) 62: 37–72
App
endi
x 1.
Rec
ords
of
swan
s an
d ge
ese
foun
d to
hav
e co
llide
d w
ith w
ind
turb
ines
. Ref
eren
ces:
1 =
Eve
raer
t 200
8; 2
= Z
ehtin
djie
v&
Whi
tfie
ld 2
010;
3 =
Zeh
tindj
iev
& W
hitf
ield
201
1; 4
= S
taat
liche
n V
ogel
schu
tzw
arte
201
2; 5
= B
ioco
nsul
t & A
rsu
2010
; 6 =
Mus
ters
et a
l.19
96; 7
= W
inke
lman
198
9; 8
= F
ijn et
al.
2007
, 9 =
Fijn
et a
l.20
12; 1
0 =
Krij
gsve
ld &
Beu
ker
2009
; 11
= V
eerb
eek
et a
l. 20
12; 1
2=
Bev
ange
r et
al.2
009;
13
= R
odzi
ewic
z 20
09; 1
4 =
Höt
ker e
t al
.200
6; 1
5 =
Ahl
én 2
002;
16
= B
OW
ind
2008
; 17
= E
colo
gy C
onsu
lting
2012
; 18
= O
sbor
n et
al.
2000
; 19
= Jo
hnso
n et
al.
2000
; 20
= Jo
hnso
n et
al.
2002
a; 2
1 =
John
son
et a
l. 20
02b;
22
= Jo
hnso
n et
al.
2003
;23
= F
ernl
ey e
t al
.20
06; 2
4 =
Pen
dleb
ury
2006
; 25
= E
ricks
on e
t al
.20
03; 2
6 =
Eric
kson
et
al.
2004
; 27
= J
ain
2005
. Cou
ntrie
s: B
=B
elgi
um; N
L =
Net
herla
nds;
N =
Nor
way
; PO
L =
Pol
and;
S =
Sw
eden
; UK
= U
nite
d K
ingd
om; U
SA =
Uni
ted
Stat
es o
f A
mer
ica.
Obs
erva
tion
met
hods
: AC
C =
acc
iden
tal f
indi
ng; C
S =
car
cass
sea
rch;
RA
D =
rad
ar; F
L =
flig
ht o
bser
vatio
ns t
hrou
gh/a
cros
s w
ind
farm
; BC
= b
ird c
ount
s. *
= li
near
alig
nmen
t; **
= tu
rbin
es in
2 li
nes;
***
= c
lust
er.
Spec
ies
No.
N
o. f
light
s W
ind
farm
B
uilt
No.
tur
bine
s Y
ears
/w
inte
rs
Obs
. D
urat
ion
CS
linke
d R
efs
colli
sion
sw
ithi
n w
ind
nam
e/lo
cati
on(h
ub h
eigh
t)of
pos
t-
met
hod
of p
ost-
to b
ird
farm
cons
truc
tion
cons
truc
tion
pr
esen
cem
onit
orin
gm
onit
orin
g
Dom
estic
Goo
se2
Not
rec
orde
dB
oude
wijn
kana
al,
2000
–14
*5
CS
c. 26
day
s/ye
ar
NO
1B
elgi
um20
01(6
0 m
)(f
ortn
ight
ly;
2002
–200
6)D
omes
tic G
oose
1N
ot r
ecor
ded
Klu
izen
dok,
20
0511
**3
CS
c. 26
day
s/ye
ar
NO
1B
elgi
um(9
8 m
)(f
ortn
ight
ly;
2005
–200
7)G
reyl
ag G
oose
1N
ot r
ecor
ded
Oos
tdam
, Bel
gium
<20
0123
**
7C
Sc.
26 d
ays/
year
N
O1
(23–
55 m
)(f
ortn
ight
ly;
2001
–200
7)G
oose
sp.
029
6,42
0
Sain
t Nik
ola,
20
0952
***
2aC
S, R
AD
78
day
s/w
inte
r Y
ES
2, 3
bird
-flig
hts
Bul
garia
(105
m)
FL &
BC
(435
turb
ines
in
200
9/10
; se
arch
ed in
70
,450
in
c. 50
day
s 20
10/1
1ain
201
0/11
)W
hoop
er S
wan
1N
ot r
ecor
ded
Nie
bull-
Fahr
ehof
t, N
ot
?A
CC
AC
CN
O4
Ger
man
ykn
own
Mut
e Sw
an1
Not
rec
orde
dK
ossd
orf,
Ger
man
y20
0415
1
1 C
SO
nly
1 se
arch
NO
4(1
25 m
)M
ute
Swan
1N
ot r
ecor
ded
Nau
en-I
, Ger
man
y19
9922
1C
S6
days
N
O4
(85–
100
m)
(6–1
2 vi
sits
pe
r tu
rbin
e,
in 2
006)

70 Swans, geese and wind farms
© Wildfowl & Wetlands Trust Wildfowl (2012) 62: 37–72
App
endi
x 1
(cont
inue
d)
Spec
ies
No.
N
o. f
light
s W
ind
farm
B
uilt
No.
tur
bine
s Y
ears
/w
inte
rs
Obs
. D
urat
ion
CS
linke
d R
efs
colli
sion
sw
ithi
n w
ind
nam
e/lo
cati
on(h
ub h
eigh
t)of
pos
t-
met
hod
of p
ost-
to b
ird
farm
cons
truc
tion
cons
truc
tion
pr
esen
cem
onit
orin
gm
onit
orin
g
Mut
e Sw
an1
Not
rec
orde
dSc
hlal
ach,
Ger
man
y20
1016
1C
Sc.
22 d
ays
NO
4(1
79 m
)(f
ortn
ight
ly F
eb–
Dec
, in
2011
)M
ute
Swan
1N
ot r
ecor
ded
Seel
ow, G
erm
any
1996
1 +
13
AC
CA
CC
NO
4(8
5–14
5 m
)M
ute
Swan
1N
ot r
ecor
ded
Witt
man
nsdo
rf,
1994
–7
1C
Sc.
52 d
ays
NO
4G
erm
any
1997
(63–
85)
(200
3–20
04)
Mut
e Sw
an1
Not
rec
orde
dZ
itz-W
arch
au,
2003
204
CS
61–1
50 d
ays/
year
N
O4
Ger
man
y(1
12 m
)(N
ov 2
003–
Mar
200
7)W
hite
-fro
nted
Goo
se2
Not
rec
orde
dZ
itz-W
arch
au,
1997
–20
4C
SN
O4
Ger
man
y20
03(1
12 m
)Sw
an s
p.1
Not
rec
orde
dK
lein
Mut
z,
2003
8A
CC
AC
CN
O4
Ger
man
y(1
18 m
)W
hite
-fro
nted
Goo
se1
Not
rec
orde
dH
eide
hof-
Jüte
rbog
, 20
0731
?C
Sc.
22 d
ays/
year
NO
4G
erm
any
(149
m)
(for
tnig
htly
Fe
b–D
ec)
Bea
n G
oose
1N
ot r
ecor
ded
Göl
lnitz
, Ger
man
y20
016
AC
CA
CC
NO
4(9
3–94
m)
Goo
se s
p.1
Not
rec
orde
dE
tzin
-II,
Ger
man
y20
063
11
CS
Onl
y 1
sear
chN
O4
(149
m)
Goo
se s
p.1
Not
rec
orde
dZ
acho
w-I
I,
1994
–3
?C
SO
nly
1 si
ngle
N
O4
Ger
man
y19
98(5
5–85
m)
sear
ch/y
ear
Mut
e Sw
an1
Not
rec
orde
dSt
utho
f, G
erm
any
?c.
10?
CS
Onl
y 1
sing
le
NO
4(<
150
m)
sear
ch/y
ear
Mut
e Sw
an4
Not
rec
orde
dD
olla
rt, G
erm
any
?L
arge
win
d ?
CS
?N
O4
farm
(<10
0m)
Mut
e Sw
an2
Not
rec
orde
dW
ybel
sum
er, G
erm
any
?L
arge
win
d ?
CS
?N
O4
farm
(<10
0m)
Swan
sp.
3N
ot r
ecor
ded
Wyb
elsu
mer
, Ger
man
y?
??
CS
?N
O4
Gre
ylag
Goo
se1
Not
rec
orde
dW
ybel
sum
er, G
erm
any
??
?C
S?
NO
4M
ute
Swan
1N
ot r
ecor
ded
? (in
Nie
ders
achs
en,
?<
101
CS
52 d
ays
NO
4G
erm
any)
(<10
0)(w
eekl
y, 20
01)
Gre
ylag
Goo
se1
Not
rec
orde
dR
ieps
ter
Ham
rich,
??
??
??
?4
Ger
man
yG
reyl
ag G
oose
1N
ot r
ecor
ded
Oev
enum
-Föh
r, ?
??
??
?4
Ger
man
y

Swans, geese and wind farms 71
© Wildfowl & Wetlands Trust Wildfowl (2012) 62: 37–72
Bea
n G
oose
1N
ot r
ecor
ded
Bel
gern
, Ger
man
y?
11
CS
Oct
199
9–N
O4
Mar
200
0B
ean
Goo
se1
Not
rec
orde
dA
sche
kipp
e ?
1?
CS
?N
O4
Trat
tend
orf-
Zer
re,
Ger
man
yM
ute
Swan
1N
ot r
ecor
ded
Kre
vese
, Ger
man
y?
1?1
CS
52 d
ays
NO
4(<
100
m)
(wee
kly,
2000
)G
oose
sp.
1M
ute
Swan
1N
ot r
ecor
ded
Wes
tfeh
mar
n,
??
?C
S1
sear
ch p
er w
eek
NO
4G
erm
any
(<10
0 m
)B
arna
cle
Goo
se6
Not
rec
orde
dFe
hmar
n, G
erm
any
1990
>75
***
1C
S &
RA
DA
utum
n 20
09Y
ES
4, 5
(sev
eral
site
s)
(<10
0 m
)B
rent
Goo
se1
Not
rec
orde
dK
reer
ak, N
ths
1990
51
CS
c. 18
0 da
ys(3
0 m
)(2
8.04
.90–
29.0
4.91
)N
O6
Mut
e Sw
an3
Not
rec
orde
dU
rk, N
ethe
rland
s19
8725
*2
CS
Dai
ly in
aut
umn;
Y
ES
7(3
0 m
)1–
2 tim
es/w
eek
in
win
ter
and
sprin
gB
ewic
k’s
Swan
0–2
1,66
4+
Wat
erka
apto
cht,
2003
8*1
CS
&
31 s
earc
h-da
ys
YE
S8,
9(1
01 g
roup
s)N
ths
(78
m)
RA
D(w
inte
r 20
06/0
7)E
CN
test
-par
k,
2003
–200
69*
*1
Nth
s(9
0 m
)G
reyl
ag G
oose
2N
ot r
ecor
ded
Ann
a V
osdi
jk, N
ths
2007
5*1
CS
1–2
times
/wee
k?
10(8
0 m
)G
reyl
ag G
oose
6N
ot r
ecor
ded
Sabi
napo
lder
, Nth
s19
956*
2C
S &
RA
D13
8 se
arch
-day
sY
ES
11(4
8 m
)in
2-y
ear
stud
yC
anad
a G
oose
1N
ot r
ecor
ded
Sabi
napo
lder
, Nth
s19
956*
2C
S &
RA
D13
8 se
arch
-day
sY
ES
11(4
8 m
)in
2-y
ear
stud
yW
hoop
er S
wan
1N
ot r
ecor
ded
Smøl
a, N
orw
ay20
0268
***
7C
S52
day
s/ye
arN
O12
(70
m)
(wee
kly;
200
3–20
09)
Gre
ylag
Goo
se3
Not
rec
orde
dSm
øla,
Nor
way
2002
68**
*7
CS
52 d
ays/
year
NO
12(7
0 m
)(w
eekl
y; 2
003–
2009
)M
ute
Swan
5N
ot r
ecor
ded
Kis
ielic
e-20
0727
***
?C
S?
?4,
13
Łod
ygow
o, P
olan
d(8
5 m
)G
reyl
ag G
oose
1N
ot r
ecor
ded
Elg
ea A
lava
, Spa
in<
2003
???
?C
S?
?4
Gre
ylag
Goo
se1
Not
rec
orde
dE
lgea
-Urk
illa,
Spa
in20
0340
***
?C
S?
?4
Gre
ylag
Goo
se1
Not
rec
orde
dG
uipú
zcoa
-Ála
va,
<20
09??
??
CS
??
4Sp
ain
Mut
e Sw
an
1N
ot r
ecor
ded
Skån
e (c.
20
site
s),
<20
0251
1C
S1
visi
t/si
teN
O14
, 15
Swed
en(v
arie
d)(A
ug–O
ct 2
002)
Pink
-foo
ted
Goo
se0
9B
arro
w O
ffsh
ore,
20
0630
***
1FL
b21
day
sY
ES
16U
K(7
5 m
)(2
007)
Pink
-foo
ted
Goo
se0
4 gr
oups
Hel
lrigg
, UK
2011
4***
1C
S, B
C
12 s
earc
h-da
ys; 3
8 h
YE
S17
(80
m)
& F
Lfl
ight
obs
erva
tions
(22.
12.1
1–09
.03.
12)

72 Swans, geese and wind farms
© Wildfowl & Wetlands Trust Wildfowl (2012) 62: 37–72
App
endi
x 1
(cont
inue
d)
Spec
ies
No.
N
o. f
light
s W
ind
farm
B
uilt
No.
tur
bine
s Y
ears
/w
inte
rs
Obs
. D
urat
ion
CS
linke
d R
efs
colli
sion
sw
ithi
n w
ind
nam
e/lo
cati
on(h
ub h
eigh
t)of
pos
t-
met
hod
of p
ost-
to b
ird
farm
cons
truc
tion
cons
truc
tion
pr
esen
cem
onit
orin
gm
onit
orin
g
Can
ada
Goo
se0
909
obse
rvat
ions
Buf
falo
Rid
ge,
1994
–199
935
4***
4
CS
& B
CFo
rtni
ghtly
bird
Y
ES
18, 1
9,U
SA(3
6–50
m)
coun
ts a
nd s
earc
hes
20(1
5 M
ar–1
5 N
ov);
21–9
1 tu
rbin
es
chec
ked
each
yea
r (1
996–
1999
)Sn
ow G
oose
027
8 ob
serv
atio
nsB
uffa
lo R
idge
, 19
94–1
999
354*
**
4C
S &
BC
YE
S18
, 19,
USA
(36–
50 m
)20
Whi
te-f
ront
ed G
oose
092
obs
erva
tions
B
uffa
lo R
idge
, 19
94–1
999
354*
**
4C
S &
BC
YE
S18
, 19,
(in 1
997)
USA
(36–
50 m
)20
Can
ada
Goo
se2
Not
rec
orde
dK
lond
ike,
USA
2002
16*
1C
S &
BC
BC
mos
tly p
re-
NO
c21
, 22,
(6
5 m
)co
nstr
uctio
n; 1
3 23
, 24
sear
ches
(mon
thly,
M
ar 2
002–
Mar
200
3C
anad
a G
oose
0N
ot r
ecor
ded
Nin
e C
anyo
n, U
SA20
0230
0***
1
CS
19 s
earc
hes
(4–5
N
O25
(pro
xim
ity n
ot
(60
m)
days
eac
h; S
ep
asse
ssed
)20
02–A
ug 2
003)
Can
ada
Goo
se1
11 g
roup
s St
atel
ine,
USA
2001
–200
245
4***
2
CS
& B
C5–
6 se
arch
es o
f U
NC
LE
AR
26(3
63 b
irds)
(50
m)
399
turb
ines
in
2002
; 6–7
sea
rche
s of
454
turb
ines
in
200
3C
anad
a G
oose
0N
ot r
ecor
ded
Top
of I
owa,
USA
2001
89**
* 2
CS
c. 15
0 se
arch
es/y
ear
NO
23, 2
4,
(72
m)
(i.e.
eve
ry 2
–3 d
ays)
27
unde
r 26
of
89
turb
ines
in A
pr–D
ec
2003
and
Mar
–Dec
20
04.
a Car
cass
sea
rche
s re
port
ed fo
r one
win
ter;
flig
ht-li
ne d
ata
reco
rded
in tw
o w
inte
rs. N
umbe
r of
flig
hts
said
to b
e fo
r flig
hts
with
in p
roje
ct a
rea
(i.e.
not n
eces
saril
y th
roug
hth
e w
ind
farm
), th
ough
flig
hts
thro
ugh/
acro
ss th
e w
ind
farm
illu
stra
ted
on m
aps
in th
e re
port
, and
64%
of
flig
hts
wer
e at
rot
or h
eigh
t. G
roup
s of
turb
ines
sto
pped
inJa
nuar
y to
red
uce
colli
sion
ris
k (Z
ehtin
djie
v &
Whi
tfie
ld 2
011)
.b O
bser
vatio
ns m
ade
at a
dis
tanc
e of
7–9
km
.c U
se o
f K
lond
ike
stud
y ar
ea b
y w
ater
bird
s sa
id to
be
low
; onl
y sp
ecie
s of
wat
erfo
wl o
bser
ved
was
Can
ada
Gee
se, w
ith 4
3 fl
ocks
(4,8
45 in
divi
dual
s) s
een
flyi
ng o
ver
the
stud
y ar
ea in
the
year
-long
pre
-con
stru
ctio
n su
rvey
in 2
001
(Joh
nson
et a
l. 20
02b)
.

73
© Wildfowl & Wetlands Trust Wildfowl (2012) 62: 73–96
Population size and breeding success of Icelandic Whooper Swans Cygnus cygnus: results
of the 2010 international census
COLETTE HALL1*, JACQUELINE R. GLANVILLE1, HELEN BOLAND2,ÓLAFUR EINARSSON3, GRAHAM MCELWAINE4, CHAS A. HOLT5,
CHRISTOPHER J. SPRAY6 & EILEEN C. REES1
1Wildfowl & Wetlands Trust, Slimbridge, Gloucestershire GL2 7BT, UK.2BirdWatch Ireland, Unit 20, Block D, Bulford Business Campus, Kilcoole, Co. Wicklow, Ireland.
3Smàrarima 39, IS-112 Reykjavik, Iceland.4Irish Whooper Swan Study Group, 100 Strangford Road, Downpatrick, Co. Down BT30 7JD, UK.
5British Trust for Ornithology, The Nunnery, Thetford, Norfolk IP24 2PU, UK.6UNESCO Centre for Water Law, Policy and Science, University of Dundee,
Dundee DD1 4HN, UK.*Correspondence author. E-mail: [email protected]
Abstract
Trends in total population size and mid-winter distribution have been determined for theIcelandic Whooper Swan population through coordinated international censuses,undertaken in January across its wintering range in Britain, Ireland and Iceland, at c. 5-yearlyintervals from 1986 onwards. A total of 29,232 swans recorded during the sixth internationalcensus in January 2010 represented an increase of 11% on the previous census in 2005 andis the highest census total to date. Overall, 35.8% of the population (10,452 swans) wasrecorded in the Republic of Ireland, 30.8% (8,999) in England, 15.8% (4,616) in NorthernIreland, 9.1% (2,659) in Scotland and 7.8% (2,278) in Iceland, with the combined total inWales and the Isle of Man accounting for < 1% of birds counted. There was a significantincrease across censuses (1986–2010) in the proportion of birds wintering in England, incomparison with the rest of the range, whereas the Republic of Ireland and Scotland saw asignificant decline. This suggests an overall shift to the southeast in the swans’ winterdistribution, though a prolonged period of cold, snowy weather prior to the January 2010census may have resulted in more birds moving south from Scotland, or potentially frommainland Europe, in this year. The majority of Whooper Swans in Ireland were recorded onpasture in 2010, whilst in Britain they were seen mainly on arable land. Although the frozenconditions in 2010 are likely to have influenced habitat choice, there has been a generalincrease in the use of arable land by Whooper Swans since 1995.
Key words: distribution, habitat, trends in numbers, Icelandic population, internationalcensus, productivity, Whooper Swans.

74 Icelandic Whooper Swan census 2010
© Wildfowl & Wetlands Trust Wildfowl (2012) 62: 73–96
The Whooper Swan Cygnus cygnus has awidespread breeding distribution in thenorthern Palaearctic, extending fromIceland and northern Scandinavia, acrossRussia, to the Pacific coast (Brazil 2003;Rees et al. 2002). The Icelandic-breedingpopulation of Whooper Swan is one of fivepopulations described for this species(Brazil 2003; Wetlands International 2006);ringing and count programmes indicate thatmost of the Icelandic Whooper Swansmigrate to winter in Britain and Ireland, witha small proportion (500–1,300 individuals)remaining to overwinter in Iceland (Black &Rees 1984; Gardarsson 1991; Rees et al.2002). Satellite tracking studies havedemonstrated that the swans may undertakethe 1,400 km overseas flight betweenIreland and Iceland either direct or viaScotland (Rees 2009), but there is aminimum 800 km overseas flight betweenBritain and Iceland, and the swans arevulnerable to being blown off course orunable to make landfall if they encounterstrong head or side winds during the flight(Pennycuick et al. 1996; Rees 2009). In theearly part of the 20th century, the swans fedmainly on aquatic vegetation during thewinter months, but use of agricultural landbecame more frequent from the 1960sonwards, at a time of agriculturalintensification in Britain and Ireland. Thehabitat switch on to cropped land (arableand agriculturally-improved pasture),together with an increase in the numbers ofbirds wintering in Britain and Ireland duringthe second half of the 20th century, hasresulted in some conflict with agriculturalinterests, particularly in relation to re-seededgrasslands, winter cereals, root crops and oil
seed rape (Robinson et al. 2004; Chisholm &Spray 2002).
Whooper Swans have been monitoredannually in Britain since the 1950s, largelythrough the Wetland Bird Survey (WeBS;formerly the National Wildfowl Counts),undertaken each month during the winter,and extended to Northern Ireland in 1986.Similarly, the Irish Wetland Bird Survey (I-WeBS) has monitored waterbird numbersand distribution in the Republic of Irelandsince winter 1994/95. Additional count dataon Whooper Swans in Ireland have beencollected by the Irish Whooper Swan StudyGroup (IWSSG) since the early 1990s.Numbers of Whooper Swans wintering inaccessible areas of Iceland have beenrecorded as part of the annual winter birdcensus coordinated by the IcelandicInstitute of Natural History (IINH) eachyear since 1952. Although coverage forWeBS and I-WeBS includes many wetlandsites in Britain and Ireland, the dailydispersal of Whooper Swans away fromwetland roost sites and their tendency tofeed at temporary wetlands and in non-wetland (generally farmland) habitats meansthese surveys miss a substantial proportionof the population. Likewise, countsundertaken annually in Iceland may misssome overwintering birds because the swansare rather scattered at this time andaccessing some areas by foot or car can bedifficult in harsh weather conditions.Coordinated species-specific surveys thatinclude these areas are, therefore, requiredto provide accurate estimates of populationsize, which are used to identify sites ofnational and international importance forthe species, with regular counts of ≥ 1% of

Icelandic Whooper Swan census 2010 75
© Wildfowl & Wetlands Trust Wildfowl (2012) 62: 73–96
the total population being one of the criteriaused for designating sites Special ProtectionAreas under the EU Birds Directive.Extensive coordinated surveys are alsoimportant for verifying trends in numbersidentified by the national countprogrammes, and for describing anychanges in feeding habitat as habitat is notusually recorded in the WeBS and I-WeBSprogrammes.
An international census of the Icelandic-breeding Whooper Swan population hasbeen carried out in mid-January at c. 5-yearintervals since 1986, as part of a widercensus of wintering migratory swans inEurope, coordinated by the IUCN-SSC/Wetlands International Swan SpecialistGroup. Results from the early censusesshow fluctuating numbers, with totals of16,742, 18,035 and 15,842 individualsrecorded in 1986, 1991 and 1995,respectively (Salmon & Black 1986; Kirby etal. 1992; Cranswick et al. 1997). More recentcensuses have shown a growth in thepopulation, with totals of 20,856 WhooperSwans in 2000 and 26,366 recorded in 2005(Cranswick et al. 2002, Worden et al. 2009).As the number of Icelandic WhooperSwans has increased there has been anoticeable shift in the distribution of birds across countries, with an increasingproportion located in England (Worden et al.2009). Additionally, there are indicationsthat birds are moving to southern locationsearlier in the winter than has previously beennoted (Spray 2007). The number of swansremaining to overwinter in Iceland has alsoincreased, although as a proportion of thetotal population there has been only smallvariation between censuses.
This paper presents the results of thesixth international census of WhooperSwans in Britain, Ireland and Iceland, which took place in January 2010. It aims to describe trends in the numbers and mid-winter distribution of the IcelandicWhooper Swan population from the firstinternational census (in 1986) onwards andalso to determine regional variation in thepercentage of juveniles recorded. Thehabitats on which the birds were observedduring each of the censuses since 1995 areanalysed to assess any major changes inhabitat use by the swans over time.
MethodsThe 2010 international census of IcelandicWhooper Swans was coordinated by theWildfowl & Wetlands Trust (WWT) andfollowed the methods used in previousyears, as well as covering the same countareas (details in Worden et al. 2009). Thecensus in Britain was organised by WWT, inIreland by BirdWatch Ireland and theIWSSG, and in Iceland by Ólafur Einarssonand the IINH. Counts were undertaken by anetwork of volunteers (including WeBS andI-WeBS counters and IWSSG members) andprofessional staff.
The main census dates of 16–17 January2010 were chosen to coincide with theWeBS and I-WeBS counts in that month. Inaddition, counters were asked to visit sitesknown to have held, currently hold or may potentially be suitable for WhooperSwans but are not regularly covered by these other surveys. An aerial survey wasundertaken in Ireland on 22 January toensure complete coverage of areas withlimited accessibility: the Rivers Suck, Brosna
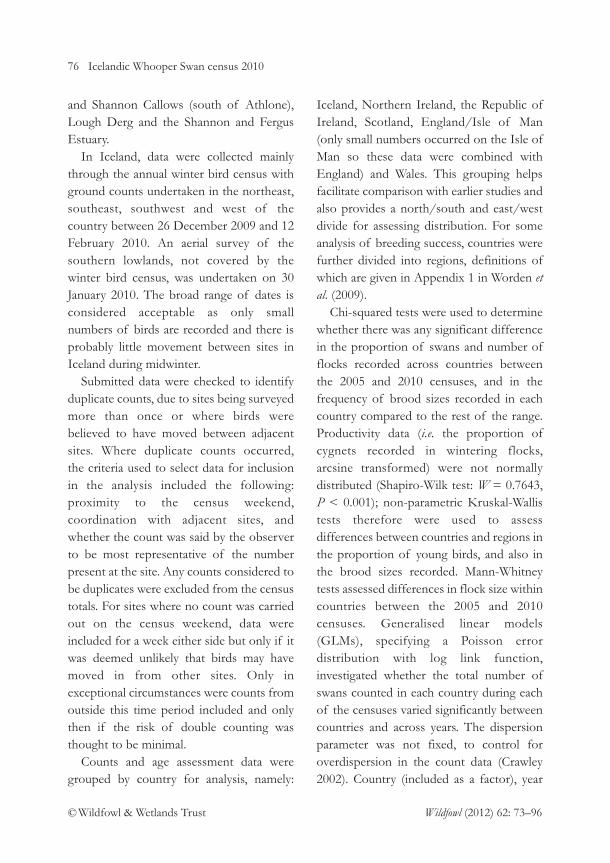
76 Icelandic Whooper Swan census 2010
© Wildfowl & Wetlands Trust Wildfowl (2012) 62: 73–96
and Shannon Callows (south of Athlone),Lough Derg and the Shannon and FergusEstuary.
In Iceland, data were collected mainlythrough the annual winter bird census withground counts undertaken in the northeast,southeast, southwest and west of thecountry between 26 December 2009 and 12February 2010. An aerial survey of thesouthern lowlands, not covered by thewinter bird census, was undertaken on 30January 2010. The broad range of dates isconsidered acceptable as only smallnumbers of birds are recorded and there isprobably little movement between sites inIceland during midwinter.
Submitted data were checked to identifyduplicate counts, due to sites being surveyedmore than once or where birds werebelieved to have moved between adjacentsites. Where duplicate counts occurred, the criteria used to select data for inclusionin the analysis included the following:proximity to the census weekend,coordination with adjacent sites, andwhether the count was said by the observerto be most representative of the numberpresent at the site. Any counts considered tobe duplicates were excluded from the censustotals. For sites where no count was carriedout on the census weekend, data wereincluded for a week either side but only if itwas deemed unlikely that birds may havemoved in from other sites. Only inexceptional circumstances were counts fromoutside this time period included and onlythen if the risk of double counting wasthought to be minimal.
Counts and age assessment data weregrouped by country for analysis, namely:
Iceland, Northern Ireland, the Republic ofIreland, Scotland, England/Isle of Man(only small numbers occurred on the Isle ofMan so these data were combined withEngland) and Wales. This grouping helpsfacilitate comparison with earlier studies andalso provides a north/south and east/westdivide for assessing distribution. For someanalysis of breeding success, countries werefurther divided into regions, definitions ofwhich are given in Appendix 1 in Worden etal. (2009).
Chi-squared tests were used to determinewhether there was any significant differencein the proportion of swans and number offlocks recorded across countries betweenthe 2005 and 2010 censuses, and in thefrequency of brood sizes recorded in eachcountry compared to the rest of the range.Productivity data (i.e. the proportion ofcygnets recorded in wintering flocks, arcsine transformed) were not normallydistributed (Shapiro-Wilk test: W = 0.7643,P < 0.001); non-parametric Kruskal-Wallistests therefore were used to assessdifferences between countries and regions inthe proportion of young birds, and also inthe brood sizes recorded. Mann-Whitneytests assessed differences in flock size withincountries between the 2005 and 2010censuses. Generalised linear models(GLMs), specifying a Poisson errordistribution with log link function,investigated whether the total number ofswans counted in each country during eachof the censuses varied significantly betweencountries and across years. The dispersionparameter was not fixed, to control foroverdispersion in the count data (Crawley2002). Country (included as a factor), year

Icelandic Whooper Swan census 2010 77
© Wildfowl & Wetlands Trust Wildfowl (2012) 62: 73–96
(included as a variate with 1986 = year 1, totest for trends over time) and the quadraticfunction of year (i.e. year2, to test for anycurvilinearity in population trends) wereincluded as explanatory variables in theinitial maximal model. Two-way interactionterms were also tested for significantvariables. Non-significant variables wereomitted sequentially from the GLM, theleast significant variable being omitted first,so that the final model was parsimonious.Linear regression analysis of the proportionof birds recorded in each country (arcsinetransformed) in the international censusesfrom 1986 onwards further tested for trendsin the mid-winter distribution of WhooperSwans over time.
Results
Coverage
The weekend of the census followed aperiod of very cold weather in Britain andIreland, with the majority of the regioncovered in snow and many waterbodiescompletely frozen. Although a thaw had setin by the time the census was undertaken,some areas were still difficult to access.
In Britain, 64% of the counts (whereswans were recorded, n = 247) wereconducted on the core weekend, with afurther 30% within three days either side. Allcounts were carried out between 12 and 24January, with the exception of one at TheWash, Lincolnshire/Norfolk which wasundertaken on 3 January. The counts carriedout late in January were mainly in theScottish Highlands where conditions weretoo poor to undertake surveys on the coreweekend.
In Northern Ireland, counts wereundertaken between 15 and 27 January, with33% (where swans were recorded, n = 102)carried out on the core weekend and afurther 45% within three days either side.Those sites covered outside this periodincluded Upper Lough Erne, which couldnot be counted on the core weekend due to fog. In the Republic of Ireland, 62% of counts (where swans were recorded, n = 284) were conducted on the coreweekend, whilst 23% were carried outwithin three days either side. The remainingcounts were undertaken outside this period,but between 10 and 31 January.
Counts in Iceland were carried outbetween 26 December and 12 February.Coverage was good for most regions with theexception of the northeast where, based onnumbers from previous years, it was thoughtthat 20–50 swans may have been missed. It isalso possible that 10–20 birds may have beenmissed in western areas, although coveragethere was considered to be fairly good. Anaerial survey of the southern lowlands didnot cover an area between Skógar andMeðalland where up to 50 swans have beenlocated in previous censuses.
Numbers and distribution
A total of 29,232 Whooper Swans wasrecorded in 755 flocks in Britain, Irelandand Iceland during the January 2010 census(Table 1), a 10.9% increase on the 26,366swans recorded in 2005 (Fig. 1, Table 2). Allcountries except Scotland saw an increase intotal numbers, with the rate of increase inNorthern Ireland and the Republic ofIreland being less than that of the entirepopulation (Table 2). Over 40% of the

Table 1. Numbers of Whooper Swans recorded in Iceland, Ireland and Britain during theinternational census in January 2010.
Number Number Number Number of swans of flocks of swans of flocks
Iceland EnglandSouth 1,222 88 Cambridgeshire 4,546 27Southwest 654 20 Lancashire 2,405 14Northeast 327 10 Norfolk 1,426 11West 50 3 Cumbria 313 10Southeast 25 1 Northumberland 100 5Total 2,278 122 Cheshire 71 2
Humberside 36 3Northern Ireland Lincolnshire 22 1Londonderry 1,673 29 South Yorkshire 21 2Fermanagh 1,020 27 West Yorkshire 20 1Down 548 10 Shropshire 10 2Antrim 520 13 Gloucestershire 8 1Armagh 508 13 Bedfordshire 6 3Tyrone 347 10 Kent 3 2Total 4,616 102 Devon 3 2
Somerset 2 1Republic of Ireland Northamptonshire 2 2Galway 1,104 35 Cornwall 2 1Mayo 966 33 Suffolk 1 1Cavan 865 29 Essex 1 1Donegal 854 18 Leicestershire 1 1Roscommon 774 24 Total 8,999 93Offaly 650 9Wexford 641 5 ScotlandClare 639 17 Dumfries & Galloway 940 21Westmeath 566 7 Highland 393 22Kerry 537 6 Strathclyde 265 23Waterford 485 11 Tayside 253 12Meath 416 7 Orkney 166 11Monaghan 414 23 Fife 139 3Tipperary 276 8 Shetland 136 28Cork 215 10 Lothians 122 2Longford 210 8 Western Isles 118 16Limerick 194 2 Borders 66 2Sligo 186 9 Grampian 51 2Laois 151 2 Central 10 3Leitrim 130 12 Total 2,659 145Kildare 112 5Wicklow 41 2 WalesLouth 25 1 Gwynedd 113 3Kilkenny 1 1 Dyfed 45 2Total 10,452 284 Clwyd 23 2
Powys 20 1Isle of Man 27 1 Total 201 8
Overall total 29,232 755
78 Icelandic Whooper Swan census 2010
© Wildfowl & Wetlands Trust Wildfowl (2012) 62: 73–96

Icelandic Whooper Swan census 2010 79
© Wildfowl & Wetlands Trust Wildfowl (2012) 62: 73–96
swans were located in Britain, 51.5% inIreland and 7.8% in Iceland. There was a significant shift in the distribution ofswans across countries between 2005 and2010 (χ2
6 = 799.5, P < 0.001) (Table 2). The number of swans counted variedsignificantly both by country and over time(GLM: F24,4 = 9.30, P < 0.001 for country;F24,1 = 9.25, P < 0.01 for year2). There wasa significant increase in the proportion ofthe population recorded in England/Wales/Isle of Man across all censuses (1986to 2010) (linear regression: F5,1 = 143.41, t = 11.98, P < 0.001), and a significantdecrease in Scotland (F5,1 = 19.23, t = –4.39,P < 0.05) and the Republic of Ireland
(F5,1 = 45.78, t = –6.77, P < 0.01), with theproportion recorded in Northern Irelandand in Iceland remaining relatively stableover this period (F5,1 = 0, t = –0.03 and F5,1 = 0.1, t = 0.32, respectively, n.s. in eachcase; Fig. 2).
In Britain, the majority of birds (30.8% ofthe overall population) were recorded inEngland; the proportion wintering therebeing notably higher than during the 2005census (24.6%; Table 2 & Fig. 2). Swanswere distributed from Northumberland toDevon, with the largest concentrationsoccurring at the Ouse Washes, Norfolk/Cambridgeshire, and Martin Mere,Lancashire, where flocks totalled 5,632 and
30,000
25,000
20,000
15,000
10,000
5,000
0
Num
ber
of W
hoop
er S
wan
s
IcelandEngland
Republic of IrelandScotland
Northern IrelandWales & Isle of Man
1986 1991 1995 2000 2005 2010
Figure 1. . Number of Whooper Swans recorded during the international censuses of the Icelandic-breeding populations from 1986–2010 inclusive.

80 Icelandic Whooper Swan census 2010
© Wildfowl & Wetlands Trust Wildfowl (2012) 62: 73–96
distributed across the country from theShetland Isles to Dumfries & Galloway(Table 1, Fig. 2). Total numbers ranged fromone individual to 271, with the largest flocksobserved in Strathclyde, Highland andDumfries & Galloway. Except for Dumfries& Galloway, all counties held considerablyfewer birds compared with the numbersrecorded in 2005.
Wales and the Isle of Man each held < 1% of the total population (Tables 1 & 2).Seven sites were found to have WhooperSwans in Wales, where 8–72 swans werecounted, and one flock was seen on the Isleof Man (Fig. 3a).
Table 2. Total numbers of Whooper Swans recorded in Iceland, Ireland and Britain duringthe international censuses in January 2005 and 2010, and the percentage change between the2005 and 2010 censuses. Total numbers in 2010 were compared with 2005 using Chi-squaretests with d.f. = 1 for comparison of each country with the rest of the range, and d.f. = 6 foroverall comparison.
Number of Number of % change Comparison ofbirds in 2005 birds in 2010 in number total numbers
of birds
χ2 P
Iceland 1,556 2,278 46.4 77.2 <0.001
Northern Ireland 4,331 4,616 6.6 4.1 <0.05
Republic of Ireland 9,748 10,452 7.2 8.9 <0.005
England 6,480 8,999 39.3 265.9 <0.001
Scotland 4,142 2,659 –38.5 564.7 <0.001
Wales 94 201 113.8 28.8 <0.001
Isle of Man 15 27 80.0 2.3 n.s.
Overall 26,366 29,232 10.9 799.5 <0.001
2,052, respectively (Table 1, Fig. 3a).Whooper Swans were recorded at a further45 sites, where total numbers ranged from asingle bird to 337. Ten counties, which heldbirds in 2005 recorded no birds in 2010,although these accounted for < 2% of theprevious census total for England andconsisted mainly of flocks of one or twobirds. Five counties recorded birds in 2010where none were seen in 2005 but thesecontributed < 1% of the 2010 total.
Scotland held 9.1% of the population, anotably smaller proportion than in 2005(15.7%; Table 2 & Fig. 2), and swans werelocated at 139 sites within Scotland,

Icelandic Whooper Swan census 2010 81
© Wildfowl & Wetlands Trust Wildfowl (2012) 62: 73–96
In Ireland, 35.7% of the population wasrecorded in the Republic of Ireland whilst15.8% were seen in Northern Ireland, aslight reduction on the proportion observedin each country during 2005 (37% and16.4%, respectively) (Table 2, Fig. 2).Whooper Swans were recorded in allcounties except Carlow and Dublin (Table1). Londonderry, Fermanagh and Galwayheld the highest proportions of birds; Louthand Kilkenny had just 25 and one swanrespectively, but no swans were recorded inthese two counties during the previouscensus. Loughs Neagh & Beg (Antrim/Londonderry/Tyrone/Armagh/Down),Lough Foyle (Londonderry/Donegal) andUpper Lough Erne (Fermanagh) held the
highest numbers, with 1,803, 883 and 799individuals, respectively (Fig. 3a). A further210 sites in Ireland held birds, with totalnumbers ranging from one to 506 swans.
A slightly higher proportion of thepopulation overwintered in Iceland comparedwith 2005 (Fig. 2). Swans were predominantlyseen in the south, southwest and northeast ofthe country (Table 1, Fig. 3b). The largestconcentrations were located at Hólsá (290),Þykkvabæjarvatn (182), and Landbrot andMeðalland (131) in the south, and at Breiðanog Álar, Lake Mývatn (182) in the northeast.Elsewhere, birds were distributed in smallerflocks, ranging from one to 86 individuals.Whooper Swans were often observed alongstretches of river or coastline, most notably
50
45
40
35
30
25
20
15
10
5
0
Perc
enta
ge o
f ce
nsus
tota
l
1986 1991 1995 2000 2005 2010
Iceland Northern Ireland Scotland England/IOM &Wales
Republic ofIreland
Figure 2. Changes in the distribution of Whooper Swans across Iceland, Ireland and Britain during theinternational censuses of 1986–2010. Note: Wales and Isle of Man have been combined with Englandas each only contributes <1% to the census totals each year.

82 Icelandic Whooper Swan census 2010
© Wildfowl & Wetlands Trust Wildfowl (2012) 62: 73–96
Figure 3. Distribution of WhooperSwans recorded during theinternational census in January2010: a) Britain and Ireland; b)Iceland. Symbols represent totalnumbers recorded at a site.
b)
a)1–50
51–100
101–209
210–883
1,083–5,632
1–25
26–100
101–290

Icelandic Whooper Swan census 2010 83
© Wildfowl & Wetlands Trust Wildfowl (2012) 62: 73–96
along the southwest coast between Stafnesand Hvalfjörður, where a combined total of419 birds was recorded.
There was a significant difference in theoverall number of flocks across the rangebetween the 2005 and 2010 censuses (Table3), which is likely a consequence of thesignificant decrease in the number of flocksseen in Scotland and the increase inEngland/Isle of Man compared with the restof the range. The latter, however, can beattributed to swans at the Ouse Washes beingcounted at numerous feeding sites in 2010rather than at a single roost site as in 2005.This was confirmed on excluding the OuseWashes from the analysis (one flock in 2005;35 flocks in 2010), upon which there was nosignificant difference in the overall number offlocks across the range between censuses (χ2
5 = 10.4, n.s.) nor in England/Isle of Mancompared with elsewhere (χ2
1 = 0.0, n.s.).There was still a significant difference in thenumber of flocks recorded in Scotlandcompared to the rest of the range, though toa lesser extent (χ2
1 = 9.7, P < 0.005), withfewer flocks than expected recorded.
The majority of flocks consisted of ≤ 25birds, representing 65% of all flocksobserved (Fig. 4). Only three flocks of > 500 individuals were recorded, these being found in England at the Ouse Washesin Cambridgeshire/Norfolk (two flocksconsisting of 1,262 and 672 individuals) andat Martin Mere in Lancashire (one flock of1,286 individuals). England/Isle of Mansaw the widest range of flock sizes (Table 3),reflecting the large flocks recorded on theOuse Washes and at Martin Mere, whilst inScotland over 80% contained 25 or fewerbirds and the majority of these held less
than ten. Iceland also saw a large proportionof small flocks, but there the tendency is forWhooper Swans to disperse into very smallgroups.
There was a significant difference in flocksize across the range between the 2005 and2010 censuses (W = 609065, P < 0.01)(Table 3). Fewer flocks consisted of ≤ 25individuals in 2010 (65.4%) compared with2005 (74.5%), with a higher proportion ofmedium-sized flocks (26–100 birds; 19.7%in 2005 cf. 26.1% in 2010) and large flocks(101–500 birds; 5.8% in 2005 cf. 8.5% in2010) in the most recent census. Comparingflock size within each country between thetwo censuses found a significant differencefor Wales and England/Isle of Man (Table3), with a higher proportion of medium-sized flocks (26–100 birds) in 2010 in bothcountries (0% in 2005 cf. 37.5% in 2010 forWales; 18.5% cf. 27.6% for England/Isle ofMan), and fewer with ≤ 25 birds (100% in2005 cf. 62.5% in 2010 in Wales; 69.2% cf. 51.1% in England/Isle of Man). Onexcluding the Ouse Washes from thisanalysis, to test whether the numerousflocks recorded there in 2010 affected the results, there was still a significantdifference in flock size across the rangebetween censuses (though to a lesser extent;W = 602574, P = <0.05). No significantdifference between years was found forEngland/Isle of Man (W = 3949, n.s.),however, indicating that a high proportionof the larger flocks in England were locatedat the Ouse Washes during the 2010 census.
Sites of conservation importance
During the census, 14 sites in Ireland and sixin Britain supported numbers exceeding the

84 Icelandic Whooper Swan census 2010
© Wildfowl & Wetlands Trust Wildfowl (2012) 62: 73–96
Tab
le 3
. Num
ber
of f
lock
s an
d m
ean
floc
k si
ze o
f W
hoop
er S
wan
s re
cord
ed in
Ice
land
, Ire
land
and
Brit
ain
durin
g th
e in
tern
atio
nal
cens
uses
in Ja
nuar
y 20
05 a
nd 2
010.
The
Isl
e of
Man
has
bee
n in
clud
ed w
ith E
ngla
nd fo
r the
pur
pose
of
this
ana
lysi
s as
onl
y on
e fl
ock
was
obs
erve
d in
eac
h ye
ar. T
he n
umbe
r of
flo
cks
reco
rded
dur
ing
the
2005
and
201
0 ce
nsus
es w
ere
com
pare
d us
ing
a C
hi-s
quar
e te
stw
ith d
.f. =
1 fo
r com
paris
on o
f ea
ch c
ount
ry w
ith th
e re
st o
f th
e ra
nge,
and
d.f.
= 5
for o
vera
ll co
mpa
rison
. Man
n-W
hitn
ey te
sts
wer
eus
ed to
com
pare
flo
ck s
ize
with
in e
ach
coun
try
and
over
all b
etw
een
2005
and
201
0.
2005
2010
Flo
ck n
umbe
r F
lock
siz
e co
mpa
riso
nco
mpa
riso
n
Num
ber
Mea
n N
umbe
r M
ean
χ2P
WP
of f
lock
sfl
ock
size
of f
lock
sfl
ock
size
±
s.e
.±
s.e
.
Icel
and
126
12.3
± 1
.612
218
.7 ±
3.4
0.1
n.s.
1540
2.5
n.s.
Nor
ther
n Ir
elan
d10
242
.6 ±
8.5
102
45.3
± 6
.40.
3n.
s.10
021.
0n.
s.
Rep
ublic
of
Irel
and
288
33.8
± 3
.228
436
.8 ±
2.9
0.8
n.s.
7933
7.0
n.s.
Eng
land
& I
sle
of M
an65
99.9
± 5
5.1
9496
.0 ±
21.
67.
1<
0.01
4555
.0<
0.05
Scot
land
219
18.9
± 2
.414
518
.3 ±
3.0
12.9
<0.
001
4091
4.0
n.s.
Wal
es11
8.5
± 2
.48
25.1
± 7
.10.
3n.
s.78
.0<
0.01
Ove
rall
811
32.5
± 4
.875
538
.7 ±
3.2
17.5
<0.
005
6090
65.0
<0.
01

Icelandic Whooper Swan census 2010 85
© Wildfowl & Wetlands Trust Wildfowl (2012) 62: 73–96
current 1% threshold used to indicate sitesof international importance (210 birds;Wetlands International 2006), including sixthat did not hold such numbers in 2005(Appendix 1). Fifteen of these twenty sitessupported at least 1% of the numbersrecorded during the 2010 census (290 birds),of which four were in Britain and 11 inIreland (Appendix 1). Ten sites that qualifiedin 2005 did not maintain internationallyimportant numbers in 2010. Five sites in Britain held nationally important numbers (110; Musgrove et al. 2011), onlytwo of which held these concentrations in 2005, including the Ribble Estuary which held numbers above the threshold for international importance during the
previous census. Of the nine sites in Irelandwhich supported numbers greater than theall-Ireland threshold for site importance(130; Crowe et al. 2008), only StrangfordLough (which held internationally important numbers during the 2005 census) hadpreviously qualified in 2005.
Age and brood size data
A total of 23,413 Whooper Swans was agedduring the 2010 census, with the highestnumbers aged in England and the Republicof Ireland (Table 4). The overall percentageof young was 16.3%, ranging from 13.8% inEngland/Isle of Man to 19.1% in NorthernIreland. The variation in the proportion ofyoung differed significantly between
90
80
70
60
50
40
30
20
10
0
Freq
uenc
y (%
of
tota
l flo
cks)
1–25 26–100 101–500 >500
Overall Iceland Scotland WalesNorthernIreland
Republic ofIreland
England/IOM
Figure 4. Frequency of flocks of each category recorded in Iceland, Ireland and Britain in January2010. Number of flocks recorded in each country (n values) are: Iceland = 386, Northern Ireland =102, Republic of Ireland = 284, England/Isle of Man = 94, Scotland 145, Wales = 8, Overall = 755.

Table 4. Proportion of young, mean brood size and frequency of brood sizes of WhooperSwans in Iceland, Ireland and Britain in January 2010 (see Appendix 1 in Worden et al. 2009for regional definitions).
% Number Mean Brood sizeyoung aged brood
size 1 2 3 4 5 6
IcelandNortheast 11.6 259 1.00 2 – – – – –South 17.0 871 2.34 16 21 10 10 2 –Southwest 21.9 479 2.79 6 2 6 1 3 1West 26.2 42 2.75 2 – – 1 1 –Total 17.8 1,651 2.43 26 23 16 12 6 1
Northern Ireland 19.1 4,017 2.06 129 97 60 28 6 4
Republic of IrelandNortheast 16.5 1,888 2.35 17 20 14 3 6 –Northwest 17.6 3,224 2.22 56 52 25 22 6 1Southeast 16.5 1,477 2.58 12 20 29 7 2 1Southwest 15.7 1,363 2.33 26 21 18 7 4 2Total 16.8 7,952 2.33 111 113 86 39 18 4
Ireland total 17.6 11,969 2.21 240 210 146 67 24 8
ScotlandNorthern Isles 25.6 133 2.13 6 4 4 2 – –Northwest 20.8 106 – – – – – – –Northeast 12.3 65 1.17 5 1 – – – –Southwest 17.8 600 1.84 15 16 5 2 – –Southeast 18.3 360 2.04 8 8 6 – 1 –Total 18.8 1,264 1.90 34 29 15 4 1 –
EnglandNorthwest 19.9 2,562 1.85 74 54 31 6 2 –Northeast 21.4 56 4.00 – – – 1 – –East Central 11.0 5,714 1.89 137 98 59 15 2 2South 0.0 10 – – – – – – –Total 13.8 8,342 1.88 211 152 90 22 4 2
Wales 18.2 187 1.50 2 2 – – – –
Britain total 14.5 9,793 1.88 247 183 105 26 5 2
Overall total 16.3 23,413 2.08 513 416 267 105 35 11
86 Icelandic Whooper Swan census 2010
© Wildfowl & Wetlands Trust Wildfowl (2012) 62: 73–96

Icelandic Whooper Swan census 2010 87
© Wildfowl & Wetlands Trust Wildfowl (2012) 62: 73–96
countries (Kruskal Wallis: H5 = 12.06, P < 0.05), but there was no significantdifference in the proportion of youngbetween regions within each country(Kruskal Wallis: H9 = 8.82, n.s, H4 = 6.41,n.s., and H3 = 3.07, n.s., for Britain, Irelandand Iceland, respectively; Table 4).
The overall mean brood size was 2.08cygnets per successful pair amongst the1,347 families assessed, only marginallylower than the previous census (2.3 cygnets),and ranged from 1.5 cygnets in Wales to 2.43in Iceland (Table 4). Most families (69%)had relatively small broods of one or twocygnets, few (11%) were observed with fouror more and no families had more than sixcygnets (Table 4). A comparison of the
frequency of small (1–2 cygnets) and larger(3–6 cygnets) brood sizes recorded fordifferent countries found that a higherproportion of the larger broods wererecorded in Iceland and the Republic ofIreland than elsewhere (Iceland: χ2
1 = 4.7, P < 0.05; Republic of Ireland: χ2
1 = 17.6, P < 0.001) whereas smaller brood sizes were more frequent in England (χ2
1 = 14.8, P < 0.001).
Habitat use
Habitat data were collected for over 80% ofall swans counted. The majority of birdswere seen on pasture (51.2%) and arableland (37.5%), with relatively few seen onpermanent standing water (Table 5, Fig. 5).
Table 5. Percentage of Whooper Swans recorded on different habitat types in January 2010.
Iceland Britain Northern Republic of Ireland Ireland
Number of swans (n) 2,278 8,762 4,616 7,883
Permanent standing water 38.7 6.0 3.3 7.8
River 29.1 0.5 0 6.3
Coastal 25.6 1.9 0.1 0.4
All pasture 0.1 11.5 77.9 79.9
Improved pasture (dry) 0 6.1 71.4 52.9
Improved pasture (wet) 0 1.8 6.0 15.2
Rough/unimproved pasture (dry) 0.1 3.4 0.5 5.7
Rough/unimproved pasture (wet) 0 0.2 0 6.1
All arable 3.3 76.6 18.7 5.0
Arable growing 3.3 38.8 0 0.2
Arable waste 0 37.8 18.7 4.8
Other 3.2 3.4 0 0.6

88 Icelandic Whooper Swan census 2010
© Wildfowl & Wetlands Trust Wildfowl (2012) 62: 73–96
Birds in Britain were mainly seen onarable land (with growing crops or waste)(76.6%) whilst in Ireland dry, improvedpasture was the preferred habitat (71.4% inNorthern Ireland and 52.9% in the Republicof Ireland). These habitat types were rarelyused, if at all, in Iceland, where the majorityof birds were recorded using permanentstanding water (38.7%), rivers (29.1%) andcoastal areas (25.5%).
DiscussionDespite the cold and snowy weatherconditions experienced in Britain andIreland prior to the January 2010 census,which made surveying conditions difficult insome areas, coverage of all sites known to
be used by swans was thought to be good. Anumber of sites were visited in the weekafter the census, following a thaw across thecountry, and it is possible that birdmovements occurred during this time. Allattempts were made during data collation,however, to try to reduce the possibility ofduplicate counts being included in theanalysis. It has been suggested that swansmay have been missed or undercounted inIreland due to the wider distribution ofbirds away from their traditional sites as aresult of the weather (Boland et al. 2010),which resulted in more effort being requiredto find some flocks. The number missed,however, is not believed to be notably morethan during a typical season (O. Crowe pers.
70
60
50
40
30
20
10
0
Num
ber
of s
wan
s (%
of
tota
l)
1995 (n = 12,033) 2000 (n = 16,063) 2005 (n = 19,332) 2010 (n = 21,261)
Permanent standingwater
All pasture All arable Other
Figure 5. Distribution of Whooper Swans on permanent standing water, pasture, arable and ‘other’habitats in Britain and Ireland in January 1995, 2000, 2005 and 2010.

Icelandic Whooper Swan census 2010 89
© Wildfowl & Wetlands Trust Wildfowl (2012) 62: 73–96
comm.). It is possible that a similar situationoccurred in Britain; however, indicationsfrom counters suggest coverage there wasfairly extensive. Based on counts in previousyears, around 120 birds may have beenmissed in Iceland due to a few areas notbeing surveyed. This represents just over5% of the total recorded for Iceland in 2010but only 0.4% of the overall census total.The total presented in this report, therefore,is thought to be an accurate estimate of thepopulation size of Icelandic WhooperSwans in January 2010.
The total of 29,232 Whooper Swans wasthe highest to date, representing an 11%increase on the total counted in 2005. Itcontinues the period of sustained growththat has occurred since the 1995 censusalthough the rate of increase was lower thanseen previously, with an increase of 31%recorded between the 1995 and 2000censuses, and 26% between 2000 and 2005.
An increase in wintering numbers wasevident in all countries across the range,except for Scotland where numbers werelower than in 2005. The rate of increase in Ireland and the Isle of Man was lowerthan that of the population as a whole.Conceivably, the cold weather in Britain andIreland in December 2009 and January 2010affected the distribution of swans, pushingbirds southwards, although similar weatherconditions were experienced across bothislands. Some evidence for this could beinferred when comparing total numbersbetween the 2005 and 2010 censuses, withmany northern counties in Scotland holdingconsiderably fewer birds in 2010, while thesouthern county of Dumfries and Gallowaysaw a marked increase. The census total for
England was also notably higher, mainly dueto the large increase at the Ouse Washes(Cambridgeshire/Norfolk) but there was nomajor increase in any of the northerncounties in England. As supplementaryfeeding occurs at WWT centres during thewinter (located at Caerlaverock in Dumfries& Galloway, Martin Mere in Lancashire, andWelney in Norfolk) birds may have movedto these sites during cold weather as they canbe assured of easy access to food. InIreland, swans had moved away from theirtraditional areas and were absent from manyregular sites and were reported in placeswhere they had not been recorded before(Boland et al. 2010). This may also have beenthe case in Scotland, resulting in birds beingmissed, but it is thought unlikely that thiswould account for such a large difference inthe census totals between 2005 and 2010.
There has been some evidence that otherspecies of wildfowl, such as Bewick’s SwanCygnus columbianus bewickii, are tending towinter closer to their breeding grounds withthe milder winters of the early 2000s(Worden et al. 2006). Since the 1991 census,however, there has been a significantincrease in the proportion of the overallpopulation of Whooper Swans wintering inEngland, with a corresponding decrease inScotland, though to a lesser extent. Therehas also been a downward trend in theproportion recorded in Ireland, significantlyin the Republic of Ireland. Only Englandhas seen a consistently higher rate ofincrease in numbers when compared withthe overall population increase. This wouldsuggest that the population as a whole isshifting its range south and in 2010 this mayhave been exaggerated by cold weather

90 Icelandic Whooper Swan census 2010
© Wildfowl & Wetlands Trust Wildfowl (2012) 62: 73–96
movements. In Scotland and Ireland,Whooper Swans are widely distributedacross many sites. In contrast, WhooperSwans in England continue to beconcentrated at just a few sites, the majorityat Martin Mere and the Ouse Washes. Bothsites have seen a sustained increase innumbers since the 1995 census, with 1.8 and5.4 fold increases occurring, respectively.The disproportionate increase seen inEngland is predominately a result of theincrease at the Ouse Washes, where in 2010,the increase accounted for 89% of the risein total numbers recorded in England. Asimilar southerly shift in the winteringdistribution of the Iceland/Greenlandpopulation of Pink-footed Goose Anser
brachyrhynchus has also occurred (Gill et al.1997), with an increasing proportion of thepopulation being recorded in Norfolk, themost southerly region in Britain where thesebirds winter. The most likely cause of this isthe birds’ preference for foraging on post-harvest sugar beet waste, a crop that wasincreasing in Norfolk at that time, partlybecause it is highly nutritious and partlybecause birds can feed largely undisturbedby farmers because this is a by-product ofno commercial value. It is possible thatWhooper Swans are moving south forsimilar reasons, though more investigation isrequired to determine whether habitatchoice is the determining factor.
It is also possible that an influx of birdsfrom the Northwest European population,which breeds from Fenno-Scandia tonorthwest Russia and winters in northwestand central mainland Europe, has added tothe numbers recorded during the census.Laubek et al. (1999) suggested that the large
increase in the Northwest Europeanpopulation since the 1980s has resulted in anincreasing number of these birds winteringin Britain, particularly in southeast England,and these movements may be influenced bysevere weather. In January 2010, mainlandEurope also experienced very cold andsnowy conditions. Numbers of WhooperSwans in the Netherlands (the southern endof the wintering range of the NorthwestEuropean population) were only slightlyhigher than during previous years of milderwinters, however (2,212 in 2010 comparedwith 2,184 in 2009), and the monthly trendwas also similar to that of previous years,with peak numbers recorded in January(Hornman et al. 2012). The highest numberswere observed in the east of theNetherlands, indicating that a small numberof birds may have moved in from furthereast/northeast, as is often the case duringcolder winters (Ridgill & Fox 1990; M.Hornman pers. comm.), but there were noclear indications for an influx of swans frommainland Europe into southeast England(the area closest to Whooper Swans sites inmainland Europe) during winter 2009/10winter. For instance, there were no reportedsightings in Britain in winter 2009/10 ofringed Whooper Swans from the NorthwestEuropean population (K. Brides pers.comm.). A census of Whooper Swans inIceland in the late summer/autumn prior toan international census may help to providefurther insight into the level of influx ofbirds from the continent (estimated at a few hundred birds in the 1990s; Laubek et al. 1998), albeit that this may vary withannual variation in weather conditions.Undertaking the population censuses within

Icelandic Whooper Swan census 2010 91
© Wildfowl & Wetlands Trust Wildfowl (2012) 62: 73–96
Iceland rather than on the winteringgrounds would help to resolve the issue of whether immigration/emigration isoccurring but, given that Whooper Swansare widely dispersed across Iceland duringthe summer, and move from moulting tostaging areas in the autumn (Gardarsson &Skarphedinsson 1984), the practicalities ofundertaking such a survey would need to beconsidered with care.
Many of the British and Irish sitessupporting internationally importantnumbers in 2005 did so in 2010, althoughsome saw considerable variation in totalnumbers. There was a marked change,however, in the list of sites supportingnationally important numbers. Only twosites in Britain maintained qualifyingnumbers between the two censuses, whilstall those holding more than the all-Irelandthreshold did not do so in 2005, with theexception of Strangford Lough, which wasformally internationally important. Thesedifferences are, in part, likely to relate to thechange in distribution caused by the coldweather in January 2010, with swans inIreland using areas away from theirtraditional sites and the possible shift southin Scotland. Given this, it is difficult toconclude whether the variation in qualifyingsites is indicative of a genuine shift inwintering sites used.
The 2010 results show a small increase in the proportion of the populationoverwintering in Iceland following a periodof stability between 1995 and 2005, with therate of increase in total numbers betweenthe 2005 and 2010 censuses being muchhigher than that of the overall population(46% in Iceland compared with 11%
overall). This alone provides little evidence,however, of a shift in the distribution of thepopulation, i.e. an increasing proportionwintering closer to their breeding grounds inIceland, hence further monitoring isrequired to see whether this upward trendcontinues.
Although no significant difference wasfound in the proportion of young recordedacross regions there was considerablevariation, ranging from 26.2% in westIceland (small sample size) to 11.0% in east-central England. In Britain and Ireland, the highest proportion of young was found amongst flocks in the Northern Islesof Scotland, northwest Scotland andnorthwest England (excluding northeastEngland where only a few birds were aged).There was a significant difference in thefrequency of brood sizes between countries,with larger families observed in Iceland andIreland, reflected in the mean brood sizewhich was highest in various regions ofthese countries. This variation in breedingsuccess may reflect the preference forWhooper Swan families to stay closer totheir breeding grounds, with non-breedingbirds travelling further south (Rees et al.
1997).Analysis of habitat use by Whooper
Swans during the international censusessuggest a steady decline since 1995 in theuse of permanent standing water with acorresponding increase in the use of arableland. It should be noted, however, thatweather conditions in 2010 are likely to havehad a strong influence on habitat choice,with many waterbodies being frozen for along period of time and, in some regions,swans were observed in areas away from

92 Icelandic Whooper Swan census 2010
© Wildfowl & Wetlands Trust Wildfowl (2012) 62: 73–96
their usual sites. Similarly, it was suggestedthat wet, often flooded conditions duringthe 2005 census may also have influencedhabitat selection, away from permanentwaterbodies towards flooded grassland(Worden et al. 2009). The difference inhabitat use is, however, noticeable betweenall censuses since 1995 which would suggestthat swans are potentially altering theirchoice of feeding habitat. Furtherinvestigation and research is, however,needed to assess to what extent this is trulyoccurring.
The WeBS 2010 January count recorded atotal of 10,996 Whooper Swans in Britainand Northern Ireland (Holt et al. 2011),which represents 67% of the census totalfor the country, highlighting the fact thatWeBS misses a proportion of thepopulation. This, together with thepossibility that more birds may be winteringin Iceland, emphasises that a species-specificcensus is necessary to produce an accurateestimate of population size. Annual indicesderived from WeBS data follow a trendsimilar to that calculated from theinternational censuses, indicating apronounced increase in numbers from themid- 1990s to the early 2000s in Britain,followed by a more steady increase up to2009/10 (i.e. the latest year for WeBS dataWhooper Swan trends published to date),whilst for Northern Ireland the index showsa very gradual increase in winteringnumbers. This suggests that WeBS currentlyprovides a reasonable indication of thetrend in the Icelandic Whooper Swanpopulation.
Results from the 2010 census show asustained growth in the Icelandic Whooper
Swan population and provide furtherevidence of a southerly shift in its winteringdistribution. The increase in numbers maybe attributable to several good breedingseasons for the population in the early 21stcentury, with the proportion of youngpresent in wintering flocks estimated at15.4%, 20.7%, 16.8%, 15.4% and 16.3% in2006/07–2010/11 inclusive (Wildfowl &Wetlands Trust 2011), but survival analysesare required to determine any changes inmortality rates over time. Continuedmonitoring is required, however, to clarifywhether this shift is sustained and to whatdegree the cold weather in 2010 may haveexaggerated the pattern of occurrence,particularly given that results from the 2005census suggested the proportion of swanswintering in Scotland was starting toincrease.
Acknowledgments
We give grateful thanks to the large team ofobservers, many of whom are volunteers, ofthe Wetland Bird Survey (WeBS), the Irish-Wetland Bird Survey (I-WeBS) and the IrishWhooper Swan Study Group, for making aparticular effort to cover all knownWhooper Swan sites in their areas during thecensus, particularly given the adverseweather conditions in Britain and Ireland inJanuary 2010. We are similarly grateful to theteam of counters who undertook the mid-winter counts in Iceland, organised by theIcelandic Institute of Natural History. Ourthanks and appreciation also go to the manylocal organisers who contributed time andeffort in coordinating counts in the variouscountries and regions, which ensured fullcoverage across the range. We thank all

Icelandic Whooper Swan census 2010 93
© Wildfowl & Wetlands Trust Wildfowl (2012) 62: 73–96
those who undertook additional travels tolocate Whooper Swans, and also FinnurLogi Jóhannsson and Lieutenant StephenByrne of the Irish Air Corps for piloting theplanes during aerial surveys in Iceland andIreland, respectively. We are also grateful toNeil Calbrade, Heidi Mellan and MarciaSayer at the British Trust for Ornithologyfor supplying WeBS data and informationneeded to organise the survey in Britain (onbehalf of the WeBS partnership), and toJulia Newth for providing helpful adviceduring the analysis. Kane Brides kindlychecked the BTO and the WWT databasesto determine whether Whooper Swansringed in continental Europe were resightedin Britain or Ireland in winter 2009/10 and Menno Hornman provided usefulinformation on Whooper Swan numbers inthe Netherlands. Baz Hughes, RichardHearn, Carl Mitchell, Olivia Crowe, PatrickSmiddy, Leif Nilsson and Tony Fox madehelpful comments and suggestions onearlier drafts of this paper. WeBS is apartnership between the British Trust forOrnithology, the Royal Society for theProtection of Birds and Joint NatureConservation Committee (the latter onbehalf of the Council for NatureConservation and the Countryside, theCountryside Council for Wales, NaturalEngland and Scottish Natural Heritage), inassociation with the Wildfowl & WetlandsTrust. I-WeBS is a joint project of theNational Parks and Wildlife Service of theDepartment of Arts, Heritage and theGaeltacht and BirdWatch Ireland. The 2010international Whooper Swan census wasfunded, in part, through the Goose & SwanMonitoring Programme, organised by the
Wildfowl & Wetlands Trust on behalf ofthe Wildfowl & Wetlands Trust, the JointNature Conservation Committee andScottish Natural Heritage.
References
Black, J.M. & Rees, E.C. 1984. The structure andbehaviour of the Whooper Swan populationwintering at Caerlaverock, Dumfries andGalloway, Scotland: an introductory study.Wildfowl 35: 21–36.
Boland, H., McElwaine, J.G., Henderson, G.,Hall, C., Walsh, A. & Crowe, O. 2010.Whooper Cygnus cygnus and Bewick’s C.
columbianus bewickii Swans in Ireland: resultsof the International Swan Census, January2010. Irish Birds 9: 1–10.
Brazil, M.A. 2003. The Whooper Swan. T. & A.D.Poyser, London, UK.
Chisholm, H. & Spray, C. 2002. Habitat usageand field choice by wintering Mute andWhooper Swans in the Tweed Valley,Scotland. In E.C. Rees, S.L. Earnst & J.Coulson (eds.), Proceedings of the FourthInternational Swan Symposium, 2001.Waterbirds 25 (Special Publication 1): 177–182.
Cranswick, P., Bowler, J.M., Delany, S., Einarsson,Ó., Gardarsson, A., McElwaine, J.G., Rees,E.C. & Wells, J.H. 1997. Whooper Swanswintering in Britain, Ireland and Iceland:international census, January 1995. Wildfowl
47: 17–30.Cranswick, P.C., Colhoun, K., Einarsson, Ó.,
McElwaine, G., Gardarsson, A., Pollitt, M. &Rees, E.C. 2002. The status and distributionof the Icelandic Whooper Swan population:results of the international Whooper Swancensus 2000. In E.C. Rees, S.L. Earnst & J.Coulson (eds.), Proceedings of the FourthInternational Swan Symposium, 2001.Waterbirds 25 (Special Publication 1): 37–48.

94 Icelandic Whooper Swan census 2010
© Wildfowl & Wetlands Trust Wildfowl (2012) 62: 73–96
Crawley, M.J. 2002. Statistical Computing. An
Introduction to Data Analysis using S-Plus. J.Wiley & Sons, Chichester, UK.
Crowe, O., Austin, G.E., Colhoun, K.,Cranswick, P.A., Kershaw, M. & Musgrove,A.J. 2008. Estimates and trends of waterbirdnumbers wintering in Ireland, 1994/95 to2003/04. Bird Study 55: 66–77.
Gardarsson, A. 1991. Movements of WhooperSwans Cygnus cygnus neckbanded in Iceland.In J. Sears & P.J. Bacon (eds.), Proceedings of the Third IWRB International SwanSymposium, Oxford 1989. Wildfowl (SpecialSupplement 1): 189–194.
Gardarsson, A. & Skarphedinsson, K.H. 1984. Acensus of the Icelandic Whooper Swanpopulation. Wildfowl 35: 37–47.
Gill, J.A., Watkinson, A.R. & Sutherland, W.J.1997. Causes of the redistribution of Pink-footed Geese Anser brachyrhynchus in Britain.Ibis 139: 497–503.
Holt, C.A., Austin, G.E., Calbrade, N.A., Mellan,H.J., Mitchell, C., Stroud, D.A., Wotton, S.R.& Musgrove, A.J. 2011. Waterbirds in the UK
2009/10: The Wetland Bird Survey. BTO/RSPB/JNCC, Thetford, UK.
Hornman, M., Hustings, F., Koffijberg K.,Kleefstra, R., Kaassen O., van Winden, E.,SOVON Ganzen- en Zwanenwerkgroep &Soldaat, L. 2012. Watervogels in Nederland
in 2009/2010. SOVON-rapport 2012/02,Waterdienst-rapprt BM 12.06. SOVONVogelonderzoek Nederland, Nijmegen, TheNetherlands. [In Dutch with Englishsummary.]
Kirby, J., Rees, E.C., Merne, O., & Gardarsson, A. 1992. International census of WhooperSwans in Britain, Ireland and Iceland: January1991. Wildfowl 43: 20–26.
Laubek, B., Knudsen, H.L. & Ohtonen, A. 1998.Migration and winter range of WhooperSwans Cygnus cygnus breeding in differentregions of Finland. In B. Laubek (Ph.D.
thesis), The Northwest European Whooper Swan
(Cygnus cygnus) population: ecological and
management aspects of an expanding waterfowl
population, pp. 1–33. University of Aarhus,Aarhus, Denmark.
Laubek, B., Nilsson, L., Wieloch, M., Koffijberg,K., Sudflet, C. & Follestad, A. 1999.Distribution, numbers and habitat choice ofthe NW European Whooper Swan Cygnus
cygnus population: results of an internationalcensus in January 1995. Vogelwelt 120: 141–154.
Musgrove, A.J., Austin, G.E., Hearn, R.D., Holt,C.A., Stroud, D.A. & Wotton, S.R. 2011.Overwinter population estimates of Britishwaterbirds. British Birds. 104: 364–397.
Pennycuick, C.J., Einarsson, Ó., Bradbury,T.A.M. & Owen, M. 1996. MigratingWhooper Swans Cygnus cygnus: satellite tracksand flight performance calculations. Journal of
Avian Biology 27: 118–134.Rees, E.C. 2009. Lough Neagh Wetlands Whooper
Swan Study: Project Report. WWT Report toIrish Whooper Swan Study Group, Wildfowl& Wetlands Trust, Slimbridge, UK.
Rees, E.C., Kirby, J.S. & Gilburn, A. 1997. Siteselection by swans wintering in Britain; theimportance of habitat and geographiclocation. Ibis 139: 337–352.
Rees, E.C., Colhoun, K., Einarsson, Ó.,McElwaine, G., Petersen A. & Thorstensen,S. 2002. Whooper Swan Cygnus cygnus. In C.V.Wernham, M.P. Toms, J.H. Marchant, J.A.Clark, G.M. Siriwardena & S.R. Baillie (eds.),The Migration Atlas: Movements of the Birds of
Britain and Ireland, pp. 154–157. T. & A.D.Poyser, London, UK.
Robinson, J.A., Colhoun, K., McElwaine, J.G. &Rees, E.C. 2004. Whooper Swan Cygnus cygnus(Iceland population) in Britain and Ireland 1960/61
to 1999/2000. Waterbird Review Series, TheWildfowl & Wetlands Trust/Joint NatureConservation Committee, Slimbridge, UK.

Icelandic Whooper Swan census 2010 95
© Wildfowl & Wetlands Trust Wildfowl (2012) 62: 73–96
Salmon, D.G. & Black, J.M. 1986. The January1986 Whooper Swan census in Britain,Ireland and Iceland. Wildfowl 37: 172–174.
Spray, C. 2007. Whooper Swan. In R. Forrester, I. Andrews, C. McInerny, R. Murray, B.McGowan, B. Zonfrillo, M. Betts, D. Jardine & D. Grundy (eds.), The Birds of
Scotland. Volume 1, pp. 133–136. ScottishOrnithologists Club, Aberlady, Scotland, UK.
Wetlands International. 2006. Waterbird Population
Estimates – Fourth Edition. WetlandsInternational, Wageningen, The Netherlands.
Wildfowl & Wetlands Trust 2011. Goose & SwanMonitoring Programme: Whooper Swan.WWT/JNCC/SNH online report, WWT
Slimbridge. http://monitoring.wwt.org.uk/species/whooper.php (accessed on 11 June2012.)
Worden, J., Cranswick, P.A., Crowe, O.,McElwaine, G. & Rees, E.C. 2006. Numbersand distribution of Bewick’s Swan Cygnus
columbianus bewickii wintering in Britain andIreland: results of the International Censuses,January 1995, 2000 and 2005. Wildfowl 56: 3–22.
Worden, J., Crowe, O., Einarsson, Ó.,Gardarsson, A., McElwaine, G. & Rees, E.C.2009. Population size and breeding successof the Icelandic Whooper Swan Cygnus
cygnus: results of the January 2005international census. Wildfowl 59: 17–40.
Appendix 1. Sites in Britain and Ireland exceeding current 1% thresholds for internationalimportance (210; Wetlands International 2006) and national importance for Britain (110;Musgrove et al. 2011) and Ireland (130; Crowe et al. 2008) in January 2010, with the percentagechange in numbers compared with the 2005 census.
Site County No. of % Change swans from 2005in 2010
Sites of international importance in Britain and IrelandOuse Washes (arable) Cambridgeshire, Norfolk 5,632 66Martin Mere & surrounding area Lancashire 2,052 19Loughs Neagh and Beg Antirm, Armagh, Down, 1,803 19
Londonderry, TyroneLough Foyle Donegal, Londonderry 883 –7Upper Lough Erne Fermanagh 799 29Cashen River & Estuary Kerry 506 121Wexford Harbour & Slobs† Wexford 411 204River Foyle Donegal, Londonderry, Tyrone 389 –12Shannon Callows Galway, Offaly, Roscommon, 364 –16
Tipperary, WestmeathLough Oughter Complex Cavan 361 33Shannon & Fergus Estuary Clare, Kerry, Limerick 339 54Lough Swilly Donegal 338 –33Nene Washes† Cambridgeshire 337 327River Suck (Aerial) Galway, Roscommon 331 2

96 Icelandic Whooper Swan census 2010
© Wildfowl & Wetlands Trust Wildfowl (2012) 62: 73–96
Appendix 1 (continued)
Site County No. of % Change swans from 2005in 2010
Solway Estuary Dumfries & Galoway, Cumbria 290 –43Little Brosna Callows† Offaly, Tipperary 279 1,016Lough Iron† Westmeath 261 +Blackwater Callows Cork, Waterford 225 –57Pear Tree Grove, Pilling Moss† Lancashire 215 +Kelton Mains† Dumfries & Galloway 210 +
Sites of national importance in BritainWigtown Bay Dumfries & Galloway 177 19Ballone† Highland 142 +Ribble Estuary* Lancashire 119 –67Abbey House, Abbeytown† Cumbria 116 +Loch a`Phuill (Tiree)† Strathclyde 115 1,050
Sites of All-Ireland importance in IrelandRiver Blackwater (Meath)† Meath 207 +River Lagan† Antrim, Down 204 1,569River Boyne† Meath 190 +The Cull & Killag† Wexford 181 71Mullaghmore (Moylough/ Galway 174 81
L. Nalarsagh)†River Moy† Mayo 169 635Strangford Lough* Down 138 –41Foxhall/Cloghans Hill† Galway 136 +East Ballinamore Lakes† Cavan, Leitrim 135 16
† Site did not qualify during the 2005 census.* Site was of higher importance status during the 2005 census.+ Site held no birds during the 2005 census.
Sites that did not maintain either internationally or nationally important numbersbetween the 2005 and 2010 censuses: Farmland near South Kinkell (Perth & Kinross),Finn-Lacky Catchment (Monaghan Fermanagh), Glen Lough (Westmeath), Loans ofTullich/Cromarty Firth (Ross & Cromarty), Loch Insh & Spey Marshes (Inverness), LochLeven (Fife), Loch of Strathbeg (Aberdeenshire), Lyonstown Stud Farm (Tipperary), NorthCentral Galway Lakes (Galway), Rinn Lough Lakes (Leitrim), River Isla; Bridge of Crathies(Perth & Kinross), River Tweed Norham (Northumberland), Tacumshin Lake (Wexford),Tara Mines Tailings Ponds (Meath), Tralee Bay, Lough Gill & Akeragh Lough (Kerry),Turraun Nature Reserve (Offaly), Wetlands east of Ballinrobe (Mayo Galway).

97
© Wildfowl & Wetlands Trust Wildfowl (2012) 62: 97–116
Habitat use, disturbance and collision risks forBewick’s Swans Cygnus columbianus bewickii
wintering near a wind farm in the Netherlands
RUBEN C. FIJN1*, KAREN L. KRIJGSVELD1, WIM TIJSEN2, HEIN A.M. PRINSEN1 & SJOERD DIRKSEN1
1Bureau Waardenburg, P.O. Box 365, 4100 AJ Culemborg, Netherlands.2De Dolven 39, 1778 JP Westerland, Netherlands.*Correspondence author. E-mail: [email protected]
Abstract
Each winter ~ 30% of the Northwest European Bewick’s Swan Cygnus columbianus
bewickii population feeds in Polder Wieringermeer, the Netherlands, on waste crops leftafter the harvest. The area has also become important for generating energy as a resultof wind farm development. This study analyses pre- and post-construction data onBewick’s Swan distribution, movements and foraging behaviour in the vicinity of anine-turbine wind farm site, in order to determine the effects of wind turbines onwintering swans. The swans’ flight-lines between feeding areas and the roost wererecorded visually and using radar over 10 evenings in good weather conditions. Foodavailability on different agricultural plots appeared to be an important factor explainingswan numbers and distribution in the area. In circumstances with even food availabilityearly in the season, swans showed a preference for foraging in areas further away fromthe turbines, indicating some displacement caused by the turbines. Nevertheless, swansincreasingly fed closer to the wind turbines during the course of the season in responseto food availability. The likelihood that a single Bewick’s Swan passing through thewind farm will collide with a turbine (collision risk) at the nine-turbine site, determinedfrom swan movements through the wind farm (number of swan flights per unit lengthper unit time) and from regular searches for carcasses, was estimated at 0–0.04% inwinter 2006/2007. Avoidance behaviour was observed, with birds navigating aroundand between the lines of turbines. The observed disturbance of foraging birds early inthe season, the acquired knowledge of avoidance responses, and the calculatedcollision rates in this study can be used for future assessments during planning andconstruction of new wind farms in wintering areas of Bewick’s Swans, especially inareas where important congregations of world or flyway populations occur.
Key words: barrier effects, Bewick’s Swan, collision, disturbance, Wieringermeer,wind turbines.
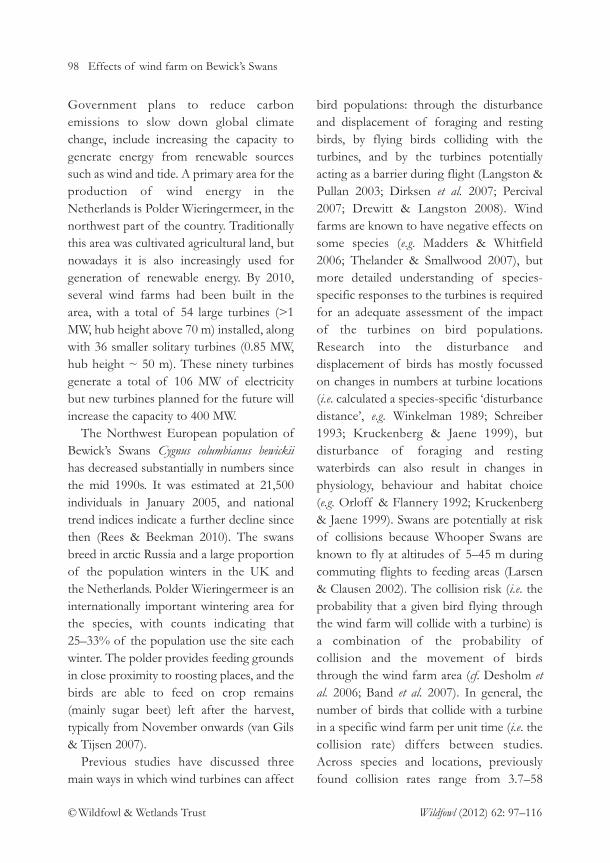
98 Effects of wind farm on Bewick’s Swans
© Wildfowl & Wetlands Trust Wildfowl (2012) 62: 97–116
Government plans to reduce carbonemissions to slow down global climatechange, include increasing the capacity togenerate energy from renewable sourcessuch as wind and tide. A primary area for theproduction of wind energy in theNetherlands is Polder Wieringermeer, in thenorthwest part of the country. Traditionallythis area was cultivated agricultural land, butnowadays it is also increasingly used forgeneration of renewable energy. By 2010,several wind farms had been built in thearea, with a total of 54 large turbines (>1MW, hub height above 70 m) installed, alongwith 36 smaller solitary turbines (0.85 MW,hub height ~ 50 m). These ninety turbinesgenerate a total of 106 MW of electricitybut new turbines planned for the future willincrease the capacity to 400 MW.
The Northwest European population ofBewick’s Swans Cygnus columbianus bewickii
has decreased substantially in numbers sincethe mid 1990s. It was estimated at 21,500individuals in January 2005, and nationaltrend indices indicate a further decline sincethen (Rees & Beekman 2010). The swansbreed in arctic Russia and a large proportionof the population winters in the UK and the Netherlands. Polder Wieringermeer is aninternationally important wintering area forthe species, with counts indicating that25–33% of the population use the site eachwinter. The polder provides feeding groundsin close proximity to roosting places, and thebirds are able to feed on crop remains(mainly sugar beet) left after the harvest,typically from November onwards (van Gils& Tijsen 2007).
Previous studies have discussed threemain ways in which wind turbines can affect
bird populations: through the disturbanceand displacement of foraging and restingbirds, by flying birds colliding with theturbines, and by the turbines potentiallyacting as a barrier during flight (Langston &Pullan 2003; Dirksen et al. 2007; Percival2007; Drewitt & Langston 2008). Windfarms are known to have negative effects onsome species (e.g. Madders & Whitfield2006; Thelander & Smallwood 2007), butmore detailed understanding of species-specific responses to the turbines is requiredfor an adequate assessment of the impact of the turbines on bird populations.Research into the disturbance anddisplacement of birds has mostly focussedon changes in numbers at turbine locations(i.e. calculated a species-specific ‘disturbancedistance’, e.g. Winkelman 1989; Schreiber1993; Kruckenberg & Jaene 1999), butdisturbance of foraging and restingwaterbirds can also result in changes inphysiology, behaviour and habitat choice(e.g. Orloff & Flannery 1992; Kruckenberg& Jaene 1999). Swans are potentially at riskof collisions because Whooper Swans areknown to fly at altitudes of 5–45 m duringcommuting flights to feeding areas (Larsen& Clausen 2002). The collision risk (i.e. theprobability that a given bird flying throughthe wind farm will collide with a turbine) isa combination of the probability ofcollision and the movement of birdsthrough the wind farm area (cf. Desholm etal. 2006; Band et al. 2007). In general, thenumber of birds that collide with a turbinein a specific wind farm per unit time (i.e. thecollision rate) differs between studies.Across species and locations, previouslyfound collision rates range from 3.7–58
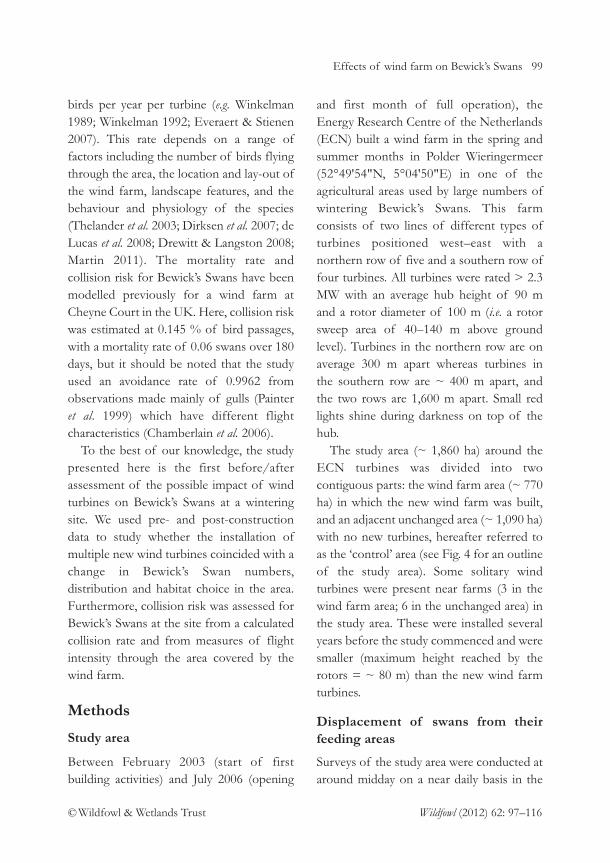
Effects of wind farm on Bewick’s Swans 99
© Wildfowl & Wetlands Trust Wildfowl (2012) 62: 97–116
birds per year per turbine (e.g. Winkelman1989; Winkelman 1992; Everaert & Stienen2007). This rate depends on a range offactors including the number of birds flyingthrough the area, the location and lay-out ofthe wind farm, landscape features, and thebehaviour and physiology of the species(Thelander et al. 2003; Dirksen et al. 2007; deLucas et al. 2008; Drewitt & Langston 2008;Martin 2011). The mortality rate andcollision risk for Bewick’s Swans have beenmodelled previously for a wind farm atCheyne Court in the UK. Here, collision riskwas estimated at 0.145 % of bird passages,with a mortality rate of 0.06 swans over 180days, but it should be noted that the studyused an avoidance rate of 0.9962 fromobservations made mainly of gulls (Painteret al. 1999) which have different flightcharacteristics (Chamberlain et al. 2006).
To the best of our knowledge, the studypresented here is the first before/afterassessment of the possible impact of windturbines on Bewick’s Swans at a winteringsite. We used pre- and post-constructiondata to study whether the installation ofmultiple new wind turbines coincided with achange in Bewick’s Swan numbers,distribution and habitat choice in the area.Furthermore, collision risk was assessed forBewick’s Swans at the site from a calculatedcollision rate and from measures of flightintensity through the area covered by thewind farm.
Methods
Study area
Between February 2003 (start of firstbuilding activities) and July 2006 (opening
and first month of full operation), theEnergy Research Centre of the Netherlands(ECN) built a wind farm in the spring andsummer months in Polder Wieringermeer(52°49'54"N, 5°04'50"E) in one of theagricultural areas used by large numbers ofwintering Bewick’s Swans. This farmconsists of two lines of different types ofturbines positioned west–east with anorthern row of five and a southern row offour turbines. All turbines were rated > 2.3MW with an average hub height of 90 mand a rotor diameter of 100 m (i.e. a rotorsweep area of 40–140 m above groundlevel). Turbines in the northern row are onaverage 300 m apart whereas turbines in the southern row are ~ 400 m apart, and the two rows are 1,600 m apart. Small redlights shine during darkness on top of thehub.
The study area (~ 1,860 ha) around theECN turbines was divided into twocontiguous parts: the wind farm area (~ 770ha) in which the new wind farm was built,and an adjacent unchanged area (~ 1,090 ha)with no new turbines, hereafter referred toas the ‘control’ area (see Fig. 4 for an outlineof the study area). Some solitary windturbines were present near farms (3 in thewind farm area; 6 in the unchanged area) inthe study area. These were installed severalyears before the study commenced and weresmaller (maximum height reached by therotors = ~ 80 m) than the new wind farmturbines.
Displacement of swans from theirfeeding areas
Surveys of the study area were conducted ataround midday on a near daily basis in the

100 Effects of wind farm on Bewick’s Swans
© Wildfowl & Wetlands Trust Wildfowl (2012) 62: 97–116
winter, prior to construction (from 23October 2000 until 7 March 2001), andagain after construction (from 27 October2006 until 25 January 2007), to determinewhether the swans were displaced fromsome of their feeding areas. The number ofwintering swans present was recorded oneach occasion, together with theirdistribution across the site and foragingbehaviour. Swan numbers and distributionwere also recorded in winters 2003/04 to2005/06 inclusive, but these surveys werepart of the monthly waterbird countsundertaken in the Netherlands, so were lessfrequent than in winters 2000/2001 and2006/2007. Nevertheless, they provide agood indication of the numbers of swanspresent for each winter between the twostudy seasons. The distance from eachgroup of swans (taken from the centre ofthe group) to the nearest turbine wasmeasured using ArcGIS for each of thecount days.
The swans’ favoured food in the PolderWieringermeer (mainly waste sugar beetand, to a lesser extent, carrots and potatoes)was available only between harvest andploughing, the length of this period beingdetermined by the farmers (Dirksen et al.
1991; W. Tijsen unpubl. data). Foodavailability in the study area was recordedduring 2006/2007 (but not in 2000/2001)by mapping the different crop types on afield-by-field basis, keeping track of theharvest and noting the ploughing dates. Bydoing so, the total number of hectares ofsugar beet fields was recorded. Fromfarming records the total number ofhectares of sugar beet fields in the studyarea in 2000/2001 could be determined.
Quantification of Bewick’s Swanflights
The movements of swans passing the windfarm area during flights to and from night-time roosts were recorded visually and withradar. The use of radar provided preciseinformation on flight behaviour (flight-lines) through and around the wind farms,as well as quantifying the number of flights,particularly during hours of darkness whenvisual observations were not possible. Theradar system used was an X-band marinesurveillance radar with a peak power of 12kW (Furuno FR1510 MARK–3, X-bandpulse repeat frequency 9,410 ± 30 MHz,vertical beam width 20°, rotation speed 24rpm, supplied by Radio Holland Rotterdam)mounted on a 2 m high tripod. Radar rangewas set to 2.8 km to cover the entire studyarea. Due to lower detection probability atthe outer limit of the radar range, effectivelya circle around the radar with a radius of 2.5km (19.6 km2) was sampled. The radarsystem was positioned 0.8–1.5 km from theturbines and the radar thus reached aminimum of ~ 1 km beyond the turbines.
Bewick’s Swan movements in the studyarea were monitored using radar over fiveevenings and the following mornings inwinter 2000/01 from four hours aroundsunset and four hours around sunrise (twohours before until two hours after, in eachcase), to provide the Environmental ImpactAssessment (EIA) of the proposed windfarm with baseline data on the flight-pathstaken by the birds. Fieldwork was alsocarried out on seven evenings in 2006/2007,in differing but albeit generally goodweather conditions for the time of year

Effects of wind farm on Bewick’s Swans 101
© Wildfowl & Wetlands Trust Wildfowl (2012) 62: 97–116
(temperature = 6°–15°C, wind direction =S–SW; wind speed = 3–7 Bft; cloud cover =4/8 to 8/8; precipitation = dry, with onlyoccasional showers), from approximately 2 h before to 2 h after sunset. The departureof different groups of Bewick’s Swans fromthe fields to roosting areas on nearby LakeIJsselmeer was highly synchronised andoccurred over a relatively short period oftime. Observations continued until allswans, as determined by the swan surveyearlier that day, had left the study area forthe roost. In case of poor visibility (due todarkness), species identification wasdetermined from the birds’ flight calls andthe characteristic behaviour (size and speed)of echoes on the radar screen. If a potentialgroup of swans seen on the radar was out ofaudible range, one of the field observers was directed towards the flying group toconfirm species identification. Swanmovements were also recorded on threeadditional evenings in 2006/2007 at asecond wind farm in Polder Wieringermeer(‘Waterkaaptocht’; 52°51'46"N, 5°02'22"E;~ 4 km from the study area), which has eightsimilar 2.3 MW turbines in one line (seeKrijgsveld et al. 2009), to increase thenumber of flight records.
All bird tracks observed in the field weredigitised and, if positively identified by fieldobservers, flight-path specifications (i.e. date,time, species, number of birds and altitudeof flight) were stored in an ArcGIS database.This database was used to produce maps ofthe swans’ flight-lines within and around theboundaries of the wind farms. The detailedflight data made it possible to calculate theproportion of the swans present in the studyarea and in adjacent feeding areas that passed
through the wind farm during flights to theroost. About 30 min after sunset observerswere not able to observe flying swans in thefield; however, at close distances, structuressuch as wind turbines might still be visible to flying swans, especially when somebackground illumination is present. As theexact extent of this phenomenon isunknown, we decided in this study to set theboundary between dark and light at 30 minafter sunset, in other words when observersencountered reduced visibility. A diversionfrom the intended flight-path was defined asoccasions when a swan discontinued itsflight direction, in either the horizontal orvertical plane. These avoidance records wereused in calculating swan movement (‘flux’)through the wind farm, which in turn wasused to determine collision risk as describedbelow.
Collision risk
The collision risk for Bewick’s Swans in thestudy area was calculated by dividing thecollision rate by the flux (i.e. the number ofBewick’s Swan per area [m2] within the windfarm per unit time). Collision rate wasinvestigated by regular searches for corpsescombined with corpse disappearance rateexperiments. Between 27 November 2006and 2 February 2007, the area below theturbines in the study area and also at theWaterkaaptocht wind farm was searched forcollision victims at 2–3 day intervals. Theadditional wind farm was included toincrease the probability of finding collisionvictims, as earlier research found that thefrequency with which birds collided withturbines was low (e.g. Winkelman 1992;Krijgsveld et al. 2009). The area within a

102 Effects of wind farm on Bewick’s Swans
© Wildfowl & Wetlands Trust Wildfowl (2012) 62: 97–116
radius of 100 m of each turbine wassearched, on the basis that previous studiesfound that victims fall within a radius of upto 1.1 times the hub height of the turbine(Winkelman 1992; Grünkorn et al. 2009), i.e.up to 88 m in this study. Swans are expectedto fall at even closer range due to their highbody mass (Krijgsveld et al. 2009). Thesearched area (100 m radius) therefore wasconsidered large enough to include allpotential victims. We included only thoseturbines under which vegetation type andheight did not obstruct visibility of potentialvictims. Nevertheless, the total searched areain the winter of 2006/2007 was 15,697,457m2 (98.6%) of a total area of 15,927,874 m2
around the turbines in both wind farms. Thearea below a turbine was searched eitherwith binoculars from the base of the turbine(ECN wind farm) or by walking in parallellines 4–6 m apart (Waterkaaptocht, seeKrijgsveld et al. 2009), depending onvisibility of potential victims. Because swansare conspicuous, with their large size andwhite colour, a detection probability of100% was assumed. All victims foundduring the searches were recorded,photographed and sent to the Dutchveterinary laboratory CIDC-Lelystad for post
mortem examination (internally andexternally) to determine the cause of death.
Scavenging predators, such as CommonBuzzard Buteo buteo and Red Fox Vulpes
vulpes, roam the study area and mightremove swan corpses during the studyperiod, resulting in underestimates ofcollision rates. To determine thedisappearance rate, seven defrostedcarcasses were laid out in the study area (1Brent Goose Branta bernicla, 4 Bewick’s
Swans and 2 Mute Swans Cygnus olor), placedsemi-randomly in all directions at distancesof 1–100 m from the turbines. Turbinesused for the disappearance test were notused in victim searches, to avoid predatorsand scavengers being attracted to theformer, which could lead to an increase indisappearance of collision victims. Presenceand condition (eaten, moved, buried) ofcarcasses were registered for two weeks aftercarcasses had been laid out. The probabilitythat a carcass remained at a location wascalculated as the probability that a carcasspresent on day t was still present at day t + 1,day t + 2, etc. Calculations were similar tothose undertaken by Winkelman (1992) tofacilitate comparison with other studies.
The number of collision victims,corrected for observer efficiency anddisappearance rate (Nc), was determined bycorrecting the number of victims found(Nf), for the probability that a victimremains at the location rather thandisappearing through scavenging (Pd), theprobability of finding a victim (Pf), thefraction of the total area (100 m radius)underneath the turbine that was searched(Fs), and for the fraction of days of theresearch period that victims were searchedfor (Fd). The corrected number of collisionvictims used to calculate the collision ratefor swans within the whole wind farm wasthus calculated as follows (followingWinkelman 1992): Nc = Nf / (Pd × Pf ×Fs × Fd).
Statistical analysis
Data were analysed using SPSS version 15.0.Changes in swan numbers wintering in thestudy area over the years were calculated as a

Effects of wind farm on Bewick’s Swans 103
© Wildfowl & Wetlands Trust Wildfowl (2012) 62: 97–116
proportion of the total number recordedacross Polder Wieringermeer (Fig. 1). Thenumbers of swans in the wind farm area andthe adjacent unchanged (‘control’) area didnot follow a normal or a Poisson distribution(Figs. 1 & 2); non–parametric statistics (Chi-square test and Spearman Rank correlation)therefore were used to analyse these data.Distance to the nearest turbine in relation todate (Fig. 3) was analysed using a logarithmicregression. Linear regressions on arcsinetransformed proportionate data were used tomodel the carcass disappearance rate (Fig. 5).Mean values are given ± s.d. unless otherwisestated.
Results
Swan numbers during the winter
Bewick’s Swans were present in the studyarea from 23 October to 7 March in winter2000/01 and from 1 November to 28January in winter 2006/07. The maximumnumbers counted in the study area (i.e. inboth the ‘control’ and the wind farm areas)were significantly lower in 2006/07 than in2000/01 (χ2
1 = 36.9, P < 0.001; Table 1).The shorter period that swans were presentin the area, in combination with the lowerpeak counts, resulted in fewer swan-daysbeing recorded in the year followingconstruction than beforehand (χ2
1 = 128.6,P < 0.001). The wind farm area and theadjacent ‘control’ area showed a similardecrease in the total number of swan-days,but the seasonal maximum count decreasedmore substantially within the wind farm site(Table 1).
In contrast, the maximum number ofbirds present across the whole of Polder
Wieringermeer was higher after construction (Table 1). Pre-construction, in 2000/2001,up to 89% of the winter’s maximum number of swans counted across PolderWieringermeer was found in the wind farmarea and 70% in the adjacent ‘control’ area.Post-construction, in 2006/2007, thesepercentages decreased to 24% and 29%respectively. The proportion of the totalnumber of birds in Polder Wieringermeerthat visited the study area decreasedsignificantly in the years between 2000/2001and 2006/2007 (rs = –0.90, n = 5, P < 0.05;Fig. 1).
The proportion of the NorthwestEuropean Bewick’s Swan populationwintering in Polder Wieringermeer hasincreased during the study, from 5% of thetotal population in 2000/2001 to 11% in2006/2007 (Rees & Beekman 2010; Table1). In contrast, the study area within PolderWieringermeer appears to have become lessattractive with 5% of the NorthwestEuropean population present in 2000/2001and 3% in 2006/2007.
Swan feeding distribution
There was a within-winter shift in thedistribution of swans across the study areain relation to variation in the availability ofsugar beet remains following the harvest inthe 2006/2007 season. Numbers in the‘control’ area correlated significantly withthe number of hectares of fields with food remains in that area during habitatassessments (rs = 0.38, n = 85, P < 0.01), butthere was no significant association betweenthe number of swans and the number ofhectares with food remains in the wind farmarea (rs = 0.24, n = 64, n.s.). In 2000/2001

104 Effects of wind farm on Bewick’s Swans
© Wildfowl & Wetlands Trust Wildfowl (2012) 62: 97–116
such a shift was not observed and Bewick’sSwans were present in both ‘control’ andwind farm areas throughout the season.
The number of birds in the wind farmarea increased when the number of hectareswith available food decreased in the ‘control’area (rs = –2.53, n = 85, P < 0.05; Fig. 2).
These results imply that, when food wasavailable on fields both with and withoutturbines, the swans generally foraged in the area without the newly-constructedturbines. Up to 530 birds (95% of the peakcount for the study area in 2006/07) wererecorded on fields within the area with new
Table 1. Numbers of swan-days (sum of number of swans on each day of the field season,on days when counts were missing, gaps in data were calculated as the average of the twocounts spanning the missing count) and seasonal maximum numbers in the ‘control’ andwind farm areas in the two study seasons 2000/2001 and 2006/2007. Also shown are theproportions of the total number of birds wintering in the Wieringermeer and of the totalNorthwest European population. Changes in abundance between the two study seasons areexpressed as a percentage.
2000/2001 2006/2007 Change
Total number of swan-days
‘Control’ area 20,714 4,546 – 78%
Wind farm area 34,586 9,526 – 72%
Seasonal maximum count
‘Control’ area 860 550 – 36%
Wind farm area 1,099 530 – 52%
Polder Wieringermeer 1,230 2,233 + 82%
Proportion of Wieringermeer birds
‘Control’ area 0.70 0.29 – 59%
Wind farm area 0.89 0.24 – 73%
NW European population (Rees & Beekman 2010)
23,000 21,500* – 7%
Proportion of NW European population
Polder Wieringermeer 0.05 0.11 + 120%
Entire study area 0.05 0.03 – 40%
*Note that the Northwest European population figure for Bewick’s Swans described in Rees& Beekman (2010) is based on the census of January 2005 and not 2007.

Effects of wind farm on Bewick’s Swans 105
© Wildfowl & Wetlands Trust Wildfowl (2012) 62: 97–116
turbines on 12 individual days in November,but these were resting on grass and notforaging. At the beginning of the 2006/2007 season, when sugar beet remains wereavailable in both areas, the swans foragedpredominantly in the ‘control’ area. Later inthe season when most of the fields in the‘control’ area had been ploughed, the swansmoved to the wind farm area and closer tothe turbines to utilise the sugar beet remainsthat were still available there.
Bewick’s Swans foraged significantlycloser to the turbines as the seasonprogressed (Fig. 3; logarithmic regression ofdistance of birds to the nearest turbineversus date: F1,84 = 65.62, r2 = 0.44, P < 0.001). This effect was attributablemainly to a large number of birds feeding at
greater distances from the turbines at thestart of the season. Excluding these birdsfrom the analysis still resulted in asignificant, albeit smaller, decrease in thedistance of the swans from the turbines as the winter progressed (F1,77 = 21.05, r2 = 0.22, P < 0.001). The decrease indistance was not due to the distribution ofharvested fields as the distance of harvestedfields to the turbines did not decreasesignificantly during the course of the season(linear regression of distance of fields to thenearest turbine versus date: F1,32 = 0.39, r2 = 0.01, P = n.s.). The distance betweenforaging and resting Bewick’s Swans and theturbines was on average 560 m (s.e. = 57.9, n = 86), whereas the minimum recordeddistance was 125 m.
Figure 1. Maximum numbers of swans counted each winter in the study area and across the PolderWieringermeer. The proportion of the Bewick’s Swans wintering in Polder Wieringermeer recorded inthe study area is also illustrated. The wind farm was built during the summer months between summer2003 and summer 2006.

106 Effects of wind farm on Bewick’s Swans
© Wildfowl & Wetlands Trust Wildfowl (2012) 62: 97–116
Swan flights in the study area
Swans flew towards the roosting sites in thelate evening and early night. At least 1,664Bewick’s Swan flight-paths for 101 groupsflying to the roost were recorded in bothwind farms during eight out of tenfieldwork evenings in 2006/2007 (flightswere not recorded during two evenings asswans were absent from the study area andno swans flew past from adjacent areas).This is a minimum estimate of the totalnumber of swan flights as 33 groups wererecorded only as radar tracks in complete
darkness, > 30 minutes after sunset. Thebirds giving these tracks could be identifiedas Bewick’s Swans on the basis of flight callsbut group size could not be determined. Aminimum group size was estimated on theseoccasions, based on the number of birdscounted by the field observer earlier in theday. There was substantial variation in thetiming of the evening flights to the roost.Of all groups of swans, 61 ± 41% (range:0–100%, n = 7 nights, 101 groups) flew afterdark (> 30 min after sunset) each night in2006/2007. Group size was limited to 16 ±41 (range 1–300) birds at maximum. Of all
ha in Impact
n in Control
ha in Control
n in Impact
Figure 2. Numbers of swans in the ‘Control’ (no new large wind turbines) and wind farm ‘Impact’(nine new large wind turbines) sections of the study area in relation to the availability of sugar beetremains. Early in the winter, when waste sugar beet was available in both areas, Bewick’s Swans fed inareas away from the turbines.

Effects of wind farm on Bewick’s Swans 107
© Wildfowl & Wetlands Trust Wildfowl (2012) 62: 97–116
individual swans flying towards the roostingsites, 75 ± 35% (range: 0–100%, n = 7nights, 1,664 birds) flew after dark. Birdsthat flew past the outer edge of the windfarm adjusted their flight direction at adistance of a few hundred metres atmaximum (n = 562 birds). Of all swanspresent in the area an average per day of 16 ± 22.5% (range: 0–65%) flew throughthe wind farm during commuting flights(Table 2).
In 2000/2001, Bewick’s Swans generallyflew in straight lines from fields where theyhad been feeding during the day towards theroost site (Lake IJsselmeer), although nofixed flight-paths through the landscape
were identified. Foraging areas were similarin 2006/2007 (albeit not identical to thoserecorded in 2000/01, due to crop rotationand a decrease in the area of sugar beetavailable) and birds were seen to fly in asimilar direction to the roost. In 2006/2007 birds adjusted their flight-paths to the presence of the wind turbines duringboth light and darkness; however, neitherlarge deflections around the entire windfarm nor panic reactions in the air wereobserved. Birds avoided turbines bynavigating around individual turbines andbetween rows of turbines (as illustrated for the evening of 24 November 2006 inFig. 4).
Figure 3. Distance of Bewick’s Swan flocks in the study area to the nearest turbine during the courseof winter 2006/07, from 1 November onwards (logarithmic regression with r2 = 0.44).

108 Effects of wind farm on Bewick’s Swans
© Wildfowl & Wetlands Trust Wildfowl (2012) 62: 97–116
Collision rate estimates
Two Bewick’s Swans were found dead during> 2 months of searching for corpses in thestudy area (31 field days, average intervalbetween searches = 2.3 days). Collision withthe wind turbines could be ruled out as thecause of death in both cases for the followingreasons: 1) there were no fractures ordislocations found during post mortem
examinations, 2) the birds were found > 150m from the turbines, and 3) the birds were
found upwind of the wind farm and the windforce was strong (4–5 Bft) on both days.Dissection did not reveal a clear cause ofdeath and it was assumed that the swans haddied of natural causes or been killed by apredator. That no swans were found to havecollided with the turbines during the studyperiod does not however, mean that thecollision rate was zero. In order to considerthe potential consequences of collision–related mortality, a collision rate wasdetermined based on the assumption that
Table 2. Bewick’s Swan flights in the study area (ECN) and in the nearby Waterkaaptochtwind farm (WK), recorded as visual and radar observations of the swans’ flight-paths. Thenumber of swans that were present in, or flying through the study area is shown; thepercentage of these birds that flew close to or through the wind farm during commutingflights (% head towards wind farm), and thus potentially at risk of collision, was calculated(i.e. number flying towards wind farm/number swans*100). Of the birds that flew toward the wind farm, some avoided the wind farm entirely (% deflecting, i.e. numberdeflecting/number swans*100) and some flew through the wind farm (% through wind farm,i.e. number through wind farm/number swans*100).
Date Location No. swans % head to % deflecting % through wind farm wind farm
21 Nov 2006 ECN 94 18 14 4
24 Nov 2006 ECN 294 100 98 2
01 Dec 2006 ECN 51 100 100 0
07 Dec 2006 ECN 459 66 1 65
16 Jan 2007 ECN 9 100 100 0
01 Dec 2006 WK 351 43 12 32
03 Jan 2007 WK 227 70 53 16
10 Jan 2007 WK 206 26 17 9
Mean ± s.d. 211 ± 155.1 65 ± 33.6 49 ± 44.0 16 ± 22.5

Effects of wind farm on Bewick’s Swans 109
© Wildfowl & Wetlands Trust Wildfowl (2012) 62: 97–116
one turbine victim was found in this study.This does not provide an absolute measure ofcollision rate, but does give a maximumestimate of collision rate for the studiedseason. This figure can subsequently be usedto estimate maximum collision risk (see nextsection). The probability that a victim wasfound (Pf) was set to 1 (see Methods section).
The disappearance tests found that sevencarcasses placed in the study areadisappeared at a slow rate (Fig. 5). After fourdays, two were scavenged but all were stillpresent and recognisable. Only one bird, aMute Swan, totally disappeared during the14-day trial; it was found to have been buriedby a Red Fox at the foot of a turbine, six days
after being laid out. The remaining sixcarcasses were still present and recognisableafter fourteen days. A scavenging animalmoved two birds, by 1 m and 25 mrespectively. The probability (Pd) that a birdwas still present (after the average searchinterval in this study: 2.3 days) was 0.97(linear regression: Pd = –0.0255* number ofdays since placement + 1.026, r2 = 0.71, Fig.5). The proportion of the total areaunderneath the turbine that was searched(Fs) was 0.986. The proportion of days overthe search period that victims were searchedfor (Fd) was set to 1 as the mean intervalbetween searches was smaller than thequickest disappearance of laid-out corpses.
Figure 4. Map of the study area, showing the wind farm area (eastern part) and the adjacent ‘control’area (western part), with Bewick’s Swan flight-paths (arrows) from foraging fields to the LakeIJjsselmeer roost on 24 November 2006. Numbers adjacent to the arrows indicate group size. Insertshows the location of the study area within the Netherlands.

110 Effects of wind farm on Bewick’s Swans
© Wildfowl & Wetlands Trust Wildfowl (2012) 62: 97–116
Fitting the number of collision victimsfound (between zero and one) to the aboveparameters, gives an estimated collision rateof 0–1.05 swans colliding with the turbineseach season for both wind farm sites. Thestudy season consisted of 1,163 ‘turbinesearch days’ (number of turbines * numberof search days) so the estimated collisionrate is 1.05/1,163 = 0.0009 per turbine pernight. This collision rate implies a maximumof approximately 2–3 victims per winter (15October – 15 March) in both wind farmsconsidered in this study.
Collision risk
The near-daily swan counts gave an average of132 Bewick’s Swans present each eveningduring the 2006/2007 winter. Of these 132
birds, 16% flew through the wind farm area(see the swan flights section above). Assumingthat the route to and from the roosting area isflown twice per day, and that dusk flights areas risky as dawn flights (noting that light levelsare low in both cases), an average of 42 swan-flights pass the turbines every 24 h. With anestimated maximum collision rate of 0.0009birds per turbine per night, the maximumcollision risk can be calculated as: (17(turbines) * 0.0009)/42 = 0.0004 (fraction), or0.04% of all swans passing the two windfarms. Because no actual collision victimswere found, this collision risk reflects themaximum risk; the actual risk estimate is of0–0.04 % of Bewick’s Swans passing theseparticular turbines colliding with them in each24 h period.
y = -0.026x + 1.026
r2 = 0.714
y = -0.063x + 1.087
r2 = 0.825
0%
20%
40%
60%
80%
100%
0 2 4 6 8 10 12 14
Days since lay-out date
Presence Non-scavenged
Figure 5. Status of seven carcasses for up to 14 days after being placed in the study area. Shown are thepercentage of carcasses still present at the location after x days (black bars, closed line, linear regressionr2 = 0.71 and a slope of –0.026) and the percentage of carcasses remaining at the location without beingscavenged by predators (grey bars, dotted line linear regression r2 = 0.83 and a slope of –0.063).

Effects of wind farm on Bewick’s Swans 111
© Wildfowl & Wetlands Trust Wildfowl (2012) 62: 97–116
Discussion
Disturbance of foraging swans
The proportion of the total number ofBewick’s Swans wintering in PolderWieringermeer that visited the study areawas significantly lower after construction ofthe wind farm (2006/2007) than before itwas built (2000/2001). This decrease wasparticularly evident in the wind farm area incomparison with the adjacent area,suggesting that the birds had been displacedby the newly-constructed turbines. Whilstthe installation of the turbines seems tohave made the wind farm area less attractiveto the swans, the birds’ use of the ‘control’area (without newly-built turbines) alsodiminished, probably due to changes in foodavailability between the two study seasons.In particular, a smaller proportion of thestudy area was used for sugar beetcultivation in 2006/07 compared with2000/2001 (100 ha versus 64 ha). On arrivalin the Netherlands, Bewick’s Swans startfeeding on water plants in other parts of thecountry and only start feeding on cropremains in Polder Wieringermeer later in theseason (Beekman et al. 1991; Dirksen et al.
1991). The timing of availability of harvestwaste is thus important for winteringBewick’s Swans in the Netherlands and anabsence or lower availability of crop remainsmight cause shifts to other foraging areas.
Our study found that displacement ofBewick’s Swans from the wind farm areawas most evident at the start of the season,when there appeared to be an abundantfood supply for the birds. The swans weremore likely to forage in areas withoutturbines while food was available in both the
‘control’ and wind farm areas. Only later inthe season, when food sources were limitedto just the wind farm area, swansincreasingly fed in areas closer to theturbines. This decreasing distance betweenforaging swans and the turbines may be dueto a lack of food further afield, tohabituation to the wind farm, or acombination of these factors. Displacementby wind turbines has also been reported forWhooper Swan Cygnus cygnus and for severalspecies of geese, with the displacement ofbirds evident up to 400 m of the turbines(Winkelman 1989; Kruckenberg & Jaene1999). Habituation to wind turbines has also been found for the same species(Kruckenberg & Jaene 1999; Larsen &Madsen 2000; Madsen & Boertman 2008).Devereux et al. (2008) showed that winteringfarmland birds (non–waterbirds) were notinfluenced by wind turbines; however, ourresults suggest that these results are notapplicable across all species wintering infarmland areas.
Barrier effects
Although the swans appeared to bedisplaced from potential feeding areas, therewas no evidence for the wind farm acting asa barrier during the evening flight; the birdsnavigated between and around the turbinesduring their flights to the roost. This abilityto adjust their flight-paths is in line withstudies made of other waterbird species(Dirksen et al. 1998; Tulp et al. 1999;Desholm & Kahlert 2005; Masden et al.
2009). The small size of the wind farm inthis study (nine turbines in two rows) andthe large spacing between turbines may havehelped to ensure that these two lines did not

112 Effects of wind farm on Bewick’s Swans
© Wildfowl & Wetlands Trust Wildfowl (2012) 62: 97–116
act as a barrier to flying birds. The use ofmodern large wind turbines may help bothto make the structures more obvious to thebirds (thus reducing collision risk) and alsoperhaps reduce the chance that birdsperceive the turbines as barriers because thelarger spacing between individual turbinesmakes it easier for the birds to pass betweenthem (Krijgsveld et al. 2009). The samereasoning can be applied to increasing thenumbers of turbines within a wind farm, asmore turbines will enhance the perceivedbarrier effect. The orientation of the turbinerows will also have an effect, since turbinesconstructed in rows parallel onto thedominant flight direction of birdscommuting between foraging and sleepingareas will present less of a barrier than whenperpendicular to it. In the extreme, such abarrier effect could potentially renderroosting or foraging sites inaccessible,especially where the energetic costs ofavoidance make significant additionalcontributions to energy budgets. Due tocrop rotation, flight-paths could potentiallychange between years. In this study, trackingof flight-paths was limited to only one pre-and one post-construction year; adequateassessment of barrier effects requiresmonitoring in multiple pre- and post-construction years.
Collision risk
Avian turbine collision risk varies widelybetween species and also between habitats;for instance, raptors are often found tocollide with turbines in mountainous areas(de Lucas et al. 2008; Smallwood &Thelander 2008). Swans and geese are rarelyreported as turbine victims, although swan
collisions with power-lines have beenrecorded frequently (e.g. Brown et al. 1992;Rees 2006). This study found no collisionvictims among Bewick’s Swans during theresearch period, but the assumed onecollision victim per season would equate to0–0.04% of swans passing the wind farmturbines. These probabilities are very lowbut are similar to results from extensiveresearch at two other turbine farmsinvolving geese and swan in other parts ofthe Netherlands (Krijgsveld et al. 2009). Thecollision risk at this wind farm is lower thanthat calculated for Bewick’s Swans in the UK(from Chamberlain et al. 2006) at a largerstudy site (26 versus 9 turbines), located nearRomney Marsh, a proposed Ramsar sitewith nationally important numbers ofBewick’s Swans for the UK. However,numbers of swans on Romney Marsh weremuch lower (mean maximum = 123 swansper winter during 2005–2009, Calbrade et al.2010) than in the current study at the PolderWieringermeer.
This study covered no evenings andmornings with fog or mist; on nights withpoor visibility, collision risk for swans couldbe higher (Brown et al. 1992). However,evenings or mornings with poor visibility (< 300 m) were rare (five out of 114 dusks and dawns, Royal NetherlandsMeteorological Institute, KNMI-stationBerkhout, 21.11.2006–6.01.2007, downloaded from www.knmi.nl), so effects of fog ormist probably have negligible effects on thecollision risks found in this study.
Given our various assumptions, wesuggest a mortality rate of 0–3 swan victimsper winter for the whole wind farm, ofsimilar order of magnitude to 0.06 swans

Effects of wind farm on Bewick’s Swans 113
© Wildfowl & Wetlands Trust Wildfowl (2012) 62: 97–116
per 180 days found for the UK (fromChamberlain et al. 2006). Collision risk canbe estimated, but where low, actual collisionrates can be difficult to determine. In otherstudies, casualties are most frequent in bird-rich areas and on mountain ridges (Hötker etal. 2006; Thelander & Smallwood 2007; deLucas et al. 2008), but elsewhere, chances ofcollision are much lower. To date, no clearavian population effects from wind turbineshave been demonstrated, although theseeffects will be greater for long-lived specieswith low reproductive rates, such as seabirdsand raptors (Thelander et al. 2003; Horch &Keller 2005; Hötker et al. 2006; Stienen et al.
2007). In the case of the Bewick’s Swans inPolder Wieringermeer the collision riskcalculated in this study is so low that it is notexpected to cause negative effects on thelocally wintering swans. However, as PolderWieringermeer now supports large numbersof individual wind farms, the combinedeffects of all these wind turbines, togetherwith changes in cropping and land use,could combine to reduce overall winteringnumbers of swans even in the absence ofcollision mortality.
Implications for conservation andfuture developments
In conclusion, this study shows thatalthough the collision risk for swans withturbines was low at the site, wind farms canresult in a diminished use of foraginghabitat. Increasing demand for renewableenergy could result in more and largerturbines which could reduce theattractiveness and carrying capacity ofPolder Wieringermeer for winteringBewick’s Swans. Polder Wieringermeer is a
key wintering area for > 3% of theNorthwest European Bewick’s Swanpopulation, whilst the adjacent LakeIJsselmeer roosts are of internationalimportance under the EC Birds Directiveand are designated as a Natura 2000Specially Protected Area. This Birds’Directive Annex I species has declined inrecent years (Wetlands International 2006;Rees & Beekman 2010) so changes to thepotential carrying capacity of theseimportant areas should be considered withcaution. The increasing use of rural land inPolder Wieringermeer for the constructionof wind turbines may have adverse impactson the quality of the habitat for winteringwaterbirds in the future.
Acknowledgements
This study was commissioned by ECNWind Energy Facilities and Wim Stam andHenk Kouwenhoven of Dutch utility Nuon.All monitoring was carried out by the BirdWorking Group Wierhaven, BureauWaardenburg and Alterra. We thankeveryone involved in the fieldwork for theircontribution. Jan van Gils kindly providedhelpful comments and additional data aboutnumbers of birds in earlier years. Thanks toNIOO Nieuwersluis for the swans we usedin our carcass experiments. We expressspecial appreciation to all the farmers fortheir cooperation and the possibility to doresearch on their land. We would like toexpress our gratitude to Mark Collier, EileenRees, Tony Fox and two anonymousreferees for providing helpful comments toimprove the manuscript. All fieldworkrelated to this study has been conducted inaccordance with Dutch law.

114 Effects of wind farm on Bewick’s Swans
© Wildfowl & Wetlands Trust Wildfowl (2012) 62: 97–116
References
Band, W., Madders, M. & Whitfield, D.P. 2007.Developing field and analytical methods toassess avian collision risks at wind farms. In M.de Lucas, G.F.E. Janss & M. Ferrer (eds.), Birds
and wind farms. Risk Assessment and Mitigation,pp. 259–275. Quercus, Madrid, Spain.
Beekman, J.H., Van Eerden, M.R. & Dirksen, S.1991. Bewick’s Swans Cygnus columbianus
bewickii utilizing the changing resource ofPotamogeton pectinatus during autumn in theNetherlands. In J. Sears & P.J. Bacon (eds.),Proceedings Third IWRB International SwanSymposium, Oxford 1989. Wildfowl SpecialSupplement 1: 238–248.
Brown, M., Linton, E. & Rees, E.C. 1992. Causesof mortality among wild swans in Britain.Wildfowl 43: 70–79.
Calbrade, N.A., Holt, C.A., Austin, G.E., Mellan,H.J., Hearn, R.D., Stroud, D.A., Wotton, S.R.& Musgrove, A.J. 2010. Waterbirds in the UK
2008/09: The Wetland Bird Survey.
BTO/RSPB/JNCC in association withWWT, Thetford, UK.
Chamberlain, D.E., Rehfisch, M.R., Fox, A.D.,Desholm, M. & Anthony, S.J. 2006. Theeffect of avoidance rates on bird mortalitypredictions made by wind turbine collisionrisk models. Ibis 148: 198–202.
De Lucas, M., Janss, G.F.E., Whitfield, D.P. &Ferrer, M. 2008. Collision fatality of raptorsin wind farms does not depend on raptorabundance. Journal of Applied Ecology 45:1695–1703.
Desholm, M. & Kahlert, J. 2005. Avian collisionrisk at an offshore wind farm. Biology Letters
1: 296–298.Desholm, M., Fox, A.D., Beasley, P.D.L. &
Kahlert, J. 2006. Remote techniques forcounting and estimating the number ofbird–wind turbine collisions at sea: a review.Ibis 148 (Suppl. 1): 76–89.
Devereux, C.L., Denny, M.J.H. & Whittingham,M.J. 2008. Minimal effects of wind turbineson the distribution of wintering farmlandbirds. Journal of Applied Ecology 45: 1689–1694.
Dirksen, S., Beekman. J.H. & Slagboom, T.H.1991. Bewick’s Swans Cygnus columbianus
bewickii in the Netherlands: numbers,distribution and food choice during thewintering season. In J. Sears & P.J. Bacon(eds.), Proceedings Third IWRB InternationalSwan Symposium, Oxford 1989. Wildfowl
Special Supplement 1: 238–248.Dirksen, S., Spaans, A.L., Van der Winden, J. &
Van den Bergh, L.M.J. 1998. Nocturnal flightpatterns and altitudes of diving ducks in theIJsselmeer area. Limosa 71: 57–68. [In Dutchwith English summary.]
Dirksen, S., Spaans, A.L. & Van der Winden, J.2007. Collision risks for diving ducks at semi-offshore wind farms in freshwater lakes: acase study. In M. de Lucas, G.F.E. Janss & M.Ferrer (eds.), Birds and Wind Farms. Risk
Assessment and Mitigation, pp. 201–218.Quercus, Madrid, Spain.
Drewitt, A.L. & Langston, R.H.W. 2008.Collision effects of wind-power generatorsand other obstacles on birds. Annals of the
New York Academy of Sciences 1134: 233–266.Everaert, J. & Stienen, E.W.M. 2007. Impact of
wind turbines on birds in Zeebrugge(Belgium). Significant effect on breeding terncolony due to collisions. Biodiversity and
Conservation 16: 3345–3359.Grunkorn, T., Diederichs, A., Pöszig, D.,
Diederichs, B. & Nehls, G. 2009. How manybirds collide with wind turbines? Natur und
Landschaft 84: 309–314. [In German withEnglish summary.]
Horch, P. & Keller, V. 2005. Windkraftanlagen
und Vogel – ein Konflikt? SchweizerischeVogelwarte Sempach, Sempach, Switzerland.Available on http://www.vogelwarte.ch/. [InGerman.]

Effects of wind farm on Bewick’s Swans 115
© Wildfowl & Wetlands Trust Wildfowl (2012) 62: 97–116
Hötker, H., Thomsen, K-M. & Köster, H. 2006.Impacts on biodiversity of exploitation of renewable
energy sources: the example of birds and bats. Facts,
gaps in knowledge, demands for further research, and
ornithological guidelines for the development of
renewable energy exploitation. Michael–Otto–Institut im NABU, Bergenhusen, Germany.http://bergenhusen.nabu.de/bericht/englische%20windkraftstudie.pdf.
Hunt, W.G., Jackman, R.E., Hunt, T.L., Driscoll,D.E. & Culp, L. 1998. A population study of
golden eagles in the Altamont Pass Wind Resource
Area: population trend analysis 1994–1997.
NREL/SR–500–26092, Subcontract No.XAT–6–16459–01. Predatory Bird ResearchGroup University of California, Santa Cruz,California, USA.
Krijgsveld, K.L., Akershoek, K., Schenk, F., Dijk,F. & Dirksen, S. 2009. Collision of birds withmodern large wind turbines. Ardea 97:357–366.
Kruckenberg, H. & Jaene, J. 1999. Zum Einfluss eines Windparks auf die Verteilungweidender Blässgänse im Rheinland(Landkreis Leer, Niedersachsen). Natur und
Landschaft 74: 420–424. [In German withEnglish summary.]
Langston, R.H.W. & Pullan, J.D. 2003. Windfarms
and birds: An analysis of the effects of windfarms on
birds, and guidance on environmental assessment
criteria and site selection issues. Report RSPB/BirdLife International for the Convention onthe Conservation of European Wildlife andNatural Habitats, Standing Committee 23rdMeeting, Strasbourg, 1–4 December 2003, 58pp. Council of Europe, Strasbourg, France.
Larsen, J.K. & Madsen, J. 2000. Effects of windturbines and other physical elements on fieldutilization by Pink–footed Geese (Anser
brachyrhynchus): a landscape perspective.Landscape Ecology 15: 755–764.
Larsen, J.K. & Clausen, P. 2002. Potential wind park impacts on whooper swans in
winter: the risk of collision. Waterbirds 25:327–330.
Madders, M. & Whitfield, D.P. 2006. Uplandraptors and the assessment of wind farmimpacts. Ibis 148 (Suppl. 1): 43–56.
Madsen, J. & Boertmann, D. 2008. Animalbehavioral adaptation to changing landscapes:spring-staging geese habituate to wind farms.Landscape Ecology 23: 1007–1011.
Martin, G.R. 2011. Understanding bird collisionswith man-made objects: a sensory ecologyapproach. Ibis 153: 239–254.
Masden, E.A., Haydon, D.T., Fox, A.D., Furness,R.W., Bullman, R. & Desholm, M. 2009.Barriers to movement: impacts of windfarms on migrating birds. ICES Journal of
Marine Science 66: 746–753.Orloff, S. & Flannery, A. 1992. Wind turbine
effects on avian activity, habitat use and mortality
at Altamont Pass and Solano County Wind
Resource Areas, 1989–1991. California EnergyCommission, Sacramento, California (USA).www.energy.ca.gov/reports.
Painter, A., Little, B. & Lawrence, S. 1999.Continuation of Bird Studies at Blyth Harbour
Wind Farm and the Implications for Offshore Wind
Farms. Report by Border Wind Limited DTI,ETSU W/13/00485/00/00, Hexham, UK.
Percival, S.M. 2007. Predicting the effects ofwind farms on birds in the UK: thedevelopment of an objective assessmentmethod. In M. de Lucas, G.F.E. Janss & M.Ferrer (eds.), Birds and wind farms. Risk
Assessment and Mitigation, pp. 137–152.Quercus, Madrid, Spain.
Rees, E.C. 2006. Bewick’s Swan. T. & A.D. Poyser,London, UK.
Rees, E.C. & Beekman, J.H. 2010. NorthwestEuropean Bewick’s Swans: a population indecline. British Birds 103: 640–650.
Schreiber, M. 1993. Windkraftanlagen undWatvogel-Rastplatze, Storungen undRastplatzwahl von Brachvogel und

116 Effects of wind farm on Bewick’s Swans
© Wildfowl & Wetlands Trust Wildfowl (2012) 62: 97–116
Goldregenpfeifer. Natur und Landschaft 25:133–139. [In German.]
Smallwood, K.S. & Thelander, C. 2008. BirdMortality in the Altamont Pass WindResource Area, California. Journal of Wildlife
Management 72(1): 215–223. Stienen, E.W.M., Van Waeyenberge, J., Kuijken,
E. & Seys, J. 2007. Trapped within thecorridor of the Southern North Sea: thepotential impact of offshore wind farms onseabirds. In M. de Lucas, G.F.E. Janss & M.Ferrer (eds.), Birds and wind farms. Risk
Assessment and Mitigation, pp. 71–80. Quercus,Madrid, Spain.
Thelander, C.G., Smallwood, K.S. & Rugge, L.2003. Bird risk behaviors and fatalities at the
Altamont Pass Wind Resource Area. NationalRenewable Energy Laboratory, Golden,Colorado, USA. http://www.nrel.gov/wind/pdfs/33829.pdf.
Thelander, C.G. & Smallwood, K.S. 2007. TheAltamont Pass Wind Resource Area’s effectson birds: a case history. In M. de Lucas,G.F.E. Janss & M. Ferrer (eds.), Birds and
Wind Farms. Risk Assessment and Mitigation, pp25–46. Quercus, Madrid, Spain.
Tulp, I., Schekkerman, H., Larsen, J.K., Van derWinden, J., Van de Haterd, R., Van Horssen,P., Dirksen, S. & Spaans, A.L. 1999. Nocturnal
flight activity of sea ducks near the wind farm Tunø
Knob in the Kattegat. Bureau Waardenburgreport 99.64, Culemborg, the Netherlands.
van Gils, J.A. & Tijsen, W. 2007. Short–termforaging costs and long–term fueling rates in central-place foraging swans revealed by giving-up exploitation times. American
Naturalist 169: 609–620.Wetlands International. 2006. Waterbird Population
Estimates – Fourth Edition. WetlandsInternational, Wageningen, the Netherlands.
Winkelman, J.E. 1989. Vogels en het windpark nabij
Urk (NOP): aanvaringsslachtoffers en verstoring van
pleisterende eenden ganzen en zwanen. RIN–report89/15. RIN, Arnhem, the Netherlands. [InDutch with English summary.]
Winkelman, J.E. 1992. De invloed van de
Sep–proefwindcentrale te Oosterbierum (Fr.) op
vogels. 1. Aanvaringsslachtoffers. Rijksinstituutvoor Natuurbeheer (RIN) report 92/2.Instituut voor Bos- en Natuuronderzoek(IBN-DLO), Arnhem, the Netherlands. [InDutch with English summary.]
Photograph: Bewick’s Swans on pasture in the Netherlands by Jelger Herder (www.digitalnature.org).
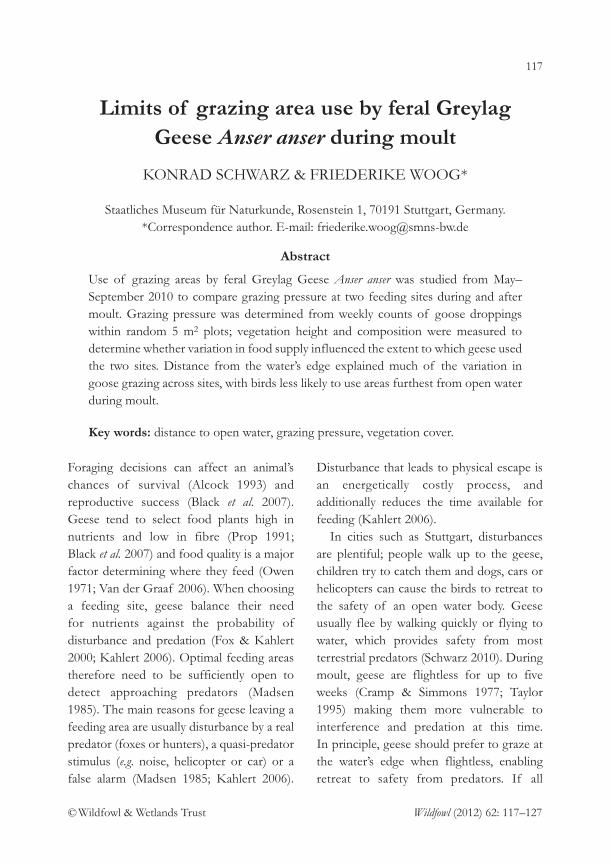
117
© Wildfowl & Wetlands Trust Wildfowl (2012) 62: 117–127
Limits of grazing area use by feral GreylagGeese Anser anser during moult
KONRAD SCHWARZ & FRIEDERIKE WOOG*
Staatliches Museum für Naturkunde, Rosenstein 1, 70191 Stuttgart, Germany.*Correspondence author. E-mail: [email protected]
Abstract
Use of grazing areas by feral Greylag Geese Anser anser was studied from May–September 2010 to compare grazing pressure at two feeding sites during and aftermoult. Grazing pressure was determined from weekly counts of goose droppingswithin random 5 m2 plots; vegetation height and composition were measured todetermine whether variation in food supply influenced the extent to which geese usedthe two sites. Distance from the water’s edge explained much of the variation ingoose grazing across sites, with birds less likely to use areas furthest from open waterduring moult.
Key words: distance to open water, grazing pressure, vegetation cover.
Foraging decisions can affect an animal’schances of survival (Alcock 1993) andreproductive success (Black et al. 2007).Geese tend to select food plants high innutrients and low in fibre (Prop 1991; Black et al. 2007) and food quality is a majorfactor determining where they feed (Owen1971; Van der Graaf 2006). When choosinga feeding site, geese balance their need for nutrients against the probability ofdisturbance and predation (Fox & Kahlert2000; Kahlert 2006). Optimal feeding areastherefore need to be sufficiently open todetect approaching predators (Madsen1985). The main reasons for geese leaving afeeding area are usually disturbance by a realpredator (foxes or hunters), a quasi-predatorstimulus (e.g. noise, helicopter or car) or afalse alarm (Madsen 1985; Kahlert 2006).
Disturbance that leads to physical escape isan energetically costly process, andadditionally reduces the time available forfeeding (Kahlert 2006).
In cities such as Stuttgart, disturbancesare plentiful; people walk up to the geese,children try to catch them and dogs, cars orhelicopters can cause the birds to retreat tothe safety of an open water body. Geeseusually flee by walking quickly or flying towater, which provides safety from mostterrestrial predators (Schwarz 2010). Duringmoult, geese are flightless for up to fiveweeks (Cramp & Simmons 1977; Taylor1995) making them more vulnerable tointerference and predation at this time. In principle, geese should prefer to graze atthe water’s edge when flightless, enablingretreat to safety from predators. If all

118 Grazing by feral Greylag Geese
© Wildfowl & Wetlands Trust Wildfowl (2012) 62: 117–127
geese were to do this, however, thevegetation close to the water would quicklybecome depleted or of reduced nutritionalquality, and under these circumstances thegeese may experience more agonisticbehaviour as they compete for limitedresources. Thus areas close to the waterneed not necessarily be preferred during themoult.
Detailed studies of habitat use bymoulting geese have been carried out mostlyin the birds’ natural environment, forinstance in Alaska for Black Brant Branta
bernicla nigricans (Weller et al. 1994; Lewis et al.
2011), in Greenland for Pink-footed GeeseAnser brachyrhynchus and Barnacle GeeseBranta leucopsis (Madsen & Mortensen 1987)and on the Danish island of Saltholm or inthe Oostvaarderplasen, the Netherlands, forGreylag Geese Anser anser (Fox & Kahlert2000; Loonen et al. 1991). There have,however, been few studies of habitat use bygeese in urban areas (Käßmann & Woog2008), and to the best of our knowledgethere have been no such studies to datemade during the moulting period. Urbanhabitats may differ from more naturalsettings in that geese are more used topeople, show lower flight distances, perceivepredation risk differently and are exposed toother forms of disturbances. This studytherefore analyses grazing pressure inrelation to vegetation height, vegetationcover and distance to water at two feedingsites used by Greylag Geese in an urbanenvironment (Stuttgart, Germany), andinvestigates whether the birds’ use of thesesites – particularly their proximity to water –varies depending on whether or not thebirds are in moult.
Methods
Study area and study population
Since first breeding successfully in 1995, apopulation of feral Greylag Geese Anser
anser has become established in Stuttgart,southwest Germany (48°46'N, 9°10'E;Woog et al. 2008). Numbers increased to 282individuals by 2010 (Schwarz 2010; Woog etal. 2012), and birds also moult in the area,mostly from late May – late June. Woog et al.(2011) provide a more detailed descriptionof this population.
Observations were made from 24 May –5 September 2010 at two sites in Stuttgart,used by the geese throughout their annualcycle: 1) a system of three small lakes in apark close to the inner city (“Park”), whichhas a small flock of c. 30 moulting geese,and 2) a lake 7 km to the north along theriver Neckar (Max-Eyth Lake, “MES”),heavily used for leisure activities, but alsothe most important breeding site for geesein the area, which has a flock of about 200geese during moult (Woog et al. 2008).Regularly mowed pastures around the lakesoffer year-round high quality grazing(Schwarz 2010; Woog et al. 2012) as repeatedmowing increases the protein content ofmany grasses and herbs (Ydenberg & Prins1981; Gadallah & Jefferies 1995). InStuttgart, geese are used to humans and,when able to fly, most individuals walk awayfor only a few meters to avoid them. Theystrongly react towards dogs, however,especially large ones (Schwarz 2010). Dogsand people account for 30% of knowncauses of goose mortality (n = 17) in the city(F. Woog, unpubl. data). There has been noevidence for predation by nocturnal foxes or

Grazing by feral Greylag Geese 119
© Wildfowl & Wetlands Trust Wildfowl (2012) 62: 117–127
mustelids in the past decade (2002–2012),which may be attributable to the geese beingmostly diurnal and spending the night onwater or on islands.
Data collection
Grazing pressure was expressed as droppingdensity per 5 m2, which is considered abetter measure than observational data ofhow markedly different areas are used forgrazing (Ebbinge et al. 1975; Ydenberg &Prins 1981; Woog & Black 2001; Black et al.
2007). Ninety two circular plots eachcovering 5 m2 were placed along randomlyselected transects (Park: n = 46, MES: n = 46) at varying, measured, distances fromthe water. Droppings were counted andremoved weekly from the plots. Restingpiles of droppings produced by loafinggeese where counted but later excludedfrom the analysis, as were plots close topoints where people feed the birds.
Vegetation height was measured eachmonth, by placing a ruler at three randompoints within each plot, and recording (tothe nearest mm) the maximum height of thevegetation. As the grass was of uniformlength, this gave a good measure of theheight of the sward. Vegetation cover wasalso estimated at the start of the field seasonby assessing, to the nearest 5%, thepercentage cover for herbs, grasses, mossand soil within each plot.
Data analyses
Generalized linear models (GLMs) inprogram ‘‘R’’, version 2.11.1. (RDevelopment Core Team 2010), were usedto determine factors that had a significantinfluence on grazing pressure. The number
of droppings per plot was used as thedependent variable and a quasi-Poissonerror distribution with logarithm linkfunction was used to fit these data in theGLM. To reduce the effects of datadependency between weekly measures, thenumber of droppings accumulated (i.e.grazing pressure) were analysed for differenttime periods. Firstly, the complete studyperiod (from 24 May – 5 September 2010) was considered. Secondly, to test theeffects of moult, we summed droppingsaccumulated over the four weeks when mostbirds were flightless (24 May – 20 June) andcompared this with droppings accumulatedduring four weeks when all birds werecapable of flight (9 August – 5 September).
Explanatory variables included in themodel were field number, distance to thewater, vegetation height, total vegetationcover, grass cover and herb cover. Allexplanatory variables were categorical. Thedistance to the edge of the water was classedas: 1) < 30 m, 2) 30–60 m, and 3) > 60 m;vegetation height as: 1) < 6 cm, and 2) 6–9cm; vegetation cover as: 1) ≤ 120%, and 2) > 120%; and grass cover and herb coverwere each classed as: 1) < 40%, 2) 40–80%,and 3) > 80%.
Variation in the dropping data wasexplored initially by testing the effects ofeach explanatory variable, independently, inan ANOVA. All explanatory variables were then fitted to one model (GLM)sequentially. As the cover parameters werecorrelated (vegetation cover and grass cover,r = –0.3, P = 0.003; vegetation cover andherb cover, r = 0.57, P < 0.0001; grass coverand herb cover, r = –0.96, P < 0.0001), onlytotal vegetation cover was included in the
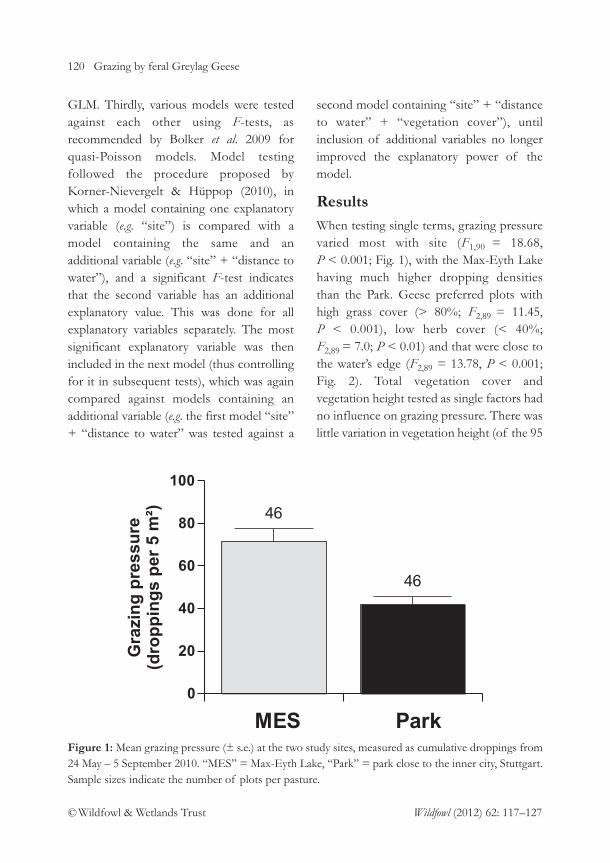
120 Grazing by feral Greylag Geese
© Wildfowl & Wetlands Trust Wildfowl (2012) 62: 117–127
GLM. Thirdly, various models were testedagainst each other using F-tests, asrecommended by Bolker et al. 2009 forquasi-Poisson models. Model testingfollowed the procedure proposed byKorner-Nievergelt & Hüppop (2010), inwhich a model containing one explanatoryvariable (e.g. “site”) is compared with amodel containing the same and anadditional variable (e.g. “site” + “distance towater”), and a significant F-test indicatesthat the second variable has an additionalexplanatory value. This was done for allexplanatory variables separately. The mostsignificant explanatory variable was thenincluded in the next model (thus controllingfor it in subsequent tests), which was againcompared against models containing anadditional variable (e.g. the first model “site”+ “distance to water” was tested against a
second model containing “site” + “distanceto water” + “vegetation cover”), untilinclusion of additional variables no longerimproved the explanatory power of themodel.
ResultsWhen testing single terms, grazing pressurevaried most with site (F1,90 = 18.68, P < 0.001; Fig. 1), with the Max-Eyth Lakehaving much higher dropping densities than the Park. Geese preferred plots withhigh grass cover (> 80%; F2,89 = 11.45, P < 0.001), low herb cover (< 40%; F2,89 = 7.0; P < 0.01) and that were close tothe water’s edge (F2,89 = 13.78, P < 0.001;Fig. 2). Total vegetation cover andvegetation height tested as single factors hadno influence on grazing pressure. There waslittle variation in vegetation height (of the 95
Figure 1: Mean grazing pressure (± s.e.) at the two study sites, measured as cumulative droppings from24 May – 5 September 2010. “MES” = Max-Eyth Lake, “Park” = park close to the inner city, Stuttgart.Sample sizes indicate the number of plots per pasture.
46
46
0
20
40
60
80
100
Gra
zing
pre
ssur
e(d
ropp
ings
per
5 m
²)
MES Park
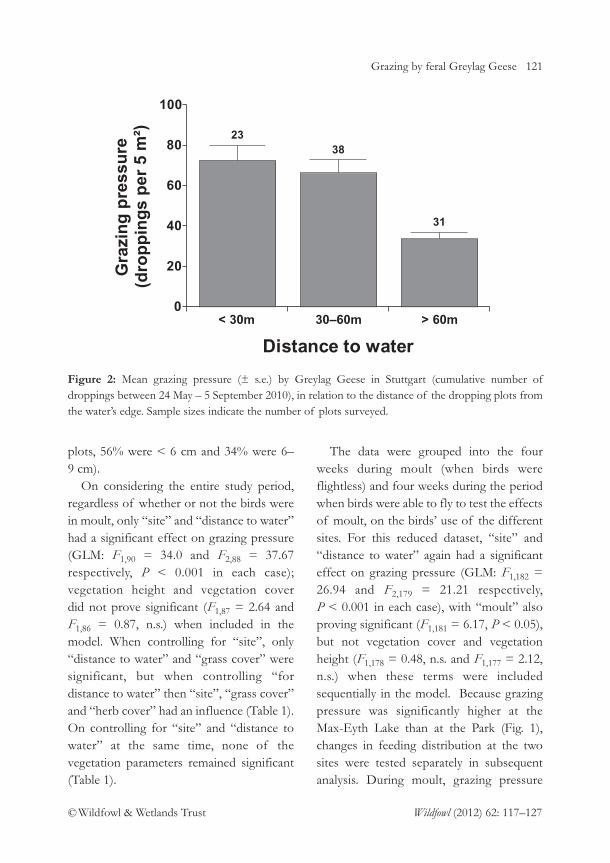
Grazing by feral Greylag Geese 121
© Wildfowl & Wetlands Trust Wildfowl (2012) 62: 117–127
plots, 56% were < 6 cm and 34% were 6–9 cm).
On considering the entire study period,regardless of whether or not the birds werein moult, only “site” and “distance to water”had a significant effect on grazing pressure(GLM: F1,90 = 34.0 and F2,88 = 37.67respectively, P < 0.001 in each case);vegetation height and vegetation cover did not prove significant (F1,87 = 2.64 and F1,86 = 0.87, n.s.) when included in themodel. When controlling for “site”, only“distance to water” and “grass cover” weresignificant, but when controlling “fordistance to water” then “site”, “grass cover”and “herb cover” had an influence (Table 1).On controlling for “site” and “distance towater” at the same time, none of thevegetation parameters remained significant(Table 1).
The data were grouped into the fourweeks during moult (when birds wereflightless) and four weeks during the periodwhen birds were able to fly to test the effectsof moult, on the birds’ use of the differentsites. For this reduced dataset, “site” and“distance to water” again had a significanteffect on grazing pressure (GLM: F1,182 =26.94 and F2,179 = 21.21 respectively, P < 0.001 in each case), with “moult” alsoproving significant (F1,181 = 6.17, P < 0.05),but not vegetation cover and vegetationheight (F1,178 = 0.48, n.s. and F1,177 = 2.12,n.s.) when these terms were includedsequentially in the model. Because grazingpressure was significantly higher at the Max-Eyth Lake than at the Park (Fig. 1),changes in feeding distribution at the twosites were tested separately in subsequentanalysis. During moult, grazing pressure
1 3
Distance to water
0
20
40
60
80
100G
razi
ng p
ress
ure
(dro
ppin
gs p
er 5
m²) 23
38
31
< 30m 30–60m > 60m
Figure 2: Mean grazing pressure (± s.e.) by Greylag Geese in Stuttgart (cumulative number ofdroppings between 24 May – 5 September 2010), in relation to the distance of the dropping plots fromthe water’s edge. Sample sizes indicate the number of plots surveyed.

122 Grazing by feral Greylag Geese
© Wildfowl & Wetlands Trust Wildfowl (2012) 62: 117–127
Tab
le 1
.Si
gnifi
canc
e of
exp
lana
tory
var
iabl
es a
dded
to
thre
e in
itial
mod
els,
to t
est
the
effe
cts
of s
ite, d
ista
nce
to w
ater
, veg
etat
ion
heig
ht a
nd v
eget
atio
n co
ver
on G
reyl
ag G
oose
gra
zing
pre
ssur
e (e
xpre
ssed
as
drop
ping
s/5m
2ac
cum
ulat
ed o
ver
the
entir
e st
udy
perio
d). E
ach
of t
he t
hree
mod
els
in t
he l
eft
colu
mn
was
tes
ted
agai
nst
that
mod
el p
lus
one
of e
xpla
nato
ry v
aria
bles
on
top
(i.e.
Dro
ppin
gs~
Dis
tanc
e to
wat
er w
as t
este
d ag
ains
t D
ropp
ings
~D
ista
nce
to w
ater
+ %
gra
ss c
over
etc
.). T
he s
ite a
nd t
he d
ista
nce
from
open
wat
er e
xpla
ined
mos
t of
the
obse
rved
var
iatio
n in
gra
zing
pre
ssur
e. S
igni
fican
t res
ults
are
giv
en in
bol
d.
Init
ial m
odel
Var
iabl
es a
dded
to
the
mod
el
Site
Dis
tanc
e %
Gra
ss%
Veg
etat
ion
% H
erbs
Veg
etat
ion
to w
ater
heig
ht
Dro
ppin
gs~
Site
XF
2,88
= 3
7.55
F2,
88=
3.2
0F
1,89
= 0
.85
F2,
88=
0.8
8F
1,89
= 0
.19
P<
0.0
01P
< 0
.05
P=
0.3
6, n
.s.P
= 0
.42,
n.s.
P=
0.6
6, n
.s.
Dro
ppin
gs~
Dis
tanc
e F
1,89
= 6
2.74
XF
2,87
= 1
5.79
F1,
88=
3.2
5F
2,87
= 1
2.13
F1,
88=
0.2
7to
wat
erP
< 0
.001
P<
0.0
01P
= 0
.07,
n.s.
P<
0.0
01P
= 0
.60,
n.s.
Dro
ppin
gs~
Site
+
XX
F2,
86=
0.7
6F
1,87
= 0
.86
F2,
86=
0.6
0F
1,87
= 2
.23
Dis
tanc
e to
wat
erP
= 0
.47,
n.s.
P=
0.3
6, n
.s.P
= 0
.55,
n.s.
P=
0.1
4, n
.s.

Grazing by feral Greylag Geese 123
© Wildfowl & Wetlands Trust Wildfowl (2012) 62: 117–127
decreased with distance to water at bothsites, but this was more evident at Max-Eyth Lake (Fig. 3; Tables 2a,b). The geeseused plots at distances of ≥ 30 m less during the moulting period. When birdswere able to fly (i.e. not moulting), distanceto water did not have a significant influenceon grazing pressure (F2.43 = 2.66, P = 0.08and F2,43 = 0.7, P = 0.5 for non-moultinggeese at MES and the Park, respectively; n.s. in each case). Moreover, grazingpressure at the Max-Eyth Lake was muchhigher than at the Park during moult (F1,90 = 70.1, P < 0.001), whereas outsidethe moulting period grazing pressure was
similar between the two sites (F1,90 = 0.21, P = 0.65, n.s.).
DiscussionDuring moult, feral Greylag Geese inStuttgart preferred to graze closer to thewater and this was not influenced byvegetation height or vegetation cover.Moulting geese used areas at greaterdistances from the water less, and thisreduced the area available for foraging. Fox& Kahlert (2000) found a reduced feedingrange of moulting Greylag Geese on theDanish island of Saltholm. This is a patternalso found for feral Greylag Geese in
Figure 3: Mean grazing pressure (± s.e.) by Greylag Geese during moult (grey bars; 24 May –20 June)and after moult (black bars; 9 August – 5 September) at the Max-Eyth Lake and the “Park”, in relationto the distance of the dropping plots from water. Sample sizes indicate the number of plots surveyed.
< 30m 30–60m > 60m
Distance to water
Gra
zing
pre
ssur
e (d
ropp
ings
per
5 m
²)
1817 11
18 17 11
0
10
20
30
40
50
60
70
5
21
20
5 2120
MoultNo moult
0
10
20
30
Max-Eyth Lake
Park

124 Grazing by feral Greylag Geese
© Wildfowl & Wetlands Trust Wildfowl (2012) 62: 117–127
Tab
le 2
. Sig
nific
ance
of
expl
anat
ory
varia
bles
add
ed t
o tw
o in
itial
mod
els,
to t
est
the
effe
cts
of d
ista
nce
to w
ater
, mou
lt, v
eget
atio
nhe
ight
and
veg
etat
ion
cove
r on
Gre
ylag
Goo
se g
razi
ng p
ress
ure
(exp
ress
ed a
s dr
oppi
ngs/
5m2 )
at:
(a) M
ax-E
yth
Lak
e, a
nd (b
) the
Par
k.E
ach
of th
e m
odel
s in
the
left
col
umn
was
test
ed a
gain
st th
at m
odel
plu
s on
e of
exp
lana
tory
var
iabl
es li
sted
(i.e
. Dro
ppin
gs ~
Dis
tanc
eto
wat
er w
as t
este
d ag
ains
t D
ropp
ings
~D
ista
nce
to w
ater
+M
oult,
etc
.). M
oult
stat
us e
xpla
ined
mos
t of
the
obs
erve
d va
riatio
n in
graz
ing
pres
sure
, with
dis
tanc
e to
the
wat
er a
lso
prov
ing
sign
ifica
nt. N
one
of th
e ve
geta
tion
para
met
ers
wer
e si
gnifi
cant
.
Init
ial m
odel
Mou
ltD
ista
nce
% G
rass
% V
eget
atio
n%
Her
bsV
eget
atio
n to
wat
erhe
ight
(a)
Max
-Eyt
h L
ake
Dro
ppin
gs~
Dis
tanc
e F
1,88
= 5
.68
xF
2,87
= 0
.12
F1,
88=
1.7
8F
2,87
= 0
.69
F1,
88=
3.1
7to
wat
erP
< 0
.05
P=
0.8
9P
= 0
.19
P=
0.5
1P
= 0
.08
Dro
ppin
gs~
Mou
ltx
F2,
88=
28.
22F
2,88
= 2
.76
F1,
89=
0.2
2F 2
,88
= 1
.41
F1,
89=
0.0
5
P<
0.0
01P
= 0
.07
P =
0.6
4P
= 0
.25
P=
0.8
3
(b)
Par
k
Dro
ppin
gs~
Dis
tanc
e F
1,88
= 5
.68
xF
2,87
= 0
.12
F1,
88=
1.7
8F
2,87
= 0
.69
F1,
88=
3.1
7to
wat
erP
< 0
.05
P=
0.8
9P
= 0
.19
P=
0.5
1P
= 0
.08
Dro
ppin
gs~
Mou
ltx
F2,
88=
28.
22F
2,88
= 2
.76
F1,
89=
0.2
2F 2
,88
= 1
.41
F1,
89=
0.0
5
P<
0.0
01P
= 0
.07
P =
0.6
4P
= 0
.25
P=
0.8
3

Grazing by feral Greylag Geese 125
© Wildfowl & Wetlands Trust Wildfowl (2012) 62: 117–127
Stuttgart. Fox & Kahlert (2000) suggest thatthe decrease in area use with distance fromthe shore was caused mainly by the predatorescape mechanism, which is heightenedduring the flightless moulting period. TheGreylags on Saltholm showed morefrequent escape responses during moult,including escapes from “quasi predatorstimuli” (Kahlert 2006), indicating thatbeing flightless made the geese more“nervous”. This was also observed inStuttgart but detailed data are missing.
Moult is an energy demanding process(Bezzel & Prinzinger 1990; Singer et al.2012). Geese become flightless for up tofive weeks and during this time need tobalance their need for food with that ofpredator and disturbance avoidance (Fox etal. 1995; Kahlert 2006). The importance ofthese needs varies between goose speciesand sites. Some goose species put on fatprior to moult and can at least partly rely ontheir body reserves during moult whereasothers need to feed (Ankney 1984; Fox &Kahlert 2005), or else they lose weight(Loonen et al. 1991; Fox & Kahlert 2005;Singer et al. 2012), and some deplete food at a site to the extent that it is no longersuitable for moulting (Loonen et al.
1991). Predator density, perceived predationrisk and probability of disturbance also vary between areas. Because these data have not yet been recorded for Stuttgart,evaluation of the importance of thedifferent factors – i.e. the need to maintainproximity to water as opposed to improvefood intake during the moult – must remainspeculative.
Compared to moulting Pink-footedGeese in Greenland (which feed 200–220 m
from water; Madsen & Mortensen 2008),and the Greylags on Saltholm (which roamup to 150 m; Fox & Kahlert 2000), Greylagsin Stuttgart rarely ventured more than 30 mfrom the water’s edge. There are severalpotential explanations for this difference.Birds in Stuttgart may have moreendogenous energy stores to rely on, or findfood sufficiently rich enough in nutrientsclose to the water. Alternatively, real orperceived predation risk may be higher inthe urban habitat than in the arctic,encouraging the geese to stay close to water,to which they can retreat quickly for safety.The landscape in the parks of Stuttgartconsists of small grasslands divided bypaths, hedges and trees and as suchcontrasts with the vast open areas of thearctic, where the birds can see predators andtake evasive action at relatively longdistances. Flight distances of winteringPink-footed Geese in Denmark were lowerin areas with obstructions to open view(Madsen 1984). The perceived predationrisk in Stuttgart therefore may be muchhigher than in more open landscapes, with a corresponding reduction in the areaavailable for feeding.
Moult migrations to sites with favourablefeeding conditions, described for manymigratory geese (Owen & Black 1990;Weller et al. 1994), occur only locallyamongst Greylag Geese in southwestGermany (F. Woog unpubl. ring re-sightingsdata). Grasses and herbs around the selectedmoulting sites in Stuttgart are likely to berich in nutrients, however, through theregular management of the parkland, asrepeated mowing generally increases theprotein content of vegetation (Ydenberg &
126 Grazing by feral Greylag Geese
© Wildfowl & Wetlands Trust Wildfowl (2012) 62: 117–127
Prins 1981; Gadallah & Jefferies 1995).Grazing pressure was highest in plots with ahigh grass and low herb cover, a pattern alsofound by Käßmann & Woog (2007) duringthe winter. More detailed studies are neededon the food plant taxa selected by the geese,including nutrient content and biomass inrelation to observed grazing patterns, toinform and improve habitat managementregimes for the birds (Bos et al. 2005).
Future studies on moulting geese in urban habitats should concentrate on thestudy of individuals, their decisions andconsequences for their survival andsubsequent reproductive success. Is thebehaviour of the Greylags in Stuttgartdependent on their condition before andduring moult? To what extent do they losebody reserves during moult and is thisaffected by their reaction towardsdisturbances? Such studies could also guidemanagement recommendations to set asideareas for undisrupted foraging, especiallyduring moult.
Acknowledgements
We thank Fränzi Korner-Nievergelt forstatistical advice and Eileen Rees, Antony Fox,Johnny Kahlert and an anonymous referee forimproving earlier versions of the manuscript.
References
Alcock, J. 1993. Animal Behavior. An Evolutionary
Approach. Sinauer Associates, Sunderland,USA.
Bezzel, E. & Prinzinger, P. 1990. Ornithologie.Ulmer, Stuttgart, Germany.
Black, M., Prop, J. & Larsson, K. 2007. Wild
Goose Dilemmas. Branta Press, Groningen,Netherlands.
Ankney, C.D. 1984. Nutrient reserve dynamics ofbreeding and molting Brant. Auk 101: 361–370.
Bolker, B.M., Brooks, M.E., Clark, C.J., Geange,S.W., Poulsen, J.R., Stevens, M.H.H. & White,J.S.S. 2007. Generalized linear mixed models:a practical guide for ecology and evolution.Trends in Ecology and Evolution 24 (3): 127–135.
Bos, D., Drent, R.H., Rubinigg, M. & Stahl, J.2005. The relative importance of foodquantity and quality for patch and habitatchoice in Brent Geese. Ardea 93: 5–16.
Cramp, S. & Simmons, K.E.L. (eds.) 1977.Handbook of the Birds of Europe, the Middle
East and North Africa – The Birds of the Western
Paleartic. Volume 1, Ostrich to Ducks. OxfordUniversity Press, Oxford, UK.
Gadallah, F.L. & Jefferies, R.L. 1995. Comparisonof the nutrient contents of the principalforage plants utilized by Lesser Snow Geeseon summer breeding grounds. Journal Applied
Ecology 32: 263–275.Ebbinge, B., Canters, K. & Drent, R. 1975.
Foraging routines and estimated daily foodintake in Barnacle Geese wintering in thenorthern Netherlands. Wildfowl 26: 5–19.
Fox, A.D. & Kahlert, J. 2000. Do moultingGreylag Geese Anser anser forage in proximityto water in response to food availabilityand/or quality? Bird Study 47: 266–274.
Fox, A.D., Kahlert, J., Ettrup, H., Nilsson, H. &Hounisen, J.P. 1995. Moulting Greylag GeeseAnser anser on the Danish island of Saltholm;Numbers, phenology, status and origins.Wildfowl 46: 16–30.
Fox, A.D. & Kahlert, J. 2005. Changes in bodymass and organ size during wing moult innon-breeding greylag geese Anser anser.
Journal of Avian Biology 36: 538–548.Kahlert, J. 2006. Factors affecting escape
behaviour in moulting Greylag Geese Anser
anser. Journal of Ornithology 147: 569–577.

Grazing by feral Greylag Geese 127
© Wildfowl & Wetlands Trust Wildfowl (2012) 62: 117–127
Käßmann, S. & Woog, F. 2007. How to cope withsnow and ice: winter ecology of feral GreylagGeese Anser anser. Wildfowl 57: 29–39.
Käßmann, S. & Woog. 2008. WinterlicheVerbreitungsmuster und Habitatnutzung vonGraugänsen Anser anser in einer süddeutschenGroßstadt. Vogelwarte 46: 131–138.
Korner-Nievergelt, F. & Hüppop, O. 2010. Dasfreie Statistikpaket “R”: Eine Einführung fürOrnithologen. Vogelwarte 48: 119–135.
Lewis, T.L., Flint, P.L., Derksen, D.V & Schmutz,J.A. 2011. Fine scale movements and habitatuse of Black Brant during the flightless wingmolt in Arctic Alaska. Waterbirds 34: 177–185.
Loonen, M.J.J.E., Zijlstra, M. & Van Eerden,M.R. 1991. Timing of wing moult in Greylag Geese Anser anser in relation to theavailability of their food plants. Ardea 79:253–258.
Madsen, J. 1985. Impact of disturbance on fieldutilization of Pink-footed Geese in West-Jutland, Denmark. Biological Conservation 33:53–63.
Madsen, J. & Mortensen, C.E. 1987. Habitatexploitation and interspecific competition ofmoulting geese in east Greenland. Ibis 129:25–44.
Owen, M. 1971. The selection of feeding site byWhite-fronted Geese in winter. Journal of
Applied Ecology 8: 905–917. Owen, M. & Black, J.M. 1990. Waterfowl Ecology.
Blackie, London, UK.Portugal, S. J., Green J.A., Piersma, T., Eichhorn,
G. & Butler P.J. 2011. Greater energy storesenable flightless moulting geese to increaseresting behaviour. Ibis 153 (4): 868–874.
Prop, J. 1991. Food exploitation patterns byBrent Geese during spring staging. Ardea 79:331–341.
R Development Core Team. 2006. R: A language
and environment for statistical computing. RFoundation for Statistical Computing, Vienna.http://www.R-project.org.
Schwarz, K. 2010. Ökologie einer expandierendenGrauganspopulation. Dip. Biol. Thesis,University of Hohenheim, Germany.
Singer, H.V., Sedinger, J.S., Nicolai, C.A., VanDellen, A.W. & Person, B.T. 2012. Timing ofremigial wing molt in female Black Brant(Branta bernicla nigricans). Auk 129: 239–246.
Taylor, E.J. 1995. Molt of Black Brant (Branta
bernicla nigricans) on the arctic coastal plain,Alaska. Auk 112: 904–919.
Van der Graaf, A.J., Coehoorn, P. & Stahl, J. 2006. Sward height and bite size affect thefunctional response of barnacle geese Branta leucopsis. Journal of Ornithology 147:479–484.
Weller, M.W., Jensen, K.C., Taylor, E.J., Miller,M.W., Bollinger, K.S., Derksen, D.V., Esler,D. & Markon, C.J. 1994. Assessment ofshoreline vegetation in relation to use bymolting Black Brant Branta bernicla nigricans
on the Alaska Coastal Plain. Biological
Conservation 70: 219–225.Woog, F. & Black, J.M. 2001. Foraging behavior
and temporal use of grasslands by Néné:implications for management. Studies in Avian
Biology 22: 319–328.Woog, F., Schmolz, M. & Lachenmaier, K. 2008.
Die Bestandsentwicklung der Graugans imStadtkreis Stuttgart. Ornithologische Jahreshefte
Baden-Württemberg 24: 141–146.Woog, F., Maierhofer, J. & Haag, H. 2011.
Endoparasites in the annual cycle of feralGreylag Geese Anser anser. Wildfowl 61:164–179.
Woog, F., Hulme, M. & Schwarz, K. 2012. All youcan eat – do peck rates of Greylag Geese(Anser anser) vary with age and social status?Journal of Ornithology. DOI 10.1007/s10336-012-0831-5.
Ydenberg, R.C. & Prins, H.H.Th. 1981. Springgrazing and the manipulation of food qualityby Barnacle Geese. Journal of Applied Ecology
18: 443–453.

128
© Wildfowl & Wetlands Trust Wildfowl (2012) 62: 128–145
Egyptian Goose Alopochen aegyptiaca: an introducedspecies spreading in and from the Netherlands
The establishment and spread of alienintroduced species often raises considerablepublic concern (Duncan et al. 2003). Thismostly relates to potential ecological effects,
such as hybridization with native species, or competition for breeding sites andlimited food resources (Weller 1969). Lately,however, economic impacts including
ABEL GYIMESI* & ROB LENSINK
Bureau Waardenburg, Department of Bird Ecology, P.O. Box 365, 4100 AJ Culemborg, the Netherlands.
*Correspondence author. E-mail address: [email protected]
Abstract
The Egyptian Goose Alopochen aegyptiaca was introduced as an ornamental species toparks in the Netherlands during the 20th century because of its exotic plumage.Escaped birds started to breed in the wild in 1967, and the species has now colonisedmost of the country. From the 1980s onwards the birds spread further to Germany,then to Denmark, while escapes from parks in Brussels established viable populationsthere and in France. This study summarises the latest available information on thenumbers and distribution of free-living Egyptian Geese in the Netherlands andEurope. The population dynamics of the species were analysed to provide a betterunderstanding of the development of the Dutch population over the past 40+ years,with special attention paid to the effects of culling, natural winter mortality andpossible habitat preferences. Numbers breeding in the Netherlands were estimated atc. 10,000 pairs in 2010, and the total population at c. 45,000 individuals in winter2010/11. Both breeding and non-breeding numbers increased exponentially (by 28%annually) from the establishment in the wild until 1999. However, the rate of increasehas slowed in the last ten years, likely due to saturation of available breeding sites andan increase in culling activity. Within-season mortality in severe winters exceeded thatduring mild winters. The success of the Egyptian Goose in the Netherlands can likelybe attributed to the abundance of freshwater areas available close to grasslands withfew trees. Extrapolation up to 2010 of trends observed in Belgium and Germany until2005 and 2006, respectively, suggests that these breeding populations together exceed16,000 pairs, bringing the total numbers breeding in northwest Europe (including pairsin Britain, France and Denmark) to > 26,000 pairs.
Key words: exotic, feral, introduced, non-native, population dynamics.

Egyptian Goose in the Netherlands and Europe 129
© Wildfowl & Wetlands Trust Wildfowl (2012) 62: 128–145
damage to agricultural crops (Conover 2002;Mangnall & Crowe 2002), social issues (e.g.defecating in recreational waters) andamenity effects (e.g. defecation in publicareas) have all become matters of extensivepublic debate (Bomford 2003; Banks et al.
2008). A better understanding of theecology and population dynamics ofintroduced species therefore is required tobetter support public discussion andprovide adequate evidence upon which tobase decision-making.
The Egyptian Goose Alopochen aegyptiaca
is one of the non-native waterfowl speciesmost rapidly spreading in Europe. It iswidespread in its native range in Africa,south of the Sahara, numbering > 500,000individuals (Brown et al. 1982; Banks et al.
2008). The species was introduced toEngland as an ornamental waterbird in the17th century, and developed into a free-living, self-sustaining population in EastAnglia, but has shown little growth innumbers in Britain over the centuries(Sutherland & Allport 1991).
In the second half of the 20th century,the species was kept in captivity at sitesacross Europe, including the Netherlands.Escaped individuals from parks in TheHague were reported breeding freely for thefirst time in 1967 (Teixeira 1979). Since then,the introduced population of EgyptianGeese has expanded and colonised all partsof the Netherlands (Lensink 1999a). Duringthe compilation of the Dutch breeding birdatlas in 1999/2000, > 4,900 pairs wereestimated breeding across 61% of the 1,674atlas squares (5 × 5 km) monitored duringthe survey (Lensink 2002). From the 1980sonwards, the species has spread deep into
Germany, with increasing numbers alsoreported from Switzerland and Denmark(Banks et al. 2008). Birds escaped from parks in Brussels in Belgium to establishanother population, now spreading intoFrance (Fouque et al. 2011), are perhapssupplemented by local escapes in bothcountries.
In contrast to the relatively slow growthof the English population since itsestablishment more than 300 years ago,rapid growth occurred on mainland Europeimmediately after first breeding in the wild.Insight into the ecology of the EgyptianGoose is required, however, to ensure thatmodels developed to predict future trends inthe European population are scientificallysound (Kampe-Persson 2010; Rehfisch et al.
2010). We here present results of a study ofthe changes in distribution and abundance,habitat selection and winter mortality of thespecies in the Netherlands (the main sourceof the Northwest European population), to better understand the populationdynamics of the Egyptian Goose in Europeand to predict its future distribution and abundance. Additionally, the currentdistribution and numbers of the EgyptianGoose in Europe are summarised and thepossible ecological, economic and socialimpacts of the species are discussed.
Methods
Data
Numbers, trends and distribution of theEgyptian Goose in the Netherlandsoriginate from data provided by the DutchCentre for Field Ornithology (SOVON)based on observations recorded during:

130 Egyptian Goose in the Netherlands and Europe
© Wildfowl & Wetlands Trust Wildfowl (2012) 62: 128–145
1) the Dutch Breeding Bird MonitoringProject (BMP) from 1990–2009, 2) theWaterbird Monitoring Scheme (WAVO)from 1975–2008, and 3) the sevennationwide breeding pairs censuses of theperiod 1967–1999/2000 (in 1967, 1972,1977, 1983, 1989, 1994, and 1999/2000).
The BMP survey in the Netherlands isdesigned to track trends in breeding birdnumbers, based on intensive mapping ofbreeding bird territories. Between Marchand July, approximately 1,500 study plots(varying in size from c. 10–250 ha) arevisited 5–10 times, depending on the type ofhabitat and species coverage, and all birdsshowing territorial or nesting behaviour are recorded (van Dijk 1993). Since thestudy plots do not reach 100% coveragenationally, SOVON presents annual changesin indices relative to the baseline year of1990, estimated using log-linear Poissonregression models of time series correctedfor missing data (Pannekoek & van Strien2005). For our study, BMP data was availableas totals for the Netherlands, and alsoseparately for the 12 provinces and 13different physical-geographical regions, forthe period 1990–2008.
The WAVO censuses are carried outmonthly from September to April at 86important wetlands in the Netherlands, aswell as at the staging sites of geese and swans(van Roomen et al. 2003). The counts arereported as monthly averages, and not asindices as in the BMP. Counts are carried outduring daytime, and hence when Egyptiangeese are at the foraging sites. Birds are onlycounted if present within the habitat (i.e. excluding birds flying over). Data from the Waterbird Monitoring Scheme
was available for the period 1975–2008.During the regular WAVO survey in mid-January (which also provides theNetherlands counts for the InternationalWaterbird Census (IWC) coordinated byWetlands International), many additionalcanals and smaller waterbodies are visited,bringing the total size of the census area toapproximately 1.95 million ha. Areas withmissing counts are imputed by standardizedmethods (van Roomen et al. 2003), providinga robust and reliable estimate of waterbirdnumbers in the Netherlands. These data wereavailable as totals and also separately for 16physical-geographical regions.
The breeding pairs census of 1999/2000provided the most recent nationwide countof the number of Egyptian Goose breedingpairs. For this census, the Netherlands wassubdivided in 1,674 atlas squares (5 × 5 km),which all contained 25 kilometre squares. Thegoals of the census were to compile a list ofbreeding bird species and to estimate thenumber of breeding pairs per atlas square. Alllandscape types within an atlas square werevisited several times during the breedingseason. If breeding density was high, oftenonly part of the atlas square was visited andthe number of breeding pairs counted therewas extrapolated proportionally to theamount of available habitats in the rest of thesquare. Like the WAVO censuses, breedingpairs census data were available for 16physical-geographical regions.
Information on Egyptian Goosenumbers outside the Netherlands wascollected by personal communication withlocal experts and from published sources onthe breeding population in Belgium(Devillers 1988; Anselin & Devos 1994;

Egyptian Goose in the Netherlands and Europe 131
© Wildfowl & Wetlands Trust Wildfowl (2012) 62: 128–145
Lensink 1999a; Banks et al. 2008) andGermany (Lensink 1996; Lensink 1998;Hüppeler 2000; Südbeck et al. 2007; Banks etal. 2008). The most recent data for Belgiumand Germany were from 2005 and 2006,respectively.
Analysis
Population growth rates for Egyptian Geesein the Netherlands were calculated by takingthe exponential of the slope of the naturallog-transformed numbers plotted per year.The estimated number of breeding pairs in2010 was calculated in two ways, both usingthe number of pairs reported in the Dutchbreeding bird atlas as a starting point(SOVON 2002). This was the most recentcomplete nationwide census of breedingEgyptian Goose pairs, estimated as 4,950pairs in 1999–2000 (Lensink 2002). Oneestimate for 2010 was based on the meangrowth rate recorded per province by theBMP surveys in the period 2000–2009.These growth rates were applied perprovince, and were relative to the number ofbreeding pairs registered during the first yearof the period (year 2000). The other methodwas also based on numbers registered ineach province in 2000, but relied on themean annual increase (i.e. 8.8% for thewhole country) in bird numbers recorded by the WAVO censuses in the period2000–2008. This growth rate was appliedper province, and again relative to thenumbers registered during the first year ofthe period (year 2000).
An estimate of the total population size(including both breeding and non-breedingbirds) in the summer of 2010 was derivedfrom the estimated number of breeding
pairs. The estimate was based on Lesliematrix calculations (Caswell 2001), assumingthat breeding commences after the firstwinter, a juvenile survival rate of 72%, adultsurvival of 83% and a production of 1.9juveniles/pair/year (Table 1; values takenfrom Lensink 1998). However, the nationaldatabase of the Royal Netherlands ShootingAssociation (Koninklijke NederlandseJagers Vereniging) shows that culling sincethe 1990s gradually increased to 20,000Egyptian Geese shot in 2008, roughly equalto 1.5 geese per 100 ha, a removal of birdsthat has remained relatively stable since then(Montizaan & Siebenga 2010). In order tothe test the effect of culling on growth rates,the model was run both with and withoutcontrolling for culling. In the former, thenumber of shot birds was corrected per age-class for the number of birds that would nothave survived until next year.
The WAVO census data were used to testthe effects of winter severity on EgyptianGoose numbers within and between years.IJnsen indices provided a measure forwinter severity. This measure is the degree-sum, on a scale of 0–100, of the number of
Table 1. Leslie matrix of the vitalpopulation parameters used to model theeffect of shooting on Egyptian Geese in theNetherlands.
1st year ≥ 2nd year
Fecundity 0 0.684Survival to 2nd year 0.720 0Survival to > 2nd year 0 0.830

132 Egyptian Goose in the Netherlands and Europe
© Wildfowl & Wetlands Trust Wildfowl (2012) 62: 128–145
frost days (minimum temperature < 0°C),ice days (maximum temperature < 0°C) and very cold days (minimum temperature < –10°C) between November and March(Van Engelen et al. 2001). The IJnsen indiceswere used as the independent variable in alinear regression model to predict changesin the annual average number of birdscounted in the winter half-year (November–March) during the years 1975–2008. A one-way ANOVA tested whether the annualchanges in numbers differed significantlyafter severe winters (with an IJnsen index of> 30; n = 7), compared to after mild winters(with an IJnsen index of < 10; n = 15). Inaddition, an ANOVA assessed within-wintermortality by testing whether the differencebetween the average numbers of individualscounted during the waterfowl censuses in November–December and January–February were lower in severe than in mildwinters. These periods are known to achievethe most extensive census coverage with thefewest imputed numbers for missing counts.Values were natural log-transformed toachieve normality.
In order to test statistically for changes indistribution, the count areas of the IWCsconducted in January each year were groupedinto 16 different physical-geographicalregions. Numbers counted in January 2000and January 2008 were log-transformed andwere subjected to simple linear correlation.
The habitat preference analysis relied onthe habitat type classification (i.e. urban areas,orchards, forests, arable land, grassland,heath, water, sandy areas, and “other”habitats) of the SOVON survey areas (n =3,959; mean ± s.d. surface area = 587 ± 955ha) of the IWC January 2000 census.
SOVON reports bird numbers per surveyarea but not specifically per habitat typewithin the area. Nevertheless, the number ofEgyptian Geese varied greatly among surveyareas (range = 0–299 birds). On omittingsurvey areas without Egyptian Geese, themean number recorded was 12.1 birds persurvey area. In order to compare the habitattypes between preferred and non-preferredareas, survey areas were selected where noEgyptian Geese were observed and alsowhere > 50 birds were observed. The surfaceareas of the nine habitat types were summedfor these two groups. Subsequently, thearcsine transformed proportions of thehabitat types within one group werecompared with a paired t-test for unequalvariances with the correspondingproportions of the other group.
Population growth rates outside theNetherlands were based on published datarelated to the breeding population inBelgium and Germany. The numbers ofbreeding pairs were natural log-transformedand exponential curves were fitted to therelationship between these and the year ofobservation. The resulting equations werethen used to extrapolate the figures forBelgium and Germany up to 2010 which,when combined with data from othercountries, provided a recent estimate of thetotal European population.
Results
Numbers in the Netherlands
Relating the most recent complete estimateof Egyptian Geese breeding in theNetherlands (4,944 breeding pairs in 1999–2000; Lensink 2002) to earlier nationwide
Egyptian Goose in the Netherlands and Europe 133
© Wildfowl & Wetlands Trust Wildfowl (2012) 62: 128–145
breeding pair censuses undertaken since1967 (reported in Lensink 1996, 2002; Table2) gave a mean annual growth rate of 28.2%of the breeding population calculated overthe whole period between 1967 and 1999.Nevertheless, the growth was not constant.The nationwide censuses and the breedingbird surveys provided similar estimates ofmean annual rates of increase (i.e. 12.1%and 12.7%, respectively) in the period of1990–1999 (BMP surveys were availableonly from 1990 onwards) but the valueswere lower than over the whole period,suggesting a slower growth rate during the1990s. The increase in the number ofEgyptian Goose pairs (NNL) with year (t) inthe period 1967–2000 could be bestdescribed by an exponential function (lnNNL = 0.25t – 488, r2
5 = 0.98, P < 0.0001).Fitting a second order polynomial did notimprove the relationship as the quadraticterm remained 0.
There were no nationwide censuses ofEgyptian Geese carried out after 1999–2000, but the BMP surveys indicated thatthe rate of increase slowed down furtherbetween 2000 and 2009 to an annual meanof 7.0% for the total Dutch population. The WAVO surveys (conducted betweenNovember and April) found a similargrowth rate (8.8%) for the period 2000–2008. The BMP surveys also allowed ananalysis at the level of the 12 Dutchprovinces and 13 physical-geographicalregions. The BMP surveys revealed a lowgrowth rate of the number of breeding pairsin nine provinces, and a growth rate of > 10% in only three provinces during the period 2000–2009 (Table 2). Thecomparison of the growth rate of the
number of breeding pairs between theperiods 2000–2009 and 1990–1999, revealeda slower growth rate after 2000 in allprovinces. At the scale of the 13 physical-geographical regions, slower growth ratesoccurred in eight, comparable growth rateswere observed in two others and a higherrate only in three cases: 1) in dunes and tidalareas at the Wadden Sea islands, and thenorthern marine clay salt marshes; 2) highersandy areas in the north of the Netherlandsand 3) higher sandy areas in the middle and southern part of the country. A paired t-test analysis comparing the slopes of thegrowth rates in the 13 regions revealed asignificantly lower increase in the last decade(t11 = 2.48, P < 0.05).
Based on the growth rate obtained perprovince from the BMP indices, the totalsize of breeding population in the 12provinces was estimated at 10,171 breedingpairs in 2010 (Estimate 1 in Table 2). TheWAVO surveys indicated a nationwideaverage annual growth rate of 8.8% between2000 and 2008. Estimate 2 for 2010 in Table2 is the product of extrapolating the numberof breeding pairs recorded in 2000 perprovince by this value, resulting in numberssimilar to Estimate 1. From Estimate 1(10,171 breeding pairs), the Leslie matrixpredicted the total population in theNetherlands (inclusive of breeding and non-breeding individuals and an ongoingculling of 20,000 individuals annually) at45,523 birds in 2010 (Fig. 1a). Withoutaccounting for culling, the growth of the population would have remainedexponential, and the size of the populationcould have reached a theoretical maximumof 66,359 breeding pairs (Fig. 1b) or a total

134 Egyptian Goose in the Netherlands and Europe
© Wildfowl & Wetlands Trust Wildfowl (2012) 62: 128–145
Tab
le 2
.N
umbe
r of
bre
edin
g pa
irs p
er p
rovi
nce
in t
he p
erio
d 19
67–2
000
(dat
a fr
om n
atio
nwid
e br
eedi
ng c
ensu
ses
repo
rted
in
Len
sink
199
6, 2
002)
and
an
estim
ate
of th
e nu
mbe
r of
bre
edin
g pa
irs in
the
Net
herla
nds
in 2
010.
The
rat
e of
incr
ease
for
the
perio
d20
00–2
009
is d
eriv
ed f
rom
the
bree
ding
bird
cen
sus
(BM
P). T
hese
rat
es p
rovi
ded
Est
imat
e 1
for
2010
, whe
reas
Est
imat
e 2
is d
eriv
edfr
om th
e in
crea
se r
ecor
ded
by th
e w
ater
fow
l cen
suse
s (W
AVO
) dur
ing
the
perio
d 20
00–2
008
(i.e.
8.8%
per
yea
r at
the
natio
nal s
cale
).
Nat
ionw
ide
bree
ding
pai
rs c
ensu
ses
BM
PE
stim
ate
Est
imat
eg
row
th r
ate
12
(%/
year
)
1967
1972
1977
1983
1989
1994
1999
–200
020
00–2
009
2010
2010
Gro
ning
en0
00
010
2813
310
.335
530
8Fr
iesl
and
00
00
255
359
4.9
580
830
Dre
nthe
00
01
1146
265
14.9
1,06
361
2O
verij
ssel
00
04
1610
553
44.
885
31,
233
Gel
derla
nd0
02
1570
365
815
4.0
1,20
61,
883
Utr
echt
00
05
2710
432
66.
762
475
4Fl
evol
and
00
00
16
438.
899
98N
oord
Hol
land
00
316
5919
062
011
.81,
890
1,43
1Z
uid
Hol
land
17
4372
128
290
891
6.4
1,65
62,
058
Zee
land
00
00
110
119
5.0
194
275
Noo
rd B
raba
nt0
00
219
6051
07.
31,
031
1,17
7L
imbu
rg0
00
01
4533
06.
561
976
2
Net
herla
nds
17
4811
534
51,
345
4,94
57.
010
,171
11,4
21
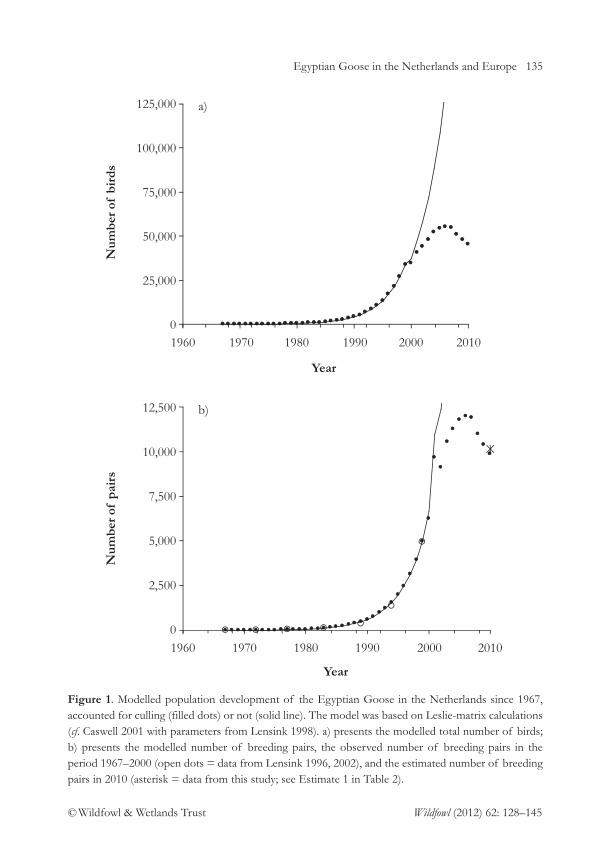
Egyptian Goose in the Netherlands and Europe 135
© Wildfowl & Wetlands Trust Wildfowl (2012) 62: 128–145
Year
Num
ber
of b
irds
a)
Year
Num
ber
of p
airs
b)
125,000
100,000
75,000
50,000
25,000
01960 1970 1980 1990 2000 2010
1960 1970 1980 1990 2000 2010
12,500
10,000
7,500
5,000
2,500
0
Figure 1. Modelled population development of the Egyptian Goose in the Netherlands since 1967,accounted for culling (filled dots) or not (solid line). The model was based on Leslie-matrix calculations(cf. Caswell 2001 with parameters from Lensink 1998). a) presents the modelled total number of birds;b) presents the modelled number of breeding pairs, the observed number of breeding pairs in theperiod 1967–2000 (open dots = data from Lensink 1996, 2002), and the estimated number of breedingpairs in 2010 (asterisk = data from this study; see Estimate 1 in Table 2).

136 Egyptian Goose in the Netherlands and Europe
© Wildfowl & Wetlands Trust Wildfowl (2012) 62: 128–145
population of 306,097 birds (assuming noeffects of habitat limitation or other densitydependent factors; Fig. 1a).
The within-year variation in the WAVOcounts showed that the highest numberswere counted in September (i.e. after the end of the breeding season), followed by asharp decreasing trend until January, andthereafter remaining roughly stable orslightly decreasing until March. There was no clear effect of winter severity(determined by IJnsen indices) on annualchanges in abundance (linear regression: r2
21
= 0.64, n.s.), nor when comparing changesin numbers following severe and mildwinters (ANOVA: F1,20 = 0.26, n.s.).However, the within-season analysis, withwinter severity as categorical factor, revealedthat the number of Egyptian Geese show asignificantly stronger decrease during severewinters than during mild ones (ANOVA:F1,20 = 9.58, P < 0.01). Based on back-transformed data, in severe winters themean number of individuals in January–February was approximately half of that in November–December (i.e. 54%). Incontrast, in mild winters the reduction innumbers was < 8% (Fig. 2).
Distribution in the Netherlands
Habitat preferences
The annual IWCs carried out in Januaryshowed that Egyptian Geese can be foundin all parts of the Netherlands, but thelargest concentrations were recorded in thelower parts of the country (generally thewestern and northern provinces), mostly inriparian areas, where breeding density was highest (often > 10 pairs per 100 ha).The species was absent from heavily
afforested areas and areas where waterbodies are lacking. However, the analysis ofthe nationwide waterfowl census dataconducted in January 2000 revealed nosignificant difference between theproportions of habitat types in count areaswhere no Egyptian Geese were countedcompared to those with > 50 birds reported(t8 = 0.87, n.s.). The only notable differenceexisted between the proportions ofgrasslands and arable areas: 51% of thecensus areas with > 50 Egyptian Geese (n = 35) was grassland (total = 12,728 ha),whereas of the survey areas where thespecies was absent (n = 3,364) only 35% was grassland (Fig. 3). In contrast, theproportion of arable land constituted 29%of the survey areas where the species wasabsent compared with 20% of the surveyareas with > 50 Egyptian Geese (in total5,008 ha).
Changes in distribution
A comparison of the numbers counted inJanuary 2000 (i.e. including adults and sub-adults; N0) and in January 2008 (N8) for16 physical-geographical regions revealedthat total numbers increased in all areas(logN8 = 0.77logN0 + 0.96, r2
15 = 0.64, P < 0.001; Fig. 4 a). However, the relativeabundance in the regions changed, revealedby the slope of the relationship beingsignificantly smaller than one (0.77 ± 0.15s.e.). This resulted from regions with largernumbers in 2000 increasing proportionallyless than regions with small numbers. Asimilar comparison to the number of birdscounted in January 2000 (N0) per physical-geographical region and the number ofbreeding pairs (i.e. only adult birds) in 2000

Egyptian Goose in the Netherlands and Europe 137
© Wildfowl & Wetlands Trust Wildfowl (2012) 62: 128–145
(N0b) in the same regions also showed aclose relationship (N0b = 0.62logN0 + 0.98,r2
15 = 0.80, P < 0.001; Fig. 4 b).
Introduced populations elsewhere inEurope
According to the latest estimates, 700 birds breed and at least 1,000 winter inEngland (Rehfisch et al. 2010). However,due to the patchy reporting of breeding
Egyptian Geese, these figures could beunderestimates and the real size of thebreeding population could be much higher(2,500–3,000 individuals suggested by Bankset al. 2008).
In Belgium, the first successful feralbreeding dates from 1982 (Segers 1984;Gabriels 1985). In 2002, the number ofbreeding pairs was estimated at 800–1,100(Banks et al. 2008), at 1,300 pairs by 2005 in
Month
Mea
n nu
mbe
r of
bir
ds
a)
Month
Mea
n nu
mbe
r of
bir
ds
b)
10,000
8,000
6,000
4,000
2,000
0
2,000
1,500
1,000
500
0
Sept. Oct. Nov. Dec. Jan. Feb. Mar. Apr.
Sept. Oct. Nov. Dec. Jan. Feb. Mar. Apr.
Figure 2. Mean number of Egyptian Geese per month in the winter half year during a) mild (n = 15) and b) severe winters (n = 7) during the period 1976–2008. During the last decade, when birdnumbers were the highest, five mild winters but no severe winters occurred, causing generally highermean numbers during mild winters (note the difference in the scale of the vertical axes).

138 Egyptian Goose in the Netherlands and Europe
© Wildfowl & Wetlands Trust Wildfowl (2012) 62: 128–145
Flanders only (Anselin & Vermeersch 2005),and at 330–590 pairs by 2007 in Wallonia only(Jacob et al. in press). The population is stillexpanding its breeding range, especially in thewestern and central part of the country(Anselin et al. 2010). According to the latestcounts, the population was estimated ataround 3,000 individuals in winter 2009(Huysentruyt et al. 2010). Based on availabledata on the breeding population in Belgium,the number of Egyptian Geese pairs (NB)increased with year (t) on average by 35.9%between 1982 and 2005 (ln NB = 0.32t – 630,r2
4 = 0.95, P < 0.01; Fig. 5). In Germany, breeding of free-living birds
started in 1981 along the river Rhine,originating from the introduced populationin the Netherlands (Lensink 1996), buildingto an estimated 2,200–2,600 pairs in 2005(Bauer & Woog 2008). Numbers in
Germany (NG), increased exponentiallyduring 1981–2005 (ln NG = 0.33t – 659, r2
4
= 0.90, P < 0.02; Fig. 5). By extrapolatingthe Belgian and German trends, the totalbreeding population in Belgium andGermany is estimated to have exceeded16,000 pairs in 2010.
In France, 618 individuals were counted in2009, with 125 breeding pairs observed inthe summer (Fouque et al. 2011). InDenmark, at least 20 pairs were breeding in2007 (Banks et al. 2008) and, according to thelatest records in 2009, a total of 544observations were listed of 1–63 individualspresent throughout the year (Kampe-Persson 2010). A small number of birdsoccur in Switzerland; two pairs have bred inan urban park each year since 2003 (Banks et
al. 2008), and in 2009 two new breeding siteswere recorded (Verena Keller, unpubl. data).
No. birds per census area
% o
f ha
bita
t typ
e of
cen
sus
area
s 100
80
60
40
20
0
0 > 50
Figure 3. Proportion of the most important habitat types in waterfowl census areas where 0 (in total3,364 areas with a surface area of 1,918,627 ha) and > 50 Egyptian Geese (in total 35 areas with asurface area of 24,866 ha) were observed in January 2000. Dotted area = arable land, vertical stripes =grassland and horizontal stripes = water. Habitat types of minor importance are omitted; henceproportions do not add up to 100%.

Egyptian Goose in the Netherlands and Europe 139
© Wildfowl & Wetlands Trust Wildfowl (2012) 62: 128–145
Furthermore, some birds are regularly seenor occasionally known to breed in Spain,Italy, Sweden, Poland and the CzechRepublic (Banks et al. 2008).
Discussion
The Egyptian Goose population in theNetherlands showed rapid exponentialgrowth shortly after feral breeding was firstrecorded in 1967. By 2010, the breedingpopulation was estimated at > 10,000 pairs,equivalent to over 45,000 individuals in thetotal mid-winter population. Breedingdensity was highest in riparian areas and51% of the larger groups of EgyptianGeese were observed on grasslands in 2000.Our results suggest that the birds generallyuse the same habitats throughout the year.Winter severity seemed to have a negativeeffect on within-winter numbers. Onsumming the breeding pairs in theNetherlands, Belgium, Germany, GreatBritain, France and Denmark we estimatedthe total number of breeding birds to be atleast 26,000 pairs in 2010.
Despite the generally increasing trend inthe Netherlands between 1967 and 2008,population growth has slowed in the pastdecade. In this latter period, the number ofbreeding pairs has increased only slightly inten out of thirteen provinces. This could bedue to increasing culling intensity, couldimply that nearly all the suitable breedingsites had been occupied earlier, or be acombination of the two as a result ofdifferent factors acting locally. Up until1994, the breeding range expanded at anaverage rate of 3.0 km per year (Lensink1998), and the species was found breeding in
Number (log) of birds Jan. 2000
Num
ber
(log
) of
bir
ds J
an. 2
008
a)
Num
ber
(log
) of
bre
edin
g pa
irs
2000
Number (log) of birds Jan. 2000
b)
4
3
2
1
00 1 2 3 4
0 1 2 3 4
4
3
2
1
0
Figure 4. Comparison of the number ofEgyptian Geese in: a) January 2000 and January2008, and b) January 2000 with the number ofbreeding pairs in 2000 in the 16 physical-geographical regions of the Netherlands. All axesare log transformed.

140 Egyptian Goose in the Netherlands and Europe
© Wildfowl & Wetlands Trust Wildfowl (2012) 62: 128–145
61% of the 1,674 atlas squares (5 × 5 km) inthe Netherlands by 1999 (Lensink 2002).Exponential growth is frequent amongstpopulations of invasive species in newlycolonised areas, often followed by a periodof little or no increase (Lensink 1999a). Innewly colonised areas, observed breedingsuccess was much higher (60–70% of nestssuccessful) than amongst earlier establishedpopulations (15–30% of nests successful;Lensink 1996), indicating density-dependentlimitations on growth. One of the physical-geographical regions where the localpopulation is still growing exponentially islocated far from the sources of the escapedpopulations (i.e. the dunes and tidal areas ofthe Wadden Sea islands), whereas the othertwo regions provide lower quality habitats(i.e. sandy areas), which might reflect theirlower preference by Egyptian Geese.Comparing all physical-geographical regions
between 2000 and 2008 revealed that thenumbers increased significantly in each ofthe different regions. However, the fact thatthe increases were greater in physical-geographical regions where numbers wererelatively low in 2000, also suggests thatdensity-dependent effects may be present.
In order to estimate the current size of theDutch Egyptian Goose population, we reliedon the observed growth rate of the breedingpopulation (BMP indices). This trendseemed to be very similar to the one derived from nationwide censusesundertaken during the period 1990–1999,and was thus assumed to be trustworthy. Inaddition, estimates from the Royal ShootingAssociation on the size of the breedingpopulation in each province of theNetherlands were close to the BMPestimates (Montizaan & Siebenga 2010).According to our modelled results, the size
Figure 5. Growth of the Egyptian Goose population in western Europe. Filled triangles and solid line(lines are exponential trends) depict Belgium, filled dots and dashed line Germany. Open symbolsindicate the extrapolated number of breeding pairs for these countries. The trend of the breedingpopulation (based on nationwide counts) in the Netherlands between 1967 and 1999 is also provided(crosses and dotted line) for comparison. Note the log-scale of the vertical axis.
Year
Num
ber
of b
reed
ing
pair
s
100,000
10,000
1,000
100
10
1
01960 1970 1980 1990 2000 2010 2020

Egyptian Goose in the Netherlands and Europe 141
© Wildfowl & Wetlands Trust Wildfowl (2012) 62: 128–145
of the national population reached itsmaximum in 2006 at nearly 12,000 pairs, andmore than 55,000 individuals in July. Byassuming an annual culling of 20,000individuals, the model predicted slightlydecreasing or stagnating numbers since then.In contrast, according to the latest estimateson the number of breeding pairs in theNetherlands, the increasing trend continueduntil 2010 (Boele et al. 2012). Thediscrepancy may occur due to the cullingfigures also being estimates, and possiblyvarying annually. Moreover, the model reliedon the assumption that the number of birds shot is equally divided among age-groups, which may not necessarily be thecase. Furthermore, the parameter values on survival and reproduction originatedfrom the early increasing phase of thepopulation, and may be lower now throughdensity-dependence. If so, this might alsoexplain why the population has stabilised(even without culling). Nevertheless, themodel clearly shows that without thegradually increasing culling since the 1990sthe population size could have alreadyreached 28,213 pairs, the potential maximumcalculated based on the amount of suitablehabitat available (SOVON unpubl. data).
Lensink (1996) reported adverse effectsof winter severity on the rate of increase forthe years 1975/76–1998/99. In ourextended study period, such clear effectswere not detected, although effects ofwinter severity on within-season changes inabundance were found. The species is notknown to conduct regular, directedmigration in the Netherlands, althoughsmaller movements do occur outside thebreeding season (Lensink 1996, 1999b).
However, more dispersion could occur insevere winters. In its natural range thespecies moves large distances to moultingsites, and also in times of food scarcity (Del Hoyo et al. 1992; Maclean 1997).Moreover, recent ringing studies in theNetherlands, Belgium and Germany foundthat individuals of the introduced Europeanpopulations also regularly disperse up toseveral hundred kilometres from the ringing site (Van Dijk & Majoor 2011).Nevertheless, severe winters occurred morefrequently during the period 1975–1999than in subsequent years, leading to greaterwinter movements, which may have causedthe discrepancy in the results of this studycompared with the earlier work of Lensink(1996). Alternatively, the increasing cullingmortality since 1999 could have masked theeffect of severe winters, or the largerpopulation may be more capable ofrecovering after a severe winter by attaininghigher reproductive success in the followingbreeding season (Lensink 1999a).
The similarity between the total numbersrecorded in January 2000 and the number ofbreeding pairs in 2000 is striking, suggestingthat the winter distribution of EgyptianGeese in the Netherlands reflects theirbreeding distribution. Although the speciesis well-known for its wide choice of breedinghabitats (Harrison 1978), they mostly preferto stay close to (< 1 km) freshwater bodies(Pitman 1963). Generally, Pleistocene soilsare thought to provide lower quality breedinghabitats (Lensink 2002), and in theNetherlands they breed most commonly intrees, old nests of other birds, or tree cavities(Lensink 1998). The Egyptian Goose feedsmainly on grass in the Netherlands, and areas

142 Egyptian Goose in the Netherlands and Europe
© Wildfowl & Wetlands Trust Wildfowl (2012) 62: 128–145
with abundant grasslands appeared to be thepreferred habitat. Our study found that thehighest concentrations occurred close towater bodies in open grasslands with a fewtrees, which is also the typical habitat for thespecies in its natural range in Africa (DelHoyo et al. 1992).
The population in England has grownslowly since its establishment more than 300years ago, whereas in the Netherlands arapid exponential growth was achievedshortly after the breeding started. Breedingsuccess of the Egyptian Goose is low inEngland (1.5 fledglings per pair; Sutherland& Allport 1991), as well as in its native range(Eltringham 1974), compared with theNetherlands (4.5 fledglings per pair; Lensink1996). Low predation pressure, and theabundantly available, fertilized grasslandsadjacent to freshwaters that createoutstanding habitats for herbivorouswaterfowl (Van Eerden et al. 2005), may bethe reason for the larger number of fledgedchicks in the Netherlands.
The size of the Egyptian Goosepopulation in northwest Europe hasincreased rapidly in the past decades andcould have exceeded 26,000 breeding pairsby 2010. Supposing a similar populationstructure as in the Netherlands, this couldtranslate to > 100,000 individuals includingthe non-breeding adults and sub-adults. Ourextrapolations are based on the assumptionthat the rate of increase was constant until2010. Based on the experiences in theNetherlands, and on the amount of suitablehabitats in Belgium and Germany, it is notlikely that the increase would have slowedsince the latest published censuses. On thecontrary, the species is expected to expand
its breeding range further. Due to thenegative effect of winter severity, the 0°Cisocline could form the approximate borderof the expansion range (Lensink 1998), andhence the species will likely spread mostlysouthwards.
The increase in abundance anddistribution of such an introduced speciescommonly result in substantial publicconcern about their eventual ecological andeconomic impacts. Waterfowl species have agreat propensity to hybridize with otherspecies (Weller 1969). Hybridizations ofEgyptian Geese mainly occur with otherintroduced goose and duck species (Lensink1996; Harrop 1998; Banks et al. 2008),although these hybrids are usually infertile(Susanne Homma and Olaf Geiter, unpubl.data). As the birds’ main food is grass, whichis abundant throughout Europe, inter-specific competition for food is likely to be ofminor significance. Although Egyptian Geeseare often observed being aggressive towardsother birds, the increasing population in theNetherlands seems not to have had a negativeeffect on the population development ofnative species so far (Lensink & van den Berk1996). Only one study reported evidence onsuch an effect, where Black SparrowhawksAccipiter melanoleucus raised fewer chicks due tousurpation of nests by Egyptian Geese(Curtis et al. 2007).
Economic impacts seem to be moreprofound. The increasing native populationin South Africa is considered to be anagricultural pest, especially around waterbodies used for moulting, whereconsiderable damage to agricultural fieldshas been reported (Maclean 1993). Youngwheat and barley shoots and leaves were

Egyptian Goose in the Netherlands and Europe 143
© Wildfowl & Wetlands Trust Wildfowl (2012) 62: 128–145
mostly consumed, but Egyptian Geese alsoseem to select surface seeds (Mangnall & Crowe 2001, 2002). Egyptian Geese havelikewise been reported feeding onagricultural fields in England (Sutherland &Allport 1991), the Netherlands (this study)and Belgium (Beck et al. 2002), althoughdamage to crops has not yet been directlymeasured. Whilst a period of a few daysgrazing may encourage plant growth (Kear1970), it is doubtful that this will ease theworries of European farmers whenincreasing numbers of Egyptian Geeseappear on their land. In England, theEgyptian Goose is on the list of species thatcan be legally shot without a special permit(source: RSPB website). In Belgium, thisholds for all exotic species, and in Germanyfor the period between 1 August and 15January. Our study shows that, if necessary,such culling measures could be effective tostop or limit further growth of EgyptianGoose populations in Europe.
Acknowledgements
The study was funded by the Invasive AlienSpecies Team of the Netherlands Ministry ofAgriculture, Nature and Food Quality. Theinformation incorporated in this publicationwas first published as a Bureau Waardenburgreport (nr. 10-029). The authors thank Petervan Horssen for the GIS analysis and HansSchekkerman, Chris van Turnhout andBerend Voslamber from SOVON for theircooperation in discussions and deliveringdata in early stages of the work. PopkoWiersma from SOVON carried out habitatsuitability index calculations. We were happyto be able to rely on data provided by A.Bloomfield, F. Majoor, B. Sage, W.R.
Siegfried and D. Vangeluwe. We want tothank Anny Anselin, Vicky Knudsen, VerenaKeller, Carol Fouque and Vincent Schrickefor providing information on the status ofEgyptian Geese elsewhere in Europe. Wealso thank Theo Boudewijn, Tom van derHave, Eileen Rees, Tony Fox and twoanonymous reviewers for providing valuablecomments on the manuscript.
References
Anselin, A. & Devos, K. 1994. Populatieschattingen
van broedvogels in Vlaanderen, periode 1989–91.
Vlavico, Gent, Belgium.Anselin, A. & Vermeersch, G. 2005. Numbers
and distribution of breeding feral geese inFlanders. Oriolus 71 (Supplement): 111–120.[In Dutch with English summary.]
Anselin, A., Vermeersch, G. & Spanoghe, G.2010. Welcome to the World? Non-nativebreeding birds in Flanders (Belgium). In H.Segers & E. Branquart (eds.), Science Facing
Aliens. Proceedings of a scientific meeting on
Invasive Alien Species, Brussels, May 11th 2009,pp. 1–5. Belgian Biodiversity Platform,Brussels, Belgium.
Banks, A.N., Wright, L.J., Maclean, I.M.D., Hann,C. & Rehfisch, M.M. 2008. Review of the status
of introduced non-native waterbird species in the area
of the African-Eurasian Waterbird Agreement:
2007 update. British Trust for Ornithology,Norfolk, UK.
Bauer, H.G. & Woog, F. 2008. Non-native and naturalised bird species (neozoa) inGermany, part I: occurrence, population sizeand status. Vogelwarte 46: 157–194. [InGerman with English summary.]
Boele, A., van Bruggen, J., van Dijk, A.J.,Hustings, F., Vergeer, J.W., Ballering, L. &Plate, C.L. 2012. Broedvogels in Nederland in
2010. SOVON Vogelonderzoek Nederland,Nijmegen, the Netherlands.
144 Egyptian Goose in the Netherlands and Europe
© Wildfowl & Wetlands Trust Wildfowl (2012) 62: 128–145
Bomford, M. 2003. Risk Assessment for the Import
and Keeping of Exotic Vertebrates in Australia.Bureau of Rural Sciences, Canberra,Australia.
Brown, L., Urban, K. & Newman, P. 1982. Birds of Africa. Academic Press, New York,USA.
Caswell, H. 2001. Matrix Population Models. SinhauerAssociatino, Sunderland, Massachusetts, USA.
Conover, M. 2002. Resolving Human-Wildlife
Conflicts – the Science of Wildlife Damage
Management. Lewis Publishers, Boca Raton,Florida, USA.
Curtis, O.E., Hockey, P.A. & Koeslag, A. 2007.Competition with Egyptian Geese Alopochen
aegyptiaca overrides environmental factors in determining productivity of blacksparrowhawks Accipiter melanoleucus. Ibis 149:502–508.
Del Hoyo, J., Elliot, A. & Sargatal, J. 1992.Handbook of the Birds of the World. LynxEdicions, Barcelona, Spain.
Devillers, P. 1988. Atlas van de Belgische Broedvogels.Koninklijke Belgische Instituut voorNatuurwetenschappen, Brussells, Belgium.
Duncan, R.P., Blackburn, T.M. & Sol, D. 2003.The ecology of bird introductions. Annual
Review of Ecology, Evolution and Systematics 34:71–98.
Eltringham, S.K. 1974. The survival of broods ofthe Egyptian Goose in Uganda. Wildfowl 25:41–48.
Fouque, C., Bemmergui, M., Bulliffon, F. &Schricke, V. 2011. The Egyptian gooseAlopochen aegyptiaca in France. Casarca 14:124–137. [In Russian.]
Gabriels, J. 1985. Atlas van de broedvogels in Limburg.Lisec, Bokrijk-Genk, Belgium.
Harrison, C.J.O. 1978. Bird Families of the World.Harry N. Abrams Publishing, New York, USA.
Harrop, A.H.J. 1998. Successful hybridisationbetween Ruddy Shelduck and EgyptianGoose. British Birds 91: 281–281.
Hüppeler, S. 2000. Nilgänse (Alopochen aegyptiacus)– Neuburger in der Avifauna Nordrhein-Westfalens. Charadrius 36: 8–24.
Huysentruyt, F., Devos, K. & Casaer, J. 2010. Het
bepalen van mogelijke herkomstgebieden bij
landbouwschade door overzomerende ganzen.Instituut voor Natuur- en Bosonderzoek,Brussels, Belgium.
Jacob, J.-P., Dehem, C., Burnel, A., Dambiermont,J.L., Fasol, M., Kinet, T. & van der Elst, D. Inpress. Atlas des Oiseaux Nicheurs de Wallonie
2001–2007. Aves & Ministere de la RegionWallonie, Liege & Jambes, Belgium.
Kampe-Persson, H. 2010. Occurrence ofEgyptian Goose Alopochen aegyptiacus inEurope. Goose Bulletin 10: 34–37.
Kear, J. 1970. The experimental assessment ofgoose damage to agricultural crops. Biological
Conservation 2: 206–212. Lensink, R. 1996. The rise of exotic bird species
in the Dutch avifauna; past, present andfuture. Limosa 69: 103–130. [In Dutch withEnglish summary.]
Lensink, R. 1998. Temporal and spatialexpansion of the Egyptian Goose Alopochen
aegyptiacus in the Netherlands, 1967–94.Journal of Biogeography 25: 251–263.
Lensink, R. 1999a. Aspects of the biology ofEgyptian Goose Alopochen aegyptiacus colonizingThe Netherlands. Bird Study 46: 195–204.
Lensink, R. 1999b. Do Egyptian Geese Alopochen
aegyptiacus migrate? Limosa 72: 160–162. [InDutch with English summary.]
Lensink, R. 2002. Nijlgans. In S.V. Nederland(eds.), Atlas van de Nederlandse broedvogels
1998–2000, pp. 108–109. KNNV Uitgeverij,Leiden, the Netherlands. [In Dutch withEnglish summary.]
Lensink, R. & van den Berk, V. 1996. Rosse
Stekelstaarteend en Nijlgans in Nederland, zijn deze
uitheemse soorten een bedreiging? Infomatie- enKennisCentrum Natuurbeheer, Wageningen,the Netherlands.

Egyptian Goose in the Netherlands and Europe 145
© Wildfowl & Wetlands Trust Wildfowl (2012) 62: 128–145
Maclean, G.L. 1993. Robert’s Birds of Southern
Africa. John Voelcker Bird Book Fund, CapeTown, South Africa.
Maclean, G.L. 1997. Egyptian Goose. In J.A.Harrison, D.G. Allan, L.G. Underhill, M.Herremans, A.J. Tree, V. Parker & C.J. Brown(eds.), The Atlas of Southern African Birds, Vol.
1, pp. Birdlife South Africa, Johannesburg,South Africa.
Mangnall, M.J. & Crowe, T.M. 2001. ManagingEgyptian geese on the croplands of theAgulhas Plain, Western Cape, South Africa.South African Journal of Wildlife Research 31:25–34.
Mangnall, M.J. & Crowe, T.M. 2002. Populationdynamics and the physical and financialimpacts to cereal crops of the EgyptianGoose Alopochen aegyptiacus on the AgulhasPlain, Western Cape, South Africa. Agriculture,
Ecosystems and Environment 90: 231–246.Montizaan, M.G.E. & Siebenga, S. 2010. WBE
Databank populatie- en afschotschijfers.Koninklijke Nederlandse Jagers Vereniging,Amersfoort, the Netherlands.
Pannekoek, J. & van Strien, A.J. 2005. TRIM 3
Manual (TRends & Indices for Monitoring Data).Statistics Netherlands, Voorburg, theNetherlands.
Pitman, C.R.S. 1963. The nesting and some otherhabitats of Alopochen, Nettapus, Plectroterus andSakidiornis. Wildfowl 16: 115–121.
Rehfisch, M.M., Allan, J.R. & Austin, G.E. 2010. The effect on the environment ofGreat Britain’s naturalized Greater CanadaBranta canadensis and Egyptian GeeseAlopochen aegyptiacus. BOU ProcNet.http://www.bou.org.uk/bouproc-net/non-natives/rehfisch-etal.
Segers, M. 1984. Broedgevallen van Nijlganzen in het Park van Boechout te Meise. Ornis
Flandriae 3: 46.SOVON. 2002. Atlas van de Nederlandse broedvogels
1998–2000. Nederlandse Fauna 5. Verspreiding
aantallen verandering. Nationaal NatuurhistorischMuseum Naturalis/KNNV Uitgeverij &European Invertebrate Survey-Nederland,Leiden, the Netherlands.
Südbeck, P., Bauer, H.-G., Boschert, M., Boye, P.& Knief, W. 2007. Rote Liste der BrutvögelDeutschlands. Berichte zum Vogelschutz 44:23–81.
Sutherland, W.J. & Allport, G. 1991. Thedistribution and ecology of naturalizedEgyptian Geese Alopochen aegyptiacus inBritain. Bird Study 38: 128–134.
Teixeira, R.M. 1979. Atlas van de Nederlandse
broedvogels. Natuurmonumenten, ‘s-Graveland,the Netherlands.
Van Dijk, A.J. 1993. Handleiding SOVON broedvogel
onderzoek. SOVON, Beek-Ubbergen, theNetherlands.
Van Dijk, K. & Majoor, F. 2011. Natal dispersalof Egyptian Geese Alopochen aegyptiacus fromThe Netherlands to Germany and vice versa.Limosa 84: 82–84. [In Dutch with Englishsummary.]
Van Eerden, M.R., Drent, R.H., Stahl, J. &Bakker, J.P. 2005. Connecting seas: westernPalaearctic continental flyway for water birds in the perspective of changing land useand climate. Global Change Biology 11: 894–908.
Van Engelen, A.F.V., Buisman, J. & Ijnsen, F.2001. A millennium of weather, winds andwater in the low countries. In P.D. Jones,A.E.J. Ogilvie, T.D. Davies & K.R. Briffa(eds.), History and Climate: Memories of the
Future?, pp. 101–124. Luwer Academic/Plenum Publishers, New York, USA.
Van Roomen, M., Hustings, F. & Koffijberg, K. 2003. Handleiding monitoringproject
watervogels. SOVON, Beek-Ubbergen, theNetherlands.
Weller, M.W. 1969. Potential dangers of exoticwaterfowl introductions. Wildfowl 20: 55–58.

146
© Wildfowl & Wetlands Trust Wildfowl (2012) 62: 146–164
Evidence for Mallard Anas platyrhynchos andAmerican Black Duck Anas rubripes competition
in western New Brunswick, Canada
MARK J. PETRIE1, RONALD D. DROBNEY2, DAN T. SEARS3 &LLWELLYN M. ARMSTRONG4
1Ducks Unlimited Inc., 17800 SE Mill Plain Blvd., Vancouver, Washington, USA.E-mail: [email protected]
2University of Missouri, 302 Anheuser-Busch Building, Columbia, Missouri, USA. 3Ducks Unlimited Canada, Unit 64, Highway 6, Amherst, Nova Scotia, Canada.4Ducks Unlimited Canada, P.O Box 1160, Oak Hammock, Manitoba, Canada.
Abstract
The hypothesis that Mallard Anas platyrhynchos and American Black Duck Anas rubripes
compete during the breeding period has generated considerable debate. To furtherevaluate this hypothesis, the following predictions were tested for sympatric Mallardand Black Duck breeding in New Brunswick: 1) Mallard and Black Duck do notpartition breeding resources in space and/or time, 2) Mallard reduce the amount ofbreeding habitat available to Black Duck, and 3) production of Mallard and BlackDuck is inversely related over time. Study results supported all predictions. Mallardand Black Duck pairs were distributed among wetland classes independent ofspecies, though Black Duck were more likely to be observed alone or without Mallardon wetlands that were surrounded by > 75% upland forest. Mallard and Black Duckhatch dates did not differ, indicating they do not temporally partition breedingresources. Black Duck were more likely to be observed on wetlands where Mallardhad been removed than on wetlands where they were not removed. This resultsupported the prediction that Mallard reduce the availability of breeding habitat forBlack Duck through interference competition. To test the prediction that productionof Mallard and Black Duck is inversely related over time, brood surveys wereconducted from 1990 to 1994 to determine relative and absolute changes in numbersof Mallard and Black Duck broods. The ratio of Black Duck to Mallard broodsdeclined from 0.938 in 1990 to 0.244 in 1994. Total number of Black Duck broodson 59 wetlands surveyed with equal effort in 1990 and 1994 declined from 45 in 1990to 19 in 1994, while Mallard broods increased from 48 in 1990 to 78 in 1994. Thesefindings support the hypothesis that Mallard and Black Duck compete.
Key words: Anas platyrhynchos, Anas rubripes, interspecific competition, niche overlap.

Mallard – Black Duck competition 147
© Wildfowl & Wetlands Trust Wildfowl (2012) 62: 146–164
The hypothesis that competition withMallard Anas platyrhynchos has contributed toa decline in Black Duck Anas rubripes hasgenerated considerable debate. Severalstudies suggest that Mallard out-competeBlack Duck for the most nutrient richbreeding habitat (Ankney et al. 1987;Merendino et al. 1993; Dwyer & Baldassare1994; Merendino & Ankney 1994), yet there is little evidence for differences inreproductive success between the twospecies (Laperle 1974; Krementz et al. 1992;Dwyer & Baldassare 1993; Longcore et al.1998; Petrie et al. 2000). Efforts to evaluatebehavioural mechanisms have providedmixed results as Mallard were dominantunder some study conditions (Brodsky &Weatherhead 1984; Brodsky et al. 1988;Seymour 1990), but not others (D’eon et al.1984; Hoysak & Ankney 1996; McAuley et
al. 1998). Black Duck populations havedeclined in some areas where Mallardincreased (Dennis et al. 1989; Petrie 1998),but have remained stable in other areas ofMallard-Black Duck sympatry (Nudds et al.1996). Zimpfer & Conroy (2006) foundevidence for density effects of Mallard onBlack Duck reproduction rates andsuggested that this may be due to Mallardreducing Black Duck carrying capacity.However, others have argued that Mallardare simply filling a niche vacated by BlackDuck (Maisonneuve et al. 2006).
Mallard and Black Duck defend wetlandterritories to protect paternity and allowfemales to forage undisturbed (Anderson &Titman 1992). In addition, the two speciestreat each other as conspecifics and excludeeach other from established breedingterritories (Seymour 1992). Black Duck
numbers could be limited by this spacingbehaviour if the two species fail to partitionbreeding resources and habitat is limiting.Although Black Duck and Mallard do notdiffer in bill morphology, foraging behaviour,or prey size selection (Eadie et al. 1979;Nudds & Bowlby 1984; Belanger et al. 1988),utilisation of different wetland types ordifferences in reproductive chronology mayenable resources to be partitioned in time asopposed to space (Toft et al. 1982). Failure topartition macro-habitat may lead to declinesin Black Duck if demands for breedingresources exceeds supply and Mallard reduce breeding habitat availability throughinterference competition. If competitioncoefficients are asymmetrical in favour ofMallard as suggested by the competitionhypothesis (Merendino et al. 1993),population trends for the two species shouldbe inversely related over time (Nudds 1992).
To evaluate the hypothesis that Mallardand Black Duck compete for breedingresources, three predictions were tested forMallard and Black Duck breedingsympatrically in western New Brunswick: 1) Mallard and Black Duck do not partitionbreeding resources in space and/or time, 2) Mallard reduce the amount of breedinghabitat available to Black Duck, and 3) production of Mallard and Black Duck isinversely related over time.
Methods
Study area
The study area was approximately 500 km2
in the Woodstock-Florenceville area of Carleton County, mid-western NewBrunswick, Canada (68°40’ N 46°15’ W).

148 Mallard – Black Duck competition
© Wildfowl & Wetlands Trust Wildfowl (2012) 62: 146–164
The area lies in the Saint John Riverecodistrict of the Continental LowlandsEcoregion. Although stands of toleranthardwood species once dominated the area,these forest types now mostly exist as smallwoodlots in an agricultural matrix asrelatively dense human settlement hasfragmented the forest. Major coniferousspecies include Red Spruce Picea rubens andEastern Hemlock Tsuga canadensis that aregenerally confined to lower slopes and valleybottoms. Most of the ecodistrict is coveredby deep non-compact soils derived fromOrdovician rocks (Anonymous 1996).Approximately 45% of the land base in thestudy area had been cleared for agriculture.Potatoes are the primary cash crop, often inrotation with grain and livestock operations.The area contained a variety of wetlandtypes including most classes of palustrinewetlands as well as riverine and lacustrinehabitats (Cowardin et al. 1979).
Prediction 1: Resource partitioning inspace and time
To test the prediction that Mallard and BlackDuck do not partition breeding resources by using different habitat types, thedistribution of breeding pairs wasdetermined using helicopter surveys.Breeding pair counts from these aerialsurveys were used in subsequent analyses ofresource partitioning. Mallard and BlackDuck pairs were surveyed on 58 wetlands in1990 that were identified from aerialphotographs. The number of wetlandssurveyed for breeding pairs was increased to72 in 1991 and to 80 in 1992 because wediscovered wetlands not visible on aerialphotographs. Two large rivers in the study
area (St. John and Meduxnekeag) were alsosurveyed in all years.
Surveys were conducted in the first weekof May 1990, 1991, and 1992 to minimisethe probability of encountering migrantbirds (Erskine et al. 1990). The same twoobservers conducted breeding pair surveysin all years. For both Mallard and BlackDuck, breeding pairs were defined as a maleand female observed together or a male orfemale observed alone. To reduce theprobability that two male Black Duck wouldbe recorded as a pair we distinguished sex ofthis species using bill colour and theappearance of scapular feathers (Ross &Fillman 1990). When one or more femaleswere observed with two or more males thenumber of females was assumed to equalthe number of breeding pairs. Groups ofbirds consisting of > 5 individuals,regardless of whether they included females,were assumed to be migrants and were notincluded in any analysis. In some surveys,groups of ≤ 5 males are considered equal tofive breeding pairs (Dzubin 1969). However,groups of ≤ 5 males may consist of birdsthat have congregated on a wetland whilefemales are laying or incubating (Dzubin1969). The conservative definition ofbreeding pair adopted here increased thelikelihood that birds were observed onwetlands used during establishment ofbreeding territories.
All wetlands surveyed for breeding pairswere classified according to Cowardin et al.
(1979) at the class level. An additionalcategory was created for eutrophic wetlandsused in treating livestock waste. Riverinehabitat in the St. John and Meduxnekeagrivers was classified to subsystem; however,

Mallard – Black Duck competition 149
© Wildfowl & Wetlands Trust Wildfowl (2012) 62: 146–164
a section of the St. John River was classifiedas lacustrine because of the presence of adam (Cowardin et al. 1979). To furtherevaluate resource partitioning, 11 habitatcharacteristics were also measured forwetlands surveyed between 1990 and 1992(Table 1). However, these characteristicswere not measured for the St. John andMeduxnekeag rivers because their sizeprecluded meaningful measurements (e.g. %upland forest cover varied widely along thelength of these rivers).
To determine if Mallard and Black Duckpartitioned habitat in time, brood surveyswere conducted to compare reproductivechronology between species. Hatch dates forboth species were estimated by back-datingduckling age. Mallard and Black Duck laysimilar sized clutches and have similarincubation periods (Bellrose 1980). Thus,high overlap in hatch dates would indicatehigh overlap in reproductive chronology.Brood surveys were conducted once every10–14 days between the last week of May andmid-July on 100 wetlands in both 1990 and1991. Eighty of the same wetlands weresurveyed in both 1990 and 1991, as were theSt. John and Meduxnekeag Rivers. Twenty ofthe wetlands surveyed in 1990 were notsurveyed in 1991 because they no longerexisted (e.g. beaver dams had broken or beenremoved) or had proven extremely difficult toaccess. Twenty wetlands surveyed in 1991,but not 1990, were created by recent beaveractivity or had been discovered but notsurveyed in 1990. Surveys were conductedfrom shore areas that provided good visibilityor by kayak depending on wetland size andwere scheduled during periods of peak broodactivity (06:00–09:00 h and 18:00–21:00 h;
Parker et al. 1992). Information on ducklingage (determined by plumage characteristics;Gollup & Marshall 1954) and number wasused to identify broods that were observedon previous visits to a wetland, to avoidduplicating counts (Ringelman & Longcore1982). Finally, a brood survey was conductedby helicopter shortly after completion ofground counts in mid-July in both 1990 and1991. Helicopter surveys were conducted onall wetlands surveyed from the ground.
To determine if Mallard and Black Duckpairs partitioned macro-habitats, Fisher’sexact test was used to examine theassociation between species and wetlandclass (SAS Institute Inc. 1990). Log-linearmodelling was used to determine whetherbreeding pair surveys could be pooledacross years when examining the associationbetween species and wetland classes. Forthis analysis, wetland classes that had fewobservations were combined to meetsample size requirements. Finally, a chi-square test was used to examine theassociation between species and wetlandclass when results from all three years werecombined (SAS Institute Inc. 1990).
In addition to wetland class, 11 habitatvariables were evaluated on their ability toexplain patterns of wetland use by Mallardand Black Duck (Table 1). Polytomouslogistic regression (Hosmer & Lemeshow1989) was used to determine whichcovariates were useful in distinguishingwetlands where both Mallard and BlackDuck were present, only Black Duck werepresent, only Mallard were present, andwetlands where neither species wasobserved. This approach was used as analternative to multivariate discriminate

150 Mallard – Black Duck competition
© Wildfowl & Wetlands Trust Wildfowl (2012) 62: 146–164
Table 1. Habitat variables used to assess Mallard and Black Duck niche partitioning.
Variable Description
WLCLASSa Wetland Classification (Cowardin et al. 1979)
ORIGINa Natural versus man-made wetlands
BEAVERa Water levels influenced by current or past beaver activity versus water levelsnot influenced by current or past beaver activity
AREAb Wetland area (ha)
PERb Wetland perimeter (m)
VDPa Visible disturbance present versus visible disturbance not present. Visibledisturbance is defined as an occupied dwelling or road travelled at least twicea day that was visible from any part of the wetland
DTDb Distance to disturbance (m), where disturbance is defined as an occupieddwelling or road travelled twice a day but is not conditional on being visiblefrom the wetland
UPLANDb Percent of upland that is forested within 500 m of wetland perimeter. Four categories of UPLAND were recognised: 1) 0–25%, 2) 26–50%, 3)51–75%, 4) 75–100%
VEGa Percent of wetland surface area covered by emergent vegetation. Four categories of VEG were recognised: 1) 0–25%, 2) 26–50%, 3)51–75%, 4) 75–100%
HERBa Percent of wetland surface area that is herbaceous sp. vegetation. Four categories of HERB were recognised: 1) 0–25%, 2) 26–50%, 3)51–75%, 4) 75–100%
ERICa Percent of wetland surface area that is ericaceous sp. vegetation. Four categories of ERIC were recognised: 1) 0–25%, 2) 26–50%, 3)51–75%, 4) 75–100%
FTa Percent of wetland surface area that is flooded tree sp. vegetation. Four categories of FT were recognised: 1) 0–25%, 2) 26–50%, 3) 51–75%,4) 75–100%
aDetermined at wetland.bDetermined from aerial photographs.

Mallard – Black Duck competition 151
© Wildfowl & Wetlands Trust Wildfowl (2012) 62: 146–164
analysis because it allows interactionsbetween variables of interest to beincorporated, can easily accommodate morethan two response levels, and does notrequire the assumption that predictorvariables are normally distributed (Johnson1998). Variables considered for inclusion inthe model included those listed in Table 1, aswell as wetland class. Data were combinedacross all 3 years (1990–1992), for a total of186 wetland * year observations. Maximumnumber of wetland * year observations was210 given that 58 wetlands were surveyed in1990, 72 wetlands in 1991, and 80 wetlandsin 1992. Preliminary descriptive analysisindicated that for some variables the numberof classes would have to be reduced.Contingency tables were constructed ofoccupancy (both species present, BlackDuck only, Mallard only, no ducks present)by each predictor variable. If there wereempty cells or cells in these tables containingonly one wetland, collapsing was necessaryas the logistic regression models would fail toconverge. The following modifications weremade to the predictor variable classes:Wetland Class (WLCLASS) = Lacustrineunconsolidated bottom (L-UB), Palustrineemergent (PEM), Palustrine unconsolidatedbottom (PUB) and Others (collapsedwetland classes); % Vegetative cover (VEG)= 0–25%, 26–100%; % Herbaceous cover(HERB) = 0–50%, 51–75%, 76–100%; % Ericaceous cover (ERIC) = 0–25%,26–75%, 76–100%; % Forested upland(UPLAND) = 0–50%, 51–75%, 76–100%.Percent flooded tree cover (FT) wasexcluded from modelling as only 10 percentof the wetlands had any flooded trees, ofwhich only one wetland hosted Mallard only.
Missing values were highest for Visibledisturbance (VD) and UPLAND (30wetland * year observations missing for each variable), with VEG, HERB, and ERIC missing 20 observations each. Weanalysed the complete data from 149 * yearobservations where the model was simplifiedvia a backwards elimination procedure. A fullmodel with main effects of all predictorvariables was initially fitted. The variableyielding the smallest likelihood ratio statistic(least significant) was then eliminated andthe model re-fitted until only significantvariables remained (Agresti 1990).
To determine if Mallard and Black Duckpartitioned habitat in time by relying ondifferences in reproductive chronology,hatch dates for both species were groupedinto discrete 10-day intervals and theassociation between species and hatch datewas evaluated using log-likelihood ratios for1990 and 1991 (G-test: PROC FREQ: SASInstitute Inc. 1990). The start date for thefirst 10-day interval was the date on whichthe first Mallard or Black Duck brood wasobserved in each year. Hatch dates from1990 and 1991 were used because samplesizes were large for both species duringthese years. This allowed contingency tablesto be constructed with narrow hatch dayintervals, while still meeting minimum cellrequirements.
Prediction 2: Mallard reduce theamount of breeding habitat availablefor Black Duck
In 1993, Mallard pairs were removed fromselected wetlands to test whether theprobability of observing a Black Duck pairis greater on wetlands where Mallard pairs

152 Mallard – Black Duck competition
© Wildfowl & Wetlands Trust Wildfowl (2012) 62: 146–164
are removed. It was assumed that observingBlack Duck at a higher rate on these removalwetlands would support the prediction thatMallard reduce the amount of habitatavailable to breeding Black Duck. Wetlandsthat were included in the removalexperiment met the following criteria; 1)occupied by a single pair of Mallard overthree consecutive days, and 2) less than 1 hain size. The 1ha size restriction was imposedto minimise the probability of includingwetlands that could accommodate morethan one pair of breeding birds. Mallard andBlack Duck pairs were observed together on larger wetlands in the study area and have been observed using the same wetlands elsewhere (Merendino et al. 1993;Merendino & Ankney 1994; McAuley et al.
1998; McAuley et al. 2004). Although thesewetlands may have resources for severalbreeding pairs, intra and interspecificcompetition can still take place in thesehabitats (Merendino & Ankney 1994).However, including large wetlands in aremoval experiment could require thatmultiple pairs be removed or confound birdresponse. For example, Black Duck pairsthat are using the wetland when Mallard are shot might abandon it because ofdisturbance.
Daily surveys of wetlands meeting thesize criterion began on 13 April along a pre-determined route. Prior to this date Mallardand Black Duck had only been observed inriverine habitats that were ice-free. Wetlandswere either observed from a vehicle orapproached on foot depending on distancefrom a road. To avoid observing wetlands atthe same time each day, we alternated thedirection along the survey route as well as
the times of day surveys were initiated.Wetlands that met both the size andoccupancy criteria were assigned to one oftwo treatments: 1) maintained free ofMallard, via removals, for the duration of the experiment, 2) Mallard remainedundisturbed (control). Wetlands wereassigned to one of these two treatmentgroups on the third consecutive day that asingle pair of Mallard was observed on thewetland. Treatment assignments (removalversus control) were alternated amongwetlands meeting the size and occupancycriteria. Between 16–22 April, seven and fivewetlands were assigned to the removal andcontrol treatments, respectively. Ten ofthese twelve wetlands were assigned atreatment on or before 19 April. A Fisher’sExact test was used to determine if theprobability of observing a Black Duck pairon a wetland was independent of whetherMallard had or had not been removed froma wetland (SAS Institute Inc. 1990).
Prediction 3: Production of Mallardand Black Duck is inversely relatedover time
To test the prediction that Mallard and BlackDuck production is inversely related overtime, changes in the ratio and absolutenumber of Mallard and Black Duck broodsfrom 1990 to 1994 were determined. Todetermine changes in the ratio of Mallardand Black Duck broods, brood surveys wereconducted in all years between 1990 and1994. The number of wetlands, as well asthe frequency at which wetlands weresurveyed, varied among years. One hundredwetlands were surveyed in 1990 and 1991 at10–14 day intervals between the last week of

Mallard – Black Duck competition 153
© Wildfowl & Wetlands Trust Wildfowl (2012) 62: 146–164
May and mid-July. Analysis of the 1990 and1991 data indicated that Mallard and BlackDuck broods did not differ in theirdistribution among wetland classes (Petrie1992, 1998). The number of wetlandssurveyed in 1992 and 1993 was reducedbecause of time constraints imposed by anongoing study of Mallard and Black Duckreproductive success (Petrie et al. 2000). In1992, 63 wetlands were sampled at two week intervals between 1–30 June, whichwas the time period in 1990 and 1991 whenthe majority of broods of both species wereobserved. Wetlands surveyed in 1992 and1993 were taken from the pool of 80wetlands sampled in both 1990 and 1991,and the 20 wetlands sampled in 1991 but not1990 (see Prediction 1). In 1994, 74wetlands were surveyed over the same timeperiod and at the same frequency as in 1990and 1991 with the exception that helicoptersurveys were conducted in 1994. Fifty nineof these 74 wetlands had been surveyed in1990 and 1991. The remaining 15 wetlandshad been surveyed in 1991 but not 1990. Allwetlands surveyed for Mallard and BlackDuck broods between 1990 and 1994 werelocated in the original study area boundariesestablished in 1990.
Absolute changes in numbers of Mallardand Black Duck broods were examined todetermine the underlying cause of any changein brood ratios. For example, Mallard : BlackDuck brood ratios could increase over timesolely as a result of increases in Mallardbroods. To examine absolute changes inbrood numbers, we compared the number ofMallard and Black Duck broods observed onthe same 59 wetlands that were surveyed inboth 1990 and 1994. These wetlands were
ground-sampled with identical effort in 1990and 1994; however, broods that were locatedonly by helicopter in 1990 were excludedwhen comparing counts between the twoyears. Sixty four percent of Mallard and 64%of Black Duck broods in 1990 were observedon these 59 wetlands. In addition, the ratio ofMallard to Black Duck broods on thesewetlands in 1990 was identical to that of thestudy area as whole. As a result, absolutechanges in Mallard and Black Duck broodsthat occurred on these 59 wetlands wereassumed to be representative of the studyarea.
To evaluate changes in the relativeabundance of Mallard and Black Duckbroods over time, linear regression was usedto determine if the slope of the linedescribing changes in the ratio of Black Duckto Mallard broods between 1990 and 1994differed significantly from zero (SAS InstituteInc. 1990). Because survey efforts were notconstant among years, a least squaresregression was conducted with weightsproportional to the number of wetlandssurveyed within a year (SAS Institute Inc.1990). To assess changes in Mallard and BlackDuck broods that occurred on the same 59wetlands surveyed with the same effort in1990 and 1994, we evaluated changes in theratio of the two species using a G-test (SASInstitute Inc. 1990), and also examinedchanges in the absolute numbers of Mallardand Black Duck broods.
Results
Prediction 1
Distribution of breeding pairs amongwetland classes (Table 2) was independent

154 Mallard – Black Duck competition
© Wildfowl & Wetlands Trust Wildfowl (2012) 62: 146–164
Tab
le 2
.Dis
trib
utio
n of
Mal
lard
(MA
L) a
nd B
lack
Duc
k (B
D) b
reed
ing
pairs
acr
oss
wet
land
cla
sses
199
0–19
92.
Wet
land
sub
syst
em /
cla
ss19
90 B
D19
90 M
AL
1991
BD
1991
MA
L19
92 B
D19
92 M
AL
%n
%n
%N
%n
%n
%n
Riv
erin
e lo
wer
per
enni
al27
.1(1
9)29
.6(1
6)34
.1
(30)
43.5
(27)
37.5
(3
0)34
.8(2
4)
Lac
ustr
ine
limne
tic25
.7(1
8)27
.8(1
5)25
.0(2
2)25
.8(1
6)17
.5(1
4)28
.9(2
0)
Palu
strin
e em
erge
nt15
.7(1
1)20
.3(1
1)17
.0(1
5)14
.5(9
)15
.0(1
2)13
.0(9
)
Palu
strin
e un
cons
olid
ated
bot
tom
27.1
(19)
13.0
(7)
12.5
(11)
8.1
(5)
15.0
(12)
11.6
(8)
Palu
strin
e sc
rub
shru
b2.
9(2
)0.
0(0
)2.
3(2
)0.
0(0
)1.
3(1
)0.
0(0
)
Palu
strin
e fo
rest
ed0.
0(0
)1.
9(1
)4.
6(4
)3.
2(2
)7.
5(6
)1.
4(1
)
Palu
strin
e aq
uatic
bed
0.0
(0)
1.9
(1)
2.3
(2)
1.6
(1)
1.3
(1)
2.9
(2)
Eut
roph
ic1.
4(1
)5.
6(3
)2.
3(2
)3.
2(2
)5.
0(4
)7.
2(5
)
TO
TA
L70
5488
6280
69

Mallard – Black Duck competition 155
© Wildfowl & Wetlands Trust Wildfowl (2012) 62: 146–164
of species in 1990 (P = 0.22, n.s.), 1991 (P = 0.90, n.s.), and 1992 (P = 0.41, n.s.).Comparison of log linear models to test forconditional independence of year withspecies and combined wetland classes,indicated that information on breeding pairdistribution could be pooled across years(likelihood ratio: χ2
18 = 17.21, P = 0.51, n.s.). Using this conditional independencemodel as a basis and contrasting it with a model characterised by furtherindependence of species and combined
wetland class, we found that Mallard andBlack Duck distribution across wetlandclasses did not differ when surveys werecombined across years (likelihood ratio: χ2
4 = 4.75, P = 0.31, n.s.). Four variables(WLCLASS, ORIGIN, PER, UPLAND)were retained in the model associatinghabitat characteristics with observations of Black Duck only, Mallard only, bothspecies present, and no ducks present (Table 3). Mallard, alone or with BlackDuck, were observed in greater proportion
Table 3. Variables retained in a model associating habitat characteristics with the presence ofMallard and Black Duck. L-UB = Lacustrine unconsolidated bottom; P-EM = Palustrineemergent; P-UB = Palustrine unconsolidated bottom; Other = Palustrine scrub shrub,Palustrine forested, Palustrine aquatic bed and Eutrophic.
Variable Wetlands with Wetlands Wetlands Wetlands Mallard and with Black with Mallard with neither Black Duck Duck only only Mallard nor
Black Duck
% (n) % (n) % (n) % (n)
L-UBa 7.1 (2) 32.2 (9) 7.1 (2) 53.6 (15)
P-EMa 17.3 (9) 21.2 (11) 11.5 (6) 50.0 (26)
P-UBa 7.0 (3) 23.3 (10) 20.9 (9) 48.8 (21)
Othera 23.1 (6) 34.6 (9) 15.4 (4) 26.9 (7)
Naturalb 8.3 (11) 28.6 (38) 15.0 (20) 48.1 (64)
Man-madeb 56.2 (9) 6.3 (1) 6.3 (1) 31.2 (5)
< 50% Forestc 16.2 (6) 13.5 (5) 21.6 (8) 48.7 (18)
50–75% Forestc 13.3 (8) 26.7 (16) 8.3 (5) 51.7 (31)
> 75% Forestc 11.5 (6) 34.6 (18) 15.4 (8) 38.5 (20)
aWLCLASS; bORIGIN; cUPLAND

156 Mallard – Black Duck competition
© Wildfowl & Wetlands Trust Wildfowl (2012) 62: 146–164
on Palustrine Unconsolidated vs. LacustrineUnconsolidated wetlands, and were morelikely to be observed on wetlands withshorter perimeters. Black Duck only or withMallards were likely to be observed ingreater proportion on Other wetlands thanon Palustrine Unconsolidated wetlands.Both species together were more likely to beobserved on man-made versus naturalwetlands: however, few man-made wetlandswere present in the study area (16 of 149wetland-years used in modelling). Of thefour variables retained in the model, onlyUPLAND was associated with the presenceof one species. Black Duck only were more
likely to be present on wetlands that had > 75% upland forest cover than wetlandsthat had < 50% upland forest cover (Table 4).
Hatch dates determined for Mallard andBlack Duck broods in 1990 and 1991 (Fig. 1)showed that the two species failed topartition breeding resources in either timeor space. Hatch dates were independent ofspecies in both 1990 (G2
4 = 4.72, P = 0.32)and 1991(G2
3 = 1.70, P = 0.64).
Prediction 2
Black Duck were more likely to be observedon wetlands where Mallard had been
Table 4. Polytomous logistic regression results of modelling Mallard and/or Black Duckpresence as a function of 10 habitat variables, wetland class, and year.
Variable Likelihood ratio (χ2) d.f. P value
HERBa 4.53 9 0.87
VEGa 1.65 3 0.65
VDa 1.92 3 0.59
DTDa 2.04 3 0.56
YEARa 6.59 6 0.36
AREAa 3.06 3 0.38
ERICa 10.84 6 0.09
BEAVERa 4.41 3 0.22
WLCLASSb 16.78 9 0.05
ORIGINb 8.80 3 0.03
PERb 14.33 3 0.01
UPLANDb 12.14 6 0.05
aVariables not retained in model based on sequential backwards elimination procedurebVariables remaining in final model

Mallard – Black Duck competition 157
© Wildfowl & Wetlands Trust Wildfowl (2012) 62: 146–164
removed than on control wetlands whereMallard were not removed (P = 0.03). Black Duck pairs were observed on five of seven removal wetlands. On all five ofthese wetlands a Black Duck pair was
observed within a day of removing Mallard (Table 5a). No Black Duck wereobserved on any of the five controlwetlands for the duration of the experiment(Table 5b).
Figure 1. Timing of Mallard and Black Duck hatch dates over 10-day intervals in: (a) 1990 (n = 76Mallard and n = 69 Black Duck clutches seen to hatch), and (b) 1991 (n = 113 and n = 77 for Mallardand Black Duck, respectively). The start date for the first 10-day interval was the date on which the firstMallard or Black Duck brood was observed in each year.
0
5
10
15
20
25
30
35
16–25 May 26 May –4 June
5–14 June 15–24 June 25 June –4 July
% Mallard
% Black Duck
0
5
10
15
20
25
30
35
40
22–31 May 1–10 June 11–20 June 21–30 June
% Mallard
% Black Duck
Hatch date
(a) 1990
(b) 1991
% C
lutc
hes
hatc
h%
Clu
tche
s ha
tch

158 Mallard – Black Duck competition
© Wildfowl & Wetlands Trust Wildfowl (2012) 62: 146–164
Table 5. Daily observations of wildfowl on: (a) removal wetlands (where Mallard were removed),and (b) control wetlands (where Mallard were not removed). MP = Mallard pair; MP-COL =Mallard pair collected; MP-NC = Mallard pair observed but failed to collect; NWO = nowildfowl observed; MM = Mallard male; MBD = male Black Duck; BDP = Black Duck pair.
(a) Removal wetland number
Observation 1 2 3 4 5 6 7day
1 MP MP MP MP MP MP MP2 MP MP MP MP MP MP MP3 MP-COL MP-COL MP-COL MP-COL MP-COL MP-COL MP-COL4 NWO BDP BDP NWO BDP, MBD BDP BDP5 MP-NC MP-NC BDP NWO MBD NWO MM6 NWO MP-NC BDP MM BDP, MBM MP-NC NWO7 MP-NC MP-COL MP-NC MM MBD, 2MM NWO BDP8 MP-COL MP-NC MP-NC NWO MBD MM MBD9 MBD MP-COL NWO NWO MM NWO BDP
10 NWO BDP MP-NC MM BDP, MBD NWO NWO11 NWO BDP NWO NWO BDP, MM NWO 2MM12 NWO NWO MP-COL MM MBD, 2MM NWO NWO13 NWO 3MM, MBD NWO NWO NWO NWO14 NWO NWO NWO MM NWO15 NWO16 NWO17 NWO18 NWO
(b) Control wetland number
1 2 3 4 5
1 MP MP MP MP MP2 MP MP MP MP MP3 MP MP MP MP MP4 MP MP MP NWO MP5 MP NWO NWO NWO MP6 MP MM MP MM MP7 MP MM MP NWO MP8 MP MM MM MP NWO9 MP MM MM MM NWO
10 MM MM MM MM NWO11 MM MM MM MM NWO12 MM MM MM NWO13 MM MM14

Mallard – Black Duck competition 159
© Wildfowl & Wetlands Trust Wildfowl (2012) 62: 146–164
Removal wetlands varied in numbers oftimes Black Duck were observed. On none of the wetlands were Black Duck pairs observed for the duration of theexperiment. Black Duck were intermittentlyobserved on removal wetlands, or a Mallardpair was observed at the site after observingBlack Duck the previous day. AdditionalMallard pairs were shot on three removalwetlands after the initial pair had beenremoved, as dictated by the treatment. Wefailed to collect Mallard pairs that wereobserved on some removal wetlands afterthe initial pair had been shot (Table 5a). Oncontrol wetlands, Mallard pairs or a singlemale Mallard were consistently observedthroughout the experiment (Table 5b).
Prediction 3
The ratio of Black Duck to Mallard broodsdecreased significantly from 0.92 in 1990 to0.22 in 1994 (F1,3 = 24.74, r2 = 0.89, P =0.02), with decreases being most apparentafter 1991 (Table 6). The ratio of BlackDuck to Mallard broods also declinedsignificantly over this five-year period when
ratios were weighted by the number ofwetlands sampled in a year (F1,3 = 27.26, r2 = 0.87, P = 0.01). Black Duck to Mallardbrood ratios also declined significantly for59 wetlands that were surveyed with equaleffort in 1990 and 1994, from 0.94 to 0.24(G2
1 = 18.0, P < 0.01). The number of BlackDuck broods observed on these 59 wetlandsdeclined from 45 in 1990 to 19 in 1994,whereas the number of Mallard broodsincreased from 48 in 1990 to 78 in 1994.Total broods of both species increased by < 5%, from 93 in 1990 to 97 in 1994.
DiscussionIncreasing Mallard populations in easternNorth America have been accompanied bymajor declines in Black Duck abundance(Collins 1974; Dennis et al. 1989; Merendino et al. 1993). Consequently, some authors have attributed the decline of Black Duck to competition and/or hybridisation withMallard (Ankney et al. 1987; Dennis et al. 1989;Merendino et al. 1993). Results of our studysupported the hypothesis that Mallard andBlack Duck compete for breeding resources.
Table 6. Changes in the ratio of Black Duck to Mallard broods in 1990–1994.
Year No. of wetlands No. Black No. Mallard Black Duck/surveyed (n) Duck broods broods Mallard ratio
1990 100 70 76 0.921
1991 100 77 116 0.664
1992 63 29 83 0.349
1993 42 17 53 0.321
1994 74 23 106 0.217

160 Mallard – Black Duck competition
© Wildfowl & Wetlands Trust Wildfowl (2012) 62: 146–164
Past attempts to document nichepartitioning among sympatric species ofwaterfowl have usually revealed differencesin macro-habitat use, diet, or morphologicaladaptations associated with foraging andmicro-habitat use (Nudds 1992). Althoughresource partitioning appears to bewidespread in the waterfowl community(Nudds 1992), we detected no interspecificdifferences in the distribution of breedingMallard and Black Duck among wetlandclasses for any year. We also found noevidence that Mallard and Black Duckpartitioned breeding habitat throughdifferences in reproductive chronology.
Earlier studies also failed to find evidenceof resource partitioning by Mallard andBlack Duck. Mallard and Black Duckbreeding in the western AdirondackMountains of New York did not differ inproportional use of four wetland habitattypes (Dwyer & Baldassare 1994).Merendino & Ankney (1994) found thatMallard and Black Duck breeding in centralOntario preferred wetlands of similar size,shape, fertility, and open water, andconcluded that competition for breedinghabitat was likely. Although these studiesgenerally focused on macro-habitatcharacteristics, the two species also fail topartition habitat through differences inmicro-habitat use or foraging ecology(Eadie et al. 1979; Nudds & Bowlby 1984;Tremblay & Couture 1986; Belanger et al.1988).
Although distribution of Mallard andBlack Duck among wetland classes wasindependent of species, log linear modellingrevealed that wetlands surrounded bygreater than 75% upland forest cover were
more likely to be occupied by Black Duckonly than by Mallard only or by both speciestogether. However, Mallard do breed withinheavily forested regions of the Black Duck’srange (Porter 1993; Dwyer & Baldassare1994; Merendino & Ankney 1994;Maisonneuve et al. 2006), so intact forests donot function as an indefinite isolatingmechanism for Black Duck (Dwyer &Baldassare 1994; Nudds et al. 1996). Whilethese results suggest that Black Duck prefermore heavily forested landscapes than doMallard, Mallard were also documentedbreeding in these landscapes (i.e. 26.9% ofall Mallard pairs were observed in wetlandssurrounded by > 75% upland forest cover).
Failure to partition breeding resourcesshould not affect Black Duck if Mallard do not prevent Black Duck from using these resources, or if breeding habitat is not limited. However, Black Duck wereobserved at a significantly higher rate onwetlands where Mallard were removed.Although sample sizes were small, no BlackDuck were observed at any time on controlwetlands where Mallard were not collected.The presence of Mallard on controlwetlands appeared to limit the use of thesewetlands by Black Duck and supports theprediction that Mallard reduce the amountof breeding habitat available to Black Duck.These results also support Seymour’s (1992)conclusion that the two species treat eachother as conspecifics when defendingbreeding territories.
Although Mallard and Black Duck werenever observed together on either treatmentor control wetlands, the two species can occurtogether on the same wetland. For example,McAuley et al. (2004) observed Mallard and

Mallard – Black Duck competition 161
© Wildfowl & Wetlands Trust Wildfowl (2012) 62: 146–164
Black Duck pairs using the same wetlands innortheast Maine. The average size of wetlandsin their study was much larger than wetlandsincluded in our removal experiment (all < 1ha), however, and included wetlands up to 113ha in size. Larger wetlands are more likely tooffer visual obstructions, which can allowpairs to isolate themselves from conspecifics.We purposely chose small treatment andcontrol wetlands to avoid this possibility.However, breeding pair densities on largerwetlands must eventually be limited byspacing behaviour regardless of the greateropportunity to achieve visual isolation in thesehabitats. It seems that Mallard occupying thesame wetlands as Black Duck may ultimatelyreduce the potential of those wetlands tosupport Black Duck because the two speciestreat each other as conspecifics (Seymour1992). Even if competition coefficients forthe two species are symmetrical, Mallardwould represent an additional source ofintraspecific density dependence for BlackDuck.
Recent efforts to model production ratesof Black Duck populations have foundevidence of intraspecific density dependenceon the breeding grounds (Zimpfer & Conroy2006). The authors suggested that evidencefor density dependence in Black Duckreproduction could mean that Black Duckare near habitat carrying capacity and thatMallard could further reduce carryingcapacity. Competition between Mallard andBlack Duck is conditional on breedinghabitat limitation. If Black Duck populationsare near carrying capacity, then the likelihoodfor competition seems high given the failureof these two species to partition resources intime or space.
Inverse changes in population sizes overtime are consistent with the hypothesis thatwaterfowl species compete (Pöysä 1984;Nudds 1992). Within our study area therewas evidence that production of Mallardand Black Duck was inversely related. Ratiosof Black Duck to Mallard broods declinedsteadily between 1990 and 1994, and surveyson the same 59 wetlands in 1990 and 1994 documented large declines in numbers of Black Duck broods. Thisdecline was entirely offset by increases inMallard broods. There were no interspecificdifferences in distribution of Mallard andBlack Duck broods among wetland classes(Petrie 1998). Thus, even if changes inrelative abundance of wetland typesoccurred between years (and there was noevidence that they did), we would expectMallard and Black Duck broods to respondsimilarly. Moreover, our conclusions are notdependent on the assumption that allbroods are observed, or that Mallard andBlack Duck broods are observed with equalprobability. We only assume that theprobability of observing Mallard and BlackDuck broods did not change over time.Changes in relative mortality rates ofMallards and Black Duck young between1990 and 1994 could have producedchanges in brood ratios, especially if thesemortality changes occurred shortly afterhatch. However, work on the study areabetween 1992 and 1994 indicated nodifferences in duckling survival between thetwo species (Petrie et al. 2000).
Inverse changes in Mallard and BlackDuck populations have been documentedelsewhere. Mallard increased by 600% insouthern Ontario between 1951 and 1971,

162 Mallard – Black Duck competition
© Wildfowl & Wetlands Trust Wildfowl (2012) 62: 146–164
while Black Duck increased by 50% (Collins1974; Merendino et al. 1993). From 1971 to1985, Mallard increased by another 51%,while Black Duck decreased by 38%(Ankney et al. 1987; Merendino et al. 1993).However, we concur with Nudds et al. (1996)that Mallard are not certain to cause declinesin Black Duck. Black Duck populationsremained stable in northwest Ontario over a40-year period despite large numbers ofMallard breeding in the region (Nudds et al.1996). Perhaps breeding habitat in northwestOntario is sufficient to meet the needs of both species and Black Duck haveexperienced no population effects as a resultof competition with Mallard. We concludethat Mallard and Black Duck will competewhere breeding resources are limiting, andconcur with Zimpfer and Conroy (2006) thatefforts to manage Black Duck using anadaptive management framework shouldinclude the possible effects of Mallard.
Acknowledgements
We thank W. Barrow for assistance with datacollection. Project funding was provided bythe Black Duck Joint Venture, CanadianWildlife Service, New Brunswick Departmentof Natural Resources and Energy, DeltaWaterfowl and Wetlands Research Station,and the Institute for Wetland and WaterfowlResearch. M. Brasher, G. Soulliere, T. Yerkesand two anonymous referees provided helpfulcomments on earlier drafts of the manuscript.
References
Agresti, A. 1990. Categorical Data Analysis. JohnWiley and Sons, New York, USA.
Anderson, M.A. & Titman, R.D. 1992. Spacingpatterns. In B.D.J. Batt, A.D. Afton, M.G.
Anderson, C.D. Ankney, D.H. Johnson, J.A.Kadlec & G.L. Krapu (eds.), Ecology and
Management of Breeding Waterfowl, pp. 251–289.University of Minnesota Press, Minneapolis,USA.
Ankney, C.D., Dennis, D.G. & Bailey, R.C. 1987.Increasing Mallards, decreasing AmericanBlack Ducks: coincidence or cause and effect?Journal of Wildlife Management 51: 523–529.
Anonymous. 1996. An ecological land classificationsystem for New Brunswick. New BrunswickDepartment of Natural Resources and Energy,Fredericton, New Brunswick, Canada.
Bélanger, L., Temblay, S. & Couture, R. 1988. Billmorphology in American Black Ducks andMallards. Canadian Field Naturalist 102: 720–722.
Brodsky, L.M. & Weatherhead, P.J. 1984.Behavioral and ecological factorscontributing to American Black Duck-Mallard hybridization. Journal of Wildlife
Management 48: 846–852.Brodsky, L.M., Ankney, C.D. & Dennis, D.G.
1988. The influence of male dominance onsocial interactions in Black Ducks andMallards. Animal Behaviour 36: 1371–1378.
Collins, J.M. 1974. The relative abundance ofducks breeding in southern Ontario in 1951and 1971. In H. Boyd (ed.), Canadian Wildlife
Service waterfowl studies in eastern Canada. 1969–
1973, pp. 32–44. Canadian Wildlife ServiceReport Series 29, CWS, Ottawa, Canada.
Conroy, M.J., Barnes, G.G., Bethke, R.W. &Nudds, T.D. 1989. Increasing Mallards,decreasing American Black Ducks – noevidence for cause and effect: a comment.Journal of Wildlife Management 53: 1065–1071.
Cowardin, L.M., Carter, V., Golet, F.C. & LaRow,E.T. 1979. Classification of wetlands anddeep water habitats in the United States. U.S.Fish and Wildlife Service Report No.FWS/OBS-79/31, USFWS, Washington,D.C., USA.

Mallard – Black Duck competition 163
© Wildfowl & Wetlands Trust Wildfowl (2012) 62: 146–164
Dennis, D.G., McCullough, G.B., North, N.R. &Collings, B. 1989. Surveys of breedingwaterfowl in southern Ontario, 1971–87.Canadian Wildlife Service Progress NotesNo. 180, CWS, Ottawa, Canada.
D’Eon, R.G., Seymour, N.R. & Boer, A.H. 1994.Black Duck-Mallard behavioral interactionsin relation to hybridization. Canadian Journal
of Zoology 72: 1517–1521.Diefenbach, D.R. & Owen, R.B. 1989. A model
of habitat use by breeding American BlackDucks. Journal of Wildlife Management 53:383–389.
Dwyer, D.P. & Baldassare, G.A. 1993. Survivaland nest success of sympatric female Mallardand American Black Ducks breeding in aforested environment. Canadian Field
Naturalist 107: 213–216.Dwyer, D.P. & Baldassare, G.A. 1994. Habitat
use by sympatric female Mallards andAmerican Black Ducks breeding in a forestedenvironment. Canadian Journal of Zoology 72:1538–1542.
Dzubin, A. 1969. Assessing breeding populationsof ducks by ground counts. SaskatoonWetlands Seminar. Canadian Wildlife Report
Series 6: 178–230.Eadie, J.M., Nudds, T.D. & Ankney, C.D. 1979.
Quantifying interspecific variation in foragingbehavior of syntopic Anas (Anatidae).Canadian Journal of Zoology 57: 412–415.
Erskine, A.J., Bateman, M.C., Goudie, R.I. &Parker, G.R. 1990. Aerial surveys for breedingwaterfowl, Atlantic Region, 1985–1989.Canadian Wildlife Service Technical ReportNo. 85, Ottawa, Ontario, Canada.
Gollop, J.B. & Marshall, W.H. 1954. A guide for aging duck broods in the field. Mississippi Flyway Council Technical Report,Minneapolis, Minnesota, USA.
Hosmer, D.W. & Lemeshow, S. 1989. Applied
Logistic Regression. John Wiley and Sons, NewYork, USA.
Hoysak, D.J. & Ankney, C.D. 1996. Correlates ofbehavioural dominance in Mallards andAmerican Black Ducks. Animal Behaviour 51:409–419.
Johnson, D.E. 1998. Applied Multivariate Methods
for Data Analysts. Duxbury Press, PacificGrove, California, USA.
Krementz, D.G., Stotts, D.B., Pendleton, G.W. &Hines, J.E. 1992. Comparative productivityof American Black Ducks and Mallardsnesting on Chesapeake Bay islands. Canadian
Journal of Zoology 70: 225–228.LaPerle, M. 1974. Effects of water level
fluctuation on duck breeding success. In H.Boyd (ed.), Canadian Wildlife Service waterfowl
studies in eastern Canada, 1969–73, pp. 18–30.Canadian Wildlife Service Report Series No.29, CWS, Ottawa, Canada.
Linton, L.R., Davies, R.W. & Wrona, F.J. 1981.Resource utilization indices: an assessment.Journal of Animal Ecology 50: 283–292.
Longcore, J.R., Clugston, D.A. & McAuley, D.G.1998. Brood size of sympatric AmericanBlack Ducks and Mallards in Maine. Journal of
Wildlife Management 62: 142–151.Maisonneuve, C., Belanger, L., Bordage, D.,
Jobin, B., Grenier, M., Beaulieu, J., Gabor, S.& Filion, B. 2006. American Black Duck andMallard breeding distribution and habitatrelationships along a forest-agriculturegradient in southern Quebec. Journal of
Wildlife Management 70: 450–459.Merendino, M.T., Ankney, C.D. & Dennis, D.G.
1993. Increasing Mallards, decreasingAmerican Black Ducks: more evidence forcause and effect. Journal of Wildlife
Management 57: 199–208.Merendino, M.T. & Ankney, C.D. 1994. Habitat
use by Mallards and American Black Ducksbreeding in central Ontario. Condor 96: 41–421.
McAuley, D.G., Clugston, D.A. & Longcore, J.R.1998. Outcome of aggressive interactions

164 Mallard – Black Duck competition
© Wildfowl & Wetlands Trust Wildfowl (2012) 62: 146–164
between American Black Ducks and Mallardsduring the breeding season. Journal of Wildlife
Management 62: 134–141.McAuley, D.G., Clugston, D.A. & Longcore, J.R.
2004. Dynamic use of wetlands by BlackDucks and Mallards: evidence againstcompetitive exclusion. Wildlife Society Bulletin
32: 465–473. Morton, E.S. 1998. Pairing in Mallards and Black
Ducks: a new view on population decline inAmerican Black Ducks. Animal Conservation 1:239–244
Nudds, T.D. & Bowlby, J.N. 1984. Predator-preysize relationships in North Americandabbling ducks. Canadian Journal of Zoology 62:2002–2008.
Nudds, T.D., Miller, M.W. & Ankney, C.D. 1996. Black Ducks: harvest, Mallards orhabitat. In J.T. Ratti (ed.), 7th International
Waterfowl Symposium, pp. 50–60. Institute forWetland and Waterfowl Research, Memphis, USA.
Nudds T.D. 1992. Patterns in breeding waterfowlcommunities. In B.D. J. Batt, A.D. Afton,M.G. Anderson, C.D. Ankney, D.H. Johnson,J.A. Kadlec & G.L. Krapu (eds.), Ecology and
Management of Breeding Waterfowl, pp. 540–567.University of Minnesota Press, Minneapolis,USA.
Parker, G.R., Petrie, M.J. & Sears, D.T. 1992.Waterfowl distribution relative to wetlandacidity. Journal of Wildlife Management 56:268–274.
Petrie, M.J. 1992. Unpublished research progressreport. University of Missouri-Columbia,Columbia, USA.
Petrie, M.J. 1998. The role of interspecificcompetition in the decline of the BlackDuck. Ph.D. Thesis, University of Missouri-Columbia, Columbia, USA.
Petrie, M.J., Drobney, R.D. & Sears, D.T. 2000.Mallard and Black Duck breeding parametersin New Brunswick: a test of the reproductive
rate hypothesis. Journal of Wildlife Management
64: 832–838.Pianka, E.R. 1973. The structure of lizard
communities. Annual Review of Ecology and
Systematics 4: 53–74.Porter, M.S. 1993. The potential for competition
between Black Ducks and Mallards inOntario. M.Sc. Thesis, University of Guelph,Guelph, Ontario, Canada.
Pöysä, H. 1984. Temporal and spatial dynamicsof waterfowl populations in a wetland area – a community ecological approach.Ornis Fennica 61: 99–108.
Ringelman, J.K. & Longcore, J.R. 1982. Survivalof juvenile Black Ducks during broodrearing. Journal of Wildlife Management 53:7–15.
Ross, R.K. & Fillman, D. 1990. Distribution ofAmerican Black Ducks and Mallards innorthern Ontario. Canadian Wildlife ServiceProgress Note 189, CWS, Ottawa, Canada.
SAS Institute. Inc. 1990. SAS/STAT User’s Guide
Statistics. Version 6, 4th edition. SAS Institute,Inc. Cary, North Carolina, USA.
Seymour, N.R. 1990. Forced copulation insympatric American Black Ducks andMallards in Nova Scotia. Canadian Journal of
Zoology 68: 1691–1696.Seymour, N.R. 1992. Interspecific territoriality
and competitive interactions betweenAmerican Black Ducks and Mallards.Wildfowl 43: 152–155.
Toft, C.A., Trauger, D.L. & Murdy, H.W. 1982.Tests for species interactions: breedingphenology and habitat use in subarctic ducks.American Naturalist 120: 586–613.
Wallace, R.K. 1981. An assessment of diet-overlap indexes. American Fisheries Society 110:72–76.
Zimpfer, N.L. & Conroy, M.J. Models ofproduction rates in American Black Duckpopulations. Journal of Wildlife Management 70:947–954.
165
© Wildfowl & Wetlands Trust Wildfowl (2012) 62: 165–175
Measurements and movements of MadagascarTeal Anas bernieri captured and ringed at Lake
Antsamaka in central-western Madagascar
FÉLIX RAZAFINDRAJAO1, H. GLYN YOUNG2* & ABDALLAH IAHIA BIN ABOUDOU1
1Durrell Wildlife Conservation Trust, BP 8511, Antananarivo 101, Madagascar.2Durrell Wildlife Conservation Trust, Les Augrès Manor, Trinity, Jersey JE3 5BP,
Channel Islands. *Correspondence author. E-mail: [email protected]
Abstract
Madagascar Teal Anas bernieri were captured at Lake Antsamaka, central-westernMadagascar, during the species’ annual wing moult to test whether the sexes could bedifferentiated on morphometrics and report on a little-known species. A total of 345birds were caught, measured and ringed over a 13 year period (1997–2009), of which73 were recaptured. Males and females did not differ significantly in body mass; forother body measurements (tarsus, culmen and skull) males were significantly larger.Body mass did not change significantly with wing length for moulting birds re-growingtheir feathers, implying an adequate food supply to maintain mass during moult at thesite. Wing length increased linearly at a rate of 5.72 mm/day in individuals recaptured1–8 days after first being caught, indicative of feather growth over this period, withgrowth rates stabilising and diminishing thereafter. One adult female (aged at least 2years) was caught eight years after first capture, indicating that Madagascar Teal canreach an age of at least 10 years in the wild. Individuals caught and ringed during moultmoved up to c. 200 km from the ringing site. Declines in numbers moulting at LakeAntsamaka during our study were linked to water depth at the site, which is in turnapparently linked to annual precipitation. Conservation of this species requiresprotection of the population in several watersheds and at moulting sites where it isvery vulnerable to disturbance, capture for food by local people and predation.
Key words: biometrics, longevity, Madagascar Teal, ringing.
The Madagascar Teal Anas bernieri is a little-known species of Anatidae, endemic toMadagascar, with a range limited principallyto the western coastal wetlands between the
Mangoky Delta and Antsiranana and alsothe extreme northeast of the country(Safford & Hawkins in press). Prior to 1990, it was known to occur only in the

166 Madagascar Teal measurements and movements
© Wildfowl & Wetlands Trust Wildfowl (2012) 62: 165–175
Manambolomaty Delta wetlands of theAntsalova region of Madagascar, where thepopulation was estimated at 100–500 birdsin 1993 (Safford 1993). The species was notincluded in the IUCN red data book before1986, but was listed as “Vulnerable” from1986–2000 (Green 1996; Collar & Stuart1985). Madagascar Teal have been observedonly on shallow fresh and brackish water,including marshes, river mouths, small lakes,estuaries and mangroves at around sea level(Morris & Hawkins 1998). It is thought thatthey may move only a few kilometresbetween nesting, moulting and dry-seasonsites (Young 2006). The most recentpopulation estimate is of just 1,500–2,500birds (Delany & Scott 2006) and the speciesis now classified as “Endangered” (BirdLifeInternational 2012).
As with all Anatidae species, MadagascarTeal typically regrow flight feathers(especially the primary and secondary wingfeathers) after the breeding season, becomingflightless for at least two weeks at this time. Incommon with close relatives such as the GreyTeal Anas gracilis, both members of the pairaccompany the brood after hatching (Younget al. 1998). Madagascar Teal ducklings fledgein c. 45–49 days, and the adults moultfollowing departure of the young (Young2006). The breeding sites become dry at thestart of Madagascar’s west coast dry season(April–December), when young teal move todry season refugia and the adults to safemoult sites such as Lake Antsamaka beforealso transferring to the refugia (Young 2006).Birds have been captured at one moultingsite, Lake Antsamaka in central-westernMadagascar, since the late 1990s to improveknowledge on the species’ ecology and
individual movements. All caught birds areringed, measured and weighed, with rainfalland lake depth also being recorded. Thispaper aims to: 1) increase the informationavailable on body measurements for non-captive Madagascar Teal (including feathergrowth rates), 2) investigate whether thebirds’ body mass varies with moult stage, 3) describe for the first time the dispersal of individual birds after moulting, and 4) provide preliminary information on thebirds’ life-span in the wild.
Study site
Lake Antsamaka, in the Antsalova district of central-western Madagascar (19°02’S, 44°22’E; Fig. 1) is part of the largerManambolomaty Ramsar site. It is shallowand saline, c. 7m above sea level, with an areaof c. 174 ha in the wet season. The lake isephemeral, typically without standing waterfrom October–December inclusive, but maybecome dry much earlier (from July),depending on the amount of rainfall in thearea and also on the extent of flooding fromRiver Manambolomaty. Lake vegetation isdominated by water lilies Nymphea stellata, N.
lotus and Logorosipho madaggascariensis, withpatches of Purple Nutsedge Cyperus rotundus
and rushes Juncus sp. The lake is an importanthabitat for waterbirds in central-westernMadagascar, and two endangered duckspecies – the Madagascar Teal and the White-backed Duck Thalassornis leuconotus insularis –occur at the site (Woolaver & Nichols 2006).
Methods
Since 1997, regular attempts have beenmade to catch Madagascar Teal at Lake

Madagascar Teal measurements and movements 167
© Wildfowl & Wetlands Trust Wildfowl (2012) 62: 165–175
Antsamaka during the moulting period(mid-April to mid-June), although in someyears the lake dried early and the birdsdeparted. In the first two years, the birdswere caught using nets 6 m long and 2 mwide, placed in the lake with a support ateach end and with the bottom 50 cm of thenet submerged. Moulting ducks werepushed slowly toward the net and corralled.In subsequent years the catching techniquewas changed and ducks were pushed towardthe vegetated edge of the lake. Once out ofthe water the ducks hid under the vegetationwhere they remained motionless and wereeasily caught by hand. For each birdcaptured a variety of measurements weretaken including skull length (mm; from top of the head to tip of the bill); culmen
(mm; from the un-feathered base of the billto its tip), tarso-metatarsus (mm; from thetarsal joint to the base of foot) and bodymass (to the nearest 1.0 g). Wing length (to the nearest mm; from carpal joint to theend of longest primary feather) was alsorecorded to determine the stage of themoult. Finally, birds were ringed withcoloured plastic rings fitted to one leg and anumbered metal ring fitted to the other leg.The metal rings were all provided by TheSociété Jersiaise in Jersey through theDurrell Wildlife Conservation Trust. It isnot possible to sex Madagascar Teal byexternal characters and, as field workerswere not trained in cloacal sexing, this wasnot undertaken to avoid undue stress to the birds. The sexes differ in their calls,
Figure 1. Location of the Madagascar Teal ringing site, Lake Antsamaka, in Madagascar.

168 Madagascar Teal measurements and movements
© Wildfowl & Wetlands Trust Wildfowl (2012) 62: 165–175
however, with males having multi-syllabicwhistles and females a harsh, croaking quack(Young 2005; Safford & Hawkins in press)and this was noted for each bird on releaseafter ringing. Sex was not assigned for thosebirds that did not call on release. The birdswere all adults and considered to be at least2 years old because wing moult does notoccur until at least one year old (i.e. after thefirst breeding attempt) and Madagascar Tealdo not breed at the Lake Antsamakamoulting site.
Rainfall and lake depth were recorded atLake Antsamaka from 2000–2009 inclusive.A rain gauge, installed and placed 1 m abovethe ground, was read at 07:00 h each daythroughout the year. Lake depth wasmonitored by weekly readings of waterlevels on a wooden post (marked at 1 cmintervals) installed in the lake. An annualcount of teal was conducted each July acrossall areas of open water in the study area:three main lakes and 3–6 small pondsamong the mangroves, depending ondrought. The counts were coordinated(made near-simultaneously) at all sites byfield workers using binoculars and spottingscopes. Differences between males andfemales for each of the body size measures(body mass, tarsus, culmen and skull length)were analysed using Mann-Whitney U tests.Spearman’s rank correlations assessedwhether there was a trend in the numbers ofbirds: 1) counted, and 2) captured over time,and also tested for an association betweenthe depth of the lake and the number ofbirds counted and caught. Linear regressionanalysis was used to determine changes inwing length (indicative of feather growth)between initial capture and recapture.
Results
A total of 345 individuals was caughtbetween 1997 and 2009, of which 73 wererecaptured in subsequent years (Table 1).The number of birds caught was very lowduring the first year because the capturesession was too late in the season comparedto the moulting period. Numbers caughtwere higher in years 2, 3 and 4 but decreasedand fluctuated thereafter; no individualswere caught in 2006, 2008 and 2009 (Table1). There was no correlation betweennumber of individuals captured and numberof individuals counted (rS = 0.46, n = 13, P = 0.15, n.s.), but there was a significantdecline over time both in the number ofindividuals caught (rS = –0.66, n = 13, P = 0.01) and in the numbers counted each year (rS = –0.64, n = 13, P = 0.04; Fig. 2). The sex ratio of captured birdswhich vocalised on release was 1.8 males toeach female (n = 210); 135 (39%) of the 345birds caught did not call. The maximuminterval between capture and recapture waseight years, for a teal originally ringed as anadult (i.e. at least 2 years old) in 1999 andrecaptured in 2007.
Biometrics data recorded for 119 maleand 64 female Madagascar Teal during themoulting period are presented in Table 2.Although males were marginally heavierthan females, sex differences in body masswere not statistically significant (U = 3205.5,P = 0.07, n.s.). Other measurements diddiffer significantly, with males having longer tarsus (U = 2270, P < 0.001), culmen(U = 1780, P < 0.001) and skull lengths (U = 1223, P < 0.001) than females, albeitthat there was substantial overlap in the

Madagascar Teal measurements and movements 169
© Wildfowl & Wetlands Trust Wildfowl (2012) 62: 165–175
Tab
le 1
: Num
ber
of in
divi
dual
Mad
agas
car
Teal
cau
ght,
ringe
d an
d re
capt
ured
fro
m 1
997–
2009
.
Yea
r N
o.
No.
rec
aptu
red
in e
ach
year
firs
t ri
nged
ring
ed19
9819
9920
0020
0120
0220
0320
0420
0520
0620
0720
0820
09
1997
153
13–
––
––
––
––
–
1998
89–
194
––
––
––
––
–
1999
66–
–20
––
53
––
1–
–
2000
94–
––
––
32
––
––
–
2001
7–
––
–1
––
––
––
–
2002
3–
––
––
––
––
––
–
2003
26–
––
––
–3
1–
3–
–
2004
27–
––
––
––
––
2–
–
2005
6–
––
––
––
––
1–
–
2006
0–
––
––
––
––
––
–
2007
12–
––
––
––
––
––
–
2008
0–
––
––
––
––
––
–
2009
0–
––
––
––
––
––
–
TO
TA
L34
53
2124
01
88
10
70
0

170 Madagascar Teal measurements and movements
© Wildfowl & Wetlands Trust Wildfowl (2012) 62: 165–175
ranges recorded for each sex (Table 2). For 27 birds caught twice which were re-growing their feathers, wing length(including primary length) correlatedsignificantly with the duration betweencatches (rs = 0.428, n = 27, P = 0.006). Winglength increased linearly at a rate of 5.72mm/day in individuals recaptured 1–8 daysafter first being caught (linear regression: R2 = 0.75, t1,20 = 8.33, P < 0.01), indicative
of feather growth over this period, withgrowth rates stabilising and diminishingthereafter (Fig. 3). Body mass recorded for birds caught for the first time in a season (i.e. omitting birds that might havelost mass because of capture a few daysearlier) appeared to be higher towards theend of the moult (indicated by longer winglengths, for birds known from subsequentcapture to be re-growing their feathers) but
0
20
40
60
80
100
120
140
1997 1998 1999 2000 2001 2002 2003 2004 2005 2006 2007 2008 2009
Number counted
Number caught
Num
ber
of b
irds
Year
Figure 2. The number of individual Madagascar Teal caught each year at Lake Antsamaka, and themaximum annual count at the site.
Table 2. Measurements and weight of Madagascar Teal during moult.
Male Female
n = 119 n = 64
Body mass (g) 378 ± 36 (290–490) 368 ± 34 (300–450)
Wing (mm) 129 ± 25 (80–210) 117 ± 28 (82–205)
Tarsus (mm) 46 ± 2 (41–50) 45 ± 2 (41–95)
Culmen (mm) 38 ± 3 (34–49) 36 ± 2 (32–48)
Skull (mm) 82 ± 2 (77–90) 79 ± 3 (75–90)

Madagascar Teal measurements and movements 171
© Wildfowl & Wetlands Trust Wildfowl (2012) 62: 165–175
the correlation between mass and wing length did not prove statistically significant(R2 = 0.29, t1,25 = 1.86, P= 0.08, n.s.; Fig. 4).
Annual rainfall ranged from 44 cm (in2005) to 329 cm (in 2004), with mean of 109cm over the years 2000–2009. The lakedepth varied between 240 cm in 2004,corresponding with the period of highestrainfall, and 50 cm (in 2006 and 2009). Lake depth was positively correlated withthe number of teal captured across years (rS = 0.77, n = 10, P = 0.009).
Four individuals ringed during the studywere re-sighted and two recoveredelsewhere in Madagascar. All observationswere at coastal locations (Fig. 5). Two birdswere caught in fishing nets at Bemia Lake(30 km from the study area) and two were
seen at Lake Bedo during a waterbird surveyin the Menabe central coastal wetlands,about 100 km south of the ringing site. Onebird was killed by hunters at Lake Bedo anda second by local people at Behoria, 200 kmnorth of Lake Antsamaka.
Discussion
The number of individuals capturedfluctuated among years during our study, butdeclined overall. This decrease may be partlybut not totally related to a decline in theoverall number of Madagascar Teal at thesite, as there was no significant correlationbetween the number of individuals capturedand the number of individuals counted.Fewer birds were caught in years when thelake was shallower, which suggests that
Figure 3. Increase in wing length (reflecting increase in feather length) recorded for individualMadagascar Teal captured and recaptured within a moulting season.

172 Madagascar Teal measurements and movements
© Wildfowl & Wetlands Trust Wildfowl (2012) 62: 165–175
variation in lake depth may influence abilityto catch teal moulting at Lake Antsamaka. Itis also possible, however, that the decline innumbers counted and caught over time is dueto birds using other sites to moult, due tohuman disturbance at the lake. The reducedcatching success therefore may be due to acombination of several factors including thelake depth, vegetation cover which serves toensure flightless ducks’ safety (the extent ofvegetation was not specifically recorded atsite, but was consistent with lake depth in thatemergent vegetation suitable for coverdisappears as the lake dries) and humandisturbance including capture effects. As of2010, we have stopped the catching andringing programme for five years whilecontinuing to monitor the number of
moulting birds at Lake Antsamaka. This willhelp to clarify the reason for the decline in thenumber of teal moulting in the site.
Like their close relative the Grey Teal(Marchant & Higgins 1990), male andfemale Madagascar Teal are similar in body mass; males are larger on average, but there is substantial overlap in the range of measures recorded (Safford &Hawkins in press). For the other body sizemeasures considered here, males weresignificantly larger than females, but againthere was substantial overlap in the ranges.Madagascar Teal therefore does not seem toshow a large degree of sexual dimorphism,and consequently it seems that body sizecannot be used to identify males and femalesreliably in the field.
Figure 4. Madagascar Teal body mass in relation to moult stage, indicated by wing length.Measurements are for first capture dates, for birds re-growing their feathers.

Madagascar Teal measurements and movements 173
© Wildfowl & Wetlands Trust Wildfowl (2012) 62: 165–175
An individual female was recaptured in2007, eight years after first being caught. Asbirds of ≤ 1 year are thought not to occur atLake Antsamaka, and captured birds thereforewere at least two years old on ringing, it seemsthat Madagascar Teal can reach at least 10
years of age in the wild. Additionally, onemale caught in the wild in 1993 lived until2004 (aged 13 years) in captivity (Young in
litt.), indicating that both wild and captiveMadagascar Teal can have long life-spans. Thesex ratio recorded for Madagascar Teal
Behoria Lake
Bemia Lake
Antsamaka Lake
Bedo Lake
Mangoky Delta
Figure 5. Sites where ringed Madagascar Teal were re-sighted, along the coast of western Madagascar.

174 Madagascar Teal measurements and movements
© Wildfowl & Wetlands Trust Wildfowl (2012) 62: 165–175
moulting at Lake Antsamaka (that calledduring handling and could be sexed) was 1.8 : 1, with males being nearly twice asnumerous as females. Sex ratios may varywithin a species’ range; for instance, if malescompete with females for food resources inthe non-breeding season or smaller-bodiedfemales require a more temperate climate(Owen & Dix 1986; Carbone & Owen 1995).Given that sex was determined by the birds’calls, however, and that 135 (39%) of the 345birds caught did not call, cloacal sexing shouldbe undertaken for Madagascar Teal at Lake Antsamaka to determine whether the apparent preponderance of males isattributable to males being more likely thanfemales to vocalise on release.
Primary feather growth rates of 5.8mm/day are similar to those of Mallard (5.5–6.7 mm/day; Panek & Majewski 1990) and the similarly sized Teal Anas crecca
(4.8 mm/day; Sjöberg 1988) in Europe.However, unlike many dabbling duck speciesin Europe (e.g. King & Fox 2012) and inAfrica (e.g. Ndlovu et al. 2011), MadagascarTeal did not lose mass during wing moult,suggesting that Lake Antasmaka not onlyprovides a safe refuge from potentialpredators during the flightless period, butthat it also supplies sufficient sources ofexogenous energy to meet the energydemands of individuals throughout themoult.
Sightings of ringed individuals indicate thatMadagascar Teal can move at least 220 kmfrom their moult site; the furthest distancebetween re-sighted birds was > 400 km withinc. 1,500 km of Madagascar coastline withwetlands potentially suitable for the birds.These sightings suggest that the teal disperse
between different breeding areas and thatindividuals may travel over large annualranges. Lake Antsamaka is an importantmoulting site for Madagascar Teal, but afterthe moult some birds move to other areas.These results indicate that long-distancemovements occur, possibly due to the birdstaking advantage of differing conditionsbetween watersheds. The fluctuation innumbers recorded moulting at LakeAntsamaka also suggests that MadagascarTeal use of a site is not stable; for instance, tealmay be forced to move to other sites whenLake Antsamaka is too dry. Ensuring thefuture survival of the endangered MadagascarTeal therefore requires conservation ofwetlands across several watersheds, includingthe shallow, well-vegetated inland wetlandsused during the moult.
Acknowledgements
We would like to thank Durrell WildlifeConservation Trust Madagascar Programme, its ex-Director Joanna Durbin and thecurrent Director Richard Lewis for giving usthe opportunity to carry out this work. We are grateful to Andrew Bamford for hiscomments and help in writing this paper,and to Tim Wright for preparing Figure 1.We also thank all the people who helped usduring the preparation of the work andBruce Dugger, Matthieu Guillemain, TonyFox and Eileen Rees for their manycomments and useful suggestions forimproving this article.
References
BirdLife International 2012. BirdLife Data Zone:Species. http://www.birdlife.org/datazone/species/search (accessed on 02.06.2012).
Madagascar Teal measurements and movements 175
© Wildfowl & Wetlands Trust Wildfowl (2012) 62: 165–175
Carbone, C. & Owen, M. 1995. Differentialmigration of the sexes of Pochard Aythya
ferina: results from a European survey.Wildfowl 46: 99–108.
Collar, N. & Stuart, S. 1985. Threatened Birds of
Africa and Related Islands. The ICBP/IUCN
Red Data Book. International Council for BirdProtection, Cambridge, UK.
Delany, S. & Scott, D. 2006. Waterbird
Population Estimates. Fourth Edition. WetlandsInternational, Wageningen, the Netherlands.
Green, A.J. 1996. An assessment of whichAnatidae taxa qualify for globally threatenedstatus. Gibier Faune Sauvage, Game Wildlife 13:777–798.
King, R. & Fox, A.D. 2012. Moulting massdynamics of female Gadwall Anas strepera
and male Wigeon A. penelope at AbbertonReservoir, South East England. Bird Study 59:252–254.
Langrand, O. 1995. Guide des Oiseaux de
Madagascar. Delachaux & Niestlé, Neachâtel-Paris, France.
Marchant, S. & Higgins, P.J. 1990. Handbook of
Australian, New Zealand and Antarctic
Birds.Volume 1. Oxford University Press,Oxford, UK.
Morris, P. & Hawkins, F. 1998. Birds of
Madagascar. A Photographic Guide. Pica Press,Montfield, UK.
Ndlovu, M., Cumming, G.S., Hockey, P.A.R. &Bruinzeel, L. 2010. Phenotypic flexibility ofa Southern African duck during moult: donorthern hemisphere paradigms apply?Journal of Avian Biology 41: 558–564.
Owen, M. & Dix, M. 1986. Sex ratios in somecommon British wintering ducks. Wildfowl
37: 104–112. Panek, M. & Majewski, P. 1990. Remex growth
and body mass of Mallards during wing molt.Auk 107: 255–259.
Safford, R. 1993. The Madagascar teal Anas bernieri. A preliminary survey from Antsalova to Morondava. Dodo, Journal
Wildlife Preservation Trusts 29: 95–102.Safford, R. & Hawkins, F. In press. Birds of Africa.
Volume 8: the Malagasy Region. Helm, London,UK.
Sjöberg K. 1988. The flightless period of free-living male Teal Anas crecca in northernSweden. Ibis 130: 164–171
Woolaver, L. & Nichols, R. 2006. Nesting survey of the White-Backed Duck at LakeAntsamaka in Western Madagascar. Threatened
Waterfowl Specialist Group News 15: 34–37.Young, G. 2005. Madagascar Teal Anas bernieri. In
J. Kear (ed.), Bird Families of the World: Ducks,
Geese and Swans, pp. 564–567. OxfordUniversity Press, Oxford, UK.
Young, G. 2006. Madagascar Teal Anas bernieri:the ecology and conservation of a shortdistance migrant. In G.C. Boere, C.A.Galbraith & D.A. Stroud (eds.), Waterbirds
around the World, pp. 252–254. The StationaryOffice, Edinburgh, UK.
Young, H.G., Sorenson, M.D. & Johnson, K.P.1998. A description of the Madagascar TealAnas bernieri and an examination of itsrelationships with the Grey Teal A. gracilis.
Wildfowl 48: 174–180.

176
© Wildfowl & Wetlands Trust Wildfowl (2012) 62: 176–189
Captive breeding and release diminishes geneticdiversity in Brown Teal Anas chlorotis, an
endangered New Zealand duck
GEMMA M. BOWKER-WRIGHT, BEN D. BELL, PETER A. RITCHIE& MURRAY WILLIAMS*
School of Biological Sciences, Victoria University of Wellington, P.O. Box 600, Wellington, New Zealand.
*Correspondence author. Email: [email protected]
Abstract
We examined levels of mitochondrial DNA (mtDNA) and DNA microsatellitegenetic variation in Brown Teal (Anas chlorotis), mainland New Zealand’s rarestwaterfowl. Samples were taken from the two remaining wild populations, a captivepopulation, and four new populations established by released captive offspring. Thelarger wild population on Great Barrier Island (GBI) had two mtDNA haplotypes,one very rare, perhaps indicative of a historic bottleneck. The captive population wasfounded exclusively from GBI individuals; it and all new populations contained onlythe common GBI haplotype. In contrast, the smaller wild population atMimiwhangata (MIW), Northland, contained 11 mtDNA haplotypes, including thecommon GBI haplotype which was probably introduced by captive-sourced releases18–20 years ago. Microsatellite allelic richness was high in wild populations comparedwith captive and new populations. We suggest that genetic supplementation shouldbe considered for the captive and new populations, and that the long-term goals ofthe Brown Teal recovery programme would benefit from assiduous and persistentgenetic management and monitoring.
Key words: Anas chlorotis, Brown Teal, captive breeding, genetic diversity,reintroduction.
Captive breeding programmes are invariablycrisis responses to extensive populationdeclines and fragmentation, and tothreatening circumstances in the wild. Theyare used to maintain the demographicviability of endangered populations and, toa lesser extent, to counteract the loss of
genetic diversity, which is a feature of smallremnant or recently founded populations.Captive breeding contributes to on-goingconservation when the progeny of anysuccessful breeding are released into thewild, either to establish a new population orto supplement an existing one. Well-

Loss of genetic diversity in Brown Teal 177
© Wildfowl & Wetlands Trust Wildfowl (2012) 62: 176–189
publicised captive breeding successes forPeregrine Falcon Falco peregrinus (Cade &Burnham 2003), Nene Branta sandvicensis
(Black 1995; Blanco et al. 1999) and ArabianOryx Oryx leucoryx (Rahbek 1993) amongmany others, raise the profile and publiclyreinforce the value of this conservationtechnique.
Captive breeding programmes are oftenestablished with low levels of geneticvariation because they are a crisis responseto a seriously depleted population. Thecaptive populations are typically small andhave restricted gene flow with any otherpopulations, conditions that cause stronggenetic drift and which eventually erodegenetic diversity. Genetic issues associatedwith captive breeding are now betterunderstood (Ebenhard 1995; Allendorf &Luikart 2007) and include the possibility ofinbreeding depression, long-term captivitycausing undesirable adaptation (Frankham2008), and concerns for the long-termviability of populations founded orsupplemented from genetically depauperatecaptive-raised progeny (O’Brian et al.
1985; Caro & Laurenson 1994; Frankham et al. 2002). A long-term managementperspective is necessary in captive breedingprogrammes to avoid these unintendedgenetic consequences for small andconfined populations.
Captive breeding programmes havefeatured in historic and contemporaryresponses to the conservation plight ofmany New Zealand birds including TakahePorphyrio hochstetteri (Lee & Jamieson 2001),Kiwi Apteryx sp. (Anon 2004), Black StiltHimantopus novaezeelandiae (Reed et al. 1993)and Brown Teal Anas chlorotis (Williams &
Dumbell 1996; O’Connor et al. 2007). Whilemodern management guidelines for theseprogrammes include statements about themanagement of genetic diversity amongcaptive animals (Dumbell 2000; Anon2004), limited consideration is given to howrepresentative released individuals are of thegenetic diversity remaining in the wildpopulations.
Historically the Brown Teal wasdistributed throughout lowland forests andon the freshwaters of New Zealand’s threemain islands, and on several near-shoreislands (Worthy 2002). It is now the rarestand most endangered waterfowl onmainland New Zealand (Miskelly 2008) withjust two natural populations remaining, onGreat Barrier Island (GBI) and surroundingMimiwhangata (MIW) on Northland’s eastcoast (Fig. 1).
A captive breeding programmecommenced in 1973, founded by 22 birdsthen in captivity, to which a further 42 wereadded within three years (Williams &Dumbell 1996). An additional 15 wild birdsentered the captive population in1987–1988; they, like all others, weresourced from GBI, the larger of tworemaining wild populations. By 2000approximately 1,700 captive-raised birds hadbeen dispersed as 66 releases to 15 regionalsites, including supplementing the smallerwild MIW population (Dumbell 2000). Atonly one site, mammal-free Tiritiri MatangiIsland, was a new population successfullyestablished. Between 2000–2008 another 16 birds from GBI were addedopportunistically to the captive populationand 474 captive-raised birds released atseven sites (K. Evans, pers. comm.).

178 Loss of genetic diversity in Brown Teal
© Wildfowl & Wetlands Trust Wildfowl (2012) 62: 176–189
Presently, “new” populations derived fromthese releases persist at Mana Island, KapitiIsland, Tiritiri Matangi Island, KaroriWildlife Sanctuary (now called “Zealandia”)and Moehau (Fig. 1), although the Moehaupopulation originates from a tiny remnant
wild population supplemented by releases ofcaptive-raised teal.
Little was known about the geneticdiversity remaining in the wild populations(Dumbell 1987) and nothing of that withinthe captive and new populations. This
Figure 1. Map of New Zealand and the locations of Brown Teal populations that were sampled. WaipuGorge and Helena Bay were the locations at which the sampled museum specimens were collected.

Loss of genetic diversity in Brown Teal 179
© Wildfowl & Wetlands Trust Wildfowl (2012) 62: 176–189
study sought to use mitochondrial andmicrosatellite DNA markers to determinethe levels of genetic diversity in the tworemaining wild Brown Teal populations, thepresent captive breeding stock, and in fourpopulations newly established by releases ofcaptive-raised teal. We use the results of our genetic analysis to make severalrecommendations for the future geneticmanagement of the Brown Teal captivebreeding and recovery programme(O’Connor et al. 2007).
MethodsBrown Teal feathers were collected fromGBI (36°11’S, 175°25’E), MIW (35°43’S,174°21’E), the captive breeding population,and new populations at Moehau (36°45’S,175°31’E), Karori Wildlife Sanctuary(41°19’S, 174°46’E), Tiritiri Matangi Island(36°52’S, 174°46’E) and Mana Island(40°57’S, 175°03’E). Feathers were takenbetween 2001 and 2007 inclusive and storedindividually in dry paper envelopes labelledwith the banding code of the bird and thearea caught. In addition, we obtained footpad tissue from two museum skins from theMuseum of New Zealand and collected inNorthland at locations where Brown Tealno longer occur; Helena Bay in 1978(35°43’S, 174°21’E) adjacent to the MIWpopulation, and Waipu River gorge in 1935(36°54’S, 174°47’E) (Bell 1959).
The base of each feather (approximately3 mm) was excised with a sterilised scalpeland DNA was purified using the standardphenol-chloroform extraction procedurefollowed by ethanol precipitation(Sambrook et al. 1989). A portion of themitochondrial DNA (mtDNA) control
region (636 bp) was amplified usingpolymerase chain reaction (PCR) and theprimers L78 (5’-GTTATTTGGTTAT -GCATATCGTG-3’) and H774 (5’-CCATATACGCCAACCGTCTC-3’), takenfrom Sorenson et al. (1999). Fivemicrosatellite DNA markers were selectedfrom the studies of Huang et al. 2005(caudo24, caudo19, caudo13, and caudo1) andMaak et al. 2003 (adph13) based on their highlevels of observed heterozygosity (HO
ranged from 0.68 to 0.97) and allelicdiversity (5–13 alleles per locus) in MallardAnas platyrhynchos. The M13 sequencemethod (Schuelke 2000) was used to labelone of the microsatellite primers in eachpair with the fluorescent marker 6FAM orVIC (Applied Biosystems).
PCR amplifications were performed in25μL volumes using 1–2 μL of DNAtemplate, 10 mM Tris pH 8.0, 50 mM KCl,1.5 mM MgCl2, 0.4 μg/ml BSA, 0.4 μM ofeach of the forward and reverse primer,200μM of each dNTP, and 0.5–1 units ofBIOTAQ DNA polymerase (Bioline). Forthe mtDNA control region, thermal cyclingwas carried out for 30 s at 94°C, 30 s at54°C, and 60 s at 72°C, each repeated for 35cycles. For the microsatellite markers, thesame conditions were used with the additionof an M13 attachment cycle added to theend of the thermal cycling conditions.
The resultant PCR products wereelectrophoresised in agarose gel and amolecular weight standard was used todetermine the size of the amplified DNAfragments. For the mtDNA control region,PCR products were purified using eithercolumn purification (Roche) or ExoSAP-IT(GE Healthcare Lifesciences), and their

180 Loss of genetic diversity in Brown Teal
© Wildfowl & Wetlands Trust Wildfowl (2012) 62: 176–189
DNA sequence was determined using dye-terminator reaction chemistry and analysedon an Applied Biosystems 3730 GeneticAnalyzer. For the microsatellite markers,PCR products of the correct size werediluted depending on their concentrationand the allele sizes were determined using anApplied Biosystems 3730 Genetic Analyzer.
Mitochondrial DNA sequences wereedited by eye and then aligned using ClustalW in MEGA v4.0 (Kumar et al. 2004).Overall levels of nucleotide diversity (π) foreach population were calculated in MEGAv4.0 (Kumar et al. 2004) and standard errorswere estimated using a bootstrap methodwith 500 replicates. DNA base frequenciesand the appropriate model of sequenceevolution were estimated using Modeltest3.7 (Posada & Crandall 1998). The level ofsequence divergence within and betweenpopulations was determined using a pair-wise analysis in DnaSP v 4.10.9 (Rozas et al.
2003). TCS v1.21 (Clement et al. 2000) wasused to estimate a phylogenetic network ofhaplotypes using statistical parsimony. Ahomogolous DNA sequence from Mallardwas retrieved from Genbank (accessionnumber AY928900; Kulikova et al. 2005) andadded to the data set as the outgroup taxon.
Microsatellite allele sizes were determinedusing the GeneMapper® v4.0 software(Applied Biosystems). Calculations of allelicrichness and tests for null alleles wereimplemented in HP-RARE 1.0 (Kalinowksi2005) using the rarefraction method tostandardise for sample size. Allele andgenotype frequencies, Observed (HO) and Expected (HE) heterozygosities, FIS,tests for Hardy-Weinberg Equilibrium(HWE), and linkage disequilibrium (LD)
were calculated using GENEPOP v4.0(Raymond & Rousset 1995). Deviationsfrom HWE were tested using global testsfor heterozygosity deficit and excess withineach population by means of the exactprobability test with Markov chainparameters (with Bonferroni correction).Linkage disequilibrium was tested for usingFisher’s exact test.
Results
Mitochondrial haplotype diversity
The DNA sequence of the mtDNA controlregion was determined for a total of 150individual Brown Teal: 49 from MIW, 39from GBI, 20 from the captive population,19 from Moehau, 12 from Karori WildlifeSanctuary, eight from Tiritiri Matangi Islandand three from Mana Island (Table 1). Thealigned sequence data set was 636 base pairslong, and contained 18 variable sites (2.8%)of which eight were parsimony-informative(1.3%). The pooled sample contained 12haplotypes (labelled A to L), with ahaplotype diversity (h) of 0.3900 andnucleotide diversity (π) of 0.0044 (Table 1).The highest level of mtDNA diversity wasfound within the MIW population, whichcontained 11 haplotypes (10 unique), with h = 0.6990 and π = 0.0088. Within the GBIpopulation, only one sample had a uniquehaplotype (labelled L) and all other sampleswere haplotype A. Haplotype (h = 0.0645)and nucleotide (π = 0.0003) diversity werelow within the GBI sample compared withMIW. Within the captive and all newpopulations only a single haplotype (A) wasfound. Considering all populations together,the most common haplotypes were A

Loss of genetic diversity in Brown Teal 181
© Wildfowl & Wetlands Trust Wildfowl (2012) 62: 176–189
Tab
le 1
.T
he s
ampl
ed B
row
n Te
al p
opul
atio
ns a
nd s
umm
ary
stat
istic
s of
gen
etic
div
ersi
ty. C
olum
n he
adin
gs: n
ms
= m
icro
sate
llite
sam
ple
size
; A=
mea
n nu
mbe
r of
alle
les
per
locu
s; A
rich
= m
ean
alle
lic r
ichn
ess;
HO
= o
bser
ved
hete
rozy
gosi
ty; H
E=
exp
ecte
dhe
tero
zygo
sity
; n m
t=
m
tDN
A
sam
ple
size
; H
=
th
e nu
mbe
r of
ha
plot
ypes
(H
); h
=
hapl
otyp
ic
dive
rsity
; S
= n
umbe
r of
seg
rega
ting
site
s; π
= n
ucle
otid
e di
vers
ity; a
nd th
e ha
plot
ypes
pre
sent
.
Mic
rosa
telli
te lo
ciM
itoc
hond
rial
DN
A
Pop
ulat
ion
n ms
AA
rich
Ho
HE
Pri
vate
F
ISn m
tH
hS
πH
aplo
type
alle
les
Mim
iwha
ngat
a 39
114.
366
0.78
20.
833
20.
0177
4911
0.69
9012
0.00
88A
, B, C
, D, E
, F, G
, (M
IW)
H, I
, J, K
Gre
at B
arrie
r 28
94.
222
0.77
30.
788
10.
2498
392
0.06
451
0.00
03A
, LIs
land
(GB
I)
Cap
tive
bree
ding
369
4.07
50.
571
0.75
11
0.16
2920
10
00
A
Moe
hau
247.
53.
322
0.52
10.
637
00.
1864
191
00
0A
Kar
ori W
ildlif
e 12
63.
369
0.50
00.
745
00.
3393
121
00
0A
Sanc
tuar
y
Tiri
tiri M
atan
gi
83
2.44
10.
313
0.51
50
0.41
188
10
00
AIs
land
Man
a Is
land
31
1.00
0n/
an/
a0
–3
10
00
A
Pool
ed s
ampl
es15
015
012
0.39
0012
0.00
44

182 Loss of genetic diversity in Brown Teal
© Wildfowl & Wetlands Trust Wildfowl (2012) 62: 176–189
(n = 118; 79%), B (n = 16; 11%) and C (n = 5; 3%). No DNA sequence differenceswere found between the GBI, captive andnew populations. However, a geneticdistance of 0.7% was found between theMIW population and all other populations.The network of mtDNA haplotypes ispresented in Fig. 2.
When the DNA sequences of theoutgroup and two museum samples wereincluded, the data set contained 80 variablesites (12.8%) and 50 parsimony-informativesites (7.8%). The Waipu River gorge samplehad a haplotype (labelled M) that was notfound in any of the contemporary samples,whereas the Helena Bay sample had
Figure 2. A phylogenetic network showing evolutionary relationships among the Brown Teal mtDNAhaplotypes found in the seven extant populations (Mimiwhangata, Great Barrier Island, the captivebreeding population, Moehau, Karori Wildlife Sanctuary, Tiritiri Matangi Island and Mana Island) andthe two sequences from museum samples (Helena Bay and Waipu River gorge). Letters denote thehaplotype identifier for samples (see Table 1 for the populations that contained haplotypes A–L).Circles denote the relative number of samples represented in each haplotype, and when more than oneindividual had a haplotype the total number is shown. The lines between haplotypes denote mutationalsteps between each DNA sequence, and closed circles indicate the inferred, unsampled haplotypes.
Loss of genetic diversity in Brown Teal 183
© Wildfowl & Wetlands Trust Wildfowl (2012) 62: 176–189
haplotype C that was present in thecontemporary MIW population. Thegenetic distance between the Helena Baymuseum sample and the GBI, captive andnew populations was 1.8% whereas thatbetween the Waipu River gorge museumsample and the GBI, captive and newpopulations was 2.3%. The genetic distancebetween the Helena Bay and Waipu Rivergorge samples was 3.2%.
Microsatellite diversity
One hundred and fifty samples weregenotyped for five microsatellite loci, 39were from MIW, 28 from GBI, 36 from thecaptive population, 24 from Moehau, 12from Karori Wildlife Sanctuary, eight fromTiritiri Matangi Island and three from ManaIsland (Table 1). Of the five loci used, twowere polymorphic (caudo24 and caudo13) andthree monomorphic (caudo19, caudo1 andadph13). A total of 14 alleles were identifiedat the caudo24 locus and eight at the caudo13
locus. The test for null alleles was non-significant over both polymorphic loci. Theinbreeding coefficient (FIS) was positive and significant within GBI, the captivepopulation, and new populations but notwithin the MIW population. No evidence oflinkage disequilibrium was found within anypopulation (P > 0.05).
MIW was in Hardy-Weinberg equilibrium(HWE) for both loci (P > 0.05), but all otherpopulations deviated from HWE at eitherone or both loci (P < 0.05). The departurefrom HWE observed in the GBI sampleswas due to a (non-significant) heterozygotedeficit (global P = 0.145) at the caudo13
locus. The captive population was in HWEfor caudo24 only and a heterozygote deficit
was found at the caudo13 locus (global P < 0.05). The new populations showedsignificant departures from HWE, duemainly to heterozygote deficit at both loci(global P < 0.001). Because of small samplesize, tests for HWE could not be performedon the Mana Island sample.
Overall the two wild populations hadgreater genetic diversity than the captive andnew populations (Table 1). Expectedheterozygosity (HE), allelic richness, andnumber of alleles per locus were highestwithin the MIW population and lowest inthe Mana Island population. Two uniquealleles were found within the MIWpopulation, one in the GBI population andanother in the captive population (Table 1).However, the unique allele found at thecaudo24 locus within the captive population(not found in either wild population) couldbe due to the limited sampling size, and ifmore samples from GBI were taken, thisallele might be detected in the wild.
DiscussionOur study found different levels of geneticdiversity among the populations of BrownTeal and the captive-raised birds had thelowest levels of diversity. The mtDNAanalysis showed that there was a lack ofgenetic diversity within the GBI wildpopulation, the source of all captive stock.Such low diversity indicates that thepopulation may have experienced ahistorical bottleneck and/or founder effect(Arrendal et al. 2004; Leonard et al. 2005;Munoz-Fuentes et al. 2005; Ogden et al.
2005). A previous study on GBI Brown Tealusing 14 allozyme markers also found nogenetic diversity within 58 individuals

184 Loss of genetic diversity in Brown Teal
© Wildfowl & Wetlands Trust Wildfowl (2012) 62: 176–189
(Daugherty et al. 1999; Dumbell 1987).Furthermore, historic field observationssuggest the species may once have beenscarce on GBI (Bell & Braithwaite 1964;Dumbell 1987), and a mid-1800s survey ofbirds on the island failed to report BrownTeal (Hutton 1868).
In contrast to GBI, the samples fromMIW revealed extensive mtDNA diversity.The high frequency of the common GBIhaplotype A (33%) in the MIW populationmost likely arose from the releases of 321captive-bred teal there between 1984–1991(Dumbell 2000). Although more extensiveDNA sampling of historic museumspecimens might show haplotype A wasonce present elsewhere within theNorthland region, it is now at a highfrequency at MIW and further releases ofcaptive-raised (GBI-sourced) birds intoMIW, or elsewhere in Northland, will onlyresult in raising its frequency and dilutingthe population’s remaining genetic diversity.The MIW population, alone, representsalmost all of the haplotype diversity nowremaining in Brown Teal.
Low levels of microsatellite DNAvariation and no mtDNA haplotypevariation were found within the newpopulations at Moehau, Karori WildlifeSanctuary, Tiritiri Matangi Island and ManaIsland. The latter three populations werefounded by small numbers of individuals(<20) and they have persisted thereafter ineven smaller numbers (Anderson 2005;Dumbell 2000; G. Timlin, pers. comm.),which means the founder effect and/orgenetic drift were likely to have been strong.Inbreeding is also a concern for the newpopulations; those at Karori Wildlife
Sanctuary and Mana Island are nowdominated by descendants of a single pair(Anderson 2005; R. Empson & G. Timlin,pers. comm.). We accept that having usedonly two microsatellite loci may lead to anunder-estimate of the number of privatealleles per population. When more locibecome available for this species a re-analysis would be prudent.
Captive breeding and release has longbeen the sole pathway for advancing thenumerical and range expansion of BrownTeal (Williams & Dumbell 1996; O’Connoret al. 2007). Brown Teal have struggled in theface of mammalian (especially mustelid)predation and, despite extensive releases(Dumbell 2000), new populations have beenestablished only recently on mustelid-freeislands (Tiritiri Matangi, Mana, Kapiti) or inmustelid-free enclaves (Karori WildlifeSanctuary, Moehau). With the exception ofMoehau, all new populations remain small(<20 birds) and are unlikely to persistwithout regular supplementation. Theremaining wild populations have declined(between 1997–2007) despite concertedtrapping of predatory mammals (Parrish &Williams 2001; Ferreira & Taylor 2003).Direct wild-to-wild transfers to establishnew populations, or to augment the tenuoussmall populations, are not included incurrent management plans (O’Connor et al.2007).
Our study highlights that: (i) the captivepopulation does not represent the full rangeof genetic diversity present in the two wildpopulations, and (ii) the new populations donot encapsulate the full genetic diversitywithin the present captive-breedingpopulation. Two serial genetic bottlenecks

Loss of genetic diversity in Brown Teal 185
© Wildfowl & Wetlands Trust Wildfowl (2012) 62: 176–189
have been introduced by the establishmentof the captive breeding programme and,again, during the release phase. There ismounting evidence that genetic bottlenecksare a concern for the long-term persistenceof newly-established populations. Empiricalstudies have emphasised the negativeconsequences of low levels of geneticvariation including inbreeding depressionand an inability to respond to environmentalchallenges (e.g. disease or climate change)(Allendorf & Luikart 2007; Amos &Balmford 2001; Frankham 1995, 1996,2005; Frankham et al. 2002).
The low levels of genetic diversity inpopulations associated with small foundersizes, whether established by wild-to-wildtransfers or by captive-raised releases, as evidenced by inbreeding depression (e.g. Hendrik & Kalinowski 2000; Briskie & Macintosh 2004) or reducedimmunocompetence (e.g. Hale & Briskie2007), can be traced to the inadequategenetic sampling from the sourcepopulation. From an evaluation of theoryand case examples, Frankham (2005)considered the importance of geneticfactors in the persistence of small isolatedpopulations to be undeniable, a viewpointre-examined and reinforced by Jamieson(2007). In effect, the debate has now largelymoved on, to a consideration of how thegenetic diversity remaining in smallpopulations of threatened species can bemanaged and maintained, and to make“genetic diversity be a fundamentalcomponent in long-term managementstrategies for threatened species” (Jamiesonet al. 2008). Management strategies thatinclude a captive breeding component must
take into account, in addition to geneticrepresentation, the negative effects ofadaptation to captivity and the accumulationof rare alleles which are deleterious butpartially recessive in the wild (Frankham2008). Furthermore, mixing geneticallyimpoverished captive-raised stock with wildpopulations may also produce offspring ofreduced fitness (Araki et al. 2007).
Without assiduous genetic management,conservation strategies which relyexclusively on captive breeding to establishnew populations or to supplement decliningones, may well achieve short-term gain byestablishing new populations, but over thelong-term produce populations with limitedevolutionary potential and which arevulnerable to any environmental change. Ifcaptive breeding and release has to remainthe sole conservation pathway for BrownTeal, as O’Connor et al. (2007) outlined, wesuggest that the present captive breedingstock should be augmented to capture thefull genetic diversity remaining in the wildpopulations. By this means the adaptivepotential within each wild populationbecomes available to all populationshenceforth. However, because so manygenerations have elapsed since the captivepopulation was established a completerenewal of the breeding stock should also beconsidered, especially while the moregenetically diverse wild population at MIWremains (potentially) large enough to supplynew captive recruits. Occasional or ad hoc
additions to the existing breeding stockcould simply perpetuate the existing geneticunder-representation.
Furthermore, we suggest that additionalgenetic diversity be introduced to all new

186 Loss of genetic diversity in Brown Teal
© Wildfowl & Wetlands Trust Wildfowl (2012) 62: 176–189
populations, but especially to the largerMoehau population, by wild-to-wildtransfers from MIW or via a reconstitutedcaptive breeding programme. Thesetransfers may need to be repeated andcertainly closely monitored, to ensure thatthose individuals added successfullyreproduce. Protocols like those suggested byHaig et al. (1990) may be able to guide thisapproach. After genetic supplementation,the small populations established wherehabitat is limited and where single familieshave become dominant (e.g. Karori WildlifeSanctuary, Mana, Kapiti, Tiritiri MatangiIslands) could be managed as a meta-population simply by rotating breedingindividuals between them and monitoringthe outcomes.
The conservation status of Brown Teal is still assessed solely on numbers(Hitchmough et al. 2007; BirdlifeInternational 2008; Miskelly et al. 2008), butthis perspective ignores the important long-term role of genetic diversity. Byincorporating genetic information whereavailable, conservation assessments could beviewed as less about number of populationsor minimum overall numbers and moreabout “equipping populations” with theadaptive potential to respond to the future’sinevitable environmental challenges.
Acknowledgements
This paper reports GB-W’s M.Sc. research at Victoria University, Wellington, NewZealand. The authors’ contributions were:study design, GB-W, BB, PR, MW;laboratory extractions and analyses, GB-W,PR; paper preparation GB-W; discussiontext contribution GB-W, MW; paper edit and
review, BB, PR, MW. Funding for thisresearch was provided from the Departmentof Conservation and through twoscholarships, The Bank of New ZealandPostgraduate Scholarship and an EcologicalRestoration Master’s Scholarship in 2007.GB-W acknowledges the Molecular EcologyLab group at Victoria University, whichprovided much technical assistance for thisproject. We acknowledge the support of the Department of Conservation, SusanMoore, Jason Roxburgh, Jo Sim, KevinEvans, The Pateke Recovery Group, andRaewyn Empson, Neil Anderson and RonGoudswaard at Karori Wildlife Sanctuary.
References
Allendorf, F.W. & Luikart, G. (eds.) 2007.Conservation and the Genetics of Populations.
Blackwell Publishing, Oxford, UK.Amos, W. & Balmford, A. 2001. When does
conservation genetics matter? Heredity 87:257–265.
Anderson, N. 2005. Report on the 2004/05 breeding
season for brown teal at Karori Wildlife Sanctuary.Karori Wildlife Sanctuary, Wellington, NewZealand.
Anon. 2004. Captive management plan for kiwi.
Threatened Species Publication No. 24.Department of Conservation, Wellington,New Zealand.
Araki, H., Cooper, B. & Blouin, M.S. 2007.Genetic effects of captive breeding cause arapid cumulative fitness decline in the wild.Science 318: 100–103.
Arrendal, J., Walker, C.W., Sundqvist, A.,Helborg, L. & Vila, C. 2004. Geneticevaluation of an otter translocation program.Conservation Genetics 5: 79–88.
Banco, P.C., Black, J.M. & Banko, W.C. 1999. TheHawaiian Goose (Branta sandvicensis). In A.Poole & F. Gill (eds.), The Birds of North
Loss of genetic diversity in Brown Teal 187
© Wildfowl & Wetlands Trust Wildfowl (2012) 62: 176–189
America, pp. 1–32. The Academy of NaturalSciences and The American Ornithologists’Union, Philadelphia and Washington D.C.,USA.
Bell, B.D. 1959. A census of the brown teal onthe Waipu river system. Notornis 8: 116–117.
Bell, B.D. & Braithwaite, D.H. 1964. The birds ofGreat Barrier and Arid Islands. Notornis 10:363–383.
Birdlife International 2008. Anas chlorotis. In IUCN2011. IUCN Red List of Threatened Species.Version 2011.2. <www.iucnredlist.org>.Downloaded on 24 February 2012.
Black, J.M. 1995. The Nene Branta sandvicensis
recovery initiative: research against extinction. Ibis 137: S153–S160.
Briskie, J.V. & Macintosh, M. 2004. Hatchingfailure increases with severity of populationbottlenecks in birds. Proceedings of the National
Academy of Science 101: 558–561.Cade, T.J. & Burnham, W. 2003. Return of the
peregrine: a North American saga of tenacity and
teamwork. The Peregrine Fund, Boise, Idaho,USA.
Caro, T.M. & Laurenson, M.K. 1994. Ecologicaland genetic factors in conservation: acautionary tale. Science 263: 485–486.
Clement, M., Posada, D. & Crandall, K.A. 2000.TCS: a computer program to estimate genegenealogies. Molecular Ecology 9: 1657–1659.
Daugherty, C.H., Williams, M. & Hay, J.M. 1999.Genetic differentiation, taxonomy andconservation of Australasian teals Anas spp.Bird Conservation International 9: 29–42.
Dumbell, G.S. 1987. The ecology, behaviour and management of New Zealand brownteal, or pateke (Anas aucklandica chlorotis).Unpublished PhD thesis. University ofAuckland, Auckland, New Zealand.
Dumbell, G.S. 2000. Brown teal captive
management plan. Threatened SpeciesOccasional Publications No. 15. Departmentof Conservation, Wellington, New Zealand.
Ebenhard, T. 1995. Conservation breeding as atool for saving animal species fromextinction. Trends in Ecology & Evolution 10:438–443.
Ferreira, S.M. & Taylor, S. 2003. Populationdecline of brown teal Anas chlorotis on GreatBarrier Island. Notornis 50: 141–147.
Frankham, R. 1995. Conservation genetics.Annual Review of Genetics 29: 305–317.
Frankham, R. 1996. Relationship of geneticvariation to population size in wildlife.Conservation Biology 10: 1500–1508.
Frankham, R. 2005. Genetics and extinction.Biological Conservation 126: 131–140.
Frankham, R. 2008. Genetic adaptation tocaptivity in species conservation programs.Molecular Ecology 17: 325–333.
Frankham, R., Ballou, J.D. & Briscoe, D.A. (eds.) 2002. Introduction to Conservation Genetics.
Cambridge University Press, Cambridge,UK.
Haig, S.M., Ballou, J.D. & Derrickson, SR. 1990.Management options for preserving geneticdiversity: Reintroduction of Guam rails tothe wild. Conservation Biology 4: 290–300.
Hale, K.A. & Briskie, J.V. 2007. Decreasedimmunocompetence in a severely bottlenecked population of an endemic New Zealand bird.Animal Conservation 10: 2–10.
Hendrik, P.W. & Kalinowski, S.T. 2000.Inbreeding depression in conservationbiology. Annual Review of Ecology, Science and
Systematics 31: 139–162.Hitchmough, R., Bull, L. & Cromarty, P. (comp.)
2007. New Zealand threat classification system
lists 2005. Department of Conservation,Wellington, New Zealand.
Hutton, F.G.S. 1868. Notes on the birds of theGreat Barrier Island. Transactions and
Proceedings of the New Zealand Institute 1:167–168.
Huang, Y., Cheng, X., Tang, B., Hu, X., Liu, Z.,Feng, J., Lou, Y., Lin, L., Xu, K., Zhao, Y.

188 Loss of genetic diversity in Brown Teal
© Wildfowl & Wetlands Trust Wildfowl (2012) 62: 176–189
& Lin, N. 2005. Characterisation of 35 novel microsatellite DNA markers from theduck (Anas platyrhynchos) genome and cross-amplification in other birds. Genetics Selection
Evolution 37:455–472.Jamieson, I.G. 2007. Has the debate over genetics
and extinction of island endemics truly beenresolved? Animal Conservation 10: 139–144.
Jamieson, I.G., Grueber, C.E., Waters, J.M. &Gleeson, D.M. 2008. Managing geneticdiversity in threatened populations: a NewZealand perspective. New Zealand Journal of
Ecology 32: 130–137.Kalinowski, S.T. 2005. HP-Rare: a computer
program for performing rarefaction onmeasures of allelic diversity. Molecular Ecology
Notes 5: 187–189.Kulikova, I.V., Drovetski, S.V., Gibson, D.D.,
Harrigan, R.J., Rohwer, S., Sorenson, M.D.,Winker, K., Zhuravlev, Y.N. & McCracken,K.G. 2005. Phylogeography of the mallard(Anas platyrhynchos): hybridization, dispersal,and lineage sorting contribute to complexgeographic structure. The Auk 122: 949–965.
Kumar, S., Tamura, K. & Nei, M, 2004. MEGA4 Integrated software for molecularevolutionary genetics analysis and sequencealignment. Briefings in Bioinformatics 5: 150–163.
Lee, W.G. & Jamieson, I.G. (eds.) 2001. The
Takahe: Fifty Years of Conservation Management
and Research. Otago University Press,Dunedin, New Zealand.
Leonard, J.A., Vila, C. & Wayne, R.K. 2005. Legacy lost: genetic variability andpopulation size of extirpated US grey wolves(Canis lupus). Molecular Ecology 14: 9–17.
Maak, S., Wimmers, K. & Neumanns, K. 2003.Isolation and characterisation of 18microsatellites in the peking duck (Anas
platyrhynchos) and their application in otherwaterfowl species. Molecular Ecology 3: 224–227.
Miskelly, C.M., Dowding, J.E., Elliott, G.P.,Hitchmough, R.A., Powlesland, R.G.,Robertson, H.A., Sagar, P.M., Scofield, R.P.& Taylor, G.A. 2008. Conservation status of New Zealand birds. Notornis 55(3): 117–135.
Munoz-Fuentes, V., Green, A.J., Negro, J.J. &Sorenson, M.D. 2005. Population structureand loss of genetic diversity in theendangered white-headed duck, Oxyura
leucocephala. Conservation Genetics 6: 999–1015.O’Brian, S.J., Roelke, M.E., Marker, L., Newman,
D., Winkler, C.A., Meltzer, D., Colly, L.,Evermann, J.F., Bush, M. & Wildt, D.E. 1985.Genetic-basis for species vulnerability in thecheetah. Science 227: 1428–1434.
O’Connor, S., Maloney, R. & Pierce, R. 2007.Pateke (Anas chlorotis) recovery plan, 2005–10.Threatened Species Recovery Plan No. 59.Department of Conservation, Wellington,New Zealand.
Ogden, R., Shuttleworth, C., McEwing, R. &Cesarini, S. 2005. Genetic management ofthe red squirrel, Sciurus vulgaris: a practicalapproach to regional conservation. Conservation
Genetics 6: 511–525.Parrish, R. & Williams, M. 2001. Decline of
brown teal (Anas chlorotis) in Northland, NewZealand, 1988–99. Notornis 48: 131–136.
Posada, D. & Crandall, K.A. 1998. Modeltest:testing the model of DNA substitution.Bioinformatics 14: 817–818.
Rahbek, C. 1993. Captive breeding – a useful tool in the preservation of biodiversity?Biodiversity and Conservation 2: 426–437.
Raymond, M. & Rousset, F. 1995. Genepop:population genetics software for exact testsand ecumenicism. Journal of Hereditary 86:248–249.
Reed, C.M., Murray, D.P. & Butler, D.J. 1993.Black stilt recovery plan. Threatened SpeciesRecovery Plan No. 4. Department ofConservation, Wellington, USA.

Loss of genetic diversity in Brown Teal 189
© Wildfowl & Wetlands Trust Wildfowl (2012) 62: 176–189
Rozas, J., Sanchez-DelBarrio, J.C., Messeguer, X. & Rozas, R. 2003. DnaSP DNApolymorphism analysis by the coalescent and other methods. Bioinformatics 19: 2496–2497.
Sambrook, J., Fritsch, E.F. & Maniatis, T. 1989.Molecular cloning: a laboratory manual. ColdSpring Harbour Laboratory Press, NewYork, USA.
Schuelke, M. 2000. An economical method forthe fluorescent labelling of PCR fragments, apoor man’s approach to genotyping ofresearch and high-throughput diagnostics.Nature Biotechnology 18: 233–234.
Sorenson, M.D., Ast, J.C., Dimcheff, D.E., Yuri, T.& Mindell, P.D. 1999. Primers for a PCR-based approach to mitochondrial genomesequencing in birds and other vertebrates.Molecular Phylogenetics and Evolution 12: 105–114.
Williams, M. & Dumbell, G.S. 1996. Brown
Teal (Pateke) Anas chlorotis recovery Plan.Threatened Species Recovery Plan No. 19.Department of Conservation, Wellington,New Zealand.
Worthy, T.H. 2002. Fossil distribution of brown teal
Anas chlorotis in New Zealand. ScienceInternal Series No. 81. Department ofConservation, Wellington, New Zealand.
Photograph: Brown Teal with brood, courtesy of New Zealand Herald/Gerard Johnson.

190
© Wildfowl & Wetlands Trust Wildfowl (2012) 62: 190–203
Feeding environments of New Zealand’s extinctmerganser revealed by stable isotope analyses
MURRAY WILLIAMS1*, RICHARD N. HOLDAWAY2 & KARYNE M. ROGERS3
1School of Biological Sciences, Victoria University, P.O. Box 600, Wellington, New Zealand.2School of Biological Sciences, University of Canterbury, Private Bag 4800, Christchurch,
New Zealand.3National Isotope Centre, GNS Science, P.O. Box 31312, Lower Hutt, New Zealand.
*Correspondence author. E-mail: [email protected]
Abstract
The likely feeding environments of individuals from each of the three populations ofNew Zealand’s extinct merganser Mergus australis were interpreted from stable isotoperatios of carbon (13C/12C) and nitrogen (15N/14N) in fossil bones and tissue frompreserved skins. Analyses of feather and claws from 10 specimens from AucklandIslands indicated the birds fed predominantly on marine prey but that somefreshwater-sourced foods may also have been consumed. Stable isotope values fromthree bones of mergansers from Chatham Island strongly suggest a marine feedinghabit while those from two mainland New Zealand bones indicated the birds fedmostly in fresh water. Merganser bones found at a New Zealand lake (Poukawa)suggest this species occupied mainland New Zealand’s fresh waters at the time offirst human settlement.
Key words: feeding, feeding environment, Mergus australis, New Zealand Merganser,stable isotope analysis.
The now-extinct New Zealand MerganserMergus australis once occurred on NewZealand’s three main islands (North, South,and Stewart Islands) and on two distantarchipelagos, Chatham Islands c. 800 km toNew Zealand’s east and Auckland Islands c.450km to its south (Holdaway et al. 2001;Worthy & Holdaway 2002). Early Polynesiansettlers extirpated the New Zealand andChatham Island populations and the lastsighting from the Auckland Islands was in
1902 (Kear & Scarlett 1970; Williams 2012). Today this enigmatic waterfowl isrepresented by just 27 skins from AucklandIslands and small numbers of bones of theother two populations derived fromPolynesian’s middens and natural deposits.
Deposits containing bones from NewZealand’s merganser population are fewand, with but one exception, have all been at coastal locations (Kear & Scarlett 1970; Worthy & Holdaway 2002). This

Feeding environments of New Zealand Merganser 191
© Wildfowl & Wetlands Trust Wildfowl (2012) 62: 190–203
distribution prompted Worthy (2004) toregard four merganser bones retrieved froman extensive natural deposit at NorthIsland’s Lake Poukawa as being from“vagrants” rather than being indicative ofthe merganser’s possible wider distribution.Collection localities specified for AucklandIslands’ specimens generally refer to theheads of sheltered bays or inlets, locations atwhich the island’s short and steepwatercourses debouch (Kear & Scarlett1970; Williams 2012). On Chatham Island,merganser bones have been retrieved fromcoastal dune deposits and, most abundantly,from a cave alongside the island’s extensivesaltwater Te Whanga Lagoon (Millener1999; Worthy & Holdaway 2002).
Mergansers (Family Anatidae, TribeMergini) are specialist fish-eating waterfowl.Five of the six extant species have Holarcticdistributions and primarily or exclusivelyinhabit lakes and rivers whereas the sixth,the now very rare Brazilian MerganserMergus octosetaceus, once occurred morewidely on Brazilian and Argentine rivers(Callaghan 2005). The coastal and marinehabitat ascribed to mergansers of the NewZealand region (Worthy & Holdaway 2002;Worthy 2004) contrasts with that of othermergansers notwithstanding the Red-breasted Merganser’s Mergus serrator use ofsheltered coastal bays, coves and estuaries(Cramp & Simmons 1977).
In this study we sought to identify theprimary feeding environments ofindividuals from all three New ZealandMerganser populations. We have attemptedthis by interpreting carbon and nitrogenstable isotopes values obtained from NewZealand and Chatham Island fossil bones
and from feathers and claws from 10Auckland Island specimen skins. Stableisotope ratios of carbon (13C/12C) are usedto indicate the primary feeding environment(marine or fresh water) (Bearhop et al. 1999;Fry 2006) and of nitrogen (15N/14N) toindicate comparative trophic levels at whichbirds within each population fed. Theresults are compared with carbon andnitrogen isotope values obtained fromfeather and bones of other merganserspecies.
Methods
Specimens and tissue analysed
We were permitted to sample undertailcovert feathers, entire hind claws and a ribbone from 10 museum skins of AucklandIsland’s mergansers and bone from NewZealand and Chatham Island-sourcedmergansers (Appendix 1). From oneAuckland Island specimen (NHM1904.8.4.1; 1904.8.4.2) we obtained feather,claw and bone and from four others, featherand claw (Appendix 1) which allowed us topresent isotope ratios from different tissuesof an individual. Two specimens providingfeather and claw samples (NHM 1904.8.4.1;samples 9, 10 and NHM 1901.10.21.58;samples 13, 14, Appendix 1) were initiallypreserved in formalin (Ogilvie-Grant 1905).Two feather (7, 25) and one claw (8) samplescame from young birds in juvenile plumagewhereas all others samples were from adultbirds (see Appendix 1 in Williams 2012).
The two fossil New Zealand-sourcedlimb bones were from Polynesian middenson Old Neck, Stewart Island and at MarfellsBeach, Lake Grassmere, South Island

192 Feeding environments of New Zealand Merganser
© Wildfowl & Wetlands Trust Wildfowl (2012) 62: 190–203
(Worthy 1998a,b). The three ChathamIsland bones were fragments of sternaretrieved from the natural deposit in Te Anaa Moe cave near Te Whanga Lagoon(Millener 1999; Appendix 1).
Feather and bone samples from othermerganser species were obtained fromspecimens in the collections of the NaturalHistory Museum, Tring, UK (Appendix 2)and mean isotope values from feathers ofliving Scaly-sided Merganser Mergus
squamatus were provided by Diana Solovievaand Tony Fox (pers. comm.).
Analytical techniques
Feather and claw samples were prepared atthe Stable Isotope Laboratory, GNSScience, New Zealand. They were cleaned in2:1 chloroform/methanol v/v and air driedfor 48 h to remove surface oils (Wassenaar& Hobson 2006) and any residual museumconservation treatments, and then finelyground. The five fossil bones (samples27–31; Appendix 1) were prepared andanalysed by IsoTrace New Zealand Ltd(Dunedin, New Zealand) and the remainderby the Stable Isotope Laboratory, GNSScience, New Zealand. Extraction of bonecollagen at both laboratories followed theprocedure described by Holdaway & Beavan(1999). The cleaned bones were ground anddemineralised in 1N HCl for 24 h to removecarbonates and all organic traces, thenneutralised and rinsed with deionised water.The collagen extract was gelatinised, ultra-filtered and freeze-dried. Ground featherand claw subsamples (1.5 ± 0.1 mg neartheir tip) and dried bone powders (1.5 mg)were weighed into tin capsules for isotopicanalysis.
The samples were combusted in anANCA SL elemental analyser (EuropaScientific, Crewe, UK) and measured in a GEO 20–20 isotope ratio massspectrometer (Europa Scientific, Crewe,UK). Results are reported as %C and %N by dry mass and as δ13C or δ15N (‰) = (RSAMPLE/RSTANDARD – 1)*1,000with R = 13C/12C or 15N/14N relative toVPDB (Vienna PeeDee Belemnite) and N2
gas in air standards (Rogers 2003; Sharp2007).
Results
New Zealand Merganser
Auckland Islands
Carbon (δ13C) isotope values of feathersextended from –10.6‰ to –18.0‰ (n = 10),claw values from –11.6‰ to –19.8‰ (n = 5)and the single bone value was –11.6‰(Appendix 1, Fig. 1).
The δ13C values for two of the five clawssampled (Appendix 1, Fig 1) were c. 2‰more negative than corresponding feathervalues from the same specimens (samples9–10, 13–14), there was little difference foranother two (samples 2–3, 5–6) whereas thedifference for the fifth, a newly-fledged bird,was c. 5‰ (samples 7–8). From the singlespecimen providing bone (11), feather (10)and claw (9) samples, the δ13C values offeather and bone were similar (Fig. 1).
The δ13C values from all tissuescombined were not distributed evenlythroughout their range (–10.6‰ to –19.8‰)but appear distributed as two groupings(Fig. 1): –10.6‰ to –15.2‰ and from–16.5‰ to –19.8‰. Notwithstanding thatdifferent fractionation rates will apply

Feeding environments of New Zealand Merganser 193
© Wildfowl & Wetlands Trust Wildfowl (2012) 62: 190–203
between prey and the tissues sampled, andthe large difference between feather andclaw values from one specimen (1904.559.1;samples 7, 8), this distribution is suggestiveof two different feeding strategies amongthese individuals.
Most (12 of 16) nitrogen (δ15N) isotopevalues were within the range 15‰–18‰.The four samples providing lowest δ15Nvalues were also those with the lowest δ13Cvalues. The δ15N values from three of thefive claws sampled (Appendix 1, Fig 1) werec. 2‰ lower than corresponding feathervalues from the same specimens (samples7–8, 9–10, 13–14) but there was little
difference for the other two (samples 2–3,5–6). From the single specimen providingbone (11), feather (10) and claw (9) samples,the δ15N values of feather and bone were similar (Fig. 1) but almost 2‰ higherthan for its claw. These results suggest all mergansers were feeding on similar prey.
New Zealand
Bones from the two New Zealandspecimens (samples 27, 28; Fig. 1), bothderived from middens, had considerablylower δ15N and δ13C values than theAuckland Island and Chatham Island birds.
Figure 1. Distribution of δ15N and δ15C isotope values of Mergus australis bone, feather and clawsamples sourced from Auckland Islands, Chatham Island (encircled) and New Zealand (encircled).Sample numbers are those indicated in Appendix 1.

194 Feeding environments of New Zealand Merganser
© Wildfowl & Wetlands Trust Wildfowl (2012) 62: 190–203
Chatham Islands
Three Chatham Island merganser bones(samples 29, 30, 31; Fig. 1), all sampled fromthe same natural site, had similar δ13C valuesand these were similar to some of theAuckland Island-sourced specimens. As agroup their δ15N values were higher thanthose obtained from all other M. australis
specimens.
Other mergansers
Feathers from two Brazilian Mergansers(samples 15, 16; Appendix 2) had δ13Cvalues that were 1–3‰ lower than any ofthe Auckland Island specimens. However,they were in turn 1–2‰ higher than theSmew Mergellus albellus feather (sample 19),and considerably higher than the rangerecorded for Scaly-sided Merganser(Appendix 2). The single feather (sample 17) of Goosander Mergus merganser hadsimilar isotopic values to those of twoAuckland Island birds (samples 25, 26). The Red-breasted Merganser feather(sample 21; Appendix 2) had higher δ15N and δ13C values than any of the other merganser samples, perhapsemphasising this species’ considerable useof marine environments (Cramp &Simmons 1977).
Discussion
Observations of merganser food andfeeding at Auckland Islands
There are two records of merganser foodsat Auckland Islands. A specimen shot in1901 (NHM 1901.21.57) at McLennan Inlethad a 90 mm (“3.5 in”) Koaro Galaxias
brevipinnis, a fresh water fish, in its bill
(Hutton 1901). Kear and Scarlett (1970)reported the gut contents of a preservedpartial cadaver (NHM A/1999.1.124) whosecollection details are unknown comprised“macerated fish bones, mandibles of anerrant polychaete and an unidentifiedgastropod”. They added that “the presenceof the polychaete tends to suggest abrackish water environment”.
There are no recorded observations ofmergansers feeding at the Auckland Islandsand few from which their habitat can bediscerned with certainty. Reischek (1889)refers to a group of six mergansers(probably adults and fledglings) amongrocks on the shoreline of Waterfall Inlet.Waite (1909) quotes Captain J. Bollons(master of the government ships regularlyvisiting the subantarctic islands) as nothaving seen the bird on the coasts, buthaving found them at the heads of estuariesand especially on the island’s watercourses“picking about in the creeks”. Falla (1970) reports R.A Wilson, the collector of two specimens in 1891 (sample 26 isfrom one), as having “encountered hisquarry up the stream bed some distancefrom the coast and in a deep pool where thestream was partly dammed on a rockyterrace.”
Despite streams on Auckland and AdamsIslands being short and mostly very steep,G. brevipinnis is common along their lengthsand especially so where the stream gradientsease prior to reaching the sea (M. Williamspers. obs.). Human access up streams fromthe coastline is extremely difficult so it is notsurprising that mergansers were seen onlyon the sea at the heads of bays and inlets(see Williams 2012).

Feeding environments of New Zealand Merganser 195
© Wildfowl & Wetlands Trust Wildfowl (2012) 62: 190–203
Interpreting isotope values
Influence of formalin preservation and midden
effects
All M. australis specimens sampled fromNatural History Museum (NHM), Tring(samples 9–14, Appendix 1) had beentransported to England in formalin (Ogilvie-Grant 1905) and possibly the DublinMuseum specimen also (samples 7, 8; seeWilliams 2012). Formalin lowers δ13C valuesby up to 2‰ but has little effect on δ15N(Barrow et al. 2008 and references therein).From three specimens we obtained bothfeather and claw samples (7–8, 9–10, 13–14;Appendix 1, Fig 1); claw δ15N and δ13Cvalues were c. 2‰ lower than feather valuesfrom all which suggests a possible differentialeffect even though both tissues are keratin.There was little difference between featherand claw measurements from the other twospecimens (2–3, 5–6) which are thought tohave been transported as dry skins (Kear &Scarlett 1970). In our interpretation ofmerganser feeding environments at AucklandIsland we assume a formalin effect oflowering δ13C values by c. 2‰.
The two New Zealand fossil bones(samples 27, 28; Appendix 1) were frommiddens (Worthy 1998a,b). Temperatures atwhich Polynesians cooked birds in groundovens appear not have been high enough tohave altered the carbon and nitrogenisotopic ratios in the bone collagen (see deNiro et al. 1985) and biomolecules have beenextracted from some midden eggshellfragments (e.g. Oskam et al. 2011).
Isotope turnover and fractionation
The tissues analysed accumulate and retaindietary carbon and nitrogen over different
time periods. Feathers capture dietary carbonand nitrogen during their short period (2–4weeks) of growth. Claws, however, growcontinuously; Bearhop et al. (2003) foundthat claws have similar isotope values tofeathers and in some passerines the wholeclaw contained a record of the bird’s dietover the c. 3–5 months of its growth. Thegrowth rate of merganser claws is unknown.Bone collagen retains a dietary isotoperecord for considerably longer, with perhapsa dietary carbon turnover of 50% after about6 months (Hobson & Clark 1992).
Conversion of prey tissue to body tissueis accompanied by change in isotope ratios.In general there is a stepwise increase ofapproximately 4‰ in δ15N and ≈1‰ for δ13C (e.g. de Niro & Epstein 1978;McCutchan et al. 2003). However Bearhop etal. 1999 identified a consistent δ13Cfractionation from fish prey to CormorantPhalacrocorax carbo and Goosander feather of2.3‰, Mitzutani et al. (1992) recorded anaverage δ13C fractionation from prey tofeather for fish-eating birds of 3.3‰ in anexperimental study, and Becker et al. (2007)reported fractionation of δ13C was 2.5‰ ±0.2‰ from delipidated fish muscle to breastfeather of the marine-feeding CommonMurres Uria aalge. Furthermore, Mitzutani et al. (1991) demonstrated considerablevariation in δ13C fractionation from fishprey to different Cormorant tissues andHobson & Clark (1992) reported a diet tobone collagen δ13C fractionation of 2.6 ±1.1‰ for gulls fed solely on fish.
To assist our interpretations ofmerganser feeding environments we assumea δ13C fractionation of 2.5‰ from prey toeach of the merganser tissues sampled.

196 Feeding environments of New Zealand Merganser
© Wildfowl & Wetlands Trust Wildfowl (2012) 62: 190–203
Carbon isotope values indicative of marine and
fresh water feeding
No isotope measurements of likely marineand fresh water prey of M. australis atAuckland and Chatham Islands are knownto us. From the literature (e.g. Bearhop et al.
1999 and references therein; Bushula et al.2005; Crow et al. 2010) we derived anapproximate δ13C isotope value formerganser tissue which, taking into accountthe fractionation estimate above, couldindicate mixed marine–fresh water feeding(–17‰) and predominantly fresh waterfeeding (–21‰).
Feeding environment of AucklandIslands’ mergansers
Mergansers at the Auckland Islandsundoubtedly fed in fresh water; Bollons andWilson (loc. cit.) saw them there, Wilson shotone there (sample 26; Williams 2012) andHutton (1901) prised an exclusivelyfreshwater fish from a cadaver’s bill.However, the δ13C isotope values, most ofwhich exceed –16‰, do not indicate freshwater having been a significant feedinghabitat. The range of δ13C values lies withinthe range of values recorded for manymarine birds, including piscivorous (e.g.
Bearhop et al. 1999; Hobson et al. 1994) andsquid-eating species (e.g. Phillips et al. 2009).
Sample 26 (Appendix 1), a feather of thebird collected “up the stream bed somedistance from the coast and in a deep poolwhere the stream was partly dammed on arocky terrace” (Falla 1970) had a δ13C valueof –17.5‰. Allowing 2.5‰ fractionationfrom prey to predator suggests that, duringfeather growth, the merganser consumedprey with an average δ13C value of c. –20‰.
This is consistent with feeding in both freshwater and marine environments (see Fig. 3in Bearhop et al. 1999). There are three othersamples (8, 13, 14) which returned similarδ13C values; these samples were obtainedfrom two specimens initially preserved informalin. If applying a +2‰ correction totheir δ13C values (Barrow et al. 2008) isappropriate, then they too indicate mixedfresh water and marine feeding.
The δ15N values from feathers of all butone of the mergansers lie within a narrow4‰ range, indicative of the mergansersfeeding on similar prey at the time of feathergrowth. The most likely nearshore marineprey for mergansers would have been theabundant small omnivorous and predatoryNototheniidae fishes (Williams 1988; Paulin& Roberts 1992), while fresh water streamscontained Galaxias brevipinnis, aninvertebrate predator.
Feeding environments of NewZealand’s and Chatham Islands’mergansers
The isotope values of sample 28 (Appendix1, Fig. 1), from a midden on Stewart Island,suggests that this merganser fed primarily infresh water. The midden is at the mouth ofPaterson Inlet, a large sheltered coastal inletinto which two major rivers (Rakeahua,Freshwater), and many smaller streams,flow. These waterways drain extensive, lowrelief, peat-filled basins and although theirwaters are typically stained brown by tanninsthey support an abundant fish fauna,including diadromous and non-diadromousGalaxias species (McDowall & Chadderton1999). The δ15N value of sample 28 (9.0‰)is low relative to that for other M. australis

Feeding environments of New Zealand Merganser 197
© Wildfowl & Wetlands Trust Wildfowl (2012) 62: 190–203
samples but consistent with a diet of non-diadromous Galaxias sp. with isotope valuessimilar to those of G. gollumoides fromstreams in nearby Southland streams (δ15N = 5.15 to 6.59‰; δ13C = –21.63 to–26.76‰; Crow et al. 2010).
We interpret the δ13C isotope fromsample 27 (Appendix 1, Fig. 1) as indicativeof a diet of mixed fresh water and salt waterprey. This bone is from a midden at MarfellsBeach, a natural gravel and sand barseparating Lake Grassmere from the sea:natural fossil deposits in the dunes alsocontain many merganser bones (Worthy1998a). The compositions of those depositsclearly indicate a rich freshwater avifauna atLake Grassmere after it was separated fromthe sea c. 1800 years ago (Ota et al. 1995,Worthy 1998a). As with other barrier-barlakes such as Ellesmere and Wainono(eastern South Island) and Onoke (southernNorth Island) Grassmere would have beenconnected to the sea periodically, its waterthen becoming increasingly saline andallowing a variety of estuarine fish (e.g.Flounder Rhombosolea plebeia, MulletAldrichetta forsteri) as well as diadromousgalaxiids to enter and thrive. We considerthis bone was from a bird that fedpredominantly in Lake Grassmere, not inthe adjacent marine environment.
Chatham Island mergansers had access toa distinctive feeding environment, a largesaltwater lagoon. The high δ15N values ofthe three Chatham Island samples probablyreflects a prey fauna consisting largely ofpiscivorous fishes with δ15N enrichmentssimilar to or higher than those reported in other seabird trophic studies (Hobson et al. 1994; Thompson & Furness 1995;
Bearhop 1999). That the Chatham Islands’mergansers were primarily marine isemphasised by the presence of conspicuoussalt gland impressions on the skulls of all 44merganser crania examined at the Museumof New Zealand (see Fig. 7.2 in Worthy &Holdaway 2002). Impressions of salt glandsare barely discernible on three crania ofmergansers from Auckland Island examinedat the Natural History Museum, Tring, UK.(M. Williams unpubl. data).
Comparing Mergus australis with othermergansers
The δ15N and δ13C values of tissues ofmergansers from the Auckland Islands werehigher than those of samples from almostall other merganser species. Isotope valuesof Auckland Islands’ mergansers indicatethey fed in the marine environment morethan other mergansers, except Red-breastedMerganser. More negative δ13C values forGoosander (Bearhop et al. 1999; Morrissey etal. 2004) confirm their strong freshwaterisotopic signatures. The δ13C values for thetwo mergansers from mainland NewZealand, however, are close to or within therange reported from other freshwatermergansers (Appendix 2).
Could New Zealand’s merganser havebeen more widespread than existingbone deposits suggest?
With the exception of the Red-breastedMerganser, all extant mergansers occupyprimarily or exclusively freshwater habitats.Brazilian Mergansers are year-roundinhabitants, and Scaly-sided Mergansersseasonal inhabitants, of mountain foothillrivers whose physical characteristics are

198 Feeding environments of New Zealand Merganser
© Wildfowl & Wetlands Trust Wildfowl (2012) 62: 190–203
similar to those of many New Zealandrivers. Could New Zealand’s mergansersalso have lived in rivers or lakes beyond thecoastal fringe?
The isotopic measurements and historicobservations suggest that fresh waters werepart of, but not the exclusive, feedingenvironment of mergansers at AucklandIslands, which is unsurprising given theshort and steep nature of the islands’watercourses. The Chatham Island birds hadisotope values indicating a marine-sourceddiet which, too, is unsurprising given thepresence of the extensive Te WhaangaLagoon and the lack of anything other thansmall slow-flowing streams and peat lakeson the island. However, the isotope valuesfrom both New Zealand bones aresuggestive of fresh water feeding. The viewthat New Zealand’s merganser was a“coastal species” (Worthy & Holdaway2002; Worthy 2004) is not disproved,especially if by “coastal” was meantestuaries and coastal dune lakes. However,the Stewart Island bone (sample 28)indicates that some New Zealandmergansers may have fed mostly in freshwaters, and if that was possible on StewartIsland then it could also have been so onNorth and South Islands where, historically,their numerous rivers and lakes contained an abundant small fish fauna (McDowall2010).
Lacustrine avian bone deposits in NewZealand are rare (Worthy 2004) so thepresence of a Mergus bone at two of thethree sites excavated is significant. Althoughthe Marfells Beach site is “coastal” it is also on the shore of an extensive lake(Grassmere; Worthy 1998a) while the other,
at Lake Poukawa in Hawkes Bay (Worthy2004), is 25 km inland. Isotopic examinationof a Lake Poukawa bone would advanceecological understanding of the NewZealand population, especially if assessed inrelation to isotope measurements of otherspecies from the deposit which would haveconsumed similar prey from the lake’s watercolumn (e.g. New Zealand Scaup Aythya
novaeseelandiae, New Zealand DabchickPoliocephalus rufopectus, Great Crested GrebePodiceps cristatus, and shags Phalacrocorax sp.).The other major lacustrine site, PyramidValley in North Canterbury, is 30 km inlandand although it contained the remains ofmost endemic waterfowl and wetland birds(Holdaway & Worthy 1997) it lackedmergansers and other piscivorous birds.
The general lack of piscivorous birds inNew Zealand rivers – perhaps only BlackShag Phalacrocorax carbo represents this guildin the present avifauna – suggests that themerganser could have had little directcompetition, whereas the estuaries andcoasts of New Zealand, as well as at theAuckland and Chatham Islands, would havebeen occupied, as they still are, by a range ofindividual and group-feeding species ofshags (Family Phalacrocoracidae). Takentogether, the evidence that some AucklandIsland’s mergansers fed in fresh water, that aStewart Island bird fed mostly or exclusivelyin fresh water, that the δ13C value of theMarfells Beach specimen suggests it fed in abrackish lake, that mergansers were presenton Lake Poukawa, and that all othermerganser species inhabit rivers and lakes,suggests New Zealand’s merganser was ahitherto unrecognised occupant of its freshwaters at the time of first human settlement.
Feeding environments of New Zealand Merganser 199
© Wildfowl & Wetlands Trust Wildfowl (2012) 62: 190–203
Acknowledgements
We acknowledge the kind assistance ofcurators of bird collections at NaturalHistory Museum, Tring (Mark Adams,Joanna Cooper), Dublin Museum of NaturalHistory (Nigel Monoghan), CambridgeUniversity Zoology Museum (MichaelBrooke), Naturhistoriches Museum inVienna (Ernst Bauernfeind), StaatlichesMuseum fur Tierkunde in Dresden (MichaelPackert), Canterbury Museum (PaulScofield) and Museum of New Zealand(Alan Tennyson) for providing feathers,claws or bones for our study. We alsoappreciate Diana Solovieva and Tony Fox’skindness in providing isotope values forMergus squamatus. M. Williams records hisappreciation of the advice, encouragementand assistance from his co-authors inconducting and reporting this study, andthanks Nancy Beavan for advice on heatingeffects on stable isotope ratios. He alsoappreciated the helpful reviews provided byDavid Roshier and Manuela Forero.
References
Barrow, L.M., Bjorndal, K.A. & Reich, K.J. 2008.Effects of preservation on stable carbon andnitrogen isotope values. Physiological and
Biochemical Zoology 81: 688–693. Bearhop, S., Thompson, D., Waldron, S., Russell,
I.C., Alexander, C. & Furness, R.W. 1999. Stable isotopes indicate the extent of freshwater feeding by cormorantsPhalacrocorax carbo shot at inland fisheries inEngland. Journal of Applied Ecology 36: 75–84.
Bearhop, S., Furness, R.W., Hilton, G.M., Votier,S.C. & Waldron, S. 2003. A forensic approachto understanding diet and habitat use fromstable isotope analysis of (avian) clawmaterial. Functional Ecology 17: 270–275.
Becker, B.H., Newman, S.H., Inglis, S. &Beissinger, S.R. 2007. Diet–feather stableisotope (δ15N and δ13C) fractionation inCommon Murres and other seabirds. Condor
109: 451–456.Bushula, T., Pakhomov, E.A., Kaehler, S., Davis,
S. & Kalin, R.A. 2005. Diet and daily rationof two nototheniid fish on the shelf of thesub-Antarctic Prince Edward Islands. Polar
Biology 28: 585–593.Callaghan, D. 2005. Brazilian Merganser. In J.
Kear (ed.), Ducks, Geese and Swans of the World,pp. 749–751. Oxford University Press,Oxford, UK.
Cramp, S. & Simmons, K.E.L. (eds.) 1977.Handbook of the Birds of Europe, the Middle
East and North Africa. Oxford UniversityPress, Oxford, UK.
Crow, S.K., Closs, G.P., Waters, J.M., Booker, D.J.& Wallis, G.P. 2010. Niche partitioning andthe effect of interspecific competition onmicrohabitat use by two sympatric galaxiidstream fishes. Freshwater Biology 55: 967–982.
de Niro, M.J. & Epstein, S. 1978. Influence ofdiet on the distribution of carbon isotopes inanimals. Geochimica et Cosmochimica Acta 42:495–506.
de Niro, M.J., Schoeninger, M.J. & Hastorf, C.A.1985. Effect of heating on the stable carbonand nitrogen isotope ratios of bone collagen.Journal of Archaeological Science 12: 1–7.
Falla, R.A. 1970. Letter to Janet Kear. Falla papersMS Papers 2366–333, National Library ofNew Zealand, Wellington, New Zealand.
Fry, B. 2006. Stable Isotope Ecology. Springer, NewYork, USA.
Hobson, K.A. & Clark, R.G. 1992. Assessingavian diets using stable isotopes I: turnoverof δ13C in tissues. Condor 94: 181–188.
Hobson, K.A., Piatt, J.F. & Pitocchelli, J. 1994.Using stable isotopes to determine seabirdtrophic relationships. Journal of Animal
Ecology 63: 786–798.
200 Feeding environments of New Zealand Merganser
© Wildfowl & Wetlands Trust Wildfowl (2012) 62: 190–203
Holdaway, R.N. & Beavan, N.R. 1999. Reliable14C AMS dates on bird and Pacific rat Rattus
exulans bone gelatin, from a CaCO3-richdeposit. Journal of the Royal Society of New
Zealand 29: 185–211.Holdaway, R.N. & Worthy, T.H. 1997. A
reappraisal of the late Quaternary fossilvertebrates of Pyramid Valley Swamp, NorthCanterbury, New Zealand. New Zealand
Journal of Zoology 24: 69–121.Holdaway, R.N., Worthy, T.H. & Tennyson,
A.J.D. 2001. A working list of breeding birdspecies of the New Zealand region at firsthuman contact. New Zealand Journal of Zoology
28: 119–187.Hutton, F.W. 1901. On a marine Galaxias from
the Auckland Islands. Transactions of the New
Zealand Institute 34: 198–199.Kear, J. & Scarlett, R.J. 1970. The Auckland
Island merganser. Wildfowl 21: 78–86.McCutchan, J.H., Lewis, W.M., Kendall, C. &
McGrath, C.C. 2003. Variation in trophicshift for stable isotope ratios for carbon,nitrogen, and sulphur. Oikos 102: 378–390.
McDowall, R.M. 2010. New Zealand Freshwater
Fishes: An Historical and Ecological Biogeography.
Springer, New York, USA.McDowall, R.M. & Chadderton, W.L. 1999.
Galaxias gollumoides (Teleostei: Galaxiidae), anew fish species from Stewart Island, withnotes on other non-migratory freshwaterfishes present on the island. Journal of the
Royal Society of New Zealand 29: 77–88.Morrissey, C.A., Bendell-Young, L.I. & Elliott,
J.E. 2004. Linking contaminant profiles tothe diet and breeding location of Americandippers using stable isotopes. Journal of
Applied Ecology 41: 502–512.Millener, P.R. 1999. The history of the Chatham
Islands’ bird fauna of the last 7000 years – a chronicle of change and extinction.Smithsonian Contributions to Paleobiology 89:85–109.
Mitzutani, H., Kabaya, Y. & Wada, E. 1991.Nitrogen and carbon isotope compositionsrelate linearly in cormorant tissues and itsdiet. Isotopenpaxis 27: 166–168.
Mitzutani, H., Fukuda, M. & Kabaya, Y. 1992.13C and 15N enrichment factors of feathersof 11 species of adult birds. Ecology 73 (4):1391–1395.
Ogilvie-Grant, W.R. 1905. On the birds procuredby the Earl of Ranfurly in New Zealand andadjacent islands. Ibis 8 (5): 543–602.
Oskam, C.L., Jacomb, C., Allentoft, M.E., Walter,R., Scofield, R.P., Haile, J., Holdaway, R.N. & Bunce, M. 2011. Molecular andmorphological analyses of avian eggshellexcavated from a late thirteenth century earthoven. Journal of Archaeological Science 38 (10):2589–2595.
Ota, Y., Brown, L.J., Berryman, K.R., Fujimori,T., Miyauchi, T., Beu, A.G., Kashima, K. & Taguchi, K. 1995. Vertical techtonicmovement in northeastern Marlborough:Stratigraphic, radiocarbon and paleoecologicaldata from Holocene estuaries. New Zealand
Journal of Geology and Geophysics 38: 269–282.
Paulin, C. & Roberts, C. 1992. Rockpool Fishes of
New Zealand. Museum of New Zealand,Wellington, New Zealand.
Phillips, R.A., Bearhop, S., McGill, R.A.R. &Dawson, D.A. 2009. Stable isotopes revealindividual variation in migration strategiesand habitat preferences in a suite of seabirdsduring the non-breeding period. Oecologia
160: 795–806.Reischek, A. 1889. Notes on the islands to the
south of New Zealand. Transactions of the New
Zealand Institute 21: 378–389.Rogers, K.M. 2003. Stable carbon and nitrogen
isotope signatures indicate recovery ofmarine biota from sewage pollution at MoaPoint, New Zealand. Marine Pollution Bulletin
46: 821–827.

Feeding environments of New Zealand Merganser 201
© Wildfowl & Wetlands Trust Wildfowl (2012) 62: 190–203
Sharp, Z. 2007. Principles of Stable Isotope
Geochemistry. New Jersey, Pearson/PrenticeHall, USA.
Thompson, D.R. & Furness, R.W. 1995. Stableisotope ratios of carbon and nitrogen infeathers indicate seasonal dietary shifts innorthern fulmars. The Auk 112: 493–498.
Waite, E.R. 1909. Vertebrata of the subantarcticislands of New Zealand: Aves. In C. Chilton(ed.), The Subantarctic Islands of New Zealand.
Vol. 2, pp. 542–600. Philosophical Instituteof Canterbury, Wellington, New Zealand.
Wassenaar, L.I. & Hobson, K.A. 2006. Stable-hydrogen isotope heterogeneity in keratinousmaterials: mass spectrometry and migratorywildlife tissue subsampling strategies. Rapid
Communications in Mass Spectrometry 20: 2505–2510.
Williams, M. 2012. A merganser at AucklandIslands, New Zealand. Wildfowl 62: 3–36.
Williams, R. 1988. The nearshore fishes ofMacquarie Island. Papers and Proceedings of the
Royal Society of Tasmania 122: 233–245.Worthy, T.H. 1998a. A remarkable fossil and
archaeological avifauna from Marfells Beach,Lake Grassmere, South Island, New Zealand.Records of the Canterbury Museum 12 (1):79–176.
Worthy, T.H. 1998b. Fossil avifaunas from OldNeck and Native Island, Stewart Island –Polynesian middens or natural sites? Records of
the Canterbury Museum 12 (2): 49–82.Worthy, T.H. 2004. The Holocene fossil
waterfowl fauna of Lake Poukawa, NorthIsland, New Zealand. Tuhinga 15: 77–120.
Worthy, T.H. & Holdaway, R.N. 2002. The
Lost World of the Moa: Prehistoric Life of
New Zealand. Indiana University Press,Bloomington, USA.
Drawing: Auckland Islands Merganser by Peter Scott.
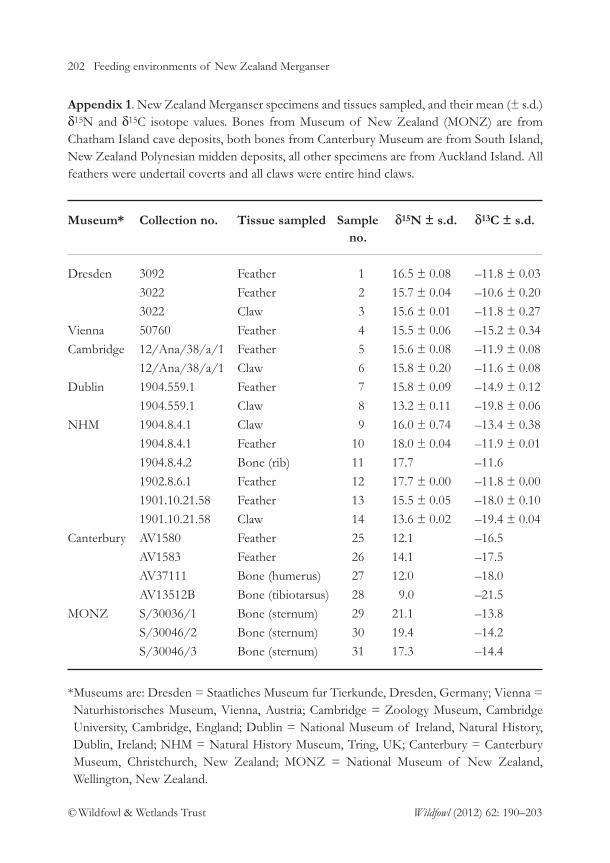
202 Feeding environments of New Zealand Merganser
© Wildfowl & Wetlands Trust Wildfowl (2012) 62: 190–203
Appendix 1. New Zealand Merganser specimens and tissues sampled, and their mean (± s.d.)δ15N and δ15C isotope values. Bones from Museum of New Zealand (MONZ) are fromChatham Island cave deposits, both bones from Canterbury Museum are from South Island,New Zealand Polynesian midden deposits, all other specimens are from Auckland Island. Allfeathers were undertail coverts and all claws were entire hind claws.
Museum* Collection no. Tissue sampled Sample δ15N ± s.d. δ13C ± s.d.no.
Dresden 3092 Feather 1 16.5 ± 0.08 –11.8 ± 0.03
3022 Feather 2 15.7 ± 0.04 –10.6 ± 0.20
3022 Claw 3 15.6 ± 0.01 –11.8 ± 0.27
Vienna 50760 Feather 4 15.5 ± 0.06 –15.2 ± 0.34
Cambridge 12/Ana/38/a/1 Feather 5 15.6 ± 0.08 –11.9 ± 0.08
12/Ana/38/a/1 Claw 6 15.8 ± 0.20 –11.6 ± 0.08
Dublin 1904.559.1 Feather 7 15.8 ± 0.09 –14.9 ± 0.12
1904.559.1 Claw 8 13.2 ± 0.11 –19.8 ± 0.06
NHM 1904.8.4.1 Claw 9 16.0 ± 0.74 –13.4 ± 0.38
1904.8.4.1 Feather 10 18.0 ± 0.04 –11.9 ± 0.01
1904.8.4.2 Bone (rib) 11 17.7 –11.6
1902.8.6.1 Feather 12 17.7 ± 0.00 –11.8 ± 0.00
1901.10.21.58 Feather 13 15.5 ± 0.05 –18.0 ± 0.10
1901.10.21.58 Claw 14 13.6 ± 0.02 –19.4 ± 0.04
Canterbury AV1580 Feather 25 12.1 –16.5
AV1583 Feather 26 14.1 –17.5
AV37111 Bone (humerus) 27 12.0 –18.0
AV13512B Bone (tibiotarsus) 28 9.0 –21.5
MONZ S/30036/1 Bone (sternum) 29 21.1 –13.8
S/30046/2 Bone (sternum) 30 19.4 –14.2
S/30046/3 Bone (sternum) 31 17.3 –14.4
*Museums are: Dresden = Staatliches Museum fur Tierkunde, Dresden, Germany; Vienna =Naturhistorisches Museum, Vienna, Austria; Cambridge = Zoology Museum, CambridgeUniversity, Cambridge, England; Dublin = National Museum of Ireland, Natural History,Dublin, Ireland; NHM = Natural History Museum, Tring, UK; Canterbury = CanterburyMuseum, Christchurch, New Zealand; MONZ = National Museum of New Zealand,Wellington, New Zealand.

Feeding environments of New Zealand Merganser 203
© Wildfowl & Wetlands Trust Wildfowl (2012) 62: 190–203
Appendix 2. Mean (± s.d.) δ15N and δ15C isotope values of merganser species and tissuessampled. All tissues were obtained from Natural History Museum, Tring, UK; the Smew,Red-breasted Merganser and Goosander specimens were collected in United Kingdom andBrazilian Merganser from Argentina (15) and Brazil (16). The Scaly-sided Merganser data arefrom the South Primorye region of eastern Russia (D. Solovieva, unpubl. data and A.D. Fox,unpubl. data).
Species Collection no. Tissue Sample δ15N ± s.d. δ13C ± s.d. sampled no.
Brazilian 1892.2.1.22 Feather 15 14.8 ± 0.04 –20.4 ± 0.02Merganser 1966.24.2 Feather 16 13.9 ± 0.03 –18.5 ± 0.01
Goosander 1934.1.1.1752 Feather 17 13.4 ± 0.01 –15.8 ± 0.321919.12.10.319 Bone 18 14.8 ± 0.06 –20.1 ± 0.21
Smew 1941.5.30.9241 Feather 19 13.8 ± 0.69 –21.7 ± 0.31S/1986.32.1 Bone 20 12.4 ± 0.10 –24.7 ± 0.24
Red-breasted 1955.3.40 Feather 21 16.8 ± 0.03 –13.3 ± 0.19Merganser S/1997.78.1 Bone 22 9.9 ± 0.04 –9.6 ± 0.27
Scaly-sided D. Solovieva, unpubl. Feather 12.1 ± 1.00 –23.5 ± 1.60Merganser data and A.D. Fox, (n = 18)
unpubl. data.

204
© Wildfowl & Wetlands Trust Wildfowl (2012) 62: 204–223
Direct and indirect evidence that productivity ofSnowy Plovers Charadrius nivosus varies with
occurrence of a nest predator
NOAH S. BURRELL & MARK A. COLWELL
Wildlife Department, Humboldt State University, 1 Harpst Street, Arcata, California 95521, USA.
E-mail: [email protected]
Abstract
The Snowy Plover Charadrius nivosus is a threatened species of shorebird that breedsalong the Pacific coast of North America where predation of eggs and chicks isthought to be a principal cause of low productivity and small population size. Datawere collated over nine years (2001–2009) at 19 breeding locations in northernCalifornia to evaluate relationships between the activity of the main predator(Common Raven Corvus corax) suspected to compromise plover reproductive successand per capita fledging success of plovers, including video camera evidence. An indexof raven activity correlated negatively with plover productivity and appeared in thefive most-competitive models, accounting for 88% of corrected-Akaike weightsexplaining variation in per capita fledging success. Activity of humans and AmericanCrows Corvus brachyrhynchos was weakly correlated with plover reproductive success.Video cameras (deployed in the last two years of the study at the site where corvidactivity was highest and most plovers bred) showed that ravens caused 70% of nestfailures at an average of 12 (± 2.82 s.e.) days after clutch initiation; humans (20%) ordrifting sand/tidal overwash (10%) caused remaining losses. Video recordingssuggested that the departure of an incubating plover prompted raven predation ofeggs. These results substantiate the notion that the Common Raven is an importantfactor limiting plover productivity in northern California, which emphasises the needfor more effective management measures for predators.
Key words: Common Raven, human disturbance, predation, reproductive success,video cameras.
Worldwide, wader populations are declining(Morrison et al. 2001; Delany et al. 2009). Avariety of causes have been implicated inthese declines, including degradation and
loss of wetland habitats in non-breedingareas (Myers et al. 1987), which affects adult survival (e.g. Burton et al. 2006), andlow productivity on breeding grounds

Corvids compromise plover productivity 205
© Wildfowl & Wetlands Trust Wildfowl (2012) 62: 204–223
(MacDonald & Bolton 2008; Teunissen et al.2008). In arctic and boreal regions, lowbreeding productivity has been linked toelevated rates of nest predation, especiallyin human-altered landscapes (Evans 2004;MacDonald & Bolton 2008) that enhancepopulations of synanthropic species (Perry& Henry 2010). A variety of studies haveimplicated corvids (Family: Corvidae) asprincipal predators responsible for lowreproductive success (see MacDonald &Bolton 2008), although evidence differsregarding the extent to which variation incorvid abundance is correlated with changesin wader productivity. For instance, Boltonet al. (2007) showed experimentally thatLapwing Vanellus vanellus nesting successwas highly variable and largely unaffected(except at sites with highest predatordensities) by lethal control of two predators(Red Fox Vulpes vulpes and Carrion CrowCorvus corone).
In North America, temperate latitudepopulations of waders that breed on oceanbeaches face a variety of threats thatcompromise their productivity (Brown et al. 2001), including habitat loss (e.g.Aiello-Lammens et al. 2011), humandisturbance (Lafferty et al. 2006) andpredation of eggs and chicks by corvids(Colwell et al. 2010). In these habitats,negative effects of predation on waderproductivity may be magnified at sites where anthropogenic refuse attracts corvidsthat subsequently depredate eggs andchicks. Additionally, human disturbancemay lead indirectly to increased levels ofnest predation, through human proximitydisplacing incubating birds from nests. This scenario has been exacerbated by
increases in corvid populations (Marzluff et al. 1994; Kelly et al. 2002; Perry & Henry 2010). Little evidence exists,however, for an evaluation of relationshipsbetween corvids and wader reproductivesuccess, which are critical for the recoveryof some populations of species listed under the U.S. Endangered Species Act(ESA).
In 1993, the United States Fish andWildlife Service (hereafter USFWS) listedthe Pacific coast population segment of theSnowy Plover Charadrius nivosus (hereafterplover) as threatened under the ESA(USFWS 1993), following evidence of areduction in number of breeding locationsand a declining population (Page & Stenzel1981; Page et al. 1991). The plover’s recoveryplan (USFWS 2007) identified three factorsthat are thought to have led to its smallpopulation size by reducing reproductivesuccess: 1) loss and degradation of breedinghabitats stemming from the spread ofinvasive vegetation (e.g. European MarramGrass Ammophila arenaria), which convertssparsely vegetated coastal habitats that arefavoured by plovers (Muir & Colwell 2010)to dense vegetative cover; 2) direct andindirect impacts imposed by human activity(Lafferty et al. 2006); and 3) direct mortalityof eggs and chicks arising from predationby native and non-native (e.g. Red Fox)vertebrates (Neuman et al. 2004; Colwell et al. 2011). While there is evidence thatsome mammalian predators occasionallydepredate Snowy Plover nests, corvids(Common Raven Corvus corax and AmericanCrow Corvus brachyrhynchos) are thought to bethe most important predators of eggs and chicks throughout the plover’s range
206 Corvids compromise plover productivity
© Wildfowl & Wetlands Trust Wildfowl (2012) 62: 204–223
(USFWS 2007; Demers & Robinson-Nilsen2012). Yet quantitative evidence forassessing the relationships between corvidabundance and plover productivity islimited.
Since the plover’s listing under the ESA,efforts have increased to quantify factorsaffecting the species’ demography, especiallythose compromising reproductive success.To date: 1) the population continues to bestable, yet depressed (i.e. < 2,000 breedingadults; USFWS 2007); 2) reproductivesuccess is often low as a result of highpredation of eggs and chicks (Neuman et al.2004; Colwell et al. 2010; Demers &Robinson-Nilsen 2012), despite efforts tomanage predators using non-lethal (Hardy& Colwell 2008) and lethal means (Neumanet al. 2004); and 3) at least onesubpopulation with chronically lowproductivity is maintained by immigrationfrom more productive areas (Mullin et al.2010). However, precise relationshipsbetween low productivity and predatoridentity and abundance are generally lacking. Corvid populations have increaseddramatically in the western United States(Robbins et al. 1986; Marzluff et al. 1994,2001; Kelly et al. 2002; Perry & Henry 2010).Given the above, we undertook a multi-yearstudy to evaluate relationships betweenSnowy Plover reproductive success and twopotentially important causes of breedingfailure: predators and humans. We use direct (e.g. video camera) and indirect (e.g. correlational analyses) evidence todetermine whether predation of eggs byCommon Ravens is an important factorlimiting productivity of plovers in our studyarea.
Methods
Study area
Researchers studied breeding plovers at 19sites in Humboldt County, California frommid-March to early September over a nineyear period, from 2001–2009 inclusive.Eight sites were ocean-fronting beaches and11 sites were gravel bars on the lower 15 kmof the Eel River (Fig. 1; Colwell et al. 2010).A breeding site was defined as a beach orgravel bar, separated from other sites byunsuitable habitat (e.g. river channel, estuary,rocky headland) or distances of several kmof unoccupied habitat (Colwell et al. 2007a),which exceeds the average home range sizeand movements of individuals (Pearson2011). For example, adults tending broodsrarely crossed river channels between sitesand adults infrequently moved among siteswithin a reproductive attempt. In mostinstances, different county, state and federalagencies managed sites.
The two habitat types, sandy beach and riverine gravel bar, differed greatly in substrate and vegetation. Coarse,heterogeneous substrates varying in sizefrom sand and pea-sized gravel to largecobble and sparse vegetation (sedges Salixsp., White Sweetclover Melilotus alba)characterised gravel bars (Colwell et al. 2010, 2011). Ocean-fronting beaches hadrelatively homogeneous sandy substratesinterspersed with dense stands of MarramGrass. On beaches, plovers tended to nest
in expansive, unvegetated patches of sand (Muir & Colwell 2010) with debrisfields of wood, shells and crustaceancarapaces, small tufts of vegetation (e.g.Marram Grass and Sea Rocket Cakile sp.)

Corvids compromise plover productivity 207
© Wildfowl & Wetlands Trust Wildfowl (2012) 62: 204–223
and miscellaneous refuse (Colwell et al.2010).
Field methods
Intensive monitoring of plovers inHumboldt County commenced in 2001
(Colwell et al. 2010, 2011; Mullin et al. 2010).Each year, researchers captured and bandednearly all unmarked breeding plovers andnewly hatched chicks in the study area.Adult plovers were marked with a uniquecombination of three coloured leg bands
Gold BluffsBeach
Big Lagoon
Clam BeachPacificOcean
SouthSpit
Eel RiverWildlife Area
Centerville Beach
HumboldtCounty, CA
HumboldtBay
Eel RiverGravel Bars
N
Kilometres0 10 20 40 60
Figure 1. Location of the main study area where Western Snowy Plovers bred in Humboldt County,California from 2001–2009.
208 Corvids compromise plover productivity
© Wildfowl & Wetlands Trust Wildfowl (2012) 62: 204–223
and a USFWS metal band wrapped withcoloured tape; newly hatched chicks weremarked with a single metal band wrappedwith brood-specific coloured tape todistinguish between chicks of similar age ina common area (Colwell et al. 2007b).
Each year, observers surveyed the 19 sitesat 7–10 day intervals from 15 March untillate August or early September to locatenests, monitor broods and re-sight bandedbirds. Observers often surveyed sitesoccupied by breeding plovers morefrequently (at 1–4 day intervals). Site visitscontinued until the last young fledged at 28days old. Observers conducted nearly allsurveys between dawn and 12:00 h. Duringsurveys, observers stopped frequently tosearch for plovers using binoculars andspotting scopes. Observers recorded thelocation of courtship scrapes, nests, broodsand adults using a global positioning system(GPS; WGS 84 datum) in ArcPad 6 and aDell Axim X50 Personal Digital Assistant(PDA) fitted with an auxiliary GPS unit(GPS Ultra Holux). From 2004–2009,observers also used this automated systemto record instantaneous 500 m point counts, determined by an alarm at fixed 20min intervals (i.e. at 07:00 h, 07:20 h, etc.),during regular surveys at 18 of 19 sites(Colwell et al. 2010). During a point count, observers counted the number ofpedestrians, dogs, vehicles, horses andcorvids (Common Ravens and AmericanCrows separately) within 500 m of theirlocation.
In 2008 and 2009, a video camera systemwas used to monitor a subset (n = 25) ofplover nests at the breeding site (ClamBeach) where corvid activity was known to
be comparatively high and the highestconcentration of plovers bred (Appendix1). Upon discovery of a nest, twoindividuals (i.e. camera crew) set up thevideo system late in the evening so as tominimise attracting corvids and humans tothe site. The system consisted of a videocamera, 100 m of cable, digital videorecorder and 12 V deep-cycle battery. Thecamera had 15 large 850 nm infrared light-emitting diodes to facilitate recording atnight up to 80 m away. The digital videorecorder operated at 30 frames per second,24 h a day. The camera crew placed thesystem in a protective container, buried inthe sand, to protect it during inclementweather and to prevent damage whencamouflaging necessitated partial burial ofthe camera. The camera was installed 15–90 m from the nest, camouflaged withvegetation, driftwood and sand so as todisguise its presence from predators andhumans. The camera system was closeenough to the nest to provide adequateillumination at night, but sufficiently distantto ensure that any effects on nest survivalwere kept to a minimum. That cameras didnot influence plover nesting success wasshown by similar daily survival rates ofnests with (mean = 0.915, 95% CI =0.875–0.944, n = 25) and without (mean =0.862, 95% CI = 0.813–0.899, n = 39)cameras. Control nests were selected atrandom from within the study area using Geographical Information System(GIS) software.
The video cameras were used to evaluate:1) the success with which field observerscould determine accurately the cause ofnest failure, by identifying a predator via the
Corvids compromise plover productivity 209
© Wildfowl & Wetlands Trust Wildfowl (2012) 62: 204–223
nest camera, and 2) the behaviour ofpredators that depredated eggs. Specifically,researchers were interested in whether ornot corvids found nests based on thecontrast of eggs with surrounding sandysubstrates (and plover tracks that were oftenvisible in the sand), or by the behaviouralresponse of adults (i.e. corvids observed anincubating adult leave the nest). Eventssurrounding nest failure therefore werereviewed to determine: 1) the interval (inseconds) between departure of theincubating plover from the nest and arrivalat the nest cup of a corvid, and 2) proximityto the nest (< 1 m; 1–5 m; > 5 m) of thecorvid when it landed.
Data summary and analyses
For each year (2004–2009), data from pointcounts were collated to develop an index ofcorvid and human activity at each site(Appendix 1). Incidence was defined as theproportion of n point counts during whichobservers detected at least one form ofhuman activity or at least one corvid. Ploverproductivity was indexed each year at a siteas the average number of young fledged (i.e.reaching 28 days) per male.
Measures of corvid incidence andabundance from point counts were highlycorrelated for beach (r6 = 0.93, P < 0.01)and river (r10 = 0.95, P < 0.01) sitesindividually and for all sites combined (r17 = 0.97, P < 0. 01). Similarly, incidenceand abundance of human activity on pointcounts was positively correlated for beach(r6 = 0.46, P < 0.01) and river (r10 = 0.99, P < 0.01) sites individually and for all sites combined (r17 = 0.99, P < 0.01).Consequently, two covariates (ravens and
crows) were used based on the incidence ofthese two potential predators derived frompoint counts to characterise the predationthreat to plover chicks and eggs. Similarly,three additional covariates (pedestrians, dogsand vehicles) were based on their incidenceson point counts to characterise the potentialnegative impacts of humans to breedingplovers. Thirteen a priori models weredeveloped based on these five covariates,representing independent hypotheses of therelationship between these variables andproductivity. The same analyses undertakenusing abundance rather than incidencemeasures gave near-identical model outputs;only models using incidence data arepresented here, however, to simplifypresentation of the results.
An information theoretic approach(Burnham & Anderson 2002) was used toevaluate relationships between predatoractivity and human activity (independentvariables) and per capita fledging success(dependent variables) at the 19 breedingsites. Multiple linear regression models wereevaluated using a priori parsimonious modelselection and inference strategies based onAkaike’s Information Criterion correctedfor small sample size (AICc) in programmeR (R Development Core Team 2005;Burnham and Anderson 2002). Akaikeweights (wi), based on the scaled-likelihoodsfor each model given the collection ofmodels and dataset analysed, were derivedfor all candidate models (Burnham &Anderson 2002). There was no evidence ofspatial autocorrelation among independentvariables based on Moran’s I (Burrell 2010).
Tests were conducted for modelgoodness-of-fit using residual standard

210 Corvids compromise plover productivity
© Wildfowl & Wetlands Trust Wildfowl (2012) 62: 204–223
error, adjusted R-squared and F-tests for allcandidate models. Comparisons of thedifferences in plover occupancy betweenbeach and river habitats, as well as the causeof nest failure, were conducted using t-testsof untransformed data and Spearman’s rank correlation. The estimates for allcovariates used in models were obtained for all breeding sites in the last six years of the study (2004–2009; i.e. site-year).Plover breeding site-year was used as thesample unit and sample dispersion isrepresented with standard error (s.e.) for all analyses. We excluded all site-years inwhich predator exclosures were used. Therelative importance of covariates of theindividual predictor (xk) based on Akaikeweight was estimated, derived from: (xk) = Σwi, where xk is in modelj. Modelaveraging was applied to the mostcompetitive models accounting for 90% ofAkaike weights (Burnham & Anderson2002), to derive unconditional betacoefficient estimates and associated 95%confidence intervals.
Results
Plover breeding activity varied greatlyamong the 19 sites (Appendix 1). Two sites(CB and GW) were occupied consistently bybreeding plovers and these locations had thehighest breeding densities (plovers per km).Overall, occupancy correlated positivelywith breeding density (r2
17 = 0.52, P < 0.01).On average, breeding density was lower onbeaches (0.75 ± 0.04) than on gravel bars(1.64 ± 0.27), but this difference did notreach statistical significance (t15 = 2.07, P = 0.06, n.s.; Fig. 2a).
Observers detected corvids on 40% of10,745 point counts (Appendix 1), with anaverage of 1.41 ± 0.06 corvids perobservation. Most (87%) observations wereof Common Ravens. Human activity (i.e.pedestrian, dog, vehicle, horse) occurred ona quarter of all point counts (Fig. 2b;Appendix 1).
Plover productivity and activity ofhumans and corvids
Per capita fledging success varied greatlyamong sites (Appendix 1). The best-fittingmodel, accounting for 37.4% of correctedAkaike weights, had fledging successcorrelate negatively with ravens andpositively with crows (Table 1). The mostcompetitive model performed well ongoodness-of-fit tests, with a comparativelylow residual standard error (0.80), asignificant F-test (F27 = 6.94, P = 0.004) andan adjusted R2
27 = 0.31. Estimates for thebeta coefficients indicate that per capitafledging success correlated negatively with raven incidence (–2.40 ± 1.59) andpositively with crow incidence (3.41 ± 3.63),although the 95% CI for crows overlappedwith zero.
The covariate ravens occurred in the topfive competitive models and had the highestimportance (0.88) based on corrected-Akaike weights. The covariate crows, whichappeared in two of the six most-competitivemodels, had comparatively low covariateimportance (0.26). Four of the top sixmodels, accounting for the top 90% of allAkaike weights, included covariates vehicles,dogs or pedestrians, but the 95% confidenceintervals all broadly overlapped zero. Thetop six models all had relatively good
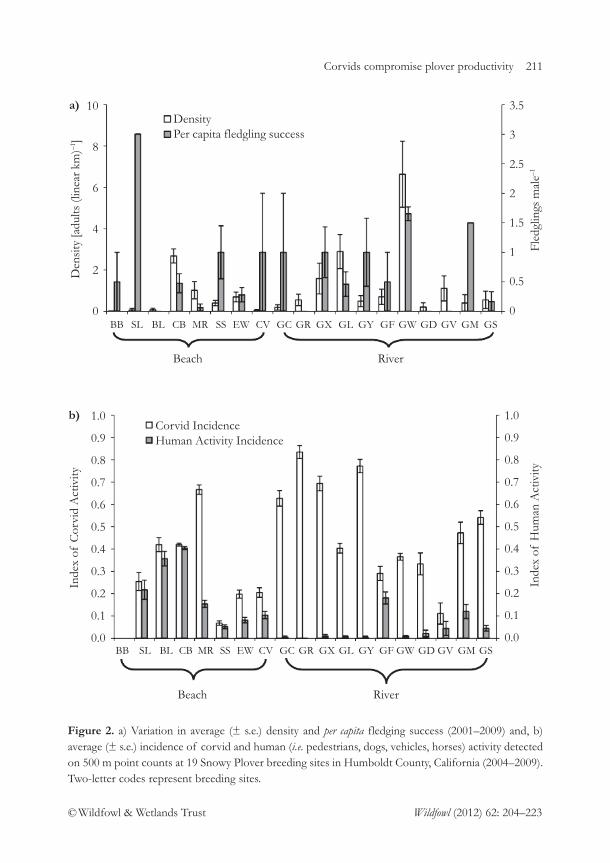
Corvids compromise plover productivity 211
© Wildfowl & Wetlands Trust Wildfowl (2012) 62: 204–223
10
8
6
4
2
0
Den
sity
[adu
lts (l
inea
r km
)–1]
a)DensityPer capita fledgling success
Beach River
BB SL BL CB MR SS EW CV GC GR GX GL GY GF GW GD GV GM GS
3.5
3
2.5
2
1.5
1
0.5
0
Fled
glin
gs m
ale–1
1.0
0.9
0.8
0.7
0.6
0.5
0.4
0.3
0.2
0.1
0.0
Inde
x of
Cor
vid
Act
ivity
b)Corvid IncidenceHuman Activity Incidence
1.0
0.9
0.8
0.7
0.6
0.5
0.4
0.3
0.2
0.1
0.0
Inde
x of
Hum
an A
ctiv
ity
Beach River
BB SL BL CB MR SS EW CV GC GR GX GL GY GF GW GD GV GM GS
Figure 2. a) Variation in average (± s.e.) density and per capita fledging success (2001–2009) and, b)average (± s.e.) incidence of corvid and human (i.e. pedestrians, dogs, vehicles, horses) activity detectedon 500 m point counts at 19 Snowy Plover breeding sites in Humboldt County, California (2004–2009).Two-letter codes represent breeding sites.

212 Corvids compromise plover productivity
© Wildfowl & Wetlands Trust Wildfowl (2012) 62: 204–223
model fit based on significant F tests, lowresidual standard errors and a moderatelyhigh adjusted R2. To obtain unconditionalbeta estimates, we averaged the top six most competitive models, which accountedfor 92.53% of Akaike weights (Table 2), and found that the covariate ravens (–1.77 ± 0.08) was negatively correlatedwith fledging success.
Evidence from video cameras
Video cameras monitored 25 nests over twoyears (Appendix 2). Cameras operatedsuccessfully at 21 nests, 7 in 2008 and 14 in2009, which represented 18% and 56% ofnests each year, respectively, at Clam Beach.Nests monitored by camera were initiatedby at least 14 different birds (6 males and 8females; see Appendix 2). Four cameras didnot record video evidence at the time of
clutch failure because the system failed (n = 3) or the camera system was vandalised(n = 1).
Cameras provided conclusive evidence oftwo main causes of clutch failure at 20 nests(Appendix 2), with Common Ravensdepredating eggs at 14 (70%) of the nests.Ravens ate eggs at an average of 12 (± 2.82s.e.) days after clutch initiation (i.e. within aweek of the start of incubation), which wassimilar in duration (t17 = 0.58, P = 0.57, n.s.)to six nests that failed for other reasons (± 2.12 s.e.). Humans (or dogs) destroyedfour (20%) clutches; two additional nestsfailed because a high tide washed over thenest or wind-driven sand buried eggs priorto clutch completion and the start ofincubation.
Each year, field observers oftencategorised the cause of failure as
Table 1. Model covariates, parameters (k), adjusted R2, ΔAICc, and Akaike weights for thesix most competitive candidate linear regression models predicting per capita fledging successof male Snowy Plovers in Humboldt County, California (2004–2009).
Model covariates k Adjusted R2 ΔAICca Akaike weights
Ravens + crows 3 0.31 – 0.37
Ravens 2 0.24 1.05 0.22
Ravens + vehicles 3 0.25 2.05 0.13
Ravens + dogs 3 0.23 2.86 0.09
Ravens + pedestrians 3 0.21 3.48 0.07
Crows + dogs 3 0.19 4.40 0.04
Null model 1 – 7.52 0.01
a Change in AICc from the most competitive, best-fitting model.

Corvids compromise plover productivity 213
© Wildfowl & Wetlands Trust Wildfowl (2012) 62: 204–223
“unknown” (Appendix 2), including 69%and 24% of nests in 2008 and 2009,respectively. For the 20 failed nests that weremonitored by cameras, 10 (77%) of the 13“unknowns” resulted from raven predation;three additional “unknowns” failed due tohuman activity. In one noteworthy case,eggs disappeared from a plover nest and anabsence of tracks and other evidence ledfield observers to classify the cause offailure as “unknown”, but video recordingsshowed that two humans removed the eggsfrom the nest. At another nest, eventuallydestroyed by high tide, a woman flushed theincubating adult, manipulated eggs, andphotographed the nest. Unleashed dogsdestroyed two incomplete clutches whenthey stepped on nests. Field observers
correctly labelled one nest destroyed by tide,but they did not determine that wind-drivensand had buried another nest.
Behaviour of corvids
Common Ravens were the only nestpredator detected by cameras. Mostpredation (31%) occurred shortly aftersunrise or later in the afternoon (44%) (Fig. 3a). In 50% of losses to ravens, itappeared that departure of an incubatingadult plover from the nest promptedpredation by a raven flying nearby. This was based on the observation that in 64% of predation events, ravens landed within 1 m of the nest (Fig. 3b) and that 50%walked directly to the nest within 1 min oflanding (Fig. 3c). In two instances, the
Table 2. Unconditional β estimates with 95% confidence intervals and covariate weightsbased on corrected-Akaike (AICc) weights for models examining relationships betweencorvid and human occurrence and per capita fledging success of Snowy Plovers.
Model averages
95% CI
Covariate wi Estimate Lower Upper
Intercept – 1.1125 0.9931 1.2319
Ravens 0.8840 –1.7660 –1.8464 –1.6856
Crows 0.2645 1.5746 –0.0624 3.2116
Dogs 0.1944 –0.3210 –0.8610 0.2190
Pedestrians 0.1127 –0.0251 –0.2003 0.1501
Vehicles 0.0781 –0.6148 –1.6352 0.4056
a Covariate weight (xk) = Σwi, where xk is in model.

214 Corvids compromise plover productivity
© Wildfowl & Wetlands Trust Wildfowl (2012) 62: 204–223
Discussion
Our results offer important insights forcorrelative studies investigating variation inthe reproductive success of waders, andhave strong management implications forthe threatened Snowy Plover population.Plovers in northern California generallyhave experienced low reproductive successattributable to predation, although at some sites plovers are occasionally highlysuccessful (Burrell 2010; Colwell et al. 2010,2011). This variation has been linked toCommon Raven abundance, and ravenswere also suspected as being the mostimportant nest predator in our study areaand elsewhere (USFWS 2007; Demers &Robinson-Nilsen 2012). The video evidencegives strong evidence for this association atthe most important breeding site in ourstudy area, and provides a foundation forimplementing more effective managementmeasures to control predation of SnowyPlover eggs by ravens and other predators(MacDonald & Bolton 2008).
Variation in reproductive success
MacDonald and Bolton (2008) reviewed anextensive literature on European waders toshow that nesting success (i.e. dailypredation rate; DPR) was highly variableacross species, years and habitats. Similarly,our results demonstrate that Snowy Ploversexhibited considerable variation in per capitafledging success (which correlated stronglyand produced nearly identical modellingresults as DPR of nests; Burrell 2010)among sites and across years. Interestingly,DPR for Snowy Plover nests at the one site(Clam Beach), occupied consistently by a
c)
b)
a)
Figure 3. Percentage of Common Ravenspredating Snowy Plover nests (n = 20): a) acrossall daylight hours, b) on landing near the nest,and c) on walking to the nest relative to thedeparture of the incubating plover.
plovers had already left the nest whenravens landed and took the eggs, illustratedby the long (> 10 min) intervals betweendeparture of the incubating adult and arrivalof a raven.

Corvids compromise plover productivity 215
© Wildfowl & Wetlands Trust Wildfowl (2012) 62: 204–223
large proportion of the population innorthern California (Burrell 2010; Mark A.Colwell, unpubl. data), is much higher thanvalues reported for nearly all waders withthe exception of the closely related KentishPlover Charadrius alexandrinus, which alsobreeds on coastal beaches (MacDonald &Bolton 2008).
Predation has been implicated as a causeof low nesting success and a principal driverof declining wader populations worldwide(MacDonald & Bolton 2008), and for somethreatened and endangered taxa. In Europe,evidence suggests that many waderpopulations have experienced unsustainablyhigh nest losses to predators. In a largesample (n = 544 site-years sampled across57 studies), MacDonald and Bolton (2008)reported that >50% of nests weredepredated in 55% of site-years or studiesreviewed. Moreover, population viabilityanalyses suggest a linkage betweenchronically high nest failure and populationdeclines in Temminck’s Stint Calidristemminckii (Rönkä et al. 2006) and NorthernLapwing Vanellus vanellus (MacDonald &Bolton 2008). Extending this reasoning,several authors have suggested that thesouthern extent of breeding range forPalearctic waders may be limited bypredation (Pienkowski 1984; Koivula &Rönkä 1998). Waders with low populationsize and at the limits of their range may beespecially vulnerable to the effects ofpredation. Interestingly, it is widelyrecognised that high rates of nest predationcontinue to limit recovery of the listedSnowy Plover population (Neuman et al.2004; USFWS 2007; Colwell et al. 2010,2011).
Snowy Plovers have experiencedchronically low nesting success in our studyarea, averaging 0.71 (± 0.28 s.e.) fledgedyoung per breeding male per year (n = 9years ending 2009; M. Colwell, unpubl.data), with predators causing the majority ofnest failures. Adult numbers are sustainedby immigration of birds from siteselsewhere along the Pacific coast of NorthAmerica (Mullin et al. 2010). The negativecorrelation between plover productivity andCommon Raven occurrence across multiplebreeding sites and multiple years addsfurther evidence for the detrimental effectsof ravens, as abundant, synanthropicomnivores (Perry & Henry 2010). Videocamera evidence collected over two yearswhere Common Ravens were stronglysuspected to be a significant nest predatorreinforced this view, with ravens consumingeggs at nearly all nests where observersclassed the cause of failure as “unknown”(i.e. eggs had disappeared from the nest cupand there was no clear sign to indicate that apredator had visited the nest).
Predation by ravens
Our videos showing that Common Ravenswere the only nest predator at the site whereplovers have experienced chronically lowbreeding success contrasts with evidencefrom European studies (MacDonald &Bolton 2008) and for the listed populationof the Snowy Plover (USFWS 2007). InEurope, nest predation is commonlyattributed to mammals, with occasionalmention of corvids and gulls (MacDonald& Bolton 2008). For Snowy Plovers, adiversity of predators has been suspected asthe cause of poor reproductive success,

216 Corvids compromise plover productivity
© Wildfowl & Wetlands Trust Wildfowl (2012) 62: 204–223
resulting in occasional lethal control(Neuman et al. 2004). In the San FranciscoBay area, where corvid populations havegrown rapidly (Kelly et al. 2002), a raven wasone of five species of bird detected byvideo cameras eating plover eggs (Demers& Robinson-Nilsen 2012). After more thana decade of studying plovers in northernCalifornia, we have only rarely observed or determined (e.g. based on tracks at nest)that other species (American Crow Corvusbrachyrhynchos, Ring-billed Gull Larusdelawarensis and Grey Fox Urocyoncinereoargenteus) have caused reproductivefailure by eating plover eggs andoccasionally chicks.
Per capita fledging success was inverselycorrelated with an index of ravenabundance, which was the only covariate ofimportance in the analyses. Moreover, at themost important breeding site (i.e. ClamBeach, where >50% of the local populationhas bred in recent years, albeit withconsistently low success; Colwell et al. 2010),video cameras showed that ravens caused70% of nest failures, and that most (77%)of the “unknown” causes of nest loss wereattributable to ravens. Additional evidencesupports this interpretation. For instance,apparent nesting success in the populationhas varied annually between 14–68%,although success has decreased with time (r8 = –0.89) coincident with a shift in thepopulation away from high quality riverinegravel bars (Colwell et al. 2011) to oceanbeaches (Colwell et al. 2010). On gravel bars,survival of nests and chicks is significantlyhigher than on ocean beaches because rockysubstrates afford greater crypsis (Colwell etal. 2011). Collectively, these observations
strongly indicate that egg predation byCommon Ravens is a major cause of lowplover productivity in our study area.
Overall, our results underestimated theimpact of corvids as egg predators forseveral reasons related to field methods.First, our classification of causes of nest failure included an “unknown”category, which accounted for the majorityof failed nests (e.g. Colwell et al. 2011).These “unknowns” occurred when eggsdisappeared prior to the predicted hatchdate for a clutch and observers lacked clearevidence (e.g. corvid tracks in the sand) atthe nest cup to determine the cause offailure. Video cameras showed that 77% ofthese “unknowns” failed owing to corvidpredation. A second reason why our datafrom early in the study (2001–2006)underestimate the importance of eggpredation is because we used exclosures toprotect many nests, especially at sites withhigh raven activity. As a result, apparentnesting success was artificially high. After2006, when we ceased using exclosuresowing to an episode of high predation onincubating adults by an unknown avianpredator, nesting success and per capitafledging success dropped to the lowestvalues recorded in 11 years (Colwell et al.2011).
We used cameras to monitor nests atClam Beach because this site had themajority of breeding plovers (Appendix 1)that experienced low nest survival andfledging success (Hardy & Colwell 2008;Colwell et al. 2010); it was also the locationwhere corvid activity was relatively high (seeAppendix 1). In most cases, ravensdepredated eggs by landing near the nest

Corvids compromise plover productivity 217
© Wildfowl & Wetlands Trust Wildfowl (2012) 62: 204–223
shortly after departure of an incubatingadult. This suggests that the initial cuepossibly used by ravens to find a nest wasthe movement of the incubating adult.However, without detailed information onthe behaviour of ravens (both those that didand did not depredate eggs) as they movedabout the study area, it is difficult toascertain conclusively the circumstancesthat led to nest predation events. Only adetailed study of the behaviour of ravensforaging in the vicinity of plover nests willincrease our understanding of howpredators detect nests. At this same site,variation in survival of plover nests was not enhanced by varying degrees of crypsis afforded to eggs by natural habitatfeatures in the vicinity of the nest (Hardy & Colwell 2012). Collectively, theseobservations suggest that abundant corvidsoverwhelmed the capacity of the physicalhabitat to sustain plover reproductivesuccess. Moreover, if this phenomenon is widespread, then some managementpractices (e.g. spreading shell hash; Colwell2010) intended to ameliorate high predationrates by enhancing the crypsis of nestingsubstrates are likely to fail.
Human disturbance
Worldwide, waders frequenting oceanbeaches are subject to high levels ofdisturbance owing close proximity tocentres of human population that favourcoastal habitats for recreation anddevelopment (Brown et al. 2001). Humandisturbance is one of three main factorsaffecting the threatened status of the plover.In our study area, reproductive success wasweakly correlated with human activity. Most
models that included vehicles, dogs orpedestrians contributed little to improvingmodel fit. This probably resulted from thecomparatively low percentage of nest orbrood failure that was caused by humanscompared to losses inflicted by corvids(Colwell et al. 2010, 2011). Nevertheless,videos showed that humans did causereproductive failure at Clam Beach (20% ofnest attempts videoed) where humanrecreational activity was highest, eitherdirectly (e.g. eggs stolen, vehicle strike) orindirectly (dogs taking the eggs or chicks)(Fig. 2b; Appendix 2). On riverine gravelbars, vehicle strikes accounted for 14% ofnest losses during 2001–2009 (Colwell et al.2011). These observations: 1) show thatplover reproductive success may becompromised at some sites by humanactivity, and 2) argue that some types ofrecreational use are incompatible withplover conservation goals and require activemanagement. Finally, it is noteworthy thatwe conducted our study in a region of lowhuman population size and often at remotesites not often frequented by humans.Elsewhere in the species’ range data suggestthat restrictions (e.g. fencing that provides arefuge for breeding plovers in areas of highhuman use) on recreational activity in closeproximity to plovers can promote breeding(Lafferty et al. 2006). Furthermore, in ourstudy area, use of fencing resulted in anincrease in breeding success at the site withhighest human activity (Wilson & Colwell2010).
Management implications
The results show that Common Ravens arethe most important factor influencing
218 Corvids compromise plover productivity
© Wildfowl & Wetlands Trust Wildfowl (2012) 62: 204–223
reproductive success of plovers in our studyarea. This result is not universal within therange of the listed population (Demers &Robinson-Nilsen 2012). The population of plovers in northern California is ademographic sink plagued by lowreproductive rates (Colwell et al. 2010;Mullin et al. 2010) and sustained byimmigration (Mullin et al. 2010). As a result,we suggest that enhanced predatormanagement should be considered for ourstudy area. Plovers initially (2001–2006) hadhigher per capita reproductive success in ourstudy area when: 1) a larger proportion ofbirds nested amidst gravel substrates thatoffered camouflage for eggs and chicks(Colwell et al. 2011), and 2) nest exclosureswere used to boost hatching success at siteswhere ravens were especially problematic(Hardy & Colwell 2008). We stopped usingexclosures after an episode of high adultmortality in 2006 (Mullin et al. 2010; Hardy& Colwell 2008). In the subsequent 6 years,exclosures were used to protect only two of250+ nests. As a result, per capita fledgingsuccess has continued to decline to a low of0.45 fledged chicks per male in 2011.Renewed interest in predator managementis therefore warranted, with the aim ofboosting plover productivity and facilitatingpopulation recovery in northern Californiaand elsewhere in the species’ range.
Acknowledgements
We are grateful to M.D. Johnson, M.Szykman Gunther, H.B. Stauffe andnumerous field assistants, especially K.M.Brindock, W.P. Goldenberg, M.A. Hardy,R.R. LeValley, S.E. McAllister, J.J. Muir, S.J.Mullin, Z.J. Nelson, S.A. Peterson, K.G.
Ross, K.A. Sesser, R.R. Smith, R.R. Thiem,A.N. Transou, C.A. Wilson and manyenthusiastic volunteers. J.H. Watkins hasprovided valuable support of our research.We thank two anonymous reviewers forinsightful comments. Our work was fundedby the California Department of Fish andGame, California Department of Parks andRecreation, Humboldt County Fish andGame Advisory Commission, HumboldtCounty Planning Department, MRBResearch, Inc., Redwood Region AudubonSociety, the Western Section of The WildlifeSociety, U.S. Bureau of Land Management,U.S. Fish and Wildlife Service, and theCalifornia Department of Fish and Game’sOil Spill Response Trust Fund through theOiled Wildlife Care Network at the WildlifeHealth Center, School of VeterinaryMedicine, University of California, Davis.
References
Aiello-Lammens, M.E., Chu-Agor, M.L.,Convertino, M., Fischer, R.A., Linkov, I. &Akçakaya, H.R. 2011. The impact of sea-level rise on Snowy Plovers in Florida:integrating geomorphological, habitat, andmetapopulation models. Global Change Biology17: 3644–3654.
Bolton, M., Tyler, G., Smith, K. & Bamford, R.2007. The impact of predator control onlapwing (Vanellus vanellus) breeding successon wet grassland nature reserves. Journal ofApplied Ecology 44: 534–544.
Brown, S., Hickey, C., Harrington, B. & Gill, R.2001. The U.S. Shorebird Conservation Plan, 2nd edition. Manomet Center forConservation Sciences, Manomet,Massachusetts, USA.
Burnham, K.P. & Anderson, D.R. 2002. Modelselection and inference: a practical

Corvids compromise plover productivity 219
© Wildfowl & Wetlands Trust Wildfowl (2012) 62: 204–223
information-theoretic approach. Springer-Verlag, New York, USA.
Burrell, N.S. 2010. Breeding patch dynamics ofthe Western Snowy Plover (Charadriusalexandrinus nivosus) in Humboldt County,California. M.Sc. Thesis, Humboldt StateUniversity, California, USA.
Burton, N.H.K., Rehfisch, M.M., Clark, N.A. &Dodd, S.G. 2006. Impacts of sudden winterhabitat loss on the body condition andsurvival of redshank Tringa totanus. JournalApplied Ecology 43: 464–473.
Colwell, M.A. 2010. Shorebird Ecology, Conservation,and Management. University of CaliforniaPress, Berkeley, California, USA.
Colwell, M.A., McAllister, S.E., Millett, C.B.,Transou, A.N., Mullin, S.M., Nelson, Z.J.,Wilson, C.A. & LeValley, R.R. 2007a.Philopatry and natal dispersal of the WesternSnowy Plover. Wilson Journal of Ornithology119: 378–385.
Colwell, M.A., Hurley, S.J., Hall, J.N. &Dinsmore, S.J. 2007b. Age-related survivaland behavior of Snowy Plover chicks. Condor109: 638–647.
Colwell, M.A., Burrell, N.S., Hardy, M.A.,Kayano, K., Muir, J.J., Pearson, W.J.,Peterson, S.A. & Sesser, K.A. 2010. Arrival times, clutch initiation dates, andreproductive success of Snowy Ploversbreeding in two distinct habitats in coastalNorthern California. Journal of FieldOrnithology 81: 349–360.
Colwell, M.A., Meyer, J.J., Hardy, M.A.,McAllister, S.E., Transou, A.N., LeValley,R.R. & Dinsmore, S.J. 2011. Western SnowyPlovers (Charadrius alexandrinus nivosus) selectnesting substrates that enhance egg crypsisand improve nest survival. Ibis 153: 303–311.
Delany, S., Scott, D., Dodman, T. & Stroud, D.2009. An Atlas of Wader Populations in Africaand Western Eurasia. Wetlands International,Wageningen, The Netherlands.
Demers, S.A. & Robinson-Nilsen, C.W. 2012.Monitoring western Snowy Plover nests withremote surveillance systems in San FranciscoBay, California. Journal of Fish and WildlifeManagement 3: 123–132.
Evans, K.L. 2004. The potential for interactionsbetween predation and habitat change tocause population declines of farmland birds.Ibis 146: 1–13.
Hardy, M.A. & Colwell, M.A. 2008. The impactof predator exclosures on Snowy Plovernesting success: A 7-year study. Wader StudyGroup Bulletin 115: 161–166.
Hardy, M.A. & Colwell, M.A. 2012. Factorsinfluencing Snowy Plover nest survival onocean-fronting beaches in coastal northernCalifornia. Waterbirds 35: 503–511.
Kelly, J.P., Etienne, K.L. & Roth, J.E. 2002.Abundance and distribution of the CommonRaven and American Crow in the SanFrancisco Bay area, California. Western Birds33: 202–217.
Koivula, K. & Rönkä, A. 1998. Habitatdeterioration and efficiency of antipredatorstrategy in a meadow-breeding wader,Temminck’s Stint (Calidris temminckii).Oecologia 116: 348–355.
Lafferty, K.D., Goodman, D. & Sandoval, C.P.2006. Restoration of breeding by snowyplovers following protection from disturbance.Biodiversity and Conservation 15: 2217–2230.
MacDonald, M.A. & Bolton, M. 2008. Predationon wader nests in Europe. Ibis 150: 54–73.
Marzluff, J.M., Boone, R.B. & Cox, G.W. 1994.Historical changes in populations andperceptions of native pest and bird species inthe west. Studies in Avian Biology 15: 202–220.
Marzluff, J.M., McGowan, K.J., Caffrey, C.,Donnelly, R.E. & Knight, R.L. 2001. Causesand consequences of expanding AmericanCrow populations. In M. Marzluff, R.Bowman & R. Donnelly (eds.), AvianConservation and Ecology in an Urbanizing World.

220 Corvids compromise plover productivity
© Wildfowl & Wetlands Trust Wildfowl (2012) 62: 204–223
Kluwer Academic Publishers, Norwell,Massachusetts, USA.
Morrison, R.I.G., Aubry, Y., Butler, R.W.,Beyersbergen, G.W., Donaldson, G.M.,Gratto-Trevor, C.L., Hicklin, P.W., Johnston,V.H. & Ross, R.K. 2001. Declines in NorthAmerican shorebird populations. Wader StudyGroup Bulletin 94: 34–38.
Muir, J.J. & Colwell, M.A. 2010. Snowy Ploversselect open habitats for courtship scrapesand nests. Condor 112: 507–510.
Mullin, S.M., Colwell M.A., McAllister, S.E. &Dinsmore, S.J. 2010. Apparent survival andpopulation growth of Snowy Plovers incoastal northern California. Journal WildlifeManagement 74: 1792–1798.
Myers, J.P., Morrison, R.I.G., Anatas, P.Z.,Harrington, B.A., Lovejoy, T.E., Sallaberry,M., Senner, S.E. & Tarak, A. 1987.Conservation strategy for migratory species.American Scientist 75: 19–26.
Neuman, K.K., Page, G.W., Stenzel, L.E.,Warriner, J.C. & Warriner, J.S. 2004. Effect ofmammalian predator management on SnowyPlover breeding success. Waterbirds 27:257–263.
Page, G.W. & Stenzel, L.E. 1981. The breedingstatus of the Snowy Plover in California.Western Birds 12: 1–40.
Page, G.W., Stenzel, L.E., Shuford, W.D. &Bruce, C.R. 1991. Distribution andabundance of the Snowy Plover on itswestern North American breeding grounds.Journal of Field Ornithology 62: 245–255.
Pearson, W.J. 2011. Effects of nest success andmate fidelity on breeding dispersal in apopulation of Snowy Plovers (Charadriusnivosus). M.Sc. Thesis, Humboldt StateUniversity, California, USA.
Perry, M.Z. & Henry, R.W. 2010. Recoveringmarbled murrelets via corvid management:A population viability analysis approach.Biological Conservation. 143: 2414–2424.
Pienkowski, M.W. 1984. Breeding biology andpopulation dynamics of Ringed Plovers(Charadrius hiaticula) in Britain andGreenland: nest predation as a possiblefactor limiting distribution and timed ofbreeding. Journal of Zoology 202: 83–114.
R Development Core Team. 2005. R: A languageand environment for statistical computing. RFoundation for Statistical Computing,Vienna, Austria.
Robbins, C.S., Bystrak, D. & Geissler, P.H. 1986.The breeding bird survey: its first fifteenyears, 1965–1979. USFWS ResourcePublication No. 157, U.S. Fish and WildlifeService, Washington D.C., USA.
Rönkä, A., Koivula, K., Ojanen, M., Pakanen,V.M., Pohjoismäki, M., Rannikko, K. &Rauhala, P. 2006. Increased nest predation ina declining and threatened Temminck’s Stint(Calidris temminckii) population. Ibis 148:55–65.
Teunissen, W., Schekkerman, H., Willems, F. &Majoor, F. 2008. Identifying predators ofeggs and chicks of Lapwing Vanellus vanellusand Black-tailed Godwit Limosa limosa in The Netherlands and the importance ofpredation on wader reproductive output. Ibis150: 74–85.
United States Fish and Wildlife Service. 1993.Threatened status for the Pacific coastpopulation of the Western Snowy Plover.Federal Register 58: 12864–12874.
United States Fish and Wildlife Service. 2007.Recovery plan for the Pacific coastpopulation of the Western Snowy Plover(Charadrius alexandrinus nivosus). U.S. Fish andWildlife Service, Sacramento, California,USA.
Wilson, C.A. & Colwell, M.A. 2010. Movementsand fledging success of Snowy Plover(Charadrius alexandrinus) chicks. Waterbirds 33:331–340.
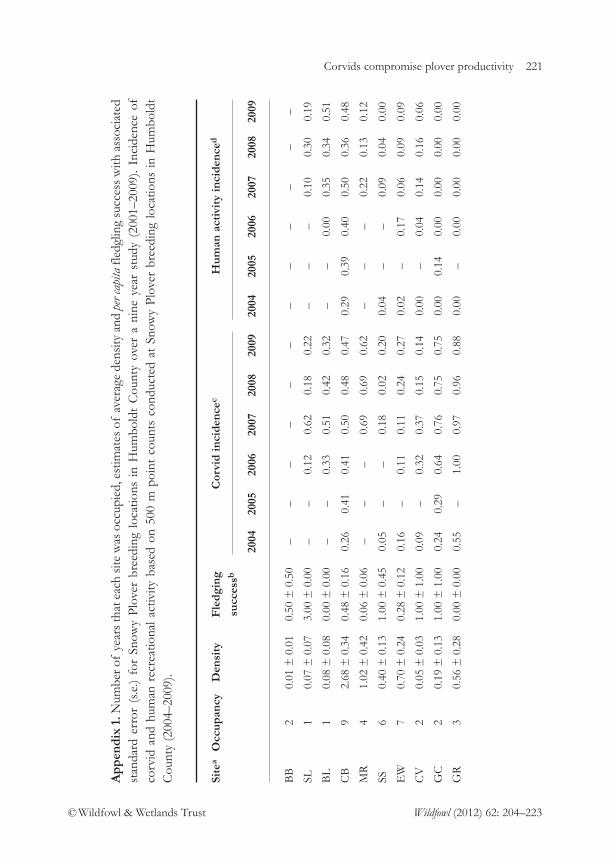
Corvids compromise plover productivity 221
© Wildfowl & Wetlands Trust Wildfowl (2012) 62: 204–223
Ap
pen
dix
1.N
umbe
r of
year
s tha
t eac
h si
te w
as o
ccup
ied,
est
imat
es o
f av
erag
e de
nsity
and
per
capi
tafle
dglin
g su
cces
s with
ass
ocia
ted
stan
dard
err
or (
s.e.)
for
Snow
y Pl
over
bre
edin
g lo
catio
ns i
n H
umbo
ldt
Cou
nty
over
a n
ine
year
stu
dy (
2001
–200
9). I
ncid
ence
of
corv
id a
nd h
uman
rec
reat
iona
l act
ivity
bas
ed o
n 50
0 m
poi
nt c
ount
s co
nduc
ted
at S
now
y Pl
over
bre
edin
g lo
catio
ns in
Hum
bold
tC
ount
y (2
004–
2009
).
Site
aO
ccu
pan
cyD
ensi
tyF
led
gin
gC
orvi
d i
nci
den
cec
Hu
man
act
ivit
y in
cid
ence
d
succ
essb
2004
2005
2006
2007
2008
2009
2004
2005
2006
2007
2008
2009
BB
20.
01 ±
0.0
10.
50 ±
0.5
0–
––
––
––
––
––
–
SL1
0.07
± 0
.07
3.00
± 0
.00
––
0.12
0.62
0.18
0.22
––
–0.
100.
300.
19
BL
10.
08 ±
0.0
80.
00 ±
0.0
0–
–0.
330.
510.
420.
32–
–0.
000.
350.
340.
51
CB
92.
68 ±
0.3
40.
48 ±
0.1
60.
260.
410.
410.
500.
480.
470.
290.
390.
400.
500.
360.
48
MR
41.
02 ±
0.4
20.
06 ±
0.0
6–
––
0.69
0.69
0.62
––
–0.
220.
130.
12
SS6
0.40
± 0
.13
1.00
± 0
.45
0.05
––
0.18
0.02
0.20
0.04
––
0.09
0.04
0.00
EW
70.
70 ±
0.2
40.
28 ±
0.1
20.
16–
0.11
0.11
0.24
0.27
0.02
–0.
170.
060.
090.
09
CV
20.
05 ±
0.0
31.
00 ±
1.0
00.
09–
0.32
0.37
0.15
0.14
0.00
–0.
040.
140.
160.
06
GC
20.
19 ±
0.1
31.
00 ±
1.0
00.
240.
290.
640.
760.
750.
750.
000.
140.
000.
000.
000.
00
GR
30.
56 ±
0.2
80.
00 ±
0.0
00.
55–
1.00
0.97
0.96
0.88
0.00
–0.
000.
000.
000.
00

222 Corvids compromise plover productivity
© Wildfowl & Wetlands Trust Wildfowl (2012) 62: 204–223
Ap
pen
dix
1 (c
ontin
ued)
Site
aO
ccu
pan
cyD
ensi
tyF
led
gin
gC
orvi
d i
nci
den
cec
Hu
man
act
ivit
y in
cid
ence
d
succ
essb
2004
2005
2006
2007
2008
2009
2004
2005
2006
2007
2008
2009
BG
X4
1.59
± 0
.74
1.00
± 0
.43
0.34
–0.
820.
880.
710.
770.
00–
0.00
0.00
0.02
0.03
GL
62.
89 ±
0.8
20.
46 ±
0.2
10.
200.
440.
430.
700.
600.
580.
000.
000.
030.
000.
000.
04
GY
30.
49 ±
0.2
71.
00 ±
0.5
80.
480.
720.
880.
920.
910.
930.
000.
000.
000.
000.
020.
00
GF
30.
70 ±
0.3
70.
50 ±
0.5
00.
190.
140.
330.
320.
220.
410.
130.
000.
080.
190.
320.
12
GW
96.
63 ±
1.6
1.65
± 0
.12
0.25
0.27
0.38
0.50
0.44
0.38
0.00
0.03
0.01
0.01
0.01
0.01
GD
10.
21 ±
0.2
10.
00 ±
0.0
00.
27–
0.40
0.48
0.31
0.29
0.00
–0.
000.
050.
040.
00
GV
31.
11 ±
0.6
10.
00 ±
0.0
00.
08–
0.25
––
–0.
00–
0.25
––
–
GM
10.
40 ±
0.4
01.
50 ±
0.0
00.
40–
0.00
0.59
0.50
0.42
0.10
–0.
000.
190.
130.
08
GS
20.
56 ±
0.4
20.
17 ±
0.1
70.
200.
250.
520.
740.
690.
420.
000.
000.
000.
020.
060.
12
aTw
o-le
tter
code
s re
pres
ent
bree
ding
loca
tions
(i.e.
site
s); t
hey
are
liste
d no
rth
to s
outh
(be
ache
s) a
nd d
own-
to
upst
ream
(gr
avel
bar
s; i.e
.tho
seco
des
begi
nnin
g w
ith a
“G
”).
bPe
r cap
itafle
dgin
g su
cces
s (f
ledg
ed c
hick
s m
ale–
1 ).
cIn
cide
nce
(pro
port
ion)
of
all p
oint
cou
nts
in w
hich
cor
vids
wer
e de
tect
ed w
ithin
a 5
00 m
rad
ius
of a
n ob
serv
er.
dIn
cide
nce
(pro
port
ion)
of
all p
oint
cou
nts i
n w
hich
ped
estr
ians
, dog
s, ve
hicl
es a
nd/o
r hor
ses w
ere
dete
cted
with
in a
500
m ra
dius
of
an o
bser
ver.
(–)
indi
cate
s si
te w
as n
ot s
urve
yed
in g
iven
sea
son.

Corvids compromise plover productivity 223
© Wildfowl & Wetlands Trust Wildfowl (2012) 62: 204–223
Appendix 2. Summary of video-monitored Snowy Plover nests at Clam Beach, HumboldtCounty, California (2008–2009).
Date Determined outcome of
nest attempt
Year Nest Male Female Clutch Camera Failed or Field Video camera
Identity initiated installed hatched observation
2008 CN06 GV:GB VW:GW 25-Apr 26-Apr 1-May Unknown Common Raven
CS07 OR:RY VW:YY 28-Apr 2-May 2-May Unknown Common Raven
CS13 GV:GB BP:OG 9-May 22-May 29-May Unknown Common Raven
CS18 VW:OW GL:WO 25-May 7-Jun 23-Jun Unknown Common Raven
CS19 OR:YR WW:YG 26-May 30-May 1-Jun Unknown Common Raven
CS26 OR:YR RY:YW 27-Jun 30-Jun 20 & Vehiclea Vehiclea
29 Jul
CS27 VW:OW GL:WO 30-Jun 30-Jun 21-Jul Unknown Common Raven
2009 CN02 OR:YR OR:RR 17-Mar 20-Mar 21-Mar Unknown Dog
CN03 Unknown Unknown 20-Mar 24-Mar 24-Mar Common Raven Common Raven
CN04 VW:BR VW:GW 23-Mar 24-Mar 25-Mar Unknown Common Raven
CN09 WW:YB BP:OG 29-May 29-May 30-May Common Raven Dog
CN10 WW:YB BP:OG 6-Jun 12-Jun 26-Jun Tidal overwash Tidal overwash
CN11 WW:YB BP:OG 5-Jul 8-Jul 15-Jul Common Raven Common Raven
CN12 VW:BR VW:YY 11-Jul 16-Jul 1-Aug Unknown Common Raven
CS04 OR:YR OR:RR 17-Apr 19-Apr 3-May Unknown Common Raven
CS05 VW:OW VW:YY 25-Apr 2-May 29-May Hatched Hatched
CS07 VW:BR VW:GW 2-May 8-May 9-May Unknown Human
CS08 WW:YB BP:OG 12-May 15-May 17-May Common Raven Common Raven
CS10 GV:GB X:R 17-May 18-May 20-May Unknown Buried by sand
CS11 VW:BR VW:YY 5-Jun 8-Jun 9-Jun Common Raven Common Raven
CS12 VW:BR VW:YY 13-Jun 16-Jun 2-Jul Unknown Common Raven
a Truck crushed 2 eggs; 3rd egg hatched.

224
© Wildfowl & Wetlands Trust Wildfowl (2012) 62: 224–227
Ducks foraging on swan faeces
TETSUO SHIMADA
The Miyagi Prefectural Izunuma-Uchinuma Environmental Foundation,17-2 Shikimi, Wakayanagi, Kurihara, Miyagi 989-5504, Japan.
E-mail: [email protected]
Abstract
Foraging on avian faeces by birds is uncommon apart from the consumption ofnestling faeces by songbird parents. Here, observations made of five Mallard Anas
platyrhynchos, three Green-winged Teal A. crecca and one Baikal Teal A. formosa seenfeeding on Whooper Swan Cygnus cygnus faeces, on the ice in Lake Izunuma, Japan, on10 February 2010, are described. The faeces of herbivorous Whooper Swanscontained undigested vegetation which, when dissolved in water on top of the ice,was available for consumption by the ducks.
Key words: Coprophagy, ducks, faeces, Whooper Swans.
Coprophagy is rare in birds in comparisonwith other animals such as mammals andinsects. Gallant (2004) reported that White-winged Crossbills Loxia leucoptera foraged onRiver Otter Lontra canadensis faeces, perhapsconsuming fish bones or undigested fishpresent in the droppings. Faeces can be usedas a source of carotenoids by birds; forinstance, the brightly coloured yellow on thehead of the Egyptian Vulture Neophron
percnopterus is obtained by ingestingcarotenoid pigments from the excrement ofungulates (Negro et al. 2002). In wildfowl,Whooper Swans Cygnus cygnus have beenobserved in aggressive confrontations overtheir own and their neighbours’ faeces,which contained large amounts ofundigested barley (Black & Rees 1984).Foraging on avian faeces by birds isuncommon, however, apart from the
consumption of nestling faeces by songbirdparents (Hurd 1991).
I had an opportunity to observe ducksforaging on swans faeces when their lakewas covered with ice in February 2010. The observations are presented here as afurther contribution to knowledge on aviancoprophagy.
Methods
Field observations were conducted at LakeIzunuma (369 ha area; 38°47’N, 141°07’E)in Tome City, Miyagi Prefecture, Japan, awell-known wintering area for wildfowl,supporting Greater White-fronted GooseAnser albifrons, Whooper Swan, Mallard Anas
platyrhynchos, Northern Pintail A. acuta,Green-winged Teal A. crecca and GoosanderMergus merganser.
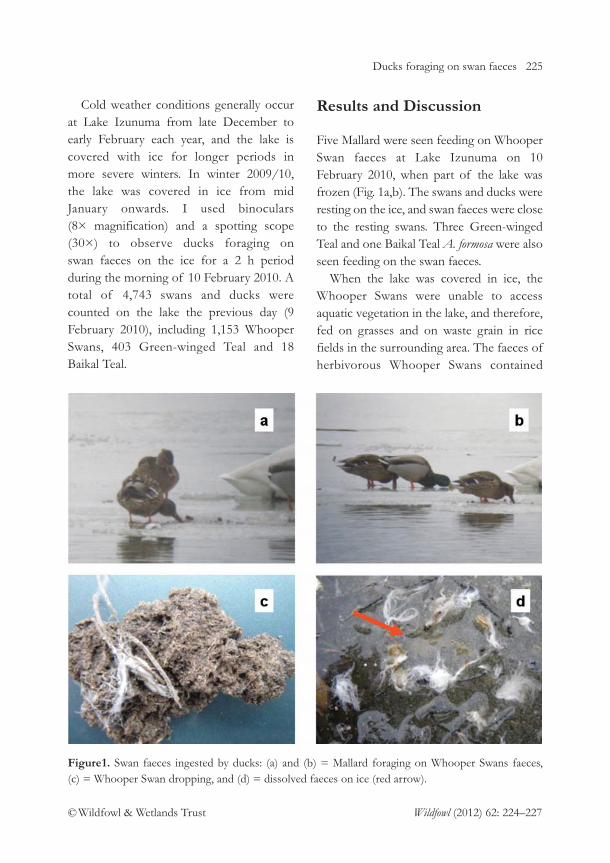
Ducks foraging on swan faeces 225
© Wildfowl & Wetlands Trust Wildfowl (2012) 62: 224–227
Cold weather conditions generally occurat Lake Izunuma from late December toearly February each year, and the lake iscovered with ice for longer periods in more severe winters. In winter 2009/10, the lake was covered in ice from mid January onwards. I used binoculars (8× magnification) and a spotting scope(30×) to observe ducks foraging on swan faeces on the ice for a 2 h periodduring the morning of 10 February 2010. Atotal of 4,743 swans and ducks werecounted on the lake the previous day (9February 2010), including 1,153 WhooperSwans, 403 Green-winged Teal and 18Baikal Teal.
Results and Discussion
Five Mallard were seen feeding on WhooperSwan faeces at Lake Izunuma on 10February 2010, when part of the lake wasfrozen (Fig. 1a,b). The swans and ducks wereresting on the ice, and swan faeces were closeto the resting swans. Three Green-wingedTeal and one Baikal Teal A. formosa were alsoseen feeding on the swan faeces.
When the lake was covered in ice, theWhooper Swans were unable to accessaquatic vegetation in the lake, and therefore,fed on grasses and on waste grain in ricefields in the surrounding area. The faeces ofherbivorous Whooper Swans contained
Figure1. Swan faeces ingested by ducks: (a) and (b) = Mallard foraging on Whooper Swans faeces, (c) = Whooper Swan dropping, and (d) = dissolved faeces on ice (red arrow).

226 Ducks foraging on swan faeces
© Wildfowl & Wetlands Trust Wildfowl (2012) 62: 224–227
undigested fibrous vegetation (Fig. 1c)which when dissolved in water on top of theice (Fig. 1d) was available to be filtered andconsumed by the ducks. The three duckspecies observed (Mallard, Green-wingedTeal and Baikal Teal) are omnivorous(Young 2005; Fox 2005; Moores 2005) andin Japan they include rice grain, wild cerealseeds, herbs, submerged plant and aquaticinsects in their diet (Haneda 1962). Theundigested fibre would likely have been theprimary nutrient derived from the swanfaeces by the ducks, but the quantity ofswan faeces consumed by the ducks and thenutritional value of the faeces wasunknown.
Anatidae have been found to digest a lowproportion of the organic matter invegetation ingested; estimates generallyrange from 18–40% for leaf material, butvary with the type of food being taken(Buchsbaum et al. 1986; Gadallah & Jefferies1995; Van der Wal et al. 1998; Durant et al. 2002). For all vegetable foods, a largeproportion of the undigested materialexcreted in the birds’ droppings is fibre.Nevertheless, for some other organisms,such remains in faeces can offer some food value. For example, Barnacle GooseBranta leucopsis droppings were consumed by Svalbard Reindeer Rangifer tardandus
platyrhynchus, with the Reindeer selectinggoose droppings containing grass fragments, as these were more profitable as a foodsource than grazing on the sparse foragegenerally available in the local environment(van der Wal & Loonen 1998).
In early February, waste grain in the fieldsaround Lake Izunuma is usually depleteddue to the intense foraging activity by
Greater White-fronted Geese (Shimada &Mizota 2008). Food resources for ducksaround the lake therefore were low, added towhich the ice and snow cover in this severeweather would have covered feeding sites,further decreasing food availability. Theperiod of time that swan faeces wereaccessible on the ice was restricted to a fewweeks, until the ice melted. Nevertheless,swan faeces may have offered a relativelyprofitable food resource for the ducksduring this time of low food availability,high thermoregulatory costs and highlyrestricted foraging conditions.
Acknowledgements
I express sincere thanks to K. Ueda and C.Mizota for reading the draft and providingcritical comments, to M. Kamioki forinforming me of coprophagy in birds, andto A. Bowman for improving my English. Ialso thank the editor and two anonymousreviewers for their helpful comments.
References
Black, J.M. & Rees, E.C. 1984. The structure andbehaviour of the population of WhooperSwans wintering at Caerlaverock, Dumfriesand Galloway, Scotland. Wildfowl 35: 21–36.
Buchsbaum, R., Wilson, J. & Valiela, I. 1986.Digestibility of plant constituents by CanadaGeese and Atlantic Brant. Ecology 67: 386–393.
Durant, D., Fritz, H., Blais, S. & Duncan, P. 2003.The functional response in three species ofherbivorous Anatidae: effects of swardheight, body mass and bill size. Journal of
Animal Ecology 72: 220–231. Fox, T. 2005. Eurasian and American Green-
winged Teal Anas crecca/carolinensis. In J. Kear(ed.), Bird Families of the World: Ducks, Geese

Ducks foraging on swan faeces 227
© Wildfowl & Wetlands Trust Wildfowl (2012) 62: 224–227
and Swans, pp. 609–613. Oxford UniversityPress, Oxford, UK.
Gadallah, F.L. & Jefferies, R.L. 1995. Foragequality in brood rearing areas of the lessersnow goose and the growth of captivegoslings. Journal of Applied Ecology 32: 276–287.
Gallant, D. 2004. White-winged Crossbills obtainfrom river otter feces. Wilson Bulletin 116:181–184.
Haneda, K. 1962. Study on the feeding type andcommunity of geese and ducks living ininland waters. XIII. Food of geese and ducks.Physiology and Ecology 10: 98–129. [In Japanesewith English summary.]
Hurd, P.L., Weatherhead, P.J. & McRae, S.B. 1991.Parental consumption of nestling feces:good food or sound economics? Behavioral
Ecology 2: 69–76.Moores, N. 2005. Baikal Teal Anas formosa. In
J. Kear (ed.), Bird Families of the World:
Ducks, Geese and Swans, pp. 606–608. OxfordUniversity Press, Oxford, UK.
Negro, J.J., Grande, J.M., Tella, L.J., Garrido, J.,Hornero, D., Donazar, J.A., Sanchez-Zapata,J.A., Benitez, J.R. & Barcell, M. 2002. An
unusual source of essential carotenoids.Nature 416: 807–808.
Shimada, T. & Mizota, C. 2008. Temporal andspatial changes in foraging distribution of anincreasing population of wintering GreaterWhite-fronted Geese over on decade (1997/98 to 2007/08): a case study for an areaaround Lake Izunuma-Uchinuma. Japanese
Journal of Ornithology 57: 122–132. [InJapanese with English summary.]
van der Wal, R. & Loonen, M.J.J.E. 1998. Goosedroppings as food for reindeer. Canadian
Journal of Zoology 76: 1117–1122.Van der Wal, R., Van de Koppel, J. & Sagel, M.
1998. On the relation between herbivoreforaging efficiency and plant standing crop:an experiment with Barnacle Geese. In
R. Van der Wal (auth.), Defending the marsh:
herbivores in a dynamic coastal ecosystem, pp. 25–37. Ph.D. Thesis, University ofGroningen, the Netherlands.
Young, G. 2005. Northern Mallard Anas
platyrhnchos. In J. Kear (ed.), Bird Families of the
World: Ducks, Geese and Swans, pp. 513–517.Oxford University Press, Oxford, UK.
Photograph: Whooper Swans foraging in rice fields by Rikio Ito.

228
© Wildfowl & Wetlands Trust Wildfowl (2012) 62: 228
Announcement
The 9th Conference of the European Ornithologists’ Union
(28–31 August 2013, Norwich, UK)
The European Ornithologists’ Union (EOU) has been founded as an equal partnershipamong avian biologists across Europe to provide an international forum for the advancementof European ornithology in all its aspects. The bi-annual conferences provide ideal platformsto get in contact, exchange ideas and disseminate knowledge. The Council of the EOU andthe local organisers cordially invite you to join the 9th EOU conference to be held inNorwich, UK, from 28–31 August 2013.
This event will be organised jointly by the University of East Anglia (UEA) and the BritishTrust for Ornithology (BTO), Royal Society for the Protection of Birds (RSPB), BritishOrnithologists’ Union (BOU), and the Edward Grey Institute of Oxford University (EGI).The conference will cover the full range of ornithological research, including both basic andapplied aspects. The programme will be composed of plenaries, symposia, contributed oralpresentations and poster sessions.
Information on the scientific programme, conference venue, deadlines, registration fees,contact details for the organisers, and excursions are available and will be updated on theconference website at http://wwww.norwich.eounion.org/index.php.
For information about previous conferences (including pdfs of abstract books) and the EOUin general, please visit the EOU website on http://www.eounion.org.

229
©Wildfowl & Wetlands Trust Wildfowl (2012) 62: 229–233
Wildfowl
Instructions for Authors
This information can also be found at http://www.wwt.org.uk/conservation/saving-wetlands-and-wildlife/publications/wildfowl, together withPDF files of papers from earlier editions ofWildfowl.
Editorial policyWildfowl is an international scientific journalpublished annually by the Wildfowl & WetlandsTrust (WWT). It disseminates original materialon the ecology, biology and conservation of wildfowl (Anseriformes) and ecologically-associated birds (such as waders, rails andflamingos), and on their wetland habitats.Research and review articles related to policydevelopment and application are welcome.Material on habitat management is also sought,particularly where this is directed to theconservation of wildfowl and other wetlandbirds.
In all cases material should not have beenpublished elsewhere or be subject to currentconsideration for publication in other journals.
Policy on ethics for ornithological researchResearch projects submitted as papers forpublication in Wildfowl must have proper regardfor animal welfare and habitat conservation, andemploy humane practices. Attention is drawn tothe guidelines published in Animal Behaviour
61: 271–275 and on the journal’s website:www.elsevier.com/wps/find/journaldescription.cws_home/622782/authorinstructions#6002.The impact of a particular study should beevaluated in terms of the possible gains inknowledge (and the practical use of thisknowledge), weighed against potential adverseconsequences for individuals, habitats orpopulations. Papers are considered for publication in Wildfowl solely on the condition that the workreported was undertaken within relevant legalstatutes, or where work is carried out in areas
lacking legislation or regulation, the work shouldconform to ethical standards expected in the UK.
The Editor reserves the right to review and rejectpapers on this basis.
ManuscriptsThere is no page charge for published papers. Allpapers accepted for publication become thecopyright of WWT. Colour figures can beincluded, but the authors or their organisationswould be expected to cover the additional cost ofthe colour pages.
Initial submissionManuscripts should be prepared in accordancewith the Instructions to Authors to Wildfowl. TheEditor reserves the right to modify manuscriptsthat do not conform to scientific, technical,stylistic or grammatical standards and minoralterations of this nature will normally be seen byauthors only at the proof stage.
An electronic version of the paper, in MS Word,should be submitted as an email attachment to The Editor at [email protected] should be received no later than 15 May for publication in December of the sameyear. However, WWT reserves the right topostpone publication until the issue of thefollowing year.
Types of paper
Standard papers
A standard paper should present the results oforiginal research. The data must not have beenpublished elsewhere, and the text should notnormally be longer than 8,500 words. The formatrequired for standard papers is described below.
Review papers
Papers on topical subjects of relevance to thejournal’s remit. Reviews are often designed to

230 Instructions for Authors
©Wildfowl & Wetlands Trust Wildfowl (2012) 62: 229–233
Title page – this should contain:A concise and informative title (as short aspossible). Do not include the authorities fortaxonomic names in the title.
A list of authors’ names (commencing with thecorrespondence author), along with their contactaddress details that should be valid for thecoming year. Use first names and subsequentinitials, not just initials, for authors. For instance,Adrian D. Smith, not A. D. Smith. An E-mailaddress should be included for the first orcorresponding author.
A running header of not more than 45characters.
Abstract – this should state the main purpose ofthe paper and give the key results, conclusions andrecommendations. The Abstract should notinclude references or speculation, and should notexceed 340 words. Please note that all text shouldbe written in the “third person”; i.e. “A study was carried out ...” and not “I carried out a studyof ...”.
Key words – a list, in alphabetical order, of fivewords or short phrases, excluding words used inthe title.
ntroduction – this should give the background tothe study, including the hypotheses being testedand the reasons why the study is thought to beworthwhile.
Methods – a concise description of data collection,analytical methods, and equipment used (whereappropriate), in sufficient detail for the work tobe repeated.
Results – the results of the analyses, drawingattention in the text to information provided in the tables and figures. Where appropriate, the Results should follow the order offieldwork/analysis presented in the Methodssection.
Discussion – highlight the significance of theresults in relation to the objectives for the work,
summarise a particular subject area and/or tostimulate debate and further research. Theyshould be presented in a style similar to that ofstandard papers as far as possible, and should notexceed 8,500 words.
Short communications
Short communications present new informationthat is often obtained from preliminary researchor as a by-product of larger projects. A flexiblestructure is opted for in the presentation of thesepapers, with the author including as muchintroductory, methodological and discussionmaterial as is necessary to show the context andrelevance of the communication. However, shortcommunications should follow the standardformat, be concise and limited to a maximum of3,000 words.
Field surveys
Survey and expeditionary material that providesnew data on particular species or wetlands ofspecial interest for waterbirds is also acceptable.Field survey reports should be of general interestto the readers of Wildfowl, and are normallylimited to a maximum of five printed pages. Theyshould include reference to the location of moredetailed information on the work undertaken.Survey and expedition reports must be written inWildfowl style and follow the format of standardpapers.
Manuscript formatManuscripts should be typed in double linespacing with a generous margin (c. 3.25 cm) eachside. Pages should be numbered consecutively,including those containing acknowledgements,references, tables and figure legends. It ispreferable that authors prepare their main text inMicrosoft Word (Garamond font) and graphs in Microsoft Excel. Manuscripts must be inEnglish and spelling should conform to theConcise Oxford Dictionary of Current English. Thepassive voice is preferred; the active voice may beused only occasionally, typically to emphasize apersonal opinion in the Introduction orDiscussion.

Instructions for Authors 231
©Wildfowl & Wetlands Trust Wildfowl (2012) 62: 229–233
and place them in the context of the broaderscientific field. Where appropriate, resultingrecommendations, e.g. for future management orresearch, should be clearly set out.
Acknowledgements – should be concise andappropriate.
References – when mentioned in the text,references should be listed in chronologicalorder, separated by a semi-colon. Citation ofwork by one or two authors should be in full(Owen 1980; Bannister & Walker 1998), butwhere there are more than two authors, thecitation should be abbreviated to et al. (Worden etal.) in the text. When different groups of authors with the same first author and date occur, they should be cited as (Thomson et al.
1991a, b).In the reference list, the references should be
given in alphabetical order, all authors’ namesbeing quoted, with the journal name in full and initalics. For example:
Baldassarre, G.A. & Bolen, E.G. 1994. Waterfowl Ecology
and Management. Wiley & Sons, New York, USA.
Béchet, A., Giroux, J.-F., Gauthier, G., Nichols, J.D. &Hines, J.E. 2003. Spring hunting changes theregional movements of migratory Greater Snow Geese. Journal of Applied Ecology 40: 553–564.
Follestad, A. 1994. Background for a management planfor geese in Norway. NINA Utredning 65: 1–78. [InNorwegian with English summary.]
Frederiksen, M., Fox, A.D., Madsen, J. & Colhoun, K.2001. Estimating the total number of birds using astaging site. Journal of Wildlife Management 65: 282–289.
Nudds, T.D. 1992. Patterns in breeding waterfowlcommunities. In B.D.J. Batt, A.D. Afton, M.G.Anderson, C.D. Ankney, D.H. Johnson, J.A. Kadlec& G.L. Krapu (eds.), Ecology and management of
breeding waterfowl, pp. 540–567. University ofMinnesota Press, Minneapolis, USA.
Owen, M. 1980. Wild Geese of the World. B.T. Batsford,London, UK.
Wetlands International. 2002. Waterbird Population
Estimates, 3rd edition. Global Series No. 12,
Wetlands International, Wageningen, TheNetherlands.
Worden, J., Mitchell, C.R., Merne, O.J. & Cranswick,P.A. 2004. Greenland Barnacle Geese Branta
leucopsis in Britain and Ireland: results of theinternational census, spring 2003. Unpublishedreport to JNCC, The Wildfowl & Wetlands Trust,Slimbridge, UK.
When referring to articles written in a languageother than English, give the title in the originallanguage. If the article is in a language other thanEnglish but contains an English summary, thisshould be stated in parentheses at the end of thecitation, as shown for the Follestad (1994) paperabove. References should be cited as “in press”only if the paper has been accepted forpublication. Work not yet submitted forpublication may be cited in the text and attributedto its author as “full author name, unpublisheddata”.
Tables
Each table should be on a separate page,numbered and titled. Table headings should beconcise and tables should be numberedconsecutively in the text as Table 1, etc. Datashould not be duplicated in both figure and tableform. Footnotes should be listed as letters notnumbers.
Horizontal rules should be used in the tablesthemselves; use vertical rules only whenabsolutely necessary. The horizontal lines shouldbe kept to a minimum, ideally limited to singlehorizontal lines before and after column headingsand at end of table (e.g. Simple 1 format inMicrosoft Word), with blank rows used toseparate information presented within a tablewhere needed to help interpretation. Keep tablesin portrait format if possible, to fit one column(width: 6 cm) or 1 page (width: 13 cm) ofWildfowl.
Figures
Each figure should be on a separate page, withfigure headings listed on a separate sheet. Figuresshould be about 50% larger than final printedsize; any drawn or printed figures supplied for

232 Instructions for Authors
©Wildfowl & Wetlands Trust Wildfowl (2012) 62: 229–233
scanning should be of a high quality and largeenough to take up to 50% reduction. Figuresshould fit to a single column (60 mm width, final size) or page (130 mm width) in thepublished paper. Authors should take care toensure that symbols, labels, lines, etc. are largeenough to allow reduction to a final size of c. 8point, so that capital letters will be about 2 mmtall on publication. High contrast dots or linepatterns are preferable to using different shadesof grey, since they provide greater clarity onprinting. Multiple graphs within one figure,should be marked with (A), (B), etc, and with anexplanation for each provided in the figureheading. Authors should aim to ensure that thereis no wasted space between multiple graphs.
Figures should not be boxed and tick marks must be on the outside of the axes. Tomake best use of space, you may need torearrange parts of figures, for instance so that they appear side by side. Legends shouldfurnish enough detail for figures to beunderstood without reference to the text. Ifsymbols are straightforward (circles, squares,crosses or triangles), include them in the figure legend; otherwise they should be explainedin the figure heading. Please keep the type size thesame on legends and keys for all figures. Letteringshould be in Garamond font with capitals usedfor the initial letter of the first word only. Boldlettering should not be used. Units of axesshould appear in parentheses after the axis name.
If possible, please submit your artwork inelectronic form. Large files (> 6MB) should besubmitted on disk or CD. Vector graphics (e.g.line artwork) should be saved in EncapsulatedPostscript Format (EPS), and bitmap files (e.g.half-tones) in Tagged Image File Format (TIFF).Ideally, vector graphics that have been saved in ametafile (.WMF) or pict (.PCT) format should beembedded within the text file at the end of thepaper.
Scientific Names
Apply capitals as follows: Bewick’s Swan, Pink-footed Goose etc.; but swans or geese.Follow an appropriate authority for common
names, e.g. Checklist of Birds in Britain and Ireland,
Birds of the Western Palearctic etc. Give the scientific(Latin) name of each species in full, in italics, atfirst mention in the main text, not separated by acomma or brackets, e.g. ...Red-throated DiverGavia stellata was... . If there are many species, cite a check-list which may be consulted forauthorities instead of listing them in the text. Donot give authorities for species cited frompublished references. Where appropriate, followthe Voous order of species.
Presentation of statistical information
Most statistical tests result in an estimate of thelikelihood that a particular result could havearisen by chance. This probability is denoted by P.
Authors are encouraged to follow the normalconvention of indicating the probability of theresult having arisen by chance and should beindicated by the use of < (less than) followed bythe appropriate level (0.05, 0.02, 0.01, 0.001)taken from a set of statistical tables. Any resultwith a probability greater than 0.05 should beregarded as not significant and denoted by n.s. inthe text, (not by P > 0.05). Authors are stronglyrecommended to follow the practice of using anull hypothesis before carrying out a test. In all cases, present the degrees of freedom, using a post-fix to the statistic symbol, for instance: χ2
4, r28, t28.
Authors should ensure that the test they carry outis appropriate and the data are acceptable for theparticular test. Ensure that the statistic iscalculated correctly when small samples areinvolved (this includes the use of Yates’correction for the calculation of χ2
1).
Examples of the style in which to present resultsare:
“... and the difference is significant (χ21 = 6.9,
P < 0.01).”“... the correlation between A and B issignificant (r28 = 0.79, P < 0.001).”“The difference between the samples is notsignificant (t17 = 1.2, n.s.).”“Examination of the data using an ANOVAgives F12,23 = 29.1, P < 0.001.”
RevisionAll submitted manuscripts are subject to peerreview, normally by at least two referees. If amanuscript is returned for revision, thecorresponding author will be instructed tocomplete this exercise by a specific date; if anextension is required please contact the EditorialAssistant. It is expected that a manuscriptaccepted for publication in Wildfowl is in a formwhich is satisfactory to the author/s and willtherefore not require changes at proof stage,other than the correction of errors occurringduring the preparation for printing.
Pre-publicationProofs will be sent to the correspondence authorby e-mail, as an Acrobat PDF (portable document format) file. Acrobat Reader will be required inorder to read this file. This software can bedownloaded (free of charge) from the followingweb site: www.adobe.com/products/acrobat/readstep2.html
Only minor alterations may be accepted atthis stage, unless approved by the Editor. Proofsmust be returned to the editorial office by firstclass/air mail and by the date given. Alternatively,
authors may use email to submit amendmentsproviding the changes are clear and concise. TheEditor reserves the right to correct the proofs,using the accepted version of the typescript, ifthe author’s amendments are overdue and thejournal would otherwise be delayed. Proofsshould be checked very carefully. It is thecorresponding author’s responsibility to ensurethat proofs are correct in every respect.
ReprintsFollowing publication, an electronic (PDF) copyof the paper will be sent to the correspondingauthor by e-mail. The PDF file will be sent toother authors of the paper on request.
If you have any queries regarding thesubmission of papers to Wildfowl, please write to the Editor or send an e-mail to:[email protected]
The Wildfowl & Wetlands TrustSlimbridge, Gloucestershire GL2 7BTUnited KingdomTel: +44 (0)1453 891900 Fax: +44 (0)1453 891901 or 890827E-mail: [email protected]
Instructions for Authors 233
©Wildfowl & Wetlands Trust Wildfowl (2012) 62: 227–231