
WILD TIGERS: 2005-2015 - World Wildlife Fund
206
Setting Priorities for the Conservation and Recovery of WILD TIGERS: 2005-2015 THE TECHNICAL ASSESSMENT
-
Upload
khangminh22 -
Category
Documents
-
view
2 -
download
0
Transcript of WILD TIGERS: 2005-2015 - World Wildlife Fund

Setting Priorities for the Conservation and Recovery of
WILD TIGERS: 2005-2015
T H E T E C H N I C A L A S S E S S M E N T

Setting Priorities for the Conservation and Recovery of
WILD TIGERS: 2005–2015T H E T E C H N I C A L A S S E S S M E N T
© 2006 wcs, wwf, smithsonian, stf
Sanderson, E., J. Forrest, C. Loucks, J. Ginsberg, E. Dinerstein, J. Seidensticker, P. Leimgruber, M. Songer, A. Heydlauff, T. O’Brien, G. Bryja, S. Klenzendorf and E. Wikramanayake. 2006. Setting Priorities for the Conservation and Recovery of Wild Tigers: 2005-2015. The Technical Assessment. WCS, WWF, Smithsonian, and NFWF-STF, New York – Washington, D.C.

Authors
Eric Sanderson, Ph.D.
Associate Director
Living Landscapes Program, WCS
Jessica Forrest, M.Sc.
Associate Conservation Ecologist
Living Landscapes Program, WCS
Colby Loucks, M.E.M.
Senior Conservation Specialist
Conservation Science Program, WWF–US
Josh Ginsberg, Ph.D.
Vice President
Conservation Operations, WCS
Eric Dinerstein, Ph.D.
Chief Scientist & Vice President
Conservation Science Program, WWF–US
John Seidensticker, Ph.D.
Senior Scientist
Wildlife & Conservation Center, SNZP
Peter Leimgruber, Ph.D.
Director
Conservation GIS Laboratory, SNZP
Melissa Songer, Ph.D.
Laboratory Manager
Conservation GIS Laboratory, SNZP
Andrea Heydlauff, M.Sc.
Tiger Program Coordinator
Science & Exploration Program, WCS
Timothy O’Brien, Ph.D
Senior Conservation Scientist
Science & Exploration Program, WCS
Gosia Bryja, M.Sc.
Program Manager
Living Landscapes Program, WCS
Eric Wikramanayake, Ph.D.
Senior Scientist
Conservation Science Program, WWF–US
Sybille Klenzendorf, Ph.D.
Director
Species Conservation Program, WWF–US
Setting Priorities for the Conservation and Recovery of Wild Tigers: 2005–2015. The Technical
Assessment is part two of a two–part document. Part one is entitled: Setting Priorities for the
Conservation and Recovery of Wild Tigers: 2005–2015. A User’s Guide.
i
Acknowledgements
This project was funded by Save The Tiger Fund, a partnership between the ExxonMo-bil Foundation, the National Fish and Wildlife Foundation and the Critical Ecosystem Partnership Fund; the United States Fish and Wildlife Service; and the United Nations Foundation.
The following people and organizations contributed to this work by providing data, ideas, and information about tigers. This document belongs to them.
We thank: Vladimir Konstantinovich Abramov, Firoz Ahmed, Zubtsov Sergey Anatolev-ich, David Ashwell, Aslan, Shyam Bajimaya, Tariq Aziz, Lt. Col. S.R. Banerjee, Helene Barnes, Sergei Bereznuk, Liesje Birchenough, Jake Brunner, Cat Action Treasury, Cen-ter for Wildlife Studies, Anwaruddin Choudhury, M.D. Mohsinuzzaman Chowdhury, Sarah Christie, Conservation International, Tom Clements, Dan Cole, James Compton, R.S. Chundawat, Peter Cutter, Tom Dahmer, Jenny Daltry, Chheang Dany, Yuri Dar-man, Arundhati Das, Peter Davidson, Avin Deen, Hu Defu, Etienne Delattre, William Duckworth, Yuri Dunishenko, Susie Ellis, Roland Eve, Anwar Faruque, Fauna and Flora International, Thomas J. Foose, Neil Franklin, Steve Galster, Suwanna Gauntlett, Global Security Network, M.G. Gogate, John Goodrich, Antonia Gorog, Mike Griffi th, Mel-vin Gumal, Martin Hardiono, Siti Hawa, Sun Hean, Joe Heffernan, Hornocker Wildlife Research Institute, Luke Hunter, M. Anwarul Islam, Shant Raj Jnawali, A.J.T. Johns-ingh, Arlyne Johnson, K. Ullas Karanth, Kae Kawanishi, Huy Keavuth, Linda Kerley, Sarala Khaling, M. Monirul H. Khan, Mohammed Khan, Munjurul Hannan Khan, King Mahendra Trust for Nature Conservation, Jagdish Krishnaswamy, Alexander Kulikov, Margaret F. Kinnaird, Jayant Kulkarni, Samba Kumar, Ruth Laidlaw, Lazovsky State Nature Reserve, Robert Lee, Eve Li, Matthew Linkie, Barney Long, Anthony J. Lynam, David Macdonald, Tom Maddox, Debbie Martyr, Matyushken, U Myint Maung, Me-hernosh Mavalwala, Andy Maxwell, Chuck McDougal, Tessa McGregor, Prachi Mehta, Vivek Menon, Gumal Melvin, Judy Mills, Dunishenko Yuri Mifodievich, Minnesota Zoo Foundation, Dale Miquelle, Sangita Mitra, Biswajit Mohanty, Mohd Khan Momin, An-iruddha Mookerjee, Jeff R. Muntifering, Myanmar Forest Department, Myanmar WCS Tiger Team, U Than Myint, Kinzang Namgay, A.S. Negi, Dusit Ngoprasert, James D. Nichols, Igor Georgievich Nikolaev, Musa Nordin, Kristin Nowell, Dwi Nugroho, Mo-hammed Nuruzzaman, P.J. Nyhus, Annette Olsson, Sandrine Pantel, John Parr, Mr. Saroj Patnaik, Anak Pattanavibool, Phoenix Fund, U Saw Htoo Tha Po, Chiranjibi Pokheral, Colin Poole, Elisabet Purastuti, Howard Quigley, Alan Rabinowitz, M.D. Shamsur Rahman, Mowdudur Rahman, Arup Rajouria, K Ramesh, Latika Nath Rana, Ranth-ambhore Foundation, Tim Redford, Rebecca Respess, Harsha Reddy, Ali Reza, William Robichaud, Selphine Vann Roe, Philip D. Round, Royal Bardia National Park, Royal Shukla Phanta Wildlife Reserve, Galina Salkina, V.B. Sawarkar, George B. Schaller, Kalus

Setting Priorities for the Conservation and Recovery of Wild Tigers: 2005–2015
ii
Schmitt, P.K. Sen, Wan Shaharrudin, Chris Shepherd, Nancy Sherman, Mahendra K. Shrestha, Saksit Simchareon, Anthony Simms, James LD Smith, Meas Sopha, Kate Stan-ford, Robert Steinmetz, Nico VanStrien, Sunarto, Mel Sunquist, Ranjit Talwar, Chado Tenzin, U Tin Than, Rob Tizard, Kanchan Thapa, Valmik Thapar, Ronald Tilson, TRAF-FIC, Karma Tsherimg, University of Florida, University of Minnesota, USAID, Ahmad Zafi r Abdul Wahab, Joe Walston, WCS Asia Program, Per Wegge, Hunter Weiler, Philip Wells, Hariyo T. Wibisono Untung, Unrung Wijayanto, WildAid, Nurul Winarni, WWF, Pralad Yonzon, Ahmad Zafi r, Endi Zhang, Zoological Society of London, and Sergei Zubtsov.
We would like to thank Eric Wikramanayake for contributing Box 1 and Box 4, Mahen-dra Shrestha for Box 2, Robin Naidoo for Box 3, and Judy Mills for contributing the Trade in Tiger Parts.
We gratefully acknowledge Tim Bean, Michelle Brown, Willa Didier, Jamie Robertson, Danielle Shanahan, and Pia Terranova for their help preparing maps for the report.
We also gratefully acknowledge general support for landscape ecology at WCS from the Prospect Hill Foundation. GIS software grants from the ESRI Conservation Program sup-ported analyses at WCS, WWF, and the Smithsonian’s National Zoological Park, Wildlife Conservation Center.
iii
Executive Summary
Wild tigers are in a precarious state. Our best approximation concludes that tiger habi-tats throughout India, Indochina, and Southeast Asia are now 40% less than what we estimated in 1995. As the Economic Tigers of Asia leap onto the world stage, wild tiger populations in those countries are in steep decline; today tigers occupy a mere 7% of their historical range and the threats are mounting, rather than diminishing.
A world without tigers is hard to imagine, but red fl ags are being hoisted across the tiger’s range. In India, poaching in what were thought to be well-protected Tiger Reserves has been so intense recently that it has become a national issue eliciting an investigation by a Prime Ministerial Commission. In Indochina, widespread poaching of tigers and wildlife continues to create empty forests, and the development of the proposed trans-national economic corridors in the region will further fragment Indochina’s remaining forests and create dispersal barriers. In Sumatra and Malaysia, vast oil palm and acacia plantations are predicted to result in complete conversion of some of the richest lowland rain forests on Earth, habitats that were populated by tigers only a few years ago. The increasing demand for tiger parts for folk medicines in China and Southeast Asia and for costume adornment among Tibet’s growing middle-class has intensifi ed threats to tigers across the range. Despite these setbacks, this is hardly the time for inaction or retreat. To paraphrase E. O. Wilson, tigers can’t afford another century, or even another decade like the last one. Indeed, we must rededicate and galvanize our efforts to make tigers and tiger habitats a conservation imperative in the remaining landscapes of Asia.
Tigers are a conservation dependent species. They require protection from killing, an adequate prey base, and adequate habitat area. While the tiger as a species may not go extinct within the next two decades, the current trajectory will surely cause wild popula-tions to disappear in many places, or shrink to the point of “ecological extinction”—where their numbers are too few to play their role as the top predator in the ecosystem. Therefore, now, more than ever, tigers need homeland security.
There are two possible strategies to ensure the future of wild tigers. One calls for securing a few tiger populations in increasingly isolated reserves while ignoring the retreat of for-ests outside. However, the natural history features of tigers—their need for large areas as top predators and their extreme territoriality—make this a poor option. The recent spate of killings in Tiger Reserves—regarded as the crown jewels of India’s protected areas sys-tem—suggest that providing adequate protection to insular reserves is not enough.
A second approach—one which we endorse—is to create tiger landscapes, where core ar-eas are linked with habitat corridors that allow the ecological requirements of wild tigers to be conserved as well. Such a strategy will require the support of the people living in the region. Although seemingly a diffi cult task, the successes of the Terai Arc Landscape Proj-
Setting Priorities for the Conservation and Recovery of Wild Tigers: 2005–2015
iv
ect being implemented in the foothills of Nepal and Northwestern India—in the midst of some of the densest human populations in South Asia—shows that creating corridors and eliciting the support of local people for tiger conservation is indeed possible. The suc-cesses are predicated on the reality that tiger conservation also results in conservation of ecological services that support and enhance local economies and livelihoods and so are in their self-interest. Another important aspect is to keep landscapes intact for tigers, best illustrated in the Russian Far East, which not only ensures the persistence of tigers into the future but leads to natural recolonization of neighboring areas, which has happened in China.
Large mammals, including tigers, have coexisted for centuries with dense human popu-lations. The release of the 1997 Tiger Conservation Unit Analysis (TCU 1.0) identifi ed where tigers can live in the future. During the decade since, experiences from implement-ing fi eld conservation projects have confi rmed that the future of wildlife conservation in Asia depends on judicious land use planning—zoning—of human use areas, core wildlife habitat, buffer zones, and corridors in large conservation landscapes to restore the har-mony that once existed in the wildland-village interface of rural Asia.
This document, based on the concept of Tiger Conservation Landscapes (TCL 2.0), improves on the original analysis by: 1) compiling more accurate satellite imagery to improve mapping of potential tiger habitat; 2) building a new spatial database of tiger status and distribution; 3) incorporating new knowledge gained about tiger biology to create a standard for measuring the quality of tiger landscapes; 4) employing a systematic measure of human infl uence on tiger habitat (the “human footprint”); 5) automating the process of landscape delineation to make updates more rapid, rigorous, and transpar-ent; 6) analyzing the sensitivity of results to assumptions made about tiger dispersal and minimum area size to support breeding tigers; and 7) updating priorities that move tiger conservation forward emphasizing representation and resilience. TCL 2.0 is truly a “liv-ing document” that has benefi ted from open peer-review and that can continue to guide conservation efforts into the future. To learn how the analysis was done in detail, please refer to “Setting Priorities for the Conservation and Recovery of Wild Tigers: 2005–2015. The Technical Assessment.”
In this User’s Guide (Dinerstein et al 2006) and the Technical Assessment, we highlight the remaining tigerlands—the large landscapes of habitat, often anchored by protected areas—that are Global Priorities for conservation. In order to go beyond the current state of tigerland, we also focus on those places where habitat restoration or improved conser-vation measures could bring tiger populations back from the brink of extinction. All are dependent on local, regional, national, and international support to sustain them, and must be integrated into national and regional resource and land management programs. Only such efforts can redirect the current downward trajectory to ensure survival of wild
v
tiger populations. For this generation to deprive future generations of the chance to see or track a wild tiger or to hear its royal roar is a travesty.
We have identifi ed 76 Tiger Conservation Landscapes (TCLs) across the tiger’s current range (see map). Each landscape is classifi ed into a “taxonomy” measuring their contri-bution to current tiger conservation and further prioritized in terms of their contribution to representation of tigers across the range. Global Priority landscapes were identifi ed in all major biomes and bioregions where tigers occur. Investing in these global priorities will ensure conservation of not just tigers, but “tigerness,” the suite of adaptations tigers have evolved to live in habitats as different as mangrove swamps and boreal forests.
Our results show that the Indian Subcontinent bioregion has the largest number of TCLs (40, of which 11 are of Global Priority). The Northern Forests of Nepal-India-Bhutan-Myanmar, Western and Eastern Ghats, Sundarbans, and the tall grasslands and riparian forests of the Terai Arc set the foundation for tiger conservation across a diverse array of habitats in this bioregion. Yet, this bioregion also has the most questionable habitats, where we were unable to assess or determine if tigers still do, or can, persevere in small, isolated habitat patches.
The Indochina bioregion supports 20 TCLs, but these account for the largest total area (~540,000 km2) among the four bioregions, primarily because they represent vast swathes along the mountain regions of Myanmar and Thailand (notably the Tenasserim moun-tains range) and the Annamite Mountains of Laos and Viet Nam. Six are Global Priori-ties. The large areas of dry forest mosaics in Cambodia are likely the best such forest habitats for tigers across its range. Unfortunately tigers have largely been extirpated from many of the lowlands within this bioregion, and restoring tigers to these areas will re-quire a sustained, long-term effort. Please note that TCL 37 spans both the Indian Sub-continent and Indochina bioregions and was intentionally double counted (thus included in the total number of TCLs in the Indian subcontinent and Indochina bioregion) due to the large amount of habitat present in both bioregions.
The Southeast Asia bioregion includes 15 TCLs, with three being Global Priorities. The latter are primarily in the montane regions, centered on Malaysia’s Taman Negara Na-tional Park, and Sumatra’s Kerinci National Park. In Sumatra’s large Leuser ecosystem the status of tigers is unknown, but it overlaps with critical habitat for the orang-utan and Sumatran rhinoceros and has been designated as both a World Heritage Site and Man and Biosphere reserve, confi rming the importance of this ecosystem to Sumatra’s natural heritage.
The Russia Far East bioregion contains two TCLs, including the world’s largest, which is 270,000 km2. This TCL is primarily in Russia, but extends into northeast China, which has recently recorded tigers on its side of the border. Although this vast mixed temperate
Executive Summary
Setting Priorities for the Conservation and Recovery of Wild Tigers: 2005–2015
vi
forest TCL has approximately 10% of its area under protection, the rest is unprotected wilderness in which the tiger is still able to persist. Rapid changes due to privatization and leasing of this forest to timber industries may constrain the future of the Amur tiger.
Our fi ndings show that in each of the fi rst three bioregions, the range of the tiger has contracted dramatically since 1995. Much of this change undoubtedly rests with changes in methodology and improvements in the underlying datasets, but it is also true that most of the signs we do have point to continuing declines in tiger habitat and numbers. How many wild tigers remain is impossible to know without systematic surveys across the range. Moreover our assessment is limited by the quality of available land cover maps, lack of range-wide measurements of prey numbers, our poor understanding of tiger dis-persal, and incomplete information on other aspects of tiger biology. Though we under-stand tigers better than before, we still have much to learn.
Tiger conservation over the next decade will require building Tiger Conservation Land-scapes into the development agenda of range states and regional plans, and we suggest several important areas for funding to defi ne a holistic strategy, which includes: 1) recruiting global and regional spokesperson(s) of great stature to speak for tiger conservation, 2) mainstreaming tiger conservation into national and regional develop-ment plans, 3) making TCL 2.0 broadly accessible and actively promoting its conclusions within Tigerland, 4) continuing attention to curtailing the trade in tiger parts from TCLs, 5) issuing periodic, public report cards on the status of tigers in TCLs, 6) fi nancing of case studies demonstrating how TCLs can be linked to ecosystem services and zoned as part of the entire resource management program in a country, and 7) continuing to advance the science of tiger conservation.
The same factors that endanger tigers could be brought to bear to save them if the politi-calwill can be found. Asia’s economic wealth creates new resources that can be invested in Asia’s natural patrimony. And few species inspire an increasingly affl uent, conserva-tion-minded public like the tiger. Economic development depends on transboundary cooperation—so does tiger conservation.
Conservation of tigers will help conserve ecosystems and landscapes that provide human populations with essential ecological services to ensure necessities such as food and water, and for maintaining a high-quality environment for health and economic reasons; it is not just tigers, but people who require conservation in tigerland. We must act now, not just to preserve this awe-inspiring creature, but to ensure the health of ecosystems that also subsidize our own well-being.
vii
Table of Contents
Acknowledgements
Executive Summary
Table of Contents
List of Tables and Figures
Prologue
Chapter 1 Introduction
1.1 Successes of the 1997 Framework Document
1.2 The Need for a Tiger Framework Document (TCL 2.0)
Chapter 2 Methods Used to Assemble Tiger Data Layers for TCL 2.0
2.1 Introduction
2.2 Questionnaire Survey Methodology
2.3 Summary Questionnaire Results
2.4 Discussion of Questionnaire Analysis and Results
2.5 Tiger Ecology: What We Know and What We Need to Know
2.6 Survey Methods for Tigers and Prey
Chapter 3 Land Cover Data for Tiger Conservation Landscapes
3.1 Objectives for land cover mapping
3.2 What We Have Learned About Remaining Tiger Habitats
3.3 Conclusions
Chapter 4 Delineating Tiger Conservation Landscapes
4.1 Introduction
4.2 Component Parts of a Range-Wide Tiger Conservation Strategy
4.3 Methodology for Delineating TCLs
4.4 Results: Delineation of Tiger Landscapes
4.5 Discussion: Interpretation of TCL Delineation
4.6 Conclusions
Chapter 5 Sensitivity Analysis
5.1 Introduction
5.2 Methodology for Sensitivity Assessment
5.3 Sensitivity Analysis Results
5.4 Discussion of Sensitivity Results
5.5 Conclusion
Page
i
iii
vii
xx
xiii
2
5
8
9
11
16
20
23
26
27
32
33
35
38
51
58
66
68
68
72
80
84
Setting Priorities for the Conservation and Recovery of Wild Tigers: 2005–2015
viii
Chapter 6 A New Taxonomy for Tiger Conservation Landscapes –
Setting Classes and Priorities
6.1 Introduction
6.2 Classifying Tiger Conservation Landscapes
6.3 Prioritizing Tiger Conservation Landscapes
6.4 Results: Classes and Priorities of Tiger Conservation Landscapes
6.5 Discussion
Chapter 7 Putting TCLs in Context – Protected Areas, Other
Designated Areas, and Selected Megafauna
7.1 Protected Areas
7.2 Overlap of TCLs with Areas Identifi ed by Intergovernmental Organizations
Chapter 8 NGO Investment in Tiger Conservation Units 1.0 (1998-2003)
8.1 Introduction and Data Constraints
8.2 Funding of Tiger Conservation Across TCUs (TCU 1.0)
8.3 Next Steps
Chapter 9 Recommendations for Improving the Process
9.1 Recommendations for the Land Cover Data
9.2 Recommendations for Tiger Location, Density & Breeding data
9.3 Establishing Gold Standard Baselines
9.4 Closing the Knowledge Gap
9.5 Prey data & Annual Sampling Efforts
Epilogue
Appendices
Appendix 1 Survey Tools
Appendix 2 Scores Used to Prioritize TCLs
Appendix 3 Contributors to the TCU & TCD Questionnaires
Appendix 4 What We Know Now About TCUs
Appendix 5 Detailed Description of Methods for Land Cover Creation
Appendix 6 Cambodia Tiger Conservation Status Review
Glossary
References
85
86
91
93
106
109
111
116
116
118
120
121
123
124
125
126
A1.1
A2.1
A3.1
A4.1
A5.1
A6.1
G.1
R.1
ix
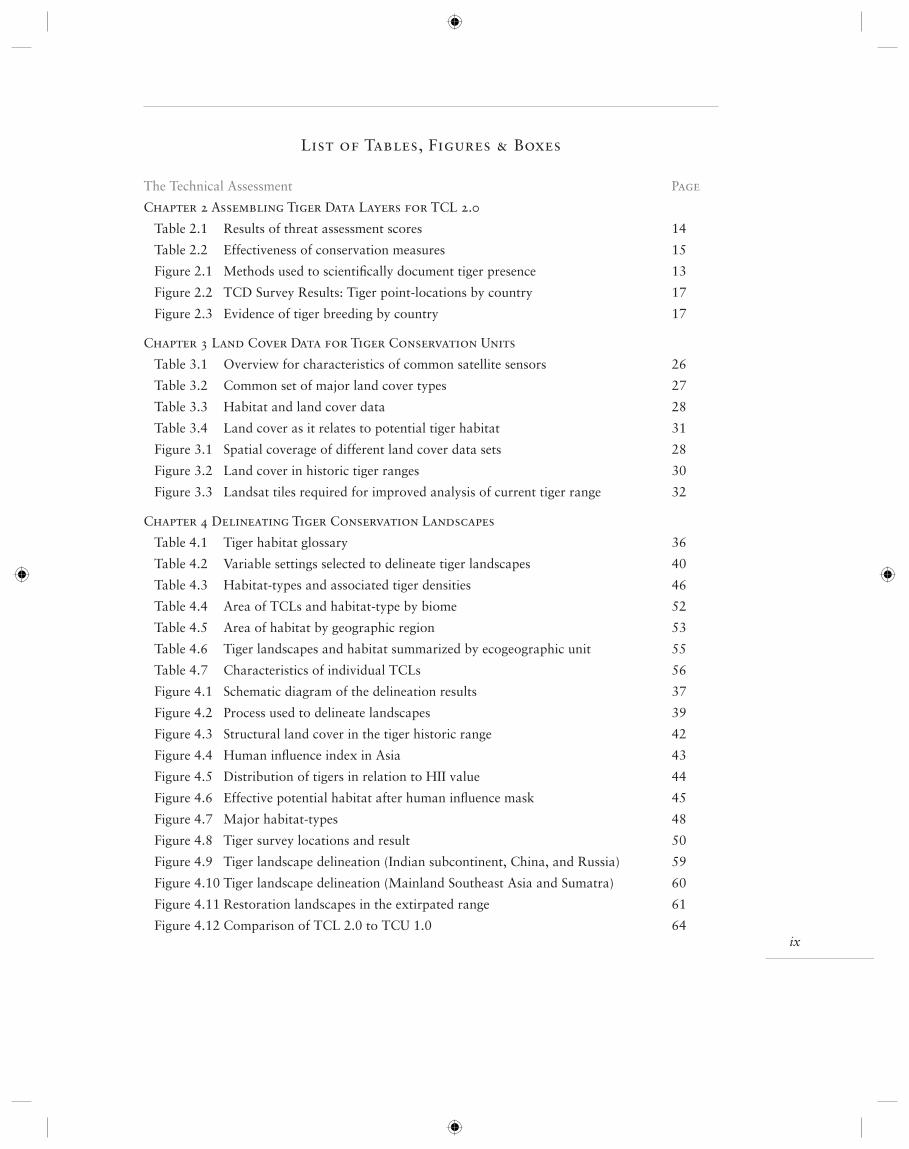
List of Tables, Figures & Boxes
The Technical Assessment
Chapter 2 Assembling Tiger Data Layers for TCL 2.0
Table 2.1 Results of threat assessment scores
Table 2.2 Effectiveness of conservation measures
Figure 2.1 Methods used to scientifi cally document tiger presence
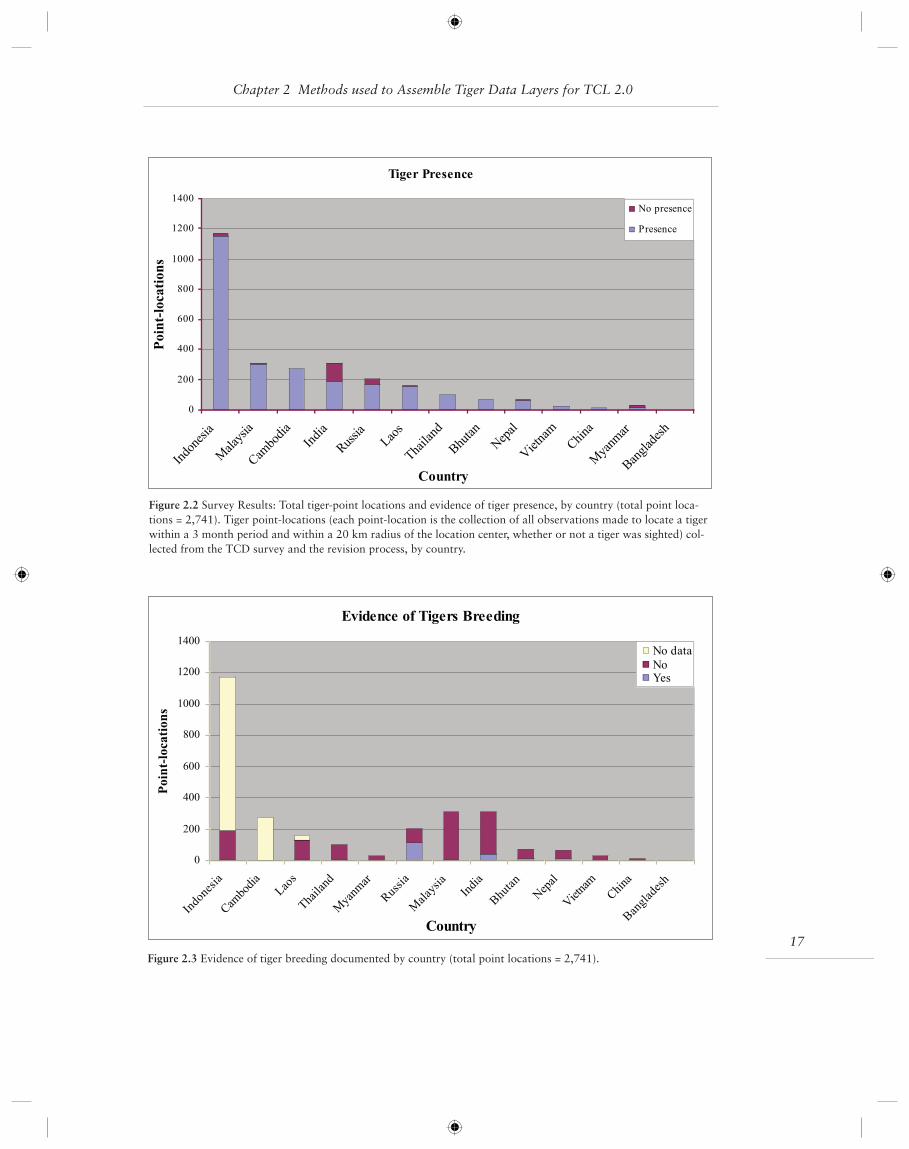
Figure 2.2 TCD Survey Results: Tiger point-locations by country
Figure 2.3 Evidence of tiger breeding by country
Chapter 3 Land Cover Data for Tiger Conservation Units
Table 3.1 Overview for characteristics of common satellite sensors
Table 3.2 Common set of major land cover types
Table 3.3 Habitat and land cover data
Table 3.4 Land cover as it relates to potential tiger habitat
Figure 3.1 Spatial coverage of different land cover data sets
Figure 3.2 Land cover in historic tiger ranges
Figure 3.3 Landsat tiles required for improved analysis of current tiger range
Chapter 4 Delineating Tiger Conservation Landscapes
Table 4.1 Tiger habitat glossary
Table 4.2 Variable settings selected to delineate tiger landscapes
Table 4.3 Habitat-types and associated tiger densities
Table 4.4 Area of TCLs and habitat-type by biome
Table 4.5 Area of habitat by geographic region
Table 4.6 Tiger landscapes and habitat summarized by ecogeographic unit
Table 4.7 Characteristics of individual TCLs
Figure 4.1 Schematic diagram of the delineation results
Figure 4.2 Process used to delineate landscapes
Figure 4.3 Structural land cover in the tiger historic range
Figure 4.4 Human infl uence index in Asia
Figure 4.5 Distribution of tigers in relation to HII value
Figure 4.6 Effective potential habitat after human infl uence mask
Figure 4.7 Major habitat-types
Figure 4.8 Tiger survey locations and result
Figure 4.9 Tiger landscape delineation (Indian subcontinent, China, and Russia)
Figure 4.10 Tiger landscape delineation (Mainland Southeast Asia and Sumatra)
Figure 4.11 Restoration landscapes in the extirpated range
Figure 4.12 Comparison of TCL 2.0 to TCU 1.0
Page
14
15
13
17
17
26
27
28
31
28
30
32
36
40
46
52
53
55
56
37
39
42
43
44
45
48
50
59
60
61
64
Setting Priorities for the Conservation and Recovery of Wild Tigers: 2005–2015
x
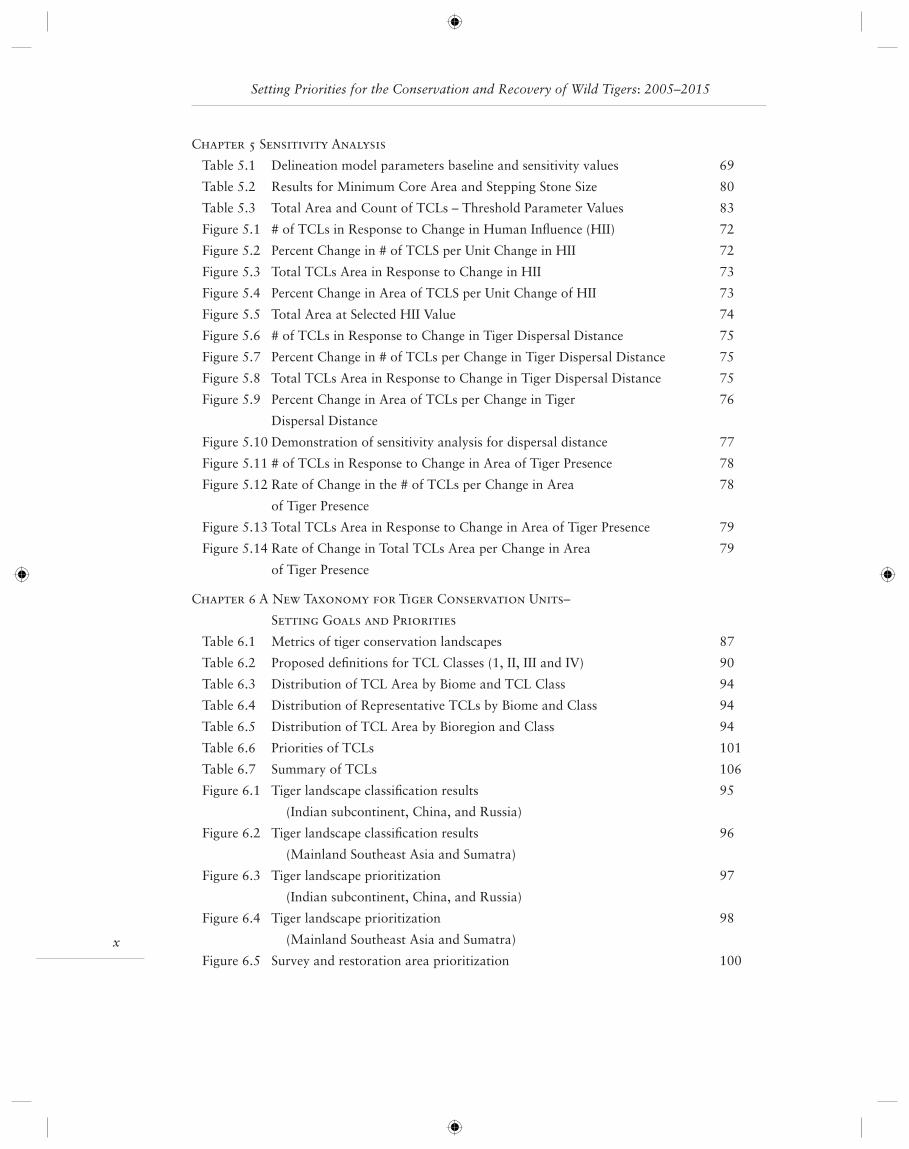
Chapter 5 Sensitivity Analysis
Table 5.1 Delineation model parameters baseline and sensitivity values
Table 5.2 Results for Minimum Core Area and Stepping Stone Size
Table 5.3 Total Area and Count of TCLs – Threshold Parameter Values
Figure 5.1 # of TCLs in Response to Change in Human Infl uence (HII)
Figure 5.2 Percent Change in # of TCLS per Unit Change in HII
Figure 5.3 Total TCLs Area in Response to Change in HII
Figure 5.4 Percent Change in Area of TCLS per Unit Change of HII
Figure 5.5 Total Area at Selected HII Value
Figure 5.6 # of TCLs in Response to Change in Tiger Dispersal Distance
Figure 5.7 Percent Change in # of TCLs per Change in Tiger Dispersal Distance
Figure 5.8 Total TCLs Area in Response to Change in Tiger Dispersal Distance
Figure 5.9 Percent Change in Area of TCLs per Change in Tiger
Dispersal Distance
Figure 5.10 Demonstration of sensitivity analysis for dispersal distance
Figure 5.11 # of TCLs in Response to Change in Area of Tiger Presence
Figure 5.12 Rate of Change in the # of TCLs per Change in Area
of Tiger Presence
Figure 5.13 Total TCLs Area in Response to Change in Area of Tiger Presence
Figure 5.14 Rate of Change in Total TCLs Area per Change in Area
of Tiger Presence
Chapter 6 A New Taxonomy for Tiger Conservation Units–
Setting Goals and Priorities
Table 6.1 Metrics of tiger conservation landscapes
Table 6.2 Proposed defi nitions for TCL Classes (1, II, III and IV)
Table 6.3 Distribution of TCL Area by Biome and TCL Class
Table 6.4 Distribution of Representative TCLs by Biome and Class
Table 6.5 Distribution of TCL Area by Bioregion and Class
Table 6.6 Priorities of TCLs
Table 6.7 Summary of TCLs
Figure 6.1 Tiger landscape classifi cation results
(Indian subcontinent, China, and Russia)
Figure 6.2 Tiger landscape classifi cation results
(Mainland Southeast Asia and Sumatra)
Figure 6.3 Tiger landscape prioritization
(Indian subcontinent, China, and Russia)
Figure 6.4 Tiger landscape prioritization
(Mainland Southeast Asia and Sumatra)
Figure 6.5 Survey and restoration area prioritization
69
80
83
72
72
73
73
74
75
75
75
76
77
78
78
79
79
87
90
94
94
94
101
106
95
96
97
98
100

xi
Chapter 7: Putting TCLs in Context: Protected Area’s, Other Designated
Areas, and Selected Megafauna
Table 7.1 Overlap of TCLS with protected areas
Table 7.2 World Heritage Sites, Wetlands of International Importance,
& UNESCO MAB Reserve overlap with TCLs
Table 7.3 Overlap of Selected Megafauna with TCUs
Figure 7.1 Overlap of TCLs with WDPA (2005)
Figure 7.2 Overlap of TCLs with UNESCO MAP Reserves, Ramsar Sites,
and World Heritage Sites
Figure 7.3 Overlap of TCLs with Select Endangered Megafauna
Chapter 8: NGO Investment in Tiger Conservation Units (1998–2003)
Table 8.1 Expenditures per TCU 1.0, 1998–2003
Figure 8.1 TCU Investments by Bioregion, 1998–2003
109
112
113
110
114
115
117
119
xii
PROLOGUE
Whether the tiger is viewed with awe and fear because of its massive power, or admired for its fl aming beauty, the shadowed presence of this great cat permeates the forests where it still endures, and echoes hauntingly in those forests from which it has recently gone extinct. The species has a small but worldwide core of persistent advocates con-cerned about its future, not only because of its sheer magnifi cence, but also as an icon of conservation, symbolizing the imperative of protecting all animals and plants within its realm. As this report points out, 93% of the tiger’s original range has been lost in the past 150 years. And the decline in numbers and distribution continues. The situation is grave. On the Indian subcontinent, with the largest remaining tiger population, only 11% of original habitat remains, and the remainder is increasingly fragmented and often degrad-ed. Tigers also face threats other than loss of habitat, competing with local communities for deer, wild pigs, and other natural prey. On the positive side, tigers are resilient and adaptable, needing only ample space, natural prey, cover, and water, and they are able to reproduce rapidly.
In 1997 the World Wildlife Fund and Wildlife Conservation Society, with fi nancial and programmatic support from the Save the Tiger Fund, produced an important report that identifi ed areas where tigers still lived or could live, and suggested various conserva-tion initiatives to prevent the extinction of fragmented breeding populations. Much new information on status and distribution has become available during the past decade, various important ideas on how best to conserve tigers have broadened, and technologi-cal advances have greatly improved how data and ideas can be used to set conservation priorities. This new report, far-sighted in concept and elegant in analysis, offers timely and essential information. The approach to conservation amplifi es the ecological focus of the original report on preserving tigers in their various distinct habitats from coastal mangroves and open woodlands to rain forest. The goal is to preserve whole landscapes with the cats managed in large tracts of habitat that include core areas, buffer zones, and dispersal routes.
The vision is grand, the task diffi cult and expensive—but essential. It involves gather-ing more knowledge at each site about tigers and their prey, as well as about the local communities; it requires realistic policies and laws; it means protecting key areas with a trained and active guard force; and, above all, it must have the involvement of local peoples who recognize the spiritual and cultural values of tigers and treasure an ecologi-cal integrity upon which their livelihood depends. India is currently debating whether to give land title to the many families that are settled within government forests. What long-term effect would this have on managing landscapes for tigers?
xiii
Too few investigators are in the fi eld to collect ecological information, monitor wildlife, and actively resolve confl icts between tigers and people. However, knowledge alone will not assure the tiger’s survival. It is a matter of sadness and apprehension that during the past several years, tigers in several of India’s reserves have been decimated by poachers: Tigers have been wiped out in Sariska and Namdapha, and severely reduced in Panna and Ranthambore, to name just four reserves, in spite of a large guard force and much money for conservation. Tiger bones and hides are smuggled principally into China, the former for medicine and the latter to be worn by Tibetans as a statement of status and fashion.
Better international cooperation is necessary on issues such as this. A knowledge gap must be closed, as the report notes, but so too must a protection gap. Tiger habitat ex-tends across national borders. Russia and China already collaborate in a trans-frontier effort at protection and management, as do Nepal and India, and a similar initiative is needed, for example, between China and India, Myanmar and India, Myanmar and Thai-land, and among Laos, Vietnam, and Cambodia.
This thorough report provides compelling data that also represents a strong call for ac-tion. Priorities are clear and options still remain open in all tiger countries. In the fi nal analysis, saving the tiger is a moral issue, an act of conscience, to which each country must make a sincere national commitment.
— George B. Schaller


Setting Priorities for
the Conservation and Recovery
of Wild Tigers: 2005-2015
The Technical Assessment
Setting Priorities for the Conservation and Recovery of Wild Tigers: 2005-2015. The Technical Assessment is part two of a two-part document. Part one is titled: Setting Priorities for the Con-
servation and Recovery of Wild Tigers: 2005-2015. A User’s Guide.

Setting Priorities for the Conservation and Recovery of Wild Tigers: 2005–2015
2
Chapter i Introduction
1.1 Successes of the 1997 Framework Document
The conservation of wild tigers rests upon answering to two similar biological questions: What controls tiger populations? And what controls the probability of their persistence? The fi rst question concerns the tiger’s ecology and behavior; the second mixes ecology and human values. We need to know enough about the tigers’ ecological needs to be able to conserve them and resolve the confl icts they face with people. The principal challenge conservationists face is how to prevail over short-term human interests that leave land-scapes devoid of tigers.
With the publication of A Framework for Identifying High Priority Areas and Actions for the Conservation of Tigers in the Wild in 1997 (Dinerstein et al. 1997; hereafter TCU 1.0), conservation scientists and practitioners welcomed a new vision for saving tigers on their home ground. The Framework Document shifted conservation thinking from the tiger population as the total number of individuals in the whole species or subspecies, to identifying and focusing conservation attention on geographically distinct groups of tigers (subpopulations) between which there is little or no demographic or genetic exchange. It established as a primary goal, the conservation of “tigerness,” the suite of adaptations tiger populations have evolved to persist across a wide array of habitats, from mangroves to montane forests, and feeding on prey assemblages as diverse as primates in lowland rain forests to takin and other high-elevation ungulates at timberline. This ecological ap-proach to conserving tigers recognized the tiger’s genetic distinctiveness across its range, but also behavioral, demographic, and ecological distinctiveness. It recognized the value of tigers as top predators in ecosystems and their role as umbrella species for conserva-tion of other species and ecological processes.
Above all, TCU 1.0 indicated where tigers could live but had been extirpated, where wild tigers still roam, and where wild tigers might occur if we knew more about these areas. Tiger’s once vast range spanned 70 degrees of latitude and 100 degrees of longitude from the Russian Far East south to Indonesia, and west to central Asia and the Indian sub-continent, south of the Himalayas. The maps of actual and potential tiger distribution in TCU 1.0 demonstrated the severe fragmentation and drastic reduction of space where this largest of the cats once ranged or could still persist. Apart from their primary distri-bution, tigers once lived adjacent to the Caspian Sea and on the Greater Sunda Islands of Sumatra, Java, and Bali. Except for Sumatra, where tigers now live in scattered, critically endangered subpopulations, they have disappeared from these outer islands and the Cas-pian shores. All the fragmented tiger subpopulations will continue to decline unless reme-dial measures are directed at each. Hostile conditions prevail in the areas between forest fragments; forest fragmentation and deterioration continues; prey populations have been decimated; and tigers in whole forest blocks are being poached. Many of the potential ti-
3
ger subpopulations identifi ed in 1997 are so small that a single threatening event—patho-gens, poachers, fl oods, fi res, or droughts—could rapidly decimate these remnant popula-tions. The primary value of TCU 1.0 was that governments and conservationists now had a collective image of where priority conservation actions could be directed at individual subpopulations to ward off their individual extinctions, rather than directed at the species as a whole. This has allowed tiger conservationists to shift their focus from the activity of saving the tiger, which had been the prevailing species-orientated conservation paradigm, to results-focused actions of supporting sustainable populations of wild tigers in their dif-ferent habitats by protecting, recovering, and linking these together wherever possible.
This new vision for tiger conservation went far beyond saving tigers in a few well-known reserves and national parks to conserving tigers in large, tiger-friendly landscapes. This shift in spatial scale was important because all reserves are often too small to contain vi-able populations of large carnivores (Woodroffe and Ginsberg 1998) and reserves are, or will eventually become, isolated. Thus, the species-based approach was essentially a pro-cess of honoring the well-known places where tigers lived and where most will eventually die out. A generation of conservation science has taught us to recognize this as a hospice strategy. In contrast, a landscape-scale approach to tiger conservation, born in part from STF investments based on the TCU framework, aligned conservation efforts with science, rather than continuing to funnel disproportionate funding to small parks whether they were viable or not but were in the public eye and championed by individuals and groups. We care passionately about tigers living in these areas but in the end our science predicts that most will not survive.
TCU 1.0 established an ecological basis for tiger conservation investments. TCU 1.0 af-fi rmed that effective conservation must be based on sound science. The working hypoth-esis is that for tigers to survive over the long term, tigers and their prey must be managed at a landscape scale; only this approach will ensure the persistence of tigers. Effective ti-ger landscapes must include core areas (national parks and reserves) of protection, buffer zones where tigers are fully protected, dispersal corridors to connect core areas, restora-tion of degraded lands, and initiatives through which the conservation of tigers directly or indirectly meets the need of local people.
These landscapes where tiger subpopulations lived or could live were deemed Tiger Conservation Units, TCUs, in TCU 1.0 and the TCUs became the fundamental level for conservation investment to create conditions where these subpopulations can remain viable or can be made viable (see Chapter 8 for a summary of investments in tiger con-servation by TCU). TCUs were prioritized by regions in recognition of the differences in tiger density in various vegetation types and biomes. The amount of tiger prey available living in various vegetation types and biomes across the tiger’s broad geographical range varies from about 1 to 100 individual prey animals per km². Monitoring has demonstrat-ed that tiger densities vary by a factor of 30, from less than 0.5 per 100km² (tigers one
Chapter 1 Introduction
Setting Priorities for the Conservation and Recovery of Wild Tigers: 2005–2015
4
year of age and older) in the temperate forests of the Russian Far East and some tropical rainforests to more than 15 per 100km² in the fl ood plain grasslands and riverine forests of Nepal and India. The area it takes to support viable tiger subpopulations in different vegetation types varies accordingly. A critical threat to tiger subpopulations, which has been documented since the publication of TCU 1.0, is that tiger prey populations are depressed both within and outside protected areas through most of their remaining range (papers in Seidensticker et al. 1999).
TCU 1.0 recognized that you cannot manage what you cannot measure. Reactive man-agement is inevitable when ecological knowledge is insuffi cient to allow reliable science-based predictions. Save The Tiger Fund, with principal partners including the Wildlife Conservation Society, World Wildlife Fund, Wildlife Institute of India, Flora and Fauna International, Sumatran Tiger Conservation Project, Zoological Society of London, University of Florida, University of Minnesota, and U.S. Fish and Wildlife Service, has supported a decade of work to overcome our inadequate knowledge of tiger distribution, dispersal behavior, and ecological needs that were outlined in TCU 1.0. It is now time to bring this updated and new information together with more recent land cover and hu-man footprint data (Sanderson et al. 2002). At conferences and workshops sponsored by Save The Tiger Fund, including the Tigers 2000 symposium at the Zoological Society of London in 1997 (Seidensticker et al. 1999), the 1998 Year of the Tiger Conference in Dallas (Tilson et al. 2000), and the Assessing our Success workshop held at the Wild-life Conservation Society in New York in 1999 (Ginsberg 2001), the ineffectiveness of individual conservation practitioners, organizations, alliances, and networks working without a common vision and language was recognized as a primary threat to the tiger’s future. Consequently, when the Save The Tiger Fund suggested to WCS and WWF that we should update and refocus tiger conservation actions based on the new information that has become available over the last decade, we immediately sought key additional partners to join in this effort. Financial and technical support was readily offered by Save The Tiger Fund, World Wildlife Fund–U.S., Wildlife Conservation Society, United Na-tions Foundation, U.S. Fish and Wildlife Service, Critical Ecosystem Partnership Fund, Zoological Society of London, the Smithsonian Institution, and from our many contribu-tors listed in the Acknowledgements. The effort has spanned 18 months. The result is the best image of where tiger conservation is today and where and how we should continue or refocus our investments.
Wild tiger conservation is an umbrella for the protection of all biodiversity in the Asian forests where they live and for the ecological services these forests provide. Tiger areas conserve watersheds, protect fl ood plains, and rice bowls and in many ways contribute to human development indirectly as being the justifi cations for protected areas that provide many ecological subsidies from nature conservation. It is heartening for tiger conser-vationists that we have gained ground for some tiger subpopulations, but we have lost

5
ground elsewhere. We know that we have to do better than we have done so far if wild tigers are to survive. The challenge of saving the tiger is at the heart of conservation. A world without tigers is a world without hope . . . like a clear night sky without stars. A world without tigers would be a terrible loss, symbolizing a morbid disregard for our natural heritage, natural places, and the essential goods and services these areas provide for all of us.
— John Seidensticker, Eric Dinerstein, Joshua R. Ginsberg
1.2 The Need for a Tiger Framework Document (TCL 2.0)
TCU 1.0 broke new ground as a conservation tool for prioritizing investments for wide-ranging species. Specifi cally, it provided strategic guidance to conserving tigers by mov-ing beyond a focus on individual protected areas and instead promoted landscape-scale conservation across a variety of land use types. TCU 1.0 also united two fundamental goals of biodiversity conservation, the representation of habitats and the conservation of the ecological adaptations associated with distinct species assemblages. For the fi rst time, prioritization was based less on which population had the highest estimated number of tigers, but rather, within a given habitat type or biome, which block or blocks of habitat, dubbed Tiger Conservation Units (TCUs), offered a tiger population the best chance of long-term persistence. Persistence was estimated by three main variables: the confi gura-tion of the landscape, poaching pressure on tigers and their prey, and general trends in tiger numbers.
The success of TCU 1.0 can be evaluated in several ways. First, several major donors interested in tiger conservation adopted the framework to guide investments towards the most promising areas for tiger conservation within each biome and bioregion. Second, it prompted researchers to investigate areas identifi ed by TCU 1.0 as poorly surveyed to fi ll in gaps in knowledge. Third, it also did the reverse, stimulating some biologists to revisit areas where they questioned the validity of some of the rankings of TCUs. These last two steps provided much needed checks on the original analysis, which was conducted over a three-month period. Finally, the representation approach to tiger conservation was ap-plied to other wide-ranging species such as jaguar, bears, elephants, and crocodiles (Sand-erson et al. 2002).
Nearly a decade has passed since the publication of TCU 1.0 and an even longer period in terms of the underlying data used to conduct that analysis. The purpose of this study (hereafter TCL 2.0) is to:
1) update the still widely-used TCU 1.0 by incorporating progress made in conserva-tion theory, and new results from in-depth fi eld studies and surveys on tigers, their prey and habitats across the tiger’s range;
2) reassess, revise, and redefi ne what we are now calling the Tiger Conservation Land-
Chapter 1 Introduction
Setting Priorities for the Conservation and Recovery of Wild Tigers: 2005–2015
6
scapes (TCLs) based on changes in land cover and habitat availability over the last decade, and refi ne the TCU boundaries using new GIS analyses;
3) employ global datasets on threats and human use, and incorporate analyses that place tiger conservation in the context of information databases such as the 2004 World Directory of Protected Areas or the global distribution of World Heritage Sites; incorporate information on other fl agship species such as rhinos, elephants and orang-utans; and examine priorities in light of the tiger project investments database devel-oped and maintained by the Zoological Society, London;
4) improve the transparency and rigor in identifying and ranking TCLs through com-puter-based methods that will facilitate easy updating and allow us to measure prog-ress towards conservation goals; and
5) overlay updated TCL priorities in conjunction with other regional conservation initiatives, such as priority areas for elephants, and world heritage sites, to identify syn-ergies and gaps in biodiversity conservation investments.
The outcomes will provide a revised roadmap for tiger conservation through recommen-dations for the next 10 years, and identify areas of collaboration for regional conserva-tion action. It will also allow us to better track investments in biodiversity conservation aimed directly at tiger conservation and biodiversity and resource management in gener-al. To create a truly living document, we hope to take the data collected for this exercise, and our analyses, and develop an online Tiger Conservation Database—an interactive science tool that provides data and analysis created during our proposed project using interactive map server technology and online publishing. Hence we use the terminol-ogy “TCL 2.0” to indicate that the current exercise will be updated more regularly, with smaller, incremental improvements over time as is done with small upgrades of software.
There is a widely held belief that while some tiger populations in selected TCLs have increased over the past decade, the total tiger population is still in decline. We need to reverse the downward trajectory as rapidly as possible in key areas identifi ed by this analysis. On the plus side, we can point to some clear successes on how to move forward.STF and other donor investments led to the creation of fl agship landscape-scale conserva-tion projects, such as those underway in the Terai-Arc Landscape in Nepal/India, and in the Russian Far East. Research conducted by STF grant recipients have provided us with better estimates of tiger and prey densities in key parts of TCLs that enable us to sharpen our predictions about how productive different habitat types can be for tigers. Expanded information on where tigers do and do not exist was generously provided by numerous fi eld workers and greatly aided our analyses. However, improved capture of informa-tion on survey efforts, and particularly on negative results (places where no tigers were found), would help us hone these analyses further.
7
The vastly improved data on tigers that we did obtain, and on conservation efforts, al-lowed us, in this analysis, to develop a classifi cation of TCLs based on the tiger’s ecologi-cal requirements that is a precursor to, but separate from, their prioritization. We fi rst classifi ed tiger conservation landscapes into distinct classes (Class I, Class II, Class III, and Class IV) with each of these classes related to the probability of reaching our goals for tiger conservation over the next decade. Subsequently, we then prioritized individual TCLs by bioregion and biome, maintaining our goal of representation of ‘tigerness’ across their range.
Hence, the guiding principles of the TCL 2.0 analysis are:
1) ensuring that the concept of “tigerness” (representation of the suite of adaptations by tigers to different habitats) stays central to prioritization of conservation invest-ments across its range;
2) securing the breeding populations within TCLs because they serve as the source populations for the recovery of tigers and their prey across the TCL landscape;
3) increasing the potential for expanding breeding populations across TCLs through appropriate land use designations and incentives; and
4) identifying and strengthening zones of poor connectivity between and among TCLs to create large functioning conservation landscapes for tigers and the species that fall under their umbrella effect.
Taken together, these principles, or building blocks, enable us to begin thinking about the concept of meta-TCLs, giant landscapes of reconnected habitat spanning vast areas of the tigers’ range. Over the long term, we envision promoting the idea of 100,000 tigers by the year 2100 across TCLs. The steps for the recovery of tiger and prey populations have long been known: reduce poaching, protect breeding habitat, reduce competition with domestic livestock, and provide the incentives for rural people to coexist with wildlife in tiger-friendly landscapes. The fi eld techniques and technologies are available to achieve this visionary goal if the political will is matching. TCL 2.0 is a footbridge to that vision-ary goal.
— Eric Dinerstein, John Seidendsticker, Joshua R. Ginsberg
Chapter 1 Introduction
Setting Priorities for the Conservation and Recovery of Wild Tigers: 2005–2015
8
Chapter 2 Methods Used to Assemble Tiger
Data Layers for TCL 2.0
2.1 Introduction
Data on the status and distribution of tigers that are current and systematically collected are essential to plan and monitor the effectiveness of tiger conservation efforts. In this context, spatially explicit data were used to drive the delineation and prioritization of tiger conservation landscapes (TCLs) across their entire range. This represents a major advance from the original 1997 Framework Document (TCU 1.0), which delineated tiger habitat using a method based largely on a geographic information system analysis of for-est cover maps, supplemented only when possible by information collected from regional and local experts as well as published and unpublished results. To map tiger habitat in 2005, we rely much more heavily on tiger distribution data. This advance was possible due to knowledge gained on the status and distribution of tigers in the wild since the publication of the 1997 Framework Document. This refl ects the concerted effort of the Save The Tiger Fund, the U.S. Fish and Wildlife Service, 21st Century Tiger, and the role of international and national non-governmental organizations (e.g. the Wildlife Conser-vation Society, World Wildlife Fund, Wildlife Institute of India, Flora and Fauna Interna-tional, Sumatran Tiger Conservation Project, Zoological Society of London, University of Florida, and the University of Minnesota), and national governments to work to conserve tigers in their native habitats, and to ensure that data collected in these efforts is widely available. Although both tigers, and tiger conservationists, continue to face many chal-lenges, we now have a base of information on which to build better and more effective conservation efforts.
In many places across the tiger range, positive changes have occurred: conservation mea-sures have been implemented, and people and governments are committing themselves to tiger conservation both through activities on the ground, policy change, and by raising and supplying necessary funds to support conservation efforts. However, many questions remain unanswered such as the extent of threats, where and what is being done to con-serve tigers, the effectiveness of tiger conservation efforts, and the status and changing status of tiger populations across their range.
To try to answer these questions, we decided that our fi rst step must be to systematically build a comprehensive database of tiger data from governments, researchers, experts, and conservationists working on the ground throughout the tigers range. To construct this database, we designed two questionnaires to extract tiger information at two distinct scales: the scale of the TCUs as defi ned in the 1997 Framework Document, and the scale of point locations of tigers. Responses to these questionnaires were used to assist in delin-eating and prioritizing TCLs for TCL 2.0 as described in subsequent chapters. They also serve as a measure for examining how effective past tiger conservation efforts have
9
been, while creating a baseline against which future tiger conservation efforts can be compared.
2.2 Questionnaire Survey Methodology
In Spring 2004 two types of questionnaires, prefaced by a cover letter and accompanied by maps of the region, were e-mailed to 273 individuals believed to be working in or around TCUs that were delineated in 1997. Descriptive and quantitative questions were aimed to document, through expert and on the ground knowledge, the status of tigers and tiger conservation within TCUs. Their answers were used to help determine the new delineation and prioritization for TCLs in 2005.
2.2.1 Mailing ListWe created an expansive list, both geographically as well as being representative of a wide range of expertise with regards to tiger conservation. Names and e-mail addresses were initially collected from WCS, WWF, and STF contacts that included all known re-searchers or people with tiger knowledge from NGO’s, governments, academia, and indi-viduals working in tiger range. Contacts were also taken from published and unpublished reports, as well as ‘gray literature.’ Upon receiving the questionnaire packet, respondents were asked to inform the sender of other individuals to whom the questionnaires could be sent as well as to indicate if they had received the packet in error.
2.2.2 Questionnaire DesignTwo questionnaires were designed and implemented. The fi rst questionnaire, labeled “TCU Questionnaire,” focused on collecting information on existing TCUs (TCU 1.0), including status of tigers, evidence of breeding, a threats assessment, determining what conservation measures were present and ranking their effectiveness, and information about the contributing researcher(s). If a respondent received the questionnaire but did not have information for a particular TCU, they were asked to indicate on the map pro-vided (by circling the appropriate area) where their information pertained. An example of the TCU Questionnaire is provided in Appendix 1.
Respondents were asked to assess the status of tiger populations through a series of ques-tions about attempts made to scientifi cally document tigers. Questions asked whether ti-gers had been documented and if so through what methods; we also asked about knowl-edge of tigers breeding; if there was a scientifi cally documented population estimate and to describe methods used to calculate that estimate.
For the threats assessment section, we used a modifi ed form of The Five-S Framework for Site Conservation to calculate a vulnerability score for the TCU in question (Nature Conservancy 2000; Coppolillo et al. 2003). In this section, we provided a list of potential threats and asked the respondent to rank the severity (S) (how much is the threat reduc-ing tiger populations?); urgency (U) (when will the threat occur, if it is not occurring now?); recovery time (R) (how long will it take for tigers to recover from the threat if it
Chapter 2 Methods used to Assemble Tiger Data Layers for TCL 2.0
Setting Priorities for the Conservation and Recovery of Wild Tigers: 2005–2015
10
were to be removed?); the percentage of area (Pa) of TCU affected by the threat; and the probability (Po) of the threat occurring, assuming it is not occurring already. This meth-odology allowed us to distinguish and include both currently occurring and prospective threats in the analysis. We supplied guidelines to indicate the parameters for each vari-able, which could be ranked from 0 to 3 (Appendix 1). We used the following equation to determine a threat score (or vulnerability index) for each threat:
∑{(U + R) x S x Pa x Po}
Scores were calculated and summed for each threat to obtain an overall threat score for each TCU or other area. We also examined the total value for each threat across the tiger’s range (Table 2.1).
Conservation measures were assessed by fi rst providing a comprehensive list of potential measures, such as education, patrolling, monitoring, etc, and then asking respondents fi rst if the conservation measure was present and if so, to rank the effectiveness of that measure on a scale of 1 to 5; 1 signifying that it is not effective at all and 5 indicating the conservation measure is fully effective. If the conservation measure was not effective, but the respondent indicated that it would be in the near future, a score of 0.5 was used. To summarize conservation effectiveness for each TCU, we summed the effectiveness re-sponses for all conservation measures (Table 2.2). These summed scored would later be used in the TCL prioritization process (see Chapter 6).
For purposes of prioritization, it was necessary to further summarize the TCU questionnaire data into measures of population status, breeding, threats, and conserva-tion measures for each TCU. In general if we received multiple responses for the same TCU we averaged the values, except for where results were reported by response rather than by TCU.
In many cases the questionnaires were not fully completed and only some information was provided. Fields that were left blank were documented as “no data”; if the respon-dent answered “unknown” or “don’t know” these responses were also documented. In general if certain fi elds in the Threats Assessment were left blank, scores could not be determined. However, for certain TCUs where Severity (S), Proportion of Area (Pa), or Probability of Occurrence (Po) were fi lled in as zero, the threat score equaled zero due to the nature of the equation used above. If more than 10 conservation measures were left blank (out of 22 given measures), and the respondent did not indicate that the conserva-tion measure was not present nor would it be in the near future, an accurate conservation effectiveness score could not be calculated for that measure and it was fl agged as an area in need of data.
The second questionnaire, the “Tiger Conservation Database (TCD) Survey” was sent in conjunction with the TCU Questionnaire and focused on tiger-point locations, search effort, evidence of tiger presence or absence and tiger breeding, as well as observation
11
and location methods. A point location (referenced by latitude and longitude coordinates) was defi ned as the collection of all observations made to locate a tiger within a three-month period and within a 20 km radius of the location center, whether or not a tiger was sighted. Tigers do not need to have been sighted to record an observation, only that a tiger or tiger sign was searched for using scientifi c methods (Sanderson et al. 2002). Point data from the TCD surveys, complemented by additional data points gleaned from the literature (below) were used in TCL delineation.
2.2.3 Additional Data PointsBesides data gathered from the TCD survey, additional tiger-point locations were added from other sources such as reports to Save the Tiger Fund (STF) and the U.S. Fish and Wildlife Service (USFWS), which have funded numerous studies on tigers, their habitat, prey, and ecology. We included information from 217 STF fi nal reports (1995–2004), 9 additional USFWS reports (1998–2001) and 27 reports published by WWF, WCS, Cat Action Treasury, scientifi c papers, published reports, and data from the Project Tiger Web site: http://projecttiger.nic.in/map.htm (Appendix 3).
2.2.4 Data Collected from Two Open Revision PhasesOn June 28, 2005 an e-mail was sent to the revised tiger distribution list (n = 162) with a detailed letter requesting their review of the fi rst draft of the newly defi ned TCLs, as well as maps of the tiger data used to produce the delineation. The letter contained a link to a specially created web page (http://www.wcs.org/tigermaps) where the fi rst draft of maps could be downloaded, along with a PowerPoint fi le with explicit instructions and information as to how the maps were created, how to review them, and how to submit comments. Participants were given three weeks to respond and were sent weekly e-mail reminders. Prior to this e-mail, a letter went out on June 10 giving notice that a revision period would be coming up so that participants would be prepared in advance. Again, on December 2, 2005, the participants were solicited to review and comment on the draft classifi cation and prioritization of the previously delineated TCLs. The same methods were used to solicit a review of the maps: a PowerPoint fi le with all relevant information for review and submitting comments was made available for download. As in the fi rst round, an e-mail went out on November 23rd indicating that the second revision phase would be occurring on December 1. We hoped that these additional e-mails would give people the appropriate forewarning in order to get as much feedback as possible.
2.3 Summary Questionnaire Results
2.3.1 TCU QuestionnairesThree mailings to an initial 274 participants (May 25, June 9, and June 29, 2004) re-duced the list of potential respondents to 162 individuals due to insuffi cient e-mail ad-dresses as well as eliminating multiple entries from organizations where one individual responded for the group. Out of 162 individuals, 58% responded (n = 94). This included
Chapter 2 Methods used to Assemble Tiger Data Layers for TCL 2.0
Setting Priorities for the Conservation and Recovery of Wild Tigers: 2005–2015
12
individuals who did not submit data but responded in some manner. Twenty-seven (17%) individuals responded with tiger-point data, and 77 individuals (48%) submitted data in the form of one or more questionnaires (respondents were asked to complete a separate questionnaire per TCU) resulting in 102 total questionnaires. Seventy-nine percent (n = 81) of the questionnaires referred to 59 of the existing 159 TCUs, and for 15 of those TCUs we received more than 1 questionnaire. Twenty individuals responded to areas out-side of TCUs, 12 of whom provided location maps for their comments and 8 provided no location. Of the 59 TCUs for which we received data, 22 were the original Level 1 TCUs, 5 were Level 2, 26 were Level 3, and 6 were Level 4.
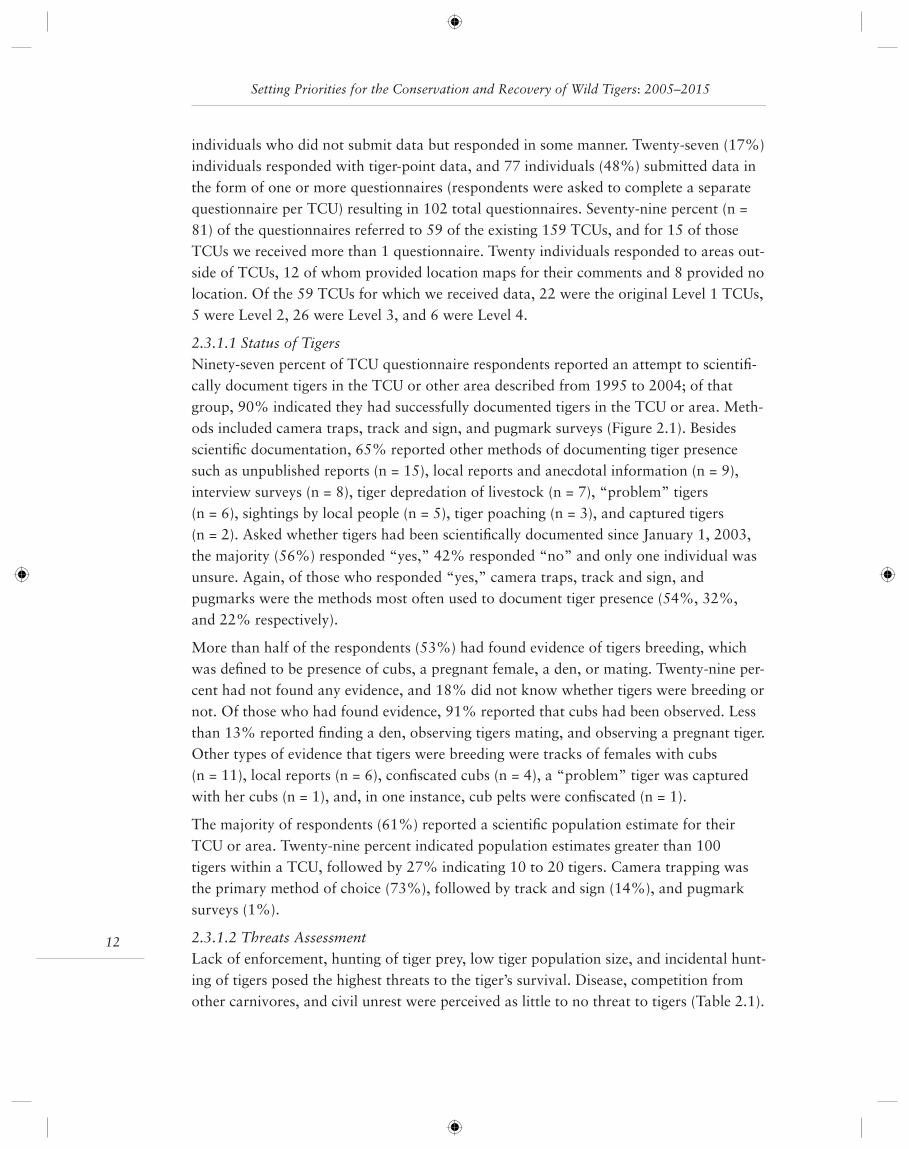
2.3.1.1 Status of TigersNinety-seven percent of TCU questionnaire respondents reported an attempt to scientifi -cally document tigers in the TCU or other area described from 1995 to 2004; of that group, 90% indicated they had successfully documented tigers in the TCU or area. Meth-ods included camera traps, track and sign, and pugmark surveys (Figure 2.1). Besides scientifi c documentation, 65% reported other methods of documenting tiger presence such as unpublished reports (n = 15), local reports and anecdotal information (n = 9), interview surveys (n = 8), tiger depredation of livestock (n = 7), “problem” tigers (n = 6), sightings by local people (n = 5), tiger poaching (n = 3), and captured tigers (n = 2). Asked whether tigers had been scientifi cally documented since January 1, 2003, the majority (56%) responded “yes,” 42% responded “no” and only one individual was unsure. Again, of those who responded “yes,” camera traps, track and sign, and pugmarks were the methods most often used to document tiger presence (54%, 32%, and 22% respectively).
More than half of the respondents (53%) had found evidence of tigers breeding, which was defi ned to be presence of cubs, a pregnant female, a den, or mating. Twenty-nine per-cent had not found any evidence, and 18% did not know whether tigers were breeding or not. Of those who had found evidence, 91% reported that cubs had been observed. Less than 13% reported fi nding a den, observing tigers mating, and observing a pregnant tiger. Other types of evidence that tigers were breeding were tracks of females with cubs (n = 11), local reports (n = 6), confi scated cubs (n = 4), a “problem” tiger was captured with her cubs (n = 1), and, in one instance, cub pelts were confi scated (n = 1).
The majority of respondents (61%) reported a scientifi c population estimate for their TCU or area. Twenty-nine percent indicated population estimates greater than 100 tigers within a TCU, followed by 27% indicating 10 to 20 tigers. Camera trapping was the primary method of choice (73%), followed by track and sign (14%), and pugmark surveys (1%).
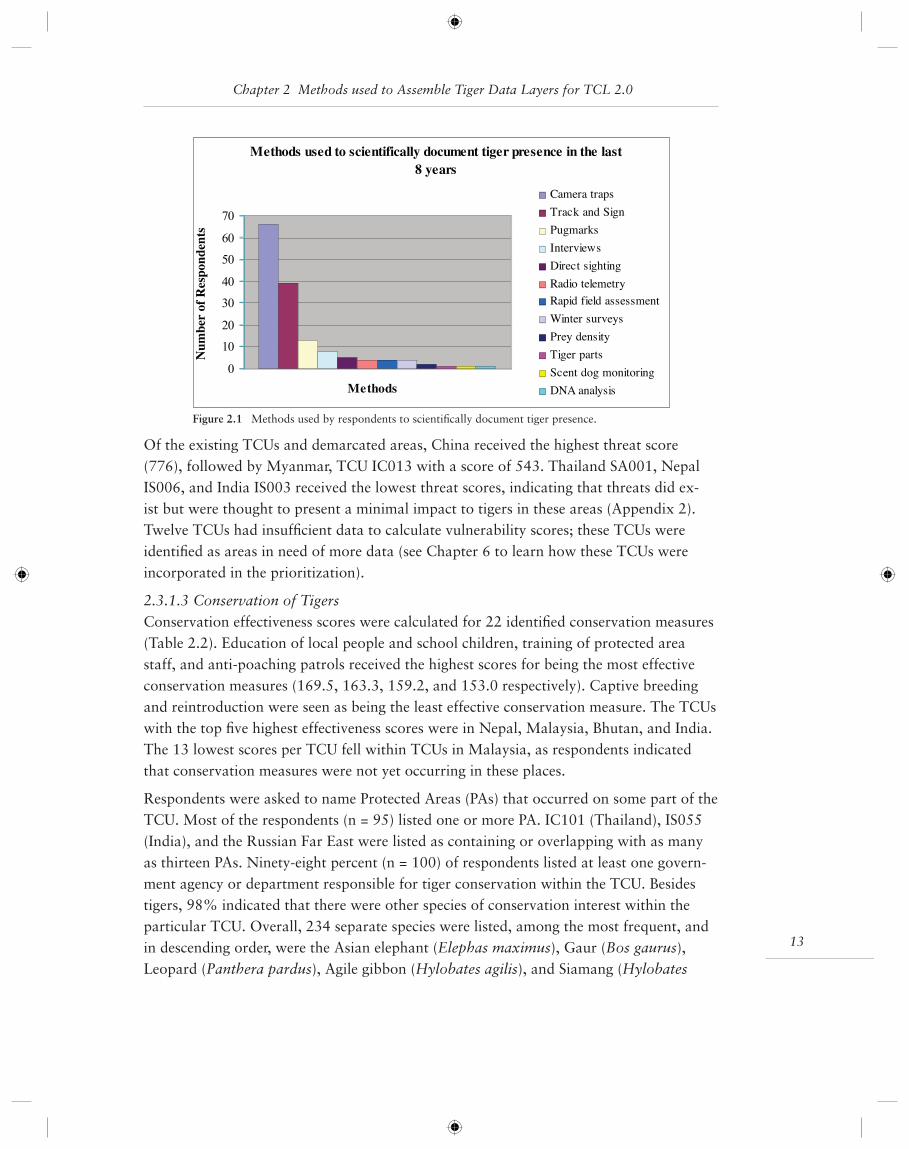
2.3.1.2 Threats AssessmentLack of enforcement, hunting of tiger prey, low tiger population size, and incidental hunt-ing of tigers posed the highest threats to the tiger’s survival. Disease, competition from other carnivores, and civil unrest were perceived as little to no threat to tigers (Table 2.1).
13
Chapter 2 Methods used to Assemble Tiger Data Layers for TCL 2.0
Of the existing TCUs and demarcated areas, China received the highest threat score (776), followed by Myanmar, TCU IC013 with a score of 543. Thailand SA001, Nepal IS006, and India IS003 received the lowest threat scores, indicating that threats did ex-ist but were thought to present a minimal impact to tigers in these areas (Appendix 2). Twelve TCUs had insuffi cient data to calculate vulnerability scores; these TCUs were identifi ed as areas in need of more data (see Chapter 6 to learn how these TCUs were incorporated in the prioritization).
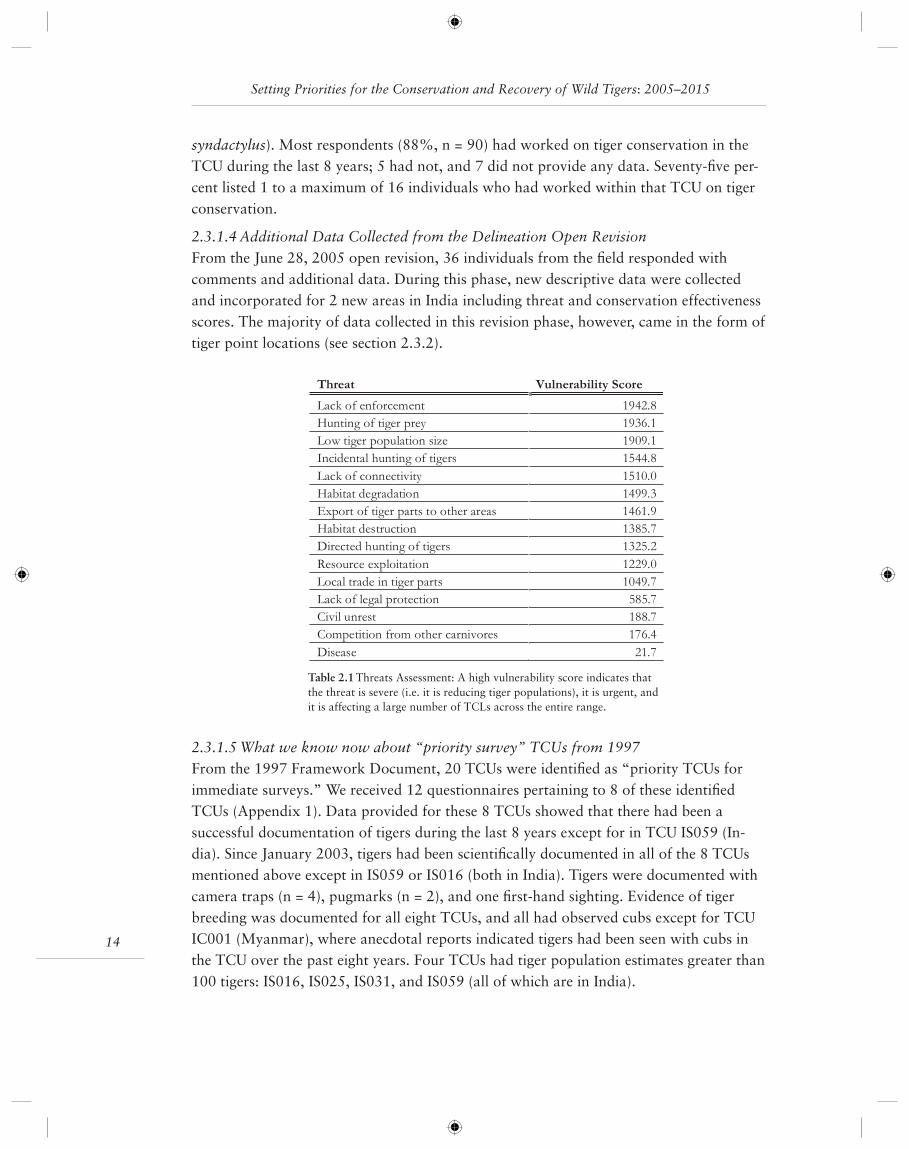
2.3.1.3 Conservation of TigersConservation effectiveness scores were calculated for 22 identifi ed conservation measures (Table 2.2). Education of local people and school children, training of protected area staff, and anti-poaching patrols received the highest scores for being the most effective conservation measures (169.5, 163.3, 159.2, and 153.0 respectively). Captive breeding and reintroduction were seen as being the least effective conservation measure. The TCUs with the top fi ve highest effectiveness scores were in Nepal, Malaysia, Bhutan, and India. The 13 lowest scores per TCU fell within TCUs in Malaysia, as respondents indicated that conservation measures were not yet occurring in these places.
Respondents were asked to name Protected Areas (PAs) that occurred on some part of the TCU. Most of the respondents (n = 95) listed one or more PA. IC101 (Thailand), IS055 (India), and the Russian Far East were listed as containing or overlapping with as many as thirteen PAs. Ninety-eight percent (n = 100) of respondents listed at least one govern-ment agency or department responsible for tiger conservation within the TCU. Besides tigers, 98% indicated that there were other species of conservation interest within the particular TCU. Overall, 234 separate species were listed, among the most frequent, and in descending order, were the Asian elephant (Elephas maximus), Gaur (Bos gaurus), Leopard (Panthera pardus), Agile gibbon (Hylobates agilis), and Siamang (Hylobates
Methods used to scientifically document tiger presence in the last8 years
0
10
20
30
40
50
60
70
Methods
Num
ber
of R
espo
nden
tsCamera traps
Track and Sign
Pugmarks
Interviews
Direct sighting
Radio telemetry
Rapid field assessment
Winter surveys
Prey density
Tiger parts
Scent dog monitoring
DNA analysis
Figure 2.1 Methods used by respondents to scientifi cally document tiger presence.
Setting Priorities for the Conservation and Recovery of Wild Tigers: 2005–2015
14
syndactylus). Most respondents (88%, n = 90) had worked on tiger conservation in the TCU during the last 8 years; 5 had not, and 7 did not provide any data. Seventy-fi ve per-cent listed 1 to a maximum of 16 individuals who had worked within that TCU on tiger conservation.
2.3.1.4 Additional Data Collected from the Delineation Open RevisionFrom the June 28, 2005 open revision, 36 individuals from the fi eld responded with comments and additional data. During this phase, new descriptive data were collected and incorporated for 2 new areas in India including threat and conservation effectiveness scores. The majority of data collected in this revision phase, however, came in the form of tiger point locations (see section 2.3.2).
2.3.1.5 What we know now about “priority survey” TCUs from 1997From the 1997 Framework Document, 20 TCUs were identifi ed as “priority TCUs for immediate surveys.” We received 12 questionnaires pertaining to 8 of these identifi ed TCUs (Appendix 1). Data provided for these 8 TCUs showed that there had been a successful documentation of tigers during the last 8 years except for in TCU IS059 (In-dia). Since January 2003, tigers had been scientifi cally documented in all of the 8 TCUs mentioned above except in IS059 or IS016 (both in India). Tigers were documented with camera traps (n = 4), pugmarks (n = 2), and one fi rst-hand sighting. Evidence of tiger breeding was documented for all eight TCUs, and all had observed cubs except for TCU IC001 (Myanmar), where anecdotal reports indicated tigers had been seen with cubs in the TCU over the past eight years. Four TCUs had tiger population estimates greater than 100 tigers: IS016, IS025, IS031, and IS059 (all of which are in India).
Threat Vulnerability Score
Lack of enforcement 1942.8
Hunting of tiger prey 1936.1
Low tiger population size 1909.1
Incidental hunting of tigers 1544.8
Lack of connectivity 1510.0
Habitat degradation 1499.3
Export of tiger parts to other areas 1461.9
Habitat destruction 1385.7
Directed hunting of tigers 1325.2
Resource exploitation 1229.0
Local trade in tiger parts 1049.7
Lack of legal protection 585.7
Civil unrest 188.7
Competition from other carnivores 176.4
Disease 21.7
Table 2.1 Threats Assessment: A high vulnerability score indicates that the threat is severe (i.e. it is reducing tiger populations), it is urgent, and it is affecting a large number of TCLs across the entire range.
15
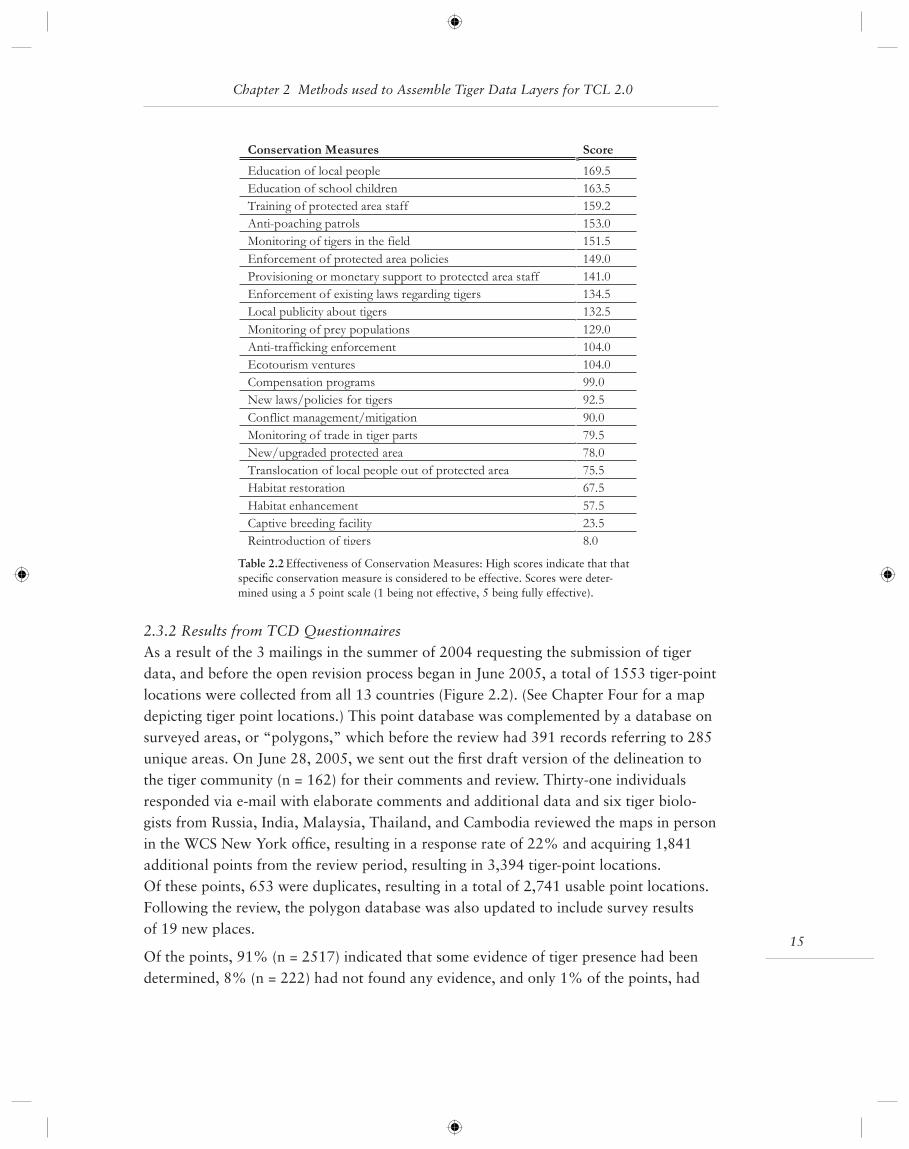
2.3.2 Results from TCD QuestionnairesAs a result of the 3 mailings in the summer of 2004 requesting the submission of tiger data, and before the open revision process began in June 2005, a total of 1553 tiger-point locations were collected from all 13 countries (Figure 2.2). (See Chapter Four for a map depicting tiger point locations.) This point database was complemented by a database on surveyed areas, or “polygons,” which before the review had 391 records referring to 285 unique areas. On June 28, 2005, we sent out the fi rst draft version of the delineation to the tiger community (n = 162) for their comments and review. Thirty-one individuals responded via e-mail with elaborate comments and additional data and six tiger biolo-gists from Russia, India, Malaysia, Thailand, and Cambodia reviewed the maps in person in the WCS New York offi ce, resulting in a response rate of 22% and acquiring 1,841 additional points from the review period, resulting in 3,394 tiger-point locations. Of these points, 653 were duplicates, resulting in a total of 2,741 usable point locations. Following the review, the polygon database was also updated to include survey results of 19 new places.
Of the points, 91% (n = 2517) indicated that some evidence of tiger presence had been determined, 8% (n = 222) had not found any evidence, and only 1% of the points, had
Chapter 2 Methods used to Assemble Tiger Data Layers for TCL 2.0
Conservation Measures Score
Education of local people 169.5
Education of school children 163.5
Training of protected area staff 159.2
Anti-poaching patrols 153.0
Monitoring of tigers in the field 151.5
Enforcement of protected area policies 149.0
Provisioning or monetary support to protected area staff 141.0
Enforcement of existing laws regarding tigers 134.5
Local publicity about tigers 132.5
Monitoring of prey populations 129.0
Anti-trafficking enforcement 104.0
Ecotourism ventures 104.0
Compensation programs 99.0
New laws/policies for tigers 92.5
Conflict management/mitigation 90.0
Monitoring of trade in tiger parts 79.5
New/upgraded protected area 78.0
Translocation of local people out of protected area 75.5
Habitat restoration 67.5
Habitat enhancement 57.5
Captive breeding facility 23.5
Reintroduction of tigers 8.0
Table 2.2 Effectiveness of Conservation Measures: High scores indicate that that specifi c conservation measure is considered to be effective. Scores were deter-mined using a 5 point scale (1 being not effective, 5 being fully effective).
Setting Priorities for the Conservation and Recovery of Wild Tigers: 2005–2015
16
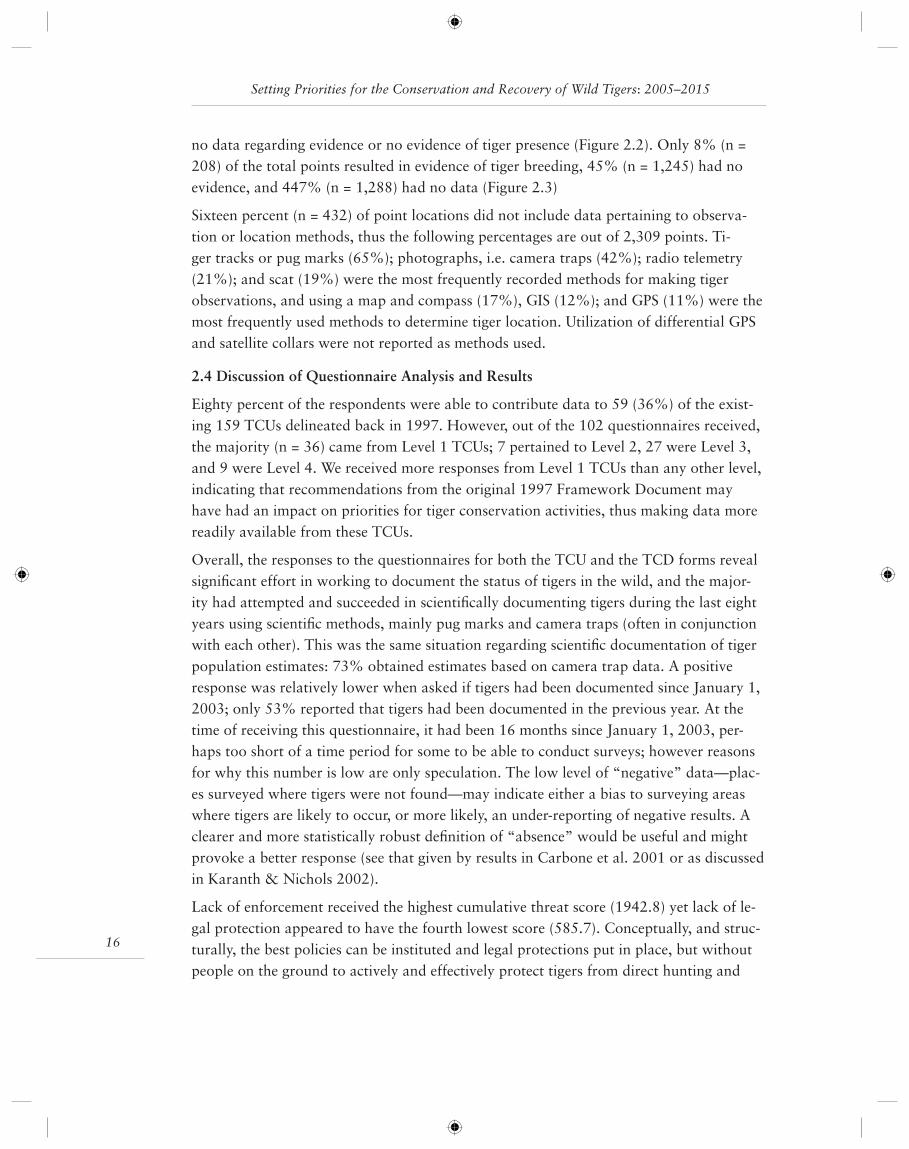
no data regarding evidence or no evidence of tiger presence (Figure 2.2). Only 8% (n = 208) of the total points resulted in evidence of tiger breeding, 45% (n = 1,245) had no evidence, and 447% (n = 1,288) had no data (Figure 2.3)
Sixteen percent (n = 432) of point locations did not include data pertaining to observa-tion or location methods, thus the following percentages are out of 2,309 points. Ti-ger tracks or pug marks (65%); photographs, i.e. camera traps (42%); radio telemetry (21%); and scat (19%) were the most frequently recorded methods for making tiger observations, and using a map and compass (17%), GIS (12%); and GPS (11%) were the most frequently used methods to determine tiger location. Utilization of differential GPS and satellite collars were not reported as methods used.
2.4 Discussion of Questionnaire Analysis and Results
Eighty percent of the respondents were able to contribute data to 59 (36%) of the exist-ing 159 TCUs delineated back in 1997. However, out of the 102 questionnaires received, the majority (n = 36) came from Level 1 TCUs; 7 pertained to Level 2, 27 were Level 3, and 9 were Level 4. We received more responses from Level 1 TCUs than any other level, indicating that recommendations from the original 1997 Framework Document may have had an impact on priorities for tiger conservation activities, thus making data more readily available from these TCUs.
Overall, the responses to the questionnaires for both the TCU and the TCD forms reveal signifi cant effort in working to document the status of tigers in the wild, and the major-ity had attempted and succeeded in scientifi cally documenting tigers during the last eight years using scientifi c methods, mainly pug marks and camera traps (often in conjunction with each other). This was the same situation regarding scientifi c documentation of tiger population estimates: 73% obtained estimates based on camera trap data. A positive response was relatively lower when asked if tigers had been documented since January 1, 2003; only 53% reported that tigers had been documented in the previous year. At the time of receiving this questionnaire, it had been 16 months since January 1, 2003, per-haps too short of a time period for some to be able to conduct surveys; however reasons for why this number is low are only speculation. The low level of “negative” data—plac-es surveyed where tigers were not found—may indicate either a bias to surveying areas where tigers are likely to occur, or more likely, an under-reporting of negative results. A clearer and more statistically robust defi nition of “absence” would be useful and might provoke a better response (see that given by results in Carbone et al. 2001 or as discussed in Karanth & Nichols 2002).
Lack of enforcement received the highest cumulative threat score (1942.8) yet lack of le-gal protection appeared to have the fourth lowest score (585.7). Conceptually, and struc-turally, the best policies can be instituted and legal protections put in place, but without people on the ground to actively and effectively protect tigers from direct hunting and
17
Tiger Presence
0
200
400
600
800
1000
1200
1400
Indonesia
Malaysia
Cambodia
India
Russia
Laos
Thailand
Bhutan
Nepal
Vietnam
China
Myanmar
Bangladesh
Country
Point-locations
No presence
Presence
Figure 2.2 Survey Results: Total tiger-point locations and evidence of tiger presence, by country (total point loca-tions = 2,741). Tiger point-locations (each point-location is the collection of all observations made to locate a tiger within a 3 month period and within a 20 km radius of the location center, whether or not a tiger was sighted) col-lected from the TCD survey and the revision process, by country.
Evidence of Tigers Breeding
0
200
400
600
800
1000
1200
1400
Indonesia
Cambodia
Laos
Thailand
Myanmar
Russia
Malaysia
India
Bhutan
Nepal
Vietnam
China
Bangladesh
Country
Point-locations
No data
NoYes
Figure 2.3 Evidence of tiger breeding documented by country (total point locations = 2,741).
Chapter 2 Methods used to Assemble Tiger Data Layers for TCL 2.0
Setting Priorities for the Conservation and Recovery of Wild Tigers: 2005–2015
18
hunting of tiger prey, lack of enforcement can have a cascading effect and render legal policies ineffective. Increasing enforcement is not the panacea for tiger conservation, but identifying where and why enforcement is not occurring—whether due to lack of capacity building, funding, incentive, or effective punishments—and to determine in places where there is effective enforcement, and how this is impacting tiger populations, is a worthy and needed endeavor.
The most effective conservation measures (those that had the four highest scores) were all related to education and training: education of local people and school children, training of protected area staff, and anti-poaching patrols. Involving communities and individuals of all ages, and building local and national capacity were viewed as effective conservation measures, and should be an integral component of tiger conservation. Over 70% of re-spondents indicated that some type of education or training was occurring in their TCU.
Questionnaire respondents were asked to list other species of importance besides the tiger within the TCU on which they were reporting. Two hundred and thirty-four other spe-cies were listed and included mammals, birds, fi sh, reptiles, herps, amphibians, and plant species. The top 8 consecutively-listed species were the asian elephant, gaur, asiatic black bear, leopard, agile gibbon, siamang, clouded leopard, and dhole. These species were listed for all levels of TCUs indicating that tigers are not the only conservation priority within these areas, and that a vast array of wildlife including many endangered species, live within these TCUs.
We were able to capture data pertaining to tiger distribution (from TCD questionnaires) and descriptive data pertaining to general tiger conservation efforts resulting in informa-tion for threats and conservation measures (through the TCU questionnaires). We did not capture signifi cant or adequate data regarding the status of tiger prey, as only 2 questions on the TCU questionnaire dealt limitedly with this topic. The vulnerability index calcu-lated for hunting of tiger prey placed this threat as the second highest and monitoring of tiger prey placed in the middle as an effective conservation measure. Long-term stud-ies regarding the status of tiger prey do exist (Karanth et al. 2004; Miquelle et al. 1996; 1999; and O’Brien et al. 2003), however there is both the need to compile tiger prey data that already exist as well as conduct far more long-term research to determine prey estimates and status across the tigers range. The lack of availability of these data poses a constraint in assessing the state of tigers in the wild and reaffi rms that efforts in the future need to involve determining the status of prey populations.
2.4.1 Limitations, Constraints, and RecommendationsThe most important data collected from the questionnaires pertained to tiger presence, tiger breeding, and scores from the threats assessment and effectiveness of conservation measures. These variables helped delineate and determine classifi cation and prioritiza-tion for TCLs in 2005. However, we believe that we did not capture all available data. Data sharing, especially on a large scale, comes with many issues. Researchers and sci-
19
entists, either individuals or those working for organizations and governments, have put tremendous effort and resources into collecting their own data—data that will aid in tiger conservation efforts, but also data that they hope to publish, and to which they are connected and have ownership. Pooling such data into a large, collective process goes against what many scientists have spent years doing. We tried to counteract any feelings of mistrust or fear from the beginning by sharing our clear objectives, our methods along the way, how data would be processed and contributors acknowledged, by having open revisions, as well as having one point of contact for participants to communicate with and answer questions at any time. We also asked for data to be submitted at a courser scale so as not to compete with any local analysis objectives which they might have.
Besides not wanting to share data, we believe that other data gaps exist for other reasons. Some data are just scarce (i.e. prey data, specifi c data on the trade of tiger parts, ecologi-cal tiger data from inaccessible areas due to political situations, etc); sometimes data collected incidentally are not recorded in a systematic manner, for instance data on prey occurrence in camera trapping exercises. Another reason may be that we were unable to capture a wide enough distribution with the questionnaires through our contacts list; also, we believe that data confi rming tiger absence may not have been as readily supplied as data showing tiger presence. Out of 3,394 point locations, 88% (n = 2,973) had con-fi rmed tiger presence. We stressed that a tiger point location was defi ned as “search ef-fort” regardless of whether a tiger was found or not, and that survey efforts that resulted in not fi nding tigers is just as important, if not more so, than efforts that determined tiger presence.
Besides the scarcity of data, there is the issue of questionnaire data quality. Keeping ques-tions open ended, asking about methods used and how estimates or locations were deter-mined can help to some extent determine the credibility or weight of responses; however, remaining true to the inclusive process we defi ned from the beginning, all comprehensible data were entered in the database and used for the classifi cation process (see Chapter 6). We recognize that a fi ner fi lter on data quality would be desirable, and should be part of the iterative revisions of this document.
Certain questions posed issues for respondents whether it was due to format or word-ing, and blanks were left for some TCUs in both the threats assessment and conserva-tion effectiveness sections. This might have been avoided if we had done a sample test submitting questionnaires not just to reviewers, but also to a sub-sample of participants or researchers in the fi eld, creating a “focus-group” approach in order to identify poten-tial issues, such as formatting, and clarity of instructions. Unfortunately, due to a limited amount of time and resources, these steps were not taken.
This effort, imperfect as it may be in some respects, provides the fi rst systematic effort to collect comprehensive information on tiger conservation across the range. It provides a baseline for comparison to future efforts while informing our current effort to prioritize
Chapter 2 Methods used to Assemble Tiger Data Layers for TCL 2.0
Setting Priorities for the Conservation and Recovery of Wild Tigers: 2005–2015
20
areas for tiger conservation. Moreover it provides a measure of the success of past invest-ments in tiger conservation to develop the information presented here.
In setting the best and most accurate conservation priorities for the tiger, this process highlighted the need for transparency and for using the best communications efforts possible to capture data and expert knowledge from those who know the tiger best. The questionnaires used were created for this project and were most likely not the most ef-fi cient means to capture data, because researchers have used alternate formats in which to enter years of data. Establishing a regular reporting mechanism that both rewards tiger researchers and conservationists through public credit for their efforts while insuring their participation through requirements attached to future tiger grants, is just the begin-ning of continuing the model here of documenting the status and distribution of tiger conservation and maintaining this “living document.”
— Andrea Heydlauff, Eric Sanderson, Colby Loucks, John Seidensticker
2.5 Tiger Ecology: What We Know and What We Need to Know
The earliest phases of tiger conservation, and fi eld efforts to save tigers, focused on tiger ecology: the early and continuing work initiated by the Smithsonian Institution in Nepal, long term ecological studies in Russia initiated by the Hornocker Wildlife Institute, and the extensive work on tiger ecology conducted in Nagarahole National Park, all gave us clear and important insights into the ecology of the species in a wide range of habitats. These studies, and others, are extremely well summarized in two books: Seidensticker et. al. 1999, and Tilson and Seal 1987. More recent work in Malaysia, India, and elsewhere complements the continuing work at the key, long-term study sites.
The increase in both interest and funding for tiger conservation in the 1990s, in large measure spurred by the creation of the Save the Tiger Fund, has nonetheless not seen a concomitant increase in studies on the ecology and behavior of the tiger. For all the ur-gent interest in tigers, the conservation community has spent relatively little time studying the ecology of tigers in the past decade. While we have made great strides in our under-standing of tiger distribution and threats to persistence, we still know relatively little about tigers across much of the range of the species. In the following section we summa-rize some of the key ecological information we do know, and suggest important areas for future research.
Tigers are found in an astonishing variety of habitat types, including tropical lowland evergreen, dry deciduous, pine, temperate broadleaf, swamp, and mangrove, as well as grasslands in the Himalayan foothills. Their current distribution extends from south of the equator on Sumatra to the Russian Far East and from Vietnam to India. Across this huge area, they inhabit a wide range of elevations and climatic regimes. The wide habitat tolerance indicates the ecological fl exibility of tigers; given enough prey and protection, it seems that tigers can thrive almost anywhere within their historic range.
21
The reproductive biology of tigers refl ects a species capable of responding quickly to changes in the environment. In India and Nepal, females are capable of breeding at 3 years of age, have large litters (2–5 young per litter) after a relatively short gestation of 3.5 months. Their short inter-birth intervals (20 months) mean that on average an adult female produces 1.8 young per female per year. Females re-cycle quickly if a litter is lost. This results in the capacity of populations to tolerate a harvest (legal or illegal) of adult animals and to recover quickly from population crashes. Not surprisingly, some of the highest tiger densities occur in India and Nepal in areas where tigers and their prey are well protected. In the Russian Far East, Amur tiger females have smaller litters (range 1–4, mean 1.7; Smirnov and Michqelle 1999) and longer inter-birth intervals for an overall reproductive rate of 0.61 young per female per year. In spite of the more limited capacity for population growth, the Amur tiger population has grown steadily since the 1960s.
In good habitat, tigers may enjoy high survival rates. Territory holding males and fe-males have survival rates approaching 90% per year and young have a 60% survival rate (Karanth and Stith 1999). Karanth and Stith identify poaching and loss of prey as the primary sources of mortality for wild tigers. In the absence of these mortality factors, and coupled with the high reproductive potential, tigers should be able to fi ll a habitat to carrying capacity relatively quickly. They argue that even small, isolated populations have low risk of extinction in the absence of catastrophes and disease. Even poaching pressure as high as 20% of the subadult and adult population appears unlikely to drive a popula-tion to extinction. Loss of prey, however, alters the dynamics of tiger populations, lowers the carrying capacity of the environment, reduces cub survival, and probably reduces the survival of sub-adults that must disperse through degraded environments.
Tiger social systems appear to be similar in India, Nepal, and in the Russian Far East (RFE). The adult sex ratio is 2.4 females to 1 male in the RFE and 3 to 1 in India/Nepal. Female home ranges are stable, but not exclusive. In both Russia and India/Nepal, fe-males share portions of their ranges, but likely separate in space and time. The degree of overlap may refl ect relatedness among tigresses; daughters may try to establish ranges ad-jacent to their mothers (Karanth 2001). Male ranges may encompass up to seven female ranges but three female ranges within a male’s range appear more typical. In Russia, there may be more overlap among males and male ranges typically include two to three female home ranges. Tigers do patrol their territories and attempt to defend them against intrud-ers, through scent marking, advertisement, and occasionally aggression.
After their second year, young tigers disperse from their maternal territory and attempt to establish their own territories. Mothers may make room for their daughters by budding off a part of their home range. More home ranges are available for females due to natural (and induced) mortality, and there are more female territories than male. Young male tigers must disperse and often move further than females, increasing the risk of mortality. In general mortality among dispersing tigers may be as high as 30 to 45%.
Chapter 2 Methods used to Assemble Tiger Data Layers for TCL 2.0
Setting Priorities for the Conservation and Recovery of Wild Tigers: 2005–2015
22
Given a cohort of 100 newborn tigers, Karanth (2001) estimates that only 20 will ever have opportunity to breed.
Although an important aspect of resilience is a measure of the tiger’s dispersal capa-bilities, little is actually known about how tigers move, and how they are affected by fragmented landscapes (Sunquist et al. 1999). The only dataset available was collected by Smith (1993) in Chitwan, Nepal. The conclusions were that males dispersed ap-proximately 3 times further than females and most females remained in close proximity to their mothers. Although fi ndings indicated that dispersal distances were short, there has been evidence (some anecdotal) that tigers are capable of moving great distances (Sunquist 1981, Heptner and Sludskii 1992). In the past tigers have been documented in places that were thought to be foreign to them (the Caspian tiger was seen in steppe and desert areas), and covered great distances in relatively short periods of time (Hept-ner and Sludskii 1992). Today, tigers are faced with increasingly fragmented landscapes, and whose survival is negatively affected by the creation and usage of roads (Kerley et al. 2002). Although tigers might be able to move through fragmented areas, there is no doubt that connectivity plays an integral part in assisting tigers, mainly males, to survive dispersal in order to get the chance to reproduce.
Cats require cat food and tigers are no exception. Sunquist et al. (1999) speculate that the divergence and evolution of tigers within Panthera was due in part to radiation and diversifi cation of ungulates. The relationship between tiger density and ungulate biomass is well established and consistent from India to Russia and Sumatra. Karanth and Stith (1999) models of tiger persistence indicate that prey depletion is the single biggest threat to tiger persistence in a landscape through its effect on survival in all age classes and the reduction in carrying capacity.
Although we appear to understand tiger ecology quite well in parts of India and the Rus-sian Far East, most of our information on the natural history of tigers comes from only a few locations so we are limited in the ability to generalize. We have no ecological data for tigers from the majority of the range in Southeast Asia and Indochina. Although we are slowly developing density and population estimates (Kawanishi and Sunquist 2004), few studies examine the prey populations in conjunction with tigers, few studies use rigorous sampling schemes that allow population estimation, and few studies are examining life history parameters of tigers.
In the next decade, as we attempt to reverse trends in tiger numbers, and move from the success we have had in stabilizing and, in some cases, growing individual populations, an understanding of tiger ecology across the range of habitats in which tigers occur would be useful, if not important. However, with relatively limited resources, we understand that focusing our studies and priorities is critical. Looking forward to our next effort to design a priority setting exercise for tigers, we will want to ensure that we not only have the data we are using today with better resolution and quality, but also that we are able

23
Chapter 2 Methods used to Assemble Tiger Data Layers for TCL 2.0
to take the early efforts at spatially-explicit modeling of dispersal and connectivity of ti-ger habitat, and apply this more broadly to make a map for the recovery and restoration of tiger populations across their range. Spatially explicit population models are useful for modeling tiger persistence in landscapes but the models are very sensitive to habitat specifi c demography and to dispersal estimates.
Therefore, we strongly recommend the following studies be seen as priorities for funding, or continued funding, wherever possible:
• Long-term ecological studies should continue to be supported: while they are often a signifi cant draw on resources, these studies provide critical insights into the variation, fl exibility, and resilience of tiger populations. Furthermore, they are one of the few ways that we can actually monitor, and evaluate, the direct impact of our conservation actions on that which we care most about: healthy tiger populations.
• Any spatially explicit modeling effort needs some simple, but critically hard to collect, data. We are sorely lacking in any real estimates of reproduction and survival of tigers in rainforest habitats. These habitat types support relatively low densities of tigers, and prey, and therefore present an important, and diffi cult conservation challenge. The ra-pidity with which tigers have been removed from ecosystems in Cambodia, Myanmar, and Thailand also suggests low productivity, and that restoring tigers in good habitat blocks may be much more diffi cult that we have previously anticipated. We just don’t know.
• Increasingly, we see the establishment of large, inter-connected landscapes as essen-tial for the recovery, and long term health, of tigers (Kerley at al. 2002). Our ability to make models that assess connectivity and persistence is rapidly improving (see Appen-dices), but what is lacking are data that allow us to assess the accuracy and predictive power of these models. We lack any robust data set on tiger dispersal and collecting these data across several types of habitat surely is critical to our understanding of how to retain and expand connectivity.
— Tim O’Brien, Joshua R. Ginsberg
2.6 Survey methods for tigers and prey
Making meaningful inferences about the distribution and abundance of tigers and their prey presents special challenges to wildlife biologists. Tigers are rare creatures due to their low densities in most of Asia and to their elusive habits. We often notice tigers only after they have passed through, leaving evidence detected by sign counts or photographs of a camera trap. Many prey species are also rare either because of low density, shyness of humans or nocturnal habits. Because we require reliable estimates of tiger abundance for effective conservation, and because we cannot search the entire tiger realm for evi-dence of their occurrence, we must be very clear and specifi c about our sampling targets and our sampling designs.

Setting Priorities for the Conservation and Recovery of Wild Tigers: 2005–2015
24
It is almost impossible to cover 100% area of a park or landscape during a survey for tigers or prey. In order for a sub-sample to be generalized across the landscape, sam-pling must be designed to accommodate inferences for the areas not visited. There are a number of books that deal with sampling issues relevant for tigers and their prey, includ-ing Karanth and Nichols 2002, Williams et al. 2002, and Thompson 2004. Systematic sampling across a study area is recommended for initial surveys aimed at determining the distribution and abundance of a species or when long-term monitoring is a goal. Adap-tive sampling methods (Thompson and Seber 1996) may be appropriate when the target species are clustered in space. However, adaptive sampling can be very demanding when executed over a large area (hundreds of square kilometers for example) and search rules need to be carefully defi ned. Stratifi ed sampling or sampling based on resource alloca-tion functions may be appropriate when the study area has a range of habitats and prior information about abundance in these habitats. This is especially useful for prey surveys or in areas where the probability of detecting tiger occurrence is habitat dependent.
The most basic data we can collect during surveys of tigers and prey is presence/absence data, or more accurately detection/non detection data—in which we attempt to determine the probability that a habitat unit is occupied. Patch-occupancy models (MacKenzie et al. 2002) are based on multiple visits to a sub-sample of habitat units. They have the advan-tage of being able to use any sign as evidence of presence. Estimation of occupancy does not require identifying individuals and may be especially useful when the objective of the survey is the determination of the extent of a species occurrence. It may also play a role in the estimation of abundance of territorial species.
Capture/recapture methods have been demonstrated as a useful tool for the estimation of tiger abundance and density (Karanth and Nichols 2002). In their most basic form, all population estimation techniques are a means of relating count statistics from a portion of the study area to population size using a constant of proportionality (detection prob-ability) that relates the count to the population estimate. The capture/recapture sampling approach allows the estimation of detection probabilities through the use of individual identifying marks such as photo IDs from camera traps, DNA from scat, or the scent of tigers identifi ed by trained dogs. The key to success in population estimation is to maxi-mize the detection probability either by locating camera traps in areas of high activity based on prior knowledge of tiger activities, or use of baits to attract tigers to traps. The programs CAPTURE and MARK offer a number of estimation procedures based on the nature of the detection probability (uniform, varies by individual, varies over time, etc). It is also possible, under certain circumstances, to borrow estimated detection probabilities from other studies and apply them to data samples that are inadequate to estimate cap-ture probabilities because of low recapture rates.
New advances in DNA fi ngerprinting offer the possibility of estimating abundance based on non-invasive sampling of hair, feces, or feathers. The DNA serves as an identifi cation

25
marker that is as useful as a photograph. The technique requires the isolation of suffi cient quantities of high quality DNA and development of nDNA or mtDNA microsatellite markers. Sample preservation, properly incorporating the probabilistic identifi cations into the capture recapture analyses, the determination of the sampled area, and address-ing the population closure assumption remain issues to be resolved, but the technique holds great promise.
Line transect estimation based on distance sampling remains the most common method of estimating ungulate prey populations. Like capture/recapture, distance sampling offers a method of relating count statistics to population size based on detection probabilities. Detection probabilities are expected to decline as distance from the transect increases and the key to distance sampling is modeling the distribution of perpendicular sighting distances (detection function) appropriately. The area sampled is also incorporated using the length of transects and perpendicular distances. Line transect surveys may be used for individuals or for clusters of individuals. They may also be used for dung or pellet counts when data on dung decay rates are available. The program DISTANCE allows for model-ing of the detection function and the ability to choose between alternative models.
In some situations, it may only be feasible to use indices of population size rather than actual estimates to make inferences about the relative abundance of animals. The utility of such relative abundance indices rests on the basic assumption that there is some mono-tonic relationship between the abundance and the index usually described by a propor-tionality constant (such as a detection probability). The more we know about the nature of that relationship, the more useful the index. A second challenge for the successful use of abundance indices is the assumption that the probability of detection is constant between two time periods. This means that changes in the index between time 1 and time 2 represent changes in abundance rather than changes in detection or some other form of bias. Standardization of survey methods and data collection may minimize sources of bias in relative abundance indices. Generally indices are more useful to compare abun-dance across time (e.g between years) rather than across space (e.g. between landscapes). However, in cases where environment or habitat may affect the form of the relationship between the index and true abundance, the use of co-variates in an analysis of variance framework may be a useful method for reducing bias.
— Tim O’Brien, Ullas Karanth
Chapter 2 Methods used to Assemble Tiger Data Layers for TCL 2.0

Setting Priorities for the Conservation and Recovery of Wild Tigers: 2005–2015
26
Chapter 3 Land Cover Data for Tiger Conservation Landscapes
3.1 Objectives for Land Cover Mapping
Fragmentation, degradation and destruction of intact landscapes ultimately lead to habitat loss and are among the gravest threats to tigers. Habitat losses probably have been dramatic at regional and local scales (e.g. FAO 2003), yet their extent has not been quantifi ed for most of the tiger’s geographic range. Even the most basic land cover maps necessary to determine the extent of remaining tiger habitat are diffi cult to acquire and frequently unavailable for conservation assessments. One objective for our revision of the TCUs is to compile the best, most recent information available on land cover in the tiger’s geographic range.
While defi nitions may be cumbersome, our use of the term land cover, rather than habi-tat, is important. Land cover type describes the earth surface feature that can easily be mapped from satellite imagery or aerial photography. Usually land cover types repre-sent major habitat or land use types, such as forest, grassland, wetland, agriculture, and urban. Strictly speaking land cover type is different from habitat, because habitat may encompass features such as prey abundance that cannot easily be mapped using aerial photos or satellite imagery.
3.1.1 Methodology for Assembling DataBy contacting organizations and specialists in range countries, we compiled currently available land cover data sets for the tiger range. Two general types of data exist for compilation of a tiger habitat map: land cover maps derived from recent Landsat satellite imagery (e.g., Leimgruber et al. 2003, 2005), and coarse resolution regional land cover data sets based on 1-km AVHRR or MODIS satellite data (e.g., Loveland et al. 1991, Friedl et al. 2002) (Table 3.1).
Different types of satellite imagery have been widely used for mapping land cover at regional and local scales. These tend to vary in spatial resolution (i.e. the grain of the image), temporal resolution (how frequently they can take an image of the same spot on earth), scale (the area covered by an image), and radiometric range (the range of electro-magnetic radiation they record). Table 3.1 provides a basic overview of three of the more commonly used sensors for broad-scale land cover analysis.
ResolutionSensor nameSpatial Temporal
Radiometric resolution
Landsat TM/ETM+ 15-30 m 16 days 7 multispectral bands, 1panchromatic
Advanced Very High ResolutionRadiometer (AVHRR)
1,000 m 12 hours 3 multispectral bands
Moderate ResolutionSpectroradiometer (MODIS)
250-1,000 m 1-2 days 32 multispectral bands(3 useful for land cover)
Table 3.1 Overview for characteristics of common satellite sensors
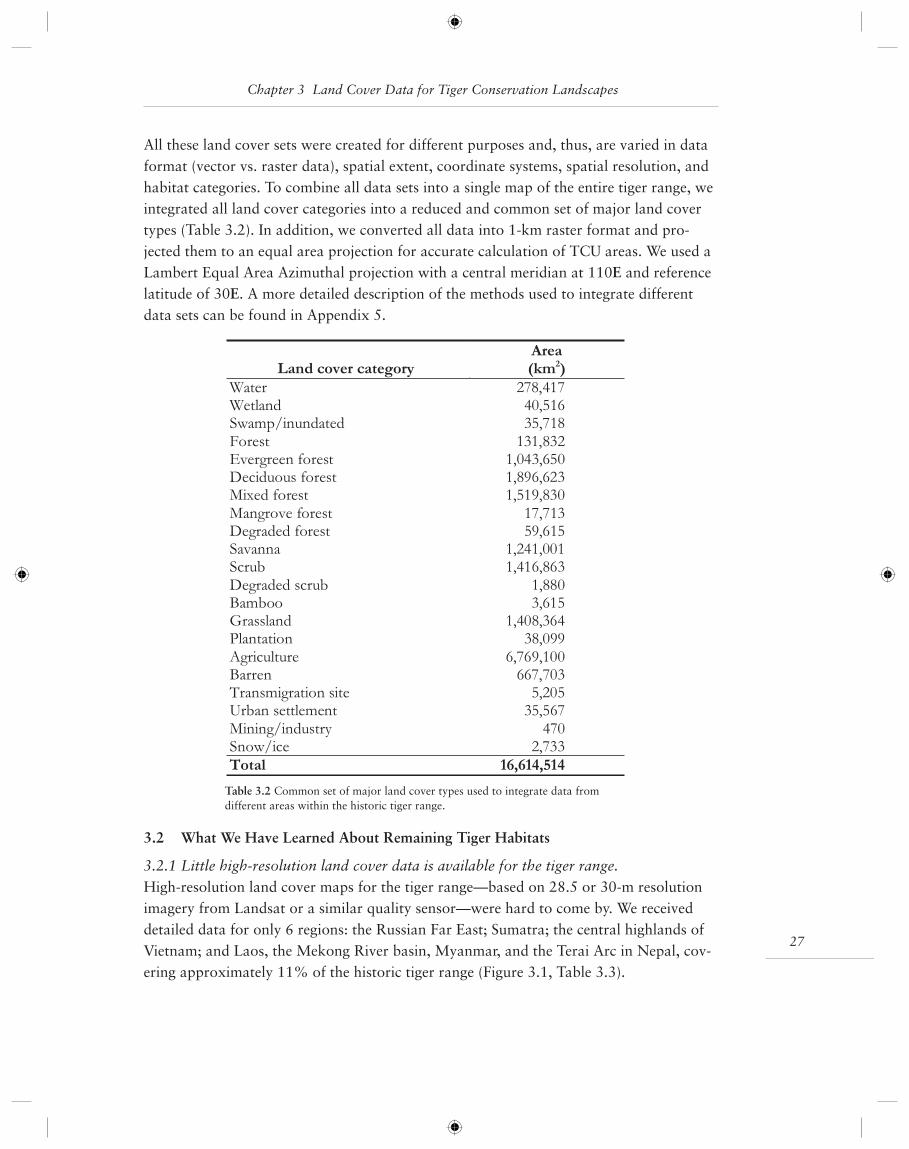
27
All these land cover sets were created for different purposes and, thus, are varied in data format (vector vs. raster data), spatial extent, coordinate systems, spatial resolution, and habitat categories. To combine all data sets into a single map of the entire tiger range, we integrated all land cover categories into a reduced and common set of major land cover types (Table 3.2). In addition, we converted all data into 1-km raster format and pro-jected them to an equal area projection for accurate calculation of TCU areas. We used a Lambert Equal Area Azimuthal projection with a central meridian at 110E and reference latitude of 30E. A more detailed description of the methods used to integrate different data sets can be found in Appendix 5.
3.2 What We Have Learned About Remaining Tiger Habitats
3.2.1 Little high-resolution land cover data is available for the tiger range.High-resolution land cover maps for the tiger range—based on 28.5 or 30-m resolution imagery from Landsat or a similar quality sensor—were hard to come by. We received detailed data for only 6 regions: the Russian Far East; Sumatra; the central highlands of Vietnam; and Laos, the Mekong River basin, Myanmar, and the Terai Arc in Nepal, cov-ering approximately 11% of the historic tiger range (Figure 3.1, Table 3.3).
Land cover categoryArea(km2)
Water 278,417Wetland 40,516Swamp/inundated 35,718Forest 131,832Evergreen forest 1,043,650Deciduous forest 1,896,623Mixed forest 1,519,830Mangrove forest 17,713Degraded forest 59,615Savanna 1,241,001Scrub 1,416,863Degraded scrub 1,880Bamboo 3,615Grassland 1,408,364Plantation 38,099Agriculture 6,769,100Barren 667,703Transmigration site 5,205Urban settlement 35,567Mining/industry 470Snow/ice 2,733Total 16,614,514
Table 3.2 Common set of major land cover types used to integrate data from different areas within the historic tiger range.
Chapter 3 Land Cover Data for Tiger Conservation Landscapes
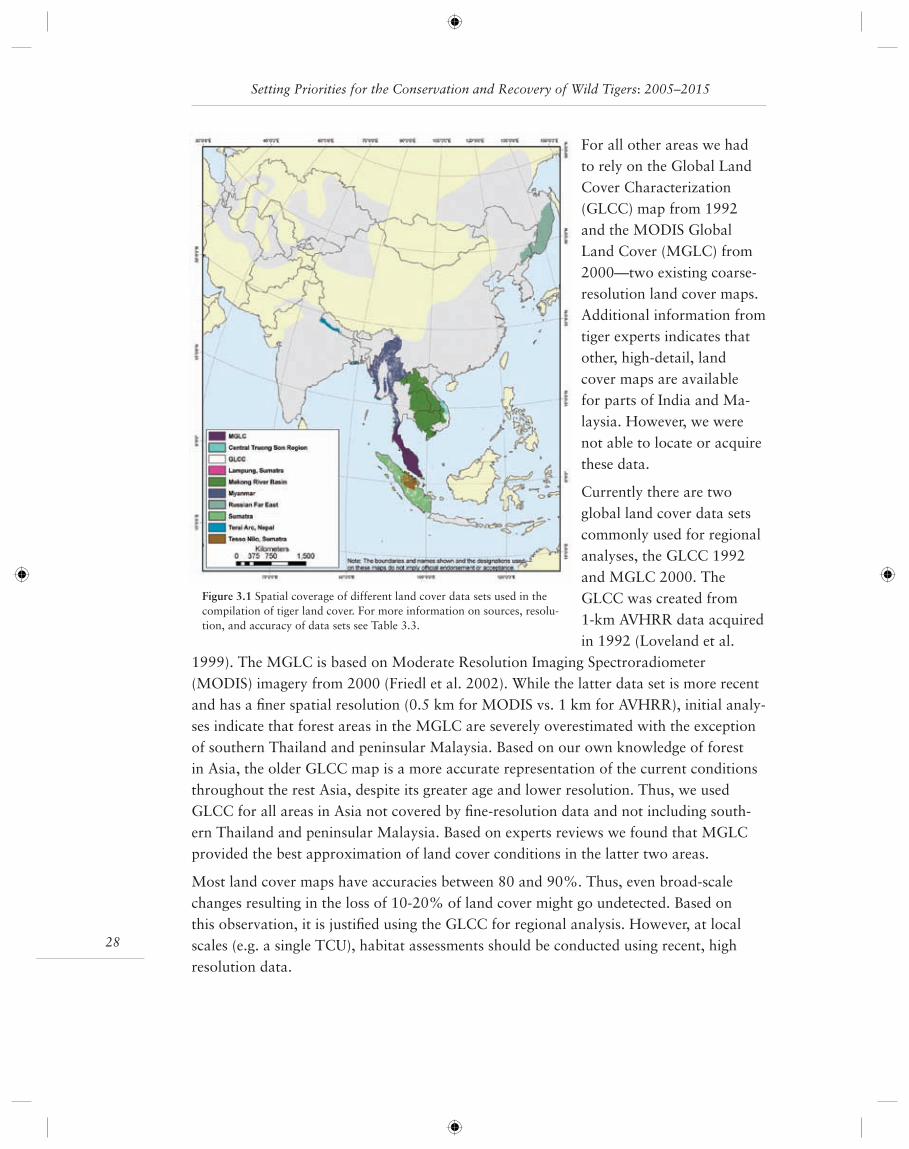
Setting Priorities for the Conservation and Recovery of Wild Tigers: 2005–2015
28
For all other areas we had to rely on the Global Land Cover Characterization (GLCC) map from 1992 and the MODIS Global Land Cover (MGLC) from 2000—two existing coarse-resolution land cover maps. Additional information from tiger experts indicates that other, high-detail, land cover maps are available for parts of India and Ma-laysia. However, we were not able to locate or acquire these data.
Currently there are two global land cover data sets commonly used for regional analyses, the GLCC 1992 and MGLC 2000. The GLCC was created from 1-km AVHRR data acquired in 1992 (Loveland et al.
1999). The MGLC is based on Moderate Resolution Imaging Spectroradiometer (MODIS) imagery from 2000 (Friedl et al. 2002). While the latter data set is more recent and has a fi ner spatial resolution (0.5 km for MODIS vs. 1 km for AVHRR), initial analy-ses indicate that forest areas in the MGLC are severely overestimated with the exception of southern Thailand and peninsular Malaysia. Based on our own knowledge of forest in Asia, the older GLCC map is a more accurate representation of the current conditions throughout the rest Asia, despite its greater age and lower resolution. Thus, we used GLCC for all areas in Asia not covered by fi ne-resolution data and not including south-ern Thailand and peninsular Malaysia. Based on experts reviews we found that MGLC provided the best approximation of land cover conditions in the latter two areas.
Most land cover maps have accuracies between 80 and 90%. Thus, even broad-scale changes resulting in the loss of 10-20% of land cover might go undetected. Based on this observation, it is justifi ed using the GLCC for regional analysis. However, at local scales (e.g. a single TCU), habitat assessments should be conducted using recent, high resolution data.
Figure 3.1 Spatial coverage of different land cover data sets used in the compilation of tiger land cover. For more information on sources, resolu-tion, and accuracy of data sets see Table 3.3.
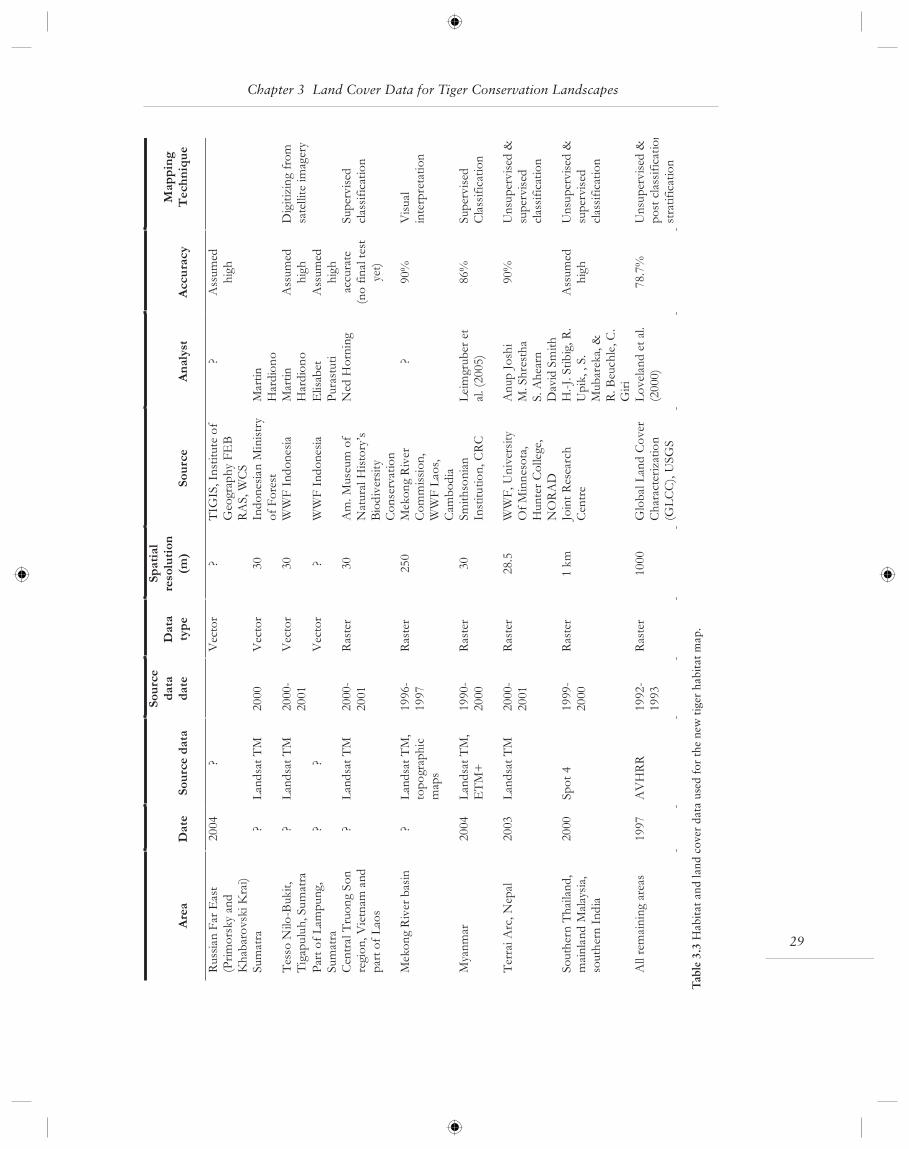
29
Chapter 3 Land Cover Data for Tiger Conservation Landscapes
Tab
le 3
.3 H
abit
at a
nd la
nd c
over
dat
a us
ed f
or t
he n
ew t
iger
hab
itat
map
.
Area
Date
Sourcedata
Source
data
date
Data
type
Spatial
resolution
(m)
Source
Analyst
Accuracy
Mapping
Technique
RussianFarEast
(Primorskyand
KhabarovskiKrai)
2004
?Vector
?TIGIS,Instituteof
GeographyFEB
RAS,WCS
?Assumed
high
Sumatra
?LandsatTM
2000
Vector
30
IndonesianMinistry
ofForest
Martin
Hardiono
TessoNilo-Bukit,
Tigapuluh,Sumatra
?LandsatTM
2000-
2001
Vector
30
WWFIndonesia
Martin
Hardiono
Assumed
high
Digitizingfrom
satelliteimagery
PartofLampung,
Sumatra
??
Vector
?WWFIndonesia
Elisabet
Purastuti
Assumed
high
CentralTruongSon
region,Vietnamand
partofLaos
?LandsatTM
2000-
2001
Raster
30
Am.Museumof
NaturalHistory’s
Biodiversity
Conservation
NedHorning
accurate
(nofinaltest
yet)
Supervised
classification
MekongRiverbasin
?LandsatTM,
topographic
maps
1996-
1997
Raster
250
MekongRiver
Commission,
WWFLaos,
Cambodia
?90%
Visual
interpretation
Myanmar
2004
LandsatTM,
ETM+
1990-
2000
Raster
30
Smithsonian
Institution,CRC
Leimgruberet
al.(2005)
86%
Supervised
Classification
TerraiArc,Nepal
2003
LandsatTM
2000-
2001
Raster
28.5
WWF,University
OfMinnesota,
HunterCollege,
NORAD
AnupJoshi
M.Shrestha
S.Ahearn
DavidSmith
90%
Unsupervised&
supervised
classification
SouthernThailand,
mainlandMalaysia,
southernIndia
2000
Spot4
1999-
2000
Raster
1km
JointResearch
Centre
H.-J.Stibig,R.
Upik,,S.
Mubareka,&
R.Beuchle,C.
Giri
Assumed
high
Unsupervised&
supervised
classification
Allremainingareas
1997
AVHRR
1992-
1993
Raster
1000
GlobalLandCover
Characterization
(GLCC),USGS
Lovelandetal.
(2000)
78.7%
Unsupervised&
postclassification
stratification
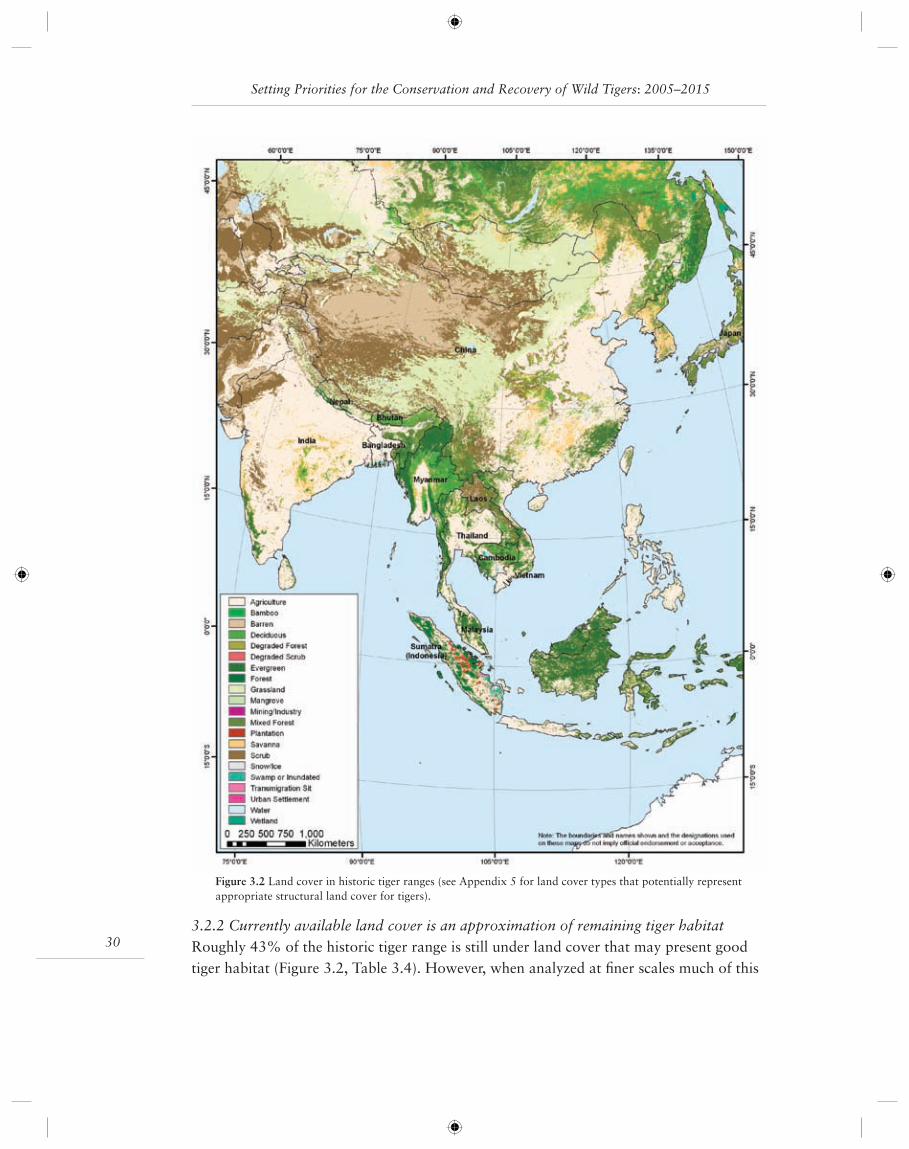
Setting Priorities for the Conservation and Recovery of Wild Tigers: 2005–2015
303.2.2 Currently available land cover is an approximation of remaining tiger habitatRoughly 43% of the historic tiger range is still under land cover that may present good tiger habitat (Figure 3.2, Table 3.4). However, when analyzed at fi ner scales much of this
Figure 3.2 Land cover in historic tiger ranges (see Appendix 5 for land cover types that potentially represent appropriate structural land cover for tigers).
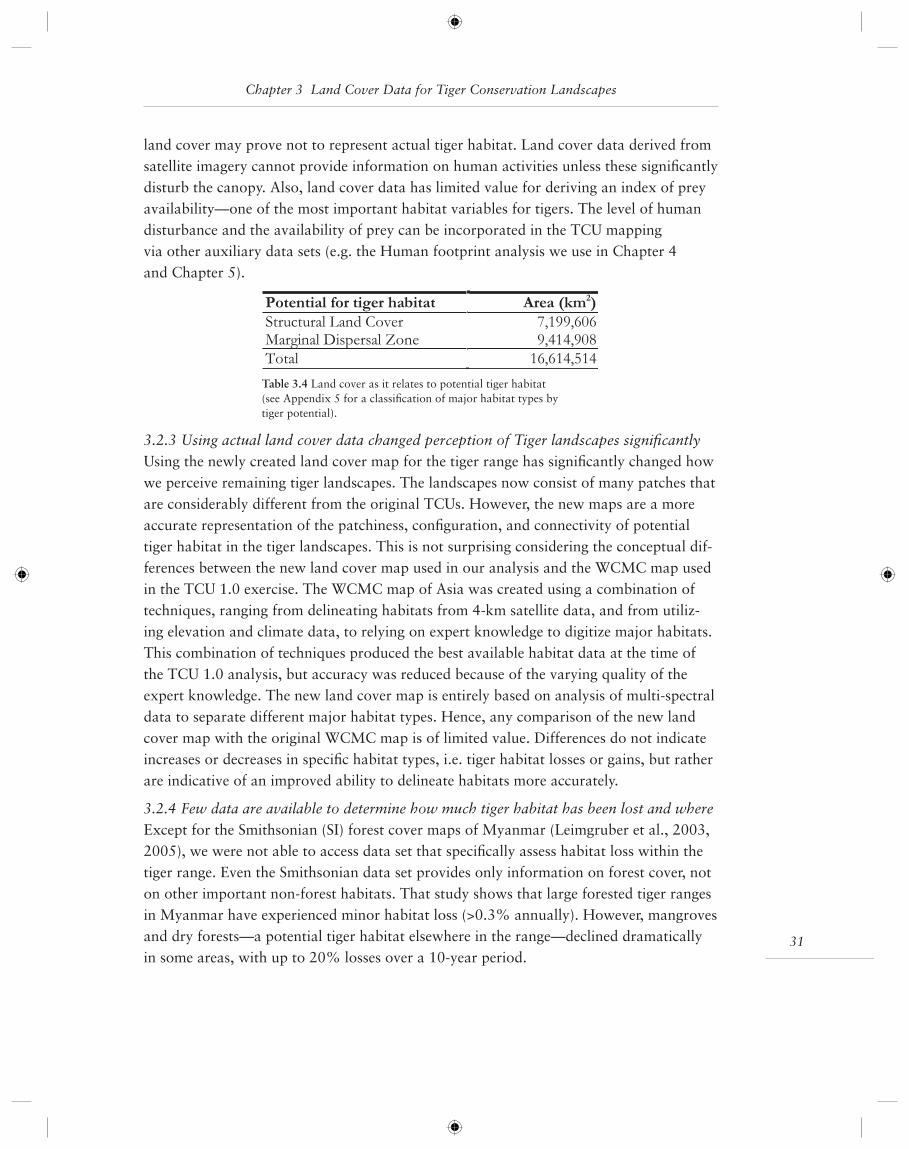
31
Chapter 3 Land Cover Data for Tiger Conservation Landscapes
land cover may prove not to represent actual tiger habitat. Land cover data derived from satellite imagery cannot provide information on human activities unless these signifi cantly disturb the canopy. Also, land cover data has limited value for deriving an index of prey availability—one of the most important habitat variables for tigers. The level of human disturbance and the availability of prey can be incorporated in the TCU mapping via other auxiliary data sets (e.g. the Human footprint analysis we use in Chapter 4 and Chapter 5).
3.2.3 Using actual land cover data changed perception of Tiger landscapes signifi cantly Using the newly created land cover map for the tiger range has signifi cantly changed how we perceive remaining tiger landscapes. The landscapes now consist of many patches that are considerably different from the original TCUs. However, the new maps are a more accurate representation of the patchiness, confi guration, and connectivity of potential tiger habitat in the tiger landscapes. This is not surprising considering the conceptual dif-ferences between the new land cover map used in our analysis and the WCMC map used in the TCU 1.0 exercise. The WCMC map of Asia was created using a combination of techniques, ranging from delineating habitats from 4-km satellite data, and from utiliz-ing elevation and climate data, to relying on expert knowledge to digitize major habitats. This combination of techniques produced the best available habitat data at the time of the TCU 1.0 analysis, but accuracy was reduced because of the varying quality of the expert knowledge. The new land cover map is entirely based on analysis of multi-spectral data to separate different major habitat types. Hence, any comparison of the new land cover map with the original WCMC map is of limited value. Differences do not indicate increases or decreases in specifi c habitat types, i.e. tiger habitat losses or gains, but rather are indicative of an improved ability to delineate habitats more accurately.
3.2.4 Few data are available to determine how much tiger habitat has been lost and where
Except for the Smithsonian (SI) forest cover maps of Myanmar (Leimgruber et al., 2003, 2005), we were not able to access data set that specifi cally assess habitat loss within the tiger range. Even the Smithsonian data set provides only information on forest cover, not on other important non-forest habitats. That study shows that large forested tiger ranges in Myanmar have experienced minor habitat loss (>0.3% annually). However, mangroves and dry forests—a potential tiger habitat elsewhere in the range—declined dramatically in some areas, with up to 20% losses over a 10-year period.
Potential for tiger habitat Area (km2)Structural Land Cover 7,199,606Marginal Dispersal Zone 9,414,908
Total 16,614,514
Table 3.4 Land cover as it relates to potential tiger habitat (see Appendix 5 for a classifi cation of major habitat types by tiger potential).

Setting Priorities for the Conservation and Recovery of Wild Tigers: 2005–2015
32
3.3 Conclusions
We were able to compile a new regional land cover data set for the tiger range. This map represents a signifi cant improvement over the WCMC map used during the fi rst TCU analysis. Because of signifi cant advances in satellite remote sensing, geospatial analysis technology, and information tech-nology, one would assume consis-tent information on habitat extent and changes during the past 10 years is available for all of the tiger range. Unfortunately this is not true. No consistent high-reso-lution land cover data set exists that spans even signifi cant por-tions of the tiger range. What is available are data from individual studies, frequently conducted with different goals and not specifi cally designed to detect tiger habitat or to quantify changes in tiger habitat. Even these more detailed maps cover only 11% of the tiger range.
This newly developed land cover data for the tiger range can serve as a baseline assessment, but we urgently need to update this map with new satellite imagery (see Figure 3.3 for key ar-eas). To achieve better monitoring of tiger habitats and changes to these habitats we need:
1) repeated (every 5 years), wall-to-wall satellite imagery for all TCUs;
2) standardized analysis/classifi cation of these satellite images into land cover catego-ries and, if possible, tiger habitats;
3) time series of satellite images to determine the rate of habitat loss in different parts of the tiger range.
— Peter Leimgruber, Melissa Songer
Figure 3.3 Landsat tiles required for improved analysis of current tiger range
33
Chapter 4 Delineating Conservation Landscapes
4.1 Introduction
In the 1997 TCU 1.0 document a tiger conservation unit (TCU) was defi ned as “a block or cluster of blocks of existing habitats that contain, or have the potential to contain, interacting populations of tigers” (Dinerstein et al. 1997). This defi nition enabled a geographic information system (GIS) analysis based on tropical forest cover maps newly available from the World Conservation Monitoring Center (MacKinnon, J. 1997). TCUs were prioritized based on their size, presumed connectivity to each other and expert as-sessments of threats and population status. Importantly, areas where there was no or little information on tigers, but appeared to have habitat, were classifi ed as “priority for sur-vey.” Areas in China and Russia with tigers were excluded, as were areas in central Asia from which tigers had been extirpated. The 1997 effort was highly successful in drawing attention and funding for fi eld-based conservation of tigers, creating much of the infor-mation that fuels our current efforts.
Since that time, we have learned a lot about tiger status and distribution. Many of the “priority for survey” areas have now been surveyed, confi rming tiger presence in places like Melghat, Panna, and Kazaranga in India (Chundawat and van Gruisen 2004, Karanth et al. 2004b), but not in vast areas of Myanmar (Lynam et al. 2003) and China (Tilson et al. 2004). Research in the interim has revealed the importance of prey popula-tions for defi ning tiger habitat, rather than a strictly structural defi nition (for example, based on vegetative cover). New research techniques have also been developed and for-malized that allow for improved estimation of tiger densities using infrared camera traps and capture-recapture estimation techniques (Karanth and Nichols 1998). In the past 10 years, conservation measures have increased in parts of the tiger’s range, which has been critical for securing tiger populations in some areas; still, tigers remain under grave threat in many other parts of their range.
Entering this priority-setting exercise our information base now consists of:
1) a systematic collection of tiger observation localities from the last 10 years (see Chapter 2);
2) a systematic survey of tiger researchers about the current status of TCUs (see Chapter 2)
3) ecological estimations of tiger densities specifi c to habitat-type;
4) an improved land use/land cover layer (see Chapter 3);
5) a global dataset on human impact, which can be used to compare human impact from one part of the range to another (Sanderson et al. 2002); and
6) a global dataset on habitat types (Olson et al. 2001).
Setting Priorities for the Conservation and Recovery of Wild Tigers: 2005–2015
34
Each of these inputs represents an improvement over the data available in the past, but all of them have problems. As described earlier in Chapter 2, the tiger localities and TCU survey suffer from a not-entirely satisfactory return rate of surveys sent to members of the tiger research and conservation community, while the land cover/land use dataset has been assembled from local, regional, and global datasets (Chapter 3), depending on what was available per region, many of which have localized problems. Despite these short-comings, these datasets enable us to take a more sophisticated approach to defi ning tiger conservation units than was previously available.
Over the same period, the art and science of conservation planning has also advanced. Building on TCU 1.0, in 1999 the Wildlife Conservation Society and partners conducted a data synthesis and priority-setting exercise for the jaguar (Sanderson et al. 2002). The jaguar study effectively incorporated lessons learned in the fi rst TCU exercise while adopting several new methods as well. First, it provided a data structure that encom-passed all of the historical range of the species, recognizing the importance of keeping the historical range as a baseline. Second the method built on the “priority for survey” areas of the fi rst TCU exercise to acknowledge upfront areas where knowledge exists and where it doesn’t, as measured across the community of jaguar experts. Known areas of the jaguar range were subdivided into areas of presence and areas of breeding popula-tions suitable for long-term conservation efforts. Third, the jaguar exercise incorporated point locality information into the data synthesis as an independent check against the ex-perts’ informed opinions of areas. Fourth, as with the fi rst tiger exercise, the jaguar study maintained the importance of eco-geographic variation in tiger populations as the basic unit for priority-setting; that is, in order to a save a species, it is important to identify and conserve populations of the species in all the important habitats and regions where it oc-curs across the range. Fifth and fi nally, the methodology provides a classifi cation system that completely tessellated the historical range of the species, so that all parts of its range are named as part of a global strategy for species conservation. This method has subse-quently been adapted for other species, including the American crocodile, Mongolian gazelle, and African lion.
For the purpose of defi ning tiger conservation units in this new assessment, it is impor-tant that they fi t within both short-term and long-term conservation strategies for tigers. In the short-term it is critical to acknowledge that tigers are still endangered across most of their range, therefore identifying and conserving existing populations is the fi rst step toward long-term success. Over the long-term however, ensuring that existing small populations survive is insuffi cient; we need to move toward conservation that provides the opportunity for re-colonization of extirpated areas, connectivity between populations, and larger, more robust populations if we are to meet our goal of 100,000 tigers across the historical range by 2100.
35
4.2 Component Parts of a Range-Wide Tiger Conservation Strategy
To set spatial priorities across the tiger’s range, we sought to divide the region into the most meaningful units for tiger conservation investment at the regional scale. This fi rst required that we defi ne categories that are most appropriate for this purpose. These cat-egories were then further refi ned to work within the constraints of the limited, and often imperfect, information that was actually available to map these areas. From our tiger da-tabase we were able to draw certain conclusions about where tigers are confi rmed to be present or absent, areas where we know tigers have been breeding recently, and areas we know have been extirpated due to human activity. For most of the remaining areas across the range, we lacked tiger survey information—for these places we were forced to make assumptions about tiger presence, absence, or their continued unknown status based on help from our tiger, land cover, and human impact datasets.
Using all information available to us, we divided the tiger range into landscapes, which represent the minimum unit for regional-scale investment and management (acknowledg-ing that local-level investment and management is often conducted at a smaller scale). The name “landscapes” refl ects an important change in management area defi nitions from TCU 1.0, where tiger habitat was categorized into tiger conservation “units.” The term landscape refl ects that tigers are essentially “landscape species” (Sanderson et al. 2002), using large, heterogeneous areas where multiple biological habitat types as well as many different kinds of human uses often apply. Landscapes delineated in this new assessment are grounded fi rmly to a revised defi nition of “habitat,” which suggests that suitable habitat consists not only of land cover that is suitable for tigers (as in TCU 1.0), but with suffi cient prey as well (Karanth et al. 2004b). Because we lack adequate range-wide information on prey abundance, we used range-wide human impact indices as a rough surrogate for the likelihood of suffi cient prey.
Accordingly, we developed the following defi nition of a Tiger Conservation Landscape for this analysis:
A Tiger Conservation Landscape (TCL) is a block or cluster of blocks of habitat1 meeting a minimum size threshold specifi c to habitat-type2, where tigers have been confi rmed to occur in the last 10 years and are not known to have been extirpated.
A TCL has the following attributes:
• A TCL has evidence of one or more tigers over the last 10 years;
• In accordance with the fi rst delineation, a TCL can consist of several adjacent blocks of habitat among which tigers can disperse, up to a distance of 4 km, which is consid-ered the approximate threshold of non-habitat that tigers will cross (Dinerstein et al. 1997);
Chapter 4 Delineating Tiger Conservation Landscapes
1“Habitat” as referred to here is “effective potential habitat”, or suitable land cover of low human impact2“Habitat-type” refers to major habitat type defi ned by ecoregions. Examples include “tropical grasslands” and “tem-perate mixed forests”.
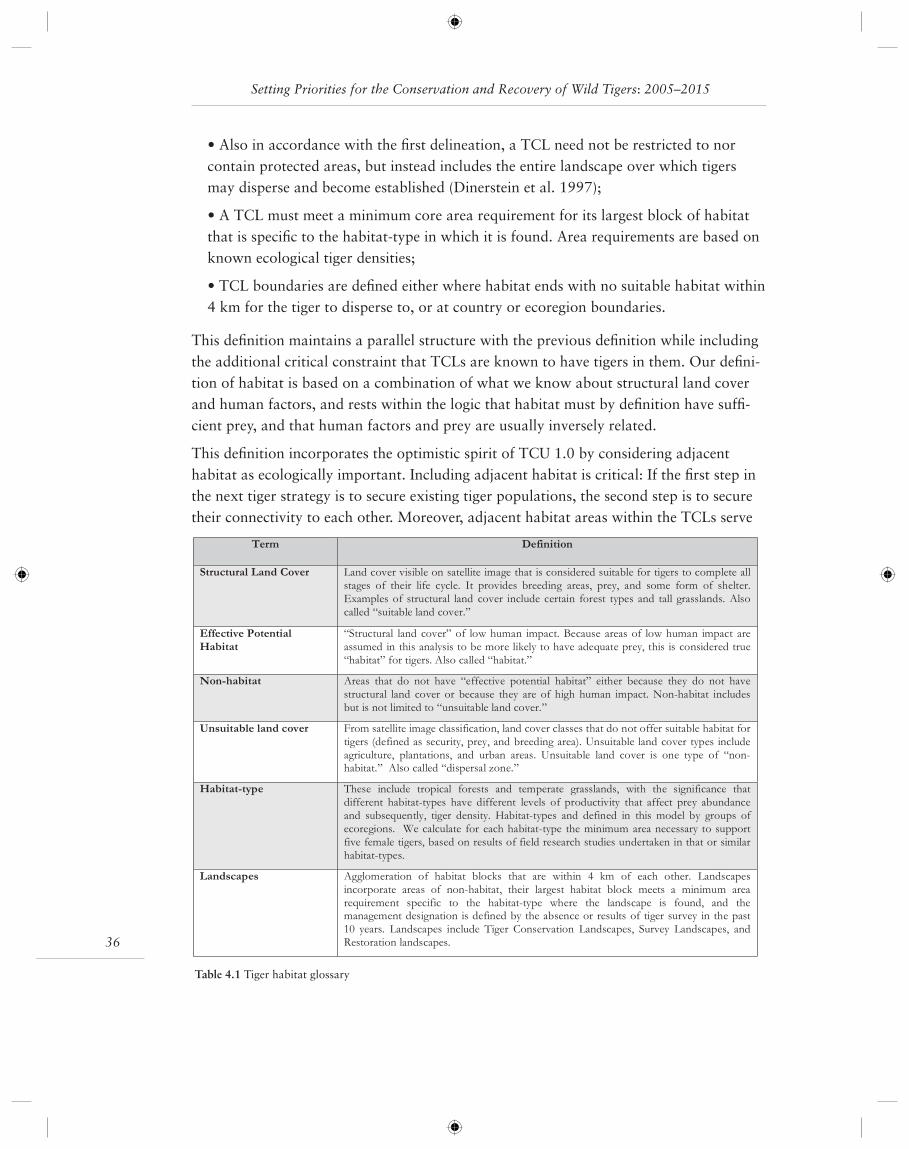
Setting Priorities for the Conservation and Recovery of Wild Tigers: 2005–2015
36
• Also in accordance with the fi rst delineation, a TCL need not be restricted to nor contain protected areas, but instead includes the entire landscape over which tigers may disperse and become established (Dinerstein et al. 1997);
• A TCL must meet a minimum core area requirement for its largest block of habitat that is specifi c to the habitat-type in which it is found. Area requirements are based on known ecological tiger densities;
• TCL boundaries are defi ned either where habitat ends with no suitable habitat within 4 km for the tiger to disperse to, or at country or ecoregion boundaries.
This defi nition maintains a parallel structure with the previous defi nition while including the additional critical constraint that TCLs are known to have tigers in them. Our defi ni-tion of habitat is based on a combination of what we know about structural land cover and human factors, and rests within the logic that habitat must by defi nition have suffi -cient prey, and that human factors and prey are usually inversely related.
This defi nition incorporates the optimistic spirit of TCU 1.0 by considering adjacent habitat as ecologically important. Including adjacent habitat is critical: If the fi rst step in the next tiger strategy is to secure existing tiger populations, the second step is to secure their connectivity to each other. Moreover, adjacent habitat areas within the TCLs serve
Term Definition
Structural Land Cover Land cover visible on satellite image that is considered suitable for tigers to complete all
stages of their life cycle. It provides breeding areas, prey, and some form of shelter.
Examples of structural land cover include certain forest types and tall grasslands. Also
called “suitable land cover.”
Effective PotentialHabitat
“Structural land cover” of low human impact. Because areas of low human impact areassumed in this analysis to be more likely to have adequate prey, this is considered true“habitat” for tigers. Also called “habitat.”
Non-habitat Areas that do not have “effective potential habitat” either because they do not have
structural land cover or because they are of high human impact. Non-habitat includes
but is not limited to “unsuitable land cover.”
Unsuitable land cover From satellite image classification, land cover classes that do not offer suitable habitat fortigers (defined as security, prey, and breeding area). Unsuitable land cover types includeagriculture, plantations, and urban areas. Unsuitable land cover is one type of “non-habitat.” Also called “dispersal zone.”
Habitat-type These include tropical forests and temperate grasslands, with the significance that
different habitat-types have different levels of productivity that affect prey abundance
and subsequently, tiger density. Habitat-types and defined in this model by groups of
ecoregions. We calculate for each habitat-type the minimum area necessary to support
five female tigers, based on results of field research studies undertaken in that or similar
habitat-types.
Landscapes Agglomeration of habitat blocks that are within 4 km of each other. Landscapesincorporate areas of non-habitat, their largest habitat block meets a minimum arearequirement specific to the habitat-type where the landscape is found, and themanagement designation is defined by the absence or results of tiger survey in the past10 years. Landscapes include Tiger Conservation Landscapes, Survey Landscapes, andRestoration landscapes.
Table 4.1 Tiger habitat glossary

37
Chapter 4 Delineating Tiger Conservation Landscapes
as a buffer to threatened populations. Including adjacent non-habitat within proximity of habitat patches is important for reestablishing connectivity between and among tiger habitat patches. Because the concept of habitat is key to delineating the landscape, we provide a brief glossary of defi nitions in Table 4.1. Terms defi ned in this table will be further discussed later in this chapter.
In addition to designating areas where tigers are known to occur, we also provide management designations to areas outside TCLs. Within the current tiger range, three additional designations are important:
Restoration Landscapes Large areas of structural land cover under low human infl uence where survey efforts since 1995 have not revealed evidence of tigers.
Survey Landscapes Large areas of structural land cover under low human infl uence where tiger status is unknown. To our knowledge, these areas have not been surveyed since 1995.
Fragments with Tigers Small areas of structural land cover of low to high human infl uence that show evidence of tigers. These areas are too small to meet the minimum area requirement to be TCLs, but are important nonetheless for supporting the tigers that live there.
Figure 4.1 Schematic diagram of the delineation results
Setting Priorities for the Conservation and Recovery of Wild Tigers: 2005–2015
38
In a similar manner, we classify remaining habitat outside of the current range into “Ex-tirpated Landscapes.” Extirpated Landscapes include large areas of habitat in China and central Asia, and small habitat blocks on the island of Java. Extirpation in some of these areas is recent, in some cases within the last 20 to 50 years.
All remaining areas of both the current and extirpated portions of the tiger’s range are categorized as “Lost Habitat.” These areas do not meet the criteria necessary to be a landscape or Fragment with Tigers. Included in this category are areas either lacking structural land cover for tigers and effective potential habitat in blocks too small to sup-port tigers.
The defi nitions above help support components of a comprehensive tiger strategy aimed at the long-term, which include research and survey, restoration, and recognition of some areas that have been removed from the tiger’s range. Together they allow us to comment on the status of tigers in all parts of the tiger’s historical range. A schematic of the results is provided in Figure 4.1.
4.3 Methodology for Delineating TCLs
The delineation of TCL 2.0 incorporates four main inputs not available at the time of TCU 1.0: new tiger distribution data; a new land cover classifi cation; human infl uence measures; and tiger density information by habitat-type. Other range-wide datasets incor-porated into the delineation were data on the historical and extirpated tiger ranges, eleva-tion, ecoregion, and country boundaries. In this section we describe how these datasets were analyzed to produce the tiger landscapes (Figure 4.2 and Table 4.2).
In summary our methods include the following sequential steps:
1) Defi ne the historic tiger range as the study extent.
2) Assign “structural land cover” based on the land cover data.
3) Map effective potential habitat by excluding high human infl uence areas.
4) Reconnect areas through connectivity (dispersal) analysis and fi lter to minimum habitat sizes.
5) Apply tiger data and assign area designations.
6) Merge “areas” into “landscapes.”
7) Map extirpated range.
A priori decision rules were developed based on the best available ecological information available to us. We developed a GIS program written in an Arc/AML script to automate the delineation process in order to incorporate updated datasets, to vary parameters to achieve the most accurate results (see Chapter 5), to add new decision rules, and to re-spond to comments from tiger experts.
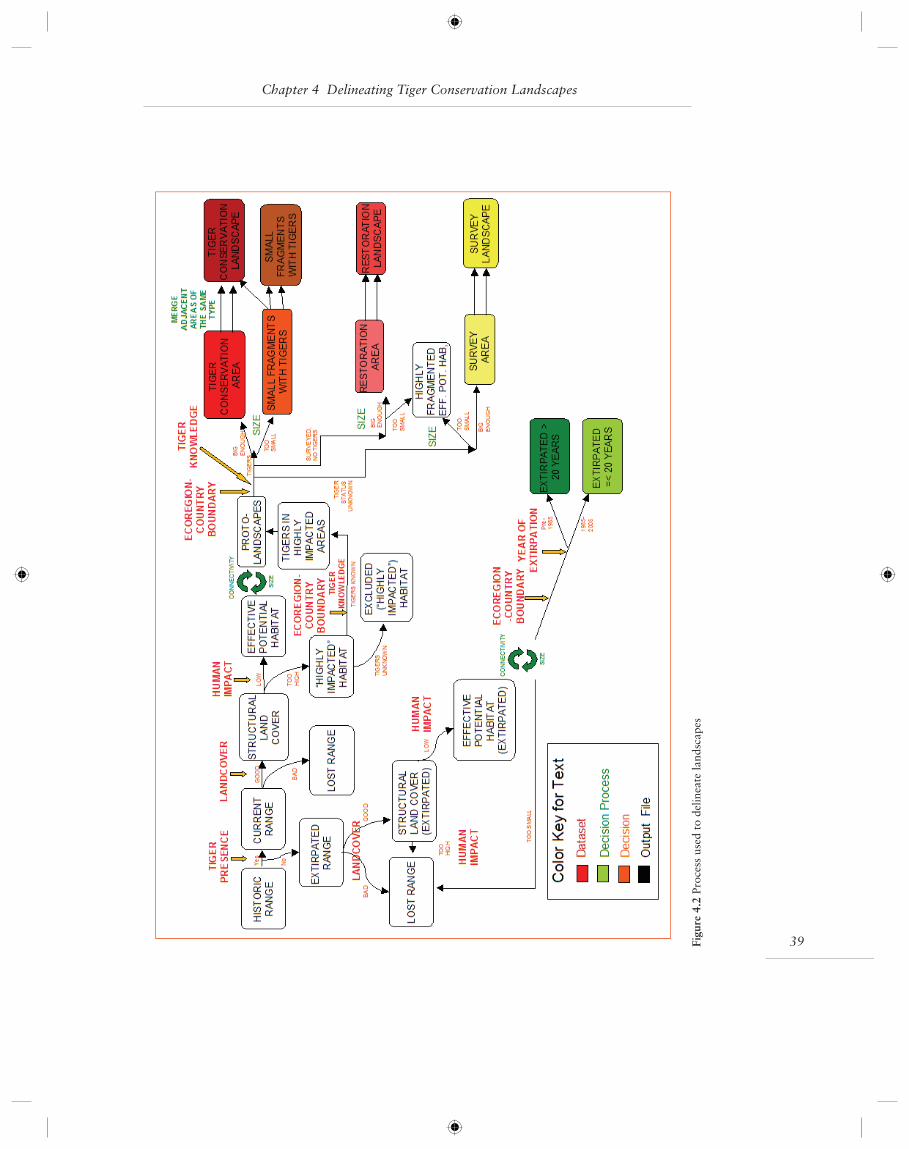
39
Chapter 4 Delineating Tiger Conservation Landscapes
Figu
re 4
.2 P
roce
ss u
sed
to d
elin
eate
land
scap
es
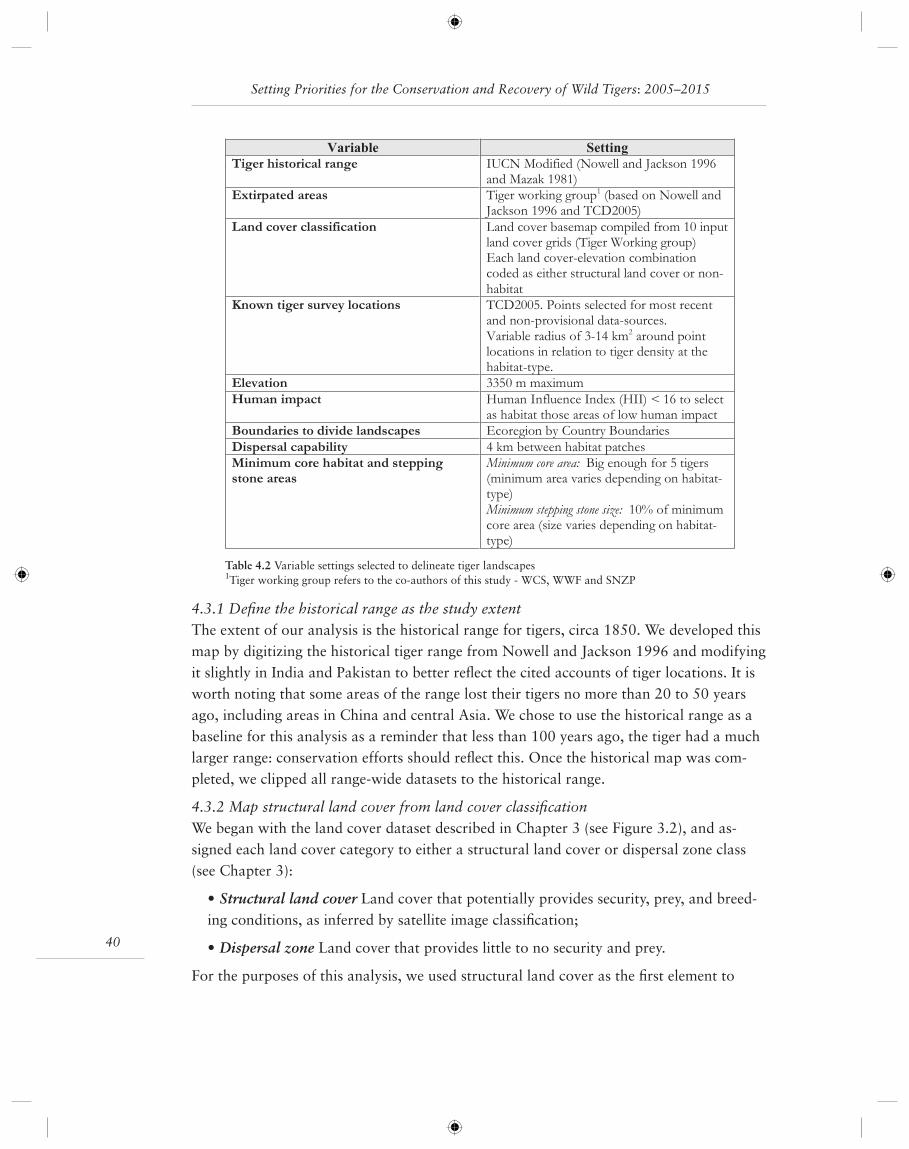
Setting Priorities for the Conservation and Recovery of Wild Tigers: 2005–2015
40
4.3.1 Defi ne the historical range as the study extentThe extent of our analysis is the historical range for tigers, circa 1850. We developed this map by digitizing the historical tiger range from Nowell and Jackson 1996 and modifying it slightly in India and Pakistan to better refl ect the cited accounts of tiger locations. It is worth noting that some areas of the range lost their tigers no more than 20 to 50 years ago, including areas in China and central Asia. We chose to use the historical range as a baseline for this analysis as a reminder that less than 100 years ago, the tiger had a much larger range: conservation efforts should refl ect this. Once the historical map was com-pleted, we clipped all range-wide datasets to the historical range.
4.3.2 Map structural land cover from land cover classifi cationWe began with the land cover dataset described in Chapter 3 (see Figure 3.2), and as-signed each land cover category to either a structural land cover or dispersal zone class (see Chapter 3):
• Structural land cover Land cover that potentially provides security, prey, and breed-ing conditions, as inferred by satellite image classifi cation;
• Dispersal zone Land cover that provides little to no security and prey.
For the purposes of this analysis, we used structural land cover as the fi rst element to
Variable Setting
Tiger historical range IUCN Modified (Nowell and Jackson 1996and Mazak 1981)
Extirpated areas Tiger working group1 (based on Nowell andJackson 1996 and TCD2005)
Land cover classification Land cover basemap compiled from 10 inputland cover grids (Tiger Working group)Each land cover-elevation combinationcoded as either structural land cover or non-habitat
Known tiger survey locations TCD2005. Points selected for most recentand non-provisional data-sources.Variable radius of 3-14 km2 around pointlocations in relation to tiger density at thehabitat-type.
Elevation 3350 m maximum
Human impact Human Influence Index (HII) < 16 to selectas habitat those areas of low human impact
Boundaries to divide landscapes Ecoregion by Country Boundaries
Dispersal capability 4 km between habitat patches
Minimum core habitat and steppingstone areas
Minimum core area: Big enough for 5 tigers(minimum area varies depending on habitat-type)Minimum stepping stone size: 10% of minimumcore area (size varies depending on habitat-type)
Table 4.2 Variable settings selected to delineate tiger landscapes1Tiger working group refers to the co-authors of this study - WCS, WWF and SNZP
41
Chapter 4 Delineating Tiger Conservation Landscapes
delineate the landscapes, and the dispersal zone (also called “non-habitat”) as undiffer-entiated dispersal areas (Figure 4.3). The exact assignments of land cover classes to tiger habitat is provided in Appendix 5.
We assigned all structural land cover above 3,350 meters, all of which is found in the Hi-malayan mountain chain, to the non-habitat category. This elevation has been selected to correspond geographically with the highest areas in the Himalayas that tigers are believed to be resident, based on evidence of breeding data in the tiger database (TCD)3.
We refi ned the grassland and scrub vegetation classes with elevation thresholds. Mon-tane grasslands above 2,000 meters altitude were re-classifi ed from structural land cover to non-habitat. Tigers do not utilize these high elevation grasslands to the extent that they use lower elevation grassland habitat (Seidensticker pers. comm. 2005). For similar reasons, we also reclassifi ed scrub vegetation higher than 2,000 meters elevation to non-habitat.
A fi lter was applied across the structural land cover map to exclude patches less than 5 km2 (effectively creating a minimum mapping unit of 5 km2 for the analysis).
Structural land cover for tigers ideally includes the following three basic elements: (1) Security is defi ned as the ability of tigers to survive in a variety of ecosystems and with limited threat of persecution; (2) Prey-base is the ability of the land cover type to support populations of major prey species that form the basis of the tiger’s diet; and (3) Breed-ing areas represent those ecosystems where both security and prey-base are at suffi ciently high levels as to allow for successful breeding and rearing of offspring. Satellite-based land cover mapping is insuffi cient to verify that all of these conditions have been met, so we next applied a human infl uence measure to exclude areas that appear to have habitat, but are unlikely to support tiger populations.
4.3.3 Map effective potential habitat by excluding high human infl uence areasHuman presence, in addition to land cover, has a signifi cant infl uence on the distribution of tigers, with impacts that range from hunting of the tiger’s prey base, to direct persecu-tion of tigers, to human infrastructure development. Often an area that looks like suitable habitat from a satellite image will be devoid of wildlife because of human impact, which has been dubbed the “empty forest” phenomenon (Redford 1992). To avoid overestimat-ing tiger habitat, we incorporate the Human Infl uence Index (HII), a precursor to the Hu-man Footprint dataset (Sanderson et al. 2002), into the analysis. The HII is composed of the weighted sum of human population, land use, and power infrastructure datasets and scores each 1 km2 pixel throughout the globe on a scale of 1 to 72, with 72 refl ecting the highest human infl uence (Figure 4.4).
In order to determine the HII threshold important to tigers, we compared the average human infl uence values of points where tigers have been found (“presences”), and points where tigers have not been found (“putative absences”), to the overall distribution of
33,350 m may not be the precise elevation up to which tigers are actually resident, but given the shortcomings of the elevation dataset, this is the value we selected based on geographic correspondence between elevation and evidence of tigers breeding data.
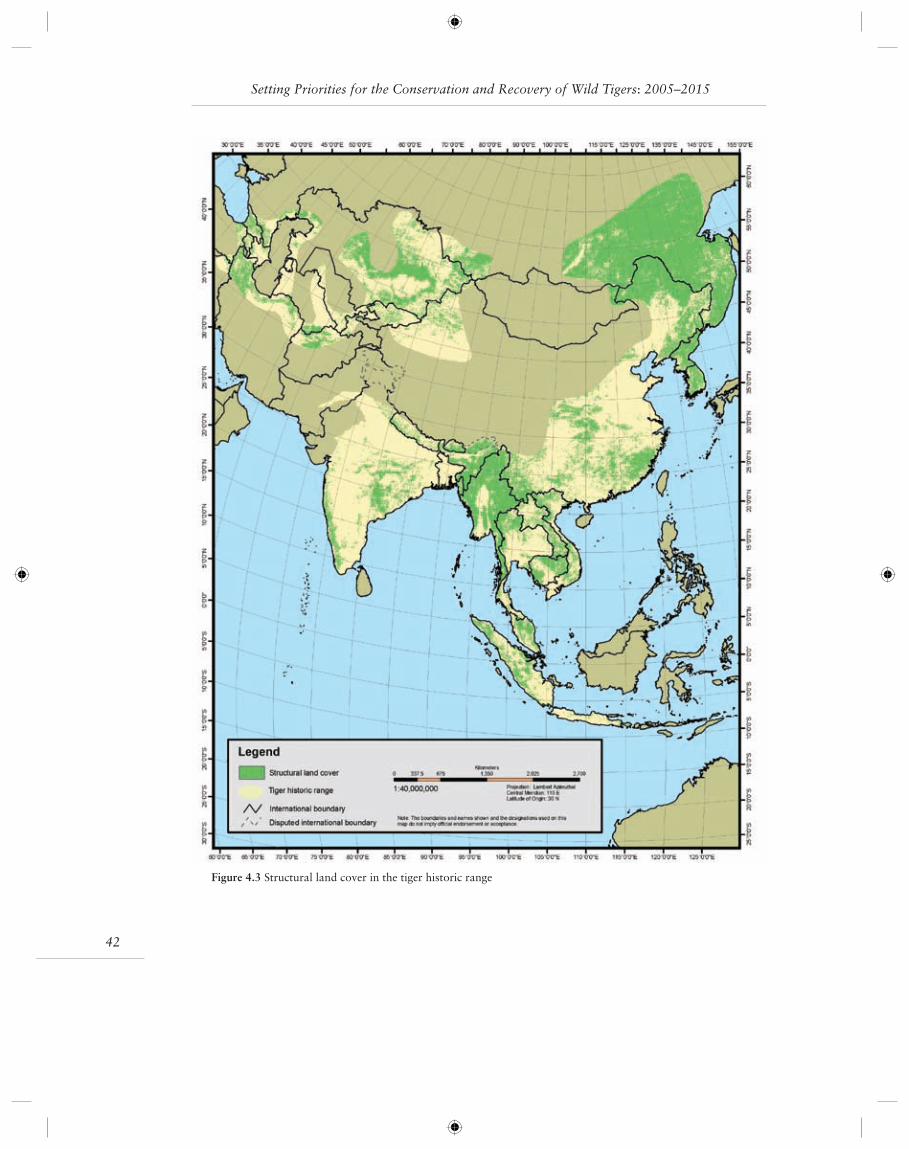
Setting Priorities for the Conservation and Recovery of Wild Tigers: 2005–2015
42
Figure 4.3 Structural land cover in the tiger historic range
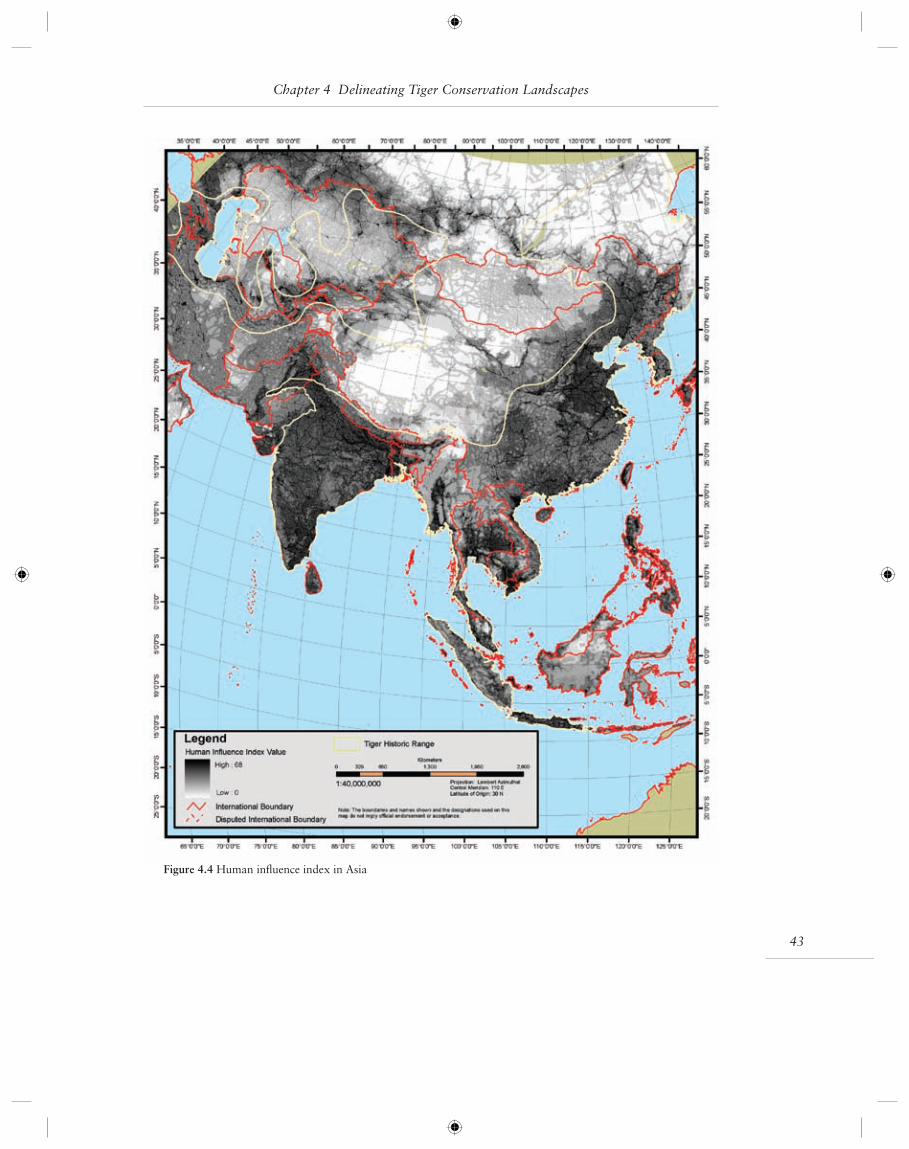
43
Chapter 4 Delineating Tiger Conservation Landscapes
Figure 4.4 Human infl uence index in Asia
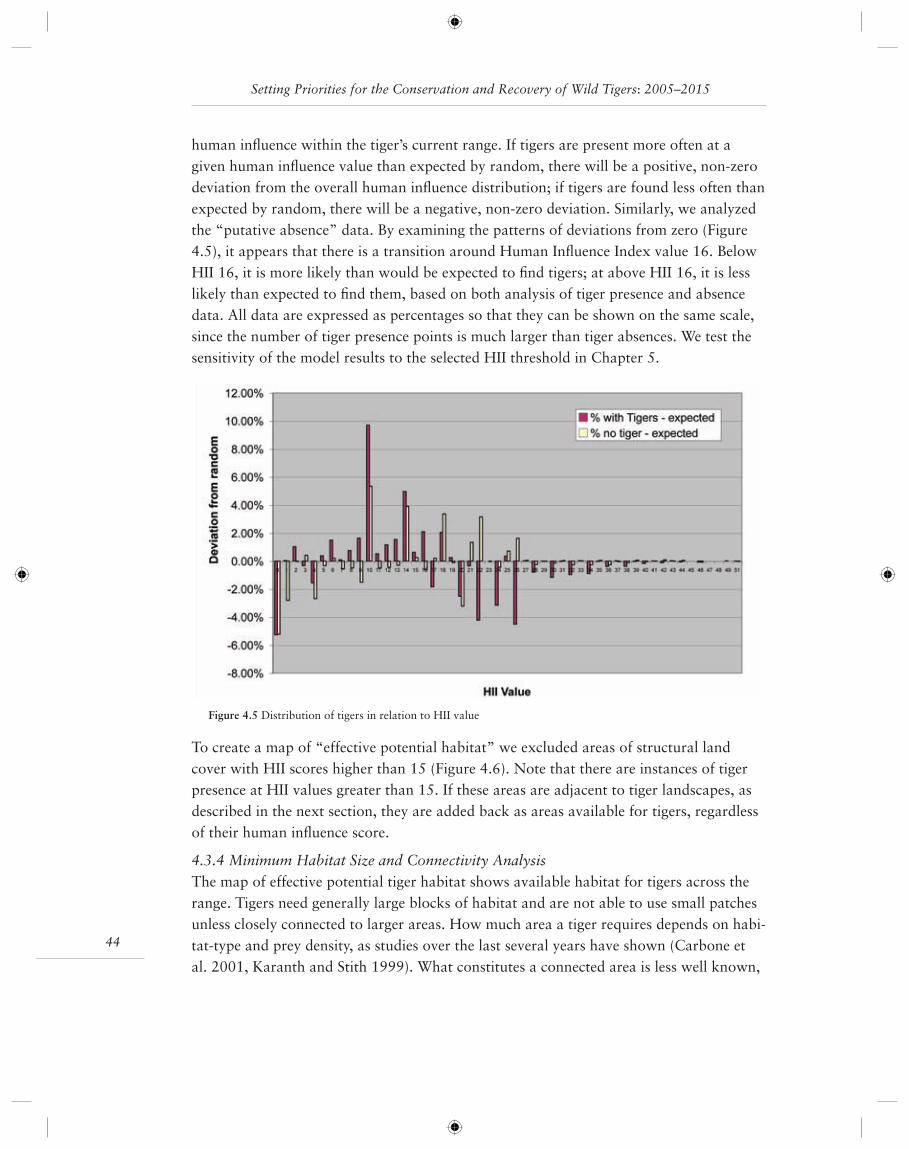
Setting Priorities for the Conservation and Recovery of Wild Tigers: 2005–2015
44
human infl uence within the tiger’s current range. If tigers are present more often at a given human infl uence value than expected by random, there will be a positive, non-zero deviation from the overall human infl uence distribution; if tigers are found less often than expected by random, there will be a negative, non-zero deviation. Similarly, we analyzed the “putative absence” data. By examining the patterns of deviations from zero (Figure 4.5), it appears that there is a transition around Human Infl uence Index value 16. Below HII 16, it is more likely than would be expected to fi nd tigers; at above HII 16, it is less likely than expected to fi nd them, based on both analysis of tiger presence and absence data. All data are expressed as percentages so that they can be shown on the same scale, since the number of tiger presence points is much larger than tiger absences. We test the sensitivity of the model results to the selected HII threshold in Chapter 5.
To create a map of “effective potential habitat” we excluded areas of structural land cover with HII scores higher than 15 (Figure 4.6). Note that there are instances of tiger presence at HII values greater than 15. If these areas are adjacent to tiger landscapes, as described in the next section, they are added back as areas available for tigers, regardless of their human infl uence score.
4.3.4 Minimum Habitat Size and Connectivity AnalysisThe map of effective potential tiger habitat shows available habitat for tigers across the range. Tigers need generally large blocks of habitat and are not able to use small patches unless closely connected to larger areas. How much area a tiger requires depends on habi-tat-type and prey density, as studies over the last several years have shown (Carbone et al. 2001, Karanth and Stith 1999). What constitutes a connected area is less well known,
Figure 4.5 Distribution of tigers in relation to HII value
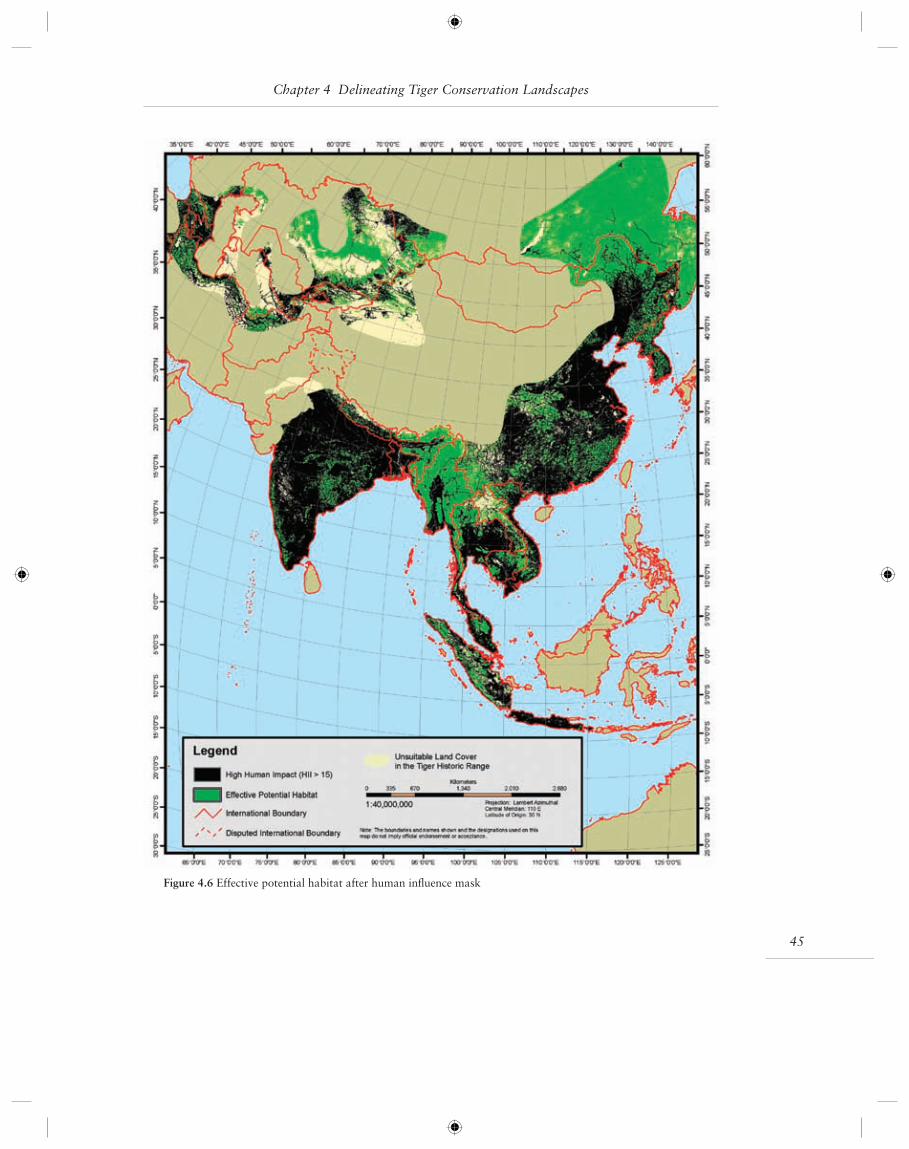
45
Chapter 4 Delineating Tiger Conservation Landscapes
Figure 4.6 Effective potential habitat after human infl uence mask
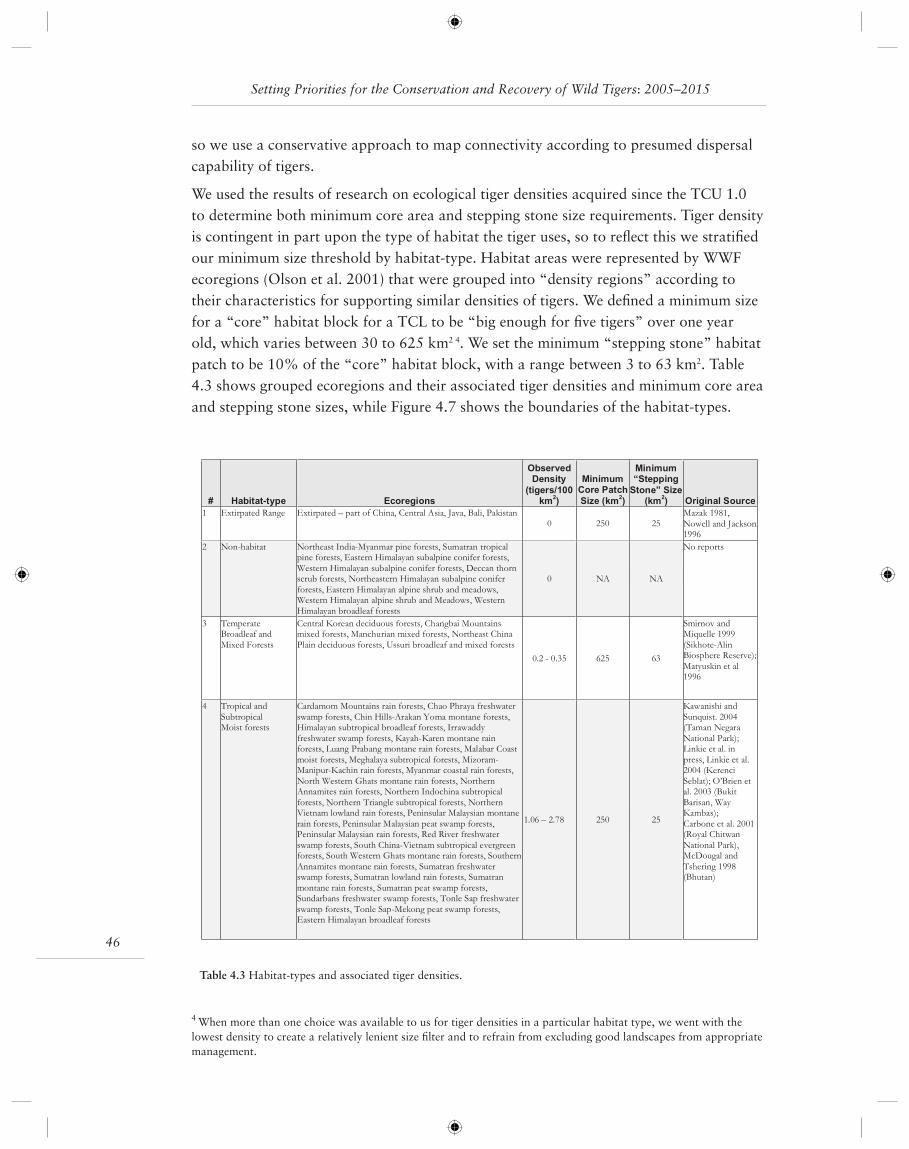
Setting Priorities for the Conservation and Recovery of Wild Tigers: 2005–2015
46
so we use a conservative approach to map connectivity according to presumed dispersal capability of tigers.
We used the results of research on ecological tiger densities acquired since the TCU 1.0 to determine both minimum core area and stepping stone size requirements. Tiger density is contingent in part upon the type of habitat the tiger uses, so to refl ect this we stratifi ed our minimum size threshold by habitat-type. Habitat areas were represented by WWF ecoregions (Olson et al. 2001) that were grouped into “density regions” according to their characteristics for supporting similar densities of tigers. We defi ned a minimum size for a “core” habitat block for a TCL to be “big enough for fi ve tigers” over one year old, which varies between 30 to 625 km2 4. We set the minimum “stepping stone” habitat patch to be 10% of the “core” habitat block, with a range between 3 to 63 km2. Table 4.3 shows grouped ecoregions and their associated tiger densities and minimum core area and stepping stone sizes, while Figure 4.7 shows the boundaries of the habitat-types.
4 When more than one choice was available to us for tiger densities in a particular habitat type, we went with the lowest density to create a relatively lenient size fi lter and to refrain from excluding good landscapes from appropriate management.
# Habitat-type Ecoregions
ObservedDensity
(tigers/100km
2)
MinimumCore Patch
Size (km2)
Minimum“Stepping
Stone” Size(km
2) Original Source
1 Extirpated Range Extirpated – part of China, Central Asia, Java, Bali, Pakistan0 250 25
Mazak 1981,
Nowell and Jackson1996
2 Non-habitat Northeast India-Myanmar pine forests, Sumatran tropicalpine forests, Eastern Himalayan subalpine conifer forests,
Western Himalayan subalpine conifer forests, Deccan thornscrub forests, Northeastern Himalayan subalpine conifer
forests, Eastern Himalayan alpine shrub and meadows,Western Himalayan alpine shrub and Meadows, Western
Himalayan broadleaf forests
0 NA NA
No reports
3 TemperateBroadleaf and
Mixed Forests
Central Korean deciduous forests, Changbai Mountainsmixed forests, Manchurian mixed forests, Northeast China
Plain deciduous forests, Ussuri broadleaf and mixed forests
0.2 - 0.35 625 63
Smirnov andMiquelle 1999
(Sikhote-AlinBiosphere Reserve);
Matyuskin et al1996
4 Tropical and
SubtropicalMoist forests
Cardamom Mountains rain forests, Chao Phraya freshwater
swamp forests, Chin Hills-Arakan Yoma montane forests,Himalayan subtropical broadleaf forests, Irrawaddy
freshwater swamp forests, Kayah-Karen montane rainforests, Luang Prabang montane rain forests, Malabar Coast
moist forests, Meghalaya subtropical forests, Mizoram-Manipur-Kachin rain forests, Myanmar coastal rain forests,
North Western Ghats montane rain forests, NorthernAnnamites rain forests, Northern Indochina subtropical
forests, Northern Triangle subtropical forests, NorthernVietnam lowland rain forests, Peninsular Malaysian montane
rain forests, Peninsular Malaysian peat swamp forests,Peninsular Malaysian rain forests, Red River freshwater
swamp forests, South China-Vietnam subtropical evergreenforests, South Western Ghats montane rain forests, Southern
Annamites montane rain forests, Sumatran freshwaterswamp forests, Sumatran lowland rain forests, Sumatran
montane rain forests, Sumatran peat swamp forests,Sundarbans freshwater swamp forests, Tonle Sap freshwater
swamp forests, Tonle Sap-Mekong peat swamp forests,Eastern Himalayan broadleaf forests
1.06 – 2.78 250 25
Kawanishi and
Sunquist. 2004(Taman Negara
National Park);Linkie et al. in
press, Linkie et al.2004 (Kerenci
Seblat); O’Brien etal. 2003 (Bukit
Barisan, WayKambas);
Carbone et al. 2001(Royal Chitwan
National Park),McDougal and
Tshering 1998(Bhutan)
Table 4.3 Habitat-types and associated tiger densities.
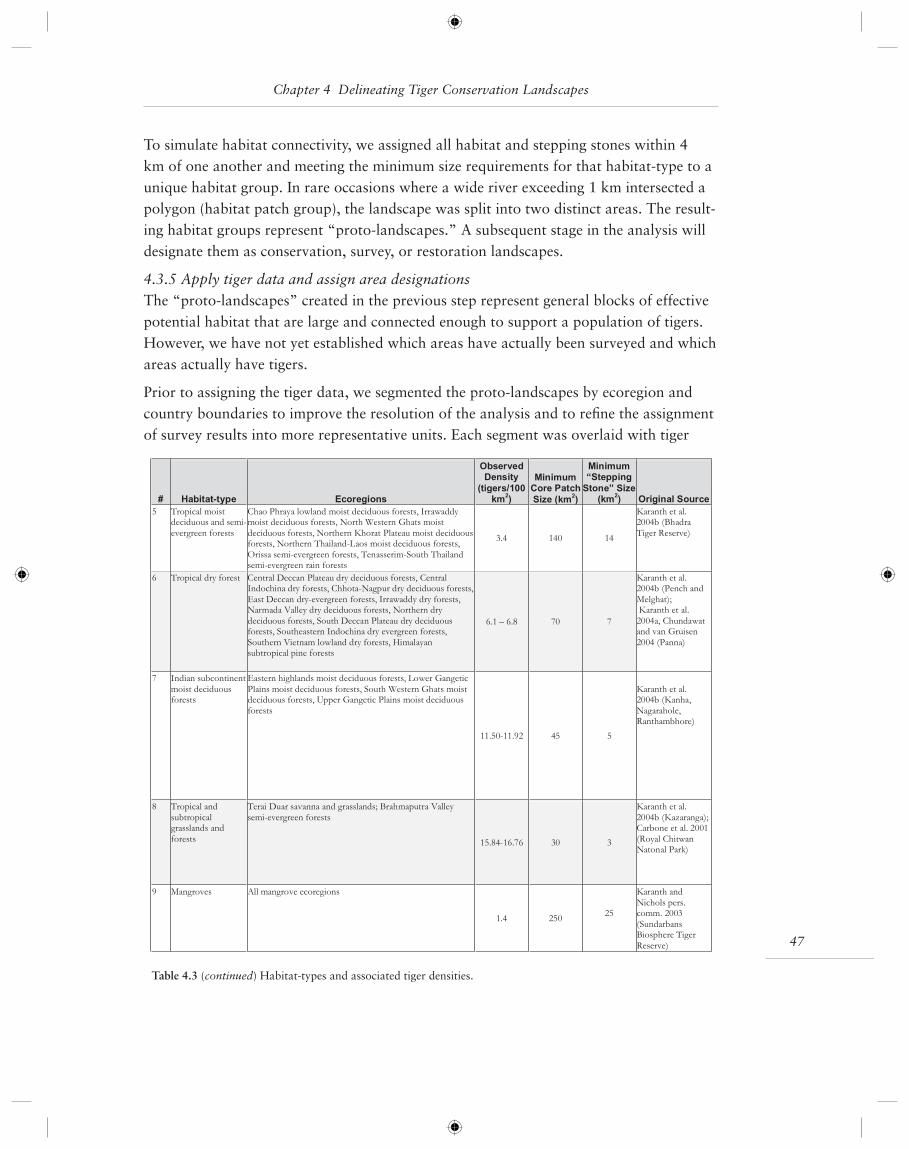
47
Chapter 4 Delineating Tiger Conservation Landscapes
To simulate habitat connectivity, we assigned all habitat and stepping stones within 4 km of one another and meeting the minimum size requirements for that habitat-type to a unique habitat group. In rare occasions where a wide river exceeding 1 km intersected a polygon (habitat patch group), the landscape was split into two distinct areas. The result-ing habitat groups represent “proto-landscapes.” A subsequent stage in the analysis will designate them as conservation, survey, or restoration landscapes.
4.3.5 Apply tiger data and assign area designationsThe “proto-landscapes” created in the previous step represent general blocks of effective potential habitat that are large and connected enough to support a population of tigers. However, we have not yet established which areas have actually been surveyed and which areas actually have tigers.
Prior to assigning the tiger data, we segmented the proto-landscapes by ecoregion and country boundaries to improve the resolution of the analysis and to refi ne the assignment of survey results into more representative units. Each segment was overlaid with tiger
# Habitat-type Ecoregions
ObservedDensity
(tigers/100km
2)
MinimumCore Patch
Size (km2)
Minimum“Stepping
Stone” Size(km
2) Original Source
5 Tropical moistdeciduous and semi-
evergreen forests
Chao Phraya lowland moist deciduous forests, Irrawaddymoist deciduous forests, North Western Ghats moist
deciduous forests, Northern Khorat Plateau moist deciduousforests, Northern Thailand-Laos moist deciduous forests,
Orissa semi-evergreen forests, Tenasserim-South Thailandsemi-evergreen rain forests
3.4 140 14
Karanth et al.2004b (Bhadra
Tiger Reserve)
6 Tropical dry forest Central Deccan Plateau dry deciduous forests, CentralIndochina dry forests, Chhota-Nagpur dry deciduous forests,
East Deccan dry-evergreen forests, Irrawaddy dry forests,Narmada Valley dry deciduous forests, Northern dry
deciduous forests, South Deccan Plateau dry deciduousforests, Southeastern Indochina dry evergreen forests,
Southern Vietnam lowland dry forests, Himalayansubtropical pine forests
6.1 – 6.8 70 7
Karanth et al.2004b (Pench and
Melghat);Karanth et al.
2004a, Chundawatand van Gruisen
2004 (Panna)
7 Indian subcontinent
moist deciduousforests
Eastern highlands moist deciduous forests, Lower Gangetic
Plains moist deciduous forests, South Western Ghats moistdeciduous forests, Upper Gangetic Plains moist deciduous
forests
11.50-11.92 45 5
Karanth et al.2004b (Kanha,
Nagarahole,Ranthambhore)
8 Tropical and
subtropicalgrasslands and
forests
Terai Duar savanna and grasslands; Brahmaputra Valley
semi-evergreen forests
15.84-16.76 30 3
Karanth et al.
2004b (Kazaranga);Carbone et al. 2001
(Royal ChitwanNatonal Park)
9 Mangroves All mangrove ecoregions
1.4 25025
Karanth and
Nichols pers.comm. 2003
(SundarbansBiosphere Tiger
Reserve)
Table 4.3 (continued) Habitat-types and associated tiger densities.

Setting Priorities for the Conservation and Recovery of Wild Tigers: 2005–2015
48
Figure 4.7 Major habitat-types
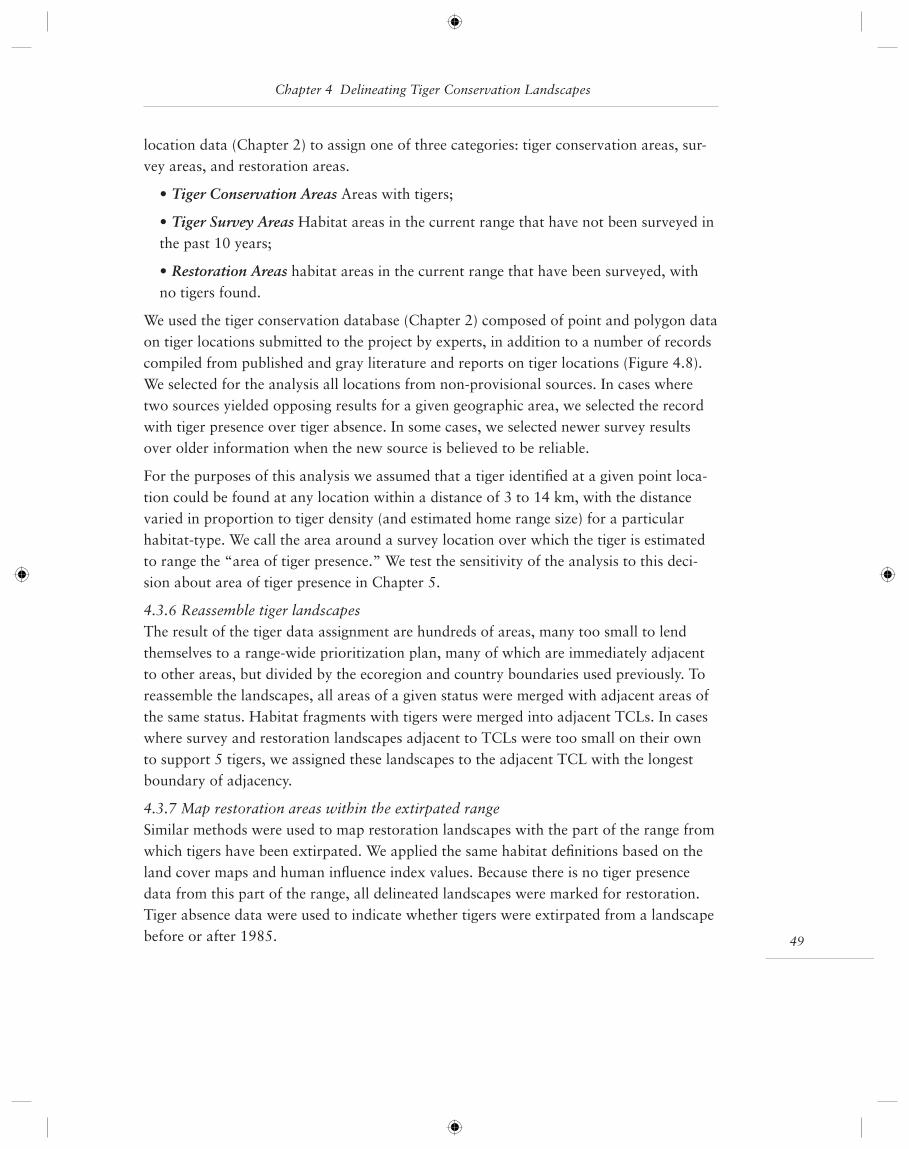
49
Chapter 4 Delineating Tiger Conservation Landscapes
location data (Chapter 2) to assign one of three categories: tiger conservation areas, sur-vey areas, and restoration areas.
• Tiger Conservation Areas Areas with tigers;
• Tiger Survey Areas Habitat areas in the current range that have not been surveyed in the past 10 years;
• Restoration Areas habitat areas in the current range that have been surveyed, with no tigers found.
We used the tiger conservation database (Chapter 2) composed of point and polygon data on tiger locations submitted to the project by experts, in addition to a number of records compiled from published and gray literature and reports on tiger locations (Figure 4.8). We selected for the analysis all locations from non-provisional sources. In cases where two sources yielded opposing results for a given geographic area, we selected the record with tiger presence over tiger absence. In some cases, we selected newer survey results over older information when the new source is believed to be reliable.
For the purposes of this analysis we assumed that a tiger identifi ed at a given point loca-tion could be found at any location within a distance of 3 to 14 km, with the distance varied in proportion to tiger density (and estimated home range size) for a particular habitat-type. We call the area around a survey location over which the tiger is estimated to range the “area of tiger presence.” We test the sensitivity of the analysis to this deci-sion about area of tiger presence in Chapter 5.
4.3.6 Reassemble tiger landscapesThe result of the tiger data assignment are hundreds of areas, many too small to lend themselves to a range-wide prioritization plan, many of which are immediately adjacent to other areas, but divided by the ecoregion and country boundaries used previously. To reassemble the landscapes, all areas of a given status were merged with adjacent areas of the same status. Habitat fragments with tigers were merged into adjacent TCLs. In cases where survey and restoration landscapes adjacent to TCLs were too small on their own to support 5 tigers, we assigned these landscapes to the adjacent TCL with the longest boundary of adjacency.
4.3.7 Map restoration areas within the extirpated rangeSimilar methods were used to map restoration landscapes with the part of the range from which tigers have been extirpated. We applied the same habitat defi nitions based on the land cover maps and human infl uence index values. Because there is no tiger presence data from this part of the range, all delineated landscapes were marked for restoration. Tiger absence data were used to indicate whether tigers were extirpated from a landscape before or after 1985.
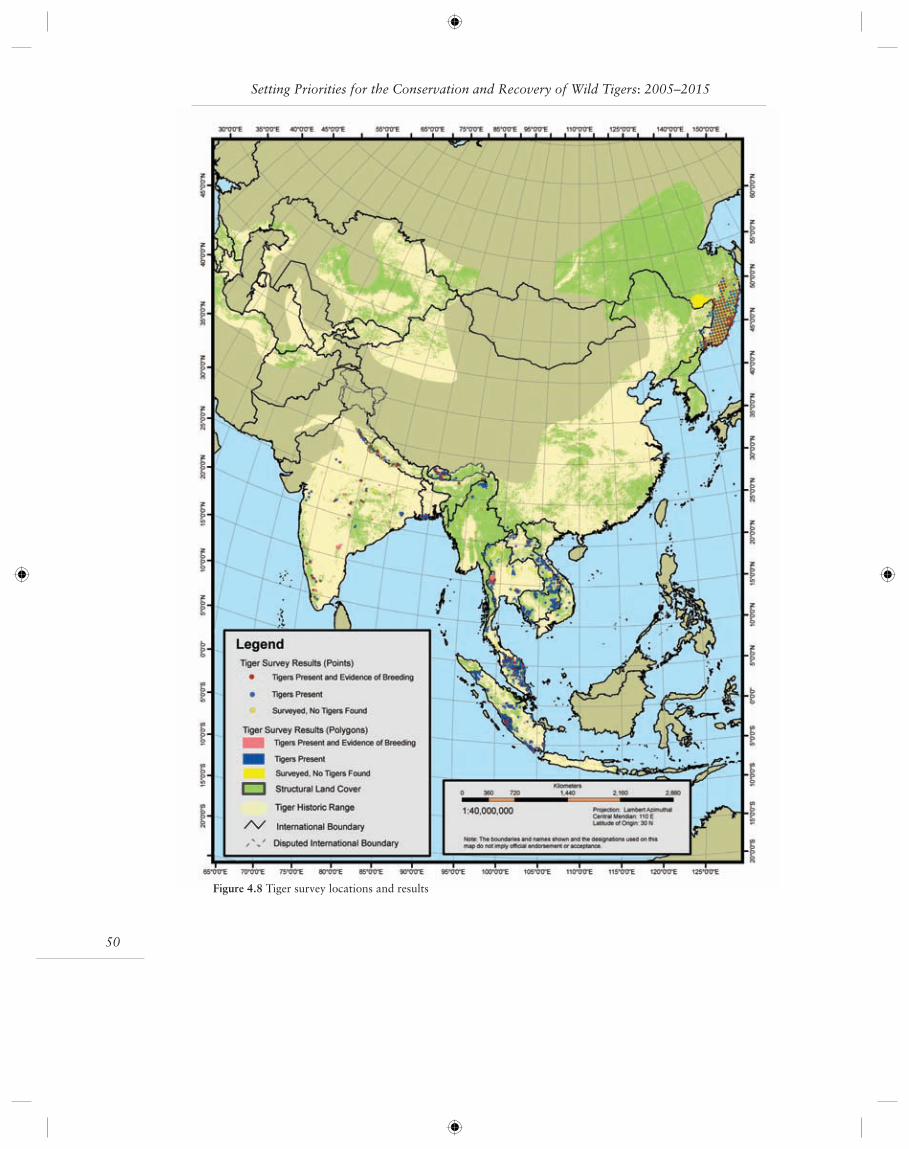
Setting Priorities for the Conservation and Recovery of Wild Tigers: 2005–2015
50
Figure 4.8 Tiger survey locations and results

51
Chapter 4 Delineating Tiger Conservation Landscapes
4.3.8 AutomationThe delineation methods described in sections 4.3.1 through 4.3.7 were automated using an ARC/INFO Arc Macro Language (AML) script (ESRI ArcGIS 8.3, Redlands, CA.) The original analysis, when conducted “by hand” during development, required over three weeks of work. The script now allows us to complete the process in approximately 20 minutes, following the preparation and standardization of input data layers. Automation of the process enables the analysis to be truly “living”—with every change in any of the inputs, a revised range-wide analysis can be produced effi ciently.
4.3.9 Field reviewThe delineation results were reviewed from June to August 2005, after making the draft results available for download from a Web site and notifying our list of over 160 tiger experts. Over 35 tiger conservationists representing organizations from all 13 countries in the current tiger range responded. The responses helped us to update the TCD with over 1,600 survey locations, improve the land cover dataset, and modify the methodology used to delineate landscapes.
4.4 Results: Delineation of Tiger Landscapes
4.4.1 Status of tiger habitat across the rangeUsing the above set of methods, we identifi ed 76 TCLs, 491 Survey Landscapes, 34 Restoration Landscapes, and 543 Small Fragments with Tigers in the current tiger range (Figures 4.9 – 4.10). In the extirpated range of China, central Asia, and Java, 427 restoration landscapes were delineated, 14 of which are believed to have been inhabited by tigers within the past 20 years (Figure 4.11).
TCLs effectively make up an area of 1,184,911 km2, only about 7.1%, of the historical range of tigers. In effect, tigers have lost 92.9% of their range over the last 150 years.
Survey landscapes, where the status of tigers is unknown, make up 431,306 km2, roughly 2.6% of historical range.
Within the current range, areas for restoration make up 326,954 km2 (or roughly 2.0% of historical range); in the extirpated part of the range, restoration landscapes occupy a much larger area (4,520,467 km2, or 27.2% of the historical range), although tigers are no longer present there. 513,522 km2 of this has been lost to tigers for less than 20 years.
These estimates of tiger habitat lost and remaining are based on the overall landscape areas. Because of the connectivity rules these areas include some in which tigers can not live (“non-habitat”). The amount of non-habitat within a TCL can vary from 20 to 90% depending on the area; on average, the values is approximately 55%. In short, even with our more restrictive defi nitions of habitat used in this exercise, our TCLs still overesti-mate the amount of habitat actually available to tigers within a TCL.
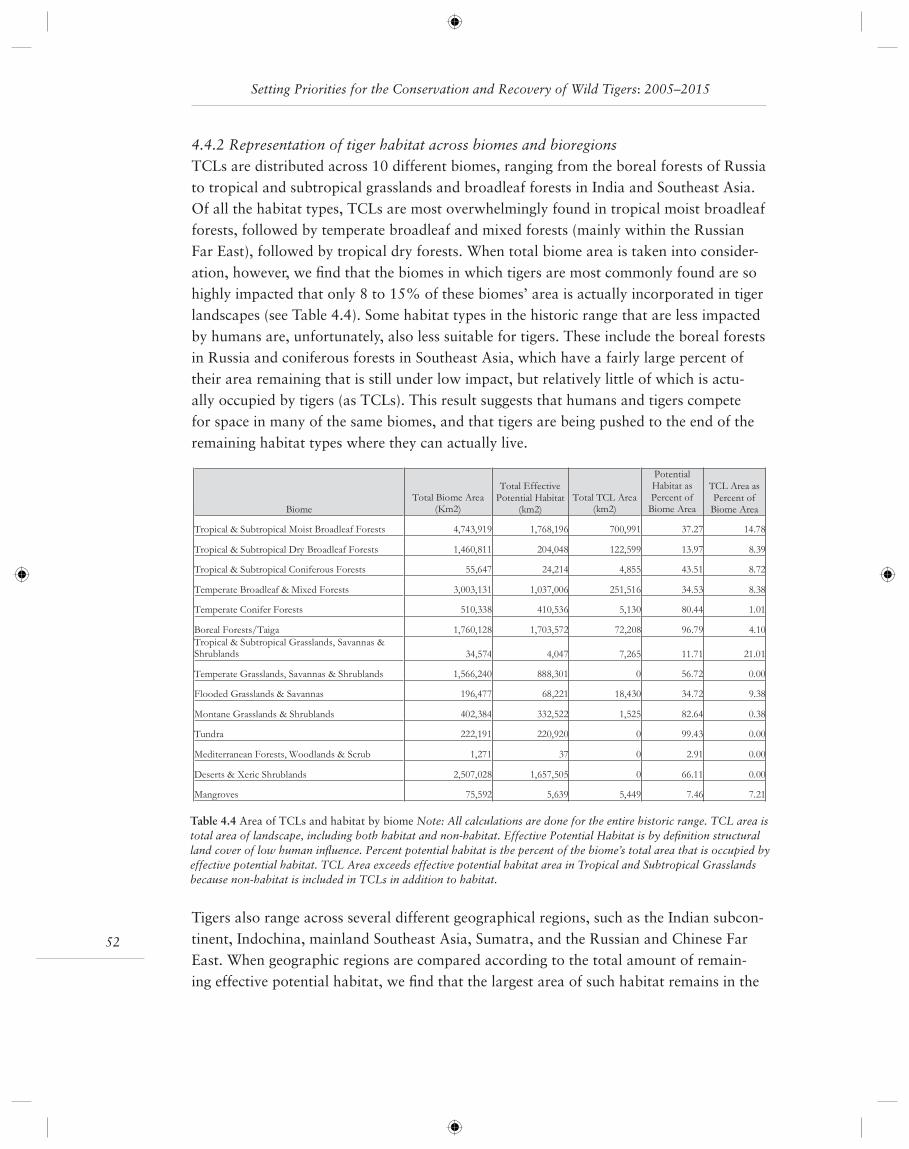
Setting Priorities for the Conservation and Recovery of Wild Tigers: 2005–2015
52
4.4.2 Representation of tiger habitat across biomes and bioregionsTCLs are distributed across 10 different biomes, ranging from the boreal forests of Russia to tropical and subtropical grasslands and broadleaf forests in India and Southeast Asia. Of all the habitat types, TCLs are most overwhelmingly found in tropical moist broadleaf forests, followed by temperate broadleaf and mixed forests (mainly within the Russian Far East), followed by tropical dry forests. When total biome area is taken into consider-ation, however, we fi nd that the biomes in which tigers are most commonly found are so highly impacted that only 8 to 15% of these biomes’ area is actually incorporated in tiger landscapes (see Table 4.4). Some habitat types in the historic range that are less impacted by humans are, unfortunately, also less suitable for tigers. These include the boreal forests in Russia and coniferous forests in Southeast Asia, which have a fairly large percent of their area remaining that is still under low impact, but relatively little of which is actu-ally occupied by tigers (as TCLs). This result suggests that humans and tigers compete for space in many of the same biomes, and that tigers are being pushed to the end of the remaining habitat types where they can actually live.
Tigers also range across several different geographical regions, such as the Indian subcon-tinent, Indochina, mainland Southeast Asia, Sumatra, and the Russian and Chinese Far East. When geographic regions are compared according to the total amount of remain-ing effective potential habitat, we fi nd that the largest area of such habitat remains in the
BiomeTotal Biome Area
(Km2)
Total EffectivePotential Habitat
(km2)Total TCL Area
(km2)
PotentialHabitat asPercent ofBiome Area
TCL Area asPercent ofBiome Area
Tropical & Subtropical Moist Broadleaf Forests 4,743,919 1,768,196 700,991 37.27 14.78
Tropical & Subtropical Dry Broadleaf Forests 1,460,811 204,048 122,599 13.97 8.39
Tropical & Subtropical Coniferous Forests 55,647 24,214 4,855 43.51 8.72
Temperate Broadleaf & Mixed Forests 3,003,131 1,037,006 251,516 34.53 8.38
Temperate Conifer Forests 510,338 410,536 5,130 80.44 1.01
Boreal Forests/Taiga 1,760,128 1,703,572 72,208 96.79 4.10
Tropical & Subtropical Grasslands, Savannas &Shrublands 34,574 4,047 7,265 11.71 21.01
Temperate Grasslands, Savannas & Shrublands 1,566,240 888,301 0 56.72 0.00
Flooded Grasslands & Savannas 196,477 68,221 18,430 34.72 9.38
Montane Grasslands & Shrublands 402,384 332,522 1,525 82.64 0.38
Tundra 222,191 220,920 0 99.43 0.00
Mediterranean Forests, Woodlands & Scrub 1,271 37 0 2.91 0.00
Deserts & Xeric Shrublands 2,507,028 1,657,505 0 66.11 0.00
Mangroves 75,592 5,639 5,449 7.46 7.21
Table 4.4 Area of TCLs and habitat by biome Note: All calculations are done for the entire historic range. TCL area is total area of landscape, including both habitat and non-habitat. Effective Potential Habitat is by defi nition structural land cover of low human infl uence. Percent potential habitat is the percent of the biome’s total area that is occupied by effective potential habitat. TCL Area exceeds effective potential habitat area in Tropical and Subtropical Grasslands because non-habitat is included in TCLs in addition to habitat.
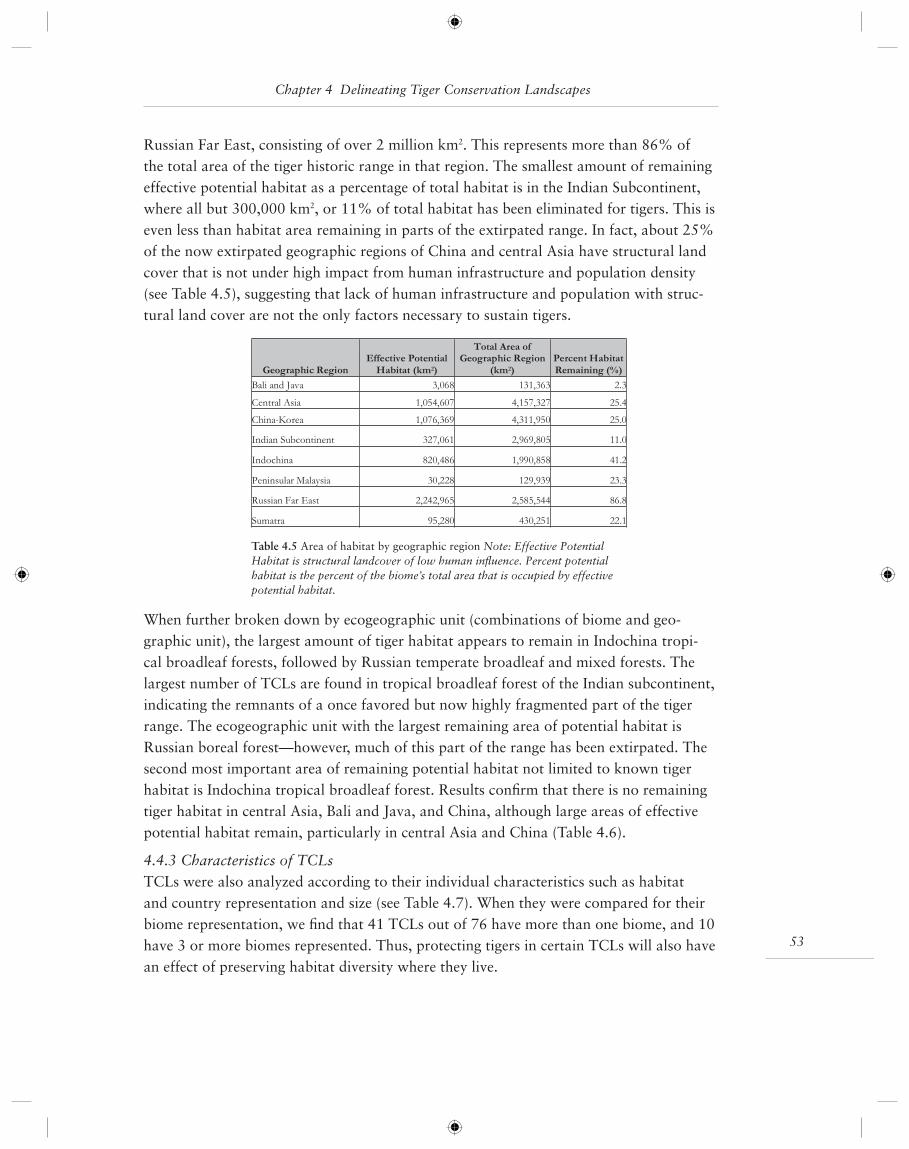
53
Chapter 4 Delineating Tiger Conservation Landscapes
Russian Far East, consisting of over 2 million km2. This represents more than 86% of the total area of the tiger historic range in that region. The smallest amount of remaining effective potential habitat as a percentage of total habitat is in the Indian Subcontinent, where all but 300,000 km2, or 11% of total habitat has been eliminated for tigers. This is even less than habitat area remaining in parts of the extirpated range. In fact, about 25% of the now extirpated geographic regions of China and central Asia have structural land cover that is not under high impact from human infrastructure and population density (see Table 4.5), suggesting that lack of human infrastructure and population with struc-tural land cover are not the only factors necessary to sustain tigers.
When further broken down by ecogeographic unit (combinations of biome and geo-graphic unit), the largest amount of tiger habitat appears to remain in Indochina tropi-cal broadleaf forests, followed by Russian temperate broadleaf and mixed forests. The largest number of TCLs are found in tropical broadleaf forest of the Indian subcontinent, indicating the remnants of a once favored but now highly fragmented part of the tiger range. The ecogeographic unit with the largest remaining area of potential habitat is Russian boreal forest—however, much of this part of the range has been extirpated. The second most important area of remaining potential habitat not limited to known tiger habitat is Indochina tropical broadleaf forest. Results confi rm that there is no remaining tiger habitat in central Asia, Bali and Java, and China, although large areas of effective potential habitat remain, particularly in central Asia and China (Table 4.6).
4.4.3 Characteristics of TCLsTCLs were also analyzed according to their individual characteristics such as habitat and country representation and size (see Table 4.7). When they were compared for their biome representation, we fi nd that 41 TCLs out of 76 have more than one biome, and 10 have 3 or more biomes represented. Thus, protecting tigers in certain TCLs will also have an effect of preserving habitat diversity where they live.
Geographic RegionEffective PotentialHabitat (km2)
Total Area ofGeographic Region
(km2)Percent HabitatRemaining (%)
Bali and Java 3,068 131,363 2.3
Central Asia 1,054,607 4,157,327 25.4
China-Korea 1,076,369 4,311,950 25.0
Indian Subcontinent 327,061 2,969,805 11.0
Indochina 820,486 1,990,858 41.2
Peninsular Malaysia 30,228 129,939 23.3
Russian Far East 2,242,965 2,585,544 86.8
Sumatra 95,280 430,251 22.1
Table 4.5 Area of habitat by geographic region Note: Effective Potential Habitat is structural landcover of low human infl uence. Percent potential habitat is the percent of the biome’s total area that is occupied by effective potential habitat.
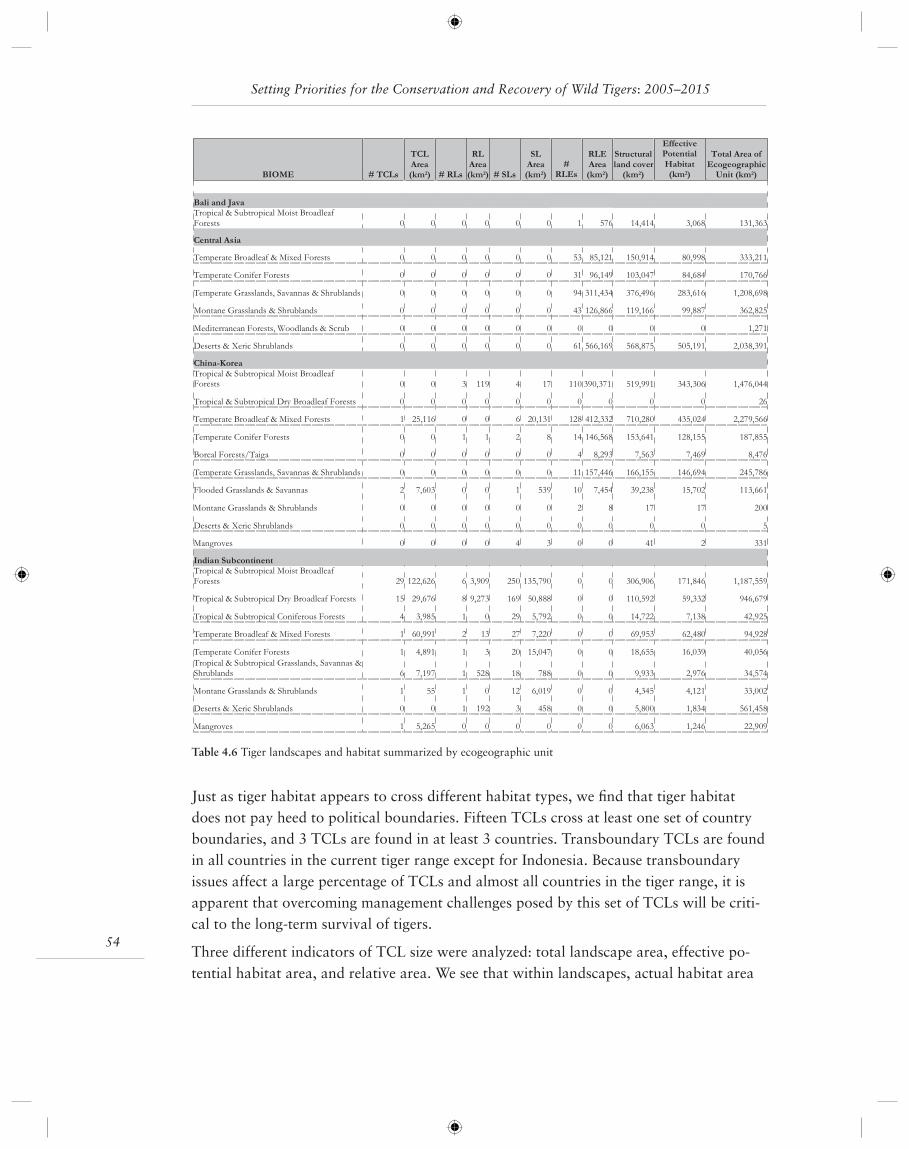
Setting Priorities for the Conservation and Recovery of Wild Tigers: 2005–2015
54
Just as tiger habitat appears to cross different habitat types, we fi nd that tiger habitat does not pay heed to political boundaries. Fifteen TCLs cross at least one set of country boundaries, and 3 TCLs are found in at least 3 countries. Transboundary TCLs are found in all countries in the current tiger range except for Indonesia. Because transboundary issues affect a large percentage of TCLs and almost all countries in the tiger range, it is apparent that overcoming management challenges posed by this set of TCLs will be criti-cal to the long-term survival of tigers.
Three different indicators of TCL size were analyzed: total landscape area, effective po-tential habitat area, and relative area. We see that within landscapes, actual habitat area
BIOME # TCLs
TCLArea(km2) # RLs
RLArea(km2) # SLs
SLArea(km2)
#RLEs
RLEArea(km2)
Structuralland cover(km2)
EffectivePotentialHabitat(km2)
Total Area ofEcogeographicUnit (km2)
Bali and JavaTropical & Subtropical Moist BroadleafForests 0 0 0 0 0 0 1 576 14,414 3,068 131,363
Central Asia
Temperate Broadleaf & Mixed Forests 0 0 0 0 0 0 53 85,121 150,914 80,998 333,211
Temperate Conifer Forests 0 0 0 0 0 0 31 96,149 103,047 84,684 170,766
Temperate Grasslands, Savannas & Shrublands 0 0 0 0 0 0 94 311,434 376,496 283,616 1,208,698
Montane Grasslands & Shrublands 0 0 0 0 0 0 43 126,866 119,166 99,887 362,825
Mediterranean Forests, Woodlands & Scrub 0 0 0 0 0 0 0 0 0 0 1,271
Deserts & Xeric Shrublands 0 0 0 0 0 0 61 566,169 568,875 505,191 2,038,391
China-KoreaTropical & Subtropical Moist BroadleafForests 0 0 3 119 4 17 110 390,371 519,991 343,306 1,476,044
Tropical & Subtropical Dry Broadleaf Forests 0 0 0 0 0 0 0 0 0 0 26
Temperate Broadleaf & Mixed Forests 1 25,116 0 0 6 20,131 128 412,332 710,280 435,024 2,279,566
Temperate Conifer Forests 0 0 1 1 2 8 14 146,568 153,641 128,155 187,855
Boreal Forests/Taiga 0 0 0 0 0 0 4 8,293 7,563 7,469 8,476
Temperate Grasslands, Savannas & Shrublands 0 0 0 0 0 0 11 157,446 166,155 146,694 245,786
Flooded Grasslands & Savannas 2 7,603 0 0 1 539 10 7,454 39,238 15,702 113,661
Montane Grasslands & Shrublands 0 0 0 0 0 0 2 8 17 17 200
Deserts & Xeric Shrublands 0 0 0 0 0 0 0 0 0 0 5
Mangroves 0 0 0 0 4 3 0 0 41 2 331
Indian SubcontinentTropical & Subtropical Moist BroadleafForests 29 122,626 6 3,909 250 135,790 0 0 306,906 171,846 1,187,559
Tropical & Subtropical Dry Broadleaf Forests 15 29,676 8 9,273 169 50,888 0 0 110,592 59,332 946,679
Tropical & Subtropical Coniferous Forests 4 3,985 1 0 29 5,792 0 0 14,722 7,138 42,925
Temperate Broadleaf & Mixed Forests 1 60,991 2 13 27 7,220 0 0 69,953 62,480 94,928
Temperate Conifer Forests 1 4,891 1 3 20 15,047 0 0 18,655 16,039 40,056
Tropical & Subtropical Grasslands, Savannas &Shrublands 6 7,197 1 528 18 788 0 0 9,933 2,976 34,574
Montane Grasslands & Shrublands 1 55 1 0 12 6,019 0 0 4,345 4,121 33,002
Deserts & Xeric Shrublands 0 0 1 192 3 458 0 0 5,800 1,834 561,458
Mangroves 1 5,265 0 0 0 0 0 0 6,063 1,246 22,909
Table 4.6 Tiger landscapes and habitat summarized by ecogeographic unit
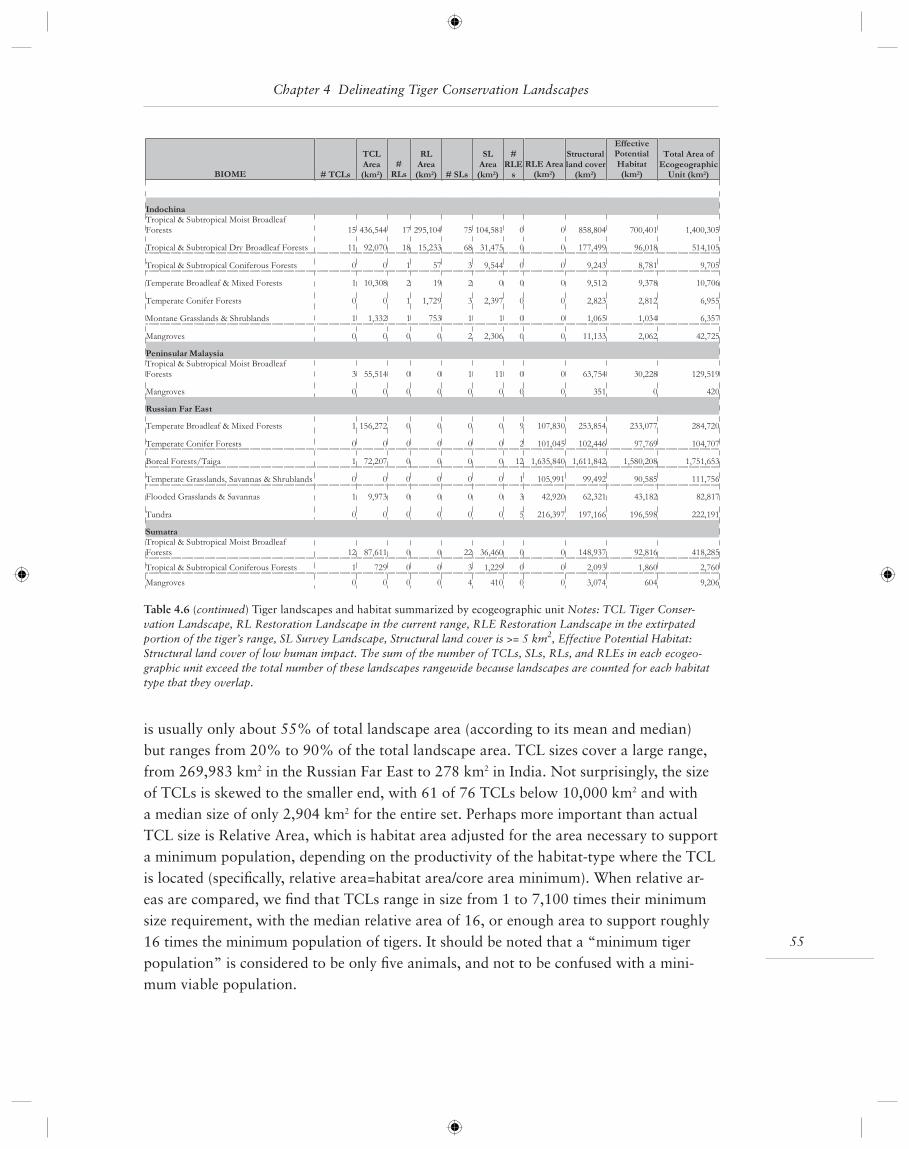
55
Chapter 4 Delineating Tiger Conservation Landscapes
is usually only about 55% of total landscape area (according to its mean and median) but ranges from 20% to 90% of the total landscape area. TCL sizes cover a large range, from 269,983 km2 in the Russian Far East to 278 km2 in India. Not surprisingly, the size of TCLs is skewed to the smaller end, with 61 of 76 TCLs below 10,000 km2 and with a median size of only 2,904 km2 for the entire set. Perhaps more important than actual TCL size is Relative Area, which is habitat area adjusted for the area necessary to support a minimum population, depending on the productivity of the habitat-type where the TCL is located (specifi cally, relative area=habitat area/core area minimum). When relative ar-eas are compared, we fi nd that TCLs range in size from 1 to 7,100 times their minimum size requirement, with the median relative area of 16, or enough area to support roughly 16 times the minimum population of tigers. It should be noted that a “minimum tiger population” is considered to be only fi ve animals, and not to be confused with a mini-mum viable population.
BIOME # TCLs
TCLArea(km2)
#RLs
RLArea(km2) # SLs
SLArea(km2)
#RLEsRLE Area(km2)
Structuralland cover(km2)
EffectivePotentialHabitat(km2)
Total Area ofEcogeographicUnit (km2)
IndochinaTropical & Subtropical Moist BroadleafForests 15 436,544 17 295,104 75 104,581 0 0 858,804 700,401 1,400,305
Tropical & Subtropical Dry Broadleaf Forests 11 92,070 18 15,233 68 31,475 0 0 177,499 96,018 514,105
Tropical & Subtropical Coniferous Forests 0 0 1 57 3 9,544 0 0 9,243 8,781 9,705
Temperate Broadleaf & Mixed Forests 1 10,308 2 19 2 0 0 0 9,512 9,378 10,706
Temperate Conifer Forests 0 0 1 1,729 3 2,397 0 0 2,823 2,812 6,955
Montane Grasslands & Shrublands 1 1,332 1 753 1 1 0 0 1,065 1,034 6,357
Mangroves 0 0 0 0 2 2,306 0 0 11,133 2,062 42,725
Peninsular MalaysiaTropical & Subtropical Moist BroadleafForests 3 55,514 0 0 1 11 0 0 63,754 30,228 129,519
Mangroves 0 0 0 0 0 0 0 0 351 0 420
Russian Far East
Temperate Broadleaf & Mixed Forests 1 156,272 0 0 0 0 9 107,830 253,854 233,077 284,720
Temperate Conifer Forests 0 0 0 0 0 0 2 101,045 102,446 97,769 104,707
Boreal Forests/Taiga 1 72,207 0 0 0 0 12 1,635,840 1,611,842 1,580,208 1,751,653
Temperate Grasslands, Savannas & Shrublands 0 0 0 0 0 0 1 105,991 99,492 90,585 111,756
Flooded Grasslands & Savannas 1 9,973 0 0 0 0 3 42,920 62,321 43,182 82,817
Tundra 0 0 0 0 0 0 5 216,397 197,166 196,598 222,191
SumatraTropical & Subtropical Moist BroadleafForests 12 87,611 0 0 22 36,460 0 0 148,937 92,816 418,285
Tropical & Subtropical Coniferous Forests 1 729 0 0 3 1,229 0 0 2,093 1,860 2,760
Mangroves 0 0 0 0 4 410 0 0 3,074 604 9,206
Table 4.6 (continued) Tiger landscapes and habitat summarized by ecogeographic unit Notes: TCL Tiger Conser-vation Landscape, RL Restoration Landscape in the current range, RLE Restoration Landscape in the extirpated portion of the tiger’s range, SL Survey Landscape, Structural land cover is >= 5 km2, Effective Potential Habitat: Structural land cover of low human impact. The sum of the number of TCLs, SLs, RLs, and RLEs in each ecogeo-graphic unit exceed the total number of these landscapes rangewide because landscapes are counted for each habitat type that they overlap.
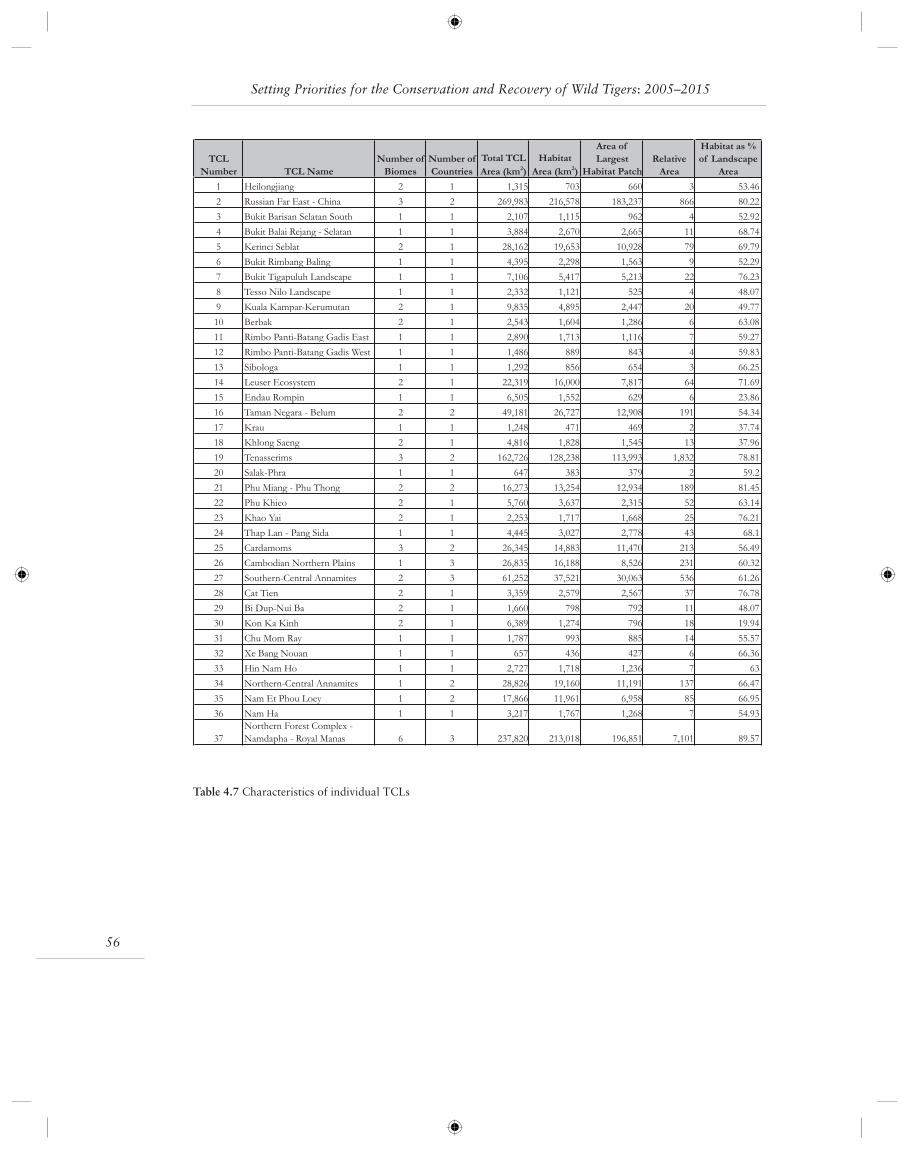
Setting Priorities for the Conservation and Recovery of Wild Tigers: 2005–2015
56
TCLNumber TCL Name
Number ofBiomes
Number ofCountries
Total TCLArea (km2)
HabitatArea (km2)
Area ofLargest
Habitat PatchRelative
Area
Habitat as % of Landscape
Area
1 Heilongjiang 2 1 1,315 703 660 3 53.46
2 Russian Far East - China 3 2 269,983 216,578 183,237 866 80.22
3 Bukit Barisan Selatan South 1 1 2,107 1,115 962 4 52.92
4 Bukit Balai Rejang - Selatan 1 1 3,884 2,670 2,665 11 68.74
5 Kerinci Seblat 2 1 28,162 19,653 10,928 79 69.79
6 Bukit Rimbang Baling 1 1 4,395 2,298 1,563 9 52.29
7 Bukit Tigapuluh Landscape 1 1 7,106 5,417 5,213 22 76.23
8 Tesso Nilo Landscape 1 1 2,332 1,121 525 4 48.07
9 Kuala Kampar-Kerumutan 2 1 9,835 4,895 2,447 20 49.77
10 Berbak 2 1 2,543 1,604 1,286 6 63.08
11 Rimbo Panti-Batang Gadis East 1 1 2,890 1,713 1,116 7 59.27
12 Rimbo Panti-Batang Gadis West 1 1 1,486 889 843 4 59.83
13 Sibologa 1 1 1,292 856 654 3 66.25
14 Leuser Ecosystem 2 1 22,319 16,000 7,817 64 71.69
15 Endau Rompin 1 1 6,505 1,552 629 6 23.86
16 Taman Negara - Belum 2 2 49,181 26,727 12,908 191 54.34
17 Krau 1 1 1,248 471 469 2 37.74
18 Khlong Saeng 2 1 4,816 1,828 1,545 13 37.96
19 Tenasserims 3 2 162,726 128,238 113,993 1,832 78.81
20 Salak-Phra 1 1 647 383 379 2 59.2
21 Phu Miang - Phu Thong 2 2 16,273 13,254 12,934 189 81.45
22 Phu Khieo 2 1 5,760 3,637 2,315 52 63.14
23 Khao Yai 2 1 2,253 1,717 1,668 25 76.21
24 Thap Lan - Pang Sida 1 1 4,445 3,027 2,778 43 68.1
25 Cardamoms 3 2 26,345 14,883 11,470 213 56.49
26 Cambodian Northern Plains 1 3 26,835 16,188 8,526 231 60.32
27 Southern-Central Annamites 2 3 61,252 37,521 30,063 536 61.26
28 Cat Tien 2 1 3,359 2,579 2,567 37 76.78
29 Bi Dup-Nui Ba 2 1 1,660 798 792 11 48.07
30 Kon Ka Kinh 2 1 6,389 1,274 796 18 19.94
31 Chu Mom Ray 1 1 1,787 993 885 14 55.57
32 Xe Bang Nouan 1 1 657 436 427 6 66.36
33 Hin Nam Ho 1 1 2,727 1,718 1,236 7 63
34 Northern-Central Annamites 1 2 28,826 19,160 11,191 137 66.47
35 Nam Et Phou Loey 1 2 17,866 11,961 6,958 85 66.95
36 Nam Ha 1 1 3,217 1,767 1,268 7 54.93
37
Northern Forest Complex -
Namdapha - Royal Manas 6 3 237,820 213,018 196,851 7,101 89.57
Table 4.7 Characteristics of individual TCLs
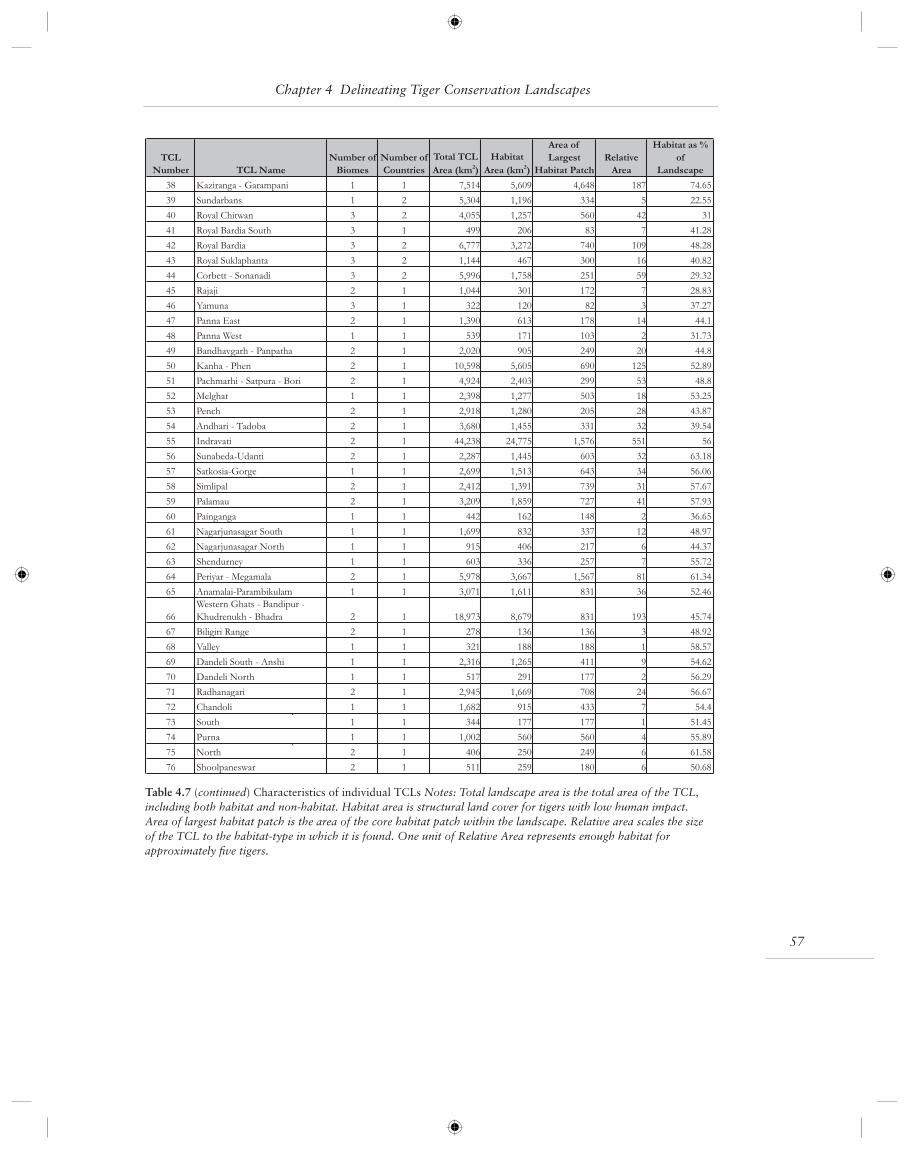
57
Chapter 4 Delineating Tiger Conservation Landscapes
TCLNumber TCL Name
Number ofBiomes
Number ofCountries
Total TCLArea (km2)
HabitatArea (km2)
Area ofLargest
Habitat PatchRelative
Area
Habitat as % of
Landscape
38 Kaziranga - Garampani 1 1 7,514 5,609 4,648 187 74.65
39 Sundarbans 1 2 5,304 1,196 334 5 22.55
40 Royal Chitwan 3 2 4,055 1,257 560 42 31
41 Royal Bardia South 3 1 499 206 83 7 41.28
42 Royal Bardia 3 2 6,777 3,272 740 109 48.28
43 Royal Suklaphanta 3 2 1,144 467 300 16 40.82
44 Corbett - Sonanadi 3 2 5,996 1,758 251 59 29.32
45 Rajaji 2 1 1,044 301 172 7 28.83
46 Yamuna 3 1 322 120 82 3 37.27
47 Panna East 2 1 1,390 613 178 14 44.1
48 Panna West 1 1 539 171 103 2 31.73
49 Bandhavgarh - Panpatha 2 1 2,020 905 249 20 44.8
50 Kanha - Phen 2 1 10,598 5,605 690 125 52.89
51 Pachmarhi - Satpura - Bori 2 1 4,924 2,403 299 53 48.8
52 Melghat 1 1 2,398 1,277 503 18 53.25
53 Pench 2 1 2,918 1,280 205 28 43.87
54 Andhari - Tadoba 2 1 3,680 1,455 331 32 39.54
55 Indravati 2 1 44,238 24,775 1,576 551 56
56 Sunabeda-Udanti 2 1 2,287 1,445 603 32 63.18
57 Satkosia-Gorge 1 1 2,699 1,513 643 34 56.06
58 Simlipal 2 1 2,412 1,391 739 31 57.67
59 Palamau 2 1 3,209 1,859 727 41 57.93
60 Painganga 1 1 442 162 148 2 36.65
61 Nagarjunasagar South 1 1 1,699 832 337 12 48.97
62 Nagarjunasagar North 1 1 915 406 217 6 44.37
63 Shendurney 1 1 603 336 257 7 55.72
64 Periyar - Megamala 2 1 5,978 3,667 1,567 81 61.34
65 Anamalai-Parambikulam 1 1 3,071 1,611 831 36 52.46
66
Western Ghats - Bandipur -
Khudrenukh - Bhadra 2 1 18,973 8,679 831 193 45.74
67 Biligiri Range 2 1 278 136 136 3 48.92
68 Valley 1 1 321 188 188 1 58.57
69 Dandeli South - Anshi 1 1 2,316 1,265 411 9 54.62
70 Dandeli North 1 1 517 291 177 2 56.29
71 Radhanagari 2 1 2,945 1,669 708 24 56.67
72 Chandoli 1 1 1,682 915 433 7 54.4
73
p
South 1 1 344 177 177 1 51.45
74 Purna 1 1 1,002 560 560 4 55.89
75
p
North 2 1 406 250 249 6 61.58
76 Shoolpaneswar 2 1 511 259 180 6 50.68
Table 4.7 (continued) Characteristics of individual TCLs Notes: Total landscape area is the total area of the TCL, including both habitat and non-habitat. Habitat area is structural land cover for tigers with low human impact. Area of largest habitat patch is the area of the core habitat patch within the landscape. Relative area scales the size of the TCL to the habitat-type in which it is found. One unit of Relative Area represents enough habitat for approximately fi ve tigers.
Setting Priorities for the Conservation and Recovery of Wild Tigers: 2005–2015
58
4.5 Discussion: Interpretation of TCL Delineation
4.5.1 Advances in version 2.0The delineation of tiger conservation landscapes, and associated areas, includes sev-eral advances in the science of range-wide priority-setting and has implications for tiger conservation across the species range. The results are the most current, objective assess-ment of tiger status and distribution available to date. They build from newly revised datasets on tiger distribution (Chapter 2) and land cover (Chapter 3), and they combine these datasets with others to produce a systematically derived map of tiger habitat dis-tribution and occupancy. The results arise from a hierarchical methodology that begins with the tiger’s historical range, then peels away areas of non-habitat, those with human infl uence exceeding that which is tolerated by tigers, and then removes areas where tiger survey data are negative or lacking. Each part of the range is clearly labeled in terms of its potential contribution to tiger conservation. Results are presented in a representative framework, including the major biome and regional distinctions across the range.
An important advance that builds on the last decade of fi eld research on tigers are the habitat specifi c densities that are used to designate variably sized areas of suffi cient habi-tat in different parts of the range. Habitat-specifi c thresholds are provided for minimum core areas and stepping-stones.
Another key advance that has not previously been used in species-level rangeiwide prior-ity setting exercises is the incorporation of the human infl uence thresholds to represent “too much” human pressure on areas of apparent structural habitat. The use of the Hu-man Fsootprint analysis (Sanderson et al. 2002) in this way represents a potential solu-tion to the “empty forest” problem highlighted over 10 years ago (Redford 1992). This solution is portable to other species mapping problems and may yield insights into the distributions of different species.
Importantly, this process is automated and therefore immediately repeatable with each update to the input data sets. Automating the process creates the potential for a truly “living document.” As new data comes in from fi eld surveys, as the land cover dataset is updated, as our understanding of human-tiger confl ict improves, our range-wide results can be updated. Automation also enables sensitivity analysis of parameter decisions, im-proving our understanding of model performance, as described in Chapter 5.
4.5.2 Data limitations and model complicationAll models suffer from the qualities of the input datasets. Complicated models also suf-fer from the number of model relationships that need to be described and the parameter choices that need to be made. Every decision point provides an opportunity for error and uncertainty to enter the process. These delineation results, while the best that we can sup-ply at this juncture, are affected by both data defi ciencies and complication.
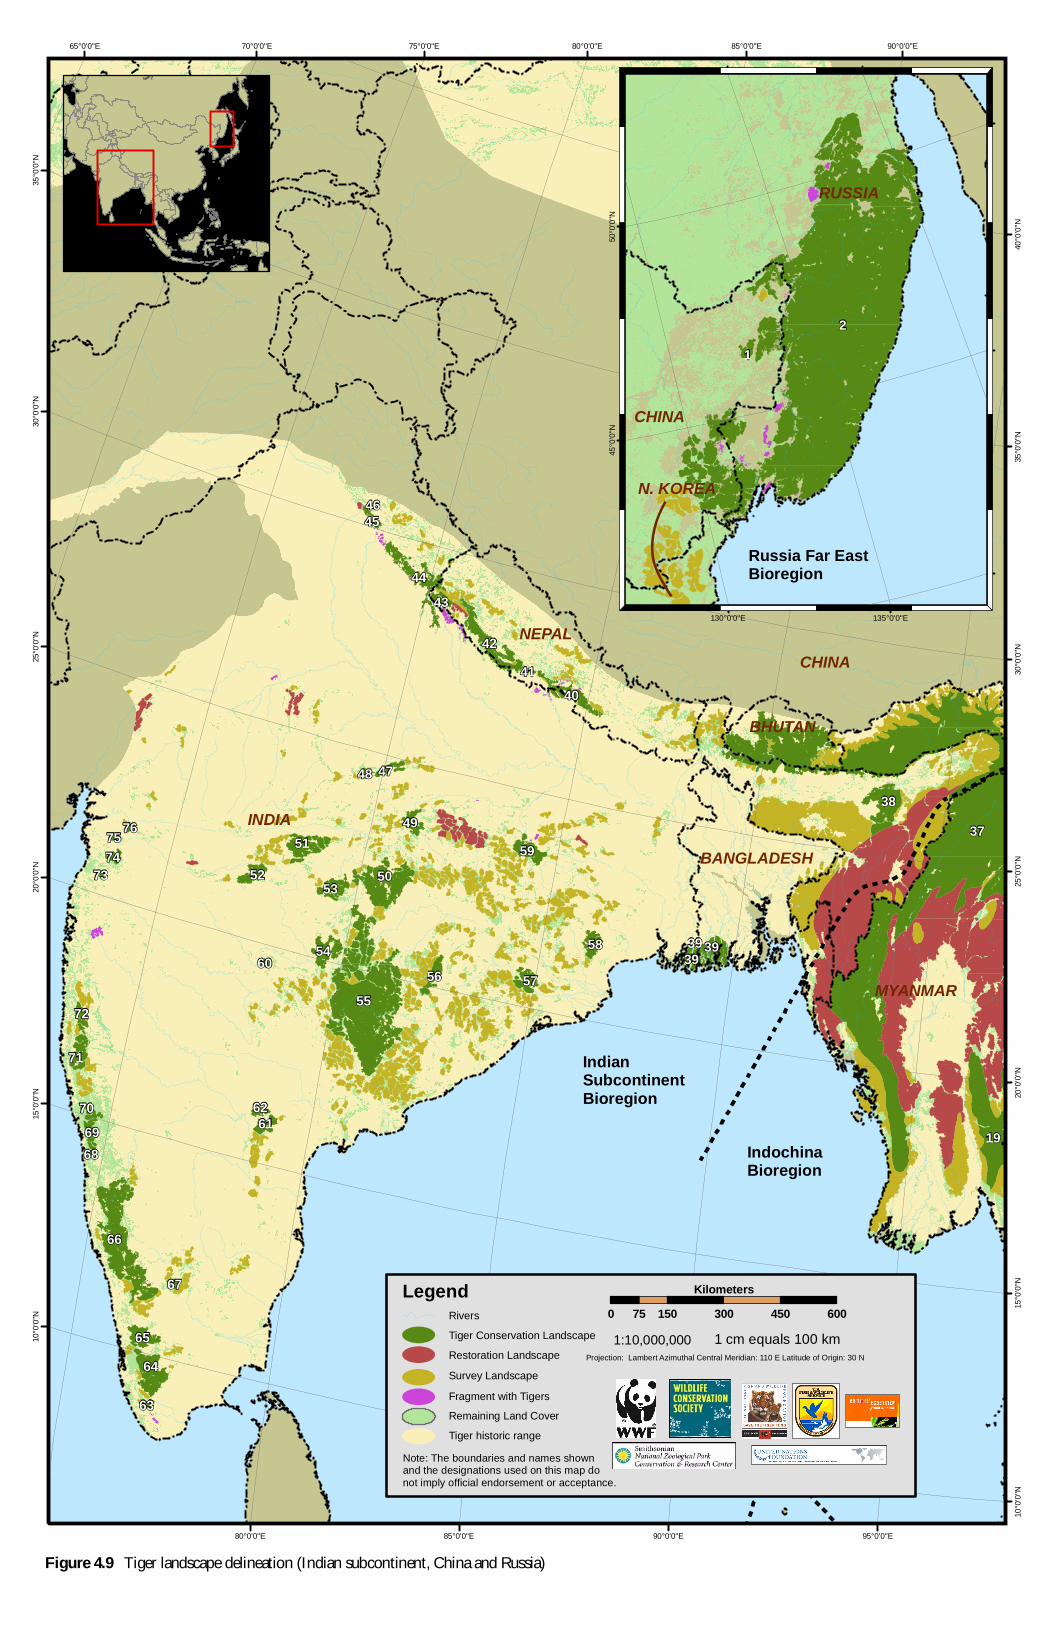
37
55
19
38
66
50
42
44
64
51
40
54 39
59
65
71
53
57
58
52
69
56
49
61
72
47
43
45
39
74
62
63
48
70
76
41
60
75
39
73
46
68
67
75°0'0"E70°0'0"E65°0'0"E
80°0'0"E
80°0'0"E
85°0'0"E
85°0'0"E
90°0'0"E
90°0'0"E
95°0'0"E
10°0'
0"N
10°0'
0"N
15°0'
0"N
15°0'
0"N
20°0'
0"N
20°0'
0"N
25°0'
0"N
25°0'
0"N
30°0'
0"N
30°0'
0"N
35°0'
0"N
35°0'
0"N40
°0'0"N
21
130°0'0"E 135°0'0"E45
°0'0"N
50°0'
0"N
Indian SubcontinentBioregion
Russia Far EastBioregion
INDIA
NEPAL
BANGLADESH
MYANMAR
CHINA
BHUTAN
CHINA
RUSSIA
N. KOREA
IndochinaBioregion
Legend
Note: The boundaries and names shown and the designations used on this map do not imply official endorsement or acceptance.
RiversTiger Conservation LandscapeRestoration Landscape
Remaining Land Cover
Survey LandscapeFragment with Tigers
Tiger historic range
Projection: Lambert Azimuthal Central Meridian: 110 E Latitude of Origin: 30 N
0 150 300 450 60075Kilometers
1 cm equals 100 km1:10,000,000
Tiger landscape delineation (Indian subcontinent, China and Russia)Figure 4.9

37
19
27
5
16
26
25
9
7
38
34
14
35
21
6
30
4
15
22
18
24
8
3
36
28
11
33
10
2331
29
12
13
17
32
20
95°0'0"E
95°0'0"E
100°0'0"E
100°0'0"E
105°0'0"E
105°0'0"E
110°0'0"E
110°0'0"E 115°0'0"E
115°0'0"E
5°0'0"
S
5°0'0"
S
0°0'0"
0°0'0"
5°0'0"
N
5°0'0"
N
10°0'
0"N
10°0'
0"N
15°0'
0"N
15°0'
0"N
20°0'
0"N
20°0'
0"N
25°0'
0"N
25°0'
0"NSoutheast AsiaBioregion
IndochinaBioregion
LAOS
THAILAND
VIETNAM
MYANMAR
INDIA
CAMBODIA
INDONESIA
MALAYSIA
Legend
Note: The boundaries and names shown and the designations used on this map do not imply official endorsement or acceptance.
Rivers
Fragment with Tigers
Restoration LandscapeTiger Conservation Landscape
Tiger historic rangeRemaining Land Cover
Survey Landscape
1:10,000,000 1 cm equals 100 km0 125 250 375 50062.5
Kilometers
Projection: Lambert AzimuthalCentral Meridian: 110 ELatitude of Origin: 30 N
Figure 4.10 Tiger landscape delineation (Mainland Southeast Asia and Sumatra)
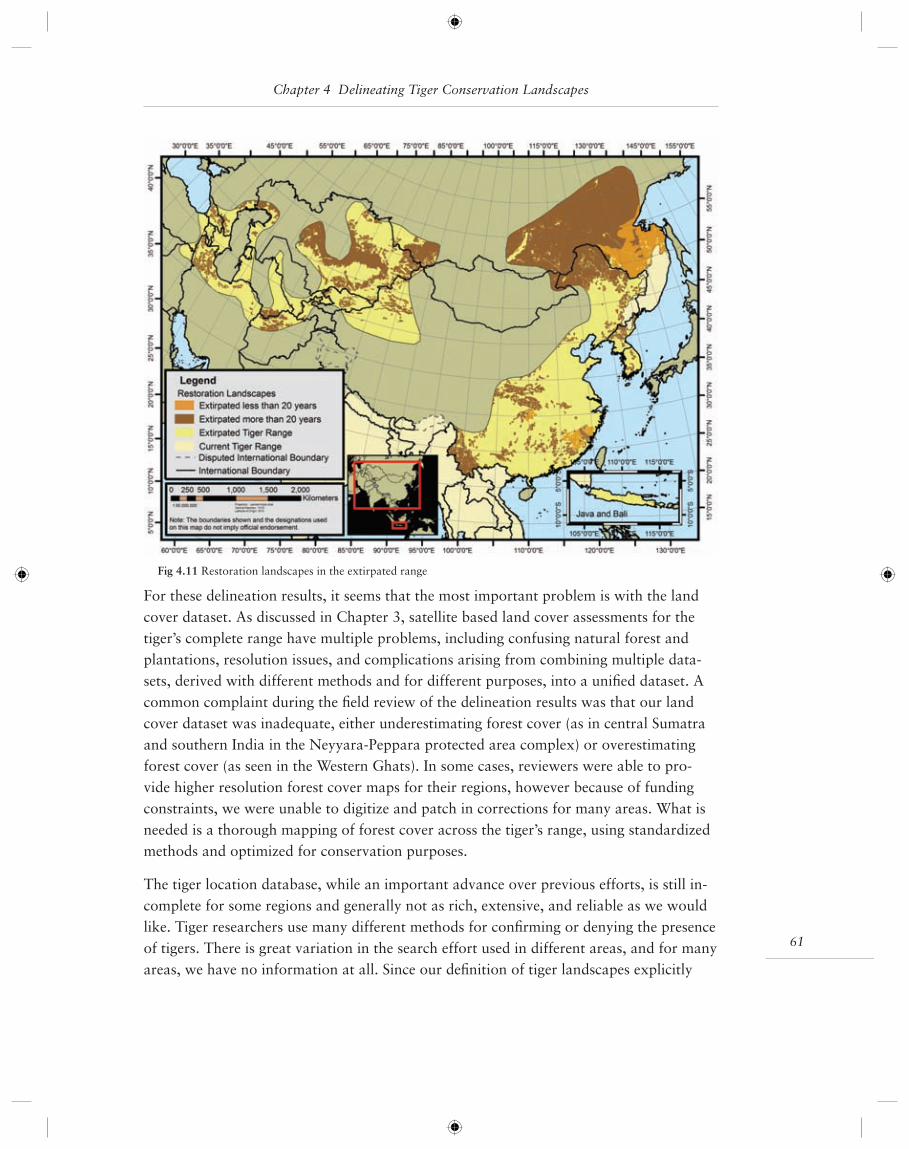
61
Chapter 4 Delineating Tiger Conservation Landscapes
For these delineation results, it seems that the most important problem is with the land cover dataset. As discussed in Chapter 3, satellite based land cover assessments for the tiger’s complete range have multiple problems, including confusing natural forest and plantations, resolution issues, and complications arising from combining multiple data-sets, derived with different methods and for different purposes, into a unifi ed dataset. A common complaint during the fi eld review of the delineation results was that our land cover dataset was inadequate, either underestimating forest cover (as in central Sumatra and southern India in the Neyyara-Peppara protected area complex) or overestimating forest cover (as seen in the Western Ghats). In some cases, reviewers were able to pro-vide higher resolution forest cover maps for their regions, however because of funding constraints, we were unable to digitize and patch in corrections for many areas. What is needed is a thorough mapping of forest cover across the tiger’s range, using standardized methods and optimized for conservation purposes.
The tiger location database, while an important advance over previous efforts, is still in-complete for some regions and generally not as rich, extensive, and reliable as we would like. Tiger researchers use many different methods for confi rming or denying the presence of tigers. There is great variation in the search effort used in different areas, and for many areas, we have no information at all. Since our defi nition of tiger landscapes explicitly
Fig 4.11 Restoration landscapes in the extirpated range

Setting Priorities for the Conservation and Recovery of Wild Tigers: 2005–2015
62
incorporates consideration of tiger survey results, omissions from the results can strongly affect the results. Since we lacked scientifi c survey results for many parts of the range, and often lacked adequate information to make an informed judgment about the reliabil-ity of tiger reports in a given area, were often forced to use the default decision of assign-ing a landscape with tiger information if any report was received.
A related issue is how to deal with large, connected habitats with only a few tiger obser-vations. According to the current model rules, a positive tiger observation connotes tiger presence in a block of connected habitat up to the nearest set of ecoregional or country boundaries. This rule is somewhat arbitrary, but it provides a mechanism for segment-ing vast connected forest blocks (for example in Myanmar and connected areas in India, Thailand, and Laos) with only scattered tiger observations. Unfortunately, the habitat and country boundaries used still not do justice to actual variation in tiger distribution within a given habitat block. This has caused problems of analysis and interpretation in forested areas of Myanmar, Thailand, and Cambodia, in particular, where information on tiger distribution (and knowledge of other factors affecting tigers more generally) varies from one area of the habitat block to another.
It is important to note that the scale and grain of this analysis affects the interpretation of the results. When we began the project, we made choices about the type of data and methods to use that would be most appropriate to fulfi lling its objectives, which was to map tiger habitat across the entire range and to objectively compare these habitats for investment purposes. We therefore selected regional scale datasets, and adopted a set of management defi nitions and decision rules that could be applied across the range. Al-though this set of methods was appropriate at the regional scale, a level of detail at the local scale was sacrifi ced. To help clarify local priorities not expressed in the regional-scale maps, national scale assessments using higher resolution datasets and methodolo-gies fi ne-tuned to the local cultural and habitat characteristics would help to clarify local priorities for conservation effort. One example of a fi ner-scale analysis of tiger status at a national level is a recent assessment undertaken by a broad consortium of government agencies and non-governmental groups in Cambodia (see Appendix 6). The data used for these analyses will be made available to any party or group wishing to make a fi ner-scale, sub-regional or national analysis.
Local level assessments such as this might also stress the importance of areas with tigers that may be too small to be a regional investment priority, but are nonetheless locally important for their benefi ts to environmental education and ecotourism income, in addition to their obvious benefi t of continuing to harbor small populations of tigers and their prey. In Sumatra, Way Kambas National Park, as well as a currently unprotect-ed mosaic of plantation and lowland forest habitat in Jambi province, might fall into this category of places.
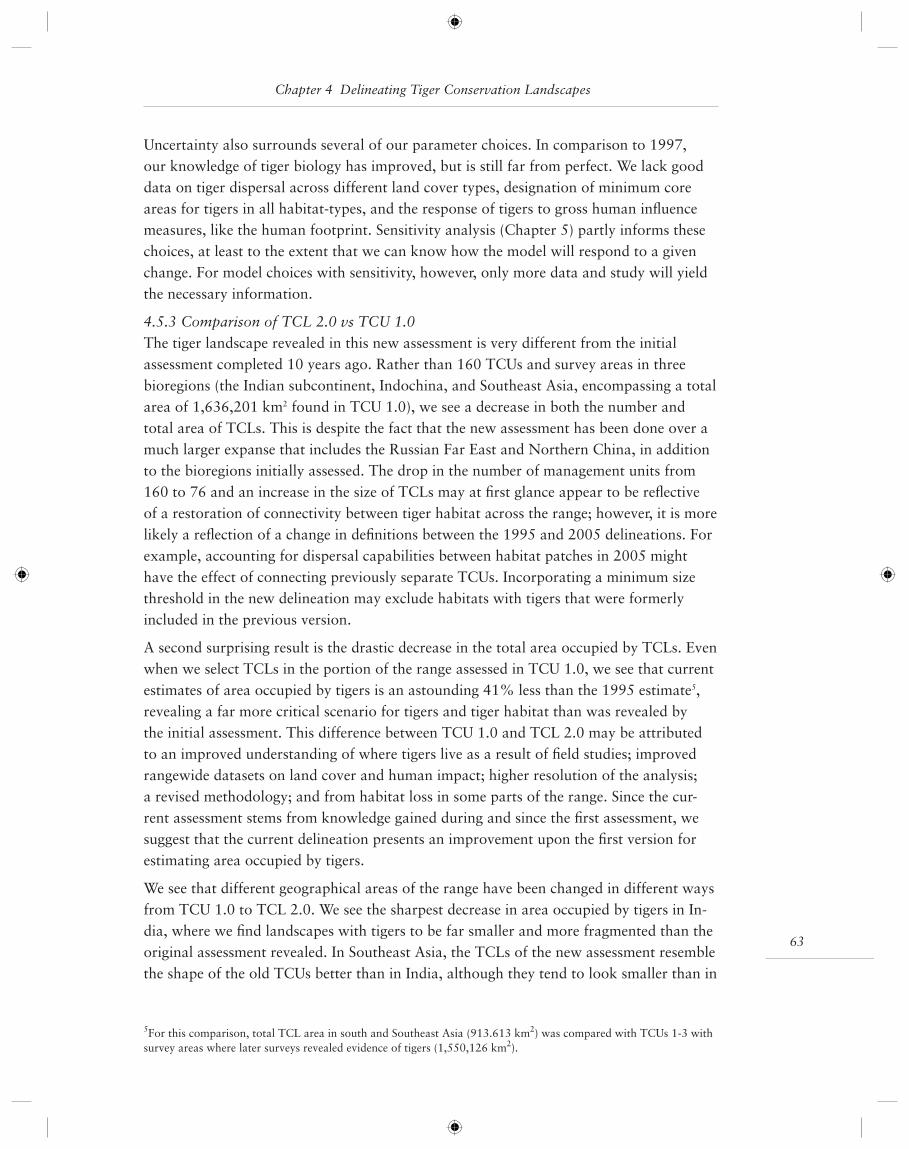
63
Chapter 4 Delineating Tiger Conservation Landscapes
Uncertainty also surrounds several of our parameter choices. In comparison to 1997, our knowledge of tiger biology has improved, but is still far from perfect. We lack good data on tiger dispersal across different land cover types, designation of minimum core areas for tigers in all habitat-types, and the response of tigers to gross human infl uence measures, like the human footprint. Sensitivity analysis (Chapter 5) partly informs these choices, at least to the extent that we can know how the model will respond to a given change. For model choices with sensitivity, however, only more data and study will yield the necessary information.
4.5.3 Comparison of TCL 2.0 vs TCU 1.0The tiger landscape revealed in this new assessment is very different from the initial assessment completed 10 years ago. Rather than 160 TCUs and survey areas in three bioregions (the Indian subcontinent, Indochina, and Southeast Asia, encompassing a total area of 1,636,201 km2 found in TCU 1.0), we see a decrease in both the number and total area of TCLs. This is despite the fact that the new assessment has been done over a much larger expanse that includes the Russian Far East and Northern China, in addition to the bioregions initially assessed. The drop in the number of management units from 160 to 76 and an increase in the size of TCLs may at fi rst glance appear to be refl ective of a restoration of connectivity between tiger habitat across the range; however, it is more likely a refl ection of a change in defi nitions between the 1995 and 2005 delineations. For example, accounting for dispersal capabilities between habitat patches in 2005 might have the effect of connecting previously separate TCUs. Incorporating a minimum size threshold in the new delineation may exclude habitats with tigers that were formerly included in the previous version.
A second surprising result is the drastic decrease in the total area occupied by TCLs. Even when we select TCLs in the portion of the range assessed in TCU 1.0, we see that current estimates of area occupied by tigers is an astounding 41% less than the 1995 estimate5, revealing a far more critical scenario for tigers and tiger habitat than was revealed by the initial assessment. This difference between TCU 1.0 and TCL 2.0 may be attributed to an improved understanding of where tigers live as a result of fi eld studies; improved rangewide datasets on land cover and human impact; higher resolution of the analysis; a revised methodology; and from habitat loss in some parts of the range. Since the cur-rent assessment stems from knowledge gained during and since the fi rst assessment, we suggest that the current delineation presents an improvement upon the fi rst version for estimating area occupied by tigers.
We see that different geographical areas of the range have been changed in different ways from TCU 1.0 to TCL 2.0. We see the sharpest decrease in area occupied by tigers in In-dia, where we fi nd landscapes with tigers to be far smaller and more fragmented than the original assessment revealed. In Southeast Asia, the TCLs of the new assessment resemble the shape of the old TCUs better than in India, although they tend to look smaller than in
5For this comparison, total TCL area in south and Southeast Asia (913.613 km2) was compared with TCUs 1-3 with survey areas where later surveys revealed evidence of tigers (1,550,126 km2).
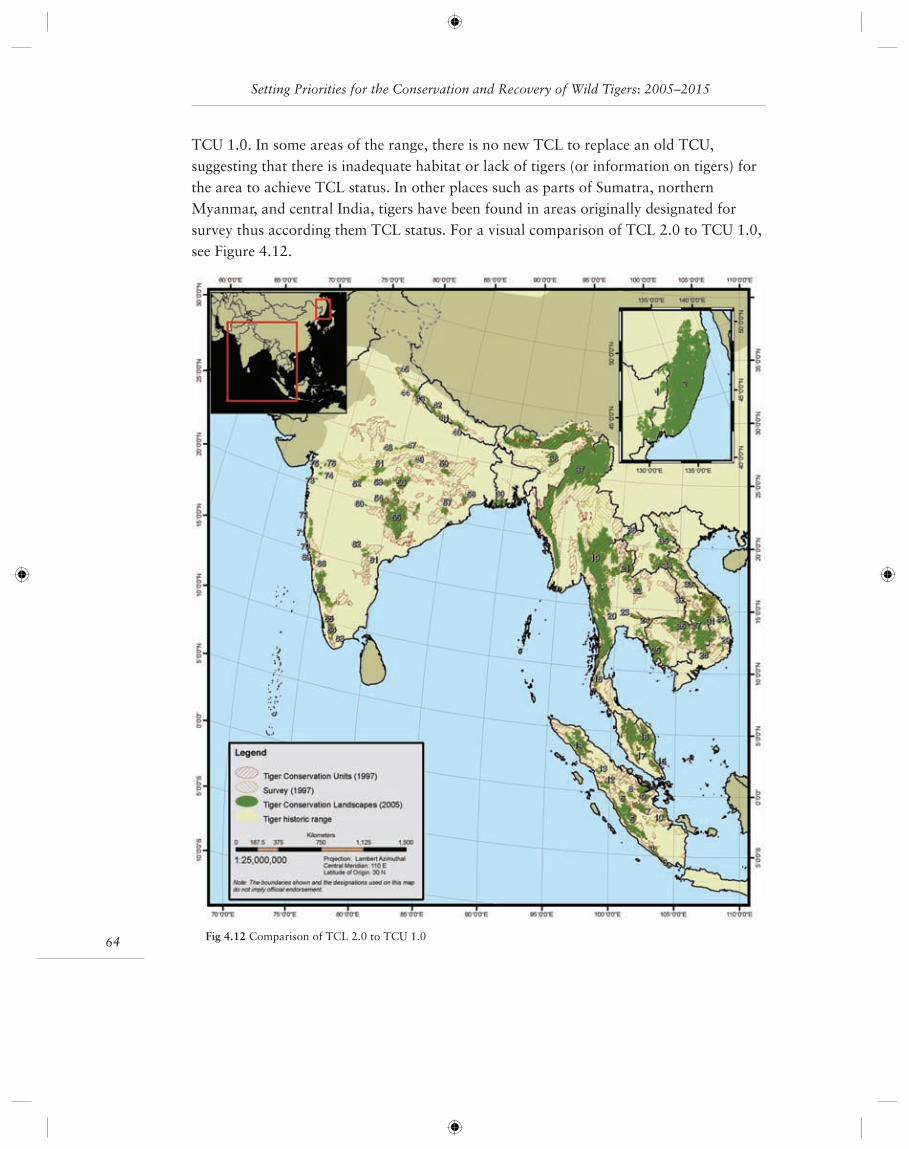
Setting Priorities for the Conservation and Recovery of Wild Tigers: 2005–2015
64
TCU 1.0. In some areas of the range, there is no new TCL to replace an old TCU, suggesting that there is inadequate habitat or lack of tigers (or information on tigers) for the area to achieve TCL status. In other places such as parts of Sumatra, northern Myanmar, and central India, tigers have been found in areas originally designated for survey thus according them TCL status. For a visual comparison of TCL 2.0 to TCU 1.0, see Figure 4.12.
Fig 4.12 Comparison of TCL 2.0 to TCU 1.0
65
Chapter 4 Delineating Tiger Conservation Landscapes
4.5.4 Recommendations arising from the delineation process
The way in which TCLs were defi ned and delineated lend themselves to certain manage-ment recommendations. Given the data we have assembled, these areas have been iden-tifi ed as the most important areas for tiger conservation, each harboring one or more tiger populations and the matrix of habitat and non-habitat area types where they exist. Within the TCLs themselves, we recommend that conservation strategies focus on secur-ing existing tiger and tiger prey populations (particularly through protection and restora-tion of their breeding areas), protect existing tiger habitat from land conversion to agri-culture and settlements, expand the current protected area network to encompass more of the tiger range in that area, and restore connectivity between patches of actual habitat within landscapes.
Our results indicate that TCLs tend to be clustered, offering the potential of forming even larger landscapes if connectivity between them can be reestablished. For example, there is a cluster of TCLs in the Terai Arc of India and Nepal; another set in central India; and another in central Indochina, including Myanmar, Laos, and Thailand. Such TCL clusters represent large expanses of suitable habitat interrupted by stretches of non-habitat more than 4 km.
Focusing conservation efforts on certain large TCLs will provide important fodder for saving tigers in the wild. For example, TCL #37 (Northern Forest Complex - Namdapha - Royal Manas) has the largest, relative area of 7,100 km2 (with potential to support an estimated 35,500 tigers). It has within its boundaries six different biomes and crosses the boundaries of three countries. Conservation of this TCL will require transboundary cooperation and recognition of the different roles tigers play in different biome types. But successful conservation efforts in this area will go a long way towards achieving our goals for tigers.
A long-term tiger restoration strategy would seek to reconnect adjacent TCLs to increase the opportunity for tiger meta-populations to recover and persist. The success of such a strategy would also seek to reconnect survey and restoration landscapes as well as more fragmented potential habitat outside of landscapes with TCLs. Such reconnection could support tiger dispersal or even residence in the long-term.
Restoration landscapes are large areas of potential habitat of low human impact that have been surveyed in the past 10 years, with no evidence of tigers. As stated above, these landscapes would need to be managed in such a manner to restore tiger populations, either through reconnection with existing TCLs or through active tiger reintroduction.
Survey landscapes, like restoration landscapes, are large areas of potential habitat of low human impact. Unlike restoration landscapes, these landscapes have not been surveyed in the past 10 years (or have been surveyed but with results unknown to this study). Man-agement recommendations are similar to restoration landscapes, with the added recom-
Setting Priorities for the Conservation and Recovery of Wild Tigers: 2005–2015
66
mendation that the area be surveyed and results submitted to revise the delineation maps. Chapter 6 (Classifi cation and Prioritization) provides further details on how investments and conservation efforts should proceed for TCLs, survey, and restoration landscapes.
More than 400 restoration (or extirpated) landscapes have been identifi ed in China, central Asia, and Java, which make up extirpated parts of the tiger’s historical range. These areas have been incorporated into the analysis as a reminder that these areas once supported tiger populations, some of which may be necessary to restore if we are to reach a goal of 100,000 tigers by 2100. While tiger habitat restoration strategies in the near term might not focus on these areas, it is important to remember that some large areas of potentially suitable habitat remain in China and central Asia.
4.6 Conclusions
As recently as 150 years ago, tigers ranged over vast areas of the Indian subcontinent, Southeast Asia, Indonesia (including Sumatra, Java, and Bali), China and Korea, central Asia, and the Russian Far East. Today, tigers range over only a small fraction (only 7%) of their former range. Current estimates of tiger habitat suggest a far more serious, albeit perhaps realistic, assessment of tiger habitat than the initial assessment, with current esti-mates 41% less than 1995 estimates. Of the tiger landscapes that remain, the majority do not have enough area to support a population of more than 100 tigers.
Tigers continue to range over a diversity of habitat types, but those favored by tigers—such as tropical moist and dry broadleaf forests in India and Southeast Asia and temper-ate mixed forest in the Russian Far East—are also some of the most common in Asia and favored by people. This competition with people in the tropical biomes mentioned limits tigers to 8 to 15% of that biome’s area in the tiger’s historic range.
The vast amount of tiger habitat remains in small landscapes under 10,000 km2, with most landscapes only around 3,000 km2. However, 15 large TCLs increase the average size of TCLs tremendously. More than half of the TCLs have more than one habitat type, so protecting these will also protect habitat diversity and niches for other species. Sev-eral TCLs cross political boundaries, causing each mainland country of the tigers current range to host a transboundary TCL. Indeed, effective solutions to transboundary man-agement of TCLs in all of these countries will be a critical step to securing (and hopefully rebuilding) tiger populations into the future. Securing tiger populations and habitat in the largest TCLs will be critical to meeting the goal of 100,000 tigers by 2100—however, this will not be possible without effective transboundary conservation efforts.
Tigers are a species in crisis and have already lost much of the battle with humans. How-ever, large areas of habitat remain and their populations are recoverable with success-ful conservation. Indeed, future development efforts that are zoned to occur outside of landscapes (including landscapes with and without tigers), that address tiger conservation

67
Chapter 4 Delineating Tiger Conservation Landscapes
issues in their development plans, and that observe potential connections between land-scapes will go a long way to ensuring that humans, tigers, and other wildlife will be able to coexist on the same continent for years in the future.
— Jessica Forrest, Eric Sanderson, Gosia Bryja,aaaaaa Colby Loucks, John Seidensticker, Timothy O’Brien
Setting Priorities for the Conservation and Recovery of Wild Tigers: 2005–2015
68
Chapter 5 Sensitivity Analysis
5.1 Introduction
In Chapter 4, we described the methods used to delineate tiger habitat across the range of the species. These methods were based on a priori decision rules in which criteria were selected based on the best available knowledge on tiger ecology and behavior. This stan-dard set of criteria enabled us to maximize the use our current knowledge about tigers in an objective and consistent manner across the entire range, allowing us to compare the potential for conservation success in different areas where they live. During the delinea-tion process, however, we were faced with many decisions when defi ning tiger conserva-tion landscapes (TCL’s) - challenges not unfamiliar to other species modeling efforts. Such challenges developed from uncertainties about the set of assumptions drawn from our current knowledge of tiger ecology used to guide the delineation, and questions about the accuracy and quality of data layers used in our analyses. Indeed, despite advances in research and knowledge on tiger ecology in the past 10 years, uncertainties remain about tiger dispersal patterns, sensitivity to human impact, density at carrying capacity in dif-ferent habitat types, and how these characteristics might vary across the range. Moreover, problems arise with the accuracy and consistency of the data we do have. Although we made signifi cant efforts to update the basic data inputs for this exercise (Chapters 2 and 3), we are aware of continued imperfections in the base data layers.
We realize that our limited understanding of tiger biology and ecology along with the recognized problems with datasets can have powerful implications on the delineation results and hence on fi nancial and programmatic investments in tiger conservation. Our tiger conservation planning effort can, thus, benefi t from the sensitivity analysis to bet-ter understand how sensitive our delineation results are to the choice of parameters. The analysis involves re-running our model to determine how the results vary in response to a change in one of the input parameters. This process can be useful for determining which input variables need to be estimated more carefully.
Variables that we decided to test include the human infl uence index, tiger dispersal distance between habitat patches, area of tiger presence defi ned by the radius from a point location, and minimum core area requirement. Sequentially adjusting individual thresholds of our model parameters allowed us to generate alternative TCL delineations. By knowing how the model responds to different parameter sets, we can make more informed decision about parameter choices and identify which factors are most important to research in the future.
5.2 Methodology for Sensitivity Assessment
For the sensitivity analysis we used an Arc/AML script to test 4 main parameters that af-fect the fi nal delineation results: (1) human infl uence, (2) tiger dispersal distance (3) area
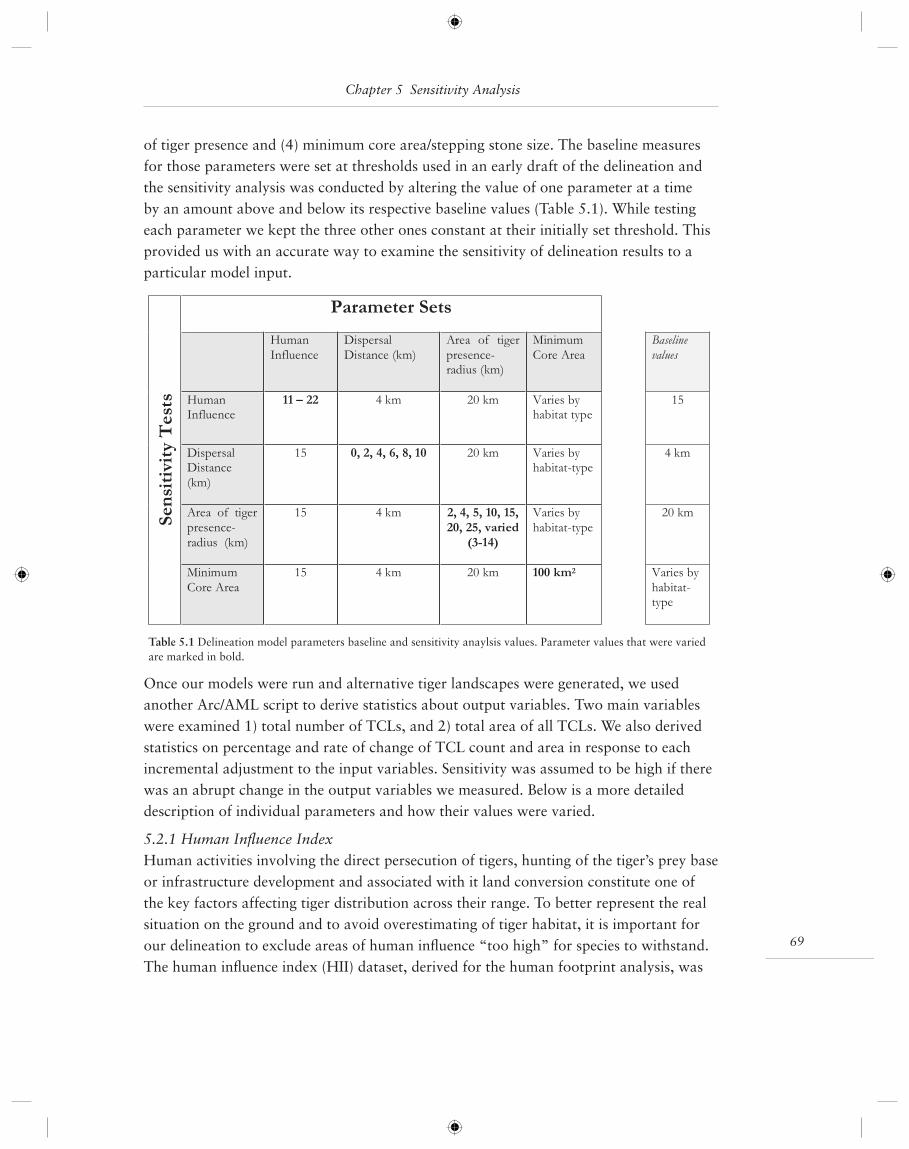
69
Chapter 5 Sensitivity Analysis
of tiger presence and (4) minimum core area/stepping stone size. The baseline measures for those parameters were set at thresholds used in an early draft of the delineation and the sensitivity analysis was conducted by altering the value of one parameter at a time by an amount above and below its respective baseline values (Table 5.1). While testing each parameter we kept the three other ones constant at their initially set threshold. This provided us with an accurate way to examine the sensitivity of delineation results to a particular model input.
Once our models were run and alternative tiger landscapes were generated, we used another Arc/AML script to derive statistics about output variables. Two main variables were examined 1) total number of TCLs, and 2) total area of all TCLs. We also derived statistics on percentage and rate of change of TCL count and area in response to each incremental adjustment to the input variables. Sensitivity was assumed to be high if there was an abrupt change in the output variables we measured. Below is a more detailed description of individual parameters and how their values were varied.
5.2.1 Human Infl uence IndexHuman activities involving the direct persecution of tigers, hunting of the tiger’s prey base or infrastructure development and associated with it land conversion constitute one of the key factors affecting tiger distribution across their range. To better represent the real situation on the ground and to avoid overestimating of tiger habitat, it is important for our delineation to exclude areas of human infl uence “too high” for species to withstand. The human infl uence index (HII) dataset, derived for the human footprint analysis, was
Parameter Sets
Human
Influence
Dispersal
Distance (km)
Area of tiger
presence-radius (km)
Minimum
Core Area
Baseline
values
HumanInfluence
11 – 22 4 km 20 km Varies byhabitat type
15
DispersalDistance
(km)
15 0, 2, 4, 6, 8, 10 20 km Varies byhabitat-type
4 km
Area of tiger
presence-
radius (km)
15 4 km 2, 4, 5, 10, 15,20, 25, varied
(3-14)
Varies by
habitat-type
20 kmSen
siti
vity
Tes
ts
Minimum
Core Area
15 4 km 20 km 100 km2 Varies by
habitat-type
Table 5.1 Delineation model parameters baseline and sensitivity anaylsis values. Parameter values that were varied are marked in bold.
Setting Priorities for the Conservation and Recovery of Wild Tigers: 2005–2015
70
used as a proxy for anthropogenic impact on the land and it was incorporated to inves-tigate the relationship between the patterns of tiger distribution and the level of human pressure. The HII dataset represents the sum of infl uence from human population density, land transformation, accessibility, and technological development, and varies from 0 to 72 (Sanderson et al. 2002). HII value of 15 was derived from statistical calculations (see Chapter 4) to represent the most appropriate threshold for delineating areas with levels of human impact low enough to be considered suitable tiger habitat. Since there is un-certainty associated with assumptions behind the analysis, how tigers respond to human pressure in different habitats, and how the HII dataset represents real human impact on tigers, a sensitivity analysis was conducted to help us better understand the response of tiger landscapes to variations in the HII parameter value.
The landscape sensitivity analysis was run by altering the human infl uence index above and below its previously derived baseline HII value of 15 in the range from HII of 11 to HII of 22 while keeping dispersal, area of presence, and minimum core area values con-stant. We rerun the model by incrementing the value of human impact by one to account for all possible changes in the tiger response to small variations in human infl uence.
5.2.2 Dispersal DistanceLandscape connectivity is considered an important element of landscape structure be-cause of its importance to metapopulation persistence. The diffi culty surrounding the notion of landscape connectivity is that it must be assessed at the scale of the interaction between the particular species and the landscape and this interaction is not always fully understood. Moreover, variations in non-habitat type, prey availability, and cultural attitudes affect the friendliness of the matrix to tiger dispersal and associated dispersal distances in different parts of the range. The ability of tigers to move through non-habitat determines the degree of landscape connectivity and thereby affects the number and size of potential tiger habitats and TCLs. In the 1997 TCU 1.0 analysis, a simple and univer-sal dispersal distance of 5 km was selected because of our limited information on tiger dispersal patterns in different types of habitats (Dinerstein et al. 1997). Because little new information on dispersal has emerged since that time, we selected the baseline distance of 4 km for TCL 2.0 to simplify complex habitat delineation calculations, at the same time recognizing the uncertainty on how this value represents the tiger’s perception of the landscape.
Sensitivity analysis helped us thus examine the landscape response to the range of poten-tial dispersal distances. We tested six different scenarios of delineation results adjusting the threshold distance—as in the case of human infl uence index—above and below the baseline value of 4 km. The dispersal range in the model was varied from 0 km, where we assume tigers are unable to move across the unsuitable habitat, to a value of 10 km where the entire range was assumed to be highly connected and tigers could easy travel across non-habitat areas. The model was rerun with 2 km increments, while

71
Chapter 5 Sensitivity Analysis
human infl uence, distribution, and minimum core area parameter values were kept at their baseline values.
5.2.3 Area of Tiger PresenceThe area over which a tiger identifi ed at a particular point will range is represented in our model by a circular radius around a tiger point location. For the baseline input for this delineation, we assumed that a tiger found at a given point location could be found at any location within 20 km of that point1 (within an area of 1,256 km2). In reality, how-ever, the tiger distribution can vary quite drastically across its extent and a tiger’s home range is contingent in part on such factors as the habitat type it uses, the season or social structure. As noted in Chapter 4 there are also some problems with the tiger distribu-tion data that were compiled from different sources leaving many gaps in our knowledge about tiger presence or absence in a part of its range.
Bearing in mind those uncertainties, we wanted to test how our assumptions about area of tiger presence affect the delineation results. First, we ran the model with the small area of tiger presence with radius from the point location set at 2 and 4 km (representing tiger presence areas of 13 and 50 km2, respectively) Then, we reran the model with radii ranging from 5 km to 25 km (representing tiger presence areas of 79 km2 to 1,963 km2), incrementing the radius by 5 km. In order to better refl ect the large variation in tiger biology and behavior in different types of habitat, we also ran the delineation model with variable radius ranging from 3 km to 14 km (representing tiger presence areas of 30 to 625 km2), depending on where the tiger point was in relation to habitat type. We applied smaller radii to tiger points found in habitat types that support higher densities of tigers, and larger radii to tiger points found in habitats that support lower densities, consistent with the tiger densities by habitat type defi ned in Chapter 4. The three other variables, human infl uence index, dispersal distance, and minimum core area remained fi xed at the baseline value through all model runs. Since, the radius around the tiger location points was not increased by a constant value, calculating simple percentage change in number and area of TCLs would not allow us to accurately interpret results. Instead, we calcu-lated the rate of change in count and area of TCLs per change in the radius used to derive area of tiger presence.
5.2.4 Minimum Core Area and Stepping Stone Patch SizeEarly delineation efforts were based on the constant minimum core area set to 100 km2 and stepping stone size set to 10 km2. In our fi nal delineation the minimum area varied from 30 to 625 km2. and was based on the variation of tiger densities in different habi-tats. Stepping stone patches were scaled at 10% of the size of the core area with a range between 3 to 62 km2. For our analysis, we investigated changes in the tiger land-scape structure once we reran our delineation model with the minimum core area and with stepping stone size at constant value of 100 km2 and 10 km2 respectively. We ran
4 This radius was selected initially because in our survey of tiger experts for the tiger conservation database (see Chapter 2), we asked them to submit tiger survey results for a 20 km radius. In actuality, experts submitted data in many formats, ranging from one point per survey location or tiger sighting to one point per 20 km radius.
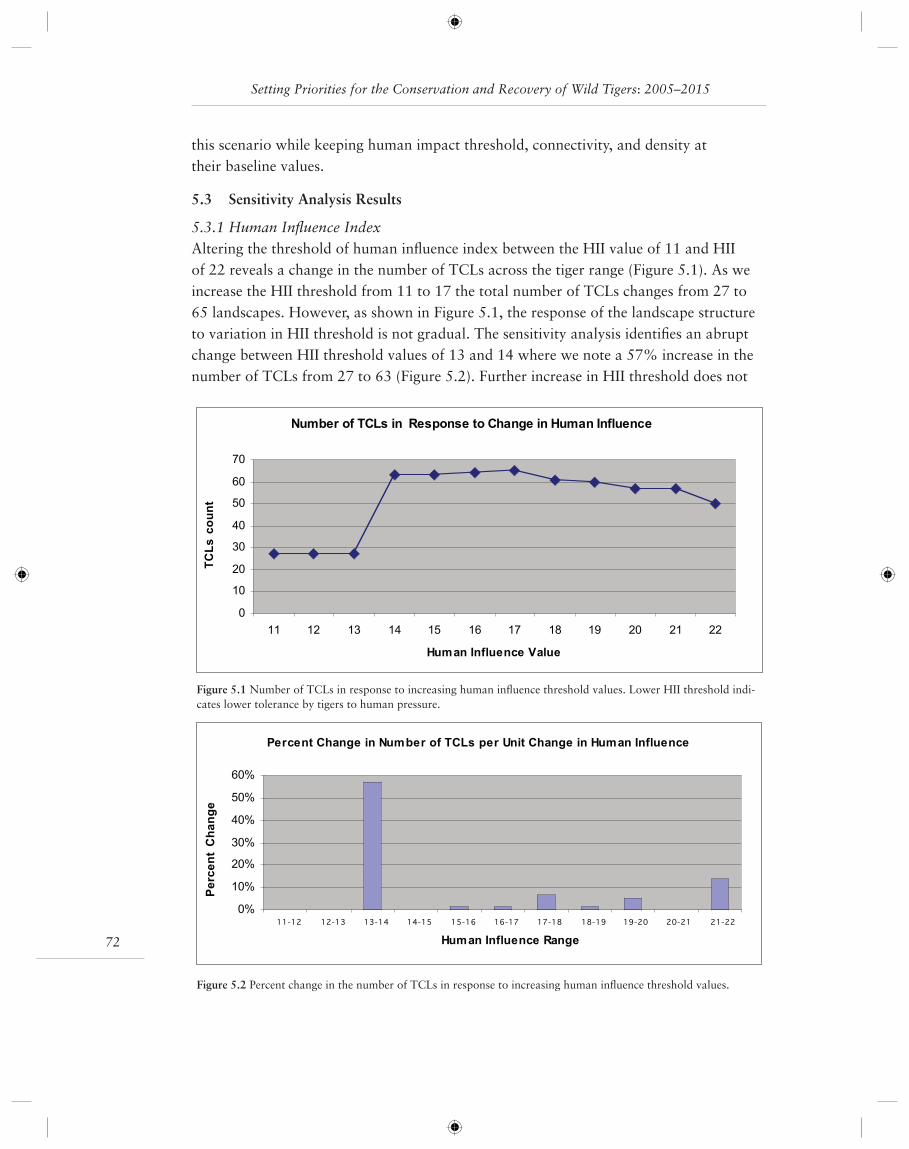
Setting Priorities for the Conservation and Recovery of Wild Tigers: 2005–2015
72
this scenario while keeping human impact threshold, connectivity, and density at their baseline values.
5.3 Sensitivity Analysis Results
5.3.1 Human Infl uence Index Altering the threshold of human infl uence index between the HII value of 11 and HII of 22 reveals a change in the number of TCLs across the tiger range (Figure 5.1). As we increase the HII threshold from 11 to 17 the total number of TCLs changes from 27 to 65 landscapes. However, as shown in Figure 5.1, the response of the landscape structure to variation in HII threshold is not gradual. The sensitivity analysis identifi es an abrupt change between HII threshold values of 13 and 14 where we note a 57% increase in the number of TCLs from 27 to 63 (Figure 5.2). Further increase in HII threshold does not
Number of TCLs in Response to Change in Human Influence
0
10
20
30
40
50
60
70
11 12 13 14 15 16 17 18 19 20 21 22
Human Influence Value
TCLscount
Figure 5.1 Number of TCLs in response to increasing human infl uence threshold values. Lower HII threshold indi-cates lower tolerance by tigers to human pressure.
Percent Change in Number of TCLs per Unit Change in Human Influence
0%
10%
20%
30%
40%
50%
60%
11-12 12-13 13-14 14-15 15-16 16-17 17-18 18-19 19-20 20-21 21-22
Human Influence Range
PercentChange
Figure 5.2 Percent change in the number of TCLs in response to increasing human infl uence threshold values.
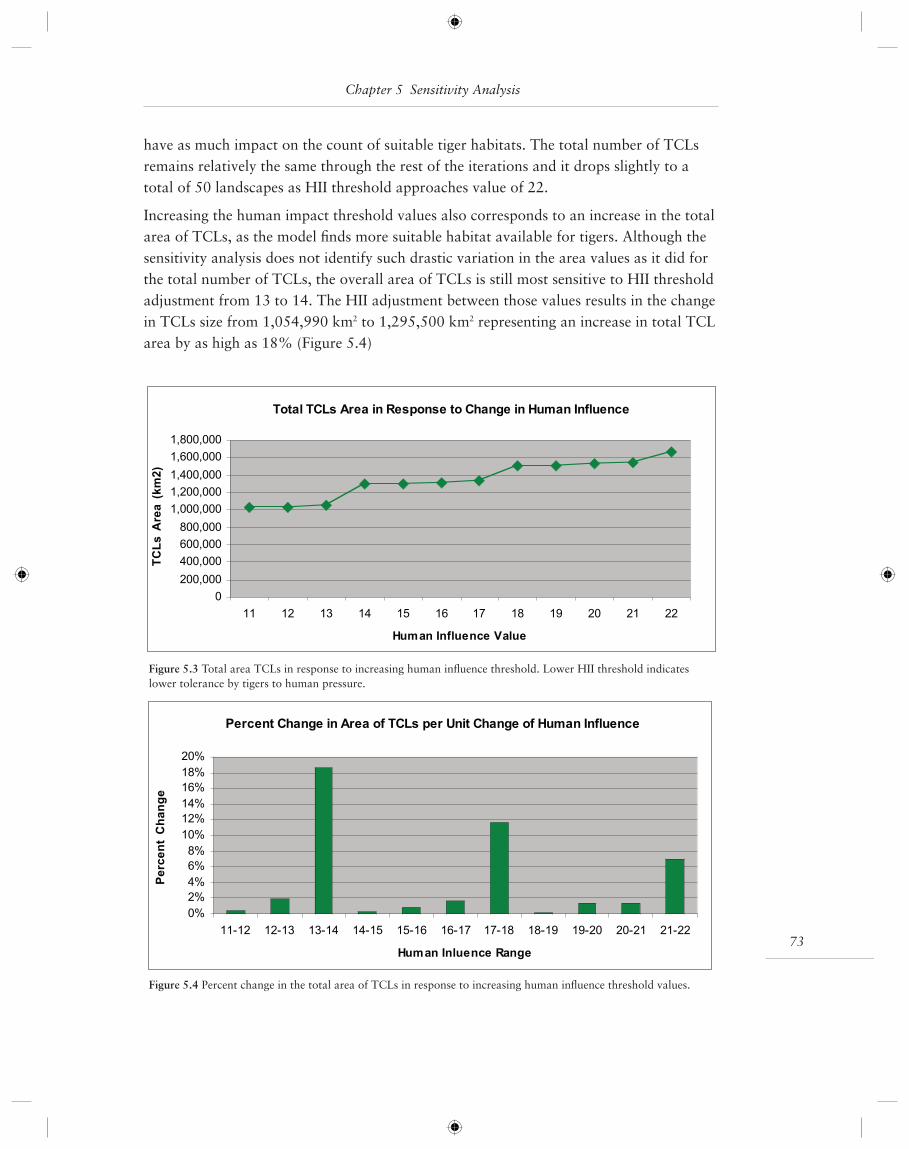
73
Chapter 5 Sensitivity Analysis
have as much impact on the count of suitable tiger habitats. The total number of TCLs remains relatively the same through the rest of the iterations and it drops slightly to a total of 50 landscapes as HII threshold approaches value of 22.
Increasing the human impact threshold values also corresponds to an increase in the total area of TCLs, as the model fi nds more suitable habitat available for tigers. Although the sensitivity analysis does not identify such drastic variation in the area values as it did for the total number of TCLs, the overall area of TCLs is still most sensitive to HII threshold adjustment from 13 to 14. The HII adjustment between those values results in the change in TCLs size from 1,054,990 km2 to 1,295,500 km2 representing an increase in total TCL area by as high as 18% (Figure 5.4)
Total TCLs Area in Response to Change in Human Influence
0
200,000
400,000
600,000
800,000
1,000,000
1,200,000
1,400,000
1,600,000
1,800,000
11 12 13 14 15 16 17 18 19 20 21 22
Human Influence Value
TCLsArea(km2)
Figure 5.3 Total area TCLs in response to increasing human infl uence threshold. Lower HII threshold indicates lower tolerance by tigers to human pressure.
Percent Change in Area of TCLs per Unit Change of Human Influence
0%
2%
4%
6%
8%
10%
12%
14%
16%
18%
20%
11-12 12-13 13-14 14-15 15-16 16-17 17-18 18-19 19-20 20-21 21-22
Human Inluence Range
PercentChange
Figure 5.4 Percent change in the total area of TCLs in response to increasing human infl uence threshold values.
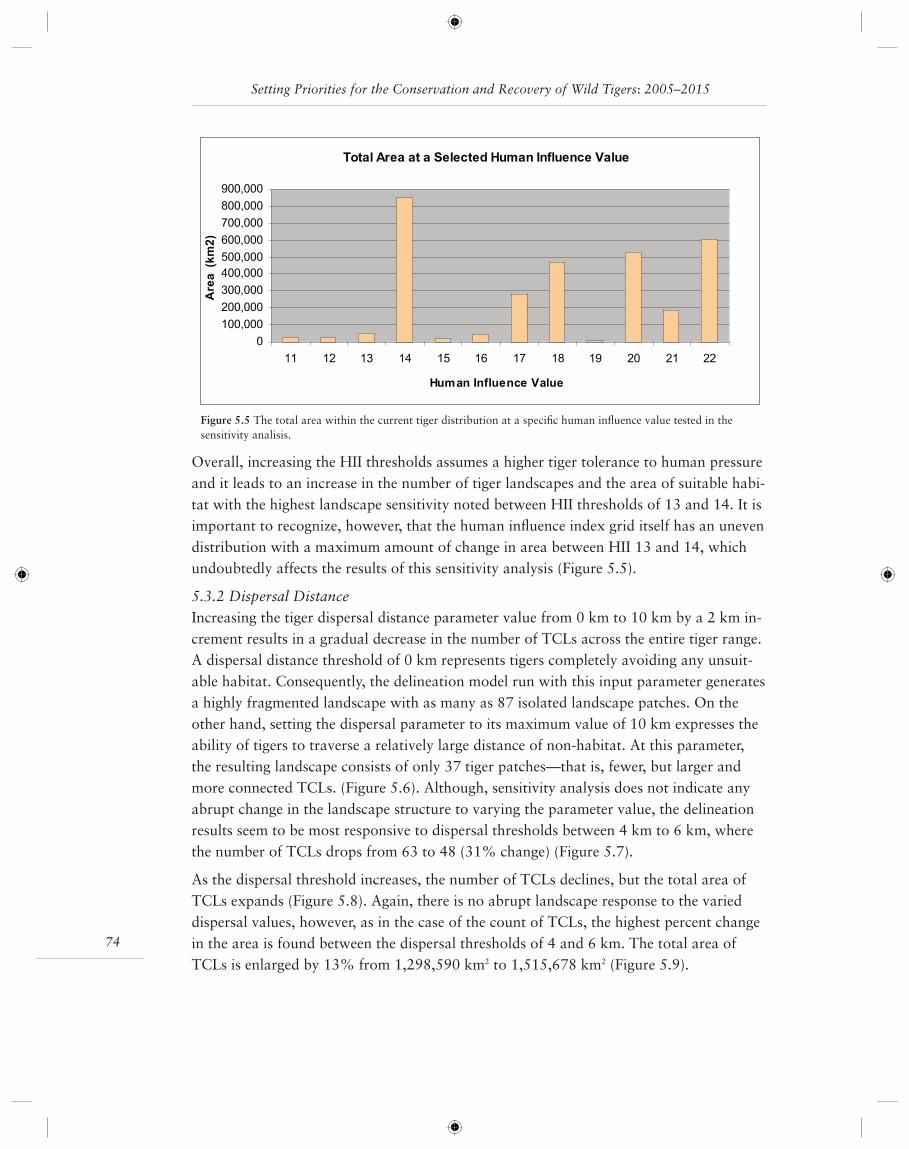
Setting Priorities for the Conservation and Recovery of Wild Tigers: 2005–2015
74
Overall, increasing the HII thresholds assumes a higher tiger tolerance to human pressure and it leads to an increase in the number of tiger landscapes and the area of suitable habi-tat with the highest landscape sensitivity noted between HII thresholds of 13 and 14. It is important to recognize, however, that the human infl uence index grid itself has an uneven distribution with a maximum amount of change in area between HII 13 and 14, which undoubtedly affects the results of this sensitivity analysis (Figure 5.5).
5.3.2 Dispersal DistanceIncreasing the tiger dispersal distance parameter value from 0 km to 10 km by a 2 km in-crement results in a gradual decrease in the number of TCLs across the entire tiger range. A dispersal distance threshold of 0 km represents tigers completely avoiding any unsuit-able habitat. Consequently, the delineation model run with this input parameter generates a highly fragmented landscape with as many as 87 isolated landscape patches. On the other hand, setting the dispersal parameter to its maximum value of 10 km expresses the ability of tigers to traverse a relatively large distance of non-habitat. At this parameter, the resulting landscape consists of only 37 tiger patches—that is, fewer, but larger and more connected TCLs. (Figure 5.6). Although, sensitivity analysis does not indicate any abrupt change in the landscape structure to varying the parameter value, the delineation results seem to be most responsive to dispersal thresholds between 4 km to 6 km, where the number of TCLs drops from 63 to 48 (31% change) (Figure 5.7).
As the dispersal threshold increases, the number of TCLs declines, but the total area of TCLs expands (Figure 5.8). Again, there is no abrupt landscape response to the varied dispersal values, however, as in the case of the count of TCLs, the highest percent change in the area is found between the dispersal thresholds of 4 and 6 km. The total area of TCLs is enlarged by 13% from 1,298,590 km2 to 1,515,678 km2 (Figure 5.9).
Total Area at a Selected Human Influence Value
0
100,000
200,000
300,000
400,000
500,000
600,000
700,000
800,000
900,000
11 12 13 14 15 16 17 18 19 20 21 22
Human Influence Value
Area(km2)
Figure 5.5 The total area within the current tiger distribution at a specifi c human infl uence value tested in the sensitivity analisis.
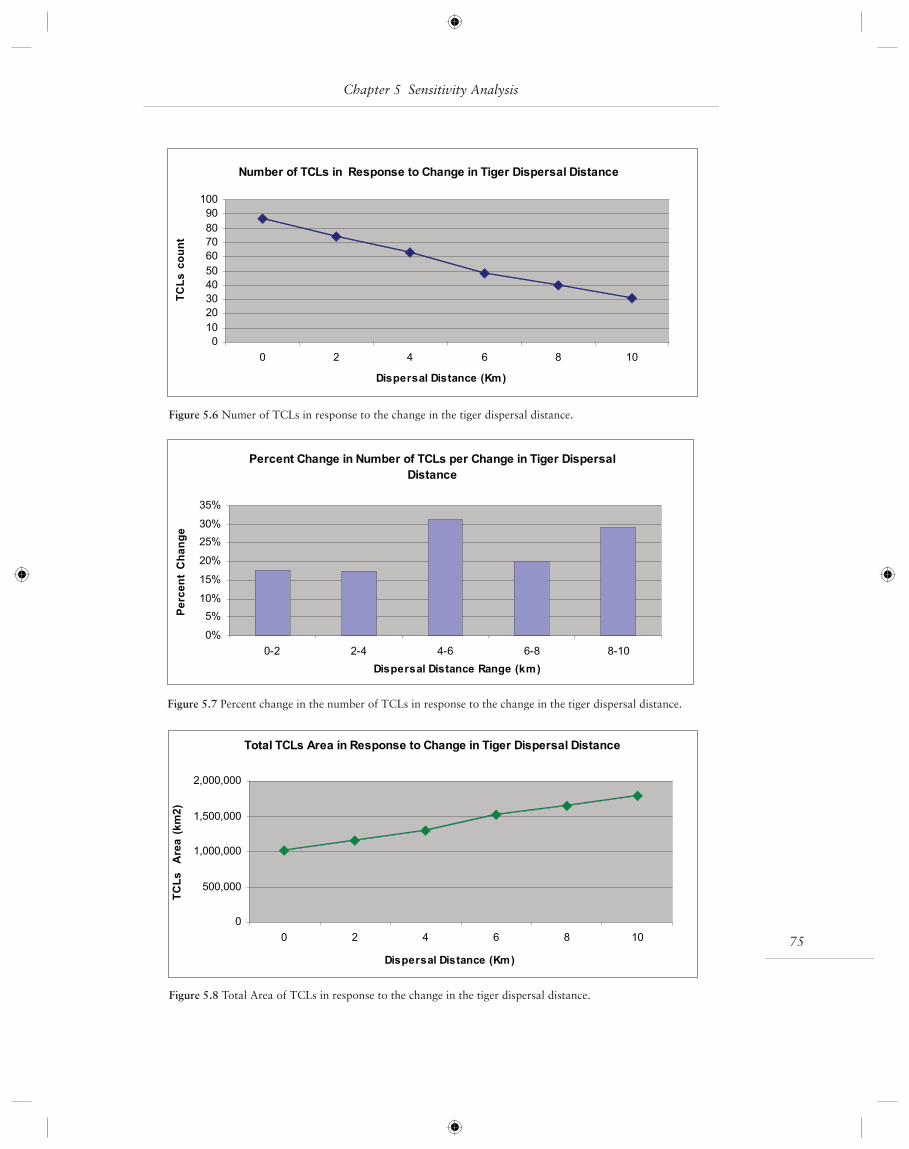
75
Chapter 5 Sensitivity Analysis
Number of TCLs in Response to Change in Tiger Dispersal Distance
0
10
20
30
40
50
60
70
80
90
100
0 2 4 6 8 10
Dispersal Distance (Km)
TCLscount
Figure 5.6 Numer of TCLs in response to the change in the tiger dispersal distance.
Percent Change in Number of TCLs per Change in Tiger Dispersal
Distance
0%
5%
10%
15%
20%
25%
30%
35%
0-2 2-4 4-6 6-8 8-10
Dispersal Distance Range (km)
PercentChange
Figure 5.7 Percent change in the number of TCLs in response to the change in the tiger dispersal distance.
Total TCLs Area in Response to Change in Tiger Dispersal Distance
0
500,000
1,000,000
1,500,000
2,000,000
0 2 4 6 8 10
Dispersal Distance (Km)
TCLsArea(km2)
Figure 5.8 Total Area of TCLs in response to the change in the tiger dispersal distance.
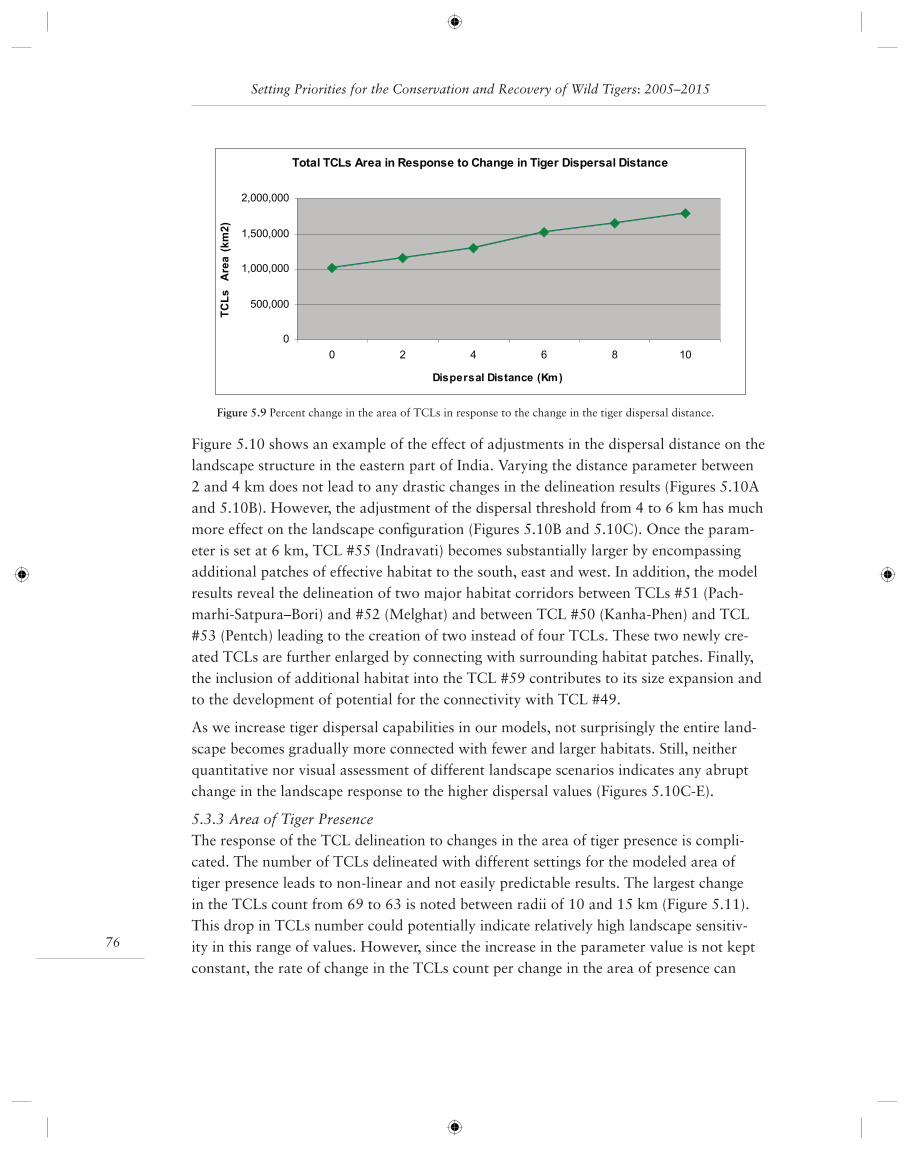
Setting Priorities for the Conservation and Recovery of Wild Tigers: 2005–2015
76
Figure 5.10 shows an example of the effect of adjustments in the dispersal distance on the landscape structure in the eastern part of India. Varying the distance parameter between 2 and 4 km does not lead to any drastic changes in the delineation results (Figures 5.10A and 5.10B). However, the adjustment of the dispersal threshold from 4 to 6 km has much more effect on the landscape confi guration (Figures 5.10B and 5.10C). Once the param-eter is set at 6 km, TCL #55 (Indravati) becomes substantially larger by encompassing additional patches of effective habitat to the south, east and west. In addition, the model results reveal the delineation of two major habitat corridors between TCLs #51 (Pach-marhi-Satpura–Bori) and #52 (Melghat) and between TCL #50 (Kanha-Phen) and TCL #53 (Pentch) leading to the creation of two instead of four TCLs. These two newly cre-ated TCLs are further enlarged by connecting with surrounding habitat patches. Finally, the inclusion of additional habitat into the TCL #59 contributes to its size expansion and to the development of potential for the connectivity with TCL #49.
As we increase tiger dispersal capabilities in our models, not surprisingly the entire land-scape becomes gradually more connected with fewer and larger habitats. Still, neither quantitative nor visual assessment of different landscape scenarios indicates any abrupt change in the landscape response to the higher dispersal values (Figures 5.10C-E).
5.3.3 Area of Tiger PresenceThe response of the TCL delineation to changes in the area of tiger presence is compli-cated. The number of TCLs delineated with different settings for the modeled area of tiger presence leads to non-linear and not easily predictable results. The largest change in the TCLs count from 69 to 63 is noted between radii of 10 and 15 km (Figure 5.11). This drop in TCLs number could potentially indicate relatively high landscape sensitiv-ity in this range of values. However, since the increase in the parameter value is not kept constant, the rate of change in the TCLs count per change in the area of presence can
Total TCLs Area in Response to Change in Tiger Dispersal Distance
0
500,000
1,000,000
1,500,000
2,000,000
0 2 4 6 8 10
Dispersal Distance (Km)
TCLsArea(km2)
Figure 5.9 Percent change in the area of TCLs in response to the change in the tiger dispersal distance.
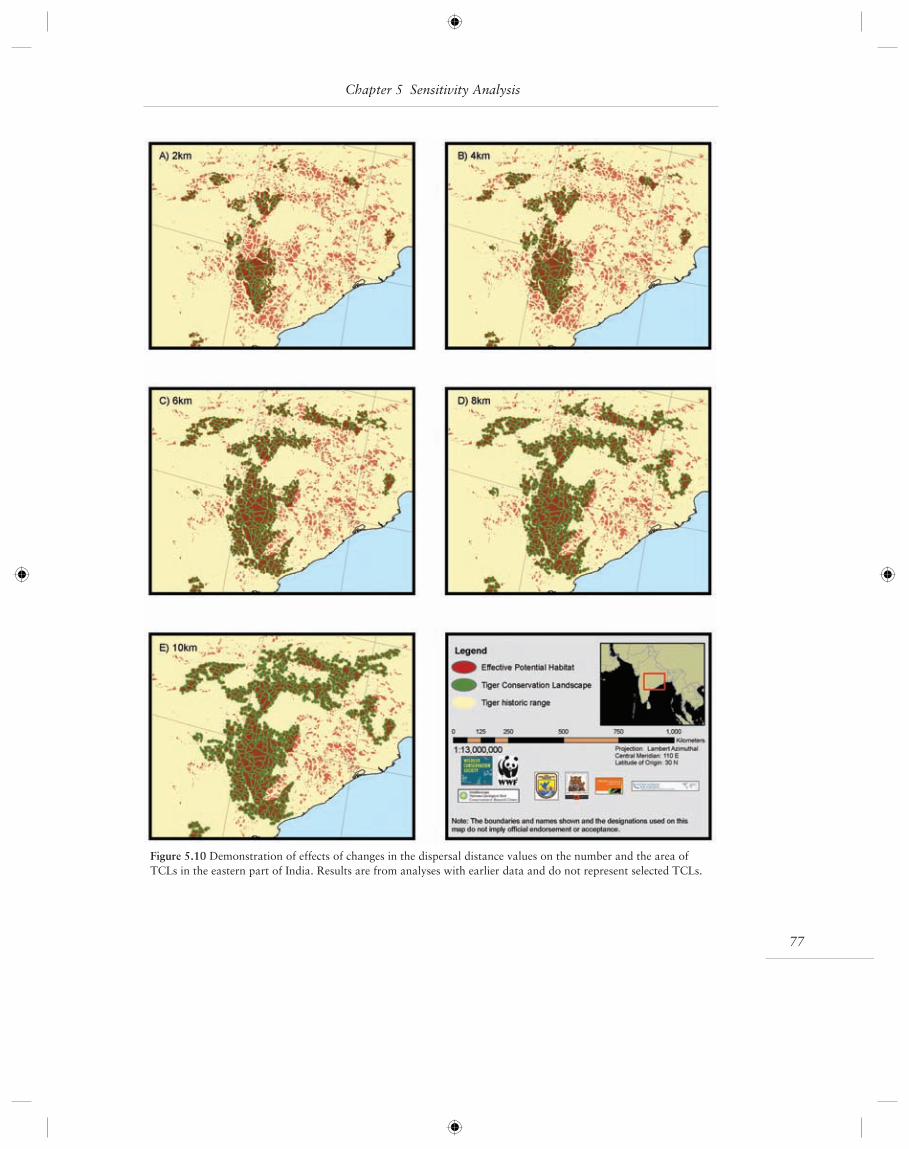
77
Figure 5.10 Demonstration of effects of changes in the dispersal distance values on the number and the area of TCLs in the eastern part of India. Results are from analyses with earlier data and do not represent selected TCLs.
Chapter 5 Sensitivity Analysis
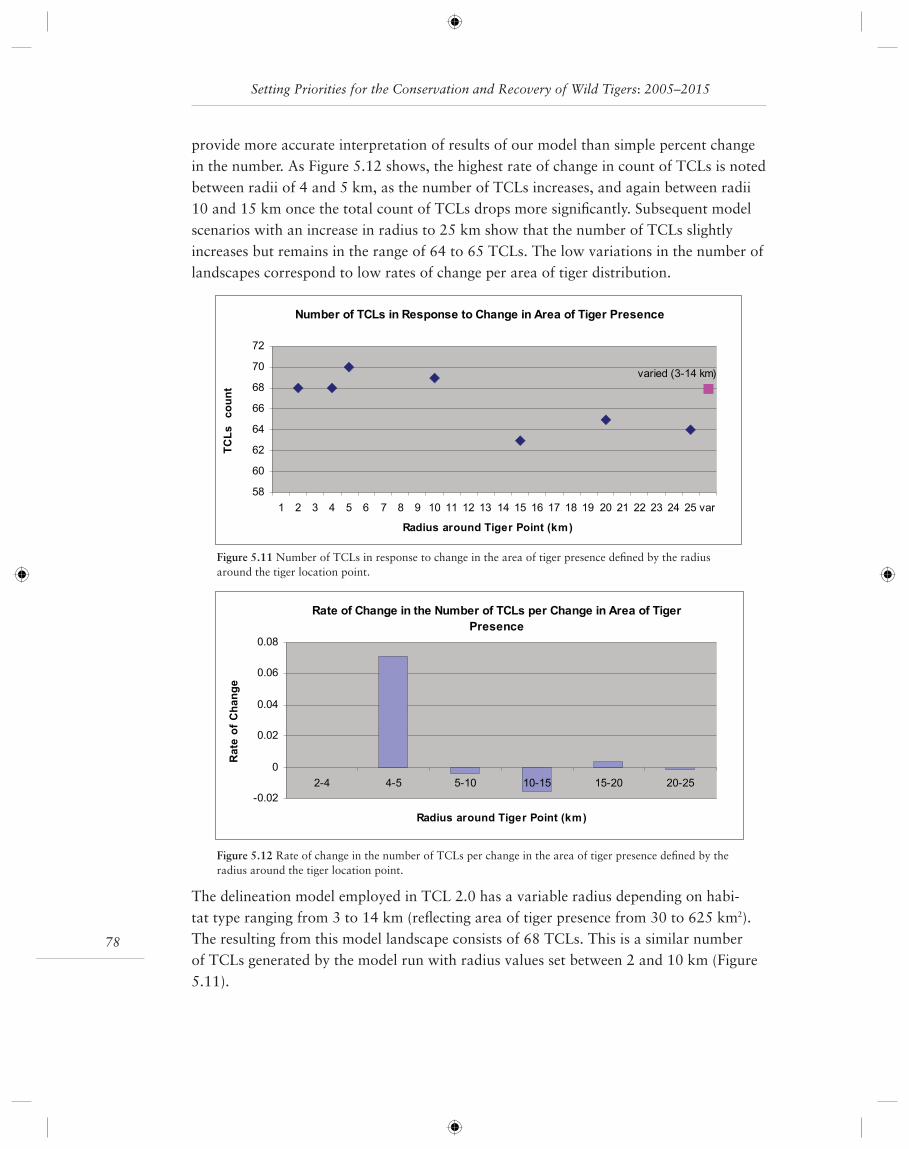
Setting Priorities for the Conservation and Recovery of Wild Tigers: 2005–2015
78
provide more accurate interpretation of results of our model than simple percent change in the number. As Figure 5.12 shows, the highest rate of change in count of TCLs is noted between radii of 4 and 5 km, as the number of TCLs increases, and again between radii 10 and 15 km once the total count of TCLs drops more signifi cantly. Subsequent model scenarios with an increase in radius to 25 km show that the number of TCLs slightly increases but remains in the range of 64 to 65 TCLs. The low variations in the number of landscapes correspond to low rates of change per area of tiger distribution.
The delineation model employed in TCL 2.0 has a variable radius depending on habi-tat type ranging from 3 to 14 km (refl ecting area of tiger presence from 30 to 625 km2). The resulting from this model landscape consists of 68 TCLs. This is a similar number of TCLs generated by the model run with radius values set between 2 and 10 km (Figure 5.11).
Number of TCLs in Response to Change in Area of Tiger Presence
varied (3-14 km)
58
60
62
64
66
68
70
72
1 2 3 4 5 6 7 8 9 10 11 12 13 14 15 16 17 18 19 20 21 22 23 24 25 var
Radius around Tiger Point (km)
TCLscount
Figure 5.11 Number of TCLs in response to change in the area of tiger presence defi ned by the radius around the tiger location point.
Rate of Change in the Number of TCLs per Change in Area of Tiger
Presence
-0.02
0
0.02
0.04
0.06
0.08
2-4 4-5 5-10 10-15 15-20 20-25
Radius around Tiger Point (km)
RateofChange
Figure 5.12 Rate of change in the number of TCLs per change in the area of tiger presence defi ned by the radius around the tiger location point.
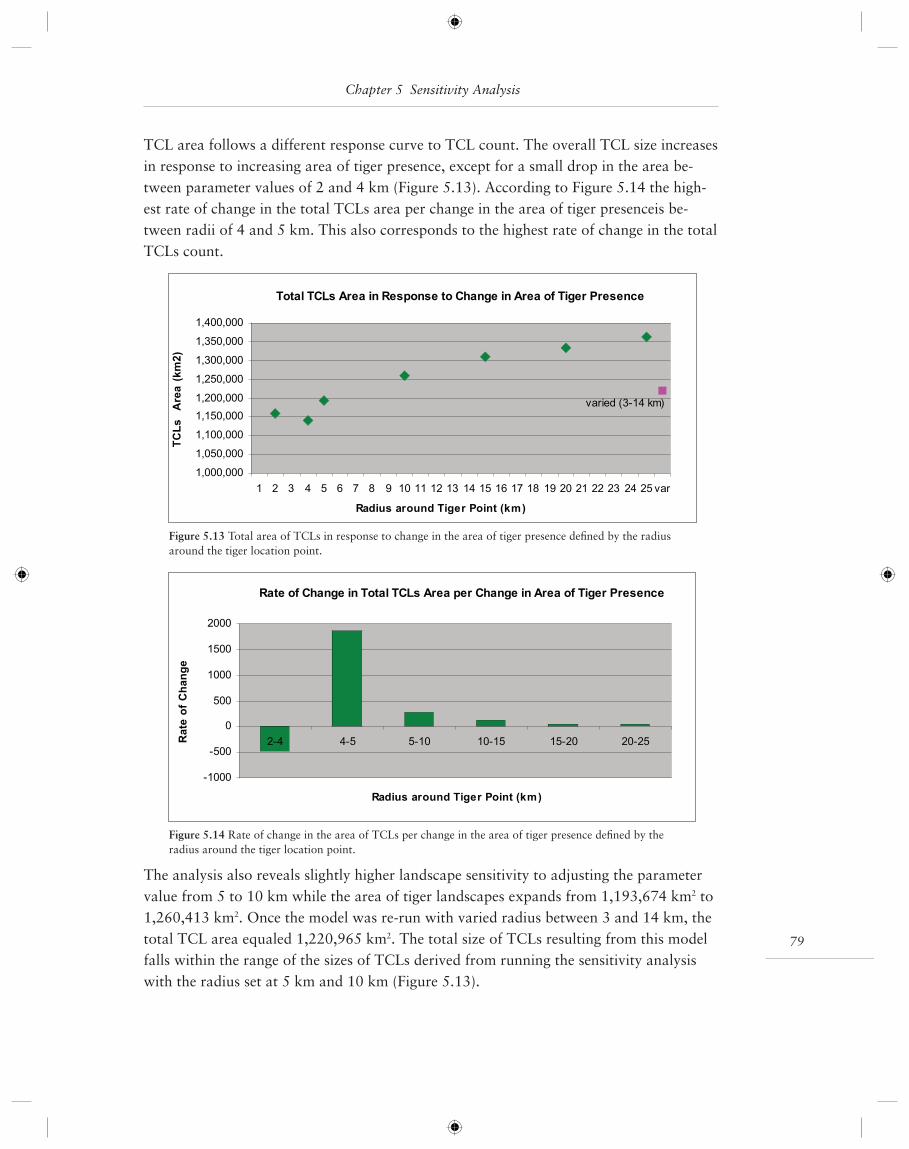
79
TCL area follows a different response curve to TCL count. The overall TCL size increases in response to increasing area of tiger presence, except for a small drop in the area be-tween parameter values of 2 and 4 km (Figure 5.13). According to Figure 5.14 the high-est rate of change in the total TCLs area per change in the area of tiger presenceis be-tween radii of 4 and 5 km. This also corresponds to the highest rate of change in the total TCLs count.
The analysis also reveals slightly higher landscape sensitivity to adjusting the parameter value from 5 to 10 km while the area of tiger landscapes expands from 1,193,674 km2 to 1,260,413 km2. Once the model was re-run with varied radius between 3 and 14 km, the total TCL area equaled 1,220,965 km2. The total size of TCLs resulting from this model falls within the range of the sizes of TCLs derived from running the sensitivity analysis with the radius set at 5 km and 10 km (Figure 5.13).
Total TCLs Area in Response to Change in Area of Tiger Presence
varied (3-14 km)
1,000,000
1,050,000
1,100,000
1,150,000
1,200,000
1,250,000
1,300,000
1,350,000
1,400,000
1 2 3 4 5 6 7 8 9 10 11 12 13 14 15 16 17 18 19 20 21 22 23 24 25 var
Radius around Tiger Point (km)
TCLsArea(km2)
Figure 5.13 Total area of TCLs in response to change in the area of tiger presence defi ned by the radius around the tiger location point.
Rate of Change in Total TCLs Area per Change in Area of Tiger Presence
-1000
-500
0
500
1000
1500
2000
2-4 4-5 5-10 10-15 15-20 20-25
Radius around Tiger Point (km)
RateofChange
Figure 5.14 Rate of change in the area of TCLs per change in the area of tiger presence defi ned by the radius around the tiger location point.
Chapter 5 Sensitivity Analysis
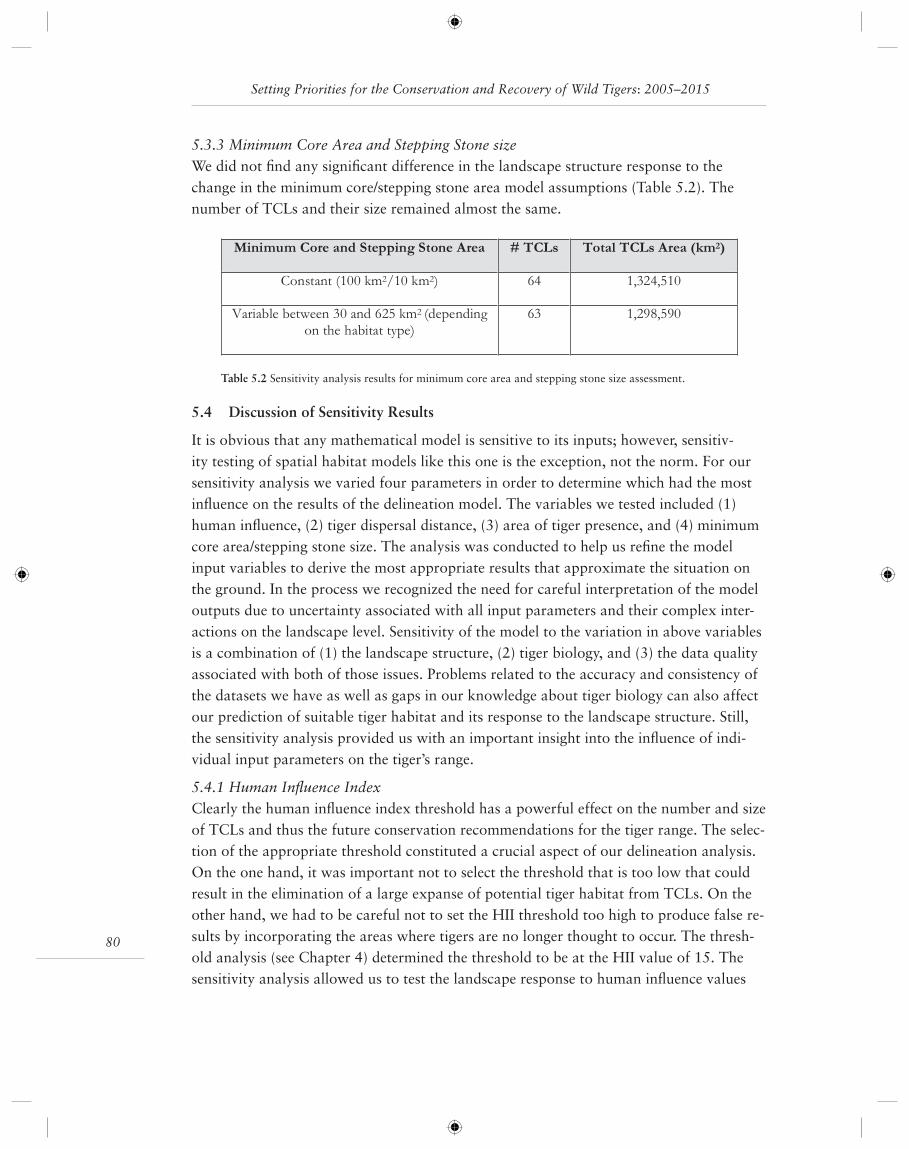
Setting Priorities for the Conservation and Recovery of Wild Tigers: 2005–2015
80
5.3.3 Minimum Core Area and Stepping Stone sizeWe did not fi nd any signifi cant difference in the landscape structure response to the change in the minimum core/stepping stone area model assumptions (Table 5.2). The number of TCLs and their size remained almost the same.
5.4 Discussion of Sensitivity Results
It is obvious that any mathematical model is sensitive to its inputs; however, sensitiv-ity testing of spatial habitat models like this one is the exception, not the norm. For our sensitivity analysis we varied four parameters in order to determine which had the most infl uence on the results of the delineation model. The variables we tested included (1) human infl uence, (2) tiger dispersal distance, (3) area of tiger presence, and (4) minimum core area/stepping stone size. The analysis was conducted to help us refi ne the model input variables to derive the most appropriate results that approximate the situation on the ground. In the process we recognized the need for careful interpretation of the model outputs due to uncertainty associated with all input parameters and their complex inter-actions on the landscape level. Sensitivity of the model to the variation in above variables is a combination of (1) the landscape structure, (2) tiger biology, and (3) the data quality associated with both of those issues. Problems related to the accuracy and consistency of the datasets we have as well as gaps in our knowledge about tiger biology can also affect our prediction of suitable tiger habitat and its response to the landscape structure. Still, the sensitivity analysis provided us with an important insight into the infl uence of indi-vidual input parameters on the tiger’s range.
5.4.1 Human Infl uence IndexClearly the human infl uence index threshold has a powerful effect on the number and size of TCLs and thus the future conservation recommendations for the tiger range. The selec-tion of the appropriate threshold constituted a crucial aspect of our delineation analysis. On the one hand, it was important not to select the threshold that is too low that could result in the elimination of a large expanse of potential tiger habitat from TCLs. On the other hand, we had to be careful not to set the HII threshold too high to produce false re-sults by incorporating the areas where tigers are no longer thought to occur. The thresh-old analysis (see Chapter 4) determined the threshold to be at the HII value of 15. The sensitivity analysis allowed us to test the landscape response to human infl uence values
Minimum Core and Stepping Stone Area # TCLs Total TCLs Area (km2)
Constant (100 km2/10 km2) 64 1,324,510
Variable between 30 and 625 km2 (dependingon the habitat type)
63 1,298,590
Table 5.2 Sensitivity analysis results for minimum core area and stepping stone size assessment.
81
below and above this threshold and either identify a new potential threshold or confi rm our previous results of threshold analysis.
As expected the number of TCLs and their size increased with increasing human infl u-ence threshold values, refl ecting a higher tolerance by tigers to human pressure, therefore “opening” larger areas to their use. The abrupt change in the total area of TCLs as the response to increasing the human infl uence index from HII value of 13 to 14 shows high landscape sensitivity to this threshold level. The change in the total area is not as drastic and it reveals a three-tiered response where the model is most sensitive to HII change between values of 13 and 14 and then again between HII values of 17 and 18. We recog-nize, however, that the results of the analysis in some part refl ect the fact that the human infl uence index itself has a non-linear distribution with different total areas at each HII value, which occurs as a result of the scoring system applied to layers used to create the human infl uence index map. Due to this non-linear distribution of the human infl uence values, we note that changing the HII threshold between 13 and 14 may represent more “real” change in human impact rather than the “real” change in tiger response to varia-tions in HII values.
In this context, we can still make conclusions about how tigers in the wild might re-spond to increasing or decreasing human impact. For the purpose of the fi nal delinea-tion presented in this report, we selected human infl uence index value of 15 based on the HII threshold analysis (Chapter 4). If we assume that the HII value of 15 represents the current situation on the ground, then our sensitivity results indicates that further develop-ment or any other types of human impact could have a severe negative effect on the fu-ture tiger persistence since the number of TCLs and their total area shrinks signifi cantly. On the other hand, we can assume that if higher infl uenced areas are made more usable for tigers we can potentially create larger areas of tiger habitat. Policy interventions, for example, that make poaching less likely or lessen confl ict between people and tigers may greatly expand the amount of habitat available for tigers.
5.4.2 Dispersal DistanceImproving habitat quality and developing dispersal corridors between suitable habitats is imperative for tiger persistence across their range. The sensitivity analysis supports the conclusion that increasing tiger dispersal capabilities leads to fewer but larger and connected habitats and less fragmentation. There were no obvious discontinuities in the sensitivity results. Still, the model showed slightly higher sensitivity to changes in the pa-rameter values from 4 to 6 km. For example in the eastern part of India, when the disper-sal distance was set at 6 km, the total area of TCLs expanded by encompassing surround-ing habitat patches and by connecting with each other. Once the distance was increased above 6 km, the rate of change remained relatively the same.
Since the sensitivity analysis did not reveal any threshold that signifi cantly infl uenced the output variables, we decided to maintain the initial dispersal distance value set at 4 km
Chapter 5 Sensitivity Analysis
Setting Priorities for the Conservation and Recovery of Wild Tigers: 2005–2015
82
and err towards less connected landscape since over much of the tiger’s range, tigers that leave a habitat block are often at great risk of being killed before they can reach a second suitable habitat block. Since landscape connectivity is considered to be an important fac-tor determining population survival, the tiger interaction with the landscape must be bet-ter understood. Further research has to be undertaken to explore how habitat structure, level of human disturbance and human attitudes affect tiger dispersal patterns and thus affect their distribution across the range.
5.4.3 Area of Tiger PresenceThe area of tiger presence in our model is represented by the radius around the tiger point location. Initially and in our baseline studies for this chapter, we assumed that a tiger searched for at a given point location could be found at any location within 20 km of that point. The same threshold was used for other species in the rangewide priority set-tings efforts as a standardized value. Our initial decision rule was thus weighed towards overestimating the extent of the existing known tiger range. In reality the tiger extent may be much smaller and may vary depending on the on habitat quality, prey availability, the tiger’s sex, and the season.
Our sensitivity analysis revealed a complex response of the landscape to the area of tiger presence parameter. For TCL 2.0, we ultimately selected a variable radius depending on habitat type. The choice of this variable parameter also falls in the mid range of the pa-rameter values (4 to 15 km) that led to the highest rates of change in the total count and area of TCLs. Still, it is not clear exactly what drives the range-wide response of area of presence to the tiger conservation landscapes delineated except that it is related to the dis-tribution of habitat patches, their inter-patch distance, and the locations of tiger points, as recorded in the tiger database. There may be biome or bioregional specifi c response to any and all of these relationships. Further study is required to better understand the tiger-landscape interactions.
5.4.4 Minimum Core Area and Stepping Stone SizeAs with the thresholds related to human infl uence index, dispersal distance and tiger distribution radius there are also some uncertainties associated with the area required to support a viable population of tigers. An early draft of the current delineation applied the rule of minimum core area of 100 km2 and stepping stone size of 10 km2. For the delineation of TCLs presented in TCL 2.0 we used results of research on tiger densities to determine both minimum core area and stepping stone size requirements. Since tiger density varies depending on the type of habitat the tiger uses, the minimum core area size was selected based on the area requirement to support at least 5 tigers over 1 year old and it was stratifi ed by habitat type. The resulting minimum area varied from 30 to 625 km2. Stepping stone patches were scaled at 10% of the size of the core area with a range between 3 to 62 km2.
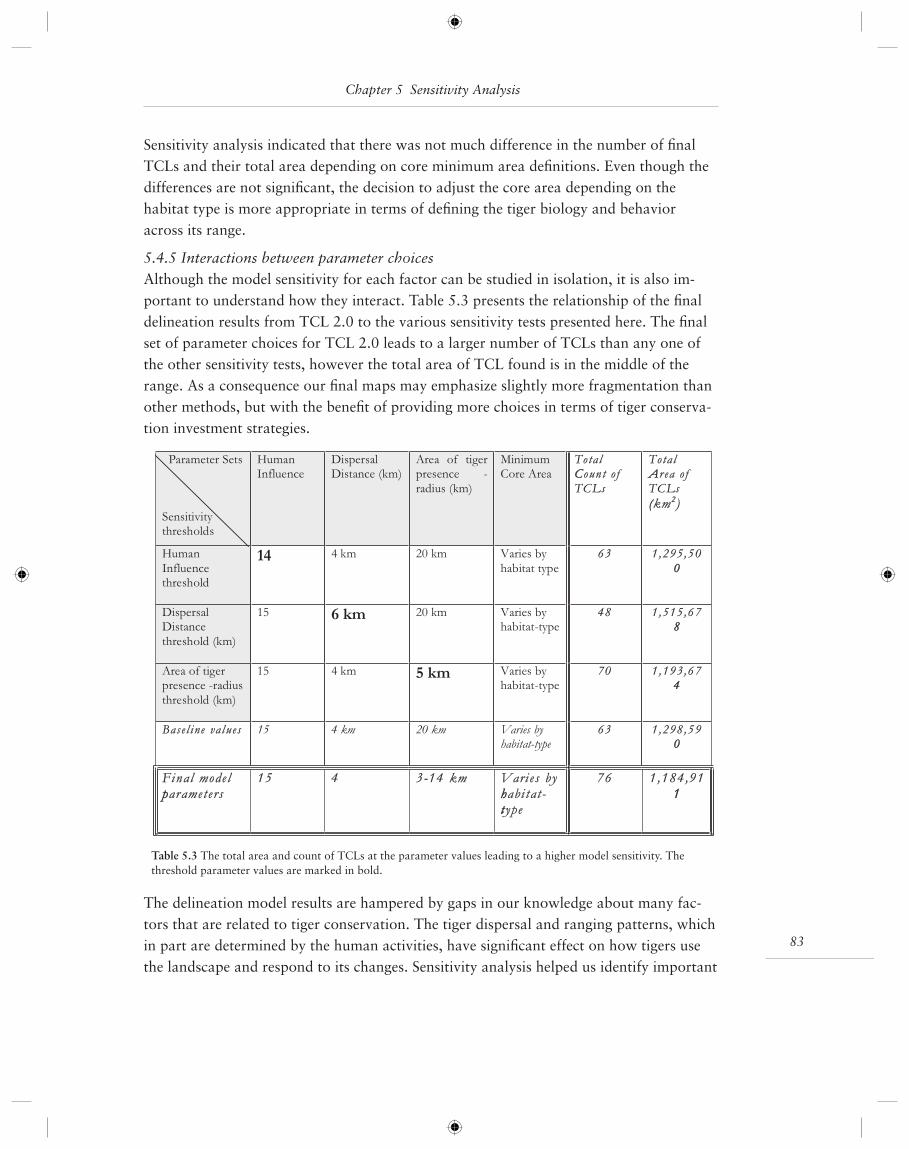
83
Sensitivity analysis indicated that there was not much difference in the number of fi nal TCLs and their total area depending on core minimum area defi nitions. Even though the differences are not signifi cant, the decision to adjust the core area depending on the habitat type is more appropriate in terms of defi ning the tiger biology and behavior across its range.
5.4.5 Interactions between parameter choicesAlthough the model sensitivity for each factor can be studied in isolation, it is also im-portant to understand how they interact. Table 5.3 presents the relationship of the fi nal delineation results from TCL 2.0 to the various sensitivity tests presented here. The fi nal set of parameter choices for TCL 2.0 leads to a larger number of TCLs than any one of the other sensitivity tests, however the total area of TCL found is in the middle of the range. As a consequence our fi nal maps may emphasize slightly more fragmentation than other methods, but with the benefi t of providing more choices in terms of tiger conserva-tion investment strategies.
The delineation model results are hampered by gaps in our knowledge about many fac-tors that are related to tiger conservation. The tiger dispersal and ranging patterns, which in part are determined by the human activities, have signifi cant effect on how tigers use the landscape and respond to its changes. Sensitivity analysis helped us identify important
Parameter Sets
Sensitivitythresholds
HumanInfluence
DispersalDistance (km)
Area of tigerpresence -
radius (km)
MinimumCore Area
TotalCCoun t o f
TCLs
TotalAArea o f
TCLs
((km22)
Human
Influencethreshold
14 4 km 20 km Varies by
habitat type
63 1,295,50
00
DispersalDistance
threshold (km)
15 6 km 20 km Varies byhabitat-type
48 1,515,6788
Area of tigerpresence -radius
threshold (km)
15 4 km 5 km Varies byhabitat-type
70 1,193,6744
Base l ine val ues 15 4 km 20 km Varies byhabitat-type
63 1,298,5900
Final mode lpparameters
15 4 3--14 km Varies byhhabi tat -tt ype
76 1,184,9111
Table 5.3 The total area and count of TCLs at the parameter values leading to a higher model sensitivity. The threshold parameter values are marked in bold.
Chapter 5 Sensitivity Analysis
Setting Priorities for the Conservation and Recovery of Wild Tigers: 2005–2015
84
parameters and test assumptions about tiger ecology and behavior, and it revealed that, in some cases, small changes in the parameter values could yield signifi cantly different results in the availability of suitable habitat. Table 5.3 shows the total area and count of TCLs resulting from the model run with parameter values that had the strongest impact on the delineation patterns, compared to other tested values. Results of our analysis indicate that the highest model sensitivity was recorded once we varied human infl uence index and the area of tiger presence parameter thresholds. The landscape structure de-fi ned by the number and area of TCLs has changed more signifi cantly at the HII value of 14 and at the area of tiger presence determined by the radius of 5 km. Signifi cant varia-tions in the model results indicate the need for careful assessment of those parameters and thus for more research to better understand the tiger response to the human pressure or prey dynamics. At the same time, the high sensitivity of the model to these parameters shows that improvements in habitat quality—by reducing threats to tigers from poach-ing or prey depletion, by changing peoples attitudes or by securing prey availability—can help tigers expand their ranges and withstand higher human impact, and consequently increase chances for their persistence.
The adjustments in the dispersal distances, although they yielded different delineation results, did not lead to abrupt changes in the tiger landscape, but rather caused a smooth transition in the count and size of TCLs with each subsequent increment. The model showed only slightly higher landscape sensitivity once the tiger dispersal distance was increased from 4 to 6 km. Nevertheless, the dispersal distance parameter, once set to 6 km, led to signifi cantly different delineation results than the ones obtained from the models run with baseline values. It resulted in a highly connected landscape composed of 48 TCLs with a high proportion of suitable habitat encompassing an area as large as 1,515,678 km2. Based on the results, we may assume that even a slight improvement in the habitat quality—by restoring dispersal corridors or by minimizing human pressure in non-habitat areas—can signifi cantly enhance our long-term tiger conservation strategies.
5.5 Conclusion
Sensitivity analysis is an under-used tool in species conservation planning. As we demon-strate here, sensitivity analysis can inform the complicated set of choices made in model-ing species distributions across the range. Although sensitivity analysis does not tell us what to do, it does inform the consequences of our choices in terms of model perfor-mance. For tigers, we have just scratched the surface. There is still uncertainty related to the impact of individual parameters, their complex interactions at various locations of the tiger range, and their ability to represent the real situation on the ground. Sensitivity analysis should be geared toward identifying parameters that, if known with a higher pre-cision, would decrease the uncertainty in our delineation model. Further data exploration is therefore warranted, particularly to examine how data in different ecological settings may be differentially sensitive to the parameter choices made.
— Gosia Bryja, Jessica Forrest, Eric Sanderson
85
Chapter 6 A New Taxonomy for Tiger Conservation Landscapes:
Setting Classes and Priorities for Tiger Conservation
6.1 Introduction
After delineating tiger conservation landscapes, the next important step is to set priorities among them. Setting priorities for tiger conservation landscapes means giving the tiger conservation community clear, practical recommendations on which areas are most im-portant for conservation of tigers over the next decade, while looking toward the value of these landscapes to tigers for the long term. Tiger conservation landscape priorities refl ect our goals, our ability to measure progress toward those goals, and an assessment of the places where we can most likely succeed.
When establishing criteria for prioritization, we need to keep in mind several factors. First and foremost, what are our goals for tiger conservation, now and in the future? Sec-ond, based on current understanding of tiger conservation biology, what is important for long-term tiger survival in an area and across the range? Third, how do priorities from TCL 2.0 compare to priorities established in TCU 1.0? All these considerations should be addressed in our new taxonomy for identifying tiger conservation areas, and our mecha-nisms for prioritizing them.
6.1.1 Goals for tiger conservationA few years ago, the Wildlife Conservation Society adopted a long-term goal of having 100,000 tigers across the historical range by 2100 (Ginsberg 2001). Given the current state of tiger conservation, which remains dire, this goal does indeed seem far away, though we should remember that less than 125 years ago, places like Chitwan were producing tigers at a prodigious rate. Having such a long-term vision, however, helps guide us in making investment decisions. While we may focus in the short term on secur-ing existing breeding populations, we also need to consider how those populations might eventually contribute to the establishment of healthy regional metapopulations across all parts of the tiger range.
In the meantime, we need to recognize the current realities of tiger conservation. The re-alities suggest that the few tigers that live today in the wild persist in small, isolated pop-ulations, mainly in protected areas, where they continue to live under threat from direct mortality, prey depletion, and habitat loss. In major parts of their range they have been extirpated during the twentieth century, notably in central Asia, islands of Indonesia, and in China. The only exception to this overall gloomy trend is the Russian Far East, where interconnected, breeding populations persist, though recent work suggest that even these populations may be more subdivided that we would like.
In short, tigers are still in trouble. Thus our most immediate goals should focus on secur-ing existing breeding populations in large areas of habitat wherever we can fi nd them.
Setting Priorities for the Conservation and Recovery of Wild Tigers: 2005–2015
86
Breeding populations are the fundamental building block of any tiger conservation strat-egy. In the longer term, these populations will be the basis for developing interconnected tiger meta-populations across habitats and regions, and eventually to restore tigers to all parts of the historical range. However our most immediate goal must be to identify and work to conserve breeding populations.
As in our previous priority-setting exercise (Dinerstein et al. 1997), these populations need to represent the different ecological situations where tigers were historically found. We want not only to conserve tigers as set-pieces, but tigers as dynamic, functional actors in the settings where they occur; we want to conserve representative “tigerness” in all its diversity of circumstances, from the grasslands of Nepal to the conifer forests of Russia. Moreover, setting priorities across different habitat types and bioregions will ensure that we conserve populations across the historical range that serve as a foundation on which to build a successful range-wide program of conservation and restoration.
We know that tiger populations need prey and safe habitat to survive. Research over the past decades has shown that tigers require abundant prey, and some structural cover (trees or tall grass) spread over a large enough area to contain many territories, where the size of those territories depends strongly on habitat type. This understanding refl ects a subtle, but signifi cant, change in our understanding from a decade ago, when we rec-ognized the importance of habitat, but did not fully appreciate the importance of prey as a habitat component in defi ning where tigers will persist. Given suffi cient prey and an absence of persecution, tigers are remarkably catholic in their habitat requirements.
In addition to prey and habitat, tigers need to be free from persecution to thrive. Setting tiger priorities requires not only an examination of the biological factors promoting tiger success (e.g. prey, habitat), but also the human factors determining their fate, notably threats and the off-setting conservation measures. Tigers today require not only our for-bearance to leave their homes and food supplies intact, but also the willingness of people to live with them and all that entails economically, socially, and spiritually.
Thus, securing existing breeding populations requires 1) identifying breeding populations and 2) the conditions that will support them in major habitat types and regions within the currently occupied range, then 3) working in those areas with interested people to create the supporting conditions tigers require—prey, habitat, freedom from persecu-tion—so that tigers will continue to act as a wild species in Asia. It is a tall order, but the necessary work for the next ten years of tiger conservation.
6.2 Classifying Tiger Conservation Landscapes
6.2.1 Information for classifying TCLsThe conditions known for successful tiger conservation suggest fi ve metrics for categoriz-ing and prioritizing TCLs, namely:

87
1 - status of tiger populations (size, breeding status);
2 - status of prey populations (prey biomass, diversity relative to potential, assessment of threat to prey);
3 - habitat area (total area scaled by habitat-specifi c home range, number of full home range sized blocks, potential for connectivity);
4 - threat from persecution (assessment of threats, direct and indirect); and
5 - conservation measures (assessment of current and future conservation work).
In many cases, we will be hampered by lack of information about even the most basic metrics of tiger conservation. However we have through the current exercise assembled several indices to select from to help us in our task (see Chapter 2). These are detailed in Table 6.1.
In addition each TCL is characterized by:
6 - biome (percentage areas of different potential habitat within the TCL based on the land cover analysis (Chapter 3), and calculated from the geographic information system (GIS)), and;
7 - bioregion (as defi ned in the fi rst prioritization exercise in South and Southeast Asia, but extended now to include central Asia, China and Russia, and identifi ed through GIS analysis).
Chapter 6 A New Taxonomy for Tiger Conservation Landscapes
Potential Data source
Tiger population size TCU questionnaire, categorical assessmentBreeding status TCU questionnaire, yes/no/don’t know assessment; also
Tiger Point Database, same assessmentPrey biomass Limited information from TCU questionnairePrey diversity Limited information from TCU questionnaireThreat to prey TCU questionnaire: 5S type assessmentRelative area Calculation from land cover classification; literature survey
for approximate home range sizes by habitat typeNumber of blocks larger than ahome range
Calculation from land cover classification; literature surveyfor approximate home range sizes by habitat type
Potential for connectivity Inter-TCL distances; intra-TCL patch size and distributionstatistics
Area under protection Calculated from TCL delineation and protected areas(WDPA) database; effectiveness for some protected areas israted on the TCU questionnaire
Threats Measures TCU questionnaire, list of measures with assessment ofeffectiveness
Conservation Measures TCU questionnaire, list of measures with assessment ofeffectiveness
Table 6.1 Metrics of tiger conservation landscapes important for long term tiger conservation.
Setting Priorities for the Conservation and Recovery of Wild Tigers: 2005–2015
88
Unfortunately, an important gap in our understanding revolves around the status of tiger prey. We lack systematic, range-wide information are on prey status and abundance. Thus, although we know that abundant prey is a key factor for determining tiger persis-tence across the range, we cannot include prey in this assessment of tiger conservation priorities. However we recommend that over the next 10 years, substantive effort be placed in developing information on the prey base in all TCLs.
For the other parameters, analysis shows that there is signifi cant overlap between TCU 1.0 and the new TCLs (TCL 2.0), as described in the Chapter 4. New TCLs for which no questionnaire data are available, either because of lack of overlap, lack of response from the fi eld, or simply ignorance, are rated as “Insuffi cient information for prioritization.”
6.2.2 Class defi nitions for Tiger Conservation LandscapesIn TCU 1.0, TCUs were ranked within major habitat types and bioregions, such that the highest ranking (most important TCUs) were scored as Level I-globally important, im-portant second tier TCUs as Level II-regionally important, and third tier TCUs as Level III-locally important. To determine these levels, TCUs were scored by measures of habitat area, confi guration, threat and population status; the three highest ranking TCUs in each ecogeographic unit became Level I, the next Level II, etc. This model has been replicated elsewhere (e.g. Sanderson et al. 2002).
The problem with this kind of scoring system is that it does not clearly separate relative priorities, for example in a portfolio, from the “absolute” measure of how much a given landscape contributes to tiger conservation. A highly ranked area might be highly ranked because it is really good for tigers or because it is just the best there is within an ecore-gional context. Only a close reading will distinguish the two.
In TCL 2.0 we chose a new way to rank our new TCLs: to fi rst classify tiger conservation landscapes into distinct classes related to their current status and probability of reaching our goals for tiger conservation over the next decade, then to prioritize individual units to ensure representation across biomes and bioregions for tigers across the range. Clas-sifi cation provides an absolute metric of contributions of a landscape to tiger conserva-tion; prioritization provides the relative value of a given area to meeting conservation and representation goals.
To this end, we propose that a Class I TCL be defi ned as a “success” for tiger conserva-tion. For reasons explored elsewhere in this report, we defi ne “success” as a known and secured breeding population of tigers in areas large enough for a substantive population. That is, a Class I TCL should possess:
1) a known breeding population;
2) with a suffi cient prey base; and
3) suffi cient habitat area (enough for 100+ tigers), scaled by habitat type; which is
89
4) under little or no threat, either because the threat levels are low or have been miti-gated by conservation; and
5) conservation measures are in place, both locally and nationally, to ensure its long term conservation.
Class defi nitions are conditional in that all conditions must be met all for a landscape to be assigned to Class I. Conditional defi nitions make it clear to us, and to the world, what tigers need to persist.
Providing Class defi nitions also enables us to set clear and measurable goals. For ex-ample, investors in tiger conservation may chose to work to conserve at least three Class I TCLs in all parts of the tiger’s current range.
In the new assessment, “lower” class TCLs are those that have potential to reach Class I status, but need more conservation effort to reach that status. Class II TCLs are TCLs that have the potential to secure a breeding population through conservation efforts in the next 10 years. Class II TCLs will typically be places where there is suffi cient habitat, but where threats are reducing tiger populations, prey populations or both, such that conservation measures, if implemented with vigor and dedication, could protect popula-tions and allow the TCL to recover to Class I status over the next 10 years.
Class III TCLs will require even more effort and longer time horizons, perhaps because there is insuffi cient habitat, the prey bases are too diminished to recover within the next ten years, or there is a lack of commitment to tiger conservation by local people and government in that TCL. Thus though important, their conservation will likely take a sustained effort of more than 10 years to rebuild habitat and connectivity to the required state.
Finally there will be TCLs where we lack enough information to credibly distinguish what class of TCL they are; these areas with insuffi cient information are marked as Class IV. Providing the required information could immediately reclassify these TCLs into a higher class type. Table 6.2 summarizes the proposed defi nitions of the different TCL Classes if adequate data on all criteria were available. Box 6.1 shows the operationalized defi nitions given the limitations of the current databases.
Table 6.2 represents a summary of class defi nitions; operationalizing these defi nitions, we need to refl ect the data we have from the questionnaires, point data and geographic infor-mation system analysis to make these distinctions. These operational defi nitions, in terms of specifi c data items, are provided in Box 6.1, Data Requirements for TCL Classes.
6.2.3 Data Limitations on Tiger Conservation Landscape Classifi cationAs discussed in Chapter 2, we lack systematic information on prey status across the range, so though we recognize the importance of prey in predicting future tiger persis-tence, we are unable to incorporate this information into the classifi cation or prioritiza-
Chapter 6 A New Taxonomy for Tiger Conservation Landscapes

Setting Priorities for the Conservation and Recovery of Wild Tigers: 2005–2015
90
PopulationStatus*
Prey Population* Habitat Area Threats totigers
ConservationMeasures
Class I TCL Scientificallyestimatedpopulations100 tigers, andevidence ofbreeding
Evidence ofstable and diverseprey populations
Enough inter-connected habitatfor 100 femaletiger home rangeequivalents,scaled by habitattype
Little to none,either becauseof lack ofthreat orconservation
Effectiveconservationmeasures in place,activeenforcement,likely someprotection
Class II TCL Populations50 tigers
A basis for preypopulations torise, but notcurrentlysufficient
Enough inter-connected habitatfor 50 tiger homerange equivalents
Threatspotentially canbe mitigated inthe next 10years
Basis forconservation inplace, butinsufficient effort
Class III TCL Some tigers Prey non-existentor so low that 10years or more isrequired forrecovery
Less than 50 tigerhome rangeequivalents ofhabitat
Threats existand probablycan not besufficientlymitigated in thenext 10 years
Need to build thebasis (legal, actual)for conservation
Class IV TCL Insufficient information on three or more conditions
Table 6.2 Proposed defi nitions for TCL Classes (I, II, III and IV)1. Note: Insuffi cient data exists to systematically evaluate TCLs with respoect to these criteria across the tiger’s current range.
Class I Requirement A Class I TCL meets all of the following criteria:
1) Habitat Area: Total habitat ≥ minimum area to support 100 tigers, scaled by habitat type or documented evidence of a population ≥ 100 tigers.
2) Breeding: Must have evidence of breeding. (Must have questionnaire or point data.)
3) Threats: Lower 50% of range of threat level (range normalized to a 0–1 range). Lower range of threat level is equivalent to lower level of threat.
4) Conservation Effectiveness: Upper 75% of range (range normalized to 0–1 range), meaning better conservation effectiveness. (That is, 25th percentile and above compared with all conserva-tion scores)
Class II Requirement A Class II TCL meets all of the following criteria:
1) Habitat area: Total habitat in TCL ≥ minimum area to support 50 tigers, scaled by habitat type or documented evidence of 50 tigers
2) Threats: Lower 75% of range of threat level (range normalized to a 0–1 range). Lower range of threat level is equivalent to lower level of threat.
Class III Requirement A Class III TCL meets all of the following criteria:
1) All remaining TCLs for which some information on threats and conservation measures is avail-able, but not classifi ed as Class I or II.
Class IV Requirement A Class IV TCL meets all of the following criteria:
1) All remaining TCLs, not classifi ed as Class I, II or III. (i.e. Suffi cient data on threats and conser-vation effectiveness are not available to this analysis.)
Box 6.1 Data Requirements for TCL Classes
1See Box 5.1 for operationalized defi nitions given current databases
91
Chapter 6 A New Taxonomy for Tiger Conservation Landscapes
tions reported here. Similarly though the scientifi c assessment of tiger populations has advanced considerably over the last 8 years, we lack suffi cient information to apply the population size criteria consistently across the entire range.
Many TCLs span multiple biomes and/or regions, and that different portions of the same TCL may have different classifi cations and/or prioritizations in different biomes and bioregions. Only portions of TCLs with enough potential habitat in a given biome and bioregion were classifi ed and prioritized as potentially representing that biome.
6.3 Prioritizing Tiger Conservation Landscapes
6.3.1 Information for prioritizing Tiger Conservation LandscapesClassifi cation provides a measure of the current status and potential of each landscape to contribute to tiger conservation. However it is also important to consider TCLs in sets that ensure portfolio goals of representation, redundancy and resilience. As in TCU 1.0, we believe it is critical that we conserve tigers in all the different kinds of ecological settings where they occur. Tigers are extraordinary animals, with a remarkable ability to survive in habitats as different as the boreal forests of Russia and the dry tropical forests of India. Into the future, we need to ensure that “tigerness”—the qualities of tigers in the all these different ecosystems—is conserved along with tigers as wild species. This prin-ciple has been adopted in other species based prioritization exercises (e.g. jaguars, Sand-erson et al. 2002).
In the context of conservation priority-setting, we represent these distinctions through an ecogeographic context, defi ned by geographic surrogates for important distinctions in tiger biology. For this exercise we are using a combination of biomes (as defi ned in Olson et al. 2001) and bioregions, as per the TCU 1.0, though now extended to cover all of the tiger’s historical range. TCLs in this analysis were prioritized such that priority areas in each biome and each bioregion were identifi ed. We suggest that goals for tiger conserva-tion also be expressed in an ecogeographic context; for example, working toward mul-tiple Class I TCLs in each biome by bioregion combination.
We based our ecological criteria for tiger conservation on the principles of representa-tion, redundancy, and resistance. Conservation theory and practice suggests that these principles are necessary to conserve species in the wild. For tigers, we seek to sustain and improve TCL representation in each major habitat type (representation), secure one large or several smaller TCLs in each major habitat (redundancy), and prioritize those TCLs that have potential for tiger populations to resist disturbance events.
We prioritized the TCLs based on two primary data inputs: (1) TCL Class ranking and (2) the total habitat area within the TCL. We used the TCL Class rankings as a starting point to prioritize, and then used the total habitat area within the TCLs to identify which TCL should be elevated to a higher priority to meet ecogeographic representation of TCLs. We felt that these two information sources would provide a transparent and simple
Setting Priorities for the Conservation and Recovery of Wild Tigers: 2005–2015
92
method in which to prioritize the TCLs, with the assumption that tiger populations in larger habitat areas would be more resistant to future disturbances.
We established four priority levels for prioritizing TCL:
o Global priorities for tiger conservation
o Regional priorities for tiger conservation
o Long-term priorities for tiger conservation
o Insuffi cient information to prioritize
6.3.2 Prioritization of Tiger Conservation LandscapesWe used the following steps in sequential order to assess and prioritize each TCL to meet our goals of representation, redundancy, and resistance.
Step 1. All Class I TCLs are assigned Global Priority. The Class I TCLs represent the best places to conserve tigers based on ecological, conservation, and threat, and there-fore will form the basis for any global tiger conservation strategy. They are the back-bone of any long-term strategy to save tigers. As such, all Class I TCLs were identifi ed as Global priority TCLs.
Step 2. Assign to Global Priority the largest Class II TCL in any biome which does not have representation. This step is to ensure representation of all major habitat types as tiger priorities, so as to capture the unique evolutionary history of tigers across their historic range.
Step 3. Within the two major habitat types, tropical moist and tropical dry forest (which include >75% of the count of TCLs), assign to Global Priority the largest Class II TCLs so that there are at least 3 Global Priority TCLs in each bioregion. This step is meant to ensure redundancy of tiger populations in the most important habitat types in which they are still found. Unfortunately there are not enough TCLs in other biomes to allow this step to be more broadly applied.
Step 4. Assign to Regional Priority all remaining Class II TCLs. Class II TCLs have the potential to become Class I over the next 10 years with increased conservation invest-ment. They are the next generation of landscapes for tiger conservation and in some biomes and bioregions, essential to fi lling out the tiger conservation portfolio. Many of these areas are of critical national and regional importance.
Step 5. Within the two major habitat types, tropical moist and tropical dry forest, assign to Regional Priority the largest Class III TCLs so that there are at least three Regional Priority TCLs in each bioregion. This step is meant to ensure redundancy of tiger populations in the most important habitat types in which they are still found. Again too few TCLs were found in other biomes to allow this step to be more broadly applied.
93
Chapter 6 A New Taxonomy for Tiger Conservation Landscapes
Step 6. Assign to Long-term Priority all remaining Class III TCLs. Class III landscapes will take conservation effort above and beyond the next decade to bring them back to Class I status. However some of these landscapes have great national and local im-portance and our deserving of continued attention to national and local conservation authorities and organizations.
Step 7. Assign to Insuffi cient Information to Prioritize to all Class IV TCLs. Class IV landscapes suffer from lack of information, usually about ongoing conservation effort and the level of threat within the landscape. Adding this information to the database will enable us to place these landscapes within the classifi cation and prioritization taxonomy.
6.3.3 Prioritization of Survey and Restoration LandscapesAs with the TCL prioritization, we prioritized both the Survey and Restoration Land-scapes based on the concepts of representation, redundancy, and resistance. For each bio-region we identifi ed as “priority” the TCLs in the top 20% based on total habitat area.
6.4 Results: Classes and Priorities of Tiger Conservation Landscapes
6.4.1 Classes of Tiger Conservation LandscapesOf the 76 Tiger Conservation Landscapes, 16 were designated Class I, 15 as Class II, 23 as Class III and 22 as Class IV (Figures 6.1 and 6.2). While only 21% of the TCLs were placed in Class I, the greater average size of these areas mans that over 77% of the total area of delineated as TCLs is categorized as Class I—breeding tiger populations in large areas with some conservation and relatively lower threats. Class II TCLs make up ap-proximately 10% of TCLs by area—these landscapes have the potential to be recovered over the next 10 years, given more conservation effort. The remaining Class III TCLs will take longer to recover—they comprise 4.3% of the total TCL area; and 8.6% of TCLs need more information in order to classify (Class IV).
The distribution of TCLs across biomes is uneven (Tables 6.3 and 6.4). TCLs are heavily weighted toward tropical moist forests, and tropical biome types more generally, both in terms of number and area. (These may be due at least in part to the fact that these are the most common biomes in South and SE Asia).
Areas and numbers of distinct TCLs are not always parallel. For example, there is a large amount of TCL area in temperate broadleaf and mixed forests, but all of this area comes from two very large TCLs: the Russian Far East and the Northern Forest Complex–Nam-dapha–Royal Minas landscape.
At least one, representative Class I TCLs, is found in every biome except Mangroves (Table 6.4), but the number varies considerably by biome, from 16 within the tropical moist forests, to only one for several of the temperate biome types. The distribution of Class II, III, and IV TCLs shows similar distributions, heavily weighted toward tropical biome types. Recall that for a TCL to be “representative” of a given biome or bioregion
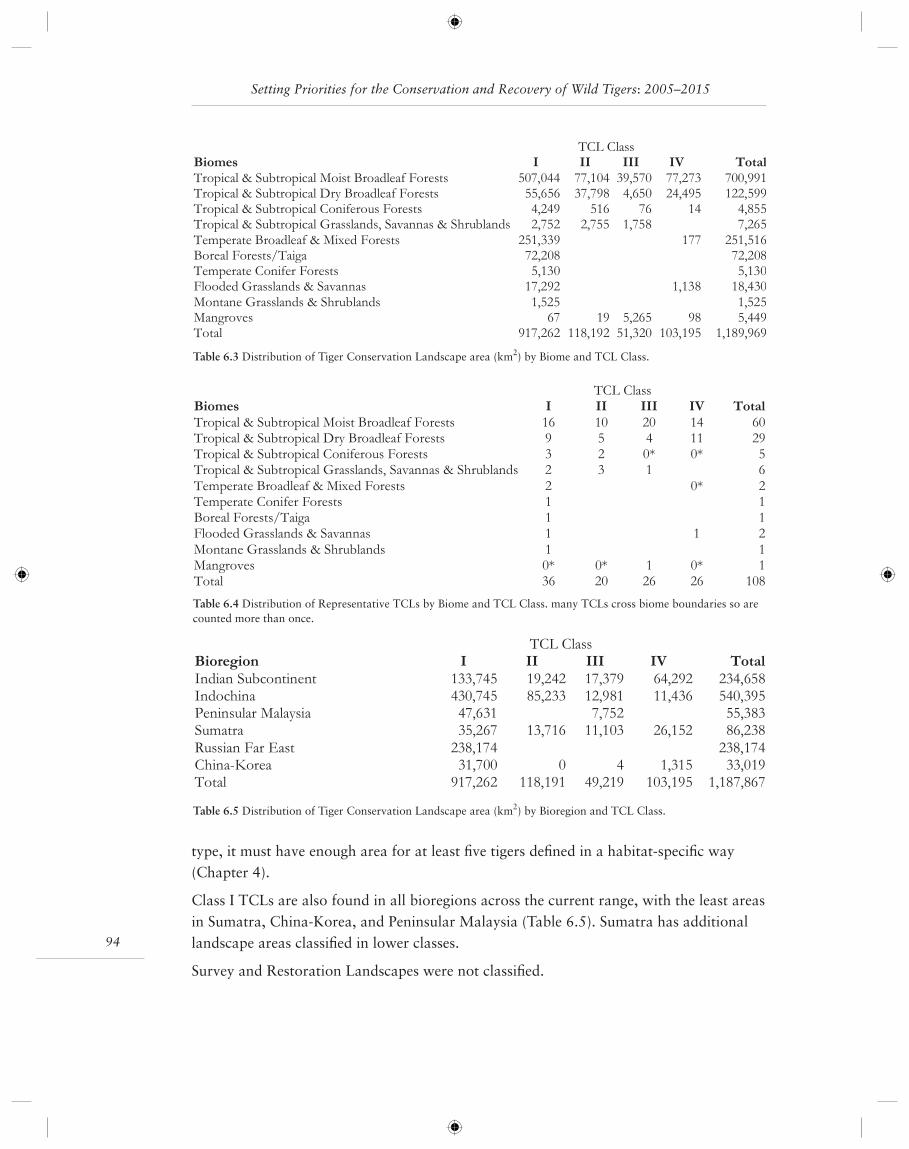
Setting Priorities for the Conservation and Recovery of Wild Tigers: 2005–2015
94
type, it must have enough area for at least fi ve tigers defi ned in a habitat-specifi c way (Chapter 4).
Class I TCLs are also found in all bioregions across the current range, with the least areas in Sumatra, China-Korea, and Peninsular Malaysia (Table 6.5). Sumatra has additional landscape areas classifi ed in lower classes.
Survey and Restoration Landscapes were not classifi ed.
TCL ClassBiomes I II III IV TotalTropical & Subtropical Moist Broadleaf Forests 507,044 77,104 39,570 77,273 700,991Tropical & Subtropical Dry Broadleaf Forests 55,656 37,798 4,650 24,495 122,599Tropical & Subtropical Coniferous Forests 4,249 516 76 14 4,855Tropical & Subtropical Grasslands, Savannas & Shrublands 2,752 2,755 1,758 7,265Temperate Broadleaf & Mixed Forests 251,339 177 251,516Boreal Forests/Taiga 72,208 72,208Temperate Conifer Forests 5,130 5,130Flooded Grasslands & Savannas 17,292 1,138 18,430Montane Grasslands & Shrublands 1,525 1,525Mangroves 67 19 5,265 98 5,449Total 917,262 118,192 51,320 103,195 1,189,969
Table 6.3 Distribution of Tiger Conservation Landscape area (km2) by Biome and TCL Class.
TCL ClassBiomes I II III IV TotalTropical & Subtropical Moist Broadleaf Forests 16 10 20 14 60Tropical & Subtropical Dry Broadleaf Forests 9 5 4 11 29Tropical & Subtropical Coniferous Forests 3 2 0* 0* 5Tropical & Subtropical Grasslands, Savannas & Shrublands 2 3 1 6Temperate Broadleaf & Mixed Forests 2 0* 2Temperate Conifer Forests 1 1Boreal Forests/Taiga 1 1Flooded Grasslands & Savannas 1 1 2Montane Grasslands & Shrublands 1 1Mangroves 0* 0* 1 0* 1Total 36 20 26 26 108
Table 6.4 Distribution of Representative TCLs by Biome and TCL Class. many TCLs cross biome boundaries so are counted more than once.
TCL ClassBioregion I II III IV TotalIndian Subcontinent 133,745 19,242 17,379 64,292 234,658Indochina 430,745 85,233 12,981 11,436 540,395Peninsular Malaysia 47,631 7,752 55,383Sumatra 35,267 13,716 11,103 26,152 86,238
Russian Far East 238,174 238,174China-Korea 31,700 0 4 1,315 33,019Total 917,262 118,191 49,219 103,195 1,187,867
Table 6.5 Distribution of Tiger Conservation Landscape area (km2) by Bioregion and TCL Class.
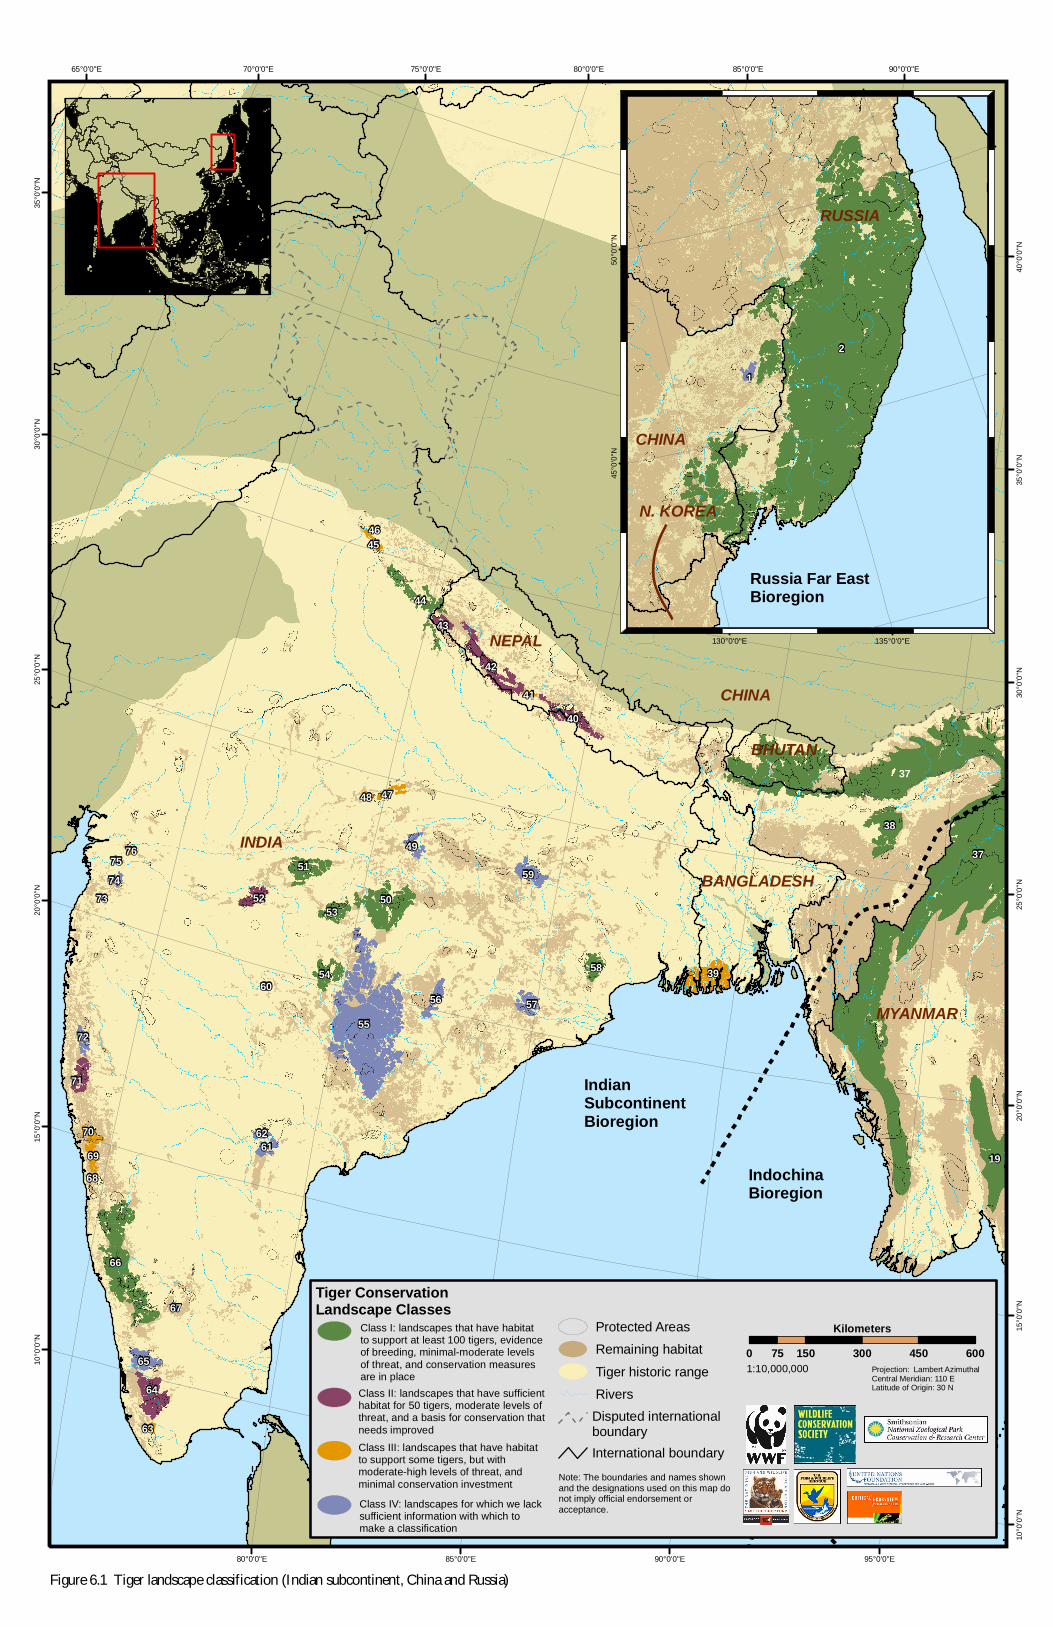
37
55
19
38
66
50
42
44
64
51
40
54 39
59
65
71
53
57
58
52
69
56
49
61
72
47
43
45
74
62
63
48
70
76
41
60
75
73
46
68
67
75°0'0"E70°0'0"E65°0'0"E
80°0'0"E
80°0'0"E
85°0'0"E
85°0'0"E
90°0'0"E
90°0'0"E
95°0'0"E
10°0
'0"N
10°0
'0"N
15°0
'0"N
15°0
'0"N
20°0
'0"N
20°0
'0"N
25°0
'0"N
25°0
'0"N
30°0
'0"N
30°0
'0"N
35°0
'0"N
35°0
'0"N
40°0
'0"N
2
1
130°0'0"E 135°0'0"E
45°0
'0"N
50°0
'0"N
Indian SubcontinentBioregion
Russia Far EastBioregion
INDIA
NEPAL
BANGLADESH
MYANMAR
CHINA
BHUTAN
CHINA
RUSSIA
N. KOREA
IndochinaBioregion
0 150 300 450 60075Kilometers
Projection: Lambert AzimuthalCentral Meridian: 110 ELatitude of Origin: 30 N
1:10,000,000
Tiger Conservation Landscape Classes
Class II: landscapes that have sufficient habitat for 50 tigers, moderate levels of threat, and a basis for conservation that needs improved
Class IV: landscapes for which we lack sufficient information with which to make a classification
Class I: landscapes that have habitat to support at least 100 tigers, evidence of breeding, minimal-moderate levels of threat, and conservation measures are in place
37
Note: The boundaries and names shown and the designations used on this map do not imply official endorsement or acceptance.
Remaining habitatTiger historic rangeRivers
International boundary
Disputed international boundary
Protected Areas
Class III: landscapes that have habitat to support some tigers, but with moderate-high levels of threat, and minimal conservation investment
Figure 6.1 Tiger landscape classification (Indian subcontinent, China and Russia)
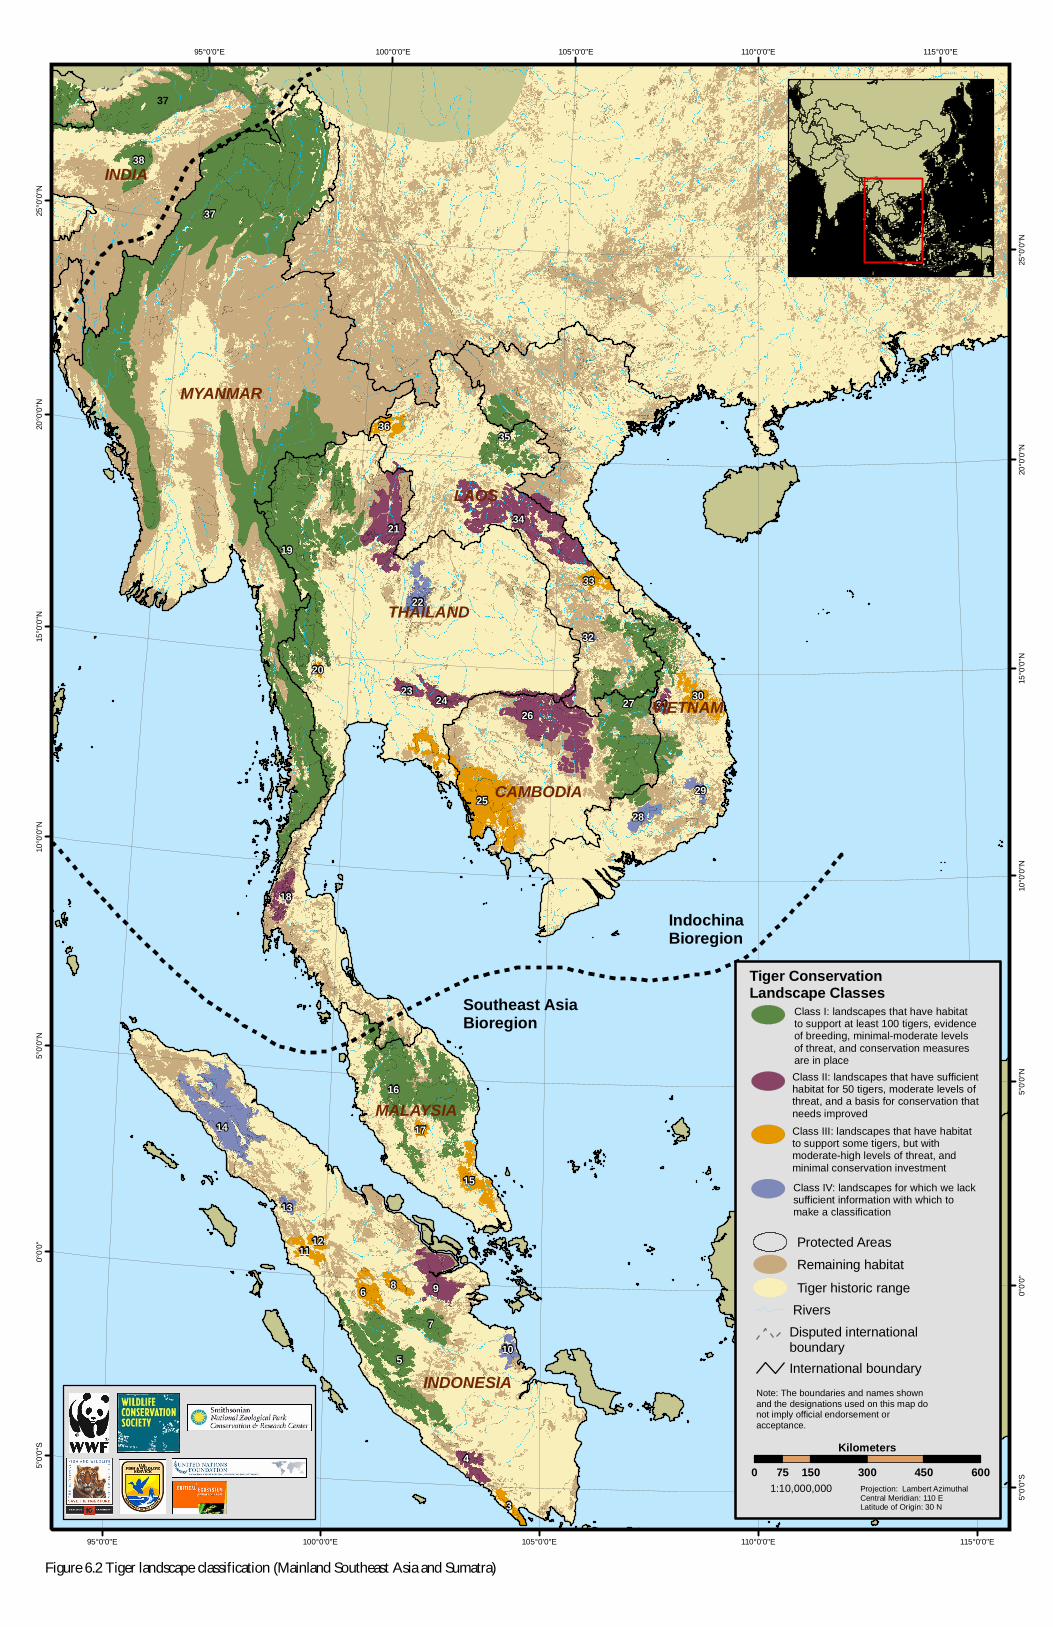
37
19
27
16
5
26
25
14
9
21
7
6
38
34
35
30
4
15
22
18
24
8
3
36
28
11
33
10
2331
29
12
13
17
32
20
95°0'0"E
95°0'0"E
100°0'0"E
100°0'0"E
105°0'0"E
105°0'0"E
110°0'0"E
110°0'0"E 115°0'0"E
115°0'0"E
5°0'0"
S
5°0'0"
S
0°0'0"
0°0'0"
5°0'0"
N
5°0'0"
N
10°0'
0"N
10°0'
0"N
15°0'
0"N
15°0'
0"N
20°0'
0"N
20°0'
0"N
25°0'
0"N
25°0'
0"NSoutheast AsiaBioregion
IndochinaBioregion
LAOS
THAILAND
VIETNAM
MYANMAR
INDIA
CAMBODIA
INDONESIA
MALAYSIA
0 150 300 450 60075Kilometers
Projection: Lambert AzimuthalCentral Meridian: 110 ELatitude of Origin: 30 N
1:10,000,000
37
Tiger Conservation Landscape Classes
Class II: landscapes that have sufficient habitat for 50 tigers, moderate levels of threat, and a basis for conservation that needs improved
Class IV: landscapes for which we lack sufficient information with which to make a classification
Class III: landscapes that have habitat to support some tigers, but with moderate-high levels of threat, and minimal conservation investment
Class I: landscapes that have habitat to support at least 100 tigers, evidence of breeding, minimal-moderate levels of threat, and conservation measures are in place
Note: The boundaries and names shown and the designations used on this map do not imply official endorsement or acceptance.
Rivers
International boundary
Disputed international boundary
Tiger historic rangeRemaining habitatProtected Areas
Figure 6.2 Tiger landscape classification (Mainland Southeast Asia and Sumatra)
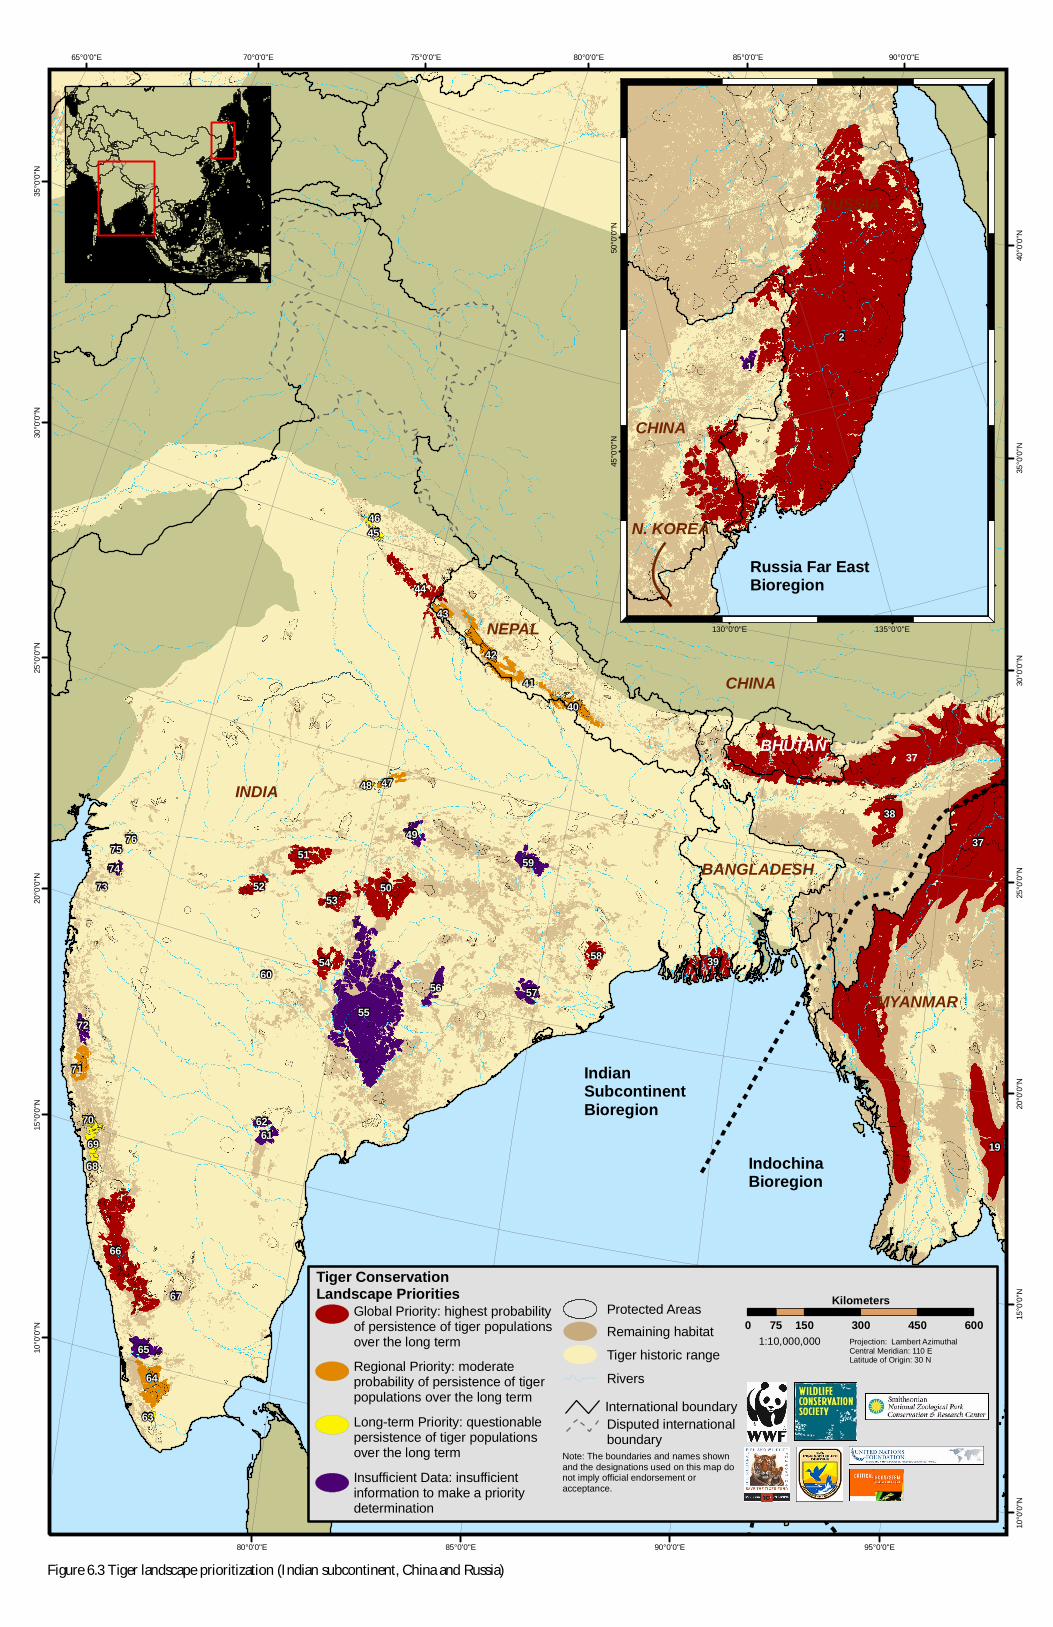
37
55
19
38
66
50
42
44
64
51
40
54 39
59
65
71
53
57
58
52
69
56
49
61
72
47
43
45
74
62
63
48
70
76
41
60
75
73
46
68
67
75°0'0"E70°0'0"E65°0'0"E
80°0'0"E
80°0'0"E
85°0'0"E
85°0'0"E
90°0'0"E
90°0'0"E
95°0'0"E
10°0'
0"N
10°0'
0"N
15°0'
0"N
15°0'
0"N
20°0'
0"N
20°0'
0"N
25°0'
0"N
25°0'
0"N
30°0'
0"N
30°0'
0"N
35°0'
0"N
35°0'
0"N40
°0'0"N
2
1
130°0'0"E 135°0'0"E45
°0'0"N
50°0'
0"N
Indian SubcontinentBioregion
Russia Far EastBioregion
INDIA
NEPAL
BANGLADESH
MYANMAR
CHINA
BHUTAN
CHINA
RUSSIA
N. KOREA
IndochinaBioregion
Tiger Conservation Landscape Priorities
Global Priority: highest probability of persistence of tiger populations over the long termRegional Priority: moderate probability of persistence of tiger populations over the long termLong-term Priority: questionable persistence of tiger populations over the long termInsufficient Data: insufficient information to make a priority determination
0 150 300 450 60075Kilometers
Projection: Lambert AzimuthalCentral Meridian: 110 ELatitude of Origin: 30 N
1:10,000,000
37
Disputed international boundary
RiversTiger historic rangeRemaining habitat
Note: The boundaries and names shown and the designations used on this map do not imply official endorsement or acceptance.
International boundary
Protected Areas
Figure 6.3 Tiger landscape prioritization (Indian subcontinent, China and Russia)
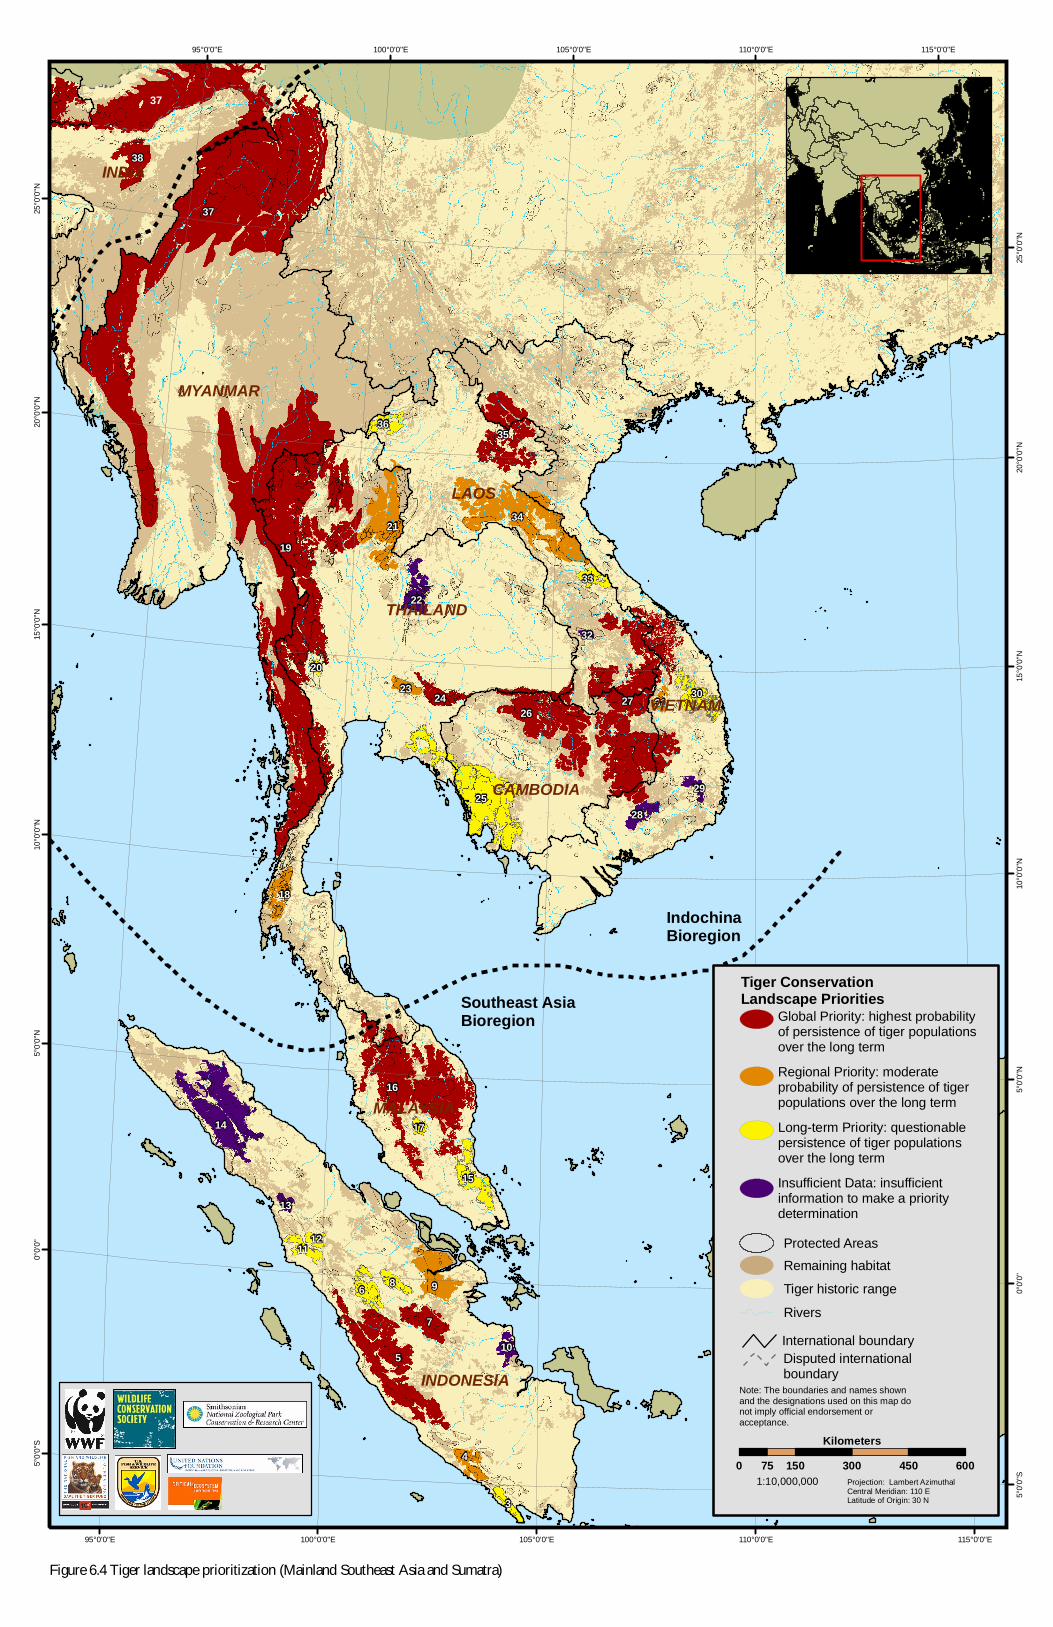
37
19
27
16
5
26
25
14
9
21
7
6
38
34
35
30
4
15
22
18
24
8
3
36
28
11
33
10
2331
29
12
13
17
32
20
95°0'0"E
95°0'0"E
100°0'0"E
100°0'0"E
105°0'0"E
105°0'0"E
110°0'0"E
110°0'0"E 115°0'0"E
115°0'0"E
5°0'0"
S
5°0'0"
S
0°0'0"
0°0'0"
5°0'0"
N
5°0'0"
N
10°0'
0"N
10°0'
0"N
15°0'
0"N
15°0'
0"N
20°0'
0"N
20°0'
0"N
25°0'
0"N
25°0'
0"NSoutheast AsiaBioregion
IndochinaBioregion
LAOS
THAILAND
VIETNAM
MYANMAR
INDIA
CAMBODIA
INDONESIA
MALAYSIA
Tiger Conservation Landscape Priorities
Global Priority: highest probability of persistence of tiger populations over the long termRegional Priority: moderate probability of persistence of tiger populations over the long termLong-term Priority: questionable persistence of tiger populations over the long termInsufficient Data: insufficient information to make a priority determination
0 150 300 450 60075Kilometers
Projection: Lambert AzimuthalCentral Meridian: 110 ELatitude of Origin: 30 N
1:10,000,000
37
Disputed international boundary
RiversTiger historic rangeRemaining habitat
Note: The boundaries and names shown and the designations used on this map do not imply official endorsement or acceptance.
International boundary
Protected Areas
Figure 6.4 Tiger landscape prioritization (Mainland Southeast Asia and Sumatra)
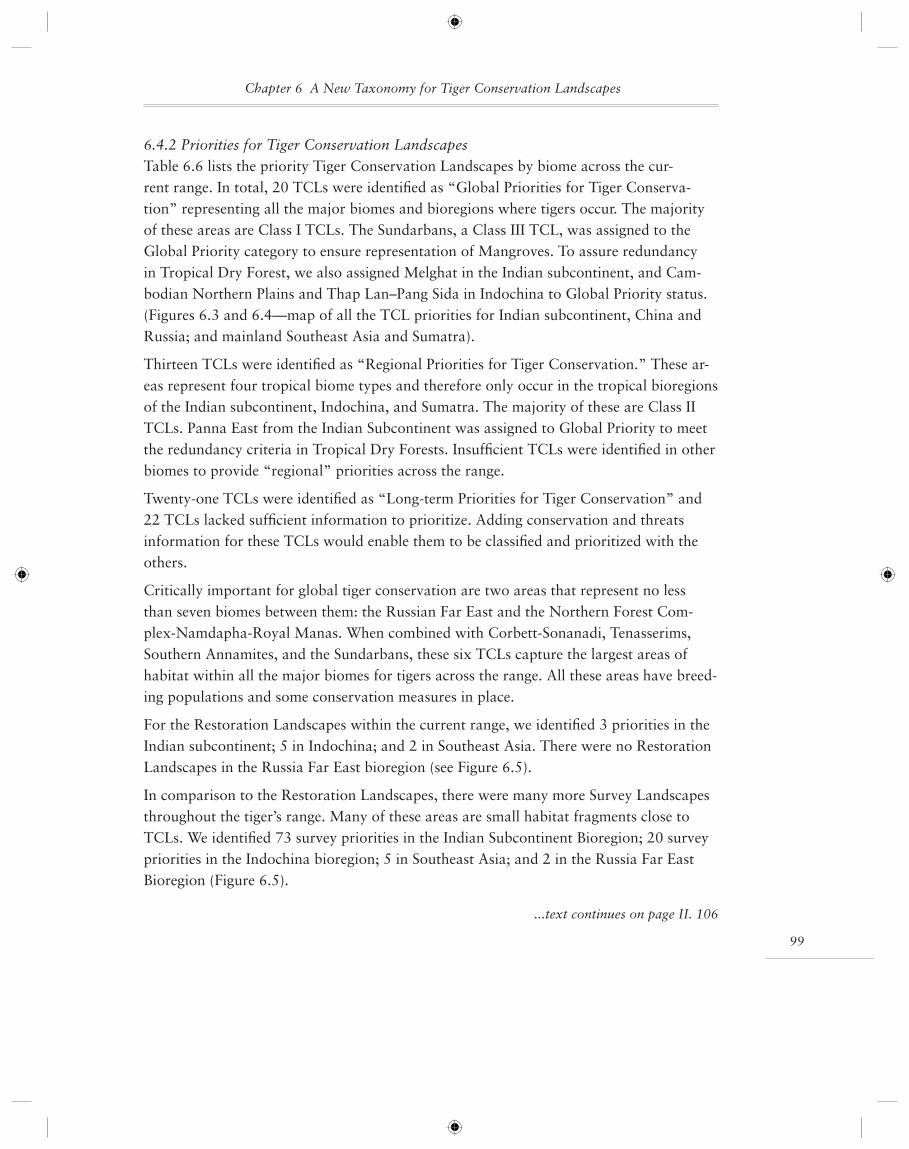
99
6.4.2 Priorities for Tiger Conservation LandscapesTable 6.6 lists the priority Tiger Conservation Landscapes by biome across the cur-rent range. In total, 20 TCLs were identifi ed as “Global Priorities for Tiger Conserva-tion” representing all the major biomes and bioregions where tigers occur. The majority of these areas are Class I TCLs. The Sundarbans, a Class III TCL, was assigned to the Global Priority category to ensure representation of Mangroves. To assure redundancy in Tropical Dry Forest, we also assigned Melghat in the Indian subcontinent, and Cam-bodian Northern Plains and Thap Lan–Pang Sida in Indochina to Global Priority status. (Figures 6.3 and 6.4—map of all the TCL priorities for Indian subcontinent, China and Russia; and mainland Southeast Asia and Sumatra).
Thirteen TCLs were identifi ed as “Regional Priorities for Tiger Conservation.” These ar-eas represent four tropical biome types and therefore only occur in the tropical bioregions of the Indian subcontinent, Indochina, and Sumatra. The majority of these are Class II TCLs. Panna East from the Indian Subcontinent was assigned to Global Priority to meet the redundancy criteria in Tropical Dry Forests. Insuffi cient TCLs were identifi ed in other biomes to provide “regional” priorities across the range.
Twenty-one TCLs were identifi ed as “Long-term Priorities for Tiger Conservation” and 22 TCLs lacked suffi cient information to prioritize. Adding conservation and threats information for these TCLs would enable them to be classifi ed and prioritized with the others.
Critically important for global tiger conservation are two areas that represent no less than seven biomes between them: the Russian Far East and the Northern Forest Com-plex-Namdapha-Royal Manas. When combined with Corbett-Sonanadi, Tenasserims, Southern Annamites, and the Sundarbans, these six TCLs capture the largest areas of habitat within all the major biomes for tigers across the range. All these areas have breed-ing populations and some conservation measures in place.
For the Restoration Landscapes within the current range, we identifi ed 3 priorities in the Indian subcontinent; 5 in Indochina; and 2 in Southeast Asia. There were no Restoration Landscapes in the Russia Far East bioregion (see Figure 6.5).
In comparison to the Restoration Landscapes, there were many more Survey Landscapes throughout the tiger’s range. Many of these areas are small habitat fragments close to TCLs. We identifi ed 73 survey priorities in the Indian Subcontinent Bioregion; 20 survey priorities in the Indochina bioregion; 5 in Southeast Asia; and 2 in the Russia Far East Bioregion (Figure 6.5).
...text continues on page II. 106
Chapter 6 A New Taxonomy for Tiger Conservation Landscapes
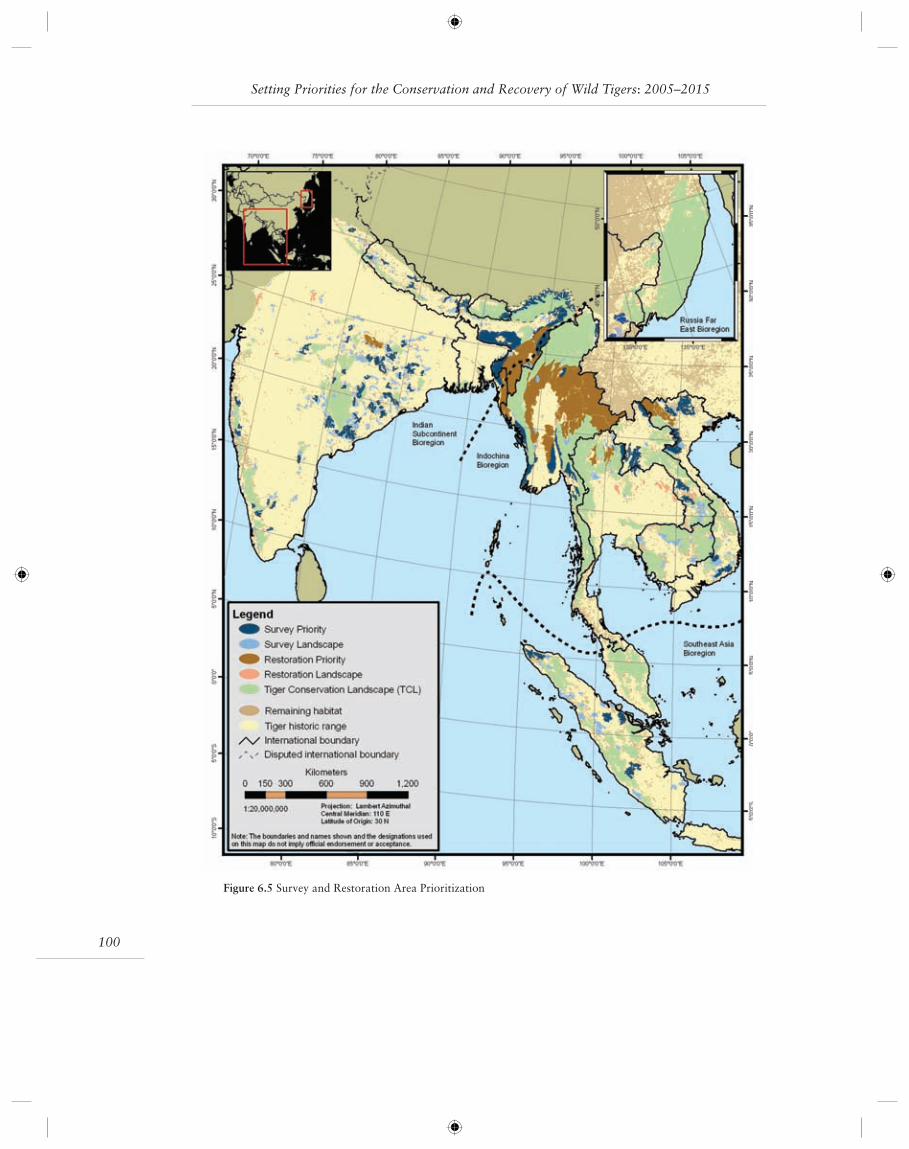
Setting Priorities for the Conservation and Recovery of Wild Tigers: 2005–2015
100
Figure 6.5 Survey and Restoration Area Prioritization
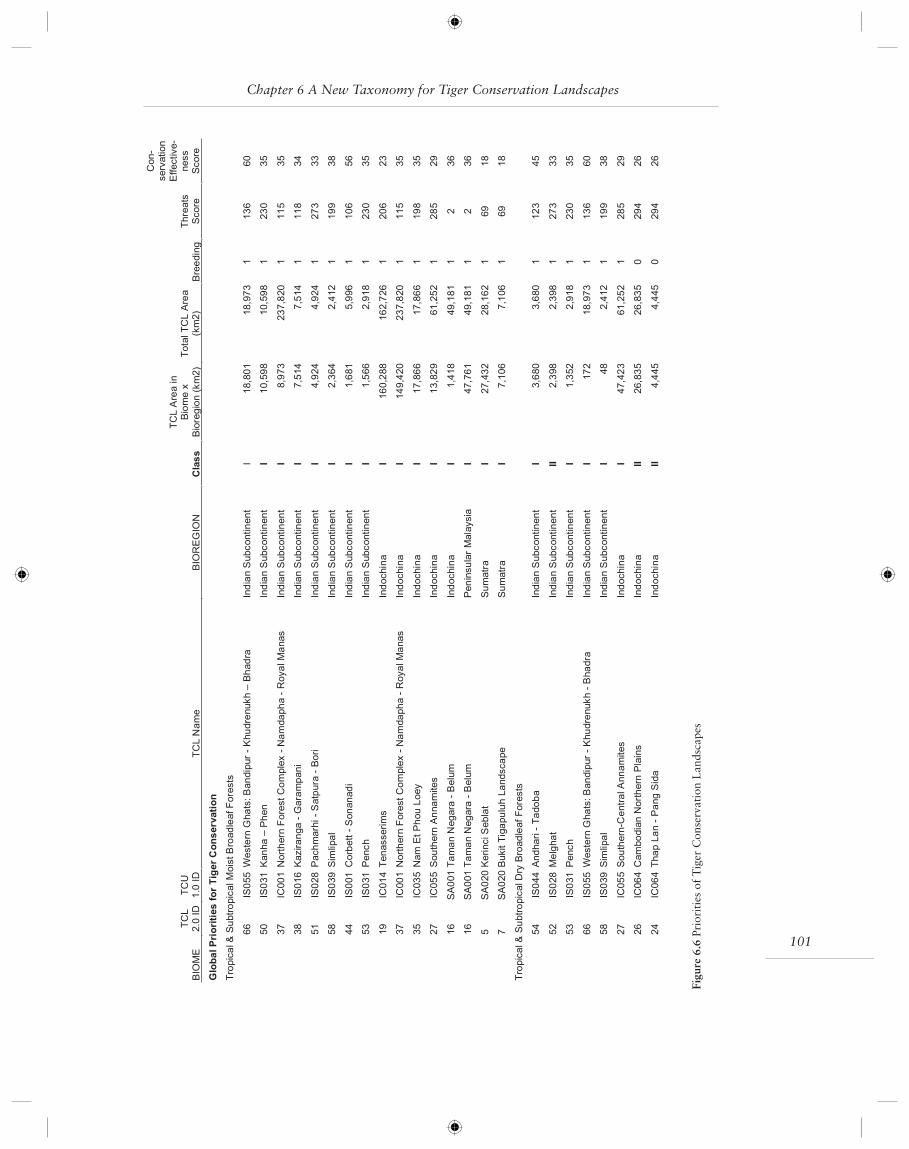
101
Chapter 6 A New Taxonomy for Tiger Conservation Landscapes
Figu
re 6
.6 P
rior
itie
s of
Tig
er C
onse
rvat
ion
Lan
dsca
pes
BIOME
TCL
2.0ID
TCU
1.0ID
TCLName
BIOREGION
Class
TCLAreain
Biomex
Bioregion(km2)
TotalTCLArea
(km2)
Breeding
Threats
Score
Con-
servation
Effective-
ness
Score
GlobalPrioritiesforTigerConservation
Tropical&SubtropicalMoistBroadleafForests
66
IS055WesternGhats:Bandipur-Khudrenukh–Bhadra
IndianSubcontinent
I18,801
18,973
1136
60
50
IS031Kanha–Phen
IndianSubcontinent
I10,598
10,598
1230
35
37
IC001NorthernForestComplex-Namdapha-RoyalManas
IndianSubcontinent
I8,973
237,820
1115
35
38
IS016Kaziranga-Garampani
IndianSubcontinent
I7,514
7,514
1118
34
51
IS028Pachmarhi-Satpura-Bori
IndianSubcontinent
I4,924
4,924
1273
33
58
IS039Simlipal
IndianSubcontinent
I2,364
2,412
1199
38
44
IS001Corbett-Sonanadi
IndianSubcontinent
I1,681
5,996
1106
56
53
IS031Pench
IndianSubcontinent
I1,566
2,918
1230
35
19
IC014Tenasserims
Indochina
I160,288
162,726
1206
23
37
IC001NorthernForestComplex-Namdapha-RoyalManas
Indochina
I149,420
237,820
1115
35
35
IC035NamEtPhouLoey
Indochina
I17,866
17,866
1198
35
27
IC055SouthernAnnamites
Indochina
I13,829
61,252
1285
29
16
SA001TamanNegara-Belum
Indochina
I1,418
49,181
12
36
16
SA001TamanNegara-Belum
PeninsularMalaysia
I47,761
49,181
12
36
5SA020KerinciSeblat
Sumatra
I27,432
28,162
169
18
7SA020BukitTigapuluhLandscape
Sumatra
I7,106
7,106
169
18
Tropical&SubtropicalDryBroadleafForests
54
IS044Andhari-Tadoba
IndianSubcontinent
I3,680
3,680
1123
45
52
IS028Melghat
IndianSubcontinent
II2,398
2,398
1273
33
53
IS031Pench
IndianSubcontinent
I1,352
2,918
1230
35
66
IS055WesternGhats:Bandipur-Khudrenukh-Bhadra
IndianSubcontinent
I172
18,973
1136
60
58
IS039Simlipal
IndianSubcontinent
I48
2,412
1199
38
27
IC055Southern-CentralAnnamites
Indochina
I47,423
61,252
1285
29
26
IC064CambodianNorthernPlains
Indochina
II26,835
26,835
0294
26
24
IC064ThapLan-PangSida
Indochina
II4,445
4,445
0294
26
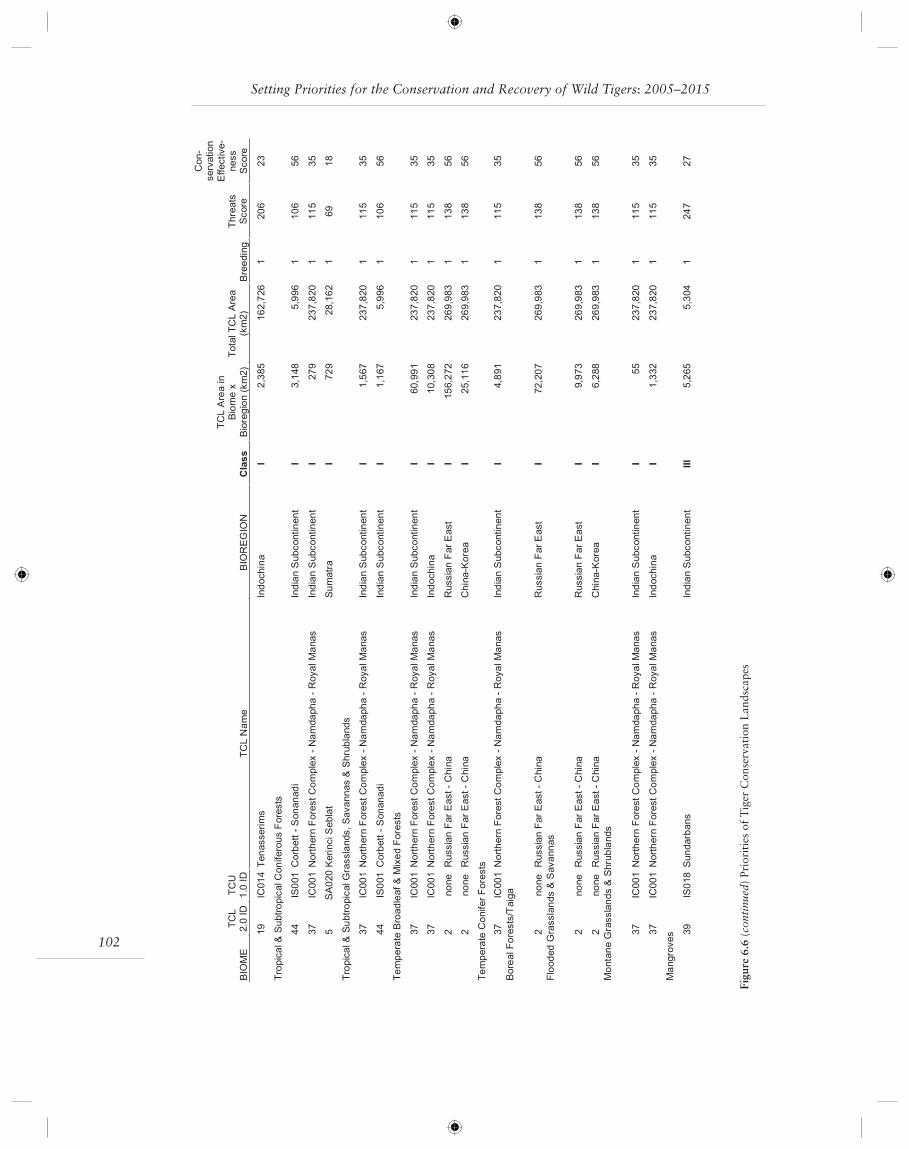
Setting Priorities for the Conservation and Recovery of Wild Tigers: 2005–2015
102
Figu
re 6
.6 (
cont
inue
d) P
rior
itie
s of
Tig
er C
onse
rvat
ion
Lan
dsca
pes
BIOME
TCL
2.0ID
TCU
1.0ID
TCLName
BIOREGION
Class
TCLAreain
Biomex
Bioregion(km2)
TotalTCLArea
(km2)
Breeding
Threats
Score
Con-
servation
Effective-
ness
Score
19
IC014Tenasserims
Indochina
I2,385
162,726
1206
23
Tropical&SubtropicalConiferousForests
44
IS001Corbett-Sonanadi
IndianSubcontinent
I3,148
5,996
1106
56
37
IC001NorthernForestComplex-Namdapha-RoyalManas
IndianSubcontinent
I279
237,820
1115
35
5SA020KerinciSeblat
Sumatra
I729
28,162
169
18
Tropical&SubtropicalGrasslands,Savannas&Shrublands
37
IC001NorthernForestComplex-Namdapha-RoyalManas
IndianSubcontinent
I1,567
237,820
1115
35
44
IS001Corbett-Sonanadi
IndianSubcontinent
I1,167
5,996
1106
56
TemperateBroadleaf&MixedForests
37
IC001NorthernForestComplex-Namdapha-RoyalManas
IndianSubcontinent
I60,991
237,820
1115
35
37
IC001NorthernForestComplex-Namdapha-RoyalManas
Indochina
I10,308
237,820
1115
35
2noneRussianFarEast-China
RussianFarEast
I156,272
269,983
1138
56
2noneRussianFarEast-China
China-Korea
I25,116
269,983
1138
56
TemperateConiferForests
37
IC001NorthernForestComplex-Namdapha-RoyalManas
IndianSubcontinent
I4,891
237,820
1115
35
BorealForests/Taiga
2noneRussianFarEast-China
RussianFarEast
I72,207
269,983
1138
56
FloodedGrasslands&Savannas
2noneRussianFarEast-China
RussianFarEast
I9,973
269,983
1138
56
2noneRussianFarEast-China
China-Korea
I6,288
269,983
1138
56
MontaneGrasslands&Shrublands
37
IC001NorthernForestComplex-Namdapha-RoyalManas
IndianSubcontinent
I55
237,820
1115
35
37
IC001NorthernForestComplex-Namdapha-RoyalManas
Indochina
I1,332
237,820
1115
35
Mangroves 39
IS018Sundarbans
IndianSubcontinent
III
5,265
5,304
1247
27
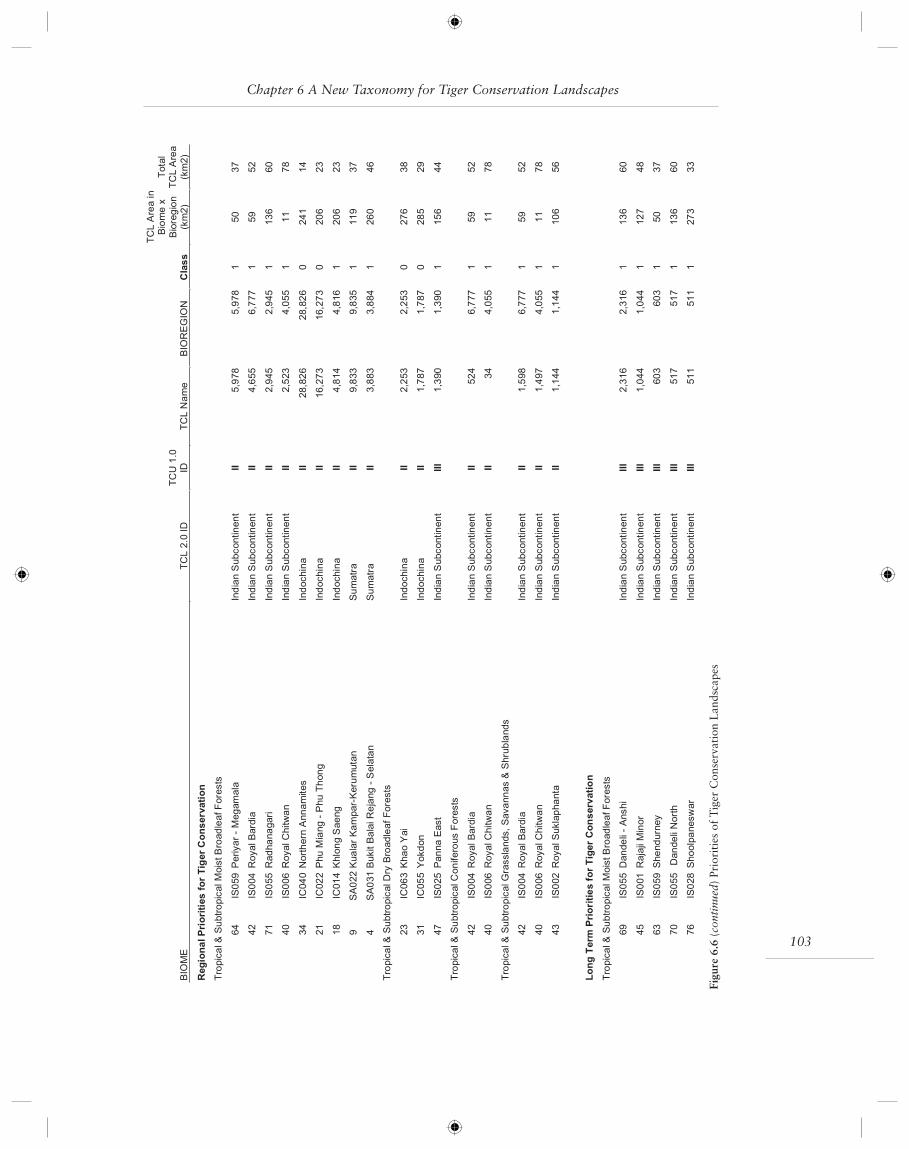
103
Chapter 6 A New Taxonomy for Tiger Conservation Landscapes
Figu
re 6
.6 (
cont
inue
d) P
rior
itie
s of
Tig
er C
onse
rvat
ion
Lan
dsca
pes
BIOME
TCL2.0ID
TCU1.0
IDTCLName
BIOREGION
Class
TCLAreain
Biomex
Bioregion
(km2)
Total
TCLArea
(km2)
RegionalPrioritiesforTigerConservation
Tropical&SubtropicalMoistBroadleafForests
64
IS059Periyar-Megamala
IndianSubcontinent
II5,978
5,978
150
37
42
IS004RoyalBardia
IndianSubcontinent
II4,655
6,777
159
52
71
IS055Radhanagari
IndianSubcontinent
II2,945
2,945
1136
60
40
IS006RoyalChitwan
IndianSubcontinent
II2,523
4,055
111
78
34
IC040NorthernAnnamites
Indochina
II28,826
28,826
0241
14
21
IC022PhuMiang-PhuThong
Indochina
II16,273
16,273
0206
23
18
IC014KhlongSaeng
Indochina
II4,814
4,816
1206
23
9SA022KualarKampar-Kerumutan
Sumatra
II9,833
9,835
1119
37
4SA031BukitBalaiRejang-Selatan
Sumatra
II3,883
3,884
1260
46
Tropical&SubtropicalDryBroadleafForests
23
IC063KhaoYai
Indochina
II2,253
2,253
0276
38
31
IC055Yokdon
Indochina
II1,787
1,787
0285
29
47
IS025PannaEast
IndianSubcontinent
III
1,390
1,390
1156
44
Tropical&SubtropicalConiferousForests
42
IS004RoyalBardia
IndianSubcontinent
II524
6,777
159
52
40
IS006RoyalChitwan
IndianSubcontinent
II34
4,055
111
78
Tropical&SubtropicalGrasslands,Savannas&Shrublands
42
IS004RoyalBardia
IndianSubcontinent
II1,598
6,777
159
52
40
IS006RoyalChitwan
IndianSubcontinent
II1,497
4,055
111
78
43
IS002RoyalSuklaphanta
IndianSubcontinent
II1,144
1,144
1106
56
LongTerm
PrioritiesforTigerConservation
Tropical&SubtropicalMoistBroadleafForests
69
IS055Dandeli-Anshi
IndianSubcontinent
III
2,316
2,316
1136
60
45
IS001RajajiMinor
IndianSubcontinent
III
1,044
1,044
1127
48
63
IS059Shendurney
IndianSubcontinent
III
603
603
150
37
70
IS055DandeliNorth
IndianSubcontinent
III
517
517
1136
60
76
IS028Shoolpaneswar
IndianSubcontinent
III
511
511
1273
33
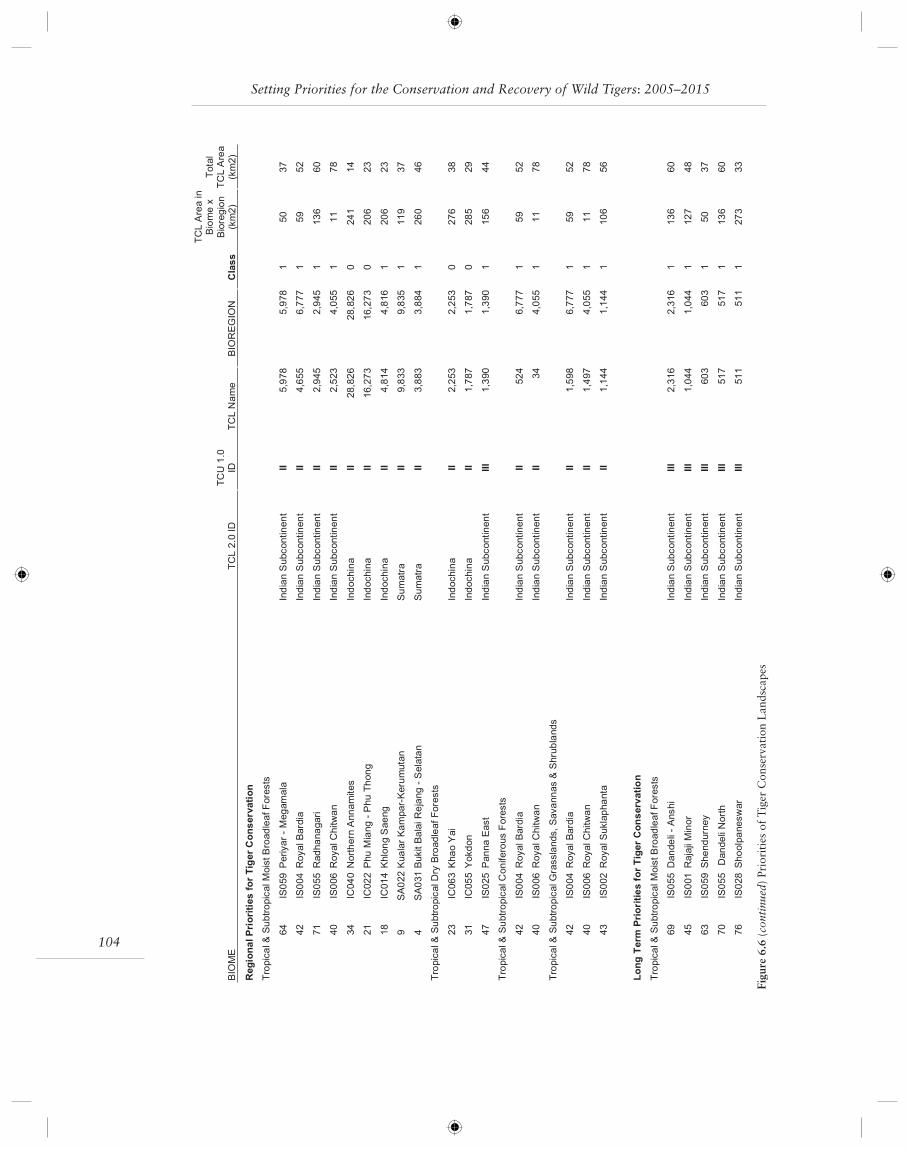
Setting Priorities for the Conservation and Recovery of Wild Tigers: 2005–2015
104
Figu
re 6
.6 (
cont
inue
d) P
rior
itie
s of
Tig
er C
onse
rvat
ion
Lan
dsca
pes
BIOME
TCL2.0ID
TCU1.0
IDTCLName
BIOREGION
Class
TCLAreain
Biomex
Bioregion
(km2)
Total
TCLArea
(km2)
RegionalPrioritiesforTigerConservation
Tropical&SubtropicalMoistBroadleafForests
64
IS059Periyar-Megamala
IndianSubcontinent
II5,978
5,978
150
37
42
IS004RoyalBardia
IndianSubcontinent
II4,655
6,777
159
52
71
IS055Radhanagari
IndianSubcontinent
II2,945
2,945
1136
60
40
IS006RoyalChitwan
IndianSubcontinent
II2,523
4,055
111
78
34
IC040NorthernAnnamites
Indochina
II28,826
28,826
0241
14
21
IC022PhuMiang-PhuThong
Indochina
II16,273
16,273
0206
23
18
IC014KhlongSaeng
Indochina
II4,814
4,816
1206
23
9SA022KualarKampar-Kerumutan
Sumatra
II9,833
9,835
1119
37
4SA031BukitBalaiRejang-Selatan
Sumatra
II3,883
3,884
1260
46
Tropical&SubtropicalDryBroadleafForests
23
IC063KhaoYai
Indochina
II2,253
2,253
0276
38
31
IC055Yokdon
Indochina
II1,787
1,787
0285
29
47
IS025PannaEast
IndianSubcontinent
III
1,390
1,390
1156
44
Tropical&SubtropicalConiferousForests
42
IS004RoyalBardia
IndianSubcontinent
II524
6,777
159
52
40
IS006RoyalChitwan
IndianSubcontinent
II34
4,055
111
78
Tropical&SubtropicalGrasslands,Savannas&Shrublands
42
IS004RoyalBardia
IndianSubcontinent
II1,598
6,777
159
52
40
IS006RoyalChitwan
IndianSubcontinent
II1,497
4,055
111
78
43
IS002RoyalSuklaphanta
IndianSubcontinent
II1,144
1,144
1106
56
LongTerm
PrioritiesforTigerConservation
Tropical&SubtropicalMoistBroadleafForests
69
IS055Dandeli-Anshi
IndianSubcontinent
III
2,316
2,316
1136
60
45
IS001RajajiMinor
IndianSubcontinent
III
1,044
1,044
1127
48
63
IS059Shendurney
IndianSubcontinent
III
603
603
150
37
70
IS055DandeliNorth
IndianSubcontinent
III
517
517
1136
60
76
IS028Shoolpaneswar
IndianSubcontinent
III
511
511
1273
33
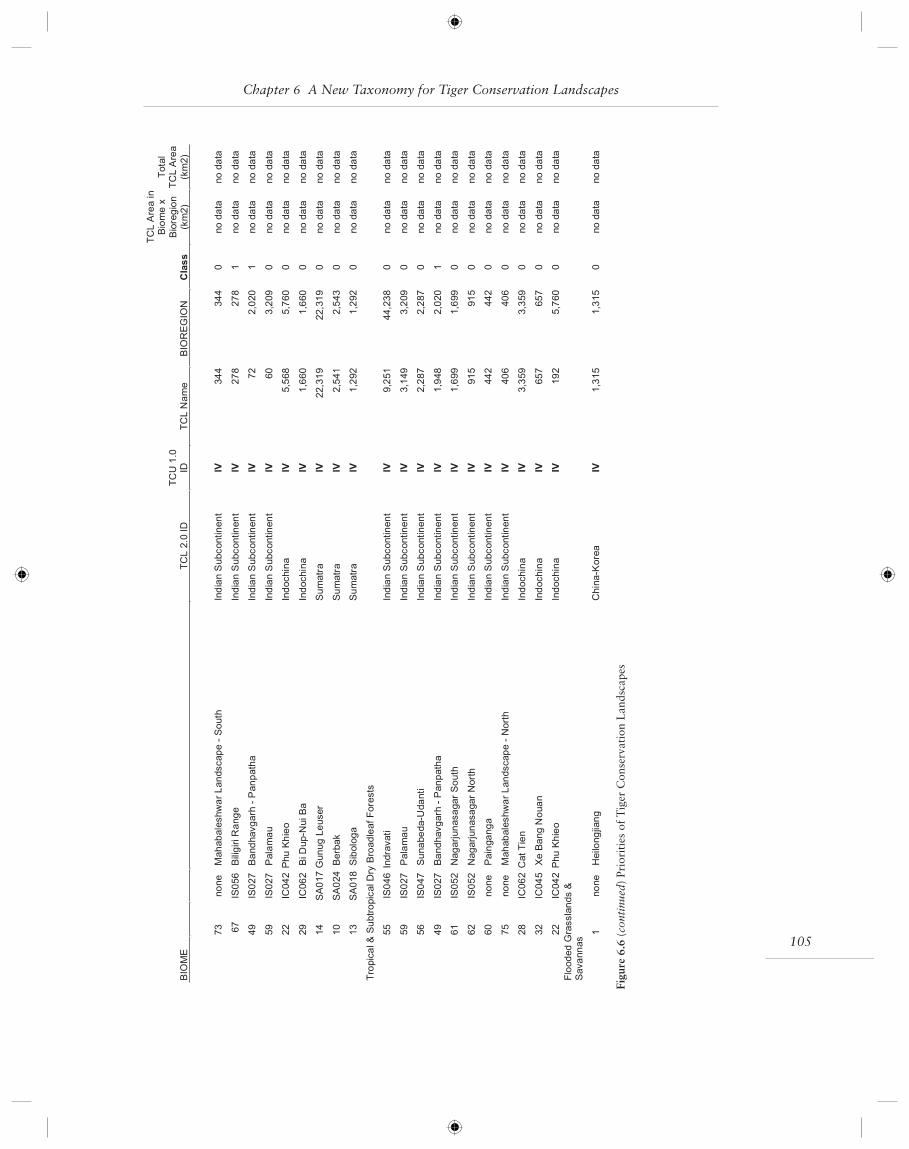
105
Chapter 6 A New Taxonomy for Tiger Conservation Landscapes
Figu
re 6
.6 (
cont
inue
d) P
rior
itie
s of
Tig
er C
onse
rvat
ion
Lan
dsca
pes
BIOME
TCL2.0ID
TCU1.0
IDTCLName
BIOREGION
Class
TCLAreain
Biomex
Bioregion
(km2)
Total
TCLArea
(km2)
73
none
MahabaleshwarLandscape-South
IndianSubcontinent
IV344
344
0nodata
nodata
67
IS056BiligiriRange
IndianSubcontinent
IV278
278
1nodata
nodata
49
IS027Bandhavgarh-Panpatha
IndianSubcontinent
IV72
2,020
1nodata
nodata
59
IS027Palamau
IndianSubcontinent
IV60
3,209
0nodata
nodata
22
IC042PhuKhieo
Indochina
IV5,568
5,760
0nodata
nodata
29
IC062BiDup-NuiBa
Indochina
IV1,660
1,660
0nodata
nodata
14
SA017GunugLeuser
Sumatra
IV22,319
22,319
0nodata
nodata
10
SA024Berbak
Sumatra
IV2,541
2,543
0nodata
nodata
13
SA018Sibologa
Sumatra
IV1,292
1,292
0nodata
nodata
Tropical&SubtropicalDryBroadleafForests
55
IS046Indravati
IndianSubcontinent
IV9,251
44,238
0nodata
nodata
59
IS027Palamau
IndianSubcontinent
IV3,149
3,209
0nodata
nodata
56
IS047Sunabeda-Udanti
IndianSubcontinent
IV2,287
2,287
0nodata
nodata
49
IS027Bandhavgarh-Panpatha
IndianSubcontinent
IV1,948
2,020
1nodata
nodata
61
IS052NagarjunasagarSouth
IndianSubcontinent
IV1,699
1,699
0nodata
nodata
62
IS052NagarjunasagarNorth
IndianSubcontinent
IV915
915
0nodata
nodata
60
none
Painganga
IndianSubcontinent
IV442
442
0nodata
nodata
75
none
MahabaleshwarLandscape-North
IndianSubcontinent
IV406
406
0nodata
nodata
28
IC062CatTien
Indochina
IV3,359
3,359
0nodata
nodata
32
IC045XeBangNouan
Indochina
IV657
657
0nodata
nodata
22
IC042PhuKhieo
Indochina
IV192
5,760
0nodata
nodata
FloodedGrasslands&
Savannas
1none
Heilongjiang
China-Korea
IV1,315
1,315
0nodata
nodata
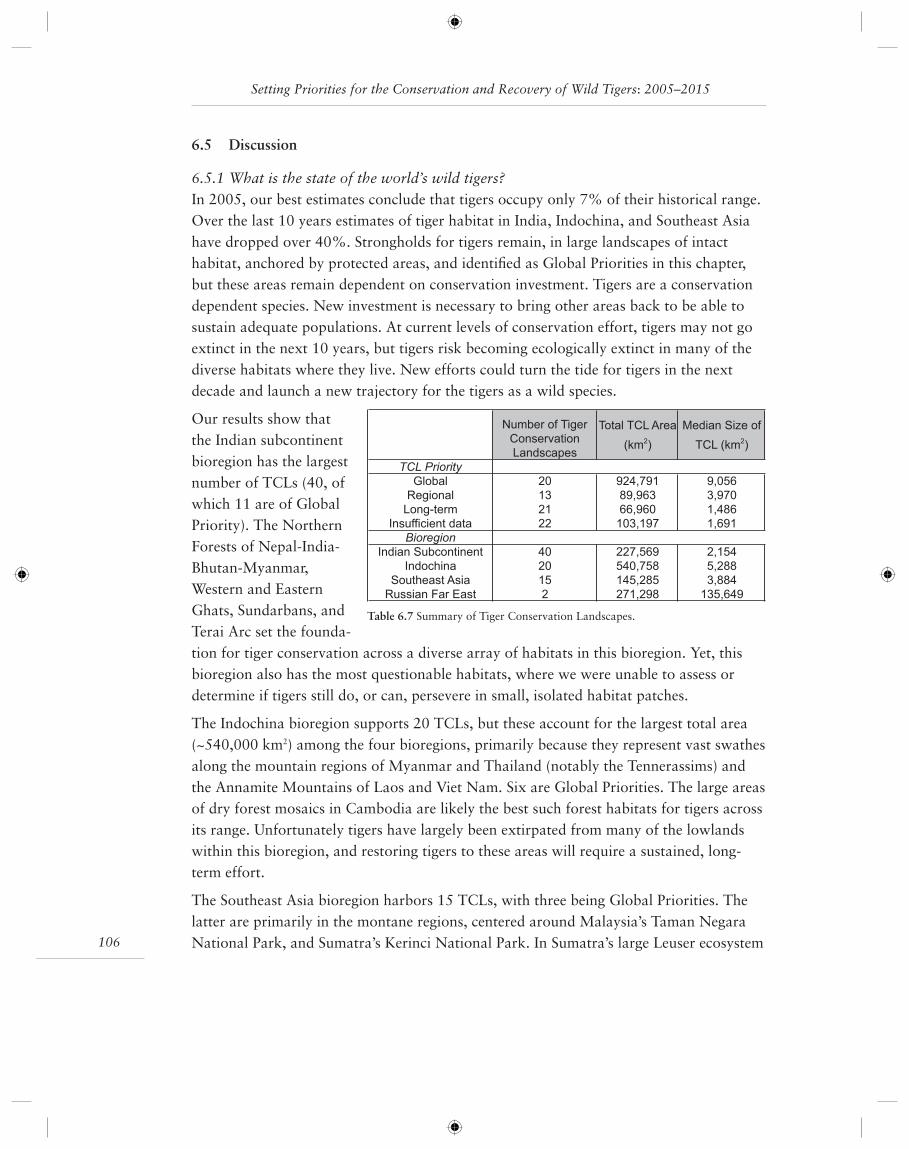
Setting Priorities for the Conservation and Recovery of Wild Tigers: 2005–2015
106
6.5 Discussion
6.5.1 What is the state of the world’s wild tigers?In 2005, our best estimates conclude that tigers occupy only 7% of their historical range. Over the last 10 years estimates of tiger habitat in India, Indochina, and Southeast Asia have dropped over 40%. Strongholds for tigers remain, in large landscapes of intact habitat, anchored by protected areas, and identifi ed as Global Priorities in this chapter, but these areas remain dependent on conservation investment. Tigers are a conservation dependent species. New investment is necessary to bring other areas back to be able to sustain adequate populations. At current levels of conservation effort, tigers may not go extinct in the next 10 years, but tigers risk becoming ecologically extinct in many of the diverse habitats where they live. New efforts could turn the tide for tigers in the next decade and launch a new trajectory for the tigers as a wild species.
Our results show that the Indian subcontinent bioregion has the largest number of TCLs (40, of which 11 are of Global Priority). The Northern Forests of Nepal-India-Bhutan-Myanmar, Western and Eastern Ghats, Sundarbans, and Terai Arc set the founda-tion for tiger conservation across a diverse array of habitats in this bioregion. Yet, this bioregion also has the most questionable habitats, where we were unable to assess or determine if tigers still do, or can, persevere in small, isolated habitat patches.
The Indochina bioregion supports 20 TCLs, but these account for the largest total area (~540,000 km2) among the four bioregions, primarily because they represent vast swathes along the mountain regions of Myanmar and Thailand (notably the Tennerassims) and the Annamite Mountains of Laos and Viet Nam. Six are Global Priorities. The large areas of dry forest mosaics in Cambodia are likely the best such forest habitats for tigers across its range. Unfortunately tigers have largely been extirpated from many of the lowlands within this bioregion, and restoring tigers to these areas will require a sustained, long-term effort.
The Southeast Asia bioregion harbors 15 TCLs, with three being Global Priorities. The latter are primarily in the montane regions, centered around Malaysia’s Taman Negara National Park, and Sumatra’s Kerinci National Park. In Sumatra’s large Leuser ecosystem
TCL Priority
Global 20 924,791 9,056
Regional 13 89,963 3,970
Long-term 21 66,960 1,486
Insufficient data 22 103,197 1,691
Bioregion
Indian Subcontinent 40 227,569 2,154
Indochina 20 540,758 5,288
Southeast Asia 15 145,285 3,884
Russian Far East 2 271,298 135,649
Number of Tiger
Conservation
Landscapes
Total TCL Area
(km2)
Median Size of
TCL (km2)
Table 6.7 Summary of Tiger Conservation Landscapes.
107
the status of tigers is unknown, but it overlaps with critical habitat for the orang-utan and Sumatran rhinoceros and has been designated as both a World Heritage Site and Man and Biosphere reserve, confi rming the importance of this ecosystem to Sumatra’s natural heritage. Bukit Barisan Selatan, representing the southern most outpost of the tiger’s range, is facing mounting pressures from habitat destruction.
The Russia Far East bioregion is home for two TCLs, including the world’s largest, which is 270,000 km2. This TCL is primarily in Russia, but extends into Korea and northeast China, which has recently recorded tigers on its side of the border. Although this vast mixed temperate forest TCL has approximately 10% of its area under protection, the rest is also unprotected wilderness in which the tiger is still able to persist. However rapid changes due to privatization and leasing of this forest to timber industries darken the future of the Amur tiger.
6.5.2 Setting goals for tiger conservationThis chapter provides the information necessary to develop clear, objective, measurable, and broadly-based goals for tiger conservation. The classifi cation system is designed as a measuring stick against which TCLs can be evaluated today and into the future. Ten years from now, how many Class I TCLs will still have breeding populations and enough habitat for 100 tigers? Ten years from now, how many Class II TCLs will have had suf-fi cient conservation to bring them up to Class I levels? Ten years from now, how many Class IV TCLs will still be unknown to the tiger community at large?
We suggest that as part of a long-term strategy, the next decade should focus on ensuring tigers representation of tigers across all the major biomes where they occur. The TCLs marked as Global Priorities in Table 6.6 provide the palette of choices for investment by biome. Most of these areas have ongoing conservation efforts that need to be recognized, supported, and strengthened. Representation of “tigerness” is still possible but it requires a commitment to investment. Tigers remain dependent on our conservation success.
There are two large TCLs (the Russian Far East and the Northern Forest Complex-Nam-dapha-Royal Manas) where investment to maintain tigers will provide representation across many biomes. Add to these the Tennerassims, Southern Annamites and investment in the Corbett-Sonandi and other Terai Arc TCLs, and we have in place potential strong-holds to anchor tiger conservation across the range.
Additional investments should be focused on bringing Class II TCLs, mainly marked as regional priorities for conservation, to the Class I levels. These areas, and to a lesser extent, the Class III TCLs form the basis for establishing multiple populations and even-tually linking up areas if these places are incorporated into longer-term zoning plans by governments. Many of these landscapes are of great national and local importance and form the staging ground for the following decades, investments to save the tiger.
Chapter 6 A New Taxonomy for Tiger Conservation Landscapes
Setting Priorities for the Conservation and Recovery of Wild Tigers: 2005–2015
108
6.5.3 Recognizing realityIf the good news is that investments to save tigers and tigerness are still possible, the bad news is that the choices for investment, and the areas with tigers, are becoming fewer with each passing year. Beyond the Tropical Moist Forests and the Tropical Dry Forests, it’s hard to fi nd redundancy—that is multiple, independent areas that represent tigers in that biome type. “Redundancy” as a conservation planning principle is equivalent to the folk wisdom of “not putting all your eggs in one basket.” Having multiple instances of tigers in different biomes would help insure against the unexpected loss of an area. Un-fortunately regional representation isn’t possible except in scattered instances. There are too many biomes where there is only one place to invest and in some cases, even that one place is less than optimal.
Another important consideration is that though we outline here an objective measuring stick for tiger conservation; in fact we lack the data to fully implement it. Ideally our measures of tiger population potential would be based on systematic assessments of tiger populations, not habitat, but that data is lacking for most of the TCLs outlined. We also lack almost entirely a sense of where the prey are and in what numbers, though anecdotal evidence suggests that wild prey animals (e.g. boars, wild cattle, wild deer) are declining across Asia as areas become more fragmented and accessible. Even our habitat classifi ca-tion, the best yet produced for tiger conservation, is lacking in many respect and the sub-ject of much comment through our peer-review process (Chapter 4). For 22 of our TCLs we lack even the basic information on the level of threat and the conservation measures in place. Tigers need prey, habitat and freedom from persecution to thrive—our informa-tion base on all these points is imperfect and therefore our priorities, as described, need further verifi cation with experts on the ground.
Finally we accept good science is necessary but not suffi cient to conservation. Science tells us what tigers need and where it is needed, as outlined in this chapter; however, tiger conservation will require more.
Tiger conservation over the next decade will require building Tiger Conservation Land-scapes into the development agenda of range states. Thus, we suggest several important areas for funding to defi ne a holistic strategy, which includes a socialization campaign to take these results to decision-makers across Asia, recruiting spokespeople with the cha-risma and time to take the message of tiger conservation to the world, and working to integrate these results into regional land use and economic development plans, so that as Asia’s economic tigers continue to rise, wild tigers are not left behind.
— Eric Sanderson, Colby Loucks, Jessica Forrest, Gosia Bryja, Sybille Klenzendorf, Eric Dinerstein, Joshua Ginsberg, John Seidensticker
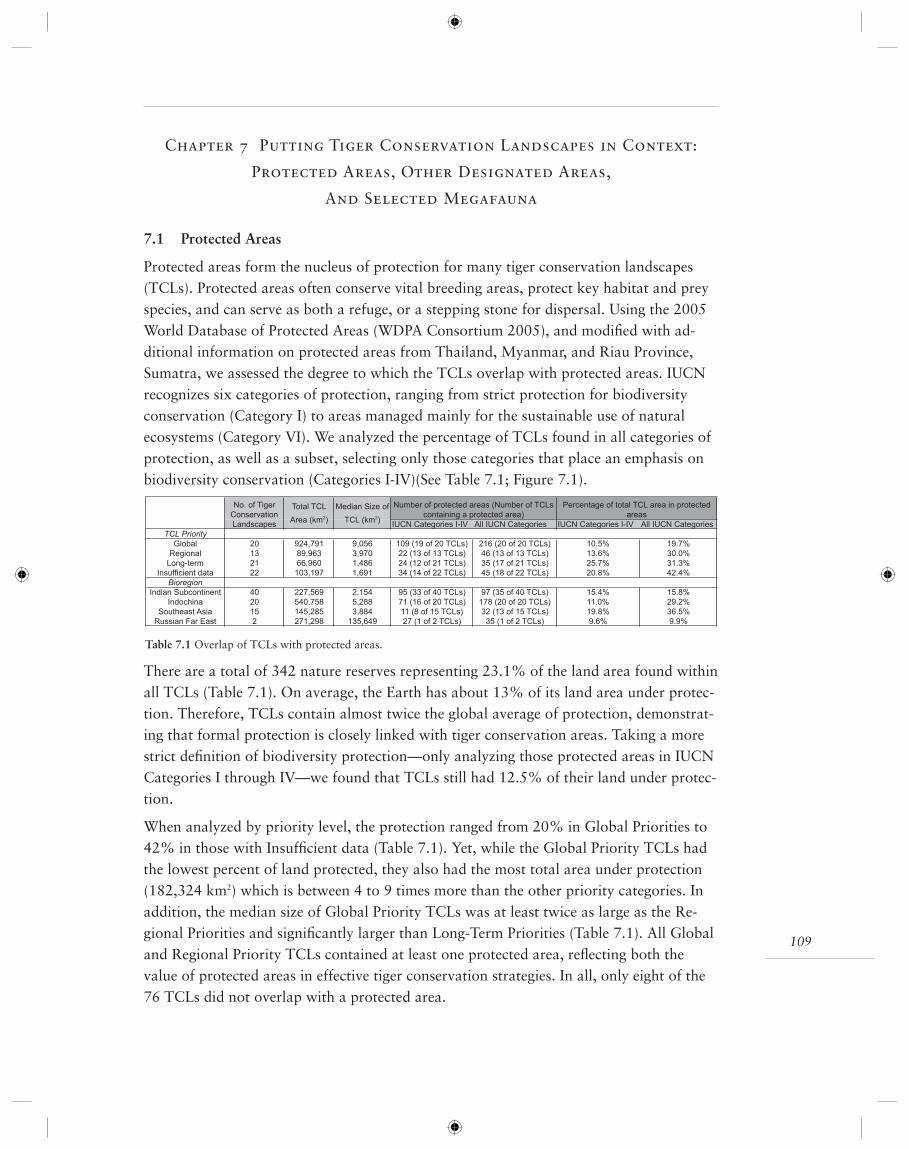
109
Chapter 7 Putting Tiger Conservation Landscapes in Context:
Protected Areas, Other Designated Areas,
And Selected Megafauna
7.1 Protected Areas
Protected areas form the nucleus of protection for many tiger conservation landscapes (TCLs). Protected areas often conserve vital breeding areas, protect key habitat and prey species, and can serve as both a refuge, or a stepping stone for dispersal. Using the 2005 World Database of Protected Areas (WDPA Consortium 2005), and modifi ed with ad-ditional information on protected areas from Thailand, Myanmar, and Riau Province, Sumatra, we assessed the degree to which the TCLs overlap with protected areas. IUCN recognizes six categories of protection, ranging from strict protection for biodiversity conservation (Category I) to areas managed mainly for the sustainable use of natural ecosystems (Category VI). We analyzed the percentage of TCLs found in all categories of protection, as well as a subset, selecting only those categories that place an emphasis on biodiversity conservation (Categories I-IV)(See Table 7.1; Figure 7.1).
There are a total of 342 nature reserves representing 23.1% of the land area found within all TCLs (Table 7.1). On average, the Earth has about 13% of its land area under protec-tion. Therefore, TCLs contain almost twice the global average of protection, demonstrat-ing that formal protection is closely linked with tiger conservation areas. Taking a more strict defi nition of biodiversity protection—only analyzing those protected areas in IUCN Categories I through IV—we found that TCLs still had 12.5% of their land under protec-tion.
When analyzed by priority level, the protection ranged from 20% in Global Priorities to 42% in those with Insuffi cient data (Table 7.1). Yet, while the Global Priority TCLs had the lowest percent of land protected, they also had the most total area under protection (182,324 km2) which is between 4 to 9 times more than the other priority categories. In addition, the median size of Global Priority TCLs was at least twice as large as the Re-gional Priorities and signifi cantly larger than Long-Term Priorities (Table 7.1). All Global and Regional Priority TCLs contained at least one protected area, refl ecting both the value of protected areas in effective tiger conservation strategies. In all, only eight of the 76 TCLs did not overlap with a protected area.
IUCN Categories I-IV All IUCN Categories IUCN Categories I-IV All IUCN Categories
TCL Priority
Global 20 924,791 9,056 109 (19 of 20 TCLs) 216 (20 of 20 TCLs) 10.5% 19.7%
Regional 13 89,963 3,970 22 (13 of 13 TCLs) 46 (13 of 13 TCLs) 13.6% 30.0%
Long-term 21 66,960 1,486 24 (12 of 21 TCLs) 35 (17 of 21 TCLs) 25.7% 31.3%
Insufficient data 22 103,197 1,691 34 (14 of 22 TCLs) 45 (18 of 22 TCLs) 20.8% 42.4%
Bioregion
Indian Subcontinent 40 227,569 2,154 95 (33 of 40 TCLs) 97 (35 of 40 TCLs) 15.4% 15.8%
Indochina 20 540,758 5,288 71 (16 of 20 TCLs) 178 (20 of 20 TCLs) 11.0% 29.2%
Southeast Asia 15 145,285 3,884 11 (8 of 15 TCLs) 32 (13 of 15 TCLs) 19.8% 36.5%
Russian Far East 2 271,298 135,649 27 (1 of 2 TCLs) 35 (1 of 2 TCLs) 9.6% 9.9%
Number of protected areas (Number of TCLs
containing a protected area)
Percentage of total TCL area in protected
areasMedian Size of
TCL (km2)
No. of Tiger
Conservation
Landscapes
Total TCL
Area (km2)
Table 7.1 Overlap of TCLs with protected areas.
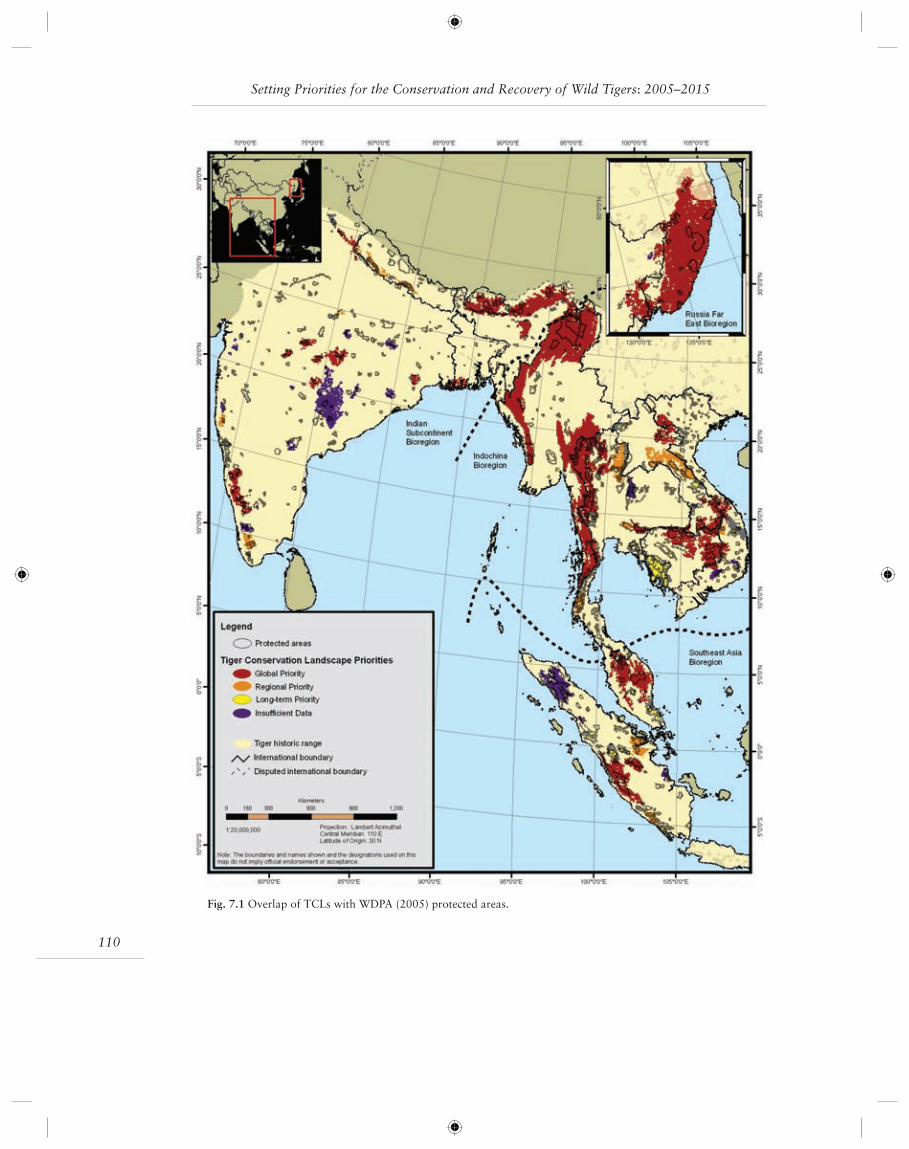
Setting Priorities for the Conservation and Recovery of Wild Tigers: 2005–2015
110
Fig. 7.1 Overlap of TCLs with WDPA (2005) protected areas.
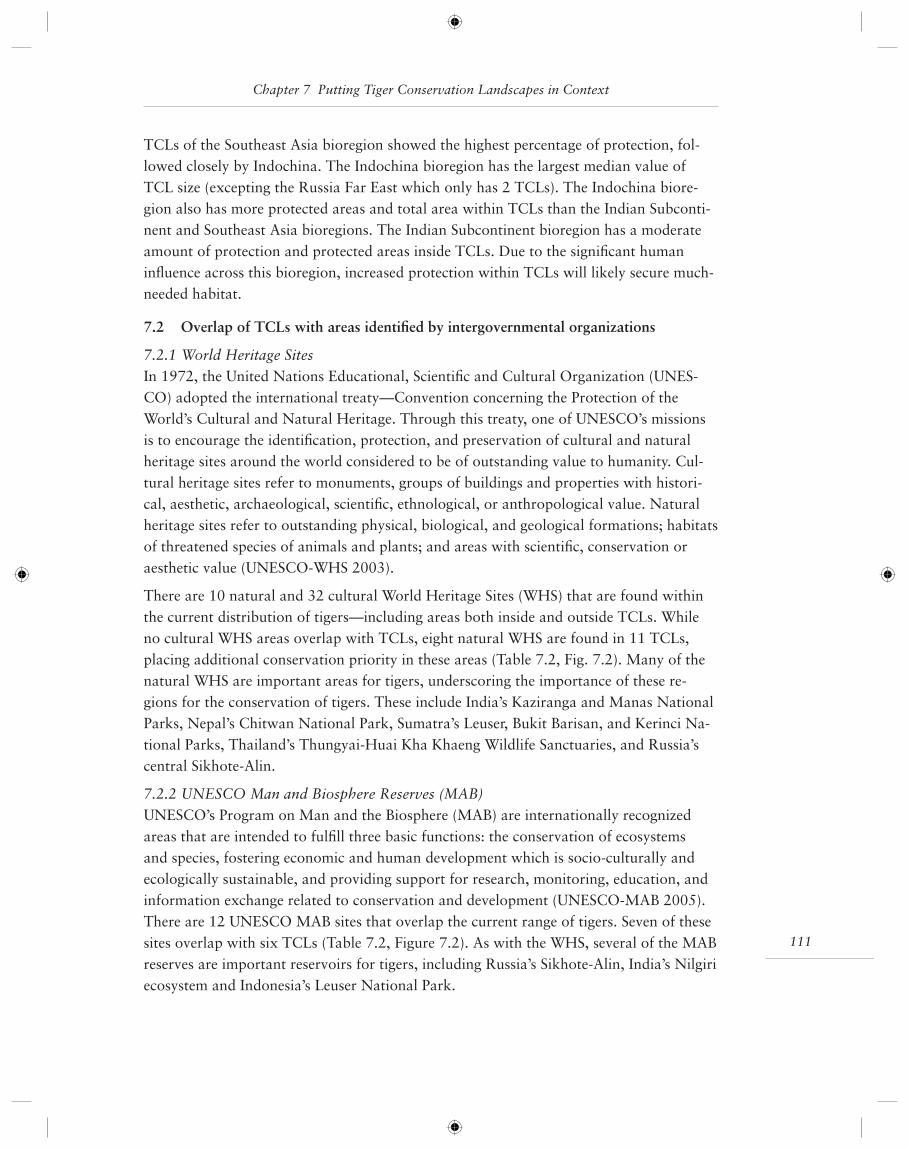
111
TCLs of the Southeast Asia bioregion showed the highest percentage of protection, fol-lowed closely by Indochina. The Indochina bioregion has the largest median value of TCL size (excepting the Russia Far East which only has 2 TCLs). The Indochina biore-gion also has more protected areas and total area within TCLs than the Indian Subconti-nent and Southeast Asia bioregions. The Indian Subcontinent bioregion has a moderate amount of protection and protected areas inside TCLs. Due to the signifi cant human infl uence across this bioregion, increased protection within TCLs will likely secure much-needed habitat.
7.2 Overlap of TCLs with areas identifi ed by intergovernmental organizations
7.2.1 World Heritage Sites In 1972, the United Nations Educational, Scientifi c and Cultural Organization (UNES-CO) adopted the international treaty—Convention concerning the Protection of the World’s Cultural and Natural Heritage. Through this treaty, one of UNESCO’s missions is to encourage the identifi cation, protection, and preservation of cultural and natural heritage sites around the world considered to be of outstanding value to humanity. Cul-tural heritage sites refer to monuments, groups of buildings and properties with histori-cal, aesthetic, archaeological, scientifi c, ethnological, or anthropological value. Natural heritage sites refer to outstanding physical, biological, and geological formations; habitats of threatened species of animals and plants; and areas with scientifi c, conservation or aesthetic value (UNESCO-WHS 2003).
There are 10 natural and 32 cultural World Heritage Sites (WHS) that are found within the current distribution of tigers—including areas both inside and outside TCLs. While no cultural WHS areas overlap with TCLs, eight natural WHS are found in 11 TCLs, placing additional conservation priority in these areas (Table 7.2, Fig. 7.2). Many of the natural WHS are important areas for tigers, underscoring the importance of these re-gions for the conservation of tigers. These include India’s Kaziranga and Manas National Parks, Nepal’s Chitwan National Park, Sumatra’s Leuser, Bukit Barisan, and Kerinci Na-tional Parks, Thailand’s Thungyai-Huai Kha Khaeng Wildlife Sanctuaries, and Russia’s central Sikhote-Alin.
7.2.2 UNESCO Man and Biosphere Reserves (MAB) UNESCO’s Program on Man and the Biosphere (MAB) are internationally recognized areas that are intended to fulfi ll three basic functions: the conservation of ecosystems and species, fostering economic and human development which is socio-culturally and ecologically sustainable, and providing support for research, monitoring, education, and information exchange related to conservation and development (UNESCO-MAB 2005). There are 12 UNESCO MAB sites that overlap the current range of tigers. Seven of these sites overlap with six TCLs (Table 7.2, Figure 7.2). As with the WHS, several of the MAB reserves are important reservoirs for tigers, including Russia’s Sikhote-Alin, India’s Nilgiri ecosystem and Indonesia’s Leuser National Park.
Chapter 7 Putting Tiger Conservation Landscapes in Context
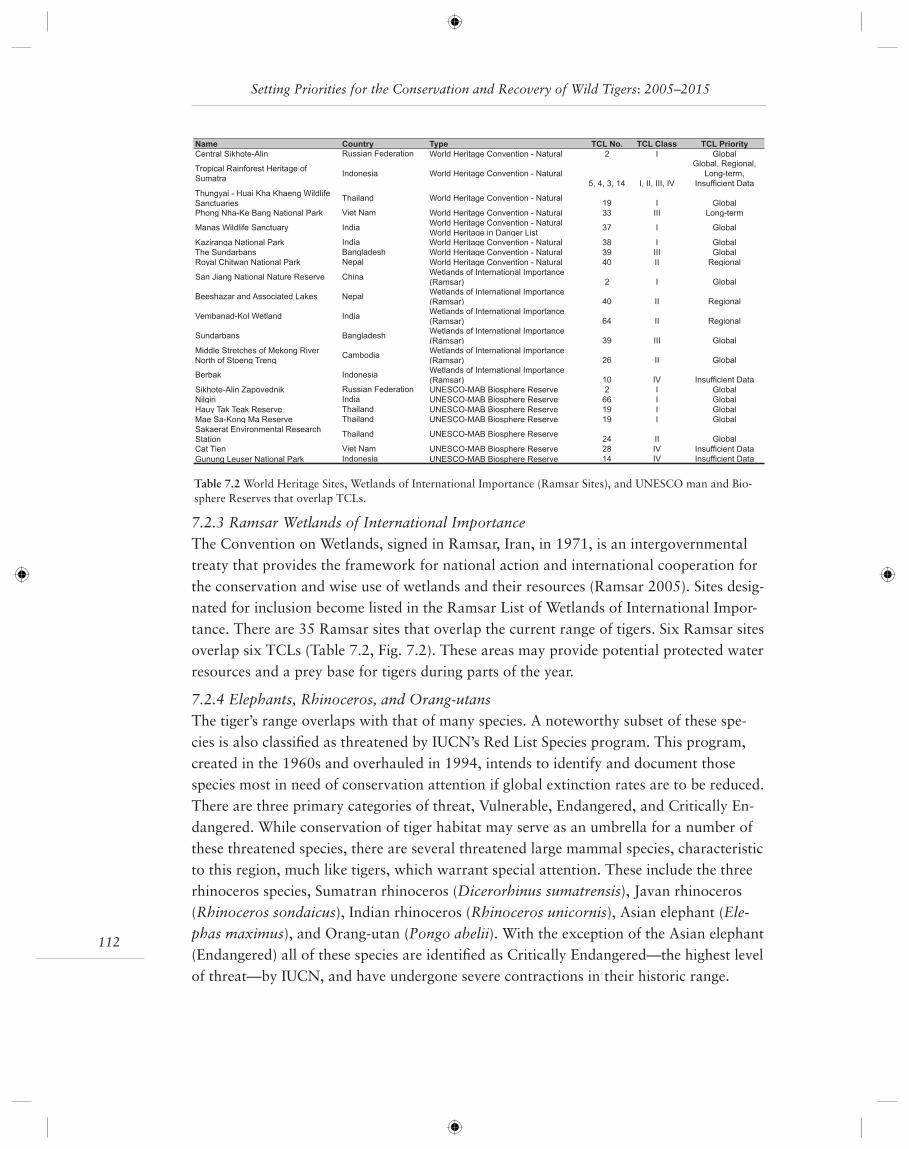
Setting Priorities for the Conservation and Recovery of Wild Tigers: 2005–2015
112
7.2.3 Ramsar Wetlands of International ImportanceThe Convention on Wetlands, signed in Ramsar, Iran, in 1971, is an intergovernmental treaty that provides the framework for national action and international cooperation for the conservation and wise use of wetlands and their resources (Ramsar 2005). Sites desig-nated for inclusion become listed in the Ramsar List of Wetlands of International Impor-tance. There are 35 Ramsar sites that overlap the current range of tigers. Six Ramsar sites overlap six TCLs (Table 7.2, Fig. 7.2). These areas may provide potential protected water resources and a prey base for tigers during parts of the year.
7.2.4 Elephants, Rhinoceros, and Orang-utansThe tiger’s range overlaps with that of many species. A noteworthy subset of these spe-cies is also classifi ed as threatened by IUCN’s Red List Species program. This program, created in the 1960s and overhauled in 1994, intends to identify and document those species most in need of conservation attention if global extinction rates are to be reduced. There are three primary categories of threat, Vulnerable, Endangered, and Critically En-dangered. While conservation of tiger habitat may serve as an umbrella for a number of these threatened species, there are several threatened large mammal species, characteristic to this region, much like tigers, which warrant special attention. These include the three rhinoceros species, Sumatran rhinoceros (Dicerorhinus sumatrensis), Javan rhinoceros (Rhinoceros sondaicus), Indian rhinoceros (Rhinoceros unicornis), Asian elephant (Ele-phas maximus), and Orang-utan (Pongo abelii). With the exception of the Asian elephant (Endangered) all of these species are identifi ed as Critically Endangered—the highest level of threat—by IUCN, and have undergone severe contractions in their historic range.
Name Country Type TCL No. TCL Class TCL Priority
Central Sikhote-Alin Russian Federation World Heritage Convention - Natural 2 I Global
Tropical Rainforest Heritage of
SumatraIndonesia World Heritage Convention - Natural
5, 4, 3, 14 I, II, III, IV
Global, Regional,
Long-term,
Insufficient Data
Thungyai - Huai Kha Khaeng Wildlife
SanctuariesThailand World Heritage Convention - Natural
19 I Global
Phong Nha-Ke Bang National Park Viet Nam World Heritage Convention - Natural 33 III Long-term
Manas Wildlife Sanctuary IndiaWorld Heritage Convention - Natural
World Heritage in Danger List37 I Global
Kaziranga National Park India World Heritage Convention - Natural 38 I Global
The Sundarbans Bangladesh World Heritage Convention - Natural 39 III Global
Royal Chitwan National Park Nepal World Heritage Convention - Natural 40 II Regional
San Jiang National Nature Reserve ChinaWetlands of International Importance
(Ramsar) 2 I Global
Beeshazar and Associated Lakes NepalWetlands of International Importance
(Ramsar) 40 II Regional
Vembanad-Kol Wetland IndiaWetlands of International Importance
(Ramsar) 64 II Regional
Sundarbans BangladeshWetlands of International Importance
(Ramsar) 39 III Global
Middle Stretches of Mekong River
North of Stoeng TrengCambodia
Wetlands of International Importance
(Ramsar) 26 II Global
Berbak IndonesiaWetlands of International Importance
(Ramsar) 10 IV Insufficient Data
Sikhote-Alin Zapovednik Russian Federation UNESCO-MAB Biosphere Reserve 2 I Global
Nilgiri India UNESCO-MAB Biosphere Reserve 66 I Global
Hauy Tak Teak Reserve Thailand UNESCO-MAB Biosphere Reserve 19 I Global
Mae Sa-Kong Ma Reserve Thailand UNESCO-MAB Biosphere Reserve 19 I Global
Sakaerat Environmental Research
StationThailand UNESCO-MAB Biosphere Reserve
24 II Global
Cat Tien Viet Nam UNESCO-MAB Biosphere Reserve 28 IV Insufficient Data
Gunung Leuser National Park Indonesia UNESCO-MAB Biosphere Reserve 14 IV Insufficient Data
Table 7.2 World Heritage Sites, Wetlands of International Importance (Ramsar Sites), and UNESCO man and Bio-sphere Reserves that overlap TCLs.
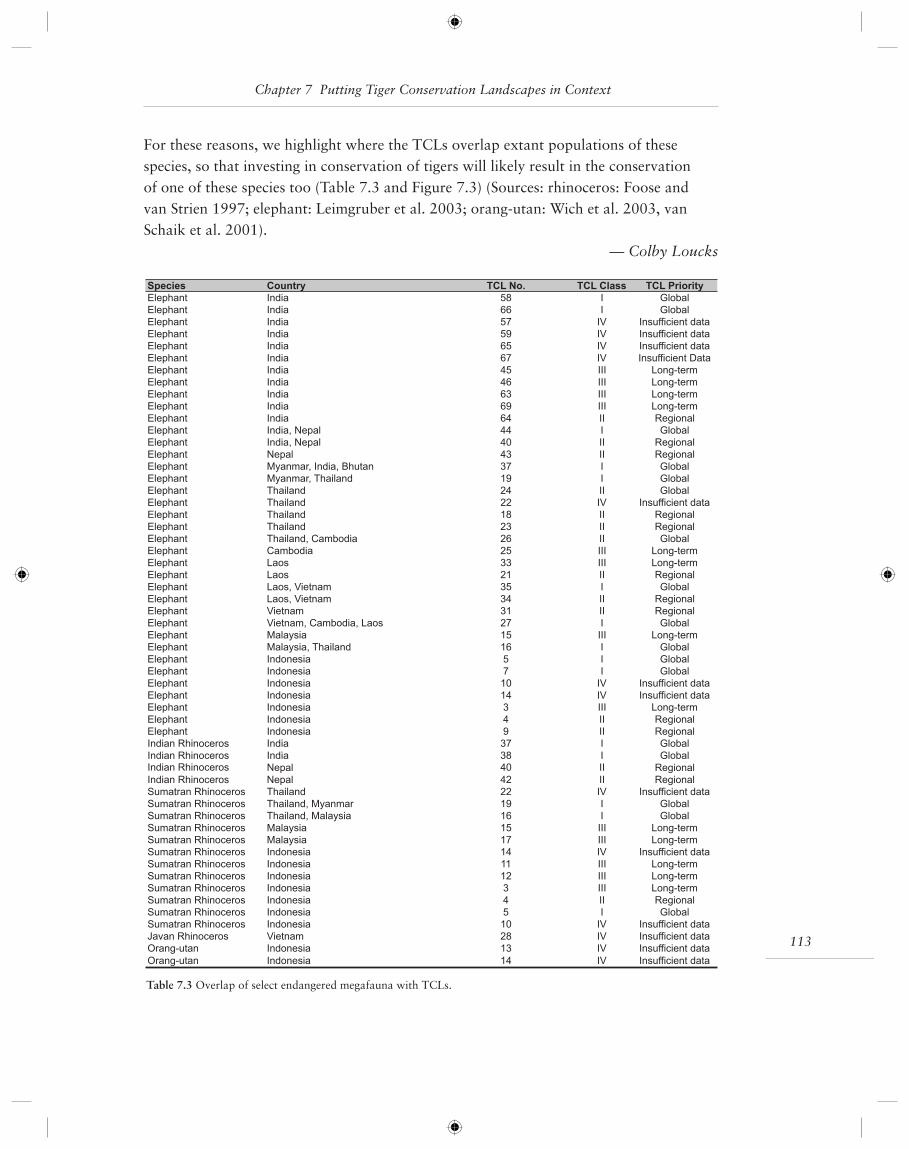
113
Chapter 7 Putting Tiger Conservation Landscapes in Context
For these reasons, we highlight where the TCLs overlap extant populations of these species, so that investing in conservation of tigers will likely result in the conservation of one of these species too (Table 7.3 and Figure 7.3) (Sources: rhinoceros: Foose and van Strien 1997; elephant: Leimgruber et al. 2003; orang-utan: Wich et al. 2003, van Schaik et al. 2001).
— Colby Loucks
Species Country TCL No. TCL Class TCL Priority
Elephant India 58 I Global
Elephant India 66 I Global
Elephant India 57 IV Insufficient data
Elephant India 59 IV Insufficient data
Elephant India 65 IV Insufficient data
Elephant India 67 IV Insufficient Data
Elephant India 45 III Long-term
Elephant India 46 III Long-term
Elephant India 63 III Long-term
Elephant India 69 III Long-term
Elephant India 64 II Regional
Elephant India, Nepal 44 I Global
Elephant India, Nepal 40 II Regional
Elephant Nepal 43 II Regional
Elephant Myanmar, India, Bhutan 37 I Global
Elephant Myanmar, Thailand 19 I Global
Elephant Thailand 24 II Global
Elephant Thailand 22 IV Insufficient data
Elephant Thailand 18 II Regional
Elephant Thailand 23 II Regional
Elephant Thailand, Cambodia 26 II Global
Elephant Cambodia 25 III Long-term
Elephant Laos 33 III Long-term
Elephant Laos 21 II Regional
Elephant Laos, Vietnam 35 I Global
Elephant Laos, Vietnam 34 II Regional
Elephant Vietnam 31 II Regional
Elephant Vietnam, Cambodia, Laos 27 I Global
Elephant Malaysia 15 III Long-term
Elephant Malaysia, Thailand 16 I Global
Elephant Indonesia 5 I Global
Elephant Indonesia 7 I Global
Elephant Indonesia 10 IV Insufficient data
Elephant Indonesia 14 IV Insufficient data
Elephant Indonesia 3 III Long-term
Elephant Indonesia 4 II Regional
Elephant Indonesia 9 II Regional
Indian Rhinoceros India 37 I Global
Indian Rhinoceros India 38 I GlobalIndian Rhinoceros Nepal 40 II Regional
Indian Rhinoceros Nepal 42 II Regional
Sumatran Rhinoceros Thailand 22 IV Insufficient data
Sumatran Rhinoceros Thailand, Myanmar 19 I Global
Sumatran Rhinoceros Thailand, Malaysia 16 I Global
Sumatran Rhinoceros Malaysia 15 III Long-term
Sumatran Rhinoceros Malaysia 17 III Long-term
Sumatran Rhinoceros Indonesia 14 IV Insufficient data
Sumatran Rhinoceros Indonesia 11 III Long-term
Sumatran Rhinoceros Indonesia 12 III Long-term
Sumatran Rhinoceros Indonesia 3 III Long-term
Sumatran Rhinoceros Indonesia 4 II Regional
Sumatran Rhinoceros Indonesia 5 I Global
Sumatran Rhinoceros Indonesia 10 IV Insufficient data
Javan Rhinoceros Vietnam 28 IV Insufficient data
Orang-utan Indonesia 13 IV Insufficient data
Orang-utan Indonesia 14 IV Insufficient data
Table 7.3 Overlap of select endangered megafauna with TCLs.
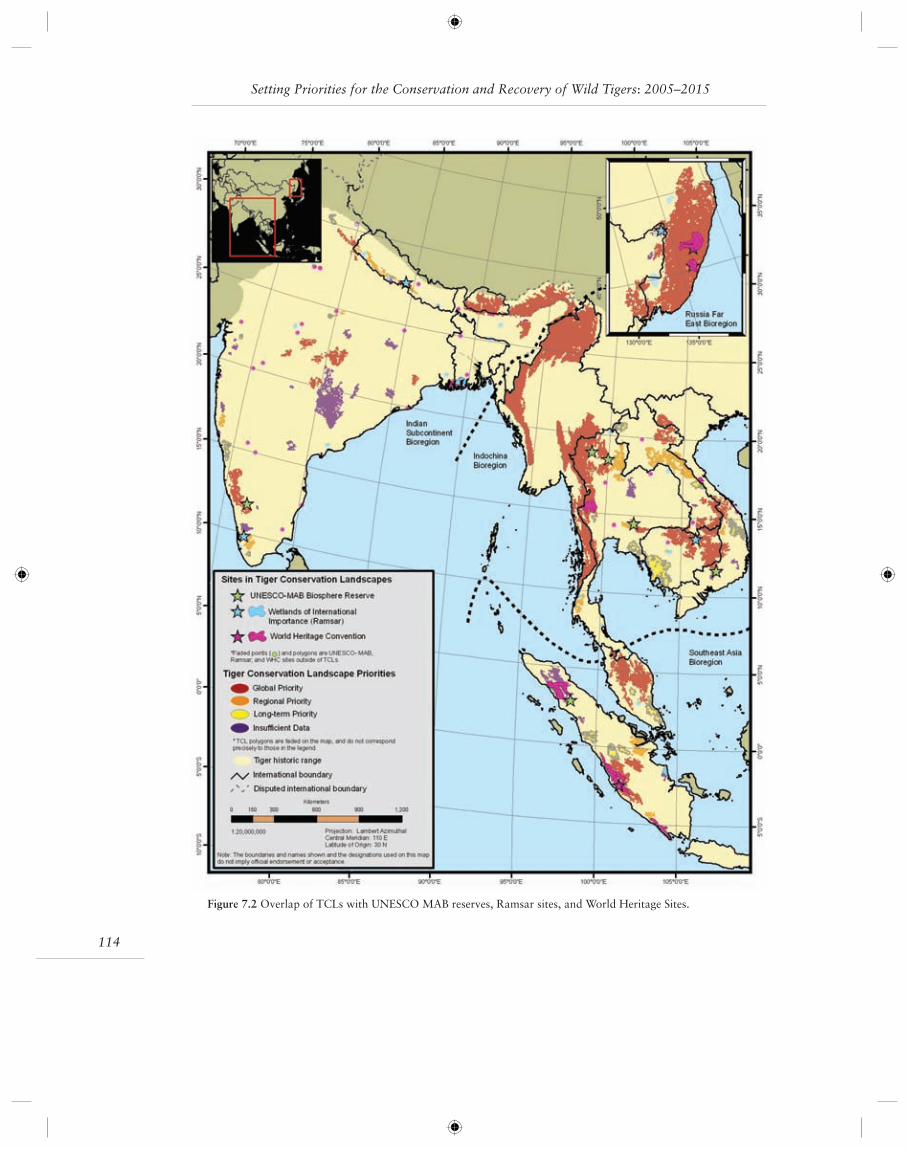
Setting Priorities for the Conservation and Recovery of Wild Tigers: 2005–2015
114
Figure 7.2 Overlap of TCLs with UNESCO MAB reserves, Ramsar sites, and World Heritage Sites.
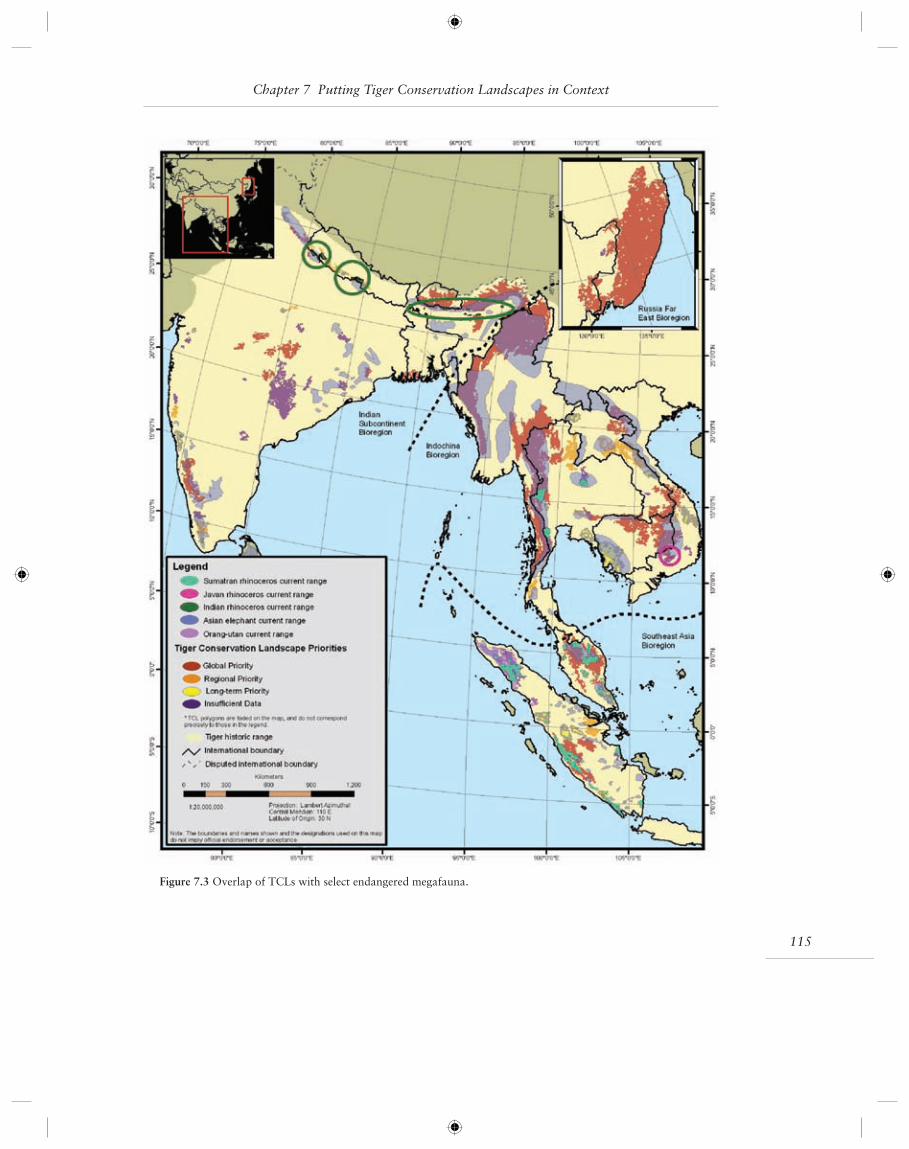
115
Chapter 7 Putting Tiger Conservation Landscapes in Context
Figure 7.3 Overlap of TCLs with select endangered megafauna.
Setting Priorities for the Conservation and Recovery of Wild Tigers: 2005–2015
116
Chapter 8 NGO Investment in Tiger Conservation Units, 1998–2003
8.1 Introduction and Data Constraints
One of the main objectives of the 1997 TCU 1.0 Framework Document was to create a framework that would assist in effectively guiding resources and efforts, in the shape of funding and research to help conserve tigers. Funds for conservation are limited, this we know, but since TCU 1.0, the question arises as to how much funding has been spent on conserving tigers, and to where has it been allocated: have donors invested in top priority TCUs identifi ed in TCU 1.0? Data for funding tiger conservation presented here is from the IUCN/SSC Cat Conservation Projects Database. This database has a secure and pri-vate online data entry and reporting interface and is scheduled to become publicly acces-sible in 2006. Currently, funding data are supplied by all of the major implementing and funding NGOs for tiger conservation, as well as some of the much smaller organizations, and data have been crosschecked to prevent duplicated entries in the database.
For the years between 1998 and 2000, the existing funding data for investment in ti-ger conservation are both complete and of high quality. Data entry for 2001 to 2003 is almost complete however information from a few of the smaller agencies is missing. A breakdown of WWF India’s Tiger Conservation Program by geographical area has not yet been obtained for 2001 to 2003 and for the purposes of this analysis we had to as-sume that WWF continued to focus on the same areas and in approximately the same proportions as they did during 1998 to 2000. WWF fi gures of total funding for the program between 2001 and 2003 have been distributed accordingly among the TCUs presented in the table below. These approximate entries will be refi ned during 2005.
Government funds, which are used for operating protected areas for example, are not included, and non-tiger-directed funds are included only partially and only where they clearly have potential to benefi t tigers. Other factors affecting the accuracy of fi nancial re-cords include: differing fi nancial years between institutions; variations in exchange rates; bank transfer fees; and administrative costs, all of which have been accounted for.
There are several ways to run geographically based database reports: 1. All funds allocat-ed to the single most important TCU (or country) in the project; 2. Funds appropriately split between TCUs (or countries) with Key Focus or Substantial listing for each project; 3. Funds appropriately split between all TCUs (or countries) involved in the project no matter how marginally. All reports used here have been run with country Key Focus and/or TCU All settings. The TCUs referred to in this chapter are the TCUs which were delineated and prioritized in TCU 1.0.
8.2 Funding of Tiger Conservation Across TCUs (TCU 1.0)
Table 1 represents the top 52 TCUs with the highest recorded levels of funding. This is the maximum number of TCUs that can be reported on with the database’s current re-

117
porting options; it leaves only a few small TCUs, all in India and all with recorded invest-ment of less than $10,000, grouped together and categorized by “other”.
The total recorded expenditure in TCUs is $23,392,744. This fi gure covers only “on the ground” projects and does not include funds spent on non-geographically focused measures such as national educational program, conferences, publications, and wildlife trade investigations. The total recorded spending in all categories for the same period is $31,0064,009. This means the ontheground funds represent 75% of the total spend-ing. Eighty-six percent of this on the ground funding has gone to just twenty TCUs, and 64% has gone to the top ten: the Russian Far East, Kerinci Seblat, Manas-Namdapha, Dandeli-Bandipur, Bardia-Banke, Khao Yai, Chitwan-Parsa-Valmiki, Ranthambore and Taman Negara. These are all Level 1 TCUs except for Ranthambore, and include some of the most important tiger areas in fi ve countries (India, Russia, Indonesia, Malaysia, and Nepal). Ranthambore’s presence in the top ten despite its level III rank is indicative of its
Chapter 8 NGO Investment in Tiger Conservation Units, 1998–2003
TCU Amount TCU Amount107 Bach Ma-Nui Thanh $10,000 44 $179,303
90 Nui Hoang Lien $13,776 27 Bagdara-Hazaribagh $213,738
7 $13,858 99 Nam Theun Nakai-Vu Quang $220,303
8 $13,858 101 Phu Khieo-Nam Nao $255,883
62 Arakan Yomas $14,500 3 Dudwa-Kailali $261,790
152 Berbak-Sembilang $19,980 24 Panna-Son Gharial $269,650
47 Sitapani-Udanti $28,265 60 Northern Triangle $334,978
122 Kulen Promtep-Thap Lan $29,453 18 Sunderbans $341,814
145 Gunung Leuser-Lingga Isaq $29,760 61 Chin Hills $373,924
94 $46,232 1 Rajaji-Corbett $416,540
46 Indravati-Navegaon $52,10173 Huay Kha Khaeng-Thung YaiNaresuan $481,967
48 $56,364 2 Sukla Phanta-Kishanpur $567,339
9 $56,585 113 Virachay-Xe Piane-Yok Don $607,591
110 $60,303 161 SW Primorye and North Korea $632,912
162 Heilongjiang area $63,581 159 Way Kambas $688,089
163 Southern China $64,858158 Bukit Barisan Selatan-BukitmnnHitam $696,187
93 Song Da Forest $69,348 129 Taman Negara $699,007
63Shan Plateau $74,600 20 Ranthambore $739,540
39 Simlipal-Kotgarh $82,916 6 Chitwan-Parsa-Valmiki $805,076
5 $95,128 125 Phnom Bokor-Aural $904,540
12 $111,102 121 Khao Yai $917,770
19 $115,355 4 Bardia-Banke $1,013,423
Other $118,558 55 Dandeli-Bandipur $1,156,849
31 Kanha-Pench $124,732 10 Manas-Namdapha $1,479,037
154 Dangku $132,200 148 Kerinci Seblat-Seberida $1,666,372
28 Melghat $139,401 160 Russian Far East $5,656,444
16 Kaziranga-Meghalaya $175,864
Table 8.1 Expenditure per TCU 1.0, 1998-1003 inclusive.
Setting Priorities for the Conservation and Recovery of Wild Tigers: 2005–2015
118
“ambassador” value as a place for visitors to see tigers, as well as of the efforts of dedi-cated individuals associated with the park over the years.
The difference between the amount of funding allocated to the top-ranked TCU160 in the Russian Far East and the rest of the TCUs—TCU160 has received 24% of the to-tal TCU budget—is due, in part, to the fact that it represents virtually all the remaining habitat in Russia and quite possibly the world’s single largest remaining unfragmented population of tigers. Donors consider Russia a good investment for these reasons, as well as the low human density, strong collaboration among NGOs, and a history of conserva-tion based on good science.
TCU investments grouped by bioregion show that the Indian subcontinent has received the majority of funds (36.5%), followed by the northern temperate. The spread of fund-ing here is very similar to that presented during the Society of Conservation Biology Conference in 2002, showing proportional rises in investment most notably in Indonesia (mostly but not entirely in Kerinci Seblat-Seberida) and in Malaysia (almost entirely in Taman Negara).
Preliminary investigations of the spread of funding with reference to project activities highlights several interesting differences between Russia and India. For example, propor-tionally much more is spent on ecological studies and monitoring in Russia than in India. Both countries have a strong emphasis on protection measures but in India these are almost all focused at the reserve level while in Russia efforts are more wide-ranging, op-erating between protected areas and with more coordination across the country in terms of both antipoaching and wildlife trade investigations. More is spent in India on factors targeted at living alongside tigers than in Russia and, less predictably, considerably more funds go towards education and awareness work in Russia than in India.
Currently, it is not possible to produce a report indicating which agencies have invested in the individual TCUs, but the improvements to the database in 2005 will enable such reports. A large-scale analysis of funding sources from 1998 to 2003 reveals that the two most signifi cant donors are WWF and the STF with 28% and 25% respectively, followed by WCS and the USFWS with 10% and 8%, and then 21st Century Tiger and the David Shepherd Wildlife Foundation at 3%.
8.3 Next steps
In order to assess the effectiveness of our investments in TCUs, and adjust our planning accordingly, we must monitor the status of the target areas. Inclusion of fi elds in the data-base for key indicators of success in each TCU will possibly help produce charts showing, for example, changes in investment focus over time plotted against trends in tiger or prey density, habitat integrity, human disturbance, incidences of poaching, human attitudes, etc. Advice from the tiger conservation community on what fi elds to create for this pur-pose, and how to obtain the necessary data is needed.
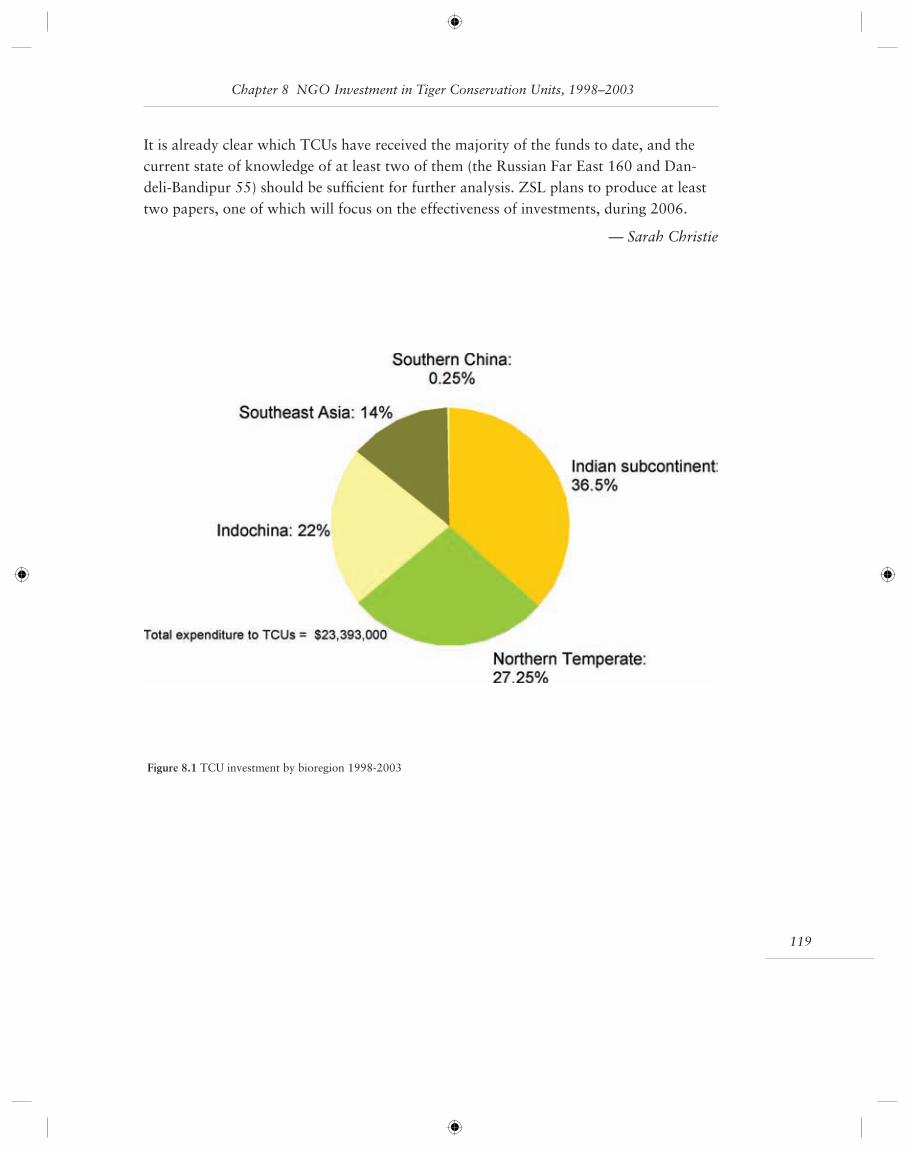
119
It is already clear which TCUs have received the majority of the funds to date, and the current state of knowledge of at least two of them (the Russian Far East 160 and Dan-deli-Bandipur 55) should be suffi cient for further analysis. ZSL plans to produce at least two papers, one of which will focus on the effectiveness of investments, during 2006.
— Sarah Christie
Figure 8.1 TCU investment by bioregion 1998-2003
Chapter 8 NGO Investment in Tiger Conservation Units, 1998–2003
Setting Priorities for the Conservation and Recovery of Wild Tigers: 2005–2015
120
Chapter 9 Recommendations for Improving the Process
In the preceding sections we have developed a delineation process that defi nes current tiger habitat and a taxonomy that informs us of the current status of tigers across their range. Using this taxonomy, we have made recommendations for the priorities for tiger conservation over the next decade, with our recommendations ensuring that tigers will persist, we hope fl ourish, in representative habitats and areas across their range.
The methods that we have used to delineate TCLs, that form the basis of the taxonomy, and which help us set priorities for tiger conservation, have drawn on a number of sourc-es of information and data. We have endeavored, wherever possible, to develop method-ologies that are transparent, systematic, and easily repeatable so that we can continue to refi ne, and modify this analysis as new data become available. We have, we hope, fulfi lled our commitment to make this a living document. Meeting that commitment puts greater value on improving the datasets on which we based our analyses as this will allow us to refi ne and revise recommendations on something less than a decadal scale.
Our desire to set range-wide priorities required datasets that, for the most part, had a range-wide scope. No dataset is perfect, and in many cases, we were unable to include data because it was too fragmentary across the range of the species. Nonetheless, the pro-cess has identifi ed some clear gaps in our data, and in this section of the report we discuss priorities for improving the data, and the process, of our analyses.
9.1 Recommendations for the Land Cover Data
Access to satellite imagery and geospatial analysis technologies (e.g. GIS, GPS) has ex-panded dramatically since the last TCL analysis, making possible the acquisition of detailed information about habitats over large areas and at frequent time intervals. Despite the recent malfunctioning of Landsat 7 (USGS 2003), which probably will end the 30-year succession of Landsat satellites and images, new high- and mid-resolution data are likely to increase in availability. For example the ASTER (15 m) and MODIS (250 to 500 m) sensors onboard Terra already provide interesting alternatives to Landsat (Abrams 2000; Friedl et al. 2002). However, free Landsat data sets for almost all areas on the globe are already available for the 1990s and 2000s (Tucker et al. 2004). The limiting factor in the future most likely will be the cost and time necessary to analyze hundreds of satellite images rather than the resources required to purchase satellite data.
In this revision of TCLs, we would have liked to have collated all available Landsat satel-lite imagery for the tiger range, map habitats and assess habitat changes over the past two decades. However, time and resource constraints did not allow for such an analy-sis. Instead we compiled all existing data. The results from our land cover compilation and mapping were sobering. Despite the availability of Landsat images for most of the tiger range, few areas had detailed land cover maps available. In addition, classifi cation
121
schemes among these areas were very different, making integration of the data into a single tiger land cover map diffi cult and problematic.
Habitat loss, fragmentation and degradation are major threats to tiger populations. Habitat extent and the rate at which remaining habitat are disappearing are among the conservation measurements that could be determined fairly consistently and easily. In fact, regular acquisition of satellite data may even provide some sort of early warning system to identify areas where threats to tiger habitats and the associated populations are increasing rapidly. Similar early warning systems for detection of vegetation changes have already been proposed for MODIS data and are in an experimental phase at NASA.
One of the most important 10-year goals for tiger conservation should be the creation of a consistent and accurate map of remaining tiger habitats that also provides estimates on habitat conversion rates for different areas. This ambitious goal is probably best achieved in several steps:
1) Compile comprehensive satellite image archive for all tiger TCLs. (It will take roughly 700 Landsat images to map the historic tiger range; only about 100 to map current TCLs (see Chapter 3, Figure 3.3);
2) Make digital and hardcopy images widely available for tiger surveys, monitoring, and conservation projects funded by Save The Tiger Fund and USFWS;
3) Create partnerships with NASA, JPL, USGS to assure satellite image acquisition over these areas in the future—international NGOs should probably continue to push for regular wall-to-wall global coverage as was done for the creation of Geocover (Tucker et al. 2004);
4) Create basic land cover/habitat maps based on satellite images (these should use a consistent methodology and land cover classifi cation system);
5) Combine satellite images from different dates to determine rates of habitat loss in TCLs;
6) Make all spatial data widely available through an Internet portal (by putting maps into public domain, conservation organizations can encourage greater data sharing among groups).
These data would not only benefi t tiger conservation. Many of the TCLs represent re-maining intact landscapes in Asia that also support a wide range of other important spe-cies.
9.2 Recommendations for Tiger Location, Density, and Breeding Data
In 1995, we recognized the importance of tigers to our analysis, but our knowledge of tiger status—even at the level of presence and absence—was suffi ciently weak that these data were not weighted heavily in setting priorities in the original Framework docu-
Chapter 9 Recommendations for Improving the Process
Setting Priorities for the Conservation and Recovery of Wild Tigers: 2005–2015
122
ment. In the current analysis, and in particular in developing the TCL taxonomy, we have placed increased importance on our current knowledge of the distribution of tigers, and on the distribution of breeding populations of tigers across tiger range. In large measure, we were able to highlight the importance of tiger location and breeding data because of the investment in surveys, and the development of better monitoring techniques (Carbone et al.; Karanth et al. 2004a, 2004b; Miquelle et al. 1999).
Our methods, however, were not without problems. In order to have suffi cient data across the range of tigers, we have had to use a very coarse fi lter in our analysis—all tiger point location data was included in our analyses, and there was a wide variation in qual-ity of these data. Some TCLs benefi ted from detailed camera trapping data that indicate not only occurrence, but in some cases both absolute or relative density (Karanth et al. 2004a; 2004b; Carbone et al. 2001). Point locations in some TCLs were derived only from interview surveys (e.g. much of Cambodia: Nowell et al 1999) despite that follow-up surveys indicate that these survey data were fl awed, or there has been a recent, and se-vere, contraction of range of tigers in Cambodia (briefl y summarized in Weiler and Pantel 2004). The implications of using such a coarse fi lter are signifi cant (Karanth et al. 2003), and we aim to improve the data available for the fi nal report through a process of expert review and collection of additional data.
It is distressing nonetheless, that despite signifi cant expenditures for research and con-servation of the tiger, there is no central source for current, range-wide tiger distribution information. Collecting the data for this exercise, as it is for most large-scale, range-wide exercises, was sometimes like pulling teeth. Through the process of developing this analy-sis, we have collated the vast majority of published information on recent distribution of tigers; however, we are also aware that a huge amount of information remains unpub-lished, and that despite our best efforts, a signifi cant proportion of data were unavailable for our analyses. Because there is no current, systematic way to capture point-location data on tiger presence, and absence, it remains impossible to easily answer simple ques-tions: where are tigers now and where are we looking for them? Capturing published and, more importantly, unpublished information in a standardized format is essential. Capturing unsuccessful tiger surveys (if there is such a thing) is equally important to learn where tigers are absent. Finally, recognizing the efforts of tiger researchers is important to foster a spirit of cooperation among tiger biologists and promote the exchange, rather than the sequestering of important data.
One of the most important 10-year goals for improving our ability to set priorities for tiger conservation should be the creation of a database that will provide for an annual, repeatable, scientifi c assessment of the known distribution of tigers. A prototype of such a database was developed by the Wildlife Conservation Society to manage its own tiger data and was used in our current analyses. Such a database will have the following key attributes:
123
• The database will collect point location data on tiger survey, survey effort, and re-sults of the survey (presence/absence; density etc.).
• Data will be accepted from all tiger conservationists working in different countries, different institutions and different cultures, gathered in range nations in a standardized manner and disseminated directly to the decision-makers who ultimately will deter-mine the fate of the tiger.
• Database entries will clearly tag the method of survey
• All contributions would be voluntary. In exchange for a minimal data contribution, the contributor and their institution would be publicly acknowledged and the contribu-tor and their institution would receive a letter acknowledging their contribution.
• All contributors will be eligible to apply for a complete distribution of the dataset.
9.3 Establishing Gold Standard Baselines
Over the last decade conservation efforts have been catalyzed across the tiger range by support of the STF and other donors. Yet few projects include monitoring of tigers, or their prey, as an explicitly stated part of their conservation strategy. While expenditures on monitoring may seem like a black hole, and some feel that we risk counting tigers into extinction, the need for some form of monitoring in each signifi cant tiger conservation landscape is critical. The way in which these monitoring programs are designed critically affects the ability of the studies to provide useful data (see Karanth et al. 2003). In many places surveys that focus on tracking relative densities of tigers and their prey in represen-tative habitats may be suffi cient. However, in developing our priorities for tiger conserva-tion we identifi ed a lack of well-stratifi ed, statistically robust, monitoring programs as a continuing problem in assessing the status of tigers, understanding trends in numbers (either relative or absolute) and in assessing the effectiveness of our conservation efforts over the long-term.
Perhaps the most ambitious program is that conducted under the Amur Tiger Monitor-ing Program, a program that has received strong, and consistent support of STF and other donors. Initiated in 1997, the program monitored trends in the population of tigers and their prey (Miquelle et al. 2003). Sixteen monitoring sites are distributed across the range of Amur tigers to ensure representation of parameters relevant to tiger abundance (protected status, north-south and east-west gradients). The program aims to provide a mechanism that will assess changes in the density of tigers, as well as other potential in-dicators of population status, within their current range over long. This program comple-ments an even more ambitious project—a full range survey of tigers across the Russian Far East. This survey mobilizes hundreds of participants to count tiger tracks in the snow across the range of the species in Russia. The fi rst survey, was organized in 1995–1996 largely out of concern over the status of the population after the poaching crises of the early 1990’s. The results of this survey provided a robust set of baseline data that indicat-
Chapter 9 Recommendations for Improving the Process
Setting Priorities for the Conservation and Recovery of Wild Tigers: 2005–2015
124
ed that there were 330 to 371 adult tigers, and some 100 young in the Russian Far East. This survey was repeated in February 2005.
The surveys in the RFE provide exceptional clarity on the status and trends in tiger numbers in that region. While it is probably unrealistic to assume that we can develop such systems range-wide (the lack of snow across tiger range complicates the process), we nonetheless feel that establishing gold-standard baseline monitoring programs that are stratifi ed across habitat, ecoregion, and political boundaries would greatly enhance both our knowledge about the status of tigers, and our ability to focus conservation efforts. Such a system would serve to help develop best practices for tiger conservation by en-abling us to assess the effectiveness of our actions, and serve as an early-warning system for the tiger population trends range-wide.
9.4 Closing the Knowledge Gap
The fi rst Framework document highlighted the extent of our ignorance about tiger status and distribution. As a result, many large, and critically important, areas have been sur-veyed and assessed for the status of tigers, and the threats they face. In Cambodia, Myan-mar, Malaysia, Vietnam, Lao PDR, south China, Indonesia, and elsewhere in tiger range, new surveys have given us an insight into the true state of tiger populations across the range of the species. The results have not always been ones that have made those of us who care about tigers happy—across much of Cambodia and Myanmar, for instance, the surveys documented extensive local extirpation of tigers. But these surveys have helped identify the key, and often critical, areas for future conservation efforts, reducing the scope of our uncertainty, and increasing the leverage, and focus, of our efforts to secure core tiger populations, manage prey populations, and eventually revive tiger populations in the extensive, if depleted, habitat that still remains.
Yet, in this new analysis, many areas remain as a priority for survey—either explicitly, or implicitly. While many of these areas will no doubt prove a disappointment, some may harbor critical populations of tigers. For instance, the vast expanse of the Gunung Leusur Reserve in northern Sumatra is, no doubt, some of the best habitat available for Suma-tran tigers. While the political situation in the region is daunting, a lack of systematic surveys of the area leaves the status, and importance, of this TCL uncertain. Nonetheless, conservationists remain hopeful that the vast expanse of Leuser will ensure the persis-tence of tigers in the reserve. Furthermore, the recent post-tsunami peace process in Aceh Province gives the fi rst opportunity in a decade to organize a signifi cant fi eld survey in the region. Hence, we recommend strongly that surveys of currently unknown areas be conducted to ensure that we are investing our funds, and efforts, in those places that offer the best long-term hope for tigers.
125
9.5 Prey Data & Annual Sampling Efforts
For decades, tiger biologists have known that a healthy prey base is a necessary, if not suffi cient, criterion for a health tiger population (Seidensticker 1987). From India (Karanth et al. 2004b) to the Russian Far East (Miquelle et al. 1996; 1999) to Indonesia (O’Brien et al. 2003), studies have shown the critical importance of tiger prey in sus-taining healthy tiger populations. In recent years, studies have given us insights into the current status, and natural levels, of tiger prey in a number of habitats (e.g. Jathana et al. 2003; Miquelle et al. 1999, unpublished). In the Russian Far East and north-east China, in parts of India, and in one reserve in Indonesia, established baselines allow us to moni-tor efforts to protect and recover tiger prey: such data, collected in a systematic and long term fashion, are lacking from across the tiger’s range.
With the exception of Russian studies that look across a range of land-use types, most surveys of prey that have been conducted have tended to focus on studies on prey densi-ties in protected areas: while a critical, and important fi rst step, the lack of well stratifi ed data from outside areas of full protection makes it very diffi cult to extrapolate those few data we have in any meaningful way. Furthermore, data on prey availability outside of protected areas is critical to developing our understanding of connectivity and landscape-level processes.
While this report has jump-started the process of development of a synthetic database that captures information on tiger presence/absence, and densities, no such database or collation of data exists for studies of tiger prey: data on surveys for tiger prey is rarely captured in any systematic way. Reams of data on the distribution and relative capture rates of prey, collected in camera-trapping surveys for tigers and other individually-marked animals, remains unanalyzed, and often is poorly curated. Because recent efforts that link camera trapping to line-transect analyses suggest that algorithms can be devel-oped to link relative capture rates to absolute abundance (e.g. O’Brien et al. 2003) the real value of these data has often been underestimated.
In our questionnaire survey, data on tiger prey was notably absent. In part this was because of a lack of specifi c questions on the issue, but even in those questions asked, response rates were poor. Subjective analysis of prey populations, while perhaps valuable for determining broad, long-term trends, is inadequate for managing tiger populations.
Given the critical importance of prey to both the maintenance and recovery of tiger popu-lations, we strongly recommend that a systematic effort be made to both capture exist-ing information on prey density and abundance, and to develop a large-scale, stratifi ed survey to estimate and monitor prey levels across the range of the tiger.
— Joshua Ginsberg, John Seidensticker, Eric Dinerstein, Peter Leimgruber
Chapter 9 Recommendations for Improving the Process
Setting Priorities for the Conservation and Recovery of Wild Tigers: 2005–2015
126
Epilogue
The tenuous relationship between tigers and humans has pushed the wild tiger to the brink of extinction. Poised at the top of the ecosystems where it lives, the endangered ti-ger is an indicator of ecosystems in crisis. People continue to kill tigers and to overwhelm landscapes where tigers live. Tigers are under constant threat from poaching to satisfy the unremitting demand for tiger parts used in folk medicine and for ornamentation. To save wild tigers, we must devise strategies to eliminate the consumption of tigers. People continue to destroy, fragment, and degrade existing and potential tiger habitats. Over-harvesting of the tiger’s prey causes injury to the cycle of human-wildlife coexistence in most of the remaining forests of Asia where tigers still survive. To save wild tigers, we must create landscapes friendly to both tigers and humans. We have insuffi cient knowl-edge of what tigers need to survive in the changing landscapes of Asia and inadequate tools to meet these needs. To save wild tigers, we must catalyze efforts to increase knowl-edge, skills, and cooperation to support wild tiger conservation. Wild tigers suffer from a lack of recognition and visibility to mobilize multi-sector support. To save wild tigers, we must gain recognition, visibility, and support to make wild tigers valuable to people.
Incomplete knowledge of the state of tiger populations has made it diffi cult to set pri-orities and agendas for action. We will never have all the information we need, but the powerful images, evidence, and narrative in the 1997 Framework Document (TCU 1.0) established the fi rst baselines on which to establish a common agenda and set of priorities for conservationists striving to save wild tigers across Asia. TCU 1.0 brought an unprec-edented degree of information together for the fi rst time and began to translate the many different languages used in tiger conservation into the common language and science of conservation biology. It instilled hope that with concerted effort the resilient tiger could be brought back from the brink of extinction by people working together with a common vision and understanding of the tiger’s needs in human-dominated landscapes. Because it addressed tiger conservation at a range-wide scale never attempted before, it showed how enduring partnerships among governments, non-government organizations, businesses, and social and religious institutions are necessary to secure a future for wild tigers.
A principal lesson from TCU 1.0 was the need to move from a reactive to a proactive tiger conservation agenda. But TCU 1.0 is a static document. In the face of continually shifting natural and political landscapes in Asia, TCU 1.0 was being outfl anked by new emerging threats and changing conditions on the ground and internationally. In 2003 the Save The Tiger Fund and its partners—The Wildlife Conservation Society, World Wildlife Fund-US, Smithsonian’s National Zoological Park, U.S. Fish and Wildlife Service, UN Foundation, and Zoological Society of London— commissioned this project “Setting Priorities for Conservation and Recovery of Wild Tigers: 2005–2015” and worked with tiger conservationists across the tiger’s range to catalyze efforts to increase knowledge,

127
skills, and cooperation to support wild tiger conservation. This is a “living document” and will continue to be updated, which is essential to enable us to predict emerging changes and threats to wild tigers and rapidly communicate these to our partners so we can develop our strategic solutions together. Sustained conservation of wild tigers in ever-changing environments requires strategic and fl exible allocations of resources to key tiger landscapes, anchored by new leadership capacity, sound sciences, best business practices, and public awareness.
Our vision is a world in which wild tigers thrive in natural habitats across their Asian range in harmony with people. People save what they value. To secure a place for wild tigers in our world, live tigers must be worth more to people than tiger parts, and land-scapes with tigers must be worth more to people than landscapes where tigers are ex-tinct. Wild tigers can be indicators of achieving large-scale conservation and improved human livelihoods. The tiger is a conservation-dependent species and isolated efforts are not enough to address today’s threats to tigers. Saving the tiger requires continuous and concerted vigilance and effort. There is no universal formula for saving wild tigers, but by building on the foundations of earlier efforts, such as the national park, wilderness, and biodiversity conservation movements; by fostering a global commitment to tiger conser-vation; and by linking conservation and human welfare, we can harness fl exible strategies to secure the tiger’s long-term survival.
The challenge of saving the tiger is the heart of conservation. A world without tigers is a world without hope—like a clear night sky without stars. A world without tigers would be a terrible loss, symbolizing a morbid disregard for natural places and our natural heritage. Help us to save wild tigers. We see saving the tiger as a test: if we pass, we get to keep the planet.
— John Seidensticker, Ph.D. Chairman, Save the Tiger Fund Council
Epilogue

Setting Priorities for the Conservation and Recovery of Wild Tigers: 2005–2015
A1.1
A1–1 Cover Letter
May 9, 2004
Dear Tiger Researcher and Conservationist,
In 1995-1996, tiger conservationists, with support of Save The Tiger Fund and led by research-
ers at the World Wildlife Fund and the Wildlife Conservation Society, prepared a Framework
Document for conservation of high priority areas and actions for tiger conservation (Dinerstein
et al. 1997). This is a powerful document and is a new vision of how to think about saving ti-
gers on their home ground. I love how the authors did not use the words “plan” or “strategy”
in the title. In my mind, this document has been a vision with its powerful images and quanti-
ties, evidence, and narrative. This vision is grounded in sustainability, landscapes, bioregions,
and in tiger ecology. It plays the key role in bridging the fundamental disconnection between
development and formulation of a strategy and its implementation. In short—this document
has had a central place in moving tiger conservation forward across the tiger’s entire range.
Ten years have passed since we initiated the fi rst Framework Document for tiger conservation,
and in that time much has changed. Funding for tiger conservation has increased signifi cantly
and much research and conservation has been supported by range states, by Save The Tiger
Fund, and by the U.S. Fish & Wildlife Service Rhinoceros & Tiger Conservation Fund (USF-
WS). As a result, we know a lot more about the status of tigers across their range. In addition,
technology has moved forward in leaps and bounds, bringing the potential to revise and refi ne
our cover maps for Asian forests. New datasets on the impact or “footprint” of humans also
allows us to consider what we know about tigers and forests in a new perspective. Clearly, a
decade later, it is time to revise the Framework Document.
The Save The Tiger Fund, in collaboration with the USFWS, the U.N. Foundation, and the
Critical Ecosystem Partnership Fund, have provided funding to the original NGO partners—
WCS and WWF—and to the Smithsonian Institution (SI) to work on revising the Framework
Document. Each of these institutions has also made signifi cant contributions in funds and staff
time to move forward this process. Without your help, however, we will not be able to meet
our goal of using the best available information to set priorities for the next decade of tiger
conservation. To meet this goal we need to bring together the information that everyone in the
tiger community has worked so hard to collect. While the past decade has seen many studies
undertaken of tigers, their prey, and the threats which face them, nowhere has even the most
coarse-grained data been brought together to help us see the broader picture of the status, and
future, of tigers in the wild.
We have attached two surveys to this e-mail, or this document, that we hope will help all of us
bring together the most current information on tigers. The purpose of these two surveys, the
Tiger Conservation Database Survey (TCDS) and the Tiger Conservation Unit (TCU) Ques-
A1.2
tionnaire, is to document the current state of knowledge about tiger conservation in order to
prepare the groundwork for a revision of the Framework Document. The results of the surveys
will be compiled and shared widely to enhance our knowledge about tigers, identify gaps in
our understanding, understand changes that have occurred since 1995, and inform new prior-
ity-setting and conservation investments.
You are receiving this material because you are acknowledged as an expert on tigers in all or
some part of the tiger’s historical range. Each piece of information provided by you will be
tagged with your name and institutional affi liation and distributed back to you along with
the completed data set, either through an Internet forum or distribution on CDROM. If you
would prefer that your data not be distributed, please indicate that on the attached forms. Any
information that you share with us will only be used for this exercise and will include a full
acknowledgement of your contribution.
Attached you will fi nd the two questionnaires along with their instructions and defi nitions for
particular fi elds—one focuses on tiger information at the point scale, the other at the TCU
scale. If at any time you need additional materials or have any questions, please send them to
Andrea Heydlauff at [email protected], and she will facilitate your requests. You can com-
plete the surveys either electronically (preferable) or on hardcopy. Please return the forms to
Andrea Heydlauff at the Wildlife Conservation Society by June 30th 2004.
Our preference is to receive electronic copies of the form, which can be sent to:
Alternatively you can mail hardcopies of the forms to:
Tiger Conservation Database
c/o Andrea L. Heydlauff
Wildlife Conservation Society
International Department
2300 Southern Blvd.
Bronx NY 10460 USA
Your timely assistance is much appreciated, and the information that you provide will be
crucial to understanding the larger picture, and to see both our successes and challenges in our
quest to secure a future for wild tigers.
On behalf of both our donor and conservation partners, as well as people everywhere con-
cerned about tigers, we thank you in advance for your assistance and participation.
John Seidensticker
Chairman, Save The Tiger Fund and SNZP
Eric Dinerstein, WWF
Joshua Ginsberg, WCS
Setting Priorities for the Conservation and Recovery of Wild Tigers: 2005-2015

A1.3
Appendix 1
A1–2 TCU Questionnaire Instructions
Dear Tiger Researcher and Conservationist,
Thank you for agreeing to complete the TCU Questionnaire. Please fi ll out one of these survey
forms for each TCU (or comparable area which you designate in China and Russia) for which
you have information from the last 8 years. You need not have worked in the area person-
ally to complete the data form below but you should have suffi cient familiarity to answer the
following questions. Please replicate the form as many times as necessary. You can complete
the form either electronically (preferable) or on hardcopy. Please return the forms to Andrea
Heydlauff at the Wildlife Conservation Society by June 30th, 2004.
These instructions and defi nitions are to simply clarify certain questions within the survey.
Please use these defi nitions when answering the questions. If any question seems unclear, please
send an e-mail to [email protected]
Note that questions are deliberately designed not only to document current patterns and
threats, but also to query potential threats and conservation measures in the future.
Instructions for Submission of TCU Questionnaire
Please provide your name, postal and electronic mail (e-mail) addresses and your phone num-
ber with applicable country codes. At your option, please also provide the name and addresses
of your institutional affi liation. If you complete multiple forms, you need only provide your
address and contact information on the fi rst form. However for each new primary observer,
please provide full name and contact information.
Forms can be completed by hand and mailed to:
Tiger Conservation Database
c/o Andrea Heydlauff
Wildlife Conservation Society
International Dept.
2300 Southern Blvd.
Bronx NY 10460 USA
To e-mail an electronic contribution to the FDTC (which we would prefer), e-mail the com-
pleted MS Excel data form to [email protected], writing your name, country, and date in the
subject line of your e-mail message.
Defi nitions
Researcher Identifi cation Information
Researcher You need not have worked in the area personally to complete the data form but
you should have suffi cient familiarity to answer the following questions.
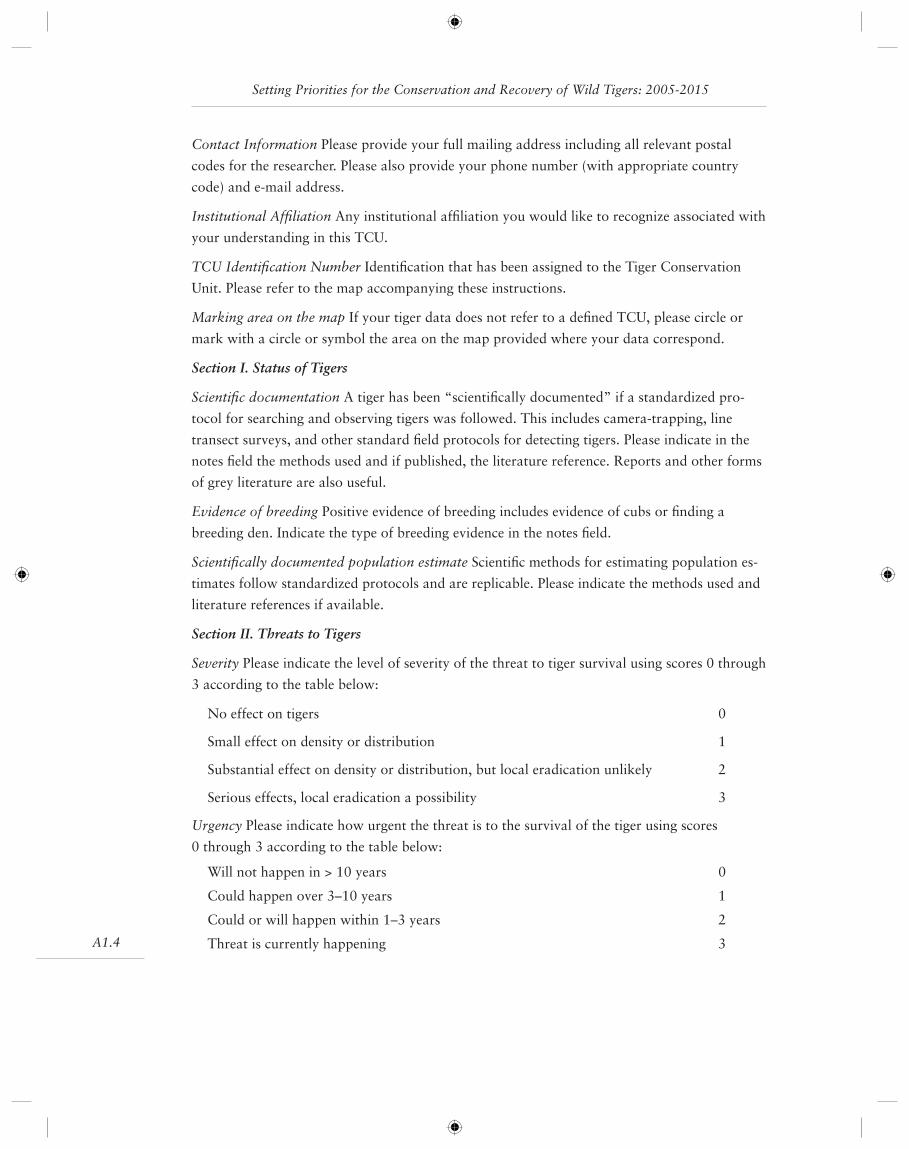
A1.4
Setting Priorities for the Conservation and Recovery of Wild Tigers: 2005-2015
Contact Information Please provide your full mailing address including all relevant postal
codes for the researcher. Please also provide your phone number (with appropriate country
code) and e-mail address.
Institutional Affi liation Any institutional affi liation you would like to recognize associated with
your understanding in this TCU.
TCU Identifi cation Number Identifi cation that has been assigned to the Tiger Conservation
Unit. Please refer to the map accompanying these instructions.
Marking area on the map If your tiger data does not refer to a defi ned TCU, please circle or
mark with a circle or symbol the area on the map provided where your data correspond.
Section I. Status of Tigers
Scientifi c documentation A tiger has been “scientifi cally documented” if a standardized pro-
tocol for searching and observing tigers was followed. This includes camera-trapping, line
transect surveys, and other standard fi eld protocols for detecting tigers. Please indicate in the
notes fi eld the methods used and if published, the literature reference. Reports and other forms
of grey literature are also useful.
Evidence of breeding Positive evidence of breeding includes evidence of cubs or fi nding a
breeding den. Indicate the type of breeding evidence in the notes fi eld.
Scientifi cally documented population estimate Scientifi c methods for estimating population es-
timates follow standardized protocols and are replicable. Please indicate the methods used and
literature references if available.
Section II. Threats to Tigers
Severity Please indicate the level of severity of the threat to tiger survival using scores 0 through
3 according to the table below:
No effect on tigers 0
Small effect on density or distribution 1
Substantial effect on density or distribution, but local eradication unlikely 2
Serious effects, local eradication a possibility 3
Urgency Please indicate how urgent the threat is to the survival of the tiger using scores
0 through 3 according to the table below:
Will not happen in > 10 years 0
Could happen over 3–10 years 1
Could or will happen within 1–3 years 2
Threat is currently happening 3

A1.5
Appendix 1
Recovery time Please indicate how long in years it would take for tigers to recover form that
particular threat if the threat was alleviated, using scores 0 through 3 according to the table
below:
Immediate or < 1 year 0
1–10 years recovery 1
10–100 years recovery 2
100 + years or never 3
Percentage of TCU affected by threat: Please indicate how much of the TCU is currently
affected by that particular threat using scores 0 through 3 according to the table below:
1–10% 0
10–25% 1
25–50% 2
> 50% 3
Probability of occurrence: If the threat is not occurring yet, estimate the probability that it will
occur on a 0 – 1 scale (e.g. 0.5 indicates 50% chance that the threat will occur). If the threat is
already occurring, indicate “1.”
Section III. Conservation of Tigers
Conservation measures present: Please indicate using Y for yes and N for no if the particular
conservation measure has been implemented within the TCU since 1995.
Effectiveness of conservation measures: Please circle the number that corresponds to how
effective you believe these measures to have been. 1 is the lowest ranking of not effective at
all—no difference made with respect to tiger conservation, 3 is a middle ranking some effectiv-
ness—some positive outcomes with respect to tiger conservation, 5 is the highest ranking of
fully effective—meets all expectations with respect to tiger conservation.
Present in the near future If you indicated that the conservation measure was not present in
the last 8 years, please can you indicate in the far right column if you believe that conservation
measure will be present in the near future.
Protected Areas Please write in the name of the Protected Area and next to it, circle the num-
ber that best indicates how effective the Protected Areas has been in protecting tigers and tiger
habitat.
Government Agency If a unit of government of your country is involved in tiger conservation
within this particular TCU, please indicate in the space provided.
Species of conservation interest Please indicate any other species (from any taxa) that is found
within this TCU in which there lies a conservation interest.

A1.6
Section IV. Researchers collecting data on tigers within the TCU during the last 8 years
Please indicate whether you personally have worked in this TCU in the last 8 years and indi-
cate the names, institutions, addresses, phone and fax numbers, and e-mails of other research-
ers who have worked in the TCU over the past 8 years as well.
Section V. Additional comments
Please feel free to add any additional information that you feel would be benefi cial, as well as
any additional comments you would like to share.
Setting Priorities for the Conservation and Recovery of Wild Tigers: 2005-2015
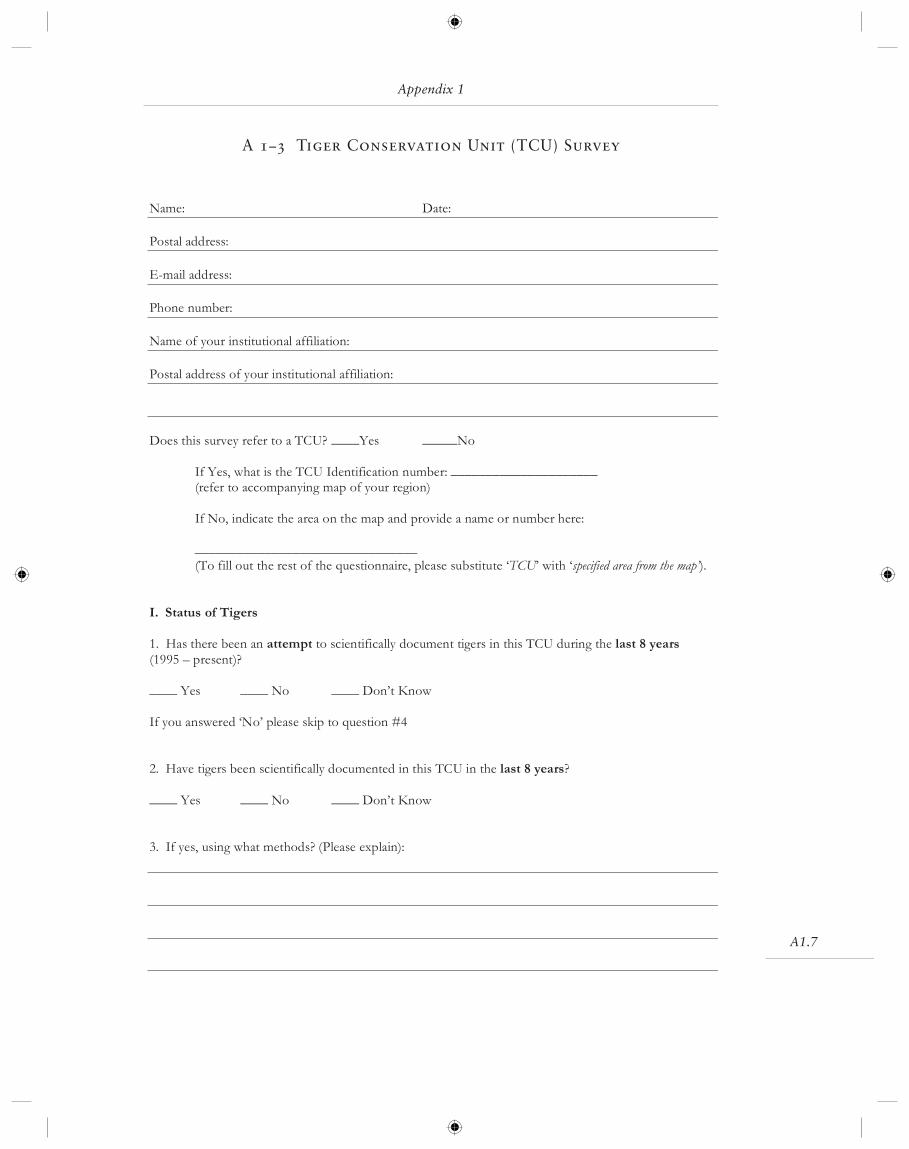
A1.7
Appendix 1
A 1–3 Tiger Conservation Unit (TCU) Survey
Name: Date:
Postal address:
E-mail address:
Phone number:
Name of your institutional affiliation:
Postal address of your institutional affiliation:
Does this survey refer to a TCU? ____Yes _____No
If Yes, what is the TCU Identification number: _____________________(refer to accompanying map of your region)
If No, indicate the area on the map and provide a name or number here:
________________________________(To fill out the rest of the questionnaire, please substitute ‘TCU’ with ‘specified area from the map’).
I. Status of Tigers
1. Has there been an attempt to scientifically document tigers in this TCU during the last 8 years(1995 – present)?
____ Yes ____ No ____ Don’t Know
If you answered ‘No’ please skip to question #4
2. Have tigers been scientifically documented in this TCU in the last 8 years?
____ Yes ____ No ____ Don’t Know
3. If yes, using what methods? (Please explain):

A1.8
4. Is there any other documentation (besides scientific) of tigers present in the TCU in the last 8 years?
____ Yes ____ No
If yes, please explain:
5. Have tigers been scientifically documented in this TCU since January 1, 2003?
____ Yes ____ No ____ Don’t Know
6. If Yes, using what methods? (If methods used are same as in question #3, write “same”):
7. Is there evidence of tigers breeding in this TCU during the last 8 years?
____ Yes ____ No ____ Don’t Know
8. If Yes, what is that evidence of tigers breeding (check all that apply):
_____ Cubs Observed _____ Den Found _____ Pregnant Female Observed
_____ Observed Tigers Mating
9. Other (please explain):
Setting Priorities for the Conservation and Recovery of Wild Tigers: 2005-2015

A1.9
Appendix 1
10. Is there a scientifically documented population estimate for tigers in this TCU?
____ Yes ____ No ____ Don’t Know
11. What is the estimated number of tigers in that population?
_____ 1 – 10 _____ 10 – 20 _____ 20 – 50 _____ 50 – 100 _____ more than 100
_____ Other _____ Don’t Know
12. What scientific method was used to determine the population estimate? (Please explain):
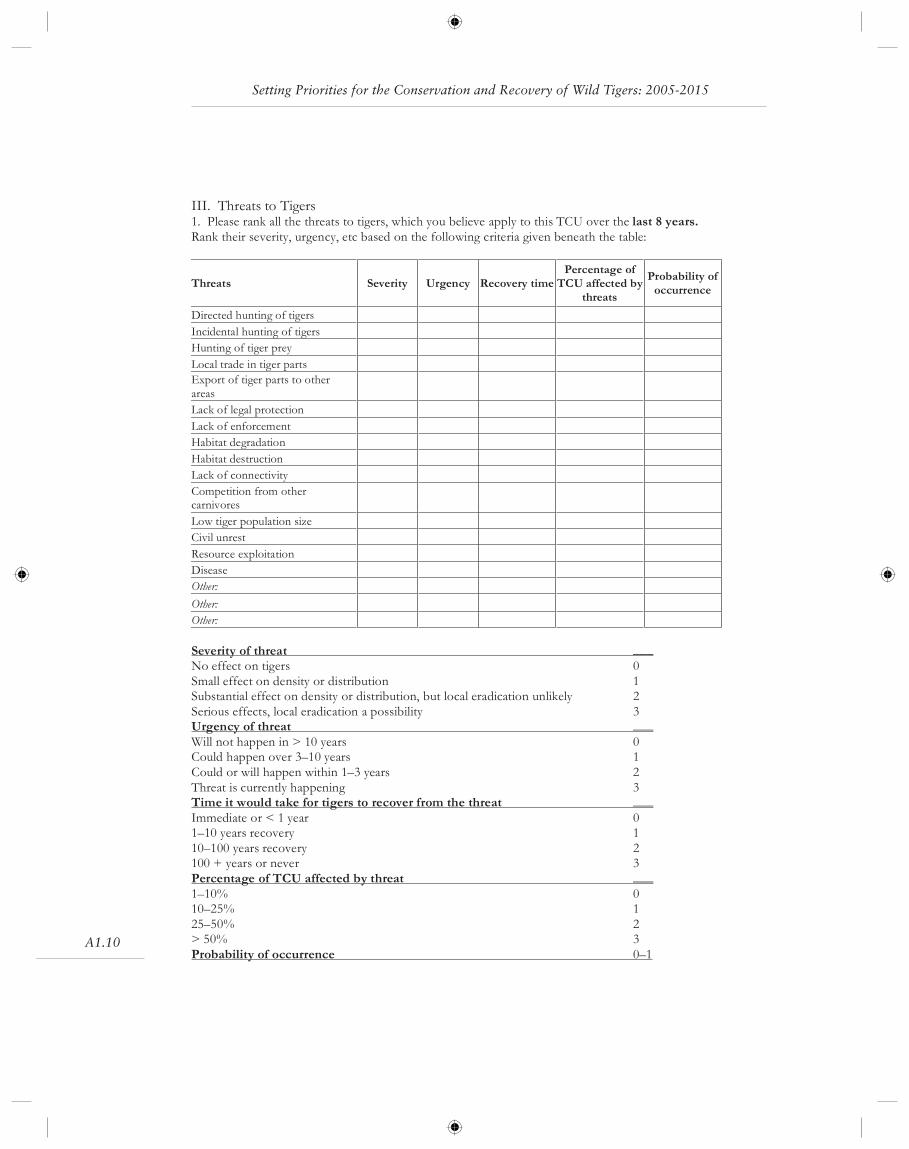
A1.10
III. Threats to Tigers1. Please rank all the threats to tigers, which you believe apply to this TCU over the last 8 years.Rank their severity, urgency, etc based on the following criteria given beneath the table:
Threats Severity Urgency Recovery timePercentage ofTCU affected by
threats
Probability ofoccurrence
Directed hunting of tigers
Incidental hunting of tigers
Hunting of tiger prey
Local trade in tiger parts
Export of tiger parts to otherareas
Lack of legal protection
Lack of enforcement
Habitat degradation
Habitat destruction
Lack of connectivity
Competition from othercarnivores
Low tiger population size
Civil unrest
Resource exploitation
Disease
Other:
Other:
Other:
Severity of threat ___No effect on tigers 0
Small effect on density or distribution 1Substantial effect on density or distribution, but local eradication unlikely 2
Serious effects, local eradication a possibility 3Urgency of threat ___Will not happen in > 10 years 0Could happen over 3–10 years 1
Could or will happen within 1–3 years 2
Threat is currently happening 3Time it would take for tigers to recover from the threat ___Immediate or < 1 year 01–10 years recovery 1
10–100 years recovery 2100 + years or never 3
Percentage of TCU affected by threat ___1–10% 010–25% 1
25–50% 2> 50% 3
Probability of occurrence 0–1
Setting Priorities for the Conservation and Recovery of Wild Tigers: 2005-2015

A1.11
Appendix 1
IV. Conservation of Tigers
1. Please indicate the conservation measures which have been taken over the last 8 years in this TCU andrank their effectiveness; if the conservation measure does not currently exist, please indicate if you believe itmight exist in the near future.
Present inlast 8 years?Yes / No
Conservation MeasuresEffectiveness of conservationmeasuresNot effective Fully effective
If not present will itbe in the nearfuture?Yes / No
Monitoring of tigers in the field 1 2 3 4 5
Monitoring of prey populations 1 2 3 4 5
Monitoring of trade in tiger parts 1 2 3 4 5
New laws/policies regarding tigers 1 2 3 4 5
Anti-poaching patrols 1 2 3 4 5
Anti-trafficking enforcement 1 2 3 4 5
Enforcement of protected areapolicies 1 2 3 4 5
Training of protected area staff 1 2 3 4 5
Enforcement of existing lawsregarding tigers 1 2 3 4 5
Provisioning or monetary support toprotected area staff 1 2 3 4 5
New / upgraded protected area 1 2 3 4 5
Habitat restoration 1 2 3 4 5
Habitat enhancement 1 2 3 4 5
Education of local people 1 2 3 4 5
Education of schoolchildren 1 2 3 4 5
Translocation of local people out ofprotected area 1 2 3 4 5
Local publicity about tigers 1 2 3 4 5
Ecotourism ventures 1 2 3 4 5
Reintroduction of tigers 1 2 3 4 5
Captive breeding facility 1 2 3 4 5
Compensation programs: 1 2 3 4 5
Conflict management/mitigation 1 2 3 4 5
Other: 1 2 3 4 5
Other: 1 2 3 4 5
Other: 1 2 3 4 5
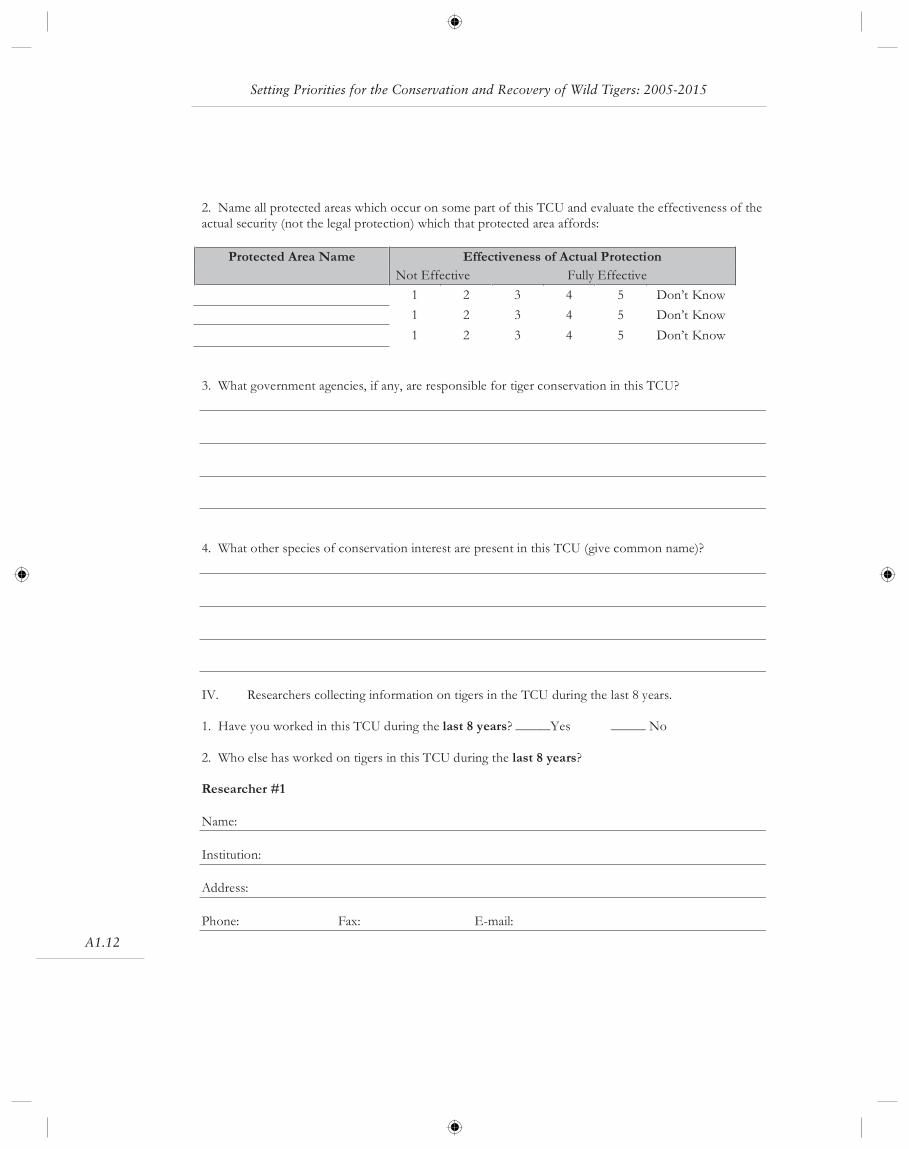
A1.12
2. Name all protected areas which occur on some part of this TCU and evaluate the effectiveness of the
actual security (not the legal protection) which that protected area affords:
Protected Area Name Effectiveness of Actual ProtectionNot Effective Fully Effective
1 2 3 4 5 Don’t Know
1 2 3 4 5 Don’t Know
1 2 3 4 5 Don’t Know
3. What government agencies, if any, are responsible for tiger conservation in this TCU?
4. What other species of conservation interest are present in this TCU (give common name)?
IV. Researchers collecting information on tigers in the TCU during the last 8 years.
1. Have you worked in this TCU during the last 8 years? _____Yes _____ No
2. Who else has worked on tigers in this TCU during the last 8 years?
Researcher #1
Name:
Institution:
Address:
Phone: Fax: E-mail:
Setting Priorities for the Conservation and Recovery of Wild Tigers: 2005-2015

A1.13
Researcher #2
Name:
Institution:
Address:
Phone: Fax: E-mail:
Researcher #3
Name:
Institution:
Address:
Phone: Fax: E-mail:
V. Additional Comments:
Appendix 1
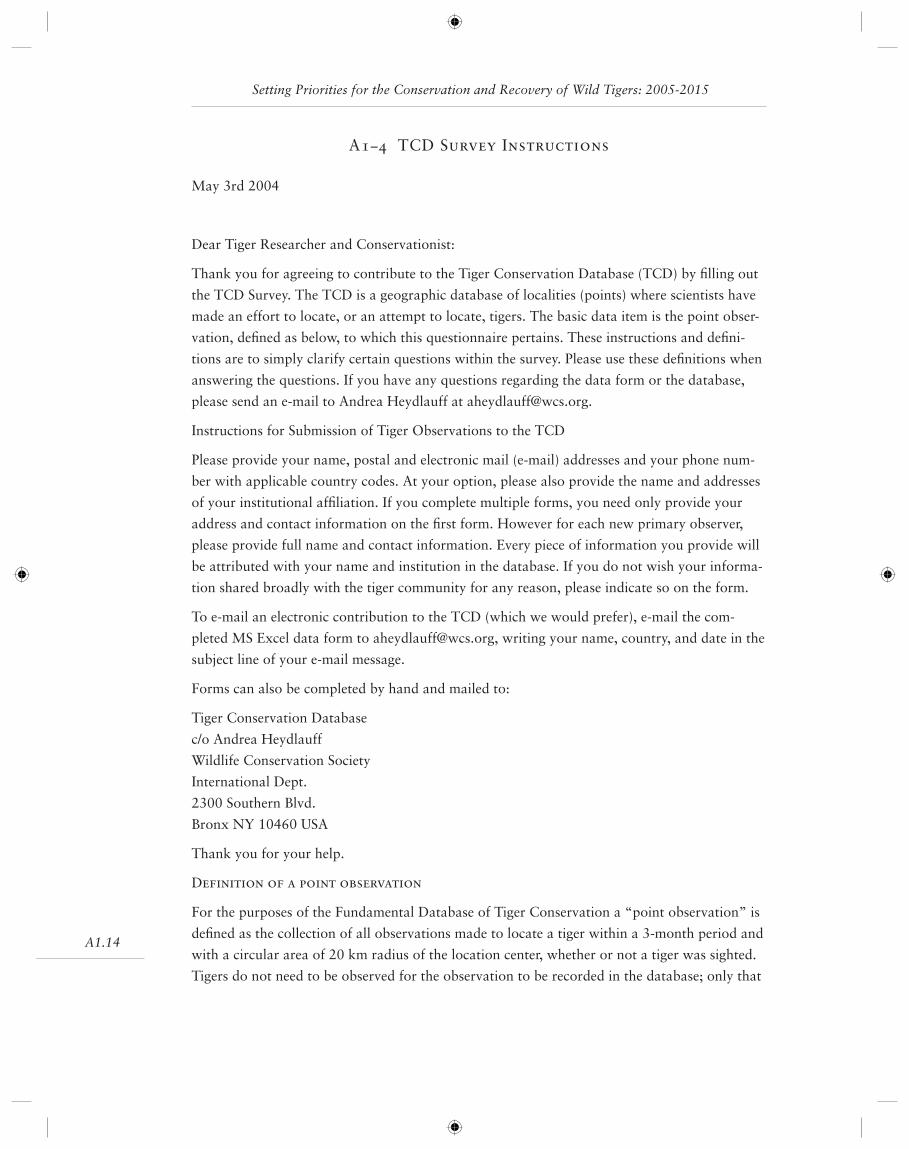
A1.14
A1–4 TCD Survey Instructions
May 3rd 2004
Dear Tiger Researcher and Conservationist:
Thank you for agreeing to contribute to the Tiger Conservation Database (TCD) by fi lling out
the TCD Survey. The TCD is a geographic database of localities (points) where scientists have
made an effort to locate, or an attempt to locate, tigers. The basic data item is the point obser-
vation, defi ned as below, to which this questionnaire pertains. These instructions and defi ni-
tions are to simply clarify certain questions within the survey. Please use these defi nitions when
answering the questions. If you have any questions regarding the data form or the database,
please send an e-mail to Andrea Heydlauff at [email protected].
Instructions for Submission of Tiger Observations to the TCD
Please provide your name, postal and electronic mail (e-mail) addresses and your phone num-
ber with applicable country codes. At your option, please also provide the name and addresses
of your institutional affi liation. If you complete multiple forms, you need only provide your
address and contact information on the fi rst form. However for each new primary observer,
please provide full name and contact information. Every piece of information you provide will
be attributed with your name and institution in the database. If you do not wish your informa-
tion shared broadly with the tiger community for any reason, please indicate so on the form.
To e-mail an electronic contribution to the TCD (which we would prefer), e-mail the com-
pleted MS Excel data form to [email protected], writing your name, country, and date in the
subject line of your e-mail message.
Forms can also be completed by hand and mailed to:
Tiger Conservation Database
c/o Andrea Heydlauff
Wildlife Conservation Society
International Dept.
2300 Southern Blvd.
Bronx NY 10460 USA
Thank you for your help.
Defi nition of a point observation
For the purposes of the Fundamental Database of Tiger Conservation a “point observation” is
defi ned as the collection of all observations made to locate a tiger within a 3-month period and
with a circular area of 20 km radius of the location center, whether or not a tiger was sighted.
Tigers do not need to be observed for the observation to be recorded in the database; only that
Setting Priorities for the Conservation and Recovery of Wild Tigers: 2005-2015
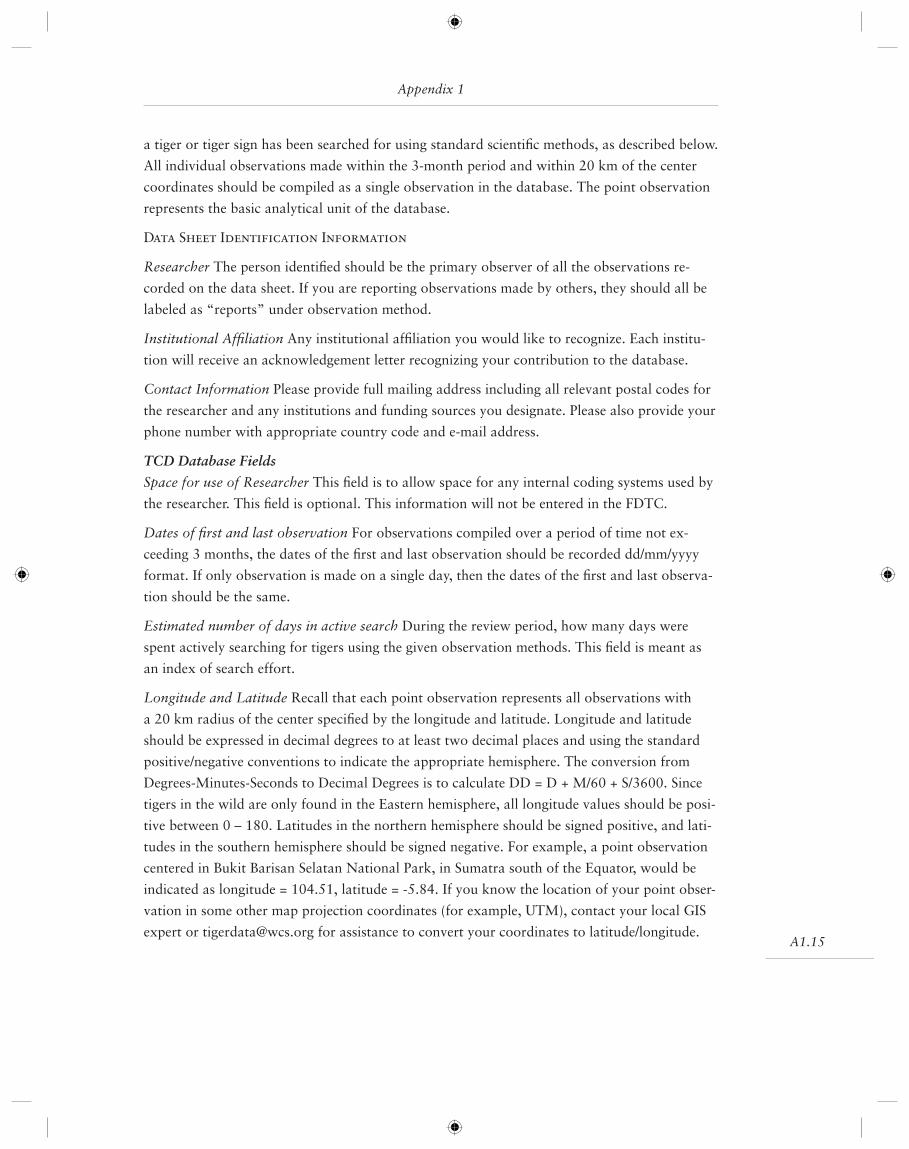
A1.15
a tiger or tiger sign has been searched for using standard scientifi c methods, as described below.
All individual observations made within the 3-month period and within 20 km of the center
coordinates should be compiled as a single observation in the database. The point observation
represents the basic analytical unit of the database.
Data Sheet Identifi cation Information
Researcher The person identifi ed should be the primary observer of all the observations re-
corded on the data sheet. If you are reporting observations made by others, they should all be
labeled as “reports” under observation method.
Institutional Affi liation Any institutional affi liation you would like to recognize. Each institu-
tion will receive an acknowledgement letter recognizing your contribution to the database.
Contact Information Please provide full mailing address including all relevant postal codes for
the researcher and any institutions and funding sources you designate. Please also provide your
phone number with appropriate country code and e-mail address.
TCD Database Fields
Space for use of Researcher This fi eld is to allow space for any internal coding systems used by
the researcher. This fi eld is optional. This information will not be entered in the FDTC.
Dates of fi rst and last observation For observations compiled over a period of time not ex-
ceeding 3 months, the dates of the fi rst and last observation should be recorded dd/mm/yyyy
format. If only observation is made on a single day, then the dates of the fi rst and last observa-
tion should be the same.
Estimated number of days in active search During the review period, how many days were
spent actively searching for tigers using the given observation methods. This fi eld is meant as
an index of search effort.
Longitude and Latitude Recall that each point observation represents all observations with
a 20 km radius of the center specifi ed by the longitude and latitude. Longitude and latitude
should be expressed in decimal degrees to at least two decimal places and using the standard
positive/negative conventions to indicate the appropriate hemisphere. The conversion from
Degrees-Minutes-Seconds to Decimal Degrees is to calculate DD = D + M/60 + S/3600. Since
tigers in the wild are only found in the Eastern hemisphere, all longitude values should be posi-
tive between 0 – 180. Latitudes in the northern hemisphere should be signed positive, and lati-
tudes in the southern hemisphere should be signed negative. For example, a point observation
centered in Bukit Barisan Selatan National Park, in Sumatra south of the Equator, would be
indicated as longitude = 104.51, latitude = -5.84. If you know the location of your point obser-
vation in some other map projection coordinates (for example, UTM), contact your local GIS
expert or [email protected] for assistance to convert your coordinates to latitude/longitude.
Appendix 1
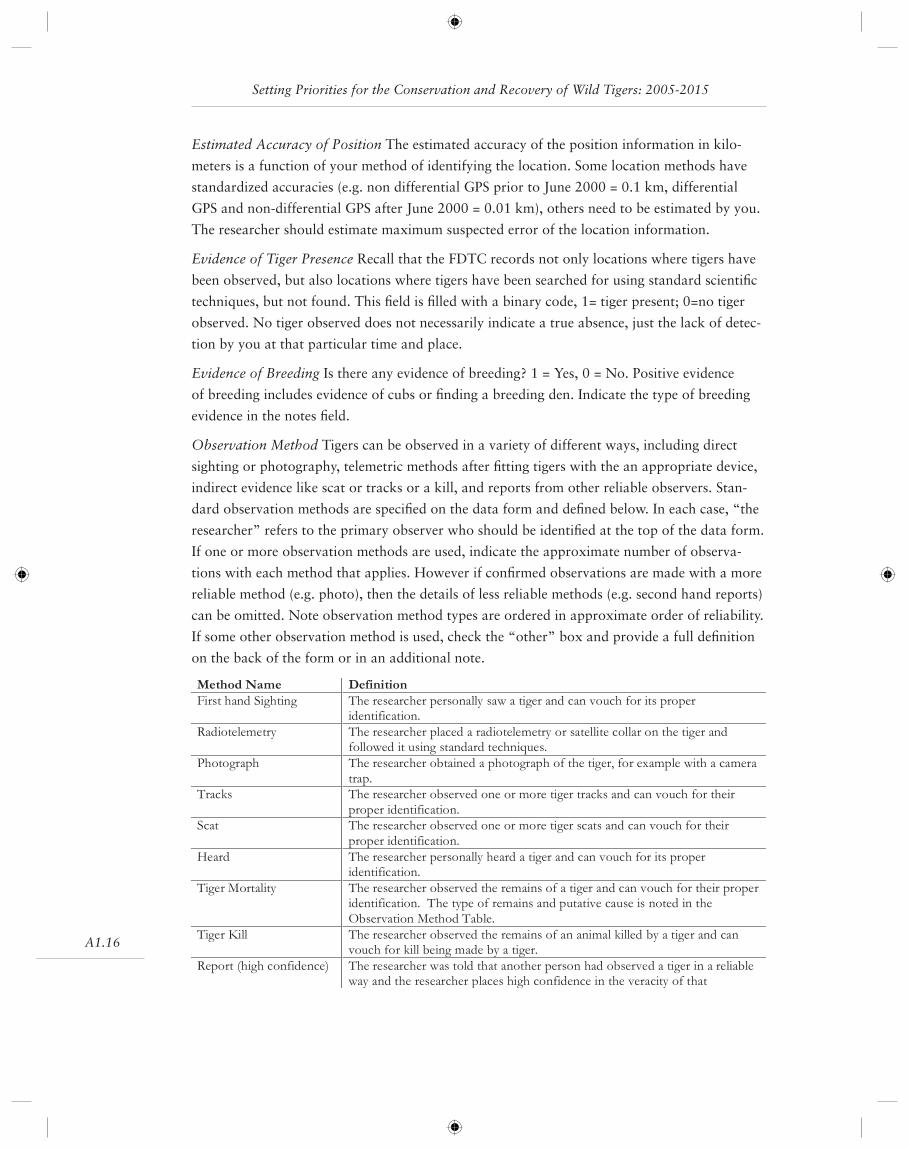
A1.16
Estimated Accuracy of Position The estimated accuracy of the position information in kilo-
meters is a function of your method of identifying the location. Some location methods have
standardized accuracies (e.g. non differential GPS prior to June 2000 = 0.1 km, differential
GPS and non-differential GPS after June 2000 = 0.01 km), others need to be estimated by you.
The researcher should estimate maximum suspected error of the location information.
Evidence of Tiger Presence Recall that the FDTC records not only locations where tigers have
been observed, but also locations where tigers have been searched for using standard scientifi c
techniques, but not found. This fi eld is fi lled with a binary code, 1= tiger present; 0=no tiger
observed. No tiger observed does not necessarily indicate a true absence, just the lack of detec-
tion by you at that particular time and place.
Evidence of Breeding Is there any evidence of breeding? 1 = Yes, 0 = No. Positive evidence
of breeding includes evidence of cubs or fi nding a breeding den. Indicate the type of breeding
evidence in the notes fi eld.
Observation Method Tigers can be observed in a variety of different ways, including direct
sighting or photography, telemetric methods after fi tting tigers with the an appropriate device,
indirect evidence like scat or tracks or a kill, and reports from other reliable observers. Stan-
dard observation methods are specifi ed on the data form and defi ned below. In each case, “the
researcher” refers to the primary observer who should be identifi ed at the top of the data form.
If one or more observation methods are used, indicate the approximate number of observa-
tions with each method that applies. However if confi rmed observations are made with a more
reliable method (e.g. photo), then the details of less reliable methods (e.g. second hand reports)
can be omitted. Note observation method types are ordered in approximate order of reliability.
If some other observation method is used, check the “other” box and provide a full defi nition
on the back of the form or in an additional note.
Method Name DefinitionFirst hand Sighting The researcher personally saw a tiger and can vouch for its proper
identification.
Radiotelemetry The researcher placed a radiotelemetry or satellite collar on the tiger andfollowed it using standard techniques.
Photograph The researcher obtained a photograph of the tiger, for example with a camera
trap.
Tracks The researcher observed one or more tiger tracks and can vouch for their
proper identification.
Scat The researcher observed one or more tiger scats and can vouch for their
proper identification.
Heard The researcher personally heard a tiger and can vouch for its properidentification.
Tiger Mortality The researcher observed the remains of a tiger and can vouch for their properidentification. The type of remains and putative cause is noted in the
Observation Method Table.
Tiger Kill The researcher observed the remains of an animal killed by a tiger and canvouch for kill being made by a tiger.
Report (high confidence) The researcher was told that another person had observed a tiger in a reliableway and the researcher places high confidence in the veracity of that
Setting Priorities for the Conservation and Recovery of Wild Tigers: 2005-2015

A1.17
Location Method Similarly there are a variety of standard methods for determining your geo-
graphic location. If you use some other method of locating your observation, please check the
“other” box and provide a full defi nition.
Notes: Any additional note about the observation that you would like to include about this
particular observation. Additional information might be about the number of tigers you believe
you observed at the point, the sex and ages of the tiger(s) observed, the conservation status of
the tigers, comments about the reliability of the observation, publications or reports resulting
from this observation, or any other information you would assist someone else in interpreting
your observation. If necessary, attach additional pages of notes, clearly labeling each observa-
tion in the note fi eld.
Report (low confidence) The researcher was told that another person had observed a tiger in a reliableway, but the researcher is unsure about of the reliability of the observation.
Other The tiger was observed in some other manner which is described fullyby the researcher.
Method Name DefinitionNon-differential GPS The researcher used a global positioning system device without
differential correction. Prior to June 2000, the accuracy of such adevice was typically 0.1 km. After June 2000, the accuracy of such adevice is typically 0.01 km.
Differential GPS The researcher used a global positioning system device with differentialcorrection.
Satellite collar The researcher fitted the tiger with a satellite collar
Telemetry Fix The researcher fitted the tiger with a VHS type telemetry collar.
Map and Compass The researcher used a map and compass in the field.
GIS The researcher used a geographic information system.
Dead Reckoning The researcher used a map without a compass and after returning fromthe field.
Second hand Report The researcher was told where the tiger was observed by the personwho made the observation.
Third hand Report The researcher was told where the tiger was observed by the some oneother than the person who made the observation.
Other The researcher used a different method which is fully defined in aseparate note.
Appendix 1

Setting Priorities for the Conservation and Recovery of Wild Tigers: 2005–2015
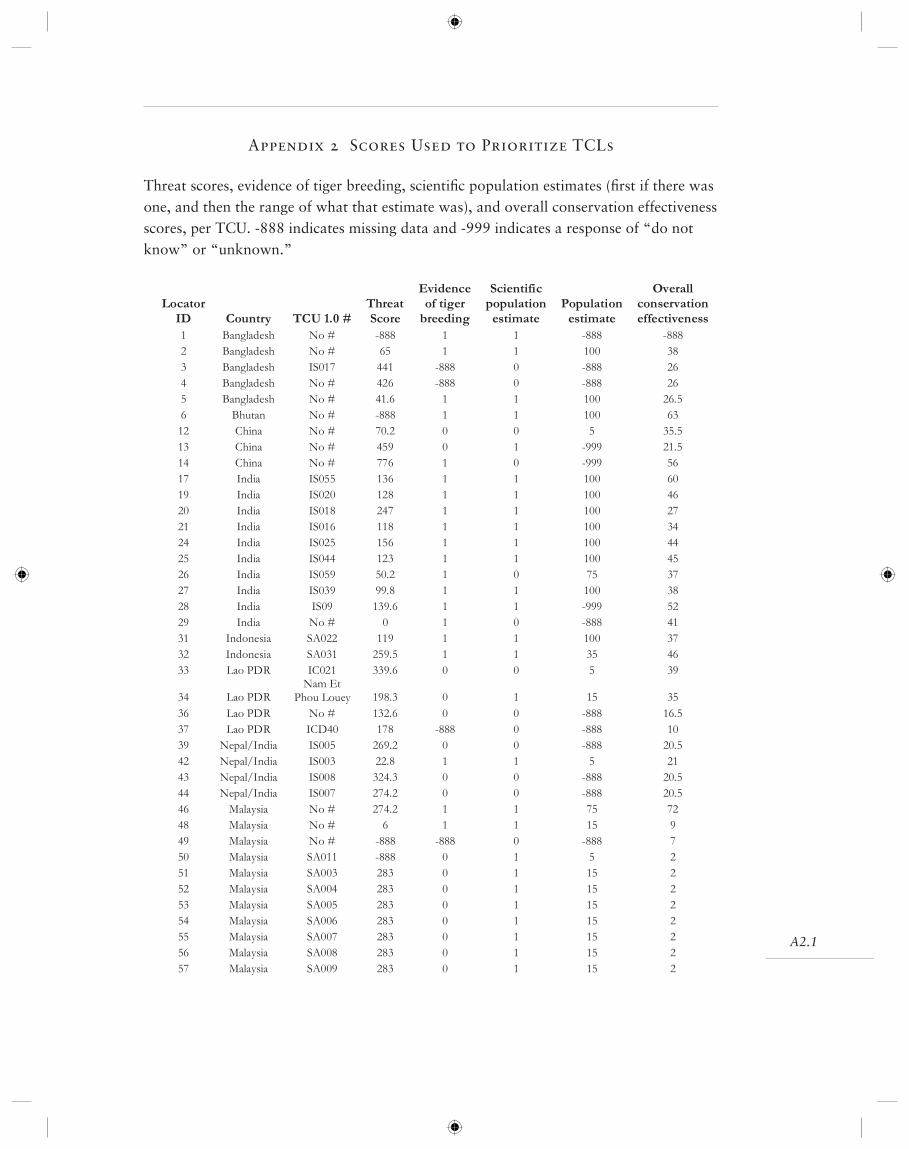
A2.1
Appendix 2 Scores Used to Prioritize TCLs
Threat scores, evidence of tiger breeding, scientifi c population estimates (fi rst if there was one, and then the range of what that estimate was), and overall conservation effectiveness scores, per TCU. -888 indicates missing data and -999 indicates a response of “do not know” or “unknown.”
LocatorID Country TCU 1.0 #
ThreatScore
Evidenceof tigerbreeding
Scientificpopulationestimate
Populationestimate
Overallconservationeffectiveness
1 Bangladesh No # -888 1 1 -888 -888
2 Bangladesh No # 65 1 1 100 38
3 Bangladesh IS017 441 -888 0 -888 26
4 Bangladesh No # 426 -888 0 -888 26
5 Bangladesh No # 41.6 1 1 100 26.5
6 Bhutan No # -888 1 1 100 63
12 China No # 70.2 0 0 5 35.5
13 China No # 459 0 1 -999 21.5
14 China No # 776 1 0 -999 56
17 India IS055 136 1 1 100 60
19 India IS020 128 1 1 100 46
20 India IS018 247 1 1 100 27
21 India IS016 118 1 1 100 34
24 India IS025 156 1 1 100 44
25 India IS044 123 1 1 100 45
26 India IS059 50.2 1 0 75 37
27 India IS039 99.8 1 1 100 38
28 India IS09 139.6 1 1 -999 52
29 India No # 0 1 0 -888 41
31 Indonesia SA022 119 1 1 100 37
32 Indonesia SA031 259.5 1 1 35 46
33 Lao PDR IC021 339.6 0 0 5 39
34 Lao PDRNam Et
Phou Louey 198.3 0 1 15 35
36 Lao PDR No # 132.6 0 0 -888 16.5
37 Lao PDR ICD40 178 -888 0 -888 10
39 Nepal/India IS005 269.2 0 0 -888 20.5
42 Nepal/India IS003 22.8 1 1 5 21
43 Nepal/India IS008 324.3 0 0 -888 20.5
44 Nepal/India IS007 274.2 0 0 -888 20.5
46 Malaysia No # 274.2 1 1 75 72
48 Malaysia No # 6 1 1 15 9
49 Malaysia No # -888 -888 0 -888 7
50 Malaysia SA011 -888 0 1 5 2
51 Malaysia SA003 283 0 1 15 2
52 Malaysia SA004 283 0 1 15 2
53 Malaysia SA005 283 0 1 15 2
54 Malaysia SA006 283 0 1 15 2
55 Malaysia SA007 283 0 1 15 2
56 Malaysia SA008 283 0 1 15 2
57 Malaysia SA009 283 0 1 15 2
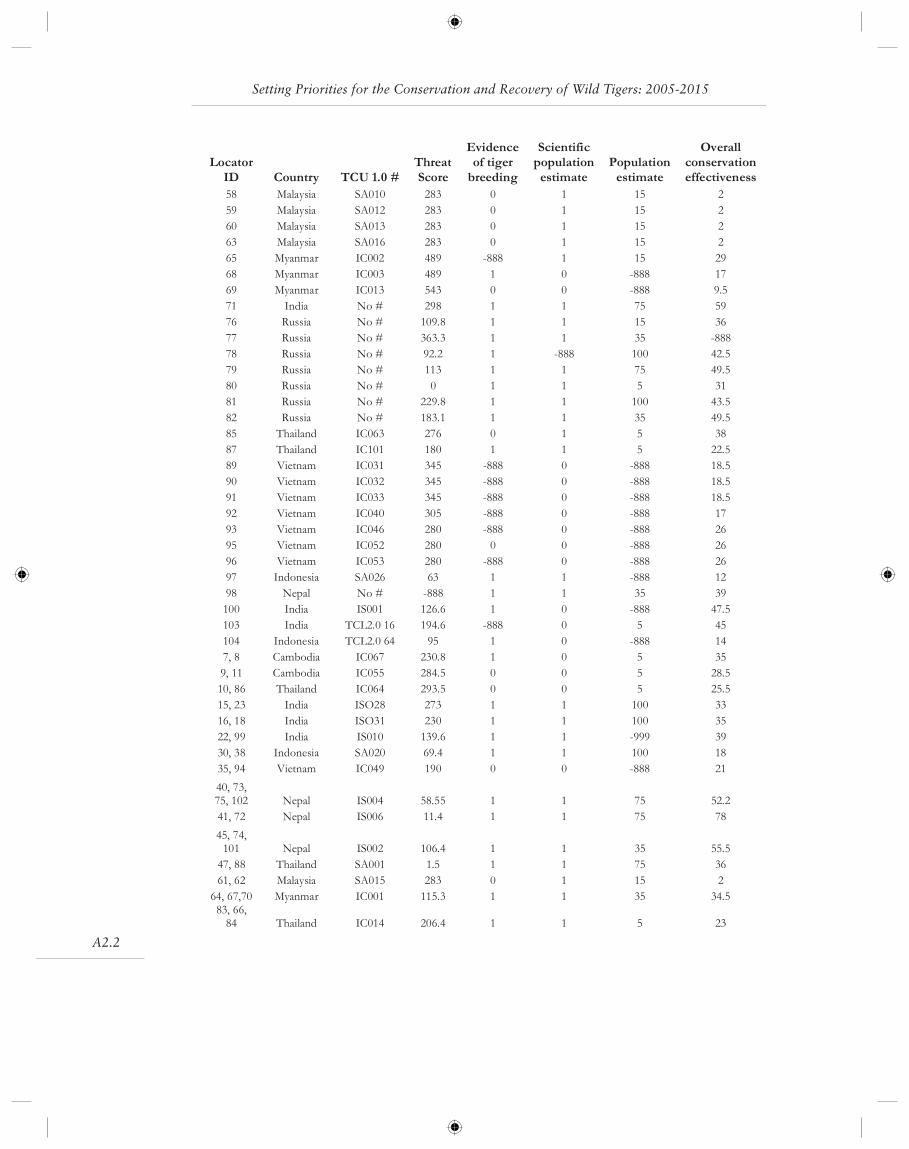
A2.2
Setting Priorities for the Conservation and Recovery of Wild Tigers: 2005-2015
LocatorID Country TCU 1.0 #
ThreatScore
Evidenceof tigerbreeding
Scientificpopulationestimate
Populationestimate
Overallconservationeffectiveness
58 Malaysia SA010 283 0 1 15 2
59 Malaysia SA012 283 0 1 15 2
60 Malaysia SA013 283 0 1 15 2
63 Malaysia SA016 283 0 1 15 2
65 Myanmar IC002 489 -888 1 15 29
68 Myanmar IC003 489 1 0 -888 17
69 Myanmar IC013 543 0 0 -888 9.5
71 India No # 298 1 1 75 59
76 Russia No # 109.8 1 1 15 36
77 Russia No # 363.3 1 1 35 -888
78 Russia No # 92.2 1 -888 100 42.5
79 Russia No # 113 1 1 75 49.5
80 Russia No # 0 1 1 5 31
81 Russia No # 229.8 1 1 100 43.5
82 Russia No # 183.1 1 1 35 49.5
85 Thailand IC063 276 0 1 5 38
87 Thailand IC101 180 1 1 5 22.5
89 Vietnam IC031 345 -888 0 -888 18.5
90 Vietnam IC032 345 -888 0 -888 18.5
91 Vietnam IC033 345 -888 0 -888 18.5
92 Vietnam IC040 305 -888 0 -888 17
93 Vietnam IC046 280 -888 0 -888 26
95 Vietnam IC052 280 0 0 -888 26
96 Vietnam IC053 280 -888 0 -888 26
97 Indonesia SA026 63 1 1 -888 12
98 Nepal No # -888 1 1 35 39
100 India IS001 126.6 1 0 -888 47.5
103 India TCL2.0 16 194.6 -888 0 5 45
104 Indonesia TCL2.0 64 95 1 0 -888 14
7, 8 Cambodia IC067 230.8 1 0 5 35
9, 11 Cambodia IC055 284.5 0 0 5 28.5
10, 86 Thailand IC064 293.5 0 0 5 25.5
15, 23 India ISO28 273 1 1 100 33
16, 18 India ISO31 230 1 1 100 35
22, 99 India IS010 139.6 1 1 -999 39
30, 38 Indonesia SA020 69.4 1 1 100 18
35, 94 Vietnam IC049 190 0 0 -888 21
40, 73,75, 102 Nepal IS004 58.55 1 1 75 52.2
41, 72 Nepal IS006 11.4 1 1 75 78
45, 74,101 Nepal IS002 106.4 1 1 35 55.5
47, 88 Thailand SA001 1.5 1 1 75 36
61, 62 Malaysia SA015 283 0 1 15 2
64, 67,70 Myanmar IC001 115.3 1 1 35 34.583, 66,84 Thailand IC014 206.4 1 1 5 23
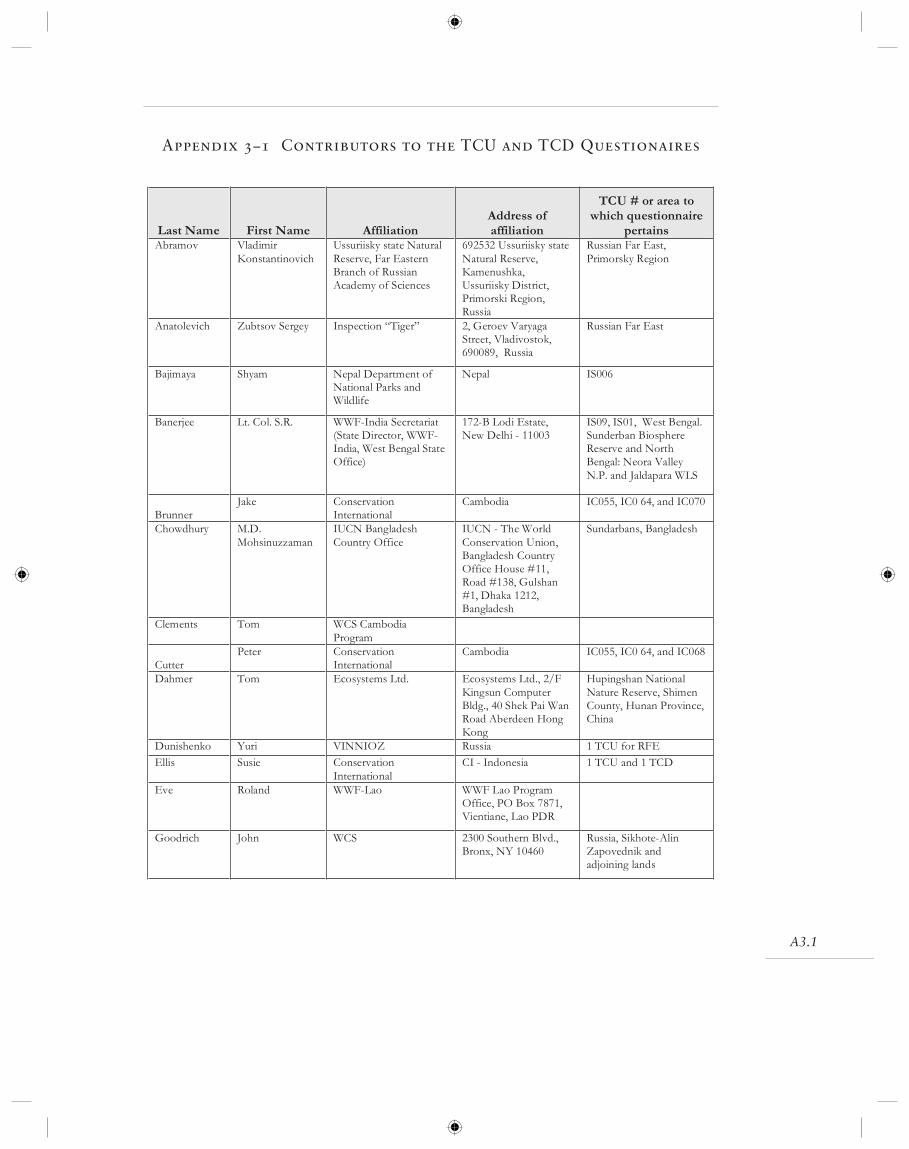
A3.1
Appendix 3–1 Contributors to the TCU and TCD Questionaires
Last Name First Name AffiliationAddress ofaffiliation
TCU # or area towhich questionnaire
pertainsAbramov Vladimir
KonstantinovichUssuriisky state NaturalReserve, Far EasternBranch of RussianAcademy of Sciences
692532 Ussuriisky stateNatural Reserve,Kamenushka,Ussuriisky District,Primorski Region,Russia
Russian Far East,Primorsky Region
Anatolevich Zubtsov Sergey Inspection “Tiger” 2, Geroev VaryagaStreet, Vladivostok,690089, Russia
Russian Far East
Bajimaya Shyam Nepal Department ofNational Parks andWildlife
Nepal IS006
Banerjee Lt. Col. S.R. WWF-India Secretariat(State Director, WWF-India, West Bengal StateOffice)
172-B Lodi Estate,New Delhi - 11003
IS09, IS01, West Bengal.Sunderban BiosphereReserve and NorthBengal: Neora ValleyN.P. and Jaldapara WLS
BrunnerJake Conservation
InternationalCambodia IC055, IC0 64, and IC070
Chowdhury M.D.Mohsinuzzaman
IUCN BangladeshCountry Office
IUCN - The WorldConservation Union,Bangladesh CountryOffice House #11,Road #138, Gulshan#1, Dhaka 1212,Bangladesh
Sundarbans, Bangladesh
Clements Tom WCS CambodiaProgram
CutterPeter Conservation
InternationalCambodia IC055, IC0 64, and IC068
Dahmer Tom Ecosystems Ltd. Ecosystems Ltd., 2/FKingsun ComputerBldg., 40 Shek Pai WanRoad Aberdeen HongKong
Hupingshan NationalNature Reserve, ShimenCounty, Hunan Province,China
Dunishenko Yuri VINNIOZ Russia 1 TCU for RFE
Ellis Susie ConservationInternational
CI - Indonesia 1 TCU and 1 TCD
Eve Roland WWF-Lao WWF Lao ProgramOffice, PO Box 7871,Vientiane, Lao PDR
Goodrich John WCS 2300 Southern Blvd.,Bronx, NY 10460
Russia, Sikhote-AlinZapovednik andadjoining lands
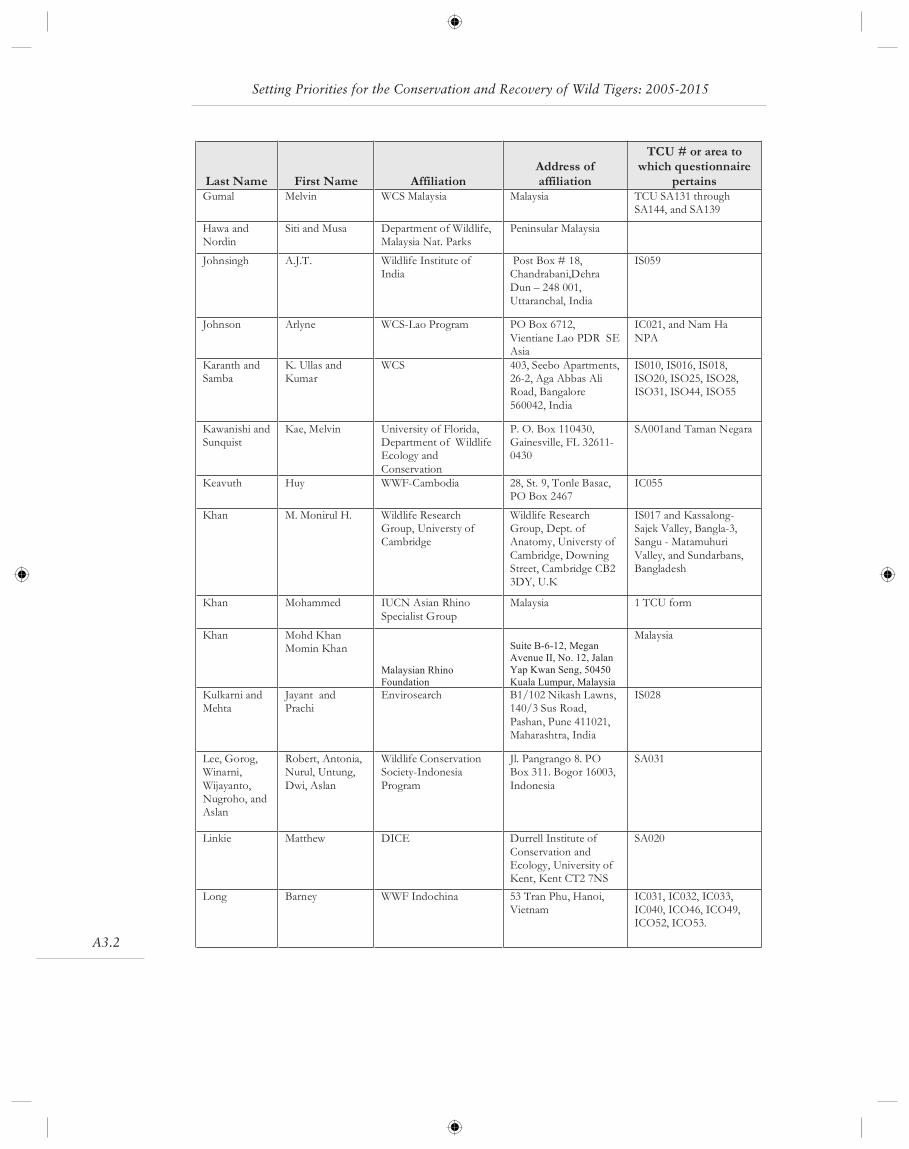
A3.2
Setting Priorities for the Conservation and Recovery of Wild Tigers: 2005-2015
Last Name First Name AffiliationAddress ofaffiliation
TCU # or area towhich questionnaire
pertainsGumal Melvin WCS Malaysia Malaysia TCU SA131 through
SA144, and SA139
Hawa andNordin
Siti and Musa Department of Wildlife,Malaysia Nat. Parks
Peninsular Malaysia
Johnsingh A.J.T. Wildlife Institute ofIndia
Post Box # 18,Chandrabani,DehraDun – 248 001,Uttaranchal, India
IS059
Johnson Arlyne WCS-Lao Program PO Box 6712,Vientiane Lao PDR SEAsia
IC021, and Nam HaNPA
Karanth andSamba
K. Ullas andKumar
WCS 403, Seebo Apartments,26-2, Aga Abbas AliRoad, Bangalore560042, India
IS010, IS016, IS018,ISO20, ISO25, ISO28,ISO31, ISO44, ISO55
Kawanishi andSunquist
Kae, Melvin University of Florida,Department of WildlifeEcology andConservation
P. O. Box 110430,Gainesville, FL 32611-0430
SA001and Taman Negara
Keavuth Huy WWF-Cambodia 28, St. 9, Tonle Basac,PO Box 2467
IC055
Khan M. Monirul H. Wildlife ResearchGroup, Universty ofCambridge
Wildlife ResearchGroup, Dept. ofAnatomy, Universty ofCambridge, DowningStreet, Cambridge CB23DY, U.K
IS017 and Kassalong-Sajek Valley, Bangla-3,Sangu - MatamuhuriValley, and Sundarbans,Bangladesh
Khan Mohammed IUCN Asian RhinoSpecialist Group
Malaysia 1 TCU form
Khan Mohd KhanMomin Khan
Malaysian Rhino
Foundation
Suite B-6-12, Megan
Avenue II, No. 12, Jalan
Yap Kwan Seng, 50450
Kuala Lumpur, Malaysia
Malaysia
Kulkarni andMehta
Jayant andPrachi
Envirosearch B1/102 Nikash Lawns,140/3 Sus Road,Pashan, Pune 411021,Maharashtra, India
IS028
Lee, Gorog,Winarni,Wijayanto,Nugroho, andAslan
Robert, Antonia,Nurul, Untung,Dwi, Aslan
Wildlife ConservationSociety-IndonesiaProgram
Jl. Pangrango 8. POBox 311. Bogor 16003,Indonesia
SA031
Linkie Matthew DICE Durrell Institute ofConservation andEcology, University ofKent, Kent CT2 7NS
SA020
Long Barney WWF Indochina 53 Tran Phu, Hanoi,Vietnam
IC031, IC032, IC033,IC040, ICO46, ICO49,ICO52, ICO53.
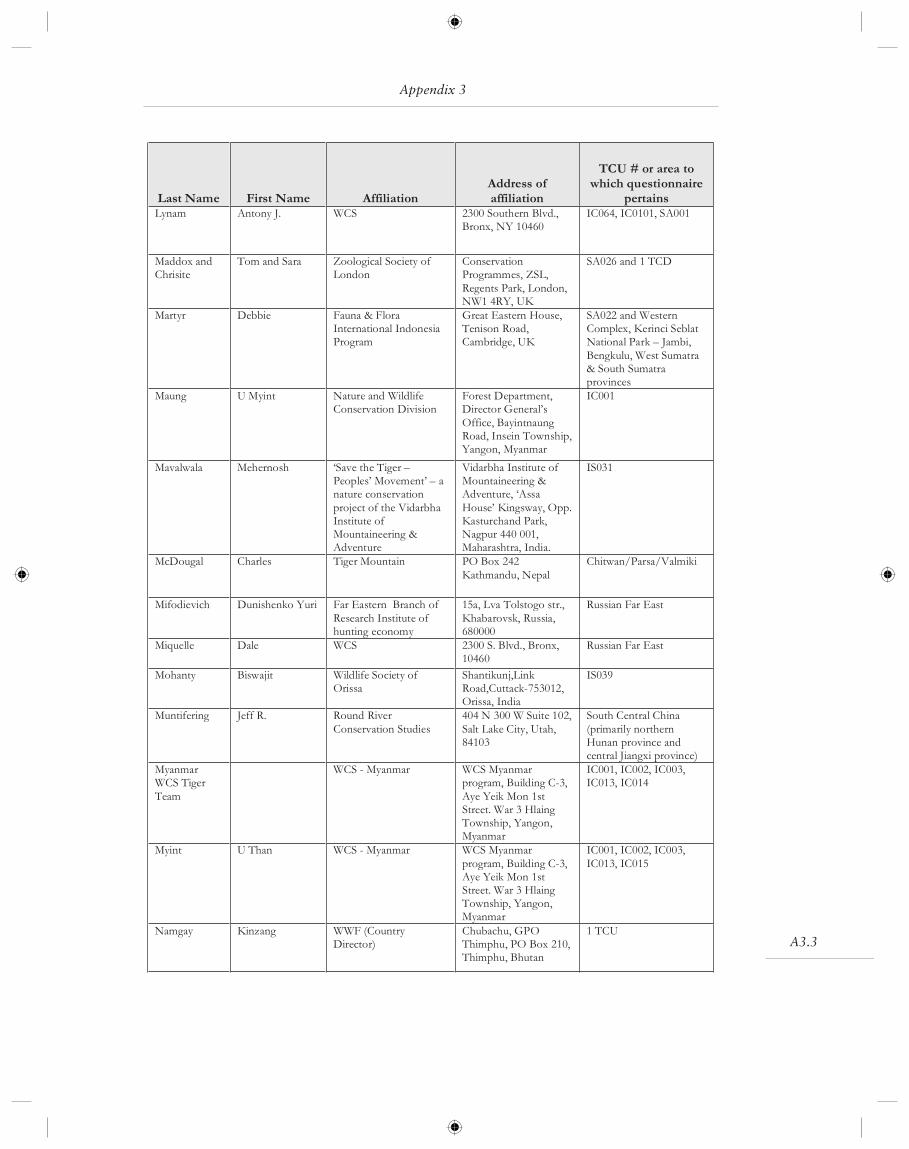
A3.3
Last Name First Name AffiliationAddress ofaffiliation
TCU # or area towhich questionnaire
pertainsLynam Antony J. WCS 2300 Southern Blvd.,
Bronx, NY 10460IC064, IC0101, SA001
Maddox andChrisite
Tom and Sara Zoological Society ofLondon
ConservationProgrammes, ZSL,Regents Park, London,NW1 4RY, UK
SA026 and 1 TCD
Martyr Debbie Fauna & FloraInternational IndonesiaProgram
Great Eastern House,Tenison Road,Cambridge, UK
SA022 and WesternComplex, Kerinci SeblatNational Park – Jambi,Bengkulu, West Sumatra& South Sumatraprovinces
Maung U Myint Nature and WildlifeConservation Division
Forest Department,Director General’sOffice, BayintnaungRoad, Insein Township,Yangon, Myanmar
IC001
Mavalwala Mehernosh ‘Save the Tiger –Peoples’ Movement’ – anature conservationproject of the VidarbhaInstitute ofMountaineering &Adventure
Vidarbha Institute ofMountaineering &Adventure, ‘AssaHouse’ Kingsway, Opp.Kasturchand Park,Nagpur 440 001,Maharashtra, India.
IS031
McDougal Charles Tiger Mountain PO Box 242Kathmandu, Nepal
Chitwan/Parsa/Valmiki
Mifodievich Dunishenko Yuri Far Eastern Branch ofResearch Institute ofhunting economy
15a, Lva Tolstogo str.,Khabarovsk, Russia,680000
Russian Far East
Miquelle Dale WCS 2300 S. Blvd., Bronx,10460
Russian Far East
Mohanty Biswajit Wildlife Society ofOrissa
Shantikunj,LinkRoad,Cuttack-753012,Orissa, India
IS039
Muntifering Jeff R. Round RiverConservation Studies
404 N 300 W Suite 102,Salt Lake City, Utah,84103
South Central China(primarily northernHunan province andcentral Jiangxi province)
MyanmarWCS TigerTeam
WCS - Myanmar WCS Myanmarprogram, Building C-3,Aye Yeik Mon 1stStreet. War 3 HlaingTownship, Yangon,Myanmar
IC001, IC002, IC003,IC013, IC014
Myint U Than WCS - Myanmar WCS Myanmarprogram, Building C-3,Aye Yeik Mon 1stStreet. War 3 HlaingTownship, Yangon,Myanmar
IC001, IC002, IC003,IC013, IC015
Namgay Kinzang WWF (CountryDirector)
Chubachu, GPOThimphu, PO Box 210,Thimphu, Bhutan
1 TCU
Appendix 3
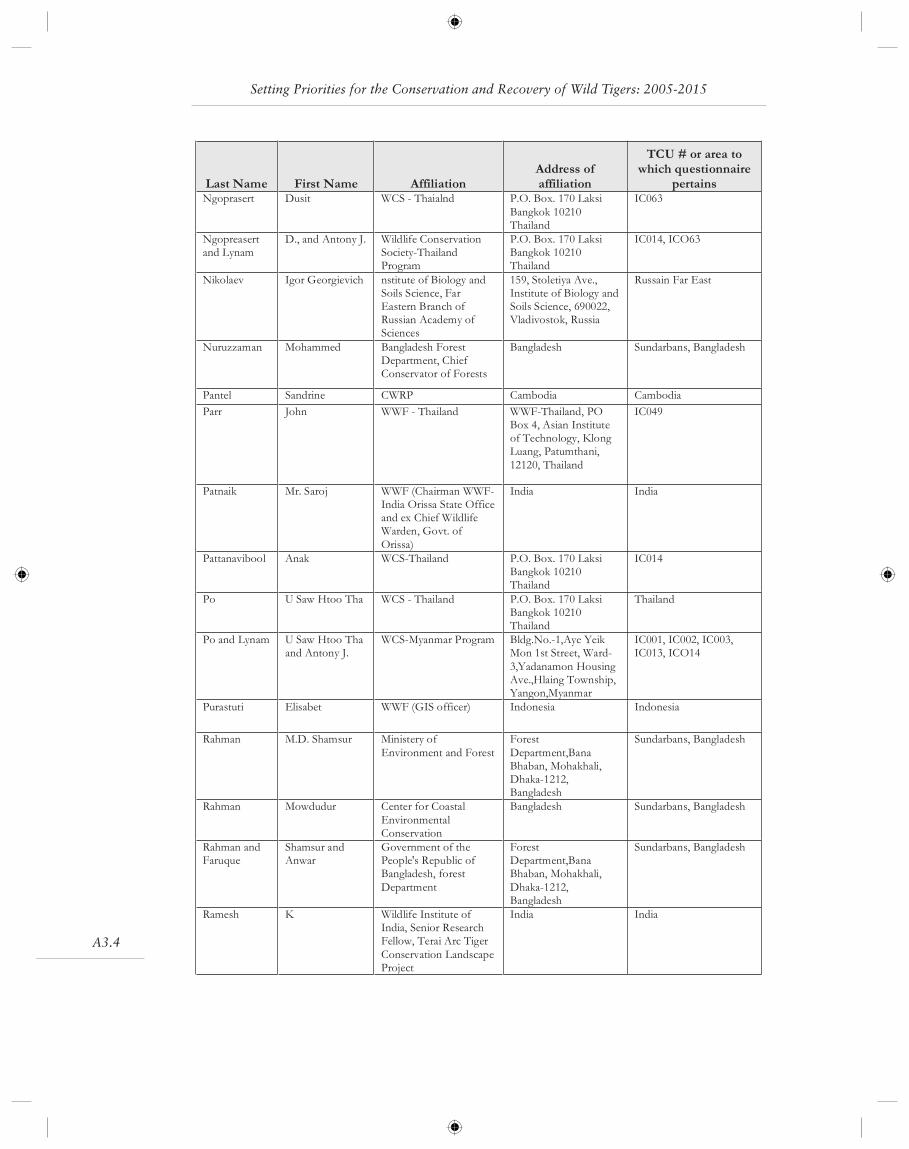
A3.4
Last Name First Name AffiliationAddress ofaffiliation
TCU # or area towhich questionnaire
pertainsNgoprasert Dusit WCS - Thaialnd P.O. Box. 170 Laksi
Bangkok 10210Thailand
IC063
Ngopreasertand Lynam
D., and Antony J. Wildlife ConservationSociety-ThailandProgram
P.O. Box. 170 LaksiBangkok 10210Thailand
IC014, ICO63
Nikolaev Igor Georgievich nstitute of Biology andSoils Science, FarEastern Branch ofRussian Academy ofSciences
159, Stoletiya Ave.,Institute of Biology andSoils Science, 690022,Vladivostok, Russia
Russain Far East
Nuruzzaman Mohammed Bangladesh ForestDepartment, ChiefConservator of Forests
Bangladesh Sundarbans, Bangladesh
Pantel Sandrine CWRP Cambodia Cambodia
Parr John WWF - Thailand WWF-Thailand, POBox 4, Asian Instituteof Technology, KlongLuang, Patumthani,12120, Thailand
IC049
Patnaik Mr. Saroj WWF (Chairman WWF-India Orissa State Officeand ex Chief WildlifeWarden, Govt. ofOrissa)
India India
Pattanavibool Anak WCS-Thailand P.O. Box. 170 LaksiBangkok 10210Thailand
IC014
Po U Saw Htoo Tha WCS - Thailand P.O. Box. 170 LaksiBangkok 10210Thailand
Thailand
Po and Lynam U Saw Htoo Thaand Antony J.
WCS-Myanmar Program Bldg.No.-1,Aye YeikMon 1st Street, Ward-3,Yadanamon HousingAve.,Hlaing Township,Yangon,Myanmar
IC001, IC002, IC003,IC013, ICO14
Purastuti Elisabet WWF (GIS officer) Indonesia Indonesia
Rahman M.D. Shamsur Ministery ofEnvironment and Forest
ForestDepartment,BanaBhaban, Mohakhali,Dhaka-1212,Bangladesh
Sundarbans, Bangladesh
Rahman Mowdudur Center for CoastalEnvironmentalConservation
Bangladesh Sundarbans, Bangladesh
Rahman andFaruque
Shamsur andAnwar
Government of thePeople's Republic ofBangladesh, forestDepartment
ForestDepartment,BanaBhaban, Mohakhali,Dhaka-1212,Bangladesh
Sundarbans, Bangladesh
Ramesh K Wildlife Institute ofIndia, Senior ResearchFellow, Terai Arc TigerConservation LandscapeProject
India India
Setting Priorities for the Conservation and Recovery of Wild Tigers: 2005-2015
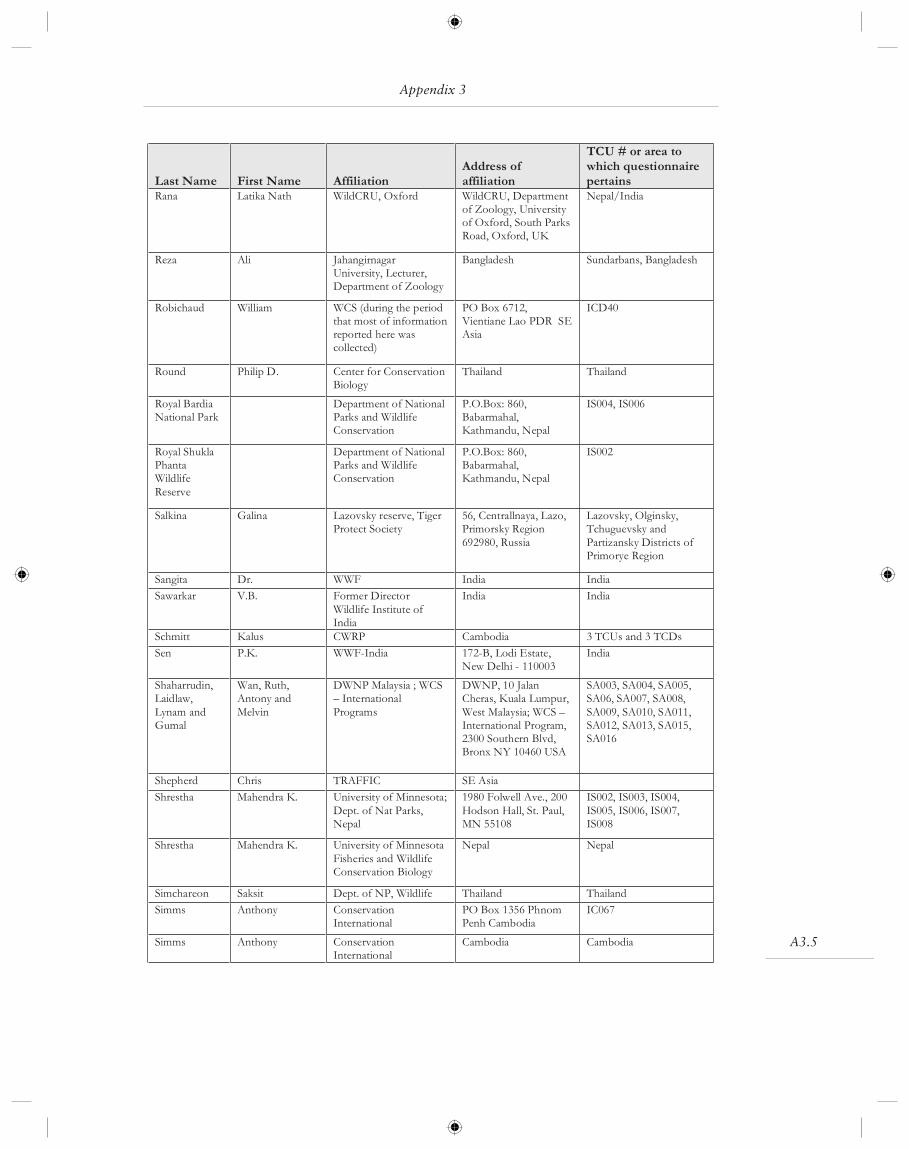
A3.5
Last Name First Name AffiliationAddress ofaffiliation
TCU # or area towhich questionnairepertains
Rana Latika Nath WildCRU, Oxford WildCRU, Departmentof Zoology, Universityof Oxford, South ParksRoad, Oxford, UK
Nepal/India
Reza Ali JahangirnagarUniversity, Lecturer,Department of Zoology
Bangladesh Sundarbans, Bangladesh
Robichaud William WCS (during the periodthat most of informationreported here wascollected)
PO Box 6712,Vientiane Lao PDR SEAsia
ICD40
Round Philip D. Center for ConservationBiology
Thailand Thailand
Royal BardiaNational Park
Department of NationalParks and WildlifeConservation
P.O.Box: 860,Babarmahal,Kathmandu, Nepal
IS004, IS006
Royal ShuklaPhantaWildlifeReserve
Department of NationalParks and WildlifeConservation
P.O.Box: 860,Babarmahal,Kathmandu, Nepal
IS002
Salkina Galina Lazovsky reserve, TigerProtect Society
56, Centrallnaya, Lazo,Primorsky Region692980, Russia
Lazovsky, Olginsky,Tchuguevsky andPartizansky Districts ofPrimorye Region
Sangita Dr. WWF India India
Sawarkar V.B. Former DirectorWildlife Institute ofIndia
India India
Schmitt Kalus CWRP Cambodia 3 TCUs and 3 TCDs
Sen P.K. WWF-India 172-B, Lodi Estate,New Delhi - 110003
India
Shaharrudin,Laidlaw,Lynam andGumal
Wan, Ruth,Antony andMelvin
DWNP Malaysia ; WCS– InternationalPrograms
DWNP, 10 JalanCheras, Kuala Lumpur,West Malaysia; WCS –International Program,2300 Southern Blvd,Bronx NY 10460 USA
SA003, SA004, SA005,SA06, SA007, SA008,SA009, SA010, SA011,SA012, SA013, SA015,SA016
Shepherd Chris TRAFFIC SE Asia
Shrestha Mahendra K. University of Minnesota;Dept. of Nat Parks,Nepal
1980 Folwell Ave., 200Hodson Hall, St. Paul,MN 55108
IS002, IS003, IS004,IS005, IS006, IS007,IS008
Shrestha Mahendra K. University of MinnesotaFisheries and WildlifeConservation Biology
Nepal Nepal
Simchareon Saksit Dept. of NP, Wildlife Thailand Thailand
Simms Anthony ConservationInternational
PO Box 1356 PhnomPenh Cambodia
IC067
Simms Anthony ConservationInternational
Cambodia Cambodia
Appendix 3
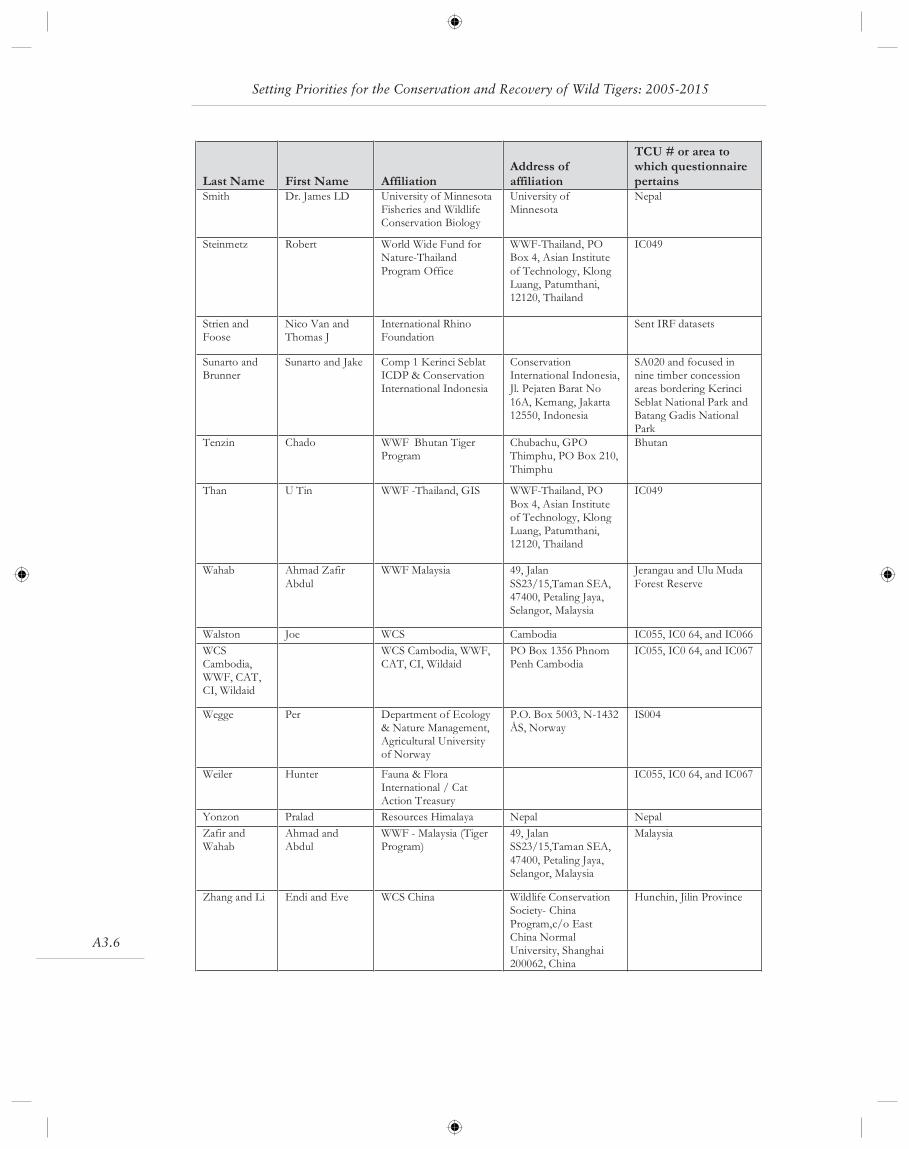
A3.6
Last Name First Name AffiliationAddress ofaffiliation
TCU # or area towhich questionnairepertains
Smith Dr. James LD University of MinnesotaFisheries and WildlifeConservation Biology
University ofMinnesota
Nepal
Steinmetz Robert World Wide Fund forNature-ThailandProgram Office
WWF-Thailand, POBox 4, Asian Instituteof Technology, KlongLuang, Patumthani,12120, Thailand
IC049
Strien andFoose
Nico Van andThomas J
International RhinoFoundation
Sent IRF datasets
Sunarto andBrunner
Sunarto and Jake Comp 1 Kerinci SeblatICDP & ConservationInternational Indonesia
ConservationInternational Indonesia,Jl. Pejaten Barat No16A, Kemang, Jakarta12550, Indonesia
SA020 and focused innine timber concessionareas bordering KerinciSeblat National Park andBatang Gadis NationalPark
Tenzin Chado WWF Bhutan TigerProgram
Chubachu, GPOThimphu, PO Box 210,Thimphu
Bhutan
Than U Tin WWF -Thailand, GIS WWF-Thailand, POBox 4, Asian Instituteof Technology, KlongLuang, Patumthani,12120, Thailand
IC049
Wahab Ahmad ZafirAbdul
WWF Malaysia 49, JalanSS23/15,Taman SEA,47400, Petaling Jaya,Selangor, Malaysia
Jerangau and Ulu MudaForest Reserve
Walston Joe WCS Cambodia IC055, IC0 64, and IC066
WCSCambodia,WWF, CAT,CI, Wildaid
WCS Cambodia, WWF,CAT, CI, Wildaid
PO Box 1356 PhnomPenh Cambodia
IC055, IC0 64, and IC067
Wegge Per Department of Ecology& Nature Management,Agricultural Universityof Norway
P.O. Box 5003, N-1432ÅS, Norway
IS004
Weiler Hunter Fauna & FloraInternational / CatAction Treasury
IC055, IC0 64, and IC067
Yonzon Pralad Resources Himalaya Nepal Nepal
Zafir andWahab
Ahmad andAbdul
WWF - Malaysia (TigerProgram)
49, JalanSS23/15,Taman SEA,47400, Petaling Jaya,Selangor, Malaysia
Malaysia
Zhang and Li Endi and Eve WCS China Wildlife ConservationSociety- ChinaProgram,c/o EastChina NormalUniversity, Shanghai200062, China
Hunchin, Jilin Province
Setting Priorities for the Conservation and Recovery of Wild Tigers: 2005-2015

A3.7
Last Name First Name AffiliationAddress ofaffiliation
TCU # or area towhich questionnairepertains
Zubtsov Sergei Inspection Tiger Russia Russian Far East
Appendix 3
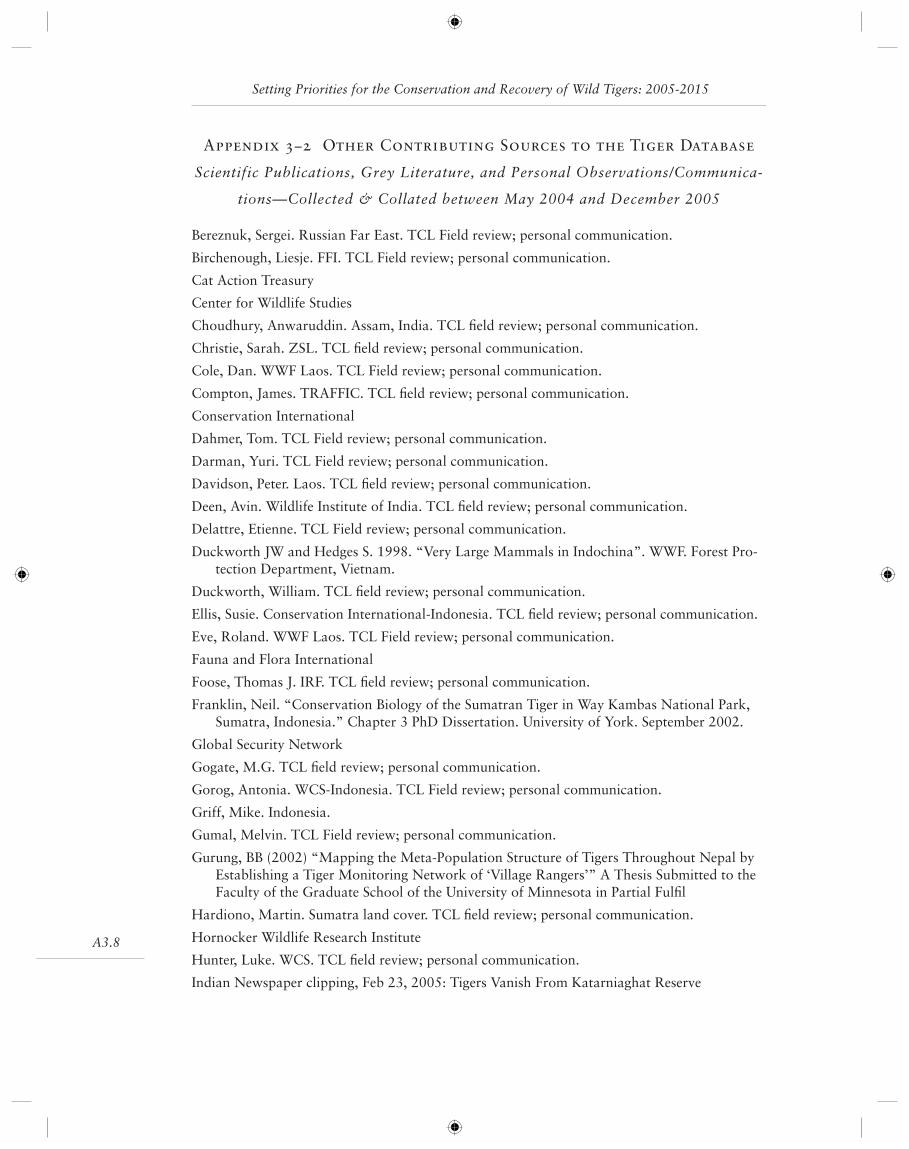
A3.8
Setting Priorities for the Conservation and Recovery of Wild Tigers: 2005-2015
Appendix 3–2 Other Contributing Sources to the Tiger Database
Scientific Publications, Grey Literature, and Personal Observations/Communica-
tions—Collected & Collated between May 2004 and December 2005
Bereznuk, Sergei. Russian Far East. TCL Field review; personal communication.
Birchenough, Liesje. FFI. TCL Field review; personal communication.
Cat Action Treasury
Center for Wildlife Studies
Choudhury, Anwaruddin. Assam, India. TCL fi eld review; personal communication.
Christie, Sarah. ZSL. TCL fi eld review; personal communication.
Cole, Dan. WWF Laos. TCL Field review; personal communication.
Compton, James. TRAFFIC. TCL fi eld review; personal communication.
Conservation International
Dahmer, Tom. TCL Field review; personal communication.
Darman, Yuri. TCL Field review; personal communication.
Davidson, Peter. Laos. TCL fi eld review; personal communication.
Deen, Avin. Wildlife Institute of India. TCL fi eld review; personal communication.
Delattre, Etienne. TCL Field review; personal communication.
Duckworth JW and Hedges S. 1998. “Very Large Mammals in Indochina”. WWF. Forest Pro-tection Department, Vietnam.
Duckworth, William. TCL fi eld review; personal communication.
Ellis, Susie. Conservation International-Indonesia. TCL fi eld review; personal communication.
Eve, Roland. WWF Laos. TCL Field review; personal communication.
Fauna and Flora International
Foose, Thomas J. IRF. TCL fi eld review; personal communication.
Franklin, Neil. “Conservation Biology of the Sumatran Tiger in Way Kambas National Park, Sumatra, Indonesia.” Chapter 3 PhD Dissertation. University of York. September 2002.
Global Security Network
Gogate, M.G. TCL fi eld review; personal communication.
Gorog, Antonia. WCS-Indonesia. TCL Field review; personal communication.
Griff, Mike. Indonesia.
Gumal, Melvin. TCL Field review; personal communication.
Gurung, BB (2002) “Mapping the Meta-Population Structure of Tigers Throughout Nepal by Establishing a Tiger Monitoring Network of ‘Village Rangers’” A Thesis Submitted to the Faculty of the Graduate School of the University of Minnesota in Partial Fulfi l
Hardiono, Martin. Sumatra land cover. TCL fi eld review; personal communication.
Hornocker Wildlife Research Institute
Hunter, Luke. WCS. TCL fi eld review; personal communication.
Indian Newspaper clipping, Feb 23, 2005: Tigers Vanish From Katarniaghat Reserve
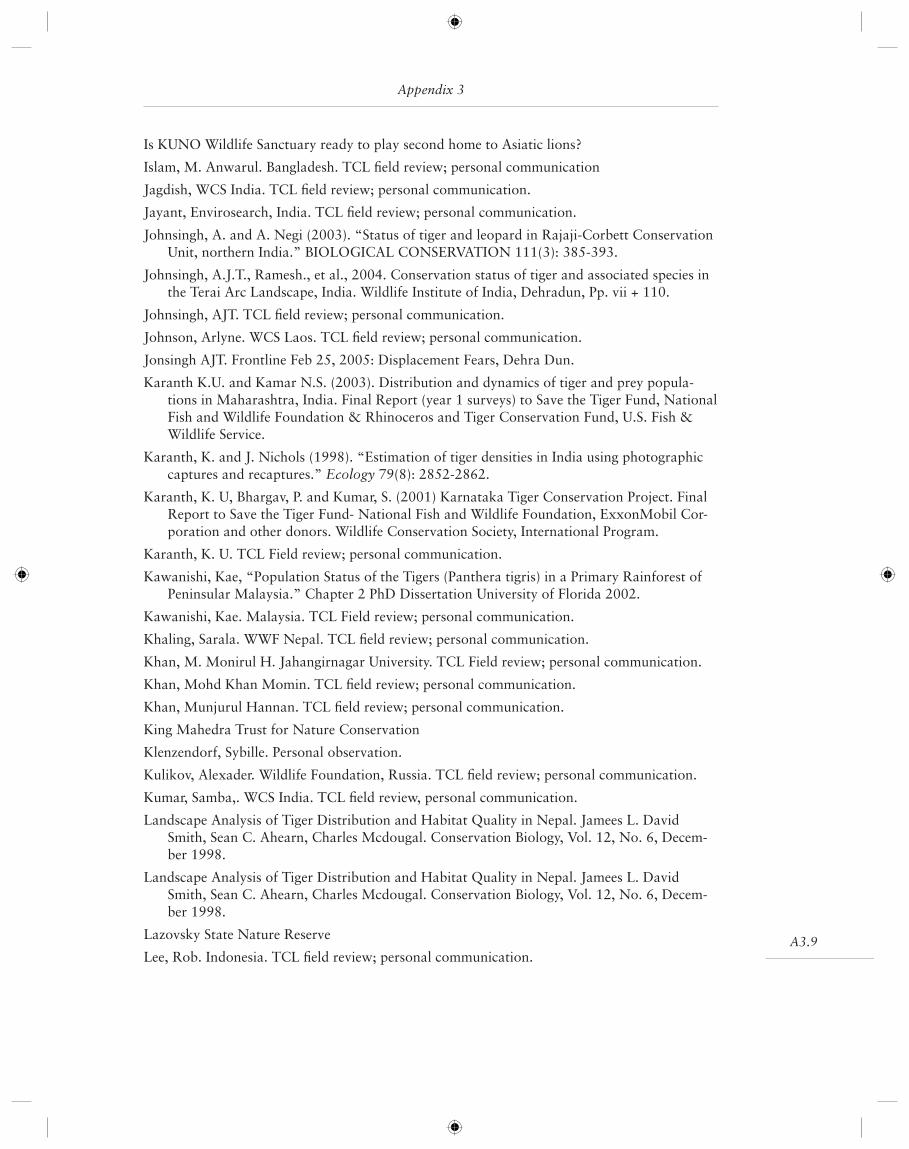
A3.9
Is KUNO Wildlife Sanctuary ready to play second home to Asiatic lions?
Islam, M. Anwarul. Bangladesh. TCL fi eld review; personal communication
Jagdish, WCS India. TCL fi eld review; personal communication.
Jayant, Envirosearch, India. TCL fi eld review; personal communication.
Johnsingh, A. and A. Negi (2003). “Status of tiger and leopard in Rajaji-Corbett Conservation Unit, northern India.” BIOLOGICAL CONSERVATION 111(3): 385-393.
Johnsingh, A.J.T., Ramesh., et al., 2004. Conservation status of tiger and associated species in the Terai Arc Landscape, India. Wildlife Institute of India, Dehradun, Pp. vii + 110.
Johnsingh, AJT. TCL fi eld review; personal communication.
Johnson, Arlyne. WCS Laos. TCL fi eld review; personal communication.
Jonsingh AJT. Frontline Feb 25, 2005: Displacement Fears, Dehra Dun.
Karanth K.U. and Kamar N.S. (2003). Distribution and dynamics of tiger and prey popula-tions in Maharashtra, India. Final Report (year 1 surveys) to Save the Tiger Fund, National Fish and Wildlife Foundation & Rhinoceros and Tiger Conservation Fund, U.S. Fish & Wildlife Service.
Karanth, K. and J. Nichols (1998). “Estimation of tiger densities in India using photographic captures and recaptures.” Ecology 79(8): 2852-2862.
Karanth, K. U, Bhargav, P. and Kumar, S. (2001) Karnataka Tiger Conservation Project. Final Report to Save the Tiger Fund- National Fish and Wildlife Foundation, ExxonMobil Cor-poration and other donors. Wildlife Conservation Society, International Program.
Karanth, K. U. TCL Field review; personal communication.
Kawanishi, Kae, “Population Status of the Tigers (Panthera tigris) in a Primary Rainforest of Peninsular Malaysia.” Chapter 2 PhD Dissertation University of Florida 2002.
Kawanishi, Kae. Malaysia. TCL Field review; personal communication.
Khaling, Sarala. WWF Nepal. TCL fi eld review; personal communication.
Khan, M. Monirul H. Jahangirnagar University. TCL Field review; personal communication.
Khan, Mohd Khan Momin. TCL fi eld review; personal communication.
Khan, Munjurul Hannan. TCL fi eld review; personal communication.
King Mahedra Trust for Nature Conservation
Klenzendorf, Sybille. Personal observation.
Kulikov, Alexader. Wildlife Foundation, Russia. TCL fi eld review; personal communication.
Kumar, Samba,. WCS India. TCL fi eld review, personal communication.
Landscape Analysis of Tiger Distribution and Habitat Quality in Nepal. Jamees L. David Smith, Sean C. Ahearn, Charles Mcdougal. Conservation Biology, Vol. 12, No. 6, Decem-ber 1998.
Landscape Analysis of Tiger Distribution and Habitat Quality in Nepal. Jamees L. David Smith, Sean C. Ahearn, Charles Mcdougal. Conservation Biology, Vol. 12, No. 6, Decem-ber 1998.
Lazovsky State Nature Reserve
Lee, Rob. Indonesia. TCL fi eld review; personal communication.
Appendix 3
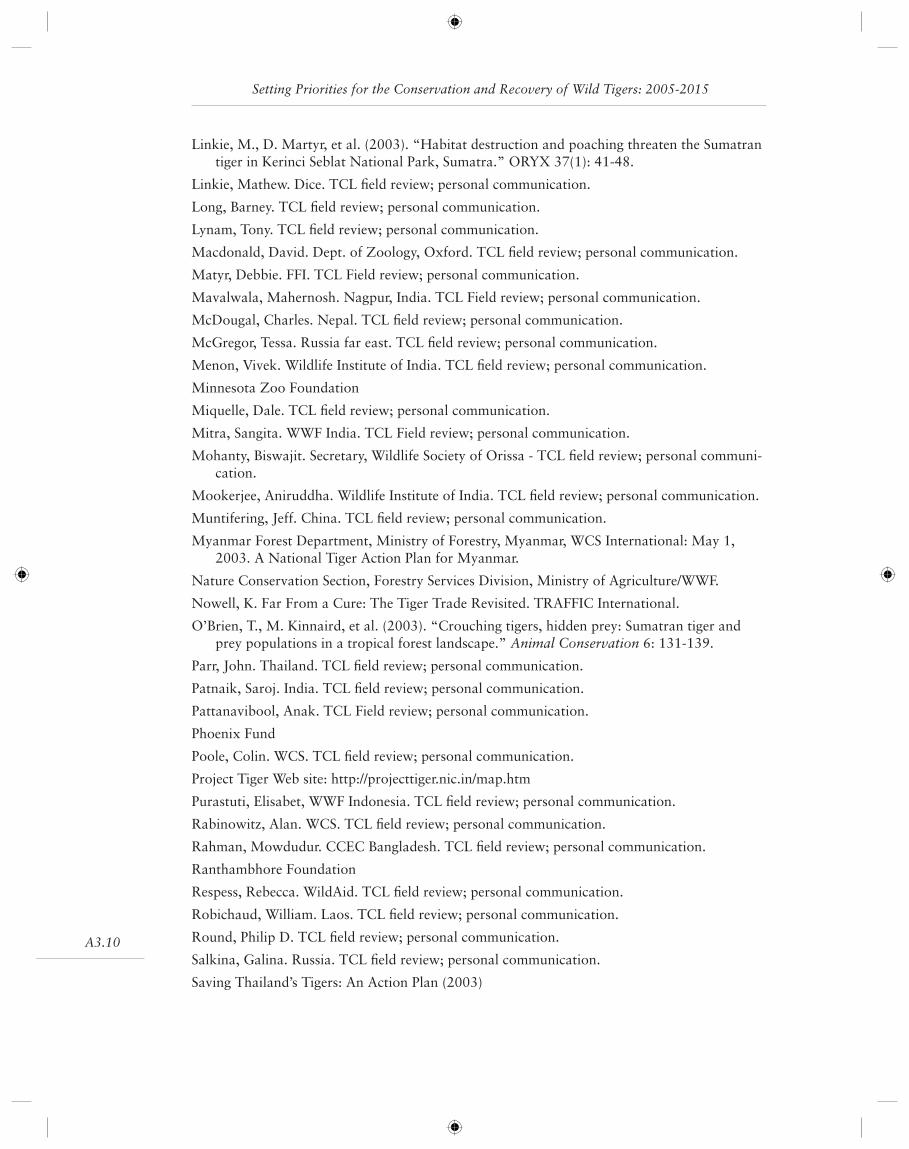
A3.10
Setting Priorities for the Conservation and Recovery of Wild Tigers: 2005-2015
Linkie, M., D. Martyr, et al. (2003). “Habitat destruction and poaching threaten the Sumatran tiger in Kerinci Seblat National Park, Sumatra.” ORYX 37(1): 41-48.
Linkie, Mathew. Dice. TCL fi eld review; personal communication.
Long, Barney. TCL fi eld review; personal communication.
Lynam, Tony. TCL fi eld review; personal communication.
Macdonald, David. Dept. of Zoology, Oxford. TCL fi eld review; personal communication.
Matyr, Debbie. FFI. TCL Field review; personal communication.
Mavalwala, Mahernosh. Nagpur, India. TCL Field review; personal communication.
McDougal, Charles. Nepal. TCL fi eld review; personal communication.
McGregor, Tessa. Russia far east. TCL fi eld review; personal communication.
Menon, Vivek. Wildlife Institute of India. TCL fi eld review; personal communication.
Minnesota Zoo Foundation
Miquelle, Dale. TCL fi eld review; personal communication.
Mitra, Sangita. WWF India. TCL Field review; personal communication.
Mohanty, Biswajit. Secretary, Wildlife Society of Orissa - TCL fi eld review; personal communi-cation.
Mookerjee, Aniruddha. Wildlife Institute of India. TCL fi eld review; personal communication.
Muntifering, Jeff. China. TCL fi eld review; personal communication.
Myanmar Forest Department, Ministry of Forestry, Myanmar, WCS International: May 1, 2003. A National Tiger Action Plan for Myanmar.
Nature Conservation Section, Forestry Services Division, Ministry of Agriculture/WWF.
Nowell, K. Far From a Cure: The Tiger Trade Revisited. TRAFFIC International.
O’Brien, T., M. Kinnaird, et al. (2003). “Crouching tigers, hidden prey: Sumatran tiger and prey populations in a tropical forest landscape.” Animal Conservation 6: 131-139.
Parr, John. Thailand. TCL fi eld review; personal communication.
Patnaik, Saroj. India. TCL fi eld review; personal communication.
Pattanavibool, Anak. TCL Field review; personal communication.
Phoenix Fund
Poole, Colin. WCS. TCL fi eld review; personal communication.
Project Tiger Web site: http://projecttiger.nic.in/map.htm
Purastuti, Elisabet, WWF Indonesia. TCL fi eld review; personal communication.
Rabinowitz, Alan. WCS. TCL fi eld review; personal communication.
Rahman, Mowdudur. CCEC Bangladesh. TCL fi eld review; personal communication.
Ranthambhore Foundation
Respess, Rebecca. WildAid. TCL fi eld review; personal communication.
Robichaud, William. Laos. TCL fi eld review; personal communication.
Round, Philip D. TCL fi eld review; personal communication.
Salkina, Galina. Russia. TCL fi eld review; personal communication.
Saving Thailand’s Tigers: An Action Plan (2003)
A3.11
Seidensticker, John. with A. Kumar 2004: TCL fi eld review-trip report for Valmiki, personal communication.
Sen, PK. WWF India. TCL fi eld review; personal communication.
Shepherd, Chris. TRAFFIC. TCL fi eld review; personal communication.
Shrestha, Mahendra. Nepal. TCL Field Review; personal communication.
Smith, JLD, Cutter P, “Assessing the Status of Tigers in the Western Forest Complex of Thai-land and developing a landscape scale management plan.” Final Report to the National Fish and Wildlife Foundation. University of Minnesota, October 2002.
Steinmetz, Rob. WWF Indochina - TCL fi eld review; personal communication.
Sunarto Sunarto, TCL fi eld review; personal communication
Tenzin, Chado. WWF Bhutan. TCL fi eld review; personal communication.
Tilson R., Defu H., Muntifering J., Nyhus P.J. Dramatic Decline of wild South China tigers Panthera tigris amoyensis: fi eld survey of priority tiger reserves. Oryx 38(1): 40-47 Jan 2004.
Tizard, Rob. TCL fi eld review; personal communication.
University of Florida
University of Minnesota
USAID
WCS
Wegge P., Pokheral C.P., Jnawali S.R., Effects of trapping effort and trap shyness on estimates of tiger abundance from camera trap studies, Animal Conservation (2004) 7, 251-256.
Wells, Philip. Indonesia. TCL fi eld review; personal communication.
Wild Aid
WildAid map: Lomphat tiger & leopard 2004.jpg
WWF
WWF-Nepal Program. Sept 2002. Status, Distribution, and Monitoring of Tigers in Protected Areas of Terai Arc Landscape-Nepal. Compiled and edited by Shiv Raj Bhatta.
Yonzon, Pralad. Nepal. TCL fi eld review; personal communication.
Zoological Society of London
Appendix 3

Setting Priorities for the Conservation and Recovery of Wild Tigers: 2005–2015

A4.1
Appendix 4 What We Know About TCUs
Identified in 1997’s Framework Document as ‘Immediate Surveys’
TCU's identified in TCU1.0 as "Immediate survey's needed"Indian subcontinent
Immediate survey units TCU1.0 ID
TCU's for which
we have
questionnaire data
Attempt to
scientifically
document tigers?
IS016 Yes Yes
IS025 Yes Yes
IC070
IS029
Tiger population status neededIS010 Yes Yes
IS031 Yes Yes
IS055 Yes Yes
IS059 Yes No
IS052
IS027
Indochina immediate survey units
IC001 Yes Yes
IC004
IC024
IC023
IC012
IC070
Southeast Asia immediatesurvey units
Tiger population status neededSA026 Yes Yes
SA018
SA027
SA023

Setting Priorities for the Conservation and Recovery of Wild Tigers: 2005–2015
A5.1
Appendix 5 Detailed Description of Methods
for Land Cover Creation
Creating the Asia polygons land cover map for delineating the Tiger Conservation Land-scapes (TCLs) was mostly an exercise in data integration. Yet, because of considerable variation in formats, projections, spatial resolution, and land cover classifi cation systems, this process was very time-consuming.
In the initial processing, all data were projected to a Lambert Azimuthal Equal Area projection. In the next step, the data attribute tables were expanded to include our major land cover types, as well as a unique identifi er for each of the sources and a unique nu-merical identifi er for each of the original habitat types (Table A5.1).
After expanding the attributes, we rasterized all polygon data using the unique habitat identifi ers, to produce ArcInfo grids with a 1-km cell size. Similarly, we imported all raster datasets into ArcInfo grid format and resampled the grids to a 1-km resolution. All resulting raster data sets were combined into a single land cover grid. After the integra-tion the original data attribute tables were joined based on the unique habitat identifi ed. This procedure allowed us to retain all original information even after integrating all data into a single land cover grid. The method also allowed for subsequent addition of data sets as they became available.
Based on group discussions, suitability codes (structural land cover and marginal disper-sal zone) were created for each of the major habitat categories and also added into the attribute table. These suitability codes were the basis for the TCL delineation and were also used in the TCL classifi cation.
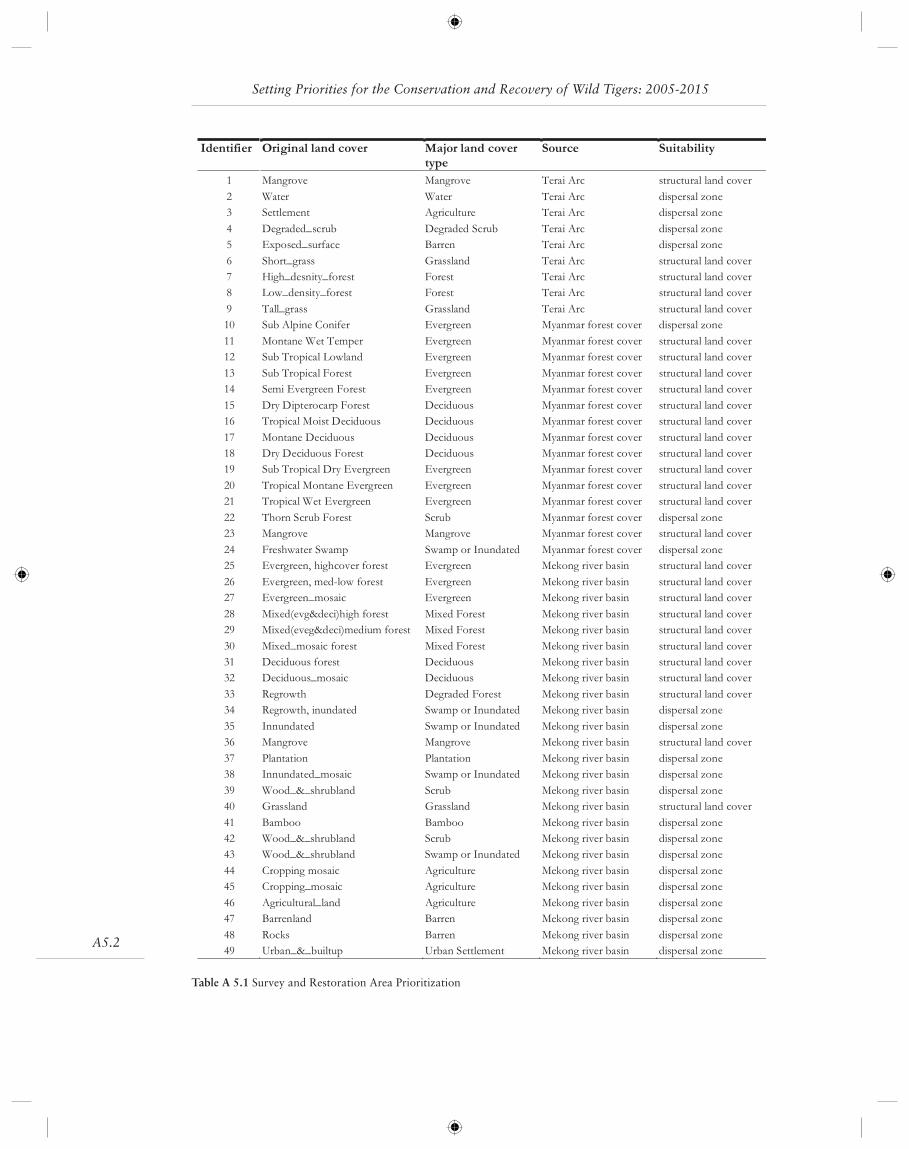
A5.2
Setting Priorities for the Conservation and Recovery of Wild Tigers: 2005-2015
Identifier Original land cover Major land covertype
Source Suitability
1 Mangrove Mangrove Terai Arc structural land cover
2 Water Water Terai Arc dispersal zone
3 Settlement Agriculture Terai Arc dispersal zone
4 Degraded_scrub Degraded Scrub Terai Arc dispersal zone
5 Exposed_surface Barren Terai Arc dispersal zone
6 Short_grass Grassland Terai Arc structural land cover
7 High_desnity_forest Forest Terai Arc structural land cover
8 Low_density_forest Forest Terai Arc structural land cover
9 Tall_grass Grassland Terai Arc structural land cover
10 Sub Alpine Conifer Evergreen Myanmar forest cover dispersal zone
11 Montane Wet Temper Evergreen Myanmar forest cover structural land cover
12 Sub Tropical Lowland Evergreen Myanmar forest cover structural land cover
13 Sub Tropical Forest Evergreen Myanmar forest cover structural land cover
14 Semi Evergreen Forest Evergreen Myanmar forest cover structural land cover
15 Dry Dipterocarp Forest Deciduous Myanmar forest cover structural land cover
16 Tropical Moist Deciduous Deciduous Myanmar forest cover structural land cover
17 Montane Deciduous Deciduous Myanmar forest cover structural land cover
18 Dry Deciduous Forest Deciduous Myanmar forest cover structural land cover
19 Sub Tropical Dry Evergreen Evergreen Myanmar forest cover structural land cover
20 Tropical Montane Evergreen Evergreen Myanmar forest cover structural land cover
21 Tropical Wet Evergreen Evergreen Myanmar forest cover structural land cover
22 Thorn Scrub Forest Scrub Myanmar forest cover dispersal zone
23 Mangrove Mangrove Myanmar forest cover structural land cover
24 Freshwater Swamp Swamp or Inundated Myanmar forest cover dispersal zone
25 Evergreen, highcover forest Evergreen Mekong river basin structural land cover
26 Evergreen, med-low forest Evergreen Mekong river basin structural land cover
27 Evergreen_mosaic Evergreen Mekong river basin structural land cover
28 Mixed(evg&deci)high forest Mixed Forest Mekong river basin structural land cover
29 Mixed(eveg&deci)medium forest Mixed Forest Mekong river basin structural land cover
30 Mixed_mosaic forest Mixed Forest Mekong river basin structural land cover
31 Deciduous forest Deciduous Mekong river basin structural land cover
32 Deciduous_mosaic Deciduous Mekong river basin structural land cover
33 Regrowth Degraded Forest Mekong river basin structural land cover
34 Regrowth, inundated Swamp or Inundated Mekong river basin dispersal zone
35 Innundated Swamp or Inundated Mekong river basin dispersal zone
36 Mangrove Mangrove Mekong river basin structural land cover
37 Plantation Plantation Mekong river basin dispersal zone
38 Innundated_mosaic Swamp or Inundated Mekong river basin dispersal zone
39 Wood_&_shrubland Scrub Mekong river basin dispersal zone
40 Grassland Grassland Mekong river basin structural land cover
41 Bamboo Bamboo Mekong river basin dispersal zone
42 Wood_&_shrubland Scrub Mekong river basin dispersal zone
43 Wood_&_shrubland Swamp or Inundated Mekong river basin dispersal zone
44 Cropping mosaic Agriculture Mekong river basin dispersal zone
45 Cropping_mosaic Agriculture Mekong river basin dispersal zone
46 Agricultural_land Agriculture Mekong river basin dispersal zone
47 Barrenland Barren Mekong river basin dispersal zone
48 Rocks Barren Mekong river basin dispersal zone
49 Urban_&_builtup Urban Settlement Mekong river basin dispersal zone
Table A 5.1 Survey and Restoration Area Prioritization
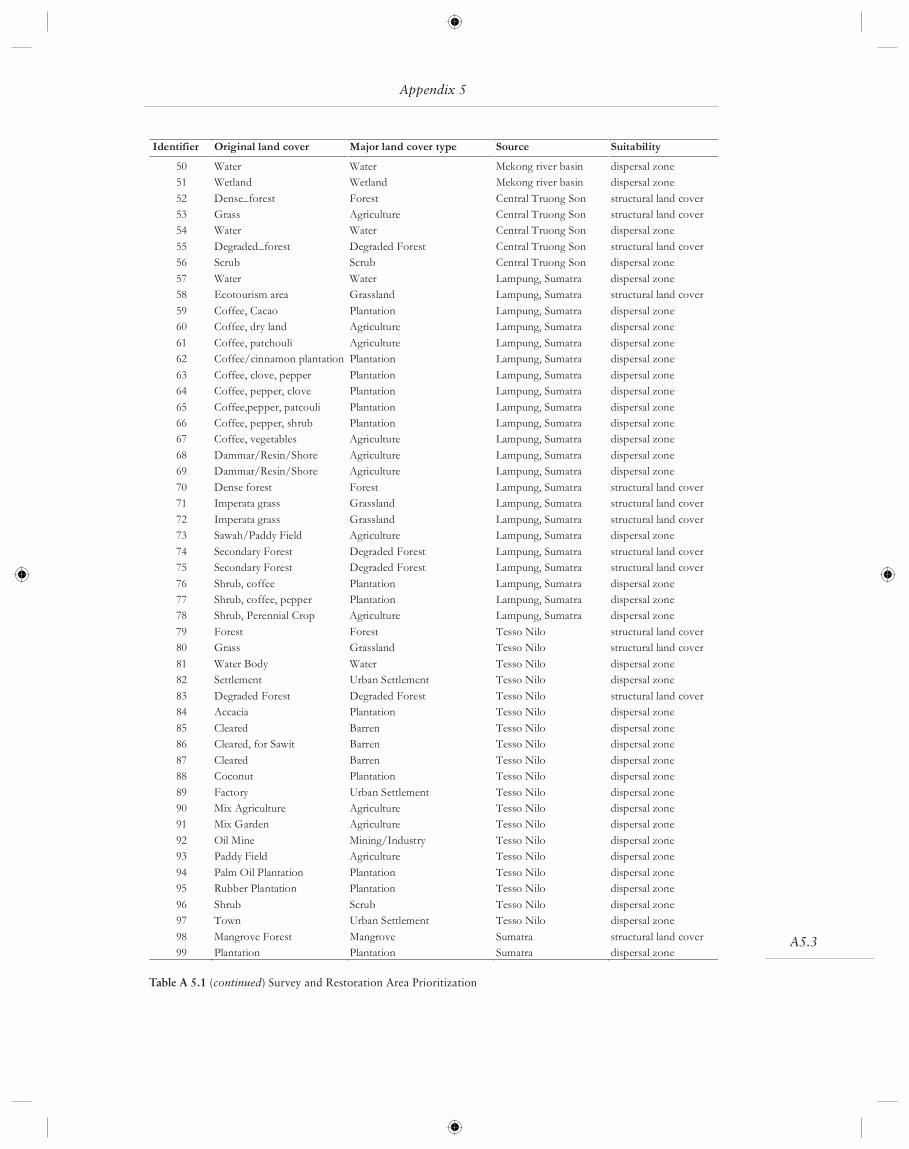
A5.3
Identifier Original land cover Major land cover type Source Suitability
50 Water Water Mekong river basin dispersal zone
51 Wetland Wetland Mekong river basin dispersal zone
52 Dense_forest Forest Central Truong Son structural land cover
53 Grass Agriculture Central Truong Son structural land cover
54 Water Water Central Truong Son dispersal zone
55 Degraded_forest Degraded Forest Central Truong Son structural land cover
56 Scrub Scrub Central Truong Son dispersal zone
57 Water Water Lampung, Sumatra dispersal zone
58 Ecotourism area Grassland Lampung, Sumatra structural land cover
59 Coffee, Cacao Plantation Lampung, Sumatra dispersal zone
60 Coffee, dry land Agriculture Lampung, Sumatra dispersal zone
61 Coffee, patchouli Agriculture Lampung, Sumatra dispersal zone
62 Coffee/cinnamon plantation Plantation Lampung, Sumatra dispersal zone
63 Coffee, clove, pepper Plantation Lampung, Sumatra dispersal zone
64 Coffee, pepper, clove Plantation Lampung, Sumatra dispersal zone
65 Coffee,pepper, patcouli Plantation Lampung, Sumatra dispersal zone
66 Coffee, pepper, shrub Plantation Lampung, Sumatra dispersal zone
67 Coffee, vegetables Agriculture Lampung, Sumatra dispersal zone
68 Dammar/Resin/Shore Agriculture Lampung, Sumatra dispersal zone
69 Dammar/Resin/Shore Agriculture Lampung, Sumatra dispersal zone
70 Dense forest Forest Lampung, Sumatra structural land cover
71 Imperata grass Grassland Lampung, Sumatra structural land cover
72 Imperata grass Grassland Lampung, Sumatra structural land cover
73 Sawah/Paddy Field Agriculture Lampung, Sumatra dispersal zone
74 Secondary Forest Degraded Forest Lampung, Sumatra structural land cover
75 Secondary Forest Degraded Forest Lampung, Sumatra structural land cover
76 Shrub, coffee Plantation Lampung, Sumatra dispersal zone
77 Shrub, coffee, pepper Plantation Lampung, Sumatra dispersal zone
78 Shrub, Perennial Crop Agriculture Lampung, Sumatra dispersal zone
79 Forest Forest Tesso Nilo structural land cover
80 Grass Grassland Tesso Nilo structural land cover
81 Water Body Water Tesso Nilo dispersal zone
82 Settlement Urban Settlement Tesso Nilo dispersal zone
83 Degraded Forest Degraded Forest Tesso Nilo structural land cover
84 Accacia Plantation Tesso Nilo dispersal zone
85 Cleared Barren Tesso Nilo dispersal zone
86 Cleared, for Sawit Barren Tesso Nilo dispersal zone
87 Cleared Barren Tesso Nilo dispersal zone
88 Coconut Plantation Tesso Nilo dispersal zone
89 Factory Urban Settlement Tesso Nilo dispersal zone
90 Mix Agriculture Agriculture Tesso Nilo dispersal zone
91 Mix Garden Agriculture Tesso Nilo dispersal zone
92 Oil Mine Mining/Industry Tesso Nilo dispersal zone
93 Paddy Field Agriculture Tesso Nilo dispersal zone
94 Palm Oil Plantation Plantation Tesso Nilo dispersal zone
95 Rubber Plantation Plantation Tesso Nilo dispersal zone
96 Shrub Scrub Tesso Nilo dispersal zone
97 Town Urban Settlement Tesso Nilo dispersal zone
98 Mangrove Forest Mangrove Sumatra structural land cover
99 Plantation Plantation Sumatra dispersal zone
Table A 5.1 (continued) Survey and Restoration Area Prioritization
Appendix 5
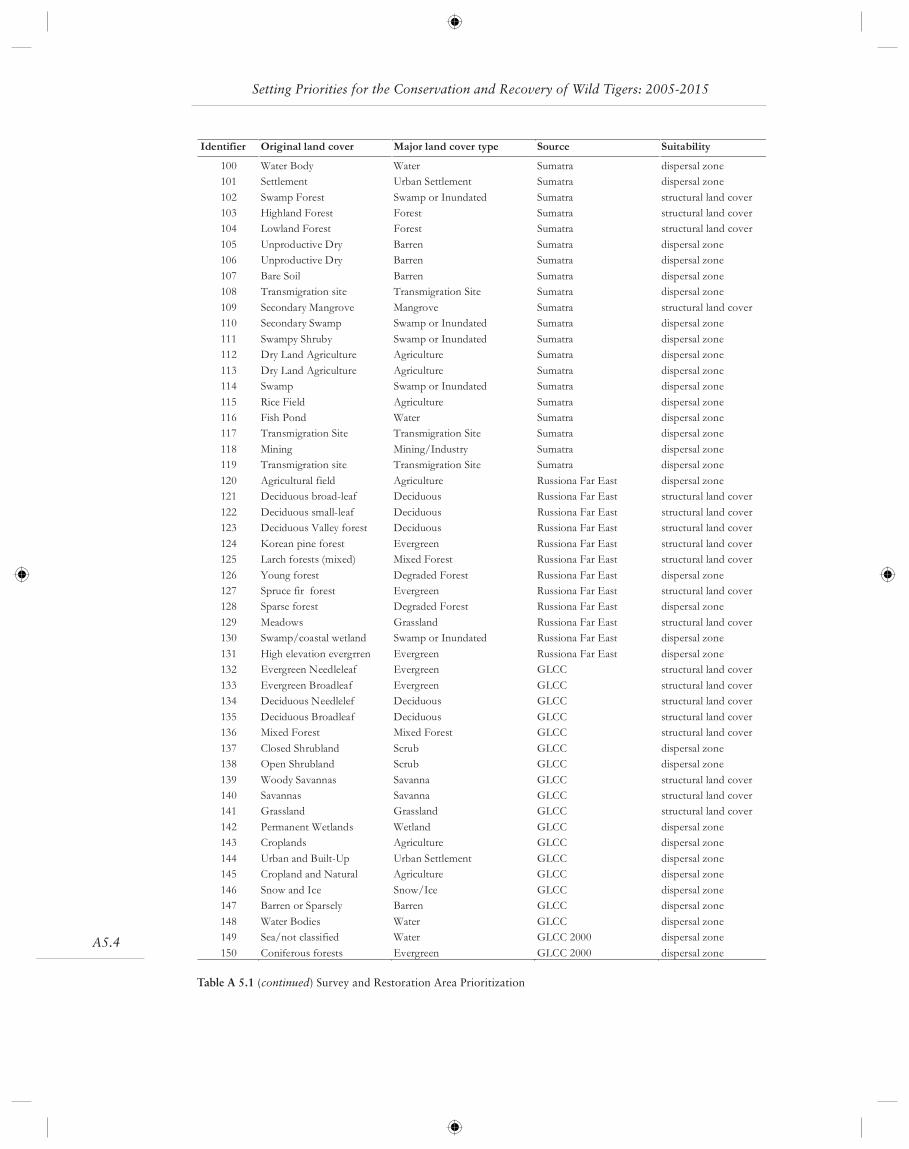
A5.4
Identifier Original land cover Major land cover type Source Suitability
100 Water Body Water Sumatra dispersal zone
101 Settlement Urban Settlement Sumatra dispersal zone
102 Swamp Forest Swamp or Inundated Sumatra structural land cover
103 Highland Forest Forest Sumatra structural land cover
104 Lowland Forest Forest Sumatra structural land cover
105 Unproductive Dry Barren Sumatra dispersal zone
106 Unproductive Dry Barren Sumatra dispersal zone
107 Bare Soil Barren Sumatra dispersal zone
108 Transmigration site Transmigration Site Sumatra dispersal zone
109 Secondary Mangrove Mangrove Sumatra structural land cover
110 Secondary Swamp Swamp or Inundated Sumatra dispersal zone
111 Swampy Shruby Swamp or Inundated Sumatra dispersal zone
112 Dry Land Agriculture Agriculture Sumatra dispersal zone
113 Dry Land Agriculture Agriculture Sumatra dispersal zone
114 Swamp Swamp or Inundated Sumatra dispersal zone
115 Rice Field Agriculture Sumatra dispersal zone
116 Fish Pond Water Sumatra dispersal zone
117 Transmigration Site Transmigration Site Sumatra dispersal zone
118 Mining Mining/Industry Sumatra dispersal zone
119 Transmigration site Transmigration Site Sumatra dispersal zone
120 Agricultural field Agriculture Russiona Far East dispersal zone
121 Deciduous broad-leaf Deciduous Russiona Far East structural land cover
122 Deciduous small-leaf Deciduous Russiona Far East structural land cover
123 Deciduous Valley forest Deciduous Russiona Far East structural land cover
124 Korean pine forest Evergreen Russiona Far East structural land cover
125 Larch forests (mixed) Mixed Forest Russiona Far East structural land cover
126 Young forest Degraded Forest Russiona Far East dispersal zone
127 Spruce fir forest Evergreen Russiona Far East structural land cover
128 Sparse forest Degraded Forest Russiona Far East dispersal zone
129 Meadows Grassland Russiona Far East structural land cover
130 Swamp/coastal wetland Swamp or Inundated Russiona Far East dispersal zone
131 High elevation evergrren Evergreen Russiona Far East dispersal zone
132 Evergreen Needleleaf Evergreen GLCC structural land cover
133 Evergreen Broadleaf Evergreen GLCC structural land cover
134 Deciduous Needlelef Deciduous GLCC structural land cover
135 Deciduous Broadleaf Deciduous GLCC structural land cover
136 Mixed Forest Mixed Forest GLCC structural land cover
137 Closed Shrubland Scrub GLCC dispersal zone
138 Open Shrubland Scrub GLCC dispersal zone
139 Woody Savannas Savanna GLCC structural land cover
140 Savannas Savanna GLCC structural land cover
141 Grassland Grassland GLCC structural land cover
142 Permanent Wetlands Wetland GLCC dispersal zone
143 Croplands Agriculture GLCC dispersal zone
144 Urban and Built-Up Urban Settlement GLCC dispersal zone
145 Cropland and Natural Agriculture GLCC dispersal zone
146 Snow and Ice Snow/Ice GLCC dispersal zone
147 Barren or Sparsely Barren GLCC dispersal zone
148 Water Bodies Water GLCC dispersal zone
149 Sea/not classified Water GLCC 2000 dispersal zone
150 Coniferous forests Evergreen GLCC 2000 dispersal zone
Table A 5.1 (continued) Survey and Restoration Area Prioritization
Setting Priorities for the Conservation and Recovery of Wild Tigers: 2005-2015
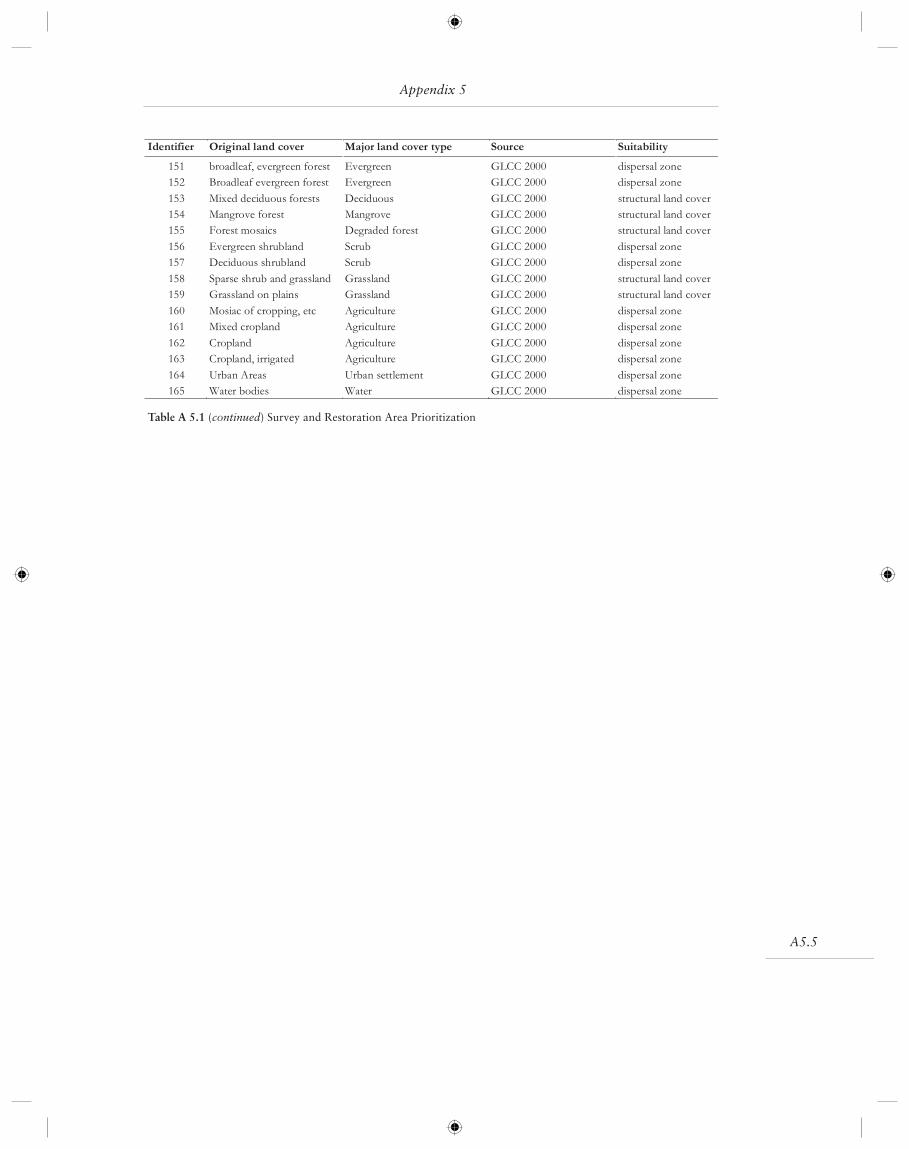
A5.5
Identifier Original land cover Major land cover type Source Suitability
151 broadleaf, evergreen forest Evergreen GLCC 2000 dispersal zone
152 Broadleaf evergreen forest Evergreen GLCC 2000 dispersal zone
153 Mixed deciduous forests Deciduous GLCC 2000 structural land cover
154 Mangrove forest Mangrove GLCC 2000 structural land cover
155 Forest mosaics Degraded forest GLCC 2000 structural land cover
156 Evergreen shrubland Scrub GLCC 2000 dispersal zone
157 Deciduous shrubland Scrub GLCC 2000 dispersal zone
158 Sparse shrub and grassland Grassland GLCC 2000 structural land cover
159 Grassland on plains Grassland GLCC 2000 structural land cover
160 Mosiac of cropping, etc Agriculture GLCC 2000 dispersal zone
161 Mixed cropland Agriculture GLCC 2000 dispersal zone
162 Cropland Agriculture GLCC 2000 dispersal zone
163 Cropland, irrigated Agriculture GLCC 2000 dispersal zone
164 Urban Areas Urban settlement GLCC 2000 dispersal zone
165 Water bodies Water GLCC 2000 dispersal zone
Table A 5.1 (continued) Survey and Restoration Area Prioritization
Appendix 5

Setting Priorities for the Conservation and Recovery of Wild Tigers: 2005–2015
A6.1
Appendix 6 Cambodia Tiger Conservation Status Review
Detailed Description of Methods for Land Cover Creation
The attached Cambodia tiger status map is an attempt to characterize current tiger distri-bution and status in Cambodia and more accurately represent the various types of tiger landscapes as set out in the 2005 Tiger Conservation Landscape (TCL 2.0) review exer-cise.
Some of the conventions and defi nitions have been modifi ed slightly to be either more explicit than those provided in the TCL 2.0 document or more appropriate for defi ning the various management areas in the Cambodian context.
Basic information layers
1. Tiger Occurrence Points and Areas
All records of tigers or tiger sign (see detailed descriptions below) since January 2000 are categorized into one of the following 3 categories:
• Provisional records Credible reports of tiger or occurrence of tiger sign that do not meet the criteria below.
• Confi rmed records Points where tigers have been documented through one of the fol-lowing:
− Direct sightings (live or remains found in the wild)
− Camera trap photos
− Track observations by trained fi eld personnel satisfying any of the following condi-tions: total length > 100 mm; total width > 110 mm; pad width > 70 mm
• Breeding sites Sites satisfying one of the following conditions:
− Points where juvenile tigers have been directly observed in their wild setting.
− Points where tracks of juvenile tigers occur with tracks of adult tigers moving in the same direction at apparently the same time (i.e. conditions rule out confusion with leopards).
− Areas defi ned by a 7 km buffer around sets of confi rmed records collected in both dry and wet seasons for period of at least 2 consecutive years where no point is more than 7 km distant from any other (could be a buffered single point—as in the case of a single camera trap station or water feature with repeat records).
2. Background Themes
Digital georeferenced data used in the delineation and/or presentation of tiger occurrence patterns.
A6.2
• Potential Tiger Habitat Areas that satisfy the following 3 conditions:
1) Natural dryland forest formations or mosaic of forested areas with other natural vegetation formations where closed canopy patches of at least 1 km2 occur within a maximum distance of 4 km from each other over the landscape; and where
2) Points of available water occur within 10 km of each other; and where
3) Known tiger prey species have been documented at points throughout the landscape separated by no more than 10 km.
• Disturbance Areas All area within 3 km of village sites or within 1 km of a transporta-tion route (not including remote cart tracks, seasonal dirt roads, or walking trails) and selected RAPPMap impact areas1. For mapping purposes, the following classes of distur-bance areas are defi ned (see mapping example below):
− Disturbance nodes Disturbance areas as modeled by 3 km circular buffers around human settlements.
− Disturbance corridors Disturbance areas as defi ned by 1 km buffers of transporta-tion routes not within 2 km of a disturbance node.
• Suitable Tiger Habitat Areas of potential tiger habitat that do not coincide with distur-bance nodes.
Management Categories and Associated Mapping Conventions
The maps include (potentially) all of the categories shown on the TCU review maps plus one additional category—Tiger Dispersal Corridors (Number 1 below):
1) Tiger Dispersal Corridor Areas of unsuitable habitat less than 4 km long but greater than 2 km wide that link areas of suitable tiger habitat greater than 500 km2 that show at least provisional evidence of tigers.
2) Tiger Conservation Landscapes Contiguous areas of suitable tiger habitat greater than 1,000 km2 in size (or smaller areas of suitable tiger habitat linked by Dispersal Corridors) that have had periodic surveys over the last 5 years and show consistent confi rmed evidence of tigers over that period.
3) Tiger Restoration Landscapes Contiguous areas of suitable tiger habitat greater than 1,000 km2 in size where an established population of tigers (to the best of our knowledge) occurred historically but where relatively high survey effort over the last 5 years has failed to generate any confi rmed records of tigers. Additionally, these areas must be in close enough proximity to a viable source population such that conserva-tion or restoration efforts could realistically lead to tigers repopulating the area (i.e. areas that would require the translocation of tigers are not considered).
4) Tiger Survey Landscapes Contiguous areas of suitable tiger habitat greater than 1,000 km2 in size where survey effort has been relatively low over the last 5 years and
Setting Priorities for the Conservation and Recovery of Wild Tigers: 2005-2015
1The RAPPMap assessment took place in October 2004 and identifi ed areas within Cambodia’s protected area sys-tem that were under the impact of various human activities (Lacerda et al. 2005). The areas included in here include areas that are being logged or otherwise physically degraded by human activity but not areas identifi ed to be under the impact of hunting as the intensity of hunting activities remains undifferentiated.

A6.3
Appendix 6
where surveys (if any) in the last 5 years have failed to produce repeated confi rmed evidence of tigers.
5) Small Fragments with Tigers Contiguous areas of suitable tiger habitat less than 1,000 km2 in size that show confi rmed evidence of tigers within the last 5 years.
Additional Assumptions and Clarifi cations
The following notes provide clarifi cation of various assumptions and considerations used in the process of delineating Cambodian tiger landscapes:
• Data categories on the map. Although we included criteria for breeding points and tiger restoration landscapes for analysis purposes, please note that no data satisfi ed these criteria at the time the map was fi nalized, and therefore they are not represented on the map.
• Survey effort. Although survey efforts at different sites have certainly not been equivalent, combined efforts since January 2000 are deemed to have been suffi cient to confi dently detect the presence of tiger—if indeed tigers still occur in these areas—in all large blocks (>1,000 km2) of potential habitat with the exception of the 3 tiger survey landscapes identifi ed.
• Landscape versus Fragment. The 1,000 km2 threshold for a landscape (as opposed to a fragment) is based on the approximate area necessary to support 12 adult tigers
Convex “lobes” of suitable
habitat included only if they
contain at least provisional
records
Internal ‘disturbance nodes’ included
if less than 50 km2in size
Internal ‘disturbance
corridors’ included
Figure A6.1 Illustration of some mapping conventions used.
A6.4
under conservative conditions. The 12 tiger estimate is based on a conservatively large estimated male home range of 150 km2 (1.5 times Rabinowitz’s (1993) estimated Indo-chinese home range size of 100 km2) and assuming 1 overlapping female range (conser-vative estimate) for each male range (i.e. 6 males + 6 females = 12 adults).
• Date of Records Used. The TCU review process gives equal weight to tiger records from the last 10 years. This was considered to be too liberal a threshold for all areas of Cambodia based on a pattern of targeted hunting that has accelerated sharply since 1990 (Kenney et al. 1995). Therefore, only records dating from January 2000 have been considered in this assessment.
Notes on Specifi c Sites (Numbers correspond to numbers on reference map)
1) Virachey Trans-boundary Area Consistent records over more than 5 years. Recent reports suggest that tigers are still actively targeted by poachers in the area. The Virachey site links with sites in Laos that may also be important for tiger conservation (e.g. Xe Pian NBCA).
2) Cambodian Eastern Plains Although records of tiger have been sparse over the years, recent increases in survey effort have yielded many new records including recent photo-traps of large male tigers along the western boundary of Lomphat Wildlife Sanctuary and in the Srepok Wilderness Area of the Mondulkiri Protected Forest. Breeding has been indicated by one record of adult and juvenile walking together in the MPF.
3)Cardamom Mountains Tiger records have been dispersed throughout this area with 2 major clusters of records emerging. Although the landscape provides connectivity for the dispersal and interaction of tigers, large blocks of relatively high human impact are almost certainly devoid of tigers.
4) Phnom Voeene Triangle This area adjoins what has been designated a tiger conser-vation landscape and there appears to be potential for tigers to move in and out of the area from Virachey. However, the radically different character of the landscape (i.e. fl at, mostly dry forests and signifi cantly greater human traffi c in the Voeene area prompted a consensus decision to designate the area as a distinct landscape in need of additional surveys to assess the status of tigers.
5) Prey Long Wilderness This is the third largest wilderness area in the country and prob-ably the least thoroughly surveyed for tigers. Although interview surveys in the late 1990s concluded that the area supported the lowest density of tigers in the country (Nowell et al. 1999), there have been consistent anecdotal reports throughout the years and the con-sensus is that tiger status will remain unclear until additional surveys are carried out.
6) Western Kulen Promtep This site shows a number of confi rmed tiger records occur-ring within the last 5 years and therefore satisfi es most conditions to qualify as a Tiger Conservation Landscape. However, given that 1) all records are prior to 2003, 2) records
Setting Priorities for the Conservation and Recovery of Wild Tigers: 2005-2015
A6.5
Appendix 6
prior to that time have been only sparse in time and space, and 3) there have been only sparse patrols by rangers trained to recognize tiger sign over the last 3 years, the current status of tigers at the site is considered poorly understood and additional surveys are needed to assess their status. The southern lobe of this area where there are several records of tigers was not included as the consensus was that this area has sustained signifi cant conversion to agriculture and other development so as to render it unsuitable habitat for tigers.
7) Bokor-Kirirom Corridor Recent aerial surveys indicate that this area still provides reasonable vegetation structure and condition (i.e. degraded forest and bamboo down to approximately 30 meters maximum of the major roadway forming a corridor of at least 3 kilometers in width) to conceivably allow dispersal of tigers. However, land conver-sion trends and a growing amount of traffi c along the road that passes through the area indicate that the corridor’s integrity is already in serious doubt. The corridor is thus con-sidered viable but this condition is under immediate threat unless focused conservation efforts are urgently applied.
Participating Organizations
Cat Action Treasury-Cambodia (Hunter Weiler)Conservation International-CambodiaFFI Cambodia ProgrammeBiodiversity and Protected Areas Management Project, Ministry of Environment (Peter Cutter)WCS-Cambodia ProgramWildAid-Cambodia ProgramWildAid-Thailand ProgramWWF-Cambodia Conservation Program
References
Kenney, J. S., J. L. D. Smith, A. M. Starfi eld, and C. W. McDougal. 1995. The long-term effects of tiger poaching on population viability. Conservation Biology 9:1127-1133.
Lacerda, L., K. Schmitt, P. G. Cutter, and S. Meas 2005. Management Effectiveness Assessment of the System of Protected Areas in Cambodia using WWF’s RAPPAM Methodology. Bio-diversity and Protected Area Management Project, Ministry of Environment, Phnom Penh, Cambodia.
Nowell, K., S. Hean, H. Weiler, and J. L. D. Smith. 1999. National Status Survey for Tigers in Cambodia. Cat News 30:4-8.
Rabinowitz, A. 1993. Estimating the Indochinese tiger Panthera tigris corbetti population in Thailand. Biological Conservation 65:213-217.
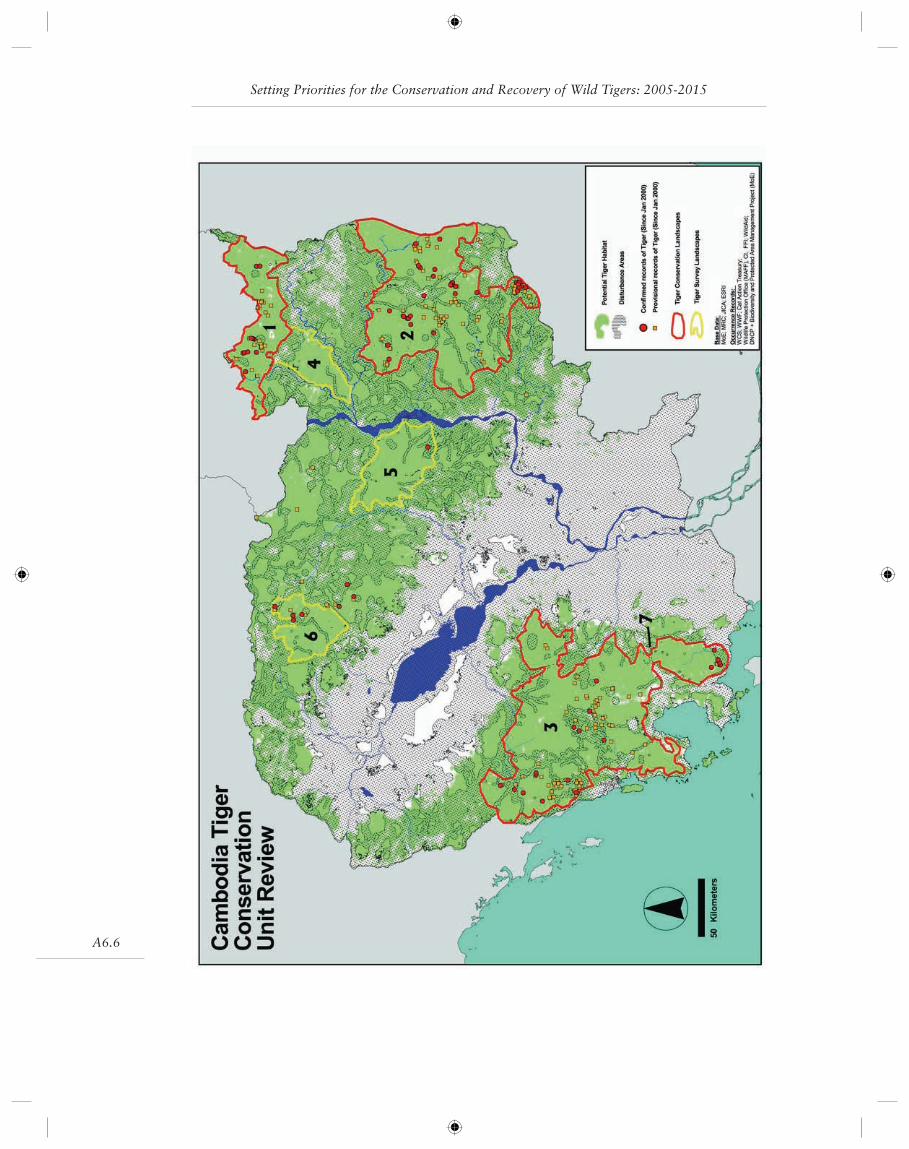
A6.6
Setting Priorities for the Conservation and Recovery of Wild Tigers: 2005-2015
G.1
GLOSSARY
Classifi cation Categorizes TCLs according to their current condition for supporting tiger populations
Effective Potential Habitat Structural land cover of low human impact
Fragment with Tigers Small areas of structural land cover of low to high human infl u-ence that show evidence of tigers. These areas are too small to meet the minimum area requirement to be TCLs, but are important nonetheless for supporting the tigers that live there. Also Tiger Habitat Fragments.
Human Infl uence Index (HII) A global dataset which scores each 1 km2 pixel through-out the globe on a human infl uence scale of 1–72, with 72 refl ecting the highest human infl uence. It is the weighted sum of human population, land use, and power infrastructure datasets (Sanderson et al. 2002).
Potential Habitat Structural land cover in patches ≥ 5 km2
Prioritization Prioritizes TCLs and Survey and Restoration Landscapes in each major habitat type according to their urgency for future conservation effort and investment
Restoration Landscapes Large areas of structural land cover under low human infl uence where survey efforts since 1995 have not revealed evidence of tigers.
Structural Land Cover Land cover types that are thought to be suitable for tigers. Also called “suitable land cover.”
Survey Landscapes Large areas of structural land cover under low human infl uence where tiger status is unknown. To our knowledge, these areas have not been surveyed since 1995.
TCU 1.0 First rangewide assessment of tiger habitat, with the analysis done in 1995 and published in 1997. The south and Southeast Asia portion of the tiger’s current range was divided into 160 management units called Tiger Conservation Units (TCUs) and these units were prioritized for conservation investment and survey. The work was published as “A Framework for Identifying High Priority Areas and Actions for the Conservation of Tigers in the Wild” (Dinerstein et al. 1997). Also referred to as the Framework Docu-ment.
TCL 2.0 This report. Second rangewide assessment of tiger habitat, with work done from 2003 to 2005. Tiger habitat was analyzed across the entire historical tiger range (includ-ing China and the Russian Far East) with resultant management landscapes called Tiger Conservation Landscapes (TCLs), Survey Landscapes, Restoration Landscapes, and Frag-
G.2
ments with Tigers. TCLs, Survey and Restoration landscapes were further classifi ed as to their current status for supporting tigers and their priority for future investment. Details of the methods and results are written in two complementary documents, one for a tech-nical audience and one for policy-makers. Both are included in this document.
Tiger Conservation Database (TCD) Database of geographically referenced points (tiger point locations) and areas that have been surveyed for tigers, and the results of those surveys. Indicates tiger presence, absence, breeding, and evidence of extirpation; survey methods used to document tigers; data source; and geographical location. Sources include expert submissions, published information, and reports to STF.
Tiger Conservation Landscape (TCL) a block or cluster of blocks of habitat meeting a minimum, habitat-specifi c size threshold, where tigers have been confi rmed to occur in the last 10 years and are not known to have been extirpated.
Tiger Point Location GPS coordinate at which a tiger was identifi ed or a survey took place. Point locations are stored in the Tiger Conservation Database, along with informa-tion on evidence of breeding, methods used to document tigers, and source.
TCU Questionnaire Questionnaire distributed to tiger experts in 2004 asking about the status of the 1995 delineated TCUs.
Setting Priorities for the Conservation and Recovery of Wild Tigers: 2005-2015
R.1
References
Abrams, M. 2000. The Advanced Spaceborne Thermal Emission and Refl ection Radiometer (ASTER): Data products for the high spatial resolution imager on NASA’s Terra platform. International Journal of Remote Sensing, 21 (5), pp.847-859.
Carbone C, Christie S, Conforti K, Coulson T, Franklin N, Ginsberg JR, Griffi ths M, Holden J, Kawanishi K, Kinnaird M, Laidlaw R, Lynam A, Macdonald DW, Martyr D, McDougal C, Nath L, O’Brien T, Seidensticker J, Smith DJL, Sunquist M, Tilson R, Shahruddin WNW. 2001. The use of photographic rates to estimate densities of tigers and other cryptic mam-mals. Animal Conservation. 75-79 Part 1, Feb 2001.
Chundawat R. S. and Van Gruisen J. 2004. Tigers of the dry forest: do they have enough space to survive. Pp. 85-86. V. Thapar, ed. Tiger: the Ultimate Guide. New York: CDS Books.
Coppolillo, P., Gómez, H., Maisels, F. & Wallace, R. 2004. Selection criteria for suites of land-scape species as a basis for site-based conservation. Biol. Conserv. 115, 419–430.
Dinerstein, E., C. Loucks, A. Heydlauff, E. Wikramanayake, G. Bryja, J. Forrest, J. Ginsberg, S. Klenzendorf, P. Leimgruber, T. O’Brien, E. Sanderson, J. Seidensticker and M. Songer. 2006. Setting Priorities for the Conservation and Recovery of Wild Tigers: 2005-2015. A User’s Guide. WWF, WCS, Smithsonian, and NFWF-STF, Washington, D.C. - New York.
Dinerstein, E., E. Wikramanayake, J. Robinson, U. Karanth, a. Rabinowitz, D. Olson, T. Mathey, P. Hedo, M. Connor, G. Hemley, and D. Bolze. 1997. A framework for identify-ing high priority areas and actions for the conservation of tigers in the wild. WWF, WCS, NFWS-STF.
FAO. 2003. State of the world’s forest. FAO, Rome, Italy: 100 pp. [www document]. URL http://www.fao.org/forestry/site/10168/en.
Foose, T.J. and N. van Strien (editors). 1997. Asian Rhinos – Status, Survey and Conservation Action Plan. IUCN, Gland, Switzerland, and Cambridge, UK. 112 + V pp.
Friedl, M. A., McIver, D. K., Hodges, J. C. F., Zhang, X., Muchoney, D., Strahler, A. H., Woodcock, C. E., Gopal, S., Schnieder, A., Cooper, A., Baccini, A., Gao, F., & Schaaf, C. (2002) Global land cover from MODIS: Algorithms and early results. Remote Sensing of the Environment 83: 287-302.
Ginsberg, J., ed. 2001. Saving the Tiger: Assessing Our Success. New York: Wildlife Conserva-tion Society and National Fish and Wildlife Foundation.
Hayward, G., D. G. Miquelle, E. N. Smirnov, and C. Nations 2002. Monitoring Amur tiger populations: characteristics of track surveys in snow. Wildlife Society Bulletin 29: 553-542.
Heptner, V.G and Sludskii, A.A. 1972. Mammals of the Soviet Union – volume II, part 2, Carnivora, (Hyenas and Cats). English translation, ed. R. S. Hoffman. Washington DC, Smithsonian Institution Libraries and the National Science Foundation.
Karanth and Nichols personal communication, data from 2003 for Sundarbans Biosphere Tiger Reserve.
Karanth K.U., Chundawat RS, Nichol JD, Kumar NS. Estimation of tiger densities in the tropi-cal dry forests of Panna, Central India, using photographic capture-recapture sampling. Animal Conservation 7: 285-290 Part 3, Aug 2004.
Karanth K.U., Nichols JD. 1998. Estimation of tiger densities in India using photographic cap-tures and recaptures. Ecology 79 (8): 2852-2862 Dec 1998.
R.2
Karanth, K. U., J. D. Nichols., N. S. Kumar., W. A. Link and J. E. Hines. 2004b. Tigers and their prey: Predicting carnivore densities from prey abundance. Proceedings of the Natural Academy of Sciences. 101: 4854-4858.
Karanth, K.U., Nichols, J.D., Seidensticker, J., Dinerstein, E., Smith, J.L.D., McDougal, C., Johnsingh, A.J.T., Chundawat, R.S., Thapar, V., 2003. Science defi ciency in conservation practice: the monitoring of tiger populations in India. Animal Conservation 6, 1-10.
Karanth, K.U., Stith, B.M., 1999. Prey depletion as a critical determinant of tiger population viability, In: Seidensticker, J., Christie, S., Jackson, P. (Eds.), Riding the Tiger: Tiger Con-servation in Human-dominated Landscapes. Cambridge University Press, Cambridge, pp. 100-113.
Kawanishi K. Sunquist M.E. 2004. Conservation status of tigers in a primary rainforest of Peninsular Malaysia, Biological Conservation 120 (3): 329-344 Dec 2004.
Kerley, L. L., Goodrich, J.M., Miquelle, D.M., Smirnov, E.N., Quigley, H.B. and Hornocker, M.G. 2002. Effects of Roads and Human Disturbance on Amur Tigers, Conservation Biol-ogy 16 (1): 97-108.
Leimgruber, P., J.B. Gagnon, C. Wemmer, D.S. Kelly, M.A. Songer, and E.R. Selig. 2003. Frag-mentation of Asia’s remaining wildlands: implications for Asian elephant conservation. Animal Conservation 6: 347-359.
Leimgruber, P., Kelly, D. S., Mueller, T., & Songer, M. A. 2004. Forest dynamics and conserva-tion priorities in Myanmar 1990-2000. Annual Meeting of Society of Conservation Biol-ogy, New York City.
Leimgruber, P., Kelly, D. S., Steininger, M., Brunner, J., Müller, T., & Songer, M. A. 2003. For-est Cover Dynamics in Myanmar 1990-2000. Report to the U.S. Fish & Wildlife Service, Washington, D.C.
Linkie et al., in press (Kerenci Selbat)
Linkie M., Smith R.J., Leader-Williams N. Mapping and predicting deforestation patterns in the lowlands of Sumatra. Biodiversity and Conservation 13(10) September 2004.
Linkie, M, G. Chapron. D. J. Marter, J. Holden, and N. Leader-Williams. In press.
Loveland, T. R., Reed, B. C., Brown, J. F., Ohlen, D. O., Zhu, J., Yang, L. & Merchant, J. W. 2000. Development of a global land cover characteristics database and IGBP DISCover from 1-km AVHRR Data. International Journal of Remote Sensing 21:1303–1330.
Lynam A. et al. 2003. A National Tiger Action Plan for the Union of Myanmar. Myanmar For-est Department, Ministry of Forestry, Myanmar, WCS International. May 1, 2003.
MacKenzie, D. I., J. D. Nichols, G. B. Lachman, S. Droege, J. A. Royle, and C. A. Langtimm. 2002. Estimating site occupancy rates when detection probabilities are less than one. Ecol-ogy 83:2248–2255.
Mackinnon, J. (Ed.). 1997. Protected Areas Systems Review of the Indo-Malayan Realm. Asian Bureau of Conservation and World Conservation Monitoring Centre for the World Bank.
Matyuskhin E. N., Pikunov D.G., Dunishenko Y.M., Miquelle D.G., Nikolaev I.G., Smirov E.N., Salkina G.P., Abramov V.K., Bazylnikov V.I., Yudin V.G., and Korkishko V.G. 1996. Numbers, distribution and habitat status of the Amur tiger in the Russian Far East. Final Report to the USAID Russian Far East Environmental Policy and Technology Project.
Mazak, V. 1981. Panthera tigris. Mammalian Species 152:1-8.
McDougal C. and Tshering K. 1998. The Tiger Conservation Strategy for the Kingdom of Bhu-
Setting Priorities for the Conservation and Recovery of Wild Tigers: 2005-2015
R.3
tan Thimpu: Nature Conservation Section, Forest Services Division, Ministry of Agricul-ture and WWF.
Miquelle, D.G., E.N. Smirnov, H.G. Quigley, M.G. Hornocker, I. N. Nikolaev, and E.N. Maty-ushkin. 1996. Food habits of Amur tigers in Sikhote-Alin Zapovednik and the Russian Far East, and implications for conservation. Journal of Wildlife Research 1:138-147
Miquelle, D.G., Smirnov, E.N., Merrill, T.W., Myslenkov, A.E., Quigley, H.B., Hornocker, M.G., Schleyer, B., 1999. Hierarchical spatial analysis of Amur tiger relationships to habi-tat and prey. In: Seidensticker, J., Christie, S., Jackson, P. (Eds.), Riding the Tiger: Tiger Conservation in Human-dominated Landscapes. Cambridge Universtiy Press, Cambridge, pp. 71-99.
Nature Conservancy, 2000. T. Nature Conservancy, The Five-S Framework for Site Conserva-tion: A Practioner’s Handbook for Site Conservation Planning And Measuring Conserva-tion Success. , The Nature Conservancy, Washington, DC (2000).
Nowell K., and P. Jackson, editors. 1996. Status survey and conservation action plan; wild cats. World Conservation Union, Gland, Switzerland.
Nowell, K. 1999. Cambodia Tiger Conservation Program progress report to Save the Tiger Fund.
O’Brien TG, Kinnaird MF, Wibisono HT, 2003. Crouching tigers, hidden prey: Sumatran tiger and prey populations in a tropical forest landscape. Animal Conservation 6: 131-139 Part 2, May 2003.
Olson D.M., Dinerstein E., Wikramnayake E.E., Burgess N.D., Powell G.V.N., Underwood E.C., D’Amico J., Itoua I., Strand H.E., Morrison J.C., Loucks C.J., Alnutt T.F., Ricketts T.H., Umikokura Y., Lamoreux J.F., Wettengel W.W., Hedao P., Kassem K.R. 2001. Ter-restrial Ecoregions of the World: A New Map of Life on Earth. Biological Conservation 51(11) 933-938. November 2001.
Project Tiger Web site:http://projecttiger.nic.in/map.htm
Ramsar Convention on Wetlands. 2005. Ramsar Web Site. Internet Web Site: http://www.ramsar.org, Accessed on January 21, 2005.
Redford, KH. The empty forest. Bioscience. Vol. 42, no. 6, pp. 412-422. 1992.
Sanderson E.W., Redford K., et al. 2002. Planning to Save a Species: the Jaguar as a Model. Conservation Biology 16(1) 58-72, February 2002.
Sanderson, E.W., M. Jaiteh, M. A. Levy, K.H. Redford, A.V. Wannebo, and G. Woolmer. 2002. The human footprint and the last of the wild. BioScience (10):891-904.
Schaller, G.B. 1967. The Deer and the Tiger: A Study of Wildlife in India. Univ. Chicago Press, Chicago, IL, USA.
Seidensticker, J, S. Christy, P. Jackson, eds. 1999. Riding the Tiger: Tiger Conservation in Hu-man-dominated Landscapes. Cambridge: University of Cambridge Press.
Seidensticker, J. 1986. Large carnivores and the consequences of habitat insularization: ecol-ogy and conservation of tigers in Indonesia and Bangladesh. Pp. 1-41 in S.D. Miller and D.D. Everett (eds.) Cats of the World: Biology, Conservation, and Management. National Wildlife Federation, Washington, D.C.
Seidensticker, J. 1987. Bearing witness: observations on the extinctions of Panthera tigris balica and Panthera tigris sondaica. In Tigers of the world: the biology, biopolitics, management and conservation of an endangered species: 1–8. Tilson, R. L. & Seal, U. S. (Eds). Park
References
R.4
Ridge, NJ: Noyes Publication.
Smirnov, E. N., and D. G. Miquelle. 1999. Population dynamics of the Amur tiger in Sikhote-Alin State Biosphere Reserve. In: Seidensticker, J., Christie, S., Jackson, P. (Eds.), Riding the Tiger: Tiger Conservation in Human-dominated Landscapes. Cambridge Universtiy Press, Cambridge, pp. 61-70.
Smith, J.L.D. 1993. The role of dispersal in structuring the Chitwan tiger population. Behav-ior, 124, 165-95.
Sunquist, M.E. 1981. The social organization of tigers in Royal Chitwan National Park, Ne-pal. Smithsonian Contributions to Zoology, 336, 1-98.
Sunquist M.E., Karanth, K.U., Sunquist, F. 1999. Ecology, behavior and resiliance of the tigers and its conservation needs. In: Seidensticker, J., Christie, S., Jackson, P. (Eds.), Riding the Tiger: Tiger Conservation in Human-dominated Landscapes. Cambridge University Press, Cambridge, pp. 5-18.
Thompson, S. K., and G. A. F. Seber. 1996. Adaptive Sampling. New York: J. Wiley & Sons.
Thompson, WL. (ed.). 2004. Sampling Rare or Elusive Species: Concepts, Designs and Tech-niques for Estimating Population Parameters. Island Press, Washington. 429 pp
Tilson & Seal 1987. Tigers of the World. Noyes Pub., Park Ridge, NJ, USA.
Tilson R., Defu H., Muntifering J., Nyhus P.J. 2004. Dramatic decline of wild South China tigers: fi eld survey of priority tiger reserves. Oryx Vol 38 No 1. January 2004
Tilson, R., P. Nyhus, P. Jackson, H. Quigley, M. Hornocker, J. Ginsberg, D. Phemister, N. Sher-man, and J. Seidensticker, eds. 2000. Securing a future for the world’s wild tigers. Washing-ton D. C.: Save the Tiger Fund, National Fish and Wildlife Foundation.
Tucker, C.J., Grant, D.M., Dykstra, J.D. 2005. NASA’s Global Orthorectifi ed Landsat Dataset. Photogrammetric Engineering & Remote Sensing. 70(3), 313-322.
United Nations Educational, Scientifi c, and Cultural Organization (UNESCO-MAB). 2005. Man and Biosphere Program. Internet Web Site: http://www.unesco.org/mab/nutshell.htm. Accessed on January 21, 2005.
United Nations Educational, Scientifi c, and Cultural Organization (UNESCO-WHS). 2003. World Heritage Sites. Internet Web Site: http://whc.unesco.org/pg.cfm?cid=160. Accessed on January 21, 2005.
van Schaik, C.P., K.A. Monk, and J.M. Yarrow Robertson. 2001. Dramatic decline in organ-utan numbers in the Leuser Ecosystem, Northern Sumatra. Oryx 35(1): 14-25.
WDPA Consortium. 2004. World Database on Protected Areas. Copyright World Conserva-tion Union (IUCN) and UNEP-World Conservation Monitoring Centre (UNEP-WCMC), 2004.
Weiler, H. and Pantel, S. 2004. Progress of tiger conservation in Cambodia. GTF News 3(3): 3-6.
Wich, S.A., I. Singleton, S.S. Utami-Atmoko, M.L. Geurts, H.D. Rijksen, and C.P. van Schaik. 2003. The status of the Sumatran orang-utan Pongo abelii: an update. Oryx 37(1): 49-54.
Williams B.K., Nichols J.D., Conroy M.J. 2002. Analysis and management of animal popula-tions. San Diego: Academic press.
Woodroffe, R., and J. Ginsberg. 1998. Edge effects and the extinction of populations inside protected areas. Science 280: 2126-2128.
Setting Priorities for the Conservation and Recovery of Wild Tigers: 2005-2015

Cert no. SW-COC-1516
Cover photos by (left to right): Martin Harvey/WWF, Dennis DeMello/WCS, Julie Larsen Maher/WCS
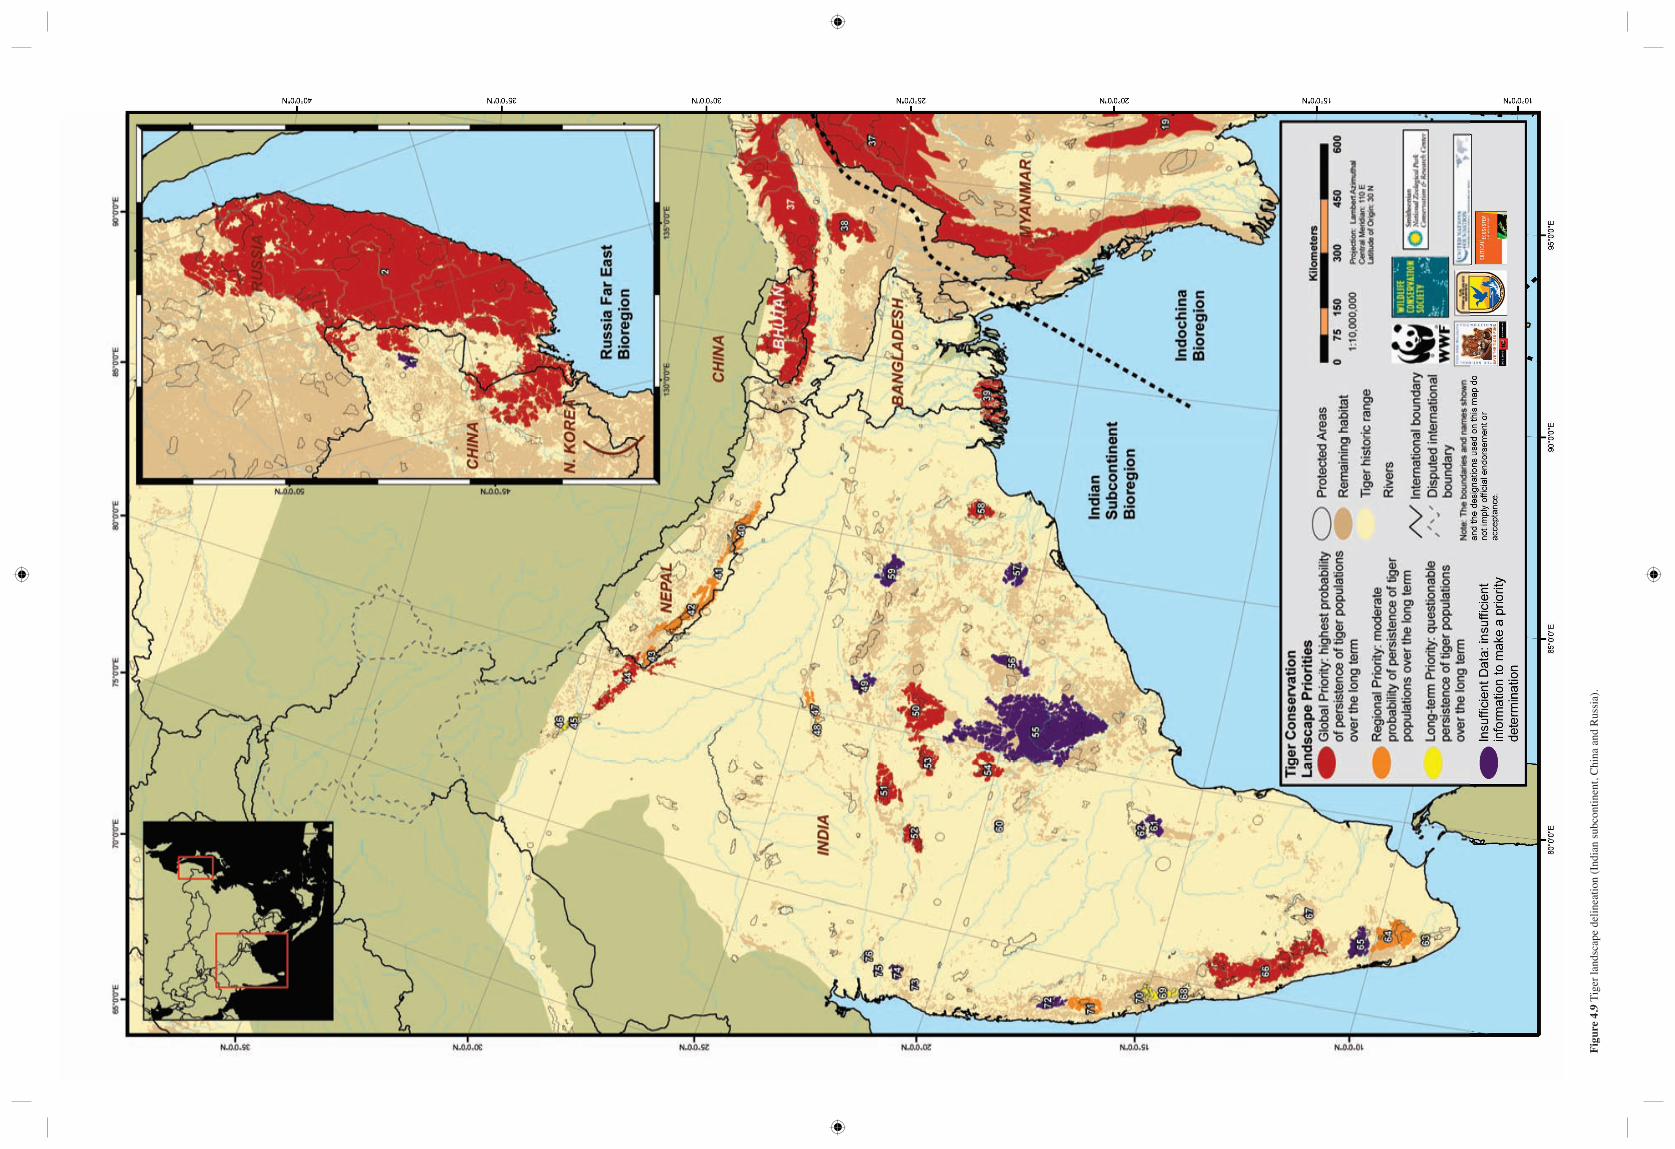
Fig
ure
4.9
Tig
er la
ndsc
ape
delin
eatio
n (I
ndia
n su
bcon
tinen
t, C
hina
and
Rus
sia)
.
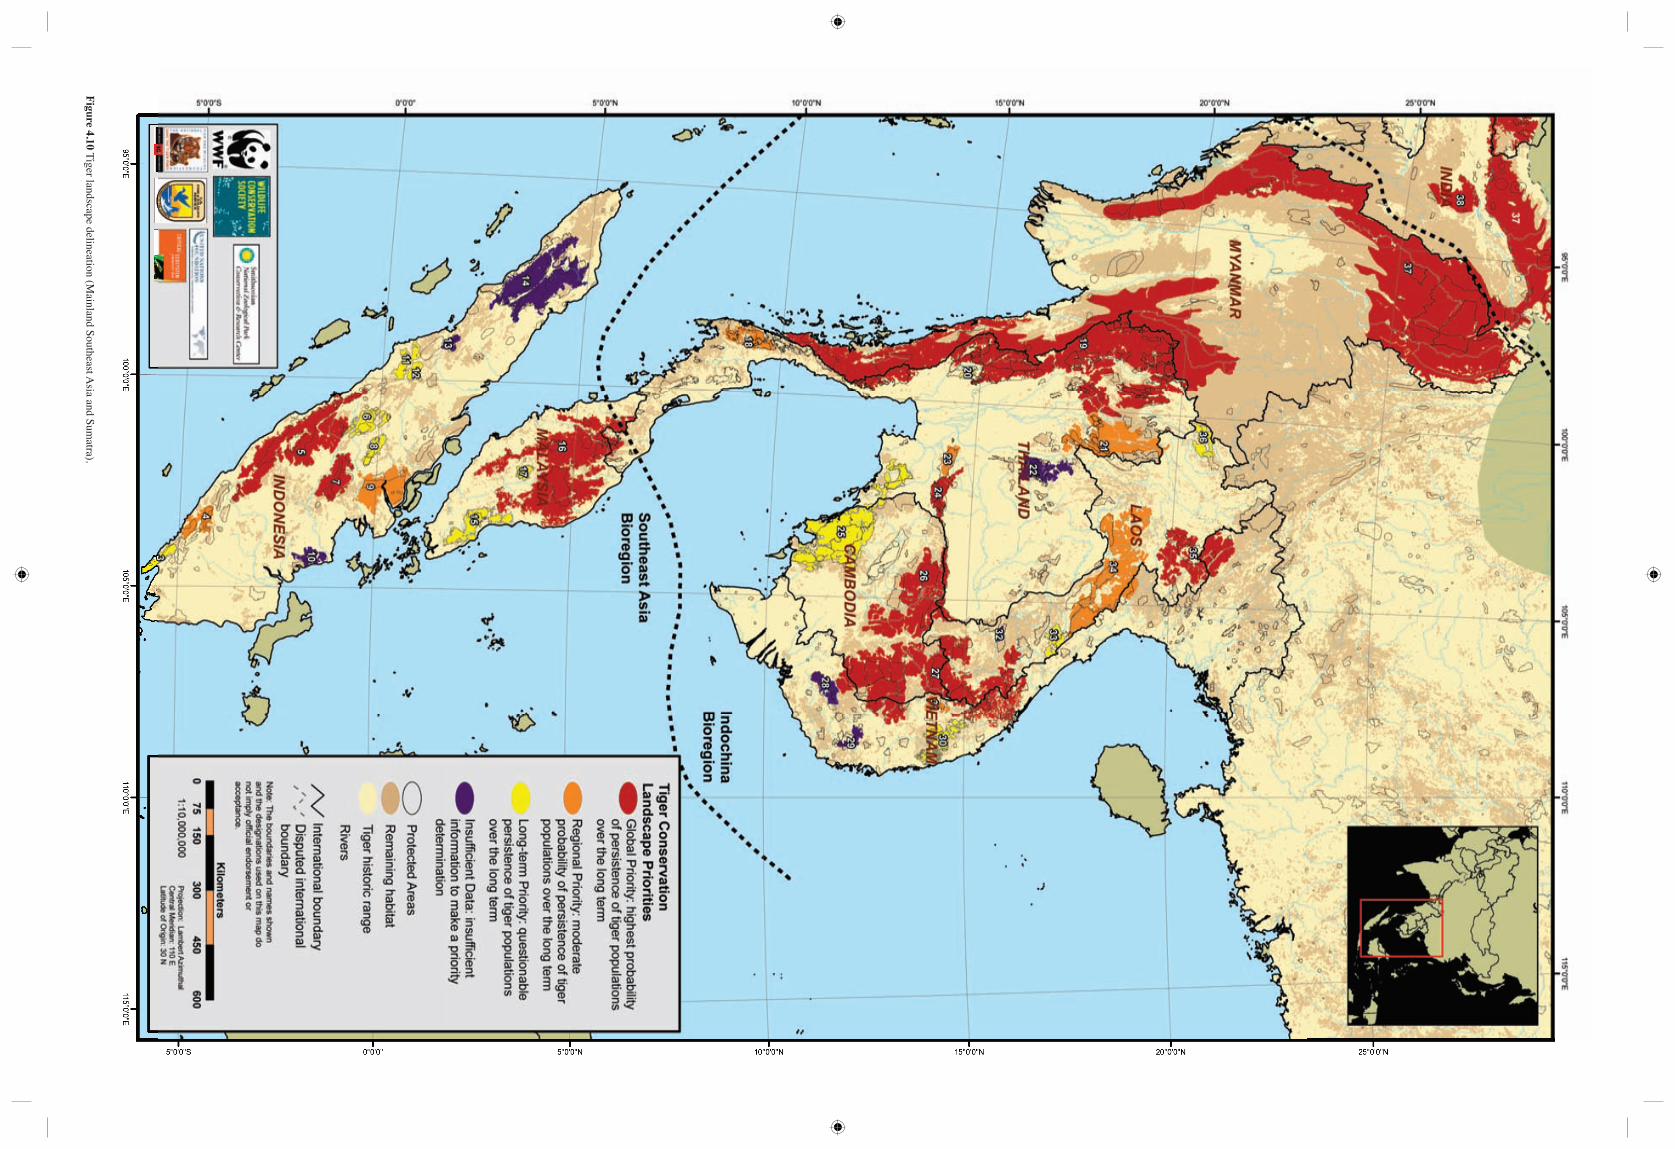
Figure 4.10 T
iger landscape delineation (Mainland Southeast A
sia and Sumatra).
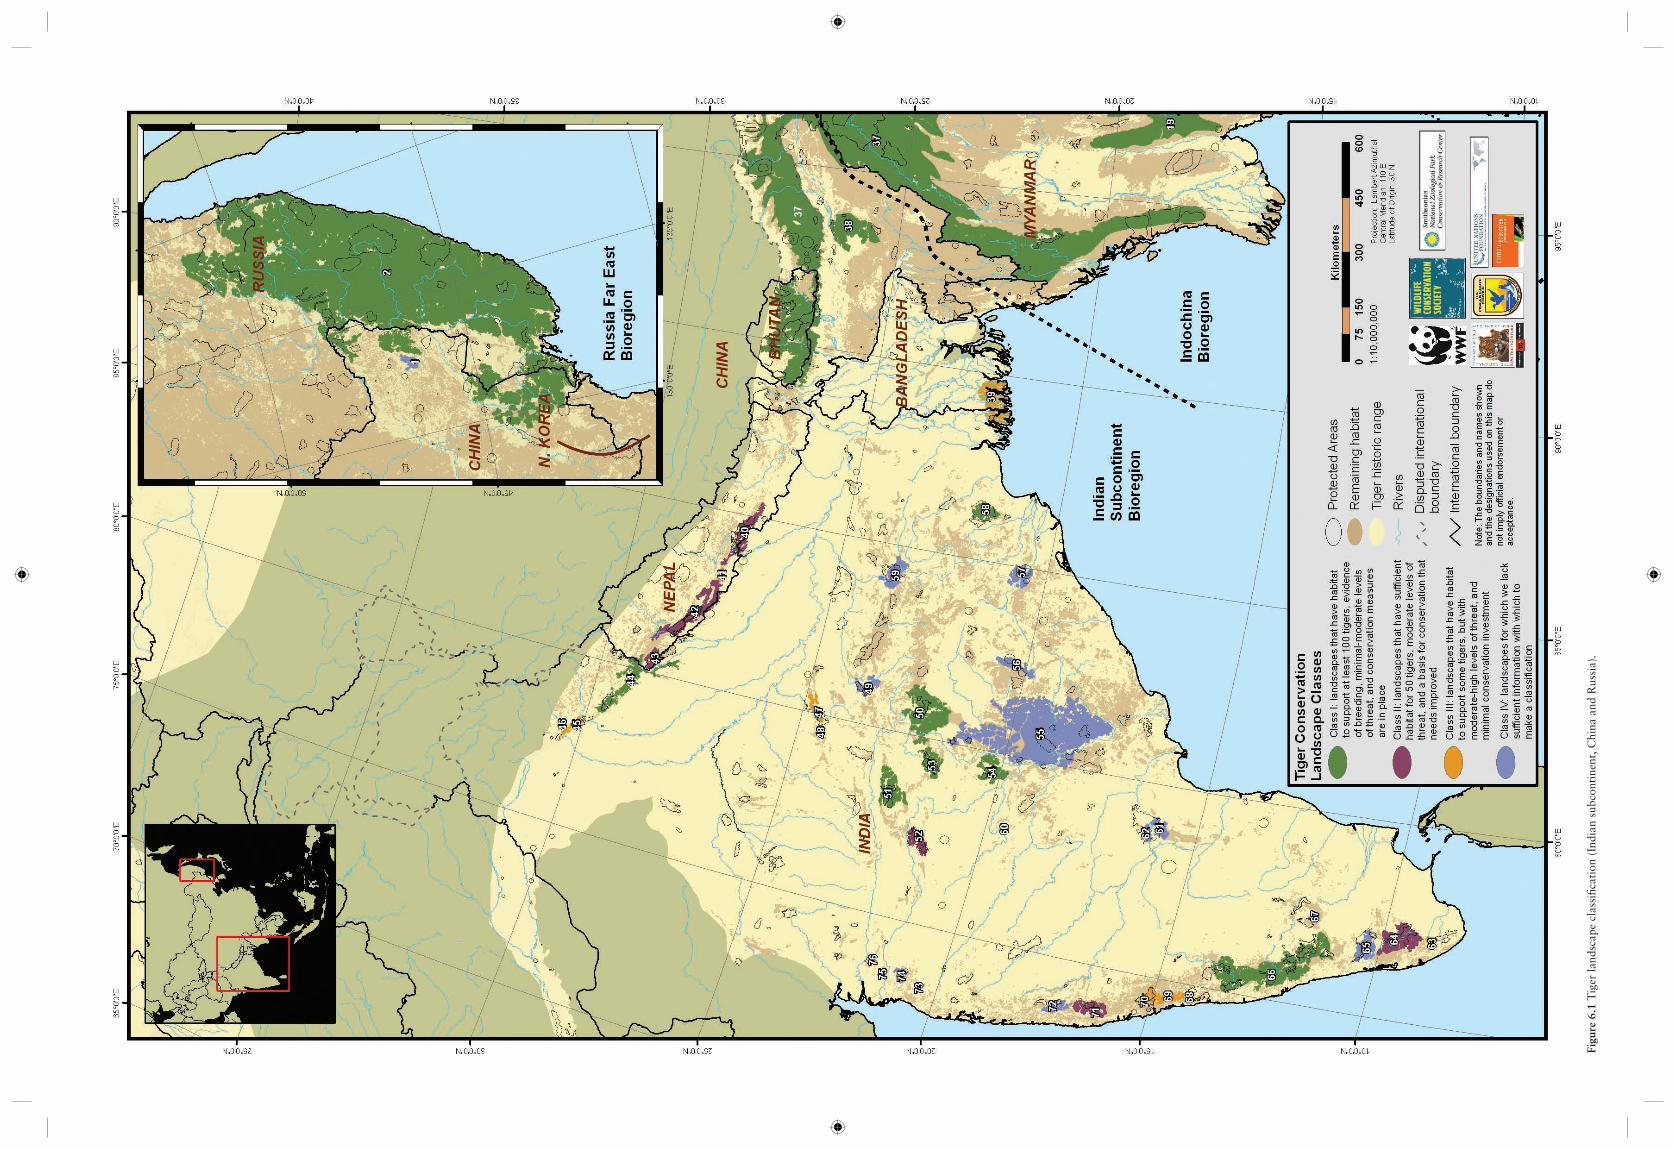
Figu
re 6
.1 T
iger
land
scap
e cl
assi
fi cat
ion
(Ind
ian
subc
onti
nent
, Chi
na a
nd R
ussi
a).
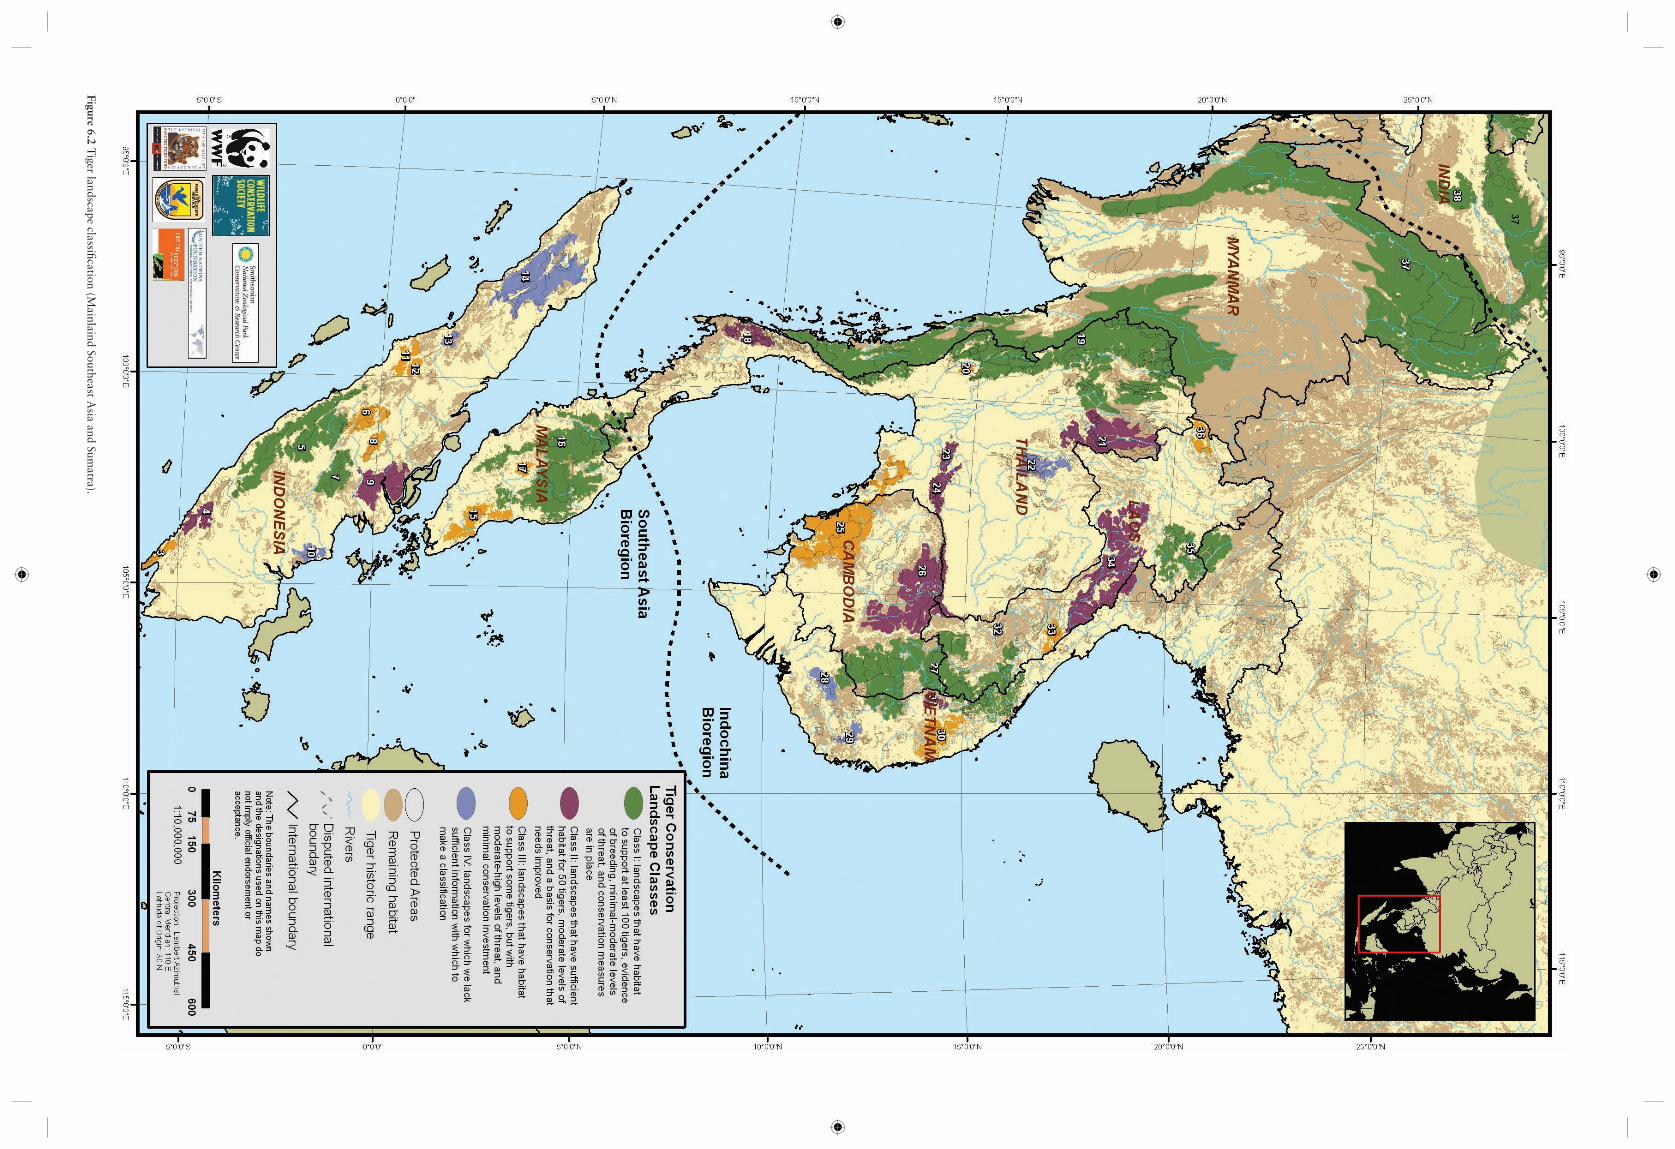
Figure 6.2 Tiger landscape classifi cation (M
ainlaind Southeast Asia and Sum
atra).
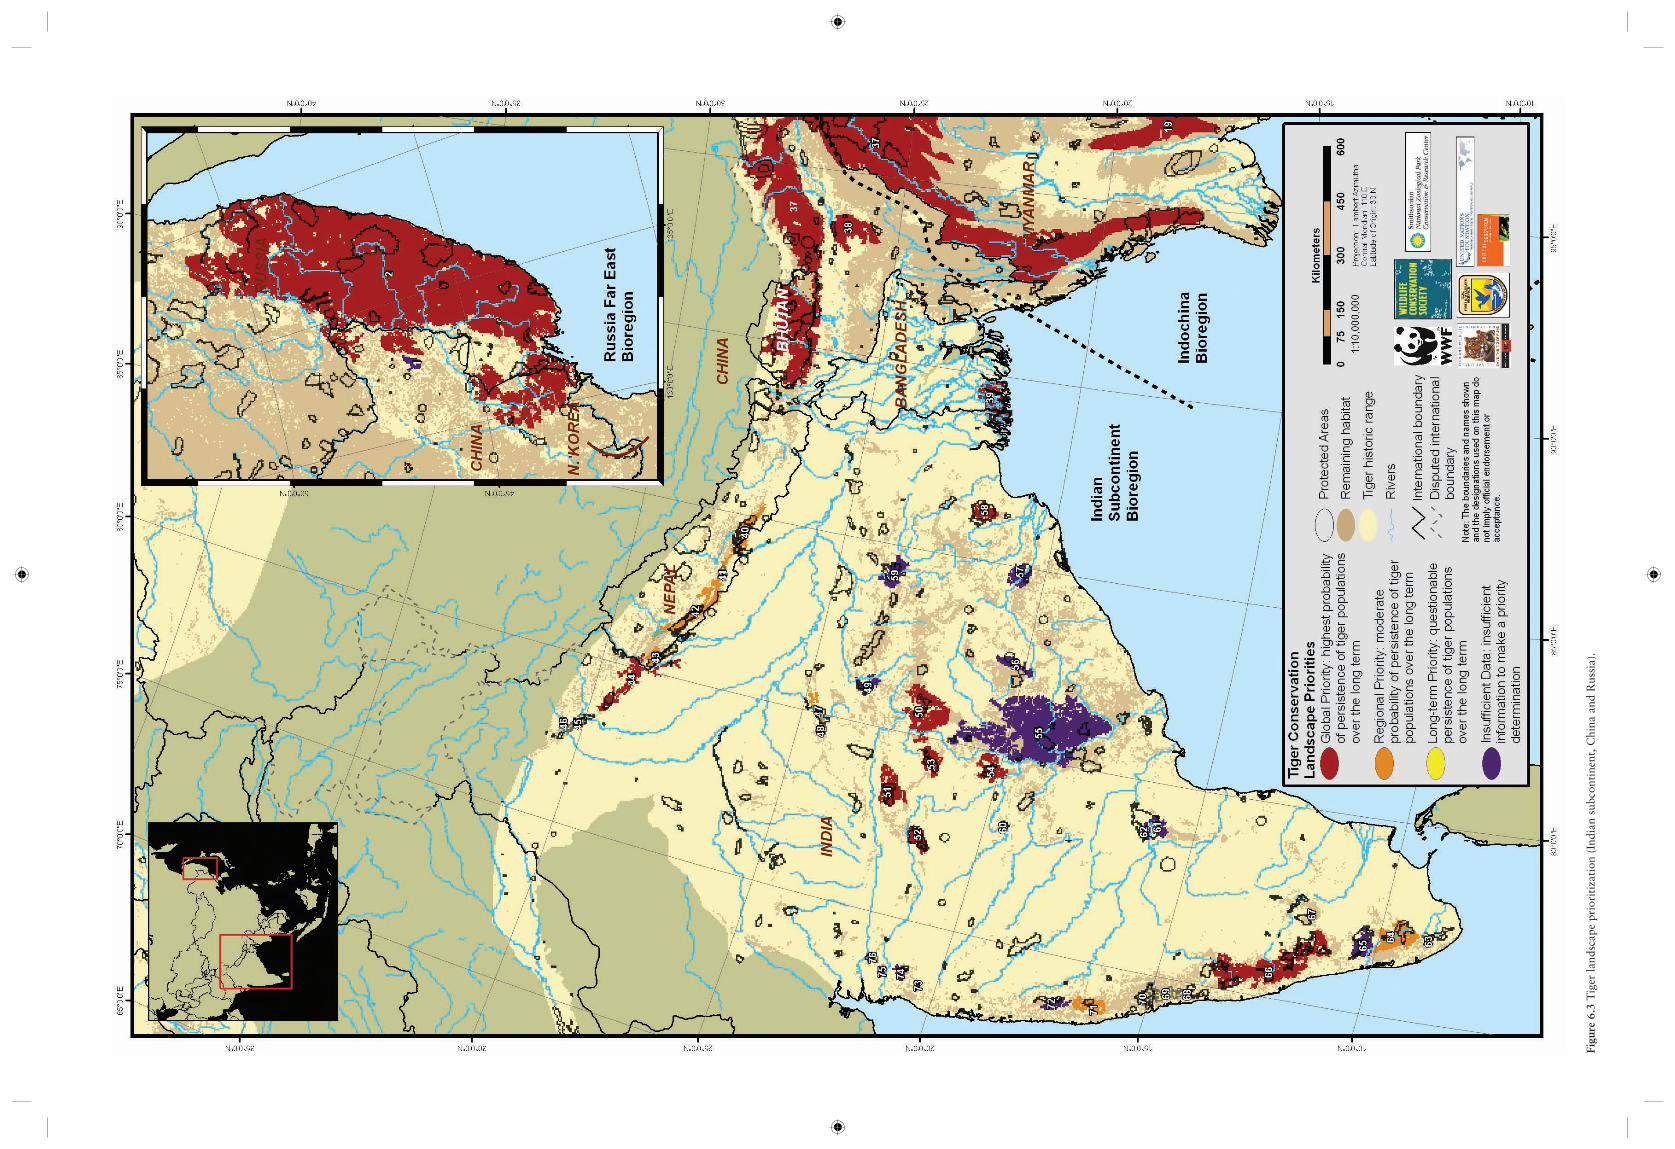
Figu
re 6
.3 T
iger
land
scap
e pr
iori
tiza
tion
(In
dian
sub
cont
inen
t, C
hina
and
Rus
sia)
.
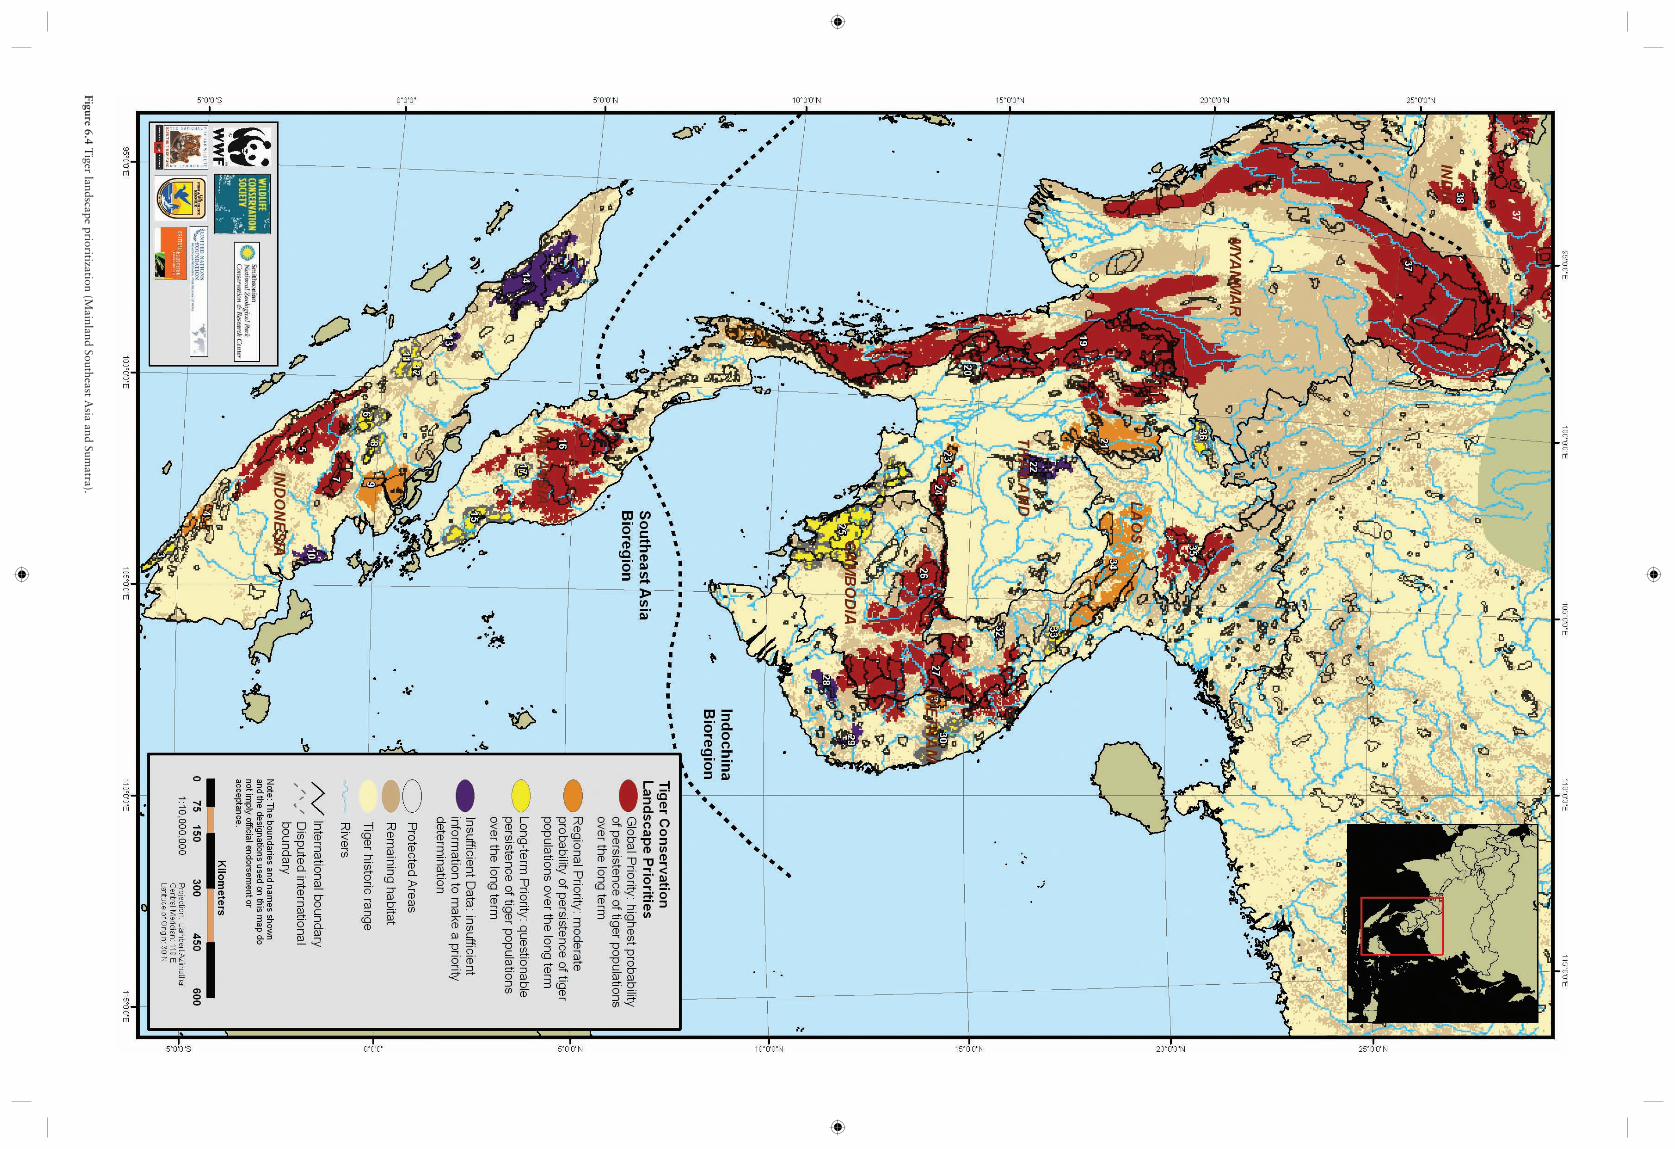
Figure 6.4 Tiger landscape prioritization (M
ainland Southeast Asia and Sum
atra).