Widespread occurrence of power-law distributions in inter-repeat distances shaped by genome dynamics
11
Widespread occurrence of power-law distributions in inter-repeat distances shaped by genome dynamics Alexandros Klimopoulos a , Diamantis Sellis b , Yannis Almirantis a, ⁎ a National Center for Scientific Research “Demokritos,” Institute of Biology, 153 10 Athens, Greece b Department of Biology, Stanford University, Stanford, CA 94305-5020, USA abstract article info Article history: Accepted 6 February 2012 Available online 18 February 2012 Keywords: transposable elements power-law distribution genome evolution fractal globule Repetitive DNA sequences derived from transposable elements (TE) are distributed in a non-random way, co- clustering with other classes of repeat elements, genes and other genomic components. In a previous work we reported power-law-like size distributions (linearity in log–log scale) in the spatial arrangement of Alu and LINE1 elements in the human genome. Here we investigate the large-scale features of the spatial ar- rangement of all principal classes of TEs in 14 genomes from phylogenetically distant organisms by studying the size distribution of inter-repeat distances. Power-law-like size distributions are found to be widespread, extending up to several orders of magnitude. In order to understand the emergence of this distributional pat- tern, we introduce an evolutionary scenario, which includes (i) Insertions of DNA segments (e.g., more recent repeats) into the considered sequence and (ii) Eliminations of members of the studied TE family. In the pro- posed model we also incorporate the potential for transposition events (characteristic of the DNA transpo- sons' life-cycle) and segmental duplications. Simulations reproduce the main features of the observed size distributions. Furthermore, we investigate the effects of various genomic features on the presence and extent of power-law size distributions including TE class and age, mode of parental TE transmission, GC content, de- letion and recombination rates in the studied genomic region, etc. Our observations corroborate the hypoth- esis that insertions of genomic material and eliminations of repeats are at the basis of power-laws in inter- repeat distances. The existence of these power-laws could facilitate the formation of the recently proposed “fractal globule” for the confined chromatin organization. © 2012 Elsevier B.V. All rights reserved. 1. Introduction Interspersed repeats are mostly inactive repetitive sequences de- rived from initially active transposable elements (TEs), which are found in almost all eukaryotic genomes (Jurka, 1998). In some species they account for a large percentage of the genome's size, as in human ~45% (Lander et al., 2001; Makalowski, 2003), opossum ~ 52% (Gentles et al., 2007) and mouse ~ 38% (Waterston et al., 2002). In a previous work (Sellis et al., 2007) we investigated the large- scale features of Alu and L1 spatial arrangement in the human genome by studying the size distribution of inter-repeat distances. In most cases, we found power-law-like size distributions often span- ning several orders of magnitude. We also proposed a model for the emergence of this type of distributions consisting of neutral processes of genomic evolution based on TE turnover. Here, we extend this study into 14 genomes from various taxonomic groups, for TE families from every major TE class. After detecting power- law-like inter-repeat size distributions in several cases, we focus on the correlation between distribution features and various genomic proper- ties. Thus, we attempt to understand the dynamics at the origin of this particular pattern and using computer simulations test the plausibility of the proposed model, as extended here in order to apply for both ret- roelements and DNA transposons. Two questions may be formulated: (a) whether this model can explain the observed distributions and (b) why in some cases power-laws are more extended, while in others linearity is rudimentary or completely absent. We will address again these questions in the final section. 1.1. Background information on genomic clustering of transposable elements The proliferation of transposable elements interacts in a complex way with other aspects of whole-genome evolutionary dynamics, im- proving in several cases genome functionality (see Bowen and Jordan, 2002; Jurka, 2008, and references given therein). Repeats can be Gene 499 (2012) 88–98 Abbreviations: TE(s), Transposable element(s); SIM, Subsequently Inserted geno- mic Material. All repeated DNA incorporated in the genome after the proliferation of a TE subfamily; I-D skew, (D-I)/(D+I), where D and I are the populations of Direct and Inverted repeat pairs respectively; FrPL, All cases showing a power law over all examined cases for a given organism and a given TE class; ME, Mean Extent of the linear region of a distribution in log-log scale. ⁎ Corresponding author. Tel.: + 30 2106503619; fax: + 30 2106511767. E-mail addresses: [email protected] (A. Klimopoulos), [email protected] (D. Sellis), [email protected] (Y. Almirantis). 0378-1119/$ – see front matter © 2012 Elsevier B.V. All rights reserved. doi:10.1016/j.gene.2012.02.005 Contents lists available at SciVerse ScienceDirect Gene journal homepage: www.elsevier.com/locate/gene
Transcript of Widespread occurrence of power-law distributions in inter-repeat distances shaped by genome dynamics

Gene 499 (2012) 88–98
Contents lists available at SciVerse ScienceDirect
Gene
j ourna l homepage: www.e lsev ie r .com/ locate /gene
Widespread occurrence of power-law distributions in inter-repeat distances shapedby genome dynamics
Alexandros Klimopoulos a, Diamantis Sellis b, Yannis Almirantis a,⁎a National Center for Scientific Research “Demokritos,” Institute of Biology, 153 10 Athens, Greeceb Department of Biology, Stanford University, Stanford, CA 94305-5020, USA
Abbreviations: TE(s), Transposable element(s); SIMmic Material. All repeated DNA incorporated in the gena TE subfamily; I-D skew, (D-I)/(D+I), where D and Iand Inverted repeat pairs respectively; FrPL, All casesexamined cases for a given organism and a given TElinear region of a distribution in log-log scale.⁎ Corresponding author. Tel.: +30 2106503619; fax:
E-mail addresses: [email protected] (A. [email protected] (D. Sellis), [email protected].
0378-1119/$ – see front matter © 2012 Elsevier B.V. Aldoi:10.1016/j.gene.2012.02.005
a b s t r a c t
a r t i c l e i n f oArticle history:Accepted 6 February 2012Available online 18 February 2012
Keywords:transposable elementspower-law distributiongenome evolutionfractal globule
Repetitive DNA sequences derived from transposable elements (TE) are distributed in a non-randomway, co-clustering with other classes of repeat elements, genes and other genomic components. In a previous workwe reported power-law-like size distributions (linearity in log–log scale) in the spatial arrangement of Aluand LINE1 elements in the human genome. Here we investigate the large-scale features of the spatial ar-rangement of all principal classes of TEs in 14 genomes from phylogenetically distant organisms by studyingthe size distribution of inter-repeat distances. Power-law-like size distributions are found to be widespread,extending up to several orders of magnitude. In order to understand the emergence of this distributional pat-tern, we introduce an evolutionary scenario, which includes (i) Insertions of DNA segments (e.g., more recentrepeats) into the considered sequence and (ii) Eliminations of members of the studied TE family. In the pro-posed model we also incorporate the potential for transposition events (characteristic of the DNA transpo-sons' life-cycle) and segmental duplications. Simulations reproduce the main features of the observed sizedistributions. Furthermore, we investigate the effects of various genomic features on the presence and extentof power-law size distributions including TE class and age, mode of parental TE transmission, GC content, de-letion and recombination rates in the studied genomic region, etc. Our observations corroborate the hypoth-esis that insertions of genomic material and eliminations of repeats are at the basis of power-laws in inter-repeat distances. The existence of these power-laws could facilitate the formation of the recently proposed“fractal globule” for the confined chromatin organization.
© 2012 Elsevier B.V. All rights reserved.
1. Introduction
Interspersed repeats are mostly inactive repetitive sequences de-rived from initially active transposable elements (TEs), which arefound in almost all eukaryotic genomes (Jurka, 1998). In somespecies they account for a large percentage of the genome's size, asin human ~45% (Lander et al., 2001; Makalowski, 2003), opossum~52% (Gentles et al., 2007) and mouse ~38% (Waterston et al., 2002).
In a previous work (Sellis et al., 2007) we investigated the large-scale features of Alu and L1 spatial arrangement in the humangenome by studying the size distribution of inter-repeat distances.In most cases, we found power-law-like size distributions often span-ning several orders of magnitude. We also proposed a model for the
, Subsequently Inserted geno-ome after the proliferation ofare the populations of Directshowing a power law over allclass; ME, Mean Extent of the
+30 2106511767.mopoulos),gr (Y. Almirantis).
l rights reserved.
emergence of this type of distributions consisting of neutral processesof genomic evolution based on TE turnover.
Here, we extend this study into 14 genomes from various taxonomicgroups, for TE families fromeverymajor TE class. After detectingpower-law-like inter-repeat size distributions in several cases, we focus on thecorrelation between distribution features and various genomic proper-ties. Thus, we attempt to understand the dynamics at the origin of thisparticular pattern and using computer simulations test the plausibilityof the proposed model, as extended here in order to apply for both ret-roelements and DNA transposons. Two questions may be formulated:(a) whether this model can explain the observed distributions and(b) why in some cases power-laws are more extended, while in otherslinearity is rudimentary or completely absent. We will address againthese questions in the final section.
1.1. Background information on genomic clustering of transposableelements
The proliferation of transposable elements interacts in a complexway with other aspects of whole-genome evolutionary dynamics, im-proving in several cases genome functionality (see Bowen and Jordan,2002; Jurka, 2008, and references given therein). Repeats can be
89A. Klimopoulos et al. / Gene 499 (2012) 88–98
partially incorporated into coding sequences (Deininger and Batzer,1999; Volff and Brosius, 2007; Abrusan et al., 2008). As shown inboth cases of retrotransposition, by either retrotransposons or rerto-transposed genes (Okamura and Nakai, 2008) new promoters aredistributed into the genome, thus modifying its regulatory pattern(Medstrand et al., 2005). Repeats may also be recruited for playingan often unknown functional role, as there are repeats known toform groups of conserved not expressed (CNE) sequences (see e.g.,Xie et al., 2006; Lowe et al., 2007). It is very probable that the prolif-eration of several TE families has provided a variety of advantages tohost genomes, without positive selection of newly transposed copies.In the well-studied case of the distribution of the old Alus, which inthe human genome is clearly skewed towards high-GC content re-gions, it has been shown (Brookfield, 2001) that this GC preferencecannot be due to positive selection (for comprehensive reviews forseveral TE types, see Kapitonov and Jurka, 2006; Jurka et al., 2007).
The distribution of most classes of transposable elements in thegenome often deviates from randomness. In the human genome,LINE1s (L1) are found with a higher probability in the AT-rich geno-mic compartments, while the older Alu subfamilies have a clear pref-erence for the GC-rich genomic regions (see e.g., Brookfield, 2001;Pavlicek et al., 2001; Deininger and Batzer, 2002; Jurka et al., 2004;Hackenberg et al., 2005). This tendency seems to be shared by LINEsand SINEs in several organisms. MIRs, which are ancient SINEs, followa distribution similar to old Alus with respect to GC content, despitetheir composition: Alus are GC-rich, while MIRs are AT-rich(Matassi et al., 1998; Jurka and Kapitonov, 1999). DNA transposonsdo not show any marked preference for GC content or gene density,at least when studied all together (Ovcharenko et al., 2005). However,some DNA transposons, e.g., the non-autonomous DNA transposonMER53 show some target site preference (Jurka and Kapitonov,1999). LTR retrotransposons also seem to show little dependence onGC content, at least in the rat, mouse and human genomes (Yang etal., 2004). Several other tendencies for co-localization of repeatswith functional regions, like cis-regulatory modules and conservedregions have been found (see, e.g., Table 2 in Jurka et al., 2007) con-cerning mainly retroelements.
2. Results and discussion
2.1. Power-law-like distribution of transposable elements in severalgenomes
The purpose of the present article is to systematically investigatethe distribution of representative TE populations at chromosomalscale for various species. To this end, we study the size distributionof the inter-repeat spacers for a given TE population (mostly inactivecopies) using the cumulative size distribution (see supplementary file6). We define N(S) as the number of spacers with length larger orequal to S (in nucleotides, nt) and plot the logarithm of N(S) versusthe logarithm of S. Linearity in such log–log plots indicates a power-law distribution (Newman, 2005). Power-laws in nature usuallyhave an upper and a lower cutoff, which determine the linear regionin log–log scale, where self-similarity is observed (Sellis et al., 2007;Clauset et al., 2009). In what follows, each figure that representsinter-repeat size distributions also includes curves for 10 random sur-rogate data sets (for details, see “Methods”). Notice also that for eachTE population an upper limit in the divergence from the consensussequence or a lower limit in the length (excluding very truncatedcopies) is imposed.
The principalfinding of the present study is that for allmajor TE clas-ses, power-law-like distributions are of widespread occurrence. The ex-tent (E) of the linear region in log–log plots provides a simple measurefor judging the validity of a power-law-based description. An additionalquantity characterizing a power-law is the negative exponent (slope) ofthe cumulative distribution μ. The slope for a typical power-law does
not exceed the value of μ=2, as μb2 is a condition leading to a non-convergent standard deviation (Newman, 2005). Fig. 1 presents someexamples of power-law-like distributions formed by inter-repeat dis-tances. “Supplementary Table I” in supplementary file 1 includes allcases of studied transposable element populations forming a power-law, sorted by organism and chromosome (330 cases). Representativeplots are given in the supplementary file 2: “Plots.” In supplementaryfile 3: “Supplementary Table II,” the full list of examined transposableelements, including ones without a power-law, is given (1331 cases).Table 1 presents an abridged version of our results. Two quantities sum-marizing the characteristics of power-laws in whole TE classes perorganism are used: (i) Mean extent of the linear region of the distribu-tion in log–log scale (ME) per organism for the three TE classes (SINEs,LINEs and DNA elements), which are mostly studied in this work. (ii)The fraction (FrPL) of all cases showing a power-law over all examinedcases for a given organismand a given TE class. Here as individual “case”we consider the size distribution of spacers for a given TE family or sub-family in a given chromosome.
2.2. The “insertion–elimination model”
Our working hypothesis is that the power-law-like distributions ofTEs can be explained with simple neutral processes of genomic evolu-tion based on TE turnover. The “insertion–elimination model,” as intro-duced in Sellis et al. (2007), is based on models initially formulated forthe explanation of fractality in aggregation patterns in physicochemicalsystems (Takayasu et al., 1991). Our suggestion takes into account theone-dimensional topology of DNA and includes molecular events wellestablished to occur in genome dynamics in the course of evolutionarytime.
We here summarize the main points of the proposed model: Let usconsider a sequence where a population of “markers” (representingthe members of a TE population) is distributed, initially at random.Then,we assume the followingmolecular events, eachwith an assignedprobability of incidence: [1] Elimination of a marker (repeat) of the ini-tial population, occuring either by recombinational excision or due toprogressive decomposition by nucleotide substitutions and/or indelevents. This leads to the aggregation (merging together) of the spacersinitially separated by the eliminated repeat. [2] Incorporation into exist-ing spacers of subsequently inserted genomicmaterial (SIM) such as re-peats ofmore recent TE families, viral or other exogenousDNA, etc. [3] Afraction of the total chromosome (chosen at random) is copied withcertain probability and then the copy is inserted at a random position.[4] In some simulations, the random insertion of markers is continuedduring the action of the previously described types of events. In thesecases, a number of random transposition events are also introduced.This combination of duplication and transposition events is introducedin order to simulate the life-cycle of DNA transposons.
Using the insertion–elimination model, we simulate genomesevolving under a variety of parameter values. Initially we includeonly the type [1] and [2] events (see Fig. 2). We find that both alarge number of elimination events [1] and large values of SIM [2] re-sult in a more extended linear region in the transient power-law-likedistributions (Fig. 2a, b). On the contrary, inclusion of transpositions[4] reduces the extent of the linear region (Fig. 2c). This is intuitivelyexpected, because the power-law extent depends on the formation oflong spacers and the larger the spacer, the higher is the probability ofa random re-insertion to split the spacer into shorter segments.
All of the above simulationswere repeatedwith the inclusion of seg-mental duplication events, which increased the final sequence lengthby 20%. This modification (i.e., inclusion of events of type [3]) did notqualitatively affect the derived results (figures not shown), thus verify-ing that the proposed model remains robust if segmental duplications,which are frequent in the history of several genomes, are taken intoaccount. Details of the simulations are provided in supplementary file 5.

Fig. 1. Examples of power-law-like size distributions. Six examples of power-laws in inter-repeat spacers' cumulative size distributions in whole chromosomes. Genomic curves areaccompanied in each plot by 10 curves of surrogate data (continuous lines), corresponding to randomly distributed markers.
90 A. Klimopoulos et al. / Gene 499 (2012) 88–98
2.3. Are the properties of power-laws in inter-repeat distances' sizedistributions compatible with insertion–elimination dynamics?
In the present work, we include members of all known TE classesin seven mammalian and seven non-mammalian genomes, notwith-standing that the studied material is unevenly distributed. In the fol-lowing, we present our findings examining simultaneously theircompatibility with the proposed model.
The crucial factors for the generation and increased extent of log–log linearity, in the framework of the insertion–elimination model,are high rates of SIM insertion and of repeat elimination (Fig. 2a,b).We also infer from the model that repeat populations need a matura-tion time (a minimum age) for the emergence of a power-law in theirinter-repeat size distribution. This maturation time is probably differ-ent in each organism depending on the particular genome dynamics.Inter-species comparison of the propensity for power-law formation
is attempted in the following. However, such comparisons are notquantifiable in a straightforward way as they require the combinationof several parameters. An overview of power-law formation in thestudied genomes is given in Table 1. Details and the role of species-or TE class-specific factors will be discussed in what follows.
2.3.1. Elimination of repeats in mammals affects the extent of power-laws:The role of recombinational excision of inverted repeat pairs
There is evidence, mainly for SINEs and LINEs, that TE eliminationoccurs extensively through recombinational excisions (see Jurka et al.,2004; Jurka et al., 2005),wheremechanistic aspects are discussed, espe-cially for SINEs. One type of recombinational excision is the eliminationof inverted repeat pairs; i.e., TE pairs sharing high similarity whosemembers are in opposite orientations (Lobachev et al., 2000; Stengeret al., 2001). Retroelements have a tendency to go through successivebursts of amplification in genomes (Deininger and Batzer, 2002),
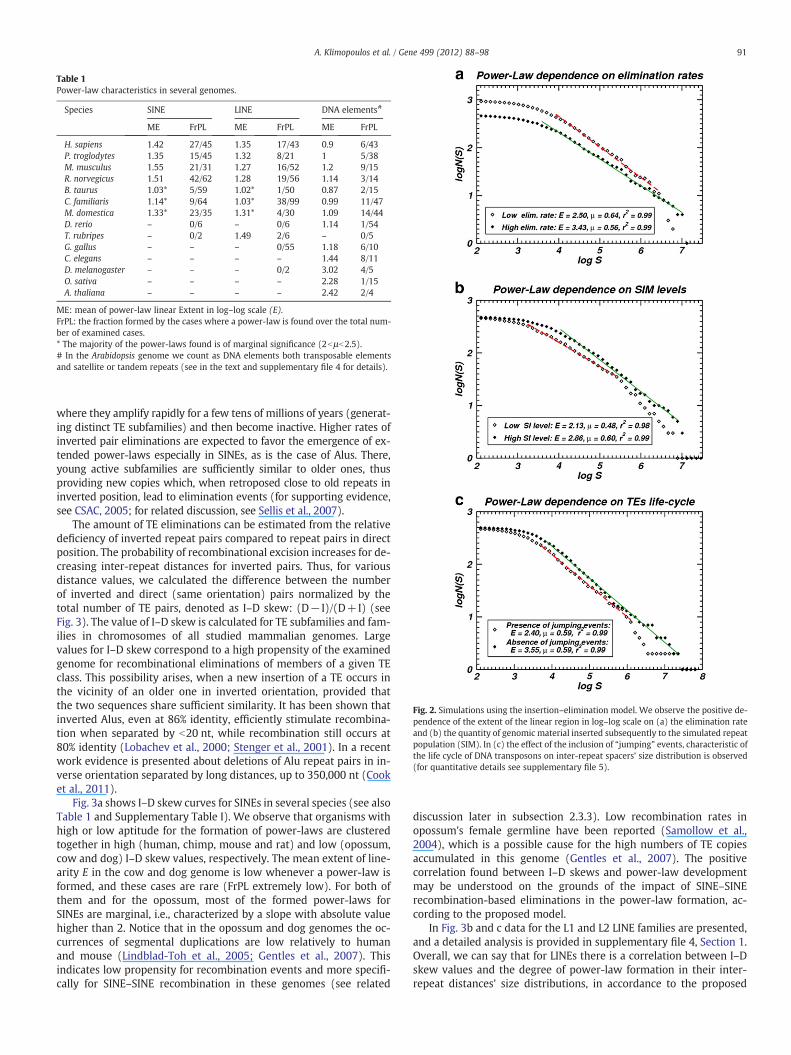
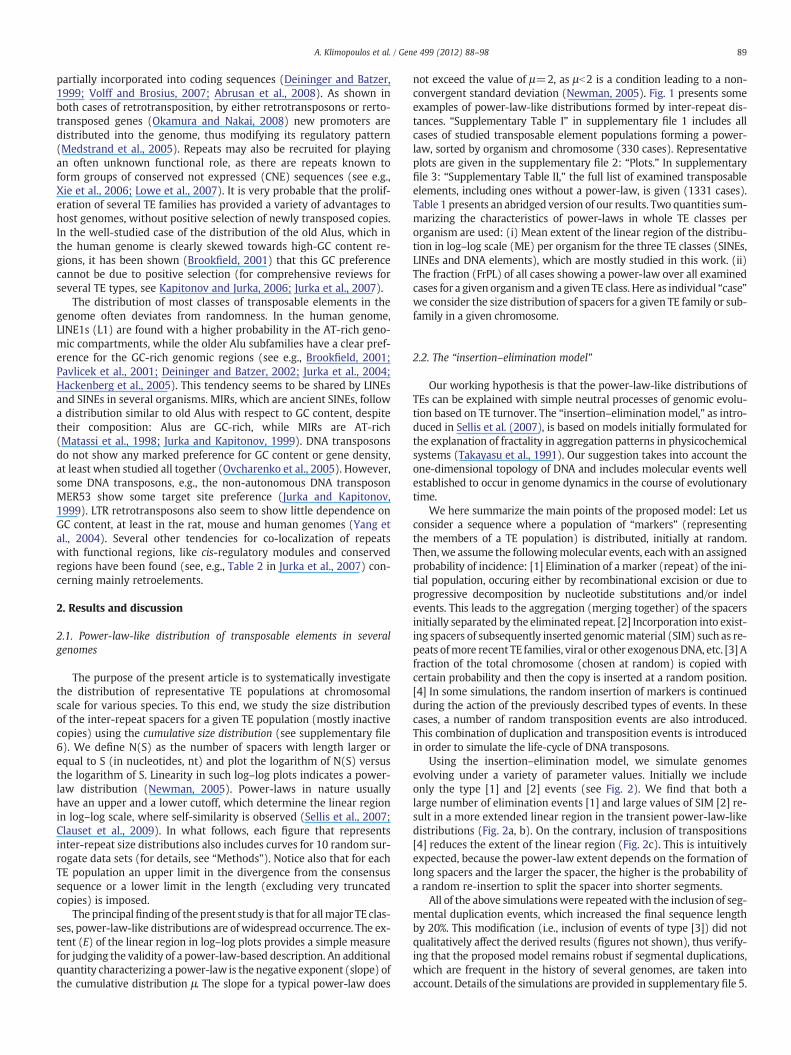
Table 1Power-law characteristics in several genomes.
Species SINE LINE DNA elements#
ME FrPL ME FrPL ME FrPL
H. sapiens 1.42 27/45 1.35 17/43 0.9 6/43P. troglodytes 1.35 15/45 1.32 8/21 1 5/38M. musculus 1.55 21/31 1.27 16/52 1.2 9/15R. norvegicus 1.51 42/62 1.28 19/56 1.14 3/14B. taurus 1.03* 5/59 1.02* 1/50 0.87 2/15C. familiaris 1.14* 9/64 1.03* 38/99 0.99 11/47M. domestica 1.33* 23/35 1.31* 4/30 1.09 14/44D. rerio – 0/6 – 0/6 1.14 1/54T. rubripes – 0/2 1.49 2/6 – 0/5G. gallus – – – 0/55 1.18 6/10C. elegans – – – – 1.44 8/11D. melanogaster – – – 0/2 3.02 4/5O. sativa – – – – 2.28 1/15A. thaliana – – – – 2.42 2/4
ME: mean of power-law linear Extent in log–log scale (E).FrPL: the fraction formed by the cases where a power-law is found over the total num-ber of examined cases.* The majority of the power-laws found is of marginal significance (2bμb2.5).# In the Arabidopsis genome we count as DNA elements both transposable elementsand satellite or tandem repeats (see in the text and supplementary file 4 for details).
Fig. 2. Simulations using the insertion–elimination model. We observe the positive de-pendence of the extent of the linear region in log–log scale on (a) the elimination rateand (b) the quantity of genomic material inserted subsequently to the simulated repeatpopulation (SIM). In (c) the effect of the inclusion of “jumping” events, characteristic ofthe life cycle of DNA transposons on inter-repeat spacers' size distribution is observed(for quantitative details see supplementary file 5).
91A. Klimopoulos et al. / Gene 499 (2012) 88–98
where they amplify rapidly for a few tens of millions of years (generat-ing distinct TE subfamilies) and then become inactive. Higher rates ofinverted pair eliminations are expected to favor the emergence of ex-tended power-laws especially in SINEs, as is the case of Alus. There,young active subfamilies are sufficiently similar to older ones, thusproviding new copies which, when retroposed close to old repeats ininverted position, lead to elimination events (for supporting evidence,see CSAC, 2005; for related discussion, see Sellis et al., 2007).
The amount of TE eliminations can be estimated from the relativedeficiency of inverted repeat pairs compared to repeat pairs in directposition. The probability of recombinational excision increases for de-creasing inter-repeat distances for inverted pairs. Thus, for variousdistance values, we calculated the difference between the numberof inverted and direct (same orientation) pairs normalized by thetotal number of TE pairs, denoted as I–D skew: (D− I)/(D+I) (seeFig. 3). The value of I–D skew is calculated for TE subfamilies and fam-ilies in chromosomes of all studied mammalian genomes. Largevalues for I–D skew correspond to a high propensity of the examinedgenome for recombinational eliminations of members of a given TEclass. This possibility arises, when a new insertion of a TE occurs inthe vicinity of an older one in inverted orientation, provided thatthe two sequences share sufficient similarity. It has been shown thatinverted Alus, even at 86% identity, efficiently stimulate recombina-tion when separated by b20 nt, while recombination still occurs at80% identity (Lobachev et al., 2000; Stenger et al., 2001). In a recentwork evidence is presented about deletions of Alu repeat pairs in in-verse orientation separated by long distances, up to 350,000 nt (Cooket al., 2011).
Fig. 3a shows I–D skew curves for SINEs in several species (see alsoTable 1 and Supplementary Table I). We observe that organisms withhigh or low aptitude for the formation of power-laws are clusteredtogether in high (human, chimp, mouse and rat) and low (opossum,cow and dog) I–D skew values, respectively. The mean extent of line-arity E in the cow and dog genome is low whenever a power-law isformed, and these cases are rare (FrPL extremely low). For both ofthem and for the opossum, most of the formed power-laws forSINEs are marginal, i.e., characterized by a slope with absolute valuehigher than 2. Notice that in the opossum and dog genomes the oc-currences of segmental duplications are low relatively to humanand mouse (Lindblad-Toh et al., 2005; Gentles et al., 2007). Thisindicates low propensity for recombination events and more specifi-cally for SINE–SINE recombination in these genomes (see related
discussion later in subsection 2.3.3). Low recombination rates inopossum's female germline have been reported (Samollow et al.,2004), which is a possible cause for the high numbers of TE copiesaccumulated in this genome (Gentles et al., 2007). The positivecorrelation found between I–D skews and power-law developmentmay be understood on the grounds of the impact of SINE–SINErecombination-based eliminations in the power-law formation, ac-cording to the proposed model.
In Fig. 3b and c data for the L1 and L2 LINE families are presented,and a detailed analysis is provided in supplementary file 4, Section 1.Overall, we can say that for LINEs there is a correlation between I–Dskew values and the degree of power-law formation in their inter-repeat distances' size distributions, in accordance to the proposed
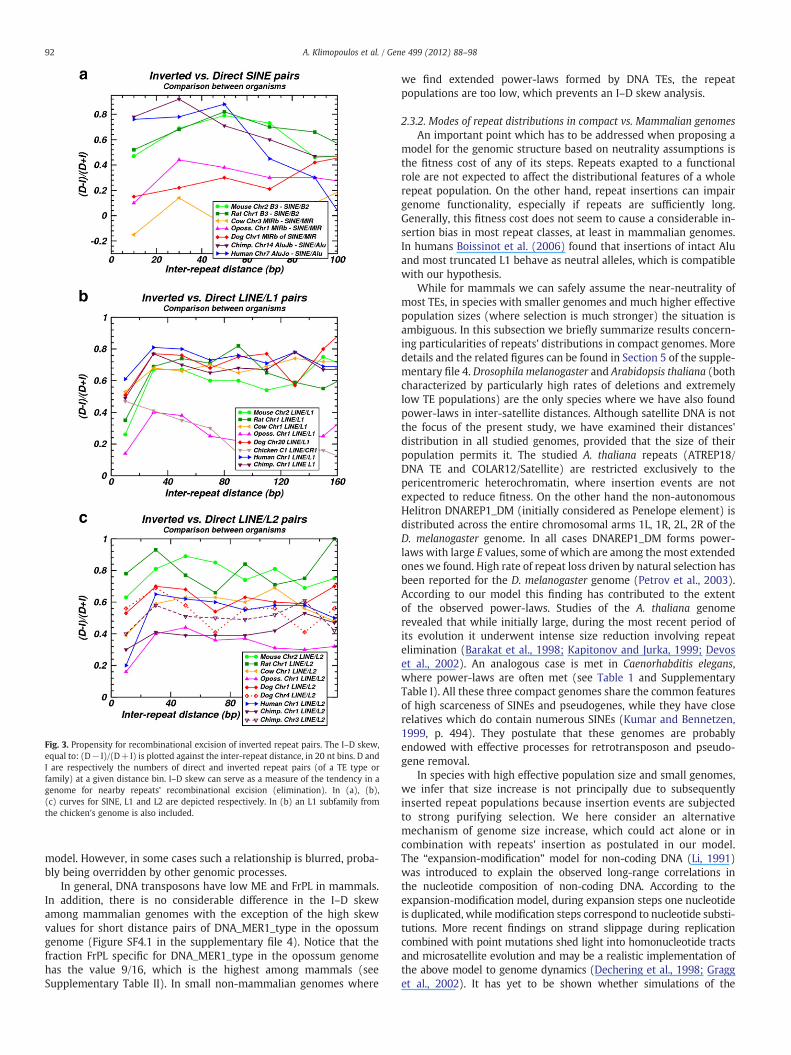
Fig. 3. Propensity for recombinational excision of inverted repeat pairs. The I–D skew,equal to: (D− I)/(D+I) is plotted against the inter-repeat distance, in 20 nt bins. D andI are respectively the numbers of direct and inverted repeat pairs (of a TE type orfamily) at a given distance bin. I–D skew can serve as a measure of the tendency in agenome for nearby repeats' recombinational excision (elimination). In (a), (b),(c) curves for SINE, L1 and L2 are depicted respectively. In (b) an L1 subfamily fromthe chicken's genome is also included.
92 A. Klimopoulos et al. / Gene 499 (2012) 88–98
model. However, in some cases such a relationship is blurred, proba-bly being overridden by other genomic processes.
In general, DNA transposons have low ME and FrPL in mammals.In addition, there is no considerable difference in the I–D skewamong mammalian genomes with the exception of the high skewvalues for short distance pairs of DNA_MER1_type in the opossumgenome (Figure SF4.1 in the supplementary file 4). Notice that thefraction FrPL specific for DNA_MER1_type in the opossum genomehas the value 9/16, which is the highest among mammals (seeSupplementary Table II). In small non-mammalian genomes where
we find extended power-laws formed by DNA TEs, the repeatpopulations are too low, which prevents an I–D skew analysis.
2.3.2. Modes of repeat distributions in compact vs. Mammalian genomesAn important point which has to be addressed when proposing a
model for the genomic structure based on neutrality assumptions isthe fitness cost of any of its steps. Repeats exapted to a functionalrole are not expected to affect the distributional features of a wholerepeat population. On the other hand, repeat insertions can impairgenome functionality, especially if repeats are sufficiently long.Generally, this fitness cost does not seem to cause a considerable in-sertion bias in most repeat classes, at least in mammalian genomes.In humans Boissinot et al. (2006) found that insertions of intact Aluand most truncated L1 behave as neutral alleles, which is compatiblewith our hypothesis.
While for mammals we can safely assume the near-neutrality ofmost TEs, in species with smaller genomes and much higher effectivepopulation sizes (where selection is much stronger) the situation isambiguous. In this subsection we briefly summarize results concern-ing particularities of repeats' distributions in compact genomes. Moredetails and the related figures can be found in Section 5 of the supple-mentary file 4. Drosophila melanogaster and Arabidopsis thaliana (bothcharacterized by particularly high rates of deletions and extremelylow TE populations) are the only species where we have also foundpower-laws in inter-satellite distances. Although satellite DNA is notthe focus of the present study, we have examined their distances'distribution in all studied genomes, provided that the size of theirpopulation permits it. The studied A. thaliana repeats (ATREP18/DNA TE and COLAR12/Satellite) are restricted exclusively to thepericentromeric heterochromatin, where insertion events are notexpected to reduce fitness. On the other hand the non-autonomousHelitron DNAREP1_DM (initially considered as Penelope element) isdistributed across the entire chromosomal arms 1L, 1R, 2L, 2R of theD. melanogaster genome. In all cases DNAREP1_DM forms power-laws with large E values, some of which are among the most extendedones we found. High rate of repeat loss driven by natural selection hasbeen reported for the D. melanogaster genome (Petrov et al., 2003).According to our model this finding has contributed to the extentof the observed power-laws. Studies of the A. thaliana genomerevealed that while initially large, during the most recent period ofits evolution it underwent intense size reduction involving repeatelimination (Barakat et al., 1998; Kapitonov and Jurka, 1999; Devoset al., 2002). An analogous case is met in Caenorhabditis elegans,where power-laws are often met (see Table 1 and SupplementaryTable I). All these three compact genomes share the common featuresof high scarceness of SINEs and pseudogenes, while they have closerelatives which do contain numerous SINEs (Kumar and Bennetzen,1999, p. 494). They postulate that these genomes are probablyendowed with effective processes for retrotransposon and pseudo-gene removal.
In species with high effective population size and small genomes,we infer that size increase is not principally due to subsequentlyinserted repeat populations because insertion events are subjectedto strong purifying selection. We here consider an alternativemechanism of genome size increase, which could act alone or incombination with repeats' insertion as postulated in our model.The “expansion-modification” model for non-coding DNA (Li, 1991)was introduced to explain the observed long-range correlations inthe nucleotide composition of non-coding DNA. According to theexpansion-modification model, during expansion steps one nucleotideis duplicated, while modification steps correspond to nucleotide substi-tutions. More recent findings on strand slippage during replicationcombined with point mutations shed light into homonucleotide tractsand microsatellite evolution and may be a realistic implementation ofthe above model to genome dynamics (Dechering et al., 1998; Gragget al., 2002). It has yet to be shown whether simulations of the

Fig. 4. SINE maternal vs. paternal germline transmission. Ratios of SINE densities onchromosome X relative to autosomes (X/A) from seven mammalian genomes areplotted against the corresponding divergence from the family consensus. For eachdivergence value on the x-axis, the corresponding ratio, for all lower divergence values,is depicted (i.e., cumulatively). Organisms in which paternal or maternal TE prolifera-tion predominates are clustered together.
93A. Klimopoulos et al. / Gene 499 (2012) 88–98
combination of nucleotide-clusters' expansion with point mutations dogenerate long-range correlations (as the “expansion-modification”model does) and if this dynamics leads to inter-repeat spacers'power-law-like size distributions. While evidence we present indi-cate that in several cases the insertion–elimination model signifi-cantly participate in the formation of the observed distributionalpatterns, the expansion–modification model of W. Li could also con-tribute to these patterns. This may be particularly important for theemergence of the observed power-laws in compact genomes.
Further discussion on differences in the modes of proliferation ofDNA TEs vs. retroelements in mammalian genomes and the influenceof these differences on the observed linearity in log–log plots is pro-vided in supplementary file 4 Section 6 “DNA transposons in mamma-lian genomes.”
2.3.3. Elimination of repeats: several trendsThe frequency of occurrence and extent of power-laws for DNA
transposons is higher in rodents than in primates (Table 1). This find-ing can be explained by the higher deletion rates of non-functionalDNA in rodents than in mammals (Waterston et al., 2002), in accor-dance to the insertion–elimination model's prediction. Along thesame lines is the lack of ancient TEs in the mouse genome: they com-prise only 5% compared to the corresponding 22% of the human ge-nome (Waterston et al., 2002). A similar picture stems from thecomparison of the two examined fish genomes. Danio rerio is practi-cally deprived of power-laws, while for Takifugu rubripes linearityin log–log plot is found in about 25% of the examined cases (seeSupplementary Table II), despite the lack of complete chromosomesavailable for this genome (see “Methods”). The propensity for power-law formation in T. rubripes is most probably related to the intenserepeat elimination rate hypothesized for the evolutionary past of thisgenome on the basis of its strongly reduced size (McLysaght et al.,2000; Semon and Wolfe, 2007).
We should here stress the complex role of eliminations in theformation of power-law-like distributions. A large number of elimina-tions, as seen in our simulations and deduced from the study of geno-mic data, is related to the appearance of power-law-like sizedistributions with large extent E. However, the continuous elimina-tion of repeats in a given population finally destroys any pattern inthe spacers' size distribution. This complexity is enhanced by therole of recombination in the TE proliferation. In some cases, as inthe genome of C. elegans, TEs are clustered in regions with highmeiotic recombination rate (Jurka and Kapitonov, 1999). On theother hand, in several genomes, a higher density of TEs is found inareas of low recombination. This occurs in D. melanogaster (Petrovet al., 2003) and might also underlie the observed ERV (endogenousretroviruses) accumulation in low recombination rate regions inopossum chromosomes (Gentles et al., 2007). These findings onmodes of co-localization of TEs with genomic loci of high or low re-combination rates are compatible with our observation of weakpower-laws in some genomes with high TE populations (cow, dog;see Supplementary Table I) and of frequent and well-shaped power-laws when the inverse condition holds (D. melanogaster, A. thalianaand C. elegans). Notice that the rate of DNA loss in Drosophila is ap-proximately 75 times faster than that estimated for mammaliangenomes (Petrov and Hartl, 1997).
In rodents and primates, especially for non-LTR retrotransposons,both high repeat numbers and elimination rates, which are sufficientfor the formation of power-laws, coexist. Illegitimate recombinationis especially efficient among Alu and in other families of short SINEs.As several authors comment (see, e.g., Abrusan et al., 2008), illegiti-mate recombination is an effective mechanism for repeat elimination.This feature leads these TEs to exhibit the highest spatial variability,and according to the proposed insertion–elimination model, this isthe reason for the promptness of SINEs and particularly Alus toform extended power-laws.
2.3.4. Modes of SINE parental germline transmission differentiategenomes propensity to form power-laws
Jurka and co-workers (Jurka et al., 2002; Jurka et al., 2004; Jurka etal., 2005) have shown that SINEs in the human and mouse genomeare proliferating mainly through the male germline, where both in-sertions and eliminations of TEs mostly occur. In the dog genomeSINEs are transposing mainly through the female germline. Theycalculated the ratio of SINE densities on chromosome X to the SINEdensities on the autosomes (X/A) in these three genomes for severaldivergence values. They found that in the human and mouse genomeSINEs are overrepresented in autosomes with X/A values close to 2/3, while for the dog genome this proportion is close to 4/3. Thesesimple fractions correspond to pure male and female transmission,respectively.
We have extended the analysis presented in Jurka et al. (2007,Fig. 2) to SINEs of all mammalian genomes included in our study(see Fig. 4 herein). More recent (low divergence) TE populations,although more reliable for inferring the proliferation mode as lessexposed to interchromosomal translocations and eliminations, arefewer; thus, the corresponding X/A ratios are prone to statistical fluc-tuations. Ignoring the very small divergence values, the X/A ratios forthe cow, opossum and dog genomes are larger than the ratios forchimpanzee, rat, mouse and human. Notice that X/A TE population ra-tios, expected purely on the basis of germline transmission, are onlyapproximations of the really observed ones, which are also influencedby different chromosomal GC content, recombination rates and otherfactors (Kvikstad and Makova, 2010). We observe that genomes witha low X/A ratio, close to the value corresponding to paternal SINEtransmission, exhibit a higher propensity for power-law formation.However the biological impact of germline-specific transmission ofTEs is still unclear (Jurka et al., 2007). SINE–SINE recombination rateis an important prerequisite for power-laws due to the role of recom-binational excisions, as already discussed. This recombination rate isparticularly low in the dog genome as also indicated by data inFig. 3a herein. In Fig. 3 of Jurka et al. (2007) comparison of human,mouse and dog genomes with respect to the SINE accumulation intoGC-rich regions is shown. Such an accumulation occurs in thehuman genome only for old SINE populations. They found that inthe mouse genome even young SINEs accumulate in GC-rich regions,while in the dog genome there is virtually no GC dependence in bothyoung and old SINEs' spatial distribution. This finding indicates thatSINE–SINE recombination rates are particularly low in the doggenome, as post-insertional changes in the distribution of SINE ele-ments have been attributed to SINE–SINE recombination (Hackenberg

Fig. 5. The effect of divergence from the subfamily consensus on the extent of thepower-law. One case of SINE and one of DNA (Helitron) TE are presented in (a) and(b), respectively.
94 A. Klimopoulos et al. / Gene 499 (2012) 88–98
et al., 2005). Loss of target site duplications (TSDs) in human and rat butnot in the dog genome is also consistent with the prediction of lowSINE–SINE recombination rate in the dog genome. The human/rat/dogSINE loss rate ratios are found to be 5.0:6.5:1.0, respectively (Gentleset al., 2005). Moreover, Jurka and co-workers remark that, in contrastto human and mouse genomes, very few segmental duplications havebeen found in the dog genome (Lindblad-Toh et al., 2005). This remarkin view of the triggering of such duplications by SINE–SINE recombina-tion is again in agreement with the hypothesis causally connectingpower-law extent with the form of the curves in our Fig. 4 (cf. alsoFig. 3a and related discussion). It remains to be shown whether low re-combinational propensity is related to the maternal SINE transmissionin general, as indicated by the correlation between maternal transmis-sion and scarceness of power-laws in inter-repeat distances. We didnot perform an analogous study for L1 elements, as they accumulateon chromosome X due to selection related to their participation in theX-inactivation (Abrusan et al., 2008; Kvikstad and Makova, 2010).
2.3.5. Power-law dependence on the age of the TE family and onsimilarity with the family consensus
According to the proposed model, we expect power-law-like dis-tributions to be observed only for TE families that are present in thegenome more than a minimum amount of time, which is requiredfor the power-law formation. As a measure of the relative ages of TEfamilies within a genome we can use the mean divergence from thefamily consensus (see Gentles et al., 2007). The divergence valuesare from RepeatMasker (Smit et al., 1996–2010). We find thatamong all the TEs following a power-law-like distribution, only in20 out of 330 cases the mean divergence was lower than 10% andonly in one lower than 5% (see Supplementary Table I). We concludethat all the repeat populations where a power-law is formed are fixedrepeats, and therefore likely to be neutral or nearly neutral.
Notice that TEs of the same subfamily have approximately thesame age. However, they don't share the same divergence value.Their divergences are distributed almost normally as individual cop-ies have been exposed to a particular history of local mutation andrecombination events. In all the examined cases we find that the“best” power-law (i.e., more extended, lower absolute value of theslope) is obtained if we consider only a subset of a TE population,with divergence values ranging from 0 up to a threshold value.
In order to demonstrate this property we compare, in a number ofTE subfamilies, two subsets of the TE populations: one, including onlyindividual TEs with divergence less than a threshold (maximumdivergence) and the other including the same number of TEs with di-vergence larger than the maximum divergence (examples are shownin Fig. 5). For SINE and LINE elements, the TEs with larger divergencesform considerably deteriorated power-laws with lower mean extent.However, in DNA elements the difference between repeat popula-tions with low and high divergence is much less pronounced (supple-mentary file 4, Section 2: “Effects of repeats' divergence and length”).
This property is in accordance with the proposed insertion–elimination model as a direct consequence of the similarity require-ment for recombinational excisions. Thus, TEs sharing a high degree ofsimilarity with their consensus, and therefore being more similar toeach other, form power-law-like distributions with large extent E andlow absolute value of the slope μ. The positive dependence of power-law-like distributions on the threshold of maximum divergence wasfirst found in the case of human Alus (Sellis et al., 2007) and is hereverified for all TE classes in many genomes. The lower dependence ofthe extent of power-laws on maximum divergence, which is ob-served in DNA elements, brings further evidence in favor of the hy-pothesis that their eliminations from a genome relies mostly ongradual decomposition than on recombinational excisions, if comparedto retroelements.
Another measure for the similarity between a TE copy and itsconsensus sequence is the length of the TE. Repeating the previous
analysis, with a minimum length threshold instead of a maximum di-vergence, shows that less truncated TEs always form better power-laws (see supplementary file 4 Figures SF4.4,5). This is also in accor-dance to the proposed model, because less truncated TEs are bettercandidates for participation in recombinational elimination events.Especially for LINEs, where truncation of the newly retroposed copyis very common, the imposition of a threshold on the length insteadof a threshold on the divergence was found to be more effective forobtaining a better-shaped power-law.
2.3.6. Power-law dependence on the GC contentFor several mammalian species, there is evidence that SINEs and
LINEs are initially inserted almost randomly in the genome, with aslight preference towards AT-rich genomic regions, and then theyare eliminated with higher probability in low-GC and high-GC iso-chores, respectively (Pavlicek et al., 2001; Deininger and Batzer,2002; Hackenberg et al., 2005). Previously, in Section 2.3.4 treatingparental germlines' transmission, we discussed human–mouse–dogdifferences in SINE genomic distributions, with respect to GC genomiccontent (Jurka et al., 2007, Fig. 3). On that basis, we are focusing hereon the effect of the genomic GC content on the extent of power-lawsfound for SINEs in the mouse and dog genomes. It has been suggested(Jurka et al., 2005) that the accumulation of mouse SINEs in GC-richregions is due to the excess of DNA duplications over deletions ingene-dense regions that tend to be GC-rich. This finding indicates,according to the insertion–elimination model, that more extendedpower-laws should be formed in SINE inter-repeat distances in themouse GC-poor sub-genome, as there eliminations are not selectedagainst.
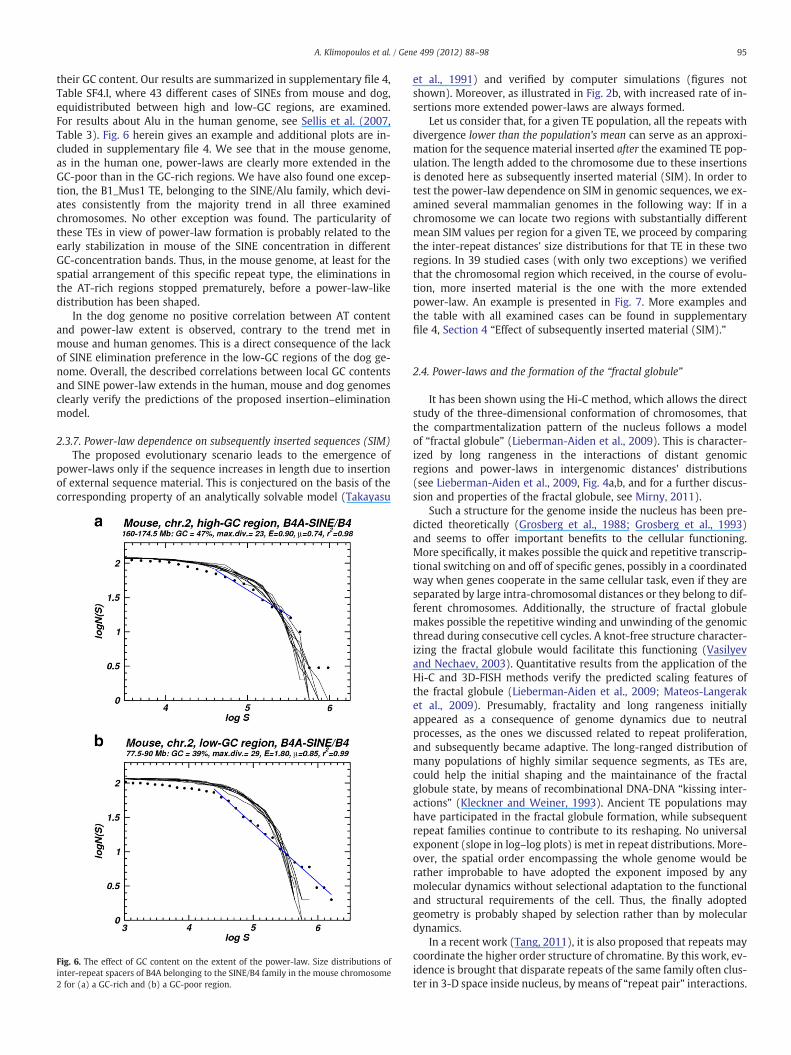
In order to test this prediction we compare the spatial distribu-tions of the same number of TEs in genomic regions differing in
95A. Klimopoulos et al. / Gene 499 (2012) 88–98
their GC content. Our results are summarized in supplementary file 4,Table SF4.I, where 43 different cases of SINEs from mouse and dog,equidistributed between high and low-GC regions, are examined.For results about Alu in the human genome, see Sellis et al. (2007,Table 3). Fig. 6 herein gives an example and additional plots are in-cluded in supplementary file 4. We see that in the mouse genome,as in the human one, power-laws are clearly more extended in theGC-poor than in the GC-rich regions. We have also found one excep-tion, the B1_Mus1 TE, belonging to the SINE/Alu family, which devi-ates consistently from the majority trend in all three examinedchromosomes. No other exception was found. The particularity ofthese TEs in view of power-law formation is probably related to theearly stabilization in mouse of the SINE concentration in differentGC-concentration bands. Thus, in the mouse genome, at least for thespatial arrangement of this specific repeat type, the eliminations inthe AT-rich regions stopped prematurely, before a power-law-likedistribution has been shaped.
In the dog genome no positive correlation between AT contentand power-law extent is observed, contrary to the trend met inmouse and human genomes. This is a direct consequence of the lackof SINE elimination preference in the low-GC regions of the dog ge-nome. Overall, the described correlations between local GC contentsand SINE power-law extends in the human, mouse and dog genomesclearly verify the predictions of the proposed insertion–eliminationmodel.
2.3.7. Power-law dependence on subsequently inserted sequences (SIM)The proposed evolutionary scenario leads to the emergence of
power-laws only if the sequence increases in length due to insertionof external sequence material. This is conjectured on the basis of thecorresponding property of an analytically solvable model (Takayasu
Fig. 6. The effect of GC content on the extent of the power-law. Size distributions ofinter-repeat spacers of B4A belonging to the SINE/B4 family in the mouse chromosome2 for (a) a GC-rich and (b) a GC-poor region.
et al., 1991) and verified by computer simulations (figures notshown). Moreover, as illustrated in Fig. 2b, with increased rate of in-sertions more extended power-laws are always formed.
Let us consider that, for a given TE population, all the repeats withdivergence lower than the population's mean can serve as an approxi-mation for the sequence material inserted after the examined TE pop-ulation. The length added to the chromosome due to these insertionsis denoted here as subsequently inserted material (SIM). In order totest the power-law dependence on SIM in genomic sequences, we ex-amined several mammalian genomes in the following way: If in achromosome we can locate two regions with substantially differentmean SIM values per region for a given TE, we proceed by comparingthe inter-repeat distances' size distributions for that TE in these tworegions. In 39 studied cases (with only two exceptions) we verifiedthat the chromosomal region which received, in the course of evolu-tion, more inserted material is the one with the more extendedpower-law. An example is presented in Fig. 7. More examples andthe table with all examined cases can be found in supplementaryfile 4, Section 4 “Effect of subsequently inserted material (SIM).”
2.4. Power-laws and the formation of the “fractal globule”
It has been shown using the Hi-C method, which allows the directstudy of the three-dimensional conformation of chromosomes, thatthe compartmentalization pattern of the nucleus follows a modelof “fractal globule” (Lieberman-Aiden et al., 2009). This is character-ized by long rangeness in the interactions of distant genomicregions and power-laws in intergenomic distances' distributions(see Lieberman-Aiden et al., 2009, Fig. 4a,b, and for a further discus-sion and properties of the fractal globule, see Mirny, 2011).
Such a structure for the genome inside the nucleus has been pre-dicted theoretically (Grosberg et al., 1988; Grosberg et al., 1993)and seems to offer important benefits to the cellular functioning.More specifically, it makes possible the quick and repetitive transcrip-tional switching on and off of specific genes, possibly in a coordinatedway when genes cooperate in the same cellular task, even if they areseparated by large intra-chromosomal distances or they belong to dif-ferent chromosomes. Additionally, the structure of fractal globulemakes possible the repetitive winding and unwinding of the genomicthread during consecutive cell cycles. A knot-free structure character-izing the fractal globule would facilitate this functioning (Vasilyevand Nechaev, 2003). Quantitative results from the application of theHi-C and 3D-FISH methods verify the predicted scaling features ofthe fractal globule (Lieberman-Aiden et al., 2009; Mateos-Langeraket al., 2009). Presumably, fractality and long rangeness initiallyappeared as a consequence of genome dynamics due to neutralprocesses, as the ones we discussed related to repeat proliferation,and subsequently became adaptive. The long-ranged distribution ofmany populations of highly similar sequence segments, as TEs are,could help the initial shaping and the maintainance of the fractalglobule state, by means of recombinational DNA-DNA “kissing inter-actions” (Kleckner and Weiner, 1993). Ancient TE populations mayhave participated in the fractal globule formation, while subsequentrepeat families continue to contribute to its reshaping. No universalexponent (slope in log–log plots) is met in repeat distributions. More-over, the spatial order encompassing the whole genome would berather improbable to have adopted the exponent imposed by anymolecular dynamics without selectional adaptation to the functionaland structural requirements of the cell. Thus, the finally adoptedgeometry is probably shaped by selection rather than by moleculardynamics.
In a recent work (Tang, 2011), it is also proposed that repeats maycoordinate the higher order structure of chromatine. By this work, ev-idence is brought that disparate repeats of the same family often clus-ter in 3-D space inside nucleus, by means of “repeat pair” interactions.
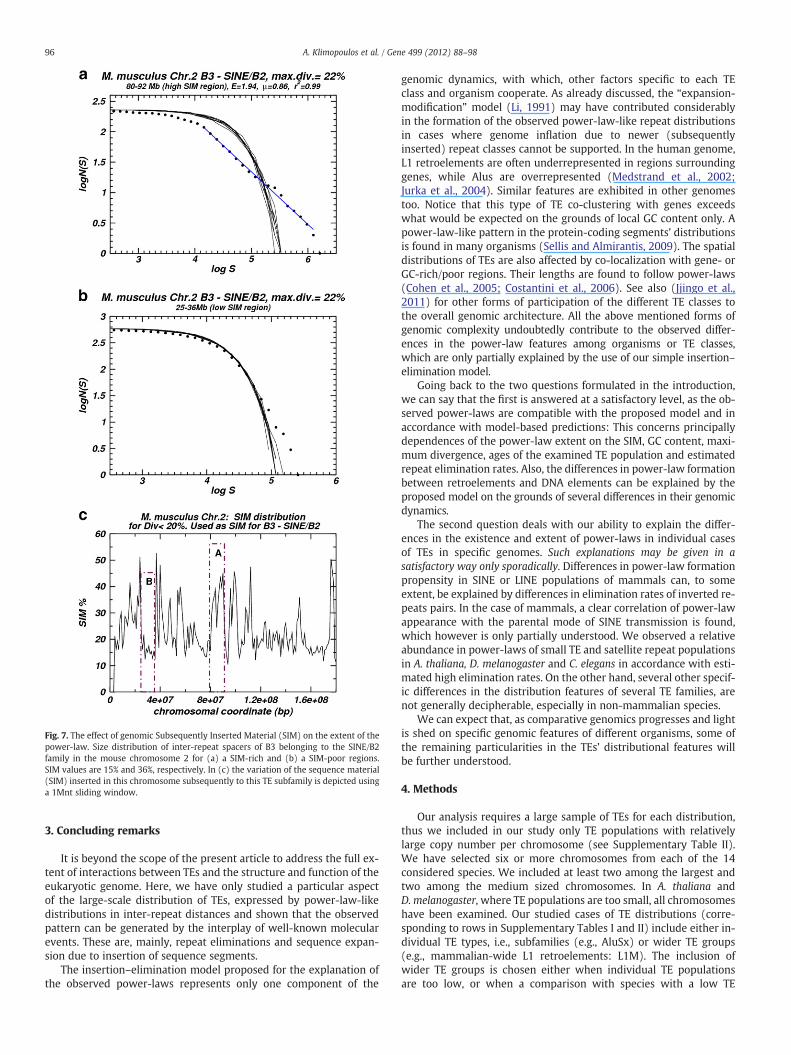
Fig. 7. The effect of genomic Subsequently Inserted Material (SIM) on the extent of thepower-law. Size distribution of inter-repeat spacers of B3 belonging to the SINE/B2family in the mouse chromosome 2 for (a) a SIM-rich and (b) a SIM-poor regions.SIM values are 15% and 36%, respectively. In (c) the variation of the sequence material(SIM) inserted in this chromosome subsequently to this TE subfamily is depicted usinga 1Mnt sliding window.
96 A. Klimopoulos et al. / Gene 499 (2012) 88–98
3. Concluding remarks
It is beyond the scope of the present article to address the full ex-tent of interactions between TEs and the structure and function of theeukaryotic genome. Here, we have only studied a particular aspectof the large-scale distribution of TEs, expressed by power-law-likedistributions in inter-repeat distances and shown that the observedpattern can be generated by the interplay of well-known molecularevents. These are, mainly, repeat eliminations and sequence expan-sion due to insertion of sequence segments.
The insertion–elimination model proposed for the explanation ofthe observed power-laws represents only one component of the
genomic dynamics, with which, other factors specific to each TEclass and organism cooperate. As already discussed, the “expansion-modification” model (Li, 1991) may have contributed considerablyin the formation of the observed power-law-like repeat distributionsin cases where genome inflation due to newer (subsequentlyinserted) repeat classes cannot be supported. In the human genome,L1 retroelements are often underrepresented in regions surroundinggenes, while Alus are overrepresented (Medstrand et al., 2002;Jurka et al., 2004). Similar features are exhibited in other genomestoo. Notice that this type of TE co-clustering with genes exceedswhat would be expected on the grounds of local GC content only. Apower-law-like pattern in the protein-coding segments’ distributionsis found in many organisms (Sellis and Almirantis, 2009). The spatialdistributions of TEs are also affected by co-localization with gene- orGC-rich/poor regions. Their lengths are found to follow power-laws(Cohen et al., 2005; Costantini et al., 2006). See also (Jjingo et al.,2011) for other forms of participation of the different TE classes tothe overall genomic architecture. All the above mentioned forms ofgenomic complexity undoubtedly contribute to the observed differ-ences in the power-law features among organisms or TE classes,which are only partially explained by the use of our simple insertion–elimination model.
Going back to the two questions formulated in the introduction,we can say that the first is answered at a satisfactory level, as the ob-served power-laws are compatible with the proposed model and inaccordance with model-based predictions: This concerns principallydependences of the power-law extent on the SIM, GC content, maxi-mum divergence, ages of the examined TE population and estimatedrepeat elimination rates. Also, the differences in power-law formationbetween retroelements and DNA elements can be explained by theproposed model on the grounds of several differences in their genomicdynamics.
The second question deals with our ability to explain the differ-ences in the existence and extent of power-laws in individual casesof TEs in specific genomes. Such explanations may be given in asatisfactory way only sporadically. Differences in power-law formationpropensity in SINE or LINE populations of mammals can, to someextent, be explained by differences in elimination rates of inverted re-peats pairs. In the case of mammals, a clear correlation of power-lawappearance with the parental mode of SINE transmission is found,which however is only partially understood. We observed a relativeabundance in power-laws of small TE and satellite repeat populationsin A. thaliana, D. melanogaster and C. elegans in accordance with esti-mated high elimination rates. On the other hand, several other specif-ic differences in the distribution features of several TE families, arenot generally decipherable, especially in non-mammalian species.
We can expect that, as comparative genomics progresses and lightis shed on specific genomic features of different organisms, some ofthe remaining particularities in the TEs’ distributional features willbe further understood.
4. Methods
Our analysis requires a large sample of TEs for each distribution,thus we included in our study only TE populations with relativelylarge copy number per chromosome (see Supplementary Table II).We have selected six or more chromosomes from each of the 14considered species. We included at least two among the largest andtwo among the medium sized chromosomes. In A. thaliana andD. melanogaster, where TE populations are too small, all chromosomeshave been examined. Our studied cases of TE distributions (corre-sponding to rows in Supplementary Tables I and II) include either in-dividual TE types, i.e., subfamilies (e.g., AluSx) or wider TE groups(e.g., mammalian-wide L1 retroelements: L1M). The inclusion ofwider TE groups is chosen either when individual TE populationsare too low, or when a comparison with species with a low TE
97A. Klimopoulos et al. / Gene 499 (2012) 88–98
population numbers is desired. In some cases, after a preliminarystudy, we chose to present the level of TE population (family or sub-family) where the linearity in log–log plot becomes more obvious.The TEs we studied in each of the considered chromosomes are repre-sentative of the main TE classes. When possible, we examined thesame or related TE families in different organisms, in order to allowcomparisons.
Marginal occurrences of power-laws (with 2bμb2.5) are includedin Supplementary Table I marked with an asterisk. The r2 values foralmost all considered power-laws (~98%) is higher than 0.98 andare also given in Supplementary Table II.
The genomic coordinates of TEs were extracted from RepeatMas-ker output files downloaded from the UCSC genome browser, www.genome.ucsc.edu; with the exception of C. elegans for which theassembled chromosomes (release 1998-11-09) where downloadedfrom NCBI genomic biology, ftp://ftp.ncbi.nih.gov/genomes.
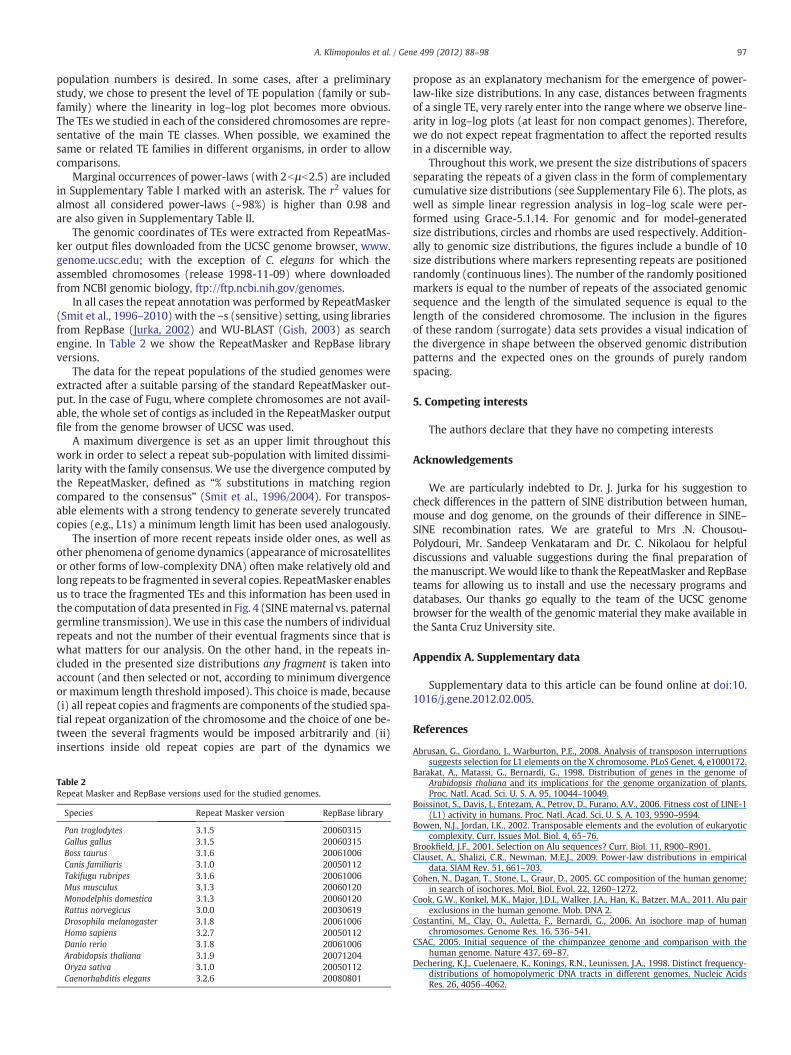
In all cases the repeat annotation was performed by RepeatMasker(Smit et al., 1996–2010) with the –s (sensitive) setting, using librariesfrom RepBase (Jurka, 2002) and WU-BLAST (Gish, 2003) as searchengine. In Table 2 we show the RepeatMasker and RepBase libraryversions.
The data for the repeat populations of the studied genomes wereextracted after a suitable parsing of the standard RepeatMasker out-put. In the case of Fugu, where complete chromosomes are not avail-able, the whole set of contigs as included in the RepeatMasker outputfile from the genome browser of UCSC was used.
A maximum divergence is set as an upper limit throughout thiswork in order to select a repeat sub-population with limited dissimi-larity with the family consensus. We use the divergence computed bythe RepeatMasker, defined as “% substitutions in matching regioncompared to the consensus” (Smit et al., 1996/2004). For transpos-able elements with a strong tendency to generate severely truncatedcopies (e.g., L1s) a minimum length limit has been used analogously.
The insertion of more recent repeats inside older ones, as well asother phenomena of genome dynamics (appearance of microsatellitesor other forms of low-complexity DNA) often make relatively old andlong repeats to be fragmented in several copies. RepeatMasker enablesus to trace the fragmented TEs and this information has been used inthe computation of data presented in Fig. 4 (SINEmaternal vs. paternalgermline transmission). We use in this case the numbers of individualrepeats and not the number of their eventual fragments since that iswhat matters for our analysis. On the other hand, in the repeats in-cluded in the presented size distributions any fragment is taken intoaccount (and then selected or not, according to minimum divergenceor maximum length threshold imposed). This choice is made, because(i) all repeat copies and fragments are components of the studied spa-tial repeat organization of the chromosome and the choice of one be-tween the several fragments would be imposed arbitrarily and (ii)insertions inside old repeat copies are part of the dynamics we
Table 2Repeat Masker and RepBase versions used for the studied genomes.
Species Repeat Masker version RepBase library
Pan troglodytes 3.1.5 20060315Gallus gallus 3.1.5 20060315Boss taurus 3.1.6 20061006Canis familiaris 3.1.0 20050112Takifugu rubripes 3.1.6 20061006Mus musculus 3.1.3 20060120Monodelphis domestica 3.1.3 20060120Rattus norvegicus 3.0.0 20030619Drosophila melanogaster 3.1.8 20061006Homo sapiens 3.2.7 20050112Danio rerio 3.1.8 20061006Arabidopsis thaliana 3.1.9 20071204Oryza sativa 3.1.0 20050112Caenorhabditis elegans 3.2.6 20080801
propose as an explanatory mechanism for the emergence of power-law-like size distributions. In any case, distances between fragmentsof a single TE, very rarely enter into the range where we observe line-arity in log–log plots (at least for non compact genomes). Therefore,we do not expect repeat fragmentation to affect the reported resultsin a discernible way.
Throughout this work, we present the size distributions of spacersseparating the repeats of a given class in the form of complementarycumulative size distributions (see Supplementary File 6). The plots, aswell as simple linear regression analysis in log–log scale were per-formed using Grace-5.1.14. For genomic and for model-generatedsize distributions, circles and rhombs are used respectively. Addition-ally to genomic size distributions, the figures include a bundle of 10size distributions where markers representing repeats are positionedrandomly (continuous lines). The number of the randomly positionedmarkers is equal to the number of repeats of the associated genomicsequence and the length of the simulated sequence is equal to thelength of the considered chromosome. The inclusion in the figuresof these random (surrogate) data sets provides a visual indication ofthe divergence in shape between the observed genomic distributionpatterns and the expected ones on the grounds of purely randomspacing.
5. Competing interests
The authors declare that they have no competing interests
Acknowledgements
We are particularly indebted to Dr. J. Jurka for his suggestion tocheck differences in the pattern of SINE distribution between human,mouse and dog genome, on the grounds of their difference in SINE–SINE recombination rates. We are grateful to Mrs .N. Chousou-Polydouri, Mr. Sandeep Venkataram and Dr. C. Nikolaou for helpfuldiscussions and valuable suggestions during the final preparation ofthemanuscript.Wewould like to thank the RepeatMasker and RepBaseteams for allowing us to install and use the necessary programs anddatabases. Our thanks go equally to the team of the UCSC genomebrowser for the wealth of the genomic material they make available inthe Santa Cruz University site.
Appendix A. Supplementary data
Supplementary data to this article can be found online at doi:10.1016/j.gene.2012.02.005.
References
Abrusan, G., Giordano, J., Warburton, P.E., 2008. Analysis of transposon interruptionssuggests selection for L1 elements on the X chromosome. PLoS Genet. 4, e1000172.
Barakat, A., Matassi, G., Bernardi, G., 1998. Distribution of genes in the genome ofArabidopsis thaliana and its implications for the genome organization of plants.Proc. Natl. Acad. Sci. U. S. A. 95, 10044–10049.
Boissinot, S., Davis, J., Entezam, A., Petrov, D., Furano, A.V., 2006. Fitness cost of LINE-1(L1) activity in humans. Proc. Natl. Acad. Sci. U. S. A. 103, 9590–9594.
Bowen, N.J., Jordan, I.K., 2002. Transposable elements and the evolution of eukaryoticcomplexity. Curr. Issues Mol. Biol. 4, 65–76.
Brookfield, J.F., 2001. Selection on Alu sequences? Curr. Biol. 11, R900–R901.Clauset, A., Shalizi, C.R., Newman, M.E.J., 2009. Power-law distributions in empirical
data. SIAM Rev. 51, 661–703.Cohen, N., Dagan, T., Stone, L., Graur, D., 2005. GC composition of the human genome:
in search of isochores. Mol. Biol. Evol. 22, 1260–1272.Cook, G.W., Konkel, M.K., Major, J.D.I., Walker, J.A., Han, K., Batzer, M.A., 2011. Alu pair
exclusions in the human genome. Mob. DNA 2.Costantini, M., Clay, O., Auletta, F., Bernardi, G., 2006. An isochore map of human
chromosomes. Genome Res. 16, 536–541.CSAC, 2005. Initial sequence of the chimpanzee genome and comparison with the
human genome. Nature 437, 69–87.Dechering, K.J., Cuelenaere, K., Konings, R.N., Leunissen, J.A., 1998. Distinct frequency-
distributions of homopolymeric DNA tracts in different genomes. Nucleic AcidsRes. 26, 4056–4062.
98 A. Klimopoulos et al. / Gene 499 (2012) 88–98
Deininger, P.L., Batzer, M.A., 1999. Alu repeats and human disease. Mol. Genet. Metab.67, 183–193.
Deininger, P.L., Batzer, M.A., 2002. Mammalian retroelements. Genome Res. 12,1455–1465.
Devos, K.M., Brown, J.K., Bennetzen, J.L., 2002. Genome size reduction throughillegitimate recombination counteracts genome expansion in Arabidopsis. GenomeRes. 12, 1075–1079.
Gentles, A.J., Kohany, O., Jurka, J., 2005. Evolutionary diversity and potential recombi-nogenic role of integration targets of non-LTR retrotransposons. Mol. Biol. Evol.22, 1983–1991.
Gentles, A.J., et al., 2007. Evolutionary dynamics of transposable elements in the short-tailed opossum Monodelphis domestica. Genome Res. 17, 992–1004.
Gish, W., 2003. WU-BLAST v.2.0,10/05/2005. http://blast.wustl.edu.Gragg, H., Harfe, B.D., Jinks-Robertson, S., 2002. Base composition of mononucleotide
runs affects DNA polymerase slippage and removal of frameshift intermediatesby mismatch repair in Saccharomyces cerevisiae. Mol. Cell. Biol. 22, 8756–8762.
Grosberg, A., Nechaev, S.K., Shakhnovich, E.I., 1988. The role of topological constraintsin the kinetics of collapse of macromolecules. J Phys France 49, 2095–2100.
Grosberg, A., Rabin, Y., Havlin, S., Neer, A., 1993. Crumpled globule model of the three-dimensional structure of DNA. Europhys. Lett. 23, 373–378.
Hackenberg, M., Bernaola-Galvan, P., Carpena, P., Oliver, J.L., 2005. The biased distribu-tion of Alus in human isochores might be driven by recombination. J. Mol. Evol. 60,365–377.
Jjingo, D., Huda, A., Gundapuneni, M., Marino-Ramirez, L., Jordan, I.K., 2011. Effect ofthe transposable element environment of human genes on gene length and ex-pression. Genome Biol. Evol. 3, 259–271.
Jurka, J., 1998. Repeats in genomic DNA: mining andmeaning. Curr. Opin. Struct. Biol. 8,333–337.
Jurka, J., 2002. Repbase Update: a database and an electronic journal of repetitive ele-ments. Trends Genet. 16, 418–420.
Jurka, J., 2008. Conserved eukaryotic transposable elements and the evolution of generegulation. Cell Mol. Life Sci. 65, 201–204.
Jurka, J., Kapitonov, V.V., 1999. Sectorial mutagenesis by transposable elements.Genetica 107, 239–248.
Jurka, J., Krnjajic, M., Kapitonov, V.V., Stenger, J.E., Kokhanyy, O., 2002. Active Aluelements are passed primarily through paternal germlines. Theor. Popul. Biol. 61,519–530.
Jurka, J., Kohany, O., Pavlicek, A., Kapitonov, V.V., Jurka, M.V., 2004. Duplication, coclus-tering, and selection of human Alu retrotransposons. Proc. Natl. Acad. Sci. U. S. A.101, 1268–1272.
Jurka, J., Kohany, O., Pavlicek, A., Kapitonov, V.V., Jurka, M.V., 2005. Clustering, duplica-tion and chromosomal distribution of mouse SINE retrotransposons. Cytogenet.Genome Res. 110, 117–123.
Jurka, J., Kapitonov, V.V., Kohany, O., Jurka, M.V., 2007. Repetitive sequences in complexgenomes: structure and evolution. Annu. Rev. Genomics Hum. Genet. 8, 241–259.
Kapitonov, V.V., Jurka, J., 1999. Molecular paleontology of transposable elements fromArabidopsis thaliana. Genetica 107, 27–37.
Kapitonov, V.V., Jurka, J., 2006. Self-synthesizing DNA transposons in eukaryotes. Proc.Natl. Acad. Sci. U. S. A. 103, 4540–4545.
Kleckner, N., Weiner, B.M., 1993. Potential advantages of unstable interactions forpairing of chromosomes in meiotic, somatic, and premeiotic cells. Cold SpringHarb Symp. Quant. Biol. 58, 553–565.
Kumar, A., Bennetzen, J.L., 1999. Plant retrotransposons. Annu. Rev. Genet. 33,479–532.
Kvikstad, E.M., Makova, K.D., 2010. The (r)evolution of SINE versus LINE distributionsin primate genomes: sex chromosomes are important. Genome Res. 20, 600–613.
Lander, E.S., Linton, L.M., Birren, B., Nusbaum, C., Zody, M.C., Baldwin, J., 2001. Initial se-quencing and analysis of the human genome. Nature 409, 860–921.
Li, W., 1991. Expansion-modification systems: A model for spatial 1/f spectra. Phys.Rev. A 43, 5240–5260.
Lieberman-Aiden, E., et al., 2009. Comprehensive mapping of long-range interactionsreveals folding principles of the human genome. Science 326, 289–293.
Lindblad-Toh, K., Wade, C.M., Mikkelsen, T.S., Karlsson, E.K., Jaffe, D.B., Kamal, M., 2005.Genome sequence, comparative analysis and haplotype structure of the domesticdog. Nature 438, 803–819.
Lobachev, K.S., Stenger, J.E., Kozyreva, O.G., Jurka, J., Gordenin, D.A., Resnick, M.A., 2000.Inverted Alu repeats unstable in yeast are excluded from the human genome.EMBO J. 19, 3822–3830.
Lowe, C.B., Bejerano, G., Haussler, D., 2007. Thousands of human mobile element frag-ments undergo strong purifying selection near developmental genes. Proc. Natl.Acad. Sci. U. S. A. 104, 8005–8010.
Makalowski, W., 2003. Not junk after all. Science 300, 1246–1247.Matassi, G., Labuda, D., Bernardi, G., 1998. Distribution of the mammalian-wide inter-
spersed repeats (MIRs) in the isochores of the human genome. FEBS Lett. 439,63–65.
Mateos-Langerak, J., et al., 2009. Spatially confined folding of chromatin in the inter-phase nucleus. Proc. Natl. Acad. Sci. U. S. A. 106, 3812–3817.
McLysaght, A., Enright, A.J., Skrabanek, L., Wolfe, K.H., 2000. Estimation of synteny con-servation and genome compaction between pufferfish (Fugu) and human. Yeast17, 22–36.
Medstrand, P., van de Lagemaat, L.N., Mager, D.L., 2002. Retroelement distributions inthe human genome: variations associated with age and proximity to genes.Genome Res. 12, 1483–1495.
Medstrand, P., van de Lagemaat, L.N., Dunn, C.A., Landry, J.R., Svenback, D., Mager, D.L.,2005. Impact of transposable elements on the evolution of mammalian gene regu-lation. Cytogenet. Genome Res. 110, 342–352.
Mirny, L.A., 2011. The fractal globule as a model of chromatin architecture in the cell.Chromosome Res. 19, 37–51.
Newman, M.E.J., 2005. Power laws, pareto distributions and Zipf's law. Contemp. Phys.46, 323–351.
Okamura, K., Nakai, K., 2008. Retrotransposition as a source of new promoters. Mol.Biol. Evol. 25, 1231–1238.
Ovcharenko, I., Loots, G.G., Nobrega, M.A., Hardison, R.C., Miller, W., Stubbs, L., 2005.Evolution and functional classification of vertebrate gene deserts. Genome Res.15, 137–145.
Pavlicek, A., Jabbari, K., Paces, J., Paces, V., Hejnar, J.V., Bernardi, G., 2001. Similar inte-gration but different stability of Alus and LINEs in the human genome. Gene 276,39–45.
Petrov, D.A., Hartl, D.L., 1997. Trash DNA is what gets thrown away: high rate of DNAloss in Drosophila. Gene 205, 279–289.
Petrov, D.A., Aminetzach, Y.T., Davis, J.C., Bensasson, D., Hirsh, A.E., 2003. Size matters:non-LTR retrotransposable elements and ectopic recombination in Drosophila. Mol.Biol. Evol. 20, 880–892.
Samollow, P.B., et al., 2004. First-generation linkage map of the gray, short-tailed opos-sum,Monodelphis domestica, reveals genome-wide reduction in female recombina-tion rates. Genetics 166, 307–329.
Sellis, D., Almirantis, Y., 2009. Power-laws in the genomic distribution of coding seg-ments in several organisms: an evolutionary trace of segmental duplications, pos-sible paleopolyploidy and gene loss. Gene 447, 18–28.
Sellis, D., Provata, A., Almirantis, Y., 2007. Alu and LINE1 distributions in the humanchromosomes: evidence of global genomic organization expressed in the form ofpower laws. Mol. Biol. Evol. 24, 2385–2399.
Semon, M., Wolfe, K.H., 2007. Reciprocal gene loss between tetraodon and zebrafishafter whole genome duplication in their ancestor. Trends Genet. 23, 108–112.
Smit, A.F.A., Hubley, R., Green, P., 1996–2010. RepeatMasker Open-3.0. www.repeatmasker.org.
Stenger, J.E., Lobachev, K.S., Gordenin, D., Darden, T.A., Jurka, J., Resnick, M.A., 2001.Biased distribution of inverted and direct Alus in the human genome: implicationsfor insertion, exclusion, and genome stability. Genome Res. 11, 12–27.
Takayasu, H., Takayasu, M., Provata, A., Huber, G., 1991. Statistical properties of aggre-gation with injection. J. Stat. Phys. 65, 725–745.
Tang, S.-J., 2011. Chromatin organization by repetitive elements (CORE): a genomicprinciple for the higher-order structure of chromosomes. Genes 2, 502–515.
Vasilyev, O.A., Nechaev, S.K., 2003. Topological correlations in trivial knots: new argu-ments in favor of the representation of a crumpled polymer globule. Theor. Math.Phys. 134, 142–159.
Volff, J.N., Brosius, J., 2007. Modern genomes with retro-look: retrotransposed ele-ments, retroposition and the origin of new genes. Genome Dyn. 3, 175–190.
Waterston, R.H., Lindblad-Toh, K., Birney, E., Rogers, J., Abril, J.F., Agarwal, P., 2002. Ini-tial sequencing and comparative analysis of the mouse genome. Nature 420,520–562.
Xie, X., Kamal, M., Lander, E.S., 2006. A family of conserved noncoding elements de-rived from an ancient transposable element. Proc. Natl. Acad. Sci. U. S. A. 103,11659–11664.
Yang, S., et al., 2004. Patterns of insertions and their covariation with substitutions inthe rat, mouse, and human genomes. Genome Res. 14, 517–527.