![Menschenhaut [Human skin]](https://static.fdokumen.com/doc/165x107/6326d24f24adacd7250b1364/menschenhaut-human-skin.jpg)
Wide-field spatial mapping of in vivo tattoo skin optical properties using modulated imaging
12
Lasers in Surgery and Medicine 41:442–453 (2009) Wide-Field Spatial Mapping of In Vivo Tattoo Skin Optical Properties Using Modulated Imaging Frederick R. Ayers, 1 * David J. Cuccia, PhD, 2 Kristen M. Kelly, MD, 3 and Anthony J. Durkin, PhD 1 1 University of California–Irvine, Beckman Laser Institute, Irvine, California 92612 2 Modulated Imaging, Inc., Irvine, California 92612 3 University of California–Irvine, Dermatology, Irvine, California 92612 Background and Objectives: Modulated imaging is a new modality capable of wide-field, spatially resolved measurement of in vivo optical properties. Based on spatial light modulation, the method is inexpensive, non-contact, and allows spatial mapping of tissue absorption and reduced scattering coefficients at any wavelength between 450 and 1,100 nm. Currently, clinicians rely on qualitative visual inspection to guide parameter selection for laser- based tattoo removal. MI provides quantitative measure- ments of multi-colored tattooed skin which may help guide treatment and objectively assess response. Study Design/Materials and Methods: We have meas- ured the spatially varying optical properties of multi- colored tattooed skin over a 50 mm 50 mm field of view at wavelengths ranging from 650 to 970 nm using MI. These measurements were compared to a similar field of view of non-tattooed skin from an adjacent area. Results: We have determined the differentiated optical properties in vivo of multi-colored tattooed skin versus non- tattooed skin. Conclusions: MI provides spatially resolved quantitative information with potential for quantitative assessment of response to treatment and may provide guidance for laser tattoo removal in the future. Lasers Surg. Med. 41:442– 453, 2009. ß 2009 Wiley-Liss, Inc. Key words: spectral imaging; tattoo characterization INTRODUCTION Once practiced by a small portion of society, skin tattooing has become more common place. A recent survey suggests that one in four Americans has at least one tattoo [1]. Following this growth in the practice of tattooing has been an increase in demand for laser tattoo removal. The same survey estimated that 17% of those with a tattoo had considered removing it. The standard of care for tattoo removal involves the use of one of four, or a combination of, Q-switched lasers operating at wavelengths of 532, 694, 755, and 1064 nm. While laser tattoo removal has been effective, it is often an expensive and time-consuming process. Amateur tattoos often require four to six sessions to affect near complete erasure. Professional tattoos, which use more robust pigments and are generally placed at higher concentrations in the dermis, require an average of 8–12 treatments. In both cases treatments are typically spaced over 4–8 weeks [2,3]. Complications include skin scabbing or blistering due to excessive absorption of laser energy by the surrounding tissue, hypo and hyper pigmen- tation, and spontaneous tattoo darkening due to the presence of titanium dioxide or ferric oxide [2,4,5]. Ideally, treatment will remove the tattoo with the fewest number of sessions while minimizing these complications. Currently, laser wavelength selection, as well as other parameters such as fluence, is chosen by the clinician based on qualitative observation and previous clinical experience. The majority of literature involving laser tattoo removal effectiveness has been based on clinical case studies of treatments; however, access to objective information related to tattoo composition, such as optical properties, may provide an avenue with which to improve the efficiency of the treatment. In the mid 1990s, Haedersdal et al. measured the spectral reflectance of tattooed skin from 300 to 800 nm to establish ranges of maximum absorption for several colors. Thirteen tattoos involving fourteen different colors, the most common being red and green, were included in the study [6]. The authors suggested that spectral reflectance information could be used to guide laser selection, but this study did not separate scattering and absorption in the reflectance measurements. Without separating the effect of reduced scattering in the diffuse reflectance values, the accuracy of the absorption values is compromised [7,8]. Also, there is likely usable clinical information contained in the reduced scattering values. Baumler et al. [9] used a spectrophotometer over the wavelengths of 320–1,100 nm to measure the absorption spectra of 41 commercially available pigments suspended in solvent. More recently, Beute et al. [10] performed similar in vitro spectral analysis on 28 common tattoo Contract grant sponsor: Laser Microbeam and Medical Pro- gram (LAMMP) NIH; Contract grant number: P41 RR01192; Contract grant sponsor: U.S. Air Force Office of Scientific Research, Medical Free-Electron Laser Program; Contract grant numbers: F49620-00-2-0371, FA9550-04-1-0101; Contract grant sponsor: The Beckman Foundation; Contract grant sponsor: ASLMS Student Travel Grant. *Correspondence to: Frederick R. Ayers, Beckman Laser Institute, 1002 Health Sciences Rd, Irvine, CA 92612. E-mail: [email protected] Accepted 4 May 2009 Published online in Wiley InterScience (www.interscience.wiley.com). DOI 10.1002/lsm.20782 ß 2009 Wiley-Liss, Inc.
Transcript of Wide-field spatial mapping of in vivo tattoo skin optical properties using modulated imaging

Lasers in Surgery and Medicine 41:442–453 (2009)
Wide-Field Spatial Mapping of In Vivo Tattoo Skin OpticalProperties Using Modulated Imaging
Frederick R. Ayers,1* David J. Cuccia, PhD,2 Kristen M. Kelly, MD,3 and Anthony J. Durkin, PhD1
1University of California–Irvine, Beckman Laser Institute, Irvine, California 926122Modulated Imaging, Inc., Irvine, California 926123University of California–Irvine, Dermatology, Irvine, California 92612
Background and Objectives: Modulated imaging isa new modality capable of wide-field, spatially resolvedmeasurement of in vivo optical properties. Based on spatiallight modulation, the method is inexpensive, non-contact,and allows spatial mapping of tissue absorption andreduced scattering coefficients at any wavelength between450 and 1,100 nm. Currently, clinicians rely on qualitativevisual inspection to guide parameter selection for laser-based tattoo removal. MI provides quantitative measure-ments of multi-colored tattooed skin which may help guidetreatment and objectively assess response.Study Design/Materials and Methods: We have meas-ured the spatially varying optical properties of multi-colored tattooed skin over a 50 mm� 50 mm field of view atwavelengths ranging from 650 to 970 nm using MI. Thesemeasurements were compared to a similar field of view ofnon-tattooed skin from an adjacent area.Results: We have determined the differentiated opticalproperties in vivo of multi-colored tattooed skin versus non-tattooed skin.Conclusions: MI provides spatially resolved quantitativeinformation with potential for quantitative assessment ofresponse to treatment and may provide guidance for lasertattoo removal in the future. Lasers Surg. Med. 41:442–453, 2009. � 2009 Wiley-Liss, Inc.
Key words: spectral imaging; tattoo characterization
INTRODUCTION
Once practiced by a small portion of society, skintattooing has become more common place. A recent surveysuggests that one in four Americans has at least one tattoo[1]. Following this growth in the practice of tattooing hasbeen an increase in demand for laser tattoo removal. Thesame survey estimated that 17% of those with a tattoo hadconsidered removing it. The standard of care for tattooremoval involves the use of one of four, or a combination of,Q-switched lasers operating at wavelengths of 532, 694,755, and 1064 nm. While laser tattoo removal has beeneffective, it is often an expensive and time-consumingprocess. Amateur tattoos often require four to six sessionsto affect near complete erasure. Professional tattoos, whichuse more robust pigments and are generally placed athigher concentrations in the dermis, require an average of8–12 treatments. In both cases treatments are typically
spaced over 4–8 weeks [2,3]. Complications include skinscabbing or blistering due to excessive absorption of laserenergy by the surrounding tissue, hypo and hyper pigmen-tation, and spontaneous tattoo darkening due to thepresence of titanium dioxide or ferric oxide [2,4,5]. Ideally,treatment will remove the tattoo with the fewest number ofsessions while minimizing these complications. Currently,laser wavelength selection, as well as other parameterssuch as fluence, is chosen by the clinician based onqualitative observation and previous clinical experience.
The majority of literature involving laser tattoo removaleffectiveness has been based on clinical case studiesof treatments; however, access to objective informationrelated to tattoo composition, such as optical properties,may provide an avenue with which to improve the efficiencyof the treatment. In the mid 1990s, Haedersdal et al.measured the spectral reflectance of tattooed skin from300 to 800 nm to establish ranges of maximum absorptionfor several colors. Thirteen tattoos involving fourteendifferent colors, the most common being red and green,were included in the study [6]. The authors suggested thatspectral reflectance information could be used to guidelaser selection, but this study did not separate scatteringand absorption in the reflectance measurements. Withoutseparating the effect of reduced scattering in the diffusereflectance values, the accuracy of the absorption values iscompromised [7,8]. Also, there is likely usable clinicalinformation contained in the reduced scattering values.Baumler et al. [9] used a spectrophotometer over thewavelengths of 320–1,100 nm to measure the absorptionspectra of 41 commercially available pigments suspendedin solvent. More recently, Beute et al. [10] performedsimilar in vitro spectral analysis on 28 common tattoo
Contract grant sponsor: Laser Microbeam and Medical Pro-gram (LAMMP) NIH; Contract grant number: P41 RR01192;Contract grant sponsor: U.S. Air Force Office of ScientificResearch, Medical Free-Electron Laser Program; Contract grantnumbers: F49620-00-2-0371, FA9550-04-1-0101; Contract grantsponsor: The Beckman Foundation; Contract grant sponsor:ASLMS Student Travel Grant.
*Correspondence to: Frederick R. Ayers, Beckman LaserInstitute, 1002 Health Sciences Rd, Irvine, CA 92612.E-mail: [email protected]
Accepted 4 May 2009Published online in Wiley InterScience(www.interscience.wiley.com).DOI 10.1002/lsm.20782
� 2009 Wiley-Liss, Inc.

pigments which were mixed with agar. While providinghelpful information for common pigments, this is not apractical method for guiding laser tattoo removal because ofthe potential for an even larger number of dyes available.Colors in a tattoo are often a combination of pigmentschosen by and known only to the original tattoo artist. Also,bench top spectroscopy does not provide information aboutthe in vivo distribution of pigment, nor does it providereduced scattering coefficient or the optical properties ofthe underlying skin. On a different tack, O’goshi et al. [11]used confocal scanning laser microscopy to visualize theparticle size and density of a tattoo. While this technique isuseful for documenting some of the microscopic features oftattoos, this technology is limited in so far as it scans at asingle wavelength and cannot provide rapid wide-fieldcharacterization of spectral properties.
In this article, we present a new technique, known asmodulated imaging (MI) that may be useful for clinicalcharacterization of tattoo pigment prior to tattoo removal.MI is a spatially resolved, non-contact imaging modalitybased on diffuse optical spectroscopy (DOS) principleswhich can provide quantitative absorption and scatteringcontrast of superficial in vivo tissue. In this article, we haveapplied MI to several multi-colored tattoos. Using MI,we demonstrate that we are able to distill macroscopicreflectance images into spatially resolved maps of opticalproperties. In addition, we are able to render absorptionand reduced scattering spectra between 650 and 970 nm,from different regions of these tattoos.
MATERIALS AND METHODS
MI is a new wide-field spectral imaging modality thatrelies on measurements, acquired by a CCD camera, ofdiffuse reflectance in the spatial frequency domain todeduce the absorption coefficient and the reduced scatter-ing coefficient on a pixel by pixel basis [12]. Additionally, byincorporating a filter wheel or liquid crystal tunable filterinto the data acquisition, 2-D optical property maps canbe rendered at multiple wavelengths. The first row ofFigure 1a shows a stylized field of view imaged by MI whenilluminated with planar light (Frequency 0). We alsocommonly refer to this as ‘‘DC illumination.’’ Below thisrow, are samples of the image with increasing spatialfrequency patterns projected onto the field of view (Fre-quencies 1 and 2). Each frequency is imaged three timeswith a 1208 phase shift between images to completely tilethe field of view. By combining the three phase-shiftedillumination images, the signal can be demodulated intomaps of frequency dependent diffuse reflectance for thefield of view and are graphically represented in Figure 1b.This phase shift and demodulation scheme is not unique toMI and is described in the literature [13,14]. Using tissuesimulating liquid phantoms, Cuccia et al. [12] demon-strated the frequency dependent diffuse reflectance isdirectly related to the wavelength dependent absorptionand scattering coefficients and this relationship couldbe solved analytically using the diffusion approximationor numerically using a Monte–Carlo simulation. Due
Fig. 1. The MI instrument field of view. a: A tattoo is illuminated with planar light at
Frequency 0. Frequency 1 shows the tattoo illuminated with a spatial sine wave pattern that is
phase shifted 1208 as you move from the leftmost image to the rightmost image. Frequency 2
shows a similar image set with a higher frequency sine wave pattern. b: The three phase
shifted patterns are demodulated to form a map of frequency dependent, non-modulated diffuse
reflectance similar to the map of diffuse reflectance generated with planar illumination.
WIDE-FIELD SPATIAL MAPPING 443

to the limitations of the diffusion approximation wheninterrogating highly absorbing tissue, results presentedhere were solved numerically [12,15]. The work that wedescribe here is the first published in vivo data using MI.All data were acquired in the Beckman Laser Institutemedical clinic under a protocol reviewed by the UC IrvineInvestigational Review Board.
A MI system based on Figure 2 was employed for a seriesof tattoo measurements and is the standard researchsystem employed by the lab to carry out functional studiesof in vivo tissue. The near-infrared regime is particularlysuited to measurements of endogenous chromophoresincluding oxy, deoxy hemoglobin concentrations and waterfraction. The system itself was designed for a myriad ofstudies including longitudinal studies of cancer progres-sion in preclinical animal models, surveillance of recon-structive tissue flaps, and functional brain imaging inpreclinical animal models. Broadband light was generatedwith a Newport Corporation power source (NewportCorporation, Irvine CA) and a 250 W Tungsten lamp. Thislight was used to illuminate a DLP Developers Kit1,024�768 pixel digital micro-mirror device (Texas Instru-ment, Dallas, TX) which spatially modulated the light to beprojected. Frequency patterns for the spatial modulationwere generated using the sine function in Matlab (TheMathWorks, Natick, MA) and sent to the projection devicevia PowerPoint (Microsoft Corporation, Redmond, WA) ascontrolled by LabVIEW 7.1 (National Instruments, Austin,TX). The patterned light was projected directly onto thesubject’s skin approximately 300 mm from the projectorsystem and at approximately a 108 angle to the detectioncamera. Distance from the system and location of the field of
view was maintained with a simple metal frame built withoptic post assemblies (Thorlabs, Newton, NJ) which is notshown in the diagram.
Reflected light images were acquired with a NuanceMultispectral Imaging System (CRi, Inc., Woburn, MA)which consists of a liquid crystal tunable filter capableof acquiring at discrete wavelengths (10 nm bandwidth)between 650 and 1,100 nm and a 1,040� 1,392 pixel, frontilluminated CCD camera. Camera-based four by fourbinning of pixels was employed to optimize the signal-to-noise ratio of the CCD. Interrogating subsurface featureswith light is inherently lower resolution so our measure-ments are not negatively affected by the choice to bin[12,16]. With polarizers incorporated into the optics of thecamera and the projection system, we were able to cross-polarize the light to reject specular reflection from the skin.Images were saved as TIFF images to the laptop computerfor post-acquisition processing. The field of view of the MIsystem is scalable, but for this study was 50 mm� 50 mm.Measurements were taken at four spatial frequencies, oneunmodulated, zero frequency plus three progressivelyhigher frequencies, and spectrally every 20 nm from 650to 990 nm. The acquired wavelength range was limited bythe hardware of the MI system outlined above. Spectralreflectance images were calibrated for system responseusing a 96 mm� 96 mm� 10 mm tissue simulating phan-tom having known optical properties (ma¼ 0.0188 mm�1
and m0s ¼ 1.098 mm�1 at 650 nm). This is a polydimethylsi-loxane (PDMS) phantom and incorporates India ink as anabsorber and TiO2 as a scattering agent [17]. Spectralabsorption and scattering coefficients of the calibrationphantom were verified using a two-distance frequencydomain photon migration (FDPM) measurement which is aself-calibrating measurement [18].
While a number of fitting methods can be employed toextract the absorption and scattering coefficient, we havefound that a lookup table method based on the results of‘‘White’’ Monte–Carlo simulation provides rapid computa-tion with acceptable accuracy [12,19]. Using this method,modeled diffuse reflectance values for each of two spatialfrequencies are generated for a population of absorptionand reduced scattering combinations. By intersecting thetwo distinct sets of spatial frequency dependent reflectancevalues, a lookup table can be generated, a subset of whichis graphically represented in Figure 3. A continuum ofabsorption values (ma) and reduced scattering values ðm0sÞhave been overlaid onto a plot of diffuse reflectance valuesfor spatial frequency 1 on the horizontal axis and spatialfrequency 2 on the vertical axis. Intersections on thisoverlay represent unique absorption and reduced scatter-ing combinations and are located on the larger graph atthe values of diffuse reflectance for the chosen frequencies.For the purpose of processing real data, measurements ofdiffuse reflectance, scaled to the properties of the calibra-tion phantom, at each spatial frequency are used to rapidlylook up the proper absorption and scattering combinationas shown in this graph. This processing is done in Matlaband employs the griddata function. In the article by Cucciaet al. [12], a similar approach was shown to accurately
Fig. 2. Diagram of the modulated imaging system. Light
generated by a Tungsten lamp is directed onto the digital
micro-mirror device (DMD) chip which generates the spatial
frequency patterns. These patterns are projected directly onto
the region of interest on the subject and the diffuse reflectance
is captured at discrete wavelengths by the CCD camera and
incorporated liquid crystal tunable filter (LCTF).
444 AYERS ET AL.

deduce optical properties of homogeneous liquid phantomsover a wide range of optical properties, with recoveredvalues deviating by less than 10% from expected reducedscattering values and less than 15% from expect absorptionvalues. All data processing and analysis were done on aWindows Professional 64-bit Edition desktop running adual-core 3 GHz Pentium D processor.
The advantages in computation speed for this scheme arehighlighted when we compare the processing time betweenthe lookup-table based process and an iterative, least-squares based method. To deduce the average opticalproperties of a small, 3.7 mm� 4 mm, 21� 23 pixel regionof normal skin, the iterative process requires 2 hours tocompute solutions while the lookup-table based processrequired 6 minutes. This efficiency is essential for thelarger field-of-views used in this study. Additionally, thelookup table does not require an initial guess of opticalproperties which is advantageous when dealing with thelarge dynamic range of optical properties between normaland multi-colored tattooed skin. Typical non-tattooed skinwill have optical properties in a tight range of values [20]. Alookup table needs only to be created using an absorptionand scattering set large enough to capture the appropriatein vivo values. However, because the absorption andscattering coefficients of tattooed skin have not been fullycharacterized, we have attempted to capture a much largerrange of optical properties in our lookup table which isoutlined in Table 1. The ability to accurately determineabsorption and reduced scattering coefficient based on a
two frequency look-up table relies on the relative decreasein contrast to absorption versus reduced scattering as thefrequency increases The first frequency was always afrequency of zero, which corresponds to broad area uniformillumination, and is typically the frequency that is mostsensitive to the absorption coefficient [12]. The secondfrequency used for the look-up table was kept above0.16 cycles per mm which has less sensitivity to absorptionversus wavelength, but is sufficiently sensitive to scatter-ing so that absorption is easily separable from reducedscattering coefficient.
In this article, we present MI results obtained for threetattoos from separate volunteers. Figure 4 shows digitalcolor photographs for each of the three tattoos and theboundaries of the measurement field of view. The firstsubject (Fig. 4a) was a 29-year-old Caucasian female witha 6-year-old tattoo on her right shoulder blade. Thesecond subject (Fig. 4b) is a 30-year-old Hispanic male witha 14-year-old tattoo on his upper, left arm. The third subject(Fig. 4c) is a 20-year-old Caucasian female with a 1-year-oldtattoo located on her right shoulder blade.
RESULTS
Figure 5 shows the average optical properties for aselected region of non-tattooed skin on each subject. Foreach graph shown, the solid line corresponds to data fromsubject #1 (tattoo depicted in Fig. 4a), the dotted linecorresponds to data from subject #2 (tattoo depicted in Fig.4b), and the broken dashed line corresponds to data fromsubject #3 (tattoo depicted in Fig. 4c). All three regionsdemonstrate absorption spectra with elevated absorptionvalues in the visible portion of the wavelength spectrumand at the long wavelength end of the spectrum as the firstwater peak is approached. As expected, data from thesubject with the clinically least pigmented skin (Fig. 4a)shows the lowest absorption values and data from thesubject with the clinically darkest skin (Fig. 4b) shows thehighest absorption values. The second graph in the figureshows the average reduced scattering coefficient, which issimilar for each subject.
TABLE 1. Parameters of the Monte–Carlo Generated
Lookup Table
Lookup table parameters
Number points, ma 349
Min ma 0.003 mm�1
Max ma 0.70 mm�1
Number points, m0s 138
Min m0s 0.15 mm�1
Min m0s 7.0 mm�1
Diffuse reflectance values were calculated for each of the
frequencies at every combination of the 349 absorption
coefficients (ma) and 138 reduced scattering coefficients ðm0sÞ.Because the optical properties of in vivo tattooed skin have not
been fully characterized, a large range of absorption and
reduced scattering values were incorporated.
Fig. 3. A graphical representation of the Monte–Carlo
generated look-up table. The center grid is made up of
horizontal lines marking absorption values (ma) decreasing
from left to right, and vertical lines marking reduced scattering
values ðm0sÞ decreasing from top to bottom. Each intersection
represents a unique combination of absorption and reduced
scattering and has a particular diffuse reflectance value for the
non-modulated light on the x-axis and the modulated light on
the y-axis.
WIDE-FIELD SPATIAL MAPPING 445

Figure 6 plots the average broadband diffuse reflectance,average absorption coefficients and average reducedscattering coefficients versus wavelength of three differ-ently colored tattooed regions of interest, as well as a regionof non-tattooed skin, for the first subject (Fig. 4a). This is atattoo of a sunflower and features green, red-orange, andburnt-red colors. We have selected regions of interestcorresponding to each of these colors to highlight the abilityof MI to differentiate between them in the near-infraredspectrum. Looking to the graph of absorption versuswavelength, (Fig. 6c) the solid line corresponds to theregion of normal skin. The absorption features seen inFigure 5 above cannot be seen here because of the expandedscale needed to capture the range of absorption observed forthe tattooed skin, which are several orders higher inmagnitude than for normal skin. The dotted line corre-sponds to a green region of the tattoo and features a large,downward sloping spectrum as we move from 650 to 870 nmwhich includes the visible red spectrum and the start of thenear-infrared spectrum. The dashed line corresponds to a
red-orange portion of the tattoo. As expected, this region ofinterest shows significantly lower absorption values in the650–870 nm range of the spectrum, but is still severalorders higher than that of non-tattooed skin. The brokendashed line corresponds to a burnt-red portion at the centerof the sunflower. This area is the darkest portion of thetattoo in terms of clinical appearance and our MI dataindicate that this region contains high absorption valuesthroughout the measured near-infrared spectrum. Whilethe absorption values for each of the selected regions ofinterest are all significantly higher than that of non-tattooed skin, we can see in Figure 6d, the graph of reducedscattering coefficient versus wavelength, that scattering inthe tattooed skin remains on the same scale as non-tattooedskin. The suppressed values relative to those of non-tattooed skin for the scattering coefficient of the dotted lineand dashed line are not true values and are related toscattering versus absorption cross-talk in the homogenousmodel that occurs at higher levels of absorption. Similarreduced scattering spectra are observed in the second tattoo
Fig. 4. Three tattoos investigated with the modulated imaging system: (a) A sunflower tattoo
featuring green, orange, and burnt-red colors, (b) a green leaf tattoo feature green and blue
colors, (c) a sun tattoo featuring yellow and orange colors. The field-of-view used for each tattoo
is outlined by the dashed line.
Fig. 5. Mean optical properties for non-tattooed skin of each subject. From left to right: The
calibrated unmodulated diffuse reflectance, the mean recovered absorption coefficient, and the
mean reduced scattering coefficient.
446 AYERS ET AL.
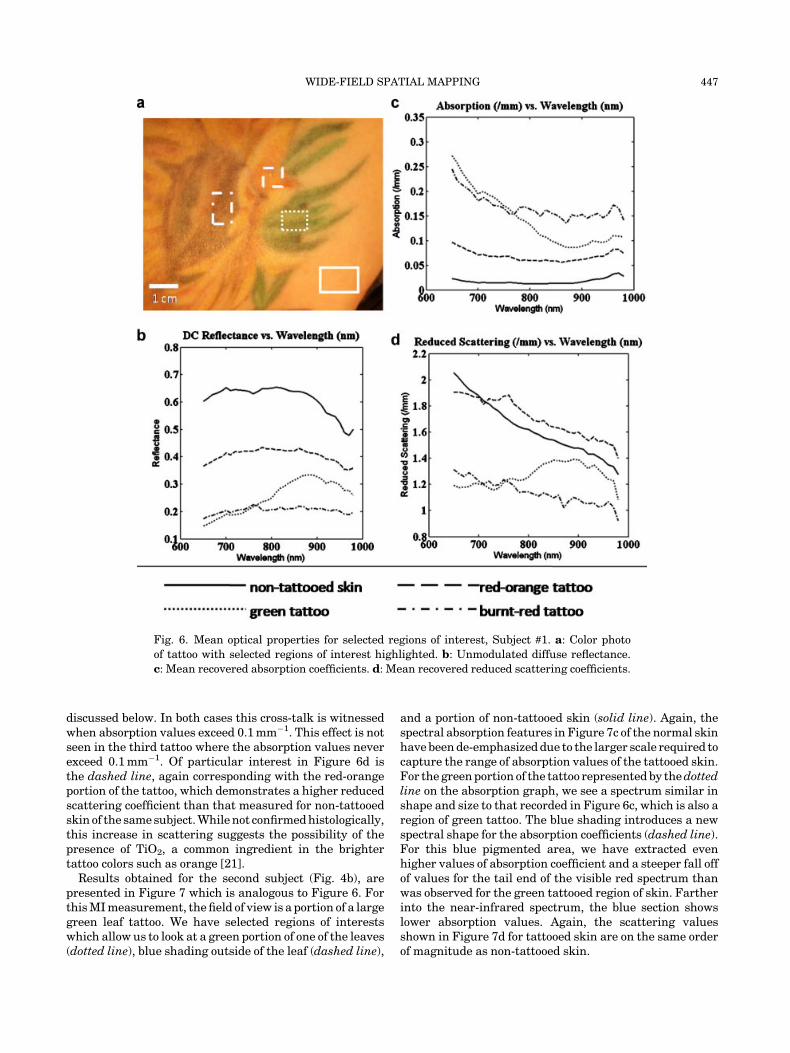
discussed below. In both cases this cross-talk is witnessedwhen absorption values exceed 0.1 mm�1. This effect is notseen in the third tattoo where the absorption values neverexceed 0.1 mm�1. Of particular interest in Figure 6d isthe dashed line, again corresponding with the red-orangeportion of the tattoo, which demonstrates a higher reducedscattering coefficient than that measured for non-tattooedskin of the same subject. While not confirmed histologically,this increase in scattering suggests the possibility of thepresence of TiO2, a common ingredient in the brightertattoo colors such as orange [21].
Results obtained for the second subject (Fig. 4b), arepresented in Figure 7 which is analogous to Figure 6. Forthis MI measurement, the field of view is a portion of a largegreen leaf tattoo. We have selected regions of interestswhich allow us to look at a green portion of one of the leaves(dotted line), blue shading outside of the leaf (dashed line),
and a portion of non-tattooed skin (solid line). Again, thespectral absorption features in Figure 7c of the normal skinhave been de-emphasized due to the larger scale required tocapture the range of absorption values of the tattooed skin.For the green portion of the tattoo represented by the dottedline on the absorption graph, we see a spectrum similar inshape and size to that recorded in Figure 6c, which is also aregion of green tattoo. The blue shading introduces a newspectral shape for the absorption coefficients (dashed line).For this blue pigmented area, we have extracted evenhigher values of absorption coefficient and a steeper fall offof values for the tail end of the visible red spectrum thanwas observed for the green tattooed region of skin. Fartherinto the near-infrared spectrum, the blue section showslower absorption values. Again, the scattering valuesshown in Figure 7d for tattooed skin are on the same orderof magnitude as non-tattooed skin.
Fig. 6. Mean optical properties for selected regions of interest, Subject #1. a: Color photo
of tattoo with selected regions of interest highlighted. b: Unmodulated diffuse reflectance.
c: Mean recovered absorption coefficients. d: Mean recovered reduced scattering coefficients.
WIDE-FIELD SPATIAL MAPPING 447

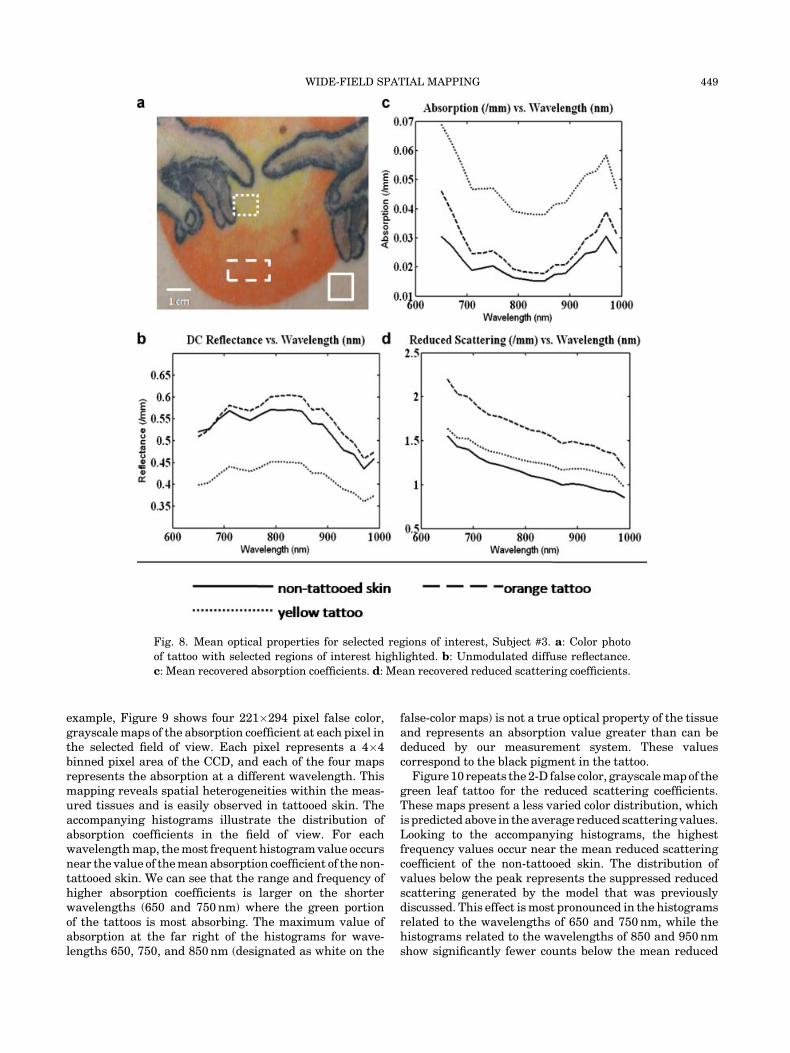
Finally, we present data from the third tattoo (Fig. 4c)which features two hands reaching toward each otheracross a yellow and orange sun. We have selected regions ofinterest corresponding to yellow (dotted line) and orangeregions (dashed line), as well as normal skin (solid line).The spectral plots of diffuse reflectance, absorption co-efficient, and reduced scattering coefficient can be seenin Figure 8. Again, the trend of high absorption values(Fig. 8c) for the tattooed region relative to the non-tattooedregion continues. Because the yellow portion of the tattooappears to be a brighter shade than the orange portion ofthe tattoo, it might be assumed that a yellow tattoo (dottedline) would be less absorbing than an orange tattoo (dashedline). However, we see that for this particular tattoothat the opposite is true. Additionally, by comparing theoptical properties of the region of non-tattooed skin and theregion of orange tattoo, we can see that while the diffuse
reflectance (Fig. 8b) is similar for both regions of interest,the absorption (Fig. 8c) and reduced scattering (Fig. 8d)coefficients for both areas is substantially different. Whencompared to non-tattooed skin, the orange tattoo’s recov-ered reduced scattering coefficient is balanced by its higherabsorption coefficient resulting in similar reflectancespectra. Again, the elevated reduced scattering value(Fig. 8d) in the orange section may be an indicator thatthe orange pigment contains a scattering agent such asTiO2. This demonstrates one of the advantages of the MIsystem over a simple reflectance measurement that doesnot separate absorption from scattering.
While average optical properties for an area of tissueare helpful in certain circumstances, Figures 9 and 10illustrate a different way to look at the optical propertiesof tissue which harnesses the imaging ability of ourtechnology. Using the leaf tattoo from subject #2 as an
Fig. 7. Mean optical properties for selected regions of interest, Subject #2. a: Color photo of
tattoo with selected regions of interest highlighted. b: Unmodulated diffuse reflectance.
c: Mean recovered absorption coefficients. d: Mean recovered reduced scattering coefficients.
448 AYERS ET AL.
example, Figure 9 shows four 221�294 pixel false color,grayscale maps of the absorption coefficient at each pixel inthe selected field of view. Each pixel represents a 4�4binned pixel area of the CCD, and each of the four mapsrepresents the absorption at a different wavelength. Thismapping reveals spatial heterogeneities within the meas-ured tissues and is easily observed in tattooed skin. Theaccompanying histograms illustrate the distribution ofabsorption coefficients in the field of view. For eachwavelength map, the most frequent histogram value occursnear the value of the mean absorption coefficient of the non-tattooed skin. We can see that the range and frequency ofhigher absorption coefficients is larger on the shorterwavelengths (650 and 750 nm) where the green portionof the tattoos is most absorbing. The maximum value ofabsorption at the far right of the histograms for wave-lengths 650, 750, and 850 nm (designated as white on the
false-color maps) is not a true optical property of the tissueand represents an absorption value greater than can bededuced by our measurement system. These valuescorrespond to the black pigment in the tattoo.
Figure 10 repeats the 2-D false color, grayscale map of thegreen leaf tattoo for the reduced scattering coefficients.These maps present a less varied color distribution, whichis predicted above in the average reduced scattering values.Looking to the accompanying histograms, the highestfrequency values occur near the mean reduced scatteringcoefficient of the non-tattooed skin. The distribution ofvalues below the peak represents the suppressed reducedscattering generated by the model that was previouslydiscussed. This effect is most pronounced in the histogramsrelated to the wavelengths of 650 and 750 nm, while thehistograms related to the wavelengths of 850 and 950 nmshow significantly fewer counts below the mean reduced
Fig. 8. Mean optical properties for selected regions of interest, Subject #3. a: Color photo
of tattoo with selected regions of interest highlighted. b: Unmodulated diffuse reflectance.
c: Mean recovered absorption coefficients. d: Mean recovered reduced scattering coefficients.
WIDE-FIELD SPATIAL MAPPING 449
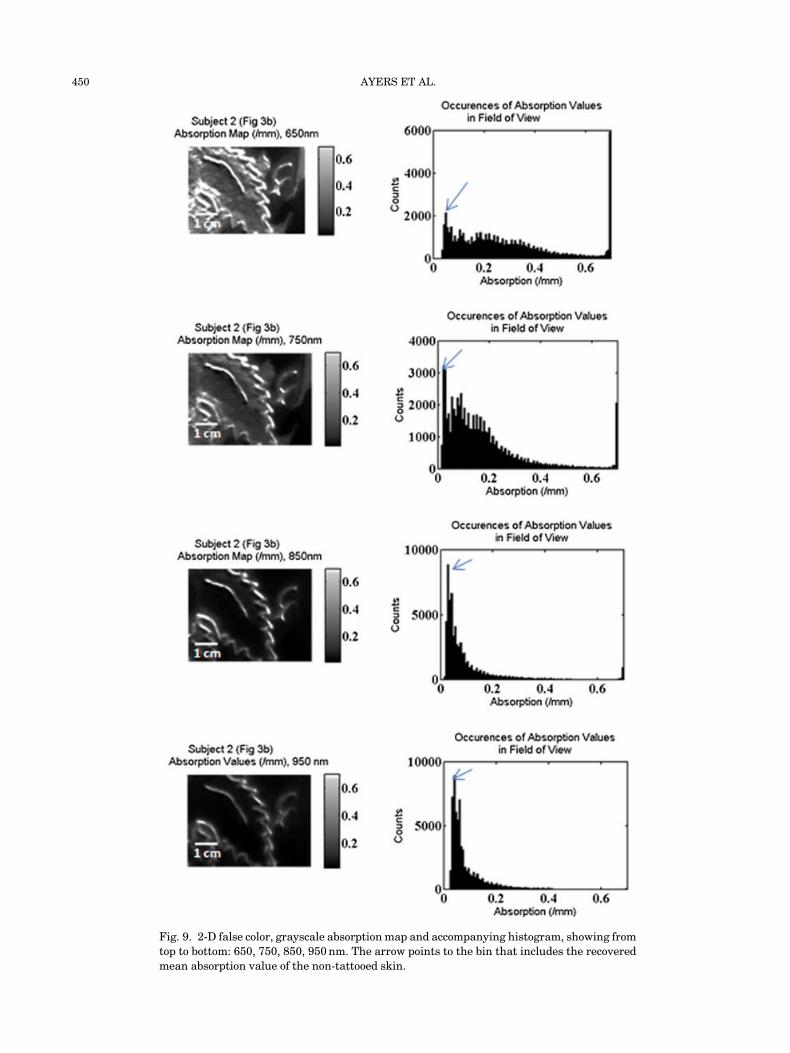
Fig. 9. 2-D false color, grayscale absorption map and accompanying histogram, showing from
top to bottom: 650, 750, 850, 950 nm. The arrow points to the bin that includes the recovered
mean absorption value of the non-tattooed skin.
450 AYERS ET AL.

Fig. 10. 2-D false color, grayscale reduced scattering map and accompanying histogram,
showing from top to bottom: 650, 750, 850, 950 nm. The arrow points to the bin that includes the
recovered mean reduced scattering value of the non-tattooed skin.
WIDE-FIELD SPATIAL MAPPING 451

scattering value. These higher wavelength maps show veryhigh uniformity in color. Again the highest reducedscattering values depicted in white on the maps are causedby absorption values greater than can be deduced by ourmeasurement system. By looking at the extreme values ofboth absorption and reduced scattering together, it is easyto recognize these as corresponding to regions of blackpigment.
DISCUSSION
Tattoos presented here were all untreated and subjectswere not enrolled in a tattoo removal program. Future workin this area will involve volunteers who are seeking lasertattoo removal. This will allow for a longitudinal study ofthe response to therapy. Additionally, access to a pool ofsubjects undergoing tattoo removal will enable an inves-tigation of the predictive ability of MI to guide wavelengthselection for treatment, or the potential to provide dosim-etry guidance to the clinician based on the optical proper-ties of the native skin. While our current resultsdemonstrate the ability of MI to provide relevant informa-tion for the purpose of laser tattoo removal, this longitudi-nal study will better guide discussion of the appropriateinsertion point of this technology into the therapeuticprocess. Also as noted in the Materials and MethodsSection, we used an established MI instrument which wasoptimized for 650 to 970 nm wavelength range. Additionalstudies should incorporate wavelengths near the opera-tional wavelengths of the single and double frequencyNd:YAG lasers, those most commonly utilized for tattooremoval. This will require an MI instrument that alsomeasures the visible spectrum to at least 532 nm as well ascapturing 1,064 nm.
Both absorption and reduced scattering contribute todiffuse reflectance. Because of this, an unknown change inthe reduced scattering coefficient could obscure a change inabsorption that may not be recognized either visually orthrough a simple diffuse reflectance measurement. This is aparticular strength of MI. As previously implied in theresults obtained from yellow and orange regions of thetattoos imaged here, MI can provide information related tothe reduced scattering coefficient that is not easilydiscerned based on clinical appearance. Titanium dioxideand ferric oxide are two scattering agents that are oftenused in tattoo dyes in order to render certain colors morevibrant. Both of these agents are troublesome for lasertattoo removal as they are not dispersed like the dyesthemselves and instead may blacken in response to highintensity laser energy, leaving discoloration to the treatedskin rather than improved cosmesis [5]. Currently, whenthe presence of these agents is suspected, the therapeuticlaser is test fired onto a point of the tattoo in question.Presence is then confirmed if the region darkens. Obvi-ously, the ability to a priori determine the presence of theseagents has the potential to benefit both the patient and thetreating professional.
In this article, we have highlighted the complexities of MIin order to properly introduce the technology. However, as
the technique is optimized and reduced to clinical practice,we expect that the underlying process will be transparent tothe end user and provide an acquisition and processingexperience similar to other simple reflectance techniqueswhile providing the additional information of separatedabsorption and reduced scattering coefficients. For exam-ple, data acquisition time for this set of investigations wasin the 10- to 15-minute range. Because this was our firstset of in vivo investigations, the emphasis has been oncollecting complete spectra over the 650–990 nm range.Consequently, seventeen wavelengths were acquired atfour different frequencies at 256�256 binned pixels result-ing in 144 Mb of data. However, only two frequencies arerequired to extract the absorption and reduced scatteringcoefficient at a given wavelength. Thus, acquisition timescan be dramatically reduced by reducing the number ofwavelengths to four wavelengths near those of the fourtherapeutic lasers and acquiring at only the required twofrequencies. Additionally, because the novelty of thisprocess exists in the processing algorithms rather thanthe equipment, the system can be made with consumergrade components ensuring an economical price point.
Future work will also benefit from improved light modelsfor the MI data analysis. While we currently are able toshow excellent contrast among highly absorbing regions oftattooed skin, we have observed that the absorptioncoefficients are overestimated for absorption coefficientsabove 0.10 mm�1. This leads to cross-talk between theabsorption value and the reduced scattering value, which isunderestimated. This is a result of employing a homoge-nous light transport model to a non-homogenous, layeredtissue system. Tattoo ink particles are not uniformlydistributed in the skin; instead they are concentrated atthe epidermal/dermal interface. Because this layer isseveral orders of absorption higher than the native tissue,the layer problem is likely exaggerated and can be seen inthe figures above. Nevertheless, results obtained using ahomogenous model are still illuminating in many cases. Atthe same time, we are actively working to incorporate a two-layer light transport model into the analysis [22] and expectthat the currently observed upper absorption limits are notthe absolute limits of the method. Conversely, Cuccia et al.[12] showed that MI could accurately determine absorptioncoefficients well below the values we have shown for non-tattooed skin.
CONCLUSIONS
In this article, we have reported the first set of in vivoresults that we have obtained with the MI instrument inthe near-IR spectrum, evaluating both non-tattooed andtattooed skin. Results for normal, non-tattooed skin wereconsistent with those reported elsewhere [20]. Addition-ally, we were able to determine absorption coefficientvalues up to ten times higher than the absorption of non-tattooed skin while still being able to quantitativelyseparate reduced scattering and exhibit the flexibilityof our system. Results are presented both as averageoptical properties and as spatially resolved property maps
452 AYERS ET AL.

effectively covering a tissue area of 5 cm�5 cm. This abilityto simultaneous measure a scalable area of tissue is aprimary strength of this system when compared to pointsource-detector technologies. The ability to separate scat-tering and absorption over a wide-field plane has potentialfor guiding wavelength selection for tattoo removal andmay improve treatment success.
ACKNOWLEDGMENTS
This work was supported by the Laser Microbeam andMedical Program (LAMMP) NIH grant P41 RR01192; theU.S. Air Force Office of Scientific Research, Medical Free-Electron Laser Program (F49620-00-2-0371 and FA9550-04-1-0101); The Beckman Foundation; ASLMS StudentTravel Grant.
REFERENCES
1. Laumann AE, Derick AJ. Tattoos and body piercings in theUnited States: A national data set. J Am Acad Dermatol2006;55(3):413–421.
2. Sweeney SM. Tattoos: A review of tattoo practices andpotential treatment options for removal. Curr Opin Pediatr2006;18(4):391–395.
3. Tanzi EL, Lupton JR, Alster TS. Lasers in dermatology: Fourdecades of progress. J Am Acad Dermatol 2003;49(1):1–31;quiz 31–34.
4. Handley JM. Adverse events associated with nonablativecutaneous visible and infrared laser treatment. J Am AcadDermatol 2006;55(3):482–489.
5. Ross EV, et al. Tattoo darkening and nonresponse after lasertreatment: A possible role for titanium dioxide. ArchDermatol 2001;137(1):33–37.
6. Haedersdal M, Bech-Thomsen N, Wulf HC. Skin reflectance-guided laser selections for treatment of decorative tattoos.Arch Dermatol 1996;132(4):403–407.
7. Cerussi A, et al. In vivo absorption, scattering, andphysiologic properties of 58 malignant breast tumors deter-mined by broadband diffuse optical spectroscopy. J BiomedOpt 2006;11(4): 044005.
8. Bevilacqua F, et al. Broadband absorption spectroscopy inturbid media by combined frequency-domain and steady-state methods. Appl Opt 2000;39(34):6498–6507.
9. Baumler W, et al. Q-switch laser and tattoo pigments:First results of the chemical and photophysical analysis of41 compounds. Lasers Surg Med 2000;26(1):13–21.
10. Beute TC, et al. In vitro spectral analysis of tattoo pigments.Dermatol Surg 2008;34(4):508–515; discussion 515–516.
11. O’Goshi K, Suihko C, Serup J. In vivo imaging of intradermaltattoos by confocal scanning laser microscopy. Skin ResTechnol 2006;12(2):94–98.
12. Cuccia DJ, et al. Quantitation and mapping of turbid mediaoptical properties using modulated imaging. J Biomed Opt2009 (in press).
13. Neil MAA, Juskaitis R, Wilson T. Method of obtainingoptical sectioning by using structured light in a conventionalmicroscope. Opt Lett 1997;22(24):1905–1907.
14. Carlson AB, Crilly PB, Rutledge JC. Communication sys-tems: An introduction to signals and noise in electricalcommunication, 4th edition. McGraw-Hill Series in Electricaland Computer Engineering. Boston: McGraw-Hill; 2002. xiii,850 p.
15. Yoon G, Prahl A, Welch AJ. Accuracies of the diffusionapproximation and its similarity relations for laser irradiatedbiological media. Appl Opt 1989;28(12):2250–2255.
16. Pogue BW, et al. Image analysis methods for diffuse opticaltomography. J Biomed Opt 2006;11(3):33001.
17. Ayers F, et al. Fabrication and characterization of silicone-based tissue phantoms with tunable optical properties inthe visible and near infrared domain. In Design andPerformance Validation of Phantoms Used in Conjunctionwith Optical Measurements of Tissue. 2008. San Jose, CAUSA: SPIE.
18. Haskell RC, et al. Boundary conditions for the diffusionequation in radiative transfer. J Opt Soc Am A Opt Image SciVis 1994;11(10):2727–2741.
19. Swartling J, et al. Accelerated Monte Carlo models tosimulate fluorescence spectra from layered tissues. J OptSoc Am A Opt Image Sci Vis 2003;20(4):714–727.
20. Tseng SH, Grant A, Durkin AJ. In vivo determination of skinnear-infrared optical properties using diffuse optical spectro-scopy. J Biomed Opt 2008;13(1): 014016.
21. Timko AL, et al. In vitro quantitative chemical analysis oftattoo pigments. Arch Dermatol 2001;137(2):143–147.
22. Weber JR, et al. Non-contact imaging of absorption andscattering in layered tissue using spatially-modulated struc-tured light. Appl Phys 2009 (in press).
WIDE-FIELD SPATIAL MAPPING 453