Wide-area monitoring and control at Hydro-Quebec: past, present and future
12
Abstract—This paper recalls the 30-year history of wide-area measurements at Hydro-Québec. At present, a state-of-the art, eight-PMU-based wide-area monitoring system commissioned in 2004 is on line, feeding the EMS with GPS-synchronized angles, frequencies, and harmonic distortion measurements from key 735-kV busses. Specific to Hydro-Québec is the current use of one such system for frequency regulation reporting and control-room implementation of preventive measures against geomagnetic storm-induced contingencies. Building on this experience, the Hydro-Québec research institute, together with TransÉnergie, is developing advanced applications which, in the long term, will go beyond active monitoring to safely initiate targeted control actions aimed at extending system power transfer limits with respect to both transient and long-term stability. In addition to the major improvement in inter-area mode damping shown previously by the authors, this paper demonstrates that, surprisingly, wide- area control of Static Var Compensators (SVC) will also vastly extend the first-swing stability margins. Finally, initial results on a wide-area measurement-based secondary voltage control of the extensive park of dynamic shunt compensators in our grid using a single pilot voltage from the load center are very encouraging. Index Terms—Wide-area measurements and control, power system stabilizer (PSS), FACTS, SVC, power system stability, small-signal stability, inter-area oscillations, phasor measurement units (PMU) , damping controller, transfer limits. I. A BRIEF HISTORY OF WIDE-AREA MONITORING AT HYDRO-QUÉBEC IDE-AREA measurements at Hydro-Québec started in 1976 when a team of IREQ researchers successfully measured the voltage angle shift between Arnaud (north- east Québec) and Boucherville (south shore of Montreal), two 735-kV substations separated by more than 1000 km [1- 2]. The angle shift was obtained from a highly accurate counting of the zero-crossings of the sinusoidal voltage waveforms synchronized by means of Loran C-based clocks. The synchronizing error was less than 46 μs, which represents about 1° electrical angle of the 60-Hz I. Kamwa, J. Béland, C. Lafond, R. Grondin, are with Hydro-Québec, IREQ 1800 boul. Lionel-Boulet, Varennes, Qc, Canada J3X 1S1 (e-mail: [email protected]) . G. Trudel and D. McNabb are with Hydro-Québec, TransÉnergie Complexe Desjardins, Montréal, Qc, Canada H5B1H7 (e-mail: [email protected]). fundamental phasor. At that time, measurement of the phasor amplitude was not in the scope of the project. These findings culminated in 1988 with the commissioning of the so-called Angle Shift Measurement System (ASM-NET), better known in French as SMDA (Système de Mesure du Décalage Angulaire). The 1988 release of the ASM-NET involved four 735-kV substations each equipped with IREQ-made measurement units synchronized on the IRIG B clock. The amplitudes were computed from the crest of the voltage waveforms while the angles were still determined from accurate zero-crossing counting. These data were transferred in real time to the Hydro-Québec control center once every cycle of the 60 Hz. Table 1 summarizes the evolution of the ASM-NET concept at Hydro-Québec. It is a mature and highly reliable system with a 99% availability over the years. As illustrated in Fig. 1, the system consists of eight PMUs and a SCADA linked directly to the EMS and located adjacent to the TransÉnergie control center in downtown Montreal. This represents about 25% of the 735-kV buses in the system. Since 2004, modern PMUs customized by Macrodyne [13] to include some algorithmic features specific to Hydro-Québec have been in use quite successfully. These new features migrated from the previous generation of IREQ-made PMUs are voltage harmonic distortion up to the 10 th component and voltage asymmetry. These variables are required by the Hydro-Québec preventive control schemes against geomagnetic storms induced contingencies. The new SCADA is responsible for collecting (at a 60-Hz sampling rate) the wide-area phasors and harmonic data in real time. Processing is then performed on-line for time reconciliation and transmission/GPS error correction before transfer of the results to the appropriate applications below. 1. Post-mortem analysis of major events: This type of application [8] is performed basically in two departments with a security constrained remote access to the SCADA: a) The team in charge of “grid behaviour” from the automatisms and protection department (Asset Management Division), and b) the team in charge of “Grid Capacity and Operating Strategies” from the operations planning department (Transmission Planning Division). The remote access to the Oracle database is Java-based. 2. Validation of stability models: This is achieved by comparing the stability simulation of the contingency with the Wide-Area Monitoring and Control at Hydro-Québec: Past, Present and Future I. Kamwa, Fellow Member, IEEE J. Béland, Non Member G. Trudel, Member, IEEE R. Grondin, Senior Member, IEEE C. Lafond, Member D. McNabb, Non Member W 1-4244-0493-2/06/$20.00 ©2006 IEEE.
Transcript of Wide-area monitoring and control at Hydro-Quebec: past, present and future
Abstract—This paper recalls the 30-year history of wide-area
measurements at Hydro-Québec. At present, a state-of-the art, eight-PMU-based wide-area monitoring system commissioned in 2004 is on line, feeding the EMS with GPS-synchronized angles, frequencies, and harmonic distortion measurements from key 735-kV busses. Specific to Hydro-Québec is the current use of one such system for frequency regulation reporting and control-room implementation of preventive measures against geomagnetic storm-induced contingencies. Building on this experience, the Hydro-Québec research institute, together with TransÉnergie, is developing advanced applications which, in the long term, will go beyond active monitoring to safely initiate targeted control actions aimed at extending system power transfer limits with respect to both transient and long-term stability. In addition to the major improvement in inter-area mode damping shown previously by the authors, this paper demonstrates that, surprisingly, wide-area control of Static Var Compensators (SVC) will also vastly extend the first-swing stability margins. Finally, initial results on a wide-area measurement-based secondary voltage control of the extensive park of dynamic shunt compensators in our grid using a single pilot voltage from the load center are very encouraging.
Index Terms—Wide-area measurements and control, power system stabilizer (PSS), FACTS, SVC, power system stability, small-signal stability, inter-area oscillations, phasor measurement units (PMU) , damping controller, transfer limits.
I. A BRIEF HISTORY OF WIDE-AREA MONITORING AT HYDRO-QUÉBEC
IDE-AREA measurements at Hydro-Québec started in 1976 when a team of IREQ researchers successfully
measured the voltage angle shift between Arnaud (north-east Québec) and Boucherville (south shore of Montreal), two 735-kV substations separated by more than 1000 km [1-2]. The angle shift was obtained from a highly accurate counting of the zero-crossings of the sinusoidal voltage waveforms synchronized by means of Loran C-based clocks. The synchronizing error was less than 46 µs, which represents about 1° electrical angle of the 60-Hz I. Kamwa, J. Béland, C. Lafond, R. Grondin, are with Hydro-Québec, IREQ 1800 boul. Lionel-Boulet, Varennes, Qc, Canada J3X 1S1 (e-mail: [email protected]) . G. Trudel and D. McNabb are with Hydro-Québec, TransÉnergie Complexe Desjardins, Montréal, Qc, Canada H5B1H7 (e-mail: [email protected]).
fundamental phasor. At that time, measurement of the phasor amplitude was not in the scope of the project. These findings culminated in 1988 with the commissioning of the so-called Angle Shift Measurement System (ASM-NET), better known in French as SMDA (Système de Mesure du Décalage Angulaire). The 1988 release of the ASM-NET involved four 735-kV substations each equipped with IREQ-made measurement units synchronized on the IRIG B clock. The amplitudes were computed from the crest of the voltage waveforms while the angles were still determined from accurate zero-crossing counting. These data were transferred in real time to the Hydro-Québec control center once every cycle of the 60 Hz. Table 1 summarizes the evolution of the ASM-NET concept at Hydro-Québec. It is a mature and highly reliable system with a 99% availability over the years.
As illustrated in Fig. 1, the system consists of eight PMUs and a SCADA linked directly to the EMS and located adjacent to the TransÉnergie control center in downtown Montreal. This represents about 25% of the 735-kV buses in the system. Since 2004, modern PMUs customized by Macrodyne [13] to include some algorithmic features specific to Hydro-Québec have been in use quite successfully. These new features migrated from the previous generation of IREQ-made PMUs are voltage harmonic distortion up to the 10th component and voltage asymmetry. These variables are required by the Hydro-Québec preventive control schemes against geomagnetic storms induced contingencies.
The new SCADA is responsible for collecting (at a 60-Hz sampling rate) the wide-area phasors and harmonic data in real time. Processing is then performed on-line for time reconciliation and transmission/GPS error correction before transfer of the results to the appropriate applications below.
1. Post-mortem analysis of major events: This type of application [8] is performed basically in two departments with a security constrained remote access to the SCADA: a) The team in charge of “grid behaviour” from the automatisms and protection department (Asset Management Division), and b) the team in charge of “Grid Capacity and Operating Strategies” from the operations planning department (Transmission Planning Division). The remote access to the Oracle database is Java-based.
2. Validation of stability models: This is achieved by comparing the stability simulation of the contingency with the
Wide-Area Monitoring and Control at Hydro-Québec: Past, Present and Future
I. Kamwa, Fellow Member, IEEE J. Béland, Non Member G. Trudel, Member, IEEE
R. Grondin, Senior Member, IEEE C. Lafond, Member D. McNabb, Non Member
W
1-4244-0493-2/06/$20.00 ©2006 IEEE.

2recordings, giving the same grid configuration in the simulation and reality. Therefore, in addition to the PMU recorded data, network state at the triggering time as well as the sequence of event is required. Both are obtained from the control center through the state estimator (LASER).
3. Frequency regulation statistics: The system frequency waveform available on the TransEnergie website is obtained in real time from the ASM-NET.
4. Real-time detection of geomagnetic storms: a trigger built from the wide-area harmonic data is automatically generated and sent to the grid operators who then take preventive actions according to pre-established procedures.
5. Backup signal for load-frequency control: from the wide-area bus frequency and angle shifts, the ASM-NET computes the accumulated time error between the system voltage waveform and the universal coordinated time. This measure is sent to the LFC which uses it as a backup signal.
6. Optional link to the state estimator: Three angle shifts from the ASM-NET are sent to the state estimator data concentrator where they could help to improve the state estimate. It is planned to make the remaining five angle-shifts in the present ASM-NET available to the state estimator. However, the added value of eight wide-area data should not be overstated, given that the Hydro-Québec state estimator relies already on 8000 measurements.
Table 1: Evolution of the Hydro-Québec ASM-NET (1976-2004)
Year (version)
Synchro. Signal (accuracy)
Nb of PMUs
Rate Hz
Data concentrator features
1976 (0.0)
LC (46 µs)
2 1 Custom database
1981 (3.0)
GEOS
3 30 4000 records possible
1988 (4.0)
IRIG-B (20 µs)
4 60 1)Central unit on a HP-1000 computer. Visualisation on a sun computer using a X-Windows based multi-users operating syst. 2)Voltage asymmetry computation 3)New “Raima” database with 10 000 records of angle and 600 records of voltage asymmetry
1991 (4.0)
IRIG-B (20 µs)
8 60 Four more PMUs
1995 (4.0)
IRIG-B (20 µs)
8 60 Computation of bus voltage harmonic content up to the 10th.
1998 (4.1)
IRIG-B (20 µs)
8 60 Continuous record up to 6 months
2004 (5.0)
GPS (1 µs)
8 60 Change from IREQ made PMU to Macrodyne PMU. Change from Raima to ORACLE database
II. WIDE-AREA MONITORING TECHNOLOGY ASSESSMENT In 1995, wide-area technology was rapidly improving subsequently, in the following of IEEE Std 1344 [14] and the publicity around the newly introduced Macrodyne PMU [13]. Hydro-Québec was considering it as a viable alternative for developing more secure special protection systems [3, 9]. However, the planning department expressed serious concerned about the reliability of this not yet proven
technology. There were also some concerns that existing DFT-based voltage magnitude and frequency tracking alone could not provide an acceptable signal quality for fast wide-area applications, given that the series-compensated Hydro-Québec grid shows significant electromagnetic resonances in a frequency range starting from 4 Hz up to harmonic frequencies [25].
J.-CARTIER
MANICOUAGAN
600 km
CHURCHILL FALLS COMPLEX (5 600 MW)
JAMES BAY COMPLEX
(15 000 MW)
MANIC-OUTARDES COMPLEX (8 100 MW)
34 %
MONTAGNAIS
CHURCHILL
ARNAUD
MICOUA CHIBOUGAMAU
RADISSON
NEMISCAU
LG-4TILLY
LG-3 CHISSIBI
ROBERT-BOURASSA
Nepool
DES CANTONS
APPALACHES
LÉVIS
CHÂTEAUGUAY
CHÉNIER
ALBANEL
ABITIBI
GRAND-BRÛLÉ
CHAMOUCHOUANE
SAGUENAY
LAURENTIDES
LA VÉRENDRYE
22
2
2
1
2
20 % 20 %
32 % 34 %
40 % 26 %
17 %
16 %
44 %
40 %
2
2
3
2
LEGEND 735 Kv Substation DC Converter Series Compensation DC Line Synchronous CondensersStatic Var Compensators
1- DUVERNAY 2- BOUCHERVILLE3- CARIGNAN
N.Y.PA
DATA CONCENTRATOR : MONTRÉAL
QUÉBEC AREA
NICOLET
1000 km
400 km
1 2
3
40 %
HERTEL
1
82
4
3
5 6
7
PMU
Fig. 1: Hydro-Québec’s ASM-NET configuration from 1991 to now.
Figure 2 illustrates the spectral analysis of an actual COMTRADE record of a 735-kV bus voltage. The frequency deviation is filtered with a 2.5-cycle low-pass FIR filter while the voltage magnitude is derived unfiltered from the one-cycle DFT-based phasor. Clearly, a one Hz power oscillation can be observed. However, additional interfering sinusoidal components at 5 and 27 Hz result in non-smooth signals that can hardly be used in sensitive applications without additional filtering (cf. [18] for additional considerations regarding the results in Fig. 2). To assess the reliability and performance of wide-area technology in special stability applications, a research project was started in August 1996, with three new IREQ-made PMUs installed on the grid in fall 1997. Hydro-Québec decided to explore a range of measurement algorithms ranging from adaptive Kalman filtering [22] and recursive least-squares [21] to classical recursive DFT [18] to determine which class of methods best met the needs of this highly colored network. The test bed is sketched in Fig. 3, while the block diagrams of the processing algorithms are illustrated in Fig. 4. The input sampling rate was set at 64 pts/cycle while the phasors were transferred to IREQ’s concentrator every 3 cycles.

0 0 . 1 0 . 2 0 . 3 0 . 4 0 . 5 0 . 6 0 . 7
-0 . 1
-0 . 0 5
0
0 . 0 5
0 . 1
Spe
ed(H
z)
t e m p s (s e c . )
(a ) P ro n y a n a ly s is o f t h e p o s t -fa u lt re s p o n s e : F re q u e n c y D e via t io n
A c t u a l s ig n a lP ro n y M o d e l o f t h e s ig n a la m p = 0 . 0 9 8 9 4 6 ; fn = 0 . 9 5 9 1 4 ; z e t a = 0 . 2 7 2 0 9a m p = 0 . 0 5 1 9 3 1 ; fn = 3 2 . 1 0 3 3 ; z e t a = 0 . 0 4 1 1 8 5
1 0-1
1 00
1 01
1 02
0 . 0 0 5
0 . 0 1
0 . 0 1 5
0 . 0 2
0 . 0 2 5
0 . 0 3
0 . 0 3 5
0 . 0 4
0 . 0 4 5
H z
Spe
ed(H
z)
S p e c t ra l d e n s i t y
0 0 . 1 0 . 2 0 . 3 0 . 4 0 . 5 0 . 6 0 . 7-0 . 0 8
-0 . 0 6
-0 . 0 4
-0 . 0 2
0
0 . 0 2
0 . 0 4
0 . 0 6
Vol
tage
(pu)
t e m p s (s e c . )
(b ) P ro n y a n a ly s is o f t h e p o s t - fa u l t re s p o n s e : In t e rfe rr in g V o lt a g e
A c t u a l s ig n a lP ro n y M o d e l o f t h e s ig n a la m p = 0 . 0 4 7 2 9 5 ; fn = 2 7 . 8 5 0 3 ; z e t a = 0 . 0 4 3 7 9a m p = 0 . 0 0 9 1 5 8 4 ; fn = 5 . 3 6 3 3 ; z e t a = 0 . 0 2 7 1 4 2
1 0-1
1 00
1 01
1 02
1
2
3
4
5
6
7
8
9
x 1 0-3
H z
Vol
tage
(pu)
S p e c t ra l d e n s it y
Fig. 2 : Spectral analysis of a typical bus voltage from the Hydro-Québec’s eastern transmission system. (a) estimated frequency deviation ; (b) interfering voltage.
UMP
UMP
UMPSCADA
GPS
DATA USER
Public links:- Remote control of PMUs- File Transfer
Dedicated Links: Synchronous real-time communications
Site #1
Site #2
Site #3
Optional dedicated link
Ethernet Link
Némiskau
Boucherville
Arnaud
- Phasors and status to SCADA - Commands/controls to PMU
WIN95
WIN95
WIN95
WIN95/NT
WIN95/NT
IREQ (Office)
IREQ (Lab)
to SPS (Response-Based Wide-Area Control)
735kV SubstationsTransÉnergie
Fig. 3: Setup of the three-terminal experiment with custom signal processing algorithms.
The tested algorithms in Fig.5 consist in the following main modules: 1. A complex-signal Kalman filter-based phasor estimation [19] 2. A 2.5-cycle FIR Kay filter-based frequency estimator [18]
(algo. #1) 3. A two-stage adaptive band-pass filtering-based frequency
estimation (algo. #2 and #3) [20] 4. A α−β−γ tracker for accurate acceleration estimation
from the raw frequency [23]. The thresholds for events recording on the SCADA are summarized below: • Inter-PMU angle shift variation (3 cycles): 1o
• Inter-PMU frequency shift (instantaneous): 80-mHz • Single-channel voltage angle (resp. amplitude) variation (over
3cycles): 2o (resp. 10%).
ip(k)
vp(k)
ia(k)
ib(k)
ic(k)
va(k)
vb(k)
vc(k)Clarke Transform
1:19220Hz sampling rate
to SCADA
1:2to Frequency algo.
Vp (32 pts/cycle)
64 pts/cycle
Ip
In
Vn
64 pts/cycleRaw dataCOMTRADE Format
Vp
Complex-domain Kalman FilterPhasor computation
Instantaneous phasors Fundamental phasors
Downsampling
DownsamplingDelta-SigmaA2DConverter
735kV (bottom graphic)
Raw
Spike
VpKayFilter
1:2
α−β−γ Tracker Acceleration
Frequency #2
Frequence #3
Phase
Angle
1:48
to SCADA(20
Hz sampling rate)
Stage #1
Stage #2
1:2Vp1
unwrapping
Frequency #1
frequency
Quadraturebandpass filtersbased adaptivefrequency estimation
Quadraturebandpass filtersbased adaptivefrequency estimation
Downsampling
Downsampling
mitigation
(from top graphic)
Fig. 4: Signal processing flowchart
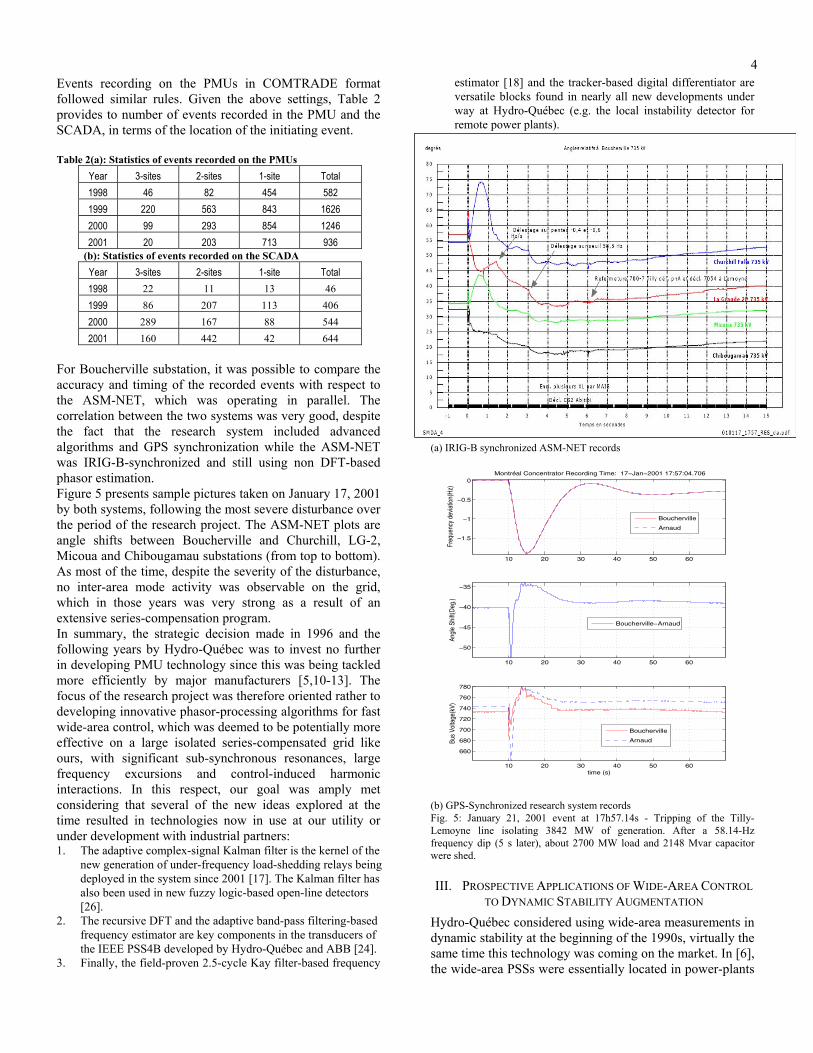
4Events recording on the PMUs in COMTRADE format followed similar rules. Given the above settings, Table 2 provides to number of events recorded in the PMU and the SCADA, in terms of the location of the initiating event. Table 2(a): Statistics of events recorded on the PMUs
Year 3-sites 2-sites 1-site Total 1998 46 82 454 582 1999 220 563 843 1626 2000 99 293 854 1246 2001 20 203 713 936
(b): Statistics of events recorded on the SCADA Year 3-sites 2-sites 1-site Total 1998 22 11 13 46 1999 86 207 113 406 2000 289 167 88 544 2001 160 442 42 644
For Boucherville substation, it was possible to compare the accuracy and timing of the recorded events with respect to the ASM-NET, which was operating in parallel. The correlation between the two systems was very good, despite the fact that the research system included advanced algorithms and GPS synchronization while the ASM-NET was IRIG-B-synchronized and still using non DFT-based phasor estimation. Figure 5 presents sample pictures taken on January 17, 2001 by both systems, following the most severe disturbance over the period of the research project. The ASM-NET plots are angle shifts between Boucherville and Churchill, LG-2, Micoua and Chibougamau substations (from top to bottom). As most of the time, despite the severity of the disturbance, no inter-area mode activity was observable on the grid, which in those years was very strong as a result of an extensive series-compensation program. In summary, the strategic decision made in 1996 and the following years by Hydro-Québec was to invest no further in developing PMU technology since this was being tackled more efficiently by major manufacturers [5,10-13]. The focus of the research project was therefore oriented rather to developing innovative phasor-processing algorithms for fast wide-area control, which was deemed to be potentially more effective on a large isolated series-compensated grid like ours, with significant sub-synchronous resonances, large frequency excursions and control-induced harmonic interactions. In this respect, our goal was amply met considering that several of the new ideas explored at the time resulted in technologies now in use at our utility or under development with industrial partners: 1. The adaptive complex-signal Kalman filter is the kernel of the
new generation of under-frequency load-shedding relays being deployed in the system since 2001 [17]. The Kalman filter has also been used in new fuzzy logic-based open-line detectors [26].
2. The recursive DFT and the adaptive band-pass filtering-based frequency estimator are key components in the transducers of the IEEE PSS4B developed by Hydro-Québec and ABB [24].
3. Finally, the field-proven 2.5-cycle Kay filter-based frequency
estimator [18] and the tracker-based digital differentiator are versatile blocks found in nearly all new developments under way at Hydro-Québec (e.g. the local instability detector for remote power plants).
(a) IRIG-B synchronized ASM-NET records
10 20 30 40 50 60
−1.5
−1
−0.5
0
Freq
uenc
y de
viat
ion(
Hz)
Montréal Concentrator Recording Time: 17−Jan−2001 17:57:04.706
10 20 30 40 50 60
−50
−45
−40
−35
Angl
e Sh
ift(D
eg.)
10 20 30 40 50 60
660
680
700
720
740
760
780
Bus
Volta
ge(k
V)
time (s)
Boucherville
Arnaud
Boucherville−Arnaud
Boucherville
Arnaud
(b) GPS-Synchronized research system records Fig. 5: January 21, 2001 event at 17h57.14s - Tripping of the Tilly-Lemoyne line isolating 3842 MW of generation. After a 58.14-Hz frequency dip (5 s later), about 2700 MW load and 2148 Mvar capacitor were shed.
III. PROSPECTIVE APPLICATIONS OF WIDE-AREA CONTROL TO DYNAMIC STABILITY AUGMENTATION
Hydro-Québec considered using wide-area measurements in dynamic stability at the beginning of the 1990s, virtually the same time this technology was coming on the market. In [6], the wide-area PSSs were essentially located in power-plants
5for the purpose of increasing the inter-area mode damping with zero-adverse impact on local modes. Recently, attention shifted more toward the numerous shunt compensators spread around the system since at the present time they simply do not contribute to inter-area mode damping [34]. Following the initial results in [7] and given that the theoretical basis of our wide-area damping control has already been presented [6], the focus here will be to assess the value of the advanced control scheme in a comprehensive way using more realistic network data, assumptions, configurations and contingencies. In fact, the criterion chosen for judging the control effectiveness is the stability margin in MW based on the same set of contingencies used in planning the operations for power transfer limits.
The control configuration is shown in Fig. 6 with the PSS transfer function given by [24]:
71
2 8
11166
1 1 1 1w II
I
w PMU I I
sT sTsTPSS K
sT sT sT sT
++= × −
+ + + +
⎛ ⎞⎛ ⎞⎜ ⎟⎜ ⎟⎝ ⎠⎝ ⎠
with 1 2 7 8
12; 0.3 ; 0.1 ;
0.0833 ; 0.1 ; 0.12I w PMU
I I I I
K T s T s
T s T T s T s
= = =
= = = =
⎧⎨⎩
For global control, the washout time constant is increased to Tw=1s and the gain KI reduced by a factor 16, 13 and 20 for SVC No. 880, 882 and 814 [7]. The same settings are used at all substations since the fact that they are all in the James Bay north and South areas means that they have the same controllability/observability phase shapes [7]. (a) System configuration
Externalgrid
880
660 Mvar
882
2 units 2 units
660 Mvar
660 Mvar
8142 units
(35,000 MW)
(b) PSS configuration
External grid(35,000 MW)
330 MVASVC
PSS
SCADAΣ
Vref
Wide-AreaMeasurements
θR1-θR2
+
+
θL-θR
VR
VL
VR1 VR2
Z
Fig. 6: System and control configurations. The PSS input signal is respectively (θL- θR ) in local mode and (θR1- θR2 ) in wide-area mode. The former is the angle shift between the SVC bus (L) and a neighboring bus (across line impedance Z [34]) while the latter is the angle shift between two remote busses.
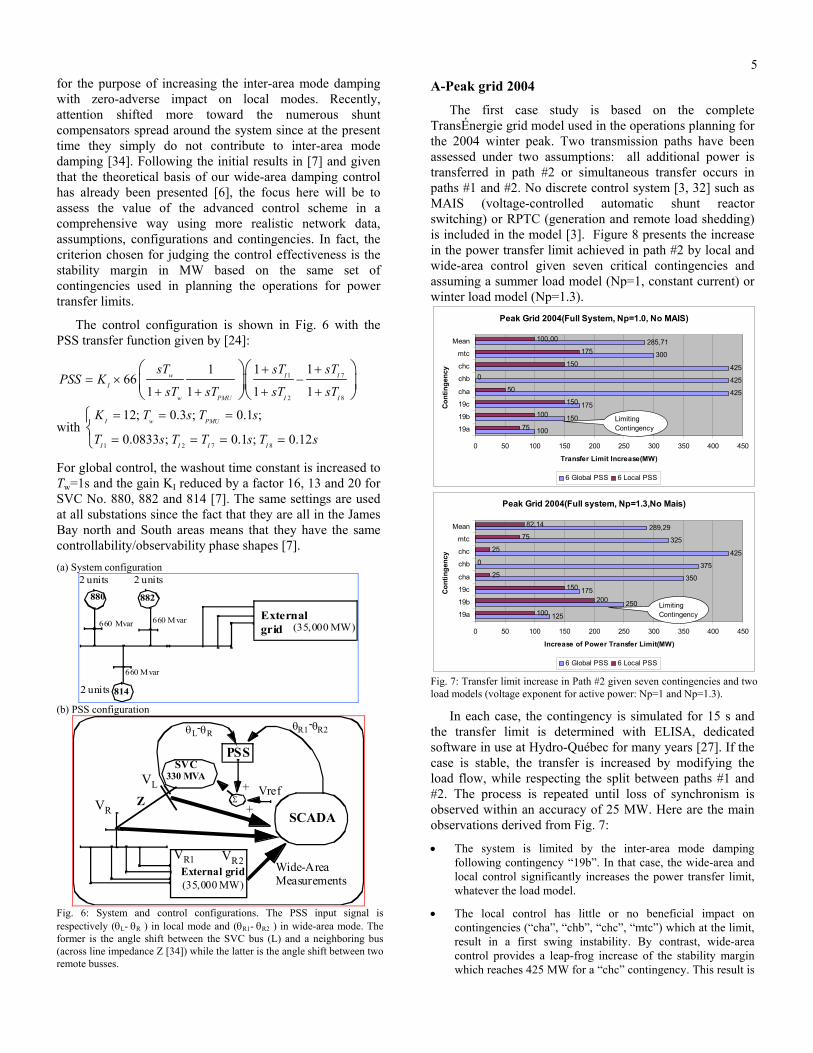
A-Peak grid 2004
The first case study is based on the complete TransÉnergie grid model used in the operations planning for the 2004 winter peak. Two transmission paths have been assessed under two assumptions: all additional power is transferred in path #2 or simultaneous transfer occurs in paths #1 and #2. No discrete control system [3, 32] such as MAIS (voltage-controlled automatic shunt reactor switching) or RPTC (generation and remote load shedding) is included in the model [3]. Figure 8 presents the increase in the power transfer limit achieved in path #2 by local and wide-area control given seven critical contingencies and assuming a summer load model (Np=1, constant current) or winter load model (Np=1.3).
Peak Grid 2004(Full System, Np=1.0, No MAIS)
100
150
175
425
425
425
300
285,71
75
100
150
50
0
150
175
100,00
0 50 100 150 200 250 300 350 400 450
19a
19b
19c
cha
chb
chc
mtc
Mean
Cont
inge
ncy
Transfer Limit Increase(MW)
6 Global PSS 6 Local PSS
Limiting Contingency
Peak Grid 2004(Full system, Np=1.3,No Mais)
125
250
175
350
375
425
325
289,29
100
200
150
25
0
25
75
82,14
0 50 100 150 200 250 300 350 400 450
19a
19b
19c
cha
chb
chc
mtc
Mean
Cont
inge
ncy
Increase of Power Transfer Limit(MW)
6 Global PSS 6 Local PSS
Limiting Contingency
Fig. 7: Transfer limit increase in Path #2 given seven contingencies and two load models (voltage exponent for active power: Np=1 and Np=1.3).
In each case, the contingency is simulated for 15 s and the transfer limit is determined with ELISA, dedicated software in use at Hydro-Québec for many years [27]. If the case is stable, the transfer is increased by modifying the load flow, while respecting the split between paths #1 and #2. The process is repeated until loss of synchronism is observed within an accuracy of 25 MW. Here are the main observations derived from Fig. 7:
• The system is limited by the inter-area mode damping following contingency “19b”. In that case, the wide-area and local control significantly increases the power transfer limit, whatever the load model.
• The local control has little or no beneficial impact on contingencies (“cha”, “chb”, “chc”, “mtc”) which at the limit, result in a first swing instability. By contrast, wide-area control provides a leap-frog increase of the stability margin which reaches 425 MW for a “chc” contingency. This result is

6of fundamental significance, since it reveals a conceptual gap between local and wide-area control, a gap related to wide-area information and impossible to compensate by means of a gain increase or otherwise.
These conclusions are confirmed in Fig. 8 using a simultaneous power transfer scenario. The increase in the transfer limit is even larger, although giving a due account to the voltage quality reduces the amount of the gains. In such a case, the security limit is not enhanced (due to “chb” and “cha”) but the overall stability margin (reliability) is still vastly improved, with an average limit gain of 378 MW.
Six Global PSS on the Peak Grid 2004 (Full system, Np=1.3, No Mais): Simultaneous Transfer in Paths #1 & #2
250
500
400
825
850
0
1625
635,71
175
350
275
0
125
1150
575
378,57
-100 100 300 500 700 900 1100 1300 1500 1700
19a
19b
19c
cha
chb
chc
mtc
Mean
Con
tinge
ncy
Total Transfer Limit Increase(MW)
No Voltage Criteria: limiting contingency=19b With Voltage Criteria:Limiting Contingency=cha
Fig. 8: Transfer limit increase under simultaneous transfer in paths #1 and #2 given seven contingencies. When voltage criteria are used, a stable case is rejected if the transient-voltage profile violates operating requirements.
To quantify the “value of damping”, an elusive quantity to which some engineers assign only a qualitative value, we removed up to eight PSSs from a large hydro plant, which plays a key role in stimulating and damping the inter-mode. Figure 10 shows that the wide-area control is able to compensate for the missing of six PSSs under a path #2 transfer and eight PSSs under a simultaneous transfer in paths #1 and #2.
Global Control on the Full Grid: Peak Winter Conditions (2004)No PSS on n 500-MVA Units in a large Hydro-Plant with m =11 units
10025
125
725 775
0
1175
417,86
25 0 50150 175
325250
128,57
0
200
400
600
800
1000
1200
1400
19a 19b 19c cha chb chc mtc Average
Contingency
Tran
sfer
Lim
it In
crea
se(M
W)
Simultaneous Transfert on Paths #1 & #2: n=8 PSS out Transfer on Path #1 only (n=6 PSS out)
Limiting contingency
Fig. 9: Power transfer limit increase in Path #2 for the seven contingencies in the design criteria and two types of load models.
Given that one generator is 500 MVA and one SVC is 330 MVA and given that both the generator and SVC PSS have a signal range of ±10%, it turns out that a single wide-area PSS can provide as much damping as a 1.5-generator PSS in the first case and two PSSs in the second case. Since it is the practice at Hydro-Québec to restrict the transfer by 100 MWx(n-1) when n PSSs are out of service in the hydro
plant considered in Fig. 9, we can estimate (roughly) that, with respect to damping, wide-area control raises the operating limit by 500 MW on a single-path transfer and by 800-MW for a simultaneous transfer.
B-Peak grid 2003 The next case study is derived from the grid in actual
operation in February 2003. The load-flow is a state-estimator snapshot and is characterized by the outage for maintenance of one 735-kV line in the eastern corridor and one SVC in the James Bay corridor. By varying the power transfer in path #1 giving a nearly constant power transfer in path #2, we derived 60 configurations from the base case. The behavior of eleven of them is illustrated in Fig. 10. Each dot corresponds to a given configuration a, b, c, …, k and it appears that the angle-shift in path #1 increased significantly as the total transfer in this path is increased linearly.
Increasing the system Stress in the Power Transmission Path #1
20
30
40
50
60
70
80
90
25000 27000 29000 31000 33000 35000 37000
System Load in MW
Angl
e Sh
ift o
f Pat
h #1
in D
eg.
Stressing Path #1 with Path #2 at a Constant Transfer Level
7500
8000
8500
9000
9500
5000 7000 9000 11000 13000 15000 17000
Path #1 Total Transfer (MW)
Path
#2
Tota
l Tra
nsfe
r (M
W)
Fig. 10: Features of the ten base cases considered: each dot is a configuration from “a” (Load=25 000 MW) to “k” (Load=37 000 MW)
Peak Grid-2003 with one Line and one SVC out
26,09%
36,00%31,25%
11,59%
-10,67%
0,00%
-20,00%
-10,00%
0,00%
10,00%
20,00%
30,00%
40,00%
Loss of Synchronism Voltage violation Combined Improvement
Effic
ienc
y of
the
Cont
rol S
chem
e
Global(6 SVC) Local(6 SVC)
Fig. 11: System reliability assessment for thirteen contingencies applied to sixty system configurations (Total = 780 cases with 69 loss of synchronism and 75 voltage violations in the base case without supplementary control).
These 60 configurations were then simulated over thirteen contingencies (including the previous seven), with and
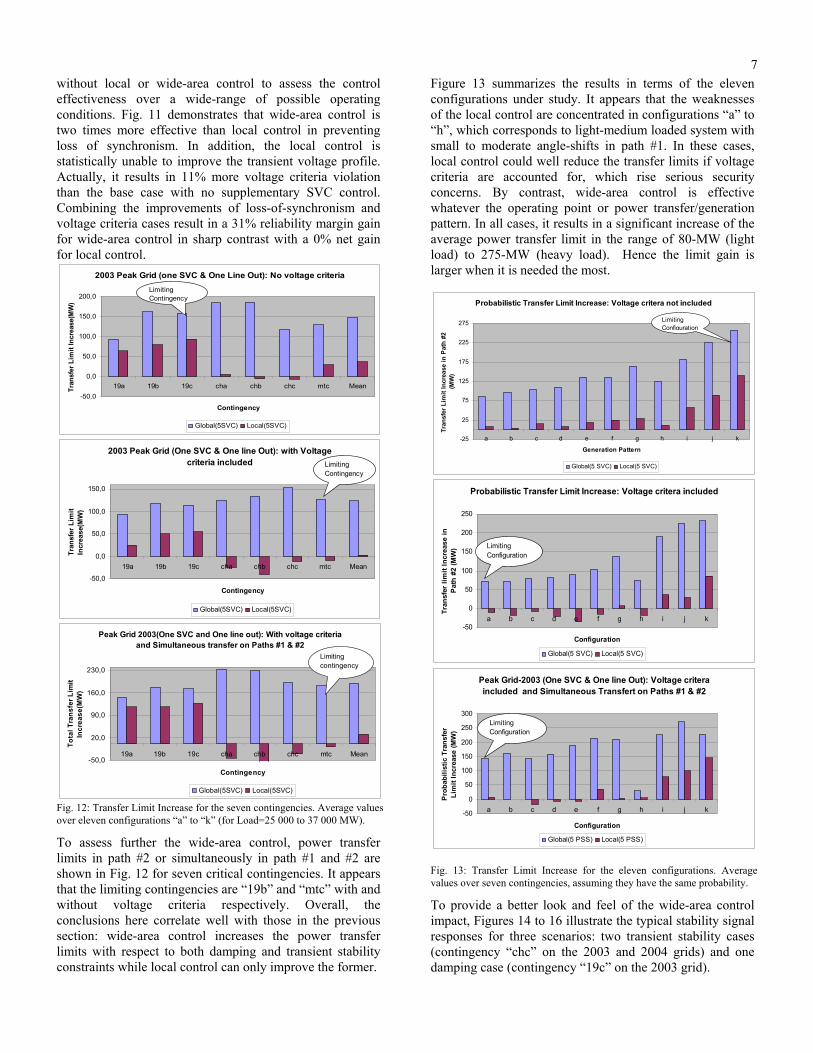
7without local or wide-area control to assess the control effectiveness over a wide-range of possible operating conditions. Fig. 11 demonstrates that wide-area control is two times more effective than local control in preventing loss of synchronism. In addition, the local control is statistically unable to improve the transient voltage profile. Actually, it results in 11% more voltage criteria violation than the base case with no supplementary SVC control. Combining the improvements of loss-of-synchronism and voltage criteria cases result in a 31% reliability margin gain for wide-area control in sharp contrast with a 0% net gain for local control.
2003 Peak Grid (one SVC & One Line Out): No voltage criteria
-50,0
0,0
50,0
100,0
150,0
200,0
19a 19b 19c cha chb chc mtc Mean
Contingency
Tran
sfer
Lim
it In
crea
se(M
W)
Global(5SVC) Local(5SVC)
Limiting Contingency
2003 Peak Grid (One SVC & One line Out): with Voltage
criteria included
-50,0
0,0
50,0
100,0
150,0
19a 19b 19c cha chb chc mtc Mean
Contingency
Tran
sfer
Lim
it In
crea
se(M
W)
Global(5SVC) Local(5SVC)
Limiting Contingency
Peak Grid 2003(One SVC and One line out): With voltage criteria
and Simultaneous transfer on Paths #1 & #2
-50,0
20,0
90,0
160,0
230,0
19a 19b 19c cha chb chc mtc Mean
Contingency
Tota
l Tra
nsfe
r Lim
it In
crea
se(M
W)
Global(5SVC) Local(5SVC)
Limiting contingency
Fig. 12: Transfer Limit Increase for the seven contingencies. Average values over eleven configurations “a” to “k” (for Load=25 000 to 37 000 MW).
To assess further the wide-area control, power transfer limits in path #2 or simultaneously in path #1 and #2 are shown in Fig. 12 for seven critical contingencies. It appears that the limiting contingencies are “19b” and “mtc” with and without voltage criteria respectively. Overall, the conclusions here correlate well with those in the previous section: wide-area control increases the power transfer limits with respect to both damping and transient stability constraints while local control can only improve the former.
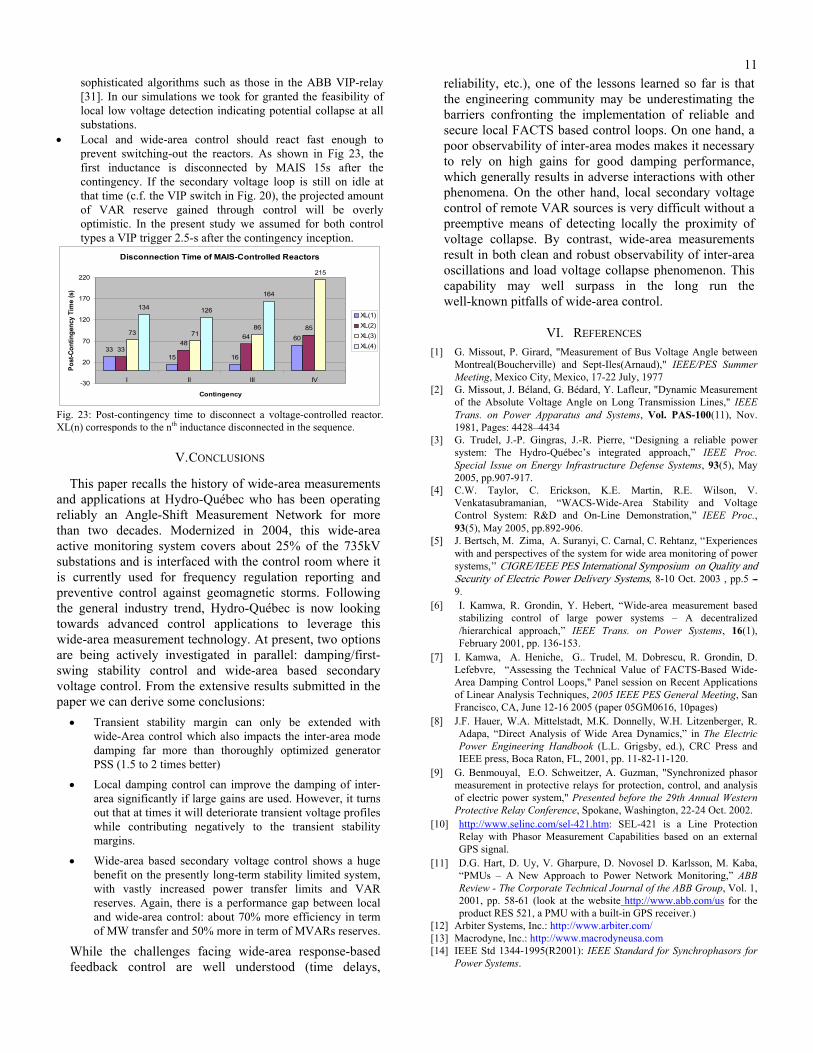
Figure 13 summarizes the results in terms of the eleven configurations under study. It appears that the weaknesses of the local control are concentrated in configurations “a” to “h”, which corresponds to light-medium loaded system with small to moderate angle-shifts in path #1. In these cases, local control could well reduce the transfer limits if voltage criteria are accounted for, which rise serious security concerns. By contrast, wide-area control is effective whatever the operating point or power transfer/generation pattern. In all cases, it results in a significant increase of the average power transfer limit in the range of 80-MW (light load) to 275-MW (heavy load). Hence the limit gain is larger when it is needed the most.
Probabilistic Transfer Limit Increase: Voltage critera not included
-25
25
75
125
175
225
275
a b c d e f g h i j k
Generation PatternTr
ansf
er L
imit
Incr
ease
in P
ath
#2
(MW
)
Global(5 SVC) Local(5 SVC)
Limiting Configuration
Probabilistic Transfer Limit Increase: Voltage critera included
-50
0
50
100
150
200
250
a b c d e f g h i j k
Configuration
Tran
sfer
lim
it In
crea
se in
P
ath
#2 (M
W)
Global(5 SVC) Local(5 SVC)
Limiting Configuration
Peak Grid-2003 (One SVC & One line Out): Voltage critera included and Simultaneous Transfert on Paths #1 & #2
-50
0
50
100
150
200
250
300
a b c d e f g h i j k
Configuration
Pro
babi
listic
Tra
nsfe
r Li
mit
Incr
ease
(MW
)
Global(5 PSS) Local(5 PSS)
Limiting Configuration
Fig. 13: Transfer Limit Increase for the eleven configurations. Average values over seven contingencies, assuming they have the same probability.
To provide a better look and feel of the wide-area control impact, Figures 14 to 16 illustrate the typical stability signal responses for three scenarios: two transient stability cases (contingency “chc” on the 2003 and 2004 grids) and one damping case (contingency “19c” on the 2003 grid).

8The main observation from these plots is that while improving the damping of the 0.4Hz mode significantly (Fig. 15), the local control may destabilize a basically stable case (Fig. 14) inducing a net loss of transfer capability.
0 5 10 1540
60
80
100
120
140
160
Ang
le=L
G2−
CH
U(d
eg.)
Actual Grid (Winter 2003): Generation pattern "d" − No MAIS & Contingency "chc"
0 5 10 150.4
0.5
0.6
0.7
0.8
0.9
1
Vol
tage
−705
(pu)
0 5 10 15−300
−200
−100
0
100
200
300
SV
C M
VA
R(#
1)
time(s)
No PSS:Base+1075MW
6−Local PSS:Base+1050MW
6−Global PSS:Base+1225MW
Fig. 14: 2003 grid (medium load) – Configuration “d”. Local PSS destabilizes a stable case (i.e. 25-MW transfer limit reduction).
0 5 10 150
20
40
60
80
100
Ang
le=L
G2−
CH
U(d
eg.)
Actual Grid (Winter 2003): Generation pattern "k" − No MAIS & Contingency "19c"
0 5 10 150.6
0.7
0.8
0.9
1
Vol
tage
−705
(pu)
0 5 10 15
−200
0
200
400
SV
C M
VA
R(#
1)
time(s)
No PSS:Base−350MW
6−Local PSS:Base−100MW
6−Global PSS:Base−25MW
Fig. 15: 2003 Grid (heavy load). Local PSS is nearly equivalent to the base case (250 vs 350 MW limit increase for local vs wide-area PSS).
0 5 10 15
0
50
100
Ang
le=L
G2−
CH
U(d
eg.)
Peak Grid 2004 : full system − No MAIS & contingency "chb"
0 5 10 15
0.4
0.6
0.8
1
Vol
tage
−715
(pu)
0 5 10 15
−300
−200
−100
0
100
200
300
SV
C M
VA
R(#
3)
time(s)
No PSS:Base+950MW
6−Local PSS:Base+950MW
6−Global PSS:Base+1300MW
Fig. 16: 2004 grid - No improvement with Local PSS while Global PSS increases the transfer limit by 350 MW
0 5 10 15
−1
−0.8
−0.6
−0.4
−0.2
0
0.2
0.4
PSS input signal: b)Peak grid 2003− Configuration "k"
SV
C #
1(ra
d)
time(s)
0 5 10 15
−0.5
0
0.5
1
PSS input signal: a)Peak grid 2004
SV
C #
1(ra
d)
Local PSS(1) x 16Global PSS(1)
Fig. 17: High loop gains required for effective local PSS.
In contrast to some generally accepted (but unsubstantiated) view, local control is not always a panacea because due to a poor observability, it comes with some practical concerns:
• It needs large gain (from 4 to 20 times more) than wide-area local [7] to achieve a similar damping effect. As well known, a high gain control loop is always at risk of sensitivity to noise, adverse nonlinear interactions and some time limit cycle-effects. Figure 17 illustrate that on the SVC 880, the local PSS input is 16 times less than the wide-area PSS input. Additionally, we see that the local signal contains a spike and is not well-shaped in the first half-cycle of the inter-area swing. This is possibly the reason why local control has no (or negative) impact on the first swing instability.
• Another pitfall of local control is illustrated in Fig. 18: when heavily loaded lines in the SVC corridor are switched on-off,

9the local PSS induces large (and useless) variations of the SVC MVAR production in contrast with the no-control or wide-area control situations. A possible solution is to reduce the gain by a factor of 2 or 3, which will result in a corresponding reduction the inter-area damping, thus dipping further the gap between local and wide-area control.
4 6 8 10 12 14
40
41
42
43
44
45
Ang
le=L
G2−
CH
U(d
eg.)
Actual Grid (Winter 2003): Sequence of single line switching in a parallel corridor
4 6 8 10 12 14−300
−200
−100
0
100
200
300
time(s)
SV
C M
VA
R(#
2)
No PSS
6−Local PSS
6−Global PSS
Fig. 18: Sensitivity to on-off line switching in the vicinity of SVC #1.
IV. FUTURE APPLICATIONS OF WIDE-AREA MEASUREMENT TO SECONDARY VOLTAGE CONTROL
Hitherto the TransÉnergie system was transient or dynamic stability limited. But today, voltage stability is of a bigger concern here [32, 33] and elsewhere [31], especially after the august 2003 blackout in the North-East America [30]. The question of course is to know if wide-area measurements have any value for this rather slow application. The pilot voltage measurement feeding a secondary voltage control loop is just as slow as the ACE signal in the load-frequency control loop, such that an accurate time-tagging is presumably not necessary to achieve the required closed-loop performance. However, for systems where a secondary voltage loop is not yet in place such as in North-America, one may take advantage of the newly deployed wide-area measurements not only in fast voltage control as currently developed at BPA [4] but also in more traditional secondary voltage control as practiced in Europe for many years [28]. This will leverage the value of the technology by combining many applications such as passive/active monitoring, damping/first-swing control, fast/slow voltage control, etc. under a single measurement backbone. We expect that a mixed package will better attract the interest of utilities facing a wide-range of problems than an approach focusing on a single application. That’s why after years focusing on monitoring and damping/first-swing applications only, Hydro-Québec is now actively investigating possible use of wide-area voltage measurements to enhance long-term stability through secondary voltage control [31, 33]. The first step of our study consisted in assessing the potential of “remote information” (i.e. observability) and “remote control” (i.e. controllability) in the context of secondary voltage control. To this aim, we first performed a voltage step on the largest synchronous condenser in the
load center (Duvernay condenser with 3x350MVAR) and determined the static voltage gain at remote busses equipped with shunt compensators. Then we similarly excited each remote dynamic shunt device and computed the static voltage gain at the load center in Montreal (average voltage value on the 735-kV metropolitan ring [32]).
Voltage Step in MTL (Duvernay Sychronous Condenser)
0
0,2
0,4
0,6
0,8
1
1,2
ALB NEM CHI MAN ABI LTD CHM LEV LVD DUV
Local Measurement of Remote Voltage
Obs
erva
bilit
y in
dex
Montreal Pilot Voltage Response
0
0,2
0,4
0,6
0,8
1
1,2
ALB NEM ABI CHI CHM MAN LEV LVD LTD DUV
Excitation Site
Cont
rola
bilit
y In
dex
Fig. 19: Load voltage static observability (Top) and static Controllability with respect to all dynamic shunt compensators in the system (2001 peak grid with one line outage). The results summarized in Fig. 19 demonstrate that the static observability of the load voltage at remote locations is decreasing uniformly as the shunt device distance from Montreal increases (cf. Fig. 1 for approximate locations). The static controllability of the load voltage is even more sensitive to the remoteness of the controlling device. However, since no controllability measure in Fig. 18 is zero as such, every remote dynamic shunt device can theoretically participate in supporting the load voltage, provided that they have enough information to trigger their action.
To put these ideas in practice, we implemented a local secondary voltage control scheme [28, 33] to compare it with a wide-area based secondary voltage control [31] (Fig. 21). Basically, the SVC reference voltage is modulated by an error signal VS derived from a locally estimated pilot voltage (VR) or from a wide-area measurement based pilot voltage (VWAMS). The former is generally an estimate of the voltage magnitude at the closest bus towards the load (by using for instance a line drop compensation scheme [16, 28]) while the later could be the average voltage magnitude on a metropolitan high-voltage ring [31, 32]. The filter time constant Tf, should be large enough to ensure a necessary dynamic decoupling with the primary voltage

10controller. Giving that a slow common mode is generally observed in Hydro-Québec network dynamic responses at a frequency around 0.05-Hz (Fig. 5), we selected Tf=25s in the study. This resulted in a control signal Vc deprived of any inter-area or governor dynamics, making it well suited for an interaction-free secondary voltage control. Finally, an optional nonlinear device shown in Fig. 20 can be used to quickly boost the output signal up to a positive limit when u>∆Vmax. Hence, for ∆Vmax=5%, the compensation tops to the limit when the load voltage is 5% below the target voltage. The booster will roughly compensate for the slow response of the decoupling filter by pushing the SVC to the maximum allowed MVAR production as soon as the voltage collapse indicator (VIP) posts a triggering signal. However, it will return to a linear operating range for small deviations around the target voltage.
K1+sTf
SVC
POWER
SYSTEM
Local Pilot Voltage
SCADA: Wide-Area
NonLinear Ehancer
f(u)
Pilot Voltage
Local vs Wide-AreaSelector
VREFWide-AreaPhasor Measurements
(VL,I
L)
Vcu
++
VWA M S
VR
MVARinjection
VoltageCollapseIndica tor
VL
Σ
-
VS
VIP
Σ-
VTARG ET
+
VS f u( ) sign u( ) 1 1
1 u∆Vmax----------------⎝ ⎠
⎛ ⎞2
+---------------------------------–
⎝ ⎠⎜ ⎟⎜ ⎟⎜ ⎟⎛ ⎞
∆Vm ax 0 05pu⋅≈
VTARGET 1 0pu⋅≈
= =
Vb
Optional blockLimiter
0
LIM
Decoupling F ilter
Fig. 20: Secondary voltage control scheme based on Local or Wide-Area Pilot voltage. The target voltage can be larger than 1. LIM=3%; Tf=25s for global control and Tf=2.5s for local control [33]. To compare the above local and wide-control scheme, four long-term stability limited scenarios were generated from the peak grid 2004. The stability model included all transformers with on-load-tap-changers as well as the shunt reactors equipped with the voltage-controlled switching system (MAIS [3]) When a bus voltage is abnormally low (<0.97pu) for a certain period of time, the (fully local) MAIS device automatically disconnected a shunt reactor. At the limit, all shunt reactors in the load area will be switched out just before a complete collapse. Therefore, one simple way to measure the effectiveness of any voltage collapse prevention scheme is to count the number of reactors disconnected as a result of a voltage-limited contingency. Another approach is to use the ELISA [27] software as in section III to determine the power transfer limit gains with respect to long-term stability (i.e. 300s simulation duration).
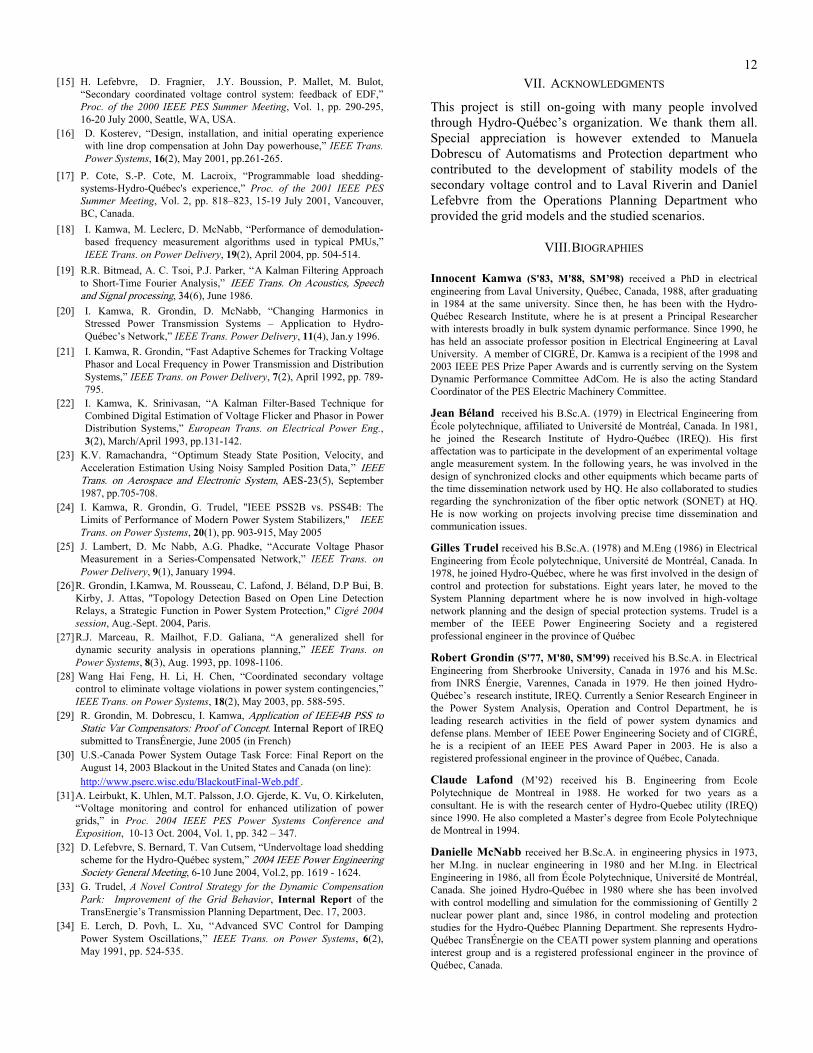
The results from these two approaches are shown in Fig. 21. For contingency IV, both local and wide-area control prevent disconnection of any reactors, compared to the base case where 3 reactors where required for long-term stability of system. However, in all other cases, wide-area control out-passed local control by 1 or 2 reactors. Giving that each reactor represents 330 MVAR, the total reactive reserve against voltage collapse provided by each of the control schemes is impressive, whatever the contingency: from 660
to 990 MVAR in the wide-area case and 330 to 990 MVAR in the local control case. Again in Figure 21, the transfer limit in path #1 provides a complementary picture of the three studied situations: while the worst-case limit is only 100-MW without control, it jumps to 1050 and 1725-MW for local and wide-area control respectively. The biggest gap between local and wide-area control is 1425-MW on contingency IV while the biggest gap between wide-area control and the base case is 3100-MW on contingency III.
Local vs Global Measurement based Secondary Voltage Control
4 4 4
3
2
3
2
0
1 1 1
00
0,5
1
1,5
2
2,5
3
3,5
4
4,5
I II III IV
Contingency
Nb o
f Shu
nt In
duct
ance
s Sw
itche
d
Base Local(11 SVC & 4 Condensers) Global(11 SVC & 4 Condensers)
Local vs Global Measurement based Secondary Voltage Control
100
900500
2000
1125 1050
2175 22001950
1725
3600 3600
0
500
1000
1500
2000
2500
3000
3500
4000
I II III IV
Contingency
Pow
er T
rans
fer L
imit
in P
ath
#1
MW
Base Local(11 SVC & 4 Condensers) Global(11 SVC & 4 Condensers)
Fig. 21: Performance of Global and Local Secondary Voltage in term of VAR reserve and MW transfer. All shunt compensation devices are used in the secondary control with the exception of MANIC and DUVERNAY synchronous condensers.
Voltage Profile During a Collapse in MTL
0,92
0,93
0,94
0,95
0,96
0,97
0,98
0,99
1
ALB NEM CHI MAN ABI LTD CHM LEV LVD DUV
Local Measurement of Remote Voltage
pu
Fig. 22: Feasibility of low voltage detection indicating potential collapse based on local measurements only. For each shunt device (ALB being the farthest from the load), the locally estimated pilot voltage is that of the closest bus towards the load (DUV is in the load center). However a great care should be exercised in interpreting local control results, for the following reasons: • Local control is very difficult to implement effectively when
the SVC is far from the load. Figure 223 shows that given a 0.95-pu load voltage, the VAR sources North of Abitibi (1000-km from MTL) will see practically a flat voltage profile at their closest bus towards the south. Therefore, even if technically feasible, detecting the voltage collapse will require
11sophisticated algorithms such as those in the ABB VIP-relay [31]. In our simulations we took for granted the feasibility of local low voltage detection indicating potential collapse at all substations.
• Local and wide-area control should react fast enough to prevent switching-out the reactors. As shown in Fig 23, the first inductance is disconnected by MAIS 15s after the contingency. If the secondary voltage loop is still on idle at that time (c.f. the VIP switch in Fig. 20), the projected amount of VAR reserve gained through control will be overly optimistic. In the present study we assumed for both control types a VIP trigger 2.5-s after the contingency inception.
Disconnection Time of MAIS-Controlled Reactors
3315 16
60
3348
6485
73 7186
215
134 126
164
-30
20
70
120
170
220
I II III IV
Contingency
Post
-Con
tinge
ncy
Tim
e (s
)
XL(1)XL(2)XL(3)XL(4)
Fig. 23: Post-contingency time to disconnect a voltage-controlled reactor. XL(n) corresponds to the nth inductance disconnected in the sequence.
V. CONCLUSIONS
This paper recalls the history of wide-area measurements and applications at Hydro-Québec who has been operating reliably an Angle-Shift Measurement Network for more than two decades. Modernized in 2004, this wide-area active monitoring system covers about 25% of the 735kV substations and is interfaced with the control room where it is currently used for frequency regulation reporting and preventive control against geomagnetic storms. Following the general industry trend, Hydro-Québec is now looking towards advanced control applications to leverage this wide-area measurement technology. At present, two options are being actively investigated in parallel: damping/first-swing stability control and wide-area based secondary voltage control. From the extensive results submitted in the paper we can derive some conclusions:
• Transient stability margin can only be extended with wide-Area control which also impacts the inter-area mode damping far more than thoroughly optimized generator PSS (1.5 to 2 times better)
• Local damping control can improve the damping of inter-area significantly if large gains are used. However, it turns out that at times it will deteriorate transient voltage profiles while contributing negatively to the transient stability margins.
• Wide-area based secondary voltage control shows a huge benefit on the presently long-term stability limited system, with vastly increased power transfer limits and VAR reserves. Again, there is a performance gap between local and wide-area control: about 70% more efficiency in term of MW transfer and 50% more in term of MVARs reserves.
While the challenges facing wide-area response-based feedback control are well understood (time delays,
reliability, etc.), one of the lessons learned so far is that the engineering community may be underestimating the barriers confronting the implementation of reliable and secure local FACTS based control loops. On one hand, a poor observability of inter-area modes makes it necessary to rely on high gains for good damping performance, which generally results in adverse interactions with other phenomena. On the other hand, local secondary voltage control of remote VAR sources is very difficult without a preemptive means of detecting locally the proximity of voltage collapse. By contrast, wide-area measurements result in both clean and robust observability of inter-area oscillations and load voltage collapse phenomenon. This capability may well surpass in the long run the well-known pitfalls of wide-area control.
VI. REFERENCES [1] G. Missout, P. Girard, "Measurement of Bus Voltage Angle between
Montreal(Boucherville) and Sept-Iles(Arnaud)," IEEE/PES Summer Meeting, Mexico City, Mexico, 17-22 July, 1977
[2] G. Missout, J. Béland, G. Bédard, Y. Lafleur, "Dynamic Measurement of the Absolute Voltage Angle on Long Transmission Lines," IEEE Trans. on Power Apparatus and Systems, Vol. PAS-100(11), Nov. 1981, Pages: 4428–4434
[3] G. Trudel, J.-P. Gingras, J.-R. Pierre, “Designing a reliable power system: The Hydro-Québec’s integrated approach,” IEEE Proc. Special Issue on Energy Infrastructure Defense Systems, 93(5), May 2005, pp.907-917.
[4] C.W. Taylor, C. Erickson, K.E. Martin, R.E. Wilson, V. Venkatasubramanian, “WACS-Wide-Area Stability and Voltage Control System: R&D and On-Line Demonstration,” IEEE Proc., 93(5), May 2005, pp.892-906.
[5] J. Bertsch, M. Zima, A. Suranyi, C. Carnal, C. Rehtanz, ‘‘Experiences with and perspectives of the system for wide area monitoring of power systems,’’ CIGRE/IEEE PES International Symposium on Quality and Security of Electric Power Delivery Systems, 8-10 Oct. 2003 , pp.5 --- 9.
[6] I. Kamwa, R. Grondin, Y. Hebert, “Wide-area measurement based stabilizing control of large power systems – A decentralized /hierarchical approach,” IEEE Trans. on Power Systems, 16(1), February 2001, pp. 136-153.
[7] I. Kamwa, A. Heniche, G.. Trudel, M. Dobrescu, R. Grondin, D. Lefebvre, “Assessing the Technical Value of FACTS-Based Wide-Area Damping Control Loops," Panel session on Recent Applications of Linear Analysis Techniques, 2005 IEEE PES General Meeting, San Francisco, CA, June 12-16 2005 (paper 05GM0616, 10pages)
[8] J.F. Hauer, W.A. Mittelstadt, M.K. Donnelly, W.H. Litzenberger, R. Adapa, “Direct Analysis of Wide Area Dynamics,” in The Electric Power Engineering Handbook (L.L. Grigsby, ed.), CRC Press and IEEE press, Boca Raton, FL, 2001, pp. 11-82-11-120.
[9] G. Benmouyal, E.O. Schweitzer, A. Guzman, "Synchronized phasor measurement in protective relays for protection, control, and analysis of electric power system," Presented before the 29th Annual Western Protective Relay Conference, Spokane, Washington, 22-24 Oct. 2002.
[10] http://www.selinc.com/sel-421.htm: SEL-421 is a Line Protection Relay with Phasor Measurement Capabilities based on an external GPS signal.
[11] D.G. Hart, D. Uy, V. Gharpure, D. Novosel D. Karlsson, M. Kaba, “PMUs – A New Approach to Power Network Monitoring,” ABB Review - The Corporate Technical Journal of the ABB Group, Vol. 1, 2001, pp. 58-61 (look at the website http://www.abb.com/us for the product RES 521, a PMU with a built-in GPS receiver.)
[12] Arbiter Systems, Inc.: http://www.arbiter.com/ [13] Macrodyne, Inc.: http://www.macrodyneusa.com [14] IEEE Std 1344-1995(R2001): IEEE Standard for Synchrophasors for
Power Systems.
12[15] H. Lefebvre, D. Fragnier, J.Y. Boussion, P. Mallet, M. Bulot,
“Secondary coordinated voltage control system: feedback of EDF,” Proc. of the 2000 IEEE PES Summer Meeting, Vol. 1, pp. 290-295, 16-20 July 2000, Seattle, WA, USA.
[16] D. Kosterev, “Design, installation, and initial operating experience with line drop compensation at John Day powerhouse,” IEEE Trans. Power Systems, 16(2), May 2001, pp.261-265.
[17] P. Cote, S.-P. Cote, M. Lacroix, “Programmable load shedding-systems-Hydro-Québec's experience,” Proc. of the 2001 IEEE PES Summer Meeting, Vol. 2, pp. 818–823, 15-19 July 2001, Vancouver, BC, Canada.
[18] I. Kamwa, M. Leclerc, D. McNabb, “Performance of demodulation-based frequency measurement algorithms used in typical PMUs,” IEEE Trans. on Power Delivery, 19(2), April 2004, pp. 504-514.
[19] R.R. Bitmead, A. C. Tsoi, P.J. Parker, ‘‘A Kalman Filtering Approach to Short-Time Fourier Analysis,” IEEE Trans. On Acoustics, Speech and Signal processing, 34(6), June 1986.
[20] I. Kamwa, R. Grondin, D. McNabb, “Changing Harmonics in Stressed Power Transmission Systems – Application to Hydro-Québec’s Network,” IEEE Trans. Power Delivery, 11(4), Jan.y 1996.
[21] I. Kamwa, R. Grondin, “Fast Adaptive Schemes for Tracking Voltage Phasor and Local Frequency in Power Transmission and Distribution Systems,” IEEE Trans. on Power Delivery, 7(2), April 1992, pp. 789-795.
[22] I. Kamwa, K. Srinivasan, “A Kalman Filter-Based Technique for Combined Digital Estimation of Voltage Flicker and Phasor in Power Distribution Systems,” European Trans. on Electrical Power Eng., 3(2), March/April 1993, pp.131-142.
[23] K.V. Ramachandra, ‘‘Optimum Steady State Position, Velocity, and Acceleration Estimation Using Noisy Sampled Position Data,’’ IEEE Trans. on Aerospace and Electronic System, AES-23(5), September 1987, pp.705-708.
[24] I. Kamwa, R. Grondin, G. Trudel, "IEEE PSS2B vs. PSS4B: The Limits of Performance of Modern Power System Stabilizers," IEEE Trans. on Power Systems, 20(1), pp. 903-915, May 2005
[25] J. Lambert, D. Mc Nabb, A.G. Phadke, “Accurate Voltage Phasor Measurement in a Series-Compensated Network,” IEEE Trans. on Power Delivery, 9(1), January 1994.
[26] R. Grondin, I.Kamwa, M. Rousseau, C. Lafond, J. Béland, D.P Bui, B. Kirby, J. Attas, "Topology Detection Based on Open Line Detection Relays, a Strategic Function in Power System Protection," Cigré 2004 session, Aug.-Sept. 2004, Paris.
[27] R.J. Marceau, R. Mailhot, F.D. Galiana, “A generalized shell for dynamic security analysis in operations planning,” IEEE Trans. on Power Systems, 8(3), Aug. 1993, pp. 1098-1106.
[28] Wang Hai Feng, H. Li, H. Chen, “Coordinated secondary voltage control to eliminate voltage violations in power system contingencies,” IEEE Trans. on Power Systems, 18(2), May 2003, pp. 588-595.
[29] R. Grondin, M. Dobrescu, I. Kamwa, Application of IEEE4B PSS to Static Var Compensators: Proof of Concept. Internal Report of IREQ submitted to TransÉnergie, June 2005 (in French)
[30] U.S.-Canada Power System Outage Task Force: Final Report on the August 14, 2003 Blackout in the United States and Canada (on line): http://www.pserc.wisc.edu/BlackoutFinal-Web.pdf .
[31] A. Leirbukt, K. Uhlen, M.T. Palsson, J.O. Gjerde, K. Vu, O. Kirkeluten, “Voltage monitoring and control for enhanced utilization of power grids,” in Proc. 2004 IEEE PES Power Systems Conference and Exposition, 10-13 Oct. 2004, Vol. 1, pp. 342 – 347.
[32] D. Lefebvre, S. Bernard, T. Van Cutsem, “Undervoltage load shedding scheme for the Hydro-Québec system,” 2004 IEEE Power Engineering Society General Meeting, 6-10 June 2004, Vol.2, pp. 1619 - 1624.
[33] G. Trudel, A Novel Control Strategy for the Dynamic Compensation Park: Improvement of the Grid Behavior, Internal Report of the TransEnergie’s Transmission Planning Department, Dec. 17, 2003.
[34] E. Lerch, D. Povh, L. Xu, ‘‘Advanced SVC Control for Damping Power System Oscillations,’’ IEEE Trans. on Power Systems, 6(2), May 1991, pp. 524-535.
VII. ACKNOWLEDGMENTS
This project is still on-going with many people involved through Hydro-Québec’s organization. We thank them all. Special appreciation is however extended to Manuela Dobrescu of Automatisms and Protection department who contributed to the development of stability models of the secondary voltage control and to Laval Riverin and Daniel Lefebvre from the Operations Planning Department who provided the grid models and the studied scenarios.
VIII. BIOGRAPHIES
Innocent Kamwa (S'83, M'88, SM’98) received a PhD in electrical engineering from Laval University, Québec, Canada, 1988, after graduating in 1984 at the same university. Since then, he has been with the Hydro-Québec Research Institute, where he is at present a Principal Researcher with interests broadly in bulk system dynamic performance. Since 1990, he has held an associate professor position in Electrical Engineering at Laval University. A member of CIGRÉ, Dr. Kamwa is a recipient of the 1998 and 2003 IEEE PES Prize Paper Awards and is currently serving on the System Dynamic Performance Committee AdCom. He is also the acting Standard Coordinator of the PES Electric Machinery Committee.
Jean Béland received his B.Sc.A. (1979) in Electrical Engineering from École polytechnique, affiliated to Université de Montréal, Canada. In 1981, he joined the Research Institute of Hydro-Québec (IREQ). His first affectation was to participate in the development of an experimental voltage angle measurement system. In the following years, he was involved in the design of synchronized clocks and other equipments which became parts of the time dissemination network used by HQ. He also collaborated to studies regarding the synchronization of the fiber optic network (SONET) at HQ. He is now working on projects involving precise time dissemination and communication issues.
Gilles Trudel received his B.Sc.A. (1978) and M.Eng (1986) in Electrical Engineering from École polytechnique, Université de Montréal, Canada. In 1978, he joined Hydro-Québec, where he was first involved in the design of control and protection for substations. Eight years later, he moved to the System Planning department where he is now involved in high-voltage network planning and the design of special protection systems. Trudel is a member of the IEEE Power Engineering Society and a registered professional engineer in the province of Québec
Robert Grondin (S'77, M'80, SM'99) received his B.Sc.A. in Electrical Engineering from Sherbrooke University, Canada in 1976 and his M.Sc. from INRS Énergie, Varennes, Canada in 1979. He then joined Hydro-Québec’s research institute, IREQ. Currently a Senior Research Engineer in the Power System Analysis, Operation and Control Department, he is leading research activities in the field of power system dynamics and defense plans. Member of IEEE Power Engineering Society and of CIGRÉ, he is a recipient of an IEEE PES Award Paper in 2003. He is also a registered professional engineer in the province of Québec, Canada.
Claude Lafond (M’92) received his B. Engineering from Ecole Polytechnique de Montreal in 1988. He worked for two years as a consultant. He is with the research center of Hydro-Quebec utility (IREQ) since 1990. He also completed a Master’s degree from Ecole Polytechnique de Montreal in 1994.
Danielle McNabb received her B.Sc.A. in engineering physics in 1973, her M.Ing. in nuclear engineering in 1980 and her M.Ing. in Electrical Engineering in 1986, all from École Polytechnique, Université de Montréal, Canada. She joined Hydro-Québec in 1980 where she has been involved with control modelling and simulation for the commissioning of Gentilly 2 nuclear power plant and, since 1986, in control modeling and protection studies for the Hydro-Québec Planning Department. She represents Hydro-Québec TransÉnergie on the CEATI power system planning and operations interest group and is a registered professional engineer in the province of Québec, Canada.