
AGRICULTURAL PRODUCTIVITY Agriculture Sector Modernization ...
Upload
khangminh22Category
view
6download
0
Munich Personal RePEc Archive
Why is productivity slowing down?
Goldin, Ian and Koutroumpis, Pantelis and Lafond, François
and Winkler, Julian
Oxford Martin School, University of Oxford, Mathematical Institute,
University of Oxford, Department of Economics, University of
Oxford
19 March 2020
Online at https://mpra.ub.uni-muenchen.de/99172/
MPRA Paper No. 99172, posted 23 Mar 2020 03:07 UTC

1
Why is productivity slowing down?
Ian Godlin1*, Pantelis Koutroumpis1,2, François Lafond1,2,3 and Julian Winkler1,2,4
1Oxford Martin Programme on Technological and Economic Change, Oxford Martin School, University of Oxford 2Institute for New Economic Thinking, Oxford Martin School, University of Oxford
3Mathematical Institute, University of Oxford 4Department of Economics, University of Oxford
March 2020
Abstract
The recent decline in aggregate labor productivity growth in leading economies has been widely
described as a puzzle, even a paradox, leading to extensive research into possible explanations. Our
review confirms the magnitude of the slowdown and finds that it is largely driven by a decline in total
factor productivity and capital deepening. Disaggregation reveals that a significant part of the slowdown
is due to sectors that experienced the large benefits from ICTs in the previous period, and that an
increasing gap between frontier and laggard firms suggests slower technology diffusion and increasing
misallocation of factors. We evaluate explanations that attempt to reconcile the paradox of slowing
productivity growth and technological change, including mismeasurement, implementation lags for
technologies, and creative destruction processes.
JEL codes: O40, E66, D24
Acknowledgements
We are indebted to Nils Rochowicz for excellent research assistance, and grateful for the helpful
comments of Beatrice Faleri, Anthon Pichler, Matteo Richiardi, Luis Valenzuela, Jangho Yang, and the
editor and anonymous reviewers of this paper. Participants in the discussions and seminars on this paper
at the OECD, INET, European Commission JRC, and Arrowgrass also enriched our work, which would
not have been possible without funding support from the Oxford Martin School.
* Corresponding author: Ian Goldin, Professor of Globalisation and Development, University of Oxford; Professorial Fellow, Balliol College, University of Oxford; Director, Oxford Martin Programme on Technological and Economic Change ([email protected])
2
1. Introduction
Labor productivity growth is widely seen as the main long-run determinant of per capita output
growth and improving living standards. The decline in measured labor productivity growth over recent
decades has raised serious concerns, both in academic circles and among business and policy decision
makers. Three decades after Robert Solow’s famous quip that ‘you can see the computer age everywhere
but in the productivity statistics’ (Robert M. Solow, 1987), this slowdown remains a puzzle, not least for
those who believe technological change has accelerated.
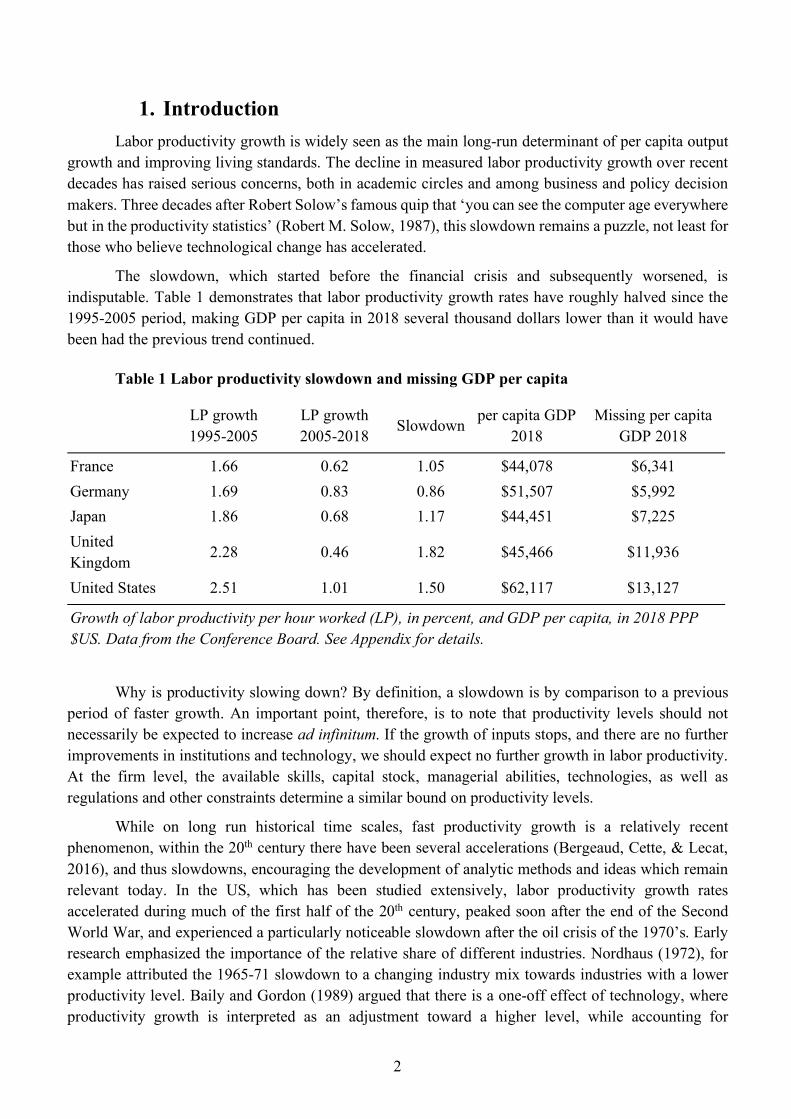
The slowdown, which started before the financial crisis and subsequently worsened, is
indisputable. Table 1 demonstrates that labor productivity growth rates have roughly halved since the
1995-2005 period, making GDP per capita in 2018 several thousand dollars lower than it would have
been had the previous trend continued.
Table 1 Labor productivity slowdown and missing GDP per capita
LP growth
1995-2005
LP growth
2005-2018 Slowdown
per capita GDP
2018
Missing per capita
GDP 2018
France 1.66 0.62 1.05 $44,078 $6,341
Germany 1.69 0.83 0.86 $51,507 $5,992
Japan 1.86 0.68 1.17 $44,451 $7,225
United
Kingdom 2.28 0.46 1.82 $45,466 $11,936
United States 2.51 1.01 1.50 $62,117 $13,127
Growth of labor productivity per hour worked (LP), in percent, and GDP per capita, in 2018 PPP
$US. Data from the Conference Board. See Appendix for details.
Why is productivity slowing down? By definition, a slowdown is by comparison to a previous
period of faster growth. An important point, therefore, is to note that productivity levels should not
necessarily be expected to increase ad infinitum. If the growth of inputs stops, and there are no further
improvements in institutions and technology, we should expect no further growth in labor productivity.
At the firm level, the available skills, capital stock, managerial abilities, technologies, as well as
regulations and other constraints determine a similar bound on productivity levels.
While on long run historical time scales, fast productivity growth is a relatively recent
phenomenon, within the 20th century there have been several accelerations (Bergeaud, Cette, & Lecat,
2016), and thus slowdowns, encouraging the development of analytic methods and ideas which remain
relevant today. In the US, which has been studied extensively, labor productivity growth rates
accelerated during much of the first half of the 20th century, peaked soon after the end of the Second
World War, and experienced a particularly noticeable slowdown after the oil crisis of the 1970’s. Early
research emphasized the importance of the relative share of different industries. Nordhaus (1972), for
example attributed the 1965-71 slowdown to a changing industry mix towards industries with a lower
productivity level. Baily and Gordon (1989) argued that there is a one-off effect of technology, where
productivity growth is interpreted as an adjustment toward a higher level, while accounting for

3
implementation lags. The 1970’s slowdown, was largely attributed to the productivity-reducing
adaptation of capital to rising energy costs (Bruno, 1982). Notions of input utilization and
mismeasurement were prominent, with for instance the idea of a decrease of the capital services obtained
from a given level of capital stocks, because energy-intensive capital is utilized less intensively and
scrapped faster (Baily (1981). Sichel (1997) and Baily and Gordon (1989) looked into the effect of
mismeasurement and found that it did not help explain more than a third of the aggregate slowdown.
Mismeasurement and lags in technological adoption also featured prominently in explanations of the
productivity paradox of the 90’s, together with an emphasis on complementary investment and
adjustment costs (Brynjolfsson, 1993; Brynjolfsson & Hitt, 1996; Brynjolfsson & Hitt, 2000; David,
1990).
This paper seeks to explain the current slowdown, which began in the early years of this century,
as we show in Table 1 by comparing the decade before 2005 with the following period, until 2018. In
considering what constitutes an effective explanation we have sought to satisfy three criteria. First, a
good explanation must be quantitatively significant (the scale criterion). Roughly speaking (see Table
1), we are looking for a missing 1 percentage point of labor productivity growth per year. For this reason,
as an example, while price indexes in the high-tech sectors probably overestimate inflation, the bias is
small, and these sectors themselves are not large enough in size to explain a significant part of the
slowdown.
Second, a good explanation needs to show time consistency in the sequencing of cause and effect
(the sequencing criterion). At least for the US, there is a broad consensus that productivity started
slowing down around 2004-05. To explain this, a causal factor needs to exhibit a change around or before
that period. Therefore, for instance, because the global financial crisis of 2007-08 occurred after the start
of the slowdown it can be dismissed as a cause, even though, as we show below, it may have accentuated
and deepened the slowdown. On the basis of this criterion, explanations which depend on slow secular
developments, such as ageing or a changing pace of technological change, are also unlikely to provide
an explanation for a break in trend as observed in the US. The sequencing criterion is not as sharply
defined for Europe, where there was no obvious productivity revival around the turn of the century, so
that secular factors may not be excluded there based on the sequencing criterion.
Third, a good explanation needs to have wide geographical scope and applicability (the scope
criterion). The productivity slowdown is to a large extent a worldwide phenomenon, with almost all
OECD countries and many emerging economies exhibiting lower productivity growth over a similar
period (Askenazy, Bellmann, Bryson, & Moreno Galbis, 2016; Cusolito & Maloney, 2018; Erber,
Fritsche, & Harms, 2017; OECD, 2015). It is implausible that all these countries experienced the
slowdown at roughly the same time but for different reasons, which is why the synchronised collapse in
productivity leads us to identify factors that go beyond local conditions. So, for example, changes to
labor market institutions unique to a specific country are unlikely to explain either the sustained national
or global scope of the productivity slowdown (Askenazy et al., 2016).
This paper synthesizes a large literature that attempts to explain the slowdown. We consider in
turn the arguments grouped under the following broad areas: mismeasurement, labor quality, capital
growth, composition effects, global factors and trade, and technology. In each section we review the
evidence and conclude with a short summary where we critically evaluate the extent to which the

4
evidence satisfies the scale, sequencing and scope thresholds necessary to explain the slowdown in
productivity growth.
Before evaluating the wide-ranging literature on causes of the slowdown, in Section 2 we clarify
the nature of the problem by using standard growth accounting for five large developed countries,
France, Germany, Japan, US and the UK, with data from the EU KLEMS. We confirm two findings that
are important for evaluating potential explanations. First, changes in labor composition have not
contributed substantially, as compared to capital deepening and TFP. Second, the decline in TFP appears
to predate the crisis.
Section 3, reviews the extensively debated mismeasurement explanation for the slowdown. This
explanation contends that systematic measurement biases, in various forms, have caused a decline in
measured productivity growth. It is compelling as an explanation for the productivity paradox since it
reconciles the slowdown with perceived rapid technological change. The mismeasurement hypothesis
also coincides with a significant increase in intangible capital linked both to a real and mismeasured
slowdown effect. However, the conclusions in many of the proposed sources of such bias fall short of
explaining a change in productivity growth, at least of sufficient magnitude to explain the scale and
sequencing of the measured slowdown.
The following sections consider the dynamics of the inputs of productivity growth, starting in
Section 4 with the composition of the labor force, and more specifically education, skills, migration,
ageing, and labor market institutions. We show that these have not demonstrably contributed to the
slowdown in productivity growth, although the demand for new skills driven by technological change,
as well as the impact of an ageing population at times play a role in explaining differences in productivity
performance.
A decline in the rate of capital deepening has contributed to the slowdown, and Section 5
distinguishes two core arguments to explain this phenomenon. The first relates to the financial crisis and
suggests that the decline in investment is a cyclical phenomenon driven by financial constraints and
weak aggregate demand. A second candidate explanation recognizes that the slowdown started in the
years preceding the crisis, and suggests that structural factors may have been important, including
primarily a change in the composition of capital towards intangibles (which are riskier), but also slowing
competition and increasing short-termism.
Section 6 discusses various attempts to understand the slowdown by looking at the firm, industry
and regional level disaggregated evidence. First, traditional industry-level growth accounting studies
reveal that specific sectors (such as retail) contributed most to the slowdown, in large part because they
benefited from high productivity growth thanks to computerization in the previous period. Second, a
recent strand of literature documents an increasing dispersion of firm-level productivity, suggesting
slower technology diffusion and/or slower factor reallocation. Together with evidence on lower business
dynamism (entry-exit) and increasing market power, these micro studies help us understand deeper
causal factors and possible sources of policy intervention.
Section 7 investigates the role of trade and globalization. Growing international trade and better
organization of international production into global value chains led to productivity gains in the past.
Due to the recent slowdown in trade, it is possible that the productivity slowdown reflects the end of an
adjustment to higher level due to static gains from trade having been reaped. On the basis of our synthesis
of recent studies, we are unable to confirm that changes in trade contributed significantly to the

5
slowdown, not least as the slowdown is not uniformly preceded by trade frictions and different industries
and countries integrated at different speeds, which our sequencing and scope criteria suggest undermines
the significance of these explanations.
Section 8 examines explanations related to technology. We first find that research efforts do not
appear to have slowed dramatically, but there does appear to be a decline in how well research translates
into productivity. As Gordon (2016) has prominently pointed out, the technologies of the past 150 years
have had such a profound impact that it is not surprising if current technologies are not able to produce
the same impressive effects. However, for others, such as Brynjolfsson, Rock, and Syverson (2017),
current technologies do have a transformative potential, although it may not be fully realized yet. We
present and critically examine the arguments of this debate by describing how creative destruction has
had negative short-term effects and taken a long time to materialize into productivity gains in previous
periods of transformative technological change.
Finally, in Section 9 we summarise the key findings and conclude by showing that while no
single factor accounts for the slowdown entirely, a small number of explanations taken together appear
to match the scale, sequencing and geographical scope of the slowdown.
2. Growth accounting The basic idea of growth accounting is that aggregate output may grow either because more
inputs are utilized, or because they are used more efficiently. Robert M Solow (1957) put this idea on
firm ground by identifying how this decomposition follows from clear economic assumptions: a stable
and smooth functional relationship between inputs and outputs at the economy-wide aggregation level,
inputs paid at their marginal product, constant returns to scale, and Hicks-neutral technical change.
Robert M Solow (1957) originally found that most of post-war US growth was not due to the growth of
inputs, but to inputs being used more efficiently. The “Solow residual” was born and soon re-baptized
“a measure of our ignorance”, prompting a significant strand of research into improving measurement
of inputs to reduce this unexplained growth of output. In particular, Jorgenson and Griliches (1967)
demonstrate that improvements in human capital are a major determinant. As we shall see, most research
today still concerns better measurements of inputs, such as intangible capital.
While major efforts of data collection and harmonization have taken place, modern growth
accounting still often starts from a relatively simple decomposition, which we report here. We
decompose the growth in real output per unit of labor, 𝑦" , as
Δ log 𝑦" = 𝛼" Δ log ℎ" + (1 − 𝛼")Δ log 𝑘" + Δ log 𝐴" , (1)
where 𝐴" denotes TFP, 𝑘" represents capital services per unit of labor, ℎ" is an index of the composition
of labor, and 𝛼" is the labor compensation share of income. To get relatively long time series, we follow
Gordon and Sayed (2019) and merge data from two vintages of EU-KLEMS (see Appendix for details).
Labor productivity is measured as value added per hour worked. Figure 1 reports the 5-year moving
average of labor productivity growth and its three components. A relatively long moving average makes
it more difficult to evaluate the effects of the financial crisis but helps highlight the secular trends.

6
Figure 1: Decomposition of labor productivity growth rates. The line shows the growth rate of aggregate labor productivity. All variables are centered 5-year moving averages. The data is obtained by merging all available data from the 2012 and 2019 releases from EU KLEMS, see Appendix for details.
7
While it is hazardous interpret the patterns by simply visualizing 5-year moving averages, Figure
1 appears suggests that the productivity slowdown precedes the financial crisis, although the crisis may
have made the situation significantly worse. The slowdown cannot be attributed to labor composition,
as this contributes relatively little to overall labor productivity growth. Instead, capital deepening as well
as TFP growth are responsible for most of the growth. In the pre-crisis period, Figure 1 suggests
noticeable differences between countries in terms of the evolution of the relative contribution of capital
deepening and TFP. In the US, the absolute contribution of capital is fairly constant, suggesting that TFP
is responsible for most of the fluctuations, but this is not as clear for other countries. The situation is
different post-crisis, where the pro-cyclicality of investment may have made the slowdown worse,
although it is difficult to evaluate this with 5-year moving averages; we discuss this further in Section 5.
Figure 1 also contextualises the productivity paradox of the 90’s: the productivity revival in the US
between 1996 and 2005, typically attributed to the gains from computerisation, is far from obvious in
the other countries. In contrast, the slowdown after 2004 is pervasive.
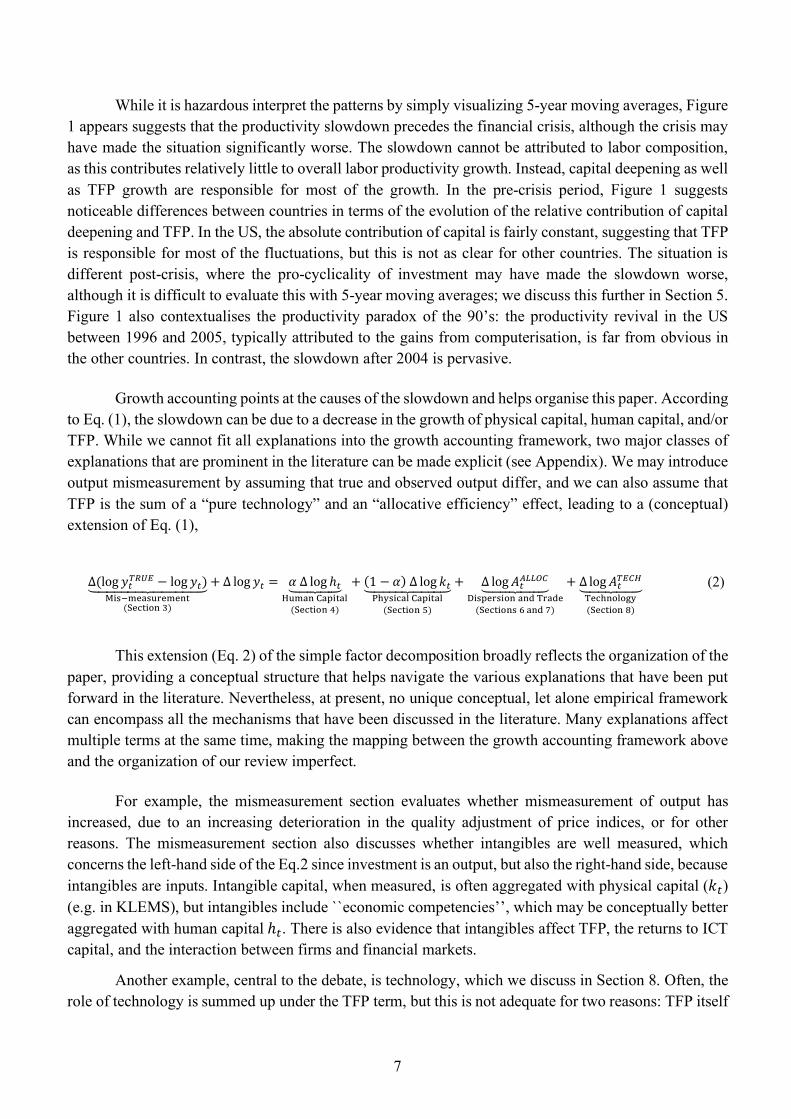
Growth accounting points at the causes of the slowdown and helps organise this paper. According
to Eq. (1), the slowdown can be due to a decrease in the growth of physical capital, human capital, and/or
TFP. While we cannot fit all explanations into the growth accounting framework, two major classes of
explanations that are prominent in the literature can be made explicit (see Appendix). We may introduce
output mismeasurement by assuming that true and observed output differ, and we can also assume that
TFP is the sum of a “pure technology” and an “allocative efficiency” effect, leading to a (conceptual)
extension of Eq. (1),
Δ(log 𝑦"3456 − log 𝑦")78888889888888:;<=>?@A=BC@?@DE(F@GE<HDI)
+ Δ log 𝑦" = 𝛼Δ log ℎ"788988:JB?ADKAL<EAM(F@GE<HDN)
+ (1 − 𝛼)Δ log 𝑘"7888898888:OPQ=<GAMKAL<EAM(F@GE<HDR)
+ Δ log 𝐴"STTUV78889888:W<=L@C=<HDADXYCAX@(F@GE<HD=ZADX[)
+ Δ log 𝐴"36V\788988:Y@GPDHMH]Q(F@GE<HD^)
(2)
This extension (Eq. 2) of the simple factor decomposition broadly reflects the organization of the
paper, providing a conceptual structure that helps navigate the various explanations that have been put
forward in the literature. Nevertheless, at present, no unique conceptual, let alone empirical framework
can encompass all the mechanisms that have been discussed in the literature. Many explanations affect
multiple terms at the same time, making the mapping between the growth accounting framework above
and the organization of our review imperfect.
For example, the mismeasurement section evaluates whether mismeasurement of output has
increased, due to an increasing deterioration in the quality adjustment of price indices, or for other
reasons. The mismeasurement section also discusses whether intangibles are well measured, which
concerns the left-hand side of the Eq.2 since investment is an output, but also the right-hand side, because
intangibles are inputs. Intangible capital, when measured, is often aggregated with physical capital (𝑘") (e.g. in KLEMS), but intangibles include ``economic competencies’’, which may be conceptually better
aggregated with human capital ℎ". There is also evidence that intangibles affect TFP, the returns to ICT
capital, and the interaction between firms and financial markets.
Another example, central to the debate, is technology, which we discuss in Section 8. Often, the
role of technology is summed up under the TFP term, but this is not adequate for two reasons: TFP itself

8
is “a measure of our ignorance” and includes a lot more than technology; and technological change is
also reflected in other terms, because it is embodied in capital inputs, and it profoundly affects the returns
to different types of skills, allocative efficiency through monopoly rents or changes in business
dynamism, and the relevance of our measurement systems.
The conceptual framework summarised above clarifies key dimensions of productivity growth,
and helps us to organise our analysis, even though it necessarily cannot adequately capture the full set
of factors or the complexity of their interactions. To address this, we now turn to a comprehensive
thematic discussion, beginning with mismeasurement.
3. Mismeasurement
While the level of labor productivity is directly affected by a mismeasurement of output, it is
only when mismeasurement increases that it could explain a slowdown in productivity growth. This
could occur because mismeasurement in a given sector increases, or because the most mismeasured
sectors are becoming a larger share of the economy.
In this section we discuss the areas where mismeasurement might exist and whether it is linked
to the productivity slowdown. These are sectors of the economy that are either hard to measure (notably
in services), belong to the non-market economy (household and public sectors), are informal and/or
unobserved thus lacking official reporting (including a range of legal and illegal activities), or where
corporate tax differences across countries may affect productivity estimates.
We look into the emergence of free goods and unmeasured consumer surplus, predominantly as
a result of Information and Communications Technologies (ICT) adoption. We then examine the pitfalls
of providing quality adjustments to economic output and accurate price indexes for new goods and
products. Last, we discuss the implications from the growing role of intangible capital as an input of
production and whether this coincides with the period of the observed slowdown across the world.
3.1 Shifts in reporting, boundaries and profits
Some of the sectors that are included in national accounts pose considerable measurement
challenges due to the lack of market valuation (non-market sectors) and the conceptual difficulty in
defining a unit and constructing price indices, namely the household sector, the public sector and the
service producing sectors (Hulten, 2010). We discuss the services sectors in section 3.1.1 and the non-
market sectors in 3.1.2. Apart from these cases, some economic activities are either not observed (alluded
to as the Non-Observed Economy, see NOE reports), informal (where the unit of production is not
officially registered) or fall within the intersection of NOE and informal activities. These may include
“the care of one's own children, unpaid volunteer work for charities, and illegal activities” where the
lack of data makes it hard to accurately measure their value (Pritzker, Arnold, & Moyer, 2015). We
define these activities under the broad definition of the informal sector and discuss their measurement
issues in Section 3.1.3. Last, we discuss the effects of tax favourable reporting that is linked to profit
shifting practices of multinational firms (Section 3.1.4) to explore whether changes in this may have
contributed to the observed decline in productivity growth.

9
3.1.1 Services sectors
The national accounts framework is best suited for goods-producing sectors but less so for
services, leading in a long history of failed attempts to monitor their performance†. The reasons are both
related to data availability and the conceptual underpinnings of their measured productivity. Prices for
the goods-producing sectors have been easier to collect, in contrast to prices from the services sectors
which have suffered from a lack of coverage (unreported at the firm level) and direct price comparisons.
Because of this, relatively arbitrary (“makeshift”) deflators have been used for real outputs along with
estimates directly proportional to specific inputs (Griliches, 1992). The issue is made worse by the fact
that services outputs are very heterogenous, and there if often an absence of information about “what is
being transacted” and “what services correspond to the payments made to the providers” (Griliches,
1992). The data shortcomings have been partly addressed, as a result of the attention probed to these
issues by the 1995 Boskin commission ‡. Triplett and Bosworth (2008) argue that serious service data
did not begin in the US before the 1980s and 1990s and there are still no annual surveys conducted for
half of the service industries or PPI services price indexes. As the value-added from services sectors has
reached 70% of GDP for OECD and 65% for all economies. around the world, this explanation meets
the scope and sequencing criterion but fails in the scale as the change over the past 20 years is 5 p.p for
all economies and 10 p.p. for OECD ones (World Bank, 2020).
3.1.2 Νon-market sectors
Non-market sectors like education and health and are often not adequately addressed by the
productivity literature (Baily & Gordon, 2016). Spending on health has steadily increased since the 2000s
(from 12.54% in 2000 to 16.9% of GDP in 2018 in the US§), while spending on education has barely
increased (rising from 5.8% of US GDP in 2000 to 6.1 of GDP in 2018** with a similar trend for the
majority of OECD countries). Average TFP growth in the US was -1.3% for the health sector during
1987-1995, -0.6% during 1995-2004 and -0.3% during 2004-2014 †† . Meanwhile, productivity in
education in the US has remained largely constant over the past four decades with slight increases over
time. In the EU, education has seen small reductions in productivity growth rates for most of the period,
although there are considerable doubts regarding the veracity of these numbers (Triplett & Bosworth,
2008). There is little agreement on how to measure productivity in education and also a range of
uncertainties in the interpretation of productivity measures in healthcare, in part due to gaps in the
allocation of healthcare costs (Triplett & Bosworth, 2008). To achieve a better understanding of the
† The collection of economic data in the US goes back to 1810, first as a by-product of population censuses and later in
the 1860s in an attempt to monitor the goods producing sectors along with transportation and communications. “Selected” service sectors were gradually added over the 20th century censuses but the volume of data and practical limitations prevented their inclusion in sufficient detail to inform productivity research.
‡ The Boskin commission led statistical agencies to achieve a vast expansion in inputs coverage, introduced service-specific price measures (PPI), new deflators for high-technology capital goods, improved capital stock measures and the NAICS as the new industry classification in the US
§ Similar changes in health spending have been shown in Japan and the UK and a slower growth in Germany and France. All these countries have reached very close to the level of 10% of GDP in 2018. The composition of this expenditure by private and public means is - for the majority of high income countries – less than 30% for private whereas in the US private spending is more than 50% of total health spending (OECD, 2018).
** https://data.oecd.org/eduresource/education-spending.htm †† Bureau of Labor Statistics' Multifactor Productivity Tables.
10
expenditures in health services (for example are expenditures increasing because of higher prices, more
people receiving healthcare, or for other reasons) the Bureau of Economic Analysis (BEA) developed a
new satellite account (HCSA) that measures healthcare spending by disease type instead of the goods
and services purchased (Dunn, Rittmueller, & Whitmire, 2015). The goods and services data approach
nevertheless is still used to populate official statistics for healthcare - like GDP. At the heart of this issue,
is the reliability of price deflators for medical prices. Several studies have pointed to inflated CPI growth
for healthcare (Aizcorbe & Highfill, 2020; Dunn, Grosse, & Zuvekas, 2018) and show that the medical
CPI growth in the US is higher by 1 p.p. per year compared to other deflators that better capture overall
and disease-specific treatment costs. These effects result in a misleading increase in medical costs and
hence asmaller implied productivity growth of the sector. Despite these findings, the goods and services
data approach nevertheless is still used to populate official statistics for healthcare - like GDP‡‡. Given
the increasing importance of the sector as a percentage of total output and the slower actual growth rate
in costs, this mismeasurement explanation fits the sequencing and scope criteria but largely fails to meet
the scale criteria as the difference is not big enough to impact significantly on overall productivity
growth. With the exception of owner-occupation of dwellings and the services of paid domestic staff,
personal and domestic services by members of households for their own final consumption are excluded
from the reported economic production- if they were included, the vast majority of unemployed would
need to be counted as self-employed (System of National Accounts 2008). For the period which is of
interest to us, it is conceivable that household’s own production increased, as since the early 2000s an
increasing investment in consumer electronics and a sharp rise in the equipment and network quality has
led to a higher proportion of time spent on this subsector. We will come back to the question of
unmeasured consumer surplus in Section 3.2.
ICTs may also have affected the production boundary through the rise of digital platforms that
have enabled households to offer transport and house rental services (through the likes of Uber and
AirBnB)§§. While this practice is not new, as households have been offering informal services for a long
time, its scale is unprecedented.: in 2017 the capitalization of AirBnB exceeded the combined
capitalization of Hilton and Hyatt. The extent to which GDP captures this depends on the ways that
household and corporate incomes are reported as any additional household income will show up in
national statistics if platforms require their users to do so. Ahmad, Ribarsky, and Reinsdorf (2017)
estimate that in the UK, total investment would increase by only 0.04% if Uber drivers’ cars were
accounted for as investment which is far too low to contribute to the persistent slowdown in productivity
observed. However, this is only one part of the change that can arise from variations in the treatment of
consumer durables in national accounts, as is further explored in the next section, notably for the case of
ICT services which, like cloud computing, are under-reported in official statistics (Byrne & Corrado,
2017).
There are undoubtedly measurement issues in the public sector, but the impact of these on
economic output is less pronounced compared to the ones we already discussed. As most of public sector
output is not distributed through markets (and even when this is done, the prices do not reflect the full
costs but most often their labor inputs) it is hard to have reliable valuation data and even worse, reliable
‡‡ https://www.bea.gov/data/special-topics/health-care Accessed on 14/01/2020 §§ There have been several initiatives across countries to report the profits from rental platforms and transport services

11
output price indexes (Hulten, 2010). This leads to cost based input measurements as a proxy for real
output. With these reservations in mind, it appears that the sector has experienced a slowdown for the
period between 1972 and 2015 in the US and across the EU. In the US even in the period 1995-2005
when the rest of the economy experienced an increase in productivity, in the public sector it stagnated
(Gordon & Sayed, 2019). However, in the EU since 2005 labor productivity for the public sector
recorded almost twice the rate of productivity growth compared to the rest of the economy (1.11%
compared to 0.63% for the entire economy).
3.1.3 Informal sectors
In this section we consider the non-observed and the informal parts of the economy. This includes
a range of activities that correspond to different motives and policy environments which shape economic
measurement. At times, for example, flexible – informal – work arrangements might be encouraged,
while others are made illegal and curtailed, and considered tax avoidance or in breach of regulations
(SNA, 2008). Aspects of this include the household services that shift from own-consumption to the
production boundary (discussed in the previous section), illegal market activities (such as the
manufacture and distribution of narcotics, illegal transportation in the form of smuggling of goods and
of people, and services which in certain jurisdictions are illegal, such as prostitution) as well as legal but
unobservable exchange of and services (goods or services provided by ineligible or unregistered entities).
The informal sector is estimated to represent on average 17% of GDP in a sample of 162 countries
during the period 1999 – 2007 (F. Schneider, Buehn, & Montenegro, 2010)***. The estimated size of the
shadow economy is significant even in OECD economies, although thanks to better capture of informal
activities, not least to address money laundering and terror financing concerns, it is reported to be
declining. In the US the shadow economy is estimated to have dropped from 8.5% of GDP in 2003 to
5.1% in 2018, in Germany from 16.7% to 9.6% and in Japan from 11% to 8.5% during the same period
(Enste, 2018; F. Schneider & Boockmann, 2018). Alternative methods for measuring the size of the
shadow economy also point to a decreasing trend across most countries, with considerable variation in
the extent of this decline (Medina & Schneider, 2018). However, the decline in the informal sector is
unlikely to be a significant contributor to slowing productivity. For one, it is not clear that it is less
productive than the rest of the economy, so its absorption into official data could work in the opposite
direction and offset productivity declines. While the size of this sector is non negligible in scale, the
sequencing of changes in the measurement of the sector’s activities did not occur prior to the observed
changes in productivity growth, so changes in the measurement of informal activities are not a
satisfactory explanation of the slowdown.
3.1.4 Profit shifting activities
Profit shifting is another possible source of mismeasurement which has been increasing
significantly since the early 1980s across OECD countries. It is worth emphasizing that not all forms of
profit shifting affect national accounts in the same way. For example, profit shifting through intragroup
*** In Sub-Saharan Africa the shadow economy is estimated at more than a third of economic activity (38%), in Europe and Central Asia it is 37% and in high income OECD countries it averaged 14%.

12
interest payments is not relevant, but transfer prices (the prices that each firm buys or sells at within its
divisions, group and subsidiaries) and the offshoring of intangibles affect GDP, corporate operating
surpluses, factor shares, and trade balances. The latter correspond to 6/7 of the profits globally shifted to
tax havens (Tørsløv, Wier, & Zucman, 2018)†††. As a result, the missing profits of multinational firms
can affect productivity estimates and possibly explain a part of the observed slowdown. It is estimated
that the level of the misreported profits globally accrued to almost $600 billion in 2015 or 40% of the
total multinationals’ profits, mainly in the form of profits which are realised outside the country of
incorporation of the multinational companies not being appropriately reported (Ahmad & Schreyer,
2016; Tørsløv et al., 2018). Global profit shifting comes predominantly from revenues originating from
the OECD countries (Cobham & Janský, 2018). Bruner, Rassier, and Ruhl (2018) and Tørsløv et al.
(2018) estimate that the US GDP for 2015 would be 1.5% higher if shifted profits were reported in the
country in which the activity really takes place.
Interestingly, the rate of profit shifting has been rising since the 1970s with a sharp protracted
increase after the 1990s until 2015. During that period (1970-2015) the pre-tax profitability of US
multinationals in tax haven affiliates has increased from 50% to 350% compared to a rather stable 50%
margin in non-haven affiliates. The large European countries are not excluded from this trend, as capital
shares are apparently under-estimated by about 2 to 2.5 p.p for Germany, the UK, France and Italy,
almost twice the 1.1 p.p figure found for the US (see Tørsløv et al. (2018)). Given the scale and timing
of profit shifting, this could represent a significant part of the explanation of the slowdown. Profit shifting
also helps explain the exceptional economic performance of the relatively small tax-haven countries,
which unlike other countries have experienced robust GDP and productivity growth, particularly since
the financial crisis. For example, in Ireland labor productivity growth ranged between 5.3-9.6% during
2009-2011 and despite the Euro crisis grew at 5.8% in 2014, a remarkable 21.8% in 2015, before settling
back to 2.4% in 2016, still well above the Euro area growth of 1.8% in that year‡‡‡.
Guvenen, Mataloni, Rassier, and Ruhl (2017) using confidential survey data of US
multinationals, construct US GDP adjusted for profit shifting. Using this corrected measure of output,
labor productivity growth was 0.25p.p. higher in 2004 to 2008, as compared to official statistics, and
0.09p.p. lower after 2008. These adjustments have direct effects on low tax countries GDP estimates too,
not only for the smaller ones where the effects are 4-5 times their annual GDP for the period of study
(like Bermuda, British Virgin Islands and Cayman) and also but also for countries like Ireland and the
Netherlands where these activities are estimated to account for 9-13% of their annual GDP. Interestingly,
the drop in the corrected measures in 2008-2014 might be related to multinationals’ decision to exit the
survey that was used to estimate these results.
3.2 Free goods and unmeasured surplus
There is a growing consensus in the literature that digital technology is increasingly affecting
consumers directly, in ways that are excluded from the scope of GDP. In the framework of Hulten and
Nakamura (2017), innovation can be ‘output-saving’. Rather than saving inputs when TFP growth shifts
††† The statistics presented in (Tørsløv et al., 2018) are corrected for the share of shifted profits that affect macroeconomic
outcomes. ‡‡‡ Source: https://www.oecd-ilibrary.org/industry-and-services/oecd-productivity-statistics-volume-2017-issue-1/labor-
productivity-growth-total-economy_pdty-v2017-1-table2-en

13
the production function, innovation implies that less (measurable) output is needed to achieve the same
utility levels.
Departing from growth accounting, a large set of studies has been devoted to evaluating the
effects of free or mismeasured digital goods on consumer surplus. Byrne, Fernald, and Reinsdorf (2016)
and Byrne, Oliner, and Sichel (2017) evaluate the contributions of internet quality and e-commerce,
finding that TFP growth in 2004-2014 would be only five basis points higher. Along with Syverson
(2017), they review recent studies estimating the value of free digital goods, and found generally modest
effects, even though the numbers vary considerably. One approach is to measure the time consumers
spend online. With their valuation of individuals’ time, Brynjolfsson and Oh (2012) estimate that the
consumer surplus created by these services is around $100 billion per year in the US alone, a significant
number but one that still represents only 3.3% of Syverson’s ‘missing’ $3 trillion from the economy.
Using much more generous assumptions, Syverson’s (2017) find that the extra surplus from these
services could be values to up $863 billion, closer to explaining a third of the missing growth.
More recent estimates by Brynjolfsson, Collis, and Eggers (2019), using discrete choice
experiments, suggests a rather high estimate, with the median consumer requiring $17,530 to be willing
to give up all search engines for a year. In contrast, using different valuation methods, for instance based
on observed prices for internet tracking and advertising, Ahmad et al. (2017) find that Wikipedia
represents an insignificant value as compared to GDP. They evaluate that adding advertising-funded
‘free’ media into household expenditures would increase GDP marginally, for instance 0.04 p.p for 2011-
13 in the US. While the consensus in the literature appears to be that unmeasured consumer surplus from
new digital services is not large enough to explain a major part of the productivity slowdown, there is a
recognition that measuring the effects of the new wave of digital services on consumer welfare is
imperfect.
Following the traditional accounting framework, L. Nakamura, Samuels, and Soloveichik (2017)
model the impact of free goods on private businesses as business information that affects their
intermediate inputs and as “consumer information” or “consumer entertainment” for households.
Viewers of “free” goods are effectively paid to view advertising or marketing material, and this is
subsequently matched to their cost of production. The impact of “free” goods on real annual GDP growth
(for the US) for the period 1995-2014 would be around 0.089 p.p and TFG growth by 0.048 p.p. – not
enough to be a major contributor to the productivity slowdown. While many free digital goods are
financed by advertising, Ahmad et al. (2017) note that advertising-financed ‘free’ goods still appear in
GDP through the higher price paid for the advertised products.
3.3 Quality adjustment of price indices
Increased efficiency and product quality may lead to lower measured real output and productivity
if output statistics do not reflect improvements in the quality of goods and services. If, say, a constant
number of units is sold but quality increases and the price stays constant, we would expect our true
measure of real output to increase. This will only be the case if our price index is quality-adjusted, so
that price per quality-adjusted unit decreases (Boskin, Dulberger, Gordon, Griliches, & Jorgenson, 1996;
Gordon, 1990; Nordhaus, 1996). This issue has become even more relevant today due to the growth of
the digital economy and ICT services (Abdirahman, Coyle, Heys, & Stewart, 2017).

14
A typical example that highlights this effect is that the price of a phone bill has remained largely
unchanged over the last decade, yet the volume of text messages, minutes, and data provided in new
bundles has grown substantially (OFCOM, 2014). Other examples related to smartphones are digital
photos and high accuracy GPS services. In both cases, consumption (for example, number of photos
taken) has increased rapidly, but the sales of standalone cameras and GPSs have gone down, and the
quality-adjusted price of cell phones has reduced rapidly but not dramatically, by an annual average of
21.9 percent for the period 2000-2004, 15.3 percent for 2004-2008 and 16.3 for 2008-2014 (Byrne &
Corrado, 2017).
Several recent studies have attempted to estimate quality-adjustment in key digital products. For
instance, Abdirahman et al. (2017) find that official prices of telecommunication services could have
fallen by up to 90%, instead of the 10% reported between 2010 and 2015. Byrne et al. (2017) suggest
that the recent observed slowdown in decrease of microprocessor prices is an artefact of the matched
model methodology adopted for constructing the PPI and disappears once a hedonic method accounting
for wider dimensions of performance is adopted. Ahmad et al. (2017) found very significant differences
between ICT-related price indices in different countries, and noted that this mismeasurement translates
into an upper-bound revision to GDP growth rates of 0.2% per year. National accounts fail to pick up
the actual impact of ICT technologies for another reason: as ICT moves from a commodity to a service
delivery sector (through cloud computing and containerization) the demand for hardware appears to stall
and the levels of utilization increase but are harder to detect (Byrne & Corrado, 2017). The strong growth
in cloud services and system design services point to them making a bigger contribution on GDP, which
may not be adequately identified. The productivity growth of the ICT sector based on corrected prices
has been estimated at 1.4 p.p per year for the period 2004 –2014 largely due to prices falling at an annual
rate of 26% for servers and storage. Even with these corrections, the slowdown in the ICT sector is real
and the experience of the 1990s and early 2000s is likely a poor indicator for the relative productivity
growth of ICT in the future (Byrne & Corrado, 2017).
Another well-known issue relates to the measurement of new types of goods. For example, the
comparisons of tablets to (older) laptops is far from perfect. Statistical offices offer a range of techniques
to compare “new models” with previous ones, including a matching process or judgmental
adjustments§§§ to construct price indices. While this is a difficult endeavour, it can be effective and does
not necessarily lead to inflation: under competitive conditions, one can expect the prices of incumbent
goods to move in tandem with the new good and capture a reasonable portion of the price change (Triplett,
2006).
More subtly, however, if new types of goods replace existing ones, the procedure followed by
statistical agencies to impute price changes from the average of surviving products will overestimate
inflation. This is compelling as an explanation of the productivity paradox, because this implies that it
is precisely when creative destruction is accelerating that growth would be more significantly
§§§ Lowe (1999) states: “The weakness of this method lies in that it relies on the skill and experience of the individual collector, on the fact that it is inconsistently applied, and that the collector’s evaluation appears to be coloured by the price difference between the old and new items.” Triplett (2006) adds that “whatever the merit of the judgemental quality adjustment method for, say, clothing, it is doubtful that it has much merit for the “high tech” electronic goods”.

15
mismeasured.**** Aghion, Bergeaud, Boppart, Klenow, and Li (2019) estimate that missing growth from
this effect represented 0.5% annually in the US, with slightly higher numbers post 2006. Missing growth
is mostly sectors such as hotels and restaurants rather than manufacturing and hence this explanation
does not fit well the sequencing criterion.
Mismeasured ICT prices are likely to explain a part of missing productivity. However, the
relatively small contribution of ICT to GDP, combined with the stagnating productivity growth in non-
ICT sectors suggests that for reasons of scale this does not adequately explain the slowdown. Moreover,
the relatively abrupt slowdown in productivity growth (at least in the US) was not preceded by a rapid
change in ICT, so it does not satisfy our sequencing criterion. Nor does it satisfy our scope criterion, as
countries with significant variations in ICT intensities and different adoption rates have experienced
similar slowdowns, even when a range of corrected PPI and investment deflators are used for the relevant
subsectors (Syverson, 2017).
3.4 Intangibles
A further source of mismeasurement arises from the distinction between intermediate inputs and
capital. In the last decades, it has increasingly been recognised that many non-physical assets provide
services over multiple years and should therefore be treated as capital rather than intermediates. If the
growth of intangible investment is underestimated, output growth is underestimated because investment
is a share of output. It also implies that inputs are mismeasured, because investment increases the capital
stock, causing a bias in the decomposition of growth between capital and TFP.
3.4.1 What are intangible inputs and how mismeasured are they?
Corrado and Hulten (2014) and Corrado, Hulten, and Sichel (2009) consider three broad
categories of intangible inputs: computerized information for software and data, innovative property for
research and design, and economic competencies for advertising and organisational structures. One
example for the last category is that they estimate that 21% of the wage costs of workers in management,
marketing, and administration with tertiary education can be considered as investment into
organisational capital. The 2008 revision of the System of National Accounts for the US, and the 2014
ONS National Accounts Blue Book for the UK, recognized the importance of accounting for intangibles,
and included the capitalisation of certain types of R&D investment.
Measuring the stock of intangible capital and its depreciation rates is inherently difficult. Unlike
tangible goods, where units are clearly defined, intangibles, such as intellectual property or branding,
are difficult to quantify, even before any quality-adjustments are to be considered. The literature offers
methods to calculate depreciation rates for various types of intangibles through R&D surveys or a
‘software’ model derived from a traditional industry surveys, complemented with accounts drawn from
employment and wage data in specific occupations. An updated review of estimates of the depreciation
**** This argument builds on the work of Feenstra (1994) on price indexes and product varieties, Bils and Klenow (2001) on the effect of product variety and quality adjustments, Bils (2009) on observed price increases of durable goods into quality changes and true inflation, Broda and Weinstein (2010) on the missing growth from entry and exit of products in the nondurable retail sector and Byrne et al. (2017) on the missing growth in the semiconductor sector.

16
rates can be found in de Rassenfosse and Jaffe (2018), who estimate a rate of R&D depreciation between
1-5%, although this rate can be higher in the first two years.
Natural capital is another form of intangible capital (corporations using allowances for emissions
treat them as such in their books) and accounting for this, in the form of positive or negative externalities
that enter the system of national accounts, has been the focus of a large strand of the literature that relates
to intangible capital. Accounting for natural capital, in the form of positive or negative externalities that
enter the system of national accounts, has been the focus of a large strand of the literature that relates to
intangible capital. For example, the negative externalities due to air-pollution for some industries have
been found to exceed their value added by 0.8-5.6 times (Muller, Mendelsohn, & Nordhaus, 2011). In
this vein, Obst and Vardon (2014), describe the ways to include environmental assets in the system of
national accounts while Schreyer and Obst (2015) demonstrate a consistent approach to account for
energy and mineral resources with an application to Australia. Pertaining to the core argument of this
paper Brandt, Schreyer, and Zipperer (2017) include the impact of natural capital in productivity
measurements and show that the direction of productivity growth adjustments depends on the rate of
change of natural capital extraction relative to the rate of change of other inputs. Similar work is
underway at the IMF†††† and the United Nations‡‡‡‡.
3.4.2 How intangible mismeasurement affect productivity statistics
Investment, including intangible investment in principle, is a part of output. Thus, if the rate of
growth of non-measured investment has risen in recent years, output growth in underestimated, and so
is the growth of output per worker. Investment also increases the capital stock, which is itself an input
in growth accounting. As a result, because TFP is computed as a residual, the mismeasurement of
intangibles can have non-trivial consequences on measured TFP growth. Brynjolfsson et al. (2017),
discussing the recent high growth in investment in artificial intelligence, point out that in initial stages
of investment in a new domain, the growth rates of investment tend to be higher than the growth rates of
capital, while the reverse is true in later periods. If investment and capital in this domain are not
measured, this creates a TFP mismeasurement cycle: In early periods, output is more underestimated
than inputs, so TFP growth is underestimated. In later periods, it is the effect of the capital stock that is
more underestimated, so too much growth is attributed to TFP where it should be attributed to intangibles
capital growth.
3.5 Summary
Recent studies have found that although there are significant measurement errors in national
accounts, not least in the ICT sector, these have not worsened to the point that in their scale, sequencing
or scope they would completely explain the slowdown in productivity growth. Neither has the economy
dramatically shifted towards sectors where real output of final goods is thought to be underestimated,
including heathcare. Nevertheless, there are two major findings in this section that appear to be linked.
First, the digital economy does provide large unmeasured benefits, and there is a clear shift towards
sectors and assets that are measured with more uncertainty, such as various forms of intangible capital.
†††† https://www.imf.org/external/pubs/ft/qna/pdf/na.pdf ‡‡‡‡ https://seea.un.org/home/Natural-Capital-Accounting-Project

17
Second, these assets can be moved to tax havens and escape official statistics as shown by the rapid rise
in multinational profit shifting over the past two decades. While the introduction of ICT and other new
technologies are challenging for measurement systems, as is profit shifting and the measurement of
intangibles, the scale, scope and sequencing of introduction of these technologies and of changes in
accounting for value added and intangibles does not provide an adequate explanation of the slowdown
in productivity growth.
4. Labor force composition
Our growth accounting decomposition in Eq. 2 includes an input that covers potential
explanations for the slowdown that are linked to the characteristics of the workforce. Within this input,
we broadly categorise labor characteristics under education and skills, migration, ageing, leisure
technologies, and labor market institutions. In this section, we examine aggregate measures of human
capital accumulation, like educational attainment, and consider whether the skill mismatch may have
increased. Demographic factors, including migration and ageing, may affect productivity in the future
through direct channels (age-productivity relationships) as well as indirect channels (savings or shifting
consumption preferences). We examine these and an emerging literature on the role of technology in
lowering labor supply, as well as the possible impact of the recent rise of digital labor markets, before
reviewing the discussion surrounding labor market institutions and concluding with an assessment of the
possible contribution of issues associated with labor markets to the productivity slowdown.
4.1 Education and Skills
4.1.1 Educational Attainment
A possible explanation for the productivity slowdown could be a slowdown in educational
attainment or a growing skill mismatch. The importance of education for labor productivity and wages
is one of the most established relationships in the economic literature (Mincer, 1958). In a traditional
framework, wages are equal to the marginal product of labor, and subsequent wage premia imply higher
output (Heckman, Lochner, & Todd, 2006).
In this context a slowdown in productivity could be caused by a general slowdown in educational
attainment in the advanced economies. The OECD provides data that differentiates between different
types of education. The share of people with less than a secondary education dropped steadily (OECD
total, France, UK), but subsequently stabilized (US and Germany), which is consistent with the literature
on the plateauing of high school diplomas in the US (C. Goldin & Katz, 2008; OECD, 2017a).
Meanwhile, the share of the population with tertiary education has been increasing in a stable, linear
fashion for each country studied. Goodridge, Haskel, and Wallis (2016) also find that the labor force
composition has improved overall in the UK. As a result, a secular slowdown in educational attainment
is not a candidate explanation for the recent global productivity slowdown.
Whether this trend will be sustained going forward is unclear, and concerns have been raised
about rising student debt (Gordon, 2016). In a recent paper, Corrado, O'Mahony, and Samek (2018)
establish that growth in UK enrolment numbers, while still positive, has declined. The trend is similar in
the US, where fees also increased significantly. However, credit constraints seem to have played a less
significant role in the slowdown in university admissions in the US, given the high returns to education
compared to the real interest rates faced by young scholars (Heckman et al., 2006). Jorgenson, Ho, and

18
Samuels (2016) point out that the emergence of IT-producing industries drove higher college premia,
yet these are expected to plateau in the near future. They project that the rates of growth of average
educational attainment to decline in the period 2014-2024. The forecasts in Bosler, Daly, Fernald, and
Hobijn (2016) are similar, noting that educational attainment in the medium run could even turn negative
if employment rates of low-educated workers rebound to pre-recession levels.
4.1.2 Skill mismatch
In view of the continued rise in educational attainment, a potential explanation for the
productivity slowdown is that, while the overall supply of skills is still growing, there is mismatch
between the supply and demand of specific skills. For instance, in periods of fast technological change,
we should expect the skills associated to new technologies to be in too short supply and that skill biased
technological change will lead to a differential impact on a range of occupations (Acemoglu & Autor,
2011).
There is a consensus that skill biased technological change led to the hollowing out of the wage
distribution in the 2000s, when middle wage cognitive routine occupations were automated (Goos,
Manning, & Salomons, 2014). This may have led to deskilling technological change, contributing to the
skills mismatch and pushing workers with intermediate levels of education to take low productivity jobs.
In combination with the emergence of digital platforms, a larger share of such workers now participates
in the gig economy (Coyle, 2017).
Recent research on changes in the allocation of workers in the context of the productivity
slowdown is inconclusive. On the one hand, Goodridge et al. (2016) find that employment was re-
allocated towards high-productivity industries in the UK. Patterson, Şahin, Topa, and Violante (2016)
calculate that most labor was reallocated to low productivity occupations, accounting for up to two-thirds
of the slowdown. These findings can be reconciled by the fact that the latter considers sectoral differences
in matching frictions, which means that a larger fraction of workers are placed in low productivity
occupations irrespective of industry and employee characteristics. However, the extent of reallocation
between sectors with high productivity levels makes it unlikely that reallocation between sectors is
significantly contributing to the slowdown in productivity growth. Research by the OECD on cross-
sectional data suggests that low mismatch is correlated, along with other factors, with good policies on
bankruptcy laws, residential mobility, and the flexibility of wage negotiations (McGowan & Andrews,
2017).
4.2 Migration
Net migration has increased in the OECD countries since the 1960s with significant fluctuations
as a response to business cycles as well as national policies and geopolitical events. These changes have
manifested themselves with significant variation across countries and different categories of migration
(OECD, 2018a). In practice, migration enters the productivity discussion by predominantly affecting
labor supply. The productive use of migrants’ skills and their reflection in national accounts cannot be
ascertained a priori.
One approach to identify the effects of migration on productivity is to evaluate the impact of
refugee waves on local economies. Studying the impact of events like the Mariel boatlift of Cuban
refugees in the US has not led to a consensus on the employment, wage or productivity impacts (Borjas

19
& Monras, 2017; Card, 1990; Peri & Yasenov, 2015). There are several reasons for this outcome. First,
surges in refugees have particular characteristics which differ markedly from each other, including in
the origin, education, skills and age of the refugees and in their destination. Refugees also differ from
migrants, who tend to be of working age and drawn to employment opportunities. The clustering of
economic migrants in dynamic cities also differentiates their impact – they are both a source of
dynamism and drawn by the dynamism of rapidly growing cities.
In both the US and European Union, the impact of immigration on productivity has been shown
to be positive (Beerli & Peri, 2017), with immigrants contributing both skills and entrepreneurial activity
(Borjas & Doran, 2012; Mitaritonna, Orefice, & Peri, 2017; Ottaviano, Peri, & Wright, 2013). One study
suggests that they are three times more likely to be innovators and start businesses than the average
citizen, in part because they are more likely to move to highly productive areas in the first place (MGI,
2016). Peri (2012) shows that immigration is positively correlated with TFP growth in the US, with the
efficiency gains larger for unskilled workers than skilled. Comparing migration flows in OECD
economies against their impacts on labor markets and controlling for the skills of immigrants, Boubtane,
Dumont, and Rault (2016) found that the US and Germany exhibit productivity changes close to zero or
even negative, while the UK and France benefited from these inflows.
The effects on entrepreneurship are also significant: 40% of all Fortune 500 companies were
founded by first- or second-generation immigrants, and more than half of US startups valued at $1 billion
or more before going public (often referred as unicorns) have at least one immigrant co-founder (I.
Goldin, Pitt, Nabarro, & Boyle, 2018). Immigrants accounted for 28.5% of all new US businesses formed
in 2015 despite accounting for just 14.5% of the overall US population. In addition, in both the UK and
US they are almost twice as likely as the native-born population to establish their own business (I.
Goldin, Cameron, & Balarajan, 2011).
Despite the role that migrants can play in enhancing innovation and productivity, it is not possible
to link the decline in labor productivity growth to changes in migration policy. In terms of our criteria
of scale, sequencing and scope, the large fluctuations between countries and across time in migrant
inflow do not match changes in productivity, which typically predate significant changes in migration
policy in OECD countries. To give one example, the addition in the period 2000 to 2004 of 15 countries
to the Schengen area of Western Europe, which allows free migration, did not lead to increased
productivity. Meanwhile, Japan has experienced a decline in aggregate productivity on the same scale
as Germany, despite Germany having experienced significant inflows of migrants.
4.3 Ageing
Two demographic trends are responsible for an ageing population globally: increasing longevity
and declining birth rates. Research for the US documents an overall improvement in life expectancy
across all age groups, with the possible exception of US late-middle-aged white males (Case & Deaton,
2015). In other advanced countries and in many emerging economies, similar trends in life expectancy
are evident, with a resulting surge in the number of people aged over 65 as a compared to those aged 16-
64. The notable exception is Africa which is still experiencing a youth bulge (World population
prospects: The 2017 revision). Here we discuss three potential effects of ageing on productivity: a direct
effect due to a link between age and productivity, a macroeconomic effect of ageing on saving rates, and
a structural change effect due to changing patterns of demand.

20
4.3.1 Age and productivity
Understanding how productivity changes with age is often problematic due to selection bias (old
workers remain in the workforce because of good health, and are therefore not representative), omitted
variables in determining wages (seniority and anti-ageism laws), and generational effects (Lee, 2016).
Analysing Austrian data, Mahlberg, Freund, Crespo Cuaresma, and Prskawetz (2013) neither determine
a negative correlation between firms’ productivity and their shares of older employees, nor find evidence
of overpayments. In a similar strand, Börsch-Supan (2013) examine the relevant empirical literature
attempting to estimate a decline in productivity linked to ageing and rebuke this hypothesis. The concerns
regarding lower productivity of the older population also are largely dismissed in a report by the US
National Research Council (NRC, 2012).
While firm-level evidence hardly points at negative effects of age on productivity, regional or country
level differences offer a different perspective. Maestas, Mullen, and Power (2016), exploiting variation
across US states, find that a higher share of population above 60 is associated with slower labor force
growth and slower labor productivity growth, and report sizable effects: per capita GDP growth during
1980-2010 was 9.2% lower than what it would have been if the share of under 60 had been constant. Liu
and Westelius (2016) find that the share of mid-age population at the prefecture level in Japan was
positively associated with higher productivity growth. Liu and Westelius (2016) find that the share of
mid-age population at the prefecture level in Japan was positively associated with higher productivity
growth. Recent research has investigated the link between ageing and entrepreneurship, with Liang,
Wang, and Lazear (2014) finding that countries with an older population exhibit lower rates of business
formation.
Overall, this suggests that the effect of age on productivity is, if anything, indirect. For instance,
it is possible that firm-level productivity is not affected by age, but aggregate regional productivity is
affected by age because the structure of demand is different; we come back to this issue below. In any
case, while gradual ageing may explain some of the secular decline in productivity, it does not provide
a good explanation for the sharper collapse observed in the US after 2004, or in other countries after the
crisis.
4.3.2 Macroeconomics of ageing
Population ageing affects the availability and rates of returns of both labor and capital inputs, but
there is no consensus on the nature and extent of the effect on productivity (Lee, 2016). Lee (2016),
Eggertsson, Mehrotra, and Summers (2016) and Teulings and Baldwin (2014) argue that ageing may
have an indirect effect in causing secular stagnation by driving interest rates to the zero lower bound.
Lower and negative population growth rates would increase the supply of savings, to the extent that
individuals need to save for retirement. At the same time, a higher saving rate would lead to lower
demand for consumption goods, reducing investment opportunities for firms. Both shifts lead to a lower
equilibrium rate of interest. However, Eichengreen (2015) found that empirically increases in
dependency ratios have roughly equally negative effects on both the demand and supply of savings.
An ageing labor force combined with low cost of capital also leads to a stronger incentive towards
capital-biased technical change, leading to higher productivity. Acemoglu and Restrepo (2017) observed
a faster rate of adoption of automation in countries with older populations, which more than offsets any

21
effects on output caused by labor scarcity. However, the direction of this effect may well reverse once
the shift in the population pyramid becomes more pronounced in the coming decades.
4.3.3 Consumption patterns and Baumol disease
Some sectors intrinsically have slower rates of technological progress, often because by their
very nature it is difficult to incorporate new machines and technologies in their production process. This
``cost disease’’ observed originally for orchestras by Baumol and Bowen (1966) has important
consequences for aggregate productivity growth: if for demand-side reasons the share of low-
productivity growth sectors tends to increase, aggregate productivity growth may be expected to slow
down.
Consumption baskets may change drastically as individuals age, so aging is a potential source of
a shift of aggregated consumption baskets towards low-productivity growth sectors, as healthcare and
entertainment are often seen as low productivity growth sectors. Siliverstovs, Kholodilin, and Thiessen
(2011), using country-level panel data, found that an older population was associated with a shift of
employment shares away from agriculture and industry towards personal services and the financial
sector. Moreno-Galbis and Sopraseuth (2014) find that ageing helps explain job polarization, as it
increases the demand for low wage personal services. While aging may have a non-negligible effect, we
will see in Section 6.1 that the overall magnitude of the changes in sectoral shares appears too small to
explain a large part of recent the productivity slowdown.
4.4 Leisure technology and labor supply
New leisure technologies could play a role in labor force participation rates. Hall (2017) points
out that an additional 1.6 hours for men and 1.2 hours for women are spent every week on leisure
activities, which largely include time watching television and playing video games. Aguiar, Bils,
Charles, and Hurst (2017) directly relate improvements in technology to increasing leisure demand and
find that this explains a large part of the decreasing labor supply of young males. However, Bridgman
(2018) develops a method to impute the value of leisure time for the post-war period in the US, and
found that household consumption of digital goods is not large enough to have a significant impact on
the value of leisure; in fact he finds that the productivity growth of leisure time has been falling.
A more direct channel is that digital technologies may disrupt productivity directly, for example
because of working hours spent on social media, and indirectly, by forming new distracting habits that
reduce capacity to work (Khawand, 2010; Mark, Gudith, & Klocke, 2008). While intuitively attractive,
this area still lacks thorough economic analysis, given that it presents an important measurement
challenge. In fact, it is not immediately obvious which direction this bias would take; while such habits
certainly could worsen productivity at work, the same technologies may have enabled a rise in working
time outside the office, while commuting, at home, travelling or on holiday. Time-use surveys could
provide an opportunity to investigate this phenomenon.
4.5 Labor market institutions
Labor market institutions create the frameworks within which labor markets operate. Such
structures do not directly change the labor force composition, and thus generally manifest as a residual
item in a standard productivity decomposition. We synthesize the literature on this by identifying three

22
ways by which labor market institutions may have contributed to the slowdown in labor productivity
growth: labor hoarding, worker mobility, and digital labor markets.
4.5.1 Labor hoarding and wage flexibility
Labor hoarding, by which firms keep workers on the payroll despite falling demand to avoid
future re-hiring costs, may have become more significant since the financial crisis. If output decreases
but paid hours worked is constant, labor productivity falls. As noted by (Askenazy et al., 2016),
institutional differences across European countries suggest that different propensity of labor hoarding
may explain some differences in countries’ experiences post-crisis.
Hoarding may be easier in countries where wages are less rigid, such as the UK. Pessoa and Van
Reenen (2014) make the point that low unemployment with low productivity growth in the UK after the
crisis can be explained by high wage flexibility. After the financial crisis hit, workers accepted a lower
real wage, and unemployment recovered quickly. Combined with credit constraints that made capital
less attractive, firms substituted capital with labor, resulting in lower capital per worker ratios that are
detrimental to labor productivity. This may explain the lower contribution of capital deepening to labor
productivity growth post the financial crisis.
4.5.2 Worker mobility
Using harmonized measures of job creation and destruction in a sample of industrial and
emerging economies, Haltiwanger, Scarpetta, and Schweiger (2014) find evidence that stringent hiring
and firing regulations tend to reduce the pace of job reallocation. Cette, Fernald, and Mojon (2016)
looked into the productivity effects from anticompetitive regulations in product and labor markets and
simulate the effects of large structural reform programs. Their results suggest that all countries could
expect sizeable gains in TFP from the implementation of pro-competitive regulation practices. However,
considering regulation more broadly as an explanation of the productivity slowdown, Fernald, Hall,
Stock, and Watson (2017) found no evidence that industries with the highest increase in regulation
(measured by a text-based index) generally experience slower productivity growth.
In the labor market, worker mobility may be hampered by noncompete agreements, whereby
employees agree not to join competing firms within a particular timeframe or location. (Starr, Prescott,
& Bishara, 2019) find that such agreements bind 20% of labor force participants in the US at any given
point in time, with measurable effects on wages for both high- and low-skilled workers. They estimate
that signing a noncompete agreement before accepting a job raises wages by almost 10%. (Fallick,
Fleischman, & Rebitzer, 2006) suggest that the difficulty in enforcing noncompete clauses in California
is a prime reason for high rates of job-hopping in Silicon Valley, which has facilitated the diffusion of
talent and spurred innovation. “No-poaching” agreements are similar in nature to noncompete contract,
but are agreed between employers instead of between employers and their employees. (Krueger &
Ashenfelter, 2018) find that a staggering 58% of major franchises in the US include agreements by which
employers agree not to ‘poach’ employees from each other. They are particularly widespread in low-
wage occupations in the US and provide a potentially fruitful area for future research into the effects of
restricted competition on labor market outcomes.
23
4.5.3 Digital labor markets
In the UK, a persistent increase in self-employment, zero-hour contracts, and the rise of the “gig
economy” may be responsible for a recent increase in unskilled labor (Coyle, 2017). In addition to skill
mismatch (see Section 4.1.2), the gig economy may be detrimental to overall labor productivity because,
as compared to longer-term job contracts, it is associated with lower rates of investment in skill
accumulation, experience and lower levels of loyalty of workers to their contractors. In spite of this, such
platforms often improve utilisation rates for certain services, with the most notable case being that of
Uber (Cramer & Krueger, 2016). This may enhance skill matching, especially for rarer skills, and reduce
hiring costs (A. O. Nakamura, Shaw, Freeman, Nakamura, & Pyman, 2009). While the effects of digital
labor markets on unemployment duration are covered extensively by Kuhn and Mansour (2014) and
work cited therein, their effects on wages and productivity are not clear (Cramer & Krueger, 2016).
Goldfarb and Tucker (2019) also emphasise the role of collaboration through digital platforms, although
much of this is constrained within traditional boundaries of the firm. A benefit from the digital platforms
is that they provide new, large-scale and precise data on labour markets, expanding the boundaries of
research going forward.
4.6 Summary
The growth accounting exercise set out in Section 2 suggests that changes in labor force
composition are not a significant explanation for the slowdown in labor productivity. However,
technology has made specific skills scarce and others obsolete, possibly increasing a skill mismatch and
worsening TFP growth. This is likely to become more significant as artificial intelligence and associated
technologies substitute for and augment different segments of the workforce in the coming decades.
There are concerns that an older population may be less entrepreneurial, and that older consumers
may also shift consumption towards low productivity growth services. However, ageing also increases
incentives for automation. The effect of an ageing population may also be felt through the operation of
capital markets, but again in a direction that is not obvious a priori. Ageing is pervasive in developed
countries, satisfying our scope criterion. Some reported estimates suggest that the scale may also be non-
negligible. However, ageing fails our sequencing criteria: it may contribute to secular patterns, but
clearly cannot explain a more sudden drop in productivity. The argument that new leisure technologies
may decrease labor supply remains under-researched, but presents potential avenues for future work.
Changes to labor market institutions are emerging from the introduction of digital platforms, which may
fit the sequencing and scope of the slowdown. TFP would capture many of these elements as they are
currently measured, which underscores the earlier point that future productivity growth is largely a result
of the efficient use of skills, rather than simply their supply.
5. Physical and intangible capital
As we have seen in Section 2, labor productivity decompositions show that while TFP is the
dominant factor, a slowdown in capital deepening is also a major cause of the slowdown. For the US,
TFP and capital deepening each contributed only 0.5 p.p to labor productivity growth in the post 2004
period, against 1.7 p.p for TFP and 1.2 p.p for capital in 1995-2004 (Baily & Montalbano, 2016). We

24
review several reasons for the slowdown of investment: a cyclical slowdown due to the financial crisis,
an increase in market concentration, and the nature of intangibles.
5.1 Cyclical effect from the financial crisis
Decomposing cyclical and secular factors is particularly important in order to understand whether
slow labor productivity growth is “the new normal” or not.
For the OECD, Ollivaud, Guillemette, and Turner (2016) compute that (trend) labor productivity
growth fell from about 1.8% to 1% from 2000 to 2008, with most of the decline being due to the
slowdown of TFP growth from about 1% to 0.4%. In contrast, the post-crisis period was marked by a
further decrease of trend labor productivity growth which can be attributed to a slower growth of capital
deepening.
The TFP slowdown also started before the crisis in the US. But while a slowdown in investment
may be responsible for part of the post-crisis slowdown, Fernald et al. (2017) argue that investment had
a “normal” cyclical behavior, and the particularly disappointing recovery must thus be attributed to
slower TFP growth and weaker labor force participation. This finding is based on removing cyclical
fluctuations based on the assumption of a stable relationship between macroeconomic variables (for
example, output) and unemployment (Okun’s law) and comparing investment with previous periods of
recovery. But simpler or alternative methods lead to similar evaluations (see, for example, the discussion
by Reichlin in Fernald et al. (2017). Most strikingly, the capital-output ratio returned to its pre-recession
trend in these models.
We list three explanations for a cyclical crisis-driven slowdown of investment. The first is that
the crisis led to a substantial increase in financial frictions. The returns on productive capital (including
intangibles) have remained relatively stable around 6.5%, while the returns on safe assets have
decreased, suggesting a substantial increase in the risk premia. This has been the case since 2000, but
has become more marked since the financial crisis of 2008 (Caballero, Farhi, & Gourinchas, 2017).
Besley, Roland, and Van Reenen (2020) derive an aggregate measure of credit frictions by modelling
firms’ probability of defaulting, and find that credit frictions may have contributed to a half of the 9.3%
fall in labor productivity levels between 2008 and 2009.
The second explanation for procyclical investment behavior is that depressed aggregate demand
led to slower investment growth (Askenazy et al., 2016). Calibrating investment equations for the OECD
with an accelerator effect, whereby investment depends on output, Ollivaud et al. (2016) estimate that
the demand shock from the financial crisis may explain half of the decreased contribution of capital to
labor productivity growth. Using a different method and looking at the US, Reifschneider, Wascher, and
Wilcox (2015)’s unobserved components model also suggests sizable effects of the financial crisis on
output, through a lower potential output endogenous to these demand shocks.
The third is that government investment also fell post-crisis, contributing around a fifth of the
fall of investment as a share of GDP, with potentially longer-run (and harder to measure) consequences
for productivity (Ollivaud et al., 2016).
We will discuss the role of intangibles as a secular trend below, but we briefly note here two
ways in which the financial crisis affected intangibles and TFP. First, the negative consequences of a
lack of investment in infrastructure also apply to “soft” infrastructure. These “public intangibles”, as

25
defined by Corrado, Haskel, and Jona-Lasinio (2017b), are built from investments in information,
scientific and cultural assets, and investment in societal competencies, such as human health and
knowledge capital built through a nation’s health and school systems. Second, Redmond and Van
Zandweghe (2016), looking at US data, found that stricter credit conditions prevailing during the crisis
led to a substantial decline of R&D investment, and thus of TFP growth.
5.2 Structural effects
While it is clear that investment is pro-cyclical, it is less evident that investment is behaving
“normally”. Using data on publicly traded firms in the US, Alexander and Eberly (2018) found that the
slowdown of investment relative to fundamentals started in the early 2000s, and ascribed this to two
factors: a shift of investment towards industries in which capital cannot be relocated easily (for example,
energy production or telecommunication transmission), and a shift toward intangibles.
Another factor unrelated to the crisis is increasing concentration and decreasing competition.
Average markups in the US have more than tripled since 1980 across almost all industries, mostly driven
by an increase at the top decile, and De Loecker and Eeckhout (2017) argue that this is due to an increase
in market power, rather than higher costs. Gutiérrez and Philippon (2017) find evidence for the US that
decreasing domestic competition leads to lower investment, especially into intangible assets, by the
industry leader. Through causal analysis with three different identification strategies, they find that
investment would increase significantly with higher competition, even if it were only through the threat
of entry of competitors. As we will discuss in Section 6.2.4, however, the relationship between
concentration, competition, investment and innovation is not straightforward and increased
concentration may be a sign of increased competition benefitting to most productive firms. Haskel and
Westlake (2017) use data from a handful of OECD countries to demonstrate how the rise in markups is
particularly pronounced in industries which are intensive in their use of intangible capital. Thus, while
the rise in markups may reflect a rise in market power, markups did not increased substantially once
capital stocks are adjusted for intangibles (Ayyagari, Demirguc-Kunt, & Maksimovic, 2018). Other
explanations for the low investment rates may still be necessary. Declining investment rates could also
be due to an increase in short-termism amongst top managers (Haskel & Westlake, 2017; Lazonick,
2014). In firms where the pay of the top management is linked to firm performance on the stock market,
with the purpose to align the incentives of managers with those of the firms, Lazonick (2014) finds that
an increasing amount of resources are spent on stock buybacks instead of long term investment which
would improve productivity. Similarly, Gutiérrez and Philippon (2017) argue that this change in
corporate governance within a large number of firms led to lower investment rates in long-term projects.
5.3 Intangible capital
Broadly defined intangibles have been the largest systematic driver of growth over the last 50
years (Corrado & Hulten, 2010) and represent a growing share of investment in the US, the UK and
Japan (Corrado et al., 2009; Fukao, Miyagawa, Mukai, Shinoda, & Tonogi, 2009; Haskel & Westlake,
2017; Marrano, Haskel, & Wallis, 2009). In fact, business investment in intangibles has been higher than
investment into tangible capital since the late 1980’s.
Once the stock of intangibles is accounted for, capital deepening in revised accounts is
responsible for half of labor productivity growth in the US, and TFP contributions decrease accordingly
26
(Corrado & Hulten, 2014). In fact, absorbing R&D intensity into a separate TFP term shows that tangible
capital deepening explains no productivity gains whatsoever (Fernald & Jones, 2014; C. I. Jones, 2002).
According to these calculations, R&D intensity alone explains up to 58% of productivity growth in the
US between 1950 and 2007.
These startling effects on productivity bring us back to the nature of intangible capital, which
allows established firms to accumulate market power (Haskel & Westlake, 2017). This happens because
some forms of intangible capital benefit from synergies, such as knowledge capital that can be
recombined into new forms and is often easy to scale at near zero marginal cost, thus generating
increasing returns for incumbents. Additionally, smaller firms or startups can face barriers to entry in the
form of funding opportunities, since the difficulties related to valuing such capital make it hard to list as
collateral. Intangible investment of larger firms can also benefit smaller firms, for example through the
diffusion of new technology.
Precisely because of their higher spillover effects compared to tangible capital, a slowdown in intangible
investment is worse than a slowdown in physical capital investment. As a result, while there is evidence
that investment into intangibles has been impacted by the financial crisis to a lesser extent than tangible
investment, its overall adverse impact on labor productivity might have been worse. This idea is
reinforced in Goodridge et al. (2016), who suggested that part of the TFP growth slowdown might be
due to missing lagged spillovers, resulting from the slowdown of R&D investment in the 90’s and
2000’s. Corrado, Haskel, and Jona-Lasinio (2017a) find a substantial effect of intangible investment on
TFP growth. Using EUKLEMS data for 1998-2007, they estimate a contribution 6 times as large for
intangibles than for workforce skill. They also find evidence that the returns to ICT capital are stronger
when intangible capital is higher, in line with the idea that there are complementarities between ICT
capital and intangible capital (Brynjolfsson et al., 2017).
A shift of capital towards intangibles could also dampen risk appetites as investment in
intangibles is generally sunk and thus riskier. Consequently, the more economies shift to higher shares
of intangibles in production the more the risk profile of the capital stock is deteriorating (Haskel &
Westlake, 2017). This effect was also amplified during the financial crisis, as credit constraints may
have affected productivity by reducing intangible investment, which is more difficult to use as collateral
than physical investment. (Duval, Hong, & Timmer, 2017) present evidence that the financially more
vulnerable firms had a higher decline in TFP growth after the crisis, and this effect was stronger in
countries with a higher credit supply shock
Besides R&D, intangibles also include economic competencies and good management practices.
Haldane (2017) argues that management practices are indeed a good predictor for productivity at the
firm level, and slower diffusion of best practices could help explain the productivity gap between frontier
and laggard firms, which we discuss in the next Section. To translate into productivity improvements,
technological change often requires a change in companies’ internal processes and organization. During
the productivity paradox of the 90’s, insufficient organizational change was identified as one of the key
points holding back technology diffusion (Brynjolfsson, 1993; Brynjolfsson & Hitt, 1996; Brynjolfsson
& Hitt, 2000). Similar arguments can be made today, where organizational change complementary to
the development of AI are just starting and will take time to fully impact on businesses and productivity
(Brynjolfsson et al., 2017).

27
5.4 Summary
The weakness in investment is a major cause of the slowdown. The key question is whether
investment has declined because of cyclical or structural reasons. On the one hand, cyclical explanations
are strong – the financial crisis depressed aggregate demand, and increased financial constraints, both
for firms and governments. These effects have been evaluated quantitatively and taken together can
account for a sizable portion of the decline in the post-crisis period. The financial crisis was global, and
we may expect financial frictions to be affected in a relatively similar fashion in all countries. On the
other hand, the slowdown in investment started, at least in the US, in the early 2000’s, before the crisis,
so structural explanations are necessary to account for the part of the slowdown due to lower capital
deepening. Several explanations have been put forward, such as a higher share of intangible capital, a
decline in competition, and a rise in short-termism, all of which may have applied relatively similarly in
advanced economies, satisfying our scope criteria, and that taken together have a plausibly important
impact, satisfying our scale criteria.
6. Productivity dispersion Growth decomposition suggests that most of the secular slowdown is due to a slowdown of TFP.
TFP is a residual, so many factors that are not directly measured as inputs can affect it, but it remains
customary to think of TFP growth as mostly driven by technological progress. When considering
aggregate TFP, however, it is important to realize that growth can be due not only to technological
progress of smaller units, but also to a change in the relative sizes of the different units.
In this section, we first discuss the idea that productivity is slowing down because low
productivity growth sectors are becoming a bigger part of the economy, a classic theme of the previous
productivity slowdown literature. Next, we review the recent work on the distribution of firm-level
productivity, which points to the simultaneous rise of superstar firms co-existing with zombie firms,
suggesting that misallocation has increased and knowledge diffusion from frontier to laggard firms has
slowed down. Finally, we briefly discuss the evolution of regional disparities.
6.1 Sector-level productivity growth and structural change
Are some specific sectors responsible for the slowdown and are stagnating productivity sectors
becoming a larger part of the economy? William Baumol famously pointed out that aggregate
productivity growth would under certain conditions asymptotically equal the rate of progress of the
slowest industry (Baumol, 1967). In the context of the productivity slowdown, it may well be that the
rapidly innovating sectors are capturing a declining share of total output, or are not systemically
important (Oulton, 2001).
Decomposing the growth of US TFP by sectors shows that manufacturing, wholesale and retail
trade, services and agriculture were responsible for a large fraction of both the acceleration of aggregate
TFP growth between 1995-2004 compared to 1987-1995, and its slowdown in 2004-2015 compared to
1995-2004 (Baily & Montalbano, 2016). This highlights a point often emphasized by Gordon (2016):
productivity growth can be thought of as an adjustment of the levels, with an innovation leading to a
new normal level of productivity, that is, a transitory period of high productivity growth. Baily and

28
Montalbano (2016) relate the experience of the retail sector to the rise of large scale retailers driving out
small shops, until they reached overcapacity in the post 2004 period.
Using a different sectoral aggregation, (Cette et al., 2016) found that in the US most of the 1990’s
productivity surge was due to ICT producing industries. Consistent with (Baily & Montalbano, 2016),
market services such as retail had a strong productivity growth in the early 2000’s, benefiting from ICT-
related reorganization, but fell back to lower growth after 2004. Murray (2017) found that almost all the
slowdown in average labor productivity growth between 1995-2004 and 2004-2015 in the US can be
explained by a within sector slowdown, with labor reallocation playing no role. (Byrne et al., 2016),
using new TFP growth rates while keeping industry shares fixed to 1987, do not find any evidence that
growth of low TFP growth industries as a share of output explains much of the productivity slowdown.
If anything, it complicates the puzzle. However, using a different period (1947-67 vs 1996-2016), dataset
(World KLEMS), and measure of productivity (output per unit of labor services), Duernecker,
Herrendorf, and Valentinyi (2017) found that that around a third of the slowdown can be attributed to
changing shares. Taken together, this suggests that Baumol disease may be behind some of the secular
decline, although the slowdown in recent years is hardly associated with changing sectoral shares.
In the UK, Haldane (2017) and Billet and Schneider (2017) examined productivity growth trends
at the sectoral level pre- and post- financial crisis and found that all sectors have been affected by the
recent slowdown in productivity growth. Goodridge et al. (2016) show that 35% of the TFP growth
slowdown can be explained by the performance in the oil and gas, as well as financial service industries,
while Haldane (2017) notes that financial services account for almost a third (0.5% out of 1.7%) of the
pre- vs post-financial crisis difference. Tenreyro (2018) traced three quarters of the productivity
slowdown to manufacturing and finance (post vs pre- financial crisis, excluding 2007-09), with ICT and
professional, scientific and technical services explaining the rest. In manufacturing, the slowdown in
labor productivity growth is due to both a slowdown in capital deepening and TFP, which themselves
may be attributed to both low levels post crisis but also high levels pre-crisis. A one-off improvement
due to structural transformation and offshoring was taking place during the 2000-07 period, creating a
sharp contrast between pre- and post-crisis periods. The slowdown is also marked in finance, because of
a pre-crisis high level, perhaps partly due to measurement issues. In contrast to manufacturing, the
slowdown can be overwhelmingly attributed to TFP, not a lack of investment.
Attempting to summarize the industry-level evidence on both sides of the Atlantic, (Gordon &
Sayed, 2019) interpret the European experience as similar to the US but with a lag. They do confirm that
the productivity growth surge of 1995-2005 is a US experience, by contrast to the rather clear and
uninterrupted downward trend in Europe after the 1970’s, as shown in (Bergeaud et al., 2016). On the
industry level, (Gordon & Sayed, 2019) make it clear that most of fluctuations (upward and also
downward, with the slowdown) are due to commodities-producing industries, not services. Looking at
OECD STAN data for 10 countries, Cantner, Graf, and Prytkova (2018) confirm that the slowdown is
mostly due to a within sector decline, particularly strong and consistent across countries in
manufacturing industries.
Taking stock of this literature, it does not seem like Baumol’s cost disease is a valid explanation
for the current productivity slowdown, since sectoral shares of GDP have not changed significantly.
However, key sectors that are large in size experienced a significant productivity slowdown, especially

29
when compared to the previous decades where they tended to overperform. The industry-level evidence
suggests that the current slowdown may reflect a pause in the adjustment of productivity towards higher
levels made possible by the ICT revolution.
6.2 Firm-level productivity dispersion
There are strikingly large productivity differences between firms, even within highly
disaggregated industries (Andrews, Criscuolo, & Gal, 2016; Syverson, 2011). Dispersion is, at first sight,
a sign of misallocation – if productivity levels are given, aggregate productivity would increase if the
inputs of low productivity firms were reallocated towards high productivity firms. Thus, aggregate
productivity growth is driven not only by an increase in the average productivity of firms, but also by
increasing allocative efficiency: low productivity firms shrinking or exiting, high productivity firms
growing faster, and new entrants being more productive on average.
As a result, even if the average productivity growth of existing firms was constant, a productivity
slowdown could occur as a result of a decline in allocative efficiency alone. We start by discussing some
salient empirical patterns that suggest that this may be the case: entry-exit rates and job reallocation
flows have declined, and productivity dispersion has increased. To interpret these facts, we provide a
discussion of the recent advances on the measurement of misallocation. We then briefly discuss potential
causes, including lower competition and technological change.
6.2.1 Falling business dynamism
Over the last decade, a decline in business dynamism has been documented, mostly using two
indicators. First of all, the prevalence of young firms in the US economy appears to have declined.
Decker, Haltiwanger, Jarmin, and Miranda (2014) and Foster, Grim, Haltiwanger, and Wolf (2019)
document a decline in the share of employment young firms. While the decline appears secular at an
aggregate level since the late 1980s, it hides a substantial boom and bust in the high tech sector in the
period 1995-2005, which coincides with the labor productivity revival for the US. Gutiérrez and
Philippon (2017) show that in the census data, entry and exit rates have fallen since the 1980s, from
around 0.13 to around 0.09 in 2015.
Second, employee flows have decreased. Hyatt and Spletzer (2013) document that hires,
separations, job creation, job destruction, and job-to-job flows have all declined since the late 1990’s, in
a staircase fashion (stable during normal time and falling during recessions). About half of this decline
is due to the decline in single quarter jobs, and compositional effects (such as an aging population) do
not explain entirely the decline.
Decker, Haltiwanger, Jarmin, and Miranda (2018) contrast two explanations for a slowing job
reallocation: either the dispersion of the shocks has decreased, or frictions and adjustment costs have
affected the responsiveness to these shocks, that is, firms with higher productivity did not increase
employment as quickly or strongly. They find that responsiveness has decreased, particularly for young
firms in the high tech sector. While this lower reallocation was driven by the consolidation of the retail

30
sector into highly productive “big-box” (large volume) shops in the pre-2000 period, the post-2000
slowdown in job reallocation is associated with ICT producing and using sectors§§§§.
Overall, however, business dynamism statistics are a direct but imperfect measure of creative
destruction. For instance, if the dominant source of innovation is innovation by incumbents, an
acceleration or slowdown of innovation will not be reflected in business dynamism statistics (Hsieh &
Klenow, 2018). As a result, rather than documenting reallocation, the recent literature attempts to
evaluate misallocation and the changes in allocative efficiency. Before delving into the methods and
results from this literature, we discuss the evidence of productivity dispersion.
6.2.2 Superstar vs zombie firms
There is a substantial divergence between firms at the ‘frontier,’ defined as the top 5% most
productive firms in the distribution, and the rest of the firms, in a sample of 23 OECD countries (Andrews
et al., 2016). Those at the frontier have increased their productivity by around 40% on average since
2010, while the rest experienced slow, if any, productivity growth. The firms with the highest
productivity growth tend to be exporters, foreign-owned, located in productive regions, concentrated in
a small number of sectors, relatively larger, and invest substantially in R&D (Haldane, 2017). Moreover,
superstar firms tend to arise mostly in sectors that are characterized by high patent intensity (Autor,
Dorn, Katz, Patterson, & Van Reenen, 2017), or, more generally, by intangible capital intensity (Haskel
& Westlake, 2017).
In addition to this divergence, there is an observed decline in turnover at the productivity frontier
(Andrews et al., 2016). Out of the firms at the top 5% of the productivity distribution, there are now
significantly more which were already at or near the frontier two years before, as compared to a period
at the beginning of the 2000s. In fact, the UK the productivity slowdown post-crisis emerges from the
slowdown in productivity growth for the already-productive firms at the frontier (P. Schneider, 2018).
In contrast to superstar firms, zombie firms can be thought of as firms that manage to survive
despite negative productivity. While many unproductive firms failed during the financial crisis, a
significant fraction of them are still in operation. Among the reasons for this lack of exit are the lack of
competitive pressure and bank forbearance (Andrews et al., 2016; Andrews, McGowan, & Millot, 2017).
Since the financial crisis, quantitative easing and the associated exceptionally low interest rates have
allowed zombie firms to live on cheap credit, with fiscal forbearance through tax exemptions and
subsidies increasing the life of firms, not least those with political weight arising from their large number
of employees or significance to the local economy.
Zombie firms hold labor and capital that could otherwise be employed more productively. Citing
evidence from Japan, Caballero, Hoshi, and Kashyap (2008) emphasise that zombie firms also hamper
productivity growth rates in healthy firms by appropriating not just inputs, but also bank lending.
However, as Haldane (2017) and Arrowsmith et al. (2013) point out, the effects on aggregate
productivity of the exit of those zombie firms would not be very large, so forbearance is unlikely to
§§§§ Redmond and Van Zandweghe (2016) investigated whether credit conditions affected TFP through job
reallocation. Tighter credit constraints led to a lower rate of creation of new and potentially more productive jobs, but also to
a higher rate of destruction of (presumably less productive) jobs. As a result, the overall effect of credit constraints on reallocation and thus TFP growth was likely to be small.

31
account for a large proportion of the missing productivity growth. Thus, while the persistence of low
productivity firms suggests that productivity could be improved by reforming exit policies (Andrews et
al., 2017), explain the full scale of the productivity slowdown requires establishing a broader decline in
the contribution of allocative efficiency to growth.
The prominence of the discussion of zombies and superstar firms makes it clear that the size of
the tails of the productivity distribution matter are important. As we will see in the next section, other
measures of dispersions have been used, typically the standard deviation of the logarithm of labor, capital
or total factor productivity. A notable issue is that the detailed properties of the distribution of
productivity are not yet fully understood. We do not know, for instance, if the high prevalence of extreme
values in the micro data is a real phenomenon, an accounting artefact, or a measurement error. It is
concerning that even for the US, the “corrections” that are done prior to making the data available to
researchers may well be driving most results on dispersion and misallocation (Nishida, Petrin,
Rotemberg, & White, 2016). Yang et al. (2019), looking at 9 million observations over ten years in
Europe, show that firm-level labor productivity is well fitted by a Lévy distribution, a distribution with
power law tails and infinite variance. This suggests that extreme values are a normal feature of the data
and that trimming, a common practice, may drive some of the existing results in the literature. A related,
and potentially very significant finding is that many firms have negative value-added, implying that their
negative profits, or losses, are higher than their wage bill. , (Ardanaz-Badia, Awano, & Wales, 2017;
Yang et al., 2019). Chart 17a in Haldane (2017) shows that in UK administrative data, the 10th percentile
of the distribution of gross value added per worker was very close to zero in 2009. As a result, log-
transforming the data to measure growth rates, value-added TFP, or the standard deviation of the log
levels, is impossible unless one discards some of the most valuable datapoints to understand
misallocation.
With these caveats in mind, we now discuss the findings of a rising firm-level productivity
dispersion, and relate it to the productivity slowdown.
6.2.3 Misallocation
Business dynamism and productivity dispersion are largely indirect and clearly imperfect
measures of misallocation. Similarly, there are many sources of productivity dispersion so that relating
it to misallocation and the productivity slowdown is far from straightforward. An increasing dispersion
driven by a fast-expanding technological frontier is in itself positive, although it begs the question of
why laggard firms do not catch-up (Foster et al., 2019). In contrast, a slowdown in the firms pushing the
frontier, a slowdown in those catching up, and a slowdown in exit of the least productive could
independently or collectively be responsible for an aggregate productivity slowdown. The literature
generally distinguishes between statistical and structural productivity growth decompositions. Estimates
based on purely statistical decompositions, most recently the Olley-Pakes covariance method, suggest
that that allocative efficiency has been a very large contributor to aggregate productivity growth. Decker,
Haltiwanger, Jarmin, and Miranda (2017), using comprehensive micro data for the US, decomposed US
average labor productivity growth between a negative within-firm productivity growth (slightly less than
–3%), and an Olley-Pakes covariance (between productivity and size), which measures allocative
efficiency, of around 4%. They found that the post-2004 period, compared to 1997-99, is marked by a
decline of the Olley-Pakes covariance term only, suggesting that a lower contribution of allocative
efficiency can explain most of the productivity slowdown.
32
Ultimately, however, statements about allocative efficiency ought to refer to a benchmark of
optimal allocation. A number of recent contributions to the literature have developed more "structural"
productivity decompositions,, characterizing misallocation through model-based identifying
assumptions (see Restuccia and Rogerson (2017). One important issue is that we generally observe firm-
level revenue (price times quantity) but not prices, so that measures of TFP are based on revenue (TFPR)
rather than on physical output (TFPQ). The framework of Hsieh and Klenow (2009) has been highly
influential because it provides a method to evaluate misallocation when data is scarce: under their
assumptions, all the dispersion in TFPR is due to distortions, rather than to fundamental differences in
TFPQ. However, this result relies on strong assumptions that are unlikely to hold (Haltiwanger, Kulick,
& Syverson, 2018), so differences in TFPR may reflect not only misallocation but also intrinsic
differences between firms such as demand shifters, or even forces that we expect to have a positive long-
run effect, such as innovative firms pushing the frontier faster.
Despite methodological issues, several recent studies of misallocation speak to the productivity
slowdown by evaluating the evolution of misallocation over time. An interesting result is that capital
misallocation appears to have increased significantly, while labor misallocation does not, at least in some
countries. Gopinath, Kalemli-Özcan, Karabarbounis, and Villegas-Sanchez (2017) found that the within
industry standard deviation of the logarithm of the marginal revenue product of capital had a clear
upward tendency in Spain, Italy and Portugal (but not in central Europe or the US) since the 90’s. In
their estimate for Spanish manufacturing, efficient TFP is roughly the same in 1999 and 2012, while the
observed TFP is 6-12 pp lower, so rising misallocation had sizeable effects on the slowdown. They
interpret this as a rising capital misallocation, and, as Cette et al. (2016), point to low interest rates as the
main cause. Barnett, Batten, Chiu, Franklin, and Sebastia-Barriel (2014) look at firm-level data in the
UK and also find an increasing dispersion of the rates of return on capital, starting around 2007 and until
the end of their sample (2011). They postulate that capital reallocation slowed down after the financial
crisis, and present evidence that the positive relationship between investment incentives (firm-level
capital rates of returns) and actual investment (firm-level capital growth rates) disappeared after the
financial crisis.
When discussing misallocation patterns, an important distinction should be drawn between the
distance to the efficient frontier, and the contribution of allocative efficiency to aggregate growth
(Baqaee & Farhi, 2019). First, in an economy with frictions, the equilibrium allocation is not at the
efficient frontier so that a higher allocative efficiency could be achieved by reducing frictions and thus
moving toward the frontier, although this would only be a level effect. Baqaee and Farhi (2019) find that
the distance to the frontier has slightly increased in recent decades, due to increasing markups. Second,
when idiosyncratic frictions or technical efficiency change, aggregate productivity increases as a direct
result, but also because the new equilibrium dictates that producers reallocate their input demand towards
the most productive suppliers – the latter effect is a form of improvement in allocative efficiency (by
contrast to technical efficiency), and the authors find that it has contributed about half of the growth of
aggregate TFP in the last two decades in the US.
6.2.4 Competition, markups and concentration
If misallocation has increased, or if reallocation is less dynamic, what is the cause? The theoretical
literature often specifies generic “frictions”, without being specific as to the underlying causes. As noted
above, in the last few years, however, a number of papers have found that markups have increased and
33
concentration has decreased, suggesting a decline in competitive pressure. De Loecker, Eeckhout, and
Unger (2020), in particular, have documented an increase in markups since the 1980s in the US, broadly
speaking in all sectors. They observe that this increase is mostly due to the upper tail of the distribution
and operates through reallocation: superstar firms with high markups are becoming larger; it is also these
firms that have a low labor share, so this pattern contributes to the aggregate fall of the labor share
(Autor, Dorn, Katz, Patterson, & Van Reenen, 2017).
The rise of markups and concentration suggests that some firms are able to exert market power,
possibly erecting barriers to entry and protecting rents. However, superstar firms being the more
productive, a reallocation towards them should have increased aggregate productivity growth. As
Syverson (2019) argue, increased concentration may be due to higher competition. It is possible, for
instance, that digital innovation has made it easier for consumers to substitute across firms, perhaps
thanks to online retail. This increased competition may have "legitimately" benefitted the most
productive firms (Autor et al., 2017), leading to increased concentration. In support of this hypothesis,
Autor et al. (2017) also find that sectors with the strongest rise in markups and concentration are also the
most technologically dynamic, in terms of patent intensity. It remains possible, of course, that an increase
in concentration initially due to fairer competition eventually leads to welfare-reducing outcomes.
6.3 Regional disparities
The economic geography literature often distinguishes between different types of agglomeration
externalities, such as labor, input markets pooling and knowledge spillovers, with an ongoing debate on
whether these externalities operate within narrow sectors (as in Marshallian districts), or if diversity in
large cities is a support to innovation. This provides several candidate mechanisms to explain the
productivity slowdown. The changes in sectoral shares, geographical allocation of resources, and the
nature of spillovers may collectively induce patterns that affect aggregate productivity. While regional
disparities are well studied, there is a dearth of studies evaluating a specific mechanism quantitatively
that is tied to the productivity slowdown.
An interesting fact is that in the last two decades, within-country regional dispersion has
increased whereas OECD-wide dispersion has declined due to the significant catch-up from poor regions
in Eastern Europe, Chile and Mexico, and mostly thanks to an increased specialization in tradable sectors
(OECD, 2018b). Martin, Sunley, Gardiner, Evenhuis, and Tyler (2018), in a rare attempt at dissecting
the productivity slowdown at the city level, analysed city-level data for the UK after 1971. They find
that the shift towards service sectors has been a negative contributor to productivity, leaving
manufacturing regions of the North more affected by this structural change. But their data also suggest
that regions have converged in terms of their sectoral structure, and that within sector productivity
dynamics is largely responsible for the slowdown.
Thus, the limited available evidence available points to sector-specific dynamics, which we
reviewed above, and the role of trade, which we turn to in the next section. There is room for further
research in this area, for example, by evaluating whether the increasingly intangible nature of investment
changes agglomeration economies, and how this affects aggregate productivity quantitatively.

34
6.4 Summary
Overall, accounting for changing sectoral shares does not help to explain the slowdown in labor
productivity growth, at least not the sharp most recent decline. It is insufficient in scale and also does
not fit the sequencing criteria. Sectoral disaggregation, however, reveals that the slowdown permeates
the economy across all sectors. The ending of a period of high productivity growth in ICT and ICT-using
sectors such as manufacturing and retail and wholesale trade, at least in the US, has had some impact on
productivity growth.
At the firm level, there is a divergence in productivity between firms at the frontier and the rest.
Simultaneously, concentration and markups are also increasing across a number of economically
significant industries. This begs the question of why the factors boosting the productivity of superstar
firms are not diffusing, or not as fast as in the past. One hypothesis is that superstar firms are increasingly
able to erect barriers to entry, perhaps because intangible capital is easier to appropriate, and the
regulations to prevent this are not yet in place or are not enforced. Another hypothesis is that diffusion
takes a long time, and we should expect long lags from the point when an initial innovation pushes the
productivity frontier, and its full impact on aggregate productivity, a point emphasized by the optimists
in the productivity paradox debate.
Many estimates of rising misallocation are quantitatively large, but do not necessarily fit well our
scope criterion. Capital misallocation appear to have risen more in southern than in northern Europe, for
instance. It is difficult to evaluate our sequencing criteria, simply because comprehensive firm-level
datasets are too recent to evaluate secular changes. There does not appear to be a large change in 2004
for the US or after the GFC everywhere, and while productivity dispersion has increased, this was mostly
before the GFC.
7. Globalization, trade and offshoring
Globalisation is thought to be an important driver of productivity growth in the last decades.
Firms’ improved access to foreign markets, both for production supply chains and for the export of final
goods, has led to staggering growth of trade in goods and services. Gains from trade are essentially gains
in world allocative efficiency, which is why in Eq. (2) we put this section under the allocative efficiency.
But as we see below, trade also affects investment in physical, intangible and human capital, as well as
innovation efforts.
We first draw from the extensive trade literature to explain why growth in trade expanded and
has subsequently plateaued. We then identify several channels through which trade increases
productivity and show how given the microeconomic evidence, the slowdown in the growth of labor
productivity relates to the slowdown in the growth of trade. For reasons we explain, it is not possible to
fully ascertain that changes in trade are associated with the overall slowdown in productivity.
7.1 Slowdown in global trade
Trade has been a significant driver of economic growth for much of the past century, but its
growth has stagnated as the export-to-GDP ratio for the world has not changed since the financial crisis
(Baldwin, 2009; Hoekman, 2015). Causes for the slowdown include cyclical factors related to the
financial crisis, as trade is historically highly responsive to changes in output. Structural components

35
might also keep growth in trade supressed permanently, such as the one-off integration of China and
former communist countries or technological advancements that enabled the spread of long and complex
Global Value Chains (GVCs).
Weakness in demand in the aftermath of the global financial crisis may be a primary cause of the
slowdown in trade, as it has been notably more pronounced in countries hit hardest by the crisis
(Constantinescu, Mattoo, & Ruta, 2016). Import volumes for the US and the Eurozone are 20% below
their pre-crisis trend, while GDP levels are 8% and 13% lower, respectively. The collapse of investment
accounts for a significant share of the slowdown in trade growth for the G7 countries, as imports are
much more responsive to investment than changes in private consumption (Bussière, Callegari, Ghironi,
Sestieri, & Yamano, 2013).
Constantinescu et al. (2016) acknowledge that weakness in aggregate demand accounts for
roughly half the gap between trend and realised import growth, concluding that structural components
have played a role as well. The rate of increase in trade between the mid-1980s and mid-2000s may itself
have been an outlier, largely due to the emergence of China as an exporter, as well as the collapse of
communism. In addition to these geopolitical factors, technological advancements, notably in
communications and transportation, have fuelled an expansion in the use of GVCs (Baldwin, 2016).
Thus, the slowdown in trade can be linked to the slowdown either in the development of new
technologies, or in the adoption of new technologies. Protectionist policies have not been found to
explain much of the slowdown in trade, but may pose a significant headwind going forward (Hoekman,
2015). Overall, these structural components would indicate that trade has become less responsive to
output growth, and the slowdown in the growth of trade may be permanent.
It is unclear the extent to which the slowdown in trade influenced productivity growth rates, with
endogeneity posing a challenge for analysis. In one example, Constantinescu, Mattoo, and Ruta (2019)
estimate that a 10% increase in backward GVC participation (foreign value added in gross exports) leads
to a 1.6pp increase in average labor productivity growth rates in manufacturing, acknowledging
uncertainties in their estimate and identification strategy. As the foreign value added share of exports
appears to have grown roughly 2% a year in the decade starting 1995, but dropped to significantly less
than 1% in the years between 2005 to 2014, this may explain roughly 0.2pp of the missing labour
productivity growth per year in manufacturing sectors. This would be consistent with the observed
slowdown in terms of its scope and sequencing.
7.2 Reorganization of global value chains
Criscuolo and Timmis (2017) discuss how the emergence of GVCs has enabled cheaper
production, specialisation, competition, and the diffusion of technologies and knowledge. They also
highlight the strong complementarity between the rise of services in developed countries and the
diffusion of GVCs, a point elaborated in Baldwin (2016).
7.2.1 Offshoring and outsourcing
Offshoring is not only a way to exploit efficiencies abroad, usually through cheaper labor costs
in developing countries, but also increases a firm’s access to foreign markets. A helpful model in
understanding a firm’s dual decision of supplier location and production location is developed in Antràs
36
and Helpman (2004), who highlight the tendency for highly productive firms to offshore, contingent on
their reliance on ‘headquarter’ inputs.
The model receives empirical support in numerous studies, such as Helpman, Melitz, and Yeaple
(2004) for the US, and Delgado, Fariñas, and Ruano (2002) for Spain, who find that (i) firms choosing
to export are highly productive prior to exporting, and (ii) among firms choosing to engage in foreign
trade the most productive will commit to offshoring. Productivity gains from offshoring are significant,
and are usually captured by already-productive firms (Schwörer, 2013).
7.2.2 Specialisation in high skilled work
The overall impact of trade on human capital is debatable. Exposure to Chinese import
competition in the US has contributed to a 25% decline in manufacturing employment within commuting
zones, with similar findings for local labor markets in Europe (Autor, Dorn, & Hanson, 2013; Bloom,
Draca, & Van Reenen, 2016). However, using evidence on the expansion in export activity in the US,
Feenstra, Ma, and Xu (2017) estimate that the net effect of access to foreign markets on employment is
near zero within commuting zones. This would indicate that labor reallocates into other notably high
skilled, occupations less prone to being moved offshore. Indeed, Feenstra and Hanson (1996, 1999)
suggest that offshoring increased employment of high skilled workers within industries in the US,
increasing the skill premium by 15% between 1979 and 1990.
7.2.3 The role of competition
The role of competition is scrutinized in Melitz (2003), who proposes that aggregate productivity
in an industry rises through the exit of the least productive firms and the extra exports generated by the
most productive firms. Exporting alone has been shown to significantly boost firm productivity by up to
19% in American plants sampled between 1984 and 1992(Bernard & Jensen, 1999).
Foreign competition could also affect the rate of domestic innovation, although the evidence here
is limited. Bloom et al. (2016) find by observing patenting behaviour that Chinese import competition
led to higher technological innovation within firms in Europe. Despite similar impacts for local labor
markets, the US experienced a lower issuance of patents following increased exposure to Chinese
imports within regions (Autor, Dorn, Hanson, Pisano, & Shu, 2016).
7.2.4 Offshoring of services and knowledge spillovers
Traditionally, services provided abroad through foreign investment are often supplied at the
location of production. Recent innovations in ICT technologies have changed that paradigm, whereby a
growing number of service inputs are offshored, and outputs are sold to suppliers and consumers abroad
(Freund & Weinhold, 2002). Amiti and Wei (2009) show that the offshoring of services has grown at an
annual rate of 6.3% in the US between 1992 and 2000. They find that service offshoring has accounted
for 10% of the average growth in labor productivity in those years, arguing that this is largely due to a
re-allocation of labor to more productive tasks.
The offshoring of services also contributes significant knowledge spillovers. Javorcik (2004)
estimates that a 4% increase in the share of foreign-owned firms increases output of domestic firms by
15% in a sample of Lithuanian firms. In some instances, FDI inflows come in the form of acquisitions

37
with the intent to acquire skilled workers and technological expertise (Griffith, Redding, & Van Reenen,
2004; OECD, 2008).
Antràs and Helpman (2004) note the importance of strong property rights in enabling the
outsourcing of administrative, or ‘headquarter’ services. This point has been investigated in the context
of R&D specifically: protection of intellectual property rights abroad leads to faster offshoring of R&D
and higher aggregate rates of innovation, especially for high-tech industries (Canals & Şener, 2014;
Şener & Zhao, 2009).
7.3 Summary
While the efficiency gains from trade are clear, the varied nature of productivity benefits from
trade hinder precise estimations of the full impact from the slowdown in trade. Although it is uncertain
that the slowdown in trade meets our scale criterion, it is appealing for its good fit of the geographical
scope criterion. As for the sequencing, trade features the cyclical effects from the Great Recession, as
well as structural components that have also emerged through the integration of developing countries
and the completion of adoption of new communication and transportation technologies. However, the
latter would not adequately explain the change in productivity trend in the US from around 2004. Even
if trade did not cause the slowdown, it may be hampering the recovery. Protectionism may be a further
blow to the recovery of international trade and therefore to improvements in productivity going forward.
8. Technological change
The debate around the productivity slowdown is often presented as an argument between techno-
optimists and techno-pessimists. Gordon (2016) argues that past waves of technological change, such as
steam power, electricity, or the internal combustion engine had a major but temporary impact on
productivity. He argues that current new technologies, in particular digital, are unlikely to have such a
significant impact as they affect only specific aspects of human activity, such as communication and
entertainment. Moreover, most of the productivity benefits of digitization may already have been
harvested, through greater automation in manufacturing, retail, logistics and finance, in the late 1990’s
and early 2000’s.
In contrast, Brynjolfsson and McAfee (2012, 2014) and Brynjolfsson et al. (2017) argue that the
ICT and AI revolutions are still in their infancy, and that it will take some time for their full potential to
unfold. They argue that the technologies are still being developed, and that complementary investments,
innovation, organizational changes and diffusion are needed before the full productivity potential of the
ICT industrial revolution will be realized. Mokyr (2014)’s analysis, similar to Gordon’s in that it is also
rooted in extensive historical analysis, suggests that there are new technologies being currently
developed that have the potential to become GPTs, enabling sustained productivity growth and welfare
improvements, for example genomics. Pratt (2015) argues that the fusion of ICT with other new
technological areas, notably robotics, will generate spectacular new gains in living standards.
In this section, we consider these arguments and investigate four sources of a potential decline
of innovation or its effects on the real economy. These are: lower investment in R&D and inventive
activities, escalating cost and complexity of innovating, lags in the diffusion of innovations, and a faster
depreciation of existing capital and infrastructure due to current innovation.

38
8.1 Research and innovation efforts
The OECD (2017b) reports that aggregate R&D expenditures have not slowed dramatically
across OECD countries after the recession, yet the level of funding by governments has plateaued since
2010. The decline in government investment has been offset by the increase in business R&D spending,
accounting for more than 60% of total R&D expenditure in the OECD. While all types of research grew
steadily in OECD countries both before and after the crisis, funding into basic science grew faster relative
to applied and experimental research. This changing composition stems from a larger contribution from
universities to R&D funding, although large variations persist between countries. Notably, basic science
research performed by businesses in the US has more than doubled between 2005 and 2015.
Besides differentiating between applied and basic science research, Mervis (2017) uses data from
the National Science Foundation to show that medical research funding by the US government has
experienced the largest increase. This shift of funding towards the health sector may be expected to have
a negative impact on productivity growth, because technological progress in health and pharmaceutical
research is known to be increasingly costly and suffer from decreasing returns (DiMasi, Grabowski, &
Hansen, 2016). Additionally, health services are consumed directly by households, which has
implications for productivity. A workforce in good health is more productive. In fact, to make this
mechanism more explicit, it is arguable that we should extend national accounts so that public investment
in the health system contributes to the growth of public intangible capital (Corrado et al., 2017b).
However, McNerney, Savoie, Caravelli, and Farmer (2018), using the World Input-Output database,
report Health and Social Work to be one the lowest output multiplier sectors. Research that improves
productivity in intermediate sectors, such as energy or capital goods, would thus be expected to have a
larger aggregate effect, everything else being equal, because they have a higher output multiplier (Baqaee
& Farhi, 2017).
The availability of skills and researchers in the labor force is unlikely to explain the productivity
slowdown. Although the supply of doctorates in science and engineering shows ‘some signs of
slowdown’ (OECD, 2016), except for Japan the number of PhDs awarded continued to grow between
2002 and 2012. According to data from the OECD, the number of full-time researchers in OECD
countries has kept rising, from 3.2 million in 2000 to 4.8 million in 2015.
Policies play an important role in stimulating innovation. Edler, Cunningham, Gök, and Shapira
(2013) examined seven different sets of policy measures to stimulate the generation and dissemination
of innovation by businesses and concluded that there are large differences in the effect of those policies.
For example, policy measures can have different effects on the relative rate of ‘radical’ versus
‘incremental’ innovation. Meanwhile, some strategies like standardization and the introduction of
production norms could have altogether negative effects on innovation despite boosting productivity
growth. Complicating matters further, the OECD (2017b) finds substantial heterogeneity in the levels of
tax incentives for R&D in different countries, and that the most innovative are not those with the highest
tax incentives. While innovation policy matters, to explain the slowdown there would need to be an
important change in policy that occurred prior to the synchronized slowdown. No such dramatic change,
common to all countries affected by the slowdown and with the right timing, appears to have been
identified. Similarly, it is conceivable that different sectors and different technologies react differently
to policy, so that structural change would imply a change in the aggregate effects of policy. Yet,
structural change has taken place rather smoothly in advanced economies.

39
The OECD (2017b) also documents that commercial R&D is a highly concentrated activity, both
across firms and across countries. Across countries, most of the high-impact research papers and patents
are produced in only four or five countries, and within advanced economies the 50 businesses with the
largest R&D expenditures on average account for around half of the total business R&D spending.
Veugelers (2018) points out that inequality in R&D expenditures has not increased in Europe and may
have even slightly decreased before 2012. She notes that churn among the R&D leaders is low, yet
whether this phenomenon is new is unclear.
An increasing share of global R&D is now performed in emerging economies. After the 1999
decision in China to accelerate economic development through innovation, R&D expenditures by firms
located there rose from 0.5% to 1.5% of GDP between 2000 and 2013 (Boeing, Mueller, & Sandner,
2016). According to data from the OECD, China spends almost as much as the US on R&D, in PPP
terms. Little is known about the impact of a changing composition of global R&D on productivity growth
in advanced economies. Micro-level evidence for the US suggests that firms enjoy spillovers from R&D
done by other firms if they are close in the technological space, but suffer from R&D done by firms
operating in similar markets (Bloom, Schankerman, & van Reenen, 2013). Thus, the effect of emerging
economies R&D on advanced economies productivity is unclear a priori.
Because both R&D and rates of adoption of specific technologies are procyclical, it has been
suggested that lower technology adoption resulted from the financial crisis (Anzoategui, Comin, Gertler,
and Martinez (2019) but this has not been demonstrated. Finally, (Phelps, 2013) argued that innovation
started slowing down in the 1960’s, after a period of mass flourishing. He attributes the slowdown in
innovation to a change in values and institutions.
Overall, growth in R&D expenditure has not slowed noticeably on aggregate, although its
composition may have changed. A larger share of R&D expenditure is being taken up by private
businesses, and more is being allocated to the funding of basic science. There is also some evidence of
reallocation in government research efforts to the healthcare sector, which could be one potential source
of a slowdown in aggregate productivity stemming from changes in innovation.
8.2 Research Productivity
While research efforts may not have declined noticeably, innovation rates could still be lower if
research productivity declines. Here we discuss theoretical arguments regarding changes in research
productivity as knowledge accumulates, and then turn to the empirical evidence.
One of the simplest arguments about research productivity is the fishing-out hypothesis: there is
a fixed pond of ideas, and we are fishing the easiest first. In other words, the low-hanging fruit has
already been picked (Cowen, 2011). Gordon (2016), for example, argues that many of the drivers of
productivity of previous industrial revolutions (steam, electricity) were innovations that could only be
made once (such as urbanisation and the hygiene revolution) and have a level effect, not a growth effect
on productivity.
On the other hand, knowledge should become easier to find as knowledge progresses because
new ideas arise out of existing ideas. The more ideas there are, the more ideas can be found (Arthur,
2009; Weitzman, 1998). However, as the space of ideas expands, it may become increasingly hard to
explore. B. F. Jones (2009) suggests that an expanding scientific frontier also creates a ‘burden of
40
knowledge’, as generating original scientific contributions requires more and more knowledge. In
support of this theory, empirical evidence suggests that (i) the age at which scientists and inventors make
their most significant contributions has been increasing, (ii) the share of scientific papers and patents
that is written by a team of several authors is increasing (B. F. Jones, Wuchty, & Uzzi, 2008; Wuchty,
Jones, & Uzzi, 2007), suggesting that researchers cope with the increasing burden of knowledge by being
more specialized and working in teams, and (iii) the likelihood of switching field is decreasing, again
suggesting that the burden of knowledge is creating higher barriers to entry into fields.
It has been argued that ICT, by making knowledge more accessible or by making science more
automatable (see for instance King et al. (2009) could make research more productive. If we push the
argument to the extreme, artificial intelligence could eventually lead to rising research productivity and
an intelligence explosion (Bostrom, 2014). Similarly Mokyr, Vickers, and Ziebarth (2015) argue that the
tools available for science and technology (especially ICT) can help search across information silos,
store vast amounts of data and analyse it at a fraction of the cost compared to a decade ago. These tools
allow further combinations of existing resources and knowledge to be exploited in the future
(Brynjolfsson & McAfee, 2012). Yet, testing a number of macroeconomic implications of this
“accelerationist” view, Nordhaus (2015) finds little evidence for it.
An indicator to determine research productivity is measures of research inputs per patent.
Griliches (1994) is an early example, showing that the number of patents per researcher in the US
economy has been on a more or less continuous decline for several decades. However, the OECD
(2017b) shows that research spending per patent is highly heterogenous across countries. To test this
hypothesis directly, endogenous growth models suggest that we need to determine whether a constant
level of research effort leads to a constant productivity growth (Bloom, Jones, Van Reenen, & Webb,
2017). Under this assumption, if research inputs stay constant, TFP should keep growing at the same
rate. This hypothesis is overwhelmingly rejected, as is evident in the raw numbers: TFP growth in the
US has been at best stable or even declining since 1930, whereas measured research input has increased
by a factor of 23. In other words, while productivity keeps growing at a constant, or even lower rate, the
efforts to achieve this have been increasing. Anzoategui et al. (2019) suggest that a decrease in R&D
productivity started in the early 2000’s. Estimating a standard DSGE model extended to endogenize TFP
growth as depending on innovation and adoption decisions, they find that the pre-crisis TFP slowdown
starting around 2005 could be attributed to lags in the consequences of a decrease in R&D productivity.
The decline at the aggregate level could mask differences in research productivity trends at the
micro level. The pharmaceutical sector is one area where declining research productivity has been
emphasised. Research spending per drug has increased continuously and substantially, so much that it
has been termed ‘Eroom’s law,’ with the letters reversing the seemingly exponential increase in
computing power associated with Moore’s law. Indeed, Bloom et al. (2017) confirm the decline in
research productivity in medical research, and present similar evidence for agricultural yields and even
for Moore’s law itself, which was only upheld by a significant expansion in research effort. Repeating
the exercise at the firm level and measuring research output as increases in sales, they find that research
productivity increased only for a small fraction of firms. A large majority have seen their research
productivity decline, sometimes substantially so.
Looking at new molecular entities specifically, Myers and Pauly (2019) put forward evidence for
the low-hanging fruit hypothesis. Since the demand for medical products in increasing, the industry

41
responds by increasing research effort; however, in a world where good ideas are researched first, the
marginal productivity of R&D is declining so that increasing demand leads to lower average research
productivity.
8.3 Diffusion and lags
One explanation for the productivity paradox, by which productivity growth slows down despite
accelerating innovation, is simply that it takes time for new technologies to diffuse, for companies and
workers to adapt, and for complementary investments to take place.
This argument was put forward by David (1990), addressing Solow’s observation that the
benefits of computers were not yet evident in productivity numbers. David draws a historical parallel
between the diffusion of the computer and the electrical dynamo during the electrification of the US in
the late 19th century. For both the dynamo and the computer, there were significant time lags between
the first key inventions and their impacts on aggregate productivity. The key explanation is the
prevalence of old technologies in the existing capital stock. First, old methods and capital remain more
efficient during the initial phases of the GPT’s development, so firms have no financial incentive to
switch early to the new technology. Thus, investments to improve the GPT, as well as complementary
innovations are needed before the new GPT becomes superior, and firms have little incentive to scrap
existing capital. Such investments require time to make and are lumpy, so that improvement in the GPT
itself can take decades, as was the case for the dynamo, which only superseded steam four decades after
the first major inventions. Major productivity effects for firms occurred only when a complete
reorganization of factories was realized. David (1990) also emphasizes inherent mismeasurement issues
when new technologies are introduced.
The evidence for long lags is also documented in Gordon (2016), who argues that the
revolutionary century after the Civil War was made possible by the unique clustering of great inventions
in the late 19th century, such as the railroad, the steamship and the telegraph. These were followed by
electricity, but also a range of inventions that changed lifestyles and improved the standard of living:
canned food, electric refrigerators, sewing machines, public waterworks, X-rays, antibiotics, and others.
For Gordon, the inventions since 1970 concern a narrow sphere of the economy, having to do with
entertainment, communication, and the collection and processing of information - by contrast to other
goods and services like clothing, shelter, transportation, health and working conditions, whose progress
he argues slowed down after 1970.
While an assessment of the nature of technological change in different periods poses considerable
challenges, many concur with Gordon in viewing productivity growth as successive adjustment of the
levels (“one big wave” (Gordon, 1999) or “the great leap forward” (Gordon, 2016)), with each jump
based on a different GPT. Jovanovic and Rousseau (2005) find that measured aggregate productivity
growth first slows down for extended periods, before it picks up significantly, as a GPT emerges.
However, even during the productivity slowdown, the economy shows signs of restructuring and
innovative activity, as firm dynamism increases, the number of patented inventions grows, initial public
offerings take progressively younger firms to market, and investment into young firms increases relative
to investment by old firms. They also derive and test a number of other empirical predictions for the
previous two GPT waves, which they mostly confirm for both waves: (i) the skill premium rises, since
demand for skilled workers to enable the firms’ transition increases, (ii) TFP growth slows at the
42
beginning of the wave, (iii) entry, exit, and mergers of firms increases, (iv) stock prices fall initially as
old capital depreciates in value, (v) younger and smaller firms do better than larger and older firms in
terms of stock market performance and investment, and (vi) interest rates rise while the trade deficit
worsens because of higher consumption. In considering these factors, they do not find that ICT
technologies diffused faster than electricity, challenging arguments for current innovations having
manifested themselves immediately.
Bresnahan (2010) delivers an updated survey on the literature on GPTs, emphasising diffusion
lags and the need for complementary innovation and investment. Furthermore, slow productivity growth
in itself is not an unusual historical occurrence. Rather, periods of fast TFP growth are the exception.
Without new technologies, TFP growth arguably comes from improved allocative efficiency, which by
itself cannot sustain TFP growth rates indefinitely. Brynjolfsson et al. (2017), reviewing existing
explanations for the current productivity paradox, also conclude that lags in implementation are the most
significant explanation. Similarly, van Ark (2016) supports the idea that the digital economy is still in
its ‘installation phase,’ and productivity effects will occur once the technology enters the ‘deployment
phase.’
Bergeaud et al. (2016) describe the experience of 13 advanced economies over the 20th century
as driven by two waves, a big one in the early to mid-20th century in the US (later in in Europe), driven
by inventions from the Second Industrial Revolution, and a smaller one towards the end of the century
driven by ICTs. This concurs with Gordon and Sayed (2019) in explaining the European post 1970’s
slowdown as the end of a period of convergence with the US.
Improvement in technology can also have effects on the shorter run. Basu, Fernald, and Kimball
(2006) argue that technological improvements are contractionary in the short run due to a drop in
utilization of existing capital and a reduction in investment. Inputs and investment recover with increases
in output over the next few years.
8.4 Creative destruction and faster depreciation
In addition to lags, there are reasons to believe that when a new technology is introduced, older
capital depreciates faster. If this is the case, it provides a plausible explanation for the productivity
paradox: it is precisely because innovation accelerates that productivity growth slows down more
quickly. For instance, based on a few examples such as Amazon replacing brick-and-mortar bookshops,
Komlos (2016) argues that creative destruction has become faster. This suggests that one should use
faster depreciation or scrapping rates, both for tangible and intangible capital for technologies which are
advancing more rapidly.
The review of the literature by Li and Hall (2016) suggests rates of depreciation of R&D capital
ranging from negative rates to 100% a year. Their own methodology produces estimates ranging from
6% to 88%, depending on the sector and dataset. A recent study by de Rassenfosse and Jaffe (2018)
examined the revenue stream associated with Australian patents, obtained through survey, and estimated
a rate of R&D depreciation between 2-7%. Overall, this suggests that there is a large degree of
uncertainty regarding the stock of R&D capital, implying a potential for mismeasuring TFP growth by
a large amount. Goodridge et al. (2016), investigating the productivity puzzle in the UK using ONS data,
computed an alternate series for various types of capital using alternate depreciation rates. Assuming
higher post-2009 depreciation rates (multiplied by 1.5), they found that under reasonable assumptions
43
this premature scrapping might explain up to 15% of the missing 13 p.p of productivity growth in the
UK.
While the argument in Goodridge et al. (2016) for this is motivated by the financial crisis, there
is a more general theoretical argument: during phases of profound technological transformation, society
as a whole has to adapt. During the previous industrial revolution and the 1970s and 80s introduction of
computing, it took a long time for firms and workers to adapt and complementary innovations to develop
(David, 1990). As an example, consider AI and autonomous vehicles: not only may the education system
need to be reformed to train people with the right skills, but other institutions such as contract and the
judiciary systems need to be reformed, for instance to deal with the responsibility of autonomous non-
human entities. Creative destruction makes entire branches of knowledge obsolete and requires new
frameworks, as well as sets of institutions, including government regulations, but this is extremely hard
to capture in the data.
An understanding of the role of creative destruction requires a deeper knowledge of what
underpins the decisions to innovate and adopt new technology. A key element in that respect is
competition. Schumpeter (1942) argued that increasing concentration could drive innovation but Arrow
(1962), for instance, argues for a linear negative relationship. Scherer (1967) proposed an inverted-U
relationship leading Cohen and Levin (1989) to state the empirical results bearing on the Schumpeterian
hypotheses are inconclusive. Goettler and Gordon (2011) study the Intel and AMD duopoly – a case of
ICT durables, not services – using a model that includes firms’ dynamic pricing and investment decisions
while taking into account the dynamic behavior of consumers. They find a negative link between
competition and innovation, partly due to the need for a monopolist of a durable good to maintain
demand and partly because of the higher margins they earn. Product differentiation is directly linked to
innovation and competition: with near perfect substitute products firms need to innovate to survive, but
when differentiation declines innovation drops and then picks up again (U-shaped curve) in response to
firms’ local market power. Goettler and Gordon (2014) expand their approach for a dynamic oligopoly
market with endogenous innovation rate and market structure. In line with the ICT durables’ findings
they argue that low differentiation increases innovation but as quality increases the market enters a
winner-take-all environment, leaving lagging firms to fight over decreasing residual profits. We consider
this approach as a significant differentiation from research that fixes market structure or allows it to vary
exogenously with innovation and this is a key reason why these endogenous changes of market structure
give contradicting results compared to other work.
More broadly the interplay between competition and productivity appears to be treated differently
in economics: the Industrial Organization literature often looks into market power questions with strong
assumptions about marginal costs while the trade literature has interpreted observed productivity growth
as indicative of greater efficiency, although this is only valid under perfect or monopolistic competition
(De Loecker & Van Biesebroeck, 2016). Despite their differences, both the trade and IO literature neglect
key aspects of the interplay of competition and productivity, including the potential contribution of
imported intermediate inputs and in geographical proximity to suppliers and markets. It also blurs the
differences between global and local competition.
8.5 Summary
Ultimately, long run aggregate labor productivity growth comes from innovation. Aggregate

44
investment in R&D activities does not appear to have slowed significantly, but to some extent has shifted
from public to corporate funding, where it is highly concentrated, as well as towards health and
pharmaceuticals, which may not have spillovers as high as ICTs did. Nevertheless, a new wave of
technological development is taking place, especially in digital technologies, that have the potential to
be considered GPTs. The rewards from investment should not be expected to be reaped immediately.
Historically, complementary investments are necessary, there are significant lags in diffusion, and
replacing the existing capital stock can lead to the stranding of assets. Finally, while there are opposite
theoretical arguments regarding the evolution of research productivity as knowledge increases, it appears
that maintaining a steady rate of productivity growth has required an increasing number of researchers.
The timing of the slowdown in productivity cannot be associated with any synchronised
significant change in research funding or diffusion across the range of countries which experienced the
slowdown. Besides, we do not see why recent technologies are, as has been suggested, comparatively
inferior to the ones that emerged during the 19th and the early 20th century. The ICT deal primarily with
digitized information, its transmission and analysis, which appears to be at least be as important, if not
more, to the development of every economic sector as were many previous GPTs. This view is more
optimistic than the Gordon hypothesis that dismisses the significance of current technological progress.
It nevertheless is difficult to agree with the techno-optimists, as the effects from new technologies
remains to be proven. Even if we are currently experiencing a highly significant technological transition
taking place with lags, these lags may not necessarily be the result of a normal adaption process. Weaker
competition due to excessive market power, for example, may have potentially limited the gains from
ICT over the past decades. Clearly, technological development and diffusion are central to productivity
growth, but to date we see insufficient evidence that changes in this account for the scale, sequencing or
scope of the decline in productivity in the early 2000s.
9. Conclusion The possible reasons for an observed generalised slowdown in productivity across a wide range
of countries over a relatively short period of time are wide and varied. It is a mistake to identify any one
single factor as the dominant or primary reason which explains the slowdown everywhere. Our review
nevertheless identified a small set of forces and mechanisms that taken together are likely to explain
most of the slowdown. In the process, as they do not meet our criteria of scale, scope and sequencing,
we also have eliminated many candidate explanations for the slowdown in productivity growth as being
largely inconsequential.
There are clear measurement issues in times of intense technological change, creating substantial
uncertainty. First, the rising dependence on intangible capital can affect national accounts through direct
measurement implications on the inputs and outputs, but also indirectly, as intangibles are much easier
to relocate to tax havens and more likely to escape national accounts. Second, even if increasing
mismeasurement of ICT-related goods and services is unlikely to explain all the slowdown, it may have
contributed a non-negligible fraction of the difference. Overall, the literature shows that accounting for
these factors can significantly change measured productivity growth.
In terms of the role of labor markets during the slowdown period, we looked into the changes in
population structure due to ageing, in the composition of the demand for skills, in policies with respect
45
to immigration, and in new institutional arrangements in labor markets. We found that they may all have
had some relationship to aggregate productivity growth, although none of these are individually
substantial enough to account for the productivity slowdown. We noted that while labor productivity
decomposition exercises tend to exclude labor quantity or quality as the main factor behind the
slowdown, the potential effects reported in the literature are likely to be reflected in a decreased TFP.
Investment, whether into tangible or intangible capital, does form a significant part of the
explanation both because of cyclical and structural reasons. The recent recession depressed aggregate
demand, and increased financial constraints, both for firms and governments. The cyclical explanation
is only partial though, as the decline in investment rates started much earlier (early 2000s in the US).
This suggests a role for structural explanations, including a rising share of intangible capital, the increase
in concentration and a rise in short-termism.
Further disaggregation highlights new angles of the slowdown. First, there is a consensus that
most sectors are affected, and the sectoral shares have not changed enough to support the Baumol
hypothesis that the increasing size of low-productivity sectors is responsible for the slowdown. At the
firm level, we observe a divergence between firms at the frontier and the rest, coupled by increasing
concentration and market power across industries. The factors that drive productivity growth for the
industry leaders are not diffusing as quickly as they did in the past. One interpretation is that superstar
firms are increasingly able to erect barriers to entry, perhaps because intangible capital is easier to
appropriate and the regulations to prevent this are not yet in place and even if they are, these are not
enforced.
The slowdown in trade may have also damaged the rate at which domestic productivity accrues
benefits from foreign competition and export markets through its varied channels. Many of the gains
from trade are static, so it is possible that the slow productivity of the current period reflects the end of
a one-off effect. Greater trade-openness may have led to the development, now more or less achieved,
of highly productive global value chains. This would explain why the slowdown is global, although there
is insufficient evidence to fully assess this effect quantitatively.
The slowdown in TFP is large, and having dismissed many of the explanations above suggests
that technological change is a strong candidate cause for the slowdown. We have shown however that
both the techno-optimists and techno-pessimists are likely to be missing the key drivers of the slowdown.
The evidence is that investments in technology have not drastically diminished, although productivity
gains from these investments are becoming lower, in the sense that more researchers are needed to
achieve a constant rate of productivity growth. We are not convinced by the techno-pessimist view that
ICTs are in principle comparatively inferior to previous GPTs, and believe that it is entirely possible that
a vastly improved capability to transmit and analyse digitized information and the progress in artificial
intelligence could be as significant as the capabilities arising from previous GPTs. We, however, also
are not convinced by the techno-optimists, as the hypothesis of lags remains an act of faith that can only
be tested in the future. Meanwhile, the current slowdown is more dramatic than previous periods where
adjustments costs and lags have had a smaller impact on productivity, so even if the techno-optimists are
proved right in anticipating big increases in productivity, they do not explain the scale, sequencing and
scope of the current slowdown.
Our final remarks relate to factors that could be considered in this discussion and which we have
not highlighted. First, advanced economies are the focus of the paper, and the extension of our analysis
46
to other economies is an important area for research. While some of the mechanisms presented above
are relevant for developing and emerging economies, they are likely to be characterized by different
dynamics. Second, while there is some research on specific market regulations, the broader role of
institutions is not fully addressed in the literature. Our paper suggests that improvements in aggregate
productivity do not only require investment in plant, equipment and infrastructure, or the hardware of
economies, but also in health, education, R&D and regulatory reforms, or the software, with these
intangibles having become more significant. Last, the explanations considered in this paper are often
overlapping and can jointly help explain the observed slowdown, but there is no complete, coherent
theoretical framework that can be applied empirically to fully capture these complexities. This would be
another valuable area for future research.
Bibliography Abdirahman, M., Coyle, D., Heys, R., & Stewart, W. (2017). A Comparison of Approaches to
Deflating Telecoms Services Output. ESCoE Discussion Paper, 2017-04. Acemoglu, D., & Autor, D. (2011). Chapter 12 - Skills, Tasks and Technologies: Implications for
Employment and Earnings. In D. Card & O. Ashenfelter (Eds.), Handbook of Labor Economics (Vol. 4, pp. 1043-1171): Elsevier.
Acemoglu, D., & Restrepo, P. (2017). Secular Stagnation? The Effect of Aging on Economic Growth in the Age of Automation. American Economic Review P&P, 107(5), 174-179.
Aghion, P., Bergeaud, A., Boppart, T., Klenow, P. J., & Li, H. (2019). Missing Growth from Creative Destruction. American Economic Review, 109(8), 2795-2822.
Aguiar, M., Bils, M., Charles, K. K., & Hurst, E. (2017). Leisure Luxuries and the Labor Supply of Young Men. National Bureau of Economic Research Working Paper Series, No. 23552.
Ahmad, N., Ribarsky, J., & Reinsdorf, M. (2017). Can potential mismeasurement of the digital economy explain the post-crisis slowdown in GDP and productivity growth? Retrieved from https://www.oecd-ilibrary.org/content/paper/a8e751b7-en
Ahmad, N., & Schreyer, P. (2016). Are GDP and Productivity Up to the Challenges of the Digital Economy? International Productivity Monitor, 30, 4-27.
Aizcorbe, A. M., & Highfill, T. (2020). Price Indexes for US Medical Care Spending, 1980–2006. Review of Income and Wealth, 66(1), 205-226.
Alexander, L., & Eberly, J. (2018). Investment hollowing out. IMF Economic Review, 66(1), 5-30. Amiti, M., & Wei, S. J. (2009). Service Offshoring and Productivity: Evidence from the US. The
World Economy, 32(2), 203-220. Andrews, D., Criscuolo, C., & Gal, P. N. (2016). The Best versus the Rest. OECD Productivity
Working Papers, 5. Andrews, D., McGowan, M. A., & Millot, V. (2017). Confronting the zombies: Policies for
productivity revival. OECD Economic Policy Papers, 21. Antràs, P., & Helpman, E. (2004). Global Sourcing. Journal of Political Economy, 112(3), 552-580. Anzoategui, D., Comin, D., Gertler, M., & Martinez, J. (2019). Endogenous Technology Adoption and
R&D as Sources of Business Cycle Persistence. American Economic Journal:
Macroeconomics, 11(3), 67-110. Ardanaz-Badia, A., Awano, G., & Wales, P. (2017). Understanding firms in the bottom 10% of the
labour productivity distribution in Great Britain: “the laggards”, 2003 to 2015. Retrieved from London:
Arrow, K. (1962). Economic Welfare and the Allocation of Resources for Invention. In The Rate and Direction of Inventive Activity: Economic and Social Factors (pp. 609-626): Princeton University Press.

47
Arrowsmith, M., Griffiths, M., Franklin, J., Wohlmann, E., Young, G., & Gregory, D. (2013). SME forbearance and its implications for monetary and financial stability. Bank of England Quarterly Bulletin, 53(4), 296-303.
Arthur, W. B. (2009). The nature of technology : what it is and how it evolves. London: Allen Lane. Askenazy, P., Bellmann, L., Bryson, A., & Moreno Galbis, E. (2016). Productivity Puzzles Across
Europe: Oxford University Press. Autor, D. H., Dorn, D., & Hanson, G. H. (2013). The China Syndrome: Local Labor Market Effects of
Import Competition in the United States. American Economic Review, 103(6), 2121-2168. Autor, D. H., Dorn, D., Hanson, G. H., Pisano, G., & Shu, P. (2016). Foreign Competition and
Domestic Innovation: Evidence from U.S. Patents. National Bureau of Economic Research
Working Paper Series, No. 22879. Autor, D. H., Dorn, D., Katz, L. F., Patterson, C., & Van Reenen, J. (2017). The Fall of the Labor
Share and the Rise of Superstar Firms. National Bureau of Economic Research Working Paper Series, No. 23396.
Ayyagari, M., Demirguc-Kunt, A., & Maksimovic, V. (2018). Who are America's star firms? : The World Bank.
Baily, M. N. (1981). Productivity and the Services of Capital and Labor. Brookings Papers on Economic Activity, 1.
Baily, M. N., & Gordon, R. J. (1989). The Productivity Slowdown, Measurement Issues, and the Explosion of Computer Power. National Bureau of Economic Research Reprint Series, No.
1199. Baily, M. N., & Gordon, R. J. (2016). Comments and Discussion. Brookings Papers on Economic
Activity, 158-182. Baily, M. N., & Montalbano, N. (2016). Why is US productivity growth so slow? Possible
explanations and policy responses. Hutchins Center Working Papers. Baldwin, R. (2009). The Great Trade Collapse: Causes, Consequences and Prospects: CEPR Press. Baldwin, R. (2016). The Great Convergence: Harvard University Press. Baqaee, D. R., & Farhi, E. (2017). The Macroeconomic Impact of Microeconomic Shocks: Beyond
Hulten's Theorem. National Bureau of Economic Research Working Paper Series, No. 23145. Baqaee, D. R., & Farhi, E. (2019). Productivity and Misallocation in General Equilibrium. The
Quarterly Journal of Economics, 135(1), 105-163. Barnett, A., Batten, S., Chiu, A., Franklin, J., & Sebastia-Barriel, M. (2014). The UK productivity
puzzle. Bank of England Quarterly Bulletin, 54(2), 114-128. Basu, S., Fernald, J. G., & Kimball, M. S. (2006). Are Technology Improvements Contractionary?
American Economic Review P&P, 96(5), 1418-1448. Baumol, W. J. (1967). Macroeconomics of Unbalanced Growth: The Anatomy of Urban Crisis. The
American Economic Review, 57(3), 415-426. Baumol, W. J., & Bowen, W. G. (1966). Performing Arts: The Economic Dilemma - A Study of
Problems Common to Theater, Opera, Music and Dance. New York. Beerli, A., & Peri, G. (2017). The Labor Market Effects of Opening the Border: Evidence from
Switzerland. KOF Working Papers, 431. Bergeaud, A., Cette, G., & Lecat, R. (2016). Productivity Trends in Advanced Countries between 1890
and 2012. Review of Income and Wealth, 62(3), 420-444. Bernard, A. B., & Jensen, J. B. (1999). Exceptional exporter performance: cause, effect, or both?
Journal of International Economics, 47(1), 1-25. Besley, T. J., Roland, I. A., & Van Reenen, J. (2020). The Aggregate Consequences of Default Risk:
Evidence from Firm-level Data. National Bureau of Economic Research Working Paper Series, No. 26686.

48
Billet, I., & Schneider, P. (2017). Bitesize: Exploring UK sectoral productivity. In Bank Underground (Vol. 2018). https://bankunderground.co.uk/2017/01/19/bitesize-exploring-uk-sectoral-productivity/.
Bils, M. (2009). Do Higher Prices for New Goods Reflect Quality Growth or Inflation?*. The Quarterly Journal of Economics, 124(2), 637-675.
Bils, M., & Klenow, P. J. (2001). The Acceleration of Variety Growth. American Economic Review, 91(2), 274-280.
Bloom, N., Draca, M., & Van Reenen, J. (2016). Trade Induced Technical Change? The Impact of Chinese Imports on Innovation, IT and Productivity. The Review of Economic Studies, 83(1), 87-117.
Bloom, N., Jones, C. I., Van Reenen, J., & Webb, M. (2017). Are Ideas Getting Harder to Find? National Bureau of Economic Research Working Paper Series, No. 23782.
Bloom, N., Schankerman, M., & van Reenen, J. (2013). Identifying Technology Spillovers and Product Market Rivalry. Econometrica, 81(4), 1347-1393.
Boeing, P., Mueller, E., & Sandner, P. (2016). China's R&D explosion—Analyzing productivity effects across ownership types and over time. Research Policy, 45(1), 159-176.
Borjas, G. J., & Doran, K. B. (2012). The Collapse of the Soviet Union and the Productivity of American Mathematicians. The Quarterly Journal of Economics, 127(3), 1143-1203.
Borjas, G. J., & Monras, J. (2017). The labour market consequences of refugee supply shocks. Economic Policy, 32(91), 361-413.
Börsch-Supan, A. (2013). Myths, scientific evidence and economic policy in an aging world. The Journal of the Economics of Ageing, 1-2, 3-15.
Boskin, M. J., Dulberger, E., Gordon, R. J., Griliches, Z., & Jorgenson, D. W. (1996). Toward a More Accurate Measure of the Cost of Living. Final Report to the Senate Finance Committee.
Bosler, C., Daly, M. C., Fernald, J. G., & Hobijn, B. (2016). The Outlook for U.S. Labor-Quality Growth. National Bureau of Economic Research Working Paper Series, No. 22555.
Bostrom, N. (2014). Superintelligence: Paths, Danger, Strategies: Oxford University Press. Boubtane, E., Dumont, J.-C., & Rault, C. (2016). Immigration and economic growth in the OECD
countries 1986–2006. Oxford Economic Papers, 68(2), 340-360. Brandt, N., Schreyer, P., & Zipperer, V. (2017). Productivity Measurement with Natural Capital.
Review of Income and Wealth, 63(s1), S7-S21. Bresnahan, T. F. (2010). Chapter 18 - General Purpose Technologies. In B. H. Hall & N. Rosenberg
(Eds.), Handbook of the Economics of Innovation (Vol. 2, pp. 761-791): North-Holland. Bridgman, B. (2018). Is Productivity on Vacation? The Impact of the Digital Economy on the Value of
Leisure. BEA Working Papers, 0148. Broda, C., & Weinstein, D. E. (2010). Product Creation and Destruction: Evidence and Price
Implications. American Economic Review, 100(3), 691-723. Bruner, J., Rassier, D. G., & Ruhl, K. J. (2018). Multinational Profit Shifting and Measures throughout
Economic Accounts. National Bureau of Economic Research Working Paper Series, No. 24915.
Bruno, M. (1982). World Shocks, Macroeconomic Response, and the Productivity Puzzle (Rev). National Bureau of Economic Research Working Paper Series, No. 942.
Brynjolfsson, E. (1993). The productivity paradox of information technology. Commun. ACM, 36(12), 66-77.
Brynjolfsson, E., Collis, A., & Eggers, F. (2019). Using massive online choice experiments to measure changes in well-being. Proceedings of the National Academy of Sciences, 116(15), 7250-7255.
Brynjolfsson, E., & Hitt, L. (1996). Paradox Lost? Firm-Level Evidence on the Returns to Information Systems Spending. Management Science, 42(4), 541-558.
Brynjolfsson, E., & Hitt, L. M. (2000). Beyond Computation: Information Technology, Organizational Transformation and Business Performance. Journal of Economic Perspectives, 14(4), 23-48.

49
Brynjolfsson, E., & McAfee, A. (2012). Race Against the Machine: How the Digital Revolution is
Accelerating Innovation, Driving Productivity, and Irreversibly Transforming Employment and the Economy: Digital Frontier Press.
Brynjolfsson, E., & McAfee, A. (2014). The Second Machine Age: Work, Progress, and Prosperity in a Time of Brillliant Technologies WW Norton & Company.
Brynjolfsson, E., & Oh, J. H. (2012). The attention economy: Measuring the value of free digital services on the internet (Vol. 4).
Brynjolfsson, E., Rock, D., & Syverson, C. (2017). Artificial Intelligence and the Modern Productivity Paradox: A Clash of Expectations and Statistics. National Bureau of Economic Research Working Paper Series, No. 24001.
Bussière, M., Callegari, G., Ghironi, F., Sestieri, G., & Yamano, N. (2013). Estimating Trade Elasticities: Demand Composition and the Trade Collapse of 2008-2009. American Economic
Journal: Macroeconomics, 5(3), 118-151. Byrne, D. M., & Corrado, C. A. (2017). ICT Prices and ICT Services: What Do They Tell Us About
Productivity and Technology. International Productivity Monitor, 33, 150-181. Byrne, D. M., Fernald, J. G., & Reinsdorf, M. B. (2016). Does the United States Have a Productivity
Slowdown or a Measurement Problem? Brookings Papers on Economic Activity, 109-157. Byrne, D. M., Oliner, S. D., & Sichel, D. E. (2017). How Fast are Semiconductor Prices Falling?
Review of Income and Wealth, 64, 679-702. Caballero, R. J., Farhi, E., & Gourinchas, P.-O. (2017). Rents, Technical Change, and Risk Premia
Accounting for Secular Trends in Interest Rates, Returns on Capital, Earning Yields, and Factor Shares. American Economic Review P&P, 107(5), 614-620.
Caballero, R. J., Hoshi, T., & Kashyap, A. K. (2008). Zombie Lending and Depressed Restructuring in Japan. American Economic Review P&P, 98(5), 1943-1977.
Canals, C., & Şener, F. (2014). Offshoring and intellectual property rights reform. Journal of Development Economics, 108, 17-31.
Cantner, U., Graf, H., & Prytkova, E. (2018). The Composition Nature of Productivity and Innovation Slowdown. Jena Economic Research Papers, 2018-006.
Card, D. (1990). The Impact of the Mariel Boatlift on the Miami Labor Market. Industrial and Labor Relations Review, 43(2), 245-257.
Case, A., & Deaton, A. (2015). Rising morbidity and mortality in midlife among white non-Hispanic Americans in the 21st century. Proceedings of the National Academy of Sciences, 112(49), 15078.
Cette, G., Fernald, J. G., & Mojon, B. (2016). The pre-Great Recession slowdown in productivity. European Economic Review, 88, 3-20.
Cobham, A., & Janský, P. (2018). Global distribution of revenue loss from corporate tax avoidance: re-estimation and country results. Journal of International Development, 30(2), 206-232.
Cohen, W. M., & Levin, R. C. (1989). Empirical studies of innovation and market structure. In R. Schmalensee & R. Willig (Eds.), Handbook of Industrial Organization (Vol. 2, pp. 1059-1107): Elsevier.
Constantinescu, C., Mattoo, A., & Ruta, M. (2016). Does the global trade slowdown matter? Journal of Policy Modeling, 38(4), 711-722.
Constantinescu, C., Mattoo, A., & Ruta, M. (2019). Does vertical specialisation increase productivity? The World Economy, 0(0), 1-18.
Corrado, C. A., Haskel, J. E., & Jona-Lasinio, C. (2017a). Knowledge Spillovers, ICT and Productivity Growth. Oxford Bulletin of Economics and Statistics, 79(4), 592-618.
Corrado, C. A., Haskel, J. E., & Jona-Lasinio, C. (2017b). Public Intangibles: The Public Sector and Economic Growth in the SNA. Review of Income and Wealth, 63(s2), S355-S380.
Corrado, C. A., & Hulten, C. R. (2010). How Do You Measure a "Technological Revolution"? American Economic Review, 100(2), 99-104.
50
Corrado, C. A., & Hulten, C. R. (2014). Innovation Accounting. In Measuring Economic Sustainability
and Progress (pp. 595-628): National Bureau of Economic Research, Inc. Corrado, C. A., Hulten, C. R., & Sichel, D. E. (2009). Intangible Capital and U.S. Economic Growth.
Review of Income and Wealth, 55(3), 661-685. Corrado, C. A., O'Mahony, M., & Samek, L. (2018). Measuring education services as intangible social
infrastructure. Paper presented at the 35th IARIW General Conference, Copenhagen, Denmark. Cowen, T. (2011). The Great Stagnation: How America Ate All The Low-Hanging Fruit of Modern
History, Got Sick, and Will (Eventually) Feel Better: Dutton. Coyle, D. (2017). Precarious and productive work in the digital economy. National Institute Economic
Review(240), R5-R14. Cramer, J., & Krueger, A. B. (2016). Disruptive Change in the Taxi Business: The Case of Uber.
American Economic Review P&P, 106(5), 177-182. Criscuolo, C., & Timmis, J. (2017). The Relationship Between Global Value Chains and Productivity.
International Productivity Monitor, 32, 61-83. Cusolito, A. P., & Maloney, W. F. (2018). Productivity Revisited: Shifting Paradigms in Analysis and
Policy. Retrieved from Washington, D.C.: David, P. A. (1990). The Dynamo and the Computer: An Historical Perspective on the Modern
Productivity Paradox. The American Economic Review, 80(2), 355-361. De Loecker, J., & Eeckhout, J. (2017). The Rise of Market Power and the Macroeconomic
Implications. National Bureau of Economic Research Working Paper Series, No. 23687. De Loecker, J., Eeckhout, J., & Unger, G. (2020). The Rise of Market Power and the Macroeconomic
Implications. The Quarterly Journal of Economics. De Loecker, J., & Van Biesebroeck, J. (2016). Effect of International Competition on Firm
Productivity and Market Power. National Bureau of Economic Research Working Paper Series,
No. 21994. de Rassenfosse, G., & Jaffe, A. B. (2018). Econometric evidence on the depreciation of innovations.
European Economic Review, 101, 625-642. Decker, R. A., Haltiwanger, J., Jarmin, R. S., & Miranda, J. (2014). The Role of Entrepreneurship in
US Job Creation and Economic Dynamism. Journal of Economic Perspectives, 28(3), 3-24. Decker, R. A., Haltiwanger, J., Jarmin, R. S., & Miranda, J. (2017). Declining Dynamism, Allocative
Efficiency, and the Productivity Slowdown. American Economic Review P&P, 107(5), 322-326.
Decker, R. A., Haltiwanger, J. C., Jarmin, R. S., & Miranda, J. (2018). Changing Business Dynamism and Productivity: Shocks vs. Responsiveness. National Bureau of Economic Research Working
Paper Series, No. 24236. Delgado, M. A., Fariñas, J. C., & Ruano, S. (2002). Firm productivity and export markets: a non-
parametric approach. Journal of International Economics, 57(2), 397-422. DiMasi, J. A., Grabowski, H. G., & Hansen, R. W. (2016). Innovation in the pharmaceutical industry:
New estimates of R&D costs. Journal of Health Economics, 47, 20-33. Duernecker, G., Herrendorf, B., & Valentinyi, A. (2017). Structural Change within the Service Sector
and the Future of Baumol's Disease. CEPR Discussions Paper, DP12467. Dunn, A., Grosse, S. D., & Zuvekas, S. H. (2018). Adjusting Health Expenditures for Inflation: A
Review of Measures for Health Services Research in the United States. Health Services Research, 53(1), 175-196.
Dunn, A., Rittmueller, L., & Whitmire, B. (2015). Introducing the New BEA Health Care Satellite Account. Survey of Current Business, 95(1).
Duval, R., Hong, G. H., & Timmer, Y. (2017). Financial Frictions and the Great Productivity Slowdown. IMF Working Paper, WP/17/129.
Edler, J., Cunningham, P., Gök, A., & Shapira, P. (2013). Impacts of Innovation Policy: Synthesis and Conclusions.
51
Eggertsson, G. B., Mehrotra, N. R., & Summers, L. H. (2016). Secular Stagnation in the Open Economy. American Economic Review P&P, 106(5), 503-507. doi:doi: 10.1257/aer.p20161106
Eichengreen, B. (2015). Secular Stagnation: The Long View. American Economic Review P&P,
105(5), 66-70. Enste, D. H. (2018). The shadow economy in industrial countries. Retrieved from Erber, G., Fritsche, U., & Harms, P. C. (2017). The Global Productivity Slowdown: Diagnosis, Causes
and Remedies. Intereconomics, 52(1), 45-50. Fallick, B., Fleischman, C. A., & Rebitzer, J. B. (2006). Job-Hopping in Silicon Valley: Some
Evidence concerning the Microfoundations of a High-Technology Cluster. The Review of Economics and Statistics, 88(3), 472-481.
Feenstra, R. C. (1994). New Product Varieties and the Measurement of International Prices. American Economic Review, 84(1), 157-177.
Feenstra, R. C., & Hanson, G. H. (1996). Globalization, Outsourcing, and Wage Inequality. The American Economic Review, 86(2), 240-245.
Feenstra, R. C., & Hanson, G. H. (1999). The Impact of Outsourcing and High-Technology Capital on Wages: Estimates for the United States, 1979-1990. The Quarterly Journal of Economics,
114(3), 907-940. Feenstra, R. C., Ma, H., & Xu, Y. (2017). US Exports and Employment. National Bureau of Economic
Research Working Paper Series, No. 24056. Fernald, J. G., Hall, R. E., Stock, J. H., & Watson, M. W. (2017). The Disappointing Recovery of
Output after 2009. Brookings Papers on Economic Activity, 2017(1), 1-81. Fernald, J. G., & Jones, C. I. (2014). The Future of US Economic Growth. American Economic Review
P&P, 104(5), 44-49. Foster, L., Grim, C., Haltiwanger, J., & Wolf, Z. (2019). Innovation, Productivity Dispersion, and
Productivity Growth. In C. Corrado, J. Haskel, J. Miranda, & D. Sichel (Eds.), Measuring and Accounting for Innovation in the 21st Century: University of Chicago Press.
Freund, C., & Weinhold, D. (2002). The Internet and International Trade in Services. American Economic Review, 92(2), 236-240.
Fukao, K., Miyagawa, T., Mukai, K., Shinoda, Y., & Tonogi, K. (2009). Intangible investment in Japan: Measurement and contribution to economic growth. Review of Income and Wealth,
55(3), 717-736. Goettler, R. L., & Gordon, B. R. (2011). Does AMD Spur Intel to Innovate More? Journal of Political
Economy, 119(6), 1141-1200. Goettler, R. L., & Gordon, B. R. (2014). Competition and product innovation in dynamic oligopoly.
Quantitative Marketing and Economics, 12(1), 1-24. Goldfarb, A., & Tucker, C. (2019). Digital Economics. Journal of Economic Literature, 57(1), 3-43. Goldin, C., & Katz, L. F. (2008). The Race Between Education and Technology: Belknap Press. Goldin, I., Cameron, G., & Balarajan, M. (2011). Exceptional People
How Migration Shaped Our World and Will Define Our Future (STU - Student edition ed.): Princeton University Press.
Goldin, I., Pitt, A., Nabarro, B., & Boyle, K. (2018). Migration and the economy: Economic realities, social impacts and political choices. Citi GPS: Global Perspectives & Solutions.
Goodridge, P., Haskel, J. E., & Wallis, G. (2016). Accounting for the UK Productivity Puzzle: A Decomposition and Predictions. Economica.
Goos, M., Manning, A., & Salomons, A. (2014). Explaining Job Polarization: Routine-Biased Technological Change and Offshoring. American Economic Review, 104(8), 2509-2526.
Gopinath, G., Kalemli-Özcan, Ş., Karabarbounis, L., & Villegas-Sanchez, C. (2017). Capital Allocation and Productivity in South Europe. The Quarterly Journal of Economics, 132(4), 1915-1967.
Gordon, R. J. (1990). The Measurement of Durable Goods Prices: University of Chicago Press.

52
Gordon, R. J. (1999). U.S. Economic Growth since 1870: One Big Wave? The American Economic
Review, 89(2), 123-128. Gordon, R. J. (2016). The Rise and Fall of American Growth: The U.S. Standard of Living since the
Civil War: Princeton University Press. Gordon, R. J., & Sayed, H. (2019). The Industry Anatomy of the Transatlantic Productivity Growth
Slowdown. National Bureau of Economic Research Working Paper Series, No. 25703. Griffith, R., Redding, S., & Van Reenen, J. (2004). Mapping the Two Faces of R&D: Productivity
Growth in a Panel of OECD Industries. The Review of Economics and Statistics, 86(4), 883-895.
Griliches, Z. (1992). Output Measurement in the Service Sectors: University of Chicago Press. Griliches, Z. (1994). Productivity, R&D, and the Data Constraint. The American Economic Review,
84(1), 1-23. Gutiérrez, G., & Philippon, T. (2017). Declining Competition and Investment in the U.S. National
Bureau of Economic Research Working Paper Series, No. 23583. Guvenen, F., Mataloni, R. J., Jr., Rassier, D. G., & Ruhl, K. J. (2017). Offshore Profit Shifting and
Domestic Productivity Measurement. National Bureau of Economic Research Working Paper
Series, No. 23324. Haldane, A. (2017). Productivity puzzles. Speech given by Andy Haldane, Chief Economist, Bank of
England at the London School of Economics. Hall, R. E. (2017). The Anatomy of Stagnation in a Modern Economy. Economica, 84(333), 1-15. Haltiwanger, J., Kulick, R., & Syverson, C. (2018). Misallocation Measures: The Distortion That Ate
the Residual. National Bureau of Economic Research Working Paper Series, No. 24199. Haltiwanger, J., Scarpetta, S., & Schweiger, H. (2014). Cross country differences in job reallocation:
The role of industry, firm size and regulations. Labour Economics, 26, 11-25. Haskel, J. E., & Westlake, S. (2017). Capitalism without Capital: The Rise of the Intangible Economy:
Princeton University Press. Heckman, J. J., Lochner, L. J., & Todd, P. E. (2006). Chapter 7 Earnings Functions, Rates of Return
and Treatment Effects: The Mincer Equation and Beyond. In E. Hanushek & F. Welch (Eds.), Handbook of the Economics of Education (Vol. 1, pp. 307-458): Elsevier.
Helpman, E., Melitz, M. J., & Yeaple, S. R. (2004). Export Versus FDI with Heterogeneous Firms. American Economic Review, 94(1), 300-316.
Hoekman, B. (2015). The Global Trade Slowdown: A New Normal? : CEPR Press. Hsieh, C.-T., & Klenow, P. J. (2009). Misallocation and Manufacturing TFP in China and India. The
Quarterly Journal of Economics, 124(4), 1403-1448. Hsieh, C.-T., & Klenow, P. J. (2018). The Reallocation Myth. Center for Economic Studies Working
Paper, 18-19. Hulten, C. R. (2010). Chapter 23 - Growth Accounting. In B. H. Hall & N. Rosenberg (Eds.),
Handbook of the Economics of Innovation (Vol. 2, pp. 987-1031): North-Holland. Hulten, C. R., & Nakamura, L. (2017). Accounting for Growth in the Age of the Internet: The
Importance of Output-Saving Technical Change. National Bureau of Economic Research
Working Paper Series, No. 23315. Hyatt, H. R., & Spletzer, J. R. (2013). The recent decline in employment dynamics. IZA Journal of
Labor Economics, 2(1). Jäger, K. (2017). EU KLEMS Growth and Productivity Accounts 2017 release - Description of
Methodology and General Notes. Retrieved from Javorcik, B. S. (2004). Does Foreign Direct Investment Increase the Productivity of Domestic Firms?
In Search of Spillovers Through Backward Linkages. American Economic Review, 94(3), 605-627.
Jones, B. F. (2009). The Burden of Knowledge and the "Death of the Renaissance Man": Is Innovation Getting Harder? The Review of Economic Studies, 76(1), 283-317.
53
Jones, B. F., Wuchty, S., & Uzzi, B. (2008). Multi-University Research Teams: Shifting Impact, Geography, and Stratification in Science. Science, 322(5905), 1259.
Jones, C. I. (2002). Sources of U.S. Economic Growth in a World of Ideas. American Economic
Review, 92(1), 220-239. Jorgenson, D. W., & Griliches, Z. (1967). The Explanation of Productivity Change. The Review of
Economic Studies, 34(3), 249-283. Jorgenson, D. W., Ho, M. S., & Samuels, J. D. (2016). Education, Participation, and the Revival of
U.S. Economic Growth. National Bureau of Economic Research Working Paper Series, No. 22453.
Jovanovic, B., & Rousseau, P. L. (2005). Chapter 18 - General Purpose Technologies. In P. Aghion & S. N. Durlauf (Eds.), Handbook of Economic Growth (Vol. 1, pp. 1181-1224): Elsevier.
Khawand, P. (2010). The New New Inbox: How Email and Social Media Changed Our Lives--The
Complete Surey Report. Retrieved from King, R. D., Rowland, J., Oliver, S. G., Young, M., Aubrey, W., Byrne, E., . . . Clare, A. (2009). The
Automation of Science. Science, 324(5923), 85. Komlos, J. (2016). Has Creative Destruction become more Destructive? In The B.E. Journal of
Economic Analysis & Policy (Vol. 16). Krueger, A. B., & Ashenfelter, O. (2018). Theory and Evidence on Employer Collusion in the
Franchise Sector. National Bureau of Economic Research Working Paper Series, No. 24831. Kuhn, P., & Mansour, H. (2014). Is Internet Job Search Still Ineffective? The Economic Journal,
124(581), 1213-1233. Lazonick, W. (2014). Profits Without Prosperity. Harvard Business Review. Lee, R. (2016). Chapter 2 - Macroeconomics, Aging, and Growth. In J. Piggott & A. Woodland (Eds.),
Handbook of the Economics of Population Aging (Vol. 1, pp. 59-118): North-Holland. Li, W. C. Y., & Hall, B. H. (2016). Depreciation of Business R&D Capital. National Bureau of
Economic Research Working Paper Series, No. 22473. Liang, J., Wang, H., & Lazear, E. P. (2014). Demographics and Entrepreneurship. National Bureau of
Economic Research Working Paper Series, No. 20506. Liu, Y., & Westelius, N. (2016). The Impact of Demographics on Productivity and Inflation in Japan.
IMF Working Paper, WP/16/237. Lowe, R. (1999). The use of the regression approach to quality change for durables in Canada. Paper
presented at the Fifth Meeting of the International Working Group on Price Indices, Reykjavik, Iceland.
Maestas, N., Mullen, K. J., & Power, D. (2016). The Effect of Population Aging on Economic Growth, the Labor Force and Productivity. RAND Labor & Population Working Paper, WR-1063-1.
Mahlberg, B., Freund, I., Crespo Cuaresma, J., & Prskawetz, A. (2013). Ageing, productivity and wages in Austria. Labour Economics, 22, 5-15.
Mark, G., Gudith, D., & Klocke, U. (2008). The cost of interrupted work: more speed and stress. Paper presented at the Proceedings of the SIGCHI Conference on Human Factors in Computing Systems, Florence, Italy.
Marrano, M. G., Haskel, J. E., & Wallis, G. (2009). What happened to the knowledge economy? ICT, intangible investment, and Britain's productivity record revisited. Review of Income and
Wealth, 55(3), 686-716. Martin, R., Sunley, P., Gardiner, B., Evenhuis, E., & Tyler, P. (2018). The city dimension of the
productivity growth puzzle: the relative role of structural change and within-sector slowdown. Journal of Economic Geography, 18(3), 539-570.
McGowan, M. A., & Andrews, D. (2017). Skills mismatch, productivity and policies: Evidence from the second wave of PIAAC. OECD Economics Department Working Papers, 1403.
McNerney, J., Savoie, C., Caravelli, F., & Farmer, J. D. (2018). How production networks amplify economic growth. arXiv.org.

54
Medina, L., & Schneider, F. (2018). Shadow Economies Around the World: What Did We Learn Over the Last 20 Years? IMF Working Paper, WP/18/17.
Melitz, M. J. (2003). The Impact of Trade on Intra-Industry Reallocations and Aggregate Industry Productivity. Econometrica, 71(6), 1695-1725.
Mervis, J. (2017). Data check: U.S. government share of basic research funding falls below 50%: Science.
MGI. (2016). People on the move: Global migration's impact and opportunity. Retrieved from Mincer, J. (1958). Investment in Human Capital and Personal Income Distribution. Journal of Political
Economy, 66(4), 281-302. Mitaritonna, C., Orefice, G., & Peri, G. (2017). Immigrants and firms’ outcomes: Evidence from
France. European Economic Review, 96, 62-82. Mokyr, J. (2014). Secular stagnation? Not in your life. Mokyr, J., Vickers, C., & Ziebarth, N. L. (2015). The History of Technological Anxiety and the Future
of Economic Growth: Is This Time Different? Journal of Economic Perspectives, 29(3), 31-50. Retrieved from http://www.aeaweb.org/articles?id=10.1257/jep.29.3.31
Moreno-Galbis, E., & Sopraseuth, T. (2014). Job polarization in aging economies. Labour Economics, 27, 44-55.
Muller, N. Z., Mendelsohn, R., & Nordhaus, W. D. (2011). Environmental Accounting for Pollution in the United States Economy. American Economic Review P&P, 101(5), 1649-1675.
Myers, K., & Pauly, M. (2019). Endogenous productivity of demand-induced R&D: evidence from pharmaceuticals. The RAND Journal of Economics, 50(3), 591-614.
Nakamura, A. O., Shaw, K. L., Freeman, R. B., Nakamura, E., & Pyman, A. (2009). Jobs Online. In D. H. Autor (Ed.), Studies of Labor Market Intermediation (pp. 27-65): University of Chicago Press.
Nakamura, L., Samuels, J. D., & Soloveichik, R. (2017). Measuring the "Free" Digital Economy within the GDP and Productivity Accounts. ESCoE Discussion Paper.
Nishida, M., Petrin, A., Rotemberg, M., & White, K. (2016). Measuring Cross-Country Differences in Misallocation. Center for Economic Studies Working Paper, 16-50.
Nordhaus, W. D. (1972). The Recent Productivity Slowdown. Brookings Papers on Economic Activity,
3. Nordhaus, W. D. (1996). Do Real-Output and Real-Wage Measures Capture Reality? The History of
Lighting Suggests Not. In The Economics of New Goods (pp. 27-70): National Bureau of Economic Research, Inc.
Nordhaus, W. D. (2015). Are We Approaching an Economic Singularity? Information Technology and the Future of Economic Growth. National Bureau of Economic Research Working Paper Series, No. 21547.
NRC. (2012). Aging and the macroeconomy: Long-term implications of an older population. Retrieved from Washington, DC.: https://www.nap.edu/catalog/13465/aging-and-the-macroeconomy-long-term-implications-of-an-older
O'Mahony, M., & Timmer, M. P. (2009). Output, Input and Productivity Measures at the Industry Level: The EU KLEMS Database*. The Economic Journal, 119(538), F374-F403.
Obst, C., & Vardon, M. (2014). Recording environmental assets in the national accounts. Oxford
Review of Economic Policy, 30(1), 126-144. OECD. (2008). The Internationalisation of Business R&D. OECD. (2015). The Future of Productivity. Paris: OECD Publishing. OECD. (2016). OECD Science, Technology and Innovation Outlook 2016: OECD Publishing. OECD. (2017a). Education at a Glance 2017. Paris: OECD Publishing. OECD. (2017b). OECD Science, Technology and Industry Scoreboard 2017: OECD Publishing. OECD. (2018a). International Migration Outlook 2018. Paris: OECD Publishing.

55
OECD. (2018b). Productivity and Jobs in a Globalised World-(How) Can All Regions Benefit? : OECD.
OFCOM. (2014). Cost and value of communications services in the UK. Retrieved from Ollivaud, P., Guillemette, Y., & Turner, D. (2016). Links between weak investment and the slowdown
in productivity and potential output growth across the OECD. Ottaviano, G. I. P., Peri, G., & Wright, G. C. (2013). Immigration, Offshoring, and American Jobs.
American Economic Review P&P, 103(5), 1925-1959. Oulton, N. (2001). Must the Growth Rate Decline? Baumol's Unbalanced Growth Revisited (Vol. 53). Patterson, C., Şahin, A., Topa, G., & Violante, G. L. (2016). Working hard in the wrong place: A
mismatch-based explanation to the UK productivity puzzle. European Economic Review, 84, 42-56.
Peri, G. (2012). The Effect Of Immigration On Productivity: Evidence From U.S. States. The Review
of Economics and Statistics, 94(1), 348-358. Peri, G., & Yasenov, V. (2015). The Labor Market Effects of a Refugee Wave: Applying the Synthetic
Control Method to the Mariel Boatlift. National Bureau of Economic Research Working Paper Series, No. 21801.
Pessoa, J. P., & Van Reenen, J. (2014). The UK Productivity and Jobs Puzzle: Does the Answer Lie in Wage Flexibility? The Economic Journal, 124(576), 433-452.
Phelps, E. S. (2013). Mass flourishing: How grassroots innovation created jobs, challenge, and change: Princeton University Press.
Pratt, G. A. (2015). Is a Cambrian Explosion Coming for Robotics? Journal of Economic Perspectives, 29(3), 51-60.
Pritzker, P. S., Arnold, K., & Moyer, B. C. (2015). Measuring the Economy: A Primer on GDP and the National Income and Product Accounts. Retrieved from
Redmond, M., & Van Zandweghe, W. (2016). The Lasting Damage from the Financial Crisis to U.S. Productivity. Economic Review(Q I), 39-64.
Reifschneider, D., Wascher, W., & Wilcox, D. (2015). Aggregate Supply in the United States: Recent Developments and Implications for the Conduct of Monetary Policy. IMF Economic Review,
63(1), 71-109. Restuccia, D., & Rogerson, R. (2017). The Causes and Costs of Misallocation. Journal of Economic
Perspectives, 31(3), 151-174. Scherer, F. M. (1967). Research and Development Resource Allocation Under Rivalry. The Quarterly
Journal of Economics, 81(3), 359-394. Schneider, F., & Boockmann, B. (2018). Die Größe der Schattenwirtschaft – Methodik und
Berechnungen für das Jahr 2018. Retrieved from Linz und Tübingen: Schneider, F., Buehn, A., & Montenegro, C. E. (2010). Shadow Economies All over the World. World
Bank Policy Research Working Paper, 5356. Schneider, P. (2018). The UK's productivity puzzle is in the top tail of the distribution. In Bank
Underground (Vol. 2018). https://bankunderground.co.uk. Schreyer, P., & Obst, C. (2015). Towards Complete Balance Sheets in the National Accounts: The case
of Mineral and Energy Resources. OECD Green Growth Papers, 2015/02. Schumpeter, J. A. (1942). Capitalism, socialism, and democracy. London: Harper & Brothers. Schwörer, T. (2013). Offshoring, domestic outsourcing and productivity: evidence for a number of
European countries. Review of World Economics, 149(1), 131-149. Şener, F., & Zhao, L. (2009). Globalization, R&D and the iPod Cycle. Journal of International
Economics, 77(1), 101-108. Sichel, D. E. (1997). The Productivity Slowdown: Is a Growing Unmeasurable Sector the Culprit? The
Review of Economics and Statistics, 79(3), 367-370. Siliverstovs, B., Kholodilin, K. A., & Thiessen, U. (2011). Does aging influence structural change?
Evidence from panel data. Economic Systems, 35(2), 244-260.

56
Solow, R. M. (1957). Technical change and the aggregate production function. The review of
Economics and Statistics, 312-320. Solow, R. M. (1987). We'd better watch out. New York Times. Starr, E., Prescott, J. J., & Bishara, N. (2019). Noncompetes in the U.S. Labor Force. U of Michigan
Law & Econ Research Paper, 18-013. System of National Accounts 2008. (2009). New York: United Nations. Syverson, C. (2011). What Determines Productivity? Journal of Economic Literature, 49(2), 326-365. Syverson, C. (2017). Challenges to Mismeasurement Explanations for the US Productivity Slowdown.
The Journal of Economic Perspectives, 31(2), 165-186. Syverson, C. (2019). Macroeconomics and Market Power: Context, Implications, and Open Questions.
Journal of Economic Perspectives, 33(3), 23-43. Tenreyro, S. (2018). The fall in productivity growth: causes and implications. Speech given by
Silvanva, External MPC Member, Bank of England at Queen Mary University of London. Teulings, C., & Baldwin, R. (2014). Secular stagnation: facts, causes and cures: Center for Economic
Policy Research. Tørsløv, T. R., Wier, L. S., & Zucman, G. (2018). The Missing Profits of Nations. National Bureau of
Economic Research Working Paper Series, No. 24701. Triplett, J. E. (2006). Handbook on Hedonic Indexes and Quality Adjustments in Price Indexes:
Special Application to Information Technology Products. Paris: OECD Publishing. Triplett, J. E., & Bosworth, B. P. (2008). The State of Data for Services Productivity Measurement in
the United States. International Productivity Monitor, 16, 53-71. van Ark, B. (2016). The Productivity Paradox of the New Digital Economy. International Productivity
Monitor, 31, 3-18. Veugelers, R. (2018). Has the European Corporate R&D Landscape become Increasingly more
Concentrated in a Few Happy 'Superstars'? In E. Commission (Ed.), Science, Research and Innovation Performance of the EU 2018 (pp. 355-373): Publications Office in Luxembourg.
Weitzman, M. L. (1998). Recombinant Growth. The Quarterly Journal of Economics, 113(2), 331-360. World population prospects: The 2017 revision. (2017). Retrieved from Wuchty, S., Jones, B. F., & Uzzi, B. (2007). The Increasing Dominance of Teams in Production of
Knowledge. Science. Yang, J., Heinrich, T., Winkler, J., Lafond, F., Koutroumpis, P., & Farmer, D. (2019). Measuring
Productivity Dispersion: A Parametric Approach Using the Lévy Alpha-Stable Distribution. doi:http://dx.doi.org/10.2139/ssrn.3468301
Appendix
Missing GDP
In the spirit of Syverson (2017), to highlight the consequences of slowing productivity, we compute what
GDP would have been, should the productivity slowdown not have occurred. We use data from The
Conference Board Total Economy Database™, April 2019. We use the “original” instead of “adjusted”
data, because we do not want our numbers to be corrected by one and only one explanation (ICT
deflators, which is what is adjusted in the “adjusted” version). Our measure of labor productivity is
output per hour worked, and the GDP numbers are real GDP expressed in 2018 PPP $.

57
The realized (compound annual) growth rate of labor productivity is defined as
𝑔 = a𝑦bcd^𝑦bccRedbcd^>bccR − 1
The counterfactual growth rate, 𝑔f, is the growth rate of the previous period, 1995-2005, computed
similarly. Using a tilde to denote a variable should the slowdown not have occurred, the “missing” per
capita GDP is
𝑌hbcd^𝑁bcd^ −𝑌bcd^𝑁bcd^ =
𝑌bcd^𝑁bcd^ a𝑦fbcd^𝑦bcd^ − 1e,
where 𝑌 is real GDP, 𝑁 is population, 𝑦bcd^ = 𝑌bcd^/𝐿bcd^ is labor productivity. Thus, we only need
data on real GDP per capita, 𝑌bcd^/𝑁bcd^ , and the ratio of counterfactual to real labor
productivity,𝑦fbcd^/𝑦bcd^, which is
𝑦fbcd^𝑦bcd^ =𝑦bccR (1 + 𝑔f)(bcd^>bccR)𝑦bccR (1 + 𝑔)(bcd^>bccR) = a1 + 𝑔f1 + 𝑔e
(bcd^>bccR)
Putting this together,
𝑀𝑖𝑠𝑠𝑖𝑛𝑔𝐺𝐷𝑃𝑝𝑐 = 𝐺𝐷𝑃𝑝𝑐bcd^ ua1 + 𝑔f1 + 𝑔e(bcd^>bccR) − 1v
In Table 1, we report (𝑔f − 𝑔) as the “slowdown”.
Growth accounting
This section details the methodology for decomposing labor productivity growth. The Total
Economy database used for Table 1 also contains growth accounting data, but starts only in 1990. To
obtain longer series, we closely following closely fromGordon and Sayed (2019) and merge two
versions of EU KLEMS(Jäger, 2017),(O'Mahony & Timmer, 2009). The 2019 release generally
covers 1995-2017, while the 2012 release covers 1970-2010, but not for all variables and *****. The
overall trends in the two datasets are similar, but productivity growth in the US is noticeably lower in
the EU-KLEMS data as compared to the Conference Board data. It should be noted that changes in
accounting standards, from the ESA 1995 to ESA 2010, may cause minor discrepancies between the two
***** For the 2019 release, we extract data for the listed countries and variables from the statistical database, which we
downloaded from the main webpage http://www.euklems.eu/query/. (Release date: November 2019. Downloaded February 2020). The 2012 release comes in the form of Excel spreadsheets, which we downloaded separately for each country on the main site in July 2019 (All files can be accessed at http://www.euklems.net/eukISIC4.shtml. For example, the US file is http://www.euklems.net/data/nace2/USA_output_12i.xlsx).

58
releases. For example, the 2019 release, which follows the ESA 2010, separately reports the stock of
R&D and other intellectual property products.
Table 2: EU KLEMS variables definition
Variable Name Description in EU KLEMS
EU KLEMS 2012 release
𝐿𝑃_𝐼 Volume index of value added per hour worked (computed from aggregate value
added and hours worked)
𝑉𝐴𝐶𝑜𝑛𝐿𝐶 Contribution of labor composition change to value added growth
𝑉𝐴𝐶𝑜𝑛𝑇𝐹𝑃 Contribution of TFP to value added growth
EU KLEMS 2019 release
𝐿𝑃1_𝐺 Growth rate of value added per hour worked (computed from industry “bottom-
up” contributions)
𝐿𝑃1𝐶𝑜𝑛𝑇𝑎𝑛𝑔𝑁𝐼𝐶𝑇 Contribution of tangible non-ICT capital services to the growth of value added
per hour worked
𝐿𝑃1𝐶𝑜𝑛𝑇𝑎𝑛𝑔𝐼𝐶𝑇 Contribution of tangible ICT capital services to the growth of value added per hour worked
𝐿𝑃1𝐶𝑜𝑛𝐼𝑛𝑡𝑎𝑛𝑔𝑆𝑜𝑓𝑡𝐷𝐵 Contribution of intangible software and databases capital services to the growth of value added per hour worked
𝐿𝑃1𝐶𝑜𝑛𝐼𝑛𝑡𝑎𝑛𝑔𝑅𝐷 Contribution of intangible R&D capital services to the growth of value added
per hour worked
𝐿𝑃1𝐶𝑜𝑛𝐼𝑛𝑡𝑎𝑛𝑔𝑂𝐼𝑃𝑃 Contribution of intangible other intellectual property products capital services to
the growth of value added per hour worked
𝐿𝑃1𝐶𝑜𝑛𝐿𝐶 Contribution of labor composition change to the growth of value added per hour worked
𝐿𝑃1𝐶𝑜𝑛𝑇𝐹𝑃 Contribution of TFP to the growth of value added per hour worked
Table 3: Use of EU KLEMS variables for growth accounting
EU KLEMS
release
Labor
productivity
growth
Contribution of
labor composition
Contribution of capital
deepening
Contribution of
Total Factor
Productivity
2019 𝐿𝑃1_𝐺 𝐿𝑃1𝐶𝑜𝑛𝐿𝐶 𝐿𝑃1𝐶𝑜𝑛𝑇𝑎𝑛𝑔𝑁𝐼𝐶𝑇+ 𝐿𝑃1𝐶𝑜𝑛𝑇𝑎𝑛𝑔𝐼𝐶𝑇+ 𝐿𝑃1𝐶𝑜𝑛𝐼𝑛𝑡𝑎𝑛𝑔𝑆𝑜𝑓𝑡𝐷𝐵+ 𝐿𝑃1𝐶𝑜𝑛𝐼𝑛𝑡𝑎𝑛𝑔𝑅𝐷+ 𝐿𝑃1𝐶𝑜𝑛𝐼𝑛𝑡𝑎𝑛𝑔𝑂𝐼𝑃𝑃
𝐿𝑃1𝐶𝑜𝑛𝑇𝐹𝑃

59
To merge the data, we first perform growth decomposition for each possible year in each release,
so that labor productivity is expressed in growth rates and is decomposed using data from the same
release. We then preferentially use data from the 2019 release, and complement it as needed by data
from the 2012 release. Table 2 lists the data series in EU KLEMS needed to complete the decomposition.
Table 3 shows how each variable necessary for growth accounting is subsequently computed.
Two points to note are that, following Gordon and Sayed (2019), (i) we use a slightly different
concept for labor productivity growth over the two releases; (ii) In EUKLEMS 2012, capital deepening
contribution is computed as a residual. We have tested alternative methods, for (i) by computing
“LP1_Q” from the bottom-up in EUKLEMS 2012, and for (ii) by computing the contribution of capital
ourselves, using the labor share and the growth of hours worked. The differences were small enough that
for simplicity and transparency we use the simplest methodology here.
Conceptual framework
While growth accounting cannot provide a full-fledged framework to encompass all explanations
reviewed here, extending the basic “sources of growth’’ framework with two additional terms is enough
to provide a relatively accurate map of our paper. Let us start by repeating the basic growth accounting
equation, as used e.g. by KLEMS†††††.
Δ log 𝑦" = 𝛼Δ log ℎ" + (1 − 𝛼)Δ log 𝑘" + Δ log 𝐴" , (A1)
Our review, of course, addresses these three terms: a potential decline of the growth rates of
human capital (ℎ",see Section 4 on Labor force composition), physical capital intensity (𝑘", see Section
5 on Physical and intangible capital), and a decline of TFP growth, often associated with technology
(𝐴", see Section 8 on Technological change).
The literature, however, proposes two additional major explanations for the slowdown, and it is
possible to make them appear explicitly. The first one is mismeasurement, which can concern inputs and
output. Real output can be mis-measured because of boundary issues or because of inaccurate price
indices. In the relevant section (Section 3, Mis-measurement), we cover all these forms of mis-
measurement. For simplicity here, we assume that only output is mis-measured. We can write the identity
Δ log 𝑦"3456 = Δ log 𝑦" + Δ(log 𝑦"3456 −log 𝑦") (A2)
For the right-hand side of (A1) to match the left-hand side of (A2), we need to be a bit careful. If
we assume that inputs are well measured, the terms Δ log ℎ" and Δ log 𝑘" will not change, but the
parameter𝛼 might. In practice, 𝛼 is taken to be the labor compensation share of nominal income, so if
output mismeasurement only comes from a mismeasurement of the price index, 𝛼 need not change. TFP
††††† Our derivations here are purely for exposing concepts. In particular, Eq. (A1) differs from Eq. (1) by having the
parameter 𝛼 being time-independent. In Eq. (1), we write explicitly the time dependence since KLEMS uses a time varying labor share compensation of income.
2012 Δ log𝐿𝑃_𝐼 𝑉𝐴𝐶𝑜𝑛𝐿𝐶 Δ log𝐿𝑃_𝐼 − 𝑉𝐴𝐶𝑜𝑛𝐿𝐶− 𝑉𝐴𝐶𝑜𝑛𝑇𝐹𝑃
𝑉𝐴𝐶𝑜𝑛𝑇𝐹𝑃

60
growth, of course, would be different. We omit the notation 𝛼3456for convenience (or assume that mis-
measurement only comes from the price index), and write
Δ log 𝑦"3456 = 𝛼Δ log ℎ" + (1 − 𝛼)Δ log 𝑘" + Δ log 𝐴"3456 . (A3)
The second major source of explanation for the slowdown is a composition effect, either through
a sector-level Baumol disease effect, or as firm-level misallocation. The most basic idea is that aggregate
TFP can grow because each sector or firm becomes more productive, or because the more productive
sector or firms become a higher share of the aggregate. At a conceptual level, we may write
Δ log 𝐴"3456 = Δ log 𝐴"STTUV + Δ log 𝐴"36V\ , (A4)
where we use changes in logs only to suggest that each term would usually be a growth rate. There exists
a large literature that discusses different methods to perform this decomposition, possibly with extra
terms such as productivity growth due to entry and exit. Without going into details, the two basic
approaches are statistical and theory-based decompositions. Even though much of the differences
between the different methods boils down to the choice of weights to be used for performing a weighted
average of the TFP growth of individual firms/sectors (see e.g. . Baqaee and Farhi (2019) for a recent
discussion), different methods give different results and different notions of allocative efficiency or
reallocation. Also, the interpretation often changes if we consider the decomposition across firms rather
than sectors. Substituting Eq. (A4) and (A2) into (A3) yields Eq. (2) in the main text.
Copyright © 2022 FDOKUMEN