
SLOWING THE GROWTH OF U.S. HEALTH CARE EXPENDITURES: WHAT ARE THE OPTIONS
46
SLOWING THE GROWTH OF U.S. HEALTH CARE EXPENDITURES: WHAT ARE THE OPTIONS? Karen Davis, Cathy Schoen, Stuart Guterman Tony Shih, Stephen C. Schoenbaum, and Ilana Weinbaum The Commonwealth Fund January 2007 Prepared for The Commonwealth Fund/Alliance for Health Reform 2007 Bipartisan Congressional Health Policy Conference ABSTRACT: Health care expenditures are expected to continue to rise rapidly over the next decade, outpacing income and imposing stress on families, businesses, and public budgets. Evidence indicates that the U.S. should be able to achieve savings and better value for this investment by creating more efficient and effective health care and insurance systems. This report reviews factors contributing to high expenditures and examines strategies that have the potential to achieve savings, slow spending growth, and improve health system performance. These strategies cluster into six areas: 1) increasing the effectiveness of markets with better information and greater competition; 2) reducing high insurance administrative overhead and achieving more competitive prices; 3) providing incentives to promote efficient and effective care; 4) promoting patient- centered primary care; 5) investing in infrastructure such as health information technology; and 6) investing strategically to improve access, affordability, and equity. Support for this research was provided by The Commonwealth Fund. The views presented here are those of the authors and not necessarily those of The Commonwealth Fund or its directors, officers, or staff, or of The Commonwealth Fund Commission on a High Performance Health System or its members. This and other Fund publications are available online at www.cmwf.org . To learn more about new publications when they become available, visit the Fund’s Web site and register to receive e-mail alerts . Commonwealth Fund pub. no. 989.
-
Upload
independent -
Category
Documents
-
view
0 -
download
0
Transcript of SLOWING THE GROWTH OF U.S. HEALTH CARE EXPENDITURES: WHAT ARE THE OPTIONS
SLOWING THE GROWTH OF U.S. HEALTH CARE
EXPENDITURES: WHAT ARE THE OPTIONS?
Karen Davis, Cathy Schoen, Stuart Guterman
Tony Shih, Stephen C. Schoenbaum, and Ilana Weinbaum
The Commonwealth Fund
January 2007
Prepared for The Commonwealth Fund/Alliance for Health Reform
2007 Bipartisan Congressional Health Policy Conference
ABSTRACT: Health care expenditures are expected to continue to rise rapidly over the next decade, outpacing income and imposing stress on families, businesses, and public budgets. Evidence indicates that the U.S. should be able to achieve savings and better value for this investment by creating more efficient and effective health care and insurance systems. This report reviews factors contributing to high expenditures and examines strategies that have the potential to achieve savings, slow spending growth, and improve health system performance. These strategies cluster into six areas: 1) increasing the effectiveness of markets with better information and greater competition; 2) reducing high insurance administrative overhead and achieving more competitive prices; 3) providing incentives to promote efficient and effective care; 4) promoting patient-centered primary care; 5) investing in infrastructure such as health information technology; and 6) investing strategically to improve access, affordability, and equity.
Support for this research was provided by The Commonwealth Fund. The views presented here are those of the authors and not necessarily those of The Commonwealth Fund or its directors, officers, or staff, or of The Commonwealth Fund Commission on a High Performance Health System or its members. This and other Fund publications are available online at www.cmwf.org. To learn more about new publications when they become available, visit the Fund’s Web site and register to receive e-mail alerts. Commonwealth Fund pub. no. 989.

iii
CONTENTS
List of Figures ................................................................................................................. iv
About the Authors ........................................................................................................... v
Executive Summary....................................................................................................... vii
Introduction ....................................................................................................................1
Trends in Health Expenditures and Variations in Costs ....................................................2
Health Expenditures...................................................................................................2
Variations in Cost and Quality ...................................................................................7
Addressing Factors Contributing to High Spending Levels and Rising Trends..................9
Strategies for Achieving Savings and Improving Health System Performance.................. 12
Increasing the Effectiveness of Markets: Incentives for Value-Driven
Health Plans and Improved Competition ................................................................. 12
Generating Information on Clinical and Cost-Effectiveness to Enhance
Coverage Policy and Medical Decision-Making ....................................................... 14
Improving Insurance Efficiency: Private Markets, Medicare, and Medicaid............... 17
Achieving Competitive Pharmaceutical Prices.......................................................... 19
Rewarding Quality and Efficiency ........................................................................... 20
Strengthening Primary Care ..................................................................................... 22
Information Systems and Information Exchange....................................................... 24
Strategic Investments to Improve Access, Affordability, and Equity .......................... 26
Current Federal Legislative Proposals ............................................................................. 26
Summary ....................................................................................................................... 28
Notes............................................................................................................................. 29
iv
LIST OF FIGURES
Figure ES-1 International Comparison of Spending on Health, 1980–2004................... vii
Figure ES-2 Growth in National Health Expenditures (NHE) Under
Various Scenarios ........................................................................................x
Figure 1 International Comparison of Spending on Health, 1980–2004.....................2
Figure 2 Growth in National Health Expenditures: Private, Public,
and Total Expenditures, 1980–2005 ............................................................3
Figure 3 Health Expenditure Growth 1980–2005 for Selected Categories
of Expenditures...........................................................................................4
Figure 4 Percentage of National Health Expenditures Spent on
Health Administration and Insurance, 2003 .................................................5
Figure 5 Monthly Percentage Change in Health Insurance
Stock Price Index, 1996–2006.....................................................................6
Figure 6 Health Expenditures for Selected Type of Services, 2000–2015 ...................7
Figure 7 States with Higher Medicare Spending per Enrollee
Do Not Have Lower Rates of Mortality, 2003............................................8
Figure 8 Costs of Care for Medicare Beneficiaries with Multiple
Chronic Conditions, by Hospital Referral Regions, 2001............................9
Figure 9 Growth in National Health Expenditures (NHE) Under
Various Scenarios ...................................................................................... 11
Figure 10 Percent of Different Physicians Seen by Patients
in Academic Medical Centers Varies ......................................................... 16
Figure 11 Improvements in Use of Beta Blockers After a Heart Attack...................... 20
Figure 12 Health Care Costs Concentrated in Sick Few—
Sickest 10 Percent Account for 64 Percent of Expenses ............................. 22
Figure 13 Primary Care Doctors Use of Electronic Patient Medical
Records, 2006........................................................................................... 24
v
ABOUT THE AUTHORS
Karen Davis, Ph.D., president of The Commonwealth Fund, is a nationally recognized
economist with a distinguished career in public policy and research. In recognition of her work,
she received the 2006 AcademyHealth Distinguished Investigator Award. Before joining the Fund,
she served as chairman of the Department of Health Policy and Management at The Johns
Hopkins Bloomberg School of Public Health, where she also held an appointment as professor of
economics. She served as deputy assistant secretary for health policy in the Department of Health
and Human Services from 1977 to 1980, and was the first woman to head a U.S. Public Health
Service agency. A native of Oklahoma, she received her doctoral degree in economics from Rice
University, which recognized her achievements with a Distinguished Alumna Award in 1991.
Ms. Davis has published a number of significant books, monographs, and articles on health and
social policy issues, including the landmark books Health Care Cost Containment; Medicare Policy;
National Health Insurance: Benefits, Costs, and Consequences; and Health and the War on Poverty.
Cathy Schoen, M.S., is senior vice president for research and evaluation at The Commonwealth
Fund and research director for the Commission on a High Performance Health System, overseeing
the Commission’s Scorecard project and surveys. Previously, Ms. Schoen was director of special
projects at the University of Massachusetts Labor Relations and Research Center and on the
research faculty of the UMass School of Public Health. During the 1980s, she directed the Service
Employees International Union’s Research and Policy Department in Washington, D.C. Earlier,
she served as a member of the staff of President Carter’s national health insurance task force and as
a senior health advisor during the 1988 presidential campaign. Prior to federal service, she was a
research fellow at the Brookings Institution. She holds an undergraduate degree in economics from
Smith College and a graduate degree in economics from Boston College. She is the author and
coauthor of many publications on health care coverage and quality issues.
Stuart Guterman has been senior program director for The Commonwealth Fund’s Program on
Medicare’s Future since May 2005. He is responsible for the Fund’s research agenda on Medicare
issues, the development, management, and review of grants to be funded under the program,
analyses related to the current performance and future improvements in the Medicare program,
and disseminating the results of the Fund’s activities and other research related to these topics.
Prior to joining the Fund, Mr. Guterman was director of the Office of Research, Development,
and Information at the Centers for Medicare and Medicaid Services from 2002 to 2005. Before
that, he was a senior analyst at the Congressional Budget Office, a principal research associate in
the Health Policy Center at the Urban Institute, and deputy director of the Medicare Payment
Advisory Commission (and its predecessor, the Prospective Payment Assessment Commission)
from 1988 through 1999. Previously, Mr. Guterman was chief of institutional studies in the Health
Care Financing Administration’s Office of Research, where he directed the evaluation of the
Medicare Prospective Payment System for inpatient hospital services and other intramural and
extramural research on hospital payment.
vi
Tony Shih, M.D., M.P.H., joined The Commonwealth Fund in 2006 as the senior program
officer overseeing the Fund’s Program on Quality Improvement and Efficiency. Dr. Shih came
from IPRO, an independent not-for-profit health care quality improvement organization (QIO),
where he held a variety of positions since 2001, most recently as Vice President, Quality
Improvement and Medical Director, Managed Care. In this position he developed and managed
large-scale quality improvement projects for the Medicare population and designed quality
measures and quality improvement studies for Medicaid managed care markets. Previously, Dr.
Shih was the assistant medical director for a community-based mental health clinic in Northern
California serving immigrant and refugee populations. He is board-certified in Public Health and
Preventive Medicine, and has expertise in epidemiology, health services research, and in the
principles and practice of health care quality improvement. Dr. Shih holds a B.A. in Economics
from Amherst College, an M.D. from New York University School of Medicine, and an M.P.H.
from Columbia University Mailman School of Public Health.
Stephen C. Schoenbaum, M.D., M.P.H., is executive vice president for programs of
The Commonwealth Fund and Executive Director of The Commonwealth Fund Commission
on a High Performance Health System with responsibility for coordinating the development and
management of the Fund’s program areas. He is also a member of the Fund’s executive
management team. Prior to joining the Fund in February 2000, he was president of Harvard
Pilgrim Health Care of New England and senior vice president of Harvard Pilgrim Health Care,
responsible for delivery system operations in a mixed staff and network model HMO with
approximately 150,000 members. Prior to joining Harvard Community Health Plan in 1981, Dr.
Schoenbaum was a member of the Department of Medicine at Brigham and Women’s Hospital
and did epidemiologic research in obstetrics and infectious diseases. He is a lecturer in the
Department of Ambulatory Care and Prevention, Harvard Medical School, the author of more
than 125 scientific articles and papers, and the editor of a book on measuring clinical care. Dr.
Schoenbaum received an A.B. from Swarthmore College with honors, an M.D. from Harvard
Medical School (cum laude), and an M.P.H. from Harvard School of Public Health. He also
completed the Program for Management Development at Harvard Business School.
Ilana Weinbaum, M.Sc., is committee administrator for the Oregon State Legislature Health
and Human Services Committee and former commission associate for The Commonwealth Fund
Commission on a High Performance Health System. Ms. Weinbaum completed her M.Sc. in
Health Policy, Planning and Finance through a joint program between the London School of
Economics and the London School of Hygiene and Tropical Medicine. After graduating from the
University of Pennsylvania with a B.A. in Health and Societies, she worked for a small nonprofit
public health agency in Philadelphia.
vii
EXECUTIVE SUMMARY
U.S. health care expenditures have risen rapidly in the last six years, imposing
increasing stress on families, businesses, and public budgets. Health spending is rising faster
than the economy as a whole and faster than workers’ earnings. In recent years, insurance
administrative overhead has been rising faster than other components of health spending,
while pharmaceutical spending has increased more rapidly than spending on other health
care services.
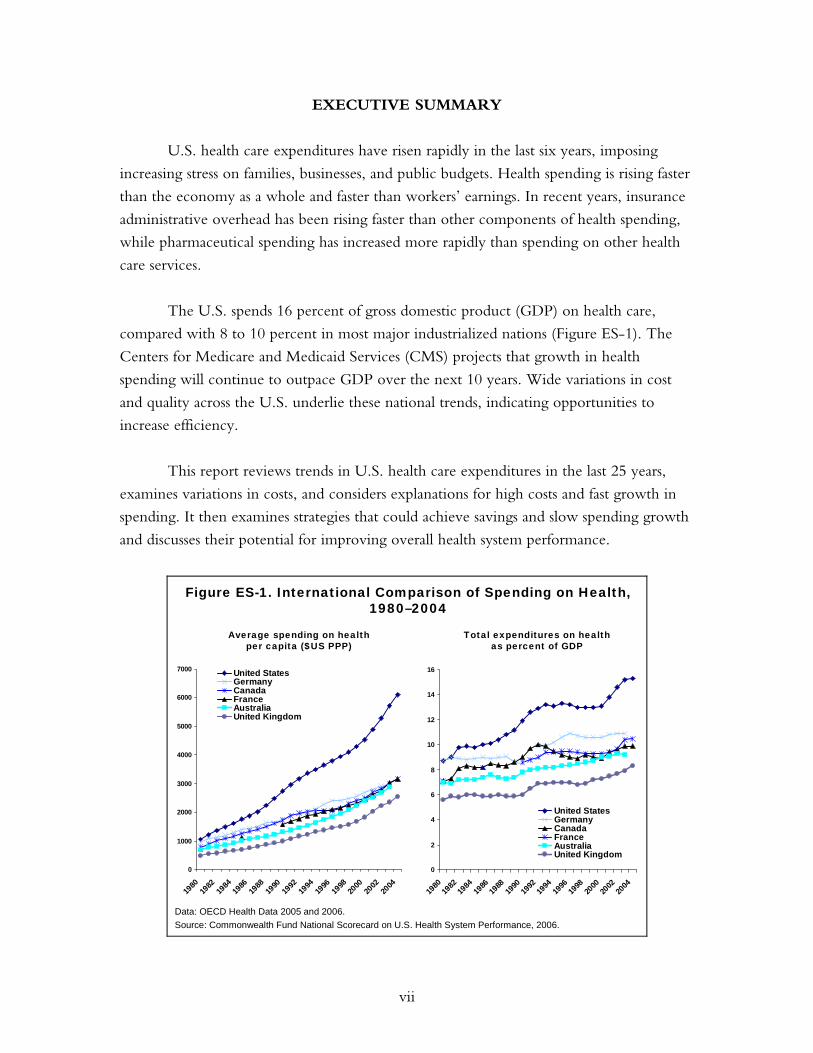
The U.S. spends 16 percent of gross domestic product (GDP) on health care,
compared with 8 to 10 percent in most major industrialized nations (Figure ES-1). The
Centers for Medicare and Medicaid Services (CMS) projects that growth in health
spending will continue to outpace GDP over the next 10 years. Wide variations in cost
and quality across the U.S. underlie these national trends, indicating opportunities to
increase efficiency.
This report reviews trends in U.S. health care expenditures in the last 25 years,
examines variations in costs, and considers explanations for high costs and fast growth in
spending. It then examines strategies that could achieve savings and slow spending growth
and discusses their potential for improving overall health system performance.
Figure ES-1. International Comparison of Spending on Health, 1980–2004
0
1000
2000
3000
4000
5000
6000
7000
1980
1982
1984
1986
1988
1990
1992
1994
1996
1998
2000
2002
2004
United StatesGermanyCanadaFranceAustraliaUnited Kingdom
Data: OECD Health Data 2005 and 2006.
0
2
4
6
8
10
12
14
16
1980
1982
1984
1986
1988
1990
1992
1994
1996
1998
2000
2002
2004
United StatesGermanyCanadaFranceAustraliaUnited Kingdom
Average spending on healthper capita ($US PPP)
Total expenditures on healthas percent of GDP
Source: Commonwealth Fund National Scorecard on U.S. Health System Performance, 2006.
viii
From a public perspective, the most desirable strategies to address high and rising
health care costs would involve: 1) eliminating duplicative or unnecessary care and
reducing administrative overhead; 2) preventing illnesses or complications and detecting
conditions at an early stage; 3) avoiding unneeded hospitalizations; and 4) enhancing
productivity and efficiency in the provision of care. Although there may come a time
when the nation is compelled to make a tradeoff between spending on health care and
other high priorities, there is currently ample evidence that we can achieve savings and
efficient payment, insurance, and care delivery systems and still improve health outcomes,
quality of care, and access to care.
Health care costs vary substantially across the United States. For example, the
Dartmouth Atlas of Health Care shows that Medicare outlays per beneficiary adjusted for
area wage costs ranged from $4,530 in Hawaii to $8,080 in New Jersey in 2003. Yet
studies find no systematic relationship between spending more and achieving longer lives
or higher quality of care for Medicare beneficiaries. Evidence of extensive variations in
costs and quality and studies documenting provision of duplicative, inappropriate, and
unnecessary care have led the Institute of Medicine (IOM) and other experts to conclude
that the U.S. health care system could improve quality, access, and cost performance.
The IOM defines efficiency as achieving the highest level of quality for a given level of
resources. Whether comparing U.S. performance to international benchmarks of high
value or to benchmarks set within the U.S., it is clear there are opportunities to improve
the yield we reap given the resources we invest in health care.
One-time savings are likely to derive from approaches that address factors that
contribute to current high levels of U.S. expenditures, inefficiency, and waste. These
factors include:
• overuse, inappropriate, or ineffective use of care;
• payment incentives that reward the delivery of more services, without
consideration to clinical value or cost-effectiveness;
• market power of insurers, providers, and the health industry, including
pharmaceutical companies, device manufacturers, and other suppliers to set prices
above competitive market levels;
• a low ratio of primary to specialty care physicians and services;
• access barriers to preventive and primary care that contribute to avoidable
hospital admissions, emergency department use, and complications of chronic
and acute disease;
ix
• a lack of well-coordinated care that leads to unsafe, duplicative, or conflicting care;
• inadequate information systems and information exchange; and
• high administrative costs, including the high proportion of insurance premiums
used to cover overhead costs, the complexity of insurance benefit design and
duplicative and uncoordinated requirements, and administrative costs for providers.
The principal factors that contribute to long-term trends in rising expenditures that
might be amenable to policy change are somewhat different. They include:
• introduction of new technologies/innovations without comparative information
on clinical outcomes or cost-effectiveness to guide decisions on adoption and use;
• wages and prices of other hospital-purchased goods and services;
• growing market power and consolidation of insurers, providers, and the health
industry including pharmaceutical companies, device manufacturers, and other
suppliers contributing to less choice and higher prices; and
• the increasing prevalence of chronic diseases.
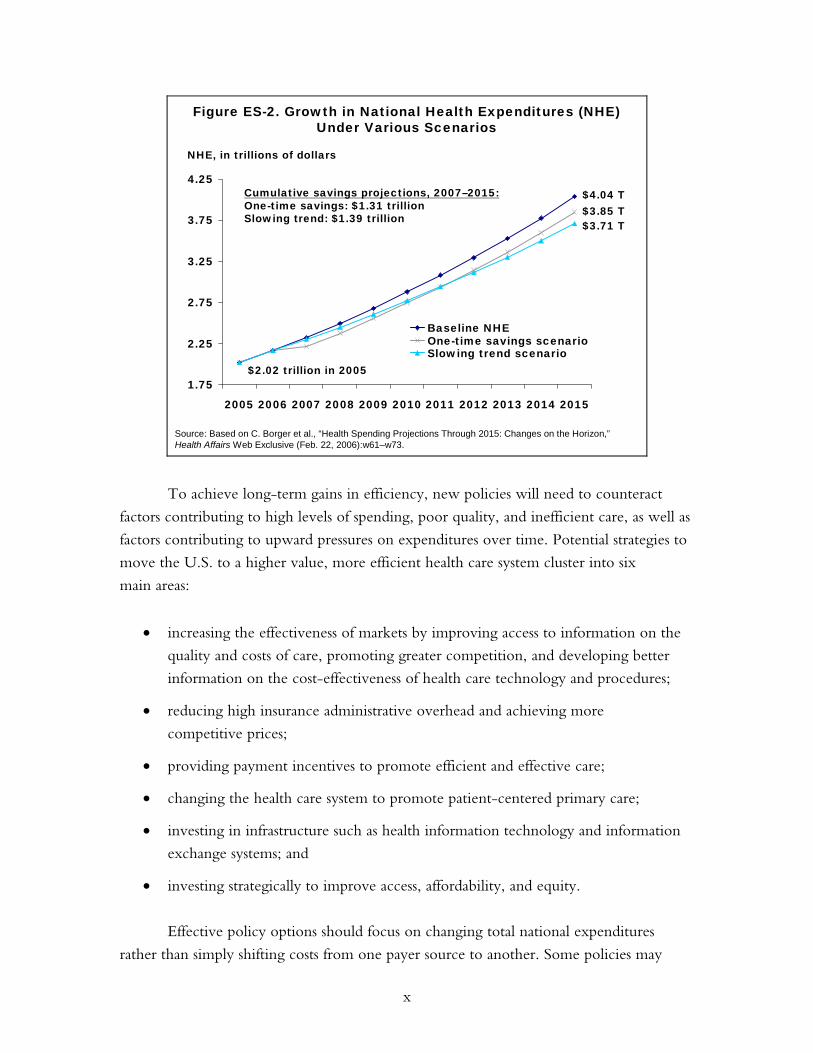
Both strategies that achieve one-time savings as well as those that address cost
trends could yield substantial cumulative gains over time. A policy option that has the
effect of achieving a one-time reduction in the level of health care spending by 5 percent
in 2007 would achieve cumulative savings over the eight-year period from 2007 to 2015
of $1.31 trillion. A policy option that has the effect of lowering the average rate of
increase in health care outlays by one percentage point a year would yield cumulative
savings of $1.39 trillion over the same period. In combination, one-time changes in
spending levels plus even small changes in projected rates of increase interact to produce
even more substantial long-term yields (Figure ES-2).
x
Figure ES-2. Growth in National Health Expenditures (NHE) Under Various Scenarios
Source: Based on C. Borger et al., “Health Spending Projections Through 2015: Changes on the Horizon,” Health Affairs Web Exclusive (Feb. 22, 2006):w61–w73.
NHE, in trillions of dollars
2
1.75
2.25
2.75
3.25
3.75
4.25
2005 2006 2007 2008 2009 2010 2011 2012 2013 2014 2015
Baseline NHEOne-time savings scenarioSlowing trend scenario
$2.02 trillion in 2005
Cumulative savings projections, 2007–2015:One-time savings: $1.31 trillionSlowing trend: $1.39 trillion $3.71 T
$3.85 T$4.04 T
To achieve long-term gains in efficiency, new policies will need to counteract
factors contributing to high levels of spending, poor quality, and inefficient care, as well as
factors contributing to upward pressures on expenditures over time. Potential strategies to
move the U.S. to a higher value, more efficient health care system cluster into six
main areas:
• increasing the effectiveness of markets by improving access to information on the
quality and costs of care, promoting greater competition, and developing better
information on the cost-effectiveness of health care technology and procedures;
• reducing high insurance administrative overhead and achieving more
competitive prices;
• providing payment incentives to promote efficient and effective care;
• changing the health care system to promote patient-centered primary care;
• investing in infrastructure such as health information technology and information
exchange systems; and
• investing strategically to improve access, affordability, and equity.
Effective policy options should focus on changing total national expenditures
rather than simply shifting costs from one payer source to another. Some policies may
xi
have a greater effect on federal budget outlays, while others may affect outlays by state
government, employers, or households. Achieving improved value for the national
investment in health care requires policies that achieve net gains for the whole country. At
the national level, the policies should:
• be amenable to federal policy action;
• improve health outcomes, quality, access, efficiency, or equity;
• have a high likelihood of significant reduction in expenditure levels and/or trends
compared with current projections, or achieve a net improvement in value;
• be evidence-based and feasible to implement; and
• be reasonable first steps toward longer-term reforms.
At the federal level, there are a range of legislative proposals that seek to improve
efficiency and contain health expenditures. Legislative proposals that have been introduced
in Congress address four major areas: simplifying, standardizing, and introducing
negotiated pricing into Medicare Part D; enhancing the utilization of health information
technology and building a national interoperable technology system; integrating value-
based purchasing into Medicare payments; and improving public access to information on
the quality and price of medical services.
There is a compelling need for a coherent public and private sector strategy, with
all parties working in concert toward agreed-upon health system aims. Such a strategy
should place high priority on policies and practices that have the potential to move our
nation toward benchmark levels of performance on access, quality, and efficiency, so that
the U.S. health system could achieve commensurate value for the significant resources
it commands.

1
SLOWING THE GROWTH OF U.S. HEALTH CARE EXPENDITURES:
WHAT ARE THE OPTIONS?
INTRODUCTION
Health care expenditures have risen rapidly in the last six years, imposing increasing stress
on families, businesses, and public budgets. Since 2000, the average family health
insurance premium for employer-based insurance has grown 81 percent, while median
family income has increased by only 11 percent—straining the finances of employers and
households alike.1 In fact, high premiums and out-of-pocket health care costs are the
American public’s number-one health care concern.2 With further growth in public
coverage, private insurance, and personal health care expenditures expected, government,
employers, and individuals will be forced to make difficult budget choices.
Higher spending on new health care technology has yielded substantial gains in life
expectancy and quality of life.3 Longer and healthier lives are valued highly, and estimates
suggest that the economic gains from improved health outcomes exceed the requisite
increased spending on health care.4 But there is also evidence of substantial waste and
inefficiency throughout the health care system, as well as evidence that regions of the
country that spend more on care do not necessarily have better health outcomes.5
From a public perspective, the most desirable strategies to address high and rising
health care costs would involve: 1) eliminating duplicative or unnecessary care and
reducing administrative overhead; 2) preventing illnesses or complications and detecting
conditions at an early stage; 3) avoiding unneeded hospitalizations; and 4) enhancing
productivity and efficiency in the provision of care. Although there may come a time
when the nation is compelled to make a tradeoff between spending on health care and
other high priorities, there is ample evidence that we can achieve savings and efficient
payment, insurance, and care delivery systems and still improve health outcomes, quality
of care, and access to care.
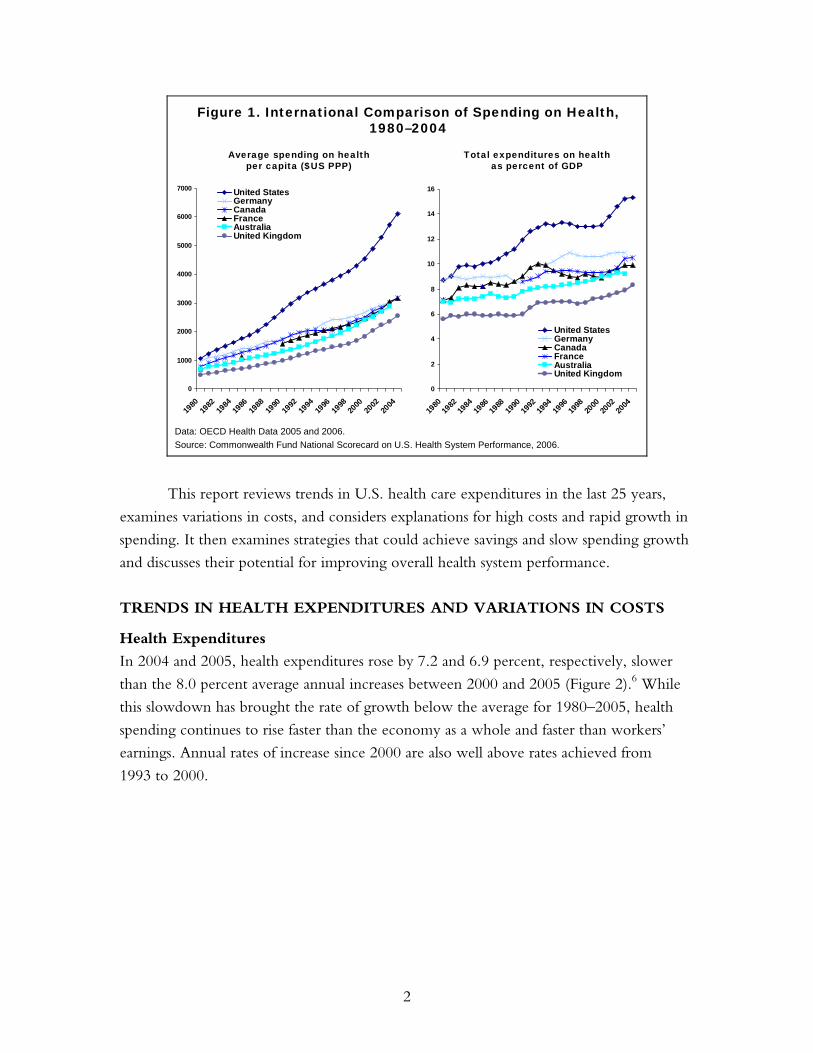
The recent experience of many other nations demonstrates that it is indeed
possible to achieve substantially lower per capita health care costs than those in the U.S.,
as well as slower health spending growth (Figure 1). The U.S. spends 16 percent of gross
domestic product (GDP) on health care compared with 8 to 10 percent in most major
industrialized nations. The U.S. spent $6,280 per capita on health care in 2004—more
than double the amount spent in other major countries.
2
Figure 1. International Comparison of Spending on Health, 1980–2004
0
1000
2000
3000
4000
5000
6000
7000
1980
1982
1984
1986
1988
1990
1992
1994
1996
1998
2000
2002
2004
United StatesGermanyCanadaFranceAustraliaUnited Kingdom
0
2
4
6
8
10
12
14
16
1980
1982
1984
1986
1988
1990
1992
1994
1996
1998
2000
2002
2004
United StatesGermanyCanadaFranceAustraliaUnited Kingdom
Average spending on healthper capita ($US PPP)
Total expenditures on healthas percent of GDP
Data: OECD Health Data 2005 and 2006.Source: Commonwealth Fund National Scorecard on U.S. Health System Performance, 2006.
This report reviews trends in U.S. health care expenditures in the last 25 years,
examines variations in costs, and considers explanations for high costs and rapid growth in
spending. It then examines strategies that could achieve savings and slow spending growth
and discusses their potential for improving overall health system performance.
TRENDS IN HEALTH EXPENDITURES AND VARIATIONS IN COSTS
Health Expenditures
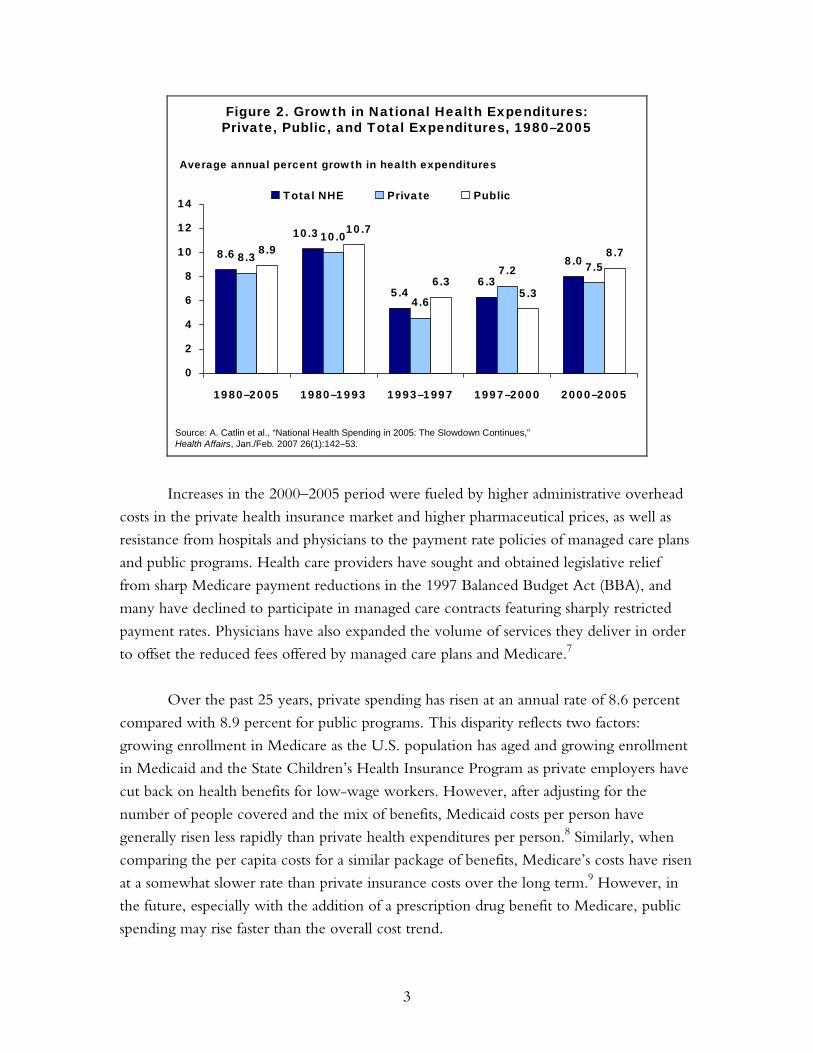
In 2004 and 2005, health expenditures rose by 7.2 and 6.9 percent, respectively, slower
than the 8.0 percent average annual increases between 2000 and 2005 (Figure 2).6 While
this slowdown has brought the rate of growth below the average for 1980–2005, health
spending continues to rise faster than the economy as a whole and faster than workers’
earnings. Annual rates of increase since 2000 are also well above rates achieved from
1993 to 2000.
3
Figure 2. Growth in National Health Expenditures:Private, Public, and Total Expenditures, 1980–2005
8.6
5.46.3
8.08.3
10.0
4.6
7.2 7.58.9
6.35.3
8.7
10.3 10.7
0
2
4
6
8
10
12
14
1980–2005 1980–1993 1993–1997 1997–2000 2000–2005
Total NHE Private Public
Average annual percent growth in health expenditures
Source: A. Catlin et al., “National Health Spending in 2005: The Slowdown Continues,”Health Affairs, Jan./Feb. 2007 26(1):142–53.
Increases in the 2000–2005 period were fueled by higher administrative overhead
costs in the private health insurance market and higher pharmaceutical prices, as well as
resistance from hospitals and physicians to the payment rate policies of managed care plans
and public programs. Health care providers have sought and obtained legislative relief
from sharp Medicare payment reductions in the 1997 Balanced Budget Act (BBA), and
many have declined to participate in managed care contracts featuring sharply restricted
payment rates. Physicians have also expanded the volume of services they deliver in order
to offset the reduced fees offered by managed care plans and Medicare.7
Over the past 25 years, private spending has risen at an annual rate of 8.6 percent
compared with 8.9 percent for public programs. This disparity reflects two factors:
growing enrollment in Medicare as the U.S. population has aged and growing enrollment
in Medicaid and the State Children’s Health Insurance Program as private employers have
cut back on health benefits for low-wage workers. However, after adjusting for the
number of people covered and the mix of benefits, Medicaid costs per person have
generally risen less rapidly than private health expenditures per person.8 Similarly, when
comparing the per capita costs for a similar package of benefits, Medicare’s costs have risen
at a somewhat slower rate than private insurance costs over the long term.9 However, in
the future, especially with the addition of a prescription drug benefit to Medicare, public
spending may rise faster than the overall cost trend.
4
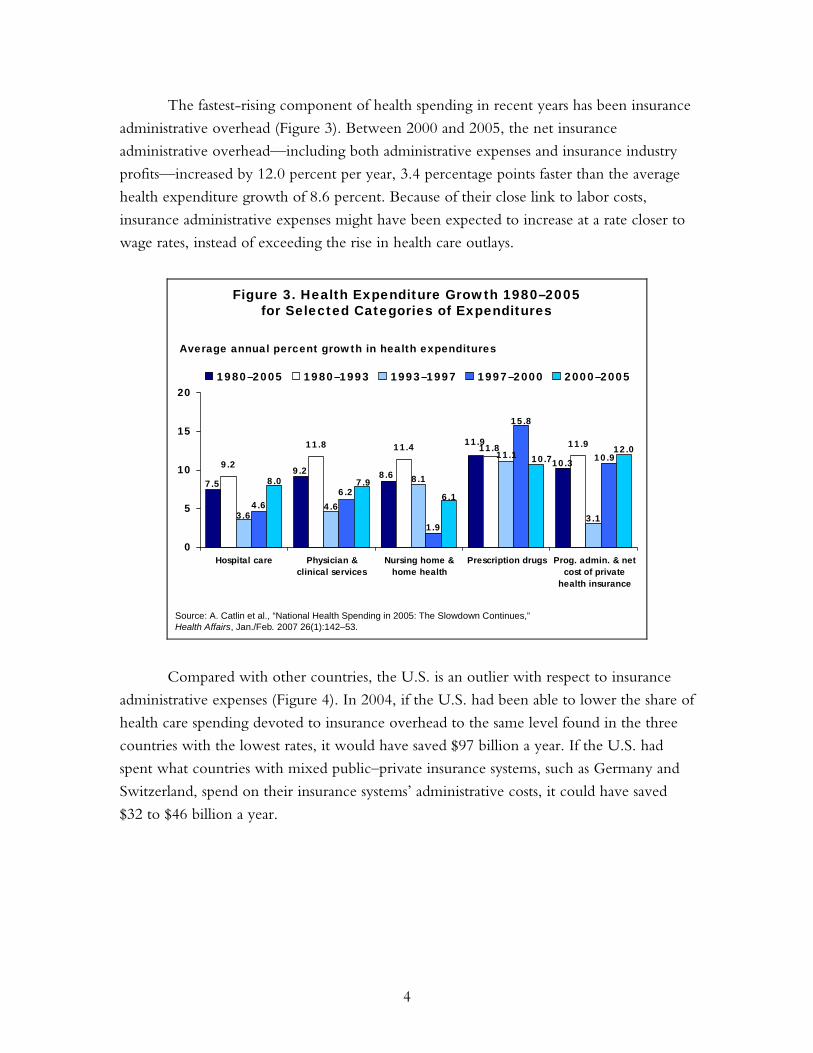
The fastest-rising component of health spending in recent years has been insurance
administrative overhead (Figure 3). Between 2000 and 2005, the net insurance
administrative overhead—including both administrative expenses and insurance industry
profits—increased by 12.0 percent per year, 3.4 percentage points faster than the average
health expenditure growth of 8.6 percent. Because of their close link to labor costs,
insurance administrative expenses might have been expected to increase at a rate closer to
wage rates, instead of exceeding the rise in health care outlays.
Figure 3. Health Expenditure Growth 1980–2005for Selected Categories of Expenditures
9.2
11.8 11.4 11.9
7.59.2
10.38.6
11.911.8
8.1
4.63.6
11.1
3.14.6
6.2
1.9
15.8
10.9
8.0 7.96.1
10.712.0
0
5
10
15
20
Hospital care Physician &clinical services
Nursing home &home health
Prescription drugs Prog. admin. & netcost of private
health insurance
1980–2005 1980–1993 1993–1997 1997–2000 2000–2005
Average annual percent growth in health expenditures
Source: A. Catlin et al., “National Health Spending in 2005: The Slowdown Continues,”Health Affairs, Jan./Feb. 2007 26(1):142–53.
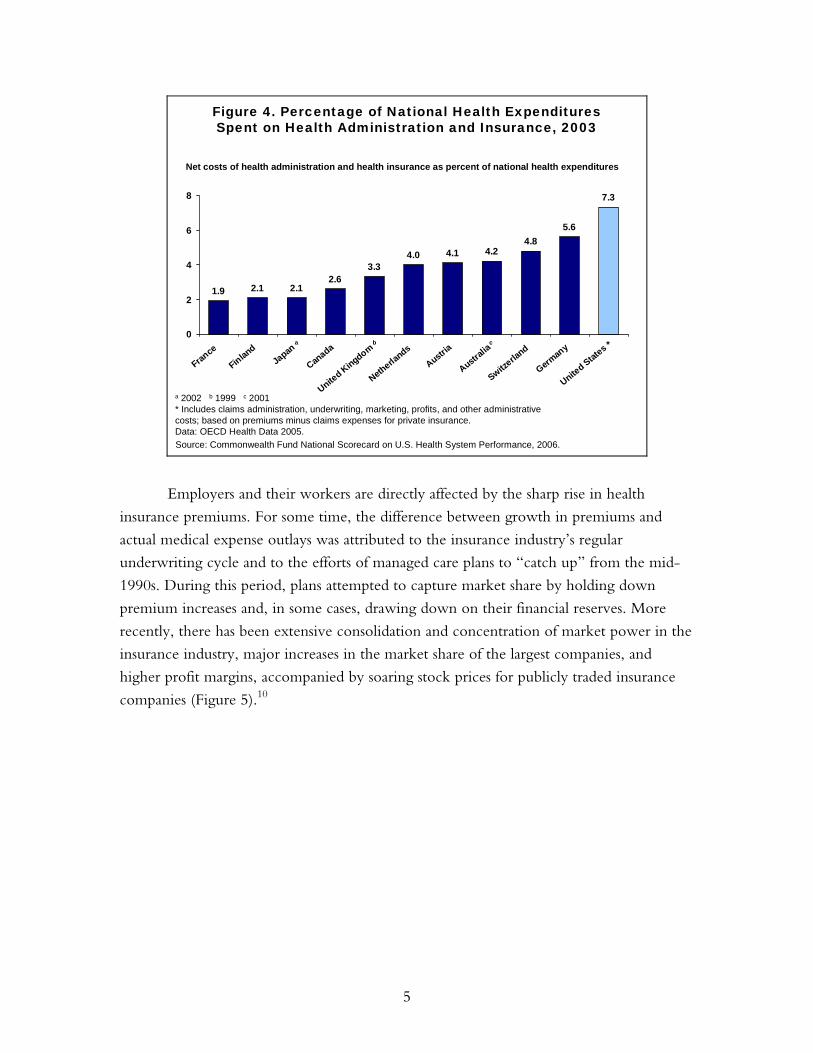
Compared with other countries, the U.S. is an outlier with respect to insurance
administrative expenses (Figure 4). In 2004, if the U.S. had been able to lower the share of
health care spending devoted to insurance overhead to the same level found in the three
countries with the lowest rates, it would have saved $97 billion a year. If the U.S. had
spent what countries with mixed public–private insurance systems, such as Germany and
Switzerland, spend on their insurance systems’ administrative costs, it could have saved
$32 to $46 billion a year.
5
Figure 4. Percentage of National Health ExpendituresSpent on Health Administration and Insurance, 2003
a 2002 b 1999 c 2001* Includes claims administration, underwriting, marketing, profits, and other administrative costs; based on premiums minus claims expenses for private insurance.Data: OECD Health Data 2005.
Net costs of health administration and health insurance as percent of national health expenditures
1.9 2.1 2.12.6
3.34.0 4.1 4.2
4.85.6
7.3
0
2
4
6
8
France
Finland
Japan
Canada
United Kingdom
Netherla
nds
Austria
Australi
a
Switzerla
nd
German
y
United Stat
esa b c *
Source: Commonwealth Fund National Scorecard on U.S. Health System Performance, 2006.
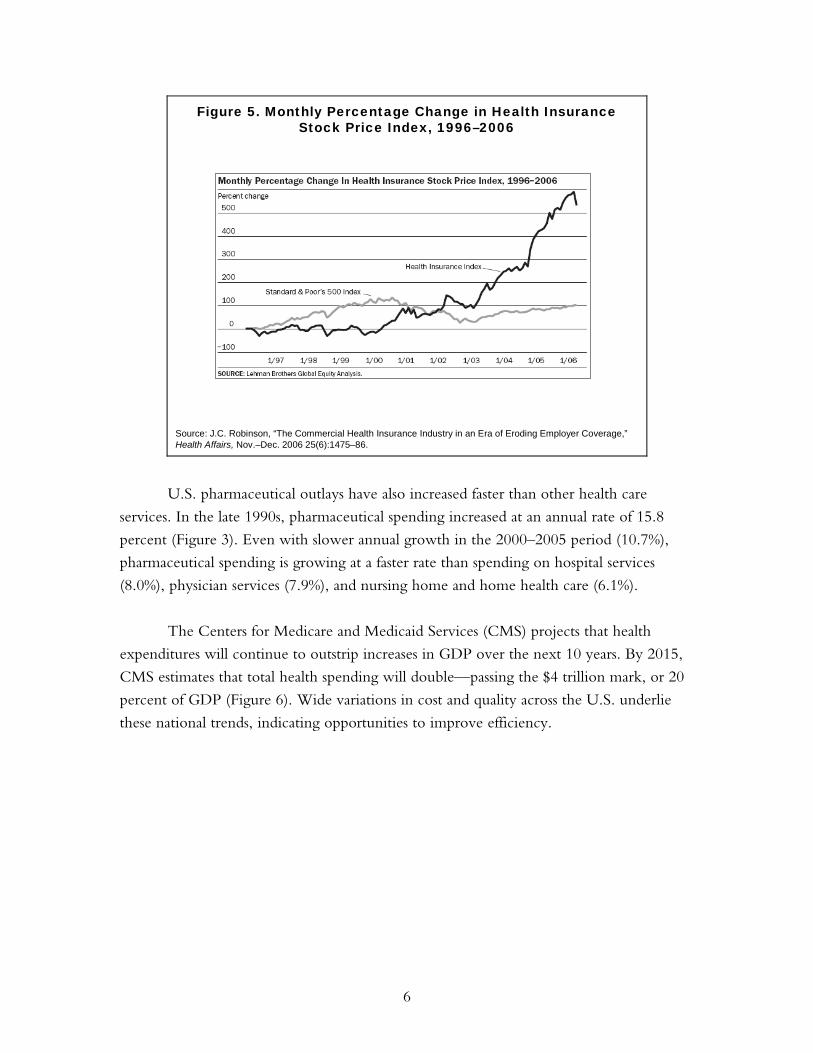
Employers and their workers are directly affected by the sharp rise in health
insurance premiums. For some time, the difference between growth in premiums and
actual medical expense outlays was attributed to the insurance industry’s regular
underwriting cycle and to the efforts of managed care plans to “catch up” from the mid-
1990s. During this period, plans attempted to capture market share by holding down
premium increases and, in some cases, drawing down on their financial reserves. More
recently, there has been extensive consolidation and concentration of market power in the
insurance industry, major increases in the market share of the largest companies, and
higher profit margins, accompanied by soaring stock prices for publicly traded insurance
companies (Figure 5).10
6
Figure 5. Monthly Percentage Change in Health InsuranceStock Price Index, 1996–2006
Source: J.C. Robinson, “The Commercial Health Insurance Industry in an Era of Eroding Employer Coverage,” Health Affairs, Nov.–Dec. 2006 25(6):1475–86.
U.S. pharmaceutical outlays have also increased faster than other health care
services. In the late 1990s, pharmaceutical spending increased at an annual rate of 15.8
percent (Figure 3). Even with slower annual growth in the 2000–2005 period (10.7%),
pharmaceutical spending is growing at a faster rate than spending on hospital services
(8.0%), physician services (7.9%), and nursing home and home health care (6.1%).
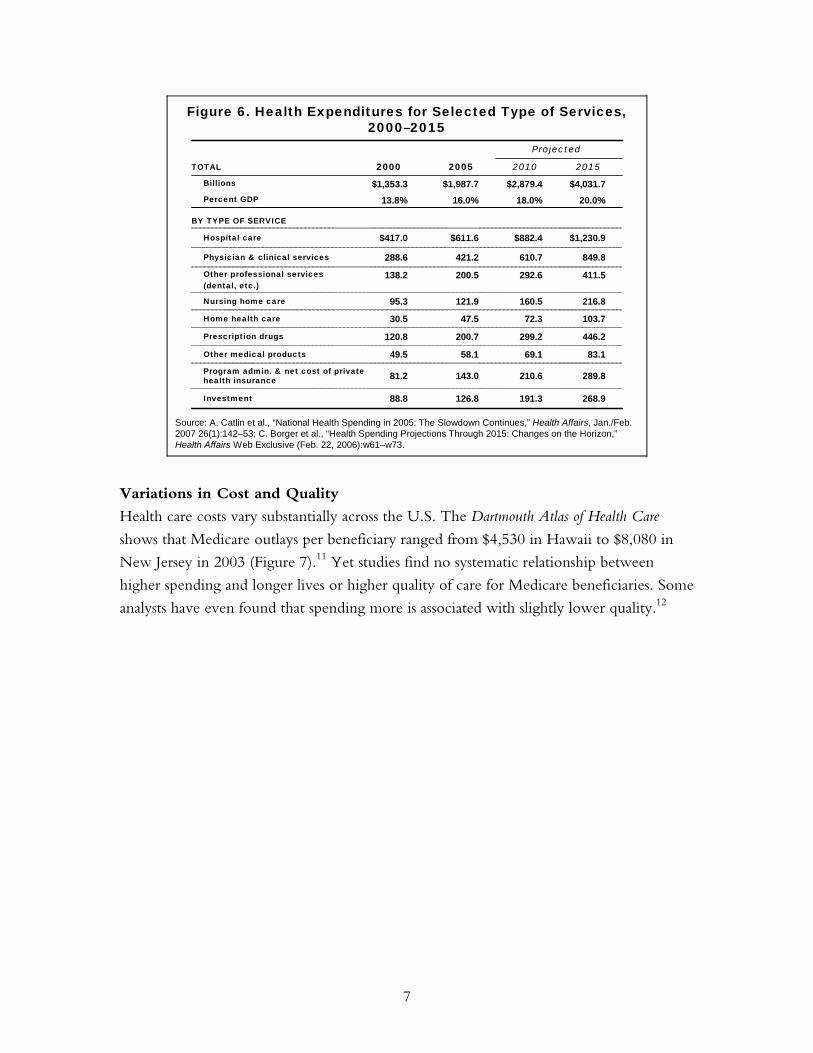
The Centers for Medicare and Medicaid Services (CMS) projects that health
expenditures will continue to outstrip increases in GDP over the next 10 years. By 2015,
CMS estimates that total health spending will double—passing the $4 trillion mark, or 20
percent of GDP (Figure 6). Wide variations in cost and quality across the U.S. underlie
these national trends, indicating opportunities to improve efficiency.
7
Figure 6. Health Expenditures for Selected Type of Services, 2000–2015
Projected
BY TYPE OF SERVICE
289.8210.6143.081.2Program admin. & net cost of private health insurance
849.8610.7421.2288.6Physician & clinical services
103.772.347.530.5Home health care
411.5292.6200.5138.2Other professional services (dental, etc.)
446.2299.2200.7120.8Prescription drugs
268.9191.3126.888.8Investment
83.169.158.149.5Other medical products
216.8160.5121.995.3Nursing home care
$1,230.9$882.4$611.6$417.0Hospital care
20.0%18.0%16.0%13.8%Percent GDP
$4,031.7$2,879.4$1,987.7$1,353.3Billions
2015201020052000TOTAL
Source: A. Catlin et al., “National Health Spending in 2005: The Slowdown Continues,” Health Affairs, Jan./Feb. 2007 26(1):142–53; C. Borger et al., “Health Spending Projections Through 2015: Changes on the Horizon,” Health Affairs Web Exclusive (Feb. 22, 2006):w61–w73.
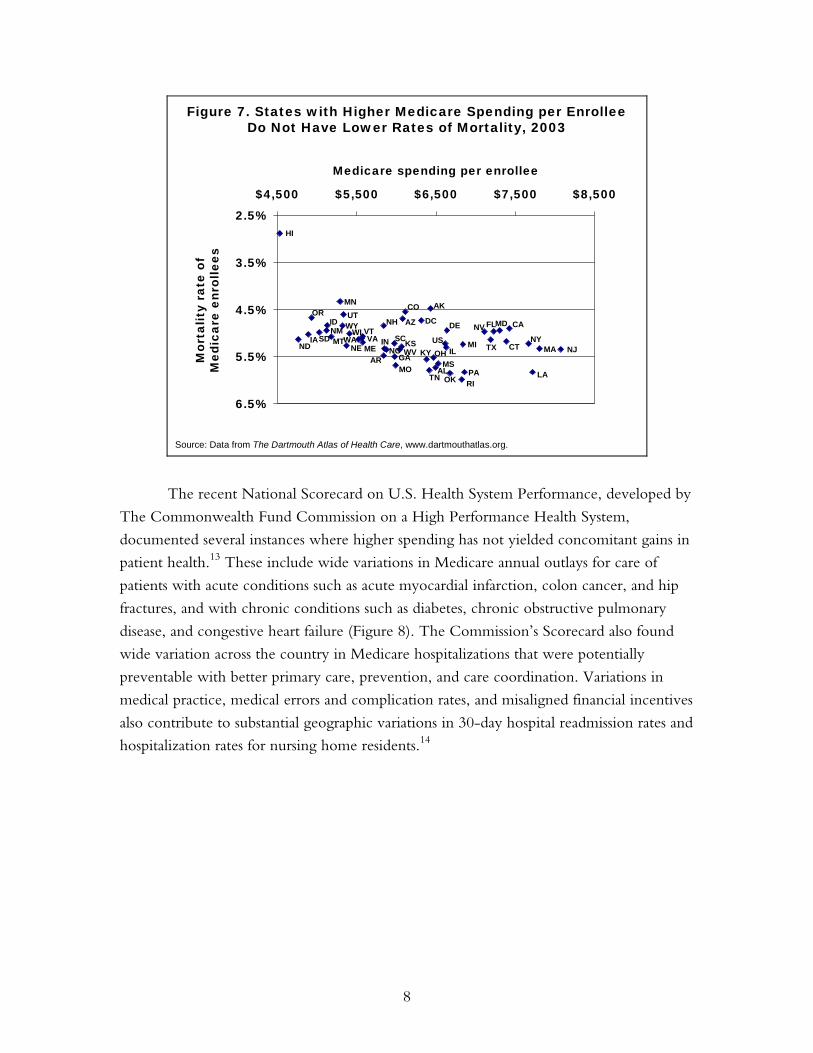
Variations in Cost and Quality
Health care costs vary substantially across the U.S. The Dartmouth Atlas of Health Care
shows that Medicare outlays per beneficiary ranged from $4,530 in Hawaii to $8,080 in
New Jersey in 2003 (Figure 7).11 Yet studies find no systematic relationship between
higher spending and longer lives or higher quality of care for Medicare beneficiaries. Some
analysts have even found that spending more is associated with slightly lower quality.12
8
2.5%
3.5%
4.5%
5.5%
6.5%
$4,500 $5,500 $6,500 $7,500 $8,500
Medicare spending per enrollee
HI
NDIA
OR
SDNMID
MT
MN
WYUT
NE
WIWA VA
VT
MEAR
NH
INNC
SC
GAMO
WVKS
AZ
CO
DC
KY
TN
AK
OH
ALMS
USIL
DE
OK RI
MI
PA
NV
TX
FLMD
CT
CA
NY
LA
MA NJ
Mor
talit
y ra
te o
fM
edic
are
enro
llees
Figure 7. States with Higher Medicare Spending per EnrolleeDo Not Have Lower Rates of Mortality, 2003
Source: Data from The Dartmouth Atlas of Health Care, www.dartmouthatlas.org.
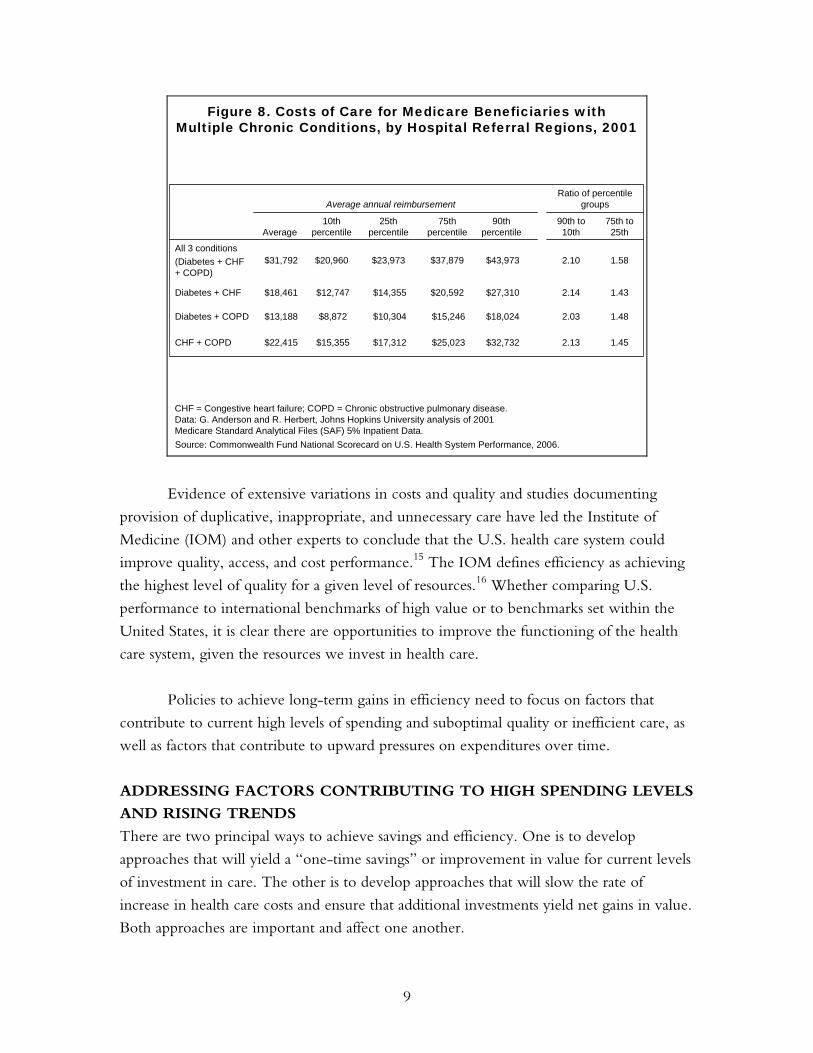
The recent National Scorecard on U.S. Health System Performance, developed by
The Commonwealth Fund Commission on a High Performance Health System,
documented several instances where higher spending has not yielded concomitant gains in
patient health.13 These include wide variations in Medicare annual outlays for care of
patients with acute conditions such as acute myocardial infarction, colon cancer, and hip
fractures, and with chronic conditions such as diabetes, chronic obstructive pulmonary
disease, and congestive heart failure (Figure 8). The Commission’s Scorecard also found
wide variation across the country in Medicare hospitalizations that were potentially
preventable with better primary care, prevention, and care coordination. Variations in
medical practice, medical errors and complication rates, and misaligned financial incentives
also contribute to substantial geographic variations in 30-day hospital readmission rates and
hospitalization rates for nursing home residents.14
9
Figure 8. Costs of Care for Medicare Beneficiaries withMultiple Chronic Conditions, by Hospital Referral Regions, 2001
Ratio of percentile groupsAverage annual reimbursement
2.13
2.03
2.14
2.10
90th to 10th
$32,732
$18,024
$27,310
$43,973
90th percentile
$22,415
$13,188
$18,461
$31,792
Average
$25,023
$15,246
$20,592
$37,879
75th percentile
1.45$17,312 $15,355 CHF + COPD
1.48$10,304 $8,872 Diabetes + COPD
1.43$14,355$12,747Diabetes + CHF
1.58$23,973$20,960All 3 conditions(Diabetes + CHF+ COPD)
75th to 25th
25th percentile
10th percentile
CHF = Congestive heart failure; COPD = Chronic obstructive pulmonary disease.Data: G. Anderson and R. Herbert, Johns Hopkins University analysis of 2001 Medicare Standard Analytical Files (SAF) 5% Inpatient Data.Source: Commonwealth Fund National Scorecard on U.S. Health System Performance, 2006.
Evidence of extensive variations in costs and quality and studies documenting
provision of duplicative, inappropriate, and unnecessary care have led the Institute of
Medicine (IOM) and other experts to conclude that the U.S. health care system could
improve quality, access, and cost performance.15 The IOM defines efficiency as achieving
the highest level of quality for a given level of resources.16 Whether comparing U.S.
performance to international benchmarks of high value or to benchmarks set within the
United States, it is clear there are opportunities to improve the functioning of the health
care system, given the resources we invest in health care.
Policies to achieve long-term gains in efficiency need to focus on factors that
contribute to current high levels of spending and suboptimal quality or inefficient care, as
well as factors that contribute to upward pressures on expenditures over time.
ADDRESSING FACTORS CONTRIBUTING TO HIGH SPENDING LEVELS
AND RISING TRENDS
There are two principal ways to achieve savings and efficiency. One is to develop
approaches that will yield a “one-time savings” or improvement in value for current levels
of investment in care. The other is to develop approaches that will slow the rate of
increase in health care costs and ensure that additional investments yield net gains in value.
Both approaches are important and affect one another.
10
One-time savings are likely to derive from approaches that address factors that
contribute to current high levels of U.S. expenditures, inefficiency, and waste. These
factors include:
• overuse, inappropriate, or ineffective use of care;
• payment incentives that reward the delivery of more services, without
consideration to clinical value or cost-effectiveness;
• market power of insurers, providers, and the health industry, including
pharmaceutical companies, device manufacturers, and other suppliers to set prices
above competitive market levels;
• a low ratio of primary to specialty care physicians and services;
• access barriers to preventive and primary care that contribute to avoidable
hospital admissions, emergency department use, and complications of chronic
and acute disease;
• a lack of well-coordinated care that leads to unsafe, duplicative, or conflicting care;
• inadequate information systems and information exchange; and
• high administrative costs, including the high proportion of insurance premiums
used to cover overhead costs, the complexity of insurance benefit design and
duplicative and uncoordinated requirements, and administrative costs for providers.
The principal factors that contribute to long-term trends in rising expenditures that
might be amenable to policy change are somewhat different. They include:
• introduction of new technologies/innovations without comparative information
on clinical outcomes or cost-effectiveness to guide decisions on adoption and use;
• wages and prices of other hospital-purchased goods and services;
• growing market power and consolidation of insurers, providers, and the health
industry including pharmaceutical companies, device manufacturers, and other
suppliers contributing to less choice and higher prices; and
• the increasing prevalence of chronic diseases.
It is critical to consider ways to achieve one-time savings as well as address cost
trends, because both strategies could yield substantial cumulative gains over time. Consider
a policy option that has the effect of achieving a one-time reduction in the level of health
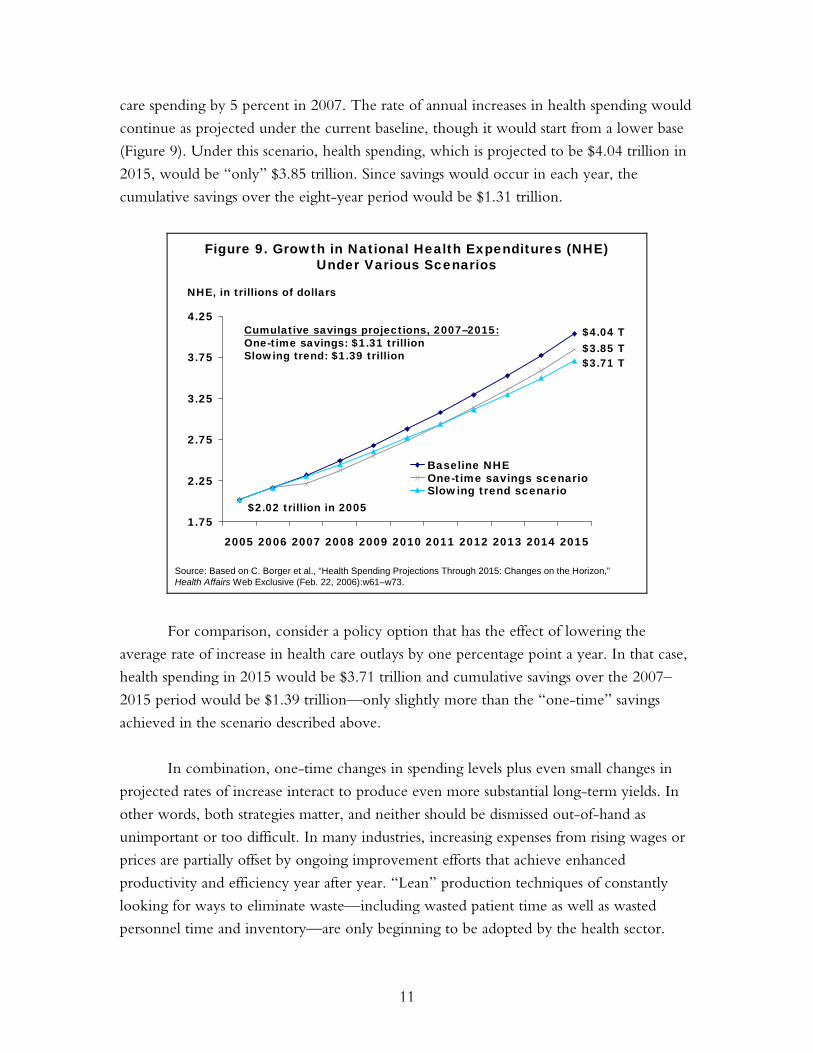
11
care spending by 5 percent in 2007. The rate of annual increases in health spending would
continue as projected under the current baseline, though it would start from a lower base
(Figure 9). Under this scenario, health spending, which is projected to be $4.04 trillion in
2015, would be “only” $3.85 trillion. Since savings would occur in each year, the
cumulative savings over the eight-year period would be $1.31 trillion.
Figure 9. Growth in National Health Expenditures (NHE)Under Various Scenarios
11
1.75
2.25
2.75
3.25
3.75
4.25
2005 2006 2007 2008 2009 2010 2011 2012 2013 2014 2015
Baseline NHEOne-time savings scenarioSlowing trend scenario
$2.02 trillion in 2005
Cumulative savings projections, 2007–2015:One-time savings: $1.31 trillionSlowing trend: $1.39 trillion $3.71 T
$3.85 T$4.04 T
Source: Based on C. Borger et al., “Health Spending Projections Through 2015: Changes on the Horizon,” Health Affairs Web Exclusive (Feb. 22, 2006):w61–w73.
NHE, in trillions of dollars
For comparison, consider a policy option that has the effect of lowering the
average rate of increase in health care outlays by one percentage point a year. In that case,
health spending in 2015 would be $3.71 trillion and cumulative savings over the 2007–
2015 period would be $1.39 trillion—only slightly more than the “one-time” savings
achieved in the scenario described above.
In combination, one-time changes in spending levels plus even small changes in
projected rates of increase interact to produce even more substantial long-term yields. In
other words, both strategies matter, and neither should be dismissed out-of-hand as
unimportant or too difficult. In many industries, increasing expenses from rising wages or
prices are partially offset by ongoing improvement efforts that achieve enhanced
productivity and efficiency year after year. “Lean” production techniques of constantly
looking for ways to eliminate waste—including wasted patient time as well as wasted
personnel time and inventory—are only beginning to be adopted by the health sector.
12
STRATEGIES FOR ACHIEVING SAVINGS AND IMPROVING HEALTH
SYSTEM PERFORMANCE
Potential strategies to move the U.S. to a higher value, more efficient health care system
cluster into six main areas:
• increasing the effectiveness of markets by improving access to information on the
quality and costs of care, promoting greater competition, and developing better
information on the cost-effectiveness of health care technology and procedures;
• reducing high insurance administrative overhead and achieving more
competitive prices;
• providing payment incentives to promote efficient and effective care;
• changing the health care system to promote patient-centered primary care;
• investing in infrastructure such as health information technology and information
exchange systems; and
• investing strategically to improve access, affordability, and equity.
Effective policy options should focus on changing total national expenditures
rather than simply shifting costs from one payer source to another. Some policies may
have a greater effect on federal budget outlays, while others may affect outlays by state
government, employers, or households. Achieving improved value for the national
investment in health care requires policies that achieve net gains for the whole country. At
the national level, the policies should:
• be amenable to federal policy action;
• improve health outcomes, quality, access, efficiency, or equity;
• have a high likelihood of significant reduction in expenditure levels and/or trends
compared with current projections, or achieve a net improvement in value;
• be evidence-based and feasible to implement; and
• be reasonable first steps toward longer-term reforms.
Increasing the Effectiveness of Markets: Incentives for Value-Driven Health
Plans and Improved Competition
Across the U.S., there are various private and public initiatives to improve quality by
holding physicians and hospitals accountable for delivering care according to clinical
guidelines through performance reporting and pay-for-performance incentives. Sometimes
13
called “value-based purchasing,” these efforts focus particularly on underuse of preventive
and essential, effective care, especially for patients with acute conditions (e.g., heart
attacks) or chronic diseases (e.g., diabetes or asthma) and seek to encourage efficient care
practices for patients with complex or serious illness. In sharp contrast, recent insurance
market trends have moved in the opposite direction, with ever-higher deductibles creating
incentives for patients to forgo preventive care or chronic disease management.
Again and again, studies have found that high cost-sharing, including deductibles,
leads patients—particularly those with low or modest incomes—to forgo both essential
and more discretionary care. This can have negative consequences, particularly for those
with chronic disease and lower incomes.17 Recent studies of prescription drug benefit
designs indicate that failure to cover or to impose high copayments on essential
medications for patients with chronic conditions can result in avoidable complications,
leading to higher total costs of care from increased use of emergency rooms and
hospitals.18 Yet, current federal tax policy favors insurance plans with high front-end
patient cost-sharing across the board. The current trend in insurance benefit design and
current tax policy, combined with purchaser efforts to hold providers more accountable,
creates “a marked conflict of incentives in the healthcare marketplace.”19
“Value-driven” health benefit designs and tax policies that support such designs (or
are at least neutral) could better align patient and provider incentives.20 They could, for
example, encourage patients to seek primary, preventive, and essential medical care and
medications by providing either full coverage or nominal copayments for such services,
while targeting higher cost-sharing on supply-sensitive specialized services that are subject
to overuse. A starting point would be to amend the current rules for federal health savings
accounts—exempting essential, primary, and preventive care from deductibles required
under such plans and applying lower cost-sharing for use of “high-value” provider
networks. Federal policy could encourage employer groups to experiment with health
plan designs that cover asthma, diabetes, and other disease management programs that
waive cost-sharing for patients who participate in disease management programs or obtain
care from physician groups that take on coordinating roles.
Providing incentives for more effective and efficient care will require better
information. Currently, U.S. health care markets provide little by way of comparative
information about the quality of care (adherence to guidelines, outcomes of care, or safety)
or the costs, whether for a specific service or total costs for an episode of care. Expanded
collection and public reporting of data on quality and long-term comparative costs would
enable benchmarking and inform efforts to improve. Studies indicate that public reporting
can spur innovation and improvement efforts by hospitals and physician groups by
14
appealing to their professionalism and pointing to areas for improvement as well as
achievable levels of higher performance.21 To the extent that patients face choices of
alternative sources of care, information on outcomes could also encourage patients to
seek care in networks of excellence. Strategies to support public reporting will require
collaborative approaches that cut across public and private payers to enable collection
and dissemination of broad, community-based information. Policy strategies to promote
transparency and enhance value in the Medicare program are discussed in other reports
in this series.22
Policies could also encourage shared decision-making between patients and
providers. Studies indicate that engaging patients for such interventions as management of
back pain or chronic disease can lead to better patient outcomes, in addition to being cost-
effective. Yet, patients often are left out of end-of-life care decisions, lack information
about the benefits and risks of alternative treatment choices, or receive little instruction or
support to manage their care at home.23 Federal initiatives that support the development
of shared decision-making tools, or demonstration programs using Medicare or Medicaid
payment incentives to encourage and support physician practices that take such patient-
centered care approaches, could encourage patient engagement.
All of the above policies—taking a value-based approach to insurance design,
aligning patient and physician incentives, and engaging patients—require information
about the clinical and cost effectiveness of alternative treatment options. This will be
especially true as medial science progresses, since “new” is not always better. Decision
makers often have little information to inform their coverage or payment choices. Such
information is critical for ensuring that care decisions and expenditures yield value.
Generating Information on Clinical and Cost-Effectiveness to Enhance
Coverage Policy and Medical Decision-Making
A major factor in the current high level of and anticipated future growth in health
spending is technological change, including innovations in equipment, medications,
treatments, and procedures.24 Unlike in other markets, technology in the health care
market tends to raise costs in two ways: 1) technological advances can increase the per-unit
cost of care, by providing more complex and expensive modes of “standard” treatment;
and 2) new technologies can provide opportunities to treat patients with characteristics or
conditions that older technologies were unable to treat safely or effectively.25
Better medical decision-making is crucial for improving the performance of the
health care system. To improve medical decision-making, more and better information
15
about the benefits, risks, and costs of new medical treatments, procedures, and
technologies is needed. Substantial increases in funding of basic sciences, clinical research,
and translational research are having the desired result of expanding the number of
potentially valuable new medical tools in the pipeline. Yet, there has not been a
comparable focus on building the evidence base to support informed adoption and use of
these tools. As a result, health care decision makers are routinely faced with difficult
clinical and financial decisions without having reliable information on the comparative
clinical value or cost-effectiveness of alternative treatments.
In addition to informing coverage and payment decisions, high-quality evidence
regarding the risks, benefits, and costs of health care interventions is also necessary for
sound clinical decision-making. Moreover, this information can facilitate the development
of reliable measures of quality, which in turn will support the alignment of financing and
other incentives to encourage higher quality and increased health system efficiency.
Health care purchasers are generally not influential participants in the clinical
research enterprise. To remedy this, we need research design mechanisms that permit
payers to play a major role in developing the evidence needed to support their purchasing
decisions. Evidence-based decision-making has been widely identified as a critical
component of efforts to obtain better value for health care. This activity cannot succeed
without targeted efforts to identify, produce, and disseminate the evidence required to
inform payer and coverage decisions.
Analyses of Medicare data repeatedly reveal wide variations in cost and quality
performance across the country between states and hospital referral regions. These analyses
identify geographic areas and care systems that are among the top performers in terms of
quality of care (i.e., care outcomes and clinical indicators) and are also able to deliver care
at lower costs, compared with national averages. The high-performing areas typically have
fewer physicians involved in the care of patients, fewer hospital readmissions or transitions
across sites of care, and greater reliance on primary care. The link between more intensive
use of specialists and multiple physicians and higher costs without gains in quality remains,
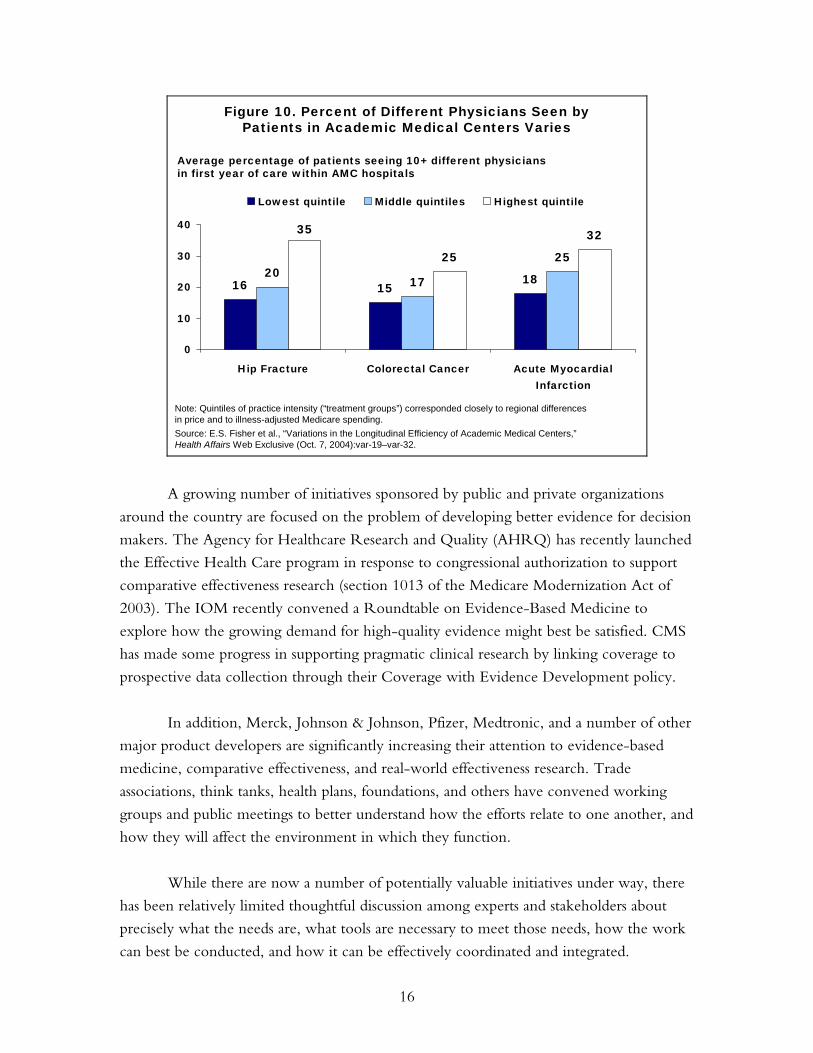
even when analysis is restricted to academic health care centers. Patients cared for in
centers with costs in the top quintile were about twice as likely to see 10 or more different
physicians over the course of the year after hospitalization for a hip fracture or a heart
attack as were patients seen in the lowest-cost quintile (Figure 10).26 The geographic area
comparisons as well as comparisons among specific care systems indicate that it should be
possible to achieve net gains in value if the nation developed payment and delivery system
polices that encourage and support more effective and efficient care.
16
Figure 10. Percent of Different Physicians Seen byPatients in Academic Medical Centers Varies
16 151820
17
2525
3235
0
10
20
30
40
Hip Fracture Colorectal Cancer Acute MyocardialInfarction
Lowest quintile Middle quintiles Highest quintile
Note: Quintiles of practice intensity (“treatment groups”) corresponded closely to regional differences in price and to illness-adjusted Medicare spending.Source: E.S. Fisher et al., “Variations in the Longitudinal Efficiency of Academic Medical Centers,” Health Affairs Web Exclusive (Oct. 7, 2004):var-19–var-32.
Average percentage of patients seeing 10+ different physiciansin first year of care within AMC hospitals
A growing number of initiatives sponsored by public and private organizations
around the country are focused on the problem of developing better evidence for decision
makers. The Agency for Healthcare Research and Quality (AHRQ) has recently launched
the Effective Health Care program in response to congressional authorization to support
comparative effectiveness research (section 1013 of the Medicare Modernization Act of
2003). The IOM recently convened a Roundtable on Evidence-Based Medicine to
explore how the growing demand for high-quality evidence might best be satisfied. CMS
has made some progress in supporting pragmatic clinical research by linking coverage to
prospective data collection through their Coverage with Evidence Development policy.
In addition, Merck, Johnson & Johnson, Pfizer, Medtronic, and a number of other
major product developers are significantly increasing their attention to evidence-based
medicine, comparative effectiveness, and real-world effectiveness research. Trade
associations, think tanks, health plans, foundations, and others have convened working
groups and public meetings to better understand how the efforts relate to one another, and
how they will affect the environment in which they function.
While there are now a number of potentially valuable initiatives under way, there
has been relatively limited thoughtful discussion among experts and stakeholders about
precisely what the needs are, what tools are necessary to meet those needs, how the work
can best be conducted, and how it can be effectively coordinated and integrated.
17
Improving Insurance Efficiency: Private Markets, Medicare, and Medicaid
In the U.S., insurance-related administrative costs per person and as a percent of national
health expenditures are the highest in the world and rising rapidly. The difference
between premiums and claims payments—that is, net insurance administrative costs and
profits—has increased 75 percent over the past five years. Despite the move toward
electronic billing, overhead costs have been increasing at annual rates well in excess of
total spending on physicians or hospitals. Currently, net private insurance overhead and
administrative costs account for 14 percent of total private insurance expenditures.
Fragmentation of insurance plans and risk pools across individual and small group markets
contributes to the high overhead costs, as do marketing, underwriting, multiple complex
benefit designs, provider price negotiations and network management, and high rates of
churning in enrollment.
The private insurance market is also highly concentrated. In all but three states, the
dominant carrier accounts for 50 percent or more of total private insurance enrollment, and
the top three carriers control 65 percent to 100 percent of the market in all but 14 states.27
Commercial insurance profit margins are at record levels: the five leading commercial
insurance carriers each paid out only 80 percent of premium revenues in medical claims as
of 2003. Operating profit margins ranged from 7.7 percent to 10.2 percent. Insurance
carriers’ profit margins have fueled a surge in stock prices in recent years.
Recent consolidation of health plans participating in Medicaid programs, including
multi-state carriers, has enabled plans to enter and exit state markets depending on target
rates of return. The consolidation puts upward pressure on Medicaid payment rates to
plans in order to maintain participation.28 As a recent Wall Street Journal front-page article
noted, Medicaid has become a big and lucrative market for private managed care plans.29
The article also noted arrangements such as limited oncology care networks that increase
margins for plans but make it difficult for Medicaid beneficiaries to receive appropriate and
timely care.
The complexity of current insurance arrangements and the lack of streamlined,
coordinated efforts on reporting, credentialing, quality standards, price negotiations, and
other billing-related administrative costs also increase insurance-related costs to physicians
and hospitals. One study in California estimated that billing and insurance-related
administrative costs account for about 20 percent of total private health care expenditures in
the state, not counting administration costs related to quality review or care management.30
18
Some employers are eliminating the insurance “middleman” in employee health
benefits. Techniques include: directly contracting with physicians and hospitals; self-
insuring but contracting with insurers to administer the health benefit; replacing
pharmaceutical benefit managers with organizations paid an administrative fee or requiring
transparency of pharmaceutical benefit managers and “fee-only” contracts.31
Pooling individual and small group markets through insurance “connectors,” such
as that under development in Massachusetts, has the potential to lower insurance
administrative costs by pooling risk, creating more efficient group health plans, and
reducing payments to insurance brokers who advise employers on selection of plans.32 The
federal government could encourage such group arrangements through tax policy or
support of start-up costs or reinsurance arrangements that would be contingent on
participation in the insurance connector. Eligibility for federal tax deductibility could also
be linked to efforts to streamline and simplify processes to lower insurance administrative
costs for providers, as could requirements for public transparency in insurance pricing and
administrative costs.
Within Medicare, changes to the way the program pays for private plans have also
led to higher rates. Currently, Medicare Advantage plans are paid 12.4 percent more per
enrollee, compared with enrollee costs in fee-for-service Medicare.33 On an aggregate
basis, this amounts to $5 billion in added costs per year. Although on average Medicare
Advantage plans provide richer benefits than fee-for-service coverage, the impact of
benefit designs on individual enrollees can vary substantially from plan to plan.34
Medicare could also reduce administrative costs by offering a comprehensive
benefit option, “Medicare Extra,” that would combine current Medicare benefits,
Medigap benefits, and prescription drug coverage in one unified plan.35 Savings from
reduced administrative layers would help finance enhanced benefits, with total premium
costs at or below current private supplemental options. Offering a comparable benefits
package under traditional Medicare and “leveling the playing field” would encourage
competition with private plans based on quality and performance.36
Medicaid program administrative costs are related to high rates of churning in and
out of coverage. Complex paperwork, enrollment, and recertification processes result in
higher than necessary administrative costs and barriers to maintaining stable coverage.
Typically, a high percentage of children and adults loses coverage during any one month
and returns later in the year. This churning makes it difficult to maintain continuity of
care or hold plans accountable for the quality and efficiency of care provided over time.
19
Federal minimum standards could reduce barriers to coverage by simplifying the
enrollment and recertification processes and easing the asset tests. This could improve
access to preventive and primary care and lower overhead costs, thus enhancing the
effectiveness and efficiency of Medicaid coverage.
Achieving Competitive Pharmaceutical Prices
Anderson and Reinhardt argue that a major reason health care costs in the U.S. are higher
than in other countries is that we pay higher prices. There is a general reluctance to use
the nation’s purchasing power to negotiate reasonable rates.37 In one study, the average
price in 2003 for 30 leading prescription drugs in the U.S. was 52 percent lower in
Canada than in the U.S., 59 percent lower in France, and 47 percent lower in the United
Kingdom.38 A recent newspaper article noted: “As Europe and Japan take a hard line on
pharmaceutical prices, drug makers are getting an ever-higher percentage of sales and
profits from the United States.”39 One drug company reported that its prices in the United
States rose 11 percent in the third quarter of 2006, while falling 3 percent in Europe and 5
percent in Japan. Another report noted that the combined profits of seven major drug
companies hit 18 percent in 2004, or $34.3 billion.40
These numbers indicate that there may be substantial opportunity for the market
power of large drug purchasers such as Medicare to reduce prices and achieve savings. For
example, the Veterans Administration (VA) obtained a 24 percent discount off the
manufacturer’s favored commercial price for patented products.41 The VA’s success may or
may not apply to Medicare. The VA was able to take advantage of its ability to buy at the
margin—that is, use its large purchasing power to negotiate more favorable prices without
distorting the market for the drugs that it buys. Medicare, with its 43 million beneficiaries,
may not be able to do so, but the program could wield substantially greater market power
because of its size and thus might be able to extract reasonable price concessions.
Moreover, Medicare could partner with other payers to put pressure on drug companies
to reduce excessive prices.
Another way that Medicare could use its role as a major purchaser would be to
extend the “coverage with evidence development” approach, which it has applied in a
few cases. This approach links Medicare coverage of specific promising technologies
(including drugs) to a requirement that patients participate in a registry or clinical trial.42
This would provide access to promising drugs while encouraging post-marketing
surveillance and the development of better evidence to determine whether and how new
drugs would be effective. This approach could be productively adopted by private payers
as well.
20
Rewarding Quality and Efficiency
Private and public payers, purchasers, and providers have over the past several years been
developing strategies to change the payment system to reward quality and better outcomes,
rather than quantity with no regard to outcomes. The Leapfrog Group’s Incentive and
Reward Compendium lists almost 100 programs around the country aimed at providing
financial incentives to improve quality.43 Several of these initiatives are already beginning
to produce results, indicating that this approach holds some promise.44
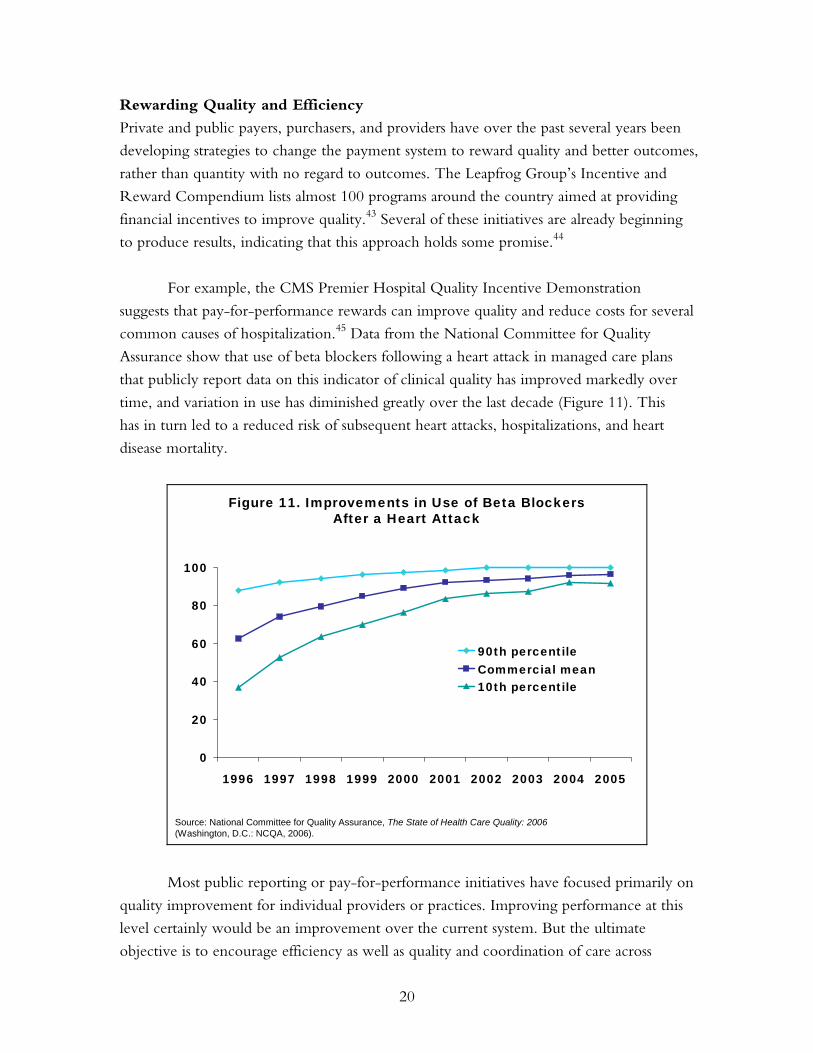
For example, the CMS Premier Hospital Quality Incentive Demonstration
suggests that pay-for-performance rewards can improve quality and reduce costs for several
common causes of hospitalization.45 Data from the National Committee for Quality
Assurance show that use of beta blockers following a heart attack in managed care plans
that publicly report data on this indicator of clinical quality has improved markedly over
time, and variation in use has diminished greatly over the last decade (Figure 11). This
has in turn led to a reduced risk of subsequent heart attacks, hospitalizations, and heart
disease mortality.
Figure 11. Improvements in Use of Beta BlockersAfter a Heart Attack
Source: National Committee for Quality Assurance, The State of Health Care Quality: 2006(Washington, D.C.: NCQA, 2006).
0
20
40
60
80
100
1996 1997 1998 1999 2000 2001 2002 2003 2004 2005
90th percentileCommercial mean10th percentile
Most public reporting or pay-for-performance initiatives have focused primarily on
quality improvement for individual providers or practices. Improving performance at this
level certainly would be an improvement over the current system. But the ultimate
objective is to encourage efficiency as well as quality and coordination of care across
21
providers. This would ensure that efficient, high-quality care is provided to the growing
number of people with chronic illnesses—those who have the greatest health care needs
and account for the majority of health care costs.
Health system efficiency is especially important, given the high level of spending in
the U.S. compared with other countries and the absence of correspondingly better
outcomes. In fact, even within the country, spending and outcomes are generally not
related. Median spending per Medicare beneficiary with all three of the following
conditions—diabetes, chronic obstructive pulmonary disease, and congestive heart
failure—across 306 hospital referral regions is almost $30,000, but spending across regions
ranged from less than $15,000 to almost $80,000.46 No obvious correlation between cost
and quality of care for the three conditions was found, but there were some areas with
high quality and low costs. Providers in other areas could be challenged to follow the
example of those in the high-efficiency areas by being given incentives to improve.
Medicare payment might also be structured to reward more efficient areas. For example,
physician fee updates might only be permitted in more efficient areas and sustainable
growth rate limits applied in high-cost/low-quality areas.
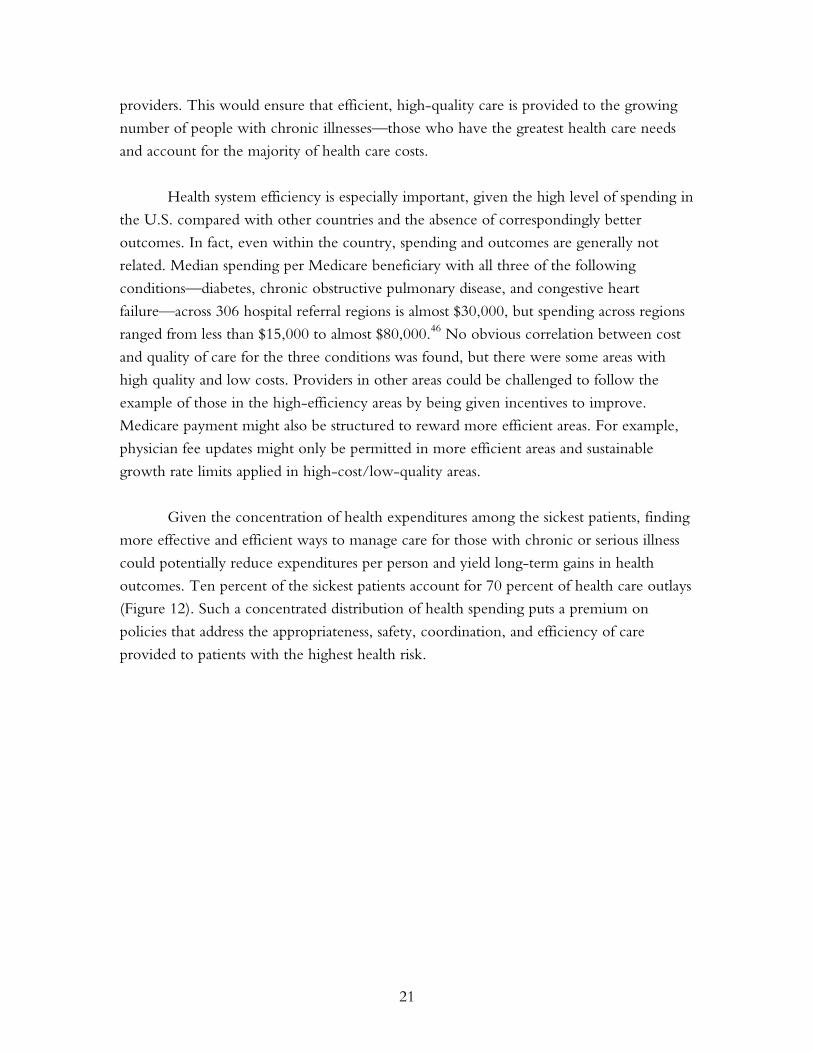
Given the concentration of health expenditures among the sickest patients, finding
more effective and efficient ways to manage care for those with chronic or serious illness
could potentially reduce expenditures per person and yield long-term gains in health
outcomes. Ten percent of the sickest patients account for 70 percent of health care outlays
(Figure 12). Such a concentrated distribution of health spending puts a premium on
policies that address the appropriateness, safety, coordination, and efficiency of care
provided to patients with the highest health risk.
22
0%10%20%30%40%50%60%70%80%90%
100%
U.S. Population Health Expenditures
Figure 12. Health Care Costs Concentrated in Sick Few—Sickest 10 Percent Account for 64 Percent of Expenses
1%5%
10%
49%
64%
24%
Source: S. H. Zuvekas and J. W. Cohen, “Prescription Drugs and the Changing Concentration of Health Care Expenditures,” Health Affairs, Jan./Feb. 2007 26(1):249–57.
50%
97%
$36,280
$12,046
$6,992
$715
Distribution of health expenditures for the U.S. population,by magnitude of expenditure, 2003
Expenditure threshold (2003 dollars)
Coordination is an increasingly important dimension of health care delivery, with a
rising proportion of the population—especially seniors—having multiple chronic
conditions and being treated by multiple doctors. The more than 20 percent of Medicare
beneficiaries with five or more chronic conditions are treated by an average of almost 14
different doctors in a given year.47 In our current payment system, there is little to
encourage physicians to communicate with each other about patients. Measures that assess
coordination among providers and payment policies that encourage them to consider the
continuum of care are essential. This could be accomplished by basing payment on longer
episodes of care related to a patient’s acute or chronic conditions, rather than individual
hospital stays or ambulatory encounters.
Strengthening Primary Care
There is ample evidence that the supply of primary care physicians is inversely related to
total costs of health services, while health outcomes are generally better in areas with a
strong foundation of primary care physicians.48 Costs vary significantly for similar
population groups across geographic areas or care systems because of differences in the
style of medical practice, ratios of primary to more specialized physicians, and the extent
to which primary care physicians play a central, coordinating role. Areas with relatively
higher supplies of specialists and more extensive use of multiple specialists use more
specialized, expensive resources and treatments. Fisher and colleagues at Dartmouth
Medical School find that the key determinant of geographic variations in the total cost of
23
caring for patients with certain conditions is the supply of specialists and ratio of specialist
to primary care physicians. After accounting for health risks, they found that patients in
areas with more specialist physicians visit such physicians more frequently and receive
more specialized procedures.49
Unfortunately, there has been a persistent trend of declining interest in primary
care medical specialties among graduating medical students.50 Three strategies could
capitalize on the potential for primary care to improve efficiency in the United States:
increasing the primary care workforce; expanding the use of primary care teams, including
nurses; and strengthening financial incentives and support of enhanced capacity in primary
care practices to provide accessible, effective, and efficient care.
Strategies for increasing the workforce include financial incentives for providers
(e.g., higher relative pay for primary care practice and loan forgiveness programs) and
training institutions (e.g., higher federal support for graduate medical education in primary
care). Incentives could also be used to expand the non-physician primary care workforce,
including advanced practice nurses. Case management or capitation payments could make
practicing primary care more attractive by increasing practice support systems (including
the use of care teams) and establishing off-hours care programs that ensure reasonable and
predictable working hours. Such direct support of primary care practices strengthens their
capacity to care for patients and enhances their appeal to medical students.
The three major primary care specialty organizations, the American Academy of
Family Physicians (AAFP), the American College of Physicians (ACP), and the American
Academy of Pediatrics (AAP), have all advocated for “medical homes.” The ACP defines
the advanced medical home as “a physician practice that provides comprehensive,
preventive, and coordinated care centered on their patient’s needs, using health information
technology and other process innovations to assure high quality, accessible, and efficient
care.”51 In order for these types of practices to succeed, changes in workforce and training
policies, as well as payment reforms are needed. For example, instead of fee-for-service
payments, a payment structure based on a monthly fee for every patient enrolled in the
medical home could support teams and new practice arrangements and provide incentives
for desired behaviors such as care coordination, preventive services, and investment in
advanced information systems.52 Such reform could increase the primary care workforce
and improve primary care practice. One new promising piece of Medicare legislation
might help to alleviate reimbursement concerns for primary care practices. The Tax Relief
and Health Care Act of 2006 calls for a Medicare Medical Home Demonstration Project
that will offer management fees to clinicians who serve as personal physicians and
incentive payments to physicians in practices that provide medical home services.
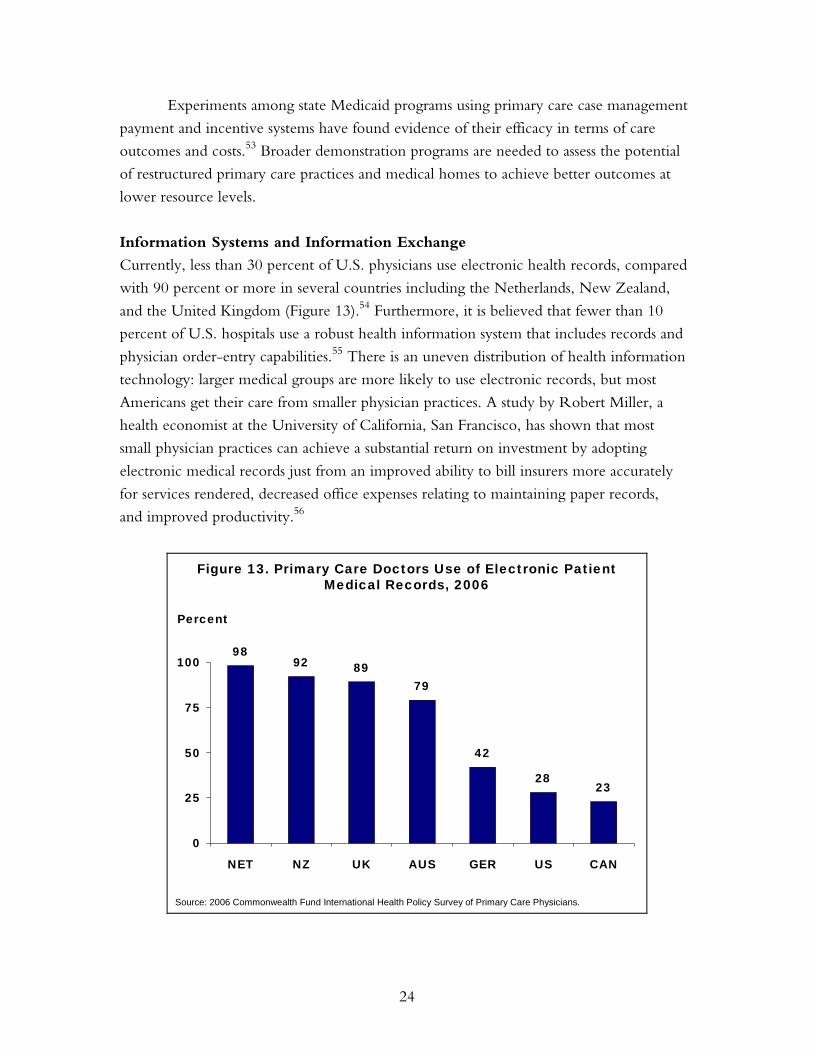
24
Experiments among state Medicaid programs using primary care case management
payment and incentive systems have found evidence of their efficacy in terms of care
outcomes and costs.53 Broader demonstration programs are needed to assess the potential
of restructured primary care practices and medical homes to achieve better outcomes at
lower resource levels.
Information Systems and Information Exchange
Currently, less than 30 percent of U.S. physicians use electronic health records, compared
with 90 percent or more in several countries including the Netherlands, New Zealand,
and the United Kingdom (Figure 13).54 Furthermore, it is believed that fewer than 10
percent of U.S. hospitals use a robust health information system that includes records and
physician order-entry capabilities.55 There is an uneven distribution of health information
technology: larger medical groups are more likely to use electronic records, but most
Americans get their care from smaller physician practices. A study by Robert Miller, a
health economist at the University of California, San Francisco, has shown that most
small physician practices can achieve a substantial return on investment by adopting
electronic medical records just from an improved ability to bill insurers more accurately
for services rendered, decreased office expenses relating to maintaining paper records,
and improved productivity.56
Figure 13. Primary Care Doctors Use of Electronic Patient Medical Records, 2006
9892 89
79
42
2823
0
25
50
75
100
NET NZ UK AUS GER US CAN
Percent
Source: 2006 Commonwealth Fund International Health Policy Survey of Primary Care Physicians.
25
There is no consensus about whether health information technology would
actually reduce overall medical care expenditures for the U.S. health care system.
However, there seems little question that it would improve health system performance
and could potentially lower overall costs, depending upon how well it is managed. Just a
few of the advantages of health information technology include legibility, which is
particularly important in terms of improving communication and reducing medical errors
when care is shared among multiple providers; the ability to provide decision-support,
including reminders and prompts to help clinicians make the most appropriate diagnoses,
choose tests efficiently, and prescribe and apply appropriate treatments; and the ability to
aggregate information about a patient and reduce duplication of testing.
In order to achieve these benefits, there is a need for initial investment and
centralized functions, including setting technology standards and managing information
exchanges that enable patient data from multiple sources (e.g., physicians, hospitals,
pharmacies, laboratories, nursing homes, and home health nurses) to be aggregated, shared,
and analyzed, with appropriate privacy protections. The investment required to achieve
this type of interoperability in the health care system has been estimated to be $150 billion
initially, with an annual maintenance cost of $50 billion—a large sum, but a small fraction
of our total health care expenditures.57 These costs do not include the acquisition and
maintenance of technologies at the level of the provider.
Denmark has invested in a central information exchange, and now has a high level
of connectedness at an annual cost of $2 million for its 5.3 million population, or 40 cents
per resident.58 The nonprofit organization that sets standards and serves as a portal for all
health information has continuous up-to-date electronic information on filled medications,
lab and imaging orders and results, hospital discharge letters, and specialist consult letters
on every Danish resident. This information is accessible with patient permission to
physicians, home health nurses, and other health personnel, in addition to being directly
accessible to patients. Over 98 percent of primary care physicians have purchased their
own electronic health record systems, which conform to nationally set standards.
Physicians report that the systems are beneficial for themselves and their patients, and a
study has found that their use has led to “higher quality and throughput by individual
general practitioners.”59 The investment in technology has been associated with a 20
percent increase in the number of general practitioner patient visits per day, reduced cost
of medications, improved preventive care adherence, and a lower cervical cancer mortality
rate resulting from preventive care reminders.
26
Strategic Investments to Improve Access, Affordability, and Equity
U.S. costs are also high as a result of poor access to primary and preventive care. High and
rising rates of the uninsured and underinsured in the under-65 population contribute to
excess reliance on hospital emergency rooms and admission to the hospital for potentially
preventable complications of chronic and acute conditions. Recent studies indicate that
uninsured people and those with unstable coverage are more likely to experience duplicate
tests, delays, and errors in the receipt of diagnostic test results. Insurance gaps and benefit
designs that discourage essential or preventive care contribute to higher longer-term costs
of care and undermine quality by erecting barriers to timely access to effective care.60
Fragmented and unstable coverage, moreover, thwarts efforts to share information that are
essential for the success of pay-for-performance and other programs that support higher-
quality, more efficient care.
Investments in insurance reforms to extend coverage to the full population,
pool health risks, and enable coordinated public and private information systems and
payment policies are essential to provide a foundation for a more efficient, high-value
health system.
CURRENT FEDERAL LEGISLATIVE PROPOSALS
At the federal level, there is a range of legislative proposals that seek to improve efficiency
and contain health expenditures. Proposals in the 109th Congress address four major areas:
simplifying, standardizing, and introducing negotiated pricing into Medicare Part D;
enhancing the utilization of health information technology and building a national
interoperable technology system; integrating value-based purchasing into Medicare
payments; and improving public access to information on quality and price.
Medicare Part D:
• Facilitate negotiations with pharmaceutical manufacturers to reduce the purchase
cost of pharmaceuticals covered by Part D plans; require participating manufacturers
to make products available at negotiated prices to all qualified federal health
care providers.
• Allow Part D beneficiaries to import covered products from Canada.
• Simplify Medicare Part D by establishing standardized benefits packages.
27
Health Information Technology:
• Establish a national public–private collaborative to recommend uniform policies
and standards in an effort to develop a nationwide interoperable health
information infrastructure.
• Provide grants and/or loans to facilitate purchase and utilization of technology systems.
Various proposals target providers in general, small practices, as well as regional health
information organizations.
• Fund demonstration products to determine best practice in various areas related to
health information technology, including information requirements of rural and
frontier physicians and methods to integrate technology systems into clinical education.
• Provide incentives to physicians for writing electronic prescriptions.
• Require all associated carriers to establish standardized electronic health records for
individuals covered by the Federal Employees Health Benefits Program.
• Establish independent health record banks to store individual lifetime electronic
health records.
Value-Based Purchasing in Medicare:
• Develop a measurement system within the Medicare program to provide value-based
payments to hospitals, physicians and practitioners, health plans, and end-stage renal
disease facilities.
• Various proposals call for the development of quality measurements that would allow
value-based purchasing to be utilized in determining payments to Medicare Advantage
and Part D plans, chronic kidney disease facilities, home health agencies, skilled
nursing facilities, and providers of physical and occupational therapy.
Public Information on Quality and Price:
• Ensure that average and individual payment rates for inpatient and outpatient procedures
and physician services are available to the public on the Medicare Web site.
• Require all hospitals to report data on the price and utilization frequency of designated
services and pharmaceuticals.
• Require the Secretary of Veterans Affairs to publish report cards on quality.
• Encourage state Medicaid plans to make information about hospital charges and
estimates of out-of-pocket expenses available to the public.
28
SUMMARY
The U.S. is an outlier in the level of health care spending, with far higher spending on
health care per capita than other countries. There is ample evidence that the U.S. does not
obtain value for money spent, and that there are wide variations in health care spending
across the U.S. that do not contribute to better health outcomes.
Substantial net gains in quality at lower costs are potentially achievable from
realigning payment incentives to reward efficient and high-quality care, reshaping market
incentives to reward value-driven health care, improving administrative efficiency, and
redesigning care delivery systems to enhance primary care. Such reforms would be
founded on enhanced information about the quality and cost-effectiveness of care and
appropriate deployment of modern information technology. Fragmented policies that
focus on one aspect of care or shift expenditures from one payer source to another, or
from one sector to another, will not result in transformation of the health care system to
yield high performance.
There is a compelling need for a coherent public and private sector strategy, with
all parties working in concert toward agreed-upon health system aims. Such a strategy
should place high priority on policies and practices that have the potential to move our
nation toward benchmark levels of performance on access, quality, and efficiency, so that
the U.S. health system could achieve commensurate value for the significant resources
it commands.
29
NOTES
1 Calculated from the Henry J. Kaiser Family Foundation/Health Research and Educational
Trust Annual Employer Health Benefits Surveys and U.S. Census Bureau data. 2 C. Schoen, S. K. H. How, I. Weinbaum, J. E. Craig, Jr., and K. Davis, Public Views on
Shaping the Future of the U.S. Health System (New York: The Commonwealth Fund, Aug. 2006). 3 D. M. Cutler, “Making Sense of Medical Technology,” Health Affairs Web Exclusive (Feb. 7,
2006):w48–w50. 4 D. M. Cutler, A. B. Rosen, and S. Vijan, “The Value of Medical Spending in the United
States, 1960–2000,” New England Journal of Medicine, Aug. 31, 2006 355(9):920–27. 5 C. Schoen, K. Davis, S. K. H. How, and S. C. Schoenbaum, “U.S. Health System
Performance: A National Scorecard,” Health Affairs Web Exclusive (Sept. 20, 2006):w457–w475; J. S. Skinner, D. O. Staiger, and E. S. Fisher, “Is Technological Change in Medicine Always Worth It? The Case of Acute Myocardial Infarction,” Health Affairs Web Exclusive (Feb. 7, 2006):w34–w47.
6 A. Catlin, C. Cowan, S. Heffler et al. “National Health Spending in 2005: The Slowdown Continues,” Health Affairs, Jan./Feb. 2007 26(1):142–53.
7 K. Davis, Making Health Care Affordable for All Americans, Invited testimony before the U.S. Senate, Committee on Health, Education, Labor, and Pensions, Jan. 28, 2004.
8 J. Holahan and A. Ghosh, “Understanding the Recent Growth in Medicaid Spending, 2000–2003,” Health Affairs Web Exclusive (Jan. 26, 2005):w5-52–w5-62.
9 K. Davis and S. R. Collins, “Medicare at Forty,” Health Care Financing Review, Winter 2005/2006 27(2):53–62.
10 J. C. Robinson, “The Commercial Health Insurance Industry in an Era of Eroding Employer Coverage,” Health Affairs, Nov./Dec. 2006 25(6):1475–86; J. C. Robinson, “Consolidation and the Transformation of Competition in Health Insurance,” Health Affairs, Nov./Dec. 2004 23(6):11–24.
11 The Dartmouth Atlas of Health Care contains data from a population-based survey regarding resource inputs, utilization, and outcomes of care among 3,436 hospital service areas and 306 hospital referral regions in the U.S. and is available at http://www.dartmouthatlas.org.
12 K. Baicker and A. Chandra, “Medicare Spending, the Physician Workforce, and Beneficiaries’ Quality of Care,” Health Affairs Web Exclusive (Apr. 7, 2004):w4-184–w4-197.
13 The Commonwealth Fund Commission on a High Performance Health System, Why Not the Best? Results from a National Scorecard on U.S. Health System Performance (New York: The Commonwealth Fund, Sept. 2006).
14 Ibid. 15 Institute of Medicine, Crossing the Quality Chasm: A New Health System for the 21st Century
(Washington, D.C.: National Academies Press, 2001); Institute of Medicine, To Err Is Human, Building a Safety Health System (Washington, D.C.: National Academies Press, 2000); Institute of Medicine, Rewarding Provider Performance: Aligning Incentives in Medicare (Washington, D.C.: National Academies Press, 2006).
16 Institute of Medicine, Rewarding Provider Performance, 2006, p. 16.
30
17 S. R. Collins, Health Savings Accounts and High-Deductible Health Plans: Why They Won’t Cure
What Ails U.S. Health Care, Invited testimony before the U.S. Senate, Committee on Finance, Subcommittee on Health, Hearing on “Health Savings Accounts,” Sept. 26, 2006; C. Schoen, M. M. Doty, S. R. Collins, and A. L. Holmgren, “Insured But Not Protected: How Many Adults Are Underinsured?” Health Affairs Web Exclusive (June 14, 2005):w5-289–w5-302.
18 J. Hsu, M. Price, J. Huang et al., “Unintended Consequences of Caps on Medicare Drug Benefits,” New England Journal of Medicine, June 1, 2006 354:(22)2349–59; D. G. Safran, T. Neuman, C. Schoen, M. S. Kitchman, I. B. Wilson, B. S. Cooper, A. Li, H. Chang, and W. H. Rogers, “Prescription Drug Coverage and Senior: Findings from a 2003 National Survey,” Health Affairs Web Exclusive (Apr. 19, 2005):w5-152–w5-166.
19 A. Rosen, “Grounding Coverage in Value, A Paradigm for Linking Quality and Costs,” Medical Care, May 2006 44(5):389–91.
20 M. E. Chernew, A. B. Rosen, and A. M. Fendrick, “Rising Out-of-Pocket Costs in Disease Management Programs,” American Journal of Managed Care, Mar. 2006 12(3):150–54.
21 J. Colmers, Public Reporting and Transparency (New York: The Commonwealth Fund, Jan. 2007).
22 S. Guterman and M. P. Serber, Enhancing Value in Medicare: Demonstrations and Other Initiatives to Improve the Program (New York: The Commonwealth Fund, Jan. 2007); Colmers, Public Reporting, 2007.
23 See the Center for Shared Decision Making at Dartmouth Hitchcock Medical Center (http://www.dhmc.org/webpage.cfm?site_id=2&org_id=108&gsec_id=0&sec_id=0&item_id=2486). The Chronic Care Model was developed by Ed Wagner, M.D., M.P.H., director of the MacColl Institute for Healthcare Innovation, Group Health Cooperative of Puget Sound, and colleagues with support from The Robert Wood Johnson Foundation.
24 T. Bodenheimer, “High and Rising Health Care Costs. Part 2: Technologic Innovation,” Annals of Internal Medicine, June 7, 2005 142(11):932–37; D. M. Cutler and M. McClellan, “Is Technological Change in Medicine Worth It?” Health Affairs, Sept./Oct. 2001 20(5):11–29.
25 Cardiac catheterization is an example of the former phenomenon, and laparoscopic gall bladder surgery is an example of the latter. In both instances, procedures like these have improved health care and contributed to healthier, longer lives.
26 E. S. Fisher, D. E. Wennberg, T. A. Stukel et al., “Variations in the Longitudinal Efficiency of Academic Medical Centers,” Health Affairs Web Exclusive (Oct. 7, 2004):var19–var32.
27 J. C. Robinson, “Consolidation,” 2004. 28 J. C. Robinson, “Commercial Health,” 2006. 29 B. Martinez, “In Medicaid, Private HMOs Take a Big, and Lucrative, Role,” Wall Street
Journal, Nov. 15, 2006. 30 J. Kahn, R. Kronick, M. Kreger et al., “The Cost of Health Insurance Administration in
California: Estimates for Insurers, Physicians, and Hospitals,” Health Affairs, Nov./Dec. 2005 24(6):1629–39.
31 D. Wessel, B. Wysocki, Jr., and B. Martinez, “Spending Bypass: As Health Middlemen Thrive, Employers Try to Tame Them,” Wall Street Journal, Dec. 29, 2006.
32 B. Martinez, “Health Care Consultants Reap Fees from Those They Evaluate,” Wall Street Journal, Sept. 18, 2006.
31
33 B. Biles, L. H. Nicholas, B. S. Cooper, E. Adrion, and S. Guterman, The Cost of
Privatization: Extra Payments to Medicare Advantage Plans—Updated and Revised (New York: The Commonwealth Fund, Nov. 2006).
34 B. Biles, L. H. Nicholas, and S. Guterman, Medicare Beneficiary Out-of-Pocket Costs: Are Medicare Advantage Plans a Better Deal? (New York: The Commonwealth Fund, May 2006).
35 K. Davis, M. Moon, B. S. Cooper, and C. Schoen, “Medicare Extra: A Comprehensive Benefit Option for Medicare Beneficiaries,” Health Affairs Web Exclusive (Oct. 4, 2005):w5-442–w5-454.
36 “Lowering Medicare Drug Prices,” Editorial, New York Times, Nov. 14, 2006. 37 G. F. Anderson, U. E. Reinhardt, P. Hussey, and V. Petrosyan, “It’s the Prices, Stupid:
Why the United States Is So Different from Other Countries,” Health Affairs, May/June 2003 22(3):89–105. They note that the supplies of doctors, nurses, and hospital beds are not greater in the United States than in other countries nor are basic use rates. In fact, U.S. patients are admitted to the hospital less frequently and typically have shorter stays for each diagnosis than their counterparts in other countries, resulting in U.S. hospital days per capita that are well below the OECD median. U.S. average doctors visits per year are similar to other countries overall. U.S. patients, however, use more specialized physicians and receive more intensive specialized services (e.g., MRIs, CT scans, and coronary angioplasties) than patients in other countries.
38 G. F. Anderson, D. G. Shea, P. S. Hussey et al., “Doughnut Holes and Price Controls,” Health Affairs Web Exclusive (July 21, 2004):w4-396–w4-404.
39 A. Berenson, “Pfizer and Other Drug Makers Report Higher Profits,” New York Times, Oct. 20, 2006.
40 Families USA, The Choice: Health Care for People or Drug Industry Profits (Washington, D.C.: Families USA, 2005).
41 J. Hahn, The Pros and Cons of Allowing the Federal Government to Negotiate Prescription Drug Prices, CRS Report for Congress, RS22059 (Washington, D.C.: Congressional Research Service, Feb. 18, 2005).
42 S. R. Tunis and S. D. Pearson, “Coverage Options for Promising Technologies: Medicare’s ‘Coverage with Evidence Development,’” Health Affairs, Sept./Oct. 2006 25(5):1218–30.
43 See The Leapfrog Group Compendium at http://ir.leapfroggroup.org/compendium/. 44 M. B. Rosenthal, B. E. Landon, S. L. Normand et al., “Pay for Performance in Commercial
HMOs,” New England Journal of Medicine, Nov. 2, 2006 355(18):1895–902. 45 Guterman, Enhancing Value, 2007. 46 Data analysis by Gerard F. Anderson for The Commonwealth Fund, as cited in S. Guterman,
Medicare Physician Payment: Are We Getting What We Pay For? Are We Paying for What We Want? Invited testimony before the U.S. House of Representatives, Energy and Commerce Committee, Subcommittee on Health, July 25, 2006.
47 Partnership for Solutions, “Medicare: Cost and Prevalence of Chronic Conditions,” Fact Sheet, July 2002.
48 B. Starfield, L. Shi, and J. Macinko, “Contribution of Primary Care to Health Systems and Health,” Milbank Quarterly, 2005 83(3):457–502.
32
49 E .S. Fisher, D. E. Wennberg, T. A. Stukel et al., “The Implications of Regional Variations
in Medicare Spending, Part 1: The Content, Quality, and Accessibility of Care,” Annals of Internal Medicine, Feb. 18, 2003 138(4):273–87; E. S. Fisher, D. E. Wennberg, T. A. Stukel et al., “The Implications of Regional Variations in Medicare Spending, Part 2: Health Outcomes and Satisfaction with Care,” Annals of Internal Medicine, 2003 138(4):288–98.
50 H. Biola, L. A. Green, R. L. Phillips et al., “The U.S. Primary Care Physician Workforce: Persistently Declining Interest in Primary Care Medical Specialties,” American Family Physician, Oct. 15, 2003 68(8):1484.
51 American College of Physicians, The Impending Collapse of Primary Care Medicine and Its Implications for the State of the Nation’s Health Care (Philadelphia: ACP, Jan. 30, 2006). Available at http://www.acponline.org/hpp/statehc06_1.pdf (accessed Oct. 30, 2006).
52 American College of Physicians, The Advanced Medical Home: A Patient-Centered, Physician-Guided Model of Health Care (Philadelphia: ACP, Jan. 30, 2006). Available at http://www.acponline.org/hpp/adv_med.pdf (accessed Oct. 30, 2006).
53 R. E. Hurley, H. H. Pham, and G. Claxton, “A Widening Rift in Access and Quality: Growing Evidence of Economic Disparities,” Health Affairs Web Exclusive (Dec. 6, 2005):w5-566– w5-576.
54 C. Schoen, R. Osborn, P. T. Huynh, M. M. Doty, J. Peugh, and K. Zapert, “On the Front Lines of Care: Primary Care Doctors’ Office Systems, Experiences, and Views in Seven Countries,” Health Affairs Web Exclusive (Nov. 2, 2006):w555–w571.
55 A. K. Jha, T. G. Ferris, K. Donelan et al., “How Common Are Electronic Health Records in the United States? A Summary of the Evidence,” Health Affairs Web Exclusive (Oct. 11, 2006): w496–w507.
56 R. H. Miller, C. West, T. M. Brown et al., “The Value of Electronic Health Records in Solo or Small Group Practices,” Health Affairs, Sept./Oct. 2005 24(5):1127–37.
57 R. Kaushal, D. Blumenthal, E. G. Poon et al., “The Costs of a National Health Information Network,” Annals of Internal Medicine, Aug. 2, 2005 143(3):165–73.
58 I. Johansen, “The Danish Health Sector: Benefits, Challenges and Strategies of Using Information Technology and Electronic Medical Records in Primary Health Care” (manuscript submitted to The Commonwealth Fund, Nov. 2006).
59 Ibid. 60 S. R. Collins, K. Davis, M. M. Doty, J. L. Kriss, and A. L. Holmgren, Gaps in Health
Insurance: An All-American Problem (New York, The Commonwealth Fund, Apr. 2006); Schoen, “National Scorecard,” 2006.
33
RELATED PUBLICATIONS
Publications listed below can be found on The Commonwealth Fund’s Web site at www.cmwf.org.
Learning From High Performance Health Systems Around the Globe (January 10, 2007). Karen Davis. Invited testimony before the U.S. Senate, Committee on Health, Education, Labor, and Pensions. State Strategies to Expand Health Insurance Coverage: Trends and Lessons for Policymakers (January 2007). Alice Burton, Isabel Friedenzohn, and Enrique Martinez-Vidal. Public Reporting and Transparency (January 2007). John M. Colmers. Enhancing Value in Medicare: Demonstrations and Other Initiatives to Improve the Program (January 2007). Stuart Guterman and Michelle P. Serber. The State Children’s Health Insurance Program: Past, Present, and Future (January 2007). Jeanne M. Lambrew. Health Care Spending: An Encouraging Sign? (January 2007). Stephen C. Schoenbaum, Karen Davis, and Alyssa L. Holmgren. On the Front Lines of Care: Primary Care Doctors’ Office Systems, Experiences, and Views in Seven Countries (November 2, 2006). Cathy Schoen, Robin Osborn, Phuong Trang Huynh, Michelle M. Doty, Jordon Peugh, and Kinga Zapert. Health Affairs Web Exclusive (In the Literature summary). The Cost of Privatization: Extra Payments to Medicare Advantage Plans—Updated and Revised (November 2006). Brian Biles, Lauren Hersch Nicholas, Barbara S. Cooper, Emily Adrion, and Stuart Guterman. Health Savings Accounts and High-Deductible Health Plans: Why They Won’t Cure What Ails U.S. Health Care (September 26, 2006). Sara R. Collins. Invited testimony before the U.S. Senate, Committee on Finance, Subcommittee on Health. U.S. Health System Performance: A National Scorecard (September 20, 2006). Cathy Schoen, Karen Davis, Sabrina K. H. How, and Stephen C. Schoenbaum. Health Affairs Web Exclusive (In the Literature summary). Squeezed: Why Rising Exposure to Health Care Costs Threatens the Health and Financial Well-Being of American Families (September 2006). Sara R. Collins, Jennifer L. Kriss, Karen Davis, Michelle M. Doty, and Alyssa L. Holmgren. Why Not the Best? Results from a National Scorecard on U.S. Health System Performance (September 2006). The Commonwealth Fund Commission on a High Performance Health System. Framework for a High Performance Health System for the United States (August 2006). The Commonwealth Fund Commission on a High Performance Health System. Public Views on Shaping the Future of the U.S. Health System (August 2006). Cathy Schoen, Sabrina K. H. How, Ilana Weinbaum, John E. Craig, Jr., and Karen Davis.
34
Medicare Physician Payment: Are We Getting What We Pay For? Are We Paying for What We Want? (July 25, 2006). Stuart Guterman. Invited testimony before the U.S. House of Representatives, Energy and Commerce Committee, Subcommittee on Health. Gaps in Health Insurance: An All-American Problem (April 2006). Sara R. Collins, Karen Davis, Michelle M. Doty, Jennifer L. Kriss, and Alyssa L. Holmgren. Medicare Extra: A Comprehensive Benefit Option for Medicare Beneficiaries (October 4, 2005). Karen Davis, Marilyn Moon, Barbara S. Cooper, and Cathy Schoen. Health Affairs Web Exclusive (In the Literature summary). Insured But Not Protected: How Many Adults Are Underinsured? (June 14, 2005): Cathy Schoen, Michelle M. Doty, Sara R. Collins, and Alyssa L. Holmgren, Health Affairs Web Exclusive (In the Literature summary). Prescription Drug Coverage and Senior: Findings from a 2003 National Survey (April 19, 2005). Dana Gelb Safran, Tricia Neuman, Cathy Schoen et al. Health Affairs Web Exclusive (In the Literature summary). Medicare at Forty (Winter 2005/2006). Karen Davis and Sara R. Collins. Health Care Financing Review, vol. 27, no. 2 (In the Literature summary). Making Health Care Affordable for All Americans (January 28, 2004). Karen Davis. Invited testimony before the U.S. Senate, Committee on Health, Education, Labor, and Pensions.