AGRICULTURAL PRODUCTIVITY Agriculture Sector Modernization ...
397
POLICY RESEARCH ON AGRICULTURAL PRODUCTIVITY Undertaken for the Agriculture Sector Modernization Project (ASMP) of the Ministry of Agriculture by
-
Upload
khangminh22 -
Category
Documents
-
view
0 -
download
0
Transcript of AGRICULTURAL PRODUCTIVITY Agriculture Sector Modernization ...

POLICY RESEARCH ON
AGRICULTURAL PRODUCTIVITY
Undertaken for the
Agriculture Sector Modernization Project (ASMP) of the Ministry of Agriculture
by

1Senior Research Fellow, Gamani Corea Foundation,
2MARGA Consultant
Final Report
June 2021
Wasanthi Wickramasinghe1
Parakrama Samaratunga2

i
Contents
EXECUTIVE SUMMARY
CHAPTER 1 ........................................................................................................................................... 1
INTRODUCTION .................................................................................................................................. 1
1.1 BACKGROUND OF THE STUDY ............................................................................................. 1
1.2 OBJECTIVES & SCOPE OF THE STUDY ................................................................................. 1
1.3 CONCEPTUAL FRAMEWORK AND RESEARCH METHODOLOGY .................................. 2
1.3.1 Research Hypothesis .................................................................................................................. 2
1.3.2 Technical Approach ................................................................................................................... 3
1.3.3 Conceptual Framework .............................................................................................................. 6
1.4 EMPIRICAL ANALYSIS ............................................................................................................ 7
1.4.1 Analysis of import substitution Crop Sector .............................................................................. 7
1.4.2 Analysis of Export promotion fruit crop sector ....................................................................... 10
1.5 DATA COLLECTION ................................................................................................................ 11
1.6 ORGANIZATION OF THE REPORT ....................................................................................... 13
CHAPTER 2 ......................................................................................................................................... 14
REVIEW OF POLICIES ON AGRICULTURE .................................................................................. 14
2.1 ECONOMY-WIDE POLICIES AFFECTING AGRICULTURE .............................................. 14
2.1.1 Liberalization of the economy – 1977 ..................................................................................... 15
2.1.2 Structural adjustment policy – 1988 – 90 ................................................................................ 16
2.1.3 Second wave of liberalization (SWL) – 1984 .......................................................................... 17
2.1.4 Devolution of power to provincial councils – 1988 ................................................................. 18
2.1.5 Nationwide poverty alleviation program -1990 ....................................................................... 20
2.1.6 Export led growth and diversification program – 1977 to 1990s ............................................. 20
2.1.7 Ratifying WTO trade regulations - 1995 ................................................................................. 21
2.1.8 Ratifying regional trade agreements – 2000 onwards .............................................................. 22
2.2 AGRICULTURE SECTOR POLICIES & PUBLIC EXPENDITURE ...................................... 23
2.2.1 Scientific Agriculture, Science Policy and Agricultural Research Policy .............................. 24
2.2.2 Agricultural Extension in the DOA of Sri Lanka .................................................................... 50
2.2.3 Irrigation Policy and Public Expenditure on Irrigation Infrastructure ..................................... 61
2.2.4 Fertilizer Policy in Sri Lanka ................................................................................................... 64
2.2.5 National Seed Policy ................................................................................................................ 70
2.2.6 Policies on Farm Machinery and Mechanization ..................................................................... 80
2.2.7 Road infrastructure................................................................................................................... 86
2.2.8 Agriculture Credit and Finance Policies .................................................................................. 92
2.2.9 Agriculture Insurance Policies ................................................................................................. 96
2.2.10 Public Expenditure Programs of the government and investment prioritization ................... 104

ii
CHAPTER 3 ....................................................................................................................................... 108
NATURE AND MAGNITUDE OF PRIVATE SECTOR INVESTMENT IN AGRICULTURE AND
ITS DETERMINANTS ...................................................................................................................... 108
3.1 POLICY INCENTIVES FOR PRIVATE SECTOR PARTICIPATION ...................................... 108
3.2 THE CURRENT DEPICTION OF PRIVATE SECTOR INVESTMENT IN AGRICULTURE 110
3.2.1. Hayleys agriculture ................................................................................................................... 110
3.2.2. CIC Agri business (private) limited .......................................................................................... 116
3.3. DETERMINANTS OF INVESTING IN AGRICULTURE BY PRIVATE SECTOR ............... 124
CHAPTER 4 ....................................................................................................................................... 130
CROP-SPECIFIC PARTIAL FACTOR PRODUCTIVITY, TOTAL FACTOR PRODUCTIVITY
AND DECOMPOSITION OF AGRICULTURAL OUTPUT GROWTH ......................................... 130
4.1 IMPORT SUBSTITUTING DOMESTIC FOOD CROP SECTOR ......................................... 132
4.1.1 Rice/Paddy ................................................................................................................................ 133
4.1.2 Maize ......................................................................................................................................... 150
4.1.3 Chilli ......................................................................................................................................... 160
4.1.4 Potato ........................................................................................................................................ 171
4.1.5 Soybean ..................................................................................................................................... 185
4.1.6 Big Onion .................................................................................................................................. 198
4.2 EXPORT PROMOTING DOMESTIC FOOD CROP SECTOR .............................................. 210
4.2.1 Pineapple ................................................................................................................................... 211
4.2.2 Banana ....................................................................................................................................... 226
4.2.3 Papaya ....................................................................................................................................... 234
4.2.4 Passion fruit ............................................................................................................................... 245
CHAPTER 5 ....................................................................................................................................... 249
FINDINGS, CONCLUSION AND RECOMMENDATIONS ........................................................... 249
5.1 FINDINGS ................................................................................................................................ 249
5.1.1 Findings from the crop sector specific productivity analysis ..................................................... 259
5.2 CONCLUSION ......................................................................................................................... 267
5.3 RECOMMENDATIONS .......................................................................................................... 269
POLICY RECOMMENDATIONS..................................................................................................... 280
6. REFERENCES ………………………………………………………………………………………………………………..289

iii
List of Tables
Table 2.1: Achievement of targeted OFC seed production in 2018 79
Table 2.2: Import value of harvesting and threshing machinery 82
Table 2.3: Timeline of Changes in Mechanization 84
Table 2.4: Road length in km by class of road in Sri Lanka from 1990 to 2018 90
Table 2.4: Loss Compensation based on risk assessment for paddy farmers 100
Table 2.5: Government expenditure in the crop insurance and important policy changes 103
Table 2.6: Sectoral Allocations in Public Investment Programmes from 105
1979-86 to 1996-2000 (percentages)
Table 2.7: Investment Priority Areas 106
Table 2.8: Investment Priority Areas in Rs Mn 107
Table 3.1: CIC budget allocation for rice and vegetable R&D 123
Table 3.2: Project activities eligible for incentives and type of incentive 128
Table 4.1: Decomposition analysis of paddy output growth 139
Table 4.2: Spread of Variety Bw367 141
Table 4.3: Yield Potential of main paddy varieties 146
Table 4.4: Return to Investment by different breeding method 147
Table 4.5: Maize extent cultivated during maha and yala season by main district 151
Table 4.6: Per ha Labour use in maize farming by country and states of India 153
Table 4.7: Input growth per annum by type of input in maize farming 154
Table 4.8.a: Input, TFP and output growth of maize farming and its shares 155
Table 4.8.b: Average productivity of chilli in countries in the region, 2010-2018 162
Table 4.9: Per ha labour use for chilli cultivation, 2012 164
Table 4.10: Decomposition of output growth of chillie 166
Table 4.11: Farmers Adoption of main chilli varieties by location 168
Table 4.12.a: Chilli Varieties Released 169
Table 4.12.b: Per ha labour use in potato farming in Sri Lanka and India by state 173
Table 4.12.c: Output growth, input growth by type of input and TFP growth 176
Table 4.13: Seed potato production and imports, 1985 – 2018 179
Table 4.14: Average yield of soybean of Sri Lanka and India 188
Table 4.15: Per ha labour use in soybean farming in Sri Lanka and India 189
Table 4.16: Production, imports and supply of Big Onion 200
Table 4.17: Average yield of Big Onion in neighboring countries 201
Table 4.18: Per ha labour use in Big Onion farming in Sri Lanka and 202
Indian States
Table 4.19: Factor intensification on land by factor 204
Table 4.20: Adoption of Big Onion Varieties 208
Table 4.21: Area harvested, yield and production in Sri Lanka and 215
neighbouring countries
Table 4.22: Labour use in pineapple farming and labour productivity 221
Table 4.23: Results of Cobb – Douglas production function 222
Table 4.24: Results of maximum-likelihood estimates for parameters 223
of the stochastic frontier
Table 4.25: Determinants of technical inefficiency 224
Table 4.26: Area harvested, yield and production of banana in 229
Sri Lanka and neighbouring countries
Table 4.27: Input use, yield and labour productivity by type of banana variety 230
Table 4.28: Socio-economic characteristics, different agricultural 231
practices and technology adopted by sample farmers
Table 4.29: Results of the regression analysis of banana 233
(Method: Least Squares)

iv
Table 4.30: Land productivity, labour use and labour productivity of 240
papaya by variety
Table 4.31: Socio-economic characteristics, different agricultural 242
practices and technology adopted by sample farmers
Table 4.32: Results of the regression analysis of papaya 243
(Method: Least Squares)
Table 4.33: Factor use and productivity information in passion fruit farming 246
Table 5.1: No of researchers employed in agricultural research system 255
in Sri Lanka and neighbouring countries in FTE units
Table 5.2: Tariff applied on Sri Lanka fruit exports, 2019 263
Table 5.3: Mean and coefficient of variation of average yield and factor 266
productivity of fruit growing farmers

v
List of Figures
Figure 2.1: Agricultural GDP, Total GDP in real terms and Agricultural
GDP as a Percentage of Total GDP 36
Figure 2.2: Agricultural GDP, Research Expenditure in Nominal
terms and Research Expenditure as a Percentage of Total GDP 38
Figure 2.3: Annual Nominal and Real expenditure for Research and 42
for Extension
Figure 2.4: Annual Expenditure on Research and Extension at FCRDI
in Nominal and Real terms 44
Figure 2.5: Annual Expenditure on Research and Extension at HORDI 44
in Nominal and Real terms
Figure 2.6: Annual Expenditure on Research and Extension at FRDI in 45
Nominal and Real terms
Figure 2.7: Annual Expenditure on Research and Extension at RRDI in 45
Nominal and Real terms
Figure 2.8: Irrigation Investments since 1990 61
Figure 2.9: Major Irrigated area under cultivation 1980-2017 62
Figure 2.10: Expenditure on fertilizer subsidy over the years (nominal value) 69
Figure 2.11: Components of the seed supply system (Turner, 2002) 75
Figure 2.12: Seed paddy multiplication process, SPMDC of DOA 76
Figure 2.13: Production of OFC seeds, SPMDC of DOA 78
Figure 2.14: Recurrent, capital and total expenditure allocation for the 79
government seed program
Figure 2.15: No of tractors imported and new registration of land vehicles 80
Figure 2.16 : Tractor imports by product in quantity, 1961-2018 81
Figure 2.17: Tractor imports by product in value terms, 1961-2018 81
Figure 2.18: Provincial composition of road network in km 91
Figure 2.19: Investment in rural road infrastructure under Maga Neguma Program 91
Figure 2.20: Nominal value of credit granted for paddy and other crops 94
under NCRCS
Figure 2.21: Loan recovery rate for paddy and other crops under NCRCS 94
Figure 2.22: Performance of paddy insurance schemes over the years 101
Figure 2.23: Insurance premium collected from 1989 to 2018 101
Figure 2.24: The difference between insurance premium collected and the 102
indemnities paid from 1989 to 2018
Figure 4.1: Paddy production from 1990 to 2017 133
Figure 4.2: Extent cultivated by different agro-ecological zone and season 134
Figure 4.3: Total Cultivated extent of paddy from 1979 to 2017 by season 134
Figure 4.4: Average yield of paddy by season from 1979 to 2016 135
Figure 4.5: Average yield of paddy by neighboring country 135
Figure 4.6: Labour use in paddy production from 1990 to 2017 136
Figure 4.7: Labour productivity of paddy from 1990 to 2017 136
Figure 4.8: Land and labour productivity of paddy 137
Figure 4.9: TPF growth index of paddy 137
Figure 4.10: TFP growth index and weather index from 1990 to 2017 138
Figure 4.11: Varietal spread of main paddy varieties 140
Figure 4.12: Spread of BG 94-1 and At 362 paddy varieties in Ampara East 141

vi
Figure 4.13: Registered and certified seed paddy issues in mt 142
Figure 4.14: Land productivity, input intensification on land and TFP growth 142
of Paddy
Figure 4.15: Irrigation ratio in paddy cultivation 143
Figure 4.16: Per ha fertilizer and agrochemical use, base year 1990 143
Figure 4.17: Per ha labour and machinery use, base year 1990 143
Figure 4.18: Production, Imports and Demand of Maize from 1980 to 2017 150
Figure 4.19: Total maize extent cultivated from 1980 to 2018 151
Figure 4.20: National average yield of Maize, 1980 to 2018 152
Figure 4.21: National Average Yield by country 152
Figure 4.22: Labour use in maize production from 1990 to 2018 153
Figure 4.23: Labour productivity of maize by country and state of India 154
Figure 4.24: Land extent and TFP growth index, base year 1991 155
Figure 4.25: Cultivated extent of Chilli during Maha and Yala seasons, 160
1972-2017
Figure 4.26: Green Chilli Production during Maha and Yala seasons, 161
1972 -2018
Figure 4.27: Quantity of dry chilli imports, 1961 – 2017 162
Figure 4.28: Green chilli average yield 1972 – 2018 163
Figure 4.30: Percentage of chilli farmers reported mechanical ploughing 164
Figure 4.29: Per ha labour use in chillie cultivation during maha and yala seasons 164
Figure 4.31: Labour productivity of green chilli by season 165
Figure 4.32: TFP growth Index for chilli farming, base year 1990. 165
Figure 4.33: Adoption of MI 1 and MI11 chilli varieties in 1980‘s 167
Figure 4.34: Adoption of MI 11 and KA 2 chilli varieties after 2005 167
Figure 4.35: Extent and production of potato, 1980 – 2018 171
Figure 4.36: Potato extent in major cultivating districts during maha and 172
yala seasons
Figure 4.37: Average potato yield in Sri Lanka and neighbouring countries 173
Figure 4.38: Labour use in potato farming 174
Figure 4.39: Labour productivity of potato farming Sri Lanka and Indian States 174
Figure 4.40: Machinery use for land preparation and irrigation in potato farming 175
Figure 4.41: Potato land extent, 1998 as the base year and TFP growth index, 175
1991 as the base year
Figure 4.42.a: Land productivity growth, TFP growth and factor intensification 176
on land
Figure 4.42.b: Per ha input use by type of input 177
Figure 4.43: Cultivated extent of Soybean during maha and yala season 186
Figure 4.44.a: Total Soybean supply by means of production and imports 187
Figure 4.44.b: Production and Import quantity of Soybean 187
Figure 4.45: Soybean yield during maha and yala season 189
Figure 4.46: Per ha labour use and the labour productivity of soybean 190
Figure 4.47: Machinery power use for land preparation and threshing in 190
Soybean farming
Figure 4.48: Labour Productivity of soybean Kg/man day 191
Figure 4.49: Land extent and TFP growth index, 1992 yala 192
Figure 4.50: Land productivity, factor intensification on land and 193
TFP growth index, base year 1992
Figure 4.51: Growth of Land productivity, factor intensification on land 193
and TFP

vii
Figure 4.52: Soybean cultivated extent during yala season 195
Figure 4.53: Soybean cultivated extent during maha season 195
Figure 4.54: Cultivated extent of Big Onion during maha and yala seasons 198
Figure 4.55: Cultivated extent of Big Onion during yala season by district 199
Figure 4.56: Average yield of Big Onion during Yala season 201
Figure 4.57: Per ha labour use in Big Onion farming 202
Figure 4.58: Labour productivity of Big Onion in Sri Lanka and Indian States 202
Figure 4.59: Land and labour productivity of Big Onion 203
Figure 4.60: Land extent and TFP growth index based on base year 1991 yala 204
Figure 4.61: Input Intensification, TFP and Land productivity 204
Figure 4.62: Weedicide and pesticide use per ha in US dollar terms 205
Figure 4.63: Government seed production and imports, Mt 206
Figure 4.64: Pineapple Extent harvested 211
Figure 4.65: Total pineapple production 212
Figure 4.66: Extent and yield of pineapple, 2001 to 2018 212
Figure 4.67: Pineapple exports in quantities by type of export 213
Figure 4.68: Pineapple exports in value by type of export 213
Figure 4.69: Value of fresh pineapple exports by export destination 214
Figure 4.70: FOB and wholesale prices of Pineapple 214
Figure 4.71: Pineapple average yield in Sri Lanka and neighbouring 214
Countries (kg/ha)
Figure 4.72: Pineapple yield in major producing areas 216
Figure 4.73: Planting density maintained in pineapple farming 217
Figure 4.74: Average fruit size of pineapple 217
Figure 4.75: Percentage of farmers who leased land by lease period 218
Figure 4.76: Average yield of pineapple by main cultivating districts 218
Figure 4.77: Fertiliser use in pineapple farming 219
Figure 4.78: The relationship between land productivity and factor 225
productivity index
Figure 4.79: Total banana cultivated extent and cultivated extent by district 226
Figure 4.80: Production and export of banana 227
Figure 4.81: Banana exports from 2001 to 2017 227
Figure 4.82: Total cultivated extent of papaya, 1983 – 2017 234
Figure 4.83: Cultivated extent of papaya by main districts 235
Figure 4.84: Production and exports of papaya 2001 – 2017 236
Figure 4.85: FOB and wholesale price of papaya, 2018 236
Figure 4.86: Papaya exports from 2001 to 2017 237
Figure 4.87: Papaya exports by export destination 237
Figure 4.88: Average yield of papaya in Sri Lanka and in neighbouring 238
countries
Figure 4.89: Average yield of papaya 2001 – 2018 238
Figure 4.90: Extent, yield and production base year 2001 239
Figure 4.91: relationship between land productivity and factor productivity 244
Figure 4.92: Passion fruit yield in kg per ha 245
Figure 4.93: Wholesale price of passion fruit 246

viii
Figure 5.1: Government expenditure/allocation for agriculture by type of item 252
Figure 5.2: Agricultural research expenditure in Sri Lanka and neighbouring 253
countries as base year 2000
Figure 5.3: Agricultural research expenditure in Sri Lanka and
neighbouring countries in constant dollar terms 254
Figure 5.4: Premia collected, indemnities paid and allocation for AAIB 258
Figure 5.5: FAO, ITC 263
Figure 5.6: Export value contribution of main fruit exports relative to total 264
fruit & nut export value
Figure 5.7: Farming experience of fruit farmers by fruit 265
APPENDICES
Appendix 1: TFP Measurements and TFPG Estimation Methods 292
Appendix 2: Supplementary Tables 299
ANNEXES
Annex 1: Stakeholders of the Key Informant survey 360
Annex 2: Questionnaire – Factors affecting productivity of Pineapple (Sample) 361

ix
EXECUTIVE SUMMARY
This Study intends to carry out in-depth policy research in the area of Agricultural
Productivity. MARGA was commissioned by the Project Management Unit of the
Agriculture Sector Modernization Project (ASMP) of the ministry of agriculture to identify
knowledge gaps, policy and regulatory inconsistencies for the allocation of public agriculture
expenditures to improve agriculture productivity, and to recommend adjustments, reforms or
new policies needed to make the agriculture sector more competitive, responsive to the
market demands, sustainable and resilient. The study estimated agricultural growth trends and
total and partial factor productivities of key agricultural sub-sectors of Sri Lanka and
decomposed the agricultural growth into its sources of growth to assess the effects of public
investments, such as research, extension, rural roads, irrigation, insurance, finance among
others on the productivity of selected agricultural sub-sectors with a comparison of regional
countries. Output growth of ten crop sectors over the period from 1990 to 2018 was
decomposed into growth due to input growth and TFP growth (growth of efficiency of input)
and further decomposed into land expansion growth, growth of factor intensification on land
and TFP growth. Total Factor Productivity (TFP) measures how efficiently agricultural land,
labour, capital, and materials (agricultural inputs) are used to produce agricultural output.
Based on the determinants of productivity growth, the study proposes the required changes in
policies and the changes required in prioritizing government expenditure allocations and
essential changes in regulations as recommendations.
In the last few decades, there has been no or negligible structural change in farming in Sri
Lanka. Food crop production is predominantly carried out by small farmers in the informal
sector. Land, labour and capital are constraining factors for sector growth. Policies introduced
after the liberalization of the economy in various stages have focused on getting increased
participation of the private/corporate sector, especially in the market operations by relaxing
the trade restrictions and providing incentives. Import tariffs are used continuously to protect
the cereals and other food crops cultivating small farmer from the competition as TFP growth
in the domestic food crop sector has not been on par with the competing neighbouring
countries. Export promotion strategy that has been adopted for the fruit crops sector can
benefit owing to the growing tropical fruit demand in the world and the 0% tariff regimes and
fewer sanitary and Phyto-sanitary restrictions in the importing destinations.
Technological innovations in increasing land productivity in the domestic food crop sector
have been low mainly due to the limited availability of technology particularly in terms of
new varieties with high yields and with better adaptability to farmers to adopt. Applied
research programs directed toward these crops attaining ‗Research potential‘ (RP) yield and
new scientific discoveries (e.g., in biotechnology) utilized to attain the ―science potential‘
yield determine the extent to which Sri Lanka can bridge the research and science gap for
technological innovations. The most significant technological breakthrough in the recent past
is the introduction of chilli hybrid variety by the department of agriculture.

x
Government emphasis has largely been on irrigation investments and fertilizer subsidy
transfers. Although irrigation and fertilizer are essential inputs for the realization of yields of
new varieties, the growth in output due to factor accumulation will eventually taper off,
making the growth process unsustainable in the long run unless the technology frontier
shifted upward with new technologies. Therefore, investment in research and development is
essential for long-term growth. As cited in the literature, particularly the research agenda of
the world‘s richest countries during post green revolution era have been shifting away from
the interests of the productivity-enhancing technologies to other areas. The role of
international research agencies such as CGIAR as the global biological commons in genetic
resources for agricultural productivity improvement in developing countries has now been in
the interest of few states. Two international treaties on IPR have a strong bearing on the
incentives and rules of germplasm sharing. The private sector and multinational companies
are now dominating the seed industry and patenting of plants. Hence, open access to genetic
resources and technology spillovers are becoming more constrained. Certain imported
technologies are becoming costly and not adaptive. Therefore country will need to become
more self-reliant in the provision of agricultural R&D. Public research system has a vital
share in creating new knowledge and technology as private, corporate and non-governmental
sectors have limited incentives for innovations compared to neighbouring countries
Due to the inadequate funding for agriculture research and not duly recognizing the role of
the Department of Agriculture as the main public research and extension arm of the domestic
food crop sector, there is a large setback in the agricultural R&D program in the food crop
sector. Policies, programs, human resources and funding are not in place to undertake new
technology research. However, countries such as India and more recently Bangladesh in
South Asia, Vietnam have made remarkable achievements in adopting new technologies
owing to the policies and institutional changes adopted. This study makes a strong case that
an effective public sector research system is critical in bridging the science and research gap
for technology generation. Several recommendations have been made in this direction.
Sri Lanka is leading in South Asia in adopting mechanical technology in tillage, harvesting
and processing largely to the rising wage rate in the agriculture sector and imported
technology by the private sector. In transferring and upscaling technology, the role of the
value chain has made significant achievements globally. Sri Lanka also records similar
achievements in sectors such as Maize and this is particularly important in the advent of the
devolved public sector extension system. Digital technology has several solutions to be
merged into technology transfer programs.
The private sector‘s role is significant for productivity enhancement through mechanization,
machinery production, quality seed production and being a partner of supply/value chain and
risk management. It is therefore important to increase the space for the private
sector/corporate sector mainly by recognizing their role, facilitating financial and other
infrastructure, maintaining a stable trade policy regime, minimizing regulatory bottlenecks
and establishing contract enforcement mechanism.

1
CHAPTER 1
INTRODUCTION
1.1 BACKGROUND OF THE STUDY
Sri Lanka‘s domestic agriculture sector is a small farmer dominant sector characterised by
less abundant land and labour for cultivation. Paddy/Rice crops occupy about 820,000 ha
of land, almost 80 percent of the cultivated field crop extent. Field crops cultivated other
than rice, primarily constitutes a subsidiary food crop sector in Sri Lanka. It is mainly
comprised of other field crops and vegetables cultivated in highlands and in the lowlands
during dry season. Crops such as chilli, onion, potato and the traditional subsistence crops
constitutes the subsidiary field crop sector and vegetables cultivated through two different
farming systems, namely up country and low country constitutes the vegetables sector. Its
cultivation is primarily for domestic consumption. Fruit crop sector is comprised of
perennial crops that are cultivated mainly as intercrops or mixed crops. Currently fruit
sector occupies about 150,000 ha.
In the long run, sustainable agricultural growth can only be achieved through increased
productivity as resources are becoming scarce for production. There are limitations when
further increasing land for agriculture as labour is moving out of agriculture and the cost
of capital is increasing. Hence, increasing agricultural output growth can only be achieved
through increased Total Factor Productivity (TFP), the amount of output per unit of total
factors used in the production process and a more efficient use of resources becomes
increasingly important as the country begin to face resource constraints in terms of land,
labour and capital.
1.2 OBJECTIVES & SCOPE OF THE STUDY
This Study intends to carry out in-depth policy research in the area of Agricultural
Productivity, in order to identify knowledge gaps, policy and regulatory inconsistencies in
the area of Agricultural Productivity for the allocation of public agriculture expenditures
to improve agriculture productivity, and to recommend adjustments, reforms or new
policies needed to make agriculture sector more competitive, responsive to the market
demands, sustainable and resilient.
Study attempt to estimate agricultural growth trends and total and partial factor
productivities of key agricultural sub-sectors in Sri Lanka, and to assess the effects of
public investments, such as research, extension, rural roads, irrigation, insurance, finance

2
among others on productivity of selected agricultural sub-sectors with a comparison of
regional countries.
Recommendations will be drawn on policy reforms, new policy formulations or strategies
in order to address the identified issues.
Specific Objectives
Estimate the Partial Factor Productivity growth of Agricultural sub sectors and
specific crop sectors namely Rice, Maize, Soybean, Big Onion, Potato, Chili,
Banana, Papaya, Pineapple & Passion fruit with special emphasis on land and
labor productivity while comparing the situation in Sri Lanka with that of regional
countries such as India, Bangladesh, Thailand, and Vietnam.
Estimate the Total Factor Productivity growth in different agricultural sub-sectors
of Sri Lanka and decompose the agricultural output growth in Sri Lanka into their
sub-components.
Determine the effects of public investment such as Research & Extension, Rural
roads, Irrigation, Credit and Insurance on total factor productivity growth.
Examine the nature and magnitude of private sector investment on agriculture and
ascertain its determinants.
Identify the major policy and regulatory changes that affected the partial factor
productivities of the Agricultural sub sectors and provide
suggestions/recommendations for policy/regulatory changes to improve Partial
Factor Productivities with the details of the responsible authorities to undertake
changes.
Recommend appropriate policy instruments that the government could use to
implement the proposed policy changes to which improve the agriculture sector
competitiveness & sustainability, identify the implementing authorities (Relevant
Ministries, Departments or other Organization) and the procedure to be followed
in order to make policy changes/policy formulation a reality.
1.3 CONCEPTUAL FRAMEWORK AND RESEARCH METHODOLOGY
1.3.1 Research Hypothesis
Limitations for further increasing land for cultivation coinciding with labour moving out
of agriculture and rising cost of capital poses the challenges for increasing output growth
in the domestic food crop sector. Increasing productivity of inputs is the only option left
for achieving output growth.

3
Decomposing output growth to its sources of growth helps understand the growth through
its total input use and the growth due to productivity of all inputs, which is measured by
Total Factor Productivity (TFP). Technological progress, changes in factor utilization
rates, product market competition, returns to scale, and changes in input quality including
climate disturbances determines the TFP growth. The changes required in policies,
institutions and the allocation of public agriculture expenditures influencing TFP growth
can be studied by building a relationship between TFP growth and its determinants.
The evidence is that rapid growth in public investment in research and development,
irrigation and other infrastructure, extension and human resource development along with
crop production strategy and policy support have helped to expand TFP and output
growth in many developing countries.
Analysing the trend of partial factor productivities; labour and land productivity in
agriculture helps understand the relative endowments of land and labour as well as the
possible technologies in relation to labour and land saving technologies for TFP growth.
1.3.2 Technical Approach
Defining partial factor productivity growth
Partial productivity of input 𝑖,
𝐴𝑖, =𝑄𝑡/ 𝑋𝑖, (Q – output X – inputs A- Productivity)
Then the partial productivity growth of input 𝑖 at time 𝑡 is
Δln𝐴𝑖, = Δln𝑄𝑡 − Δln𝑋𝑖,𝑡
where Δln𝑄𝑡 = ln𝑄𝑡− ln𝑄𝑡−1 Δln𝑋𝑖,𝑡 = ln𝑋𝑖,𝑡 - ln𝑋𝑖,𝑡-1
Partial productivity growth of input i = output growth – growth of input i
Labour productivity growth = output growth – labour input growth
Land productivity growth = output growth – land input growth
Total Factor Productivity and Total Factor Productivity Growth(TFPG)
Total Factor Productivity = Multifactor Productivity
Total factor productivity measures the increase in total output which is not accounted for
by increases in total inputs.
Output Growth = Accumulation of Factor Inputs (Factor Input Growth)
Land, Labour, Capital
+
Total Factor Productivity Growth (TFPG)

4
Portion of output not explained by the amount of inputs used in
production
TFP and Partial Factor Productivity
TFP growth is the weighted sum of the partial productivity growth rates for all the inputs,
where the weights are the inputs' cost-share weights.
.
Partial productivity measures are driven by TFP growth in the long run.
If labour and capital are considered,
Labour productivity growth is TFP growth and capital deepening,
If land and other inputs (labour, capital) are considered,
Land productivity (Yield) growth is TFP growth and input (labour, capital)
intensification
The growth in the primary factors (commonly called as factor accumulation) is subject to
diminishing returns. Therefore, the growth in output due to factor accumulation will

5
eventually taper off, making the growth process unsustainable in the long run. However,
the growth in factor productivity has increasing returns characteristics. That is, there is no
limit to the growth in output that is due to factor productivity.

Page | 6
1.3.3 Conceptual Framework
TFP growth influencing factors –
Output Growth = Measured/conventional Input Growth + Total Factor Productivity Growth (TFPG)
Unmeasured/ Unconventional + Unmeasured Quality + Technology
Input Growth of Input Growth
Land (Ac)
- Irrigated land(public)
- Non -Irrigated land
- Pump irrigated
Seed (Ac)
- Improved seed
Labour (mandays)
Machinery Power (Ac)
- 2 Wheel tractors
- 4 Wheel tractors
- Combined harvesters
Fertiliser (Kg)
Other Inputs (Ac)
Rainfall
Publicly provided
inputs -
infrastructure –
Roads, Markets
Financial Inputs -
credits
Training & Skills
development
Literacy
Quality seed
/planting material
programs
Soil degradation
New Technology
- Generate locally
- Generate local + international
- Borrowed
Technology Transfer
- Spill over
- Disseminate
Adoption
May involve capital
Irrigation Expenditure
Subsidies
Government role – Policy making - Economy wide /Sector/ crop specific Policies - Providing inputs, promote input use, improve
input quality Public expenditure
Private sector - Private sector investments – Input production -seed production, machinery imports and supply, other input supply

Page | 7
1.4 EMPIRICAL ANALYSIS
1.4.1 Analysis of import substitution Crop Sector
Crops Studied
Rice/Paddy sub sector
Maize sub sector -Second largest field crop grown mainly for the production of animal
feed
Other Field Crop Sector
Chili
Big Onion
Soybean
Potato
Methods of TFP and PFP Measurements
In this study, Tornqvist- Theil index approach of the Growth Accounting method was
employed to calculate the TFP growth of import substitution crop sector for which time
series data was available. A detailed description of the method is given in appendix
(Appendix 1). (Y= output, X = input, n= number of inputs, A =TFP and β = factor share)
TFP growth is estimated by subtracting total input growth from output growth;
Land productivity and labour productivity can be directly measured, nevertheless growth
decomposition by resources also gives rise to the same productivity growth explained in
ẊLand , and ẊLabour,
-

Page | 8
TFP estimated by Tornqvist- Theil index approach of the Growth Accounting method has
been described as "a measure of our ignorance"; it is a 'black box' of the residual part of
the output growth that we cannot yet explain. Growth accounting approach therefore
allows for the estimation of TFPG which not only includes the technological progress but
also growth of unmeasured inputs and measured input quality. In addition it captures the
effects of factors such as factor utilization rates, imperfect competition in product markets
and non-constant returns to scale.
Inputs and Outputs
• Output is measured in terms of farm output at producer level
• Inputs include broadly land, labour and capital. It is also considered land and land
saving capital, labour and labour saving capital
• Irrigation considered as a quality parameter of land for paddy
Irrigated Land =1.7 * rainfed area
• Pesticide and weedicides are considered as foreign exchange spent in US Dollar
terms
• Fertiliser in quantities
• Machinery use is equated to land area mechanized.
• Aggregation of output and input into national level
Agriculture
sub sectors
Crops TFPG estimation method Data and approach
Rice Rice From 1990- 2017
Growth accounting –
Residual TFPG Tornqvist-
Theil index
Output
district total maha & yala
national total
Input output coefficients -
taken from crop enterprise
budget representing either
districts or national
Factor shares from
Crop enterprise budget
Maize Maize
Subsidiary
Food Crop
Sector
Soy bean
Chilli
Big Onion
Potato

Page | 9
Factors influencing Total Factor Productivity Growth (TFPG) and Input Intensification
In addition to technological progress, TFP growth (as conventionally measured) captures
the changes in input quality, unmeasured inputs and the effects of factors such as factor
utilization rates, imperfect competition in product markets and non-constant returns to
scale. However, TFP growth does not capture technological progress that is embodied in
new capital equipment.
The changes in policies, policy outcomes, institutions, availability of public goods and
services, private sector, international partner‘s participation and economic integration that
are influencing TFP growth and Input intensification in domestic food crop sector was
studied by reviewing the sector with various information sources, including literature
from developing countries.
Technology can be exotic, adapted or locally developed or may be embodied in new
capital equipment or disembodied. Embodied technology is transferred through imports
of new machinery and other equipment. By the way of economic integration, countries
can benefit from foreign R&D through ―technology spillovers‖. The Public and private
sector‘s role of disseminating technology is important. The factors relating to the
adoption of technology are also important that credit may play a role in adopting new
technology.
Unmeasured/ Unconventional Input
Rainfall
Publicly provided inputs -infrastructure –Roads, Markets
Financial Inputs - credits
Unmeasured Quality of Input
Quality seed /planting material programs
Training & Skills development
Literacy and Rural education
Soil degradation
Main categories of Variables influencing Input intensification
Resource Endowments
Prices and costs
Input policies- subsidies
Infrastructure - irrigation
Institutions - promotions
Private sector involvement

Page | 10
1.4.2 Analysis of Export promotion fruit crop sector
Crops Studied
Pineapple
Banana
Papaya
Passionfruit
Factor Productivity Gap among fruit growing Farmers (efficiency gap)
Due to the limitation of time series data for productivity analysis, a cross sectional
analysis is performed. Productivity gains through technical change as a result of research
or by the transfer of new technologies, is considered to be constant within the year of the
study and was not considered. Of the sources of agricultural growth, efficiency gains
through the greater technical and allocative efficiency of farmers in response to better
information and education is the focus of this analysis. This varies among farmers due to
farmers‘ level of technical knowledge (a number of agronomic practices in crop
establishment), socioeconomic status (education, tenure, and nonfarm income) and
accessibility to information and markets. For export fruit crop sector, the factor
productivity index was developed to measure the factor productivity gap between
farmers.
Factors affecting the farmer‘s efficiency in using resources and choosing the existing
technology for increasing productivity were estimated by developing a regression model.
A proxy variable was constructed to measure the efficiency i.e. quantity production per
Rs spent by farmer. This measure is approximated to Factor Productivity. Factor
productivity is calculated as in the following equation. In the total cost calculation,
financial cost was taken.
Factor Productivity = Total production (Q)/ Total Cost
This proxy variable is used to analyse the factor productivity gap among farmers within a
year due to efficiency and was regressed with variables that are determinants of
productivity across a year. If farmers get more output from money he spent on
production, the farmer is considered to be more efficient in using his resources and in
choosing the existing technology. Factors determining productivity are variables
representing the farmers‘ level of technical knowledge (a number of agronomic practices
in crop establishment) and socioeconomic status (education, tenure, and income).
The multiple regression model is expressed implicitly as:
FPi = ƒ( X, Z) +E
X= technology used and technical knowledge
Z= socioeconomic factors

Page | 11
Partial productivity of land and labour was directly measured that it requires less data and
relies on fewer methodological assumptions.
A stochastic frontier function was derived for pineapple farming.
1.5 DATA COLLECTION
Due consideration was given to;
* Conventional/ measured and unconventional/ unmeasured inputs
* Method of accounting for changes in quality of inputs and outputs
* Coverage and level of disaggregation of inputs and outputs
* Degree of spatial disaggregation of the input, output and price data
Method of data collection
Secondary sources: Existing databases and information in literature
• International data bases- FAO data, USDA ERS, IFPRI
• Countrywide data bases - Sector Model developed for Sri Lanka
• Department of Census and Statistics- Production and extent of all agricultural
data, paddy statistics and other field crop statistics, labour statistics, literacy
• Department of agriculture- Cost of cultivation data, crop enterprise data, study
reports, annual reports, journals, expenditure allocations, technology releases,
adoption rates
• HARTI – price data, study reports, data bank data, library materials
• Central bank – annual reports, public expenditure, agriculture sector reviews
Primary data collection
Field Survey using structured questionnaire – Farm Survey
• to collect cost of production data for fruit crops and other related information.
• 100 Banana, Pineapple, Papaya farmers and 50 Passion fruit farmers from major
producing areas
Papaya - A sample of 100 farmers were interviewed from Kurunegala and Vavuniya
districts. Farmers represented Mahawa, Nikaweratiya, Anamaduwa, Kotavehera,
Vavuniya North, Cheddikulam and Vavuniya ASC areas, the main papaya growing ASC‘s
in the district. Data collection was carried out from 2019 September to November 2019
using pretested interview schedules/questionnaires by experienced field staff with the
assistance of AI of the ASC.
Pineapple - A sample of 100 farmers were interviewed from Gampaha district. Farmers
represented Urapola, Mirigama, Vake, ASC areas, the main pineapple growing ASC‘s in
the district. Data collection was carried out from 2019 October to December 2019 using
Page | 12
pretested interview schedules/questionnaires by experienced field staff with the assistance
of AI of the ASC.
Banana - A sample of 100 farmers were interviewed from Rathnapura, Hambantota and
Moneragala districts. Farmers represented Embilipitiya, Ambalanthota, Thanamalwila,
Sevanagala and Sooriyawewa ASC areas, main banana growing ASC‘s in the district.
Data collection was carried out from 2019 November to January 2020 using pretested
interview schedules/questionnaires by experienced field staff with the assistance of AI of
the ASC.
Passionfruit -A sample of 40 farmers were interviewed from Kalutara district. Farmers
represented the ASC areas, main passiofruit growing ASC‘s in the district. Data
collection was carried out from 2019 December to 2020 January using pretested interview
schedules/questionnaires by experienced field staff with the assistance of AI of the ASC.
Structured Interviews with key informants from the public sector
• To gather information related to existing setup, its weakness in achieving the
desired outcomes, policy options and necessary regulatory changes for agriculture
productivity enhancement
• Verifiying the findings of the study
• Department of Agriculture, Mahaweli Authority,
Structured Interviews with key informants from the private sector
• To collect information related to the private sector‘s investment in agriculture and
to ascertain its determinants
• Private sector input suppliers, importers or companies in agriculture and
agribusiness, Chamber of commerce, Agents
Focus group discussion with farmer groups
Lesson learned from other countries
PFP comparison among regional countries
A comparative analysis within the regional countries was carried out in terms of partial
factor productivity of land and labour in relation to crop sub sectors to get an insight to
the possible technologies and economic statuses of crop farmers as well as the land
utilization capacity.
Success stories from the region
Bangladesh‘s success story of maize and potato productivity improvements in the recent
past with the private sector Involvement in Bangladesh Agriculture

Page | 13
1.6 ORGANIZATION OF THE REPORT
The next chapter gives a detail account of the past policies of the government that were
aimed at achieving various objectives at different times from the period of liberalization
of the economy. Effectiveness of those policies on agricultural productivity growth has
also been reviewed when and where it is relevant with the supporting literature. Chapter 3
and 4 fill the knowledge gap. Performed functions by the private sector in achieving
agricultural productivity growth in the domestic food crop sector and the determinants of
their continued contribution in terms of investment and programs have been reviewed in
chapter 3. Chapter 4 analyses the crop-wise partial factor productivities viz. land and
labour productivity and the Total Factor productivity (TFP) growth estimated for rice,
maize, chili, big onion, potato and soybean also the technical efficiency and factor
productivity gap calculated for farmers cultivating pineapple, banana, papaya and
passion-fruit against the technology, institutions, markets and the related policy and
regulatory frameworks, public and private sector investments and international partners‘
participation in these sectors. This chapter identifies policy plus regulatory gaps along
with inconsistencies in Sri Lanka‘s policy formulation compared to neighbouring
countries in achieving agricultural productivity growth in domestic food crop sector.
Chapter 5 summarizes the findings and proposes policy instruments as recommendations.

Page | 14
CHAPTER 2
REVIEW OF POLICIES ON AGRICULTURE
This section reviews the policies that have been in implementation in the last few decades
and the influence it had on the domestic food crop sector and the specific polices and
public expenditure programs which aimed at promoting efficient agricultural inputs use
for the production and enhancement in the productivity of agricultural inputs for the
growth in the domestic agriculture sector. Economy-wide, sectoral and crop specific
policies, regulations, public expenditure programs and institutional framework are the
focus of the policy survey.
2.1 ECONOMY-WIDE POLICIES AFFECTING AGRICULTURE
The present epoch in the economic history of Sri Lanka began with the economic and
trade liberalization, along with deregulation of economic activities, adopted by the new
government elected to power in 1977. The major changes effected by the government
under this new policy regime were in macroeconomic and trade sectors of the economy
and agriculture was not a direct target area. However, the changes in the overall economic
policy had significant effects on the performance of the agricultural sector as well as the
sector policies that shaped the future path of agricultural development in Sri Lanka.
Particularly, liberalization of agricultural trade manifested profound impacts on the
agricultural sector which hitherto operated under heavy trade protection proliferated
under the inward looking economic policies held by the governments preceding 1977.
In addition to economic liberalization of 1977 and its policy derivatives that followed in
subsequent years, there was another nationwide change which was political in its
orientation that had far reaching implications on the agricultural sector of the country.
This was the devolution of hitherto centralized administrative powers of the central
government among nine newly formed provincial councils. Not all administrative
functions were so devolved but agricultural administration and the agricultural extension
service fell among the devolved functions. This proved to be a definitive policy change
that affected agricultural production and productivity in the country.
Although numerous changes were effected over time in the areas of macroeconomic and
trade policies, only the following major policy scenarios along with the devolution of
power in 1988, listed in chronological order, are discussed in this study particularly in
relation to their effects on the agricultural sector of Sri Lanka.
- 1977 - Liberalization of the economy
- 1984 - Second wave of liberalization
- 1987 - Structural adjustment policy

Page | 15
- 1988 - Devolution of power to provincial councils
- 1990 - Nationwide poverty alleviation program –―Jansaviya‖ program
- 1977 to 1990s - Export led growth and diversification
- 1995 - Ratifying WTO Uruguay round on agriculture
- 2000 onwards - Ratifying regional trade agreements
2.1.1 Liberalization of the economy – 1977
Economic liberalization in Sri Lanka in 1977 immediately followed the change of
government in the electoral polls in 1977, but apparently without prior preparation and
planning. This was neither following any worldwide wave of liberalization nor was
guided by any recognized international organization such as the WTO (WTO came into
being much later in 1995). As a result the economic liberalization in Sri Lanka in the
beginning happened to be an unplanned operation effected primarily on a political
motivation to expunge the inward looking economic paradigm of the day and launch on a
rapid growth path with the economic opportunities presumably available within the
ensuing liberal economic scenario. Its implementation continued, therefore, as a ―learning
by doing‖ exercise which caused both desirable as well as undesirable consequences over
time particularly in relation to agriculture.
Among numerous stated objectives of liberalization relating to enhancement of the
overall economy of Sri Lanka ―rejuvenating the agricultural sector‖ was a prominent one.
Nevertheless, no specific policy instruments relating to agriculture were laid out. In fact
the strategies adopted in the period 1977 – 1980 were mainly aimed at reducing
administrative controls and interventions in the economy (Karlic et al.,1996). This
included reducing quantitative restrictions in trade, some reduction of tariffs and reducing
export taxes on agricultural products. Expansion of fiscal expenditure especially in order
to undertake the Accelerated Mahaweli River Diversion and Farmer Settlement project
was another prominent feature of this period. This is one aspect of the policy package at
the time which had a direct positive impact on agricultural production and rural
employment, a result that emerged not at the current period but some six years later.
A negative impact on agricultural production and farm income ensued the depressed farm
prices of locally produced food crops resulting from the liberalization of the imports of
food products. IPS (2008) shows that the domestic food production sector was ―ignored‖
at this period (in favor of industrial expansion) by way of reducing and holding static the
government expenditure allocated for agricultural research and expenditure and this had a
prolonged impact on agricultural productivity growth in the country.
Page | 16
However, the overall short term economic impact of liberalization (from 1977 to 1980)
has been reported to be positive. According to Karlic et al. (1966) the overall economic
impact had been as follows.
- Dismantling trade and payment restrictions, notably through the removal of most
import licensing requirements.
- Unifying the exchange rate and allowing it to be reflected in developments in the
balance of payments.
- Restructuring (plantation) agricultural prices and export taxes to increase resources
for the essential tree crops sector.
- Adjusting the prices of essential consumer goods, production inputs and public
services.
- Restructuring government priorities to promote investment while substantially
reducing widespread subsidies on food and fertilizer.
- Liberalizing interest rates and curtailing central bank lending to promote savings
and more rational allocation of credit.
As a result of these reforms, it was reported, that there were pronounced effects on
economic activity and GDP growth doubled from 3 percent to 6 percent between 1977
and 1980.
The period between 1980 and 1987, however, marked a difference. The major policy
thrust was on maintaining macroeconomic stability with the help of the IMF than on
extending the aforesaid reforms. There were several factors responsible for the slowdown
of economic reforms and the onset of prolonged civil unrest and disturbances was the
prominent cause. The second factor was the discontinuation of the initial liberalization of
trade and payments system while the third was the appreciation of the real effective
exchange rate during the period 1980 – 1984. GDP growth fell during this period and the
major event that had a direct bearing on agriculture was the freezing (in nominal terms) of
the fertilizer subsidy and the national food stamp program.
2.1.2 Structural adjustment policy – 1988 – 90
The government developed a new economic plan in January 1988 with the objectives of
reducing macroeconomic imbalances and removing structural impediments to growth.
This program was supported by the Structural Adjustment Facility (SAF) of the IMF and
was locally referred to as the Structural Adjustment Program (SAP). The brunt of the
adjustments made under SAP was felt on the government expenditure budget and, among
others, the allocations on subsidies and transfers plus the normal investment expenditure
were seriously affected. This indicates the pressure applied by the budgetary process on
food subsidies and the funds allocated for agricultural research and extension.
Page | 17
This was ingrained into the founding principles of the structural policies of SAP which
envisage that ―public sector claims on resources‖ should be reduced and the industrial
sector supported by the state should be more outwardly oriented. An export oriented
development program specifically aimed at the industrial sector was also undertaken
under the SAP in 1988 and details of this endeavor will be discussed separately in a
coming section.
In spite of the ambitious plan, the first year‘s (1988) performance of the SAP fell
considerably short of expectations (Karlic et al.,1996). Real GDP grew by only 3 percent
while the rate of inflation touched 15 percent. Overall balance of payments also recorded
a substantial deficit. None of these, however, had any direct implications on the food
crops agriculture of the country. The reasons for this failure of the SAP, though, was
identified as a set of noneconomic factors i.e. rapid deterioration of national security and
some decisions made on political grounds prior to the presidential polls and parliamentary
elections in the end of 1988 and early 1989 respectively.
The macroeconomic crisis of 1988 continued into the second and third years of the SAP
too and the response of the government to this was a pronounced tightening of fiscal and
monetary policies and a depreciation of the SL Rupee. The impact of this was felt in the
agricultural sector as the subsidies on fertilizer, rice and wheat were phased out in 1989
and 1990 and the prices of petroleum products were increased substantially as well.
Relatively restrained policies showed some positive impacts on the macroeconomy in late
1989 and continued into 1990, the third year of SAP, as well. Despite the macroeconomic
improvements the food crop agriculture of Sri Lanka was adversely affected by the
lagged effect of the rupee depreciation of the previous year and the increases of the
controlled prices of wheat, sugar, fertilizer and petroleum products. Yet some
improvements in the overall economy were discerned, according to Karlic et al. (1996),
by the end of 1990, the third year of SAP, such as,
- A reduction in civil service employment by 10 percent
- Privatization of some small manufacturing enterprises
- Tariff reforms that reduced the maximum tariff to 50 percent, accompanied by an
extension of the coverage of excise duties
- Liberalization of ocean freight and airline services
- Increases in foreign exchange allocations for education and travel.
2.1.3 Second wave of liberalization (SWL) – 1984
The so called Second Wave of Liberalization surrounds some confusion. SWL was not an
official designation of a program but rather a popular epithet. In fact, there is some more
confusion caused by implicating it with SAP undertaken in 1988, which was discussed in

Page | 18
the previous section. Nevertheless, there are some features of SAP purposely left out of
the discussion therein in order to be presented here as they were popularly held as the
features of SWL.
As was elucidated in the previous section, 1984 was a year of macroeconomic
stabilization but not one of domestic economic reforms. As such, treating 1984 as the year
of SWL is somewhat inaccurate as the SWL was popularly interpreted as a mission of
―privatization of state owned enterprises‖. In this case it is more appropriate to identify
SWL more closely with SAP, specifically its first year 1987.
It was shown in the previous section that, in addition to macroeconomic stabilization SAP
envisaged reducing the claims on resources by the public sector and supporting industrial
establishments with government backing. This resulted in the SAP being inclined to,
- The conversion of some enterprises to public liability companies that would
operate on commercial principles
- Privatization of selected enterprises
- Promotion of private sector access to activities previously reserved for the public
sector
Consequently numerous public corporations were privatized and a number of agriculture
and agro-industry based public corporations (such as Sugar Corporation, Oils and Fats
Corporation and the Marketing Department) were also included in the lot. Current
thinking in the field of economics supports this course of action on efficiency grounds but
the state faced with stiff resistance by social and political activists. The reduction of
country‘s agricultural output during these years was also implicated to the government‘s
liberalization and privatization policy, but quite erroneously as it was a result of a
persistent drought. The merits of this line of actions were equivocal and hotly debated
mainly on social and political grounds.
2.1.4 Devolution of power to provincial councils – 1988
As consequence of the signing of the Indo-Lanka Peace Accord between India and Sri
Lanka in 1988, hitherto centrally executed administration of Sri Lanka was devolved to
the nine newly constituted Provincial Councils. Some functions of the central government
were devolved and handed over to the provincial governments while some continued to
be under the center. As far as agriculture is concerned, the Ministry of Agriculture,
responsible for overall planning for the agricultural sector of the country and providing
some directions to the provinces remained at the center as usual. But the main department
under the ministry or the ―work horse‖ of it, the Department of Agriculture (DOA), was
partially devolved.

Page | 19
The DOA under the central government at the time consisted of 6 technical divisions
namely the Research division (RD), Extension division(ED), Education and Training
division (E&TD), Seeds and Planting Material division (SPMD), Seed Certification and
Plant Protection division (SC&PPD) and Agricultural Economics and Planning division
(AE&PD). Out of these the ED, E&TD and SE&PD were deemed suitable by the
authorities to be devolved. The RD, SPMD and SC&PPD were retained in the DOA of
the central government due to ‗technical reasons‘ which will be explained in a later
section. The AE&PD was later reverted to the central DOA based on the same technical
reasons.
This devolution of functions of the DOA, in effect, led to a disintegration of the
monolithic agricultural development program conducted and administered by the center
in two main ways.
- The RD developed new crop varieties and new agricultural technologies and passed
them to the training staff of the E&TD as well as the extension workers in the ED
through the regular in-service training program conducted by the E&TD as well as
through the Regional Technical Working Group (RTWG) meetings held seasonally.
In addition to this technological flow from the researchers to the extension officers,
there was a reverse flow of information from the extension officers on technical
problems encountered in the field, to the research community. With the devolution of
the extension service to the provincial administrations the aforesaid two-way
information flow and the research-extension rapport completely broke down.
Although the RTWGs were replaced by Provincial Technical Working Group
meetings the intended results were not realized because the research personnel and the
extension personnel belonged to two different administrations, central government
and provincial governments respectively, with different agendas, not to mention the
attitudes.
- When the DOA had all the functions under one umbrella driving countrywide or
region-wide agricultural programs were technically and administratively feasible to a
great extent. The program of breeding new improved rice varieties, producing high
quality seeds of those varieties, popularizing them and realizing a near hundred
percent adoption and doubling county‘s rice production within 15 years (from 1968 to
1983) is a concrete example vouching for this. Nevertheless, due to the divergence of
interests and priorities between the center and the provinces such achievements have
now become all but impossible. This is a problem that the present political system has
apparently failed to overcome.

Page | 20
2.1.5 Nationwide poverty alleviation program -1990
In keeping with the pre-election pledge the new president of Sri Lanka elected to power
in December 1988 launched an ambitious poverty alleviation program named
―Janasaviya‖ (People‘s Power) in 1990. The pledge was to grant an income subsidy of
Rs.5000 per month for every family falling below the poverty line of income. This, in
economic terms, was clearly infeasible but the program was inaugurated with several
scaling downs in coverage, but in all administrative districts of Sri Lanka. One main
feature of the program was to reduce the size of the smallest administrative unit in the
country, the Grama Niladhari (GN) division, in order to make it possible for the GNs to
personally monitor the Janasaviya recipients and their progress. This necessitated the
expansion of the GN carder by about 5000 additional carders. The strategy adopted by the
government was to immediately absorb about 2000 village level agricultural extension
workers (Krushikarma Vyapthi Sevakas) or the KVSs, as they were popularly known, of
the DOA and a little higher a number of Cultivation Officers (COO) employed by the
Department of Agrarian Services (DAS) in to the GN carder.
This resulted in a vacuum in the areas of agricultural extension services and agricultural
service delivery at the village level. This was particularly a social loss as the KVSs were
trained professionals holding one year diplomas from Schools of Agriculture of the DOA.
At the time of this change the KVSs were mainly engaged in the Training and Visiting
(T&V) extension program of the DOA under which they had to visit selected groups of
―contact farmers‖ according to a set schedule. This was the main mode of extension of the
time supplemented with various group activities and on farm demonstrations, all of which
were organized with the participation of the KVSs. This entire village level extension
program was totally disrupted by the removal of the KVS carder from the rural
institutional set up and this proved to be a significant blow to the agricultural
development efforts of the country.
2.1.6 Export led growth and diversification program – 1977 to 1990s
Even though Export Led Growth (ELG) and agricultural diversification have become
catch phrases in professional and policy circles since early 1990s there has not been a
dedicated government program specifically committed to these purposes in Sri Lanka. In
fact, product diversification and ELG were implicit but embedded in the principles behind
the liberalization of the economy in 1977. This entails product diversification within
agriculture as well as a movement of economic activity from agriculture to industry and
services.
Diversification within agriculture first stated in late1970s with the drive of the Ministry of
Agriculture that encouraged farmers producing traditional crops to switch to non-

Page | 21
traditional crops such as cut flowers. This officially un-inaugurated program also
established specialized ―export crop villages‖ such as the beetle leaf producer‘s villages
in Gampaha district. Further, an agricultural project funded by USAID dedicated to
research and extension on agricultural crop diversification, (MARD) aiming at newly
irrigated Mahaweli project areas was established during this period. Much later in mid
1990s another foreign funded project entitled Perennial Crop Diversification Project
(PECRODEP) was established in the Mid-Country areas of Sri Lanka to introduce
diversification to the marginally productive perennial crop farms in the area.
The DOA, in spite of being the main agricultural research and extension arm of the
government did not apparently field a concerted effort in the areas of crop diversification
and agricultural export promotion. On the contrary, the Department of Minor Export
Crops (presently the Department of Export Agriculture) from its beginning made a
significant contribution of promoting quality spices for both local and export markets but
Sri Lanka has not been a big player in the world spice market, except for cinnamon. The
Export Development Board (EDB) of Sri Lanka, on the other hand is actively engaged in
finding new markets for Sri Lankan agricultural products and providing information and
advice to the current and prospective exporters of agricultural products.
Despite the efforts, crop diversification, neither for export nor for domestic market, have
held foot among Sri Lankan small farmers. However, some medium scale farmers and
large corporate organizations have adopted the concept of diversification aiming at
foreign markets. Large and medium scale producers of cut flower and foliage as well as
some exotic fruits such as cantaloupe and vegetables such as gherkin are good examples.
Nevertheless, the extent and spread of such enterprises are not adequate to help Sri Lanka
to achieve the coveted goal of export led growth. May be the recent advent of large
irrigated farms producing local fruits like mango and a possible expansion of pineapple
and newly introduced dragon fruit would be able to drive the country in this direction.
2.1.7 Ratifying WTO trade regulations - 1995
World Trade Organization (WTO) is the only international organization that regulates the
global rules of trade between nations, aiming at ensuring to the extent possible, smooth,
predictable and free international trade. Sri Lanka has been a member of it since its
beginning in 1995 and Sri Lanka‘s annual international trade volume has shown a marked
growth since then (Kannangara and Keron, 2018).
However, as was mentioned earlier Sri Lanka‘s trade liberalization (in 1977) well
preceded the establishment of the WTO. The pre-WTO (or pre Uruguay Round) South
Asian Economies including Sri Lanka were characterized by direct public sector
incentives for production such as research and development, extension services and input
subsidies i.e. for fertilizer, irrigation and credit (Mikik, 2007).

Page | 22
What is most important for agricultural trade is the Uruguay round of negotiations which
resulted in the Agreement on Agriculture which Sri Lanka has ratified and hence obliged
to adhere to. The other important event is the Doha round trade negotiations started in
2001. In this round discussions and negotiations were undertaken on the important issues
of trade facilitation, Trade Related Aspects of Intellectual Property Rights (TRIPS) and
―Aid for Trade‖. Sri Lanka is still continuing negotiations on these issues.
The WTO operates on the economic principles of international trade and this dictates the
total absence or having only very low subsidies as well as the absence of non-tariff
barriers. South Asian economies including Sri Lanka, which used to have high levels of
distortions, have tended to set their maximum bound rates of tariffs for their agricultural
commodities at very high levels. However, Sri Lanka has agreed to set the maximum
bound rate of tariff for her imports at 50 percent but the operational levels are around 30
percent. These are very low tariff levels for a country in the South Asian region. For
example, India has set her maximum bound rate at 300 percent. As such, Sri Lanka has
apparently been drawn in to a major blunder by her trade negotiators.
2.1.8 Ratifying regional trade agreements – 2000 onwards
Starting from 2000 Sri Lanka has ratified two bilateral trade agreements and three
multilateral trade agreements, chiefly but not exclusively, within South Asia. The bilateral
agreements are Indo-Sri Lanka Free Trade Agreement (ISFTA) of 2000 and Pakistan-Sri
Lanka Free Trade Agreement (PSFTA) of 2006 while the multilateral agreements are the
agreement on Global System of Tariff Preference (GSTP) of 1988, Asia Pacific Trade
Agreement (APTA) of 2005 (previously Bangkok Agreement of 1975) and South Asia
Free Trade Agreement (SAFTA) of 2006. Further, Sri Lanka is in the process of
negotiating a China-Sri Lanka Free Trade Agreement and a SAARC Agreement on Trade
in Services (Ministry of Foreign Affairs, 2016).
A free trade agreement among a group of countries is one that intends to promote, among
other things, growth through employment generation by removing restrictions to inter-
country movement of labor and eliminating all trade restrictions totally within the group.
In this sense none of the above ―free trade‖ agreements are actual free trade agreements.
They could best be named as preferential trade agreements in which the member
countries offer certain trade concessions like reduced tariff rates for trade within the
group in order to promote trade volumes of the member countries and promote
competition and thereby improve the quality of the commodities traded. Interestingly, the
above agreements were earlier referred to as preferential trade agreements in official
usage as well as in technical literature.
Page | 23
However, Sri Lankan agriculture doesn‘t seem to have derived the aforesaid kind of
benefits to a satisfactory degree. The composition of the volume of trade has been biased
against agricultural commodities in favor of industrial goods. Agricultural commodities
have only been classified as exemptions from the negative lists or have been excluded
from the positive lists except in a few cases (Samaratunga et al., 2007). Thus, the main
beneficiary in Sri Lanka from regional trade agreements has been the industrial sector.
2.2 AGRICULTURE SECTOR POLICIES & PUBLIC EXPENDITURE
Although subsequent political regimes adopted broadly a different approach to implement
various sector policies and programs, all government gave its priority to develop
irrigation infrastructure for dry zone agriculture development. The priority received for
research and development, quality seed production and quality seed import, extension and
technology transfer, mechanization, efficient fertiliser use, and other supportive services
for risk management, credit facilities etc was mostly in line with the broad policy
framework of the government and the changing international setting. Road infrastructure
and other infrastructure development accelerated after mid 90‘s have been positively
effecting the functioning of agriculture input and output market. Except during the period
1990-1994, fertiliser subsidy has been in operation in the country either in the form of
direct price subsidy or cash subsidy. Irrigation and fertiliser policy aimed to achieve the
agriculture growth through factor accumulation. Yet, bringing new technology and
innovations to farm are more vital in increasing land productivity through increasing total
factor productivity.
In Sri Lanka it is found in most instances government policies are not well formulated
with a set of objectives, instruments and implementation strategy rather incomprehensive
policy documents prepared by the ministry time to time responsible for implementation of
government programs are found.
This section first reviews the research policy coupled with science policy in the domestic
food crop sector, its capacity in terms human capital and public expenditure allocations
for achieving the undeclared objective of bridging the science gap and the research gap.
Extension policy is reviewed next that underwent a complete transformation with the
devolution and implementation of social welfare programs. Policies related to agriculture
inputs mainly water and fertiliser and expenditure on these programs are next reviewed.
Seed policy will be discussed next. Policies favouring mechanization and the
development of rural road infrastructure are also discussed. Finally, credit and finance
and insurance policies are reviewed.

Page | 24
2.2.1 Scientific Agriculture, Science Policy and Agricultural Research Policy
Emergence of scientific agriculture and agricultural education
Agricultural sector policies and investment are all about agricultural development and
ultimately, overall economic development of a country. Agricultural growth, and thereby
development, had transformed from a natural resource based industry to a science based
(especially mechanical, chemical and biological sciences) industry during the 20th
century. The resulting attempts at ‗yield growth‘ instead of ‗area growth‘ in agriculture
necessitated the practice of agricultural research, a new enterprise. The history of the
world‘s agricultural development elucidates that even the least developed countries had
established agricultural research institutes of some form or the other by the mid-20th
century. Quite interestingly, the seeds of agricultural research had been laid in Sri Lanka
in as early as 1822 at the Royal Botanic Garden at Peradeniya in the form of botanic
investigations of indigenous plant varieties with possible commercial potentials (Pain,
1981). Since then the DOA‘s research service has grown into a countrywide network of
18 research institutes and centers spread around the country. These subsequent
developments will be discussed in a following section of this paper.
In addition to research, a concurrent need emerged for a service that provided education
in newly discovered agricultural technologies to the rural populace: the agricultural
extension service. The practice of science based agriculture gave rise to formal
agricultural education at advanced technical college and university levels in order to turn
out the trained man power required for growing research and extension sectors. This, in
effect, led to increasing public investment aiming, somewhat indirectly though, at the
final goal of agricultural growth and development.
Sri Lanka‘s response to the need of agricultural education was initially visible very early,
in 1880s. However this was rather an informal training of selected groups of trainees on
research and various other activities of the Royal Botanic Garden. This was expanded in
to the ―School Garden Movement‖ under the newly established Department of
Agriculture (DOA) at Peradeniya, yet again an informal program. The first formal
institution of agricultural education in Sri Lanka was set up in 1916 in the form of School
of Agriculture under the DOA at Peradeniya. The ‗School‘ offered a two year diploma in
English for those who were recruited by the DOA as Agricultural Instructors for
extension work and a one year certificate course in Sinhala for teachers and Village
Headmen (Natesan,1981). Later over the years, the number of ‗Schools‘ had been
increased to 8, and are spread all over the country. University level agricultural education,
however, was late to start in Sri Lanka and the first Faculty of Agriculture was founded in
University of Ceylon at Peradeniya in 1947. Nevertheless, the number of faculties
specializing in agriculture in various state universities has risen to nine within a relatively
short span of about 60 years.

Page | 25
Public vs. private sector contribution to modernization of agriculture
All the above developments viz. agricultural research, extension, education and allied
institutional changes, emanated mainly from the public sector except in a few cases where
private profit seeking entities had a role as input providers to the farmers through free or
monopolistic (in varying degrees) market mechanism. The private sector does not venture
into agricultural research, the products of which are quite often of public good or
common property nature for which private property rights cannot be secured through
patents or other legal processes. With no secure private property rights, it is clearly
understood that the private firms are unable to sell their products in the open market and
earn profits on their investments. Thus, it is evident the public sector involvement is
mandatory in providing the farmers with the new technology needed for agricultural
growth in the majority of circumstances. For the public sector to engage in this activity
there should be sound public policies to guide its research, extension and other
development activities. In pure economic terms, government allocates public funds for
these activities and it is therefore accountable to the public that the investment made on
providing new agricultural technology earns a justifiable rate of return on investment.
Further, introduction of new technology leads to structural change in the economy and
consequently results in social changes that, sometimes, could prove socially undesirable
and politically unacceptable. Moreover, technological change needs new institutions to
efficiently effect the desired changes. Thus, developing agriculture by means of
generating and dissemination of new technology needs, as a necessary precursor, a set of
well thought of research and development policies.
2.2.1.1 National science policy and agricultural research policy: A critical review
It is deemed appropriate to start this section with an important caveat. The heading of this
section may perhaps imply a detailed description or analysis of a wide variety of issues
viz. all possible components of a national science policy, mainly science education and
man power development and scientific Research and Development (R&D) in a broad
array of disciplines including agriculture. Further, agricultural research policy (of Sri
Lanka) is another broad area of activities covering R&D in food crops sub-sector,
plantation sector, export agricultural sector etc. However, the statement of objectives of
this study explicitly indicates that the main thrust of current research is an analysis of
total and partial factor productivity growth and the underlying past and present policy
issues. In view of this background the reviews of science and agricultural policies keep
away their science education involvement. Also the review relating to ‗agriculture‘ is
essentially centered on the policies and other developments pertaining to the food crops
sub-sector.

Page | 26
2.2.1.1.a Development of a science policy and its impact on agriculture
As was indicated in the previous section, modern day drive towards economic growth and
development is science and technology based and therefore, in ideal circumstances,
guided by a sound national science policy. Agricultural research in a country, in fact,
comprises a subset of activities undertaken within the guidelines provided by her national
science policy, again under ideal circumstances (Ruttan, 1987). This may be the situation,
at least to a substantial extent, in economically advanced and better organized countries.
Nevertheless, in less developed nations the status quo often diverges substantially from
the said ideal. The development of the national science policy and agricultural research
policy in Sri Lanka is a telling example of this.
Scientific research, in some rudimentary form, started in Sri Lanka during British colonial
rule. They took the form of explorations, surveying etc. in order to cater to the
commercial interests of the colonial rule. Even agricultural research in the late 19th
century largely belonged to this category as research on cultivation of coffee and tea at
the time and rubber some years later were the responsibility of the DOA
(Wickramasinghe, 2006). Even though such research were governed by the broad
‗commercial policy‘ of the colonial government, that could hardly be classified as a
development policy let alone a ‗research policy‘. Somewhat more ‗genuine‘ an
agricultural development policy for Sri Lanka covering the food crop production
activities of the predominantly rural populace was enacted by the colonial government
after the Bengal famine of 1911 and the 1st World War that resulted in a shortage of food
grains and the government of Ceylon (now Sri Lanka) found it difficult to import the
necessary quantities of food (Wickramasinghe, 2006).
The series of events leading to the development of a national science policy in Sri Lanka
was marked by the formation of the Sri Lanka (then Ceylon) Association for the
Advancement of Science in 1944. Within four years of its formation it was able to begin
an effective agitation by the local scientists to get the politicians and science
administrators to recognize the role of science and scientists in national development.
They pressed hard immediately after National Independence in 1948 for a national
organization for science and technology following the model of Indian Science Policy
Resolution (Wickramasinghe, 2006). However, this proposal had to be presented to
several subsequent governments before it finally resulted in the formation of the National
Science Council (NSC) in 1968. The ‗seven point Science Policy Statement‘ was
presented to the government and was officially accepted as the Science and Technology
Policy of Sri Lanka in 1978. However, this policy concentrated more on science
education than on research.
The NSC was replaced by the Natural Resources, Energy and Science Authority
(NARESA) in 1982. NARESA and its predecessor NSC were semi government institutes
under the Ministry of Science and Technology and they ―played a major role in funding

Page | 27
research in all areas of Science and Technology (S&T) including agriculture‖
(Wickramasinghe, 2006). But almost all research on food crops sector were undertaken
by the DOA with the annual budgetary allocations from the Treasury in this field and the
percentage financial contributions made by the above organizations proved to be minimal.
The situation in other state organizations could well be the same while the major
beneficiaries could be the university academics, although official statistics to support this
view could not be traced.
Even though the said financial contributions to agricultural research by NSC or NARESA
have been modest the S&T policy document published in1986 was a significant example
of efforts made towards establishing an agricultural research policy for Sri Lanka.
Following a recommendation of this document the Council for Agricultural Research
Policy was set up in 1987 with a view to regulate, fund and monitor research activities in
the entire agricultural sector of Sri Lanka. Funding agricultural research by NARESA
seized to exist with the setting up of Sri Lanka Council for Agricultural Research Policy
(SLCARP) as managing funds for agricultural research hence forth came under her
purview. Creation of SLCARP also owes a great deal to the World Bank funded
Agricultural Research Project (ARP) of the time. Nevertheless, according to
Wickremasinghe (2006) ARP recommendations did not receive the endorsement of the
larger section of the scientific community in Sri Lanka. The importance of this incident is
in the major criticism leveled against the proposal that ―it geared towards the
establishment of new organizations rather than towards strengthening R&D capabilities
within those already in existence‖: an argument apparently stands valid even at present as
would be elaborated later on. Further details on SLCARP operations will be presented
and discussed in the next section.
Further, NARESA was later reconstituted as the National Science Foundation (NSF) on
the recommendation by the Presidential Task Force (PTF) of 1991. Parallel to the NSF a
new commission was also established under the Ministry of Science and Technology as
the National Science and Technology Commission (NASTC). This new commission has
recently published a comprehensive policy document entitled ―National Science and
Technology Policy‖ with a mission for ―A prosperous nation with scientifically literate
and innovative people with a strong and stable economy based on highly developed
scientific and technological capabilities‖. This is a detailed document comprising ten
policy objectives that cover a wide range of science and technology related issues. The
impact of this policy proposal is yet to be seen.
2.2.1.1.b Agricultural research policy: Development and performance
Ministry of Agriculture is the apex body that has direct access to the political stream and
is responsible for policy and strategic planning for the entire food crop production sector
along with relevant coordination, monitoring and evaluation activities. Unfortunately
though, it often lacks technical expertise in agriculture, but is keen on maintaining the

Page | 28
administrative supremacy, and this results in passing down many of her responsibilities to
the technical Departments directly under her. This dilutes the contribution of the Ministry
in planning policies and programs not only on research but also on extension and other
development related activities. Consequently, planning of agricultural research (for the
food crops sector) has historically become a function of the DOA with only minimal
contribution from the ministry. It would have been more appropriate if the ministry is
fortified with well qualified and experienced technocrats who could effectively translate
the political needs and aspirations of the time to the scientists could in turn engage in
forming research policies and strategies, and thereby actively participate in the policy
process.
As introduced in the last section, establishment of SLCARP under the ministry, at least in
part was supposed to fill this void. But SLCARP has under its purview not only the
research in food crop agriculture but also research in other sectors as plantation
agriculture, export agriculture sector, animal production sector etc. and this involves the
allocation of funds, monitoring and evaluation of research programs of 13 research
institutes. To perform all the above SLCARP has only seven qualified officers and 14
members of supporting staff which seems thoroughly inadequate. Moreover, under the
present administrative setting in Sri Lanka nine ministries deal with agriculture and rural
development and nearly all are involved in some type of agricultural research of
extension (World Bank, 2007). In fairness to SLCARP, it should be acknowledged that
the enormous task of coordinating this many organizations is bound to result in serious
inefficiency for any organization in its place. This is especially so in the Sri Lankan
context where administrative rigidities and often diverging political interests among the
ministries pose significant problems of cooperation and collaboration.
Further, among multiple functions of SLCARP, the major activities are, 1) the INFORM
program responsible for formulating and revising National Agricultural Research
Programs and research priorities, 2) the program of disbursing allowances under
agricultural research grants, 3) activities relating to the National Agricultural Research
Plan (NARP) and 4) capacity building in agriculture. It is worth reiterating in this context
that effective execution of all these responsibilities may not be expected from SLCARP
with such inadequacies in manpower and other resources. Also, this situation is seemingly
a serious hindrance to the design and operation of an effective agriculture research policy
in Sri Lanka.
It was made clear in above sections that the DOA has been the driving force behind the
food crops sector research in Sri Lanka, both before and after the attempts to formulate
overall agricultural research policies. During her century old history the DOA has made
numerous significant successes in generating technological breakthroughs in agriculture.
Although the DOA has been the sole driving force behind these there has not been a well-
articulated overarching research policy covering the entire agriculture sector. The

Page | 29
Hundred Year Anniversary publication of Tropical Agriculturist (1981), the DOA‘s
technical journal, reviews the history of DOA‘s activities, but presents only some
fragmented success stories but not a sign of such a policy. The discussion in previous
sections did not reveal the presence of a strong national science policy, especially in
recent decades, that guided DOA‘s agricultural research either. Yet this does not imply
that the research efforts of the DOA had been going astray in the past. The following
cursory look into the past achievements of the DOA with the ‗fragmented‘ policies of her
various programs, divisions and institutes, in the later years, bears testimony to this.
- The research program on ‗understanding the influence of agro-ecological variation
on dry-land agriculture‘ and the ‗soil survey‘ started in Mahailuppallama research
station in early 1950s culminated in the preparation of the ‗agro-ecological map‘ for
the entire island in 1960. This was further developed to include micro-level agro-
ecological variations as well by the Land Use Division in peradeniya in subsequent
years. The agro-ecological map finalized by 1970 is presently the base for regional
and crop based planning of all agricultural activities and policies of Sri Lanka.
- The rice varietal improvement program of Sri Lanka began in early 1950s following
the ‗pure line selection‘ adopted so far was found incapable of achieving the desired
yield potential. The program started with importing Indica varieties of rice and inter-
breeding, but was replaced later by cross-breeding Indica and Japonica varieties
which culminated in 1957 with the release the variety H4 which became widely
popular and marking the start of the subsequent H series of varieties covering all age
classes of rice. These varieties that are presently being called Old Improved
Varieties (OIVs) led to a remarkable increase in the average yield of rice in Sri
Lanka. The rice breeding program continued further, introducing the medium height
plant type challenging the short statured plant type introduced Asia-wide by the
International Rice Research Institute (IRRI) of the Philippines. This plant type
resulted in remarkable success by releasing BG11-11 in early 1970s and it was
followed by the BG series consisting of the New Improved Varieties (NIVs) that
continues till today. In addition, the rice breeding program introduced the
Coordinated Rice Varietal Trial (CRVT) program which also continues to date, in
order to test the adaptability and stability of the yields of the large number of rice
varieties under different agro-ecological conditions and thereby attain higher rice
yield in all rice growing areas. The rice breeding program of the DOA has been
instrumental in achieving near self-sufficiency in rice in Sri Lanka.
- Soil Chemistry division of then Central Agricultural Research Station (CARI) at
Gannoruwa launched a research program to find fertilizer recommendations for rice
with the introduction of highly fertilizer responsive rice varieties mentioned above.
This was at a time of low prices of chemical fertilizer. But with the global oil crisis
in 1973, the need for more ‗conservational‘ use of chemical fertilizers, especially
urea, arose and the research program switched its attention accordingly by
concentrating on effective fertilizer placement instead of usual method of

Page | 30
broadcasting. In addition, through the accumulation of knowledge of some
inefficiencies in the use of Fertilizer Mixtures (V mixtures and TDM), the ‗division‘
changed her fertilizer policy entirely towards Straight Fertilizers (instead of
mixtures) and through their research that followed, made a complete set of fertilizer
recommendations for the whole country by 2000. However, blanket-
recommendations for large areas are obviously a sub-optimal strategy since the
presence of micro-level variations in agro-ecological conditions lead to concomitant
variations in fertilizer needs, in different areas in Sri Lanka. This understanding led
to a scheme of farm level soil testing and making appropriate fertilizer
recommendations with the collaboration of the extension personnel, at recent times.
- The main ‗research policy‘ governing the activities of the Dry Zone Agricultural
Research Station (ARS) at Mahailuppallama at its inception in 1950 was identifying
and promoting crops that could be cultivated in the Dry Zone, purely in dry lands
under rain fed conditions. The activities undertaken for decades under this ‗policy‘
are explained by Fernando (1981) and Pain (1981). Nevertheless in early 1970s
came an important change with the inception of the Mahaweli River Diversion
Project under which the first settlements were to be made in ―System H‖ area
surrounding Mahailuppallama. The government‘s plan to establish small irrigated
farms under the project made her priority to conduct research and to set up a small
pilot project. This responsibility was vested upon ARS changing her long held
program on dry land agriculture substantially. The ARS scientists stood up to the
challenge by introducing new research areas such as water management and
breeding crop varieties suitable for irrigated agriculture etc. as well as managing the
―100 acre‖ pilot project, in addition to her existing dry land agricultural research.
Much later in early1980s, the same station was made a Regional Research Station
under the country wide Agricultural Extension and Adoptive Research Program
funded by the World Bank and even later in early 1990s it was made the ―Field Crop
Research Institute‖ (FCRDI) as it continues to date. The point is that the
responsibilities and even the name of this institute underwent many changes over a
long period of time, but without much guidance from an overall agricultural research
policy not to mention a national science policy. But, by and large, the
responsibilities were fulfilled.
This is but a few of the numerous significant achievements. These were, however,
purposefully selected and highlighted due to two reasons. First, they have lasted over long
periods of time: starting even before the time the concept of overarching research policies
were conceived, but have delivered the goods. Second, over their long periods of
operation they had been undergoing changes, being repeatedly revised in response to
changing technical challenges plus economic and political changes. These observations
reveal that the research programs of the DOA, although led by ―fragmented policies‖,
have had the ‗dynamism‘ and the ‗resilience‘, two essential characteristics of a successful

Page | 31
research program or a policy, even by today‘s standards. This is not, nevertheless, to
assert that the DOA research program was totally successful or foolproof in all areas. Yet,
any scientific estimates do not exist to prove the social cost-benefit ratios pertaining to the
agricultural research program of Sri Lanka either. Finally, the foregoing discussion may
result in an open question as to how ‗Socio- Economically‘ and ‗Politically‘ viable would
be the sizeable public investment being proposed currently on initiating a new
overarching agricultural research policy in Sri Lanka, and creating a large institutional
structure to plan and execute the same. This open question, however, is by no means
meant to be a leading question cast upon the intelligent readership.
The above credentials notwithstanding, a word of caution is needed here. The Structural
Reorganization of the DOA of early 1990s, or the ―Restructuring‖ as it was popularly
known, brought some profound changes to its research organization. The more or less
discipline oriented organization so far of the Research Division of the DOA was
rearranged to form four Institutes of crop group orientation as the ―Horticultural Research
and Development Institute‖ (HORDI), ―Field Crop Research and Development Institute‖
(FCRDI), Rice Research and Development Institute‖ (RRDI) and ―Fruit Crop Research
and Development Institute‖ (FCRDI) and a host of Regional Research Centers (RRCs)
were divided for administrative purposes to fall under the above four Institutes. Although
the Institutes have been assigned with a Development responsibility in addition to
research, no additional allocations of financial and manpower resources in significant
proportions appear to have been made. A detailed appraisal of this Reorganization or the
productivity of the resulting organization could not be traced. Thus, further elaboration on
this last development in the DOA was found infeasible.
2.2.1.2 A new paradigm of research policy: Innovation and its prospects
The concept of research policy became a subject of wide discourse among the academics
and professionals following, and as an outgrowth of, a major conference held at the
University of Minnesota of USA in 1970 on the methodology of assessing and planning
of agricultural research (Ruttan, 1982). According to Vernon Ruttan, an expert on
agricultural research of world acclaim, ―research policy is not a formal science and
judgments make an integral part of it. Such judgments arise out of a combination of
scientific analysis, professional experience and personal perceptions of people of their
responsibility towards the results of scientific inquiry and technological development
(Ruttan, 1982)‖. As such, the analysis of agricultural research policy presented in this
paper comprises hard facts and their analyses as well as personal experiences and the
viewpoints of the author. The concept mentioned above might, most probably, have
undergone changes since and new paradigms emerged, but the said complexity of the
subject of making and analyzing agricultural research policies still seem to exist
unchanged.
Page | 32
The latest and apparently most highly placed policy document of Sri Lanka is entitled
―Reviving Sri Lanka‘s Agricultural Research and Extension System; Towards More
Innovation and Market Orientation‖ by the World Bank, Colombo (2007). As implied by
the title this work introduces a ‗new paradigm‘ centered on ‗innovation‘ and ‗market
orientation‘. In view of the theme of the current exercise, at least a brief review of this
work is in order. The World Bank document covers a wide range of issues and delves in
to depths of detail in some respects. However, the following discussion is confined
mainly to the issues of agricultural research policy and the allied organizational
amendments. The World Bank report treats research, extension and some other
development issues in an interwoven fashion in many places but the following account
treats research separately, mainly in order to conform to the layout chosen for this paper.
Extension component will be exclusively dealt with later in a separate chapter.
The World Bank report observes that agricultural research in Sri Lanka has grown very
slowly- slower than the growth of agriculture itself. They attribute the slow growth to the
organization of agricultural research, may be the policies behind rather than to the very
low public investment in it. The issue of public investment will be dealt with in a
subsequent section and the emphasis here is on the organization and the policy relating to
agriculture, specifically the food crop sector, of Sri Lanka.
The ‗report‘ levels two major critiques on Sri Lankan food crop research system.
1. Research (and extension) in Sri Lanka is supply driven and Top- Down in its
approach to the farmers.
2. It does not respond to the research demands of the users of technology and does not
secure the participation of the private sector in designing research projects and
programs.
Both these assertions are true, but there are valid reasons for these – and these reasons
have not been given due consideration in the ‗report‘. The past achievements of Sri
Lankan researchers have been ignored and implications of largely agrarian structure of Sri
Lankan agriculture sector have not been properly recognized. On the other hand it is
apparently over enthusiastic on propelling its innovation model and promoting the
involvement of private sector- in Sri Lankan case the profit oriented corporate sector.
Scientific advancements, or scientific ‗innovations‘ of the DOA mentioned earlier such as
breeding rice varieties to achieve self- sufficiency in rice or formulating fertilizer
recommendations for new rice varieties obviously entail top–down and supply driven
approaches. The great majority of small farmers did not have any expertise needed for
contributing to a bottom-up program. And the very few corporate sector organizations
had neither the expertise nor any incentive to participate in a high level research policy
designing exercise. Even in relation to the need stressed in the report for demand driven
research, the aforesaid structure of the country‘s (food crop producing) agricultural sector

Page | 33
poses serious problems. The research demands of the small farmers with low levels of
education could be finding solutions, for instance, on countering a hitherto unknown pest
problem or on the suitable fertilizer recommendation for a problem soil. Small farmers
may feel the need for diversifying their activities to increase their farm incomes but they
are in most cases unaware of alternative farming or cropping systems and new enterprises
suitable for the agro-ecological regions they are operating in. The suitable bottom-up
solution to these situations is usually found with the help of a village level extension
worker who can better understand the problem in-situ and report it to the appropriate
research organization. This sort of bottom-up research planning existed in the DOA in the
form of RTWG system. Although this system has disappeared after the disintegration of
the DOA extension system, due credit should be given to the presence of the concept of
bottom-up and demand driven research planning in Sri Lanka. With the presently growing
popularity of mobile phones and smart phones among the farmers and the advent of on-
line agricultural extension services the modalities of operation may improve, but the
importance of a grass root level extension and adaptive research is not likely to be totally
eliminated.
The World Bank report proposes four wide ranging changes to the Agricultural Research
Policy and the Related Institutional Setup in Sri Lanka. First, the ineffectiveness and
inadequacy of SLCARP as the country‘s apex agricultural research policy organization is
recognized. However, it is proposed that SLCARP be elevated to the proposed new apex
body- the National Agricultural Innovation Council (NAIC) which is to be chaired by the
President of the country, following the model of Council of Scientific and Industrial
Research in India. This is supposed to provide a Platform for Innovations that gives
importance to new areas of science. This idea is an encouraging one and if implemented,
would bear great potentials. However, the deficiencies of SLCARP were discussed in
some detail previously in this paper and accordingly, elevating it to NAIC could prove to
be a task requiring a large public investment and organizational reforms. Furthermore, the
NAIC and its operational process is supposed to entail the participation of academics,
professionals from all concerned research organizations, bearcats from related public
institutions such as trade ministry, environmentalists, perhaps civil society organizations
and a host of interested private sector organizations and/or personnel. Even though this is
not meant to be a note of discouragement, it is imperative to note the task is of
monumental proportions and entails enormous challenges.
Second, the national agricultural policy is proposed to be formed as 8 to 10 Mission
Oriented (or Mission Mode) programs focusing primarily on economic accomplishments
such as ―the development of dairy industry to reduce dairy imports to less than 40 percent
of domestic consumption‖. The implementation of national innovation program will be
assigned to a consortium representing the major stake holders around the topic, involving
the private sector, universities, farmer organizations, research and extension and other
government agencies‖.

Page | 34
This, nevertheless, is a development program rather than a research program. As the
current paper is focused on research policies and programs further details are not
discussed here.
Third, it is proposed to form ―Provincial Agricultural Innovation Councils‖ (PIACs) in
each province with direct links to the NAIC. They are to focus on ‗strategic development
initiatives at the provincial level‘. This proposition is made following the success
observed in district-based ―Agricultural Technology Management Agencies‖ (ATMAs) of
India. But in Sri Lanka there are a few issues of concern in this connection.
The political and administrative divide between the central government and provincial
governments is one. Under this unfortunate political environment, the general experience
shows that the priorities set by the center are not adhered to by the provinces because the
provincial political priorities win the day.
Moreover, under the present system of devolving subjects and funds agricultural
extension is a subject under provincial governments whereas research is under the central
government and allocation of funds occurs accordingly. The poor functioning of the
PTWGs mentioned previously is a good example for this dichotomy. On the other hand, if
by some chance, the center coerces the provinces to spend on PAIC activities out of their
financial allocations, that would further aggravate the situation as the provincial ministers
always take the upper hand and manipulate the situation for getting their ―pound of
flesh‖.
The other point which is more on technical grounds emanate from the fact that the
provinces in Sri Lanka, unlike the ‗districts‘ in India, do not have enough trained
manpower, particularly in agricultural research. Thus the success of ATMAs in India may
not be replicated in PAICs in Sri Lanka. The last concern pertains to the participation of
private sector. The NAIC, most certainly based in Colombo, may be able to secure some
private sector participation and the participants would be a couple of large corporations,
several firms involved in seed and planting material imports and some medium and small
scale agri-business entrepreneurs. The concept of private sector participation presented in
the World Bank document apparently holds this group at the back of her mind. But, in the
far away provinces where bulk of the agricultural production of Sri Lanka is undertaken
by hundreds of thousands of smallholder farmers who are with no more than primary
education, finding qualified scientists for research (and development) planning is but a far
cry.
Finally to reiterate, the New Paradigm based on Innovation presented in the World Bank
policy document is essentially centered on Market Oriented Innovations and with a heavy
biased towards Private Sector Participation. It is repeatedly stressed that this is a policy
program with no inherent flow in it. The proposal follows the path to development
through Commercialized Agriculture and Agribusiness, a globally accepted strategy at the

Page | 35
present times. The forgoing criticism arises though, from the fact that the food crop
agriculture in Sri Lanka is not yet commercialized to the extent stipulated there and the
involvement of the private sector is only in domestic trade of primary commodities. Only
a couple of large corporations are involved in agricultural research and development of
agribusiness is still not in the hands of a broad group of entrepreneurs spread all over the
country. Under these circumstances a heavy dependence on Sri Lankan private sector for
innovations seems to be of questionable validity. There may be suggestions of ―Market
Driven‖ innovations aiming at some commercial interests of large firms: But their
contribution towards ―Scientific Innovations‖ catering to country‘s agricultural
productivity and the small farmers in rural Sri Lanka is questionable. The proposals in the
World Bank document would be of more relevance to Sri Lanka once she has emerged
from the predominantly rural and poorly productive agriculture prevailing today:
hopefully in a decades time or so.
2.2.1.3 Public Investment In Financial And Human Capital In Agricultural Research
Domestic Food Crops sector of the economy of Sri Lanka employs and sustains a
majority of the population but impinges on critical areas of poverty, food security and
some related social issues of the sort. In view of the relatively low productivity of the
food crops sector, Investing in Research and Development (R&D) in it has been clearly
recognized as one principal strategy of developing Sri Lankan economy. As a result,
various governments have strived to attain growth and sustainability in food crops sector
of Sri Lanka, often through modified policy package on agricultural R&D depending on
the times and contexts they faced. The times and contexts had been clearly marked by
different development paradigms as well as political priorities adopted by the respective
governments. Such variations in public policies and strategies gave rise to the observed
changes in public investment in agricultural research from time to time. This is the main
subject discussed in the following section.
The historical developments in science, scientific agriculture, agricultural research and
agricultural research policy in Sri Lanka have already been explored in various sections
of this paper, mostly in qualitative terms. Hence, they are not intended to be repeated here
unless essentially needed. Instead, the following account is restricted to a quantitative
analysis of the public investment in agricultural research on food crops through the
research system of the DOA, the exclusive government arm on the subject.
Data and the Sources
The time period considered for the present review and analysis is restricted from 2000 to
2017 because of the limited length of the available data time series. The main body of
data used in this study comprises the series of ‗annual expenditure on agricultural
research‘ extracted from the ―Performance Reports‖ published annually by the DOA. This
series provides expenditure estimates on R&D for various Research Institutes and

Page | 36
Regional Research Centers separately, as well as in aggregate for the DOA. In addition,
the benefits of R&D in the Department of Agriculture (DOA) disaggregated by its various
Institutes and Centers are also published in the ―Performance Reports‖, but to a limited
extent.
Although such data are available for periods prior to 2000, it is important to note that they
are not presented under the currently operational Institutes and Centers established after
the ―Restructuring of DOA‖ effected early in early 1990s. Further information was also
gathered, where possible, from literature published by some Sri Lankan and international
institutions as well.
Policies on Food Crops Sector and on the DOA
As a prelude to an analysis of public investment in agricultural R&D, a scanty picture of
agriculture in the total economy of Sri Lanka is presented in Table 1 and Figure 2.1.
Accordingly, the GDP of Sri Lanka has been growing for the last 23 years at an average
rate of 4 percent per year but the agricultural sector has been growing at a very slow rate.
Nevertheless, it is important to note that established research and extension institutes in
the food crop production sector were in existence in Sri Lanka as component parts of the
Department of Agriculture (Pain, 1981; Schokman, 1981). As was mentioned earlier, the
structure of the DOA underwent a profound change as a result of the ―Restructuring‖ took
place in early 1990s resulting in her present organizational structure depicted in Chart 1.
Accordingly, the DOA at present comprises 10 technical Institutes and Centers as her
central elements and 15 Regional Research Centers spread all over the country as
peripheral units.
Figure 2.1: Agricultural GDP, Total GDP in real terms and Agricultural GDP as a Percentage of
Total GDP
Source: Annual Reports, Central Bank of Sri Lanka
0
5
10
15
20
25
0
2,000,000
4,000,000
6,000,000
8,000,000
10,000,000
12,000,000
14,000,000
16,000,000
Ag.
GD
P a
s a
% o
f To
tal G
DP
Ag.
GD
P a
nd
To
tal G
DP
(R
s. M
illio
n)
Nominal GDP in Sri (Rs. Million) Nominal Agricultural GDP
Agricultural GDP as a % of GDP

Page | 37
Even though the current analysis concentrates on the period starting at 2000, a scanty
review of the period prior to 1977 characterized by ‗the paradigm of closed economy‘ is
included here, to serve as a comparison against the ensuing major analysis over the period
2000 – 2017. In the years prior to 1977 the import substitution and food self-sufficiency
were implemented by the state with much force as the principal policies (IPS, 2008). The
DOA, which consisted of the three main technical divisions of research, extension and
seed production, was the chief mechanism available to the government for carrying out its
primarily ‗inward looking‘ agricultural program of the day. Hence the DOA was rather
generously financed by the national treasury for achieving the most coveted economic
goal at the time: of ‗self-sufficiency‘ in food. Arguably, this resulted in most favorable
terms of state resource allocation for research and extension in Sri Lanka‘s agriculture,
although reliable quantitative data on this aspect could not be availed of. In addition to
direct government allocation of funds for research and extension the inward looking
agricultural policy was supplemented through agricultural support prices, input subsidies
and different degrees of domestic product market interventions and protectionist trade
policies.
The aforementioned inward looking and import substitution agricultural took a sharp turn
following the overall economic liberalization policy adopted by Sri Lankan government
in 1977. Yet, about 30 years since this land mark policy change no consensus exists that
Sri Lanka has attained a successful outward looking agricultural sector (IPS 2015). Trade
protection was drastically reduced depressing domestic agricultural prices discouraging
agriculture in the short run. Ad hoc changes on import duties and quantitative restrictions
further aggravated the situation by increasing price uncertainty facing domestic
producers. In the long run, government budget on research and extension was curtailed
and the growth in productivity started stagnating consequently (Samaratunga, 2009). Only
the regulatory policies in relation to plant protection and the production of seed and
planting materials progressed. But in the presence of the above problems not much of a
positive impact on productivity and national output has resulted in. Relatively liberal
trade policy is argued to be an overall pro-poor measure that brings benefits through
increased efficiency in agriculture. Nevertheless, reduced emphasis on agricultural
research and extension could in no way be justified in view of its negative impact on long
run productivity growth in agriculture and not to mention was made on the economic
welfare of over 30 percent of the rural population depending on it for livelihood
(Weeraheva 2017).
On the other extreme, Figures 2.1 and 2.2 depict that food crop agriculture accounts for
only about 15 percent of the annual Total GDP while only 0.15 percent of agricultural
GDP had been allocated for research and extension on Food Crops on average, for the
period 2000 to 2017. This is an extremely unsatisfactory situation compared to other
Asian countries and developed countries have recorded such spending of 0.63 percent and
2.6 percent respectively in 1995 (Beintema et al 2008). Further, the present absence of a
strong policy stance on productivity improvement and the persistent policy void on

Page | 38
promoting domestic agriculture have only lead to the adoption of subsidies on fertilizer
and enhanced price supports as the only ―Production Promoting‖ policies. The dominant
fertilizer subsidy policy of the last two decades and the relatively weak technology
improvement policies such as the land-use policy, irrigation policy and inconsistent trade
policies and their impacts are discussed elsewhere in this report.
Figure 2.2: Agricultural GDP, Research Expenditure in Nominal terms and Research
Expenditure as a Percentage of Total GDP
Source: Central Bank of Sri Lanka, Annual reports DOA, Budget estimates
Present Funding Arrangements for Agricultural R&D
As was mentioned earlier funding for agricultural R&D had been provided to various
government institutes directly from the early days by the National Treasury under her
annual voted expenditure. Alternatively, the plantation crop research institutes received
their capital and operational expenditure from CESS funds administered by the treasury.
This practice came to an end in 1987 at the enactment of the National Agricultural
Research Policy (NARP) and the establishment of the Council for Agricultural Research
Policy (SLCARP). The Sri Lanka Council for Research Policy (SLCARP) is the umbrella
organization that oversees the country‘s public agricultural R&D system. Instead of the
former practice under which R&D funds were directly disbursed by the Public Treasury, a
new system was established under which SLCARP first scrutinizes all claims for
agricultural R&D and then authorizes the disbursement of funds by the Treasury. The
recipient institutes of R&D funds has currently been formed in to a group named the
-
0.05
0.10
0.15
0.20
0.25
0
200,000
400,000
600,000
800,000
1,000,000
1,200,000
Re
sear
ch E
xpe
nd
itu
re a
s a
% o
f A
g. G
DP
No
min
al A
g. G
DP
an
d R
ese
arch
Exp
en
dit
ure
(R
s. M
illio
n)
Year
Nominal Agricultural GDP NominalResearch Expenditure (Rs. Million)
Research as a % of Agricultural GDP

Page | 39
‗National Agricultural Research Institutes (NARIs)‘ which consists of 13 organizations
including the CARP Secretariat and a relatively smaller higher education sector
(SLCARP, 2012a).
The NRIs accounted for 85 percent of Sri Lanka‘s public agricultural R&D expenditure in
2009 while the funds for the non-plantation sector stagnated around SLRs.400 million
(World Bank, 2007). Private sector‘s agricultural R&D investment data in Sri Lanka is
hard to come by. Private sector engagement in agricultural R&D is mainly limited to
export crops, rice, vegetable seeds and floriculture which, even in aggregate, is negligible
in its volume compared to public sector R&D expenditure (Girihagama et al., 2012).
As mentioned earlier the total funding allocated by NARP for research on food crops in
Sri Lanka is thoroughly inadequate for the task at hand. DOA is the sole organization
which focuses on increasing productivity in the food crop sector, raising incomes of the
farm households and strengthening export led agricultural growth in Sri Lanka. It also
engages itself in a number of agricultural activities outside research such as production
and distribution of seeds plus planting material and in-service agricultural education.
Nevertheless, only the four Crop Research Institutes receive funds earmarked for research
from the National Treasury. And yet, an Institute could retain only a portion of the total
allocation it receives for her own research program while the rest is distributed among the
Regional Research Centers coming under the institute‘s purview. Direct disbursement of
research funds, with or without the prior approval from SLCARP, from the treasury was
the major modality of providing funds to the research institutes of the DOA right
throughout in the past. However, after the establishment of SLCARP an additional
scheme that provided a limited amount of project specific funds was also provided to the
research institutes through a competitive bidding process for a limited period but this
system has seized to exist recently.
The present structure of the DOA, as depicted in Chart 1, reveals its current tendency to
organize her research activities along the lines four selected crop groups as Vegetables
(HORDI), Field crops (FCRDI), Rice (RRDI) and Fruits (FCDI). This is a result of the
somewhat controversial ―Restructuring‖ of DOA in mid 1990s. The structure of the
research facility of the DOA prior to ―Restructuring‖, however, was different and based
on academic, or professional, disciplines as Botany, Agronomy, Chemistry, Entomology
and Plant Pathology. The principal scientists were based in the Central Agricultural
Research Institute (CARI) at Gannoruwa. The Research Officers (ROs) were located in
numerous Research Stations spread all over the country and they were technically
reporting to their respective Principal Scientists at the CARI. The particular crops
researched on would depend on the agro-climatic regions where the research stations
were located. Which of these two systems were more efficient or productive is an
interesting question – but deemed outside the purview of this study.

Page | 40
Investment in R&D and related returns
A clarification on the terminology used in this section is in order right at the outset. The
first term of the common abbreviation R&D is Research, which usually connotes ―basic‖
or ―Scientific‖ investigations that lead to scientific ―Discoveries‖ or industrial
―Innovations‖. Yet, such novel discoveries need the activity called ―Development‖ such
as product development, before they are applied at production or ―industrial‖ level. This
is the basis of the common abbreviation R&D found in literature as a precursor to
―Innovation‖ in any industry.
However, in relation to small farmers‘ agriculture, research takes place, in most cases, in
Research Stations and most of these turn out relatively simple ―innovations‖ that can be
directly applied at farmers‘ fields. After the research phase, therefore, what is needed is
not further in-house development but the conveyance of the new knowledge or new
material to the farm level: a process which, in common parlance of agriculturists, is called
Agricultural Extension. Consequently, the precursor before innovative agriculture in the
smallholder farmers‘ sector in Sri Lanka can be more aptly called R&E rather than
conventional R&D. Therefore, R&E will be used hereinafter in this paper instead of
R&D.
In fact, all research institutes of the DOA today comprise a small Extension unit to
facilitate the ―Transfer‖ of the ―Technology‖ they generate. This may be a result of the
former ―Research‖ institutes of the DOA being transformed into ―Research and
Development‖ institutes following the restructuring in mid 1990s. Furthermore, the
research institutes of the DOA prior to restructuring did not engage in extension activities.
The research findings and recommendations used to be channeled through the Education
and Training Division to the Agricultural Officers and other extension personnel of the
Extension Division, all in the DOA. This channel of generation and dissemination of
agricultural technological information used to be an institutional arrangement spanning all
the 22 administrative districts of Sri Lanka.
Nonetheless, this uniformity of coverage in R&D services was disturbed as a result of the
agricultural extension service being classified as a ―devolved function‖ which would be
administered by the nine ―Provincial Councils‖: the semiautonomous political and
administrative divisions introduced under the Constitutional Reforms of 1987. The
implication of this was the disintegration of the agricultural research-extension channel
prevailed hitherto. Instead, nine individual ―Provincial Agriculture Departments‖
responsible for providing extension services to the respective provinces emerged, but
without any research capacity to support their extension programs.
Even though some repetition is involved the following paragraph may be warranted in
order to put some aspects of the present research system in perspective. The ―Research
and Development Institutes‘ of the DOA embarking on their own extension activities (to
the extent possible) in later years were perhaps necessitated by the void created by these

Page | 41
circumstances. As was mentioned earlier, DOA is holding the monopoly of research on
food crops in Sri Lanka and therefore the recipient of the lion‘s share of funds allocated to
agricultural research in the country. The other major resource deployed on food crops
research is the sizeable fleet of trained man power. It was pointed out earlier that out of
all agricultural research institutes in the NARS, DOA employs the largest work force.
In the event of investing public resources heavily in the field of agricultural research it is
imperative that the government should also have prior knowledge on the rate of economic
and/or social returns to such investments in order to justify their allocation. Unfortunately
though, undertaking systematic economic and social evaluations of this nature on crop
research undertaken by the DOA (in four crop groups, each containing many individual
crops), is a daunting task. This is further compounded by the fact that the four research
institutes are undertaking developmental (particularly extension) activities to some extent.
As a consequence, such studies relating to the food crops sector in Sri Lanka are very rare
and a few notable exceptions are due to Niranjan (2004) and Niranjan et al. (2001). These
studies too are on the single crop of rice, for which an appreciably long data time series
could be traced. The case of evaluating all research of the DOA is much more demanding
and therefore remaining hitherto unexplored. However, the present study is to throw some
light on this area that is in relative obscurity.
Research Expenditure of DOA
The first input needed for the present analysis is a data time series on research
expenditure in as much detail as possible. The best available source of data, the annual
―Performance Reports‖ of the DOA is limited to 23 years i.e. from 1994 to 2017. In fact,
some data, particularly on Man Power, are restricted to an even shorter series from 2010
to 2017. Aggregate DOA level data on research expenditure so extracted are presented in
Annex Table 2 and for expositional purposes in Fig.3.The aggregate research expenditure
for the DOA is the summation of the expenditures of four individual Research Institutes
viz. Field Crops Research and Development Institute (FCRDI), Horticultural Research
and Development Institute (HORDI), Rice Research and Development Institute (RRDI)
and Fruit Research and development Institute (FRDI). (Details of these individual
institutes are discussed elsewhere in this paper).

Page | 42
Figure 2.3: Annual Nominal and Real expenditure for Research and for Extension
Source: Central Bank of Sri Lanka, Annual reports DOA, Budget estimates
Annual data set out in Fig. 2.3 in both nominal and real terms, reveal that the aggregate
research and extension (R&E) expenditure of the DOA, have been rising over the entire
period under study, except for a nearly one third dip in 2000 – 2003 period. This looks
encouraging at the first sight but the data reveal the disturbing truth that the increases in
expenditure have not been keeping pace with the increasing rate of inflation, as implied
by the real expenditure figures being constantly lower than the nominal figures.
Furthermore, the gaps between the real and nominal expenditure figures have been
widening right throughout the period indicating the constant devaluation of the DOA‘s
annual research and extension budgets. The broadening gap between the research and
extension expenditures also implies a growing bias in the DOA towards research over
extension. Whether this is a consistent policy of the DOA maintained over time is not
clear, and in which case the economic logic behind such a policy should be formally
justified.
Having observed that the expenditure of the DOA on R&E has been in an increasing
trend the next important parameter to be determined is the rate of growth. Fig. 2.3 shows
that the main period of growth in R&E expenditure was from 2000 - 2003 to 2016 and
related data establishes that the annual (nominal) expenditure of Rs.113 million in 2003
had shot up to Rs.1945 million in 2016, which is a multiplication of the former by a factor
of 17. A crude estimate of the average rate of year to year growth is an astounding 400
percent (or 4 times) per year. Needless to say this figure cannot be interpreted as an
annual growth rate that can be sustained over an extended period of time as the
expenditure curves set out in Fig. 2.3 pertains to a short term growth phenomenon that
approximates an exponential phase of a growth curve. Within this short period an even
-
500.00
1,000.00
1,500.00
2,000.00
2,500.00
3,000.00
3,500.00
1990 1995 2000 2005 2010 2015 2020
Exp
end
itu
re (
Mill
ion
Rs.
) Annual Expenditure on Research and Extension
Extension (Nominal) Research (Nominal) Extension (Real)
Research (Real) Total (R+E)(N ominal) Total (R+E) (Real)

Page | 43
shorter sub-period from 2009 to 2012 within which the research and extension
expenditure has grown at roughly 400 percent per year, could be found. This sudden
surge of investment may be attributed to the urgency felt at the policy circles in the event
of ―Foodflation‖ of 2008 (see Samaratunga, 2008 for details), of accelerating food
production in Sri Lanka. However, the growth rates implied by the figures quoted for the
period in Girihagama et.al (2012) of R&D expenditure in the DOA are much lower. But
this is to be expected since their study covered the period from 1990 to 2008, which was
the period of stagnant investment in agricultural R&D in Sri Lanka (see Fig.3).
Stagnation of public investment in agricultural R&D in Sri Lanka is attributed mainly to
constraints caused by the drain of the budgetary resources due to the 29 year war. But
Samaratunga (2009) argues that it was the neglect at the policy levels of the investment in
R&E owing to the declining world food prices and the consequent prospect of meeting Sri
Lankan food demand with imports. Further, he argues that the liberalization policy of
1977-78 turned the interest of both the polity and the general citizenry away from
developing agricultural productivity. In fact, this laid back attitude pervaded the
agriculture sector in the wake of liberalization and averted a timely drive of diversifying
agriculture that could exploit the new export opportunities opened up by trade
liberalization.
On the subject of R&E expenditure, the next important issue is the adequacy of
investment. Going back to Figure 2.2, it could be ascertained that in the decade of 1990s
the investment in R&E had been a tiny fraction of Ag.GDP, which itself was a negligible
percentage of total GDP. The expenditure on R&E grew to a noticeable level with the
growth of Ag.GDP and the increase of R&E as a percentage of Ag.GDP is referred to as
an increase in Agricultural Research Intensity (NRI). This percentage expenditure (NRI)
fluctuated widely, yet the maximum it reached was 0.22 percent of Ag.GDP. This level of
investment is dismally low and inadequate for sustainable development of agriculture
according to agricultural development literature which suggests that a decent level would
be about 2 percent of Ag. GDP (Gert-Jan Stads et al., 2005). However, Sri Lanka is close
but below her neighbors in this respect since in India and Bangladesh this percentage is
0.4 and 0.32 percent, respectively (Girihagama et al.,2012). Yet Sri Lanka cannot be
complacent in this respect since the present NRI of 0.22 percent is far below that is
recommended level in National Agricultural Research Plan (2012), of 1.5 percent.
The data on R&E expenditure presented above are the aggregates of data pertaining to the
four individual Research Institutes that constitute the research of the DOA. These four
Institutes are uniform in administrative structure but they vary on their research activities
and the crops they research on. Nevertheless, data on such individual activities are not
available and only the Institute totals of expenditure could be traced. These data are
presented in graphic mode in Figures 2.4, 2.5, 2.6, and 2.7 for FCRDI, HORDI, FRDI and
RRDI respectively. All these institutes share similar trends with the aggregate R&E
expenditure of Sri Lanka (Figure 2.3).

Page | 44
Figure 2.4: Annual Expenditure on Research and Extension at FCRDI in Nominal and
Real terms
Source: Central Bank of Sri Lanka, Annual reports DOA, Budget estimates
Figure 2.5: Annual Expenditure on Research and Extension at HORDI in Nominal and
Real terms
Source: Central Bank of Sri Lanka, Annual reports DOA, Budget estimates
0.00
50.00
100.00
150.00
200.00
250.00
1990 1995 2000 2005 2010 2015 2020
Exp
en
dit
ure
(M
illio
n R
s.)
Annual Nominal and Real Research Expenditure - FCRDI
Expenditure (Nominal) Expenditure (Real)
0.00
50.00
100.00
150.00
200.00
250.00
300.00
350.00
400.00
1990 1995 2000 2005 2010 2015 2020
Exp
en
dit
ure
(R
s. M
illio
n)
Annual Nominal and Real Research Expenditure - HORDI
Expenditure (Nominal) Expenditure (Real)

Page | 45
Figure 2.6: Annual Expenditure on Research and Extension at FRDI in Nominal and Real
terms
Source: Central Bank of Sri Lanka, Annual reports DOA, Budget estimates
Figure 2.7: Annual Expenditure on Research and Extension at RRDI in Nominal and Real
terms
Source: Central Bank of Sri Lanka, Annual reports DOA, Budget estimates
0.00
50.00
100.00
150.00
200.00
250.00
300.00
350.00
400.00
450.00
500.00
1990 1995 2000 2005 2010 2015 2020
Exp
en
dit
ure
(R
s. M
illio
n)
Annual Nominal and Real Research Expenditure - FRDI
Expenditure (Nominal) Expenditure (Real)
0.00
50.00
100.00
150.00
200.00
250.00
1990 1995 2000 2005 2010 2015 2020
Ex[p
en
dit
ure
(R
s. M
illio
n)
Annual Nominal and Real Research Expenditure - RRDI
Expenditure (Nominal) Expenditure (Real)

Page | 46
One peculiarity could be found in the case of FRDI which records research expenditure
only from 2006 (Figure 2.6). This is because FRDI was newly instituted in 2006 by
separating the fruit crop research component from HORDI. From this point onwards
HORDI handles only the vegetable research component but interestingly her research
budget has not recorded a declined as a result (Figure 2.5).
Apart from capital expenditure, the other factor the state employs in R&E is the trained
man power. On the whole the DOA employs 43 percent of Sri Lanka‘s agricultural
scientists but it accounted for just 26 percent of public agricultural spending in 2009
(Girihagama et al.,2010). As such, the following discussion on food crops R&E is chiefly
centered on the whole of DOA and its activities.
Data in this respect is available only from 2010 onwards and they are presented
graphically in Figure 8. Trained man power resource is divided into two categories as
Grade 1 and 2 in this analysis. Grade 1 consists of the officers belonging to ‖Sri Lanka
Agriculture Service‖ i.e. University Graduates in agriculture or pure science. Grade 2
comprises the supporting services viz. research assistants, laboratory technicians,
laboratory assistants and agricultural instructors who hold diplomas in agriculture or
similar qualifications but do not hold university degrees. Figure 8 clearly shows that both
these categories have increased in strength over time. But the Grade 2 carder has
increased three folds from 2010 to 2017 whereas the Grade 1 carder has grown by less
than two folds. This reveals a growing worsening in the balance between Grade 1 and
Grade 2 carder strengths. Moreover, the Grade 1 carder which is responsible for new
innovations etc. has grown only by 250 over the last 7 years. In the light of the national
plan (NARP) of increasing the NRI to 1.5 percent this expansion of high level man power
seems inadequate. Another side of engaging and upgrading man power for R&E is the
program of post graduate training and non-degree training opportunities. Data on this area
pertaining to DOA operations were not recorded in this study and it remains a future need
for improvement. However, Girihagama et al.,( 2012) report that the Full Time Employed
(FTE) man power per every one million farmers in Sri Lankan agricultural research
system has been on an increasing trend from 2000 to 2009, recording the highest level of
154 FTE per one million farmers, in 2009. It is imperative to note however that this
pertains to the NARS which comprises many institutions outside food crop production
sector, which is the main focus of this paper.
Benefits from R&E on the Food Crops Sector
Unfortunately in Sri Lanka the benefit side of research (or R&E) is very poorly recorded
and the Performance Report published by the DOA provides an account of new crop
varieties released annually and a descriptive record of research and extension activities
undertaken each year. Only the varieties released can be clearly quantified and the
descriptive accounts provided on the other activities are not readily applicable in a

Page | 47
quantitative analysis. They may be subjected to an analysis of qualitative data, but this is
a protracted procedure and therefore was not attempted in this study.
The data on crop varieties released annually, despite year to year fluctuations, presents a
most encouraging observation that there is an increasing trend in total number of crop
varieties released per year. This could be treated as an indication of an increasing trend in
―returns to investment‖ in R&E. Release of rice varieties is the most consistent in
introducing new varieties over the years but its dominance over the other crop groups
have declined over the years. Lowest but equally consistent varietal releases pattern can
be seen in relation to Other Field Crops (OFCs) as well. A remarkable observation made
is the growing dominance of Fruit crops and Vegetable crops in the varietal release
program of the DOA and this is an encouraging development in the light of the present
national interest in enhancing exportable agricultural products. On the whole the varietal
release program of the DOA can be treated as a success story.
Although the release of varieties over time provides a certain benefit from the R&E
activities it is imperative to mention that releasing a variety per say is only a part of the
process that leads to the realization of real economic (and social) benefits to the society.
Final economic benefit to the society depends on the net social returns obtained by
cultivating the said variety by the entire society. This depends on many parameters such
as the area cultivated to the variety and the level of production which finally results in the
desired economic impact of supply shift. If adoption of a variety by the society takes
time, the rate of adoption becomes an important factor in comparing the merits amongst
new varieties. There is additional information such as demand and supply elasticities of
the commodity concerned as well. (see for example Niranjan, 2004). As such, proper
analyses of the impact of resource and time allocated for any R&E project is a highly
demanding task.
Finally, as mentioned earlier as well, only a very few studies of this nature are available
in relation to Sri Lankan agriculture. Niranjan (2001 and 2004) are prominent among
them but they again are limited to rice. These studies show that the impact of rice
research in Sri Lanka has been positive and they indicate National Agricultural Research
Benefits (ANRBs) in aggregate terms to be 46.01, 54.39 and 58.22 million Rupees in in 3
different trade scenarios, in response to 37 percent increase of research expenditure on
rice. The Internal Rates of Return (IRR) computed by Niranjan (2004) range from 174 (in
trade protection) to 162 percent (in free trade) and according to these results it is
concluded that investment in rice research had been economically profitable: and Sri
Lanka had, therefore, been underinvesting in rice research. Yet the fact remains that this
is in relation to rice only whereas the present study covers a range of crops viz. Rice,
numerous Subsidiary Field Crops (SFCs) and numerous Vegetable and Fruit crops. Thus,
any attempt to generalize the above findings for the entire food crop sub-sector is not
warranted. The implication of this is that similar studies should be conducted in other

Page | 48
types of crops as well in order to help the policy makers in prioritizing crop research
investments in Sri Lanka.
Agricultural Research & Political considerations
A National Agricultural Research Policy (NARP) was formulated in the early 1980s to
foster a public national agricultural system that ensures demand orientation, client
orientation and high quality in its research and dissemination. However, the resulting
agricultural research system is also essentially government-centered, and not successful in
commercializing agriculture and promoting regional specialization and vertical
diversification. Enhancing agricultural research and technology by increasing budgetary
and human resources allocation, with a focus on much broader aspects like livelihood
improvement, rural development, food security and agro based industries is a necessary
condition for policy reforms in technology generation. Within the present context of
globalization, adaptive research too emerges as very important in buying or acquiring
foreign technology and transferring successfully to different locations in the country (IPS
2015).
In spite of these merits of buying and burrowing of agricultural technology there are some
important issues that should be given serious consideration at the same time. The reliance
on international trade and development is a widely advocated strategy of the modern day,
especially by international development agencies as well as trading organizations.
Previously discussed World Bank document is one good example. It stresses on Market
Led research and development and even the Innovation culture proposed there is based on
commerce, may be more than on science. The Top-Down approach to technological
innovation is viewed as an ‗unsuitable‘ approach for Sri Lanka. This implicitly suggests
that generation of top level scientific and technological innovations is an activity almost
entirely reserved for advanced countries and large multinational corporations. This could
result in, particularly in the case of biological resources and crop varieties, these countries
and corporations being the monopolies holding exclusive property rights on them. In this
event the researchers in less developed countries would be relegated to the state of
‗adaptive researchers‘ responding to the market demand for imported crop varieties and
technologies. The morale of local scientists would deteriorate under such a setup where
opportunities for ―up-stream‖ research and top-down application of agricultural
technology are seriously thwarted. Putting the scientific community of a country in such
straight-jackets cannot be considered a progressive step towards the development of
science and technology. Furthermore, the merits of some research programs in Sri Lanka
of, sometimes denigrated, top-down format were discussed in detail in a previous section.
On the other hand, the imported ‗improved‘ crop varieties produce higher yields but with
the application of large doses of agrochemicals (which are also imported). This is in stark
contrast with the present move towards agro-chemical free agriculture and to a lesser
extent, organic agriculture. These are national policy priorities explicitly identified in

Page | 49
―National Policy Framework – Vistas of Prosperity and Splendor‖ (2019), the national
policy statement of the newly elected President of Sri Lanka. This may imply moderate
input agriculture based on improved and cross-bred indigenous crop varieties through
agricultural research in Sri Lanka. Another aspect of dependence on imported biological
technology promoted by commercial interests is the gradual displacement of local crop
varieties resistant to pests and diseases and compatible with Sri Lankan food habits.
(There are some unconfirmed claims that the local varieties are more nutritious). The
almost disappearance of Sri Lankan tomato variety called ―Goraka Thakkali‖ due to the
popularization of thick-skinned salad varieties with better shelf quality. The crux of the
argument, however, is that the true ‗economic or social costs‘ of the loss of indigenous
crop varieties to the nation has not been properly evaluated and Sri Lankan agriculture is
being driven by imported crop varieties and allied technology based on the ‗financial‘
gains and the commercial interests of certain parties.
As such, even after taking all precautions, there remains an array of interrelated questions
with adopting modern inputs and technologies, such as the potential benefits and risks.
Therefore new policies and institutions are needed to achieve benefits without incurring
undesirable costs. What should be the roles of the private and the public sectors in
effecting such policies and hence, how the modern technology and the new institutions
can help poor people escape poverty and to make the agricultural development more
inclusive is a valid question in the agricultural sector in Sri Lanka. Moreover, private
sector participation in technology development in sections of the market where positive
research results exist, the possibility of securing the appropriation of their private benefits
to the proprietors through a legal property right system is government‘s responsibility.
Nevertheless, this is to be practiced with protective measures for research results as well
via carefully designed patents and intellectual property rights (IPR). Consequently, the
state has to play a role in preventing exclusion of certain strata of farmers and preventing
the country from being overly dependent on foreign technologies that can be controlled
by alien economic or political powers.

Page | 50
2.2.2 Agricultural Extension in the DOA of Sri Lanka
Agricultural extension service is the vehicle that carries agricultural technology
developed in the research institutes all the way to its final users, mainly the small farmers
in rural areas in developing countries like Sri Lanka. According to Arthur T Mosher, a
pioneer in the study of rural extension in developing countries, the rural extension
workers, in addition to being the vehicle of technology perform a multitude of roles as the
encouraging companion, the rural errand boy, the business advisor and the like, within the
farming community. As such, the rural extension agents‘ service is intertwined with
almost every link of the agricultural development network of a developing country. May
be as a result, different aspects of agricultural extension have been discussed to varying
degrees in different sections of this paper. Some repetition therefore is unavoidable in the
following account of the agricultural extension service but every attempt is made to keep
it to a minimum and make this discussion short.
2.2.2.1 History and development of the extension service
The distant history and development of DOA‘s extension service have already been
touched upon briefly in the beginning of this paper (A detailed description of this subject
is presented by Arasasingham, 1981). Therefore, only a few selected and yet important
developments of recent times that had serious impacts on extension and thereby on
agriculture at large, are elaborated in the following narrative.
After a long series of qualitative changes in the functions and quantitative changes in the
staff strength of the extension service over a long period of time, a major change took
place in the DOA with the appointment of a Deputy Director of Agricultural Extension
along with the establishment of an exclusive Division of Agricultural Extension (DAE) in
1964. Following this, District Agricultural Offices were established in each of the 22
administrative districts of the country and these Offices were headed by 22 District
Agricultural Extension Officers (DAEOs). The district offices at the time had 6 to 17
Agricultural Instructors (AIs) and 20 to Krushikarma Vyapthi Sevekas (KVSs) (the
village level agricultural extension workers), depending on the size and the farmer
population of the respective districts (Arasasingham, 1981). This development is the
beginning of an exclusive division dedicated to agricultural extension service in the DOA.
Within the districts DAEOs were in overall charge of the administration of the extension
staff while holding numerous other responsibilities on planning and execution of the
agricultural program of the district as well. As a result, they seldom provided technical
guidance to their staff (Arasasingham, 1981), a negative attribute inherent in the
organizational setup at the time.
The extension service at this time was centered on individual and group meetings
conducted by the KVSs at farming villages, under the supervision of AIs. This program
was supplemented with Varietal and Method demonstrations conducted mainly by AIs.

Page | 51
Both AIs and KVSs had responsibilities other than extension such as distribution of rice
seeds.
This organizational and functional scheme relating to agricultural extension of DOA
continued without a significant change until the countrywide implementation of the
―Agricultural Extension and Adaptive Research Project‖ (AE&ARP). This project was
blueprinted, technically guided and totally funded by the World Bank during the period
1980 to 1984. Leaving the Adaptive Research component out, the basic plan behind the
implementation of the Agricultural Extension component of the AE&ARP is as follows.
- Training and Visiting (T&V) system was adopted as the basic method of
extension at farm level. Under this system a given number of farmers per each
KVS range were designated as ‗contact farmers‘ and visiting each of them
according to a fixed fortnightly schedule was compulsory to the KVSs. The
contact farmers were responsible to spread the extension messages delivered to
them by the KVSs among a group of ‗follower farmers‘ assigned to each of them.
Accordingly, the extension messages delivered by the KVSs were supposed to
spread among the entire farmer community within their respective ranges.
- The development of the extension messages the KVSs would deliver in their
fortnightly visits are done by the AIs, Subject Matter Officers (SMOs), Subject
Matter Specialists (SMSs) and Agricultural Officers (AOs), mainly in the
District. The messages depend chiefly on the stage of the crop in the field and the
agronomic and other needs of the crop at that stage. Answering any special
questions from the farmers on any problems such as the emergence of an
unknown pest outbreak is also the responsibility of this group. (Help may be
obtained from the Research and Education and Training divisions if and when
necessary).
- Upgrading of technical knowledge and skills of extension personnel is rendered
through In Service Training Programs conducted on a regular program by the
Education and Training division.
- Regional Technical Working Group (RTWG) conducted for each Agro-
Ecological Region before the beginning of each season is the forum that brings
researchers and extension personnel together, to act as a two way information
conduit. In addition to edification of the extension staff with new technological
advances in research institutes, encouraging Bottom-Up research planning is one
major purpose of this mechanism.
In order to fulfill the large requirement of field level extension agents the exiting small
contingent of KVSs was expanded to over 2000. This system was later severely criticized
by the World Bank (2007) itself (citing a local analyst), stating that ―the system was very
complex; most of its elements worked independently and adopted the traditional Top-
Down modality‖.

Page | 52
On the contrary, nevertheless, the AR&ARP, at least in principle, had a significant
potential for improving agricultural productivity at that time during which individual
farmer contacts was the extension method needed by the predominantly rural agriculture
of Sri Lanka. It is true, however, that the program did not realize its full potential,
sometimes due to usual bureaucratic inefficiencies resulting chiefly from the high level
officials acting more as administrators rather than technical frontrunners and sometimes,
due to project design problems leading to resource misallocations within the project itself.
One glaring example was that only a very few KVSs owned even bicycles: even they
were their private property but not provided by the project or any public authority for
duty related purposes. The KVSs had to travel long distances to cover their circuit of
contact farmers within the allocated periods of time. The ratio of farmers to KVSs has
been, reportedly 3000:1 in the beginning of the system. (But this ratio declined later with
the previously mentioned recruitment of a large number of new KVSs). However, author
knows from personal experience that the majority of KVSs in the Dry Zone attempted to
cover such long distances they had to cover on foot, and often failed. This was a clear
loophole of the project design in which a large number of field vehicles (Four-Wheel
Drives) were provided by the project for the use of higher officials.
Damaging though, these are organizational inefficiencies and defects in the initial plan.
Nevertheless, deficiencies of this nature could be remedied in substantial proportions with
the help of experiences accumulating over time and with dedicated leadership of the
authorities concerned.
2.2.2.2 Downfall of the extension system
The extension service that had been operating, at least with some degree of success under
the AE&AR project (and the T&V extension system) experienced its downfall with two
sweeping political ‗reforms‘ introduced in mid 1980s and early 1990s. Both these events
and their impacts on agricultural research and extension were discussed in several
previous sections. But brief accounts on the political events and their implications,
especially relating to agricultural extension, are presented blow, in spite of the repetition
involved, in the interest of the continuity of this section.
The two political events and their implications on agricultural extension in Sri Lanka are
as follows.
1. The first episode was the official proclamation in 1987of ‗devolution of power‘ of the
central government of Sri Lanka to newly established ―Provincial Councils‖ in the nine
provinces of the country. Agricultural research was identified as a non-devolved
function and therefore held with the Central government while agricultural extension
was devolved to be administered by the Provincial Councils. The practical operation of
‗devolved‘ extension activities started in1989 only in 8 provincial departments as the

Page | 53
Northern Provincial council was not properly functioning due to the ongoing civil
strife.
On the other hand, extension functions in the so-called ―Inter-Provincial Areas‖ (the
areas under large irrigation projects that traverse the boundaries of two or more
provinces) were retained with the central government and managed by the newly
formed ―Extension and Training Center‖ (ETC) under the DOA. ETC started with
about 224 staff members including directors, supervisors and field extension workers
assigned to mainly rice growing interprovincial areas. The ETC of the DOA continued
with the T&V extension program in the inter-provincial areas with some subsequent
modifications.
However, the details of extension programs carried out by the ―Provincial Departments
of Agriculture‖ (PDOAs) are not clear. Approximately 875 extension staff worked in
the eight provinces and the farmers to extension officer ratio has been 3000: 1 but
reportedly this has been as high as 7000: 1 in some areas (World Bank, 2007).
In addition to all the above there existed the ―Mahaweli Authority of Sri Lanka‖
(MASL) which was solely responsible for extension in the productive settlements
under the Mahaweli River Diversion Scheme. Except from participating in RTWG
meetings of the DOA, MASL operated totally autonomously without any linkages with
either research or extension agencies. Consequently MASL was perhaps the
agricultural organization least affected by the aforementioned political reforms in Sri
Lanka.
The above story clearly shows the breakdown of the personal-contact based
agricultural extension system of Sri Lanka. In addition, the segregation of the
extension system from the research system demolished the research-extension link
operating through RTWG mechanism and the calamitous results of this were explained
earlier. Also, the failure of the attempt to replace the RTWGs by PTWGs, and the
reasons for that, were explained earlier.
2. The second major blow to the agricultural extension service of Sri Lanka was, as
pointed out earlier, the transfer of the entire KVS carder engaged in field level
extension to Janasaviya program, an activity totally outside agriculture. The features of
this program and the implications on agriculture were discussed earlier in more detail
and therefore not repeated here. Suffice it to say here that this event rendered the entire
agricultural extension service of the country devoid of a single field level agent. That
was the end of agricultural extension based on individual contact modality in Sri
Lanka.
Following the above pervasive changes an apparently related development came about
with the establishment of a new ministry entitled the ―Ministry of Agrarian Services
and Development‖ (MAS) and renaming of the formerly Department of Agrarian

Page | 54
Services as the ―Department of Agrarian Services and Development‖ (DASD) mainly
to provide subsidies and other services to the farmers. Along with this a new
permanent carder of 9600 village level agents, rather oddly designated as ―Agricultural
Research and Development Assistants‖ (ARDAs) was established for whom the
required educational qualification was only GCE ordinary level education. Even
though the ARDAs are supposed to devote three days per week to agricultural
extension activities they were not given any post-recruitment education or in-service
training in agriculture. This much is enough to show the mismatch between the needs
of the rural agricultural sector and the placement of ARDAs to serve those needs.
After these sweeping changes effected in agriculture in general and in agricultural
extension in particular, some new trends could be observed emerging in DOA
extension programs. This may be as an attempt to comply with the new extension
methodologies spreading around the word on the one hand and, on the other hand, as
an attempted remedy to deal with the inadequacy of a sizeable extension work force in
the field.
The first was the beginning and gradual growth of the use of computers in all areas of
DOA activities. This is an obvious result of the global trend of declining prices and
consequent spread of Information and Communication Technology (ICT). But in the
case of extension, the arrival of computers and other ICT facilities led to the second
‗innovation‘ of increased use of mass communication using printed matter, audio-
visual material as well as other multimedia products to make-up, at least partially, for
the dearth of village level extension workers. These modern applications definitely
increased the efficiency and output of the high and middle-level officers and
technicians while improving the quality of extension aids produced, and hence their
effectiveness. The third new extension modality introduced was group extension
activities. One outstanding example was the Rice Yaya (tract) Program implemented
by the ETC in interprovincial areas. A ‗technology package‘ consisting of eight
mandatory practices was introduced to all the farmers of an entire Yaya (tract) and the
farmers‘ adherence to the mandatory practice was monitored throughout the season.
The Yayas were rotated seasonally until an entire village or a larger area is fully
covered. Another group extension method adopted was the ―Field School‖ approach
for educating a group of farmers on a selected technology or a technique. These
relatively recent extension methodologies may have achieved the desired results to
varying degrees, but systematic studies of their effectiveness and the allied benefit-cost
ratios could not be found for making firm conclusions on their viability.
2.2.2.3 Social change and potentials for agricultural extension
With the passage of time several social and economic parameters in Sri Lanka‘s
predominantly rural agricultural sector have changed significantly. Some, but not all, of
these changes may have positive implications towards better extension service.

Page | 55
Simultaneously, but specifically in the last three decades approximately, the field of
technology has seen many advances that have definite positive impacts on modern
agricultural extension. The following brief review attempts to examine these
developments and their possible impacts on agricultural extension in Sri Lanka.
Within the last five decades there has been a series of demographic changes in the rural
sector, of which the major one being a population growth. This has led to a reduction of
farm size (in some areas) and an increase in agricultural labor force. Hence the extension
programs of early decades, even in 1970s, did not hesitate to introduce labor intensive
practices, such as transplanting of rice, while introduction of farm machinery was given
only limited or zero attention. But a marked change was observed in, roughly, the last
three decades during which the population grew at a lower rate but the demographic
composition changed resulting in a higher percentage of younger strata in the society. At
the same time the level of educational attainment in these younger members increased
substantially. From an agricultural point of view this could be seen as a progressive
phenomenon as the level of education of the farmers is often positively correlated to
adoption of new technology. This makes the returns to investment in extension as well.
But another concomitant social change particularly in current decades is that these
educated younger members of farm families tended to leave agriculture to look for
employment in industry and services sectors. The promising picture anticipated above in
agriculture has faded away due to shrinking of agricultural labor force has already been
created. Consequently, a change in extension methodology and extension priorities
indicated a need to change.
On the contrary, the advent of modern ICT unambiguously opened new vistas for
improved agricultural extension. The social developments of the last two or more decades
were also encouraging as, even in the farming community, mobile phones and more
recently smart phones were becoming increasingly common. The response of the DOA to
this emerging scenario was an increase in her investment in ICT for the purpose of
improving extension in the rural sector. However, had the younger members of the
populace who are the heaviest users of ICT devices remained in agriculture, the returns to
this investment could have been much larger. Quite early in this period the DOA
upgraded her Audio-Visual Center in order to expand the use of audio-visual extension
aids in group extension activities and in mass communication through radio and television
media. An extension hot-line was also introduced to provide speedy solutions to farmers‘
agricultural problems. Personal Computers and Tablets also were provided, first to higher
level extension personnel, as well.
This drive towards modern extension culminated in the establishment of the ―National
Agricultural Information and Communication Center‖ (NAICC) headed by a Director, in
2007. The former audio-visual center and the printing press are also placed under this
new Center. New extension initiatives have been set up under the Center and the

Page | 56
designing and popularization of Agricultural Extension Apps for speedy dissemination of
extension information is a prominent one. Information on area specific fertilizer
recommendations, crop forecasts and early warnings etc. are presently available through
these Apps. Plans have also been made and the implementation begun to provide
Agricultural Instructors (AIs) all over the country with Tabs so that agricultural problems
at field level could be immediately transmitted to the new ―Crop Clinic‖ that provides
quick solutions. This is presently functional only in a few provinces due to the fact that
the program was planned and to be coordinated by the DOA in the central government
while the provinces have to fund it in their districts. This could be an example for the
frictions and conflicts possible between the Central and Provincial administrations.
Finally, since the extension service is the major institution that is responsible for
technology dissemination at the grass root level, and this task is still not satisfactorily
completed, there are some popularly held criticisms on it, some of which are even shared
by professional commentators. The most popular one is that the agricultural extension
services in Sri Lanka is supply driven and limitedly focused on farmers‘ needs and
aspirations. The second critique is that public extension service in Sri Lanka is crop wise
institutionalized or compartmentalized. The argument raised here is that extension is
provided by many different specialized institutions whereas the farmers in Sri Lanka
cannot be distinguished strictly by crops and enterprises such as exclusive paddy farmers
or livestock farmers (IPS, 2015). Thus a new institutional arrangement for an extension
system that suits integrated small farming systems including fruits and vegetables stands
out as a policy priority in Sri Lankan agriculture.
Thirdly, both policy and institutional reforms are deemed necessary to bring R&D and
extension under one umbrella while the role of public-private partnerships in the process
of technology generation and transfer should be strengthened. Agricultural extension is
under increasing pressure to become more effective and more responsive to clients‘ needs
and less costly to the government. Despite various attempts to improve effective
dissemination of agricultural technology, the process of such reforms still remains
incomplete, according to the public eye. It is also stressed that technology dissemination
through extension has to be customized by strengthening existing extension approaches
with adequate investments in budgetary and human resource provisions. The state has to
play a specific role in ensuring inclusion of small-holder farmers in the adoption process
some new technologies which they might exclude themselves of, due to technical
difficulties or high costs of adoption involved.
2.2.2.4 New proposals for improving agricultural extension
The newest proposals and recommendations to improve the agricultural extension system
of Sri Lanka are found in the same World Bank document of 2007 discussed earlier in
relation to the research system. Some structural proposals for the extension system are
very similar to those discussed before in relation to the research system and hence not

Page | 57
reiterated here. However, some of the propositions made in relation to extension are
technically related to those made with respect to the research system. Such issues are
discussed here in ways consistent with the opinions expressed in the discussion on the
research system.
WB document proposes group extension based on organized ―Producer Groups‖ of
farmers as an extension modality with great potential in Sri Lanka. It also observes that
Sri Lanka is ahead of every other country in South Asia in forming such farmer groups.
Yet, at the same time caution is also expressed that the extension system is still supply-
driven instead of market-driven in the provinces where ―Community Based Organization‖
(CBO) model is at work. As CBOs lack the ‗production-function‘ according to the WB
report, it is indicated that they can end up being political, more interested in seeking
subsidies and other services from Government.
Based on observations made on a program implemented by Western Province PDOA and
another program initiated by a group of large corporations (based in Colombo), the WB
document presents two impressive examples of applying successfully the group extension
approach. WPDOA case is identified by WB as ―market driven, well organized and
pursuing a five-ear strategic plan validated by farmers‖. The WP extension service
routinely runs farmer trainings on agribusiness management, entrepreneurship and a host
of other agro-based as well as nonagricultural household industries. The other success
story is a program run by a group of hybrid maize seed companies. They provide
technical assistance to groups of farmers (whose location is not provided) as well as
coordinate with feed manufacturers to arrange buy-back contracts and, sometimes,
arrange credit and crop insurance facilities for the farmers. Both these examples are true
success stories; one as a group extension program for small farmers but the other as a
private commercial enterprise that employs farmers‘ labor and land resources. This is a
profit making business enterprise primarily serving the interests of a large private
business entity rather than a model of agricultural extension aiming at, in addition to
farmer income, a host of development issues such as food and nutritional security, food
diversity, efficient resource use in complex farming systems etc. Therefore, implications
of these success stories on designing and planning an effective agricultural extension
policy and an institutional framework for entire Sri Lanka would call for further reflection
and critique.
Relating to the WPDOA program one could easily find some special reasons for its
success, of course in addition to the competence and commitment of the staff involved.
WP is the smallest and most urbanized province in Sri Lanka with the best road
infrastructure and transport facilities. Therefore, an intensive and regular farmer training
program, such as the one indicated above, is possible in WP with a limited staff. Specific
features of the program such as trainings provided in agri-business management and
entrepreneurship are not feasible everywhere in the country as PDOAs do not have
adequate numbers of staff trained in these disciplines. In WP however, even in an absence

Page | 58
of such expertise in-house, it is quite convenient to secure the services of private trainers
because of the highly urban setting. If private sector participation, which is a highly
valued feature of modern extension quite often, is needed (this is not indicated in the
given case) such participation can be conveniently secured due to the same urban setting
in WP. Further, enterprises promoted in the said program as ornamental flowers and
landscape and interior design have an economic potential only in highly urbanized areas.
Considerations of this nature lead to the conclusion that the highly successful extension
program highlighted in the WB document is rather a special case but not a general case
for Sri Lanka. Hence the suggestion by the WB that WPDOA‘s extension program should
be followed as an example by all provinces does not seem to be well placed. It is quite
clear to a person who is aware of the intricacies of Sri Lanka such as the geographical,
infrastructural, socio-economic and agricultural diversities offered by the nine provinces,
or the 25 districts, would feel hesitant to accept a sweeping generalization of an ideal
based on an incongruous special case.
Recommendations on structural issues of extension system
The WB document presents four major structural issues acting as stumbling blocks in the
effective operation of the extension system of Sri Lanka. It is encouraging to note all
these agree with the observations and findings reported earlier in various sections of this
paper. For the continuity of the discussion they are briefly presented below as well.
- Devolution of agricultural extension to the provinces has created a ‗functional
disconnect‘ between the ETC (within the DOA) and the PDOAs in the provinces.
This prevents the whole country from working according to a common strategy.
- There is an imbalance of talent and resources between the ETC and PDOAs and
also, there is an ‗attitudinal problem‘ that makes working together difficult.
Although the ETC has considerable talent and resources at hand and capable of
providing a lot of technical support to PDOAs, it does not take place optimally
because of the attitudinal problem as to who should be in charge.
- All research departments and institutes fall under the jurisdiction of MOA and
they are funded by the central government. Extension being a devolved function,
individual plans are drawn up and funded by the respective PDOAs in the
provinces. This gives rise to ‗built-in administrative hurdles‘ to be overcome in
bridging the research – extension gap.
- Under the present system the only prevailing link between research and extension
is the biannual PTWG meetings that currently concentrate on the production plans
for the coming season but do not provide a platform for planning and
implementing a long-term agricultural development strategy.

Page | 59
Recommendations for national and provincial institutes for extension
The recommendations given in the WB document for a national plan and an institutional
framework for extension are quite similar to her scheme proposed in relation to research.
Therefore, some details are not repeated here.
In order to maintain coherence with programs for research and innovation, the plan and
programs proposed for extension presupposes the existence of the NAIC explained
earlier. Under this or parallel to this, the proposed ―National Agricultural Extension
Center (NAEC)‖ serves as the apex body on planning and programing extension
activities. This could, by closely working with the counterpart research centers, review
―Strategic Research and Extension Plans‖ (SERPs) and innovation proposals submitted
for funding by ―Provincial Agricultural Innovation Councils‖ (PAICs).
PAICs are another set of provincial level organizations proposed in this scheme. The role
of PAICs is to ensure collaborative work between research and extension workers in
developing SERPs and their successful implementation with NAIC funding. Priority is
given to projects or programs that would link research with extension and/or link
extension with private firms or NGOs.
The creation of the aforementioned NAEC is justified in the WB document in detail and
summarized below.
- Creating a center of excellence in extension strategy, approach and methods which
also acts as a repository of a wide variety of relevant information would be
directly useful for all parties involved in agriculture.
- Conducting systematic monitoring and evaluation of all extension programs and
activities is a necessity for meeting national goals and objectives.
- NAEC would possess a sizeable IT system that would link the province, district
and divisional level institutes and provide them with current technical and market
information.
In spite of the validity of these justifications, there are some concerns that require further
attention. In setting up of the proposed NAEC the role of already existing ETC is not
even mentioned despite the fact that it is the largest national institute which is most well
equipped with both physical and human resources needed for extension. Further, the
proposed plan of action includes reviewing SERPs in close collaboration with research
centers. The SERPs, on the other hand, are supposed to be prepared by PDOAs of
provincial governments and research institutes/centers of the central government, in
collaboration with each other. The research - extension divide under the present system of
government was discussed in detail several times previously. As such, assuming such a
close collaboration would occur without a pervasive reorganization of the current system
seems to be a serious lapse.

Page | 60
On the other hand the proposal on establishing an IT system that networks all central,
provincial and regional institutes is not a novel idea. As explained before the DOA has
already established the NAICC which could be easily upgraded to serve the said
purposes, rather than establishing an entirely new system.
A proposition
The foregoing review of the extension system and the preceding review of the research
system of Sri Lanka unequivocally lead to one glaring revelation that Sri Lankan
agriculture for the last three and a half decades has been persistently beset by the systemic
disconnect between research and extension. While both components suffered from its
cataclysmic consequences, the extension system isolated in the provincial system and
sundered from the essential support of research and training has to face the brunt of the
problem. It was revealed earlier that the cause of this obstacle was a mishandling of a
political imperative in mid 1980s, without giving due regards to the inherent peculiarities
of agriculture.
Yet, the mistakes of the past need not be perpetuated: and they ought to be changed for
the betterment of the situations. Therefore, the alternative that is logical and appropriate
would be to remove agricultural extension away from the list of ‗devolved subjects‘ and
place it under the ETC of DOA.
This proposition is certain to be labeled as radical, if not outlandish, particularly owing to
its political implications. There would be stiff resistance from provincial councils as they
would not like to relinquish their authority on such an important subject. Nevertheless,
with persuasive representations to the top political leadership, it is imperative that this
change may be effected in the interest of the entire agricultural sector and thereby the
entire population of Sri Lanka.

Page | 61
2.2.3 Irrigation Policy and Public Expenditure on Irrigation Infrastructure
Irrigation water for cultivation is most prioritised policy of the government even prior to
independence to achieve the food security of the country. Public expenditure programmes
for construction, rehabilitation, operation and maintenance of irrigation infrastructure
were the main emphasis that the state placed on the development of the domestic food
crop sector after independence.
New construction, rehabilitation, operation and maintenance of irrigation
infrastructure
Through irrigation development it is expected to expand the cultivable area, to increase
cropping intensity (both maha and yala cultivation) and to increase the quality of land.
Construction of large reservoirs received attention of all governments. The public
investment program allocated about 13 % of its investment for irrigation infrastructure
development during pre Mahaweli period while it rose to more than 30% during
Mahaweli construction. Increasing public investment in irrigation came to a peak during
the time when the largest ever multipurpose irrigation project, Mahaweli was undertaken
in 1979-1985 period. Some 128,250 Ha of land in the dry zone brought under cultivation
with irrigation water. Investment in minor (Village) works has remained more or less
static and has continued to be the smallest category and was only 3 per cent of total
investment during 1980‘s. Investment in irrigation declined rapidly in the 1990s with the
completion of the Mahaweli programme and most of the major irrigation works (Figure
2.8). Expenditures have focused on O&M, rehabilitation and water management with
foreign funds and local funds. It dropped to 13 per cent by 1990, and thence to 2-3 per
cent from the mid-1990s of the public investment program.
Figure 2.8: Irrigation Investments since 1990
Source: Central Bank of Sri Lanka, Budget Estimates, Kikuchi (2002)
0.0
2000.0
4000.0
6000.0
8000.0
10000.0
12000.0
19
90
19
91
19
92
19
93
19
94
19
95
19
96
19
97
19
98
19
99
20
00
20
01
20
02
20
03
20
04
20
05
20
06
20
07
20
08
20
09
20
10
20
11
20
12
20
13
20
14
20
15
20
16
20
17
Mahaweli authority (Rs Mn)
Total capital expenditure on irrigation
Irrigation Investments - Public Irrigation Investmentsin Sri Lanka (Source:M.Kuchi)

Page | 62
From 2006 onwards, again attention was paid to invest mainly on new reservoir
constructions aiming at productively using of the available water resources (Figure 2.8).
In this background the public investment in 2009 was made for the construction of
multipurpose irrigation schemes and trans-basin diversions, targeting to utilize water to
address the emerging demand from agriculture as well as non-agricultural sectors. Also
funds were mobilized for rehabilitation of existing irrigation schemes and dams and other
works. Mainly domestic funds were diverted for the construction of new reservoirs such
as Moragahakanda and Kaluganga reservoir, Menik ganga, Deduru Oya, Rambukkan Oya
reservoirs etc. Major Irrigated area under cultivation increased from 1980‘s at a rate of
1.13% per annum (Figure 2.9).
Figure 2.9: Major Irrigated area under cultivation 1980-2017
Source: Department of Census and Statistics
Currently several government agencies are involved in the construction, operation and
management of irrigation systems. Of the total irrigated area, about 400,000 ha are under
major schemes which are considered more than 80 ha of command area. Of that 3/4 th of
the area is administered by the Irrigation Department and ¼ th is by the Mahaweli
Authority. About 200,000 hectares of irrigated land under minor schemes (below 80 ha)
is administered by the Department of Agrarian Services and it is estimated that minor
schemes may number over 15,000, of which only half are operational. There are several
minor schemes that have been abandoned, while new ones are always being constructed
or abandoned ones rebuilt. Since irrigation development and management is a devolved
subject, at the provincial level too there are provincial irrigation agencies for irrigation
development and management and agrarian services. There are many agencies
responsible for irrigation that is causing duplication and inefficient use of manpower and
institutional resources.
y = 209289e0.0113x R² = 0.6879
0
50000
100000
150000
200000
250000
300000
350000
400000
19
80
19
82
19
84
19
86
19
88
19
90
19
92
19
94
19
96
19
98
20
00
20
02
20
04
20
06
20
08
20
10
20
12
20
14
20
16
Major irrigated Area under cultivation(ha)
Major irrigated

Page | 63
Irrigation systems are jointly managed in major schemes with the management
responsibility given to the farmer below the distributary level. In the minor schemes the
management responsibility is entirely with the farmers. O&M is still being largely
financed by the government, although farmer contribution in the form of labour is
forthcoming. Allocation for O&M by the government is declining and therefore level and
quality of O&M is on the decline. Irrigation water is a free public good to the farmers.
Although it was attempted to levy a charge for water, basically to recover operation and
maintenance costs (O&M costs) by introducing the cost recovery program that
commenced in 1984 in the Mahaweli areas, this program has remained suspended at
present.
Currently there is no policy on water allocation from major water courses or water bodies
for various purposes. The government through the Cabinet of Ministers decide on water
allocation for various purposes on a situation by situation basis or when an issue arises
with respect to water allocation. The situation is really critical during the years with less
rainfall.
Other irrigation infrastructure and machinery: Agro-wells, pumps and other
structures
In major and minor schemes alike, farmers use pump water mostly for irrigating other
food crops (OFCs). Besides lifting groundwater, farmers use pumps for lifting water from
rivers, canals or tanks (dead storage in particular) to irrigate their crops. More than 70
percent of lined dug-wells are found in minor irrigation schemes. Unlined dug-wells are
found only in major irrigation schemes, while tubewells are found mostly in minor
schemes. Since 1989, the government has been making major efforts to promote lined
dug-wells in both major and minor irrigation schemes in the dry zone through extending a
subsidy to farmers. Both in major and minor schemes, the distribution of agro-wells
between the command and the highland is about 30:70—more agro-wells are set up in the
highland than in the command.
Lined dug-wells have been promoted by the government and non-profit making
organizations through subsidies. In contrast, the unlined dug-well and the tubewell have
been diffused entirely under farmers‘ own initiative.
It was especially after 1989 when the government commenced the well subsidy program
that the investments in agro-wells and pumps rose sharply. The investments in agro-wells
and pumps showed rapid increases again in the mid-1990s. However, the rate of increase
seems to have been declining since then. Such trends have been brought about mainly by
the deceleration of the increase in lined dug-wells and pumps.

Page | 64
2.2.4 Fertilizer Policy in Sri Lanka
Chemical fertilizer became a predominantly important agricultural input with the green
revolution in the world and Sri Lanka took initiative to use chemical fertilizer for high
yielding varieties to improve the productivity. Therefore, fertilizer policy was first
focused on promoting the chemical fertilizer use among paddy farmers. In 1957, high
yielding varieties (improved old varieties) which are responsive to chemical fertilizers
were introduced to Sri Lankan paddy farmers (Wickramasinghe et al, 2010). This was a
new technology for paddy farmers and therefore, a need aroused to promote the high
yielding varieties and chemical fertilizer use. In order to encourage chemical fertilizer
use, a fertilizer policy was formed with the aim to provide subsidies for fertilizer,
guaranteed price for the output (paddy), improve the availability of fertilizer and
awareness of fertilizer use among farmers through extension. Over the years, government
has assisted the farmers through two different approaches in an alternative manner in
cutting down the fertilizer cost. First is by introducing a subsidized fixed price for the
fertilizers and the gap between the subsidized price and the market price is paid by the
government. Since these fertilizers are mainly imported (95 percent), the volatility in
international prices were absorbed by the government. The second approach offered a
fixed amount of cash or a fixed proportion of the cost and the rest is borne by the
government. Institutional setup has also been developed over the time to deliver an
effective subsidy scheme. Currently the movement is towards organic fertilizer and
integrated soil management systems with the concerns on health of the population and the
environment.
Evolution of fertilizer policy
Pre-liberal era (1948-1976)
The first fertilizer policy was introduced in 1962. It was a fertilizer subsidy programme
initiated to promote the use of chemical fertilizer in paddy farming. A direct subsidy was
given by reducing the market price of fertilizers. Urea, Muriate of Potash (MOP) and
Triple Super Phophate (TSP) were subsidized. The programme expected that the farmers
will tend to use chemical fertilizer and they would achieve profit maximizing level of
production. During that period, supply and distribution of fertilizer was handled by three
private firms.
In 1964, government entered fertilizer trade establishing Ceylon Fertilizer Corporation
(CFC). It involved in importing, mixing, storing and distribution of fertilizer to cater the
demand from paddy and other food crops sectors.
CFC took over the sole authority of importing fertilizer by 1971 based on the policy on
government intervention in international trade. This is the time in which stringent closed
economic policies were introduced. Therefore, private sector participation in wholesale
sector was contracted to nearly 25 percent of the fertilizer use.

Page | 65
By 1975, the subsidy policy was extended to other food crops in an effort to increase the
fertilizer use efficiency. The aim was to prevent outflow of subsidized fertilizer from
paddy to other food crops. A uniform rate of 33 percent was offered for all the crops and
continued until trade liberalization.
Liberalization of the economy (1977-1987)
With trade liberalization in 1977, government allowed seven other private and public
corporations to enter the importation of fertilizer. CFC handled 60 percent of the imports
and the rest was distributed among seven other corporations.
Fertilizer subsidy policy was handled by the treasury up until 1978. Thereafter, the
National Fertilizer Secretariat (NFS) was given the authority to administer the subsidy
scheme. A uniform rate of 50 percent of the CIF value was imposed as the subsidy rate
since November 1978. Custom duty (12.5 percent) and business turnover tax (5 percent)
were exempted for fertilizer.
In 1979, the subsidy rate was further increased for urea (50 percent to 85 percent) and for
other fertilizers (50 percent to 75 percent). NFS came into operation in 1979. It involved
in coordinating all the activities related to fertilizer importation, distribution and
utilization. The main task of NFS was to increase the fertilizer use efficiency.
Subsidy rates were fluctuated during the period of 1979 to 1983 considering the volatility
of fertilizer prices in the international market. For urea it varied between 85 percent to 60
percent and for NPK mixtures it varied from 75 to 40 percent.
Thereafter, the fertilizer prices remained stable during the period 1983 to 1987. During
this period, macro-economic stabilization is observed and domestic reforms were not
prominent.
Structural adjustment policy (1988-1990)
In 17th
December 1988, regulation of fertilizer act No 68 of 1988 was formed. It was an
act ―to regulate the importation, manufacture, formulation and distribution of fertilizer
and to provide for matters connected therewith or incidental thereto‖ (Laws of Sri Lanka,
2014). With the increasing involvement of private sector, NFS was given the authority to
issue licenses for above activities under this act.
In 1988, government had to impose a budgetary restriction of 600 million LKR for
fertilizer subsidy scheme due to the soaring fertilizer prices in the international market. In
the same year, certain fertilizers were excluded from the subsidy scheme (rock phosphate1
1 Rock phosphate is the only fertilizer produced domestically.

Page | 66
and sulphate of ammonia). Urea, TSP, MOP and NPK mixtures were eligible for the
subsidy scheme.
A decision was taken to abolish the subsidy scheme since 1st January 1990. This was the
era the government began to revolute power to provincial councils and privatization of
public corporations took place. Further, a nationwide poverty alleviation programme was
introduced to provide an income subsidy for those who fall below the poverty line.
Since 1994
In 1994, the fertilizer subsidy scheme was reintroduced considering the soaring Urea
prices. A fixed price rate was given for urea, SA, MOP and TSP.
Lowering distortions including subsidies and non-tariff barriers were discussed under
these WTO regulations. In 1996, the subsidy on SA was abolished and since 1997, the
subsidy was offered only for urea. From 1998 to 2003, a 50kg bag of urea was given
at.350 LKR. Urea price was increased to 800 LKR, 600 LKR and 550 LKR in 2004,2005
and 2006 respectively.
With the new fertiliser subsidy2005, farmers were given the three main fertilisers at 350
Rs per 50 kg which is the lowest price recorded for all three fertilisers after withdrawal of
the study in 1990. By having such a low price for all three fertilisers; Urea, TSP and
MOP, it was intended that farmers would adopt the recommendation given by the
department of agriculture. By issuing only the recommendation, it was on the other hand
intended that farmers those who use more than the recommendation would stick to the
recommendation.
In 2016, fertiliser subsidy scheme was revised with the provision of a cash grant in place
of the provision of fertiliser. The government converted the fertiliser subsidy to an
allowance of Rs. 25,000 per hectare up to a maximum of two hectares per paddy farmer
per annum in place of the provision of a 50 kg bag of fertiliser at Rs. 350. Further, the
government extended the fertiliser subsidy for tea, coconut and rubber as well in 2016
under which a cash grant of Rs. 15,000, Rs. 9,000 and Rs. 5,000, respectively was
provided per hectare per annum. Other field crops (potato, onion, chili, soy bean and
maize) received 10,000 LKR/Ha/Year. Cash grants were executed through state banks.
Those were People‘s bank, Bank of Ceylon, National Savings Bank and Regional
Development Bank.
2018 A decision was taken by the Cabinet of Ministers, in March 2018, to terminate the
cash grant of the fertiliser subsidy programme and replace it with the provision of
fertiliser to farmers, to avoid issues that arose in implementing the cash grant policy.
Accordingly, an approved amount of fertiliser was provided to farmers at a concessionary
price of Rs. 500 per 50 kg bag for paddy and Rs. 1,500 per 50 kg bag in respect of other
crops (such as potatoes, onions, capsicum, corn and soya) from the Yala season in 2018

Page | 67
onwards. The programme was initiated from Yala season in 2018. Provision of high
quality fertilizer was an objective under the theme "Poison Free Country".
Parallel to this subsidy scheme, the theme ―A Wholesome Agriculture - A Healthy
Populace - A Toxin Free Nation" was promoted from 2016 to 2019. Under that,
promotion of production and utilization of organic fertilizer, bio-fertilizer and gradual
reduction of chemical fertilizer use through Integrated Plant Nutrition Systems (IPNS)
was promoted. Provision of soil and plant testing facilities for site specific fertilizer
application, assuring timely availability of chemical fertilizers in adequate quantities,
prevention of misuse of fertilizer subsidy scheme, promoting application of straight
fertilizers and promoting production of fertilizer using locally available raw materials
were the other objectives of the fertilizer policy.
According to the current national policy framework; Vistas of Prosperity and Splendour,
introduction of an integrated soil fertility management system and promoting organic
farming were given attention. In 2020, cabinet released approval for issuing fertilizer free
of charge for paddy farmers who possess minimum of 2 ha of lands. Urea and super
phosphate were approved under this scheme.
Recommendation reforms for paddy cultivation
Different fertilizer recommendations were introduced for paddy farmers time to time as a
result of continuous research for paddy sector. It began in 1956 and recommendations
were given in 1959, 1964, 1971, 1980, 1990, 1993, 1996, 2001 and 2013.
Fertilizer mixtures were introduced to supply balanced nutrients. In 1950, three fertilizer
mixtures were introduced for dry zone, wet zone and sandy soil in North and East
provinces. In 1971, more mixtures were introduced based on different factors such as
availability, farmers‘ response, nutrient accumulation, fertilizer use efficiency, pollution,
yield levels and water availability. There were seven mixtures available namely; for dry
and intermediate zone, wet zone, wet zone iron toxic soils, wet zone boggy soils, dry and
intermediate zone soils, wet zone poorly drained soils and wet zone poorly drained iron
toxic soils. In 1980, three mixtures were introduced. Those were for dry and intermediate
zone, wet zone and a mixture for whole areas.
In 1990, direct fertilizers were promoted to reduce the unwanted nutrient application.
Under that, ammonium sulphate and urea were recommended as the nitrogen source.
Triple Super Phophate (TSP) and Single Super Phophate (SSP) were recommended for
phosphorous source. Muriate of Potash (MOP) was recommended for potassium source.
Considering the fertilizer use efficiency of different nutrient sources, fertilizer sources
were changed time to time. For nitrogen source, ammonium sulphate was recommended

Page | 68
in 1950 and in 1964, prilled urea was introduced. In 2013, granular urea was
recommended. For phosphorous source, rock phosphate was recommended in 1950.
Thereafter, in 1956 rock phosphate was recommended for wet zone and TSP for dry zone.
In 1964, rock phosphate was recommended for all rice fields. Again in 1964, rock
phosphate or bone meal was recommended for wet zone and TSP for dry zone. In 1980,
TSP was recommended for all rice fields. For Potassium source, MOP was introduced in
1950. In 1990, 3.5 tons of rice straw was recommended for one-hectare paddy field to
supply the potassium requirement. In 1993, straw and MOP together were recommended
for iron toxic soils. In 2013, use of both straw and MOP was recommended for all types
of paddy fields.
Time of application of fertilizer is critically important for the efficient fertilizer use
particularly to prevent unnecessary leaching. In 1950, nitrogen fertilizer was
recommended to apply as a basal application. In 1956, it was recommended to split the
application as basal and a top dressing 30 days before flowering. In 1964,
recommendation was changed to use as three top dressings. In 1971, two
recommendations were given. One basal application and three top dressings were
recommended for 3 months variety and one basal application and four top dressings were
recommended for 4 months varieties. In 2001, it was recommended to use one basal
application and three top dressings for all varieties. In 2013, four top dressings were
recommended for nitrogen fertilizer.
For potassium fertilizer, in 1964 it was recommended to apply as a basal plus a top
dressing two weeks before planting. In 1990, it was recommended only to apply as a
basal application. In 1996, it was recommended to apply as a basal plus two top dressings
for iron toxic soils. In 2001, it was recommended to apply in basal application plus one
top dressing at planting. In 2013 it was recommended to apply as two top dressings at 4
weeks and 6 weeks after planting. For iron toxic soils, it was recommended to use in basal
application plus three top dressings. Posphorous application was recommended as a basal
application. Zinc sulphate was introduced in 2001 to apply as a micronutrient source per
one season for all the paddy fields. Currently, research is in progress for nano-fertilizer
production, organic fertilizer production and micro-nutrient application to assess the
requirement of micronutrients. A considerable level of private sector involvement is
evident in introducing recommendations for fertilizers especially introducing
micronutrients.
Expenditure on fertilizer subsidy
Sri Lankan government continued to offer the fertilizer subsidy over the past 57 years
regardless of the budgetary burden it caused. Figure 2.10 shows the expenditure of
government for the fertilizer subsidy from 1985 to 2018. The contribution as a percentage
of GDP remains 0.2 over the last four years.

Page | 69
Figure 2.10: Expenditure on fertilizer subsidy over the years (nominal value)
Source: Annual reports of Central Bank of Sri Lanka
0
10000
20000
30000
40000
50000
60000
Mill
ion
LK
R
Year Rs.Million

Page | 70
2.2.5 National Seed Policy
This policy encompasses mainly the institutions, regulations and public expenditure
programs for production and marketing of quality seed and planting materials. Providing
quality seeds enhances the efficiency of resource use. However the effectiveness of the
policy instruments is the relevant policy issue.
Larger proportion of seed is supplied to the farmer through informal sector until now. The
seeds which belong to the formal seed sector include those certified by the seed
certification Services (SCS) of Department of Agriculture (DOA). Formal sector seed
supply was a monopoly of the government. With the opening up of the economy after
1977, agricultural policy continued to evolve broadly in the direction of gradual
government withdrawal from the production of seeds and was directed towards opening
up the other field crops sector to trickle down the development of the seed technology in
the rest of the world through imports. Promotion of private sector and farmers in seed
production, facilitation of safe import of quality materials, removal of impediments in
quarantine procedures are some of the important policy directive changes towards this
direction.
Seed import liberalization, privatization of government seed farms, enacting the Seed Act
as a regulation policy are the major changes brought with the liberalisation of the seed
sector. Currently the formal seed sector is comprised of both government and private
sector seed production and seed imports. Therefore this sector has to comply with local,
national, and - in some crops - global dimensions. The informal seed system is normally
localized at the farm or community level and has relatively little organization.
Evolution of seed policy
The first formal arrangement of the seed sector was reported with the establishment of the
Department of Agriculture (DOA) in 1912 by the British. They assigned the
responsibility of producing seeds and planting materials of major food crops to the
Central Agricultural Research Institute. Seed sector became an organized sector by 1950s
with these developments and the introduction of the hybrid seeds for the paddy sector.
In 1960s, in response to the green revolution polices of developing countries, research
and development in high yielding varieties was encouraged by the Sri Lankan
government. By 1972, nearly 71 percent of the farmers were adopting high yielding
varieties (Dhanapala 1999). However, still the government had a monopoly for the seed
market until liberalization policies were implemented. It is observed that up until late
1980s, the Department of Agriculture remained the sole supplier of seeds. Private sector
was allowed to import certain seeds in particular exotic seeds since 1984. Further
initiatives in private sector participation in seed industry was hindered by the highly

Page | 71
subsidized prices for seeds, lack of access to basic seeds, technology and the policy
environment.
In 1990, private sector participation was allowed in seed production and supply
considering the rising demand for quality seeds. Seed Certification and Plant Protection
Centre (SCPPC) of the Department of Agriculture was established in 1990 to assure a
quality seed supply with the private sector participation in the market. Three government
owned seed farms were privatized in 1993. Meanwhile, a committee comprising private
and public sectors was formed to review the seed importation and government seed
pricing.
Further, imports of all seeds and planting materials were duty free in 1995 to keep the
prices low. By 1996, nearly 90 percent of the farmers were using high yielding varieties
(Henegedara 2002).
A National Seed Policy (NSP) was brought forwarded and approved in 1996 with the
objective of establishing a viable seed industry for the country. NSP was expected to
assure the availability of quality of seeds and planting materials for the farmers. This
policy consists of matters related to varietal development and release, provision of basic
seeds and planting material, commercial seed production, processing, marketing and
utilization, importation, coordination and development assistance, certification and
quality promotion and other support activities. This policy aimed to provide guidelines to
promote the private sector participation in quality seed production. Thereafter,
commercial seed production and marketing were mainly handled by the private sector and
the government intervention was gradually declined. In 1998, Hingurakgoda seed farm
which was owned by the DOA was privatized and the preliminary work related to
privatization of Pelwehera seed farm was completed. A grant of 100 million LKR was
provided to seed production centres in Maha Iluppallama, Batalagoda, Ambalantota,
Bata-Ata and Nikaweratiya.
Plant Protection Act No 35 of 1999 was enacted repealing the Plant Protection Ordinance
which was introduced in 1924 with several amendments. The act was aimed to protect the
domestic plants and animals from introduction of pest and diseases from abroad. It
controlled and managed the importation of those materials. Therefore, seed and plant
material importation had to comply with the newly introduced quarantine regulations
which can be considered as another milestone in the seed sector. Director General of
Agriculture is given the administrative authority of this act and the Department of Plant
Quarantine is the executing body.
In 30th
July 2003, Seed Act No 22 of 2003 was enacted. It was ―AN ACT TO
REGULATE THE QUALITY OF SEED AND PLANTING MATERIALS; AND TO
PROVIDE FOR MATTERS CONNECTED THEREWITH OR INCIDENTAL
THERETO‖. The Director General of Agriculture is the in-charge of general

Page | 72
administration of this act and discharges the functions assigned to him by this act. The
National Seed Council was established under this act. It comprises of Secretary to the
Ministry, Director General of Agriculture, Director of the Seed Certification Department
of Agriculture, the Executive Director of the Sri Lanka Council for Agricultural Research
Policy (SLCARP), Director-General of the Sri Lanka Standards Institution (SLSI) and
four of other members are appointed by the minister to represent seed producers, users
and importers (private sector). The secretary to the ministry is appointed as the Chairman
of the council. The functions of the council are given under eight subheadings. It covers ―
a) preparation of guidelines and principles to ensure production and distribution of
high quality seeds and planting materials.
b) Periodic reviews for planting materials and seed production
c) Advise the minister and other relevant authorities in matters pertaining to
production and supply of seeds and planting materials to farmers
d) Periodic reviews of quality of seeds and planting materials
e) Minimum limits such as germination viability, genetic purity, appearance,
damaged seeds, water content and pests for seeds and planting materials available
in the market
f) Minimum labeling requirement for seeds and planting materials available in the
market
g) Quality and size of containers of the seeds and planting materials for different
species
h) Protection of new varieties through necessary actions‖
Seed Certification Service
Under the Seed Act No 22 of 2003, Director- seed certification is given the authority of
following responsibilities.
(a) ―exercise the exclusive right to certify seed and planting materials grown in Sri
Lanka;
(b) issue seals, stickers, stamps and labels with the mark or seal of the Seed
Certification Service;
(c) prohibit any locally produced seed of any crop variety or hybrid from being
described and sold as "certified seed" of that crop variety or hybrid if has not been
produced in accordance with the rules for production of certified seed published
and administered by the Seed Certification Service of the Department of
Agriculture and in the case of imported seed. prohibit any seed of any crop variety
or hybrid being described and sold as "Certified Seed" of that crop variety or
hybrid unless the Seed Certification Service of the Department of Agriculture has
recognized the official system of seed certification in the country of origin of that
seed;

Page | 73
(d) monitor the production and processing of seed and check that the standards for
certification are met;
(e) enter premises and inspect seed conditioning and storage facilities:
(f) check registers of seed movement and identity;
(g) implement the standards for seed certification as may be determined by the
Council;
(h) use approved procedures in field inspection, seed testing, monitoring, seed
conditioning, collecting seed samples and affixing, certified labels to seed lots
that qualify for certification;
(i) ensure that certified seed are packed, sealed and labelled in the prescribed
manner;
(j) take samples of locally produced and imported seeds and check conformity with
prescribed standards;
(k) establish and publish standards for seed certification; and'
(l) maintain and publish a list of producers and suppliers of certified seed and
planting materials‖ (Seed Act No 22 of 2003).
All the seed handlers are required to register under the Director-in-Charge of the Seed
Certification in Department of Agriculture (DOA)2. A monitoring procedure follows and
renewals and cancellations are decided by the Department of Agriculture. Seed
certification service is offered under the department for locally produced seeds and for
imported seeds. Local seed production is monitored until it reaches the farmer. Imported
seeds are checked with the country of origin and checked in the department‘s laboratory.
A list of certified seeds and planting material suppliers and producers is maintained and
published by the department of agriculture. The act states the regulations and penalties in
violating the procedures. However, the act is lack of a compensation method when the
seeds do not provide the promising results for the farmers (Hirimuthugodage, 2014). It is
identified that no-gazetting of the regulations of the seed act has become a barrier to make
necessary action in regulating the sector.
Seed Certification and Plant Protection Centre (SCPPC) of DOA
The SCPPC of DOA involves in administration of operational functions of the Plant
Protection Act No. 35 of 1999, Control of Pesticides Act No.33 of 1980 and Seed Act No.
22 of 2003. Therefore, it assists in regulatory and legislative aspects of the above acts.
2 The center is called the Seed Certification and Plant Protection Centre (SCPPC) of DOA.
Page | 74
The centre is headed by a director and there are 5 additional directors under the director
ACPPC. It provides the services on
a) ―Supervising the quality assurance of locally produced seed & planting material.
b) Supervision and making pesticide recommendations & safe use of pesticides in
different growth stages of crops.
c) Supervision of exchange of plant genetic resources among countries.
d) Supervision the implementation of plant protection act and establish international
phytosanitary agreements.
e) Coordination and supervision of plant protection activities in Sri Lanka‖.
In terms of seed certification, the SCPPC has an additional director for seed certification
service. There are 35 units including 4 seed testing laboratories, 6 post control testing
farms and 24 seed certification regional offices scattered island wide. It provides services
by introducing bar code system for seed label, GPS mapping system for mother plant,
cold room facilities for all Seed testing laboratories and introduction of molecular
detection methods for seed health testing.
A National Agriculture Policy (NAP) was formed in 2007. The policy aimed following
aspects for the seed industry.
a) ―Produce and supply high quality seeds and planting materials of commercial
varieties in a competitive environment with the participation of state and private
sector
b) Maintain seed security by having buffer stocks of certified seeds of recommended
varieties
c) Strict enforcement of government certification and quarantine regulations with
regards to seeds and planting materials
d) Enact laws to ensure that the seeds and planting material available in the market
are of good quality
e) Discourage the importation of crop varieties having terminator gene‖
In 2010, based on the new policy regime ―The Emerging Wonder of Asia‖; modernization
of 10 underutilized seed farms to cater the demand for other field crops was planned
during 2010-2015.
The current policy framework Vistas of Prosperity and Splendour has identified
―Expansion of agriculture production by providing good seed and planting materials‖ as a
strategy under agriculture sector. The activities of the strategy include the following into
consideration in production of seeds and planting materials (MOF, 2020).
Introduce a ―domestic seeds policy‟ to produce quality seeds at international
standard

Page | 75
A standards certificate will be made compulsory to import seeds
Promote private sector to produce quality planting material on a large scale
Establish a seeds bank under the Ministry of Agriculture to ensure seed safety
Seed production and supply mechanism in Sri Lanka (Formal seed sector)
Seed supply in Sri Lanka similar to other countries of the region consists of a formal and
an informal sector. Nearly more than 90 percent of the seeds were supplied by the
informal sector (FAO, 2000). For paddy sector, nearly 20 percent of the requirement of
Certified Seeds is produced through the formal process while the rest is informally
produced using Registered Seeds and Certified Seeds. Figure 2.11 shows a diagram
representing the typical seed supply system of a country in transition stage. Only the
formal sector can be regulated through polices and laws although informal sector seeds
are sold in the market. Therefore, we consider the information pertaining to the formal
seed sector in Sri Lanka.
Figure 2.11: Components of the seed supply system (Turner, 2002)
The supply mechanism is implemented and administered by the Seed and Planting
Material Development Centre (SPMDC) under the DOA. Since its establishment, the
SPMDC has taken several measures to improve the mechanism of supplying high quality
seeds and planting materials to the domestic cultivation. The center is administered by a
director and there are four additional directors for which three are for different crop
categories namely; paddy and Other Field Crops (OFC); Vegetable seed and planting
material; Potato and one additional director assigned for development activities of the

Page | 76
SPMDC. There are 16 DDA (seeds) offices maintained all over the country. There are 27
farms of SPMDC which produce basic seed and certified planting material. Moreover, 3
Special Units (Vegetable Seed Centre, Bean Seed Centre and Seed Potato Stores) and 32
Sales Centers are also maintained.
The mission of the SPMDC is ―to assure the supply of high quality seeds and planting
materials at reasonable prices to the farming community of Sri Lanka‖ (DOA, 2018).
The center has following objectives.
Production of basic seed and planting material in government farms and
distribution
Production of certified seeds under contract growing and distribution
Management of government farms
Seed enterprise development and co-ordination
Maintenance of buffer seed stocks
Coordination of seeds and planting material supply
Seed paddy
The local production of seeds go through the following process are considered as quality
seeds to be sold at the market (Figure 2.12).
Figure 2.12: Seed paddy multiplication process, SPMDC of DOA
Breeder seeds are produced and supplied by the Rice Research and Development Institute
(RRDI) located in Batalagoda and its substations. These seeds are used to produce
foundation seeds. FSP is used to produce registered seed paddy (RSP)3. Currently, FSP
and RSP of 27 paddy varieties are produced by 10 government farms (DOA, 2018). RSP
is used to produce certified seed paddy (CSP) which is ready to be distributed among
farmers to produce consumption paddy.
Nearly 500,000 ha of land is cultivated in Yala season and 780,000 ha in Maha season.
Altogether, nearly 1,280,000 ha of paddy extent is cultivated annually. In order to
cultivate the above extent, 6,400,000 bushels4 of CSP is required. The estimated RSP
requirement is nearly 160,000 bushels. In 2018, the production of RSP was 65 percent of
3 FSP and RSP categories are called basic seed paddy.
4 1bu = 20.5 kg
Breeder Seeds
Foundation Seed Paddy
(FSP)
Registered Seed Paddy
(RSP)
Certified Seed Paddy
(CSP)
Consumption Paddy

Page | 77
the requirement (104,231 bushels) due to the drought conditions. However, achieving 25
percent of the RSP requirement is considered as a healthy level or acceptable level for the
sector.
Considering the demand for quality seed paddy and resource limitations in government
owned farms to produce the total requirement, SPMDC conducted the collaborative seed
programme with the participation of several agencies including private sector
organizations. Under this programme the Registered seed is supplied to the contract
growers as well as to private seed growers including private sector organizations. In
return they provide CSP to the SPDMC. Sometimes they sell directly to the farmers
without selling to the SPDMC.
CSP is mainly produced by the private sector using RSP. Nearly 20 percent of the
requirement of CSP is produced through the formal process while the rest is informally
produced using RSP and CSP. The SPMDC targets to purchase 60,000 bushels of CSP
annually through Contract Seed Production Programme to maintain a buffer stock. In
2018, 50709 bushels have been purchased by the SPMDC.
Seed paddy is issued by the 15 DDA (seeds) offices and the sales centers attached to
those offices. During the two seasons of 2018, seed paddy sales was around 152,269
bushels through these centres.
Foundation Seed is mainly issued to the farm programme of SPDMC and little amount is
issued to the contract growing programme to get registered seed.
OFCs
SPMDC produces and supply all the necessary basic seeds (foundation and registered)
requirement of OFCs excluding maize and groundnut. Nearly 25 percent of the certified
seeds are supplied by the SPMDC. Hybrid maize seeds are imported and 5 percent of the
maize seed requirement is domestically produced and those are open pollinated varieties.
Around 15 percent of the groundnut seeds are domestically produced and the rest is
imported.
Breeder seeds are supplied by the Field Crop Research and Development Institute and its
sub stations. There are 11 OFCs and thirty-six varieties (black gram, green gram, cowpea,
soybean, maize, groundnut, sesame, finger millet, chili, onion and sun hemp). Breeder
seeds are used to produce foundation seeds and only the government farms are involved
in producing foundation seeds (Figure 2.13). The capacity of government farms is not
adequate to produce the total seed requirement. Therefore, private sector is also
contributing in registered seed production through the ―contract seed production
programme‖. All the certified seeds are produced by the private sector. Occasionally,
germination tested seeds are purchased when the demand surpasses the supply. In 2018,

Page | 78
nearly 820 mt of seeds have been produced and 482.7 mt of OFC seeds have been
distributed due to the unfavorable climatic conditions (DOA, 2018).
Figure 2.13: Production of OFC seeds, SPMDC of DOA
Production & Supply of Vegetable Seeds
SPMDC produces 70 varieties of 18 local vegetable crops (DOA, 2018). There are 6
hybrid varieties among those. Breeder seeds are supplied by the Horticultural Crops
Research & Development Institute (HORDI). Basic seed production (foundation and
registered) is conducted by the government farms. In 2018, 4448.75kg of basic seeds
were produced for 26 varieties of 15 vegetable crops. Standard class seeds are produced
by the government farms, private sector organizations and contract seed production
system. In 2018, the standard seed production was 17740.08 kg which is nearly twofold
of the previous year. Hybrids seeds are produced for tomato, cucumber, bitter gourd and
brinjal. The amount produced in 2018 was 256.95kg. Distribution of seeds is done though
the SPMDC sales outlets & registered dealer network. In 2018, the amount distributed
was nearly 17166.41kg (DOA, 2018). Dealer network consists of ―Agrarian Service
Centres (ASCS), Cooperative societies, Farmer organizations, Provincial DOA and
private registered seed merchants‖ and the network has been strengthened in 2017 by
increasing the number to 300 members (DOA, 2017).
Production & Issues of Seed Potato
Seed potatoes are produced by only the government farms in Nuwara Eliya district. The
seed production program has been improved to provide seeds (G1 seeds) to farmers
which facilitates the own seed production (DOA, 2018).
Production & Supply of Planting Material
There are 22 DOA farms and 4 research farms involved in producing planting materials
such as budded plants, rooted cuttings, seedlings and suckers of fruit crops and other
plants. In 2018, total planting material production was 1,089,317. It is slightly a low
figure compared to 2017 due to drought conditions.
Breeder seeds
Foundation seeds
Registered seeds
Certified seeds

Page | 79
Figure 2.14: Recurrent, capital and total expenditure allocation for the government seed
program
Source: Central Bank of Sri Lanka, Budget estimates
Table 2.1: Achievement of targeted OFC seed production in 2018
Crop
Annual National
seed requirement
for a normal
season (according
to NFFP 16-18)
(kg)
Targeted
Percentage
production of
SPMDC
Produced amount
of seeds in 2018
(kg)
Produced amount
as a percentage of
national seed
requirement
Maize 2,226,148 5 49,154 2.2
Chili 18,081 25 2907 16.0
Soy bean 1,074,575 25 120,598 11.2
Cowpea 399,960 25 64,483 16.1
Ground nut 1,869,300 15 275,575 14.7
Green gram 691,478 25 197,415 28.5
Sesame 211,640 25 15,206 7.2
Finger millet 61,745 25 17,317 28.0
Black gram 356,480 25 78,483 22.0
Source: SPMDC,DOA, 2018
0
50
100
150
200
250
300
350
400
450
19
97
19
98
19
99
20
00
20
01
20
02
20
03
20
04
20
05
20
06
20
07
20
08
20
09
20
10
20
11
20
12
20
13
20
14
20
15
20
16
20
17
20
18
Allocation for Government Seed Program, Rs Mn in 1996 constant prices
Recurrent Capital Total

Page | 80
2.2.6 Policies on Farm Machinery and Mechanization
Mechanization in Sri Lanka started as far back as late 1940‘s with the introduction of the
Massey Ferguson 4 wheel tractor and the usage was limited to a few large scale
plantations. Tractor use in land preparation in irrigated rice farming began with the
formation of state run tractor pool for hire, hire services by cooperative societies,
preferential import duties and low interest credit. Four wheel tractors were popular that
time. Use of two wheel tractor began in late 1960‘s with the introduction of Sri Lankan
designed British land master in 1960‘ which later manufactured by Japan, China and
India. It was affordable to individual farmers to own it. After 1970‘s other field crop
sector also started using tractor power in land preparation. Since the economic reform in
the late 80s, the private sector rapidly emerged as the major player in meeting the demand
for greater farm/tractor power uses.
Figure 2.15: No of tractors imported and new registration of land vehicles
Source: FAO, Central Bank of Sri Lanka
Tractor imports were significantly increased after 1994 when the government waived
duty on machinery and equipment imported for use in the application of new and
innovative technologies in agriculture (Figures 2.15 & 2.16). One other major influence
for this trend was the introduction of tractors from neighboring India at lower costs
compared to the European counterparts. The supply and import of agricultural machinery
were exempted from VAT. In 2004, tariff on machinery reduced to 3% from 5%. Highest
imports of 2 wheel tractors/ pedestrian controlled tractors are reported in 2008. After
2008, again 4 wheel tractor became more abundant in the fields (Figure 2.17). When the
import tariff structure was simplified in 2010 machinery became under zero tariff. For
tractor imports nearly 100 Mn US dollars of foreign exchange had been spent in 2011. In
2013, government introduced VAT on tractors and implements for the first time in the

Page | 81
history of this industry. This added to the selling price which was transferred to the
farmer.
Figure 2.16 : Tractor imports by product in quantity, 1961-2018
Source: FAO, Central Bank of Sri Lanka
Figure 2.17: Tractor imports by product in value terms, 1961-2018
Source: FAO, Central Bank of Sri Lanka
The next important introduction of machinery in paddy farming was the threshing
machine either propelled by tractor or as a separate machine. In 1970‘s The Farm
Mechanization and Research Centre (FMRC) introduced a 2 wheel tractor operated

Page | 82
thresher designed by FMRC. Later harvesting machinery were introduced. Today, four
wheel tractors, threshers like agrimec, combine threshers and combine harvester are used
for threshing. Most of the farmers in rain-fed areas used agrimec and four-wheel tractors
for threshing as the size of cultivated land plots in rain-fed areas being very small and
combine thresher or combine harvester not being able to be used in swampy paddy lands
in rainfed areas in the wet zone. With the introduction of larger combine-harvesters,
individual machine owners emerged as the primary suppliers of hiring services. The
initially introduced large combine harvesters were widely adopted in the irrigated dry
zone with large tracks at its initial phase of its adoption. Later mini combine harvesters
suits to average farm size started to be available in the fields.
As shown in the import values in the table below (Table 2.2), imports of combine
harvester with thresher are on the increase in the last few years preferably adopting
combine harvester for the purpose of threshing mostly in the irrigated large tracks.
Table 2.2: Import value of harvesting and threshing machinery
Import Value in ‘000 US $
Combine Harvester- thresher
Threshing Machinery Thresher
Harvesting machinery for
agricultural produce
Harvesting and Threshing machinery
Total
2001 371 0 257 628
2002 138 13 182 333
2003 164 1 111 276
2004 944 412 83 1439
2005 3855 2102 261 6218
2006 3832 3281 513 7626
2007 3293 1906 337 5536
2008 6481 4657 467 11605
2009 4052 1855 792 6699
2010 14261 1294 176 15731
2011 24555 2843 253 27651
2012 17677 196 204 18077
2013 12338 109 235 12682
2014 4129 8 125 4262
2015 16498 69 316 16883
2016 33773 11 957 34741
2017 8399 14 199 8612
Source: ITC, FAO

Page | 83
Apart from imports of farm machineries, designing, manufacturing and adjusting
imported machineries to local needs are important components of this industry. FMRC is
the responsible government agency that has been inexistence for long years. FMRC The
Farm Mechanization and Research Centre (FMRC) task lies in the introducing of
effective agricultural mechanization technologies for the crops grown which are
compatible with the socio-economic and field conditions prevailing in various regions of
the country. The FMRC tests, designs and develops appropriate technologies to suit local
conditions. The commercial production of farm machinery is not mandatory to FMRC
and therefore the private sector machinery manufactures who are registered at the DOA
produce these machines in accordance with the FMRC designs followed by the tender
procedures of the DOA.
Mostly farm implements are imported and distributed by private agri-business firms in the
corporate sector since it involves large investments. Moreover these firms have their own
plants for making required changes for better adoption of these machineries in the field.
These firms also have taken steps to introduce new machineries to the farmers based on
experience in other countries.
Also there are local private sector manufactures those who design, manufacture and sell
machineries at local level. Mostly these are agriculture implements for various farm
activities.
Government policy also emphasises to support development and manufacture of
agricultural machinery, and the promotion of agricultural mechanization through public
and private sector participation. The 2012-2015 National Agricultural Policy provides
clear directions for implementing a comprehensive package providing credit and tax
concessions for machinery, equipment and extension services for farmers engaged in such
activities in agriculture.
When mechanization in OFC sector is concerned, machinery power is used for land
preparation for entire fields except there are topographical limitations for adoption.
Several types of machineries have been accustomed to suit the operation related to
weeding, seeding, harvesting, threshing etc with some success.
Farm Implements Designed and Invented by FMRC
Two Wheel Tractor Operated 3 Tine Plough/Tiller, Seeders, Threshers, Water Pump,
Inter-Cultivator
Farm Implements Imported and Distributed by Private Agri-Business Firms
Rotavator, Motorized Weeder, Four Wheel Tractor, Seeder
Farm Machinery Developed and Sold by Local Manufacturers

Page | 84
Two Wheel Tractor Operated Disc Plough, Four Wheel Tractor Operated Seeder, Altered
Combine Harvester for Maize Threshing, Paddy Agrimec Altered for Threshing of Finger
Millet, Seed Master, Rotavator Altered for Earthing Up, Modified FMRC Maize
Thresher, Altered Combine Harvester for Maize
Other than machinery and agriculture implements, adoption of irrigation equipment is
also important in mechanization of agriculture. In particular, the increasing use of motor
pumps is a significant contribution to the development of small-scale irrigation. The
Government of Sri Lanka promoted the rapid adoption of water pumps through
interventions such as the development of groundwater wells for agriculture; provision of
subsidies and credit facilities for purchasing micro-irrigation equipment; and government
policies on tax, tariffs and extension support. In 2006, the government introduced a
reduction of 50% of the tax payable on the profit for 5 years for companies importing drip
irrigation equipment (through amendments to the Inland Revenue Act No. 10 of 2006).
Table 2.3: Timeline of Changes in Mechanization
Source: Abeyratne, F (2017)
Time line of changes in mechanization is given in table above (Table 2.3)

Page | 85
In 2000, the Government of Sri Lanka initiated a subsidy program to encourage the
installation of micro-irrigation (MI) with agro-wells. Owning a water pump was an
eligibility criterion for receiving the subsidy. The program facilitated the adoption of
micro-irrigation systems by over 900 farmers. From 2005 to 2010, the Ministry of
Agriculture promoted drip irrigation systems, which included a solar panel, solar-powered
water pump and drip irrigation kit. The Department of Agriculture established another
program in 2013, with the objective of expanding the adoption of drip and sprinkler
technology in the dry and intermediate zones of Sri Lanka.
Currently all pumps are subject to taxes, including 15% VAT, 2% Nation Building Tax
(NBT) and 5% cess. The government provides support to local water pump assemblers
through the reduced general custom duty. (Aheeyar, M et al 2019); Providing tariff
concessions for agricultural machinery and the open economic policies adopted by
successive governments encouraged the private sector to import water pumps from China
and other countries. Low-cost pumps in turn increased the ability of smallholders to
access agricultural technologies. Yet, the relatively high cost of pump and irrigation
technology packages, alongside the lack of capital or access to loans for investment, are
major constraints to the adoption of these packages for many smallholder farmers.
Additional policy mechanisms, such as targeted subsidies, concessional loan schemes,
etc., may be needed.
Today, Sri Lanka has a largely mechanized agriculture sector next to Bangladesh in South
Asia. Machinery use in land preparation and harvesting is common in most food crop
faming. Labour use in agriculture has come down. There is a large scope opened to
mechanization in several management practices including seeding, weeding, lift irrigation
due to scarcity of labour and banning of agro chemicals for weeding. Importers are of the
view that imported machines are cheap and durable. Therefore policies should be directed
to add value through he forward linkages of modernization of agriculture through
mechanization.

Page | 86
2.2.7 Road infrastructure
A proper road network is crucial for connecting input and output markets. Therefore,
among many infrastructure facilities, road network has a considerable impact on rural
agriculture. Ancient Sri Lanka had a road network connecting the religious places and
ports from the capital cities of the ruling kings. Historically, Sri Lanka‘s road network
development was initiated during the colonial period mainly to transport commercial
plantation crop products to the ports and to facilitate the other activities such as
administration and defense of the country. A railroad network was developed during this
period and a canal system was developed during the period of Dutch as a means of
transportation. Thoroughfares ordinance No.10 of 1861 is ―an ordinance to amend and
consolidate the law relating to public thoroughfares in Sri Lanka‖ which is an indication
of some formality in the road network development activities of the country
(Thoroughfares Ordinance, 1862). Prior to the introduction of motor vehicles in 1940,
roads were constructed to move the animal drawn carts (RDA, 2020). Thereafter, road
transport became the most widely used transport mechanism.
Road development in Early 20th
The road network of Sri Lanka was maintained and developed by the Public Works
Department in 1950s (RDA, 2020). In 1959, Sri Lanka had 19, 104 km long road network
out of which 12, 000 km was access roads (Kumarage, 2003). Considering the
significance of the road development activities, by mid 1960s the responsibility of the
Public Works Department was confined to public roads and buildings excluding its
responsibility on other dimensions such as water supply and drainage and housing.
Identifying the importance of road development and maintenance, a new Department of
Highways was formed in 1969. The new department was solely established for the
development and maintenance of class A, B, C, D and E roads. There were approximately
28,000 km road network in 1969. Bridges were handled by a separate ―Bridges Division‖
maintained under the Public Works Department.
In 1971, most of the functions of the Highways Department were transferred by forming
two organisations namely; the Territorial Civil Engineering Organisation (TCEO) and the
State Development and Construction Corporation (SD & CC). Additionally, to the road
development and maintenance, the TCEO had the responsibility to improve and maintain
the irrigation works including village tanks, irrigation canals and to assist local authorities
to improve local roads and bridges. The State Development and Construction Corporation
(SD & CC) was formed to construct the bridges and other civil engineering work. The
functions of the Highways Department were confined to planning, design and supervision
of major roads and bridges.
Road Development during 70’s and 80’s
In 1978, the functions of TCEO were transferred back to the Department of Highways.
Road Development Authority was formed under the Ministry of Highways in 1983. It is
formed by the RDA Act No 73 of 1981. Initially the functions of RDA were to implement
certain construction works. Thereafter, its functions were expanded and the functions of

Page | 87
the Department of Highways were transferred to the RDA in 1986. RDA was given the
sole responsibility of developing and maintaining all the roads and the bridges. The
estimated road length was 28,000 km including all the four categories of roads A, B, C, D
and E.
In 1989, with the 13th
constitutional amendment; provincial councils were formed. Under
that, C, D and E roads and the bridges came under the authority of corresponding
provincial councils. Approximately 17,000 km of roads were in C, D and E classes.
Sri Lanka‘s road classification shows three main categories namely; national roads,
secondary roads and access roads. National roads consist of A & B types of roads which
are managed by the Road Development Authority. The secondary roads belong to class C
and D roads which are called provincial roads and managed by the provincial councils.
Third category of roads is the access roads and class E roads come under this category.
Those are managed by local authorities which includes Pradeshiya Sabha, municipal or
urban councils depending on the administrative area. There are some access roads
managed by different institutions such as Forest Department, Irrigation Department,
Mahaweli Authority, Wildlife Department, Fisheries and Aquatic Resources Department
and plantation companies. The length of these roads was estimated to be 68,843 km in
1990 and around 1000 km are estimated to be added annually (Kumarage, 2003). These
roads are built through voluntary work (Shramdana), provincial council funds and
acquisition of private roads as public roads. Those roads (access roads) mostly remained
unpaved in rural areas while kept paved in urban areas. However, proper inventories are
not maintained for these roads. Mostly, those roads were built in an ad-hoc manner and
considered of poor quality due to the limited maintenance and use of poor engineering
techniques (Kumarage, 2003).
Thoroughfares (Amendment) Act, No. 9 of 1988 and Thoroughfares (Amendment) Act,
No. 81 of 1988 were came into effect to amend the Thoroughfares Ordinance.
1991 onwards
Sri Lanka‘s road network consists of National Highways (A & B class roads and
expressways), provincial roads (C & D class roads), unclassified local authority roads and
other roads, including those maintained by state sector agencies (CBSL, 2017). Highways
and Expressways are maintained and developed by the RDA. Provincial and local
governments maintain C and D roads. Table 2.2 and Figure 2.1 show the road network of
Sri Lanka from 1990 to 2018. It illustrates that total road network has increased from 25,
738 km in 1990 to 31,144 km by 20185.
―Maga Neguma‖ programme initiated in 2004 which supported the rural road
development has significantly contributed to this provincial road network expansion.
Nearly 60 percent of the roads in Sri Lanka come under ‗C‘ (40 percent) and ‗D‘ (20
percent) categories. A considerable improvement in class ‗C‘ roads is observed since
2009 which is soon after the end of civil war of the country.
5 Record keeping on class ‘E’ roads has been excluded since 2006.

Page | 88
Since 2009 to date, development of road transportation was considered a key priority
compared to the other means of transportation such as rail, air and sea transportation. The
National Thoroughfares Act No 40 of 2008 came into effect to provide ― planning,
design, construction, development , maintenance and administration of an integrated
public road network in Sri Lanka; to provide legal framework necessary to facilitate
private sector investment and participation in road construction, development and
maintenance; to assist the provincial councils and local authorities in the development in
the development and maintenance of roads; to promote and facilitate community based
organisations engaging in the construction, maintenance and management of roads and
public roads; and to provide matters connected therewith or incidental thereto‖ (National
Thoroughfares Act, 2008).
Road rehabilitation especially in Northern and Eastern provinces, construction of rural
roads under ‗Maga Neguma‘ programme, construction of highways and flyovers were the
goals of the government. In 2009, the re-opening of A9 road significantly facilitated
goods and passenger transportation to Jaffna. Measures were continued to rehabilitate
national roads in the Northern and Eastern provinces. The estimated cost was 123 billion
LKR. Rehabilitation of 1,174 km of roads was planned under the Trincomalee Integrated
Infrastructure Project (TIIP) under which Northern Spring and Eastern Revival
programmes are driven (CBSL, 2009). Road density per square kilometer in Sri Lanka
was 1.6 km which is a comparatively high figure compared to the other countries in the
region. RDA spent 78,186 million LKR in 2009 which is nearly 47 percent increase or
roads and bridges.
Major road development projects continued were Southern Expressway Project,
Colombo-Katunayake Expressway Project, Colombo Outer Circular Highway Project and
Colombo – Kandy alternate highway project. Four flyovers were completed and four
more were planned. The longest bridge in the country connecting Trincomalee and
Kinniya was opened during 2009.
2010: Road development was given prominence under the ―Randora‖ infrastructure
development programme. In order to support the government policy on road
development, ―The national road master plan‖ was developed. It considered construction,
development, maintenance and rehabilitation of highways, expressways and bridges.
Rural roads were covered under the ‗Maga Neguma‘ programme which was initiated in
2004. Weak Bridge Programme (WBP) has identified 169 bridges and 15 of those were
rehabilitated while construction of 32 bridges was commenced. Similar to 2009, linking
the North and East with the other areas of the country continued. Conflict Affected Area
Rehabilitation Project (CAARP) to reconstruct 190 km of roads in the Northern and
Eastern Provinces, North Road Connectivity Project (NRCP) to construct further 170 km
of national roads in the North Central and Northern Provinces and rehabilitation of 140
km of provincial roads in the Northern Province come under that objective. The
Sanguppidi Bridge was opened reducing the distance to Jaffna by nearly 80 kilometers
and thereby cutting down the travel time by nearly three hours (CBSL,2010).

Page | 89
2011: The government‘s objective on linking the regions was continued through Northern
and Eastern road development projects and ‗Maga Neguma‘. The Southern expressway
was opened for traffic which is an important milestone of the transport sector in Sri Lanka
(CBSL, 2011).
2012: The Trincomalee Integrated Infrastructure Project (TIIP), which was initiated in
2008 was completed in 2012. Other projects were continued. Rehabilitation of A020 road
from Anuradhapura to Rambawa and the B268 road from Mannipay to Kaithady were
completed in 2012 (CBSL, 2012).
2013: Construction of new roads and rehabilitation of existing roads were continued in
2013 as well. Based on the National Road Master Plan (2007-2017), development of
expressways and highways under ‗Randora‘ programme and development of rural roads
under ‗Maga-Neguma‘ were successfully continued. Colombo - Katunayake Expressway
(CKE) and other extensions to the expressways, flyovers and rehabilitated Padeniya -
Anuradhapura road were opened for traffic during 2013 (CBSL, 2013).
2014: Several road development projects were continued based on the National Road
Master Plan. Assistance was received from ADB, UK, France, Japan and Korean
Economic Development Cooperation Fund (EDCF) for several projects. Meanwhile,
Northern Road Rehabilitation Project (NRRP), the Conflict Affected Region Emergency
Project (CAREP) and the Northern Road Connectivity Project (NRCP) were continued
(CBSL, 2014).
2015: Road development was given top priority to facilitate the economic activities and
regional connectivity. Extensions for expressways were continued and flyovers and
bridges were constructed. Existing projects were continued while a new agreement was
signed with the Kuwait Fund for Arab Economic Development (KFAED) to reconstruct
25 bridges on national highways. Government commenced a rural access road
improvement programme called ‗Integrated Road (i-ROAD) Investment Programme‘
with the help of ADB. ‗Maga Neguma‘ rural road development programme also
continued during the year.
2016: Road development work continued in 2016 as well giving road development a high
priority. There were several projects funded through bilateral and multilateral
arrangements. Japan, France, Austria, Saudi Arabia, the United Kingdom, Kuwait and the
OPEC Fund for International Development (OFID) were among those. Further, World
Bank funded for improving the climate resilience of road infrastructure through the
Climate Resilience Improvement Project (CRIP).
2017-2018: Regardless of the tight fiscal conditions in 2017 and 2018, the road
development projects were continued giving priority. The total length of the expressway
network by 2018 was 170 km and it is expected to achieve 350 km by 2021. Currently, it
is expanded to Hambantota and Katunayake -Kadawatha- Kerawalapitiya. The road
network is expected to expand to Kandy and Ratnapura (RDA,2020).

Page | 90
Currently, Ministry of Highways and Road Development is the apex body of road
network of Sri Lanka. Road Development Authority is responsible for the maintenance
and development of national highway network. It includes class A and B roads and
expressways. Provincial and local governments maintain C and D roads. As table 2.4 and
figure 2.18 shows, C class road network has expanded considerably and mainly in
agricultural provinces.
Table 2.4: Road length in km by class of road in Sri Lanka from 1990 to 2018
Year A B C D E Expressways Total
1990 4,116 6,331 9,640 5,150 501 25738
1991 4,116 6,465 9,453 5,200 516 25750
1992 4,216 6,671 8,917 5,280 516 25600
1993 4,220 6,722 8,961 5,296 381 25580
1994 4,220 6,854 8,765 5,300 381 25520
1995 4,220 6,908 8,457 5,346 554 25485
1996 4,221 6,926 8,457 5,346 554 25503
1997 4,221 6,926 7,900 4,643 771 24461
1998 4,222 6,926 7,756 4,564 891 24359
1999 4,221 7,241 7,824 5,926 1,076 26288
2000 4,222 7,265 7,315 5,425 1,735 25962
2001 4,337 7,571 7,536 5,720 1,662 26826
2002 4,339 7,670 7,682 5,763 1,700 27154
2003 4,339 7,670 8,136 5,765 1,913 27823
2004 4,339 7,679 8,136 5,771 1,935 27860
2005 4,314 7,706 8,257 6,074 1,968 28319
2006 4,219 7,553 9,565 5,412 26,750
2007 4,219 7,655 9,575 5,418 26,867
2008 4,219 7,670 9,552 5,546 26,988
2009 4,216 7,704 11,231 5,855 29,006
2010 4,219 7,800 11,316 5,783 29,119
2011 4,219 7,800 11,424 6,356 95 29,895
2012 4,219 7,945 11,304 6,287 95 29,850
2013 4,219 7,949 11,669 6,726 121 30,684
2014 4,215 7,993 11,837 7,193 161 31,398
2015 4,215 7,995 12,497 6,385 170 31,262
2016 4,215 7,995 12,497 6,385 170 31,262
2017 4,215 7,995 12,565 6,190 170 31,135
2018 4,215 8,005 12,565 6,190 170 31,144
Source: CBSL (A),(2006,2019). Economic and Social Statistics of Sri Lanka

Page | 91
Figure 2.18 shows the current composition of roads and provincial distribution of road
network. The lowest road length is observed in Eastern province while it is the highest in
North-Western province. In all the provinces, C and D class roads constitute more than 50
percent. Expressways are confined to Western and Southern provinces.
Figure 2.18: Provincial composition of road network in km
Source: Economic and Social Statistics of Sri Lanka, CBSL (A),(2019).
Investment in rural road development under ―Maga Neguma‖ programme which was
initiated in 2004 increased to about more than Rs Mn 5000 by 2014 significantly
contributing provincial road network expansion (figure 2.19).
Figure 2.19: Investment in rural road infrastructure under Maga Neguma Program
Source: Budget Estimates, Ministry of Finance

Page | 92
2.2.8 Agriculture Credit and Finance Policies
Need for credit and financial facilities for agriculture was evident with the informal
financial markets operated before the formal financial market came into operate.
However, the existence of informal arrangements is still prominent due to many reasons
such as its flexibility in repayment and accessibility. Majority of the farmers in Sri Lanka
(more than 85 percent) are small scale farmers or subsistence scale. When their main
income source is agriculture, it is hard for them to save the input costs for the next season.
This was exacerbated when they shifted from traditional agriculture to modern agriculture
with the green revolution. That is basically a movement from cultivation of traditional
varieties to hybrid varieties for which input cost especially the fertilizer and agrochemical
cost is quite high and essential to apply (CBSL, 1998). Therefore, a formal financial
market and credit facilities were built-up time to time assist the agriculture sector. The
Land Commissioner‘s Department is considered as the first source of institutional credits
in rural agriculture (CBSL, 1998).
Evolution of agricultural credit and finance polices
Pre-liberal era (1948-1976)
Institutional arrangements for agricultural credit were began since 1947. It commenced
with three loan schemes namely; the short term cultivation loans disbursed by the
Department of Food Production, the medium term loans disbursed by the Co-operative
Agricultural Production and Sales (CAPS) societies for purchasing machineries and the
long term credits provided for CAPS societies to purchase vehicles and to construct
storage facilities (Sanderatne, 2002). These schemes were continuously expanded by
increasing the coverage of the societies and the money allocated. For example, the
amount disbursed from 1947 to 1953 increased from 4.36 million LKR to 15.86 million
LKR. The functions of the CAPS societies were further expanded during 1956/1957
period converting those societies to multi-purpose cooperatives. The credit amount
increased to 21.9 million LKR. However, the credit disbursed was declined to 10.6
million LKR by 1963 due to loan defaults.
A new scheme was introduced in 1963 which is named Expanded Credit Scheme. It
considered share of capital in the cooperative, area cultivated and loan repayment in
granting loans for the burrowers. The scheme has disbursed 34.6 Million LKR by 1964.
The New Agricultural Credit Scheme was introduced in 1967 replacing the previous
scheme. Under this scheme, cooperatives had to obtain funds from the government and to
lend those to farmers. Central Bank of Sri Lanka is involved in financing cooperatives
and small-scale agriculture through the establishment of the People‘s Bank in 1963.
Thereafter, in 1974 Bank of Ceylon also joined the new agricultural credit scheme and
Hatton National Bank joined with a limited scope (Sanderatne, 2002). Central Bank lent
money at a lower rate to the banks and cooperatives involved in this credit scheme. The

Page | 93
credit limit for paddy was increased depending on the type of practices and purpose.
Crops other than paddy such as chili, red onion, potato, vegetables, big onions, ground
nuts and maize were included in the scheme.
Agricultural and Industrial Credit Corporation Ordinance of 1943 was amended in 1970
by the Agricultural and Industrial Credit Corporation (Amendment) Act (No. 5 of 1970).
This act regulates and authorized to lend money to undertake cultivation or processing
related agriculture investments. The amendment allowed the corporation ―to borrow, or
accept deposits of, money from the Government, the Central Bank of Ceylon, or from any
other source approved by the Monetary Board of such Bank, on such terms and
conditions as may be determined by agreement between the corporation and the
Government, or such Bank, or such other source, as the case may be‖.
Comprehensive Rural Credit Scheme was introduced in 1973 to provide credits through
the rural banks operated by the cooperative societies. The scheme supported obtaining
loans or purchasing inputs and other agricultural activities. Further it extended the support
for other credit needs such as consumption, emergencies and housing.
Liberalization of the economy (1977-1987) and onwards
Comprehensive Rural Credit Scheme initiated in 1973 existed up to 1986. In 1977/1978
Maha season, the loan amount was increased by nearly 62 percent due to relaxing of the
eligibility criteria for receiving the loans. Thereafter, the disbursed amount was
considerably declined with the loan defaults. This scheme existed until 1985 and in 1986,
the scheme was replaced by the New Comprehensive Rural Credit Scheme (NCRCS).
This scheme was not crop specific and was more flexible giving farmer the freedom to
choose. Credits were provided for consecutive three years and the Central Bank
facilitated repayment difficulties for crop losses due to natural calamities by rescheduling
the loans and refinancing facilities were provided at an annual interest rate of 1.5 percent
for the banks. Banks were given the authority to make the decisions on providing loans
based on repayment history and a proper monitoring and evaluation procedure was
introduced. Loans were based on area of cultivation and when the repayment history is
satisfactory, the banks were able to grant cultivation loans without a guarantee up to a
maximum level specified. People‘s Bank, Bank of Ceylon, Hatton National Bank, Indian
Overseas Bank, Regional Rural Development Bank, Thrift and Credit Cooperative
Societies involved in the scheme with the Central Bank‘s guarantee on 50 percent of
defaults (Sanderatne, 2002). A Credit Guarantee Fund has been established by the
Central Bank of Sri Lanka for this purpose. The Rural Credit Advisory Board was formed
to meet and discuss the issues pertaining to rural credit and rural development.
Thereafter, NCRCS continued up until today with several changes time to time.

Page | 94
Figure 2.20 shows the nominal value of loans granted under NCRCS for paddy and other
crops over time. Chilies, red onions, potatoes and other subsidiary food crops come under
‗other crops‘ category.
Figure 2.20: Nominal value of credit granted for paddy and other crops under NCRCS
Source: CBSL annual reports 2009, 2018
Loan recovery was a major issue in implementing the credit schemes for agriculture over
the years. Figure 2.21 shows the loan recovery rate for paddy and other crops over the
time for NCRCS.
Figure 2.21: Loan recovery rate for paddy and other crops under NCRCS
Source: CBSL annual reports 2009, 2018
0
1000
2000
3000
4000
5000
60001
98
9/1
99
0
19
91
/19
92
19
93
/19
94
19
95
/19
96
19
97
/19
98
19
99
/20
00
20
01
/20
02
20
03
/20
04
20
04
/20
05
Mah
a
20
05
/20
06
Mah
a
20
06
/20
07
Mah
a
20
07
/20
08
Mah
a
20
08
/20
09
Mah
a
20
09
/20
10
Mah
a
20
10
/20
11
Mah
a
20
11
/20
12
Mah
a
20
12
/20
13
Mah
a
20
13
/20
14
Mah
a
20
14
/20
15
Mah
a
20
15
/20
16
Mah
a
20
16
/20
17
Mah
a
20
17
/20
18
Mah
a
Miil
ion
LK
R
Paddy Other Crops
20
30
40
50
60
70
80
90
100
19
89
/19
90
19
91
/19
92
19
93
/19
94
19
95
/19
96
19
97
/19
98
19
99
/20
00
20
01
/20
02
20
03
/20
04
20
04
/20
05
Mah
a
20
05
/20
06
Mah
a
20
06
/20
07
Mah
a
20
07
/20
08
Mah
a
20
08
/20
09
Mah
a
20
09
/20
10
Mah
a
20
10
/20
11
Mah
a
20
11
/20
12
Mah
a
20
12
/20
13
Mah
a
20
13
/20
14
Mah
a
20
14
/20
15
Mah
a
20
15
/20
16
Mah
a
20
16
/20
17
Mah
a
20
17
/20
18
Mah
a
Per
cen
tage
Paddy Other Crops

Page | 95
Currently, CBSL implements ―Sarusara‖- New Comprehensive Rural Credit Scheme
(NCRCS) which is funded by the GOSL, through Licensed Commercial Banks and
Licensed specialized Banks as an interest subsidy scheme and a credit guarantee scheme
as well (CBSL, 2018).
International Fund for Agriculture Development (IFAD) had funded the National
Agribusiness Development Programme (NADeP) completed in 2017 and another 5
refinance loan components under Smallholder Agri-business Partnership Programmes
(SAPP) in 2018. The funds of these programmes were handled by the CBSL through
Licensed Commercial Banks and Licensed specialized Banks. The policy existed up to
2020 had the objectives of strengthening the rural credit institutions which assists in
farmers‘ financial activities, introducing a simple procedure and a concessionary interest
rate in obtaining agricultural and agribusiness loans, to establish a mandatory share of
agricultural credits in state banks and to utilize the Govi Setha fund effectively for
agricultural credit (Ministry of Agriculture, 2019).
The current policy of ―National Policy Framework Vistas of Prosperity and Splendour‖
states its expectations to introduce a simple low interest agricultural credit scheme to
farmers (MOF, 2020).

Page | 96
2.2.9 Agriculture Insurance Policies
Sri Lanka was the first developing country in Asia to have launched an ‗all-risk‘
insurance of the paddy crop on a limited experimental scale with Food and Agriculture
Organization (FAO) assistance (Ray, K.,1981). In 1956, the Sri Lankan government
recognized agricultural insurance as a mechanism to increase agricultural productivity
and to offer relief and protection to the socially and economically beleaguered segment of
the population. During the same year, the country sought the assistance of the FAO in the
preparation of the operational framework of an agro-insurance scheme. The first
experimental crop insurance scheme (CIS) in Sri Lanka was introduced in 1958 for rice
cultivation. This scheme covered about 28,000 acres of paddy in selected areas of six
districts and was administered by the Department of Agrarian Services.
Progress of agricultural insurance in Sri Lanka can be traced back to the following
periods:
1958/59 to 1960/61
This scheme was implemented on an administrative basis and it covered six different
districts to study the problems in each region for a period of 4 years in order to gain
knowledge and to test the farmers‘ reaction. The administration of the crop insurance
scheme was carried out by the Commissioner of Agrarian Services with the assistance
and co-operation of other departments whose activities had a bearing on or relevance to
the cultivation of paddy.
This pilot project which commenced in 1958/59 covered 28,000 acres in six districts,
which was approximately 3% of the total physical extent of land cultivable with paddy
and this operated for 3 years.
Under this pilot scheme, the collection of premium was in principle, to be after the
harvest in order to make it less onerous for the farmers.
Crop Insurance Act No. 13 of 1961
This Crop Insurance Act passed by the Parliament provided the necessary legal
framework for the operation of a regular CIS, which commenced from 1961/62 maha
season. This Act provided the necessary legislative authority for the operation of a crop
insurance scheme, which could be considered as the second phase of development.
The Act vested the minister in charge with authority to specify and expand the areas of
operation of the scheme where deemed feasible. The insurance of paddy crop was made
compulsory in the area specified by the Minister under the Act, and hence all persons
having interest in paddy cultivation within such areas were automatically insured under
the scheme.

Page | 97
1962/63 to 1972
The Crop Insurance Act No. 13 of 1961 became operative and the area under insurance
gradually increased to around 200,000 acres. This operated until 1973.
1973 to 1983
The third phase of development of agricultural insurance began with the repeal of the
Crop Insurance Act No. 13 of 1960 and the enactment of the Agricultural Insurance Law
No. 27 of 1973, which took effect in April 1974. The agricultural insurance scheme was
subjected to various experimental changes in administration.
The Agricultural Insurance Law No. 27 of 1973
In 1973, the Act No. 13 of 1961 was replaced by the Agricultural Insurance Law No. 27
of 1973 which came into operation in April 1974, making provisions for a more
comprehensive and compulsory scheme.
The objectives of Act No. 27 are as follows:
i. To operate a comprehensive agricultural insurance scheme for the benefit of
paddy crop farmers;
ii. To undertake research studies necessary for the promotion and development of
agricultural insurance.
This scheme was to be implemented in 3 stages as follows:
i. Insurance of the paddy crop in the country;
ii. Insurance of livestock and selected subsidiary food crops;
iii. Insurance of non-traditional food crops.
The scheme was partly subsidised by the Government, which funded the administrative
costs.
The Act provides for compulsory insurance of the paddy crop and any person having an
interest in the paddy crop in any area coming under the purview of the Act is deemed to
have entered into a contract of insurance with the Board against the loss of such crop.
The enactment of the new law effected the following major changes:
a) It established an autonomous body called the Agricultural Insurance Board (AIB)
to administer and operate the agricultural insurance system in Sri Lanka.
b) An insurance scheme embracing the entire country was introduced.
c) The law provided for compulsory insurance of paddy crop and granted authority
to the AIB for the prosecution of defaulting farmers.

Page | 98
d) The premium had to be paid in advance during a payment period fixed for the
season by the AIB.
e) The law provided for expansion of the scheme where voluntary insurance of
specified crops and species of livestock to be undertaken.
f) An agricultural insurance fund was established to manage the financial operations
of the scheme.
1983 to 1987
The next phase of the scheme began in 1983, with certain important policy changes and
operational changes. The main policy changes effected in respect of paddy insurance are
appended.
a) An interest-free, long- term government loan of Rs.50 million was obtained to
build up a readily accessible loss reserve to meet any deficit between premia
collection and indemnity payable. This grant was invested to generate interest,
which was utilized to meet the deficit.
b) Curtailing producers' indemnity payment like ‗prorating‘ was abolished both at
individual level and area-wise group level.
c) Indemnity payments were expedited to reach the farmers in time before the next
season‘s cultivation.
d) The paddy insurance rules and regulations were revised to entertain genuine
claims relaxing some rigid technical conditions and requirements.
e) An incentive for non-claimants was provided by way of free insurance after five
seasons of continuous no-claim period.
The Agricultural and Agrarian Insurance Act No. 20 of 1999
Agricultural Insurance Board (AIB), which functioned with fairness from the government
consolidated fund since its inception in 1974 was brought within a broader framework by
the Agricultural and Agrarian Insurance Board Act. No 20 of 1999 which came into effect
from August 16, 1999 with a view to establishing the scheme on a self-finance basis.
The new Act made the following provisions:
a) To broaden the scope of the AIB and establish the Agricultural and Agrarian
Insurance Board (AAIB) to provide insurance for agricultural and horticultural
crops and medicinal plants, livestock, fisheries and forestry, agricultural
equipment and implements, the storage and preservation of agricultural and
horticultural produce and produces of medicinal plants and fisheries and forest
produces.
b) To provide medicinal benefits and social security schemes for agriculturists; and

Page | 99
c) To repeal the Agricultural Insurance Law No. 27 of 1973, thereby permitting
private insurers to undertake crop insurance
All powers and duties conferred or imposed on the Agricultural Insurance Board
established by the Agricultural Insurance Law, No. 27 of 1973, by the Farmers Pension
and Social Security Benefit Scheme Act No. 12 of 1987, the Fishermans Pension and
Social Securities Benefit Scheme Act, No. 23 of 1990 were repealed.
With the implementation of the new scheme, the activities hitherto handled by the
Agricultural Insurance Board (AIB) were transferred to the newly established
Agricultural and Agrarian Insurance Board (AAIB). Since the monopoly of the AIB in
respect of agricultural insurance was eliminated by the new Act, other insurance
companies involved in the sector have the opportunity to pursue agricultural insurance.
The Agricultural Insurance Law was repealed and the Agricultural and Agrarian
Insurance Board (AAIB) was established under Agricultural and Agrarian Insurance Act.
While continuing its former business, steps were taken by the new AAIB to design new
insurance schemes for seed farms, model farms, seed stores, livestock, fisheries,^
floriculture and coconut.
The insurance schemes designed by the AAIB on the request of the Perennial Crops
Development Project for perennial crops, Department of Export Agriculture for export
agriculture crops, Southern Development Authority for maize cultivation in the Southern
region and the Tea Research Institute and Tea Small Holding Development Authority for
smallholder tea plantation continued to be in operation during the year under review.
Ceylinco Insurance Company Ltd. (CICL), which is the only private insurer operating in
the agricultural sector, expanded its services to various sectors including life insurance for
farmers during 1999 after the enactment of the new Act.
2000 onwards
In 2000, AAIB has introduced new insurance schemes for (i) tobacco cultivation under
the Ceylon Tobacco , (ii) agricultural projects under FSC system, (iii) seed paddy and
model farming, (iv) tea nurseries and plants under the Tea Research Institute and the Tea
Small Holding Authority and, (v) the scheme for sesame, Kurakkan and Maize crops.
AIB broadened its scope by introducing a technical method of loss assessment for crops
such as onion and ground nut. Action has been taken to introduce new insurance schemes
for foliage and cut flowers, medicinal plants, storage of agricultural products and
medicinal products and a scheme for insuring agricultural machinery.
In 2003, the AAIB added two more crops, namely, banana and ginger under its crop
insurance scheme. CICL implemented special insurance schemes, namely, the Post-

Page | 100
Harvest Crop Insurance Scheme for paddy and the Ceylinco -Seylan ―Govi
Rakawaranaya‖, which offered special life and health insurance cover to crop credit
customers.
National Insurance Trust Fund was formed in 2006 based on the Act No.28 of 2006.
Crop insurance scheme was established in 2013 according to the budget proposal in 2012
for farmers who receive subsidized fertilizer under the ―Kethata Aruna Pohora Diriya‖
programme. It is a compulsory Insurance scheme as a remedial measure to mitigate
damages caused to cultivations due to droughts, flood and wild elephants and operated as
per circular No.BD/EE/118/01/BP/2013,dated 21/06/2013, issued by the Ministry of
Finance & Planning. Farmers contribute Rs. 150/= at the time of purchase of each
chemical fertilizer bag of 50 kg as a premium (Rs.3/-per 1 kg of fertilizer) during each
cultivation season. The insurance premium is charged at the time of purchasing fertilizer
at the Agrarian Services Centres and Cooperative Societies which are selling subsidized
fertilizer. In addition, a crop insurance levy of 1% of the annual profit is also collected by
NITF from all licenced banks, registered insurance companies and financed companies.
Insurance benefit is paid subject to a maximum limit of Rs.25,000/-per
hectare(Rs.10,000/-per acre) in the event of a total loss. The Cultivation Loss Assessment
Committee should assess the damages based on the stage of cultivation. After receipt of
recommended claims from Agrarian Development Centers to NITF, claims are processed
and payments are directly credited to the bank accounts of farmers.
The currently implemented risk layering model offers insurance to all farmers who
cultivate paddy as follows (Table 2.4).
Table 2.4: Loss Compensation based on risk assessment for paddy farmers
Risk Parameter Loss
Compensation
Self-Retention Layer 20% yield reduction
Market insurance layer
(subsidised premium attached to
the fertiliser subsidy)
20% to 100% Yield loss is the loss
parameter when compensation
/indemnities are paid on the basis of
total cost of production Rs. 40,000
NITF
Up to Rs.10,000
Market failure layer Treasury
Upto Rs. 40,000
Source: Wickramasinghe, 2020
Crop Insurance has expanded for five other crops including, Potato, Big Onion, Chillie,
Maize and Soya Bean, in 2017. (Will be paid compensation upto maximum of 10,000
rupees per acre for damages to crops in times of a calamity). ―Compulsory Crop
Insurance Scheme‖ was introduced in year 2018 by extending the insurance coverage for
other commercial crops such as maize, soya been, big onion, potatoes and chilli and cover

Page | 101
the actual loss of the crop damage in order to minimize the financial risk of the
Government and compensate farmers without causing difficulties as well.
Also the government has decided to offer farmers insurance free of charge for six
varieties of crops including paddy from the Yala season, 2018. (Onion, Potatoes, maize,
Soyabean and Chillie, in the case of cultivation damage Rs.40,000 per acre or Rs.
100,000 per hectare will be paid as claim benefits)
Figure 2.22: Performance of paddy insurance schemes over the years
Source: CBSL, (2009, 2018)
Figure 2.23: Insurance premium collected from 1989 to 2018
Source: Annual reports, CBSL various issues
0
100
200
300
400
500
600
700
800
900
Are
a ('
00
0 H
a)
Area Cultivated Total Area Insured

Page | 102
Insurance premium collected has increased after 2005 when the insurance scheme was
attached to the feriliser subsidy program of 2005. With this program entire paddy farmers
were included to the insurance program. However, the indemnities paid in return for the
crop losses have also increased (Figure 2.23 & 2.24).
Operations of the crop insurance programme for paddy sector shows that in the recent
years AAIB continues pay larger indemnities against insured paddy crop making crop
insurance alone as a risk sharing strategy against the climate disturbances an
unsustainable policy.
Figure 2.24: The difference between insurance premium collected and the indemnities
paid from 1989 to 2018
Source: Annual reports, CBSL various issues
-140000
-120000
-100000
-80000
-60000
-40000
-20000
0
20000
40000
60000
19
89
/19
90
…
19
91
Yal
a
19
92
/19
93
…
19
94
Yal
a
19
95
/19
96
Mah
a
19
97
Yal
a
19
98
/19
99
Mah
a
20
00
Yal
a
20
01
/20
02
Mah
a
20
03
Yal
a
20
04
/20
05
Mah
a
20
06
Yal
a
20
07
/20
08
Mah
a
20
09
Yal
a
20
10
/20
11
…
20
12
Yal
a
20
13
/20
14
…
20
15
Yal
a
20
16
/20
17
…
20
18
Yal
a (b
)
Difference between Premia Collected and Indemnities Paid (Rs.’000)

Page | 103
Table 2.5: Government expenditure in the crop insurance and important policy changes
Year
Current Transfer
(Rs.Mn) Remarks
1990 12.7
1991 3.6
1992 11.1
1993 23.8
1994 20
1995 11.2
1996 8.6
1997 0
1998 14.6
1999 30
The Agricultural and Agrarian Insurance Act
No. 20 of 1999
2000 31 .7
2001 36.2
2002 32.2
2003 0
2004 28
2005 31
2006 38
Formation of National Insurance Trust Fund in
2006 (Act No.28 of 2006).
2007 37.9
2008 327
2009 130.9
2010 125
2011 790.4
2012 134.8
2013 138 Crop Insurance Scheme
2014 2,100.30
2015 2,276.00
2016 2,690.00
2017 2,760.00 Expanded Insurance Scheme
2018 2,835.00 Compulsory Crop Insurance Scheme/ Free of
charge
2019 3,340.00
Source: Annual reports, CBSL various issues

Page | 104
2.2.10 Public Expenditure Programs of the government and investment
prioritization
Public investment programme and its share in Agriculture
Sectoral allocation of resources in the Public Investment Programme (PIP) has varied
over time in accordance with measures taken by government to deal with prevailing
economic and political conditions and also with total resource availability. The PIP, a
rolling plan, is flexible and reflects changes in government policies and priorities from
year to year. The PIP is divided according to economic sectors viz., Agriculture,
Industries, Social Overheads, Economic Overheads and Human Settlements. It lists
projects by sectors under three categories: on going, annuals and new projects. Those that
do not fit into any sector are grouped under a heading "Miscellaneous". Resource
requirements are indicated by the implementing agencies for a period of five years from
the current year. The aggregate of requirements of all agencies gives total resource
requirements.
Total resource availability is estimated from resource flows that are dependent on
international trade effects on primary commodities, the vagaries of weather on agriculture
and upon international assistance. Thus, these have a direct control over the size of the
PIP. Domestic savings are inadequate to finance the investment programme and recurrent
expenditure of the government, so foreign assistance is always needed.
The government priorities in 1984 were decided to:
(i) provide adequately for O&M allocations as a first priority.
(ii) exclude activities that could easily and efficiently be undertaken by the private sector.
(iii) embark on: - quick-yielding, production oriented projects which would reduce the
balance of payments problem. - essential infrastructure needs in power, irrigation,
transport and communications. - urgent needs in health, education housing and nutritional
standards of the people.
The completion of the Agriculture Food and Nutrition Strategy Study later in the same
year identified areas of the agriculture sector that were starved of investment, such as the
plantation sub-sector, for which the Medium Term Investment Programme was
implemented. However, the declining trend was not reversed. From the latter part of
1987, civil strife began to spread all over the country. As a result, revenue collection fell
from an average of 21 per cent of GDP to 18.8 per cent in 1988. Export earnings declined
further and private transfers from migrant Sri Lankan workers leveled off. To add to these
difficulties, in 1989 the new government launched its lead programme on poverty
alleviation, employment generation, nutrition and other social welfare measures to fulfil
its election promises.

Page | 105
The PIP for 1989-93 (Table 2.6.) was formulated to take these constraints and changes
into account. In its 1989 Policy Framework Paper, the government agreed with the IMF
and World Bank to bring stability and to contain inflation.
The main reforms to be effected during 1989-93 included:
a) reduction of the PIP from 11 per cent to 9 per cent of GDP.
b) reduction of the overall deficit from 12.5 per cent to 8 per cent of GDP.
c) reduction of domestic borrowing from 6.4 per cent to 3.8 per cent of GDP.
However, to accommodate the government's new lead programme, subsidies and current
transfers would increase during 1990-1991 but should level off thereafter. The Transport
Sector Master Plan and the ongoing Power sector study were other areas that would
compete for additional investments. Thus, a further shift of emphasis away from
agriculture was envisaged.
Table 2.6: Sectoral Allocations in Public Investment Programmes from 1979-86 to
1996-2000 (percentages)
Source: Public Investment Programme, Ministry of Finance
Although areas starved of investment were identified in the National Agriculture Food
and Nutrition Strategy Study, the absorptive capacity of the agencies within the
agriculture sector did not improve to the point where they became real competitors for
irrigation. Total Public Investment at the end of the 1980s was around Rs.30 billion. It
was not expected to grow at more than 2 per cent per year in the 1990s, with the adoption
of the new Policy Framework by the Government in consultation with donors. However,

Page | 106
this control was not exercised in practice. Total public investment rose from around Rs.38
billion in 1991 to Rs.61 billion in 1996, with expectations of Rs. 114 billion in 2001.
Investment Priority Areas identified in the 2017 public investment programmme:
Irrigation water resources development
Trans-basin diversion
New reservoir development and construction
Augmentation of feasible existing reservoirs
Rehabilitation of existing tanks and reservoirs
Increase the water use and conveyance efficiency
Table 2.7: Investment Priority Areas
Source: Department of National Planning
Assistance to Agriculture
Promoting new hybrid and high yielding varieties of cash crops and establishing
seed cultivation farms
Introducing latest agricultural equipment and technologies in production and
market value chain including post-harvesting
Establishing large scale agro enterprises for value addition and product
diversification
Establishing a fully empowered Agro Marketing Authority – development of
markets, infrastructure in value chain
Introducing and popularizing Agro Financial Tools & Products
Building agricultural roads and market places
Strengthening agriculture extension services, introducing best practices
Promoting production and use of eco-friendly agro-chemicals
Strengthening research and development on new varieties, technology and new
market trends
Introducing e Agriculture to distribute information to the farming community
Implementing agriculture crop insurance Scheme to compensate farmers for the
losses due to floods, droughts and other natural calamities.

Page | 107
Table 2.8: Investment Priority Areas in Rs Mn
Source: Department of National Planning

Page | 108
CHAPTER 3
NATURE AND MAGNITUDE OF PRIVATE SECTOR INVESTMENT
IN AGRICULTURE AND ITS DETERMINANTS
3.1 POLICY INCENTIVES FOR PRIVATE SECTOR PARTICIPATION
Of the main stakeholders engaged in agriculture; state, private sector, subsistence and
commercial farmers and the international partners, the role played by the private sector
more definitely the corporate sector is of significant importance as state withdrew from
various functions that had been performing before liberalization of the economy. Policies
were oriented creating an enabling environment for private investment in agriculture to
earn a reasonable return on to their investment while achieving growth in agriculture
sector.
Until mid-1980s, the public sector had the monopoly over the seed industry in Sri Lanka. An
organized seed production and distribution program was initiated by the Department of
Agriculture (DOA) after selection and breeding of improved paddy varieties in the late 1950s.
In between 1960 to 1980, the industry matured within the state sector and in late 1970s, the
National Seed Certification Service began functioning. Improved seed for all food crops was
produced, imported and marketed exclusively by the DOA until 1984, when the first step
towards privatization was taken.
Private sector was allowed importing and marketing of exotic vegetable seeds at that point.
Until then, the highly subsidized seed prices, poor access to improved basic seeds and
technology and a restrictive policy stifled any initiatives by the private sector to enter the seed
industry. With the time of that, government encourages the private sector to invest in
Agriculture other than trading.
As the first turn on, in 1994 the government sold off seed farm at Thalawa and a
committee comprising public and private sector was established to review the system of
importing seeds. In 1996, the government approved the National Seed Policy, which
sought to increase the role of the private sector in development, production and
marketing, while reducing the role of the state primarily to regulation. In 1998 and 2000
respectively, another two seed farms (Hingurakgoda and Pelwehera) were privatized. The
Government produced only foundation seeds, which 2 were then issued to private
growers for production and marketing. The majority of seeds used for paddy is actually
retained by farmers themselves from their own crop. The Plant Protection Act, which
envisaged a slackening of restrictions on the import of seeds, was approved by the
Parliament in 1999.

Page | 109
By 1994, Sri Lanka had already gone through a liberalization process whereby most non-
tariff barriers to trade had been removed. In addition, duty has been waived on a number
of commodities for cost of living considerations. Imports of all seed and planting
materials for agriculture are duty-free and the duty has been waived on machinery and
equipment imported for use in the application of new and innovative technologies in
agriculture. At recent past, in 2010, imports for agricultural machinery were provided in a
zero duty rate.
Private sector has an excessive potential in investing in Agriculture. The following
schematic representation indicates the opportunities for private investment in Agriculture,
in Sri Lanka. Looking at the present picture, supply of inputs, development of physical
infrastructure, transfer of technology and support services prevails more or less in the
sector. However, these basic components of opportunities, should be accessed under the
supervision of the public sector and should be monitored accordingly.
Investment Opportunities
Supply of Inputs
Seeds / Planting materials
Bio-fertilizers
Packaging materials
Tools / machinery
Development of Physical Infrastructure
Market centers
Cold Storage / Warehouse
Sorting-grading-packing centers
Industrial sites
Transfer of Technology
Controlled Agriculture
High demand / high valued
crops / Livestock products
Off season production
techniques
Processing and Value addition
Integrated Production systems
Support Services
Research and Extension
Testing and certification
Refrigerated transportation
Storage / warehouse facilities
Forward Contracts (web-based)
Crop Insurance

Page | 110
3.2 THE CURRENT DEPICTION OF PRIVATE SECTOR INVESTMENT IN
AGRICULTURE
There are numerous private entities active in investing in agriculture. Predominantly these
private entities tend to invest in seed market, machinery and agro- chemical market.
Some of the important companies in Sri Lankan seed market include, Tropical
Seeds/OPEX Holdings, Best Seeds (a representative of East West Seed), CIC Agri
Business, Hayleys Agriculture, Supreme Marketing Company, and Lankem Ceylon PLC-
Agro. In view of the machinery industry, Hayleys Agriculture, Dimo Sri Lanka, Divi
Shakthi, Helix Engineering (Pvt) Ltd, Dave Tractors (Pte) Ltd, Brown & Company PLC,
Agfour Engineering, and Jinasena Agriculture are some of the pioneers.
In this study, it specifically aims at Hayleys Agriculture and CIC Agribusiness, for
explaining the trend of investing in Agriculture and to explore the government sustenance
and draw backs for investing in Agriculture.
3.2.1. Hayleys agriculture
Hayleys has grown from a small proprietorship in Sri Lanka‘s southern city Galle, into
one of Sri Lanka‘s largest, most diversified public companies. The 140 year Hayleys
chronicle traverses the tapestry of time, changing with it and taking shape from it.
Today Hayleys is a Sri Lankan multinational conglomerate renowned globally and locally
in certain specialized areas of expertise such as Agriculture & Agri Business,
Transportation & Infrastructure and Consumer & Leisure.
A quoted and truly broad-based company, in the 52 years since its incorporation Hayleys,
has had a record of 26 scrip issues and 4 modestly-priced rights issues, together with
dividend payouts averaging 25% in each of these years.
The Hayleys Agriculture, comprises by vast range of sectors.
Sectors
Crop Nutrition
Soil and Water Management
Seeds and Planting Solutions
Crop Protection
Agri Mechanization

Page | 111
3.2.1.1. Nature of the investment and the present context
3.2.1.1.1. Agri Mechanization
Offer a range of machinery for agriculture mechanization from tractors and rice trans-
planters to sprayers and combine harvesters and market products covering Paddy, Tea,
Coconut and Dairy sectors.
Heavy Machinery (Tractors and implements, combine harvesters, trans planters)
Light Machinery (Knap sack sprayer, midst blowers, power sprayers, bush
cutters, fogging machines, weeders)
Tea Machinery (Tea harvesters, Tea bush pruners, Earth augers )
Protected Agriculture (Locally fabricated net house, free fabricated greenhouse,
insect proof nets, UV treated polythene, shade nets, mulch films, anti -birds nets,
fencing nets, nylon blue nets, mesh nets, locally fabricated greenhouses and other
accessories)
Micro irrigation (Drip irrigation, sprinkler irrigation and other accessories)
Dairy Machinery (Milking systems, milking machines, chaff cutters )
Coconut Machinery (De-huskers and shredders)
Hayleys (Hayleys Agri Equipment Division), plays a vital role especially in Agriculture
machinery, in Sri Lanka. As there are three main stages in the Agriculture process: Pre-
harvest, Harvest and Post- harvest, Hayleys focus their devotion in pre- harvest and
harvest, predominantly in Open Field Crops such as Paddy and Maize. For land
preparation, equipments such as tractors, Crop establishment rice trans-planters and
harvesting equipments, the harvesters (Primarily for paddy). For other sectors; dairy, tea
and coconut. Primarily regards to the paddy; the company concentrates on crop
establishment and crop harvesting, as the land preparation is common. (The land
preparation is irrespective to the crop). Government tenders are the common channel of
occupying the opportunity to supply the machinery. According to the Head of the
Agriculture Machinery Division of Hayleys Agriculture; Mr. A. Rajap; Hayleys has
supplied about 600 trans-planters for past few years. Hayleys train farmers to establish the
nursery and to use the mechanized trans- planter, while promoting the Dapoc nursery
substituted for manual broadcasting. Mechanized transplanting has many advantageous
trend over manual transplanting particularly in saving labor cost, increase in yield and
production at low cost. Hence the situation prevails so, there are some issues denoted
with that can be reckoned as risks for the farmers, such as water issues (scarcity ,
precipitation patterns, issuing of water from the authorized bodies) and the reluctance of
farmers by themselves to establish and maintain a nursery. Relying on some collaborative
research works implemented with RRI, Batalegoda, it was found that, transplanting has a
trend of increasing the yield at least 10%, absolutely for 4 months and, 3 ½ months
varieties; while 3 months varieties susceptible for the planting stress. There is an

Page | 112
opportunity to use the mechanized weeder for weeding, when the row planting is done,
instead of using sprayers. Observing the dynamics of using trans planters , in some areas
it has been identified that some pockets of people (North western Province), who acquire
the subsidy of Rs.100,000 from the regional/ provincial government, for purchasing the
machinery, and doing the transplanting as a business on a hire basis, and had been
successful. So this can be imaged as a future trend of utilizing more machinery and will
be determinant for invest in Agriculture. In some areas the farmers has abandoned the
usage of mechanized transplanters, and also in some particular areas the chairman of the
farmer organization has the responsibility of the machine, not willing to distribute among
other farmers. Again some pockets of people tend to earn by hiring their machinery, and
they continue it as a business where they have been successful. Though there are some
practical restrictions in Sri Lanka, custom hiring also another future trended better
practice, where the farmer gives the whole pick to the particular contractor. And the
contractor will bring the machinery to the nursery and does the transplanting.
Contemporary there are some customary mindsets that restrict the utilization of
agriculture machinery. Farmers expect the technology of the machine to suit the manual
practice. Apart from climatic restrictions like water scarcity, lack of knowledge of
farmers, and the low adaptability rate of the community where there the training programs
which provided are not taken into. Practically though the company tends to conduct
training programs on Dapoc nursery establishment, the farmers still willing to continue
broadcasting.
When looking at some point of view about the future trends, the company will be testing
a trans- planter, specifically developed for the parachute nursery. This imported machine
developed by the supplier could be used as a future development in the stream of
agriculture machinery, to overcome the labor shortage and also to continue a quality
transplanting.
When discussing the rationalism in the investment, most as the private companies,
Hayleys themselves measuring it, in the terms of potentials. First the areas which are
suitable for mechanized are going to be recognized. Then, identifying of the suitable
machines which can be used for is carried out. Afterwards, those identified suitable
machines are brought up to the country and test here (Because, all machines are not
suitable for the country itself; so have to test minimum one season/ mostly two seasons).
For instance one model of a combine harvester had been tested for three seasons. Then
the modifications have been done and introduce to the field. Repeatedly, if further more
modifications found, after introducing, modifications should be continued afterwards.
Quality parameters of the harvest can be refined by utilizing the machinery. Moisture
content of the rice is a kind of a parameter that measures the quality. So, dryers has a
great prospect in machinery for that perspective. There is an impending demand for
mobile dryers in present. Fix dryers are capable of drying fixed 10 tons batch 12 hours

Page | 113
where the drying gradient is 1% per hour. Mobile dryers, with a lesser time dries two-
four tons per batch within an hour. Institute of Post -Harvest Technology (IPHT), a
government body has developed a continuous dryer capable to dry at most 66kgs within
in 12 minutes at 160 degrees. As a collaborative venture, Hayleys tends to join in
developing this new invention. Though the inventors has applied for obtaining the patent
for this invention, the higher temperature which operates by has some minus effects on
the quality of the rice. It can increases the percentage of the broken rice and the taste of
the rice can be altered. So the two-way discussions will be undertaken to readjust those
effects and introduce to the field and market.
Some drawbacks have been sorted in investing on Agriculture machinery in Sri Lanka.
Fundamentally, the company has once spent one million of amount to assemble a
combine harvester. And a difficulty may emerge in handing over a machine for one
million, and the way upon the farmers will lose the affordability.
There are some drawbacks in the channel of being mechanized by the farming
communities too. The farmers who practice mechanization for the agriculture have to
invest added cost to than the non- mechanized farmer. So, this will be a loss of the benefit
to the particular farmer. To come over with the mentioned issue, an income intensive
should be granted to the farmer who practices, or willing to practice mechanization for
farming. `
Transforming from manual agriculture to mechanized agriculture can be a great substitute
for labor shortage. Required labor hours for nursery establishment in the manual
procedure estimated like as, half a day for 80 trays (half acres) and other than, for
managing the nursery until 14 days, watering, drying (once in two days), foliar
application (14 days period) and other management practices. Nonetheless a mechanized
trans- planter only requires, one day, with two people (Operating and supporting) for two
and half acres.
Other than paddy and other open field varieties of crops, Hayleys has glimpsed into
dealing in machinery of tea, rubber, coconut like major exporting crops also. The
company has developed a tea harvester, where the company promotes itself machine
plucking of tea is quality than the hand plucking, because of the fact where the
fermentation has not started yet, and regrowth of the shoot can be further occur. (Because
of the fine cut)
Not only paddy, as open field varieties, the company has undergone a process of testing
on a maize harvester and a groundnut thresher. (Pod). And also the company has
developed and introduced a coconut de-husking machine, which is newly following
demonstrations. Other than that, also the company has developed a rubber tapping knife.
Furthermore, Farm waste dredgers / pulverized, which decomposes fast the thrown by s
of agriculture also has been developed by the company. When look on other than

Page | 114
harvesting of crops, the company has developed equipments for maintenance purposes
too. Such as, pruning machines, earth augers for tea cultivation. Agriculture is not a sole
component of crop, so the company has contributed for the dairy sector too. Portable
milking machine, chop cutters like machinery and equipments have been introduced by
the company for the ease of dairy farmers.
Specifying the protected agriculture sector implementing by the company, the range of
products varies to shade nets, UV polythenes, insect proof nets, fruit and vegetable covers
(Banana branches, insect attacks, and rodents‘ attack), poly tunnels, and net houses. This
emerging protected agriculture products have been tested in the filed level as trials. At the
moment company conducts a trial with a grape farmer in Jaffna. To examine the effect of
color of the shade net, in regards to the increase in the yield, harness and the size of the
grape fruit. (Green and black shade nets have been normally used and especially this
research is carried out to determine the effect of the white color shade nets).
Extension is the channel which transmits these theoretical aspects into practical scenario.
However, as in the present, the public extension sector is administrated by the regional
government, and it has caused to shrink the capability of the department, though there are
several plans and new projects have been implemented. At the moment, Hayleys also has
stepped into extension service. On one aspect, they train and make aware the farmers and
the owners of the machineries about the operational and maintenance, when the machine
is bought. And on the other hand, they provide extension services to the government
extension officers about those machinery.
On the view of collaboration with other entities, Hayleys and SLINTEC has some
preliminary plans to sign for an agreement for manufacturing soluble urea. As SLINTEC
is totally and thoroughly relying on the patent, the business plan initiation was not
successful, and SLINTEC itself now has joined with an Indian company for the
manufacturing of soluble urea. Internationally the company has linkages with two entities
operational under United Nation: The Center for Sustainable Agriculture, which
recognizes all the private sector machinery, manufacturers and processes and The
ANTAC, which is the government officials to develop standards for the machinery. It is
experienced that, though setting up standards has no issues, the implementation of those
standards have more concerns such as the prevailing stage of the country. Otherwise,
when the standards become very stringent, it will reach far beyond the average farmer.
The flexibility of parameters, which concern in preparing those standards should be
renowned.
Presently, government is more likely to be rely and depend on imports done by the private
sectors, other than testing those machinery by the government. So, from one aspect it may
be a burden for the private sectors too. This issue was aroused some years back when a
seeder (Which to fix to the tractor) has been imported by the company after getting the
government tender. When the company exhibited the samples to the government

Page | 115
authorities, there was no dispute. By the time when company suggested for
recommendations, to specify the varieties, those government authorities denied to do so,
and suggested the company to examine it, in the field and the market. Lastly, when the
seeder was introduced to the field, the department stated that the machine is not suitable
for the field. There is a depiction of what the government does not want to be accountable
in the flow, where the strength of the partnership ventures tends to be faded.
For expanding the acceptability of future demands and trends in agriculture, the company,
looks forward and willing to continue, to work with the universities, where in the
meantime they had functioned with University of Peradeniya, specially predominating the
agricultural engineering aspect. Conducting researches in different thematic areas,
mapping the fields of Sri Lanka and also, testing hydroponics. This future prospect will
be a noble way of sharing technology. The company themselves owns an Agriculture
Training School, where they have provided the training service to about 300 advanced
level teachers in agriculture stream. Initially the company has received the syllabus and it
has mentioned some machinery which are out dated. In this particular scenario,
government can connect with the private sector to get the private sector involvement
because, company itself willing to explore the new technology to the school syllabus.
When citing the practice of advanced technology by the company, Hayleys has applied
the drone technology to the tea plantation sector and paddy sector. Basically, the drone
technology has been used for chemical application. This technology had been used once
for maize cultivation, when there was the epidemic situation caused by fall army worm.
There are several advantages in using this technology in agriculture. When, drone systems
is used for chemical application, other than manual application by a knap-sack sprayer,
the user himself does not expose to chemicals. And as the emission is efficient, drone
technology is faster compared to the manual sprayer. With the intention of promoting the
significance of adopting to this advanced technology, the marketing communication
division of the company has produced videos and documentary about advanced drone
technology. Yet, there also some issues in regulating in the practical field level. In war era
of the country, the government has some regulation restrictions on the quantity of lifting.
The company has to grant the approval by the government, if the quantity of lifting
exceeds one kilogram, and that regulation is still has not taken off.
When looking on eye in agriculture production, Hayleys produce the stainless steel knap-
sack sprayer, since 1970s. In about 2013, when the government took back the custody
payments for 0%, a competition was aroused between the imported companies and local
companies. Though this issue was taken for the consideration of treasury, asking for a
protection over this matter. The government sector (National Committee on Economic
Development) did not lend a strong encouragement for the local manufactures, where
their opinion was that private sector should stand by their own. When considering the
other machinery such as tractors, the major parts of those machinery are the engine and

Page | 116
the gearbox. The manufacturing of those components is hard as the volume and the
requirement of Sri Lanka is very small. As there are less plants for manufacturing,
importing is effective. So, the local value addition will be basically the labor. Though
there are some South Asian countries like as Bangladesh who manufactures machinery
locally based on the fact of cheap labor, the present trend of those countries also moving
for imports by China.
Adjusting on the future demand, the company has established the ―Agri machine
operation‖, since 2019. At the initiation level, the company has started testing harvesters,
before introducing. Depending on the type of harvesting of paddy (Full feed harvesting)
in Sri Lanka, the company wanted to introduce a Hay baler, which can bale, and planned
to introduce to the dairy farmers in areas like Kurunegala and Polonnaruwa. Taiwan has
manufactured a machine to produce rope from straw where Hayleys also looking forward
to introduce that machine into Sri Lanka. It will be a good and cheaper alternation than
coir to make coir. And also there are some other equipment that the company is looking
forward to introduce to Sri Lanka like as preparing pallets using coconut husks. Agro
biotech is the functioning agent of Hayleys who undertakes the tissue culture, located in
Nanu –Oya. They function multiplication for the parental materials sent from the mother
country, and also looking forward to produce materials in here itself. The multiplication
of G0 of potato seeds was not viable depending on several factors, majorly the high cost
of production, lacking of fields and more rounds of multiplication trials. Hayleys own
70% of market share for seed potato in Sri Lanka. Calling upon the future demand,
Hayleys has introduced a new variety, which is resistant to heat to Jaffna area, which has
good pattern of growth.
When citing on the competition faced by Hayleys, as a business entity, they face for price
competition with competitors as they try to import the same machinery which Hayleys
introduced mostly for the first time, to a low price rate.
3.2.2. CIC Agri business (private) limited
Chemical Industries Colombo (CIC) Limited was incorporated in 1964 and at present it is
better known as CIC Holdings PLC. CIC has initiated the business as an importing entity
of chemicals to Sri Lanka (Crop solution, paints and chemical was the main business).
Lending the path to Agriculture from Chemical industry, the government had thrust
emerging private institutes to invest in Agriculture, other than trading. The general ill
perception of the community about chemical usage was plus point on initiating the
agriculture pathway.
CIC Agri Businesses (Private) Limited is a one of the main businesses of CIC Holdings
PLC, which contains all the agriculture related businesses in CIC Group. It consists of
several companies namely;
CIC Seeds (Private) Limited

Page | 117
CIC Agri Produce Export (Private) Limited
CIC Agri Produce Marketing (Private) Limited
CIC Dairies (Private) Limited
This manages over 10,000 acres of farmland and work with over 20,000 rural farmers in
producing a wide range of Agri Produce including Healthy Rice, Fruits, Vegetables,
Seeds and grains and Dairy products which caters to the country‘s food security, nutrition
and import substitution initiatives. CIC uses internationally-accepted food safety
standards and good agricultural practices that creates the product that contains the
wholesome goodness and nutritional value required for nourishment. CIC also makes
substantial investments in their research and development facilities which include rice
breeding, soil labs, seed labs, food labs and tissue culture labs and work with reputed
overseas principals for developing modern technologies comprising high yielding and
pest resistant crop varieties into the country.
In addition, its own crop and livestock farms act as technology transfer centres to the
farming community of Sri Lanka introducing new agricultural technologies.
Out grower system of CIC practiced on seed paddy, soy bean and bitter gourd giving
great opportunity for local farmers to reap continuous income for their agricultural
produce irrespective to market fluctuations.
As a private sector business organization CIC is conducting private rice research center in
Pelwehera seed farm and conduct variety evaluation trials, hybridization programs to
introduce good quality, high yielding varieties. Hence, CIC seeds (private) ltd provides
great services to the nation. CIC 3-1 is their first breeder seed variety which was
introduced as a recommended variety. CIC rice mainly targeting export market and it is
great opportunity to earn foreign exchange to the country. CIC farm produce good quality
Cavendish banana for local and export markets. Big onion true seed project supply quality
big onion seeds for farmers and this helps to cut down the highest portion of big onion
seed importing to country and this also helps to save foreign exchange. Plant nursery
provides budded, grafted and tissue cultured plants of fruit crops, plantation crops,
ornamental plants, forest plants and etc.
CIC provide training facilities for university and other agriculture base higher educational
level students and also facilitate farm visit opportunities for school children, farmers and
higher educational students.
In addition to that, CIC provide soil and seed testing service to the farmers using their
fully equipped laboratory facilities.
In 1984/ 1985, when the government liberalized the seed sector, government encouraged
private traders to establish in seed sector, where majority traders joined in importing the

Page | 118
vegetable seed sector. The CIC Seed farm commenced its operations in early 1990‘s with
the production and marketing of chili seed. Though the seed paddy was a messy operation
with a high volume and low margin, the company acquired the Thalawa Seed Farm in
1992, the first farm to be privatized by the government, and initiated a seed paddy
production program using the farm as a basis. CIC retains couple of seed categories. CIC
undergoes the multiplication of basic materials of the government: public varieties (Ex-
Batalegoda, Mahailluppallama and other research stations). And the distribution is
processing through selling in their own farms and distributing among out- growers. Apart
from that CIC recently has engaged in producing their own varieties. Based on the
performance of the Thalawa farm, the government awarded the management rights of two
other large state farms namely Hingurakgoda in 1998 and Pelwehera in 2000 to the CIC
on a long term lease (Rs. 5 million, per year, per farm) with a view to enhancing the local
seed production. The initial thrust of the company was to develop a sound seed paddy
business. According to the information provided by the CIC within a short period of time,
CIC Seeds became a major player in the national seed paddy supply system with a market
share of about 30 percent. To avert the risk bearing by depending on seed paddy program
with seasonal income, the company diversified its activities to produce other seed
varieties and planting materials in the CIC farms as well as under contract growing. A
trading operation too was initiated to import and supply hybrid vegetable seed and seed
potatoes. The company today has become the foremost seed company in the country. The
government has taken up steps to regulate the monopoly of seeds by particular entity, by
providing the parental line free for everyone. And also there are some government
regulations, and agreement on the seed sector, where those entities should sell the seeds
lower price than the imported seeds, because a cost has not been allocated for the
Research and Development.
The CIC set up a lab in Pelwehera to analyze soil and as a result researchers were in a
position to recommend the fertilizer depending on the type of soil. The CIC Agri
Businesses moved up the rice yield from 55 bushels per acre to 125 bushels at
Hingurakgoda and planned to raise the yield up to 175 bushels per acre.
The CIC ventured into farming in 1998 with the leasing of a 1,500 acre government farm
in Hingurakgoda. At Hingurakgoda there were two interesting activities a) the
Agricultural Machinery Yard where the CIC Agri became accustomed to combine
harvesters and other implements imported to suit local conditions. These harvesters are
very useful to farmers as large areas could be harvested in double quick time, than using
the manual labor. b) 50-acre Cavendish banana plantation where banana is planted under
strict international conditions and the processing plant of banana exports. The packing
house of banana was built to process banana for export market as per the agreement with
one of the world‘s largest fruit exporter DOLE. This pack house has capacity of handling
and storing 20 MT. The production of Cavendish banana ranges from 800000 to 900000
kg s per annum, while planting material production counts around 175,000 plants.

Page | 119
There are about 150 acre lands in the farm under micro irrigated banana crop. Cavendish,
Kolikuttu, Ambul, Amban, Seeni & pulathisi are the main varieties cultivated in the farm.
There is a collection of Banana varieties such as ‗Kolikuttu‘, ‗Seeni‘, ‗Ambul‘, ‗Ambun‘,
‗Cavendish‘, ‗Suwandel‘, ‗Pulathisi‘, ‗Alu‘ etc. and to supply the required materials use
the Tissue Culture Laboratory.
The CIC leased the Pelwehera Government seed farm at Dambulla in 2000. At present
both Hingurakgoda and Pelwehera farms are well developed using modern technology.
The Pelwehera farm consists of Mango Germ plasm Collection, Agri Technology Park,
Agribusiness Centre, Juiceez, Planting Material Display Centre, Desert Plant Greenhouse,
Greenhouse Cultivation, Herbal garden, Commercial Vegetable garden, Fruit Garden,
Banana Mother Plant Orchard, Mango Mother Plant Orchard and the Citrus Garden.
Around 1,300 acres of the Pelwehera Farm is under paddy cultivation and it is also
focused at Agro Tourism while the Windsor Park holiday chalets take the center place of
agro tourism. It includes Mango cultivation, Vegetable Garden, Machinery Yard, Seed
Processing Unit, Banana Cultivation, Plant Nursery, Home Garden, Compost Production
unit, Livestock Production and the Agri Holiday Resorts.
The CIC Agri not only raised their farms to modern levels as model farms where they
obtained highest yields and ran them profitably and brought up their farms to the most
modern level, but also offered every possible assistance to share the successful
experiences with the farmers and any other person interested in farming. The company
provides advice on poultry farming, cattle rearing, piggery, compost fertilizer
manufacture, fresh water prawn and fish farming, etc.
3.2.2.1. Structural Distribution of Farms owned by CIC
CIC Holdings has been at the forefront of Sri Lanka‘s Agriculture Industry. Agriculture is
by far the largest industrial sector in Sri Lanka, with approximately one third of the
population employed in it. Agriculture holds a special place not only in Sri Lanka‘s
economy, but in its culture and traditions as well. CIC Holdings has taken an approach to
farming that looks not only at the bottom line, but uplifting of the rural farmers as well.
CIC‘s most significant farms, in terms of size and output, are the Hingurakgoda Farm, the
Pelwehera Farm, and the Malwanegama Thalawa Farm.
Hingurakgoda Seed Farm -Total Extent – 1,300 acres
Pelwehera Seed Farm - Total Extent – 670 acres
Thalawa Seed Farm - Total Extent – 206 acres

Page | 120
Hingurakgoda Farm
Hingurakgoda in the Polonnaruwa district has traditionally been one of the most famous
areas for paddy cultivation in Sri Lanka. CIC acquired the 1,340 acre farm in 1998 from
the government on a long-term lease agreement.
Of the 1,340 acres, as much as 750 are being used for paddy cultivation. Hingurakgoda
farm is best known for its cultivation of seed paddy, and is the largest seed paddy
production farm in Sri Lanka.
The farm‘s main source of water is the Minneriya Reservoir. The highland area of this
farm is used for the production of perennial crops as well as livestock, making it a multi-
discipline farmland.
This farm acts as a fine example of the adoption of modern agricultural technology and
increased mechanization and automation while protecting traditional farming knowledge
and conventional agricultural methods.
As mentioned above, the Hingurakgoda farm is a multi-discipline farm, and is comprised
of the following areas:
Paddy Cultivation
The 750 acres of paddy farms produces approximately 130,000 bushels of seed paddy to
the local market every year. Ten popular varieties of rice are grown in the farm. Since
acquisition by CIC, the farm‘s average yield of paddy per acre has increased from 60
bushels in 1998 to more than 130 bushels at present.
CIC employs an efficient network of out growers to produce high quality seed paddy that
supplements farm production. Using the farm as a nucleus, these out growers are given
technical knowledge and other forms of assistance. Seed paddy – produced within the
farm and by out growers – is distributed throughout the Country using an island-wide
dealer network.
Special research trials are conducted in collaboration with the Department of Agriculture
to test new hybrid varieties of rice.
Bananas
The farm has a banana plantation that covers an area of just over 50 acres. High quality
bananas are grown for the export markets using modern technology and the latest
agricultural methods. The farm uses a high-tech sprinkler system for the supply of water
and fertilizer.

Page | 121
Machinery Unit
The farm has a fully equipped machinery division that provides services to the farm and
maintains agricultural machinery such as combine harvesters and combine threshers. This
facility also functions as a testing location for new agricultural machinery.
Pelwehera Farm
CIC acquired the Pelwehera Farm in the year 2000 under the prevailing government‘s
privatization program. The farm is located 2 km from Dambulla and covers 634 acres.
Owing to the farm being in an advanced state of disuse and disrepair when acquired, a Rs.
100 million infusion was provided to improve the infrastructure and facilities within the
farm. Today, this is considered the most diversified farm in the country.
Big Onion Seed Production – established to provide quality seeds to farmers throughout
the country.
Tissue Culture Laboratory – To produce tissue culture planting material of fruits and
ornamental plants
Rice Quality Testing Laboratory – Supports the Paddy Breeding Programme and
Quality Rice Programme.
Banana Plantation – 150 acres of bananas grown using micro-irrigation techniques.
Paddy Breeding Section – Sri Lanka‘s first private sector paddy breeding program to
introduce new varieties of paddy.
Banana Packing House – This facility is used to pack bananas for the export market
with a capacity of 20 MT per day.
3.2.2.2. Research and development involvement by CIC
CIC Breeding Program
To improve quality of the paddy seeds CIC had stepped in to the good quality seed
production. In 2006 CIC had invested on paddy breeding project. In the beginning they
built green houses that had cost 12 laks. And purchased land from Pelwehera to plant the
breeding materials. Pelwehera is the first and the biggest privet sector that is available in
Sri Lanka. Other than that CIC allocated more staff members for the breeding program,
Including researchers and assistants and helpers.
Following comprehensive research and a development program carried out in its farm, the
company has developed over 10 rice types. In the beginning the breeding had been done
using local varieties. The paddy industry cannot be rely on those local varieties due to

Page | 122
few reasons such as low yield and eating quality is low. Many traditional varieties such
as Kalu Heenati, Elvee and Suwandel with attributed medicinal values have been
identified and developed with improved productivity and aimed at international markets.
All these rice types are now marketed under the ―Golden Crop‖ brand. In addition to
growing in its three farms the company acquired the services of over 3,000 farmers in the
Mahaweli System B, C & H and entrusted them with the task of multiplying the rice
varieties identified and developed by the company. The CIC developed four rice varieties
for the export market and already introduced new red rice ‗Basmathi‘ and a new colored
rice variety to the international and local markets. These two rice varieties were specially
targeted at higher income group and there is a good demand for these types of rice
varieties overseas also.
When citing on challenges faced by the company, one was the development of highlands
in these farms. There were about 2250 acres of land with more than 60 percent in the
highland. These highlands had to be developed by improving infrastructure facilities such
as irrigation, farm roads, perimeter fencing and staff housing. Many programs were
initiated in highlands to produce field crop seeds, fruits, vegetables and various types of
livestock products. These farms were able to increase the livelihood of neighboring rural
community.
In initial ages, the government had supported for the private sector rice research program.
But it had been changed over with the years with newly appointed governments. In 2012
the rice research project was expanded. More land had been purchased for the research
and more staff members had been hired for the research and field works. The capital had
been invested on these facilities was 25 to 30 Mn rupees. And the recurrent expenditure
was 10 Mn rupees. But then, when it comes to 2014 the budget for the research had been
cut down almost by half. To 5 to 6 Mn rupees. From 2014 onwards the budget remains
same each year until now.
Crop Research Station Pelwehera
Earlier days Sri Lanka had cultivated the improved crops that had been imported. After
that government invested on research programs on crop development program. Up until
2014 private sector did not involve in crop researches but CIC, joined the industry in
2014 and developed around 500 varieties up to now.
They involved in developing hybrid Capsicum, Chilies, Okra and Brijal, mainly, with the
help of DOA. For this project Minneriya and Pelwehera both used as research fields.
They took local germ plasmas through DOA and developed them as their requirements.
For this research project CIC has allocated a laboratory and experienced staff. Now they
produce 70 kg seeds per month. For the purpose of development they hired graduates.

Page | 123
For 2020 CIC invested 24 Mn rupees for crop breeding and 18 Mn rupees for only for
hybrid researches. Other than that by this section they produce breeder seeds and genetic
purification, agronomic trails had been done.
CIC being a pioneer company and as an active giant in agriculture sector in Sri Lanka as a
private entity, they own resources, in human and capital too. Agriculture being a
blooming pathway to private sector, CIC has a great potential especially in seed
production sector, than other private entities. Yet, as to their opinion the government
influence should be a stimulator to invest more in Agriculture field, as Agriculture is
earning profits, at a marginal rate.
Table 3.1: CIC budget allocation for rice and vegetable R&D
Year Budget allocation (Rs)
2014/15
2015/16
2016/17
2018/19
2019/20
8,154,946
5,615,940
5,105,400
6,763,860
5,544,660
Source: CIC Agri Bussiness
The agriculture of Sri Lanka, should be transformed to modern agriculture in real time.
Though there are so many sectors being developed under the developing agriculture, the
rate is too minor. The information system of agriculture should be reformed, with anytime
available data on agriculture production and marketing channels. Sri Lanka can initiate
the demo farms under the modernization, yet, the process should be out of political
influential (Selection of the farmers, consultations).

Page | 124
3.3. DETERMINANTS OF INVESTING IN AGRICULTURE BY PRIVATE
SECTOR
The basic trading ambition of any private sector entity can be characterized as that of
being able to sell low-cost products into high-value markets, and thereby maximize profit
margins.
Relative Involvement of private sector as a stakeholder in the national flow of
agriculture
Private sector nature in agricultural decision making at the same time the environment
for that decision making heavily is dependent on the sound of the government
interventions into collaborative sense of working, agricultural research, rural
infrastructure, and market relationships. As to discussion evidences done with the
major acting private sector entities mentioned above, ―private companies wishes to be
in the process of implementation rather than be an entity of discussions only.
Government now undergoes the administration relying on the control mode,
nevertheless this setup should be altered into development mode, and it will
encourage private entities to invest more in agriculture and developing more joint
partnerships with public sector.‖
―The role of private sector in the implementation and the monitoring level should be
marked specifically, as the consultation provided by the private sector in the
foundation, should be conceded out to the implementation process also. If the local
sector and the private sector is going to work as a team, the private sector will also
have the opportunity to work in decision making process too.‖
―A strengthen partnership between the government sector and the private sector is
essential for the stability of the agriculture sector in Sri Lanka. Yet, the practical set-
up is quite different from the theoretical perception. Still the public sector has some
suspicion on the private sector in collaborative ventures, and when developing the
linkage private sector also has a responsibility to work in compatibly. Because the co-
operate sector has a different attitude than the private sector relying on the work
ethics. This issue of perception may be a disadvantage in the long term of
development. So, when the policy formation is going to implement, there are some
clear cuts to be addressed. Though private sector is willing to provide their
contribution to the process, the government still pays a reluctant to fulfill the demand
or the necessity of the request of the private sector in regards. Private sector aims at
the profit oriented culture, therefore the private sector needs the government to fulfill
their needs too. They look for government support in conducting research and
development in particular stream and in testing the machinery for suitability in the
country.‖

Page | 125
Existing modalities for Public-Private- Producer -Partnerships for investment
Public Private Producer Partnerships can be used as a great way of promoting the
entities to stimulate investing more in agriculture, where the risk embedded with
company itself is low in the venture.
In Sri Lanka, several partnership programs have been implemented throughout the
years. Maize, exotic vegetables, fruits, dairy products have in lined with these
partnership programs where those private entities gain the opportunity to invest more.
Hayleys Agriculture, CIC Agribusiness, Plenty Foods Ltd, and Ceylon Agro
Industries, CBL are some pioneer companies engaged in those partnership programs.
Out grower programs also can be tallied under those partnership programs.
Under Out Grower (OG) farming system, implemented by Ceylon Agro Industries
for maize cultivation, OG farmers and OG firms enter into a signed agreement
where the OG firm agreed to buy-back the harvest at the right quality range at the
agreed price-range and farmers to supply their entire harvest from OG farming
operation only to the OG firm. Further, OG farmers were facilitated by a bank to
obtain credit up to 30,000.00 LKR per acre which was channeled to the OG firm
to provide on-time supply of basic inputs: hybrid seeds, crop protection
chemicals and fertilizer along with agricultural extension services throughout the
season and the insurance company for an insurance premium.
Currently also, the sister company of Hayleys ; the HJS is engaging with a buy-
back project of Gherkin in Wakarei , where Hayleys is supplying inputs such as
irrigation equipments for that particular buy- back system.
As mentioned by Hayleys, tenders are the dominant channels in supplying the
equipmnets for the government. They obtain the quota and relying on that they may
supply the requested to the Department of Agriculture, the projects implemented
under the government as NADeP.
CIC also engages with partnership programs for maize cultivation and also for dairy
industry. They supply inputs for the producers in the value chain, where they promote
a buy- back system. (NADeP)
CIC has initiated collaborative program with DOLE Company for production of
Cavendish Banana (Trials on, exchanging germ-plasm), which was taken off after five
years.
Policies and the enabling environment for investment

Page | 126
Creating a favorable policy environment is considered to be an effective way to
promote private investment in agriculture. Considerable attention has been paid to
analyze what constitutes an ‗enabling environment‘ and what are the factors that
would contribute to its creation. By and large, the provision of an enabling
environment lies with the government.
As to the key persons, in Sri Lanka, the government support for research and
development for the private sector is at the minimal level. The company itself has
faced to some difficulties when the imported machines had tested from the FMRC.
The process of certification and testing is too lengthy and time consuming. When
another party joins in the buying process, it awaits the customer more and
consequently the customer demand will be diminished. Once the FMRC has
recommended the machinery is not suitable for using, they must provide some
suggestions for modifications. Hayleys once modified a rejected machinery by FMRC
and the customer company who purchased that, utilizes the machinery very well and
they continued the purchasing process as well. So, it is better if the government and
government authorities encourage the private entities by not only evaluating the draw
backs, but also giving the instructions and suggestions for modifications too.
Policies and the enabling environment for investment should be strengthen by,
Ensuring stability and security, including the safeguarding of rights to land and
other property, contract enforcement and crime reduction.
Improving regulations and taxation, both domestically and for international
investments.
Providing infrastructure and financial market institutions; and facilitating labor
markets by fostering a skilled workforce, crafting flexible and fair labor regulation
and helping workers cope with change.
India and China, both of these countries, agri machinery is subsidized at the hand
of the farmer. This is the case in most of Asian neighbours, such as Vietnam,
Philippines etc. The subsidies range from 10% to 30%, and is done so to
encourage farming as well as to improve the productivity and the profitability of
the farmer.
Government can well afford to facilitate reduce costs of inputs by removing the
added costs on agri machineries and equipments. The first and foremost would be
to remove all taxes that are levied on the machineries and implements. The next
step would be to introduce agricultural financing, at least through the state banks,
in a manner that farmers can access them faster and with less red-tape. Combined,

Page | 127
this could bring down existing costs by around 18% to 20%, which is substantial
for a farmer.
As the private sector key interviewees mentioned, there is a huge drawback in
government on encouraging the usage and the manufacturing or importing of
agriculture machinery when comparing with other Asian countries. When
comparing with the countries like India, there influence of the government of
encouraging manufactures is stronger. When referring to the data of Ministry of
Science and Technology, it reveals that before 1962, all most all the tractors have
been imported and by 1961/62, 880 tractors were produced. In 1973, all the
imports were banned (Engines and pumps also). The imports were important until
a capacity for producing them locally was established, and then the imports were
severely restricted. Not only banning or restricting the imports, but also more
expenditure on research and development on Agricultural Mechanization
influenced local manufactures. Patent providing was another measure used in
India, for inspiring the investment in private sector and public entities on
agricultural mechanization.
Policies aligned with quarantine process in Sri Lanka is merely a constraint in
investing, as to CIC in Cavendish banana processing, quarantine restrictions were
badly affected, but with the interference of the public authorities, the company
was allowed importing, 80 test tubes of in breeds and they were quarantined for a month
and released.
Policies trends and incentives to investment The relevant policies for promoting investment are those that drive a wedge between
value added as observed and the value added that would otherwise prevail in an
undistorted opportunity costs situation with the use of border prices.
These policies include:
■ Tariffs and export taxes, trade quotas, price subsidies or taxes on outputs and
intermediate inputs, domestic price interventions, credit subsidies or rationing.
As the view to the key persons, the government implications of taxes on imported
machinery has a great influence on the investment of private sector in agriculture.
Basically tractors and harvesters are free from the VAT. But other products such as
UV polythene, they are entitled with the VAT. There is an identified trend of farmers
in the willingness of being mechanized. So, the demand for that willingness should be
amplified by the government. If there is a system to encourage farmers for being
mechanized like by providing a subsidy as countries like Bangladesh (50% subsidy

Page | 128
for rice trans-planters and rice harvesters), and Vietnam, the farmers will be more to
likely to use machinery, and ultimately the production and productivity of agriculture
will be increased, with the use of the technology.
■ High protection to non-agriculture sector and/or selected industries.
■ Exchange rate misalignment
Incentives and concessions are fuel factors supplied by the government for the private
sector who invests in agriculture field. To foster agricultural industries, a particular
number of attractive investment incentive schemes have been granted to investors, by
the BOI which is structured to function as a central facilitation point for investors
while granting very attractive incentives and various other facilities such as tax
holidays or preferential tax rates, exemptions from customs duty and foreign
exchange controls. Following chart illustrates an incentive scheme applicable for
agriculture for different project activities.
Table 3.2: Project activities eligible for incentives and type of incentive
Source: BOI, Sri Lanka
Nature of the market avenue and market segmentation
In Sri Lanka, the market size is relatively small compared to fixed cost involved in
many investment to undertake. Therefore, these entities undergo different strategies in
marketing. These companies target on identifiable group of customers who have
unique needs and preferences (niche market). Commonly the private sector entities in
Sri Lanka in Agriculture market look forward with seed production, chemical industry
Project Activity Type of Incentives
Agriculture
Food Processing
Industrial & Machine Tool
Manufacture
(eg: Agricultural tools)
Other Designated Enterprises
(eg: Rubber products)
Investments in excess of Rs. 500 mn
in specified agricultural services
Tax Rates
1-3 years : 0
4-5 years : 10%
6th year onwards
Agriculture & Food Processing : 15%
Others : 20%
Duty free imports of capital goods
Duty free imports of raw materials
(for export quantities)
State land on 30-50 yrs lease

Page | 129
and machinery. CIC Agribusiness mostly drives with seed production and agro
chemical industry, where Hayleys Agriculture deals with agricultural mechanization
specifically.

Page | 130
CHAPTER 4
CROP-SPECIFIC PARTIAL FACTOR PRODUCTIVITY, TOTAL
FACTOR PRODUCTIVITY AND DECOMPOSITION OF
AGRICULTURAL OUTPUT GROWTH
In the first section of this chapter, crop-wise partial factor productivities viz. land and
labor productivity and the Total Factor productivity (TFP) growth have been estimated
for rice, maize, chili, big onion, potato and soybean following Tornqvist- Theil index
approach of the growth accounting methodology explained in chapter 1. These crops
have been analysed within the import substitution framework that growth of these crop
sectors is expected to meet the local demand. Growth of these crop sectors have been
decomposed into their input growth and TFP growth components. Growths have been
converted to growth index parameters by taking, in most instances, 1990 as the base year.
Land productivity has been decomposed into growth of factor intensification on land and
to TFP growth. Labour productivity determinants i.e. labour use on land and land
productivity have also been calculated.
TFPG estimated by Tornqvist- Theil index approach of the Growth Accounting method
includes not only the technological progress but also the growth of unmeasured inputs
and growth of unmeasured input quality, as illustrated in the conceptual framework. Also
TFPG captures the effects of factors such as factor utilization rates, imperfect competition
in product markets and non-constant returns to scale.
TFP and partial growth parameters estimated from 1990 to 2017 for the above crops
were analyzed against the technology, institutions, markets and the policy and regulatory
frameworks, public and private sector investments and international partners‘
participation in these sectors wherever it is relevant prevailed during the said period in
order to to understand the outcome of TFP growth. Taking neighboring countries
experiences on the same development process, comparisons were made to highlight the
relevant causal factors of their growth performances. Situation in Sri Lanka was
compared with that of India, Bangladesh, Vietnam and Thailand.
In the second section of the chapter, technical efficiency and the factor productivity gap
between farmers cultivating pineapple, banana, and papaya were analyzed. Factor
productivity index calculated here has been approximated as a technical efficiency
component of TFP since the analysis has been done on cross section for the year 2019.
Technical efficiency varies among farmers due to farmers‘ level of technical knowledge
(a number of agronomic practices in crop establishment), socioeconomic status
(education, tenure, and nonfarm income) and accessibility to information and markets.
The factors affecting farmers‘ efficiency of using resources and choosing the existing
technology for increasing productivity has been estimated by developing a regression

Page | 131
model. For pineapple, stochastic frontier function was also developed. Qualitative
assessment on factors affecting productivity was performed for passion fruit crop.

Page | 132
4.1 IMPORT SUBSTITUTING DOMESTIC FOOD CROP SECTOR

Page | 133
4.1.1 Rice/Paddy
Paddy (rice), the staple food crop in Sri Lanka comprises the biggest share in the
agricultural GDP (nearly 10% of agricultural GDP). Self-sufficiency in paddy production
has been the primary goal in view of increasing food security in the country from its
historical time. Wide array of policies were implemented by the successive governments
to achieve this goal and has been of success irrespective of its cost effectiveness. Large
scale irrigation investments, subsidised fertiliser, investment on research and
development, investment on extension and education and paddy purchasing at a
guaranteed price are among the main intervention programs implemented throughout in
various degrees with huge budgetary allocations and donor assistance.
Increasing production over the last few decades brought the country near self-sufficiency
(> 90%) in rice and more than 70 % of self-sufficiency in cereal. Owing to the increased
cultivated area, especially the proportionately increasing cultivable area under irrigation
with new improved high yielding varieties and fertiliser, a continuous growth of the
paddy sector could have been achieved. The growth momentum achieved during 70‘s in
paddy sector became to a standstill during 80‘s but the growth was regained during 90‘s
on average 2.5% growth rate with fluctuations in production that Sri Lanka reached self-
sufficiency except for considerable imports only during bad weathered years (Figure 4.1).
Figure 4.1: Paddy production from 1990 to 2017
Source: Department of Census and Statistics
The investment on irrigation continued that the average irrigated area increased from 230
thousand ha during 90‘s to 293 thousand ha by 2010-2018, particularly in the dry zone
North representing major paddy producing areas. Cultivated extent under paddy increased
y = 2158.4e0.0258x R² = 0.7901
0
1000
2000
3000
4000
5000
6000
19
90
19
91
19
92
19
93
19
94
19
95
19
96
19
97
19
98
19
99
20
00
20
01
20
02
20
03
20
04
20
05
20
06
20
07
20
08
20
09
20
10
20
11
20
12
20
13
20
14
20
15
20
16
20
17
Tho
usa
nd
Mt
Paddy Production

Page | 134
after the end of civil war in the northern dry zone, mainly rain-fed areas (Figure 4.2 &
4.3). Therefore, maha cultivation increased farmers cultivating with rainfall.
Figure 4.2: Extent cultivated by different agro-ecological zone and season
Source: Department of Census and Statistics
Figure 4.3: Total Cultivated extent of paddy from 1979 to 2017 by season
Source: Department of Census and Statistics
0
100
200
300
400
1991-2000 2001-2010 2011-2019
Exte
nt
('0
00
ha)
Paddy Land Extent
Irrigated Maha DZ South IR Maha DZ Mahaweli IR Maha IZ & WZ IR Maha
DZ North IR Maha Rainfed Maha Irrigated Yala Rainfed Yala
0
100,000
200,000
300,000
400,000
500,000
600,000
700,000
800,000
900,000 Cultivated Extent, ha
Maha Season
Yala season

Page | 135
4.1.1.a Productivity
Land productivity
Average paddy yield increased from 2.5 mt/ha to 4.5 mt/ha in the last 35 years registering
nearly 1.2 per cent growth during maha season and 0.9 percent growth during yala season
(Figure 4.4).
Figure 4.4: Average yield of paddy by season from 1979 to 2016
Source: Department of Census and Statistics
Figure 4.5: Average yield of paddy by neighboring country
Source: FAO
Sri Lanka has achieved a comparable productivity growth within the region and Sri
Lankan yield was higher than the main paddy exporter in the world, Thailand. In the
beginning of 90‘s Vietnam rice yield exceeded the Sri Lankan rice yield. Due to the high
prominence Viet Nam placed on their Hybrid rice research program which began in 1983,
y = 2910.1e0.012x R² = 0.84
y = 3088.6e0.0092x R² = 0.634
0
500
1,000
1,500
2,000
2,500
3,000
3,500
4,000
4,500
5,000
19
79
19
81
19
83
19
85
19
87
19
89
19
91
19
93
19
95
19
97
19
99
20
01
20
03
20
05
20
07
20
09
20
11
20
13
20
15
Average Yield kg/ha
Maha season Yala season
0
1000
2000
3000
4000
5000
6000
7000
19
61
19
64
19
67
19
70
19
73
19
76
19
79
19
82
19
85
19
88
19
91
19
94
19
97
20
00
20
03
20
06
20
09
20
12
20
15
20
18
Yie
ld k
g/h
a
Sri Lanka India
Thailand Vietnam
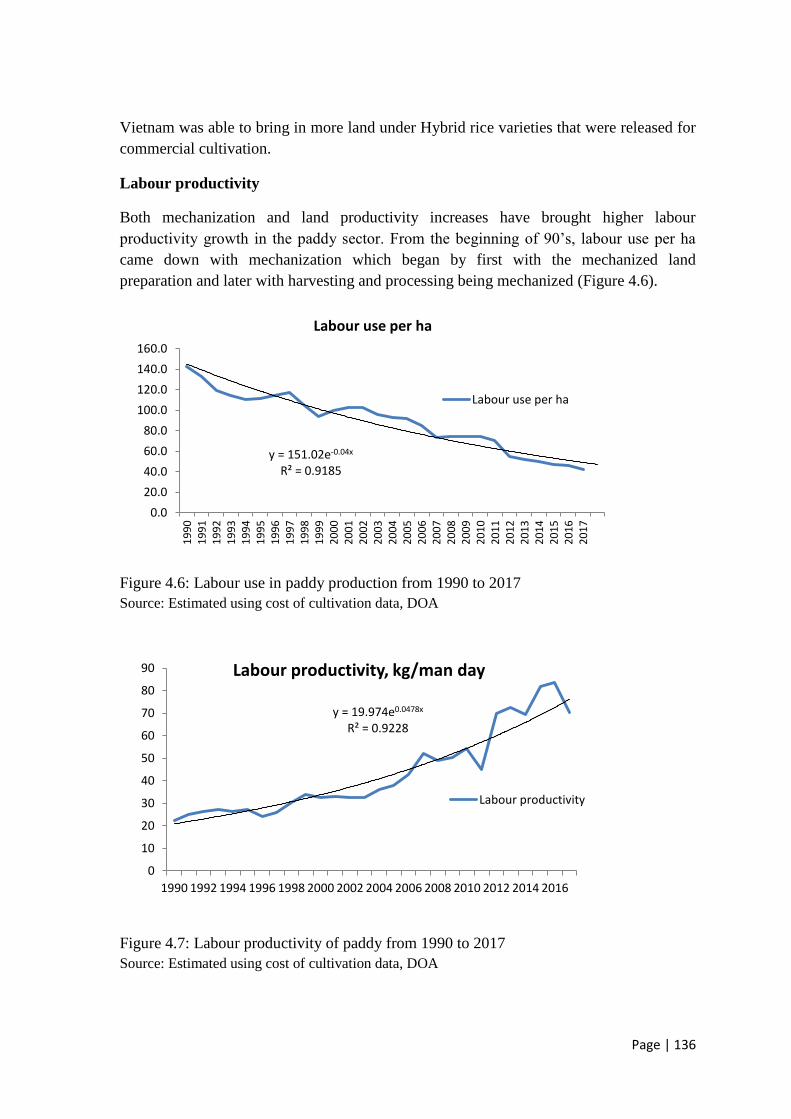
Page | 136
Vietnam was able to bring in more land under Hybrid rice varieties that were released for
commercial cultivation.
Labour productivity
Both mechanization and land productivity increases have brought higher labour
productivity growth in the paddy sector. From the beginning of 90‘s, labour use per ha
came down with mechanization which began by first with the mechanized land
preparation and later with harvesting and processing being mechanized (Figure 4.6).
Figure 4.6: Labour use in paddy production from 1990 to 2017
Source: Estimated using cost of cultivation data, DOA
Figure 4.7: Labour productivity of paddy from 1990 to 2017
Source: Estimated using cost of cultivation data, DOA
y = 151.02e-0.04x R² = 0.9185
0.0
20.0
40.0
60.0
80.0
100.0
120.0
140.0
160.0
19
90
19
91
19
92
19
93
19
94
19
95
19
96
19
97
19
98
19
99
20
00
20
01
20
02
20
03
20
04
20
05
20
06
20
07
20
08
20
09
20
10
20
11
20
12
20
13
20
14
20
15
20
16
20
17
Labour use per ha
Labour use per ha
y = 19.974e0.0478x R² = 0.9228
0
10
20
30
40
50
60
70
80
90
1990 1992 1994 1996 1998 2000 2002 2004 2006 2008 2010 2012 2014 2016
Labour productivity, kg/man day
Labour productivity

Page | 137
Early 90‘s paddy farming operation required 140 man days per ha which is now only 42
man days per ha (Figure 4.6). In the irrigated dry zone labour use is still low that
mechanized land preparation, mechanized harvesting and threshing, direct seeding and
weedicide application are the common practices that labour requirement per ha is only
13-14 man days.
Labour productivity has been increasing at a compound growth rate of 4.7 percent over
last 35 years (Figure 4.7) and in the last few years it shows about 6 percent growth.
Figure 4.8: Land and labour productivity of paddy
Source: Estimated using cost of cultivation data, DOA and Department of Census and Statistics
Total factor productivity, sources of output growth and determinant of TFP growth
Output growth achieved by factors other than inputs or the total factor productivity is
reviewed in this section comparing it with the input growth.
Figure 4.9: TPF growth index of paddy
-3%
-2%
-1%
0%
1%
2%
3%
4%
5%
6%
7%
1990 -1995 1995 - 2000 2000 - 2005 2005 - 2010 2010 - 2017Pro
du
ctiv
ity
gro
wth
p.a
.
Labour productivity
Land productivity
0
20
40
60
80
100
120
140
1990 1992 1994 1996 1998 2000 2002 2004 2006 2008 2010 2012 2014 2016
TFP Growth Index
TFP is approximated
to TFP growth index
and It is calculated by
taking year 1990 =100
and percentage TFP
growth year to year.

Page | 138
According to the TFP growth index, total factor productivity had been declining for the
period from 1990 to 1996. However after 1996 TFP shows a stable increase except bad
weathered years, 2011 flood, 2017.
Figure 4.10: TFP growth index and weather index from 1990 to 2017
Note: Weather index is calculated dividing harvested extent by sown extent of paddy
Weather is a factor that affects the Total Factor Productivity. Extremely affected years
due to bad weather were excluded in the TFP growth estimation done for different periods
to capture other factors that are determinant of TFP growth other than weather.
Decomposition analysis of the paddy output growth is given in table 4.1. The analysis
does not cover the period 1980‘s. Towards late 1990‘s new improved varieties that had
been developed by that time had been almost adopted by the paddy farmers. The main
varieties BG 94-1, BG 300, BG 350 were among them. By late 1990‘s more than 11%
paddy extent had been cultivated with BG 352 which was released in 1992. A urea biased
policy was implemented during 90‘s that Irrigation to Fertiliser ratio increased
particularly after subsidy was re-established. In 1996, the subsidy on SA was abolished
and since 1997, the subsidy was offered only for urea. It is observed from above analysis,
during 90‘s the irrigated area has increased at a rate of 7-8 % while fertilizer use has
increased at a rate of 21 % in the second half of the decade, especially urea use.
Total Factor Productivity growth had been negative during early 90‘s, depicting that other
factors other than inputs have not been conducive for productivity improvement and the
input use had been efficiently responding to increase output. This is evidenced from the
finding of Wickramasinghe et al. (1995) that they had found not only the national rice
grain yield is stagnating, but also the grain yields in research fields were gradually
declining during this period. The grain yield of rice cultivars grown with high N fertilizer
in long term N response studies had showed a declining trend during 90‘s. They had
0
20
40
60
80
100
120
140
1990 1992 1994 1996 1998 2000 2002 2004 2006 2008 2010 2012 2014 2016
TFPGIndex Weather Index

Page | 139
understood that the reduced nutrient uptake at important growth stages of the rice crop
due to reduction in soil nutrient, particularly micro nutrients supply was a major
limitation to increased rice yields.
Table 4.1: Decomposition analysis of paddy output growth
1990-95 1997-00 2000-05 2005-10 2012-17
Land Extent 4.7% 6.0% 1.1% 3.2% 2.9%
Irrigated Area expansion 7.6% 8.1% 1.3% 1.4% 1.2%
Irrigated Land =1.7 * rainfed area 5.4% 6.6% 1.2% 2.7% 2.4%
Labour -0.6% 0.0% -1.1% -1.0% -1.7%
Fertiliser 9.1% 21.6% -1.3% -3.8% -2.9%
Agro- chemicals (mainly
weedicides)
5.9% 11.0% 2.1% 15.0% 1.9%
Tractor power 10.8% 14.1% 4.9% 7.8% 7.3%
Seed 4.7% 6.0% 1.1% 3.2% 2.9%
Irrigation Ratio 2.9% 2.0% 0.2% -1.7% -1.7%
Input growth 4.1% 6.8% 0.6% 2.9% 1.9%
Output growth 2.7% 7.9% 1.8% 5.4% 3.2%
TFPG -1.4% 1.1% 1.2% 2.5% 1.3%
Share of Input growth on output
growth
87% 32% 54% 59%
Share of TFP growth on output
growth
13% 68% 46% 41%
Source: study estimates
Increasing fertiliser prices, extension education and introducing Zinc sulphate as a
micronutrient source to apply per one season for all the paddy fields in 2001 would have
made it efficient fertilizer use in paddy farming. In 1998 on wards DOA implemented the
Rice Yaya (tract) Program, a ‗technology package‘ consisting of eight mandatory
practices that was introduced to all the farmers of an entire Yaya (tract). Adoption of BG
352 and BG 358 also happened during this period. TFP growth during the period from
200-2005 was 1.2% that contributed 68% of the growth of output.

Page | 140
Figure 4.11: Varietal spread of main paddy varieties
Source: DOA
Even though the pest and diseases were problematic for rice cultivation in the early
1970‘s, with the increase in the usage of improved varieties with required genetic
resistance to many biotic stresses and improvement of farmer pest management practices,
the requirement of using more agrochemical for pest disease control is minimal. Herath
Banda et al. (1998) revealed that weed infestation was the most disastrous constraint to
bridge the yield gap between farmer‘s level and at research potential yield. The period
from 2005 to 2010, the use of weedicide became one of the main input embodied
technologies that brought yield increments. TFP growth contribution was 46 % during
this period. Adoption new varieties At 362 and BG 360 was started during this period
(Figure 4.11). Fertiliser use by farmers also brought to the level of DOA recommendation
with the new policy implemented after 2005, thereby reduce the total fertliser use in
paddy production.
Period after 2010, main varieties that had been in cultivation for more than 30 years have
been replaced with two new varieties, At 362 and Bw 367 particularly in major dry zone
paddy producing areas (Figure 4.12 &table 4.2). These varieties are very high yielding
varieties with more adaptive characters. TFP growth after 2010 can be attributed to these
varieties.
0
5
10
15
20
25
30
35
401
99
5
19
96
19
97
19
98
19
97
20
00
20
01
20
02
20
03
20
04
20
05
20
06
20
07
20
08
20
09
20
10
20
11
20
12
20
13
20
14
20
15
20
16
Ad
op
tio
n R
ate
%
Varietal Adoption
Bg 300 Bg 352 Bg 304Bg 305 Bg 358 Bg 360At 362 Bg 94-1

Page | 141
Figure 4.12: Spread of BG 94-1 and At 362 paddy varieties in Ampara East
Source: Cost of cultivation, DOA
Table 4.2: Spread of Variety Bw367
Year Area %
Reporting
2015/2016 Maha Kurunegala 18.00
Polonnaruwa 16.00
2016/2017 Maha Anhuradhapura 8.00
Polonnaruwa 14.00
Mahaweli ―H ― 10.00
2017/2018 Maha Kurunegala 6.00
Polonnaruwa 5.00
Mahaweli ―B ― 17.00
Trincomalee 19.00
Source: Cost of cultivation, DOA
Quality seed production is also contributing to TFP growth. Certified seed paddy
production is mainly done by the private seed producers such as private companies, seed
producers‘ cooperatives, farmer organizations, and individual farmers using the registered
seed paddy produced by SPMDC. Registered and certified seed paddy issues have
increased as shown in the figure below (figure 4.13). Nevertheless the formal seed paddy
production is about only 20% (which varies annually) of the national requirement, while a
considerable informal seed paddy production is occurred in the country using the
registered and certified seeds.
0
10
20
30
40
50
60
70
80
90
BG 94-1
At 362

Page | 142
Figure 4.13: Registered and certified seed paddy issues in mt
Source: SPMDC, DOA.
Land productivity, input intensification and TFP growth
The following graphical presentations illustrate the level of input intensification on land
and its effect on land productivity and the contribution of TFP on land productivity
(figure 4.14). Factor intensification on land is continuously declining in the paddy sector
after 1990. Of the main factors increasing land productivity, irrigation ratio is nearly
constant during the period of the analysis (figure 4.15). Fertilizer and agrochemicals show
a reverse relationship (figure 4.16). With regard to the machinery power and labor use, it
shows again a reverse relationship and the cumulative effect is declining factor
intensification (figure 4.17). Total factor productivity growth is contributing to the land
productivity growth amidst declining factor intensification on land. This phenomenon is
common in developed countries in their agriculture development.
Figure 4.14: Land productivity, input intensification on land and TFP growth of Paddy
Source: Study estimates
0
500
1000
1500
2000
2500
3000
3500
2006 2010 2018
Registered and certified Seed Paddy Issues in mt
-
20
40
60
80
100
120
140
19
90
19
91
19
92
19
93
19
94
19
95
19
96
19
97
19
98
19
99
20
00
20
01
20
02
20
03
20
04
20
05
20
06
20
07
20
08
20
09
20
10
20
11
20
12
20
13
20
14
20
15
20
16
20
17
Input Intensification on Land
Land Productivity
TFPG

Page | 143
Figure 4.15: Irrigation ratio in paddy cultivation
Source: Department of Census and Statistics
Figure 4.16: Per ha fertilizer and agrochemical use, base year 1990
Source: Study estimates using cost cultivation data
Figure 4.17: Per ha labour and machinery use, base year 1990
Source: Study estimates using cost cultivation data
y = 0.0267ln(x) + 0.4601 R² = 0.5451
0.00
0.20
0.40
0.60
0.80
1990 1992 1994 1996 1998 2000 2002 2004 2006 2008 2010 2012 2014 2016
Irrigation Ratio = Area cultivated under irrigation/total cultivated area
Irrigation Ratio
Log. (Irrigation Ratio)
0
50
100
150
200
1990 1992 1994 1996 1998 2000 2002 2004 2006 2008 2010 2012 2014 2016
Fertiliser
Agro Chemicals(Weedicide)
-50
0
50
100
150
200
250
1990 1992 1994 1996 1998 2000 2002 2004 2006 2008 2010 2012 2014 2016
Labour
Machinery power

Page | 144
4.1.1.b Determinants of TFP growth
National rice breeding program in Sri Lanka
The average yield of traditional rice varieties in about 1900 was about 0.65 t/ha (13
bushels/ac) and over the ensuing 100 years, rice scientists have been able to increase it
over 7 fold. In fact, there are now rice varieties with potential yields exceeding 11t/ha and
the national average yield is now approaching 5t/ha.
In about 1920 initial pure line selection method was taken place, after the phenotypic
selection method in rice breeding history. That is selection of individual plants from
population of traditional varieties for grain yield and other desirable attributes, and has
been found that only 10% of yield increment could be obtained through pure line
selection over traditional varieties in Sri Lanka (Pain, 1986). Sri Lanka has released first
Old Improved Variety in 1957 keeping a landmark as an earlier country to start hybrid
program (Pain, 1986). The first collaborative venture with International Rice Research
Institute (IRRI) taken place at the same time in 1960. In 1969 Sri Lanka and IRRI
renewed the program and included technology transfer activities. From 1960 to date the
International Rice Gene bank holds in trust 2,027 types of rice varieties from Sri Lanka.
Similarly aligned with the hybrid program; mass selection, bulk method are some of the
key breeding methods followed throughout the breeding programs. The rice researchers
soon realized that the quickest way of increasing yield was through application of
chemical fertilizer. This was by then practiced elsewhere, particularly in Europe. But in
Sri Lankan context, most indigenous varieties were susceptible to lodging and diseases,
especially the blast disease, and the susceptibility to both these conditions were
aggravated by application of nitrogen fertilizer and some resistant varieties, unfortunately,
were not responsive to fertilizer, driven the necessities for breeding new varieties. Such
varieties, namely, the H series emerged in the mid1950s with the breeding efforts that
commenced in the late 1940s. The H varieties were characterized by resistance to leaf
blast and good response to applied chemical fertilizer. However, with heavy fertilizer use
even H varieties were susceptible to lodging leading to crop losses and poor milling
quality of grain.
Developing lodging resistant varieties was become the major challenge for the rice
breeders, but fortunately, a new plant type created in Taiwan around 1960, exemplified by
Taichung (Native 1) paved the way. It had short sturdy lodging resistant stems and short,
upright, narrow leaves which could efficiently capture sunlight. The IRRI based in the
Philippines, experimenting with the new plant type developed the variety IR 8. However,
both IR 8 and Taichung Native 1 failed to perform in Sri Lanka due to several reasons.
Consequently, a major interdisciplinary rice improvement program was launched with the
objective of breeding short statured lodging resistant and fertilizer responsive varieties
which were also resistant to diseases. Bacterial leaf blight (BLB) had turned out to be a

Page | 145
major disease both here and elsewhere in Asia. A series of new improved varieties (NIVs)
were released with the requisite attributes and a yield potential. The new varieties had
adequate resistance to BLB, and by 1974 the extent under them increased to over 55% as
against the old improved varieties (OIVs, the H series) which were reduced to 24%. Over
the years, more and more NIVs began to emerge, a major one being BG 94-1, a 3.5 month
variety, which was able to replace even the existing 4 and 4.5 month varieties because of
the higher yield potential and the ability to cultivate in both Maha and Yala seasons. The
resulting conservation of water and field time was notable. The farmer acceptance of
these NIVs continued to steadily increase replacing both the OIVs and the traditional
varieties, and prompting breeders to steadily develop more and more dwarf statured
varieties with increasingly higher yields.
Although the NIVs had resistance to leaf diseases, they were found to be susceptible to
several pests such as brown plant hopper and gall midge. However, our breeders were
again able to breed varieties resistant to these pests with the introduction of resistant
genes from some Indian varieties. Interestingly, two of the new varieties that emerged, Bg
400-1 and Bg 276-5 also showed resistance to iron toxicity, enabling their introduction to
high iron soils in the Wet Zone. In fact, they replaced the low yielding traditional
varieties there from.
Until about the late 1980s the rice breeding thrust had essentially been for productivity to
achieve self-sufficiency. The breeding scope thereafter broadened also to accommodate
other attributes such as grain quality, nutritional value and consumer preference. All the
NIVs bread hitherto were, however, white except Bg34-6 which was red but with limited
yield potential. However, given the demand for red rice both from the northern and
southern regions, a new high yielding variety of red rice, At 16 was developed for
cultivation in the high potential areas. In the last two decades, NIVs exceeding 7-8t/ha
such as Bg 358, Bg 352, Bg 300 and At 362 which are now the most popular varieties
among farmers emerged.
Rice Research Development Institute in Sri Lanka which is the key responsible institute
for rice breeding mostly practiced the conventional breeding method for the rice varietal
improvement. The process used in this program at present is modified bulk method. Since
from the past Sri Lanka has released thousands of improved varieties.).
Breeding programs on obtaining the hybrid vigor is still not a perfect technology. RRDI
released the hybrid variety Bg 407-H in 2015 which has a 10 % yield increase compared
to high yielding OPVs. However hybrid seed production has limitation due to low F1
yields in seed production. This is how when China first developed their hybrid seeds
which they overcame later. FAO, in collaboration with IRRI, Japanese scientists, the
China National Hybrid Rice Research and Development Centre (CNHRRDC) and other
selected national research centres, initiated its global hybrid rice programme in 1986 to
expedite the widespread use of hybrid rice technologies outside China. Sri Lanka‘s hybrid

Page | 146
rice research programme started in the 1980s and by late 90‘s evaluation of promising
CMS lines introduced from IRRI and from other countries and the transfer of cytoplasmic
male sterility from IRRI-developed lines to Sri Lankan lines had started
(Abeysiriwardena, Abeysekera and Dhanapala, 1997). Constraints such as lack of high
performing germplasms, separate hybrid unit are some draw backs for hybrid technology
practices in Sri Lanka. When rice breeding research in Sri Lanka is compared with the
world, there is a huge gap between technological advancements in the breeding program.
Application of high concentrations of post-emergent broad-spectrum systemic herbicide,
glyphosate was prevalently used to control rice weeds in Asian countries including Sri
Lanka, which is now officially banned for paddy cultivation. Inducing herbicide
resistance (HR) in cultivated rice is a novel approach to enhance selectivity and crop
safety. Studies on induced HR in Sri Lankan rice varieties are limited and studies are
required to include HR rice in a cropping program
Adoption of Varieties
Popularity of rice varieties is complex. Spatial as well as temporal variation of popularity
of rice varieties could be seen. Bg 352, Bg 300, At 362, Bg 358, Bg 94-1, Bg 360 and Bg
358 are the most popular varieties among recommended varieties by DOA. Yield
potential and other characteristics are given in table 4.3.
Table 4.3: Yield Potential of main paddy varieties
Variety Year
released Pedigree
Recommen
ded for
Maturity
duration
(days)
Higher
yield
Recorded/
Potential
Yield (t/ha)
Bg 94-1 1975 IR 262/Ld 66 GC 105 8.5 /7
BG 300 90 6.5
Bg 350 1986 Bg 94-1///Bg 401-1/80-
3717 GC 105 8.5
Bg 352 1992 Bg 380/Bg 367-4 GC 105 7
Bg 358 1996/07 Bg 12-1 / Bg 1492 GC 106 9.5
Bg 360 1999 88-5089/Bg 379-2 WZ 105 7
At 362 2002 GC 105 10
Bw 367 2012
Source: DOA
Out of them At 362 and Bg 360 showed increasing trends of popularity while Bg 358 and
Bg 94-1 showed decreasing trends. However Bg 352, Bg 300 and Bg 358 showed stable

Page | 147
trends of popularity while Bg 300 and Bg 352 are the most popular rice varieties in Sri
Lanka.
Return to Rice breeding in Sri Lanka
Rice breeding is an unprecedented success story in the annals of research in Sri Lanka on
account of highly dedicated rice breeders and other rice scientists that has made the
country self-sufficient in rice. Return on investment for the 40-year period, 1959 to 1999
on rice breeding and varietal selection reveals that a 1% increase in research investment
increased national rice production by 0.37% (Niranjan, 2004). The benefit cost ratio and
the internal rate of return were remarkable, being 2311 and 174% respectively.
According to the results of M.D.T. Dayananda Bg 300, Bg 352 and Bg 358 have higher
adoption rate. Bg 360 has medium adaption rate and Bg 304 and Bg 305 has lower
adoption. And results revealed that, Bg 358 gives highest IRR within 20 years and it is
due to the higher attainable yield and the high adoption rate. Bg 300 is occupied 224% of
IRR it resulted because of the high adaption rate. Attainable yield also high in Bg 300 but,
it is lower than Bg 358. When comparing Bg 352 and Bg 360, Bg 352 have high adoption
rate than the Bg 360. Even though is it is Bg 360 32 resulted 99% IRR while Bg 352
resulted 95%. Bg 300 is ―keeri samba‖ and it fetch higher price than the Bg 352 (Nadu).
Because of that, Bg 360 is having high return than Bg 352. Bg 304 has lower adoption
rate. Hence, it results low returns. Bg 305 also having low adoption rate. But attainable
yield is very high. Because of that Bg 305 resulted 113% IRR.
According to the study done by E.M.G.A.Ilangarathna, NPV, BCR and IRR for
conventional breeding, RGA conventional, MAS and hybrid technologies are as follows
(Table 4.4).
Table 4.4: Return to Investment by different breeding method
Source: Ilangaratne, 2019

Page | 148
Highest NPV resulted to the hybrid technology that is Rs. 190.48 billion and the lowest
NPV is for MAS, that is Rs.18.59 billion. Compared to conventional with RGA, general
conventional method resulted into a lower NPV over time. It relies that hybrid technology
bring characteristic incremental gains over other technologies. According to the
sensitivity analysis, adoption rate, potential yield and elasticity of demand showed higher
sensitivity to the NPV and IRR.
Current rice breeding objectives in Bathalagoda Rice Research Institute
The Institute continues to play a major role in the country‘s rice sector by releasing new
high yielding rice varieties and introducing improved rice production and protection
technologies to help farmers realize the yield potentials of the area. The research and
development program at RRDI focus on increasing farm productivity from current 4.3
t/ha to 5.0 t/ha within the next 5 years while reducing cost of production and improving
grain quality of rice.
In an effort to attain a quantum jump in rice yields, breeding program has been focused to
develop varieties with a few tillers, sturdy culm and heavy panicles – a plant architecture
designated as the new-plant type. Both traditional varieties and introduced lines from
IRRI are used in the breeding program. The hybrid rice research program has been further
strengthened.
Current initiatives of IRRI
There are some current initiatives in IRRI. Under three projects, IRRI is helping Sri
Lanka develop varieties such as: Green Super Rice, which produces stable yields with
less input; Hybrid Rice which produces more yields and is climate resilient; Climate-
smart rice, which can withstand the effects of climate change. IRRI is tracking the
diffusion of rice varieties across South Asia and aims to generate widely accessible
databases on crop improvement. This will allow better understanding of the impact of
food-crop genetics research on increasing availability of food for the poor and food-
insecure in the region. The Closing Rice Yield Gaps with Reduced Environmental
Footprint (CORIGAP) Project is one of several projects by IRRI, which aims to raise the
productivity, profitability, and resilience of rice farming systems while ensuring
environmental sustainability.
New technology directions to increase land productivity, labour productivity and
sustainability
The machine transplanting method of crop establishment which was introduced under
Yaya II program launched by DOA and Korea Project on International Agriculture
(KOPIA) didn‘t drive a momentum as farmers didn‘t take up this technology widely. This
transplanting machinery was introduced to reduce weedicide usage, to promote

Page | 149
mechanical weeding and to increase the yield. According to a study done in Rajanganaya
area, varieties such as BW367, AT362, BG359 and BG370 are found to be better varieties
that can adopt machine transplanter in the dry zone. Transplanting is found to be giving
more than 10% yield increase and weed free cultivation will increase the yield by 30%.
4.1.1.c Lessons from other countries
Viet Nam Hybrid rice research program
Viet Nam Hybrid rice research began in 1983 with the objective of evaluating CMS lines,
identifying respective maintainer and restorer lines; improving F1 seed production; and
evaluating hybrid rice varieties developed in China and by IRRI. In the late 1980s, the
national hybrid rice programme was placed under the leadership of the Minister of
Agriculture and Rural Development. In addition to two FAO TCP projects, the
government has provided a budget of about US$300 000 annually. Hybrid rice varieties
such as Shanyou 63, Shanyou gui 99, Jinyou 63, Boyou 64, Trang Nong 15 were released
for commercial cultivation. The area planted to hybrid rice increased from about 11 000
ha in 1992 to about 102 000 ha in 1996. Progress was also made in F1 seed production.
Seed production increased from about 302 kg/ha in 1992 to about 1 751 kg/ha in 1996
(Quach, 2002).
By 2010, the cultivation area of hybrid rice has reached 600,000 ha, gaining an average
yield of 6.3 – 6.8 tones per ha, which offers a higher yield of 1.5 tones in comparison with
conventional rice cultivated with the same conditions. This contributes to an achievement
of annual increase in paddy rice production of 800,000 – 900,000 tons annually. Seed
production covers an area of 1,500 – 1,700 ha with an average yield of 2 tones/ha
providing a self-supporting of approx. 20% of total seed demand.
Vietnam is further improving the development of Hybrid combinations by solving the
problems in relation to science technology for the mass production of quality rice as a rice
exporting country. Expansion of private companies, joint venture and cooperation with
other countries in the region, encouragement of foreign organisations and individuals in
breeding investment & rice hybrid production are prioritized in Vietnam.

Page | 150
4.1.2 Maize
Maize is a C4 crop with a high photosynthetic rate that adaptive to various climatic
conditions and uses water efficiently. Maize is grown as a rain-fed upland crop mainly
during maha season in Sri Lanka. Its cultivation has now spread in the entire dry zone
districts; Badulla, Ampara, Moneragala, Anuradhapura, Kurunegala becoming the most
cultivated other field crop in Sri Lanka.
As the poultry industry gained its momentum with the local private sector and the
multinational companies venturing into the poultry industry, the demand for maize
substantially increased for the making of poultry feed. Imports continued to meet the
requirement that import of maize were under liberal trade regime.
Figure 4.18: Production, Imports and Demand of Maize from 1980 to 2017
Source: Department of Census and Statistics
The first hybrid maize seeds were introduced by Ceylon Agro Industries in 1998 into the
country and the company facilitated the farmers to benefit from the 1999 central bank
introduced Forward Sale Contract (FSC) program. The main intervention in this sector
for the development of maize as a commercial crop was carried out as the RDD of central
bank continued the promotion of Forward Sale Contracts (FSCs) among farmers and
buyers, for agricultural marketing in the country. Through this programs farmers were
supported by the purchasing companies with a package including high quality seeds,
fertilizer, farming advice and importantly, and a buy back guarantee for the crop. The
RDD promoted this scheme by coordinating the activities undertaken by different
stakeholders including PFIs, buyers, farmers, farmer associations and government and
non - government organizations throughout the country. Buying companies also provided
0
50,000
100,000
150,000
200,000
250,000
300,000
350,000
400,000
19
80
19
82
19
84
19
86
19
88
19
90
19
92
19
94
19
96
19
98
20
00
20
02
20
04
20
06
20
08
20
10
20
12
20
14
20
16
Mt Production Imports Demand

Page | 151
assistance through facilitating credit to farmers at low interest through banks and crop
insurance schemes.
In 2005 a cess was imposed on maize to support the local production. Maize production
increased. During 2009, import tax on maize was increased and later, importation was
restricted since March 2009 to protect local producers.
Maize is now the second important cereal in terms of cultivation extent and production.
Of local production 80-85% goes as a raw material for poultry and cattle feed industry.
Figure 4.19: Total maize extent cultivated from 1980 to 2018 Source: Department of Census and Statistics
Table 4.5: Maize extent cultivated during maha and yala season by main district
Maha Season
Ampara Anuradhapura Badulla Kurunegala Moneragala Sri Lanka
1980-90 4342 5411 4951 1039 4373 27728
1990-00 5764 7216 4805 857 4354 28508
2000-10 3940 9782 4829 768 6080 29816
2010-18 4441 19571 4573 1225 19231 53509
Yala season
Anuradhapura Badulla Sri Lanka
1980-90 160 245 1931
1990-00 144 231 1713
2000-10 493 1747 4995
2010-18 1340 4002 9127
Source: Department of Census and Statistics
0
10,000
20,000
30,000
40,000
50,000
60,000
70,000
80,000
19
80
19
82
19
84
19
86
19
88
19
90
19
92
19
94
19
96
19
98
20
00
20
02
20
04
20
06
20
08
20
10
20
12
20
14
20
16
20
18
ha
Cultivated Extent

Page | 152
4.1.2.a Productivity
Land productivity
Average maize yield increased from 1000 kg/ha to nearly 4000 kg/ha in the last 18 years
registering nearly 8 per cent growth of national average yield (Figure 4.20). Sri Lankan
maize yield is now comparable with the maize yield of countries in the region except
Bangladesh. Country benefited from international technology transfers from its first
introduction of hybrid maize variety by Ceylon Agro Industries in 1998. Bangladesh has
achieved an unprecedented growth in maize yields in this region owing to the policies
adopted by Bangladesh (Figure 4.21). A detail account of Bangladeshi‘s achievement in
maize production is given later in this section.
Figure 4.20: National average yield of Maize, 1980 to 2018 Source: Department of Census and Statistics
Figure 4.21: National Average Yield by country Source: FAO
0
500
1000
1500
2000
2500
3000
3500
4000
19
80
19
82
19
84
19
86
19
88
19
90
19
92
19
94
19
96
19
98
20
00
20
02
20
04
20
06
20
08
20
10
20
12
20
14
20
16
20
18
Average National Yield, kg/ha
0
1000
2000
3000
4000
5000
6000
7000
8000
1980-90 1990-00 2000-10 2010-18
National Average Maize Yield by Country, Kg/ha
Sri Lanka Bangladesh India Thailand Vietnam

Page | 153
Labour productivity
Labour use in maize cultivation gradually declined as with land preparation and threshing
being mechanized over the years. Labour use in different states in India for maize
cultivation is more or less similar to Sri Lanka (table 4.6).
Table 4.6: Per ha Labour use in maize farming by country and states of India
2004/05 2006/07 2014/15 2015/16
India
Andhra Pradesh 81.3 77.0 67.2 59.4
Karnataka 69.3 69.5 63.6 64.6
Rajasthan 68.0 72.9 66.7 77.3
Bangladesh 123.5
Sri Lanka 97.6 98.8 64.2 70.0
Source: Indian Ministry of Agriculture and Farmers welfare, Bangladeshi Ministry of Planning (2015),
Study estimates for Sri Lanka
Figure 4.22: Labour use in maize production from 1990 to 2018 Source: Study estimates
Bangladesh labor use is still high that labour productivity in maize farming in Sri Lanka
and Bangladesh has converged (Table 4.6 & Figure 4.23).
0
20
40
60
80
100
120
140
160
180
198
9/9
0 M
aha
199
1/9
2 M
aha
199
2/9
3 M
aha
199
3/9
4 M
aha
199
4/9
5 M
aha
199
6/9
7 M
aha
199
7/9
8 M
aha
199
8/9
9 M
aha
199
9/20
00
Mah
a
200
0/20
01
Mah
a
200
1/20
02
Mah
a
200
2/20
03
Mah
a
200
3/20
04
Mah
a
200
4/20
05
Mah
a
200
5/20
06
Mah
a
200
6/20
07
Mah
a
200
7/20
08
Mah
a
200
8/20
09
Mah
a
200
9/20
10
Mah
a
201
0/20
11
Mah
a
201
1/20
12
Mah
a
201
2/20
13
Mah
a
201
3/20
14
Mah
a
201
4/20
15
Mah
a
201
5/20
16
Mah
a
201
6/20
17
Mah
a
201
7/20
18
Mah
a
Labour Use per ha

Page | 154
Figure 4.23: Labour productivity of maize by country and state of India Source: Indian Ministry of Agriculture and Farmers welfare, Bangladeshi Ministry of Planning (2015),
Study estimates for Sri Lanka
Total factor productivity
Commercializing of maize cultivation which began as the introduction of hybrid varieties
in 1998 moving from subsistence farming to adopting improved management practices
brought a complete change in maize production in terms of extent and productivity of
maize farming in Sri Lanka.
Table 4.7: Input growth per annum by type of input in maize farming
Input growth p.a
Land
Extent
Fertiliser Labour Seed Machinery
for land
preparation
Machinery
power for
threshing
Chemicals
and other
1991-2000 -1% -1% -2%
2000-2005 2% 25% 1% 3% 45%
2005-2010 12% 12% 8% -8% 20% 17% 7%
2010-2018 3% 5% -3% 4% 4% 4% 3%
Source: Study estimates
0
10
20
30
40
50
60
70
80
90
100
2004/05 2006/07 2014/15 2015/16
Labour productivity, kg/md
Andhra Pradesh KarnatakaRajasthan BangladeshSri Lanka
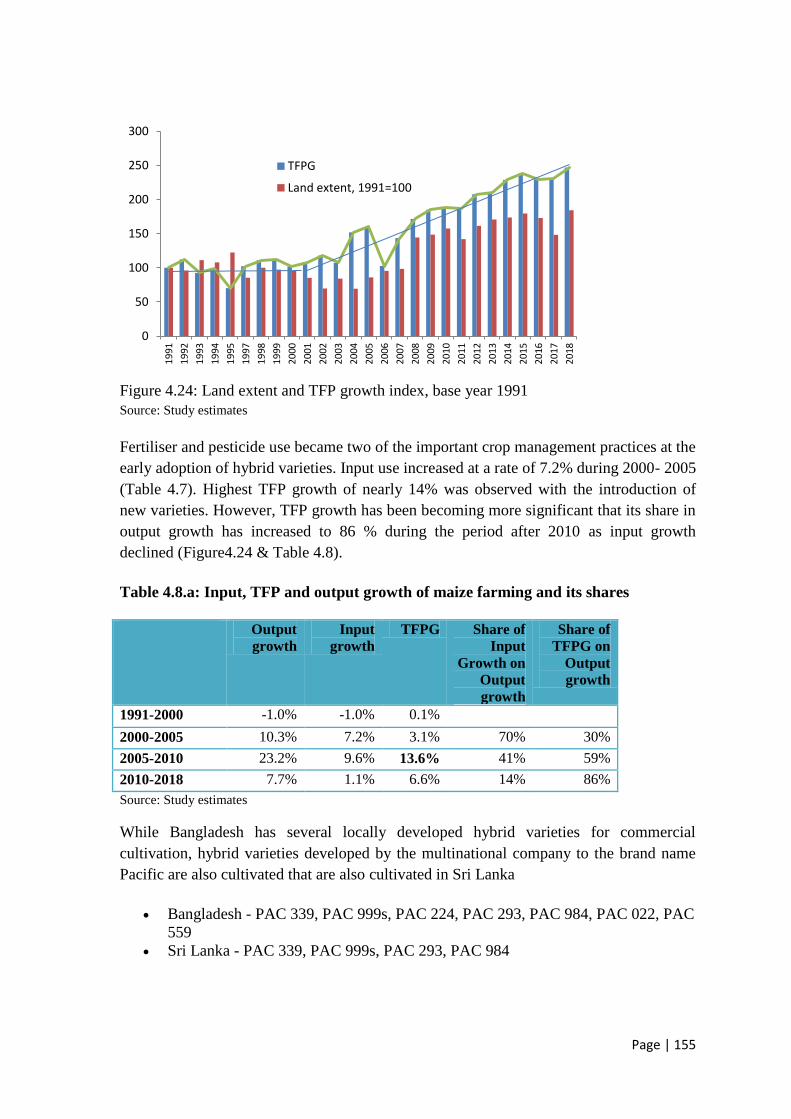
Page | 155
Figure 4.24: Land extent and TFP growth index, base year 1991
Source: Study estimates
Fertiliser and pesticide use became two of the important crop management practices at the
early adoption of hybrid varieties. Input use increased at a rate of 7.2% during 2000- 2005
(Table 4.7). Highest TFP growth of nearly 14% was observed with the introduction of
new varieties. However, TFP growth has been becoming more significant that its share in
output growth has increased to 86 % during the period after 2010 as input growth
declined (Figure4.24 & Table 4.8).
Table 4.8.a: Input, TFP and output growth of maize farming and its shares
Output
growth
Input
growth
TFPG Share of
Input
Growth on
Output
growth
Share of
TFPG on
Output
growth
1991-2000 -1.0% -1.0% 0.1%
2000-2005 10.3% 7.2% 3.1% 70% 30%
2005-2010 23.2% 9.6% 13.6% 41% 59%
2010-2018 7.7% 1.1% 6.6% 14% 86%
Source: Study estimates
While Bangladesh has several locally developed hybrid varieties for commercial
cultivation, hybrid varieties developed by the multinational company to the brand name
Pacific are also cultivated that are also cultivated in Sri Lanka
Bangladesh - PAC 339, PAC 999s, PAC 224, PAC 293, PAC 984, PAC 022, PAC
559
Sri Lanka - PAC 339, PAC 999s, PAC 293, PAC 984
0
50
100
150
200
250
300
19
91
19
92
19
93
19
94
19
95
19
97
19
98
19
99
20
00
20
01
20
02
20
03
20
04
20
05
20
06
20
07
20
08
20
09
20
10
20
11
20
12
20
13
20
14
20
15
20
16
20
17
20
18
TFPG
Land extent, 1991=100

Page | 156
In Bangladesh, 100% of maize germplasm has been introduced through multilateral
agreement with CIMMYT. Therefore, maize breeding is largely dependent on
international cooperation and assistance.
4.1.2.b Determinant of TFP growth
Contract farming and out-grower schemes in Maize Production in Sri Lanka
The introduction of hybrid maize seeds to Sri Lanka in 1998 was an excessive turn on in
the maize cultivation industry. With the poor performance of stabilization schemes,
policy-makers began to pay more interest on market-based solutions for dealing with
market uncertainty. Then, the contract farming (CF) was recognized as a mean to reduce
risks related to price and quality and as a way to reduce coordination costs within the food
supply chain. In addition, CF is considered as a risk transferring mechanism, which
enables small scale farmers to transfer market risks to global agribusiness firms.
Therefore, contract farming can possibly be considered as both risk reduction and risk
transfer strategy, with reference to agriculture sector. Contract farming and out-grower
schemes are an important component of many current public-private partnerships (PPPs)
in developing countries
A forward sales contract (FSC) is an agreement between the seller and buyer to deliver a
specified quantity of a commodity to the buyer at some time in the future for a specified
price or in accordance with a specified pricing formula. A forward contract can be either
extended to contract farming system by delivering inputs and extension service or
confined to forward contract as it is.
As an alternative to the conventional government intervention in agricultural marketing,
the Central Bank of Sri Lanka (CBSL), introduced FSCs under the ‗Govi Sahanaya’
purchasing/pledge loan scheme in 1999. The Regional Development Department (RDD)
is the apex agency to regulate these development credit schemes, under CBSL. The CBSL
had allocated Rs. 2650 million for farmers and Rs. 6500 million for buyers per year,
under the pledge loan scheme. The private companies such as Plenty Foods Ltd, KST
Company Ltd and Ceylon Agro Industries were the pioneers who joined the program.
After completion of ten year‘s direct involvement in 2009 by the CBSL, the system was
left to its own operation, without further involvement of the CBSL. Since then, FSCs
between farmers and buyers have altered to different forms and shapes and a few have
developed to CF System.
Under Out Grower (OG) farming system, implemented by Ceylon Agro Industries, OG
farmers and OG firms enter into a signed agreement where the OG firm agreed to buy-
back the harvest at the right quality range at the agreed price-range and farmers to supply
their entire harvest from OG farming operation only to the OG firm. Further, OG
farmers were facilitated by a bank to obtain credit up to 30,000.00 LKR per acre

Page | 157
which was channeled to the OG firm to provide on-time supply of basic inputs: hybrid
seeds, crop protection chemicals and fertilizer along with agricultural extension
services throughout the season and the insurance company for an insurance
premium.
Mode of operation of contractual system
As to the literature, 89% of the cultivation in 2012 (by extent) was done in Maha season
in upland, utilizing the rainfall. In these areas, contacted farmers were grouped into
seventy to eighty member clusters and a leader farmer had been appointed for each
cluster.
Improved technology of cultivation is being supplied to the farmers in the form of regular
field visits conducted by a trained field officer. All the inputs (seeds, fertilizer and agro
chemical) were distributed through leader farmers at the onset of the cultivation season.
Before the distribution of inputs, farmers had to sign the contractual agreement for the
upcoming season, which included the detail of expected quality, quantity, price and date
of the delivery. At the next step, farmers were required to pay a price advance
(approximately 75% of the value of the inputs) to obtain the necessary inputs. Farmers
were provided with on-call extension service, whenever necessary. During the harvesting,
famers were provided with tarpaulin canvas to lessen the accumulation of moisture level
during post-harvest handling. Farmers had to transport the product from their own fields
to a temporary storage center, normally established at leader famer‘s premises. At the
storage center, samples were tested for quality standards and payments were credited to
the bank accounts of individual farmers within five working days. It is revealed that, full-
time farmers who have higher proportion of agricultural income, higher agricultural land
holdings as well as agricultural experience and family labor participation were more
prominent in adopting contract farming system. Besides that, the interaction of package of
services provided by the buyers, such as input and extension had positively and
significantly affected the productivity (yield/ha) achieved by the contract farmers.
Further, contract farmers have been able to fetch a higher price than the open market
price, in most of the instances.
4.1.2.c Lessons from other countries
Convergence of Sri Lankan yield within Asia and hybrid development breeding
program
In 1950s, he Department of Agriculture, Sri Lanka, attempted to develop maize hybrids
but it did not gain grounds, because the private sector had not been developed at that time
to take over hybrid seed production as seen in many maize- growing countries such as

Page | 158
United States of America. In addition, there was no demand for such high cost seed s
from the subsistence farmers who preserved their own seed requirements after each crop.
Demonstrations organized by the private sector and the Department of Agriculture in
farmers‘ fields to introduce hybrids with improved cultivation practices paid rich
dividends, creating a new interest among farmers on hybrid maize cultivation.
Attempts to improve the yield of open-pollinated corn were mostly disappointing. While
it was possible to develop many different varieties, or to change the characteristic
appearance of a variety by visual selection for special features, little progress was made in
raising inherent yielding ability of a well- established variety. A field of open- pollinated
corn is composed of both high- and low –yielding plants. The high- yielding plants result
from favorable gene combinations; but the same favorable gene combinations are not
always reproduced in the progenies of the high yielding plants since the plants are
fertilized by pollen produced on both good and poor plants, all of which are highly
heterozygous. This research program attempted to develop hybrids of intermediate
maturity, with high yield and quality, to replace exotic hybrids of which seeds are very
costly.
In 1998, a program was initiated to meet the requirement of developing hybrids locally
by introducing inbred lines released by the International Maize and Wheat Improvement
Center (CIMMYT) in Mexico, and Thailand, to develop hybrid maize varieties locally.
Initial program was solely dependent upon exotic inbred lines in which over 160 different
hybrids were developed between them, which were evaluated for yield and other
desirable grain characters. Among the patent lines, there are six lines selected for Quality
Protein Maize (QPM), which contain high percentage of lysine and tryptophan and four
lines selected for drought resistance. In addition, there are two lines for multiple disease
resistance, four lines for developing hybrids for using as local checks and twenty- three
lines for general yield. Hybrids were developed to combine these characters into their
progenies. Simultaneously a program was launched to develop inbred lines locally after
deliberate selection of source materials, to give rise to high heterotic progenies. High
heterosis, uniformity, tolerance to stress grain yield and quality were given attention in
hybrid development. Of the 56 lines generated, first hybrids that were developed as early
generation hybrids, were evaluated during Maha 2000/2001.
The maize is given as the first priority crop under other field crops in research and
development programs at Field Crops Research and Development Institute of DoA. The
several OPVs and hybrids were developed in the country in collaboration with CIMMYT
during last 40 years. Farmers are demanding hybrid maize seeds and 95% of maize area is
under hybrid maize. The 95% of the total hybrid seed requirement is met by imported
high yielding hybrids. Hence national average productivity has increased up to 3.6 t/ha.

Page | 159
The main drawback is sustaining the productivity in maize lands due to land degradation
and other abiotic and biotic stresses.
The current maize hybrid development breeding program is set to develop and introduce
Maize hybrids having a yield potential of 8-9 t/ha under favorable ecosystems and
desirable plant characters (erect leaves and strong stem) and ear characters (compete husk
cover and grain filling up to tip). Further, development of Maize hybrids and parental
lines for moisture stressed ecosystems is carried out under the program
.
Philippines takes lead in approving / commercializing Bt maize and Glyphosate tolerant
maize

Page | 160
4.1.3 Chilli
Chilli is one of the important cash crops grown in the country. It was traditionally a
Chena crop that occupied large tracks (about 5 acre per farmer) in the dry zone Chena and
was cultivated with maha rains. Cultivation during Yala takes place with supplementary
irrigation. Part of the demand was met with imports from India. During the 1970-1977
closed economy period, chilli was promoted as import substituting crop and the imports
were restricted. Extent cultivated sharply increased (Figure 4.25). However, legal
restrictions on Chena cultivation and irrigation development in the dry zone dropped the
extent under maha cultivation from its peak recorded in 1977. Chilli continued to be a
protected crop even under the open market economic policies introduced in 1977 by
limiting the government monopoly imports only to off seasons. During 1980‘s to the
beginning of 1990‘s there was a clear shift of chillie cultivation to irrigated rice fields
particularly under Mahaweli H. Expansion of cultivation in Mahaweli H increased crop
yields and higher total production. By 80‘s farmers had adopted the variety MI 2 (variety
released by the DOA in 1973) that gave a higher yield than MI 1. Chillie production
recorded the highest in the country in 1986 & 1990 which was amounted to 106 thousand
mt. A Floor Price Scheme was also implemented by the government for dry chillie
purchases.
Figure 4.25: Cultivated extent of Chilli during Maha and Yala seasons, 1972-2017
Source: Department of Census and Statistics
Liberalization policies implemented on the import substitution crop sector after 1992
affected the dry chilli production in the country significantly. In 1992, imports were
handed over to the private sector subject to quota and licenses. In 1994 imports of chilli

Page | 161
were completely liberalized. Immediately after liberalizing, bulk quantities of dry chilli
were imported by the private sector that badly affected the farm gate price. In 1996 the
government removed the existing 35% duty on imported chilli which resulted imported
chilli from India flooded the market at a very low price. Farmers couldn‘t compete with
the price of imported dried chilli arriving from India. Subsequently the dry chilli
production drastically declined and the chilli cultivation mainly took place for green chilli
production.
Currently maha cultivation takes place in dry uplands ‗Goda hena‖ mainly in
Anuradhapura (44%), Moneragala (18%). In Kalpitiya Peninsula chilli is cultivated in
both maha and yala seasons with supplementary irrigation. Close proximity to Marketing
infrastructure at in Norochcholai Dedicated Economic is an advantage for chilli farmers
in Kalpitiya.
Total green chilli production in 2018 amounted to 60,600 mt from both seasons (Figure
4.26). Only less than half of the green chilli goes for annual dry chilli production which is
about 7,500 Mt. Therefore imports have increased sharply to meet the annual chilli
demand (Figure 4.27). In 2016, country imported 51,040 tons of chilli amounting to
92,534 thousand US Dollars (92 million US Dollars) from India. Sri Lanka is a main
export destination for Indian dry chilli exports (15- 18% of dry chilli exports of India to
Sri Lanka) and relatively lower FOB price is maintained.
Figure 4.26: Green Chilli Production during Maha and Yala seasons, 1972 -2018
Source: Department of Census and Statistics
0
10,000
20,000
30,000
40,000
50,000
60,000
70,000
19
72
19
74
19
76
19
78
19
80
19
82
19
84
19
86
19
88
19
90
19
92
19
94
19
96
19
98
20
00
20
02
20
04
20
06
20
08
20
10
20
12
20
14
20
16
20
18
Greeen Chilli Production (Mt)
Maha Season
Yala Season
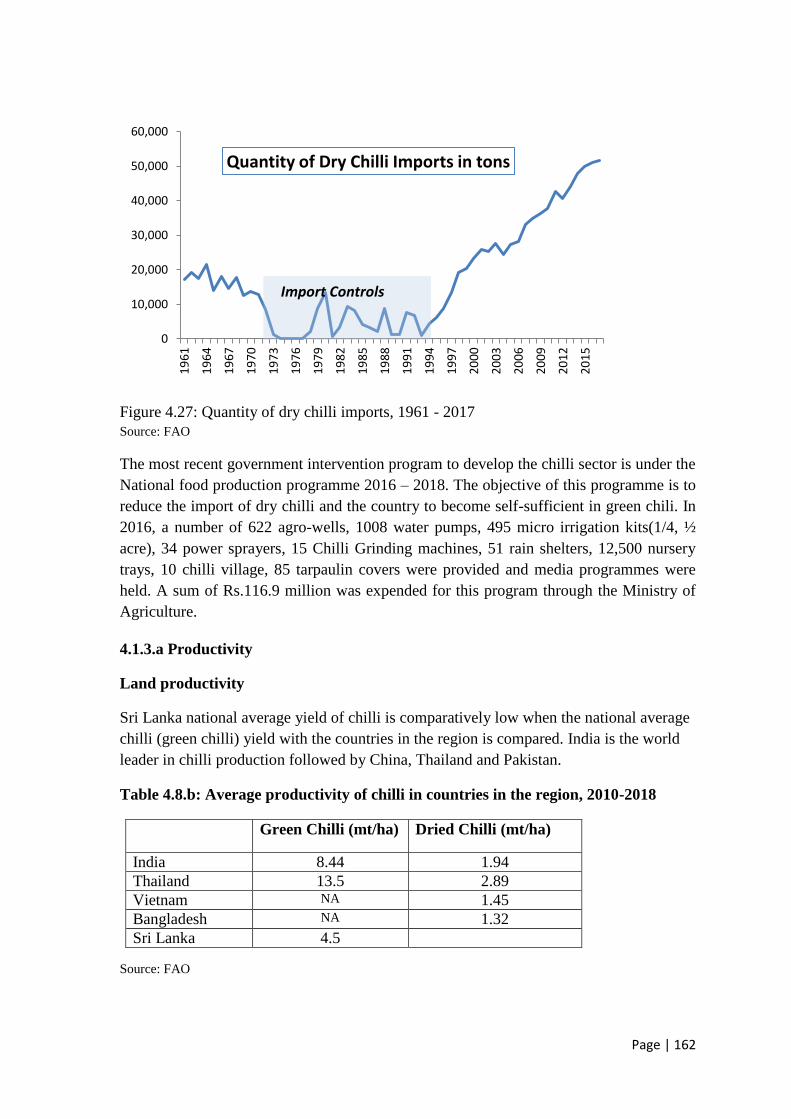
Page | 162
Figure 4.27: Quantity of dry chilli imports, 1961 - 2017
Source: FAO
The most recent government intervention program to develop the chilli sector is under the
National food production programme 2016 – 2018. The objective of this programme is to
reduce the import of dry chilli and the country to become self-sufficient in green chili. In
2016, a number of 622 agro-wells, 1008 water pumps, 495 micro irrigation kits(1/4, ½
acre), 34 power sprayers, 15 Chilli Grinding machines, 51 rain shelters, 12,500 nursery
trays, 10 chilli village, 85 tarpaulin covers were provided and media programmes were
held. A sum of Rs.116.9 million was expended for this program through the Ministry of
Agriculture.
4.1.3.a Productivity
Land productivity
Sri Lanka national average yield of chilli is comparatively low when the national average
chilli (green chilli) yield with the countries in the region is compared. India is the world
leader in chilli production followed by China, Thailand and Pakistan.
Table 4.8.b: Average productivity of chilli in countries in the region, 2010-2018
Green Chilli (mt/ha) Dried Chilli (mt/ha)
India 8.44 1.94
Thailand 13.5 2.89
Vietnam NA 1.45
Bangladesh NA 1.32
Sri Lanka 4.5
Source: FAO
0
10,000
20,000
30,000
40,000
50,000
60,000
19
61
19
64
19
67
19
70
19
73
19
76
19
79
19
82
19
85
19
88
19
91
19
94
19
97
20
00
20
03
20
06
20
09
20
12
20
15
Quantity of Dry Chilli Imports in tons
Import Controls

Page | 163
The first yield shift is observed with the introduction of chili as a cash crop from Chena
into Mahaweli areas with supplementary irrigation (figure 4.28). The variety MI 2 was
promoted during this period. The potential yield of DOA released varieties is given in
table below. Again after 2009, yield trend is observed with the introduction of series of
new high yielding varieties by DOA.
Figure 4.28: Green chilli average yield 1972 - 2018
Source: Department of Census and Statistics
Labour productivity
Since the maha cultivation takes place in dry uplands ‗Goda hena‖ mainly in
Anuradhapura and Moneragala, both labour and machinery power are not abundantly
used for land preparation and crop management (Figure 4.29). Therefore per ha labour
use in maha season is relatively less than yala season (Figure 4.30). During yala
cultivation pump irrigation is practiced that require machinery power.
0
1000
2000
3000
4000
5000
6000
7000
8000
19
72
19
74
19
76
19
78
19
80
19
82
19
84
19
86
19
88
19
90
19
92
19
94
19
96
19
98
20
00
20
02
20
04
20
06
20
08
20
10
20
12
20
14
20
16
20
18
Kg/ Ha Average Yield
Maha season
Yala SeasonCrop Diversification in
Mahaweli H

Page | 164
Figure 4.29: Percentage of chilli farmers reported mechanical ploughing
Source: Study estimates
Figure 4.30: Per ha labour use in chillie cultivation during maha and yala seasons
Source: Study estimates
Table 4.9: Per ha labour use for chilli cultivation, 2012
Country/State Mandays/ha
Maharashtra, India md/ha
Small Farms 425
medium Farms 434
Large Farms 451
Sri Lanka
Maha season 296
Yala Season 427
Source: Jagtap et al, 2012, study estimates for Sri Lanka
0.0
20.0
40.0
60.0
80.0
100.0
120.0
19
90
19
91
19
92
19
93
19
94
19
95
19
96
19
97
19
98
19
99
20
00
20
01
20
02
20
03
20
04
20
05
20
06
20
07
20
08
20
09
20
10
20
11
20
12
20
13
20
14
20
15
20
16
20
17
Percentage reported at least 1st mechanical plouhing
Maha Season
Yala season
0
100
200
300
400
500
600
1990 1992 1994 1996 1998 2000 2002 2004 2006 2008 2010 2012 2014 2016 2018
Labour Use mandays per ha
Maha Season
Yala Season

Page | 165
Per ha labour use for chilli cultivation in some states in India is similar to Sri Lanka
(Table 4.9). However, Indian labour productivity is higher than that of Sri Lanka as chilli
land productivity in India is higher than Sri Lanka.
Figure 4.31: Labour productivity of green chilli by season
Source: Study estimates
Total factor productivity
TFPG index constructed for maha chilli cultivated is given in the figure below (Figure
4.32) for the 1990-2017 period. Growth of TFP is observed throughout the period with a
sharp increase after 2010/11.
Figure 4.32: TFP growth Index for chilli farming, base year 1990.
Source: Study estimates
0
5
10
15
20
25
30
35
40
19
90
19
91
19
92
19
93
19
94
19
95
19
96
19
97
19
98
19
99
20
00
20
01
20
02
20
03
20
04
20
05
20
06
20
07
20
08
20
09
20
10
20
11
20
12
20
13
20
14
20
15
20
16
20
17
20
18
kg produced per man day
Maha season
Yala Season
0
50
100
150
200
250
19
89/9
0…
19
91/9
2…
19
92/9
3…
19
93/9
4…
19
94/9
5…
19
95/9
6…
19
96/9
7…
19
97/9
8…
19
98/9
9…
19
99/0
0…
20
00/0
1…
20
01/0
2…
20
02/0
3…
20
03/0
4…
20
04/0
5…
20
05/0
6…
20
06/0
7…
20
07/0
8…
20
08/0
9…
20
09/1
0…
20
10/1
1…
20
11/1
2…
20
12/1
3…
20
13/1
4…
20
14/1
5…
20
15/1
6…
20
16/1
7…
20
17/1
8…
TFPG Index

Page | 166
Highest TFP growth is observed during the period from 2010 to 2015 (Table 4.10), when
new improved high yielding varieties started to release from the FCRDI of DOA. The
years 2016 & 2017 were badly hit due to drought.
Table 4.10: Decomposition of output growth of chillie*
Land expansion
growth
Land productivity
growth
Land intensification
growth
TFPG
1990-1995 4.9% 0.3% -3.8% 4.1%
1995-2000 -6.2% 1.1% 0.8% 0.3%
2000-2005 -4.7% 1.7% -1.5% 3.2%
2005-2010 -3.4% 0.9% -0.1% 1.0%
2010-2015 0.2% 11.3% -1.3% 12.6%
2015-2018 0.2% -7.4% 1.1% -8.5%
*Output growth = Land expansion growth +Land productivity growth
Land productivity growth = Land Intensification growth +TFP growth
Source: Study estimates
The outputs of varietal development program, combined quality seed production program
of DOA and private sector (CIC) and the expansion of cultivation in Kalpitiya belt with
supplementary irrigation are main factors can be explained for the TFP growth over the
period based on few factors.
4.1.3.b Determinant of TFP growth
Varietal development program of Chilli
Locally developed MI 1 and MI 11 were the main varieties grown in 80‘s. Most MI 1
grown areas were replaced with MI 11 variety by latter part of 80‘s (Figure 4.33). In
order to face the dry chilli stiff competition from India under liberalized regime, and to
increase the efficiency and productivity of chilli production, local breeding programs
were undertaken. From mid 90‘s there were chilli hybrid seed imports in very small
quantities in the market when the seed imports were liberalized in 1990.
Although there were seed imports, MI 2 and KA 2 were widely adopted varieties by
dryland farmers. MI 2 and KA 2 varieties have similar yields, but KA 2 is more adapted
to biotic and abiotic stresses (Figure 3.34). No specific hybrid import had the adaptability
to the local conditions to create a substantial demand. Under the varietal development
programs of the DOA few open pollinated varieties were released to increase the farm
yields. KA-2 was released in 1991 that has the same potential yield as MI 2 under low
management practices and occasional water stress. It shows well managed cultivation

Page | 167
with assured water can reach the potential yield as in the Mahaweli H area during crop
diversification.
Figure 4.33: Adoption of MI 1 and MI11 chilli varieties in 1980‘s
Source: DOA
Figure 4.34: Adoption of MI 11 and KA 2 chilli varieties after 2005
Source: DOA

Page | 168
Table 4.11: Farmers Adoption of main chilli varieties by location
MI
2
KA
2
MI
1
Dil
Hit
Hee
n
mir
is
Ga
lkir
iya
ga
ma
MIC
H
Oth
er
*
2005 yala Kalawewa 62 38
2005/2006 Maha Anuradhapura 32 8 8
52
2006 yala Mahaweli " H " 86 4 10
2006/2007 Maha Anuradhapura 68 32
2007 yala Mahaweli " H " 82 12 6
2007/2008 Maha Anuradhapura 28 19 16
37
2008 yala Mahaweli " H " 82 12
2008/2009 Maha Anuradhapura 4 72 4
20
2009/2010 Maha Anuradhapura 24 50
26
2010/2011 Maha Anuradhapura 10 34
4
52
2011/2012 Maha Anuradhapura 14 46
40
2012/2013 Maha Anuradhapura 8 66
26
2013/2014 Maha Anuradhapura 10 90
2014/2015 Maha Anuradhapura 17 77
6
2015/2016 Maha Anuradhapura 13 37
30 10
10
2016/2017 Maha Anuradhapura 14 48
22
16
2017/2018 Maha Anuradhapura 17 20 7 37 7 7 5
Other varieties represents traditional and imported hybrids
Source: DOA
The varieties MI Green, Galkiriyagama Selection, MI waraniya 1, MICH 3, MIPC 1 were
developed mainly for green chilli production after 2009 (Table 4.11) with a potential
yield of 10-15 t/ha. First local chilli hybrid, MICH HY 1 developed by the Department of
Agriculture was released in year 2015 with the green chilli yield potential of 32t/ha.
Yet, MI 2 and KA-2 are the widely adopted varieties by farmers. The new varieties are on
the adoption. According to a HARTI survey in 2012, only 2% farmers in sample location
in Anuradhapura knew about the variety Galkiriyagama Selection and none of the farmer
had known about MI green variety. These two varieties were released in 2009. According
to the DOA, high incidences of pest and diseases, particularly leaf curl complex (LCC),
moisture stress, use of inferior quality seeds, poor crop management and high input costs
have hindered realizing potential yield of chilli. The ban on agrochemical monocrotophos
in 1995 is also considered to have negatively affected in controlling particularly leaf curl
complex (LCC). Monocrotophos is still being used in India. Reduced tank water retention
capacity due to siltation of tank beds of many small tanks in the dry zone has caused less
water for maintenance of cultivation.
National average green chilli yields have been able to increase to 7.6 mt/ha during maha
and 6.6 mt/ha during yala.

Page | 169
Table 4.12.a: Chilli Varieties Released
1962 MI – 1 Myliddy X Tuticorin) 1000 - 2000 kg ha-1 of dry
chillies
1973 MI - 2
Selection from MI – 1
With supplementary irrigation, the average yield in yala
is about 2500 - 3000 kg ha-1 and in maha about 1500 -
2000 kg ha-1 dry chillies
1991 KA - 2
MI - 2 X PC – 1
The average dry chilli yield of KA - 2 under
supplementary irrigation is about 2500 - 3000 kg ha-1 in
the Yala season and about 1500 - 2000 kg ha-1 in the
Maha season.
1996 Arunalu (BL - 39) MI - 2 X Santaka 1996
Yala season under irrigation is about 2500 - 3500 kg ha-
1 and in the Maha season under Rainfed conditions is
about 1500 - 2000 kg ha-1.
2002 MI-HOT
(BL39 x IR) x KA-2 2002
With supplementary irrigation, the average yield in Yala
is about 2500-3500 kg ha-1 and in Maha about 2000 kg/
ha.
2009 MI Green
(MI 2 x IR) (MI 2 x 142A)
2009
Pods are having dark green shiny surface with high level
of pungency. Under irrigated condition potential yield of
this variety is 12-15t/ha as green chilli.
2009 Galkiriyagama
selection
Selection from locally grown landrace in Anuradhapura
district during 1990s
2011 MICH-03 and
Waraniya-01
2015 MI Chilli Hybrid 1 MICH HY 1 (1st Local chilli Hybrid)
(Galkiriyagama inbred line x MI Waraniya 1 inbred
line)
32 t/ha, Moderate Resistant to Chilli Leaf Curl Complex
2017 MICH HY 2
Source: DOA
In 2015 the 1st local chilli hybrid, MICH HY 1 was developed by the Department of
Agriculture in their chilli hybridization program that started in 2009 (Table 4.12.a). This
hybrid variety is highly suitable for green chilli with the potential yield of 32 t/ha of green
chilli. MICH HY 1 performs well in all the major chilli growing areas within the country
during both Yala and Maha seasons. This variety is Moderate Resistant to Chilli Leaf
Curl Complex, the major problem in chilli cultivation within the country. Local hybrid
varieties exhibit superior characters than most hybrid imports. Therefore this technology
breakthrough can shift chilli production frontier with supported intervention. Particularly,
seed production program needs to be streamlined for quality seed production.

Page | 170
Seed Production
Currently 25 % of the seed requirement is the target of the formal seed supply program as
most varieties are OPVs. This is a combined effort of DOA and private sector,
particularly CIC. When demand for hybrid varieties go up, 100% hybrid seed requirement
must be produced and seed production program needs to be streamlined for quality seed
production. Already there are private sector investments in chilli hybrid seed production
and state banks have disbursed loans for chilli seed production in poly tunnels. In order to
absorb these seed farmers into formal seed supply system, regulatory guidelines are
required to maintain the quality of chilli seed production through the seed act.
Seed and planting material Development Centre of DOA produces 7000 - 9000 Kg of
local chilli seeds annually. These seed are produced by farmers selected from seed and
planting material Development Centre. Those have been established as chilli seed
villages. Among those villages, Kahalla chilli village make more contribution to the chilli
seed production.
Current Interventions by the Ministry of Agriculture as development programs
Input intensification and TFP growth promoting interventions are carried out as
development programs that are targeted to different food crop sector achievements
through the ministry. Introducing new technology, financial support, providing machinery
and other equipment and infrastructure development are common components of these
interventions. Credit is an important input for adoption of technology and optimum use of
inputs. A great majority of food crop growing commercial farmers depended on credit to
finance their production activities. According to a study done by HARTI, 90 percent of
farmers who cultivated chilli had obtained credit.
In 2016, Ministry of Agriculture implemented a program to provide a number of 622
agro-wells, 1008 water pumps, 495 micro irrigation kits(1/4, ½ acre), 34 power sprayers,
15 Chilli Grinding machines, 51 rain shelters, 12,500 nursery trays, 10 chilli village, 85
tarpaulin covers and a sum of Rs.116.90 million was expended under the Ministry of
Agriculture for the purpose. With a view to steering new farmers towards chilli
cultivation, there is a program to pay Rs 10,000 per hectare under 50% government
contribution for ploughing the lands of farmers, provide them with with chilli seed at 50%
concessionary rate, conduct demonstrations to control chilli leaf curl complex and make
aware officers and farmers. In addition 583,000 polythene bags for 50% farmer
contribution were supplied to home gardens with a view to disseminating chilli
cultivation.
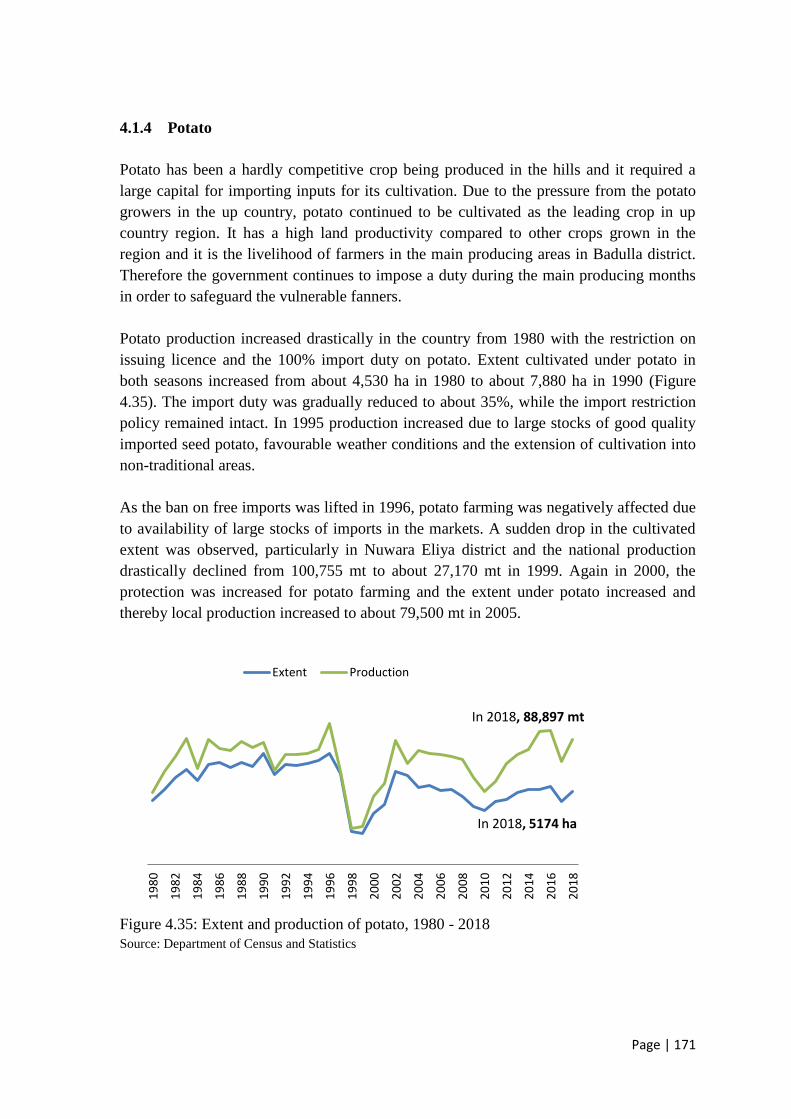
Page | 171
4.1.4 Potato
Potato has been a hardly competitive crop being produced in the hills and it required a
large capital for importing inputs for its cultivation. Due to the pressure from the potato
growers in the up country, potato continued to be cultivated as the leading crop in up
country region. It has a high land productivity compared to other crops grown in the
region and it is the livelihood of farmers in the main producing areas in Badulla district.
Therefore the government continues to impose a duty during the main producing months
in order to safeguard the vulnerable fanners.
Potato production increased drastically in the country from 1980 with the restriction on
issuing licence and the 100% import duty on potato. Extent cultivated under potato in
both seasons increased from about 4,530 ha in 1980 to about 7,880 ha in 1990 (Figure
4.35). The import duty was gradually reduced to about 35%, while the import restriction
policy remained intact. In 1995 production increased due to large stocks of good quality
imported seed potato, favourable weather conditions and the extension of cultivation into
non-traditional areas.
As the ban on free imports was lifted in 1996, potato farming was negatively affected due
to availability of large stocks of imports in the markets. A sudden drop in the cultivated
extent was observed, particularly in Nuwara Eliya district and the national production
drastically declined from 100,755 mt to about 27,170 mt in 1999. Again in 2000, the
protection was increased for potato farming and the extent under potato increased and
thereby local production increased to about 79,500 mt in 2005.
Figure 4.35: Extent and production of potato, 1980 - 2018
Source: Department of Census and Statistics
19
80
19
82
19
84
19
86
19
88
19
90
19
92
19
94
19
96
19
98
20
00
20
02
20
04
20
06
20
08
20
10
20
12
20
14
20
16
20
18
Extent Production
In 2018, 5174 ha
In 2018, 88,897 mt

Page | 172
Potato cultivation takes place in two major seasons; maha and yala in Nuwara Eliya and
Badulla districts and in Jaffna district during maha. Potato farming is one of the principle
livelihoods of farming communities in Badulla district. In the district, on average 3,840
ha are cultivated with potato in rice fields during yala season (Kumburu Kannaya) as well
as in uplands during maha season (Kandu Kannaaya). In Nuwara Eliya district, maha
cultivation mainly takes place from January to March and yala cultivation from June to
September. Accordingly, the main production from Nuwara Eliya district reaches the
market from April to June (maha harvest) and from October to December (yala harvest).
In Badulla district, two main peak producing seasons are found between February to April
(maha harvest) and from October to November (yala harvest). Potato extent cultivated in
Badulla, Nuwaraeliya and other districts during maha and yala seasons is given below
(Figure 4.36).
Figure 4.36: Potato extent in major cultivating districts during maha and yala seasons
Source: Department of Census and Statistics
Potato is one of the crops that require inputs intensively for its cultivation. More than 95
percent of commercial potato farmers depended on credit to finance their production
activities. For the main input, seed potato, farmers mainly depended on private sector
seed imports for its cultivation. Inferior quality and the disease susceptibility of the seeds
available in the market and the high cost of imported seeds were significantly making the
farming not economical and viable. Seed potato represents more than 50% of the capital
cost of potato farming owing to the scarcity of healthy seed potatoes at a reasonable price.
Farmers are largely dependent on credit from financial institutions. Government rapid
multiplication program using tissue culture technology which began in 1997 for
producing pre basic seeds made a considerable impact on the seed potato supply and
potato production in the recent years.
0
500
1000
1500
2000
2500
3000
3500
4000
4500
5000
1990 1992 1994 1996 1998 2000 2002 2004 2006 2008 2010 2012 2014 2016 2018
ha Badulla maha season Nuwaraeliya- maha season
Other maha season Badulla - yala season
Nuwaraeliya - yala season

Page | 173
4.1.4.a Productivity
Land productivity
Figure 4.37: Average potato yield in Sri Lanka and neighbouring countries
Source: FAO
In the early adoption of the exotic varieties, increasing use of inputs resulted in potato
yield increase from 5 mt/ha to 14 mt /ha. Then the yield was stagnating from mid-80‘s to
the end of 90‘s until the local micro-propagated local seed production began. Sri Lankan
yields are having yield gap of 5mt/ha within the region.
Labour productivity
The determinants of labour productivity, i.e. per ha labour use and the land productivity
of potato farming in Sri Lanka are not comparable with Indian potato farming. Sri Lankan
potato farmers use more than twice the labour use in India and the land productivity of
potato farming is low in Sri Lanka (Table 4.12.b, Figure 4.37, Figure 4.38 & Figure 4.39).
Table 4.12.b: Per ha labour use in potato farming in Sri Lanka and India by state
Labour Use (mandays/ha)
2004/05 2015/16
India
Bihar 157.6 89.9
Himachal Pradesh 101.5 68.7
Uttar Pradesh 129.8 82.6
West Bengal 178.2 154.7
Sri Lanka 302.2 274.7
0
5,000
10,000
15,000
20,000
25,000 Potato Yield, kg/ha BangladeshIndiaSri LankaThailand

Page | 174
Figure 4.38: Labour use in potato farming Source: Study estimates
Figure 4.39: Labour productivity of potato farming Sri Lanka and Indian States Source: Indian Ministry of Agriculture and Farmers welfare, study estimates for Sri Lanka
Mechanization in potato framing is on the adoption mainly in land preparation (Figure
4.40). In order to increase the labour productivity of potato farming, mechanization is
considered as viable strategy. Mechanization towards preparation of beds to the ridge and
furrow system with 2 wheel tractor propelled implements are being designed by
Seethaeliya scientists.
Plans are also underway to introduce drip irrigation system better technology than
sprinkler irrigation for water management. A cable system to transport produce from farm
field to the collector point is also being planned.
0
100
200
300
400
500
600
1991 1993 1995 1997 1999 2001 2003 2005 2007 2009 2011 2013 2015 2017
Labour use, md/ha
0
50
100
150
200
250
2004/05 2015/16
Labour Productivity, kg/md
Bihar Himachal Pradesh
Uttar Pradesh West Bengal
Sri Lanka

Page | 175
Figure 4.40: Machinery use for land preparation and irrigation in potato farming
Source: Study estimates
Total factor productivity
After the removal of licensing on imports in 1996 potato became relatively less attractive
and this policy shock continued until, the protection was increased for potato farming
again in 2000. TFP drops sharply during this period (1996 to 1998) (Figure 4.41). TFP
shows an increase after 2000 with the protection policy and with the local seed production
program increasing the local seed supply over potato seed imports. A review of local seed
production program is given below. From 2005 to 2017 TFP was growing at 1.3% per
annum (Table 4.12).
Figure 4.41: Potato land extent, 1998 as the base year and TFP growth index, 1991 as the
base year Source: Study estimates
0%
10%
20%
30%
40%
50%
60%
70%
80%
90%
100%
1990 1992 1994 1996 1998 2000 2002 2004 2006 2008 2010 2012 2014 2016
Machinery use for Land preparation ofthe cultivated extentMachinery use for Irrigation of thecultivated extent
0
50
100
150
200
250
19
91
19
92
19
93
19
94
19
95
19
96
19
97
19
98
19
99
20
00
20
01
20
02
20
03
20
04
20
05
20
06
20
07
20
08
20
09
20
10
20
11
20
12
20
13
20
14
20
15
20
16
20
17
TFP Index
Land Extent 1998=100

Page | 176
Table 4.12.c: Output growth, input growth by type of input and TFP growth
2005 -2017
Growth p.a.
Input growth p.a.
Land Extent -0.10
Fertiliser -2.89
Labour -1.29
Seed -0.08
Machinery power – land preparation 8.37
Machinery power -Irrigation 3.06
Chemicals and other - Pesticides 5.65
Total Input growth -0.005
output growth 1.338
TFPG 1.342
Source: Study estimates
While farmers reducing fertilizer for cultivation at a rate of 2.89 p.a., agrochemicals use
to control pest and disease are increasing at a rate of 5.65 % p.a. (Table 4.12.c)
Input Intensification and TFP
Land productivity is mainly attributed to the TFP growth that is evidenced since 2003
which is growing at 1.3 % p.a.
Figure 4.42.a: Land productivity growth, TFP growth and factor intensification on land
Source: Study estimates
0
50
100
150
200
19
90
19
91
19
92
19
93
19
94
19
95
19
96
19
97
19
98
19
99
20
00
20
01
20
02
20
03
20
04
20
05
20
06
20
07
20
08
20
09
20
10
20
11
20
12
20
13
20
14
20
15
20
16
20
17
Land Productivity Growth, TFPG and Factor Intensification on Land
Land productivity growth TFPG Factor intensification on land

Page | 177
Figure 4.42.b: Per ha input use by type of input
4.1.4.b Determinants of TFP
Need of a consistence policy on potato sector
Government policy towards this sector varied significantly over the years due to number
of reasons including government fiscal policy and pressure from different groups. Though
government liberalized the potato industry from late 70‘s government imposed a high
duty or restricted on issuing license for edible potato imports in certain years. Conversely,
in some years, government relaxed the duty and a more liberalized market was
maintained to increase the welfare of the consumers. Accordingly local production
drastically changed hampering a stable policy on potato. Therefore tariff and non-tariff
measurements are the main policy instruments of the government which determines the
potato production in the country. Production decisions, management of the crop and
importantly seed production program are affected by the trade policy on edible potato.
Variety development program and quality seed potato production in Sri Lanka
Main varieties grown in Sri Lanka are primarily imported varieties. In the initial variety
development programs, few varieties were developed from lines received from
International Potato Centre such as Sita, Krushi. However farmer‘s adoption of these
varieties was very low. Although the department has recommended few varieties Granola,
Hillstar, Desiree, Sante, raja, Kondor, Isna, farmer‘s adoption is mostly the variety
Granola. Hillstar is a high yielding local variety suitable to local climate that can be a
competitive variety with many imported varieties. However, Granola and Desiree were
the two main imported seed varieties cultivated by more than 60% of the potato farmers
0.0
500.0
1000.0
1500.0
2000.0
2500.0
3000.0
3500.0
4000.0
4500.0
1990 1992 1994 1996 1998 2000 2002 2004 2006 2008 2010 2012 2014 2016
Fertiliser (kg/ha)
Chemicals and other (US dollars/ha)
Seed (kg/ha)

Page | 178
in 2005. By now Granola has become the mostly cultivated variety and it is the variety
being used for seed production by the department in its mini- tuber production program.
Few recent introductions such Red La Soda and Sassy are recommended by DOA and are
being cultivated in Jaffna area.
According to the current variety development program, new exotic varieties which are
imported by private sector are tested for their adaptability.
Until the liberalization of seed potato industry, the formal seed supply to the potato
farmers was fulfilled through imported seed potatoes multiplied in the DOA seed farms.
Seed potato imports were liberalized in 1989 and the dominant role played by the
government seed farms became less important. Seed imported by the private sector
entered into the market in large quantities and farmers started to mainly dependent on
seed potato imported from Europe for cultivation. Currently seed potatoes are imported
under zero import duty. Majority of the seed requirement was met through informal seed
system comprising exchange among neighbors, friends, relatives, and villages and non-
availability of quality planting material in adequate quantities and at affordable prices was
the major bottleneck in potato cultivation.
The widespread adoption of tissue culture – or micro-propagation - as a means of
multiplying disease-free plants that can then be used to produce healthy seed tubers for
farmers was a major innovation for the potato industry in developed countries in the
1970s. Although this technology delivers healthy seed tubers, micro-propagation of
plantlets was costly, requiring sophisticated technology and well-trained staff which was
a constraint for many developing countries. Nevertheless, several countries adopted less
expensive ways of propagating seeds with tissue culture technology and by now they
have been able to produce good quality seeds at a low price.
In 1997, Seethaeliya agriculture research station of DOA started the government rapid
multiplication program using tissue culture technology and it started to make an impact
on the seed potato supply. In vitro plants that are produced in research labs are being
cultivated in hydroponic and aeroponic systems under protected tunnels for the
production of minitubers. Pre basic seeds/minitubers (GO) produced are used in
multiplication programme in five seed potato farms in N‘Eliya Districts. Excess seed
materials of the above are issued to seed growers in the area specially in Badulla district.
Currently research divisions (Seethaeliya & Bandarawela), government seed farms
(Seetheliya, Mipilimana, Piduruthalagala, Udaradalla, Kandapola, Bopaththalawa) and
private sector contract growers together supply seed potato requirement under this
program. Under this program, 4th
to 5th
generation seeds are marketed by the DOA farms
as certified seeds for commercial cultivation. Although current mini-tuber production can
meet the demand of the local cultivation, involuntary imports are done during rainy
season.

Page | 179
Table 4.13: Seed potato production and imports, 1985 - 2018
Year
Production
(Mt) in
Government
Farms
Go
seed issues
to Contract
growers
Imports
(Mt) Remarks
1985 1830
2450
1986 2606
1966 Government imports
1987 2481
1970 1988 2692
1350
1989 2091
3500
Seed potato imports were liberalized in 1989
1990 329
150
1991 420
1300
1992 899
1526
1993 215
565
1994 330
8025
Zero import duty on seed potatoes imports were announced
1995 --
14187
1996 --
5200
1997 --
1122
1998 --
1707
1999 NA
1764
2000 NA
2795
2001 NA
6725
2002 NA
7029
2003 NA
5031
2004 NA
3724
2005 NA
5718
2006 228
2245
G1 & G2 and C1,C2 &C3 seeds are issued for commercial cultivation by government Farms
2007
1782
2008
140,500 (No) 1208
2009 218
1010
2010 201
1015
2011 289
1097
2012 388
1926
2013 515
2218
2014 324
1817
2015 714
2485
2016 345
2840
2017 699 1, 113,055 1611
2018 784 974,870
Source: DOA, Department of Customs, ITC trademap

Page | 180
With the commencement of new potato production program, G1 seed potato is produced
and supplied to farmers for self-seed production. Seed potato production by government
farms, G0 seed issues to contract growers and seed imports from 1985 to 2018 are given
in table 4.13.
Strengthening of formal potato seed production system by integrating micro-propagation
is a sound technological option (Wickramasinghe, 2012). The success of the adoption of
this technology is largely attributed to the efforts of the research stations, DOA and the
provincial extension services and also the interventions such as IFAD for diffusion of this
technology to farmers through Farmer Field Schools (FFS).
4.1.4.c Lessons learned from the region
Variety development program and seed Potato production program in India
In India, Potato breeding program was initiated, in 1935 in Potato Breeding Station,
Shimla. Regular breeding program was started in 1949, with the establishment of Central
Potato Research Institute (CPRI), at Patna. Headquarters of CPRI was later on shifted to
Shimla, in 1956, in order to facilitate hybridization, and maintenance of seed health. The
major breakthrough of potato development program, came in 1963 with the development
of ―Seed Plot Technique‖, which made it possible to raise, evaluate, select and multiply
breeding material under disease free materials in plains. This led to the development of a
system, wherein crossing was attempted in the hills and raising of seedling, evaluation
and maintenance of segregating population was done in the plains. All varieties released
by the CPRI carry the prefix KUFRI as a memento, to the place of hybridization. Later in
1971, All India Coordinated Research Project on Potato (AICRP-Potato) was initiated
with its headquarters at CPRI. The mandate of AICRP (Potato) is to coordinate and
monitor multi location trials with improved potato hybrids; agronomic practices related to
crop production vis-à-vis identification of remunerative potato-based cropping systems;
plant protection measures and post- harvest technologies, all aimed at increasing
production, productivity and utilization of potato in the country.
The breeding methods of potato in India can array as;
Introduction
Clonal Selection
Hybridization and Selection
Backcross method
Heterosis
Biotechnology

Page | 181
Till date, 50 potato varieties have been produced and released by CPRI for cultivation
under diverse agro-climatic conditions of the country. Out of these 50 varieties, 24
varieties are under cultivation today.
CPRI has developed ‗Seed Plot Technique‘ in 1970s to carry out disease-free seed
production in the sub-tropical Indian plains under low aphid period. This technique, aided
by biotechnological approaches for virus elimination, has sustained the National Potato
Seed Production programme. An alternate technology for crop production through
botanical seed called ‗True Potato Seed‘ (TPS) has been developed by the CPRI, which is
suitable for regions where quality seed tubers cannot be produced. The TPS technology
offers low cost on seed, case in storage and transportation, and lower incidence of
diseases and insect-pests. Three TPS hybrids namely, TPS C-3, HPS I/13 and 92 PT-27
have been recommended for commercial cultivation. Tissue culture technology has been
widely used for production of disease free quality planting material.
Two interspecific potato somatic hybrids viz., Solanum tuberosum dihaploid C-13 (+) S.
etuberosum, and C-13 (+) S. pinnatisectum resistant to Potato Virus Y and late blight
have been developed. Four new hybrid varieties of potatoes, developed by the central
potato research institute, have been recommended for release as commercial varieties. It
is intended that, the new varieties -- ms/92-2015, hybrid jw-160, hybrid ht/92-621 and
hybrid sm/87-185 -- would boost potato production in the entire country and offer wide
choice to various regions to adopt the suitable variety for export and processing.
CPRI Shimla, has developed transgenic using crylab and asmotion gene for resistance
against potato tuber moth and late blight disease. CPRI, in collaboration with JNU, New
Delhi developed 8 Indian varieties using AMAL gene for increase total protein content.
Transgenic potatoes have been developed for late blight resistance, reduction of cold
induced sweetening, high protein content, Potato Tuber Moth, virus resistance (Potato
Virus Y, Potato Apical Leaf Curl Virus) and altered plant architecture. Two indigenous
genes and gene constructs have been cloned. Scientists at the National Institute for Plant
Genome Research (NIPGR) in New Delhi are planning to seek regulatory approval for
commercial cultivation of a high protein potato that they have developed through genetic
modification. Nick named 'protato' the protein packed genetically modified (GM) potato
contains 60 per cent more protein than a wild-type potato and has increased levels of
several amino acids.
Variety development program and seed potato production program in Bangladesh
Potato production in Bangladesh also expanded in remarkable fashion: from 343,000 t in
1961 to 7.9 million t in 2010. Area harvested jumped from 56,000 to 435,000 ha during
the same period. Various factors outlined above in the case of India also apply to

Page | 182
Bangladesh. In addition, one key element catalyzing the potato s expansion in Bangladesh
was the successful introduction of shorter duration, high–yielding rice varieties.
Tuber crops research came as breakthrough in Bangladesh in 1960 by releasing
―Eigenheimer‖ of potato variety through introduction. With a view to diversify the
research activities on potato, the Potato Research Centre was established in 1977 and later
on, it named as Tuber Crops Research Centre (TCRC) in 1988. Introduction and selection
of exotic potato varieties has been the major means of variety selection since its
inception. In this process, established varieties are imported from different countries and
evaluated for 4 to 5 generation under Bangladesh condition. On the other hand, some
research programme is done under the programme of germplasm evaluation and selection
where, most of the cases, germplasm are imported from other countries Hybridization has
been started since 1999 at TCRC. Within the limitations, the TCRC, BARI has already
released 5 varieties. Under this process, 6 to 8 generation of evaluation is required for
release of a variety following hybridization.
For recent TCRC, BARI has released total about 58 varieties. Out of 58 varieties released
by TCRC, BARI, 46 from exotic varieties and 5 from germplasm received from
International Potato Center (CIP) and 5 varieties released from hybridized materials
developed by TCRC.
The new era has been started in TCRC by giving 5 potato varieties: BARI Alu-35, BARI
Alu-36, BARI Alu-37, BARI Alu-40, and BARI Alu-41 from their own hybridization
programme. These varieties are much more acclimatized with the own environment and
performed more than 40 t/ha tubers yield that is very important to increase national
average yield and even though it‘s taste to eat like as that of local variety. Bangladesh
Agriculture Research Institute (BARI) has also developed late blight resistant RB potato
using its own cultivars in 2006 in collaboration with Wisconsin University and
Indonesian University which are currently under greenhouse and field trial. While, BARI
Alu-46 is being a late blight disease resistance variety, farmers need not to use fungicide
during the growing period of potato. It is assumed that annually Tk. 430million foreign
currencies will be saved. It will reduce use of fungicide and eventually lessen
environmental pollution.
Scientists from BARI's Tuber Crops Research Center (TCRC) developed the transgenic
lines by crossing the leading Bangladeshi varieties (Diamant, Cardinal, Multa, Granula,
Local) with transgenic variety Katahdin at Wisconsin University and Indonesian and
tested them in greenhouse and multi-location field trial.

Page | 183
Status of collection and conservation:
TCRC, BARI has collected about 400 exotic potato varieties, 300 TPS progenies and
2500 potato germplasm. The exotic varieties and germplasm are generally collected from
the Netherlands, France, Germany, India, UK, USA, Philippines, Taiwan, Indonesia,
Canada and CIP, Peru. So far, TCRC are maintaining more than thousand germplasm and
about 40 varieties. All the exotic varieties and hybrid clones are being multiplied at
BSPC, BARI, Debigonj and conserve there as well. At present TCRC, BARI is
maintaining most of the released varieties. Most of them are being maintained under field
as well as laboratory conditions as in vitro plantlets or micro tubers and some are also
maintained as true seeds in the laboratory.
Tissue culture/In vitro seed potato supply
Horticulture Improvement Center under Bangladesh Agriculture Development
Corporation (BADC) has taken step against the existing crisis of breeder potato-seed.
They are expecting that it could be solved easily through successful expansion of tissue
culture technology at the grassroots. BADC thinks there has been a bright prospect of
enhancing the production of breeder seed through best uses of the innovated technology
and the farmers have a vital role to make the prospect into realistic. Accordingly, BADC
has undertaken a programme for producing 25,000 metric tons of seed-potato through
applying tissue culture technology by 2012 in the country. To make the effort a complete
success, two more tissue culture laboratories would be set up soon as mentioned by
BADC officials.
While private sector such as The Bengal Seeds Company Limited has undertaken a
program for producing 948 metric tons of different category seed potato through applying
tissue culture technology during the current season and the plants are growing well. Apart
from NGO like Bengal Seed Company, BRAC is also producing tissue culture plating
materials of potato in Bangladesh.
Mini-tuber seed potato supply
There is a great potential of mini-tuber seed supply and multiplication in Bangladesh,
whether from tissue culture or hydroponically produced pre-basic materials and or
imported mini-tuber multiplication by contact growers or at farmer level through guided
seed plot technique supported by Dept. of Agriculture Extension, Bangladesh. This
approach could be also visible by private companies who have already established
production of pre-basic seed potato and contact grower channel. Tuber Crop Research
Center, Bangladesh Agriculture Development Corporation and Seed Certification Agency
(SCA) of Bangladesh could play pioneer role to establish mini-tuber seed supply chain.
Certified seeds of ‗A‘ class and downgraded seed of ‗C‘ class might be cheaply available
during growing season if mini-tuber multiplication system become establish in

Page | 184
Bangladesh at farmer level supported by DAE. Thus, a simplified schematic diagram is
shown below for mini-tuber supply chain of formal sector.
Meristem Culture Technique
The viruses and other diseases of potato can be eliminated by using meristem culture
technique; around 20 biotech labs in the universities, research institutes, government and
private organization in Bangladesh using meristem culture technique to produce virus free
seed potato. The meristem culture-derived plantlets from the biotech labs are cultured
sequentially to produce the breeder seed, foundation seed and certified seeds.
Future Programs
"Feed the Future Biotechnology Potato Partnership" is newly launched project where
intended to develop the sector of potato production using the high technology. As a result
of this project, Bangladesh is willing to introduce '3R-gene potato', a genetically modified
organism (GMO) or biotech potato variety, which would save 25-28 per cent production
cost as the BT variety is late-blight disease resistant, a fungal disease. To this end, a
Memorandum of Understanding (MoU) was signed between Bangladesh Agricultural
Research Council (BARC) and Michigan State University on November 3, this year to.
Bangladesh Agriculture Research Institute (BARI) is the implementing agency of the
research partnership project.

Page | 185
4.1.5 Soybean
Soybean, Glycine max (L.) Merr., a food legumes rich in protein has a good potential to
promote as a commercial crop in Sri Lanka. It is grown to process as a vegetable protein
in various forms and as an animal feed supplementary. It can be processed in to a wide
range of food products for human consumption, such as textured vegetable protein (TVP),
soy curd (tofu), soy ice cream, soy source, soy milk and soy oil. Soybean is used in as a
raw material in production of poultry feed. Soybean can be cultivated both in the Dry and
Intermediate zones of Sri Lanka and in general soybean requires relatively less amount of
water for cultivation than many other upland crops such as maize, chili and onion.
Therefore, soybean can be cultivated with minimum supplementary irrigation. Currently,
cultivation is limited to Anuradhapura district and System H of the Mahaweli Irrigation
scheme.
Cultivation of soybean is a relatively new to Sri Lanka, although it is reported soybean
has been growing in some localities in upcountry from ancient times. From late 50‘s FAO
and WHO promoted Soybean as a non-animal based food supplementary to meet the
nutritional needs at low cost in Asia. In 1967, soybean varietal trial and agronomic trials
were started on a limited scale in the dry zone areas of the country at the Agricultural
Research Station at Mahailluppallama. One of the important mandates of FAO started
Freedom from Hunger Campaign (FHC) was the introduction of cultivation of soybean
in Sri Lanka.
In 1975, UNDP–FAO International Soybean Project (INTSOY) provided funding to the
Soybean Development Program in Sri Lanka which was started to expedite the
possibilities of utilizing soybean for food as well as for feed purpose. Until 1981‘s, the
program was executed by the FAO in collaboration with INTSOY headquartered at the
University of Illinois, USA. The objective of the INTSOY program was to improve
human nutrition around the world through the expanded use of soybeans both as human
and animal feed. This program was expected to address a wide range of issues related to
the cultivation of soybean and its uses. This included the introduction of small – medium
scale processing units for extraction of soybean oil as a viable alternative by solvent
extraction method, promotion and developing new markets for soy foods and integration
of soybeans into traditional diets and food recipes of Sri Lankans. In 1979, a fully
equipped pilot scale processing plant for carrying out product development research and
human resource development was established at Central Agricultural Research Institute at
Gannoruwa with the assistance from UNDP, UNICEF and CARE (Shurtleff and Ayoyagi,
2004).
Soybean cultivation in early years mainly was on up lands during maha season and
limited cultivation in yala season with supplementary irrigation. During the INTSOY
project period, the cultivated extent of soybean increased and 5185 ha had been cultivated
in 1984. The govemment introduced a Floor Price Scheme in 1979 to protect the local

Page | 186
famers under which the Paddy Marketing Board (PMB) got involved in purchasing soya
bean from the local farmers. According to studies, this scheme was not effective as a
salvage price. For example, for a long period between 1982/83 maha and 1995 yala the
floor price remained constant, while the production cost was increasing, leading to a
decline in the net profit. The declining profit discouraged the local farmers to invest on
soya bean. Due to the absence of a proper marketing system and importation of soy based
products including defatted soy flour, soy oil and soy sauce at relatively lower prices,
cultivation dropped gradually and it decreased to about 694 ha in 2000 (Figure 4.43).
The demand for soybean in the open market is very limited and therefore, majority of
farmers cultivate this crop by signing a forward sales agreement with the soybean product
manufacturing industries. After the year 2000, due to the expansion of the soy based
product manufacturing industries, the cultivated extent gradually increased. Yala season
cultivation under supplementary irrigated conditions in paddy fields expanded and
cultivated extent increased to about 8316 ha in 2017.
Figure 4.43: Cultivated extent of Soybean during maha and yala season Source: Department of Census and Statistics
Total supply to the soy food and feed production has increased from early 2000 with the
private sector coming to the processing industry (Figure 4.44). Of the total requirement,
imports constitute 30 % in 2016 & 2017. The local production goes mainly for production
of soy based food products while entire imports go to animal feed production.
0
1000
2000
3000
4000
5000
6000
7000
8000 Extent Cultivated, ha
Yala Season
Maha Season

Page | 187
Figure 4.44.a: Total Soybean supply by means of production and imports
Source: Department of Census and Statistics, Department of Custom
In 2017, the total production of soybean was 14,363 mt and country imported 3,176 mt of
soybean from USA.
Figure 4.44.b: Production and Import quantity of Soybean Source: Department of Census and Statistics, Department of Custom
Using Low Cost Extrusion cooker Thriposha production program began with the
assistance of the CARE Canada in 1976. The flour in Thriposha made from locally grown
soybean in whole and mixed to a ratio of Maize 70 to Soy 30. Soybean usage was 1566
tonnes per year, purchased from local sellers and Paddy Marketing Board at the start of
the program. From 2010, Sri Lanka Thriposha Ltd., a fully government owned Company
belonging to the Ministry of Health undertakes Thriposha production program. In 2012,
around 3310 mt was used for Thriposha production.
0
5000
10000
15000
20000Tonnes
Total Soybean Supply
0
2000
4000
6000
8000
10000
12000
14000
16000
18000
20000
Production (tonnes)
Import Quantity (tonnes)

Page | 188
Companies who process soybean to produce Soy based food and animal feeds plays an
important role in increasing production and productivity of soybean having their buyback
programs and supporting farmers with quality inputs. These companies have their
contract farmers who supply good quality seeds for which DOA provides training for
farmers. Oil extraction plant was installed recently to extract oil and to produce oilcake
as by product for animal feed. In 2018, 219,917 tons of oilcake was imported to the
animal feed industry mainly from India and USA.
As a cheap source of protein and as an animal feed, there is a good potential to promote
soybean as a commercial crop in Sri Lanka. Soybean can be easily cultivated under
rainfed condition in uplands during the maha and in yala seasons, under supplementary
irrigation in the paddy fields compared with the other legumes. Relatively low labour
requirement for management and the possibility for mechanization due to synchronized
maturity can increase labour productivity from soybean farming.
4.1.5.a Productivity
Land productivity
Average soybean yield fluctuates around 1.5 per ha. This is comparable to the average
soybean yield of India, Thailand and Vietnam (Table 4.14). Nevertheless India cultivates
2000 times the extent of Sri Lanka and India is the 5th largest producer of soybean in the
world. When the Indian soybean farming is considered, soybean was a new crop in India
and its commercial cultivation was started only during 1968-70, the same years, soybean
was introduced to Sri Lanka. It is commercially cultivated for production of oil (75-80%)
and de-oiled cake (DOC) or soymeal as a byproduct. Less than 25% soybean is used for
the production of soy based food products. The extent under Soybean in India is 11
million ha.
Table 4.14: Average yield of soybean of Sri Lanka and India
Average Yield(Kg/ha)
Sri Lanka India
1970 to 1980 1097.5 847.8
1980 to 1990 909.9 749.8
1990 to 2000 933.3 988.3
2000 to 2010 1525.1 1035.9
2010 to date 1479.6 1093.6
Source: Department of Census and Statistics

Page | 189
Soybean yield shows a clear shift after 2002 (Figure 4.45) when private sector assured
marketing of farmers produce. During this period average soybean yield was increased by
more than 9% per annum. Both maha and yala yields have more or less converged with
the reduced maha cultivation and increased yala cultivation.
Figure 4.45: Soybean yield during maha and yala season
Source: Department of Census and Statistics
Labour productivity
The labour productivity index calculated from 1992 Yala season onwards shows that
during the last 25 years, index has increased by 100% partly attributed to the
mechanization and the land productivity increases in the crop sector (Figure 4.46 &
Figure 4.47). Soybean requires less labour for management compared to many other field
crops and mechanization can be done easily due to synchronized maturity. The average
labour use per ha in 1992 was 150 man days and it dropped to 100 man days by dropping
the labour use by 50 %. Mechanization in tillage and threshing grew fast that ploughing
and threshing were 100% mechanized by 2000. Land productivity shift in early 2000
contributes to the other 50% increase in labour productivity (Figure 4.47).
However compared to labour productivity of soybean cultivation in India, labour
productivity of Sri Lanka is low (Figure 4.48). Still Sri Lankan farmers use more labour
for management of the crop. On average Indian farmer uses 25 to 60 man days per ha for
soybean cultivation while Sri Lankan farmers use more than 100 man days per ha (Table
4.15). This labour requirement is mainly for preparation of beds & ridges, seeding,
weeding, water management and harvesting are higher. After 2010, weedicide
application for manual weeding is reported.
0
0.5
1
1.5
2
2.5
3 Soybean Yield, Mt/ha
Maha Season
Yala Season
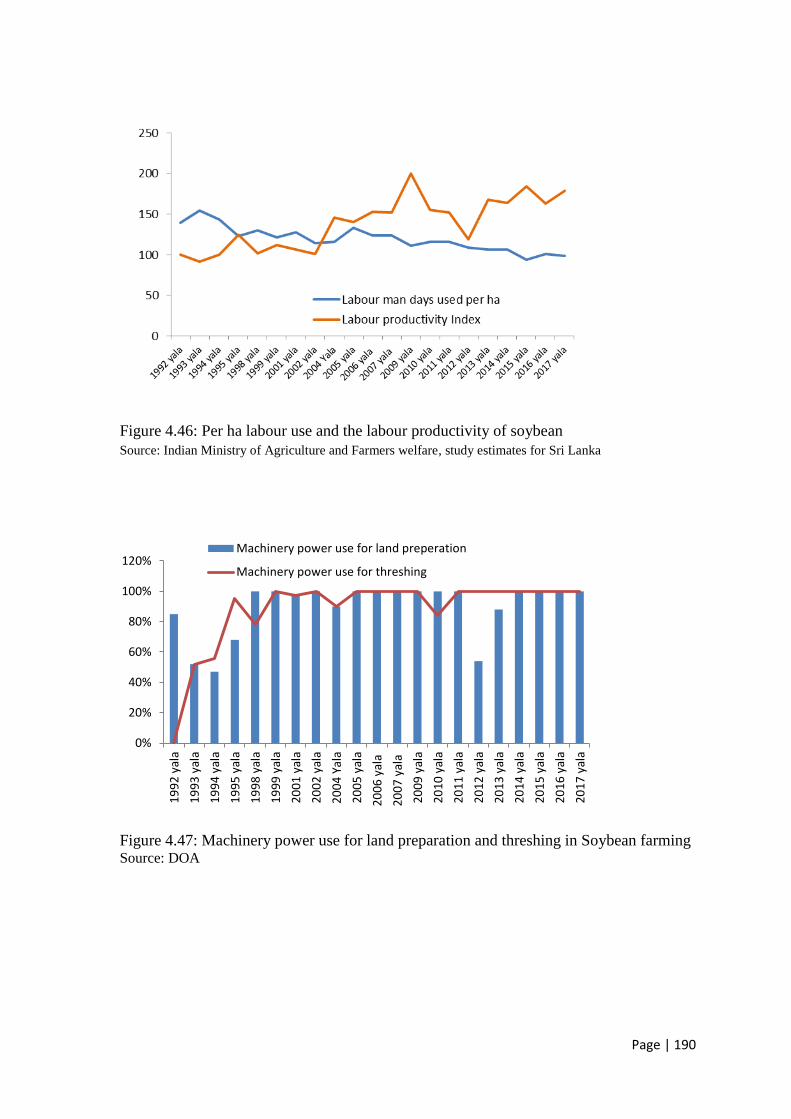
Page | 190
Figure 4.46: Per ha labour use and the labour productivity of soybean
Source: Indian Ministry of Agriculture and Farmers welfare, study estimates for Sri Lanka
Figure 4.47: Machinery power use for land preparation and threshing in Soybean farming Source: DOA
0%
20%
40%
60%
80%
100%
120%
19
92
yal
a
19
93
yal
a
19
94
yal
a
19
95
yal
a
19
98
yal
a
19
99
yal
a
20
01
yal
a
20
02
yal
a
20
04
Yal
a
20
05
yal
a
20
06
yal
a
20
07
yal
a
20
09
yal
a
20
10
yal
a
20
11
yal
a
20
12
yal
a
20
13
yal
a
20
14
yal
a
20
15
yal
a
20
16
yal
a
20
17
yal
a
Machinery power use for land preperation
Machinery power use for threshing

Page | 191
Figure 4.48: Labour Productivity of soybean Kg/man day
Table 4.15: Per ha labour use in soybean farming in Sri Lanka and India
Labour mandays use per ha
2004-05 2012-13 2015-16
India Chhattisgarh 21.8 23.5 44.6
Madhya Pradesh 43.7 34.4 31.3
Maharashtra 60.9 57.7 54.8
Rajasthan 45.6 38.9 42.3
2004 Yala 2013 Yala 2016 Yala
Sri Lanka 116.0 108.0 101.3
Source: Indian Ministry of Agriculture and Farmers welfare, study estimates for Sri Lanka
Total factor productivity
TFP index constructed for soybean for the 1992-2017 period is given in the figure below
(Figure 4.49). When 2012 the extreme weather year (2012 drought) is not accounted,
three different periods can be found based on average TFP values as prior to 2004, 2004-
2010 and 2010 onwards.
0
10
20
30
40
50
60
2004-05 2012-13
Labour Productivity
Chhattisgarh Madhya PradeshMaharashtra RajasthanSri Lanka

Page | 192
Figure 4.49: Land extent and TFP growth index, 1992 yala = 100 Source: study estimates
Input Intensification and TFP
Below discusses the land productivity gains achieved through factor intensification on
land and TFP. Over the period of this analysis there is no significant increase in total
factor intensification on land (Figure 4.50 & figure 4.51)). However the disaggregated
analysis shows agrochemical use has increased with the private sector investments in this
sector from early 2000. Pre weedicide application, plant protection chemicals application
and nitrogen fixing bacteria inoculation are some of the management practices
encouraged by private sector. These inputs have component of capital embodied
technology and disembodied technology that increases the TFP. Use of good quality
seeds for planting is also contributory factor for increased TFP with the private sector
coming into venturing in soybean production.
0
50
100
150
200
250
300
350
19
92
yal
a
19
93
yal
a
19
94
yal
a
19
95
yal
a
19
98
yal
a
19
99
yal
a
20
01
yal
a
20
02
yal
a
20
04
Yal
a
20
05
yal
a
20
06
yal
a
20
07
yal
a
20
09
yal
a
20
10
yal
a
20
11
yal
a
20
12
yal
a
20
13
yal
a
20
14
yal
a
20
15
yal
a
20
16
yal
a
20
17
yal
a
Land extent, 1992 Yala =100
TFPG Index

Page | 193
Figure 4.50: Land productivity, factor intensification on land and TFP growth index, base
year 1992 Source: Study estimates
Figure 4.51: Growth of Land productivity, factor intensification on land and TFP
Source: Study estimates
Due to the scattered cultivation and comparatively small extents are cultivated, the impact
of biotic constraints to soybean production is relatively small in Sri Lanka. Diseases in
soybean are rarely observed. Although no severe outbreaks of pests or diseases have been
recorded in soybean, some pests are becoming destructive that pesticide use has risen
since early 2000 as the cultivated extents started to increase.
0
20
40
60
80
100
120
140
160
180
200
19
92
19
93
19
94
19
95
19
98
19
99
20
01
20
02
20
04
20
05
20
06
20
07
20
08
20
10
20
11
20
12
20
13
20
14
20
15
20
16
20
17
Land ProductivityFactor Intensification on landTFPG Index

Page | 194
Pesticide application is on the increase. Pest infestations due to climate change and the
cultivation of PB 1 for almost 40 years is a problem. At the stage of pod maturating ―bean
fly damage‖ is observed. Bad management practices such as farmers applying glyphosate
to dry up the leaves at harvesting are reported.
4.1.5.b TFP determinant factors
TFP change in these two periods can be explained based on few factors.
1. Entering the private sector in soy processing industry and their investment in
contract farming
2. Cultivation expansion in Mahaweli H where water stress is less (Figure 4.52 &
figure 4.53).
3. An assured market for soybean to the soybean farmers
4. Extension support of DOA for quality seed production
Due to the fact that there is no demand for soybean in the open market, most of the
growers are willing to cultivate this crop only when a contract grower system is available.
In most of these contract agreements, the marketing company supply seeds and other
inputs while the grower agrees to sell the produce at a fixed price.
Non-availability of quality seeds is another hindrance for the profitable cultivation of
soybean due to loss of germinability within the short period of time. The main reason for
loss of viability within short period of time is high oil content of soybean seed. Therefore,
seeds cannot be stored for a long period. The most adaptable variety, Pb 01 loses its
viability within 3-4 months after harvesting. The unsteady market also affected on low
availability of quality seeds.
Private sector ventured into soy processing industry made investments to develop good
quality seeds.
Plenty food private limited
It is a pioneer company in cereal food production in Sri Lanka started its operation in
1996. Locally grown soybean are purchased for the production of cereal samaposha They
gradually build a system of contract growing with farmers in major irrigated schemes,
Huruluwewa, Dewahuwa, Nachchcaduwa. They supply seeds and other inputs to farmers
and purchases soybean to an agreed price. In 2005, they started a program with IFS to
give farmers an inoculum for nitrogen fixation. They also provide fungicides for seed
treatment. The company has its own extension program and is closely working with
FCRDI in Maha Illuppallama. They also have seed farmers who produce seeds for their
own farmers as DOA seed production is not in required quantities. Current extent under

Page | 195
company contract grower system is 4000 Ac. The average farmer yield is 859 kg per Ac
(2122 kg/ha). Best farmers yield rise to 3705 kg/ha. Seed production subsidies – 2013
Figure 4.52: Soybean cultivated extent during yala season
Source: Department of Census and Statistics
Figure 4.53: Soybean cultivated extent during maha season
Source: Department of Census and Statistics
Variety Development Program
The Department of Agriculture has three recommended soybean varieties for
general cultivation by the farmers. But the variety Pb 01 which was introduced
during early stages of the Soybean development program is still popular among
0
1000
2000
3000
4000
5000
60001
98
4
19
86
19
88
19
90
19
92
19
94
19
96
19
98
20
00
20
02
20
04
20
06
20
08
20
10
20
12
20
14
20
16
20
18
Cultivated Extent in Yala Season
Anuradhapura
Mahaweli H
0
500
1000
1500
2000
2500
3000
3500Cultivated Extent in Maha Season
Anuradhapura
Mahaweli H

Page | 196
local farmers. Variety PM 13 and PM 25 were locally developed and PM 13 is
almost similar to the Pb 01 in many characteristics but the demand is low
compared to the Pb 01. Among the recommended varieties Pb 01 matures with 80-
85 days with a yield of 1,700-2,000 kg/ha. PM
Soyabean seeds are not permitted to import as a planting material under plant
quarantine act
Since this is an introduced crop, there is no genetic variability exists within the
country
Objective of the current soybean breeding program is to develop varieties having yields
above 5 t/ ha under irrigated and 3 t/ ha under rain fed conditions together with the other
desirable traits such as determinate growth habit, large seeds and tolerance/ resistance to
pest & diseases.
• Three F6, three F4, one F3 and two F1 populations were established in the field as bulk
populations for generation advancement. Three new crosses were made with the objective
of developing high yielding varieties. Further evaluations will be carried out.
Hundred and seven lines received from Michigan State University were evaluated with
the local recommended varieties to select lines with high yielding and agronomic
characters which will be suited for mechanical harvesting. Further evaluation will be
carried out.
• Eight promising lines selected from germplasm evaluation of the lines received from
Michigan State University were evaluated in PYT. Trial will be repeated due to poor
plant count.
• The lines with better characters compared to Pb 01 of M7 generation obtained by
irradiating seeds of the variety Pb 01 with 50 kr, 100 kr, 150 kr, 200 kr and 250 kr
strengths were selected to evaluate in PYT.
4.1.5.c Lessons from other countries
Soybean breeders continuously adapt tools and technologies that encompass classical
breeding, mutation breeding and marker-assisted selection, biotechnology and transgenic
approaches, gene silencing, and genome editing. In addition to breeding technologies,
improved agronomics, precision agriculture and digital agriculture have advanced
soybean production and profitability
In most other parts of the world, GM varieties of soybeans are replacing non-GM
varieties and providing cost advantages, at least in the immediate term. India has not yet
allowed the cultivation of GM varieties of soybeans. If India does not keep pace with the

Page | 197
rest of the world in adopting new technologies, it will lose the domestic as well as the
export market to other major soybean producing countries such as Brazil, Argentina and
the United States. It seems that the niche India enjoys in the export of non-GM soya
products to the European Union is small compared with the loss of the domestic and
international markets to soya products from GM varieties being grown in other countries.
Indian soybeans lose their competitive edge because of poor productivity. The recent
productivity level of soybeans in India is about one-half of the average yield in China and
one-third of that in the United States, Argentina and Brazil. Moreover, soybean yield in
India is stagnant around 1 000 kg/ha, but input requirements are rising because of the
increasing susceptibility to insects and pests and the nutritional imbalances in soil,
resulting in a small squeeze on farm income.

Page | 198
4.1.6 Big Onion
Big onion (Allium cpa Var. Cepa of family Alliaceae) cultivation was started as a cash
crop in the 1980s‘ in order to supplement the income of the paddy farmers during the dry
season. Initial cultivation got under way in rice fields in the mid country intermediate
zone which was then spread towards the areas in the low country dry zone. Big onion is a
highly seasonal crop and its cultivation is limited to the yala season in paddy fields
(Figure 4.54). Therefore, the main big onion production takes place during the months
of August to October. Accordingly, domestic big onion supply from yala season arrive the
market from August to October which meets only 25 - 30% of the big onion demand.
Nearly 70 % of requirement is still imported to the country mainly from India and
Pakistan.
Figure 4.54: Cultivated extent of Big Onion during maha and yala seasons Source: Department of Census and Statistics
Big onion cultivation has mainly spread over the areas in Anuradhapura and Matale
districts (Figure 4.55) and the cultivation is mainly confined to localities in Sigiriya,
Dambulla, Galewela, Devahuwa, Naula, Mahaweli H area and surrounding areas due to
the specific climatic suitability for big onion cultivation.
0
1000
2000
3000
4000
5000
6000
7000
8000Cultivated Extent, ha
Maha seasoon
Yala Season

Page | 199
Figure 4.55: Cultivated extent of Big Onion during yala season by district Source: Department of Census and Statistics
Big onion cultivation is primarily determined by the import policy of the government and
the trade barriers in exporting countries, particularly India in addition to the prevailing
weather. Extent cultivated increases in the years when the producer prices of the
preceding season were favourable owing to the implementation of import restricting
policy by the government. In contrary extent cultivated drops when imports are
liberalized.
Until mid-1996, government adopted a trade restrictive policy for the imports of big
onion which involved import licensing requirement and high import tariff. In mid-1996,
the Government liberalised the imports by removing the licensee requirement and duty
waivers were provided. Also 1996 recorded a year of drought. Cultivation extent dropped
and the stiff competition from cheaper imports continued. Big onion cultivation further
dropped. In 1998 India banned big onion exports resulting very high price in the local
market. That prompted many farmers in the Matale District and Mahaweli 'H' area to
cultivate big onions in 1999. However, from following season farmers started to face the
competition from imports.
In 2006 government made tariff adjustments to protect certain domestic agriculture
produces. Customs duty on big onion imports increased from Rs. 10 per kg to Rs. 20 per
kg and a cess of Rs. 10 per kg was introduced on imported big onions to ensure a fair
price to local big onion producers. Cultivated extent increased by nearly 1,500 ha in 2006
and more than a 50% increase in cultivated extent was observed in Mahaweli H area.
Due to the import duty waivers granted in 2008, farmers dropped cultivation.
0
1000
2000
3000
4000
5000
6000
7000
8000 Extent Cultivated during Yala Season, ha
Mahaweli H
Anuradhapura
Matale
Yala Season

Page | 200
Due to the increase in the extent of cultivation in the Northern Province and the increase
in the Special Commodity Levy on imports targeting the harvesting time, production of
big onions increased since 2011.
In 2015, 5875 ha was cultivated both maha (612 ha) and yala (5263 ha) season and
89,770 mt was produced. Cultivation dropped after 2015 due to bad weather and
subsequent drop in big onion seed production. In 2019 India banned big onion exports
that led to huge shortage in big onion supply in the market.
Table 4.16: Production, imports and supply of Big Onion
Production Imports Total supply % Imports
2001 31,966 114,586 146,552 78%
2002 31,560 133,679 165,239 81%
2003 32,301 134,174 166,475 81%
2004 37,508 120,080 157,588 76%
2005 55,552 122,454 178,006 69%
2006 73,616 130,441 204,057 64%
2007 92,166 164,551 256,717 64%
2008 57,371 173,611 230,982 75%
2009 81,707 159,510 241,217 66%
2010 58,930 170,072 229,002 74%
2011 61,037 177,538 238,575 74%
2012 83,561 152,929 236,490 65%
2013 69,635 149,490 219,125 68%
2014 101,166 162,373 263,539 62%
2015 89,767 225,421 315,188 72%
2016 65,222 113,652 178,874 64%
Source: Department of Census and Statistics, FAO
4.1.6.a Productivity
Land productivity
National average yield of big onion was 9 mt/ha before 1998 and it has increased to about
12 mt during the recent past. However, the highest national average yield of 13.8 mt/ha
was recorded in the year 1999.

Page | 201
Figure 4.56: Average yield of Big Onion during Yala season Source: Department of Census and Statistics
Table 4.17: Average yield of Big Onion in neighboring countries
Average Yield (kg/Ha)
Sri Lanka India Bangladesh Thailand Vietnam
1980-90 8,177 10,289 4,022 10,590 3,105
1990-00 9,164 10,539 4,098 13,183 2,996
2000-10 10,547 13,270 5,711 26,019 3,141
2010-18 14,405 16,025 9,075 26,347 3,684
Source: FAO
Big onion yield of Sri Lanka is comparable to big onion yield of India. However,
Thailand yield exceeds 25 mt per ha (Table 4.17).
Labour productivity
Onion crop is highly labour intensive and labour accounts to the main cost component in
big onion production. The preparation of nursery, transplanting, weeding, and harvesting
are accounted for main share of labour. Big onion cultivation is more or less a family
enterprise in Sri Lanka that utilises the family labour for the operations. Per ha labour use
has come down from 500 man days to 300 man days from 1999 to 2017.
0
5,000
10,000
15,000
20,000
25,000
Big Onion Average Yield - Yala Season, kg/Ha

Page | 202
Figure 4.57: Per ha labour use in Big Onion farming Source: Study estimates
Table 4.18: Per ha labour use in Big Onion farming in Sri Lanka and Indian States
Labour use per ha (man days)
2004/05 2006/07 2014/15 2015/16
Maharashtra 233.2 187.1 194.7 179.6
Karnataka 141.2
81.4 99.2
Gujarat
149.5 211.6 213.4
2005 Yala 2007 Yala 2014 Yala 2016 Yala
Sri Lanka 417.4 397.7 333.4 326.0
Source: Indian Ministry of Agriculture and Farmers welfare, study estimates for Sri Lanka
Figure 4.58: Labour productivity of Big Onion in Sri Lanka and Indian States
Source: Indian Ministry of Agriculture and Farmers welfare, study estimates for Sri Lanka
0
100
200
300
400
500
600
700
1991Yala
1993Yala
1995Yala
1997Yala
1999Yala
2001Yala
2003Yala
2005Yala
2007Yala
2009Yala
2011Yala
2013Yala
2015Yala
2017Yala
Labour use, md/ha
0
20
40
60
80
100
120
140
19
91…
19
92…
19
93…
19
94…
19
95…
19
96…
19
97…
19
98…
19
99…
20
00…
20
01…
20
02…
20
03…
20
04…
20
05…
20
06…
20
07…
20
08…
20
09…
20
10…
20
11…
20
12…
20
13…
20
14…
20
15…
20
16…
20
17…
Labour Productivity, kg/md
Maharashta
Karnataka
Sri Lanka

Page | 203
However labour use in big onion cultivation in main states of India is as twice as low
compared to labour use in Sri Lanka (Table 4.18). Labour productivity of big onion in
India is much higher in states like Maharashta compared to Sri Lanka due to both
efficient labour use and average yield (Figure 4.58).
In China, U.S.A. and many European countries, onion cultivation is fully mechanized.
India has initiated programs to develop machineries and implements to mechanize onion
farming activities to bring down the current level of labour use to compete with world
partners. ICAR-Directorate of Onion & Garlic Research provides the leadership.
Figure 4.59: Land and labour productivity of Big Onion Source: Study estimates
Of the two factors responsible for labour productivity, drop in per ha labour use after
1999/2000 also contributed to increase labour productivity (Figure 4.59).
Total factor productivity
TFP index estimated for the yala season by the study is graphically shown below (Figure
4.60). Since 2005, significant TFP growth is observed. This is shown by increased per
annum land productivity growth from the period of 1991 to 2005 and 2005 to 2017 with
declining per capita growth of input intensification on land (Figure 4.61). The
disaggregated factor input intensification on land is considered, the use of fertilizer, seed,
labour and machinery use has decreased while the use of chemicals has slightly increased
(Table 4.19).
0
50
100
150
200
250
1991Yala
1993Yala
1995Yala
1997Yala
1999Yala
2001Yala
2003Yala
2005Yala
2007Yala
2009Yala
2011Yala
2013Yala
2015Yala
2017Yala
Land Productivity Labour Productivity

Page | 204
Figure 4.60: Land extent and TFP growth index based on base year 1991 yala
Source: Study estimates
Figure 4.61: Input Intensification, TFP and Land productivity
Source: Study estimates
Table 4.19: Factor intensification on land by factor
Fertiliser Labour Seed
Machinery
for land
preparation
Machinery
irrigation
Chemicals
and other
1991-2005 8.5% 0.0% 0.2% 2.7% 0.6% 4.9%
2005-2017 -2.0% -2.2% -2.1% 0.3% -0.1% 5.5%
Source: Study estimates
0
50
100
150
200
250
300
19
91…
19
92…
19
93…
19
94…
19
95…
19
96…
19
97…
19
98…
19
99…
20
00…
20
01…
20
02…
20
03…
20
04…
20
05…
20
06…
20
07…
20
08…
20
09…
20
10…
20
11…
20
12…
20
13…
20
14…
20
15…
20
16…
20
17…
Land Extent - 1991 Yala =100TFP IndexTFP Index
-2%
-1%
0%
1%
2%
3%
4%
5%
1991-2005 2005-2017
TFPG
Input intensification on land
Land productivity growth

Page | 205
Figure 4.62: Weedicide and pesticide use per ha in US dollar terms Source: Study estimates
To cultivate one ha of land it is required 7.5 - 8.5 kg of true seeds. If proper nursery
techniques are used with high quality seeds it can be reduced up to 6-7 kg/ha.
4.1.6.b TFP determinant factors
Varietal technology and quality seed production
Seeds play a vital role as the important input that determines the yield level of big onion.
DOA imported over 95 percent of onion seed before 1990. Since ASCs are scattered
throughout the country, farmers had access to DOA seed. After 1990, however, with the
change in the administrative structure and withdrawal of KVSs, private seed dealers
emerged. Since then, the government permitted private sector to import onion seed
(DOA, 1990).
The National Seed Policy of commercializing the seed and planting material sector was
announced in 1996. The Seed Act focuses on enhancing the production and marketing of
high quality seeds. Government initiated the duty free import of seed and planting
material. The private sector was expected to play an important role in the seed industry.
Since then, the seed imports that were made illegally by the private sector constituted
80% of the seed requirement. As importation of true seed costs a large amount of foreign
exchange in addition to the problems
0
20
40
60
80
100
120
1991Yala
1993Yala
1995Yala
1997Yala
1999Yala
2001Yala
2003Yala
2005Yala
2007Yala
2009Yala
2011Yala
2013Yala
2015Yala
2017Yala
Weedicide Cost in US dollars
Pesticide cost in US Dollars

Page | 206
Except for a few selections of Indian varieties, big onion cultivation is mainly dependant
on seed varieties imported from India by private traders. Varieties, Rampur Red, Nasic
Red, Pusa Red and Agri found light red are recommended for Sri Lankan conditions
considering the factors such as high yield, seed setting ability, storage adaptability,
pungency, colour, etc.
Pusa red - Variety was developed at IARI, New Delhi, India. It is well adapted to
dry zone of Sri Lanka. 90- 100 days to mature the crop. Average yield is about 20-
25 mt/ha. High pungency, Light rose in colour
Rampure -Originated from India. Well adapted to dry zone in Sri Lanka. Takes
85- 90 days to mature the crop. The yield is about 15-20 mt/ha with better
storability. light rose in colour, High pungency
Agri found light red - Variety developed at India by mass selection well adapted
to dry zone to cultivate as a yala crop under irrigation. Pink in colour and it takes
about 90-100 days to mature. average yield is about 15-20 mt/ha with good
storability.
Nasic red-Mainly cultivate as vegetable. Dark red in colour poor storability.
Kalpitiya Selection and MI Pusa Red are two of the selections by the Department of
Agriculture. Dambulu Red is a farmer selection of MI Pusa Red.
According to field information, Nasic Red has the highest production, but lacks the
storing quality. Rampur Red on the other hand has a higher keeping quality though its
yield is somewhat low. The Dambulu selection has both yield as well as keeping quality.
Seeds are produced in the country during the maha season by a process of vernalisation.
Until the government supported true seed production program had actively implemented
since 2005, imported varieties; RampurRed and Nasic Red were widely cultivated. in
main producing areas (Table 4.20).
Big Onion Seed Production in Sri Lanka
One of the main factors that determine the yield of big onion is the quality of seeds. In
order to supply good quality seeds with high keeping quality at a lower price both
government and private sector developed seed production programs.
Government Supported Big onion True Seed Production Program
Though true seed production programme started in 1984/85 maha season, it has shown a
considerable progress only in 2005 in the Matale district. In the Matale district, the
highest production level was recorded in 2009/10 maha season (4,500kg). Galewela and

Page | 207
Dambulla are the major big onion seed producing ASCs in the Matale district. Also
considerable production is recorded in Kimbissa, Kongahawela and Naulla ASC areas of
the district. In Anuradhapura and Mahaweli areas, the seed production only takes place in
maha season and the seed production was at a low level before 2008. In the Anuradhapura
district, seed production started in 2004/05 maha season. A significant production was
recorded in 2009/10 maha season.
Private Sector Big Onion True Seed Production
In addition to the government supported big onion true seed productions, few private
sector companies have engaged in seed production in the Matale and Anuradhapura
districts. CIC, Hayleys, Onesh and Agstra are the private sector big onion seed production
companies in the Matale district.
CIC is the leading big onion true seed producer producing 3000 kg of seed during the
financial year of 2009/ 10. Seed production is done in the maha season using poly tunnel
with high technology. They have enough cold storage facilities for mother bulbs. The
cold storage was built with the collaboration of the Regional Economic Advancement
project (REAP). They have their own mother bulb production programmes and out
grower system for mother bulbs. Produced seeds are tested in the company laboratory
which has ISO quality certification. Agri Found light red (―Galewela light Red‖) and
―Pusa Red‖ (Dambulu Red) are the varieties of seed produced by CIC. Produced seeds
are packed in aluminum packages. Lack of foundation seed and lack of technical support
by the DOA are pointed as the major problems in producing big onion seeds by the CIC.
Hayles started big onion true seed production in 2009/ 10 maha season. They had bought
mother bulbs from the farmers within the area on the recommendation of the Agriculture
Instructor (AI). They have produced only 132 kg of seeds and have distributed them to
farmers through dealers. Before releasing the seeds they had tested for germination in
their own labs. Produced seeds are packed in aluminum packets. Lack of foundation seeds
and skilled labour shortage are the major problems they had faced in seed production
process.
2012 - Big Onion seed production was started in Govt. seed farm MI for the first time.
Below figure shows the government seed production and imports quantities (Figure 4.63).

Page | 208
Figure 4.63: Government seed production and imports, Mt Source: DOA, Department of customs
Table 4.20: Adoption of Big Onion Varieties
% %
2005 Yala Rampur 80 2011 Yala Rampur 60
Nasik red 16 Local 40
Poona red 4 2012 Yala Dambulu red 74
2006 Yala Rampur 90 Imported 26
Nasik red 10 2013 Yala Dambulu red 58
2007 Yala Rampur 78 Nasik 33
Nasik red 14 other 9
Dambulu red 8 2014 Yala Nasik 54
2008 Yala Rampur 60 Rampoor 17
Dambulu red- 26 Local 29
Nasik red 14 2015 Yala Local 98
2009 Yala Nask red 30 Nasik 2
Dambulu red 27 2016 Yala Lanka seed 96
Galewela red 19 Nasik 4
Rampur 13 2017 Yala Lanka seed 97
Other 11 Rampur 3
2010 Yala Rampur 59 2018 Yala
Local 40
Nasik red 1
Source: DOA
0
5000
10000
15000
20000
25000
30000
35000
40000
45000
2006 2007 2008 2009 2010
Govt. Sponsored - MahaGovt. Sponsored -yalaPrivate (CIC) - MahaImports Total

Page | 209
Effect of trade policies on big onion cultivation decisions and the investment decision
on seed production by private sector
Big onion cultivation is primarily determined by the import policy of the govemmcnt.
Significant increases in cultivated extents are observed if favourable producer prices
prevailed during the preceding season.
The availability of supplementary irrigation for cultivation
In a productivity development program supplementary irrigation should be an essential
component as is an important input in big onion cultivation.

Page | 210
4.2 EXPORT PROMOTING DOMESTIC FOOD CROP SECTOR

Page | 211
4.2.1 Pineapple
Pineapple was initially a home grown fruit which later became one of the leading
commercial fruit crops grown in Sri Lanka. Now it is mainly grown by smallholders (less
than 10 acres) and a few large-scale farmers. The two types of pineapples grown in Sri
Lanka are Mauritius and Kew. Despite being Sri Lanka a small producer with less than
1% of the world production, Sri Lankan pineapple has a high demand in the world
market. Mauritius variety, one of the tastiest pineapple varieties fetching high price in the
world market is grown in Sri Lanka.
Pineapples are normally intercropped with mature coconut trees or cultivated as a mixed
crop. The majority of pineapples are grown on leased coconut or bare land in Gampaha
and Kurunegala districts. However due to unavailability of larger plots of land for leasing,
pineapple cultivation is often fragmented. Extent under pineapple crop has increased in
the last few decades and shows a setback after 2013 (Figure 4.64). The decline in extent
cultivated is attributed to a number of reasons including access difficulties to suitable land
due to land parceling for commercial and residential purposes, volatility of prices and
spread of diseases harming cultivation.
Figure 4.64: Pineapple Extent harvested
Source: Department of Census and statistics
Of the total cultivated extent, Kurunegala and Gampaha now occupy 50 % of the extent.
There is either little or no irrigation for pineapple farming in these two districts and
therefore farmers depend fully on rainfall. Cultivation in Kurunegala district has declined
in the last few years while cultivation has spread into other districts. Mauritius variety is
mainly cultivated in Gampaha and Kurunegala districts while Kew variety which is used
for processing is cultivated in districts like Moneragala, Badulla and Hambantota.
0
1000
2000
3000
4000
5000
6000
7000
19
85
19
87
19
89
19
91
19
93
19
95
19
97
19
99
20
01
20
03
20
05
20
07
20
09
20
11
20
13
20
15
20
17
Extentharvested, ha

Page | 212
According to the FAO statistics, production has been gradually decreasing after mid 90‘s
although extent under pineapple increased until 2013 causing continuous declining of
pineapple yield. Country produced 58,460 mt of pineapple in 2005 which dropped to
34,651 mt in 2018 (Figure 4.65 & figure 4.66).
Figure 4.65: Total pineapple production
Source: FAO
Figure 4.66: Extent and yield of pineapple, 2001 to 2018 Source: FAO
Pineapple has a high demand locally and in the export market in the form of fresh, juice,
dried or preserved. Sri Lanka export only 2-6 % of the production to its main export
destinations. However, according exporters this figure should be higher as pineapples are
exported in crates mixed with other fruits and vegetables under a separate HS code.
Nevertheless, local demand has been rising with the rapidly expanding tourism sector
which demands exotic fruits. Fresh pineapple exports have increased up to 2004 by
volume and have decreased sharply until 2012. During this period Sri Lankan main export
destination has shifted from Maldives to Germany with a high value exports. Currently,
0
10000
20000
30000
40000
50000
60000
70000
Production in tonnes
0
2000
4000
6000
8000
10000
12000
14000
Yield, kg per ha
Extent, ha

Page | 213
Germany, USA and UAE are main export destinations for fresh pineapple and processed
pineapple (Figure 4.67, figure 4.68 & figure 4.69).
Figure 4.67: Pineapple exports in quantities by type of export Source: FAO, ITC trademap
Figure 4.68: Pineapple exports in value by type of export Source: FAO, ITC trademap
0
500
1000
1500
2000
2500
3000
3500
40001
97
5
19
77
19
79
19
81
19
83
19
85
19
87
19
89
19
91
19
93
19
95
19
97
19
99
20
01
20
03
20
05
20
07
20
09
20
11
20
13
20
15
20
17
Export Quantity in tons
Pineapples
Pineapples canned
0
1000
2000
3000
4000
5000
6000
7000
19
75
19
77
19
79
19
81
19
83
19
85
19
87
19
89
19
91
19
93
19
95
19
97
19
99
20
01
20
03
20
05
20
07
20
09
20
11
20
13
20
15
20
17
Export Value in '000 US $
Fresh Pineapple
Pineapples canned

Page | 214
Figure 4.69: Value of fresh pineapple exports by export destination
Source: FAO, ITC trademap
Export of fresh pineapple was significantly determined by the average exchange rate and
the domestic price of pineapple. Price difference between FOB and wholesale price in
2018 (Figure 4.70) shows that new markets in EU and USA are appealing to exporters
although finding exportable quality pineapples in sufficient quantities is a problem.
Pineapple fetches a relatively lower price in UAE markets than EU and USA markets.
Pineapples grown in Sri Lanka has an increasing demand both locally and in
internationally.
Figure 4.70: FOB and wholesale prices of Pineapple Source: HARTI
0
100
200
300
400
500
600
Jan Feb Mar Apr May Jun Jul Aug Sep Oct Nov Dec
Pineapple Price, Rs/kg FOB Price
Wholesale Price

Page | 215
4.2.1.a Land productivity
When the yield of pineapple is compared with neighbouring countries, Sri Lankan yield is
very low, although its distinct taste has captured high price in the international market.
Also it is noted that Sri Lankan yield are stagnating and declining while other countries‘
yields are increasing (Table 4.21).
Table 4.21: Area harvested, yield and production in Sri Lanka and neighbouring
countries
2016 2017
Area
harvested
ha
Yield
kg/ha
Production
tonnes
Area
harvested
ha
Yield
kg/ha
Production
tonnes
Bangladesh 13561 14800 200701 14359 14753 211833
India 110000 17491 1924000 111000 16766 1861000
Sri Lanka 5136 8757 44977 4783 8829 42229
Thailand 73228 24286 1778439 86454 24558 2123177
Viet Nam 34642 16033 555407 36658 16857 617944
Source: FAO
Despite Thailand being a large producer of pineapple, it is not a top exporter of fresh
pineapples but a top exporter of canned pineapples. Quality pineapple of medium size is
preferred in fresh pineapple trade whilst pineapple used for processing needn‘t such
specifications. Pineapple yield in Thailand and Philippine is 3 to 5 times higher than Sri
Lankan yield where multinational companies grow pineapple as mono crop plantations
(Figure 4.71).
Figure 4.71: Pineapple average yield in Sri Lanka and neighbouring countries (kg/ha) Source: FAO
0
5000
10000
15000
20000
25000
30000
35000
40000
45000
19
61
19
64
19
67
19
70
19
73
19
76
19
79
19
82
19
85
19
88
19
91
19
94
19
97
20
00
20
03
20
06
20
09
20
12
20
15
India BangladeshPhilippines Sri LankaThailand Viet Nam

Page | 216
Pineapple yield estimated from sample data by DOA and the study shows that pineapple
in major growing areas either stagnating or declining that range from 12000 to 15000 kg
per ha.
Figure 4.72: Pineapple yield in major producing areas Source: DOA and sample survey 2019
Land productivity related factors
Variety
The two types of pineapples grown in Sri Lanka are Mauritius and Kew. These two
varieties are medium size varieties. Since Sri Lanka go by quality for size of the fruit,
increasing land productivity has limitations.
Planting density
Limited land resource is one the main problems faced. To better utilize land, plant density
is increased by growing the pineapples in double and triple rows and reducing the spacing
between them. Most of the sample farmers had planted an average of 5000 – 7500 suckers
in an acre in double rows (12350 – 18525 per ha) (Figure 4.73). Some farmers had
planted in triple rows. This planting density is higher compared to their earlier practice of
planting less number of plants. However, companies such as Dole plant between 27000 –
33000 pineapple plants per acre (mono cropping) in Thailand and Philippine. The
Department of Agriculture, Sri Lanka now recommends that 10,000 plants be planted per
acre. Also FCRDC of DOA has developed new varieties with leaves having no thorns to
ease the management of the crop between plants. This overcomes the problem of getting
pricked and to allow cultivation with a reduced spacing more practical. However, the
availability of such varieties is unknown to many growers.
0
5000
10000
15000
20000
2000 2005 2012 2017 2019
Yield (second year) (Kg/ha)

Page | 217
Figure 4.73: Planting density maintained in pineapple farming
Source: DOA, sample survey 2019
Figure 4.74: Average fruit size of pineapple
Source: FAO
The requirement of fruits for freight is the size of the fruit to be between 1-1.25 Kg and
no bigger. By having more plants per acre, the size of the fruit gets smaller. It is observed,
national average size of the pineapple has decreased over time depicting the grower‘s
practice of planting suckers more closely (Figure 4.74).
Tenure period of the leased land
Since finding quality land to cultivate is a difficulty, most lands are taken in lease
agreements. Lands were taken for 5 years (44%) earlier but now it has subsided to 3
(12%) (Figure 4.76). This has implications for long term sustainability of the land
resource as farmers would grow the crop for three years and move from the land creating
more land scarcity and leaving an unfertile land for rehabilitation.
0
5000
10000
15000
20000
2000 2005 2012 2017 2019
Planting densityplants per ha
0.00
0.50
1.00
1.50 Average size of a pineapple
Average size of apineapple, kg weightof a fruit

Page | 218
Figure 4.75: Percentage of farmers who leased land by lease period
Source: Sample survey 2019
Although the economic life of a pineapple plot is around 4-5 years with one plant crop
and 2-3 ratoon crops, now there is a tendency to harvest the ―plant crop‖ and 1-2 ―ratoon
crops‖ that is abide with the leasing period.
.
Per annum leasing cost is around Rs 10,000 that ranges from Rs. 5000 to Rs. 20,000 for
land leased in mature coconut lands for under cultivation.
Moving farmer from traditional areas to new areas
Traditionally, pineapple was grown mainly in Kurunegala and Gampaha districts but now
with land parcelling, the area of cultivation has reduced particularly in Kurunegala district
(Figure 4.76). Hence some growers have moved to newer areas which are less
productive. Pineapple yield in Kurunegala district is declining. Also sample farmers have
moved to rubber uprooting areas in other nearby districts such as Ratnapura on a lease
agreement basis to grow pineapple as an intercrop.
Figure 4.76: Average yield of pineapple by main cultivating districts
Source: Department of Census and Statistics
0
10
20
30
40
50
1year 3 years 4 years 5 years 6 years 8 years 10 Years
% farmers leasedland by Leaseperiod
0
5
10
15
20
25
2010 2011 2012 2013 2014 2015 2016 2017 2018
Yie
ld m
t/h
a
SL Moneragala
Kurunegala Gampaha
Hambantota

Page | 219
Good quality planting material
Pineapples are normally propagated from ―slips‖ or ―suckers‖. Suckers arise from the
underground parts of the plant or the stem suckers are used mainly by sample farmers
although propagation can also be done through slips that arise from the fruiting stem and
from the crown on top of the fruit. However these methods are rarely used in Sri Lanka.
Nearly 50% of the growers have used their own planting material for new planting and
the others have used suckers from their friends or neighbours. Only one farmer had
purchased through farmer organization.
When the quality planting material production in formal sector is considered it is only
DOA produces pineapple suckers in very small quantities to disseminate new technology.
From 2014 to 2018 DOA has issued 173,784 suckers (requirement of nearly 10 ha).
Although it was promoted to produce tissue cultured pineapple plants through various
programs as an alternative technology to produce disease free planting materials, the
technology was not proper that tissue cultured pineapple plants did not guarantee
flowering and also deformities in fruits are also observed in pineapple in the field.
All farmers practice fungicide treatment before planting.
Fertiliser Use
Pineapple consume a heavy dose of NPK amounting to about 2000 kg per ha (Figure
4.77). The practice of use of liquid fertilizers is now low. This is attributed to the
decreased quality of pineapples upon heavy use of the liquid fertilizers. This application
is above the department recommendation. Irrational use of fertilizer depletes the soil
quality further and the requirement become more. No reports of soil testing being done in
the sample locations. Fertilizer mixtures with micronutrients are on the trend.
Figure 4.77: Fertiliser use in pineapple farming
Source: DOA, sample survey 2019
0
2000
4000
6000
8000
10000
12000
2000 2005 2012 2017 2019
Kg
pe
r h
a NPK
Compost

Page | 220
Hormone application
Currently farmers are able to better control the harvesting periods through the application
of hormones. Therefore pineapples can be grown throughout the year. The hormones
stimulate flowering and pineapples can be harvested 3.5 to 4 months from the time of
application.
Agrochemical Use
Growers are using high concentrations of weedicide in each harvest. There is no proper
regulation of weedicide application. The increase use of the weedicide by the growers is
to increase the yield in new lands. The practice of mulching is almost none.
The place of mechanization in pineapple cultivation although minimal apart from land
preparation, irrational use of the weedicides can be replaced by introducing adjustable
weeders.
Extension and dissemination of new technology
Despite pineapple being an important economic crop, the attentiveness given to its
cultivation by the authorities is not significant. Services provided and role of AI as
extension agents are little or no effective. Experienced farmers have limited involvement
with extension officers. New farmers source know-how information and input
information from other growers, experienced farmers, friends, the local input shop owner
and through programs conducted by chemical supplying companies. Experienced farmers
get information about new fertilizers and other agrochemicals mainly from the local shop
or through programs conducted by chemical supplying companies. For new farmers
information flows to them from experienced farmers and not government agriculture
extension officers
Collector also plays a role in providing information to farmers since majority of growers
sell to local collectors who provide transport and warehousing for pineapples and then re
sells them to either exporters, processors or other collectors/wholesalers who distribute
pineapples to other parts of the country. A networking is seen among the collectors as
well. Information on export quality parameters are passed on to farmers through
collectors. Some input suppliers function as the collectors.
There are programs by the DOA to introduce new pineapple areas with new farmers.
Research knowledge is disseminated as a package in these programs.
Quality of Pineapple harvest
According to the sample information, the quality of pineapple harvest gets lowered of the
ratoon crop in subsequent harvests as below presented.

Page | 221
Also the stem suckers harvested in initial crop has more vigor than the stem suckers
harvested in subsequent ratoon crops. Farmers find it more economical to go for only one
to two ratoon crops and not further.
4.2.1.b Labour productivity
Most operation in pineapple farming is by labour except land preparation which is done
by four wheel tractors. There is either little or no irrigation for pineapple farming in main
pineapple growing districts and therefore farmers depend fully on rainfall. The highest
labour requirement is for planting of suckers. Considering one plant crop and two ratoon
crops, 1/3 rd of establishment labour is added to crop maintenance labour per year to
calculate the labour requirement for one crop harvest in the sample study. According to
the DOA crop enterprise budgets, more than 200 man days have been used per one crop
in 2005, 2012 and 2017. In 2019 only 107 labour days have been used as study finds.
Accordingly the labour productivity ranges from 150 to 230 kg per man day over the
period from 2000- 2019.
Table 4.22: Labour use in pineapple farming and labour productivity
Source: DOA, sample survey 2019
4.2.1.c Total factor productivity
Due to the limitation of time series data, productivity gains through technical change
cannot be estimated. It is also the fact that much technical changes in pineapple farming
has not happened. Technical efficiency estimated in previous study shows that mean
technical efficiency in intercropped pineapple production in Kurunegala district is 85 per
cent, a relatively higher technical efficiency.
Year 1 Year 2 Year 3
Grade 1 60% 50% 38%
Grade 2 26% 30% 34%
2000 2005 2012 2017 2019
Yield (second year) (Kg/ha) 15000 12500 12500 16500 11730
Crop Establishment labour
(md/ha) –
62 135 153 182 49
Crop Maintenance and
harvesting Labour (md/ha)
65 79 66 87 58
Total Labour per one crop
harvest md/ha
127 214 219 269 107
Labour productivity 231 158 189 190 202

Page | 222
TFP gaps between pineapple farmers due to differences in efficiency of resource are the
focus of pineapple crop sector productivity analysis. Using cross sectional data from the
primary data collected in the field survey stochastic frontier function was derived.
TFP measurement: results from the Stochastic Frontier model
The specification of the empirical model requires the choice of an appropriate functional
form. In this study, the Cobb-Douglas functional form was chosen since a more general
functional form to identify the impact of each input on pineapple production.
The OLS estimates of the production function in Cobb- Douglas form id given by:
In Yi = β0 + β1 In(land) + β2 In(Labour) + β3 In(Establishment) + β4 In(Pesticide) + β5
In(Fertilizer) + β6 In(Hormone) + β7 In(Weed) + β8 In(Machinery) + β9 In(Other
costs)
In the below table (table 4.23) suggests that, out of nine explanatory variables area of land
statistically significant impact on production of pineapple followed by weedicide other
factor which determines the production of pine apple.
Table 4.23: Results of Cobb – Douglas production function
Variable Coefficient Standard error t - ratio
Constant 8.596 0.428 20.06
Ln land 0.988 0.052 18.96***
Ln labour 0.066 0.036 1.799*
Ln establishment -0.024 0.024 -1.012
Ln pesticide -0.017 0.041 -0.423
Ln fertilizer 0.0071 0.018 0.390
Ln hormone -0.0035 0.017 -0.202
Ln weed 0.031 0.012 2.50**
Ln machinery 0.0030 0.0039 0.77
Ln other costs 0.0036 0.0038 0.962
Note: ***.**and * represents the 1%, 5% and 10% significant levels respectively
As size of extent land increases by one acre, on average production of pine apple will
increase by 98% assuming that other factors held constant. Similarly, 1% increase in
weedicide cost will enhance the average production of pine apple by 0.031% while 1%
increase in usage of labour, it will raise the production by 0.066% in the study. However,
rest of other inputs used in production of pine apple were not significant in the model.
In addition to the OLS estimation of the Cobb – Douglas function, the stochastic frontier
production function for pineapple farmers is assumed to be:

Page | 223
In Yi = β0 + β1 In(land) + β2 In(Labour) + β3 In(Establishment) + β4 In(Pesticide) + β5
In(Fertilizer) + β6 In(Hormone) + β7 In(Weed) + β8 In(Machinery) + β9 In(Other
costs) + Vi - Ui
Where, Vi are assumed to be independently distributed normal random variables with zero
mean and variance, σ2
independently distributed of Ui and Ui are non-negative technical
inefficiency effects, which are assumed to be independently distributed.
Table 4.24: Results of maximum-likelihood estimates for parameters of the
stochastic frontier
Variable Coefficient Standard error t - ratio
Constant 8.83 47.95 0.184
Ln land 0.949 0.048 19.62***
Ln labour 0.019 0.033 0.588
Ln establishment -0.023 0.020 -1.133
Ln pesticide 0.0321 0.034 0.927
Ln fertilizer 0.021 0.016 1.34*
Ln hormone -0.0049 0.014 -0.54
Ln weed 0.036 0.011 3.24**
Ln machinery 0.0018 0.0035 0.52
Ln other costs 0.0040 0.0030 1.33*
Note: ***, **and * represents the 1%, 5% and 10% significant levels respectively
Sigma-squared 0.0117 Sig value = 6.71
Gamma (λ) 0.575 Sig value = 0.032
Log- likelihood function = 72.08
Maximum likelihood estimate of the frontier production function were obtained using the
Frontier 4.1 program and its results presented in the above table (Table 4.24). The signs
of all the variables in the production function conform to a priori expectations except
costs of establishment and hormone. The gamma (λ) parameter value is 0.575 implies that
the technical inefficiency effects are significant in the stochastic frontier model and that
the traditional production function, with no technical inefficiency effects, is not an
adequate representation of the data.
Likelihood ratio test for the null hypothesis that all the coefficients of the inefficiency
model are equal to zero was also rejected which implies that the explanatory variables
have a significant effect on the level of the technical inefficiency in the model.

Page | 224
Results of maximum-likelihood estimates proved that, logs of land extent, has more
contributes to the pineapple production followed by weedicide and usage. Also, fertilizer
and other costs also influencing the production of pine apple in the model.
Results from the technical efficiency analysis reveal that on an average, the pine apple
farmers in Gampaha district are operating with 53% of technical efficiency and there is a
47% of possibility to improve in efficiency with the given inputs and technology.
With such magnitude of inefficiency level, an investigation of the factors that may cause
such level of inefficiency can help for policy making and thus, primary aim of the
inefficiency models was to identify those socioeconomic and other characteristics, which
contribute to technical inefficiency.
Table 4.25: Determinants of technical inefficiency
Variable Coefficient Standard error t - ratio
Dolomite use 0.047 0.028 1.66*
Ownership of land -0.028 0.026 -1.09
Age 0.0006 0.0011 0.532
Education 0.031 0.027 1.11
Type of planting material 0.069 0.051 1.18
Agric service centre -0.075 0.026 -2.87***
Planting density -0.000059 0.000012 -4.71***
Note: *** and * represents the 1% and 10% significant levels respectively
Out of 7 factors that determine the technical inefficiency, dolomite use, agric service
centre and Planting density are the major determinants in the model (Table 4.25).
Dolomite use has positive sign indicates that, uses of more dolomite in pine apple farming
contributed to more inefficiency at 10% significant level. The coefficient of agrarian
service centre has negative sign reveals that, the Urapola farmers are relatively more
efficient than other farmers in the study. The coefficient of planting density has negative
sign, but its value very close to zero shows that higher the density will reduce the
technical inefficiency. In other words, higher the planting density, higher the technical
efficiency but its impact is very low in the production of pine apple. All other variables
included in the technical inefficiency model were insignificant.

Page | 225
Results from the Factor Productivity Index calculation
Figure 4.78: The relationship between land productivity and factor productivity index
The above relationship between land productivity and factor productivity shows that there
is a higher variability of factor productivity compared to land productivity. In order to
obtain same yield, while some farmers are using less resources the other farmers are using
resources abundantly. May be it is due to the fact that technically efficient farmers
practise better management practices while other are not adopting. Other factors may be
that farmers are moving to marginal lands for cultivation due to land availability issues
and land degradation because of continuous cultivation on same land. This establishes the
findings from the above stochastic frontier analysis that the technical efficiency of
pineapple farming has decreased compared to the finding of the study done earlier. In
order to get higher yields farmers are resorted to apply non-optimal level of fertiliser and
weedicides. None of the farmers practice mulching and use the fertiliser recommendation.
Soil testing has not been done in these farm lands.
y = 14384x + 4959.3 R² = 0.1861
0
1000
2000
3000
4000
5000
6000
7000
8000
9000
0.0000 0.0500 0.1000 0.1500
Lan
d p
rod
uct
ivit
y
Factor Productivity Index

Page | 226
4.2.2 Banana
Banana {Musa spp.) is the most widely cultivated and consumed fruit in Sri Lanka and
also the most popular fruit globally. It covers nearly 55% of fruit cultivation area in Sri
Lanka. It is also an attractive perennial fruit crop for farmers as it gives economic gains
throughout the year. Currently, nearly 45,000 ha (20,000 ha and 25,000 ha in wet zone
and dry + intermediate zones respectively) of land is under banana cultivation in Sri
Lanka. Annual banana production is around 674,000 mt and average yield is 11.5 mt/ha.
Figure 4.79: Total banana cultivated extent and cultivated extent by district
Source: Department of Census and Statistics, FAO
Banana Cultivation is widely spread in the districts Moneragala, Hambantota and
Ratnapura and can be grown all over the island (Figure 4.79). In Moneragala more than
6000 ha are under banana cultivation. Since banana is said to be originated in the Indo-
Malaysian region of Southwest Asia, several indigenous/local varieties are spread all over
the Island. Of that, Ambul, Seeni, Kolikuttu and, Ambun are the most popular varieties
growing in the country as a fruit. Varieties that are grown for curry making also
constitutes a significant area. Recently introduced Cavendish variety is on the increase of
its cultivation.
The drought years experienced a drastic drop of banana cultivation until banana
cultivation became a crop under irrigated schemes. Due to severe drought in 1972 banana
area dropped drastically. Paddy lands under Mahaweli Authority of Sri Lanka (MASL),
farmers were allowed to cultivate OFC other than paddy and banana and papaya are
0
10000
20000
30000
40000
50000
60000
70000
19
61
19
64
19
67
19
70
19
73
19
76
19
79
19
82
19
85
19
88
19
91
19
94
19
97
20
00
20
03
20
06
20
09
20
12
20
15
Banana Area cultivated, ha
Gadm36_lka_1.shp
< 470 Ha
470 - 1150 Ha
1150 - 1970 Ha
1970 - 3500 Ha
3500 - 6000 Ha
> 6000 Ha

Page | 227
cultivated in crop rotations. Recent increase in area and production is mainly attributed to
the large scale cultivation of banana by Dole company with supplementary irrigation.
Figure 4.80: Production and export of banana
Out of the total production only around 5 percent is exported (figure 4.80). The main
production is consumed locally. The recently introduced Cavendish variety has an
increasing demand in the export market due to the consumer preference in the world
market for its quality and taste of the fruit. It is estimated that yield of banana can be
increased to the range 45-50 MT per hectare with the use of proper management systems,
and the extensive use of high-yield varieties such as Cavendish bananas, which are the
most popular (and sometimes the only) variety in most countries in the world. Except for
very thin niche markets, local varieties serve the local demand.
Figure 4.81: Banana exports from 2001 to 2017
0
100,000
200,000
300,000
400,000
500,000
600,000
700,000
800,0002
00
3
20
04
20
05
20
06
20
07
20
08
20
09
20
10
20
11
20
12
20
13
20
14
20
15
20
16
20
17
Production in tonnes Exports in tonnes
0
5000
10000
15000
20000
25000
20
01
20
02
20
03
20
04
20
05
20
06
20
07
20
08
20
09
20
10
20
11
20
12
20
13
20
14
20
15
20
16
20
17
banana exports in ton

Page | 228
Exports grew sharply after cultivation began in Sri Lanka by a giant global partner in
world trade entering into an agreement under BOI (Figure 4.81). Over 80 percent of the
world banana trade is controlled by five companies, including DOLE, the largest fresh
fruit producer in the world accounts for quarter of banana production in the world. Dole
Lanka Pvt. Ltd. is a subsidiary of Dole Asia Holdings Pte. Ltd. Founded in Hawaii in
1851, Dole Asia Holdings Pte. Ltd., based in Singapore, is the global operating
headquarters of the Dole Group of companies owned by the ITOCHU Corporation and
does business in more than 70 countries. Dole is one of the world's largest producers and
marketers of high-quality fresh fruit and fresh vegetables and produces and markets a
worldwide line of packaged and frozen foods. Dole Lanka operates several banana farms
in the country from 2005, primarily located in Buttala, Demodara, Embilipitiya, Kuda
Oya, and Mahiyanganaya. Like most tropical fruits, bananas are highly perishable, which
need efficient harvesting, packing and transportation systems when export markets are
targeted.
At the early stages of introducing Cavendish to Sri Lanka, CIC was collaboratively linked
with DOLE Food Company for five years of time. More overly policies enacted to
quarantine process, severely affected on initial steps of the Cavendish banana introduction
to Sri Lanka, where the public sector interference was provided to loosen those
restrictions by allowing import of disease free planting materials, and released after a
period of one month.
Bananas for export are shipped green in refrigerated vessels that prevent them from
ripening before arrival. Once they reach the destination they are ripened in special
facilities.
The Cavendish type banana is cultivated in CIC farms, located in Hingurakgoda and
Pelwehera. The Hingurakgoda farm owns 50-acres of Cavendish banana plantation where
banana is planted under strict international conditions and the processing plant of banana
exports. The packing house of banana was built to process banana for export market as
per the agreement with one of the world‘s largest fruit exporter DOLE. This pack house
has capacity of handling and storing 20 MT of banana per day under controlled
temperatures. High quality bananas are grown for the export markets using modern
technology and the latest agricultural methods. The farm uses a high-tech sprinkler
system for the supply of water and fertilizer. Pelwehera farm has a banana plantation of
150 acres where the cultivation is irrigated with micro-irrigation techniques.
CIC produces and sells approximately 3,000 MT of Cavendish bananas every year
(exports and local markets included). Another initiative taken by CIC is to embark on
contracted orchards to grow Cavendish bananas to meet the demands of this growing
market. CIC produces around 175,000 planting material per annum. CIC exports between
25 to 50 metric tons of Banana every month to European Countries. In addition, the
company also supplies the export quality banana to all leading supermarkets in Sri Lanka

Page | 229
and is also available at all Fresheez and Juiceez outlets. Demand for high quality bananas
has been on the increase, and CIC seeks to collaborate with exporters and out-growers to
grow Cavendish bananas.
This Cavendish fruit has an increasing demand in the export market, generated by the
non- destructive quality of the fruit in exporting and the high food quality and taste of the
fruit. The Middle East is a prime export market for CIC bananas. Banana Export
destinations - Saudi Arabia Qatar United Arab Emirates
There are plans to extend the plantation of bananas to other parts of the island.
Sri Lanka records the lowest national yield among the countries studied (Table 4.26).
Average yield is mostly determined by the type of banana variety cultivated.
Table 4.26: Area harvested, yield and production of banana in Sri Lanka and
neighbouring countries
Source: FAO
4.2.2.a Land productivity and labour productivity
Land productivity and labour productivity of main banana varieties cultivated by local
farmers for domestic market are presented below from the study. Ambul variety has the
highest yield compared to Seeni and Kolikuttu varieties when the first crop harvest is
concerned. Kolikuttu variety is susceptible to Panama disease and therefore kolikuttu
cultivation is kept only up to its first crop harvest in most instances. It is therefore a
common practice in mahaweli areas to practice crop rotation. After cultivation of
kolikuttu variety, farmers will grow paddy for few seasons. Ambul variety is resistance to
the diseases. Usually ambul and seeni cultivations will go for few years. Panama wilt,
banana streak virus disease, yellow sigatoka, and banana bunchy top are common
2016 2017
Area
harvested Yield Production
Area
harvested Yield Production ha kg/ha tonnes ha kg/ha tonnes Bangladesh 47432 16824 798012 48644 16592 807104 India 841000 34643 29135000 860000 35438 30477000 Sri Lanka 57256 11499 658389 57976 11621 673764 Thailand 42606 23258 990926 43000 23256 1000000 Vietnam 120041 16177 1941935 125456 16303 2045352

Page | 230
diseases. Fusarium wilt of banana, popularly known as Panama disease, is a lethal fungal
disease caused by the soil-borne fungus Fusarium oxysporum f. sp. cubense (Foc).
Compared to Kolikuttu and Seeni varieties, Ambul has a high yield. Above 40 mt/ha yield
can be obtained from properly maintained Ambul cultivation. Cavendish bananas can go
up to 45-50 mt per hectare yield with the use of proper management systems (Table 4.27)
Table 4.27: Input use, yield and labour productivity by type of banana variety
Source: Sample survey 2019
4.2.2.b Factor productivity analysis
The results of the factor productivity gaps arising from efficiency of resource use through
technical and allocative efficiency by farmers in response to better information and
education are presented here. A proxy variable measures the efficiency i.e. quantity
production per Rs spent by banana farmer. This proxy variable was regressed with
variables given below. In constructing the dependent variable; quantity production per Rs
spent, cost of cultivation was calculated. Cost of cultivation included two cost
components, the establishment cost and the maintenance cost. Kolikuttu banana usually
stays in the field for 14 months. Harvesting starts from 13-14 months after planting and is
grown as annual crop. Ambul and Seeni banana varieties are considered as perennials
having harvest every year. Of these varieties the second year harvest was taken as the
output for the productivity analysis. The establishment cost is considered as a fixed cost
and the fixed cost component of a year was taken as the establishment cost. The variable
cost of the second year was taken as the maintenance cost. With this information, the
dependent variable was constructed by dividing banana output/harvest by total cost per
year.
2019 Ambul Kolikuttu Seeni
Planting density (Plants/ha) 1191 2543 1156
NPK (kg/ha) 4425* 3520* 2708*
Compost (kg/ha)
Crop Establishment labour
(md/ha)
36 45 37
Crop Maintenance and
harvesting Labour (md/ha)
187 197 169
Yield (Kg/ha) 43041 21129 32143
Establishment Cost 76653 99228 80981
Maintenance Cost 557572 616757 467158
Labour productivity 230 107 190

Page | 231
The farmers chosen in this study are from Uda Walawa irrigation scheme, the main
banana growing area in the country. Once in 1982 the management of Uda Walawe
project came under administration of Mahaweli Authority of Sri Lanka (MASL), farmers
were allowed to cultivate OFC other than paddy. It was revealed later that since 1986
until 2001, an increase in part of land occupied by OFC increased from 5 % to 40 %, out
of which 30 % were bananas. These southern Dry Zone soils were well suited to OFC
cultivation. Apart from Banana, papaya is grown in crop rotations with paddy.
Table 4.28: Socio-economic characteristics, different agricultural practices and
technology adopted by sample farmers
Factors Attribute % Respondents
Age of the HH Above 40 years 77%
40 years or below 23%
Level of Education HH GCE (O/L) and above 30%
Below GCE(O/L) 70%
Land Extent < = 1 Ac 3%
>1 Ac 97%
Land ownership Own 37%
Other 63%
Experience in farming > 40 10%
< = 40 90%
Experience in Banana farming < = 5 years 45%
> 5 years 55%
Banana Variety
Ambul=1 36%
kolikuttu=2 32%
Seeni=3 32%
Planting density > 600 plants per ac 35%
< = 600 plants per ac 65%
Micronutrients Yes 30%
No 70%
Mechanical land preparation Yes 47%
No 53%
Mechanical weeding Yes 35%
No 65%
Training on banana cultivation Yes 20%
No 80%
Technical advices on banana cultivation
Yes 74%
No 26%
Source: Sample survey 2019

Page | 232
A descriptive analysis is given in the table above
Analytical Model
The independent variables of the factor productivity gap analysis were the selected socio-
economic characteristics and agricultural practices and technologies farmers have adopted
in their cultivation.
The multiple regression model is expressed implicitly as:
FPi = β0+ β1Χ1+ β2Χ2+ β3Χ3+ β4Χ4+ β5Χ5+ β6Χ6+ β7Χ7+ β8Χ8+ β9Χ9+ β10Χ10+
β11Χ11+ β12Χ12+ β13Χ13
Where, FPi = Quantity produced per Rs
β0 = Constant term
βk = Coefficient to be estimated
Χ1 = Age of banana farmers in years
Χ2 = Education level in years
Χ3 = Land size
Χ4 = Ownership
Χ5 = Experience in farming
Χ6 = Experience in Banana farming
Χ7 = Banana Variety
Χ8 = Planting density
Χ9 = Micronutrients
Χ10 = Mechanized land preparation
Χ11 = Machinery Weeding
Χ12 = Technical Advice
Χ13 = Trainings on Banana cultivation
In the sample there are 10 % farmers who have more than 40 years of farming experience.
There were the few original new settlers who occupied these lands in 80‘s. Most farmers
have more than 5 years of banana farming experience. These farmers are technically
efficient that factor productivity significantly increased with experience. Education is
highly significant that educated farmers use resources efficiently. Highest resource use
efficiency is observed in Seenikesel cultivation. Educated experienced farmers can act as
extension agents who have wider knowledge on better management practices.

Page | 233
Table 4.29: Results of the regression analysis of banana (Method: Least Squares)
Variable Coefficient Std. Error t-Statistic Prob.
Age of HH -0.0000573 0.000713 -0.080382 0.9361
Level of Education HH 0.011613 0.003615 3.212461 0.0019
Land Extent 0.003633 0.002894 1.255344 0.2128
Land Ownership 0.013224 0.008938 1.479466 0.1427
Experience in farming 0.00119 0.000678 1.755714 0.0827
Experience in Banana
farming
-0.000177 0.00072 -0.246462 0.8059
Variety : Ambul -0.052047 0.009516 -5.469343 0
Kolikuttu -0.079123 0.020198 -3.917469 0.0002
Seeni 0.028075 0.040203 0.698341 0.4869
Planting Density 0.0000233 3.02E-05 0.772388 0.442
Application of Micronutrients -0.007208 0.008754 -0.823387 0.4126
Mechanized Land
Preparation
-0.011019 0.007914 -1.392391 0.1674
Machinery Weeding -0.002606 0.008412 -0.30981 0.7575
Technical Advices 0.005739 0.009044 0.634549 0.5274
Trainings on Banana
cultivation
-0.005476 0.011379 -0.481199 0.6316
R-squared 0.547598
Adjusted R-squared 0.473084
S.E. of regression 0.036654
Durbin-Watson stat 2.085494

Page | 234
4.2.3 Papaya
Papaya has been cultivated in Sri Lanka primarily as a home garden crop. Due to viral
infections home garden cultivation dropped in wet zone areas. Disease problem and
cultivators getting a very high percentage of "male" or non-bearing trees were a perennial
problem with papaya growing.
Figure 4.82: Total cultivated extent of papaya, 1983 - 2018 Source: Department of Census and Statistics
In 1999 the Department of Agriculture recommended first papaya variety ―Ratna‖, a self-
pollinated composite variety with good quality fruit which was developed by HORDI
from a Malaysian inbred line. However, this variety did not assure 100% fruit-bearing
trees and was not resistant to virus diseases.
Sooner Department of agriculture recommended the importation of hybrid variety Red
lady after successful trials in Mahaweli areas. Introduction of this variety made a
breakthrough in papaya production that extent under cultivation and the commercial
cultivation increased sharply. This variety has several superior characteristics. It is an
extra dwarf, early bearing and vigorous and productive crop that is tolerant to ring-spot
virus. The flesh of the fruit is thick red, hard, with a good aroma and has good keeping
and serving quality and the best papaya variety for transport. This variety fetches a good
market internationally. Fruits weighing 2-5 kilos are commonly obtained under Sri
Lankan conditions.
With the introduction of new varieties initially Ratna and then Red lady, cultivation
revived and spread into dry zone areas. At present the extent of papaya cultivation is 6178
ha (2018). Papaya extent has increased from 3000 ha in 2001 to 8080 ha in 2010 which
dropped again after 2010 (Figure 4.82). Kurunegala district is the highest producer in the
0
1,000
2,000
3,000
4,000
5,000
6,000
7,000
8,000
9,000
10,000
19
83
19
85
19
87
19
89
19
91
19
93
19
95
19
97
19
99
20
01
20
03
20
05
20
07
20
09
20
11
20
13
20
15
20
17
Extent Cultivated(estimated), ha

Page | 235
country by 2018. Cultivation in the wet zone districts has gown down. Hambanthota
Anuradapura and Gampah, districts cultivated more than 370 ha (figure 4.83).
Cultivated Extent of Papaya, 2018
Figure 4.83: Cultivated extent of papaya by main districts Source: Department of Census and Statistics
Papaya has a very high demand in the local market. Before introducing the new varieties,
there had been some papaya imports from Thailand and Singapore to meet the local
papaya demand. Although international trade statistics show two digit values of papaya
exports from 2000 (Figure 4.84), papaya had been exported to Germany, Bangladesh,
Bahrain and Maldives in small quantities. The fruit is used as fresh fruit as well as for
other processed products. Exporting papaya shows an increasing trend with the
introduction of new improved exotic varieties, particularly ―Red Lady‖ which has a very
high demand in the international market.
Gadm36_lka_1.shp < 50 Ha50 - 140 Ha140 - 280 Ha280 - 370 Ha > 370 Ha
-
500
1,000
1,500
2,000
2,500
2010 2011 2012 2013 2014 2015 2016 2017 2018
Extent Cultivated, ha
Hambantota
Anuradhapura
Kurunegala

Page | 236
Figure 4.84: Production and exports of papaya 2001 - 2017
Source: FAO, ITC
However papaya demand in the local market is still competitive that papaya FOB prices
are lower than local market wholesale prices during some period of the year making it
profitable for farmers to supply to local market (Figure 4.85). Papaya has a good
demand for local as well as export markets.
.
Figure 4.85: FOB and wholesale price of papaya, 2018 Source: HARTI
0
10000
20000
30000
40000
50000
60000
70000
20
01
20
02
20
03
20
04
20
05
20
06
20
07
20
08
20
09
20
10
20
11
20
12
20
13
20
14
20
15
20
16
20
17
Production ('000 No.)
Exports (tons)
0
50
100
150
200
250
Jan Feb Mar Apr May Jun Jul Aug Sep Oct Nov Dec
Papaya prices in local market and international market, Rs/kg
Wholesale Price
FOB Price

Page | 237
Figure 4.86: Papaya exports from 2001 to 2017
Source: FAO, ITC
Papaya exports show a continuous increase after 2013 bringing in some 3.5 million
dollars to the country by exporting 5,072 mt of fresh papaya. UAE is the main destination
of papaya exports (Figure 4.86 and figure 4.87).
Figure 4.87: Papaya exports by export destination Source: FAO & ITC
4.2.3.a Land productivity and labour productivity
When the average yield of neighboring countries are concerned, Sri Lankan yield is only
higher than Bangladesh (if one nut is assumed to be 1.5 -2 kg) (Figure 4.88). India
produces 45% of the world production and Indian papaya yield is 120 times the South
Asian yield. Sri Lanka has to compete with India for the international market particularly
UAE market.
0
1000
2000
3000
4000
5000
6000
Papaya Exports in tons
0
500
1000
1500
2000
2500
3000
20
01
20
02
20
03
20
04
20
05
20
06
20
07
20
08
20
09
20
10
20
11
20
12
20
13
20
14
20
15
20
16
20
17
Tho
usa
nd
US
Do
llars
Other Countries (Japan,USA, EU)
United Arab Emirates

Page | 238
Figure 4.88: Average yield of papaya in Sri Lanka and in neighbouring countries
Source: FAO
As farmer adopting the new varieties, significant average yield increases of papaya is
seen (Figure 4.89). Quality seed production of Ratna variety and availability of quality
hybrid imports are the contributory factors for adoption of this technology.
Figure 4.89: Average yield of papaya 2001 - 2018 Source: Department of Census and Statistics
There is a drop in extent cultivated after 2011 and a yield increase is observed since then
up to 2014 depicting more efficient farmers to remain in commercial cultivation (Figure
4.90).
0
5,000
10,000
15,000
20,000
25,000
30,000
35,000
40,000
45,000
50,000
Bangladesh India Thailand Sri Lanka(Nuts/ha)
World South Asia
Average yield by country and region, kg/ha
2010-2015
2015-2018
0
1000
2000
3000
4000
5000
6000
7000
8000
9000
10000
20
01
20
02
20
03
20
04
20
05
20
06
20
07
20
08
20
09
20
10
20
11
20
12
20
13
20
14
20
15
20
16
20
17
20
18
Yield (No per ha)

Page | 239
Figure 4.90: Extent, yield and production base year 2001= 100 Source: FAO
The size of the fruit is also an important quality parameter that leads to farmer‘s selection
of variety apart from the yield. The market failure with large size fruit supplies coming to
market due to cultivation of Red Lady variety, farmers tend to cultivate alternative
varieties. In 2014-15, 'Horana Papaya Hybrid' variety was recommended and released by
the FCDRI of DOA. It is a medium size variety with high yield. It is still being
popularized among farmers through various programs. Apart from locally promoted
varieties, varieties such as Solo Sun Rise, Tainung are on the adoption by farmers.
Tainung is an important hybrid developed in Taiwan that has resistance to papaya ring-
spot virus disease which was developed from a cross between Florida (FL-77-5) and the
Costa Rica Red.
The land productivity and labour productivity across years are compared based on
statistics from DOA crop enterprise budgets, DCS estimates and the sample of the study
and are given below for the years 2005, 2012, 2017 and 2019. It shows very high yield
variability across years and across main producing areas. Potential average yield at
farmers level are comparable to international high yields. Varieties such as Red Lady
have yields to the level of average yield of India. Nevertheless, farmer‘s choice of variety
is determined by not only yield but also the size of the fruit is an important parameter.
0
50
100
150
200
250
Extent Production Yield

Page | 240
Table 4.30: Land productivity, labour use and labour productivity of papaya by
variety
20051 2012
1 2017
1 2019
2 2019
2
District Puttlam Puttlam Puttlam Kurunegala Vavuniya
Variety Ratna Red Lady Red Lady Tainung/Red
Lady
Red Lady
Land productivity (Yield)
DOA and study sample estimates
kg per ha
42778 42778 128000 34762 74849
DCS district average estimates
number of fruits per ha
7760 15929 10522 7710 10524
Kg per ha Range*
Minimum 11640 31858 21045 15421 21048
Maximum 15520 79644 52612 23131 52619
Labour Use (DOA and study
estimates)
Crop Establishment labour (md/ha) 150 125 135 98 85
Crop Maintenance and harvesting
Labour (md/ha)
147 147 158 306 227
Labour Productivity (kg/md) 193 204 568 98 278
*2 kg & 5 kg per ha for Red Lady and 1.5 kg &2.5 kg per ha for Ratna & Tainung 1 DOA crop enterprise budgets,
2 Study estimates
Crop establishment labour component is calculated considering economic life of papaya crop is two years.
4.2.3.b Total Factor Productivity Gap among Papaya Farmers: Findings from the
cross section study
The factors affecting farmer‘s efficiency of using resources and choosing the existing
technology for increasing productivity was estimated by developing a regression model.
A proxy variable was constructed to measure the efficiency i.e. quantity production per
Rs spent by farmer. This measure is approximated to Factor Productivity. This proxy
variable is used to analyse the total factor productivity gap among farmers within a year
due to efficiency and was regressed with variables that are determinants of productivity
across a year. If farmer gets more output from money he spent on production, farmer is
considered to be more efficient in using resources and choosing the existing technology.
Factors determining productivity are variables representing the farmers‘ level of technical
knowledge (a number of agronomic practices in crop establishment) and socioeconomic
status (education, tenure, and income).

Page | 241
In constructing the dependent variable; quantity production per Rs spent, cost of
cultivation was calculated. Cost of cultivation included two cost components, the
establishment cost and the maintenance cost. Usually one papaya crop stays in the field
for 3 years. Harvesting starts from 7-8 months after planting. The second year harvest was
taken as the output for the productivity analysis. The establishment cost is considered as a
fixed cost and the fixed cost component of a year was taken as the establishment cost.
The variable cost of the second year was taken as the maintenance cost. With this
information, the dependent variable was constructed by dividing papaya output/harvest by
total cost per year.
The independent variables of the analysis were the selected socio-economic
characteristics and agricultural practices and technologies farmers have adopted in their
cultivation.
Analytical Model
The multiple regression model is expressed implicitly as:
FPi = β0+ β1Χ1+ β2Χ2+ β3Χ3+ β4Χ4+ β5Χ5+ β6Χ6+ β7Χ7+ β8Χ8+ β9Χ9+ β10Χ10+
β11Χ11+ β12Χ12+ β13Χ13+ β14Χ14+ β15Χ15+ β16Χ16+E
Where, FPi = Quantity produced per Rs
β0 = Constant term
βk = Coefficient to be estimated
Χ1 = Age of papaya farmers in years
Χ2 = Education level in years
Χ3 = Income
Χ4 = Experience in Papaya farming
Χ5 = Land size
Χ6 = District (dummy variable)
Χ7 = Type of Cultivation (dummy variable)
Χ8 = Papaw Variety (dummy variable)
Χ9 = Planting density
Χ10 =Type of Planting Material (dummy variable)
Χ11 = Type of Fertiliser Applied (dummy variable)
Χ12 = Compost Applied (dummy variable)
Χ13 = Mulching (dummy variable)
Χ14 = Weedicide Applied (dummy variable)
Χ15 = Machinery Weeding (dummy variable)
Χ16 = Selling Papaya to export companies (dummy variable)
E = Independent error term
A descriptive analysis is given in the table below.

Page | 242
Table 4.31: Socio-economic characteristics, different agricultural practices and
technology adopted by sample farmers
Factors Attribute % Respondents
Age (Years) of the HH Above 40 years 73%
40 years or below 27%
Level of Education HH GCE (O/L) and above 36%
Below GCE(O/L) 64%
Monthly Income of the family > 40000 Rs /month 36%
< 40000 Rs /month 64%
Experience in Papaya farming < = 5 years 86%
> 5 years 14%
Land Extent ( Ac ) < = 1 Ac 57%
>1 Ac 43%
District Kurunegala 57%
Jaffna 43%
Type of Cultivation Mono Cultivation 70%
As an Under Crop 30%
Papaw Variety Red Lady 64%
Taninug 36%
Planting density > 600 plants per ac 20%
< = 600 plants per ac 80%
Type of Planting Material Plants/seedlings 50%
Seeds 50%
Type of Fertiliser Applied Straight 41%
Mixed 59%
Compost Applied Yes 36%
Not 64%
Mulching Yes 55%
No 45%
Weedicide Applied Yes 20%
No 80%
Machinery Weeding Yes 34%
No 66%
Selling Papaya to export companies Yes 20%
No 80%

Page | 243
Results of the regression analysis of papaya are given in table 4.32. Of the main socio-
economic factors, age and education are somewhat significant. Although majority farmers
are above 40 years of age, most farmers are new to papaya farming.
All sample farmers use supplementary irrigation during drought periods. Studies (Aheer
et al 2005) have shown that papaya cultivation under micro-irrigation has higher
economic viability and adopting micro irrigation technology by papaya farmers can
increase productivity and profitability.
Having the district variable significant it shows that Jaffna farmers have used resources
efficiently. Land size is a significant factor. In the sample, 57% of farmers are cultivating
less than 1 Ac. In order to increase the efficiency of production at least more than one
acre of cultivation is advisable.
Table 4.32: Results of the regression analysis of papaya (Method: Least Squares)
Variable Coefficient Std.
Error
t-
Statistic
Prob.
C -0.382 0.131 -2.913 0.007 ***
Combine Variable (Age, Education
level, Experience)
0.022 0.008 2.624 0.014 **
Monthly Income of the family 0.0006 0.000 -1.589 0.123
Land Size 0.060 0.016 3.708 0.001 ***
District 0.169 0.043 3.925 0.000 ***
Type of Cultivation -0.051 0.026 -1.983 0.057 *
Papaw Variety 0.049 0.033 1.506 0.143
Planting density 0.000 0.000 2.033 0.051 *
Type of Planting Material -0.045 0.031 -1.465 0.154
Type of Fertiliser Applied 0.003 0.041 -0.078 0.938
Compost Applied -0.036 0.019 -1.927 0.064 *
Mulching 0.147 0.032 4.599 0.000 ***
Weedicide Applied -0.024 0.024 -0.967 0.341
Machinery Weeding 0.091 0.021 4.304 0.000 ***
Selling Papaya to export companies -0.009 0.028 -0.320 0.751
R-squared 0.782
Adjusted R-squared 0.677
S.E. of regression 0.05556
Durbin-Watson stat F-statistic 1.787

Page | 244
Good management practices such as mulching, machinery weeding are increasing the
factor use efficiency of papaya farmers.
Figure 4.91: relationship between land productivity and factor productivity
The above relationship between land productivity and factor productivity (land is not
included as a factor) of papaya farming shows that farmers those who use resource
efficiently by adopting good management practices have increased their land
productivity. Higher the efficiency of resource use the higher the land productivity
(Figure 4.91).
Land productivity = TE + initial fertility and other conditions +input use cross sectional
analysis
y = 121677x + 7909.7 R² = 0.482
0
10000
20000
30000
40000
50000
60000
70000
80000
90000
100000
0.000 0.100 0.200 0.300 0.400 0.500
Lan
d p
rod
uct
ivit
y
Factor Productivity

Page | 245
4.2.4 Passion fruit
– Mostly cultivated in homesteads
– Most farmers interviewed are new entrants to the cultivation. There are farmers
who have traditionally been in passion fruit cultivation have dropped cultivation
for years and stated again. There is no consistency/constancy.
– NGOs have promoted passion fruit cultivation as an additional income support
– Private sector such as Elpitiya plantation has started commercial cultivation in
small scale.
– Planting density varies around 400 plants per acre.
– Harvesting quantity varies around 150 kg/ 200 kg per week.
– Harvesting begins 6 months after planting and can have the crop for about 4-5
years.
4.2.4.a Land productivity and labour productivity
Yield estimated by the study is significantly lower than the DOA estimates for the first
three years of the crop (figure 4.92). Passion fruit cultivation is a mostly a sub
commercial cultivation that management of the crop is important determinant of yield
which is determined by price of passion fruit.
Figure 4.92: Passion fruit yield in kg per ha.
Note: 2012, 2015 and 2017 yield estimates were from crop enterprise budget
of DOA. Study 2019 estimates records only up to the 3rd
year of harvest as
sample consisted of new farmers.
Planting density and the fertilizer application do not show much variation across the
years. Farmers had followed the recommendations of the DOA since most cultivation had
guided by the support of the extension officer. Most farmers are new to the cultivation.
0
5000
10000
15000
20000
25000
30000
2012 2015-2017 2019
Yield in kg per ha
1st year 2nd year
3rd year 4th year
5th year

Page | 246
The data does not provide adequate concrete information on productivity parameters
(Table 4.33). Therefore a qualitative assessment has been done on productivity of passion
fruit cultivation.
Table 4.33: Factor use and productivity information in passion fruit farming
Crop establishment cost and labour component was accounted by assuming economic life of passion fruit
crop as five years. 1 DOA Crop Enterprise Budgets,
2 Study estimates
4.2.4.b Productivity related factors
1. Output price – farmers tend to use better management practices when the prices
are attractive. However, there is high price volatility in the market (Figure 4.93).
Passion fruit cultivation is a viably profitable cultivation when price fluctuates
between, Rs. 60.00 and Rs. 120.00. Growers will be more benefitted when the
output price ranges in between Rs. 80.00 and Rs.120.00.
Figure 4.93: Wholesale price of passion fruit
0
50
100
150
200
250
300
350
Jan Feb Mar Apr May Jun Jul Aug Sep Oct Nov Dec
Whole sale price of passionfruit Rs per Kg
Gampaha Kalutara
20001 20051 20121 20171 20192
Planting density (Plants/ha) 1100 1125 1125 1125 1059
NPK (kg/ha) 759 776 866 866 1022
Compost (kg/ha) 7500 5625 11250 1792
Crop Establishment labour (md/ha)
39 215 216 216 278
Crop Maintenance and harvesting Labour (md/ha)
245 190 105 105 278
Yield (second year) (Kg/ha) 10000 28000 28000 28000 8736
Establishment Cost (Rs) 66,675 330550 607220 1078700 565320
Maintenance Cost (Rs) 67,804 112984 178382 389872 466657
Labour productivity (kg/md) 40 120 189 189 26

Page | 247
Source: HARTI
2. Shift in area of cultivation
2002 2018
3. Better Management Practices - Management practices like as pruning and trellising of
wines increases the yield of the crop. Trellising is being practiced by establishing a poll in
between two wines. The yield can be increased using some techniques such as
encouraging the crop to grow downward by cutting down the tendrils, where the crop
tends to grow upward and that technique may result in plant stress, and will stimulate the
growing pattern, and decrease the foliage cover. It may affect the emerging of flowers,
hence pollination should be used to encourage flowering rate. Hand pollination should be
done in the case of less pollinators. NPK and less amount of Borax or liquid fertilizer
application are necessary for the growth. (Passion fruit requires less amount of fertilizer
for the growth). Passion fruit is less affected crop by pests, where shoot shallowing
caused by the deficiency of nutrients, bat attacks and porcupine attacks could be
observed.
4. Better Varieties – Horana Gold, virus free passion fruits variety, released by the
FCRDC, in 2017 is getting popular presently as some early varieties like Mahaweli, failed
due to less yield capacity. Extension agents promote growers to produce and maintain the
stock of ―Horana Gold‖ seeds through hand pollination.
5. Financial Assistance – New passion fruit cultivations introduced in some instances has
happened as a donor assisted partnership, out growing, and buyback programs. The donor
agencies tend to offer micro finance assistance for the passion fruit growers. For instance,
Microfinance Berendina Institute (Gte) Ltd (BMI), a leading poverty-alleviation agency
in the Microfinance Sector is extending assistance for passion fruit cultivation under its
microfinance initiative in popularizing this cultivation in the Ipalogama area in
Gadm36_lka_1.shp
<10 ha
10 - 25 ha
25 - 100 ha
100 - 200 ha
Gadm36_lka_1.shp
<10 ha
10 - 25 ha
25 - 100 ha

Page | 248
Anuradhapura district, and IFAD funded partnership programs implemented under
National Agribusiness Development Program, in Northern area for Passion fruit
cultivation was embedded with a micro finance assistance.
6. Partnerships and Buy-back Programs – Passion fruit that are cultivated as a partnership
program or under buyback programs, stakeholders in those programs supply facilitates
like; technical training, extension services and assists with selected inputs such as micro
irrigation systems and water pumps to manage water as well as other equipment required
for passion fruit cultivation (Pruning tools). In buyback programs, the particular company
buys the harvest from the grower. Presently, Cargills Ceylon PLC, and Lanka Canneries
(Pvt) Ltd as collectors, plays a prominent role in these programs and the collected harvest
used for processing. Various ranges of market products can be observed as ready to drink
juices and cordials. As highlight bulletins, Cargills (Ceylon) PLC together with SOLID a
project by USAID ceremonially handed over equipment to farmers in Anuradhapura and
Vavuniya recently as part of the 100 acre fruit cultivation project that was initiated in
2015. Cargills in collaboration with USAID has mobilised 250 farmers from
Mahavilachchiya, Anuradhapura and Kilinochchi wherein each farmer is supported to
cultivate half an acre of land with passion fruit. Cargills has entered into a buy-back
agreement with the participating farmers with a minimum price pre-agreed yet offering
higher prices as market fluctuates. Cargills also provides extension services to the farmers
to enhance product quality and productivity. SOLID under USAID facilitates technical
training and assists with selected inputs such as micro irrigation systems and water pumps
to manage water as well as other equipment required for passion fruit cultivation. And
also, cultivation of passion fruit in immature areas of rubber grown lands was proposed as
a pilot project in Devitura. Project commenced in end 2015 on a 2 Hectare land in
Kirimatiya Division in Elpitiya. Project is on a buy back agreement with Lanka
Canneries (Pvt) Ltd. (LCPL). Technical advice is being provided by Department of
Agriculture, Sri Lanka.
Success Story:
The World Bank report published in February 2014, stated the success story of Mrs. D.M.
Sumanawathie from Siyambalanduwa who has empowered by the Second Community
Development and Livelihood Improvement Project (Gemidiriya) funded by World Bank. She
was initially engaged with paddy cultivation where in somedays herself and her husband
earned only Rs.125.00 per day. By moving in to passion fruit cultivation she was able to earn
around Rs. 62,400.00 by selling passion fruit trees. The total investment by the project in
her passion fruit cultivation was Rs.4700, which included 100 passion fruit plants, wire
and technological inputs. Today, Sumanawathie earns over Rs. 18,000 a month from her
passion fruit cultivation per week alone.‖ it states.

Page | 249
CHAPTER 5
FINDINGS, CONCLUSION AND RECOMMENDATIONS
In this analysis, efficiency of domestic food crop sector was measured by calculating
Total Factor Productivity (TFP). TFP measures how efficiently agricultural land, labor,
capital, and materials (agricultural inputs) are used to produce agricultural output. Land
productivity and labour productivity were also calculated which are used to measure
agricultural productivity performances. Source of output growth was decomposed in to
growth due to input growth and TFP growth (growth of efficiency of input) and source of
growth was further decomposed in to land expansion growth, growth of factor
intensification on land and TFP growth.
This chapter summarizes the findings of the study encompassing productivity growth of
ten crop sectors studied over the period from 1990 to 2018 and the determinants of
productivity growth. Study proposes the required changes in policies and the changes
required in prioritizing government expenditure allocations and essential changes in
regulations as recommendations.
Study examined the TFP determinants by reviewing the sector in detail. Due to
inadequacy of data, especially the lagged data on research and development no
quantitative analysis was performed for developing a model in order to examine how
these determinants may have contributed to agricultural TFP growth. This is one of the
limitations of the analysis that it is not possible to quantify the effect of different public
expenditure allocations on TFP growth. Nevertheless, results of some studies that had
analysed the impact of public expenditure using cost benefit analysis have been discussed
in various chapters. Simple regression models have been developed in other countries
with lagged variables according to the data availability.
5.1 FINDINGS
1. No significant structural changes in domestic food crop farming
Sri Lankan domestic food crop sector is characterized by less land and less labour
abundant small farmer dominated sector. There has been no or negligible structural
change in farming. Food crop production is predominantly carried out by small farmers in
the informal sector.
According to department of census and statistics, small holder sector is classified as
consisting of farmers owning less than 20 ac and holdings comprising more than 20 ac are

Page | 250
considered as estates. Generally estate sector represents the plantation crops in Sri Lanka.
Except the Dole Lanka operations, food crop sector does not operate at large scale. In the
small holding sector, more than 66% of farmers are having less than 2 ac land plots. In the
older settlement schemes in Ampara and Polonnaruwa, farmers own/operate farms larger
than 2 ac.
Number of Farmers Extent
< 1 Ac 937,195 442,057
1 - 2 Ac 590,256 749,168
< 2 Ac 1,527,451 1,191,225
Food crop production involves a large number of individuals making decision based on
the available information and resources.
In the main OFC cultivating areas, semi-subsistence family labour dependant farming is
predominant. Yet sub-commercial systems with cultivation based on market signals are
emerging (Wickramasinghe, 2013).
2. Share and the role of the public sector, private sector (corporate sector), farmers
(commercial/subsistence) and international agencies including NGOs in the Sri
Lankan agriculture have changed
Policies after liberalizing the economy in various stages have focused on getting
increased participation of the private sector for activities of the food crop sector partially
withdrawing government from activities such as input supply, output purchasing. Policies
reviewed in chapter 2 deals with a detail account of this.
Government sector‘s involvement is mainly on the provision of irrigation and other
infrastructure, implementing regulatory measures and research and development
functions. Seed production, fertilizer delivery, credit and insurance continue to be part of
functions of the government.
The strength of department of agriculture as the main government institute for research
and development of the domestic food crop sector has been diluted by not recognizing its
pivotal role for food crop sector development. Existence of large vacuum of human
resources is weakening the entire research system of the department of agriculture.
Engagement with international agencies for germplasm exchange, technology transfers,
human resource training has gradually declined. The involvement of international
agencies in India and Bangladesh is comparatively significant.

Page | 251
Private sector is mainly involved in importing fertilizer, agro chemicals, machinery and
improved/hybrid seeds. Corporate sector is also involved in seed and planting material
production, research and development and diffusion of machinery technology in varying
scales. Main determinants of private sector investment in domestic food crop sector are
market size, available option to share risk, incentives, and their involvement in
stakeholder dialog for decision making. The private sector engagement in India,
Bangladesh, and Vietnam in developing new varieties/ hybrids, manufacturing
machineries is remarkable. These countries have large markets.
Sri Lankan environmental laws and regulations and the social acceptance have not been
conducive for large scale operations of multinational companies like Dole Lanka in Sri
Lanka unlike in other countries in Asia for the production in the crop sector. Contract
grower system is most effective in terms of expansion of area. Eg. Contract grower
system of maize.
Farming community represents both commercial and semi-subsistence farmers. Although
semi-subsistence farmers do not respond adequately to market signals, commercial
orientated farmers are in need of information and market signals.
3. Country continues to adopt import substitution strategy for field crops while
export promotion strategy for fruit crops
Domestic food crop sector is hardly competitive in the international trade that Sri Lanka
is not efficiently using resources as Sri Lankan TFP in the domestic food crop sector is
low compared to neighboring countries. Therefore trade policy instruments such as tariffs
have been used in Sri Lanka to maintain import substitution strategy for cereals and other
food crops.
With the opening of the economy in 1977, doors were open for technology transfer in
terms of technology products; improved seeds, machinery, agrochemicals which
positively impacted and crop sector was not opened for competition. When Structural
Adjustment Policies were implemented in 1989 and the fertilizer subsidy was removed
abruptly, farmers‘ response as a reaction to this shock affected the TFP of paddy sector.
Subsequently, subsidy scheme was reinstated in 1991 that up to now fertilizer subsidy is
implemented in various forms and degrees. In 1996 when the other field crop sector was
opened, it affected the other field crop sector that farmers abandoned dry chili production
midst the already affected production due to prevalence of diseases. From 1998, country
started implementing a seasonal tariff imposition method to protect the seasonal local
supplies from import competition.
Export promotion strategy has been adopted for fruit crops to benefit from tropical fruit
demand in the world. This sector is stagnating in the recent years.

Page | 252
4. Government expenditure is mainly diverted to input intensification
Government expenditure on irrigation investments and fertilizer subsidy transfers
constitute the main budgetary allocations and investment on research and development
which has very high returns is less than 2% of the total agriculture and irrigation
expenditure (Figure 5.1).
Irrigation investment and fertilizer subsidy accounted to about 75 % of the total
investment on agriculture and irrigation after 2011. It is widely held opinion that
monitory benefits of these transfers and investments have trickled down the line.
Although irrigation and fertilizer are essential inputs for realization of yields of new
varieties, it was found in 80‘s, 90‘s that paddy yields were stagnating and were declining
in the absence of new technology. This leads to unnecessary resource use and inefficient
production. If the technology frontier cannot be shifted upward by introducing new
varieties and technologies, intensification of inputs or adding more capital on land would
lead to diminishing returns like what was observed in 80‘s and 90‘s in paddy sector. The
growth in output due to factor accumulation will eventually taper off, making the growth
process unsustainable in the long run. Therefore, investment on research and development
is essential for long-term growth.
Figure 5.1: Government expenditure/allocation for agriculture by type of item
Source: Central bank, budget estimates
0
5000
10000
15000
20000
25000
30000
1997-2005 2005-2010 2011-2018
Government expenditure/ allocations for agriculture in constant prices, Rs Mn
Irrigation Fertilizer Subsidy Credits
Research and development Extension and training Seed programs

Page | 253
5. Spending on research and human resources development has been below the
regional trends
When the national research expenditure by government in the neighbouring countries is
compared, Sri Lanka‘s investment in agriculture research and development is diverging
within the region (Figure 5.2 & figure 5.3). In measured in 2011 PPP dollar terms,
investment in agriculture research has been declining until 2010 and rose to the same
level of 2000 in 2016, mostly to the corresponding employees‘ salary increase in the state
and statutory research institutes.
Figure 5.2: Agricultural research expenditure in Sri Lanka and neighbouring countries as
base year 2000 =100
Source: ASTI, IFPRI
Research expenditure given in constant 2011 US dollars term further confirms that Sri
Lanka has not made a progress in allocating funds to this sector.
0
20
40
60
80
100
120
140
160
180
200National Agricultural Research Expenditure
2011 PPP dollars, 2000 =100
Bangladesh Vietnam
India Sri Lanka
ASTI‘s national agricultural research expenditure data is
categorized as salary-related expenses, operating and program
costs, and capital investments by government, non-profit, and
higher education agencies. Data on spending by private entities are
excluded, due to lack of availability

Page | 254
Figure 5.3: Agricultural research expenditure in Sri Lanka and neighbouring countries in
constant dollar terms
Source: ASTI, IFPRI
However, research expenditure as a percentage of GDP is highest in Sri Lanka which is
nearly 0.5% of agricultural GDP. In India, Bangladesh and Vietnam research expenditure
as a percentage of GDP are around 0.3, 0.4 and 0.2 respectively. Nevertheless agriculture
GDP in these countries are many time higher than Sri Lankan GDP.
In India, funding comes from four main sources: the central government provides about
50 per cent; state governments, about 20 per cent; private companies and cooperatives, 16
per cent; and foreign donors provide the rest. Private- sector research consisted primarily
of research on crop management and processing technology. Private companies have also
been in investing on exploiting hybrid vigor.
Researchers, total (FTEs)
ASTI‘s data on national agricultural researchers are expressed in full-time equivalent
(FTE) researchers (with official researcher status) employed at government, nonprofit,
and higher education agencies. Data on agricultural researchers employed by the private
sector are excluded due to lack of availability. FTE calculations take into account the
proportion of time scientists actually spend on research as opposed to other activities
(Table 5.1).
0
10
20
30
40
50
60
70
80
90
100
National Agriculture Research Expenditure in million constant 2011 US Dollars
Vietnam Bangladesh Sri Lanka

Page | 255
Table 5.1: No of researchers employed in agricultural research system in Sri Lanka
and neighbouring countries in FTE units
Bangladesh India Sri Lanka Vietnam
2000 1,590.4 13,106.6 517.7 2,461.4
2001 1,531.0 12,816.3 540.1 2,561.0
2002 1,580.8 12,643.9 543.4 2,715.8
2003 1,630.6 12,495.1 512.8 2,934.2
2004 1,669.1 12,346.9 501.7 2,933.3
2005 1,745.5 12,391.1 525.0 3,206.3
2006 1,792.4 12,003.6 582.9 3,250.8
2007 1,817.3 11,866.4 625.7 3,322.6
2008 1,841.7 11,811.3 652.4 3,513.8
2009 1,855.1 11,786.6 618.8 3,703.0
2010 1,960.8 12,042.3
3,744.2
2011 1,999.6 12,311.6
2012 2,121.0 12,674.2
2013
12,784.2
2014
12,746.6
Source: ASTI, IFPRI
6. Rate of technological innovations have been low
This is mainly due to the limited availability of technology particularly in terms of new
varieties with high yield and with better adaptability to farmers to adopt. ‗Research
potential‘ (RP) yield attained as a result of a successful applied research program directed
toward these crops and the ―science potential‘ yield increase attainable if new scientific
discoveries (e.g., in biotechnology) are made and utilized in an applied research program
are concerning issues in this regard.
Sri Lanka still cultivate varieties that were produced or introduced in its early adoption up
to today and in some instances it is the only promising variety grown for years.
Sri Lanka has not been able to exploit the science in technology development in the
recent past although Sri Lanka is the one of the earliest countries produced new improved
varieties through hybridization during green revolution, and adopted breeding method
such as mutation breeding

Page | 256
Soybean variety PB 1 is cultivated now for 40 years.
Dambulu Red selection, one selection of Pusa red emerged as a promising cultivar of Big
onion after 30 years of its cultivation
Chilli –Late but promising hybrid has been developed superior to imported hybrids.
Granola is only promising variety cultivated in potato farming
Pineapple -'Mauritius'
Eg. Yield Increase through Heterosis/hybrid vigor -Countries in the region have exploited
the heterosis/hybrid vigor of chilli, maize and other cross pollinated crops about many
decades ago. Sri Lanka was able produce chilli hybrid variety in 2015 a country that has a
very high genetic variability. We are late adopters of this technology.
Tissue culture technology – only successful in potato propagation and banana propagation
Until the bio safety policy is formulated, Bt technology cannot be tested in the fields.
Also there are issues related to adoption of available varieties.
Semi-subsistence nature of farming and low innovations
Food crop production involves large number of individuals making decision based
on the available information and resources. Most peasant farmers do not respond
adequately to market signals. Absence of a commercial orientation
Land ownership issues and adoption
Land fragmentation is common and there are second generation and third
generation land right issues particularly in settlement schemes. Cultivation on
short-term lease agreements (1 to 5 years) is found in settlement schemes as well
as in fruit crop cultivation. All this land related issues have hindered adopting
most advanced technologies available and better management practices that
affects the productivity.
7. Increasing wage rate has led to mechanization and adoption of other labour
saving management practices
Machinery use and application of weedicide are common practices farmers adopted due
to high wage rate of farm labour. Use of machinery and weedicides has contributed to the
TFP growth for their disembodied technology component although it involves a part of
technology embodied in capital. Therefore these two operations have been widely
adopted by farmers.

Page | 257
Rising wage rates in agriculture sector in response to rising wage rates in the non-
agricultural sector is made it increasing returns for mechanization. Mechanization
technology has a capital - embodied component and TFP increasing component.
Therefore both farmer and the input supplier are benefited from this technology adoption.
The other important consideration is that lately developed machineries in Japan are better
suited to small farm size in Sri Lanka. Early adoption of large tractors and harvesters
were replaced later with small-sized, light-weight tractors and harvesters
Sri Lanka has a largely mechanized agriculture sector next to Bangladesh in South Asia.
Machinery use in land preparation and harvesting is common in most food crop faming.
There is a large scope opened to mechanization in several management practices with
banning of some chemicals for weeding and due to scarcity of labour.
One of the important management practices that is being abundantly practiced by farmers
to overcome the shortage of labour and the rising wage rates is the weedicide application
which is commonly observed particularly after 2007. This technology is also having two
components that beneficial for farmer and the input supplier. However the TFP increasing
component of weedicide application which is a financial benefit to farmers has a social
cost that is latent; environmental cost and health cost. These costs are needed to be taken
for consideration when polices are designed.
Use of machine transplanter and weeder for crop establishment and weeding is the next
stage of mechanization in the paddy sector. However this technology is so far not yet
perfect. It has not been widely adopted. This combined technology can reduce the
weedicide application and transplanting can increase the land productivity by 10%.
Private sector is more likely to invest in diffusing this technology as this innovation is
embodied in capital goods that private sector finds a large market. Due to the market size
the private sector has in the other field crop sector for mechanization they are less likely
to invest in the mechanization in OFC sector other than maize. Therefore public sector
needs to take steps to develop or to be supplied machineries in the small crops sectors.
8. Contract grower system emerged as an institutional innovation that ensures
greater participation of the farmers in the free market system
Contract grower system which was introduced in late 90‘s by the government can be
considered as an important institutional innovation that organized farmers to a buyer or to
a processor who is competitively trading in business. Mostly processors operate in
monopolistic competition having a brand for their products, have been able to organize
farmers for quality and efficient production. Buyers themselves provide quality inputs,

Page | 258
knowhow and credit. This is experienced not only in Sri Lanka but also other neighboring
countries.
Eg. Maize contract grower program in Sri Lanka and Bangladesh
This innovation has been able to fill the extension gap that yield gap between average
farmer and the best performing farmer has converged within short period of time. If this
system can couple with information system it is easier to bring in new technology to farm.
9. Climate disturbances are increasingly affecting the sector productivity
Erratic rainfall pattern, climate changes in the agro-climatic regions and resultant
deviation in the typical maha and yala seasons have made the crop production more
vulnerable in the country. The drought has become a recurrent phenomenon and farmers
have to undergo either to abandon cultivation, shift to alternative crops, or to incur crop
losses. Significant drought occurrences were observed during 1986/1987, 1992, 1996,
2001, and 2004 and consecutively for 3 years from 2015 to 2018 in the country and 2011
is a flood year.
Government has introduced various insurance schemes for addressing the impact of crop
losses due to drought, floods, pest and disease attacks and other wild animal damages.
Operations of the crop insurance programme for paddy sector shows that in the recent
years AAIB continues pay larger indemnities against insured paddy crop making crop
insurance alone as a risk sharing strategy against the climate disturbances an
unsustainable policy.
Research on seasonal rainfall patterns and the shift of seasons, drought assessment, timing
of cultivation, introducing alternative crops and other various areas are open for policy
consideration apart from insurance schemes.
Figure 5.4: Premia collected, indemnities paid and allocation for AAIB
Source: Central Bank, Budget estimates
0
1000
2000
3000
1999-2005 2006-2013 2014-2018
Exp
en
dit
ure
(R
s. M
n)
Government Expenditure on Insurance
Premia Collected Indemnities Paid Allocation for AAIB

Page | 259
5.1.1 Findings from the crop sector specific productivity analysis
Paddy
Total Factor Productivity in the paddy sector shows a stable growth of 1.56% per annum
after 1996 except bad weathered years, 2011, 2017. Adoption of new varieties released by
the DOA and use of weedicide embodied yield increasing technology are the main
determinants of TFP growth in the paddy sector after 1996. Fertiliser policy revision to
include micronutrients, quality seed production and adoption of transplanting for direct
seeding are also contributory factors.
Total factor productivity growth contributed to the land productivity growth amidst
declining factor intensification on land. However, adoption of hybrid technology in
Vietnam made Vietnam paddy yield to surpass the Sri Lankan paddy yield since the
beginning of 90‘s. Rice breeding program of Sri Lanka initially attempted to elevate the
genetic potential of rice varieties that gives high yields. Next, the objective of many
breeding program were to develop varieties to withstand biotic and abiotic stress. Also
varieties developed for quality improvement of rice. Irrigation and fetiliser were essential
factors for realizing the yield potentials. Breeding programs on obtaining the highbred
vigor is still not a perfect technology. Tapping hybrid vigor is important to increase
yields.
The machine transplanting method of crop establishment which was introduced under
Yaya II program launched by DOA and Korea Project on International Agriculture
(KOPIA) didn‘t drive a momentum as farmers didn‘t take up this technology widely. This
transplanting machinery was introduced to reduce weedicide usage, to promote
mechanical weeding and to increase the yield. According to a study done in Rajanganaya
area, varieties such as BW367, AT362, BG359 and BG370 are found to be better varieties
that can adopt machine transplanter in the dry zone. Transplanting is found to be giving
more than 10% yield increase and weed free cultivation will increase the yield by 30%.
This phenomenon is common in developed countries in their agriculture development.
Through mechanization, tillage, harvesting and threshing technologies were brought to
paddy farming that increased the labour productivity registering 4.7 % growth of labour
productivity p.a. The highest labour productivity achievement in agriculture sector is in
the paddy sector. Private sector was instrumental in diffusing this technology. This
embodied technology has a non-price component that led to benefit farmers and largely
adoption.
Breeding programs on obtaining the hybrid vigor is still not a perfect technology. RRDI
released the hybrid BG 252 in 2015 which has a 10 % yield increase compared to high

Page | 260
yielding OPVs. However hybrid seed production has limitation due to low F1 yields in
seed production. This is how when China first developed their hybrid seeds which they
overcame later. Therefore, FAO, in collaboration with IRRI, Japanese scientists, the
China National Hybrid Rice Research and Development Centre (CNHRRDC) and other
selected national research centres, initiated its global hybrid rice programme in 1986 to
expedite the widespread use of hybrid rice technologies outside China. Sri Lanka‘s hybrid
rice research programme started in the 1980s and by late 90‘s evaluation of promising
CMS lines introduced from IRRI and from other countries and the transfer of cytoplasmic
male sterility from IRRI-developed lines to Sri Lankan lines had started
(Abeysiriwardena, Abeysekera and Dhanapala, 1997).
Currently used weedicides are solito and sofit.
Maize
Maize, the second important cereal crop in Sri Lanka in terms of cultivation extent and
production by now brought institutional innovation in agriculture that extent cultivation
expanded from 23,000 ha in 2005 to 70,000 ha 2017 through contract grower system.
Assured market, imported hybrid varieties, organised input supply and extension are key
components of this innovation. Maize mainly has a growing derived demand in the feed
industry and processed food industry. During initial innovation period from 2005 to
2010, TFP grew at 13.5 % p.a. Land and labour productivity are comparable within the
region. Bangladesh has the highest yield in the region owing to their breeding program.
Bangladesh has produced several hybrid varieties. Sri Lankan hybrid program has not
been able to produce hybrids that are adopted by local farmers. More than 95% of the
area is cultivated with exotic hybrids. The current yield level of 3.4 mt per ha can be
further increased exploiting the hybrid vigor by incorporating new germplasm to the
breeding program. In Bangladesh, 100% of maize germplasm has been introduced
through multilateral agreement with CIMMYT and maize breeding is largely dependent
on international cooperation and assistance.
Chilli
Chilli is one of the traditional Chena crops of which cultivation was affected during mid-
90‘s with the implementation of the liberalization policies. Sri Lanka couldn‘t compete
with Indian imports. Dried chilli production gradually dropped and farmers cultivated
chilli only for green chillie production. Although chilli germplasm has high variability
within the country next to India, it was late that country was able to achieve its potential
yield by exploiting hybrid vigor. After 2010, there is a revival of chilli sector with area
expansion and land productivity increase owing to the development few high yielding OP
varieties and 2 hybrids registering 12 % TFP growth p.a. during 2010 to 2015.

Page | 261
Chilli being a highly cross pollinated crop significant high level of exploitable heterosis is
reported. Hybrids are highly productive and respond very well to hitech management
practices and always assure a uniform quality produce to the market.
Exploitation of heterosis by developing hybrids is the best way of achieving higher yield
and other quality characters. Most of the chilli growing countries in the world have
increased the productivity using hybrid chilli varieties along with high-tech agriculture
(green house, drip and sprinkler irrigation). The productivity has increased by about
51.39% from 1.44 ton ha−1 in 2000 to 2.18 ton in 2016 globally due to the cultivation of
high yielding hybrid cultivars in place of the traditional open pollinated cultivars.
Although hybrid program in Sri Lanka was delayed, the hybrid varieties developed by
FCRDI of DOA are superior to many exotic hybrid varieties. The price of imported
hybrid seeds is very high and most of the exotic chilli hybrids are highly susceptible to
major pest and diseases in chilli showing less adaptability under local condition. There is
a scope for harnessing hybrid vigor further through varietal development program. F 1
seed production program should be given priority in the research agenda of DOA.
Potato
Potato crop receives the importance in the up country region for its high land and labour
(physical) productivity. Nevertheless, Sri Lanka‘s land productivity and labour
productivity of potato are very low compared to India and Bangladesh. Labour
productivity of Indian potato farming is more than twice the Sri Lankan labour
productivity, since Indian potato farming employees less labour and land productivity of
potato farming is higher in India.
The only promising variety grown in Sri Lanka is Granola and farmers have been
cultivating this variety throughout. Countries in the region like India and Bangladesh
have advanced breeding programs and have released new improved OPV, hybrid and
varieties using advanced Bio technology for commercial cultivation with the support of
private sector, international agencies. The use of input in the potato farming is declining
at a rate of -0.005 p.a. while TFP growth is reporting 1.3% per annum.
Soybean
Soybean yield shows a clear shift after 2002 as private sector engaged with farmers on
contract basis for soybean cultivation since soybean has a derived demand in the
processed food industry in Sri Lanka and open market sales are risky. This assured
marketing of farmers produce and the input supply and extension caused to better
adoption good management practices by farmers. These technology embodied inputs and
the use of good quality seeds for planting are contributory factors for increased TFP with

Page | 262
the private sector coming into venturing in soybean production Sri Lankan yields are
comparable with India nevertheless the labour productivity is low in spite of tillage and
threshing is 100% mechanized.
The negative TFP growth experiencing before 2002 was changed with the intervention by
private sector. Based on TFP index values it shows that TFP growth after 2010 is more or
less stagnating. The closest reason for this is the cultivation of one variety for 40 years.
PB 1 is the mostly grown variety as a promising variety which is the first exotic variety
introduced to the country. Although the extension gap has been filled by realizing the
potential best farmer yields with contract grower system, research gap and science gap are
needed to be filled.
Big Onion
A TFP growth of 4.5 p.a. was observed after big onion farming brought under protection
after 1998. Although land productivity now is comparable with India, Sri Lanka uses
more labour for various crop management activities. A closer look at TFP growth shows
that the TFP growth achievement owing to the adoption of Dambulu Red variety, a
selection of Pusa Red variety and the use of true seed for cultivation has now reached its
potential.
Export food crop sector
Export promotion strategy that has been adopted for fruit crops can benefit from tropical
fruit demand in the world and the tariff regime for imports in those countries. Of the main
fruit crops focused in this study, pineapple, banana and papaya are exported to main
destination market with 0% tariff. Fewer restrictions on sanitary and phyto-sanitory
requirements are the other advantages in the importing destinations.
Most Sri Lanka fruit exports happen outside the global supply chain except banana.
Export performances of the three crops considered in this study constitute about 30 -40 %
of fruit and nut exports in the country over the last 10 years. Export value has increased
and the significance of banana exports is seen that pineapple is losing its export share and
banana is gaining its share as Dole Lanka started its operation in Sri Lanka entering Sri
Lanka to the global supply chain. Sri Lanka is competing with India in the Middle East
papaya export market. India is one of the largest papaya producers in the world.

Page | 263
Table 5.2: Tariff applied on Sri Lanka fruit exports, 2019
MFN tariffs
Effectively applied tariffs
Pref. Margin
Papaya
UAE/Middle East 0% 0% 0%
Maldives 15% 15% 0%
EU/ Scandinavian 0% 0% 0%
Russian Federation 3% 2.25% 0.75%
Pineapple
Maldives 0% 0% 0%
UAE/Middle East 0% 0% 0%
EU 5.80% 0% 5.80%
United States of America 1% 1% 0%
Japan 12.10% 12.10% 0%
Banana
UAE/Middle East 0% 0% 0%
EU/ Scandinavian 16.32% 4.32% 12%
Maldives 7.50% 7.50% 0%
United States of America 0.35% 0% 0.35%
Source: ITC
Figure 5.5: FAO, ITC
0
5000
10000
15000
20000
25000
30000
20
01
20
02
20
03
20
04
20
05
20
06
20
07
20
08
20
09
20
10
20
11
20
12
20
13
20
14
20
15
20
16
20
17
Export Value of Banaa, Pineaple andPapaya in 000 US Dollars

Page | 264
Figure 5.6: Export value contribution of main fruit exports relative to total fruit & nut
export value
Source: FAO, ITC
In the export market, quality is an important parameter that increasing physical
productivity alone does not guarantee the exploitation of the increased share of the
market. Size, appearance, taste are some of the important quality parameters that are
specific to these fruit crops. Recent exploitation of the export market of banana and
papaya is due to the new varieties introduced to the country. Cavendish and Red Lady
varieties are preferred in the banana and papaya export markets. Also these two exotic
varieties have yields higher than the local varieties. More value added pineapple exports
are picking up the market.
Expansion of Cavendish cultivation in Sri Lanka is as a result of technology transfer
through foreign direct investment program. With this FDI, new variety, tissue culture
technology for planting material production, new management practices, technology and
protocols for quality and standards maintenance, post-harvest operations were brought.
Operation of large scale banana cultivations by multi-national companies is subject
serious challenges from environmental front. The second stage of transferring the new
technology happened as a result of the agreement CIC had with Dole Lanka. CIC started
Cavendish cultivation in their farms and with contract growers establishing processing
unit for post-harvest preparation. Cavendish suckers are produced in the CIC tissue
culture labs. This technology is further disseminated through DOA intervention to the
farmers in small scale. However the export market share of Dole is many times higher
than the CIC for Cavendish grown in Sri Lanka.
Contract grower system is also common among papaya export farmers that private sector
exporters have contract growers for papaya production. Pineapple growers sell their
0%
5%
10%
15%
20%
25%
30%
35%
40%
45%Pineapple
papaya
Banana

Page | 265
harvest to collectors who sort and sell again to exporters and local wholesalers. Collector
is the main contact person for information and technology. Services provided and role of
AI as extension agents was found to be least effective and collector plays his role instead.
At present scope of the input suppliers/collectors are limited to few information including
export quality parameters, which can be widened through training as in the case of
Bangladesh retailer training program. The existing network in the private sector among
collectors can be encompassed to the government system.
There are lots of new entrants to papaya farming and passion fruit farming who are either
introduced by specific development programs of the government or NGO‘s or private
sector. There exists an extension gap that needs to be filled in these sectors. Also
experienced farmers growing banana and pineapple can be identified as important
partners of extension programs.
Figure 5.7: Farming experience of fruit farmers by fruit
Source: Sample survey 2019
Factor/resource use efficiency gaps existing among farmers provides useful information
on the prevailing gaps of farmers‘ level of technical knowledge (a number of agronomic
practices in crop establishment), socioeconomic status (education, tenure, and nonfarm
income) and accessibility to information and markets. When the efficiency gaps of
factor/resource use among farmers who are cultivating fruit crops are concerned,
pineapple farmers shows the lowest gap. The gap between average farm yield and best
practice farmers yield is less for pineapple. It is only Mauritius and Kiwi varieties are
being cultivated in Sri Lanka and most farmers in main producing areas in Gampaha are
cultivating variety Mauritius and are getting an average yield of 11.7 Mt/ha. However
there exists higher variability of factor productivity compared to land productivity.
70%
18%
3% 10%
56%
29%
9% 6% 11%
17% 23%
49%
1% 2%
11%
86%
2 years or less than 2years
More than 2 years andless than 5 years
More than 5 years andless than 10 years
More than 10 years
Passionfruit
Papaya
Pineapple
Banana

Page | 266
When banana farming is considered, the variability of land productivity and factor
productivity are less among Embul farmers compared to Seeni and Kolikutu farmers.
Kolikuttu farmers have the highest variability in yield. Variability in Kolikuttu yield is
mainly due to its susceptibility to diseases.
Factor productivity of papaya farming in Vavuniya is more than double the factor
productivity of Kurunegala farmers due to yield difference. The high variability of papaya
farming in the producing areas shows the information gap among farmers on technical
knowledge. Huge extension gap exist among papaya farmers as many of them are new
entrants to papaya farming. Accessibility to information and markets is important.
Table 5.3: Mean and coefficient of variation of average yield and factor productivity
of fruit growing farmers
Average Yield Factor Productivity
mt/ha CV kg/Rs CV
Pineapple 15.15 11% 0.115 30%
Banana
Seeni 32.14 36% 0.114 57%
Kolikuttuu 21.13 48% 0.038 52%
Embul 43.14 27% 0.123 24%
Papaya 0.144 68%
Kurunegala 39.18 47% 0.072 43%
Vavuniya 75.81 63% 0.198 49%
Source: Sample survey 2019

Page | 267
5.2 CONCLUSION
Most of these crops cultivated in the region are not native to this region, mostly
introduced in various times in the recent history. Nevertheless, countries have adopted
new technology for better utilizing the genetic potential of these crops to achieve
agricultural productivity to produce more food to feed people and to generate foreign
exchange. Vision, bringing in technology through research and development and
partnering with international agencies, bringing capital for development through private
sector participation and multinational investments are striking features of their success in
achieving growth in their food crop sectors in their countries. The size of the Indian and
Bangladesh economies and the stage of the development of their economies are
considerable factors in this comparison.
Sri Lanka has somewhat drifted away from the global research and development
programs since mid 80‘s. Several reasons can be attributed to this including the political
instability after 1983, the gradual distancing from working collaboratively with
International NGO and other international agencies with the development of distrust on
NGO activities in Sri Lanka, flow of technology and technology products at a lower price
from international markets after opening the economy and for others.
Changing development paradigm also played a significant role in agricultural productivity
improvement in developing countries. CGIAR played an important role in agricultural
productivity improvement during the green revolution period. Sri Lanka was successfully
engaged in collaborations with international partners during this period. Gene transfers
for paddy NIV during green revolution period is a historical breakthrough in technology
generation.
With Globalization, technology products transferred through imports became more
accessible and inexpensive.
International development assistance also took a different dimension that multinational
companies that are themselves became part of development assistance. Bangladesh and
India are working with these organizations.
The emerging private seed sector in Bangladesh includes both multinational companies
and domestic seed businesses. The leading seed companies in Bangladesh are Monsanto
(Bangladesh) Limited, Syngenta (Bangladesh) Limited, BRAC, Pioneer, Advanta,
National Agri Care, CP seed, Alfa Seed International, Rashel Seed, Lal Teer Seed
Limited, ACI Seed, Auto Equipment Ltd., Kushtia Seed Store, Siddiquis Seeds, Supreme
Seed Company Ltd., Alpha Agro Limited, Getco Agro Vision Ltd., United Seed Store,
Agri Concern, etc. Most of the world‟s seed multinationals get cultivars into Bangladesh
through locally owned collaborating companies.

Page | 268
Apart from that, internal factors such as less funds allocated for research and
development, less human resource training opportunities given, adopting more inward
looking perspective are attributable factors of low innovations.
Most public expenditure was allocated to irrigation investments and as transfers in terms
subsidies particularly fertilizer subsidy. Rural infrastructure development reduced largely
the transaction cost of input supply that famer‘s accessibility to agrochemicals, seeds and
other inputs was vastly improved.
With regard to the institutional factors that science and technology adoption to improve
agricultural productivity, two important changes can be highlighted.
1. Orientation of DOA as a professional organization was gradually converted to a
more an administrative set up. During this period other apex bodies like CARP,
NASTEC were set up for research administration.
(In 1994, the prime role of formulating science and technology policy was assigned to NASTEC, which also had been
assigned the task of advising the government on policies and plans for the development of science and technology, and their
application in facilitating economic growth, improvement of efficiency and competitiveness of industry, agriculture and
services. NASTEC was also expected to advice and assist the government in formulating policies and plans for the
development of the science and technology human resource base, allocation of funds for research and its proper
management, and promotion of conditions necessary for the advancement of science and technology in the country. Other
important functions assigned to this organization included prioritization of scientific issues of national significance,
evaluation of performances of science and technology institutions, and organizing a biennial convention to review and
assess the scientific and technological needs of the country.)
2. Extension became under provincial administration with less technical more
administrative set up and coupling poverty alleviation intervention
implementations with the extension system.
Rising wage rates in agriculture sector in response to rising wage rates in the non-
agricultural sector made it increasing returns for mechanization. Private sector captured
this market and played a significant role. Nevertheless, Sri Lanka had not been quite
successful in benefiting from the multiplier effects of backward linkages of
mechanization through establishing machinery plants, assembling units and some
innovations.

Page | 269
5.3 RECOMMENDATIONS
Recommendations given in this section include the policy instruments proposed by the
study to increase the productivity of the domestic food crop sector within the framework
of a more competitive, market demand responsive, sustainable and resilient agriculture
sector. Policies or the plans of action initiated by the government to guide decisions and
achieve specified objectives are implemented through various policy instruments. They
can be a legislation, executive decrees, investment projects, development programs or
collaborations among institutions. Instruments may be combined; a program may have an
investment component, or may require an executive decree before it can be carried out.
Legislation and decrees define the rules of the game and establish programs, such as
guarantee funds, subsidies, and formation of associations, among many other activities.
Policy instruments proposed in the study include interventions/strategies to address the
policy gaps existing in the current policies and the policy instruments to address new
challenges to increase the productivity of the domestic food crop sector.
Study identifies following priority areas for policy intervention.
1. Bridging the research gap and science gap
2. Developing cost-effective and labour saving farm technologies and to benefit
from technology transfer imports and technology spill-overs
3. Bridging the extension gap and up-scaling of technology
4. Increase the space for private sector/Corporate sector for productivity
enhancement through mechanization, machinery production, quality seed
production
5. Managing price volatility arising due to greater global integration of Sri
Lankan food crop sector
6. Integration of agriculture policy with other related policies enabling
productivity growth within the framework of market demand responsive,
sustainable and resilient agriculture sector
7. Develop a mechanism for prioritization of investments ear marked for
productivity improvement within the fiscal space of the government
8. Develop a mechanism to adjust policy instruments to the changes in the rules
of the game and regulations of international institution.
Bridging the research gap and science gap
As the study surfaced, developing countries' collective effort in search of new technology
is now mostly bound to state capacity to invest in technology generation and hence
innovation. The primary reason is changes in the supply and demand for agricultural
technologies in the world‘s richest countries, which have been the main producers of
agricultural technologies. These countries will no longer provide the same levels of

Page | 270
productivity-enhancing technologies, suitable for adaptation and adoption in food-deficit
countries, as they did in the past. This trend has been compounded by a reduction of rich-
country support for the international agricultural research system, which had already
diverted its own attention away from productivity-enhancing technologies. These changes
mean that developing countries will have to become more self-reliant in the development
of applicable agricultural technologies. To achieve complete self-reliance will be beyond
the ability of many countries, especially given recent and ongoing structural changes in
science and scientific institutions—in particular the rise of modern biotechnologies and
other high-tech agriculture, and the associated roles of intellectual property. The largest
developing countries— Brazil, China, and India—are making the transition (Pardey,
2006). Nevertheless countries like Sri Lanka have a limited scope to benefit from
agricultural research developments in the technology advanced countries in the future as
it has in the past for productivity-enhancing technologies, suitable for adaptation. Open
access to genetic resources and technology spill overs are becoming more constrained.
Certain imported technologies are becoming costly and not adaptive. Therefore country
will need to become more self-reliant in the provision of agricultural R&D. Public
research system has the vital share in creating new knowledge and technology as private,
corporate and non-governmental sectors have limited incentives for innovations.
Therefore the study makes a strong case that effective public sector research system is
critical in bridging the science and research gap for technology generation. Strengthening
research and development in the field crop sector through increased resource allocation
and the improvement of the allied institutional setup in the public sector is vital. Of the
main technological innovations, bio chemical technology innovation is mainly in the hand
of public sector as mechanised technology is largely being diffused by private/corporate
sector in Sri Lanka.
The role of Department of Agriculture (DOA) is crucial as the apex body in research and
development in the food crop sector and DOA is needed to be repositioned as
scientifically- orientated, autonomous and accountable institute to lead the research
program in the food crop sector. Adequate funds and resources, focus, trained staff,
internal incentive system, flexible institutional arrangements are important pre-requisites
for effective and efficient functioning of DOA.
Stable budgetary support consistent with the needs of the evolving research programmes
should be ensured following the norms of the developing and developed countries. Strong
political forces still support subsidies for irrigation and fertiliser which continue to divert
funds from long-term agricultural investments with greater impacts of agricultural
productivity.
Although the traditional funding method of block grants to research institutes is said to be
no consideration of research priorities, research productivity, or research planning in
general by some literature (Pardey et al 2006), India considers block grant is still relevant

Page | 271
than competitive grants in commodity based research. Government funding to the Indian
NARS is mostly in the form of block grants to different institutes under the successive
Five Year Plans Pal, 2017).
Under the restricted funding scenario, regional research institutes of DOA can
collaboratively design focussed research programs with universities and international
agencies by sharing resources. DOA can develop comprehensive food crop sector
development medium term research and development programs with resource plans (state
support, private sector, international agencies).
SLCARP can play a facilitating role for research and development from its current
functioning as an administrator in research funding and monitoring of research. NARP
competitive research funding program can focus only on collaborative research programs
partnering many institutes.
Devise modalities for training which can be coupled with science and technology transfer
is one of the ways to regain the technology innovations within the research system. The
opportunities given in these programs should aim to bridge the ‗science gap‘; new
developments in science and technology. Ministry of Agriculture can strengthen the
coordination activities with the international agencies such as IRRI, CYMMIT, ICRISAT,
EU, UN agencies.
Not filling the DOA staff vacancies for many years creating large staff vacuum is a grave
concern in developing any program for intervention which should be addressed
immediately. It is important to reduce AR/FR restrictions for the effective functioning of
DOA. Also devising modalities to retain the scientists at DOA is important.
Unlike the conventional scientific methods, when modern scientific methods are adopted
in research and development it involves several procedures, protocols and safety
mechanisms apart from modern scientific infrastructure. This is another area that
scientific community has to work together to develop an effective public research system.
Sri Lanka does not produce genetically engineered (GE) crops. The National Science
Foundation (NSF) established a Steering Committee for Biotechnology in 1992 to
promote and support biotechnology research in universities and research institutions.
In 1997, the Ministry of Science & Technology (MoST) identified biotechnology as
a thrust area for development in Sri Lanka and a loan from Asian Development Bank
(ADB) was made available for the development of human resources and capabilities
in some selected universities and research.
Some GE research is carried out at the laboratory level, but no development exists at a
commercial level. Sri Lanka signed and ratified the Cartagena Protocol on Biosafety in
2004. Sri Lanka is in the process of developing policies to regulate and promote

Page | 272
biotechnology. Most of the policies are incomplete, or not fully implemented. Sri Lanka
is developing multiple policies to regulate and promote biotechnology. However, these
policies are still at various stages of development or implementation.
Developing cost-effective and labour saving farm technologies and to benefit from
technology transfer imports and technology spill-overs
Under the scenario of negligible private-sector involvement in agricultural R&D and a
scarce public-sector resource, one of the policy choices for Sri Lanka will be to make
enabling environment to make the best of the available resources to capitalize on
international technology spillovers and to maximize payoffs by utilizing available genetic
resources for segmented markets (eg. health, taste parameters).
Importing of technology also plays a pivotal role in the present context of globalization. It
is impossible and uneconomic for a country to be ―self-sufficient‖ in technology where it
is cheaper to import commercially or gain access through international cooperation.
Therefore replicating the foreign technology directly or after necessary adaptability
research is important in the modern context. Especially the high level technology which is
not feasible or uneconomic to be generated within the country belongs to this category. It
is important that trade regulatory and administrative bottlenecks to be lessened for free
movement of technology transfer, testing for local conditions, setting standards
(particularly for machinery).
With regard to the import of Genetically Engineered (GE) plants, Plant Protection Act No
35 of 1999 does not contain restrictions on the import of GE plants. Nevertheless the
general quarantine procedure for importing plants and plant products states that
Genetically Modified Organisms (GMOs) and Living Modified Organisms (LMOs) are
not allowed to be imported to the country. Due to the absence of a functioning approval
mechanism in effect for bio technology related imports, low tech bio technology imports
such as tissue cultured plants import has also been restricted. This was experienced when
banana tissue culture plants were first imported. Import of hybrid seeds is free of such
restriction and they are in adoption.
On the other hand, OFC sector is still predominantly a semi-subsistence family labour
dependant farming system although few farming systems have evolved as sub-
commercial systems based on market signals. Therefore less input demanding
technologies are still needed to be developed. Genetic improvement of local varieties that
are adapted to local conditions is also vital. While more affluent farmer groups to be
benefited by modern technologies, smaller producers can benefit from local varieties that
require less input by producing for niche markets. It is a prerequisite to preserve the

Page | 273
locally adapted varieties and seed production and to improve the genetic potential of local
varieties and maintain a seed stock in the region by promoting seed growing farmers.
In order to exploit the locally available genetic variability of crops, there should be a
mechanism to protect the existing gene pool. Regulatory provisions should be established
to protect such varieties. The program of collection and preservation of germplasm in-situ
or ex-situ needs to be given the importance in the DOA priorities. Farmers who are
protecting and preserving these genes need to be rewarded.
It is timely to bring in policies and institutions for harnessing mechanical power,
alternative low cost electric power, and automation and information technology for
productivity improvement in domestic food crop sector. Specifically third stage of
mechanization after tillage and harvesting mainly involves small machinery development
fitting to different crop management operations. Backward linkages can lead to
innovations with right policies and institutions are in place.
FMRC, DOA, private sector, universities jointly can prepare a strategic plan and initiate
programs for mechanization and it should be considered as an investment priority. Lesson
can be learnt from India. DOA can take the leadership.
Bridging the extension gap and up- scaling of technology
As mentioned earlier, the effectiveness of public extension service has been weakening
since extension became under provincial administration coupling with poverty alleviation
programs. On the other hand effectiveness of public agricultural extension is particularly
large when it is implemented alongside complementary upstream or downstream
interventions (access to seeds and other inputs, assistance in marketing produce)
(Waddington et al. 2014). For an example, Yaya programs implemented in 90‘s in
interprovincial areas that attempted to bridge the yield gap of rice showed significant
results. As was found out in the study, some crop sectors such as papaya, passion-fruit
have large extension gaps.
Nevertheless study draw some findings related to various forms of value chain
innovations that have been introduced by up- and downstream companies or input output
companies to overcome constraints and enhance access to adoption of new technologies.
In the wake of liberalization, a number of institutional innovations for technology transfer
in agricultural value chains were emerged. Value chain innovations include smallholder
contracting with interlinked technology transfer, guarantee structures with technology
suppliers or financial institutions, and special purpose programs. Contract grower system
which was introduced by central bank in 1999 through its Forward Sale Contract (FSC)
program made a value chain innovation in commercializing maize to become the second

Page | 274
largest field crop in the country. These value chain innovations have been instrumental in
transferring hybrid technology. Also study found contract grower system can reduce
transaction costs involved in dissemination and adoption of new technology to a large
extent.
Diffusion of hybrid maize technology, tissue cultured Cavendish banana, one of the
horizontal technology spillover introduced by CIC to their farms through vertical
spillovers from FDI program and the improved management practices introduced through
Soybean contract grower system by Plenty food are some of these technology transfers
caused to increase the productivity significantly as discussed in the study.
Although vertical spillovers from FDI engaging in global value chains are found in many
developing countries, the difficulty to acquire land, due to practical (e.g. high population
and farm density in fertile areas) or legal constraints (e.g. foreign ownership of land not
being allowed) and social pressures (e.g. from surrounding communities or international
civil society) that induce large reputational costs from being associated with ―land
grabbing‖ are observed (Swinnen & et al, 2016). Sri Lanka is no exception.
It is also observed that value chain partners themselves can act as the extension agent. In
some sectors retailers function as extension agents for technology transfer in productivity
development of some crop sectors and this is common in countries like Bangladesh (eg.
Bangladesh retailer program). The role played by the collectors and input suppliers as
extension agents in technological and information transfer should be identified and they
can be trained and equipped with new knowledge for productivity development of crop
sectors in particular the fruit crop sector. Experienced farmers can also act as extension
agents when clustering farmers to farmer organizations. Therefore recognizing these
alternative extension methods outside the formal system to reinforce those systems is
important. Study identifies contract grower system is an important value chain innovation
that can bridge the extension gap.
It is common to observe that these value chain innovations are set in the context of
imperfect financial and technology markets and weak contract enforcing institutions as
observed in other literature (Swinnen & et al, 2016). Government finance programs and
risk sharing institutional arrangements are important. Improving contract enforcement is
another promising avenue for improving the enabling environment for technology
adoption, as it can reduce the risk of hold-ups. Alternative dispute settlement institutions
outside courts, increasing transparency of contracts, training farmers in their
rights/obligations as contractors etc are prerequisites.
If the incentive for the up- stream or down- stream companies in these value chains to
technology transfer is relatively less especially with technologies with long gestation
period or higher risk involved, some farmers will be excluded from private sector
programs. Public interventions are needed to focus on those market segments.

Page | 275
Geographical distance between the origin of technology and where it is used should no
longer be a factor for non-adoption of technology. Digital technology has several
solutions to be merged into technology transfer programs. Public programs could learn
from the institutional design of the private sector in bringing different partners to the
table. Although the existing formal decentralised extension system to be absorbed to the
central government is a step that requires lot of government commitment, a momentum is
needed to gather around it. Technology dissemination through development programs
implemented by the ministry of agriculture and institutes under the ministry such as
DOA, Agrarian Development Department is to be streamlined and qualified agriculture
graduates are to be absorbed for these programs.
Increase the space for private sector/corporate sector for productivity enhancement
– mechanization, machinery production, quality seed production, become partner of
supply/value chain and risk management
Private/corporate sector plays a major role in mechanization of food crop sector in Sri
Lanka. Also they play a vital role in quality seed production and import of seeds. Private
sector plays several roles as important actor in the supply/value chain. Current formal
seed market constitutes about 25 -30% of the total seed requirement and of which
corporate sector and registered seed growers have a considerable share with the private
sector was called for investing in seed industry.
Unlike the neighbouring India and Bangladesh, Sri Lankan private sector has not
considerably invested in research and development to a number of factors including the
Intellectual Property Right (IPR) issue and other legislative hindrance. Any expansion in
the relative importance of private funding, or public–private partnerships in the provision
of agricultural R&D, has been for technologies associated with inputs such as chemicals,
seeds, and machines or with off-farm processes.
Private sector involvement in productivity improvement through technology generation,
up-scaling and transfer depends on factors for which government needs interventions.
Private sector needs to be recognized as a productivity development partner in the
stakeholder dialogue. Managing the risk is other important factor that determines the
participation of private sector in value chains.
Therefore it is important to introduce risk sharing business modalities that private sector
can partnering with farmers and government from quality seed production to output
market in the supply/value chain. Formation of direct farmer linkages with

Page | 276
supermarkets/retailers, processors and other value chain partners can pass on the market
signals from consumer to producer.
Improving contract enforcement is another promising avenue for improving the enabling
environment for technology adoption, as it can reduce the risk of hold-ups. Legal issues in
the contract grower system are to be considered to address both parties to make sure the
legal provisions in the contract agreements to secure the rights of contract partners and
proper conduct of the agreements. As it is generally either not possible or too costly to
resolve disputes in courts, alternative dispute settlement institutions can play an important
role. Other measures can include increasing transparency of contracts, supporting
alternative dispute settling arrangements, training farmers in their rights/obligations as
contractors etc. Public- Private- Producer Partnerships can be used as a great way of
promoting the entities to stimulate investing more in agriculture, where the risk embedded
with company itself is low in the venture.
Providing infrastructure and financial market institutions; and facilitating labor markets
are important for the functioning of private sector. Ensuring stability and security,
improving regulations and taxation are some of the enabling environment for both
domestically and for international investments.
Appropriate institutions are to be established for intellectual property rights protection for
private investment in the generation of embodied innovations. Seed Act needs to have
provisions to protect right of the seed producers at the same time the quality of seed
production. It will be very important to have a mechanism to protect and regulate the
quality of the seeds and the planting materials production particularly when the F1 seed
production program start to implement extensively.
Many of the value chains currently in operation are outside the global value chain. Most
fruit crops exported to main destination market with 0% tariff and with fewer restrictions
on sanitary and phyto-sanitory requirements. International negotiations for bilateral
agreements need to be intensified to harness the space for private sector operation. It is
important to strengthen the activities of the division in the ministry of agriculture for
international negotiation for bilateral agreements to facilitate finding export markets.
Managing price volatility arising due to greater global integration of Sri Lankan
food crop sector
With the opening of the economy in 1977, doors were open for technology transfer in
terms of technology products; improved seeds, machinery, agrochemicals which
positively impacted since crop sector was not opened for competition. When Structural

Page | 277
Adjustment Policies were implemented in 1989, as the fertilizer subsidy was removed
abruptly, it affected the TFP of paddy sector. Until now fertilizer subsidy is implemented
in various forms and degrees. In 1996 when the other field crop sector was opened, it
affected the other field crop sector that farmers abandoned dry chilli production. From
1998, country started implementing a seasonal tariff imposition method to protect the
seasonal local supplies from import competition. It is important to maintain a stable trade
policy since most of the crops cultivated are hardly competitive in the international trade
that Sri Lanka is not efficiently using resources as Sri Lankan TFP in the domestic food
crop sector is low compared to neighboring countries.
With the collapse of the WTO negotiations, the rules for global trade and development
has taken a different dimension that global institutes have given serious consideration to
the principle of subsidiarity in production and trade - that whatever can be produced
locally with reasonable cost should be produced and traded locally - as a way of
preserving or enhancing the health of both environment and society.
A 'New Deal' for agriculture in developing countries would be in the direction the
integration of trade into a development strategy that will put the emphasis on raising
incomes and employment in the agricultural sector, achieving food security through a
significant degree of food self-sufficiency, and promoting ecologically sustainable
production instead of integration of agriculture into world trade.
Accordingly, Sri Lanka can follow the import substitution strategy for field crop sector
that target TFP growth with protection.
It is important to minimize the impact of economy-wide and trade policy changes on
agriculture. Maintaining a stable trade policy is conducive for private sector investment
and continuity of their investment and for adopting better management practices by
farmers. Abrupt policy changes are adversely affecting the sector. Therefore it is
important to minimize the impact of economy-wide and trade policy changes on
agriculture.
Integration of agriculture policy with other related policies enabling productivity
growth within the framework of market demand-responsive, sustainable and
resilient agriculture sector
Through a consultation with all breeders and scientists in the DOA, universities,
international partners and private sector should devise a plan to formulate science and
technology policy to benefit from science and technology development in other part of
the world for agriculture productivity growth.

Page | 278
TFP growth associated with weedicide application cannot be justified. Therefore health
and environmental tax on weedicides to account the environmental and health cost
associated with application of weedicides to be introduced.
Upgrade the existing information systems in agriculture sector to a common platform
with different algorithms to access information by various stakeholders; farmer, policy
makers, input suppliers and other market participants, researchers and other interested
groups with the support of IT specialists.
A plan is to be drawn for mechanization and other machinery and equipment (hydroponic
systems, poly tunnels, etc) and irrigation technology development in line with the
industrial policy. DOA and FMRC can jointly work with industry experts.
Current agriculture insurance policy is to be coupled with other risk minimizing strategies
to make the current program to be effective and sustainable in productivity improvement.
Develop a mechanism to investment prioritization for productivity improvement
subject to fiscal space of the government
Investment prioritizations are to be implemented as a rolling plan which is reviewed
annually with a panel of the experts. Guiding principles are to be laid from the existing
knowledge and with support of further research. (Policy models already developed for Sri
Lanka can be tested for their validity for the purpose)
It is needed to incorporate the sector investment plan in the national investment program
to avoid ad-hoc investment prioritization.
Budget transfers in terms of fertiliser subsidy which is largely transferred to paddy
farmers can be reduced by offering a better paddy price for farmers. Also implementing
research findings into policies can bring down the subsidy expenditure as it happened in
2013 adopting fertiliser recommendation revision for paddy by reducing 30% of N in
basal applications.
New irrigation construction expenditure would taper off in the future as the potential
irrigated area has been largely exploited. The recurrent droughts implies the water use
efficiency is important than bringing more lands under irrigation.
This suggests that more financial resources should be diverted to research and
development to face the new challenges and to generate new knowledge and technology.

Page | 279
Develop a mechanism to adjust policy instruments to the changes in the rules of the
game and regulations of international institutions to benefit from new technology,
markets.
Recent development in the world trade and trade agreements, changing shape of the
development assistance, role played by multi-national companies are to be studied to
identify required changes.
Funding should be allocated for conducting research in this area and for participation in
international programs. HARTI has a vital role in contributing in this domain of research.
Division in the ministry of agriculture for international negotiation for bilateral
agreements can be expanded to undertake the research activities and this technical body
of the ministry is to coordinate relevant research agencies to undertake research.
A high level technical person is to head the division to represent the country and be
responsible for designing required changes in policy instruments.

280 | P a g e
POLICY RECOMMENDATIONS

281 | P a g e
1. Increased budgetary allocation for research and development in the sectoral budget for
a comprehensive food crop sector development medium term plan
Responsible Agencies - Ministry of Agriculture, Ministry of Finance, Ministry of Plan
Implementation, DOA, SLCARP
Recommendations
Allocate more funding for research and development
Allocate additional funding to the DOA budget as block grant to research and
development programs in the medium plans
Guiding principles:
Adhering to neighboring country standards
Compromise transfer payments to investments in agriculture expenditure budget
\
Country Period Increased Research Expenditure
Vietnam
India
Bangladesh
Sri Lanka
2000-2010
2000-2014
2000-2018
2000-2018
100 to 180
100 to 155
100 to 136
100 to 107
Expenditure Item Year 2017 2018
Irrigation (Rs.Mn)
Recurrent 3158 3210
Capital 10902 11133
Total 14060 14343
Fertilizer Subsidy (Rs.Mn) Recurrent 30361 26948
Research and Development (Rs.Mn)
Recurrent 1615 1726
Capital 382 459
Total 1996 2185
Extension and Training (Rs.Mn)
Recurrent 1250 1529
Capital 374 585
Total 1624 2114
Seed Certification and Plant Protection
(Rs.Mn)
Recurrent 1265 1470
Capital 684 797
Total 1946 2267

282 | P a g e
2. Reposition of DOA, the largest national food crop research and development institute in
Sri Lanka accountable to the national development objectives, as scientifically-
orientated, autonomous institute. (DOA strength in terms of institutional capacity and
the human resource base is vital to lead the research program in the food crop sector.)
Responsible Agencies - Ministry of Agriculture, Ministry of Finance, DOA
Recommendations
Allocation of more funding – Current R&D capital budget of 500 Rs Mn to be increased
adhering to the trends of neighbouring countries (DOA is mandated to undertake research
to 30% – 32% of Ag GDP (Value added))
To fill the vacancies immediately for the posts of scientists and technicians at the DOA
that have been accumulated for many years and allocate funds in the recurrent budget
As a policy, the Research Scientist to be absorbed to the DOA research cadre on merit
basis. (Scheme of Recruitment)
Revisit the Agriculture service minute to address human resource development as a
prerequisite for institutional capacity development and incorporate post graduate training;
MSc, PhD in the promotion scheme of DOA research staff.
DOA institutional set up to be oriented as more scientific basis than administrative.
A separate promotion scheme for technical staff to be devised outside the promotion
scheme of the research scientists.
Research managers should be given flexibility to work in a transparent and accountable
system.
Develop more transparent on-line operative financial and administrative
regulations/formalities
Devise incentive system in return to impact of research and other innovative undertakings
by scientists
. – Breeder rights, Professorships like in IFS, private sector partnerships and other benefits and
incentives
Although the Seed Act acknowledges the breeder-rights, mechanism has not been devised to
benefit DOA researchers. The Plant Varietal Protection Act been in preparation acknowledges the
intellectual property right and patenting of new varieties developed by DOA on institute basis. A
mechanism should be devised to trickle down the benefit to the scientists.
Specific roles and related institution (governing principles) of DOA institutes should be
recognized.
To prepare medium term research and development plans like in India as rolling plans
which will be updated annually with impact assessment

283 | P a g e
3. Agenda for Training
Responsible Agencies - Ministry of Agriculture, Ministry of Finance, DOA, Department of
External resources, National Science foundation, SLCARP, Ministry of Higher Education
Recommendations
Human resource development program to be jointly designed emphasising training to be
coupled with DOA research and development program and technology transfer. The
opportunities given in these programs should aim to bridge the ‗science gap‘; new
developments in science and technology.
Introduce mission- mode research and development program to the DOA research
program with a component of post graduate training at postgraduate training institute (eg.
PGIA) in Sri Lanka (possibly with international collaborations).
(USDA- land grant universities model in the US and the ICAR – State agricultural
universities model in India provide guiding principles)
Allocate of additional funding to the DOA budget as a block grant to implement the
mission-mode R&D program that includes studentships
Redesign National Science Foundation‘s research programs and scholarships to cater to
research agenda of the DOA
Regional research institutes of DOA can collaboratively design focussed research
programs with universities, and international agencies (eg RRDI – Wayamba University)
by sharing existing field and laboratory facilities at the DOA and the universities for
research activities.
Enter MOUs with universities oversees for technology transfer and training
Promoting sandwich programs with overseas universities
Entering into joint research programs with International agencies
Strengthen the coordination activities in the Ministry with the international agencies,
IRRI, CYMMIT, ICRISAT, EU, UN agencies such as Commission on Science and
Technology for Development of the UNCTAD
Designate institutes for international collaborations

284 | P a g e
4. Mainstreaming new/up to date technology to increase land productivity, labour
productivity and sustainability
Responsible agencies – DOA, SLCARP, NSF, Universities
Recommendatons
Exploitation of heterosis/ hybrid vigor of F 1 in cross pollinated plants which is globally
common.
Biotechnology Research
Jones envisages a continuum of technologies within modern biotechnology, existing as a
gradient from “lower-tech” processes from biologic nitrogen fixation to tissue culture, to
the “higher-tech” recombinant DNA techniques for diagnostics and genetic engineering
(Davies 2003).
Tissue culture and micro-propagation, Marker-assisted breeding, Advanced genetic
engineering and transgenic crops
Transgenic modification confers a number of benefits, including tolerance to biotic stresses
(insects and disease), abiotic stresses (drought), suitable plant structure for machinery
compliance, improved nutrition, taste and appearance, herbicide tolerance and reduced use of
synthetic fertilizers. Given the challenges of increasing water scarcity and land degradation, such
technologies potentially increase productivity per area unit or plant.
Frontier technologies such as Artificial intelligence (AI), Internet of Things (IoT), Big
Data, 5G, Drones, Nanotechnology, Solar photovoltaic (Solar PV) for low cost
automated small machinery development, plant disease management, early warning of
pest outbreaks, developing low-cost diagnostic toolkit for extension workers, market
intelligence, risk assessment

285 | P a g e
5. Legislations, protocols and guidelines for technology innovations
Responsible Agencies - Ministry of Agriculture, Ministry of Science and Technology, Ministry
of Environment
Recommendations
Plant Varietal Protection (PVP) Act been in preparation needs to address
the legal provisions to safeguard the rights of local farmers and their traditional
knowledge.
Farmers‘ rights to receive benefits arising out of farmers' protected plant genetic
resources if such resources are used by the breeders to develop new varieties
Some of the aspects failed to address in Seed Act and Plant Protection Act
o Seed Act – breeder rights are acknowledged but no implementation strategy for a
rewarding system
o Plant Protection Act of 1999 – does not exclude GE products import but
contradicts with general quarantine procedure for importing plants and plant
products states that Genetically Modified Organisms (GMOs) and Living
Modified Organisms (LMOs)
the possible private-public funding arrangement for research and development with
intellectual property rights IPR
Finalise the National Biosafety Framework which includes the National Biosafety Policy and
the National Biosafety Act that has been developed in conformity with the country‘s
commitments to the Cartagena Protocol signed and ratified by Sri Lanka in order to
undertake biotechnology research for commercial cultivation
Active participation in agreements with international partners for genetic materials exchange
within the provision of the International Treaty on Plant Genetic Resources for Food and
Agriculture of FAO
Strong institutional framework for implementation of seed act, plant protection actor/and
plant varietal protection act- Seed Certification and Plant Protection Center can follow the
model of Sri Lanka Standards Institute

286 | P a g e
6. Enabling environment for value chain innovations to technology transfer, extension and
up-scaling of technology
Responsible Agencies – Ministry of Agriculture, Ministry of Finance, Ministry of Trade and
Commerce
Recommendations
Recognize private sector/corporate sector as a development partner
Financial support for purchasing new technology – credit, subsidies
Free Access to information
Establish a mechanism to implement pilot/project basis outscaling/ upscaling of
innovations nationally that are currently being implemented by DOA Institutes, ministry
of agriculture as development programs
Formalize the Central bank implemented Forward Sales Contract program
Accommodate market demand signals of the value chain to be incorporated in the
research and development programs
Enter into bilateral agreements with trading partners
Establish contract enforcement and dispute settlement institution
The need of an institute like AgEnt/ADA to be established by the government
Design public sector training programs for extension agents in the value chain including
retailers, collectors
Lessen the trade regulatory and administrative bottlenecks for technology import
Establish a functioning approval mechanism in effect for bio technology related imports
Maintain stability and consistency of trade and market operation policies
Facilitate the functioning of value chain through rural infrastructure development
Targeted interventions
Dry chilli production program to be organized in to a value chain from F1 seed supplier to 250g ,500 g
dry chilli packet in super markets –Lessons from maize program implemented in Sri Lanka

287 | P a g e
7. Data and information as necessary prerequisites for productivity improvement
Responsible Agencies – DOA, HARTI, ICTA
Recommendations
Amalgamating existing information systems with different algorithms to cater the needs
of different users
Digitised paddy land registry http://www.aginfo.lk which contains Metadata of
farmers
croplook.net web based crop production related AI level data collection system
covering entire country
HARTI food information system
Expand the current data and information collection programs ex. Cost of cultivation
Developing a geo referenced information system with real time data feeding system using
farmer motivated web based application (APP) and develop algorithms to translate as
information to users
Individual farm field is the lowest geo referenced data layer. On top of this layer,
information available at other geographical boundaries can be fed to this information
system. Farmer can feed real time discrete data using an APP to the system to fill the
information gaps. Eg. The rainfall at farm level, drought impact, availability of stocks
Agriculture Instructor‘s office at ADCs to be modernized as the interphase for exchange
of information and training AIs on information technology and incorporate IT in the
curriculum of agriculture schools

288 | P a g e
8. Institutional support and other interventions for land productivity, labour
productivity improvement and sustainability
Responsible Agencies – Ministry of Agriculture, Ministry of Finance, Ministry of Environment
Recommendations
Imposition of environmental tax on weedicides
Designing a comprehensive risk management programme which is integrated in a broader
programmes for development and climate risk management and considering weather
derivative contracts and catastrophic risk in it
Development of an Index based insurance for farmers which is integrated in a
comprehensive risk management programme
To strengthen the activities of the international relations division in the ministry of
agriculture for international negotiation and bilateral agreements
A high level technical person is to head the international relations division in the ministry
of agriculture to represent the country and to coordinate the relevant research agencies
such as HARTI, SEPC of the DOA that undertake studies on international relations.
A separate division at HARTI to carry out research studies on international relations and
agriculture
Changing world order, international treaties, world trade and trade agreements, global
value chains, changing shape of the development assistance, role played by multi-
national companies are some of the areas to undertake studies. Funding should be
allocated for conducting research in this area and for participation in international
programs.
To focus NARP competitive research funding program of SLCARP only on collaborative
research programs partnering many institutes.
SLCARP to establish investment prioritization criteria based on impact of public
expenditure on food crop sector output growth.
Related databases are needed to maintain and the existing models can be explored.

289 | P a g e
REFERENCES
Abeysekera S.W.Status, D.S. Abeysiriwarden and D.B. Weeratunge (2002) Policies and expectations for the hybrid
rice research and development programme in Sri Lanka Adoption of Hybrid Rice in Asia - Policy Support,
Proceedings of the workshop on policy support for rapid adoption of hybrid rice on large-scale production in
Asia, FAO 2002
Abeyratne F. and H. Takeshima (2020) The evolution of agricultural mechanization in Sri Lanka , An evolving
paradigm of agricultural mechanization development: how much can Africa learn from Asia?, IFPRI
Aheeyar, M., H. Manthrithilake, C Ranasinghe, M Rengaraj, Y Gamagedara and J. Barron, (2019) Mechanizing
water lifting through pumps: a case study in Sri Lanka. Colombo, Sri Lanka: International Water Management
Institute (IWMI). 61p. (IWMI Working Paper 188). doi: 10.5337/2019.206
Aluwihare, P. B. and M. Kikuchi (1991). Irrigation investment trends in Sri Lanka: New construction and beyond,
Colombo. Sri Lanka: International Water Management Institute, 1991
Arasasingham, S.R. (1981) Agricultural extension in Sri Lanka, Department of Agriculture, Peradeniya (Sri Lanka)
Extension Division
Bangladesh Bureau of Statistics (2015) Report on the Productivity Survey of Maize Crop 2014, Productivity
assessment survey of different agricultural crops programme, Statistics and Informatics Division, Ministry of
Planning of Bangladesh
Beintema N.M. and Gert-Jan Stads (2008) Diversity in Agricultural Research Resources in the Asia-Pacific Region,
Agricultural Science and Technology Indicators Initiative, International Food Policy Research Institute and
Asia-Pacific Association of Agricultural Research Institutions
CBSL, Economic and Social Statistics of Sri Lanka, Colombo
CBSL, Annual Report, Central Bank of Sri Lanka, Colombo
Department of Census and Statistics
Dhanapala M.P. (1999) Bridging the rice yield gap in Sri Lanka, Expert Consultation on ―Bridging the Rice Yield
Gap in Asia and the Pacific‖, held in Bangkok, Thailand, 5-7 October, 1999. FAO, Rome, Italy. (FAO/RAP
Publication: 1999/41).
Directorate of Economics and Statistics, Department of Agriculture Cooperation and farmers welfare, Ministry of
Agriculture and Farmers welfare, Government of India
DOA, Annual Performance Reports, Seed and Planting Material Development Centre (SPMDC), Department of
Agriculture
DOA, Annual reports, Department of Agriculture
DOA, Cost of Cultivation, Department of Agriculture
FAO, FAOSTAT
Girihagama P., Rahija M., and Stads Gert-Jan (2012) Recent developments in public agricultural research, ASTI,
IFPRI

290 | P a g e
HARTI, Food Information system
Henegedara, G. M. (2002). Agricultural policy reforms in the paddy sector in Sri Lanka: An overview.
https://www.semanticscholar.org/paper/Agricultural-Policy-Reforms-in-the-Paddy-Sector-in-
Henegedara/7668cf5748ec1744f10eac6d01b8a92aa02aa7e7. Accessed on 01.05.2020.
Hirimuthugodage, D. (2014). Does Sri Lanka Need a New Seed Act? Institute of Policy Studies (IPS).
http://www.ips.lk/talkingeconomics/2014/05/22/does-sri-lanka-need-a-new-seed-act/. Accessed on 09.05.2020.
ICAR
Ilangarathna E.M.G.A (2019) An Ex-ante Assessment of New Rice Breeding Technologies to Sri Lanka,
undergraduate thesis submitted in partial fulfillment of the requirements for the degree of Bachelor of Science
in Agricultural Technology and Management, University of Peradeniya
IPS (2008), ―Does Foodflation Call for Agricultural Reforms?‖, Sri Lanka State of the Economy (SOE) Report
2008, Institute of Policy Studies, Colombo, Sri Lanka.
IPS (2015), ―Policy Reforms for Sustained Growth in Agriculture‖, Sri Lanka State of the Economy (SOE) Report
2015, Institute of Policy Studies, Colombo, Sri Lanka.IPS (2016), ―Role of Economic Incentives in Financing
Agricultural Investments‖, Sri Lanka State of the Economy (SOE) Report 2016, Institute of Policy Studies,
Colombo, Sri Lanka.
ITC, Trademap
Jagtap, P.P., Shingane U.S. and Kulkarni K.P. (2012) Economics of Chilli Production in India, African Journal of
Basic & Applied Sciences 4 (5): 161-164, 2012 ISSN 2079-2034
Karlik J., Bell M., Martin M., Rajcoomar S., and Sisson C. (1996) An Overview of Economic Developments in Sri
Lanka, Financial Programming and Policy : The Case of Sri Lanka, IMF
Kikuchi, M., R. Barker; P. Weligamage; and M. Samad. 2002. Irrigation sector in Sri Lanka: Recent investment
trends and the development path ahead. Research Report 62, Colombo, Sri Lanka: International Water
Management Institute, January 2002
Kumarage A. S. (2003) RURAL ROADS And COMMUNITY ACCESS IN SRI LANKA: AN OVERVIEW,
Colombo
Ministry of Finance, Budget Estimates
Ministry of Foreign Affairs
Natesan (1981) Agricultural extension in Sri Lanka, Department of Agriculture, Peradeniya (Sri Lanka) Extension
Division
Niranjan F. (2004) Return to agricultural research in Sri Lanka, unpublished PhD Thesis, University of Peradeniya
Pain A. (1986) Agricultural Research in Sri Lanka: An Historical Account, Modern Asian Studies , Volume 20 ,
Issue 4 , October 1986 , pp. 755 – 778, Cambridge University Press
Quach Ngoc An, (2002) Hybrid rice production in Viet Nam, Adoption of Hybrid Rice in Asia - Policy Support,
Proceedings of the workshop on policy support for rapid adoption of hybrid rice on large-scale production in
Asia, FAO 2002

291 | P a g e
Ruttan, Vernon W. (1987) Agricultural research policy and development, FAO
Samaratunga, P.A. (2009), ―A Note on Agricultural Development Issues in Sri Lanka‖, Mimeo, Institute of Policy
Studies of Sri lanka, Colombo.
Samaratunga, P., Karunagoda, K. and Thibbotuwawa, M. (2007) ―Mapping and Analysis of the South Asian
Agricultural Trade Liberalization Efforts & quot; in ESCAP (eds), Agricultural Trade: Planting the Seeds of
Regional Liberalization in Asia (pp. 33-74), ARTNeT Studies in Trade and Investment 60, UNESCAP,
Bangkok, Thailand.
Schokman, D. (1981) Tropical agriculturist 1881-1981, Tropical agriculture in Lakshman W. D., and C.A. Tisdell
(2000) Sri Lanka's Development Since Independence: Socio-economic Perspectives and analyses, Nova Science
Publishers
Shurtleff, W. and A. Aoyagi (2004) Sri Lanka: soya pioneer in the third world (1979-1980s), A special report on the
history of soy pioneers around the world. A chapter from the unpublished manuscript, history of soybeans and
soyfoods: 1100 B.C. to the 1980s.
Turner M. ( 2001) The role of national seed policies in re-structuring the seed sector in CEEC, CIS and other
Countries in Transition, FAO Plant production and protection paper 168, Food and Agriculture Organization
of the United Nations, ISSN 0259-2517
Weerahewa J (2017) Modernizing Agriculture in Sri Lanka—Status and Challenges. In: Athukorala P, Ginting E,
Hill H, Kumar U (eds) The Sri Lankan economy: charting a new course. Asian Development Bank, Manila
Wickremasinghe, S. (2006) Development of the National Agricultural Research System (NARS) in Sri Lanka with
special reference to food crops sub-sector : issues related to science policy, J. Natn. Sci. Foundation Sri Lanka
2006 34(2): 69-83
Wickramasinghe, W., G. Samarasinha, and S. Epasinghe (2010) Fertilizer policy on paddy farming: An Evaluation
of 2005 Subsidy Programme. Hector Kobbekaduwa Agrarian Research and Training Institute, Colombo 07.
Research report 135, ISBN: 978-955-612-104-9. http://dl.nsf.ac.lk/ohs/harti/23595.pdf.
Wickramasinghe W. D, (2012) Multiple effects and impact of small farmer (FFS based) seed potato production in
Badulla district, Dry Zone Livelihood Support & Partnership (DZLiSP) Program, report submitted to Ministry
of Agriculture
World Bank. (2007) Reviving Sri Lanka's Agricultural Research and Extension System : Towards More Innovation
and Market Orientation. Washington, DC. © World Bank.
https://openknowledge.worldbank.org/handle/10986/13044 License: CC BY 3.0 IGO.‖

292 | P a g e
Appendix 1
TFP Measurements and TFPG Estimation Methods
In general, the TFP measurement methods that have been used in empirical productivity
studies can be grouped into two main approaches: conventional or non-frontier methods
and frontier analysis. The first approach assumes outputs are efficiently produced on the
production frontier while the second allows for outputs being produced off the frontier.
The frontier analysis is often applied to cross-sectional or panel data, whereas the
conventional approach is mainly applied to time series macro-productivity data sets.
Both the conventional and frontier approaches can be further classified into parametric
and nonparametric methods. The nonparametric method does not impose a specific
functional form, whereas the parametric method imposes a functional form and employs
econometric techniques in estimating a production function, a cost function or a profit
function. Table 1 summarizes the principal methods used in measuring TFP and the
corresponding data requirements.

293 | P a g e
The two TFPG methods used in this study are described here.
Nonparametric Growth Accounting Method
Although there are several approaches for measuring TFP (as shown in Table 1), a
suitable approach depends on the objectives of the study and data availability. Since
study aims to examine sources of agricultural growth at national level, the growth
accounting framework is considered the most appropriate. The competitive equilibrium
conditions which are the underlying assumptions of the growth accounting approach are
reasonable. It is assumed agricultural sector is well characterised by a perfectly
competitive market in the sense that there are a large number of farmers who maximise
profit (or minimise cost) and take prices as given. It is generally recognized that farmers
are price takers in input and output markets. Compared with other industries, such as
manufacturing and services, the agricultural
sector is considered a suitable case study for applying the growth accounting method.
Under the growth accounting framework, the discrete-time Tornqvist approximation to
the continuous-time Divisia index is employed. The method implicitly specifies a
translog form of the production function but does not explicitly estimate the function.
Constant returns to scale (CRS) is assumed, implying that all factor income shares sum to
one. It is national income based growth accounting in the sense that most output and
input data are obtained from the national accounts.
The growth accounting method begins with the basic production function that explains
the relationship between output and input, expressed as follows (Oguchi, 2004):
Qt = AtF (Lt , Nt ,Kt ) (1)
where t Q = real output at time t
Lt= labour quantity at time t
Nt = land quantity at time t
Kt = capital quantity at time t
At = level of efficiency at time t
Totally differentiating equation (1) with respect to time gives:

294 | P a g e
Dividing both sides by Qt gives:
Rearranging equation (3) gives:
where ( ^ ) indicates the instantaneous growth rate of the variable and , , L N K MP MP
MP stand for the marginal product of labour, land and capital, respectively. In a perfectly
competitive market, producers maximize profit and will employ each input where its
marginal product equals its real factor price. That is, the real wage rate (w) equals the
marginal product of labour ( ) L MP ; the real rate of land rent (r) equals the marginal
product of land ( ) N MP and the real rate of return(i) equals the marginal product of
capital ( ) K MP . Hence, replacing marginal products with factor prices, equation (4) can
be rewritten as:

295 | P a g e
Equation (5) indicates that output growth can be decomposed into the growth rate of the
efficiency level and the growth rate of labour, land and capital, weighted by their output
elasticities or factor income shares. The first component is the shift in the production
function (representing technical change) and the latter is the movement along the
production function (representing input growth and input substitution).
Rearranging equation (5), the estimation of TFP growth ( ) t TFPG can be expressed as
the residual part of output growth that cannot be explained by the combined growth of
physical inputs:
Since the differentiation is applicable only to continuous variables, the growth rate terms
in the above equations refer to an instantaneous rate of change. However, in practice,
discrete data, especially annual data, are normally used in empirical work. Hence, the
discrete annual data can be applied to approximate equation (6) by taking the average of
two consecutive periods:
The labour and land inputs are adjusted for their quality changes. For labour, the
adjustment method accounts for the effect of qualitative changes in age, sex and
education. The land input used in crop production is adjusted by the effect of irrigation,
to account for multiple cropping.

296 | P a g e
The Tornqvist-Theil index is a superlative index which is exact for the linear
homogeneous translog production function (Diewert). A further advantage of the
Tornqvist-Theil index is that it accounts for changes in quality of inputs. Because current
factor prices are used in constructing the weights, quality improvements in inputs are
incorporated, to the extent that these are reflected in higher wage and rental rates
(Capalbo and Vo).
The Tornqvist-Theil index provides consistent aggregation of inputs and outputs under
the assumptions of competitive behavior, constant returns to scale, Hicks-neutral
technical change, and input-output separability. However, Caves, Christensen and
Diewert have shown that Tornqvist-Theil indices are also superlative under very general
production structures, i.e., nonhomogeneous and nonconstant returns to scale, so they
should provide consistent aggregation across a range of production structures (Antle and
Capalb)
Non Parametric Frontier Approach: Malmquist Productivity Index Using DEA
Index captures the TFP Change as efficiency change and technical change between two
periods with cross sectional output input information.
Malmquist productivity index depends upon four different distance functions.
Output and input quantity data for a cross-section of firms in periods s and t, the
production frontier can be identified using DEA and are used them in computing the
distance needed. In general following four linear programming problems are solved:
These four LP‘s are solved under CRS assumption
0.5
0.5
, , , , , , , , ,
, ,
, ,
s t
o s t s t o s t s t o s t s t
s t
o t t o t t
s t
o s s o s s
m m m
d d
d d
q q x x q q x x q q x x
x q x q
x q x q

297 | P a g e
The technical change measure is the geometric mean of 2 technical change measures -
TC0 evaluated at the period 0 data point and TC1 evaluated at the period 1 data point.
Again, in a more complicated example (more inputs and/or outputs) this need not be the
case.
Recall that all these distance functions are CRS - hence any scale efficiency changes will
affect the TEC measure.
x
q
0
E
D
qs
qa
qc
qt
qb
xs xt
Frontier in
period s
Frontier in
period t
[dot(qt, xt)]
-1 = max , ,
st -qit + Qt 0,
xit - Xt 0,
0,
[dos(qs, xs)]
-1 = max , ,
st -qis + Qs 0,
xis – Xs 0,
0,
[dot(qs, xt)]
-1 = max , ,
st -qis + Qt 0,
xis - Xt 0,
0,
[dos(qt, xt)]
-1 = max , ,
st -qit + Qs 0,
xit – Xs 0,
0,
Efficiency change =
as
ct
/
/Technical change =
5.0
/
/
/
/
bs
as
ct
bt

298 | P a g e
It can be decomposed into efficiency change and technical change:
The input-orientated Malmquist productivity index is given by:
Output-orientated and input-orientated Malmquist indexes coincide if the technology
exhibits constant returns to scale.
The Malmquist Productivity index does not adequately account for scale change.
The Malmquist productivity index does not satisfy transitivity property. So we need to
use the EKS method to make them transitive.
5.0
,
,
,
,
,
,,,,
ssto
ssso
ttto
ttso
ssso
ttto
sstsod
d
d
d
d
dm
qx
qx
qx
qx
qx
qxxxqq
0.5, ,
, ,
s s t t s s
s t t t t t
d q x d q xTFPC
d q x d q x
Efficiency change Technical change

299 | P a g e
Appendix 2
Supplementary Tables
Sources of Information
Table 1 National Science Foundation
ASTI/CGIAR
Department of Agriculture
Table 2 to Table 5 Central Bank of Sri Lanka
Budget Estimates
Department of Agriculture
Kikuchi & Aluvihare (1990)
Table 6 to Table 9 Department of Agriculture
Sample Survey, 2019

300 | P a g e
Table 1: Public Expenditure on Research and Developmnt by source of information
Source National Science Foundation ASTI /
CGIAR
Department of
Agriculture Agricultural sciences (current price Rs.
Million)
ASTI data Spending, Expenditure on
Research &
Development (Rs Mn)
Year Research and
development
(current price
Rs. Million)
Agricultural
sciences
(current price
Rs. Million)
Higher
education
(Rs. Million)
State
sector
(Rs.
Million)
Business
enterprise/
Industry
(Rs.
Million)
(Current
Rs. million)
Million
2011
constant
PPP dollars
1997 203.10
1998 191.10
1999 210.00
2000 1810 1262.1 104.5 222.20
2001 1165.8 84.9 262.10
2002 1159.2 78.1 267.90
2003 1199.9 74.3 263.00
2004 3807.5 1003 26% 1360.3 77.4 313.50
2005 1381.2 71.2 363.40
2006 5119.2 1259 25% 1985.9 92.0 558.90
2007 2100.0 85.3 658.40
2008 5047.7 1670 33% 2320.0 81.0 690.70
2009 2401.0 79.2 759.80
2010 8778.2 2926 33% 2632.0 70.7 760.80
2011 2997.1 77.5 870.10
2012 3351.1 78.2 1256.60
2013 9670 2693 28% 3618.5 79.5 1310.70
2014 10350 4078 39% 501.7 2211.3 1364.8 4179.2 89.2 1412.70
2015 11904 3746 31% 419.3 2035.1 1291.7 4527.9 95.9 1895.10
2016 5494.9 112.4 1821.30
2017 1996.20

301 | P a g e
Table 2: Total Public Agriculture (Food Crop Sector) Expenditure by expenditure
program
Year Agriculture GDP (Rs.mn)
Irrigation (Rs.mn)
Fertilizer (Rs.mn)
Research and development (Rs.mn)
Extension and training (Rs.mn)
Seed programs (Rs.mn)
Credits (Rs.mn)
Insurance (Rs.mn)
1997 111659 1,895 203.1 104.0 87.2 590 7.4
1998 124370 2,152 191.1 115.5 96.7 479 6.1
1999 137678 5301.8 1,390 210.0 145.9 211.1 463 6.5
2000 156108 5128.1 1,733 222.2 166.2 200.0 517 7.2
2001 175774 6245.3 3,650 262.1 187.7 195.0 736 8.1
2002 192665 7643.8 2,448 267.9 178.3 172.3 934 6.2
2003 205599 8072.1 2,191 263.0 174.9 109.4 1224 7.2
2004 223926 5198.6 3,572 313.5 233.0 141.7 1345 30.6
2005 249790 8599.3 6,946 363.4 273.0 205.0 1949 9.6
2006 287840 6186.5 11,867 558.9 412.5 424.9 1944 19.9
2007 297342 6861.8 11,000 658.4 479.7 470.5 2014 22.7
2008 262271 7890.2 26,450 690.7 516.7 389.0 3162 21.8
2009 289906 13284.5 26,935 759.8 520.9 395.0 3401 15.4
2010 333137 11765.2 26,028 760.8 573.7 578.5 4084 15.3
2011 418104 13852.6 29,802 870.1 643.0 964.5 7171 184.6
2012 590114 28729.0 36,456 1256.6 791.4 1137.2 10070 78.3
2013 613694 36198.8 19,706 1310.7 955.4 1188.2 9872 136.2
2014 717910 46548.7 31,802 1412.7 1024.7 1342.7 8047 55.2
2015 637567 49082.6 49,571 1895.1 1711.5 1783.6 12094 154.7
2016 650510 9326.0 27,771 1821.3 1513.9 1769.7 13554 67.7
2017 735382 14059.7 30,361 1996.2 1624.0 1946.1 12271 8.8
2018 14342.9 26,948 2184.5 2113.8 2266.7 16981 5.1

302 | P a g e
0.0
5000.0
10000.0
15000.0
20000.0
25000.0
30000.0
1997-2005 2005-2010 2011-2018
Exp
end
itu
re (
Rs.
mn
)
Year
Expenditure
Irrigation Fertilizer Credits
Research and development Extension and training Seed programs
Insurance

303 | P a g e
Table 3: Public Expenditure for Irrigation, fertilizer, Research and development, Extension and training, Seed programs
Year Irrigation (Rs.Mn) Fertilizer subsidy (Rs.Mn)
Research and Development (Rs.Mn)
Extension and Training (Rs.Mn)
Seed Certification and Plant Protection (Rs.Mn)
Recurrent Capital Total Recurrent Recurrent Capital Total Recurrent Capital Total Recurrent Capital Total
1997 1,895 160.9 42.2 203.1 95.7 8.3 104.0 78.0 9.2 87.2
1998 2,152 164.0 27.1 191.1 90.8 24.7 115.5 48.7 48.0 96.7
1999 1627.4 3674.4 5301.8 1,390 188.0 22.0 210.0 108.4 37.5 145.9 104.8 106.4 211.1
2000 1670.8 3457.3 5128.1 1,733 195.3 27.0 222.2 137.3 28.9 166.2 105.5 94.5 200.0
2001 1670.6 4574.7 6245.3 3,650 236.0 26.0 262.1 158.0 29.7 187.7 90.0 105.0 195.0
2002 1732.7 5911.1 7643.8 2,448 258.6 9.3 267.9 170.2 8.1 178.3 101.6 70.6 172.3
2003 1680.7 6391.4 8072.1 2,191 255.2 7.8 263.0 166.9 8.0 174.9 101.9 7.5 109.4
2004 1830.6 3367.9 5198.6 3,572 295.9 17.7 313.5 216.3 16.7 233.0 116.3 25.4 141.7
2005 1972.3 6627.0 8599.3 6,946 315.1 48.3 363.4 226.0 47.0 273.0 128.0 77.0 205.0
2006 2646.4 3540.1 6186.5 11,867 467.9 91.0 558.9 340.5 72.1 412.5 268.6 156.3 424.9
2007 2911.1 3950.7 6861.8 11,000 562.6 95.8 658.4 415.3 64.4 479.7 309.9 160.6 470.5
2008 3309.8 4580.3 7890.2 26,450 598.8 91.9 690.7 440.8 75.9 516.7 310.3 78.8 389.0
2009 3456.1 9828.4 13284.5 26,935 628.2 131.5 759.8 457.7 63.3 520.9 298.3 96.7 395.0
2010 3717.2 8048.0 11765.2 26,028 642.3 118.5 760.8 486.7 87.0 573.7 351.8 226.7 578.5
2011 3878.1 9974.5 13852.6 29,802 696.8 173.3 870.1 531.0 112.0 643.0 324.2 640.3 964.5
2012 3766.6 24962.5 28729.0 36,456 783.2 473.4 1256.6 606.2 185.2 791.4 409.9 727.3 1137.2
2013 3963.8 32235.0 36198.8 19,706 835.1 475.6 1310.7 642.9 312.5 955.4 478.2 710.0 1188.2
2014 4264.1 42284.6 46548.7 31,802 874.9 537.8 1412.7 673.0 351.7 1024.7 758.6 584.1 1342.7
2015 4981.4 44101.2 49082.6 49,571 1407.5 487.6 1895.1 1099.5 612.0 1711.5 1106.2 677.4 1783.6
2016 3088.4 6237.6 9326.0 27,771 1460.5 360.8 1821.3 1149.0 364.9 1513.9 1158.9 610.8 1769.7
2017 3158.1 10901.6 14059.7 30,361 1614.6 381.6 1996.2 1250.4 373.6 1624.0 1264.7 684.4 1946.1
2018 3210.1 11132.8 14342.9 26,948 1726.0 458.5 2184.5 1528.8 585.0 2113.8 1470.2 796.5 2266.7

304 | P a g e
Table 4: Public Expenditure for Credit Programs
Year Paddy (Rs.Mn)
Other Crops (Rs. Mn)
All Crops (Rs.Mn)
1997 412 178 590
1998 327 152 479
1999 312 151 463
2000 399 118 517
2001 402 334 736
2002 444 490 934
2003 713 511 1224
2004 904 441 1345
2005 1364 585 1949
2006 1217 727 1944
2007 1030 984 2014
2008 1604 1558 3162
2009 1846 1555 3401
2010 2541 1543 4084
2011 4418 2753 7171
2012 5527 4543 10070
2013 5427 4445 9872
2014 4762 3285 8047
2015 5202 6892 12094
2016 6384 7170 13554
2017 5561 6710 12271
2018 6879 10102 16981

305 | P a g e
Table 5: Public Expenditure for insurance
Operations of the Crop Insurance Programme - Paddy Sector (Position as at 31 December 2018)
Cultivated
Season
Area
Cultivated
(‘000 ha)
(1)
Area Insured
(‘000 ha) (2)
Premia Collected
(Rs.mn) (3)
Indemnities Paid
(Rs. mn) (4)
Difference between
Premia Collected and
Indemnities Paid (Rs.mn)
(5)=(3)-(4)
AAIB CICL Total AAIB CICL Total AAIB CICL Total AAIB CICL Total
1997 730.0 21.0 0.6 21.6 12.9 0.5 13.4 7.3 0.1 7.4 5.6 0.4 5.9
1998 872.0 14.6 1.0 15.6 9.3 0.5 9.8 5.8 0.3 6.1 3.4 0.2 3.7
1999 879.0 13.2 1.5 14.7 8.3 1.3 9.6 5.8 0.7 6.5 2.5 0.6 3.1
2000 1361.0 11.4 4.2 15.7 7.1 5.9 13.0 4.0 3.3 7.2 3.1 2.6 5.7
2001 798.0 5.4 7.6 13.0 2.7 6.7 9.4 3.0 5.1 8.1 -0.3 1.6 1.3
2002 850.0 4.0 8.0 12.0 2.5 7.1 9.6 2.0 4.2 6.2 0.6 2.8 3.4
2003 1019.0 8.4 20.1 28.5 6.0 12.2 18.2 3.8 3.4 7.2 2.2 8.8 11.0
2004 800.0 6.0 37.9 43.9 5.1 21.4 26.5 8.6 22.0 30.6 -3.5 -0.7 -4.1
2005 938.0 9.4 18.7 28.1 7.7 12.8 20.6 3.8 5.8 9.6 3.9 7.0 10.9
2006 909.0 7.7 44.5 52.1 5.5 32.4 37.9 2.1 17.8 19.9 3.4 14.6 18.0
2007 813.0 7.3 31.4 38.7 6.0 23.8 29.7 1.0 21.6 22.7 4.9 2.1 7.1
2008 1052.0 14.0 15.6 29.6 12.8 11.7 24.5 10.4 11.4 21.8 2.4 0.2 2.6
2009 977.0 24.4 5.2 29.6 26.6 3.6 30.2 12.4 3.0 15.4 14.2 0.6 14.8
2010 1065.0 22.3 4.4 26.6 40.9 2.9 43.8 13.6 1.7 15.3 27.3 1.2 28.5
2011 1217.0 28.6 7.6 36.2 60.0 6.3 66.4 171.9 12.6 184.6 -111.9 -6.3 -118.2
2012 1169.0 40.7 8.8 49.4 94.3 6.5 100.8 72.8 5.6 78.3 21.5 1.0 22.5
2013 1228.0 25.2 5.8 30.9 74.1 3.7 77.8 131.5 4.7 136.2 -57.4 -1.0 -58.4
2014 968.0 19.5 6.2 25.7 57.4 4.4 61.8 52.6 2.6 55.2 4.8 1.8 6.7
2015 1202.0 22.5 7.7 30.2 75.5 6.3 81.8 146.5 8.2 154.7 -71.0 -1.9 -72.9
2016 1194.0 37.7 8.6 46.3 68.0 6.4 74.3 65.7 2.0 67.7 2.3 4.4 6.6
2017 809.0 22.7 7.5 30.2 7.2 6.1 13.4 5.6 3.2 8.8 1.7 2.9 4.6
2018 1027.0 1027.8 6.2 1034.1 43.9 5.2 49.1 1.9 3.2 5.1 42.0 2.0 44.0

306 | P a g e
Table 6: Enterprise Budget of Papaya by Variety, District and Year
Table 6.1
Crop variety - Rathna
District - Puttalam
2005
Crop establishment Crop maintenance Total labour cost Rs./Ha.
Operation Input quantity
Input cost Rs./Ha.
Power cost Rs./Ha.
Labour Mds/Ha.
Labour cost Rs./Ha.
1st year 2nd year 3rd year 4th year
Fencing 100 25000 25000
Poles 140 35000 35000
Barb wire (kg) 250 26500 26500
Nails (kg) 10 1100 1100
Land preparation (4w tractor) 8750 8750
Preparation of pits
Planting (No. of plants) 1125 16875 50 12500 29375
Fertilizer application 28 7000 7000
NPK (kg)** 1294 32315 32315 29603 29603 29603
Compost (kg) 4500 5625 5625 8875 8875 8875
Manual weeding 23 5750 5750 5750 5750 5750
Crop maintenance
Chemical weed control
Pest control 6200 6 1500 7700 7700 7700 7700
Irrigation 350000 10000 90 22500 382500 32500 32500 32500
Fixing support (wind break)**
Harvesting 78000 78000 78000
Land rent 10000 10000 10000 10000 10000

307 | P a g e
Total labour (man day) 297 460 460 460
Total cost Rs. 483615 18750 74250 576615 172428 172428 172428
Yield Kg./ha. 38500 42778 37250
Producer price
Gross income Rs./ha. 519750 577503 502875

308 | P a g e
Table 6.2
Crop variety - Red Lady
District - Puttalam
2012
Crop establishment Crop maintenance Total labour cost Rs./Ha.
Operation Input quantity
Input cost Rs./Ha.
Power cost Rs./Ha.
Labour Mds/Ha.
Labour cost Rs./Ha.
1st year 2nd year 3rd year 4th year
Fencing 100 80000 80000
Poles 140 630000 63000
Barb wire (kg) 250 48000 48000
Nails (kg) 10 3250 3250
Land preparation (4w tractor)
6000 6000
Preparation of pits 15 12000 12000
Planting (No. of plants) 1125 23625 10 8000 31625
Fertilizer application
NPK (kg)** 1575 37800 15 24000 61800 62070 62070 62070
Compost (kg) 22500 191250 13 10400 201650 201650 201650 201650
Manual weeding 23 18400 18400 18400 18400 18400
Crop maintenance
Chemical weed control
Pest control 9970 6 4800 14770 14770 14770 14770
Irrigation 250000 18000 90 72000 340000 90000 90000 90000
Fixing support (wind break)**
45000 45000
Harvesting 249600 249600 249600
Land rent 50000 50000 50000 50000 50000
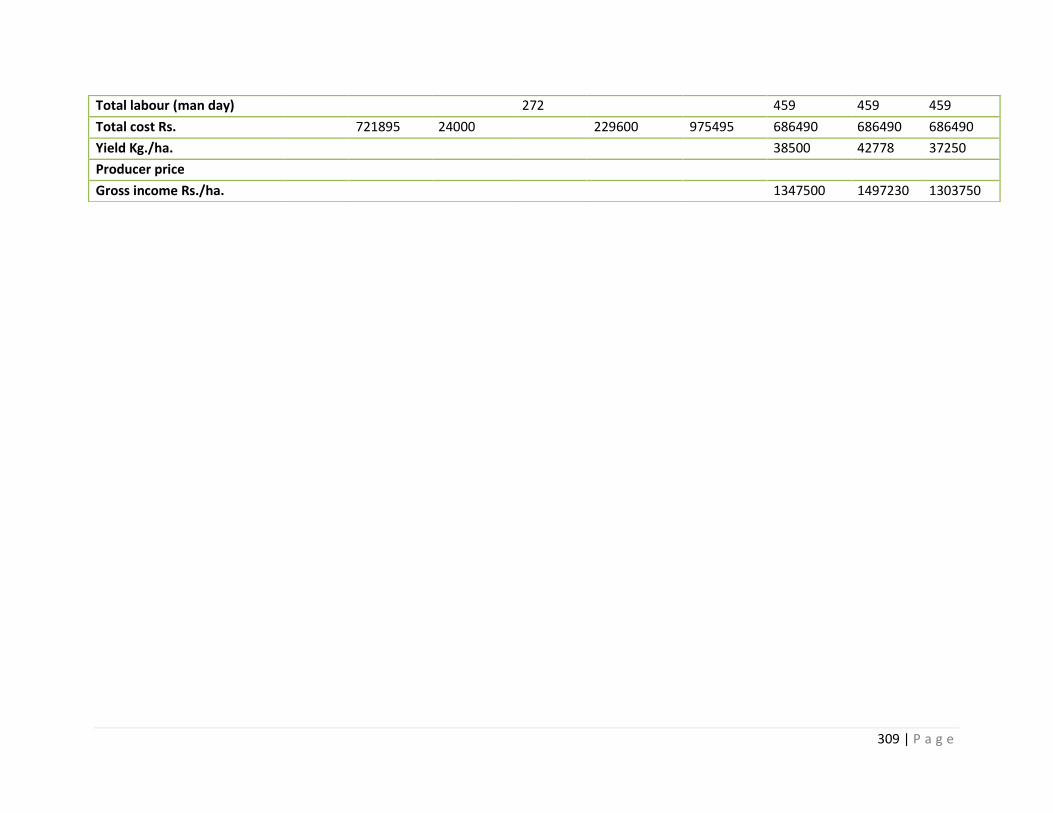
309 | P a g e
Total labour (man day) 272 459 459 459
Total cost Rs. 721895 24000 229600 975495 686490 686490 686490
Yield Kg./ha. 38500 42778 37250
Producer price
Gross income Rs./ha. 1347500 1497230 1303750

310 | P a g e
Table 6.3
Crop variety - Red Lady
District - Puttalam
2017
Crop establishment Crop maintenance Total labour cost Rs./Ha.
Operation Input quantity
Input cost Rs./Ha.
Power cost Rs./Ha.
Labour Mds/Ha.
Labour cost Rs./Ha.
1st year 2nd year 3rd year
Fencing 100 110000 110000
Poles 140 84000 84000
Barb wire (kg) 250 51500 51500
Nails (kg) 10 6000 6000
Land preparation (4w tractor)
10000 10000
Preparation of pits 21 23100 23100
Planting (No. of plants) 1600 80000 14 15400 95400
Fertilizer application
NPK (kg)** 2616 130800 21 23100 153900 135900 135900
Compost (kg) 32000 320000 18 19800 339800 339800 339800
Manual weeding 20 22000 22000 22000 22000
Crop maintenance
Chemical weed control
Pest control 12240 9 9900 22140 22140 22140
Irrigation 565200 90 99000 784200 219000 219000
Fixing support (wind break)**
100000 100000
Harvesting 93 102400 102400 170667 68267
Land rent 125000 125000 125000 125000

311 | P a g e
Total labour (man day)
Total cost Rs. 1474740 130000 424700 2029440 1034506 932106
Yield Kg./ha. 76800 128000 51200
Producer price
Gross income Rs./ha. 3456000 5760000 2748295

312 | P a g e
Table 6.4
Crop variety - Red Lady
District - Vavuniya
2019
Operation Input quantity
Input cost Rs./Ha.
Power cost Rs./Ha.
Labour Mds/Ha.
Labour cost Rs./Ha.
Total Cost
Crop Establishment
Land preparation (4w tractor)
9225 53 65,835 75,061
Planting (No. of plants) 1381 71404 32 41,580 112,984
188,044
Crop maintenance
1st year
Fertilizer application 18 23,633 23,633
NPK (kg)** 217 10520 10,520
Compost (kg) 5043 17009 17,009
Manual/ machinery weeding 18937 31 39,894 58,831
Pest control 19949 10522 30 39,096 69,566
Irrigation 16134 48 62,442 78,576
Harvesting 33 42,849 42,849
Land rent 15,000
315,985
Yield Kg./ha. 21,234
Producer price 30
637,007
2nd year
Fertilizer application 15 19,412 19,412
NPK (kg)** 360 14805 14,805
Compost (kg) 5187 20419 20,419
Manual/ machinery weeding 16604 29 38,211 54,815
Pest control 27749 15690 40 51,699 95,138
Irrigation 16469 55 71,840 88,309
Harvesting 88 114,037 114,037
Land rent 15,000
Total Cost 421,934
Yield Kg./ha. 74,849
Producer price 30
2,245,481
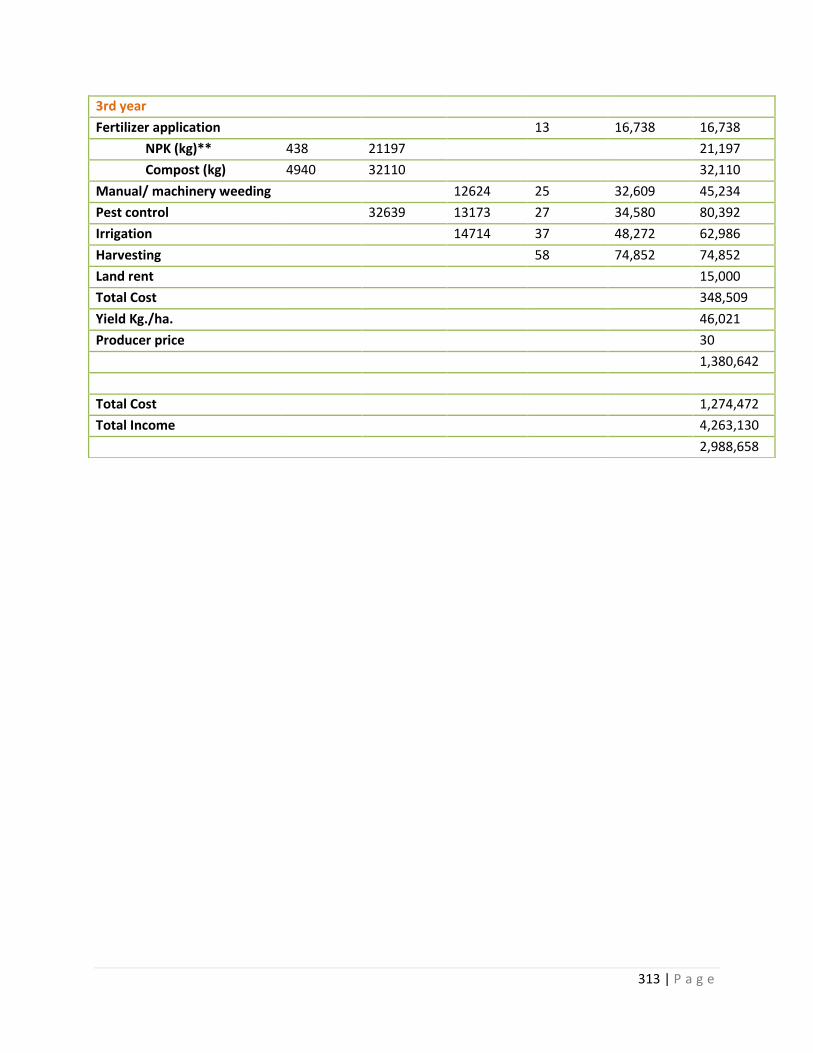
313 | P a g e
3rd year
Fertilizer application 13 16,738 16,738
NPK (kg)** 438 21197 21,197
Compost (kg) 4940 32110 32,110
Manual/ machinery weeding 12624 25 32,609 45,234
Pest control 32639 13173 27 34,580 80,392
Irrigation 14714 37 48,272 62,986
Harvesting 58 74,852 74,852
Land rent 15,000
Total Cost 348,509
Yield Kg./ha. 46,021
Producer price 30
1,380,642
Total Cost 1,274,472
Total Income 4,263,130
2,988,658

314 | P a g e
Table 6.5
Crop variety – Taninung/Red Lady
District - Kurunegala
2019
Operation Input quantity
Input cost Rs./Ha.
Power cost Rs./Ha.
Labour Mds/Ha.
Labour cost Rs./Ha.
Total Cost
Crop Establishment
Fencing 77585 38 56908 134493
Land preparation (4w tractor)
70416 39 54026 124443
Planting (No. of plants) 1424 62778 21 26744 89522
213964
Crop maintenance
1st year
Fertilizer application 38 49428 49428
NPK (kg)** 1627 50222 50222
Compost (kg) 5686 31539 31539
Chemical Weeding 7267 8645 4 5211 21123
Manual/ machinery weeding 10616 42 55210 65826
Pest control 6349 4485 22 29134 39968
Irrigation 33068 57 73688 106756
Harvesting 43 55590 55590
Land rent 15000
435453
Yield Kg./ha. 14857
Producer price 35
519984
2nd year
Fertilizer application 27 35748 35748
NPK (kg)** 1968 48963 48963
Manual/ machinery weeding 11347 45 58735 70082
Pest control 5451 5729 46 59225 70405
Irrigation 78085 86 112271 190355
Harvesting 102 132639 132639
Land rent 15000
Total Cost 563192
Yield Kg./ha. 34762
Producer price 40

315 | P a g e
1390465
3rd year
Fertilizer application 20 26602 26602
NPK (kg)** 1129 73710 73710
Manual/ machinery weeding 10685 42 55229 65914
Irrigation 85642 122 158409 244052
Harvesting 52 67217 67217
Land rent 15000
Total Cost 492495
Yield Kg./ha. 20012
Producer price 40
800477.6
Total Cost 1705104
Total Income 2710926
1,005,822

316 | P a g e
Table 7: Crop Enterprise Budget of Banana
Table 7.1
Banana
District – Gampaha
2000
Crop establishment Crop maintenance Total labour cost Rs./Ha.
Operation Input quantity/ha
Input cost Rs./Ha.
Power cost Rs./Ha.
Labour Mds/Ha.
Labour cost Rs./Ha.
1st year
2nd year 3rd year
4th year
5th year
Fencing
Poles
Barb wire (kg)
Nails (kg)
Land preparation (4w tractor) 7600 7600
Preparation of pits
Planting (No. of plants) 1100 plants 22000 53 9275 13250
Fertilizer application 14522kg 12100 18 3150 15250 21476 21476 21476 15250
NPK (kg)**
Dolomite** (kg)
Kieserite** (kg)
Compost (kg) 4.51 mt 4500 50 8750 13250 6425 6425 6425 6425
Crop maintenance 45 7875 7875 7875 7875 7875 7875
Chemical weed control 2800 2 350 3150 3150 3150 3150 3150
Pest control 113kg 2145 3 525 2670 2670 2670 2670 2670
Irrigation
Harvesting 2800 2800 2800 2275

317 | P a g e
Land rent 4000 4000 4000 4000 4000 4000
Total labour (man day) 171 95 95 95 92
Total cost Rs. 47545 7600 29925 85070 48396 48396 48396 41645
Yield Kg./ha. 24200 22000 19800 15400
Producer price 8 Rs./kg
Gross income Rs./ha. 193600 176000 158400 123200

318 | P a g e
Table 7.2
Crop variety - Ambul
District - Rathnapura
2005
Crop establishment Crop maintenance Total labour cost Rs./Ha.
Operation Input quantity/ha
Input cost Rs./Ha.
Power cost Rs./Ha.
Labour Mds/Ha.
Labour cost Rs./Ha.
1st year 2nd year 3rd year 4th year 5th year
Fencing 100 30000
Poles 140 35000 35000
Barb wire (kg) 250 26500 26500
Nails (kg) 10 1100 1100
Land preparation (4w tractor)
9000 9000
Preparation of pits
Planting (No. of plants) 1100 16500 70 21000 37500
Fertilizer application 33 9900 9900
NPK (kg)** 1485 36828 36828 40728 40728 40728 40728
Dolomite** (kg)
Kieserite** (kg)
Compost (kg) 4500 6750 6750 10050 10050 10050 10050
Crop maintenance 26 7800 7800 8100 8100 8100 8100
Chemical weed control 6000 7 2100 8100 5900 5900 5900 5900
Pest control 23500 23500 23500 23500
Irrigation 150000 10000 45 13500 173500 26400 26400 26400 26400
Harvesting 8400 8400 8400 8400
Land rent 8400 8400 193 214 195 165
Total labour (man day) 281

319 | P a g e
Total cost Rs. 287078 19000 84300 390378 130878 137178 131478 122478
Yield Kg./ha. 25500 38250 28679 17000
Producer price
Gross income Rs./ha. 255000 382500 286790 170000

320 | P a g e
Table 7.3
Crop variety - Ambul
District - Rathnapura
2012
Crop establishment Crop maintenance Total labour cost Rs./Ha.
Operation Input quantity/ha
Input cost Rs./Ha.
Power cost Rs./Ha.
Labour Mds/Ha.
Labour cost Rs./Ha.
1st year 2nd year 3rd year 4th year 5th year
Fencing 100 80000 80000
Poles 140 63000 63000
Barb wire (kg) 250 48000 48000
Nails (kg) 10 3250 3250
Land preparation (4w tractor)
15000 15000
Preparation of pits 20 16000 16000
Planting (No. of plants) 1100 55000 25 20000 75000
Fertilizer application
NPK (kg)** 1540 36960 13 10400 47360 47360 47360 47360
Dolomite** (kg) 550 8250 8250 8250 8250 8250
Kieserite** (kg) 330 26400 26400 26400 26400 26400
Compost (kg) 11000 99000 20 16000 115000 115000 115000 115000
Crop maintenance 26 20800 20800 20800 20800 20800
Chemical weed control 11250 7 5600 16850 16850 16850 16850
Pest control 14750 14750 14750
Irrigation 300000 12000 45 36000 348000 48000 48000 48000
Harvesting 70400 84000 72000 48000
Land rent 90000 90000 90000 90000 90000 90000
Total labour (man day) 256 204 221 206 60

321 | P a g e
Total cost Rs. 741110 27000 204800 972910 452530 466130 520130 138000
Yield Kg./ha. 25500 38250 28679 17000
Producer price 1275000 1912500 1433950 850000
Gross income Rs./ha.

322 | P a g e
Table 7.4
Crop variety - Kolikuttu
District - Rathnapura
2012
Crop establishment Crop maintenance Total labour cost Rs./Ha.
Operation Input quantity/ha
Input cost Rs./Ha.
Power cost Rs./Ha.
Labour Mds/Ha.
Labour cost Rs./Ha.
1st year 2nd year 3rd year 4th year 5th year
Fencing 100 80000 80000
Poles 140 63000 63000
Barb wire (kg) 250 48000 48000
Nails (kg) 10 3250 3250
Land preparation (4w tractor)
15000 15000
Preparation of pits 20 16000 16000
Planting (No. of plants) 1600 80000 25 20000 100000
Fertilizer application
NPK (kg)** 2240 53760 13 10400 64160 56480 56480 56480
Dolomite** (kg) 800 12000 12000 12000 12000 12000
Kieserite** (kg) 480 38400 38400 38400 38400 38400
Compost (kg) 16000 144000 20 16000 160000 160000 160000 160000
Crop maintenance 26 20800 20800 20800 20800 20800
Chemical weed control 11250 7 5600 16850 16850 16850 16850
Pest control 14750 14750 14750
Irrigation 300000 12000 45 36000 348000 48000 48000 48000
Harvesting 70400 84000 72000 48000
Land rent 90000 90000 90000 90000 90000 90000
Total labour (man day) 256 204 221 206 60

323 | P a g e
Total cost Rs. 843660 27000 204800 1075460 527680 541280 529280 138000
Yield Kg./ha. 24000 30000 30000 20800
Producer price
Gross income Rs./ha. 1800000 2250000 2250000 1560000

324 | P a g e
Table 7.5
Crop variety - Seeni Kesel
District - Rathnapura
2012
Crop establishment Crop maintenance Total labour cost Rs./Ha.
Operation Input quantity/ha
Input cost Rs./Ha.
Power cost Rs./Ha.
Labour Mds/Ha.
Labour cost Rs./Ha.
1st year 2nd year 3rd year 4th year 5th year
Fencing 100 80000 80000
Poles 140 63000 63000
Barb wire (kg) 250 48000 48000
Nails (kg) 10 3250 3250
Land preparation (4w tractor)
15000 15000
Preparation of pits 20 16000 16000
Planting (No. of plants) 1100 44000 25 20000 64000
Fertilizer application
NPK (kg)** 1540 36960 13 10400 47360 42080 42080 42080
Dolomite** (kg) 550 8250 8250 8250 8250 8250
Kieserite** (kg) 330 26400 26400 26400 26400 26400
Compost (kg) 11000 99000 20 16000 115000 181000 181000 181000
Crop maintenance 26 20800 20800 20800 20800 20800
Chemical weed control 11250 7 5600 16850 16850 16850 16850
Pest control 14750 14750 14750
Irrigation 300000 12000 45 36000 348000 48000 18000 48000
Harvesting 70400 84000 72000 48000
Land rent 90000 90000 90000 90000 90000 90000
Total labour (man day) 256 204 221 206 60

325 | P a g e
Total cost Rs. 730110 27000 204800 961910 518530 532130 520130 138000
Yield Kg./ha. 19800 25200 23800 19000
Producer price
Gross income Rs./ha. 792000 1008000 952000 760000

326 | P a g e
Table 7.6
Crop variety - Ambul
District - Rathnapura
2017
Crop establishment Crop maintenance Total labour cost Rs./Ha.
Operation Input quantity/ha
Input cost Rs./Ha.
Power cost Rs./Ha.
Labour Mds/Ha.
Labour cost Rs./Ha.
1st year 2nd year 3rd year 4th year 5th year
Fencing 100 120000 120000
Poles 140 84000 84000
Barb wire (kg) 250 51500 51500
Nails (kg) 10 6000 6000
Land preparation (4w tractor)
22230 22230
Preparation of pits 30 36000 36000
Planting (No. of plants) 1100 71500 15 18000 89500
Fertilizer application
NPK (kg)** 1733 86625 13 15600 102225 89850 89850 89850
Dolomite** (kg)
Kieserite** (kg)
Compost (kg) 11000 110000 20 24000 134000 128000 128000 128000
Crop maintenance 26 31200 31200 31200 31200 31200
Chemical weed control 14255 23 27600 41855 33484 26787 21430
Pest control 20058 20058 20058
Irrigation 366000 29925 45 54000 449925 83925 83925 83925
Harvesting 105600 126000 108000 72000
Land rent 110000 110000 110000 110000 110000 110000
Total labour (man day) 272 210 224 206 60

327 | P a g e
Total cost Rs. 885625 66410 326400 1278435 602117 615820 592463 182000
Yield Kg./ha. 25500 38250 28679 17000
Producer price
Gross income Rs./ha. 1351500 2027250 1519987 1172500

328 | P a g e
Table 7.7
Crop variety - Kolikuttu
District - Rathnapura
2017
Crop establishment Crop maintenance Total labour cost Rs./Ha.
Operation Input quantity/ha
Input cost Rs./Ha.
Power cost Rs./Ha.
Labour Mds/Ha.
Labour cost Rs./Ha.
1st year 2nd year 3rd year 4th year 5th year
Fencing 100 120000 120000
Poles 140 84000 204000
Barb wire (kg) 250 51500 51500
Nails (kg) 10 6000 6000
Land preparation (4w tractor)
22500 22500
Preparation of pits 40 48000 48000
Planting (No. of plants) 1600 200000 17 220400 220400
Fertilizer application
NPK (kg)** 2520 126000 14 16800 142800 124800 124800 124800
Dolomite** (kg)
Kieserite** (kg)
Compost (kg) 16000 160000 20 24000 184000 178000 178000 178000
Crop maintenance 26 31200 31200 31200 31200 31200
Chemical weed control 14255 23 27600 41855 33484 26787 21430
Pest control 18150 18150 18150
Irrigation 366000 29925 45 54000 449925 83925 83925 83925
Harvesting 105600 126000 108000 72000
Land rent 110000 110000 110000 110000 110000 110000
Total labour (man day) 285 211 225 207 60

329 | P a g e
Total cost Rs. 1103500 66680 342000 1632180 685159 698862 675505 182000
Yield Kg./ha. 24000 30000 30000 20800
Producer price
Gross income Rs./ha. 2760000 3450000 3450000 2663500

330 | P a g e
Table 7.8
Crop variety - Seeni kesel
District - Rathnapura
2017
Crop establishment Crop maintenance Total labour cost Rs./Ha.
Operation Input quantity/ha
Input cost Rs./Ha.
Power cost Rs./Ha.
Labour Mds/Ha.
Labour cost Rs./Ha.
1st year 2nd year 3rd year 4th year 5th year
Fencing 100 120000 120000
Poles 140 84000 84000
Barb wire (kg) 250 51500 51500
Nails (kg) 10 6000 6000
Land preparation (4w tractor)
22230 22230
Preparation of pits 30 36000 36000
Planting (No. of plants) 1100 71500 15 18000 89500
Fertilizer application
NPK (kg)** 1733 86625 13 15600 102225 89850 89850 89850
Dolomite** (kg)
Kieserite** (kg)
Compost (kg) 11000 110000 20 24000 134000 134000 134000 134000
Crop maintenance 26 31200 31200 31200 31200 28600
Chemical weed control 14255 23 27600 41855 41855 33484 26787
Pest control 18150 18150 18150
Irrigation 366000 29925 45 54000 449925 83925 83925 83925
Harvesting 105600 126000 108000 72000
Land rent 110000 110000 110000 110000 110000 110000
Total labour (man day) 272 215 229 211 60

331 | P a g e
Total cost Rs. 885625 66410 326400 1278435 614580 626609 599312 182000
Yield Kg./ha. 19800 25200 23800 19000
Producer price
Gross income Rs./ha. 950400 1209600 1142400 1183500

332 | P a g e
Table 7.9
Crop variety - Ambul
Region - Mahaweli (Embilipitiya/Ambalanthota/Thanamalwila/Sewanagala/Sooriyawewa)
2019
Crop establishment
Input quantity/ha
Input cost Rs./Ha.
Power cost Rs./Ha.
Labour Mds/Ha.
Labour cost Rs./Ha.
Total Cost Rs./Ha.
Crop establishment
Land preparation (4w tractor) and preperation of pits
20289 29 43500 63789
Application of systemic insecticides 2364 2364
Planting (No. of plants) 1191 7 10500 10500
Crop maintenance
Fertilizer application 23 34500 34500
NPK (kg)** 2439 68012 68012
NPK with micronutrients (kg)
175 18875 18875
Chemical weed control 15792 4528 5 7500 27820
Mechanical/manual weeding 5066 26 39000 44066
Irrigation 34 51000 51000
Maintenance 35 52500 52500
Harvesting 31 46500 46500
Land rent 134582
Total cost Rs. 554508
Yield Kg./ha. 18137
Producer price 23
Gross income Rs./ha. 417151
Crop maintenance
Fertilizer application 28 42000 42000
NPK (kg)** 4212 101300 101300
NPK with micronutrients (kg)
213 19451 19451
Chemical weed control 11931 4168 4 6000 22099
Mechanical/manual weeding 5640 17 25500 31140
Irrigation 35 52500 52500

333 | P a g e
Maintenance 31 46500 46500
Harvesting 72 108000 108000
Land rent 134582
Total cost Rs. 557572
Yield Kg./ha. 43040
Producer price 23
Gross income Rs./ha. 989943
Crop maintenance
Fertilizer application 28 42000 42000
NPK (kg)** 5140 101461 101461
NPK with micronutrients (kg)
99 16796 16796
Chemical weed control 10414 4117 3 4500 19031
Mechanical/manual weeding 2470 12 18000 20470
Irrigation 33 49500 49500
Maintenance 31 46500 46500
Harvesting 73 109500 109500
Land rent 134582
Total cost Rs. 539840
Yield Kg./ha. 43527
Producer price 24
Gross income Rs./ha. 1044648

334 | P a g e
Table 7.10
Crop variety - Kolikuttu
Region - Mahaweli (Embilipitiya/Ambalanthota/Thanamalwila/Sewanagala/Sooriyawewa)
2019
Crop establishment
Input quantity/ha
Input cost Rs./Ha.
Power cost Rs./Ha.
Labour Mds/Ha.
Labour cost Rs./Ha.
Total Cost Rs./Ha.
Crop establishment
Land preparation (4w tractor) and preperation of pits
26953 30 45000 71953
Application of systemic insecticides
4775 2 3000 7775
Planting (No. of plants) 2543 13 19500 19500
Crop maintenance
Fertilizer application 29 43500 43500
NPK (kg)** 3264 88009 88009
NPK with micronutrients (kg)
256 43533 43533
Chemical weed control 28373 4446 7 10500 43319
Mechanical/manual weeding 4273 21 31500 35773
Irrigation 48 72000 72000
Maintenance 49 73500 73500
Harvesting 43 64500 64500
Land rent 170623
Total cost Rs. 733985
Crop maintenance 0 0
Fertilizer application 5 7500 7500
NPK (kg)** 741 22971 22971
NPK with micronutrients (kg)
Chemical weed control
Mechanical/manual weeding 1606 5 7500 9106
Irrigation
Maintenance 25 37500 37500
Harvesting 31 46500 46500
Land rent 170623

335 | P a g e
Total cost Rs. 294200
Yield Kg./ha. 21129
Producer price 92
Gross income Rs./ha. 1943868
Crop maintenance
Fertilizer application
NPK (kg)**
NPK with micronutrients (kg)
Chemical weed control
Mechanical/manual weeding
Irrigation
Maintenance
Harvesting
Land rent 170623
Total cost Rs.
Yield Kg./ha. 27055
Producer price 56
Gross income Rs./ha. 1515080

336 | P a g e
Table 7.11
Crop variety - Seeni
Region - Mahaweli (Embilipitiya/Ambalanthota/Thanamalwila/Sewanagala/Sooriyawewa)
2019
Crop establishment
Input quantity/ha
Input cost Rs./Ha.
Power cost Rs./Ha.
Labour Mds/Ha.
Labour cost Rs./Ha.
Total Cost Rs./Ha.
Crop establishment
Land preparation (4w tractor) and preperation of pits
22700 25 37671 60372
Application of systemic insecticides 3499 3 4477 7976
Planting (No. of plants) 1156 8 12634 12634
Crop maintenance
Fertilizer application 19 28521 28521
NPK (kg)** 1727 49914 49914
NPK with micronutrients (kg)
100 17049 17049
Chemical weed control 14634 3108 5 7778 25520
Mechanical/manual weeding 4107 22 32485 36592
Irrigation 36 54687 54687
Maintenance 41 62190 62190
Land rent 100337
Total cost Rs. 455,792
Crop maintenance
Fertilizer application 23 34797 34797
NPK (kg)** 2543 68131 68131
NPK with micronutrients (kg)
165 27890 27890
Chemical weed control 10423 3293 4 5835 19552
Mechanical/manual weeding 3840 15 22902 26742
Irrigation 34 51144 51144
Maintenance 38 57741 57741
Harvesting 54 80824 80824
Land rent 100337

337 | P a g e
Total cost Rs. 467,158
Yield Kg./ha. 32143
Producer price 35
Gross income Rs./ha. 1125004
669211
Crop maintenance
Fertilizer application 25 36885 36885
NPK (kg)** 2485 61639 61639
NPK with micronutrients (kg)
68 11691 11691
Chemical weed control 10807 3293 3 5033 19133
Mechanical/manual weeding 36466 12 17674 54140
Irrigation 31 46765 46765
Maintenance 38 56366 56366
Harvesting 70 104947 104947
Land rent 100337
Total cost Rs. 491,904
Yield Kg./ha. 36476
Producer price
Gross income Rs./ha.

338 | P a g e
Table 8: Crop Enterprise Budget of Pineapple
Table 8.1
Crop variety - Pineapple
District- Gampaha
2000
Crop Establishment Crop Maintenance Total CostRs/ha
Input Power Cost
Labour
Operation Qty/ha Cost Rs/ha
Rs/ha Mds/ha Cost Rs/ha
1st Year 2nd Year 3rd Year 4th Year 5th Year
Fencing
Poles
Barbed wire (Kg)
Nails (Kg)
Land Preparation(4WT) 8000 8000
Preparation of ridges 30 5250 5250
pre-treatment of planting material
Planting (No. of suckers) 12500 37500 32 5600 43100
Establishment cost 56350
Fertilizer Application
NPK (Kg)*
Earthing up
Compost (Kg)

339 | P a g e
Kieserite (Kg)
Pineapple Mix (Kg) (1st Year) 1235 12597 20 3500 16097
Pineapple Mix (Kg) (2nd Year) 2470 25194 35 6125 31319
Pineapple Mix (Kg)(3rd Year ) 1235 12597 28 4900 17497
Urea (Kg) (3rd Year) 610 3965 3965
NPK *
Lime (Kg)
Manual Weeding/ Mulching 25 4375 4375 4375 4375 4375 4375
Chemical Weeding 6000 3 525 6525
Pest Control 3920 5 875 4795 4795 4795 4795 4795
Hormone application
Watching
Harvesting 3500 4200 4200 5600
Land Rent(Rs/ha) 30000 3000 3000 3000 3000 3000
Total Labour (Mds) 178 115 112 84 92
Total Cost 8000 31150 91142 46989 37832 16370 17770
Yield (Kg/ha)- Total Fruit Production 12500 15000 15000 20000
Producer Price (Rs/Kg) 15 13 10 8
Gross Income (Fruits) (Rs/ha) 187500 195000 150000 16000
Gross Income(From Suckers) (Rs/ha) 31250 50000
Total Gross Income Rs./ha 218750 245000 150000 16000

340 | P a g e
Table 8.2
Crop variety - Pineapple
District- Gampaha
2005
Crop Establishment Crop Maintenance Total CostRs/ha
Input Power Cost
Labour
Operation Qty/ha Cost Rs/ha
Rs/ha Mds/ha Cost Rs/ha
1st Year 2nd Year 3rd Year 4th Year
Fencing 100 30000 30000
Poles 140 35000 35000
Barbed wire (Kg) 250 26500 26500
Nails (Kg) 10 1100 1100
Land Preparation(4WT) 8750 8750
Preparation of ridges
pre-treatment of planting material
Planting (No. of suckers) 12500 51500 35 10500 62000
Establishment cost
Fertilizer Application 10 3000 3000
NPK (Kg)* 1400 29932 29932 32392 32392
Earthing up 13 3900 3900 3900 3900
Compost (Kg)
Kieserite (Kg)
Pineapple Mix (Kg) (1st Year)
Pineapple Mix (Kg) (2nd Year)

341 | P a g e
Pineapple Mix (Kg)(3rd Year )
Urea (Kg) (3rd Year)
NPK *
Lime (Kg)
Manual Weeding/ Mulching 25 7500 7500 7500 7500
Chemical Weeding 5250 5 1500 6750 6750 6750
Pest Control 5000 5 1500 6500 6500 6500
Hormone application 1750 5 1500 3250 3250 3250
Watching 16 4800 4800 4800 4800
Harvesting 6000 6000 6000
Land Rent(Rs/ha) 9000 9000 9000 9000 9000
Total Labour (Mds) 214 99 99 99
Total Cost 165032 8750 64200 237982 80092 80092 15000
Yield (Kg/ha)- Total Fruit Production
12500(Fruits/ha) 12500(Fruits/ha) 20000(Fruits/ha)
Producer Price (Rs/Kg)
Gross Income (Fruits) (Rs/ha) 275000 250000 280000
Gross Income(From Suckers) (Rs/ha)
35000 35000
Total Gross Income Rs./ha 310000 285000 280000

342 | P a g e
Table 8.3
Crop variety - Pineapple
District- Gampaha
2012
Crop Establishment Crop Maintenance Total CostRs/ha
Input Power Cost
Labour
Operation Qty/ha Cost Rs/ha
Rs/ha Mds/ha Cost Rs/ha
1st Year 2nd Year
3rd Year 4th Year
Fencing 100 60000 60000
Poles 140 63000 63000
Barbed wire (Kg) 250 48000 48000
Nails (Kg) 10 3250 3250
Land Preparation(4WT) 16250 16250
Preparation of ridges
pre-treatment of planting material
Planting (No. of suckers) 12500 100000 35 21000 121000
Establishment cost 248500
Fertilizer Application
NPK (Kg)*
Earthing up
Compost (Kg) 10000 37500 13 7500 45000
Kieserite (Kg)
Pineapple Mix (Kg) (1st Year)
Pineapple Mix (Kg) (2nd Year)

343 | P a g e
Pineapple Mix (Kg)(3rd Year )
Urea (Kg) (3rd Year)
NPK * 1688 51000 10 6000 57000 57000 57000
Lime (Kg) 2000 10800 5 3000 13800
Manual Weeding/ Mulching 25 15000 15000 15000 15000
Chemical Weeding 4413 5 3000 7413 7413 7413
Pest Control 3660 5 3000 6660 6660 6660
Hormone application 1926 5 3000 4926
Watching 16 9600 9600 9600 9600
Harvesting 13200 13200 13200
Land Rent(Rs/ha) 15000 15000 15000 15000 15000
Total Labour (Mds) 232 96 96 20
Total Cost 338549 16250 138900 493699 131673 131673 28200
Yield (Kg/ha)- Total Fruit Production 12500 12500 20000
Producer Price (Rs/Kg)
Gross Income (Fruits) (Rs/ha) 1062500 1062500 1700000
Gross Income(From Suckers) (Rs/ha) 96000 96000
Total Gross Income Rs./ha 1158500 1158500 1700000

344 | P a g e
Table 8.4
Crop variety - Pineapple
District- Gampaha
2017
Crop Establishment Crop Maintenance Total CostRs/ha
Input Power Cost
Labour
Operation Qty/ha Cost Rs/ha
Rs/ha Mds/ha Cost Rs/ha
1st Year 2nd Year 3rd Year 4th Year
Fencing 100 120000 120000
Poles 140 84000 84000 84000
Barbed wire (Kg) 250 51500 51500 51500
Nails (Kg) 10 6000 6000 6000
Land Preparation(4WT) 32110 32110
Preparation of ridges
pre-treatment of planting material 7233 18 21600 28833
Planting (No. of suckers) 16,500 247,500 46 55200 302700
Establishment cost 625143
Fertilizer Application
NPK (Kg)* 1,980 99,000 13 15600
Earthing up
Compost (Kg) 10,000 100,000 13 15600 115,600
Kieserite (Kg) 248 10,643 10643 14,190 14,190
Pineapple Mix (Kg) (1st Year)
Pineapple Mix (Kg) (2nd Year)
Pineapple Mix (Kg)(3rd Year )
Urea (Kg) (3rd Year)
NPK * 13 15600 114600 114600 114600
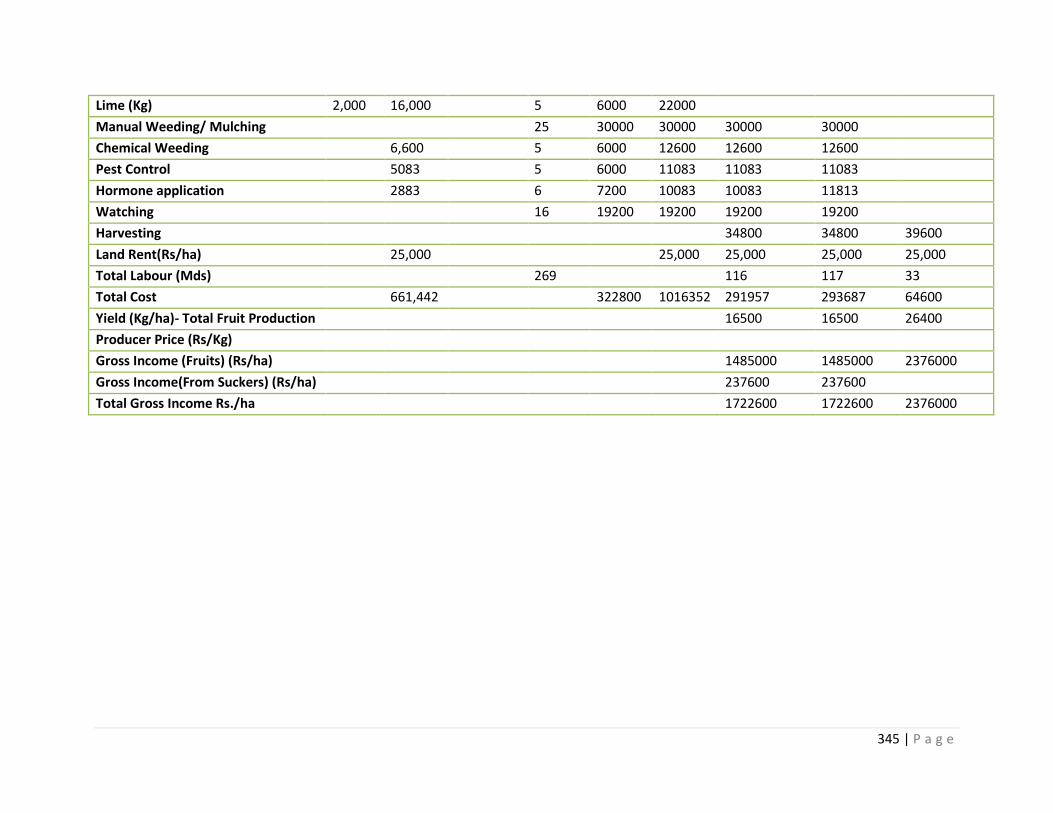
345 | P a g e
Lime (Kg) 2,000 16,000 5 6000 22000
Manual Weeding/ Mulching 25 30000 30000 30000 30000
Chemical Weeding 6,600 5 6000 12600 12600 12600
Pest Control 5083 5 6000 11083 11083 11083
Hormone application 2883 6 7200 10083 10083 11813
Watching 16 19200 19200 19200 19200
Harvesting 34800 34800 39600
Land Rent(Rs/ha) 25,000 25,000 25,000 25,000 25,000
Total Labour (Mds) 269 116 117 33
Total Cost 661,442 322800 1016352 291957 293687 64600
Yield (Kg/ha)- Total Fruit Production 16500 16500 26400
Producer Price (Rs/Kg)
Gross Income (Fruits) (Rs/ha) 1485000 1485000 2376000
Gross Income(From Suckers) (Rs/ha) 237600 237600
Total Gross Income Rs./ha 1722600 1722600 2376000

346 | P a g e
Table 8.5
Crop variety - Pineapple
District- Gampaha
2000 2005 2012 2017 2019
Crop Establishment
Machinery/ power cost 8000 8750 16250 32110 38393
Land Preparation (4WT)
Labour Cost 10850 40500 84000 218400 70293
No.of Labourers 62 135 153 182 49
Input Cost including imputed cost 37500 114100 262550 512233 244096
Fencing related inputs 62600 114250 141500 50193 (33%)
Pre-treatment 7233 6997
Lime/Dolomite 10800 16000 6434 (27%)
Compost 37500 100000
Planting density (Number of Suckers per Ha) 12500 12500 12500 16500 14549
Planting material Cost 37500 51500 100000 247500 232777
Crop Establishment Cost 56350 163350 362800 762743 352781
Total Fixed Cost 56350 163350 362800 352781
Crop Maintenance
1st Year (90 sample)
Fertiliser (Kg) 1235 1400 1688 1980 2731
Fertiliser Cost 12597 29932 51000 109643 110,784
Agrochemicals Cost 9920 12000 9999 14566 19,194

347 | P a g e
Weedicides 6000 5250 4413 6600 7,899
Pesticides 3920 5000 3660 5083
Hormone 1750 1926 2883
Machinery/Power Cost 1,895
Labour Cost 9275 23700 36600 84000 108,974
Labour days 53 79 66 70 79
Harvesting Cost 6000 13200 34800
Land rent 3000 9000 15000 25000 24886
Total Cost 34792 80632 125799 268009 265,734
YIELD (Kg/Ha) 12500 12500(Fruits/ha) 12500 16500 15157
2nd Year (79 sample)
Fertiliser (Kg) 2470 1400 1688 1980 2313
Fertiliser Cost 25,194 29932 51000 109643 73,610
Agrochemicals Cost 3,920 12000 8073 14566 15,220
Weedicides 6600 6,705
Pesticides 5083
Hormone 2883
Machinery Cost 1,180
Labour Cost 11,375 23700 36600 104400 81,017
Labour days 65 79 66 87 58
Harvesting cost 3,500 6000 13200 34800
Land rent 3,000 9000 15000 25000 24886
Total Cost 46,989 80632 123873 288409 195,914
YIELD 15000 12500(Fruits/ha) 12500 16500 11730
3rd Year (17 sample)

348 | P a g e
Fertiliser (Kg) 1845 1400 1688 1980 1886
Fertiliser Cost 16562 29932 51000 99000 50,313
Agrochemicals Cost 3920 12000 8073 14566 15,600
Weedicides 6600 7,284
Pesticides 5083
Hormone 2883
Machinery Cost 2,676
Labour Cost 10150 23700 36600 104400 61,359
Labour days 58 79 66 87 43
Land rent 3000 6000 13200 34800 24886
Harvesting cost 4200 9000 15000 25000
Total Cost 37,832 80632 123873 277766 154,835
YIELD 15000 20000(Fruits/ha) 20000 26400 12697

349 | P a g e
Table 9: Crop Enterprise Budget for Passion fruit
Table 9.1
Crop variety - Passion fruit
District - Gampaha
2000
Crop Establishment Crop Maintainence - Total Cost (Rs/ha)
Input Power Cost
Labour
Operation Qty/ha Cost Rs/ha
Rs/ha Mds/ha Cost Rs/ha
1st Year
2nd Year
3rd Year
4th Year
5th Year
Land Preparation(4WT) 7600 7600
Planting (No. of plants) 1100 Plants
11000 19 3325 14325
Fertilzer application 30 5250 5250 5250 5250 5250 875
Urea (Kg) 198 1386 1386 1386 1386 1386
Rock Phosphate (Kg) 379 2735 2735 2735 2735 2735
MOP (Kg) 182 2548 2548 2548 2548 2548
Poultry (Load) 2 1482 1482 1482 1482 1482 1482
NPK (Kg)*
Compost (Kg)
Kieserite (Kg)
Lime (Kg)/Dolamite
Trelising & training 20 3500 3500

350 | P a g e
Poles 1200 30000
Barbed wire (Kg) 150 11250
Pruning 20 3500 3500 3500 3500 3500 3500
Manual Weeding 175 30625 30625 17500 17500 17500 13125
Pollination
Irrigation 2500 20 3500 6000 6000 6000 6000 6000
Harvesting 20 3500 3500 7778 9333 8556 7000
Land Rent 3000 3000 3000 3000 3000 3000
Total Labour (Mds) 304 214 223 219 160
Total Cost (Rs.) 63401 10100 53200 126701 51179 52734 51957 34982
Yield (Kg/ha)- Total Fruit Production 4000 10000 12000 11000 9000
Producer Price (Rs/Kg) 15
Gross Income (Rs/ha) 60000 150000 180000 165000 135000

351 | P a g e
Table 9.2
Crop variety - Passion fruit
District - Kaluthara
2005
Crop Establishment Crop Maintainence - Total Cost (Rs/ha)
Input Power Cost
Labour
Operation Qty/ha Cost Rs/ha
Rs/ha Mds/ha Cost Rs/ha
1st Year
2nd Year
3rd Year
4th Year
5th Year
Fencing 100 30000 30000
Poles 140 35000 35000
Barbed wire (Kg) 250 26500 26500
Nails (Kg) 10 1100 1100
Land Preparation(4WT) 8750 19 5700 14450
Planting (No. of plants) 1125 16875 62 18600 35475
Fertilzer application 40 12000 12000
Urea (Kg)
Rock Phosphate (Kg)
MOP (Kg)
Poultry (Load)
NPK (Kg)* 776 13234 13234 24738 33585 42026 33586
Compost (Kg) 7500 7500 7500 12000 12000 12000
Kieserite (Kg) 68 3400 3400
Lime (Kg)/Dolamite
Trelising & training 35 10500 10500
Poles 1125 28125 28125
Barbed wire (Kg) 150 21000 21000
Pruning 1750 1750 1750

352 | P a g e
Manual Weeding 100 30000 30000 17500 17500 17500 14000
Pollination 30 9000 9000 17500 17500 14000 10500
Irrigation 125000 6000 20 6000 137000 12000 12000 16000 16000
Harvesting 9000 20 6000 6000 14000 14000 10500 7000
Land Rent 9000 9000 9000 9000 9000
Total Labour (Mds) 426 205 205 205 120
Total Cost (Rs.) 286734 14750 127800 429284 108488 117335 122776 90086
Yield (Kg/ha)- Total Fruit Production
7125 28000 20000 14000 5000
Producer Price (Rs/Kg)
Gross Income (Rs/ha) 156750 616000 440000 308000 110000

353 | P a g e
Table 9.3
Crop variety - Passion fruit
District - Kaluthara
2012
Crop Establishment Crop Maintainence - Total Cost (Rs/ha)
Input Power Cost
Labour
Operation Qty/ha Cost Rs/ha
Rs/ha Mds/ha Cost Rs/ha
1st Year
2nd Year
3rd Year
4th Year
5th Year
Fencing 100 70000 70000
Poles 140 63000 63000
Barbed wire (Kg) 250 48000 48000
Nails (Kg) 10 3250 3250
Land Preparation(4WT) 20000 19 13300 33000
Planting (No. of plants) 1125 33750 62 43400 77150
Fertilzer application
Urea (Kg)
Rock Phosphate (Kg)
MOP (Kg)
Poultry (Load)
NPK (Kg)* 866 24488 40 28000 52488 48250 57958 57958
Compost (Kg) 5625 16875 16875 21094 21094 21094
Kieserite (Kg)
Lime (Kg)/Dolamite 563 2970 2970
Trelising & training 35 24500 24500
Poles 1125 56250 56250
Barbed wire (Kg) 150 28800 28800
Pruning 6300 6300 6300

354 | P a g e
Manual Weeding 15 10500 10500 10500 10500 10500
Pollination 30 21000 21000 21000 21000 21000
Irrigation 200000 10000 20 14000 224000 24000 24000 24000
Harvesting 20 14000 14000 28000 28000 21000
Land Rent 15000 15000 15000 15000 15000
Total Labour (Mds) 341 154 154 144
Total Cost (Rs.) 492383 30000 238700 760783 174144 183852 176852 14000
Yield (Kg/ha)- Total Fruit Production
7125 28000 20000 14000
Producer Price (Rs/Kg)
Gross Income (Rs/ha) 285000 1120000 800000 560000 200000

355 | P a g e
Table 9.4
Crop variety - Passion fruit
District - Kaluthara
2017
Crop Establishment Crop Maintainence - Total Cost (Rs/ha)
Input Power Cost
Labour
Operation Qty/ha Cost Rs/ha
Rs/ha Mds/ha Cost Rs/ha
1st Year 2nd Year 3rd Year 4th Year 5th Year
Fencing 100 120,000 120,000
Poles 140 84,000 84,000
Barbed wire (Kg) 250 51,500 51,500
Nails (Kg) 10 6000 6,000
Land Preparation(4WT) 30,000 19 22,800 52,800
Planting (No. of plants) 1,125 84,375 62 74,400 158,775
Fertilzer application
Urea (Kg)
Rock Phosphate (Kg)
MOP (Kg)
Poultry (Load)
NPK (Kg)* 866 30,206 40 48,000 78,206 76,333 91,391 106,444 106,444
Compost (Kg) 11,250 112,500 112,500 119,700 119,700 119,700 119,700
Kieserite (Kg) 124 5,332 5,332 2,666 2,666 2,666 2,666
Lime (Kg)/Dolamite 563 4,504 4,504 4,504 4,504 4,504 4,504
Trelising & training 35 42,000 42,000
Poles 1,125 163,125 163,125
Barbed wire (Kg) 150 34,500 34,500

356 | P a g e
Pruning 10,800 10,800 10,800
Manual Weeding 15 18,000 18,000 18,000 18,000 18,000 18,000
Pollination 30 36,000 36,000 36,000 36,000 36,000 36,000
Irrigation 366,000 15,000 20 24,000 405,000 39,000 39,000 39,000 39,000
Harvesting 20 24,000 24,000 48,000 48,000 36,000 30,000
Land Rent 37,500 37,500 37,500 37,500 37,500 37,500
Total Labour (Mds) 341 154 154 144 130
Total Cost (Rs.) 979542 45000 409,200 1,433,742 392,503 407,561 410,614 393,814
Yield (Kg/ha)- Total Fruit Production
7,125 28,000 25,000 14,000 5,000
Producer Price (Rs/Kg)
Gross Income (Rs/ha) 427,500 1,680,000 1,500,000 840,000 571,500

357
Table 9.5
Crop variety - Passion fruit
District - Kaluthara
2019
Input Power Cost
Labour Total Cost
Operation Qty/ha Cost Rs/ha
Rs/ha Mds/ha Cost Rs/ha
Crop Establishment
Land Preparation(4WT) 125 179801 179801
Planting (No. of plants) 1059 38984 61 66720 105704
Fertilzer application
Dolamite (Kg) 434 12648 30 44346 56995
Compost (Kg) 1792 16239 16239
Trelising & training 63 94740 94740
Poles 1143 63002 63002
Barbed wire (Kg) 148 48840 48840
565321
Crop Maintainence - Total Cost (Rs/ha)
Year 1
Fertilzer application
NPK (Kg)* 708 24256 58 86759 111015
Pruning 50 74453 74453
Mechanical/manual weeding 15202 44 65375 80577
Pollination 89 132929 132929
Harvesting 116 173672 173672
572646
Yield (Kg/ha)- Total Fruit Production 5880
88.00
517443
Crop Maintainence - Total Cost (Rs/ha)
Year 2
Fertilzer application
NPK (Kg)* 1022 33347 25 36911 70258
Pruning 27 39900 39900
Mechanical/manual weeding 16898 40 60139 77037
Pollination 49 73126 73126
Harvesting 138 206336 206336
466658
Yield (Kg/ha)- Total Fruit Production 8736

358
90.23
698919
Crop Maintainence - Total Cost (Rs/ha)
Year 2
Fertilzer application
NPK (Kg)* 1152 40320 26 38948 79269
Pruning 27 39900 39900
Mechanical/manual weeding 18163 42 62311 80474
Pollination 48 72428 72428
Harvesting 136 203340 203340
475411
Yield (Kg/ha)- Total Fruit Production 8852
92.50
818843
Total Labour (Mds)
Total Cost (Rs.)
Yield (Kg/ha)- Total Fruit Production
Year 1
Year 2
Year 3
Producer Price (Rs/Kg)
Gross Income (Rs/ha)

359
Annex 1: Stakeholders of the Key Informant Survey (Recordings)
Director General /DOA
1. The role of department of agriculture in releasing technology that has been developed by
institute other than department of agriculture to farmers
Does DOA have the sole of authority? OR other institute also has the authority in
releasing technology.
2. What system is the most effective in innovations of technology ?
(a) Conducting own R&D by DOA (Direct government undertaking)
(b) Directly funding others to conduct R&D (e.g., government funds research through the
National Science Foundation grants, CARP), and
(c) GOVERNMENT providing incentives for others to conduct more R&D - ‗private‘
R&D by strengthening intellectual property rights
OR any other?
3. How informed is the DOA on R&D of research community out side DOA?
4. Commercializing and up-scaling of new technology – Effectiveness of Existing
mechanism????
Scientists DOA Institutes
Rice Research and Development Institute
Fruit Crops Research and Development Institute
Field Crop Research and Development Institute
PGRC
Seeds and Planting Materials Development Institute
SEPC
Extension and Training Centre
Seed certification and plant protection centre
Crop Leaders
Officers of Other Institutes
Mahaeweli Development
Agrarian services centers
NITF
Agrarian Insurance Board
NSF
CARP
Private sector – Hayles, CIC, Fruits Associations
Farmer Organizations/ Retailers

360
Factors affecting Productivity of Pineapple
District :………………………….
Divisional Secretariat : …………………………
Agrarian Service Center : …………………………
Grama Niladari Division : …………………………
Agro Ecological Zone : …………………………
Water Source/Irrigation Method : 1. Minor 2. Rainfed 3.Drip 4.Sprinkler
Business Owner/ Farmers Name : …………………………………………
Is your business registered : …………………………………………
Address : …………………………………………
………………………………………….
…………………………………………
Investigators Name : …………………………………………
Date : …………………………………………
Annex 2

361
1. Household Information: 1.1 No. of member in the Household: ……………….
1.2 Details of the Household
Serial
Number
1
Relationship
to the head
of the
household
Sex 1. Female 2. Male
Age
(Years)
Level of
Education Activity Main
Occupation
Monthly
Income
in
Rupees
Secondary
Occupation Monthly
Income in
Rupees
(කේතය-1)
2 3 4 (Code-2 (Code-3 (Code-4) (Code-5)
5 6 7 8 0 1
0 2
0 3
0 4
0 5
0 6
0 7
0 8
0 9
1 0
1 1
1 2
(Code -1) (Code -2) (Code -3) (Code - 4/5) Relationship to the Household head
Level of Education work Main / Secondary occupation
1 Head 1. 1-5 year 1. Employed 1. Farming
2Husband / Wife 2. 6-8 year 2. Unemployed (involuntary/seeking
employment)
2. Self-Employment (Please specify ....)
3. Son / daughter 3Years 9-11 (up to GCE) 3. Unemployed (voluntary)) 3. Agricultural hire d worker
4 Brother/a sister 4. Passed the GCE (O / L) 4. Students 4. Non-agricultural hired worker
5. Nephew/Neece 5. Passed the GCE (A / L) 5. Retired, old, frail, infant, etc. 5. Craftsman Jobs
6. Grandson /
granddaughter
6. Undergraduate 6. Housewife 6. Private sector salaried jobs
7. Mother / father 7. Graduate 7. Other 7. Foreign Employment (Domestic
Worker etc.)
8. Other 8. No -schooling / Unable to write 8.Government jobs
9. No-schooling / Can write 9. Other
10 Not eligible to go to school

362
2. Details of Owned Land Cultivated
Extent in Acres
Ownership
(Code-6)
Location 1.In the residential
village
2.Outside
2018 Pineapple cultivated extent 2018 Other crops cultivated
Cultivated
Extent
Acres
Irrigation
method
((Code 7)
Pineapple
Variety
((Code 8)
Cultivated
Extent
Acres
Irrigation
method
(Code 7)
Cultivated
Crop (Code
9)
1 Homestead
2 Highland
2.1 ……….
2.2 ……....
2.3 ……..
3 Lowland
3.1 ………..
3.2 ……….
3.3 ……….
3.4 ……….
4 Chena Land
4.1 ………….
4.2 …………
4.3 ………….
4.4 …………
Code: 6
Owner Ship
Code: 7
Water supply
Code :8
Pineapple Varity Code:9
Cultivated crops
1.Own 1Lake 1.mauritius 1.
2. Joint ownership 2.Canal/oya 2.kew 2.
3. Taken up 3. Rain water 3.singapore spanish 3.
4.lease 4. Agriculture Well 4. 4.
5. Mortgaged 5. Drip water 5. 5.
6. illegal 6. Sprinkler 6. 6.
7. Government taxes 7. 7. 7.
8. Plantation company taxes 8. 8 8.

363
3. Details of Pineapple extent cultivated on Lease/rent
Land
Plot Cultivated
Extent in
Ac
1.Rent
2.Lease
3.Morgaged
How long
have you
been
cultivating?
(Years)
Rent/Lease/.M
ortgaged
Period
(Years)
1. Under Crop 2. Mono Crop
Nature of
Lease/Rent
Rent amount
3.1 What are the problems / conditions associated with tenant, lease or mortgage
pineapple cultivation?
1......................................................................................................................................
2......................................................................................................................................
3. …….……………………………………………………………………………………………………….. …………………… 3.2 What are the land related problems to expand the pineapple cultivation?
1..............................................................................................................................................
2. ............................................................................................................................................
4. Ownership of Machineries (Owned);
Tool Purchased on
Cash /lease
Year of
Purchased Value Brand
4 Wheel Tractor
2 Wheel Tractor
Sprayer
Water pump
Lorry
Weeder
Other

364
05. General Information on Pineapple Farming
5.1 Experiences in Farming (Years) .................
5.2 Experience in Pineapple farming (Years): …………..
5.3 Extent of Pineapple cultivation, Yield
Serial
number Extent
Cultivated
Type of Cultivation
1. Mono Crop
2.Mixed Crop
3.Under crop
(state under which crop))
(Varity)
Code: 10
Type of Planting
material
Code: 11
Yield in 2018
(No of
fruits/kg))
Code: 10 Varity: 1.Mauritius 2.Kew 3.Singapore Spanish
Code: 11 Type of Planting material: l Ground Suckers 2.stem Suckers 3.slips 4.crown 5.Tissue
Culture
5.4 Pineapple cultivation compared to previous years:
1. Decreased 2. Increased 3 Unchanged
5.5 What were the reasons for the increase / decrease in the amount of land used for pineapple
cultivation?
.................................................................................................................................................
5.6 Are you satisfied with the yield? 1. Yes 2. No
5.6.1 If No, give reasons
...............................................................................................................................................
5.7 Does the yield vary depending on the size of the land? 1. Yes 2. No
5.7.1 Give reasons. ...........................................................................................................
5.8 Disposal of Harvest/ Marketing
Instances
of
marketing
Quantity
kg
To whom the
harvest was
marketed
(Code 12)
Place of
Disposal/
marketing
(Code13)
Price
Rs/kg
Cost
incurred
Rs.
Transport
cost Rs.
1
2
3

365
Code:12 To whom the harvest
was marketed Code : 13 Place of
Disposal
1.Retailer 6.Processor 1. Farm gate 5.Manin Market
2.Wholesaler 7.Exporter 2. House 6.Other(specify)
3.Collector 8.Village fair 3.Village fair
4.Contractor 9.Other(specify) 4.Road side
5.Under forward agreement
5.8.1 Are you satisfied with the price received? 1. Yes 2. No
5.8.2 If No, give reasons.
....................................................................................................................................
5.9 Supply of Pineapple for Export
5.9.1 Are you a supplier of pineapple for export 1. Yes 2. No
5.9.2 If yes, what are the institutes buy your products? .............................
5.9.3 Are those institutes buying: 1) in stocks 2. Selected fruits/ nuts.
5.9.4 How do you manage your pineapple cultivation to get fruits to satisfy the export
requirements?
1. Weight ............. 2. Shape ...................... 3.Fruit and Crown ratio........... 4. Other
5.9.5 Are you satisfied with the export price? Yes 2. No
5.9.6 If "No" What problems do you have?
............................................................................................................................................... 5.10 Do you grow organic pineapples? 1. Yes 2. No
5.10.1 If "Yes" cultivated 1. High demand 2. Better Price 3...............
5.10.2 You don't grow organic pineapple 1. Low Yield 2. No significant price difference
6. Use of planting materials (plants)
6.1 Quantity of pineapple planting (plant) used for 1 acre / the source of planting material
: Planting
Variety 1.Mauritius
2.Kew
3.Singapore
Spanish
Type of
Planting
material (Code:11)
Plants per Acre
Cost of
a plant
(Rs)
How are
you
getting
planting
materials (Code:12)
How do you
identify
healthy
planting
materials
for
cultivation (Code:13)
Spacing
between
plants 1.Single row
2.Double row
3.Other
Expected
harvest
(1 acre)
For Mono
cultivation
Under-
cultiva
ted
land
Code: 11 Type of Planting material: 1. Ground Suckers 2.stem Suckers 3.slips 4.crown 5.Tissue Culture

366
Code: 12 How to get: 1. Own 2.DOA 3.Agrarian Services Dept. 4.Private Company 5.Friends 6.Neighbor
7. Farmer Organization 8.NGO 9.Other
Code: 13 Plants are identified; 1. Presence of spine leaves 2.fruit yield 3.fruit weight 4.farmer preference
5.drought Resistance 6.cultivated extent 7.other
6.2 Does spacing between plants affect the yield? 1.yes 2.No
6.3 To the answer above Reasons
.........................................................................................................
6.4 Does the spacing of plants differ in other ways (such as grafting plants ....)? 1.yes 2.no
6.5 If yes Explain ..
..............................................................................................................................................
6.6 Are you satisfied with the painting materials purchased ? 1.yes 2.no
6.7 If not reasons
1.price is not affordable
2.quality is not acceptable
3.required quantities not available at required time
4.other (specify)
6.8 Planting and Harvesting period
Type of planting
material
Code: 10/11
…………………..
Type of planting
material
Code: 10/11
…………………
Type of planting
material
Code: 10/11
…………………..
Time of planting material
Harvesting time:
Harvest 1
Harvest 2
Harvest 3
Harvest 4
6.9 Diseases and use of chemicals
Infectious diseases Insect Damages Fungal Damages
Varity&Type of
Planting
material
Code:10/11
Disease use
chemicals Disease use
chemicals Disease use
chemicals

367
Pre-treatment
6.10 Do you know about pre-treatment measures used before planting pineapple?1.Yes
2.No
6.11 How did you know about pre-treatment?
1.AI 2.kpns 3.other farmers 4.experience 5.others
6.12 What are the chemical used for pre-
treatment?................................................................
6.13 What problems do you have at the time of planting these
pineapples?.....................................
Moisture content in the soil
6.15 What are the measures you take to protect moisture content in the soils?
1. Mulch of Coir Dusk 2. Hay 3. Leaves 4.other
6.17 If yes, who advises you?
1.AI 2.kpns 3.other farmers 4.experence 5.others
6.18 How do you maintain cultivation during the drought season
1..Water Motor Application 2.Sp 3. Other
6.19 What problems do you have during the drought?
.....................................................................................................................................
7. Pineapple Cultivation - Labor use
7.1 Pineapple cultivation- Which labor do you use most? (Please specify the order)
The type of labor Sequence
number
Reasons to use it
1 Family labor
2 Attam labor
3 Hired labor
7.2 Do you use Hired Women labor for pineapple cultivation? 1. Yes 2. No
7.2.1 If yes, please explain why it is used.
1. .................................................................................................................................
2. .................................................................................................................................
7.3 Is family women labor used for pineapple cultivation? 1. Yes 2. No
7.3.1 If so, how would it affect the family's daily routine?
1. ........................................................................................................................................
2. ........................................................................................................................................

368
7.4 What are the difficulties in obtaining labor for pineapple cultivation as a whole?
................................................................................................................................
2. ................................................................................................................................
Soil testing of lands
7.5 Is soil testing done on the soil before pineapple planting? 1. Yes 2. No
7.5.1 “Yes” Who was aware of this? 1.AI 2.kpns 3.other farmers 4.experence 5.others
7.5.2 Do you follow the instructions? 1. Yes 2. No
7.5.3 If yes, what were the results?
...........................................................................................................................................
7.5.4 If "No", explain why you don't follow the instructions.
.................................................................................................................................
8. Cost of production of Pineapple
(Only obtain information on one pineapple plot that can provide relevant information)
8.1 Specify the serial number of the selected land for production cost. (As per Question 2)
Serial Number of the Land
2018
8.3 8.2 Source of water for the land: …………….
8.4 You Cultivation: 1.Normal 2.Organic Pineapple
8.4 The crops grown in the last 5 years in the above plots 1. .............. 2 ................ 3. .............
8.5 Other costs for farm power and machinery (Only for the above plots)
Machine
Using the driving force of the
machine
Other labor
Equipment used Male
Female
Contract
(Rs.) Machine (2w,4w)
Used Time
1.Own 2.Hired
If Hired Price Family labor day
Hired labor day
Rent cost (Rs.)
Rent food cost
F
H
F
H
Land preparation -1
Land preparation -2
Laying the beds

369
8.5.1 To protect the cultivation (Only for the above plots)
Fencing
Quantity
unit price
(Rs.)
Total
amount (Rs.)
The Transport
Cost (Rs.)
The use of labor
Male
Female Contract
(Rs.) F H F H
Posts
Barbed Wire Kg.
Nails (kg)
Other ......
8.6 Planting Material Type / Price / Planting Costs (Only for the above plots)
Varity
1.Mauritius
2.Kew
3.Singapore
Spanish
Type of Planting material
(Code: 10)
Cost of planting material
(Rs.)
Who's
buying? (Code: 14)
Total
amount (Rs.)
The Transpor
t Cost (Rs.)
Using labor for planting
Expected yield Acre
Spacing between plants 1.Single row 2.Double row
Male
Female
Contract
(රු.) F H F H
Code: 10 Type of Planting material:
1. Ground Suckers 2.stem Suckers 3.slips 4.crown 5.Tissue Culture 6.seedling
Code: 14 Buy: 1. Own 2.DOA 3.Agrarian Services Dept. 4.Private Company 5.Friends 6.Nneighbor 7.Farmer
Organization 8.NGO 9.Other
8.7 To select that pineapple variety What are the reasons? 1. Being a recommended pineapple variety 2. Easy availability
3. Resistance to pests and diseases 4. Increasing market demand
5.Customer Interest 6. Other.....
8.8 What is your opinion on the quality of the planting material used? 1Poorly 2. Moderate 3. Good
8.9 Pre-treatment of Planting material (Only for the above plots)
The amount of planting
material used for Pre-
treatment (Plants)
The amount
of Planting
(Plants
Used Safe chemical type
Safe chemical
cost (Rs.)
Safe chemical Transport Cost (Rs.)
For planting material safety the use of labor
Male
Female
Hired Cost (Rs.)
Hired food
cost (Rs.)
F H F H

370
8.10 Safe chemicals were used for pre-treatment with "no" procedures and costs which? 8.11 Procedures: ……………………………………………………………………………………………………………………. 8.12 Cost (Rs) : …………………………
9. Use of fertilizer 9.1 Application of fertilizer and cost incurred - (Only for the above plots)
Type of
Fertilizer
Year1
Year2
Year3
Year4
Year5
Quantity Value Quantity Value Quantity Value Quantity Value Quantity Value
Dolomite (Kg)
Compost (Kg)
Kieserite (Kg)
N (Kg)
P (Kg)
K (Kg)
NPK (Kg)
TRANSPORT COST
9.2 Fertilizer application for Labor (Labor Days) - (Only for the above plots)
Fertilizer Year1
Year2
Year3
Year4 Year5
Male Female Male Female Male Female Male Female Male Female
F H F H F H F H F H F H F H F H F H F H
Dolomite (Kg)
Compost (Kg)
Kieserite (Kg)
N (Kg)
P (Kg)
K (Kg)
NPK (Kg)
9.3 From whom did fertilizer be purchased?1.CIC 2.Hayles 3.Baur 4. ASC Center 5. Other
9.4 Who got the knowledge on fertilizer application? 1.AI 2.kpns 3.other farmers 4.experence
5.others
9.5 Fertilizer application 1. Recommended quantities 2. At his own discretion 9.6 Because of the application

371
Fertilizer application The next harvest 1. Low 2.Fantastic 3.No
change
The reasons
1. Recommended quantities
2. At his own discretion
10. Use of Hormone Hormone Type and Cost - (Only for the above plots)
Type of
Hormone
Year1 Year2 Year3 Year4 Year5
Quantity Value Quantity Value Quantity Value Quantity Value Quantity Value
10.1 Hormone sprayers and applied labor ( Labor Days) (Only for the above plots)
Type of Sprayers 1.Hand 2.Motor
Year
For the machine Manpower for the machine
Other labor
1.Own 2.Hired
If own Oil /
maintenance cost
If the rent Price
Family Labor DAY
Hired Labor DAY
Hired Food Cost (Rs))
Male Female Contract F H F H
1
2
3
4
5
10.2 Time of application of Hormone 1. Days of planting.......... 2. ...................... 3.
............................
10.3 Where did you get the idea of using Hormone?
1.AI 2.kpns 3.other farmers 4.experence 5.others 10.4 Hormone application 1. Recommended quantities 2. At his own discretion

372
10.5 Because of the application
Fertilizer application The next harvest 1. Low 2.Fantastic 3.No
change
The reasons
1. Recommended quantities
2. At his own discretion
11. Pest and Disease Control Pest and Disease Type and Cost - (Only for the above plots)
Type of Pest and
Disease
Year1
Year2
Year3
Year4
Year5
Quantity Value Quantity Value Quantity Value Quantity Value Quantity Value
11.1 Pest and Disease sprayers and applied labor ( Labor Days) (Only for the above plots)
Type of Oil sprayers 1.Hand 2Motor
Year For the machine Manpower for the machine
Other labor
1.Own 2.Hired
If own Oil /
maintenance cost
If the Hired Price (Rs)
Family Labor DAY
Hired Labor DAY
Hired Food Cost (Rs)
Male Female Contract Rs. F H F H
1
2
3
4
5
11.2 Pest and Disease - From whom did you learn the application?
1.AI 2.kpns 3.other farmers 4.experence 5.others
11.3 Pest and Disease application 1. Recommended quantities 2. At his own discretion

373
11.4 Because of the application Pest and Disease application
The next harvest
1. Low 2.Fantastic 3.No change
The reasons
1. Recommended quantities
2. At his own discretion
12.Chemical Weeding භාවිතය Chemical Type and Cost - (Only for the above plots))
Type of
Chemical
Year1
Year2
Year3
Year4
Year5
Quantity Value Quantity Value Quantity Value Quantity Value Quantity Value
12.1 Chemical Weeding - Sprayers and applied labor ( Labor Days) (Only for the above plots)
Type of Oil sprayers 1.Hand 2.Motor
Year For the machine Manpower for the machine
Other labor
1.Own 2.Hired
If own Oil /
maintenance cost
If the Hired Price (Rs)
Family Labor DAY
Hired Labor DAY
Hired Food Cost (Rs)
Male Female Contract Rs. F H F H
1
2
3
4
5

374
12.2 Chemical Weeding - From whom did you learn the application?
1.AI 2.kpns 3.other farmers 4.experence 5.others
12.3 Chemical Weeding application 1. As per the above instructions 2. At his own discretion
12.4 Because of the application Chemical Weed application
The next harvest
1. Low 2.Fantastic 3.No change
The reasons
1. Recommended quantities
2. At his own discretion
13. Mechinary Weeding 13.1 Mechinary Weeding - Sprayers and applied labor - ( Labor Days) (Only for the above
plots)
Type of Oil sprayers 1.hand 2.motor
Year For the machine Manpower for the machine
Other labor
1.Own 2.Hired
If own Oil /
maintenance cost
If the Hired Price (Rs)
Family Labor DAY
Hired Labor DAY
Hired Food Cost (Rs)
Male Female Contract
Rs.
F H F H
1
2
3
4
5
13.2 Mechinary Weeding - From whom did you learn the application?
1.AI 2.kpns 3.other farmers 4.experence 5.others
13.3 Machinery weeding application 1. As per the above instructions 2. . At his own discretion
13.4 Problems with Machinery Weeding for pineapple cultivation as a whole?
………………………………………………………………………………………………………………………………………………………
13.5 Are we using polythene to cover the soil for weed control? 1. Yes 2. No
14.Water supply - For water motors
14.1 Please refer to source of water:: ...................................

375
14.2 Water, Machinery & Labor - ( Labor Days) (Only for the above plots)
Type of Water Motor
1.Fuel 2.Current
Year For the machine Manpower for the machine
Other labor
1.Own 2.Hired
තමාගේ නම් ගතල්/විදුලි නඩත්තු වියදම
If the Hired Price (Rs)
Family Labor DAY
Hired Labor DAY
Hired Food Cost (Rs)
Male Female Contract Rs. F H F H
1
2
3
4
5
14.3 How often do you water before harvesting?................. 14.4 Do You Need More Water? 1. Yes 2. No 14.5 Leave a comment: ......................................................................................................
15. Details of Harvesting (Only for the above plots)
Year1 Year 2 Year3 Year4 Year5 total
Frequency of lotus
Quantity of harvested (Kg)
Less than 1 Kg
More than 1 Kg
Amount of waste (Kg)
balance
Average Kg per Nut
15.1 Labor use Harvesting Season
Year1
Year2
Year3
Year4 Year5
Male Female Male Female Male Female Male Female Male Female
F H F H F H F H F H F H F H F H F H F H 1 2 3 4 5
15.2 (Harvesting) If Contract given in details: .............................................................................................................................................................................................................................................................................. 15.3 What problems do you have during this pineapple harvest season?
........................................................................................................................................

376
16. Harvest of the above plots
1 2 3 4 5
16.1 Pineapple harvested area (acre)
16.2
If there is a decline in pineapple harvest, what are the reasons?
1. Climate factors
2. Pests and diseases 3. Damage to animals 4. Other (mention)...................
1 Yield (Kg)
2 Harvest available (Kg)
16.3 If the yield is less than the yield, what are the reasons?
1 Decreased inputs 2 Lack of labor 3 Lack of water 4 Degradation of seed quality 5 Insects and diseases 6 Other (specify) …………………….
17. Total cost of transporting the farm from home to house (Only for the above plots) Use vehicles For the vehicle Loading / Loading
Human labor Contract
Rs. vehicles year 1.Own
2.Hired Own The
cost Hired The
cost Male Female
M F M F
1
2
3
4
5 18. Total cost of moving from farm to market place (Only for the above plots)
Use vehicles
For the vehicle Loading / Loading Human labor
ContractRs.
vehicles year 1.Own 2.Hired
Own The cost
Hired The cost
Male Female
M F M F
1
2
3
4
5
19 Harvest Sale (for above plots only)
Year1
Year2
Year3
Year4
Year 5
total
1. Quantity of harvested
(Kg)
2. Did you sell the stock at
once ? 1.Yes 2.No

377
3. If yes, then the price
given is Rs.
4 If "No" Did
you sell it? 1.Yes 2.No
5. If yes, then the price
given is Rs.
Grade 1.
Grade 2.
Grade 3.
................
................
................
...............
...............
...............
..................
..................
..................
................
................
................
................
................
................
.............
.............
.............
6. Selling from time to
time? 1.Yes 2.No
7.If sold periodically
Price:
19.1 Other labor (only for the above plots)
Year1
Year2
Year3
Year4 Year5
Male Female Male Female Male Female Male Female Male Female
F H F H F H F H F H F H F H F H F H F H
Weeding
Looking after
Adding Soil Harvesting process
Other
Other
19.2 Daily Salary - (Per Day) - Yala 2018
Cultivation practice
Hired labor (With meals)
Hired labor (With meals)
Daily wage (Rs.) Daily wage (Rs.)
M F M F 1 Clearing the land
2 Weed control
3 Preparation of nursery
4 Land preparation -1
5 Land preparation -2
6 Land preparation -3
7 Crop Protection -Planting of

378
poles
8 Laying the beds
9 Planting of seeds
10 Fertilizer application
11 Hormone application
12 Application of pest
13 Weed control
14 Water supply
15
Looking after
16 Harvesting
17 Harvest transport
18 Harvesting process
19 Harvest transport
20 Other
(Provide the following information based on all land production).
20.Management of Produce/ Harvest
Year 1 Year 2 Year 3 Year 4 Year 5 total
1. Obtained from this land Harvest (Kg)
2. From other lands (Kg)
3. Total pineapple harvest (Kg)
4. Amount of waste (Kg)
)
5. The amount sold
(Kg)
6. Average price
(Rs./Kg)
7.At the sale price during the year Range (Rs./Kg)
21Training / Awareness
21.1 Have you participated in any kind of training / awareness program on pineapple
cultivation?
1. Yes 2. No
21.2 If yes, state the details
Name of the program /
course
the year
Organized organization
/ officer
Assessment of the program
The nature of the program (Code 10)
Did the knowledge
used? 1. Yes 2. No
If yes, give reasons

379
22. Where do you get technical advice for pineapple cultivation?
1. DOA 2. Private sector (cic / baurs / heylease /other)
3. NGO 4.Other (specify…)
23. What type of advice /services have you received?
Type of services
1.Yes
2.No
Officer
1 Farm Planning and development
2 Financial management
3 Farm record keeping
4 Weed management
5 Pest and disease control
6 Pest and disease indexing
7 Fertilizer recommendation
8 Soil fertility tests
9 Irrigation advice
10 Processing and grading Advice
11 Post-harvest management
12 Forward sales agreements
13 Market information and marketing
14 Nursery management
15 Credit facilities arrangement
16 Other (specify.)

380
24. Do you satisfied with overall extension service received by you?
25. What are the constraints do you face in pineapple cultivation?
problems Yes No If yes reason suggestion
1 Financial (credit facilities)
2 land
3 machinery
4 Hired labor
5 Chemical fertilizer
6 compose
7 Irrigation water
8 price
9 middleman
10 Extension service
11 Pest and disease
12 other inputs (eg.hormone)
13 Other (specify)
26. Have you obtained training on pineapple cultivation? 1. Yes 2.No
If yes what type of training have you received?
Area of training
Received service 1.yes 2.no
Weather adopted 1. Yes 2. no
If not why?
1 Financial management
2 Farm planning and development
3 Crop management
4 Soil fertility management
Category 1.Yes 2.No
1.Production technologies
2.Management and marketing
3.processing and value adding
4.Record keeping and accounts maintaining

381
5 Nursery management
6 Agro processing and value adding
7 Marketing
8 Pest and disease management
9 Quality improvement and hygienic production
10 Organic farming
11 Farm record keeping and accounts maintaining
12 other
27. Home Loans & Payments: (Loans & Others)
27.1 Have you obtained any loans or loans for farming in the last 5 years? 1.Yes 2.No
(Including mortgage loans).
27.2 Loans
The way of
borrowing
The reason for the
loan
Loan Amount
Pineapple
cultivation Size
Annual interest
Payment period
Approved hold
Amount to be
paid now
Reasons for non-
payment
(Code1) (Code 2) (Code 3) (Code 4)
Code 1 Code 2 Code 3 Code 4 1 State Banks 1. For pineapple cultivation 1 no guarantee 1 the pay day is still ahead 2 Private banks 2 For paddy cultivation 2 Real estate 2. Pineapple Crop destruction 3. Sanasa 3. For animal husbandry 3 Vehicles 3. Debt cutting from the government 4 Samurdhi Bank 4Consumption 4 jewelery 4. Cultivation of disease 5 Agrarian Bank 5. Function 5. Machinery 5. . Other........ 6. The village merchant 6. For Business 6 Personal guarantee 7. The merchant outside the village 7. Loans Escape 7 House Items 8 People who give money interest 8. Housing Development 8. Payment Method 9. Neighbors / relatives 9.Other........ 9. . Other........ 10. Other........
28. Have you participate any post harvest practices/processing before
selling pineapple? 1.Yes 2.No ( if no go to ques. No. 32)

382
29. If yes type of processing adopted?
Value adding /processing
1.yes 2.No
Grading
Cleaning
Packaging
Dehydration
Others(specify)
30. Have you find any price difference after adding value for pineapple? 1. Yes 2.No
31. If yes what benefit have you derived from value addition?
Benefit
Response
Farm gate price increased by <10% Farm gate price increased by 10% -15% Farm gate price increased by 15% -20% Farm gate price increased by 20%-25% Farm gate price increased by >25%
32. Have you faced any difficulties in marketing of pineapple? 1. Yes 2.No 33. If yes what type of problems are you facing in marketing of pineapple? 1. Developed market Centre not available for pineapple
2. Middle man not paid reasonable price for pineapple
3. Quantity not enough to bring to nearest market as transport cots is high.
4. Transport facilities not adequately developed or difficult to find.
5. Price are fluctuating not stable price for pineapple
6. Price paid for pineapple are not enough to cover the cost of production
7. Existing marketing channels are inadequate
8. Any other
34. What are your suggestions to overcome above problems?
……………………………………………………………………………………………………………..
35. Have you encountered pre and post-harvest losses before selling?
1. Yes 2. No
36. What is the % loss out of total production?

383
% of loss
Pineapple
(code 11)
1.damages occurred when harvesting 2.handling at farm (collecting and transporting to store) 3.at store before transporting to market (decayed at store) 4.damaged made by birds animals after harvested 5.transport to market 6.other … Code: 11
1. <5 % 2. 6%-10% 3. 11%-15% 4. 6%-20% 5. >25%
37. Do you need storage facilities to store your products before selling? 1. Yes 2.No
38. What type of assistance do you need to find storage facilities? ………………………………………………………………………………………………………………………………………………………………………………………………………………………………
39. Do you willing to undertake processing? 1. Yes 2.No (If No go to ques. No. 42)
40. If yes what type of processing do you wish to start?
Type of processing
pineapple
Dehydration for local market
Dehydration for export market
Chips production
Other (specify)
41. If you are willing to undertaken processing what constrains do you face in Starting? 1. Startup capital 2 .working capital 3. Technology 4. Procurement of machinery 5. Skilled labor 6. Other
42. Do you cultivate pineapple as out grower affiliated with any? Company/producer/exporter? 1. Yes 2.No (if No go to ques. No. 46) 43. If yes please give information 1. Name of contractor/company/exporter: …………………. 2. Date started: ……………… 3. Type of contractual arrangement (legal agreement/mutual agreement/ Mutual understanding) 4. Valid period: …………….
44. Type of assistance obtained under out grower arrangements 1. Financial assistance provided to purchase inputs (annul/seasons) 2 Supplied inputs (planting/material/fertilizer/agro chemicals/hormones Etc.) On Agreement to supply the produce to company Contractors/exporter and pay
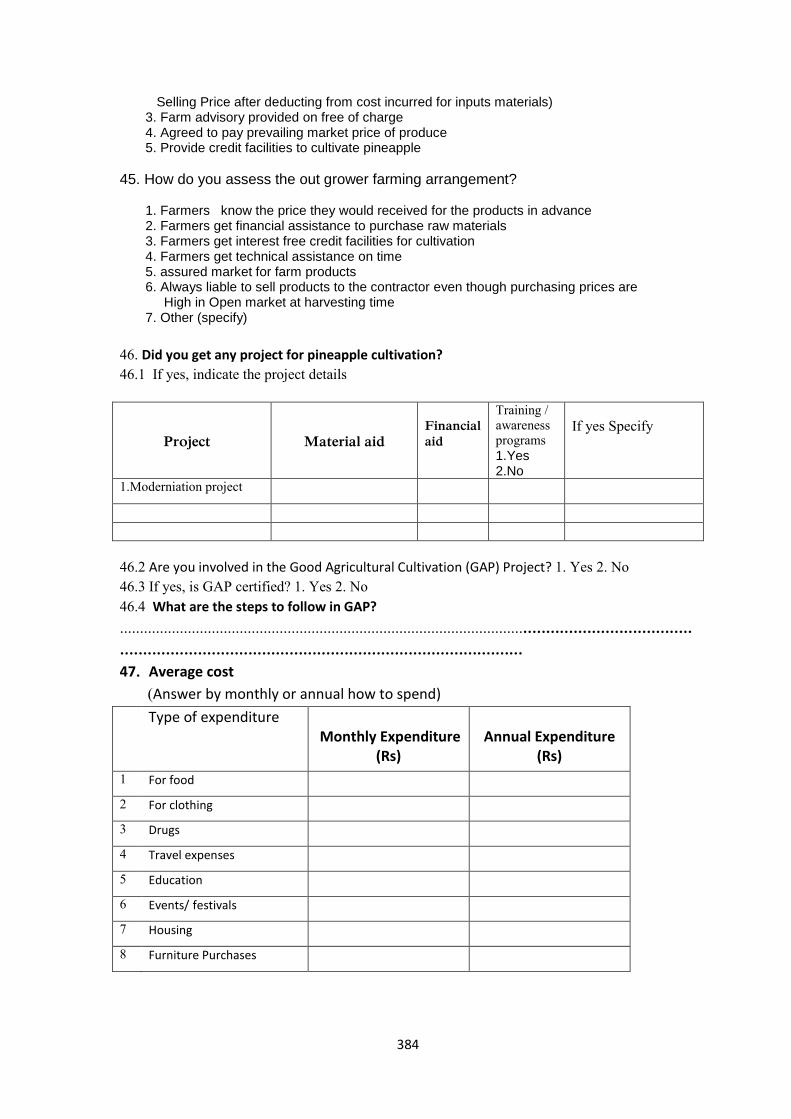
384
Selling Price after deducting from cost incurred for inputs materials) 3. Farm advisory provided on free of charge 4. Agreed to pay prevailing market price of produce 5. Provide credit facilities to cultivate pineapple
45. How do you assess the out grower farming arrangement? 1. Farmers know the price they would received for the products in advance 2. Farmers get financial assistance to purchase raw materials 3. Farmers get interest free credit facilities for cultivation 4. Farmers get technical assistance on time 5. assured market for farm products 6. Always liable to sell products to the contractor even though purchasing prices are High in Open market at harvesting time 7. Other (specify)
46. Did you get any project for pineapple cultivation?
46.1 If yes, indicate the project details
Project
Material aid
Financial
aid
Training / awareness programs
1.Yes 2.No
If yes Specify
1.Moderniation project
46.2 Are you involved in the Good Agricultural Cultivation (GAP) Project? 1. Yes 2. No
46.3 If yes, is GAP certified? 1. Yes 2. No
46.4 What are the steps to follow in GAP?
..........................................................................................................................................
........................................................................................
47. Average cost
(Answer by monthly or annual how to spend)
Type of expenditure Monthly Expenditure
(Rs)
Annual Expenditure
(Rs)
1 For food
2 For clothing
3 Drugs
4 Travel expenses
5 Education
6 Events/ festivals
7 Housing
8 Furniture Purchases

385
9 Debt settlement
10 social services
11 Other...................
48. Household Income (In the past year - Rs.)
Source of income
Last month
Last 6
months
In the year 2018
1 Proceeds from the sale of pineapples
2. By selling pineapple plants
2 By selling other agro-crops
3 By selling permanent crops
4 Income from paddy cultivation
5 Animal Husbandry (Milk, Dung,
Fertilizer, Sale of Animals)
6 Agricultural hire work
7 Non-agricultural rent
8 Trading
9 Pensions
10 Private sector jobs
11 Government jobs
12 of Foreign Employment
13 Samurdhi Donations
14 Ping stairs
15 Other...................
49. Your views on the issues that should be prioritized for increasing the productivity
of Pineapple
1........................................................................................................................
2.........................................................................................................................
3.........................................................................................................................
4.........................................................................................................................
5.........................................................................................................................
end