Whole-genome analysis of pseudorabies virus gene expression by real-time quantitative RT-PCR assay
22
BMC Genomics Research article Whole-genome analysis of pseudorabies virus gene expression by real-time quantitative RT-PCR assay Dóra Tombácz, Judit S Tóth, Pál Petrovszki and Zsolt Boldogkői Address: Department of Medical Biology, Faculty of Medicine, University of Szeged, Somogyi B. st. 4., Szeged, H-6720, Hungary E-mail: Dóra Tombácz - [email protected]; Judit S Tóth - [email protected]; Pál Petrovszki - [email protected]; Zsolt Boldogkői* - [email protected] *Corresponding author Published: 23 October 2009 Received: 22 May 2009 BMC Genomics 2009, 10:491 doi: 10.1186/1471-2164-10-491 Accepted: 23 October 2009 This article is available from: http://www.biomedcentral.com/1471-2164/10/491 © 2009 Tombácz et al; licensee BioMed Central Ltd. This is an Open Access article distributed under the terms of the Creative Commons Attribution License ( http://creativecommons.org/licenses/by/2.0), which permits unrestricted use, distribution, and reproduction in any medium, provided the original work is properly cited. Abstract Background: Pseudorabies virus (PRV), a neurotropic herpesvirus of pigs, serves as an excellent model system with which to investigate the herpesvirus life cycle both in cultured cells and in vivo. Real-time RT-PCR is a very sensitive, accurate and reproducible technique that can be used to detect very small amounts of RNA molecules, and it can therefore be applied for analysis of the expression of herpesvirus genes from the very early period of infection. Results: In this study, we have developed and applied a quantitative reverse transcriptase-based real-time PCR technique in order to profile transcription from the whole genome of PRV after lytic infection in porcine kidney cells. We calculated the relative expression ratios in a novel way, which allowed us to compare different PRV genes with respect to their expression dynamics, and to divide the PRV genes into distinct kinetic classes. This is the first publication on the whole-genome analysis of the gene expression of an alpha-herpesvirus by qRT2-PCR. We additionally established the kinetic properties of uncharacterized PRV genes and revised or confirmed data on PRV genes earlier examined by traditional methods such as Northern blot analysis. Our investigations revealed that genes with the same expression properties form clusters on the PRV genome: nested overlapping genes belong in the same kinetic class, while most convergent genes belong in different kinetic classes. Further, we detected inverse relationships as concerns the expressions of EP0 and IE180 mRNAs and their antisense partners. Conclusion: Most (if not all) PRV genes begin to be expressed from the onset of viral expression. No sharp boundary was found between the groups of early and late genes classified on the basis of their requirement for viral DNA synthesis. The expressions of the PRV genes were analyzed, categorized and compared by qRT2-PCR assay, with the average of the minimum cycle threshold used as a control for the calculation of a particular R value. In principle, this new calculation technique is applicable for the analysis of gene expression in all temporally changing genetic systems. Background The pseudorabies virus (PRV; also called Aujeszky's disease virus or suid herpesvirus type 1) is a member of the alpha-herpesviruses and an important pathogen of pigs, causing Aujeszky's disease [1]. The PRV is a valuable model organism in herpesvirus research [2] and also a powerful tool in neuroscience, employed to map neural circuits [[3-5], and [6]] and gene delivery [7]. The PRV life cycle is primarily controlled at the level of transcrip- tion. The genes of a-herpesviruses are divided into three Page 1 of 22 (page number not for citation purposes) BioMed Central Open Access
Transcript of Whole-genome analysis of pseudorabies virus gene expression by real-time quantitative RT-PCR assay
BMC Genomics
Research articleWhole-genome analysis of pseudorabies virus gene expression byreal-time quantitative RT-PCR assayDóra Tombácz, Judit S Tóth, Pál Petrovszki and Zsolt Boldogkői
Address: Department of Medical Biology, Faculty of Medicine, University of Szeged, Somogyi B. st. 4., Szeged, H-6720, Hungary
E-mail: Dóra Tombácz - [email protected]; Judit S Tóth - [email protected]; Pál Petrovszki - [email protected];Zsolt Boldogkői* - [email protected]*Corresponding author
Published: 23 October 2009 Received: 22 May 2009
BMC Genomics 2009, 10:491 doi: 10.1186/1471-2164-10-491 Accepted: 23 October 2009
This article is available from: http://www.biomedcentral.com/1471-2164/10/491
© 2009 Tombácz et al; licensee BioMed Central Ltd.This is an Open Access article distributed under the terms of the Creative Commons Attribution License (http://creativecommons.org/licenses/by/2.0),which permits unrestricted use, distribution, and reproduction in any medium, provided the original work is properly cited.
Abstract
Background: Pseudorabies virus (PRV), a neurotropic herpesvirus of pigs, serves as an excellentmodel system with which to investigate the herpesvirus life cycle both in cultured cells and in vivo.Real-time RT-PCR is a very sensitive, accurate and reproducible technique that can be used todetect very small amounts of RNA molecules, and it can therefore be applied for analysis of theexpression of herpesvirus genes from the very early period of infection.
Results: In this study, we have developed and applied a quantitative reverse transcriptase-basedreal-time PCR technique in order to profile transcription from the whole genome of PRV after lyticinfection in porcine kidney cells. We calculated the relative expression ratios in a novel way, whichallowed us to compare different PRV genes with respect to their expression dynamics, and to dividethe PRV genes into distinct kinetic classes. This is the first publication on the whole-genomeanalysis of the gene expression of an alpha-herpesvirus by qRT2-PCR. We additionally establishedthe kinetic properties of uncharacterized PRV genes and revised or confirmed data on PRV genesearlier examined by traditional methods such as Northern blot analysis. Our investigations revealedthat genes with the same expression properties form clusters on the PRV genome: nestedoverlapping genes belong in the same kinetic class, while most convergent genes belong in differentkinetic classes. Further, we detected inverse relationships as concerns the expressions of EP0 andIE180 mRNAs and their antisense partners.
Conclusion: Most (if not all) PRV genes begin to be expressed from the onset of viral expression.No sharp boundary was found between the groups of early and late genes classified on the basis oftheir requirement for viral DNA synthesis. The expressions of the PRV genes were analyzed,categorized and compared by qRT2-PCR assay, with the average of the minimum cycle thresholdused as a control for the calculation of a particular R value. In principle, this new calculation techniqueis applicable for the analysis of gene expression in all temporally changing genetic systems.
BackgroundThe pseudorabies virus (PRV; also called Aujeszky'sdisease virus or suid herpesvirus type 1) is a memberof the alpha-herpesviruses and an important pathogen ofpigs, causing Aujeszky's disease [1]. The PRV is a valuable
model organism in herpesvirus research [2] and also apowerful tool in neuroscience, employed to map neuralcircuits [[3-5], and [6]] and gene delivery [7]. The PRVlife cycle is primarily controlled at the level of transcrip-tion. The genes of a-herpesviruses are divided into three
Page 1 of 22(page number not for citation purposes)
BioMed Central
Open Access

major temporal classes (immediate-early, IE or a; early, Eor b, and late, L or g), which are regulated in acoordinated, cascade-like fashion [[8] and [9]]. First,the IE genes are expressed, independently of de novoprotein synthesis from the virus. The products of thesegenes are transcription factors and other regulatoryproteins. PRV IE180 protein [homologous to herpessimplex virus (HSV) ICP4 protein] is the major regulatorof the transcription of the E genes, which in turn aremainly involved in replication of the viral DNA. Blockersof DNA synthesis inhibit the E gene expression to amuch lesser extent than the L gene expression. On a finerscale, the E genes can be subdivided into b1 (E) and b2(E/L) genes. Finally, the L genes are transcribed,encoding mainly structural proteins involved in virionassembly. The expression of the L genes is partially (g1,leaky L genes) or completely (g2, true L genes)dependent on the viral DNA replication. HSV encodes5 IE genes: icp0, icp4, icp22, icp27 and icp47. By contrast,PRV has been reported to express ep0 (homologous toicp0 of HSV; [10] and ul54 (the homolog of icp27 of HSV;[11]) proteins in the E kinetics, and it lacks the icp47gene. The ie180 gene of PRV has been shown to be a trueIE gene in various experimental systems [[12] and [13]];however, there is no consensus as to whether the US1protein (Rsp40; homologous to HSV ICP22) is expressedin the IE [14] or the E kinetics [15]. Herpesviruses arecapable of two types of infections: lytic (or productive)and latent [2]. In the lytic pathway, the entire transcrip-tion machinery of the herpesvirus is initiated, and theprogress of infection eventually leads to the productionof new virions and the lysis of infected cells. In contrast,in latency, only a limited segment (LAT region) of theherpesvirus genome is transcriptionally active, no newvirus particles are produced and the cells survive theinfection. A characteristic feature of the organization ofthe herpesvirus genome is the presence of nested genesproducing 3'-coterminal transcripts. The read-through ofoverlapping genes is regulated by the ICP27 protein,which helps in the recognition of the internal polyAsignals, resulting in differential transcript lengths [16].The gene expression of a-herpesviruses, such as HSVtypes 1 and 2, Varicella-zoster virus, bovine herpesvirustype 1 and PRV has been investigated earlier bytraditional methods including Northern blot analysis,ribonuclease protection assay, and end-point RT-PCRanalysis. However, each of these techniques is associatedwith a number of disadvantages. For example, Northernblot analysis is labor-intensive, allows only semiquanti-tative determination of the mRNA level and is unsuitablefor multiple mRNA analysis. Moreover, hybridization-based membrane arrays profile changes in a nonlinearfashion, tending to overemphasize large alterations, andthey are insensitive to smaller variations. Ribonucleaseprotection assay-based methods require the use of
polyacrylamide gel electrophoresis and typically utilizeradioactively labeled probes. The limitations of endpointPCR technique are the time-consuming procedure, thepoor precision and the variable endpoints betweensamples. Over the past few years, microarray techniqueshave revolutionized practically all disciplines of mole-cular biology, including herpesvirus research. As com-pared with traditional methods, microarray analysis issuperior in that it is applicable for the simultaneousanalysis of a large number of genes, and even wholegenomes. The disadvantage of DNA chip technology isassociated with the uncertain quality control: it isimpossible to assess the identity of DNA immobilizedon any microarray. Further, there are many artifactsassociated with image and data analysis. Real-time RT-PCR is an alternative to microarray techniques for theanalysis of transcription from multiple genes. The mainadvantage of real-time PCR is that it is more sensitive tolow-fold changes than other high-throughput assays. Inaddition, the real-time PCR technique provides areproducible quantitation of DNA copies, and has alarge dynamic range, and various controls can beincluded to ensure accuracy, such as a loading controlto verify equal cDNA loading, a no-primer control toprove a measure of non-amplification-related back-ground, a no-template control to screen for contamina-tion of reagents or false amplification, and a no-RTcontrol with confirm the absence of DNA contamina-tion. In contrast to microarray techniques, in real-timePCR the parameters for each gene can be optimizedindividually. Moreover, the identity of PCR products canbe confirmed through melting curve analysis, restrictionendonuclease analysis, or DNA sequencing. In fact, real-time PCR is often used to verify gene expression dataobtained by microarrays. Nevertheless, considerablepitfalls may be associated with this technique. Themajor limitations of real-time RT-PCR relative tomicroarray techniques are the higher cost and laborintensiveness for a large number of samples. Anotherdisadvantage of real-time PCR as compared with blottingtechniques is that only the accumulation, but not thesize of the transcripts can be monitored. Microarraytechniques have recently been applied to investigateherpesvirus gene expression [[17-19] and [20]]; toanalyze the effects of the deletion of particular viralgenes or of the specific experimental conditions onwhole-genome viral gene expression [[21,22], and [23]];and to analyze the impact of virus infection on theexpression of cellular genes [[24-26] and [27]]. Theexpression of PRV genes has been studied by traditionalmethods, but many its genes have not yet beencharacterized at all. Flori and co-workers [27] investi-gated the dialog between PRV and epithelial cells, butobtained poor resolution for viral transcripts that did notprovide conclusive data on the temporal expression of
BMC Genomics 2009, 10:491 http://www.biomedcentral.com/1471-2164/10/491
Page 2 of 22(page number not for citation purposes)

the PRV genes. To date, Real-time RT-PCR has not beenfrequently utilized in herpesvirus research for globalgene expression analysis. With this technique Oster andHöllsberg [28] carried out a kinetic analysis of 35 genesof human herpesvirus 6B, a b-herpesvirus, and Dittmerand colleagues [29] performed a whole-genome profil-ing of the rhesus monkey rhadinovirus, a g-herpesvirus.As far as we are aware, no genome-wide expression dataobtained by qRT2-PCR have been published so far on a-herpesviruses. In the present study, we describe thedevelopment and utilization of a real-time RT-PCR assayfor the global analysis of PRV gene expression. Weapplied a novel method that allows the kinetic char-acterization of individual PRV genes, and also thecomparison of the expression dynamics of differentviral genes. Expression profiles were constructed on thebasis of relative expression ratios (Rs) calculated asdescribed in the Materials section. This method isapplicable for the analysis of gene expression in anygenetic system that progressively changes in time.
ResultsExperimental designFor each gene, a minimum of 3 independent replicateswere carried out for statistical confidence, and themedian of these values along with the standard errorwas calculated. In these experiments, porcine kidney(PK)-15 epithelial cells were infected with PRV with alow multiplicity of infection [MOI; 0.1 plaque-formingunits (pfu)/cell]. The reason for this was that ourpreliminary experiments indicated that infecting cellswith a low dose of the virus produced a much betterresolution of the cycle threshold (Ct) values for PRVgenes at different time points than infecting with ahigher MOI (data not shown). However, the use of a lowMOI led to a larger proportion of the cells remaininguninfected; accordingly, in order to avoid the initiationof a new infection cycle we chose a relatively shortmaximal incubation period. Initially, we attempted an 8-h investigation period, but observed a second infectionwave of the virus (data not shown), and therefore werestricted our analysis to 6 h post-infection (pi). Thetranscription of PRV genes was monitored at 5 timepoints: 0, 1, 2, 4 and 6 h. Prior to PRV infection, cellswere either untreated or treated with cycloheximide(CHX), a protein synthesis blocker, or phosphonoaceticacid (PAA), an inhibitor of DNA synthesis. We usedstrand-specific primers for the reverse transcription, oneof the reasons for this being that we intended to excludethe distorting effects of potential overlapping antisenseRNAs transcribed from the antiparallel DNA strands,which cannot be distinguished by oligo-dT- or randompriming-based RT (this issue will be described else-where). Another reason was that it produced a much
higher amount of specific cDNAs than oligo-dT priming(data not shown), which was especially important underour experimental conditions with a low MOI. Weutilized the mathematical model for relative quantifica-tion described by Soong et al. [30]; however, wecalculated the R values in a different way: we used theaverage of the maximal ECt-sample values for each gene asa control, which was normalized with the average of thecorresponding 28S values (ECt-reference). Thus, in ourcalculation, a particular R value indicates the ratio of themRNA level of a gene at a given time point to themaximal RNA level of this gene (maximal gene expres-sion occurred at 6 h pi for all genes except us3 and llt2,which peaked at 4 h and at 2 h pi, respectively). Therelative amounts of the transcripts of different genescannot be compared because the primer efficiencies mayvary both in RT and in PCR. Even so, use of the maximalexpression as the control value allows a comparison ofthe expression dynamics of viral genes both at individualtime points and across the entire infection period. Thespecificity of the PCR products was confirmed by qualitycontrol experiments, including Tm analysis and PAGE(formation of a single product with the appropriatemolecular weight was accepted); if some doubtsremained, the amplification products were subjected toDNA sequencing or restriction endonuclease analysisusing amplicons containing recognition sites for aparticular restriction endonuclease [see Additional file1]. The accuracy of sampling and qRT2-PCR analysiswere ensured by using loading controls, as well as no-RT,no-primer and no-template controls (Figure 1).
Reproducibility of the internal controlA major concern regarding the choice of internalreference gene control in viral gene expression studiesis the constancy of the reference gene products through-out the entire examination period. We tested whether the28S ribosomal RNA of the pig fulfilled this requirement,and found that this gene was suitable as reference genefor the study of PRV infection, at least in our 6-hexamination period. The 28S rRNA values were highlyreproducible: the mean value ± SD of all measurementsthe experiments was 8.03 ± 0.61 cycles throughout(Figure 2).
Classification of PRV genes in terms of dependence on denovo protein synthesis and DNA replicationTraditionally, lytic herpesvirus genes are classified intodistinct kinetic groups on the basis of the effects ofprotein and DNA synthesis inhibition on the geneexpression. In general, inhibitory drugs are applied toinfected cells for a prolonged incubation period (24, 48or 72 h; [[31,32] and [33]]. Instead, similarly to Stingleyet al [18], we used shorter incubation periods (2, 4 and 6
BMC Genomics 2009, 10:491 http://www.biomedcentral.com/1471-2164/10/491
Page 3 of 22(page number not for citation purposes)

h for CHX, and 4 and 6 h for PAA) and compared theinhibitory effects of these drugs by calculating the Rvalue ratios for the treated and untreated samples.
CHX analysisTo test the requirement of de novo protein synthesis forPRV mRNA production, PK-15 cells were untreated ortreated with 100 μg/ml CHX prior to the infection ofcells with the virus. At the indicated time points, RNAwas isolated and converted to cDNA, which wassubsequently analyzed by qRT2-PCR. The degree ofinhibition [1-Ri-CHX) × 100] was found to range between97.3 and 100% for all but one protein encoding PRVgene (the ie180 gene) and two antisense transcripts [thelong-latency transcript-1 (llt1), antiparallel to ep0, andthe long-latency transcript-2 (llt2), antiparallel to ie180).IE180 mRNA displayed a significantly increased level ofexpression in the CHX-treated samples at the analyzed 3time points: 2.27-fold at 2 h; 5.55-fold at 4 h; 1.4-fold at6 h pi (Figure 3). We explain this phenomenon in thatthe IE180 proteins exert an inhibitory effect on their ownsynthesis (upon the binding of their own promoters; [34]),which is resolved by CHX blocking protein synthesisfrom the IE180 mRNAs. The other exception for thenegative CHX effect is llt2: a 1.72-fold increase at 2 h anda 3.983-fold increase at 4 h. Interestingly, at 6 h pi llt2 issignificantly repressed by CHX. The repression of llt1expression at 2 h pi is relatively low (Ri-CHX-2h = 0.281),
Figure 1Controls for qRT2-PCR. Polyacrylamide gelelectrophoresis of the products from 30 cycles of real-timePCR on cDNA derived from PK-15 cells infected by the PRVfor 1, 2, 4 or 6 h or from cells infected by the virus for 4 or 6h and treated with CHX or PAA. A no-template control wasused for each primer pair, consisting of water, to test forfalse-positive results, and no-RT control was used to ensurethe absence of DNA contamination. The GeneRuler™ LowRange DNA Ladder (Fermentas) is shown at the left side ofthe photo. The cDNAs of ie180 gene (a) and ul30 gene (b)were used for the presentation.
28S rRNA
Time (h)
0 1 2 3 4 5
Ct (
mea
n +
SE
)
0
2
4
6
8
10
12
14
16
18
Figure 2Reproducibility of the reference control. Theconstancy of the 28S rRNA level (shown by the similar Ctvalues) throughout the 6-h infection period indicates thatthis gene serves as an appropriate reference control.
Time (h)
1 2 3 4 5 6 7
Ri-C
HX
0
1
2
3
4
5
6ep0llt1llt2ie180
Figure 3Effects of the CHX on the expression of ie180, llt1, llt2and ep0 genes. This Figure shows the dependence of thePRV gene expression on de novo protein synthesis on twogenes (ie180 and ep0) and two antisense transcripts (llt1 andllt2) overlapping these genes. PK-15 cells infected with PRVwere incubated in the presence or absence of CHX for 2, 4or 6 h. The CHX-mediated inhibition of viral geneexpression (Ri-CHX) was calculated as follows: Ri-CHX =RCHX/RUT, where RCHXis the R value of the CHX-treatedsamples; and RUTis the R value of the untreated samples.
BMC Genomics 2009, 10:491 http://www.biomedcentral.com/1471-2164/10/491
Page 4 of 22(page number not for citation purposes)

but this antisense transcript is significantly blocked byCHX at 4 and 6 h pi. Overall, our CHX analysis indicatedthat the only true IE protein-encoding gene of PRV isie180. While the icp27 and icp0 genes in the HSV are IEgenes, their PRV homologs ul54 [11] and ep0 [10] geneswere earlier described as E genes, which was confirmedby our CHX analysis. The icp22 gene of HSV is expressedwith IE kinetics; our analysis revealed that its homo-logous counterpart, the us1 gene of PRV, is significantlyblocked by CHX, and hence it is not an IE gene. As aresult of CHX treatment, LLT2 exhibits elevated levels at2 and 4 h pi, which indicates that IE180 transcriptionfactor exerts a negative effect on its expression. Thus,LLT2 appears to be an IE transcript. However, llt2displays fairly low relative expression at 1 h pi [seeAdditional file 2], and therefore it cannot be regarded asan IE gene beyond doubt.
PAA analysisFor examination of the dependence of the PRV genes onDNA replication, PK-15 cells were infected with the virusin the absence or presence of 400 μg/ml PAA, aninhibitor of DNA polymerase. It was expected that PAAwould exert a more drastic effect on the L genes becausethe expressions of these genes are highly dependent onDNA replication. However, PAA must affect the E geneexpression, too. The reason for this is that the geneexpression is dependent not only on the promoteractivity, but also on the copy numbers of the genes,which are higher after DNA replication than in the initialphase of infection when the PRV DNA is represented in asingle copy in a cell (at least in our system). Theinhibitory effect of PAA on gene expression wascalculated by using the ratio of the R values for thePAA-treated/untreated samples at 6 h pi (Ri-PAA = R6h-
PAA/R6h-UT): a low ratio indicates a strong inhibitoryeffect and vice versa. The PRV genes were ranked fromthe least inhibited (highest Ri-PAA) to the most inhibited(lowest Ri-PAA). We expected that such a ranking of thePRV genes on the basis of the inhibitory effect wouldprovide natural clusters of E and L genes. Indeed, theresults obtained conformed fairly well to the datapublished earlier on HSV and PRV genes, though thereis a certain degree of disagreement between the datapublished by the different authors on the HSV genes, andonly incomplete expression data are available for thePRV genes. Moreover, in many cases a PRV gene ischaracterized without comparative analysis, e.g. "itappears 3 h pi". For comparison of the HSV and PRVgenes, we used five main sources for the HSV data:microarray data published by Wagner [35,36]; variousexpression data compiled by Roizman [37,38]; and thedata collected by Mettenleiter [39]. For the PRV genes,we used the data compiled by Mettenleiter [39]. We
classified the analyzed but uncategorized PRV genes viathe following principles: if the mRNA was detectedbetween 1 and 2 h pi,, between 3 and 4 h pi, or 5 h pi,the particular gene was classified as E, E/L or L,respectively. In the upper part of the ranking list(Table 1, Figure 4), [see Additional file 3], we mostlyfind typical E genes, with typical L genes in the bottompart of the list. However, we could not draw a clear-cutline between the E and L genes; instead, we put the 15genes with intermediate values in the E/L group. Theprecise locations of borderlines between kinetic classeswere drawn arbitrarily, because we found smoothtransitions between the Ri-PAA values. We chose a typicalE gene (ul52) of the HSV as the last member of the Egroup, and a typical L gene (ul32) of the HSV as the firstmember of the L group. The 3 protein-encoding geneswith the highest Ri-PAA values were ul30 (0.851), ul23(0.752) and us3 (0.739). These high Ri-PAA valuesindicate that PAA does not exert a significant cytotoxiceffect on the gene expression apart from blocking DNAreplication. The 2 LLT transcripts display a surprisingresponse to PAA treatment: the level of LLT1 increases to2.94-fold at 4 h, and drops to 0.007-fold at 6 h pi relativeto the untreated sample; while the level of LLT2 increasesmarkedly close to 40-fold at 4 h, and 3-fold at 6 h pi(this phenomenon will be discussed later). The geneswith the lowest Ri-PAA values are all but one (us1: 0.042)L genes in the HSV: ul16 (0.000), ul1 (0.041) and ul38(0.042). The strong inhibitory effect of PAA on the us1expression is surprising because it is an IE gene in theHSV. The ie180 gene expression is also significantlyinhibited by PAA (0.211); however, we found that ie180and to a certain extent us1 were expressed in an"irregular" manner in other analyses, too (see later).ul11 and ul21, which are L genes in HSV, do not appearto belong in the E kinetic class. Both genes werecharacterized as L genes in the PRV by De Wind et al.[59] using Northern blot analysis. Furthermore, ul13 isan L gene in the HSV, but its transcripts were detected at2 h pi in the PRV. The ul2 and ul5 genes are E genes inthe HSV, but were characterized as E/l and L genes,respectively, in the PRV by Dean and Cheung [55,60],respectively, which is in agreement with our results. Weclassified the kinetically still uncharacterized PRV genesas follows; E genes: us3, ul29 and ul30, L genes: ul17,ul18, ul27, ul32, ul33, ul35, ul37 and ul41. Peaking ofthe us3 gene expression at 4 h can be explained by theimportant role of US3 protein kinase in blocking theapoptotic pathway of the compromised cell in the Ephase of infection [61]. Our kinetic classificationsaccorded more strongly with those published on theHSV than with those on the PRV. The reason may be thatthe expression profiling of PRV genes was performed byothers with low resolution techniques. Our data allowthe following conclusions: (1) there is no sharp
BMC Genomics 2009, 10:491 http://www.biomedcentral.com/1471-2164/10/491
Page 5 of 22(page number not for citation purposes)

Table 1: Function and kinetic grouping of PRV genes
Name Transcription Kinetics Function(s)b ReferencesWagner37 Wagner38 Roizman39 Roizman40 Mettenleiter41 Mettenleiter41 Our
dataa
orf-1 - - - - - ND L unknownul54 (*ICP27) IE IE IE IE IE E E transcription regulation [40]ul53 (gK) L EL L L L (EL) 3 h pi E/L viral egress [40]ul52 E E E E E (E) 2 h pi E DNA replication [40]ul51 L EL L L L E L viral egress/oralgen unknown [40]ul50 (*dUTPase) E E E E E (EL) 3 h pi E dUTPase, viral replication [27]ul49.5 (gN) L L L2 L2 L L L virion entry [39]ul49 (*VP22) E? E L L E (EL) 4 h pi L virion formation, tegumentation [27]ul48 (*VP16, IE-TIF) ? EL L L L (L) 8 h pi L gene regulation, viral egress [41]ul47 (*VP13/14) E EL L2 L2 L L L secondary envelopment [41]ul46 (*VP11/12) E EL L L L E E/L unknown function, tegument protein [41]ul27 (gB) E EL L1 L1 E ND L cell-cell spread, virus entry [27]ul28 (*ICP18.5) E EL L L E E E DNA cleavage and packaging [27]ul29 (*ICP8) E E E E ND ND E DNA replication [27]ul30 E E E L E ND E DNA replication [27]ul31 L EL L2 L2 L (L) 6 h pi L nuclear egress [42]ul32 L EL L2 L2 L ND L DNA packaging [2]ul33 L EL ? L L ND L encapsidation of viral DNA [43]ul34 L L ? L ND (EL) 3 h pi L nuclear egress [14]ul35 (*VP26) L L L2 L2 L ND L capsid protein [44]ul36 (*VP1/2) ? EL L2 L2 L (EL) 3-9 h pi L tegumentation and egress [45]ul37 L E L L L (E) 2 h pi L secondary envelopement, egress [45]ul38 (*VP19c) L L L2 L2 L (E) 2 h pi L capsid protein [46]ul39 (RR1) E E E E E (E) E/L E/L nucleotide synthesis [46]ul40 (RR2) E E E E E E E nucleotide synthesis [47]ul41 (VHS) L EL L L L ND L RNase, gene regulation [48]ul42 L E E E E L L DNA replication [47]ul43 L EL ? L E E E/L unknown [49]ul44 (gC) L L L2 L2 L L L viral entry, virion attachment [50]ul26 E L L L L L L scaffold protease [52]ul25 L EL L L L L L capsid protein [51]ul24 (*VP24) L L L L L L L unknown [52]ul23 (TK) E E E E E E E nucleotide synthesis [47]ul22 (gH) L L L2 L2 L L L viral entry, cell-cell spread [47]ul21 L E ? L L L E capsid maturation [47]ul20 L EL L L L ND E/L capsid transport [2]ul19 (*VP5) L EL L1 L1 L (L) 16 h pi L capsid protein [53]ul18 (*VP23) L EL L L L ND L capsid protein [27]ul17 L EL L L L ND L DNA cleavage and encapsidation [2]ul16 ? EL ? L L ND L unknown, interacts with UL11 [27]ul15 L EL L L L ND E/L DNA cleavage and encapsidation [27]ul14 L EL ? L L L E/L DNA cleavage and packaging [47]ul13 (*VP18.8) L EL L L L (E) EL E protein phosphorylation [47]ul12 (*AN) E E E E E (E) EL E alkaline nuclease [47]ul11 L EL L(?) L L L E secondary envelopement [47]ul10 (gM) L E L L L E L egress, secondary envelopement [54]ul9 (*OBP) E E L(?) E E E E ori depentent DNA synthesis [54]ul8 (*OBPC) E E E E E (E/L) 3-5 h pi E DNA replication [54]ul7 ?E E ? ND L (E/L) dE E/L unknown [54]ul6 L E ? ND L (E/L) dE L capsid protein, portal protein [54]ul5 E E E E E (L) 6 h pi L DNA replication [55]ul4 E E ? L L (L) 6 h pi E/L unknown [55]ul3.5 - - - - - E/L L replication, cell-to-cell spread [55]ul3 L L L2 L2 L E/L L unknown [55]ul2 (*UNG) E E E L E E/L L DNA repair [55]ul1 (gL) E EL1 L L L E/L L viral entry, cell-to-cell spread [55]ep0 (*ICP0) IE IE IE IE E E E gene regulation [10]llt1 L ND ND ND ND ND L latency [56]llt2 L ND ND ND ND ND E latency [56]ie180 (*ICP4) IE IE IE IE IE IE E/L gene regulation [13]us1 (*RSp40/ICP22) IE IE IE IE IE IE L regulator of gene expression [27]us3 (PK) E E E E/L E E E nuclear egress [27]
BMC Genomics 2009, 10:491 http://www.biomedcentral.com/1471-2164/10/491
Page 6 of 22(page number not for citation purposes)

boundary between the E and L genes; (2) classification ofthe PRV genes on the basis of the Ri-PAA values yieldedsimilar results those for the homologous HSV genes. Anoteworthy exception is the us1 gene, which accordingto our PAA analysis is expressed in L kinetics; (3) theie180 and llt genes cannot be classified on the basis ofthe Ri-PAA data alone, because they display uniqueexpression kinetics; (4) LLT1 and LLT2 respond differ-ently to CHX and PAA treatment, indicating that theseantisense transcripts are, at least partially, under differentregulation. We assume that the putative antisensepromoter (ASP; [10]) controls the expression of LLT2.
Kinetics of PRV gene expression in untreated cellsReal-time RT-PCR is a high-resolution technique, whichallows a detailed analysis of gene expression dynamicsand a reliable temporal classification of viral mRNAswithout drug treatment. The data from these experimentsare presented in detail in the text [see Additional file 2and 4]. The us3 PRV gene peaks at 4 h, llt2 at 2 h, whilethe other genes reach their maximum at 6 h within the0-6 h examination period.
0-6 h incubation periodThe accurate and reproducible data generated by real-time PCR allow the analysis of gene expressionthroughout the entire time course of infection. In orderto classify genes on the basis of their expression kinetics,we performed Pearson's correlation analysis for eachgene pair of the PRV, using the net increase (RΔ) in eachtime interval for the comparison [see Additional file 4b].Genes were clustered into the same group if theirpairwise correlation coefficients were high, rangingfrom r ≥ 0.9 to 0.99 depending on the group.Surprisingly, genes belonging in a particular group veryrarely give similarly high values as any of the genesbelonging in other groups. Albeit Pearson's coefficientexpresses the kinetic properties of a gene in singlenumbers, the expression curves of genes belonging in thesame group proved to be very similar (Figures 5, 6, 7, 8,9, 10, 11, 12, 13, 14, 15). We distinguished 10 gene sets.Group L1 of PRV genes (each pair shared r ≥ 0.989values) contains 24 genes, of which 22 were identified as
L and two as E/L genes by our PAA analysis. The onlyexception was ul13 which although an L gene in theHSV, behaved as an E gene in all of our analyses. Theprofile curves of the genes clustered on the basis ofPearson's correlation of pairwise RΔ values, gave verysimilar patterns of expression within the groups. In eachperiod of time, the expression curves can also becharacterized by the formula: RΔ(t+1) - RΔt (Table 2).For example, group L1 was characterized by hardly anychange in the first 2 h, a moderate rise in mRNA levelbetween 2 and 4 h, and a sudden increase in mRNA copynumber from 4 to 6 h (0/+/++). Group L2 (r ≥ 0.99)contains one E/L and 6 L genes. The expression profilesof these genes are characterized by a continuousintensive increase from 2 to 6 h (0/+/+). Our PAAanalysis revealed that all of the 6 members of group L3(r ≥ 0.99) are L genes, except for us1, which is an IE genein the HSV. In our system, therefore, most of the data(except the relatively high R2h for us1), suggest that it isan L gene. This group is characterized by the expressionprofile 0+/0-/+++. Group E1 (r ≥ 0.91; with 5 members)and group E2 (r ≥ 0.901, with 5 members) comprise Egenes, except for ul53, which is an L gene in the HSV.However, this gene is characterized as an E gene in thePRV [39], which was confirmed by our PAA analysis.These genes are characterized by the expression profile:0+/+/-. Group E3 (r = 0,964, 2 members: ul11 and ul9),expression profile: +/+/0+; Group E4 (r = 0.996, 2members: ul12 and us4), profile: 0/+/0. Group M1 (r ≥0.933) is composed of 8 members, shown by our PAAanalysis to exhibit either E or L kinetics. The expressionprofiles of these genes are very similar (0/+/++), whichdraws attention to the fact that PAA analysis alone is notsufficient for the grouping of genes with a similarexpression profile. The 3 members of group M2 exhibit avery high correlation (r ≥ 0.998) and similar expressionprofiles (0/++/+). Group LLT (r > 0.946) contains 2 llt genesthat have an unusual expression profile (++/- -/+++). Thefollowing 4 genes cannot be clustered on the basis ofPearson's coefficients: ie180 (- -/++/++), ul30 (- -/- -/++),ul34 (+/+/+) and us3 (+/++/- - -), which are likewiseunusual Indeed, these genes have peculiar expressionprofiles (Figure 16). The expression profile can also be
Table 1: Function and kinetic grouping of PRV genes (Continued)
us4 (gG) E E L L E/L E E/L unknown [57]us6 (gD) L E L1 E/L E/L ND E/L entry [27]us7 (gI) E E L L L (L) 6 h pi E/L cell-to-cell spread [27]us8 (gE) E E L2 L2 L E E/L cell-to-cell spread [58]us9 (*11K) E E ? L L L E/L anterograde spreed of virus [58]us2 (*28K) E E ? L L (L) 5 h pi E/L unknown [27]
This Table demonstrates the function and kinetic classification of PRV genes in comparison with available data on HSV and PRV genes.a PRV genes were classified on the bases of the ratio of the PAA-treated and untreated samples, at 6 h pi.b Gene functions in italics rely on studies of the HSV-1 homologs.
BMC Genomics 2009, 10:491 http://www.biomedcentral.com/1471-2164/10/491
Page 7 of 22(page number not for citation purposes)

Figure 4Clustering of genes on the basis of the effects of PAA on gene expression. Horizontal bars show the PRV genesranked on the basis of Ri-PAA values in an increasing sequence. Early and late gene clusters were separated by a set of geneslabeled as E/L using arbitrarily given threshold values.
BMC Genomics 2009, 10:491 http://www.biomedcentral.com/1471-2164/10/491
Page 8 of 22(page number not for citation purposes)

visualized by heatmap presentation, using the expressiondata generated with the RΔtvalues (Figure 17).
Co-regulated gene clustersWe utilized our data to analyze whether the expressionproperties of PRV genes localized in adjacent genomicloci display similarities.
PAA analysisFigure 18 shows an intriguing relationship betweengenes categorized on the basis of the data of the PAA
experiments. Nested 3' co-terminal genes were found tobelong in the same kinetic classes, indicating theexistence of shared regulatory mechanisms of geneexpression. An exception is the late ul27 gene, whichforms a cluster overlapping in parallel with the ul28 andul29 genes expressed with E kinetics. Of the 11 divergentpairs, 6 genes were found to belong in the same and 5 indifferent kinetic classes. A further special feature of thePRV genome is that the convergent genes mostly belongin different kinetic classes (Figure 18). The potential roleof such organization of the herpesvirus genome is
Time (h)
0 1 2 3 4 5 6 7
R(t
+1)
-Rt
0,0
0,2
0,4
0,6
0,8
1,0
1,2
1,4ul28ul23ep0ul29ul53
Group E2
Figure 6Grouping and plotting of PRV genes using their RΔ
values. Pearson's correlation analysis was performed togroup the PRV genes into clusters on the basis of similarexpression dynamics (using pairwise RΔ values) over the fourtime intervals.
Time (h)
0 1 2 3 4 5 6 7
R(t
+1)
-Rt
0,0
0,1
0,2
0,3
0,4
0,5
0,6ul11ul9
Group E3
Figure 7Grouping and plotting of PRV genes using their RΔ
values. Pearson's correlation analysis was performed togroup the PRV genes into clusters on the basis of similarexpression dynamics (using pairwise RΔ values) over the fourtime intervals.
Time (h)
0 1 2 3 4 5 6 7
R(t
+1)
-Rt
0,0
0,1
0,2
0,3
0,4
0,5
0,6
us4ul12
Group E4
Figure 8Grouping and plotting of PRV genes using their RΔ
values. Pearson's correlation analysis was performed togroup the PRV genes into clusters on the basis of similarexpression dynamics (using pairwise RΔ values) over the fourtime intervals.
Time (h)
0 1 2 3 4 5 6 7
R(t
+1)
-Rt
0,0
0,1
0,2
0,3
0,4
0,5
0,6
0,7ul21ul50ul43ul40ul54
Group E1
Figure 5Grouping and plotting of PRV genes using their RΔ
values. Pearson's correlation analysis was performed togroup the PRV genes into clusters on the basis of similarexpression dynamics (using pairwise RΔ values) over the fourtime intervals.
BMC Genomics 2009, 10:491 http://www.biomedcentral.com/1471-2164/10/491
Page 9 of 22(page number not for citation purposes)

discussed later. It may be noted that most US genesbelong in the E/L kinetic class accounting for 37.5% ofthis group.
Pearson's correlationAnalysis of the gene clusters generated by using Pearson'scorrelation coefficients revealed that genes within thesame clusters are often located in neighboring genomicpositions. Group L1 is composed of 24 members. Theadjacent ul1, ul2, ul3, ul5 and ul6 genes are members ofthis group. The high pairwise correlation coefficients and
the similar profile curves of the RΔ values of these genescannot be explained by the nested co-localization alone,because ul5 and ul6 are divergent genes and do notoverlap with ul1, ul2 and ul3. The ul44 gene is convergentwith ul24 and ul26; and ul22 is divergent with ul20.Moreover, ul27 is convergent with ul47 and ul48. Itshould e borne in mind that ul26 and ul27, an adjacentgene pair in the HSV, are relocalized into a remoteposition in the PRV, due to a large inversion, but retaintheir expression properties. This is also true for ul44,ul47, and ul48 (there is no ul45 gene in the PRV). Severalgenes (us2, us6, us8 and us9) in the US region of the PRV
Time (h)
0 1 2 3 4 5 6 7
R(t
+1)
-Rt
-0,2
0,0
0,2
0,4
0,6
0,8
1,0
1,2
1,4
1,6
1,8 orf-1ul24ul37ul10ul1ul2ul47ul35us9ul44ul22ul20ul17ul26us6ul19ul3ul5ul6ul48us2ul13ul27us7
Group L1
Figure 9Grouping and plotting of PRV genes using their RΔ
values. Pearson's correlation analysis was performed togroup the PRV genes into clusters on the basis of similarexpression dynamics (using pairwise RΔ values) over the fourtime intervals.
Time (h)
0 1 2 3 4 5 6 7
R(t
+1)
-Rt
-0,2
0,0
0,2
0,4
0,6
0,8
1,0ul41ul46ul32ul25ul3.5ul33ul4
Group L2
Figure 10Grouping and plotting of PRV genes using their RΔ
values. Pearson's correlation analysis was performed togroup the PRV genes into clusters on the basis of similarexpression dynamics (using pairwise RΔ values) over the fourtime intervals.
Time (h)
0 1 2 3 4 5 6 7
R(t
+1)
-Rt
-0,5
0,0
0,5
1,0
1,5
2,0
2,5
us1ul49ul31ul16ul36ul38
Group L3
Figure 11Grouping and plotting of PRV genes using their RΔ
values. Pearson's correlation analysis was performed togroup the PRV genes into clusters on the basis of similarexpression dynamics (using pairwise RΔ values) over the fourtime intervals.
Time (h)
0 1 2 3 4 5 6 7
R(t
+1)
-Rt
0,0
0,2
0,4
0,6
0,8
1,0
1,2us8ul15ul18ul8ul49.5ul51ul39ul7
Group M1
Figure 12Grouping and plotting of PRV genes using their RΔ
values. Pearson's correlation analysis was performed togroup the PRV genes into clusters on the basis of similarexpression dynamics (using pairwise RΔ values) over the fourtime intervals.
BMC Genomics 2009, 10:491 http://www.biomedcentral.com/1471-2164/10/491
Page 10 of 22(page number not for citation purposes)
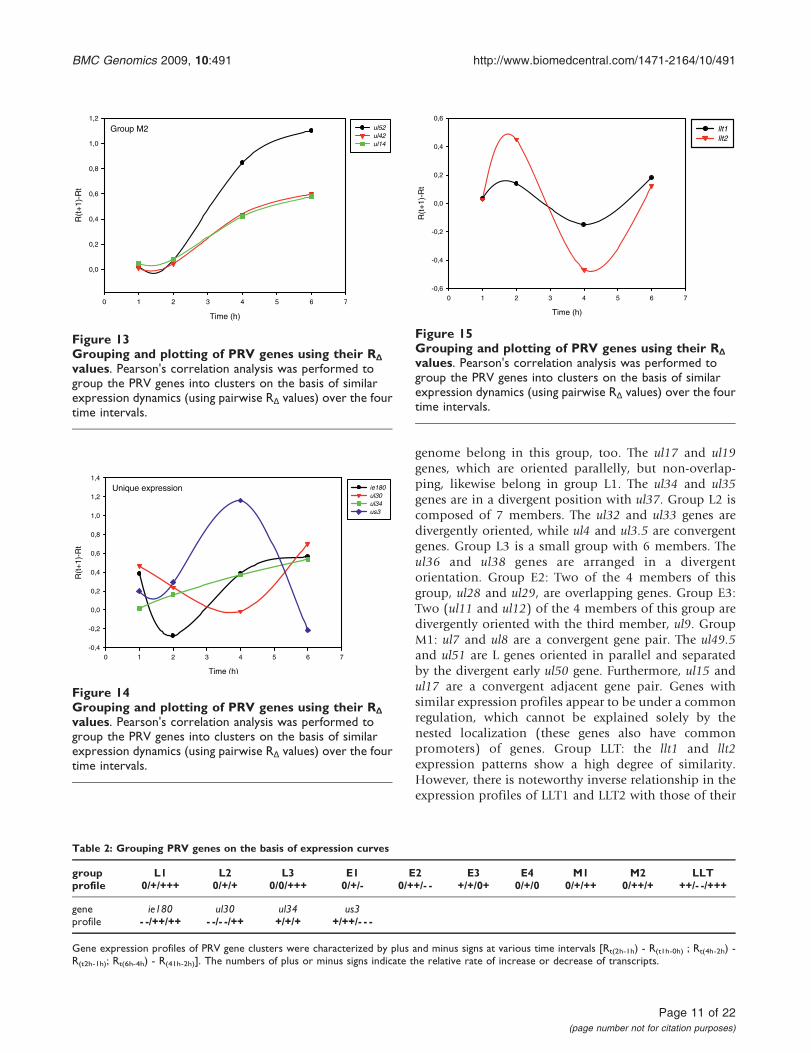
genome belong in this group, too. The ul17 and ul19genes, which are oriented parallelly, but non-overlap-ping, likewise belong in group L1. The ul34 and ul35genes are in a divergent position with ul37. Group L2 iscomposed of 7 members. The ul32 and ul33 genes aredivergently oriented, while ul4 and ul3.5 are convergentgenes. Group L3 is a small group with 6 members. Theul36 and ul38 genes are arranged in a divergentorientation. Group E2: Two of the 4 members of thisgroup, ul28 and ul29, are overlapping genes. Group E3:Two (ul11 and ul12) of the 4 members of this group aredivergently oriented with the third member, ul9. GroupM1: ul7 and ul8 are a convergent gene pair. The ul49.5and ul51 are L genes oriented in parallel and separatedby the divergent early ul50 gene. Furthermore, ul15 andul17 are a convergent adjacent gene pair. Genes withsimilar expression profiles appear to be under a commonregulation, which cannot be explained solely by thenested localization (these genes also have commonpromoters) of genes. Group LLT: the llt1 and llt2expression patterns show a high degree of similarity.However, there is noteworthy inverse relationship in theexpression profiles of LLT1 and LLT2 with those of their
Time (h)
0 1 2 3 4 5 6 7
R(t
+1)
-Rt
0,0
0,2
0,4
0,6
0,8
1,0
1,2ul52ul42ul14
Group M2
Figure 13Grouping and plotting of PRV genes using their RΔ
values. Pearson's correlation analysis was performed togroup the PRV genes into clusters on the basis of similarexpression dynamics (using pairwise RΔ values) over the fourtime intervals.
Time (h)
0 1 2 3 4 5 6 7
R(t
+1)
-Rt
-0,4
-0,2
0,0
0,2
0,4
0,6
0,8
1,0
1,2
1,4ie180ul30ul34us3
Unique expression
Figure 14Grouping and plotting of PRV genes using their RΔ
values. Pearson's correlation analysis was performed togroup the PRV genes into clusters on the basis of similarexpression dynamics (using pairwise RΔ values) over the fourtime intervals.
Time (h)
0 1 2 3 4 5 6 7
R(t
+1)
-Rt
-0,6
-0,4
-0,2
0,0
0,2
0,4
0,6
llt1llt2
Figure 15Grouping and plotting of PRV genes using their RΔ
values. Pearson's correlation analysis was performed togroup the PRV genes into clusters on the basis of similarexpression dynamics (using pairwise RΔ values) over the fourtime intervals.
Table 2: Grouping PRV genes on the basis of expression curves
group L1 L2 L3 E1 E2 E3 E4 M1 M2 LLTprofile 0/+/+++ 0/+/+ 0/0/+++ 0/+/- 0/++/- - +/+/0+ 0/+/0 0/+/++ 0/++/+ ++/- -/+++
gene ie180 ul30 ul34 us3profile - -/++/++ - -/- -/++ +/+/+ +/++/- - -
Gene expression profiles of PRV gene clusters were characterized by plus and minus signs at various time intervals [Rt(2h-1h) - R(t1h-0h) ; Rt(4h-2h) -R(t2h-1h); Rt(6h-4h) - R(41h-2h)]. The numbers of plus or minus signs indicate the relative rate of increase or decrease of transcripts.
BMC Genomics 2009, 10:491 http://www.biomedcentral.com/1471-2164/10/491
Page 11 of 22(page number not for citation purposes)

complementary partners, EP0 and IE180 mRNAs, respec-tively (Figure 19).
DiscussionGene expressions of a-herpesviruses have already beenanalyzed by various techniques including Northern-blotand microarray analysis. Different authors have oftenassigned the same genes to different kinetic groups,which may be explained by the poor resolution of theapplied techniques. Only partial data are available onthe expression of PRV genes. Flori et al. [27] carried outgenome-wide gene expression analysis via a microarraytechnique, but this approach did not produce evaluabledata on the kinetic properties of the PRV genes. Weemployed a novel qRT2-PCR technique using (1) strand-specific primers for the RT to obtain a higher yield and toeliminate the effects of the potential antisense tran-scripts; and (2) the average maximal ECt values as thecontrols for the calculation of relative expression ratios(Rs). Other approaches, such as the models of Pfaffl's[62] and Souazé et al., [63], and the ΔCt and ΔΔCtmodels [64] are simpler than the model we used;however, they all neglect the variation in the amplifica-tion efficiencies between cDNA samples, which waspresent in our system. Traditionally, herpesvirus genesare grouped into kinetic classes on the basis of geneexpression inhibitory effects of protein and DNAsynthesis-blocking reagents. The IE genes should not besignificantly inhibited by any of the above substances,the E genes are inhibited only by DNA synthesisblockers, and the expression of the L genes is substan-tially inhibited by both protein and DNA synthesis
blockade. We grouped the PRV genes into IE, E, E/L andL categories on the basis of the results of CHX and PAAtreatment (Table 1), [see Additional file 3]. Our findingsconformed well with those published for the HSV genes.The expression of the ie180 gene is enhanced by CHXtreatment. The explanation of this phenomenon lies inthe fact that the ie180 protein normally inhibits its ownexpression a short time after the onset of virus infection,a feature which is absent in CHX-treated cells due tonovel protein synthesis being blocked by the drug. Theother PRV genes were inhibited to a significant extent byCHX at every examined time point. Consequently, ie180is the only IE gene of the PRV. The ep0 and ul54 genes (IEgenes in the HSV) were shown to be E genes by others[[10] and [11]], and this was confirmed by our analyses.Interestingly, us1, which is an IE gene in the HSV,appeared to be an L gene in most of our analyses: itsexpression was significantly inhibited by PAA; it affordeda low amount of mRNAs at 1 h pi, and a high rate ofincrease of transcript level at 4-6 h pi, all of these being Lcharacteristics. Furthermore, together with a set of Lgenes, us1 belongs in group L2 according to theclustering of the genes on the basis of pairwise Pearsoncorrelation coefficients. The moderately high relativeamount of us1 transcripts at 2 h pi is the only E-likecharacteristic of this gene. However, us1 displays a highCt value, suggesting a low absolute amount of transcriptsat 2 h pi. We may mention here that the Ct value of atranscript is dependent on the primer efficiency; thesedata therefore cannot be reliably used to the estimate theabsolute transcript amount. If the us1 gene has animportant function early in the lytic cycle of the virus, itmight fulfill this without de novo synthesis by beingreleased upon infection from the tegument layer of thevirus where it might be incorporated. Our data do notdemonstrate a clear-cut demarcation line between thegroups of E and L genes, suggesting that the categoriza-tion of herpesvirus genes on the basis of the require-ments for DNA replication might be arbitrary. Thekinetic types of genes identified by our PAA analysisresemble homologous HSV genes more than thepublished PRV genes, which can be explained by thesemiquantitative methods used for the kinetic analysis ofthe PRV genes. The present study revealed that temporalclassification of herpesvirus genes is also possiblethrough study of the gene expression of untreated cellsin consequence of the high sensitivity of the real-timeRT-PCR technique. As a further interesting point, wedetected mRNAs by qRT2-PCR in all but 3 PRV genes asearly as 1 h pi [see Additional file 4]. This observationindicates that PRV genes are either leaky or subject toregulatory mechanisms which have not yet been eluci-dated. We found that E genes are generally expressed in ahigher proportion than L genes at 1, 2 and 4 h, asindicated by their higher R values at these time points
Time (h)
0 1 2 3 4 5 6 7
R v
alue
s
0,0
0,2
0,4
0,6
0,8
1,0
1,2
1,4
1,6
1,8
2,0ie180us1us3ul40 (E)ul24 (L)llt1llt2
Profile curves of genes
Figure 16Expression kinetics of some selected genes via their Rvalues. This Figure shows the expression curves involvingthe R values of the only IE (ie180) gene, a typical E gene(ul40) and a typical L (ul24) gene, two genes with irregularexpression profiles: us1 (local minimum at 4 h pi) and us3(maximal expression at 4 h pi), and llt1 and llt2.
BMC Genomics 2009, 10:491 http://www.biomedcentral.com/1471-2164/10/491
Page 12 of 22(page number not for citation purposes)

Figure 17Clusters of PRV RΔ values identified by the hierarchical clustering method. The dendogram depicts the whole-genome profiling of protein-coding PRV genes, following de novo infection of PK-15 cells. Green indicates negative RΔ values,white low RΔ values, gray intermediate RΔ values, and black the highest level of increase in viral mRNA detected between twotime points.
BMC Genomics 2009, 10:491 http://www.biomedcentral.com/1471-2164/10/491
Page 13 of 22(page number not for citation purposes)
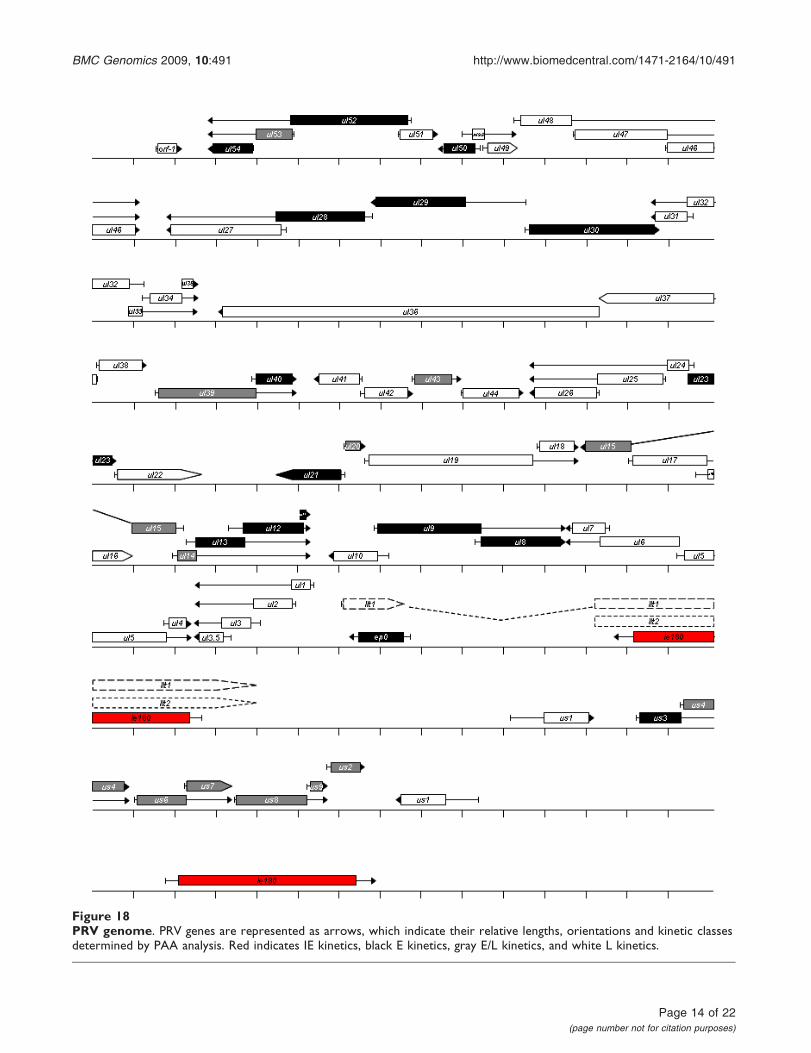
Figure 18PRV genome. PRV genes are represented as arrows, which indicate their relative lengths, orientations and kinetic classesdetermined by PAA analysis. Red indicates IE kinetics, black E kinetics, gray E/L kinetics, and white L kinetics.
BMC Genomics 2009, 10:491 http://www.biomedcentral.com/1471-2164/10/491
Page 14 of 22(page number not for citation purposes)

[see Additional file 4a]. The E gene products proved todisplay a higher net increase (RΔ) than the L genes withinthe 0-1 h, 1-2 h and 2-4 h pi periods. However, by the4-6 h pi interval, this trend had definitely reversed, i.e.the L genes exhibited high R(6h-4h) values (Additional file4b). Unexpectedly, the ratio of increase (Ra) between 1and 2 h was higher for a number of L genes than any ofthe E genes [see Additional file 4c]. Since the R2h valuesof these L genes were lower than those of the E genes, thehigh R(2h/1h) value is a result of the very low R1h valuesof late genes. Most of the L genes also have higherR(4h/2h) and R(6h/4h) values than those of E genes, whichis explained by the fact that the E genes reach a relativelyhigh expression level by 1 h pi. The classification of thePRV genes through the CHX and PAA analyses led toresults very similar those generated by the analysis ofuntreated cells via the following calculation: R(6h-4h)/R(1h-0h) [see Additional file 5]. The differences betweenthe results of the two approaches can be explained in
that PAA analysis alone gives only a rough picture of thegene expression; a detailed kinetic analysis of the viralgene expression furnishes a more sophisticated picture.Some genes classified as E or L by PAA analysis display"irregular" kinetics under untreated conditions. Theie180 and perhaps us1 genes cannot be classified byPAA analysis alone. Analysis of the transcription kineticsof overlapping transcript sets is an important issue. It isnot known whether downstream genes on polycistronicmRNAs are translated, and if so, to what extent. Thismakes interpretation of the mRNA expression datadifficult because the mRNA levels cannot be correlatedwith the amounts of the corresponding proteins, whichare the workhorse molecules in regulating cellularphysiology. In principle, a downstream gene is translatedif it is transcribed from its own promoter. Theoretically,downstream genes could also be translated from apolycistronic RNA if alternative splicing removedupstream gene(s) from the pre-mRNA, or if potentialIRES-like sequences helped recruit ribosomes, therebyinitiating a cap-independent translation from the down-stream gene (we have found no data in the literatureconcerning these possibilities). Thus, analysis of thedownstream genes without discriminating betweentranscription from their own promoters or by read-through from upstream genes might result in a falsecategorization. The PRV genes were also classified byanalysis of the gene expression throughout the entireexamination period by using Pearson's correlationanalysis. Genes with similar expression profiles (highpairwise r values) were placed in the same group. Genesin the same kinetic class (identified by PAA analysis) aregenerally situated in the same group generated by the useof Person's correlation. Moreover, members of a parti-cular group (with high r values) rarely display highcorrelation coefficients with genes belonging in differentgroups. The PRV genes conformed well to 10 patterns ofexpression. Only 4 viral genes (ie180, ul30, ul34and us3)did not fit into any of the 10 groups. We found aninverse expression profile of the sense/antisense partnersin the ep0-llt1 and ie180-llt2 genes (Figure 19). Combi-nation of the untreated data with the results of the CHXand PAA analyses revealed an interesting relationship forcoordinated regulation of sense/antisense partners. TheCHX analysis suggested that IE180 protein facilitates LAP(latency-associated transcript promoter) activity, andinhibits ASP (putative antisense promoter activity). ThePAA treatment resulted in a significantly elevatedantisense transcript level at 3 of the 4 time points inLLTs, which indicates the existence of another regulatorylevel besides IE180 protein action. We assume thattranscription from one DNA strand negatively influencesthe expression of transcripts from the complementaryDNA strand. The interaction can occur at the level oftranscription (RNA polymerase moving in one direction
Time (h)
0 1 2 3 4 5 6 7
R(t
+1)
-Rt
-0,2
-0,1
0,0
0,1
0,2
0,3
0,4
0,5
0,6
Time (h)
0 1 2 3 4 5 6 7
R(t
+1)
-Rt
-0,6
-0,4
-0,2
0,0
0,2
0,4
0,6
0,8
llt1ep0
llt2ie180
Figure 19Inverse expression profiles of sense/antisensetranscripts. The expression curves of RΔ reveal show aninverse relationship between the mRNAs of genes and theirantisense transcripts: ep0/llt1 and ie180/llt2.
BMC Genomics 2009, 10:491 http://www.biomedcentral.com/1471-2164/10/491
Page 15 of 22(page number not for citation purposes)
along one of the DNA strands inhibits RNA polymerasemoving in another direction) and/or translation byforming double-stranded RNAs by the sense and anti-sense transcripts. As an example, PAA has a negativeeffect on the transcription of ie180 (the level of IE180mRNA is reduced to a quarter) at 4 h pi, which results ina lower rate of transcription from ie180 (therebyfacilitating the expression of LLT2); and a lower amountof inhibitory IE180 proteins, which also facilitates LLT2expression. Overall, the LLT2 level increases 39.4-foldrelative to the untreated conditions. Furthermore, geneswith the same kinetic properties exhibit a distinctivedistribution pattern along the PRV genome. Nestedgenes appear to belong in the same kinetic group.Additionally, convergent genes and gene clusters in most(3 out of 11) cases belong to different kinetic classes. Itshould be remembered that the PAA-based approachand the time intervals applied for kinetic analysisproduce only a coarse resolution of gene expression. Itis possible that convergent genes allocated to the samekinetic classes might display different expression profileson a finer scale. The above genome organizationprinciples may point to the existence of as yet unknownregulatory mechanisms. It may be speculated whether aread-through of transcription across convergent genes isthe basis of this regulation. Moreover, groups formed interms of high Pearson's correlation coefficients containmany genes localized at adjacent loci on the PRVgenome. Most genes with high correlation coefficientsare not nested genes. This means that the similarity oftheir expression profiles cannot be explained by thecontrol of a common promoter. Further, several genes inthe same group are separated by genes that displaydifferent kinetic profiles. These results suggest theexistence of a genetic mechanism that synchronizesgene expression on a higher-order (chromatin?) scale.
ConclusionAlthough the relative amounts of the transcripts betweengenes cannot be compared because primer efficienciesmay vary both in RT and in PCR, our method allows acomparison of genes on the basis of their expressiondynamics. We detected the expression of almost all genesfrom the earliest time point (1 h), Further, we havefound that a sharp boundary cannot be drawn a betweenthe groups of E and L genes in terms of expressionprofiles. We have also found that the PRV has only asingle IE gene (the ie180 gene) and that the us1 gene isexpressed in L kinetics. Our kinetic studies revealed thatPAA analysis alone is not sufficient for the classificationof genes on the basis of their expression profiles. Theanalysis of gene expression throughout the 6 h examina-tion period demonstrated that these genes can besubdivided into further clusters, and that genes showing
significant differences in response to PAA treatment canhave very similar expression characteristics in untreatedconditions. In our analysis, nested genes displayed thesame expression profiles, whereas convergent genesmostly exhibited different kinetic properties. It shouldbe noted that a finer resolution of the gene expressionmight expose slight differences in the expressions ofnested genes. Approximately half of the divergent genesbelong in the same class, and the other half of them indifferent kinetic classes. The new calculation techniquethat we have developed is also applicable to evaluate theloss-of-function phenotypes of mutant herpesvirusesviruses and, in principle, for the analysis of geneexpression in every temporally changing genetic system.
MethodsCells, viruses and infection conditionsMonolayer cultures of immortalized porcine kidney 15(PK-15) cells were maintained at 37°C in an atmosphereof 95% air, 5% CO2 in Dulbecco's modified Eaglemedium (DMEM) supplemented with 5% fetal bovineserum (Gibco) and 80 μg gentamicin per ml. StrainKaplan of pseudorabies virus (PRV-Ka) was used for geneexpression analysis. The virus stock was prepared byinfecting PK-15 cells with 10 plaque forming units (pfu)/cell PRV-Ka followed by incubation of the cells until acomplete cytopathic effect was observed. For the analysisof the PRV transcriptome, rapidly-growing semi-conflu-ent PK-15 cells were infected with a low multiplicity ofinfection (MOI; 0.1 pfu/cell) of the virus, and incubatedfor 1 h, after which the virus suspension was removedand the cells were washed with phosphate-bufferedsaline (PBS). Subsequently, new culture medium wasadded to the cells, which were further cultivated for 0, 1,2, 4 or 6 h. Cells were incubated in the presence orabsence of 100 μg/ml cycloheximide (CHX), a transla-tion inhibitor, or 400 μg/ml phosphonoacetic acid(PAA), an inhibitor of DNA synthesis (both purchasedfrom Sigma-Aldrich) 1 h prior to virus infection. Mock-infected cells, treated in the same way as infected cells,were used as controls.
Preparation of viral DNAViral DNA was used to test the efficiency and specificityof the primers applied in real-time PCR. The viral DNAwas purified as follows. Monolayers of PK-15 cells wereinfected with the PRV at an MOI of 10, and cultivated at37°C until a complete cytopathic effect was observed.Subsequently, culture medium was collected withoutdisrupting the cells and clarified by centrifugation at4,000 rpm for 10 min using a Sorvall GS-3 rotor. Next,the virus in the supernatant fluids was sedimented on a30% sucrose cushion by ultracentrifugation at 24,000rpm for 1 h using a Sorvall AH-628 rotor. The
BMC Genomics 2009, 10:491 http://www.biomedcentral.com/1471-2164/10/491
Page 16 of 22(page number not for citation purposes)

sedimented virus was resuspended in sodium Tris-EDTAbuffer. After the addition of proteinase-K (l00 μg/mlfinal concentration) and sodium dodecyl sulfate (SDS;0.5% final concentration), the lysate was incubated at37°C for 1 h, which was followed by phenol-chloroformextraction and dialysis.
PrimersPrimers were designed through use of the Primer Express(Applied Biosystems) and FastPCR Professional (PrimerDigital Ltd.) oligonucleotide design software accordingto the given guidelines. Primer pairs were designed fromthe 3'-end regions of ORFs for each gene (Table 3). Theul26 and ul26.5, and orf1 and orf1.2 genes containoverlapping ORFs; and we therefore, did not employdistinct primers for them. Primer specificity was verifiedby BLAST searches of the GenBank database (NationalCenter for Biotechnology Information (NCBI) websitehttp://www.ncbi.nlm.nih.gov/BLAST/. All primers werepurchased from Bio Basic Inc. (Mississauga, Ontario,Canada).
Polymerase chain reactionA conventional PCR technique was used to check on thepotential DNA contamination and the quality andspecificity of the primers. The PCR reaction was carriedout by standard methods on a Veriti™ 96-Well ThermalCycler (Applied Biosystems) with the following para-meters: 1 cycle of 94°C for 4 min; 30 cycles of 94°C for 1min, 60°C for 1 min and 72°C for 2 min; and 1 cycle of72°C for 7 min. The PCR reaction was carried out byusing the GC Rich PCR System (Roche). The completeDNA sequence of the PRV is a composite of 6 differentstrains [65], but the variation between them is very small(around 1%). Most of the sequence data (86.7%) havebeen derived from strain Kaplan (PRV-Ka), which weused in our experiments. To circumvent the problem ofgenetic background differences, we tested 2 or moreprimers for RT and PCR reactions for non-Ka sequencesand selected those that performed best; alternatively, wesequenced the particular DNA region and designed newprimers on the basis of the sequence data. For each gene,we designed and tested various primers, and selectedthose, which did not produce primer dimers or othernonspecific products. For those genes where we couldnot eliminate the problem of primer dimer formation, inevery cycle we applied an extra extension step with anelevated temperature (below the Tm of the specificproduct and well above the Tm of the primer dimers) forthe detection.
RNA preparationPK-15 cells (5 × 10⁶ cells per flask) were washed in PBSand harvested for RNA isolation at 0, 1, 2, 4 and 6 h pi.
For quantitative RT2-PCR, total RNA was extracted fromthe cells with the NucleoSpin RNA II Kit (Macherey-Nagel GmbH and Co. KG) according to the manufac-turer's instructions. Briefly, cells were collected by low-speed centrifugation, lysed in a buffer containing thechaotropic ions needed for the inactivation of RNasesand providing the conditions for binding of nucleic acidsto a silica membrane. Next, contaminating DNA wasremoved with RNase-free rDNase solution (included inthe NucleoSpin RNA II Kit). Subsequently, the RNAsolution was treated with Turbo DNase (Ambion Inc.) toremove potential residual DNA contamination. Finally,RNA was eluted in RNase-Free Water (supplied with thekit) in a total volume of 60 μl. RNA concentration wasdetermined in triplicate by spectrophotometric analysisof the absorbance at 260 nm with a BioPhotometer Plus(Eppendorf). The RNA solution was stored at -80°Cuntil use.
Quantitative real-time RT-PCRA two-step quantitative real-time RT-PCR was carried outfor the transcriptional analysis. For each gene, aminimum of 3 independent replicates (separate infec-tions) were performed.
Reverse transcription (RT) Total RNA isolated frominfected cell cultures subjected to drug treatment (CHXor PAA) was reverse-transcribed into cDNA for PCRanalysis. RTs were performed in 5 μl of solutioncontaining 0.07 μg of total RNA, 2 pmol of the gene-specific primer, 0.25 μl of dNTP mix (10 μM finalconcentration), 1 μl of 5× First-Strand Buffer, 0.25 μl (50units/μl) of SuperScript III Reverse Transcriptase (Invi-trogen) and 1 U of RNAsin (Applied Biosystems Inc.)and the mixture was incubated at 55°C for 60 min. Thereaction was stopped by raising the temperature to 70°Cfor 15 min. No-RT control reactions (RT reactionswithout Superscript III enzyme) were run to test thepotential viral DNA contamination by conventionalPCR. RNA samples with no detectable DNA contamina-tion were used for quantitative RT-PCR reactions. First-strand cDNAs were diluted 10-fold with DEPC-treatedwater (Ambion Inc.), then subjected to real-time PCRanalysis.
Real-time quantitative PCR experiments were performedwith a Rotor-Gene 6000 cycler (Corbett Life Science). Allreactions were carried out in 20-μl reaction mixturescontaining 7 μl of cDNAs, 10 μl of ABsolute QPCR SYBRGreen Mix (Thermo Fisher Scientific), 1.5 μl of forwardand 1.5 μl of reverse primers (10 μM each). The runningconditions were as follows: (1) 15 min at 95°C,followed by 30 cycles of 94°C for 25 sec (denaturation),60°C for 25 s (annealing), and 72°C for 6 s (extension).
BMC Genomics 2009, 10:491 http://www.biomedcentral.com/1471-2164/10/491
Page 17 of 22(page number not for citation purposes)

Table 3: Primer sequencesa
Nameb Forward primer sequence (5'-3')c Reverse primer sequence (5'-3')d Primercoordinatese
Size ofamplicon
(bp)f
orf1 GCC TCG TGT TTC TGA TCC TGC TC AAC ACG ACA GAC TCC CGG AGC A 2204-2252 49ul54 TGC AGC TAC ACC CTC GTC C TCA AAA CAG GTG GTT GCA GTA AA 2730-2795 66ul53 CCA AGG CGC TGT ACC TCT G TGT GCC GCT CAT AGT GCA G 3912-3977 66ul52 CGC GCA ACT TTC ACT TCC ACG CA TGC GCT CGA AGA AGC TCT CGT A 5325-5376 93ul51 GCT CAT GCA CCT GTA CCT CTC G ACG TCG GAC ATC ACC ACG TTG C 7989-8096 108ul50 CTT CTT CGA GGT CTT TGC GC ATG TCG TAT CCG GCG TCC T 8921-8971 51ul49.5 TGA CAT TTT ATA TCT GCC TCC TGG TGC AGC ATC CGG GTG C 9447-9525 79ul49 CAT CAC CGT GTG CGA G CTT TTC CCT TCC GCC CG 10247-10329 83ul48 AGG TGC GGA TCA AGA TGG AG CAG TAC GTG TGG TCG CGG T 11305-11359 55ul47 GAG CTC ATG GAC GCG CTC CTG GCG CAT GAC GGC GTC 13684-13767 84ul46 TGC TGT GGT CGA CGT TCG TCT GGG CCT TGT GCT TGA A 14435-14494 60ul27 ACT ACG AGG ACT ACA ACT ACG TGC G GTC ACC CGC GTG CTG ATC 17512-17575 64ul28 GCG CTC TAC TTT GCG GTG GAG AA GAA CTC GCT GAC GCA CCA ATC G 19781-19879 117ul29 CTG ATC CTG CGC TAC TGC G ACT GCA TCG TGA TCC CCG 22609-22675 67ul30 TCA TCA CGA AGA AGA AGT ACA TCG G CCT TCA TGA GCA TCT TGC CG 27959-28015 57ul31 GTG GCA GAC CAT GTT CGT GT GGT CTC CCG TCT CCC TTC TT 28809-28859 51ul32 TGC TCA GCT ACT CGG AGA ACA AC CAC GGG CTC GAT GCA GTC 29841-29893 53ul33 CGC GCG AGC TGG AAG T TGC GTG TGG GCC AGA TAA 31031-31094 64ul34 AGC ACA ACA ACG TGA TCC TGG GAG AGG CTC ATG CCG GTG 31696-31747 52ul35 ATC ATG TCC TTC GAC CCG AAC GAG CGT CTG CGC GGT GA 32238-32288 51ul36 CGT CGG TGG GTA TTA GAG ACC A GAA CAA GAG CCA TGG ATT TTC G 34451-34501 51ul37 CTA CGA CAT GGA CTT TGT GCA GGA AGT TGG TGT GCT GCG CCA CGT A 44556-44611 56ul38 CAC CCG GAA CTC GTG CAT GTA CAG AAG AAA CAC TCC TCC CAC G 46118-46273 156ul39 GCT GGC CAA GTT CAA GAC G CGC ACA TGT CGA TGA GCA G 48701-48759 59ul40 GGA CTT TCC CAT GGC GC GCT CGA AAA AGT TGG TGT GCT T 49802-49854 53ul41 TGA AGA ACG AGA CGC GGG TGT GTT TCC AAA ACA GGC CC 50475-50525 51ul42 GCT CCC CGA GCG TCG CAT GAT GCA GTA GTC GTT GAA CTC 52118-52173 56ul43 CTG GTG CAG GCG TAC GTG A GGA TTT AAT GCT AGT GGC GCA 53904-53954 51ul44 TCG TGA GCA GCA TGA TCG T GTC GCC ATG ATG ACC AGC 55368-55437 70ul26 TTC TTC CTC GGC GTC GTC AAC TG GTA GTT GCT CAG CAG GTA CAG CA 56962-57087 126ul25 GGC AGT TTG GCG TCT CCA G CCA GGC AGA GAA AGT ACA GGA GG 57336-57386 51ul24 TGT GCT TCG TCA TCG AGC TC TGG GCG TGT TGA GGT TCC 59249-59305 57ul23 ATG ACG GTC GTC TTT GAC CGC CAC CGC TGA TGT CCC CGA CGA TGA A 59818-59898 81ul22 GGC GGC CAT CAC CGT GAG AAT AGC CCT CGG AGG AGA 62574-62647 74ul21 TCA GCT GTT TCG GGC GC ATT GAG GAC GAT GGA GAT GTT GG 64500-64551 52ul20 GAG AAC GAC GCG CTG CTG AG CAG GAG GCT CAC CAC GTG 66226-66309 84ul19 TCT TTG CGG AGA AGG CCA G GCT CTC GGT GCG CGC 69841-69905 65ul18 TGG TGC TGA ACA TGA TCT TCC GGA TGA GCG ACA GCA GGA T 71443-71502 60ul17 GGC GTT TTC CTC TTC GAC TAC TAC CAC CCT TAT AAC CTC CCC GC 74663-74713 51ul16 CTG TGG CGC CAG GCG GAC AA GAT CTT GCG GCG GGG GAG CAT G 75670-75780 111ul15 CAG AAG CAA AAG ACC CCC G CGA GTT GAA CTG CTT GAC GAA A 72204-72254 51ul14 CGG ACA AGA AAA ACC CCG AG CCT GTT TGG CCG CCA TAA A 77167-77217 51ul13 AGC CAC CTG GAC GTC AAG G CCA TGA GGC TAA AGT CCC CG 78083-78173 91ul12 GCA GAC GGA GAT GCG CTT CCG AGA ACA GGT ACT TGG CG 79394-79449 56ul11 ATG GGA CAG TGT TGC TGC C TCA AAG TCC TCG AAC GCG T 80084-80178 95ul10 CAT TTT GTG TTT CTC GCC CTC TTT ACC CGT GCC CTT GCA GG 81390-81443 54ul9 CAA GTT CAA GCA CCT GTT CGA TGA GGC TGT CGT TGA CGC 83337-83392 56ul8 CCG CTG ATC CTG CCC TG GAA GAT GGG CTC CAT GTG G 86355-86405 51ul7 TCC GCG GGT TCG CCT TC AGC GAG AGC ACG CGG TC 87217-87271 55ul6 CAG GAG CTG ATC CGC TGC TGT TGG AGT ACG AGA CGG ACA C 87687-87765 79ul5 TGG ACA TGG CCA CCT ACG T ACC GCG CGA TGG TCA T 91530-91592 63ul4 GAG CGA GAC CGA CCA TGA C TTA TTT CGT AAA ACG AGT AGG CCA 91849-91899 51ul3.5 CAA CGG AGC ATC AAC GCC TC ATT GAT CGC GGT AGC AAC AGG A 92478-92658 181ul3 CTG GGC GCA GCA CGT TCC ACG GAC GCG ACC ATA 93502-93552 51ul2 TTC AGG ACC TGC CCG CAC TTT GGA ACT CAG TCC ACG CTC CAG TCG A 93914-93999 86ul1 CTG GTC AAC CCC TTT GTC G CGC CTC ATT TAA GGG CTC TC 94928-94987 60ep0 GGG TGT GAA CTA TAT CGA CAC GTC TCA GAG TCA GAG TGT GCC TCG 96956-97006 51ie180 CAT CGT GCT GGA CAC CAT CGA G ACG TAG ACG TGG TAG TCC CCC A 103988-104056 69us1 AGC TCA ACG AGC GCG ACG TCT A CGG AAG CTA AAC TCG GAC GCG A 116466-116602 137us3 GGG CTT TCC TGA TTT ACA AGA TGT AAG GGC GGC GGA CG 119245-119295 51us4 ACC TCG ATC TAC ATC TGC GTC G GGC CCT GGT GAT CGC CAT 120764-120850 87us6 TGG AAC GAC GAG AGC TTC AGG GTA GAA CGG CGT CAG GAA TCG 121690-121749 60
BMC Genomics 2009, 10:491 http://www.biomedcentral.com/1471-2164/10/491
Page 18 of 22(page number not for citation purposes)

The absence of nonspecific products or primer dimers wasindicated by observation of a single melting peak inmelting curve analysis. An additional extension anddetection step was applied for those primers thatproduced primer dimmers: for 2 s at a temperature justbelow the Tm of the specific product and substantiallyabove the Tm of the primer dimers. With this techniquewe could eliminate nonspecific fluorescent signals pro-duced by primer dimers. Following the PCR reaction,melting curve analysis was performed to control ampli-fication specificity (specificity was defined as the produc-tion of a single peak at the predicted temperature and theabsence of primer dimers) by measuring the fluorescenceintensity across the temperature interval from 55°C to95°C. The 28S ribosomal (r)RNA used as the loadingcontrol (reference gene) was amplified in each run. H2Owas included as a no-template control, and cDNA derivedfrom the reverse-transcribed RNAs of non-infected cellswas used as a negative mock-infected control. We appliedSYBR Green-based real-time PCR because of the lowercosts and simpler protocol than for TaqMan probe-basedmethods for instance. It has recently been demonstratedthat the SYBR-based method of detection is as sensitiveand specific, and has a similar dynamic range to that ofthe TaqMan-based technique [66].
Calculation of relative expression ratio (R)We calculated the R value by using the followingequation:
R =( max) max
( ):
( max) mEsampleCt sample
EsampleCt sample
ErefCt ref aax
( ),
ErefCt ref
where R is the relative expression (quantification) ratio;E is the efficiency of amplification; Ct is the cyclethreshold value; sample refers to any particular gene at agiven time point; and ref is the 28S rRNA, which wasused as a reference gene and was amplified in each run.Average Ct values with their standard error (SE) valuesand amplification efficiencies with SE are shown in
Additional file 6. This equation is similar to that used bySoong et al [30]. However, instead of individual values,we used the average maximal value of ECt for each geneas the control. The relative copy numbers of mRNAs werecalculated by normalizing cDNAs to 28S rRNA using theComparative Quantitation module of the Rotor-Gene6000 software (Version 1.7.28, Corbett Research), whichautomatically calculates the real-time PCR efficiencysample-by-sample. Thresholds were set automatically bythe software.
Analysis and presentation of dataData were analyzed by the Microsoft Excel program,using the average and the standard deviance functions.The inhibitory effect of CHX or PAA was calculated viathe ratio of the drug-treated and untreated R values at 2,4 and 6 h pi for CHX: Ri-CHX = RCHX/RUT, or 4 and 6 h pifor PAA: Ri-PAA = RPAA/RUT. Thus, a low value indicates ahigh inhibitory effect and vice versa. The net increase in aproduct was calculated by subtracting the R value at timepoint t+1 from that at t (RΔ = R(t+1)-Rt), where t = 0, 1, 2,4 or 6 h and (t+1) = 1, 2, 4 or 6 h. The ratios of adjacentR values (rate of change; Ra) were calculated with thefollowing equation: Ra = R(t+1)/Rt; t = 1, 2, 4 or 6 h;(t+1) = 2, 4 or 6 h. Pearson's correlation analysis was usedto evaluate qRT2-PCR data, as an alternative method forthe grouping of PRV genes into kinetic classes. Pearson'scorrelation coefficient (r) was calculated as follows.
r =− −
=∑
−
( )( )
( )
Xi X Yi Yi
n
n SxSy1
1
A correlation is a number between -1 and +1 thatmeasures the degree of association between two vari-ables [labeled here as X and Y, which are the RΔ values oftwo different genes in the same time interval (i)]. X and
Y are the average values, n is the sample number, and SXand SY are the standard deviances (errors) for X and Y,respectively. A positive value for the correlation implies apositive association and a negative value implies a
Table 3: Primer sequencesa (Continued)
us7 CCC GGG AAG ATA GCC ATG AAG AAG ATC AGG AGG ACG ACG 123144-123199 56us8 CTT CGA CGT CTG GTT CCG C GGT CAC GCC ATA GTT GGG C 125136-125202 67us9 CAG GAC GAC TCG GAC TGC TA AGG AAC TCG CTG GGC GT 125395-125453 59us2 CGG CTG GAC ACG GAG TG AGT TCA GGT ACT GGA TCC CGT T 126171-126222 5228S GGG CCG AAA CGA TCT CAA CC GCC GGG CTT CTT ACC CAT T 54
a This table shows the list of primer pairs used for analysis of PRV gene expression:b name of the primersc forward primer sequencesd reverse primer sequencese Coordinates refer to the PRV genome sequence in strain Ka (NCBI Reference Sequence: NC_006151.1).f size of the amplified products (amplicons) Underlined sequences were not available from strain Ka, and therefore we sequenced these DNAsegments.
BMC Genomics 2009, 10:491 http://www.biomedcentral.com/1471-2164/10/491
Page 19 of 22(page number not for citation purposes)

negative or inverse association. Genes were clustered byusing a complete linkage hierarchical clustering methodwith a centered correlation similarity metric with Cluster3.0 software (Stanford University). To view the clusteringresults generated by Cluster 3.0, we used Alok Saldanha'sJava TreeView.
Gel electrophoresisLarger DNA fragments generated by conventional PCRwere run on 1% agarose/TBE gels containing ethidiumbromide and visualized under UV illumination, usingMarker 16 (Lambda DNA/Eco130I; Fermentas) to sizeDNA fragments. Smaller DNA fragments generated byqRT2-PCR were run in a 12% polyacrylamide gel toensure that the amplified products had the correct size.DNA fragments were visualized with ethidium bromidestaining under UV illumination. A GeneRuler™ LowRange DNA Ladder (Fermentas) was included in each run.
Restriction endonuclease analysisIf there were doubts concerning the identity of the amplifiedproduct, restriction endonuclease analysis was performed toconfirm the specificity of the qRT2-PCR products.
Construction of recombinant plasmidsPlasmids containing PRV DNA fragments were constructedfor DNA sequencing analysis, which was performed ifprimers designed on the basis of sequence data relating tonon-Ka strains performed badly; or if the identity ofamplicons generated by real-time PCR was uncertain. PRVDNAs were subcloned by using two methods: PCRamplification of the particular DNA segment; or subcloningof the desired DNA region by standard molecular cloningprotocols. Amplified products were subcloned to the pGEM(Promega) vector in accordance with the manufacturer'sinstructions. PRV BamHI fragments to be sequenced weresubcloned to the pRL525 vector [67].
DNA sequencingSubcloned DNA fragments were subjected to DNA sequen-cing with the ABI Prism™ 3730xl DNA sequencer (AMEBioscience Ltd.). DNA sequences were analyzed by using theChromas Lite 2.01 software (Technelysium Pty Ltd).
Competing interestsThe authors declare that they have no competing interests.
Authors' contributionsDT carried out the standard and real-time PCR, theagarose and polyacrylamide gel electrophoresis, and theDNA sequencing, and participated in the evaluation ofthe primary data. JT took part by performing the reversetranscription reactions, purified PRV RNA, and propa-gated PK-15 cells. PP participated in performing thereverse transcription reactions. ZB coordinated the study,
propagated viruses and isolated viral DNAs. All authorshave read and approved the final manuscript.
Additional material
Additional file 1Validation of qRT2-PCR products by restriction endonucleaseanalysis. In a few cases, the specificity of PCR products was confirmedby restriction endonuclease assay. Polyacrylamide gel electrophoresis ofqRT2-PCR products, using primers ul54 (lanes 1 and 2) and us4 (lanes3 and 4). Amplicon specificity was confirmed by restriction endonucleaseanalysis, using SalI (lane 2) and HpaII (lane 4) enzymes. TheGeneRuler™ Low Range DNA Ladder is shown on the left.Click here for file[http://www.biomedcentral.com/content/supplementary/1471-2164-10-491-S1.JPEG]
Additional file 2Grouping PRV genes according to their expression in untreated cells.Data of R values of untreated samples.Click here for file[http://www.biomedcentral.com/content/supplementary/1471-2164-10-491-S2.DOC]
Additional file 3PRV genes ranked on the basis of the effect of PAA on geneexpression. PRV genes were classified on the basis of the inhibitory effectof PAA (Ri-PAA) on gene expression. Early genes are separated by E/Lgenes from late genes. The ie180 gene was classified as IE gene becauseits expression was not inhibited by CHX treatment. a R values of PAA-treated samples at 4 h post-infection. b Relative expression ratios of PRVgenes after PAA-treatment at 6 h post-infection. c Ri-PAA values at 4 hpost-infection. d PRV genes ranked on their Ri-PAA (6 h pi) values. e Ri-
PAA values of PRV genes after 6 hours post-infection.Click here for file[http://www.biomedcentral.com/content/supplementary/1471-2164-10-491-S3.PDF]
Additional file 4PRV genes ranked on the basis of their expression profiles. a R valuesGenes were ranked on the basis of their R values at different time points.a PRV genes ranked on the basis of R values at 1 h pi. b Relative expressionratios of PRV genes at 1 h pi. c Order of R values of PRV genes at 2 h pi. d Rvalues after 2 hours post infection. e PRV genes ranked on the basis of Rvalues at 4 h pi. f R values at 4 h pi. b. RΔ values Genes were ranked on thebasis of their RΔ values at different time intervals. a Order of RΔ values ofPRV genes in the interval 1 h-2 h. b RΔ values in the interval between 1 and2 h. c PRV genes ranked on the basis of their RΔ values in the infectionperiod from 2 to 4 hours. d RΔ values in the interval 2 h-4 h. e PRV genesranked on their basis of their RΔ values in the interval 4 h-6 h. f RΔ valuesin the infection period: 4 h-6 h. c. Ra values Genes were ranked on the basisof their Ra values at different time intervals. a Order of Ra values of PRVgenes in the interval 1 h-2 h. b Ra values in the interval between 1 and 2hours. c PRV genes ranked on the basis of their Ra values in the infectionperiod from 2 to 4 hours. d Ra values in the infection period from 2 to 4hours. e PRV genes ranked on their basis of their Ra values in the interval 4h-6 h. f Ra values in the interval 4 h-6 h.Click here for file[http://www.biomedcentral.com/content/supplementary/1471-2164-10-491-S4.PDF]
BMC Genomics 2009, 10:491 http://www.biomedcentral.com/1471-2164/10/491
Page 20 of 22(page number not for citation purposes)

Additional file 5PRV genes ranked on the basis of their R(6h-4h)/R1h ratios. R(6h-4h)/R1h values.Click here for file[http://www.biomedcentral.com/content/supplementary/1471-2164-10-491-S5.PDF]
Additional file 6Average cycle threshold (a) and amplification values (b) withstandard errors.a Average of cycle threshold (Ct) values based on almostthree separated reactions. b Standard error of the mean.Click here for file[http://www.biomedcentral.com/content/supplementary/1471-2164-10-491-S6.DOC]
AcknowledgementsThis study was supported by Hungarian National Fund for HumanFrontiers Science Program Young Investigator grant (No. RGY0073/2006)to Z.B.
References1. Aujeszky A: A contagious disease, not readily distinguishable
from rabies, with unknown origin. Veterinarius 1902,25:387–396.
2. Pomeranz LE, Reynolds AE and Hengartner CJ: Molecular biologyof pseudorabies virus: impact on neurovirology and veter-inary medicine. Microbiol Mol Biol Rev 2005, 69(3):462–500.
3. Card JP and Enquist LW: Transneuronal circuit analysis withpseudorabies viruses. Curr Protoc Neurosci 2001, Chapter 1(Unit1.5).
4. Boldogkõi Z, Sík A, Dénes A, Reichart A, Toldi J, Gerendai I,Kovács KJ and Palkovits M: Novel tracing paradigms-geneticallyengineered herpesviruses as tools for mapping functionalcircuits within the CNS: present status and future prospects.Prog Neurobiol 2004, 72(6):417–445.
5. Boldogkõi Z, Bálint K, Awatramani GB, Balya D, Busskamp V,Viney TJ, Lagali PS, Duebel J, Pásti E, Tombácz D, Tóth JS, Takács IF,Scherf BG and Roska B: Genetically timed, Activity sensor andRainbow transsynaptic viral tools. Nature Methods 2009,6:127–130.
6. Ekstrand MI, Enquist LW and Pomeranz LE: The alpha-herpes-viruses: molecular pathfinders in nervous system circuits.Trends Mol Med 2008, 14(3):134–140.
7. Boldogkõi Z, Szabó A, Vrbová G and Nógrádi A: Pseudorabiesvirus-based gene delivery to rat embryonic spinal cordgrafts. Hum Gene Ther 2002, 13(6):719–729.
8. Demarchi JM, Schmidt CA and Kaplan AS: Patterns of Transcrip-tion of Human Cytomegalovirus in Permissively InfectedCells. J Virol 1980, 35(2):277–286.
9. Honess RW and Roizman B: Regulation of Herpesvirus Macro-molecular Synthesis I. Cascade Regulation of the Synthesisof Three Groups of Viral Proteins. J Virol 14(1):8–19.
10. Cheung AK: Cloning of the latency gene and the early protein0 gene of pseudorabies virus. J Virol 1991, 65:5260–5271.
11. Huang C and Wu CY: Characterization and expression of thepseudorabies virus early gene UL54. J Virol Methods 2004,119:129–136.
12. Feldman LT, Demarchi JM, Ben-Porat T and Kaplan AS: Control ofabundance of immediate-early mRNA in herpesvirus (pseu-dorabies)-infected cells. Virology 1982, 116:250–262.
13. Ihara S, Feldman L, Watanabe S and Ben-Porat T: Characterizationof the immediate-early functions of pseudorabies virus.Virology 1983, 131:437–454.
14. Fuchs W, Ehrlich C, Klupp BG and Mettenleiter TC: Character-ization of the replication origin (Ori(S)) and adjoining partsof the inverted repeat sequences of the pseudorabies virusgenome. J Gen Virol 2000, 81:1539–1543.
15. Zhang G and Leader DP: The structure of the pseudorabiesvirus genome at the end of the inverted repeat sequencesproximal to the junction with the short unique region. J GenVirol 1990, 71:2433–2441.
16. Hann LE, Cook WJ, Uprichard SL, Knipe DM and Coen DM: Therole of herpes simplex virus ICP27 in the regulation of UL24gene expression by differential polyadenylation. J Virol 1998,72(10):7709–7714.
17. Chambers J, Angulo A, Amaratunga D, Guo H, Jiang Y, Wan JS,Bittner A, Frueh K, Jackson MR, Peterson PA, Erlander MG andGhazal P: DNA microarrays of the complex human cytome-galovirus genome: profiling kinetic class with drug sensitiv-ity of viral gene expression. J Virol 1999, 73(7):5757–5766.
18. Stingley SW, Ramirez JJ, Aguilar SA, Simmen K, Sandri-Goldin RM,Ghazal P and Wagner EK: Global analysis of herpes simplexvirus type 1 transcription using an oligonucleotide-basedDNA microarray. J Virol 2000, 74(21):9916–9927.
19. Kennedy PG, Grinfeld E, Craigon M, Vierlinger K, Roy D, Forster Tand Ghazal P: Transcriptomal analysis of varicella-zoster virusinfection using long oligonucleotide-based microarrays. J GenVirol 2005, 86(10):2673–2684.
20. Aguilar JS, Devi-Rao GV, Rice MK, Sunabe J, Ghazal P andWagner EK: Quantitative comparison of the HSV-1 andHSV-2 transcriptomes using DNA microarray analysis.Virology 2006, 348(1):233–241.
21. Yang WC, Devi-Rao GV, Ghazal P, Wagner EK and Triezenberg SJ:General and specific alterations in programming of globalviral gene expression during infection by VP16 activation-deficient mutants of herpes simplex virus type 1. J Virol 2002,76(24):12758–74.
22. Sun A, Devi-Rao GV, Rice MK, Gary LW, Bloom DC, Sandri-Goldin RM, Ghazal P and Wagner EK: Immediate-early expres-sion of the herpes simplex virus type 1 ICP27 transcript isnot critical for efficient replication in vitro or in vivo. J Virol2004, 78(19):10470–10478.
23. Karaca G, Hargett D, McLean TI, Aguilar JS, Ghazal P, Wagner EKand Bachenheimer SL: Inhibition of the stress-activated kinase,p38, does not affect the virus transcriptional program ofherpes simplex virus type 1. Virology 2004, 329(1):142–156.
24. Blanchard Y, Le MN, Le CM, Blanchard P, Leger J and Jestin A:Cellular gene expression survey of PseudoRabies Virus(PRV) infected Human Embryonic Kidney cells (HEK-293).Vet Res 2006, 37:705–723.
25. Brukman A and Enquist LW: Suppression of the interferon-mediated innate immune response by pseudorabies virus. JVirol 2006, 80:6345–6356.
26. Ray N and Enquist LW: Transcriptional response of a commonpermissive cell type to infection by two diverse alphaher-pesviruses. J Virol 2004, 78:3489–3501.
27. Flori L, Rogel_Gaillard C, Cochet M, Lemonnier G, Hugot K,Chardon P, Robin S and Lefèvre F: Transcriptomic analysis ofthe dialogue between Pseudorabies virus and porcineepithelial cells during infection. BMC Genomics 2008, 9:123.
28. Øster B, Bundgaard B and Höllsberg P: Viral gene expressionpatterns in human herpesvirus 6B-infected T cells. J Virol2002, 76(15):7578–7586.
29. Dittmer DP, Gonzalez CM, Vahrson W, DeWire SM, Hines-Boykin Rand Damania B: Whole-genome transcription profiling ofrhesus monkey rhadinovirus. J Virol 2005, 79(13):8637–8650.
30. Soong R and Tabiti K: Detection of colorectal micrometastasisby quantitative RT-PCR of cytokeratin 20 mRNA. Proceedingsof the American Association for Cancer Research 2000, 41:391,XP002149389.
31. Stewart JP, Janjua NJ, Sunil-Chandra NP, Nash AA and Arrand JR:Characterization of Murine Gammaherpesvirus 68 Glyco-protein B (gB) Homolog: Similarity toEpstein-Barr Virus gB(gpllO). J Virol 1994, 68(10):6496–6504.
32. Wu J, O'Neill J and Barbosa MS: Late temporal gene expressionfrom the human cytomegalovirus pp28US (UL99) promoterwhen integrated into the host cell chromosome. J Gen Virol2001, 82:1147–1155.
33. Sanfilippo CM and Blaho JA: ICP0 Gene Expression Is a HerpesSimplex Virus Type 1 Apoptotic Trigger. J Virol 2006, 80(14):6810–6821.
34. Gómez-Sebastián S and Tabarés E: Negative regulation of herpessimplex virus type 1 ICP4 promoter by IE180 protein ofpseudorabies virus. J Gen Virol 2004, 85:2125–2130.
35. Some Genetic Functions Encoded by Herpes Simplex Virustype 1. http://darwin.bio.uci.edu/~faculty/wagner/table.html.
36. The Genetic and Transcription Map of the HSV-1 Genome.http://darwin.bio.uci.edu/~faculty/wagner/hsvimg04z.jpg.
37. Roizman B: The function of herpes simplex virus genes: Aprimer for genetic engineering of novel vectors. Proc Nat AcadSci 1996, 93:11307–11312.
BMC Genomics 2009, 10:491 http://www.biomedcentral.com/1471-2164/10/491
Page 21 of 22(page number not for citation purposes)

38. Roizman B and Campadelli-Fiume G: Alphaherpes viral genes andtheir functions. Human Herpesviruses - Biology, Therapy andImmunoprophylaxis Cambridge: Cambridge University Press: ArvinA, et al 2007, 70–92.
39. Pseudorabies virus gene annotations. http://www.fli.bund.de/prv_gene_annotations+M52087573ab0.html.
40. Baumeister J, Klupp BG and Mettenleiter TC: Pseudorabies virusand equine herpesvirus 1 share a nonessential gene which isabsent in other herpesviruses and located adjacent to ahighly conserved gene cluster. J Virol 1995, 69:5560–5567.
41. Bras F, Dezelee S, Simonet B, Nguyen X, Vende P, Flamand A andMasse MJ: The left border of the genomic inversion ofpseudorabies virus contains genes homologous to theUL46 and UL47 genes of herpes simplex virus type 1, butno UL45 gene. Virus Res 1999, 60:29–40.
42. Fuchs W, Klupp BG, Granzow H, Osterrieder N andMettenleiter TC: The Interacting UL31 and UL34 GeneProducts of Pseudorabies Virus Are Involved in Egressfrom the Host-Cell Nucleus and Represent Components ofPrimary Enveloped but Not Mature Virions. J Virol 2002, 76(1):364–378.
43. Reynolds AE, Fan Y and Baines JD: Characterization of the UL33gene product of herpes simplex virus 1. Virology 2000,266:310–8.
44. McNabb DS and Courtney RJ: Identification and characteriza-tion of the herpes simplex virus type 1 virion proteinencoded by the UL35 open reading frame. J Virol 1992,66:2653–63.
45. Klupp BG, Fuchs W, Granzow H, Nixdorf R and Mettenleiter TC:Pseudorabies virus UL36 tegument protein physically inter-acts with the UL37 protein. J Virol 2002, 76:3065–3071.
46. Braun A, Kaliman A, Boldogkõi Z, Aszódi A and Fodor I: Sequenceand expression analyses of the UL37 and UL38 genes ofAujeszky's disease virus. Acta Vet Hung 2000, 48(1):125–136.
47. de Wind N, Berns A, Gielkens A and Kimman T: Ribonucleotidereductase-deficient mutants of pseudorabies virus areavirulent for pigs and induce partial protective immunity. JGen Virol 1993, 74:351–359.
48. Ambagala AP, Hinkley S and Srikumaran S: An early pseudorabiesvirus protein down-regulates porcine MHC class I expres-sion by inhibition of transporter associated with antigenprocessing (TAP). J Immunol 2000, 164:93–99.
49. Powers L, Wilkinson KS and Ryan P: Characterization of theprv43 gene of pseudorabies virus and demonstration that itis not required for virus growth in cell culture. Virology 1994,199:81–88.
50. Robbins AK, Watson RJ, Whealy ME, Hays WW and Enquist LW:Characterization of a pseudorabies virus glycoprotein genewith homology to herpes simplex virus type 1 and type 2glycoprotein. J Virol 1986, 58(2):339–347.
51. Kaelin K, Dezelee S, Masse MJ, Bras F and Flamand A: The UL25Protein of Pseudorabies Virus Associates with Capsids andLocalizes to the Nucleus and to Microtubules. J Virol 2000,74:474–482.
52. Dezélée S, Bras F, Vende P, Simonet B, Nguyen X, Flamand A andMasse MJ: The BamHI fragment 9 of pseudorabies viruscontains genes homologous to the UL24, UL25, UL26, andUL 26.5 genes of herpes simplex virus type 1. Virus Res 1996,42:27–39.
53. Yamada S, Imada T, Watanabe W, Honda Y, Nakajima-Iijima S,Shimizu Y and Sekikawa K: Nucleotide sequence and transcrip-tional mapping of the major capsid protein gene ofpseudorabies virus. Virology 1991, 185:56–66.
54. Dijkstra JM, Fuchs W, Mettenleiter TC and Klupp BG: Identifica-tion and transcriptional analysis of pseudorabies virus UL6to UL12 genes. Arch Virol 1997, 142:17–35.
55. Dean HJ and Cheung AK: A 3'coterminal gene cluster inpseudorabies virus contains herpes simplex virus UL1, UL2,UL3 gene homologs and a unique UL3.5 open readingframe. J Virol 1993, 67:5955–5961.
56. Krause PR, Croen KD, Ostrove JM and Straus SE: Structural andKinetic Analyses of Herpes Simplex Virus Type I Latencyas-sociated Transcripts in Human Trigeminal Ganglia and inCell Culture. J Clin Invest 1990, 86(1):235–241.
57. van Zijl M, Gulden van der H, de Wind N, Gielkens A and AntonBerns A: Identification of Two Genes in the Unique ShortRegion of Pseudorabies Virus; Comparison with HerpesSimplex Virus and Varicella-zoster Virus. J Gen Virol 1990,71:1747–1755.
58. Brideau AD, Banfield BW and Enquist LW: The Us9 gene productof pseudorabies virus, an alphaherpesvirus, is a phosphory-lated, tail-anchored type II membrane protein. J Virol 1998,72:4560–70.
59. de Wind N, Peeters B, Zijderveld A, Gielkens ALJ, Berns AJM andKimman TG: Mutagenesis and characterization of a 41-kilobase-pair region of the pseudorabies virus genome:transcription map, search for virulence genes, and compar-ison with homologs of herpes simplex virus type 1. Virology1994, 200:784–790.
60. Dean HJ and Cheung AK: Identification of the pseudorabiesvirus UL4 and UL5 (helicase) genes. Virology 1994, 202(2):962–7.
61. Van Minnebruggen G, Favoreel HW, Jacobs L and Nauwynck HJ:Pseudorabies virus US3 protein kinase mediates actin stressfiber brakedown. J Virol 2003, 77(16):9074–80.
62. Pfaffl MW: A new mathematical model for relative quantifi-cation in real-time RT-PCR. Nucleic Acids Res 2001, 29(9):e45.
63. Souazé F, Ntodou-Thomé A, Tran CY, Rostène W and Forgez P:Quantitative RT-PCR: limits and accuracy. Biotechniques 1996,21(2):280–285.
64. Livak KJ and Schmittgen TD: Analysis of relative gene expres-sion data using real-time quantitative PCR and the 2ΔΔ C(T)Method. Methods 2001, 25(4):402–408.
65. Klupp BG, Hengartner CJ, Mettenleiter TC and Enquist LW:Complete, annotated sequence of the pseudorabies virusgenome. J Virol 2004, 78(1):424–440, Erratum in: J Virol 2004, 78(4):2166.
66. Papin J, Vahrson W, Hines-Boykin R and Dittmer DP: Real-timequantitative PCR analysis of viral transcription. Methods MolBiol 2005, 292:449–480.
67. Elhai J and Wolk CP: A versatile class of positive-selectionvectors based on the nonviability of palindrome-containingplasmids that allows cloning into long polylinkers. Gene 1988,68(1):119–138.
Publish with BioMed Central and every scientist can read your work free of charge
"BioMed Central will be the most significant development for disseminating the results of biomedical research in our lifetime."
Sir Paul Nurse, Cancer Research UK
Your research papers will be:
available free of charge to the entire biomedical community
peer reviewed and published immediately upon acceptance
cited in PubMed and archived on PubMed Central
yours — you keep the copyright
Submit your manuscript here:http://www.biomedcentral.com/info/publishing_adv.asp
BioMedcentral
BMC Genomics 2009, 10:491 http://www.biomedcentral.com/1471-2164/10/491
Page 22 of 22(page number not for citation purposes)