White Paper No. 25 - NJ Election Law Enforcement Commission
30
White Paper No. 25 Top Local Elections in New Jersey – A Tale of Two Cities and More www.elec.state.nj.us January, 2015 Election Law Enforcement Commission L E EC 1973
-
Upload
khangminh22 -
Category
Documents
-
view
3 -
download
0
Transcript of White Paper No. 25 - NJ Election Law Enforcement Commission

White Paper No. 25 Top Local Elections in New Jersey –
A Tale of Two Cities and More www.elec.state.nj.us
January, 2015
Election
Law
Enforcement
Commission
L E EC
1973

Located at: 28 W. State Street, 13th Floor, Trenton, New Jersey
ACKNOWLEDGEMENT
The Commissioners would like to thank the various staff members involved in this report, which is the 25th
white paper released by the New Jersey Law Enforcement Commission (ELEC) since 1988.
This series has received national and even international recognition, and its contents often have been cited in media reports, the political science literatures, studies prepared by sister agencies and advocacy groups.
Besides serving as reference works, the reports also provide valuable background and guidance for the Governor’s Office, legislators and other policymakers.
Deputy Director Joseph W. Donohue is the author of White Paper 25, “Top Local Elections in NJ- A Tale of Two Cities and More
.”
General editors and proofreaders included Executive Director Jeffrey M. Brindle, Director of Information Technology Carol Neiman, Compliance Director Amy F. Davis and Research Associate Steven Kimmelman. Director of Finance and Administration Christopher Mistichelli checked many of the numbers.
Administrative Assistant Elbia L. Zeppetelli also helped with proofreading, and brought her usual finesse to formatting the final version.
A special thanks to Todd J. Wojcik, Director of Campaign Financing, and Clerk Igor Milewski. Todd and Igor arranged for the retrieval of dozens of boxes of older paper reports in an off-site storage facility to help verify candidate totals, and helped track down several spools of microfiche that also were critical for research of early campaigns. Todd also helped with proofreading.
All 25 white papers are available on ELEC’s website at www.elec.state.nj.us. For earlier research into local campaign finance trends and valuable historical background on municipal elections in the state, see these two reports by Director Brindle: White Paper 18: “Local Campaign Financing: An Analysis of Trends in Communities Large and Small (2005),” and White Paper 14: “Local Campaign Financing (2000).”

TABLE OF CONTENTS
NJ Election Law Enforcement Commission Page i White Paper No. 25
PAGE NO.
SUMMARY ............................................................................................................................................ 1 NEWARK – THE HISTORIC 2014 CAMPAIGN ............................................................................. 2 NEWARK – 2014 VS 1982 .................................................................................................................... 9 JERSEY CITY – ANOTHER LOCAL CAMPAIGN EPICENTER .............................................. 12 SOME COUNTIES ALSO SPENDING BIG .................................................................................... 14 TOP INDIVIDUAL SPENDERS ........................................................................................................ 15 BALLOT QUESTIONS ALSO DRAW BIG BUCKS ...................................................................... 17 LOCAL SPENDING TRENDS UPWARD ....................................................................................... 20 RECOMMENDATIONS ..................................................................................................................... 23 PREVIOUS WHITE PAPERS ........................................................................................................... 26

TABLE OF CONTENTS
NJ Election Law Enforcement Commission Page ii White Paper No. 25
TABLES
PAGE NO.
1. Top 10 Most Expensive Local Races in New Jersey ................................................................... 2
2. Spending on Four-Year Election Cycle for 2014 Newark Municipal Election ........................... 3
3. Rising Cost of Elections in Newark ............................................................................................. 5
4. Major Categories of Spending in 2014 Newark Elections ........................................................... 6
5. Major Areas of Spending by Independent Committees and Candidates in 2014
Newark Elections ......................................................................................................................... 6
6. Breakdown of Expenses Identified as Television, Radio or Media Advertising
in 2014 Newark Elections ............................................................................................................ 7
7. Breakdown of Spending on Television, Radio or Media Advertising by Type ........................... 8
8. Major Categories of Spending in 1982 Newark Elections ........................................................... 9
9. Breakdown of Media Costs in 1982 Newark Elections ............................................................... 9
10. Major Categories of Spending 2014 versus 1982 Newark Elections ........................................ 10
11. Breakdown of Media Costs- 2014 versus 1982 Newark Elections............................................ 11
12. Top 25 Most Expensive Local Races in New Jersey ................................................................. 13
13. Top 5 Largest Individual Spenders Among Local and County Candidates ............................... 16
14. Spending by Fundraising Committees Controlled by Cory Booker .......................................... 17
15. Top 10 Costliest County and Municipal Ballot Questions ........................................................ 19
16. Spending on County and Municipal Elections by Decade ......................................................... 20
17. Combined Spending on County and Municipal Elections Ranked by Year .............................. 20
18. Comparison of Most Expensive Election Years in New Jersey ................................................ 21
19. Spending on County and Municipal Elections by Year ............................................................. 22
20. How Disclosure would Change for Independent Groups under ELEC
Legislative Proposal ................................................................................................................... 23

SUMMARY
NJ Election Law Enforcement Commission Page 1 White Paper No. 25
Newark, New Jersey's largest city by population and the 67th largest nationally, has dominated the top local races during the past 40 years. Since 1974, the four most expensive races, based on inflation adjusted numbers, all took place in “Brick City.” Seven of the top 25 all-time local races occurred there (Page 13).
While Newark has had the most expensive elections, Jersey City, the state’s second most populous municipality, has had more (9 versus 7) among the top 25 all-time races (Page 13). The most expensive Jersey City race cost $7.6 million in inflation adjusted dollars and ranks sixth among all elections. It took place in 2001, when Glenn Cunningham became the city’s first African-American mayor.
Together, Newark and Jersey City had 16 of the top 25 costliest local elections. Hoboken was the only other city in the top 25. The 2009 campaign in Hoboken cost $3.1 million and ranked 25th
Disregarding inflation, the 2014 Newark election, in which Councilman Ras Baraka defeated former assistant state Attorney General Shavar Jeffries, was the most expensive local election ever ($12.6 million). Adjusting for inflation, it was surpassed only by the 2006 Newark election, which was equal to $13.4 million in 2014 dollars (Page 2).
(Page 13).
The 2014 election was especially notable because it signaled a new era in local New Jersey politics when several independent groups spent a combined $5.5 million (Page 3). That was nearly 22 times more than the previous record in a local election (excluding independent spending on ballot questions) (Page 4).
The involvement of independent groups has led to a sharp change in the pattern of spending, notably a major increase in mass media spending. Eighty-two percent of all independent spending went to media, primarily for either TV or radio. By contrast, candidates spent just 31 percent of their budgets on media (Page 6).
Six of the other top 25 local elections took place in counties. The most expensive county election occurred in Bergen County in 2002, when Dennis McNerney defeated state Sen. Henry McNamara. The race cost $10.1 million in inflation adjusted dollars and ranks 5th
No candidate individually spent more than Jerramiah Healy, who sank $3.5 million into a 2009 election in which he won reelection as Jersey City’s mayor (Page 15).
among all elections (Page 14).
Former Newark Mayor Cory Booker, who mostly raised funds using joint committees, appears to be the most prolific local fundraiser of all time. His committees raised and spent more than $20 million on five Newark elections (Page 17).
The most spent on a local ballot question was the $1.2 million outlay by supporters and opponents of a 2010 proposal to allow private operation of Trenton’s water supply (Page 18).
In the three decades between 1985 and 2014, the most spending on local elections occurred in 2002 at $60.1 million (inflation adjusted)(Page 20). A total of $763 million has been spent on municipal and county elections during those three decades (Page 22).

NEWARK - THE HISTORIC 2014 CAMPAIGN
NJ Election Law Enforcement Commission Page 2 White Paper No. 25
Since the 1970s, Newark has been one of the state’s biggest political battlegrounds. So much so it inspired the documentary film “Street Fight” about the 2002 campaign.
All four campaigns between 2002 and 2014 topped $10 million in inflation adjusted dollars. They are the top four most costly local elections ever held in New Jersey.
No other municipality has come close in terms of overall spending on elections, according to the first-ever attempt by ELEC to rank the most expensive local races since 1974.
The 2006 Newark campaign, which topped $13.4 million factoring in inflation, was the most expensive local election ever in New Jersey.
Yet it was the $12.6 million campaign in 2014 that really stands apart. It brought a major new dimension to local politics in New Jersey- the emergence of independent groups not under the direct control of parties or candidates. Those groups also are beginning to dominate politics nationally and at the state level.
Table 1 Top 10 Most Expensive
Local Races in New Jersey
LOCATION YEAR TYPE AMOUNT (UNADJUSTED)
AMOUNT (IN 2014
DOLLARS) KEY RACE
Newark 2006 Municipal $11,437,051 $13,439,543 Cory Booker defeats Ronald Rice for mayor.
Newark 2014 Municipal $12,562,933 $12,562,933 Ras Baraka defeats Shavar Jeffries for mayor.
Newark 2002 Municipal $ 8,692,816 $11,437,916 Mayor Sharpe James defeats Cory Booker.
Newark 2010 Municipal $ 9,827,153 $10,670,090 Mayor Cory Booker defeats Clifford Minor.
Bergen County 2002 General $ 7,667,682 $10,089,055 Dennis McNerney defeats Henry
McNamara for Executive.
Jersey City 2001 Municipal $ 5,655,735 $ 7,561,143 Glenn Cunningham defeats Tom DeGise to become mayor.
Jersey City 2009 Municipal $ 5,889,743 $ 6,500,820 Mayor Jerramiah Healy defeats Louis Manzo.
Jersey City 1989 Municipal $ 3,041,000 $ 5,803,435 Gerald McCann defeats Glenn Cunningham to become mayor.
Essex County 1978 General $ 1,514,107 $ 5,505,844 Peter Shapiro defeats Robert Notte to Become Executive.
Jersey City 2013 Municipal $ 5,269,015 $ 5,354,690 Steven Fulop defeats Jerramiah Healy for mayor.

NEWARK - THE HISTORIC 2014 CAMPAIGN
NJ Election Law Enforcement Commission Page 3 White Paper No. 25
These so-called “outside” groups spent a total of $5.5 million during the election year alone- an unprecedented 44 percent of the full four-year election cycle spending for 2014 (Newark candidates run every four years). By contrast, candidates spent $7 million – 56 percent.
No previous municipal election had ever drawn anything close to that much spending by independent groups. One group alone- Newark First- spent just under $4.5 million on the campaign. The biggest spending candidate committee spent less than half that sum.
Table 2 Spending on Four-Year Election Cycle for 2014 Newark Municipal Election
CANDIDATE OR JOINT CANDIDATE COMMITTEE NAME SPENT PERCENT Jeffries, Caraballo, Amador, Gonzalez, Waters, Ramos, Speight, Lloyd, Bankston, and Logan $ 2,164,729
Booker, Gonzalez, Onque, Green and Cobb Latham $ 1,577,638 Crump, Council, James, McCallum, Chaneyfield-Jenkins, Osborne, and Lopez $ 829,071
Baraka, Ras* $ 603,118 Quintana, Luis $ 281,814 Amador, Augusto $ 278,937 Ramos, Anibal $ 242,250 Sharif, Darrin $ 152,691 28 other Candidate Committees that Spent Less than $100,000 each $ 683,049 Runoff $ 169,070 Local Parties $ 73,001 SUBTOTAL-CANDIDATES AND PARTIES $ 7,055,368 56
INDEPENDENT COMMITTEES
Newark First $ 4,465,486 Working Families Organization $ 410,001 Newark Families for Progress $ 285,591 NJ Workers Voices $ 163,361 American Federation of Teachers $ 109,996 Committee for Economic Growth and Social Justice $ 73,130 SUBTOTAL- INDEPENDENT SPENDING $ 5,507,565 44 GRAND TOTAL $12,562,933 100 *Subtracts funds transferred to next election.
Newark First was chiefly funded by Education Reform Now, a New York City-based group and is a major advocate of privately run charter schools. It supported former assistant state Attorney General Shavar Jeffries and opposed Councilman Ras Baraka, who won the election.
Education Reform Now also backed Newark Families for Progress, another independent group.

NEWARK - THE HISTORIC 2014 CAMPAIGN
NJ Election Law Enforcement Commission Page 4 White Paper No. 25
On the other side of the debate and siding with Baraka were Working Families Organization, NJ
Workers Voices, American Federation of Teachers and Committee for Economic Growth and Social Justice.
How significant was the independent spending in this year’s Newark election?
It was nearly 22 times larger than the $251,629 spent by Better Education for New Jersey’s Kids Inc. in the 2013 Jersey City election. That outlay was considered the largest previous example of independent spending in a New Jersey local election not involving a ballot question.
NEWARK CAMPAIGN SPENDING TOPS INFLATION
The cost of campaigning in Newark has risen even more than the rate of inflation since 1974.
The 1974 campaign cost $489,411, or nearly $2.4 million when adjusted for inflation. By comparison, the 2014 campaign cost $12.6 million.
The difference is 434 percent, which is higher than the rise in cost of living over the 40-year period of 381 percent.
There are various reasons why the cost of elections in Newark is higher than in other municipalities. For one thing, there is a mayor and nine council members. That can easily lead to two dozen or more candidates in a major election year. Like other non partisan May Municipal election cities, Newark has runoff elections to decide close races, which further boosts the cost of the election.
Newark also is the state’s largest city, meaning candidates have to send out more mail and knock on more doors than in other cities. Newark also is located in the New York media market, one of the most expensive in the country. And unlike small municipalities, it bids out millions of dollars of public contracts annually that act like cat nip to some contributors.

NEWARK - THE HISTORIC 2014 CAMPAIGN
NJ Election Law Enforcement Commission Page 5 White Paper No. 25
Table 3 Rising Cost of Elections in Newark
YEAR TOTAL SPENDING IN 2014 DOLLARS
CHANGE- 2014 VS 1974
COST OF LIVING– 2014 VS 1974
1974 $ 2,352,938
1978 $ 1,941,509 1982 $ 2,328,669 1986 $ 3,453,095 1990 $ 3,835,665 1994 $ 3,007,663 1998 $ 4,746,786 2002 $11,437,916 2006 $13,439,543 2010 $10,670,090 2014 $12,562,933 434 381
2014 ELECTION: EXPENSIVE AND MEDIA DRIVEN
The candidates of decades past would barely recognize today’s campaigns.
For one thing, independent groups are increasingly becoming involved in local politics, a trend likely to accelerate. Candidates and committees spend their money differently today than in the past. And candidates of three decades ago would be stunned by the overall price tag.
Newark candidates and committees spent $12.6 million over the four-year, 2014 election cycle. In dollars unadjusted for inflation, it was the most expensive local campaign in history. Even accounting for inflation, it ranks second only behind the 2006 Newark election.
ELEC analyzed $9.8 million of that spending. This total represents nearly all election year spending, and 80 percent of total spending for the full four-year election cycle.
To allow an apples-to-apples comparison with spending in the 1982 Newark election (see page 9), which includes only election year spending, the analysis left out $914,690 spent by several incumbents in the three years leading up to the election.
NEWARK - THE HISTORIC 2014 CAMPAIGN
NJ Election Law Enforcement Commission Page 6 White Paper No. 25
It also omitted about $1.6 million raised and spent by former Mayor Cory Booker and his slate, nearly all of it before 2014. Booker announced in December 2012 that he was running for U.S. Senate.1 He won that campaign on October 16, 2013 and stepped down as mayor on October 31, 2013.2
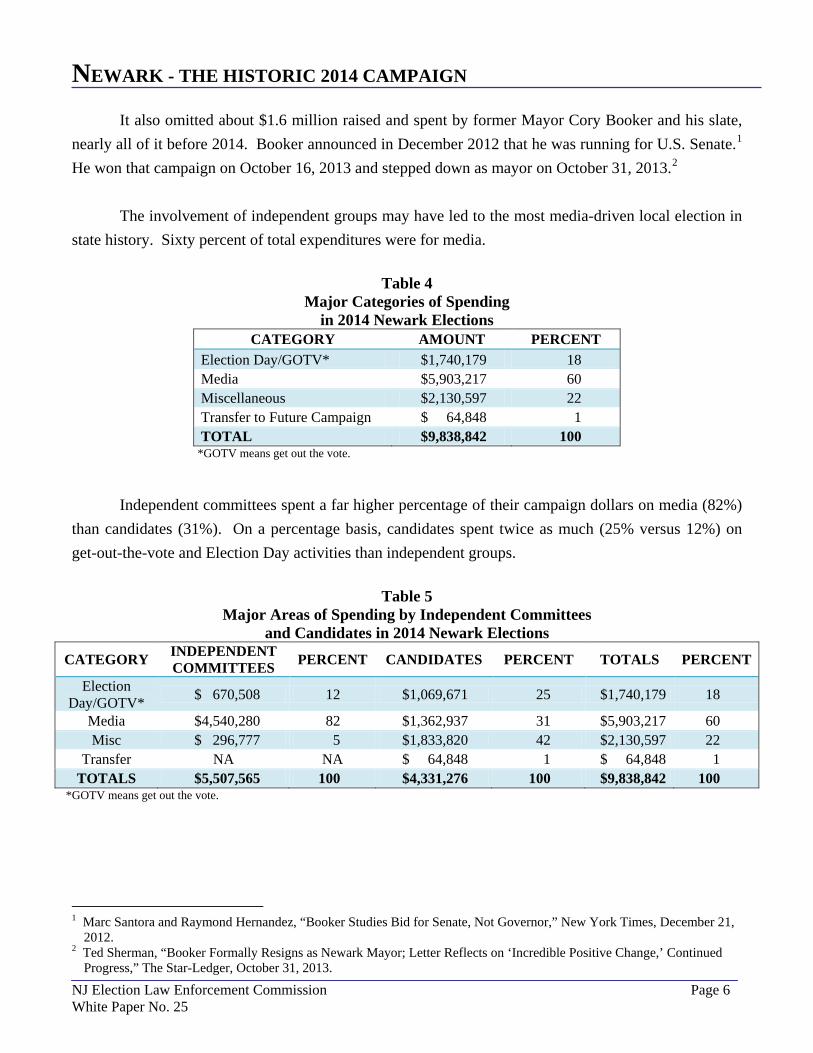
The involvement of independent groups may have led to the most media-driven local election in state history. Sixty percent of total expenditures were for media.
Table 4
Major Categories of Spending in 2014 Newark Elections
CATEGORY AMOUNT PERCENT Election Day/GOTV* $1,740,179 18 Media $5,903,217 60 Miscellaneous $2,130,597 22 Transfer to Future Campaign $ 64,848 1 TOTAL $9,838,842 100
*GOTV means get out the vote.
Independent committees spent a far higher percentage of their campaign dollars on media (82%)
than candidates (31%). On a percentage basis, candidates spent twice as much (25% versus 12%) on get-out-the-vote and Election Day activities than independent groups.
Table 5
Major Areas of Spending by Independent Committees and Candidates in 2014 Newark Elections
CATEGORY INDEPENDENT COMMITTEES PERCENT CANDIDATES PERCENT TOTALS PERCENT
Election Day/GOTV* $ 670,508 12 $1,069,671 25 $1,740,179 18
Media $4,540,280 82 $1,362,937 31 $5,903,217 60 Misc $ 296,777 5 $1,833,820 42 $2,130,597 22
Transfer NA NA $ 64,848 1 $ 64,848 1 TOTALS $5,507,565 100 $4,331,276 100 $9,838,842 100
*GOTV means get out the vote.
1 Marc Santora and Raymond Hernandez, “Booker Studies Bid for Senate, Not Governor,” New York Times, December 21,
2012. 2 Ted Sherman, “Booker Formally Resigns as Newark Mayor; Letter Reflects on ‘Incredible Positive Change,’ Continued
Progress,” The Star-Ledger, October 31, 2013.
NEWARK - THE HISTORIC 2014 CAMPAIGN
NJ Election Law Enforcement Commission Page 7 White Paper No. 25
Candidates also spent a far higher proportion of their spending on overhead and other miscellaneous expenses (42% versus 5%) while 1 percent of candidate funds was transferred to the next election.
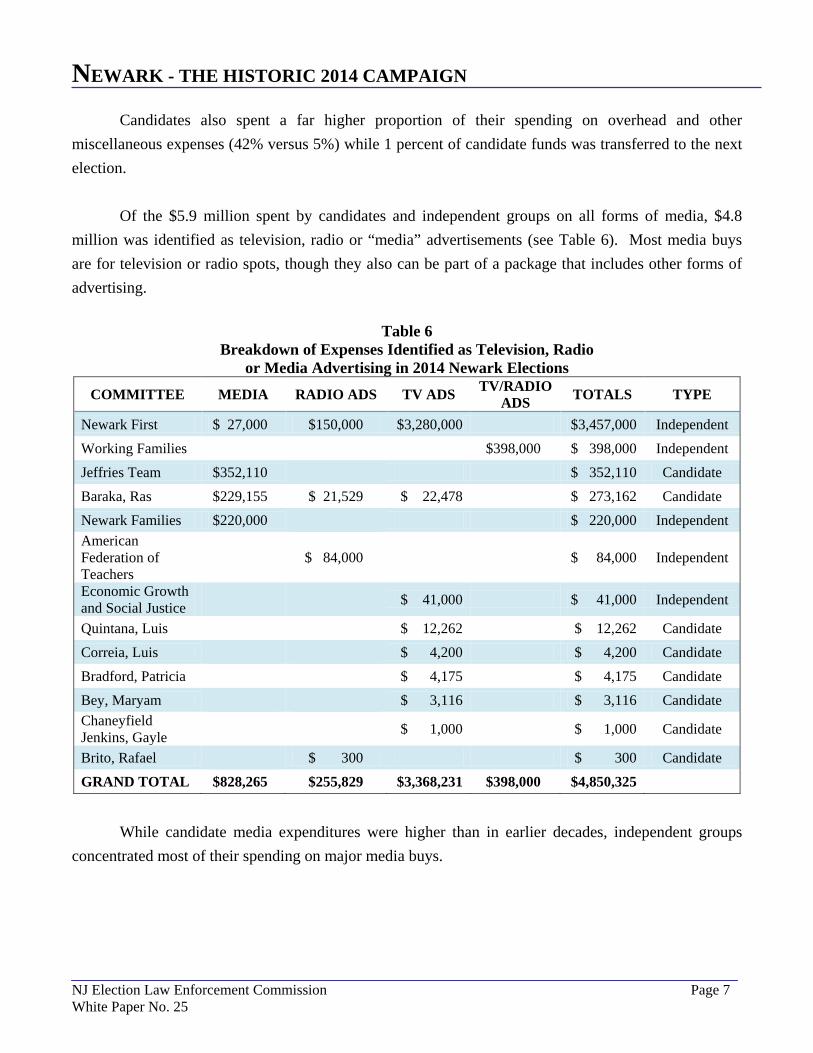
Of the $5.9 million spent by candidates and independent groups on all forms of media, $4.8 million was identified as television, radio or “media” advertisements (see Table 6). Most media buys are for television or radio spots, though they also can be part of a package that includes other forms of advertising.
Table 6 Breakdown of Expenses Identified as Television, Radio
or Media Advertising in 2014 Newark Elections COMMITTEE MEDIA RADIO ADS TV ADS TV/RADIO
ADS TOTALS TYPE
Newark First $ 27,000 $150,000 $3,280,000 $3,457,000 Independent Working Families $398,000 $ 398,000 Independent Jeffries Team $352,110 $ 352,110 Candidate Baraka, Ras $229,155 $ 21,529 $ 22,478 $ 273,162 Candidate Newark Families $220,000 $ 220,000 Independent American Federation of Teachers $ 84,000 $ 84,000 Independent
Economic Growth and Social Justice $ 41,000 $ 41,000 Independent
Quintana, Luis $ 12,262 $ 12,262 Candidate Correia, Luis $ 4,200 $ 4,200 Candidate Bradford, Patricia $ 4,175 $ 4,175 Candidate Bey, Maryam $ 3,116 $ 3,116 Candidate Chaneyfield Jenkins, Gayle $ 1,000 $ 1,000 Candidate
Brito, Rafael $ 300 $ 300 Candidate
GRAND TOTAL $828,265 $255,829 $3,368,231 $398,000 $4,850,325
While candidate media expenditures were higher than in earlier decades, independent groups
concentrated most of their spending on major media buys.

NEWARK - THE HISTORIC 2014 CAMPAIGN
NJ Election Law Enforcement Commission Page 8 White Paper No. 25
Table 7 Comparison of Spending on Television,
Radio or Media Advertising TYPE INDEPENDENT PERCENT
OF TOTAL CANDIDATE PERCENT OF TOTAL TOTAL
TV Ads $3,321,000 $ 47,231 $3,368,231 Media $ 247,000 $581,265 $ 828,265 TV/Radio Ads $ 398,000 NA $ 398,000 Radio Ads $ 234,000 $ 21,829 $ 255,829
GRAND TOTAL $4,200,000 87 $650,325 13 $4,850,325
1982 VERSUS 2014- MAJOR CHANGES IN HOW CANDIDATES AND COMMITTEES SPEND THEIR MONEY
The year 1982 was filled with challenges and milestones.
A short but brutal recession gripped the nation in the same year Great Britain battled Argentina over the Falkland Islands. Ronald Reagan was serving his second year as president. “ET” was a major box office success, the Weather Channel made its appearance on cable television and the first computer virus, called “Elk Cloner,” started a dastardly trend that still plagues cyberspace.3
In New Jersey, Tom Kean had just taken office as governor. He was greeted with his most difficult year as a revenue shortfall forced budget cuts and increases in the income, sales and gasoline taxes.4
In Newark, Kenneth Gibson, elected as the city’s first African American mayor in 1970, won his fourth term. He fended off a challenge from Earl Harris, the city council president.
The 1982 race cost an estimated $1,156,890. In 2014 dollars, it tallied $2.8 million. Incumbent Gibson spent $567,000- nearly $1.4 million in 2014 dollars. Harris spent at least
$169,129, or $414,532 in today’s dollars.
A detailed breakdown was performed on the nearly $1.2 million in total spending. The following table gives the results.
3 Wikipedia.com chronology for 1982. 4 Jill Pollack, “Taxes Rise by $350 Million,” Trenton Evening Times, January 1, 1983.

NEWARK – 2014 VS 1982
NJ Election Law Enforcement Commission Page 9 White Paper No. 25
Table 8 Major Categories of Spending
in 1982 Newark Elections CATEGORY AMOUNT PERCENT
Miscellaneous $ 538,982 47 Media $ 484,756 42 Election Day/GOTV* $ 132,446 11 Transfer to Future Campaign $ 706 0.1
TOTAL $1,156,890 100 *GOTV means get out the vote
Miscellaneous includes meals, rent, contributions made to charities or other candidates, supplies,
utilities, and repayment of loans.
Even though 1982 was the year Time Magazine featured a computer as its Man of the Year,5
a breakdown of media costs shows candidates relied overwhelmingly on paper to distribute their messages.
It would be years before websites, robocalls and digital advertising became a part of local campaigns.
Table 9 Breakdown of Media Costs in
1982 Newark Elections CATEGORY AMOUNT PERCENT
Mail/Printing $236,704 49 Signs $ 85,438 18 Radio Advertisements $ 55,735 11 Newspaper Advertisements $ 45,333 9 Advertising- Misc. $ 37,322 8 Billboards $ 24,224 5
TOTAL $484,756 100
THE 2014 NEWARK ELECTION VERSUS THE 1982 ELECTION
In comparing the cost of the 2014 and 1982 Newark elections, the most telling factor is the explosion of media spending.
5 Wikepedia.com chronology for 1982.

NEWARK – 2014 VS 1982
NJ Election Law Enforcement Commission Page 10 White Paper No. 25
If the $484,756 spent on media in 1982 was adjusted for inflation, the same amount of media spending would cost nearly $1.2 million today. Media spending in the 2014 election exceeded $5.9 million- nearly five times more.
Media costs today take up a far bigger share of spending compared to the 1982 campaign budget- 60 percent versus 42 percent.
Money spent on Election Day and get-out-the-vote activities also is up substantially from 1982 ($1.7 million versus $132,446) and is higher on a percentage basis (22% versus 11%).
Table 10 Major Categories of Spending
2014 Versus 1982 Newark Elections CATEGORY 2014 PERCENT 1982 PERCENT
Miscellaneous $2,130,597 18 $ 538,982 47 Media $5,903,217 60 $ 484,756 42 Election Day/GOTV* $1,740,179 22 $ 132,446 11 Transfer to Future Campaign $ 64,848 1 $ 706 0.1
TOTAL $9,838,842 100 $1,156,890 100 *GOTV means get out the vote
While miscellaneous expenses were up in total dollars spent (nearly $2.1 million versus about
$538,982), they were down sharply on a percentage basis (18% versus 47%).
Miscellaneous includes meals, fundraising, rent, polling, contributions made to charities or other candidates, supplies, utilities, consulting and repayment of loans.
One caveat: miscellaneous totals may be inflated because candidate descriptions of their expenses aren’t always clear. Is a consultant, for instance, hired to do polling, fundraising, political strategy, or GOTV? Candidates often don’t say. When the purpose of the expense was not obvious, it was placed in miscellaneous.
A detailed look at media expense shows stark differences (See Table 11).
No Newark candidates or committees reported using television advertisements in 1982.

NEWARK – 2014 VS 1982
NJ Election Law Enforcement Commission Page 11 White Paper No. 25
At least $3.4 million was spent in 2014- nearly 57 percent of the media total.
Radio advertisements did play a significant role in campaigns in 1982. Candidates spent a
combined $55,735 on radio buys- nearly 11 percent of their media budgets.
While it was impossible to break out the cost of all radio buys in 2014, those strictly identified as
such totaled $255,829. That is a significant jump from 1982. But on a percentage basis, it is a small
portion of current media outlays (4%).
Mail and printed literature continues to play an important role in campaigns. But its percentage
of the media budget fell from 49 percent to 13 percent even though total dollars more than tripled.
Campaign spending on signs, newspaper advertisements and billboards all reflected significant
drops both in dollars and as a percentage of overall spending.
Clearly, paper is passé in the digital age.
Another sign of this shift- while there were no outlays for online ads, websites or robocalls in
1982, they represent a small but indispensable part of modern campaigns.
Table 11
Breakdown of Media Costs- 2014 Versus 1982 Newark Elections
CATEGORY 2014 PERCENT 1982 PERCENT Television Advertising $3,368,231 57 NA NA Advertising- Not Identified $ 931,397 16 $ 37,322 8
Mail/Printing $ 775,622 13 $236,704 49 TV/Radio Ads- Combined Buy $ 398,000 7 NA NA
Radio Advertisements $ 255,829 4 $ 55,735 11 Signs $ 98,184 2 $ 85,438 18 Online $ 39,711 1 NA NA Newspaper Advertisements $ 20,818 0.4 $ 45,333 9
Billboards $ 7,756 0.1 $ 24,224 5 Website $ 4,857 0.1 NA NA Robocalls $ 2,812 0.05 NA NA TOTAL $5,903,217 100 $484,756 100

JERSEY CITY – ANOTHER LOCAL CAMPAIGN EPICENTER
NJ Election Law Enforcement Commission Page 12 White Paper No. 25
JERSEY CITY- ANOTHER SETTING FOR MAJOR ELECTIONS
While Newark has hosted the largest local elections in state history, Jersey City, the state’s second most populous municipality, has had nine campaigns extending from 1977 to 2009 that ranked in the top 25 while Newark has seven ranging from 1986 through 2014 (See Table 12 below).
Like Newark, Jersey City has a large population that is highly diverse, resides in a major media market, holds elections that typically attract dozens of candidates, has runoff elections in addition to regular municipal elections and has a big budget and lots of contracts.
The most costly election took place in 2001, when former council member Glenn Cunningham defeated former council President Tom DiGise.
The 2001 Jersey City election cost an estimated $7.6 million in inflation adjusted dollars. But the campaign had added significance besides being the city’s most expensive race.
Cunningham, who later became a state senator, became the first African-American mayor in Jersey City history.

JERSEY CITY – ANOTHER LOCAL CAMPAIGN EPICENTER
NJ Election Law Enforcement Commission Page 13 White Paper No. 25
Table 12 Top 25 Most Expensive Local Races in New Jersey
R A N K
LOCATION YEAR TYPE AMOUNT (UNADJUSTED)
AMOUNT (IN 2014
DOLLARS) KEY RACE
1 Newark 2006 Municipal $11,437,051 $13,439,543 Cory Booker defeats Ronald Rice for mayor.
2 Newark 2014 Municipal $12,562,933 $12,562,933 Ras Baraka defeats Shavar Jeffries for mayor.
3 Newark 2002 Municipal $ 8,692,816 $11,437,916 Mayor Sharpe James defeats Cory Booker.
4 Newark 2010 Municipal $ 9,827,153 $10,670,090 Mayor Cory Booker defeats Clifford Minor.
5 Bergen County 2002 County $ 7,667,682 $10,089,055 Dennis McNerney defeats Henry
McNamara for executive.
6 Jersey City 2001 Municipal $ 5,655,735 $ 7,561,143 Glenn Cunningham defeats Tom DeGise to become mayor.
7 Jersey City 2009 Municipal $ 5,889,743 $ 6,500,820 Mayor Jerramiah Healy defeats Louis Manzo.
8 Jersey City 1989 Municipal $ 3,041,000 $ 5,803,435 Gerald McCann defeats Glenn Cunningham for mayor.
9 Essex County 1978 County $ 1,514,107 $ 5,505,844 Peter Shapiro defeats Robert Notte for Executive.
10 Jersey City 2013 Municipal $ 5,269,015 $ 5,354,690 Steven Fulop defeats Jerramiah Healy for mayor.
11 Bergen County 1986 County $ 2,374,662 $ 5,128,860 William McDowell defeats Matthew
Feldman for executive.
12 Newark 1998 Municipal $ 3,265,789 $ 4,746,786 Mayor Sharpe James defeats Ronald Rice And Mildred Crump.
13 Essex County 2002 County $ 3,203,840 $ 4,215,579 Joseph DiVincenzo defeats Thomas Giblin for executive.
14 Newark 1990 Municipal $ 2,117,287 $ 3,835,665 Mayor Sharpe James, Unopposed, Reelected.
15 Jersey City 1997 Municipal $ 2,554,639 $ 3,767,904 Bret Schundler defeats Jerramiah Healy for mayor.
16 Jersey City 1985 Municipal $ 1,658,324 $ 3,652,696 Anthony Cucci defeats Gerald McCann for mayor.
17 Jersey City 1981 Municipal $ 1,347,568 $ 3,509,292 Gerald McCann defeats Walter Sheil for mayor.
18 Newark 1986 Municipal $ 1,598,783 $ 3,453,095 Sharpe James defeats Mayor Kenneth Gibson.
19 Essex County 1986 County $ 1,558,418 $ 3,365,914 Nicholas Amato defeats Executive Peter Shapiro.
20 Bergen County 2010 County $ 3,092,145 $ 3,357,378 Kathleen Donovan defeats Executive
Dennis McNerney
21 Jersey City 1977 Municipal $ 855,638 $ 3,342,336 Thomas FX Smith defeats William Macci for mayor.
22 Jersey City 2005 Municipal $ 2,720,386 $ 3,297,438 Mayor Jerramiah Healy defeats Melissa Holloway.
23 Camden County 1994 County $ 1,981,926 $ 3,166,016 Michael McLaughlin defeats Sheriff
William Simon.
24 Essex County 1994 County $ 1,972,253 $ 3,150,564 James Treffinger defeats Cardell Cooper for executive.
25 Hoboken 2009 Municipal $ 2,845,551 $ 3,140,785 Peter Cammarano defeats Dawn Zimmer for mayor.

SOME COUNTIES ALSO SPENDING BIG
NJ Election Law Enforcement Commission Page 14 White Paper No. 25
COUNTY CAMPAIGNS ALSO DRAW BIG BUCKS
While Newark and Jersey City had 16 of the top 25 most expensive local races, eight county races also made the list.
Three occurred in Bergen County (1986, 2002, 2010), four in Essex County (1978, 1986, 1994, 2002) and one in Camden County (1994).
The most costly county showdown occurred in 2002, when Democrat Dennis McNerney defeated Republican state Sen. Henry McNamara for county executive.
At $10.1 million in 2014 dollars, it was nearly twice as expensive as the next costliest county race.
The Bergen County race was unusual because of heavy involvement from out-of-county committees, particularly among Democrats. It resulted in an unusually large and late breaking wave of spending against McNamara.
The next costliest race also is the oldest county race among the top 25. It occurred in 1978, when Democrat Peter Shapiro defeated Republican Robert Notte to become Essex County Executive. In inflation adjusted dollars, the campaign topped $5.5 million.
One Camden County campaign slipped into the top 25 (it was 24th
). It was distinctive in that all the other county campaigns on the list featured county executive showdowns. The 1994 Camden County campaign was headlined by a sheriff’s election.
In that $3.2 million contest, Democrat Michael McLaughlin upset Democrat-turned-Republican Sheriff William Simon.

TOP INDIVIDUAL SPENDERS
NJ Election Law Enforcement Commission Page 15 White Paper No. 25
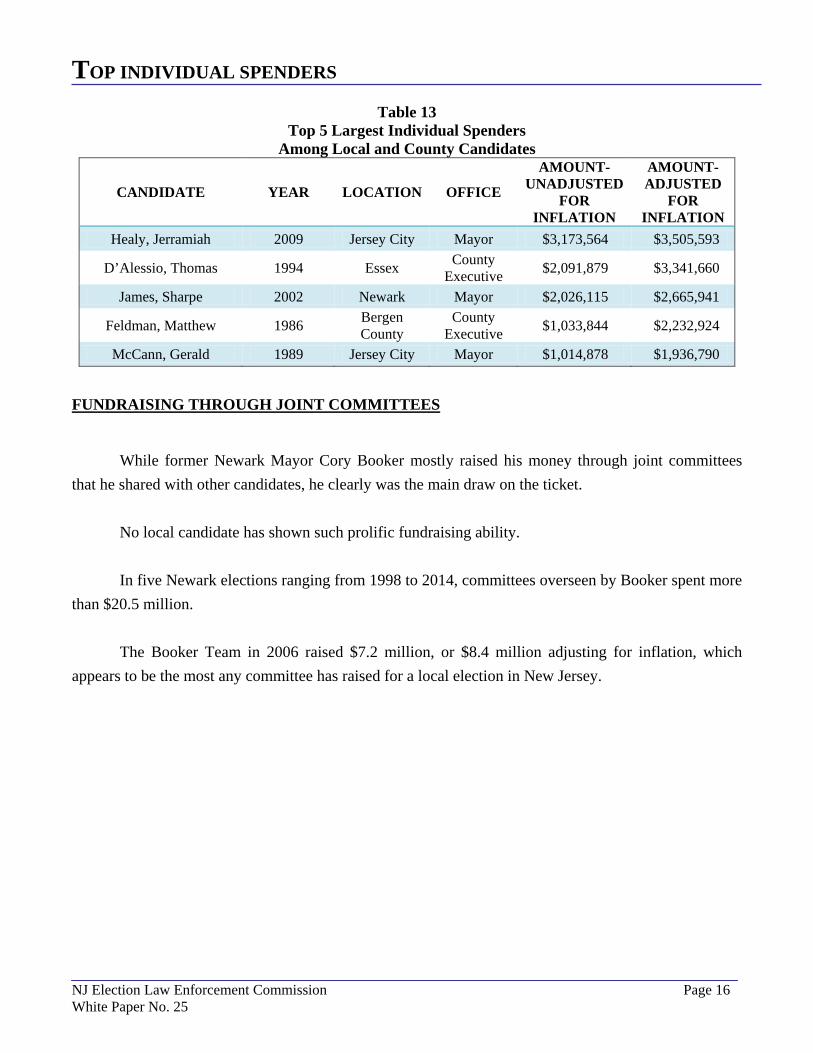
Many candidates in recent elections have conducted their campaigns using joint committees, particularly mayoral and council candidates. Joint committees can raise more money than individual committees, and they consolidate fundraising efforts, saving time and money.
There have been some municipal and county campaigns where individual candidates raised and spent large sums on their own.
The largest known individual spender was former Jersey City Mayor Jerramiah Healy. Healy spent $3.2 million- about $3.5 million in today’s dollars- winning reelection in 2009.
Technically, the $2.1 million raised by former Essex County Executive Thomas D’Alessio ranks as the second largest campaign fund ever amassed by a local candidate. Raised for the 1994 election, it would be valued at $3.3 million in 2014 dollars.
However, D’Alessio ended up resigning from office and never ran for reelection due to an indictment and conviction on money laundering and extortion charges.6 He was allowed by ELEC to redistribute his remaining funds to charities, other candidates or contributors.7
In what stands as the second most expensive municipal campaign, the 2002 Newark election, Mayor Sharpe James spent $2 million (not counting transfers to his future campaign)- the equivalent of $2.7 million. James ranks as the third largest spender individually.
James also is believed to be the first local candidate to spend more than $1 million running for office. Running unopposed, he spent $1,054,807 on his 1990 election- an amount equal to $1.9 million in 2014 dollars.
Former Democratic state Senator Matthew Feldman, who ranks fourth, spent the equivalent of $2.2 million seeking the Bergen County executive post in 1986 but lost to Republican Sheriff William McDowell.
Rounding out the top 5 is former Jersey City Mayor Gerald McCann, who spent the equivalent of $1.9 million on the 1989 mayoral contest, which he won.
6 Diane C. Walsh, “Former Essex Exec Sentenced to 46 Months for Extortion,” The Star-Ledger, September 15, 1994. 7 Diane C. Walsh, “Essex Ex-Exec Must Yield Campaign Accounts,’’ The Star-Ledger, June 15, 1994.
TOP INDIVIDUAL SPENDERS
NJ Election Law Enforcement Commission Page 16 White Paper No. 25
Table 13 Top 5 Largest Individual Spenders
Among Local and County Candidates
CANDIDATE YEAR LOCATION OFFICE
AMOUNT- UNADJUSTED
FOR INFLATION
AMOUNT-ADJUSTED
FOR INFLATION
Healy, Jerramiah 2009 Jersey City Mayor $3,173,564 $3,505,593
D’Alessio, Thomas 1994 Essex County Executive $2,091,879 $3,341,660
James, Sharpe 2002 Newark Mayor $2,026,115 $2,665,941
Feldman, Matthew 1986 Bergen County
County Executive $1,033,844 $2,232,924
McCann, Gerald 1989 Jersey City Mayor $1,014,878 $1,936,790
FUNDRAISING THROUGH JOINT COMMITTEES
While former Newark Mayor Cory Booker mostly raised his money through joint committees that he shared with other candidates, he clearly was the main draw on the ticket.
No local candidate has shown such prolific fundraising ability.
In five Newark elections ranging from 1998 to 2014, committees overseen by Booker spent more than $20.5 million.
The Booker Team in 2006 raised $7.2 million, or $8.4 million adjusting for inflation, which appears to be the most any committee has raised for a local election in New Jersey.

BALLOT QUESTIONS ALSO DRAW BIG BUCKS
NJ Election Law Enforcement Commission Page 17 White Paper No. 25
Table 14
Spending by Fundraising Committees Controlled by Cory Booker
CANDIDATE YEAR LOCATION
AMOUNT- UNADJUSTED
FOR INFLATION*
Booker Team 2006 Newark $ 7,189,185 Booker Team 2010 Newark $ 7,741,964 Booker Team 2002 Newark $ 3,075,335 Booker Team 2014 Newark $ 1,577,638 Booker, Cory 2002 Newark $ 856,991 Booker, Cory 1998 Newark $ 80,129
TOTAL $20,521,242 *Not including transfers to following election.
Aside from what he raised for Newark campaigns, he went on to raise $17.5 million for his U.S.
Senate elections in 2013 and 2014.8
WATER SUPPLIES, BLUE LAWS AND INCINERATORS- SPENDING ON LOCAL BALLOT INITIATIVES
Ballot initiatives in New Jersey are not as prevalent as in some states like California, where public referenda typically can draw tens of millions of dollars in spending pro and con.
At both the state and local levels in New Jersey, spending has been modest. The most expensive statewide referendum, which in 1976 allowed casinos in Atlantic City, cost nearly $1.4 million, or nearly $5.6 million in 2014 dollars.
No local referenda have drawn even a quarter of that spending.
Only two local ballot question votes cost more than $1 million on an inflation adjusted basis. Coincidentally, both took place in Mercer County.
8 www.politicalmoneyline.com query on 12/29/2014.

BALLOT QUESTIONS ALSO DRAW BIG BUCKS
NJ Election Law Enforcement Commission Page 18 White Paper No. 25
Research indicates the largest was the $1.2 million (inflation adjusted) spent in 2010 mostly to promote a ballot question that would have allowed a private water company to assume control of Trenton’s water supply.
The main supporter, The Committee for Trenton Yes (New Jersey American Water Company) outspent opponents heavily- $1.2 million versus just under $7,000 in reported spending by Stop The Sale, a coalition of local residents.
Despite the lopsided outlays, the proposed $80 million sale was rejected by nearly 80 percent of local voters.9
On the other hand, the larger investment paid off for opponents of a proposed referendum in 1988 that would have required deposits up to 25 cents on all beverage containers sold in Mercer County.
Mercer Citizens for Recycling Committee, a coalition of businesses and private citizens opposed to the so-called bottle bill, spent nearly $1.1 million (inflated adjusted). Friends of the Bottle Bill spent the equivalent of just $64,320. The public question was defeated 3-1.10
Spending was more even but the results also were lopsided in 1993 when Bergen County voters considered a repeal of the county’s long-time ban on Sunday shopping.
Vote Yes for Sunday Shopping, a coalition of retailers, advocated the Blue Law repeal, while Vote No-Vote Informed Bergen opposed the public question. They spent a combined $895,646 in 2014 dollars. County residents rejected the repeal by more than 80,000 votes.11
9 Meir Rinde, “Voters Sink Water Deal,” Trenton Times, June 16, 2010. 10 Michael Booth, “Voters Defeat Bottle Bill 3-1,” Trenton Times, November 9, 1988. 11 Christopher Mumma, “Sunday Shopping Just Didn’t Sell- Blue Law Repeal Doomed from the Start,” The Record,
November 4, 1993.

BALLOT QUESTIONS ALSO DRAW BIG BUCKS
NJ Election Law Enforcement Commission Page 19 White Paper No. 25
Table 15 Top 10 Costliest County and Municipal Ballot Questions
COMMITTEE LOCATION YEAR SPENT
AT THE TIME
SPENT (IN 2014
DOLLARS) Committee for Trenton Yes Trenton 2010 $1,098,502 Stop The Sale Trenton 2010 $ 6,297
TOTAL $1,104,799 $1,199,565 Mercer Citizens for Recycling Committee Mercer County 1988 $ 532,318
Friends of The Bottle Bill Mercer County 1988 $ 32,160
TOTAL $ 564,478 $1,128,956 Vote Yes for Sunday Shopping Committee Bergen County 1993 $ 325,344
Vote No-Vote Informed Bergen Bergen County 1993 $ 221,000
TOTAL $ 546,344 $ 895,646 Westinghouse Monmouth County Resource Management Inc Monmouth County 1991 $ 479,983 $ 834,753
JCPL Committee Aberdeen Township 1995 $ 277,453 $ 430,828 Union City Children First Union City 2004 $ 335,320 $ 420,201 Property Tax Relief for Moorestown Moorestown 2011 $ 361,727 $ 380,765
Responsible People Vote No Elizabeth 1999 $ 232,598 $ 330,395 Citizens for An Affordable Government Toms River 2002 $ 178,060 $ 234,289
Vote Yes for Our Schools Elizabeth 2000 $ 160,117 $ 220,243
LOCAL SPENDING TRENDS UPWARD
Statistics compiled since 1985 show that spending on municipal and county elections, after adjustments for inflation, has risen steadily though not dramatically over the last three decades.
In nominal dollars (unadjusted for inflation), spending increased from $171 million between 1985 and 1994 to $333 million between 2005 and 2014. That represents a 94 percent increase between the two decades.
But the increase is not as big as it seems. When the two decades are compared using actual buying power, it drops to just 16 percent.

LOCAL SPENDING TRENDS UPWARD
NJ Election Law Enforcement Commission Page 20 White Paper No. 25
Table 16
Spending on County and Municipal Elections by Decade
PERIOD TOTAL- NO INFLATION
ADJUSTMENT
PERCENT INCREASE
2005-2014 VS 1984-1994
TOTAL- ADJUSTED FOR
INFLATION
PERCENT INCREASE
2005-2014 VS 1984-1994
2005-2014 $332,835,046 94 $365,926,873 16 1995-2004 $259,500,877 $357,478,146 1985-1994 $171,174,630 $316,527,640 Average Per Year $ 25,450,352 $ 34,664,422
On an inflated adjusted basis, the average spent on municipal and county elections during the
past 30 years was nearly $35 million.
Interestingly, in the eight years when total spending topped $40 million (inflation adjusted) major campaigns occurred in either Newark or Jersey City. Clearly, the costly non-partisan, May Municipal campaigns in those two cities help explain the major yearly fluctuations in overall spending on local campaigns. Also, campaigns in Bergen and Essex Counties, which also tend to be expensive, take place during same years as Newark’s mayoral election.
Table 17 Combined Spending on County and Municipal Elections Ranked by Year
YEAR TOTAL-
NO INFLATION ADJUSTMENT
TOTAL- ADJUSTED FOR
INFLATION
MAJOR MAY MUNICIPAL ELECTION
2002 $45,691,414 $60,120,282 Newark 2006 $47,014,631 $55,246,335 Newark 2005 $39,389,074 $47,744,332 Jersey City 2010 $40,228,861 $43,679,545 Newark 1994 $26,595,513 $42,484,845 Newark 2014 $41,974,127 $41,974,127 Newark 2001 $31,116,760 $41,599,947 Jersey City 1990 $22,386,481 $40,555,219 Newark
The peak year for local spending occurred in 2002, when it topped $60 million in 2014 dollars.
LOCAL SPENDING TRENDS UPWARD
NJ Election Law Enforcement Commission Page 21 White Paper No. 25
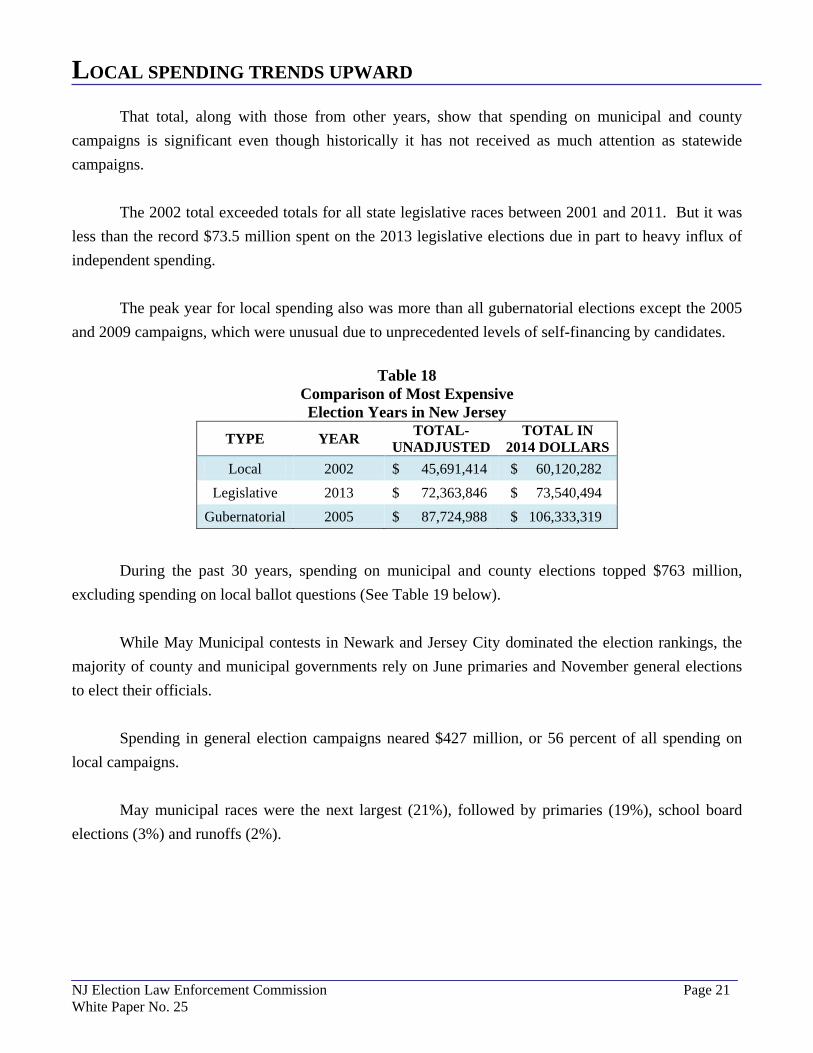
That total, along with those from other years, show that spending on municipal and county campaigns is significant even though historically it has not received as much attention as statewide campaigns.
The 2002 total exceeded totals for all state legislative races between 2001 and 2011. But it was less than the record $73.5 million spent on the 2013 legislative elections due in part to heavy influx of independent spending.
The peak year for local spending also was more than all gubernatorial elections except the 2005 and 2009 campaigns, which were unusual due to unprecedented levels of self-financing by candidates.
Table 18 Comparison of Most Expensive Election Years in New Jersey
TYPE YEAR TOTAL- UNADJUSTED
TOTAL IN 2014 DOLLARS
Local 2002 $ 45,691,414 $ 60,120,282 Legislative 2013 $ 72,363,846 $ 73,540,494
Gubernatorial 2005 $ 87,724,988 $ 106,333,319
During the past 30 years, spending on municipal and county elections topped $763 million, excluding spending on local ballot questions (See Table 19 below).
While May Municipal contests in Newark and Jersey City dominated the election rankings, the majority of county and municipal governments rely on June primaries and November general elections to elect their officials.
Spending in general election campaigns neared $427 million, or 56 percent of all spending on local campaigns.
May municipal races were the next largest (21%), followed by primaries (19%), school board elections (3%) and runoffs (2%).

LOCAL SPENDING TRENDS UPWARD
NJ Election Law Enforcement Commission Page 22 White Paper No. 25
Table 19 Spending on County and
Municipal Elections by Year* YEAR SCHOOL
BOARDS MAY
MUNICIPAL RUNOFFS PRIMARIES GENERAL TOTAL
2014 $ 713,349 $ 17,109,195 $ 1,635,397 $ 8,151,242 $ 14,364,944 $ 41,974,127 2013 $ 668,706 $ 5,405,694 $ 390,332 $ 7,645,129 $ 13,761,299 $ 27,871,160 2012 $ 890,317 $ 1,917,271 $ 0 $ 4,781,629 $ 10,461,975 $ 18,051,192 2011 $ 1,532,896 $ 2,614,118 $ 0 $ 6,335,900 $ 17,243,093 $ 27,726,007 2010 $ 922,009 $ 12,252,253 $ 202,357 $ 10,933,931 $ 15,918,311 $ 40,228,861 2009 $ 1,365,683 $ 8,257,673 $ 908,643 $ 7,010,509 $ 15,408,037 $ 32,950,545 2008 $ 1,242,057 $ 2,978,762 $ 45,451 $ 4,228,810 $ 15,462,449 $ 23,957,529 2007 $ 952,667 $ 2,878,373 $ 214,624 $ 10,213,427 $ 19,412,829 $ 33,671,920 2006 $ 1,249,311 $ 19,513,579 $ 695,479 $ 7,941,317 $ 17,614,945 $ 47,014,631 2005 $ 906,521 $ 5,963,133 $ 1,486,184 $ 7,459,561 $ 23,573,675 $ 39,389,074 2004 $ 1,011,427 $ 3,777,563 $ 0 $ 4,487,863 $ 18,162,670 $ 27,439,523 2003 $ 771,341 $ 2,707,717 $ 181,432 $ 6,652,403 $ 18,198,974 $ 28,511,867 2002 $ 909,700 $ 12,806,223 $ 1,261,307 $ 9,632,981 $ 21,081,203 $ 45,691,414 2001 $ 584,579 $ 5,910,607 $ 2,504,402 $ 4,927,861 $ 17,189,311 $ 31,116,760 2000 $ 630,481 $ 3,143,226 $ 197,639 $ 3,590,297 $ 14,462,488 $ 22,024,131 1999 $ 764,018 $ 2,384,371 $ 76,265 $ 5,326,911 $ 16,994,552 $ 25,546,117 1998 $ 626,276 $ 8,292,634 $ 623,593 $ 4,238,305 $ 13,412,371 $ 27,193,179 1997 $ 489,454 $ 4,017,293 $ 489,956 $ 3,396,535 $ 10,238,967 $ 18,632,205 1996 $ 411,979 $ 2,202,229 $ 107,325 $ 2,452,830 $ 10,309,048 $ 15,483,411 1995 $ 618,973 $ 2,376,908 $ 30,446 $ 2,664,280 $ 12,171,663 $ 17,862,270 1994 $ 369,761 $ 4,335,391 $ 859,437 $ 4,944,092 $ 16,086,832 $ 26,595,513 1993 $ 286,401 $ 2,951,047 $ 105,127 $ 2,604,399 $ 10,888,257 $ 16,835,231 1992 $ 175,912 $ 1,586,664 $ 99,648 $ 2,554,349 $ 10,593,093 $ 15,009,666 1991 $ 309,715 $ 1,632,051 $ 0 $ 2,780,855 $ 13,312,176 $ 18,034,797 1990 $ 218,736 $ 5,515,454 $ 644,412 $ 3,051,737 $ 12,956,142 $ 22,386,481 1989 $ 242,395 $ 3,371,073 $ 840,569 $ 2,130,957 $ 10,708,456 $ 17,293,450 1988 $ 235,366 $ 2,456,249 $ 81,801 $ 1,351,173 $ 8,747,733 $ 12,872,322 1987 $ 180,111 $ 1,272,039 $ 4,983 $ 2,154,223 $ 10,837,253 $ 14,448,609 1986 $ 213,612 $ 4,636,251 $ 154,479 $ 1,062,696 $ 10,023,209 $ 16,090,247 1985 NA $ 2,287,298 $ 712,055 $ 1,393,937 $ 7,215,024 $ 11,608,314
TOTALS $19,493,753 $156,552,339 $14,553,343 $146,100,139 $426,810,979 $763,510,553 PERCENT 3 21 2 19 56 100
*Does not include spending on ballot questions.

RECOMMEDNDATIONS
NJ Election Law Enforcement Commission Page 23 White Paper No. 25
RECOMMENDATION ONE
:
More Disclosure by Independent Special Interest Groups- Since 2010, the bipartisan Election Law Enforcement Commission has been urging state officials to adopt broader disclosure rules for independent groups.
In its recent comparison of disclosure requirements among the states, the National Institute on Money in State Politics gave New Jersey a score of 40 out of a maximum of 120.12
Only eight states- Alabama, Georgia, Indiana, New Mexico, Pennsylvania, South Carolina, Tennessee, and Wisconsin- scored lower. Eleven states got the top score- Alaska, Colorado, Connecticut, Delaware, Hawaii, Idaho, Illinois, Maine, Rhode Island, Texas, and Utah.
Executive Director Jeff Brindle has outlined potential elements of a legislative reform bill and several bills have been introduced that have borrowed from his recommendations.
Table 20
How Disclosure Would Change for Independent Groups Under ELEC Legislative Proposal
Independent Spenders that Explicitly Urge a Candidate’s Election or Defeat Must Disclose CURRENT PROPOSED
Contributions Infrequent*** Yes*
Expenditures Yes Yes Independent Spenders that Use Issue Ads to Promote or Attack Candidates
Contributions Infrequent and not before election** Yes*
Expenditures Infrequent and not before election** Yes
* ELEC proposal would require disclosure only for contributions above $5,000. ** Some groups have disclosed campaign-related contributions and spending through grass roots lobbying reports
filed months after the campaign. Also, ballot questions essentially are issues settled by elections. Political committees that support or oppose ballot questions have always fully disclosed their contributions and expenses.
*** Some independent groups do fully disclose because they file their reports as political committees.
The enormous independent spending in the 2014 Newark election was unusual in that most of the details were disclosed voluntarily by the participating groups.
12 Peter Quist, “Scorecard: Essential Disclosure Requirements for Independent Spending, 2014,” National Institute on Money
in State Politics, December 3, 2014.

RECOMMEDNDATIONS
NJ Election Law Enforcement Commission Page 24 White Paper No. 25
However, detailed disclosure of contributions and expenses by independent groups is not currently mandated by New Jersey law.
For example, about $11 million of $38 million spent on the 2013 state campaigns (excluding ballot questions) omitted detailed contributions or expenses. Another $3.7 million revealed just expenses.
So nearly 38 percent of the spending in 2013 state elections came with zero or limited disclosure. ELEC is asking only that independent groups abide by the same rules now followed by candidates and parties.
RECOMMENDATION TWO
:
Detailed Expenditure Information Provided by Local Candidates and Parties should be available in a searchable online database- Electronic facsimiles of disclosure reports filed by all state, county and local candidates and committees are readily accessible via ELEC’s website.
In addition, ELEC also makes available a searchable database of contributions. The database includes some contributions dating back to the 1981 governor’s race. Local contributions are a recent addition.
ELEC began making local contributions searchable in 2009. ELEC lacks, however, a database of candidate and committee expenditures. Currently, the agency’s computer system is on the verge of a major overhaul.
Within a few years, the goal is to have all candidates file their disclosure reports electronically. Once that happens, it will be relatively easy to extract contribution and expense details from all reports and compile them into databases.
There is no reason why reports filed by local candidates should be excluded. Expanded access to expense data will make analysis easier and help assess the impact of campaign finance laws.
Since these laws are intended to be self-enforcing, there will be greater incentive for candidates not to misuse their campaign funds since expenses will be easier for the public and others to check.

RECOMMEDNDATIONS
NJ Election Law Enforcement Commission Page 25 White Paper No. 25
RECOMMENDATION THREE
:
Broaden the governmental activities law to include lobbying of local governmental entities- The fact that local elections are attracting millions of dollars in political contributions hints at the growing importance of local government. But it isn’t just elections that are drawing big bucks.
There are indications that lobbying of local officials also has become a multi-million-dollar enterprise. Since the bulk of local lobbying may involve lucrative local contracts, the public deserves to know who is deploying lobbyists to try to win those contracts.
While some lobbyists who register with ELEC voluntarily disclose their efforts to influence local officials, current law does not require such disclosure. Current law requires only disclosure of efforts to lobby state officials.
State regulated lobbyists file quarterly reports that inform the public of their latest activities, and annual reports that list their clients, fees and other information.
Legislation should be approved to require that lobbyists paid to influence local officials also register and file similar disclosure reports.

PREVIOUS WHITE PAPERS
NJ Election Law Enforcement Commission Page 26 White Paper No. 25
Number One: Contribution Limits and Prohibited Contributions
Number Two:
(1988)
Trends in Legislative Campaign Financing: 1977-1987
Number Three:
(1989)
Legislative Public Financing
Number Four:
(1989)
Ideas for an Alternate Funding Source
Number Five:
(1989)
Lobbying Reform
Number Six:
(1990)
Autonomy and Jurisdiction
Number Seven:
(1991)
Is There a PAC Plague in New Jersey
Number Eight:
? (1991)
Technology in The Future: Strengthening Disclosure
Number Nine:
(1992)
Legislative Candidates: How They Spend their Money
Number Ten:
(1994)
Nonconnected, Ideological PACs in the Garden State
Number Eleven:
(1995)
State Parties And Legislative Leadership Committees: An
Analysis
1994-1995
Number Twelve:
(1996)
Repartyization: The Rebirth of County Organizations
Number Thirteen: Trends in Legislative Campaign Financing: 1987-1997 2
(1997) nd
Number Fourteen: Local Campaign Financing (2000)
Volume (1999)
Number Fifteen: School Board Campaign Financing (2002)
Number Sixteen: A Resurgent Party System: Repartyization Takes Hold (2003)
Number Seventeen: Legislative Election 2003: The Rise of Party-Oriented Campaigning (2004)
Number Eighteen: Local Campaign Financing: An Analysis of Trends in Communities Large and
Small (2005)
Number Nineteen: The 2005 Assembly Election: New Trends On The Horizon? (2006)
Number Twenty: Legislative General Elections 2007: An Analysis Of Trends In State Senate And
Assembly Elections (2009)
Number Twenty-One: School Elections Campaign Financing: An Update (2010)
Number Twenty-Two: Trends in Legislative Campaign Financing: Fundraising in the Era of Pay-to-Play
Reform, Self-Funders and Recession • 1999-2009 3rd
Number Twenty-Three: Legislative General Elections 2011 - Rise of the Independents (2013)
Volume (2011)
Number Twenty-Four: Independents’ Day: Seeking Disclosure in a New Era of Unlimited Special Interest
Spending (2014)