White Matter Plasticity in Dancers and Musicians - CORE
136
White Matter Plasticity in Dancers and Musicians Chiara Giacosa A Thesis in The Department of Psychology Presented in Partial Fulfillment of the Requirements for the Degree of Doctor of Philosophy (Psychology) at Concordia University Montr´ eal, Qu´ ebec, Canada May 2019 c ¥ Chiara Giacosa, 2019
-
Upload
khangminh22 -
Category
Documents
-
view
1 -
download
0
Transcript of White Matter Plasticity in Dancers and Musicians - CORE

White Matter Plasticityin Dancers and Musicians
Chiara Giacosa
A Thesis
in The Department
of
Psychology
Presented in Partial Fulfillment of the Requirements
for the Degree of
Doctor of Philosophy (Psychology)
at Concordia University
Montreal, Quebec, Canada
May 2019
c¥ Chiara Giacosa, 2019

CONCORDIA UNIVERSITYSCHOOL OF GRADUATE STUDIES
This is to certify that the thesis prepared
By:
Entitled:
and submitted in partial fulfillment of the requirements for the degree of
Doctor Of Philosophy
complies with the regulations of the University and meets the accepted standards with
respect to originality and quality.
Signed by the final examining committee: Chair
External Examiner
External to Program
Examiner
Examiner
Thesis Supervisor (s)
Approved by
Chair of Department or Graduate Program Director
Dean,
Date of Defence
Chiara Giacosa
Whate matter plasticity in dancers and musicians
Psychology
Dr. Ian Ferguson
Dr. Joseph De Souza
Dr. Richard Courtemanche
Dr. Karen Li
Dr. Christopher Steele
Dr. Virginia Penhune
Dr. Aaron Johnson
June 25, 2019
Dr. André Roy Faculty of Pshychology

ABSTRACT
White Matter Plasticity in Dancers and Musicians
Chiara Giacosa, Ph.D.Concordia University, 2019
This dissertation examined training-related brain plasticity by comparing white mat-ter (WM) structure between dancers and musicians and relating the structural changes todance and music abilities. We focused on the primary motor pathways, to identify potentialstructural differences between whole-body dance training and specific-effector music training.
To this purpose, highly trained dancers and musicians, matched for years of training,were tested on a novel dance imitation task, melody discrimination, and rhythm reproduc-tion. Participants were scanned using magnetic resonance imaging (MRI). WM was analyzedat a whole-brain level in Study 1, using diffusion tensor imaging (DTI). Study 2 used prob-abilistic tractography to examine the descending motor pathways from the hand, leg, trunkand head regions. In Study 1, dancers showed increased diffusivity and reduced anisotropyin comparison to musicians in regions including the descending motor pathways, the supe-rior longitudinal fasciculus and the corpus callosum, predominantly in the right hemisphere.Consistent with this, in Study 2, dancers had increased diffusivity and greater volume in allportions of the right descending motor pathways, whereas musicians had increased anisotropy,especially in the right hand and trunk/arm tracts. Importantly, in both studies, DTI metricswere positively related with dance and negatively with melody performance. In Study 2, DTImetrics also were negatively associated with age of training start, indicating a direct relationbetween the structural changes observed and training.
Our findings indicate that different types of long-term training have distinct effects onbrain structure. In particular, dance training, which engages the whole body, appears toenhance connectivity among a broad range of cortical regions, possibly by increasing axonaldiameter and the heterogeneity of fiber orientation. In contrast, music training seems toincrease the coherence and packing of the connections linked to the trained effector(s).
This dissertation is novel in comparing brain structure between two groups of highly trainedperformers and in examining multiple DTI metrics concurrently. Further, in Study 2, wedeveloped a novel methodology to segregate themotor cortex into regions corresponding to fourmain body parts, which could be used by other researchers interested in motor connectivity.
iii

RÉSUMÉ
La Plasticité de la Matière Blanche chez le Danseurs et les Musiciens
Chiara Giacosa, Ph.D.Université Concordia, 2019
Cette thèse examine la plasticité cérébrale associée à l’entrainement à long terme.La structure de la matière blanche de danseurs a été comparée à celle de musiciens. Leschangements structurels ont été mis en relation avec les capacités liées à la danse et àla musique. Nous nous sommes concentrés sur les voies motrices primaires pour identifierles éventuelles différences structurelles entre l’entrainement du danseur mobilisant tout lecorps et celui du musicien mobilisant un effecteur spécifique.
Pour cela, des danseurs et des musiciens expérimentés, ayant un nombre d’années deformation comparable, ont été évalués sur une tâche d’imitation de danses, une tâche dediscrimination de mélodies et une tâche de reproduction de rythmes. Les participants ontété ensuite soumis à l’imagerie à résonance magnétique (IRM). Dans une première étude,la matière blanche a été analysée au niveau global du cerveau en utilisant l’imagerie partenseur de diffusion (DTI). Dans une deuxième étude, les voies motrices descendantes desrégions de la main, de la jambe, du tronc et de la tête ont été analysées à l’aide de latractographie probabilistique.
La première étude a montré que les danseurs avaient des valeurs plus élevées de diffu-sivité et des valeurs inférieures d’anisotropie par rapport aux musiciens, dans des régionsqui incluent les voies motrices descendantes, le fascicule longitudinal supérieur et le corpscalleux, surtout dans l’hémisphère droit. En accord avec ces résultats, la deuxième étudea révélé chez les danseurs, une augmentation de diffusivité et de volume dans toutes lesportions des voies motrices descendantes, alors que les musiciens avaient une augmenta-tion d’anisotropie, notamment dans les traits de la main et du tronc/bras. Il faut noterque dans les deux études, les métriques de DTI étaient corrélées négativement avec l’âgedu début de l’entrainement, ce qui indique une relation directe entre les changementsstructurels observés et l’entrainement.
Nos études montrent que les différents types d’entrainement à long terme ont des effetsdifférents sur la structure cérébrale. En particulier, la formation en danse, faisant travaillertout le corps, semble renforcer la connectivité entre une vaste gamme de régions corticales,
iv

probablement en accroissant le diamètre des axones et l’hétérogénéité de l’orientation desfibres. Au contraire, la formation musicale semble augmenter la cohérence et le tassementdes connections liées aux effecteurs entrainés.
Cette thèse introduit une nouveauté en comparant la structure du cerveau entre deuxgroupes d’artistes expérimentés et en étudiant plusieurs métriques de DTI simultané-ment. En outre, dans la deuxième étude, nous avons développé une nouvelle approcheméthodologique pour ségréguer le cortex moteur en quatres régions qui correspondent àquatre parties du corps. Cette approche pourrait être utilisée dans de futures étudess’intéressant à la connectivité des voies motrices.
v

ACKNOWLEDGEMENTS
Personal Thanks
I am deeply thankful to Virginia because she believed in me and allowed me to workon this this exciting project. Thanks for being supportive, motivating and always un-derstanding through all the phases of this project but also of my personal life. Thankyou also for guiding me, teaching with patience, always being humbly open to discussion,never imposing your opinion but always explaining everything.
Thank you to Krista, who invited me on this project, and thanks for her amazingenthusiasm.
Thanks to Falisha, for sharing with me all the testing and the other steps of theproject, and for the huge contribution with the papers!
Thanks to Nick for his great knowledge and support.
Thanks to Chris: with a couple of tips here and there you helped me go deeper inmy understanding when I was blocked.
Thank you, Elena, for your support, even from the other side of the world, for readingthe thesis and giving me your suggestions.
An especial thanks to my Mum, your daily loving presence, your constant listening,your optimism, your motivating attitude, your belief in me... You are the best exampleof love, thank you!
Thanks to my Dad, whose strong presence and guiding example are always a stimulusto go further.
And last but not least, thank you to Alain, my beloved husband who shared withme this journey, from the earliest beginning to the end and beyond. Thank you for yoursilently loving presence, for your constructive critics, for your technical and knowledgeablesupport and for all the practical help that you always give me.
All my efforts are for my beloved children, who give meaning to my life. I dedicatethis thesis to you.
vi

Study 1
We would like to thank our participants for their time, Jennifer Bailey, Emily Coffey andJamila Andoh for their assistance in the recruiting and testing process, and Ilana Leppertfor technical counselling. This work was funded by a grant from the Natural Sciences andEngineering Council of Canada (NSERC) to Dr. Krista Hyde and Dr. Virginia Penhune(238670); NSERC CREATE in Auditory Cognitive Neuroscience and Quebec BioimagingNetwork fellowships to Chiara Giacosa.
Study 2
We would like to thank our participants for their time, Jennifer Bailey, Emily Coffeyand Jamila Andoh for their assistance in the recruiting and testing process. This workwas funded by a grant from the Natural Sciences and Engineering Council of Canada(NSERC) to Dr. Krista Hyde (238670).
Conflicts of interest
The authors declare that they have no conflicts of interest.
Ethical approval
All procedures performed in studies involving human participants were in accordance withthe ethical standards of the institutional and research committee and were approved bythe Research Ethics Board at the Montreal Neurological Institute and Hospital.
Informed consent
Written informed consent was obtained from all participants included in the study. Par-ticipants were compensated for their participation.
Funding
This work was funded by a grant from the Natural Sciences and Engineering Council ofCanada (NSERC) to Dr. Krista Hyde (238670).
vii

CONTRIBUTIONS OF THE AUTHORS
This dissertation includes two studies, the first already published and the second in re-vision. Both studies are part of a bigger project that was conceived by Dr Krista Hydeand Dr. Virginia Penhune, with my participation in the final steps of its design. Thisproject included also the analyses of behavioral performance (Appendix C.C) as well asgray matter (Karpati et al., 2016, 2018) in the same sample.
Introduction and Discussion I authored the general introduction and discussionwith the supervision of Dr. Virginia Penhune and all it entails (reading of drafts andprovision of feedback, suggestions, and guidance leading to the final product).
Study 1 I was involved in the development of the behavioral test battery, the designof the MRI protocol and the adaptation of a music survey to dance and its translation intoFrench. I collected the data in collaboration with Dr. Falisha Karpati and I conductedall the WM analyses, including the coding of scripts. I wrote the manuscript with thesupervision and collaboration of Dr. Virginia Penhune. Dr. Krista Hyde, Dr. FalishaKarpati and Dr. Nicholas Foster provided feedback to the final manuscript.
Study 2 I conceived and realized Study 2 under the supervision of Dr. VirginiaPenhune. I conducted the neuroimaging, behavioral and statistical analyses and codedthe necessary scripts in multiple scripting languages. I self-taught and combined all themethods in an original manner, successfully developing a novel methodology. I authoredthe manuscript with the supervision and collaboration of Dr. Virginia Penhune. Themanuscript received feedback by Dr. Nicholas Foster and Dr. Christopher Steele.
Appendix A.A This section includes two supplementary tables to Study 1 and wereauthored by myself.
Appendix B.B This section includes the Supplementary Material that explains themethods of Study 2 in details. It was entirely developed and written by myself withfeedback from Dr. Virginia Penhune.
Appendix C.C This study includes the behavioural analyses of the project, which designI took part in, together with Dr. Penhune and Dr. Hyde. Dr. Karpati is the first authorof this paper, she ran the analyses and wrote the paper. However, I fully collaborated withDr. Karpati the recruiting and testing and gave feedback on the analyses. I also ran the sameanalyses aside in the reduced sample presented in Study 1 and 2, even where not explicitlypresented, and took part in the manuscript review, together with the other co-authors.
viii

TABLE OF CONTENTS
LIST OF TABLES . . . . . . . . . . . . . . . . . . . . . . . . . . . . . . . . . . . . . xi
LIST OF FIGURES . . . . . . . . . . . . . . . . . . . . . . . . . . . . . . . . . . . . xii
CHAPTER 1 General Introduction . . . . . . . . . . . . . . . . . . . . . . . . . . . 11.1 Overview . . . . . . . . . . . . . . . . . . . . . . . . . . . . . . . . . . . . . . 11.2 Neural correlates of dance and music . . . . . . . . . . . . . . . . . . . . . . 21.3 Why white matter? . . . . . . . . . . . . . . . . . . . . . . . . . . . . . . . . 61.4 What is DTI? . . . . . . . . . . . . . . . . . . . . . . . . . . . . . . . . . . . 7
1.4.1 DTI for voxel-based analysis . . . . . . . . . . . . . . . . . . . . . . 111.4.2 DTI for tractography . . . . . . . . . . . . . . . . . . . . . . . . . . . 11
1.5 Research Project . . . . . . . . . . . . . . . . . . . . . . . . . . . . . . . . . 141.5.1 General Procedures . . . . . . . . . . . . . . . . . . . . . . . . . . . . 141.5.2 White Matter Approaches . . . . . . . . . . . . . . . . . . . . . . . . 15
CHAPTER 2 Dance and music training have different effects on white matter diffu-sivity in sensorimotor pathways . . . . . . . . . . . . . . . . . . . . . . . . . . . . 172.1 Abstract . . . . . . . . . . . . . . . . . . . . . . . . . . . . . . . . . . . . . . 172.2 Introduction . . . . . . . . . . . . . . . . . . . . . . . . . . . . . . . . . . . . 18
2.2.1 Previous work on dance and music . . . . . . . . . . . . . . . . . . . 182.2.2 DTI measures . . . . . . . . . . . . . . . . . . . . . . . . . . . . . . . 202.2.3 Objectives and predictions of this study . . . . . . . . . . . . . . . . 21
2.3 Materials and Methods . . . . . . . . . . . . . . . . . . . . . . . . . . . . . . 212.3.1 Participants . . . . . . . . . . . . . . . . . . . . . . . . . . . . . . . . 212.3.2 General procedures . . . . . . . . . . . . . . . . . . . . . . . . . . . . 222.3.3 Diffusion tensor imaging and analysis . . . . . . . . . . . . . . . . . 23
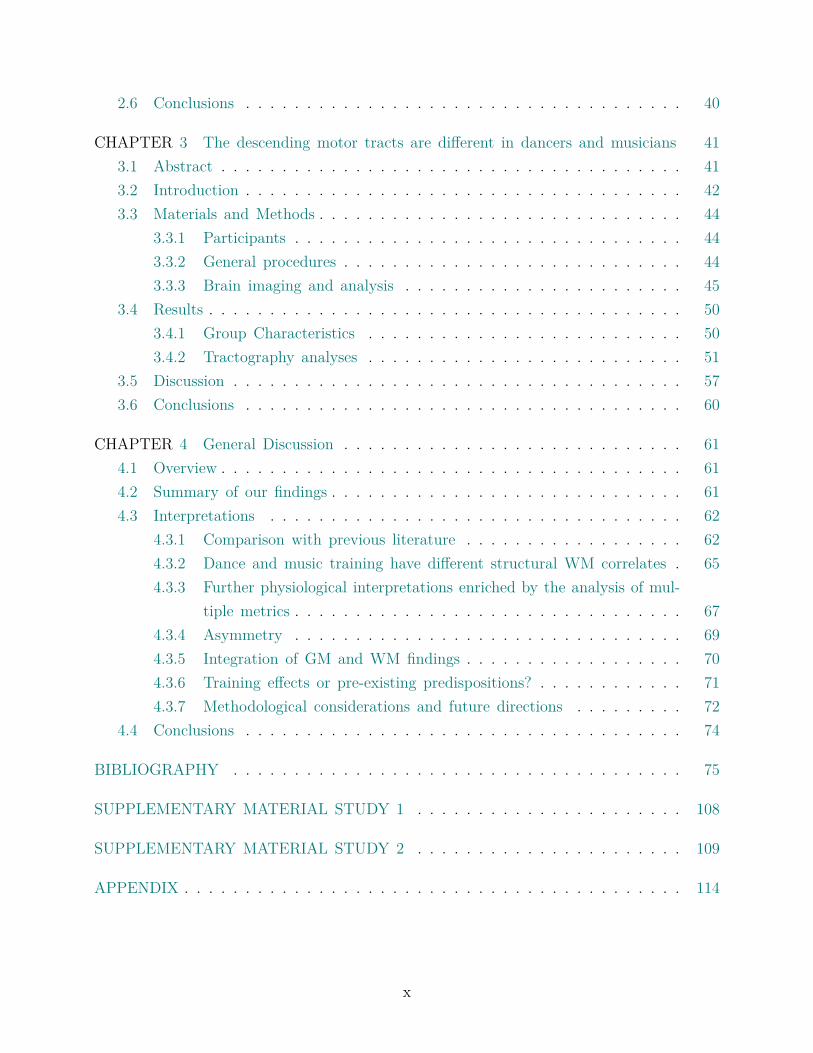
2.4 Results . . . . . . . . . . . . . . . . . . . . . . . . . . . . . . . . . . . . . . . 262.4.1 Behavioural results . . . . . . . . . . . . . . . . . . . . . . . . . . . . 262.4.2 Diffusion tensor imaging results . . . . . . . . . . . . . . . . . . . . . 28
2.5 Discussion . . . . . . . . . . . . . . . . . . . . . . . . . . . . . . . . . . . . . 342.5.1 Summary of main findings . . . . . . . . . . . . . . . . . . . . . . . . 342.5.2 The direction of diffusivity and anisotropy in dancers . . . . . . . . 352.5.3 Region specific findings . . . . . . . . . . . . . . . . . . . . . . . . . 362.5.4 Limitations and future directions . . . . . . . . . . . . . . . . . . . . 39
ix
2.6 Conclusions . . . . . . . . . . . . . . . . . . . . . . . . . . . . . . . . . . . . 40
CHAPTER 3 The descending motor tracts are different in dancers and musicians 413.1 Abstract . . . . . . . . . . . . . . . . . . . . . . . . . . . . . . . . . . . . . . 413.2 Introduction . . . . . . . . . . . . . . . . . . . . . . . . . . . . . . . . . . . . 423.3 Materials and Methods . . . . . . . . . . . . . . . . . . . . . . . . . . . . . . 44
3.3.1 Participants . . . . . . . . . . . . . . . . . . . . . . . . . . . . . . . . 443.3.2 General procedures . . . . . . . . . . . . . . . . . . . . . . . . . . . . 443.3.3 Brain imaging and analysis . . . . . . . . . . . . . . . . . . . . . . . 45
3.4 Results . . . . . . . . . . . . . . . . . . . . . . . . . . . . . . . . . . . . . . . 503.4.1 Group Characteristics . . . . . . . . . . . . . . . . . . . . . . . . . . 503.4.2 Tractography analyses . . . . . . . . . . . . . . . . . . . . . . . . . . 51
3.5 Discussion . . . . . . . . . . . . . . . . . . . . . . . . . . . . . . . . . . . . . 573.6 Conclusions . . . . . . . . . . . . . . . . . . . . . . . . . . . . . . . . . . . . 60
CHAPTER 4 General Discussion . . . . . . . . . . . . . . . . . . . . . . . . . . . . 614.1 Overview . . . . . . . . . . . . . . . . . . . . . . . . . . . . . . . . . . . . . . 614.2 Summary of our findings . . . . . . . . . . . . . . . . . . . . . . . . . . . . . 614.3 Interpretations . . . . . . . . . . . . . . . . . . . . . . . . . . . . . . . . . . 62
4.3.1 Comparison with previous literature . . . . . . . . . . . . . . . . . . 624.3.2 Dance and music training have different structural WM correlates . 654.3.3 Further physiological interpretations enriched by the analysis of mul-
tiple metrics . . . . . . . . . . . . . . . . . . . . . . . . . . . . . . . . 674.3.4 Asymmetry . . . . . . . . . . . . . . . . . . . . . . . . . . . . . . . . 694.3.5 Integration of GM and WM findings . . . . . . . . . . . . . . . . . . 704.3.6 Training effects or pre-existing predispositions? . . . . . . . . . . . . 714.3.7 Methodological considerations and future directions . . . . . . . . . 72
4.4 Conclusions . . . . . . . . . . . . . . . . . . . . . . . . . . . . . . . . . . . . 74
BIBLIOGRAPHY . . . . . . . . . . . . . . . . . . . . . . . . . . . . . . . . . . . . . 75
SUPPLEMENTARY MATERIAL STUDY 1 . . . . . . . . . . . . . . . . . . . . . . 108
SUPPLEMENTARY MATERIAL STUDY 2 . . . . . . . . . . . . . . . . . . . . . . 109
APPENDIX . . . . . . . . . . . . . . . . . . . . . . . . . . . . . . . . . . . . . . . . . 114
x

LIST OF TABLES
Table 2.1 Participant characteristics. . . . . . . . . . . . . . . . . . . . . . . . . 26Table 2.2 Cognitive results. . . . . . . . . . . . . . . . . . . . . . . . . . . . . . 28Table 2.3 Localisation of TBSS results and statistical values. . . . . . . . . . . 32Table 3.1 Participant characteristics. . . . . . . . . . . . . . . . . . . . . . . . . 51Table 3.2 Statistical results of the group contrasts with age and sex included. 54Table 3.3 Significant brain- behavioral correlations for the tracts seeded in the
right trunk and leg. . . . . . . . . . . . . . . . . . . . . . . . . . . . 55Table A1 Partial correlations between diffusivity measures and task performance.108Table A2 Subject-wise extracted mean values. . . . . . . . . . . . . . . . . . . 108Table A1 Coordinates of the centers of gravity (COGs) in the MNI space (mm)
for the four motor regions. . . . . . . . . . . . . . . . . . . . . . . . 112
xi

LIST OF FIGURES
Figure 1.1 Diffusion motion of water molecules through brain fibers. . . . . . . 7Figure 1.2 Ellipsoid and its relation with diffusion tensor. . . . . . . . . . . . . 8Figure 1.3 Shape of the ellipsoid and fiber organization. . . . . . . . . . . . . . 9Figure 1.4 Shape of the diffusion tensor as a function of MO and FA. . . . . . 10Figure 1.5 Segregation of fiber bundles tractography. . . . . . . . . . . . . . . . 12Figure 1.6 Ball and stick model of diffusion for two fiber orientations. . . . . . 14Figure 2.1 Behavioural results. . . . . . . . . . . . . . . . . . . . . . . . . . . . 27Figure 2.2 Dancers versus musicians group comparisons and brain-behaviour
correlations . . . . . . . . . . . . . . . . . . . . . . . . . . . . . . . . 30Figure 2.3 Comparison of directional measures. . . . . . . . . . . . . . . . . . . 31Figure 3.1 Reconstruction of the primary motor tracts for one hemisphere (left). 46Figure 3.2 General steps followed to create the seed masks in one hemisphere. 49Figure 3.3 Group comparison results. . . . . . . . . . . . . . . . . . . . . . . . . 53Figure 3.4 Correlations between WM and behavioral measures for the tracts
seeded in the right trunk and leg. . . . . . . . . . . . . . . . . . . . 56Figure 4.1 Enhanced tree-shape structure of descending motor pathways. . . . 68Figure A1 Template creation. . . . . . . . . . . . . . . . . . . . . . . . . . . . . 109Figure A2 Diagram of the steps followed to create the seed masks. . . . . . . . 110Figure A3 Calculation of the hand center of gravity (COG) for the right hemi-
sphere, from manually-drawn hand ROIs. . . . . . . . . . . . . . . . 111Figure A4 Seed mask creation from spheres to final masks in the right hemisphere.113
xii

CHAPTER 1
General Introduction
1.1 Overview
Dance and music are universal forms of human expression that developed across cul-tures. Although everyone has danced at a party or sung with friends, professional dancersand musicians are able to produce extraordinarily complex sequences of extremely fast,precisely timed and demanding movements that remain inaccessible to laymen. Why?Because both dancers and musicians to achieve their abilities need to follow many yearsof intense and regular training. Training, which primarily consists of learning, repeat-ing, correcting and perfecting movements, dynamically modifies brain structures in anadaptive process, called neuroplasticity (Zatorre et al., 2012; Zilles, 1992). Neuroplasticitycan occur in both the gray (GM) and the white matter (WM). Gray matter is predom-inantly composed of the neuronal cell bodies and forms the external cortical portion ofthe brain, in addition to some subcortical structures. White matter is composed of ax-ons that connect cortical regions and is organized in distinct pathways or tracts. Giventhe specificity but also the similarity and measurability of their training, dancers andmusicians provide ideal populations to investigate the distinct structural brain changesassociated with their specific skills. There is a large body of existing research examiningthe structural neural correlates of music (see Penhune, 2019; Schlaug, 2015 for reviews)but relatively little information about the structural correlates of dance (Hänggi et al.,2010). Therefore, examining the distinct structural correlates of dancers in comparisonto musicians contributes to deepen the understanding of the specific plasticity processesrelated to long-term training of the whole body versus specific body parts and of thevisual-auditory-motor integration functioning.
The purpose of this dissertation was to compare WM structure between dancers andmusicians and to investigate its relations with dance and music skills. WM has beenpreviously shown to be altered by physical and music training (Engel et al., 2014; Scholzet al., 2009; Steele et al., 2012; Taubert et al., 2010), as well as expertise (Hänggi et al.,2010; Huang et al., 2013). Three groups of dancers, musicians and control were tested ona battery of dance- and music-related tasks and underwent a magnetic resonance (MR)scan using diffusion-weighted imaging to assess WM structure. Study 1 examined WM
1

at the whole brain level to identify all regions that differed between groups. Guided bythese results, Study 2 examined the specific portions of the descending motor pathwaysthat link the head, hand, trunk and leg motor brain regions to the brainstem. Theseanalyses were designed to distinguish the effects of whole-body training (dance) versusthe training of specific effectors (music). While a more standard approach for whole brainWM investigation was used for Study 1, a novel approach, which combined a method toconsistently create subject-specific seed masks with multi-tensor probabilistic tractography,was developed in Study 2. Correlations of WM metrics with behavioral and demographicmeasures were also reported in both studies.
1.2 Neural correlates of dance and music
Dancing and playing music are disciplines that, despite their specificities, have a lot incommon. The most obvious element that they share is music itself, since dance consistsof rhythmical body movements that usually follow musical sounds (Bläsing et al., 2012;Karpati et al., 2016). The ability to produce movements in synchrony to other perform-ers or to sounds is therefore a characteristic that is clearly shared by dance and musicperformers. Dance and music similarly require the integration of visual, auditory andproprioceptive stimuli to produce motor outputs. However, the relevance of each of thesesystems differs between these two disciplines. For instance, dancers perform complex se-quences of demanding movements that activate their entire body, whereas musicians trainspecific effectors (e.g., fingers, arms or lips) to produce complex sequences of fine move-ments. Therefore, dance requires the extraordinary development of physical skills, such asstrength, flexibility, static and dynamic whole-body balance (Bläsing et al., 2012; Krasnowet al., 2011) . Conversely, music demands the development of fine-motor skills with metricprecision, such as very rapid finger shifting, as well as higher cognitive aspects of rhythm,pitch and melody manipulation (Zatorre et al., 2007; Schlaug, 2015).
There are relatively few studies that have investigated the neural basis of dance (seeKarpati et al., 2015 for a review). Nonetheless, interest has grown in the last 10 years(Krasnow et al., 2011), as the rapidly increasing body of literature shows (Dordevic et al.,2018; Burzynska et al., 2017; Meier et al., 2016; Karpati et al., 2015, 2017, 2018; Orlandiet al., 2017; Cruz-Garza et al., 2014; Amoruso et al., 2017; Poikonen et al., 2016, 2018;Orlandi and Proverbio, 2019). Structural studies have been used to identify the neu-roanatomical correlates of long-term training, whereas functional studies have investigatedbrain networks involved in dance-specific functions. Although the focus of this thesis is
2

the WM structural correlates of dance training, functional research can provide supple-mental information about the regions involved in dance and music processing, especiallygiven the small number of structural studies available (Hänggi et al., 2010; Nigmatullinaet al., 2015).
In the functional domain, both electroencephalography (EEG) and functional mag-netic resonance imaging (fMRI) have been used to examine the brain activity during theobservation or imaging of dance movements (Orgs et al., 2008; Cross et al., 2006, 2009b,a;Calvo-Merino et al., 2006, 2005; Fink et al., 2009; Olshansky et al., 2015; Fujioka et al.,2015; Bar and DeSouza, 2016). A network of regions, including frontal sensorimotor andtemporo-parietal regions, has been shown to be modulated by experience and familiarity,i.e. stronger activity was observed in trained versus untrained subjects during the obser-vation of dance movements and for physically trained versus unfamiliar movements. This“action observation network” (AON), which includes the “mirror neuron system” (Rizzo-latti et al., 2001; Rizzolatti and Craighero, 2004), is known to be engaged, not only inmovement observation but also in action execution and plays a key role in learning byimitation (Rizzolatti et al., 2001; Krüger et al., 2014; Caspers et al., 2010; Buccino et al.,2001).
The use of functional imaging to examine the neural activity during dance performanceis limited because most brain imaging techniques are not mobile and are susceptible tomotion artifacts caused by body movements. In the first study that overcame these issues,Brown et al. (2006) developed a device that allowed dancers to perform leg movementsduring positron emission tomography (PET) scanning, without moving other body parts.Beyond the sensorimotor activity observed in all leg movement tasks, with such a proce-dure it was possible to link distinct aspects of dance movement, such as metric movementand spatial patterning, to the specific activity of basal ganglia and parietal regions. Twoother studies used functional near infrared spectroscopy (fNIRS), which measures changesof blood oxygenation levels in the cortex to infer temporal and spatial dynamics of corti-cal activity. fNIRS is portable and has reduced sensitivity to body movement, thus brainactivity was recorded during the whole-body imitation of lower-limb dance-like steps. Thetiming of brain activity differed between parietal and temporal regions and as function oftask difficulty (Tachibana et al., 2011); further, temporal accuracy in the task performancedifferentiated fronto-polar from middle-temporal regions (Ono et al., 2014). Resting-statefMRI has also been used to investigate the long-lasting changes in network connectiv-ity in dancers. Resting-state connectivity is thought to reflect changes in connectivitythat result from the coactivation of functionally connected regions that are recurrentlyrecruited during training (Cantou et al., 2018). In particular, resting-state fMRI was used
3

to show enhanced functional connectivity in sensorimotor regions of dancers compared tonon-dancers (Li et al., 2015). Using resting state measures from EEG, Ermutlu et al.(2015) showed increased power in frequencies linked to the network associated with mo-tor activity, imagery and memory of dancers in comparison to fast ball athletes. Takentogether, these findings show that distinct aspects of dance training implicate a varietyof fronto-temporo-parietal regions belonging to multiple, partly interconnected, networks,with a particular enhancement of sensorimotor regions.
Few studies have investigated the structural brain correlates of dance training (Hänggiet al., 2010; Nigmatullina et al., 2015). Hänggi et al. (2010) were the first to use MRIto compare brain structure between professional dancers and untrained controls. Theirsample of female ballet dancers showed reduced GM and WM volumes, as well as reducedfractional anisotropy (FA) – an index of white matter coherence – in regions including thesupplementary motor and premotor cortex, the internal capsule and the corpus callosum.GM density reductions were also observed in the vestibular cerebellum and these volumeswere correlated to total hours of dancing experience (Nigmatullina et al., 2015). Together,these findings demonstrate that dance training affects brain structure, particularly pointingtoward GM and WM reductions, which might reflect the increased efficiency or complexityof connections of their training-related networks. However, dancers in this study hadlower body-mass indices than controls, a factor known to influence brain structure. That,together with the all-female sample, made it important to replicate their findings.
In contrast to dance, the body of research that has investigated the neural correlatesof music is much larger (Penhune, 2019; Schlaug, 2015). Functional studies comparingmusicians and non-musicians on musically relevant tasks showed a variety of changes insensorimotor, frontal, temporal and parietal regions (see Zatorre et al., 2007; Herholz andZatorre, 2012 for reviews). These regions are part of the auditory-motor dorsal streamnetwork important for linking sound and action (see Rauschecker and Scott, 2009 fora review). Evidence for musicians enhanced auditory-motor interaction comes also fromstudies that showed coactivation of motor and auditory regions during motor imageryof well-known pieces, during passive listening to rhythms or to rehearsed pieces, and inpianists observing a pianist playing or playing a silent keyboard (Baumann et al., 2007;Chen et al., 2008; Grahn and Rowe, 2009). Consistent with these findings, resting-statefunctional studies (see Cantou et al., 2018 for a review) add evidence to the enhancedfunctional connectivity in sensorimotor and auditory regions in musicians (Luo et al., 2012;Klein et al., 2016).
Structural imaging studies consistently showed enhancements in GM density, gyrifica-
4

tion or cortical thickness of musicians in comparison to controls, especially in auditory andmotor regions, including the Heschl’s gyrus (Schneider et al., 2002, 2005; Bermudez et al.,2009; Foster and Zatorre, 2010b; Gaser and Schlaug, 2003) and the planum temporale(in posterior part of the superior temporal gyrus) (Schlaug et al., 1995b; Schlaug, 2001;Zatorre et al., 1998). The length of the central sulcus, often used as indicator of the sizeof primary motor cortex (M1), was expanded in musicians compared to non-musiciansand correlated with age of training start (Amunts et al., 1997). Furthermore, specificstructural (Bangert et al., 2006) and functional (Pantev et al., 2001) enlargements of thehand and finger representations were observed in keyboard and string players, especiallyin the hemisphere mostly relevant to their training. Other regions where musicians showedincreased GM measures compared to non-musicians are the frontal (Abdul-Kareem et al.,2011; Sluming et al., 2002; James et al., 2014) and parietal regions (Foster and Zatorre,2010b; Gaser and Schlaug, 2003; James et al., 2014). The picture for white matter struc-ture is more complicated (see Moore et al., 2014 for a review). The size of the mid-sagittalcorpus callosum (CC) has been repeatedly observed to be larger in musicians compared tonon-musicians, particularly in those who started before age seven (Schlaug et al., 1995a;Oztürk et al., 2002; Lee et al., 2003; Steele et al., 2013). Other modifications in WMhave been consistently associated with musicianship in regions including the descendingmotor pathways – including the corticospinal tract (CST) and the internal capsule (IC) –as well as in the superior longitudinal fasciculus (SLF) and the arcuate fasciculus (AF).Data predominantly point to increases in FA, commonly used as a measure of fiber coher-ence, in the tracts of musicians (Bengtsson et al., 2005; Han et al., 2009; Schmithorst andWilke, 2002; Acer et al., 2018; Rüber et al., 2013; Halwani et al., 2011), however someauthors have also found FA reductions (Imfeld et al., 2009; Schmithorst and Wilke, 2002;Acer et al., 2018). These discrepancies may be due to the different cohorts compared orthe regions of interest (ROI) chosen (Halwani et al., 2011; Rüber et al., 2013). In sum,music training has been generally associated with GM and WM increases, especially inauditory-motor networks. However, the direction of training-induced changes is not alwaysconsistent, in particular for FA. Given that FA is sensitive to a variety of microstructuralproperties of WM, changes in this metric should not be interpreted only as indicatorsof fiber coherence. Thus, lower FA values might be also due to the enhancement of aspecific fiber bundle in a region where multiple bundles cross, or to the enlargement ofaxon diameters (Zatorre et al., 2012; Schlaug, 2015).
Taken together, the available literature shows evidence for brain plasticity associatedwith long-term dance and music training especially in visual- and auditory-motor networksrespectively. It further suggests that WM might be differently modified by these two types
5

of training such that dance reduces while music increases GM volume and fiber coherence.Therefore, in the present thesis, highly-trained dancers and musicians were compared toeach other with the aim 1) to identify both the common and distinct regions that areaffected by different types of training and 2) to understand the physiological and structuralWM features that characterize each type of training. In Study 1, the WM structures ofdancers were examined at a whole-brain level to identify the regions that were modifiedby dance training in comparison to music or no training. Importantly we also wantedto establish an association between training-induced structural changes and specific danceand music skills. Driven from Study 1 findings, in Study 2, the analyses focussed onthe descending motor pathways – which include the corticospinal tracts (CST) –, crucialfor the enhanced motor skills of the motor experts assessed. In particular, we aimed atverifying whether whole-body dance training enhanced connectivity across all body regionsin contrast to the specific-effector music training enhancing more focussed trained-relatedconnections. Such knowledge can deepen the insight into the mechanisms of the brain tocontrol and execute movement.
1.3 Why white matter?
Most recent models of brain function emphasize the importance of interacting neuralnetworks (Zatorre et al., 2012). Examining WM architecture allows us to study neuralnetworks at the structural level. Importantly, changes in WM have been observed afterboth short- and long-term training. For example, short periods of training – lasting for fewweeks – have been previously observed in activities, such as juggling (Scholz et al., 2009)and playing music (Chen et al., 2012), as well as training in specific laboratory-controlledtasks involving the whole body (Taubert et al., 2010) or specific effectors (Wang et al.,2013; Reid et al., 2017; Palmer et al., 2013). These studies demonstrate that physicaltraining induces structural alterations to WM, and in particular to the descending motorpathways. WM structural modifications after long-term training have also been observedin highly trained athletes (Huang et al., 2013; Wang et al., 2013; Jäncke et al., 2009), aswell as in musicians (Schlaug et al., 1995a; Lee et al., 2003; Imfeld et al., 2009; Schmithorstand Wilke, 2002; Han et al., 2009; Halwani et al., 2011; Rüber et al., 2013) and dancers(Hänggi et al., 2010) as described above. Such changes were correlated with hours ofpractice during childhood (Bengtsson et al., 2005) and age of training start (Steele et al.,2013). Moreover, studies investigating brain-behaviour correlations provide evidence ofthe relations between WM changes and skill acquisition. Sensorimotor synchronizationabilities and maximum tapping rate were positively correlated with FA in temporal and
6

sensorimotor WM pathways of samples including both musicians and non-musicians (Steeleet al., 2013; Rüber et al., 2013). In visuo-motor and auditory-motor learning and shorttraining paradigms with naïve subjects, FA was positively correlated with learning speedand performance (Engel et al., 2014; Tomassini et al., 2011; Blecher et al., 2016; Della-Maggiore et al., 2009), although negative relationships were also observed between FA andperformance on a sensorimotor finger tapping task (Steele et al., 2012) and a whole-bodybalance task (Taubert et al., 2010). Taken together this literature shows increased fibercoherence (FA) after short periods of training or in musicians with long-term training,and lower FA, maybe due to increased crossing fibers or axon diameter, in athletes anddancers who consistently trained the whole body for many years.
1.4 What is DTI?
Our understanding of WM structure in the human brain has been promoted by the de-velopment of in vivo diffusion weighted imaging (DWI) techniques (Zatorre et al., 2012).DWI is a form of MR imaging that measures the diffusion (random thermal motion) ofwater molecules in the brain and uses this information to infer the underlying structure.Water molecules constitute a large part of the volume of the brain, and their diffusionis differently constrained depending on the type of tissue in which they are located. InGM, water molecules are relatively unconstrained, and tend to move in a random pattern;in WM, water molecules are constrained by fiber bundles, and tend to move along thedirection of those fibers. DWI measures this diffusion motion and fits it to a model.
Figure 1.1 Diffusion motion of water molecules through brain fibers.
7

The most widely used model for studying diffusion in WM is diffusion tensor imaging(DTI), which describes water diffusion within each voxel with an ellipsoid (See Fig. 1.2).This ellipsoid characterizes the shape and direction of diffusion motion: a more sphericalellipsoid indicates more unrestricted diffusion with lower directionality (isotropic motion),whereas a narrower and elongated ellipsoid indicates more hindered diffusion with greaterdirectionality (anisotropic motion) (Fig. 1.3). The shape, size and orientation of theellipsoid are described by three eigenvalues corresponding to three eigenvectors, whichrespectively indicate the lengths and directions of its main axes (Fig. 1.2); such measuresare integrated in a tensor, hence the name DTI. The eigenvalues represent the magnitudeof diffusion along the principal (λ1) and two secondary perpendicular directions of motion(λ2, λ3) and characterize the shape of the ellipsoid, whereas the eigenvectors describe itsspatial orientation (Bahn, 1999).
Figure 1.2 Ellipsoid and its relation with diffusion tensor.
D = diffusion tensor; ei = eigenvector components indicating the eigenvector orientation in space; λi = eigenvalues.
The most common DTI metric is FA, which is calculated as a combination of thethree eigenvalues and is interpreted as an index of the ellipsoid elongation, or linearity. Invoxels where the water motion is more isotropic, FA is lower and tends to 0; conversely,where the water motion is more anisotropic, FA is higher and tends to 1. Beyond FA,the eigenvalues are other metrics frequently reported to examine the diffusion ellipsoid.The highest eigenvalue, λ1, is usually called axial diffusivity (AD), while the average ofλ2 and λ3 is named radial diffusivity (RD).
Like FA, other metrics, calculated from different combinations of the eigenvalues, de-scribe global features of the diffusion ellipsoid. For instance, the mean diffusivity (MD),as its name suggests, is the mean of the eigenvalues and connotes the overall magnitudeof the diffusion tensor. However, the tensor shape can be fully described only by threeorthogonal and invariant metrics (Ennis and Kindlmann, 2006). The three eigenvalues
8
Figure 1.3 Shape of the ellipsoid and fiber organization.
Fibers are shown in blue. The diffusion motion of water molecules within a voxel is shown on the right. The ellipsoid ismore spherical in absence of obstacles and in regions of crossing fibers. The shape of the ellipsoid changes with different fiberconfigurations, becoming more elongated where the fibers are densely packed and coherent and more spherical with less dense,crossing, twisting, bending or fanning fibers.
correspond to an orthogonal basis of eigenvectors (Bahn, 1999) and therefore are inde-pendent from one another. Although together they specify the magnitude of diffusivity,eigenvalues are not spatially invariant, as their order in the tensor diagonal depends onthe orientations of the eigenvectors, which determines the frame of reference. In contrast,FA is a directionally invariant metric of the tensor shape. However, on its own, FA isnot sufficient to define the diffusion tensor anisotropy. It needs to be combined with theother two orthogonal and invariant measures to convey all the information contained inthe set of the three eigenvalues, in a way that is independent of the orientation of theframe of reference. It has been proposed that FA could be complemented by the normof the tensor and the mode of anisotropy (MO) (Ennis and Kindlmann, 2006); the normrepresenting the tensor magnitude and MO the ellipsoid planarity. Ranging from -1, whichindicates a planar anisotropic tensor with two large axes and one small (pancake shape),to 1, which indicates a linearly anisotropic tensor with one long and two small axes (cigarshape), MO permits to distinguish between the linearity and the planarity of the ellipsoid(see Fig. 1.4). In this invariant set, the norm of the tensor can be reasonably substituted
9

by MD. Indeed, both MD and the norm represent the tensor magnitude and MD becomesorthogonal to FA for low FA values (Ennis and Kindlmann, 2006).
Figure 1.4 Shape of the diffusion tensor as a function of MO and FA.
The ellipsoid becomes more linear with higher FA and more planar with lower MO. Image inspired from (Ennis and Kindlmann,2006).
Therefore, in Study 1, beyond the eigenvalues, reported in terms of AD and RD as iscustomary in the field, the full set of invariant metrics (FA, MD and MO) were analysed.This allowed us to fully characterize the tensor shape, thus enhancing the precision andreliability of our interpretations. All metrics presented so far (FA, AD, RD, MD, MO)were non-directional, meaning that they were not related to any fiber bundle orientation.In Study 1, additional directional measures of the relative proportion (partial volumefractions) of primary and secondary fibers were also examined. These directional metrics,named F1 and F2, are based on the “ball and stick model” (Behrens et al., 2003) andrepresent the orientation of the two most prominent fibers within a voxel.
The parameters estimated in each brain voxel by fitting the selected model dependon the microstructural characteristics of the underlying tissues and are used to infermacrostructural anatomical features. For instance, the more densely packed and paral-lel the fibers are, the higher FA; conversely, the bigger the axon diameter and the lesscoherent the fiber directions, the lower FA and the higher RD. However, each voxel con-tains hundreds of thousand neurons, possibly belonging to multiple fiber bundles, each
10

following its own direction, and even more glial cells. Myelin sheaths, which frequentlysurround the biggest axons, constitute a barrier to water molecules, hindering their motionalong the longitudinal direction of the fibers. Microstructural properties, such as axonaldensity, diameter and membrane permeability, neurofibrils within the axons and internodeRanvier distance all affect the global water motion within a voxel (Beaulieu, 2002; Alexan-der et al., 2007; Zatorre et al., 2012; Sampaio-Baptista and Johansen-Berg, 2017). Giventhe huge scale gap between the microstructural factors influencing the estimated parame-ters across the entire voxel and the macrostructural features that are inferred across theentire brain, great care is needed in the interpretation of such studies.
1.4.1 DTI for voxel-based analysis
Among the various approaches used to analyze WM, Tract-Based Spatial Statistics (TBSS)is the most popular. TBSS is a fully-automated method specifically designed to examineWM at a whole brain level, voxel-by-voxel. The FA maps of each subject, obtained byfitting the DTI model, are first nonlinearly aligned (co-registered) in a target space; then,the common WM tracts, identified as the regions with the highest mean FA values, are“thinned” and thresholded to create a skeletonized mean FA map. Each individual FAimage is then projected onto the mean FA skeleton by aligning voxel-by-voxel the indi-vidual highest FA values of the closest relevant tract to the common skeleton. Voxelwisestatistical analyses are then conducted on the DTI metrics of choice, restricted to theskeleton map. The non-linear alignment and superposition among individual WM imagesand the restriction of the analyses to the main WM regions (thinned FA skeleton) be-tween subjects provide a common space where the principal WM areas can be compared,with reduced risk of incorrect alignment between tracts or partial volume effects at theborder with GM. The voxelwise analysis of DTI metrics in such WM regions constitutesa valuable quantitative approach for a comparison at the whole-brain level, without theneed to define the tracts or regions of interest (ROIs) a priori.
1.4.2 DTI for tractography
However, with TBSS it is only possible to identify the regions where groups differ, butnot to distinguish the specific tracts involved. Tract identification with such an approachinvolves the use of a template-based atlas, which is not always sensitive nor specificenough to identify the tracts truly affected. Although group differences occurring withina voxel may actually involve one or more of the several fiber bundles that traverse it,
11

DTI models the global diffusion across the entire voxel as coming from one coherentbundle with homogeneous physiological properties. Unfortunately, it has been estimatedthat between 63% and 90% of WM voxels contain crossing fibers (Jeurissen et al., 2013),which might vary in several characteristics, such as fiber orientation, axon diameter ordensity. Therefore, TBSS gives only a global indication of the WM voxels where thechanges occur but cannot provide any specific information about the characteristics ofeach traversing tract.
In contrast, tractography aims to identify the fiber trajectory of a selected tract thatlinks two anatomically meaningful regions of interest (ROIs), known to be crossed by thetract, “by following a continuous path of greatest diffusivity (or least hindrance)” (Cataniet al., 2002). For example, the uncinate fasciculus was isolated from the inferior-fronto-occipital fasciculus by carefully identifying two regions of interest (ROIs), one includingboth fiber bundles, and the other one including only the fibers of the uncinate fasciculus(Catani et al., 2002) (see Fig. 1.5). By joining the most likely fiber orientations acrossvoxels, tractography is able to limit the analysis to the voxels containing the tract of inter-est. Moreover, it permits the visualization of morphological differences between individualsubjects or groups within the same tract (Johansen-Berg and Behrens, 2009).
Figure 1.5 Segregation of parallel or crossing fiber bundles with an appropriate selectionof the seed ROIs for tractography.
The image shows a graphic visualization of 3D tract reconstruction from a start region (seed) to an arrival region (target),disentangling two partially overlapping tracts.
Various tractography algorithms that have been proposed. When fiber tracking isbased on the diffusion single-tensor model, only one main fiber bundle is modeled in eachvoxel, often introducing errors in tract reconstruction that can fail to identify portions of
12

a big bundle or miss entire secondary bundles (Behrens et al., 2007). Multi-tensor tractog-raphy is a more advanced model that accounts for the multiple fiber orientations withina voxel. In Study 2, we chose to implement a multi-tensor probabilistic tractography ap-proach. The advantage of choosing a probabilistic versus a deterministic approach is thatit accounts for the uncertainty in local fiber orientation caused by the incompleteness ofthe diffusion model (e.g. DTI) (Behrens et al., 2007). When using deterministic tractog-raphy, the errors due to uncertainty can propagate along the entire pathway, potentiallyresulting in erroneous tract reconstructions. On the contrary, probabilistic tractographydraws a full representation of uncertainty in voxels that are more susceptible to trackingerrors and calculates the path of greatest diffusivity (least hindrance) with a percent con-fidence. This allows tracking through regions of uncertainty due, for example, to crossingfibers. In probabilistic tractography, thousands of streamline samples are started in eachseed voxel. A streamline is any line whose tangent is parallel to the field (Johansen-Bergand Behrens, 2009); therefore, in tractography, the streamlines are the lines formed byjoining in sequence all the orientations – contained in contiguous voxels –, sampled fromthe posterior distribution of principal diffusion directions (Behrens et al., 2003, 2007).The streamline samples so obtained describe a probability distribution of the connectivityfrom the seed to the target that accounts for the uncertainty in the local fiber orienta-tions (Johansen-Berg and Behrens, 2009). The probability of the dominant streamline isthen calculated, in each voxel, as the ratio between the number of streamlines passingthrough that voxel and the total number of samples drawn from the same seed. A di-rect extension of the single-fiber tractography, based on the “ball and stick model”, ismultiple-fiber tractography (Behrens et al., 2007). The “ball and stick” model is basedon a partial volume approach in which diffusion is modelled as the combination of anisotropic component (ball) and multiple totally anisotropic components (sticks) (Behrenset al., 2003). The two-fiber tractography, used in Study 2, extends the single-fiber “balland stick model” to the case where two fibers (sticks) are modeled in each voxel, whererelevant (Fig. 1.6).
A Bayesian approach, called automatic relevance determination (ARD), was used toinfer multiple fibers only in voxels where their existence is highly probable and createthe map of fiber orientations (Behrens et al., 2007). The reason why only two fiberorientations were included in the model of both Study 1 and 2 is because, in our sample,the map of the different fiber orientations did not show continuity of voxels containing athird fiber orientation. In sum, the two-fiber probabilistic tractography approach allowedus to identify a tract of interest and compare the metrics of interest within that tractbetween different groups.
13

Figure 1.6 Ball and stick model of diffusion for two fiber orientations.
Crucially, a careful choice of the seed and target regions can permit us to separatelyanalyze specific subcomponents of one tract, even when they overlap with other sub-components or tracts. For instance, among all the interhemispheric connections, specificcallosal fibers, linking the hand motor and sensory regions, have been previously identifiedby tracking between hand WM ROIs through a portion of the medial body of the CC(Sehm et al., 2016). Similarly, Meier and colleagues tracked the fibers of the CST seededrespectively in the foot/leg and hand GM regions (Meier et al., 2016). Both the studiesreported above, however, created the seed ROIs around coordinates obtained from otherstudies. In Study 2, using sample specific ROIs, identified based on anatomical landmarks,which allowed us to track each portion of the primary motor pathways seed in the hand,head, trunk and leg separately for both hemispheres.
In conclusion, DTI is the most common approach used to quantitatively examine WMmicrostructure in order to infer its regional properties. For the purpose of this thesis,TBSS was used to identify across the whole brain which regions distinguished dancersfrom musicians or untrained controls; tractography allowed for more specific analyses ofselected components of the motor tracts.
1.5 Research Project
1.5.1 General Procedures
The research described in this dissertation aimed at comparing WM structure in highlytrained dancers with those of equally trained musicians and untrained controls. We alsoaimed to assess the relationship between brain structure and measures of training anddomain-specific task performance. Participants were practicing dancers or musicians with
14

at least ten years of formal training in their own discipline and less than three years in theother one. Control subjects were not currently enrolled in and had less than three years oftraining in dance, music or similar disciplines (such as gymnastics or figure skating) andyet were physically active (running, yoga, biking, etc.). The only other previous study onbrain structure in dancers examined a sample of ballet dancers who were all female andwho had low body-mass indices, which is known to affect brain structure (Bobb et al.,2014; Lavagnino et al., 2016; Seitz et al., 2015; Bär et al., 2015; Katzman et al., 1996;Kennedy et al., 2016; Repple et al., 2018; Hu et al., 2017; Gaudio et al., 2017; Nagaharaet al., 2014). To address these potential biases, we targeted contemporary dancers wherethere are a larger number of males and where low body weight is less common.
All participants were tested on a battery of behavioural tests designed to reflect arange of dance- to music-related skills. A complete description of the tasks and be-havioural results is reported in the Appendix C.C. They also underwent an MRI scanningto obtain standard T1-weighted images, used to examine GM (Karpati et al., 2017), andDWI images used to examine WM. Behavioural tasks included the Dance Imitation Taskwhich was developed in our laboratory based on the Dance Central video game. In thistask participants were required to imitate in real-time a selection of dance choreographiesof variable complexity. This task assesses the ability to observe and imitate in real-timewhole-body dance movements synchronised with music. Music-related tasks included theMelody Discrimination (Foster and Zatorre, 2010a) and Rhythm Synchronization tasks(Chen et al., 2008), which have previously been used to test these abilities in both mu-sicians and non-musicians. To control for and examine potential groups differences inrelevant cognitive functions, the battery also included a test of global cognitive function(Matrix Reasoning) and auditory working memory (Letter Number Sequencing and DigitSpan), drawn from the WAIS (Wechsler and Assessment, 1997; Wechsler and Company,1999).
1.5.2 White Matter Approaches
In Study 1, a DTI TBSS approach was used to compare the WM structure betweendancers, musicians and controls at the whole brain level. In Study 2, a combination ofmulti-tensor probabilistic tractography and ROI approach was used to specifically examinethe descending motor pathways of dancers and musicians. To verify whether dancers andmusicians had differential connectivity enhancements related to their specific training. Todo this I developed a novel approach to separately examine the components of the motorpathways that descend from each cortical motor representation of four main body parts
15

(head, hand, trunk and leg) bilaterally. Importantly, similar to Study 1, relevant brainmeasures were correlated with measures of behavioural performance as well as with age oftraining start, showing the association between the WM structural changes and training.
16

CHAPTER 2
Dance and music training havedifferent effects on white matter
diffusivity in sensorimotor pathways
Chiara Giacosa, Falisha J. Karpati, Nicholas E.V. Foster, Virginia B. Penhune, Krista L. Hyde
2.1 Abstract
Dance and music training have shared and distinct features. Both demand long and intense physicaltraining to master. Dance engages the whole body, and requires the integration of visual, auditoryand motor information. In comparison, music engages specific parts of the body and primarilyrequires the integration of auditory and motor information. Comparing these two forms of long-term training offers a unique way to investigate brain plasticity. Therefore, in the present study wecompared the effects of dance and music training on white matter structure using diffusion tensorimaging (DTI), and examined the relationship between training-induced brain changes and specificmeasures of dance and music abilities. To this aim, groups of dancers and musicians matched foryears of experience were tested on a battery of behavioural tasks and a range of DTI measures.
Our findings show that dancers have increased diffusivity and reduced fibre coherence in WMregions, including the corticospinal tract, superior longitudinal fasciculus and the corpus callosum.In contrast, musicians showed reduced diffusivity and greater coherence of fibres in similar regions.Crucially, diffusivity measures were related to performance on dance and music tasks that differ-entiated the groups. This suggests that dance and music training produce opposite effects on WMstructure. We hypothesize that intensive whole-body dance training may result in greater fanningof fibres connecting different brain regions, an increase in crossing fibres, or larger axon diameter. Incontrast, musical training may result in more focussed enhancements of effector-specific pathways.These findings expand our understanding of brain plasticity by emphasizing that different types oftraining can have different long-term effects on brain structure.
17

2.2 Introduction
Dance and music are universal forms of human expression that have both shared and distinct fea-tures. Both dance and music training require long, intense and quantifiable training to master.Dance training engages the whole body, and requires the integration of visual, auditory and motorinformation. It focuses on perfecting movement through observation and imitation. In comparison,music engages specific parts of the body, typically the hands and fingers, and primarily requires theintegration of auditory and motor information. Music training emphasizes perfecting sound throughlistening and refining movement. Thus, the neural systems relevant for long-term dance traininglikely include those important for whole-body control, visual and auditory sensorimotor integra-tion and the “action observation network” (AON) (Cross et al., 2009b; Grafton, 2009; Keysers andGazzola, 2009; Caspers et al., 2010). Conversely, the neural systems relevant for long-term musictraining likely include the regions important for control of specific effectors and those engaged inauditory-motor integration (Bangert et al., 2006; Lahav et al., 2007; Zatorre et al., 2007). Therefore,comparing white matter structure between dancers and musicians provides a new window to inves-tigate the neural correlates of long-term training. Examination of long-term training in a variety ofdomains has shown that it has lasting effects on brain structure and function (Maguire et al., 2000;Draganski et al., 2004; Driemeyer et al., 2008; Jäncke et al., 2009; Keller and Just, 2009; Taubertet al., 2010; Bezzola et al., 2011). Among these disciplines, music training has received particularattention (Hyde et al., 2009a,b; Schlaug et al., 2009; Herholz and Zatorre, 2012; Groussard et al.,2014; Schlaug, 2015). In contrast, research about the structural neural correlates of dance trainingis still at a very early stage and very few studies have specifically addressed this topic (Hänggi et al.,2010; Nigmatullina et al., 2015). However, these studies compared dancers only to untrained con-trols, and there were no behavioural measures of dance performance. Thus, our goals in the presentstudy were to characterize the specific effects of dance training on WM structure in comparison withanother group of experts with similar long-term sensorimotor training, and to relate those changesto their acquired skills. To do this, we directly compared expert dancers with equally well-trainedmusicians and untrained controls using both behavioural and a range of DTI measures.
2.2.1 Previous work on dance and music
The study of specialized training such as dance and music offers a unique way to study brainplasticity and its interaction with behaviour. The literature about the neural correlates of musictraining is much richer than the one about dance and has been previously reviewed (Moore et al.,2014); therefore, here, our main focus will be on dance training.
Previous research about dance has been largely behavioural. These studies have examinedvarious components of dancers’ acquired skills, such as postural, balance and motor control (Crottset al., 1996; Golomer et al., 2010; Kiefer et al., 2011; Costa et al., 2013), timing, synchrony and
18

choreography (Minvielle-Moncla et al., 2008; Waterhouse et al., 2014; Woolhouse and Lai, 2014),as well as memory (Poon and Rodgers, 2000; Vicary et al., 2014) and imagery for sequences ofmovements (Golomer et al., 2008) (see Bläsing et al., 2012 for a review). Further, dance expertisehas been shown to improve skills that are closely related to the training received, such as balance,posture and sensitivity to the biological motion of familiar actions (Calvo-Merino et al., 2010;Kattenstroth et al., 2011).
Some recent research has investigated the functional correlates of dance (see Bläsing et al.,2012; Karpati et al., 2015 for review). A large part of this literature has focused on the AON,which includes temporo-parietal and frontal sensorimotor regions that are involved in visuo-motorintegration and learning of actions performed with specific effectors (Caspers et al., 2010; Landmannet al., 2011; Krüger et al., 2014) or the whole body (Calvo-Merino et al., 2005; Cross et al., 2006,2009b; Gardner et al., 2015). In both animal and human studies (Grèzes and Decety, 2001; Rizzolattiand Craighero, 2004; Hecht et al., 2013b), these regions have been found to be engaged during theobservation and performance of mouth or single limb actions (Fadiga et al., 1995; Gallese et al.,1996; Rizzolatti et al., 1996a,b; Buccino et al., 2001; Gazzola and Keysers, 2009), as well as ofwhole-body movements (Cross et al., 2009a; Sevdalis and Keller, 2011). It has been shown thatthis network is particularly relevant for dance learning, which requires observing, simulating andimitating others’ whole-body movements (Calvo-Merino et al., 2005; Cross et al., 2006, 2009b). Inaddition to studies of dance observation, a few experiments have examined lower limb dance-likemovements which can be performed during brain imaging. Cortical, subcortical, and cerebellarregions have been shown to be involved in specific aspects of these dance-like movements (Brownet al., 2006; Tachibana et al., 2011; Ono et al., 2014). These studies are the first ones that identifiedthe regions that are functionally relevant for dance execution as opposed to dance observation.However, these paradigms have limited generalizability to real whole-body dance training, and theparticipants in these studies were not experts.
There are only few studies that have examined the structural neural correlates of dance expertise(Hänggi et al., 2010; Nigmatullina et al., 2015). Hänggi et al. (2010) compared female ballet dancersand non-dancers using voxel-based morphometry (VBM) and diffusion tensor imaging (DTI). Theyfound that dancers had decreased GM volumes in cortical and subcortical structures critical formotor control and sensorimotor integration, along with decreases in WM volume and fractionalanisotropy (FA) in sensorimotor pathways and the corpus callosum. They hypothesized that reduc-tions of WM volume and FA might be the result of greater efficiency, or enhancements in crossingfibre pathways. Although these changes in brain structure were found to be related to the age ofcommencement of training, no behavioural measures of dance performance were obtained. Further,the authors reported only two global DTI measures, which give little information about crossingfibres. Similar decreases in FA were also found in fronto-parietal and sensorimotor pathways ofprofessional gymnasts (Huang et al., 2013). Just like dancers, gymnasts are experts in whole-bodymovements and their training focuses on visual-motor integration and action observation. Therefore,
19

their similar training might result in similar changes in WM structure.
Structural brain imaging studies have shown that music training is associated with enhance-ments of grey (GM) and white matter (WM) in motor regions associated with effector-specific motorcontrol, the corpus callosum, and the auditory cortex (Schlaug et al., 1995a; Sluming et al., 2002;Gaser and Schlaug, 2003; Bengtsson et al., 2005; Bermudez and Zatorre, 2005; Bermudez et al.,2009; Han et al., 2009; Hyde et al., 2009b; Abdul-Kareem et al., 2011; Groussard et al., 2014).Further, these brain differences have been linked to performance on music-related tasks (Foster andZatorre, 2010a; Steele et al., 2013; Bailey et al., 2014; Elmer et al., 2014).
In summary, structural imaging studies in dancers and gymnasts showed a reduction in theWM volume and anisotropy localised in sensorimotor and commissural pathways, as well as fronto-parietal association fibres (Hänggi et al., 2010; Huang et al., 2013; Nigmatullina et al., 2015). Incontrast, despite some inconsistencies (Schmithorst and Wilke, 2002; Imfeld et al., 2009), studiesin musicians suggest that music training tends to increase fractional anisotropy, especially in thesensorimotor projection fibres (Bengtsson et al., 2005; Han et al., 2009) and in the corpus callosum(Schlaug et al., 1995a; Steele et al., 2013).
2.2.2 DTI measures
Currently, DTI is the most widely used method to investigate the micro-structural properties ofWM. It measures the characteristics of diffusion of water molecules in brain tissues. This motionis modelled as an ellipsoid characterised by three axes. Biological features, such as axonal size,density, coherence and degree of myelination all constrain water molecule motion, and thus influencediffusivity measures (Moseley et al., 1990; Basser et al., 1994; Neil et al., 1998; Gulani et al., 2001;Beaulieu, 2002; Assaf et al., 2008). Because no one-to-one relationship exists between any DTImeasure and the architecture of WM structure (Wheeler-Kingshott and Cercignani, 2009; Joneset al., 2013; Walhovd et al., 2014), a multi-parametric combined analysis of diffusion data is helpful.Therefore, in the present study we examined both non-directional and directional measures inorder to have a better understanding of the different possible underlying biological configurations(Alexander et al., 2007). The most commonly used DTI measure is fractional anisotropy (FA),which gives a global estimate of the elongation of the ellipsoid or the linearity of diffusion. Othernon-directional measures are: axial diffusivity (AD) which measures the amount diffusion along theprincipal axis; radial diffusivity (RD) which measures the diffusion perpendicular to the principalaxis; mean diffusivity (MD) which quantifies the amount of diffusion in each voxel; and the mode ofanisotropy (MO) which describes whether diffusion is more planar or linear (Basser and Pierpaoli,1996; Beaulieu, 2002; Ennis and Kindlmann, 2006; Assaf et al., 2008). In addition, we assessedthe partial volume fractions of primary and secondary fibres (F1 and F2). Based on the “ball andstick model” (Behrens et al., 2003), these directional measures give an estimation of the relativeproportion of the primary and secondary fibres in the voxels where the co-existence of at least two
20

fibre populations is detected.
2.2.3 Objectives and predictions of this study
Taken together, previous literature suggests that long-term dance training can have specific effects onthe sensorimotor and action observation systems. The purpose of the present study is to investigatethe effects of long-term dance training on WM structure by comparing dancers to musicians anduntrained controls. Musicians are a useful comparison group for dancers because music and dancetraining are both long and intense, require similar integration of sensory and motor information, andthe amount of training can be quantified. This can allow us to make more specific interpretationsabout any observed differences in WM structure. In addition, we wanted to relate any training-induced brain modifications to specific measures of dance and music abilities. Because previousDTI studies in dancers have found reductions in FA that are difficult to interpret, in this study,we decided to analyse multiple diffusivity measures in order to better understand the biologicalunderpinnings of diffusivity changes. We tested groups of highly trained dancers and musicianswho were matched for years of experience, and also compared them to controls with limited danceor music training. Importantly, we tested all participants on a battery of dance and music-relatedtasks, as well as tests of global cognitive function and auditory working memory. Based on previousresearch, we predicted that dancers would show reduced anisotropy in sensorimotor, fronto-parietaland callosal connections, whereas musicians would show higher anisotropy in the corticospinal tractand corpus callosum. We also expected that these changes would be related to group differences inbehavioural performance on dance- and music-based tasks.
2.3 Materials and Methods
2.3.1 Participants
Three groups of participants (age 18-40) were recruited for this study: expert dancers (N=20),expert musicians (N=19) and a control group of non-musician/non-dancers (N=20). Dancers andmusicians were either currently practicing as professionals, or students involved in professionaltraining. Their training was assessed via a detailed questionnaire developed in our lab: the MontrealDance and Music History Questionnaire (MDMHQ) (Karpati et al., 2016), based on (Bailey andPenhune, 2010; Coffey et al., 2011). Dancers and musicians had on average approximately 15 yearsof experience in their respective disciplines, controls had on average less than one year in dance,music, figure skating, and aerobics. All participants were physically active (biking, running orpracticing other physical exercises). Dancers were currently practicing contemporary dance as theirprincipal style, but had a variety of training backgrounds, including ballet, tap, jazz, swing, andballroom. Dancers whose main style was too similar to the dance task used here (i.e., urban, street
21

or hip-hop dance) were excluded. Analogously, musicians had various instrumental backgrounds,including keyboard instruments, strings, woodwinds, brass, and percussion. None of the musicianshad absolute pitch. Since the dance task was based on a video-game, participants were also excludedif they had more than 2 years of experience with dance video-games. The groups did not differ inage, sex distribution, body-mass index (BMI) or years of education (See Table 2.1). Participantshad no past or current learning or developmental disorder, neurological or psychiatric conditions,or reported current or past alcohol or substance abuse. One participant in each group was excludeddue to artefacts in the DTI data (see DTI data analysis section below: 2.3.3). The experimentalprotocol was approved by the Research Ethics Board at the Montreal Neurological Institute andHospital, and a written informed consent was obtained from all participants. All participants werecompensated for their participation.
2.3.2 General procedures
Participants took part in two testing sessions distributed over two non-consecutive days: one be-havioural and the other for MRI acquisition, including DTI. The behavioural battery includeddance- and music-related tasks as well as tests of global cognitive and memory function. The DanceImitation Task was developed in our laboratory based on the video game Dance Central 1 for theconsole Xbox Kinect 360 (Harmonix, http://www.harmonixmusic.com) using the Kinect infraredlight sensor (http://www.xbox.com/en-ca/Kinect; US Patent No. 20100197399). Participants arerequired to imitate a selection of seven dance routines of increasing levels of complexity. Scoringis based on the percent of correct moves provided by the video game scoring system. This taskassesses the ability to observe and imitate in real time whole-body dance movements synchronisedwith music. The Melody Discrimination Task (Foster and Zatorre, 2010a,b) requires participantsto detect subtle pitch changes in a series of melodies. This task assesses auditory processing andpitch discrimination. Finally, the Rhythm Synchronisation Task has been used in a number of ourprevious studies and requires participants to tap in synchrony with a series of musical rhythms. Ithas been previously used with musicians and non-musicians (Chen et al., 2008; Bailey and Penhune,2010; Bailey et al., 2014). This task assesses auditory-motor integration and fine motor response.Furthermore, a language task and three standardized cognitive tests were given to all participantsto examine any possible group differences in global cognitive or memory function: the Syllable Se-quence Discrimination Task (Foster and Zatorre, 2010b,a), that has the same design as the MelodyDiscrimination Task but uses syllables instead of tones, the Digit Span and Letter-Number Sequenc-ing subtasks from the Wechsler Adult Intelligence Scale III (Wechsler and Assessment, 1997) andthe Matrix Reasoning subtask from the Wechsler Abbreviated Scale of Intelligence (Wechsler andCompany, 1999). Full behavioural results for these groups are reported in a previous paper (Karpatiet al., 2016). For the purpose of this paper, only brief descriptions of the behavioural results andthe relationships between behavioural performance and WM diffusivity measures will be reported.
22

2.3.3 Diffusion tensor imaging and analysis
Diffusion data acquisition
Diffusion-weighted images (DWI) were acquired for all participants at the Montreal NeurologicalInstitute (MNI) on a 3T Siemens Trio MR scanner with a 32-channel head coil. The followingparameters were applied: 99 diffusion-weighted gradient directions with a b-value of 1000 s/mm2,10 b0 non-weighted images, TE of 88 ms, TR of 9340 ms, EPI factor 128, isotropic voxels of 2 x 2x 2 mm3, 72 slices, FOV of 256 mm. Ear plugs and headphones, as well as foam pads were used toreduce noise perception and head motion, respectively.
Behavioural analysis
Behavioural analyses for the full sample are reported in detail in (Karpati et al., 2016). Here, similaranalyses were conducted on the subjects used for the DTI analysis. Briefly, to allow for between-task comparisons, overall scores for the dance, melody and rhythm tasks were converted to z-scores.A linear fixed-effects model was conducted on these data, with group as a between-subjects fixedfactor and task as a within-subjects repeated measure using an unstructured covariance matrix.
Each control task was separately analysed with univariate analyses, with group as the betweensubject factor. Raw scores on each cognitive task were converted to scaled scores using standardprotocols. All analyses included age and sex as covariates of no interest.
Brain analysis
All the following analyses included age and sex as covariates of no interest. Results were consideredsignificant at p<0.05, after family-wise error (FWE) correction for multiple comparisons.
Voxelwise group comparisons of diffusivity measures
Group comparisons between dancers, musicians and controls were performed on both non-directional (RD, AD, MD, FA and MO) and directional (F1 and F2) diffusivity measures followingthe Tract-Based Spatial Statistics (TBSS) procedure, using the FMRIB Software Library (FSL v5.0)(Smith et al., 2004).
TBSS for non-directional measures
Each subject’s raw data were first corrected for eddy current distortions and head motionusing the FMRIB’s Diffusion Toolbox (FDT); then, the Brain Extraction Toolbox (BET) (Smith,2002) was used to exclude non-brain voxels from the analyses, and the diffusion tensor model wasapplied, by means of FDT, to estimate the diffusivity measures in each voxel. From the three
23

eigenvalues, axial (AD), radial (RD) and mean (MD) diffusivities were easily calculated as thehighest eigenvalue (AD), the average between the other two eigenvalues (RD) and the tensor trace(MD). Fractional anisotropy (FA) and the mode of anisotropy (MO), representing the eccentricityand type of anisotropy respectively, were also calculated with FDT.
Individual data of each diffusivity measure were then averaged and compared to the othersubjects’ data of the same measure. If one subject had at least 3 diffusivity measures that fell 3 SDout of their own group distributions, that subject was considered an outlier and excluded from therest of the analyses. According to this rule, two subjects were excluded, one dancer and one control.One musician had to be excluded due to scanning artefacts. Other vibration artefacts (Gallichanet al., 2010), which occurred especially with large x-directed gradients, were corrected by excludingthe affected frames. After correction, all subjects had more than 70 gradient directed frames ofgood quality.
Data that survived the above quality control were analysed with the TBSS method (Smithet al., 2006), implemented in FSL. First, individual FA images were non-linearly aligned to theFMRIB58_FA target template, and transformed into the 1 x 1 x 1 mmMNI152 standard space. Theresulting FA images were averaged and thinned to obtain a study-specific mean FA skeleton, whichrepresents the centres of all fibre bundles that are common to all participants. Each subject’s alignedFA image was then projected onto its individual FA skeleton, before entering the permutation-basednon-parametric voxelwise statistical analyses. The mean FA skeleton was thresholded at the valueof 0.25 in order to include only major tracts that existed in all individuals.
A similar procedure was then applied to the other diffusion measures, namely RD, AD, MD andMO. For each diffusivity measure, nonlinear registration to the common space and skeletonisationprocedure were based on the steps accomplished for FA. Then, each individual measure map wasprojected onto the mean FA skeleton, before statistical analyses were performed.
TBSS for directional measures (FSL)
In order to increase the interpretability of the diffusivity scalar measures obtained with TBSSin crossing-fibre regions, TBSS was performed also on scalars associated with a specific directionof fibres in each voxel. The model applied assumed that two fibre populations existed for eachvoxel. The model with three fibres was tested, but gave an inconsistent distribution of tertiary fibreorientations across consecutive voxels (impossibility of reconstructing smooth fibre pathways).
After the pre-processing steps, common to the previous TBSS analyses, partial volume esti-mates for fibre orientations 1 and 2 (F1 and F2 respectively) were calculated in each voxel for eachsubject. F1 and F2 were reassigned within subject at each voxel in order to ensure consistencyacross voxels, such that adjacent voxels had the same label assigned to the same fibre population.Then, F1 and F2 were reassigned again in order to ensure that orientations were consistent acrosssubjects. Both these steps were accomplished using the “tbss_x” software, part of FSL (Jbabdi
24

et al., 2010).
Voxelwise statistical analyses
For all non-directional (RD, AD, MD, FA and MO) and directional (F1 and F2) diffusivitymeasures, non-parametric permutation tests (5000 permutations per analysis) were carried out us-ing the FSL’s tool Randomise (Winkler et al., 2014) for the general linear model (GLM). Threegroup comparisons were performed: 1) dancers versus musicians, 2) dancers versus controls, and 3)musicians versus controls.
Group comparisons of the subjectwise averaged extracted values of diffusivity mea-sures
RD, FA and MO were further tested with univariate ANOVAs including age and sex as covari-ates of no interest. For each DTI measure, individual data were extracted and averaged either overthe whole WM skeleton or the ‘Dancers versus Musicians’ ROIs. The ‘Dancers versus Musicians’ROIs were selected to include all the voxels where each DTI measure differed between dancers andmusicians, thus a different ROI was created for each measure. The resulting subjectwise averagedvalues were then used in the ANOVAs to compare each parameter between groups.
Brain-behaviour relations
All analyses included age and sex as covariates of no interest. Results were considered significant atp<0.05. Family-wise error (FWE) correction for multiple comparisons was applied to all voxelwiseanalyses.
Voxelwise regressions of diffusivity measures with behavioural performance
Independent linear regressions between each diffusivity measure (dependent variables) and per-formance on each behavioural task (independent variables) were calculated by inserting the ap-propriate general linear model (GLM) matrix in the FSL’s Randomise tool. These analyses wereperformed over the whole WM skeleton and in the ‘Dancers versus Musicians’ ROIs, across allgroups together and in each one separately.
Correlations of the subjectwise averaged extracted values with behavioural perfor-mance
Each of the non-directional and directional diffusivity measures were also correlated with per-formance on behavioural tasks. Partial correlations with age and sex as covariates of no interestwere performed in SPSS over the whole WM skeleton and the ‘Dancers versus Musicians’ ROIs.
25

2.4 Results
2.4.1 Behavioural results
Group Characteristics
One-way ANOVAs conducted on age and BMI with group (dancer, musician or control) as thebetween-subjects factor did not reveal any significant differences between groups (see Table 2.1; Age:F(2,53) = 2.12, p = 0.13; BMI: F(2,53) = 0.4, p = 0.67). One-way ANOVAs conducted on yearsof dance and music training revealed significant group differences for both training types (Dance:F(2,53) > 131, p < 0.0001; Music: F(2,53) > 0.201, p < 0.0001). Post-hoc pair-wise comparisonsconfirmed that both dancers and musicians had significantly longer training in their own disciplinecompared to the other groups. Furthermore, both dancers and musicians had comparable trainingto controls in the other discipline, measured as years of music or dance training, respectively (seeTable 2.1). Univariate analyses on years of dance and music training, including age and sex ascovariates of no interest, consistently revealed significant differences for both training types (Dance:F(2,51) > 136, p < 0.0001; Music: F(2,51) > 235, p < 0.0001).
Dance and music tasks
Behavioural results for the full sample were reported previously (Karpati et al., 2016). As describedabove, three participants (one from each group) were excluded due to unreliable MRI data. For thecurrent sample we followed the same procedure and obtained consistent results with (Karpati et al.,2016). To compare task performance between groups, we performed a linear fixed-effects analysis onthe z-scores of the dance, rhythm and melody tasks (see Fig. 1.2) with group as a between-subjectsfactor and task as a within-subjects repeated measure; age and sex were considered in the modelas variables of no interest. This analysis revealed a significant interaction between group and task
Group N Age (yrs ± SD) Sex BMI
(±SD) Years of dance training (±SD)
Years of music training (±SD)
Level of education (±SD)
Dancers 19 25.1 ± 3.9 13F, 6M 21.6 ± 2.3 15.5 ± 5.2 1.7 ± 1.9 2.37 ± 0.6 Musicians 18 22.9 ± 3.4 12F, 6M 22.5 ± 3.2 1.04 ± 1.8 15 ± 3.6 2.39 ± 0.98 Controls 19 25.4 ± 5.1 12F, 7M 22.1 ± 3.1 0.4 ± 0.9 0.4 ± 1.0 2.58 ± 1.12 Comparison between groups 56 D=M=C
ns D=M=C ns
D>M=C P < 0.0001
M>D=C P < 0.0001
D=M=C ns
Table 2.1 Participant characteristics.
Education levels for each group are calculated on a scale 1-5, where 1 is the lowest (completed high school) and 5 is the highest(completed PhD).F= females, M= males, SD = standard deviation, BMI = Body Mass Index.
26
(F(4,53) = 26.4, p < 0.0001). Moreover, to compare behavioural performance between groups oneach task separately, one-way ANOVAs and Bonferroni post-hoc tests were performed. As expected,for the Dance Imitation Task, dancers outperformed both musicians and controls (ps < 0.0001).Musicians also performed better than controls (p < 0.007). Analogously, on the most music-relevanttask, the Melody Discrimination Task, musicians outperformed both dancers and controls (ps <
0.0001), whereas dancers’ performances were comparable to those of controls (p = 1). Finally, onthe Rhythm Synchronisation Task, musicians outperformed both dancers (p = 0.013) and controls(p < 0.0001) with no other significant differences between groups.
Figure 2.1 Behavioural results.
Performance on the behavioural tasks (z-scores) across the three groups (dancers = blue circles, musicians = green squares, andcontrols = red and yellow triangles).
Control tasks
In order to compare cognitive abilities between groups, one-way ANOVAs were performed for eachcontrol task separately with group as the between subject factor (See Table 2.2). Main effectsof group were found for Letter Number Sequencing (F(2, 53) = 0.5, p = 0.007), where musiciansoutperformed both dancers (p = 0.019) and controls (p = 0.016), and Matrix Reasoning (F(2, 53) =4.2, p = 0.019), where dancers (p = 0.044) and musicians (p = 0.045) both outperformed controls.No significant effect was found in either the Digit Span (F(2, 53) = 0.8, p = 0.463) or the SyllableSequence Discrimination Task (F(2, 53) = 0.3, p = 0.729).
27

Univariate analyses including age and sex as covariates of no interest confirmed the ANOVAsresults (Letter Number Sequencing: F(2, 51) = 3.675, p = 0.032; Matrix Reasoning: F(2, 51) =4.076, p = 0.023; Digit Span: F(2, 51) = 0.879, p = 0.421; Syllable Sequence Discrimination Task:F(2, 51) = 0.333, p = 0.718).
Taken together, the groups performed relatively similarly on all tasks and all were in the normalrange. This suggests that any differences on the experimental tasks or in brain structure are notlikely to be related to differences in global cognitive function.
Cognitive Tasks
Group Letter Number Sequence
Matrix Reasoning
Digit Span Syllable Sequence Discrimination
Dancers Mean ± SD (Range)
10.05 ±2.01 (8 – 15)
13.37 ±1.3 (11 – 16)
9.05 ±2.12 (7 – 13)
69.65 ±7.42 (53.33 – 86.67)
Musicians Mean ± SD (Range)
12.50 ± 2.47 (7 – 17)
13.39 ±2.03 (10 – 16)
10.11 ±2.56 (5 – 14)
67.96 ±9.24 (43.33 – 81.67)
Controls Mean ± SD (Range)
10.00 ±3.2 (5 – 18)
11.58 ±2.91 (2 – 15)
9.89 ±3.36 (5 – 18)
67.60 ±8.57 (51.67 – 83.33)
Total Mean ± SD (Range)
10.82 ±2.82 (5 – 18)
12.77 ±2.31 (2 – 16)
9.68 ±2.72 (5 – 18)
68.41 ±8.32 (43.33 – 86.67)
Comparison between groups
M>D=C P < 0.05
D=M>C P < 0.05
D=M=C ns
D=M=C ns
Table 2.2 Cognitive results.
Mean values, standard deviations (SD) and ranges for each of the cognitive measures are shown for each group separately andfor all groups together. P-values for the comparisons between groups are applicable only for significant differences.
2.4.2 Diffusion tensor imaging results
Group comparisons
In order to determine how dance training differently affects WM structure in comparison to musictraining, three group analyses were performed: dancers versus musicians, dancers versus controlsand musicians versus controls. For each analysis, five non-directional (RD, AD, MD, FA and MO)and two directional (F1 and F2) diffusivity measures were compared between groups. All significantresults have ps < 0.05, FWE corrected for multiple comparisons (see Table 2.3) for specific peakp-values and localisation and Supplementary table A.A1 for a summary).
TBSS voxelwise analysis of non-directional diffusivity measures
28

Over the whole WM skeleton and across all measures, dancers showed increased diffusivityrelative to musicians predominantly in the right hemisphere (Fig. 2.2 A). More specifically, dancershad significantly higher RD values in bilateral projection fibres(corticospinal tract (CST), coronaradiata (CR), internal (IC) and external (EC) capsules), association fibres (bilateral superior longi-tudinal fasciculus (SLF) and right cingulum), the body and splenium of the corpus callosum (CC)and in right ventral WM regions of the temporal and prefrontal lobes, including the inferior-fronto-occipital fasciculus (IFOF) and the inferior longitudinal fasciculus (ILF). Peaks of significance werereached for RD in most of the voxels of the right hemisphere (p < 0.01). Note that, except forthe CC, all the above-mentioned regions are particularly rich in crossing fibres. For instance, theprojection fibres of the CST are crossed by the association fibres of the SLF and the IFOF. AD wasalso increased in dancers, especially in the medial regions of the CC. MD values were increased indancers compared to musicians in the same WM regions as RD, although with a more symmetri-cal involvement of the left CST, SLF and body of the CC. Conversely, FA and MO were lower indancers compared to musicians in the main WM regions where RD and MD were higher in dancers.These findings are consistent since greater RD values reduce FA values. In particular, lower FAvalues were observed in similar regions of the right hemisphere, including projection fibres (CST,IC, and EC), association fibres (SLF) and, more ventrally, the crossing between the CST, the ILFand IFOF. MO differed in the same, although more extended, regions as FA, but involved also somehomologous tracts in the left hemisphere (CST and SLF).
In the group comparison of dancers versus controls, the only significant differences were foundfor MO. Analogously to the comparison with musicians, dancers had reduced MO in both hemi-spheres, although predominantly in the right. More specifically, lower MO was found in dancers’projection fibres (especially the CST), association fibres (SLF), and some ventral prefrontal regions.Consistently, compared to controls, dancers also showed trends for higher values of RD (p < 0.12)and MD (p < 0.1) in the CST crossing the SLF, in the SLF more laterally, and in the CC, the sameregions of the right hemisphere where dancers differed from musicians.
There were no significant differences in any non-directional diffusivity measures between musi-cians and controls.
Analysis of subjectwise averaged non-directional diffusivity measures
Univariate analyses were performed across all populations on the extracted values of RD, FA andMO over the whole WM skeleton and the ‘Dancers versus Musicians’ ROIs. Bonferroni-correctedbetween group post-hoc tests not including age and sex allowed for pair-wise comparisons betweengroups.
Consistent with the voxelwise analyses, over the whole WM skeleton, a main effect of groupemerged for MO (F(2,51) = 3.835; p = 0.028). Furthermore, over the ‘Dancers versus Musicians’ROIs, all measures showed significant group differences (FA: F(2,51) = 10.49, p < 0.0005; MO:F(2,51)=24.91, p < 0.0001; RD: F(2,51) = 10.22, p < 0.0005). Musicians had highest FA (musicians
29

Figure 2.2 Dancers ver-sus musicians groupcomparisons and brain-behaviour correlations
The left column (A) illustratesthe regions of significant differencebetween dancers and musiciansfor axial (AD), radial diffusivities(RD), fractional anisotropy (FA)and mode of anisotropy (MO).The right column (B) illustratesthe correlations between diffusivitymeasures and dance performance.(Column A) In comparison tomusicians, dancers have higherAD and RD (rows 1 and 2) andlower FA and MO (rows 3 and 4).1-p-values are presented over theFA mean image calculated for thepresent study sample. Images arepresented in neurological view. Allimages were taken at the sameslice level (MNI coordinates).Colours show the voxels wheregroups statistically differ (p <0.05, FWE corrected). The colourscale in the RD map (Ab) showssignificant voxels ranging from darkblue (p<0.05) to light blue (mostsignificant). (Column B) Theextracted values of AD and RD,averaged over the ‘Dancers versusMusicians’ ROIs are positivelycorrelated with dance performance(rows 1 and 2); those of FA andMO are negatively correlated withdance performance (rows 3 and 4).L= left, R = right, D = dorsal, V= ventral.ATR = anterior thalamic radia-tions, CC = corpus callosum, CB= cingulum bundle, CR = coronaradiata, CST = corticospinal tract,EC = external capsule, IC =internal capsule, IFOF = inferiorfronto-occipital fasciculus, ILF =inferior longitudinal fasciculus, SLF= superior longitudinal fasciculus.
30

Figure 2.3 Comparison of directional measures.
The left panels illustrate the coronal view; the right panels show the axial view. Coordinates on the figures are in MNI space.3a - Top row. Dancers versus Musicians, F1 (red lines). Musicians have higher F1: significant voxels range from dark blue(p<0.05) to light blue (most significant). Red lines show the orientations associated with F1 at each voxel. Principal fibresfollow the dorsal-ventral direction in the CST regions, and the anterior-posterior direction in the SLF. 3b - Middle row.Musicians versus Controls, F1 (red lines). Musicians have higher F1 (significant voxels in light blue). Principal fibres follow thedorsal-ventral direction in the CST regions, and the anterior-posterior direction in the IFOF. 3c - Bottom row. Musiciansversus Controls, F2 (blue lines). Musicians have reduced F2 (pink, here thresholded at p<0.06) in the right splenium of CC.Orientations of F2 are shown with blue lines.L = left; R = right; A= anterior; P = posterior; D = dorsal; V = ventral. ATR = anterior thalamic radiations; CC = corpuscallosum; CST = corticospinal tract; IFOF = inferior fronto-occipital fasciculus; ILF = inferior longitudinal fasciculus; SLF =superior longitudinal fasciculus; spl. = splenium.
31

Contrast ROI Diffusivity measurement WM region # of
voxels Peak
p-value Peak
t-value Peak coordinates (mm)
X Y Z
Dancers >
Musicians
Whole WM skeleton
RD R SCR/CST 9661 0.003 5.26 27 -20 25 L SCR/CST 2499 0.022 5.76 -25 -12 23 R --/SLF 24 0.049 3.22 47 6 14 R --/ATR-IFOF 19 0.050 2.52 28 30 20
AD R PCR/-- 654 0.034 4.26 20 -33 36 L --/SLF 425 0.041 3.68 -22 -41 42 R spl.CC/FM 223 0.046 4.2 6 -38 14 R body CC/ ATR 37 0.049 3.45 -6 -26 24
MD R SCR/-- 18495 0.004 6.43 21 -12 35 R --/-- 336 0.048 4.21 13 -16 7
Dancers <
Musicians
Whole WM skeleton
FA R plIC/SLF-CST 1634 0.027 4.43 27 -9 18 MO R alIC/-- 1892 0.009 4.68 22 -3 17
R rlIC/ILF-IFOF 730 0.029 4.36 36 -32 8 R ACR/ IFOF-UF 466 0.013 5.26 21 28 -7 L PCR/CST 222 0.037 3.66 -27 -24 25 L plIC/ATR 204 0.041 4.08 -19 -5 11 L rlIC/-- 77 0.047 3.34 -27 -31 12 L alIC/ATR 68 0.045 3.45 -21 8 17 L ILF-IFOF/= 38 0.049 2.46 42 -32 -12
F1 R SCR/CST 5359 0.007 5.34 26 -19 34 R body CC/ ATR 712 0.034 4.84 12 -26 27 R --/SLF 35 0.048 4.02 46 7 11 R CST/CST 28 0.049 3.52 11 -21 -25 L EC/SLF 25 0.046 5.04 -29 -11 16 R SCR/CST 10 0.050 2.87 -26 -11 22
Dancers <
Controls
Whole WM skeleton
MO R alIC/ATR 2093 0.014 4.52 23 6 18 L alIC/ATR 790 0.023 4.34 -22 16 12 R --/SLF 27 0.047 4.02 48 -11 25
Musicians >
Controls
Whole WM skeleton
F1 R plIC/CST 193 0.045 3.21 20 -12 4 R rlIC/IFOF 140 0.048 3.43 31 -29 5 R --/-- 78 0.046 3.96 29 -18 -8 R --/SLF 57 0.049 2.97 53 -22 -14 R --/ILF 15 0.050 2.84 41 -10 -18 R plIC/CST 11 0.050 2.86 26 -18 13
Regressions with dance performance
Whole WM skeleton
MO R plIC/CST 3047 0.002 -4.19 20 -8 6 L alIC/ATR-IFOF-UF 1021 0.008 -4.6 -22 16 12
DvsM ROIs
RD R SLF/SLF 2935 0.002 5.1 31 -18 36 L EC/CST 522 0.022 4.06 -28 -20 17 MD R --/SLF 2308 0.016 4.11 33 -15 38 FA R SLF/SLF 950 0.003 -4.3 32 -15 34 MO R plIC/CST 1168 0.007 -4.19 23 -12 9 F1 R SCR/-- 608 0.004 -4.06 26 0 34 R SCR/SLF 80 0.031 -2.93 29 -9 22 R EC/SLF 62 0.020 -3.23 30 -9 15
Regressions with melody performance
DvsM ROIs
AD R SCR/-- 14 0.045 -2.88 18 -7 39 R PCR/-- 11 0.041 -4.02 20 -34 38 FA R plIC/CST 434 0.008 3.92 26 -17 15 R EC/IFOF 7 0.049 2.38 32 -18 5 MO R plIC/CST 511 0.004 4.57 21 -7 9
R --/IFOF-ATR-UF 25 0.045 3.51 18 43 -8
Table 2.3 Localisation of TBSS results and statistical values.
Regions are labelled according to the JHU ICBM-DTI-81 White-Matter Labels / JHU White-Matter Tractography Atlas.WM = white matter; R = right; L = left. – = no labels provided with the first (–/) or the second (/–) atlas.alIC = anterior limb of internal capsule; ATR = anterior thalamic radiations; CC = corpus callosum; CST = corticospinal tract;EC = external capsule; FM = forceps major; IFOF = inferior fronto-occipital fasciculus; ILF = inferior longitudinal fasciculus;PCR = posterior corona radiata; plIC = posterior limb of internal capsule; rlIC = retro-lenticular part of internal capsule; SCR= superior corona radiata; SLF = superior longitudinal fasciculus; spl. = splenium; UF = uncinate fasciculus.
32

versus dancers: p < 0.0001; dancers versus controls: p = 0.023; musicians versus controls: p = 0.2)and MO (musicians versus dancers: p < 0.0001; dancers versus controls: p < 0.0005; musiciansversus controls: p=0.03), and lowest RD (musicians versus dancers: p < 0.0005; dancers versuscontrols: p=0.05; musicians versus controls: p = 0.154), whereas dancers occupied the oppositeextremes, with highest RD, and lowest FA and MO (see Supplementary table A.A2 for a summary).
TBSS voxelwise analysis of directional diffusivity measures
Consistent with the results of the non-directional measures, compared to musicians, dancersshowed reduced F1 in right projection (CR, CST) and association (SLF) pathways, as well asbilateral commissural fibres (CC), the same WM regions where these two groups differed in non-directional measures. This suggests that musicians show greater coherence in these regions. Inagreement with this finding, compared to controls, musicians had increased F1 (p < 0.05) in theinferior portions of the CST and in the ILF, where the two fibre bundles cross. These locationsare included in the regions where diffusivity (especially RD and MD) was reduced and anisotropy(FA and MO) increased in musicians compared to dancers. The orientations associated with F1correctly follow the anatomical orientation of projection and association fibres, as shown in Fig. 2.3A and B. On the other hand, F2 was reduced in the musicians’ right splenium of CC (p < 0.05).The orientations of F2 are shown in Fig. 2.3 C. No significant differences were found in F1 or F2when comparing dancers to controls.
Brain-behaviour relations
To further establish the relationship between brain structure and dance or music expertise, voxel-wise regressions were performed between all diffusivity measures and performance on behaviouraltasks (Dance Imitation, Melody Discrimination and Rhythm Synchronisation). Moreover, corre-lations between the subjectwise averaged extracted values of diffusivity measures and behaviouralperformance were analysed. All analyses were accomplished over the ‘Dancers versus Musicians’ROIs and over the whole WM skeleton, across all groups together and in each one separately.
Dance Imitation Task
Voxelwise regressions in the ‘Dancers versus Musicians’ ROIs revealed positive relations betweendance performance and RD (p < 0.01) or MD (p < 0.05), and negative associations between dancetask performance and FA, MO or F1 (p < 0.01) (Fig. 2.2 B). More precisely, better performancepredicted higher RD and MD, as well as lower FA and MO, in the right projection (CR, CST) andassociation fibres (SLF). RD and MD values were also positively associated with dance performancein the right CC, whereas MO showed negative associations in some anterior projection and associa-tion tracts, including CR, anterior limb of IC and ATR. Similar trends were also observed over thewhole WM skeleton, although significant associations were found only for MO.
Separate regressions within groups were not significant, indicating that the association is likely
33

driven by group differences, especially between dancers and musicians.
Correlation analyses with the subjectwise averaged extracted values were consistent with theanalyses of regression, showing positive relations between dance performance and diffusivity (RD,AD and MD) and negative ones with FA and MO. Significance was reached in the ‘Dancers versusMusicians’ ROIs for all measures.
Melody Discrimination Task
Regressions with the Melody Discrimination performance over the ‘Dancers versus MusiciansROI’ revealed opposite associations with diffusivity measures compared to dance performance. Bet-ter melody performance predicted lower values of RD, MD and AD, and higher values of FA andMO. More specifically, melody performance was negatively associated with RD in projection fibres,especially including the CST, and with AD and MD in small regions of the CR. Furthermore,melody performance was positively associated with both FA and MO in the right CST (with peaksof p < 0.01), also where it crosses the SLF, and, with MO only, in the anterior limb of IC. Resultsover the whole WM skeleton were not significant, nor were any of the individual group analyses.
Regression analyses were also conducted across all groups in the regions where musicians andcontrols differed. Over these ‘Musicians versus Controls’ ROIs, better melody performance predictedhigher F1 values in the right posterior limb of IC and lower F2 in the right splenium of CC. Thissuggests that music training particularly enhances these WM structures (right IC and CC).
The correlations with the subjectwise averaged values were consistent with the voxelwise re-gressions. Melody performance was negatively correlated with diffusivity measures (RD, AD andMD) and positively with FA and MO in the ‘Dancers versus Musicians’ ROIs. Conversely, no trendswere found over the whole WM skeleton.
Rhythm Synchronisation Task Regressions between diffusion measures and performanceon the rhythm task in the ‘Dancers versus Musicians’ ROIs revealed that, in musicians, betterperformance predicted higher FA values in the right SLF. No significant results were obtained forthe whole WM skeleton.
However, the correlations with the subjectwise ROI averaged diffusivity measures revealedsignificant negative associations between rhythm performance and FA or MO over the ‘Dancersversus Musicians’ ROIs; these results persisted for MO in the whole WM skeleton.
2.5 Discussion
2.5.1 Summary of main findings
This study is the first to examine the differential effects of long-term dance and music trainingon white matter (WM) structure. Our findings show that dancers have increased diffusivity and
34

reduced anisotropy in WM regions, including the CST, the SLF and the CC. In contrast, musiciansshowed reduced diffusivity and a greater proportion of primary fibres in similar regions, particularlyin the right hemisphere. Crucially, diffusivity measures were related to performance on dance andmusic tasks that differentiated the groups. Groups were well matched for age, sex, and body-massindex. Further, dancers and musicians had equal years of experience in their respective disciplines.To better understand the physiological underpinnings of the observed decreases in FA, we examinedmultiple concurrent diffusivity measures. Based on these findings, we hypothesize that increaseddiffusivity in dancers may be either related to greater heterogeneity of fibre orientation within thesetracts, or enhanced coherence of specific tracts in crossing pathways. It is also possible that ourfindings result from the combined effects of enhanced and reduced diffusivity in overlapping path-ways that are each related to specific aspects of dance training. For musicians, reduced diffusivity ismore likely due to increased coherence of effector-specific fibre pathways. This suggests that danceand music training may produce opposite effects on WM structure. Whole-body dance training mayresult in greater fanning of fibres connecting different brain regions and/or an increase in crossingfibres. In contrast, musical training may result in more focussed enhancements of effector-specificpathways.
2.5.2 The direction of diffusivity and anisotropy in dancers
In the present study, we found reduced anisotropy (FA, MO) and increased diffusivity (RD, ADand MD) in widespread WM regions of dancers in comparison to musicians with similar trends incomparison to controls. While most research in musicians has reported FA increases (Bengtssonet al., 2005; Han et al., 2009; Halwani et al., 2011; Rüber et al., 2013; Steele et al., 2013), studiesin dance and other whole-body motor activities, such as gymnastics, have found reduced FA values(Hänggi et al., 2010; Huang et al., 2013; Hummel et al., 2014).
Decreases in FA, particularly in clinical studies, have been interpreted as indicating disruptionof the organization and integrity of fibres, or damage to myelin sheaths (Werring et al., 1999; Fil-ippi et al., 2001; Concha et al., 2006; Han et al., 2009). However, in the context of learning andexpertise, other interpretations may be more relevant, such as changes in axon diameter, in the fan-ning of primary fibres, or in the density and coherence of secondary fibres in crossing fibre regions(Beaulieu, 2002; Mori and Zhang, 2006; Douaud et al., 2009, 2011; Zatorre et al., 2012). Large axondiameters have been associated with increased RD (Barazany et al., 2009), which studies in phan-toms have shown can lead to reduced FA (Fieremans et al., 2008). Indeed, large axons are usuallyless densely packed than smaller axons (LaMantia and Rakic, 1990; Alexander et al., 2010), leavingmore extracellular space between them, which could also contribute to increased RD (Barazanyet al., 2009; Beaulieu, 2009). Similarly, highly fanning tracts that make connections with broader,or even divergent (Kalil and Dent, 2014), cortical regions would have a less coherent orientationthan more coherent tracts connecting narrower regions, potentially leading to lower FA and higher
35

RD values (Budde and Annese, 2013; Chiang et al., 2014; Pasternak et al., 2014; Teipel et al., 2014;Canese et al., 2015). Consistent with this idea, Taubert et al. (2010) attributed reductions in FArelated to learning of a whole-body balance task to possible increases in crossing fibre. It might alsobe possible that increased connections with broader cortical regions are physiologically underpinnedby increased axonal branching. During development more frequent and intense activity betweenneurons guides the axons to expand and intensify connections by sprouting and extending collateralbranches (Cantallops and Routtenberg, 1999), especially in the CST (Carmel and Martin, 2014).Thus, it is possible that long-term intense training might create similar conditions, especially whentraining starts at young age.
Another reason why diffusivity might be greater in dancers compared to musicians is that manyof the regions that differed between the groups are rich in crossing fibres, particularly between theCST and SLF. The FA reductions associated with dance training were accompanied by increasesin RD and MD, with only limited changes in AD. This indicates that the observed increases in FAare not due to a decrease along the principal axis of diffusion (AD), but rather to an increase alongthe transverse axis (RD). Because RD is a combined measure of diffusivity in the two orthogonaldirections, it is impossible to know whether diffusion is increased in one or both, without lookingat the eigenvalues from which this metric is derived. In regions where many fibres cross each other,MO can be used to discriminate between an effect involving multiple fibres lying on the same plane,and one occurring along a specific direction (Douaud et al., 2011). In our study, we observedconcurrent decreases in MO and FA, suggesting that there is a preferential plane of diffusivity(Ennis and Kindlmann, 2006). Therefore, the FA decreases observed in dancers are unlikely to bedue to general changes in myelinisation of axons, which would have symmetrical effects around theprincipal axis of diffusion, and may rather be attributed to the proliferation of secondary fibres.
2.5.3 Region specific findings
Corticospinal tract
In this study, two of the WM regions where groups diverged most significantly included the corti-cospinal tract (CST) and the superior longitudinal fasciculus (SLF) where dancers showed increaseddiffusivity compared to musicians. Both of these tracts are part of the sensorimotor system. Thefibres of the CST project from the sensorimotor and premotor cortices to the motor-neurons inthe spinal cord, and this pathway plays a key role in the control of voluntary movement (Wakanaet al., 2004). The SLF connects posterior sensory to frontal regions, and is thought to be involvedin the integration of sensory and motor information for action (Ptak, 2012; Hecht et al., 2013a;Rodriguez-Herreros et al., 2015).
The finding of reduced anisotropy in the CST is consistent with the only previous study indancers (Hänggi et al., 2010) and with one in gymnasts (Huang et al., 2013). Both dance and
36

gymnastics require the ability to execute rapid and precise whole-body movements, and to rapidlyintegrate proprioceptive information, crucially transmitted via the CST. We hypothesize that whole-body dance or gymnastics training could generate intensified connections between widespread sen-sorimotor areas resulting in increased fibre branching and fanning, and thus higher RD and lowerFA values. In contrast, music requires intensive training of specific body parts which would be morelikely to lead to focal changes in WM structure that appear as local decreases in diffusivity. Long-term dance training might result in increased diffusivity in the CST because of the proliferation ofcrossing fibres. Studies of expert gymnasts showed that FA was lower in part of the CST (Huanget al., 2013). It is possible that greater diffusivity in this region of the CST was due to fibre bundlescrossing this region, such as the SLF. Supporting this hypothesis, we also observed reduced MO inthe region of the CST, which suggests that the increased diffusivity lies on the same plane, such asthe SLF (Douaud et al., 2011). While dance training might enhance crossing connections betweenwidespread cortical regions, music training might reinforce the coherence of CST principal fibres.Higher FA values have been reported in the CST of expert musicians which have been shown to berelated to childhood piano practice and finger tapping performance (Bengtsson et al., 2005; Hanet al., 2009; Rüber et al., 2013).
Thus, music and dance expertise might affect WM in two opposite directions. Indeed, per-formance on the dance and melody tasks, reflecting expertise, showed opposite relationships withdiffusivity measures: while dance performance was positively associated with diffusivity, and neg-atively with anisotropy and F1 (Fig. 2.2 B); melody performance was negatively associated withdiffusivity and positively with anisotropy.
Superior longitudinal fasciculus
The SLF is an associative fibre bundle that crosses the CST, travelling perpendicularly to it forthe majority of its length (Wakana et al., 2004). The SLF is made up of short- and long-range bi-directional fibre bundles, linking the posterior sensory regions to parietal and frontal areas (Cataniet al., 2002; Makris et al., 2005; Martino et al., 2013; Kamali et al., 2014). In particular, three fibrebundles connect the occipital and parietal lobes to the motor and prefrontal cortices; in additionthe arcuate fasciculus makes connections between the superior temporal and prefrontal cortices(Makris et al., 2005). The first three bundles are implicated in the regulation of higher aspectsof motor behaviour (Makris et al., 2005; Koch et al., 2010), as well as the visuo-spatial aspects ofworking memory (Olesen et al., 2003; Nagy et al., 2004; Klingberg, 2006; Vestergaard et al., 2011)and visuo-spatial attention (Hoeft et al., 2007; Chechlacz et al., 2012, 2013; Vallar et al., 2014;Cerami et al., 2015). The arcuate fasciculus is particularly relevant for auditory-motor integrationnecessary for perception and production of speech and music (Catani et al., 2005; Oechslin et al.,2009; Lopez-Barroso et al., 2013). In the current study, several components of the SLF differedbetween dancers and musicians, especially the long-range fronto-parietal connections (Hua et al.,
37

2008) and short-range fibres within the frontal lobe.
Similar to our findings in dancers, gymnasts showed reduced FA values in the SLF comparedwith non-athletes (Huang et al., 2013). The authors attributed these FA changes to greater axonaldiameter in SLF fibres. These changes in the SLF may be related to enhanced visuo-motor inte-gration skills developed with dance training. In support of this interpretation, FA in the SLF hasbeen linked to visuo-motor sequence learning (Tomassini et al., 2011; Steele et al., 2012).
Part of the SLF that connects posterior with frontal GM regions has been shown to be involvedin the action observation-execution matching, or “mirror neuron”, system in humans (Makris et al.,2005; Hecht et al., 2013a; Kamali et al., 2014), which is part of the action observation network. Thisnetwork is composed of sensorimotor regions of the occipital, temporal, parietal, as well as frontallobes that respond to the observation of others’ actions (Buccino et al., 2001; Cross et al., 2009b;Grafton, 2009; Caspers et al., 2010). This system has been hypothesized to be critical for dancelearning because dancers typically observe and imitate others in order to learn new movements(Cross et al., 2006). Therefore, greater efficiency of this network in dancers might partially explainthe reduction of FA that we observed in the SLF. Indeed, the conduction velocity of fibres isfacilitated by larger axon calibres (Horowitz et al., 2015) that are detectable with DTI by lowervalues of FA (Fieremans et al., 2008).
Another part of the SLF might convey vestibular responses (Spena et al., 2006), which areinhibited in dancers and other balance-trained individuals (Keller et al., 2012) to reduce destabilizingcompensatory movements in favour of increased visual (Hugel et al., 1999; Hüfner et al., 2011;Costa et al., 2013) and proprioceptive information (Jola et al., 2011; Hutt and Redding, 2014).The attenuation of the vertigo reflex in dancers has been explained in terms of the uncouplingbetween vestibular perception and reflex involving an extended network, centred around the SLFand temporo-parietal WM (Nigmatullina et al., 2015).
One possible explanation for these contrasting results of the FA direction in the SLF is thatthis fibre bundle contains various subcomponents that convey specific information (visuo-spatial,vestibular, audio-motor) between different cortical regions (Martino et al., 2013). Each subcom-ponent may therefore be differently affected by the various aspects of dance and, more generally,motor training. Future studies with tractography may investigate this hypothesis, by subdividingthe SLF into its subcomponents and linking them to specific behavioural aspects of dance training.
Corpus callosum
Dancers and musicians also differed in lateral and medial portions of the corpus callosum (CC),including the posterior body and splenium, which connect primary sensory and motor cortices(Hofer and Frahm, 2006; Wahl et al., 2007). The body of the CC links premotor and sensorimotorcortices, whereas the splenium links the visual, parietal and auditory cortices (Hofer and Frahm,2006; Knyazeva, 2013). The lateral portions of the CC are crossed by other fibre tracts, including
38

the SLF and the CST. Increased connectivity of these crossing fibres might reduce the density offibres in the lateral CC, explaining the reduced FA and augmented RD observed in dancers (Buddeand Annese, 2013). Importantly, for dancers, in the lateral portions of the CC RD was increased,whereas in the medial CC both RD and AD were increased. Because the lateral portions of CCconnect many different cortical areas, fibres in this region may tend to fan and be less coherent thanfibres in the medial CC. Therefore, the higher RD values observed in dancers may be explained interms of increased connections between sensorimotor regions. Dance and music training differcrucially in the involvement of whole-body movements as opposed to effector-specific movements,respectively. Given the somatotopic organisation of sensorimotor cortices, it is possible that dancetraining enhances connections between widespread cortical regions that involve the representation ofthe whole body. Conversely, music training may increase the density and coherence of the fibres thatlink more limited regions representing the trained effectors. Indeed, F1 was increased in our sampleof musicians, indicating increased coherence of fibres CC. This interpretation is further supportedby previous studies where musicians showed higher FA in the genu (Schmithorst and Wilke, 2002),body and splenium (Bengtsson et al., 2005; Steele et al., 2013) of CC.
The interpretation of our concomitant findings for increased RD and AD in the medial CCis more complex. The fact that FA did not differ between groups means that the ratio betweendiffusivities along the longitudinal direction (AD) and perpendicular to it (RD) is constant. Ithas been shown that anisotropy varies along the midsagittal course of the CC (Hofer and Frahm,2006). Nonetheless, the medial fibres of CC are extremely packed and parallel to each other,thus constituting one of the most coherent fibre bundles of the brain (Johansen-Berg et al., 2007).Therefore, while higher values of AD in experts are easily attributable to increased myelination,coherence or packaging of fibres, the concomitant findings for greater RD in dancers are less clear.One possibility might be that the enhanced connections between whole-body cortical representationsdeveloped with dance training result in greater heterogeneity of fibre orientation, and thus lesscoherent, and less densely packed, fibres. This would explain the global increase of the amount ofdiffusion (MD) that we observed in dancers, irrespective of the direction of motion.
2.5.4 Limitations and future directions
In this paper, we attributed the WM differences observed between groups to brain plasticity relatedto their specific training. However, with a cross-sectional design we cannot exclude the possibilitythat there were pre-existing differences in structure between groups that might underlie dance skillsand the propensity to undertake training. Longitudinal studies of dance training could allow us toverify whether WM changes were due to training or pre-existing differences; although expertise islikely to result from the combination of both environmental and genetic factors.
DTI findings must be interpreted with care due to the intrinsic limitations of this technique,especially in regions rich in overlapping pathways (e.g., the multiple components of the SLF) or
39

crossing fibres (e.g., CST and SLF). We have proposed several plausible macrostructural fibreconfigurations that may explain the observed lower FA values in dancers, such as reduced coherencedue to fanning, crossing or increased axonal diameter. Additional analyses may help to specify ourresults and future studies using techniques, such as tractography (Tournier et al., 2004; Tuch, 2004),and the estimation of the axon diameter (Assaf et al., 2008), may be useful next steps to validatethe interpretation of our findings. Furthermore, novel methodologies of investigation might explorealternative physiological explanations, such as modifications of the axonal membrane permeabilityor of the myelin thickness, that cannot be excluded neither with DTI nor tractography.
The present study revealed the most significant results in the contrast between dancers andmusicians rather than in comparison with untrained subjects. This may be the result of the factthat the highly selected dancer and musician groups may be more homogeneous than the controlgroup, merely selected to have negligible training in both dance and music. Pure and uniformgroups of experts, like our samples of dancers and musicians, may have more extreme and localisedvalues, which are more easily discernible than dispersed ones. In support of this interpretation,comparisons between specific groups of musicians revealed more evident differences than contrastswith controls (Steele et al., 2013; Bailey et al., 2014; Vollmann et al., 2014).
2.6 Conclusions
This study is the first to examine the differential effects of long-term dance and music training onWM structure. Dancers showed increased diffusivity in sensorimotor pathways in comparison tomusicians who showed greater coherence in the same regions. We propose that intensive whole-body dance training may result in greater heterogeneity of fibre orientation connecting variousbrain regions, an increase in crossing fibres, or larger axon diameter. In contrast, musical trainingmay result in more focussed enhancements of effector-specific pathways. These findings expand ourunderstanding of brain plasticity literature by emphasizing that different types of training can havedifferent long-term effects on the brain.
40

CHAPTER 3
The descending motor tracts aredifferent in dancers and musicians
Chiara Giacosa, Falisha J. Karpati, Nicholas E.V. Foster, Krista L. Hyde , Virginia B. Penhune
3.1 Abstract
Long-term motor training, such as dance or gymnastics, has been associated with increased diffusiv-ity and reduced fiber coherence in regions including the corticospinal tract. Comparisons betweendifferent types of motor experts suggest that experience might result in specific structural changesrelated to the trained effectors (e.g., hands or feet). However, previous studies have not segregatedthe descending motor pathways from different body-part representations in motor cortex (M1).Further, most previous diffusion tensor imaging (DTI) studies used whole brain analyses based ona single tensor, which provide poor information about regions where multiple white matter (WM)tracts cross.
Here, we used multi-tensor probabilistic tractography to investigate the specific components ofthe descending motor pathways in well matched groups of dancers, musicians and controls. To thisaim we developed a procedure to identify the WM regions below the motor representations of thehead, hand, trunk and leg that served as seeds for tractography.
Dancers showed increased radial diffusivity (RD) in comparison to musicians, in descendingmotor pathways from all the regions, particularly in the right hemisphere, whereas musicians hadincreased fractional anisotropy (FA) in the hand and the trunk/arm motor tracts. Further, dancersshowed larger volumes compared to both other groups. Finally we found negative correlationsbetween RD and FA with the age of start of dance or music training, respectively, and betweenRD and performance on a melody task, and positive correlations between RD and volume withperformance on a whole body dance task.
These findings suggest that different types of training might have different effects on brainstructure, likely because dancers must coordinate movements of the entire body whereas musiciansfocus on fewer effectors.
41

3.2 Introduction
Studies with dancers and athletes, using diffusion weighted imaging (DWI), point toward an associ-ation between expertise and changes in white matter (WM) architecture. In particular, in a recentpaper we showed that highly trained dancers have increased diffusivity and reduced fiber coherencein the corticospinal tract, superior longitudinal fasciculus and the corpus callosum in comparison tomusicians (Giacosa et al., 2016). Similar findings have been reported in other studies of dancers andathletes (Jäncke et al., 2009; Hänggi et al., 2010; Huang et al., 2013; Meier et al., 2016; Burzynskaet al., 2017). In comparison, studies in trained musicians have generally reported focal increases inmeasures of fiber coherence (Han et al., 2009; Halwani et al., 2011; Rüber et al., 2013; Acer et al.,2018). Reduced measures of WM coherence in dancers and athletes have been interpreted as an in-crease in crossing or fanning of fibers and attributed to enhanced connectivity between sensorimotorregions representing different body parts. In contrast, the focal increases observed in musicians mayrepresent increased coherence resulting from intensive training of specific effectors (e.g. hands). Inthe current study we test these hypotheses in a sample of highly trained musicians and dancers usingprobabilistic tractography to examine the connectivity of different body part representations in themotor cortex (M1). To do this, we developed a novel procedure to identify the seed regions for thehand, trunk/arm, leg and head in M1. Those regions were then used as seeds to track sub-divisionsof the descending primary motor pathways and compare diffusion parameters and volumes betweendancers and musicians.
Most of the previous research (Hänggi et al., 2010; Giacosa et al., 2016; Burzynska et al.,2017) is based on whole brain analyses, which provide global information about the location of WMchanges, but cannot tell us about the specific connections from individual regions. Moreover, themost common diffusion tensor imaging (DTI) model assumes that all fibers in each voxel follow thesame direction (Basser et al., 1994), which is less accurate in regions with many crossing fibers.In contrast, probabilistic tractography based on a multi-tensor model allows the reconstruction ofindividual fiber tracts (Behrens et al., 2007).
There is a large body of evidence showing neural plasticity of grey (GM) and white matterin sensorimotor regions of novices who undergo short-term training (Draganski et al., 2004; Scholzet al., 2009; Taubert et al., 2010, 2016; Bezzola et al., 2011; Sampaio-Baptista et al., 2013), as well asof trained dancers, musicians, and athletes (Schlaug et al., 1995a; Gaser and Schlaug, 2003; Jänckeet al., 2009; Hänggi et al., 2010; Wang et al., 2013; Steele et al., 2013; Schlaffke et al., 2014; Baileyet al., 2014; Huang et al., 2013; Burzynska et al., 2017; Karpati et al., 2017). Training studies inboth animals and humans show local reorganization of the specific representations of the trainedeffectors (e.g., Karni et al., 1995; Kleim et al., 2002, 1998; Morgen et al., 2004; Nudo et al., 1996;Taubert et al., 2016. Similarly, most studies with trained musicians, dancers or other athletes foundenlargements in the motor representation of the trained effectors (Elbert et al., 1995; Pantev et al.,2001; Tyč et al., 2005; Vaalto et al., 2013; Choi et al., 2015; Meier et al., 2016), and/or changes in WM
42

motor pathways (Bengtsson et al., 2005; Han et al., 2009; Imfeld et al., 2009; Wang et al., 2013; Rüberet al., 2015; Giacosa et al., 2016; Acer et al., 2018), linked to the effector used (Meier et al., 2016). Inparticular, professional dancers and gymnasts, whose training involves comparably complex whole-body movements, had lower fractional anisotropy (FA) in sensorimotor and interhemispheric motorpathways which was attributed to greater axon diameter, increased crossing or fanning of fibers,or more wide-spread connectivity (Hänggi et al., 2010; Huang et al., 2013; Giacosa et al., 2016;Burzynska et al., 2017). Conversely, long-term music training has frequently been associated withincreased FA in the corticospinal tract (CST) (Bengtsson et al., 2005; Han et al., 2009; Rüberet al., 2015, but see Imfeld et al., 2009; Schmithorst and Wilke, 2002), and in the arcuate fasciculus(Halwani et al., 2011). In a previous study (Giacosa et al., 2016), using tract-based spatial statistics(TBSS), we showed that dancers had higher radial diffusivity (RD) values, while musicians hadhigher FA, in a variety of regions, including the CST. Interestingly, controls’ RD and FA values fellbetween the two expert groups, suggesting opposite associations between dance or music trainingand WM microstructure. Consistent with these findings, Meier et al. (2016) observed lower FA andhigher RD values in ballet dancers in comparison to handball players, especially in the tract seededin the motor cortex region that included the representation of the leg/foot. Lower FA and higherRD might indicate greater fiber crossing or increased axon diameter within this tract. Together withour own results, this points to enhanced connectivity among a broader selection of brain regions fordancers, in contrast to enhanced connectivity in more focal sets of connections for musicians.
To test this hypothesis, in the current study we used a multi-tensor probabilistic tractographyapproach to compare the primary motor pathways in professional dancers and musicians with a sim-ilar amount of training. The TBSS approach that we previously used is based on the whole braindiffusion single-tensor model (Basser et al., 1994), which only represents one fiber direction. Con-versely, the multi-tensor probabilistic tractography (Behrens et al., 2003) can model more than onepossible fiber direction, allowing for a better assessment of tracts in regions with multiple crossingfibers, such as certain portions of the CST. We therefore used two-fiber probabilistic tractographyto identify the motor pathways descending from the head, hand, trunk/arm and leg/foot motorregions. To do this, we first identified the motor hand areas in each participant based on grossanatomical landmarks (Yousry et al., 1997; Caulo et al., 2007). The ROIs for the trunk/arm, legand head areas were created relative to this location. Seed masks based on these ROIs were placed inthe subjacent WM because tracking from WM is more reliable than from GM, where the orientationof fibers is neither coherent nor clearly detectable. We then tracked the fiber bundles connectingthese regions to the cerebral peduncles, and extracted diffusivity and volumetric measures acrossthe entire tracts, as well as in the WM seed masks and the posterior limb of internal capsules (plIC).This allowed us to test the hypothesis that dancers might have increased connectivity across all thebody part representations, whereas musicians might have more focused connectivity with the handregion.
43

3.3 Materials and Methods
3.3.1 Participants
Three groups of participants (age 18-40) were recruited for this study: trained dancers (N=20),trained musicians (N=19) and a control group of non-musician/non-dancers (N=20). This is thesame sample used in our previous studies examining WM and GM structure in dancers and musiciansusing whole-brain approaches (Giacosa et al., 2016; Karpati et al., 2016, 2017, 2018). Groups did notdiffer in age, sex distribution, body-mass index (BMI) or years of education (Table3.1). Participantshad no past or current developmental, neurological or psychiatric disorder, nor reported any alcoholor substance abuse. Dancers and musicians were either currently practicing as professionals, orstudents involved in professional training. Their training was assessed via a detailed questionnairedeveloped in our lab: the Montreal Dance and Music History Questionnaire (MDMHQ) (Karpatiet al., 2016), based on (Bailey and Penhune, 2010; Coffey et al., 2011). Dancers and musicianshad, on average, approximately 15 years of training in their respective disciplines, with a variety oftraining backgrounds. Controls had, on average, less than one year in dance, music, figure skating,or aerobics experience (See Table 3.1 ). All participants were physically active (biking, running orpracticing other physical exercises) and none had absolute pitch. Since the dance task was based ona video-game, participants were excluded if they had more than 2 years of experience with dancevideo-games.
One participant in each group was excluded due to artefacts in the DTI data (see Giacosa et al.,2016 for more details). The experimental protocol was approved by the Research Ethics Board atthe Montreal Neurological Institute and Hospital, and a written informed consent was obtainedfrom all participants. All participants were compensated for their participation.
3.3.2 General procedures
Participants took part in two testing sessions distributed over two non-consecutive days: one forbehavioral testing and the other for MRI acquisition, including DTI images. The behavioral batteryincluded dance- and music-related tasks as well as tests of global cognitive and memory function(described in more detail in Karpati et al., 2016. The Dance Imitation Task was developed inour laboratory based on the video game Dance Central 1 for the console Xbox Kinect 360 (Har-monix, http://www.harmonixmusic.com) to assess the ability to observe and imitate in real timewhole-body dance movements synchronised with music (Karpati et al., 2016). The Melody Dis-crimination Task (Foster and Zatorre, 2010a) assesses auditory processing and pitch discrimination.Furthermore, a language task and three standardized cognitive tests were given to all participantsto examine any possible group differences in global cognitive or memory function (Karpati et al.,2016).
44

3.3.3 Brain imaging and analysis
Diffusion data acquisition
Diffusion-weighted images (DWI) were acquired for all participants at the Montreal NeurologicalInstitute (MNI) on a 3T Siemens Trio MR scanner with a 32-channel head coil. The followingparameters were applied: 99 diffusion-weighted gradient directions with a b-value of 1000 s/mm2,10 b0 non-weighted images, TE of 88 ms, TR of 9340 ms, EPI factor 128, isotropic voxels of 2 x 2x 2 mm3, 72 slices, FOV of 256 mm. Ear plugs and headphones, as well as foam pads were used toreduce noise perception and head motion, respectively.
Tractography procedure
We developed a procedure, combining FSL and Freesurfer tools, to separately track the motorpathways connecting the head, hand, trunk or leg regions. These tracts comprise the fibers thatdescend from the primary motor and premotor cortices to the brainstem (Fig. 3.1). In the currentstudy, only the fibers originating in the WM subjacent M1 were tracked; in addition, the leg tractsincluded the fibers originating in the WM below both pre- and post-central cortices (M1 and S1respectively) because the available parcellation of the paracentral cortices, provided by the Desikan-Killiany Atlas (Desikan et al., 2006), does not allow us to distinguish between them. To analyzediffusion and volumetric measures in the four bilateral distinct components of the primary motorpathways, we defined four seed masks per hemisphere, located in the WM immediately subjacentthe M1 head, hand, trunk/arm, leg/foot representations, and the cerebral peduncles (see below andthe Supplementary Material for a detailed description on how these masks were identified). It isworth noting that separately tracking the descending tract components from each seed mask is moreprecise than tracking from the entire motor cortex and then dividing the whole tract into portions.Indeed, it would be impossible to identify the borders of the tract components along their lengthbecause they overlap. Moreover, tract shapes or sizes might differ between groups and along eachtract component.
DWI pre-processing
The first steps of the DWI image pre-processing were previously explained (Giacosa et al., 2016).Briefly, individual raw data were corrected for eddy current distortions and head motion using theFMRIB’s Diffusion Toolbox (FDT); then, non-brain voxels were excluded with the Brain ExtractionToolbox (BET) (Smith, 2002), and the diffusion tensor model was applied (FDT) to estimate thediffusivity measures in each voxel. From the three eigenvalues, fractional anisotropy (FA) and radial(RD) diffusivities were calculated as the eccentricity of anisotropy and the average between the twolowest eigenvalues (RD), respectively. One subject per group was excluded from the analyses dueto artefacts or outlier values. After correction, all subjects had between 70 and 99 gradient directed
45

Figure 3.1 Reconstruction of the primary motor tracts for one hemisphere (left).
The four seed masks are indicated in darker color in the WM below the motor cortex. The approximate location of the cerebralpeduncles and of the posterior limb of the internal capsule (IC) is also shown with red boxes. Axial view of the WM seed masksin one subject’s structural T1 image (right).
frames of good quality, which allowed full analyses for the entire sample. An average of all subjects’FA images was created in the 1 x 1 x 1 mm3 MNI152 space, after linear (FLIRT) (Jenkinson andSmith, 2001; Jenkinson et al., 2002) and non-linear (FNIRT) transformations (Andersson et al.,2007) were applied to the individual FA images.
Probabilistic tractography
After modelling crossing fibers within each voxel of the brain with BedpostX (Behrens et al., 2007),a probabilistic two-fiber tractography approach was run with FSL ProbtrackX Tool (Behrens et al.,2003, 2007) to create connectivity distribution maps of the primary motor pathways in each subject.A connectivity distribution map indicates, at each voxel, how many streamline samples, originatingfrom the seed mask, pass through that particular voxel and reach the target mask, avoiding theexclusion masks. Two fiber tracking procedures were executed for each tract: one to estimate theconnectivity map (i.e, probability tractogram) originating in the seed mask and directed to thetarget, and the other reconstructed in the opposite direction, from the target to the seed. Theprobability tractograms were normalized by dividing the number of streamline samples at eachvoxel by the total number of samples that reached the target (waytotal) and then combined toobtain a defined tract, i.e. the probability of the union of the tractograms (Pun) (Andoh et al.,2015; Oechslin et al., 2017). Thus, a union tract (Pun) indicates the probability of tracking in both
46

directions and was calculated according to the probability rules:
Pun = PA−→B ∪ PB−→A = PA−→B + PB−→A − (PA−→B ∩ PB−→A),
wherePA−→B ∩ PB−→A = PA−→B × PB−→A.
Individual Pun maps were then thresholded at 5% of the robust range of non-zero voxels (thrp =0.05, multiplied by 100) and projected onto the standard FMRIB58_FA template. The volume(Vun) of the thresholded Pun map was calculated as the number of the voxels in the FMRIB58_FAspace (which corresponds to the MNI_1mm space).
In order to extract quantitative data from the tracts, the individual thresholded Pun weremultiplied by each DTI measure (FA and RD) in the individual FA space and then projected onthe common FMRIB58_FA template to allow for group comparisons. The DTI measures werethen averaged across the entire tract, or across the extraction masks. To further investigate thevolumetric properties of the tracts, two parts of each tract were identified: the core tract (Tcore) andthe dispersion tract (Tdisp) (Oechslin2017). Tcore is the part of the tract with the most consistentfiber bundle of the pathway and corresponds to the combined probability of both tracking directions;it was therefore calculated as the binarized intersection of the tractograms created in the oppositedirection, which, in practical, means: Tcore = PA→B × PB→A. In contrast, Tdisp points to the moreperipheral part of the fiber bundle, which is less consistent between the two tracking directions;to calculate it, the binarized Tcore images were subtracted from the binarized unthresholded Pun:Tdisp,bin = Pun,bin - Tcore,bin. As before, Tcore and Tdisp were then transformed into the FMRIB58_FAspace.
Tract identification
To examine the structure of the tracts connected to different body part representations, we createdfour seed ROIs in the WM underlying the motor cortex in both hemispheres. To do this, we firstcreated a mask for the hand area based on anatomical landmarks (Yousry et al., 1997; Caulo et al.,2007) and then identified the trunk/arm, head and leg ROIs relative to that. These anatomicallybased ROIs likely contain multiple body part representations: the hand ROI would also contain thefingers and wrist, the trunk/arm ROI would contain the representations of the trunk, shoulders andarm, the head ROI would contain the throat, face and neck representations, and the leg ROI wouldcontain the leg, knee and foot representations. These WM ROIs were used as seed masks to trackthe portions of the primary motor pathways that connect each region to the ipsilateral cerebralpeduncles (see3.1). We remind that tractography between the cortical and brainstem ROIs was runbidirectionally, so that each ROI served once as target and once as seed mask. A three-voxel-thickslice, centered at x = 0 of the MNI space, was used as exclusion mask to avoid the confounding
47

fibers of the corpus callosum.
Definition of the seed and extraction masks
To create the seed masks for the four body-part regions in each hemisphere, we developed a pro-cedure that included five main steps (see the diagram in the Supplementary Material B.A2): 1)the localization of the hand regions, based on individual anatomical landmarks; 2) averaging of theindividual hand maps to create a sphere based on the center of gravity for each hemisphere; 3)localization and creation of the spheres for the other body parts, relative to the hand regions, on atemplate M1; 4) projection of the spheres on each individual space; 5) masking of the spheres withthe individual parcellation of the WM subjacent M1 (Salat et al., 2009). This procedure is intendedto be a good compromise between specificity and standardization across subjects.
As first step, the Freesurfer Recon-all Tool was applied to each subject’s structural T1 image tocalculate the individual parcellation of GM and WM, given in the individual Freesurfer conformedspace. The obtained label of the precentral cortex (M1) served as visual guidance to manuallydraw each subject’s hand region (Fig. 3.2 a), according to the well-established landmarks of thehand knob (Yousry et al., 1997; Caulo et al., 2007). Individual T1 images were coregistered to thestandard MNI152 (2mm) space via linear (FLIRT) and non-linear (FNIRT) transformations andaveraged across the entire sample to create a customized template. The Freesurfer Recon-all Toolwas then applied to the template to calculate its GM-WM parcellation that served as a furtherguidance in the determination of the masks. The manually-drawn masks of the hand regions werenon-linearly projected onto the template, averaged and thresholded at 30% (Fig. 3.2 b and c),to calculate their center of gravity (COG) in each hemisphere. Two spheres of 15 voxels (voxelsize = 1mm3) were centered around these COGs (x = 37 mm, y = -19 mm, z = 60 mm in theright hemisphere; x = -35 mm, y = -21 mm, z = 61 mm in the left) to completely include thehand regions of the precentral cortex. These were then projected back to the individual structuralT1 space from the template conformed space. Our sample-specific COGs were consistent with thecenters of the spheres previously used for defining the hand and leg regions (Meier et al., 2016; Sehmet al., 2016). The hand spheres were appropriately shifted along M1 to create the head, trunk/armand leg spheres. Since the regions containing the representations of the head and leg are moreextended in the dorso-ventral direction, the radii of their spheres were adjusted accordingly (headradius: 24 mm; leg radius: 21mm). The COG coordinates for the spheres were: x = 14 mm, y =-25 mm, z = 66 mm in the right hemisphere, and at x = -13 mm, y = -25 mm, z = 66 mm in theleft, for the trunk spheres; x = 49 mm, y = 3 mm, z = 25 mm in the right hemisphere, x = -46 mm,y = 3 mm, z = 25 mm in the left, for the head spheres; x = 13 mm, y = -25 mm, z = 54 mm in theright hemisphere, x = -13 mm, y = -25 mm, z = 54 mm in the left, for the leg spheres. All sphereswere then masked, in the individual T1 space, with the individual WM regions underlying M1,also transformed in the same space (Fig. 3.2 d). To avoid overlapping, the trunk WM masks were
48

subtracted from the hand WM masks. Finally, all WM masks were transformed into the individualdiffusion space (FA) and used as seeds for tractography (Fig. 3.2 e). The combined use of non-lineartransformations, employed to project the spheres onto the individual space, and of the automatizedsubcortical WM parcellation, used for masking the spheres, ensured that the selection of regionswas subject-specific and consistent across subjects. More details on the procedure are reported inthe Supplementary Material B.B.
Figure 3.2 General steps followed to create the seed masks in one hemisphere.
(a) User-drawn hand region (red) in one subject, axial view. (b) Average of user-drawn hand regions with center of gravity(COG) indicated as a black dot. (c) Spheres created from the COG of each body part, coronal view: hand sphere (yellow),trunk sphere (blue), leg sphere (green), head sphere (pink). The black dot is only an approximation of a COG with the redarrow showing the correspondence between the axial and coronal views. (d) The spheres (transparent colors) are overlappedwith (opaque) masking of the WM regions subjacent the precentral cortex (PCC). (e) Final seed masks in one subject, diffusionFA space.
Based on previous work (Giorgio et al., 2010), the cerebral peduncle seed masks were createdby taking two symmetrical three-voxel-thick slices centered around z = -22 mm in the MNI152 1mmspace and limited to the area around the peduncles (x range: 0, -15; y range: -14, -46, z range:-21, -23). This binarized mask was then projected onto each subject’s individual FA space andthresholded at the individual FA maps where FA > 0.2.
The masks described above were used to identify the primary motor tracts connecting specificbody-parts. Since the fiber bundle architecture might change along the tract, we aimed at analyzing
49

these tracts at different levels: not only in its entirety (whole tract), but also in the WM seedsunderlying the motor cortex and in the plIC. The latter is a key region along the descending motortracts, being the bottleneck where all fibers gather parallel and packed; thus, the plIC is oftenexamined as indicative of the entire CST. The plIC ROIs were designed in the FMRIB_FA spaceas WM 3D boxes (xright range: [20 mm, 28 mm], xleft range: [-19 mm, -27 mm], y range: [-13 mm,-26 mm], z range: [9 mm, 17 mm]) around the area labelled as ‘posterior limb of internal capsule’by the JHU ICBM-DTI-81 White-Matter Labels atlas (Mori and Crain, 2005).
Group comparisons
Once tractography was completed, all the quantitative measures were extracted from the wholeprobabilistic tracts and from the seed and plIC ROIs described above. For the DTI measures (FA,and RD), the values of these measures, contained in each voxel, were averaged across the voxels ofthe ROIs used as extraction masks for each subject; for the volumetric measures (volume of the Pun
tract = Vun, volume of Tcore = Vcore and volume of Tdisp = Vdisp), the number of the voxels of therelevant extraction masks constituted the individual values to use for the statistical analyses. Thequantitative measures were compared between groups with ANCOVA analyses, in R; age and sexwere included as nuisance variables. Because no interaction effects were observed in the analyseswhere the main effects of group were significant, we calculated type II sums of squares for theANCOVAs. To calculate pairwise group comparisons, adjusted for multiple comparisons, post-hocTukey HSD tests were also performed.
Correlations with demographic and behavioral data
In order to estimate the associations between the brain data extracted from the hand, trunk andleg whole tracts and dance or music training, partial correlations were performed, within the groupsof dancers or musicians separately, between the abovementioned extracted values and: (1) dance ormusic training duration (calculated in number of years of training), or (2) age of start of dance ormusic training. Partial correlations were executed using the ppcor R package, following the Pearsoncorrelation method and correcting for age and sex. The same partial correlation analyses were alsoperformed between the brain data extracted from the whole tracts and performance on the danceand melody tasks.
3.4 Results
3.4.1 Group Characteristics
As reported in previous papers, the groups did not differ in age, sex distribution, body-mass index(BMI) or years of education, and dancers and musicians had a similar amount of training in their
50

respective disciplines (see Table 3.1 and Giacosa et al., 2016; Karpati et al., 2016). These studiesalso showed that dancers outperformed musicians and controls on the dance task and that musiciansperformed better than dancers and controls on a melody discrimination task. Thus the groups werewell matched and demonstrated domain-specific expertise.
Group N Age (yrs ± SD) Sex BMI
(±SD) Years of dance training (±SD)
Years of music training (±SD)
Level of education (±SD)
Dancers 19 25.1 ± 3.9 13F, 6M 21.6 ± 2.3 15.5 ± 5.2 1.7 ± 1.9 2.37 ± 0.6 Musicians 18 22.9 ± 3.4 12F, 6M 22.5 ± 3.2 1.04 ± 1.8 15 ± 3.6 2.39 ± 0.98 Controls 19 25.4 ± 5.1 12F, 7M 22.1 ± 3.1 0.4 ± 0.9 0.4 ± 1.0 2.58 ± 1.12 Comparison between groups 56 D=M=C
ns D=M=C ns
D>M=C P < 0.0001
M>D=C P < 0.0001
D=M=C ns
Table 3.1 Participant characteristics.
F= females, M= males, SD = standard deviation, BMI = Body Mass Index. Education levels for each group are calculated ona scale 1-5, where 1 is the lowest (completed high school) and 5 is the highest (completed PhD).
3.4.2 Tractography analyses
General information
Statistical analyses were conducted on the mean values extracted from the entire pyramidal tracts,the plICs, as well as from the seed ROIs. For each analysis, DTI measures (fractional anisotropy(FA) and radial diffusivity (RD)) and volumetric measures (volume of the probability of the unionof bidirectional streamlines (Vun), tract core volume (Vcore), tract dispersion volume (Vdisp) wereanalyzed. All reported results are significant at p-values < .05, except where otherwise specified.Sex and age were included as covariates in all analyses.
Group differences
To assess effector-specific differences in the descending motor tracts, the DTI (FA and RD) and thevolumetric measures (Vun, Vcore, Vdisp) were compared between groups for the whole tracts, the plICROIs, often used as indicator for the entire CST, and the seed masks, where most group differencesin crossing fibers might be expected. The tracts that significantly differed between groups are shownin Fig. 3.3; the statistical values are reported in Table 2. In general, RD values were higher indancers and FA values were higher in musicians and the majority of significant effects were foundin the right hemisphere.
In the primary motor pathways seeded in the right hand region, across the entire tract, FAwas higher in musicians in comparison to dancers, while Vun was bigger in dancers, with controls’
51

values falling in between. In the plIC, RD and Vun were both higher in dancers in comparison tomusicians and, in the hand ROI, RD and Vdisp were higher. Control values fell between the twogroups. For the primary motor pathways seeded in the right trunk/arm ROI, FA was higher inmusicians compared to the other groups, whereas RD was higher in dancers versus musicians, andVun was bigger in dancers compared to both other groups. For the plIC, RD and Vun were lowerin musicians in comparison to both controls and dancers. Finally, in the seed ROI, only Vdisp wassignificantly larger in dancers in comparison to musicians. For the tract seeded in the leg regionof the right hemisphere, RD was higher in dancers compared to musicians across the whole tractand in particular in the plIC. No volumetric differences were found between groups. For the tractsseeded in the right head region, RD was higher in dancers. Consistent with this, in the plIC of thistract, RD was higher and Vun was bigger in dancers compared to musicians. Similarly, in the headseed ROI, RD was higher in dancers compared to the other groups. No difference was found forVcore in any tract. Taken together, these results show that, for the tracts seeded in the right handand trunk/arm regions, musicians have increased coherence and packing of fibers, across the entirebundles and particularly at the level of the plIC of the trunk/arm tract. In contrast, dancers haveincreased dispersion of fiber orientation across the entire bundles. For the leg and head right motorpathways, dancers show greater diffusivity in every direction, likely suggesting an increase in thefiber orientation dispersion, especially below the cortex, and/or in the size of the axon diameter.
Left-hemisphere findings were more limited and largely consistent with those in the right hemi-sphere. In the left hand seed ROI, RD was higher and Vdisp was bigger in dancers, whereas only atrend for smaller Vun was found in musicians in comparison to dancers. In the whole tract seededin the left trunk, RD and Vun values were both higher in dancers in comparison to musicians. Inthe seed region of the same tract, no significant difference between groups was found neither inthe Vcore nor in the Vdisp. No significant differences were found for either the head or leg regions.Together, these results are consistent with those of the right hemisphere, showing increased RD inthe hand and trunk tracts of dancers, likely suggesting their reduced coherence and increased fiberorientation dispersion and/or augmented axon diameter.
52

Figure 3.3 Group comparison results.
The opaque colors illustrate the portions of the tracts that differ between groups. The right hemisphere is shown on the right.R = right; L = left; D = dancers; M = musicians; C = controls; RD = radial diffusivity; FA = fractional anisotropy; Vu =volume of the union tract; Vdisp = volume of the tract dispersion; plIC = posterior limb of internal capsule.
53
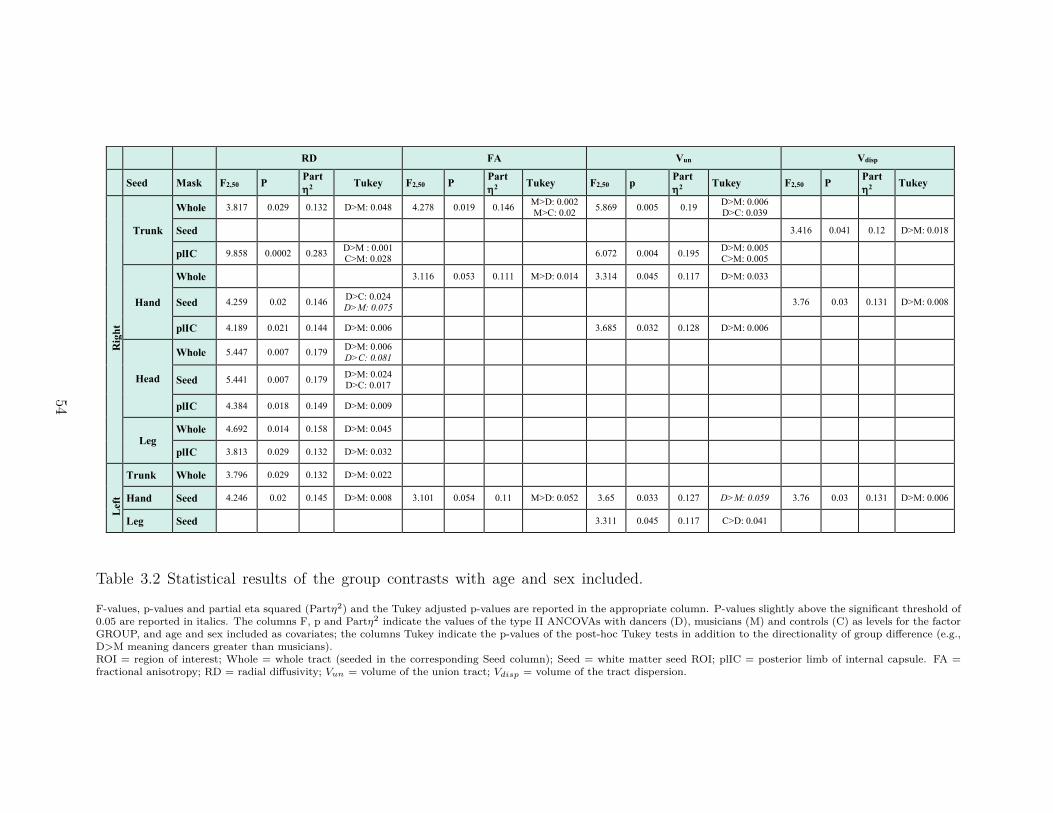
RD FA Vun Vdisp
Seed Mask F2,50 P Part 2 Tukey F2,50 P Part
2 Tukey F2,50 p Part 2 Tukey F2,50 P Part
2 Tukey
Rig
ht
Trunk
Whole 3.817 0.029 0.132 D>M: 0.048 4.278 0.019 0.146 M>D: 0.002 M>C: 0.02 5.869 0.005 0.19 D>M: 0.006
D>C: 0.039
Seed 3.416 0.041 0.12 D>M: 0.018
plIC 9.858 0.0002 0.283 D>M : 0.001 C>M: 0.028 6.072 0.004 0.195 D>M: 0.005
C>M: 0.005
Hand
Whole 3.116 0.053 0.111 M>D: 0.014 3.314 0.045 0.117 D>M: 0.033
Seed 4.259 0.02 0.146 D>C: 0.024 D>M: 0.075 3.76 0.03 0.131 D>M: 0.008
plIC 4.189 0.021 0.144 D>M: 0.006 3.685 0.032 0.128 D>M: 0.006
Head
Whole 5.447 0.007 0.179 D>M: 0.006 D>C: 0.081
Seed 5.441 0.007 0.179 D>M: 0.024 D>C: 0.017
plIC 4.384 0.018 0.149 D>M: 0.009
Leg Whole 4.692 0.014 0.158 D>M: 0.045
plIC 3.813 0.029 0.132 D>M: 0.032
Lef
t
Trunk Whole 3.796 0.029 0.132 D>M: 0.022
Hand Seed 4.246 0.02 0.145 D>M: 0.008 3.101 0.054 0.11 M>D: 0.052 3.65 0.033 0.127 D>M: 0.059 3.76 0.03 0.131 D>M: 0.006
Leg Seed 3.311 0.045 0.117 C>D: 0.041
Table 3.2 Statistical results of the group contrasts with age and sex included.
F-values, p-values and partial eta squared (Partη2) and the Tukey adjusted p-values are reported in the appropriate column. P-values slightly above the significant threshold of0.05 are reported in italics. The columns F, p and Partη2 indicate the values of the type II ANCOVAs with dancers (D), musicians (M) and controls (C) as levels for the factorGROUP, and age and sex included as covariates; the columns Tukey indicate the p-values of the post-hoc Tukey tests in addition to the directionality of group difference (e.g.,D>M meaning dancers greater than musicians).ROI = region of interest; Whole = whole tract (seeded in the corresponding Seed column); Seed = white matter seed ROI; plIC = posterior limb of internal capsule. FA =fractional anisotropy; RD = radial diffusivity; Vun = volume of the union tract; Vdisp = volume of the tract dispersion.
54

Correlations with dance or music training
For the whole tracts of the hand, trunk and leg regions, where the groups differed, we examined thecorrelations of training variables with DTI and volume measures. Younger age of start for dancerswas correlated with increased RD in the whole right trunk/arm tract, while younger age of startfor musicians was associated with higher FA. No volumetric measures correlated with age of startof dance or music training. Of note, DTI measures were related to age of training start but notwith years of training, despite age of start and years of training were correlated for both dancers(r = -.59, p = .013) and musicians (r = -.863, p < .0001). In summary, consistent with the groupdifferences, these results suggest that early start of dance training is associated with increased RD,whereas early start of music training is associated with increased FA.
Correlations with dance or musical task performance
In order to confirm that the most relevant WM differences were related to dance and musicalabilities, we calculated the partial correlations between quantitative measures, extracted from theentire hand, trunk and leg tracts in the right hemisphere, and performance on the dance and melodytasks (Karpati et al., 2016). Age and sex were included in the model as variables of no interest. Asshown in Table 3 and Fig. 4, RD and the volume were positively correlated with performance onthe dance task and negatively correlated with performance on the melody task, whereas FA did notcorrelate with any measure of task performance. In particular, in the entire right trunk tract, Vun
was positively correlated with dance performance, while RD was negatively correlated with melodyperformance. Moreover, in the right leg tract, dance performance was positively correlated withRD across the whole tract.
Right Tract
Age of dance training start
Age of music training start
Dance performance (% correct)
Melody performance (% correct)
RD FA RD Vun RD
r p r P r p r P R P
Trunk -0.51 0.034 -0.52 0.037 0.33 0.015 -0.27 0.048
Leg 0.32 0.019
Table 3.3 Significant brain- behavioral correlations for the tracts seeded in the right trunkand leg.
RD = Radial diffusivity; FA = fractional anisotropy; Vun = volume of the tract union; r = Pearson’s correlation coefficient; p= p-value; % correct = percent correct.
55
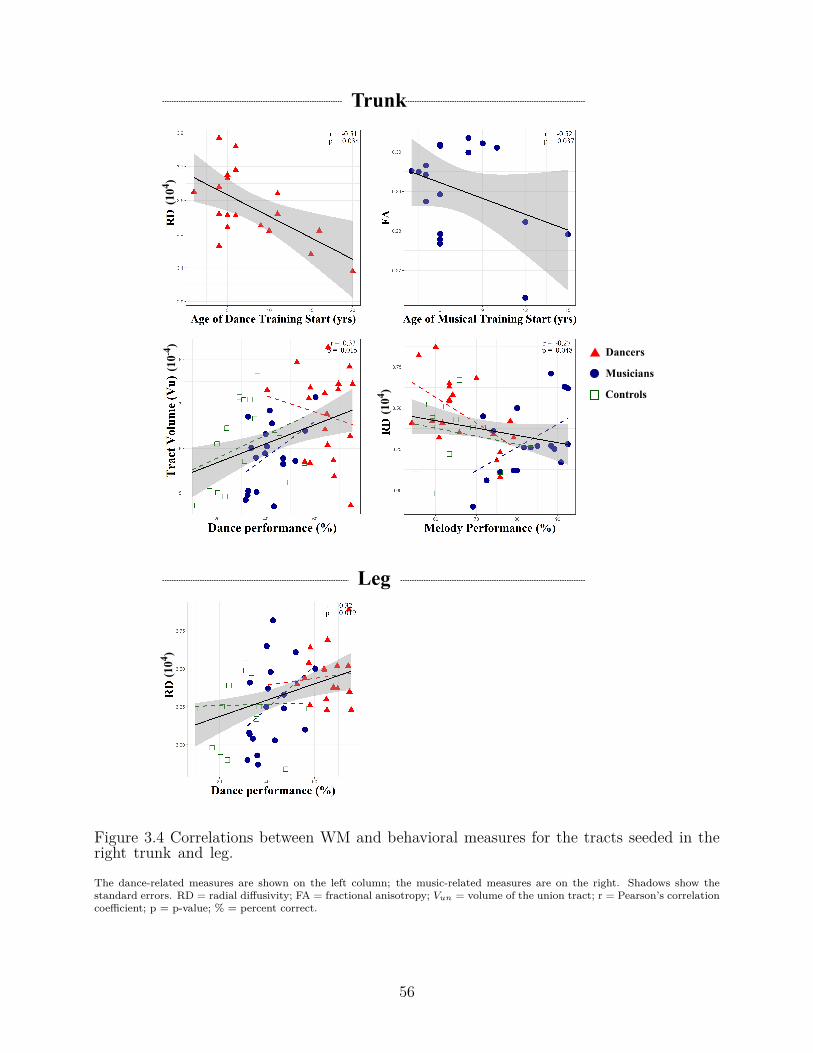
Figure 3.4 Correlations between WM and behavioral measures for the tracts seeded in theright trunk and leg.
The dance-related measures are shown on the left column; the music-related measures are on the right. Shadows show thestandard errors. RD = radial diffusivity; FA = fractional anisotropy; Vun = volume of the union tract; r = Pearson’s correlationcoefficient; p = p-value; % = percent correct.
56

3.5 Discussion
Using probabilistic two-fiber tractography, we showed that dancers had greater diffusivity (especiallyRD) in the primary motor pathways for all body regions in comparison to musicians, particularlyin the right hemisphere. In contrast, musicians had greater anisotropy (FA) in the right handand the trunk/arm tracts. Further, dancers had greater tract and dispersion volumes in theseregions compared to both the other groups. The greater diffusivity and larger volumes observed indancers might reflect increased fiber orientation dispersion, especially in proximity to the cortex, orincreased axon diameter. In contrast, the higher FA values in musicians suggest increased coherenceand packing of the fibers connecting the hand and arm motor representations. This confirms ourhypothesis that dancers have broader connectivity in a larger number of regions, while musicianshave more focused connections (Giacosa et al., 2016). Importantly, the observed differences in RDand FA were negatively correlated with the age of start of dance or music training, respectively.Finally, better dance performance was associated with increased diffusivity and volumetric measures,while better melody performance was associated with reduced RD.
Consistent with our previous study (Giacosa et al., 2016), we show that mean RD for dancerswas higher in most of the primary motor pathways, particularly on the right. Increased RD indancers might indicate enlarged axon diameter or enhanced fanning of the fiber bundles and iscompatible with a previous study comparing ballet dancers with handball players (Meier et al.,2016). Greater RD might result from use-dependent enlargement of axon diameter (Chéreau et al.,2017), and fibers with larger axon diameters are less packed, which would also contribute to in-creased RD. Higher RD is also compatible with greater fiber bundle branching or dispersion of fiberorientation. Greater branching in dancers might result from broader connectivity among represen-tations of different body parts. Co-occurring movements are represented together in the primarymotor cortex (Nudo et al., 1996); moreover, in the corticospinal tract, neurons originating in dis-tinct, even non-contiguous, portions of M1 can converge, projecting to the same motor-neuron inthe spinal cord (Hammond, 2002). Therefore, the extraordinary variety of movement combinationslearnt by dancers might lead to the encoding of a larger number of co-occuring movements andgreater complexity of motor connections that would contribute to increasing the fanning of fibers.We observed higher RD in most tracts of dancers, in particular in the right leg. The leg tract isof peculiar relevance, given its fundamental involvement in dance training. This is consistent withMeier’s and colleagues work (Meier et al., 2016), showing higher RD in the leg/foot component ofballet dancers’ CST in comparison to handball players. Similar results were observed in the righthead tract, where dancers showed increased RD, compared to both other groups. However, giventhe inherent non-specificity of diffusion measures (O’Donnell and Pasternak, 2015), we cannot ex-clude other possible explanations for higher RD, such as: decreased myelin thickness, changes inthe axonal membrane permeability and internode distance (Sampaio-Baptista and Johansen-Berg,2017).
57

In comparison to dancers, musicians had higher FA values in the right hand and trunk/armtracts. The result of concurrent higher FA in musicians and higher RD in dancers is consistent withprevious findings in the CST when comparing dancers to musicians and other athletes (Giacosaet al., 2016; Meier et al., 2016). Importantly, musicians’ FA values were also higher than controlsin the trunk/arm tract, indicating that these changes were specific to musicians, and not justrelative to the RD increases in dancers. Higher FA in the right CST (or plIC) has been previouslyshown in musicians in comparison to controls (Acer et al., 2018; Han et al., 2009; Rüber et al.,2015, but see: Imfeld et al., 2009; Schmithorst and Wilke, 2002), and it was associated with musictraining in childhood (Bengtsson et al., 2005). Here, the combination of higher FA and similar tractvolume in musicians might be explained with increased coherence and packing of fibers (Wan andSchlaug, 2010; Zatorre et al., 2012; Sampaio-Baptista and Johansen-Berg, 2017). Indeed, musicians’specific training might increase the variety of movement representations within a single effectorrepresentation (e.g., hand), thus strengthening only those specific connections. The same findingscan also be considered from the prospective that dancers, in both these tracts, showed lower FAand larger volume in comparison to musicians. Lower FA was previously observed in dancers andgymnasts (Hänggi et al., 2010; Huang et al., 2013; Giacosa et al., 2016; Meier et al., 2016; Burzynskaet al., 2017) in comparison with non-dancers. The combination of bigger volume and lower FA indancers supports the hypothesis of axon diameter augmentation with reduced packing of fibers,perhaps in combination with broader bundle fanning (see the concept of M1 fiber convergence inHammond, 2002). Taken together, our results demonstrate different types of plastic changes in thewhite matter of musicians and dancers: music training is associated with higher FA which can beinterpreted as stronger connectivity related to the specific effector trained, whereas dance training isassociated with higher RD which can be interpreted as enhanced connectivity across many effectors.
The finding that WM differences between dancers and musicians are predominantly right sidedis consistent with the whole brain findings of our previous study (Giacosa et al., 2016). Whilestructural changes have also been observed in the left hemisphere both in our study and others,(Hänggi et al., 2010; Meier et al., 2016; Burzynska et al., 2017), we hypothesize that greater changeson the right are the result of greater training of the non-dominant left hand (Rüber et al., 2013), andthe complexity and bilateral coordination of movements learned. For example, increased movementcoordination and complexity likely require broader functional bilateral activity (Horenstein et al.,2009; Noble et al., 2014), and increasing complexity of finger tapping sequences was correlated withincreased ipsilateral activation of motor regions (Harrington and Alan Fine, 2000; Verstynen et al.,2005).
Importantly, correlations with age of training start give support to our findings. Younger ageof start of dance training was negatively correlated with RD values in the entire right trunk tract,indicating that the earlier dance training started, the greater was the fiber orientation dispersion.In the same tract, age of start of music training was negatively correlated with FA, indicating thatthe earlier music training started, the more coherent were the fibers. Further, larger tract volumes
58

were associated with better performance in the dance task. These correlations validate a strongerassociation between dance training and fiber orientation dispersion and axonal enlargement, incontrast to an association between music training and changes in fiber coherence and packing.
Considering that the same tract may present different fiber bundle configurations at differentlevels, one of the goals of the present study was to examine the primary motor pathways both wherethe tracts enter the cortex (seed ROIs) and at the level of the plIC. Thinking of the fiber bundle astree-shaped, in the plIC, all fibers converge and run parallel to each other, like in the tree trunk;in contrast, in the seed regions, the multiplicity of neurons leaving the cortex constitutes the broadbranching foliage of the fiber bundles (Fig. 4.4.1). In the present study, in the right plIC of thehead and hand tracts, dancers had higher RD and Vun in comparison to musicians. Dancers’ largermotor axons, although more packed in the lower tract portions of the plIC compared to the seedregions, might be less organized than the highly packed fibers of musicians, resulting in increasedRD and larger volume. In addition, their more extensive combination of co-executed movementsmight require several M1 fibers to connect to the same motor-neurons, possibly explaining the“thicker tree-trunk”, or bigger plIC volume. In contrast, musicians’ trunk/arm plIC had lower RDvalues and smaller volume compared to both dancers and controls. This could reflect particularlymyelinated, coherent and packed fibers, supporting the hypothesis of a more sharply defined tractmorphology in the CST of musicians, as suggested by Oechslin et al. (2017).
Another interesting finding is that dancers showed higher RD and Vdisp in the hand and trunkseed ROIs bilaterally. It is worth reminding that each fiber tract was tracked bi-directionally, fromthe seed to the target and vice versa. Thus, the Vdisp included only the voxels that contained thenon-overlapping streamlines obtained from tracking in only one of the two directions, i.e. fromseed to target or the opposite (dispersion tract, Tdisp). The increased dispersion of fiber orientationis likely the consequence of microstructural properties, such as greater incoherence of fibers indancers. This might be particularly true in the seed regions, not only because these are largerROIs than the cerebral peduncles, but also because they lie right below the cortex, where is themaximal incoherence of fibers. Furthermore, the greater Vdisp observed in dancers might reflect theirincreased fiber orientation dispersion, or the fact that the tracts might be more easily identified inone direction or the other (from the cortex to the cerebral peduncles or the opposite).
Training effects or pre-existing differences?
Differences in brain structure between dancers and musicians have generally been attributed tolong and intensive training. However, it is more likely that they result from an interaction betweentraining-induced plasticity and pre-existing differences in physical characteristics, brain structureor personality traits that predispose certain people to engage in one or the other discipline (see(Penhune, 2019). However, while comparisons between trained and non-trained groups might beconfounded by differences in environmental factors such as motivation, familiarity, or personality
59
traits like perseverance, given the similar intensity of training required by both disciplines, it ishighly plausible that such factors are similar in dancers and musicians. Therefore, the brain differ-ences observed between these groups are more likely attributable to the specific training. Futurelongitudinal or targeted cross-sectional studies may more directly address the issue of distinguishingbetween the training-induced changes versus predispositions.
Advantages of our methodological procedure
The procedure we developed to identify the sub-regions of M1 has several advantages. First, theidentification of ROIs was both individual specific and consistent across groups. Another advantageis that placing these ROIs in the WM ensures more reliable tracking because the principal diffusiondirections are more certain in WM than in the cortex. Most importantly, these ROIs allowed us toseparately track each pathway from the specific region of M1. Finally, analyzing diffusion measuresat the level of both the IC and cortex provided us with additional information about the tractstructure. Of course, our sub-division of M1 is a simplified model because the descending motorpathways actually originate in overlapping body part representations, located not only in M1, butalso in the premotor, supplementary motor and somatosensory (post-central) regions (Murray andCoulter, 1981; Nudo and Masterton, 1990; Dum and Strick, 1991, 2005; Porter and Lemon, 1995).Nonetheless, this approach could still be useful for other experimental or clinical studies that aimto identify specific components of the descending motor pathways, for example to examine effector-specific outcomes of rehabilitation. In the future, functional data could be used to identify thelocation and extent of each body part representation.
3.6 Conclusions
In this paper, we developed a novel approach to compare descending motor pathways in dancersand musicians. We found that dancers have higher diffusivity values and larger tract volume acrossmost regions, with evidence for increased fiber bundle fanning at the level of the cortex, and largeraxon diameter at the level of the internal capsule. Conversely, musicians showed increased FA inthe hand and trunk/arm tracts, indicating that they have increased coherence and packing of thefibers that specifically connect the effectors they trained over time. Correlations with age-of-startof training and performance on dance and music tasks indicate that these structural changes aredirectly linked to specialized training of dancers and musicians. Taken together, our findings supportthe hypothesis that different types of training have different effects on brain structure.
60

CHAPTER 4
General Discussion
4.1 Overview
The purpose of this dissertation is to compare the WM structure of dancers and musicians and relateit to their specific training and acquired skills. In Study 1, a variety of DTI metrics were examinedtogether, at a whole-brain level, in dancers, musicians and controls, and related to performance ona dance and a melody task. In Study 2, the descending primary motor pathways from the hand,trunk/arm, leg and head regions were examined. These analyses were performed on selected DTIand volume metrics in both hemispheres. WM metrics were also correlated with task performanceand age of start of training.
4.2 Summary of our findings
Across the whole brain, dancers showed increased diffusivity (especially RD) and reduced anisotropy(FA, MO) in comparison to musicians in a variety of WM regions, including projection (such asthe CST or, more generally, the descending motor pathways), associative (SLF) or interhemispheric(CC) fibers that constitute sensorimotor networks. The extracted mean analyses revealed that mostof the structural modifications occurred in dancers. In comparison, musicians had higher FA andlower RD in the same regions, suggesting increased coherence and packing of fibers. Further, inregions where multiple fiber bundles cross, musicians had an increased proportion of primary fibers(F1), indicates that these structural alterations might concern a particular fiber bundle, leaving theothers unchanged. Consistent with these results, the analyses of the descending motor pathwaysin Study 2 showed that dancers had increased RD compared to musicians and, in some portions,to controls too. FA increases in musicians were localized to the right hand and trunk/arm tracts,particularly relevant to their specific training. Further, dancers had greater tract and dispersionvolumes compared to the other groups. The combination of dancers’ greater volumes and higherRD points toward their greater dispersion of fiber orientations or larger axonal diameter. In bothstudies, group differences were especially evident in the right hemisphere, ranging from completelylateralized changes for FA to more symmetrical ones for RD and MD.
It is crucial to remember that in our sample, dancers and musicians were well matched in yearsof training and hours of current practice. Therefore, the structural changes observed can be moredirectly linked to specific training. Importantly, for the first time in studies of dancers, DTI and
61

volume metrics were related to performance on tasks that characterized the groups. Across bothstudies, performance on the dance task showed an opposite direction of correlation with DTI metricscompared to melody performance. This suggests that acquisition of dance and music skills has adifferential impact on WM structure. Moreover, in the trunk motor tract, age of training startwas negatively related to RD in dancers and to FA in musicians, which indicates a direct relationbetween the structural changes observed and training.
4.3 Interpretations
4.3.1 Comparison with previous literature
The most general finding of the present dissertation is that dancers showed reduced anisotropy (FAand MO) and increased diffusivity metrics (RD, AD and MD) in comparison to musicians, andat a lower threshold, with controls. We hypothesize that these findings might reflect an enhancedconnectivity with enlarged axons and increased heterogeneity of fiber orientation across broaderregions in dancers, in contrast to more focused enhancements related to the trained effectors inmusicians. Our findings are consistent with other studies that showed reduced FA in subjects withlong-term motor training of the whole-body (Jäncke et al., 2009; Hänggi et al., 2010; Burzynskaet al., 2017; Meier et al., 2016; Huang et al., 2013, but see Hänggi et al., 2015 for different directionof FA changes). In contrast, subjects with short-term motor training of specific effectors showedincreased FA (Scholz et al., 2009; Palmer et al., 2013; Wang et al., 2014), with the only exceptionfor short-term whole-body balance training (Taubert et al., 2010). On the other hand, the findingof increased FA in musicians in comparison to dancers is consistent with other research (Rüberet al., 2013; Steele et al., 2013; Halwani et al., 2011; Han et al., 2009). These WM findings are notas straightforward as GM, where training more consistently results in increased volume or corticalthickness. This may be due to the effects of intensive whole-body training on a broad range of WMpathways that result in structural changes, including greater heterogeneity of fiber orientation andlarger calibre fibres. It may also be due to multiple physiological properties of WM, which maybe affected by training and reflected in DTI metrics (see discussion below), and to different fiberbundles involved (Schmithorst and Wilke, 2002; Steele et al., 2012; Acer et al., 2018).
In our studies, the FA decreases observed in dancers were mostly driven by RD increases. FA istypically inversely correlated with RD and such a relationship in training-related studies has beenobserved in musicians (Steele et al., 2012; Vollmann et al., 2014) and after a short-term training offinger-thumb movements (Reid et al., 2017). However, the only other study reporting multiple DTImetrics did not show any global differences in RD when comparing dancers to controls and handballplayers (Meier et al., 2016). Nonetheless, more specific analyses revealed higher RD values in thefoot CST tract of dancers, in comparison to the higher RD values in the hand tract of handballplayers. These relations were reversed for FA in the same tracts. Meier et al. (2016) regarded this
62

result as evidence for a direct relation between the type of training and changes in DTI metrics.We attempted to replicate this interesting finding by comparing the hand and leg tracts of theCST in dancers and musicians but did not find consistent results. There might be multiple reasonscontributing to such lack of compatibility between Meier’s and our studies. First, the comparisonbetween dancers and handball players is between two groups of athletes who train their whole-body, with a particular focus on a specific effector (feet and hands respectively). In our study,instead, the primary goal was to compare dancers with musicians, whose main distinction in motortraining depends on the engagement of the whole body versus a specific effector. Secondly, while ourtractography analyses were seeded in WM regions, Meier’s were started in regions that included GM,which leads to less reliable tracking. Importantly, the pathways tracked in Meier’s study includedtracts seeded in both in the primary motor precentral regions (M1) and the sensory postcentralcortex (S1). On the contrary, our focus was on the motor pathways descending from M1 to thebrainstem. If the aim was to include all the motor fibers, we should have included also fibers seededin premotor and supplementary motor regions, beyond those coming from S1. However, most of thefibers seeded in S1 come from the thalamus, therefore, without specific functional data, includingsuch pathways would have reduced the specificity and reliability of our study. Finally, on a moretechnical perspective, while Meier et al. excluded overlapping voxels in order to compare “pure”tract portions, our first goal was to compare the entire tract portions between groups, therefore inour approach we didn’t distinguish overlapping from unique sub-portions of each tract component.
Among the various tracts that differed between dancers and musicians in Study 1, of particularrelevance are: the descending primary motor pathways (including the CST), the SLF and the CC.All of these bundles cross each other in multiple locations, making it difficult to attribute changesto a single tract (see Steele et al., 2012). In the primary motor pathways, dancers showed increasedRD in Study 1, and greater volumes for all tract portions in comparison to musicians in Study 2.Specific increases of FA in musicians were observed in the right hand and trunk/arm tracts. Thisis consistent with previous work on dancers and subjects who followed a short-term motor training,showing an effect of training on the specific trained-related structures (Meier et al., 2016; Taubertet al., 2016; Landi et al., 2011; Bangert and Schlaug, 2006; Elbert et al., 1995) and functionalrepresentations (Pascual-Leone and Torres, 1993; Pascual-Leone et al., 1995; Svensson et al., 2003;Adkins et al., 2006).
We also found decreased FA in the SLF of dancers relative to musicians, which is consistentwith findings observed in gymnasts (Huang et al., 2013). The SLF is an associative fiber bundlethat connects frontal and temporo-parietal regions that is composed of multiple bundles belongingto the action-observation network (AON), the vestibular network and the arcuate fasciculus. Givenits structural and functional heterogeneousness, the changes that we observe at a global level of theentire fasciculus may result from the combination of distinct effects on each portion. In particular,the SLF bundles, part of the AON, might develop, with training, greater efficiency, possibly conveyedby fibers with larger axon diameter. In fact, the AON is a network of neurons that fire during
63

observation and execution of actions or movements (Buccino et al., 2001; Calvo-Merino et al.,2005; Cross et al., 2009b; Grafton, 2009; Caspers et al., 2010; Cross et al., 2006) as well as theirmental visualization (or imagery) (Grèzes and Decety, 2001; Cross et al., 2006). This network iscrucial for dance learning, which is largely based on imitation and motor rehearsal (Cross et al.,2006). Interestingly, Bar and DeSouza (2016) recently investigated the changes in brain activityas dancers learned to perform a new choreography. They found that neural activity was increasedin the supplementary motor area (SMA, part of the AON) and auditory regions during the early“rehearsal” phase of training, but decreased in the long-term “performing” phase, following thetypical inverted-U-shaped learning curve. This suggests that the cortical network engaged duringmotor learning – which includes the SMA and auditory regions, as well as the SLF – might becomemore efficient with long-term training, possibly through changes in the combination or weight ofconnections (Bar and DeSouza, 2016). Therefore, the FA decreases and RD increases that weobserved in dancers might reflect such connectivity changes related to long-term plasticity.
In Study 1, we also showed that AD and RD were higher, while MO and F1 were lower,in the CC of dancers compared to musicians. The CC, connecting homologous regions of thetwo hemispheres, is responsible for the motor coordination between the two sides of the body(Steele et al., 2013; Schmithorst and Wilke, 2002; Johansen-Berg et al., 2007; Gerloff and Andres,2002; Gooijers and Swinnen, 2014). Interhemispheric connectivity plays a crucial role in bilateralcoordination abilities, fundamental for both dance and music performance. Therefore, dancers mighthave broadened connectivity among all the body part representations, possibly inducing increasedfiber fanning, in contrast to the greater fiber coherence of musicians. To further investigate whetherdancers had enhanced interhemispheric connections between cortical representations of all bodyparts, we performed additional tractography analyses not included in Study 2. There, we usedtractography to examine the CC bundles connecting all contralateral body part motor representationin dancers and musicians. Our hypothesis was that dancers whole-body training would strengthenthe connections among all different body parts, whereas musicians bimanual motor training wouldenhance connectivity between the hand representations, maybe extending to the trunk/arm. Wetested this hypothesis with two approaches: 1) tracking from each joint seed ROI through the mid-body of the CC, 2) and specifically tracking from each joint seed ROI toward each contralateral jointrepresentation; in both approaches DTI and volumetric values were then extracted from relevantROIs located at the seed, target and regions of crossing with the descending motor pathways.Unfortunately, the results did not provide any support for this hypothesis, showing unclear patternsof group differences, that were inconsistent between the two approaches. Nonetheless, similarly toStudy 1 and 2, diffusivity was generally increased in dancers and reduced in musicians while FAhad the opposite trend. This corroborates the idea that dance training may contribute to developbroader general connectivity between motor regions.
64

4.3.2 Dance and music training have different structural WMcorrelates
One of the main findings of the present work is that multiple WM structures, including the primarymotor pathways (Study 2), differ between dancers and musicians and performance on dance andmelody tasks had opposite relationships with DTI metrics. Given that, in our sample, dancers andmusicians had a comparable amount of training, the observed WM differences can more confidentlybe attributed to the type of training. There are a few possible explanations for these opposite results:either dance and music training have the same effect on specific portions of the same structures, orthey have different effects on the same structures.
Under the first hypothesis, given the similar but specific engagement of the sensorimotor net-work in dance and music training, it would be reasonable to expect that the connections of the bodyparts trained in each discipline would be particularly strengthened. Sustained activity is known toreinforce the solicited connections by increasing the speed of information processing (Chéreau et al.,2017), which is frequently underpinned by increased myelination (Waxman, 1980; Hartline and Col-man, 2007; Saab and Nave, 2017; Nave, 2010; Fields, 2015; McDougall et al., 2018) . For musicians,the body parts and muscles recruited to play an instrument are usually small and representedcontiguously along the motor cortex. Further, the fast and fine movements learnt by musiciansrequire the ability to segregate muscles, represented in adjacent regions on the motor cortex (e.g.,fingers), and activate them separately. Such training would mainly strengthen the adjacent fibersof the trained tract (e.g., hand), increasing both myelination and orientation coherence. In con-trast, dancers showed opposite FA changes. If a similar reinforcement process occurred in dancersas in musicians, the observed higher RD and lower FA could be attributed to the strengtheningof broader connections between more extended cortical body part representations. Many of thecomplex movements learnt by dancers simultaneously involve body parts with more distant repre-sentations along the motor cortex. Each rehearsed movement would therefore reinforce the linksbetween the body parts engaged, broadening the tract connectivity and making the fibers from eachregion more intertwined with each other and less coherent.
It has also been proposed that the motor cortex does not represent each separate muscle butmight represent complex actions, or muscles recruited together (Nudo et al., 1996; Makino et al.,2016). The extraordinary amount of complex whole-body movements learnt by dancers wouldtherefore be underpinned by an increased variety of motor cortical representation of coactive mus-cles. The motor pathways connecting these amplified motor representations might explain theirbroadened and intricate motor connections.
Alternatively, it is possible that different types of training affected the same structures indifferent ways, as suggested by the opposite correlations between DTI metrics and dance or melodyperformance. Beyond increased myelination, trained connections can also be reinforced by increasedaxon diameter and axonal branching or sprouting (Zatorre et al., 2012). While increases in fiber
65

coherence and myelination induce an augmentation of FA, larger axon diameter or augmentedbranching could lead to increases in RD and, consequently, decreases in FA, as we observed indancers. Hence, whole-body dance training might induce, not only greater heterogeneity of fiberorientation, but also larger axon diameter or axonal branching, in contrast to musicians’ morecoherent and packed fibers.
Other physiological changes might occur during training that are related to speed and syn-chronization of neuronal firing. While conduction velocity of single fibres might contribute to theefficiency of pathways, the precise timing of action potentials among fibers of the same network iseven more crucial in improving synaptic transmission and information processing (Ford et al., 2015;Fields, 2015). Physiological processes that might adjust the timing of spike arrival between fibersinclude alterations of node and internode length, number of nodes of Ranvier and local modificationsof axonal diameter at the node or of membrane permeability (Ford et al., 2015; Sampaio-Baptistaand Johansen-Berg, 2017; Zatorre et al., 2012). For instance, larger diameter and shorter internodedistance was observed in the auditory brainstem axons of rodents to precisely tune their conductionvelocity and spike timing (Ford et al., 2015). Changes in the node of Ranvier lengths have beenproven to affect conduction velocity of 20%, comparable to the amount of change achievable withchanges in myelination or internode distance (Arancibia-Cárcamo et al., 2017). Further, changesin nodal length are more energy efficient than changes in myelination thickness or length (Kalleret al., 2017). Therefore, it is possible that distinct optimisations are also needed by different typesof training, such as dance and music, because of the different body parts and types of movementsinvolved. The activity of long and short axons of large and distant body parts, like limbs, recruitedduring dance training, must be precisely synchronized to each other despite their different lengths.In contrast, the signals arriving from the axons of the effectors trained by musicians, such as fin-gers, must be coordinated to adjacent axons of similar lengths. Further, the fine movements thatmusicians accomplish with their fingers can become much faster than dancers’ limb gross move-ments. Thus, the diverse synchronization processes needed in dance and music may lead to diversemorphological properties that could vary among similar, or even along the same, axons (Ford et al.,2015; Arancibia-Cárcamo et al., 2017). Moreover, across a life-time training, distinct mechanismsof plasticity might predominate at different ages. While myelination processes are particularly sen-sitive during childhood, growing of glial cells and branching of unmyelinated axons seem to be theadvantaged plastic responses during adulthood (Markham et al., 2010; Zatorre et al., 2012). Tostudy such microscopic scale features, combinations of electron microscopy, immunohistochemistryand electrophysiological analyses have been conducted in animals. In humans, techniques, such asneurite orientation dispersion and density imaging (NODDI) or AxCaliber, are able to measure themyelin thickness (g-ratio) or the axonal diameter (Ellerbrock and Mohammadi, 2018; Zhang et al.,2012; Assaf et al., 2008). Promising models that map MRI signals to microscopy (Stüber et al.,2014; Chen et al., 2017) might be used in the future to deepen the understanding of the dynamicmyelination processes undergoing late phases of training.
66

It is also important to remember that DTI metrics reflect an average measure of the propertiesof a large number of neurons in any given voxel. This suggests that the differences observed inthe descending motor pathways might also be due to changes in the bundles crossing them, suchas the interhemispheric fibers of the corpus callosum and the anterior-posterior connections ofthe superior longitudinal fasciculus. In Study 1, the structural differences between dancers andmusicians included association fibers of the SLF that connect posterior sensory to frontal cognitiveregions. As described above, the SLF connects sensory and motor regions, as well as the AON, toprefrontal areas that are implicated in memory and other executive functions. Thus the observeddifferences between dancers and musicians might reflect plasticity in pathways that regulate higherlevels of cognitive processing, and are not limited to the sensorimotor systems. The SLF alsoincludes fibers of the arcuate fasciculus, which connects temporal, parietal and frontal regions.The arcuate fasciculus has been related to visuospatial abilities and pitch-based grammar learning(Doricchi et al., 2008; Loui et al., 2011), and structural modifications have been already observedin musicians compared to non-musicians (Halwani et al., 2011).
4.3.3 Further physiological interpretations enriched by the anal-ysis of multiple metrics
In Study 1 and 2, dancers consistently showed lower values of FA in comparison to musicians. Thisresult is consistent with other studies showing reduced FA in dancers or gymnasts compared tolaymen or other athlete controls (Meier et al., 2016; Hänggi et al., 2010; Burzynska et al., 2017;Huang et al., 2013). However, as discussed in the Introduction 1.1.4, FA alone is not sufficient tomake inferences about the morphological or physiological underpinnings of such differences, since itis influenced by a variety of factors (e.g., axon size, myelin sheath thickness and length, and node ofRanvier characteristics) (Zatorre et al., 2012; Sampaio-Baptista and Johansen-Berg, 2017). BecauseFA is a composite measure proportional to AD and inversely related to RD, the joint examinationof these two metrics can allow a more detailed interpretation of our data. In our sample, in theregions where FA was lower in dancers, RD, and in some cases also AD, was higher. Although ADco-occurred with RD changes in some regions, RD changes were larger than AD ones and thereforehave a stronger impact on FA This suggests that FA increases were mostly led by the increases inRD rather than in AD. Physical activity and sensory enrichment are known to boost conductionvelocity and myelination (Zatorre et al., 2012; Canu et al., 2009; Ruegg et al., 2003; Hughes et al.,2018), and active neurons will preferentially be selected for myelination (Hines et al., 2015).
Another measure that could be analyzed is MO which was the only metric that differed betweendancers and controls in Study 1, showing that it is complementary to FA and is sensitive to changesthat other metrics are not able to detect. Despite being rarely reported in literature, MO can beused in combination with MD and FA (see Introduction 1.1.4) to fully represent the ellipsoidal shapeof diffusion (Ennis and Kindlmann, 2006). For example, for a constant value of MD, concurrent
67

reductions of FA and MO indicate a more planar (pancake) shape of the ellipsoid (see Fig. 1.1.4),which means that structural changes occur in fiber bundles that lay on a plane. However, it is crucialto remember that the ellipsoid describes diffusion within a single voxel, whereas group contrastsrefer to the metric averaged across subjects and across voxels. Therefore, it could be interestingto reconstruct voxelwise glyphs representing the relations between FA, MD and MO (Ennis et al.,2005). Following the glyph orientations across voxels, it is possible to identify the other tracts thatdiffer between groups and this could drive further tractography analyses.
Distinct structural organizations might occur at different tract levels
Another hypothesis to keep in consideration is that microstructural properties, such as axon diam-eter and internode distance, are not as constant as previously theorized but may vary significantlyalong the same axon or among similar axons (Ford et al., 2015; Arancibia-Cárcamo et al., 2017).This implies that distinct structural organizations might occur at different levels or portions of thetracts, even in presence of the same metric changes. For instance, increased RD in dancers mightbe due to the axons with larger diameters at the level of plIC that then branch and thin as theyapproach their terminals (Fig. 4.1). In contrast, at the seed and whole tract levels, higher RD
Figure 4.1 Enhanced tree-shape structure of descending motor pathways.
might be due to greater connectivity among multiple regions. To test this hypothesis, we looked
68

at the measures within the seed regions to see if there is such evidence. We would have predictedthat dancers would show greater fanning or complexity of fiber organization. However, no rele-vant differences between groups were observed in the seed regions. Since the tractography analysiswas restricted to the descending motor pathways, the hypothesis of increased branching in dancersshould be carefully pondered. The neurons that belong to the motor pathways are divergent fibersthat descend from the cortex and target the brainstem or the spinal cord. Therefore, axonal branch-ing would mostly occur at the brainstem or spinal cord level, although we cannot exclude that somebranches are formed long before reaching their targets. What could happen in the cerebral whitematter is that synergic fibers might communicate via axonal collaterals.
The plIC is a region where there is a lot of overlap between the distinct portions of the de-scending motor tracts due to its bottleneck shape. This might explain the high consistency offindings, showing dancers higher RD in this ROI, across tract portions. However, despite suchoverlap, musicians showed different changes in the plIC of the fibers seeded in the trunk/arm, withreduced RD and volume in comparison with both other groups; further, these values correlated withmelody performance. This suggests a peculiar relation between music training and the extremelypacked and myelinated trunk/arm fibers at the level of the plIC, which might indicate more efficientconnections to control arm movements, fundamental for most instrumental players.
4.3.4 Asymmetry
In both our studies, the group differences between dancers and musicians were more prominentin the right hemisphere. More changes in the right hemisphere have been previously observedin musicians compared to non-musicians (Bengtsson et al., 2005; Han et al., 2009; Rüber et al.,2013; Imfeld et al., 2009). To further explore this asymmetry, we performed supplemental analysescomparing FA between hemispheres, at the whole brain level and in an atlas-based extraction of theCST. For both dancers and musicians, we observed a left-greater-than-right asymmetry for FA acrosshemispheres and in most descending pathways, both at the whole tract and plIC level. A previousstudy examining the CST also observed this L>R asymmetry, and showed that it was not related tohandedness, suggesting that it might be an intrinsic or more genetically determined feature of thispathway (Westerhausen et al., 2007). This raises the possibility that the right hemisphere may bemore susceptible to plastic changes driven by experience. This, combined with the fact that bothdance and music require extensive training of the non-dominant side of the body might explainwhy greater differences were observed in the right hemisphere. Further, we observed that the L>Rasymmetry of FA was greater in dancers than musicians, both across the whole WM and in theCST. Dance and music performers need to enhance the abilities with their non-dominant body sidesand efficiently coordinate their bilateral motor activity (see Schlaug, 2015). Given that the righthemisphere mostly controls the contralateral body side, greater modifications of the right WM indancers and musicians might be due to a stronger effect of training on the left, non-dominant body
69

side. Despite reporting opposite trends for asymmetry values in musicians and controls, which isconsistent with their opposite findings for FA, Imfeld et al. (2009) came to the same conclusion ofgreater structural changes in one hemisphere related to training. Moreover, increasing movementcomplexity and coordination is thought to enhance bilateral activity (Horenstein et al., 2009; Nobleet al., 2014). Bilateral, in addition to unilateral, training could further stimulate the non-dominantright hemisphere and enhance its structural modifications.
4.3.5 Integration of GM and WM findings
The WM studies reported in this thesis were part of a larger project which also examined GMmeasures in the same sample (Karpati et al., 2017). The main finding from the GM study was thatboth dancers and musicians had greater cortical thickness in the right superior and middle temporalgyri in comparison to controls, and that these increases were positively correlated with performanceon both the dance and melody tasks across all participants. The superior temporal cortex is involvedin multiple functions relevant to both music and dance, from auditory processing and integrationwith the motor network, to temporal control of movements, action imitation and balance (Mendoza,2011; Bengtsson and Ullén, 2006; Bangert et al., 2006; Hickok et al., 2003; Bengtsson et al., 2004;Zatorre et al., 2007; Jola et al., 2011; Lappe et al., 2016; Karim et al., 2012; Iacoboni et al., 2001;Tachibana et al., 2011; Molenberghs et al., 2010; Karpati et al., 2017). The WM results of Study1 did not mirror the GM findings when dancers and musicians differed from controls. However,voxelwise comparison of the two trained groups revealed higher RD and MD for dancers in twoclusters subjacent to the right superior temporal gyrus in a region close to the location of the GMfindings. These WM clusters comprise the acoustic radiations, according to the Jülich HistologicalAtlas (Bürgel et al., 2006), which connect the thalamus to the primary auditory cortex (Lee, 2013).Together, these analyses show that dancers and musicians have similar GM modifications comparedto untrained subjects, but they differ in WM structures. While the auditory cortex is similarlyengaged in the auditory (musical) and multisensory processing of dance and music, the somatotopicorganization of the motor cortex (and connected fiber bundles) might accentuate the differencesbetween the effectors used in each discipline. The combination of increased diffusivity in dancersversus musicians with increased cortical thickness in both groups compared to controls supports ourinterpretation that increased RD in dancers is the result of the modification of fiber organizationrather than reduced myelination.
While the overlapping changes in auditory regions are interesting, we might have expectedGM differences in motor regions corresponding to the observed WM changes. The lack of suchfinding might be due to the fact that the structural differences in the motor cortex are too subtleto be detected at the whole-brain level. It has been observed that training-related changes in thesensorimotor cortex are locally reorganized within M1 (Kleim et al., 2002), which means that theymight not be visible at the scale of the whole brain.
70

Moreover, the temporal dynamic of changes has not been clearly investigated. In the time-scale of days to months, learning induces functional and structural transient changes, which arecharacterized by an inverted-u-shape pattern (Classen et al., 1998; Pascual-Leone et al., 1995; Barand DeSouza, 2016; Scholz et al., 2009; Draganski et al., 2004; Makino et al., 2016; Wenger et al.,2017; Chen et al., 2015; Nudo et al., 1996). However, the modifications occurring in the first phases oftraining might predominantly impact the networks related to learning of novel movements (Conneret al., 2003; Kleim et al., 2004; Taubert et al., 2010; Kaminski et al., 2013) , which do not coincidewith those engaged during the execution of well-learnt or repetitive motor tasks (Chen et al., 2012;Taubert et al., 2016; Plautz et al., 2000; Doyon et al., 2009, see Monfils et al., 2005 and Adkinset al., 2006 for reviews) and in later phases of training (Floyer-Lea and Matthews, 2004; Yin et al.,2009; Howe et al., 2011; Kawai et al., 2015). Conversely, the WM connections, established at thebeginning of training, might be continuously reinforced with regular stimulation. ROI approachescould be used to verify whether the WM differences observed in Study 2 correspond to local GM orfunctional changes in the motor representations.
Few studies have shown simultaneous changes in GM and related WM tracts in relation tolearning or training. Few weeks of complex visuo-motor training induced changes in GM densityand FA in contiguous sensorimotor regions (Scholz et al., 2009; Landi et al., 2011; Taubert et al.,2010), although the magnitude and time courses of GM and WM increases did not correlate (Scholzet al., 2009), nor the direction of changes was coherent between GM and WM in (Taubert et al.,2010). Highly trained dancers showed consistent decreases in GM and WM densities, as well asin FA, in contiguous premotor or parietal regions (Hänggi et al., 2010). However, this finding wasnot replicated in subsequent studies with dancers, gymnasts and musicians (Huang et al., 2013;Burzynska et al., 2017; Acer et al., 2018), where GM increases were accompanied by FA decreasesin not always related regions (Huang et al., 2013; Acer et al., 2018). In musicians, GM changes incomparison to non-musicians seem to be more consistent, showing increased gyrification, corticalthickness, GM volume in auditory, motor, subcortical and cerebellar regions (Schneider et al., 2002,2005; Bermudez et al., 2009; Foster and Zatorre, 2010b; Gaser and Schlaug, 2003; Vaquero et al.,2016; Hutchinson et al., 2003; Penhune, 2019). However, also in musicians, the direction of WMchanges is less coherent (Acer et al., 2018; Rüber et al., 2013; Steele et al., 2013; Halwani et al.,2011; Imfeld et al., 2009; Han et al., 2009; Schmithorst and Wilke, 2002, see Moore et al., 2014 fora review) probably because it incorporates changes of multiple bundles coexisting in a voxel anddepends on a variety of concurring microstructural factors (see section 4.3.3 above).
4.3.6 Training effects or pre-existing predispositions?
Across this dissertation, we interpreted the differences between dancers and musicians as relatedto their training. However, like all other studies in the field, participants self-select into dance andmusic training, meaning that it is impossible to discern whether the structural differences observed
71

between groups are the cause or the consequence of training. The relative contributions of nature andnurture to expertise has been extensively debated. Studies showing structural changes associatedwith learning of a new skill support the existence of training-induced plasticity (Draganski et al.,2004; Scholz et al., 2009; Taubert et al., 2010, 2016; Tomassini et al., 2011; Kodama et al., 2018).Specifically, in Study 2, the inverse correlations found between DTI metrics and age of trainingbeginning play in favor of training-induced plasticity. On the other hand, genetic or environmentalpre-existing factors may influence training commencement and continuation (Theorell et al., 2015).Evidence for pre-existing neuroanatomical characteristics linked to musical aptitude were reportedin a longitudinal study with school-age children, where the volume of Heschl’s Gyrus was a strongerpredictor of musical aptitude than musical practice (Seither-Preisler et al., 2014). Personality traitssuch as motivation, openness to experience and psychological flow – the ability to reach a stateof highly focussed concentration and absorption in an activity (Nakamura and Csikszentmihalyi,2002) – have been associated with music practice (Butkovic et al., 2015). Moreover, some aspectsof musical aptitude and creativity, as well as musicality, have been linked to genetic components(Ukkola et al., 2009; Ukkola-Vuoti et al., 2013; Mariath et al., 2017; Oikkonen et al., 2016). In studieswith twins, Mosing and Ullén have found evidence supporting the influence of genetic predispositionson musical genre, ability, practice and instrument preference (Mosing et al., 2014; Mosing andUllén, 2018; Ullén et al., 2016), as well as the independence of IQ and basic motor timing frommusical practice (Mosing et al., 2016; Ullén et al., 2016). However, a recent study from the samegroup provided the first and strongest evidence for a causal impact of musical training on brainstructure, showing greater cortical thickness and higher FA in keyboard players compared to theirnon-musician twins (de Manzano and Ullén, 2018). Taken together, this literature indicates thatit is likely that both genes and practice contribute to the neuroanatomical differences observedbetween highly trained and untrained subjects (de Manzano and Ullén, 2018). It is reasonable toconclude that physical and cognitive predispositions are likely to drive children toward the typeof training (music, dance, etc.) that is more compatible with their genetic predispositions, andsuch experience will amplify the pre-existing individual differences (Schellenberg, 2015). Further,gene-environment interaction effects – the modulatory effects of genes in response to the changingenvironment – are likely also relevant. Indeed, both genetic and shared environmental factorshave increasing influence on cognition across the lifespan (Tucker-Drob and Briley, 2014). Thus,a musically enriched environment during childhood has the potential to exaggerate the individualdifferences in musical achievement (Wesseldijk et al., 2019).
4.3.7 Methodological considerations and future directions
The research project here presented was the first one to compare dance to another type of intensivetraining with differential involvement and integration of the visual, auditory and motor systems.In addition, a novel combination of multiple approaches was developed, in Study 2, to track theportions of the motor pathways from the head, hand trunk and leg. Other scholars have previously
72

analyzed ROIs within a tract or portions of tracts using coordinates from other functional studies(e.g. Sehm et al., 2016; Meier et al., 2016). However, this is the first time that the entire motorcortex has been segregated into regions corresponding to the main body parts, according to thetopographical organization of the homunculus, without functional data. Moreover, portions of thedescending motor pathways have been separately tracked from each WM seed region subjacent tothe GM motor parcellation, allowing for the independent analysis of the motor tract componentsthat control each specific body part. It’s worth noting that tracking from the WM below the motorcortex gives more reliable results than tracking from a cortical region, because the low values of FAwithin GM are hardly interpretable in terms of fiber orientations.
Nonetheless, both studies present some methodological limitations. Given the predominanceof women in the dancer population, a big challenge in this project was to include an adequatenumber of men dancers in our sample. Since it is well-known that sex differences may influencebrain structure (Ritchie et al., 2018; Ingalhalikar et al., 2014; Sowell et al., 2007; Ruigrok et al.,2014), to avoid the confounding effects of sex we matched the male/female ratio across groups andcontrolled for sex in all analyses.
In Study 1, the DTI-based TBSS approach used has the intrinsic drawbacks of not being sensi-tive to multiple fiber bundle orientations co-existing in a voxel and of not being able to discriminatethe specific tracts affected by group modifications. Although, with tractography, in Study 2 it waspossible to select the voxels through which the tracts of interest pass, we cannot exclude that otherfiber bundles traverse some of the same voxels. Therefore, although tractography allows bettertract identification, crossing fibers can still have potential confounding effects one the DTI met-rics calculated across voxels. To overcome such issues, more advanced techniques should be used.Of particular interest, a recent combination of neurite orientation dispersion and density imaging(NODDI) with myelin water imaging (MWI) allowed for the in vivo mapping of the whole humanbrain g-ratio, which is a voxelwise index of the ratio between the axon and myelin volume fractionsrespectively (Jung et al., 2018). Other methods, such as AxCaliber, permit to measure the axondiameter distribution (without myelin sheaths) (Assaf et al., 2008), whereas magnetization transfer(MT) provides an index of the myelin content (Schmierer et al., 2004) within each voxel of the entirebrain. Another novel promising technique, called Spectral Confocal Reflectance Microscopy, usesthe spectral reflectance from the myelin multilayered sheaths wrapped around axons, to visualize3D in vivo maps of axons, myelin sheaths and even nodes of Ranvier at a nanoscale (Schain et al.,2014; Kwon et al., 2017). Such method should be applicable to the human cerebral cortex (Schainet al., 2014).
Another limitation of the tractography approach in Study 2 is that the tracts from each bodypart partially overlap, notably in the plIC. One possibility to overcome this issue would be tosegregate the overlapping portions and analyze them separately. However, the fact that we obtaineddifferences at the whole tract level between the different body parts suggests that such overlapsdid not strongly affect our results. Conversely, the hand and trunk tracts showed more similar
73

results and could thus be interpreted together. Such clustering would still be coherent with ourinterpretations, since the trunk might include the arm representation.
One of the main questions that this dissertation, and most of the literature about training-related brain changes, aims to answer is whether and to what extent training causes changes inthe brain. Traditional approaches try to investigate this question by examining associative rela-tionships, which should not be mistaken for causal relationships. Statistics alone cannot answercausal questions. Recently, causal inference methods have gained in popularity to disentangle spu-rious associations and to estimate the true causal effects. The starting point of a causal analysisis a graphical model, called causal model, that represents the causal relationships assumed by theresearcher. Causal models may be tested against experimental data to validate the assumptions.Once a causal model has been adopted, mathematical rules can be used to compute the causaleffects. However, depending on the particular configuration of the causal model and the availabledata, not all the causal relationships of the model might be solvable. It would be interesting toapply this approach to this project to assess the causal relationships between training and brainstructure (Pearl, 2009).
4.4 Conclusions
This is the first research project that compared the brain structure between highly trained dancersand musicians and linked the observed structural changes to specific measures of the acquiredabilities and age of training start. Comparing brain structure in such similar but unique domainsof training contributes to deepening our knowledge about experience-related plasticity. In Study1, the concurrent analysis of a complementary set of DTI metrics has provided a more thoroughunderstanding of the complex neuroanatomical configurations that differ between groups. In Study2, the novel approach developed to segregate M1 and the subjacent WM allowed us to examineeffector-specific components of the primary motor tracts. Together, our results showed that differenttypes of training may result in distinct structural modifications. In particular, dance training seemsto increase the heterogeneity of fiber orientation and axonal diameter, while music training seemsto reinforce more coherent fibers connecting the trained effectors, such as the descending motortracts linked to the hand. Importantly, this demonstrates that training does not necessarily induceincreases in WM structures. On the contrary, training-related structural changes are more complexand need to be carefully evaluated. Crucially, the observed correlations between DTI metrics andmeasures of dance and music skills support our interpretation that these WM differences are relatedto specific training. Finally, this work is consistent with literature showing the influence of trainingexperience on brain plasticity, but does not exclude potential interactions of training experiencewith pre-existing factors.
74
BIBLIOGRAPHY
Abdul-Kareem, I. A., A. Stancak, L. M. Parkes, and V. Sluming2011. Increased gray matter volume of left pars opercularis in male orchestral musicianscorrelate positively with years of musical performance. Journal of magnetic resonance imaging: JMRI, 33(1):24–32.
Acer, N., S. Bastepe-Gray, A. Sagiroglu, K. Z. Gumus, L. Degirmencioglu, G. Zararsiz, and M. U.Ozic2018. Diffusion tensor and volumetric magnetic resonance imaging findings in the brains ofprofessional musicians. Journal of Chemical Neuroanatomy, 88(June 2017):33–40.
Adkins, D. L., J. Boychuk, M. S. Remple, and J. A. Kleim2006. Motor training induces experience-specific patterns of plasticity across motor cortex andspinal cord. Journal of Applied Physiology, 101(6):1776–1782.
Alexander, A. L., J. E. Lee, M. Lazar, and A. S. Field2007. Diffusion tensor imaging of the brain. Neurotherapeutics, 4(3):316–329.
Alexander, D. C., P. L. Hubbard, M. G. Hall, E. A. Moore, M. Ptito, G. J. Parker, and T. B.Dyrby2010. Orientationally invariant indices of axon diameter and density from diffusion MRI.Neuroimage, 52(4):1374–1389.
Amoruso, L., A. Ibáñez, B. Fonseca, S. Gadea, L. Sedeño, M. Sigman, A. M. García, R. Fraiman,and D. Fraiman2017. Variability in functional brain networks predicts expertise during action observation.NeuroImage, 146:690–700.
Amunts, K., G. Schlaug, L. Jäncke, H. Steinmetz, A. Schleicher, A. Dabringhaus, and K. Zilles1997. Motor cortex and hand motor skills: Structural compliance in the human brain. HumanBrain Mapping, 5(3):206–215.
Andersson, J. L. R., M. Jenkinson, and S. Smith2007. Non-linear registration aka Spatial normalisation, FMRIB Technical Report TR07JA2.Technical report, FMRIB Centre, Oxford, United Kingdom.
Andoh, J., R. Matsushita, and R. J. Zatorre2015. Asymmetric Interhemispheric Transfer in the Auditory Network: Evidence from TMS,Resting-State fMRI, and Diffusion Imaging. Journal of Neuroscience.
75

Arancibia-Cárcamo, I. L., M. C. Ford, L. Cossell, K. Ishida, K. Tohyama, and D. Attwell2017. Node of Ranvier length as a potential regulator of myelinated axon conduction speed.eLife, 6.
Assaf, Y., T. Blumenfeld-Katzir, Y. Yovel, and P. J. Basser2008. AxCaliber: a method for measuring axon diameter distribution from diffusion MRI.Magn Reson Med, 59(6):1347–1354.
Bahn, M. M.1999. Invariant and Orthonormal Scalar Measures Derived from Magnetic Resonance DiffusionTensor Imaging. Journal of Magnetic Resonance, 141(1):68–77.
Bailey, J. A. and V. B. Penhune2010. Rhythm synchronization performance and auditory working memory in early- and late-trained musicians. Exp Brain Res, 204(1):91–101.
Bailey, J. A., R. J. Zatorre, and V. B. Penhune2014. Early Musical Training Is Linked to Gray Matter Structure in the Ventral Premo-tor Cortex and Auditory–Motor Rhythm Synchronization Performance. Journal of CognitiveNeuroscience, 26(4):755–767.
Bangert, M., T. Peschel, G. Schlaug, M. Rotte, D. Drescher, H. Hinrichs, H.-J. Heinze, andE. Altenmüller2006. Shared networks for auditory and motor processing in professional pianists: Evidencefrom fMRI conjunction. NeuroImage, 30(3):917–926.
Bangert, M. and G. Schlaug2006. Specialization of the specialized in features of external human brain morphology. TheEuropean journal of neuroscience, 24(6):1832–4.
Bär, K.-J., F. de la Cruz, S. Berger, C. C. Schultz, and G. Wagner2015. Structural and functional differences in the cingulate cortex relate to disease severity inanorexia nervosa. Journal of Psychiatry & Neuroscience, 40(4):269–279.
Bar, R. J. and J. F. DeSouza2016. Tracking plasticity: Effects of long-term rehearsal in expert dancers encoding music tomovement. PLoS ONE, 11(1):1–16.
Barazany, D., P. J. Basser, and Y. Assaf2009. In vivo measurement of axon diameter distribution in the corpus callosum of rat brain.Brain, 132(Pt 5):1210–1220.
Basser, P., J. Mattiello, and D. LeBihan1994. MR diffusion tensor spectroscopy and imaging. Biophysical Journal, 66(1):259–267.
76

Basser, P. J. and C. Pierpaoli1996. Microstructural and physiological features of tissues elucidated by quantitative-diffusion-tensor MRI. J Magn Reson B, 111(3):209–219.
Baumann, S., S. Koeneke, C. F. Schmidt, M. Meyer, K. Lutz, and L. Jancke2007. A network for audio–motor coordination in skilled pianists and non-musicians. BrainResearch, 1161:65–78.
Beaulieu, C.2002. The basis of anisotropic water diffusion in the nervous system - A technical review.NMR in Biomedicine, 15(7-8):435–455.
Beaulieu, C.2009. The biological basis of diffusion anisotropy. In Diffusion MRI: From quantitative mea-surement to in-vivo neuroanatomy, J.-B. H. and B. T. E., eds., chapter 6, Pp. 105–123.London, UK: Academic Press.
Behrens, T. E., H. J. Berg, S. Jbabdi, M. F. Rushworth, and M. W. Woolrich2007. Probabilistic diffusion tractography with multiple fibre orientations: What can we gain?NeuroImage.
Behrens, T. E., M. W. Woolrich, M. Jenkinson, H. Johansen-Berg, R. G. Nunes, S. Clare, P. M.Matthews, J. M. Brady, and S. M. Smith2003. Characterization and Propagation of Uncertainty in Diffusion-Weighted MR Imaging.Magnetic Resonance in Medicine.
Bengtsson, S. L., H. H. Ehrsson, H. Forssberg, and F. Ullen2004. Dissociating brain regions controlling the temporal and ordinal structure of learnedmovement sequences. European Journal of Neuroscience, 19(9):2591–2602.
Bengtsson, S. L., Z. Nagy, S. Skare, L. Forsman, H. Forssberg, and F. Ullén2005. Extensive piano practicing has regionally specific effects on white matter development.Nature Neuroscience, 8(9):1148–1150.
Bengtsson, S. L. and F. Ullén2006. Dissociation between melodic and rhythmic processing during piano performance frommusical scores. NeuroImage, 30(1):272–84.
Bermudez, P., J. P. Lerch, A. C. Evans, and R. J. Zatorre2009. Neuroanatomical Correlates of Musicianship as Revealed by Cortical Thickness andVoxel-Based Morphometry. Cerebral Cortex, 19(7):1583–1596.
77

Bermudez, P. and R. J. Zatorre2005. Differences in gray matter between musicians and nonmusicians. Annals of the NewYork Academy of Sciences, 1060(1):395–9.
Bezzola, L., S. Merillat, C. Gaser, and L. Jancke2011. Training-induced neural plasticity in golf novices. The Journal of neuroscience : theofficial journal of the Society for Neuroscience, 31(35):12444–12448.
Bläsing, B., B. Calvo-Merino, E. S. Cross, C. Jola, J. Honisch, and C. J. Stevens2012. Neurocognitive control in dance perception and performance. Acta Psychol (Amst),139(2):300–308.
Blecher, T., I. Tal, and M. Ben-Shachar2016. White matter microstructural properties correlate with sensorimotor synchronizationabilities. NeuroImage, 138:1–12.
Bobb, J. F., B. S. Schwartz, C. Davatzikos, and B. Caffo2014. Cross-sectional and longitudinal association of body mass index and brain volume.Human Brain Mapping, 35(1):75–88.
Brown, S., M. J. Martinez, and L. M. Parsons2006. The neural basis of human dance. Cerebral Cortex, 16(8):1157–1167.
Buccino, G., F. Binkofski, G. R. Fink, L. Fadiga, L. Fogassi, V. Gallese, R. J. Seitz, K. Zilles,G. Rizzolatti, and H. J. Freund2001. Action observation activates premotor and parietal areas in a somatotopic manner: anfMRI study. The European journal of neuroscience, 13(2):400–4.
Budde, M. D. and J. Annese2013. Quantification of anisotropy and fiber orientation in human brain histological sections.Front Integr Neurosci, 7:3.
Bürgel, U., K. Amunts, L. Hoemke, H. Mohlberg, J. M. Gilsbach, and K. Zilles2006. White matter fiber tracts of the human brain: three-dimensional mapping at microscopicresolution, topography and intersubject variability. NeuroImage, 29(4):1092–105.
Burzynska, A. Z., K. Finc, B. K. Taylor, A. M. Knecht, and A. F. Kramer2017. The Dancing Brain: Structural and Functional Signatures of Expert Dance Training.Frontiers in Human Neuroscience.
Butkovic, A., F. Ullén, and M. A. Mosing2015. Personality related traits as predictors of music practice: Underlying environmental andgenetic influences. Personality and Individual Differences, 74:133–138.
78

Calvo-Merino, B., S. Ehrenberg, D. Leung, and P. Haggard2010. Experts see it all: Configural effects in action observation. Psychological Research,74(4):400–406.
Calvo-Merino, B., D. E. Glaser, J. Grezes, R. E. Passingham, and P. Haggard2005. Action observation and acquired motor skills: an FMRI study with expert dancers.Cerebral cortex (New York, N Y : 1991), 15(8):1243–1249.
Calvo-Merino, B., J. Grèzes, D. E. Glaser, R. E. Passingham, and P. Haggard2006. Seeing or Doing? Influence of Visual and Motor Familiarity in Action Observation.Current Biology, 16(19):1905–1910.
Canese, R., F. Zoratto, L. Altabella, P. Porcari, L. Mercurio, F. de Pasquale, E. Butti, G. Martino,E. Lacivita, M. Leopoldo, G. Laviola, and W. Adriani2015. Persistent modification of forebrain networks and metabolism in rats following adolescentexposure to a 5-HT7 receptor agonist. Psychopharmacology (Berl), 232(1):75–89.
Cantallops, I. and A. Routtenberg1999. Activity-dependent regulation of axonal growth: posttranscriptional control of the GAP-43 gene by the NMDA receptor in developing hippocampus. J Neurobiol, 41(2):208–220.
Cantou, P., H. Platel, B. Desgranges, and M. Groussard2018. How motor, cognitive and musical expertise shapes the brain: Focus on fMRI andEEG resting-state functional connectivity. Journal of Chemical Neuroanatomy, 89(September2017):60–68.
Canu, M.-H., M. Carnaud, F. Picquet, and L. Goutebroze2009. Activity-dependent regulation of myelin maintenance in the adult rat. Brain research,1252:45–51.
Carmel, J. B. and J. H. Martin2014. Motor cortex electrical stimulation augments sprouting of the corticospinal tract andpromotes recovery of motor function. Front Integr Neurosci, 8:51.
Caspers, S., K. Zilles, A. R. Laird, and S. B. Eickhoff2010. ALE meta-analysis of action observation and imitation in the human brain. NeuroImage,50(3):1148–67.
Catani, M., R. J. Howard, S. Pajevic, and D. K. Jones2002. Virtual in vivo interactive dissection of white matter fasciculi in the human brain.Neuroimage, 17(1):77–94.
Catani, M., D. K. Jones, and D. H. Ffytche2005. Perisylvian language networks of the human brain. Annals of Neurology, 57(1):8–16.
79

Caulo, M., C. Briganti, P. A. Mattei, B. Perfetti, A. Ferretti, G. L. Romani, A. Tartaro, andC. Colosimo2007. New morphologic variants of the hand motor cortex as seen with MR imaging in a largestudy population. American Journal of Neuroradiology.
Cerami, C., C. Crespi, P. A. Della Rosa, A. Dodich, A. Marcone, G. Magnani, E. Coppi, A. Falini,S. F. Cappa, and D. Perani2015. Brain changes within the visuo-spatial attentional network in posterior cortical atrophy.J Alzheimers Dis, 43(2):385–395.
Chechlacz, M., P. Rotshtein, P. C. Hansen, S. Deb, M. J. Riddoch, and G. W. Humphreys2013. The central role of the temporo-parietal junction and the superior longitudinal fasciculusin supporting multi-item competition: evidence from lesion-symptom mapping of extinction.Cortex, 49(2):487–506.
Chechlacz, M., P. Rotshtein, P. C. Hansen, J. M. Riddoch, S. Deb, and G. W. Humphreys2012. The neural underpinings of simultanagnosia: disconnecting the visuospatial attentionnetwork. Journal of cognitive neuroscience, 24(3):718–735.
Chen, H. S.-M., N. Holmes, J. Liu, W. Tetzlaff, and P. Kozlowski2017. Validating myelin water imaging with transmission electron microscopy in a rat spinalcord injury model. NeuroImage, 153:122–130.
Chen, J. L., V. B. Penhune, and R. J. Zatorre2008. Listening to musical rhythms recruits motor regions of the brain. Cerebral cortex (NewYork, N.Y. : 1991), 18(12):2844–54.
Chen, J. L., C. Rae, and K. E. Watkins2012. Learning to play a melody: An fMRI study examining the formation of auditory-motorassociations. NeuroImage, 59(2):1200–1208.
Chen, S. X., A. N. Kim, A. J. Peters, and T. Komiyama2015. Subtype-specific plasticity of inhibitory circuits in motor cortex during motor learning.Nature Neuroscience, 18(8):1109–1115.
Chéreau, R., G. E. Saraceno, J. Angibaud, D. Cattaert, and U. V. Nägerl2017. Superresolution imaging reveals activity-dependent plasticity of axon morphology linkedto changes in action potential conduction velocity. Proceedings of the National Academy ofSciences.
Chiang, C. W., Y. Wang, P. Sun, T. H. Lin, K. Trinkaus, A. H. Cross, and S. K. Song2014. Quantifying white matter tract diffusion parameters in the presence of increased extra-fiber cellularity and vasogenic edema. Neuroimage, 101:310–319.
80

Choi, U.-S., Y.-W. Sung, S. Hong, J.-Y. Chung, and S. Ogawa2015. Structural and functional plasticity specific to musical training with wind instruments.Frontiers in Human Neuroscience.
Classen, J., J. Liepert, S. P. Wise, M. Hallett, and L. G. Cohen1998. Rapid Plasticity of Human Cortical Movement Representation Induced by Practice.Journal of Neurophysiology, 79(2):1117–1123.
Coffey, E. B. J., S. Herholz, S. Scala, and R. J. Zatorre2011. Montreal Music History Questionnaire: a tool for the assessment of music-related expe-rience in music cognition research. In The Neurosciences and Music IV, Edinburgh.
Concha, L., D. W. Gross, B. M. Wheatley, and C. Beaulieu2006. Diffusion tensor imaging of time-dependent axonal and myelin degradation after corpuscallosotomy in epilepsy patients. Neuroimage, 32(3):1090–1099.
Conner, J. M., A. Culberson, C. Packowski, A. A. Chiba, and M. H. Tuszynski2003. Lesions of the Basal forebrain cholinergic system impair task acquisition and abolishcortical plasticity associated with motor skill learning. Neuron, 38(5):819–29.
Costa, M. S. d. S., A. d. S. Ferreira, and L. R. Felicio2013. Static and dynamic balance in ballet dancers: a literature review. Fisioterapia ePesquisa, 20(3):7.
Cross, E. S., A. F. Hamilton, and S. T. Grafton2006. Building a motor simulation de novo: observation of dance by dancers. Neuroimage,31(3):1257–1267.
Cross, E. S., A. F. C. Hamilton, D. J. Kraemer, W. M. Kelley, and S. T. Grafton2009a. Dissociable substrates for body motion and physical experience in the human actionobservation network. European Journal of Neuroscience, 30(7):1383–1392.
Cross, E. S., D. J. Kraemer, A. F. C. Hamilton, W. M. Kelley, and S. T. Grafton2009b. Sensitivity of the action observation network to physical and observational learning.Cerebral Cortex, 19(2):315–326.
Crotts, D., B. Thompson, M. Nahom, S. Ryan, and R. A. Newton1996. Balance abilities of professional dancers on select balance tests. J Orthop Sports PhysTher, 23(1):12–17.
Cruz-Garza, J. G., Z. R. Hernandez, S. Nepaul, K. K. Bradley, and J. L. Contreras-Vidal2014. Neural decoding of expressive human movement from scalp electroencephalography(EEG). Frontiers in Human Neuroscience, 8(April):1–16.
81

de Manzano, Ö. and F. Ullén2018. Same Genes, different brains: Neuroanatomical differences between monozygotic twinsdiscordant for musical training. Cerebral Cortex, 28(1):387–394.
Della-Maggiore, V., J. Scholz, H. Johansen-Berg, and T. Paus2009. The rate of visuomotor adaptation correlates with cerebellar white-matter microstruc-ture. Human Brain Mapping, 30(12):4048–4053.
Desikan, R. S., F. Ségonne, B. Fischl, B. T. Quinn, B. C. Dickerson, D. Blacker, R. L. Buckner,A. M. Dale, R. P. Maguire, B. T. Hyman, M. S. Albert, and R. J. Killiany2006. An automated labeling system for subdividing the human cerebral cortex on MRI scansinto gyral based regions of interest. NeuroImage, 31(3):968–980.
Dordevic, M., R. Schrader, M. Taubert, P. Müller, A. Hökelmann, and N. G. Müller2018. Vestibulo-Hippocampal Function Is Enhanced and Brain Structure Altered in Profes-sional Ballet Dancers. Frontiers in Integrative Neuroscience, 12:50.
Doricchi, F., M. Thiebautdeschotten, F. Tomaiuolo, and P. Bartolomeo2008. White matter (dis)connections and gray matter (dys)functions in visual neglect: Gaininginsights into the brain networks of spatial awareness. Cortex, 44(8):983–995.
Douaud, G., T. E. Behrens, C. Poupon, Y. Cointepas, S. Jbabdi, V. Gaura, N. Golestani, P. Krys-tkowiak, C. Verny, P. Damier, A. C. Bachoud-Levi, P. Hantraye, and P. Remy2009. In vivo evidence for the selective subcortical degeneration in Huntington’s disease.Neuroimage, 46(4):958–966.
Douaud, G., S. Jbabdi, T. E. Behrens, R. A. Menke, A. Gass, A. U. Monsch, A. Rao, B. Whitcher,G. Kindlmann, P. M. Matthews, and S. Smith2011. DTI measures in crossing-fibre areas: increased diffusion anisotropy reveals early whitematter alteration in MCI and mild Alzheimer’s disease. Neuroimage, 55(3):880–890.
Doyon, J., P. Bellec, R. Amsel, V. Penhune, O. Monchi, J. Carrier, S. Lehéricy, and H. Benali2009. Contributions of the basal ganglia and functionally related brain structures to motorlearning. Behavioural Brain Research, 199(1):61–75.
Draganski, B., C. Gaser, V. Busch, G. Schuierer, U. Bogdahn, and A. May2004. Neuroplasticity: changes in grey matter induced by training. Nature, 427(6972):311–312.
Driemeyer, J., J. Boyke, C. Gaser, C. Buchel, and A. May2008. Changes in gray matter induced by learning–revisited. PLoS One, 3(7):e2669.
Dum, R. P. and P. L. Strick1991. The origin of corticospinal projections from the premotor areas in the frontal lobe. TheJournal of neuroscience : the official journal of the Society for Neuroscience, 11(3):667–89.
82

Dum, R. P. and P. L. Strick2005. Frontal Lobe Inputs to the Digit Representations of the Motor Areas on the LateralSurface of the Hemisphere. Journal of Neuroscience, 25(6):1375–1386.
Elbert, T., C. Pantev, C. Wienbruch, B. Rockstroh, T. Elbert, C. Pantev, C. Wienbruch, B. Rock-stroh, and E. Taub1995. Increased Cortical Representation of the Fingers of the Left Hand in String PlayersEdward Taub Published by: American Association for the Advancement of Science StableURL: https://www.jstor.org/stable/2888544 digitize, preserve and extend access to S. Sci-ence, 270(5234):305–307.
Ellerbrock, I. and S. Mohammadi2018. Four in vivo g-ratio-weighted imaging methods: Comparability and repeatability at thegroup level. Human brain mapping, 39(1):24–41.
Elmer, S., J. Hanggi, and L. Jancke2014. Interhemispheric transcallosal connectivity between the left and right planum temporalepredicts musicianship, performance in temporal speech processing, and functional specializa-tion. Brain Struct Funct.
Engel, A., B. S. Hijmans, L. Cerliani, M. Bangert, L. Nanetti, P. E. Keller, and C. Keysers2014. Inter-individual differences in audio-motor learning of piano melodies and white matterfiber tract architecture. Human Brain Mapping, 35(5):2483–2497.
Ennis, D. B., G. Kindlman, I. Rodriguez, P. A. Helm, and E. R. McVeigh2005. Visualization of tensor fields using superquadric glyphs. Magnetic Resonance inMedicine, 53(1):169–176.
Ennis, D. B. and G. Kindlmann2006. Orthogonal tensor invariants and the analysis of diffusion tensor magnetic resonanceimages. Magnetic Resonance in Medicine, 55(1):136–146.
Ermutlu, N., I. Yücesir, G. Eskikurt, T. Temel, and Ü. İşoğlu Alkaç2015. Brain electrical activities of dancers and fast ball sports athletes are different. CognitiveNeurodynamics, 9(2):257–263.
Fadiga, L., L. Fogassi, G. Pavesi, and G. Rizzolatti1995. Motor facilitation during action observation: a magnetic stimulation study. J Neuro-physiol, 73(6):2608–2611.
Fields, R. D.2015. A new mechanism of nervous system plasticity: activity-dependent myelination. Naturereviews. Neuroscience, 16(12):756–67.
83

Fieremans, E., Y. De Deene, S. Delputte, M. S. Ozdemir, E. Achten, and I. Lemahieu2008. The design of anisotropic diffusion phantoms for the validation of diffusion weightedmagnetic resonance imaging. Phys Med Biol, 53(19):5405–5419.
Filippi, M., M. Cercignani, M. Inglese, M. A. Horsfield, and G. Comi2001. Diffusion tensor magnetic resonance imaging in multiple sclerosis. Neurology, 56(3):304–311.
Fink, A., B. Graif, and A. C. Neubauer2009. Brain correlates underlying creative thinking: EEG alpha activity in professional vs.novice dancers. NeuroImage, 46(3):854–862.
Floyer-Lea, A. and P. M. Matthews2004. Changing Brain Networks for Visuomotor Control With Increased Movement Auto-maticity. Journal of Neurophysiology, 92(4):2405–2412.
Ford, M. C., O. Alexandrova, L. Cossell, A. Stange-Marten, J. Sinclair, C. Kopp-Scheinpflug,M. Pecka, D. Attwell, and B. Grothe2015. Tuning of Ranvier node and internode properties in myelinated axons to adjust actionpotential timing. Nature Communications, 6:1–14.
Foster, N. E. and R. J. Zatorre2010a. Cortical structure predicts success in performing musical transformation judgments.Neuroimage, 53(1):26–36.
Foster, N. E. V. and R. J. Zatorre2010b. A role for the intraparietal sulcus in transforming musical pitch information. Cerebralcortex (New York, N.Y. : 1991), 20(6):1350–9.
Fujioka, T., B. Ross, and L. J. Trainor2015. Beta-Band Oscillations Represent Auditory Beat and Its Metrical Hierarchy in Per-ception and Imagery. The Journal of neuroscience : the official journal of the Society forNeuroscience, 35(45):15187–98.
Gallese, V., L. Fadiga, L. Fogassi, and G. Rizzolatti1996. Action recognition in the premotor cortex. Brain, 119 ( Pt 2):593–609.
Gallichan, D., J. Scholz, A. Bartsch, T. E. Behrens, M. D. Robson, and K. L. Miller2010. Addressing a systematic vibration artifact in diffusion-weighted MRI. Hum Brain Mapp,31(2):193–202.
Gardner, T., N. Goulden, and E. S. Cross2015. Dynamic modulation of the action observation network by movement familiarity. TheJournal of neuroscience : the official journal of the Society for Neuroscience, 35(4):1561–1572.
84

Gaser, C. and G. Schlaug2003. Gray matter differences between musicians and nonmusicians. Ann N Y Acad Sci,999:514–517.
Gaudio, S., C. C. Quattrocchi, C. Piervincenzi, B. B. Zobel, F. R. Montecchi, A. Dakanalis,G. Riva, and F. Carducci2017. White matter abnormalities in treatment-naive adolescents at the earliest stages ofAnorexia Nervosa: A diffusion tensor imaging study. Psychiatry Research: Neuroimaging,266:138–145.
Gazzola, V. and C. Keysers2009. The observation and execution of actions share motor and somatosensory voxels in alltested subjects: single-subject analyses of unsmoothed fMRI data. Cerebral cortex (New York,N Y : 1991), 19(6):1239–1255.
Gerloff, C. and F. G. Andres2002. Bimanual coordination and interhemispheric interaction. Acta psychologica, 110(2-3):161–86.
Giacosa, C., F. Karpati, N. Foster, V. B. Penhune, and K. Hyde2016. Dance and music training have different effects on white matter diffusivity in sensori-motor pathways. NeuroImage, 135.
Giorgio, A., K. E. Watkins, M. Chadwick, S. James, L. Winmill, G. Douaud, N. De Stefano, P. M.Matthews, S. M. Smith, H. Johansen-Berg, and A. C. James2010. Longitudinal changes in grey and white matter during adolescence. NeuroImage.
Golomer, E., A. Bouillette, C. Mertz, and J. Keller2008. Effects of mental imagery styles on shoulder and hip rotations during preparation ofpirouettes. J Mot Behav, 40(4):281–290.
Golomer, E., F. Mbongo, Y. Toussaint, M. Cadiou, and I. Israel2010. Right hemisphere in visual regulation of complex equilibrium: the female ballet dancers’experience. Neurol Res, 32(4):409–415.
Gooijers, J. and S. P. Swinnen2014. Interactions between brain structure and behavior: The corpus callosum and bimanualcoordination. Neuroscience and Biobehavioral Reviews, 43:1–19.
Grafton, S. T.2009. Embodied cognition and the simulation of action to understand others. Annals of theNew York Academy of Sciences, 1156:97–117.
85

Grahn, J. A. and J. B. Rowe2009. Feeling the Beat: Premotor and Striatal Interactions in Musicians and Nonmusiciansduring Beat Perception. Journal of Neuroscience, 29(23):7540–7548.
Grèzes, J. and J. Decety2001. Functional anatomy of execution, mental simulation, observation, and verb generationof actions: a meta-analysis. Human brain mapping, 12(1):1–19.
Groussard, M., F. Viader, B. Landeau, B. Desgranges, F. Eustache, and H. Platel2014. The effects of musical practice on structural plasticity: the dynamics of grey matterchanges. Brain Cogn, 90:174–180.
Gulani, V., A. G. Webb, I. D. Duncan, and P. C. Lauterbur2001. Apparent diffusion tensor measurements in myelin-deficient rat spinal cords. MagnReson Med, 45(2):191–195.
Halwani, G. F., P. Loui, T. Rüber, and G. Schlaug2011. Effects of practice and experience on the arcuate fasciculus: comparing singers, instru-mentalists, and non-musicians. Front Psychol, 2:156.
Hammond, G.2002. Correlates of human handedness in primary motor cortex: A review and hypothesis.
Han, Y., H. Yang, Y. T. Lv, C. Z. Zhu, Y. He, H. H. Tang, Q. Y. Gong, Y. J. Luo, Y. F. Zang,and Q. Dong2009. Gray matter density and white matter integrity in pianists’ brain: A combined structuraland diffusion tensor MRI study. Neuroscience Letters, 459(1):3–6.
Hänggi, J., S. Koeneke, L. Bezzola, and L. Jancke2010. Structural neuroplasticity in the sensorimotor network of professional female balletdancers. Hum Brain Mapp, 31(8):1196–1206.
Hänggi, J., N. Langer, K. Lutz, K. Birrer, S. Mérillat, and L. Jäncke2015. Structural brain correlates associated with professional handball playing. PLoS ONE,10(4):1–27.
Harrington, B. and G. Alan Fine2000. Opening the "black box": Small groups and twenty-first-century sociology. Social Psy-chology Quarterly, 63(4):312–323.
Hartline, D. K. and D. R. Colman2007. Rapid conduction and the evolution of giant axons and myelinated fibers. Currentbiology : CB, 17(1):R29–35.
86

Hecht, E. E., D. A. Gutman, T. M. Preuss, M. M. Sanchez, L. A. Parr, and J. K. Rilling2013a. Process versus product in social learning: Comparative diffusion tensor imaging of neu-ral systems for action execution-observation matching in macaques, chimpanzees, and humans.Cerebral Cortex, 23(5):1014–1024.
Hecht, E. E., L. E. Murphy, D. A. Gutman, J. R. Votaw, D. M. Schuster, T. M. Preuss, G. A.Orban, D. Stout, and L. A. Parr2013b. Differences in Neural Activation for Object-Directed Grasping in Chimpanzees andHumans. Journal of Neuroscience, 33(35):14117–14134.
Herholz, S. C. and R. J. Zatorre2012. Musical training as a framework for brain plasticity: behavior, function, and structure.Neuron, 76(3):486–502.
Hickok, G., B. Buchsbaum, C. Humphries, and T. Muftuler2003. Auditory-motor interaction revealed by fMRI: Speech, music, and working memory inarea Spt. Journal of Cognitive Neuroscience, 15(5):673–682.
Hines, J. H., A. M. Ravanelli, R. Schwindt, E. K. Scott, and B. Appel2015. Neuronal activity biases axon selection for myelination in vivo. Nature Neuroscience,18(5):683–689.
Hoeft, F., N. Barnea-Goraly, B. W. Haas, G. Golarai, D. Ng, D. Mills, J. Korenberg, U. Bellugi,A. Galaburda, and A. L. Reiss2007. More Is Not Always Better: Increased Fractional Anisotropy of Superior LongitudinalFasciculus Associated with Poor Visuospatial Abilities in Williams Syndrome. Journal ofNeuroscience, 27(44):11960–11965.
Hofer, S. and J. Frahm2006. Topography of the human corpus callosum revisited–comprehensive fiber tractographyusing diffusion tensor magnetic resonance imaging. Neuroimage, 32(3):989–994.
Horenstein, C., M. J. Lowe, K. A. Koenig, and M. D. Phillips2009. Comparison of unilateral and bilateral complex finger tapping-related activation inpremotor and primary motor cortex. Human Brain Mapping, 30(4):1397–1412.
Horowitz, A., D. Barazany, I. Tavor, M. Bernstein, G. Yovel, and Y. Assaf2015. In vivo correlation between axon diameter and conduction velocity in the human brain.Brain Struct Funct, 220(3):1777–1788.
Howe, M. W., H. E. Atallah, A. McCool, D. J. Gibson, and A. M. Graybiel2011. Habit learning is associated with major shifts in frequencies of oscillatory activityand synchronized spike firing in striatum. Proceedings of the National Academy of Sciences,108(40):16801–16806.
87

Hu, S., H. Feng, T. Xu, H. Zhang, Z. Zhao, J. Lai, D. Xu, and Y. Xu2017. Altered microstructure of brain white matter in females with anorexia nervosa: adiffusion tensor imaging study. Neuropsychiatric Disease and Treatment, Volume 13:2829–2836.
Hua, K., J. Zhang, S. Wakana, H. Jiang, X. Li, D. S. Reich, P. A. Calabresi, J. J. Pekar, P. C.van Zijl, and S. Mori2008. Tract probability maps in stereotaxic spaces: analyses of white matter anatomy andtract-specific quantification. Neuroimage, 39(1):336–347.
Huang, R., M. Lu, Z. Song, and J. Wang2013. Long-term intensive training induced brain structural changes in world class gymnasts.Brain Structure and Function, 220(2):625–644.
Hüfner, K., C. Binetti, D. A. Hamilton, T. Stephan, V. L. Flanagin, J. Linn, K. Labudda,H. Markowitsch, S. Glasauer, K. Jahn, M. Strupp, and T. Brandt2011. Structural and functional plasticity of the hippocampal formation in professional dancersand slackliners. Hippocampus, 21(8):855–865.
Hugel, F., M. Cadopi, F. Kohler, and P. Perrin1999. Postural control of ballet dancers: a specific use of visual input for artistic purposes.Int J Sports Med, 20(2):86–92.
Hughes, E. G., J. L. Orthmann-Murphy, A. J. Langseth, and D. E. Bergles2018. Myelin remodeling through experience-dependent oligodendrogenesis in the adult so-matosensory cortex. Nature neuroscience, 21(5):696–706.
Hummel, N., K. Hüfner, T. Stephan, J. Linn, O. Kremmyda, T. Brandt, and V. L. Flanagin2014. Vestibular loss and balance training cause similar changes in human cerebral whitematter fractional anisotropy. PLoS ONE, 9(4):1–11.
Hutchinson, S., L. H.-L. Lee, N. Gaab, and G. Schlaug2003. Cerebellar volume of musicians. Cerebral cortex (New York, N.Y. : 1991), 13(9):943–9.
Hutt, K. and E. Redding2014. The effect of an eyes-closed dance-specific training program on dynamic balance inelite pre-professional ballet dancers: a randomized controlled pilot study. J Dance Med Sci,18(1):3–11.
Hyde, K. L., J. Lerch, A. Norton, M. Forgeard, E. Winner, A. C. Evans, and G. Schlaug2009a. Musical training shapes structural brain development. The Journal of neuroscience :the official journal of the Society for Neuroscience, 29(10):3019–3025.
88
Hyde, K. L., J. Lerch, A. Norton, M. Forgeard, E. Winner, A. C. Evans, and G. Schlaug2009b. The effects of musical training on structural brain development: A longitudinal study.Annals of the New York Academy of Sciences, 1169:182–186.
Iacoboni, M., L. M. Koski, M. Brass, H. Bekkering, R. P. Woods, M.-C. Dubeau, J. C. Mazziotta,and G. Rizzolatti2001. Reafferent copies of imitated actions in the right superior temporal cortex. Proceedingsof the National Academy of Sciences, 98(24):13995–13999.
Imfeld, A., M. S. Oechslin, M. Meyer, T. Loenneker, and L. Jancke2009. White matter plasticity in the corticospinal tract of musicians: a diffusion tensor imagingstudy. Neuroimage, 46(3):600–607.
Ingalhalikar, M., A. Smith, D. Parker, T. D. Satterthwaite, M. A. Elliott, K. Ruparel, H. Hakonar-son, R. E. Gur, R. C. Gur, and R. Verma2014. Sex differences in the structural connectome of the human brain. Proceedings of theNational Academy of Sciences, 111(2):823–828.
James, C. E., M. S. Oechslin, D. Van De Ville, C.-A. Hauert, C. Descloux, and F. Lazeyras2014. Musical training intensity yields opposite effects on grey matter density in cognitiveversus sensorimotor networks. Brain Structure and Function, 219(1):353–366.
Jäncke, L., S. Koeneke, A. Hoppe, C. Rominger, and J. Hänggi2009. The Architecture of the Golfer’s Brain. PLoS ONE, 4(3):e4785.
Jbabdi, S., T. E. Behrens, and S. M. Smith2010. Crossing fibres in tract-based spatial statistics. Neuroimage, 49(1):249–256.
Jenkinson, M., P. Bannister, M. Brady, and S. Smith2002. Improved optimization for the robust and accurate linear registration and motion cor-rection of brain images. NeuroImage, 17(2):825–41.
Jenkinson, M. and S. Smith2001. A global optimisation method for robust affine registration of brain images. Medicalimage analysis, 5(2):143–56.
Jeurissen, B., A. Leemans, J. D. Tournier, D. K. Jones, and J. Sijbers2013. Investigating the prevalence of complex fiber configurations in white matter tissue withdiffusion magnetic resonance imaging. Human Brain Mapping, 34(11):2747–2766.
Johansen-Berg, H. and T. E. J. Behrens2009. Diffusion MRI : from quantitative measurement to in-vivo neuroanatomy. AcademicPress.
89
Johansen-Berg, H., V. Della-Maggiore, T. E. Behrens, S. M. Smith, and T. Paus2007. Integrity of white matter in the corpus callosum correlates with bimanual co-ordinationskills. Neuroimage, 36 Suppl 2:T16–21.
Jola, C., A. Davis, and P. Haggard2011. Proprioceptive integration and body representation: insights into dancers’ expertise.Exp Brain Res, 213(2-3):257–265.
Jones, D. K., T. R. Knösche, and R. Turner2013. White matter integrity, fiber count, and other fallacies: the do’s and don’ts of diffusionMRI. NeuroImage, 73:239–54.
Jung, W., J. J. Lee, H.-G. Shin, Y. Nam, H. Zhang, S.-H. Oh, and J. J. Lee2018. Whole brain g-ratio mapping using myelin water imaging (MWI) and neurite orientationdispersion and density imaging (NODDI). NeuroImage, 182(September 2017):379–388.
Kalil, K. and E. W. Dent2014. Branch management: mechanisms of axon branching in the developing vertebrate CNS.Nat Rev Neurosci, 15(1):7–18.
Kaller, M. S., A. Lazari, C. Blanco-Duque, C. Sampaio-Baptista, and H. Johansen-Berg2017. Myelin plasticity and behaviour — connecting the dots. Current Opinion in Neurobiol-ogy, 47:86–92.
Kamali, A., A. E. Flanders, J. Brody, J. V. Hunter, and K. M. Hasan2014. Tracing superior longitudinal fasciculus connectivity in the human brain using highresolution diffusion tensor tractography. Brain Struct Funct, 219(1):269–281.
Kaminski, E., M. Hoff, B. Sehm, M. Taubert, V. Conde, C. J. Steele, A. Villringer, and P. Ragert2013. Effect of transcranial direct current stimulation (tDCS) during complex whole bodymotor skill learning. Neuroscience Letters, 552:76–80.
Karim, H., B. Schmidt, D. Dart, N. Beluk, and T. Huppert2012. Functional near-infrared spectroscopy (fNIRS) of brain function during active balancingusing a video game system. Gait and Posture, 35(3):367–372.
Karni, A., G. Meyer, P. Jezzard, M. M. Adams, R. Turner, and L. G. Ungerleider1995. Functional MRI evidence for adult motor cortex plasticity during motor skill learning.Nature, 377(6545):155–158.
Karpati, F., C. Giacosa, N. Foster, V. B. Penhune, and K. Hyde2016. Sensorimotor integration is enhanced in dancers and musicians. Experimental BrainResearch, 234(3).
90

Karpati, F., C. Giacosa, N. Foster, V. B. Penhune, and K. Hyde2017. Dance and music share gray matter structural correlates. Brain Research, 1657.
Karpati, F., C. Giacosa, N. Foster, V. B. Penhune, and K. Hyde2018. Structural covariance analysis reveals differences between dancers and untrained controls.Frontiers in Human Neuroscience, 12.
Karpati, F. J., C. Giacosa, N. E. Foster, V. B. Penhune, and K. L. Hyde2015. Dance and the brain: a review. Ann N Y Acad Sci, 1337:140–146.
Kattenstroth, J. C., T. Kalisch, I. Kolankowska, and H. R. Dinse2011. Balance, sensorimotor, and cognitive performance in long-year expert senior ballroomdancers. J Aging Res, 2011:176709.
Katzman, D. K., E. K. Lambe, D. J. Mikulis, J. N. Ridgley, D. S. Goldbloom, and R. B. Zipursky1996. Cerebral gray matter and white matter volume deficits in adolescent girls with anorexianervosa. The Journal of pediatrics, 129(6):794–803.
Kawai, R., T. Markman, R. Poddar, R. Ko, A. L. Fantana, A. K. Dhawale, A. R. Kampff, andB. P. Ölveczky2015. Motor cortex is required for learning but not for executing a motor skill. Neuron,86(3):800–12.
Keller, M., J. Pfusterschmied, M. Buchecker, E. Muller, and W. Taube2012. Improved postural control after slackline training is accompanied by reduced H-reflexes.Scand J Med Sci Sports, 22(4):471–477.
Keller, T. A. and M. A. Just2009. Altering cortical connectivity: remediation-induced changes in the white matter of poorreaders. Neuron, 64(5):624–631.
Kennedy, J. T., P. F. Collins, and M. Luciana2016. Higher Adolescent Body Mass Index Is Associated with Lower Regional Gray and WhiteMatter Volumes and Lower Levels of Positive Emotionality. Frontiers in neuroscience, 10:413.
Keysers, C. and V. Gazzola2009. Expanding the mirror: vicarious activity for actions, emotions, and sensations. Currentopinion in neurobiology, 19(6):666–71.
Kiefer, A. W., M. A. Riley, K. Shockley, C. A. Sitton, T. E. Hewett, S. Cummins-Sebree, and J. G.Haas2011. Multi-segmental postural coordination in professional ballet dancers. Gait Posture,34(1):76–80.
91

Kleim, J. A., S. Barbay, N. R. Cooper, T. M. Hogg, C. N. Reidel, M. S. Remple, and R. J. Nudo2002. Motor learning-dependent synaptogenesis is localized to functionally reorganized motorcortex. Neurobiology of Learning and Memory, 77(1):63–77.
Kleim, J. A., S. Barbay, and R. J. Nudo1998. Functional Reorganization of the Rat Motor Cortex Following Motor Skill Learning.Journal of Neurophysiology, 80(6):3321–3325.
Kleim, J. A., T. M. Hogg, P. M. VandenBerg, N. R. Cooper, R. Bruneau, and M. Remple2004. Cortical synaptogenesis and motor map reorganization occur during late, but not early,phase of motor skill learning. The Journal of neuroscience : the official journal of the Societyfor Neuroscience, 24(3):628–33.
Klein, C., F. Liem, J. Hänggi, S. Elmer, and L. Jäncke2016. The “silent” imprint of musical training. Human Brain Mapping, 37(2):536–546.
Klingberg, T.2006. Development of a superior frontal-intraparietal network for visuo-spatial working mem-ory. Neuropsychologia, 44(11):2171–2177.
Knyazeva, M. G.2013. Splenium of Corpus Callosum: Patterns of Interhemispheric Interaction in Children andAdults. Neural Plasticity, 2013:1–12.
Koch, G., M. Cercignani, C. Pecchioli, V. Versace, M. Oliveri, C. Caltagirone, J. Rothwell, andM. Bozzali2010. In vivo definition of parieto-motor connections involved in planning of grasping move-ments. Neuroimage, 51(1):300–312.
Kodama, M., T. Ono, F. Yamashita, H. Ebata, M. Liu, S. Kasuga, and J. Ushiba2018. Structural Gray Matter Changes in the Hippocampus and the Primary Motor Cortex onAn-Hour-to-One- Day Scale Can Predict Arm-Reaching Performance Improvement. Frontiersin human neuroscience, 12:209.
Krasnow, D., M. V. Wilmerding, S. Stecyk, M. Wyon, and Y. Koutedakis2011. Biomechanical research in dance: a literature review. Medical problems of performingartists, 26(1):3–23.
Krüger, B., M. Bischoff, C. Blecker, C. Langhanns, S. Kindermann, I. Sauerbier, M. Reiser,R. Stark, J. Munzert, and S. Pilgramm2014. Parietal and premotor cortices: activation reflects imitation accuracy during observation,delayed imitation and concurrent imitation. Neuroimage, 100:39–50.
92

Kwon, J., M. Kim, H. Park, B.-M. Kang, Y. Jo, J.-H. Kim, O. James, S.-H. Yun, S.-G. Kim,M. Suh, and M. Choi2017. Label-free nanoscale optical metrology on myelinated axons in vivo. Nature Communi-cations, 8(1):1832.
Lahav, A., E. Saltzman, and G. Schlaug2007. Action representation of sound: audiomotor recognition network while listening tonewly acquired actions. The Journal of neuroscience : the official journal of the Society forNeuroscience, 27(2):308–14.
LaMantia, A. S. and P. Rakic1990. Axon overproduction and elimination in the corpus callosum of the developing rhesusmonkey. The Journal of neuroscience : the official journal of the Society for Neuroscience,10(7):2156–2175.
Landi, S. M., F. Baguear, and V. Della-maggiore2011. One week of motor adaptation induces structural changes in primary motor cortex thatpredict long-term memory one year later. Journal of Neuroscience, 31(33):11808–11813.
Landmann, C., S. M. Landi, S. T. Grafton, and V. Della-Maggiore2011. FMRI supports the sensorimotor theory of motor resonance. PLoS One, 6(11):e26859.
Lappe, C., M. Lappe, and C. Pantev2016. Differential processing of melodic, rhythmic and simple tone deviations in musicians–anMEG study. NeuroImage, 124(Pt A):898–905.
Lavagnino, L., F. Amianto, B. Mwangi, F. D’Agata, A. Spalatro, G. B. Zunta Soares, G. A. Daga,P. Mortara, S. Fassino, and J. C. Soares2016. The relationship between cortical thickness and body mass index differs between womenwith anorexia nervosa and healthy controls. Psychiatry Research: Neuroimaging, 248:105–109.
Lee, C. C.2013. Thalamic and cortical pathways supporting auditory processing. Brain and language,126(1):22–28.
Lee, D., Y. Chen, and G. Schlaug2003. Corpus callosum: musician and gender effects. - PubMed - NCBI. Neuroreport,14(2):205–209.
Li, G., H. He, M. Huang, X. Zhang, J. Lu, Y. Lai, C. Luo, and D. Yao2015. Identifying enhanced cortico-basal ganglia loops associated with prolonged dance train-ing. Scientific Reports, 5(May 2016):1–11.
93

Lopez-Barroso, D., M. Catani, P. Ripolles, F. Dell’Acqua, A. Rodriguez-Fornells, and R. de Diego-Balaguer2013. Word learning is mediated by the left arcuate fasciculus. Proceedings of the NationalAcademy of Sciences of the United States of America, 110(32):13168–13173.
Loui, P., H. C. Li, and G. Schlaug2011. White matter integrity in right hemisphere predicts pitch-related grammar learning.NeuroImage, 55(2):500–507.
Luo, C., Z. wei Guo, Y. xiu Lai, W. Liao, Q. Liu, K. M. Kendrick, D. zhong Yao, and H. Li2012. Musical training induces functional plasticity in perceptual and motor networks: Insightsfrom resting-state fMRI. PLoS ONE, 7(5):1–10.
Maguire, E. A., D. G. Gadian, I. S. Johnsrude, C. D. Good, J. Ashburner, R. S. J. Frackowiak,and C. D. Frith2000. Navigation-related structural change in the hippocampi of taxi drivers. Proceedings ofthe National Academy of Sciences, 97(8):4398–4403.
Makino, H., E. J. Hwang, N. G. Hedrick, and T. Komiyama2016. Circuit Mechanisms of Sensorimotor Learning. Neuron, 92(4):705–721.
Makris, N., D. N. Kennedy, S. McInerney, A. G. Sorensen, R. Wang, V. S. Caviness, and D. N.Pandya2005. Segmentation of subcomponents within the superior longitudinal fascicle in humans: Aquantitative, in vivo, DT-MRI study. Cerebral Cortex, 15(6):854–869.
Mariath, L. M., A. M. da Silva, T. W. Kowalski, G. S. Gattino, G. A. de Araujo, F. G. Figueiredo,A. Tagliani-Ribeiro, T. Roman, F. S. L. Vianna, L. Schuler-Faccini, and J. B. Schuch2017. Music genetics research: Association with musicality of a polymorphism in the AVPR1Agene. Genetics and Molecular Biology, 40(2):421–429.
Markham, J. A., M. M. Herting, A. E. Luszpak, J. M. Juraska, and W. T. Greenough2010. Following Complex Environment Housing During Adulthood. Animals, 6066:9–17.
Martino, J., P. C. De Witt Hamer, M. S. Berger, M. T. Lawton, C. M. Arnold, E. M. De Lucas,and H. Duffau2013. Analysis of the subcomponents and cortical terminations of the perisylvian superiorlongitudinal fasciculus: A fiber dissection and DTI tractography study. Brain Structure andFunction, 218(1):105–121.
McDougall, S., W. Vargas Riad, A. Silva-Gotay, E. R. Tavares, D. Harpalani, G.-L. Li, and H. N.Richardson2018. Myelination of Axons Corresponds with Faster Transmission Speed in the PrefrontalCortex of Developing Male Rats. eNeuro, 5(4):ENEURO.0203–18.2018.
94
Meier, J., M. S. Topka, and J. Hänggi2016. Differences in Cortical Representation and Structural Connectivity of Hands and Feetbetween Professional Handball Players and Ballet Dancers. Neural Plasticity.
Mendoza, J. E.2011. Auditory Cortex, Pp. 301–301. New York, NY: Springer New York.
Minvielle-Moncla, J., M. Audiffren, F. Macar, and C. Vallet2008. Overproduction timing errors in expert dancers. J Mot Behav, 40(4):291–300.
Molenberghs, P., C. Brander, J. B. Mattingley, and R. Cunnington2010. The role of the superior temporal sulcus and the mirror neuron system in imitation.Human brain mapping, 31(9):1316–26.
Monfils, M. H., E. J. Plautz, and J. A. Kleim2005. In search of the motor engram: Motor map plasticity as a mechanism for encodingmotor experience. Neuroscientist, 11(5):471–483.
Moore, E., R. S. Schaefer, M. E. Bastin, N. Roberts, and K. Overy2014. Can musical training influence brain connectivity? Evidence from diffusion tensor MRI.Brain Sci, 4(2):405–427.
Morgen, K., N. Kadom, L. Sawaki, A. Tessitore, J. Ohayon, J. Frank, H. Mcfarland, R. Martin,and L. G. Cohen2004. Kinematic specificity of cortical reorganization associated with motor training. Neu-roImage, 21:1182–1187.
Mori, S. and B. Crain2005. MRI atlas of human white matter, 6th edition. Elsevier.
Mori, S. and J. Zhang2006. Principles of Diffusion Tensor Imaging and Its Applications to Basic NeuroscienceResearch. Neuron, 51(5):527–539.
Moseley, M. E., Y. Cohen, J. Kucharczyk, J. Mintorovitch, H. S. Asgari, M. F. Wendland, J. Tsu-ruda, and D. Norman1990. Diffusion-weighted MR imaging of anisotropic water diffusion in cat central nervoussystem. Radiology, 176(2):439–445.
Mosing, M. A., G. Madison, N. L. Pedersen, R. Kuja-Halkola, and F. Ullén2014. Practice Does Not Make Perfect: No Causal Effect of Music Practice on Music Ability.Psychological Science, 25(9):1795–1803.
95

Mosing, M. A., G. Madison, N. L. Pedersen, and F. Ullén2016. Investigating cognitive transfer within the framework of music practice: geneticpleiotropy rather than causality. Developmental Science, 19(3):504–512.
Mosing, M. A. and F. Ullén2018. Genetic influences on musical specialization: a twin study on choice of instrument andmusic genre. Annals of the New York Academy of Sciences, 1423(1):427–434.
Murray, E. A. and J. D. Coulter1981. Organization of corticospinal neurons in the monkey. The Journal of comparativeneurology, 195(2):339–65.
Nagahara, Y., T. Nakamae, S. Nishizawa, Y. Mizuhara, Y. Moritoki, Y. Wada, Y. Sakai, T. Ya-mashita, J. Narumoto, J. Miyata, K. Yamada, and K. Fukui2014. A tract-based spatial statistics study in anorexia nervosa: Abnormality in the fornix andthe cerebellum. Progress in Neuro-Psychopharmacology and Biological Psychiatry, 51:72–77.
Nagy, Z., H. Westerberg, and T. Klingberg2004. Maturation of white matter is associated with the development of cognitive functionsduring childhood. Journal of cognitive neuroscience, 16(7):1227–1233.
Nakamura, J. and M. Csikszentmihalyi2002. The concept of flow. In Handbook of positive psychology., Pp. 89–105. New York, NY,US: Oxford University Press.
Nave, K.-A.2010. Myelination and support of axonal integrity by glia. Nature, 468(7321):244–252.
Neil, J. J., S. I. Shiran, R. C. McKinstry, G. L. Schefft, A. Z. Snyder, C. R. Almli, E. Akbudak,J. A. Aronovitz, J. P. Miller, B. C. Lee, and T. E. Conturo1998. Normal brain in human newborns: apparent diffusion coefficient and diffusion anisotropymeasured by using diffusion tensor MR imaging. Radiology, 209(1):57–66.
Nigmatullina, Y., P. J. Hellyer, P. Nachev, D. J. Sharp, and B. M. Seemungal2015. The neuroanatomical correlates of training-related perceptuo-reflex uncoupling indancers. Cerebral Cortex, 25(2):554–562.
Noble, J. W., J. J. Eng, and L. A. Boyd2014. Bilateral motor tasks involve more brain regions and higher neural activation thanunilateral tasks: An fMRI study. Experimental Brain Research, 232(9):2785–2795.
Nudo, R. J. and R. B. Masterton1990. Descending pathways to the spinal cord, III: Sites of origin of the corticospinal tract.The Journal of Comparative Neurology, 296(4):559–583.
96

Nudo, R. J., G. W. Milliken, W. M. Jenkins, and M. M. Merzenich1996. Use-dependent alterations of movement representations in primary motor cortex ofadult squirrel monkeys. The Journal of neuroscience : the official journal of the Society forNeuroscience, 16(2):785–807.
O’Donnell, L. J. and O. Pasternak2015. Does diffusion MRI tell us anything about the white matter? An overview of methodsand pitfalls. Schizophrenia Research, 161(1):133–141.
Oechslin, M. S., M. Gschwind, and C. E. James2017. Tracking Training-Related Plasticity by Combining fMRI and DTI: The Right Hemi-sphere Ventral Stream Mediates Musical Syntax Processing. Cerebral cortex (New York, N.Y.: 1991), 28(4):1–10.
Oechslin, M. S., A. Imfeld, T. Loenneker, M. Meyer, and L. Jancke2009. The plasticity of the superior longitudinal fasciculus as a function of musical expertise:a diffusion tensor imaging study. Front Hum Neurosci, 3:76.
Oikkonen, J., P. Onkamo, I. Järvelä, and C. Kanduri2016. Convergent evidence for the molecular basis of musical traits. Scientific Reports,6(1):39707.
Olesen, P. J., Z. Nagy, H. Westerberg, and T. Klingberg2003. Combined analysis of DTI and fMRI data reveals a joint maturation of white and greymatter in a fronto-parietal network. Brain Res Cogn Brain Res, 18(1):48–57.
Olshansky, M. P., R. J. Bar, M. Fogarty, and J. F. DeSouza2015. Supplementary motor area and primary auditory cortex activation in an expert break-dancer during the kinesthetic motor imagery of dance to music. Neurocase, 21(5):607–617.
Ono, Y., Y. Nomoto, S. Tanaka, K. Sato, S. Shimada, A. Tachibana, S. Bronner, and J. A. Noah2014. Frontotemporal oxyhemoglobin dynamics predict performance accuracy of dance sim-ulation gameplay: Temporal characteristics of top-down and bottom-up cortical activities.NeuroImage, 85:461–470.
Orgs, G., J. H. Dombrowski, M. Heil, and P. Jansen-Osmann2008. Expertise in dance modulates alpha/beta event-related desynchronization during actionobservation. European Journal of Neuroscience, 27(12):3380–3384.
Orlandi, A. and A. M. Proverbio2019. Bilateral engagement of the occipito-temporal cortex in response to dance kinematicsin experts. Scientific reports, 9(1):1000.
97

Orlandi, A., A. Zani, and A. M. Proverbio2017. Dance expertise modulates visual sensitivity to complex biological movements. Neu-ropsychologia, 104:168–181.
Oztürk, A. H., B. Tasçioglu, M. Aktekin, Z. Kurtoglu, and I. Erden2002. Morphometric comparison of the human corpus callosum in professional musicians andnon-musicians by using in vivo magnetic resonance imaging. Journal of neuroradiology. Journalde neuroradiologie, 29(1):29–34.
Palmer, H. S., A. K. Håberg, M. S. Fimland, G. M. Solstad, V. Moe Iversen, J. Hoff, J. Helgerud,and L. Eikenes2013. Structural brain changes after 4 wk of unilateral strength training of the lower limb.Journal of Applied Physiology, 115(2):167–175.
Pantev, C., A. Engelien, V. Candia, and T. Elbert2001. Representational cortex in musicians. Plastic alterations in response to musical practice.Annals of the New York Academy of Sciences, 930:300–14.
Pascual-Leone, A., D. Nguyet, L. G. Cohen, J. P. Brasil-Neto, A. Cammarota, and M. Hallett1995. Modulation of muscle responses evoked by transcranial magnetic stimulation during theacquisition of new fine motor skills. Journal of Neurophysiology, 74(3):1037–1045.
Pascual-Leone, A. and F. Torres1993. Plasticity of the sensorimotor cortex representation of the reading finger in Braillereaders. Brain : a journal of neurology, 116 ( Pt 1):39–52.
Pasternak, O., I. K. Koerte, S. Bouix, E. Fredman, T. Sasaki, M. Mayinger, K. G. Helmer, A. M.Johnson, J. D. Holmes, L. A. Forwell, E. N. Skopelja, M. E. Shenton, and P. S. Echlin2014. Hockey Concussion Education Project, Part 2. Microstructural white matter alterationsin acutely concussed ice hockey players: a longitudinal free-water MRI study. J Neurosurg,120(4):873–881.
Pearl, J.2009. Causality: Models, Reasoning and Inference, 2nd edition. New York, NY: CambridgeUniversity Press.
Penhune, V. B.2019. Musical Expertise and Brain Structure: The Causes and Consequences of Training. TheOxford Handbook of Music and the Brain.
Plautz, E. J., G. W. Milliken, and R. J. Nudo2000. Effects of Repetitive Motor Training on Movement Representations in Adult SquirrelMonkeys: Role of Use versus Learning. Neurobiology of Learning and Memory, 74(1):27–55.
98

Poikonen, H., P. Toiviainen, and M. Tervaniemi2016. Early auditory processing in musicians and dancers during a contemporary dance piece.Scientific Reports, 6(1):33056.
Poikonen, H., P. Toiviainen, and M. Tervaniemi2018. Naturalistic music and dance: Cortical phase synchrony in musicians and dancers. PLoSONE, 13(4):1–18.
Poon, P. P. and W. M. Rodgers2000. Learning and remembering strategies of novice and advanced jazz dancers for skill levelappropriate dance routines. Res Q Exerc Sport, 71(2):135–144.
Porter, R. and R. Lemon1995. Anatomical substrates for movement performance: cerebral cortex and the corticospinaltract. In Corticospinal Function and Voluntary Movement, Pp. 36–89. Oxford UniversityPress.
Ptak, R.2012. The frontoparietal attention network of the human brain: action, saliency, and a prioritymap of the environment. Neuroscientist, 18(5):502–515.
Rauschecker, J. P. and S. K. Scott2009. Maps and streams in the auditory cortex: nonhuman primates illuminate human speechprocessing. Nature Neuroscience, 12(6):718–724.
Reid, L. B., M. V. Sale, R. Cunnington, J. B. Mattingley, and S. E. Rose2017. Brain changes following four weeks of unimanual motor training: Evidence from fMRI-guided diffusion MRI tractography. Human Brain Mapping, 38(9):4302–4312.
Repple, J., N. Opel, S. Meinert, R. Redlich, T. Hahn, N. R. Winter, C. Kaehler, D. Emden,R. Leenings, D. Grotegerd, D. Zaremba, C. Bürger, K. Förster, K. Dohm, V. Enneking, E. J.Leehr, J. Böhnlein, G. Karliczek, W. Heindel, H. Kugel, J. Bauer, V. Arolt, and U. Dannlowski2018. Elevated body-mass index is associated with reduced white matter integrity in two largeindependent cohorts. Psychoneuroendocrinology, 91:179–185.
Ritchie, S. J., S. R. Cox, X. Shen, M. V. Lombardo, L. M. Reus, C. Alloza, M. A. Harris, H. L.Alderson, S. Hunter, E. Neilson, D. C. M. Liewald, B. Auyeung, H. C. Whalley, S. M. Lawrie,C. R. Gale, M. E. Bastin, A. M. McIntosh, and I. J. Deary2018. Sex Differences in the Adult Human Brain: Evidence from 5216 UK Biobank Partici-pants. Cerebral Cortex, 28(8):2959–2975.
Rizzolatti, G. and L. Craighero2004. The mirror-neuron system. Annual review of neuroscience, 27:169–92.
99

Rizzolatti, G., L. Fadiga, V. Gallese, and L. Fogassi1996a. Premotor cortex and the recognition of motor actions. Brain Res Cogn Brain Res,3(2):131–141.
Rizzolatti, G., L. Fadiga, M. Matelli, V. Bettinardi, E. Paulesu, D. Perani, and F. Fazio1996b. Localization of grasp representations in humans by PET: 1. Observation versus execu-tion. Exp Brain Res, 111(2):246–252.
Rizzolatti, G., L. Fogassi, and V. Gallese2001. Neurophysiological mechanisms underlying the understanding and imitation of action.Nature Reviews Neuroscience, 2(9).
Rodriguez-Herreros, B., J. L. Amengual, A. Gurtubay-Antolin, L. Richter, P. Jauer, C. Erdmann,A. Schweikard, J. Lopez-Moliner, A. Rodriguez-Fornells, and T. F. Munte2015. Microstructure of the superior longitudinal fasciculus predicts stimulation-induced in-terference with on-line motor control. Neuroimage, 120:254–265.
Rüber, T., R. Lindenberg, and G. Schlaug2013. Differential adaptation of descending motor tracts in musicians. Cerebral Cortex,25(6):1490–1498.
Rüber, T., R. Lindenberg, and G. Schlaug2015. Differential adaptation of descending motor tracts in musicians. Cerebral Cortex,25(6):1490–1498.
Ruegg, D. G., T. H. Kakebeeke, J.-P. Gabriel, and M. Bennefeld2003. Conduction velocity of nerve and muscle fiber action potentials after a space missionor a bed rest. Clinical neurophysiology : official journal of the International Federation ofClinical Neurophysiology, 114(1):86–93.
Ruigrok, A. N., G. Salimi-Khorshidi, M.-C. Lai, S. Baron-Cohen, M. V. Lombardo, R. J. Tait, andJ. Suckling2014. A meta-analysis of sex differences in human brain structure. Neuroscience & Biobehav-ioral Reviews, 39:34–50.
Saab, A. S. and K.-A. Nave2017. Myelin dynamics: protecting and shaping neuronal functions. Current Opinion inNeurobiology, 47:104–112.
Salat, D. H., D. N. Greve, J. L. Pacheco, B. T. Quinn, K. G. Helmer, R. L. Buckner, and B. Fischl2009. Regional white matter volume differences in nondemented aging and Alzheimer’s disease.NeuroImage.
100

Sampaio-Baptista, C. and H. Johansen-Berg2017. White Matter Plasticity in the Adult Brain. Neuron, 96(6):1239–1251.
Sampaio-Baptista, C., A. A. Khrapitchev, S. Foxley, T. Schlagheck, J. Scholz, S. Jbabdi, G. C.DeLuca, K. L. Miller, A. Taylor, N. Thomas, J. Kleim, N. R. Sibson, D. Bannerman, andH. Johansen-Berg2013. Motor Skill Learning Induces Changes in White Matter Microstructure and Myelination.Journal of Neuroscience, 33(50):19499–19503.
Schain, A. J., R. A. Hill, and J. Grutzendler2014. Label-free in vivo imaging of myelinated axons in health and disease with spectralconfocal reflectance microscopy. Nature medicine, 20(4):443–9.
Schellenberg, E. G.2015. Music training and speech perception: a gene-environment interaction. Annals of theNew York Academy of Sciences, 1337(1):170–177.
Schlaffke, L., S. Lissek, M. Lenz, M. Brüne, G. Juckel, T. Hinrichs, P. Platen, M. Tegenthoff, andT. Schmidt-Wilcke2014. Sports and brain morphology – A voxel-based morphometry study with enduranceathletes and martial artists. Neuroscience, 259:35–42.
Schlaug, G.2001. V-24 The brain of musicians. Annals of the New York Academy of Sciences, Pp. 281–299.
Schlaug, G.2015. Musicians and music making as a model for the study of brain plasticity. Progress inBrain Research, 217:37–55.
Schlaug, G., M. Forgeard, L. Zhu, A. Norton, and E. Winner2009. Training-induced neuroplasticity in young children. Ann N Y Acad Sci, 1169:205–208.
Schlaug, G., L. Jäncke, Y. Huang, J. F. Staiger, and H. Steinmetz1995a. Increased corpus callosum size in musicians. Neuropsychologia, 33(8):1047–55.
Schlaug, G., L. Jäncke, Y. Huang, and H. Steinmetz1995b. In vivo evidence of structural brain asymmetry in musicians. Science (New York,N.Y.), 267(5198):699–701.
Schmierer, K., F. Scaravilli, D. R. Altmann, G. J. Barker, and D. H. Miller2004. Magnetization transfer ratio and myelin in postmortem multiple sclerosis brain. Annalsof Neurology, 56(3):407–415.
101
Schmithorst, V. J. and M. Wilke2002. Differences in white matter architecture between musicians and non-musicians: a diffu-sion tensor imaging study. Neurosci Lett, 321(1-2):57–60.
Schneider, P., M. Scherg, H. G. Dosch, H. J. Specht, A. Gutschalk, and A. Rupp2002. Morphology of Heschl’s gyrus reflects enhanced activation in the auditory cortex ofmusicians. Nature Neuroscience, 5(7):688–694.
Schneider, P., V. Sluming, N. Roberts, S. Bleeck, and A. Rupp2005. Structural, functional, and perceptual differences in Heschl’s gyrus and musical instru-ment preference. Annals of the New York Academy of Sciences, 1060(1):387–94.
Scholz, J., M. C. Klein, T. E. Behrens, and H. Johansen-berg2009. Training induces changes in white matter architecture. Nat Neurosci., 12(11):1370–1371.
Sehm, B., C. J. C. J. Steele, A. Villringer, and P. Ragert2016. Mirror Motor Activity during Right-Hand Contractions and Its Relation to WhiteMatter in the Posterior Midbody of the Corpus Callosum. Cerebral Cortex, 26(11):4347–4355.
Seither-Preisler, A., R. Parncutt, and P. Schneider2014. Size and Synchronization of Auditory Cortex Promotes Musical, Literacy, and Atten-tional Skills in Children. Journal of Neuroscience, 34(33):10937–10949.
Seitz, J., M. Walter, V. Mainz, B. Herpertz-Dahlmann, K. Konrad, and G. von Polier2015. Brain volume reduction predicts weight development in adolescent patients with anorexianervosa. Journal of psychiatric research, 68:228–37.
Sevdalis, V. and P. E. Keller2011. Captured by motion: dance, action understanding, and social cognition. Brain Cogn,77(2):231–236.
Sluming, V., T. Barrick, M. Howard, E. Cezayirli, A. Mayes, and N. Roberts2002. Voxel-based morphometry reveals increased gray matter density in Broca’s area in malesymphony orchestra musicians. NeuroImage, 17(3):1613–22.
Smith, S. M.2002. Fast robust automated brain extraction. Human Brain Mapping, 17(3):143–155.
Smith, S. M., M. Jenkinson, H. Johansen-Berg, D. Rueckert, T. E. Nichols, C. E. Mackay, K. E.Watkins, O. Ciccarelli, M. Z. Cader, P. M. Matthews, and T. E. Behrens2006. Tract-based spatial statistics: voxelwise analysis of multi-subject diffusion data. Neu-roimage, 31(4):1487–1505.
102

Smith, S. M., M. Jenkinson, M. W. Woolrich, C. F. Beckmann, T. E. Behrens, H. Johansen-Berg,P. R. Bannister, M. De Luca, I. Drobnjak, D. E. Flitney, R. K. Niazy, J. Saunders, J. Vickers,Y. Zhang, N. De Stefano, J. M. Brady, and P. M. Matthews2004. Advances in functional and structural MR image analysis and implementation as FSL.Neuroimage, 23 Suppl 1:S208–19.
Sowell, E. R., B. S. Peterson, E. Kan, R. P. Woods, J. Yoshii, R. Bansal, D. Xu, H. Zhu, P. M.Thompson, and A. W. Toga2007. Sex Differences in Cortical Thickness Mapped in 176 Healthy Individuals between 7 and87 Years of Age. Cerebral Cortex, 17(7):1550–1560.
Spena, G., P. Gatignol, L. Capelle, and H. Duffau2006. Superior longitudinal fasciculus subserves vestibular network in humans. Neuroreport,17(13):1403–1406.
Steele, C. J., J. A. Bailey, R. J. Zatorre, and V. B. Penhune2013. Early Musical Training and White-Matter Plasticity in the Corpus Callosum: Evidencefor a Sensitive Period. Journal of Neuroscience, 33(3):1282–1290.
Steele, C. J., J. Scholz, G. Douaud, H. Johansen-Berg, and V. B. Penhune2012. Structural correlates of skilled performance on a motor sequence task. Frontiers inHuman Neuroscience, 6(October):1–9.
Stüber, C., M. Morawski, A. Schäfer, C. Labadie, M. Wähnert, C. Leuze, M. Streicher, N. Barap-atre, K. Reimann, S. Geyer, D. Spemann, and R. Turner2014. Myelin and iron concentration in the human brain: A quantitative study of MRI con-trast. NeuroImage, 93:95–106.
Svensson, P., A. Romaniello, L. Arendt-Nielsen, and B. J. Sessle2003. Plasticity in corticomotor control of the human tongue musculature induced by tongue-task training. Experimental brain research, 152(1):42–51.
Tachibana, A., J. A. Noah, S. Bronner, Y. Ono, and M. Onozuka2011. Parietal and temporal activity during a multimodal dance video game: an fNIRS study.Neurosci Lett, 503(2):125–130.
Taubert, M., B. Draganski, A. Anwander, K. Muller, A. Horstmann, A. Villringer, and P. Ragert2010. Dynamic Properties of Human Brain Structure: Learning-Related Changes in CorticalAreas and Associated Fiber Connections. Journal of Neuroscience, 30(35):11670–11677.
Taubert, M., J. Mehnert, B. Pleger, and A. Villringer2016. Rapid and specific gray matter changes in M1 induced by balance training. NeuroImage,133:399–407.
103

Teipel, S. J., M. J. Grothe, M. Filippi, A. Fellgiebel, M. Dyrba, G. B. Frisoni, T. Meindl, A. L.Bokde, H. Hampel, S. Kloppel, and K. Hauenstein2014. Fractional anisotropy changes in Alzheimer’s disease depend on the underlying fibertract architecture: a multiparametric DTI study using joint independent component analysis.J Alzheimers Dis, 41(1):69–83.
Theorell, T., A.-K. Lennartsson, G. Madison, M. Mosing, and F. Ullén2015. Predictors of continued playing or singing - from childhood and adolescence to adultyears. Acta Paediatrica, 104(3):274–284.
Tomassini, V., S. Jbabdi, Z. T. Kincses, R. Bosnell, C. Pozzilli, P. M. Matthews, and H. Johansen-berg2011. Structural and Functional Bases for Individual Differences in Motor Learning. Humanbrain mapping, 32(3):494–508.
Tournier, J. D., F. Calamante, D. G. Gadian, and A. Connelly2004. Direct estimation of the fiber orientation density function from diffusion-weighted MRIdata using spherical deconvolution. Neuroimage, 23(3):1176–1185.
Tuch, D. S.2004. Q-ball imaging. Magn Reson Med, 52(6):1358–1372.
Tucker-Drob, E. M. and D. A. Briley2014. Continuity of genetic and environmental influences on cognition across the life span: Ameta-analysis of longitudinal twin and adoption studies. Psychological Bulletin, 140(4):949–979.
Tyč, F., A. Boyadjian, and H. Devanne2005. Motor cortex plasticity induced by extensive training revealed by transcranial magneticstimulation in human. European Journal of Neuroscience, 21(1):259–266.
Ukkola, L. T., P. Onkamo, P. Raijas, K. Karma, and I. Järvelä2009. Musical Aptitude Is Associated with AVPR1A-Haplotypes. PLoS ONE, 4(5):e5534.
Ukkola-Vuoti, L., C. Kanduri, J. Oikkonen, G. Buck, C. Blancher, P. Raijas, K. Karma,H. Lähdesmäki, and I. Järvelä2013. Genome-Wide Copy Number Variation Analysis in Extended Families and Unre-lated Individuals Characterized for Musical Aptitude and Creativity in Music. PLoS ONE,8(2):e56356.
Ullén, F., D. Z. Hambrick, and M. A. Mosing2016. Rethinking expertise: A multifactorial gene-environment interaction model of expertperformance. Psychological Bulletin, 142(4):427–446.
104

Vaalto, S., P. Julkunen, L. Säisänen, M. Könönen, S. Määttä, and J. Karhu2013. Long-term plasticity may be manifested as reduction or expansion of cortical represen-tations of actively used muscles in motor skill specialists. NeuroReport, 24(11):596–600.
Vallar, G., L. Bello, E. Bricolo, A. Castellano, A. Casarotti, A. Falini, M. Riva, E. Fava, andC. Papagno2014. Cerebral correlates of visuospatial neglect: a direct cerebral stimulation study. HumBrain Mapp, 35(4):1334–1350.
Vaquero, L., K. Hartmann, P. Ripollés, N. Rojo, J. Sierpowska, C. François, E. Càmara, F. T. vanVugt, B. Mohammadi, A. Samii, T. F. Münte, A. Rodríguez-Fornells, and E. Altenmüller2016. Structural neuroplasticity in expert pianists depends on the age of musical trainingonset. NeuroImage, 126:106–119.
Verstynen, T., J. Diedrichsen, N. Albert, P. Aparicio, and R. Ivry2005. Ipsilateral motor cortex activity during unimanual hand movements relates to taskcomplexity. Journal Neurophysiology, 93:1209–1222.
Vestergaard, M., K. S. Madsen, W. F. Baare, A. Skimminge, L. R. Ejersbo, T. Z. Ramsoy, C. Ger-lach, P. Akeson, O. B. Paulson, and T. L. Jernigan2011. White matter microstructure in superior longitudinal fasciculus associated with spatialworking memory performance in children. Journal of cognitive neuroscience, 23(9):2135–2146.
Vicary, S. A., R. A. Robbins, B. Calvo-Merino, and C. J. Stevens2014. Recognition of dance-like actions: memory for static posture or dynamic movement?Mem Cognit, 42(5):755–767.
Vollmann, H., P. Ragert, V. Conde, A. Villringer, J. Classen, O. W. Witte, and C. J. Steele2014. Instrument specific use-dependent plasticity shapes the anatomical properties of thecorpus callosum: a comparison between musicians and non-musicians. Front Behav Neurosci,8:245.
Wahl, M., B. Lauterbach-Soon, E. Hattingen, P. Jung, O. Singer, S. Volz, J. C. Klein, H. Stein-metz, and U. Ziemann2007. Human Motor Corpus Callosum: Topography, Somatotopy, and Link between Mi-crostructure and Function. Journal of Neuroscience, 27(45):12132–12138.
Wakana, S., H. Jiang, L. M. Nagae-Poetscher, P. C. van Zijl, and S. Mori2004. Fiber tract-based atlas of human white matter anatomy. Radiology, 230(1):77–87.
Walhovd, K. B., H. Johansen-Berg, and R. T. Káradóttir2014. Unraveling the secrets of white matter–bridging the gap between cellular, animal andhuman imaging studies. Neuroscience, 276:2–13.
105

Wan, C. Y. and G. Schlaug2010. Music making as a tool for promoting brain plasticity across the life span. Neuroscientist,16(5):566–577.
Wang, B., Y. Fan, M. Lu, S. Li, Z. Song, X. Peng, R. Zhang, Q. Lin, Y. He, J. Wang, and R. Huang2013. Brain anatomical networks in world class gymnasts: A DTI tractography study. Neu-roImage, 65:476–487.
Wang, X., M. Casadio, K. A. Weber, F. A. Mussa-Ivaldi, and T. B. Parrish2014. White matter microstructure changes induced by motor skill learning utilizing a bodymachine interface. NeuroImage, 88:32–40.
Waterhouse, E., R. Watts, and B. E. Blasing2014. Doing Duo - a case study of entrainment in William Forsythe’s choreography "Duo".Front Hum Neurosci, 8:812.
Waxman, S. G.1980. Determinants of conduction velocity in myelinated nerve fibers. Muscle & nerve,3(2):141–50.
Wechsler, D. and H. Assessment1997. Wechsler Adult Intelligence Scale, 3rd edition. San Antonio, TX: [publisher unknown].
Wechsler, D. and T. P. C. H. B. &. Company1999. Wechsler Abbreviated Scale of Intelligence. New York, NY: [publisher unknown].
Wenger, E., C. Brozzoli, U. Lindenberger, and M. Lövdén2017. Expansion and Renormalization of Human Brain Structure During Skill Acquisition.Trends in Cognitive Sciences, 21(12):930–939.
Werring, D. J., C. A. Clark, G. J. Barker, A. J. Thompson, and D. H. Miller1999. Diffusion tensor imaging of lesions and normal-appearing white matter in multiplesclerosis. Neurology, 52(8):1626–1632.
Wesseldijk, L. W., M. A. Mosing, and F. Ullén2019. Gene-environment interaction in expertise: The importance of childhood environmentfor musical achievement. Developmental psychology.
Westerhausen, R., R. J. Huster, F. Kreuder, W. Wittling, and E. Schweiger2007. Corticospinal tract asymmetries at the level of the internal capsule: Is there an associ-ation with handedness? NeuroImage, 37(2):379–386.
Wheeler-Kingshott, C. A. and M. Cercignani2009. About "axial" and "radial" diffusivities. Magn Reson Med, 61(5):1255–1260.
106

Winkler, A. M., G. R. Ridgway, M. A. Webster, S. M. Smith, and T. E. Nichols2014. Permutation inference for the general linear model. Neuroimage, 92:381–397.
Woolhouse, M. H. and R. Lai2014. Traces across the body: influence of music-dance synchrony on the observation of dance.Front Hum Neurosci, 8:965.
Yin, H. H., S. P. Mulcare, M. R. F. Hilário, E. Clouse, T. Holloway, M. I. Davis, A. C. Hansson,D. M. Lovinger, and R. M. Costa2009. Dynamic reorganization of striatal circuits during the acquisition and consolidation ofa skill. Nature Neuroscience, 12(3):333–341.
Yousry, T. A., U. D. Schmid, H. Alkadhi, D. Schmidt, A. Peraud, A. Buettner, and P. Winkler1997. Localization of the motor hand area to a knob on the precentral gyrus A new landmark.Brain, 120:141–157.
Zatorre, R. J., J. L. Chen, and V. B. Penhune2007. When the brain plays music: auditory-motor interactions in music perception andproduction. Nat Rev Neurosci, 8(7):547–558.
Zatorre, R. J., R. D. Fields, and H. Johansen-Berg2012. Plasticity in gray and white: Neuroimaging changes in brain structure during learning.Nature Neuroscience, 15(4):528–536.
Zatorre, R. J., D. W. Perry, C. A. Beckett, C. F. Westbury, and A. C. Evans1998. Functional anatomy of musical processing in listeners with absolute pitch and relativepitch. Proceedings of the National Academy of Sciences of the United States of America,95(6):3172–7.
Zhang, H., T. Schneider, C. A. Wheeler-Kingshott, and D. C. Alexander2012. NODDI: Practical in vivo neurite orientation dispersion and density imaging of thehuman brain. NeuroImage, 61(4):1000–1016.
Zilles, K.1992. Neuronal plasticity as an adaptive property of the central nervous system. - PubMed -NCBI. Annals of Anatomy, 174(5):383–91.
107

APPENDIX A
Supplementary Material for Study 1
Supplementary Tables
Table A1 Partial correlations between diffusivity measures and task performance.
Age and sex are included as covariates of no interest. Significant values are marked with . r = Pearson’s correlations; WM =white matter; DvsM ROIs = ‘Dancers versus Musicians’ regions of interest.
Table A2 Subject-wise extracted mean values
Over the whole WM skeleton and in the CST, in both hemispheres together and separately in each hemisphere, for FA and RD.RWM = right white matter; LWM = left white matter.
108
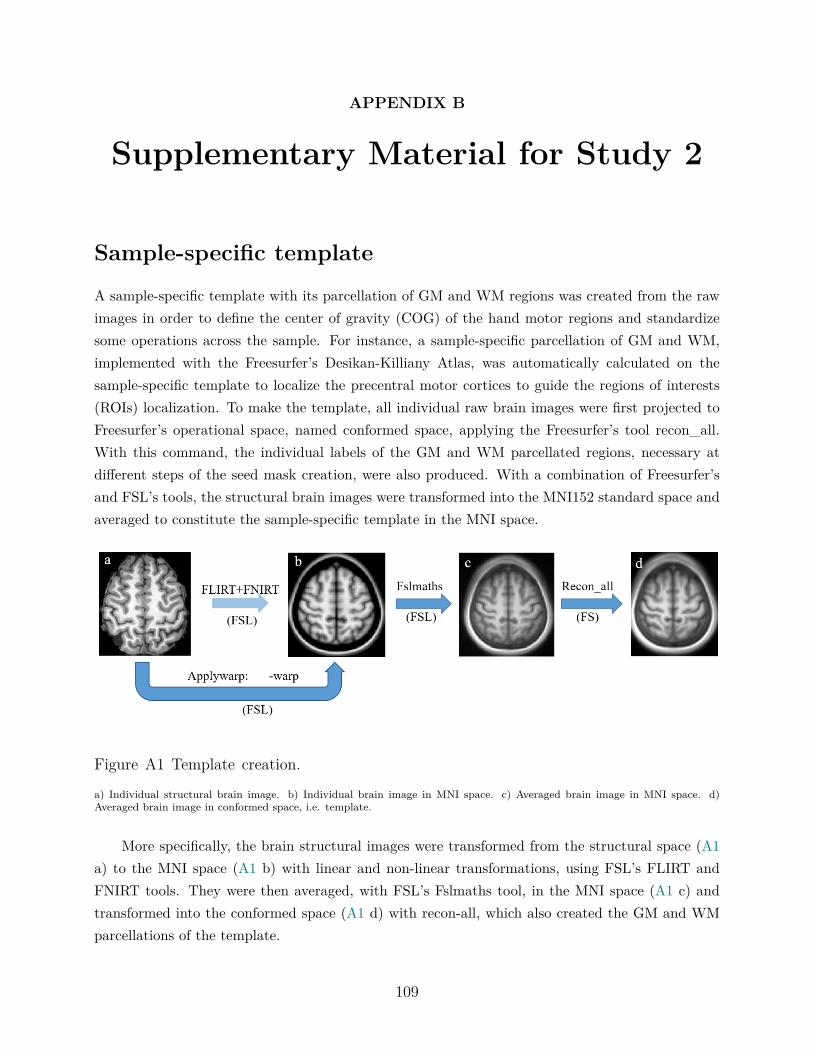
APPENDIX B
Supplementary Material for Study 2
Sample-specific template
A sample-specific template with its parcellation of GM and WM regions was created from the rawimages in order to define the center of gravity (COG) of the hand motor regions and standardizesome operations across the sample. For instance, a sample-specific parcellation of GM and WM,implemented with the Freesurfer’s Desikan-Killiany Atlas, was automatically calculated on thesample-specific template to localize the precentral motor cortices to guide the regions of interests(ROIs) localization. To make the template, all individual raw brain images were first projected toFreesurfer’s operational space, named conformed space, applying the Freesurfer’s tool recon_all.With this command, the individual labels of the GM and WM parcellated regions, necessary atdifferent steps of the seed mask creation, were also produced. With a combination of Freesurfer’sand FSL’s tools, the structural brain images were transformed into the MNI152 standard space andaveraged to constitute the sample-specific template in the MNI space.
Figure A1 Template creation.
a) Individual structural brain image. b) Individual brain image in MNI space. c) Averaged brain image in MNI space. d)Averaged brain image in conformed space, i.e. template.
More specifically, the brain structural images were transformed from the structural space (A1a) to the MNI space (A1 b) with linear and non-linear transformations, using FSL’s FLIRT andFNIRT tools. They were then averaged, with FSL’s Fslmaths tool, in the MNI space (A1 c) andtransformed into the conformed space (A1 d) with recon-all, which also created the GM and WMparcellations of the template.
109

Seed mask creation
In order to separately track the primary motor pathways connecting the head, hand, trunk or legrepresentations, we defined, in each hemisphere, the four WM regions subjacent the motor cortexthat topographically correspond to the head, hand, trunk/arm or leg/foot representations. To dothis, we developed a procedure that permits to define the seed masks for tractography, using anapproach that is at the same time sample-specific and reproducible across subjects.
Sample Specific Hand COGs
Manually draw individual hand ROI over M1 label
Project to sample-specific template
Average the hand ROIs across groups
Calculate the center of gravity (COG) of the mean hand ROI
Create hand sphere around the COG including the relevant M1
Seed Masks across Subjects
Shift and adjust the spheres along M1 (if not hand)
Project to individual structural space
Mask with individual WM parcellation subjacent M1
Project to FA space for tracking
Figure A2 Diagram of the steps followed to create the seed masks.
The yellow windows indicate the user-defined steps; the light orange windows indicate the steps that were standardized acrosssubjects.
Creation of sample-specific hand centers of gravity (COGs)
The hand is the only body part whose topographical location within the motor cortex that canbe identified using well-established gross anatomical landmarks (Yousry et al., 1997; Caulo et al.,2007). Therefore, the first step was to identify the hand motor region individually, created a spherebased on its center of gravity (COG) and then to locate the other body parts along M1 relative toits position. Hand motor regions for each individual were manually labeled in three dimensions forboth hemispheres in Freesurfer’s conformed space (A3 a). To do this we overlaid the GM label ofthe precentral cortex provided by the Desikan-Killiany Atlas on each individual structural brain.
110

To create the hand masks, we identified the hand regions defined by the hand landmarks, previouslydescribed as an omega or epsilon shaped portion of the cortex, with their variants (Yousry et al.,1997; Caulo et al., 2007). The user-drawn hand regions were then non-linearly projected onto theMNI152 standard space with the FSL’s tool applywarp (A3 b). The hand masks were then averaged(A3 c), with the FSL’s tool Fslmaths, and projected again onto the sample-specific template space(A3 d), using the Freesurfer’s tool mri_vol2vol. Finally, the COGs of the average hand masks werecalculated, in the template conformed space, using the FSL’s tool Fslstats.
Figure A3 Calculation of the hand center of gravity (COG) for the right hemisphere, frommanually-drawn hand ROIs.
(a) Individual manually-drawn hand ROI in the subject Freesurfer’s conformed space. (b) Individual manually-drawn handROI in the MNI structural space. (c) Average of all subjects manually-drawn hand ROIs in MNI 2mm space. (d) Average ofmanually-drawn hand ROIs in template conformed space (thresholded at 30%).
Creation of seed masks from COGs across subjects
Once the hand COGs were calculated, the appropriate radii were estimated to draw the handspheres around them. These parcellations were critical as visual checks for the determination ofthe radii of the spheres, allowing us to ensure that the spheres included all the relevant portions ofthe precentral cortex parcellation (Desikan-Killiany Atlas). The trunk, leg and hand spheres werecreated relative to the hand sphere positions by shifting the hand COGs along the precentral cortex(Table A1). In particular, the trunk sphere was entirely shifted along the x direction medially, sothat the sphere included a similar portion of the cortex with minimal overlapping. For the leg andhead, the spheres were first shifted along the x direction - medially and laterally respectively -, andthen along the z (both spheres) and the y (head sphere only) directions, in order to include all thecortex.
The radii were also adjusted to include all the relevant portion of the precentral motor cortex.In the end, the hand and trunk spheres had the same radii, whereas the leg and the head regions,being more elongated, had bigger radii. Because there was some overlap between the hand and thetrunk spheres, the trunk spheres were subtracted from the hand spheres; this was not necessaryfor the other spheres. While the hand, head and trunk spheres were masked with the precentral
111
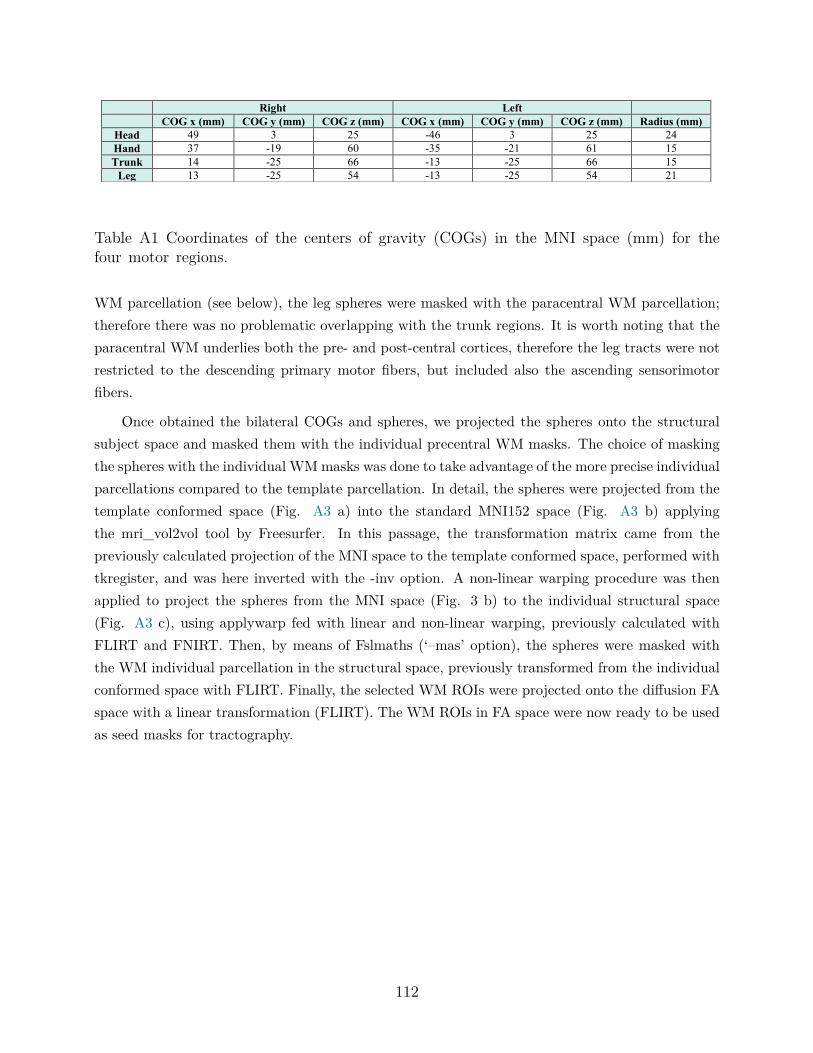
Right Left COG x (mm) COG y (mm) COG z (mm) COG x (mm) COG y (mm) COG z (mm) Radius (mm)
Head 49 3 25 -46 3 25 24 Hand 37 -19 60 -35 -21 61 15 Trunk 14 -25 66 -13 -25 66 15
Leg 13 -25 54 -13 -25 54 21
Table A1 Coordinates of the centers of gravity (COGs) in the MNI space (mm) for thefour motor regions.
WM parcellation (see below), the leg spheres were masked with the paracentral WM parcellation;therefore there was no problematic overlapping with the trunk regions. It is worth noting that theparacentral WM underlies both the pre- and post-central cortices, therefore the leg tracts were notrestricted to the descending primary motor fibers, but included also the ascending sensorimotorfibers.
Once obtained the bilateral COGs and spheres, we projected the spheres onto the structuralsubject space and masked them with the individual precentral WM masks. The choice of maskingthe spheres with the individual WMmasks was done to take advantage of the more precise individualparcellations compared to the template parcellation. In detail, the spheres were projected from thetemplate conformed space (Fig. A3 a) into the standard MNI152 space (Fig. A3 b) applyingthe mri_vol2vol tool by Freesurfer. In this passage, the transformation matrix came from thepreviously calculated projection of the MNI space to the template conformed space, performed withtkregister, and was here inverted with the -inv option. A non-linear warping procedure was thenapplied to project the spheres from the MNI space (Fig. 3 b) to the individual structural space(Fig. A3 c), using applywarp fed with linear and non-linear warping, previously calculated withFLIRT and FNIRT. Then, by means of Fslmaths (‘–mas’ option), the spheres were masked withthe WM individual parcellation in the structural space, previously transformed from the individualconformed space with FLIRT. Finally, the selected WM ROIs were projected onto the diffusion FAspace with a linear transformation (FLIRT). The WM ROIs in FA space were now ready to be usedas seed masks for tractography.
112

Figure A4 Seed mask creation from spheres to final masks in the right hemisphere.
(a) Spheres and COGs are shown in the template conformed space for the hand (yellow sphere, COG indicated by red arrow ina1), trunk (light blue sphere, COG in a2), leg (green sphere, COG in a2) and head (fuchsia sphere, COG in a3). (b) Spheresin MNI152 space. (c) Spheres in one subject individual structural space overlapping with the precentral/paracentral cortex;bottom raw shows the head transformation not visible in the same slice as the other body part regions. (d) Individual final seedmasks in one subject FA diffusion space.The light blue arrows between images indicate the transformations between images, the commands used, above the arrow, andthe Software, below the arrows (FSL and Freesurfer, FS). Above the main images transformations, the transformation matrixestimations are shown to indicate where the transformation matrices come from. For instance, to project the spheres from thetemplate space to the MNI space, it was applied the inverted matrix created with the command tkregister from the MNI spaceto the template conformed space (See Supplementary Material Fig. A1 b)→ d).
113

APPENDIX C
Sensorimotor integration is enhancedin dancers and musicians
114

894 Exp Brain Res (2016) 234:893–903
1 3
(Schneider et al. 2007). To these aims, in the present study, the behavioural correlates of long-term dance and music training were compared.
Behavioural differences between dancers and non-danc-ers as well as between musicians and non-musicians have been found using tasks in a variety of domains including motor control, perception and sensorimotor integration. In terms of motor control, both dancers and musicians have shown enhanced performance relative to their untrained counterparts. Dancers have improved balance (Crotts et al. 1996) and postural control (Rein et al. 2011) compared to non-dancers. Musicians show advantages in hand and fin-ger movements compared to non-musicians (Fernandes and de Barros 2012; Verheul and Geuze 2004). These results may be related to the finding that both dancers (Thullier and Moufti 2004) and musicians (Inui and Ichihara 2001) can better optimize and combine movements than untrained controls.
In addition to motor tasks, the correlates of long-term dance and music training have been examined using per-ceptual tasks. Perceptual studies in dancers have focused on the visual domain using dance-related stimuli. Rela-tive to non-dancers, dancers can better detect differences in moving point-light displays (Calvo-Merino et al. 2010) and show faster eye movements when viewing a dance film (Stevens et al. 2010). In contrast, perceptual studies in musicians have focused on the auditory domain (for a review, see Herholz and Zatorre 2012); especially relevant to the present study are findings that musicians can better detect differences in rhythmic and melodic stimuli than non-musicians (Foster and Zatorre 2010; Fujioka et al. 2004; Rammsayer and Altenmuller 2006).
Sensorimotor integration is a crucial aspect of both dance and music training. Dancers combine auditory infor-mation from music, along with visual information from observing their own and others’ movements, with their motor output during performance. Musicians combine vis-ual information from reading music or following a conduc-tor, as well as auditory information from the output of their own and others’ instruments, with the movements required to produce the desired sound. The forms of sensorimo-tor integration most relevant to dance and music include audiomotor and visuomotor integration. In the audiomotor domain, dancers more accurately synchronize knee bend-ing to an auditory beat than non-dancers (Miura et al. 2011, 2013), and musicians more accurately synchronize hand/finger tapping to an auditory stimulus than non-musicians (Repp 2010; Chen et al. 2008; Bailey et al. 2014). In the visuomotor domain, dancers show increased ability com-pared to non-dancers in synchronizing with observed dance movements in the absence of auditory cues (Washburn et al. 2014). Musicians have better visuomotor integra-tion compared to non-musicians, for example, in terms of
motor reproduction of visually presented temporal intervals (Aagten-Murphy et al. 2014).
Some studies in dancers and musicians have also exam-ined performance on multi-modal tasks across the auditory, visual and motor domains. These studies are especially informative since dance performance and music perfor-mance involve the integration of all three of these domains. Sofianidis et al. (2012) observed that dancers were more stable and coordinated than non-dancers in a dance syn-chronization task with visual and auditory cues. In musi-cians, audio-visuomotor performance has been mainly studied using interference paradigms (Drost et al. 2005; Keller and Koch 2008; Taylor and Witt 2015), such as play-ing chords in response to visual cues while hearing irrel-evant auditory stimuli (Drost et al. 2005). Musicians show a greater interference effect of incongruent auditory and visual information relative to non-musicians, signalling that this action-effect representation in multi-modal integration is affected by training (Drost et al. 2005).
Taken together, this literature suggests that both danc-ers and musicians show enhancements in a range of sen-sorimotor skills compared to their untrained counterparts. However, it is not yet known whether the sensorimotor enhancements associated with long-term dance training are similar to or distinct from those associated with long-term music training. To this aim, the main objective of the pre-sent study was to investigate the behavioural correlates of long-term dance versus music training by examining senso-rimotor integration in expert dancers, expert musicians and untrained controls.
In the present study, all participants were tested on a bat-tery of behavioural tasks ranging from more dance-relevant to more music-relevant tasks. This type of behavioural bat-tery provides the opportunity to investigate performance that is directly relevant to the trained skill (e.g. dancers performing a dance-related task), as well as transfer effects to the other skill (e.g. dancers performing a music-related task). A dance imitation task was the most dance relevant, in which participants executed whole-body dance move-ments simultaneously with visual and auditory stimuli. The synchronization of whole-body movements to sen-sory stimuli is a main component of dance training, while music training generally relies less on whole-body move-ments and more on effector-specific movements. Compared to dance-related tasks used in previous studies (Cross et al. 2009; Tachibana et al. 2011; Ono et al. 2014), this task includes more ecologically valid dance movements since they require use of the whole-body rather than only the lower limbs. A rhythm synchronization task, in which par-ticipants tapped a finger in synchrony with auditory stimuli, was relevant to both dance and music since rhythm is a cru-cial aspect of both types of training. Dancers often synchro-nize their movements with the rhythmic aspect of auditory
115

895Exp Brain Res (2016) 234:893–903
1 3
and visual stimuli, while musicians produce sound in accordance with perceived rhythmic stimuli. A melody dis-crimination task was the most music-relevant task, which required participants to determine whether pairs of melo-dies were the same or different. Musicians are often trained to distinguish between pitches and melodies in order to be able to analyse performed or heard music in a critical man-ner, while this is less relevant to dance training as dancers generally follow rather than produce sound. In addition, cognitive tasks (Digit Span, Letter-Number Sequencing and syllable sequence discrimination) were administered in order to test for group differences in auditory working memory (Wechsler 1997; Foster and Zatorre 2010).
On the dance imitation task, dancers were expected to outperform both musicians and controls since dance train-ing focuses on performing whole-body movements often in synchrony with auditory and visual stimuli. This is supported by the finding that dancers perform better than non-dancers on a visuomotor dance imitation task (Wash-burn et al. 2014). On the rhythm synchronization task, both musicians and dancers were expected to outperform controls. Musicians have previously shown enhanced per-formance relative to non-musicians on the same rhythm synchronization task used here (Chen et al. 2008; Bailey et al. 2014), while dancers have shown better audiomotor integration in a rhythmic context than non-dancers (Miura et al. 2011, 2013). Since both dancers and musicians have demonstrated enhanced rhythmic abilities versus untrained controls, it was expected that they would perform similarly on the rhythm synchronization task. On the melody dis-crimination task, musicians were expected to outperform both dancers and controls. Music training often involves learning to distinguish between melodies, such as identify-ing whether a produced sound was correct or incorrect, and has been previously shown to provide advantages relative to non-musicians on the same melody task used here (Fos-ter and Zatorre 2010).
Methods
Participants
Three groups of participants (aged 18–40 years) were recruited for this study: expert dancers (N = 20), expert musicians (N = 19) and a control group of non-musicians/non-dancers (N = 20) (Table 1). Dancers and musicians were either currently practicing as professionals or students involved in professional training programs. Their training was assessed via a detailed questionnaire developed in our laboratories (Coffey et al. 2011; Bailey and Penhune 2010). Dancers and musicians had on average approximately 15 years of experience in their respective disciplines, and controls had on average <1 year of experience in dance, music, figure skating and aerobics. All participants were physically active (i.e. biking, running or practicing other physical exercises). Dancers were currently practicing con-temporary dance as their principal style, but had a variety of training backgrounds including ballet, tap, jazz, swing and ballroom. Dancers whose main style was too similar to the dance task used here (i.e. urban, street or hip hop) were excluded. Musicians had various instrumental back-grounds, including keyboard instruments, strings, wood-winds, brass and percussion. None of the musicians had absolute pitch. Since the dance task was based on a video game, participants were screened for experience with dance video games; 56 out of 59 participants reported that they never or rarely (up to three times per year) played dance video games. The remaining three participants (one dancer and two musicians) reported a maximum 4 months of expe-rience with dance video games. The groups did not differ in age, sex distribution, body mass index (BMI) or level of education (Table 1). Participants had no past or current learning or developmental disorder, neurological or psychi-atric condition, or alcohol or substance abuse. This study was approved by the Research Ethics Board at the Montreal
Table 1 Participant characteristics
Education levels for each participant are calculated on a scale of 1–5, where 1 is the lowest (completed high school) and 5 is the highest (com-pleted doctorate degree)
F females, M males, SD standard deviation
Group N Age (years ± SD) Sex Body mass index (BMI) (±SD)
Years of dance training (±SD)
Years of music training (±SD)
Level of education (±SD)
Dancers 20 25.1 ± 3.9 14F, 6M 21.7 ± 2.2 15.3 ± 5.2 1.8 ± 1.9 2.35 ± 0.6
Musicians 19 23.7 ± 3.6 12F, 7M 22.5 ± 3.2 1.1 ± 1.7 16.1 ± 3.4 2.32 ± 1.0
Controls 20 25.8 ± 5.1 13F, 7M 21.8 ± 3.2 0.4 ± 0.8 0.5 ± 1.0 2.6 ± 1.1
Comparison between groups
D = M = CF(2,56) = 1.32p = 0.28
D = M = CF(2,55) = 0.38p = 0.68
D > M (p < 0.0001)D > C (p < 0.0001)M = C (p = 1)
M > D (p < 0.0001)M > C (p < 0.0001)D = C (p = 0.27)
D = M = CF(2,56) = 56p = 0.57
116
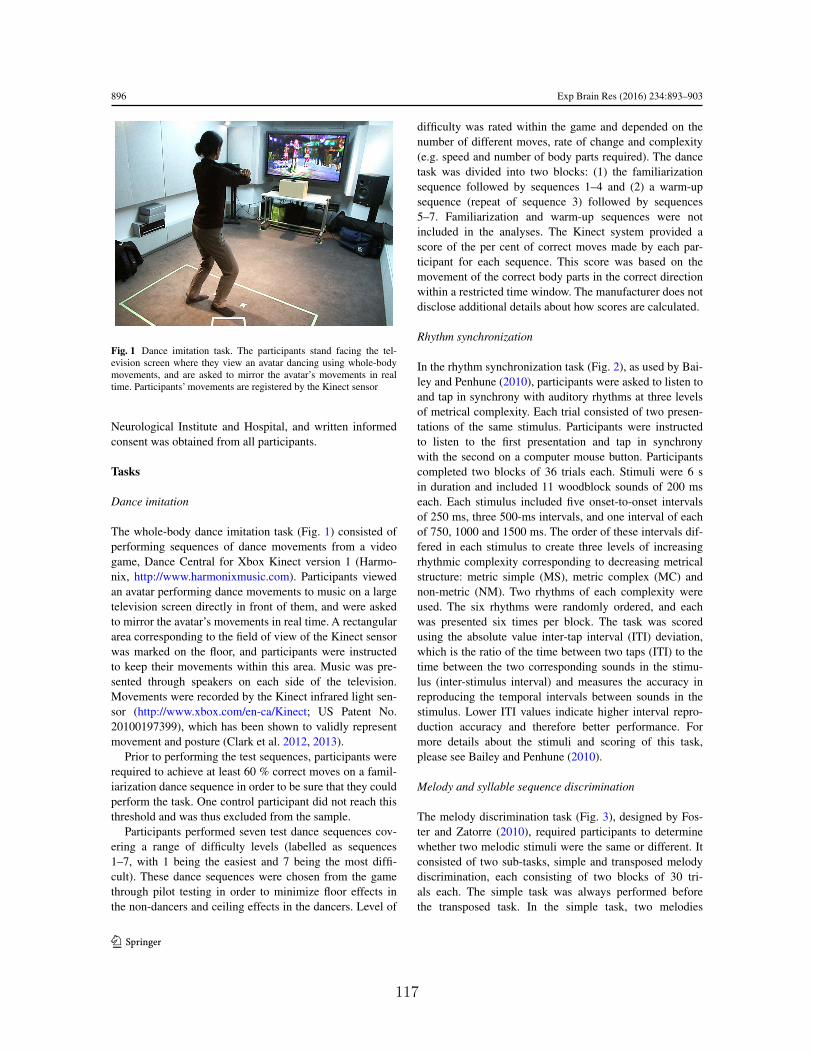
896 Exp Brain Res (2016) 234:893–903
1 3
Neurological Institute and Hospital, and written informed consent was obtained from all participants.
Tasks
Dance imitation
The whole-body dance imitation task (Fig. 1) consisted of performing sequences of dance movements from a video game, Dance Central for Xbox Kinect version 1 (Harmo-nix, http://www.harmonixmusic.com). Participants viewed an avatar performing dance movements to music on a large television screen directly in front of them, and were asked to mirror the avatar’s movements in real time. A rectangular area corresponding to the field of view of the Kinect sensor was marked on the floor, and participants were instructed to keep their movements within this area. Music was pre-sented through speakers on each side of the television. Movements were recorded by the Kinect infrared light sen-sor (http://www.xbox.com/en-ca/Kinect; US Patent No. 20100197399), which has been shown to validly represent movement and posture (Clark et al. 2012, 2013).
Prior to performing the test sequences, participants were required to achieve at least 60 % correct moves on a famil-iarization dance sequence in order to be sure that they could perform the task. One control participant did not reach this threshold and was thus excluded from the sample.
Participants performed seven test dance sequences cov-ering a range of difficulty levels (labelled as sequences 1–7, with 1 being the easiest and 7 being the most diffi-cult). These dance sequences were chosen from the game through pilot testing in order to minimize floor effects in the non-dancers and ceiling effects in the dancers. Level of
difficulty was rated within the game and depended on the number of different moves, rate of change and complexity (e.g. speed and number of body parts required). The dance task was divided into two blocks: (1) the familiarization sequence followed by sequences 1–4 and (2) a warm-up sequence (repeat of sequence 3) followed by sequences 5–7. Familiarization and warm-up sequences were not included in the analyses. The Kinect system provided a score of the per cent of correct moves made by each par-ticipant for each sequence. This score was based on the movement of the correct body parts in the correct direction within a restricted time window. The manufacturer does not disclose additional details about how scores are calculated.
Rhythm synchronization
In the rhythm synchronization task (Fig. 2), as used by Bai-ley and Penhune (2010), participants were asked to listen to and tap in synchrony with auditory rhythms at three levels of metrical complexity. Each trial consisted of two presen-tations of the same stimulus. Participants were instructed to listen to the first presentation and tap in synchrony with the second on a computer mouse button. Participants completed two blocks of 36 trials each. Stimuli were 6 s in duration and included 11 woodblock sounds of 200 ms each. Each stimulus included five onset-to-onset intervals of 250 ms, three 500-ms intervals, and one interval of each of 750, 1000 and 1500 ms. The order of these intervals dif-fered in each stimulus to create three levels of increasing rhythmic complexity corresponding to decreasing metrical structure: metric simple (MS), metric complex (MC) and non-metric (NM). Two rhythms of each complexity were used. The six rhythms were randomly ordered, and each was presented six times per block. The task was scored using the absolute value inter-tap interval (ITI) deviation, which is the ratio of the time between two taps (ITI) to the time between the two corresponding sounds in the stimu-lus (inter-stimulus interval) and measures the accuracy in reproducing the temporal intervals between sounds in the stimulus. Lower ITI values indicate higher interval repro-duction accuracy and therefore better performance. For more details about the stimuli and scoring of this task, please see Bailey and Penhune (2010).
Melody and syllable sequence discrimination
The melody discrimination task (Fig. 3), designed by Fos-ter and Zatorre (2010), required participants to determine whether two melodic stimuli were the same or different. It consisted of two sub-tasks, simple and transposed melody discrimination, each consisting of two blocks of 30 tri-als each. The simple task was always performed before the transposed task. In the simple task, two melodies
Fig. 1 Dance imitation task. The participants stand facing the tel-evision screen where they view an avatar dancing using whole-body movements, and are asked to mirror the avatar’s movements in real time. Participants’ movements are registered by the Kinect sensor
117

897Exp Brain Res (2016) 234:893–903
1 3
containing 5–13 low-pass-filtered harmonic tones were pre-sented. Tones were 320 ms in duration and included notes in the Western major scale ranging in pitch from C4 to E6. In half the trials, these melodies were identical (“same” tri-als). In the other half, one tone in the second melody was altered in pitch by up to five semitones (“different” tri-als). Key and melodic contour were not affected by this alteration. Following presentation of each melody pair, participants were asked whether the presented melodies were the same or different. The transposed task was simi-lar to the simple task, except that all second melodies were
transposed four semitones higher in pitch than the first mel-odies and the pitch alterations in the “different” trials had a magnitude of one semitone, which produced a note outside of the melody’s key. This task was scored using per cent of trials correct.
The syllable sequence discrimination task (Fig. 3), also designed by Foster and Zatorre (2010), is a control task for the melody discrimination task described above. By com-paring performance on this task to that of the melody dis-crimination task, it can be determined whether group dif-ferences on the melody task represent music-specific skills or may be due to group differences in working memory. On each trial, participants heard two syllable sequences and were asked to determine whether they were the same or different. Syllables consisted of one consonant with one vowel and were recorded in monotone from one speaker. Sequences had no meaning in English and contained 5–13 syllables of 320 ms each. On half the trials, the two sequences were identical. On the other half, one syllable was changed to a different syllable in the second sequence. Participants completed two blocks of 30 trials each. This task was scored using per cent of trials correct.
Cognitive tasks
To test for group differences in auditory working memory, participants completed two subtasks of the Weschler Adult Intelligence Scale (WAIS) III: Digit Span and Letter-Num-ber Sequencing (Wechsler 1997). Scores on each task were converted to scaled scores using standard protocols.
Fig. 2 Examples of stimuli and scoring of the rhythm syn-chronization task. Participants listen to and tap in synchrony with stimuli of three rhythmic complexities. Inter-tap interval (ITI) deviation is calculated as the ratio of the ITI to the corre-sponding inter-stimulus interval (figure adapted from Bailey and Penhune 2010)
Fig. 3 Examples of stimuli from the melody and syllable sequence discrimination tasks, in which participants hear pairs of melodies or syllable sequences and are asked to determine whether they are the same or different. Arrows show alterations in the “different” stimuli (figure adapted from Foster and Zatorre 2010)
118

898 Exp Brain Res (2016) 234:893–903
1 3
Procedure
Each participant completed all tasks in one or two ses-sions. The rhythm, melody and syllable tasks were admin-istered using Presentation software (Neurobehavioural Systems, http://www.neurobs.com), and auditory stimuli for these tasks were delivered using Sennheiser HD 25-1 II headphones at a comfortable volume. Participants were randomly assigned to one of four task orders, and the task order distribution was matched between groups. The non-dance tasks were performed between the dance task blocks to minimize the effect of fatigue on dance task performance.
Analyses
Group characteristics
Age, BMI, level of education and years of dance and music training were compared between groups (dancer, musician or control) using one-factor ANOVAs with group as the between-subjects factor. Post hoc pairwise comparisons were conducted where appropriate and corrected for multi-ple comparisons using the Bonferroni method.
Within‑task analyses
Linear fixed-effects models with repeated measures were used to analyse each task using its respective score. This technique uses a restricted maximum likelihood esti-mation method, which provides identical estimates to ANOVA when applied to balanced data (IBM Corporation 2012), but has important differences: it allows the speci-fication of the relationship between repeated measures (i.e. covariance structure) so that the sphericity assump-tion does not have to be satisfied, and it allows the inclu-sion of subjects with missing data. These models included group as a between-subjects factor and task-specific within-subject repeated measures using a compound symmetry covariance structure. Task-specific repeated measures included sequence difficulty in the dance task, rhythm complexity in the rhythm task, simple versus transposed melody discrimination subtasks, and syllable sequence versus melody discrimination tasks. Group com-parisons in the cognitive tasks were analysed using uni-variate ANCOVAs. Post hoc pairwise comparisons were conducted where appropriate and were corrected for mul-tiple comparisons using the Bonferroni method. To con-trol for effects of age and sex on task performance, these variables were included as covariates of no interest in all analyses.
Between‑task analyses
To allow for between-task comparisons, overall scores for the dance, rhythm and melody tasks were converted to z-scores (i.e. standardized scores). Since lower scores on the rhythm task correspond to better performance, z-scores for this task were multiplied by −1 so that higher z-scores corresponded to higher performance, which was consistent with the directionality of the other task scores. A linear fixed-effects model was conducted on these data, with group as a between-subjects fixed factor and task as a within-subjects repeated measure using an unstructured covariance matrix. To control for effects of age and sex on task performance, these variables were included as covari-ates of no interest.
Results
Group characteristics
One-factor ANOVAs conducted on age, BMI and level of education with group (dancer, musician or control) as the between-subjects factor revealed no significant differ-ences between groups [BMI: F(2,55) = 0.4, p = 0.68; age: F(2,56) = 1, p = 0.28; education: F(2,56) = 0.6, p = 0.57]. One-factor ANOVAs conducted on years of dance and music training with group as the between-subjects fac-tor revealed significant differences for both training types [music: F(2,55) = 271 p < 0.0001; dance: F(2,56) = 135 p < 0.0001]. Post hoc pairwise comparisons confirmed that musicians and controls did not differ in years of dance training (p = 1) and dancers and controls did not differ in years of music training (p = 0.27).
Dance imitation
Linear fixed-effects analysis using group as a between-subjects factor and sequence difficulty as a within-sub-jects repeated measure showed significant main effects of group [F(2,54) = 85, p < 0.0001] and sequence dif-ficulty [F(6,334) = 154, p < 0.0001] as well as an inter-action between group and difficulty [F(12,334) = 6, p < 0.0001]. Post hoc pairwise comparisons suggest that overall, dancers had the highest per cent moves correct, fol-lowed by musicians, and controls had the lowest per cent moves correct (p ≤ 0.003). Decomposition of the interac-tion suggests that on the easiest and three most difficult sequences, dancers performed better than both musicians and controls (p < 0.0001) with no difference between musicians and controls (p > 0.18). On the remaining three
119

899Exp Brain Res (2016) 234:893–903
1 3
intermediate sequences, dancers performed better than both other groups, and musicians performed better than controls (p ≤ 0.01).
Rhythm synchronization
Linear fixed-effects analysis using group as a between-subjects factor and stimulus complexity (MS, MC or NM) as a within-subjects repeated measure revealed significant main effects of group [F(2,54) = 13, p < 0.0001] and stim-ulus complexity [F(2,112) = 42, p < 0.0001], with no sig-nificant group by complexity interaction [F(4,112) = 0.4, p > 0.8]. Musicians showed lower ITI deviation (better performance) than both dancers and controls (p ≤ 0.007), and no difference was observed between dancers and con-trols (p = 0.19). Across groups, the lowest ITI deviations were observed for MS rhythms, followed by MC rhythms, and highest ITI deviations were observed in the NM condi-tion (p < 0.0001). In six participants (4 dancers, 1 musi-cian, 1 control), one block of this task was discarded due to at least ten instances where the participant tapped during the listening stimulus instead of the tapping stimulus. Since there was an overall learning effect between the two blocks on this task (paired t test comparing block 1 and block 2: t = 6.28, p < 0.0001), the scores of these six participants were calculated using their single block score and an adjustment to compensate for the learning effect (estimated by regression analysis of the remaining participants).
Melody and syllable sequence discrimination
Linear fixed-effects analysis using group as a between-sub-jects factor and melody versus syllable discrimination tasks as a within-subjects repeated measure revealed significant main effects of group [F(2,54) = 9, p < 0.0001] and task [F(1,56) = 7, p = 0.014], as well as a significant interac-tion between group and task [F(2,56) = 29, p < 0.0001]. Post hoc pairwise comparisons on the interaction showed that musicians performed better than both other groups (p < 0.0001) with no difference between dancers and con-trols (p = 1) in the melody task, but no group differences were found in the syllable task (p > 0.7).
Linear fixed-effects analysis using group as a between-subjects factor and simple versus transposed melody dis-crimination tasks as a within-subjects repeated measure showed significant main effects of group [F(2,54) = 28, p < 0.0001] and task [F(1,56) = 38, p < 0.0001], and a sig-nificant interaction between group and task [F(2,56) = 4, p = 0.017]. Decomposition of the interaction revealed that musicians performed better than both dancers and con-trols (p < 0.0001), with no difference between dancers and
controls (p ≥ 0.14), on both simple and transposed tasks. Both dancers and musicians performed significantly better on the simple compared to the transposed task (p ≤ 0.003), while controls did not show this difference (p = 0.095).
Z‑score analysis (Fig. 4)
Linear fixed-effects analysis on the z-scores of the dance, rhythm and melody tasks (Fig. 4) with group as a between-subjects factor and task as a within-subjects repeated measure revealed a significant main effect of group [F(2,51) = 26, p < 0.0001] and an interaction between group and task [F(4,56) = 30, p < 0.0001]. No main effect of task was found [F(2,56) = 0.001, p = 0.99].
Post hoc comparisons revealed that across tasks, dancers and musicians showed similar z-scores (p = 0.24), and both groups showed higher z-scores than controls (p < 0.0001). Decomposition of the group by task interaction showed iden-tical group differences as found in the individual task analy-ses. Post hoc analyses on the task by group interaction showed that dancers had higher z-scores on the dance task than both other tasks (p < 0.0001), and scored similarly on the rhythm and melody tasks (p = 0.4). Musicians had similar z-scores on the melody and rhythm tasks (p = 0.49), both of which were higher than their z-scores on the dance task (p < 0.0001). Con-trols scored similarly on all three tasks (p > 0.4).
Fig. 4 Performance across the three groups (dancers are shown as filled circles, musicians as unfilled squares and controls as striped tri‑angles) as measured by z-scores (adjusted for the covariates of age and sex) are shown across tasks from the most dance-related task (dance imitation), the rhythm synchronization, to the most music-related task (melody discrimination) as well as the syllable control task. As shown, dancers perform best on the dance task, and musi-cians perform best on the melody task
120

900 Exp Brain Res (2016) 234:893–903
1 3
Cognitive tasks
Univariate ANCOVAs revealed no differences between groups in the Digit Span task [F(2,54) = 1, p = 0.41]. A significant effect of group was found for the Letter-Number Sequencing task [F(2,54) = 5, p = 0.013), and post hoc pairwise comparisons showed that musicians performed better than both dancers and controls (p < 0.03) and no difference was observed between dancers and controls (p = 1).
Discussion
In the present study, performance on a battery of senso-rimotor tasks ranging from more dance-related to more music-related as well as cognitive tasks was compared between expert dancers, expert musicians and untrained controls. On the dance imitation task, dancers performed best, followed by musicians, whereas controls scored the lowest. On the rhythm synchronization and melody dis-crimination tasks, musicians performed best, while dancers and controls performed similarly. This work investigates the behavioural profiles of expert dancers and musicians and thereby increases understanding of the specificity of the effects of long-term dance versus music training.
Dance imitation
The dance-related task used in this study was a whole-body dance video game imitation task that required audio-visuo-motor integration. Participants viewed an avatar dancing to music and were asked to imitate the avatar’s movement in real time. As expected, dancers performed better than both controls and musicians on the dance task. This result indi-cates that dancers have increased audio-visuomotor inte-gration abilities involving whole-body movements relative to non-dancers. These findings are consistent with previous results from a study by Washburn et al. (2014) in which dancers performed better than non-dancers in a visuomo-tor interpersonal dance imitation task. These findings also support the work of Sofianidis et al. (2012) in which danc-ers were more stable and coordinated than non-dancers in a dance-related task involving the auditory, visual and motor domains. These results are likely explained by the fact that dance training involves performing whole-body movements in synchrony with auditory stimuli as well as other dancers. Dancers are trained to integrate the movements of multi-ple body parts (Thullier and Moufti 2004), and often learn choreography by observing and imitating movements. The advantage for dancers in this task may have been associ-ated with an enhanced ability to engage the action observa-tion network based on previous experience. This network
of brain regions is implicated in action observation, under-standing and imitation (Rizzolatti and Craighero 2004; Iacoboni 2005; Caspers et al. 2010). Consistent with these functions, dancers showed increasing engagement of this system as they learned a new dance sequence (Cross et al. 2006).
Musicians also performed better than untrained con-trols on the dance task, but only at the intermediate diffi-culty level. This indicates that music training showed some transfer to the dance imitation task. This finding supports previous work showing that musicians perform better than non-musicians in tasks involving sensorimotor integra-tion, specifically the synchronization of finger or hand/arm movements to auditory (Chen et al. 2008; Repp 2010; Bai-ley et al. 2014) or visual (Spilka et al. 2010) stimuli. Even though the specific types of movements (i.e. whole-body vs. effector-specific) and stimuli may differ between music and dance contexts, the overlap may be enough to provide musicians with an advantage in dance. It is also possible that musical training allows musicians to make better tem-poral predictions from the music used in the dance task, allowing them to make more synchronized movements. Finally, as for the dancers, musicians may have enhanced abilities to engage the action observation network during this task which may facilitate their ability to imitate and synchronize movements with the avatar. This is supported by findings of enhancements in the mirror neuron system in musicians compared to non-musicians (Bangert et al. 2006; Pau et al. 2013; Proverbio et al. 2014).
Rhythm synchronization
The rhythm synchronization task lies between the dance imitation and melody discrimination tasks on the contin-uum from more dance related to more music related, since rhythm is a crucial component of both dance and music training. Participants were asked to synchronize finger taps to auditory rhythmic stimuli of varying metrical com-plexities. Across all participants, performance decreased with increasing metrical complexity, consistent with previ-ous studies using the same task (Chen et al. 2008; Bailey and Penhune 2010) and other similar paradigms (Grahn and Brett 2007). As expected, musicians performed bet-ter than untrained controls on the rhythm synchronization task, consistent with previous reports of enhanced rhythm synchronization in musicians versus non-musicians on this same task (Chen et al. 2008; Bailey et al. 2014) as well as other work showing that musicians are less variable than non-musicians when tapping in synchrony with a chang-ing auditory stimulus (Repp 2010). Musicians also per-formed better than dancers on the rhythm synchronization task, but dancers did not perform better than untrained con-trols. This may be due to the fact the rhythm task relied on
121

901Exp Brain Res (2016) 234:893–903
1 3
finger tapping rather than whole-body movements and that finger movements are more prevalent in music than dance training.
Melody and syllable sequence discrimination
In the most music-related task, melody discrimination, participants were asked to determine whether pairs of melodies were the same or different. As expected, musi-cians performed better than both dancers and controls on this task. The syllable sequence discrimination task con-sisted of the same design except using non-musical syl-lable sequences instead of melodies, and was adminis-tered as a control for the melody discrimination task. No group differences were found in the syllable task. These results are consistent with those of Foster and Zatorre (2010), who found that musicians performed better than non-musicians on the same melody discrimination task used here, and both groups performed similarly on the syllable sequence discrimination task. The lack of group differences on the syllable task suggests that the differ-ences observed in the melody task are related to music-specific advantages in the musician group and not to audi-tory working memory differences between groups. These advantages are likely due to the fact that melody discrimi-nation is a crucial aspect of music training. Musicians must be able to hear pitch differences between melodies in order to determine whether they have correctly per-formed a musical sequence.
Overall, dancers performed similar to controls on the melody task. However, like musicians but unlike controls, they performed significantly better on the simple compared to the transposed condition of the task. This suggests that dancers’ exposure to music during training may have some effect on their ability to process melodic information.
Cognitive tasks
Cognitive tasks (Digit Span and Letter-Number Sequenc-ing) were administered to test for group differences in auditory working memory. No performance differences were found between dancers, musicians and controls on the Digit Span task; however, musicians performed bet-ter than both dancers and controls on the Letter-Number Sequencing task. These results are consistent with previous findings in musicians that years of music training was posi-tively correlated with performance on the Letter-Number Sequencing task, which places greater demands on auditory working memory (Bailey and Penhune 2010) relative to the other tasks used. Potential explanations include training-associated enhanced working memory ability in musicians, or that individuals who pursued music training may have pre-existing enhancements in such cognitive skills.
Overall results
This study is the first to compare the behavioural correlates of dance versus music training and compare task perfor-mance between expert dancers and musicians. It expands on work comparing each of these groups to their untrained counterparts by demonstrating that dancers and musicians have distinct behavioural profiles relative to untrained con-trols as well as to each other. It also builds on the literature by applying tasks across the continuum from dance relevant to music relevant in the same sample. Individual dance- or music-relevant tasks have been used independently (e.g. Washburn et al. 2014; Bailey and Penhune 2010; Foster and Zatorre 2010); however, combining them allows for the investigation of a larger range of sensorimotor abilities.
Taken together, the results of the present study sug-gest that dancers and musicians have distinct sensorimo-tor enhancements relative to untrained controls. Danc-ers showed enhanced sensorimotor integration involving whole-body movements compared to both musicians and controls as demonstrated by their higher scores on the dance imitation task. Dancers performed similarly to con-trols on the rhythm synchronization task, but performed better on the simple than transposed melody discrimina-tion (as observed in musicians but not controls), suggesting the possibility of some effect of dance training on melodic processing. As expected, musicians showed enhancements in melody discrimination and rhythm synchronization, but they also performed better than untrained controls on the dance imitation task, suggesting that music training may show some transfer to whole-body movement.
These findings have implications for sensorimotor train-ing in general. They suggest that learning a specific skill is associated with improvements in tasks with a strong rela-tion to that skill and that transference to less-related tasks may occur.
Future directions
Further work on the topic of the behavioural correlates of dance and music training will continue to advance knowl-edge on the specificity of these skills. To build on the pre-sent study, longitudinal work comparing task performance before and after dance and music training would be espe-cially informative as this would distinguish skill enhance-ment caused by training from that which may have been present before training and predisposed certain individuals to pursue training. Another important avenue for further study is the investigation of a sensitive period in the con-text of dance. Sensitive periods have been demonstrated for music (for a review, see Penhune 2011), but have not yet been investigated for dance. This topic could be exam-ined by comparing task performance between groups of
122

902 Exp Brain Res (2016) 234:893–903
1 3
early- and late-trained dancers, and would provide insight into the interaction between development and learn-ing dance-related skills such as sensorimotor integration involving whole-body movement. In addition to studying the behavioural correlates of dance versus music training, comparing the brain structural and functional correlates of these two types of training can further our understanding of their effects and provide support and explanations for the observed behavioural correlates. Our laboratory is currently investigating the grey matter (Karpati et al. 2014) and white matter (Giacosa et al. 2014) structural correlates of dance versus music training. A clinical avenue for future work is the development of dance- and music-based therapies for a variety of conditions including Parkinson’s disease (Mandelbaum and Lo 2014; Duncan and Earhart 2012) and stroke (Schneider et al. 2007). Evidence to date has demon-strated the efficacy of dance- and music-related interven-tions separately, and understanding how each may target specific skills may assist in designing protocols for specific symptoms or populations.
Conclusions
This study demonstrates that both dance and music train-ing provide advantages in sensorimotor tasks, and each is associated with a unique behavioural profile. Dancers and musicians both showed a large advantage in tasks related to their trained skill, and some transference between skills was observed. This study expands on previous work that investi-gated the behavioural correlates of dance or music training separately, and is the first study to directly compare these two types of training. This work advances the knowledge of the specificity of dance versus music training on sensori-motor skills and can be applied to the development of arts-based therapies for motor disorders. By understanding the similar and different effects of dance versus music training, one could more accurately design a therapy protocol using one or both of these types of training to target specific skills.
Acknowledgments We would like to thank our participants for their time, as well as Alessia Di Cesare, Veronica Yuk, and Dana Boebin-ger for their assistance in the data collection process. This work was funded by a grant from the Natural Sciences and Engineering Council of Canada (NSERC) to Dr. Krista Hyde.
Compliance with ethical standards
The authors declare that they have no conflict of interest. All proce-dures performed in studies involving human participants were in ac-cordance with the ethical standards of the institutional and/or national research committee and with the 1964 Helsinki Declaration and its later amendments or comparable ethical standards. Informed consent was obtained from all individual participants included in the study. Ad-ditional informed consent was obtained from all individual participants for whom identifying information is included in this article.
References
Aagten-Murphy D, Cappagli G, Burr D (2014) Musical training generalises across modalities and reveals efficient and adaptive mechanisms for reproducing temporal intervals. Acta Psychol 147:25–33. doi:10.1016/j.actpsy.2013.10.007
Bailey JA, Penhune VB (2010) Rhythm synchronization perfor-mance and auditory working memory in early- and late-trained musicians. Exp Brain Res 204:91–101. doi:10.1007/s00221-010-2299-y
Bailey JA, Zatorre RJ, Penhune VB (2014) Early musical training is linked to gray matter structure in the ventral premotor cortex and auditory–motor rhythm synchronization performance. J Cogn Neurosci 26:755–767. doi:10.1162/jocn_a_00527
Bangert M, Peschel T, Schlaug G, Rotte M, Drescher D, Hinrichs H, Heinze HJ, Altenmüller E (2006) Shared networks for auditory and motor processing in professional pianists: evidence from fMRI conjunction. NeuroImage 30:917–926
Bläsing B, Calvo-Merino B, Cross ES, Jola C, Honisch J, Ste-vens CJ (2012) Neurocognitive control in dance perception and performance. Acta Psychol 139:300–308. doi:10.1016/j.actpsy.2011.12.005
Calvo-Merino B, Ehrenberg S, Leung D, Haggard P (2010) Experts see it all: configural effects in action observation. Psychol Res 74:400–406. doi:10.1007/s00426-009-0262-y
Caspers S, Zilles K, Laird AR, Eickhoff SB (2010) ALE meta-analysis of action observation and imitation in the human brain. NeuroImage 50:1148–1167. doi:10.1016/j.neuroimage.2009.12.112
Chen JL, Penhune VB, Zatorre RJ (2008) Moving on time: brain network for auditory-motor synchronization is modulated by rhythm complexity and musical training. J Cogn Neurosci 20:226–239. doi:10.1162/jocn.2008.20018
Clark RA, Pua YH, Fortin K, Ritchie C, Webster KE, Denehy L, Bry-ant AL (2012) Validity of the Microsoft Kinect for assessment of postural control. Gait Posture 36:372–377. doi:10.1016/j.gaitpost.2012.03.033
Clark RA, Bower KJ, Mentiplay BF, Paterson K, Pua YH (2013) Concurrent validity of the Microsoft Kinect for assessment of spatiotemporal gait variables. J Biomech 46:2722–2725. doi:10.1016/j.jbiomech.2013.08.011
Coffey EBJ, Herholz SC, Scala S, Zatorre RJ (2011) Montreal Music History Questionnaire: a tool for the assessment of music-related experience in music cognition research. In: Conference proceed-ings from The Neurosciences and Music IV, Edinburgh, UK
Cross ES, Hamilton AF, Grafton ST (2006) Building a motor simu-lation de novo: observation of dance by dancers. NeuroImage 31:1257–1267. doi:10.1016/j.neuroimage.2006.01.033
Cross ES, Kraemer DJ, Hamilton AF, Kelley WM, Grafton ST (2009) Sensitivity of the action observation network to physical and observational learning. Cereb Cortex 19:315–326. doi:10.1093/cercor/bhn083
Crotts D, Thompson B, Nahom M, Ryan S, Newton RA (1996) Bal-ance abilities of professional dancers on select balance tests. J Orthop Sport Phys 23:12–17. doi:10.2519/jospt.1996.23.1.12
Drost UC, Rieger M, Brass M, Gunter TC, Prinz W (2005) Action-effect coupling in pianists. Psychol Res 69:233–241. doi:10.1007/s00426-004-0175-8
Duncan RP, Earhart GM (2012) Randomized controlled trial of community-based dancing to modify disease progression in Parkinson disease. Neurorehab Neural Repair 26:132–143. doi:10.1177/1545968311421614
Fernandes LF, de Barros RM (2012) Grip pattern and finger coordi-nation differences between pianists and non-pianists. J Electro-myogr Kines 22:412–418. doi:10.1016/j.jelekin.2012.02.007
123
903Exp Brain Res (2016) 234:893–903
1 3
Foster NE, Zatorre RJ (2010) A role for the intraparietal sulcus in transforming musical pitch information. Cereb Cortex 20:1350–1359. doi:10.1093/cercor/bhp199
Fujioka T, Trainor LJ, Ross B, Kakigi R, Pantev C (2004) Musi-cal training enhances automatic encoding of melodic con-tour and interval structure. J Cogn Neurosci 16:1010–1021. doi:10.1162/0898929041502706
Giacosa C, Karpati FJ, Foster NEV, Penhune VB, Hyde KL (2014) White matter differences in dancers and musicians. In: Confer-ence proceedings from The Neurosciences and Music V, Dijon, France
Grahn JA, Brett M (2007) Rhythm and beat perception in motor areas of the brain. J Cogn Neurosci 19:893–906. doi:10.1162/jocn.2007.19.5.893
Herholz SC, Zatorre RJ (2012) Musical training as a framework for brain plasticity: behavior, function, and structure. Neuron 76:486–502. doi:10.1016/j.neuron.2012.10.011
Iacoboni M (2005) Neural mechanisms of imitation. Curr Opin Neu-robiol 15:632–637
IBM Corporation (2012) Restricted maximum likelihood method. SPSS Statistics 21.0.0. http://www-01.ibm.com/support/knowl-edgecenter/#!/SSLVMB_21.0.0/com.ibm.spss.statistics.cs/var-comp_reml_method.htm. Accessed 10 Aug 2015
Inui N, Ichihara T (2001) Comparison of the relation between tim-ing and force control during finger-tapping sequences by pianists and non pianists. Mot Control 5:385–398
Karpati FJ, Giacosa C, Foster NE, Penhune VB, Hyde KL (2014) The specificity of dance versus music training on gray matter struc-ture. In: Conference proceedings from the 20th annual meet-ing of the Organization for Human Brain Mapping, Hamburg, Germany
Karpati FJ, Giacosa C, Foster NE, Penhune VB, Hyde KL (2015) Dance and the brain: a review. Ann N Y Acad Sci 1337:140–146. doi:10.1111/nyas.12632
Keller PE, Koch I (2008) Action planning in sequential skills: rela-tions to music performance. Q J Exp Psychol 61:275–291. doi:10.1080/17470210601160864
Mandelbaum R, Lo AC (2014) Examining dance as an intervention in Parkinson’s disease: a systematic review. Am J Dance Ther 36:160–175. doi:10.1007/s10465-014-9181-6
Miura A, Kudo K, Ohtsuki T, Kanehisa H (2011) Coordination modes in sensorimotor synchronization of whole-body movement: a study of street dancers and non-dancers. Hum Mov Sci 30:1260–1271. doi:10.1016/j.humov.2010.08.006
Miura A, Kudo K, Nakazawa K (2013) Action-perception coordina-tion dynamics of whole-body rhythmic movement in stance: a comparison study of street dancers and non-dancers. Neurosci Lett 544:157–162. doi:10.1016/j.neulet.2013.04.005
Ono Y et al (2014) Frontotemporal oxyhemoglobin dynamics predict performance accuracy of dance simulation game-play: temporal characteristics of top-down and bottom-up cortical activities. NeuroImage 85:461–470. doi:10.1016/j.neuroimage.2013.05.071
Pau S, Jahn G, Sakreida K, Domin M, Lotze M (2013) Encoding and recall of finger sequences in experienced pianists compared with musicale naïve controls: a combined behavioral and functional imaging study. NeuroImage 64:379–387
Penhune VB (2011) Sensitive periods in human development: evidence from musical training. Cortex 47:1126–1137. doi:10.1016/j.cortex.2011.05.010
Proverbio AM, Calbi M, Manfredi M, Zani A (2014) Audio-visuomo-tor processing in the musician’s brain: an ERP study on profes-sional violinists and clarinetists. Sci Rep 4:5866
Rammsayer T, Altenmuller E (2006) Temporal information process-ing in musicians and nonmusicians. Music Percept 24:37–48. doi:10.1525/mp.2006.24.1.37
Rein S, Fabian T, Zwipp H, Rammelt S, Weindel S (2011) Postural control and functional ankle stability in professional and ama-teur dancers. Clin Neurophysiol 122:1602–1610. doi:10.1016/j.clinph.2011.01.004
Repp BH (2010) Sensorimotor synchronization and perception of tim-ing: effects of music training and task experience. Hum Mov Sci 29:200–213. doi:10.1016/j.humov.2009.08.002
Rizzolatti G, Craighero L (2004) The mirror-neuron system. Annu Rev Neurosci 27:169–192
Schneider S, Schonle PW, Altenmuller E, Munte TF (2007) Using musical instruments to improve motor skill recovery following a stroke. J Neurol 254:1339–1346. doi:10.1007/s00415-006-0523-2
Sofianidis G, Hatzitaki V, McKinley P (2012) Effects of expertise and auditory guidance on traditional dance performance. J Dance Med Sci 16:57–64
Spilka MJ, Steele CJ, Penhune VB (2010) Gesture imitation in musicians and non-musicians. Exp Brain Res 204:549–558. doi:10.1007/s00221-010-2322-3
Stevens C, Winskel H, Howell C, Vidal LM, Latimer C, Milne-Home J (2010) Perceiving dance: schematic expectations guide experts’ scanning of a contemporary dance film. J Dance Med Sci 14:19–25
Tachibana A, Noah JA, Bronner S, Ono Y, Onozuka M (2011) Parietal and temporal activity during a multimodal dance video game: an fNIRS study. Neurosci Lett 503:125–130. doi:10.1016/j.neulet.2011.08.023
Taylor JE, Witt JK (2015) Listening to music primes space: pianists, but not novices, simulate heard actions. Psychol Res 79:175–182. doi:10.1007/s00426-014-0544-x
Thullier F, Moufti H (2004) Multi-joint coordination in ballet dancers. Neurosci Lett 369:80–84. doi:10.1016/j.neulet.2004.08.011
Verheul MH, Geuze RH (2004) Bimanual coordination and musical experience: the role of intrinsic dynamics and behavioral infor-mation. Mot Control 8:270–291
Washburn A, DeMarco M, de Vries S, Ariyabuddhiphongs K, Schmidt RC, Richardson MJ, Riley MA (2014) Dancers entrain more effectively than non-dancers to another actor’s movements. Front Hum Neurosci 8:800. doi:10.3389/fnhum.2014.00800
Wechsler D (1997) Wechsler adult intelligence scale, 3rd edn. Har-court Assessment, San Antonio
124