This manual should be considered a permanent part of the ...
Upload
khangminh22Category
view
2download
0
energies
Review
Which Building Services Are Considered to Have Impact onClimate Change?
David Vérez and Luisa F. Cabeza *
�����������������
Citation: Vérez, D.; Cabeza, L.F.
Which Building Services Are
Considered to Have Impact on
Climate Change? Energies 2021, 14,
3917. https://doi.org/10.3390/
en14133917
Academic Editor: Olivier Bahn
Received: 23 May 2021
Accepted: 27 June 2021
Published: 30 June 2021
Publisher’s Note: MDPI stays neutral
with regard to jurisdictional claims in
published maps and institutional affil-
iations.
Copyright: © 2021 by the authors.
Licensee MDPI, Basel, Switzerland.
This article is an open access article
distributed under the terms and
conditions of the Creative Commons
Attribution (CC BY) license (https://
creativecommons.org/licenses/by/
4.0/).
GREiA Research Group, Universitat de Lleida, Pere de Cabrera s/n, 25001 Lleida, Spain; [email protected]* Correspondence: [email protected]; Tel.: +34-973-003-576
Abstract: The building sector, as a major energy consumer with high direct and indirect CO2
emissions, plays a vital role in the fight against climate change. In order to make buildings morecomfortable, functional, efficient and safe, building services are used. Therefore, building services arethe key to decrease their contribution to climate change. Due to the lack of organized literature on thistopic, this paper presents the first comprehensive assessment of trends in the literature on buildingservices related to climate change, which was completed by conducting a bibliometric analysis ofthe existing literature on the topic. The ultimate goal is to provide a source where researchers andother interested parties can find this information in an organized manner. Results show that the mostabundant and recent studies related to building services are based on improving energy efficiency byoptimizing systems such as ventilation or lighting, the latter with the installation of LED lights. Inaddition, recent studies have focused on social factors such as housing and urban growth.
Keywords: building services; climate change; literature trends; bibliometric analysis
1. Introduction
Buildings have been identified as high energy consumers, as buildings and the build-ing construction sectors account for more than 30% of the global final energy consumptionand 40% of the total CO2 emissions, both direct and indirect [1]. However, at the same time,heating and cooling of buildings is one of the areas where there is a high potential to de-crease energy consumption and CO2 emissions [2]. Heating and cooling are indeed clearlyidentified as energy-consuming building services. Nevertheless, building services otherthan these and other building energy services (e.g., lighting) should also be considered inorder to have a holistic view of the real climate change mitigation potential of buildings.
Building services are the systems installed in buildings to make them more comfort-able, functional, efficient, and safe [3]. Building services might include building controlsystems, energy distribution, and energy supply. This traditional description includes aclassification of building services such as building management systems; energy generation,distribution and supply; escalators and lifts; facade engineering; fire safety, detection andprotection; heating, air conditioning and air conditioning systems (HVAC); ICT networks;lighting; lighting protection; refrigeration; security and alarm systems; and water, drainageand plumbing.
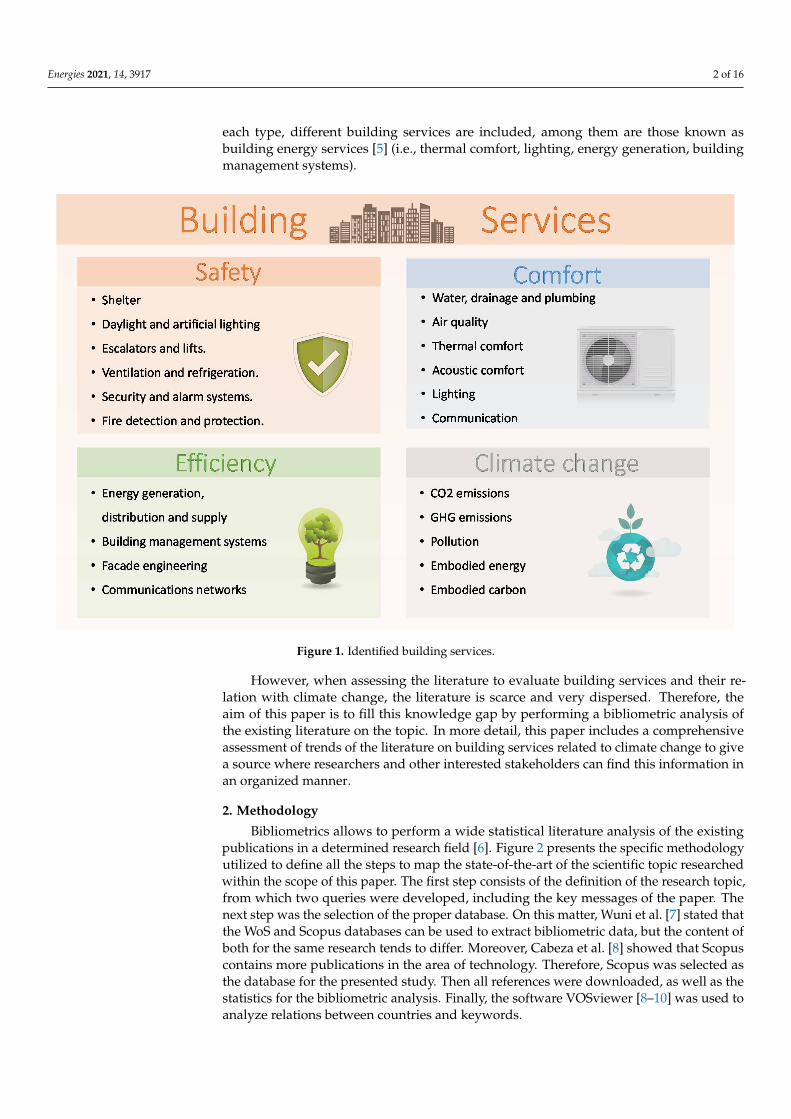
Another definition states that building services aim at achieving a safe and comfortableindoor environment whilst minimizing the environmental impact of a building [4]. Then,other concepts appear in the framework of building services, with wellbeing, circulareconomy, and climate change mitigation becoming increasingly important, such as airquality, thermal comfort, and acoustic comfort. However, a more holistic approach wouldalso include terms such as shelter, cooking, materials, embodied energy and embodiedcarbon, CO2 emissions, GHG emissions, and pollution. Therefore, a potential classificationof such building services could be the one presented in Figure 1. As it can be seen,building services have been classified into four types; safety-related services, comfort-related, services related to efficiency, and finally, services related to climate change. Within
Energies 2021, 14, 3917. https://doi.org/10.3390/en14133917 https://www.mdpi.com/journal/energies
Energies 2021, 14, 3917 2 of 16
each type, different building services are included, among them are those known asbuilding energy services [5] (i.e., thermal comfort, lighting, energy generation, buildingmanagement systems).
Energies 2021, 14, x FOR PEER REVIEW 2 of 17
energy and embodied carbon, CO2 emissions, GHG emissions, and pollution. Therefore, a potential classification of such building services could be the one presented in Figure 1. As it can be seen, building services have been classified into four types; safety-related services, comfort-related, services related to efficiency, and finally, services related to climate change. Within each type, different building services are included, among them are those known as building energy services [5] (i.e., thermal comfort, lighting, energy generation, building management systems).
Figure 1. Identified building services.
However, when assessing the literature to evaluate building services and their relation with climate change, the literature is scarce and very dispersed. Therefore, the aim of this paper is to fill this knowledge gap by performing a bibliometric analysis of the existing literature on the topic. In more detail, this paper includes a comprehensive assessment of trends of the literature on building services related to climate change to give a source where researchers and other interested stakeholders can find this information in an organized manner.
2. Methodology Bibliometrics allows to perform a wide statistical literature analysis of the existing
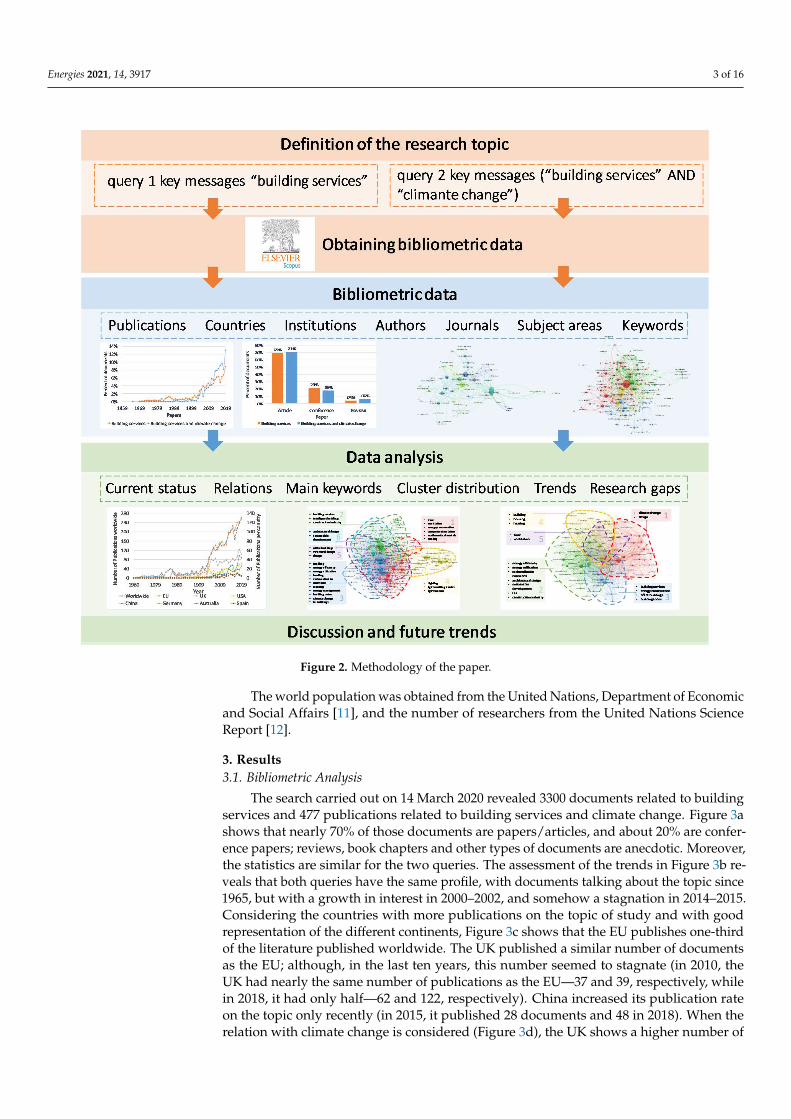
publications in a determined research field [6]. Figure 2 presents the specific methodology utilized to define all the steps to map the state-of-the-art of the scientific topic researched within the scope of this paper. The first step consists of the definition of the research topic, from which two queries were developed, including the key messages of the paper. The next step was the selection of the proper database. On this matter, Wuni et al. [7] stated that the WoS and Scopus databases can be used to extract bibliometric data, but the content of both for the same research tends to differ. Moreover, Cabeza et al. [8] showed that Scopus contains more publications in the area of technology. Therefore, Scopus was selected as the database for the presented study. Then all references were downloaded, as well as the statistics for the bibliometric analysis. Finally, the software VOSviewer [8–10] was used to analyze relations between countries and keywords.
Figure 1. Identified building services.
However, when assessing the literature to evaluate building services and their re-lation with climate change, the literature is scarce and very dispersed. Therefore, theaim of this paper is to fill this knowledge gap by performing a bibliometric analysis ofthe existing literature on the topic. In more detail, this paper includes a comprehensiveassessment of trends of the literature on building services related to climate change to givea source where researchers and other interested stakeholders can find this information inan organized manner.
2. Methodology
Bibliometrics allows to perform a wide statistical literature analysis of the existingpublications in a determined research field [6]. Figure 2 presents the specific methodologyutilized to define all the steps to map the state-of-the-art of the scientific topic researchedwithin the scope of this paper. The first step consists of the definition of the research topic,from which two queries were developed, including the key messages of the paper. Thenext step was the selection of the proper database. On this matter, Wuni et al. [7] stated thatthe WoS and Scopus databases can be used to extract bibliometric data, but the content ofboth for the same research tends to differ. Moreover, Cabeza et al. [8] showed that Scopuscontains more publications in the area of technology. Therefore, Scopus was selected asthe database for the presented study. Then all references were downloaded, as well as thestatistics for the bibliometric analysis. Finally, the software VOSviewer [8–10] was used toanalyze relations between countries and keywords.
Energies 2021, 14, 3917 3 of 16
Energies 2021, 14, x FOR PEER REVIEW 3 of 17
The world population was obtained from the United Nations, Department of Economic and Social Affairs [11], and the number of researchers from the United Nations Science Report [12].
Figure 2. Methodology of the paper.
3. Results 3.1. Bibliometric Analysis
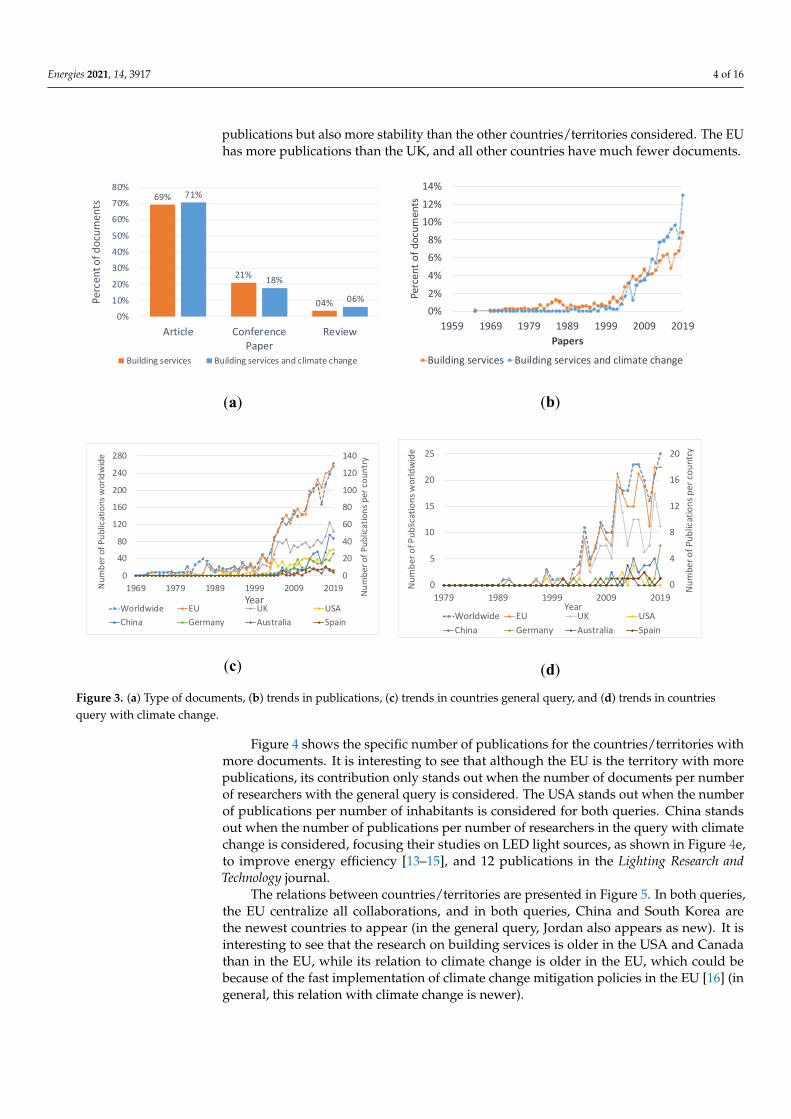
The search carried out on 14 March 2020 revealed 3300 documents related to building services and 477 publications related to building services and climate change. Figure 3a shows that nearly 70% of those documents are papers/articles, and about 20% are conference papers; reviews, book chapters and other types of documents are anecdotic. Moreover, the statistics are similar for the two queries. The assessment of the trends in Figure 3b reveals that both queries have the same profile, with documents talking about the topic since 1965, but with a growth in interest in 2000–2002, and somehow a stagnation in 2014–2015. Considering the countries with more publications on the topic of study and with good representation of the different continents, Figure 3c shows that the EU publishes one-third of the literature published worldwide. The UK published a similar number of documents as the EU; although, in the last ten years, this number seemed to stagnate (in 2010, the UK had nearly the same number of publications as the EU—37 and 39, respectively, while in 2018, it had only half—62 and 122, respectively). China increased its publication rate on the topic only recently (in 2015, it published 28 documents and 48 in 2018). When the relation with climate change is considered (Figure 3d), the UK shows a higher number of publications but also more stability than the other countries/territories considered. The EU has more publications than the UK, and all other countries have much fewer documents.
Figure 2. Methodology of the paper.
The world population was obtained from the United Nations, Department of Economicand Social Affairs [11], and the number of researchers from the United Nations ScienceReport [12].
3. Results3.1. Bibliometric Analysis
The search carried out on 14 March 2020 revealed 3300 documents related to buildingservices and 477 publications related to building services and climate change. Figure 3ashows that nearly 70% of those documents are papers/articles, and about 20% are confer-ence papers; reviews, book chapters and other types of documents are anecdotic. Moreover,the statistics are similar for the two queries. The assessment of the trends in Figure 3b re-veals that both queries have the same profile, with documents talking about the topic since1965, but with a growth in interest in 2000–2002, and somehow a stagnation in 2014–2015.Considering the countries with more publications on the topic of study and with goodrepresentation of the different continents, Figure 3c shows that the EU publishes one-thirdof the literature published worldwide. The UK published a similar number of documentsas the EU; although, in the last ten years, this number seemed to stagnate (in 2010, theUK had nearly the same number of publications as the EU—37 and 39, respectively, whilein 2018, it had only half—62 and 122, respectively). China increased its publication rateon the topic only recently (in 2015, it published 28 documents and 48 in 2018). When therelation with climate change is considered (Figure 3d), the UK shows a higher number of
Energies 2021, 14, 3917 4 of 16
publications but also more stability than the other countries/territories considered. The EUhas more publications than the UK, and all other countries have much fewer documents.
Energies 2021, 14, x FOR PEER REVIEW 4 of 17
(a)
(b)
(c)
(d)
Figure 3. (a) Type of documents, (b) trends in publications, (c) trends in countries general query, and (d) trends in countries query with climate change.
Figure 4 shows the specific number of publications for the countries/territories with more documents. It is interesting to see that although the EU is the territory with more publications, its contribution only stands out when the number of documents per number of researchers with the general query is considered. The USA stands out when the number of publications per number of inhabitants is considered for both queries. China stands out when the number of publications per number of researchers in the query with climate change is considered, focusing their studies on LED light sources, as shown in Figure 4e, to improve energy efficiency [13–15], and 12 publications in the Lighting Research and Technology journal.
69%
21%
04%
71%
18%
06%
0%
10%
20%
30%
40%
50%
60%
70%
80%
Article ConferencePaper
Review
Perc
ent o
f doc
umen
ts
Building services Building services and climate change
0%2%
4%
6%8%
10%12%
14%
1959 1969 1979 1989 1999 2009 2019
Perc
ent o
f doc
umen
ts
Papers
Building services Building services and climate change
0
20
40
60
80
100
120
140
0
40
80
120
160
200
240
280
1969 1979 1989 1999 2009 2019 Num
ber o
f Pub
licat
ions
per
cou
ntry
Num
ber o
f Pub
licat
ions
wor
ldw
ide
YearWorldwide EU UK USAChina Germany Australia Spain
0
4
8
12
16
20
0
5
10
15
20
25
1979 1989 1999 2009 2019
Num
ber o
f Pub
licat
ions
per
cou
ntry
Num
ber o
f Pub
licat
ions
wor
ldw
ide
YearWorldwide EU UK USAChina Germany Australia Spain
Figure 3. (a) Type of documents, (b) trends in publications, (c) trends in countries general query, and (d) trends in countriesquery with climate change.
Figure 4 shows the specific number of publications for the countries/territories withmore documents. It is interesting to see that although the EU is the territory with morepublications, its contribution only stands out when the number of documents per numberof researchers with the general query is considered. The USA stands out when the numberof publications per number of inhabitants is considered for both queries. China standsout when the number of publications per number of researchers in the query with climatechange is considered, focusing their studies on LED light sources, as shown in Figure 4e,to improve energy efficiency [13–15], and 12 publications in the Lighting Research andTechnology journal.
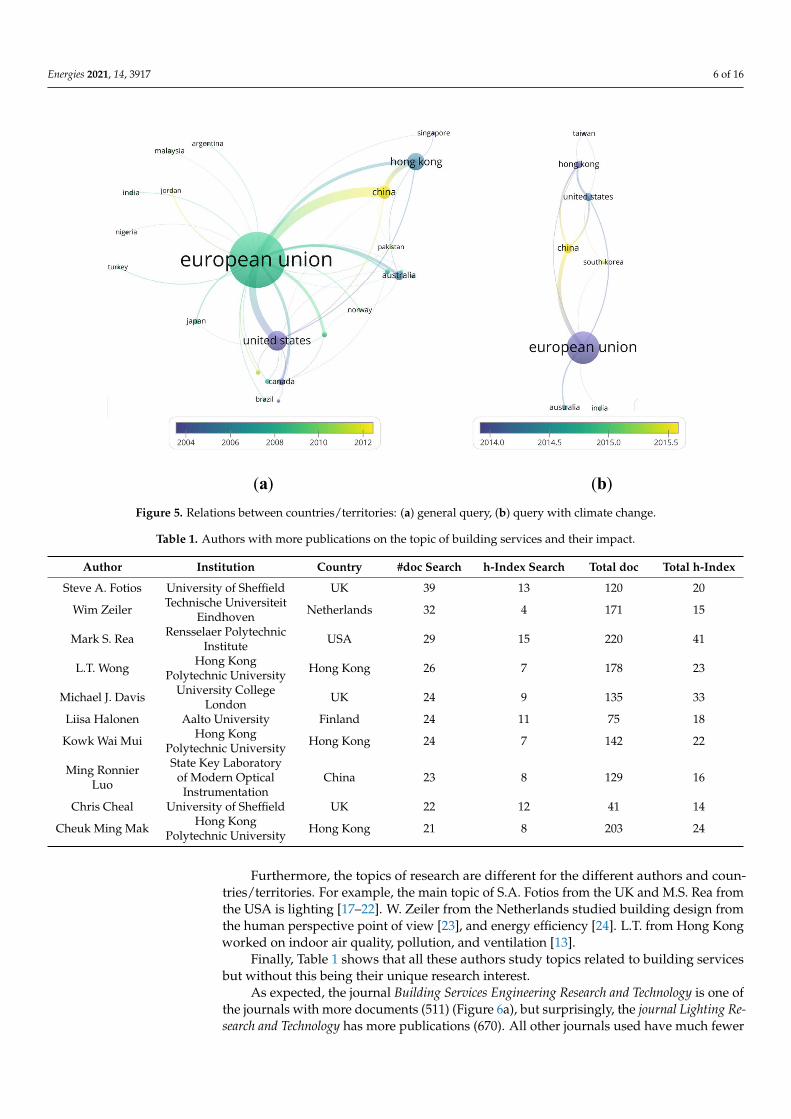
The relations between countries/territories are presented in Figure 5. In both queries,the EU centralize all collaborations, and in both queries, China and South Korea arethe newest countries to appear (in the general query, Jordan also appears as new). It isinteresting to see that the research on building services is older in the USA and Canadathan in the EU, while its relation to climate change is older in the EU, which could bebecause of the fast implementation of climate change mitigation policies in the EU [16] (ingeneral, this relation with climate change is newer).

Energies 2021, 14, 3917 5 of 16Energies 2021, 14, x FOR PEER REVIEW 5 of 17
(a)
(b)
(c)
(d)
(e)
Figure 4. Scientific production per country: (a) per million inhabitants (general query), (b) per million inhabitants (query with climate change), (c) per thousand researchers (general query), (d) per thousand researchers (query with climate change), and (e) overlay visualization for China (query 2).
The relations between countries/territories are presented in Figure 5. In both queries, the EU centralize all collaborations, and in both queries, China and South Korea are the newest countries to appear (in the general query, Jordan also appears as new). It is interesting to see that the research on building services is older in the USA and Canada than in the EU, while its relation to climate change is older in the EU, which could be because of the fast implementation of climate change mitigation policies in the EU [16] (in general, this relation with climate change is newer).
02468101214
0200400600800
10001200140016001800
# Pu
b / m
ilion
inha
bita
nts
Num
ber o
f pub
licat
ions
Country
0.00.20.40.60.81.01.21.41.61.82.0
020406080
100120140160180200
# Pu
b / m
ilion
inha
bita
nts
Num
ber
of p
ublic
atio
ns
Country
0.0
50.0
100.0
150.0
200.0
250.0
0200400600800
10001200140016001800
# pu
b /
thou
sand
res
earc
hers
Num
ber
of p
ublic
atio
ns
Country
0.0
100.0
200.0
300.0
400.0
500.0
600.0
020406080
100120140160180200
# pu
b /
thou
sand
res
earc
hers
Num
ber
of p
ublic
atio
ns
Country
Figure 4. Scientific production per country: (a) per million inhabitants (general query), (b) per million inhabitants (querywith climate change), (c) per thousand researchers (general query), (d) per thousand researchers (query with climate change),and (e) overlay visualization for China (query 2).
Table 1 lists the researchers with more documents on the topic of building services(Query 1). It is interesting to see that there is not a clear correlation between the authorswith more publications and the countries with more publications. For example, the UKincludes three authors (Steve A. Fotios, Michael J. Davis, and Chris Cheal), and only twoinstitutions are represented (University of Sheffield with two authors and Univ. CollegeLondon). Hong Kong also contributes with three researchers, but in this case, only oneinstitution is represented (Hong Kong Polytechnic University). In both cases, we find tworesearchers publishing together, Steve A. Fotios and Chris Cheal for the UK, and L.T. Wongand K.W. Mui for Hong Kong.
Energies 2021, 14, 3917 6 of 16
Energies 2021, 14, x FOR PEER REVIEW 6 of 17
(a) (b)
Figure 5. Relations between countries/territories: (a) general query, (b) query with climate change.
Table 1 lists the researchers with more documents on the topic of building services (Query 1). It is interesting to see that there is not a clear correlation between the authors with more publications and the countries with more publications. For example, the UK includes three authors (Steve A. Fotios, Michael J. Davis, and Chris Cheal), and only two institutions are represented (University of Sheffield with two authors and Univ. College London). Hong Kong also contributes with three researchers, but in this case, only one institution is represented (Hong Kong Polytechnic University). In both cases, we find two researchers publishing together, Steve A. Fotios and Chris Cheal for the UK, and L.T. Wong and K.W. Mui for Hong Kong.
Furthermore, the topics of research are different for the different authors and countries/territories. For example, the main topic of S.A. Fotios from the UK and M.S. Rea from the USA is lighting [17–22]. W. Zeiler from the Netherlands studied building design from the human perspective point of view [23], and energy efficiency [24]. L.T. from Hong Kong worked on indoor air quality, pollution, and ventilation [13].
Finally, Table 1 shows that all these authors study topics related to building services but without this being their unique research interest.
Table 1. Authors with more publications on the topic of building services and their impact.
Author Institution Country #doc Search h-Index Search Total doc Total h-Index
Steve A. Fotios University of Sheffield UK 39 13 120 20
Wim Zeiler Technische Universiteit Eindhoven
Netherlands 32 4 171 15
Mark S. Rea Rensselaer Polytechnic Institute USA 29 15 220 41
L.T. Wong Hong Kong Polytechnic University
Hong Kong 26 7 178 23
Michael J. Davis
University College London UK 24 9 135 33
Figure 5. Relations between countries/territories: (a) general query, (b) query with climate change.
Table 1. Authors with more publications on the topic of building services and their impact.
Author Institution Country #doc Search h-Index Search Total doc Total h-Index
Steve A. Fotios University of Sheffield UK 39 13 120 20
Wim Zeiler Technische UniversiteitEindhoven Netherlands 32 4 171 15
Mark S. Rea Rensselaer PolytechnicInstitute USA 29 15 220 41
L.T. Wong Hong KongPolytechnic University Hong Kong 26 7 178 23
Michael J. Davis University CollegeLondon UK 24 9 135 33
Liisa Halonen Aalto University Finland 24 11 75 18
Kowk Wai Mui Hong KongPolytechnic University Hong Kong 24 7 142 22
Ming RonnierLuo
State Key Laboratoryof Modern Optical
InstrumentationChina 23 8 129 16
Chris Cheal University of Sheffield UK 22 12 41 14
Cheuk Ming Mak Hong KongPolytechnic University Hong Kong 21 8 203 24
Furthermore, the topics of research are different for the different authors and coun-tries/territories. For example, the main topic of S.A. Fotios from the UK and M.S. Rea fromthe USA is lighting [17–22]. W. Zeiler from the Netherlands studied building design fromthe human perspective point of view [23], and energy efficiency [24]. L.T. from Hong Kongworked on indoor air quality, pollution, and ventilation [13].
Finally, Table 1 shows that all these authors study topics related to building servicesbut without this being their unique research interest.
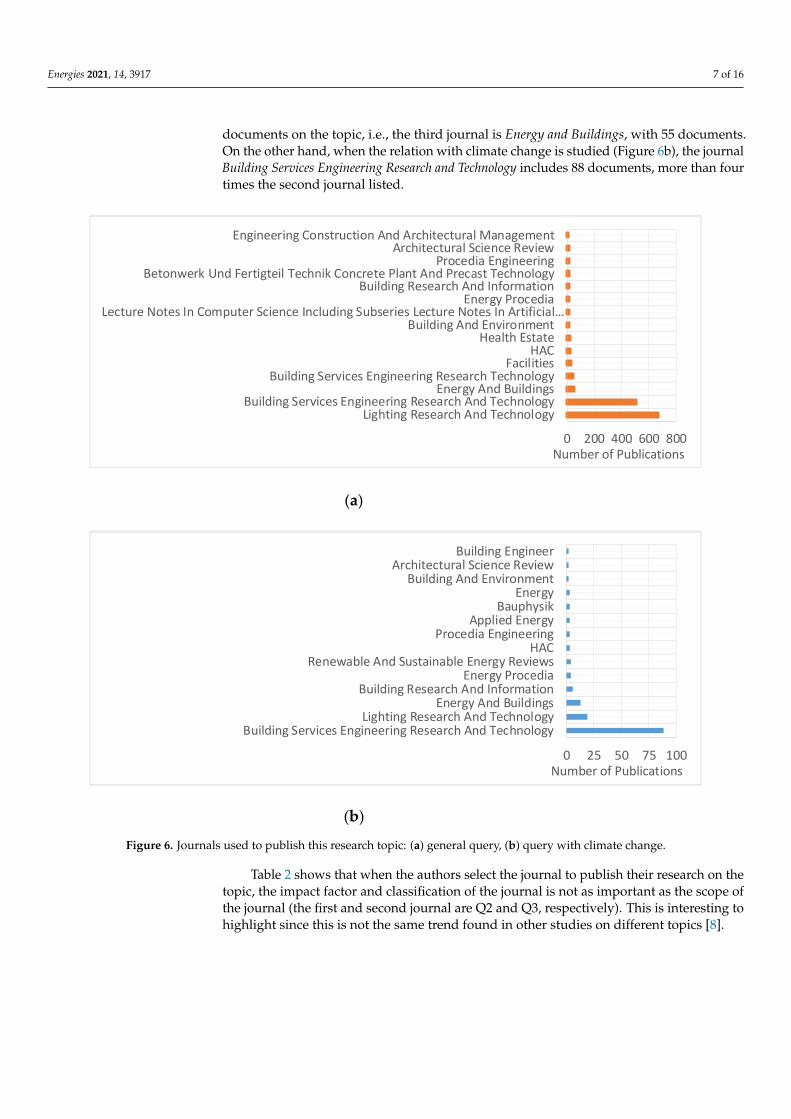
As expected, the journal Building Services Engineering Research and Technology is one ofthe journals with more documents (511) (Figure 6a), but surprisingly, the journal Lighting Re-search and Technology has more publications (670). All other journals used have much fewer
Energies 2021, 14, 3917 7 of 16
documents on the topic, i.e., the third journal is Energy and Buildings, with 55 documents.On the other hand, when the relation with climate change is studied (Figure 6b), the journalBuilding Services Engineering Research and Technology includes 88 documents, more than fourtimes the second journal listed.
Energies 2021, 14, x FOR PEER REVIEW 7 of 17
Liisa Halonen Aalto University Finland 24 11 75 18
Kowk Wai Mui Hong Kong Polytechnic University
Hong Kong 24 7 142 22
Ming Ronnier Luo
State Key Laboratory of Modern Optical
Instrumentation China 23 8 129 16
Chris Cheal University of Sheffield UK 22 12 41 14
Cheuk Ming Mak
Hong Kong Polytechnic University
Hong Kong 21 8 203 24
As expected, the journal Building Services Engineering Research and Technology is one of the journals with more documents (511) (Figure 6a), but surprisingly, the journal Lighting Research and Technology has more publications (670). All other journals used have much fewer documents on the topic, i.e., the third journal is Energy and Buildings, with 55 documents. On the other hand, when the relation with climate change is studied (Figure 6b), the journal Building Services Engineering Research and Technology includes 88 documents, more than four times the second journal listed.
(a)
(b)
Figure 6. Journals used to publish this research topic: (a) general query, (b) query with climate change.
0 200 400 600 800
Lighting Research And TechnologyBuilding Services Engineering Research And Technology
Energy And BuildingsBuilding Services Engineering Research Technology
FacilitiesHAC
Health EstateBuilding And Environment
Lecture Notes In Computer Science Including Subseries Lecture Notes In Artificial…Energy Procedia
Building Research And InformationBetonwerk Und Fertigteil Technik Concrete Plant And Precast Technology
Procedia EngineeringArchitectural Science Review
Engineering Construction And Architectural Management
Number of Publications
0 25 50 75 100
Building Services Engineering Research And TechnologyLighting Research And Technology
Energy And BuildingsBuilding Research And Information
Energy ProcediaRenewable And Sustainable Energy Reviews
HACProcedia Engineering
Applied EnergyBauphysik
EnergyBuilding And Environment
Architectural Science ReviewBuilding Engineer
Number of Publications
Figure 6. Journals used to publish this research topic: (a) general query, (b) query with climate change.
Table 2 shows that when the authors select the journal to publish their research on thetopic, the impact factor and classification of the journal is not as important as the scope ofthe journal (the first and second journal are Q2 and Q3, respectively). This is interesting tohighlight since this is not the same trend found in other studies on different topics [8].

Energies 2021, 14, 3917 8 of 16
Table 2. Journals with more publications on the topic of building services and their impact.
Journal #pub Editorial Impact factor(2018)
Classification(2018) Open Access
Lighting Researchand Technology 670 SAGE Journals 2.311 Q2 No
Building Services EngineeringResearch and Technology 558 SAGE Journals 1.170 Q3 No
Energy and Buildings 55 Elsevier 4.495 Q1 No
Facilities 33 Emerald GroupPublishing Ltd. — — Yes
Building and Environment 23 Elsevier 4.820 Q1 No
Finally, Figure 7 shows that most documents published on the topic of building ser-vices are within the area of engineering (77% in building services and 78% in buildingservices and climate change). All other areas found have a much lower number of publi-cations (i.e., computer science includes 9% of documents on building services). However,it is interesting to highlight that in building services, the next most published topics areclimate change energy 15% and environmental science 13 %.
Energies 2021, 14, x FOR PEER REVIEW 8 of 17
Table 2 shows that when the authors select the journal to publish their research on the topic, the impact factor and classification of the journal is not as important as the scope of the journal (the first and second journal are Q2 and Q3, respectively). This is interesting to highlight since this is not the same trend found in other studies on different topics [8].
Table 2. Journals with more publications on the topic of building services and their impact.
Journal #pub Editorial Impact factor
(2018) Classification
(2018) Open Access
Lighting Research and Technology
670 SAGE Journals 2.311 Q2 No
Building Services
Engineering Research and Technology
558 SAGE Journals 1.170 Q3 No
Energy and Buildings 55 Elsevier 4.495 Q1 No
Facilities 33
Emerald Group
Publishing Ltd.
--- --- Yes
Building and Environment 23 Elsevier 4.820 Q1 No
Finally, Figure 7 shows that most documents published on the topic of building services are within the area of engineering (77% in building services and 78% in building services and climate change). All other areas found have a much lower number of publications (i.e., computer science includes 9% of documents on building services). However, it is interesting to highlight that in building services, the next most published topics are climate change energy 15% and environmental science 13 %.
(a)
Engineering
Computer Science
Energy
Business, Management and
Accounting
Environmental ScienceSocial Sciences Materials Science
Medicine
Mathematics
Physics and Astronomy
Earth and Planetary Sciences
Arts and Humanities
Decision Sciences
Chemical Engineering
Economics, Econometrics and
Finance
Chemistry
Agricultural and Biological Sciences
Health …
Biochemistry, Genetics and Molecular …
Multidisciplinary
Psychology
Nursing
Pharmacology, Toxicology and …
Immunology and Microbiology
Energies 2021, 14, x FOR PEER REVIEW 9 of 17
(b)
Figure 7. Subjects used to publish this research topic: (a) general query, (b) query with climate change.
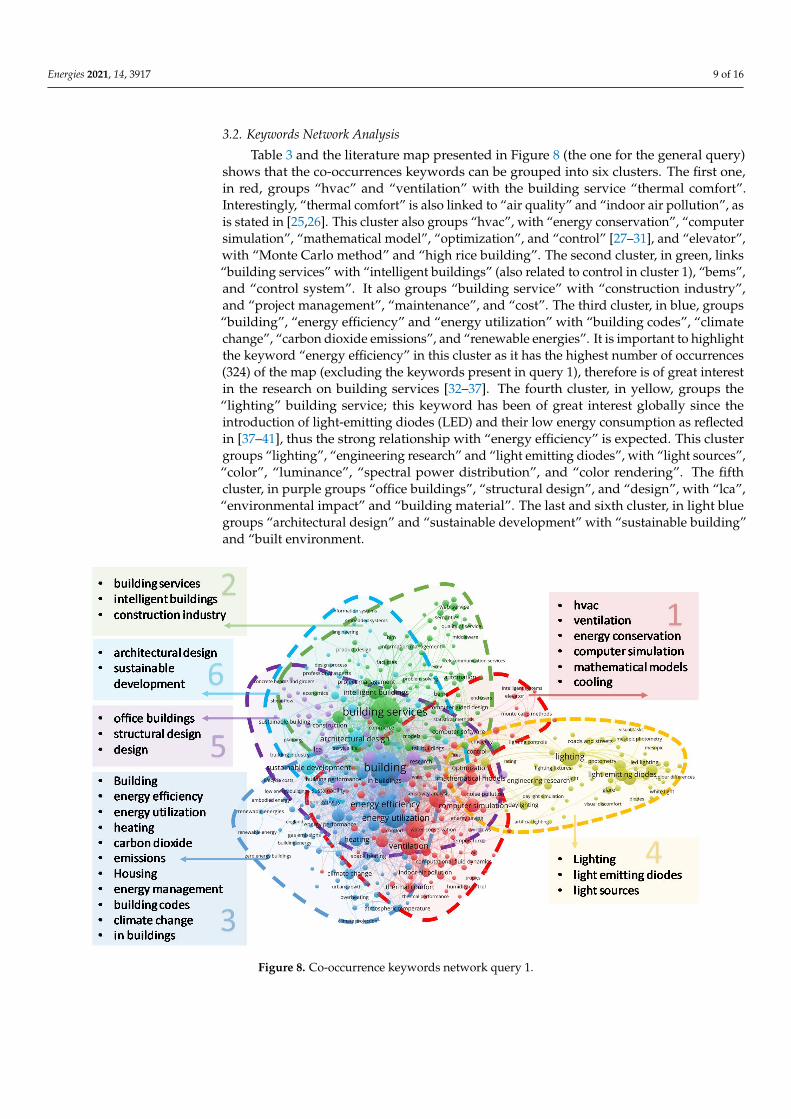
3.2. Keywords Network Analysis Table 3 and the literature map presented in Figure 8 (the one for the general query)
shows that the co-occurrences keywords can be grouped into six clusters. The first one, in red, groups “hvac” and “ventilation” with the building service “thermal comfort”. Interestingly, “thermal comfort” is also linked to “air quality” and “indoor air pollution”, as is stated in [25,26]. This cluster also groups “hvac”, with “energy conservation”, “computer simulation”, “mathematical model”, “optimization”, and “control” [27–31], and “elevator”, with “Monte Carlo method” and “high rice building”. The second cluster, in green, links “building services” with “intelligent buildings” (also related to control in cluster 1), “bems”, and “control system”. It also groups “building service” with “construction industry”, and “project management”, “maintenance”, and “cost”. The third cluster, in blue, groups “building”, “energy efficiency” and “energy utilization” with “building codes”, “climate change”, “carbon dioxide emissions”, and “renewable energies”. It is important to highlight the keyword “energy efficiency” in this cluster as it has the highest number of occurrences (324) of the map (excluding the keywords present in query 1), therefore is of great interest in the research on building services [32–37]. The fourth cluster, in yellow, groups the “lighting” building service; this keyword has been of great interest globally since the introduction of light-emitting diodes (LED) and their low energy consumption as reflected in [37–41], thus the strong relationship with “energy efficiency” is expected. This cluster groups “lighting”, “engineering research” and “light emitting diodes”, with “light sources”, “color”, “luminance”, “spectral power distribution”, and “color rendering”. The fifth cluster, in purple groups “office buildings”, “structural design”, and “design”, with “lca”, “environmental impact” and “building material”. The last and sixth cluster, in light blue groups “architectural design” and “sustainable development” with “sustainable building” and “built environment.
Engineering
Computer Science
Energy
Business, Management and
Accounting
Environmental Science
Social Sciences
Materials Science
Medicine
MathematicsPhysics and Astronomy
Earth and Planetary Sciences
Arts and Humanities
Decision Sciences
Chemical Engineering
Economics, Econometrics and
Finance
Agricultural and Biological Sciences
Figure 7. Subjects used to publish this research topic: (a) general query, (b) query with climate change.
Energies 2021, 14, 3917 9 of 16
3.2. Keywords Network Analysis
Table 3 and the literature map presented in Figure 8 (the one for the general query)shows that the co-occurrences keywords can be grouped into six clusters. The first one,in red, groups “hvac” and “ventilation” with the building service “thermal comfort”.Interestingly, “thermal comfort” is also linked to “air quality” and “indoor air pollution”, asis stated in [25,26]. This cluster also groups “hvac”, with “energy conservation”, “computersimulation”, “mathematical model”, “optimization”, and “control” [27–31], and “elevator”,with “Monte Carlo method” and “high rice building”. The second cluster, in green, links“building services” with “intelligent buildings” (also related to control in cluster 1), “bems”,and “control system”. It also groups “building service” with “construction industry”,and “project management”, “maintenance”, and “cost”. The third cluster, in blue, groups“building”, “energy efficiency” and “energy utilization” with “building codes”, “climatechange”, “carbon dioxide emissions”, and “renewable energies”. It is important to highlightthe keyword “energy efficiency” in this cluster as it has the highest number of occurrences(324) of the map (excluding the keywords present in query 1), therefore is of great interestin the research on building services [32–37]. The fourth cluster, in yellow, groups the“lighting” building service; this keyword has been of great interest globally since theintroduction of light-emitting diodes (LED) and their low energy consumption as reflectedin [37–41], thus the strong relationship with “energy efficiency” is expected. This clustergroups “lighting”, “engineering research” and “light emitting diodes”, with “light sources”,“color”, “luminance”, “spectral power distribution”, and “color rendering”. The fifthcluster, in purple groups “office buildings”, “structural design”, and “design”, with “lca”,“environmental impact” and “building material”. The last and sixth cluster, in light bluegroups “architectural design” and “sustainable development” with “sustainable building”and “built environment.
Energies 2021, 14, x FOR PEER REVIEW 10 of 17
Figure 8. Co-occurrence keywords network query 1.
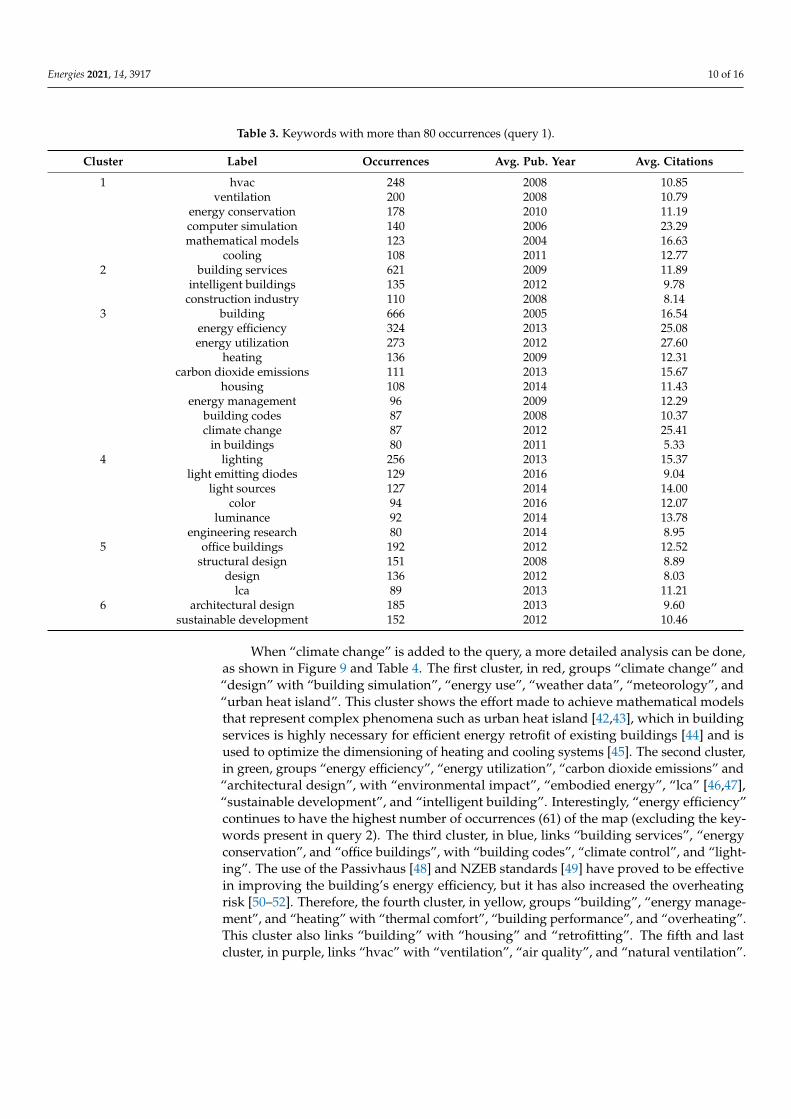
Table 3. Keywords with more than 80 occurrences (query 1).
Cluster Label Occurrences Avg. Pub. Year Avg. Citations
1 hvac 248 2008 10.85 ventilation 200 2008 10.79 energy conservation 178 2010 11.19 computer simulation 140 2006 23.29 mathematical models 123 2004 16.63 cooling 108 2011 12.77
2 building services 621 2009 11.89 intelligent buildings 135 2012 9.78 construction industry 110 2008 8.14
3 building 666 2005 16.54 energy efficiency 324 2013 25.08 energy utilization 273 2012 27.60 heating 136 2009 12.31 carbon dioxide emissions 111 2013 15.67 housing 108 2014 11.43 energy management 96 2009 12.29 building codes 87 2008 10.37 climate change 87 2012 25.41 in buildings 80 2011 5.33
4 lighting 256 2013 15.37
Figure 8. Co-occurrence keywords network query 1.
Energies 2021, 14, 3917 10 of 16
Table 3. Keywords with more than 80 occurrences (query 1).
Cluster Label Occurrences Avg. Pub. Year Avg. Citations
1 hvac 248 2008 10.85ventilation 200 2008 10.79
energy conservation 178 2010 11.19computer simulation 140 2006 23.29mathematical models 123 2004 16.63
cooling 108 2011 12.772 building services 621 2009 11.89
intelligent buildings 135 2012 9.78construction industry 110 2008 8.14
3 building 666 2005 16.54energy efficiency 324 2013 25.08energy utilization 273 2012 27.60
heating 136 2009 12.31carbon dioxide emissions 111 2013 15.67
housing 108 2014 11.43energy management 96 2009 12.29
building codes 87 2008 10.37climate change 87 2012 25.41
in buildings 80 2011 5.334 lighting 256 2013 15.37
light emitting diodes 129 2016 9.04light sources 127 2014 14.00
color 94 2016 12.07luminance 92 2014 13.78
engineering research 80 2014 8.955 office buildings 192 2012 12.52
structural design 151 2008 8.89design 136 2012 8.03
lca 89 2013 11.216 architectural design 185 2013 9.60
sustainable development 152 2012 10.46
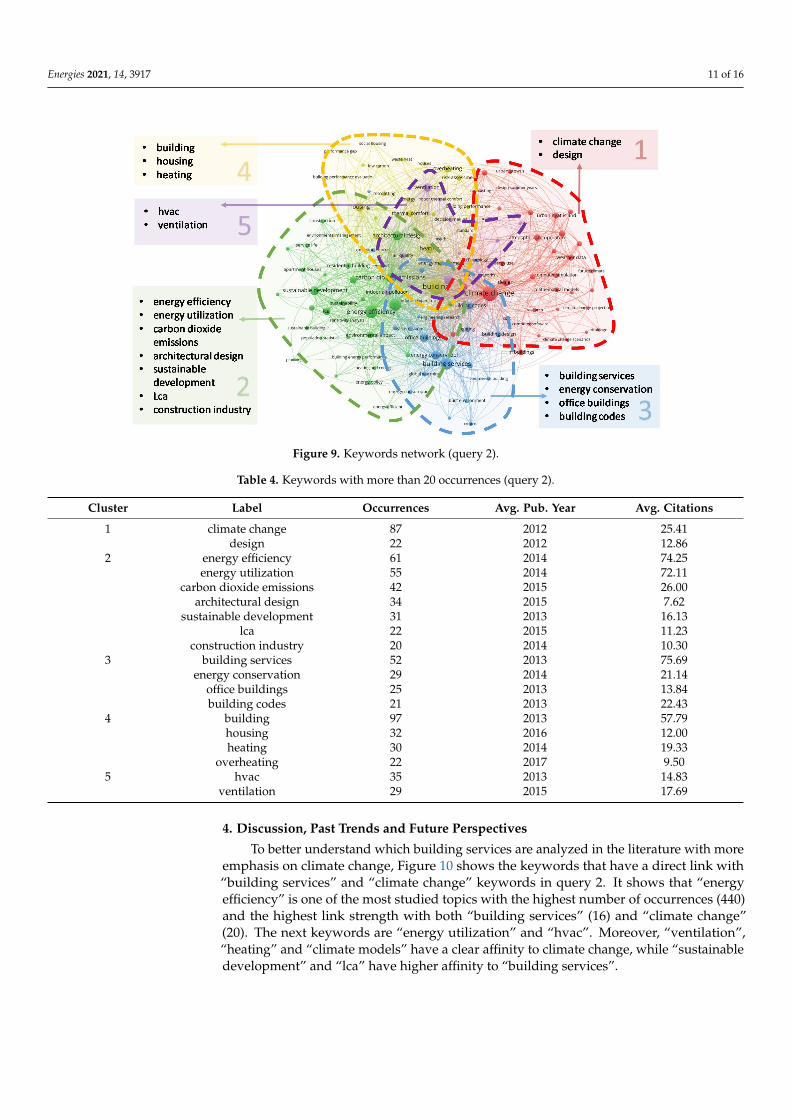
When “climate change” is added to the query, a more detailed analysis can be done,as shown in Figure 9 and Table 4. The first cluster, in red, groups “climate change” and“design” with “building simulation”, “energy use”, “weather data”, “meteorology”, and“urban heat island”. This cluster shows the effort made to achieve mathematical modelsthat represent complex phenomena such as urban heat island [42,43], which in buildingservices is highly necessary for efficient energy retrofit of existing buildings [44] and isused to optimize the dimensioning of heating and cooling systems [45]. The second cluster,in green, groups “energy efficiency”, “energy utilization”, “carbon dioxide emissions” and“architectural design”, with “environmental impact”, “embodied energy”, “lca” [46,47],“sustainable development”, and “intelligent building”. Interestingly, “energy efficiency”continues to have the highest number of occurrences (61) of the map (excluding the key-words present in query 2). The third cluster, in blue, links “building services”, “energyconservation”, and “office buildings”, with “building codes”, “climate control”, and “light-ing”. The use of the Passivhaus [48] and NZEB standards [49] have proved to be effectivein improving the building’s energy efficiency, but it has also increased the overheatingrisk [50–52]. Therefore, the fourth cluster, in yellow, groups “building”, “energy manage-ment”, and “heating” with “thermal comfort”, “building performance”, and “overheating”.This cluster also links “building” with “housing” and “retrofitting”. The fifth and lastcluster, in purple, links “hvac” with “ventilation”, “air quality”, and “natural ventilation”.
Energies 2021, 14, 3917 11 of 16Energies 2021, 14, x FOR PEER REVIEW 12 of 17
Figure 9. Keywords network (query 2).
Table 4. Keywords with more than 20 occurrences (query 2).
Cluster Label Occurrences Avg. Pub. Year Avg. Citations
1 climate change 87 2012 25.41 design 22 2012 12.86
2 energy efficiency 61 2014 74.25 energy utilization 55 2014 72.11 carbon dioxide emissions 42 2015 26.00 architectural design 34 2015 7.62 sustainable development 31 2013 16.13 lca 22 2015 11.23 construction industry 20 2014 10.30
3 building services 52 2013 75.69 energy conservation 29 2014 21.14 office buildings 25 2013 13.84 building codes 21 2013 22.43
4 building 97 2013 57.79 housing 32 2016 12.00 heating 30 2014 19.33 overheating 22 2017 9.50
5 hvac 35 2013 14.83 ventilation 29 2015 17.69
4. Discussion, Past Trends and Future Perspectives To better understand which building services are analyzed in the literature with
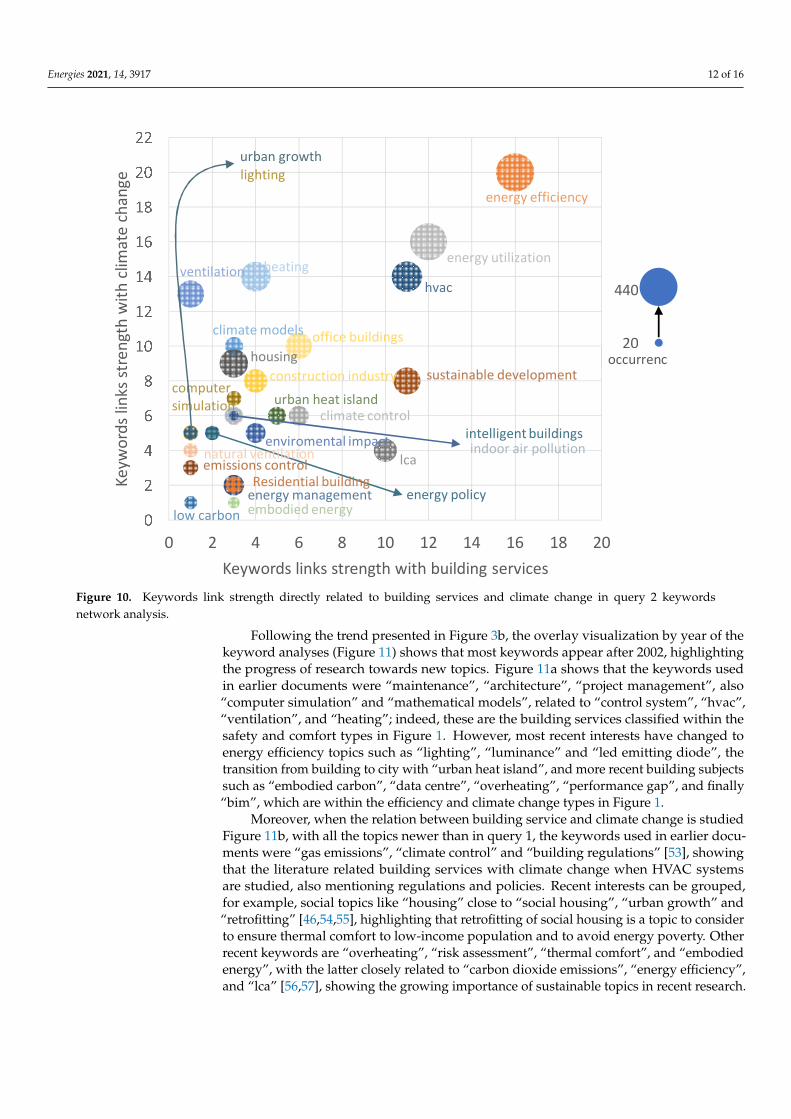
more emphasis on climate change, Figure 10 shows the keywords that have a direct link with “building services” and “climate change” keywords in query 2. It shows that “energy efficiency” is one of the most studied topics with the highest number of occurrences (440) and the highest link strength with both “building services” (16) and “climate change” (20).
Figure 9. Keywords network (query 2).
Table 4. Keywords with more than 20 occurrences (query 2).
Cluster Label Occurrences Avg. Pub. Year Avg. Citations
1 climate change 87 2012 25.41design 22 2012 12.86
2 energy efficiency 61 2014 74.25energy utilization 55 2014 72.11
carbon dioxide emissions 42 2015 26.00architectural design 34 2015 7.62
sustainable development 31 2013 16.13lca 22 2015 11.23
construction industry 20 2014 10.303 building services 52 2013 75.69
energy conservation 29 2014 21.14office buildings 25 2013 13.84building codes 21 2013 22.43
4 building 97 2013 57.79housing 32 2016 12.00heating 30 2014 19.33
overheating 22 2017 9.505 hvac 35 2013 14.83
ventilation 29 2015 17.69
4. Discussion, Past Trends and Future Perspectives
To better understand which building services are analyzed in the literature with moreemphasis on climate change, Figure 10 shows the keywords that have a direct link with“building services” and “climate change” keywords in query 2. It shows that “energyefficiency” is one of the most studied topics with the highest number of occurrences (440)and the highest link strength with both “building services” (16) and “climate change”(20). The next keywords are “energy utilization” and “hvac”. Moreover, “ventilation”,“heating” and “climate models” have a clear affinity to climate change, while “sustainabledevelopment” and “lca” have higher affinity to “building services”.
Energies 2021, 14, 3917 12 of 16
Energies 2021, 14, x FOR PEER REVIEW 13 of 17
The next keywords are “energy utilization” and “hvac”. Moreover, “ventilation”, “heating” and “climate models” have a clear affinity to climate change, while “sustainable development” and “lca” have higher affinity to “building services”.
Figure 10. Keywords link strength directly related to building services and climate change in query 2 keywords network analysis.
Following the trend presented in Figure 3b, the overlay visualization by year of the keyword analyses (Figure 11) shows that most keywords appear after 2002, highlighting the progress of research towards new topics. Figure 11a shows that the keywords used in earlier documents were “maintenance”, “architecture”, “project management”, also “computer simulation” and “mathematical models”, related to “control system”, “hvac”, “ventilation”, and “heating”; indeed, these are the building services classified within the safety and comfort types in Figure 1. However, most recent interests have changed to energy efficiency topics such as “lighting”, “luminance” and “led emitting diode”, the transition from building to city with “urban heat island”, and more recent building subjects such as “embodied carbon”, “data centre”, “overheating”, “performance gap”, and finally “bim”, which are within the efficiency and climate change types in Figure 1.
Moreover, when the relation between building service and climate change is studied Figure 11b, with all the topics newer than in query 1, the keywords used in earlier documents were “gas emissions”, “climate control” and “building regulations” [53], showing that the literature related building services with climate change when HVAC systems are studied, also mentioning regulations and policies. Recent interests can be grouped, for example, social topics like “housing” close to “social housing”, “urban growth” and “retrofitting” [46,54,55], highlighting that retrofitting of social housing is a topic to consider to ensure thermal comfort to low-income population and to avoid energy poverty. Other recent keywords are “overheating”, “risk assessment”, “thermal comfort”, and “embodied energy”, with the latter closely related to “carbon dioxide emissions”,
0 2 4 6 8 10 12 14 16 18 20
Keyw
ords
link
s str
engt
h w
ith c
limat
e ch
ange
Keywords links strength with building services
energy efficiency
hvac
energy utilizationheatingventilation
sustainable development
lca
climate control
office buildings
construction industry
urban heat island
enviromental impact
housing
climate models
computer simulation
Residential buildingenergy managementembodied energylow carbon
emissions controlnatural ventilation
energy policy
indoor air pollutionintelligent buildings
urban growthlighting
20
440
occurrenc
Figure 10. Keywords link strength directly related to building services and climate change in query 2 keywordsnetwork analysis.
Following the trend presented in Figure 3b, the overlay visualization by year of thekeyword analyses (Figure 11) shows that most keywords appear after 2002, highlightingthe progress of research towards new topics. Figure 11a shows that the keywords usedin earlier documents were “maintenance”, “architecture”, “project management”, also“computer simulation” and “mathematical models”, related to “control system”, “hvac”,“ventilation”, and “heating”; indeed, these are the building services classified within thesafety and comfort types in Figure 1. However, most recent interests have changed toenergy efficiency topics such as “lighting”, “luminance” and “led emitting diode”, thetransition from building to city with “urban heat island”, and more recent building subjectssuch as “embodied carbon”, “data centre”, “overheating”, “performance gap”, and finally“bim”, which are within the efficiency and climate change types in Figure 1.
Moreover, when the relation between building service and climate change is studiedFigure 11b, with all the topics newer than in query 1, the keywords used in earlier docu-ments were “gas emissions”, “climate control” and “building regulations” [53], showingthat the literature related building services with climate change when HVAC systemsare studied, also mentioning regulations and policies. Recent interests can be grouped,for example, social topics like “housing” close to “social housing”, “urban growth” and“retrofitting” [46,54,55], highlighting that retrofitting of social housing is a topic to considerto ensure thermal comfort to low-income population and to avoid energy poverty. Otherrecent keywords are “overheating”, “risk assessment”, “thermal comfort”, and “embodiedenergy”, with the latter closely related to “carbon dioxide emissions”, “energy efficiency”,and “lca” [56,57], showing the growing importance of sustainable topics in recent research.

Energies 2021, 14, 3917 13 of 16
Energies 2021, 14, x FOR PEER REVIEW 14 of 17
“energy efficiency”, and “lca” [56,57], showing the growing importance of sustainable topics in recent research.
(a)
(b)
Figure 11. Trends in keywords network: (a) general query, (b) query with climate change. Figure 11. Trends in keywords network: (a) general query, (b) query with climate change.
5. Conclusions
This paper presents a bibliometric-driven analysis of research trends in the field ofbuilding services and their relationship to climate change. It was developed using data from
Energies 2021, 14, 3917 14 of 16
the Scopus database from 1969 to March 2020. Two queries were analyzed, TITLE-ABS-KEY(“building service*”) and TITLE-ABS-KEY (“building service*” AND “climate change”).The results of both queries were analyzed in terms of publications by years, countriesand top journals in which the research was published and through a keyword networkanalysis. This made it possible to identify the most recent research trends. The most recentresearch on building services can be associated with safety, comfort and efficiency. Thestudies show that improvements in thermal efficiency in buildings and improvements in airquality are made by studying natural ventilation techniques coupled with HVAC systemsand the development of new HVAC technologies. On the other hand, improvements inelectrical efficiency focus on the use of LED lighting and the use of intelligent controlstrategies, optimized through building simulations. When relating building services toclimate change, the most recent studies focus on social aspects such as social housing,urban growth, and thermal comfort. The main research gaps identified are the lack ofintegration of the four groups of building services identified in this study in order to drawmore effective research in the fight against climate change. Finally, the study of buildingservices not related to energy services is also a research gap.
Author Contributions: Conceptualization, L.F.C.; methodology, D.V. and L.F.C.; formal analysis, D.V.and L.F.C.; investigation, D.V. and L.F.C.; resources, L.F.C.; data curation, L.F.C.; writing—originaldraft preparation, D.V.; writing—review and editing, L.F.C.; visualization, D.V.; supervision, L.F.C.;project administration, L.F.C.; funding acquisition, L.F.C. All authors have read and agreed to thepublished version of the manuscript.
Funding: This research was partially funded by the Ministerio de Ciencia, Innovación y Universi-dades de España (RTI2018-093849-B-C31—MCIU/AEI/FEDER, UE) and by the Ministerio de Ciencia,Innovación y Universidades—Agencia Estatal de Investigación (AEI) (RED2018-102431-T).
Data Availability Statement: Data are available upon request to the corresponding author.
Acknowledgments: The authors would like to thank the Catalan Government for the quality accred-itation given to their research group GREiA (2017 SGR 1537). GREiA is a certified agent TECNIOin the category of technology developers from the Government of Catalonia. This work is partiallysupported by ICREA under the ICREA Academia programme.
Conflicts of Interest: The authors declare no conflict of interest.
References1. International Energy Agency 2019. Available online: www.iea.org. (accessed on 15 December 2020).2. Ürge-Vorsatz, D.; Khosla, R.; Bernhardt, R.; Chan, Y.C.; Vérez, D.; Hu, S.; Cabeza, L.F. Advances Toward a Net-Zero Global
Building Sector. Annu. Rev. Environ. Resour. 2020, 45, 227–269. [CrossRef]3. Designing Buildings Wiki. Available online: www.designingbuildings.co.uk (accessed on 7 February 2020).4. Making Buildings Better. Available online: www.bsria.com (accessed on 7 February 2020).5. Building Energy Services. Available online: https://buildingenergysrv.net/ (accessed on 7 August 2020).6. Pritchard, A. Statistical Bibliography or Bibliometrics? J. Doc. 1969, 25, 348–349.7. Wuni, I.Y.; Shen, Q.; Osei-Kyei, R. Scientometric review of global research trends on green buildings in construction journals from
1992 to 2018. Energy Build. 2019, 190, 69–85. [CrossRef]8. Cabeza, L.F.; Chàfer, M.; Mata, É. Comparative analysis of web of science and scopus on the energy efficiency and climate im-pact
of buildings. Energies 2020, 13, 409. [CrossRef]9. van Eck, N.J.; Waltman, L. Software survey: VOSviewer, a computer program for bibliometric mapping. Scientometrics 2010, 84,
523–538. [CrossRef]10. Tarragona, J.; de Gracia, A.; Cabeza, L.F. Bibliometric analysis of smart control applications in thermal energy storage systems. A
model predictive control approach. J. Energy Storage 2020, 32, 101704. [CrossRef]11. UNDESA. World Population Prospects: The 2010 Revision; United Nations, Department of Economic and Social Affairs, Population
Division: New York, NY, USA, 2011.12. Nations, U. Unesco Science Report: Towards 2030; UNESCO: Paris, France, 2016.13. Mui, K.W.; Wong, L.T.; Yu, H.C.; Cheung, C.T.; Li, N. Exhaust ventilation performance in residential washrooms for bioaerosol
particle removal after water closet flushing. Build. Serv. Eng. Res. Technol. 2017, 38, 32–46. [CrossRef]14. Huang, Z.; Liu, Q.; Liu, Y.; Pointer, M.R.; Luo, M.R.; Wang, Q.; Wu, B. Best lighting for jeans, part 1: Optimising colour preference
and colour discrimination with multiple correlated colour temperatures. Light. Res. Technol. 2019, 51, 1208–1223. [CrossRef]
Energies 2021, 14, 3917 15 of 16
15. Huang, Z.; Liu, Q.; Westland, S.; Pointer, M.R.; Luo, M.R.; Xiao, K. Light dominates colour preference when correlated colourtemperature differs. Light. Res. Technol. 2018, 50, 995–1012. [CrossRef]
16. European Climate Change Programme. Available online: https://ec.europa.eu/clima/policies/eccp_en (accessed on20 June 2020).
17. Fotios, S.; Monteir, A.L.; Uttley, J. Evaluation of pedestrian reassurance gained by higher illuminances in residential streets us-ingthe day–dark approach. Light. Res. Technol. 2019, 51, 557–575. [CrossRef]
18. Fotios, S.; Cheal, C.; Fox, S.; Uttley, J. The transition between lit and unlit sections of road and detection of driving hazards afterdark. Light. Res. Technol. 2017, 51, 243–261. [CrossRef]
19. Kent, M.; Fotios, S.; Altomonte, S. Discomfort glare evaluation: The influence of anchor bias in luminance adjustments. Light. Res.Technol. 2017, 51, 131–146. [CrossRef]
20. Figueiro, M.; Kalsher, M.; Steverson, B.; Heerwagen, J.; Kampschroer, K.; Rea, M. Circadian-effective light and its impact onalertness in office workers. Light. Res. Technol. 2018, 51, 171–183. [CrossRef]
21. Rea, M. Thewhatand thewhereof vision lighting research. Light. Res. Technol. 2017, 50, 14–37. [CrossRef]22. Rea, M.; Bullough, J.D.; Brons, J. Parking lot lighting based upon predictions of scene brightness and personal safety. Light. Res.
Technol. 2015, 49, 293–304. [CrossRef]23. Zeiler, W.; Labeodan, T. Human-in-the-loop energy flexibility integration on a neighbourhood level: Small and Big Data
man-agement. Build. Serv. Eng. Res. Technol. 2019, 40, 305–318. [CrossRef]24. Sayigh, A. Sustainable High Rise Buildings in Urban Zones: Advantages, Challenges, and Global Case Studies; Springer:
Berlin/Heidelberg, Germany, 2016; 248p.25. Khalid, W.; Zaki, S.A.; Rijal, H.B.; Yakub, F. Investigation of comfort temperature and thermal adaptation for patients and visitors
in Malaysian hospitals. Energy Build. 2019, 183, 484–499. [CrossRef]26. Chenari, B.; Carrilho, J.D.; da Silva, M.G. Towards sustainable, energy-efficient and healthy ventilation strategies in buildings: A
review. Renew. Sustain. Energy Rev. 2016, 59, 1426–1447. [CrossRef]27. Eshraghi, A.; Salehi, G.; Heibati, S.; Lari, K. An enhanced operation model for energy storage system of a typical combined cool,
heat and power based on demand response program: The application of mixed integer linear programming. Build. Serv. Eng. Res.Technol. 2019, 40, 47–74. [CrossRef]
28. D’Oca, S.; Gunay, H.B.; Gilani, S.; O’Brien, W. Critical review and illustrative examples of office occupant modelling formalisms.Build. Serv. Eng. Res. Technol. 2019, 40, 732–757. [CrossRef]
29. Kalamees, T.; Väli, A.; Kallavus, U.; Kurik, L.; Alev, Ü. Simulated influence of indoor climate and ventilation on schoolworkperformance in Estonian manor schools. Int. J. Vent. 2015, 14, 153–164. [CrossRef]
30. Dols, W.S.; Emmerich, S.J.; Polidoro, B.J. Using coupled energy, airflow and indoor air quality software (TRNSYS/CONTAM) toevaluate building ventilation strategies. Build. Serv. Eng. Res. Technol. 2015, 37, 163–175. [CrossRef]
31. Vakiloroaya, V.; Samali, B.; Eager, D. Performance prediction of a new integrated central cooling plant for energy efficiency andcomfort enhancement. Build. Serv. Eng. Res. Technol. 2015, 37, 379–394. [CrossRef]
32. Sahamir, S.R.; Zakaria, R.; Omar, M.F.; Shakri, M.R.; Chughtai, M.W.; Mustafar, M. Energy Efficiency Criteria for Planning andDesign of Green Hospital Buildings Rating System. In IOP Conference Series: Materials Science and Engineering 2019; IOP: Bristal,UK, 2019; Volume 620, p. 012082. Available online: https://iopscience.iop.org/article/10.1088/1757-899X/620/1/012082/pdf(accessed on 7 August 2020). [CrossRef]
33. Bermejo-Busto, J.; Martín-Gómez, C.; Zuazua-Ros, A.; Baquero, E.; Miranda, R. Performance simulation of heat recovery ventilatorcores in cascade connection. Energy Build. 2017, 134, 25–36. [CrossRef]
34. Raide, I.; Kalamees, T.; Mauring, T. Õppetunnid esimestest passiivmajadeks kavandatud avalikest hoonetest Eestis. Proc. Est.Acad. Sci. 2015, 64, 157–167. [CrossRef]
35. Kovári, G.; Kistelegdi, I. Building performance simulation modeling techniques. Pollack Period. 2016, 11, 135–146. [CrossRef]36. Mokhtar Azizi, N.S.; Wilkinson, S.; Fassman, E. Strategies for improving energy saving behaviour in commercial buildings in
Malaysia. Eng. Constr. Archit. Manag. 2015, 22, 73–90. [CrossRef]37. Alev, Ü.; Eskola, L.; Arumägi, E.; Jokisalo, J.; Donarelli, A.; Sirén, K.; Broström, T.; Kalamees, T. Renovation alternatives to
improve energy performance of historic rural houses in the Baltic Sea region. Energy Build. 2014, 77, 58–66. [CrossRef]38. Askola, J.; Çalkin, Y.; Vaskuri, A.; Poikonen, T.; Ikonen, E. Accelerated ageing of organic LED panels using ultraviolet exposure.
Light. Res. Technol. 2018, 51, 1263–1274. [CrossRef]39. Davidovic, M.; Djokic, L.; Cabarkapa, A.; Kostic, M. Warm white versus neutral white LED street lighting: Pedestrians’ impres-
sions. Light. Res. Technol. 2019, 51, 1237–1248. [CrossRef]40. Lu, Y.; Li, W.; Xu, W.; Lin, Y. Impacts of LED dynamic white lighting on atmosphere perception. Light. Res. Technol. 2019, 51,
1143–1158. [CrossRef]41. Raul, D.; Ghosh, K. Performance of chip-on-board and surface-mounted high-power LED luminaires at different relative
hu-midities and temperatures. Light. Res. Technol. 2019, 51, 1249–1262. [CrossRef]42. Levermore, G.; Parkinson, J. The urban heat island of London, an empirical model. Build. Serv. Eng. Res. Technol. 2019, 40,
290–295. [CrossRef]43. Levermore, G.J.; Parkinson, J.B. An empirical model for the urban heat island intensity for a site in Manchester. Build. Serv. Eng.
Res. Technol. 2016, 38, 21–31. [CrossRef]

Energies 2021, 14, 3917 16 of 16
44. Filippín, C.; Larsen, S.F.; Ricard, F. Improvement of energy performance metrics for the retrofit of the built environment.Adaptation to climate change and mitigation of energy poverty. Energy Build. 2018, 165, 399–415. [CrossRef]
45. Herrera, M.; Natarajan, S.A.; Coley, D.; Kershaw, T.; Ramallo-González, A.P.; Eames, M.; Fosas, D.; Wood, M. A review of currentand future weather data for building simulation. Build. Serv. Eng. Res. Technol. 2017, 38, 602–627. [CrossRef]
46. Devi, L.P.; Palaniappan, S. Life cycle energy analysis of a low-cost house in India. Int. J. Constr. Educ. Res. 2018, 15, 256–275.[CrossRef]
47. Kovacic, I.; Reisinger, J.; Honic, M. Life Cycle Assessment of embodied and operational energy for a passive housing block inAustria. Renew. Sustain. Energy Rev. 2018, 82, 1774–1786. [CrossRef]
48. Passive House Institute. Available online: https://passivehouse.com/ (accessed on 5 October 2020).49. European Commission. Progress towards Nearly Zero-Energy Buildings Uptake. Available online: https://ec.europa.eu/energy/
topics/energy-efficiency/energy-efficient-buildings/nearly-zero-energy-buildings_en (accessed on 17 August 2020).50. Mitchell, R.; Natarajan, S. Overheating risk in Passivhaus dwellings. Build. Serv. Eng. Res. Technol. 2019, 40, 446–469. [CrossRef]51. Roberts, B.M.; Allinson, D.; Diamond, S.; Abel, B.; Das Bhaumik, C.; Khatami, N.; Lomas, K.J. Predictions of summertime
overheating: Comparison of dynamic thermal models and measurements in synthetically occupied test houses. Build. Serv. Eng.Res. Technol. 2019, 40, 512–552. [CrossRef]
52. Gao, X.; Zhao, T.; Luo, G.; Zheng, B.; Huang, H.; Han, X. Thermal Property Enhancement of Paraffin-Wax-Based Hydrox-yl-Terminated Polybutadiene Binder with a Novel NanoSiO2-Expanded Graphite-PW Ternary Form-Stable Phase Change Material.Energy Fuels 2018, 32, 4016–4024. [CrossRef]
53. Ji, Y.; Swan, W.; Fitton, R.; Fernando, T. Assessing the requirements from ‘BB101′ 2006 and 2018 for a naturally ventilatedpre-paratory school in the UK. Build. Serv. Eng. Res. Technol. 2019, 40, 638–659. [CrossRef]
54. Teli, D.; Dimitriou, T.; James, P.; Bahaj, A.; Ellison, L.; Waggott, A. Fuel poverty-induced ‘prebound effect’ in achieving theanticipated carbon savings from social housing retrofit. Build. Serv. Eng. Res. Technol. 2015, 37, 176–193. [CrossRef]
55. Gupta, R.; Kapsali, M. Evaluating the “as-built” performance of an eco-housing development in the UK. Build. Serv. Eng. Res.Technol. 2016, 37, 220–242. [CrossRef]
56. Dixit, M.K. Life cycle recurrent embodied energy calculation of buildings: A review. J. Clean. Prod. 2019, 209, 731–754. [CrossRef]57. Parkin, A.; Herrera, M.; Coley, D.A. Energy or carbon? Exploring the relative size of universal zero carbon and zero energy
de-sign spaces. Build. Serv. Eng. Res. Technol. 2019, 40, 319–339. [CrossRef]
Copyright © 2022 FDOKUMEN