The prevalence of learning disabilities in a sample of children considered hyperactive
18
Journal of Abnormal Child Psyehology, Vol. 8, No. 1, 1980, pp. 33-50 The Prevalence of Learning Disabilities in a Sample of Children Considered Hyperactive' Nadine M. Lambert 2 University of California, Berkeley Jonathan Sandoval University of California, Davis According to Wender (1971), minimal brain dysfunction/hyperactivity is the single most common childhood disorder. A recent study of the prevalence of the syndrome among a large representative population of public school children (Lambert, Sandoval, & Sassone, 1978) reported rates of children identified as hyperactive ranging between 1 and 6% depending upon the defining system. It is also widely presumed (Wender, 1971 ; Keogh, 1971) that a substantial propor- tion of such children have learning problems in school. It seems reasonable, after all, that children who are (1) inattentive, (2) impulsive, (3) motorically restless, and (4) given to inappropriate and aggressive social responses (charac- teristic observable behaviors of children labeled hyperactive [Sandoval, 1977]) are children who will be handicapped in learning in a traditional school setting. Indeed, the terms underachievement, underperformance, learning disability, and minimal brain dysfunction are often used synonymously to characterize those children who are doing poorly in school but who have normal intellectual func- tioning and an absence of positive signs of other interfering social, emotional, or health-related disorders. Ordinarily, to receive a diagnosis of hyperactivity, a child also must be seen to possess normal intellectual functioning but no other interfering social, emotional, or medical disorder. These same two conditions are also necessary for a child to be considered learning-disabled. Then too, hyperactivity and learning disabilities are much more common in boys than in girls (Lambert 1This study was supported by a grant from the National Institute of Mental Health MH 20756 and the Spencer Foundation. 2Authorship is alphabetical, reflecting equal contributions to this report. 33 0091-0627/80/0300-0033503.00/0 1980 Plenum Publishing Corporation
-
Upload
uaemmorelos -
Category
Documents
-
view
4 -
download
0
Transcript of The prevalence of learning disabilities in a sample of children considered hyperactive
Journal of Abnormal Child Psyehology, Vol. 8, No. 1, 1980, pp. 33-50
The Prevalence of Learning Disabilities in a Sample
of Children Considered Hyperactive'
Nadine M. Lambert 2
University of California, Berkeley
Jonathan Sandoval University of California, Davis
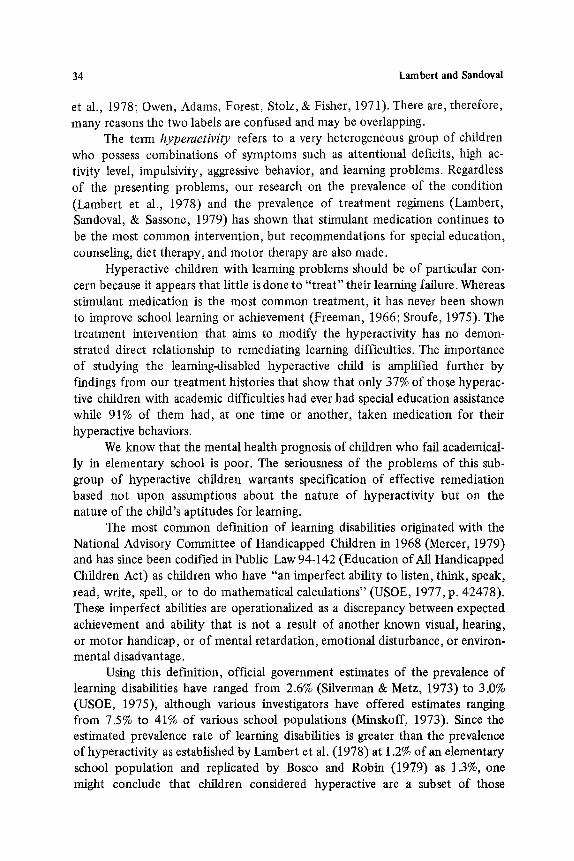
According to Wender (1971), minimal brain dysfunction/hyperactivity is the single most common childhood disorder. A recent study of the prevalence of the syndrome among a large representative population of public school children (Lambert, Sandoval, & Sassone, 1978) reported rates of children identified as hyperactive ranging between 1 and 6% depending upon the defining system. It is also widely presumed (Wender, 1971 ; Keogh, 1971) that a substantial propor- tion of such children have learning problems in school. It seems reasonable, after all, that children who are (1) inattentive, (2) impulsive, (3) motorically restless, and (4) given to inappropriate and aggressive social responses (charac- teristic observable behaviors of children labeled hyperactive [Sandoval, 1977]) are children who will be handicapped in learning in a traditional school setting. Indeed, the terms underachievement, underperformance, learning disability, and minimal brain dysfunction are often used synonymously to characterize those children who are doing poorly in school but who have normal intellectual func- tioning and an absence of positive signs of other interfering social, emotional, or health-related disorders.
Ordinarily, to receive a diagnosis of hyperactivity, a child also must be seen to possess normal intellectual functioning but no other interfering social, emotional, or medical disorder. These same two conditions are also necessary for a child to be considered learning-disabled. Then too, hyperactivity and learning disabilities are much more common in boys than in girls (Lambert
1This study was supported by a grant from the National Institute of Mental Health MH 20756 and the Spencer Foundation.
2 Authorship is alphabetical, reflecting equal contributions to this report.
33 0091-0627 /80 /0300-0033503 .00 /0 �9 1980 Plenum Publishing Corporation
34 Lambert and Sandoval
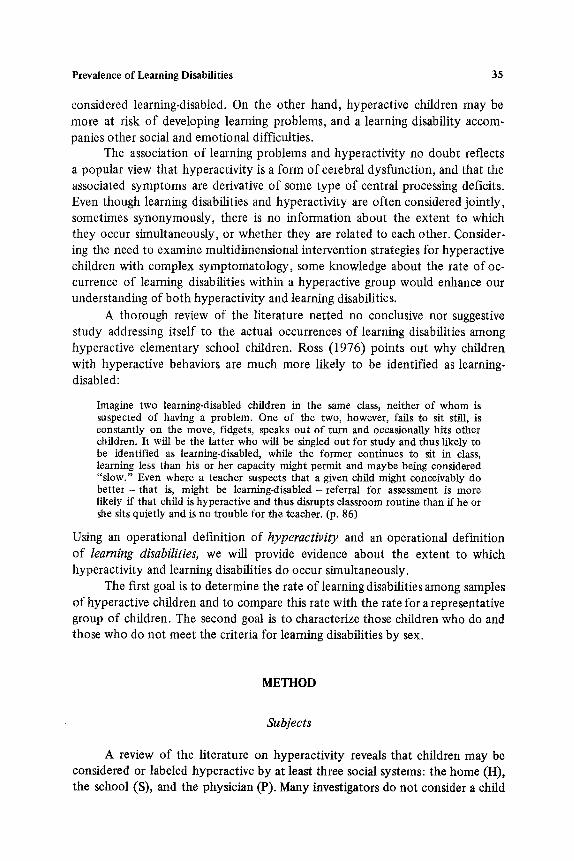
et al., 1978; Owen, Adams, Forest, Stolz, & Fisher, 1971). There are, therefore, many reasons the two labels are confused and may be overlapping.
The term hyperactivity refers to a very heterogeneous group of children who possess combinations of symptoms such as attentional deficits, high ac- tivity level, impulsivity, aggressive behavior, and learning problems. Regardless of the presenting problems, our research on the prevalence of the condition (Lambert et al., 1978) and the prevalence of treatment regimens (Lambert, Sandoval, & Sassone, 1979) has shown that stimulant medication continues to be the most common intervention, but recommendations for special education, counseling, diet therapy, and motor therapy are also made.
Hyperactive children with learning problems should be of particular con- cern because it appears that little is done to "treat" their learning failure. Whereas stimulant medication is the most common treatment, it has never been shown to improve school learning or achievement (Freeman, 1966; Sroufe, 1975). The treatment intervention that aims to modify the hyperactivity has no demon- strated direct relationship to remediating learning difficulties. The importance of studying the learning-disabled hyperactive child is amplified further by findings from our treatment histories that show that only 37% of those hyperac- tive children with academic difficulties had ever had special education assistance while 91% of them had, at one time or another, taken medication for their hyperactive behaviors.
We know that the mental health prognosis of children who fail academical- ly in elementary school is poor. The seriousness of the problems of this sub- group of hyperactive children warrants specification of effective remediation based not upon assumptions about the nature of hyperactivity but on the nature of the child's aptitudes for learning.
The most common definition of learning disabilities originated with the National Advisory Committee of Handicapped Children in 1968 (Mercer, 1979) and has since been codified in Public Law 94-142 (Education of All Handicapped Children Act) as children who have "an imperfect ability to listen, think, speak, read, write, spell, or to do mathematical calculations" (USOE, 1977, p. 42478). These imperfect abilities are operationalized as a discrepancy between expected achievement and ability that is not a result of another known visual, hearing, or motor handicap, or of mental retardation, emotional disturbance, or environ- mental disadvantage.
Using this definition, official government estimates of the prevalence of learning disabilities have ranged from 2.6% (Silverman & Metz, 1973) to 3.0% (USOE, 1975), although various investigators have offered estimates ranging from 7.5% to 41% of various school populations (Minskoff, 1973). Since the estimated prevalence rate of learning disabilities is greater than the prevalence of hyperactivity as established by Lambert et al. (1978) at 1.2% of an elementary school population and replicated by Bosco and Robin (1979) as 1.3%, one might conclude that children considered hyperactive are a subset of those
Prevalence of Learning Disabilities 35
considered learning-disabled. On the other hand, hyperactive children may be more at risk o f developing learning problems, and a learning disability accom- panies other social and emotional difficulties.
The association of learning problems and hyperactivity no doubt reflects a popular view that hyperactivity is a form of cerebral dysfunction, and that the associated symptoms are derivative o f some type of central processing deficits. Even though learning disabilities and hyperactivity are often considered jointly, sometimes synonymously, there is no information about the extent to which they occur simultaneously, or whether they are related to each other. Consider- ing the need to examine multidimensional intervention strategies for hyperactive children with complex symptomatology, some knowledge about the rate of oc- currence of learning disabilities within a hyperactive group would enhance our understanding of both hyperactivity and learning disabilities.
A thorough review of the literature netted no conclusive nor suggestive study addressing itself to the actual occurrences of learning disabilities among hyperactive elementary school children. Ross (1976) points out why children with hyperactive behaviors are much more likely to be identified as learning- disabled:
Imagine two learning-disabled children in the same class, neither of whom is suspected of having a problem. One of the two, however, fails to sit still, is constantly on the move, fidgets, speaks out of turn and occasionally hits other children. It will be the latter who will be singled out for study and thus likely to be identified as learning-disabled, while the former continues to sit in class, learning less than his or her capacity might permit and maybe being considered "slow." Even where a teacher suspects that a given child might conceivably do better- that is, might be learning-disabled- referral for assessment is more likely if that child is hyperactive and thus disrupts classroom routine than if he or she sits quietly and is no trouble for the teacher. (p. 86)
Using an operational definition of hyperactivity and an operational definition of learning disabilities, we will provide evidence about the extent to which hyperactivity and learning disabilities do occur simultaneously.
The first goal is to determine the rate of learning disabilities among samples of hyperactive children and to compare this rate with the rate for a representative group of children. The second goal is to characterize those children who do and those who do not meet the criteria for learning disabilities by sex.
METHOD
Subjects
A review of the literature on hyperactivity reveals that children may be considered or labeled hyperactive by at least three social systems: the home (H), the school (S), and the physician (P). Many investigators do not consider a child
36 Lambert and Sandoval
to be hyperactive unless he or she has been judged to be hyperactive by a physician. Other investigators, centering on the school behavior of children, accept the judgments of the classroom teacher, often formalized by a rating procedure, in identifying a child as hyperactive. Recognizing that the behavior of the child may not be the same at home as at school, still other investigators consider that the manifestations of the child's hyperactive behaviors both at home and at school must be present before hyperactivity is an appropriate label. In order to provide operational procedures for identifying hyperactive children that are consistent with many diverse views, we provided the following definitions of hyperactivity from these three defining systems.
Hyperactivity as Labeled by Social System Definers
Definitions of Hyperactivity from the Perspective of the Home. If a parent, in reply to our letter or in an interview, indicated that he or she considered the child to be hyperactive, we considered the child to be defined as hyperactive by the home environmental system.
Definitions of Hyperactivity from the Perspective of the School. Teachers and principals indicated children who (1) were considered hyperactive, (2)would, in their opinion, be considered hyperactive by a physician if their parents would consent to take them for an examination, or (3) had been referred to a physician for hyperactive behavior for the first time during the current school year. We identified a child as hyperactive in the school system if he or she was nominated in one or more of the above three categories. At the time this identification process was taking place, we were collecting a variety of academic and behavioral data on a large representative sample of pupils and coincidentally obtained classroom behavior ratings of these subjects and their classmates.
Definitions of Hyperactivity from the Perspective of the Physician. When we were able to determine that the child had seen a physician for hyperactive behavior or problems associated with hyperactive behavior, and we had obtained consent for information release from the parent, we asked the physician to com- plete the Medical Evaluation form (modeled after study of medical practices for the identification and treatment of hyperactivity [Sandoval, Lambert, & YandeU, 1976] ). Physician diagnosis of children evidencing hyperactive behaviors can be divided into two types: (1) children for whom there is no competing medical ex- planation of the behavioral difficulties and (2) children for whom another medical diagnosis is appropriate, e.g. organic brain damage. In these latter cases, the hyperactive behaviors are assumed to be secondary to the medical diagnosis. These children are termed secondary hyperactive subjects from the physician's defining system. For those children for whom there was no competing medical explanation for the behaviors, and the physician's diagnosis was hyperactivity, hyperkinesis, MBD (minimal brain dysfunction) with hyperactivity, or if the
Prevalence of Learning Disabilities 37
physician prescribed a cerebral stimulant (commonly used with hyperactive children such as Ritalin or Dexedrine) for the child's behavior, we reasoned that the physician considered the child to be hyperactive. These children are classified as primary hyperactive from the physician defining system.
Operational Criteria for Classification of Hyperactive Subfects
By applying the definitions of hyperactivity from these three defining systems, the home (H), the school (S), and the physician (P), it was possible to define hyperactive subjects operationally as follows:
1. HSP, primary hyperactives - children whom all three definers consider to be hyperactive with no competing medical diagnosis from the physician.
2. HSP, secondary hyperactives- children whom all three definers con- sider to be hyperactive, but for whom the physician has identified an organic or other explanation for their behavior problems.
3. Other hyperactives-children whom one or two, but not all three, defining systems consider to be hyperactive.
4. Formerly hyperactives - children who at a prior time, but not at the time of the learning disability inquiry, were HSP hyperactives.
The HSP hyperactive subjects also meet all of the following four criteria that are most commonly referred to in the literature.
1. Teacher and parent ratings of nonmedicated behavior on the Behavior and Temperament Survey 3 in the top 15% of the distributions of total scores for both teacher and parent ratings.
2. Physician confirmation of hyperactivity. 3. Parent report of long-term or sustained hyperactive behavior for a period
of 2 or more years. 4. Absence of positive medical findings related to a competing explana-
tion of the child's presenting problem of hyperactive behavior.
Behavior Equivalent SubJects
These subjects are children from the representative school population that was sampled for the prevalence studies. The parents of these subjects gave consent
3The Behavior and Temperament Survey is a 31 item rating scale that is similar to, but more comprehensive than Conners' Abbreviated Symptom Questionnaire. The correlation between the Behavior and Temperament Survey and the Conners is .89. The items assess attention, activity level, impulsivity, distractibility, and social behaviors.
38 Lambert and Sandoval
to participate as a eontrol subject in our longitudinal research. To be considered a behavioral equivalent control, a subject met the following criteria: (1) a teacher rating on the Behavior and Temperament Survey equivalent to those of hyperac- tive children, and (2) no evidence of parental or physician concern about hyperac- tive behavior.
Random Control Sub}ects
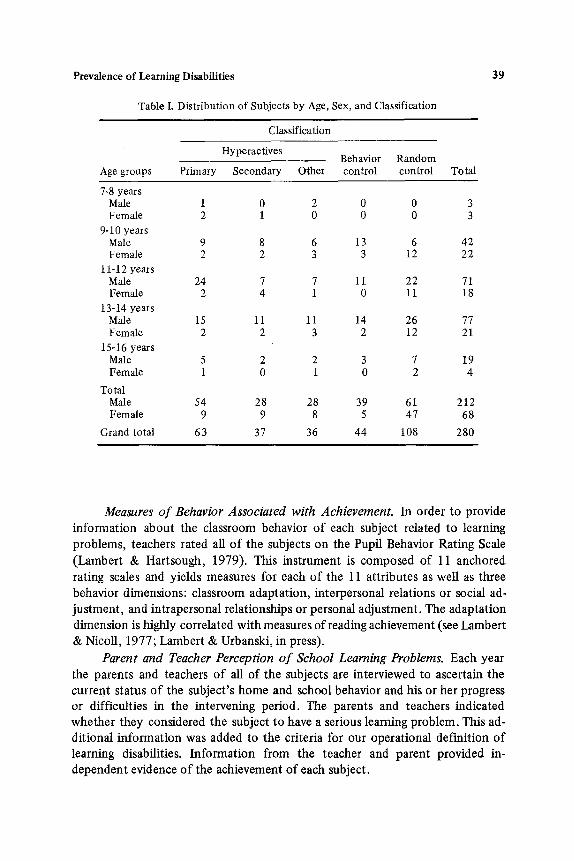
These pupil subjects were selected at random from the representative sample. We requested parents to give their permission for their participation as control subjects. These subjects are not hyperactive by any criterion but are a small subsample of the representative sample that we have been following in our longitudinal work along with the hyperactive subjects. The distribution of subjects by age and sex is shown on Table I.
Procedure
Our definition of learning disability is as follows: A child is considered to be learning-disabled if he or she evidences a severe discrepancy between currently assessed ability or presumed intellectual functioning and age/grade-appropriate school achievement, i.e., if the child is underperforming in school. Rather than rely on available but possibly unreliable group achievement measures to evaluate the presence of a learning disability, we elected to include the administration of an achievement test, along with an intelligence test and other assessment and interview procedures administered individually to our hyperactive and control subjects during the annual test administration and data collection for the life history investigation. We also included assessment of noncognitive behaviors as- sociated with reading, and information from parents and teachers about each subject's learning problems in our decision rule for learning disabilities. Using a decision rule incorporating psychometric as well as behavior evidence, we could capitalize on information about the subjects from the parents and teachers. We applied a method suggested by Barrows, Campbell, Slaughter, and Trainor (1977) in their study of the prevalence of learning disabilities in a population of adjudicated delinquents.
Measures of Ability. The WlSC-R provided data on the intellectual func- tioning of our sample. The acceptability of the WISC as a standard instrument for predicting current academic potential is described extensively by Sattler (1974). This psychometric approach to intellectual assessment includes a wide variety of mental tasks and produces an estimate of the child's academic potential by comparing his or her performance on the test with those of children of the same age level.
Prevalence of Learning Disabilities
Table I. Distribution of Subjects by Age, Sex, and Classification
39
Classification
Hyperactives Behavior Random
Age groups Primary Secondary Other control control Total
7-8 years Male 1 0 2 0 0 3 Female 2 1 0 0 0 3
9-10 years Male 9 8 6 13 6 42 Female 2 2 3 3 12 22
1 i-12 years Male 24 7 7 11 22 71 Female 2 4 1 0 11 18
13-14 years Male 15 11 11 14 26 77 Fem ale 2 2 3 2 12 21
15-16 years Male 5 2 2 3 7 19 Female 1 0 1 0 2 4
Total Male 54 28 28 39 61 212 Female 9 9 8 5 47 68
Grand total 63 37 36 44 108 280
Measures of Behavior Associated with Achievement. In order to provide information about the classroom behavior o f each subject related to learning problems, teachers rated all o f the subjects on the Pupil Behavior Rating Scale
(Lambert & Hartsough, 1979). This instrument is composed of 11 anchored rating scales and yields measures for each o f the 11 at tr ibutes as well as three behavior dimensions: classroom adaptat ion, interpersonal relations or social ad- justment , and intrapersonal relationships or personal adjustment. The adaptat ion dimension is highly correlated with measures of reading achievement (see Lambert & NicoU, 1977; Lambert & Urbanski, in press).
Parent and Teacher Perception of School Learning Problems. Each year the parents and teachers o f all of the subjects are interviewed to ascertain the current status o f the subject 's home and school behavior and his or her progress or difficulties in the intervening period. The parents and teachers indicated whether they considered the subject to have a serious learning problem. This ad- dit ional information was added to the criteria for our operational definit ion o f learning disabilities. Informat ion from the teacher and parent provided in- dependent evidence o f the achievement of each subject.
40 Lambert and Sandoval
The Ident~'fication of Learning Disabilities
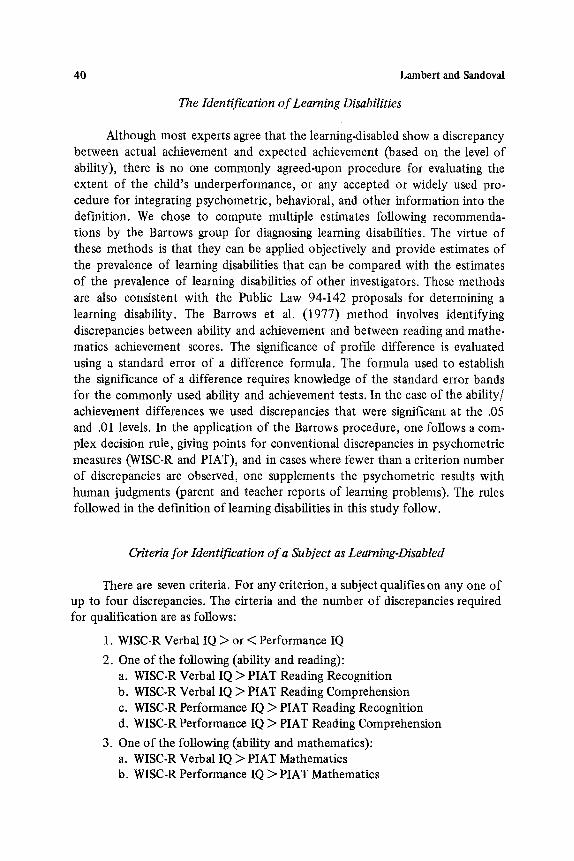
Although most experts agree that the learning-disabled show a discrepancy between actual achievement and expected achievement (based on the level of ability), there is no one commonly agreed-upon procedure for evaluating the extent of the child's underperformance, or any accepted or widely used pro- cedure for integrating psychometric, behavioral, and other information into the definition. We chose to compute multiple estimates following recommenda- tions by the Barrows group for diagnosing learning disabilities. The virtue of these methods is that they can be applied objectively and provide estimates of the prevalence of learning disabilities that can be compared with the estimates of the prevalence of learning disabilities of other investigators. These methods are also consistent with the Public Law 94-142 proposals for determining a learning disability. The Barrows et al. (1977) method involves identifying discrepancies between ability and achievement and between reading and mathe- matics achievement scores. The significance of profile difference is evaluated using a standard error of a difference formula. The formula used to establish the significance of a difference requires knowledge of the standard error bands for the commonly used ability and achievement tests. In the case of the ability/ achievement differences we used discrepancies that were significant at the .05 and .01 levels. In the application of the Barrows procedure, one follows a com- plex decision rule, giving points for conventional discrepancies in psychometric measures (WlSC-R and PLAT), and in cases where fewer than a criterion number of discrepancies are observed, one supplements the psychometric results with human judgments (parent and teacher reports of learning problems). The rules followed in the definition of learning disabilities in this study follow.
Criteria for Identification of a Subject as Learning-Disabled
There are seven criteria. For any criterion, a subject qualifies on any one of up to four discrepancies. The cirteria and the number of discrepancies required for qualification are as follows:
1. WISC-R Verbal IQ > or < Performance IQ
2. One of the following (ability and reading): a. WISC-R Verbal IQ > PlAT Reading Recognition b. WISC-R Verbal IQ > PIAT Reading Comprehension c. WlSC-R Performance IQ > PIAT Reading Recognition d. WISC-R Performance IQ > PIAT Reading Comprehension
3. One of the following (ability and mathematics): a. WISC-R Verbal IQ > PlAT Mathematics b. WlSC-R Performance IQ > PlAT Mathematics
Prevalence of Learning Disabilities 41
4. One of the following (reading and mathematics): a. PIAT Reading Recognition > or < Mathematics b. PIAT Reading Comprehension > or < Mathematics
5. One of the following (ability and classroom behavior associated with achievement): a. WlSC-R Verbal IQ > PBRS Adaptation b. WlSC-R Performance IQ > PBRS Adaptation
6. Parent interview report that a child has learning problems
7. Teacher interview report that a child has learning problems
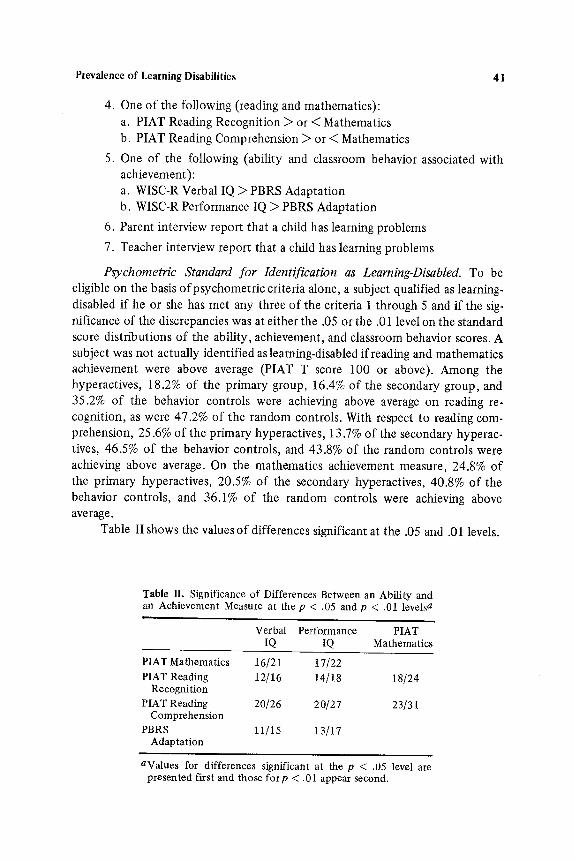
Psychometric Standard for Identification as Learning-Disabled. To be eligible on the basis of psychometric criteria alone, a subject qualified as learning- disabled if he or she has met any three of the criteria 1 through 5 and if the sig- nificance of the discrepancies was at either the .05 or the .01 level on the standard score distributions o f the ability, achievement, and classroom behavior scores. A subject was not actually identified as learning-disabled if reading and mathematics achievement were above average (PLAT T score 100 or above). Among the hyperactives, 18.2% of the primary group, 16.4% of the secondary group, and 35.2% of the behavior controls were achieving above average on reading re- cognition, as were 47.2% of the random controls. With respect to reading com- prehension, 25.6% of the primary hyperactives, 13.7% of the secondary hyperac- tives, 46.5% of the behavior controls, and 43.8% of the random controls were achieving above average. On the mathematics achievement measure, 24.8% of the primary hyperactives, 20.5% of the secondary hyperactives, 40.8% of the behavior controls, and 36.1% of the random controls were achieving above average.
Table II shows the values o f differences significant at the .05 and .01 levels.
Table II. Significance of Differences Between an Ability and an Achievement Measure at the p < .05 and p < .01 levels a
Verbal Performance PIAT IQ IQ Mathematics
PlAT Mathematics 16/21 17/22 PlAT Reading 12/16 14/18
Recognition PlAT Reading 20/26 20/27
Comprehension PBRS 11/15 13/17
Adaptation
18/24
23/31
aValues for differences significant at the p < .05 level are presented first and those for p < .01 appear second.

42 Lambert and Sandoval
RESULTS
Proportions of Sub]ects Qualifying on Each of the Learning Disability Discrepancy Criteria Irrespective of Achievement
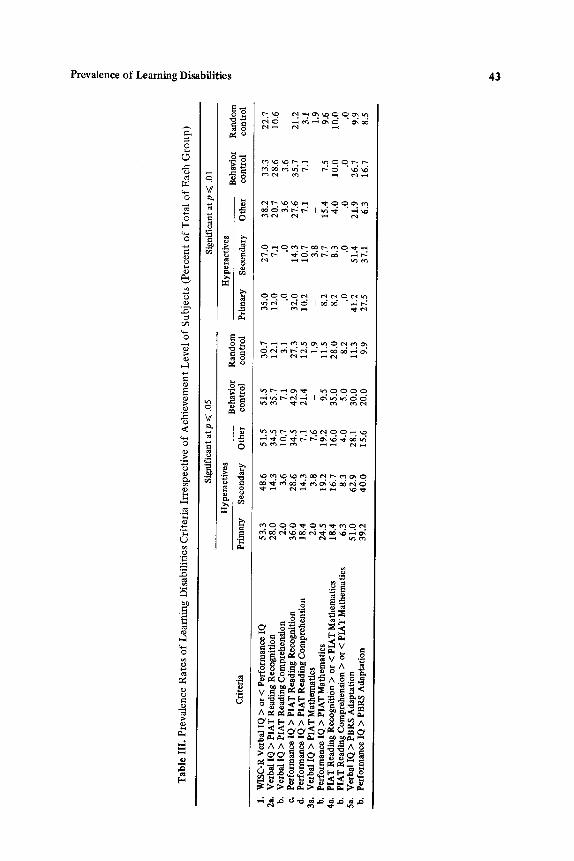
It is surprising that 30% of the control subjects had Verbal and Performance IQ discrepancies that were significant at the .05 level and 23% of this group's discrepancies were significant at the .01 level. For hyperactive subjects the large discrepancies between verbal and performance IQ scores are much more common than the expected rate (Sattler, 1974, Appendix F; Kaufman, 1979). Table III displays the proportions of the subjects with discrepancies on the various criteria significant at the .05 and .01 level. Over half of the hyperactive subjects had verbal/performance discrepancies significant at the .05 level and 35% of their scores were significantly different at the .01 level.
Significant discrepancies occurred most frequently in the calculations with the reading recognition test of the PLAT. This test measures decoding skills that usually have to be taught and learned. The frequency of these discrepancies raises questions about the extent to which the large proportion of subjects, whose readirig recognition achievement is very significantly different from their ability level, is a function of the teaching-learning experiences of the subjects and not a result of some deficit in the pupil. A smaller, though still large, propor- tion of subjects had significant discrepancies between ability and reading com- prehension than between ability and reading recognition.
The smallest proportions of subjects with significant discrepancies occurred in terms of discrepancies between Verbal IQ scores and PlAT mathematics. These results suggest that (1) mathematics is more successfully learned by these subjects, (2) the acquisition of mathematics achievement is dependent more on ability level, or (3) learning disabilities do not occur as frequently 'with mathe- matics learning. Although the explanation of the discrepancies between ability and achievement measures was not an objective of this report, the results point out that using discrepancies between ability and achievement as criteria for identification of learning disabilities is likely to identifY a very large number of subjects as eligible for special education assistance, or in turn, that a very large proportion of children are achieving significantly below expectation, despite the fact that approximately 45% of the controls are actually above average in achieve- ment.
Prevalence Rates of Learning Disabilities Irrespective of Achievement
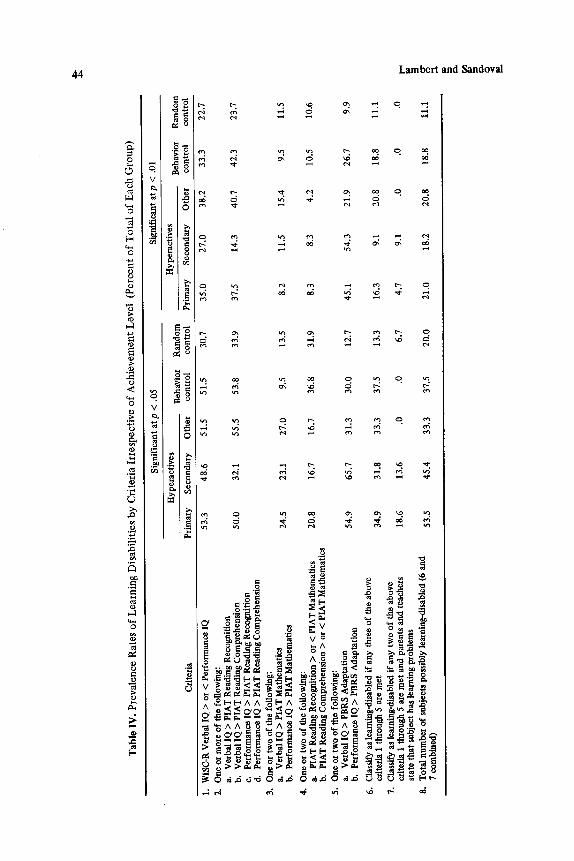
Table IV shows the proportions of subjects of each group who qualified on each of the five criteria, as well as the proportions of subjects eligible by the two learning disability standards and the proportions eligible on either one or the other learning disability standards when, as already noted, level of achieve.
Ta
ble
III
. P
rev
ale
nc
e R
ate
s o
f L
ea
rnin
g D
isab
ilit
ies
Cri
teri
a I
rre
spe
cti
ve
of
Ac
hie
ve
me
nt
Le
ve
l o
f S
ub
jec
ts (
Pe
rce
nt
of
To
tal
of
Ea
ch
Gro
up
)
Sign
ific
ant
at p
~<
.05
Sign
ific
ant
at p
~<
.01
Hyp
erac
tive
s H
yper
aeti
ves
Beh
avio
r R
and
om
B
ehav
ior
Cri
teri
a P
rim
ary
S
econ
dary
O
ther
co
ntro
l co
ntro
l P
rim
ary
Sec
onda
ry
Oth
er
cont
rol
Ran
do
m
cont
rol
ma
1.
WIS
C-R
Ver
bal I
Q >
or
< P
erfo
rman
ce IQ
2a
, V
erba
l IQ
> P
lAT
Rea
ding
Rec
ogni
tion
b.
V
erba
l IQ
> P
IAT
Rea
ding
Com
preh
ensi
on
e.
Per
form
ance
IQ >
PIA
T R
eadi
ng R
ecog
niti
on
d.
Per
form
ance
IQ >
PIA
T R
eadi
ng C
ompr
ehen
sion
3a
. V
erba
l IQ
> P
IAT
Mat
hem
atic
s b.
P
erfo
rman
ce IQ
> P
IAT
Mat
hem
atic
s 4a
. P
IAT
Rea
ding
Rec
ogni
tion
> o
r <
PIA
T M
athe
mat
ics
b.
PIA
T R
eadi
ng C
ompr
ehen
sion
> o
r <
PIA
T M
athe
mat
ics
5a.
Ver
bal
IQ >
PB
RS
Ada
ptat
ion
b.
Per
form
ance
IQ >
PB
RS
Ada
ptat
ion
53.3
48
,6
51,5
51
.5
30.7
35
.0
27.0
38
.2
33.3
28
.0
14.3
34
.5
35.7
12
.1
12.0
7.
1 20
.7
28.6
2.
0 3.
6 10
.7
7.1
3.1
.0
.0
3.6
3.6
36.0
28
.6
34.5
42
.9
27,3
32
.0
14.3
27
.6
35.7
18
.4
14.3
7,
1 21
.4
12.5
10
.2
10.7
7.
1 7.
1 2.
0 3.
8 7.
6 -
1.9
- 3,
8 -
- 24
.5
19.2
19
.2
9.5
11.5
8.
2 7.
7 15
.4
7.5
18.4
16
.7
16.0
35
.0
28.0
8.
2 8.
3 4.
0 10
.0
6.3
8.3
4.0
5.0
8.2
.0
.0
,0
.0
51.0
62
.9
28.1
30
.0
11.3
41
.2
51.4
21
.9
26.7
39
.2
40
.0
15.6
20
.0
9.9
27.5
37
.1
6.3
16.7
22.7
10
.6
21.2
3.
1 1.
9 9.
6 10
.0
.0
9.9
8.5
t~a
d~
4~
Tab
le I
V.
Pre
val
ence
Rat
es o
f L
earn
ing
Dis
abil
itie
s b
y C
rite
ria
Irre
spec
tiv
e o
f A
chie
vem
ent
Lev
el
(Per
cen
t o
f T
ota
l o
f E
ach
Gro
up
)
Cri
teri
a
1.
WIS
C-R
Ver
bal I
Q >
or
< P
erfo
rman
ce IQ
2.
O
ne o
r m
ore
of th
e fo
llow
ing:
a.
V
erba
l IQ
> P
IAT
Rea
ding
Rec
ogni
tion
b.
V
erba
l IQ
> P
IAT
Rea
ding
Com
preh
ensi
on
e.
Per
form
ance
IQ >
PIA
T R
eadi
ng R
ecog
niti
on
d.
Per
form
ance
IQ >
PIA
T R
eadi
ng C
ompr
ehen
sion
3.
O
ne o
r tw
o of
the
foll
owin
g:
a.
Ver
bal I
Q >
HA
T M
athe
mat
ics
b.
Per
form
ance
IQ >
PIA
T M
athe
mat
ics
4.
One
or
two
of th
e fo
llow
ing:
a.
PI
AT
Rea
ding
Rec
ogni
tion
> o
r <
PIA
T M
athe
mat
ics
b.
PlA
T R
eadi
ng C
ompr
ehen
sion
> o
r <
PIA
T M
athe
mat
ics
5.
One
or
two
of th
e fo
llow
ing:
a.
V
erba
l IQ
> P
BR
S A
dapt
atio
n b.
P
erfo
rman
ce IQ
> P
BR
S A
dapt
atio
n
6.
Cla
ssif
y as
lear
ning
-dis
able
d if
any
thr
ee o
f th
e ab
ove
crit
eria
1 t
hrou
gh 5
are
met
7.
C
lass
ify
as le
arni
ng-d
isab
led
if a
ny tw
o of
the
abov
e cr
iter
ia 1
thr
ough
5 a
re m
et a
nd p
aren
ts a
nd te
ache
rs
stat
e th
at s
ubje
ct h
as lv
arni
ng p
robl
ems
8.
Tot
al n
umbe
r of
sub
ject
s po
ssib
ly le
arni
ng-d
isab
led
(6 a
nd
7 co
mbi
ned)
Sig
nifi
cant
at
p <
.05
Sig
nifi
cant
at p
< .
01
Hyp
erac
tive
s B
ehav
ior
Ran
dom
H
yper
acti
ves
Beh
avio
r R
ando
m
Pri
mar
y S
econ
dary
O
ther
co
ntro
l co
ntro
l P
rim
ary
Sec
onda
ry
Oth
er
cont
rol
cont
rol
53.3
48
.6
51.5
51
.5
30.7
35
.0
27.0
38
.2
33.3
22
.7
50.0
32
.1
55.5
53
.8
33.9
37
.5
14.3
40
.7
42.3
23
.7
24.5
23
.1
27.0
9.
5 13
.5
8.2
11.5
15
.4
9.5
11.5
20.8
16
.7
16.7
36
.8
31.9
8.
3 8.
3 4.
2 10
.5
10.6
54.9
65
.7
31.3
30
.0
12.7
45
.1
54.3
21
.9
26.7
9.
9
34.9
31
.8
33.3
37
.5
13.3
16
.3
9.1
20.8
18
.8
11.1
18.6
13
.6
.0
.0
6.7
4.7
9.1
.0
.0
.0
53.5
45
.4
33.3
37
.5
20.0
21
.0
18.2
20
.8
18.8
11
.1
t~
P-
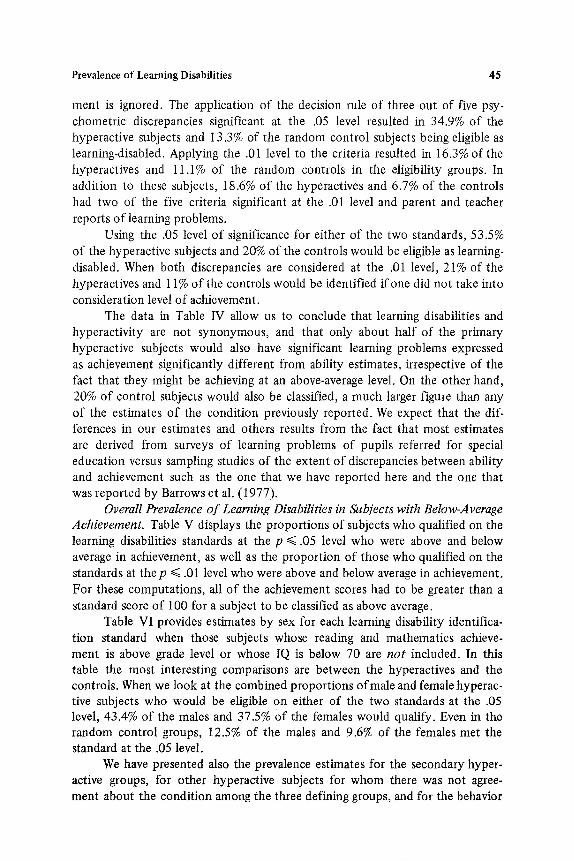
Prevalence of Learning Disabilities 45
ment is ignored. The application of the decision rule of three out of five psy- chometric discrepancies significant at the .05 level resulted in 34.9% of the hyperactive subjects and 13.3% of the random control subjects being eligible as learning-disabled. Applying the .01 level to the criteria resulted in 16.3% of the hyperactives and 11.1% of the random controls in the eligibility groups. In addition to these subjects, 18.6% of the hyperactives and 6.7% of the controls had two of the five criteria significant at the .01 level and parent and teacher reports of learning problems.
Using the .05 level of significance for either of the two standards, 53.5% of the hyperactive subjects and 20% of the controls would be eligible as learning- disabled. When both discrepancies are considered at the .01 level, 21% of the hyperactives and 11% of the controls would be identified if one did not take into consideration level of achievement.
The data in Table IV allow us to conclude that learning disabilities and hyperactivity are not synonymous, and that only about half of the primary hyperactive subjects would also have significant learning problems expressed as achievement significantly different from ability estimates, irrespective of the fact that they might be achieving at an above-average level. On the other hand, 20% of control subjects would also be classified, a much larger figure than any of the estimates of the condition previously reported. We expect that the dif- ferences in our estimates and others results from the fact that most estimates are derived from surveys of learning problems of pupils referred for special education versus sampling studies of the extent of discrepancies between ability and achievement such as the one that we have reported here and the one that was reported by Barrows et al. (1977).
Overall Prevalence of Learning Disabilities in Subjects with Below-Average Achievement. Table V displays the proportions of subjects who qualified on the learning disabilities standards at the p ~< .05 level who were above and below average in achievement, as well as the proportion of those who qualified on the standards at the p ~< .01 level who were above and below average in achievement. For these computations, all of the achievement scores had to be greater than a standard score of 100 for a subject to be classified as above average.
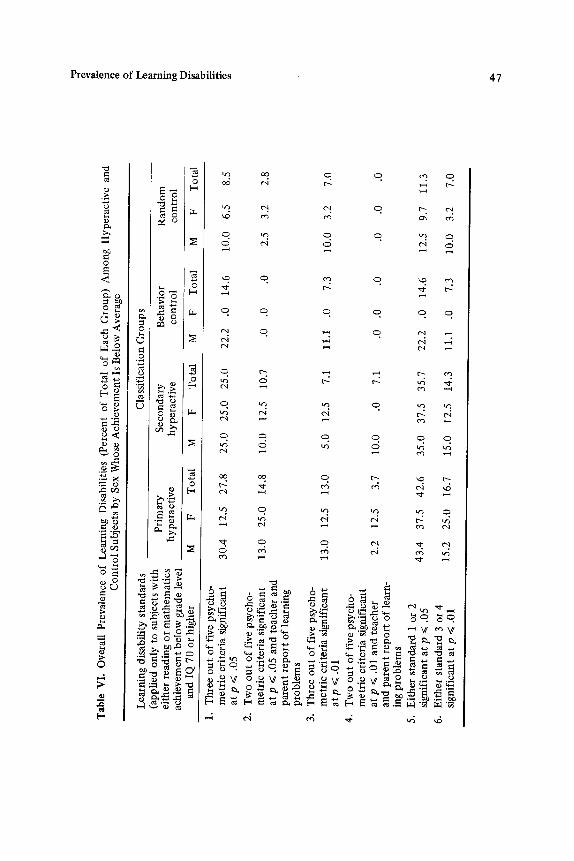
Table VI provides estimates by sex for each learning disability identifica- tion standard when those subjects whose reading and mathematics achieve- ment is above grade level or whose IQ is below 70 are not included. In this table the most interesting comparisons are between the hyperactives and the controls. When we look at the combined proportions of male and female hyperac- tive subjects who would be eligible on either of the two standards at the .05 level, 43.4% of the males and 37.5% Of the females would qualify. Even in the random control groups, 12.5% of the males and 9.6% of the females met the standard at the .05 level.
We have presented also the prevalence estimates for the secondary hyper- active groups, for other hyperactive subjects for whom there was not agree- ment about the condition among the three defining groups, and for the behavior

Tab
le V
. Pro
po
rtio
n o
f S
ubje
cts
Ach
ievi
ng A
bove
and
Bel
ow A
vera
ge Q
uali
fyin
g o
n L
earn
ing
Dis
abil
ity
Cri
teri
a at
th
e p
<~ .0
5 an
d p
~ .0
1 L
evel
s
Pri
mar
y S
econ
dary
B
ehav
ior
Ran
do
m
hy
per
acti
ves
h
yp
erac
tiv
es
con
tro
l co
ntr
ol
abov
e b
elo
w
abov
e b
elo
w
abov
e b
elo
w
abov
e b
elo
w
Eli
gibi
lity
cri
teri
a av
erag
e av
erag
e av
erag
e av
erag
e av
erag
e av
erag
e av
erag
e av
erag
e
1.
Thr
ee o
ut
of
five
psy
cho-
m
etri
c cr
iter
ia s
igni
fica
nt
.08
.58
at p
<~
,05
2.
Tw
o o
ut
of
five
psy
cho-
m
etri
c cr
iter
ia s
igni
fica
nt
at p
~<
.05
and
teac
her
.04
.31
and
par
ent
repo
rt o
f le
arn-
in
g pr
oble
ms
3.
Thr
ee o
ut
of
five
psy
cho-
m
etri
c cr
iter
ia s
igni
fica
nt
.00
at p
< .
01
4.
Tw
o o
ut
of
five
psy
cho-
m
etri
c cr
iter
ia s
igni
fica
nt
at p
<~
.01
and
teac
her
.10
and
pare
nt r
epor
t o
f le
arn-
in
g pr
oble
ms
5.
Eit
her
stan
dard
1 o
r 2
sig-
.1
2 ni
fica
nt a
t p
~< .0
5 6.
E
ithe
r st
anda
rd 3
or
4 .1
0 si
gnif
ican
t at
p ~<
.01
.00
.64
.22
.67
.43
.36
.09
.27
.11
.00
.00
.21
.70
.00
.50
.20
.60
.29
.71
.20
.00
.50
.20
.00
.00
.00
.88
.09
.91
.33
.67
.43
.57
.90
.00
1.00
.4
0 .6
0 .2
9 .7
1
g P-
Tab
le V
I. O
vera
ll P
reva
lenc
e o
f L
earn
ing
Dis
abil
itie
s (P
erce
nt o
f T
otal
of
Eac
h G
roup
) A
mo
ng
Hyp
erac
tive
and
C
on
tro
l S
ubje
cts
by
Sex
Who
se A
chie
vem
ent I
s B
elow
Ave
rage
Lea
rnin
g di
sabi
lity
sta
ndar
ds
(app
lied
onl
y to
sub
ject
s w
ith
eith
er r
eadi
ng o
r m
ath
emat
ics
ach
iev
emen
t bel
ow
gra
de l
evel
an
d IQ
70
or h
ighe
r
1.
Thr
ee o
ut
of
five
psy
cho-
m
etri
c cr
iter
ia s
igni
fica
nt
at p
~<
.05
2.
Tw
o o
ut
of
five
psy
cho-
m
etri
c cr
iter
ia s
igni
fica
nt
at p
~<
.05
and
tea
cher
and
p
aren
t re
po
rt o
f le
arni
ng
pro
ble
ms
3.
Thr
ee o
ut
of
five
psy
cho-
m
etri
c cr
iter
ia s
igni
fica
nt
atp
~<
.01
4.
Tw
o o
ut
of
five
psy
cho-
m
etri
c cr
iter
ia s
igni
fica
nt
at p
~<
.01
and
tea
cher
an
d p
aren
t re
po
rt o
f le
arn-
in
g p
rob
lem
s 5.
E
ithe
r st
anda
rd 1
or
2 si
gnif
ican
t at
p ~<
.05
6.
Eit
her
stan
dard
3 o
r 4
sign
ific
ant a
t p
< .
01
Cla
ssif
icat
ion
Gro
up
s
Pri
mar
y S
econ
dary
B
ehav
ior
Ran
do
m
hy
per
acti
ve
hype
ract
ive
con
tro
l co
ntro
l
M
F T
otal
M
F
Tot
al
M
F T
otal
M
F
Tot
al
30.4
12
.5
27.8
25
.0
25.0
25
.0
22.2
.0
14
.6
10.0
6.
5 8.
5
13.0
25
.0
14.8
10
.0
12.5
10
.7
.0
.0
.0
2.5
3.2
2.8
13.0
12
.5
13.0
5.
0 12
.5
7.1
11.1
.0
7.
3 10
.0
3.2
7.0
2.2
12.5
3.
7 10
.0
.0
7.1
.0
.0
.0
.0
.0
.0
43,4
37
.5
42.6
35
.0
37.5
35
.7
22.2
.0
14
.6
12.5
9.
7 11
.3
15.2
25
.0
16.7
15
.0
12.5
14
.3
11.1
.0
7.
3 10
.0
3.2
7.0
tm

48 Lambert and Sandoval
controls. In general, the prevalence estimates for the hyperactive groups are very similar when the .05 level for the psychometric criteria is applied. But when the groups who were identified by parent and teacher report of learning problems and two psychometric discrepancies, the prevalence estimates vary, most probably because the ability achievement discrepancies do not concur with parent and teacher reports.
The reported prevalence data by sex raises a basic question about the extent to which girls who are achieving significantly below ability and grade levels are being identified and assisted in special education programs. A rather important finding, we believe, is that the learning disability prevalence rates for male and female hyperactive and control subjects are of the same relative mag- nitudes.
CONCLUSIONS
We have reported the results of a systematic investigation of the extent of learning disabilities in a representative population of hyperactive children and a representative group of control subjects. In addition, we have provided estimates of the prevalence of the condition for other types of children considered hyperac- tive, as well as for behavior controls, those with similar behavior but whom neither the parents, their teachers, nor their physicians consider hyperactive. In general, our results show that 42.6% of hyperactive subjects who are achieving below grade level would be eligible on objective criteria for learning disabilities that involve computing differences between ability and achievement measures and applying a test of significance to them. We cannot conclude from our data that learning disabilities and hyperactivity are synonymous, but a very large number (53% using the .05 level of significance for the criteria) of hyperactive children are, by the criteria used, underperforming, even if actually achieving at or above average.
Because we have a control group of subjects that were identified from the same schools attended by the hyperactive subjects, we were also able to estimate the prevalence of the condition for a random control group. Surprisingly, this rate turned out to be 11.3% when we used discrepancy criteria that were sig- nificant at the .05 level and excluded subjects whose reading and mathematics achievement was above grade level. Perhaps an even more interesting and un- expected outcome was the finding that there were similar prevalence rates for male and female hyperactive subjects and for the control subjects. Even though they are underrepresented in special education programs, girls are almost as likely as boys to have serious discrepancies between ability and achievement.
Our rates are similar to the estimates of Campbell (personal communica- tion) who, working with the Barrows et al. (1977) method for identifying
Prevalence of Learning Disabilities 49
learning disabilities, reported a prevalence rate of learning disabilities of 19% for a control group of boys ages 12 to 15. Although different achievement tests were used and behavioral criteria were collected from test observations and dif- ferent sources (Campbell, 1978), their decision rule for eligibility was the model for our method. The two prevalence estimates of 11.3% and 19% with slightly different tests, different populations, and slightly older subjects are too high to be dismissed.
The data that we have presented do not answer questions about the pro- portion of the subjects who qualified on the learning disability standards who were the victims of poor teaching, or the proportion of the subjects for whom other factors interfered with the learning process. A most promising avenue of inquiry will be to analyze developmental, home environmental, and school history data, of the types that we are collecting in our life history studies, to attempt to identify the factors that explain the ability and achievement dis- crepancies. Such an inquiry should provide guidance in the development of ap- propriate interventions.
It is clear to us that we are not going to learn much about the nature of learning disabilities unless investigators begin by studying the extent and types of learning problems in school populations before inquiring into the nature of the problems. Simply studying characteristics of a group of subjects referred for special education is likely to divert our attention from the large number of boys and girls in the elementary and junior high school populations who are very much in need of some type of educational, if not other, intervention to improve their chances of achieving their expected level of performance. We agree with Ames (1977) that " too manyhave been quick to jump on this [learning disabilities] band wagon. Now it is time to slow down and figure out where we are going."
REFERENCES
Ames, L. B. Learning disabilities: Time to check our roadmaps. Journal of Learning Dis- abilities, 1977, 10, 327-329.
Barrows, T. S., CampheU, P. B., Slaughter, B. A., & Trainor, M. L. Procedures document for psychoeducational diagnostic services for learning disabled youths. Prepared under Grants 76 NI-99-0133 and 76-99-002 from the National Institute of Juvenile Justice and Delinquency Prevention, Law Enforcement Assistance Administration, U.S. Department of Justice. Princeton, New Jersey: Educational Testing Service, 1977.
Bosco, J. J., & Robin, S. S. Hyperkinesis: How common is it and how is it treated? In C. Whaten & B. Henker (Eds.), Hyperactive children: The social ecology of identifica- tion and treatment. New York: Academic Press, 1979.
Campbell, P. B. The definition and prevalence of learning clisability. Paper presented at the Annual Conference of the Association for Children with Learning Disabilities, 1978.
Freeman, R. D. Drug effects on learning in children: A selective review of the past thirty years. Journal of Special Education, 1966, 1, 17-42.
Kaufman, A. Intelligence testing with the WISC-R. New York: Wiley Interscience, 1979.
50 Lambert and Sandoval
Keogh, B. K. Hyperactivity and learning disorders: Review and speculation. Exceptional Children, 1971, 38, 101-107.
Lambert, N. M., & Hartsough, C. S. Pupil Behavior Rating Scale. In N. Lambert, E. M. Bower, & C. S. Hartsough (Eds.), A process for the assessment of effective student functioning. Monterey, California: Publisher's Test Service, CTB/McGraw-Hill, 1979.
Lambert, N. M., & Nicoll, R. C. Conceptual model for non-intellectual behavior and its relationship to early reading achievement. Journal of Educational Psychology, 1977, 69, 481-490.
Lambert, N. M., Sandoval, J., & Sassone, D. Prevalence of hyperactivity in elementary school children as a function of social system definers. American Journal of Ortho- psychiatry, 1978, 48, 446-463.
Lambert, N. M., Sandoval, J., & Sassone, D. Prevalence of treatment regimens for children considered to be hyperactive. American Journal of Orthopsychiatry, 1979, 49, 482-490.
Lambert, N. M., & Urbanski, C. Behavioral profiles of children with different levels of achievement. Journal of School Psychology, in press.
Mercer, C. D. ChiMren and adolescents with learning disabilities. Columbus, Ohio: Merrill, 1979.
Minskoff, J. G. Differential approaches to prevalence estimates of learning disabilities. In F. F. de la Cruz, B. H. Fox, & R. H. Roberts (Eds.), Minimal brain dysfunction. New York: New York Academy of Sciences, 1973.
Owen, F. W., Adams, P. A., Forest, T., Stolz, L. M., & Fisher, S. Learning disorders in children: Sibling studies. Monographs of the Society for Research in Child Develop- ment, 1971, Vol. 36 (4, Serial No. 144).
Ross, A. O. Psychological aspects of learning disorders and reading disorders. New York: McGraw-Hill, 1976.
Sandoval, J. The measurement of the hyperactive syndrome in children. Review of Educa- tional Research, 1977, 47, 293-319.
Sandoval, J., Lambert, N. M., & Yandell, W. Current medical practice and hyperactive children. American Journal of Orthopsychiatry, 1976, 46, 323-334.
Sattler, J. M. Assessment of children's intelligence. Philadelphia: Saunders, 1974. Silverman, L. J., & Metz, A. S. Numbers of pupils with specific learning disabilities in local
public schools in the United States: Spring 1970. In F. F. de la Cruz, B. H. Fox, & R. H. Roberts (Eds.), Minimal brain dysfunction. New York: New York Academy of Sciences, 1973.
Sroufe, L. A. Drug treatment of children with behavior problems. In F. Horowitz (Ed.), Child development research (Vol. 4), Chicago: University of Chicago Press, 1975.
United States Office of Education, Bureau of Education for the Handicapped. Estimated number of handicapped children in the United States, 1974.75. Washington, D.C.: Bureau of Education for the Handicapped, 1975.
United States Office of Education, Education of Handicapped Children. Federal Register, Vol. 42, No. 163, Tuesday, August 23, 1977, Part II.
Wender, P. Minimal brain dysfunction in children. New York: Wiley, 1971.