When climate change couples social neglect: malaria dynamics in Panamá
11
ORIGINAL ARTICLE When climate change couples social neglect: malaria dynamics in Panama ´ Lisbeth Amarilis Hurtado 1 , Lorenzo Ca ´ceres 2 , Luis Fernando Chaves 3,4 and Jose ´ E Calzada 1 A major challenge of infectious disease elimination is the need to interrupt pathogen transmission across all vulnerable populations. Ethnic minorities are among the key vulnerable groups deserving special attention in disease elimination initiatives, especially because their lifestyle might be intrinsically linked to locations with high transmission risk. There has been a renewed interest in malaria elimination, which has ignited a quest to understand factors necessary for sustainable malaria elimination, highlighting the need for diverse approaches to address epidemiological heterogeneity across malaria transmission settings. An analysis of malaria incidence among the Guna Amerindians of Panama ´ over the last 34 years showed that this ethnic minority was highly vulnerable to changes that were assumed to not impact malaria transmission. Epidemic outbreaks were linked with El Nin ˜ o Southern Oscillations and were sensitive to political instability and policy changes that did not ensure adequate attention to the malaria control needs of the Gunas. Our results illustrate how the neglect of minorities poses a threat to the sustainable control and eventual elimination of malaria in Central America and other areas where ethnic minorities do not share the benefits of malaria control strategies intended for dominant ethnic groups. Emerging Microbes and Infections (2014) 3, e27; doi:10.1038/emi.2014.27; published online 23 April 2014 Keywords: Anopheles albimanus; climate change; earth sciences; ecology; Gunas; malaria; Plasmodium; social exclusion INTRODUCTION One hundred years ago, the Panama ´ Canal was inaugurated, and ever since, it has been a major route for global commerce. 1 The Panama Canal was celebrated as a major achievement of civil and envir- onmental engineering at the time, and its construction was also a major achievement for public sanitation. 2,3 Endemic yellow fever and malaria quickly waned after intense vector control measurements were taken in ‘a hotbed of malaria’. 4 Malaria control in the Canal Zone (name of the Panama ´ Canal under the colonial rule of the United States) emphasized the long-term benefits of environmental sanita- tion. 1,3 This priority was derived from the need to render the Panama ´ Canal suitable for the colonialist exploitation of a convenient trade passage. 1,3 Nevertheless, wider health benefits were observed by all residents of the Canal Zone and its surrounding neighbor, the Repu ´ blica de Panama ´. 3,5,6 Malaria was rare in the Panama ´ Isthmus by the mid-1930s 6 and had almost disappeared by the mid-1950s. 7 Parallel to the ‘official’ history of great achievements in malaria elimination from the Canal Zone and control in the Repu ´ blica de Panama ´, there was a silent history of malaria transmission in Amerindian populations of the Panama ´ Isthmus. Earlier epidemiolo- gical 8,9 and entomological 2,10 studies on malaria in the Canal Zone revealed that poor housing, human crowding and other consequences of social exclusion exacerbated the malaria burden among Amerindian populations. Nevertheless, following the initial assessment of the mal- aria situation in the Panama ´ Isthmus, concerns about malaria in Amerindian minorities were largely absent in studies that claimed an almost final victory against malaria in Panama ´. 7 Malaria transmission was considered to be negligible in the Panama ´ Isthmus from the 1950s onwards, including at the time of the Torrijos- Carter treaty signature in 1979 11 —an agreement that warranted the return of the Canal Zone to Panamanian sovereignty 12 —and in 1999 when the Panama ´ Canal was returned to the Repu ´ blica de Panama ´. 11 In the 1950s, the Repu ´ blica de Panama ´ also began its journey toward fully recognizing the Amerindian ethnic groups as citizens, with the increased recognition of rights for the Amerindian ethnic groups through the creation of the San Blas (current Guna Yala) Comarca, the first of several Comarcas, i.e., territories designated to provide full autonomy and social integration for Amerindian minorities within the multicultural and ethnically diverse definition of the Repu ´ blica de Panama ´. 13,14 In this context, Comarca Madungandı´ was created in 1996. This region is part of the homeland of the Guna (formerly known as Kuna), an indigenous ethnic group of Panama ´ (Figure 1A). The Gunas are a Chibchan group. DNA analysis showed low variability in their mitochondrial sequences, which is compatible with a population bottleneck coincident with the time of ethnogenesis for the Chibchas, approximately 10 000 years ago. 15 Madungandı´ is a 1200 km 2 area within the Chepo district of the Panama ´ Province, on the Atlantic basin in mid-eastern Panama ´. Puente Bayano, the most accessible village in Madungandı´, is 80 km from Panama ´ City and 120 km from Colo ´ n, the two major cities in Panama ´ (Figure 1B). In 2010, there were 4217 Gunas living in the 14 villages that comprise Madungandı´, 16 with most residing along the shores of the artificial lake Bayano (Figure 1C). Approximately 90% of the Madungandı´ Guna natives live in extreme poverty, which is almost five-fold higher than the percentage observed 1 Departamento de Parasitologı´a, Instituto Conmemorativo Gorgas de Estudios de la Salud (ICGES), Apartado Postal No. 0816-02593, Ciudad de Panama ´ , Repu ´ blica de Panama ´; 2 Departamento de Entomologı´a Me ´ dica, Instituto Conmemorativo Gorgas de Estudios de la Salud (ICGES), Apartado Postal No. 0816-02593, Ciudad de Panama ´ , Repu ´ blica de Panama ´; 3 Institute of Tropical Medicine (NEKKEN), Nagasaki University, 1-12-4 Sakamoto, Nagasaki 852-8523, Japan and 4 Programa de Investigacio ´ n en Enfermedades Tropicales (PIET), Escuela de Medicina Veterinaria, Universidad Nacional, Apartado Postal No. 304-3000, Heredia, Costa Rica Correspondence: LF Chaves E-mail: [email protected] Received 17 December 2013; revised 28 February 2014; accepted 3 March 2014 OPEN Emerging Microbes and Infections (2014) 3, e27; doi:10.1038/emi.2014.27 ß 2014 . All rights reserved 2222-1751/14 www.nature.com/emi
Transcript of When climate change couples social neglect: malaria dynamics in Panamá
ORIGINAL ARTICLE
When climate change couples social neglect: malariadynamics in Panama
Lisbeth Amarilis Hurtado1, Lorenzo Caceres2, Luis Fernando Chaves3,4 and Jose E Calzada1
A major challenge of infectious disease elimination is the need to interrupt pathogen transmission across all vulnerable populations.
Ethnic minorities are among the key vulnerable groups deserving special attention in disease elimination initiatives, especially because
their lifestyle might be intrinsically linked to locations with high transmission risk. There has been a renewed interest in malaria
elimination, which has ignited a quest to understand factors necessary for sustainable malaria elimination, highlighting the need for
diverse approaches to address epidemiological heterogeneity across malaria transmission settings. An analysis of malaria incidence
among the Guna Amerindians of Panama over the last 34 years showed that this ethnic minority was highly vulnerable to changes that
were assumed to not impact malaria transmission. Epidemic outbreaks were linked with El Nino Southern Oscillations and were sensitive
to political instability and policy changes that did not ensure adequate attention to the malaria control needs of the Gunas. Our results
illustrate how the neglect of minorities poses a threat to the sustainable control and eventual elimination of malaria in Central America
and other areas where ethnic minorities do not share the benefits of malaria control strategies intended for dominant ethnic groups.
Emerging Microbes and Infections (2014) 3, e27; doi:10.1038/emi.2014.27; published online 23 April 2014
Keywords: Anopheles albimanus; climate change; earth sciences; ecology; Gunas; malaria; Plasmodium; social exclusion
INTRODUCTION
One hundred years ago, the Panama Canal was inaugurated, and ever
since, it has been a major route for global commerce.1 The Panama
Canal was celebrated as a major achievement of civil and envir-
onmental engineering at the time, and its construction was also a
major achievement for public sanitation.2,3 Endemic yellow fever
and malaria quickly waned after intense vector control measurements
were taken in ‘a hotbed of malaria’.4 Malaria control in the Canal Zone
(name of the Panama Canal under the colonial rule of the United
States) emphasized the long-term benefits of environmental sanita-
tion.1,3 This priority was derived from the need to render the Panama
Canal suitable for the colonialist exploitation of a convenient trade
passage.1,3 Nevertheless, wider health benefits were observed by all
residents of the Canal Zone and its surrounding neighbor, the
Republica de Panama.3,5,6 Malaria was rare in the Panama Isthmus
by the mid-1930s6 and had almost disappeared by the mid-1950s.7
Parallel to the ‘official’ history of great achievements in malaria
elimination from the Canal Zone and control in the Republica de
Panama, there was a silent history of malaria transmission in
Amerindian populations of the Panama Isthmus. Earlier epidemiolo-
gical8,9 and entomological2,10 studies on malaria in the Canal Zone
revealed that poor housing, human crowding and other consequences
of social exclusion exacerbated the malaria burden among Amerindian
populations. Nevertheless, following the initial assessment of the mal-
aria situation in the Panama Isthmus, concerns about malaria in
Amerindian minorities were largely absent in studies that claimed
an almost final victory against malaria in Panama.7
Malaria transmission was considered to be negligible in the Panama
Isthmus from the 1950s onwards, including at the time of the Torrijos-
Carter treaty signature in 197911—an agreement that warranted the
return of the Canal Zone to Panamanian sovereignty12—and in 1999
when the Panama Canal was returned to the Republica de Panama.11
In the 1950s, the Republica de Panama also began its journey toward
fully recognizing the Amerindian ethnic groups as citizens, with the
increased recognition of rights for the Amerindian ethnic groups
through the creation of the San Blas (current Guna Yala) Comarca,
the first of several Comarcas, i.e., territories designated to provide full
autonomy and social integration for Amerindian minorities within the
multicultural and ethnically diverse definition of the Republica de
Panama.13,14 In this context, Comarca Madungandı was created in
1996. This region is part of the homeland of the Guna (formerly known
as Kuna), an indigenous ethnic group of Panama (Figure 1A). The
Gunas are a Chibchan group. DNA analysis showed low variability in
their mitochondrial sequences, which is compatible with a population
bottleneck coincident with the time of ethnogenesis for the Chibchas,
approximately 10 000 years ago.15 Madungandı is a 1200 km2 area
within the Chepo district of the Panama Province, on the Atlantic basin
in mid-eastern Panama. Puente Bayano, the most accessible village in
Madungandı, is 80 km from Panama City and 120 km from Colon, the
two major cities in Panama (Figure 1B). In 2010, there were 4217
Gunas living in the 14 villages that comprise Madungandı,16 with most
residing along the shores of the artificial lake Bayano (Figure 1C).
Approximately 90% of the Madungandı Guna natives live in extreme
poverty, which is almost five-fold higher than the percentage observed
1Departamento de Parasitologıa, Instituto Conmemorativo Gorgas de Estudios de la Salud (ICGES), Apartado Postal No. 0816-02593, Ciudad de Panama, Republica de Panama;2Departamento de Entomologıa Medica, Instituto Conmemorativo Gorgas de Estudios de la Salud (ICGES), Apartado Postal No. 0816-02593, Ciudad de Panama, Republica dePanama; 3Institute of Tropical Medicine (NEKKEN), Nagasaki University, 1-12-4 Sakamoto, Nagasaki 852-8523, Japan and 4Programa de Investigacion en EnfermedadesTropicales (PIET), Escuela de Medicina Veterinaria, Universidad Nacional, Apartado Postal No. 304-3000, Heredia, Costa RicaCorrespondence: LF ChavesE-mail: [email protected]
Received 17 December 2013; revised 28 February 2014; accepted 3 March 2014
OPENEmerging Microbes and Infections (2014) 3, e27; doi:10.1038/emi.2014.27� 2014 . All rights reserved 2222-1751/14
www.nature.com/emi
in the rest of Panama.17 About half of the adult population, i.e.,
people over 15 years of age, is illiterate (45.9%), and only 17.5%
completed elementary education. The major economic activities are
subsistence farming and fishing, which employ 56.4% and 17.2%,
respectively, of the adult population.16 The health status of the
Guna lags behind that of other Panamanian citizens; the Guna have
a life expectancy that is between 7 and 10 years shorter than that
of other Panamanians, and a three-fold increase in the mortality
rate for children under one year of age when compared with other
Panamanians.17 Malaria is the most common infectious disease
affecting the Guna. Since 2000, approximately 45% of the malaria
cases in the entire Republica de Panama have occurred in Comarca
Mudangandı.11,18 The Guna are also commonly affected by respir-
atory and digestive infections, which are likely exacerbated by a lack
of access to basic services.19 For example, 76.3% of the population
has no access to potable water, and 84.3% has no access to basic
sanitation, e.g., disposal of wastewater.16 Housing conditions are
destitute and insect-friendly (Figure 1D), with most houses built
of wood and with thatched roofs, eaves, and unscreened doors
and windows that facilitate Anopheles spp. mosquito infestations.2
The disproportionate share of the malaria burden of the Republica
de Panama that is held by the Guna Amerindians of Comarca
Madungandi not only highlights their socially outcast condition but
also their likely enhanced vulnerability to malaria, a parasitic disease
with transmission that is sensitive to climatic variability.20–22 In this
study, we analyzed the dynamics of malaria transmission among the
Gunas from Comarca Madungandı, using a 34-year monthly malaria
case time-series from Comarca Madungandı. We assessed whether
major malaria epidemics observed in the region in the early 2000s11
represent a major dynamical regime shift, i.e., an abrupt change in the
mean and/or variability of malaria incidence.23 We also assessed
whether the malaria epidemics were related to temperature increases
in the region or whether they were related to changes in climatic
variability associated with large climatic events, such as the El Nino
Southern Oscillation (ENSO). We found that inter-annual cycles in
malaria epidemics were associated with ENSO during 1980–2013 and
that a dynamical regime shift observed at the end of 2002 might
be related to policy changes in the structure of the malaria control
program, in which personnel and funding for this program were re-
assigned within Panama’s Ministry of Health without adequate
A B
C D
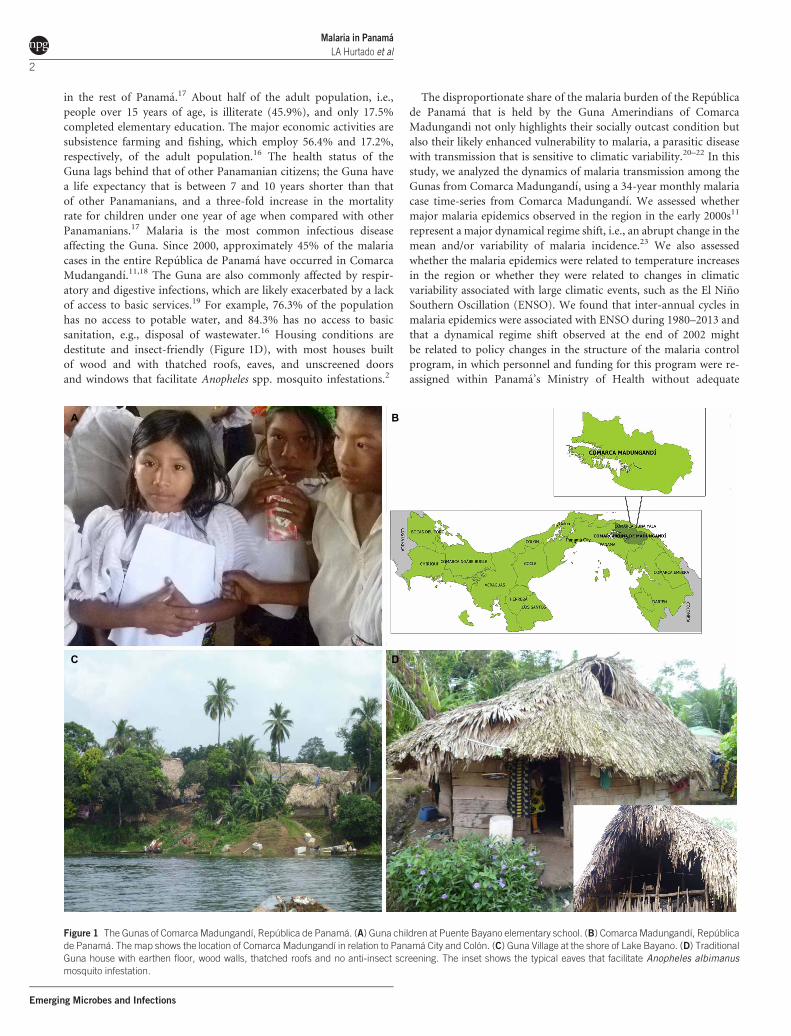
Figure 1 The Gunas of Comarca Madungandı, Republica de Panama. (A) Guna children at Puente Bayano elementary school. (B) Comarca Madungandı, Republica
de Panama. The map shows the location of Comarca Madungandı in relation to Panama City and Colon. (C) Guna Village at the shore of Lake Bayano. (D) Traditional
Guna house with earthen floor, wood walls, thatched roofs and no anti-insect screening. The inset shows the typical eaves that facilitate Anopheles albimanus
mosquito infestation.
Malaria in Panama
LA Hurtado et al
2
Emerging Microbes and Infections

preparation to tackle malaria transmission. We consider that full
inclusion of the Gunas into Panamanian society is the major challenge
for successful malaria control, and eventual malaria elimination, in the
Republica de Panama.
MATERIALS AND METHODS
Malaria and demographic data
Monthly malaria cases for Comarca Madungandı, from January 1980
to April 2013, were obtained from the East Panama Region Vector
Control Department of Panama’s Ministry of Health (Departamento
de Control de Vectores de la Region Panama Este, Ministerio de Salud,
Republica de Panama). The time series mainly records malaria cases
from a sentinel health post in Puente Bayano, the main village in
Madungandı (Supplementary Figure S1A). The time series only
included malaria cases with diagnoses that were confirmed by the
examination of Giemsa stained blood smears that were prepared using
the thick smear method8 and examined under the microscope by
trained staff at the Gorgas Institute or the Panama Este regional
Hospital. All positive slides, and 10% of the negative slides, were con-
firmed by the Public Health Central Reference Laboratory of the
Gorgas Laboratory, following the national guidelines for malaria con-
trol of the Ministry of Health of Panama. For the study period, both
the sensitivity and specificity of malaria diagnosis were consistent and
were close to 100%, highlighting the quality of the data. During the
study period, more than 95% of the malaria cases were due to
Plasmodium vivax, but during the 2002–2006 outbreak, approximately
12% of the cases were due to Plasmodium falciparum.11
Annual population size estimates (1980–2013) for the Chepo dis-
trict were obtained from the Direccion de Estadıstica y Censo of
Contralorıa General de Republica de Panama. Data from the Chepo
district was rescaled with the assumption that Gunas in Comarca
Madungandi steadily accounted for 10% of the total population, as
they did in the 2010 census (Supplementary Figure S1B).
Monthly malaria incidence per 1000 was estimated as the ratio
between the number of malaria cases and population size estimates
for each month, multiplied by 1000.
Study site and climatic data
The natural vegetation of Comarca Madungandı is a humid tropical
rainforest, with a high and stable temperature of approximately
26–27 6C and a unimodal rainfall pattern with a dry season (mid-
December to mid-April) and a wet season (mid-April to mid-
December). Rainfall, maximum temperature (TMAX) and minimum
temperature (TMIN) time series from the nearest weather station to
Madungandı were obtained from ETESA, the Panamanian National
Electrical Company. Sea surface temperature 4 (SST4, also known as,
El Nino 4 index) time series, an index for ENSO, a global climatic
phenomena associated with extreme weather in Central America was
obtained from the United States National Oceanic and Atmospheric
Administration Climate Prediction Center (http://www.cpc.ncep.
noaa.gov/data/indices/ersst3b.nino.mth.81-10.ascii). The United States
National Oceanic and Atmospheric Administration data were collected
from the area delimited by 56N–56S and 1606E–1506W of the Pacific
Ocean.
Statistical analysis
Trends in the climatic variables. We began our analysis by determin-
ing whether trends (increases in the average value) were present in the
local climatic variables: rainfall, TMAX and TMIN. We employed
locally weighted scatterplot smoothing, a non-parametric regression
method,24 to fit trends in the climatic time series data. For robustness,
we also employed empirical mode decomposition (EMD), a method
in which a time series is decomposed by building oscillatory signals—
intrinsic mode functions (IMF)—that are repeatedly subtracted from
the time series and a residue, a nonlinear trend, can be obtained after
the oscillatory components are removed.25 Details about the EMD
decomposition algorithm and a mathematically rigorous explanation
are presented by Huang et al.25
Seasonality of malaria incidence. The seasonality of the malaria
incidence time series was assessed using box diagrams for each
month.26
Malaria incidence time series correlation structure and associationwith climatic variables. We explored the correlation structure in the
malaria incidence time series by inspecting its autocorrelation func-
tion (ACF), i.e., the time series correlation with itself through time,
and the partial autocorrelation function (PACF), i.e., the correlation
between consecutive time lags.24 Information from the ACF and PACF
was used to fit an autonomous null model, i.e., a model without
covariates, of the malaria incidence data. The null model was then
used to pre-whiten the climatic covariates SST4, Rain, TMAX and
TMIN. Pre-whitening is a process in which any common autoregres-
sive structure is removed (often referred to as filtering) from a time
series to study patterns of association with a focal time series.24
Residuals from the autonomous null model together with pre-whi-
tened residuals of the climatic covariates were then used to estimate
cross-correlation functions (CCF) of malaria incidence with each of
the climatic covariates. We used the information from the CCFs to
build a full non-autonomous model that considered up to two lags
from each of the climatic covariates, selecting the lags with the highest
correlation, based on the statistical significance of the association and
the magnitude of the association. This full model was then simplified
to avoid having more parameters than necessary to understand the
dynamics of malaria incidence. We simplified the full model by a
process of backward elimination, i.e., removing the least significant
covariate in rounds.24 We used the Akaike Information Criterion
(AIC) to choose the best model in each round of model simplification.
AIC is a model selection criterion that can be used to choose the best
model after a trade-off function between the number of parameters
and likelihood is minimized.24 Finally, in all cases, assumptions about
model error were verified using standard procedures for time series
analysis.24
Breakpoints and dynamical regime shifts. To explore the possibility
that climatic variables with trends and malaria incidence in
Madungandı had dynamical regime shifts, i.e., abrupt changes in their
average and/or variance during the studied period, we employed a
parametric test based on an F distribution that compares the null
hypothesis of no change with that of a significant change. Briefly,
the method by Bai and Perron27 allows the simultaneous estimation
of several breakpoints, i.e., time points when a dynamical regime shift
occurs, via an iterative algorithm by which the number and temporal
location of breakpoints can be estimated by minimizing the Bayes
Information Criterion (BIC). BIC is a model selection criterion that
guides the best model selection when a trade-off function considering
the likelihood of a model, the number of parameters and data points
employed in parameter estimation is minimized.24
After the breakpoints were estimated, we fitted the full non-
autonomous model to the malaria incidence regimes, i.e., time series
Malaria in PanamaLA Hurtado et al
3
Emerging Microbes and Infections
segments, which were defined by the estimated breakpoints. These
models were simplified based on AIC minimization and assumptions
of the error were checked using standard procedures.28 We then
studied changes in the magnitude of climatic forcing in the malaria
time series by comparing the time series model parameter estimates
for the different segments of the split time series.28
Non-stationary patterns of association in the time–frequency
domain. The time–frequency association of non-stationary time ser-
ies, i.e., the association of cycles in time series over time, can be studied
using continuous wavelet transforms.29 Here, we used cross-wavelet
coherence analysis to determine whether peaks at a particular fre-
quency and time in SST4 correspond to similar peaks in malaria incid-
ence and local climatic variables (Rain, TMAX and TMIN) of
Comarca Madugandi, Republica Panama. We also depicted the asso-
ciation between malaria incidence and climatic factors by first decom-
posing the time series into a trend and oscillatory components via an
EMD. The power spectra of the resulting trend and IMFs were
estimated via the construction of a periodogram, which is a graphical
representation of the distribution of power (or variance) among dif-
ferent frequencies, the inverse of the period of cycles per year.24 A peak
in the periodogram indicates a dominant frequency, whose inverse is
the period of the dominant cycles in a time series.20 Given the period of
the cycles in the trend and IMFs from the EMD, we estimated their
CCFs with the climatic covariates, to untangle the specific associations
between the global (SST4, El Nino 4 index) and local (rainfall, TMAX
and TMIN) climatic covariates with inter-annual, seasonal and noisy
cycles in malaria incidence.
RESULTS
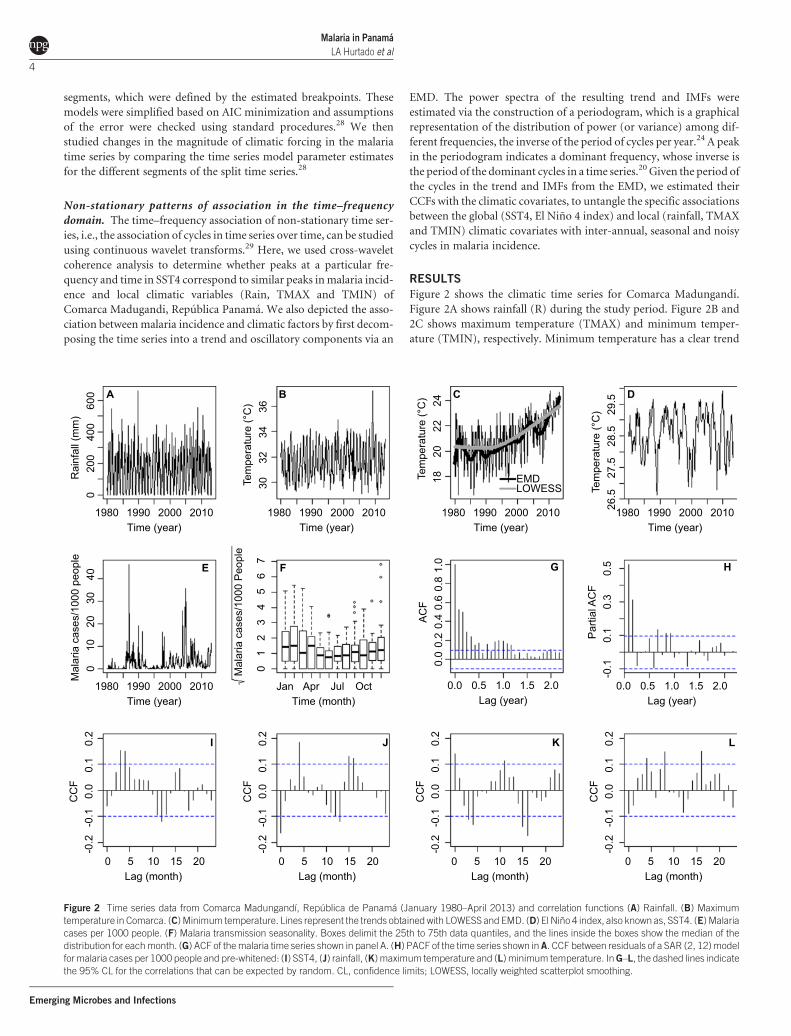
Figure 2 shows the climatic time series for Comarca Madungandı.
Figure 2A shows rainfall (R) during the study period. Figure 2B and
2C shows maximum temperature (TMAX) and minimum temper-
ature (TMIN), respectively. Minimum temperature has a clear trend
Time (year)
Rai
nfal
l (m
m)
400
200
060
0
200019901980 2010
A
Time (year)
Mal
aria
cas
es/1
000
peop
le30
2010
040
200019901980 2010
E
Time (month)
Mal
aria
cas
es/1
000
Peo
ple
51
07
63
42
JulAprJan Oct
F
Time (year)
Tem
pera
ture
(°C
)34
3230
36
200019901980 2010
B
Time (year)
EMDLOWESS
Tem
pera
ture
(°C
)22
2018
24
200019901980 2010
C
Time (year)
Tem
pera
ture
(°C
)28
.527
.526
.529
.5
200019901980 2010
D
Lag (year)
AC
F0.
80.
60.
40.
00.
21.
0
1.00.50.0 1.5 2.0
G
Lag (year)
Par
tial A
CF
0.3
-0.1
0.1
0.5
1.00.50.0 1.5 2.0
H
Lag (month)
CC
F0.
1-0
.2-0
.10.
00.
2
1050 15 20
I
Lag (month)
CC
F0.
1-0
.2-0
.10.
00.
2
1050 15 20
J
Lag (month)
CC
F0.
1-0
.2-0
.10.
00.
2
1050 15 20
K
Lag (month)
CC
F0.
1-0
.2-0
.10.
00.
2
1050 15 20
L
Figure 2 Time series data from Comarca Madungandı, Republica de Panama (January 1980–April 2013) and correlation functions (A) Rainfall. (B) Maximum
temperature in Comarca. (C) Minimum temperature. Lines represent the trends obtained with LOWESS and EMD. (D) El Nino 4 index, also known as, SST4. (E) Malaria
cases per 1000 people. (F) Malaria transmission seasonality. Boxes delimit the 25th to 75th data quantiles, and the lines inside the boxes show the median of the
distribution for each month. (G) ACF of the malaria time series shown in panel A. (H) PACF of the time series shown in A. CCF between residuals of a SAR (2, 12) model
for malaria cases per 1000 people and pre-whitened: (I) SST4, (J) rainfall, (K) maximum temperature and (L) minimum temperature. In G–L, the dashed lines indicate
the 95% CL for the correlations that can be expected by random. CL, confidence limits; LOWESS, locally weighted scatterplot smoothing.
Malaria in Panama
LA Hurtado et al
4
Emerging Microbes and Infections

of close to a 3 6C increase from 1988 to 2013, a result robustly found
with locally weighted scatterplot smoothing and EMD (Figure 2C).
Figure 2D shows the SST4, an index of ENSO associated with
Panama’s climate. Figure 2E shows the malaria incidence time series,
in which the largest epidemics occurred in 1987 and 2005. During the
34 years of the time series, a total 4976 cases were reported in the
Comarca Guna of Madungandı. Figure 2F shows the malaria season-
ality. A higher incidence of malaria tended to occur during the dry
season (December–April). Malaria incidence also shows a clear auto-
regressive pattern, supported by a decreasing ACF (Figure 2G) con-
firmed by significant PACF, coefficients at 1, 2 and 11 months of lag
(Figure 2H). The ACF and PACF suggested that malaria incidence can
be described by the following autonomous (i.e., without covariates)
seasonal autoregressive (SAR) model:
Mt~mzw1 Mt{1{mð Þzw2 Mt{2{mð Þzw12 Mt{12{mð Þ
zw1w12 Mt{13{mð Þzw2w12 Mt{14{mð Þzet
ð1Þ
where M denotes malaria incidence, m is the mean malaria incidence
for different time lags and et is an identical and independent normally
distributed error. The maxima of CCFs between the residuals of the
model in Equation (1) and the pre-whitened SST4 (Figure 2I), R
(Figure 2J), TMAX (Figure 2K) and TMIN (Figure 2L) suggest that
malaria incidence was significantly associated with SST4 (4), R (0), R
(5), TMAX (0), TMAX (17), TMIN (17) and TMIN (8), with the
number inside the parentheses indicating the lag of the association
in months.
With the information from the CCFs, we proceeded to fit the
following non-autonomous (i.e., with covariates), forced, SAR
model:
Mt ~mzw1 Mt{1{mð Þzw2 Mt{2{mð Þ
zw12 Mt{12{mð Þzw1w12 Mt{13{mð Þ
zw2w12 Mt{14{mð ÞzaSST4t{4zbRt
zb2Rt{5zc1TMAXtzc2TMAXt{17
zd1TMINt{8zd2TMINt{17zet
ð2Þ
Hereafter, this model will be referred to as the full model. This
model was simplified using the AIC (Supplementary Table S1), and
several terms were dropped resulting in the following final model:
Mt~mzw1 Mt{1{mð Þzw2 Mt{2{mð Þ
zw12 Mt{12{mð Þzw1w12 Mt{13{mð Þ
zw2w12 Mt{14{mð ÞzaSST4t{4zbRt
zd1TMINt{8zd2TMINt{17zet
ð3Þ
Parameter estimates for the model described in Equation (3) are
presented in Table 1.
The dynamical regime shift analysis showed that no breakpoints
(and their associated dynamical regime shifts) occurred in the
TMIN time series after a model such as the one described in
Equation (1) was employed to find breakpoints using the Bai and
Perron27 method (Figure 3A). In contrast, a breakpoint was found
when a similar procedure was applied to the malaria incidence time
series, on December 2002 (95% confidence limits September 2001–
February 2004), as shown by the minimization of BIC for one break-
point in Figure 3B. There were major differences in the seasonality of
malaria during the two periods separated by the dynamical regime
shift. From 1980 to 2002, although epidemics were more common
during December, January and February, no major differences were
observed across the different months (Figure 3C). In contrast, from
2003 to 2013, a clear seasonality was observed, with the number of
cases peaking during February, and the number of cases was signifi-
cantly higher at the end of the wet season in November, the dry season
(December–March) and the beginning of the wet season in April
(Figure 3D).
To test whether there were significant changes in the association of
malaria incidence with climatic variables in the regimes defined by the
breakpoint, the model presented in Equation (3) was fitted to malaria
incidence for the periods from 1980–2002 and 2003–2013. After a
process of model selection, we found that malaria incidence for
1980–2002 (Supplementary Table S2) was a second order autoregres-
sive process and was also significantly associated with El Nino 4 index
(SST4):
Mt ~mzw1 Mt{1{mð Þzw2 Mt{2{mð ÞzaSST4t{4zet ð4Þ
Using model selection (Supplementary Table S3), we found that
malaria incidence for the period from 2003–2013 was best described
by a first order seasonal autoregressive process and was significantly
Table 1 Parameter estimates for the best models of malaria incidence (per 1000 people) in Comarca Madugandı, Republica de Panama, with
and without breakpoints
Parameter (Lag-month)
Estimates (6s.e.)
No breakpoint
Breakpoint (December 2002)
Before After
mm Mean (–) 3.0660.55* 2.4560.53* 4.8060.95*
ww1Autoregressive first order, AR (1) 0.34860.049* 0.17160.057* 0.69760.066*
ww2Autoregressive second order, AR (2) 0.32260.049* 0.37660.058* —
ww12Seasonal Autoregressive, SAR (12) 20.10660.052* — 20.24860.087*
aa El Nino 4 (4) 1.7160.62* 1.4660.62* 2.1461.19
bb Rainfall (0) 20.004360.0017* — 20.00860.003*
dd1Minimum temperature (8) 0.47660.179* — —
dd2Minimum temperature (17) 0.57960.182* — —
ss2E
Variance of the error 15.61 14.13 16.16
*Statistically significant (P,0.05).
Malaria in PanamaLA Hurtado et al
5
Emerging Microbes and Infections

associated with SST4 and rainfall (P,0.05):
Mt ~mzw1 Mt{1{mð Þzw12 Mt{12{mð Þ
zw1w12 Mt{13{mð ÞzaSST4t{4zbRtzet
ð5Þ
Parameter estimates for Equations (4) and (5) are presented in
Table 1. The split model described by Equations (4) and (5) outper-
formed the model in Equation (3), with the former having an AIC of
2148, whereas the AIC for the other model was 2159, with both models
having a total of eight parameters. The results that are displayed in
Table 1 confirm the observations from Figures 2C and 2D, where a clear
seasonal structure was significant only for the 2003–2013 period.
Assumptions of error normality, variance homogeneity and temporal
independence were confirmed for the models presented in Table 1 and
Equations (1) and (2). Table 1 also shows that mean incidence was
higher during the 2003–2013 period (approximately 5 cases/1000 people,
for one month) than in the 1980–2002 period (approximately 2.5 cases/
1000 people, for one month), regardless of the two regimes having a
similar unexplained variance (approximately 15, which was also similar
to the unexplained variance of the model without a breakpoint). The
association between malaria incidence and El Nino 4 (SST4) was positive
and became stronger after the breakpoint, yet was not statistically sig-
nificant for the 2003–2013 period, when a negative and statistically
significant (P,0.05) association with rainfall was observed (Table 1).
The differences between the significant covariates in the malaria
incidence models with and without breakpoints (Table 1) may be
related to the non-stationary association between climatic factors
and malaria transmission. Non-stationary associations can be visua-
lized through cross-wavelet coherency analysis. Therefore, we per-
formed cross-wavelet coherency analyses between SST4 and malaria,
rainfall, TMAX and TMIN. SST4 was significantly associated with
inter-annual malaria cycles of four-year periods between 1980 and
1995, and eight-year periods between 1995 and 2006 (Figure 4A).
Around 1995, four-year cycles in SST4 and rainfall were associated
(Figure 4B), and a similar pattern was also observed for TMAX, which
was also associated with SST4 near 2005 (Figure 4C). Both TMAX and
TMIN where seasonally (period of one year) associated with SST4
(Figure 4C and 4D).
To further tease apart the non-stationary association between mal-
aria and climatic factors, we decomposed the malaria incidence time
series using EMD. The signal was decomposed into a trend and two
IMFs, and the power spectra of the signal components were estimated
(Figure 5). The components from EMD were the trend (Figure 5A),
the first IMF (Figure 5B) and the second IMF (Figure 5C). The trend
(Figure 5A) had most of its power, i.e., variability, at inter-annual time
scales, with clear peaks that correspond to cycles of several periods
(i.e., 1/frequency of cycles per year), primarily 16 and 4 years, as well as
shorter cycles of 18 months (Figure 5D). The first IMF (Figure 5B)
1260
1240
1220
BIC
1200
1180
4Number of Breakpoints
3210 5
A 3380
3360
3340
BIC
3320
3300
4Number of Breakpoints
3210
B40
3020
(Mal
aria
cas
es/ 1
000
peop
le)
100
3035
2520
15(M
alar
ia c
ases
/ 100
0 pe
ople
)10
50
SepTime (month)
JulMayMarJan Nov SepTime (month)
JulMayMarJan Nov
C D
Figure 3 Breakpoint analysis. BIC for breakpoint selection in (A) minimum temperature and (B) malaria incidence (per 1000 people). The breakpoint in B
corresponds to December 2002. Seasonal malaria incidence in (C) January 1980–December 2002 and (D) January 2003–April 2013. In C and D, the boxes delimit
the 25th to 75th data quantiles, and the lines inside the boxes show the median of the distribution for each month.
Malaria in Panama
LA Hurtado et al
6
Emerging Microbes and Infections

had a power peak that corresponds to seasonal variability, or one cycle
per year (Figure 5E). The second IMF (Figure 5C) had a similar
amount of variability through all of the frequencies, indicating that
the variability can be considered to be white noise because no fre-
quency dominated the power spectrum (Figure 5F). CCFs of the trend
from EMD with SST4 (Figure 6A), rainfall (Figure 6B), TMAX
(Figure 6C) and TMIN (Figure 6D) showed that inter-annual cycles
in malaria incidence were associated with El Nino 4. By contrast, the
seasonality of malaria incidence was not correlated with SST4
(Figure 6E) or rainfall (Figure 6F), but was significantly correlated
with TMAX (Figure 6G) and TMIN (Figure 6H); a similar pattern
was observed for the white noise component, which was also not
correlated with SST4 (Figure 6I) and rainfall (Figure 6J), and was
significantly correlated with TMAX (Figure 6K) and TMIN
(Figure 6L). Thus, the combined outcomes of the wavelet analysis
and the CCFs of the EMD decomposed malaria incidence time series
indicate that inter-annual malaria cycles are associated with El Nino 4
and rainfall, whereas the seasonal dynamics are mainly associated with
temperature changes.
DISCUSSION
The continued transmission of malaria among the Gunas in Panama
highlights the challenges of tropical disease elimination in multicultural
and ethnically diverse nations. Although malaria was recognized as a
major problem in the Amerindian populations by baseline research
conducted prior to malaria control in the Canal Zone,8,9 little to no
attention was directed to malaria in Amerindian populations of the
Panama Isthmus once the disease was effectively controlled in the
Canal Zone and major economic centers of the Republica de
Panama.3,7,11,30 Lake Bayano was artificially created on the Chepo river
basin in 1975. At that time, potential risks for vector-borne disease
emergence among the Gunas, a vulnerable community living in the area,
were ignored.31 After the lake was created, the Gunas, who used to live
near the river, settled on the shores next to Lake Bayano.32 Lake shores
have abundant sunlit pools, which are ideal larval habitats for Anopheles
albimanus, the major malaria vector in most of Panama and Central
America.10,33–35 Indeed, shortly after the creation of Lake Bayano, the
proliferation of ‘water lettuce’ (Pistia stratiotes) and its associated mos-
quito fauna were linked with a major outbreak of Venezuelan equine
encephalomyelitis in the area.36 Thus, the emergence of malaria in
Madungandı might be partially explained by the lack of a health impact
assessment prior to the creation of Lake Bayano and the lack of prevent-
ive vector management afterwards.1,37–39 Indeed, a similar pattern was
previously observed in Panama along the Chagres River basin.6
Following the creation of Lake Gatun in the lower Chagres River, com-
munities in the upper Chagres River were significantly less affected by
malaria than those on the shores of Lake Gatun during the 1930s.5,6
Nevertheless, the malaria burden in Madungandı was most likely unre-
corded until the 1980s, when the Puente Bayano Health post was estab-
lished to serve the indigenous communities around Lake Bayano.
At least three great malaria epidemics have struck the Gunas of
Madungandı since 1980, including one that occurred from 1987 to
1990. An El Nino event occurred in 1987. In 1988, the use of
dichloro-diphenyl-trichloroethane (DDT) as a regular tool for indoor
residual spraying (IRS) in endemic areas was terminated.40 This malaria
control policy change coincided with a time of major social instability
associated with the end of Manuel Noriega’s rule and the US invasion of
Panama,41 which greatly affected the overall functionality of public ser-
vices in the Republica de Panama.42 During 1997 and 1998, a new
malaria epidemic emerged, synchronous with major epidemics observed
in other parts of the world, especially in East Africa20,43 and South
America,44–46 which, like Panama, were subject to one of the strongest
El Nino events on record.47 The third large epidemic began in 2002–
2003, which also coincided with an El Nino event.48 This last epidemic
lasted until 2005–2006, mainly because of problems associated with the
decentralization of Panama’s Ministry of Health, where the malaria vec-
tor control program suffered a shortage of funding and personnel neces-
sary to manage focalized outbreaks quickly after their identification.
8P
erio
d (y
ear)
42
116
0.5
1980 200520001995Time (year)
19901985 2010
8P
erio
d (y
ear)
42
116
0.5
1980 200520001995Time (year)
19901985 2010
8P
erio
d (y
ear)
42
116
0.5
1980 200520001995Time (year)
19901985 2010
8P
erio
d (y
ear)
42
1
10
160.
5
1980 200520001995Time (year)
19901985 2010
A B
C D
Figure 4 Cross-wavelet coherence analysis. Coherence between SST4 and (A) malaria cases per 1000 people from January 1980 to April 2013, (B) rainfall, (C)
maximum temperature and (D) minimum temperature in Comarca Madugandı, Republica de Panama. In all analyses, a smoothing window of six months was used.
The cross-wavelet coherence scale is from zero (blue) to one (red). Red regions in the plots indicate frequencies and times for which the two series share variability (or
power). The cone of influence (within which results are not influenced by the edges of the data) and the significant coherent time-frequency regions (P,0.05) are
indicated by solid lines.
Malaria in PanamaLA Hurtado et al
7
Emerging Microbes and Infections

Our analysis supports an extended role for ENSO as a potential driver
of inter-annual malaria epidemics in Madungandı, given the robust
results derived from our different methods of analysis, which showed
a close association between the inter-annual cycles of ENSO, measured
by SST4, and malaria epidemics in Madungandı. One of the dominant
cycle periods of the epidemics is approximately 4 (exactly 3.7) years, and
its harmonics, i.e., cycles whose periods are a multiple of the dominant
period,20 such as 16 years, are oscillation periods observed in ENSO.49 A
remarkable 10-year study of malaria in eastern Panama revealed the
occurrence of epidemics every 4 years in the Chagres river basin, with
the largest epidemic observed in 1939,5,6 an El Nino year.49
Multidisciplinary studies in the Chagres river basin in the 1930s5,6
showed that dry El Nino years were associated with the dynamic gen-
eration of larval habitats in Lake Gatun shores and riverbeds along the
Chagres River basin, ideal habitats for Anopheles albimanus, the main
malaria vector around lakes in Panama, including Lake Bayano.2,33,50
The negative association between rainfall and malaria incidence in our
models suggest that a similar biological mechanism might be driving
the recent malaria epidemics in Madungandı. Furthermore, our wave-
let analysis indicates that rainfall patterns were associated with SST4 in
Panama during the study period, supporting the hypothesis that
ENSO may be linked to changes in malaria risk levels, via the dynamic
generation of An. albimanus larval habitats by abnormal rainfall pat-
terns. Mathematical models have suggested that dynamic larval hab-
itat generation can lead to increased entomological vector-borne
disease risk via the increase in mosquito density.51 In addition, recent
epidemics could have also been enhanced by the rising minimum
temperatures in eastern Panama, which might be reducing the vari-
ance in overall temperature that mosquitoes experience during their
development, a condition known to maximize the fitness of exo-
thermic organisms.52 This enhanced fitness pattern in stable environ-
ments has been observed in non-anopheline mosquitoes,53 and in
malaria parasite development inside anopheline mosquitoes,54 thus
providing a biological explanation for the associations we found
between malaria incidence, temperature and SST4.
Nevertheless, the increase in temperature likely played no role in the
dynamical regime shift that was observed for 2002. First, temperature
was not an important variable in the split model. Additionally, P.
falciparum invaded Panama in 2002 after being absent from the
Panama Isthmus since the 1970s.11 Moreover, the circulating P. falci-
parum parasites carried mutations that conferred resistance to chloro-
quine, the main antimalarial drug used to treat the disease at that
time.11,18 This invasion was likely mediated by the constant movement
of the Gunas across their homeland, which comprises certain malaria
2520
Tren
d
200520001995Time (year)
199019851980 2010 200520001995Time (year)
199019851980 2010 200520001995Time (year)
199019851980 2010
1510
50
1510
Noi
se5
0-5
105
Sea
sona
l-5
-10
-10
-15
0
A B C1e
+00
1e-0
21e
-04
1e-0
6S
pect
rum
43Cycles/year
Bandwidth = 0.0433
2
16.3 years cycle
1.5 years cycle3.7 years cycle
10 5 6
5e+0
05e
-01
5e-0
25e
-03
5e-0
4S
pect
rum
43Cycles/year
Bandwidth = 0.077
210 5 6 43Cycles/year
Bandwidth = 0.077
210 5 6
2.0
Spe
ctru
m1.
00.
50.
2D E F
Figure 5 Malaria incidence (per 1000 people) EMD and spectral analysis of IMFs. (A) Residue; (B) first IMF; (C) second IMF. Periodograms for (D) EMD residue,
which shows most of the power at inter-annual time scales, i.e., less than one cycle per year; (E) first IMF, which has the highest power at a seasonal time scale, i.e., one
cycle per year; and (F) second IMF, which has high variability across the spectra and therefore can be considered as white noise. In D–F, the blue lines are the
confidence intervals for the power spectra.
Malaria in Panama
LA Hurtado et al
8
Emerging Microbes and Infections

hotspots in northern Colombia where human mobility has been
shown to play a major role in malaria persistence,55 a possibility sup-
ported by mathematical modeling.56 An interesting characteristic of
the shift was that mean incidence increased, but there was no change in
the incidence variance. In contrast, dynamical regime shifts observed
in East Africa in the late 1990s had breakpoints, which indicated
changes in both the variance and mean incidence,28 which would be
expected in the presence of a biological amplification of temperature
trends by vectors.57 The control of the epidemic that began in 2002
also illustrates the boldness necessary to contain malaria on the edge of
elimination. In 2005, a Vector Control Task Group was created and
funded by the Panama Ministry of Health to tackle the malaria epi-
demic in Madungandı.19 This administratively autonomous group
devised an intensive operational plan to guarantee the following activ-
ities in the remote areas affected by malaria: active surveillance, rapid
outbreak containment and a high IRS coverage, aiming to cover at
least 80% of the domiciles in Madungandı.19 Thus, by means of
administrative modifications, without changes in the attention guide-
lines or malaria control procedures, a significant drop in the incidence
rate was observed 4 months after the installation of the program. At the
end of 2005, the annual parasite index (API) was 1.4, which represents
a 29% decrease compared with the API observed in the previous year
(API51.7%). This decreasing trend continued during 2006 with a
70% reduction (API50.5%) and during 2007 with a 76% reduction
(API50.4%). Additionally, the autochthonous transmission of P. fal-
ciparum was eliminated and malaria ceased to be a cause of mortality
in Madungandı.
Some of the current challenges for malaria control and elimination
among the Gunas are biological. Insecticide resistance has become
common among An. albimanus in Madungandı, where this mosquito
species is resistant to pyrethroids, but susceptible to organopho-
sphates and carbamates,58 which has led to a change in the selection
of insecticides, similar to when An. albimanus was among the first
malaria vector species in which DDT resistance was observed,59 with
vector control now being based on the application of organopho-
sphates and carbamates.58 In addition to An. albimanus, other vectors
of concern in the area are An. punctimacula,33 An. triannulatus and An.
apicimacula, whose larval ecology is not related to lake shore habitats58
and whose control will not benefit from environmental modifications
to the shores of Lake Bayano. However, the major obstacles to malaria
0.1
CC
F0.
0-0
.10.
2
15Lag (month)
1050 20
-0.2
A
0.1
CC
F0.
0-0
.10.
2
15Lag (month)
1050 20
-0.2
B
0.1
CC
F0.
0-0
.10.
2
15Lag (month)
1050 20
-0.2
C
0.1
CC
F0.
0-0
.10.
2
15Lag (month)
1050 20
-0.2
D
0.1
CC
F0.
0-0
.10.
2
15Lag (month)
1050 20
-0.2
E
0.1
CC
F0.
0-0
.10.
2
15Lag (month)
1050 20
-0.2
F
0.1
CC
F0.
0-0
.10.
2
15Lag (month)
1050 20
-0.2
G
0.1
CC
F0.
0-0
.10.
2
15Lag (month)
1050 20
-0.2
H
0.1
CC
F0.
0-0
.10.
2
15Lag (month)
1050 20
-0.2
I
0.1
CC
F0.
0-0
.10.
2
15Lag (month)
1050 20
-0.2
J
0.1
CC
F0.
0-0
.10.
2
15Lag (month)
1050 20
-0.2
K
0.1
CC
F0.
0-0
.10.
2
15Lag (month)
1050 20
-0.2
L
Figure 6 CCF between malaria incidence (per 1000 people) IMFs from an empirical mode decomposition, EMD and climatic factors. EMD residue and (A) El Nino 4
index, also known as, SST4, (B) rainfall, (C) maximum temperature and (D) minimum temperature. First IMF and (E) SST4, (F) rainfall, (G) maximum temperature and
(H) minimum temperature. Second IMF and (I) SST4, (J) rainfall, (K) maximum temperature and (L) minimum temperature. In all panels, the dashed lines indicate the
95% CL for correlations that can be expected by random. CL, confidence limit.
Malaria in PanamaLA Hurtado et al
9
Emerging Microbes and Infections

control and elimination among the Gunas are likely not biological, but
socioeconomic.60 A lack of: (i) intercultural understanding, (ii) eco-
nomic inclusion of the Gunas and (iii) multinational political com-
mitment, heavily undermines any sustainable malaria control or
elimination among this ethnic minority and, consequently, from the
Republica de Panama. Control measures such as IRS tend to be unwel-
come among the Gunas and are probably not the most effective mal-
aria control tool for their traditional housing style.19 Due to lack of
consent, the average IRS coverage per village at best reaches 50%, with
coverage ranging between 12% and 70%.19 Efforts for housing
improvement require a better understanding of ‘western housing’
benefits by the Gunas, who are, in general, cautious of any policy that
is supposed to improve their livelihoods,13 due to a long history of
neglect and abuse by the dominant groups of the Panama Isthmus.
Moreover, the deplorable socioeconomic exclusion status of the
Gunas renders impossible housing improvement as an endogenous
initiative, led and funded by an ‘autonomous’ Comarca. Adapting
traditional Guna housing to be malaria proof requires multidisciplin-
ary research, and excellent communication between researchers and
the Guna communities to ensure a successful change, as shown for
vector-borne diseases.61 Poverty and wariness of the government can
also interact and lead to the misuse of other effective malaria control
tools, as observed with insecticide treated nets in Lake Victoria
Basin.62 Similarly, the nature of the Gunas as a multinational ethnic
group highlights the need for setting a common agenda for malaria
elimination across borders, and focusing on the ethnic group beyond
the nationality of its members. Similar policies have been suggested
and implemented for mobile populations, including the Ngabe,
another major Amerindian group in Panama, many of whom season-
ally migrate across the Panama/Costa Rica border for economic rea-
sons.34 For the Gunas, the commitment requires the development of
an integrated policy between Colombia and Panama, which is hin-
dered by the ongoing civil conflict in the former.63 Thus, a major
challenge for malaria control and elimination among the Gunas,
and from the Republica de Panama, is the full inclusion of native
Amerindian minorities into a multiethnic and pluricultural
Panamanian society.
In summary, our data showed a clear association between ENSO
and the incidence of malaria in Comarca Madungandı, which put into
context, is likely exacerbated by the precarious status of the Gunas
within Panamanian society. Our analysis also supports that a dynam-
ical regime shift in transmission that was observed at the end of 2002
was likely related to malaria control policy changes, wherein the re-
assignment of personnel and funding for malaria control within the
Ministry of Health undermined the ability to combat malaria. This
policy change also coincided with the re-introduction of P. falciparum
in Panama, including drug-resistant parasites, and these elements led
to an increase in malaria incidence among the Madungandı Gunas,
which was controlled only after the malaria control unit was re-
assembled.
ACKNOWLEDGMENTS
We dedicate this work to the Gunas of Comarca Madungandı, with whom we
are working to find suitable methods for malaria elimination from their
communities, and the Republica de Panama. We thank the Departamento de
Control de Vectores del Ministerio de Salud, Republica de Panama for their
sustained support and cooperation with the malaria research performed by
Instituto Gorgas in Comarca Madungandı. We also thank ETESA for sharing
meteorological data. We thank Ms Milixa Perea from the Graduate Program in
Epidemiology and Tropical Health at Universidad Latina de Panama for
Figure 1A. Ms Chystrie Rigg from the ICGES helped with the elaboration of
Figure 1B. Luis Fernando Chaves is thankful to Ms. Junko Sakemoto for her
administrative support at Nagasaki University.
This study was supported by Instituto Conmemorativo Gorgas de Estudios de
La Salud (Jose E Calzada, Lisbeth Amarilis Hurtado and Lorenzo Caceres) and
Nagasaki University-Program for Nurturing Global Leaders in Tropical and
Emerging Communicable Diseases (Luis Fernando Chaves).
1 Sutter PS. Nature’s agents or agents of empire? Entomological workers andenvironmental change during the construction of the Panama Canal. Isis 2007; 98:724–754.
2 Zetek J. Behavior of Anopheles albimanus Wiede. and tarsimaculata Goeldi. AnnEntomol Soc Am 1915; 8: 221–271.
3 Gorgas WC. The conquest of the tropics for the white race. J Am Med Assoc 1909; 52:1967–1969.
4 Leigh JG. America’s triumph in Panama: three years’ medical and sanitary record inthe Canal Zone. Lancet 1908; 171: 1646–1649.
5 Clark HC, Komp WH. A seventh year’s observations on malaria in Panama. Am J TropMed Hyg 1938; s1–18: 271–288.
6 Clark HC, Komp WH, Jobbins DM. A tenth year’s observations on malaria in Panama,with reference to the occurrence of variations in the parasite index, during continuedtreatment with atabrine and plasmochine. Am J Trop Med Hyg 1941; s1–21: 191–216.
7 Dehne EJ. Fifty years of malaria control in the Panama area. Am J Trop Med Hyg 1955;4: 800–811.
8 Kendall AI. Malarial infection in certain native villages of the canal zone. J Am MedAssoc 1906; 46: 1266–1273.
9 Kendall AI. Malarial infection in certain native villages of the canal zone. J Am MedAssoc 1906; 46: 1151–1154.
10 Jennings AH. Some problems of mosquito control in the tropics. J Econ Entomol1912; 5: 131–142.
11 Calzada JE, Samudio F, Bayard V et al. Revising antimalarial drug policy in CentralAmerica: experience in Panama. Trans R Soc Trop Med Hyg 2008; 102: 694–698.
12 Strong RA. Jimmy Carter and the Panama Canal Treaties. President Stud Q 1991; 21:269–286.
13 Horton L. Contesting state multiculturalisms: indigenous land struggles in easternPanama. J Latin Am Stud 2006; 38: 829–858.
14 Runk JV. Indigenous land and environmental conflicts in panama: neoliberalmulticulturalism, changing legislation, and human rights. J Latin Am Geogr 2012;11: 21–47.
15 Batista O, Kolman CJ, Bermingham E. Mitochondrial DNA diversity in the KunaAmerinds of Panama. Hum Mol Genet 1995; 4, 921–929.
16 Direccion de Estadıstica y Censo. [National Census for Population XI and Housing VII.]Panama: Contralorıa General de Republica de Panama, 2011. Spanish.
17 Direccion de Polıtica Social. [Poverty in Panama: 2003 life level survey.] Panama:Ministerio de Economia y Finanzas de Republica de Panama, 2005. Spanish.
18 Samudio F, Santamarıa AM, Obaldıa N et al. Prevalence of Plasmodium falciparummutations associated with antimalrial drug resistance during an epidemic in KunaYala, Panama, Central America. Am J Trop Med Hyg 2005; 73: 839–841.
19 Caceres L, Griffith M, Calzada JE, Rovira JE, Torres R. [Guidelines for the interculturalstudy of malaria in Comarca Kuna of Madugandi.] Panama: Ministerio de Salud,Republica de Panama, 2013. Spanish.
20 Chaves LF, Koenraadt CJ. Climate change and highland malaria: fresh air for a hotdebate. Q Rev Biol 2010; 85: 27–55.
21 Lindsay SW, Birley MH. Climate change and malaria transmission. Ann Trop MedParasitol 1996; 90: 573–588.
22 Beguin A, Hales S, Rocklov J et al. The opposing effects of climate change and socio-economic development on the global distribution of malaria. Global Environ Change2011; 21: 1209–1214.
23 Scheffer M. Critical transitions in nature and society. Princeton, NJ: PrincetonUniversity Press, 2009.
24 Shumway TH, Stoffer DS. Time series analysis and its applications. 3rd ed. New York:Springer, 2011.
25 Huang NE, Shen Z, Long SR et al. The empirical mode decomposition and the Hilbertspectrum for nonlinear and non-stationary time series analysis. Proc R Soc Lond Ser AMath Phys Eng Sci 1998; 454: 903–995.
26 Venables WN, Ripley BD. Modern applied statistics with S. New York: Springer, 2002.27 Bai J, Perron P. Computation and analysis of multiple structural change models. J
Appl Econometr 2003; 18: 1–22.28 Chaves LF, Hashizume M, Satake A, Minakawa N. Regime shifts and heterogeneous
trends in malaria time series from Western Kenya Highlands. Parasitology 2012; 139:14–25.
29 Cazelles B, Chavez M, de Magny GC, Guegan JF, Hales S. Time-dependent spectralanalysis of epidemiological time-series with wavelets. J R Soc Interface 2007; 4:625–636.
30 Simmons JS. Observations on the Importance of Anopheles punctimacula as a malariavector in Panama, and report of experimental infections in A. neomaculipalpus, A.apicimacula, and A. eiseni. Am J Trop Med Hyg 1937; s1–17: 191–212.
31 Finley-Brook M, Thomas C. Treatment of displaced indigenous populations in twolarge hydro projects in Panama. Water Altern 2010; 3: 269–290.
Malaria in Panama
LA Hurtado et al
10
Emerging Microbes and Infections

32 Wali A. The transformation of a frontier: State and regional relationships in Panama,1972–1990. Hum Org 1993; 52: 115–129.
33 Loaiza JR, Bermingham E, Scott ME, Rovira JR, Conn JE. Species composition anddistribution of adult Anopheles (Diptera: Culicidae) in Panama. J Med Entomol 2008;45: 841–851.
34 Caceres L, Rovira J, Torres R et al. [Characterization of Plasmodium vivax malariatransmission at the border of Panama and Costa Rica.] Biomedica 2012; 32: 557–569. Spanish.
35 Rejmankova E, Roberts DR, Pawley A, Manguin S, Polanco J. Predictions of adultAnopheles albimanus densities in villages based on distances to remotely sensedlarval habitats. Am J Trop Med Hyg 1995; 53: 482–488.
36 Adames A, Peralta P, Saenz R, Johnson C, Galindo P. [Venezuelan EquineEncephalomyelitis (VEE) during the creation of Lake Bayano in Panama, 1977.]Rev Med Panama 1979; 4: 246–257. Spanish.
37 Mindell J, Boaz A, Joffe M, Curtis S, Birley M. Enhancing the evidence base for healthimpact assessment. J Epidemiol Community Health 2004; 58: 546–551.
38 Baird JK. Resurgent malaria at the millennium: control strategies in crisis. Drugs2000; 58: 719–743.
39 Yasuoka J, Levins R. Impact of deforestation and agricultural development onanopheline ecology and malaria epidemiology. Am J Trop Med Hyg 2007; 76: 450–460.
40 Cohen JM, Smith DL, Cotter C et al. Malaria resurgence: a systematic review andassessment of its causes. Malar J 2012; 11: 122.
41 Gilboa E. The Panama invasion revisited: lessons for the use of force in the Post ColdWar Era. Polit Sci Q 1995; 110: 539–562.
42 Nasi C. [Panama: Crisis, invasion and the New American Hegemony.] Colomb Int1990; 1: 13–24. Spanish.
43 Lindsay SW, Bødker R, Malima R, Msangeni HA, Kisinza W. Effect of 1997–98 EINino on highland malaria in Tanzania. Lancet 2000; 355, 989–990.
44 Gagnon AS, Smoyer-Tomic KE, Bush AB. The El Nino southern oscillation and malariaepidemics in South America. Int J Biometeorol 2002; 46: 81–89.
45 Poveda G, Estrada-Restrepo OA, Morales JE et al. Integrating knowledge andmanagement regarding the climate–malaria linkages in Colombia. Curr OpinEnviron Sustain 2011; 3: 448–460.
46 Poveda G, Rojas W, Quinones ML et al. Coupling between annual and ENSOtimescales in the malaria–climate association in Colombia. Environ Health Perspect2001; 109: 489.
47 McPhaden MJ. Genesis and evolution of the 1997–98 El Nino. Science 1999; 283:950–954.
48 Chaves LF, Satake A, Hashizume M, Minakawa N. Indian Ocean dipole and rainfalldrive a moran effect in East Africa malaria transmission. J Infect Dis 2012; 205:1885–1891.
49 Allan R, Lindesay J, Parker D. El Nino: Southern oscillation and climatic variability.Collingwood: CSIRO, 1996.
50 Rozeboom LE. The life cycle of laboratory-bred Anopheles albimanus Widemann. AnnEntomol Soc Am 1936; 29: 480–489.
51 Predescu M, Levins R, Awerbuch-Friedlander T. Analysis of a nonlinear system forcommunity intervention in mosquito control. Discrete Contin Dyn Syst Ser B 2006; 6:605–622.
52 Huey RB, Berrigan D. Temperature, demography, and ectotherm fitness. Am Nat2001; 158: 204–210.
53 Carrington LB, Seifert SN, Willits NH, Lambrechts L, Scott TW. Large diurnaltemperature fluctuations negatively influence Aedes aegypti (Diptera: Culicidae)life-history traits. J Med Entomol 2013; 50: 43–51.
54 Paaijmans KP et al. Influence of climate on malaria transmission depends on dailytemperature variation. Proc Natl Acad Sci USA 2010; 107: 15135–15139.
55 Sevilla-Casas E. Human mobility and malaria risk in the Naya river basin of Colombia.Soc Sci Med 1993; 37: 1155–1167.
56 Reiner RC et al. A systematic review of mathematical models of mosquito-bornepathogen transmission: 1970–2010. J R Soc Interface 2013; 10: 20120921.
57 Pascual M, Ahumada JA, Chaves LF, Rodo X, Bouma M. Malaria resurgence in the EastAfrican highlands: temperature trends revisited. Proc Natl Acad Sci USA 2006; 103:5829–5834.
58 Caceres L, Rovira J, Garcıa A, Torres R. [Determination of the resistance toorganophosphate, carbamate, and pyrethroid insecticides in PanamanianAnopheles albimanus (Diptera: Culicidae) mosquitoes.] Biomedica 2011; 31: 419–427. Spanish.
59 Trapido H. Modified response of Anopheles albimanus to DDT residual house sprayingin Panama. Am J Trop Med Hyg 1952; 1: 853–861.
60 Greenwood B. Can malaria be eliminated? Trans R Soc Trop Med Hyg 2009; 103: S2–S5.
61 Lucero DE, Morrissey LA, Rizzo DM et al. Ecohealth interventions limit triatominereinfestation following insecticide spraying in La Brea, Guatemala. Am J Trop Med Hyg2013; 88: 630–637.
62 Honjo K, Chaves LF, Satake A, Kaneko A, Minakawa N. When they don’t bite, we smellmoney: understanding malaria bednet misuse. Parasitology 2013; 140: 580–586.
63 Ellis RE. The impact of instability in Latin and South America. IEEE Eng Med Biol Mag2004; 23: 187–193.
This work is licensed under a Creative Commons Attribution-
NonCommercial-NoDerivs Works 3.0 Unported license. To view a copy of
this license, visit http://creativecommons.org/licenses/by-nc-nd/3.0
Supplementary Information for this article can be found on Emerging Microbes and Infections’ website (http://www.nature.com/EMI/)
Malaria in PanamaLA Hurtado et al
11
Emerging Microbes and Infections