What role for genomics in fisheries management and ...
15
Aquat. Living Resour. 20, 241–255 (2007) c EDP Sciences, IFREMER, IRD 2007 DOI: 10.1051/alr:2007037 www.alr-journal.org Aquatic Living Resources What role for genomics in fisheries management and aquaculture? Roman Wenne 1, a , Pierre Boudry 2 , Jakob Hemmer-Hansen 3 , Krzysztof P. Lubieniecki 4 , Anna Was 5 and Antti Kause 6 1 Department of Genetics and Marine Biotechnology, Institute of Oceanology, Polish Academy of Sciences, Powstañców Warszawy 55, 81-712 Sopot, Poland 2 IFREMER Laboratoire de Génétique et Pathologie, 17390 La Tremblade, France 3 Danish Institute for Fisheries Research, Department of Inland Fisheries, Vejlsøvej 39, 8600 Silkeborg, Denmark 4 Department of Molecular Biology and Biochemistry, Simon Fraser University, 8888 University Dr., Burnaby, BC, V5A 1S6, Canada 5 Molecular Ecology Research Group, Galway-Mayo Institute of Technology, Galway, Ireland 6 MTT Agrifood Research Finland, Biotechnology and Food Research, Biometrical Genetics, 31600 Jokioinen, Finland Received 16 May 2007; Accepted 28 August 2007 Abstract – The development and application of genomics has been facilitated in a number of fields by the availability of new methodologies and tools, such as high throughput DNA sequencing and complementary DNA (cDNA) microar- rays. Genomic tools are already used in research on commercially important fish and shellfish species. Thousands of expressed sequence tags (EST) are now available for some of these species, and the sequencing of complete genomes of tilapia, cod, salmonids, flatfishes, sea bass and Pacific oyster has been proposed. Microarray technology through simultaneous analysis of the expression of thousands of genes allows the identification of candidate genes involved in the function of multiple physiological, morphological and behavioural traits of interests in organisms and populations from different environments. This paper reviews the current development of genomic technologies, and pinpoints their potential beneficial applications as well as implications for fisheries management and aquaculture. Key words: Genomics / Genetics / Fisheries / Mariculture / Quantitative trait loci / Fish / Oyster Résumé – Quel rôle pour la génomique dans la gestion des pêches et de l’aquaculture? Le développement et l’application de la génomique ont été facilités dans un certain nombre de domaines par la disponibilité de nouveaux outils et de nouvelles méthodes, tels que le séquençage d’ADN à haut débit et les puces à ADN (« microarrays »). Les outils de la génomique sont déjà développés sur les espèces de poissons et d’invertébrés d’importance commerciale. Des milliers d’étiquettes, marqueurs de séquence exprimée (EST) sont désormais disponibles pour quelques unes de ces espèces et le séquençage du génome complet de tilapia, de la morue, de salmonidés, de poissons plats, du bar, et de l’huître creuse sont demandés. La technologie des puces à ADN, au travers d’analyse simultanée de l’expression de milliers de gènes, permet l’identification de gènes candidats impliqués dans les multiples fonctions physiologiques, morphologiques et comportementales chez les organismes et les populations d’environnements variés. Cet article pré- sente la synthèse de récents développements de ces technologies du génome, et met en évidence leurs applications potentielles ainsi que les implications dans la gestion des pêches et de l’aquaculture. 1 Introduction It is well recognised that fisheries catches have reached a plateau in recent years. Due to the high demand for fish and shellfish on the global market, aquaculture production con- tributes an increasing amount to the food supply. Management of exploited wild stocks is undergoing systematic improve- ment. Results of population genetic investigations have re- cently been incorporated as a useful tool in stock identification a Corresponding author: [email protected] in addition to morphological, biological and physiological traits. The aquaculture industry has expanded especially in South America and Asia, from where aquaculture products are also exported world-wide. Simultaneously, industry prac- tices should be sustainable and marine biodiversity should be maintained. Genomics tools combined with the already well-established aquaculture and fisheries management prac- tices can serve as a novel framework for such developments. Genomics is a field of science that deals with the structure, function and evolution of genomes. Many current DNA and
-
Upload
khangminh22 -
Category
Documents
-
view
4 -
download
0
Transcript of What role for genomics in fisheries management and ...

Aquat. Living Resour. 20, 241–255 (2007)c© EDP Sciences, IFREMER, IRD 2007DOI: 10.1051/alr:2007037www.alr-journal.org
AquaticLivingResources
What role for genomics in fisheries managementand aquaculture?
Roman Wenne1,a, Pierre Boudry2, Jakob Hemmer-Hansen3, Krzysztof P. Lubieniecki4, Anna Was5
and Antti Kause6
1 Department of Genetics and Marine Biotechnology, Institute of Oceanology, Polish Academy of Sciences, Powstañców Warszawy 55,81-712 Sopot, Poland
2 IFREMER Laboratoire de Génétique et Pathologie, 17390 La Tremblade, France3 Danish Institute for Fisheries Research, Department of Inland Fisheries, Vejlsøvej 39, 8600 Silkeborg, Denmark4 Department of Molecular Biology and Biochemistry, Simon Fraser University, 8888 University Dr., Burnaby, BC, V5A 1S6, Canada5 Molecular Ecology Research Group, Galway-Mayo Institute of Technology, Galway, Ireland6 MTT Agrifood Research Finland, Biotechnology and Food Research, Biometrical Genetics, 31600 Jokioinen, Finland
Received 16 May 2007; Accepted 28 August 2007
Abstract – The development and application of genomics has been facilitated in a number of fields by the availabilityof new methodologies and tools, such as high throughput DNA sequencing and complementary DNA (cDNA) microar-rays. Genomic tools are already used in research on commercially important fish and shellfish species. Thousands ofexpressed sequence tags (EST) are now available for some of these species, and the sequencing of complete genomesof tilapia, cod, salmonids, flatfishes, sea bass and Pacific oyster has been proposed. Microarray technology throughsimultaneous analysis of the expression of thousands of genes allows the identification of candidate genes involved inthe function of multiple physiological, morphological and behavioural traits of interests in organisms and populationsfrom different environments. This paper reviews the current development of genomic technologies, and pinpoints theirpotential beneficial applications as well as implications for fisheries management and aquaculture.
Key words: Genomics / Genetics / Fisheries /Mariculture / Quantitative trait loci / Fish / Oyster
Résumé – Quel rôle pour la génomique dans la gestion des pêches et de l’aquaculture ? Le développement etl’application de la génomique ont été facilités dans un certain nombre de domaines par la disponibilité de nouveauxoutils et de nouvelles méthodes, tels que le séquençage d’ADN à haut débit et les puces à ADN (« microarrays »). Lesoutils de la génomique sont déjà développés sur les espèces de poissons et d’invertébrés d’importance commerciale.Des milliers d’étiquettes, marqueurs de séquence exprimée (EST) sont désormais disponibles pour quelques unes deces espèces et le séquençage du génome complet de tilapia, de la morue, de salmonidés, de poissons plats, du bar, etde l’huître creuse sont demandés. La technologie des puces à ADN, au travers d’analyse simultanée de l’expressionde milliers de gènes, permet l’identification de gènes candidats impliqués dans les multiples fonctions physiologiques,morphologiques et comportementales chez les organismes et les populations d’environnements variés. Cet article pré-sente la synthèse de récents développements de ces technologies du génome, et met en évidence leurs applicationspotentielles ainsi que les implications dans la gestion des pêches et de l’aquaculture.
1 Introduction
It is well recognised that fisheries catches have reached aplateau in recent years. Due to the high demand for fish andshellfish on the global market, aquaculture production con-tributes an increasing amount to the food supply. Managementof exploited wild stocks is undergoing systematic improve-ment. Results of population genetic investigations have re-cently been incorporated as a useful tool in stock identification
a Corresponding author: [email protected]
in addition to morphological, biological and physiologicaltraits. The aquaculture industry has expanded especially inSouth America and Asia, from where aquaculture productsare also exported world-wide. Simultaneously, industry prac-tices should be sustainable and marine biodiversity shouldbe maintained. Genomics tools combined with the alreadywell-established aquaculture and fisheries management prac-tices can serve as a novel framework for such developments.Genomics is a field of science that deals with the structure,function and evolution of genomes. Many current DNA and

242 R. Wenne et al.: Aquat. Living Resour. 20, 241–255 (2007)
RNA-based studies fall into this field, even if they are oftennot strictly part of it. Genomics often simply implies the useof high throughput DNA- or RNA-based methods. It com-prises comparative, functional and environmental genomics.Comparative genomics examines whole genomes, their genecontent, gene order, structure, evolution and taxonomy. Func-tional genomics investigates the biochemical and physiologi-cal role of gene products and their interactions on a large orsmall scale. Environmental genomics encompasses studies ofmolecular variation in natural or artificial populations of differ-ent taxa and their response to environmental conditions suchas temperature or pollutants. One of the main efforts in ge-nomics has been to obtain high numbers of large pieces ofgenome sequences and to assemble them into full chromoso-mal sequences. Another goal has been to study the expressionof thousands of genes using techniques such as microarraysor other high throughput expression RNA profiling (i.e. tran-scriptomics). The analysis of the immense amount of data gen-erated by such approaches often requires the use of specificcomputerised methods, or “bioinformatics”. The knowledge ofgenomics opens new perspectives for the biotechnology of ma-rine organisms, with implications for fisheries and aquaculture.
2 Sequencing and analyses of genomes
Sequencing of genomes facilitates the development of avariety of DNA-based genetic markers that can be used forthe management of wild and cultured populations. ExpressedSequence Tags (EST) are obtained by sequencing complemen-tary DNA (cDNA) libraries. Such libraries can be obtainedfrom tissue specific libraries or generated by SuppressiveSubtractive Hybridization (SSH). EST databases for variousimportant marine species have been established (e.g. in At-lantic salmon Salmo salar: http://web.uvic.ca/cbr/grasp/ andoyster Crassostrea gigas: http://www.ifremer.fr/GigasBase/)and most sequences are submitted to databases (http://www.ncbi.nlm.nih.gov/Genbank/, http://www.ncbi.nlm.nih.gov/sites/entrez, http://compbio.dfci.harvard.edu/tgi/). ESTare the first step towards obtaining full-length cDNA andgene sequences. Sequencing of whole fish and shellfishgenomes contributes not only to the understanding of ver-tebrate and invertebrate evolution but also to environmentalgenomics and aquaculture (Crollius and Weissenbach 2005;Cossins and Crawford 2005). Full genome sequences arenow available for a few model fish species such as zebrafishDanio rerio (http://www.sanger.ac.uk/Projects/D_rerio/),fuguTakifigu rubripes (http://www.fugu-sg.org/),puffer fish Tetr-aodon nigroviridis (http://www. genome.gov/11008305),medaka Oryzias latipes (http://dolphin.lab.nig.ac.jp/medaka/index.php) and stickleback Gasterosteus aculeatus:(http://www.genome.gov/12512292). To date, only onecommercially important fish – Tilapia (Cichlid Genome Con-sortium, http://hcgs.unh.edu/cichlid/) has obtained funding forsequencing; however, knowledge of the genome sequencesof other commercially important species is critical for anefficient identification of economically important genesand polymorphisms. Recently, international collaborativeinitiatives have been undertaken with the aim of obtainingfull or partial genomic sequences of commercially important
fish and shellfish species such as salmon and rainbow trout(cGRASP, www.cgrasp.org), cod (www.codgene.ca), sea bassDicentrarchus labrax (Chini et al. 2006) and the Pacific oysterCrassostrea gigas (Hedgecock et al. 2005). Full genomesequences can be based on the sequencing and assemblageof bacterial artificial chromosomes (BAC) containing DNAfragments of the whole target genome, or using shotgunapproaches. BAC libraries are available for Atlantic salmon(Thorsen et al. 2005), rainbow trout Oncorhynchus mykiss(Palti et al. 2004), sea bass (Whitaker et al. 2006), channelcatfish Ictalurus punctatus (Quiniou et al. 2003) and oystersCrassostrea virginica and C. gigas (Cunningham et al. 2006),and they have been used to construct physical maps (e.g.salmon, Ng et al. 2005; sea bass, Volckaert et al. 2006 andchannel catfish, Quiniou et al. 2007).
3 Fisheries
3.1 Discrimination of wild populations
Population genetic research has contributed substantiallyto our understanding of how fish and shellfish species are ge-netically structured into reproductively isolated populationsthroughout their distributions. Such knowledge is of major im-portance for fisheries management because local populationsare often considered worth conserving due to their unique con-tribution to the genetic diversity of the species, which mayallow them to sustain productivity in changing environments(e.g. Hilborn et al. 2003). In addition, local populations areoften adapted to local environmental conditions and are there-fore characterised by unique morphological, physiological andlife history traits that have a genetic basis and are thereforeof conservation interest. Moreover, such populations are oftenof great economic interest. However, the actual genetic basisof quantitative traits remains largely unknown, because theiranalysis has, until recently, been logistically difficult and timeconsuming to conduct in most species. Thus, the identificationof local adaptations in natural populations has recently beenhighlighted as worthy of special attention in the years to come(e.g. Moritz 2002; van Tienderen et al. 2002; ICES 2006).
Many fish and shellfish populations have been over ex-ploited or reduced by changes in local environments. Thesepopulations are endangered and some indigenous populationsare already extinct (e.g. Dulvy et al. 2003; Reynolds et al.2005), and hence there is an urgent need for knowledge onthe basic population structure of many species. Various ge-netic markers have been used in order to identify and charac-terise populations. Studies using markers such as allozymes,mitochondrial (mt) DNA polymorphism, microsatellites, re-striction fragments length polymorphism (RFLP) and recently,amplified fragments length polymorphism / random amplifiedpolymorphic DNA (AFLP/RAPD) have successfully demon-strated significant genetic differences between populations ofmany species. However, these markers represent only a smallfraction of the total genomic polymorphism. Furthermore, theyare mostly believed to be selectively neutral, and have thusmainly been used to draw inferences about the interplay ofgene flow, genetic drift and historical processes, thereby lim-iting inferences about local adaptations in the species under

R. Wenne et al.: Aquat. Living Resour. 20, 241–255 (2007) 243
study. Single nucleotide polymorphisms (SNP) is a new classof genetic markers with powerful applications in populationgenetics (Morin et al. 2004). It will be very helpful in manag-ing natural and captive populations in the future. SNP can beidentified in inter-individual comparison of genomic DNA se-quences (e.g. Smith et al. 2005a) or sequences derived fromEST (e.g. Hayes et al. 2007). Thus, both coding and non-coding DNA sequences can be used to identify SNP and sev-eral recent studies have used some of these approaches for ini-tial SNP identification in species of relevance to fisheries andaquaculture (e.g. salmon, Ryynänen and Primmer 2006; Hayeset al. 2007; rainbow trout, Smith et al. 2005a and Arctic charrSalvelinus alpinus, Tao and Boulding 2003). Currently, highlyinformative (i.e. highly divergent) SNP can be used to discrim-inate between natural populations of both salmon (e.g. Smithet al. 2005b) and Atlantic cod (Stenvik et al. 2006).
Newly developed techniques enable screening for poly-morphisms throughout the genome. Screening for many moreloci will open new possibilities in population genetic research,moving to population genomics (Luikart et al. 2003). Globalgene expression can be examined through the use of microar-ray techniques, enabling the simultaneous analysis of thou-sands of genes. Different expression levels can be observedin specimens originating from different localities and differ-ing in functional traits (Rise et al. 2004a). Microarrays havebeen developed for a number of fish and shellfish species suchas salmonids (Rise et al. 2004a; von Schalburg et al. 2005a),killifish Fundulus (Oleksiak et al. 2002), carp Cyprinus car-pio (Gracey et al. 2004), zebrafish (Ton et al. 2002), catfish (Liand Waldbieser 2006), medaka (Kimura et al. 2004), Europeanflounder Platichthys flesus (Williams et al. 2003), Japaneseflounder Paralichthys olivaceus (Kurobe et al. 2005), mus-sel Mytilus galloprovincialis (Venier et al. 2006) and Pacificoyster (Lang et al. 2006). However, even if arrays have notbeen developed for a species, reliable estimates of gene ex-pression may still be achieved through alternative measuressuch as cross species hybridization (Renn et al. 2004) or theuse of non-array based quantification of gene expression, suchas cDNA-AFLP or differential display (Breyne et al. 2003;Venkatesh et al. 2005). It should be noted that gene expres-sion analyses essentially measure expression phenotypes. Thedegree of heritability of gene expression traits has rarely beenassessed, but is often assumed (Gibson and Weir 2005). Forthese measures to be used to illustrate population genetic dif-ferences, the environment needs to be controlled to rule outenvironmental effects on gene expression. Therefore, analysesof global gene expression require common garden approaches.Still, if properly designed such studies have great potential todisclose the genetic basis of adaptations in local populations offish and shellfish (e.g. Whitehead and Crawford 2006; Larsenet al. 2007)
Genome scans are another important group of genomictools applying the screening of a high number of markers tocover the entire genome of a species under study (e.g. Luikartet al. 2003; Storz 2005). Genome scans allow for the identi-fication of outlier loci that are potentially under selection orlinked to a locus under selection (i.e. hitch-hiking selection,Maynard Smith and Haigh 1974), thereby facilitating detectionof the genetic basis of local adaptation in natural populations.
Outliers can be detected using model based (e.g. Beaumontand Nichols 1996) or model free (e.g. Schlötterer 2002; Kaueret al. 2003) methods. Conclusions with respect to outlier sta-tus of particular loci will often be considerably strengthened,if signals of selection are supported by several different analyt-ical approaches as well as different pairwise population com-parisons (e.g. Vasemägi et al. 2005; Bonin et al. 2006). Al-lozymes, microsatellites and AFLP have been used in genomescans in non-model species (e.g. Storz and Dubach 2004;Vasemägi et al. 2005; Bonin et al. 2006), but SNP will alsobe very useful for these approaches (see e.g. Akey et al. 2002).A major advantage of genome scans is that they can be ap-plied to natural populations, thereby increasing the number ofspecies for which such approaches are possible.
3.2 Future applications in managementand conservation of natural populations
Genomics offers new and exciting possibilities for con-servation genetics in several ways. First of all, the numberof neutral genetic markers available will increase for mostspecies. This will likely improve estimates of the effects ofdemographic processes, such as population declines and bot-tlenecks, effective population sizes, identification of wild andfarmed individuals etc. (Morin et al. 2004; Kohn et al. 2006). Itmay also result in increased statistical power to detect minutelevels of population structuring and to assign individuals ofunknown origin to known baseline populations, for instancein mixed stock analyses (see e.g. Manel et al. 2005). In addi-tion, the identification of outlier loci in genome scans offer newpossibilities to identify informative markers which are suitedfor the specific question raised in each management scenario(see e.g. Banks et al. 2003; Beacham et al. 2004; Smith et al.2005b).
Another, and very promising, application of genomics inrelation to conservation is the detection of the genetic basis oflocal adaptation. Given that we know very little about this inmost species of fish and shellfish, such knowledge will greatlyimprove our ability to manage genetic diversity in natural pop-ulations. The fact that genomic resources can sometimes betransferred between closely related species means that manyspecies of fish and shellfish will effectively become “genomeenabled” in the coming years (Storz and Hoekstra 2007), facil-itating studies of the genetic basis of local adaptation.
3.2.1 Case study using Atlantic salmon
Atlantic salmon is one of the species of relevance to bothfisheries management and aquaculture, where genomic re-sources are building up rapidly. Hence this species could serveas an important case study to demonstrate the resources thatmay become available in other species in the near future, aswell as the potential applications of these resources. Genomicapproaches in Atlantic salmon have targeted both RNA andDNA levels of variation. For instance, a salmonid microarraycontaining cDNA representing 16 006 genes has been devel-oped. The genes spotted on the array have been carefully se-lected from Atlantic salmon and rainbow trout EST databases.

244 R. Wenne et al.: Aquat. Living Resour. 20, 241–255 (2007)
This array will serve as an important resource for genetic,physiological and ecological studies as well as many otherfields of salmonid research (von Schalburg et al. 2005a). Geneexpression patterns determined either for target genes or usingmicroarrays have already been used to investigate the salmonidimmune response, several disease processes and disease resis-tance (Lindenstrom et al. 2003, 2006; Rise et al. 2004b; Sighet al. 2004; Bridle et al. 2006a,b; Fast et al. 2006; Martin et al.2006; Purcell et al. 2006). Moreover, they have been used tosurvey the genes involved in the maturation and developmentof the rainbow trout ovarian and testicular tissues (von Schal-burg et al. 2005b, 2006; Bonnet et al. 2007), to examine braingene expression profiles in male salmon with different life his-tory strategies (Aubin-Horth et al. 2005a,b), to carry out toxi-cogenomic profiling of hepatic tumour promoters in rainbowtrout (Tilton et al. 2006), to investigate the response of therainbow trout transcriptome to model chemical contaminants(Koskinen et al. 2004) and to study gene expression in atrophy-ing muscle (Salem et al. 2006). Microarrays have also been ap-plied to discriminate between farmed and wild Atlantic salmonusing genome wide transcription profiles. Thus, similar tran-scription profiles characterised farmed strains from Norwayand Canada and suggested adaptation via gene expression tocommon captive environments (Roberge et al. 2006).
The DNA level has been targeted through markers such asmicrosatellites and SNP. For example, Vasemägi et al. (2005)used EST linked microsatellites in a genome scan of nat-ural populations of Atlantic salmon and identified a num-ber of outlier loci potentially under selection and it has beenshown that these markers can be used in other salmonids (Nget al. 2005). SNP have been identified through different ap-proaches. For example, five populations of chinook salmonOncorhynchus tshawytscha from Pacific North America weresurveyed for SNP at 19 loci by sequencing (Campbell andNarum 2007). Of these 13 were chosen for Taqman assays(5’ exonuclease assays) out of 58 SNP. Similarly, 1195 SNPhave been identified from EST and 121 of these have beencharacterised by pedigree analysis. As a result of the genomeduplication that took place in common ancestor of extantsalmonids 25–120 millions years ago (MYA), it has been es-timated that up to 15–20% of salmonid loci have functionalduplicates. Therefore, when identifying putative SNP in theAtlantic salmon EST database, it is important to be able todistinguish between true SNP (i.e., those corresponding to al-leles at a single locus) and paralogous sequence variants (PSV;i.e., sequence differences between duplicate loci), (Wright J.J.,Simon Fraser University, Burnaby, BC, Canada, pers. comm.;Hayes et al. 2007).
SNP with known locations on a linkage map can be used toidentify QTL, which can subsequently be genotyped in naturalpopulations. An example of such research is Atlantic salmonin which 4 full sib families (backcrossed F1 males to a femalefrom European and American parental populations) were usedto identify SNP for known QTL. The identified SNP in traitsunder selection will be genotyped in endangered wild Atlanticsalmon to demonstrate genetic differences in functional traitsamong these endangered salmon populations and may helpin their conservation (Boulding E.G., University of Guelph,Canada, pers. comm.).
The examples outlined above illustrate the immense poten-tial that genomics has to improve both fisheries managementand aquaculture. Particularly the last case shows how the twofields could be integrated through the availability of genomicresources, with considerable potential to advance conservationefforts in the species.
4 Aquaculture
4.1 Using genomic informationin aquaculture breeding
4.1.1 Constructing DNA pedigrees
In breeding programmes, information on family relationsof individuals is used when estimating genetic parameters (her-itabilities and genetic correlations) and breeding values fortraits, and when optimising selection and mating in order toavoid inbreeding. Similarly, pedigrees are useful in the man-agement of conservation programmes and wild populations(e.g. when controlling inbreeding, Wilson and Ferguson 2002).In addition to physical individual tagging, pedigrees can be de-termined using DNA markers. This procedure is quite straight-forward using microsatellites. Typically 10–20 variable ge-netic markers are needed to assign >95% of individuals tosingle pairs of parents (e.g. Vandeputte et al. 2006). To dothis, one needs tissues samples from both potential parentsand their offspring, and several freely available softwares ex-ists for parental assignment (reviewed by Jones and Ardren2003). Physical individual markers are useful when large fa-cilities exist where family groups can be held separately untilfish are large enough to be individually tagged. For instance, insalmonid breeding programs fish are typically held in hundredsof family tanks until they are individually tagged at a weightof approximately 50g (Kause et al. 2005). Using DNA pedi-grees is useful in many aquaculture breeding and conservationprogrammes when individual tagging is difficult or when fa-cilities for family tanks do not exist. Three examples of usingDNA pedigrees are presented below: walk-back selection, es-timation of genetic parameters, and conservation programmes.
Walk-back selection refers to a selection programme wherea group of superior individuals are first selected, and then onlythe selected animals are genotyped for family relations. Us-ing the established pedigree, only those superior animals thatare not too closely related are used in matings (Doyle andHerbinger 1994; Sonesson 2005). This is an improved massselection scheme to obtain genetic improvement while simul-taneously controlling for inbreeding. This is cost-effective be-cause only some hundreds of individuals among the potentially(tens of) thousands of individuals reared need to be genotyped.This is especially useful for species for which no extensiveresources are available, or for new species whose reproduc-tion cannot be fully controlled. Furthermore, there are studiesshowing that microsatellite markers are useful for determiningthe effective number of parents and their individual reproduc-tive success (e.g. Boudry et al. 2002), and level of inbreed-ing in mass selection scheme in the Nile tilapia Oreochromisniloticus (Komen H., Animal Breeding and Genetics Group,Wageningen University, The Netherlands, pers. comm.) and

R. Wenne et al.: Aquat. Living Resour. 20, 241–255 (2007) 245
the flat oyster, Ostrea edulis (Launey et al. 2001). A full pop-ulation can be genotyped for parental analysis, which allowsone to estimate heritabilities and genetic correlations to traitsof interest. Such an approach has been used on common carp(Vandeputte et al. 2005).
Likewise, DNA pedigrees are useful in conservation pro-grammes of wild fish and shellfish, especially when aimingat controlling inbreeding. Microsatellite genotyping in the in-duced mass spawns of lion-paw scallop Nodipecten subn-odosus demonstrated that some parents contribute a muchhigher percent to the progeny than expected (Petersen J.L.,Genomic Variation Laboratory, University of California Davis,Davis, CA USA, pers. comm.). Similarly, the impact of hatch-ery practices on the genetic variability of progenies canbe monitored (Taris et al. 2006). That is, when the effec-tive population size is reduced and inbreeding can decreasehatchery stocks. Microsatellite genotyping can be also use-ful in assessment of introgression to/from a natural popula-tion. Mutli-plexing (i.e. simultaneous PCR amplification) ofmicrosatellites (e.g. Taris et al. 2005) and SNP-based parent-age assignment (Rengmark et al. 2006; Anderson and Garza2006) are now greatly facilitating these types of studies.
4.1.2 Marker assisted selection
Marker assisted selection (MAS) refers to a selection pro-cedure which is improved using information from geneticmarkers. Allelic variation in genetic markers can be linkedto the variation in traits of economic interest, and thus themarker provides DNA level information on the inheritance ofthe traits. MAS is especially useful for traits that are difficultto breed using traditional means. Such traits can be costly ordifficult to record (e.g. feed efficiency, disease resistance, con-centration of omega-3-acids), they may require slaughtering ofindividuals (e.g. fillet quality, body composition), may be fromonly one sex (e.g. caviar production), or they cannot be directlyrecorded from breeding candidates (e.g. sea performance whenbreeding candidates are held at a fresh water breeding station).Moreover, MAS can be used early in life to breed for traitsthat are expressed later in life (e.g. caviar production, matu-rity age), allowing one to cull the population to save feed andmanagement costs (e.g. Martinez et al. 2005).
The practical use of markers in selection can be roughlydivided into three classes: 1) removing genetic disorders, 2)marker breeding value-selection, and 3) genomic selection.These three methods differ in the complexity of computa-tional selection tools needed and requirements of the ge-nomic data. Recessive genetic disorders, determined by a sim-ple Mendelian one-locus method can be effectively removedfrom a population using a gene test done on a small tissuessample. Individuals carrying a deleterious allele are culled,and no computationally demanding selection tools are needed.Such tests are in practical use in terrestrial farm animals (e.g.Sironen et al. 2006). Marker breeding values of individuals canbe estimated by combining information on phenotypes and asingle or several QTL segregating within a pedigreed popula-tion (Fernando and Grossman 1989). When estimating breed-ing values, genetic variation can be explained by the QTL ef-fect(s) and the remaining polygenetic parts. For a QTL to be
useful here, a genetic marker needs to be located very close tothe actual gene, i.e., within less than 1 centi Morgan (cM). Ifthis is not the case, then it is unlikely that the QTL will be ap-plicable across the whole population, and the linkage betweenthe marker and the gene will be broken down by recombina-tion during the next few generations. Thus, QTL fine mappingis needed for the QTL to be practically useful. Marker breed-ing values are used in dairy cow selection, e.g., in France andGermany (Hayes et al. 2006a).
Genomic selection refers to selection directed on allelicvariation identified across the whole genome. Allelic variationat thousands of loci as well as their effects on economic traitscan be estimated, and genomic breeding values can be thus es-timated (Meuvissen et al. 2001). After the effects of the alleleshave been established, no phenotypic information on animalsis needed in selection. The use of SNP analysis is the mostpromising method for such whole-genome analysis. Using cur-rent technology, variation in tens of thousands of SNP can besimultaneously estimated. For this method to be effective how-ever, Hayes et al. (2006a) suggested that 10–20 QTL need tobe found for each trait and up to 30 000 SNP may be needed toobtain a dense enough marker map. Methods to perform suchanalyses, together with genomic selection tools, are currentlyunder development. Thousands of putative SNP have been de-tected in Atlantic salmon (Hayes et al. 2007). Sauvage et al.(2007) reported a very high level of DNA polymorphism inthe Pacific oyster (i.e. one SNP every 60 bp in coding regionsand one every 40 bp in non-coding regions).
4.1.3 Linkage maps and QTL in aquatic species
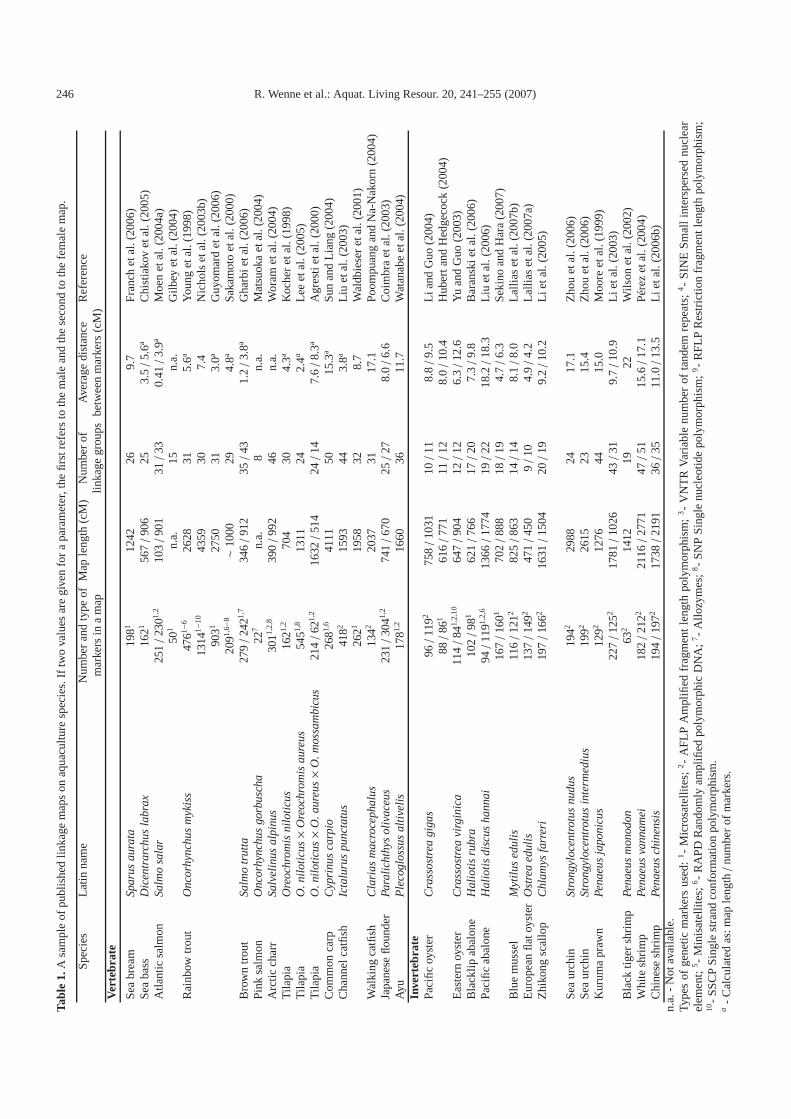
Linkage maps are needed for mapping major chromosomeregions influencing phenotypic traits (i.e. QTL). Examples ofpublished linkage maps for several major aquaculture speciesare given in Table 1. The list is illustrative rather than an ex-haustive list of linkage maps. For most of the marker maps,the average distance between markers is 2–15 cM. An averagemarker distance of 20 cM would be suitable for the location ofa QTL to a correct chromosome arm. A useful feature is thatthe male maps are often shorter than the female maps. Thus,the initial QTL mapping revealing chromosomes harbouringQTL can be more easily performed using male parents. Finemapping of QTL positions, in turn, is more effectively per-formed using female parents (Hayes et al. 2006b). For finemapping, a marker distance of 1 cM or less is needed.
A variety of markers have been used for identification ofpopulations and strains in the wild and in aquaculture with theaim of improving management. These markers can be usedfor construction of high-resolution genetic linkage maps andsearch for QTL, and finally to MAS (Liu and Cordes 2004;Sarropoulou et al. 2005a; Senger et al. 2006; Silverstein et al.2006; Montano-Perez et al. 2006). Table 2 presents an illus-trative list of QTL studies performed on several aquaculturespecies. Two observations can be made from these studies.First, most of the studies are on growth-related traits, followedby disease resistance traits. Only a few studies exist for qualityor feed utilisation traits. MAS will be especially useful for dis-ease and quality traits. Second, most of the studies on aquaticspecies have not progressed to fine-mapping. Consequently, a
246 R. Wenne et al.: Aquat. Living Resour. 20, 241–255 (2007)
Tabl
e1.
Asa
mpl
eof
publ
ishe
dli
nkag
em
aps
onaq
uacu
ltur
esp
ecie
s.If
two
valu
esar
egi
ven
for
apa
ram
eter
,the
firs
tref
ers
toth
em
ale
and
the
seco
ndto
the
fem
ale
map
.
Spe
cies
Lat
inna
me
Num
ber
and
type
ofM
aple
ngth
(cM
)N
umbe
rof
Ave
rage
dist
ance
Ref
eren
cem
arke
rsin
am
apli
nkag
egr
oups
betw
een
mar
kers
(cM
)V
erte
brat
e
Sea
brea
mSp
arus
aura
ta19
8112
4226
9.7
Fra
nch
etal
.(20
06)
Sea
bass
Dic
entr
arch
usla
brax
1621
567/
906
253.
5/
5.6a
Chi
stia
kov
etal
.(20
05)
Atl
anti
csa
lmon
Salm
osa
lar
251/
2301,
210
3/
901
31/
330.
41/
3.9a
Moe
net
al.(
2004
a)50
1n.
a.15
n.a.
Gil
bey
etal
.(20
04)
Rai
nbow
trou
tO
ncor
hync
hus
myk
iss
4761−
626
2831
5.6a
You
nget
al.(
1998
)13
141−
1043
5930
7.4
Nic
hols
etal
.(20
03b)
9031
2750
313.
0aG
uyom
ard
etal
.(20
06)
2091,
6−8
∼10
0029
4.8a
Sak
amot
oet
al.(
2000
)B
row
ntr
out
Salm
otr
utta
279/
2421,
734
6/
912
35/
431.
2/
3.8a
Gha
rbie
tal.
(200
6)P
ink
salm
onO
ncor
hync
hus
gorb
usch
a22
7n.
a.8
n.a.
Mat
suok
aet
al.(
2004
)A
rcti
cch
arr
Salv
elin
usal
pinu
s30
11,2,
839
0/
992
46n.
a.W
oram
etal
.(20
04)
Til
apia
Ore
ochr
omis
nilo
ticu
s16
21,2
704
304.
3aK
oche
ret
al.(
1998
)T
ilap
iaO
.nil
otic
us×O
reoc
hrom
isau
reus
5451,
813
1124
2.4a
Lee
etal
.(20
05)
Til
apia
O.n
ilot
icus×O
.aur
eus×O
.mos
sam
bicu
s21
4/
621,
216
32/
514
24/
147.
6/
8.3a
Agr
esti
etal
.(20
00)
Com
mon
carp
Cyp
rinu
sca
rpio
2681,
641
1150
15.3
aS
unan
dL
iang
(200
4)C
hann
elca
tfish
Icta
luru
spu
ncta
tus
4182
1593
443.
8aL
iuet
al.(
2003
)26
2119
5832
8.7
Wal
dbie
ser
etal
.(20
01)
Wal
king
catfi
shC
lari
asm
acro
ceph
alus
1342
2037
3117
.1P
oom
puan
gan
dN
a-N
akor
n(2
004)
Japa
nese
flou
nder
Para
lich
thys
oliv
aceu
s23
1/
3041,
274
1/
670
25/
278.
0/
6.6
Coi
mbr
aet
al.(
2003
)A
yuP
leco
glos
sus
alti
veli
s17
81,2
1660
3611
.7W
atan
abe
etal
.(20
04)
Inve
rteb
rate
Paci
fic
oyst
erC
rass
ostr
eagi
gas
96/
1192
758/
1031
10/
118.
8/
9.5
Lia
ndG
uo(2
004)
88/
861
616/
771
11/
128.
0/
10.4
Hub
erta
ndH
edge
cock
(200
4)E
aste
rnoy
ster
Cra
ssos
trea
virg
inic
a11
4/
841,
2,10
647/
904
12/
126.
3/
12.6
Yu
and
Guo
(200
3)B
lack
lip
abal
one
Hal
ioti
sru
bra
102/
981
621/
766
17/
207.
3/
9.8
Bar
ansk
ieta
l.(2
006)
Paci
fic
abal
one
Hal
ioti
sdi
scus
hann
ai94/
1191,
2,6
1366/
1774
19/
2218
.2/
18.3
Liu
etal
.(20
06)
167/
1601
702/
888
18/
194.
7/
6.3
Sek
ino
and
Har
a(2
007)
Blu
em
usse
lM
ytil
used
ulis
116/
1212
825/
863
14/
148.
1/
8.0
Lal
lias
etal
.(20
07b)
Eur
opea
nfl
atoy
ster
Ost
rea
edul
is13
7/
1492
471/
450
9/
104.
9/
4.2
Lal
lias
etal
.(20
07a)
Zhi
kong
scal
lop
Chl
amys
farr
eri
197/
1662
1631/
1504
20/
199.
2/
10.2
Lie
tal.
(200
5)
Sea
urch
inSt
rong
yloc
entr
otus
nudu
s19
4229
8824
17.1
Zho
uet
al.(
2006
)S
eaur
chin
Stro
ngyl
ocen
trot
usin
term
ediu
s19
9226
1523
15.4
Zho
uet
al.(
2006
)K
urum
apr
awn
Pena
eus
japo
nicu
s12
9212
7644
15.0
Moo
reet
al.(
1999
)22
7/
1252
1781/
1026
43/
319.
7/
10.9
Lie
tal.
(200
3)B
lack
tige
rsh
rim
pPe
naeu
sm
onod
on63
214
1219
22W
ilso
net
al.(
2002
)W
hite
shri
mp
Pena
eus
vann
amei
182/
2122
2116/
2771
47/
5115
.6/
17.1
Pér
ezet
al.(
2004
)C
hine
sesh
rim
pPe
naeu
sch
inen
sis
194/
1972
1738/
2191
36/
3511
.0/
13.5
Lie
tal.
(200
6b)
n.a.
-N
otav
aila
ble.
Type
sof
gene
tic
mar
kers
used
:1-
Mic
rosa
tell
ites
;2-
AF
LP
Am
plifi
edfr
agm
ent
leng
thpo
lym
orph
ism
;3-
VN
TR
Var
iabl
enu
mbe
rof
tand
emre
peat
s;4-
SIN
ES
mal
lin
ters
pers
ednu
clea
rel
emen
t;5-
Min
isat
elli
tes;
6-
RA
PD
Ran
dom
lyam
plifi
edpo
lym
orph
icD
NA
;7-
Allo
zym
es;8
-S
NP
Sin
gle
nucl
eoti
depo
lym
orph
ism
;9-
RF
LP
Res
tric
tion
frag
men
tlen
gth
poly
mor
phis
m;
10-
SS
CP
Sin
gle
stra
ndco
nfor
mat
ion
poly
mor
phis
m.
a-
Cal
cula
ted
as:m
aple
ngth/
num
ber
ofm
arke
rs.

R. Wenne et al.: Aquat. Living Resour. 20, 241–255 (2007) 247
Tabl
e2.
Asa
mpl
eof
publ
ishe
dqu
anti
tativ
etr
aitl
ociQ
TL
stud
ies
inaq
uacu
ltur
esp
ecie
s.
Spe
cies
Lat
inna
me
Tra
its
stud
ied
Ref
eren
ceV
erte
brat
eA
tlan
tic
salm
onSa
lmo
sala
rIn
fect
ious
salm
onan
aem
iaM
oen
etal
.(20
04b)
Infe
ctio
uspa
ncre
atic
necr
osis
viru
s,fu
runc
ulos
is,i
nfec
tiou
sK
jogl
umet
al.(
2005
)sa
lmon
anae
mia
Fur
uncu
losi
s,in
fect
ious
salm
onan
aem
iaG
rim
holt
etal
.(20
03)
Atl
anti
csa
lmon/R
ainb
owSa
lmo
sala
r/O
ncor
hync
huB
ody
wei
ght,
cond
ition
fact
orR
eid
etal
.(20
05)
trou
t/A
rcti
cch
arr
myk
iss/
Salv
elin
usal
pinu
sC
oho
salm
onO
ncor
hync
hus
kisu
tch
Fill
etco
lour
Ara
neda
etal
.(20
05)
Rai
nbow
trou
tO
ncor
hync
hus
myk
iss
Hat
chin
gti
me,
embr
yoni
cle
ngth
,wei
ght
Mar
tine
zet
al.(
2005
)E
mbr
yoni
cde
velo
pmen
tra
teR
obis
onet
al.(
2001
)D
evel
opm
ent
rate
Sun
din
etal
.(20
05)
Bod
yle
ngth
,the
rmot
oler
ance
Per
ryet
al.(
2005
)G
row
th,c
ondi
tion
fact
or,m
atur
ityag
eM
arty
niuk
etal
.(20
03)
Spa
wni
ngti
me
Sak
amot
oet
al.(
1999
)L
engt
h,py
lori
cca
eca,
noof
scal
esN
icho
lset
al.(
2004
)P
ylor
icca
eca
Zim
mer
man
etal
.(20
05)
The
rmot
oler
ance
Jack
son
etal
.(19
98);
Dan
zman
net
al.(
1999
)In
fect
ious
panc
reat
icne
cros
isvi
rus
Oza
kiet
al.(
2001
)In
fect
ious
hem
atop
oiet
icne
cros
isR
odri
quez
etal
.(20
04)
Cer
atom
yxa
shas
tare
sist
ance
Nic
hols
etal
.(20
03a)
Kill
er-c
ella
ctiv
ityZ
imm
erm
anet
al.(
2004
)A
lbin
ism
Nak
amur
aet
al.(
2001
)A
rcti
cch
arr
Salv
elin
usal
pinu
sG
row
thra
teTa
oan
dB
ould
ing
(200
3)T
ilap
iaO
reoc
hrom
ism
ossa
mbi
cus×O
.aur
eus
Inna
teim
mun
ity,
resp
onse
tost
ress
,gro
wth
Cna
anie
tal.
(200
4)T
ilap
iaO
reoc
hrom
isni
loti
cus×S
arot
hero
don
The
rmot
oler
ance
Moe
net
al.(
2004
c)ga
lila
eus
mal
e×O
.mos
sam
bicu
s×O
.aur
eus
fem
ale
Com
mon
carp
Cyp
rinu
sca
rpio
Col
dto
lera
nce
Sun
and
Lia
ng(2
004)
Japa
nese
flou
nder
Para
lich
thys
oliv
aceu
sL
ymph
ocys
tis
dise
ase
resi
stan
ceF
ujie
tal.
(200
6)A
sian
seab
ass
Lat
esca
lcar
ifer
Bod
yw
eigh
t,le
ngth
,con
ditio
nfa
ctor
Wan
get
al.(
2006
)In
vert
ebra
teE
aste
rnoy
ster
Cra
ssos
trea
virg
inic
aPe
rkin
sus
mar
inus
resi
stan
ceY
uan
dG
uo(2
006)
Eur
opea
nF
lato
yste
rO
stre
aed
ulis
Bon
amia
ostr
eaea
resi
stan
ceL
allia
set
al.(
2007
a)Pa
cifi
cab
alon
eH
alio
tis
disc
usha
nnai
She
ll,m
uscl
e,go
nad,
dige
stiv
egl
and
and
gill
wei
ght
Liu
etal
.(20
07)
Kur
uma
praw
nPe
naeu
sja
poni
cus
Bod
yw
eigh
t,le
ngth
Lie
tal.
(200
6a)
Blu
esh
rim
pL
itop
enae
usst
ylir
ostr
isIn
fect
ious
hypo
derm
alan
dhe
mat
opoi
etic
necr
osis
viru
sH
izer
etal
.(20
02)
resi
stan
ce

248 R. Wenne et al.: Aquat. Living Resour. 20, 241–255 (2007)
lot of effort must be focused on this area, in order for genomicstudies to be useful in practical breeding programmes.
Studies of large scale gene expression using microarrayscontaining clones from cDNA libraries are helpful in the dis-covery of candidate genes for particular/multifactorial traits(Sarropoulou et al. 2005b). However, the challenge is to findbetween-individual variation in gene expression that could beexploited in selective breeding. By simply knowing that a cer-tain gene is expressed or not is not enough, the gene must alsodisplay alternative gene variants that can be selected. More-over, gene expression is tissue and time specific, inducingmethodological challenges for the development of general se-lection tools. Hedgecock et al. (2007) recently reported tran-scriptomic analysis of growth heterosis in larvae using mega-cloning and massively parallel signature sequencing (MPSS)in the Pacific oyster Crassostrea gigas. Microarrays have beenproduced (Lang et al. 2006; Jenny et al. 2007) and are currentlyunder development to study summer mortality following SSHapproaches (Huvet et al. 2004; Saavedra and Bachère 2006).
4.1.4 Identification of sex determining factors
The understanding of sex determination systems is oneof the most sought after aspects of genomics in finfish aqua-culture. Aquaculture farmers often prefer to farm only oneof the sexes, because of its superior characteristics (Kauseet al. 2003). Moreover, production of sterile animals (e.g. us-ing triploidy) will enable further reduction of risks related toescape effects of farmed animals on natural marine popula-tions. Males are the heterogametic sex in Atlantic salmon andArctic charr Salvelinus alpinus. Several microsatellite mark-ers are linked to the sex-determining factor (SEX) in the link-age analysis (Woram et al. 2003; Artieri et al. 2006; Fujiki K.and Kwitkowski C.N., Simon Fraser University Burnaby, B.C.Canada pers. comm.). BAC or fosmid clones positive for thesemicrosatellites were isolated from libraries. Fluorescence insitu hybridisation (FISH) was used to identify their positionson chromosomes. Fosmids, BACs and BAC-ends sequenceswere used for the identification of the SEX candidate genes.Despite the great recent progress in this area, the SEX fac-tor(s) continues to be elusive in salmonids as well as in manyother fish and shellfish species.
4.1.5 Cost-benefit analyses
The development and extensive use of genomic tools in se-lection are resource demanding. Consequently, a cost-benefitanalysis would be useful for determining the advantage of us-ing genomic tools. Break-even cost of genotyping depends onthe efficiency of marker assisted selection (MAS, relative totraditional selection), the duration until the selected loci arefixed, the size of the producer level and costs of genotyping, asshown by the analysis of pig enterprise by Hayes and Goddard(2004). Likewise, breeders should determine in advance howMAS can be most effectively used. For instance, should all in-dividuals be genotyped, should individuals be genotyped earlyin life or at maturity, should only pre-selected breeding candi-dates be genotyped, could within-family selection be effective,
and what are the economical benefits and practical constraintsof the alternative selection strategies. To date, no such studieshave been performed in aquatic species.
4.2 Cultured fish and shellfish health
Genomics can help to overcome problems related to in-fectious diseases by better understanding host defence sys-tems and identifying QTL or candidate genes. Aquacultureproductivity is reduced by various pathogens. Examples of ge-nomics based studies include oomycete Saprolegnia parasitica(Torto-Alalibo et al. 2005), a bacterial agent of cold-water dis-ease Flavobacterium psychrophilum (Soule et al. 2005) anda parasitic protozoan ciliate Ichthyophthirius multifiliis, theagent of the white spot disease through virulent factors (Aber-nathy et al. 2007). The acute phase response following infec-tion of catfish with Edwarsiella ictaluri, causing enteric sep-ticaemia, was studied by high density in situ oligonucleotidemicroarray (Peatman et al. 2007). Numerous acute phase pro-teins were upregulated and many pathogen recognition recep-tors and chemokines were differentially expressed in the liver.These results were confirmed with real-time PCR. A candidategene approach was employed to find markers associated withdisease resistance in which 28 microsatellites located near andwithin the immune genes were developed (Karsi A., Missis-sippi State University USA, pers. comm.). Several microsatel-lites were associated with resistance and susceptible pheno-types. These markers have been incorporated in the catfishlinkage map, which will facilitate finding resistance QTL andwill help in development of MAS programmes. Cytokines areimportant immune system regulators in fish, and genomics andproteomics can help to develop vaccines and immunostimu-lants for aquaculture (Savan and Sakai 2006). Bao et al. (2007)identified 26 chemotactic cytokine genes, sequenced them andstudied their expression in catfish.
Whirling disease, caused by Myxobolus cerebralis,strongly affects American hatcheries and certain natural pop-ulations of rainbow trout. A European hatchery Hofer strainexhibits almost complete resistance to this pathogen. Microar-ray technology was used to study differences in global geneexpression between resistant and susceptible rainbow troutstrains (Baerwald M.R., University of California, Davis USA,pers. comm.). Several candidate genes were discovered thatindicate genetic mechanisms of resistance to whirling dis-ease in fish. To pinpoint these genetic mechanisms of resis-tance, rainbow trout full sib families under hatchery conditionswere exposed to the bacterial pathogen Yersinia ruckeri, whichcauses enteric red mouth disease and to Flavobacterium psy-chrophilum (Palti Y., NCCCWA-ARS-USDAKearneysville,USA, pers. comm.). Linkage disecquilibrium and the resis-tance to the pathogens was assessed by genotyping using mi-crosatellites linked to the four major histocompatibility (MH)genomic regions, to toll-like receptor genes and to the twocopies of tumour necrosis factor superfamily 13b. Knowledgeof the base-line MH sequence variation in the broodstock andits association/linkage disequilibrium with resistance to spe-cific pathogens is useful in monitoring loss of MH variabilityand the potential increase in susceptibility to other pathogensthat are not part of the selective breeding. Atlantic salmon

R. Wenne et al.: Aquat. Living Resour. 20, 241–255 (2007) 249
T-cell receptor alpha/delta genes exhibit vast diversity for anti-gen recognition (Yazawa et al. 2007). Differences in suscepti-bility to infectious hematopoietic necrosis virus were studiedwith microarray technology between four salmonid species(Salmo salar, Oncorhynchus nerka, O. keta and O. kisutch).The observed differences were related to species-specific dif-ferences in viral ability to enter cells, and possibly to ef-fectiveness in taking control over cellular mechanisms ratherthan from strength of the host immunological response (MillerK. and Traxler G., Pacific Biological Station Fisheries andOceans, Nanaimo, Canada, pers. comm.).
Examples of related studies in cultured invertebrates in-volve activated protein kinase (AMP) and other elements ofthe immune system in peneid shrimps and Pacific oyster (Cras-sostrea gigas, Bachère et al. 2004). In oysters, the availabil-ity of animals selected to improve their resistance against dis-eases can greatly contribute to the identification of genes orproteins involved in defence mechanisms (e.g. summer mor-tality in C. gigas: Huvet et al. 2004; Martelia sydneyi in Sac-costrea glomerata: Newton et al. 2004). Another pathogen ofshrimp is the white spot syndrome virus, which can be con-trolled by the anti-viral immunity of injected double stranded(ds)RNA molecules and single stranded (si)RNA (Westenberget al. 2005).
4.3 Alternative feed
Functional genomics can contribute to the production ofnew kinds of feed for cultured fishes. Two such examples arethe possibility of production of novel feed sources (such asplant based protein for carnivorous fish) and terrestrial trans-genic plant (e.g. soybean or rapeseed) as feed. The use of tra-ditionally marine feed components for aquaculture faces loweravailability of marine resources. These marine components canbe replaced by terrestrial vegetable ingredients, as oils. How-ever, the quality of vegetable oils needs to be improved in or-der to meet nutritional demands of farmed fish (Opsahl-Ferstadet al. 2003). Transgenic plants with increased amounts of somefatty acids in seeds, and with possibility of their extension intolonger, marine – similar fatty acids can improve quality ofvegetable oils for use as fish feed. Present evidence indicatesthat in salmonids, novel plant-based feed sources may induceonly weak genotype-by-diet interactions that would need spe-cial attention from fish breeders (Quinton et al. 2007). How-ever, novel feed ingredients may have deleterious effects onquality or biological efficiency of aquatic species, and it is achallenge to develop the feed and the hatchery animals fur-ther. Moreover, genomic approaches could also contribute toa better understanding of lipid pathways and synthesis of longchain polyunsaturated fatty acids, facilitating the selection ofgenotypes that produce a good performance when feed a lowfish oil or protein diet.
5 Conclusion
- The implementation of genomic approaches should be en-couraged in the fields of fisheries and aquaculture by sup-porting the development of genomic resources, such as
BAC libraries, fine scale linkage maps, EST databases andexpression profiling.
- Open access web-based resources, joining available ge-nomic data (EST, mapping data, BAC fingerprinting andannotation) should be developed in order to favour inte-grated collaborations.
- Studies of local adaptations in the wild and hatchery pop-ulations should incorporate genomic approaches to furtherunderstand the footprints of selection at a genome widelevel.
- The potential of molecular marker assisted selection andthe domestication process in aquaculture species should befurther explored, benefiting from the development of newgenomic resources and computational and analytical tools.
- Current QTL studies have used sparse linkage maps. Thus,we do not have DNA markers that are located close enoughto the actual gene that would allow their use in practicalbreeding programmes. Consequently, there is a need fordenser genetic maps for aquaculture species.
- Most of the QTL studies are on growth related traits, and toa lesser extent on disease resistance traits. More QTL stud-ies are needed on body composition, fillet/product quality,and feed efficiency.
- SNP data provide attractive possibilities for genomic selec-tion. Genomic methods for SNP data analysis need furtherdevelopment.
- Alternative strategies of using genomic information inbroodstock selection need to be assessed, and their cost-effectiveness needs to be evaluated.
Acknowledgements. This paper is based on the Terms of Reference“b” of the ICES Working Group on Application of Genetics to Fish-eries and Mariculture, which met in Ispra, Italy in 2007.The authors thank Dr. Elisabeth Gosling and an anonymous refereefor the text editing and constructive comments.
References
Abernathy J., Xu P., Li P., Xu D., Kucuktas H., Klesiun P., AriasC., Liu Z., 2007, Generation and analysis of expressed sequencetags from the ciliate protozoan parasite Ichthyophthirius multifil-iis. BMC Genomics 8, 176.
Agresti J.J., Seki S., Cnaani A., Poompuang S., Hallerman E.M.,Umiel N., Hulata G., Gall G.A.E., May B., 2000, Breeding newstrains of tilapia: development of an artificial center of origin andlinkage map based on AFLP and microsatellite loci. Aquaculture185, 43-56.
Akey J.M., Zhang G., Zhang K., Jin L., Shriver M.D., 2002,Interrogating a high-density SNP map for signatures of naturalselection. Genome Res. 12, 1805-1814.
Anderson E.C., Garza J.C., 2006, Power of single-nucleotide poly-morphisms for large-scale parentage inference. Genetics 172,2567-2582.
Araneda C., Neira R., Iturra P., 2005, Identification of a domi-nant SCAR marker associated with colour traits in Coho salmon(Oncorhynchus kisutch). Aquaculture 247, 67-73.
Artieri C.G., Mitchell L.A., Ng S.H.S., Parisotto S.E., DanzmannR.G., Hoyheim B., Phillips R.B., Morasch M., Koop B.F.,Davidson W.S., 2006, Identification of the sex-determining locus

250 R. Wenne et al.: Aquat. Living Resour. 20, 241–255 (2007)
of Atlantic salmon (Salmo salar) on chromosome 2. Cytogenet.Genome Res. 112, 152-159.
Aubin-Horth N., Letcher B.H., Hofmann H.A., 2005a, Interaction ofrearing environment and reproductive tactic on gene expressionprofiles in Atlantic salmon. J. Hered. 96, 261-278.
Aubin-Horth N., Landry C.R., Letcher B.H., Hofmann H.A., 2005b,Alternative life histories shape brain gene expression profiles inmales of the same population. Proc. Biol. Sci. 272, 1655-1662.
Bachère E., Guéguen Y., Gonzalez M., de Lorgeril J., Garnier J.,Romestand B., 2004, Insights into the anti-microbial defenceof marine invertebrates: the penaeid shrimps and the oysterCrassostrea gigas. Immunol. Rev. 198, 149-168.
Banks M.A., Eichert W., Olsen J.B., 2003, Which genetic loci havegreater population assignment power? Bioinformatics 19, 1436-1438.
Bao B., Peatman E., Xu P., Baoprasertkul P., Wang G., Liu Z., 2006,Characterization of 23 CC chemokine genes and analysis of theirexpression in channel catfish (Ictalurus punctatus). Dev. Comp.Immunol. 30, 783-796.
Baranski M., Loughnan S., Austin C.M., Robinson N., 2006, A mi-crosatellite linkage map of the blacklip abalone, Haliotis rubra.Anim Genet. 37, 563-570.
Beacham T.D., Lapointe M., Candy J.R., Miller K.M., Withler R.E.,2004, DNA in action: Rapid application of DNA variation tosockeye salmon fisheries management. Conserv. Genet. 5, 411-416.
Beaumont M.A., Nichols R.A., 1996, Evaluating loci for use in thegenetic analysis of population structure. Proc. R. Soc. LondonSer. B-Biol. Sci. 263, 1619-1626.
Bonin A., Taberlet P., Miaud C., Pompanon F., 2006, Explorativegenome scan to detect candidate loci for adaptation along a gradi-ent of altitude in the common frog (Rana temporaria) Mol. Biol.Evol. 23, 773-783.
Bonnet E., Fostier A., Bobe J., 2007, Microarray-based analysisof fish egg quality after natural or controlled ovulation. BMCGenomics 8, 55.
Boudry P., Collet B., Cornette F., Hervouet V., Bonhomme F., 2002,High variance in reproductive success of the Pacific oyster(Crassostrea gigas Thunberg) revealed by microsatellite-basedparentage analysis of multifactorial crosses. Aquaculture 204,283-296.
Breyne P., Dreesen R., Cannoot B., Rombaut D., Vandepoele K.,Rombauts S., Vanderhaeghen R., Inze D., Zabeau M., 2003,Quantitative cDNA-AFLP analysis for genome-wide expressionstudies Mol. Genet. Genom. 269, 173-179.
Bridle A., Morrison R., Cupit P.M., Cunningham B.M., NowakB., 2006a, Quantitation of immune response gene expressionand cellular localisation of interleukin-1β mRNA in Atlanticsalmon, Salmo salar, affected by amoebic gill disease (AGD).Vet. Immunol. Immunopathol. 114, 121-134.
Bridle A.R., Morrison R.N., Nowak B.F., 2006b, The expressionof immune-regulatory genes in rainbow trout, Oncorhynchusmykiss, during an amoebic gill disease (AGD) infection. FishShellfish Immunol. 20, 346-364.
Campbell N.R., Narum S.R., 2007, Identification of novel SNPs inChinook salmon and variation among life history types. Trans.Am. Fish. Soc., in press.
Cnaani A., Zilberman N., Tinman S., Hulata G., Ron M., 2004,Genome-scan analysis for quantitative trait loci in an F-2 tilapiahybrid. Mol. Genet. Genom. 272, 162-172.
Chini V., Rimoldi S., Terova G., Saroglia M., Rossi F., Bernardini G.,Gornati R., 2006, EST-based identification of genes expressed inthe liver of adult seabass (Dicentrarchus labrax L.). Gene 376,102-106.
Chistiakov D.A., Hellemans B., Haley C.S., Law A.S., TsigenopoulosC.S., Kotoulas G., Bertotto D., Libertini A., Volckaert F.A.M.,2005, A microsatellite linkage map of the European sea bassDicentrarchus labrax L. Genetics 170, 1821-1826.
Coimbra M.R.M., Kobayashi K., Koretsugu S., Hasegawa O., OharaE., Ozaki A., Sakamoto T., Naruse K., Okamoto N., 2003, Agenetic linkage map of the Japanese flounder Paralichthys oli-vaceus. Aquaculture 220, 203-218.
Cossins A.R., Crawford D.L., 2005, Opinion - Fish as models forenvironmental genomicsNat. Rev. Genet. 6, 324-333.
Crollius H.R., Weissenbach J., 2005, Fish genomics and biology.Genome Res. 15, 1675-1682.
Cunningham C., Hikima J.I., Jenny M.J., Chapman R.W., Fang G.C.,Saski C., Lundqvist M.L., Wing R.A., Cupit P.M., Gross P.S.,Warr G.W., Tomkins J.P., 2006, New resources for marine ge-nomics: Bacterial artificial chromosome libraries for the easternand pacific oysters (Crassostrea virginica and C. gigas). Mar.Biotech. 8, 521-533.
Danzmann R.G., Jackson T.R., Ferguson M.M., 1999, Epistasis inallelic expression at upper temperature tolerance QTL in rainbowtrout. Aquaculture 173, 45-58.
Doyle R.W., Herbinger C.M., 1994, The use of DNA fingerprint-ing for high-intensity within-family selection in fish breed-ing, Proc.5th World Congress on Genetics Applied to LivestockProduction, 7-12 August 1994, Vol. 19, Dep. Animal and PoultryScience, University of Guelph, Guelph, pp. 364-371.
Dulvy N.K., Sadovy Y., Reynolds J.D. 2003. Extinction vulnerabilityin marine populations. Fish Fish. 4, 25-64.
Fast M.D., Muise D.M., Easy R.E., Ross N.W., Johnson S.C., 2006,The effects of Lepeophthirius salmonis infection on the stressresponse and immunological status of Atlantic salmon (Salmosalar). Fish Shellfish Immunol. 21, 228-241.
Fernando R.L., Grossman M., 1989, Marker-assisted selection usingbest linear unbiased prediction. Genet. Sel. Evol. 33, 209-229.
Franch R., Louro B., Tsalavouta M., Chatziplis D., TsigenopoulosC.S., Sarropoulou E., Antonello J., Magoulas A., Mylonas C.C.,Babbucci M., Patarnello T., Power D.M., Kotoulas G., BargelloniL., 2006, A genetic linkage map of the hermaphrodite teleost fishSparus aurata L. Genetics 174, 851-861.
Fuji K., Kobayashi K., Hasegawa O., Coimbra M.R.M., SakamotoT., Okamoto N., 2006, Identification of a single major genetic lo-cus controlling the resistance to lymphocystis disease in Japaneseflounder (Paralichthys olivaceus). Aquaculture 254, 203-210.
Gharbi K., Gautier A., Danzmann R.G., Gharbi S., Sakamoto T.,Hoyheim B., Taggart J.B., Cairney M., Powell R., Krieg F.,Okamoto N., Ferguson M.M., Holm L.E., Guyomard R., 2006,A linkage map for brown trout (Salmo trutta): Chromosomehomeologies and comparative genome organization with otherSalmonid fish. Genetics 172, 2405-2419.
Gilbey J., Verspoor E., McLay A., Houlihan D., 2004, A microsatel-lite linkage map for Atlantic salmon (Salmo salar). Anim Genet.35, 98-105.
Gibson G., Weir B., 2005, The quantitative genetics of transcription.Trends Genet. 21, 616-623.
Gracey A.Y., Fraser E.J., Li W., Fang Y., Taylor R.R., Rogers J., BrassA., Cossins A.R., 2004, Coping with cold: An integrative, mul-titissue analysis of the transcriptome of a poikilothermic verte-brate. Proc. Natl. Acad. Sci. USA 101, 16970–16975.
Grimholt U., Larsen S., Nordmo R., Midtlyng P., Kjoeglum S., StorsetA., Saebo S., Stet R.J.M., 2003, MHC polymorphism and diseaseresistance in Atlantic salmon (Salmo salar); facing pathogenswith single expressed major histocompatibility class I and classII loci. Immunogenetics 55, 210-219.

R. Wenne et al.: Aquat. Living Resour. 20, 241–255 (2007) 251
Guyomard R., Mauger S., Tabet-Canale K., Martineau S., Genet C.,Krieg F., Quillet E., 2006, A type I and type II microsatellite link-age map of rainbow trout (Oncorhynchus mykiss) with presump-tive coverage of all chromosome arms. BMC Genomics 7, 302.
Hayes B.J., Chamberlain A.J., Goddard M.E., 2006a, Use of mark-ers in linkage disequilibrium with QTL in breeding programs.Proc.8th World Congress on Genetics Applied to LivestockProduction, August 13-18, 2006, Belo Horizonte, MG, Brasil.
Hayes B.J., Gjuvsland A., Omholt S., 2006b, Power of QTL mappingexperiments in commercial Atlantic salmon populations, exploit-ing linkage and linkage disequilibrium and effect of limited re-combination in males. Heredity 97, 19-26.
Hayes B., Goddard M.E., 2004, Break-even cost of genotyping ge-netic mutations affecting economic traits in Australian pig enter-prises. Livestock Production Sci. 89, 235-242.
Hayes B., Laerdahl J.K., Lien S., Moen T., Berg P., Hindar K.,Davidson W.S., Koop B.F., Adzhubei A., Høyheim B., 2007,An extensive resource of single nucleotide polymorphism mark-ers associated with Atlantic salmon (Salmo salar) expressed se-quences. Aquaculture 265, 82-90.
Hedgecock D., Gaffney P.M., Goulletquer P., Guo X.M., Reece K.,Warr G.W., 2005, The case of sequencing the Pacific oystergenome. J. Shellfish Res. 24, 429-441.
Hedgecock D., Lin J. Z., DeCola S., Haudenschild C.D., MeyerE., Manahan D.T., Bowen B., 2007, Transcriptomic analysis ofgrowth heterosis in larval Pacific oysters (Crassostrea gigas).Proc. Natl. Acad. Sci. USA 104, 2313-2318.
Hilborn R., Quinn T.P., Schindler D.E., Rogers D.E., 2003,Biocomplexity and fisheries sustainability. Proc. Natl. Acad. Sci.USA 100, 6564-6568.
Hizer S.E., Dhar A.K., Klimpel K.R., Garcia D.K, 2002, RAPDmarkers as predictors of infectious hypodermal and hematopoi-etic necrosis virus (IHHNV) resistance in shrimp (Litopenaeusstylirostris). Genome 45, 1-7.
Hubert S., Hedgecock D., 2004, Linkage maps of microsatellite DNAmarkers for the Pacific oyster Crassostrea gigas. Genetics 168,351-362.
Huvet A., Herpin A., Degremont L., Labreuche Y., Samain J.F.,Cunningham C, 2004, The identification of genes from the oys-ter Crassostrea gigas that are differentially expressed in progenyexhibiting opposed susceptibility to summer mortality. Gene 343,211-220.
ICES, 2006, Report of the Working Group on the Applicationof Genetics in Fisheries and Mariculture, 24-27 March 2006,Newport, Ireland. ICES CM 2006/MCC:04.
Jackson T.R., Ferguson M.M., Danzmann R.G., Fishback A.G.,Ihssen P.E., O’Connell M., Ccrease T.J., 1998, Identification oftwo QTL influencing upper temperature tolerance in three rain-bow trout (Oncorhynchus mykiss) half-sib families. Heredity 80,143-151.
Jenny M.J., Chapman R.W., Mancia A., Chen Y.A., McKillen D.J.,Trent H., Lang P., Escoubas J.M., Bachere E., Boulo V., LiuZ.J., Gross P.S., Cunningham C., Cupit P.M., Tanguy A., Guo X.,Moraga D., Boutet I., Huvet A, De Guise S., Almeida J.S., WarrG.W., 2007, A cDNA microarray for Crassostrea virginica andC. gigas. Mar. Biotechnol. [doi.10.1007/s 10126-007-9041-1]
Jones A.G., Ardren W.R., 2003, Methods of parentage analysis innatural populations. Mol. Ecol. 12, 2511-2523.
Kauer M.O., Dieringer D., Schlotterer C., 2003, A microsatellite vari-ability screen for positive selection associated with the “Out ofAfrica” habitat expansion of Drosophila melanogaster. Genetics165, 1137-1148.
Kause A., Ritola O., Paananen T., Mäntysaari E., Eskelinen U.,2003, Selection against early maturity in farmed rainbow trout:the quantitative genetics of sexual dimorphism and genotype-by-environment interactions. Aquaculture 228, 53-68.
Kause A., Ritola O., Paananen T., Wahlroos H., Mäntysaari E.A.,2005, Genetic trends in growth, sexual maturity and skeletal de-formations, and rate of inbreeding in a breeding programme forrainbow trout. Aquaculture 247, 177-187.
Kimura T., Jindo T., Narita T., Naruse K., Kobayashi D., Shin I.T., Kitagawa T., Sakaguchi T., Mitani H., Shima A., Kohara Y.,Takeda H., 2004, Large-scale isolation of ESTs from medakaembryos and its application to medaka developmental genetics.Mech. Dev. 121, 915-932.
Kjoglum S., Grimholt U., Larsen S., 2005, Non-MHC genetic andtank effects influence disease challenge tests in Atlantic salmon(Salmo salar). Aquaculture 250, 102-109.
Kocher T.D., Lee W.J., Sobolewska H., Penman D., McAndrewB., 1998, A genetic linkage map of a cichlid fish, the tilapia(Oreochromis niloticus). Genetics 148, 1225-1232.
Kohn M.H., Murphy W.J., Ostrander E.A., Wayne R.K., 2006,Genomics and conservation genetics. Trends Ecol. Evol. 21, 629-637.
Koskinen H., Pehkonen P., Vehniainen E., Krasnov A., Rexroad C.E.,Afanasyev S., Molsa H., Oikari A., 2004, Response of rainbowtrout transcriptome to model chemical contaminants. Biochem.Biophys. Res. Comm. 320, 745-53.
Kurobe T., Yasuike M., Kimura T., Hirono I., Aoki T., 2005,Expression profiling of immune-related genes from Japaneseflounder Paralichthys olivaceus kidney cells using cDNA mi-croarrays. Dev. Comp. Immunol. 29, 515–523.
Lallias D., Lapègue S., Haley C., Heurtebise S., Boudry P., BeaumontA., 2007a, European flat oyster, Ostrea edulis: towards the iden-tification of Bonamia resistance QTLs. 8th International MarineBiotechnology Conference. Eilat, Israel, 11-16 March 2007.
Lallias D., Lapègue S., Hecquet C., Boudry P., Beaumont A.R.,2007b, AFLP-based genetic linkage maps of the blue mussel(Mytilus edulis). Anim. Genet. 38, 340-349.
Lang P., Langdon C.J., Camara M., 2006, Transcriptome analysis ofPacific oyster Crassostrea gigas families exposed to heat stress.J. Shellfish Res. 25, 746.
Larsen P.F., Nielsen E.E. Williams T.D., Hemmer-Hansen J.,Chipman J.K., Kruhøffer M., Grønkjær P., George S.G., DyrskjøtL., Loeschcke V., 2007, Adaptive differences in gene expressionin European flounder (Platichthys flesus). Mol. Ecol., in press.
Launey S., Barre M., Gerard A., Naciri Graven Y., 2001, Populationbottleneck and effective size in Bonamia ostreae-resistant pop-ulations of Ostrea edulis as inferred by microsatellite markers.Genet. Res. 78, 259-270.
Lee B.Y., Lee W.J., Streelman J.T., Carleton K.L., Howe A.E., HulataG., Slettan A., Stern J.E., Terai Y., Kocher T.D., 2005, A second-generation genetic linkage map of tilapia (Oreochromis spp.).Genetics 170, 237-244.
Lemaire C., Allegrucci G., Naciri M., Bahri-Sfar L., Kara H.,Bonhomme F., 2000, Do discrepancies between microsatelliteand allozyme variation reveal differential selection between seaand lagoon in the sea bass (Dicentrarchus labrax)? Mol. Ecol. 9,457-467.
Li Y., Byrne K., Miggiano E., Whan V., Moore S., Keys S., CrocosP., Preton N., Lehnert S., 2003, Genetic mapping of the Kurumaprawn Penaeus japonicus using AFLP markers. Aquaculture 219,143-156.
Li Y., Dierens L., Byrne K., Miggiano E., Lehnert S., Preston N.,Lyons R., 2006a, QTL detection of production traits for the

252 R. Wenne et al.: Aquat. Living Resour. 20, 241–255 (2007)
Kuruma prawn Penaeus japonicus (Bate) using AFLP markers.Aquaculture 258, 198-210.
Li L., Guo X., 2004, AFLP-based genetic linkage maps of the Pacificoyster Crassostrea gigas Thunberg. Mar. Biotech. 6, 26-36.
Li Z., Li J., Wang Q., He Y., Liu P., 2006b, AFLP-based genetic link-age map of marine shrimp Penaeus (Fenneropenaeus) chinensis.Aquaculture 261, 463-472.
Li R.W., Waldbieser G.C., 2006, Production and utilization of a high-density oligonucleotide microarray in channel catfish, Ictaluruspunctatus. BMC Genomics 7, 134.
Li L., Xiang J., Liu X., Zhang Y., Dong B., Zhang X, 2005,Construction of AFLP-based genetic linkage map for Zhikongscallop, Chlamys farreri Joneset Preston and mapping of sex-linked markers. Aquaculture 245, 63-73.
Lindenstrom T., Sigh J., Dalgaard M.B., Buchmann K., 2006, Skinexpression of IL 1β in East Atlantic salmon, Salmo salar L.,highly susceptible to Gyrodactylus salaris infections is enhancedcompared to a low susceptibility Baltic stock. J. Fish Dis. 29,123-128.
Lindenstrom T., Buchmann K., Secombes C., 2003, Gyrodactylusderjavini infection elicits interleukin 1 beta expression in rain-bow trout skin. Fish Shellfish Immunol. 15, 107-115.
Liu Z.J., Cordes J.F., 2004, DNA marker technologies and their ap-plications in aquaculture genetics Aquaculture 242, 735-736.
Liu X., Liu X., Guo X., Gao Q., Zhao H., Zhang G., 2006, A prelim-inary genetic linkage map of the Pacific abalone Haliotis discushannai Ino. Mar. Biotech. 8, 386-397.
Liu Z., Karsi A., Li P., Cao D., Dunham R., 2003, An AFLP-based genetic linkage map of channel catfish (Ictalurus puncta-tus) constructed by using an interspecific hybrid resource family.Genetics 165, 687-694.
Liu X., Liu X., Zhang G., 2007, Identification of quantitative traitloci for growth-related traits in the Pacific abalone Haliotis discushannai Ino. Aquac. Res. 38, 789-797.
Luikart G., England P.R., Tallmon D., Jordan S., Taberlet P., 2003,The power and promise of population genomics: From genotyp-ing to genome typing. Nat. Rev. Genet. 4, 981-994.
Martin S.A., Blaney S.C., Houlihan D.F., Secombes C.J., 2006,Transcriptome response following administration of a live bac-terial vaccine in Atlantic salmon (Salmo salar). Mol. Immunol.43, 2089-2106.
Martinez V., Thorgaard G., Robinson B., Sillanpää M.J., 2005, Anapplication of Bayesian QTL mapping to early development indouble haploid lines of rainbow trout including environmental ef-fects. Genet. Res. 86, 209-221.
Martyniuk C.J., Perry G.M.L., Mogahadam H.K., Ferguson M.M.,Danzmann R.G., 2003, The genetic architecture of correlationsamong growth-related traits and male age at maturation in rain-bow trout. J. Fish Biol. 63, 746-764.
Matsuoka M.P., Gharrett A.J., Wilmot R.L., Smoker W.W., 2004,Genetic linkage mapping of allozyme loci in even- and odd-yearpink salmon (Oncorhynchus gorbuscha). J. Hered. 95, 421-429.
Maynard Smith J., Haigh J., 1974, Hitch-hiking effect of a favorablegene. Genet. Res. 23, 23-35.
Meuwissen T.H.E., Hayes B.J., Goddard M.E., 2001, Predictionof total genetic value using genome-wide dense marker maps.Genetics 157, 1819-1829.
Moen T., Hoyheim B., Munck H., Gomez-Raya L., 2004a, A linkagemap of Atlantic salmon (Salmo salar) reveals an uncommonlylarge difference in recombination rate between the sexes. Anim.Genet. 35, 81-92.
Moen T., Fjalestad K.T., Munck H., Gomez-Raya L., 2004b, A multi-stage testing strategy for detection of quantitative trait loci affect-ing disease resistance in Atlantic salmon. Genetics 167, 851-858.
Moen T., Agresti J.J., Cnaani A., Moses H., Famula T.R., Hulata G.,Gall G.A.E., May B., 2004c, A genome scan of a four-way tilapiacross supports the existence of a quantitative trait locus for coldtolerance on linkage group 23. Aquac. Res. 35, 893-904.
Montano-Perez K., Villalpando - Canchola E., Vargas – Albores F.,2006, RFLP (amplified fragment length polymorphism) and itsapplication in aquaculture. Interciencia 31, 563-569
Moore S.S., Whan V., Davis G.P., Byrne K., Hetzel D.J.S., PrestonN., 1999, The development and application of genetic markersfor the Kuruma prawn Penaeus japonicus. Aquaculture 173, 19-32.
Morin P.A., Luikart G., Wayne R.K. and the SNP workshop group,2004. SNPs in ecology, evolution and conservation. Trends Ecol.Evol. 19, 208-216.
Moritz C., 2002, Strategies to protect biological diversity and the evo-lutionary processes that sustain it. Systematic Biol. 51, 238-254.
Nakamura K., Ozaki A., Akutsu T., Iwai K., Sakamoto T., YoshizakiG., Okamoto N., 2001, Genetic mapping of the dominant al-bino locus in rainbow trout (Oncorhynchus mykiss). Mol. Genet.Genomics 265, 687-693.
Newton K., Peters R., Raftos D., 2004. Phenoloxidase and QX diseaseresistance in Sydney rock oysters (Saccostrea glomerata). Dev.Comp. Immunol. 28, 565-569.
Ng S.H.S., Artieri C.G., Bosdet I.E., Chiu R., Danzmann R.G.,Davidson W.S., Ferguson M.M., Fjell C.D., Hoyheim B., JonesS.J.M., de Jong P.J., Koop B.F., Krzywinski M.I., LubienieckiK., Marra M.A., Mitchell L.A., Mathewson C., Osoegawa K.,Parisotto S.E., Phillips R.B., Rise M.L., Von Schalburg K.R.,Schein J.E., Shin H., Siddiqui A., Thorsen J, Wye N., Yang G.,Zhu B., 2005, A physical map of the genome of Atlantic salmon,Salmo salar. Genomics 86, 396-404.
Ng S.H.S., Chang A., Brown G.D., Koop B.F., Davidson W.S., 2005,Type I microsatellite markers from Atlantic salmon (Salmo salar)expressed sequence tags. Mol. Ecol. Notes 5, 762-766.
Nichols K.M., Bartholomew J., Thorgaard G.H., 2003a, Mappingmultiple genetic loci associated with Ceratomyxa shasta resis-tance in Oncorhynchus mykiss. Dis. Aquat. Org. 56, 145-154.
Nichols K.M., Young W.P., Danzmann R.G., Robison B.D., RexroadC., Noakes M., Phillips R.B., Bentzen P., Spies I., Knudsen K.,Allendorf F.W., Cunningham B.M., Brunelli J., Zhang H., RistowS., Drew R., Brown K.H., Wheeler P.A., Thorgaard G.H., 2003b,A consolidated linkage map for rainbow trout (Oncorhynchusmykiss). Anim. Genet. 34, 102-115.
Nichols K.M., Wheeler P.A., Thorgaard G.H., 2004, Quantitative traitloci analyses for meristic traits in Oncorhynchus mykiss. Environ.Biol. Fish. 69, 317-331.
Oleksiak M.F., Churchill G.A., Crawford D.L., 2002, Variation ingene expression within and among natural populations. Nat.Genet. 32, 261-266.
Opsahl-Ferstad H.G., Rudi H., Ruyter B., Refstie S., 2003,Biotechnological approaches to modify rapeseed oil compositionfor application in aquaculture. Plant Sci. 165, 349-357.
Ozaki A., Sakamoto T., Khoo S., Nakamura K., Coimbra M.R.M.,Akutsu T., Okamoto N., 2001, Quantitative trait loci (QTLs)associated with resistance/susceptibility to infectious pancreaticnecrosis virus (IPNV) in rainbow trout (Oncorhynchus mykiss).Mol. Genet. Genomics 265, 23-31.
Palti Y., Gahr S.A., Hansen J.D., Rexroad IIIC.E., 2004,Characterization of a new BAC library for rainbow trout: evi-dence for multi-locus duplication. Anim. Genet. 35, 130-133.
Peatman, E. Baoprasertkul, P., Terhune, J., Xu, P., Nandi, S.,Kucuktas, H., Li, P., Wang, S., Somridhivej, B., Dunham, R.,

R. Wenne et al.: Aquat. Living Resour. 20, 241–255 (2007) 253
Liu, Z.J., 2007, Expression analysis of the acute phase re-sponse in channel catfish (Ictalurus punctatus) after infec-tion with a Gram negative bacterium. Dev. Comp. Immunol.[doi.10.1016/j.dci.2007.03.003].
Pérez F., Erazo C., Zhinaula M., Volckaert F., Calderon J., 2004,A sex-specific linkage map of the white shrimp Penaeus(Litopenaeus) vannamei based on AFLP markers. Aquaculture242, 105-118.
Perry G.M.L., Ferguson M., Sakamoto T., Danzmann R.G., 2005,Sex-linked quantitative trait loci for thermotolerance and lengthin the rainbow trout. J. Hered. 96, 97-107.
Poompuang S., Na-Nakorn U., 2004, A preliminary genetic map ofwalking catfish (Clarias macrocephalus). Aquaculture 232, 195-203.
Purcell M.K., Nichols K.M., Winton J.R., Kurath G,. ThorgaardG.H., Wheeler P., Hansen J.D., Herwig R.P., Park L.K., 2006,Comprehensive gene expression profiling following DNA vacci-nation of rainbow trout against infectious hematopoietic virus.Mol. Immunol. 43, 2089-2106.
Quiniou S.M.A., Katagiri T., Miller N.W., Wilson M., Wolters W.R.,Waldbieser G.C., 2003, Construction and characterization of aBAC library from a gynogenetic channel catfish, Ictalurus punc-tatus. Genet. Sel. Evol. 35, 1–11.
Quiniou S.M.A., Waldbieser G.C., Duke M.V., 2007, A first gener-ation BAC-based physical map of the channel catfish genome.BMC Genomics 8, 40.
Quinton C., Kause A., Koskela J., 2007, Breeding salmonids for feedefficiency in current fishmeal and future plant-based diet environ-ments. Genet. Sel. Evol. 39, 431-446.
Reid D.P., Szanto Z., Glebe B., Danzmann R.G., Ferguson M.M.,2005, QTL for body weight and condition factor in Atlanticsalmon (Salmo salar); comparative analysis with rainbow trout(Oncorhynchus mykiss) and Arctic charr (Salvelinus aplinus).Heredity 94, 166-172.
Rengmark A.H., Slettan A., Skaala O., Lie O., Lingaas F., 2006,Genetic variability in wild and farmed Atlantic salmon (Salmosalar) strains estimated by SNP and microsatellites. Aquaculture253, 229-237.
Renn S.C.P., Aubin-Horth N., Hofmann H.A., 2004, Biologicallymeaningful expression profiling across species using heterolo-gous hybridization to a cDNA microarray. BMC Genomics 5, 42.
Reynolds J.D., Dulvy N.K., Goodwin N.B., Hutchings J.A., 2005,Biology of extinction risk in marine fishes. Proc. R. Soc. LondonB 272, 2337-2344.
Rise M.L., von Schalburg K.R., Brown G.D., Devlin R.H., MawerM.A., Kuipers N., Busby M., Beetz-Sargent M., Alberto R.,Gibbs A.R., Hunt P., Shukin R., Zeznik J.A., Nelson C., JonesS.M.R., Smailus D.E., Jones S.J.M., Schein J.E., Marra M.A.,Butterfield Y.S.N., Stott J.M., Ng S.H., Davidson W.S., KoopB.F., 2004a, Development and application of a salmonid ESTdatabase and cDNA microarray: data mining and interspecific hy-bridization characteristics. Genome Res. 14, 478-490.
Rise M.L., Jones S.R.M., Brown G.D., von Schalburg K.R., DavidsonW.S., Koop B.F., 2004b, Piscirickettsia salmonis infection con-sistently regulates expression of a suite of genes in culturedAtlantic salmon macrophages and in hematopoietic kidney.Physiol. Genomics 20, 21-35.
Roberge C., Einum S., Guderley H., Bernatchez L., 2006, Rapid par-allel evolutionary changes of gene transcription profiles in farmedAtlantic salmon. Mol. Ecol. 15, 9-20.
Robison B.D., Wheeler P.A., Sundin K., Sikka P., Thorgaard G.H.,2001, Composite interval mapping reveals a major locus influenc-ing embryonic development rate in rainbow trout (Oncorhynchusmykiss). J. Hered. 92, 16-22.
Rodriguez M.F., LaPatra S., Williams S., Famula T., May B.,2004, Genetic markers associated with resistance to infec-tious hematopoietic necrosis in rainbow and steelhead trout(Oncorhynchus mykiss) backcrosses. Aquaculture 241, 93-115.
Ryynänen H.J., Primmer C., 2006, Single nucleotide polymorphism(SNP) discovery in duplicated genomes: intron-primed exon-crossing (IPEC) as a strategy for avoiding amplification of dupli-cated loci in Atlantic salmon (Salmo salar) and other salmonidfishes. BMC Genomics 7, 192.
Saavedra C., Bachere E., 2006, Bivalve genomics. Aquaculture 256,1-14.
Sakamoto T., Danzmann R.G., Gharbi K., Howard P., Ozaki A.,Khoo S.K., Woram R.A., Okamoto N., Ferguson M.M., HolmL.E., Guyomard R., Hoyheim B., 2000, A microsatellite link-age map of rainbow trout (Oncorhynchus mykiss) characterizedby large sex-specific differences in recombination rates. Genetics155, 1331-1345.
Sakamoto T., Danzmann R.G., Okamoto N., Ferguson M.M., IhssenP.E., 1999, Linkage analysis of quantitative trait loci associatedwith spawning time in rainbow trout (Oncorhynchus mykiss).Aquaculture 173, 33-43.
Salem M., Kennedy P.B., Rexroad C.E., Yao J.B., 2006, Microarraygene expression analysis in atrophying rainbow trout muscle:a unique non-mammalian muscle degradation model. Physiol.Genomics 28, 33-45.
Sarropoulou E., Power D.M., Magoulas A., Geisler R., Kotoulas G.,2005a, Comparative analysis and characterization of expressedsequence tags in gilthead sea bream (Sparus aurata) liver andembryos. Aquaculture 243, 69-81.
Sarropoulou E., Kotoulas G., Power D.M., Geisler R., 2005b, Geneexpression profiling of gilthead sea bream during early develop-ment and detection of stress – related genes be application ofcDNA microarray technology. Physiol. Genomics 23, 182-191.
Sauvage C., Bierne N., Lapègue S., Boudry P., 2007, Singlenucleotide polymorphisms and their relationship to codonusage bias in the Pacific oyster Crassostrea gigas. Gene[doi.10.1016/j.gene.2007.05.011].
Savan R., Sakai M., 2006, Genomics of fish cytokines. Comp.Biochem. Physiol. D-Genomics Proteonomics 1, 89-101.
Schlötterer C., 2002, Towards a molecular characterization of adap-tation in local populations. Current Opinion Genet. Dev. 12, 683-687.
Sekino M., Hara M., 2007, Linkage maps for the Pacific abalone(Genus Haliotis) based on microsatellite DNA markers. Genetics175, 945-958.
Senger F., Priat C., Hitte C., Sarropoulou E., Franch R., Geisler R.,Bargelloni L., Power D., Galibert F., 2006, The first radiation hy-brid map of a perch – like fish: The gilthead seabream (Sparusaurata L.). Genomics 87, 793-800.
Sigh J., Lindenstrom T., Buchmann K., 2004, Expression ofpro-inflammatory cytokines in rainbow trout (Oncorhynchusmykiss) during an infection with Ichthyophthirius multifiliis. FishShellfish Immunol. 17, 75-86.
Silverstein J.T., Weber G.M., Rexroad C.E., Vallejo R.L., 2006,Genetics and genomics – Integration of molecular genetics into abreeding program for rainbow trout. Isr. J. Aquac. Bamidgeh 58,231-237
Sironen A., Thomsen B., Andersson M., Ahola V., Vilkki J., 2006, Anintronic insertion in KPL2 results in aberrant splicing and causesthe immotile short-tail sperm defect in the pig. Proc. Natl. Acad.Sci. USA 103, 5006-5011.
Smith C.T., Elfstrom C.M., Seeb L.W., Seeb J.E., 2005a, Use of se-quence data from rainbow trout and Atlantic salmon for SNP de-tection in Pacific salmon. Mol. Ecol. 14, 4193-4203.

254 R. Wenne et al.: Aquat. Living Resour. 20, 241–255 (2007)
Smith C.T., Templin W.D., Seeb J.E., Seeb U.W., 2005b, Single nu-cleotide polymorphisms provide rapid and accurate estimates ofthe proportions of US and Canadian Chinook salmon caught inYukon River fisheries. North Am. J. Fish. Manage. 25, 944-953.
Sonesson A.K., 2005, A combination of walk-back and optimum con-tribution selection in fish. Genet. Sel. Evol. 37, 587-599.
Soule M., LaFrentz S., Cain K., LaPatra S., Call D.R., 2005,Polymorphism in 16S rRNA genes from Flavobacterium psy-chrophilum correlate with elastin hydrolysis and tetracycline re-sistance. Dis. Aquat. Org. 65, 209-216.
Stenvik J., Wesmajervi M.S., Damsgard B., Delghandi M., 2006,Genotyping of pantophysin I (Pan I) of Atlantic cod (Gadusmorhua L.) by allele-specific PCR. Mol. Ecol. Notes 6, 272-275.
Storz J.F., 2005, Using genome scans of DNA poplymorphism to inferadaptive population divergence. Mol. Ecol. 14, 671-688.
Storz J.F., Dubach J.M., 2004, Natural selection drives altitudinal di-vergence at the albumin locus in deer mice, Peromyscus manicu-latus. Evolution 58, 1342-1352.
Storz J.F., Hoekstra H.E. 2007, The study of adaptation and speciationin the genomic era. J. Mammalog. 88, 1-4
Sun X., Liang L., 2004, A genetic linkage map of common carp(Cyprinus carpio L.) and mapping of a locus associated with coldtolerance. Aquaculture 238, 165-172.
Sundin K., Brown K.H., Drew R.E., Nichols K.M., Wheeler P.A.,Thorgaard G.H., 2005, Genetic analysis of a development rateQTL in backcrosses of clonal rainbow trout, Oncorhynchusmykiss. Aquaculture 247, 75-83.
Tao W.J., Boulding E.G., 2003, Associations between single nu-cleotide polymorphisms in candidate genes and growth rate inArctic charr (Salvelinus alpinus L.). Heredity 91, 60-69.
Taris N., Baron S., Sharbel T.F., Sauvage C., Boudry P., 2005, Acombined microsatellite multiplexing and boiling DNA extrac-tion method for high throughput parentage analyses in the PacificOyster (Crassostrea gigas). Aquac. Res. 36, 516-518.
Taris N., Ernande B., Boudry P., 2006, Phenotypic and genetic con-sequences of size selection at the larval stage in the Pacific oyster(Crassostrea gigas). J. Exp. Mar. Biol. Ecol. 333, 147-158.
Thorsen J., Zhu B., Frengen E., Osoegawa K., de Jong P.J., Koop B.F.,Davidson W.S., Hoyheim B., 2005, A highly redundant BAC li-brary of Atlantic salmon (Salmo salar): an important tool forsalmon projects. BMC Genomics 6, 50
Tilton S.C., Givan S.A., Pereira C.B., Bailey G.S., Williams D.E.,2006, Toxicogenomic profiling of the hepatic tumor promotersindole-3-carbinol, 17 β-estradiol and β-naphthoflavone in rain-bow trout. Toxicol. Sci. 90, 61-72.
Ton C., Stamatiou D., Dzau V.J., Liew C.C., 2002, Construction ofa zebrafish cDNA microarray: gene expression profiling of thezebrafish. Biochem. Biophys. Res. Comm. 296, 1134-1142.
Torto-Alalibo T., Tian M.Y., Gajendran K., Waugh M.E., van West P.,Kamoun S., 2005, Expressed sequence tags from the oomycetefish pathogen Saprolegnia parasitica reveal putative virulencefactors. BMC Microbiol. 5, 46.
Vandeputte M., Mauger S., Dupont-Nivet M., 2006, An evaluation ofallowing for mismatches as a way to manage genotyping errors inparentage assignment by exclusion. Mol. Ecol. Notes 6, 265-267.
Vandeputte M., Kocour M., Mauger S., Dupont-Nivet M., DeGuerry D., Gela D., Vallod D., Linhart O., Chevassus B., 2005,Heritability estimates for growth-related traits using microsatel-lite parentage assignment in juvenile common carp (Cyprinuscarpio L.). Aquaculture 247, 31-32.
van Tienderen P.H., de Haan A.A., van der Linden C.G., Vosman B.,2002, Biodiversity assessment using markers for ecologically im-portant traits. Trends Ecol. Evol. 17, 577-582.
Vasemägi A., Nilsson J., Primmer C.R., 2005, Expressed sequencetag-linked microsatellites as a source of gene-associated poly-morphisms for detecting signatures of divergent selection inAtlantic salmon (Salmo salar L.). Mol. Biol. Evol. 22, 1067-1076.
Venier P., De Pitta C., Pallavicini A., Marsano F., Varotto L.,Romualdi C., Dondero F., Viarengo A., Lanfranchi G., 2006,Development of mussel mRNA profiling: Can gene expres-sion trends reveal coastal water pollution? Mutation Research-Fundamental and Molecular Mechanisms of Mutagenesis 602,121-134.
Venkatesh B., Hettwer U., Koopmann B., Karlovsky P., 2005,Conversion of cDNA differential display results (DDRT-PCR)into quantitative transcription profiles. BMC Genomics 6, 51.
Volckaert F.A.M.J., Batargias C., Chatziplis D., Chistiakov D.,Haley C.S., Hellemans B., Kotoulas G., Law A., Libertini A.,McAndrew B.J., Tsigenopoulos C., Whitaker H.A., 2006, A sec-ond generation linkage map of European sea bass. IXth Int.Symp. for Genetics in Aquaculture, Montpellier, June 25-30,2006.
von Schalburg K.R., Rise M.L., Cooper G.A., Brown G.D., GibbsR.A., Nelson C.C., Davidson W.S., Koop B.F., 2005a, Fish andChips: Various methodologies demonstrate utility of a 16,006-gene salmonid microarray. BMC Genomics 6, 126
von Schalburg K.R., Rise M.L., Brown G.D., Davidson W.S., KoopB.F., 2005b, A comprehensive survey of the genes involved inmaturation and development of the rainbow trout ovary. Biol.Reprod. 72, 687-699.
von Schalburg K.R., McCarthy S.P., Rise M.L., Hutson J.C.,Davidson W.S., Koop B.F., 2006, Expression of morphogenicgenes in mature ovarian and testicular tissues: potential stem-cellniche markers and patterning factors. Mol. Reprod. Dev. 73, 142-152.
Waldbieser G.C., Bosworth B.G., Nonneman D.J., Wolters W.R.,2001, A microsatellite-based genetic linkage map for channel cat-fish, Ictalurus punctatus. Genetics 158, 727-734.
Wang C.M., Lo L.C., Zhu Z.Y., Yue G.H., 2006, A genome scan forquantitative trait loci affecting growth-related traits in an F1 fam-ily of Asian seabass (Lates calcarifer). BMC Genomics 7, Art.No. 274.
Watanabe T., Fujita H., Yamasaki K., Seki S., Taniguchi N., 2004,Preliminary study on linkage mapping based on microsatelliteDNA and AFLP markers using homozygous clonal fish in Ayu(Plecoglossus altivelis). Mar. Biotech. 6, 327-334.
Westenberg M., Heinhuis B., Zuidema D., Vlak J.A., 2005, SiRNAinjection induces sequence-independent protection in Penaeusmonodon against white spot syndrome virus. Virus Res. 114, 133-139.
Whitaker H.A., McAndrew B.J., Taggart J.B., 2006, Constructionand characterisation of a BAC library for the European sea bassDicentrarchus labrax. Anim. Genet. 37, 526.
Whitehead A., Crawford D.L., 2006, Neutral and adaptive variationin gene expression. Proc. Natl Acad. Sci. USA 103, 5425-5430.
Williams T.D., Gensberg K., Minchin S.D., Chipman J.K., 2003, ADNA expression array to detect toxic stress response in Europeanflounder (Platichthys flesus). Aquat. Toxicol. 65, 141-157.
Wilson A.J., Ferguson M.M., 2002, Molecular pedigree analysis innatural populations of fishes: approaches, applications, and prac-tical considerations. Can. J. Fish. Aquat. Sci. 59, 1696-1707.
Wilson K., Li Y., Whan V., Lehnert S., Byrne K., Moore S.,Pongsomboon S., Tassanakajon A., Rosenberg G., Ballment E.,Fayazi Z., Swan J., Kenway M., Benzie J., 2002, Genetic map-ping of the black tiger shrimp Penaeus monodon. Aquaculture204, 297-309.

R. Wenne et al.: Aquat. Living Resour. 20, 241–255 (2007) 255
Woram R.A., Gharbi K., Sakamoto T., Hoyheim B., Holm L.E.,Naish K., McGowan C., Ferguson M.M., Phillips R.B., SteinJ., Guymard R., Cairney M., Taggart J.B., Powell R., DavidsonW.S., Danzmann R.G., 2003, Comparative genome analysis ofthe primary sex-determining locus in salmonid fishes. GenomeRes. 13, 272-280.
Woram R.A., McGowan C., Stout J.A., Gharbi K., Ferguson M.M.,Hoyheim B., Davidson E.A., Davidson W.S., Rexroad C.,Danzmann R.G., 2004, A genetic linkage map for Arctic char(Salvelinus alpinus): evidence for higher recombination rates andsegregation distortion in hybrid versus pure strain mapping par-ents. Genome 47, 304-315.
Yazawa R„ Cooper G.A., Hunt P., Beetz-Sargent M., Robb A., ConradM., McKinnel L., So S., Jantzen S., Phillips R.B., Davidson W.S.,Koop B.F., 2007, Striking antigen recognition diversity in theAtlantic salmon T-cell receptor alpha/delta locus. Dev. Comp.Immunol. [doi: 10.1016/j.dci.2007.05.002].
Young W.P., Wheeler P.A., Coryell V.H., Keim P., Thorgaard G.H.,1998, A detailed linkage map of rainbow trout produced usingdoubled haploids. Genetics 148, 839-850.
Yu Z., Guo X., 2003, Genetic linkage map of the Eastern oysterCrassostrea virginica Gmelin. Biol. Bull. 204, 327-338.
Yu Z., Guo X., 2006, Identification and mapping of disease-resistanceQTLs in the eastern oyster, Crassostrea virginica Gmelin.Aquaculture 254, 160-170.
Zhou Z., Bao Z., Dong Y., Wang S., He C., Liu W., Wang L., ZhuF., 2006, AFLP linkage map of sea urchin constructed using aninterspecific cross between Strongylocentrotus nudus (~) and S.intermedius (|). Aquaculture 259, 56-65.
Zimmerman A.M., Evenhuis J.P., Thorgaard G.H., Ristow S.S., 2004,A single major chromosomal region controls natural killer cell-like activity in rainbow trout. Immunogenetics 55, 825-835.
Zimmerman A.M., Wheeler P.A., Ristow S.S., Thorgaard G.H., 2005,Composite interval mapping reveals three QTL associated withpyloric caeca number in rainbow trout, Oncorhynchus mykiss.Aquaculture 247, 85-95.