ASSESSMENT OF LAKE NASSER FISHERIES
18
“Assessment of Lake Nasser Fisheries” Egyptian Journal of Aquatic Research. Vol. 34 (2) 2008. ASSESSMENT OF LAKE NASSER FISHERIES ALAA EL-HAWEET*, EL- HUSSEIN ADAM°, YASSER SANGQ* AND ALAA ELFAR* *National Institute of Oceanography & Fisheries, Alexandria ° Lake Nasser Development Authority, Aswan Keywords: Lake Nasser, Fishing gear, Fisheries indicators, CPUE Corresponding author: National Institute of Oceanography and Fisheries, 21556 Al-Anfushy, Alexandria, Egypt E-mail: [email protected]
Transcript of ASSESSMENT OF LAKE NASSER FISHERIES

“Assessment of Lake Nasser Fisheries” Egyptian Journal of Aquatic Research. Vol. 34 (2) 2008.
ASSESSMENT OF LAKE NASSER FISHERIES
ALAA EL-HAWEET*, EL- HUSSEIN ADAM°, YASSER SANGQ*
AND ALAA ELFAR*
*National Institute of Oceanography & Fisheries, Alexandria
° Lake Nasser Development Authority, Aswan
Keywords: Lake Nasser, Fishing gear, Fisheries indicators, CPUE
Corresponding author: National Institute of Oceanography and Fisheries, 21556 Al-Anfushy,
Alexandria, Egypt
E-mail: [email protected]

2
Abstract
Four fisheries surveys were carried out in Lake Nasser, the largest lake in Egypt (about
6000 km2), in order to assess the lake fisheries during the period from March 2006 to March
2008. Random fishing boats were inspected to investigate their fishing gears and methods (e.g.
trammel and gill nets) and their catches.
Artisanal fishery in the lake is conducted nearer to the shoreline in areas not more than
15m deep targeting only 6 species. The most dominant species were; Tilapia group (O. niloticus,
S. galilaeus, and T. zillii), pelagic fishes (A. dentex and H. forskalii) and L. niloticus. A size-
range of each species and their distribution pattern in different areas of the lake was described
for the major fish species in the lake. The time series of size distribution showed high
exploitation rate for most important commercial species in the Lake.
Catch per unit effort (CPUE) of different fishing methods in the Lake was estimated as the
catch in Kg of fish by 50m length of the nets per night or shot. The results indicate that the
southern part of the lake is more productive for gill net while the opposite is recorded for
trammel net.
Unreported landings are still considered to be a major problem in the landing estimate of
the lake which is used as a tool for fisheries management.
Options for the management of Lake Nasser fishery are suggested.

3
1. INTRODUCTION
Egypt is a country depending mainly on the inland water resources for the supply of fish as
a cheap source of protein. Lake Nasser, the largest lake in Egypt is a man made lake which
appeared after the construction of the High Dam at Aswan. Total area of the lake is about 6275
km2 at 180m
2 water level. Its long shoreline affected by the annual flood amount, with a mean
depth of 21m at 160m level as compared to about 25m at 180m level and maximum depth of 110
to 130 m. A rise in water level in a reservoir at an appropriate time can flood shallow water areas
making them available for spawning and or feeding of fish (Bishai et al, 2000).
Lake Nasser constitutes two thirds of the Dam Reservoir the other third of the Reservoir
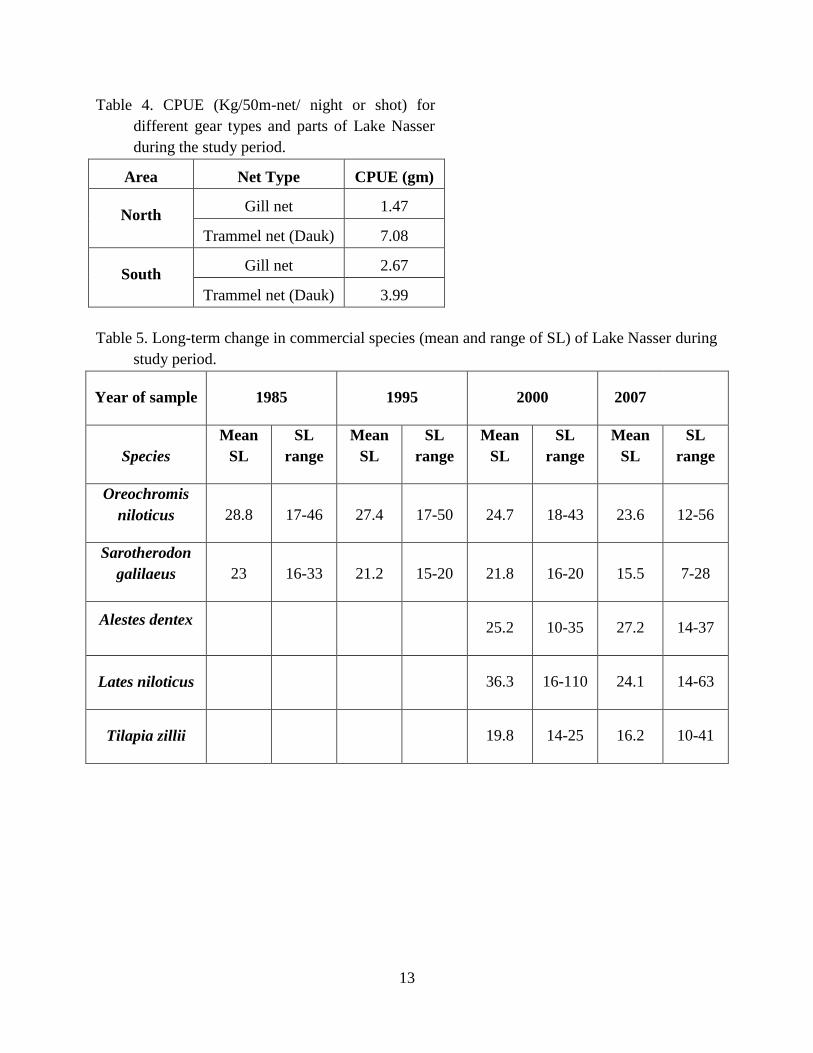
extends south to Sudan forming Lake Nubia. The lake possesses 85 side extensions (Khors), 48
are on eastern side and 37 on western side of the old Nile river channel. The important Khors
(most productive fishing sites in the Lake) are El-Ramla, Wadi Abyad, Kalabsha, Wadi El-
Allaqi, Korosko, Tushka (Latif, 1974). The exploitation rate of the different Khors is unequal.
Recently, Lake Nassser has experienced declines in fish catches and reduction in fish species
diversity (GAFRD, 2007).
Only three official landing sites present on the lake Nasser, at Aswan city, Garf Hussein
and Abu Simbel. There are some collection boats which receive the catch at the fishing grounds
and transfer it to fishing ports.
Fishery research in the lake was focused largely on the fish biology of some species which
were carried out by numerous investigators last century (e.g. Abdel-Azim, 1974; Abdel-Azim,
1982; Latif and Khallaf, 1974; Rashid, 1977; El-Etriby, 1982; Adam 2000; Latif and Khallaf,
1987; Tharwat et al., 1994; Massoud et al., 1985). Among these studies, research on stock
assessment was conducted only on some occasions without considering the ecological changes in
the lake (e.g. Entz and Latif, 1974; Ahmad, 1998; Mekkawy, 1998; Khalifa et al., 2000; Adam,
2004).
The objectives of the present study are:
1. To characterise the spatial and dynamical aspects of the Lake fisheries.
2. To define the current state of the fishery and assess the options for management.
2. MATERIAL AND METHODS
Fishery surveys were carried out to investigate the status of Lake Nasser fishery utilizing
the artisanal gears used by commercial fishermen in the lake.
Four field trips were conducted by the boat of Lake Nasser Development Authority,
Aswan, EGYPT (NARES) from March 2006 to March 2008. During each trip small fishing
boats used trammel and gill nets were inspected to get a representing sample from its catches.
Fish stocks were sampled from important khors from both sides of the main channel and
from northern and southern parts of the lake. Khor El Ramla, Amberkab, Kalabsha, Garf
Hussein, Wadi Abyad El Allaqi, Korosko, Abu Handal, Tushka west, Abu simbel and Tushka
East were selected considering its fisheries importance and some environmental factors as;
depth, bottom type and vegetation at the area (Fig. 1).

4
Data collection and analysis
An interview questionnaire was conducted to collect data from commercial fishing boats
including: date, name of khor, number of fishermen in the boat, type and measurements of the
net used (length, height and mesh size), number of shots (hauls) per day, fishing time and total
catch by species.
Measurements of total & standard lengths (mm) and total weight (g) were recorded for
each fish in the catch. All samples were measured fresh, just after they were collected.
Fisheries size-based indicators (e.g. mean of total weight & standard length and their
range) were used for characterizing fisheries of the lake.
It is assumed that the catch in weight per unit effort (CPUE) of different fishing methods
could be taken as an indication of stock abundance. CPUE was computed as the catch in gm of
fish by 50m length of the nets in a unit of time (fishing days).
3. RESULTS
Fishing gears and methods
In the northern part of the lake, fishing is mostly carried out using trammel nets, while in the
southern part fishing by float gill nets is more common. Long line fishing is also employed in
Lake Nasser. Both gear types are used along the shore at depths up to 10-15 m.
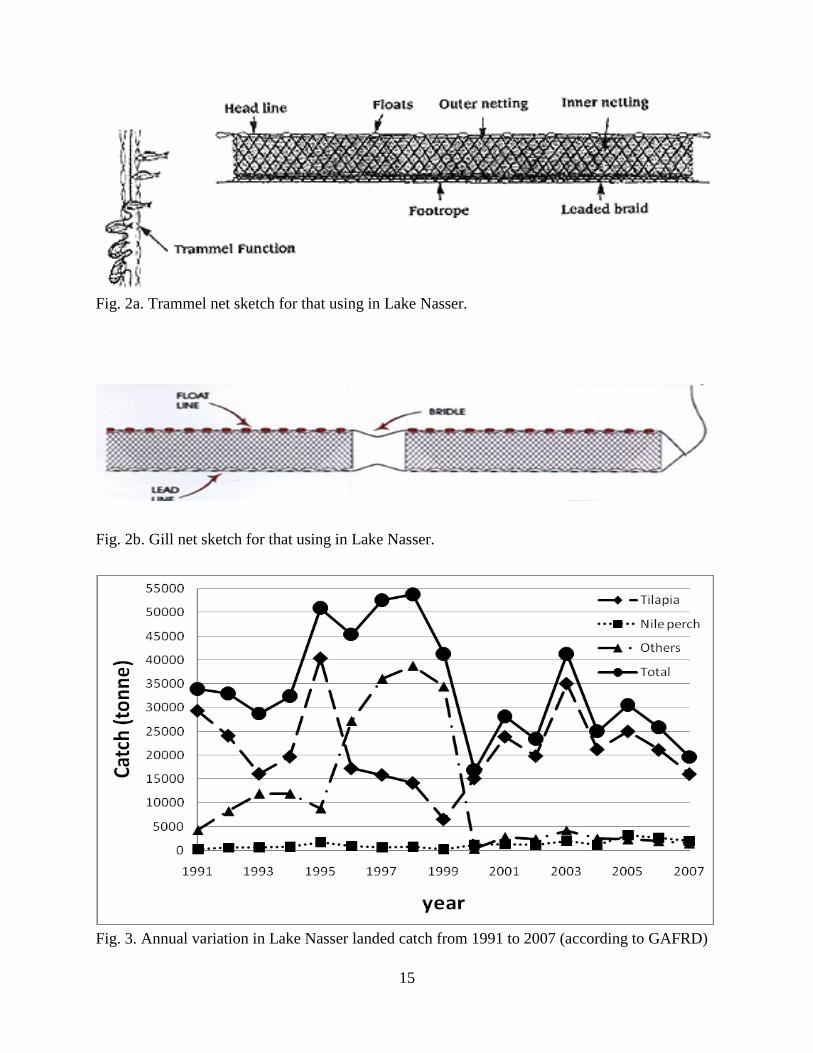
Trammel nets (locally named, Ghazl Mesagin or Duk): Trammel net is the dominant
fishing gear on the lake that is most effective for tilapia species. This net is targeting bottom and
semipelagic fishes, mainly Tilapia spp (Bolti), Lates niloticus (Samoos), and Bagrus spp
(Bayad). The net unit length ranges from 20 to 30 m and 1.5 to 2.5 m deep with mesh bar size of
inner layer usually 3 to 4 cm and outer layer from 7 to 10 cm. Tow to five units of nets joined
together. Three layered net fished in stationary manner over night or for a half hour using sound
disturbances during day or night time. A fisherman hits the surface of the water by using a pole
and drums on the deck with his feet, sending vibrations into the water. The number of shots per
day varies according to weather conditions between 10 and 15 shot /day. For over night
operation, fishing starts after darkness and continues untill just before dawn. Most of the catch is
sold fresh (Fig. 2a.).
Floating gill-net (Sakarota): This net is targeting pelagic fishes in surface layers Alestes
spp (raya), Hydrocynus spp (kalb) and Lates niloticus (samoos). A number of net units (i.e. from
20 to 40) are stringed together to form a long net. Each unit varies in length from 20 to 50m and
depth from 2.5 to 5m. The mesh bar size varies from 3.5 to 6.0cm.This fishery is operated
overnight and the catch is gutted, salted and preserved in tins (Fig.2b.).
The current state of the fishery
Fishery in Lake Nasser is mainly confined to the shallower area in each khor, and consists
of artisanal fishery using motorized and traditional small non-motorized boats. Boats in the lake
are wooden and steel, and are operated by two fishermen per boat. The catch is collected by
carrier boat from different parts of the Lake. There are about 200 carrier boats, each operating for
collecting fish from an assigned area and supplying fishermen with food.

5
Landing analysis
Two estimates for the landing are issued annually; the first by Lake Nasser Development
Authority, Aswan, Egypt which contains the fresh landed fishes at the three official landing ports
with estimate of amount of salted fishes. The second estimate by General Authority for fisheries
Resources Development (GAFRD) & contains the landed fresh fishes and the salted fishes after
being converted to fresh weight by conversion factor 1to 3. Another estimate of the non recorded
amount of fishes witch sold in the black market was also added. According to (GAFRD, 1991-
2007) the landing of the Lake was dominated by two groups of fishes tilapia (comprise four
tilapia species) and Nile perch. During 17 years (1991-2007) the total catch was affected by
tilapia except four years from 1996 to 1999, where the estimate of other fishes (including salted
and unrecorded part of catch) was more influence on the total landing (Fig. 3). During that period
the landing reached the maximum at 1998 (around 50 thousand tonnes). Last three years (2005 –
2007) fish landing decreased to the minimum amount (about 20 thousand tonnes). The bulk of
the landing was tilapia species constituting as much as 81 %. Nile perch landing was the next
most important fish with a percentage of about 10%, while the salted fish constituted about 8%.
Species Composition
Six fish species dominated the catch of the different regions of the Lake; namely
Oreochromis niloticus (O.n.), Sarotherodon galilaeus (S.g.), Alestes dentex (A.d.), Hydrocynus
forskalii (H.f.), Lates niloticus (L.n.) and Tilapia zillii (T.z.). Moreover, few other species were
recorded like Bagrus spp (Bagrus bajad and Bagrus docmak), Tetrodontus fahaka, Mormyrus
kannume (locally Bouza), Chrysichthys auratus (locally Grgour), Barbus bynni, Heterobranchus
longifilis, Synodontis schall Labeo niloticus and Clarias gariepinus.
O. niloticus was the most dominant species in weight (34%) but came second in number
(17%) while S. galilaeus was first in number (36%) but second in weight. A. dentex (14%) came
third in weight followed by H. forskalii (12%), L. niloticus (8%) and T. zillii (4%). Other species
comprise about 8% from the total catch (Fig. 4).
Size composition
The length range of O. niloticus was 12-56cm with average standard length (SL) 23.6cm
and average total weight (Wt) was 610 gm, while S. galilaeus average SL was 15.4cm with range
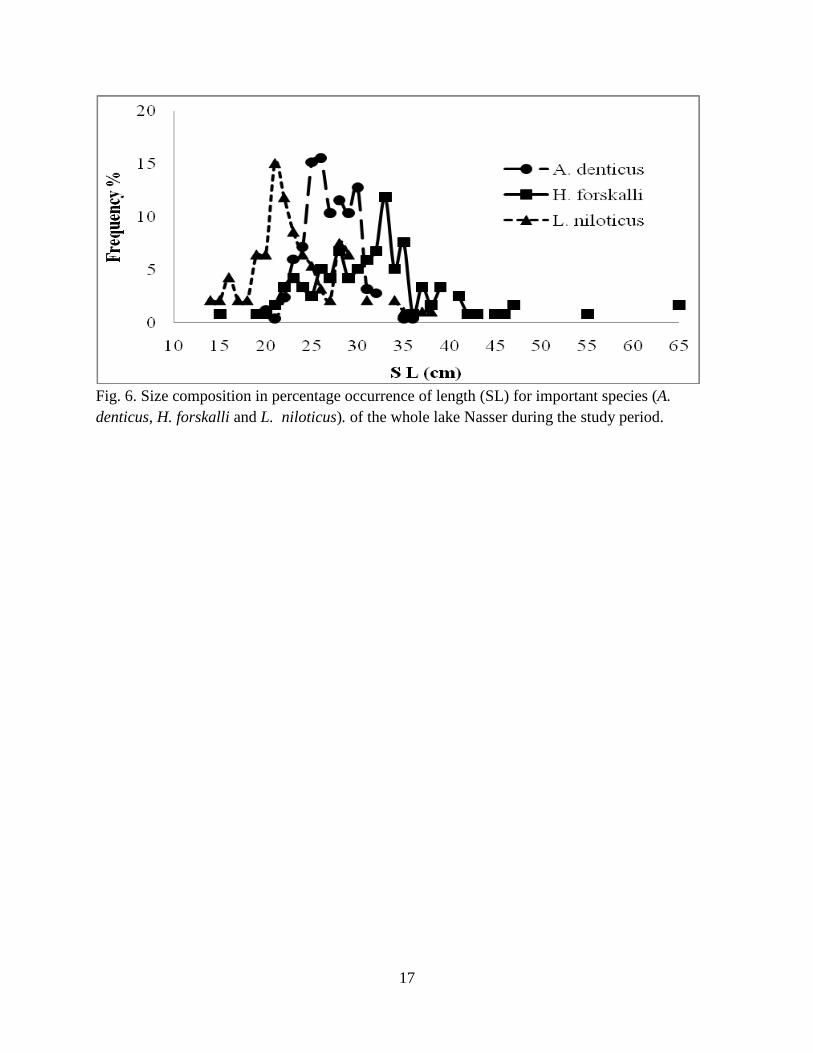
from 7 to 28cm and average Wt 166gm. A. dentex average (SL) was 27.2cm with range of 14-
37cm and average weight 245gm. H. forskalii had average SL 32.1cm with range 15-65cm and
average Wt 444gm. Moreover L. niloticus had average SL 24.1cm with range 14-63cm and
average Wt 360gm (Table 1 and Fig. 5).
Catch characteristics by different nets and area
The lake area was divided to two parts; north and south of Khore Korosko. Catch of
trammel and gill nets was used to compare the fishing status of two parts. For a given mesh size,
fishes caught cover a length range differing according to species.
Tilapia was the target species by trammel nets in both parts of the lake. S. galilaeus
dominated the northern part of the lake (62% of the total catch) followed by O. niloticus. On the
other hand, O. niloticus was the most dominant species in southern part catch (78% of the total

6
catch) followed by S. galilaeus. Moreover, T. zillii and L. niloticus came next in catch weight
(Table 2).
Gill net was targeting H. forskalii and A. dentex, the first species was abundant in the
southern part (35% of the total catch) while the second dominated in the northern part (30% of
the total catch). O. niloticus and S. galilaeus had a considerable amount in the gill net catch of
the northern part (23 and 10% respectively) while L. niloticus came in the third rank of the
southern part catch (12% of the total catch).
Mean fish length and its range differed by area and gear type. For trammel net catch, O.
niloticus had lower mean SL (23.8cm with range 14 - 39cm) in the northern part than southern
part (19.5cm with range 12-33cm). Similar trend was recognized for S. galilaeus (15 cm with 7-
19cm range and 17.6cm with 15-21cm in northern and southern parts respectively) and T. zillii
(15.8 cm with 10-22cm range and 18.1cm with 14-41cm in northern and southern parts
respectively). L. niloticus showed opposite trend, it had higher mean length in northern part
(26.5cm with range 20 - 35cm) than the southern part (20.7cm with range 15 - 28cm) as shown
in table 3.
For gill net catch, H. forskalii had almost the mean and range of SL in both parts of the
lake while A. dentex was higher in mean SL in northern part (28.3cm with 21-34cm range) than
the southern part (24.9cm with 20-37cm range). Similar trend was found for O. niloticus (27.5cm
with 14-56cm range and 21.7cm with 18-26cm range in northern and southern parts respectively)
which was opposite to L. niloticus catch (22.5cm with 14-38cm range and 24.3cm with 19-37cm
in northern and southern parts respectively). S. galilaeus showed no difference in mean length
SL in both parts.
It was observed that the number of recorded species was less in northern part than the
southern part. The six dominant species in the gill net constituted 95% of the northern part catch
while they constituted only 72.5% of the southern part catch.
Catch per unit of effort (CPUE)
Sinking (bottom) trammel nets and surface (floating) gill-nets were used for describing the
abundance in both parts of the lake. Catch per unit effort (CPUE) computed as the catch in kg of
fish by 50m length of the net in a unit of time (one night for gill net or one shot of trammel net).
The average values CUPE (Table 4), for gill-nets was lower in northern part (1.47) than southern
part (2.67) while for trammel net was higher in northern part (7.08) than southern part (3.99).
4. DISCUSSION
It is obvious that the official landing do not represent the true annual fish catch. The low
figures of estimated fish yield is mainly attributed to that a large portion of the catch is sold in
the black market at high prices and hence not recorded in the official catches. During the present
study the catch of tilapia group constitute only 55% from the catch while in the official landing
constitute 81%, and the salted fishes (H. forskalii and A. dentex) constitute 26% while in the
official landing only 8%. Such differences need to evaluate the system of collecting catch and
effort data for better management of the lake fishery.

7
The annual total catch from Lake Nasser showed high fluctuations, such condition may be
attributed to the water level changes due to the degree of the annual flood and consequently the
length of the Lake shore line (Bishai et al., 2000).
Although 75 fish species known from the Nile system have been recorded by Bishai and
Khalil (1997), and 58 species were recorded by Latif (1974)in Lake Nasser, yet nowadays, the
fisheries depend upon only a limited number of species (six or seven species) and all recorded
species were only 15 species. The former six species are adapted well to the new conditions and
indeed become the main species in the Lake. The remaining fish species have either declined to
insignificant levels or almost in their way to disappear from the Lake. Khalifa et al, (2000),
recorded for the first time, the occurrence of O. aureus but this species was not recorded during
the present study.
It was found that fishes were more abundant in the southern sectors than in the northern
one of Lake Nasser in term of relative abundance. Similar finding was explained by Khalifa et al,
(2000) that is due to less fishing effort in southern part. In the present study it was found that
trammel net used in the northern part has smaller mesh size than in the southern part. In the
Egyptian fisheries law the mesh size of net used in Dak method (as described above) should be
17cm for outer layer and 7cm for inner layer, the present survey pointed out that the outer layer
dose not exceed 10cm and the inner one 4cm and usually 3cm in northern part. Such fishing
practice affects the stock of different species. Moreover, the northern part had a wide shallower
area used for fishing than southern part.
Ecological indicators that characterize the functioning and the dynamics of exploited
ecosystems on the basis of species composition and size distribution are widely used for
describing fisheries status of a given water body (Christensen, 2005). In the present study, mean
and range of fish length and weight for different species were used to describe the status of the
fisheries in the lake.
From the relatively large catches and fish sizes (comparative with other Egyptian lakes),
one could conclude that the fishery is at an early stage of its development. However, considering
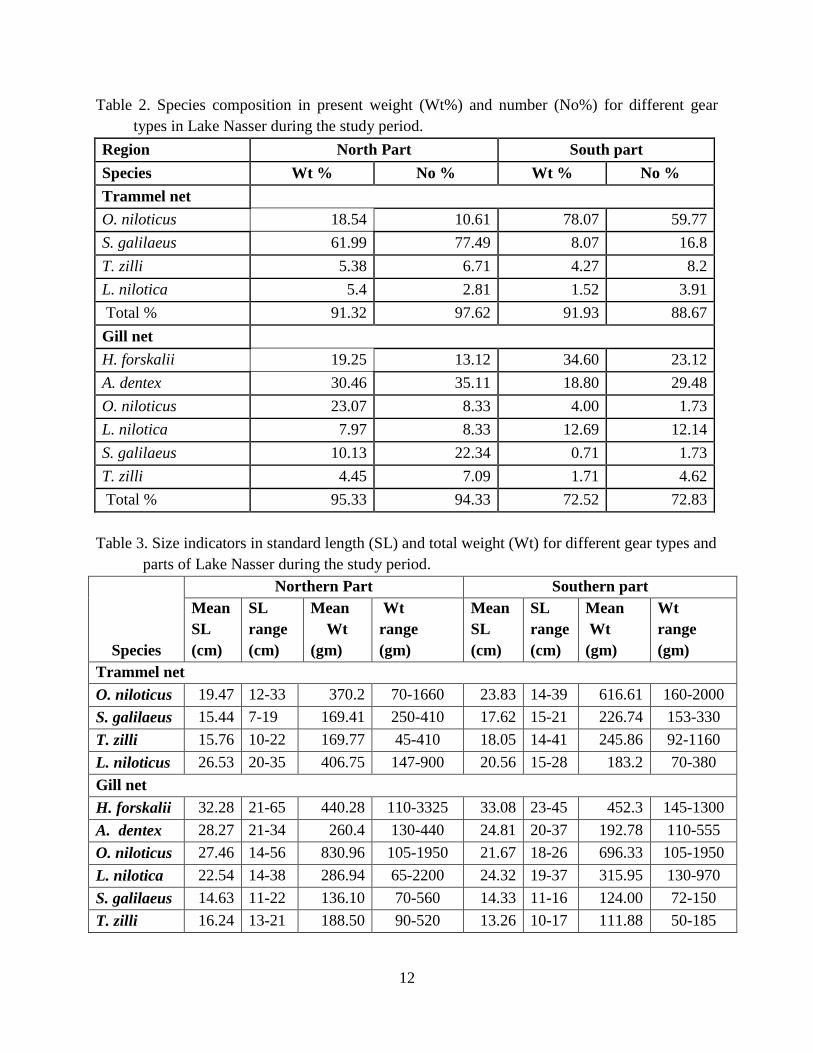
the time series analysis of catch size composition of targeting species (Table 5), it could be
realized that from 1985 to 2007, O. niloticus mean length decreased from 28.8 to 23.6cm and its
range from 17-46 to 12-56cm while S. galilaeus mean length decreased from 23to 15.5cm and its
range from 16-33 to 7-28cm during the same period of time. Moreover, L. niloticus and T. zillii
showed similar changes during the period from 2000 to 2007; the first from 36.3 to24.1with
length range from 16-110 to 12-63cm, and the second from 19.8 to 16.2cm with length range
from 14-25 to 10-41cm. This may be attributed to the decrease of mesh size of trammel net and
increase its activities along the shore area. While, A. dentex did not decrease in size during the
period from 2000 to 2007 but a slight increase in size was noted from 25.2 to 27.2cm with range
from 10-35 to 14-37cm, such finding may be related to its habit as a pelagic fish affected more
by limnological parameters and its impact on recruitment with regards that no changes in the
mesh size of gill net was occurred during that period.

8
Some targeting species stocks are suffering from fishing pressure. Adam (2004), estimated
the length at first maturity for L. niloticus, O. niloticus and S. galilaeus, as 88, 25, 24cm
respectively. The present estimate of mean lengths of the three species are less than lengths of
first maturity, in addition, their smallest lengths in the catch have decreased in the last few years.
Catch per unit effort (CPUE) is commonly used as index of relative abundance of fish in
particular area. The difference between LPUE (land per unit effort) and CPUE unfortunately
creates further uncertainty if no information about discarding or other losses of fish at lake is
available. In the present study CPUE was estimated as a real number of catch per net length per
time, the data confirmed the high abundance of S. galilaeus in the northern part of the lake that
appear in the trammel net and O. niloticus in the southern part. For gill net CPUE showed the
abundance of A. dentex in the northern part of the lake and H. forskalii in the southern part.
Although there have been considerable effort to eliminate the destructive fishing gears
from the lake, illegal fishing did not stop. Also, annual closed season was established from 15
April to 15 May since 1999 to reduce the pressure on the fish stock but the number of fishing
boats on the lake has continued to increase and the fisheries authorities still emphasize increased
fish production by any way.
Suggestions for the management of Lake Nasser fishery
The decline in the fish stocks has been attributed to: excessive fishing effort; use of
destructive fishing gears and methods; capture of immature fish; weak management and
extension systems; outdated fisheries laws and regulations; inadequate capacity to enforce laws
and regulations and limited commitment and involvement of stakeholders in management of
fisheries resources.
The present strategy of the concerned authorities aims at a considerable expansion of the
fishery for food production. Management objectives should be clearly defined. Aiming at
exploitation for maximum protein production would be a rational policy, and the main constraint
for this would be infrastructural (investments, marketing channels, transport, processing and
conservation). In general, when the exploitation level increases, the catch per effort, the fish
stock biomass and the average size of the fish in the catch will decrease as was observed in the
other lakes of Egypt with high exploitation rates.
Actions are required to address the management challenges and to reduce threats to the
lake fisheries include:
1. Manage fisheries resources sustainably (including control of effort, control of man power
increase in lake basins; elimination the use of destructive fishing gears and methods and
capture of immature fish) with enforcement of appropriate policies, laws and regulations.
2. Develop sustainable funding mechanisms for implementing fisheries programs.
Management options under varying fishing effort and mesh size changes should be
considered and their effect on the total catch, CPUE, size structure and species
composition should be assessed.

9
3. Develop effective institutional processes and governance which involve stakeholders in
planning and implementation. Policy and legal framework needs to be updated regularly to
handle the situation of the day.
REFERENCES
Abdel-Azim, M.E.: 1974, Biological studies on Tilapia nilotica L. and Tilapia galilae Art. in
Lake Nasser. M.Sc. Thesis, Alexandria. Univ., Egypt.
Abdel-Azim, M.E.: 1982, Biological Studies on Some - Cyprinids from Lake Nasser.
Unpublished Ph.D Thesis, Alexandria University, Alexandria, Egypt.
Adam El. A.: 2004, Stock assessment of some important commercial fish species of lake Nasser,
Egypt. Ph.D. Thesis, Faculty of Science, Assiut University. 396pp.
Ahmed U.K.: 1998, The population dynamics of Oreochromis niloticus and Sarotherodon
galilaeus from Lake Nasser. ICLARM Symposium on Ecological Basis and
Management Policy for Sustainable Fish Production in Lake Nasser, High Dam
Lake Development Authority, June 20-23 Aswan, Egypt.
Bishai H.M. and Khalil M.T.: 1997, Freshwater Fishes of Egypt. Egyptian Environmental
Affairs Agency (EEAA production), National Biodiversity Unit, No. 9,229pp.
Bishai H.M.; Abdel Malek S.A. and Khalil M.T.: 2000, Lake Nasser. Egyptian Environmental
Affairs Agency (EEAA production). National Biodiversity Unit. No. 11. 577pp.
Christensen V.: 2005, SCOR/IOC Working Group 119 on Quantitative ecosystem indicators for
fisheries management Quantitative Ecosystem Indicators for Fisheries
Management. (Paris, 2004). ICES Journal of Marine Science, vol. 62, no. 3.
El-Etriby, S.G.: 1982, Studies on the Reproduction Biology of Lates niloticus Cuv.&Val. from
Lake Nasser . Unpublished Ph.D. Thesis, Alexandria University, Alexandria,
Egypt.
Entz, B.A. and Latif, A.F.: 1974, Report on surveys to Lake Nasser and Lake Nubia (1972-
1973). Lake Nasser Development Center, Aswan, Working paper No 6, pp. 1-137.
GAFRD: 1995-2007, Publications of the General Authority for Development of fish Resources,
Ministry of Agriculture. Egypt, (In Arabic).
Khalifa U.S., M.Z. Agaypi and H.A. Adam: 2000, Population Dynamics of Oreochromis
niloticus L and Sarotherodon galillus Art. p. 87-90. In J. F: Craig (ed,) Sustainable
fish production in Lake Nasser: ecological basis and management policy. ICLARM
Conf. Proc.61, 184
Latif, A.F.A.: 1974, Fisheries of Lake Nasser. Aswan Regional Planning, Egypt.
Latif, A.F. and Khallaf, E.A.: 1974, Studies on Nile perch, Lates niloticus L., from Lake Nasser
.Bull. Inst. Oceanogr. & fish. A.R.E, 4: 131-64.
Latif, A.F. and Khallaf, E.A.: 1987, Growth and mortality of Tilapia species in Lake Nasser. Sci.
J. Fac. Sci., Al- Menoufia Univ., 1(1): 34-53.
Massoud, A.A.; Shenouda, Th.S. and Wadie, W.F.: 1985, Biological study of the tiger fish
Hydrocynus forskalii. Cuv., from Lake Nasser. Delta J. Sci. 9(2); 537-562.

10
Mekkawy, I.A.: 1998, Fish stock assessment of Lake Nasser, Egypt with emphasis on the
fisheries of Oreochromis niloticus and Sarotherodon galilaeus. J. Egypt. Ger. Soc.
ZooL, 35(B): 283-404.
Rashid, M.M.: 1977, On the Biology of Fishes of Genus Alestes in Lake Nasser, Egypt. Ph.D.
Thesis, Cairo University, Egypt.
Tharwat, S.; Abbass, F.; Rashid, M.: 1994, The use of five prolongation of the spawaning season
of the partially spawning fishes of genus Chrysichthys from Aswan Reservoir
Egypt. J. Union. Arab. & W. (1A) 17-45.

11
Table 1. Average fish weights and their range (gm) of
different species caught from Lake Nasser during the
study period.
Species
Average
Wt (gm)
Range of
Wt (gm)
Oreochromis niloticus 609.63 70-2000
Sarotherodon galilaeus 166.38 60-560
Alestes dentex 245.32 72-500
Hydrocynus forskalii 444.32 165-3325
Lates niloticus 360.11 65-4561
Tilapia zillii 188.61 50-1160
Bagrus spp 251 75-1580
Tetrodontus fahaka 474.58 290-940
Mormyrus spp 189.32 143-300
12
Table 2. Species composition in present weight (Wt%) and number (No%) for different gear
types in Lake Nasser during the study period.
Region North Part South part
Species Wt % No % Wt % No %
Trammel net
O. niloticus 18.54 10.61 78.07 59.77
S. galilaeus 61.99 77.49 8.07 16.8
T. zilli 5.38 6.71 4.27 8.2
L. nilotica 5.4 2.81 1.52 3.91
Total % 91.32 97.62 91.93 88.67
Gill net
H. forskalii 19.25 13.12 34.60 23.12
A. dentex 30.46 35.11 18.80 29.48
O. niloticus 23.07 8.33 4.00 1.73
L. nilotica 7.97 8.33 12.69 12.14
S. galilaeus 10.13 22.34 0.71 1.73
T. zilli 4.45 7.09 1.71 4.62
Total % 95.33 94.33 72.52 72.83
Table 3. Size indicators in standard length (SL) and total weight (Wt) for different gear types and
parts of Lake Nasser during the study period.
Species
Northern Part Southern part
Mean
SL
(cm)
SL
range
(cm)
Mean
Wt
(gm)
Wt
range
(gm)
Mean
SL
(cm)
SL
range
(cm)
Mean
Wt
(gm)
Wt
range
(gm)
Trammel net
O. niloticus 19.47 12-33 370.2 70-1660 23.83 14-39 616.61 160-2000
S. galilaeus 15.44 7-19 169.41 250-410 17.62 15-21 226.74 153-330
T. zilli 15.76 10-22 169.77 45-410 18.05 14-41 245.86 92-1160
L. niloticus 26.53 20-35 406.75 147-900 20.56 15-28 183.2 70-380
Gill net
H. forskalii 32.28 21-65 440.28 110-3325 33.08 23-45 452.3 145-1300
A. dentex 28.27 21-34 260.4 130-440 24.81 20-37 192.78 110-555
O. niloticus 27.46 14-56 830.96 105-1950 21.67 18-26 696.33 105-1950
L. nilotica 22.54 14-38 286.94 65-2200 24.32 19-37 315.95 130-970
S. galilaeus 14.63 11-22 136.10 70-560 14.33 11-16 124.00 72-150
T. zilli 16.24 13-21 188.50 90-520 13.26 10-17 111.88 50-185
13
Table 4. CPUE (Kg/50m-net/ night or shot) for
different gear types and parts of Lake Nasser
during the study period.
Area Net Type CPUE (gm)
North
Gill net 1.47
Trammel net (Dauk) 7.08
South
Gill net 2.67
Trammel net (Dauk) 3.99
Table 5. Long-term change in commercial species (mean and range of SL) of Lake Nasser during
study period.
Year of sample 1985 1995 2000 2007
Species
Mean
SL
SL
range
Mean
SL
SL
range
Mean
SL
SL
range
Mean
SL
SL
range
Oreochromis
niloticus 28.8 17-46 27.4 17-50 24.7 18-43 23.6 12-56
Sarotherodon
galilaeus 23 16-33 21.2 15-20 21.8 16-20 15.5 7-28
Alestes dentex
25.2 10-35 27.2 14-37
Lates niloticus
36.3 16-110 24.1 14-63
Tilapia zillii
19.8 14-25 16.2 10-41
14
Fig. 1. Lake Nasser with sampling sites (red circles).
15
Fig. 2a. Trammel net sketch for that using in Lake Nasser.
Fig. 2b. Gill net sketch for that using in Lake Nasser.
Fig. 3. Annual variation in Lake Nasser landed catch from 1991 to 2007 (according to GAFRD)

16
Fig. 4. Species composition in the whole lake Nasser in weight and number (in percentage)
during the study period.
Fig. 5. Size composition in percentage occurrence of length (SL) for important species (O.
niloticus, S. galilaeus and T. zillii) of the whole lake Nasser during the study period.
17
Fig. 6. Size composition in percentage occurrence of length (SL) for important species (A.
denticus, H. forskalli and L. niloticus). of the whole lake Nasser during the study period.
18
تقيم مصايد اسماك بحيرة ناصر
ػالء افاس – ٠اسش سجك – احس١ اد – ػالء اح٠ظ
ذؼذ تح١شج اصش أوثش اثح١شاخ اصش٠ زا اجش٠د استغ سحاخ ١ذا١ اج ذم١ صا٠ذ االسان تاثح١ش
ذ جغ ػ١اخ ص١ذ لاسب اص١ذ اؼا تا اطك اص١ذ ارشش . 2008 ا اسط 2006خالي افرشج اسط
ذر ػ١اخ . اص١ذ تشثان اذق ثالث١ح اطثماخ اشثان اخ١ش١ راخ اطثم ااحذ ذرشش تاثح١ش طشل١ر .تاثح١ش
ااع االسان سرذف ااع 6ان . 15اص١ذ تاثح١ش تااطك اضح امش٠ة اشاطئ االل ػما
اشا وة )تجاة اساط االسان اؼائ (اثط ا١ اجا١ االخضش)اثط اثالز االوثش ش١ػا تاثح١ش
. (اسه
ال ذضاي شىح ذش٠ة االسان ػذ ذسج١ا تاطك االضاي اثالز اؼرذ احذ ا شاو ذظ١ صا٠ذ اثح١ش
. ا ٠ؼق ػ١اخ اداسج اصا٠ذ اخطظ اسرمث١
لذ ذ دساسح ارص٠غ اػ احج السان اخرف تاثح١ش تماسرا تاث١ااخ اؼ١ خالي اؼشش ػاا
. ااض١ جذ اسذفاع سر االسرغالي تاثح١ش ذالص رسطاخ احجا االسان تاص١ذ
ذأوذ ذؼشض (رش اشثان تا١ أ اطشح ذثؼا طش٠مح اص١ذ50ص١ذ )تحساب و١اخ اص١ذ تاسث حذج اجذ
. لذ ذد الشح اخ١اساخ اخاص ترشش١ذ حس اداسج صا٠ذ ذه اثح١ش اا. اخض اسى ثح١ش ضغظ صائذ