What Foreclosed Homes Should a Municipality Purchase to Stabilize Vulnerable Neighborhoods
26
What Foreclosed Homes Should a Municipality Purchase to Stabilize Vulnerable Neighborhoods? Michael P. Johnson & David A. Turcotte & Felicia M. Sullivan Published online: 9 June 2010 # Springer Science+Business Media, LLC 2010 Abstract Over the past 3 years, increased rates of mortgage foreclosures in the U.S. have resulted in widespread bankruptcies of financial institutions and massive losses of consumer wealth. The effects have been especially pronounced in economically vulnerable regions. In response, municipalities and community-based organizations provide a variety of services to mitigate the effects of foreclosures. Purchases of foreclosed properties represent a particularly attractive strategy because they have the potential to minimize blight, reduce unanticipated housing mobility, and to provide affordable homeownership opportunities. Since the cost of such purchases far exceeds the resources available in most urban centers, not-for-profit managers must solve the following decision problem: What subset of a large number of available foreclosed properties should be acquired for neighborhood stabilization and revitalization? In this paper, we present an extension of the multi-objective nonlinear knapsack problem to generate alternative portfolios of foreclosed multifamily rental properties to jointly optimize social benefits, social costs and equity. We apply our model to the Massachusetts city of Lowell, which has faced Netw Spat Econ (2010) 10:363–388 DOI 10.1007/s11067-010-9138-3 Presented at Eleventh International Symposium on Locational Decisions (ISOLDE XI), Santa Barbara, CA, July 1, 2008; INFORMS Fall National Conference, October 12, 2008; John Glenn School of Public Affairs, The Ohio State University, October 31, 2008. M. P. Johnson (*) : F. M. Sullivan Department of Public Policy and Public Affairs, University of Massachusetts Boston, Boston, MA 02125, USA e-mail: [email protected] F. M. Sullivan e-mail: [email protected] D. A. Turcotte Department of Regional Economic and Social Development, University of Massachusetts Lowell, Lowell, MA 01854, USA e-mail: [email protected]
Transcript of What Foreclosed Homes Should a Municipality Purchase to Stabilize Vulnerable Neighborhoods

What Foreclosed Homes Should a MunicipalityPurchase to Stabilize Vulnerable Neighborhoods?
Michael P. Johnson & David A. Turcotte &
Felicia M. Sullivan
Published online: 9 June 2010# Springer Science+Business Media, LLC 2010
Abstract Over the past 3 years, increased rates of mortgage foreclosures in the U.S.have resulted in widespread bankruptcies of financial institutions and massive lossesof consumer wealth. The effects have been especially pronounced in economicallyvulnerable regions. In response, municipalities and community-based organizationsprovide a variety of services to mitigate the effects of foreclosures. Purchases offoreclosed properties represent a particularly attractive strategy because they havethe potential to minimize blight, reduce unanticipated housing mobility, and toprovide affordable homeownership opportunities. Since the cost of such purchasesfar exceeds the resources available in most urban centers, not-for-profit managersmust solve the following decision problem: What subset of a large number ofavailable foreclosed properties should be acquired for neighborhood stabilizationand revitalization? In this paper, we present an extension of the multi-objectivenonlinear knapsack problem to generate alternative portfolios of foreclosedmultifamily rental properties to jointly optimize social benefits, social costs andequity. We apply our model to the Massachusetts city of Lowell, which has faced
Netw Spat Econ (2010) 10:363–388DOI 10.1007/s11067-010-9138-3
Presented at Eleventh International Symposium on Locational Decisions (ISOLDE XI), Santa Barbara,CA, July 1, 2008; INFORMS Fall National Conference, October 12, 2008; John Glenn School of PublicAffairs, The Ohio State University, October 31, 2008.
M. P. Johnson (*) : F. M. SullivanDepartment of Public Policy and Public Affairs, University of Massachusetts Boston, Boston,MA 02125, USAe-mail: [email protected]
F. M. Sullivane-mail: [email protected]
D. A. TurcotteDepartment of Regional Economic and Social Development, University of Massachusetts Lowell,Lowell, MA 01854, USAe-mail: [email protected]

sharp increases in foreclosures since 2006. A subset of available Pareto-optimalsolutions displays policy-relevant variation in decision space and objective space.We identify a promising compromise solution that places greatest emphasis on thegoal of maximizing proximity of acquired units, and compare model results withstrategies derived from heuristics inspired by real-life applications.
Keywords Housing . Foreclosures . Multi-objective programming . Urban affairs .
Affordable housing
1 Introduction
The U.S. economic recession has had adverse effects in all sectors of the economy.The negative impact of this crisis on the U.S. housing market has been broad andprofound: since 2005, there have been substantial decreases in median housingvalues, home equity, existing home sales, mortgage refinances, total housing startsand new home sales (Joint Center for Housing Studies 2009).
A root cause of the recession is a dramatic increase in mortgage foreclosures since2006 (Bernanke 2008). Despite some recent encouraging signs that the housingmarket is stabilizing, rates of foreclosures, as well as the number of homeowners atrisk of foreclosure, remain high (Mortgage Bankers Association 2009). Unemploy-ment, a lagging indicator of economic performance, rose dramatically in 2009 andremains elevated. As a result, many households must use savings to cover mortgagecosts, resulting in increased defaults and foreclosures (First American CoreLogic2009; Joint Center for Housing Studies 2009). The effects of the foreclosure crisishave been especially pronounced in economically vulnerable regions of the U.S.such as the west, southwest, upper Midwest and southeast (RealtyTrac.com 2010;Joint Center for Housing Studies 2009; Immergluck 2009).
Effects of housing foreclosures and subsequent housing vacancies include familymental distress, increased crime, higher insurance rates on neighboring properties,evictions of renters living in buildings that have been foreclosed upon, decreasedproperty values and losses in tax revenues (Kingsley et al. 2009; Leonard and Murdoch2009). In particular, property value impacts of foreclosed housing show clear effectsover time and space, across multiple metropolitan areas (Harding et al. 2009). Inplaces with especially high foreclosure rates and clusters of distressed properties,property value impacts are multiplied (Schuetz et al. 2008).
There have been a variety of Federal policy responses to the foreclosed housingcrisis. The Housing and Economic Recovery Act of 2008 has provided $3.92 billionto be administered by the U.S. Department of Housing and Urban Development(HUD) to assist state and local governments in the acquisition and rehabilitation offoreclosed property (HUD 2008). Other Federal initiatives help provide counseling,funds and other resources to keep borrowers in their homes (Carr 2007). In addition,$4.25 billion in funds authorized by the 2009 Emergency Economic StabilizationAct of 2009 is devoted to construction of affordable rental housing (HUD 2009).
Community-based organizations have also developed strategies to target specificareas of concentrated foreclosure. In the nonprofit sector, community developmentcorporations are key actors in foreclosure prevention, as well as redevelopment of
364 M. P. Johnson et al.

vacated foreclosed properties, often in partnership with the Federal government(Taylor 2008; Malach 2008, 2009).
This paper uses decision modeling and spatial decision support, based on policysciences and practitioner expertise, to generate specific recommendations tocommunity-based organizations regarding an important tool in the fight against thenegative impacts of the foreclosure crisis: acquisition and redevelopment offoreclosed housing and subsequent resale or re-rental. Specifically, we develop amulti-objective optimization model for foreclosed housing development undercertainty, compute values for a wide range of structural parameters, apply the modelto a case study of a community-based organization developing multifamily rentalhousing, and discuss non-dominated solutions that show promise for strategy design.
1.1 Previous research
Community-based organizations (CBOs) routinely make housing developmentdecisions on the basis of explicit and policy-relevant criteria (Cohen 2000;Abandoned Houses Work Group 2005). We have not identified any CBOs that useformal decision models to select properties for investment and redevelopment. Yetwhen contemplating large numbers of possibilities, efficiencies may be lost withoutthe aid of tools designed to support decision-making processes. Some research that isgenerally supportive of this paper’s policy analytic orientation has addressed thecapacity of CBOs to better meet their missions (Glickman and Servon 1998) and totarget investments to encourage neighborhood redevelopment and revitalizationbased on neighborhood typologies (Malach 2008). Such work is consistent withoverall trends within the nonprofit sector to increase program impacts throughcollaboration and leveraging markets (McLeod and Crutchfield 2007) andrestructuring and consolidation across organizations (The Boston Foundation 2008).
There is a substantial research literature on models for affordable and subsidizedhousing development, redevelopment and management (Johnson 2010). Housingacquisition and redevelopment by government and non-profit organizations inspecific neighborhoods can be viewed as a tactical decision, i.e., which specific unitsan organization should acquire immediately to fulfill organizational goals, or as astrategic decision, i.e., what portfolio of properties should be used as a basis forlong-term policy design. This paper takes a longer-term perspective on foreclosedhousing redevelopment that is consistent with CBOs’ extensive experience withcommunity and strategic planning. The literature on model-based housing strategydesign includes a variety of math programming applications. Wright et al. (1983)model land acquisition to optimize measures of compactness, land area and cost.Gilbert et al. (1985) solve the land acquisition problem on a grid. Gabriel et al. (2006)solve a regional planning problem for “smart growth” using actual, non-uniform landparcels and multiple objectives reflecting the perspectives of a government planner, anenvironmentalist, a conservationist and a land developer.
Geographic Information Systems (GIS) and spatial decision support systems(SDSS) are used by mortgage lenders, real estate brokers, housing developers, localgovernments and community-based organizations for tax appraisals, insuranceunderwriting, regulatory compliance, housing trends, facility location, and neigh-borhood effects related to foreclosures and macroeconomic trends (Thrall 1998).
What Foreclosed Homes Should a Municipality Purchase... 365

Specific applications include community participation in service delivery, housingstock development, tax incentive programs and community planning efforts inMilwaukee (Gihose 2003) and the Minneapolis/St. Paul area (Leitner et al. 2000),and parcel selection for redevelopment in Cleveland (Simmons and Salling 1995).Zeng and Zhou (2001) developed a spatial DSS to support private-sector propertymanagement and sales, as well as identification of potential properties for purchase.
1.2 Summary and paper structure
This paper represents an initial effort to apply decision modeling and spatial decisionsupport for acquisition and redevelopment of foreclosed housing. Our problem ispolicy-relevant and adds to the domains of community-based operations researchand decision modeling for housing and community development. The strategicforeclosed housing acquisition model we develop—a nonlinear multiobjective mixedinteger math program under certainty—is a novel variant of the well-studied multi-objective knapsack problem. In applying a linear version of our decision model tothe city of Lowell, Massachusetts, we compute several innovative measures of socialimpacts of housing redevelopment. We use the weighting method to generatealternative housing acquisition strategies that represent a subset of supported non-dominated solutions.
In the next section, we develop the decision model. A case study follows. Next,we discuss the modeling and policy implications of the case study. Finally, wesummarize and identify research extensions.
2 Decision model
2.1 Problem description
The goal of the foreclosed housing redevelopment problem is to choose a subset offoreclosed multifamily housing units available for purchase for rehabilitation andresale or re-rental to optimize measures of social impacts and equity, subject to aconstraint on available resources. This multi-criteria decision problem can be solvedusing mathematical programming and decision-theoretic approaches. Generally, asthe number of alternatives and the number of objectives and constraints increase,math programming is the more desirable solution strategy. However, as the level ofuncertainty regarding structural parameters, decision-maker preferences and thenumber of decision stages increases, decision-theoretic approaches (e.g., Eiselt andSandblom 2004) may be preferable. Our case study addresses strategy design fordevelopment of 57 multifamily foreclosed properties. If a decision alternative isdefined as a subset of these properties that may feasibly be acquired according to abudget constraint, the number of decision alternatives is large enough to warrant theuse of math programming.
We represent the social impacts associated with foreclosed housing acquisitionand redevelopment by three objectives. The first objective is to maximize socialbenefits of a foreclosed housing acquisition strategy. We argue that social benefit isbest approximated by the aggregate utility perceived by occupants of redeveloped
366 M. P. Johnson et al.

units, rather than detailed social cost-benefit calculations (e.g., Johnson and Hurter1999), or more stylized models of consumer surplus (e.g., Erlenkotter 1977). Thoughprevious housing decision models have incorporated dollar-valued social costs aswell as social benefits (e.g., Johnson 2007), developing robust social cost measuresrequires econometric models and administrative data beyond the scope of thisproject. Therefore, our objectives do not include social cost minimization.
The second objective is to minimize the perceived inequity in housingacquisitions across neighborhoods, a political concern that might restrict implemen-tation of otherwise beneficial housing policies. The last objective is to maximizeefficiencies associated with foreclosed housing acquisition and redevelopment, inparticular, external economies of scale associated with proximity of acquired units.In the absence of an explicit function representing such scale economies, wemaximize the proximity of chosen properties directly. Galster et al. (2006) studiedthe effects of targeted developments in low-income/distressed communities, showingthat concentrated long-term investments in small areas produce beneficial results ascompared with other areas without such investment. For a community developer,this means that proximity to other properties it owns or manages yields socialbenefits. The only constraint is that the planning organization spends no more onacquisition and redevelopment than funds available.
Since the decision-maker chooses whether or not to acquire particular propertiesfor future development, and the properties are physical entities, the decision problemresembles a facility location problem. Social impacts of housing are associated withthe property itself, in which households reside, as well as the neighborhood in whichit is located, which absorbs externalities associated with the physical quality of theproperty and characteristics of its occupants. In this context, we cannot speak ofdemand “points” from which customers travel to patronize facilities, or to whichfacility-based services are delivered. Thus, this model is a location problem, not alocation-allocation problem.
2.2 Model formulation
2.2.1 Indexes and sets
i = 1, 2, …, I: index of candidate foreclosed unitsj = 1, 2, …, J: index of neighborhoodsnj = set of candidate foreclosed units in neighborhood j
2.2.2 Decision variables
xi = 1, if foreclosed unit i is acquired, 0 otherwisex = {xi}i=1, …, n
2.2.3 Data
Fi = estimated total acquisition and development cost for foreclosed unit idij = distance between foreclosed unit i and centroid of neighborhood j
What Foreclosed Homes Should a Municipality Purchase... 367

dik = distance between foreclosed units i and kpi = measure of accessibility of unit i to nearby neighborhoodsB = estimated budget available for property acquisition and redevelopmentNj = total number of candidate foreclosed units in neighborhood jN = total number of candidate foreclosed units in all neighborhoods; =
Pmj¼1
Nj
In practice, it is likely that an organization would develop an acquisition strategysuch that its expenditures lie within a defined range of the formal budget amount B.We then define an upper limit on expenditures BU = αUB, where αU ≥ 1 and a lowerlimit on expenditures BL = αLB, where αL≤1. To ensure that the solution to ourproblem is non-trivial and feasible, we must have BL � min
i¼1;:::;nFif g.
2.2.4 Decision model
MaximizeXni¼1
pixi ð1Þ
Minimize maxjjNj > 0
Pi2nj
xi=Pni¼1
xi
Nj=N
8>>><>>>:
9>>>=>>>;
ð2Þ
MaximizeXni¼1
Xnk¼1
1=dikð Þxixk ð3Þ
Subject to:
BL �Xni¼1
Fixi � BU ð4Þ
xi 2 0; 1f g8i ð5ÞWe refer to model (1)–(5) as the foreclosed housing acquisition and redevelop-
ment model, FHR.Objective (1) maximizes the aggregate utility associated with proximity of
families in specific foreclosed units to nearby neighborhoods. We assume that theutility of residents in redeveloped foreclosed housing is a function of increasingamenity levels of surrounding neighborhoods, and of decreasing distances to thoseneighborhoods. This assumption is consistent with principles of spatial interactionmodels (Fotheringham and O’Kelly 1989).
There are many candidates for facility location objectives that maximize equity(Marsh and Schilling 1994). Objective (2) uses the minimax (or “center” orRawlsian) objective in the belief that stabilizing and redeveloping distressedcommunities requires politically sensitive decisions regarding investments that are
368 M. P. Johnson et al.

likely inadequate to fully mitigate foreclosure problems. Therefore, we want,initially, to minimize the most-negative impacts associated with a redevelopmentstrategy, which we assume is a function of the relative level of foreclosures in eachneighborhood and relative level of investments in that neighborhood. Specifically,objective (2) minimizes the maximum disparity between the fraction of allforeclosed units acquired in neighborhood j and fraction of total foreclosed unitsavailable in neighborhood j.
Objective (3) maximizes the proximity of units for redevelopment, or equivalentlyminimizes the total distance between housing units acquired, to capture scaleeconomies in housing development. This is done through an adaptation of themaxisum dispersion objective introduced by Kuby (1987), but with distancesbetween pairs of locations replaced by the inverses of those distances.
Constraint (4) is a budget constraint; it ensures that at least one unit of housing isacquired if minimizing objective (2) is optimized, and that no more housing units areacquired than would exhaust the maximum available BU when one or both ofmaximizing objectives (1) and (3) are optimized. Thus, the number of housing unitsto be acquired and redeveloped is endogenous. Constraints (5) define allowablevalues for the binary decision variables.
The binary decision problem defined by objective (2) with the left-hand-sideinequality of constraint (4) is a nonlinear integer knapsack problem. The binarydecision problem defined by objectives (1) and (3) with the right-hand-sideinequality of constraint (4) is a multi-objective nonlinear integer knapsack problem.Exact algorithms to solve the multi-objective nonlinear integer knapsack problemexist (Isada et al. 2005). The full foreclosed housing redevelopment model (1)–(5) isa generalization of the multi-objective knapsack problem (Klamroth and Wiecek2000). The focus of this paper is a specific policy application and policy-orientedanalysis of model solutions, rather than algorithm design and implementation.Therefore, we make model FHR linear in order to apply widely-available softwarefor linear integer optimization.
2.3 Linearizing the decision model
Define U, a non-negative continuous variable, as the maximum disparity betweenthe fraction of all foreclosed units acquired in neighborhood j and the fraction oftotal foreclosed units available in neighborhood j. Values for U are enforced by newconstraints:
U �
Pi2nj
xi=Pni¼1
xi
Nj=N
8>>><>>>:
9>>>=>>>;
8jjNj > 0 ð6Þ
Our definition of U is similar to that used by Kuby (1987) to enforce a “maximin”objective. Since constraints (6) are still nonlinear, we linearize them using an
approximation toPni¼1
xi inspired by the greedy heuristic for the knapsack problem.
This reformulation is explained below. In addition, we introduce the binary variable
What Foreclosed Homes Should a Municipality Purchase... 369

zik to captures the condition that either both housing units i and k are acquired, ornot. This definition is based on Kuby (1987).
A multiobjective mixed integer linear program for foreclosed housing redevel-opment, based on model (1)–(5), follows:
MaximizeXni¼1
pixi ð1Þ
Minimize U ð2′Þ
MaximizeXni¼1
Xnk¼1
1=dikð Þzik ð3′Þ
Subject to:
U � N
NjQ
Xi2ni
xi ð7Þ
zik � xi 8k > i ð8Þ
zik � xk 8 k > i ð9Þ
BL �Xni¼1
Fi xi � BU ð4Þ
xi 2 0; 1f g8i ð5Þ
zik 2 0; 1f g8i; k ð10ÞThe first objective, which maximizes the aggregate utility associated with
proximity of families in specific foreclosed units to nearby neighborhoods, isunchanged from the original model (1)–(5). The second objective minimizes themaximum perceived inequity in foreclosed housing redevelopment across allneighborhoods, as in the original model. We achieve this goal in the currentmodel using constraints (7), explained below. The third objective shares the goalof original objective (3) to maximize the proximity of units for redevelopment,though we now define partial linearizations of the proximity product xixk withconstraints (8) and (9). The fourth constraint, limiting total expenditures, isunchanged from the original model, as are the next constraints, defining thedomain of decision variables xi. The last constraints define the range of values fornew decision variables zik.
370 M. P. Johnson et al.

Constraints (7), enforcing appropriate values for decision variable U, are derived
from (6) as follows. Suppose we wish to compute an upper bound toPni¼1
x»i , the
number of properties chosen in any feasible solution to a decision problem thatmaximizes an objective subject to fixed budget B. First, sort the estimatedacquisition and development costs Fi in ascending order such that F1 ≤ F2 ≤ … ≤
Fk ≤ … ≤ FI. Then choose the largest integer Q such thatPQk¼1
Fkxk � B, where the xi
are binary variables denoting whether property i is acquired or not. That is,
Q ¼ maxn
nXni¼1
Fi � B; and F1 � F2 � ::: � Fk � ::: � FI
�����( )
ð11Þ
Constraints (6) can then be restated as
U �
Pi2nj
xi=Q
Nj=N8j: ð12Þ
By redistributing terms in (12), we produce constraints (7). The right-hand side ofconstraints (7) is a lower bound to the right-hand side of constraints (6), ensuringthat feasible solutions to (1)–(5) remain feasible for the revised model.
2.4 Discussion of modified decision model
If there are n potential housing units for redevelopment and the study area iscomprised of m neighborhoods, then the modified model FHR, has n + n2 + 1 = O(n2)decision variables and n2 + m + 1 = O(n2) constraints. Since FHR is now ageneralization of the linear knapsack problem, which is NP-hard (Martello and Toth1990), any single-objective instance of FHR is also NP-hard. In addition, the problemof finding or counting efficient solutions to the general multi-objective combinatorialoptimization problem is NP-hard as well (Ehrgott and Gandibleux 2002). Thus,solving large instances of FHR are likely to require substantial amounts of computingtime.
Our transformation of the original nonlinear model (1)–(5) imposes newconstraints in addition to the original budget constraint. Therefore, we cannot takeadvantage of the extensive literature on efficient solutions to the linear multi-objective knapsack problem (e.g. Bazgan et al. 2009; Beausoleil et al. 2008;Klamroth and Wiecek 2000; Rui Figueira et al. 2010). We will solve FHR usingstandard integer programming software in order to focus on policy implications of arelatively small problem instance in the case study that follows.
2.5 Estimating key model parameters
2.5.1 Total development cost
The total development cost of a property is comprised of the costs of propertyacquisition, construction, insurance and planning, among others (HUD 1998). We
What Foreclosed Homes Should a Municipality Purchase... 371

define two categories that comprise total development costs for a foreclosedproperty i: acquisition cost ACi and redevelopment cost RDi. Then Fi, theparameter we have defined above as the total development cost for property i, isequal to ACi + RDi.
To compute the acquisition cost for this property, we start with the unit’s mostrecent assessed value, denoted Ai. Let VR, a “value ratio,” denote the average ratio ofactual purchase price to assessed value for similar units. This allows for theadjustment of assessed value to account for recent sales of units that are similar insize and location to unit i. Then the property acquisition cost ACi = Ai
.VR.The unit redevelopment cost, RDi, is computed by practitioners as the sum of
“hard costs” associated with labor and materials used for physical constructionand “soft costs” associated with tasks such as design, marketing, contractsupervision and others (Klinger and Susong 1996). Hard costs are based on apractitioner-defined rule-of-thumb of construction costs per square foot, RCi. Letthe total size of the unit in square feet be denoted by Si. Then total hard costs areequal to RCi
. Si. Another developer rule-of-thumb is that hard costs are a givenfraction of total development costs, denoted fD. Then the unit rehabilitation costRDi ¼ RCi � Sið Þ=fD.
2.5.2 Utility associated with proximity to local amenities
Assume that the utility that a family in housing unit i derives from proximity toneighborhood j increases in the level of neighborhood-based amenities aj anddecreases in the distance dij between the housing unit and the neighborhood. Thisassumption is consistent with spatial interaction models. The value aj can becomputed in a variety of ways; in the case study below we define it as the weightedsum of neighborhood-level indices, derived from Census and spatial data, that arelikely to be salient to families for whom the redeveloped unit i is targeted. Define therelative utility perceived by a family in unit i associated with proximity toneighborhood j as ai
dij. Let us also assume that the total utility to a family in unit i
associated with proximity to all neighborhoods is additive, and reflects the family’sbelief that quality of life is determined by the aggregate attractiveness of nearbyneighborhoods, say those within a distance D of the housing unit underconsideration. Then pi, defined above as the total utility perceived by a family inhousing unit i, is computed as:
pi ¼Xjjdij�D
ajdij
� �: ð13Þ
3 Case study
3.1 Study region and data sources
The commonwealth of Massachusetts has been hard-hit by the mortgage foreclosurecrisis. The number of foreclosure deeds recorded grew almost four-fold in just
372 M. P. Johnson et al.

2 years, from 3,130 in 2006 to 12,430 in 2008. Though the number of completedforeclosures declined in 2009 to 9,269, new filings in 2009 were up over 28% from2008, indicating still many more foreclosures to come (The Warren Group 2009,2010). As a share of all housing units, Massachusetts in 2009 ranked 22nd in thenation in foreclosure, well below rates in states hardest hit by the housing crisis,including Nevada, California and Florida (RealtyTrac.com 2010). Still, the speedand severity of the foreclosure crisis in Massachusetts has been dramatic, and hasdisproportionately affected the Commonwealth’s poorest communities (FederalReserve Bank of Boston 2010).
We apply the foreclosed housing redevelopment model to the city of Lowell.Located 30 miles northwest of Boston, with just over 100,000 residents, Lowell isethnically and racially diverse and economically disadvantaged. Data from the 2000Census indicate that Lowell’s foreign-born population is 22.9% of the total, 10percentage points higher than the national average. Similarly, non-white ethnicgroups are 32.6% of the city’s population, six percentage points higher than thenational average. Poverty rates in Lowell (about 14.7% for families and 18.3% forindividuals), like many post-industrial cities, exceed national averages. Relative tonational levels, there are lower levels of owner-occupied housing (52.5% in Lowellversus 67.3% nationally) and higher levels of renter-occupied housing (47.5% inLowell versus 32.7% nationally) (U.S. Census Bureau 2009).
Lowell saw a tripling of foreclosures from 82 in 2006 to 257 in 2007, rising againto 346 in 2008 (Federal Reserve Bank of Boston 2010). Though the number offoreclosures actually declined slightly in 2009, early data from 2010 indicate that asecond wave of foreclosures is emerging as the effects of the recession, particularlyjob losses and reduced income of households, takes effect (Howe 2010).
Local initiatives by city government, in collaboration with local community-basedorganizations, to address the foreclosure crisis include assistance provided by localnonprofits directly to homeowners to prevent foreclosure, and a ForeclosurePrevention Task Force convened by the City of Lowell, whose Property ReviewTeam assesses and supports neighborhoods or buildings which are particularlyvulnerable (Buotte 2008). This case study reflects the perspective of one of thenonprofits working with the city of Lowell.
We selected 57 foreclosed multifamily properties from the set of all foreclosedproperties in 2007 provided by the Middlesex North Registry of Deeds. Additionalattributes of housing properties were developed from research by the University ofMassachusetts Lowell with a local nonprofit organization and the Registrar ofDeeds.
All of the candidate foreclosed properties used in this case study were availablefor redevelopment as of June 2008; none had been acquired by public or privateactors. Most of the multifamily properties in this dataset are small: 72% are two-family properties and 23% are three-family properties. These properties arereasonably valuable according to their pre-foreclosure building and neighborhoodamenities: the average value of the most recent assessment is almost $287,000. Inour experience, these values are significantly higher than those for other foreclosedmultifamily properties purchased by private interests.
Figure 1 shows poverty rates across Census tracts in Lowell along with localamenities such as parks, police stations, fire stations and schools. Figure 2 shows
What Foreclosed Homes Should a Municipality Purchase... 373

tract-level rates of vacant and foreclosed housing, along with the foreclosedmultifamily units that are the focus of our case study.1
These figures demonstrate that Lowell’s vacant and foreclosed housing isgenerally concentrated in areas of higher poverty. In addition, our sample ofmultifamily foreclosed units is broadly representative of foreclosed housing ratesoverall (though somewhat less so for vacancy rates).
3.2 Computing model parameters
A national review of residential development practices generated estimates forrehabilitation cost rates ranging from a low value of $30 per square foot to $75 per
1 Tract-level data for Lowell are available only for the 2000 Census, not the more recent AmericanCommunity Survey.
Fig. 1 City of Lowell poverty rate and local amenities
374 M. P. Johnson et al.

square foot (The Enterprise Foundation 1999). A higher redevelopment cost rate of$100 per square foot was chosen based on current development practices in Lowell.In addition, based on best local development practices, we estimate that “hard costs”comprise about 69% of total development costs. We conclude that the average totaldevelopment cost for all available foreclosed multifamily rental properties is$614,174 per property (Table 1).
The target budget (B) for a hypothetical redevelopment project in Lowell was setto $5 million, which might be used in development projects over 2 years. We set thefactors for the maximum allowable expenditures (αU) and minimum allowableexpenditures (αL) as 1.20 and 0.80, respectively.
These results assume that all redevelopment projects require complete rehabili-tation, as opposed to minor repairs, and that the development organization does notalready pursue a particular strategy for acquiring foreclosed units for redevelopment,
Fig. 2 City of Lowell percent vacant housing, percent housing stock that is foreclosed and sample offoreclosed multifamily units
What Foreclosed Homes Should a Municipality Purchase... 375

for example choosing only the least expensive units in the most distressedcommunities.
To compute values for pi, the accessibility measure defined in (13), we review theliterature on local amenities for low- and moderate-income families. Similar to otherpopulations, lower-income residents desire the absence of negative factors such ashigh crime (Bartik et al. 1992) and pollution (Altschuler et al. 2004) as well as thepresence of positive factors such as high-quality schools (Bartik et al. 1992).Proximity to employment (Sanchez and Dawkins 2001), economically vital down-towns (Herbert and Belsky 2008), and supermarkets with fresh foods (Altschuler etal. 2004) are also attractive amenities for low-income dwellers. We find that richsocial networks and neighborhoods that encourage social integration are particularlyvalued by lower-income residents. These aspects may take a variety of forms:proximity to higher income populations (Hulse and Burke 2000), convenience tofriends (Sanchez and Dawkins 2001), links to city hall (Altschuler et al. 2004), andproximity to similar cultural, racial or linguistic communities (Ioannides and Zabel2008). However, certain attributes such as proximity to municipal services (Sanchezand Dawkins 2001) and open space (Altschuler et al. 2004) are, surprisingly, notparticularly important to lower-income families.
We created an amenity measure for each Census tract in Lowell (aj) by computingCensus measures of poverty rate, nonwhite population, the number of supermarketsand distance to the central business district. We then converted and normalized eachof these measures, orienting them so that lower poverty rates, higher nonwhitepopulations, greater numbers of supermarkets and lower distances to the CBD areassociated with higher values of the index. In the absence of data regarding therelative importance of these amenity components to populations who might live inthe units to be redeveloped, we assume equal weights for all amenity componentsand added them together. The result, a tract-level amenity index, is shown in Fig. 3.
Note that, contrary to conventional assumptions regarding values that residentsmight place on various neighborhood amenities, the amenity levels we havecomputed do not correspond in all cases to observed proximity of the foreclosedunits in our sample to public transportation, or to public services such as police, fireand public schools. Finally, for each candidate foreclosed housing unit, we used the
Table 1 Dollar-valued impacts of foreclosure redevelopment case study, Lowell, MA
Two-family properties Three-family andlarger properties
All properties
Number of sales observed 22 4 26
Value ratio 0.73 0.69 0.72
Number of currently foreclosed units 17 40 57
Total Development Costs
Average $564,376.83 $731,342.70 $614,173.67
Min $356,851.26 $467,408.86 $356,851.26
Max $825,327.12 $1,123,756.22 $1,123,756.22
Standard Deviation 111,476.87 153,045.91 132,523.76
376 M. P. Johnson et al.

tract-level amenity values (ai) and the Euclidean distance between each unit and thecentroid of each Census tract (dij) to compute unit-level amenity measures (pi)according to equation (13). The distance threshold (D) within which relative amenitymeasures are added together for a given unit is set to 1 mile.
3.3 Model solution
Solving a multi-objective optimization problem can mean either generating anapproximation to, or an exact representation of, the set of non-dominated solutions(including, possibly, non-supported non-dominated solutions, so-called “duality-gap” solutions), or identifying a most-preferred solution, given assumptions aboutthe decision-maker’s preferences (Cohon 1978). As this case is drawn from real-world data but does not use observations of specific decisionmakers, we choose theformer solution strategy.
Fig. 3 City of Lowell composite amenity measures by tract
What Foreclosed Homes Should a Municipality Purchase... 377

The number of non-dominated solutions to multi-objective combinatorialoptimization problems may be exponential in the problem size; this is often truefor the set of supported non-dominated solutions as well (Ehrgott and Gandibleux2002), which are greatly outnumbered by non-supported non-dominated solutions insome cases (Visée et al. 1998). While researchers have developed algorithms toidentify all non-dominated solutions, we will limit ourselves in this initial inquiry toan approximation of the set of supported non-dominated solutions. It is understoodthat this approach may result in less-desirable solutions than those that might beidentified if we searched over the entire set of non-dominated solutions (Klamrothand Wiecek 2000). We will generate an approximation to the set of supported non-dominated solutions via the weighting method (Cohon 1978).
We formulated model FHR in AMPL 8.0 and solved the model using CPLEX 8.0for AMPL (ILOG-CPLEX Division 2005a, b). We generated instances of modelFHR with weights of 1 for one objective and 0.0001 on other objectives to identifyextreme points on the Pareto frontier. We then assigned weights of 0.01, 0.1 and 1 toeach of the objective functions in turn to generate solutions that indicate a range ofsupported non-dominated solutions as a very limited approximation to the Paretofrontier. In one case we generated a promising compromise solution by assigningweights of one to the amenity and inequity objectives and 100 to the proximityobjective. Each model instance contains 3,307 integer variables (1,653 binary) and3,211 constraints after pre-processing. All eight unique solutions are solved tooptimality.
Details of model outputs for all unique non-dominated solutions generated,including decision-space results, objective function values and run-time measures,are displayed in Table 2.
The number of foreclosed properties selected for acquisition and redevelopmentranges from 7 (for the solution that minimizes inequality, as well as compromisesolutions 3 and 5) to 12 (for compromise solution 9, with weights of one for theamenity and inequity objectives and 100 for the proximity objective). Despite thecomputational complexity of model FHR, solution times in practice are quitereasonable, ranging from less than one second to about 2,100 s. Actual solutiontimes are bimodal in nature: less than 10 s for five of the eight unique solutions, andtwo orders of magnitude higher for the compromise solutions that put greatestweight on the linearized proximity objective.
Figure 4 contains a value path (ReVelle 1987) illustrating objective-space resultsof model FHR. The value path traces out each of the performance of all uniquesolutions according to each objective. The vertical axis represents the extent towhich each model instance achieves the most-desired value for a particularobjective.
The three solutions corresponding to “corners” of the Pareto frontier perform asexpected, though the solution that maximizes proximity does significantly better onone of the non-optimized objectives (Equity) than either of the other corner pointsolutions on their non-optimized objectives. Compromise solutions 1, 3 and 5 performquite well according to the equity objective and quite poorly on the proximity objective;compromise solutions 3 and 5 perform relatively poorly on the weighted amenityobjective. Compromise solution 4 is practically identical to the solution that optimizestotal amenity.
378 M. P. Johnson et al.

Tab
le2
Model
FHRsolutio
ncharacteristics
Model
instance
goals(U
niqueParetoSolutions)
Max
total
amenity
Min
inequity
Max
proxim
ityCom
prom
ise1
(111)
Com
prom
ise3
(0.010.11)
Com
prom
ise4
(0.1
0.01
1)Com
prom
ise5
(0.0110.1)
Com
prom
ise9
(1110
0)
DecisionVariables
Num
berof
propertiesselected
97
109
710
712
Num
berof
nonzeroproxim
ityvariables(zik)
3621
4536
2145
2166
Objectiv
eFunctionValues
TotalAmenity
4.32
2.06
1.39
3.72
2.07
4.32
2.12
3.23
Equ
ity5.18
1.30
2.96
1.73
1.30
5.18
1.30
1.73
TotalProximity
0.0135
0.0052
0.04
660.0081
0.0071
0.0138
0.0056
0.0230
Run-Tim
eMeasures
Solve
Tim
e(secs.)
0.41
1.05
189.27
2.38
2,09
8.85
2.41
5.94
998.27
#MIP
Sim
plex
iteratio
ns1,627
2,701
446,097
3,238
6,949,803
4,311
13,920
2,913,060
#B-and
-BNod
es11
132
7,376
7132
8,24
719
641
454
,269
What Foreclosed Homes Should a Municipality Purchase... 379
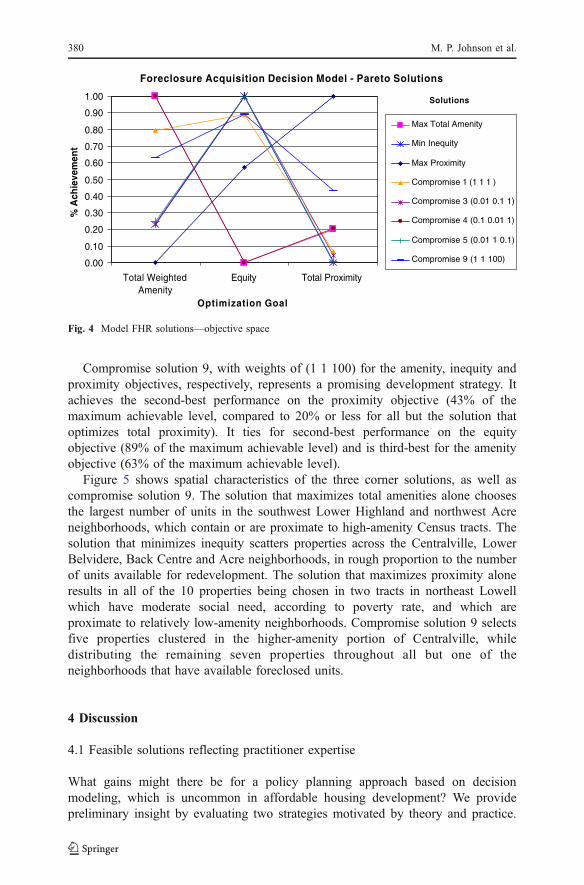
Compromise solution 9, with weights of (1 1 100) for the amenity, inequity andproximity objectives, respectively, represents a promising development strategy. Itachieves the second-best performance on the proximity objective (43% of themaximum achievable level, compared to 20% or less for all but the solution thatoptimizes total proximity). It ties for second-best performance on the equityobjective (89% of the maximum achievable level) and is third-best for the amenityobjective (63% of the maximum achievable level).
Figure 5 shows spatial characteristics of the three corner solutions, as well ascompromise solution 9. The solution that maximizes total amenities alone choosesthe largest number of units in the southwest Lower Highland and northwest Acreneighborhoods, which contain or are proximate to high-amenity Census tracts. Thesolution that minimizes inequity scatters properties across the Centralville, LowerBelvidere, Back Centre and Acre neighborhoods, in rough proportion to the numberof units available for redevelopment. The solution that maximizes proximity aloneresults in all of the 10 properties being chosen in two tracts in northeast Lowellwhich have moderate social need, according to poverty rate, and which areproximate to relatively low-amenity neighborhoods. Compromise solution 9 selectsfive properties clustered in the higher-amenity portion of Centralville, whiledistributing the remaining seven properties throughout all but one of theneighborhoods that have available foreclosed units.
4 Discussion
4.1 Feasible solutions reflecting practitioner expertise
What gains might there be for a policy planning approach based on decisionmodeling, which is uncommon in affordable housing development? We providepreliminary insight by evaluating two strategies motivated by theory and practice.
Foreclosure Acquisition Decision Model - Pareto Solutions
0.00
0.10
0.20
0.30
0.40
0.50
0.60
0.70
0.80
0.90
1.00
Total WeightedAmenity
Equity Total Proximity
Optimization Goal
% A
chie
vem
ent
Max Total Amenity
Min Inequity
Max Proximity
Compromise 1 (1 1 1 )
Compromise 3 (0.01 0.1 1)
Compromise 4 (0.1 0.01 1)
Compromise 5 (0.01 1 0.1)
Compromise 9 (1 1 100)
Solutions
Fig. 4 Model FHR solutions—objective space
380 M. P. Johnson et al.

These heuristics are not intended to be competitive with the non-dominated solutionsgenerated earlier, but instead to illustrate the range of objective-space and decision-space values associated with alternative strategies for foreclosed housing acquisitionand redevelopment.
The first strategy we consider assumes that developers wish to minimizedevelopment costs. We implement this strategy as the following greedy heuristic:compute the per-unit acquisition and development cost for each candidate foreclosedproperty and find the least-cost set of properties to acquire, subject to using as muchof the available budget as possible.
The second strategy supposes that beneficial development policies reflect voterpreferences through the median voter theorem: given single-peaked voter prefer-ences, decisions made through voting reflect the preferences of the median voter(Rosen 2004, p. 117). We implement this strategy by identifying characteristics ofvoters in the study region relevant to elected officials, construct an index based on
Fig. 5 Model FHR solutions—decision space
What Foreclosed Homes Should a Municipality Purchase... 381

these characteristics, and choose properties to develop that maximize aggregate voterpreference subject to available funds for development. In consultation with a localvoting advocacy group, we identified the following population characteristics thatmight be associated with voter behavior: percentage of population that is white;percentage of population that is female; percentage of population that arehomeowners; percentage of population that is poor, and percentage of populationthat is 55–65 years of age. We computed Census tract-level values for each attribute,normalized each attribute, and combined all attributes using equal weights into amedian voter index. We then ranked properties in descending order of median voterindex and chose properties to acquire subject to the available budget. In bothinstances, we used the ‘base case’ budget limit of $5 million.
Objective-space results for both heuristics are shown in Fig. 6. Not surprisingly,both solutions perform quite poorly on the equity objective, and are each out-performed on the amenity and proximity objectives by three other non-dominatedsolutions.
Figure 7 demonstrates that the simulated solution that minimizes per-unit develop-ment costs chooses units located in less distressed and higher-amenity neighborhoodsthan the simulated solution that maximizes voter preferences (see Fig. 2). In bothsolutions, proximity of units is fairly low.
4.2 Alternative decision problems and models
The foreclosed housing redevelopment model, FHR, is intended to provide strategicguidance to community-based organizations regarding housing acquisition andredevelopment, though not prescriptions regarding specific housing units to purchase(since any housing units in the choice set for this model would probably beunavailable a year or two hence). Therefore, we discuss alternative decision modelsthat might provide more targeted and timely guidance to CBOs. To do so, weprovide some detailed information about the U.S. foreclosure process.
Foreclosure Acquisition Decision Model - Pareto and Simulated Solutioms
0.00
0.10
0.20
0.30
0.40
0.50
0.60
0.70
0.80
0.90
1.00
Total WeightedAmenity
Equity Total Proximity
Optimization Goal
% A
chie
vem
ent
Max Total Amenity
Min Inequity
Max Proximity
Compromise 1 (1 1 1 )
Compromise 3 (0.01 0.1 1)
Compromise 4 (0.1 0.01 1)
Compromise 5 (0.01 1 0.1)
Compromise 9 (1 1 100)
Simulation 1: Total Cost
Simulation 2: Median Voter
Solutions
Fig. 6 Model FHR optimized plus heuristic solutions—objective space
382 M. P. Johnson et al.

Generally, properties for which the mortgage is unpaid for an extended periodof time are subject to auction by the lender, after good-faith efforts are made tocontact the homeowner. If this sale is unsuccessful, ownership of the propertyformally reverts to the lender, and the property is deemed real estate-owned(REO). A property may remain in REO status until purchased by public orprivate actors.
One extension to the problem represented by model FHR addresses immediateacquisition of REO properties. A CBO might know of a number of REO propertiesavailable for purchase in the near future, for development four to seven monthshence. Which property or properties should they acquire? This problem can bemodeled as a multi-criteria decision model, in which the alternatives are specificproperties, and the attributes are defined property characteristics (e.g. Eiselt andSandblom 2004). Another extension addresses the acquisition of properties before
Fig. 7 Model FHR heuristic solutions—decision space
What Foreclosed Homes Should a Municipality Purchase... 383

lenders take ownership (pre-REO properties). Here, multiple properties may becandidates for sale at different times, with different probabilities that the propertieswill actually be available for purchase, rather than being acquired by privateinvestors (“short sale”), or that the CBO will successfully purchase the property forsale, instead of being out-bid by private investors, or that the property, oncepurchased, will have redevelopment tasks completed on time, under budget and to anacceptable level of quality. This is a stochastic decision problem, which can besolved using stochastic math programming (e.g. Higle 2005) or dynamicprogramming-based approaches (e.g. Puterman 2005).
4.3 Model limitations
We have not addressed dollar-valued social benefits and costs of foreclosed housingacquisition. Doing so will require estimation of economic impacts of foreclosedhousing acquisition. This is a current subject of research (Johnson et al. 2009).Equity objective (2) (2′ in the modified model FHR) minimizes the maximum spatialconcentration of foreclosed properties in a neighborhood. However, it may also bedesirable to address relative housing market distress by accounting for variations inhousing market size. Our procedure for computing neighborhood-level amenities isincomplete; with additional resources, the creation of a physical condition measure(Bartik and Smith 1987) or a collective efficacy measure (Sampson et al. 1997)would ideally provide more detailed and realistic measures of neighborhooddesirability and strength.
We find that run times for the small model instances in this paper range from lessthan a second to over half an hour (Table 2); run times are longest for instances inwhich significantly larger weights are placed on the proximity objective (3′) ascompared to the other objectives. Solving larger instances, such as the city ofBoston, in which there were 1,562 foreclosed multifamily properties as of September28, 2009 (Citizens’ Housing and Planning Association 2009) may requirespecialized solution methods.
5 Conclusion
In the face of rising foreclosures and decreasing market values for housing, thispaper represents an initial model-building effort to provide specific, evidence-basedguidance to community development professionals regarding foreclosed andabandoned housing units for acquisition, renovation and re-sale or re-rent. We haveadapted the multiobjective knapsack problem for acquisition and redevelopment ofmultifamily rental housing in an urban area that balances three goals—minimizingamenity-weighted distance, minimizing perceived inequity and maximizing proxim-ity between housing units—that are inspired by practitioners and scholars inaffordable housing development.
The first innovation of the foreclosed housing redevelopment model is therecognition that social benefits can be adapted from spatial interaction models, inparticular, that the utility a family in a housing unit derives from proximity to a given
384 M. P. Johnson et al.

neighborhood increases in the level of neighborhood-based amenities and decreasesin the distance between the housing unit and nearby neighborhoods
The second innovation of FHR is a proximity objective that recognizespractitioner knowledge that it is more efficient to manage multiple developmentprojects for units that are located closer together rather than farther away. We adaptthe maxisum dispersion model for undesirable facilities by computing the inverse ofdistances between candidate properties.
The third innovation is the application of rules-of-thumb commonly used inpractice to estimate parameters related to total development cost. Finally, the budgetconstraint accommodates minimizing and maximizing objectives by including lowerand upper bounds, which is new to the literature on knapsack problems.
Reformulations and approximations of FHR yield a mixed integer linear program.Solutions generated by the weighting method represent a small subset of allsupported non-dominated solutions, which is in turn a subset of all non-dominatedsolutions, thus limiting the ability of the model to delineate development alternativesthat truly optimize multiple social objectives. Our solutions show significantvariation across objective function values and across actual neighborhoods thatcomprise the study area.
Our case study has generated a number of useful results. First, the model isinternally consistent: non-dominated solutions are associated with spatial distribu-tions of acquired properties that are consistent with the weights placed on the threecomponent objectives.
Second, the model generates useful policy insights. A compromise solution with arelatively large weight on the proximity objective achieves relatively highly-rankedvalues across the three objective functions, though at a cost of significantly greatersolution time. Feasible solutions designed to reflect decision-maker heuristicsderived from social and policy values consistent with real-life practice highlightthe benefits of optimization modeling.
There are a number of promising next steps for this research. Computing dollar-valued measures of social benefits through adaptations of current real estate researchwill provide estimates of the economic impacts of alternative redevelopmentstrategies. Modeling alternative equity measures may provide deeper understandingof real-world policy and political concerns. Applications of this model to large,densely populated communities might yield plausible regional- and national-levelestimates of the potential benefits of decision modeling for foreclosed housingdevelopment. Addressing housing acquisition at different stages of the foreclosureprocess and evaluating impacts of decision models in the field will help housingprofessionals to integrate decision modeling into their daily work.
Acknowledgements Thanks to Rachel Drew for her research assistance. Thanks to Steven Winter,Metropolitan Area Planning Council; Richard Howe, Jr., Registrar of Deeds, Middlesex North Registry ofDeeds; John Fraser, Graduate Student, Regional Economic and Social Development, UMass Lowell; JoeDonovan, GIS Manager, City of Lowell; Miran Fernandez, CIO, City of Lowell; John Matley, GISCoordinator, Northern Middlesex Council of Governments; Alex Brown, GIS Lab, UMass LowellEnvironmental, Earth and Atmospheric Sciences; Adam Baacke, Assistant City Manager/DPD Director,City of Lowell, and Matthew Roux, Assistant Transportation Planner, City of Lowell.
We greatly appreciate the comments and suggestions of anonymous reviewers and the editor.
What Foreclosed Homes Should a Municipality Purchase... 385

References
Abandoned Houses Work Group (2005) Revitalizing Indianapolis neighborhoods: a framework for linkingabandoned houses and redevelopment initiatives, A Second Report of the Abandoned Houses WorkGroup. City of Indianapolis, January 2005. World Wide Web: http://www.indy.gov/eGov/City/DMD/Planning/Docs/Housing/abandonedhousingreport0105.pdf. Accessed January 23, 2010
Altschuler A, Somkin CP, Adler NE (2004) Local services and amenities, neighborhood social capital, andhealth. Soc Sci Med 59(6):1219–1229
Bartik TJ, Smith VK (1987) Urban amenities and public policy. In: Mills ES (ed) Handbook of regionaland urban economics, volume II: urban economics. North-Holland, Amsterdam, pp 1207–1249
Bartik TJ, Butler JS, Liu JT (1992) Maximum score estimates of the determinants of residential mobility:implications for the value of residential attachment and neighborhood amenities. J Urban Econ 32(2):233–256
Bazgan C, Hugot H, Vanderpooten D (2009) Solving efficiently the 0–1 multi-objective knapsackproblem. Comput Oper Res 36:260–279
Beausoleil RP, Baldoquin G, Montejo RA (2008) Multi-start and path relinking methods to deal withmultiobjective knapsack problems. Ann Oper Res 157:105–133
Bernanke BS (2008) Housing, mortgage markets, and foreclosures. Speech at the Federal Reserve SystemConference on Housing and Mortgage Markets, Washington, D.C., December 4, 2008. World WideWeb: http://www.federalreserve.gov/newsevents/speech/bernanke20081204a.htm. Accessed January23, 2010
Buotte BJ (2008) Lending a hand in loan crunch. Boston Globe, February 7, 2008Carr JH (2007) Responding to the foreclosure crisis. Hous Policy Debate 18(4):837–840Citizens’ Housing and Planning Association (2009) Housing foreclosure dataset for selected municipal-
ities in the Boston metropolitan area provided to Center for Social Policy, University of MassachusettsBoston and summarized by authors
Cohen JR (2000) Abandoned housing: exploring lessons from Baltimore. Hous Policy Debate 12(3):415–448
Cohon JL (1978) Multiobjective programming and planning. Academic, New YorkEhrgott M, Gandibleux X (2002) Multiobjective combinatorial optimization—theory, methodology and
applications. In: Ehrgott M, Gandibleu X (eds) Multiple criteria optimization: state of the artannotated bibliographic surveys. Kluwer Academic Publishers, New York, pp 369–444
Eiselt HA, Sandblom C-L (2004) Decision analysis, location models and scheduling problems. Springer,Berlin
Erlenkotter D (1977) Facility location with price-sensitive demands: private, public, and quasi-public.Manage Sci 24(4):378–386
Federal Reserve Bank of Boston (2010) Foreclosure Rates in Massachusetts Cities and Towns: 1990–2009.World Wide Web: http://www.bos.frb.org/economic/dynamicdata/module1/bmap.html#app=1dc8&2888-selec tedIndex=0. Accessed February 6, 2010
First American CoreLogic (2009) Summary of Second Quarter 2009 negative equity data from firstAmerican CoreLogic. August 13, 2009. World Wide Web: http://www.loanperformance.com/infocenter/library/FACL%20Negative%20Equity_final_081309.pdf . Accessed January 22, 2010
Fotheringham AS, O’Kelly ME (1989) Spatial interaction models: formulations and applications. KluwerAcademic Publishers, Dordrecht
Gabriel SA, Faria JA, Moglen GE (2006) A multiobjective optimization approach to smart growth in landdevelopment. Socio-Econ Plann Sci 40:212–248
Galster G, Tatian P, Accordino J (2006) Targeting investments for neighborhood revitalization. J AmPlann Assoc 72(4):457–474
Gihose R (2003) Community participation, spatial knowledge production, and GIS use in inner-cityrevitalization. J Urban Technol 10(1):39–60
Gilbert KC, Holmes DD, Rosenthal RE (1985) A multiobjective discrete optimization model for landallocation. Manage Sci 31(12):1509–1522
Glickman NJ, Servon LJ (1998) More than bricks and sticks: five components of community developmentcorporation capacity. Hous Policy Debate 9(3):497–539
Harding JP, Rosenblatt E, Yao VW (2009) The contagion effect of foreclosed properties. J Urban Econ66(3):164–178
Herbert CE, Belsky ES (2008) Initial housing choices made by low-income and minority homebuyers.Cityscape 10(2):61–94
386 M. P. Johnson et al.

Higle JL (2005) Stochastic programming: optimization when uncertainty matters. In: Cole Smith J (ed)Tutorials in operations research 2005: emerging theory, methods and applications. Institute forOperations Research and the Management Sciences, Hanover, pp 30–53
Howe RP (2010) Trends in real estate in 2009. Merrimack Valley Housing Report 3(1):2Hulse K, Burke T (2000) Social exclusion and the private rental sector: the experiences of three market
liberal countries. Paper presented at the ENHR 2000 conference, Gävle June 26–30, 2000ILOG-CPLEX Division (2005a) AMPL 8.0. Incline Village, NVILOG-CPLEX Division (2005b) CPLEX 8.0 for AMPL. Incline Village, NVImmergluck D (2009) The foreclosure crisis, foreclosed properties, and federal policy: some implications
for housing and community development planning. J Am Plann Assoc 75(4):406–423Ioannides YM, Zabel JE (2008) Interactions, neighborhood selection and housing demand. J Urban Econ
63(1):229–252Isada Y, James RJW, Nakagawa Y (2005) An approach for solving nonlinear multi-objective separable
discrete optimization problem with one constraint. Eur J Oper Res 162:503–513Johnson MP (2007) Planning models for affordable housing development. Environ Plann B Plann Des 34
(3):501–523Johnson MP (2010) Housing and community development. In: Cochran J (ed) Wiley Encyclopedia of
Operations Research and Management Science, to appearJohnson MP, Hurter AP (1999) Economic impacts of subsidized housing relocation. Pap Reg Sci 78
(3):265–295Johnson MP, Turcotte D, Sullivan FM (2009) Joseph P. Healey Grant Program, “Decision Modeling for
Foreclosed Housing Acquisition in a Large Urban Area,” July 2009–July 2010. Funded at $6,000Joint Center for Housing Studies of Harvard University (2009) The State of the Nation’s Housing 2009.
Cambridge, MA. World Wide Web: http://www.jchs.harvard.edu/publications/markets/son2009/son2009.pdf. Accessed January 16, 2010
Kingsley GT, Smith R, Price D (2009) The impacts of foreclosures on families and communities. TheUrban Institute, Washington. World Wide Web: www.urban.org/UploadedPDF/411909_impact_of_forclosures.pdf. Accessed January 16, 2010
Klamroth K, Wiecek MM (2000) Dynamic programming approaches to the multiple criteria knapsackproblem. Nav Res Logist 47:57–76
Klinger M, Susong M (1996) The construction project: phases, people, terms, paperwork, processes.American Bar Association, Chicago
Kuby M (1987) Programming models for facility dispersion: the p-dispersion and maxisum dispersionproblems. Geogr Anal 19:315–319
Leitner H, Ellwood S, Sheppard E, McMaster S, McMaster R (2000) Modes of GIS Provision and theirappropriateness for neighborhood organizations: examples from Minneapolis and St. Paul, Minnesota.URISA J 12(4):45–58
Leonard T, Murdoch J (2009) The neighborhood effects of foreclosure. J Geogr Syst 11(4):317–332Malach A (2008) Managing neighborhood change: a framework for sustainable and equitable
revitalization. National Housing Institute, Montclair. World Wide Web: http://www.nhi.org/pdf/ManagingNeighborhoodChange.pdf. Accessed January 16, 2010
Malach A (2009) Stabilizing communities: a federal response to the secondary impacts of the foreclosurecrisis. The Brookings Institution, Washington. World Wide Web: http://www.brookings.edu/∼/media/Files/rc/reports/2009/02_foreclosure_crisis_mallach/02_foreclosure_crisis_mallach_report.pdf.Accessed January 16, 2010
Marsh MT, Schilling DA (1994) Equity measurement in facility location analysis: a review andframework. Eur J Oper Res 74:1–17
Martello S, Toth P (1990) Knapsack problems: algorithms and computer implementations. Wiley,Chichester
McLeod H, Crutchfield LR (2007) Creating high-impact nonprofits. Stanford Social Innovation Review.Fall 2007. World Wide Web: http://www.ssireview.org/articles/entry/creating_high_impact_nonprofits/.Accessed March 21, 2010
Mortgage Bankers Association (2009) Delinquencies and foreclosures continue to climb in latest MBANational Delinquency Survey. World Wide Web: http://www.mbaa.org/NewsandMedia/PressCenter/69031.htm. Accessed January 15, 2010
Puterman ML (2005) Markov decision processes: discrete stochastic dynamic programming. Wiley, HobokenRealtyTrac.com (2010) RealtyTrac® Year-End Report Shows Record 2.8 Million U.S. Properties With
Foreclosure Filings In 2009. World Wide Web: http://www.realtytrac.com/contentmanagement/pressrelease.aspx?itemid=8333. Accessed February 10, 2010
What Foreclosed Homes Should a Municipality Purchase... 387

ReVelle C (1987) Urban public facility location. In: Mills ES (ed) Handbook of regional and urbaneconomics, vol II. North-Holland, Amsterdam, pp 703–714
Rosen HS (2004) Public finance, 7th edn. McGraw-Hill Irwin, BostonRui Figueira J, Tavares G, Wiecek MM (2010) Labeling algorithms for multiple objective integer
knapsack problems. Comput Oper Res 37:700–711Sampson RJ, Raudenbush SW, Earls F (1997) Neighborhoods and violent crime: a multilevel study of
collective efficacy. Science 277(5328):918–924Sanchez TW, Dawkins CJ (2001) Distinguishing city and suburban movers: evidence from the American
housing survey. Hous Policy Debate 12(3):607–631Schuetz J, Been V, Ellen IG (2008) Neighborhood effects of concentrated mortgage foreclosures. J Hous
Econ 17(4):306–319Simmons R, Salling M (1995) Using GIS to make Parcel-based real estate decisions for local government:
a financial and environmental analysis of residential lot redevelopment in a Cleveland neighborhood.URISA J 7(1):7–19
Taylor J (2008) Help now, not later. Shelterforce, Spring 2008: 16–18. World Wide Web: http://www.shelterforce.org/article/211/help_now_not_later. Accessed January 23, 2010
The Boston Foundation (2008) Passion & purpose: raising the fiscal fitness bar for Massachusettsnonprofits. Prepared by Elizabeth Keating, Geeta Pradhan, Gregory H. Wassall and DouglasDeNatale. Web: http://www.tbf.org/UtilityNavigation/MultimediaLibrary/ReportsDetail.aspx?id=8014. Accessed March 21, 2010
The Enterprise Foundation (1999) Creating multifamily rental housing through renovation. Prepared byBob Santucci, Bill Batko, Carter Cosgrove + Company, Ben Hecht, Scott Hoekman, Catherine Hyde,Matt Perrenod, Jane Usero and Benjamin Warnke. Columbia, Maryland. World Wide Web: http://www.practitionerresources.org/cache/documents/36613.pdf. Accessed January 23, 2010
The Warren Group (2009) Massachusetts Foreclosures Soar 62% in 2008. Press Release, January 21.World Wide Web: http://www.thewarrengroup.com/portal/Solutions/PressReleases/tabid/190/newsid751/2206/Default.aspx. Accessed February 10, 2010
The Warren Group (2010) More Bay State Homeowners Face Foreclosure in 2009, but fewer lose theirhomes. Press Release, January 21.World Wide Web: http://www.thewarrengroup.com/portal/Solutions/PressReleases/tabid/190/newsid751/2377/Default.aspx. Accessed February 10, 2010
Thrall GI (1998) GIS applications in real estate and related industries. J Hous Res 9(1):33–59U.S. Census Bureau (2009) American FactFinder: American Community Survey: World Wide Web: http://
factfinder.census.gov/servlet/DatasetMainPageServlet?_program=ACS&_submenuId=&_lang=en&_ts=. Accessed February 6, 2010
U.S. Department of Housing and Urban Development (HUD) (1998) Analysis of total development costsin public housing. Prepared by Christopher Logan, Hin-Kin Lam, Seth Cooper and James Wallace,Abt Associates. Washington, D.C. World Wide Web: www.abtassociates.com/reports/ES-D19980856.pdf. Accessed January 26, 2010
U.S. Department of Housing and Urban Development (HUD) (2008) Preston allocates nearly $4 billion tostabilize neighborhoods in states and local communities hard-hit by foreclosure. September 26, 2008.World Wide Web: http://www.hud.gov/news/release.cfm?content=pr08-148.cfm. Accessed January23, 2010
U.S. Department of Housing and Urban Development (HUD) (2009) HUD Implementation of theRecovery Act. World Wide Web: http://portal.hud.gov/portal/page/portal/RECOVERY/about.Accessed January 23, 2010
Visée M, Teghem J, Pirlot M, Ulungu EL (1998) Two-phases method and branch and bound procedures tosolve the bi-objective knapsack problem. J Glob Optim 12(2):139–155
Wright J, ReVelle C, Cohon J (1983) A multiobjective integer programming model for the land acquisitionproblem. Reg Sci Urban Econ 13:31–53
Zeng TQ, Zhou Q (2001) Optimal decision making using GIS: a prototype of a Real Estate GraphicalInformation System (REGIS). Int J Geogr Inf Sci 15(4):207–321
388 M. P. Johnson et al.