HISPANIC PERCEPTIONS OF POLICE IN LAS VEGAS “HIGH CRIME” NEIGHBORHOODS
91
HISPANIC PERCEPTIONS OF POLICE IN LAS VEGAS “HIGH CRIME” NEIGHBORHOODS By Christopher Jo Percy Bachelor of Arts –– Sociology University of Nevada Las Vegas 2012 A Professional Paper submitted in partial fulfillment of the requirements for the Master of Arts –– Sociology Department of Sociology College of Liberal Arts The Graduate College
-
Upload
independent -
Category
Documents
-
view
0 -
download
0
Transcript of HISPANIC PERCEPTIONS OF POLICE IN LAS VEGAS “HIGH CRIME” NEIGHBORHOODS

HISPANIC PERCEPTIONS OF POLICE IN LAS VEGAS
“HIGH CRIME” NEIGHBORHOODS
By
Christopher Jo Percy
Bachelor of Arts –– Sociology
University of Nevada Las Vegas
2012
A Professional Paper submitted in partial fulfillment
of the requirements for the
Master of Arts –– Sociology
Department of Sociology
College of Liberal Arts
The Graduate College

University of Nevada Las Vegas
December 2014
ABSTRACT:
This paper utilizes survey data drawn from the Las Vegas
Metropolitan Police Department (LVMPD) and University of
Nevada Las Vegas Smart Policing Initiative (SPI) to explore
Hispanic perceptions of neighborhood disorder as well as
Hispanic perceptions of the police. The literature on
perceptions of police suggests that those who perceive
higher degrees of neighborhood disorder generally hold lower
perceptions of the police and police effectiveness. The
literature also suggests that Hispanics, as a group,
generally hold favorable attitudes towards the police. Most
of the literature sampled homogenous neighborhoods and
indicates demographic factors such as age, time in
residence, and education impact resident perceptions of
police. This analysis breaks down the studied Hispanic
population between English-speaking and Spanish-speaking to
focus on their specific perceptions of neighborhood disorder
iii

utilizing a scale of broken windows characteristics, quality
of life in neighborhood, and satisfaction with the police.
Additionally, I analyze whether being born in the United
States versus elsewhere has an impact on neighborhood and
perceptions of police.
LIST OF TABLES AND FIGURES
Figure 1. Crime Categories and Incident Codes used in Crime Ranking 14
Table 1 Distribution of Education Levels Among Respondents15
Table 2 Marital Status of Respondents16
Table 3 Employment status of Respondents17
iv

Table 4 Bivariate Relationships of Race/Ethnicity and the Independent Variables 24
Table 5 Bivariate Analysis of Race/Ethnicity Compared to Broken Windows 26
Table 6 OLS Linear Regression of Disorder Index (0-16) with Cultural Factors, Treatment Area and Controls. 27
Table 7 Logistic Regression predicting Neighborhood Quality of Life as “good” with Cultural Factors, Treatment Area, Neighborhood Disorderand Control Variables 29
Table 8 Logistic Regression predicting Perception of Crime as a problem in Neighborhood with Cultural Factors, Treatment Area, Neighborhood Disorder and Control Variables 31
Table 9 Logistic Regression predicting Perceptions of Policewith Cultural Factors, Treatment Area, Neighborhood Disorderand Control Variables 33
v

INTRODUCTION:
In 2012, The University of Nevada Las Vegas took part in
assisting the Metropolitan Las Vegas Police Department by
performing a survey of randomly sampled Las Vegas “high
crime” neighborhoods. High crime neighborhoods are those
defined by Metro as having the most violent calls for
service (CFS), disorder (CFS), and property crimes. The
saturation policing initiative then used a “matched pairs”
methodology to pair neighborhoods with similar crime
patterns. One neighborhood received treatment, the other
served as a control. The methodology for selecting “high
crime” neighborhoods is outlined in the DATA and METHODS
section below.
The survey was done in waves. Half of the surveys were
completed in control neighborhoods that did not receive
saturation policing, the other half were completed in
neighborhoods that received saturation policing. Contrary to
existing literature that shows blacks disproportionately
vi

represented in high crime neighborhoods (Barkan, Steven, &
Cohn, 2005; Correl et al., 2002; Decker & Smith, 1980; Hahn,
1971; Jefferis et al., 1997; Peek, Alston & Lowe, 1978;
Preist & Carter, 1999; Reisig & Parks, 2000; Rice & Piquero,
2005; Sampson & Raudenbush, 2004; 2005; Skogan, 1978;
Weitzer, 1999; Weitzer, 2000a; 2000b; Weitzer & Tuch, 2002),
those self-identifying as Hispanics are disproportionately
represented (51.6%).
While much work has been done in the fields of sociology and
criminology that explore resident perceptions of police
(Barkan & Cohn, 2005; Batson & Monnat, 2013; Brown &
Benedict, 2002; Cao, Frank, & Cullen, 1996; Carr & Keating,
2007; Chandek, 1999; Chermak, McGarrell & Weiss, 2001;
Cheurprakobkit & Bartsch, 1999; Cheurprakobkot, 2000; Decker
& Smith, 1980; Dunham & Alpert, 1988; Garcia & Liquin, 2005;
Hahn, 1971; Jesilow & Meyer, 2001; Jesilow, Meyer, &
Namazzi, 1995; Kaminski & Jefferis, 1998; Lasley, 1994;
Peek, Alston & Lowe, 1978; Peek, Lowe & Alston, 1981; Percy,
1986; Preist & Carter, 1999; Quillian & Pager, 2001; Reisig
vii

& Correia, 1997; Reisig & Giacomazzi, 1998; Reisig & Parks,
2000; Reitzel, Rice & Piquero, 2004; Rennison, 2007; Rice &
Piquero, 2005; Sampson & Bartusch, 1998; Sampson &
Raudenbush, 2004; 2005; Shaw et al., 1998; Skogan, 1978;
Skogan, 1989; Skogan, 1996; Sullivan, Dunham & Alpert, 1987;
Tuch & Weitzer, 1997; Weitzer, 1999;2000a;2000b; Weitzer &
Tuch, 2002; White & Menke, 1982; Wilson & Kelling, 1982;
Zevitz & Rettammel, 1990), very few reference the Hispanic
population at all (Carr, Napolitano & Keating, 2007;
Cheurorakobkit & Bartsc, 1999; Cheurprakobkit, 2000; Dunham
& Alpert, 1988; Garcia & Liquin, 2005; Jesilow & Meyer,
2001; Lasley, 1994; Reitzel & Piquero, 2004; Rennison, 2007;
Rice & Piquero, 2005; Sullivan, Dunham & Alpert, 1987;
Sampson & Raudenbush, 2005; Tuch & Weitzer, 1997). Even
fewer focus on the Hispanic population as a target of their
analysis (Cheurprakobkit, 2000; Garcia & Liquin, 2005;
Reitzel & Piquero, 2004; Rennison, 2007).
Through analysis of the Smart Policing Initiative (SPI)
survey data, I add to the existing literature by expanding
viii

our knowledge of Hispanic perceptions of police. The
information provided comes from neighborhoods identified by
the Las Vegas Metropolitan Police Department as “high crime”
areas. These are lower-income, heterogeneous neighborhoods
targeted by police to receive saturation policing in an
effort to reduce crime levels. It can be assumed that most
of the residents surveyed will fit similar socio-demographic
mold since those with the means are more likely to move out
of “high crime” environments (Chermak, McGarrell & Weiss,
2001; Dunham & Alpert, 1998; Garcia & Liquin, 2005; Geiss &
Ross, 1998; Hahn, 1971; Preist & Carter, 1999; Reisig &
Giacomazza, 1998; Sampson & Bartush, 1998; Sampson &
Raudenbush, 2004; 2005; Wilson & Kelling, 1982). Since much
of the previous research focused on differences in class and
race from the perspective of homogenous neighborhood
contexts (Carr, Napolitano & Keating, 2007; Cheurorakobkit &
Bartsc, 1999; Cheurprakobkit, 2000; Dunham & Alpert, 1988;
Garcia & Liquin, 2005; Jesilow & Meyer, 2001; Lasley, 1994;
Reitzel & Piquero, 2004; Rennison, 2007; Rice & Piquero,
2005; Sullivan, Dunham & Alpert, 1987; Sampson & Raudenbush,
ix

2005; Tuch & Weitzer, 1997; Weitzer, 1999), this inquiry
highlights perspectives of the Hispanic population within
low-income, high-crime, heterogeneous environments.
Research Questions
What are the Hispanic perceptions of police in Las Vegas
“high crime” neighborhoods? Do the views of the Hispanic
population(s) in this sample reflect the trends expressed in
the literature? Is there a significant difference between
the test and control samples with regard to the Smart
Policing Initiative? Is race/ethnicity the most telling
factor with regard to resident perceptions of police and
neighborhood quality or does neighborhood disorder have an
impact? Does the language the survey was taken in factor
into the analysis of resident perceptions of the police and
neighborhood quality?
Hypotheses
Based on the literature, I am inclined to these hypotheses.
H1 a). I expect that Hispanics in Las Vegas will report
x

lower levels of neighborhood disorder than non-
Hispanics.
b). I expect Hispanics will be more likely than non-
Hispanics to report quality of life in
neighborhood as “good.”
c). I expect Hispanics will report lower perceptions
of crime than non-Hispanics.
d). I expect Hispanics will be more likely than non-
Hispanics to perceive the quality of Metro as
“good.”
[H2] a). I expect that residents living in
neighborhoods that experienced police saturation
will report higher perceptions of crime than those
in control groups.
b). I expect that residents in test neighborhoods will
report higher levels of neighborhood disorder than
those in control groups.
c). I expect that residents in test neighborhoods will
report lower overall perceptions of the police
xi

than those in control groups.
[H3] a). I expect to show differences in outcomes by
language of origin, such that residents who
completed the survey in Spanish will report higher
perceptions of crime than English-speaking
residents.
b). I expect that Spanish-speaking respondents will
report lower levels of neighborhood disorder than
English speaking residents.
c). I expect that Spanish-speaking respondents will
report higher overall perceptions of the police
than English speaking residents.
LITERATURE:
An interest in resident perceptions of police was largely
motivated by the riots that occurred in northern cities
towards the end of the civil rights movement. Researchers
began to speculate that negative perceptions of police
complicated interactions between citizens and police (Decker
xii

& Smith, 1980; Hahn, 1971; Peek et al, 1981; Skogan, 1978;
White & Menke, 1982; Kelling & Moore, 1988). Reluctance to
turn to the police, and a lacking faith in the police as a
whole, may provide the potential for civil unrest (Brown &
Benedict, 2002). In an effort to repair perceptions of
police, agencies began to move from the “reform era” into an
era marked by an emphasis on community policing (Kelling &
Moore, 1988). To date, many believe that exploring resident
perceptions of police will provide police agencies with the
information required to improve agency practices and better
meet the needs of the communities that they serve (Barkan &
Cohn, 2005; Batson & Monnat, 2013; Brown & Benedict, 2002;
Cao, Frank, & Cullen, 1996; Carr & Keating, 2007; Chandek,
1999; Chermak, McGarrell & Weiss, 2001; Cheurprakobkit &
Bartsch, 1999; Cheurprakobkot, 2000; Decker & Smith, 1980;
Dunham & Alpert, 1988; Garcia & Liquin, 2005; Hahn, 1971;
Jesilow & Meyer, 2001; Jesilow, Meyer, & Namazzi, 1995;
Kaminski & Jefferis, 1998; Lasley, 1994; Peek, Alston &
Lowe, 1978; Peek, Lowe & Alston, 1981; Percy, 1986; Preist &
Carter, 1999; Quillian & Pager, 2001; Reisig & Correia,
xiii

1997; Reisig & Giacomazzi, 1998; Reisig & Parks, 2000;
Reitzel, Rice & Piquero, 2004; Rennison, 2007; Rice &
Piquero, 2005; Sampson & Bartusch, 1998; Sampson &
Raudenbush, 2004; 2005; Shaw et al., 1998; Skogan, 1978;
Skogan, 1989; Skogan, 1996; Sullivan, Dunham & Alpert, 1987;
Tuch & Weitzer, 1997; Weitzer, 1999; 2000a; 2000b; Weitzer &
Tuch, 2002; White & Menke, 1982; Wilson & Kelling, 1982;
Zevitz & Rettammel, 1990).
A survey of over four decades of sociological inquiry into
resident perceptions of police and policing activities shows
that the field is marked with inconsistency. Many studies
focus heavily on the analysis of blacks and whites (Barkan,
Steven, & Cohn, 2005; Correl et al., 2002; Decker & Smith,
1980; Hahn, 1971; Peek, Alston & Lowe, 1978; Preist &
Carter, 1999; Reisig & Parks, 2000; Rice & Piquero, 2005;
Sampson & Raudenbush, 2004; 2005; Skogan, 1978; Weitzer,
1999; Weitzer, 2000a; 2000b; Weitzer & Tuch, 2002) leaving
out any differences that may be shown by other ethnic
minority groups. Hispanics do not appear in this literature
xiv

on perceptions of police until 1987 (Dunham & Alpert, 1987)
and when they do, they seem to be used as a comparison group
to break the dichotomy of black vs. white studies (Carr,
Napolitano & Keating, 2007; Cheurorakobkit & Bartsch, 1999;
Cheurprakobkit, 2000; Dunham & Alpert, 1988; Garcia &
Liquin, 2005; Jesilow & Meyer, 2001; Lasley, 1994; Reitzel &
Piquero, 2004; Rennison, 2007; Rice & Piquero, 2005;
Sullivan, Dunham & Alpert, 1987; Sampson & Raudenbush, 2005;
Tuch & Weitzer, 1997). Hispanics were and are commonly
referred to simply as “other” groups, or lumped into the
heading of “non-black,”(Lasley, 1994; Rice & Piquero, 2005;
Rice & Giacomazzi, 1998; Sampson & Raudenbush, 2005;
Weitzer, 2000b).
Garcia notes, “Hispanics constitute a separate group,
distinct from both African Americans and Whites. According
to the U.S. Census Bureau (2000), Hispanics represented the
largest minority group in the U.S. (Garcia & Liquin, 2005).”
According to data from the 2010 census, that group is
growing rapidly. “The Hispanic population increased by 15.2
xv

million between 2000 and 2010, accounting for over half of
the 27.3 million increase in the total population of the
United States. Between 2000 and 2010, the Hispanic
population grew by 43 percent, which was four times the
growth in the total population at 10 percent (Ennis, Rios-
Vargas & Albert, 2011).” Inquiry into Hispanic perceptions
of neighborhoods and police would seem even more relevant in
this context. This is especially true in Nevada, which was
one of the fastest growing states overall in 2010 (Mackun &
Wilson, 2011). Cities, such as Las Vegas, NV, which tied
Raleigh, NC as the third fastest growing in the country,
should benefit strongly from a deeper understanding of the
Hispanic population (Mackun & Wilson, 2011).
Race/Ethnicity, Age, and Other Factors
Race/ethnicity plays prominently in the perception
literature (Barkan, Steven, & Cohn, 2005; Carr, Napolitano &
Keating, 2007; Cheurprakobkit, 2000; Cheurprakobkit &
Bartsch, 1999; Correl et al., 2002; Decker & Smith, 1980;
Dunham & Alpert, 1988; Garcia & Liquin, 2005; Hahn, 1971;
xvi

Jesilow & Meyer, 2001; Lasley, 1994; Peek, Alston & Lowe,
1978; Preist & Carter, 1999; Reisig & Parks, 2000; Reitzel &
Piquero, 2004; Rennison, 2007; Rice & Piquero, 2005; Sampson
& Raudenbush, 2004; 2005; Skogan, 1978; Sullivan, Dunham &
Alpert, 1987; Tuch & Weitzer, 1997; Weitzer, 1999; Weitzer,
2000a; 2000b; Weitzer & Tuch, 2002). Nearly all of these
articles summarize similar findings for blacks & whites with
regard to perceptions of police. Whites tend to view police
more favorably. Blacks, regardless of racial composition of
the samples tend towards a negative view of the police. Of
the studies that focus specifically on Hispanics
(Cheurprakobkit, 2000; Garcia & Liquin, 2005; Reitzel &
Piquero, 2004; Rennison, 2007), Cheurprakobkit found that,
“Spanish-speaking Hispanics felt more satisfied with police
performance than Whites and English-speaking Hispanics
(Cheurprakobkit, 2000).” Garcia and Liquin reported that
Hispanics had the lowest overall perceptions of police in
their sample (Garcia & Liquin, 2005). Reitzel, Rice, &
Piquero found Hispanics were more likely than non-Hispanics
to believe that the practice of profiling was widespread,
xvii
and that they had been profiled (Reitzel, Rice & Piquero,
2004), which can be interpreted as a negative stance towards
police. Rennison found that robbery against Hispanics is
less likely to be reported to police, but simple assault was
more likely to be reported than similar crimes against non-
Hispanic Asians or Whites (Rennison, 2007). Clearly there is
a lot of work left to do in the field of perceptions of
police with regard to the Hispanic population.
Age
Age is commonly positively associated with perceptions of
police (Carr, Napolitano & Keating, 2007; Percy, 1986;
Reisig & Correia, 1997; Reisig & Giacomazza, 1998; Sampson &
Raudenbush, 2005; Sullivan, Dunham & Alpert, 1987). Sampson
and Raudenbush (2005), found that older residents tend to
perceive less neighborhood disorder.
Education
Education is positively linked (Reisig & Giacomazza, 1998),
negatively linked (Percy, 1986), and shows no significance
xviii

(Jesilow, Meyer & Namazzi, 1995), according to the
literature. I would expect education to have little impact
on the results of these tests with regard to the SPI survey
because the survey focuses on “high-crime,” low-income
areas. I would guess the majority of survey respondents are
not college educated, based on the sociological link between
education and class attainment.
Sex
Demographic identification of sex does not play a prominent
role in the literature. Where it is found (Cao, Frank, &
Cullen, 1996; Rice & Piquero, 2005) females are linked
positively to perceptions of police, while males tend
towards negative perceptions.
Media and Perceptions
I include this in the literature discussion because there is
a field of inquiry that pertains to media portrayals of the
police and their effect on perceptions of the police.
(Jesilow & Meyer, 2001; Kaminski & Jefferis, 1998; Lasley,
xix

1994; Tuch & Weitzer, 1997; Weitzer, 1999) show that while
all races seem to show an increase in negative perceptions
of police following the spread of an incident of police
brutality in the media, Hispanics are more effected than
Whites, and generally less effected than Blacks. It should
be noted for the purposes of this study that the SPI survey
was performed prior to the well-publicized events in
Ferguson, MO regarding the shooting of Michael Brown. I do
not expect that any publicized event is having an effect on
this data.
THEORY
Conceptualizations about police perception that center
around neighborhood characterizations emerge in the
literature after the “broken windows” work of Kelling &
Wilson in 1982. The theoretical framework of broken windows
is posited around the notion that visual signs of physical
decay signal a decline in informal social controls (Kelling
& Wilson, 1982). The decline in social control paired with
increasing visual signs of physical decay and disorder, then
xx

invites more negative behavior to the neighborhood (Kelling
& Wilson, 1982). Once reified in the literature, measures of
neighborhood characteristics become prominent in the
perception literature (Batson & Monnat, 2013; Cao, Frank &
Cullen, 1996; Chermak, McGarrell & Weiss, 2001; Garcia &
Liquin, 2005; Geis & Ross, 1998; Quillian & Pager, 2001;
Reisig & Giacomazza, 1998; Reisig & Parks, 2000; Sampson &
Bartusch, 1998; Sampson & Raudenbush, 2004; 2005; Skogan,
1978; 1989; Weitzer, 1999; 2000a; 2000b; Weitzer & Tuch,
2002). It is important to note that many of these studies do
not indicate “broken windows” variables specifically.
However, the ones that do tend to show a positive
correlation between the presence of physical decay and the
perceived rate of crime or disorder (Cao, Frank, & Cullen;
Geis & Ross, 1998; Preist & Carter, 1999, Quillian & Pager,
2001; Reisig & Giacommazza, 1998; Sampson & Raudenbush,
2004; 2005). Additionally, these studies show that there is
a negative association between physical decay and resident
perceptions of police.
xxi

DATA and METHODS:
I utilize data gained from the survey portion of the SPI,
(n=1005). Dependent on missing data, corrected sample size
for various questions ranges from n=932 – n=996. The data
comprises tested respondents (n=498) and control respondents
(n=507) in neighborhoods identified by the Las Vegas
Metropolitan Police Department (LVMPD) as “high crime”
neighborhoods. The project employed a matched-pairs
experimental design to test the effectiveness of saturation
police in 24 designated high-crime hotspots in the Las Vegas
metropolitan area. The high-crime hotspots were compiled by
using LVMPD Area Command crime information. Geographically,
LVMPD is divided into 8 area commands across the Las Vegas
Metropolitan area. Each Area Command provided the three
highest trouble areas in their command jurisdiction, thus
generating a list of 24 high-crime areas across the valley.
This method ensured that the study was geographically
distributed across the metro region. Each of the 24 areas
represents an approximate 1-mile radius. Once the 24 areas
were defined by street name boundaries, Calls for Service
xxii

(CFS) data were used to identify three levels of offenses to
rank the areas from highest to lowest crime based on their
cumulative number of crimes. Table 1 displays the crime
categories and their respective incident codes used in our
ranking of the 24 high-crime hotspots.
Figure 1. Crime Categories and Incident Codes used in Crime Ranking
Violent CFS Disorder CFS Property CrimesRobbery, Assault, Homicide, Sexual Assault, Illegal Shooting, Person with a gun, Person with a knife, etc.
Prowler, Drunk, Reckless Driver, Fight, Suspicious Person, W anted Suspect, Narcotics, Destruction of property, and other disturbances.
Burglary, attempted burglary, Auto burglary, stolen motor vehicle, and attempted stolen motor vehicle
Codes: 407, 407G, 407Z, 413, 413A, 413B, 413 G, 415, 415A, 415B, 415C, 415D, 415G, 415Z, 420, 420G, 420Z, 426, 426Z, 434, 434G.
Codes: 403, 408, 410, 416, 416A, 416B, 416F, 416G, 416S, 416V, 425, 425A, 425B, 425G, 425H, 440, 441, 441G, 441V, 441Z, 446.
Codes: 406, 406V, 406Z, 411, 411Z.
With a ranking of the 24 high-crime hotspots, a matched-
pairs method was used to pair two areas with very similar
crime statistics. Among the pairs, one area received
saturation treatment and the other area served as the
control group. Thus, the two highest-crime hotspots were
matched together so that one will receive saturation
treatment and the other will be the control hotspot.
xxiii

Description of the sample
Hispanics make up the majority of respondents surveyed
(51.6%), a 10% increase over those who identified as “other
(41.6%)” when asked to choose which race/ethnicity they
identified with from the selections of: White (36.4%),
African American (14.6%), Asian or Asian American (3.6%),
American Indian or Native American (1.1%), Native Hawaiian
or Pacific Islander (2.7%), or Other (41.6%). A second
question regarding race/ethnicity asked, “do you consider
yourself to be Spanish/Hispanic/Latino?” Respondents were
given the opportunity to select: “No, not
Spanish/Hispanic/Latino; Yes, Mexican; Yes, Puerto Rican;
Yes, El Salvadorian; Yes, other Spanish/Hispanic/Latino.”
The responses to this second question were recoded into a
variable isolating respondents identifying as Hispanic and
analysis was completed using this recoded variable as it
contained a larger sampling of Hispanics than the previous
race/ethnicity question (51.6%). Of the Hispanic population,
17.3% of respondents took the survey in Spanish.
xxiv

Education levels of the sample population are best viewed
from this chart:
Table 1: Distribution of Education Levels Among Respondents
Education LevelRace/Ethnicity
NoDiploma
HSGrad
or GED
SomeCollege
Associates
Degree
Bachelors
Degree
Graduate
DegreeWhite 10.5% 26.9% 34.4% 11.1% 11.8% 5.3%
AfricanAmerican
14.0% 34.9% 29.5% 10.1% 7.8% 3.9%
AsianAmerican
10.0% 33.3% 16.7% 16.7% 16.7% 6.7%
AmericanIndian/Native
American
30.0% 10.0% 40.0% 10.0% 10.0% 0.0%
NativeHawaiian/PacificIslander
12.5% 29.2% 20.8% 12.5% 12.5% 12.5%
**Hispanic 29.7% 46.8% 14.3% 3.9% 2.5% 1.0%
**Hispanic calculated from q19 – Recoded into dichotomous Hispanic =1,
Other=0
Of all tested groups, we see that the Hispanic population
ranks lower than any other racial/ethnic category for
college attendance. The percentage of Hispanics is lower
xxv

than every other race/ethnic group identified in every
category from “some college – graduate degree,” and this is
consistent in comparison with every other race/ethnicity
identified.
Table 2: Marital Status of Respondents
What is your current marital status?
Race/Ethnicity
Married
Single Divorced
Widowed
Separated
Cohab.
White 32.1% 33.6% 16.0% 9.0% 2.2% 7.1%
AfricanAmerican
24.6% 45.4% 6.9% 9.2% 1.5% 12.3%
AsianAmerican
36.7% 43.3% 13.3% 0.0% 3.3% 3.3%
AmericanIndian/Native
American
11.1% 66.7% 11.1% 0.0% 0.0% 11.1%
NativeHawaiian/PacificIslander
43.5% 21.7% 8.7% 0.0% 0.0% 26.1%
**Hispanic 47.1% 28.7% 10.6% 5.5% 3.6% 8.6%
xxvi

**Hispanic calculated from q19 – Recoded into dichotomous Hispanic =1,
Other=0
The Hispanic population is the most likely of all groups to
be married (47.1%). A higher percentage of American Indians
or Native Americans are single than any other group (66.7%).
Whites lead in percentages of divorce (16.0%). African
Americans, Whites and Hispanics identify as widowed. The
percentages for African Americans and Whites are similar
(9.2%/9.0%), both race/ethnicities are nearly double
Hispanics (5.5%). There are low percentages reported for
separated amongst Whites, African Americans, Asian Americans
and Hispanics, with none reported for the Native groups.
More than a quarter of the Native Hawaiian/Pacific Islander
demographic live with a partner (26.1%).
Of those responding to the question (n=991), 76.9% of the
sample population rent their home. Males make up 51.3% of
the overall population, though the Hispanic population
xxvii

(n=488) is 52.3% female. Median age of the sample population
is 42. The median length of time at their current address is
4 years.
Employment status of the sample population:
Table 3: Employment status of Respondents
Which of the following best describes your current employment or labor force status?
Race/Ethnicity Fu
ll Time
Part Time
Unemp.
Looking
Not
Looking
FT
Student
Home
Worker
Retired
Other
Refuse
Answer
White 42.9%
9.8% 8.8% 3.5% 1.6% 3.8% 24.3%
5.0% 0.3%
AfricanAmerica
n
30.8%
12.3%
8.8% 4.6% 5.4% 2.3% 13.1%
10.8%
2.3%
AsianAmerica
n
40.6%
9.4% 18.5%
0.0% 3.1% 6.3% 28.1%
0.0% 3.1%
Am.Indian/
Native
40.0%
30.0%
9.4% 0.0% 0.0% 10.0%
0.0% 20.0%
0.0%
Hawaiian/
Islander
54.5%
13.6%
4.5% 4.5% 9.1% 4.5% 9.1% 0.0% 0.0%
**Hispanic
51.2%
14.6%
11.7%
1.0% 4.0% 11.5%
4.2% 1.9% 0.0%
**Hispanic calculated from q19 – Recoded into dichotomous Hispanic =1,
Other=0
xxviii

The majority of the Hispanic and Hawaiian Islander
populations are employed full time (51.2%/54.5%). The
American Indian/Native American group has the highest
percentage of all races in any kind of employment
(FT+PT=70%). Whites and Asian Americans boast the highest
percentages of retired people (24.3%/28.1%) respectively.
Native Hawaiian/Pacific Islanders report the highest
percentage of full time students (9.1%).
Research Questions
What are the Hispanic perceptions of police in Las Vegas
“high crime” neighborhoods? Do the views of the Hispanic
population(s) in this sample reflect the trends expressed in
the literature? Is there a significant difference between
the test and control samples with regard to the Smart
Policing Initiative? Is race/ethnicity the most telling
factor with regard to resident perceptions of police and
neighborhood quality or does neighborhood disorder have an
impact? Does the language the survey was taken in factor
xxix

into the analysis of resident perceptions of the police and
neighborhood quality?
Hypotheses
My research is guided by the following hypotheses.
H1 a). I expect that Hispanics in Las Vegas will report
lower levels of neighborhood disorder than non-
Hispanics.
b). I expect Hispanics will be more likely than non-
Hispanics to report quality of life in
neighborhood as “good.”
c). I expect Hispanics will report lower perceptions
of crime than non-Hispanics.
d). I expect Hispanics will be more likely than non-
Hispanics to perceive the quality of Metro as
“good.”
[H2] a). I expect that residents living in
neighborhoods that experienced police saturation
will report higher perceptions of crime than those
xxx

in control groups.
b). I expect that residents in test neighborhoods will
report higher levels of neighborhood disorder than
those in control groups.
c). I expect that residents in test neighborhoods will
report lower overall perceptions of the police
than those in control groups.
[H3] a). I expect to show differences in outcomes by
language of origin, such that residents who
completed the survey in Spanish will report higher
perceptions of crime than English-speaking
residents.
b). I expect that Spanish-speaking respondents will
report lower levels of neighborhood disorder than
English speaking residents.
c). I expect that Spanish-speaking respondents will
report higher overall perceptions of the police
than English speaking residents.
xxxi

Dependent Variables
This paper uses four dependent variables; perceptions of
crime, perceptions of neighborhood disorder, perception of
neighborhood quality of life, and perceptions of the police.
Perceptions of crime are taken from survey question three
that asks respondents, “Generally speaking, how would you
rate crime as a problem in your neighborhood?” Respondents
were offered the following choices: 1. Very big problem, 2.
Somewhat of a problem, 3. Not much of a problem, and 4. No
problem at all. The selections were recoded into a
dichotomous variable where “not much of a problem” and “no
problem at all” were coded as “0” and “somewhat of a
problem” and “very big problem” were coded as “1”. This
coding is used specifically for the regression analysis. The
original codings, as stated below, are used for the index
comparison of the dependent variables against the disorder
index. This is explained below and represented in Table 6.
Perceptions of neighborhood disorder are measured as an
index created from the neighborhood disorder variables in
xxxii

question 7. Ordinary least squares regression (OLS) analysis
is particular useful for showing strength and direction of a
relationship between ordinal and interval/ratio variables. I
analyze perceptions of neighborhood disorder through the use
of “broken windows” theory of Kelling & Wilson (1982). The
SPI survey utilized a series of questions assessing
respondent perceptions of neighborhood disorder that
pertained directly to broken windows measures. Respondents
were asked to rate the following questions: Are there any
homes or building with broken windows on your block; Are
there any homes, other buildings or other places on your
block which [that] have graffiti on them; are there any
abandoned or boarded up homes or buildings on your block;
Are there any vacant lots on your block; Are there any
abandoned cars on the street on your block; Are there areas
on your block where litter is a problem; Are there areas on
your block where the street or sidewalk needs repairs; Are
there areas on your block that need better lighting?
Respondents were given the following choices for response:
None; A few; Many; Don’t Know; or Refused to Answer. The
xxxiii
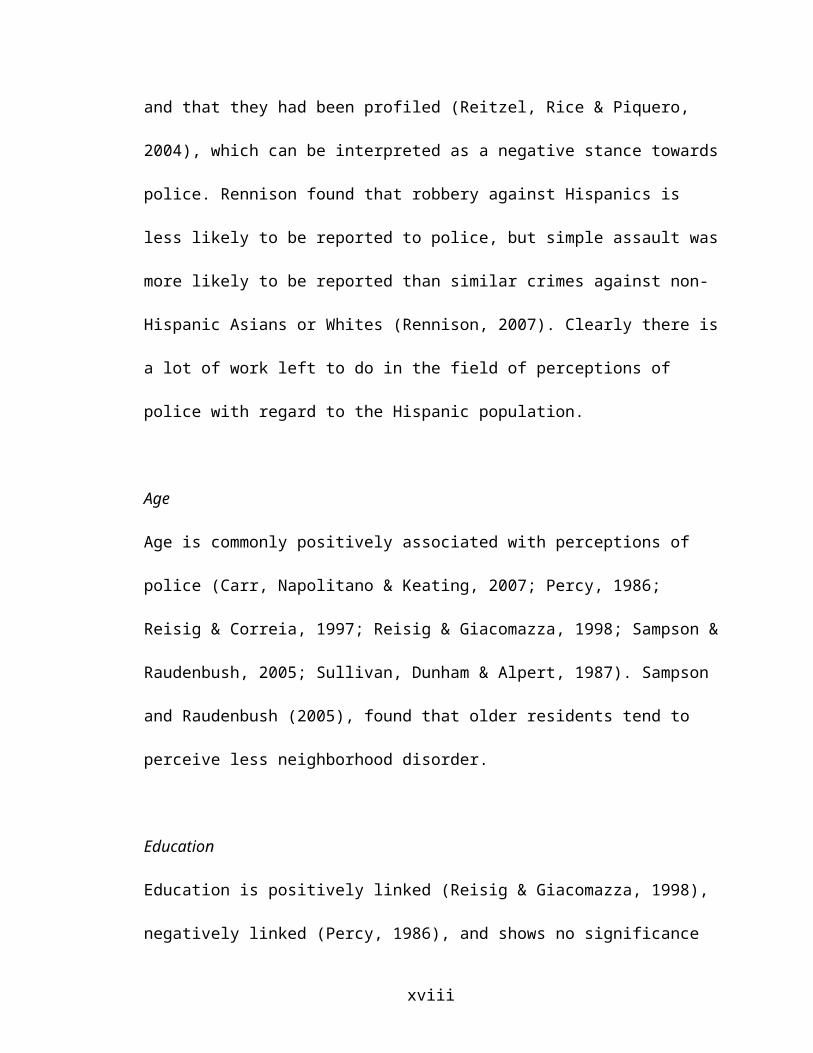
responses were first recoded into ordinal variables, “None,”
was recoded as “0”, “A few=1” and “Many =2.” “Don’t Know,”
and, “Refused to Answer,” were recoded as “Missing.” For
ordinary least squares analysis, the broken windows
variables were then combined into an index to be treated as
a continuous interval ratio variable (possibility of 0-16).
The index shows an adequate goodness of fit with a
Cronbach’s Alpha of 0.850 and a Cronbach’s Alpha based
solely on the standardized items of 0.852 for the 8 items in
the index.
Perceptions of neighborhood quality of life are taken from
question one of the survey that asks respondents to rate the
overall quality of life in their neighborhood. A response of
“1” or “2” was recoded into “1” indicating a respondent that
rated the overall quality of life in their neighborhood as
“good.” A response of “3” or “4” was coded as “0” indicating
a respondent that rated the overall quality of life in their
neighborhood as “not good.”
xxxiv

Perceptions of police are taken from question nine of the
survey. Question nine asks, “Overall, do you think the [Las
Vegas Metro] police are doing…,” respondents could select: A
very good job, a good job, a fair job, a poor job, a very
poor job, don’t know, or refused. The responses were recoded
with “A very good job, A good job,” and, “A fair job,”
recoded as “1,” “A poor job,” and, “A very poor job,”
recoded as “0,” and all other responses coded as system
missing. In this regard, any positive response became a “1,”
all negative responses a “0,” and all other regarded as
missing.
Independent Variables
The variable for “Hispanic” is coded from question 19 that
asks respondents, “Do you consider yourself to be
Spanish/Hispanic/Latino?” The majority of survey respondents
identified as “Hispanic,” 32% self-identified as “Mexican,”
0.9% identify as Puerto Rican, 3.8% identified as El
Salvadorian, 14.8% selected “other Spanish/Hispanic/Latino,”
and .1% show as an unidentified category. Most likely, the
xxxv

unidentified category is a result of data entry error. The
remaining 48.3% of respondents identified as “not
Spanish/Hispanic/Latino.” All sub-categories of this
variable in the affirmative were coded as “1.” The response,
“No, not Spanish/Hispanic/Latino,” was coded as “0.”
Nativity is assessed from question 21. All responses linked
to being born in the United States were combined and coded
as “1,” where the response, “in another country outside of
the U.S.,” was coded as “0.” A category was created for
Spanish-speaking respondents based on whether or not the
survey was taken in Spanish. If the survey was taken in
Spanish, it received the code of “1,” where surveys taken in
English received the code “0.” Areas that received treatment
were combined and coded as “1,” under the variable name
“treatment area.” Those areas that did not receive
saturation policing were coded as “0.”
I utilize broken windows questions (q7a-7h) to assess
perceptions of neighborhood disorder. Each component has
been recoded to a dichotomous variable for bivariate
xxxvi

analysis, “A few,” and “many” combined=1, “none”=0. For
logistic regression analysis, the dichotomous coding of each
disorder variable was used as independent variables. This is
reflected in the Logistic Regression Analysis Tables below
(Tables 7,8, & 9).
Control Variables
Age is treated as a continuous interval/ratio variable
calculated from the year the respondent was born,
(median=42). Gender is dichotomously coded, male=1,
female=0. Socioeconomic status (SES) is assessed from level
of education, an ordinal variable. Less than High School was
coded as “0,” high school diploma/GED as “1,” some college
as “2,” associates degree as “3,” bachelors degree as “4,”
and graduate or professional degree was coded as “5.” Length
of time at address was a continuous interval/ratio variable
reported in months, (median=48). This variable was recoded
to be a categorical (ordinal) variable where 0-12 months was
coded as “0,” 13-35 months coded as “1,” and 36+ was
combined as “2.”
xxxvii

Analysis
Bivariate analysis is beneficial for showing relationships
between dichotomous and nominal, “discrete,” variables. It
allows us to visualize whether or not variables of this type
are related in a statistically significant way. For the
analysis of this data, it is particularly useful to employ
the Chi Square test to assess whether or not comparisons of
the dependent and independent variables show any level of
statistical significance. Moreover, Chi Square shows how
this particular data differ from what we would expect to see
in a particular frequency distribution, if there are indeed
differences.
To test the stated hypotheses, I first run a bivariate
analysis of race/ethnicity (q20race), and the Hispanic
variable (Hispanic_q19) as independent variables against
Overall quality of life in the Las Vegas Valley
(LasVegas_Quality); quality of life in neighborhood
(Neighborhood_Quality); overall perception of Metro
xxxviii

(Metro_Overall); and perception of crime (crime_perception).
Results in Table 4 of the results section.
To assess race/ethnic perceptions of broken windows
characteristics, I run a bivariate analysis of
race/ethnicity against dichotomous codings of the questions
relation to broken windows. “None” is recoded as “0,” with
any presence of the various characteristics recoded together
as “1”. Results are presented in Table 5.
I first run the dependent and control variables against the
disorder index. Results of the OLS regression are shown in
Table 6 below. Logistic regression follows between each of
the dependent variables: neighborhood quality of life,
perception of crime as a problem, perception of the quality
of metro as good in comparison to each of the independent
and control variables. The results of the logistic
regression analyses are presented in Tables 7, 8, and 9.
RESULTS:
xxxix

The following section contains all of the analytic Tables as
well as brief descriptions of the information gathered in
each Table. The hypothesis testing follows the Tables.
Table 4:
Bivariate Relationships of Race/Ethnicity and the
Independent Variables
NeighborhoodQuality“Good”
CrimePerception“Problem”
Metro Overall“Positive”
Race/Ethnicity
N=885 N=882 N=856
White 237/32074.1%
203/32163.2%
283/31390.4%
AfricanAmerican
102/12879.7%
70/12655.6%
99/11883.9%
AsianAmerican
26/3281.3%
15/3246.9%
31/31100%
Am.Indian/Native
8/1080.0%
5/1050.0%
8/988.9%
Hawaiian/Islander
21/2487.5%
11/2445.8%
17/2470.8%
X2/df/Sig. 43.174,5, .000
13.863,5, .017
14.902,5, .011
N=491 N=489 N=482**Hispanic 295/491
60.1%321/48965.6%
415/48286.1%
X2/df/Sig. 36.991,1, .000
3.162,1, .075
1.904,1, .168
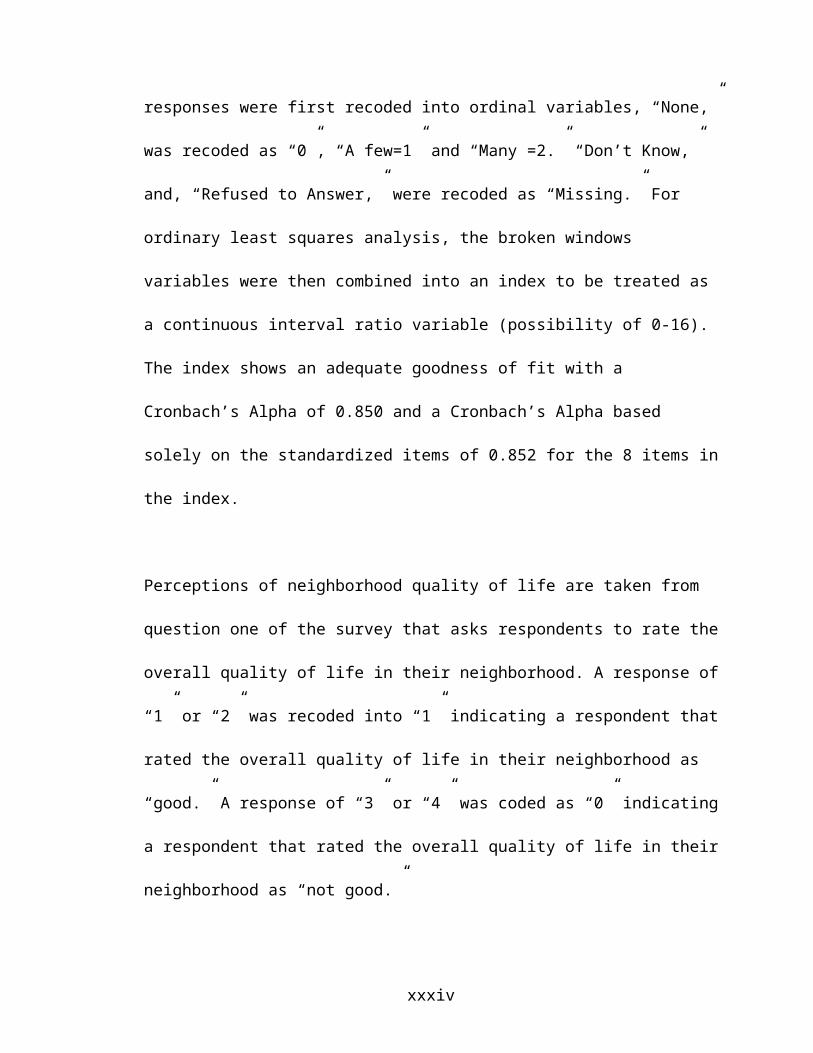
Table 4 indicates that the Chi Square statistic (X2) for
race/ethnicity (43.174, df=5) and Hispanic (36.991, df=1)
xl
are both below the expected usual threshold value of 0.05
(0.000), therefore statistically significant. The X2 for
perception of crime (13.863, df=5) and overall perceptions
of Metro (14.902, df=5) show that race/ethnicity is a
significant factor for both categories respectively
(0.017/0.011). No other test variables show statistical
significance for respondents identifying as Hispanic: Las
Vegas Quality (X2=2.375, df=1, 0.123), perception of crime
(X2=3.162, df=1, 0.075), or Metro overall quality (X2=1.904,
df=1, 0.168). Race/ethnicity is significant for every
dependent variable except perceptions of Las Vegas overall,
while identifying as Hispanic is only significant for
neighborhood level perceptions.
Cramer’s V, a measure of the magnitude or the strength of
the comparison between the racial/ethnic categories as they
relate to neighborhood quality as good, crime as a problem,
and Metro as positive report as 0.198/0.058/0.046
respectively. With regard to the Hispanic population
specifically, only the first relationship is statistically
xli

significant. With other racial/ethnic categories, Cramer’s V
statistics are 0.221/0.125/0.132 respectively. With all
racial/ethnic groups represented, we see a statistically
significant relationship, though this is not a strong
relationship as Cramer’s V is reported in a scale of 0-1.
Table 5:
Bivariate Analysis of Race/Ethnicity Compared to Broken
Windows
Broken
Windows
Graffiti
Abandone
d Homes
Broken
Sidewalk
s
Broken
Streetli
ghts
Race/Ethnicity
N=849 N=868 N=864 N=869 N=868
White 140/30645.8%
159/31151.1%
153/31249.0%
157/31450.0%
182/31557.8%
AfricanAmerican
51/12341.5%
64/12850.0%
54/12842.2%
53/12841.4%
73/12657.9%
AsianAmerican
5/3116.1%
7/3221.9%
9/3129.0%
8/3225.0%
14/3145.2%
Am.Indian/ Native
3/1030.0%
7/1070.0%
4/1040%
5/955.6%
4/944.4%
xlii

Hawaiian/Islander
8/2433.3%
5/2420.8%
6/2425.0%
7/2330.4%
13/2454.2%
X2/df/Sig. 28.597/5/.000*
38.885/5/.000*
22.917/5/.000*
27.941/5/.000*
33.493/5/.000*
**Hispanic
N=473269/47356.9%
N=482298/48261.8%
N=478274/47857.3%
N=480291/48060.6%
N=478345/47872.2%
X2/df/Sig. 24.878/1/.000*
22.177/1/.000*
19.118/1/.000*
26.127/1/.000*
25.467/1/.000*
**Hispanic calculated from q19 – Recoded into dichotomous Hispanic =1, Other=0Chi Square of 0.000 less than expected threshold value 0.05, (Statistically Significant)
Table 5 shows the number of respondents and corresponding
percentage values of each race/ethnic group that responded
in the affirmative to the presence of each of the listed
broken windows characteristics. Vacant lots, abandoned cars,
and litter were removed from the Table because they were not
statistically significant, (X2 values p > 0.05). Cramer’s V
for the race/ethnic categories are as follows: broken
windows (0.135), graffiti (0.209), abandoned homes (0.127),
broken sidewalks (0.135), broken streetlights (0.141). When
the Hispanic population is highlighted specifically and
compared to non-Hispanics the strength of relationship
xliii

changes slightly for each: broken windows (0.177), graffiti
(0.202), abandoned homes (0.146), broken sidewalks (0.169),
and broken streetlights (0.200). Again, these are
statistically significant relationships, though they are not
incredibly strong relationships.
Table 6: OLS Linear Regression of Disorder Index (0-16)
with Cultural Factors, Treatment Area and Controls.
(N=888) Model 1 Model 2 Model 3Cultural FactorsHispanic 1.713*** 1.721*** 1.299***Nativity 0.096 0.095 -0.015Spanish -0.603 -0.686 -0.531
TreatmentReceived Saturation Policing -0.250
-0.387
ControlsAge -0.035***Gender -0.637*Education 0.038Length of Time at Address
0.342*R-Square0.038 0.039 0.060
α = .05, p ≤ 0.05*, p ≤ 0.01**, p ≤ 0.001***
xliv

Table 6 shows that Hispanics perceive greater neighborhood
disorder than non-Hispanics. There is not a significant
difference between treatment areas and control areas in
their perceptions of neighborhood disorder. When age,
gender, education, and length of time at address are
included in the analysis, the significant difference between
Hispanics and non-Hispanics decreases slightly from 1.71 to
1.29. Age, tested as the continuous variable, is
statistically significant, indicating that as age increases
ones perceptions of neighborhood disorder decreases. Yet,
the longer one has lived at their current residence, their
perceptions of neighborhood disorder increase. As predicted,
education is not a statistically significant factor in this
analysis. With regard to the R-Square statistic, Model 1
explains 3.8% of the variation within the sample, Model 2
explains 3.9% and Model 3 explains 6.0% of the variation
within the sample. The models explain more variation as
factors are added to the model. Adding the test variable for
neighborhoods receiving saturation policing improves the
variation explained by 1/10th of percent. The addition of
xlv

demographic control variables allows model 3 to explain an
additional 2.1% of the variation in the sample.
xlvi

Table 7: Logistic Regression predicting Neighborhood Quality of Life as “good” with Cultural Factors, Treatment Area, Neighborhood Disorder and Control Variables.
α = .05, p ≤ 0.05*, p ≤ 0.01**, p ≤ 0.001*** Model 1 Model 2 Model 3 Model 4Model 5
HISPANIC 0.422*** 0.444*** 0.444*** 0.627* 0.630*Cultural FactorsNativity 0.981 0.969 0.931 0.907Spanish 0.827 0.688 0.506** 0.437**Treatment AreaReceived Saturation Policing 0.591*** 0.528*** 0.559**Neighborhood DisorderBroken Windows 0.411*** 0.419***Graffiti 0.519** 0.501**Abandoned Houses 0.880 0.895Vacant Lots 0.886 0.872Abandoned Cars 0.893 0.897Litter 0.672* 0.647*Broken Sidewalks 0.870 0.886Broken Lights 0.690 0.761Control VariablesAge (Continuous) 0.993Gender 1.906***Education(Less Than High School)Diploma/GED 0.806Some College 0.451Associates 0.505Bachelors 0.531
47

Graduate Degree 0.535Length of Time at Address(0-12)13-35 1.03336+ 1.399(N=803) R-Squared: 0.037 0.038 0.051 0.190 0.210
48

Table 7 shows the results from a logistic regression analysis
(reported in odds ratios) predicting “Good” neighborhood quality
of life. Looking at Table 7, we see that Hispanics are 58% less
likely than non-Hispanics to report their neighborhood as “Good”.
This ethnic pattern remains consistent across all models even
after adding control variables. In Model 3, I added the
treatment/control variable to the model. I show that residents in
treatment areas have lower odds than those in non-treatment areas
of reporting their neighborhood quality of life as good (41%
lower odds). Model 4, controls for neighborhood disorder with the
addition of eight neighborhood disorder measures. Based on the
results presented in Model 4 we see that three of the eight
measures are significant predictors of neighborhood quality of
life. Residents reporting “broken windows” in their neighborhood
are 59% less likely to report their quality of life as “Good”
compared to those not reporting visible broken windows. Those
reporting graffiti are 48% less likely than those who do not
report graffiti to see neighborhood overall quality as good.
Those reporting litter in their neighborhood are 33% less likely
than those not reporting litter to view their neighborhood
49

quality as good. The ethnic difference between Hispanics and non-
Hispanics remains even after controlling for neighborhood
disorder. Interestingly, the addition of neighborhood disorder
variables renders native language statistically significant. When
these variables are added, we see that Spanish speakers are half
as likely as non-Spanish speakers to report neighborhood quality
as good (0.506). In Model 5, I include the demographic control
variables to the analysis. Gender is the only control variable
that has a statistically significant effect on the test
population. Males are 90% more likely than females to report
neighborhood quality as good. The r-squared statistics is
valuable here. We see that adding neighborhood disorder
characteristics in Model 4 results in a 14% jump in the amount of
variation explained by the model. Controlling for demographic
factors improves the model by only 2%.
50

Table 8: Logistic Regression predicting Perception of Crime as a problem in Neighborhood with Cultural Factors, Treatment Area, Neighborhood Disorder and Control Variables
α = .05, p ≤ 0.05*, p ≤ 0.01**, p ≤ 0.001*** Model 1 Model 2 Model 3 Model 4Model 5
HISPANIC 1.381* 1.675** 1.664** 1.102 0.996Cultural FactorsNativity 1.097 1.096 1.129 1.117Spanish 0.647* 0.688 0.866 0.932Treatment AreaReceived Saturation Policing 1.207 1.248 1.244Neighborhood DisorderBroken Windows 1.560* 1.569*Graffiti 2.741*** 2.713***Abandoned Houses 1.245 1.247Vacant Lots 1.283 1.274Abandoned Cars 0.968 0.947Litter 1.398 1.432Broken Sidewalks 1.342 1.322Broken Lights 1.636* 1.606*Control VariablesAge (Continuous) 0.995Gender 0.907Education(Less Than High School)Diploma/GED 1.182Some College 1.807Associates 1.396Bachelors 1.263
51

Graduate Degree 1.256Length of Time at Address(0-12 months)13-35 Months 0.97436+ 0.523**(N=801): R-Squared: 0.006 0.013 0.014 0.199 0.204
52

Referencing Table 8, we see that the Hispanic population is 38%
more likely than the non-Hispanic population to report that crime
is a problem. When we include the cultural control variables of
Nativity and Spanish, we see that the Hispanic population becomes
nearly 70% more likely (67.5%) than non-Hispanics to report that
crime is a problem in their neighborhood. Those who took the
survey in Spanish are 0.647 times less likely (35.3%) than
English speaking respondents to report crime as a problem.
Controlling for treatment, results in a 1% change for Hispanics
over non-Hispanics, though this not statistically significant.
When the control variables for neighborhood disorder are added to
the regression in model 4, we see that racial/ethnic difference
is no longer statistically significant. Additionally, there is
again a large jump in the R-Squared statistic. Models 1, 2, & 3
together explain about 1.4% of the variation. However, when we
include neighborhood disorder in model 4, the model now explains
almost 20% (19.9) of the variation.
53
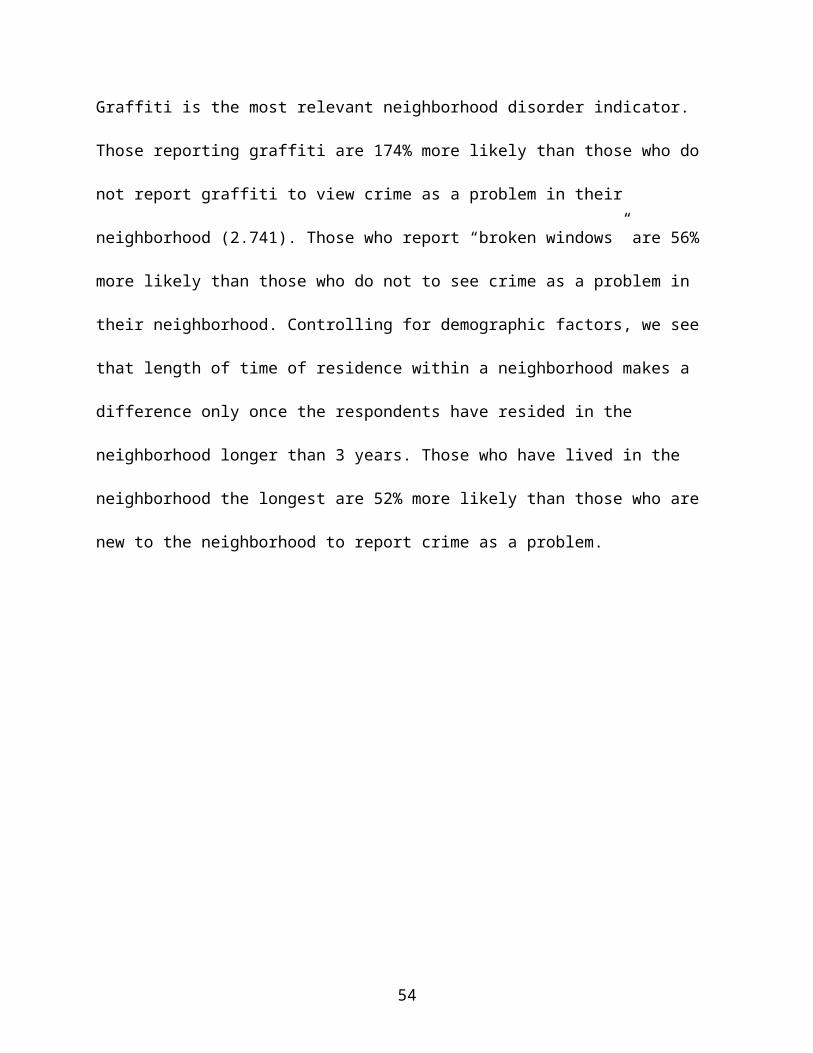
Graffiti is the most relevant neighborhood disorder indicator.
Those reporting graffiti are 174% more likely than those who do
not report graffiti to view crime as a problem in their
neighborhood (2.741). Those who report “broken windows” are 56%
more likely than those who do not to see crime as a problem in
their neighborhood. Controlling for demographic factors, we see
that length of time of residence within a neighborhood makes a
difference only once the respondents have resided in the
neighborhood longer than 3 years. Those who have lived in the
neighborhood the longest are 52% more likely than those who are
new to the neighborhood to report crime as a problem.
54

Table 9: Logistic Regression predicting Perceptions of Police with Cultural Factors, Treatment Area, Neighborhood Disorder and Control Variables
α = .05, p ≤ 0.05*, p ≤ 0.01**, p ≤ 0.001*** Model 1 Model 2 Model 3 Model 4Model 5
HISPANIC 0.784 0.494** 0.491** 0.632 0.832Cultural FactorsNativity 0.424** 0.410** 0.383** 0.370***Spanish 1.188 0.946 0.827 0.822Treatment AreaReceived Saturation Policing 0.499** 0.441*** 0.445**Neighborhood DisorderBroken Windows 0.779 0.755Graffiti 0.629 0.661Abandoned Houses 0.873 0.901Vacant Lots 0.702 0.666Abandoned Cars 0.789 0.761Litter 0.805 0.874Broken Sidewalks 0.612 0.576Broken Lights 0.932 0.947Control VariablesAge (Continuous) 1.015Gender 0.919Education(Less Than High School)Diploma/GED 1.146Some College 1.022Associates 2.117Bachelors 1.653
55

Graduate Degree 2.900Length of Time at Address(0-12 months)(13-35 months) 0.937(36 +) 1.126(N=776) R-Squared: 0.002 0.017 0.028 0.072 0.086
56

Hispanics are nearly half as likely as non-Hispanics to
report the overall quality of Metro as “good (0.494 and
0.491).” However, this is only statistically significant for
the models that take into account cultural factors (0.494)
and whether the neighborhood received the saturation
policing treatment (0.491). Race/ethnicity is not
statistically significant with regard to opinions of police
when it is the only factor analyzed. Additionally, it is no
longer significant when we control for neighborhood disorder
factors or demographic variables.
Those born in the U.S. remain approximately 40% less likely
than those born elsewhere to rate the quality of the Metro
police department as “good.” Respondents in treatment areas
are approximately half as likely as those in non-treatment
areas to rate the quality of Metro as “good.” This remains
consistent when controlling for neighborhood disorder as
well as demographics.
57

Again, looking at the R-Squared statistic for each model
shows us that the factors with the most impact in any of the
logistic regression models are the neighborhood disorder
characteristics. With regard to resident perceptions of
police, addition of the neighborhood disorder
characteristics results in a 5.0% increase in the amount of
variation explained by the model.
Hypotheses
H1 a). I expected that Hispanics in Las Vegas would report
lower levels of neighborhood disorder than non-Hispanics.
b).I expected Hispanics would be more likely than non-
Hispanics to report quality of life in neighborhood as
“good.” c). I expected Hispanics would report lower
perceptions of crime than non-Hispanics. d). I expected
Hispanics would be more likely to report that they perceive
the police as doing a “good” job than Non-Hispanics.
If we look at Table 6, we see that being Hispanic is
positively correlated with perceptions of neighborhood
58

disorder. Part “a” of the hypothesis predicted the opposite.
Table 7 shows that Hispanics are less likely than non-
Hispanics to report the overall quality of life in their
neighborhood as “Good,” this is exactly the opposite of part
(b). Additionally, Table 8 shows that Hispanics are more
likely than non-Hispanics to report that crime is a problem,
again this is exactly the opposite of part (c). We can see
from Table 9 that Hispanic respondents are less likely than
non-Hispanic respondents to view the quality of Metro as
“good,” the direct opposite of part (d). We can see from the
analysis that there is no support for the first hypothesis.
[H2] a). I expected that residents living in neighborhoods
that experienced police saturation, would be more likely to
perceive crime as a problem than those in control groups, b)
would report higher levels of neighborhood disorder than
those in control groups, and c) would be less likely to
perceive the police are doing a good job than those in
control groups.
59

Logistic regression (Table 8) shows that respondents in test
neighborhoods are more likely than those in non-treatment
areas to report crime is a problem, this is consistent with
part (a) of the second hypothesis. Linear regression shows
that there is a negative correlation between respondents in
test neighborhoods and their assessment of neighborhood
disorder, inconsistent with part (b) of the hypothesis.
Viewing Table 9, we can see that those in test neighborhoods
were less likely than those in non-test neighborhoods to
respond that the overall quality of Metro was “good,” this
is also consistent with the hypothesis H2(c). This lends
partial support to the second hypothesis. A negative
correlation with neighborhood disorder was not expected.
[H3] a) I expected to show differences in outcomes by
language of origin, such that residents who completed the
survey in Spanish would report higher perceptions of crime
than English-speaking residents, b) lower levels of
neighborhood disorder than English speaking residents, and
c) be more likely than English speaking residents to report
60

the quality of Metro as “good.”
Differences in language were not much of a factor in the
analysis. Where language was statistically significant is
represented in Table 7 and Table 8. Spanish-speaking
respondents were less likely to view crime as a problem in
their neighborhood than non-Spanish speaking respondents.
There was no longer statistical significance when treatment
area was controlled for or demographic control variables
were introduced. If we view Table 6, we see a negative
correlation, though this is not statistically significant.
Language is not a statistically significant factor with
regard to opinions of police. This suggests that there is no
support for the third hypothesis. Language is not
statistically significant with regard to neighborhood
disorder, perceptions of crime, or perceptions of police.
DISCUSSION & CONCLUSION:
This study is limited because there was no direct question
that specifically assessed SES status. Class struggles are
61

similar for all races, and likely shape perceptions
similarly. Though addition of an SES measure would have
enriched the analysis. For analysis of SES, level of
education obtained was substituted for an SES measure.
Education was not found to be statistically significant in
any of the analysis (α = .05, p > 0.05). Future studies
regarding the Hispanic population may benefit from the
addition of SES measures.
Overall, the data is well suited for analysis of perceptions
of police, quality of life in the neighborhood, and
perceptions of neighborhood disorder. It should be noted
that while the Hispanic population is well represented by
this data, making up better than 50% of the study
population, the Hispanic population illustrated by this data
resides in low-income, “high-crime” areas and should not be
assumed to represent Hispanic perceptions across classes.
Hispanic populations in higher income, low crime
environments may exhibit different characteristics.
62

It is important to note that respondents identifying as
“other” made up 41.6% of the sample population when asked to
choose which race/ethnicity they identified with when
Hispanic or Latino options were not available. However, when
a question was presented that allowed respondents to
identify as Hispanic or Latino, 51.6% of respondents chose
an option in this category. A limitation of this study is
that there is not a racial or ethnic category made available
to respondents for every country of origin or every
conceivable ethnic identity. It is conceivable that
providing additional options for racial or ethnic identity
amongst countries considered to be Latin or Central American
countries could have yielded an even higher percentage of
respondents that identified as Hispanic. Even with an
expanded number of ethnicities to choose from, some of the
population that took the survey in Spanish fell into
categories for White, Black, and Native American. This
suggests that American views on race/ethnicity are not
matched to overall ideas about race/ethnicity in the global
63

community and they may be ill suited for assessing
indigenous populations as well.
The study adds to the literature on perceptions of police by
focusing on the Hispanic population. Future studies might
approach a more diverse Hispanic population by focusing on
factors of socio-economic status, venturing out of the
studied high crime areas. Further, more complex methods of
statistical analysis may be able to flesh out more in-depth
conclusions from the existing SPI data file. The Hispanic
population remains one of the fastest growing populations in
the United States and it is imperative that social
scientists in every area make an effort to add this
demographic as a focal point of inquiry.
In line with suggested changes to policing from the
literature, perceptions of police may be improved through
efforts to diversify staffing. The closer the demographics
of the department match the demographics of the population
they serve, the more likely the community is to cooperate
64

with policing efforts. The use of integrated teams also
shows promise in improving the efficacy of policing in
diverse environments. A continued effort to focus on the
needs of the community, paying close attention to the
varying needs of culturally diverse residents, is likely to
improve relations between residents and the police.
This study has several implications for law enforcement and
community planners. First, the fact that the hypotheses,
developed from the literature, were not supported indicates
that sample populations in high-crime environments in Las
Vegas do not match the studied populations from the rest of
the literature pertaining to perceptions of police. This
study is the first of its kind in Las Vegas, and the first,
in comparison with the past studies, to isolate high-crime
environments as a focal point for analysis. That high-crime
neighborhoods in Las Vegas do not exhibit similar
homogeneity to other study samples may be indicative that
Las Vegas differs with regard to other cities with regard to
racial segregation. Many neighborhoods, at all ends of the
65

socio-economic spectrum tend to demonstrate a diverse
racial/ethnic mix. It will be necessary to conduct similar
studies in cities across the United States to see whether
this is something isolated to Las Vegas. Many of the
previous studies seem to have been conducted in the Eastern
part of the country. Performing similar studies in other
areas would help to determine whether this is an isolated
feature of Las Vegas a broader regional characteristic of
Western cities overall.
Second, the change in variation demonstrated by the addition
of neighborhood disorder characteristics provides strong
support for the previous work of Kelling and Wilson. When
broken windows variables are added to the models,
race/ethnicity is either drastically reduced in significance
or no longer statistically significant at. This indicates
that efforts to improve neighborhoods by reducing clutter,
graffiti, and damage to buildings and property are the
factors that have the largest impact on individual
perceptions of crime and the police. Additionally, they have
66

a large impact on how a respondent views the quality of
their neighborhood. These factors are far more important
than race/ethnicity or any of the demographic variables
included in the models. It may be prudent to revisit
previous studies and incorporate neighborhood disorder
variables to see if racial/ethnic differences continue to be
significant.
67
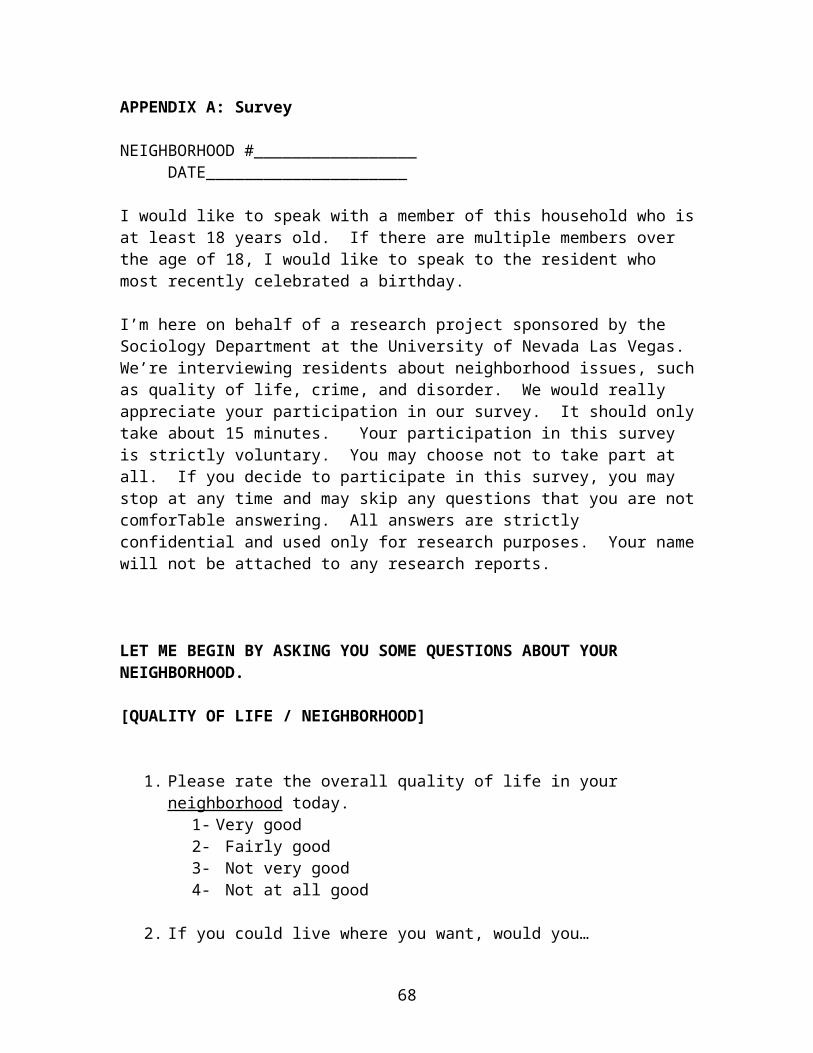
APPENDIX A: Survey
NEIGHBORHOOD #_________________DATE_____________________
I would like to speak with a member of this household who isat least 18 years old. If there are multiple members over the age of 18, I would like to speak to the resident who most recently celebrated a birthday.
I’m here on behalf of a research project sponsored by the Sociology Department at the University of Nevada Las Vegas. We’re interviewing residents about neighborhood issues, suchas quality of life, crime, and disorder. We would really appreciate your participation in our survey. It should onlytake about 15 minutes. Your participation in this survey is strictly voluntary. You may choose not to take part at all. If you decide to participate in this survey, you may stop at any time and may skip any questions that you are notcomforTable answering. All answers are strictly confidential and used only for research purposes. Your namewill not be attached to any research reports.
LET ME BEGIN BY ASKING YOU SOME QUESTIONS ABOUT YOUR NEIGHBORHOOD.
[QUALITY OF LIFE / NEIGHBORHOOD]
1. Please rate the overall quality of life in your neighborhood today.
1- Very good2- Fairly good3- Not very good4- Not at all good
2. If you could live where you want, would you…
68

1 – Stay at your current address2 – Move from your current address to another Las Vegas Valley location3 – Move to another location in Nevada4 – Move outside of Nevada
3. Generally speaking, how would you rate crime as a problem in your neighborhood?
1- Very big problem2- Somewhat of a problem3- Not much of a problem4- No problem at all
69

4. Please indicate how much of each type of activity, as far as you can tell, seems to be taking place in your neighborhood.
Not Very Often
Somewhat Often
Very Often All the Time
Vandalism, suchas, graffiti, slashing tires)Disorderly Behavior, such as rowdy, unsupervised teens.Car Break-insHome Break-insDomestic Assaults (in homes)Assaults outside of homesGang activityDrug activitySexual AssaultsRobbery
5. How safe do you feel when walking alone at night on your block?
Very safe................1
Somewhat safe............2
Somewhat unsafe..........3
Very unsafe..............4
70

DON’T KNOW...............-8
REFUSED..................-9
6. Overall, how physically safe from crime do you feel in your neighborhood?
1- Very safe2- Somewhat safe3- Not very safe4- Not safe at all
71

7. Ok, now I’m going to ask you some questions about thephysical conditions of your block. For each question please respond with none, a few or many.
NONE
A FEW
MANY
DON’T KNOW
REFUSED
7a. Are there any homes or buildings with broken windows on your block?
1 2 3 -8 -9
7b. Are there any homes, other buildings or other places on your block which have graffiti on them?
1 2 3 -8 -9
7c. Are there any abandoned or boarded up homes or buildings on your block?
1 2 3 -8 -9
7d. Are there any vacant lots on your block? 1 2 3 -8 -9
7e. Are there any abandoned cars on the street on your block?
1 2 3 -8 -9
7f. Are there areas on your block where litter is a problem?
1 2 3 -8 -9
7g Are there areas on your block where the street or sidewalk needs repairs?
1 2 3 -8 -9
7h. Are there areas on your block that needbetter lighting?
1 2 3 -8 -9
72
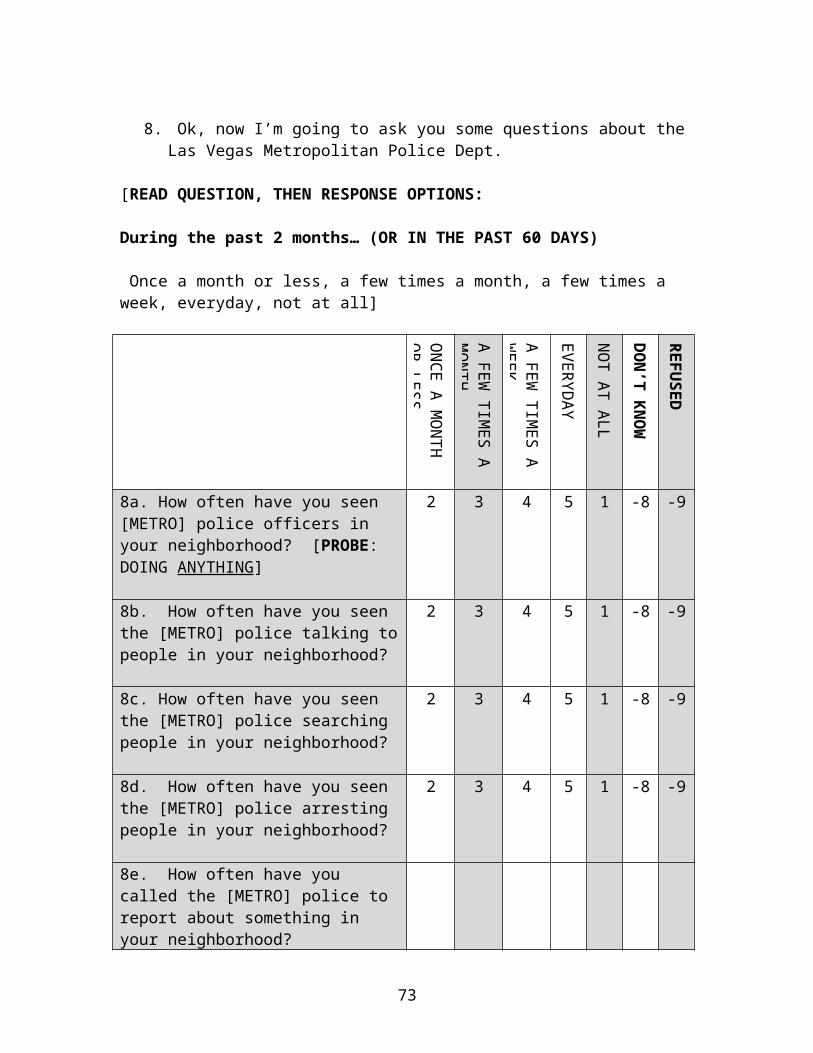
8. Ok, now I’m going to ask you some questions about the Las Vegas Metropolitan Police Dept.
[READ QUESTION, THEN RESPONSE OPTIONS:
During the past 2 months… (OR IN THE PAST 60 DAYS)
Once a month or less, a few times a month, a few times a week, everyday, not at all]
ONCE A MONTH OR LESS
A FEW TIMES A MONTH
A FEW TIMES A WEEK
EVERYDAY
NOT AT ALL
DON’T KNOW
REFUSED
8a. How often have you seen [METRO] police officers in your neighborhood? [PROBE: DOING ANYTHING]
2 3 4 5 1 -8 -9
8b. How often have you seen the [METRO] police talking topeople in your neighborhood?
2 3 4 5 1 -8 -9
8c. How often have you seen the [METRO] police searching people in your neighborhood?
2 3 4 5 1 -8 -9
8d. How often have you seen the [METRO] police arresting people in your neighborhood?
2 3 4 5 1 -8 -9
8e. How often have you called the [METRO] police to report about something in your neighborhood?
73

74

9. Overall, do you think the [LAS VEGAS METRO] police are doing……
A very good job..........1
A good job...............2
A fair job...............3
A poor job...............4
A very poor job..........5
DON’T KNOW...............-8
REFUSED..................-9
10. Please tell me if you strongly agree, agree, disagree, or strongly disagree with the following statements about the [LAS VEGAS METRO] police.
STRONGLY AGREE
AGREE
DISAGREE
STRONGLY DISAGREE
DON’T KNOW
REFUSED
10a. I have a lot of respect for the[METRO] police.
1 2 3 4 -8 -9
10b. On the whole [METRO] police officers are honest.
1 2 3 4 -8 -9
10c. I feel proud of the [METRO] police.
1 2 3 4 -8 -9
10d. I am very supportive of the 1 2 3 4 -8 -9
75

[METRO] police.
10e. The [METRO] police treat peoplefairly.
1 2 3 4 -8 -9
76

11. How likely is it that you would call the police if each of the following situations happened tomorrow: Do you think it is very likely, likely, unlikely or very unlikely.
VERY LIKELY
LIKELY
UNLIKELY
VERY UNLIKELY
DON’T KNOW
REFUSED
11a. You have a complaint againstsomeone causing problems on your block?
1 2 3 4 -8 -9
11b. You have an emergency situation?
1 2 3 4 -8 -9
11c. You see suspicious activity on your block?
1 2 3 4 -8 -9
The following questions are for descriptive (statistical) purposes.
12. First, in what year were you born? __________________
13. How many years have you lived at your current address? If less than a year, enter the number of months; if more than a year, round up.________________
14. How many years have you lived in Las Vegas, total?__________________________
15. Please rate the overall quality of life in the Las Vegas Valley today.
a. Very good
77

b. Fairly goodc. Not very goodd. Not at all good
16. What is your current marital status?
1 – Married2 – Single3 – Divorced4 – Widowed3 – Separated4 Living with a partner
17. Which of the following best describes your currentemployment or labor force status? (CHOOSE ONLY ONE)
1 – Work full-time 2 – Work part-time3 – Unemployed, looking for work4 – Unemployed, not looking for work 5 – A full-time student 6 – A homemaker 7 – Retired 8 – Other9 – Refuse to answer
18. What is the highest level of education you have completed?
1 – 0-11 years, no diploma2 – High school graduate (including GED)3 – Some college, no degree4 – Associate Degree5 – Bachelor’s Degree6 – Graduate or professional degree
19. Do you consider yourself to be Spanish/Hispanic/Latino?
78

1 – No, not Spanish/Hispanic/Latino2 – Yes, Mexican3 – Yes, Puerto Rican4 – Yes, El Salvadorian5 – Yes, other Spanish/Hispanic/Latino
20. With which racial group do you identify yourself? [ALLOW MULTIPLE RESPONSES]
1 – White/Anglo2 – African American3 – Asian or Asian American4 – American Indian or Native American5 – Native Hawaiian or Pacific Islander5 – Other
21. Were you born…
1 – In Las Vegas2 – In Nevada but not in Las Vegas3 – In the US but not in Nevada4 – In another country outside of the U.S.
22. Are you...
1 – Male2 – Female
23. Do you have children under the age of 18 living in your home?
1 – YES2 – NO
24. Do you own or rent your current home?
1 – Own2 – Rent3 – Other
79

25. Have you or any member of your household been a victim of a crime in the past….
a. 60 days? Yes……....................1
No.......................0
DON’T KNOW...............-8REFUSED..................-9
a. 6 months?Yes……....................1
No.......................0
DON’T KNOW...............-8
REFUSED..................-9
80

References:
Barkan, Steven E. and Steven F. Cohn. (2005). “Why Whites Favor Spending More Money to Fight Crime: The Role of Racial Prejudice.” Social Problems. 52 (2):300-314.
Batson, Christie D. and Shannon M. Monnat. (2013). “Neighborhood Disorder and Resident Sentiment in the Wake of the Las Vegas Foreclosure Crisis.” Population Association of America 2013 Annual Meeting Submission.
Brown, Ben and Benedict, William Reed. (2002). “Past Findings, Methodological Issues, Conceptual Issues and Policy Implications.” Policing: An International Journal of Police Strategies & Management 25(3):543-580.
Cao, Liquin, Frank, James and Francis T. Cullen. (1996). “Race, Community Context, and Confidence in Police.’’ American Journal of Police 15:3-22.
Carr, Patrick J., Napolitano, Laura, and Jessica Keating. (2007). “We Never Call the Cops and Here is Why: A Qualitative Examination of Legal Cynicism in Three Philadelphia Neighborhoods.” Criminology 45(2):445-480.
Chandek, Meghan S. (1999). ``Race, Expectations and Evaluations of Police Performance: An Empirical Assessment.’’ Policing: An International Journal of Police Strategies&Management 22:675-695.
Chermak, Steven, McGarrell, Edmund F. and Alexander Weiss. (2001). ``Citizens’ Perceptions of Aggressive Traffic Enforcement Strategies.’’ Justice Quarterly 18:365-391.
Cheurprakobkit, Sutham and Robert A. Bartsch. (1999). ``Police Work and the Police Profession: Assessing Attitudes of City Officials, Spanish-Speaking
81

Hispanics, and Their English-Speaking Counterparts.’’ Journal of Criminal Justice 27:87-100.
Cheurprakobkit, Sutham. (2000). ``Police-Citizen Contact andPolice Performance: Attitudinal Differences Between Hispanics and Non-Hispanics.’’ Journal of Criminal Justice 28:325-336.
Correll, Joshua, Park, Bernadette, Judd, Charles M., and Bernd Wittenbrink. (2002). “The Police Officer’s Dilemma: Using Ethnicity to Disambiguate Potentially Threatening Individuals.” Journal of Personality and Social Psychology 83(6):1314-1329.
Crutchfield, Robert D., Geerken, Michael R., and Walter R. Gove. (1982). "Crime Rates and Social Integration: The Impact of Metropolitan Mobility." Criminology 20:467-478.
Decker, Scott H. and Russel L. Smith. (1980). ``Police Minority Recruitment: A Note on its Effectiveness in Improving Black Evaluations of the Police.’’ Journal of Criminal Justice 8:387-393.
Decker, Scott H. (1985). ``The Police and the Public: Perceptions and Policy Recommendations.’’ Police and Law Enforcement, 1975-1981, edited by R. J. Homant and D. B. Kennedy. NewYork, NY: AMS Press. 3:89-105.
Dunham, Roger G. and Geoffrey P. Alpert. (1988). ``Neighborhood Differences in Attitudes Toward Policing: Evidence for a Mixed-Strategy Model for Policing in a Multi-Ethnic Setting.’’ Journal of Criminal Law and Criminology 79:504-521.
Ennis, Sharon R., Rios-Vargas, Merarys, and Nora G. Albert. (2011). “The Hispanic Population 2010.” Census Briefs U.S.Department of Commerce, Economics and Statistics Administration.
82

Garcia, Venessa and Liquin Cao. (2005). “Race and Satisfaction with the Police in a Small City.” Journal of Criminal Justice 33:191-199.
Geis, Karlyn J. and Catherine E. Ross. (1998). “A New Look at Urban Alienation: The Effect of Neighborhood Disorder on Perceived Powerlessness.” Social Psychology Quarterly 61(3):232-246.
Graves, Erin Michelle. (2008). “Constructing Community: Class, Privatization and Social Life in a Boston Mixed Income Housing Development.” PhD dissertation, Department of Urban Studies and Planning, MassachusettsInstitute of Technology, Cambridge, MA.
Hahn, Harlan. (1971). ``Ghetto Assessments of Police Protection and Authority.’’ Law and Society Review 6:183-194.
Jencks, Christopher and Susan E. Mayer. (1989). “Growing up in Poor Neighborhoods: How Much Does it Matter?” Science,New Series 243(4897):1441-1445.
Jencks, Christopher and Susan E. Mayer. (1990). "The Social Consequences of Growing Up in a Poor Neighborhood." Inner-City Poverty in the United States, edited by L. E. Lynn and M. G. H. McGeary. National Academy Press: Washington, DC. 111-143.
Jesilow, Paul, Meyer, Jon’a F. and Nazi Namazzi. (1995). ``Public Attitudes Toward the Police.’’ American Journal ofPolice 14:67-88.
Jesilow, Paul and Jon’a F. Meyer. (2001). ``The Effect of Police Misconduct on Public Attitudes: A Quasi-Experiment.’’ Journal of Crime and Justice 24(1):109-121.
Kaminski, Robert J. and Eric S. Jefferis. (1998). ``The
83

Effect of a Violent Televised Arrest on Public Perceptions of the Police: A Partial Test of Easton’s Theoretical Framework.’’ Policing: An International Journal of Police Strategies & Management 21:683-706.
Kelling, George L. and James Q. Wilson. (1982). “Broken Windows: The Police and Neighborhood Safety.” Atlantic Magazine, Retrieved from http://www.theatlantic.com/magazine/archive/1982/03/broken-windows/4465/
Lasley, J.R. (1994). ``The Impact of the Rodney King Incident on Citizen Attitudes Toward Police.’’ Policing and Society 3:245-255.
Mackun, Paul and Steven Wilson. (2011). “Population Distribution and Change: 2000 to 2010.” Census Briefs U.S. Department of Commerce, Economics and Statistics Administration.
Mantsios, Gregory. (2010). “Media Magic: Making Class Invisible.” Race, Class, and Gender in the United States edited by Rothenberg, Paula S. Worth Publishers: New York, NY.
Mills, C. W. [1959] (2000). “The Sociological Imagination.” Oxford University Press: New York, NY.
Parrish, P. (1993). ``Police and the Media.’’ FBI Law Enforcement Bulletin 62(9):24-25.
Pattillo, Mary. (2007). “Black on the Block: The Politics ofRace and Class in the City.” Chicago: Chicago UP.
Peek, Charles W., Alston, Jon P. and George D. Lowe. (1978).``Comparative Evaluation of the Local Police.’’ Public Opinion Quarterly 37:370-379.
Peek, Charles W., Lowe, George D. and Jon P. Alston. (1981).``Race and Attitudes Toward the Police: Another Look.’’
84

Journal of Black Studies 11:361-374.
Percy, Stephen L. (1986). ``In Defense of Citizen Evaluations as Performance Measures.’’ Urban Affairs Quarterly 22:66-83.
Priest, Thomas B. and Deborah Brown Carter. (1999). ``Evaluations of Police Performance in an African-American Sample.’’ Journal of Criminal Justice 27:457-465.
Quillian, Lincoln and Devah Pager. (2001). “Black Neighbors,Higher Crime? The Role of Racial Stereotypes in Evaluations of Neighborhood Crime.” American Journal of Sociology 107(3):717-767.
Reisig, Michael D. and Mark E. Correia. (1997). ``Public Evaluations of Police Performance: An Analysis Across Three Levels of Policing.’’ Policing: An International Journal of Police Strategies & Management 20:311-325.
Reisig, Michael D. and Andrew L. Giacomazzi. (1998). ``Citizen Perceptions of Community Policing: Are Attitudes Toward Police Important?’’ Policing: An International Journal of Police Strategies &Management 21:547-561.
Reisig, Michael D. and Roger B. Parks. (2000). ``Experience,Quality of Life, and Neighborhood Context: A Hierarchical Analysis of Satisfaction with the Police.’’ Justice Quarterly 17:607-629.
Reitzel, John D., Rice, Stephen K. and Alex R. Piquero. (2004). “Lines and Shadows: Perceptions of Racial Profiling and the Hispanic Experience.” Journal of Criminal Justice 32:607-616.
Rennison, Callie Marie. (2007). “Reporting to the Police by Hispanic Victims of Violence.” Violence and Victims 22(6):754-772.
85

Rice, Stephen K. and Alex R. Piquero. (2005). “Perceptions of Discrimination and Justice in New York City.” Policing: An International Journal of Police Strategies & Management 28(1):98-117.
Rice, Tom. (2003). “Soundlevels: An Acoustemology of Sound and Self in the Edinburgh Royal Infirmary.” Anthropology Today 19(4):4-9.
Sampson, Robert J. and Dawn Jeglum Bartusch. (1998). ``LegalCynicism and (Subcultural?) Tolerance of Deviance: The Neighborhood Context of Racial Differences.’’ Law and Society Review 32:777-804.
Sampson, Robert J. (2009). “Disparity and Diversity in the Contemporary City: Social (Dis)Order Revisited.” The British Journal of Sociology 60(1):1-31.
–––. (1991). "Linking the Micro and Macrolevel Dimensions ofCommunity Social Organization." Social Forces 70:43-64.
–––. (1985). “Neighborhood and Crime: The Structural Determinants of Personal Victimization.” Journal of Researchin Crime and Delinquency 22:7-40.
Sampson, Robert J. and W. Byron Groves. (1989). "Community Structure and Crime: Testing Social-Disorganization Theory." American Journal of Sociology 94:774-802.
Sampson, Robert J. and Stephen W. Raudenbush. (2004). “Seeing Disorder: Neighborhood Stigma and the Social Construction of ''Broken Windows'.'' Social Psychology Quarterly 67(4):319–342
–––. (2005). “Neighborhood Stigma and the Perception of Disorder.” Focus 24(1):7-11.
Sampson, Robert J., Raudenbush, Stephen W., and Felton Earls. (1997). “Neighborhoods and Violent Crime: A Multilevel Study of Collective Efficacy.” Science 277(5328):918-924.
86

Shaw, Greg M., Shapiro, Robert Y., Lock, Shmuel, and Lawrence R. Jacobs. (1998). ``The polls: crime, the police, and civil liberties.’’ Public Opinion Quarterly 62:405-407.
Skogan, Wesley G. (1978). ``Citizen Satisfaction with PoliceServices: Individual and Contextual Effects.’’ Policy Studies Journal, Special Issue, 469-479.
–––. (1989). “Communities, Crime, and Neighborhood Organization.” Crime & Delinquency 35(3):437-457.
–––. (1996). ``The Police and Public Opinion in Britain.’’ American Behavioral Scientist 39:421-432.
Smith, Douglas A. and G. Roger Jarjoura. (1988). "Social Structure and Criminal Victimization." Journal of Research in Crime and Delinquency 25:27-52.
Sullivan, Peggy S., Dunham, Roger G., and Geoffrey P. Alpert. (1987). ``Attitude Structures of Different Ethnic and Age Groups Concerning the Police.’’ Journal of Criminal Law and Criminology 78:177-193.
Tuch, Steven A. and Ronald Weitzer. (1997). ``The Polls: Racial Differences in Attitudes Toward the Police.’’ Public Opinion Quarterly 61:642-664.
Vannini, Phillip, Waskul, Dennis, Gottschalk, Simon, and Carol Rambo. (2010). “Sound Acts: Elocution, Somatic Work, and the Performance of Sonic Alignment.” Journal of Contemporary Ethnography 39(3):328-353.
Warner, Barbara D. and Glenn L. Pierce. (1993). "Re-examining Social Disorganization Theory Using Calls to the Police as a Measure of Crime." Criminology 31:493-517.
Warner, Barbara D. and Pamela Wilcox Rountree. (1997). "Local Social Ties in a Com- munity and Crime Model:
87

Questioning the Systemic Nature of Informal Social Control." Social Problems 44:520-536.
Weitzer, Ronald. (1999). ``Citizens’ Perceptions of Police Misconduct: Race and Neighborhood Context.’’ Justice Quarterly 16:819-846.
–––. (2000a). ``White, Black, or Blue Cops? Race and Citizen Assessments of Police Officers.’’ Journal of Criminal Justice 28:313-324.
–––. (2000b). ``Racialized Policing: Residents’ Perceptions in Three Neighborhoods.’’ Law and Society Review 34:129-155.
Weitzer, Ronald and Steven A. Tuch. (2002). “Perceptions of Racial Profiling: Race, Class, and Personal Experience.” Criminology 40(2):435-456.
White, Mervin F. and Ben A. Menke. (1982). ``On Assessing the Mood of the Public Towards the Police: Some Conceptual Issues.’’ Journal of Criminal Justice 10:211-230.
Zevitz, Richard G. and Robert J. Rettammel. (1990). ``Elderly Attitudes About Police Services.’’ American Journal of Police 9:25-39.
88

Christopher J. PercyUniversity of Nevada-Las Vegas, Department of Sociology4505 Maryland Parkway, Box 455033, Las Vegas, NV [email protected], or [email protected]
Education
Present Ph.D. Student, University of Nevada-Las Vegas, Las Vegas, Nevada
2012 Bachelor of Arts in Sociology, Cum LaudeUniversity of Nevada-Las Vegas, Las Vegas, Nevada
2010 Associate of Arts Oregon Transfer, High Academic Honors
Treasure Valley Community College, Ontario, Oregon
Research and Teaching Interests
Environment, Critical Theory, Demography, Quantitative Methods, Academic Success/Leadership
Honors and Awards
2012 Undergraduate Commencement Speaker – UNLV Fall Commencement
2012 Alpha Kappa Delta Sociology Honor Society
2012 Golden Key International Honor Society
2012 National Society of Leadership and Success
2010 Orlowski Candidate/Orlowski Scholarship AwardDistinguished International Officer Candidate
89

2010 NASA National Community College Aerospace Scholar
2010 All USA Academic Team/Coca-Cola Bronze Scholar
2010 Regional President, Alumni AssociationRocky Mountain Cascade Region of Phi Theta Kappa• Founded in July of 2010 – Founding Member
2009-2010 Regional President, Rocky Mountain Cascade RegionPhi Theta Kappa• Distinguished Regional Officer Team – 2010• Regional Milestone Award for Most Improved
Region
2009 Certificate of CompletionPhi Theta Kappa Leadership Development Cohort
2009 Phi Theta Kappa Honors Scholar – Honors Institute Completion
Presentations
2014 “Everyday Life in a Las Vegas ‘High Crime’ Environment.” Working paper presented at the annual meeting of the Pacific Sociological Association, Portland, OR. March 2014.
2012 “Access Through Membership: How non-profit organizations are improving opportunities for future success regardless of race, gender, and class.” Undergraduate roundTable discussion at annual meeting of the Pacific Sociological Association, San Diego, CA. March 2012.
2010 Welcome Speaker for the “Diversity Symposium.” A joint project between the Diversity Council and the Omicron Phi Chapter of Phi Theta Kappa modeled
90

after the Medical Teams International “Real Life Exhibit”.
2010 Presenter. Regional Honors in Action Conference atMt. Hood Community College, a weekend long training session for chapter advisors and officersfor the Phi Theta Kappa chapters at 23 community colleges across Idaho, Oregon, and Utah.
2010 Presentation on “Hands of Hope Northwest.”Lead chapter in assembly of “hope kits” containingneeded sanitary items.
2009 Presenter. Tillamook Training Toolkit at TillamookCommunity College, a weekend long training sessionfor chapter advisors and officers for the Phi Theta Kappa chapters at 23 community colleges across Idaho, Oregon, and Utah.
2009 Keynote Speaker. Fall Induction Ceremony for Omicron Phi Chapter of Phi Theta Kappa. Treasure Valley Community College
Research and Internship Experience
2012 Smart Policing Initiative Graduate Assistant, Department of Sociology
2011 Independent research on group involvement in collegiate environments and the role of membershipas a benefit to completion guided by Dr. Parker
2009-2010 Administrative Assistant for the Dean of Leadership DevelopmentPhi Theta Kappa Leadership Development Program.
2008-2009 Teaching Assistant, Biology Department, TVCC
91

Professional Affiliations
2014 Pacific Sociological Association
2011 Pacific Sociological Association
2011 Southwest Social Science Association
92