Hispanic Immigrant Poverty: Does Ethnic Origin Matter
21
Hispanic Immigrant Poverty: Does Ethnic Origin Matter? Dennis H. Sullivan Andrea L. Ziegert Received: 4 June 2006 / Accepted: 22 August 2007 / Published online: 30 May 2008 Ó Springer Science+Business Media B.V. 2008 Abstract Hispanic immigrant poverty is nearly double that of other immigrants. Furthermore, poverty rates among Hispanic families differ substantially by eth- nicity. This paper analyzes poverty rates for Hispanic and non-Hispanic immigrants, and also for individual Hispanic ethnic groups, to determine the relative importance of different covariates of poverty. The general conclusion is that low levels of education and fluency in English contribute to high Hispanic poverty rates and are also contributing factors to differences in poverty among Hispanic ethnic groups. In particular, the high poverty rate of Mexican immigrant households is associated with the low educational attainments of household heads, along with a relatively large number of children, relatively low English fluency and a relatively short tenure in the U.S. Immigrants from Guatemala and El Salvador have substantially lower poverty rates than Mexican immigrants despite a similar constellation of observable traits. Immigrants from South America have low poverty rates, largely due to strong family work effort and high educational attainments. The relatively low family work effort and high incidence of single parent families among Puerto Ricans overpowers the beneficial effects of higher rates of citizenship and English fluency. Keywords Ethnicity Á Immigration Á Poverty Background One can scarcely underestimate the importance of the Hispanic immigrant population when discussing poverty in the United States: of the 36.95 million poor D. H. Sullivan (&) Department of Economics, Miami University, Oxford, OH 45056, USA e-mail: [email protected] A. L. Ziegert Department of Economics, Denison University, Granville, OH, USA 123 Popul Res Policy Rev (2008) 27:667–687 DOI 10.1007/s11113-008-9096-3
Transcript of Hispanic Immigrant Poverty: Does Ethnic Origin Matter

Hispanic Immigrant Poverty: Does Ethnic OriginMatter?
Dennis H. Sullivan Æ Andrea L. Ziegert
Received: 4 June 2006 / Accepted: 22 August 2007 / Published online: 30 May 2008
� Springer Science+Business Media B.V. 2008
Abstract Hispanic immigrant poverty is nearly double that of other immigrants.
Furthermore, poverty rates among Hispanic families differ substantially by eth-
nicity. This paper analyzes poverty rates for Hispanic and non-Hispanic immigrants,
and also for individual Hispanic ethnic groups, to determine the relative importance
of different covariates of poverty. The general conclusion is that low levels of
education and fluency in English contribute to high Hispanic poverty rates and are
also contributing factors to differences in poverty among Hispanic ethnic groups. In
particular, the high poverty rate of Mexican immigrant households is associated
with the low educational attainments of household heads, along with a relatively
large number of children, relatively low English fluency and a relatively short tenure
in the U.S. Immigrants from Guatemala and El Salvador have substantially lower
poverty rates than Mexican immigrants despite a similar constellation of observable
traits. Immigrants from South America have low poverty rates, largely due to strong
family work effort and high educational attainments. The relatively low family work
effort and high incidence of single parent families among Puerto Ricans overpowers
the beneficial effects of higher rates of citizenship and English fluency.
Keywords Ethnicity � Immigration � Poverty
Background
One can scarcely underestimate the importance of the Hispanic immigrant
population when discussing poverty in the United States: of the 36.95 million poor
D. H. Sullivan (&)
Department of Economics, Miami University, Oxford, OH 45056, USA
e-mail: [email protected]
A. L. Ziegert
Department of Economics, Denison University, Granville, OH, USA
123
Popul Res Policy Rev (2008) 27:667–687
DOI 10.1007/s11113-008-9096-3

persons in 2005, 5.87 million were foreign-born, and 3.79 million were foreign-
born Hispanics.1 Our tabulations from the Census 2000 microdata show that there
are large ethnic differences among the poverty rates of immigrants. For example, we
find that the poverty rate among Hispanic immigrant households was 23.4%,
compared to only 12.7% for non-Hispanic immigrant households. Hispanic ethnic
groups also differ from each other, with a poverty rate of almost 25% among the
Mexican majority, but only 15% among Hispanic immigrants with South American
ethnicities. Despite the numbers, there has been little research on the details of
Hispanic immigrants’ poverty, particularly on the ethnic pattern.
This paper investigates observable factors that are generally associated with
poverty—family demographics, work effort, race, single parenthood, educational
attainment, English fluency, citizenship, time since immigration and regional
location—to determine the relative importance of these covariates of poverty for
Hispanic immigrants in the United States in 1999. The results may have
implications for immigration policy, and they clearly have implications for policies
designed to mitigate the poverty of Hispanic immigrants after they immigrate.
In addition to conducting the analysis for the Hispanic immigrant population
generally, we take advantage of the sheer size of the Census Public Use Microdata
Sample (over 250,000 immigrant Hispanic households) to sub-divide the Hispanic
immigrant population into six specific ethnicities (Mexican/Chicano, Puerto Rican,2
Cuban, Guatemalan, Salvadoran, and Dominican) and three residual categories
(other Central American, South American, and other Hispanic). These ethnic groups
differ in several ways observable ways, including: family size; family work effort;
educational attainment, race, gender and English fluency of the head; citizenship;
time in the U.S.; and region of residence. We employ an adaptation of the Blinder–
Oaxaca decomposition to determine which covariates are primarily responsible for
the differentials in poverty rates.
One can interpret our results as an exercise in determining both: (1) whether a
parsimonious set of observables can account for poverty differentials among
immigrant Hispanic ethnic groups; and (2) to the extent that the answer to the first
question is affirmative, which observables matter most. For example, the high
poverty rate of Mexican immigrants is primarily associated with the youth, low
educational attainment and poor English fluency of that population.
Previous Research
In spite of the increasing prevalence of Hispanics in the U.S. poverty population,
Hispanic poverty has not been extensively examined with microdata. The most
1 The exact meaning of ‘‘Hispanic’’ and other ethnic terms in discussed under Data below. The statistic
here may be found at http://ferret.bls.census.gov/macro/032006/pov/new29_000.htm.2 Persons born in Puerto Rico are U.S. citizens, and therefore not ‘‘immigrants’’ in the typical sense of the
term. The Census separately tabulates individuals who have ‘‘immigrated’’ from U.S. territories, however,
and the Puerto Rican immigrants provide a valuable benchmark because they have the advantage of
citizenship.
668 D. H. Sullivan, A. L. Ziegert
123

important exceptions are Iceland’s recent work (2003a, b) and the paper by Van
Hook et al. (2004).
Since both family income and family structure are part of the poverty calculation,
it is useful to distinguish their effects. Iceland (2003a, b) conducts a decomposition
of changes in poverty rates over time into the effects of income growth, family
structure changes, and inequality changes (calculated as a residual) for alternative
definitions of poverty. His analysis (2003b, p. 513) shows that during the 1969–
1990 period, the beneficial effects of income growth on Hispanic poverty were
almost totally offset by the adverse effects of increasing inequality, with a small
adverse effect of changes in family structure, while the reduced poverty of
Hispanics in the 1990s was almost entirely due to income growth, with a minor
added effect due to reduced inequality. Immigration is barely mentioned (2003a, pp.
85–87), however, and does not have any role in the analysis.
In terms of data design, the principal precursor to our work is the paper by Van
Hook et al. (2004), which uses the Census Public Use 1% Microdata Samples,
including Census 2000, to examine poverty among the children of immigrants. They
use a detailed list of covariates to capture both income potential and family structure
traits, including: race/ethnicity; parental education and employment status; living
arrangements and parental marital status; family size and the ages of parents and
children; and parents’ time in the United States. Regarding Hispanic immigrants in
particular, their principal conclusion is that high poverty among the children of
Hispanic immigrants can be substantially accounted for by these covariates,
especially in the most recent Census. However, their research does not investigate
differentials among Hispanic ethnic groups, the focus of our research here.
Another relevant strand of recent literature concerns the geographical pattern of
poverty. Jargowsky (1997) was a pioneer in studying the geographical pattern of
Hispanic poverty. A recent example is the conclusion of Partridge and Rickman
(2006, p. 177) that when a high share of a metropolitan area’s population is made up
of recent immigrants, that area tends to have smaller declines in metropolitan
poverty during the 1990s. This literature does not rely on data about individuals,
however, nor does it focus on ethnic origin. The only recent study that differentiates
Hispanic ethnic groups is Mogull (2005). However, that study only uses the
published tabulations for aggregate poverty of each ethnic group, and concerns itself
almost entirely with trends in aggregate poverty. It does not address the specific
issue of immigrant poverty, and because it does not use microdata, it cannot address
the basic question of which covariates might account for the poverty differentials it
describes.
Since earnings are the principal source of income for almost all immigrant
households, we expect factors associated with low earnings to be associated with
poverty, and we look to that literature to identify the key covariates for our model.
Papers by Trejo (1997, 2003) and Chiswick and Miller (2002, 2003) are the most
important background for our work.3
3 Unemployment is also relevant. De Jong and Madamba (2001, p. 25) show that after including controls
for human capital and fluency, Hispanic workers are significantly more likely to be unemployed and (for
males only) among the working poor.
Hispanic Immigrant Poverty 669
123

Trejo’s (1997) study of Mexican American wages during the 1980s emphasizes
the importance of age, literacy and educational attainment using a decomposition
design similar to ours, and concludes that ‘‘Mexican Americans earn low wages
primarily because they possess less human capital than other workers, not because
they receive smaller labor market rewards for their skills’’ (Trejo 1997, p. 1235).
Further analysis by the same author (Trejo 2003) concludes that ‘‘the sizable
earnings advantage U.S.-born Mexican Americans enjoy over Mexican immigrants
arises not just from intergenerational improvements in years of schooling and
English proficiency, but also from increased returns to human capital’’ (2003, p. 3).
Chiswick and Miller (2002, 2003) focus on the earnings of foreign-born men,
using 1990 Census microdata.4 They show (2002, pp. 37–38) that after the
introduction of numerous controls, there is still an earnings penalty (relative to men
with Western European birthplaces) of over 20 log points for immigrant men of
Mexican origin, among the highest of any of the seventeen immigrant groups
distinguished. The penalties for Cuban immigrants and Spanish-speaking immi-
grants from Latin America are somewhat smaller (about 15 log points), but still
much larger than those for immigrants from southern or eastern Europe. Among the
statistically significant controls are: education, potential work experience, years
since immigration, marital status, and citizenship status. English language skills are
also emphasized: the point estimate of the earnings bonus for English fluency
approximates the earnings effect of 3–4 years of additional education.
Taken together, the research on earnings suggests that controlling for age,
education, race, marital status, geographic location, English fluency, and length of
time in the US is important to understand Hispanic employment and earnings, while
the research that focuses directly on poverty suggests the need to add controls for
family demographics, time in the United States, and geographical location. This
paper extends the research base by determining the degree to which these covariates
are important determinants of poverty for Hispanics of different ethnic origins.
Data
As a data source we employ the 5% Public Use Microdata Sample (PUMS) from
Census 2000, as provided by the Integrated Public Use Microdata Series at the
Minnesota Population Center (see Ruggles et al. 2004). The value of using the 5%
sample rather than the 1% sample used by Van Hook et al. (2004) is that it permits
us to sub-divide the ethnic origin of Hispanics in greater detail, with group sample
sizes of over 1,000 poor households per group.
It is useful to begin with a description of what the Census means by the
‘‘Hispanic’’ population. In Census 2000, all ‘‘Hispanics’’ are distinguished by
4 Butcher and DiNardo (2002) also use Census microdata (for 1960–1990), but in a somewhat different
way. They create counterfactual wage distributions controlled for age, schooling, race/ethnicity, marital
status, geography, industry, region of origin and time in the U.S. While their paper is focused on different
issues, the details of their analysis verify the ‘‘tremendous importance of race and ethnicity’’ (2002, p. 10)
in determining the wage distribution of recent immigrants.
670 D. H. Sullivan, A. L. Ziegert
123

having self-identified as ‘‘Spanish/Hispanic/Latino’’ (the question no longer
contains the words ‘‘origin or descent’’ that appeared in the two previous Census
forms).5 Mexicans/Mexican Americans/Chicanos, Puerto Ricans, and Cubans were
given separate boxes with which to identify themselves. Other Hispanics were
permitted to write in an ethnic identification. According to Guzman, 58.5% of
Hispanics described themselves as Mexican, 9.6% as Puerto Rican and 3.5% as
Cuban (Guzman 2001, p. 2). The most common write-in origins were (in descending
order of numbers) Dominicans, Salvadorans, and Guatemalans. For the purposes of
the results we report below, we distinguish all of the ethnicities listed above, and
group the remainder into three residual categories: other Central Americans, South
Americans, and other Hispanics (some of whom are European, but a majority of
whom actually wrote in ‘‘Hispanic’’ or ‘‘Latino’’).
Since we want to study poverty, we must employ a standard of poverty. In a
nutshell, the Census poverty variable reports a family’s income as a percentage of
the ‘‘official’’ poverty threshold for that family, and attributes that poverty number
(top-coded at 500% of the poverty line) to every family member.6 For this reason,
we have elected to study the covariates of the poverty of household heads. In this
sense we are examining poverty among primary families and unrelated individual
household heads, as opposed to poverty among persons. The principal individuals
who are excluded are those in ‘‘group quarters’’ like dormitories or nursing homes,
and household members who are not members of the household head’s family. The
‘‘official’’ poverty line calculation has been subjected to a great deal of criticism
(Citro and Michael 1995; see also Iceland 2003b, who derives several results about
an alternative poverty measure), and much of this criticism is widely accepted in the
research community. We have selected the ‘‘official’’ poverty line calculation for
convenience, not because we endorse it. Our supposition is that a better measure
would be sufficiently correlated with the official measure that the relative
importance of covariates would not be greatly altered, though the levels of poverty
might be.
Because poverty lines are determined by household demographics, the first
covariates in our analysis are the number of adults and the number of own children
in the family of the household head. A larger family needs more resources, and is
more likely to be poor at any given level of income. The number of adults also
affects the family’s earnings potential. Children may also establish eligibility for
benefits that are not available to adult-only families, immigrant adults, or both.
5 In thinking about what ‘‘Hispanic/Latino’’ means to those who fill out the form, it is useful to examine
the results for the ‘‘Race’’ question on the Census 2000 form, in which it was possible for a person to list
‘‘some other race.’’ In fact, 41% of persons who gave their ethnicity as Hispanic or Latino also wrote in
Hispanic or Latino as their sole answer to the question about race, and another 5% listed Hispanic or
Latino as one of two racial identifiers (Grieco and Cassidy 2001, p. 10). In other words, the distinction
between ‘‘race’’ and ‘‘Hispanic ethnicity’’ that drives the standard Census tabulations is either
misunderstood or rejected by about half of the Hispanic population.6 The approach used for poverty calculation in Census 2000 is explained at http://www.ipums.umn.edu/
usa/pincome/povertya.html. Throughout the paper, we use the term ‘‘family’’ to cover both primary
families (a household head and his or her relatives) and household heads who are unrelated individuals.
Hispanic Immigrant Poverty 671
123

The next key covariate is the total number of hours that members of the head’s
family unit (including the head) are ‘‘usually’’ employed. Because of restrictions on
access to government benefits by immigrants, legal as well as illegal, some groups
have work incentives that are very different from others, a factor that will be
captured by a control for family work effort.
Most of the remaining covariates are traits of the household head.7 We include
age and its square and years of education and its square as the principal controls for
the human capital of the household head, similar to the earnings studies discussed
above.8 Following some of the earnings studies, we include a variable distinguishing
a household head who is self-identified as ‘‘white’’ or white in combination with
some other racial identifier, possibly serving as a measure of acculturation.9
Because of the well-known correlation of poverty with the presence of a single
female household head, we include a variable for that status. We also include
controls for citizenship status,10 English fluency,11 and the number of years an
immigrant head has been in the U.S. and its square,12 since all have been identified
as important in previous studies of immigrant earnings.
We have included controls for Census regions (Northeast, Midwest, South-
Atlantic, South-Central and West), which may affect measured poverty in several
ways. First of all, concentration into a region may affect earnings, either positively
(easier adaptation, less discrimination) or negatively (crowding in specific
occupations, reduced incentive to assimilate). Second, the poverty calculation uses
a nation-wide set of income standards, so that those who receive higher incomes
because they live in areas with a high cost of living are less likely to have incomes
below the Federal poverty line. We also control for metropolitan status, expecting
that poverty rates for immigrants may be higher in rural areas.
7 The characteristics of the household head and his or her family members are ordinarily correlated:
young parents generally have young children, poorly educated husbands generally have poorly educated
wives, etc. If one were to include the characteristics of spouses, for example, it would be necessary to
conduct separate analyses for single and married heads, and it would therefore no longer be possible to
estimate the independent effect of marital status.8 We have also experimented with dummy variables for educational attainment, but found the results less
interpretable than the ones reported below. Educational attainment is actually reported as nine grouped
grade levels. We have attributed years equal to the mid-point of the attainments for all groups except the
college educated, who were assigned a value of 16 years.9 As noted in footnote 6, Census 2000 allowed a person to report a multiracial identity, leading to the new
nomenclature ‘‘white alone or in combination.’’ To further complicate the issue, Darity et al. (2002) claim
that Hispanics often self-report race in ways that contrast with their phenotypes.10 The Census asks about citizenship, but not, of course, whether non-citizens are illegally present. This
distinction is important because ethnicities differ greatly based on this unobservable. At one end of the
spectrum, Mexicans can take advantage of a long border to immigrate illegally when prevented from
doing so legally, while at the other end of the spectrum, Puerto Ricans have a citizen’s right to immigrate
freely.11 Chiswick and Miller (2002) find that the key distinction for immigrants’ earnings is between those
who speak English ‘‘not well/not at all’’ and those who speak it ‘‘well/very well,’’ and they call the latter
‘‘fluent in English.’’ We employ the identical distinction.12 Redstone and Massey (2004) find that the Census responses are not completely reliable, but that
improved data do not generate statistically significant differences in wage equations.
672 D. H. Sullivan, A. L. Ziegert
123

Differences in Means
The upper panel of Table 1 shows the values of the means for the sample
population, tabulated by Hispanic ethnicity.13 In 1999, the published U.S. poverty
rate was 11.9%, and we have calculated the poverty rate for native-born non-
Hispanic households in the Census microsample as 10.8%. By those benchmarks,
poverty among non-Hispanic immigrant households is not especially high at 12.7%.
Their principal liability is that about 1 out of 8 non-Hispanic immigrant household
heads lacks English fluency. Given the attention in the press to Hispanic
immigration, it is perhaps surprising that there are actually more non-Hispanic
immigrant households than Hispanic immigrant households, though the fact that the
Hispanic immigrant households are larger means that the total number of persons is
about the same.
The poverty rate among Hispanic immigrant households is 23.4%, almost twice
that of non-Hispanic immigrants. Compared to non-Hispanic immigrant households,
Hispanic immigrant households are distinguished by having both more adults and
more children, and slightly greater family work effort. The Hispanic heads have
much lower educational attainments and English fluency and are relatively unlikely
to be citizens. Hispanic immigrant households are much more likely to be located in
regions that are relatively near the border with Mexico, with over 56% living in the
West and South-Central regions, compared to 40% of non-Hispanic immigrants.
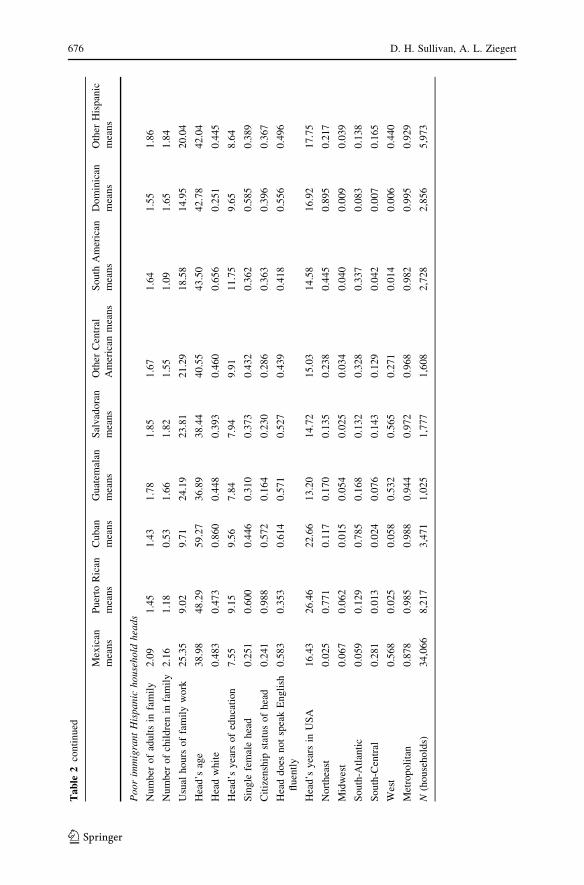
Table 2 sub-divides the Hispanic immigrant population by ethnicity. Since
slightly more than half of all Hispanic immigrants are from Mexico, their high
poverty rate of 24.6% is especially notable. When compared with other Hispanic
ethnic groups, Mexicans have somewhat larger households. The heads are generally
younger, less educated, and less likely to have the advantages of English fluency and
citizenship, though they also have greater family work effort and are less likely to be
single women. They are located primarily in regions near the border with Mexico,
and they are substantially less likely to live in a metropolitan area. It will require
further investigation to indicate which of these factors are most important.
Puerto Rican immigrant households, the second most common group, are very
different from the others. Persons born in Puerto Ricans are separately tabulated by
the Census, but are, of course, U.S. citizens (the handful who do not report it either
answered erroneously or were actually born elsewhere). It proves to be very
illuminating to have a citizen ‘‘immigrant’’ group as a benchmark. Turning to the
data in Table 2, immigrant household heads from Puerto Rico are older and more
fluent than most other Hispanic immigrant household heads. This constellation of
traits would seem likely to lead to a relatively low poverty rate, yet Puerto Rican
immigrant households have even higher poverty than Mexican immigrant house-
holds. Factors that may explain this higher poverty are that Puerto Ricans have very
low family work effort, and the heads are much more likely to be single women. A
majority lives in the Northeast region.
13 We report sample results rather than weighted population estimates. We have experimented
extensively with weighted results and have never found them to differ from sample results in any
meaningful way.
Hispanic Immigrant Poverty 673
123

Cuban immigrant households have lower poverty rates than any of the other
Hispanic immigrant ethnic groups except those from South America. Like the
Puerto Rican immigrant population, much of the Cuban immigrant population has
Table 1 Means of variables by Hispanic ethnicity, census 2000
All immigrants means Non-Hispanic means Hispanic means
All immigrant household heads
Poverty rates 0.172 0.127 0.234
Number of adults in family 1.94 1.80 2.13
Number of children in family 1.19 0.93 1.55
Usual hours of family work 32.44 31.93 33.14
Head’s age 46.28 48.80 42.84
Head white 0.525 0.529 0.520
Head’s years of education 11.72 13.23 9.65
Single female head 0.227 0.240 0.210
Citizenship status of head 0.559 0.630 0.462
Head does not speak English fluently 0.240 0.122 0.402
Head’s years in USA 22.40 24.04 20.14
Northeast 0.255 0.303 0.188
Midwest 0.104 0.127 0.072
South-Atlantic 0.172 0.169 0.177
South-Central 0.108 0.072 0.156
West 0.362 0.330 0.406
Metropolitan 0.939 0.944 0.932
N (households) 623,326 360,200 263,126
Poor immigrant household heads
Number of adults in family 1.72 1.50 1.88
Number of children in family 1.44 0.96 1.80
Usual hours of family work 17.91 13.97 20.83
Head’s age 44.01 46.69 42.02
Head white 0.475 0.452 0.492
Head’s years of education 9.82 11.82 8.33
Single female head 0.374 0.400 0.355
Citizenship status of head 0.424 0.479 0.383
Head does not speak English fluently 0.413 0.253 0.532
Head’s years in USA 18.17 18.33 18.05
Northeast 0.259 0.314 0.218
Midwest 0.083 0.121 0.055
South-Atlantic 0.150 0.163 0.141
South-Central 0.138 0.074 0.185
West 0.370 0.328 0.401
Metropolitan 0.926 0.936 0.919
N (households) 107,397 45,676 61,721
674 D. H. Sullivan, A. L. Ziegert
123

Ta
ble
2M
ean
so
fv
aria
ble
sb
yd
etai
led
His
pan
icet
hnic
ity
,ce
nsu
s2
00
0
Mex
ican
mea
ns
Pu
erto
Ric
an
mea
ns
Cu
ban
mea
ns
Gu
atem
alan
mea
ns
Sal
vad
ora
n
mea
ns
Oth
erC
entr
al
Am
eric
anm
eans
So
uth
Am
eric
an
mea
ns
Do
min
ican
mea
ns
Oth
erH
isp
anic
mea
ns
All
imm
igra
nt
His
pan
ich
ou
seh
old
hea
ds
Po
ver
tyra
tes
0.2
46
0.2
86
0.1
79
0.2
11
0.1
99
0.1
92
0.1
50
0.2
97
0.2
24
Nu
mb
ero
fad
ult
sin
fam
ily
2.3
21
.71
1.8
52
.12
2.2
12
.01
1.9
61
.90
2.0
7
Nu
mb
ero
fch
ild
ren
infa
mil
y1
.84
1.0
90
.77
1.4
31
.58
1.2
81
.13
1.5
41
.51
Usu
alh
ou
rso
ffa
mil
yw
ork
35
.30
24
.44
27
.80
36
.29
36
.39
35
.24
35
.58
28
.70
32
.80
Hea
d’s
age
40
.13
48
.57
54
.79
37
.92
38
.51
41
.50
44
.25
43
.41
43
.67
Hea
dw
hit
e0
.474
0.5
50
0.9
02
0.4
29
0.3
93
0.4
88
0.6
69
0.2
74
0.5
04
Hea
d’s
yea
rso
fed
uca
tion
8.5
310.7
611.6
09.2
39.1
411.3
812.7
610.6
010.1
1
Sin
gle
fem
ale
hea
d0
.147
0.3
72
0.2
60
0.1
84
0.2
04
0.2
67
0.2
33
0.3
73
0.2
41
Cit
izen
ship
stat
us
of
hea
d0
.334
0.9
87
0.6
89
0.2
72
0.3
21
0.4
16
0.4
89
0.4
74
0.4
64
Hea
dd
oes
no
tsp
eak
En
gli
sh
flu
entl
y
0.4
67
0.2
24
0.4
00
0.4
25
0.4
07
0.3
04
0.2
57
0.4
54
0.3
60
Hea
d’s
yea
rsin
US
A1
8.7
12
8.2
52
6.1
61
4.7
01
5.7
31
7.6
11
8.1
71
8.2
81
9.8
1
No
rthea
st0
.024
0.6
22
0.1
28
0.1
88
0.1
52
0.2
18
0.4
22
0.8
29
0.2
26
Mid
wes
t0
.095
0.0
79
0.0
23
0.0
74
0.0
27
0.0
41
0.0
46
0.0
14
0.0
47
So
uth
-Atl
anti
c0
.061
0.2
19
0.7
48
0.1
64
0.1
86
0.3
45
0.3
21
0.1
31
0.1
85
So
uth
-Cen
tral
0.2
37
0.0
30
0.0
29
0.0
74
0.1
33
0.1
09
0.0
46
0.0
10
0.1
36
Wes
t0
.583
0.0
50
0.0
72
0.4
99
0.5
00
0.2
88
0.1
65
0.0
14
0.4
06
Met
rop
oli
tan
0.8
95
0.9
77
0.9
88
0.9
57
0.9
75
0.9
73
0.9
83
0.9
93
0.9
39
N(h
ou
seho
lds)
13
8,3
49
28
,76
01
9,3
61
4,8
69
8,9
50
8,3
89
18
,20
29
,631
26
,61
5
Hispanic Immigrant Poverty 675
123
Ta
ble
2co
nti
nu
ed
Mex
ican
mea
ns
Pu
erto
Ric
an
mea
ns
Cu
ban
mea
ns
Gu
atem
alan
mea
ns
Sal
vad
ora
n
mea
ns
Oth
erC
entr
al
Am
eric
anm
eans
So
uth
Am
eric
an
mea
ns
Do
min
ican
mea
ns
Oth
erH
isp
anic
mea
ns
Po
or
imm
igra
ntH
isp
an
ich
ou
seh
old
hea
ds
Nu
mb
ero
fad
ult
sin
fam
ily
2.0
91
.45
1.4
31
.78
1.8
51
.67
1.6
41
.55
1.8
6
Nu
mb
ero
fch
ild
ren
infa
mil
y2
.16
1.1
80
.53
1.6
61
.82
1.5
51
.09
1.6
51
.84
Usu
alh
ou
rso
ffa
mil
yw
ork
25
.35
9.0
29
.71
24
.19
23
.81
21
.29
18
.58
14
.95
20
.04
Hea
d’s
age
38
.98
48
.29
59
.27
36
.89
38
.44
40
.55
43
.50
42
.78
42
.04
Hea
dw
hit
e0
.483
0.4
73
0.8
60
0.4
48
0.3
93
0.4
60
0.6
56
0.2
51
0.4
45
Hea
d’s
yea
rso
fed
uca
tion
7.5
59.1
59.5
67.8
47.9
49.9
111.7
59.6
58.6
4
Sin
gle
fem
ale
hea
d0
.251
0.6
00
0.4
46
0.3
10
0.3
73
0.4
32
0.3
62
0.5
85
0.3
89
Cit
izen
ship
stat
us
of
hea
d0
.241
0.9
88
0.5
72
0.1
64
0.2
30
0.2
86
0.3
63
0.3
96
0.3
67
Hea
dd
oes
no
tsp
eak
En
gli
sh
flu
entl
y
0.5
83
0.3
53
0.6
14
0.5
71
0.5
27
0.4
39
0.4
18
0.5
56
0.4
96
Hea
d’s
yea
rsin
US
A1
6.4
32
6.4
62
2.6
61
3.2
01
4.7
21
5.0
31
4.5
81
6.9
21
7.7
5
No
rthea
st0
.025
0.7
71
0.1
17
0.1
70
0.1
35
0.2
38
0.4
45
0.8
95
0.2
17
Mid
wes
t0
.067
0.0
62
0.0
15
0.0
54
0.0
25
0.0
34
0.0
40
0.0
09
0.0
39
So
uth
-Atl
anti
c0
.059
0.1
29
0.7
85
0.1
68
0.1
32
0.3
28
0.3
37
0.0
83
0.1
38
So
uth
-Cen
tral
0.2
81
0.0
13
0.0
24
0.0
76
0.1
43
0.1
29
0.0
42
0.0
07
0.1
65
Wes
t0
.568
0.0
25
0.0
58
0.5
32
0.5
65
0.2
71
0.0
14
0.0
06
0.4
40
Met
rop
oli
tan
0.8
78
0.9
85
0.9
88
0.9
44
0.9
72
0.9
68
0.9
82
0.9
95
0.9
29
N(h
ou
seho
lds)
34
,06
68
,21
73
,471
1,0
25
1,7
77
1,6
08
2,7
28
2,8
56
5,9
73
676 D. H. Sullivan, A. L. Ziegert
123

been in the U.S. a long time, and the household heads are much older on average
than those of any other Hispanic immigrant group. They are relatively highly
educated and likely to be citizens, but have relatively low family work effort and a
relatively low rate of English fluency, despite their relatively long length of
residence in the U.S. A majority lives in the South-Atlantic region.
Guatemalan and Salvadoran household heads generally resemble Mexican
household heads, so it is somewhat surprising that they have a lower household
poverty rate. About half of them live in the West region. Other Central Americans
have considerably greater educational attainment and English fluency than
Guatemalans or Salvadorans, though the benefits are partly offset by a greater
incidence of single female heads. South American immigrant households have even
lower poverty than Cuban immigrants. They somewhat resemble the Cubans
(relatively small households, with highly educated heads), though they are younger,
less fluent in English, and have been in the U.S. a shorter time. Dominicans have the
highest poverty rate of any ethnic group studied, and they also have notable
economic liabilities that one would expect to be associated with poverty, including
low educational attainment and English fluency and an especially high incidence of
single female heads.
The lower panel of Table 2 shows the means for the poverty population only. It
contains no surprises at all. For every ethnic group, poor households are more likely
to have low work effort, a female head, fewer adults, more children, and younger
and less-educated heads. Poor households have spent less time in the U.S., are less
fluent in English, and are less likely to be citizens. What Table 2 cannot tell us is the
relative importance of these various factors, though that would seem to be very
important for discerning any policy implications.
We proceed in three steps. First, as a basic means to evaluate the relative
importance of different covariates of poverty, we conduct probit analyses of poverty
for the entire immigrant population and for its non-Hispanic and Hispanic
components. Second we apply the same model to the Hispanic ethnic groups to
see whether there are substantial differences in the effect of covariates on different
groups. And third, we decompose ethnic group differences into those associated
with different mean values of the covariates (different average traits) and those
associated with different probit coefficients (different effects of traits on poverty).
Probit Results
If an analysis of poverty is to inform policymakers about the relative importance of
various covariates, that analysis ought to indicate the ceteris paribus effects of the
covariates, suggesting the use of a regression analysis. Because poverty is a
dichotomous variable we have employed a probit model to calculate the effects.
Table 3 shows probit results for the total sample, sub-divided by Hispanic ethnicity.
The coefficients have been restated as marginal probabilities at the mean for
continuous variables, and the marginal probability effect of changing from zero to
one in the case of dummy variables. In samples this size, almost any coefficient is
statistically significant; we have marked the exceptions.
Hispanic Immigrant Poverty 677
123

Adding an adult reduces the probability of poverty by 0.03–0.04, and adding a
child increases the probability of poverty by 0.01–0.03; the effect of an additional
child is substantially larger for Hispanic immigrants. The results show that an
additional 10 hours of family work effort reduces the probability of poverty by more
than 0.04 among non-Hispanic immigrants and more than 0.07 among Hispanic
immigrants. We would expect work effort to be strongly associated with poverty,
and it is.
The quadratic specifications for age and education are employed to permit a
curvilinear effect. We find that poverty falls with the age of the head at a decreasing
rate, and falls monotonically with the head’s years of education at an increasing rate
that is larger for Hispanics than non-Hispanics.
White households are somewhat more likely to be poor for non-Hispanics, but
racial identification does not seem to affect Hispanic poverty. The marginal effect of
being a female-headed household is dramatic, however, particularly for Hispanics.
Table 1 showed that Hispanics hardly differ from non-Hispanics in the propensity to
have a single woman as household head. However, this factor has a much larger
impact on poverty for Hispanics than for non-Hispanics. To use a comparative
metric, being a single female head has about the same poverty impact as losing
5 years of education for a non-Hispanic head, but about 8 years of education for an
Hispanic head.
Table 3 Marginal probabilities from probit analysis of poverty
Dependent variable: whether
poor (or not)
All immigrants All non-Hispanic
immigrants
All Hispanic
immigrants
Number of adults in family -0.034 -0.037 -0.040
Number of children in family 0.025 0.014 0.038
Usual hours of family work 9 10 -0.059 -0.044 -0.077
Head’s age 9 10 -0.050 -0.039 -0.063
Head’s age squared/1,000 0.016 0.015 0.025
Head white -0.009 -0.015 0.001*
Head’s years of education 0.004 0.005 0.006
Years of education squared/100 -0.076 -0.056 -0.099
Single female heada 0.075 0.034 0.128
Citizenship status of heada -0.023 -0.010 -0.036
Head does not speak English fluentlya 0.044 0.037 0.043
Head’s years in USA -0.003 -0.003 -0.004
Years in USA squared/100 0.017 0.018 0.033
Northeast 0.003 0.005 0.019
Midwest -0.016 0.002* -0.044
South-Atlantic -0.001 0.006 -0.013
South-Central 0.033* 0.017 0.041
Metropolitan -0.032 -0.030 -0.045
Pseudo R-squared 0.254 0.276 0.213
a Dummy variable; * coefficient is not significant at 0.01
678 D. H. Sullivan, A. L. Ziegert
123

The citizenship of the head has a relatively small independent impact on poverty
for Hispanic immigrants and non-Hispanic immigrants alike. Households with
heads who lack English fluency, on the other hand, are substantially more likely to
be poor: The effect of being fluent in English is equivalent to approximately 4 years
of additional education for the typical immigrant. Heads who have immigrated
within the last 8 years have a higher risk of poverty.
Taking the West as the baseline region, the marginal effect of living in the
Northeast or South-Central regions is increased poverty for Hispanics, while the
marginal effect of living in the Midwest or South-Atlantic regions is reduced
poverty for Hispanics. The regional effects are of limited substantive importance for
non-Hispanic immigrants. A metropolitan location tends to reduce poverty for
Hispanic and non-Hispanic immigrants alike.
Turning to the results for detailed Hispanic ethnicities, we will summarize some
selected results in Table 4. Adding a child somewhat increases the probability of
poverty, particularly in Mexican and Central American households. Since Table 2
showed that those are the ethnicities with the largest households, family size
differences are a potentially important source of intergroup poverty differentials.
The effect of 10 additional hours of family work does not vary greatly across ethnic
groups, though it is useful to note that it is highest for Puerto Ricans and
Dominicans.
Poverty falls monotonically with the head’s years of education at an increasing
rate in each ethnic group. The rate of decline (indicated by the coefficient on the
squared term) is particularly high for Puerto Ricans. Households with heads who
lack English fluency are more likely to be poor in every ethnic group, though the
effect is relatively small in the Cuban and Dominican populations.
Race generally does not usually have a substantial impact, Cubans and Puerto
Ricans being the notable exceptions. On the other hand, a female single head has the
least impact on immigrant poverty among Cubans, and the most among Mexicans
and Puerto Ricans. The effect of the citizenship of the head varies from insignificant
(essentially inapplicable to Puerto Ricans) to substantial for Mexicans and
Guatemalans.
For most groups, the geographical variables are neither independently statisti-
cally significant nor potentially substantively significant. Correlating the results in
Table 4 with those in Table 2, there is some tendency for groups to have higher
poverty rates where they are most concentrated, consistent with the contention of
Chiswick and Miller (2003) that living in areas in which one’s own group is highly
concentrated tends to be correlated with reduced rates of economic success. Since
Mexicans are less likely to have a metropolitan location than other ethnic groups, it
is useful to note that Mexican immigrants who live outside the metropolitan area are
considerably more likely to be poor.
Decomposition Results
The previous two sections of this paper have displayed the differences between the
poverty rates and covariates of the various ethnic groups, then assessed the effect of
Hispanic Immigrant Poverty 679
123

Tab
le4
Mar
gin
alp
rob
abil
itie
sfr
om
pro
bit
anal
ysi
so
fp
ov
erty
Dep
enden
tvar
iable
:w
het
her
poor
(or
not)
His
pan
icim
mig
rants
—et
hnic
sub-g
roups
Mex
ican
Pu
erto
Ric
an
Cu
ban
Gu
atem
alan
Sal
vad
ora
nO
ther
Cen
tral
Am
eric
an
So
uth
Am
eric
an
Do
min
ican
Oth
er
His
pan
ic
Nu
mb
ero
fad
ult
sin
fam
ily
-0
.03
4-
0.0
59
-0
.070
-0
.051
-0
.039
-0
.055
-0
.032
-0
.07
7-
0.0
36
Nu
mb
ero
fch
ild
ren
infa
mil
y0
.04
50
.013
0.0
03
*0
.043
0.0
39
0.0
38
0.0
15
0.0
28
0.0
39
Usu
alH
ou
rso
ffa
mil
yw
ork
91
0-
0.0
72
-0
.106
-0
.058
-0
.073
-0
.071
-0
.071
-0
.054
-0
.09
6-
0.0
75
Hea
d’s
age
91
0-
0.0
73
-0
.079
-0
.011
*-
0.0
68
-0
.064
-0
.053
-0
.028
-0
.08
4-
0.0
74
Hea
d’s
age
squ
ared
/1,0
00
0.0
36
0.0
08
*-
0.0
06
*0
.037
*0
.036
*0
.025
*0
.006
*0
.03
1*
0.0
34
Hea
dw
hit
e0
.01
1-
0.0
28
-0
.043
0.0
15
*0
.012
*-
0.0
09
*-
0.0
03
*-
0.0
05
*-
0.0
05
*
Hea
d’s
yea
rso
fed
uca
tio
n0
.00
30
.008
0.0
05
0.0
08
*0
.001
*0
.002
*0
.006
0.0
11
0.0
04
Yea
rsof
educa
tion
squar
ed/1
00
-0
.08
3-
0.1
47
-0
.068
-0
.102
-0
.053
-0
.063
-0
.059
-0
.11
3-
0.0
79
Sin
gle
fem
ale
hea
da
0.1
40
0.1
30
0.0
43
0.1
00
0.1
14
0.0
81
0.0
82
0.1
47
0.1
19
Cit
izen
ship
stat
us
of
hea
da
-0
.05
20
.016
*-
0.0
41
-0
.064
-0
.045
-0
.047
-0
.016
-0
.04
3-
0.0
28
Hea
dd
oes
no
tsp
eak
En
gli
shfl
uen
tly
a0
.04
40
.025
0.0
26
0.0
49
0.0
38
0.0
38
0.0
45
0.0
27
0.0
48
Hea
d’s
yea
rsin
US
A-
0.0
05
-0
.004
-0
.004
-0
.003
*-
0.0
04
-0
.004
-0
.006
-0
.00
3*
-0
.00
3
Yea
rsin
US
Asq
uar
ed/1
00
0.0
40
0.0
33
0.0
17
*0
.042
*0
.034
*0
.043
*0
.065
0.0
17
*0
.01
2*
No
rth
east
0.0
06
*0
.086
0.0
07
*-
0.0
23
*-
0.0
45
-0
.004
*0
.001
*0
.15
4-
0.0
27
Mid
wes
t-
0.0
62
0.0
47
-0
.004
*-
0.0
26
*-
0.0
32
*-
0.0
30
*0
.001
*0
.16
9*
-0
.04
2
South
-Atl
anti
c-
0.0
28
0.0
34
*0
.039
-0
.013
*-
0.0
68
-0
.003
*0
.009
*0
.16
0-
0.0
26
So
uth
-Cen
tral
0.0
49
0.0
28
*0
.049
0.0
02
*-
0.0
13
*0
.051
0.0
10
*0
.19
40
.02
4
Met
rop
oli
tan
-0
.05
3-
0.0
08
*-
0.0
26
*-
0.0
39
*-
0.0
38
*-
0.0
50
*-
0.0
22
*-
0.0
25
*-
0.0
41
Pse
ud
oR
-sq
uar
ed0
.17
70
.314
0.2
92
0.2
16
0.2
13
0.2
55
0.2
55
0.2
56
0.2
22
aD
um
my
var
iab
le;
*co
effi
cien
tis
no
tsi
gn
ifica
nt
at0
.01
680 D. H. Sullivan, A. L. Ziegert
123

the covariates on the poverty rates. The final step is to determine the extent to which
the differences in covariates can account for the differences in poverty rates, using
the probit coefficients derived in Section ‘‘Probit Results’’. We employ the ‘‘All
Immigrants’’ coefficients as a baseline for a decomposition of the differences across
ethnic groups.14
Thus, the final exercise we perform is to decompose the difference between the
poverty of each ethnic groups of immigrants and poverty among immigrants
generally, using the technique developed by Even and Macpherson (1990) to adapt
the Blinder–Oaxaca technique to a probit specification. To be clear, the analysis
variable, which we will call ‘‘the poverty rate differential,’’ is the difference
between the individual immigrant ethnic group poverty rate and the overall
immigrant poverty rate of 0.172. The decomposition exercise is this: for each
variable, we show how much of the poverty differential can be ‘‘explained’’ by the
difference in the means of that variable, evaluated with the probit coefficients for
‘‘all immigrants.’’ The portion ‘‘explained’’ by a variable can be negative, and
sometimes it is. For example, the poverty rate of Hispanic immigrants is higher than
the poverty rate for all immigrants, but the fact that the Hispanic immigrants have
more adults in the household would, in and of itself, cause the poverty rate among
Hispanic immigrants to be lower (by 0.007). It is also possible for the differences in
means to collectively ‘‘explain’’ more than 100% of the poverty differential if, for
example, the mean traits of the group predict a differential that is larger than the
actual one; we will show that this happens with Guatemalans and Salvadorans.
Table 5 shows the results of the decomposition, measured in poverty rate units.
As in previous sections, we begin by examining the results for the Hispanic
immigrant population generally. The data in Table 1 showed that the poverty rate of
Hispanic immigrant households is higher than that of all immigrant households (the
benchmark) by 0.062 (=0.234–0.172). Turning to the first column of Table 5, we see
that the larger number of adults and the larger number of children in Hispanic
households have essentially offsetting effects, but the relative youth of the Hispanic
population is of some importance. Fully half of the differential (0.031/0.062) can be
attributed to the combined effects of education and English fluency. Hispanic
immigrant heads are only slightly less likely to be single females than in the
benchmark group, so despite the importance of this factor in determining immigrant
poverty, it does not substantially affect the poverty differential. While Hispanic
immigrants are substantially less likely to be citizens, this factor is not very
important; Hispanics’ relatively short tenure in the U.S. is somewhat more so. All
variables combined ‘‘explain’’ 79% (=0.049/0.062) of the differential. The
‘‘unexplained’’ remainder is due to differences in the coefficients.
The other results in Table 5, for particular ethnic groups, can be considered
through either of two lenses: the rows (which groups of covariates are most
consistently important in accounting for poverty differentials?) and the columns (for
14 The coefficients are the actual probit estimates, not the marginal probabilities shown in Table 3. We
combine the effects of the linear and squared terms of the quadratic specifications when reporting the
decompositions.
Hispanic Immigrant Poverty 681
123

Ta
ble
5D
ecom
posi
tion
of
His
pan
icim
mig
rant
pover
tyra
tedif
fere
nce
susi
ng
‘‘al
lim
mig
rant’’
pro
bit
coef
fici
ents
His
pan
ic
po
ver
ty
rate
Mex
ican
po
ver
ty
rate
Pu
erto
Ric
an
po
ver
ty
rate
Cub
an
po
ver
ty
rate
Guat
emal
an
po
ver
tyra
te
Sal
vad
ora
n
po
ver
tyra
te
Oth
erC
entr
al
Am
eric
an
po
ver
tyra
te
So
uth
Am
eric
an
po
ver
tyra
te
Do
min
ican
po
ver
ty
rate
Oth
er
His
pan
ic
po
ver
tyra
te
Su
b-g
rou
pp
ov
erty
rate
min
us
all
imm
igra
nt
po
ver
tyra
te=
0.0
62
0.0
74
0.1
14
0.0
07
0.0
39
0.0
27
0.0
20
-0
.022
0.1
25
0.0
52
Du
eto
dif
fere
nce
sin
Nu
mb
ero
fad
ult
sin
fam
ily
-0
.007
-0
.013
0.0
10
0.0
03
-0
.006
-0
.00
8-
0.0
02
-0
.001
0.0
02
-0
.00
5
Nu
mb
ero
fch
ild
ren
infa
mil
y0
.009
0.0
16
-0
.003
-0
.00
90
.006
0.0
09
0.0
03
-0
.002
0.0
11
0.0
09
Usu
alh
ou
rso
ffa
mil
yw
ork
-0
.004
-0
.017
0.0
62
0.0
24
-0
.023
0.0
22
-0
.014
-0
.026
0.0
28
-0
.00
2
Hea
d’s
age
0.0
12
0.0
22
-0
.010
-0
.02
50
.028
0.0
25
0.0
13
0.0
08
0.0
11
0.0
10
Hea
dw
hit
e0
.000
0.0
00
0.0
00
-0
.00
30
.001
0.0
01
0.0
00
-0
.002
0.0
03
0.0
00
Hea
d’s
yea
rso
fed
uca
tion
0.0
24
0.0
36
0.0
19
0.0
03
0.0
28
0.0
27
0.0
06
-0
.012
0.0
20
0.0
19
Sin
gle
fem
ale
hea
d-
0.0
01
-0
.006
0.0
13
0.0
02
-0
.003
-0
.00
10
.002
-0
.001
0.0
12
0.0
01
Cit
izen
ship
stat
us
of
hea
d0
.002
0.0
05
-0
.013
-0
.00
30
.007
0.0
05
0.0
03
0.0
02
0.0
02
0.0
02
Hea
dd
oes
no
tsp
eak
En
gli
sh
flu
entl
y
0.0
07
0.0
10
0.0
00
0.0
06
0.0
08
0.0
06
0.0
02
0.0
01
0.0
11
0.0
05
Hea
d’s
yea
rsin
US
A0
.005
0.0
08
-0
.018
-0
.01
00
.017
0.0
14
0.0
09
0.0
12
0.0
10
0.0
05
Reg
ion
0.0
02
0.0
00
-0
.001
-0
.00
2-
0.0
01
0.0
01
0.0
01
-0
.001
0.0
00
0.0
02
Met
rop
oli
tan
Sta
tus
0.0
00
0.0
01
-0
.001
-0
.00
1-
0.0
01
0.0
00
-0
.001
-0
.002
-0
.002
0.0
00
Du
eto
cov
aria
ted
iffe
ren
ces
0.0
49
0.0
62
0.0
57
-0
.01
40
.061
0.1
01
0.0
22
-0
.024
0.1
08
0.0
46
Du
eto
coef
fici
ent
dif
fere
nce
s0
.013
0.0
12
0.0
57
0.0
21
-0
.022
-0
.07
4-
0.0
02
0.0
02
0.0
17
0.0
06
682 D. H. Sullivan, A. L. Ziegert
123

which ethnic groups is the model most ‘‘explanatory?’’). We begin by considering
the rows.
The most consistently important variables are family work effort and the head’s
years of education. One of those factors is the single most important (in absolute
value) for every ethnic group. Fluency is also somewhat important for Mexicans,
Central Americans and Dominicans. Given the close association of poverty with
single female headship, it is perhaps surprising that the considerable ethnic
differentials in that trait are not more important in explaining poverty differentials.
Except for Puerto Ricans and Dominicans, who have the highest incidence of single
female heads, this factor is simply swamped by the effect of differences in other
factors. Self-identified race and regional residence differ substantially across ethnic
groups, but never contribute much to explaining poverty differentials. The effects of
immigration traits (citizenship and years in the U.S.) are sometimes moderately
important, but very inconsistent across ethnic groups.
As to the columns, the model accounts for the differentially high poverty of
Mexicans very well. Since Mexicans make up more than half of the Hispanic
immigrant households, this is an interesting result. Though the ‘‘unexplained’’
portion of such decompositions is sometimes interpreted as ‘‘the effects of
discrimination,’’ it would not be proper to infer from our result that Mexicans suffer
little ‘‘discrimination.’’ For example, the benchmark group is ‘‘all immigrants,’’ who
may face some discrimination in general. It is, accurate, however, to infer that the
high poverty rate of Mexican immigrant households (relative to all immigrant
households) is associated with the youth and low educational attainments of
Mexican immigrant household heads, with the relatively large number of children in
Mexican immigrant households, with relatively low English fluency and with a
relatively short tenure in the U.S—all partly offset by a relatively high level of
family work effort.
The decomposition model does not perform as well in explaining the differential
poverty of some of the other Hispanic ethnic groups, and generates some puzzles
worthy of further investigation. For example, the decomposition only explains half
of the especially high poverty of immigrants from Puerto Rico. Table 2 showed that
their exceptional trait is a high proportion of single female household heads and low
family work effort; those factors and relatively low educational attainment account
for about 80% of the poverty differential, but some of the remaining variables (age,
citizenship) should actually work to mitigate poverty among Puerto Ricans. The
high poverty of Puerto Ricans is not so much a result of their observable traits as of
the fact that, according to Table 4, those adverse traits are much more important in
generating poverty among Puerto Rican immigrants than among immigrants
generally. In the light of the extent of poverty among Puerto Ricans, this topic
deserves further study.
Cuban poverty is similar to that of the benchmark group of all immigrant
households. We see that there are two important, but offsetting factors at work:
Cuban poverty is increased by low family work effort, offset by having household
heads that are, on average, substantially older than most.
As we pointed out in conjunction with Table 2, Guatemalan and Salvadoran
immigrants resemble Mexican immigrants in several ways, but their poverty rate is
Hispanic Immigrant Poverty 683
123

substantially lower. Table 5 reiterates the point. Looking at the Salvadorans, every
covariate except the number of adults and the incidence of female headship has
values associated with a high poverty rate. In fact, however, the actual poverty rate
is 0.199, while the model predicts a poverty rate of 0.273 (=0.199+0.074; this is the
interpretation of the negative ‘‘coefficient difference’’). The same phenomenon
holds for Guatemalans, though somewhat less dramatically. The evidence from
Table 4 is that the liabilities of low educational attainment and low rates of
citizenship have greater impact on the Mexicans, perhaps because the Mexicans are
less likely to have immigrated legally. The reason why Guatemalan and Salvadoran
immigrants have poverty lower than Mexicans despite similar traits is another topic
that merits further investigation. For other Central Americans the model accounts
for the poverty differential almost exactly.
The unusually low poverty rates of South American immigrants can be attributed
to unusually high family work effort and to high educational attainments of the
household heads. The model performs very well in accounting for the unusually
high poverty of Dominicans. Every trait of the Dominican population (except
metropolitan status) is associated with high poverty; low family work effort and low
educational attainment are the two most important factors.
Summing up, covariate differences effectively account for the unusually high
poverty of Mexicans and Dominicans and the unusually low poverty of South
Americans. They only account for about half of the unusually high poverty of
Puerto Ricans, and cannot account for the fact that Guatemalans and Salvadorans
have poverty rates so much lower than Mexicans in spite of a similar constellation
of traits.
Discussion
Although Trejo (1997) actually studies earnings, not poverty, he advances the claim
that ‘‘any war on Mexican-American poverty will need to attack the disturbingly
low levels of human capital possessed by Mexican-American workers’’ (Trejo 1997,
p. 1265). Our analysis leads to exactly the same result: the single most important
reason why Mexican immigrants have such high poverty rates is that they have, on
average, very low educational attainments. In fact, it is commonplace to associate
Hispanic immigrant poverty with low educational attainment. Almost all of the
Hispanic immigrant groups we identify have lower educational attainments than
non-Hispanic immigrants, and it is by far the most important factor contributing to
their high poverty rates.
The Chiswick and Miller (2002) analysis finds that English fluency is also
important for immigrants. The results presented in this paper suggest that fluency is
indeed important in explaining poverty among immigrants generally, though not
especially important in explaining the poverty differences among ethnic groups.
Improving fluency could decrease immigrant poverty substantially for Hispanics
and non-Hispanics alike.
Another crucial factor in accounting for poverty is family hours of work. It has a
very large impact on every ethnic group, and is the most important factor associated
684 D. H. Sullivan, A. L. Ziegert
123

with the high poverty of immigrants from Puerto Rico. That it is especially
important among Puerto Ricans, who are (almost) all citizens, and Cubans, who are
disproportionately citizens, suggests that there is a potential path of causation by
which eligibility for benefits is associated with low family work effort. However,
the same problem is present for Dominicans, who are not disproportionately
citizens.
That households headed by a single female are much more likely to be poor is
well-known. The tabulations in Table 2 show that this key factor differs
considerably across Hispanic ethnic groups. Since having a single female head
increases an Hispanic immigrant household’s probability of poverty by more than
12 percentage points, it should play a substantial role in the analysis. It seems to be
especially important in accounting for the poverty of Puerto Ricans (citizens, and
eligible for welfare benefits) and also Dominicans (majority non-citizens, and not
eligible for welfare).
We find that self-reported race has essentially no role in explaining poverty
differences among Hispanic immigrant ethnic groups, while citizenship per se has a
modest direct effect on the poverty of immigrants. Being a recent arrival in the U.S.
(less than 5 years) is associated with increases in the probability of poverty. By the
time an immigrant head has been in the U.S. for 10 years, this factor no longer has
an independent effect.
The principal result that falls out from the analysis of regional effects is that there
may be an adverse poverty impact from being located in the same region as the rest
of one’s ethnic group, whether it be Mexicans in Arizona or Cubans in Florida or
Puerto Ricans in New York. It is unclear how much of this is just ‘‘selection on
unobservables’’ (for example, huddling together of illegal immigrants and others
most at risk of poverty), but it is consistent with the Chiswick and Miller (2003)
hypothesis that ethnic concentration has an adverse impact on conventional
measures of economic success.
The common practice in poverty research has been to investigate Hispanic
poverty without regard to immigrants’ ethnicity. This is the first study of Hispanic
immigrant poverty to distinguish among the ethnic origins of Hispanic immigrants.
The approach is fruitful because it turns out that the different Hispanic immigrant
ethnic groups vary considerably in their typical traits. For example, the Mexican
majority has several traits that help to explain their high poverty rate: in particular,
the household heads have, on average, low educational attainments, English fluency
and tenure in the U.S. These factors account for the differentially high poverty of
the Mexican majority very well.
There are also some puzzles worthy of further investigation, particularly
regarding immigrants from Guatemala, El Salvador, and Puerto Rico. Immigrants
from Guatemala and El Salvador are rather similar to those from Mexico in their
observable traits, but their poverty rates are substantially lower, and it would be
useful to know more about why. Immigrants from Puerto Rico have low family
work effort, a high proportion of single female household heads and fairly low
educational attainment, but those factors do not fully account for the group’s very
high poverty rate, another topic worthy of further research.
Hispanic Immigrant Poverty 685
123

Policy Implications
The policy implications of our results depend on whether the focus is immigration
policy or policy to address the poverty of immigrants and their families. It is correct,
for example, that immigrants from Mexico are an important component of the U.S.
poverty population, and that low educational attainment is their principal liability.
While it is obvious from our results that an immigration policy that focused on
admitting immigrants with higher educational qualifications and English fluency
would improve U.S. poverty statistics, it is not at all obvious that measured poverty
among immigrants is an especially important metric for judging the economic
consequences of immigration policy.
Turning to policies that might affect the poverty of immigrants, the ability of
policy to alter the educational attainment of adult immigrants is presumably limited.
It is more realistic for immigrant adults to achieve reasonable fluency in English,
and our results affirm the emphasis on language skills by Chiswick and Miller
(2002).
As the paper by Borjas (2001) and the comment on it by Fix (2001) indicate,
there are major disagreements about transfer payment policy for legal immigrants.
The 1996 welfare reform essentially said that noncitizen immigrants who arrived in
the U.S. after the time of enactment were ineligible for means-tested Federal
benefits,15 though Borjas claims that the intent of the legislation has been partially
undermined by Congressional backsliding and the willingness of many states to
fund benefits for those ineligible for Federal support. Our results show that
citizenship, which conveys eligibility, is associated with meaningful reductions in
poverty, especially among immigrants from Mexico and Central America. While
Borjas and Fix disagree about the effect of immigrant eligibility restrictions, they
both agree that the strong financial incentive for low-skill immigrants to naturalize
is an unfortunate by-product of the current policy. A related issue that neither Borjas
nor Fix takes up is the eligibility of immigrant parents, particularly single parents,
for programs that support their work effort. While eligibility could create ‘‘policy
magnets’’ that draw low-skill immigrants seeking the benefits, it would also enhance
the welfare of the immigrants’ children, many of whom are citizens. Our results
show that among immigrants, especially Hispanic immigrants, single female heads
have high poverty rates that could presumably be mitigated by better work
opportunities and child care alternatives. On the other hand, eligibility for benefits
conferred by citizenship has not led to low poverty among Puerto Ricans—in fact,
quite the contrary.
References
Borjas, G. J. (2001). Welfare reform and immigration. In R. B. Blank & R. Haskins (Eds.), The new worldof welfare (pp. 369–385). Washington, DC: Brookings Institution Press.
Butcher, K. F., & DiNardo, J. (2002). The immigrant and native-born wage distributions: Evidence from
United States censuses. Industrial and Labor Relations Review, 56(1), 97–121.
15 It also restricted the eligibility of some who had arrived earlier.
686 D. H. Sullivan, A. L. Ziegert
123

Chiswick, B. R., & Miller, P. W. (2002). Immigrant earnings: Language skills, linguistic concentrations
and the business cycle. Journal of Population Economics, 15(1), 31–57.
Chiswick, B. R., & Miller, P. W. (2003). Do enclaves matter in immigrant adjustment? Working paper,
Institute of Government and Public Affairs, University of Illinois.
Citro, C. F., & Michael, R. T. (Eds.). (1995). Measuring poverty: A new approach. Washington, DC:
National Academy of Sciences.
Darity, W., Jr., Hamilton, D., & Dietrich, J. (2002). Passing on blackness: Latinos, race, and earnings in
the USA. Applied Economic Letters, 9, 847–853.
De Jong, G. F., & Madamba, A. B. (2001). A double disadvantage? Minority group, immigrant status, and
underemployment in the United States. Social Science Quarterly, 82, 117–130.
Even, W. E., & Macpherson, D. A. (1990). Plant size and the decline of unionism. Economics Letters, 32,
393–398.
Fix, M. (2001). Comment. In R. B. Blank & R. Haskins (Eds.), The new world of welfare (pp. 385–390).
Washington, DC: Brookings Institution Press.
Grieco, E. M., & Cassidy, R. C. (2001). Overview of race and Hispanic origin. Washington, DC: U.S.
Census Bureau Census 2000 Brief.
Guzman, B. (2001). The Hispanic population. Washington, DC: U.S. Census Bureau Census 2000 Brief.
Iceland, J. (2003a). Poverty in America: A handbook. Berkeley, CA: University of California Press.
Iceland, J. (2003b). Why poverty remains high: The role of income growth, economic inequality, and
changes in family structure. Demography, 40, 499–519.
Jargowsky, P. A. (1997). Poverty and place: Ghettos, barrios, and the American city. New York: Russell
Sage Foundation.
Mogull, R. G. (2005). Hispanic-American poverty. Journal of Applied Business Research, 21, 91–101.
Partridge, M. D., & Rickman, D. S. (2006). The geography of American poverty. Kalamazoo, MI: W.E.
Upjohn Institute for Employment Research.
Redstone, I., & Massey, D. S. (2004). Coming to stay: An analysis of the U.S. Census question on
immigrants’ year of arrival. Demography, 41, 721–738.
Ruggles, S., Sobek, M., Alexander, T., Fitch, C. A., Goeken, R., Hall, P. K., et al. (2004). Integratedpublic use microdata series: Version 3.0 [Machine-readable database]. Minneapolis, MN:
Minnesota Population Center.
Trejo, S. J. (1997). Why do Mexican Americans earn low wages? Journal of Political Economy, 105,
1235–1268.
Trejo, S. J. (2003). Intergenerational progress of Mexican-origin workers in the U.S. labor market. TheJournal of Human Resources, 38, 467–489.
Van Hook, J., Brown, S. L., & Kwenda, N. M. (2004). A decomposition of trends in poverty among
children of immigrants. Demography, 41, 649–670.
Hispanic Immigrant Poverty 687
123