Ethnic minority poverty in Vietnam
69
Electronic copy available at: http://ssrn.com/abstract=1719672 Working Paper February 2010 No. 169 www.chronicpoverty.org Chronic Poverty Research Centre ISBN: 978-1-906433-63-5 What is Chronic Poverty? The distinguishing feature of chronic poverty is extended duration in absolute poverty. Therefore, chronically poor people always, or usually, live below a poverty line, which is normally defined in terms of a money indicator (e.g. consumption, income, etc.), but could also be defined in terms of wider or subjective aspects of deprivation. This is different from the transitorily poor, who move in and out of poverty, or only occasionally fall below the poverty line. Ethnic minority poverty in Vietnam Bob Baulch Hoa Thi Minh Nguyen Phuong Thu Thi Phuong Hung Thai Pham Chronic Poverty Research Centre Manchester, UK Centre for Analysis and Forecasting Vietnam Academy of Social Sciences Hanoi, Vietnam National Economics University Hanoi , Vietnam
-
Upload
independent -
Category
Documents
-
view
4 -
download
0
Transcript of Ethnic minority poverty in Vietnam
Electronic copy available at: http://ssrn.com/abstract=1719672
Working Paper February 2010 No. 169
www.chronicpoverty.org Chronic Poverty Research Centre
ISBN: 978-1-906433-63-5
What is Chronic Poverty?
The distinguishing feature of chronic poverty is extended duration in absolute poverty.
Therefore, chronically poor people always, or usually, live below a poverty line, which is normally defined in terms of a money indicator (e.g. consumption, income, etc.), but could also be defined in terms of wider or subjective aspects of deprivation.
This is different from the transitorily poor, who move in and out of poverty, or only occasionally fall below the poverty line.
Ethnic minority poverty in
Vietnam
Bob Baulch
Hoa Thi Minh Nguyen
Phuong Thu Thi Phuong
Hung Thai Pham
Chronic Poverty Research Centre Manchester, UK Centre for Analysis and Forecasting Vietnam Academy of Social Sciences Hanoi, Vietnam National Economics University Hanoi , Vietnam
Electronic copy available at: http://ssrn.com/abstract=1719672
Ethnic minority poverty in Vietnam
2
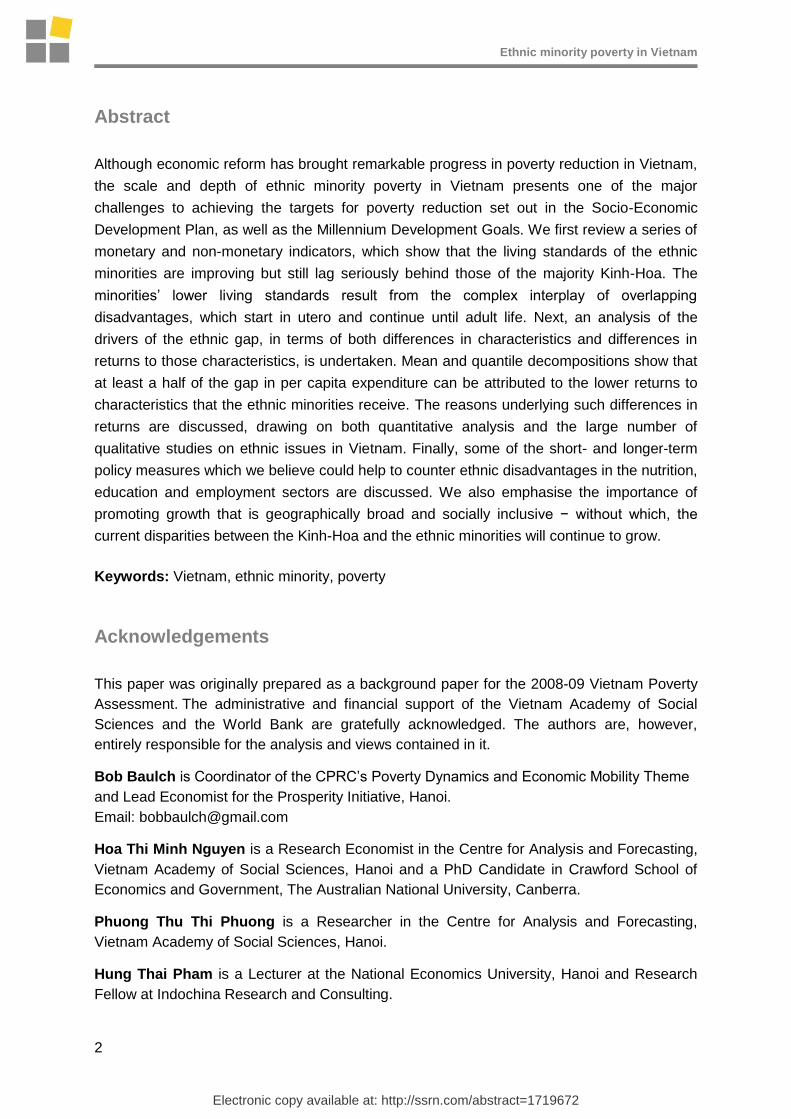
Abstract
Although economic reform has brought remarkable progress in poverty reduction in Vietnam,
the scale and depth of ethnic minority poverty in Vietnam presents one of the major
challenges to achieving the targets for poverty reduction set out in the Socio-Economic
Development Plan, as well as the Millennium Development Goals. We first review a series of
monetary and non-monetary indicators, which show that the living standards of the ethnic
minorities are improving but still lag seriously behind those of the majority Kinh-Hoa. The
minorities‟ lower living standards result from the complex interplay of overlapping
disadvantages, which start in utero and continue until adult life. Next, an analysis of the
drivers of the ethnic gap, in terms of both differences in characteristics and differences in
returns to those characteristics, is undertaken. Mean and quantile decompositions show that
at least a half of the gap in per capita expenditure can be attributed to the lower returns to
characteristics that the ethnic minorities receive. The reasons underlying such differences in
returns are discussed, drawing on both quantitative analysis and the large number of
qualitative studies on ethnic issues in Vietnam. Finally, some of the short- and longer-term
policy measures which we believe could help to counter ethnic disadvantages in the nutrition,
education and employment sectors are discussed. We also emphasise the importance of
promoting growth that is geographically broad and socially inclusive − without which, the
current disparities between the Kinh-Hoa and the ethnic minorities will continue to grow.
Keywords: Vietnam, ethnic minority, poverty
Acknowledgements
This paper was originally prepared as a background paper for the 2008-09 Vietnam Poverty
Assessment. The administrative and financial support of the Vietnam Academy of Social
Sciences and the World Bank are gratefully acknowledged. The authors are, however,
entirely responsible for the analysis and views contained in it.
Bob Baulch is Coordinator of the CPRC‟s Poverty Dynamics and Economic Mobility Theme
and Lead Economist for the Prosperity Initiative, Hanoi.
Email: [email protected]
Hoa Thi Minh Nguyen is a Research Economist in the Centre for Analysis and Forecasting,
Vietnam Academy of Social Sciences, Hanoi and a PhD Candidate in Crawford School of
Economics and Government, The Australian National University, Canberra.
Phuong Thu Thi Phuong is a Researcher in the Centre for Analysis and Forecasting,
Vietnam Academy of Social Sciences, Hanoi.
Hung Thai Pham is a Lecturer at the National Economics University, Hanoi and Research
Fellow at Indochina Research and Consulting.

Ethnic minority poverty in Vietnam
3
Contents
1 Introduction ..................................................................................................................... 4
2 A picture of ethnic minority poverty .............................................................................. 5
2.1 Ethnic minority nutrition .............................................................................................................. 11
2.2 Ethnic minority education ........................................................................................................... 18
2.3 Employment, incomes and mobility ............................................................................................ 24
2.4 Public services and social transfers ........................................................................................... 26
3 Decomposing the ethnic gap, 1998–2006 .....................................................................29
3.1 Empirical methodology ............................................................................................................... 30
3.2 Empirical results ......................................................................................................................... 33
3.3 Drivers of differences in returns .................................................................................................. 37
3.3.1 Language and cultural issues .............................................................................................. 37 3.3.2 Returns to land and land quality .......................................................................................... 38 3.3.3 Education quality and the returns to education .................................................................... 41 3.3.4 Returns to infrastructure ....................................................................................................... 42 3.3.5 Misconceptions and stereotyping of ethnic minorities ......................................................... 43
4 Policies for ethnic minority development .....................................................................44
4.1 Growth and distribution ............................................................................................................... 45
4.2 Nutrition ...................................................................................................................................... 46
4.3 Education .................................................................................................................................... 47
4.4 Employment ................................................................................................................................ 49
4.5 Integrated rural development programmes ................................................................................ 50
5 Some concluding remarks .............................................................................................52
References ..........................................................................................................................53
Appendix .............................................................................................................................57
Appendix 1: Changes in stunting and wasting rates by ethnic category, 1998-2006 ....................... 57
Appendix 2: Nutrition indicators for children under five by sex, 1998 and 2006 ............................... 57
Appendix 3: Nutrition indicators for children under five by sex, 1998 and 2006 ............................... 58
Appendix 4: Gross and net enrolments rates for rural areas, 1998 and 2006 .................................. 59
Appendix 5: Transfers as a percentage of beneficiary household expenditures .............................. 60
Appendix 6: OLS estimates for log per capita expenditure regression models of the majority and minority groups, 1998-2006 ........................................................................................................ 61
Appendix 7: Budgetary expenditures on the main ethnic minority policies and programs ............... 62
Appendix 8: Relevant decisions, decrees and resolutions ............................................................... 63
Ethnic minority poverty in Vietnam
4
1 Introduction
This background paper for the 2008–09 Vietnam Poverty Assessment presents descriptive
and multivariate analysis on ethnic minority poverty in Vietnam. The primary data sources
used for the analysis comprise the Vietnam Living Standards Surveys (VLSS) of 1993 and
1998 and the Vietnam Household Living Standards Surveys (VHLSS) of 2002, 2004 and
2006. However, other quantitative and qualitative sources are used to triangulate and
deepen the analysis where relevant.1 Section 2 of the paper aims to develop a picture (or
profile) of ethnic minority poverty in Vietnam, using both monetary (expenditure-based) and
non-monetary (nutrition and education) measures. Section 3 conducts multivariate analysis
of the correlates of minority and majority (Kinh-Hoa) living standards and decomposes these
into differences in characteristics and differences in returns to those characteristics. Section
4 reconsiders Vietnam‟s policies for ethnic minority development in the light of these findings,
and suggests some additional interventions and measures which may help to close the
widening gap between the living standards of the majority and minorities.
1 These sources include the 2008 Participatory Poverty Assessments, the 2007 Labour Force Survey,
the P135-II baseline survey and the 2009 World Bank Country Social Assessment.
Ethnic minority poverty in Vietnam
5
2 A picture of ethnic minority poverty
Although poverty is a multi-dimensional concept, and has important non-monetary
dimensions, we start by describing the poverty of the 52 ethnic minority groups in Vietnam,
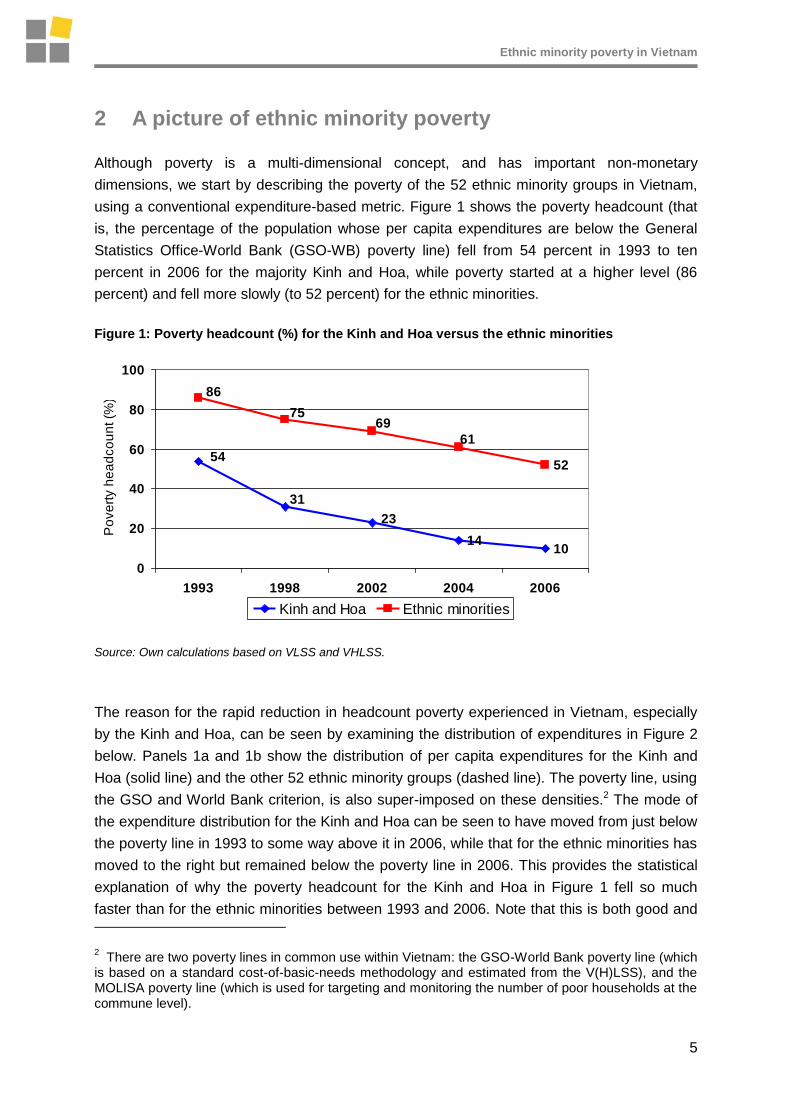
using a conventional expenditure-based metric. Figure 1 shows the poverty headcount (that
is, the percentage of the population whose per capita expenditures are below the General
Statistics Office-World Bank (GSO-WB) poverty line) fell from 54 percent in 1993 to ten
percent in 2006 for the majority Kinh and Hoa, while poverty started at a higher level (86
percent) and fell more slowly (to 52 percent) for the ethnic minorities.
Figure 1: Poverty headcount (%) for the Kinh and Hoa versus the ethnic minorities
Source: Own calculations based on VLSS and VHLSS.
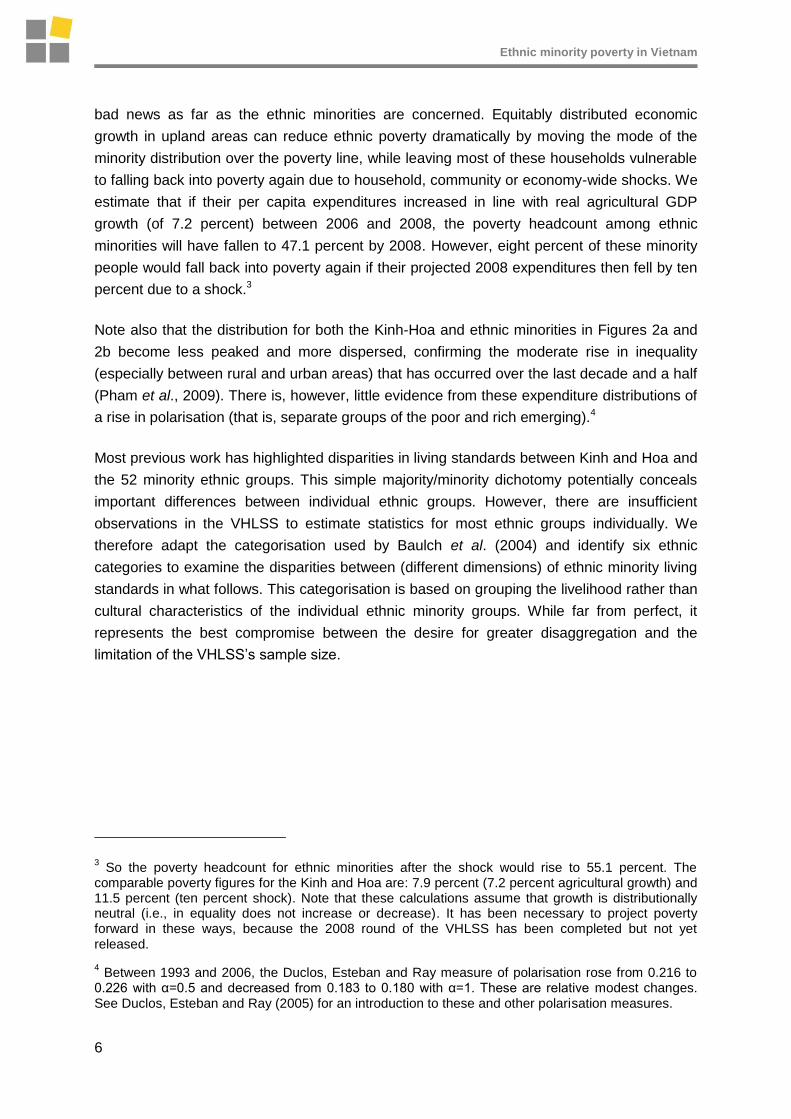
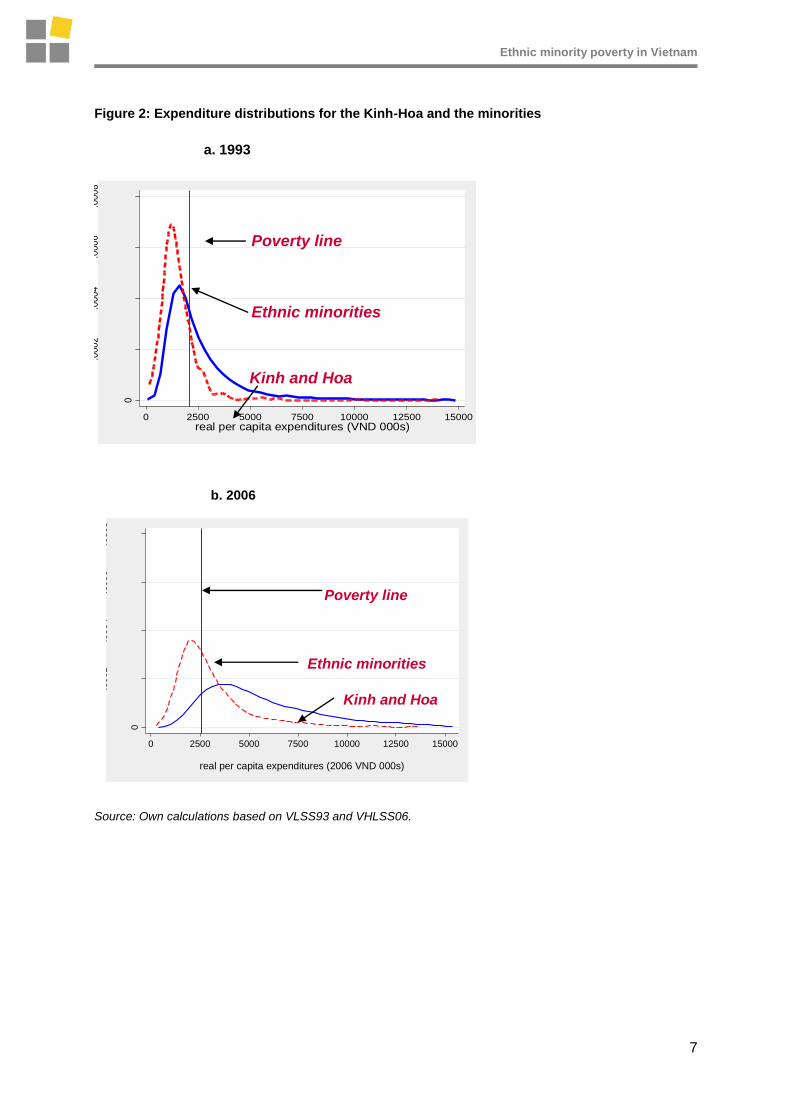
The reason for the rapid reduction in headcount poverty experienced in Vietnam, especially
by the Kinh and Hoa, can be seen by examining the distribution of expenditures in Figure 2
below. Panels 1a and 1b show the distribution of per capita expenditures for the Kinh and
Hoa (solid line) and the other 52 ethnic minority groups (dashed line). The poverty line, using
the GSO and World Bank criterion, is also super-imposed on these densities.2 The mode of
the expenditure distribution for the Kinh and Hoa can be seen to have moved from just below
the poverty line in 1993 to some way above it in 2006, while that for the ethnic minorities has
moved to the right but remained below the poverty line in 2006. This provides the statistical
explanation of why the poverty headcount for the Kinh and Hoa in Figure 1 fell so much
faster than for the ethnic minorities between 1993 and 2006. Note that this is both good and
2 There are two poverty lines in common use within Vietnam: the GSO-World Bank poverty line (which
is based on a standard cost-of-basic-needs methodology and estimated from the V(H)LSS), and the MOLISA poverty line (which is used for targeting and monitoring the number of poor households at the commune level).
1410
52
23
31
54
61
6975
86
0
20
40
60
80
100
1993 1998 2002 2004 2006
Po
ve
rty h
ea
dco
un
t (%
)
Kinh and Hoa Ethnic minorities
Ethnic minority poverty in Vietnam
6
bad news as far as the ethnic minorities are concerned. Equitably distributed economic
growth in upland areas can reduce ethnic poverty dramatically by moving the mode of the
minority distribution over the poverty line, while leaving most of these households vulnerable
to falling back into poverty again due to household, community or economy-wide shocks. We
estimate that if their per capita expenditures increased in line with real agricultural GDP
growth (of 7.2 percent) between 2006 and 2008, the poverty headcount among ethnic
minorities will have fallen to 47.1 percent by 2008. However, eight percent of these minority
people would fall back into poverty again if their projected 2008 expenditures then fell by ten
percent due to a shock.3
Note also that the distribution for both the Kinh-Hoa and ethnic minorities in Figures 2a and
2b become less peaked and more dispersed, confirming the moderate rise in inequality
(especially between rural and urban areas) that has occurred over the last decade and a half
(Pham et al., 2009). There is, however, little evidence from these expenditure distributions of
a rise in polarisation (that is, separate groups of the poor and rich emerging).4
Most previous work has highlighted disparities in living standards between Kinh and Hoa and
the 52 minority ethnic groups. This simple majority/minority dichotomy potentially conceals
important differences between individual ethnic groups. However, there are insufficient
observations in the VHLSS to estimate statistics for most ethnic groups individually. We
therefore adapt the categorisation used by Baulch et al. (2004) and identify six ethnic
categories to examine the disparities between (different dimensions) of ethnic minority living
standards in what follows. This categorisation is based on grouping the livelihood rather than
cultural characteristics of the individual ethnic minority groups. While far from perfect, it
represents the best compromise between the desire for greater disaggregation and the
limitation of the VHLSS‟s sample size.
3 So the poverty headcount for ethnic minorities after the shock would rise to 55.1 percent. The
comparable poverty figures for the Kinh and Hoa are: 7.9 percent (7.2 percent agricultural growth) and 11.5 percent (ten percent shock). Note that these calculations assume that growth is distributionally neutral (i.e., in equality does not increase or decrease). It has been necessary to project poverty forward in these ways, because the 2008 round of the VHLSS has been completed but not yet released.
4 Between 1993 and 2006, the Duclos, Esteban and Ray measure of polarisation rose from 0.216 to
0.226 with α=0.5 and decreased from 0.183 to 0.180 with α=1. These are relative modest changes. See Duclos, Esteban and Ray (2005) for an introduction to these and other polarisation measures.
Ethnic minority poverty in Vietnam
7
Figure 2: Expenditure distributions for the Kinh-Hoa and the minorities
Source: Own calculations based on VLSS93 and VHLSS06.
b. 2006
0
.00
02
.00
04
.00
06
.00
08
0 2500 5000 7500 10000 12500 15000
Pro
po
rtio
n o
f P
op
ula
tio
n
real per capita expenditures (2006 VND 000s)
Ethnic minorities
Poverty line
Kinh and Hoa
a. 1993
0
.00
02
.00
04
.00
06
.00
08
pro
po
rtio
n o
f po
pu
latio
n
0 2500 5000 7500 10000 12500 15000real per capita expenditures (VND 000s)
Poverty line
Ethnic minorities
Kinh and Hoa

Ethnic minority poverty in Vietnam
8
The snapshot of poverty measures and median expenditures in Table 1 shows that some
ethnic categories, in particular the Other Northern Uplands and Central Highland minorities,
are considerably poorer in expenditure terms than the Tay, Thai, Muong and Nung, who are
in turn poorer than the Khmer and Cham.6
Table 1: Poverty headcount, poverty gap and median per capita expenditures, rural areas 2006
It is also useful to show the deviation of the mean per capita expenditure of the six ethnic
categories from their annual mean in the last round of the VLSS and first three rounds of the
VHLSS survey (see Figure 3). As can be seen, the Kinh and Hoa have mean expenditures
above mean in years, and this difference has been growing over time. In contrast, the other
five ethnic minority categories have mean expenditures that are below the mean, and the
relative position of the Other Northern minorities and Central Highland minorities has been
declining substantially over time. In contrast, the deviations for the Khmer and Cham and
Tay, Thai, Muong and Nuong are varying over time, although the former are always closer to
the annual mean than the latter.7 These disparities in living standards between ethnic groups
are confirmed in a number of other qualitative and quantitative studies (Hoang et al., 2007;
Oxfam and Action Aid, 2008; Uplands Program, 2007; World Bank 2009).
6 Note that the poverty headcount and mean expenditures for these four ethnic categories are
statistically different from one another at the one percent level. This is not the case for the residual „Other category‟, which contains just 28 households.
7 Again, because of their small sample size, not too much should be read into the results for the other
category.
Ethnic Category
Poverty
Headcount
Poverty
Gap
Median PC
Expenditures
Obser-
vations
Kinh-Hoa 13.5% 2.7% VND 4.267 5,875
Khmer-Cham 34.6% 5.8% VND 2.819 122
Tay-Thai-Muong-Nung 45.2% 11.1% VND 2.729 420
Other Northern Uplands 72.4% 26.1% VND 1.878 239
Central Highlands 73.6% 25.7% VND 1.955 198
Others 50.1% 23.5% VND 1.942 28
Total 20.4% 4.9% VND 3.936 6,882

Ethnic minority poverty in Vietnam
9
Figure 3: Ethnic expenditure differentials, 1998–2006
Percentage deviation from annual mean
-80% -60% -40% -20% 0% 20%
Kinh-Hoa
Khmer-Cham
Tay-Thai-Muong-Nung
Other Uplands
Central Highlands
Others
1998 2002 2004 2006
Source: Own calculations based on VLSS and VHLSS.
People belonging to the six different ethnic categories in Table 1 and Figure 3 have different
levels of Vietnamese language proficiency. The Kinh obviously speak Vietnamese fluently,
as do the vast majority of Hoa, and Tay, Thai, Muong and Nung people. However,
Vietnamese language ability is generally lower among many of the Central Highlands and
Other Northern Uplands categories. While the V(H)LSS questionnaires do not ask about
people‟s fluency in Vietnamese directly, whether a household was interviewed using an
interpreter can be used as a rough proxy for their Vietnamese language ability. Calculations
using the VHLSS06 show that rural ethnic minority households who cannot speak
Vietnamese well (and were therefore interviewed via an interpreter) are 1.9 times more likely
to be poor than ethnic minority households who can speak Vietnamese, and 7.9 times more
likely to be poor than Kinh and Hoa living in rural areas. Analysis of the data from the recent
Program 135 II baseline survey also found that „those [households] who had no or limited
Vietnamese language ability were found amongst the poorest‟, while „those who spoke only
Vietnamese or both Vietnamese and ethnic minority languages were found similar in terms of
poverty rate‟ to the Kinh (Pham et al., 2008). A number of qualitative studies testify to the
powerful influence that low ability in Vietnamese has on the ethnic minorities – in particular
ethnic minority women – to access employment (Oxfam and Action Aid Vietnam, 2008),
government services (VASS, 2009), engage in markets (World Bank, 2009), and receive
social transfers.
Ethnic minority poverty in Vietnam
10
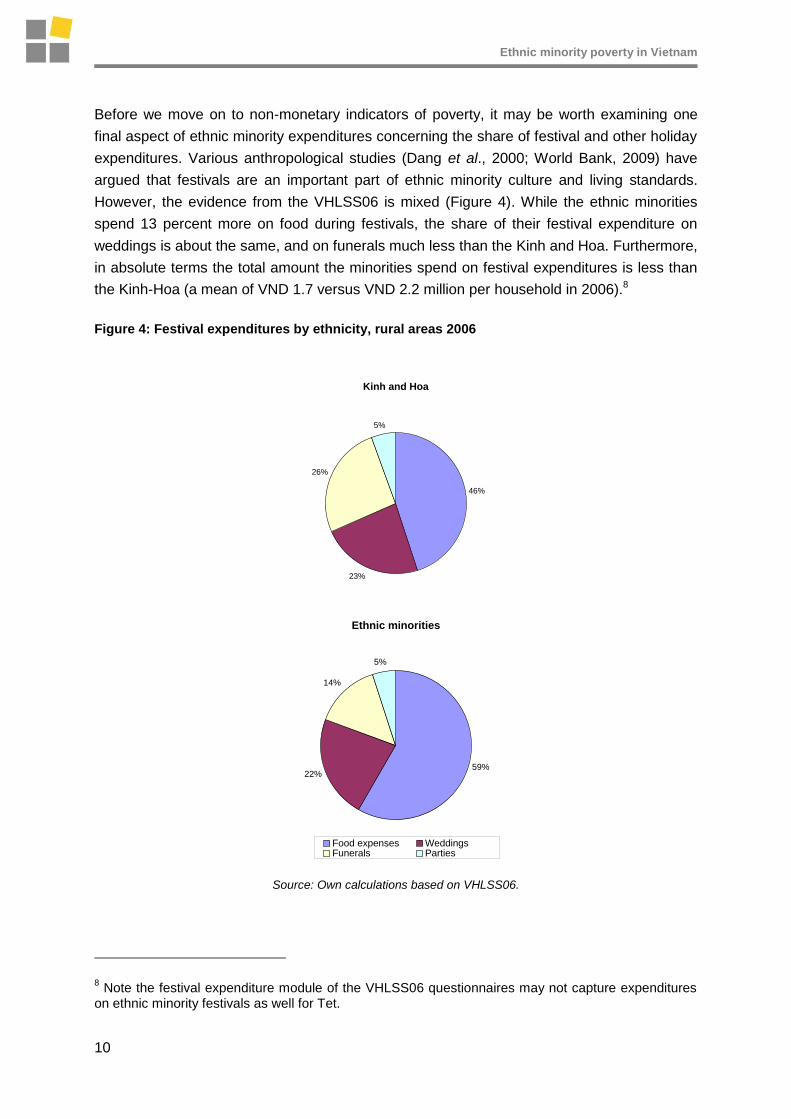
Before we move on to non-monetary indicators of poverty, it may be worth examining one
final aspect of ethnic minority expenditures concerning the share of festival and other holiday
expenditures. Various anthropological studies (Dang et al., 2000; World Bank, 2009) have
argued that festivals are an important part of ethnic minority culture and living standards.
However, the evidence from the VHLSS06 is mixed (Figure 4). While the ethnic minorities
spend 13 percent more on food during festivals, the share of their festival expenditure on
weddings is about the same, and on funerals much less than the Kinh and Hoa. Furthermore,
in absolute terms the total amount the minorities spend on festival expenditures is less than
the Kinh-Hoa (a mean of VND 1.7 versus VND 2.2 million per household in 2006).8
Figure 4: Festival expenditures by ethnicity, rural areas 2006
Kinh and Hoa
46%
23%
26%
5%
Ethnic minorities
59%22%
14%
5%
Food expenses WeddingsFunerals Parties
Source: Own calculations based on VHLSS06.
8 Note the festival expenditure module of the VHLSS06 questionnaires may not capture expenditures
on ethnic minority festivals as well for Tet.
Ethnic minority poverty in Vietnam
11
We now turn to examining some selected indicators on non-monetary welfare, starting with
nutritional indicators for children under five and then moving on to educational enrolments
and drops-outs for children, employment, income and mobility, and, finally, public services
and social benefits.
2.1 Ethnic minority nutrition
Health, especially of children, is well reflected by nutritional status. As part of the effort to
analyse the ethnic gap in Vietnam, we have calculated two nutrition indicators using
the#VLSS98 and VHLSS06 surveys:9 stunting and wasting for children aged 0–59 months.
The reference standards used are the latest World Health Organisation‟s child growth
standards (WHO, 2006). In addition, we report data from other studies on breastfeeding and
weaning practices and micronutrients deficiencies, and discuss how these relate to ethnic
minority nutrition.10
Children whose height-for-age is more than two and three standard deviations below the
median of the reference population are considered to be stunted and severely stunted,
respectively. Stunting is a reflection of chronic malnutrition as a result of failure to receive
adequate nutrition over a long period and recurrent or chronic illness (GSO, 2006).
Wasted children are the ones whose weight-for-height is more than two standard deviations
below the median of the reference population. Wasting is usually the result of a recent
nutritional deficiency. Changes in wasting rates often reflect seasonal changes in food
availability or the incidence of disease (GSO, 2006).
As shown in Table 2, Vietnam has made substantive progress in reducing stunting among
children under five, although severe stunting among this age group has not changed.
Furthermore, wasting rate has increased by one percent, for children under five years old
and by four percent for children under 24 months. The latter difference is statistically
significant at the highest levels. These results are consistent with recent annual surveys by
the National Institute of Nutrition, which found that 32.6% of children under five were stunted
in 2006 (NIN, 2007). A probable explanation for the increase wasting is that many infants in
urban areas are bottle- rather than breast-fed and that those who are breast-fed are weaned
too early.11 The recent 2006 Multiple Indicator Cluster Survey (GSO and UNICEF, 2006),
9 Note that anthropometrics modules were not included in the 2002 and 2004 VHLSS. We are grateful
to Nguyen Bui Linh, who used the WHO Anthro (version 2.02) to calculate height-for-age and weight-for-height z-scores from VLSS98 and VHLSS06 data.
10 Most other studies of nutrition in Vietnam, including the National Institute of Nutrition‟s annual
surveys and the GSO-UNICEF MICS surveys, do not disaggregate their results by ethnicity.
11 It is estimated that only half of newborns are breastfed within one hour of birth and that less than 20
percent of children under six months old are exclusively breastfed (UN, 2006). International best

Ethnic minority poverty in Vietnam
12
found that only 17 percent of children aged less than six months were exclusively breastfed,
with the percentage of exclusive breastfeeding being much higher in rural areas than in
urban areas. This suggests that young children‟s nutritional status might be improved by
encouraging breastfeeding and allowing working mothers in urban areas to have longer
maternity leave.
Poor complementary feeding makes children under 24 months of age lose weight very
quickly, so their weight-for-height will go down. Disease (especially diarrhoea) also makes
young children lose weight. The 2006 MICS results show the peak of diarrhoea prevalence is
in the weaning period, among children aged six to 23 months. That suggests more attention
needs to be given to the type of weaning foods given to children under 24 months of age.
Acute respiratory infections are also one of the correlates of nutritional status among
children. While mothers‟ knowledge, which is correlated with their education, is determinant
for health-seeking behaviour, the 2006 MICS results show only nine percent of women knew
about the danger signs of pneumonia. Therefore, work is also needed to raise mothers‟
awareness of hygiene and disease prevention.
Table 2: Nutrition indicators for children under five in the whole country
< 60 months <24 months
>=24 months and < 60 months
1998
2006
2 sample
mean comparison
test
(P-value)
1998 2006
2 sample mean comparison test
(P-value)
1998 2006
2 sample mean comparison test
(P-value)
Stunting 42% 34% 0.0000
32% 26% 0.0000 48% 38% 0.0000
Severe stunting 13% 13% 0.1817
11% 11% 0.0000 15% 14% 0.0009
Wasting 11% 12% 0.0000
11% 15% 0.0000 11% 10% 0.0000
N 2,149 1,956
757 662 1,392 1,294
Sources: Own calculations based on VLSS98 and VHLSS06.
practice suggests that all newborns should be put on the mother‟s breast immediately after birth and be exclusively breastfed until they are six months old.

Ethnic minority poverty in Vietnam
13
Although the nutritional status of Vietnam children is quite consistent with other countries in
the region at the same level of development (see Table 3), national under-five stunting rates
are high and put Vietnam among the world‟s 20 worst performers in child nutrition (Vietnam
News, 2008, quoting NIN). That the incidence of stunting in China and Thailand is around a
third of that in Vietnam, suggests that there is considerable scope for improving the height-
for-age of Vietnam‟s children.
Table 3: Nutrition status of children under-five, 2000–07
Wasting, moderate and severe (%)
Stunting, moderate and severe (%)
Vitamin A supplement
-ation full
Coverage (%)
Households consuming iodised salt (%)
Cambodia 7 37 76 73
China 11 94
Lao 7 40 69 75
Mongolia 2 21 95 83
Myanmar 2 21 94 83
Philippines 6 30 83 45
Thailand 4 12 47
Vietnam* 12 34 95 93
India 19 38 33 51
Source: UNICEF (2008) except *, which are own calculations based on VHLSS06.
Reliable statistics on micronutrient deficiencies are hard to come by for most East Asian
countries. However, the situation in Vietnam is probably not as favourable as the situation
revealed by the available cross-country statistics (last two columns of Table 3). While
Vietnam has (along with Mongolia) the highest rate of full coverage of Vitamin A
supplementation for children aged six to 60 months, this also suggests that the need for
Vitamin A supplementation is high.12 The 2006 MICS survey found only 32.5 percent of
mothers with a birth in the past two years had received a Vitamin A supplement within eight
weeks of the birth. This number is significantly higher for the Kinh (35.2 percent) than other
ethnic groups (19.2 percent) (GSO and UNICEF, 2006). A recent study of 1,657 children
under five in four regions found that the prevalence of sub-clinical vitamin A deficiency was
12 percent and the prevalence of anaemia (iron deficiency) was 28 percent, with children
under six months old and those living in the Northern Mountains being the most severely
affected (Khan et al., 2007). Small-scale studies indicate extremely high levels of
micronutrient deficiencies in some ethnic minority areas. For example, in three mountainous
areas of rural Thai Nguyen, Nguyen et al. (2008) found that 79 percent of preschool children
suffered from at least two micronutrient deficiencies, with 56 percent suffering from anaemia
12 Vitamin A is essential for eye health and proper functioning of the immune system.
Ethnic minority poverty in Vietnam
14
(iron deficiency) and 11 percent being Vitamin A-deficient. Selenium and zinc deficiencies
were even higher (at 62 and 87 percent, respectively). The percentage of households
consuming iodised salt has also probably fallen since late 2006, when the compulsory
iodisation of salt was abandoned. As discussed in Section 4, bio-fortification of staple foods,
together with fortification of other basic foodstuffs, has considerable potential to decrease
micronutrient deficiencies in Vietnam.
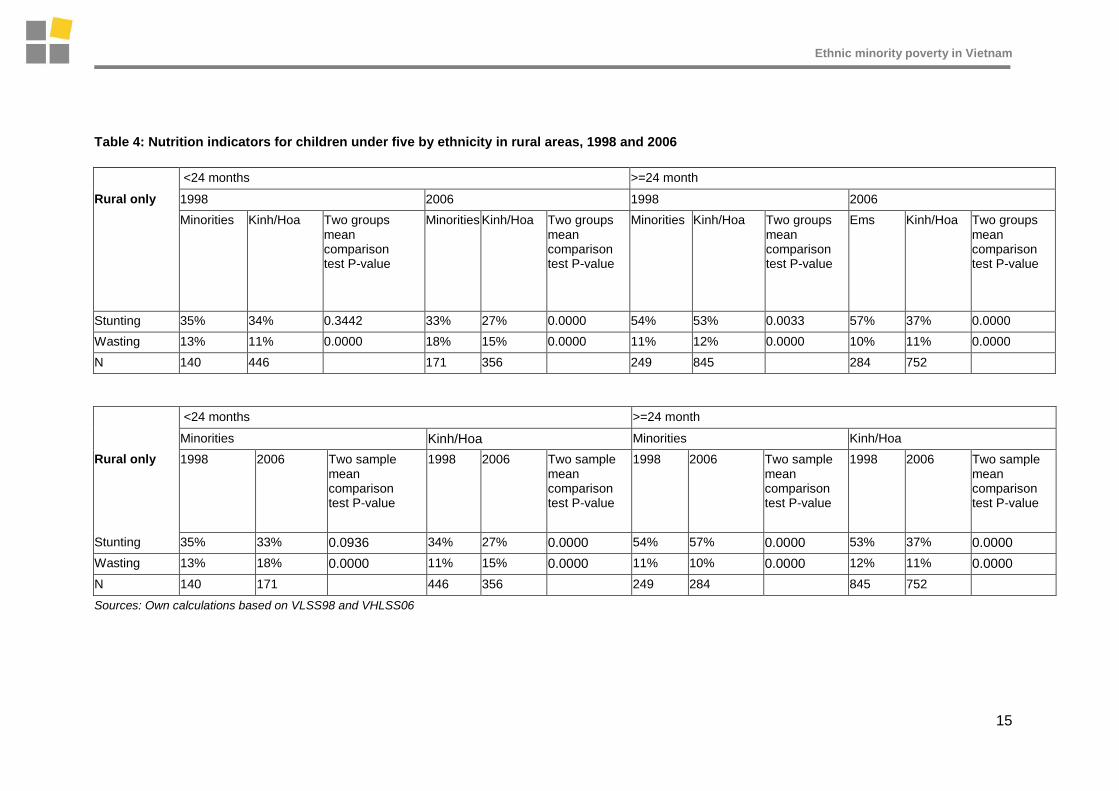
Table 4 disaggregates stunting and wasting rates by ethnicity for children under five in rural
areas. As the pattern of growth failure varies according to age, with wasting being more
common among children under 24 months and stunting observed more clearly among
children over 24 months (Young and Jaspers, 1995), we calculate nutrition indicators
separately for children under 24 months and from 24 months to 59 months.13 The Kinh-Hoa
ethnic category has done very well in reducing their stunting rates for the period 1998–2006
for both age groups, with stunting rates reduced by seven and 16 percentage points,
respectively. The ethnic minorities also made some progress, reducing stunting by two
percentage points for children under 24 months, although this difference is not statistically
significant at conventional levels. However, stunting among ethnic minority children older
than 24 months, and wasting among minority children under 24 months increased by three
and five percent, respectively. These differences are statistically different at the one percent
level. Finally, a one percent reduction in wasting among both Kinh-Hoa and minority children
over 24 months old was observed between 1998 and 2006. Again, these differences are
statistically significant at the highest levels.
13 Sample size considerations do not permit further disaggregation by age and ethnicity.
Ethnic minority poverty in Vietnam
15
Table 4: Nutrition indicators for children under five by ethnicity in rural areas, 1998 and 2006
<24 months >=24 month
Rural only 1998 2006 1998 2006
Minorities Kinh/Hoa Two groups mean comparison test P-value
Minorities Kinh/Hoa Two groups mean comparison test P-value
Minorities Kinh/Hoa Two groups mean comparison test P-value
Ems Kinh/Hoa Two groups mean comparison test P-value
Stunting 35% 34% 0.3442 33% 27% 0.0000 54% 53% 0.0033 57% 37% 0.0000
Wasting 13% 11% 0.0000 18% 15% 0.0000 11% 12% 0.0000 10% 11% 0.0000
N 140 446 171 356 249 845 284 752
<24 months >=24 month
Minorities Kinh/Hoa Minorities Kinh/Hoa
Rural only 1998 2006 Two sample mean comparison test P-value
1998 2006 Two sample mean comparison test P-value
1998 2006 Two sample mean comparison test P-value
1998 2006 Two sample mean comparison test P-value
Stunting 35% 33% 0.0936 34% 27% 0.0000 54% 57% 0.0000 53% 37% 0.0000
Wasting 13% 18% 0.0000 11% 15% 0.0000 11% 10% 0.0000 12% 11% 0.0000
N 140 171 446 356 249 284 845 752
Sources: Own calculations based on VLSS98 and VHLSS06

Ethnic minority poverty in Vietnam
16
Figure 5 presents the stunting, severe stunting and wasting rates for the six ethnic categories
in the rural area only. The Kinh-Hoa and Khmer and Cham have done well in improving their
height-for-age, thereby reducing moderate stunting by 13 and 16 percent, respectively.
Wasting has also decreased by six percentage points among the Khmer and Cham. These
changes are statistically significant at the highest levels. However, the nutritional status of
the other four ethnic categories worsened between 1998 and 2006, with stunting among the
Central Highlands increasing by seven percent and wasting among the Other Northern
minorities rising by four percent. Surprisingly, the Thay-Thai-Muong-Nung‟s stunting and
wasting rates also increased by five percent and four percent, respectively.14
Figure 5 also shows that the Kinh-Chinese made no progress in reducing severe stunting.
Severe stunting rates worsened for all other ethnic categories, except for the Khmer and
Cham and the Central Highlands minorities, although because of sample size issues only the
increase in severe stunting among the Tay-Thai-Muong-Nung is statistically significant at
conventional levels. This should be a cause for concern, as severe stunting in young children
is very hard to reverse and is likely to lead to short stature and lower intelligence in adult life
(Martorell et al., 1992). Group mean tests among the five ethnic groups show that moderate
and severe stunting rates are jointly different from each other at the one percent level in
2006, and statistically different from each other for severe stunting at the five percent level in
1998.
There are many factors which affect the nutrition of children (Haughton and Haughton, 1997).
The poor nutritional indicators observed for ethnic children may stem not only from the lower
living standard that their households have, compared with the majority counterparts. There
are also many other factors, such as parents‟ height, women‟s nutrition status when entering
the pregnancy and during the first trimester, mothers‟ education, living environment, worm
loads and the incidence of infections, especially diarrhoeal, diseases. For ethnic children
living in upland and mountainous areas, their high malnutrition rates may also relate to
geographical remoteness. In these areas, where maternal mortality and micronutrient
deficiencies are also high, efforts to reduce child malnutrition should focus on improving the
nutrition of women before and during pregnancy, as well as of children in their crucial first
two years of life.15
Finally, it should be noted that although parents in Vietnam, especially in rural areas, prefer
having sons to girls, there is no evidence of bias against the girls in nutrition. In fact, if
anything, nutrition is worse amongst boys than girls, especially during the first two years of
life (see Appendix 2 and Appendix 3).
14 All these changes are statistically significant at the one percent level, although the reduction in
moderate stunting for the Other Northern Minorities is not (see Appendix 1)
15 It is well known that poor nutrition in vitro and during the first two years of life leads to irreversible
damage in later life (Martorell et al., 1992)

Ethnic minority poverty in Vietnam
17
Figure 5: Nutrition indicators for children under five by ethnic category, 1998 and 2006
Sources: Own calculations based on VLSS98 and VHLSS06.

Ethnic minority poverty in Vietnam
18
2.2 Ethnic minority education
If the living standards of the ethnic minorities are to catch up with those of their Kinh-Hoa
counterparts, it is essential that their educational standards are improved. This sub-section
discusses education enrolments and school dropouts, using the VLSS98 and VHLSS06 data
combined with administrative data for the post-secondary level. While such an analysis is
obviously partial – it does not, for example, discuss the quality of the education received or
the standards students attain − it nevertheless reveals that the educational disadvantages
experienced by ethnic minority children and young people cumulatively increase with age,
which it turn makes it extremely difficult for them to access wage employment. Some policy
measures that may help to counter these cumulative educational disadvantages are
suggested in Section 4.
Figure 6 shows enrolment rates for primary, lower secondary and upper secondary school
age children in rural areas calculated using the VLSS98 and VHLSS06. Although there has
been little change in overall primary NER for rural areas between 1998 and 2006, the
percentage of primary school age children enrolled from the ethnic minorities has increased
by just over two percent.17 Primary NERs among children from the Central Highland
minorities and also the residual Others category have increased by around 30 percent.
Nevertheless, inspection of their GER shows that large numbers of children from the Central
Highland minorities, and especially the Khmer and Cham, go to primary school late.18
At the lower secondary school level, NER have increased by at least a fifth for all ethnic
groups, with the Other Northern Upland and the Central Highlands minorities each recording
improvements of around two-fifths. Nonetheless, these two ethnic categories remain
educationally disadvantaged, with less than half of their children attending lower secondary
school in the right age range. Almost two-fifths of the children from the Other Northern
Uplands minorities who attend lower secondary school do so late.
The disparities between net enrolment rates become most pronounced at the high school
level, where almost 60 percent of Kinh and Hoa children attend upper secondary school,
compared to just under ten percent for the Khmer and Cham. Upper secondary school
enrolments are also under 20 percent for the Other Northern minorities and the Central
Highland minorities.
17 To reflect school enrolment practices in Vietnam, these NERs have been calculated using the year
of birth of child rather than their age at the time of interview,
18 Rural primary GERs among the Central Highlands minorities and Khmer and Cham in 2006 were
110.8 percent and 120.2 percent, respectively, compared to 102 percent for the Kinh and Hoa. See Appendix 1 for details.

Ethnic minority poverty in Vietnam
19
Figure 6: Net enrolment rates, rural areas
Source: Own calculations based on VLSS98 and VHLSS02-06.
Figure 7: Net enrolment rates by schooling level, rural area, 1998 and 2006
Source: Own calculations based on VLSS98 and VHLSS06.
0
10
20
30
40
50
60
70
80
90
100
1998 2002 2004 2006
%
Ethnic Minorities
0
10
20
30
40
50
60
70
80
90
100
1998 2002 2004 2006
Primary Lower secondary Upper secondary
Kinh and Hoa
0
10
20
30
40
50
60
70
80
90
100
Primary Lower secondary Upper secondary
Kinh and Hoa Khmer and Cham Tay-Thai-Muong-Nung
Other Northern Uplands Central Highlands
0
10
20
30
40
50
60
70
80
90
100
Primary Lower secondary Upper secondary
1998 2006
Ethnic minority poverty in Vietnam
20
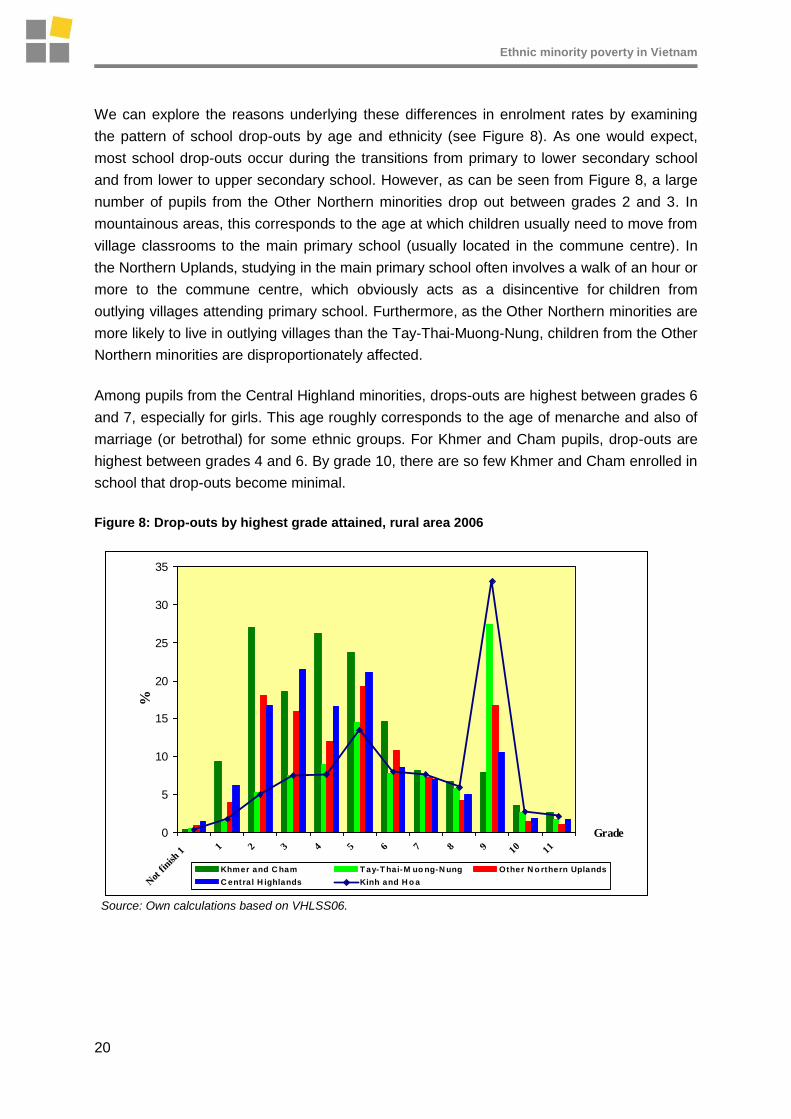
We can explore the reasons underlying these differences in enrolment rates by examining
the pattern of school drop-outs by age and ethnicity (see Figure 8). As one would expect,
most school drop-outs occur during the transitions from primary to lower secondary school
and from lower to upper secondary school. However, as can be seen from Figure 8, a large
number of pupils from the Other Northern minorities drop out between grades 2 and 3. In
mountainous areas, this corresponds to the age at which children usually need to move from
village classrooms to the main primary school (usually located in the commune centre). In
the Northern Uplands, studying in the main primary school often involves a walk of an hour or
more to the commune centre, which obviously acts as a disincentive for children from
outlying villages attending primary school. Furthermore, as the Other Northern minorities are
more likely to live in outlying villages than the Tay-Thai-Muong-Nung, children from the Other
Northern minorities are disproportionately affected.
Among pupils from the Central Highland minorities, drops-outs are highest between grades 6
and 7, especially for girls. This age roughly corresponds to the age of menarche and also of
marriage (or betrothal) for some ethnic groups. For Khmer and Cham pupils, drop-outs are
highest between grades 4 and 6. By grade 10, there are so few Khmer and Cham enrolled in
school that drop-outs become minimal.
Figure 8: Drop-outs by highest grade attained, rural area 2006
Source: Own calculations based on VHLSS06.
0
5
10
15
20
25
30
35
Not
fin
ish 1
1 2 3 4 5 6 7 8 9 10 11
Grade
%
Khmer and C ham T ay-T hai-M uo ng-N ung Other N o rthern Uplands
C entral H ighlands Kinh and H o a
Ethnic minority poverty in Vietnam
21
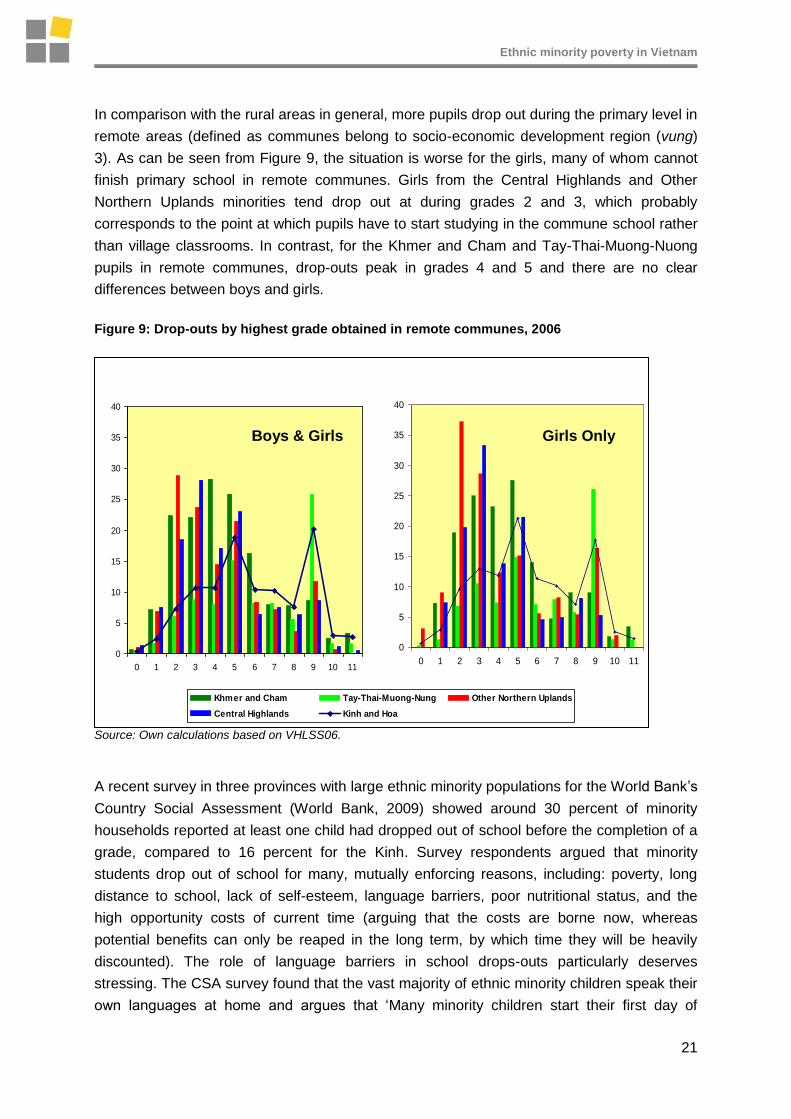
In comparison with the rural areas in general, more pupils drop out during the primary level in
remote areas (defined as communes belong to socio-economic development region (vung)
3). As can be seen from Figure 9, the situation is worse for the girls, many of whom cannot
finish primary school in remote communes. Girls from the Central Highlands and Other
Northern Uplands minorities tend drop out at during grades 2 and 3, which probably
corresponds to the point at which pupils have to start studying in the commune school rather
than village classrooms. In contrast, for the Khmer and Cham and Tay-Thai-Muong-Nuong
pupils in remote communes, drop-outs peak in grades 4 and 5 and there are no clear
differences between boys and girls.
Figure 9: Drop-outs by highest grade obtained in remote communes, 2006
Source: Own calculations based on VHLSS06.
A recent survey in three provinces with large ethnic minority populations for the World Bank‟s
Country Social Assessment (World Bank, 2009) showed around 30 percent of minority
households reported at least one child had dropped out of school before the completion of a
grade, compared to 16 percent for the Kinh. Survey respondents argued that minority
students drop out of school for many, mutually enforcing reasons, including: poverty, long
distance to school, lack of self-esteem, language barriers, poor nutritional status, and the
high opportunity costs of current time (arguing that the costs are borne now, whereas
potential benefits can only be reaped in the long term, by which time they will be heavily
discounted). The role of language barriers in school drops-outs particularly deserves
stressing. The CSA survey found that the vast majority of ethnic minority children speak their
own languages at home and argues that „Many minority children start their first day of
0
5
10
15
20
25
30
35
40
0 1 2 3 4 5 6 7 8 9 10 11
Khmer and Cham Tay-Thai-Muong-Nung Other Northern Uplands
Central Highlands Kinh and Hoa
0
5
10
15
20
25
30
35
40
0 1 2 3 4 5 6 7 8 9 10 11
Girls Only Boys & Girls
Ethnic minority poverty in Vietnam
22
primary school unprepared for instruction in Vietnamese‟. While the extension of pre-school
and pre-sessional summer classes can do much to help prepare four and five year-olds to
start learning in Vietnamese, it is unlikely that many of them will be able learn adequately in
Vietnamese by the age of six.19 Additional support in Vietnamese for ethnic minority students
whose mother tongue is not Vietnamese is therefore extremely important in, at a minimum,
grades 1 and 2.
The quality of the school which ethnic minority children attend is also clearly a vital factor,
although reliable data on school quality are rarely available. Swinkels and Turk‟s (2006)
report on an assessment of learning outcomes in 3,660 schools across the country shows
that a combination of lower quality teaching, poor facilities, long travel times and language
issues mean that grade 5 children in ethnic minority areas are learning less than those in
other parts of the country. It concludes that the ethnic minority pupils need to start school
earlier and repeat grades less, and the schools in the isolated areas should be better
resourced to overcome the deficits of their intake of pupils. There is also evidence that
schools in the poorest communes, where most ethnic minorities live, are in much poorer
physical condition than the average. Pham et al. (2008), using the P135-II‟s baseline survey,
documented the most difficulties to education access perceived by households in the P135-II
communes. Their results show that at the primary education level, insufficient physical
facilities were identified as the most serious obstacle by 85 percent of the P135-II
communes. Limited school budgets and poor living conditions for teachers were ranked as
the second most important difficulty in 42 percent of these communes. While the number of
ethnic minority teachers is increasing, most ethnic teachers have received insufficient
training in teaching methods. As a result, in some research sites of the World Bank Country
Social Assessment, ethnic teachers said that „they were perceived by their principals to be
“less qualified” and worse teachers and given subordinate jobs or administrative work‟ (World
Bank, 2009).
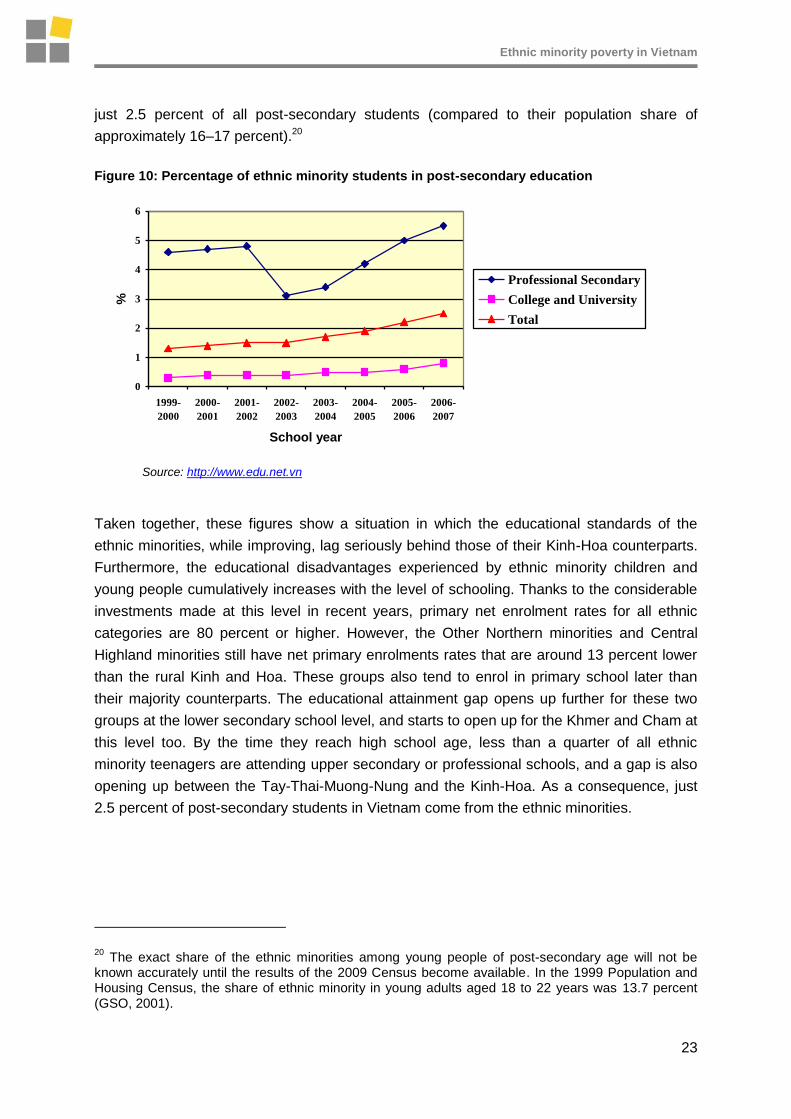
At the post-secondary level, it is not possible to disaggregate into the six ethnic categories.
However, the Ministry of Education and Training‟s statistics show a stark contrast between
the percentage of Kinh and ethnic minority students. Compared to their 12.1 percent
population share in the 1999 Census, only 1.3 percent of post-secondary students in the
1999–2000 school year were from the ethnic minorities (and only 19percent of these were
attending college or university). Although by 2006–07 the number of ethnic minority students
had almost doubled to 51,514 students, young people from the ethnic minorities still make up
19 In one North-western province, which two of the authors visited in 2007, ethnic minority children
from remote communes were given just 36 half-day summer classes before being expected to learn entirely in Vietnamese!
Ethnic minority poverty in Vietnam
23
just 2.5 percent of all post-secondary students (compared to their population share of
approximately 16–17 percent).20
Figure 10: Percentage of ethnic minority students in post-secondary education
0
1
2
3
4
5
6
1999-
2000
2000-
2001
2001-
2002
2002-
2003
2003-
2004
2004-
2005
2005-
2006
2006-
2007
School year
%
Professional Secondary
College and University
Total
Source: http://www.edu.net.vn
Taken together, these figures show a situation in which the educational standards of the
ethnic minorities, while improving, lag seriously behind those of their Kinh-Hoa counterparts.
Furthermore, the educational disadvantages experienced by ethnic minority children and
young people cumulatively increases with the level of schooling. Thanks to the considerable
investments made at this level in recent years, primary net enrolment rates for all ethnic
categories are 80 percent or higher. However, the Other Northern minorities and Central
Highland minorities still have net primary enrolments rates that are around 13 percent lower
than the rural Kinh and Hoa. These groups also tend to enrol in primary school later than
their majority counterparts. The educational attainment gap opens up further for these two
groups at the lower secondary school level, and starts to open up for the Khmer and Cham at
this level too. By the time they reach high school age, less than a quarter of all ethnic
minority teenagers are attending upper secondary or professional schools, and a gap is also
opening up between the Tay-Thai-Muong-Nung and the Kinh-Hoa. As a consequence, just
2.5 percent of post-secondary students in Vietnam come from the ethnic minorities.
20 The exact share of the ethnic minorities among young people of post-secondary age will not be
known accurately until the results of the 2009 Census become available. In the 1999 Population and Housing Census, the share of ethnic minority in young adults aged 18 to 22 years was 13.7 percent (GSO, 2001).
Ethnic minority poverty in Vietnam
24
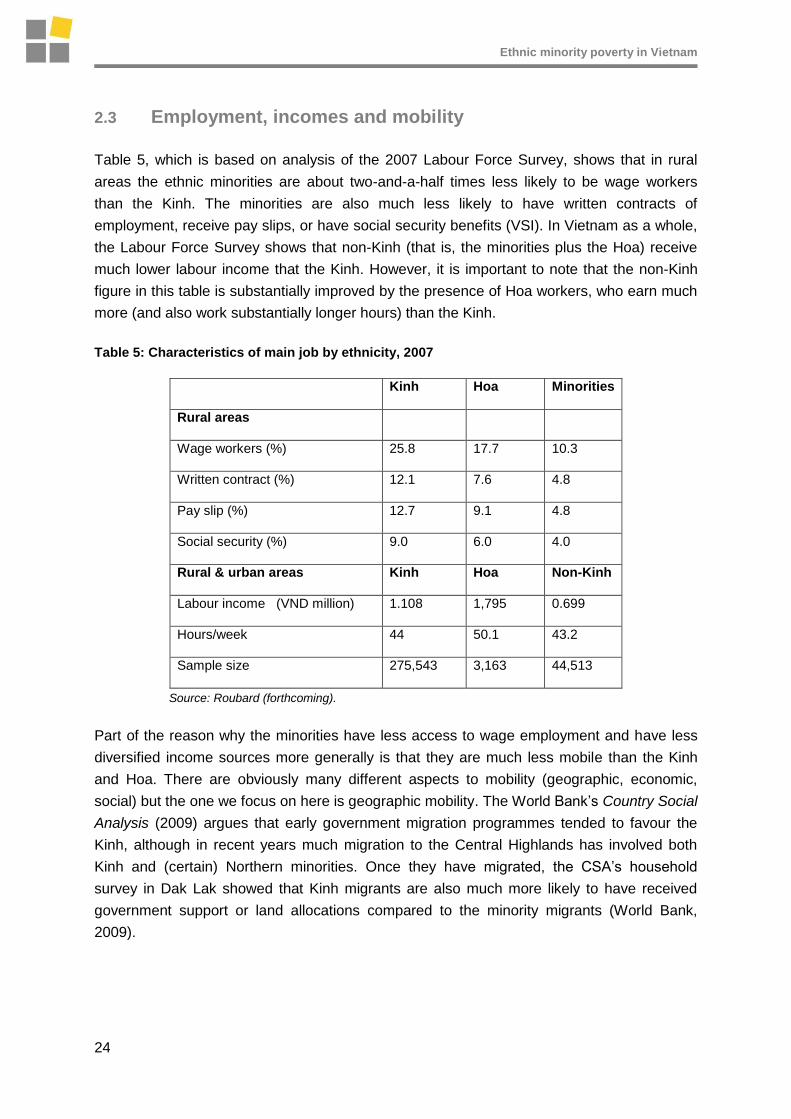
2.3 Employment, incomes and mobility
Table 5, which is based on analysis of the 2007 Labour Force Survey, shows that in rural
areas the ethnic minorities are about two-and-a-half times less likely to be wage workers
than the Kinh. The minorities are also much less likely to have written contracts of
employment, receive pay slips, or have social security benefits (VSI). In Vietnam as a whole,
the Labour Force Survey shows that non-Kinh (that is, the minorities plus the Hoa) receive
much lower labour income that the Kinh. However, it is important to note that the non-Kinh
figure in this table is substantially improved by the presence of Hoa workers, who earn much
more (and also work substantially longer hours) than the Kinh.
Table 5: Characteristics of main job by ethnicity, 2007
Kinh Hoa Minorities
Rural areas
Wage workers (%) 25.8 17.7 10.3
Written contract (%) 12.1 7.6 4.8
Pay slip (%) 12.7 9.1 4.8
Social security (%) 9.0 6.0 4.0
Rural & urban areas Kinh Hoa Non-Kinh
Labour income (VND million) 1.108 1,795 0.699
Hours/week 44 50.1 43.2
Sample size 275,543 3,163 44,513
Source: Roubard (forthcoming).
Part of the reason why the minorities have less access to wage employment and have less
diversified income sources more generally is that they are much less mobile than the Kinh
and Hoa. There are obviously many different aspects to mobility (geographic, economic,
social) but the one we focus on here is geographic mobility. The World Bank‟s Country Social
Analysis (2009) argues that early government migration programmes tended to favour the
Kinh, although in recent years much migration to the Central Highlands has involved both
Kinh and (certain) Northern minorities. Once they have migrated, the CSA‟s household
survey in Dak Lak showed that Kinh migrants are also much more likely to have received
government support or land allocations compared to the minority migrants (World Bank,
2009).
Ethnic minority poverty in Vietnam
25
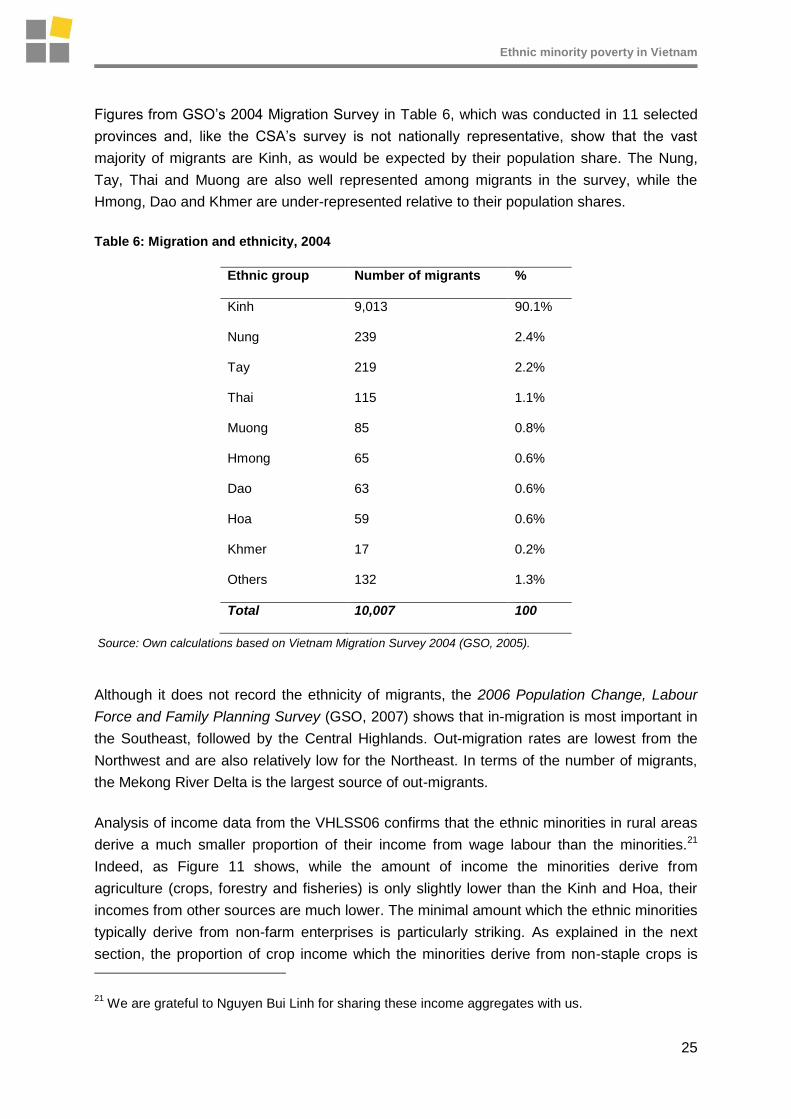
Figures from GSO‟s 2004 Migration Survey in Table 6, which was conducted in 11 selected
provinces and, like the CSA‟s survey is not nationally representative, show that the vast
majority of migrants are Kinh, as would be expected by their population share. The Nung,
Tay, Thai and Muong are also well represented among migrants in the survey, while the
Hmong, Dao and Khmer are under-represented relative to their population shares.
Table 6: Migration and ethnicity, 2004
Ethnic group Number of migrants %
Kinh 9,013 90.1%
Nung 239 2.4%
Tay 219 2.2%
Thai 115 1.1%
Muong 85 0.8%
Hmong 65 0.6%
Dao 63 0.6%
Hoa 59 0.6%
Khmer 17 0.2%
Others 132 1.3%
Total 10,007 100
Source: Own calculations based on Vietnam Migration Survey 2004 (GSO, 2005).
Although it does not record the ethnicity of migrants, the 2006 Population Change, Labour
Force and Family Planning Survey (GSO, 2007) shows that in-migration is most important in
the Southeast, followed by the Central Highlands. Out-migration rates are lowest from the
Northwest and are also relatively low for the Northeast. In terms of the number of migrants,
the Mekong River Delta is the largest source of out-migrants.
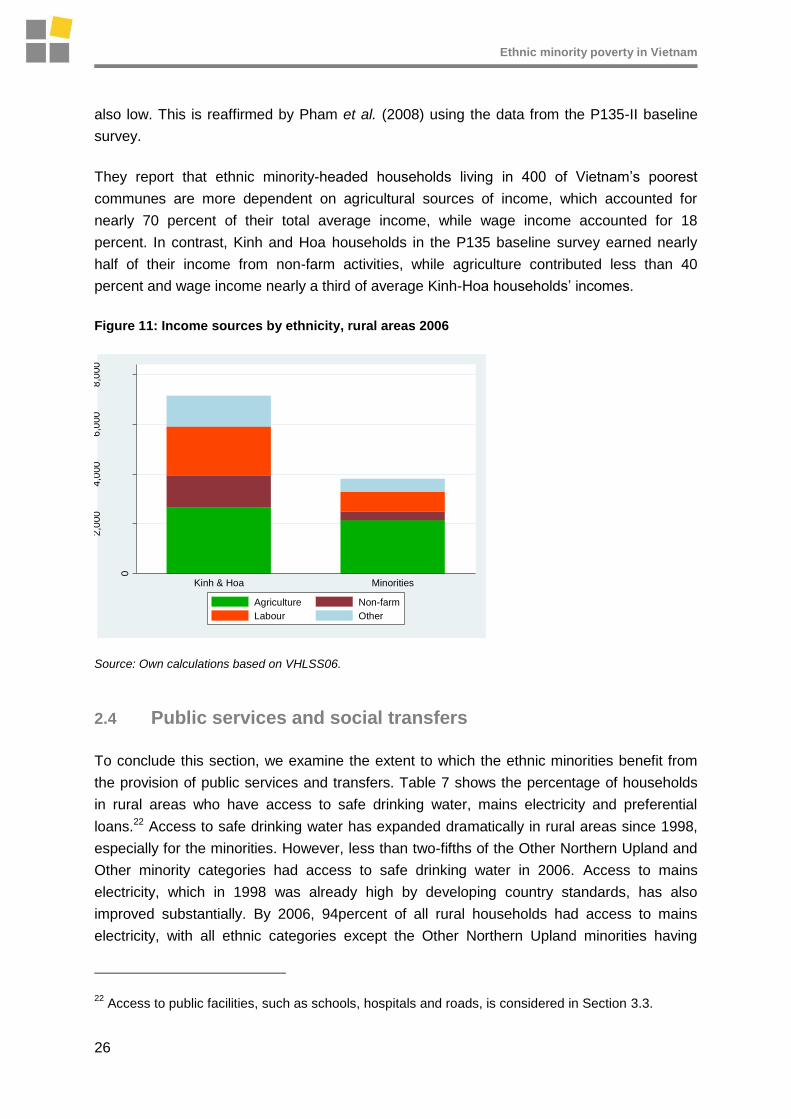
Analysis of income data from the VHLSS06 confirms that the ethnic minorities in rural areas
derive a much smaller proportion of their income from wage labour than the minorities.21
Indeed, as Figure 11 shows, while the amount of income the minorities derive from
agriculture (crops, forestry and fisheries) is only slightly lower than the Kinh and Hoa, their
incomes from other sources are much lower. The minimal amount which the ethnic minorities
typically derive from non-farm enterprises is particularly striking. As explained in the next
section, the proportion of crop income which the minorities derive from non-staple crops is
21 We are grateful to Nguyen Bui Linh for sharing these income aggregates with us.
Ethnic minority poverty in Vietnam
26
also low. This is reaffirmed by Pham et al. (2008) using the data from the P135-II baseline
survey.
They report that ethnic minority-headed households living in 400 of Vietnam‟s poorest
communes are more dependent on agricultural sources of income, which accounted for
nearly 70 percent of their total average income, while wage income accounted for 18
percent. In contrast, Kinh and Hoa households in the P135 baseline survey earned nearly
half of their income from non-farm activities, while agriculture contributed less than 40
percent and wage income nearly a third of average Kinh-Hoa households‟ incomes.
Figure 11: Income sources by ethnicity, rural areas 2006
0
2,0
00
4,0
00
6,0
00
8,0
00
VN
D 0
00s p
er
ca
pita
Kinh & Hoa Minorities
Agriculture Non-farm
Labour Other
Source: Own calculations based on VHLSS06.
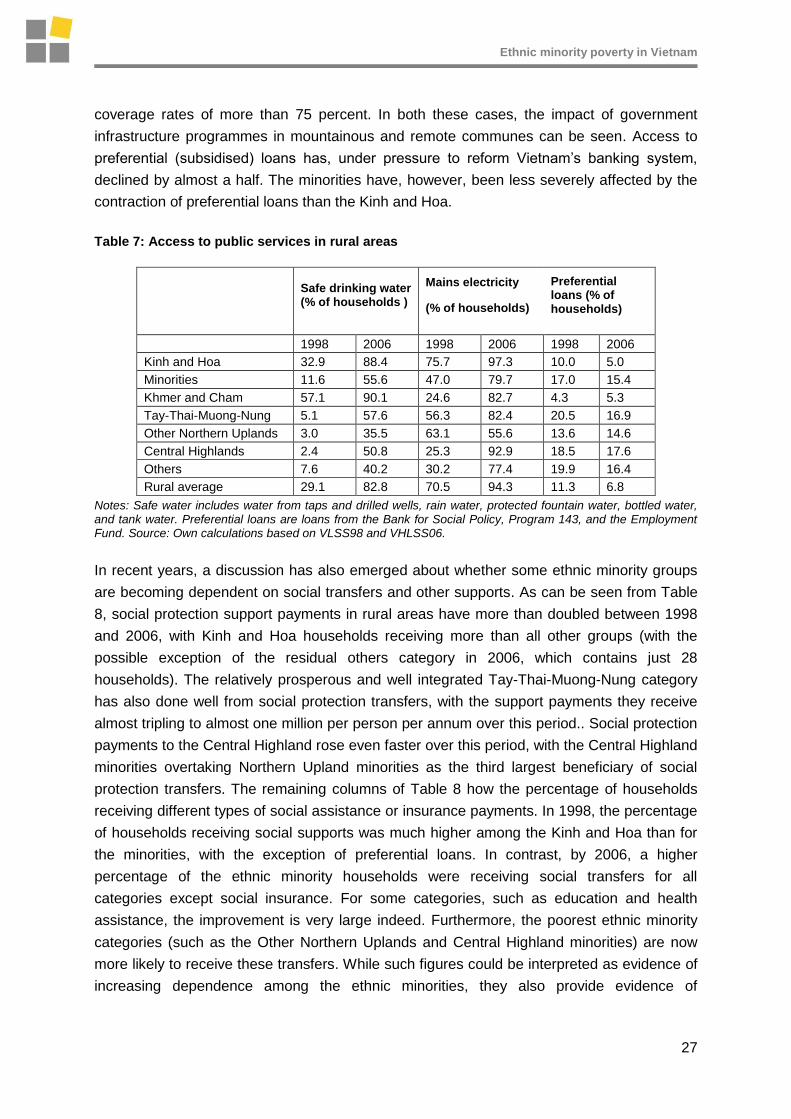
2.4 Public services and social transfers
To conclude this section, we examine the extent to which the ethnic minorities benefit from
the provision of public services and transfers. Table 7 shows the percentage of households
in rural areas who have access to safe drinking water, mains electricity and preferential
loans.22 Access to safe drinking water has expanded dramatically in rural areas since 1998,
especially for the minorities. However, less than two-fifths of the Other Northern Upland and
Other minority categories had access to safe drinking water in 2006. Access to mains
electricity, which in 1998 was already high by developing country standards, has also
improved substantially. By 2006, 94percent of all rural households had access to mains
electricity, with all ethnic categories except the Other Northern Upland minorities having
22 Access to public facilities, such as schools, hospitals and roads, is considered in Section 3.3.
Ethnic minority poverty in Vietnam
27
coverage rates of more than 75 percent. In both these cases, the impact of government
infrastructure programmes in mountainous and remote communes can be seen. Access to
preferential (subsidised) loans has, under pressure to reform Vietnam‟s banking system,
declined by almost a half. The minorities have, however, been less severely affected by the
contraction of preferential loans than the Kinh and Hoa.
Table 7: Access to public services in rural areas
Safe drinking water (% of households )
Mains electricity
(% of households)
Preferential loans (% of households)
1998 2006 1998 2006 1998 2006
Kinh and Hoa 32.9 88.4 75.7 97.3 10.0 5.0
Minorities 11.6 55.6 47.0 79.7 17.0 15.4
Khmer and Cham 57.1 90.1 24.6 82.7 4.3 5.3
Tay-Thai-Muong-Nung 5.1 57.6 56.3 82.4 20.5 16.9
Other Northern Uplands 3.0 35.5 63.1 55.6 13.6 14.6
Central Highlands 2.4 50.8 25.3 92.9 18.5 17.6
Others 7.6 40.2 30.2 77.4 19.9 16.4
Rural average 29.1 82.8 70.5 94.3 11.3 6.8
Notes: Safe water includes water from taps and drilled wells, rain water, protected fountain water, bottled water, and tank water. Preferential loans are loans from the Bank for Social Policy, Program 143, and the Employment Fund. Source: Own calculations based on VLSS98 and VHLSS06.
In recent years, a discussion has also emerged about whether some ethnic minority groups
are becoming dependent on social transfers and other supports. As can be seen from Table
8, social protection support payments in rural areas have more than doubled between 1998
and 2006, with Kinh and Hoa households receiving more than all other groups (with the
possible exception of the residual others category in 2006, which contains just 28
households). The relatively prosperous and well integrated Tay-Thai-Muong-Nung category
has also done well from social protection transfers, with the support payments they receive
almost tripling to almost one million per person per annum over this period.. Social protection
payments to the Central Highland rose even faster over this period, with the Central Highland
minorities overtaking Northern Upland minorities as the third largest beneficiary of social
protection transfers. The remaining columns of Table 8 how the percentage of households
receiving different types of social assistance or insurance payments. In 1998, the percentage
of households receiving social supports was much higher among the Kinh and Hoa than for
the minorities, with the exception of preferential loans. In contrast, by 2006, a higher
percentage of the ethnic minority households were receiving social transfers for all
categories except social insurance. For some categories, such as education and health
assistance, the improvement is very large indeed. Furthermore, the poorest ethnic minority
categories (such as the Other Northern Uplands and Central Highland minorities) are now
more likely to receive these transfers. While such figures could be interpreted as evidence of
increasing dependence among the ethnic minorities, they also provide evidence of

Ethnic minority poverty in Vietnam
28
improvements in the poverty targeting of social transfer payments to the poorest rural
groups.
Table 8: Percentage of households receiving social assistance payments
Social protection transfers (000s VNDs)
Health assistance
Social assistance (A)
Social insurance (B)
Social protection payments (A+B)
1998
Kinh and Hoa 485 18.3 10.6 9.8 18.8
Ethnic minorities 284 13.0 7.8 6.6 13.8
of which :
Khmer and Cham 20 3.7 2.5 0.2 2.7
Tay-Thai-Muong-Nung 396 14.8 5.8 10.6 15.6
Other Uplands 399 3.5 10.7 4.7 14.3
Central Highlands 98 21.0 9.5 2.8 11.8
Others 67 23.6 31.0 0.0 31.0
Rural average 449 17.3 10.1 9.2 17.9
2006
Kinh and Hoa 1,152 10.3 11.2 6.0 16.0
Ethnic minorities 804 31.5 15.4 3.8 18.5
of which
Khmer and Cham 272 24.3 4.8 0.0 4.8
Tay-Thai-Muong-Nung 995 25.0 11.3 5.7 16.3
Other Uplands 518 38.0 15.7 2.6 18.1
Central Highlands 542 46.1 29.2 1.2 29.6
Others 1,649 47.6 40.4 6.3 40.4
Rural average 1095 14.0 11.9 5.6 16.5
Source: Own calculations based on VLSS98 and VHLSS06.
Appendix 5 provides additional information on the percentage of beneficiary households‟ real
expenditures, which are accounted for by different categories of social transfer, of which
social insurance payments are clearly the most important. The value of social assistance
payments has, however, also increased more than three times between 1998 and 2006, with
Kinh-Hoa beneficiaries receiving slightly higher payments than minority beneficiaries (in both
absolute and percentage terms).
Having set out this picture of ethnic minority poverty, we now move to assessing how much
of the observed disparities in majority–minority living standards can be explained by
differences in their household and community characteristics, and how much by differences
in the returns they receive for these characteristics.
Ethnic minority poverty in Vietnam
29
3 Decomposing the ethnic gap, 1998–2006
Following the approach in the existing literature, we use per capita expenditure as the metric
to examine the gap in welfare between the majority and ethnic minorities in rural Vietnam
(see van de Walle and Gunewardena, 2001; Baulch et al., 2008). Our chosen measure is
defined as real household per capita expenditure computed on the basis of total household
food and non-food consumption over the past 12 months. We restrict our sample to rural
areas, both because this is where the vast majority of Vietnam‟s ethnic minorities live, and
because of well-known problems with the urban sampling frame for the 1998 and 2004
surveys (Pincus and Sender, 2006; VASS, 2007). Following van de Walle and
Gunewardena, (2001) and Baulch et al. (2008) we treat households headed by either Kinh or
Hoa as comprising the majority group, and households headed by the other 52 official
recognised ethnic groups as a broadly defined minority group.23 Note that it is
econometrically problematic to disaggregate the minorities further in a multiple regression
context, because of sample size issues. Approximately 14 percent of households were
headed by ethnic minorities in 1998, rising slightly to around 15 percent by 2006.
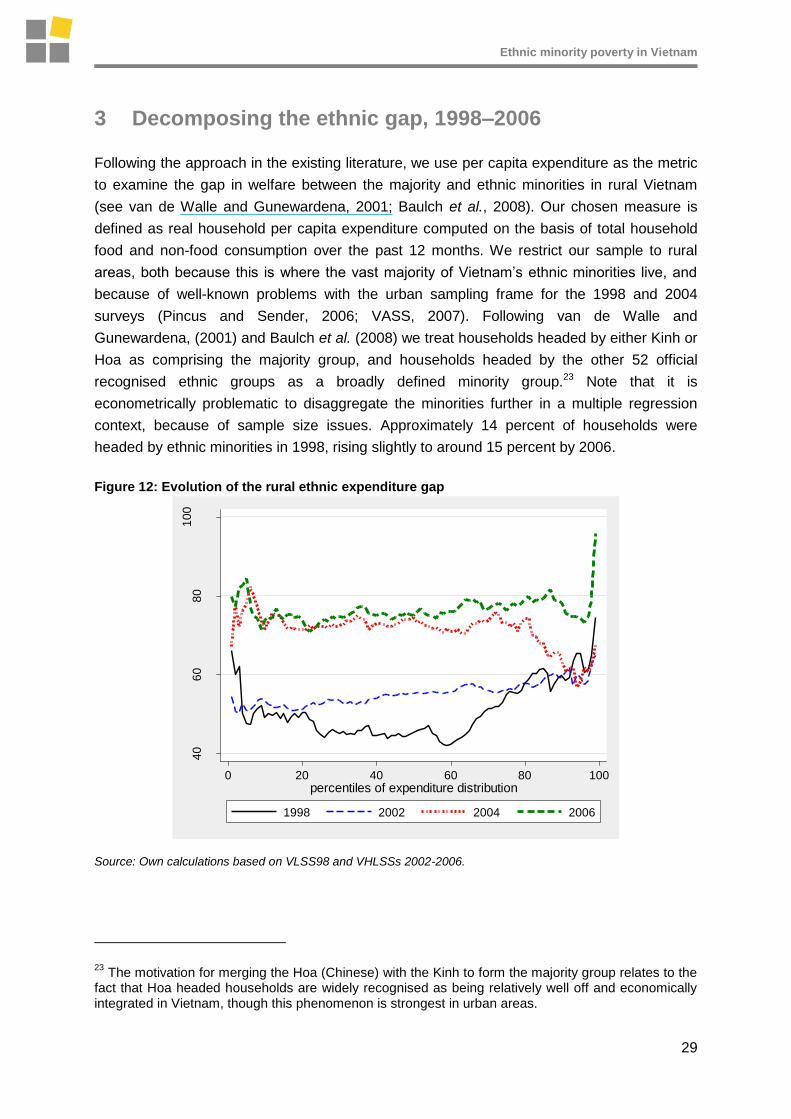
Figure 12: Evolution of the rural ethnic expenditure gap
40
60
80
10
0
% d
iffere
nce in p
c e
xpen
diture
s
0 20 40 60 80 100percentiles of expenditure distribution
1998 2002 2004 2006
Source: Own calculations based on VLSS98 and VHLSSs 2002-2006.
23 The motivation for merging the Hoa (Chinese) with the Kinh to form the majority group relates to the
fact that Hoa headed households are widely recognised as being relatively well off and economically integrated in Vietnam, though this phenomenon is strongest in urban areas.
Ethnic minority poverty in Vietnam
30
The welfare gap between the Kinh and Hoa and the ethnic minorites can be highlighted by
plotting the kernel densities for per capita household expenditure between 1993 and 2006 in
Section 2 (see Figure 2). The average per capita expenditures of Kinh-Hoa per household
was 51 percent higher than that of the minorities in 1998, and increased to 74 percent by
2006. The largest part of the increase occurred between 1998 and 2004. Figure 12 plots the
actual household expenditure gap between the Kinh-Hoa and the minority groups by
percentile ranking. It is evident that the gaps in household living standards have widened
considerably over time at almost all the non-extreme percentiles of the distribution and these
gaps exhibit a degree of stability across most of the expenditure distribution.
Given the growing gap in real per capita expenditure between the Kinh-Hoa and ethnic
minority groups, the subsequent sub-section describes the methodologies employed to
decompose that ethnic expenditure gap. The empirical results will be analysed in the third
sub-section, where a focus is placed on findings ways to explain the reasons underlying why
ethnic minorities tend to „receive‟ less from their endowments compared to their Kinh and
Hoa counterparts.
3.1 Empirical methodology
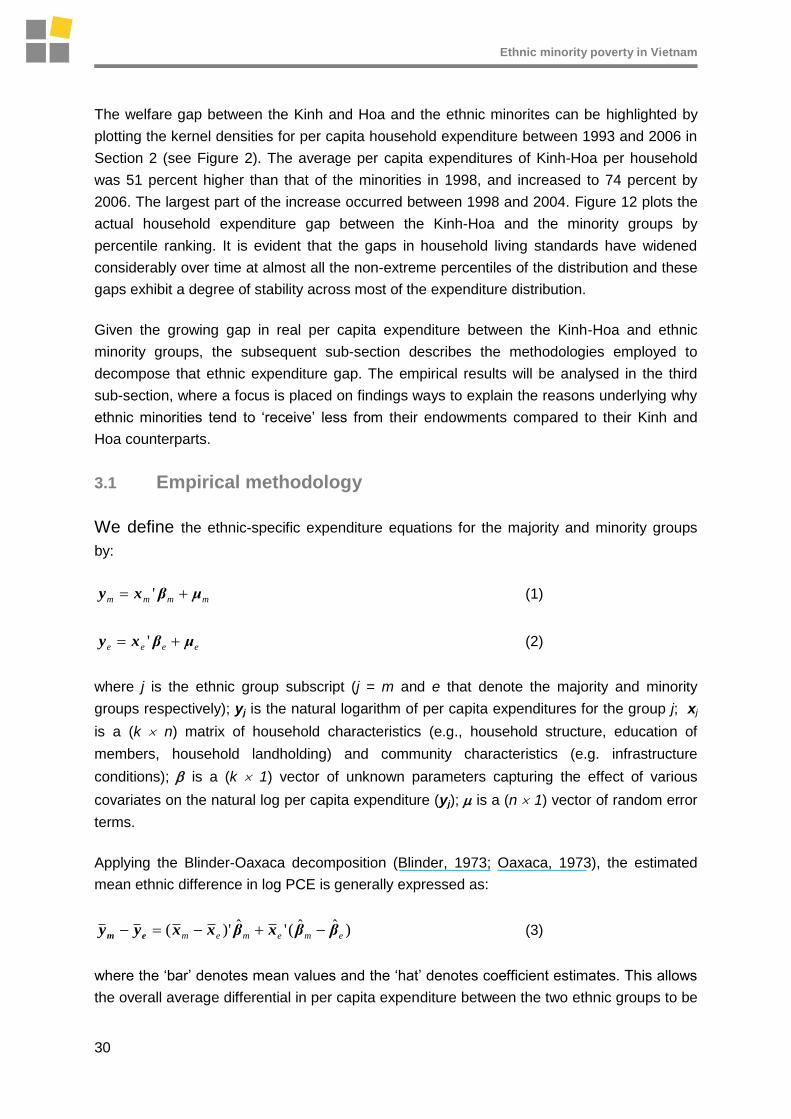
We define the ethnic-specific expenditure equations for the majority and minority groups
by:
mmmm μβxy ' (1)
eeee μβxy ' (2)
where j is the ethnic group subscript (j = m and e that denote the majority and minority
groups respectively); yj is the natural logarithm of per capita expenditures for the group j; xj
is a (k n) matrix of household characteristics (e.g., household structure, education of
members, household landholding) and community characteristics (e.g. infrastructure
conditions); is a (k 1) vector of unknown parameters capturing the effect of various
covariates on the natural log per capita expenditure (yj); is a (n 1) vector of random error
terms.
Applying the Blinder-Oaxaca decomposition (Blinder, 1973; Oaxaca, 1973), the estimated
mean ethnic difference in log PCE is generally expressed as:
)ˆˆ('ˆ)'( ememem ββxβxxyy em (3)
where the „bar‟ denotes mean values and the „hat‟ denotes coefficient estimates. This allows
the overall average differential in per capita expenditure between the two ethnic groups to be
Ethnic minority poverty in Vietnam
31
decomposed into a part attributable to differences in characteristics (also known as the
„explained‟ or „endowment‟ effect) and a part attributable to differences in the estimated
returns to characteristics between majority and minority workers (also known as the
„unexplained‟, „treatment‟ or „residual‟ effect). The second term in equation (3) is sometimes
taken to capture the effect of „unequal treatment‟ against ethnic minorities, although, as
explained in Section 3.3 below, this interpretation must be treated with caution.
This approach assumes that in the absence of „unequal treatment‟, the majority group‟s
coefficient structure prevails.24 Given that these components are (log) linear in the estimated
parameters, their sampling variances can be computed with ease. In addition, the overall
treatment and endowment components can be decomposed further into sets of
characteristics and coefficient differences, to identify the key factors driving the overall
components. In the current study, the variables are classified according to household
structure (e.g., household size, age structure composition of the household), household
education levels, landholding characteristics (e.g., household‟s access to different types of
lands), and commune characteristics (such as access to electricity, markets, post-offices,
post-offices, roads, schools and the geographic region the commune is located in).
Blinder-Oaxaca type decompositions are cast within a mean regression framework, which
provides an incomplete picture of the ethnic expenditure gap. So we also estimate a set of
conditional quantile regressions, which allows for a more detailed analysis of the relationship
between the conditional per capita expenditure distribution and selected covariates. It is well
known that, in contrast to the OLS approach, quantile regressions are less sensitive to
outliers or heteroskedasticity, and also provide a more robust estimator in the face of
departures from normality (Deaton, 1997; Koenker, 2005).
Using quantile regressions, log per capita household expenditure equations can be
estimated conditional on a given specification for various percentiles of the residuals (e.g.,
10th, 25th, 50th 75th or 90th) by minimising the sum of absolute deviations of the residuals
from the conditional specification (see Chamberlain (1994)). It should be stressed that the
precision of the parameter estimates in a quantile regression model is dependent on the
density of points at each quantile. Specifically, the quantile regression coefficients may be
more difficult to compute and the corresponding test statistics may have less statistical power
at quantiles located at the bottom or the top ends of the conditional distribution, where the
24 The minority coefficient structure could be also assumed to prevail in the absence of unequal
treatment. This can yield numerically different values for the component parts compared to expression [3] due to a conventional index-number problem.
Ethnic minority poverty in Vietnam
32
density of data points tend to be relatively thin. 25 Thus, coefficient for the minority groups at
the more extreme quantiles should be treated with due caution.
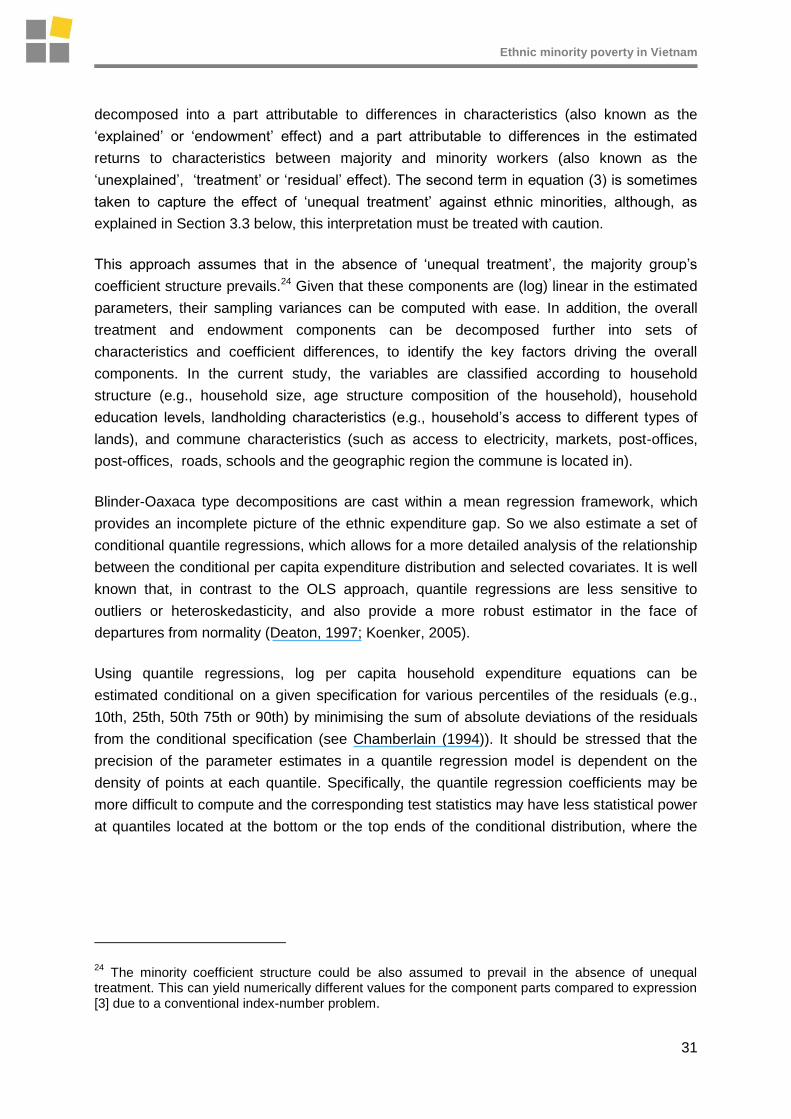
In the current case, the quantile regression for the majority and minority sub-samples can be
defined as:
mmmm μβxy ' (4)
eeee μβxy ' (5)
If Q () is taken to denote the conditional th quantile operator, then jjjjQ βxxw ')( ,
where jβ is the unknown parameter vector for the th quantile with representing the
selected quantile of interest (i.e., 0.1, 0.25, 0.5, 0.75 and 0.9 in the current application) ; j
denotes the error term, the distribution of which is left unspecified, but for which
0)( jjQ x is assumed; and j is the subscript for the ethnic groups (j = m, e).
From equations (4) and (5) the conditional th quantile of the distribution of PCE for the two
groups are then expressed as:
))((ˆ))'(()( mmmmmmmm QEQEQ yyβyyxy (6)
))((ˆ))'(()( eeeeeeee QEQEQ yyβyyxy (7)
where the „hats‟ now denote quantile regression estimates and E() is the expectations
operator. In the expressions (6) and (7), the characteristics are evaluated conditionally at the
unconditional quantile per capita expenditure value and not unconditionally as in the case of
the mean regression. The terms ))(( jjj QE ww are thus non-zero. From (6) and (7), the
gap in per capita expenditure between the majority and minority groups at the th quantile is
defined as and this can be decomposed into three parts:
25 Accordingly, the sampling variances for the quantile regression coefficients are obtained using a
bootstrapping procedure with 200 replications.
Ethnic minority poverty in Vietnam
33
RβΩβΩ ˆ'ˆ' em (8)
where )ˆˆ(ˆem βββ and em ΩΩΩ
with ))(( mmmm QE wwxΩ and ))(( eeee QE wwxΩ
and ))](())(([ eeemmm QEQE wwμwwμR
The first and second expressions on the right hand side of equation (8) are the quantile
analogues to the differences in characteristics and differences in returns components of the
conventional Blinder-Oaxaca decomposition.
Using mean characteristics in the computation of expressions [8] may provide
unrepresentative realisations for the characteristics at points other than the unconditional
mean to which they relate. Therefore, it is necessary to compute realisations of the
characteristics that more accurately reflect the relevant points on the conditional household
expenditure distribution. In order to address this issue, we use an approach originally
suggested by Machado and Mata (2005) to derive the realisations for the relevant
characteristics at different quantiles of the conditional household expenditure distribution.
The procedure involves drawing 100 observations at random and with replacement from
each of the majority and minority sub-samples. Each observation once ranked comprises a
percentile point on the log per capita household expenditure distribution. The full set of
characteristics for the observation at the th expenditure quantile is then retrieved. This
process is then replicated 500 times to obtain 500 observations at the selected th quantile.
The mean characteristics of these observations at each quantile are then used to construct
the realisations for θmΩ and θeΩ used in equation [8]. Finally, the sampling variances for the
constituent parts of [8] are computed in using the regression models‟ bootstrapped variance-
covariance matrices.
3.2 Empirical results
The mean and quantile regression estimates for the two ethnic groups, using both mean
regression and quantile regression approaches, are reported in Appendix 1.
The set of regressors covers household structure (household size, age structure composition
of the household), household education levels, landholding characteristics (households‟
access to different types of lands), and commune characteristics (such as access to
electricity, markets, post-offices, roads and schools, and the geographic region the commune
is located in). These estimates are not the subject of discussion here, to conserve space.
However, the estimates are generally signed in accordance with priors and have plausible
magnitudes. The „goodness-of-fit‟ measures are satisfactory by cross-sectional standards, for

Ethnic minority poverty in Vietnam
34
both mean and quantile regression, which is an important requirement, given the
decomposition analysis undertaken in this study.
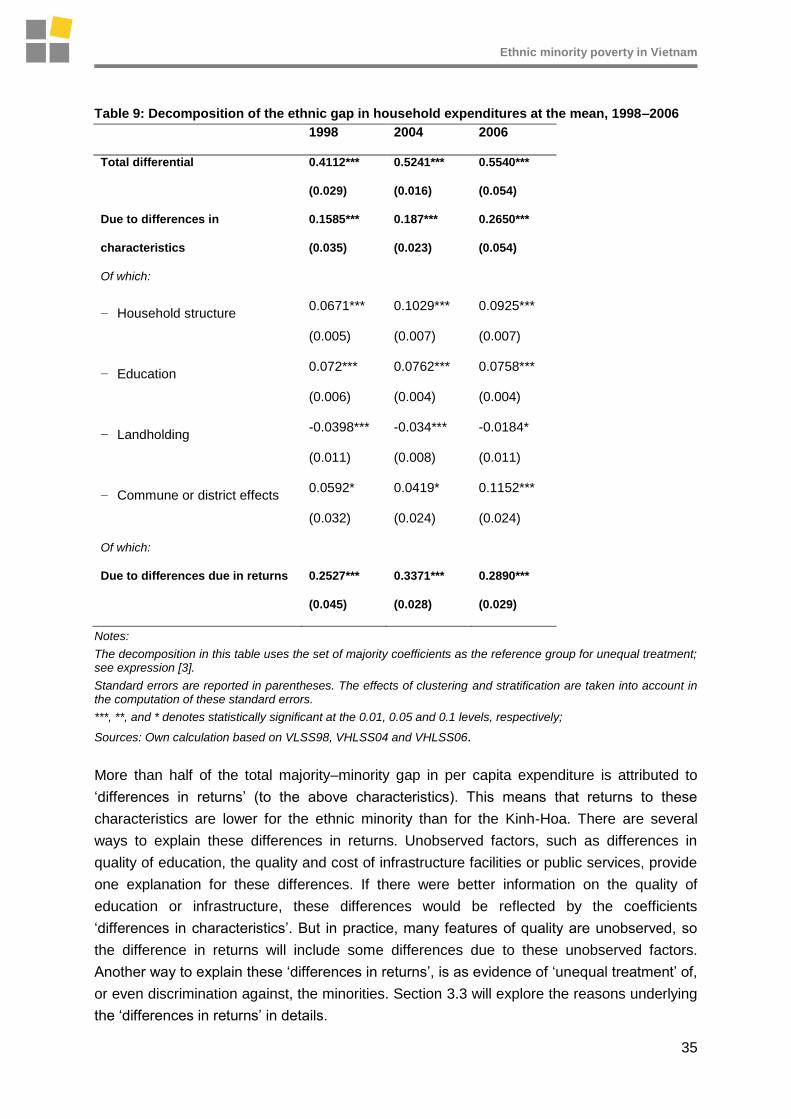
We now turn attention to the decomposition analysis contained in Table 9. The estimates
reported in this table use the Blinder-Oaxaca decomposition of equation [3], assuming the
majority coefficient structure prevails. The raw mean ethnic gap in per capita expenditures
has risen by 15.4 percent between 1998 and 2008, and this increase is statistically significant
(the absolute t-ratio corresponding to this point estimate is 2.3). Most of this increas occurred
between 1998 and 2004, during which time the ethnic gap increased by 12 percent (0.113
log points). This is in broad agreement with the findings for the existing literature on the
widening ethnic gap in Vietnam (see van de Walle and Gunewardena, 2001; Baulch et al.
2004; Hoang et al. 2007; Baulch et al., 2008).
Using the framework in [3] with the mean regression approach, such widening gap is
decomposed into „differences in characteristics‟ (i.e., household and community
characteristics) and „differences in returns‟ to those characteristics. As ethnic minorities are
not as well endowed with community, educational or physical assets as their majority
counterparts, their welfare status is lower than that of the majority. Our decomposition results
(Table 9) reveal that these „differences in characteristics‟ account for from one-third to almost
a half of the total ethnic gap. In an attempt to further decompose the „differences in
characteristics‟, we disaggregated this component into sub-groups. The differentials in
household demographic structure, education levels and commune characteristics account,
broadly in an equal share, for the overall endowment effect. However, different land-holdings
between the majority and minority groups are found to narrow the endowment differential.
The negative sign on the landholding terms in these mean decompositions probably reflects
the greater experience and knowledge that ethnic minority peoples have in farming upland
areas.26
Interestingly, the contribution of these differences in characteristics tends to increase over
time. The differences in characteristics between the majority and ethnic minority accounted
for 39 percent of the total ethnic gap in 1998, while these contributed up to 48 percent in
2006. This increase is statistically significant at ten percent level (i.e., t-ratio is 1.6537). So
our findings suggest that the endowment gap is high and accounts for an increasing part of
the majority–minority expenditure gap.
26 This is consistent with Engvall‟s (2006) findings for ethnic minorities in Lao PDR.
Ethnic minority poverty in Vietnam
35
Table 9: Decomposition of the ethnic gap in household expenditures at the mean, 1998–2006
1998 2004 2006
Total differential 0.4112*** 0.5241*** 0.5540***
(0.029) (0.016) (0.054)
Due to differences in 0.1585*** 0.187*** 0.2650***
characteristics (0.035) (0.023) (0.054)
Of which:
− Household structure 0.0671*** 0.1029*** 0.0925***
(0.005) (0.007) (0.007)
− Education 0.072*** 0.0762*** 0.0758***
(0.006) (0.004) (0.004)
− Landholding -0.0398*** -0.034*** -0.0184*
(0.011) (0.008) (0.011)
− Commune or district effects 0.0592* 0.0419* 0.1152***
(0.032) (0.024) (0.024)
Of which:
Due to differences due in returns 0.2527*** 0.3371*** 0.2890***
(0.045) (0.028) (0.029)
Notes:
The decomposition in this table uses the set of majority coefficients as the reference group for unequal treatment; see expression [3].
Standard errors are reported in parentheses. The effects of clustering and stratification are taken into account in the computation of these standard errors.
***, **, and * denotes statistically significant at the 0.01, 0.05 and 0.1 levels, respectively;
Sources: Own calculation based on VLSS98, VHLSS04 and VHLSS06.
More than half of the total majority–minority gap in per capita expenditure is attributed to
„differences in returns‟ (to the above characteristics). This means that returns to these
characteristics are lower for the ethnic minority than for the Kinh-Hoa. There are several
ways to explain these differences in returns. Unobserved factors, such as differences in
quality of education, the quality and cost of infrastructure facilities or public services, provide
one explanation for these differences. If there were better information on the quality of
education or infrastructure, these differences would be reflected by the coefficients
„differences in characteristics‟. But in practice, many features of quality are unobserved, so
the difference in returns will include some differences due to these unobserved factors.
Another way to explain these „differences in returns‟, is as evidence of „unequal treatment‟ of,
or even discrimination against, the minorities. Section 3.3 will explore the reasons underlying
the „differences in returns‟ in details.
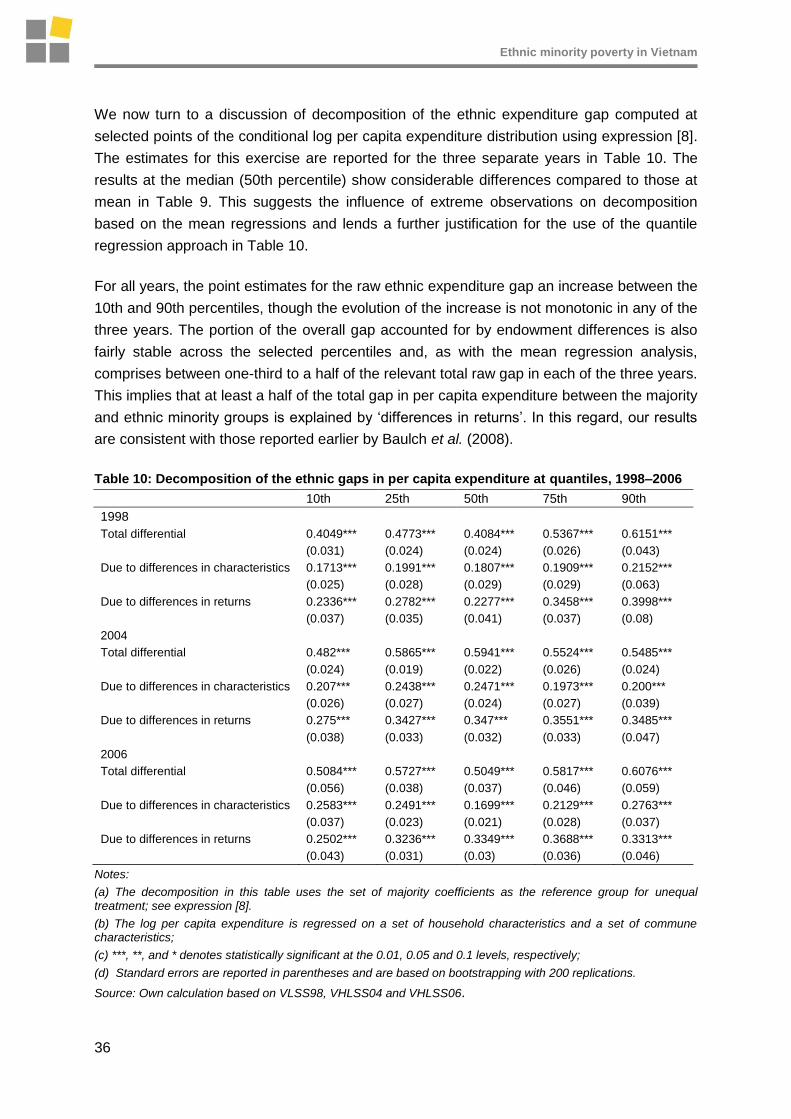
Ethnic minority poverty in Vietnam
36
We now turn to a discussion of decomposition of the ethnic expenditure gap computed at
selected points of the conditional log per capita expenditure distribution using expression [8].
The estimates for this exercise are reported for the three separate years in Table 10. The
results at the median (50th percentile) show considerable differences compared to those at
mean in Table 9. This suggests the influence of extreme observations on decomposition
based on the mean regressions and lends a further justification for the use of the quantile
regression approach in Table 10.
For all years, the point estimates for the raw ethnic expenditure gap an increase between the
10th and 90th percentiles, though the evolution of the increase is not monotonic in any of the
three years. The portion of the overall gap accounted for by endowment differences is also
fairly stable across the selected percentiles and, as with the mean regression analysis,
comprises between one-third to a half of the relevant total raw gap in each of the three years.
This implies that at least a half of the total gap in per capita expenditure between the majority
and ethnic minority groups is explained by „differences in returns‟. In this regard, our results
are consistent with those reported earlier by Baulch et al. (2008).
Table 10: Decomposition of the ethnic gaps in per capita expenditure at quantiles, 1998–2006
10th 25th 50th 75th 90th
1998
Total differential 0.4049*** 0.4773*** 0.4084*** 0.5367*** 0.6151***
(0.031) (0.024) (0.024) (0.026) (0.043)
Due to differences in characteristics 0.1713*** 0.1991*** 0.1807*** 0.1909*** 0.2152***
(0.025) (0.028) (0.029) (0.029) (0.063)
Due to differences in returns 0.2336*** 0.2782*** 0.2277*** 0.3458*** 0.3998***
(0.037) (0.035) (0.041) (0.037) (0.08)
2004
Total differential 0.482*** 0.5865*** 0.5941*** 0.5524*** 0.5485***
(0.024) (0.019) (0.022) (0.026) (0.024)
Due to differences in characteristics 0.207*** 0.2438*** 0.2471*** 0.1973*** 0.200***
(0.026) (0.027) (0.024) (0.027) (0.039)
Due to differences in returns 0.275*** 0.3427*** 0.347*** 0.3551*** 0.3485***
(0.038) (0.033) (0.032) (0.033) (0.047)
2006
Total differential 0.5084*** 0.5727*** 0.5049*** 0.5817*** 0.6076***
(0.056) (0.038) (0.037) (0.046) (0.059)
Due to differences in characteristics 0.2583*** 0.2491*** 0.1699*** 0.2129*** 0.2763***
(0.037) (0.023) (0.021) (0.028) (0.037)
Due to differences in returns 0.2502*** 0.3236*** 0.3349*** 0.3688*** 0.3313***
(0.043) (0.031) (0.03) (0.036) (0.046)
Notes:
(a) The decomposition in this table uses the set of majority coefficients as the reference group for unequal treatment; see expression [8].
(b) The log per capita expenditure is regressed on a set of household characteristics and a set of commune characteristics;
(c) ***, **, and * denotes statistically significant at the 0.01, 0.05 and 0.1 levels, respectively;
(d) Standard errors are reported in parentheses and are based on bootstrapping with 200 replications.
Source: Own calculation based on VLSS98, VHLSS04 and VHLSS06.
Ethnic minority poverty in Vietnam
37
Given the significance of „differences in returns‟ in explaining the gap between the majority
and the broadly defined ethnic minority group, there has been a lack of understanding in the
current literature on the reasons underlying these differences. Previous studies (as above)
have attributed this „differences in returns‟ component to either unobserved factors or
unequal treatment of (i.e, discrimination against) the ethnic minorities in Vietnam. However,
the evidence for this remains inconclusive. In order to shed light on such „differences in
returns‟, this paper will use other data sources to examine the drivers of returns in a more
explicit, and hopefully more satisfactory, manner.
3.3 Drivers of differences in returns
As discussed in Section 3.2, Oaxaca-Blinder decomposition results show that at least a half
of the majority–minority gap in per capita expenditure can be attributed to differences in
returns characteristics. This result needs to be interpreted with some caution because the
difference in returns component of the decomposition includes not only the coefficients of the
explanatory variables themselves but also the intercepts, which capture unobserved factors.
Candidates for these unobservable factors are very broad, ranging from the quality of
endowments, such as land, education and infrastructure, to more subtle factors, such as
language, customs and practices, and even governance. Ideally, it would be best to carry out
quantitative and qualitative analysis simultaneously in all the VHLSS sites, but it is too hard
and costly to do so on a large scale. Therefore, our explanation of the „differences in returns‟
underlying the ethnic gap is based on the combination of results from both household data
analysis and a host of participatory poverty assessments (PPAs) and anthropological
research on ethnic issues in Vietnam, summarised in the World Bank (2009) and VASS
(2009). In addition, the Baseline Survey of Programme 135 Phase 2 (P135-II) that was
implemented in 400 of the poorest communes will also be used in places.
3.3.1 Language and cultural issues
When seeking an explanation on what drives the above „differences in returns‟, one obvious
possibility is the ability of ethnic minorities to speak the Vietnamese language. Inability to
speak Vietnamese, and some traditional cultural practices, are emphasised as obstacles that
prevent ethnic minorities from being better integrated into the economy and taking advantage
of the new opportunities provided by the Doi moi in numerous qualitative studies. For
example, VASS (2009) found that language constraints underlay the difficulties experienced
by ethnic people in accessing services and information. According to the World Bank (2009),
ethnic women were often reported as being reluctant to use free services due to language
and cultural barriers.
Language, however, is not the only barrier preventing the ethnic minorities from benefiting
from mainstream economic development – there are also other socio-cultural factors. As
discussed in World Bank (2009), these may include factors such as:

Ethnic minority poverty in Vietnam
38
community levelling mechanisms that create social pressure against excess economic
accumulation and cultural perceptions of social obligations and „shared poverty‟; religious
obligations that require economic expenditures; gender expectation grounded in different
cultural models; and community ownership of land and assets.
Minorities are also reported as not being able to carry out as many economic transactions
as the Kinh, such as charging interest on loans and selling things to neighbours and kin.
These are regarded as against the minorities‟ social norms.
In attempt to capture partially the impact of ability to speak Vietnamese and some cultural
factors on the welfare status of ethnic minorities, we estimated a simple regression in which
the per capita expenditures of ethnic minority-headed households were regressed on the set
of the explanatory variables as used in the equation [3], augmented by matrilineal practice,
religion and Vietnamese language ability.27 The results show that ability to speak Vietnamese
is an important determinant of welfare for ethnic minority households. For instance in 1998,
coming from an ethnic minority-headed household whose head was unable to speak
Vietnamese language decreases real per capita expenditures by nearly ten percent. The
association of Vietnamese language ability and expenditures is similar in 2004 and 2006.
Ceteris paribus, a head‟s inability to speak Vietnamese is associated with a ten to 12
percentage point reduction in the level of per capita expenditure for ethnic minority-headed
households.28 This finding is consistent with empirical results in the literature. For instance,
Grafton et al. (2007) show that linguistic barriers to communications reduce productivity and
capital accumulation.
3.3.2 Returns to land and land quality
Ethnic minorities possess more land than the Kinh and Hoa, and their land holdings have
tended to increase over time. However, the ethnic groups‟ land bundle consists mostly of
forest land and low quality, unirrigated annual crop land, while the Kinh-Hoa have much more
water surface land and their crop land is usually irrigated and of higher quality (see Table
11). In 2004 and 2006, while more than 80 percent of the annual cropland of the Kinh and
Hoa was irrigated, only 44 percent of ethnic minority land was irrigated. At the start of the
land reform in 1993, the average ethnic minority-headed household possessed 63 percent
more land (of all types) compared to that of the Kinh-Hoa headed household. After 14 years,
this advantage increased to 154 percent. This advantage is most pronounced for forestry
land. On average, ethnic minority-headed households possess ten times more forestry land
than majority-headed households.
27 These variables are only collected in some rounds of the VLSSs and VHLSSs, and so could not
have been included as explanatory variables in the mean and quantile regressions underlying their decomposition analysis.
28 Note that these regression results did not find any evidence that matrilineal practices or religion are
statistically significant determinants of the per capita expenditures of the ethnic minorities.
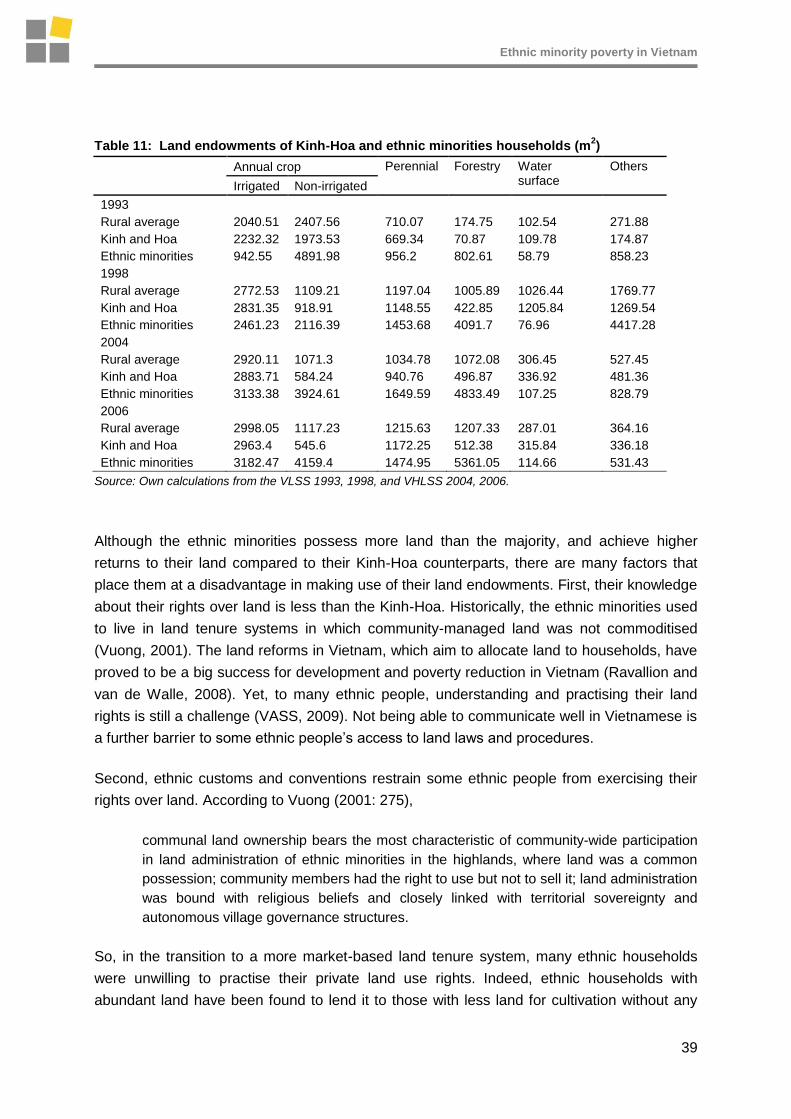
Ethnic minority poverty in Vietnam
39
Table 11: Land endowments of Kinh-Hoa and ethnic minorities households (m2)
Annual crop Perennial Forestry Water surface
Others
Irrigated Non-irrigated
1993
Rural average 2040.51 2407.56 710.07 174.75 102.54 271.88
Kinh and Hoa 2232.32 1973.53 669.34 70.87 109.78 174.87
Ethnic minorities 942.55 4891.98 956.2 802.61 58.79 858.23
1998
Rural average 2772.53 1109.21 1197.04 1005.89 1026.44 1769.77
Kinh and Hoa 2831.35 918.91 1148.55 422.85 1205.84 1269.54
Ethnic minorities 2461.23 2116.39 1453.68 4091.7 76.96 4417.28
2004
Rural average 2920.11 1071.3 1034.78 1072.08 306.45 527.45
Kinh and Hoa 2883.71 584.24 940.76 496.87 336.92 481.36
Ethnic minorities 3133.38 3924.61 1649.59 4833.49 107.25 828.79
2006
Rural average 2998.05 1117.23 1215.63 1207.33 287.01 364.16
Kinh and Hoa 2963.4 545.6 1172.25 512.38 315.84 336.18
Ethnic minorities 3182.47 4159.4 1474.95 5361.05 114.66 531.43
Source: Own calculations from the VLSS 1993, 1998, and VHLSS 2004, 2006.
Although the ethnic minorities possess more land than the majority, and achieve higher
returns to their land compared to their Kinh-Hoa counterparts, there are many factors that
place them at a disadvantage in making use of their land endowments. First, their knowledge
about their rights over land is less than the Kinh-Hoa. Historically, the ethnic minorities used
to live in land tenure systems in which community-managed land was not commoditised
(Vuong, 2001). The land reforms in Vietnam, which aim to allocate land to households, have
proved to be a big success for development and poverty reduction in Vietnam (Ravallion and
van de Walle, 2008). Yet, to many ethnic people, understanding and practising their land
rights is still a challenge (VASS, 2009). Not being able to communicate well in Vietnamese is
a further barrier to some ethnic people‟s access to land laws and procedures.
Second, ethnic customs and conventions restrain some ethnic people from exercising their
rights over land. According to Vuong (2001: 275),
communal land ownership bears the most characteristic of community-wide participation
in land administration of ethnic minorities in the highlands, where land was a common
possession; community members had the right to use but not to sell it; land administration
was bound with religious beliefs and closely linked with territorial sovereignty and
autonomous village governance structures.
So, in the transition to a more market-based land tenure system, many ethnic households
were unwilling to practise their private land use rights. Indeed, ethnic households with
abundant land have been found to lend it to those with less land for cultivation without any
Ethnic minority poverty in Vietnam
40
charge (VASS, 2009). Much less forestry land has also been allocated (to predominantly
ethnic minority households) than is the case with paddy land. Using data from the National
Land Database, Brandt et al. (2006) find that 95 percent of paddy land had been allocated to
households in 2003, compared to just under 25 percent of forestry land.29 More recent figure
from the Ministry of Agriculture and Rural Development suggests that only 19.1 percent of all
forest land was allocated to households in 2007. Not being able to secure or use their land
use rights well has prevented the minorities from using land as collateral, thereby being able
to seize opportunities to move out of the agriculture sector or to enhance their productivity
and efficiency in the agricultural sector.
In spite of higher returns to land which ethnic minority groups achieve in absolute terms,30
the ethnic minorities live in places where farm productivity and efficiency is generally lower.
At the same time, the agricultural extension services provided to the ethnic minorities are
often not appropriate, as they are based on wet rice cultivation techniques suitable for the
lowlands (Jamieson et al., 1998, Oxfam and Action Aid, 2008; World Bank, 2009). Rice
varieties which are more appropriate to the soil conditions in the mountains are often too
expensive (VASS, 2009). These call for efficiency-oriented planning and local context-based
support from the government.
Thus, given better land quality, the Kinh and Hoa have generally been more successful in
translating their land assets into higher returns under Vietnam‟s new market economy. The
Kinh-Hoa have diversified more within the agricultural sector, relying more on industrial and
perennial crops and less on low-value staple crops, and have often supplemented their farm
income with trading or services. The ethnic minorities, on the other hand, tend to be locked in
staple and traditional agriculture (World Bank, 2009). Pham et al. (2008), using data from the
P135-II Baseline Survey, reported that both the Kinh and Hoa-headed and the minority-
headed households in P135-II communes allocated about 54 percent of their land
endowments for paddy production. Minority-headed households then used most of the
remaining agricultural land for low-productivity food crops, while the Kinh and Hoa-headed
households allocated their remaining land to industrial crops. So, while food crop were the
most important source of agricultural income for the ethnic minorities after rice, the Kinh and
Hoa households relied on industrial crops to supplement their incomes from rice production.
29 Some 35 percent of the remainder was owned by economic organisations (such as State Forest
Enterprises) and another 24% percent by others (which includes the military).
30 These higher absolute returns may be explained by the fact that the minorites have little choice but
to work hard on their land (van de Walle and Gunewardena, 2001:198).
Ethnic minority poverty in Vietnam
41
3.3.3 Education quality and the returns to education
Quality of education could be an important unobserved factor underlying the aggregate
component of „differences in returns‟ reported above. As noted in Section 2, however, data
on education quality is rarely available. Furthermore, when assessing the returns to
education, it is past rather than current educational quality that is important. Our estimates on
the determinants of per capita expenditures show that, after controlling for other household
and community characteristics, the returns to education of both the majority and minority
groups are positive. Furthermore, they favour the Kinh/Hoa group at all schooling levels with
the exception of primary (see Appendix 1).31 These results are similar to those of Baulch et
al. (2008), who regressed per capita expenditure on a set of explanatory variables, including
the educational attainment of the most educated household members for the Kinh-Hoa and
the minority groups for the period 1993–2004. Their results also show that returns to
education are higher for the Kinh-Hoa households than the ethnic minority-headed
households in most cases. The same results are also observed in van de Walle and
Gunewardena (2001) for 1993 and Nguyen et al. (2009) for 2002, 2004 and 2006. This
suggests that a generalised policy of education expansion will not be enough to close the
ethnic education gap.
Regarding wage returns to education, the previous literature notes that education is an
important factor of the wage determination process in Vietnam (Pham and Reilly, 2009). It is
likely that education is more important to wage and salary employees in rural areas than
those who are self employed (either in agriculture or in the rural non-farm sector). However,
as highlighted in Section 2, the ethnic minorities are much less likely to be employed as
wage workers and are generally less mobile than the Kinh-Hoa. Furthermore, not only is
access to wage income limited for ethnic minorities, but the few ethnic minority workers who
are wage employees are subject to lower returns than the Kinh-Hoa counterparts with the
same characteristics. Pham and Reilly (2009) examined the ethnic way gap using the data
from the VHLSS 2002. After controlling for education, experience and other relevant
characteristics, they report that majority workers earn nearly 11 percent more on average
than their minority counterparts. Around two-thirds of this earnings differential is attributed to
„differences in returns‟. So the returns to educations are lower for ethnic minority than for
Kinh-Hoa wage workers.
31 Note that these, and most other studies‟, estimates of returns to education by ethnicity are very
sensitive to commune effects and show a strong correlation between education, location and labour market conditions.
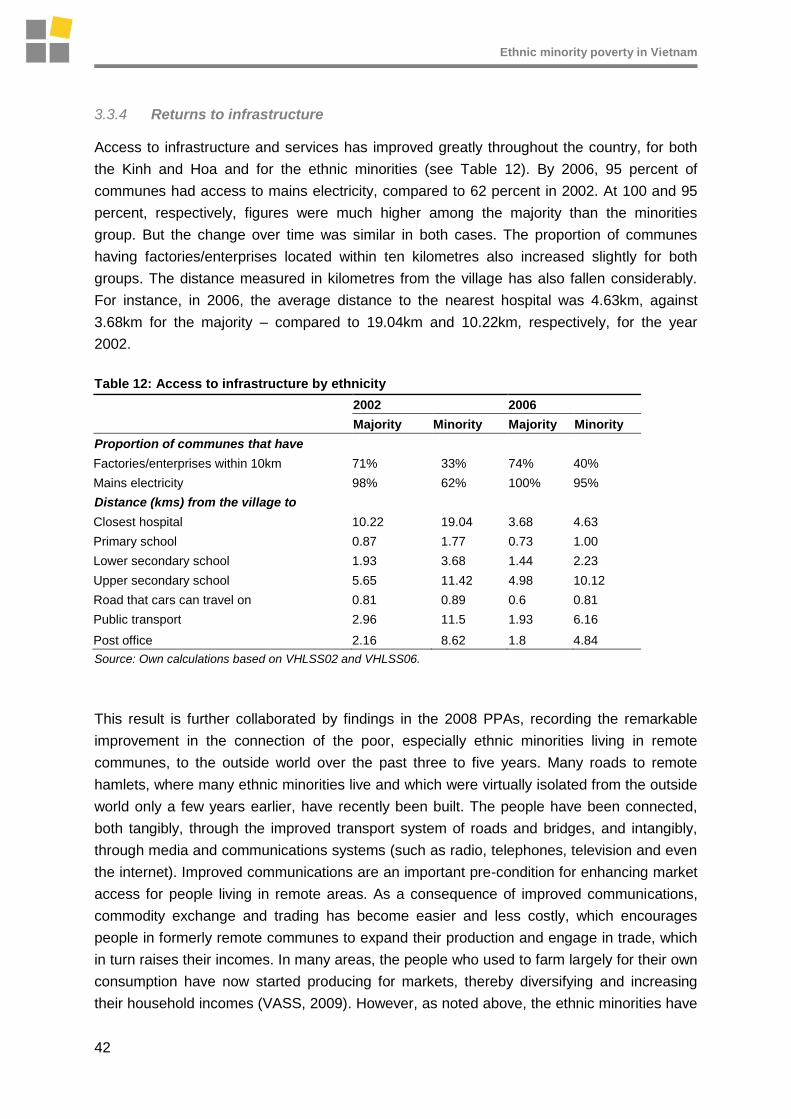
Ethnic minority poverty in Vietnam
42
3.3.4 Returns to infrastructure
Access to infrastructure and services has improved greatly throughout the country, for both
the Kinh and Hoa and for the ethnic minorities (see Table 12). By 2006, 95 percent of
communes had access to mains electricity, compared to 62 percent in 2002. At 100 and 95
percent, respectively, figures were much higher among the majority than the minorities
group. But the change over time was similar in both cases. The proportion of communes
having factories/enterprises located within ten kilometres also increased slightly for both
groups. The distance measured in kilometres from the village has also fallen considerably.
For instance, in 2006, the average distance to the nearest hospital was 4.63km, against
3.68km for the majority – compared to 19.04km and 10.22km, respectively, for the year
2002.
Table 12: Access to infrastructure by ethnicity
2002 2006
Majority Minority Majority Minority
Proportion of communes that have
Factories/enterprises within 10km 71% 33% 74% 40%
Mains electricity 98% 62% 100% 95%
Distance (kms) from the village to
Closest hospital 10.22 19.04 3.68 4.63
Primary school 0.87 1.77 0.73 1.00
Lower secondary school 1.93 3.68 1.44 2.23
Upper secondary school 5.65 11.42 4.98 10.12
Road that cars can travel on 0.81 0.89 0.6 0.81
Public transport 2.96 11.5 1.93 6.16
Post office 2.16 8.62 1.8 4.84
Source: Own calculations based on VHLSS02 and VHLSS06.
This result is further collaborated by findings in the 2008 PPAs, recording the remarkable
improvement in the connection of the poor, especially ethnic minorities living in remote
communes, to the outside world over the past three to five years. Many roads to remote
hamlets, where many ethnic minorities live and which were virtually isolated from the outside
world only a few years earlier, have recently been built. The people have been connected,
both tangibly, through the improved transport system of roads and bridges, and intangibly,
through media and communications systems (such as radio, telephones, television and even
the internet). Improved communications are an important pre-condition for enhancing market
access for people living in remote areas. As a consequence of improved communications,
commodity exchange and trading has become easier and less costly, which encourages
people in formerly remote communes to expand their production and engage in trade, which
in turn raises their incomes. In many areas, the people who used to farm largely for their own
consumption have now started producing for markets, thereby diversifying and increasing
their household incomes (VASS, 2009). However, as noted above, the ethnic minorities have
Ethnic minority poverty in Vietnam
43
tended to focus on lower value staple crops (though some of these, such as maize, are
becoming increasing marketised).
Investment in infrastructure does, however, also generate inequalities among some local
groups according to the recent PPA results. For instance, most mountainous fields in the
research sites of Thuan Hoa, Phan Dien and Binh An cannot be connected to irrigation
sources as a consequence of their high elevation. This leads to increasing inequalities
among ethnic groups, as most Kinh households farm lower fields, while ethnic minority
households farm upland fields. Demand for irrigation works on mountainous fields, which are
vital to local farmers, has barely been met (VASS, 2009). Furthermore, the new government
policy (Decree No. 154/2007/ND-CP, issued 22 October 2007) of providing free irrigation
also contributes to widening the ethnic gap, as this policy works mainly to the advantage of
the Kinh farmers, who tend to live and engage in irrigated farming in the deltas.
3.3.5 Misconceptions and stereotyping of ethnic minorities
A final source of the „differences in returns‟ is very difficult to measure quantitatively and is a
sensitive issue in policy debates in Vietnam. It is quite common for some Kinh people to have
„negative stereotypes‟ of the minorities, and these stereotypes might serve to disempower or
deprive the minorities of their economic and other rights. Our own observations (based on
considerable experience working in the areas of ethnic minority development) suggest that
ethnic minorities are frequently considered as less developed, and at times less „civilised‟ or
more „backward‟, than the Kinh. For several reasons, ethnic minorities have long been
considered different from Kinh, and the attention paid to poverty reduction in upland areas by
the government and international donors has served to reinforce the longstanding perception
that minorities are economically backward and should be assisted to „catch up‟ with the Kinh
(World Bank, 2009). Given these negative stereotypes, there has been a general tendency to
assume that ethnic minority development should involve interventions to eliminate
„backwardness‟ and/or promote assimilation with the Kinh majority. Some ethnic minority
development programmes and policies in Vietnam have included campaigns that try to
change the „cultures‟ of minority areas, including eradicating religion, primitive beliefs,
superstitions taboos and wasteful social ceremonies. Such interventions are intended to
move the ethnic minorities up the „civilisational ladder‟ and to facililate their „catching-up‟ with
the Kinh majority or even promote „Kinh-isation‟ (McElwee, 2004). This reflects the
widespread notion in many Southeast Asian countries that their majority populations should
be considered as superior to ethnic minorities (Duncan, 2004).
It is not clear, however, how such misconceptions and negative stereotyping have actually
prevented ethnic minorities from taking advantage of opportunities brought by doi moi, in the
same way as the Kinh-Hoa majority. Vietnam has laws which prevent discrimination, while
Article 5 of the Constitution states that all people, regardless of their ethnic origins, are
considered equal under law. In addition, there are no cultural codes deeply embedded in
society regarding peoples‟ „status‟ and „place‟, as might be the case in societies in which

Ethnic minority poverty in Vietnam
44
caste is an issue (such as India). These are among the most important grounds cited by
those who believe that discrimination does not exist. However, we argue that the existence of
the above stereotyping and misconceptions does represent in one way or the other some
harmful impacts on (or even implicit discrimination against) ethnic minorities. For instance, as
the „backwardness‟ of ethnic minorities is widely recognised, it could effectively decrease the
participation of ethnic minorities in society. More seriously, it may also cause disinclination of
authorities to listen and thus respond to ethnic minorities, as they are considered as less
„civilised‟ or having „inferior intellectual capacity‟.
A recent survey by the Institute of Ethnic Minority Affairs, described by the Country Social
Assessment (CSA) of the World Bank (2009) provides evidence of a number of instances of
negative stereotyping of the ethnic minorities. For instance, the belief that the minorities have
less intellectual capacity can result in investment in Kinh development to „show minorities
how to develop‟, as was the case with migration programs in Quang Tri, rather than directly
investing in minority communities themselves. Another example from the CSA where
stereotyping occurred was found in the credit system in Dak Lak. There, the Ede reported
that the staff of large commercial banks would state (either explicitly or implicitly) that
minorities did not have sufficient creditworthiness to obtain large loans, and would therefore
direct Ede to the Social Policy Bank. The belief of bankers that minorities could not handle
larger loans, or the belief among Ede that they would not receive such loans even if they
asked, accounts for the fact that many Ede have never taken out a large loan, while many
more Kinh have. Through it is not possible to generalise these observations to confirm that
there is discrimination against ethnic minorities, the existence of such misconceptions and
negative stereotyping does represent a source of disadvantages for ethnic minorities. These
could be considered as another factor that contributes to the „differences in returns‟
component of the ethnic expenditure gap reported in this paper.
4 Policies for ethnic minority development
Vietnam has a large number of policies and programmes for ethnic minority development.
These programmes and policies are too numerous and fragmented to describe in detail here,
but Appendix 7 gives details of the objectives, target groups, components and budgets of the
main policies and programmes that affect the ethnic minorities. Appendix 8 provides further
information on the relevant government decisions, decrees and resolutions governing these
policies and programmes. As noted by Nguyen and Baulch (2007), Vietnam‟s policies and
programmes have targeted ethnic minorities in three ways: based on location, household
economic status, and ethnic minority group membership. The first approach, used by
Programme 135, price and transportation subsidy policies and some components of
Programme 143, target communes in extremely difficult (Region 3) areas, without
distinguishing between the ethnicity of households living in these communes. Regional
programmes, such as Programmes 168, 173 and 186, work in the same way, though at a
more aggregated level, and have proved useful when clear divisions into geographic regions
Ethnic minority poverty in Vietnam
45
based on different production, settlement and social conditions can be identified. A second
approach targets households based on their economic status. For example, the successors
to Programme 143, and many education and health exemptions, specifically target
households that are classified as poor or hungry. Some programmes (such as Programmes
134 and 139) have added ethnicity as an additional criterion for poor households to qualify
for benefits and exemptions. A third approach, used by the Programme to Support Ethnic
Minority Households in Especially Difficult Circumstances and some provincial initiatives,
targets specific ethnic minority groups, typically those having very low populations and living
standards. Over time, as generalised economic growth raises living standards throughout
Vietnam, a shift away from location-based targeting, to policies and programmes in which the
ethnic minorities and other poor groups are specifically targeted, appears to be occurring
(Nguyen and Baulch, 2007).
In the remainder of this section, we reflect on the policy conclusions which may be drawn
from the preceding analysis and make some tentative suggestions as to how existing
programmes and policies for ethnic minority development might be extended, modified or
rationalised. We focus first on the broad area of growth and distribution, in particular how the
growth process can be made more inclusive for the minorities. Three specific areas in which
the ethnic minorities lag the Kinh and Hoa (nutrition, education and employment) are then
discussed. Finally, the role of integrated development programmes is briefly discussed.
4.1 Growth and distribution
As explained in Section 2, while the living standards of the ethnic minorities have clearly
improved over the last decade, it is also clear that the minorities have benefited less from
Vietnam‟s dramatic economic growth than the Kinh and Hoa. In part, this is due to the
widening disparities in living standards between the lowlands and uplands as, with the
exception of the Khmer and Cham, the ethnic minorities remain overwhelmingly upland
residents. However, it would be a mistake to ascribe the poverty of the ethnic minorities
entirely to geography (with the policy focus on improving infrastructure and public services in
upland areas that this is usually taken to imply). First, the questions of why more ethnic
minorities have not migrated to urban areas (plus nearby industrial zones), along with why
the minorities are under-represented in terms of wage jobs (especially outside the public
sector), needs to be addressed. Second, why is it that Kinh and Hoa workers generally earn
substantially higher returns to their human and physical capital, while their households enjoy
better access to public services, even when they live in the same upland communes as the
minorities? In short, how can Vietnam‟s future growth become more inclusive for the ethnic
minorities?
The decomposition analysis conducted in Section 3 shows that ethnic minority households
with the same endowments of education, land, capital and other assets receive returns that
are on average a half to two-thirds lower than Kinh-Hoa people who live in communes with
Ethnic minority poverty in Vietnam
46
similar characteristics. The magnitude of these differences in returns was also confirmed
using quantile regressions. However, with the possible exception of the price and
transportation subsidies paid in poor communes, all the ethnic minority policies and
programmes that Vietnam has adopted focus on improving the endowments of minority
households and the communes in which they live (CAF-IDS, 2008; Nguyen and Baulch,
2007). Very few policies or programmes address the lower returns to endowments which our
empirical analysis shows the ethnic minorities receive.
Some of the measures which we believe could help to rectify this situation include:
Developing agricultural extension systems and markets that are appropriate to the
needs and crops grown by the minorities;32
Making the laws and regulations governing the control and use of forest land more
inclusive, while continuing the reform of the State Forest enterprises;
Simplifying procedures for the minorities to gain commercial loans and (unsubsidised)
micro-credit for both agricultural and non-agricultural activities;
Pro-upland regional (and transportation) policy;
Targeted interventions in education and health (see the following sub-sections).
We now turn to some of the more specific policies that could help to counter ethnic minority
disadvantage in the nutrition, education and employment sectors.
4.2 Nutrition
The increasing incidence since 1998 of wasting among children under 24 months of age
throughout Vietnam, including in urban areas, despite rapid and reasonably broad-based
growth, is very worrying. The high levels of stunting among children over 24 months, and
especially among ethnic minority children, is a further cause for concern. However, contrary
to popular perception, under-nutrition is not simply the result of low incomes and inadequate
food intake. According to a recent global review, the two most important factors in under-
nutrition are: (i) inadequate knowledge about the benefits of exclusive breastfeeding,
complementary feeding practices and micronutrients; and (ii) the lack of time women have for
child care and themselves during pregnancy (World Bank, 2006).
Since the most damaging consequences of under-nutrition occur during pregnancy and the
first two years of life, governments with limited resources are best advised to focus their
actions on the „window of opportunity‟ between conception and 24 months of age (World
32 See Hoang et al. (2004) for a comprehensive diagnosis of ethnic minority and gender issues in
agricultural extension in Vietnam.

Ethnic minority poverty in Vietnam
47
Bank, 2006). Among the measures which we believe would help to raise the nutritional status
of Vietnam‟s population, especially ethnic minority children are:
A campaign to promote exclusive breastfeeding of infants under six months old,
coupled with extension of maternity leave for women in wage employment from four
to six month.
The introduction of a comprehensive programme for the fortification of basic foods,
such as cooking oil, flour, fish and soy sauce, with Vitamin A, iron, selenium and zinc.
The development of new varieties of bio-fortified rice and maize, along perhaps with
sweet potato and cassava, could also do much to improve micronutrient intake in
Vietnam.33
The provision of free nutritional supplements to women of childbearing age.
Measures to improve sanitation and increase the provision of clean water, especially
in remote rural communes and low income urban areas.
The objective of such measures should be to reduce nutritional difference between the
majority and minorities groups, while transforming the nutritional status of Vietnam‟s entire
population over the next ten years. The National Nutrition Programme in Thailand, which
helped to reduce moderate and severe malnutrition there by more than three-quarters in ten
years (World Bank, 2006), demonstrates what can be achieved by concerted and
coordinated nutrition policies in a single decade.
4.3 Education
As with most issues connected with ethnic minority policy in Vietnam, tackling the problem of
the low levels of education attained by most ethnic majority children, together with its
generally poor quality, requires tackling several interlocking phenomena.
To increase and maintain enrolments at the primary school level – in particular the
transition from village classrooms to the main commune primary school in
mountainous areas – it is clearly necessary to increase the number of school
branches and the accessibility of the main commune schools (via better intra-
commune roads and transportation). In the most remote mountainous areas, the
extension and improvement of „community semi-boarding schools‟ (trường bán trú
dân nuôi), along with more flexible age-enrolment criteria, also have their part to play
in increasing ethnic minority participation in grades 3 to 5. Assisting ethnic minority
children to be able to learn effectively in Vietnamese is also crucial. While the
33 See www.harvestplus.org. Unfortunately, Vietnam is not one of Harvest Plus‟s target countries in
Asia.
Ethnic minority poverty in Vietnam
48
government is committed to creating „conditions for ethnic people to learn to speak
and write in their own language to maintain and develop their ethnic culture, and
easily grasp knowledge in the school and other education institutions‟ (Article 7.2, The
Education Law 2005), ethnic children currently have little access to genuinely
bilingual education (Kosonen, 2004; MOET-UNICEF-UNESCO, 2008). Providing
instruction in both Vietnamese and ethnic minority languages is particularly important
in the first two or three grades of primary school in mountainous areas. The
experiences of some international NGOs with child-centred methodologies and village
classroom assistants (e.g., Oxfam GB in Lao Cai and Tra Vinh, Save the Children UK
in Quang Ninh and Dien Bien) are well worth reflecting on here.
To ease the transition of ethnic minority and other poor children from primary to lower
and then upper secondary school, multiple measures are also necessary. The recent
scholarship programmes for disadvantaged ethnic minority children introduced by
MOET (with ADB funding) has an important role to play in encouraging children to
make the transition and remain in secondary school. For ethnic minority girls, the
importance of personal safety and separate and hygienic sanitation facilities also
deserves to be stressed, especially at boarding school level (MOET-UNICEF-
UNESCO, 2008). If carefully and appropriately designed, conditional cash transfer
programmes can be designed. These have the potential to provide a major incentive
for ethnic minority and other parents to keep their children in school. While the
leading examples of the majority of such programmes come from Latin America (e.g.
Progressa and Oportunidades in Mexico and the Bolsa Familia in Brazil), there are
more focused and less complex Asian examples of conditional cash transfer
programmes that are well worth Vietnam studying.34
So few ethnic minority young people progress to education at the post-secondary
level, in particular, to colleges and universities that it is clear that a major initiative is
needed here. While the relatively recent abolition of separate streams for Kinh and
ethnic minority students in the major colleges and universities is to be welcomed, the
role of the three ethnic minority pre-universities is still essential to facilitate the
transition of ethnic minority students to colleges and universities. It is also clear that
the scale of the nomination (cử tuyển) system is insufficient to make much of a dent
into the dominance of Kinh, and to a lesser extent Hoa and Tay, students at the post-
secondary level (Nguyen and Baulch, 2007).35
34 See, in particular, Filmer and Schady (2008) on Cambodia, and Ahmed (2005) on Bangladesh. A
recent World Bank Policy Report (Fiszbean and Schady, 2009) provides a broad overview of conditional cash programmes throughout the developing world.
35 The number of ethnic minority students nominated to colleges and university tripled from 689 in
1998 to 1,709 in 2005 (Bui, 2006). This translates into 40 to 50 higher education places per province a year, although some provincial Departments of Education report being able to nominate almost twice this number of students. However, these places represented just 9.2 percent of the upper secondary

Ethnic minority poverty in Vietnam
49
Finally, it is important to remember that one of the major reasons cited for school drop-outs
throughout Vietnam, but especially in ethnic minority areas, is poverty itself. Faster and more
equitably distributed economic growth therefore also has an important role to play in
continuing to increase Vietnam‟s educational standards over the coming years.
4.4 Employment
The quantitative and qualitative data reviewed in Section 2 indicates that ethnic minorities
are much less likely to be waged or salaried employees than the Kinh-Hoa. Ethnic minority
workers also receive lower remuneration and less favourable benefits than Kind and Hoa
workers. These trends have been confirmed in a recent decomposition study of wage
employment using the VHLSS by Pham and Reilly (2009). As noted in Section 3, lurking
behind these statistics and studies, lies the highly contentious issue of whether the ethnic
minorities experience „unequal treatment‟ relative to the Kinh and Hoa. While the case for the
existence of „discrimination‟ against the ethnic minorities is much less clear than in Latin
America and South Asian, the econometric evidence shows consistently and robustly that the
ethnic minorities receive lower returns to their education and other assets. We explored the
drivers of these differences in returns in Section 3.3, but this analysis raises almost as many
questions as it answers. For example, is the reason that the minorities have less access to
wage jobs, for example, purely the result of their lower education levels and Vietnamese
language skills, and lack of urban networks? Or do other factors, such as the schools and
colleges they have attended, the types of friends and family contacts they have, or the way
they speak Vietnamese, also influence their ability to access wage employment? If the latter
is the case, then there may be a case for adopting one or more of the policies for enhancing
minorities returns that have been adopted in other countries (see Box 1). However, it is also
important to note that international experience suggests that the costs of poorly designed or
over-complex equal opportunity and legislation and affirmative action programmes are high
(Braunholz-Speight, 2008; Heyer and Jayal, 2009).
On the other hand, if the inability of the minorities to access wage employment is due
principally to the quantity and quality of their education, then the measures mentioned above
to improve ethnic minority education should receive priority.
Measures to improve the mobility of ethnic minority workers are also important for improving
their employment opportunities. As noted by Bryceson et al. (2008), in Vietnam this is now
less an issue of improving road access, and more one of improving access and ability to pay
for motorised transportation. It is also important to realise that, like improved irrigation and
places in the boarding system and only 0.65 percent of the ethnic minority pupils in the upper-secondary schools in 2005.
Ethnic minority poverty in Vietnam
50
other infrastructure provision, better road access has differential impacts on different
population groups, and is„likely to have the least effects on the poor‟ (Bryceson et al. 2008:
276). The ethnic minorities‟ lack of contacts and social networks in urban and peri-urban
areas, is also likely to detract from their ability to obtain waged employment. Finally, it is
possible that some ethnic minorities groups are poorly informed about the recent reforms to
the household registration (ho khau) system, and this lack of knowledge restricts their
geographic mobility. Such information is likely to be strongly associated with lack of
proficiency in the Vietnamese language.
In all events, it is important to realise that attaining employment parity for the minorities
requires multiple barriers to be overcome and is likely to take a substantial time to achieve.
Box 1. Policies to enhance ethnic minority employment
Internationally, two broad sets of policies have been used to promote greater wage employment and economic integration of ethnic minority (or indigenous) groups. These are:
Equal Opportunity Legislation, which aims to prevent people with equivalent qualifications and experience from receiving lower wages, less access to jobs or government services on grounds of their ethnicity or gender, religion or sexual orientation. Following the 1959 revolution in Cuba, for example, equal opportunity legislation was enacted alongside broader economic and social policies, which had virtually eliminated the black-white gap in living standards by the 1980s. More recently, Ecuador‟s 1998 constitution has guaranteed indigenous people communal land rights, the right to education in indigenous languages, and to participate in natural resource use decisions. Despite the prevalence of equal opportunity legislation in these and other developing and industrialised countries, numerous studies show that gaps in wages and living standards are still prevalent.
Affirmative Action programs, which give preferential treatment to members of disadvantaged groups. For example in India, since 1950 a percentage of higher education places, government jobs and some parliamentary seats are reserved for members of the scheduled castes and tribes. Similarly, Malaysia‟s New Economic Policy of 1971 set targets for native Malay or bumiputera employment in different sector together with (joint) ownership of companies. Affirmative action programs, which have also been used in South Africa and the United States, are controversial and can be criticised for helping already relatively better-off members of ethnic groups, generating resentment among other groups, and undermining advancement based purely on merit.
Source: Adapted from Braunholz-Speight (2008) and CAF-IDS (2008)
4.5 Integrated rural development programmes
Given the interlocking nature of the disadvantages which many ethnic minorities living in
mountainous areas experience, integrated rural development programmes (IDPs) have a
natural appeal, especially in rural areas. There have been a number of government and
donor-sponsored IRDPs (including Programmes 168, 173 and 186, the Vietnam Sweden
Mountain Rural Development Programme in the 1990s, the Northern Mountains Poverty
Reduction Project, ADB projects in Central Vietnam and IFAD projects in Bac Kan, Cao Bang
and elsewhere). Programme 135 is also informed by an IDP perspective, although in
practice, it was and still is largely focused on improving road access and infrastructure
Ethnic minority poverty in Vietnam
51
provision within Vietnam‟s poorest communes. Concerns that are commonly expressed
about IRDPs in other countries are that they are complicated to administer, costly and time-
intensive, thereby posing challenges to the capacity of the decentralised bureaucracies that
are usually chosen to implement them (Kumar, 1987). In other countries, bureaucracies have
also been successful in capturing large shares of the economic gains generated by IRDPs
(Ruttan, 1975). Recent experience in Central Asia, Latin America and the Middle East
suggests that target communities, and not just national and regional governments, and
village leaders must have true ownership over the IRDP process, along with the capacity to
sustain and managed new infrastructure investments (USAID, 2006). Similarly, within
Vietnam, a recent review of the Northern Mountains Poverty Reduction Project found that
tailoring public information to individual local circumstances and awareness-raising are
essential if there is to be effective community participation in these projects (World Bank,
2008). Furthermore, concerns have been expressed regarding programme capture by certain
less disadvantaged groups. Finally, because they operate in some areas but not others, IDPs
may actually increase inequality between different areas and ethnic groups.
For all these reasons, although both the „joined-up development policies‟ and improving
infrastructure in remote areas are important, we recommend a cautious approach to the
adoption of IDPs as a „panacea‟ for ethnic minority development.

Ethnic minority poverty in Vietnam
52
5 Some concluding remarks
The scale and depth of ethnic minority poverty in Vietnam presents one of the major
challenges to Vietnam achieving the targets for poverty reduction set out in the Socio-
Economic Development Plan, as well as the Millennium Development Goals. As Section 2 of
this paper demonstrates, ethnic minority poverty in Vietnam is multi-dimensional and
increases cumulatively with the life course. This is the result of the complex interplay of
several overlapping layers of disadvantage, which start in utero and continue until adult life.
Counteracting such disadvantages requires multiple interventions coordinated across a
number of sectors, which pose complex implementation challenges in Vietnam‟s multi-
layered system of government. Nonetheless, we believe that there are certain initiatives in
the nutrition and education sectors (e.g., the bio-fortification of staple foods, provision of
nutritional supplements to women of childbearing age in mountainous areas, the
development of weekly boarding schools, and the extension of simple conditional cash
transfer/scholarship programmes) that are relatively simple to implement and which would
make an important difference to the life chances of ethnic minority children. Counteracting
the disadvantages which ethnic minority people face later in life, especially improving their
rural livelihoods and access to wage employment, is more complex. In the agriculture and
forestry sectors, extension systems which are sensitive to the farming systems and tenure
practices of the different minorities require development. Improving infrastructure in the
remote villages in which the smaller and more disadvantaged ethnic groups live, also has its
role to play in improving the returns they receive to their assets. However, given the
extensive investments which have been made here in recent years, the importance of further
investments in infrastructure should not be overstated. In the wage employment field, further
work is needed, exploring the extent to which ethnic minority workers experience „unequal
treatment‟, or whether their clear inability to access wage jobs outside the public sector is a
function of their education (combined, perhaps, with „educational screening‟), networks and
Vietnamese language ability. Finally, the importance of promoting growth that is
geographically broad and socially inclusive is essential. For without a more equitable pattern
of growth, the current disparities between the majority Kinh and Hoa and the ethnic minorities
are sure to continue growing.
Ethnic minority poverty in Vietnam
53
References
Ahmed, A. (2005). Comparing Food and Cash Incentives for Schooling in Bangladesh. United Nations University/International Food Policy Research Institute.
ADB (2002). Indigenous Peoples/Ethnic Minorities and Poverty Reduction Vietnam. Manila: Asian Development Bank, Manila.
Baulch, B., and Masset, E. (2003). „Do monetary and non-monetary indicators yell the same story about chronic poverty? A study of Vietnam in the 1990s‟. World Development 31(3): 441-453.
Baulch, B., Pham, H., and Reilly, B. (2008). „Decomposing the ethnic gap in Vietnam, 1993 to 2004‟. Manuscript submitted to Oxford Economic Papers.
Baulch, B., Truong, C., Haughton, D., and Haughton, J. (2004). „Ethnic minority development in Vietnam‟., Journal of Development Studies, 43(7): 1151-1176.
Blinder, A.S. (1973) „Wage discrimination: reduced form and structural variables‟. Journal of Human Resources 8(4): 436-55.
Brandt, L., Le, D.T., Huong, G., Trang, C.T., Pham, G.L., Nguyen, N.L. and Luu, V.V. (2006). „Land access, land markets and their distributive implications in rural Vietnam‟. Mimeo, World Bank, Hanoi
Braunholz-Speight, T. (2008). „Policies responses to discrimination and their contribution to reducing chronic poverty‟, Background Paper for Chronic Poverty Report 2007-08. Manchester: Chronic Poverty Research Centre.
Bryceson, D., Bradbury, A., and Bradbury, T. (2008). „Roads to poverty reduction? exploring rural roads‟ impact on mobility in Africa and Asia‟. Development Policy Review, 26(4): 459-482.
Bui, N.D. (2006). Về chính sách phát triển giáo dục và đào tạo ở vùng dân tộc thiểu số [Education and Training Policies in the Ethnic and Mountainous Areas]. Presented at the Workshop of “60 năm công tác dân tộc” [60 Years for Ethnic Development], 9 Sept 2006, Hanoi, Vietnam.
CAF-IDS (2008). The Economic Development of Ethnic Minorities in Vietnam. Hanoi: Policy Brief, Centre for Analysis and Forecasting, and Brighton: Institute of Development Studies.
Chamberlain, G., (1994). ‟Quantile regression, censoring and the structure of wages„. In: Sims, C. and Laffont, J. (eds.), Proceedings of the Sixth World Congress of the Econometrics Society, Cambridge University Press, 171--209.
Dang, N.V., Son, Chu, T.S., and Lu, H. (2000). Ethnic Minorities in Vietnam/ Hanoi: The Gioi Publishers.
Deaton, A. (1997). The Analysis of Household Surveys: A Microeconometric Approach to Development Policy. Baltimore: John Hopkins University Press.
Duclos, J.Y., Esteban, J, and Ray, D. (2005). ‟Polarization: concepts measurement, estimation” in Barrett, C. (ed.), The Social Economics of Poverty: On Identities, Communities, Groups and Networks, Abingdon and New York: Routledge.
Duncan, C. (ed.) (2004). Civilizing the Margins: Southeast Asian Government Policies for the Development of Minorities. Ithaca: Cornell University Press.

Ethnic minority poverty in Vietnam
54
Engvall, A. (2006). „Ethnic minorities and rural poverty in Lao PDR‟. Mimeo, Stockholm School of Economics, Stockholm.
Filmer, D. and Schady, N. (2008). „Getting girls into school: evidence from a scholarship program in Cambodia‟. Economic Development and Cultural Change, 56: 581-617.
Fiszbein, A. and Schady, N. (2009). Conditional Cash Transfers: Reducing Present and Future Poverty. Policy Research Report. Washington DC: World Bank.
Glewwe, P., Koch, S. and Nguyen, B.L., (2004). „Child nutrition, economic growth and the provision of health care services in Vietnam‟. In Glewwe et al (eds.), Economic Growth and Household Welfare in Vietnam, Washington: World Bank Regional and Sectoral Studies.
Grafton, R., Kompas, T. and Owen, D. (2007). „Bridging the barriers: knowledge connections, productivity and capital accumulation‟. Journal of Productivity Analysis, 28: 219-31.
GSO (2001). Population and Housing Census Vietnam 1999 – Completed Census Results. Hanoi: Statistical Publishing House.
GSO (2005). Data and Results: Vietnam Migration Survey 2004, CD ROM. Hanoi: Center for Statistical Information Technology, General Statistics Office.
GSO (2007). The 2006 Population Change, Labour Force and Family Planning Survey: Major Findings. Hanoi: Statistical Publishing House.
GSO and UNCEF (2006). Viet Nam Multiple Indicator Cluster Survey 2006, Final Report. Hanoi, Vietnam: General Statistical Office.
Haughton, D. and Haughton, J., (1997). „Explaining child nutrition in Vietnam‟. Economic Development and Cultural Change, 45(3): 541-56.
Heyer, J. and Jayal, N.G. (2009). „The challenge of positive discrimination in India‟. CRISE Working Paper 55. Oxford: Centre for Research on Inequality and Social Exclusion.
Hoang, H., Pham, G., Tran, M. and Hansen, H. (2007). „Ethnicity and poverty reduction‟ in Nguyen, T. and Hansen, H. (eds.), Market Policy and Poverty Reduction in Vietnam. Hanoi, Vietnam: Vietnam Academy of Social Sciences, National Political Publisher.
Hoang, X.T., Le, T.Q. and Ngo, V.H. (2004). „Ethnic minorities and gender issues in agricultural extension‟, Agricultural Extension Services for the Poor Series Part 2, Sub-Group on Agricultural Extension Services for the Poor. Hanoi: VUFU NGO Resource Centre.
Jamieson, H., Cuc, L.T., and Rambo, T., (1998). The Development Crisis in Viet Nam’s Mountains. Honolulu: East West Centre.
Khan, C.K. Nguyen, X., Nguyen V.N., Ha, H,K,, West, C, and Hautvast, G. (2007). „Sub-clinical vitamin A deficiency and anemia among Vietnamese children less than five years of age‟. Asian Pacific Journal of Clinical Nutrition 16(10): 152-157.
Koenker, R. (2005). Quantile Regression, Econometric Society Monographs. Mimeo: Cambridge University Press.
Kosonen, K. (2004). Language in Education: Policy and Practices in Vietnam. Hanoi: UNICEF.
Machado, J. and Mata, J. (2005). „Counterfactual decomposition of changes in wage distributions using quantile regression models‟. Journal of Applied Econometrics, 20: 445-465.
Ethnic minority poverty in Vietnam
55
Martorell, R. et al. (1992). „Long -term consequences of growth retardation during early childhood‟. In Hernandez, M.. and Argente J. (eds.), Human Growth: Basic and Clinical Aspects. Amsterdam: Elsevier.
McElwee, P. (2004). „Becoming Socialist or becoming Kinh? Government policies for ethnic minorities in the Socialist Republic of Vietnam‟, in Duncan, C. (ed), Civilizing the Margins: Southeast Asian Government Policies for the Development of Minorities. Ithaca: Cornell University Press
MOET-UNICEF-UNESCO (2008). The Transition of Ethnic Minority Girls from Primary to Secondary Education. Hanoi: Ministry of Education and Training, United Nations Children Fund, and United Nations Educational, Scientific and Cultural Organization.
MOLISA (2005). The National Targeted Programme on Hunger Eradication and Poverty Reduction from 2006 to 2010. Hanoi: Ministry of Labour, Invalids and Social Affairs, Hanoi.
Nguyen, P.T.T. and Baulch, B. (2007). „A review of ethnic minority policies and programmes in Vietnam‟. Hanoi: Centre for Analysis and Forecasting; Brighton: Institute of Development Studies, University of Sussex.
Nguyen, T.M.H, Kompas, T., Breusch, T. and Ward, M. (2009). „Community effects and ethnic minorities: sources of inequality in Vietnam re-examined‟. Draft, Australian National University.
Nguyen, V.N.., Nguyen C.K, Nguyen X.N.., Phan P.H., Le T.H., Nguyen, T.L., Ota F, Yabutani T, Vu Q.H., Motonaka J, Nishikawa T, and Nakaya Y. (2008). „Micronutrient deficiencies and anemia among pre-school children in rural Vietnam‟. Asia Pacific Journal of Clinical Nutrition 17(1): 48-55.
NIN (2007). National Institute of Nutrition: Annual Report. Hanoi: National Institute of Nutrition.
Oaxaca, R. (1973). „Male-female wage differentials in urban labour market‟. International Economic Review, 9(3):693-709.
Oxfam and Action Aid Vietnam (2008). Participatory Poverty Monitoring in Rural Comunities in Vietnam: Synthesis Report. Hanoi: Oxfam and Action Aid
Pham, T.H and B. Reilly (2009). „Ethnic Wage Inequality: Evidence from Vietnam in 2002‟, International Journal of Manpower, vol. 30. (forthcoming).
Pham, T.H, Herrera, J., Le, D.T, Razafindrakoto, M., Roubaud, F. (2008). An Analysis of the P135-II Baseline Survey. A Research Report to UNDP and CEMA..
Pham, T.H., Nguyen, T.T, To, T.T; Hoang, T.T. (2009). „Preserving equitable growth in Vietnam‟, draft Background Paper for Vietnam Poverty Update Report, 2008-09. Mimeo: Vietnam Academy of Social Sciences and donors.
Pincus, J. and Sender, J. (2006). „Quantifying poverty in Viet Nam: Who Counts?‟. Mimeo: United Nations Development Program, Hanoi.
Ravallion, M. and van de Walle, D. (2008). Land in Transition: Reform and Poverty in Rural Vietnam. New York: Palgrave Macmillan and the World Bank.
Roubard, F. (forthcoming). „Re-assessing the ethnic gap in Vietnam: new evidence from the LFS‟. Draft, Institute of Statistical Sciences, Hanoi.

Ethnic minority poverty in Vietnam
56
Swinkels, R., and Turk, C. (2006). „Explaining ethnic minority poverty in Vietnam: a summary of recent trends and current challenges‟. Background paper for CEM/MPI meeting on Ethnic Minority Report, 28 September 2006. Hanoi: World Bank.
Tran, V., Nguyen, Q., and Mai, T. (2005). „The decentralization process and its impacts on livelihoods of ethnic minority groups: a study on decentralization process‟ in Forest Management in the
Northern and North Central Uplands of Vietnam. Hanoi: Agricultural Publishing House.
UNICEF (2008). State of the World’s Children 2008. New York: United Nations Children‟s Fund.
United Nations, (2006). Maternal and Children Nutrition in Vietnam. Hanoi: United Nations One UN Program
Uplands Program (2007). Montane Choices and Outcomes: Contemporary Transformations of Vietnam‟s Uplands, Workshop 4 January 2007, Hanoi.
VASS (2007). Vietnam Poverty Update Report 2006: Poverty and Poverty Reduction in Vietnam 1993-2004. Hanoi: National Political Publishers.
VASS (2009). Participatory Poverty Assessment (PPA). Hanoi: Viet Nam Academy of Social Sciences.
van de Walle, D. and Gunewardena, D. (2001). „Sources of ethnic inequality in Vietnam‟. Journal of Development Economics, 65(1): 177-207
van de Walle, D. (2003). „Are returns to investment lower for the poor? Human and physical capital interactions in rural Vietnam‟. Review of Development Economics, 7(4): 636–653
Viet Nam News (2008). „Malnutrition puts Viet Nam in „top‟ 20‟, 18th February 2009.
Vuong, X.T., (2001). „Changing land policies and its impacts on land tenure of ethnic minorities in Vietnam‟. Eighth workshop on community management of forest lands, Hawaii.
WHO (2006). WHO Child Growth Standards: length/height-for-weight, weight-for-length, weight-for-height and body-mass-index-for-age. Geneva: World Health Organisation: Multicentre Growth Reference Study Group.
World Bank (2006). Repositioning Nutrition as Central to Development: A Strategy for Large-Scale Action. Washington DC.:Direction in Development Series, World Bank
World Bank (2009). Country Social Analysis: Ethnicity and Development in Vietnam. Washington: World Bank
Young, H. and Jaspers, S. (1995). Nutrition Matters: People, Food and Famine. London: Intermediate Technology Publications Ltd.

Ethnic minority poverty in Vietnam
57
Appendix
Appendix 1: Changes in stunting and wasting rates by ethnic category, 1998-2006
Source: Own calculations based on VLSS98 and VHLSS06
Appendix 2: Nutrition indicators for children under five by sex, 1998 and 2006
< 24 months >=24 months
VLSS98 VHLSS06 VLSS98 VHLSS06
Boys Girls Group mean comparison test P-value
Boys Girls Group mean comparison test P-value
Boys Girls Group mean comparison test P-value
Boys Girls Group mean comparison test P-value
Urban
stunting 22% 19% 0.0029 20% 11% 0.0000 27% 24% 0.0000 26% 24% 0.0011
severe stunting 7% 7% 0.6929 8% 2% 0.0000 6% 5% 0.0776 9% 11% 0.0000
wasting 15% 9% 0.0000 19% 9% 0.0000 7% 8% 0.0336 10% 8% 0.0000
N 84 87 74 61 154 144 127 131
Rural
stunting 37% 31% 0.0000 33% 23% 0.0000 54% 51% 0.0000 40% 42% 0.0000
severe stunting 13% 11% 0.0000 19% 7% 0.0000 16% 17% 0.0000 16% 15% 0.0365
wasting 12% 11% 0.0000 19% 11% 0.0000 11% 13% 0.0000 12% 9% 0.0000
N 309 277 277 250 550 544 539 497
Source: Own calculations based on VLSS98 and VHLSS06
Stunting Severe stunting Wasting
2006 1998 Two sample mean comparison test P - v alue
2006 1998 Two sample mean comparison test P - value
2006 1998 Two sample mean comparison test P - value
Kinh & Hoa 33% 46% 0.0000 13% 13% 0.0000 12% 12% 0.0000
Khmer & Cham 21% 37% 0.0000 11% 14% 0.0747 7% 13% 0.0004
Tay - Thai - Muong - Nung
45% 40% 0.0000 18% 15% 0.0000 13% 9% 0.0000
Other Northern Uplands
51% 55% 0.3115 32% 26% 0.1047 11% 7% 0.0021
Central Highlands
59% 52% 0.0000 26% 27% 0.7355 16% 14% 0.0000

Ethnic minority poverty in Vietnam
58
Appendix 3: Nutrition indicators for children under five by sex, 1998 and 2006 (with two samples mean comparison) < 24 months >=24 months
boys Girls Boys Girls
1998 2006 Two
sample
mean
comparison
test P-
value
1998 2006 Two sample
mean
comparison
test P-value
1998 2006 Two
sample
mean
comparison
test P-
value
1998 2006 Two
sample
mean
comparison
test P-
value
Urban
stunting 22% 20% 0.0489 19% 11% 0.0000 27% 26% 0.1390 24% 24% 0.6679
severe stunting 7% 8% 0.0548 7% 2% 0.0000 6% 9% 0.0000 5% 11% 0.0000
wasting 15% 19% 0.0004 9% 9% 0.9938 7% 10% 0.0000 8% 8% 0.8439
N 84 74 87 61 154 127 144 131
Rural
stunting 37% 33% 0.0000 31% 23% 0.0000 54% 40% 0.0000 51% 42% 0.0000
severe stunting 13% 19% 0.0000 11% 7% 0.0000 16% 16% 0.8084 17% 15% 0.0000
wasting 12% 19% 0.0000 11% 11% 0.0144 11% 12% 0.0000 13% 9% 0.0000
N 309 277 277 250 550 539 544 497
Source: Own calculations based on VLSS 1998 and VHLSS 2006
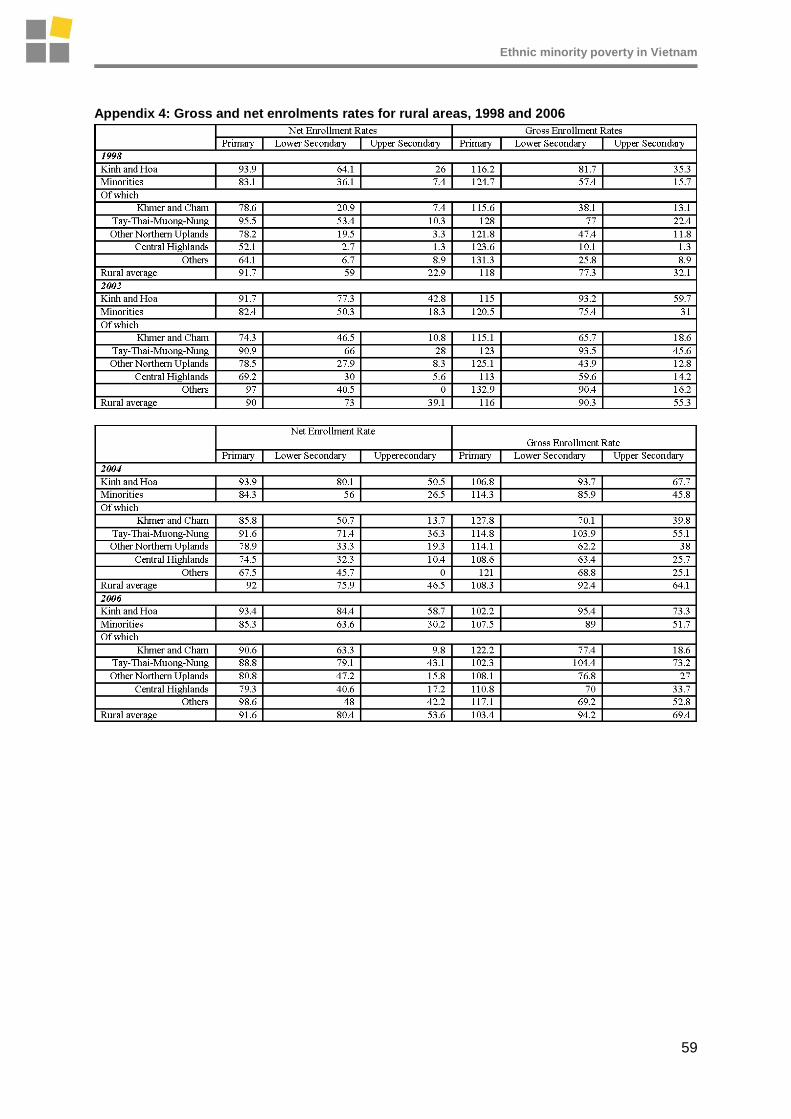
Ethnic minority poverty in Vietnam
59
Appendix 4: Gross and net enrolments rates for rural areas, 1998 and 2006

Ethnic minority poverty in Vietnam
60
Appendix 5: Transfers as a percentage of beneficiary household expenditures
Source: Own calculations based on VLSS98 and VHLSS06
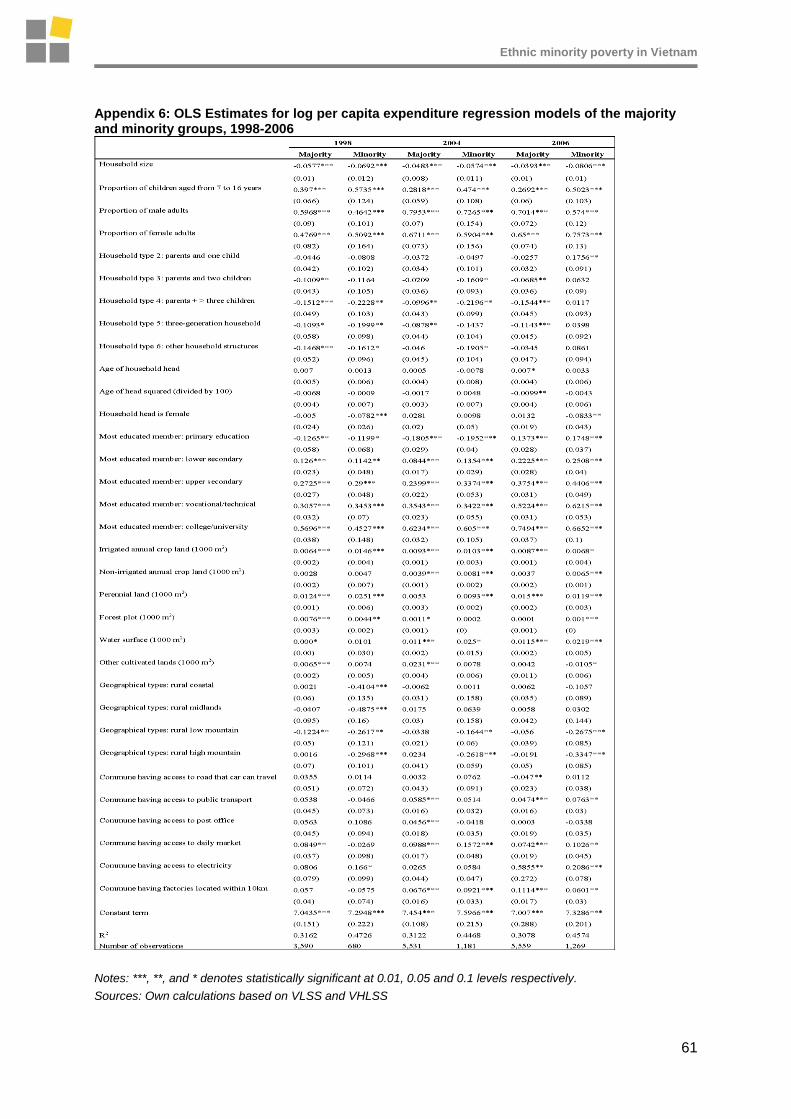
Ethnic minority poverty in Vietnam
61
Appendix 6: OLS Estimates for log per capita expenditure regression models of the majority and minority groups, 1998-2006
Notes: ***, **, and * denotes statistically significant at 0.01, 0.05 and 0.1 levels respectively.
Sources: Own calculations based on VLSS and VHLSS
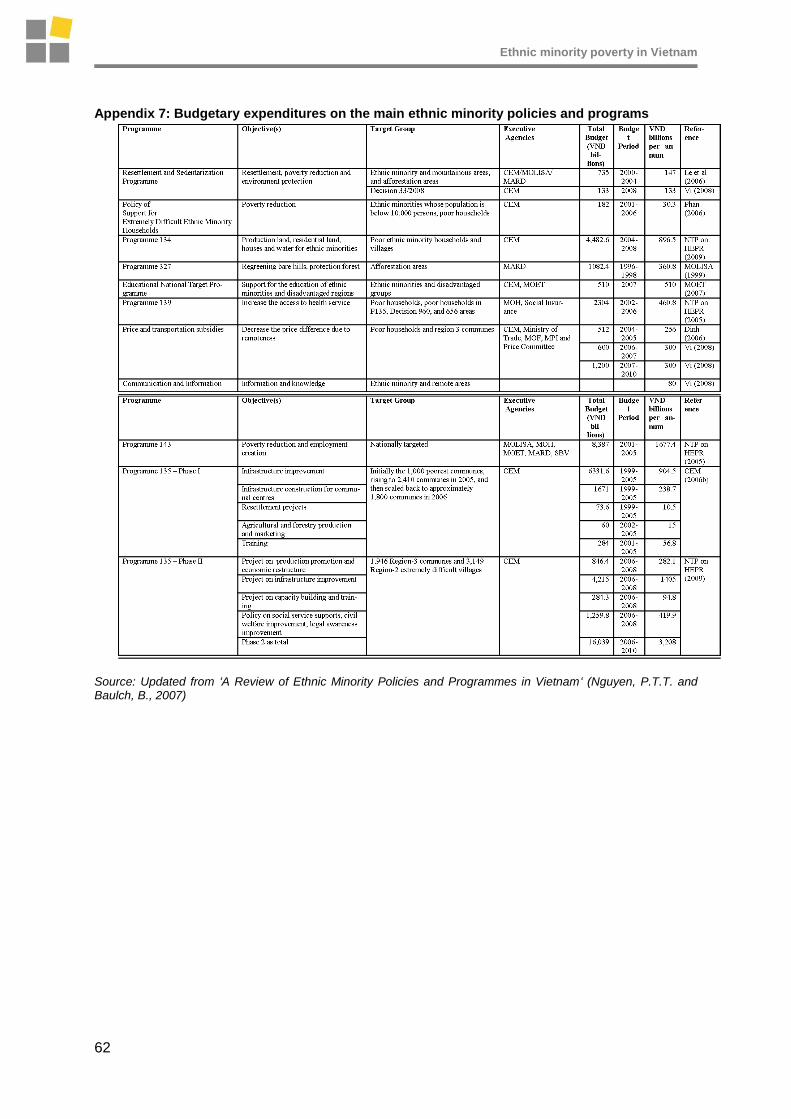
Ethnic minority poverty in Vietnam
62
Appendix 7: Budgetary expenditures on the main ethnic minority policies and programs
Source: Updated from ‘A Review of Ethnic Minority Policies and Programmes in Vietnam‘ (Nguyen, P.T.T. and Baulch, B., 2007)
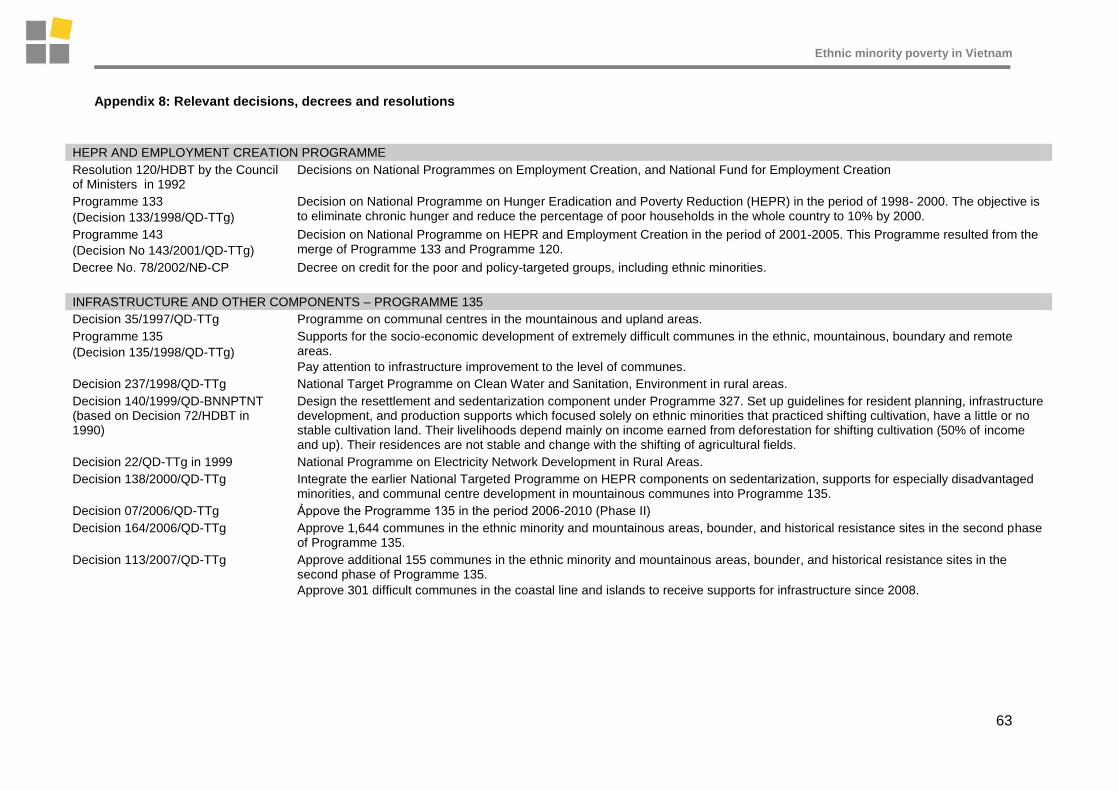
Ethnic minority poverty in Vietnam
63
Appendix 8: Relevant decisions, decrees and resolutions
HEPR AND EMPLOYMENT CREATION PROGRAMME
Resolution 120/HDBT by the Council of Ministers in 1992
Decisions on National Programmes on Employment Creation, and National Fund for Employment Creation
Programme 133
(Decision 133/1998/QD-TTg)
Decision on National Programme on Hunger Eradication and Poverty Reduction (HEPR) in the period of 1998- 2000. The objective is to eliminate chronic hunger and reduce the percentage of poor households in the whole country to 10% by 2000.
Programme 143
(Decision No 143/2001/QD-TTg)
Decision on National Programme on HEPR and Employment Creation in the period of 2001-2005. This Programme resulted from the merge of Programme 133 and Programme 120.
Decree No. 78/2002/NÐ-CP Decree on credit for the poor and policy-targeted groups, including ethnic minorities.
INFRASTRUCTURE AND OTHER COMPONENTS – PROGRAMME 135
Decision 35/1997/QD-TTg Programme on communal centres in the mountainous and upland areas.
Programme 135
(Decision 135/1998/QD-TTg)
Supports for the socio-economic development of extremely difficult communes in the ethnic, mountainous, boundary and remote areas.
Pay attention to infrastructure improvement to the level of communes.
Decision 237/1998/QD-TTg National Target Programme on Clean Water and Sanitation, Environment in rural areas.
Decision 140/1999/QD-BNNPTNT (based on Decision 72/HDBT in 1990)
Design the resettlement and sedentarization component under Programme 327. Set up guidelines for resident planning, infrastructure development, and production supports which focused solely on ethnic minorities that practiced shifting cultivation, have a little or no stable cultivation land. Their livelihoods depend mainly on income earned from deforestation for shifting cultivation (50% of income and up). Their residences are not stable and change with the shifting of agricultural fields.
Decision 22/QD-TTg in 1999 National Programme on Electricity Network Development in Rural Areas.
Decision 138/2000/QD-TTg Integrate the earlier National Targeted Programme on HEPR components on sedentarization, supports for especially disadvantaged minorities, and communal centre development in mountainous communes into Programme 135.
Decision 07/2006/QD-TTg Ảppove the Programme 135 in the period 2006-2010 (Phase II)
Decision 164/2006/QD-TTg Approve 1,644 communes in the ethnic minority and mountainous areas, bounder, and historical resistance sites in the second phase of Programme 135.
Decision 113/2007/QD-TTg Approve additional 155 communes in the ethnic minority and mountainous areas, bounder, and historical resistance sites in the second phase of Programme 135.
Approve 301 difficult communes in the coastal line and islands to receive supports for infrastructure since 2008.
Ethnic minority poverty in Vietnam
64
RESETTLEMENT AND SEDENTARIZATION
Instruction 393/1996/CT-TTg Residential planning for economic development in the ethnic mountainous area.
Decision 140/1999/QD-BNN Criteria and plans of resettlement and sedentarization.
Decision 190/2003/QD-TTg and Circular 09/2004/TTLT-BNN-BTC
Guidelines for Residential planning in the period of 2003-2020.
Decision 193/2006/QD-TTg Residential planning for 75,000 households in the special-used forests up to 2010.
Decision 33/2007/QD-TTg Support for migration Programmes for resettlement and sedentarization for the ethnic minorities in period of 2007-2010. One-off grant up to VND 15 mil/household. Support for villages on infrastructure, cadres training, and local budget. Applied for non-P134-P190-P120-P193 cases.
POLICY OF SUPPORT FOR EXTREMELY DIFFICULT ETHNIC MINORITY HOUSEHOLDS
Decision 826/1995/QD-TTg Policy of Support for Extremely Difficult Ethnic Minority Households.
Decision 30/2007/QD-TTg Define the ethnic minority extremely difficult areas.
Decision 32/2007/QD-TTg Free-interest loans to ethnic minorities in extremely difficult areas up to VND 5 mil.
DEMOCRACY
Decree 79/2003/ND-TTg Grass-root democracy at the commune level, which has created a strong basis for the decentralization of Programme 135 and others to the commune level.
Local people have the right to participate, supervise, and assess any projects in the local area which directly impact their local production, security, society and livings.
PROGRAMME 134
Decision 132/2002/QD-TTg Supports for residential and production land for ethnic minorities in Central Highlands (support of VND 4 mil per ha of reclaimed land).
Decision 105/2002/QD-TTg Supports for loans for houses by instalments in the flooding in Mekong river delta.
Decision 154/2002/QD-TTg Supports for loans for houses by instalments in the flooding in Central Highlands.
Decision 134/2004/QD-TTg Supports for production land, resident land (houses) and water for difficult ethnic minority households. P134 Budget will be repaid for their previous loans under these 2 Decisions of 105 and 154.
Joint Circular 819/2004/TTLT-UBDT-KHDT-XD-NNPTNT
Guidelines for P134: supports of VND 5 mil per ha/house is the minimum; local budget contribution is required as at least 20% of the national budget.
Decision 03/2005/QD-BNN P134 households can exploit timber wood to built houses in extremely poor and difficult situation.
Decision 1143/2006/QD-TTg Approved advances of VND 105 bil for participatory irrigation projects at the medium and small size which are really needed for ethnic minorities in the remote Central Highlands.
Ethnic minority poverty in Vietnam
65
FOREST LAND ALLOCATION
Decision 327/CT in 1992 National Programme on Reforestation to re-green of barren hills. It provided direct payment to households in exchange for forest protection and for State Forest Enterprises to establish forest plantations.
Land Law 1993 Agricultural and forest land can be allocated to households. The state officially recognized the land use rights of farm households, including the right to sell, transfer, and assign land.
Decree 02/CP in 1994 Long-term forest land allocation to organizations, households, and individuals for the forestry objective in the ethnic policy for the first time.
Decree 01/CP in 1995 Long-term forest land contracts to organizations, households and individuals.
Decision 661/1998/QD-TTg 5-million ha afforestation to rehabilitate degraded forest lands in the period of 1998-2005. Households commonly received some credit or other help to get trees replanted and were often promised a piece-rate payment per ha for protection of the land and growing tree seedlings (around 30-50,000VND per year per ha).
Decree 163/1999/ND-CP Production forest allocation to households and individuals. Land allocation and lease, forest protection and management. Households were granted “Red Books”, and household enjoyed more land-use rights than what the “Green Books” allowed.
Decision 3011/2000/UB
Son La provincial decision to implement the Programme of Forestry Land and Forest Allocation to households, individuals, organizations and communities in 2000-2003 in Son La province.
Decision 178/2001/QD-TTg Benefits from forest land allocation to households and individuals.
Decree 197/2004/ND-CP Compensation and resettlement applied in forest reallocation: land is compensated from the national budget at VND 5 mil per ha. Local budget contribution was required as at least 20% of the national budget.
Decision 04/2004/QD-BNN Procedures to exploit timber wood and other forest products.
Decision 146/2005/QD-TTg Reallocate production lands from forest state enterprises to poor ethnic minority households.
Decision 304/2005/QD-TTg Pilot forest allocation to households and communities (priorities to P132 and P134 cases in Central Highlands) with the annual support of VND 50,000/ha (which was increased to VND 100,000 per ha later).
Law on Forest Protection and Development in 2004 and Decree 23/2006/ND-CP
Forest allocation to households, organizations and village communities for forest protection and development. Normally, each household can have less than 30ha in less than 50 years.
Decision 147/2007/QD-TTg Policies on Production Forest in 2007-2015:
Individuals, households, communities under Decision 164 (extremely difficult communes) receive supports to re-green in barren hills
VND 3 mil/ha for big timber (generate income after above 10 years) or VND 2 mil/ha for small timber (less than 10 years)
Additional VND 1mil/ha if in the boundary
Additional VND 1mil/ha if in the resettlement area of hydro electric power project
Ethnic minority households, individuals and communities not under the Decision 164 receive supports to re-green in barren hills of VND 2 mil/ha
Other cases receive supports of VND 1.5 mil per ha or per 1,500 trees
Ethnic minority poverty in Vietnam
66
STATE FOREST ENTERPRISE REFORM
Law on State-Owned Enterprise 1995
State-Owned Enterprise Reform.
Decree 50/1998/ND-CP State Forest Enterprise Reform initiated.
Decision 187/1999/QD-TTg Reform of State Forest Enterprise to independent business enterprise in order to separate the public services and business activities, and to achieve a sustainable and efficient forest management. One of expectation is to release a large forest land to households.
Joint Circular 199/1999/TTLT/BNN-BTC
Implementation guidelines for the Decision 187 from the MARD and MOF.
Decree 10/2002/ND-CP Protection Forest Management Board will operate under the provincial People Committee.
Decree 170/2004/ND-CP Reform of state farm.
Decree 200/2004/ND-CP Decree on the Arrangement, Reform and Development of State Forest Enterprises.
A further State Forest Enterprise Reform on the restructuring of State Forest Enterprises, their transformation into either commercially viable wood businesses or effective public service entities, in particular, for forest protection.
Create the legal basis for State Forest Enterprise Equitization. SFEs for public services are reformed to Protection Forest Management Board. National budget is only for Special – Used and Protection Forest. Production Forest will be allocated to business SFEs (one-member limited liability companies), households, and individuals.
Decision 231/2005/QD-TTg Supports for state-owned forest enterprises to employ ethnic minority residents in 5 provinces in Central Highlands.
Circular 10/2005/BNNPTNT Implementation guidelines for the Decree 200 from the MARD.
Decree 23/2006/ND-CP Regulation on the implementation of Forest protection and development law.
EDUCATION
Decision 66 in 1985 by MOET and Circular 23 in 1985 by MOET
Regulations on organization and operation of boarding schools for ethnic minority children.
Decision 55/BGD in 1990 MOET has encouraged all 5 to 6 year pre-school children to attend one-year of (typically half-time) kindergarten, or at least, the 36-day summer-school Programme.
Law on the Universalisation of Primary-education in 1991
It encouraged schools to use the ethnic minority languages along with Vietnamese in primary school classes in ethnic minority areas.
Joint Circular 17 in 1995/ by MOLISA, MOF, MOET
Financial supports for teachers delivering extra classes and combined classes.
Decision 2590/1997/QD-BGD and Circular 16/1997/TT-BGD
Prepare ethnic minority students for university and vocational training and to develop cadres of ethnic minority teachers. Include the revision on organization and operation of boarding schools for ethnic minority children.
Decision 973/1997/QD-TTg The five-level allowance system gives priority to mountainous regions and islands to attract more cadres and teachers.
Circular 01/1997/TT-BGD Guidelines on teaching the oral and written languages of ethnic minority.
Joint Circular 54/1998/TTLT-BTC-BGD
Guidelines on school fees in the public educational system
Joint Circular 126/1998/TTLT-BTC-BGD
Financial supports for students in the ethnic boarding schools and pre-universities: exemption from school fee and examination fee; annual award if fairly-good qualification; personal staff: blanket, net, coat, mat, rain coat, trousers, shirt (uniform); two-way travelling
Ethnic minority poverty in Vietnam
67
cost once a year to visit his family; stationary (note, bag, pen, pencil, a set of colour pencils, eraser, compasses, ruler, knife or scissors, glue, colour papers); and borrow textbook.
Decision 159/2002/QD-TTg Programme on school and class infrastructure improvement; Erase the temporary classrooms and 3-shift classes.
Decision 1214/2001/BTC
Free 48-page notebook (15 books/1-2nd–grade pupil; 22 books/3-5th-grade pupil) to pupils from mountainous and extremely difficult area.
Circular 04/2001/TTLT-BGD-BTCCBCP-UBDT
The nomination policy (Cu tuyen): Pupils from local ethnic minority households (above 5 years of permanent residence) in the extremely difficult, and border areas, completed the upper-secondary education in the previous 3 years, will be selected to be under the nomination policy. They have to attend the 1-year pre-university, and then, be sent to the university/college/professional secondary schools without entrance exam. If their pre-university study result is better than Fairly Good, they will study with other normal students. If not, they will have a separated class. After graduated, they have to come back to work for their hometown in a given period at least double of their studying period.
Decision 194/2002/QD-TTg and Joint circular 13/2002/TTLT-BGD-BTC
Adjustment in scholarship and social supports for ethnic minority students in public schools.
Instruction 38/2004/CT-TTg Classes on ethnic minority languages for cadres working in the ethnic mountainous areas.
Decision 267/2005/QD-TTg Policy on priorities in vocational training for ethnic minority students in boarding schools.
Decision 164/2005/QD-TTg Programme of “Develop distance education in the period of 2005-2010”.
Decree 134/2006/ND-CP The revised nomination policy (Cu tuyen): No entrance exam. After graduated, they have to come back to work for their hometown at least 5 years (university/college) or 3 years (professional school). Students can join the formal education without pre-university attendance (if he is qualified) and then join the same class with other normal students.
The nomination policy allows up to 15% at most of students nominated to be Kinh.
Decision 82/2006/QD-TTg and Joint Circular 43/2007/TTLT/BTC-BGDĐT
Adjustment in scholarship and social supports for ethnic minority students in public schools. Scholarship is increased to VND 360,000 per head per month. Scholarship will be automatically adjusted at 80% of the official minimum average wage.
HEALTH
Decision 270 in 1993 by PM Strategy for Population and Family Planning until 2000.
Decree 95/CP in 1994 People from mountainous area as decided by CEM are exempted from health expenses.
Decision 576/1995/QD-TTG National Plan for Nutrition 1995–2000.
Resolution 37/1996/NQ-CP Strategy for Health Care for the Periods 1996–2000.
Decision 237/1998/QD-TTg National Target Programme on Clean Water and Sanitation, Environment in rural areas.
Decision 139/2002/QD-TTg Programme 139 - National Free Health Care Fund for the poor.
People having Poor Household Certificate, living in the P135 communes, areas under Decision 186 (6 provinces in the Northern mountainous) and under Decision 168 (Central Highlands), will be provided the health insurance cards. Each province will have a Health Care Fund for the Poor of which at least 75% is from the National budget. The total budget of Fund is VND 70,000/per head/year at least. The Fund will pay VND 50,000/per head/year for the health insurance cards or directly pay for actual health expenses upon receipts.

Ethnic minority poverty in Vietnam
68
PRICE AND TRANSPORTATION COST SUBSIDY
Decree 20/1998/ND-TTg, the amended Decree 02/2002/ND-CP, and Joint Circular 07/2002/TTLT/BTM-UBDT-BTC-BKHDT
The objective is to make the sales price of some social-policy items such as salt, petroleum, books, seedlings, fertilizers, and the purchase prices of agricultural/aquacultural/forest crops are the same for farmers living in remote communes as in the provincial town.
Joint Circular 11/2005/TTLT-BNV-BLDXH-BTC-UBDT
Guidelines for the implementation of subsidy system in different regions.
COMMUNICATION
Decision 975/2006/QD-TTg preceded by Decision 1637/QD-TTg in 2001
Programme 975 provides 14 different newspapers and journals free to schools, libraries, commune PCs, district PCs, provincial PCs, provincial departments of ethnic minorities, border points, and villages in the ethnic minority, mountainous and extremely difficult areas.
REGIONAL PROGRAMME
Instruction 393/TTg in 1996 Instruction on population planning and upgrading infrastructure, production arrangement in ethnic and mountainous areas.
Decision 656/1996/QD-TTg Decision on socio- economic development in the Central Highlands for the period of 1996-2000.
Decision 960/1996/QD-TTg Decision on orientation of socio- economic development in the North Mountainous region in the long term.
Instruction 515/TTg in 1997 Instruction on stimulating implementation of the Programme on Exploitation and Socio-Economic Development in Dong Thap Muoi.
Programme 186
(Decision 186/2001/QD-TTg
Supports for the Northern Mountainous Socio-Economic Development.
Programme 173
(Decision 173/2001/QD-TTg)
Supports for the Mekong River Delta Socio-Economic Development.
Programme 168
(Decision 168/2001/QD-TTg)
Supports for the Central Highlands Socio-Economic Development.
Decision 120/2003/QD-TTg Supports for the socio-economic development of provinces along the Vietnam-China boundary.
Decision 174/2004/QD-TTg Supports for the socio-economic development of 19 provinces and 64 mountainous districts bordering the Central Highlands, the west of old Region 4, and the Northern Mountainous area based on the Programme 186 and 168.
Decision 113/2005/QD-TTg Action Plan of the Government on the framework for the socioeconomic development and security of the Northern Central Coast and Southern Central Coast to 2010.
Source: Updated from ’A Review of Ethnic Minority Policies and Programmes in Vietna’ (Nguyen, P.T.T. and Baulch, B., 2007).

The Chronic Poverty Research Centre (CPRC) is an international partnership of universities, research institutes and NGOs, with the central aim of creating knowledge that contributes to both the speed and quality of poverty reduction, and a focus on assisting those who are trapped in poverty, particularly in sub-Saharan Africa and South Asia.
Partners: Bangladesh Institute of Development Studies (BIDS), Bangladesh Development Initiatives, UK Development Research and Training, Uganda Economic Policy Research Center, Uganda FIDESPRA, Benin HelpAge International, UK Indian Institute of Public Administration, India IED Afrique, Senegal Institute of Development Studies, UK Overseas Development Institute, UK Programme for Land and Agrarian Studies, South Africa University of Legon, Ghana University of Manchester, UK University of Sussex, UK
Contact: [email protected] © Chronic Poverty Research Centre 2010
www.chronicpoverty.org