In-group and out-group attitudes of ethnic majority and minority children
32
1 SHORTENED TITLE: Children’s ethnic group attitudes In-group and out-group attitudes of ethnic majority and minority children. Judith A. Griffiths Drew Nesdale Griffith University Griffith University Corresponding Author: Judith Griffiths School of Psychology Griffith University PMB50 Gold Coast Mail Centre Queensland, 9726 Australia. Phone: + 61 5552 7057 Fax: +61 5552 8291 Email: [email protected]
-
Upload
independent -
Category
Documents
-
view
3 -
download
0
Transcript of In-group and out-group attitudes of ethnic majority and minority children

1
SHORTENED TITLE: Children’s ethnic group attitudes
In-group and out-group attitudes of ethnic majority and minority children.
Judith A. Griffiths Drew Nesdale
Griffith University Griffith University
Corresponding Author:
Judith Griffiths
School of Psychology
Griffith University
PMB50
Gold Coast Mail Centre
Queensland, 9726
Australia.
Phone: + 61 5552 7057
Fax: +61 5552 8291
Email: [email protected]

2
Abstract.
Research indicates that ethnic majority group children show a consistent preference
for their ethnic in-group, whereas the ethnic preferences of minority groups are less
conclusive. The present study assessed the ethnic attitudes of 5 – 12 year old children
from an ethnic majority group (59 Anglo-Australian) and a minority group (60 Pacific
Islander). Participants rated members of Anglo-Australian, Pacific Islander, and
Aboriginal (indigenous Australian) groups. Results revealed that the majority group
participants rated the in-group more positively than the two out-groups, with the
indigenous out-group being rated less positively. In contrast, the ethnic minority
participants rated the in-group and the ethnic majority out-group equally positively,
while the Aboriginal out-group was also rated least positively. A preference for in-
group neighbours was also displayed by both the ethnic majority and ethnic minority
participants, with the Aboriginal out-group again being least preferred as neighbours.
The results also revealed that these effects varied with age for the ethnic majority, but
not the ethnic minority group participants. The results are discussed in relation to
findings on children’s ethnic attitudes and intercultural relations.

3
1. Introduction
The focus of this research was on children’s ethnic attitudes. In particular, it
was concerned with the implicit and explicit attitudes of children from a
majority/dominant (Anglo-Australian) ethnic group compared with those from an
ethnic minority/migrant (Pacific Island) group, towards their ethnic in-group, as well
as towards the ethnic out-group. In addition, the research examined the attitudes of
both of these groups to a third (Indigenous Australian) out-group.
The migration of people from one country or region to another is not a new
phenomenon, but rather dates back thousands of years. Migration occurs for a
number of reasons but regardless of the underlying motivation to migrate, one of the
consequences of migration for immigrants is that they face the task of adapting to
living in a new (host) culture (Nesdale, Rooney & Smith, 1997). An important
component of this is the increased contact between immigrants and members of the
host country. As members of the host and immigrant groups come in contact with
each other, attitudes are formed by both groups toward the other, and these attitudes
are played out daily in a multicultural community.
Australia has experienced several phases of migration. The outcome of the
first phase resulted in Anglo-Australian immigrants group establishing themselves as
the dominant group displacing the indigenous (Aboriginal) peoples. Subsequently,
there have been significant increases of European groups (e.g., Greeks and Italians)
during the 1950s and 1960s. More recently, there has been significant migration by
Middle-Eastern, Asian, and Pacific Islander ethnic groups (Nesdale et al., 1997).
The acculturation strategies and the related ethnic attitudes and preferences of
migrant adults, especially those from Asia and Europe have been documented in
Australia (e.g., Mak & Nesdale, 2001). However, little research has focused on

4
immigration and its effects in relation to young children, especially those from the
Pacific Islands. Consequently, the present research focused on the ethnic attitudes of
two groups, the dominant Anglo-Australian group and more recent migrants from the
Pacific Islands.
Research investigating ethnic attitudes of children in Australia to date has
tended to focus on the attitudes of Anglo-Australian children toward ethnic out-
groups. For example Augostinous and Rosewarne, (2001) measured Anglo-
Australian children’s stereotype knowledge as it related to indigenous (Aboriginal)
Australians, whereas Black-Gutman and Hickson (1996) and Nesdale and colleagues
(Nesdale, Maass, Griffiths & Durkin, 2003; Nesdale, Durkin, Maass & Griffiths,
2004; Nesdale, Griffiths, Durkin & Maass, 2005) were interested in Anglo-Australian
attitudes toward the ethnic in-group and an ethnic out-group. There has been little or
no research on the attitudes of an ethnic minority group toward either their in-group,
the dominant group, nor toward the Aboriginal out-group. By investigating only one
ethnic group, it is difficult to establish the current state of ethnic relations both within
and between groups in Australia. The present study sought to address this research
imbalance by examining the attitudes of dominant and ethnic minority children in
order to allow direct comparison to be drawn.
1.1 Ethnic Attitudes
In general, research on adults, adolescents, and children has revealed a strong
preference towards the ethnic in-group (Doyle & Aboud, 1995; Brown, 1995).
Although initial explanations of such findings focused on the possibility of groups
attitudes being influenced by the competition for scarce resources (Campbell, 1965), a
more widely accepted explanation has been provided by social identity theory (SIT,
Tajfel & Turner, 1979). SIT argues that in-group preference is the outcome of the

5
process of self-categorization into, and subjective identification with, the in-group by
its members, and results in the perceptual creation of groups comprised of ‘us’ and
‘them’. According to SIT, these distinctions are applied to a range of social groups,
including gender, religion, and ethnicity. SIT argues that, group members are
motivated to make favorable in-group comparisons that will protect or enhance their
social identity by imbuing the group and, by extension, themselves with positive
qualities. Consistent with this approach, in-group preference has been demonstrated
when group members rate the in-group more favorably, show a preference for other
in-group members and reward the in-group more than the out-group (see Hogg &
Abrams, 1998). This in-group preference is also enhanced as the status of the in-
group increases and there is greater identification with the in-group by its members
(see Brown, 1995; Hogg & Abrams, 1998)
Although much of the preceding research has been carried out using artificial
and short-lived groups in laboratory settings, research into the ethnic preferences of
adults and adolescents has also reported in-group preference across a number of
dimensions including choice of friends (Lenin, van Laar & Sidanius, 2003; Shams,
2001), preferred neighbours (Valk & Karu, 2001), and the allocation of traits
(Rustemli, Mertan & Ciftci, 2000).
Importantly, although there is clear research support for in-group preference,
research has shown that this does not necessarily equate to hatred for the out-group.
A number of studies with adults have indicated low correlations between in-group
positivity and the expression of negativity toward the out-group (Brewer, 1979).
1.1.2 Children’s ethnic attitudes
Researchers have also been interested in the ethnic attitudes and preferences of
children. Early research (Horowitz & Horowitz, 1938) was primarily interested in the

6
attitudes and preferences of white American children. The results of this research
showed that these children had an overwhelming and consistent preference for their
ethnic in-group. In contrast, the seminal work of Clark and Clark (1947) using the
doll paradigm investigated Black American children’s ethnic awareness and attitudes
towards the ethnic in-group and the dominant white ethnic out-group. They reported
that the majority of the Black American participants exhibited out-group preference
and described the white doll as being better, being a nicer colour, and having more
favourable attributes. Clark and Clark interpreted these results as indicating that the
Black children’s preference for the white group reflected a rejection of their own
ethnic group.
Although the validity of the doll paradigm, and the findings relation to ethnic
minority children, have been questioned by some authors (e.g.Foster, 1994; Vaughan,
1986), the methodology of Clark and Clark (1947) and Horowitz and Horowitz (1938)
was subsequently embraced by many researchers and applied to different populations
of children. To investigate the ethnic attitudes and preferences for their own and other
ethnic groups and, in some cases, national groups, researchers have presented children
with a range of stimuli representing different ethnic groups, including dolls (Hraba &
Grant, 1970) and photographs (Nesdale, et al., 2003, 2004, 2005). Children from
different ethnic groups have then been asked to indicate which doll or photograph
they would prefer to have as a friend, which has the more positive qualities, and
which they liked more. The use of interviews (Loomis, 1943), naturalistic observation
(McCandless & Hoyt, 1961) and less overt measures such as attribution tasks
(Williams, Best, Boswell, Mattson & Graves 1975) have also been employed.
The results of these studies indicated that children from majority or dominant
groups in different countries display ethnic in-group preference (e.g., Genesee, Tucker

7
& Lambert, 1978; Nesdale, et al., 2003; Vaughan, 1964, 1978). In contrast to the
findings of Clark and Clark (1947), the responses of ethnic minority children have
been less consistent than those from the dominant group children. In a review of the
American literature from the 1930 until the 1970s, Banks (1976) indicated that unlike
white Americans, Black American children showed no clear pattern of responses.
The lack of consistency shown by the Black Americans has also been revealed in
research focussing on other ethnic minority children (see Vaughan, 1964, 1978).
In an effort to overcome of the limitations of the doll technique, in particular
the forced-choice response options, multiple-item tests, including the Preschool
Racial Attitude Measure II (PRAM II, Williams et al., 1975), and, more recently, the
Multi-response Racial Attitude Measure (MRA, Doyle, Beaudet & Aboud, 1988)
have been developed. While the PRAM II was limited by its forced choice
methodology, the MRA gave children the opportunity to rate each of the groups
independently, as they were able to separately allocate the positive and negative
attributes to both groups. Doyle & Aboud (1995) reported that when given the
opportunity to rate ethnic groups independently, ethnic majority children rated both
the ethnic in-group and out-groups equally positively with increasing age. In contrast,
the ratings were significantly less positive for the ethnic out-group than the ethnic in-
group using the PRAM II. In a further comparative study, between the PRAM II and
an independent rating measure, (where the dolls are presented individually and the
participants rate each doll independently of the other), Kowalski (2003) reported that
using independent measures resulted in more favorable ratings of the out-groups by
both dominant and minority group children than when using a forced choice
methodology. In addition, although the children differentiated between the ethnic in-
group and out-groups, out-groups were still rated favorably. Kowalski concluded that

8
children do not hold strong negative out-group attitudes; instead, they simply hold
less positive attitudes.
This result is interesting as it indicates that children as young as 3-years are
capable of holding attitudes similar to those reported in older children (Nesdale et al.,
2003; 2004) and adults (Brewer, 1979). For example, in a study using the minimal
group paradigm, Nesdale et al., (2003) reported that the participants indicated greater
liking for the in-group than for the out-group. Importantly, however, while the
children indicated greater liking for the in-group, they did not report dislike or hatred
for the out-group, only that they liked them less.
1.2 Rationale for the present study.
Although much has been learnt about the ethnic attitudes of children from the
dominant ethnic group, a number of issues remain to be addressed. First, conclusions
concerning children’s ethnic attitudes have primarily been based on research assessing
children’s ethnic preferences or choices rather than on a direct assessment of their
attitudes toward different ethnic groups. When assessing children’s ethnic preferences
the questions have frequently been comparative, that is, participants have typically
been asked to name which group (out of two or more) they prefer. The conclusion
often drawn from this type of assessment is that preference of one group indicates
rejection of the other group (Aboud, 1988). In contrast, the use of independent
measures allows researchers to investigate attitudes towards both groups separately
rather than assuming that a positive attitude toward one group represents a rejection of
the other group. For example, participants might prefer one group to the other, but
may dislike both, or conversely, they might indicate a preference for one group while
indicating liking for both groups. One aim of the present research was to give

9
participants the opportunity to indicate their ethnic attitudes to one group without
reference to the other ethnic groups.
Second, much of the research into children’s ethnic preferences has focussed
on children from the dominant ethnic group. As noted earlier, there has been less
research examining these issues with ethnic minority children. Accordingly, the
second aim of the present study was to compare the attitudes of both the ethnic
majority and minority groups. Specifically, we were interested in investigating
whether ethnic majority (Anglo-Australian) and ethnic minority (Pacific Island)
children hold more favorable attitudes toward their own ethnic in-group than ethnic
out-groups. Based on the earlier findings, it was predicted that the ethnic in-group
would be rated more favorably than ethnic out-groups by the ethnic majority group.
However, although there is some ambiguity about how ethnic minority children would
respond based on earlier research by Kowalski (2003) it was expected that ethnic
minority group children would express less positive attitudes toward ethnic out-
groups. In addition, it was expected that both majority and minority group children
would express less positive, rather than negative, attitudes towards ethnic out-groups.
Third, the majority of the research to date has compared children’s attitudes
towards their ethnic in-group and one other ethnic out-group, for example, white vs.
African Americans (Epstein, Krupat & Obudho, 1976), Anglo- New Zealanders vs.
Maori (Vaughan, 1963, 1964), and Anglo- Australian vs. Pacific Islanders (Nesdale et
al., 2003). In order to extend our understanding of children’s ethnic attitudes, the
participants’ attitudes toward a third group, Aborigines were also assessed. The
Aboriginal group was included because it was an ethnic out-group of which none of
the participants was a member. In addition, it holds a special status as the original
group of inhabitants of Australia. Further, comparatively little research has addressed

10
children’s attitudes toward Aboriginal children (see Augoustinos & Rosewarne,
2001; Black-Gutman & Hickson, 1996) hence it comprised an important comparison
group. In the present study, the participants (Anglo-Australian and Pacific Islander)
were familiar with, and knowledgeable of, Aborigines through contact at the school
and in the local community. The inclusion of the Aboriginal people as a target group
meant that each participant group (i.e., Anglo-Australian and Pacific Islander) were
asked to rate two out-groups, one of which was Aboriginal. It was not immediately
clear how the participants would rate the two out-groups. One possibility was that
they would simply be rated equally positively. However, another possibility was that
the two groups were be rated differently with, perhaps the Aboriginal group rated
least positively, to reflect their lower status in Australian society.
Fourth, researchers have typically assessed children’s ethnic attitudes using a
variety of explicit measures. For example, as noted previously, children have been
presented with a representative of an ethnic group (usually via a doll or picture) and
have been asked to choose a friend or the person that they thought was ‘nice’. One
problem with such measures is that their focus (i.e., children’s ethnic group attitudes)
is quite explicit thus raising the possibility of constructed responses. Accordingly, the
present study employed both an explicit and an implicit measure of children’s ethnic
attitudes. To assess children’s explicit ethnic attitudes, a modification of the MRA
(Doyle et al., 1988) was developed. This measure allowed participants to rate the
three ethnic groups independently of each other on a common series of traits, with
each trait being rated on a bi-polar scale which allowed for the intensity of the
children’s attribution on each trait to be measured. In addition, a more implicit
measure of ethnic attitudes was employed via a modification of Valk & Karu’s (2001)
street exercise. Specifically, children in the present study were asked to allocate
11
families from the ethnic in-group and out-groups to one of a set of houses in a
hypothetical street. Arguably, this exercise is more realistic and possibly more
implicit than trait ratings and conceivably reflects more closely the attitudes of the
community in which the child lives. Extrapolating from Valk & Karu’s results with
young adults, it was expected that the children would allocate a house to the ethnic in-
group family significantly closer to their own house than they would to families from
the ethnic out-groups. Also of interest, however, was whether the children would
differentiate between the ethnic out-groups, perhaps choosing to locate one ethnic out-
group closer than the other.
Finally, we examined the participants’ ethnic attitudes as a function of their
age. Socio-cognitive theory (ST, Aboud, 1988) predicts that, beyond 7 years of age,
children’s attitudes towards ethnic out-groups become more positive whereas their
attitudes towards the in-group become less positive, as the members of the two groups
are viewed in an increasingly similar way (Doyle et al., 1988). Aboud suggests that
these attitudinal changes are a consequence of children’s ability to differentiate
individuals instead of responding to them simply as category members. Accordingly,
to enable a test of this view, the present study included samples of 6-, 8- and 10-year
old children.
2. Method.
2.1 Participants
The sample consisted of 119 children; 59 Anglo-Australian and 60 Pacific
Islanders. Of these 40 were from Grades 1 and 2 (age M = 6.5, SD = .6); 41 from
grades 3 and 4 (age M = 8.4, SD = .5), and 38 from Grades 5 and 6 (age M = 10.7, SD
= .6). There were approximately equal numbers of males and females at each age
level in the sample. Participants attended two primary schools in South-east

12
Queensland, servicing a lower – middle class community. Only those children who
had been granted parental permission were included in the sample.
2.2 Materials.
2.2.1 Photographs.
The procedure for producing the pool of photos used in the present study has
been detailed in an earlier report (Nesdale et al., 2003). Briefly, following parental
permission, a head-and-shoulders photo was taken of individual children between the
ages of 5 years and 13 years. The children were from Anglo-Australian, Pacific
Islander and Aboriginal ethnic groups. From the pool of photos, 36 were randomly
selected to form three groups corresponding to each age x gender x ethnic group
combination. For each age, gender, and ethnic group, six photographs, each
measuring 75mm x 98mm, depicting two Anglo-Australian, Pacific Island, and
Aboriginal children were used. The six photographs were displayed on a single
landscaped A4 page. Each group was separated by a 5mm vertical red line.
2.2.2 Response Booklet.
A response booklet was produced containing two sections, relating to the
different measures of interest.
2.2.2.1. Explicit Attitudes
Seven adjective pairs were adapted from the Preschool Racial Attitude
Measure II (Williams et al., 1975) and included (bad-good; friendly-unfriendly;
unhelpful – helpful; smart – stupid; clean-dirty). Each pair was presented on a 5-
point bi-polar response scale. Participants indicated the extent to which each adjective
best described the children from the three ethnic groups. The bi-polar scales were
anchored by 1 (very negative rating- e.g., very unfriendly) and 5 (very positive rating-
e.g., very friendly), with 3 indicating a neutral point. A total score was calculated for

13
each participant in relation to each of the ethnic groups that ranged from 7 (very
negative) to 35 (very positive). This scale had a Cronbach reliability of .87.
2.2.2.2 Implicit Attitudes.
The street exercise (Valk and Karu, 2001) was modified for use with young
children. A diagram of nine ‘houses’ (represented as boxes, each with a gabled roof)
was used. The middle house was shaded blue and labelled ‘your house’; the other
eight houses were not shaded. Participants were required to indicate which house
they would allocate to an Anglo-Australian, a Pacific Islander, and an Aboriginal
family. A distance score was calculated with a range of 1 (immediately next door) to 4
(furthest house from the child’s house).
2.3 Procedure.
Participants were tested individually in a quiet location near to their classroom
during scheduled school hours by the first author. After some initial conversation
designed to make the participant feel relaxed and comfortable, the participants were
directed to the response booklet. They were told that they would be shown some
photographs of other children and that they would be asked some questions about
them. To ensure that the participants were comfortable with using the bi-polar scales
they completed several practise questions. The procedure for each of the measures is
presented separately for ease of comprehension.
2.3.1 Explicit Attitudes.
Participants were shown the photographs of the representatives of the three
ethnic groups (Anglo-Australian, Pacific Island, Aboriginal) in turn, and were asked
to rate the groups on the adjective pairs using the scale. To control for order effects,
the order of presentation of each group was randomized. The questions and the

14
response options were read aloud to accommodate the limited reading ability of the
youngest participants.
2.3.2 Implicit Attitudes.
Participants were directed to the diagram in their response booklet displaying
a row of nine ‘houses’. The participants were told, “Let’s pretend that an Anglo -
Australian, a Pacific Island, and an Aboriginal family is going to move into your
street. You do not know anything about these families except which group they come
from. Because it is your street you are allowed to choose who lives in which house.
This is your house here (the experimenter pointed to the blue house). Where in
relation to your house would you like these families to live? You can put the different
families on any side of your house, but you can only put each family into one house”.
Once participants had completed the two measures, they were thanked for their
participation, and returned to their classroom.
3. Results.
Exploratory data analyses were conducted to ensure that the data met the
assumptions of normality and homogeneity of variance for ANOVA. An alpha level
of .05 was used as the significance level for all the analyses and Duncan’s Multiple
Range test (α = .05) was used to assess the significance of differences between cell
means. Partial η2 is reported as an estimate of effect size.
3.1 Explicit Attitudes.
The participants’ summed scores on the trait rating scales data were subjected
to a 3 (age: 6- vs. 8- vs. 10-years) x 2 (gender: male vs. female) x 2 (participant
ethnicity: Anglo-Australian vs. Pacific Island) x 3 (target ethnic group: Anglo-
Australian vs. Pacific Island vs. Aboriginal) ANOVA, with the last factor within
subjects.

15
The results revealed one significant main effect and two interactions. There
was a significant main effect for target ethnic group F(2, 214) = 33.31, p = .0005,
partial η2 = .24, which was qualified by two significant interactions. First, the analysis
revealed a significant target ethnic group x participant ethnic group interaction
F(2,214) = 7.254, p = .001, partial η2 = .06. Refer Figure 1.
Insert Figure 1 about here.
The Anglo-Australian participants rated their ethnic in-group as possessing
more positive attributes (M = 28.88, SD = 4.63), than the Pacific Island group (M =
26.22, SD = 4.71) who were rated more positively than the Aboriginal group (M =
23.78, SD = 6.51). In comparison, the Pacific Island participants rated the ethnic in-
group and the Anglo-Australian out-group equally positively (Ms = 28.25, 27.03, SDs
= 4.98, 4.14 respectively), and significantly more positively than the Aboriginal out-
group (M = 24.03, SD = 5.66). From another perspective, both the Anglo-Australian
and Pacific Island participants rated the Aboriginal group significantly less positively
than the other two groups.
The analysis also revealed a significant target ethnic group x age group
interaction F(4,214) = 3.99, p= .004 , partial η2 = .07, which is illustrated in Figure 2.
Insert Figure 2 about here The 6-year-olds rated the Aboriginal group less positively (M= 24.87, SD = 6.40) than
either the Anglo-Australian (M = 29.00, SD = 4.40) and Pacific Island groups (M =
27.73, SD = 4.43), whose ratings did not differ significantly. There was no significant
difference in the ratings of the Anglo-Australian and Pacific Island groups (Ms =

16
28.32, 27.10 and SDs = 4.639, 6.37 respectively) by the 8-year-olds. In addition,
these groups were rated significantly more positively than the Aboriginal group (M =
22.10, SD = 6.79). In contrast, at 10-years of age, there were no significant
differences in the ratings of the three ethnic groups (Anglo-Australian, M = 26.45, SD
= 4.04; Pacific Island M = 26.89, SD = 3.55; Aboriginal group M = 24.84, SD = 4.04).
The results also revealed that while there were no age differences in the ratings of the
Anglo-Australian and Pacific Island ethnic groups by the participants, the 8-year-olds
rated the Aboriginal ethnic group significantly less positively than the 6- and 10-year-
olds.
In addition, related samples t-tests comparing each cell mean with the neutral
mid-point of the scale were conducted to investigate whether the attitudes toward the
ethnic out-groups were negative, or simply less positive. The findings revealed that
the trait ratings for the each of the groups was located in the positive half of the scale
and were all significantly different from the neutral scale point, (ts = 5.22 to 16.98,
ps <.05. These results indicated that the ethnic out-groups were not hated; they were
simply liked less than the ethnic in-group.
3.2 Implicit Attitudes.
Participants’ housing allocation scores for each of the ethnic group ‘families’
were analysed in a 3 (age: 6- vs. 8- vs. 10-years) x 2 (gender: male vs. female) x 2
(participant ethnic group: Anglo-Australian vs. Pacific Island) x 3 (target ethnic
group: Anglo-Australian vs. Pacific Island vs. Aboriginal) ANOVA, with the last
factor within subjects. The analysis yielded two main effects and two interactions.
Main effects were revealed for target ethnic group F(2,214) = 27.74, p =
.0005, partial η2 = .21and age, F(2,107) = 4.91, p = .009, partial η2 = .10. These
effects were qualified by a significant target ethnic group x participant ethnic group

17
interaction F(2,214) = 11.71, p = .0005, partial η2 = .10 and, in turn, by a significant
target ethnic group x age group x participant ethnic group interaction, F(4,214) =
2.65, p= .034, partial η2 = .047. This interaction is shown in Figure 3.
Insert Figure 3 about here.
The results for the Anglo-Australian participants indicated that at each age the
children displayed a preference for ethnic in-group (Anglo-Australian) neighbours
rather than families from either of the ethnic out-groups. A comparison of the cell
means also revealed that the children’s attitudes towards all three ethnic groups
underwent change as a function of increasing age, with attitudes becoming more
positive. The attitude towards the ethnic in-group became more positive between 6-
years (M = 2.00, SD = 1.34) and 8 –years (M = 1.28, SD = .83), while their attitude
remained unchanged at 10-years (M = 1.48, SD = .93). Attitudes towards the ethnic
out-groups also underwent changes with increasing age. There was no difference in
the preference ratings for either the 6-year-olds or 8-year-olds towards the Pacific
Island (Ms = 2.50, 2.56; SDs = 1.25, 1.34 respectively) or the Aboriginal (M =
2.602.83; SDs = 1.00, 1.04 respectively) ethnic minority families. However, the
attitude of the 10-year-olds became significantly more positive toward the Pacific
Island ethnic out-group (M = 1.76, SD = .77) and the Aboriginal out-group (M = 2.24,
SD = .94) families.
The 6-year-olds did not significantly differentiate between either an in-group
family or an Anglo-Australian family (Ms = 1.60, 1.85, SDs =.88, 1.23 respectively)
when allocating these families a ‘house’. Both groups were preferred as neighbours
significantly more than the Aboriginal family (M = 3.20, SD = .89). By 8-years,
these children exhibited a clear in-group preference, locating the in-group family (M=

18
1.30, SD = .82) significantly closer than the Anglo-Australian family (M= 2.13, SD =
.1.06) and the Aboriginal family (M=2.65, SD =1.06). This in-group preference
continued in the allocations of the 10-year-olds. Again, the ethnic in-group family
(M= 1.30, SD = .82) was located closer than the Anglo-Australian out-group (M=
1.94, SD = .83) and the Aboriginal out-group (M= 2.65, SD = 1.06). Like the Anglo-
Australian participants, the Pacific Island participants discriminated between the
ethnic out-groups, demonstrating the least preference for the Aboriginal out-group.
4. Discussion.
The aim of the present study was to compare the attitudes of ethnic majority
and minority group children toward ethnic in-groups and out-groups, using both
explicit and implicit measures. Consistent with previous findings, it was predicted
that the ethnic majority (Anglo-Australian) participants would rate their in-group
more favorably than both the ethnic out-groups (i.e. Pacific Islander and Aboriginal).
This prediction received clear support, confirming the findings of other studies which
have also shown that ethnic majority children hold more favorable attitudes towards
their ethnic in-group than they hold for ethnic out-groups (Doyle & Aboud, 1995;
Kowalski, 2003; Nesdale et al., 2003).
However, the findings for the ethnic minority (Pacific Islander) participants
contrasted with those of the ethnic majority participants. The former group indicated
equally positive attitudes toward their ethnic in-group and the ethnic majority group,
while a less positive attitude was displayed toward the Aboriginal ethnic group. Thus,
both the ethnic majority and ethnic minority children differentiated between the
respective ethnic out-groups in their ethnic attitudes but in different ways. Although
both groups rated the Aboriginal group significantly less favorably than the other
ethnic out-group, the ethnic majority groups participants rated both out-groups less

19
favourably than the in-group, whereas, the ethnic minority group participants rated
their own group and the ethnic majority groups equally favorably.
The present study also measured the participants’ in-group and out-group
attitudes by having them respond to an implicit attitude measure. The results
indicated that the ethnic majority participants expressed a preference for the ethnic in-
group family to live closest to themselves. In contrast, the youngest aged minority
children failed to differentiate their preferences for neighbors between the in-group
and the ethnic majority group, rating them equally positively. However, by 8-years,
their in-group preference was evident in their responses. The results also indicated
that the children differentiated between the ethnic out-groups. Both the ethnic
majority and the ethnic minority allocated the least favorable location to the
Aboriginal out-group.
The preceding results are noteworthy for several reasons. First, they indicated
a certain consistency in the participants’ responses on the explicit and implicit
measures by the ethnic majority and minority children. This is noteworthy because
the implicit measure used in the present study was actually a social distance measure
which may be viewed as a more realistic measure of attitudes than the explicit
measure that was used. Indeed, whereas research has frequently revealed differences
between the results obtained on explicit versus implicit measures (see Maass, Castelli
& Arcuri, 2000), the present findings suggest that children’s ethnic attitudes are
consolidated at an early age and/or that they are sufficiently comfortable to express
them overtly. Second, the results indicate that ethnic majority children display clear
and consistently favorable in-group attitudes, further supporting previous results.
This was demonstrated by the more favorable in-group rating and was reinforced by
their preference for ethnic in-group neighbours. In contrast, the responses of the

20
ethnic minority children revealed a different pattern of results to the ethnic majority
children. In the explicit measure, these children indicated equally favorable attitudes
toward the ethnic in-group and the ethnic majority group. However, their responses to
the implicit measure showed a clear in-group preference by 8- and 10-year -olds.
In accounting for these results, it might be argued that the different responses
are a by-product of how these children differentially perceive the status of ethnic
groups in their community. Thus, the more favorable ratings given to the ethnic in-
group by the ethnic majority children may reflect their perception of the different
social status achieved by the ethnic majority and minority groups in the community.
That is to say, the attitudes of these majority children may simply be a reflection of
the ethnic status quo and they are reporting community reality. In contrast, the
responses of the ethnic minority participants may be a reflection of how they would
like the ethnic status quo to be. That is, they are reporting how they would like things
to be rather than how they actually are.
While these groups indicated different patterns of attitudes toward the ethnic
majority and minority groups, they were nevertheless in agreement in revealing the
least positive attitudes towards one of the ethnic out-groups, the Aboriginal group.
Again, it may be that these children are simply responding on the basis of established
community status and ethnic status quo. Children do not live in a vacuum, but rather
they live and operate in societies where the social structure and status of ethnic groups
are established. In Australia, the Aboriginal group is generally acknowledged as
holding the lowest social status in the eyes of the community (Griffiths, 2006).
However, it is clear that the underlying motivations for the children’s responses
require further investigation.

21
Interestingly, independent of the above findings, age effects were also
revealed on both the measures used in this study. Unlike previous studies (e.g.,
Nesdale et al., 2003) that reported no effects of age, the present study revealed
changes in attitude as a function of the participant’s age toward the Aboriginal ethnic
out-group. The participants’ attitudes toward the Aboriginal group decreased from 6-
to 8-years and then increased to 10-years of age. The basis of the differences between
the ages is not immediately clear. One possibility is that the more extreme attitudes of
the 8-year-olds compared with the 6- and 10-year-olds may be accounted for by the
particular 8-year-old age cohort that participated in this study. Specifically, this
particular group might have had bad experiences with Aboriginal children in their
community.
Alternatively, ST (Aboud, 1988) hypothesizes that with increasing age,
children’s attitudes toward out-groups should become more positive as they are
increasingly able to differentiate and respond to people as individuals rather than as
category members. This hypothesis was supported in relation to attitudes toward the
Aboriginal ethnic out-group on both measures in that, compared with the 8-year-olds,
the 10-year olds (both ethnic majority and ethnic minority children) indicated more
positive ratings and expressed greater preference to live closer to this ethnic out-
group. Additionally, the ethnic majority participants also expressed greater
preference for the ethnic minority (Pacific Island) as neighbours. In addition,
according to ST, it should also be the case that attitudes toward the ethnic in-group
should become less positive with increasing age, as children are increasingly able to
differentiate members of the in-group. This hypothesis was not supported for either
the ethnic majority or the ethnic minority groups. There was no decline in in-group

22
ratings by either the ethnic majority or the ethnic minority (Pacific Island)
participants.
Another possible explanation is that the change in attitudes with increasing
age may lie in the 10-year-olds being more image conscious than the younger children
and hence the results might reflect their increasing ability to self-regulate the
expression of less positive out-group responses in accordance with their beliefs of
what constitutes socially accepted behaviour (Rutland, Cameron, Milne & McGeorge,
2003). However, whereas this interpretation accounts for the increase from 8- to 10-
years, it does not account for the decrease from 6- to 8-years, nor can it account for
the parity between the responses of the 6- and 10-year-olds. Clearly, the issue of
changes in children’s ethnic attitudes as a function of their age also needs further
investigation.
5. Conclusions
In conclusion, the present findings highlight a number of points. First,
attitudes towards the ethnic in-group and out-groups by ethnic majority and minority
children are expressed in different ways. While the ethnic majority group expressed
consistent in-group attitude bias, there was no similar in-group bias in the explicit
attitudes of ethnic minority children. However, both the ethnic majority and the
ethnic minority children displayed less favorable attitudes toward the Aboriginal
ethnic out-group. These findings are important as they suggest that children’s ethnic
attitudes are not applied uniformly across ethnic out-groups, but rather are influenced
by the particular target out-group. They further raise the possibility that social factors
including social knowledge contribute to children’s ethnic attitudes.
These results are also interesting in the context of intercultural relations. On
the one hand, whereas succeeding generations of immigrant groups tend to enhance

23
their relative societal position as a result of education and career progression
(Nesdale,1987), the present results suggested that such was not the case for
indigenous Australians. On the other hand, it also appears likely that, although the
efforts of the schools from which the samples were drawn in promoting
multiculturalism have contributed to positive attitudes towards the immigrant ethnic
group members, they have not influenced their attitudes toward the indigenous ethnic
group. That is, whereas the multicultural policies may have been successful in relation
to immigrant groups, the less positive attitude toward the indigenous group should be
of concern and their basis should be a focus in future research.

24
References.
Aboud, F. (1988). Children and prejudice. Oxford: Blackwell.
Augoustinos, M & Rosewarne, D.L. (2001). Stereotype knowledge and
prejudice in children. British Journal of Developmental Psychology, 19(1), 143-156
Banks, W.C. (1976). White preference in Blacks: A paradigm in search of a
phenomenon. Psychological Bulletin, 83, 1179-1186.
Black-Gutman, D., & Hickson, F. (1996). The relationship between racial
attitudes and social-cognitive development in children: An Australian study.
Developmental Psychology, 32 (3), 448-456
Brewer, M.B. (1979) In-group bias in the minimal intergroup situation: A
cognitive motivational analysis. Psychological Bulletin, 86, 307-324
Brown, R. (1995). Prejudice: Its Social Psychology. Oxford, Blackwell
Campbell. D.T. (1965). Ethnocentric and other altruistic motives. In D.Levine
(Ed.). Nebraska Symposium on Motivation (pp.283-311). Lincoln: University of
Nebraska Press.
Clark, K.B., & Clark, M.P. (1947). Racial identification and preference in
Negro children. In T.M. Newcomb & E.L. Hartley (Eds.). Readings in social
psychology. New York: Holt. (pp. 169-178).
Doyle, A-B, & Aboud, F.E. (1995). A longitudinal study of white children’s
racial prejudice as a social-cognitive development. Merrill-Palmer Quarterly, 41(2),
209-228.
Doyle, A-B., Beaudet, J., & Aboud, F. (1988). Developmental patterns in the
flexibility of children’s ethnic attitudes. Journal of Cross-Cultural psychology, 19,
3-18.

25
Epstein, Y.M., Krupat, E., & Obudho, C. (1976). Clean is beautiful:
Identification and preference as a function of race and cleanliness. Journal of Social
Issues, 32(2), 109-118.
Foster, D. (1994). Racism and children’s intergroup orientations: Their
development and the question of psychological effects in minority-group children. In
A. Dawes and D. Donald (Eds.). Childhood and adversity: Psychological perspectives
from South African research. Claremont, South Africa: David Phillip Publishers
Genesee, F., Tucker, G.R., & Lambert, W.E. (1978). The development of
ethnic identity and ethnic role-taking skills in children from difference school settings.
International Journal of Psychology, 13, 39-57.
Griffiths, J.A. (2006). Children’s understanding of, and attitudes toward,
ethnic in-groups and out-groups. Unpublished manuscript, Griffith University,
Australia.
Hogg, M, A., & Abrams, D., (1998). Social identifications: A social
psychology of intergroup relations and group processes. London: Routledge.
Horowitz, E.L., & Horowitz, R,E. (1938). Development of social attitudes in
children, Sociometry, 1, 301-338
Hraba, J., & Grant, G. (1970). Black is beautiful: A re-examination of racial
preference and identification. Journal of Personality and Social Psychology, 16,
389-402.
Kowalski, K. (2003). The emergence of ethnic and racial attitudes in
preschool-aged children. Journal of Social Psychology, 143(6), 677-690.
Lenin, S., van Laar, C., & Sidanius, J. (2003). The effects of ingroup and
outgroup friendship in ethnic attitudes in college: A longitudinal study. Group
Processes and Intergroup Relations, 6(1), 76-92.

26
Loomis, C.P. (1943). Ethnic cleavages in the Southwest as reflected in two
high schools. Sociometry, 6, 7-26.
Maass, A, Castelli, L., Arcuri, L. (2000). Measuring prejudice: Implicit versus
explicit techniques. In D. Capozza, & R.Brown (Eds.). Social identity processes:
Trends in theory and research. Thousands Oaks, CA: Sage (p. 96-116).
McCandless, B., & Hoyt, J. (1961). Sex, ethnicity and play preference of
preschool children. Journal of Abnormal and Social Psychology, 62(3), 683-385.
Mak, A., & Nesdale, D. (2001). Migrant distress: The role of perceived racial
discrimination and coping resources. Journal of Applied Social Psychology, 31(12),
2632-2647.
Nesdale, A. R. (1987). Ethnic stereotypes and children. Multicultural Australia
Papers Whole No 57.
Nesdale, D., Durkin, K., Maass, A., & Griffiths, J. (2004). Group status, out-
group ethnicity, and children’s ethnic attitudes. Journal of Applied Developmental
Psychology, 25, 237-251.
Nesdale, D., Griffiths, J., Durkin, K., & Maass, A, (2005). Empathy, group
norms, and children’s ethnic attitudes. Journal of Applied Developmental
Psychology, 26(6), 623-637.
Nesdale, D., Maass, A., Griffiths, J., & Durkin, K. (2003). Effects of in-group
and out-group ethnicity on children’s attitudes towards members of the in-group and
out-group. British Journal of Developmental Psychology, 21, 177-192.
Nesdale, D., & Rooney, R. & Smith, L. (1997). Migrant ethnic identity and
psychological distress. Journal of Cross-Cultural Psychology, 28(5), 569-588.

27
Rustemli, A., Mertan, B., & Ciftci, O. (2000). In-group favoritism among
native and immigrant Turkish Cypriots: Trait evaluations of in-group and out-group
targets. Journal of Social Psychology, 140(1), 26-34.
Rutland, A., Cameron, L., Milne, A., & McGeorge, P. (2003). Self-
presentation and intergroup attitudes in children. Paper presented at the XIth
European Conference on Developmental Psychology, Catholic University of Milan,
August.
Shams, M. (2001) Social support, loneliness and friendship preference among
British Asian and non-Asian adolescents. Social Behavior and Personality, 29(4),
399-404.
Tajfel, H., & Turner, J.C. (1979). An integrative theory of intergroup conflict.
In W.G. Austin & S. Worchel (Eds.).The Social Psychology of Intergroup Relations.
Monterey: Brooks/Cole (pp. 33-47).
Valk, A & Karu, K, (2001). Ethnic attitudes in relation to ethnic pride and
ethnic differentiation. Journal of Social Psychology, 141(5), 583-601.
Vaughan, G.M. (1963). Concept formation and the development of ethnic
awareness. Journal of Genetic Psychology, 103, 93-103.
Vaughan, G.M. (1964). The development of ethnic attitudes in New Zealand
school children. Genetic Psychology Monographs, 70(1), 135-175.
Vaughan, G.M. (1978). Social change and intergroup preferences in New
Zealand. European Journal of Social Psychology, 8, 297-314.
Vaughan, G.M. (1986). Social change and racial identity: Issues in the use of
picture and doll measures. Australian Journal of Psychology, 38(3), 359-370.

28
Williams, J.E., Best, D.L., & Boswell, D.A, Mattson, L.A. & Graves, D,J.
(1975). Preschool Racial Attitude Measure II. Educational and Psychological
Measurement, 35, 3-18.
29
Captions.
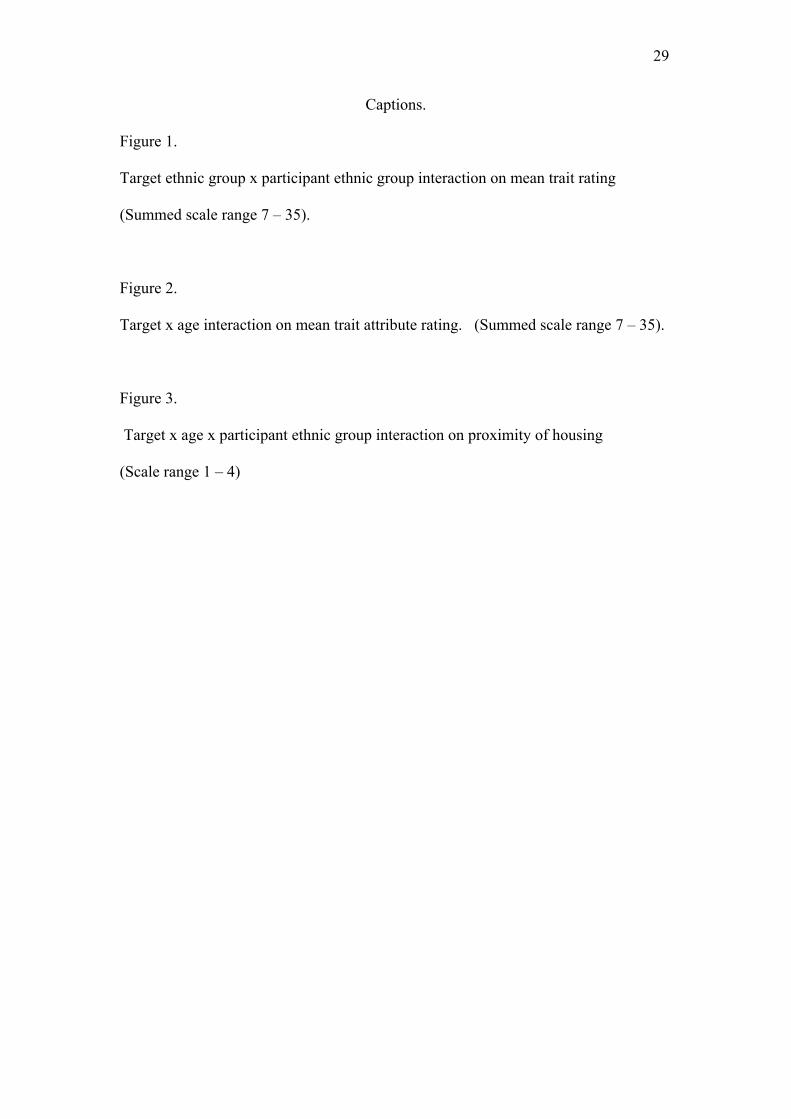
Figure 1.
Target ethnic group x participant ethnic group interaction on mean trait rating
(Summed scale range 7 – 35).
Figure 2.
Target x age interaction on mean trait attribute rating. (Summed scale range 7 – 35).
Figure 3.
Target x age x participant ethnic group interaction on proximity of housing
(Scale range 1 – 4)

30
22
24
26
28
30
Anglo-Australian Pacific Island
Participant Ethnic Group
Mea
n R
atin
g
Anglo-AustralianPacific IslandAboriginal
Figure 1. Target ethnic group x participant ethnic group interaction on mean trait rating (Summed scale range 7 – 35)

31
20
25
30
6 8 10Age Group
Mea
n R
atin
g
Anglo-AustralianPacific IslandAborigine
Figure 2. Target x age interaction on mean trait attribute rating. (Summed scale range 7 – 35)

32
1
1.5
2
2.5
3
6 8 10
Mean age
Mea
n di
stan
ce
AustralianPacific IslandAboriginal
Anglo-Australian participants.
1
1.5
2
2.5
3
3.5
6 8 10
Mean age
Mea
n di
stan
ce AustralianPacific IslandAboriginal
Pacific Island participants
Figure 3. Target x age x participant ethnic group interaction on proximity of housing (Scale range 1 – 4)