
The Salience of Racial and Ethnic Identification in Friendship Choices among Hispanic adolescents
25
10.1177/0739986305284126 Hispanic Journal of Behavioral Sciences Kao, Vaquera / Racial and Ethnic Identification in Friendship Choices The Salience of Racial and Ethnic Identification in Friendship Choices Among Hispanic Adolescents Grace Kao Elizabeth Vaquera University of Pennsylvania Using data from the National Longitudinal Study of Adolescent Health, a nationally representative sample of youth in 7th to 12th grades, this study examines how racial and ethnic identification overlap among Hispanic adoles- cents (N = 6,399). The study examines the choices of friends to evaluate the proximity of race and ethnic identifiers among Hispanics. The result show evi- dence that ethnicity and race are distinct stratifiers as evidenced by their friend- ship choices, but that ethnicity is more significant than race in determining the choice of friends of Hispanics. Racial identification of Hispanics is closely associated with choosing a friend of the same race, whether or not that person is Hispanic. Finally, when Hispanics interact with non-Hispanics, racial identity becomes another determinant of friendships. Keywords: friendships; interethnic friendships; ethnic identification; His- panic adolescents; racial identification Theoretical Considerations Early studies of race relations argued that the proportion of interracial relationships was related to the opportunity for establishing these relation- ships. In addition, interracial contact is constrained by not only opportunities but also individual preferences for interracial contact (Blau, 1977). Previous studies have demonstrated that racial relations are characterized by homo- phily bias. People select members of their own group at higher proportions than expected by their group size (Laumann, Gagnon, Michael, & Michaels, 1994). This tendency to choose people of the same race has been found since the early studies by Bogardus and the Chicago School (Bogardus, 1968; Park, 1928). Some of the contexts that limit the opportunity for interracial 23 Hispanic Journal of Behavioral Sciences Volume 28 Number 1 February 2006 23-47 © 2006 Sage Publications 10.1177/0739986305284126 http://hjbs.sagepub.com hosted at http://online.sagepub.com
Transcript of The Salience of Racial and Ethnic Identification in Friendship Choices among Hispanic adolescents
10.1177/0739986305284126Hispanic Journal of Behavioral SciencesKao, Vaquera / Racial and Ethnic Identification in Friendship Choices
The Salience of Racial andEthnic Identification inFriendship ChoicesAmong HispanicAdolescentsGrace KaoElizabeth VaqueraUniversity of Pennsylvania
Using data from the National Longitudinal Study of Adolescent Health, anationally representative sample of youth in 7th to 12th grades, this studyexamines how racial and ethnic identification overlap among Hispanic adoles-cents (N = 6,399). The study examines the choices of friends to evaluate theproximity of race and ethnic identifiers among Hispanics. The result show evi-dence that ethnicity and race are distinct stratifiers as evidenced by their friend-ship choices, but that ethnicity is more significant than race in determining thechoice of friends of Hispanics. Racial identification of Hispanics is closelyassociated with choosing a friend of the same race, whether or not that person isHispanic. Finally, when Hispanics interact with non-Hispanics, racial identitybecomes another determinant of friendships.
Keywords: friendships; interethnic friendships; ethnic identification; His-panic adolescents; racial identification
Theoretical Considerations
Early studies of race relations argued that the proportion of interracialrelationships was related to the opportunity for establishing these relation-ships. In addition, interracial contact is constrained by not only opportunitiesbut also individual preferences for interracial contact (Blau, 1977). Previousstudies have demonstrated that racial relations are characterized by homo-phily bias. People select members of their own group at higher proportionsthan expected by their group size (Laumann, Gagnon, Michael, & Michaels,1994). This tendency to choose people of the same race has been found sincethe early studies by Bogardus and the Chicago School (Bogardus, 1968;Park, 1928). Some of the contexts that limit the opportunity for interracial
23
Hispanic Journal ofBehavioral SciencesVolume 28 Number 1February 2006 23-47
© 2006 Sage Publications10.1177/0739986305284126
http://hjbs.sagepub.comhosted at
http://online.sagepub.com
relations include (but are not limited to) region of residence, neighborhoodcomposition, school composition, classroom composition, and curriculartrack (Blau, 1994; Hallinan & Smith, 1985; Hallinan & Williams, 1989).However, all these authors acknowledge that individual preferences influ-ence individuals’ willingness to interact with people of other racial groupsand that these patterns cannot be explained entirely by the structural settingsin which they relate to others.
Hallinan and Smith (1985) tested the relative importance of opportunityand status inequality hypotheses in explaining friendship patterns amongstudents at the classroom level. Opportunity implies that the primary sourceof preferences for same-race peers is simply a by-product of structuraldynamics that affect the opportunity for interaction across racial lines. Statusinequality suggests that minorities choose other minorities because they feelthreatened by the more powerful majority group. They found support for theopportunity hypothesis. Their research provides a useful insight for ourresearch because they examined how friendships at school are determined byopportunities and preferences for same-group interactions. However, theirstudy differs from ours in their examination of elementary school children ina classroom setting. Moreover, their study only examined relationshipsbetween Blacks and Whites. In 1989, Hallinan and Williams looked at highschool students. They again found support for the opportunity hypothesis.However, they did not highlight how the relative size of the racial groupsaffects the opportunity of having an interracial friendship.
Among children, the primary context from which they draw their friendsis schools and neighborhoods. For adults, however, neighborhoods, work-places, and institutions of higher education are likely to be the places fromwhich friendships are formed. Previous research suggests that networksformed at work tend to be more racially diverse than those formed elsewhere(Marsden, 1990; McPherson, Smith-Lovin, & Cook, 2001; Reskin, McBrier,& Kmec, 1999). Qian, Blair, and Ruf (2001) suggested that the high levels of
24 Hispanic Journal of Behavioral Sciences
Authors’ Note: We are grateful to the editor and anonymous reviewers for their comments. Aprevious draft of this article was presented at the 2004 Annual Meetings of the Population Asso-ciation of America. This research was supported by a grant from the National Institute of ChildHealth and Development (R01 HD38704-01A1). This research uses data from Add Health, aprogram project designed by J. R. Udry, P. S. Bearman, and K. Mullan Harris., and funded byGrant P01-HD31921 from the National Institute of Child Health and Human Development, withcooperative funding from 17 other agencies. Special acknowledgment is due to Ronald R.Rindfuss and Barbara Entwiste for assistance in the original design. Persons interested in obtain-ing data files from Add Health should contact Add Health, Carolina Population Center, 123 W.Franklin Street, Chapel Hill, NC 27516-2524 (www.cpc.unc.edu/addhealth/contract.html).
interracial marriage among highly educated Asian Americans stem fromtheir greater opportunities to interact with Whites in college.
Most of the studies interested in homogamy and homophily have lookedprimarily at interracial relations between Whites and Blacks (or Whites andnon-Whites as a single monolithic group). This was understandable becauseof the lack of data for other groups (Joyner & Kao, 2000). However, the focuson Black-White relationships also stemmed from a lack of theoretical devel-opment about how to incorporate Hispanics and Asians into studies of inter-racial contact. More often than not, researchers simply treated Hispanics andAsians like Blacks (minority status), and more recently, Asians have beengiven the “model minority” status, whereby some researchers treat them likeWhites (Kao, 1995).
The racial and ethnic composition of the United States is more complexthan in the past, which further complicates intergroup relations. Hispanicsare an appropriate group to focus on because, in some respects, they embodythe complexity of racial and ethnic relations in contemporary United States.Since the 1980 Census, researchers have increasingly classified Hispanicsusing two distinct identity markers. Hence, all Hispanics have an ethnic iden-tification (Mexican, Puerto Rican, Cuban, etc.) and a racial designation(usually White, Black, or Other).
Joyner and Kao (2000) pointed out that in contemporary society individ-uals belong to several groups, and membership to one group does notnecessarily coincide with membership in other groups. As a consequence,research on intergroup relations must consider that some characteristicsbecome more salient than others in determining what makes some types ofrelationships more common than others. In other words, previous researchsuggests that race and ethnicity may be more crucial than religion, age, oreducational differences in determining friendship choices (Blau, 1977,1994; Laumann et al., 1994). In the case of Hispanics, others have alreadydemonstrated a tendency to relate to their own pan-ethnic group (Joyner &Kao, 2000). However, these authors did not uncover whether this holds forthe racial and ethnic subgroups within the Hispanic group. Previous researchhas highlighted that ethnicity is a very important identifier for Hispanics,especially for adolescents, and they attach it to their specific country of ori-gin. Young respondents tend to refuse pan-ethnic definitions of their identity(Portes & Rumbaut, 2001; Rumbaut & Portes, 2001). Quillian and Campbell(2003), using the same data set as we do in this article, found that among His-panics, race was a significant stratifier; however, they did not examine ethnichomophily among Hispanics.
Kao, Vaquera / Racial and Ethnic Identification in Friendship Choices 25
Hispanics: A Heterogeneous Group
Some facts help to contextualize the racial and ethnic relations for His-panics in the United States. Hispanics include multiple racial and ethnicgroups within its confines, which further complicates the extent to whichHispanic identities are salient when choosing friends.
The well-known historical presence of Spaniards in most Latin Americancountries grants Hispanics the possibility of having a White racial origin.However, less is known about the presence of other racial groups in LatinAmerica. Historical accounts of these countries help understand the widearray of racial identities among the Hispanic population. Especially enlight-ening are the cases of Hispanic Blacks and Asians. It has been documentedthat during the 1500s and the 1800s about 15 million Black Africans werecoercively brought to (primarily) the southern coast of Cuba and later sent tothe rest of Latin America (Urbanski, 1972). Asian presence in Latin Americadates back to the 16th century after the Spanish colonization of the Philip-pines (Martinez Montiel, 1981). Migrants from Asia reached the highestnumbers during the 19th century, when East Asian countries were experienc-ing high levels of civil unrest, natural disasters, and economic pressures(Martinez Montiel, 1981). Despite the fact that Hispanic racial diversity hasits roots centuries ago, the U.S. government has only recently acknowledgedit. The 2000 U.S. Census acknowledges that Hispanic individuals can be ofany race (U.S. Census Bureau, 2001). Most surveys have adopted this modelby including a question that assigns Hispanics separate racial and ethnicidentifications.
Another issue in studying the friendship choices of Hispanics in theUnited States is the “opportunity” to choose friends of a different group. His-panics have been traditionally clustered in a few urban areas of the UnitedStates. However, there is evidence that their presence is becoming wide-spread across the country. More states and cities report increasing propor-tions of Hispanics among their population. In addition to established Latinoareas in New York, California, Florida, Texas, and Illinois, other cities andsuburbs in nonestablished areas are experiencing important increases of theirHispanic population (Suro & Singer, 2002). The diversity of the Hispanicpopulation is thus likely to continue to grow in the coming years. Accord-ingly, the schools that young Hispanics attend are likely to be diversesettings.
While the opportunity to interact with other groups is essential in promot-ing interethnic and interracial friendships, self-identification is also impor-tant in determining to which groups adolescents feel closest. An individualwho sees herself or himself as Hispanic White is probably more likely than
26 Hispanic Journal of Behavioral Sciences
someone who is Hispanic Black to choose a non-Hispanic White friend. Incontrast, if Hispanics of any race (White, Black, Other, and No Race) choosenon-Hispanics at comparable rates, this would suggest the relative impor-tance of Hispanic identity over racial identities. This pattern would suggestthat Hispanic is a more meaningful identity than a racial designation ofBlack, White, Other, or No Race.
The contexts in which people’s daily lives take place are very important inunderstanding how they relate to other individuals. During adolescence, thissetting is especially important because it is during adolescence that racial andethnic identities become more salient for youth. Portes and Rumbaut (2001)argued that as adolescents move from early to late adolescence, their identi-ties become less closely tied to family background characteristics. Accord-ingly, we hypothesize that friends signal an ethnic or racial identification thatmay be more meaningful than a label checked on a survey. Moreover, theracial and ethnic composition of friends can influence current and future atti-tudes about one’s own racial and ethnic group, as well as other groups.Finally, friends, and peers have substantial influences on the educationalaspirations and outcomes of youth.
We hypothesize that ethnicity will be more salient in determining thefriendship patterns of Hispanic youth because the racial stratifiers are spe-cific to the U.S. context and are likely less relevant to Hispanic youth. Racialcategories in the United States are not universal, and immigrants likely havevery different understandings of what boundaries are most salient. However,because race and not ethnicity are the primary means by which others iden-tify all individuals, we expect race to matter when Hispanics interact withnon-Hispanics (Omi & Winant, 1986).
In the current study, we examine friendship nominations by youth; hence,we hypothesized that net of the opportunities to interact, Hispanic youth willpractice ethnic homophily. The cross-sectional nature of our data prevents usfrom strongly arguing for a causal direction; however, it is reasonable toassume that, for instance, a Hispanic youth who checks the “White” box willfeel more comfortable with (and may be more accepted by) non-HispanicWhite youth than his Black Hispanic counterpart.
Data and Method
We use data from the National Longitudinal Study of Adolescent Health(hereafter Add Health), a nationally representative sample of 90,000 adoles-cents in Grades 7 through 12 in 1994 to 1995 (Bearman, Jones, & Udry,1997). We use data from the Wave I In-School Sample. Data were collected
Kao, Vaquera / Racial and Ethnic Identification in Friendship Choices 27
from students of 80 high schools that were randomly selected from a data-base of U.S. schools. The schools were stratified by size, region, urbanicity,school type, racial mix, and grade span. For each school, a feeder school wasalso selected with a probability proportional to its student contribution to thehigh school. Therefore, the school-based sample has a pair of schools in eachcommunity, and it includes a total of 134 schools, which varies from less than100 students to more than 3,000 (Bearman et al., 1997). For the current study,we excluded those schools with fewer than three students self-identified withthe race or ethnicity used as dependent variable in the model. We used thiscutoff point to ensure that the possibilities of choosing a same-race and/orethnicity relationship were real. We tested different cutoff points in auxiliaryanalyses and found very similar results (these tables are available onrequest).
Each participating school provided the study with a roster of its students.Identification numbers were assigned to the names on the roster, then copiesof the roster were made and provided to students to use in identifying theirfriends in the course of filling out the In-School Questionnaire. In-SchoolQuestionnaires were completed by more than 90,000 adolescents, represent-ing a participation rate of approximately 80% of all enrolled students at thesampled schools. It is important to note that the longitudinal design of AddHealth only applies to the smaller In-Home sample; we rely on the In-SchoolSample because of its much larger sample size. This allowed us to examinerace and ethnicity of Hispanic adolescents.
Add Health uniquely suits our research interests in several ways. First,because it allows youth to answer a question about Hispanic identificationseparately from that of race, we can differentiate between White, Black,Asian, Native American, and Other Race Hispanics. We can also includeyouth who said they were Hispanic but did not choose another racial identifi-cation—they were designated as No Race Hispanics. In addition, Add Healthallowed youth to choose between Mexican, Chicano, Puerto Rican, Cuban,Central and/or South American, and Other Hispanic ethnicity. Add Healthallowed respondents to choose up to five races. However, our analysesinclude Hispanics that chose only one race. We believe that multiracial iden-tity of Hispanics is a complex question that needs to be explored in its ownright, so we omitted these respondents from our analyses.
Finally, respondents were asked to select their friends from the school ros-ter provided by the school. Respondents could nominate up to five male andfive female friends, from either the in-school roster or from among theirout-of-school friends. If the friend was in the roster and also completed thequestionnaire we can identify characteristics of these friends such as race,ethnicity, gender, and so on. For this investigation, we use information on
28 Hispanic Journal of Behavioral Sciences
first-listed same-sex friend. We use first-listed same-sex friends to avoid con-fusion between friendship and potential romantic partners. If the first-listedfriend was not on the roster (i.e., she or he did not attend the school or wereabsent from school on that day), then we were unable to find his or her racialand/or ethnic information. In these cases, we turned to the second-listedfriend. If the respondent did not choose first or second friend or both were notin the school roster, this adolescent does not have an assigned friend. Morethan 55% of the respondents chose an identifiable same-sex friend. Whilethis proportion is not ideal, this is the only nationally representative sampleof youth that includes friends’ characteristics as reported by friends and notrespondents.
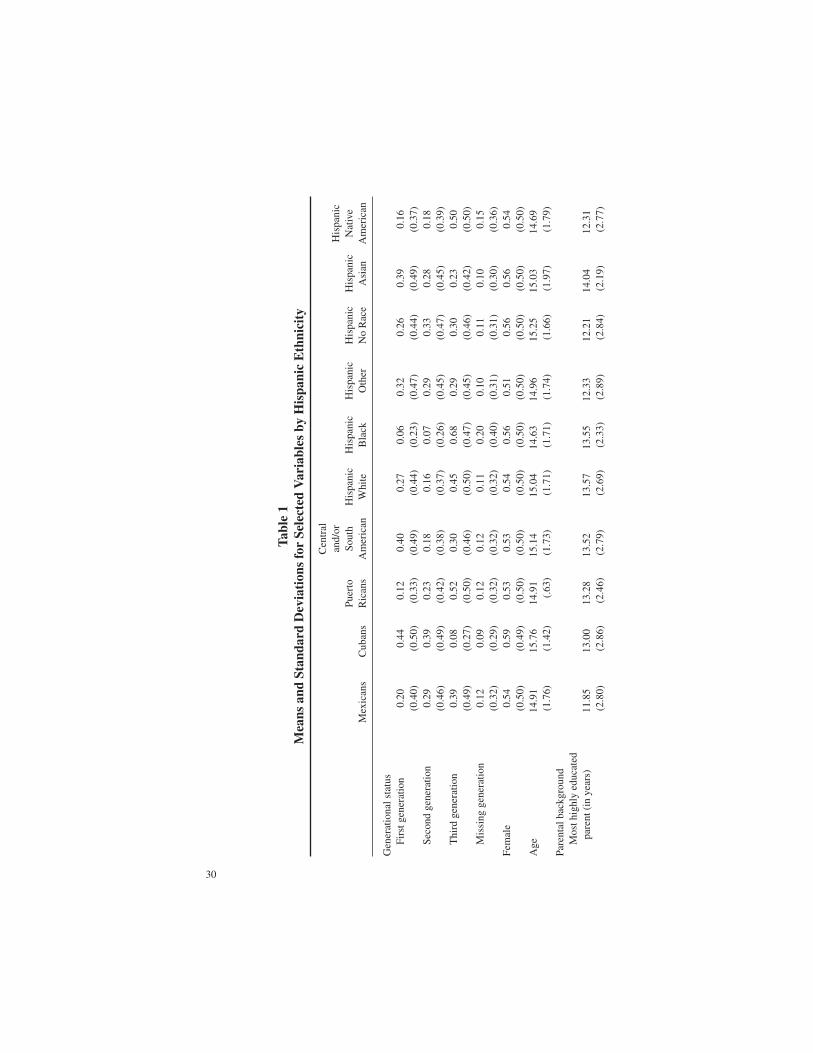
Table 1 presents the means and standard deviations of all for the maincharacteristics of the adolescents in the sample by Hispanic-ethnic andHispanic-racial groups. There is considerable diversity in the generationalstatus of the adolescents. Here, we defined first generation as those youthwho are foreign born. Second-generation youth are those who are born in theUnited States but have a foreign-born mother. Third-generation (andbeyond) youth are native-born youth with a native-born mother. About onehalf of the Puerto Ricans are third and beyond generation, making them thegroup with the highest proportion of third-generation respondents. AlthoughPuerto Ricans have U.S. citizenship, we believe that youth born in PuertoRico more closely resemble first-generation youth, and those who are born inthe United States to mothers who were born in Puerto Rico are more similarto second-generation youth. For this reason, our analyses treated PuertoRican respondents in the same way as the rest of Hispanic adolescents.Cubans and Central and South Americans are most likely to identify as firstgeneration (44% and 40%, respectively). One major difference betweenthese two groups is that 85% of Cubans are first or second generation, whileCentral and South Americans have substantial shares in all three generationallevels. Most Mexicans are third generation (40%), however, the numbers forfirst and second generation are significant (20% and 30%, respectively). Onaverage, Cubans are 1 year older than the rest of the groups. Parental educa-tion is around 12 to 13 years for most, except for the Mexican parents, whohave 1 year less of education than the other groups. This pattern is not sur-prising because others have already documented similar patterns (Portes &Rumbaut, 2001). As for the school characteristics, all ethnic groups attendmainly urban schools; this is especially true for Cubans, with 90% of therespondents in urban schools. Very few students attend rural schools regard-less of their ethnic origins. Finally, most of the students attend large schools,and this is even more true for Cubans, whose average school size is more than
Kao, Vaquera / Racial and Ethnic Identification in Friendship Choices 29
30
Tabl
e 1
Mea
ns a
nd S
tand
ard
Dev
iati
ons
for
Sele
cted
Var
iabl
es b
y H
ispa
nic
Eth
nici
ty
Cen
tral
and/
orH
ispa
nic
Puer
toSo
uth
His
pani
cH
ispa
nic
His
pani
cH
ispa
nic
His
pani
cN
ativ
eM
exic
ans
Cub
ans
Ric
ans
Am
eric
anW
hite
Bla
ckO
ther
No
Rac
eA
sian
Am
eric
an
Gen
erat
iona
l sta
tus
Firs
t gen
erat
ion
0.20
0.44
0.12
0.40
0.27
0.06
0.32
0.26
0.39
0.16
(0.4
0)(0
.50)
(0.3
3)(0
.49)
(0.4
4)(0
.23)
(0.4
7)(0
.44)
(0.4
9)(0
.37)
Seco
nd g
ener
atio
n0.
290.
390.
230.
180.
160.
070.
290.
330.
280.
18(0
.46)
(0.4
9)(0
.42)
(0.3
8)(0
.37)
(0.2
6)(0
.45)
(0.4
7)(0
.45)
(0.3
9)T
hird
gen
erat
ion
0.39
0.08
0.52
0.30
0.45
0.68
0.29
0.30
0.23
0.50
(0.4
9)(0
.27)
(0.5
0)(0
.46)
(0.5
0)(0
.47)
(0.4
5)(0
.46)
(0.4
2)(0
.50)
Mis
sing
gen
erat
ion
0.12
0.09
0.12
0.12
0.11
0.20
0.10
0.11
0.10
0.15
(0.3
2)(0
.29)
(0.3
2)(0
.32)
(0.3
2)(0
.40)
(0.3
1)(0
.31)
(0.3
0)(0
.36)
Fem
ale
0.54
0.59
0.53
0.53
0.54
0.56
0.51
0.56
0.56
0.54
(0.5
0)(0
.49)
(0.5
0)(0
.50)
(0.5
0)(0
.50)
(0.5
0)(0
.50)
(0.5
0)(0
.50)
Age
14.9
115
.76
14.9
115
.14
15.0
414
.63
14.9
615
.25
15.0
314
.69
(1.7
6)(1
.42)
(.63
)(1
.73)
(1.7
1)(1
.71)
(1.7
4)(1
.66)
(1.9
7)(1
.79)
Pare
ntal
bac
kgro
und
Mos
t hig
hly
educ
ated
pare
nt (
in y
ears
)11
.85
13.0
013
.28
13.5
213
.57
13.5
512
.33
12.2
114
.04
12.3
1(2
.80)
(2.8
6)(2
.46)
(2.7
9)(2
.69)
(2.3
3)(2
.89)
(2.8
4)(2
.19)
(2.7
7)

31
Scho
ol c
hara
cter
istic
sU
rban
0.63
0.90
0.57
0.49
0.52
0.41
0.65
0.65
0.28
0.55
(0.4
8)(0
.30)
(0.4
9)(0
.50)
(0.5
0)(0
.49)
(0.4
8)(0
.48)
(0.4
5)(0
.50)
Rur
al o
r su
burb
an0.
370.
100.
420.
510.
470.
590.
350.
350.
720.
45(0
.48)
(0.3
0)(0
.49)
(0.5
0)(0
.50)
(0.4
9)(0
.48)
(0.4
8)(0
.45)
(0.5
0)N
umbe
r of
stu
dent
s1,
175
2,27
61,
047
1,31
11,
410
842
1,28
81,
347
1,18
51,
047
(611
)(6
67)
(620
)(8
07)
(882
)(5
32)
(734
)(6
90)
(557
)(6
94)
N3,
064
549
701
2,08
51,
412
469
2,39
22,
043
189
262
Not
e:O
nly
for
His
pani
csw
ithan
iden
tifia
ble
firs
t-lis
ted
sam
e-se
xfr
iend
.
2,200 students, compared to averages of about 1,000 students in the schoolsattended by Mexicans, Central and South Americans, and Puerto Ricans.
For the analytic section of the current study, we used logistic regressionmodels to evaluate the relative proximity between race and ethnic identifiersamong Hispanics. We predicted the choices of first-listed same-sex friends’racial identities and ethnic identities. To account for this sampling design, weweighted our predictive models. In this way, we adjusted for differences inselection probabilities and response rates allowing sample totals to serve asestimates of population totals (Chantala, 2002; Chantala & Tabor, 1999;Tourangeau & Shin, 1998). In addition, Add Health was designed as anunequal probability cluster sample. This design complicates the statisticalanalysis because the observations are no longer independent and identicallydistributed. Despite that hierarchical methods are the most appropriate foranalyzing the data, in the current study we present results from plain logisticregressions. The parameters obtained using regular logistic regressions andhierarchical models do not significantly differ from each other in magnitude,sign, or level of significance (tables for the hierarchical models are availableon request).
Descriptive Analyses
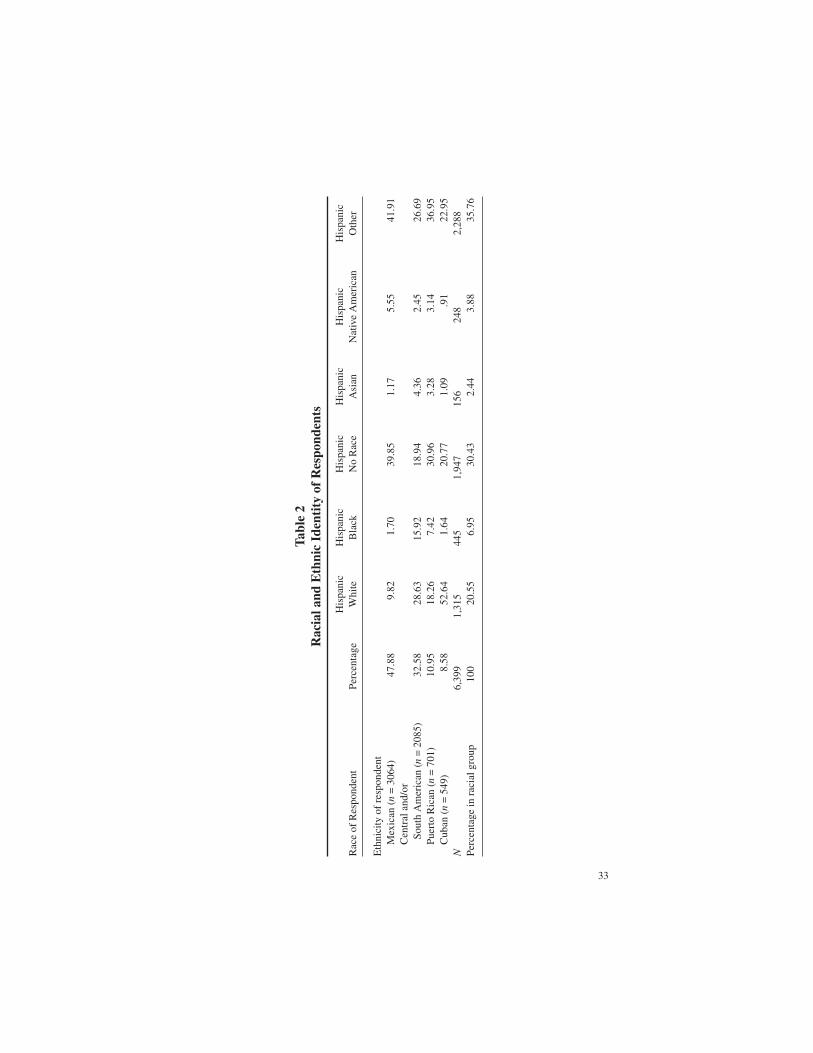
Table 2 presents the intersection of racial and ethnic identity of respon-dents used in the current study. Here we only look at Hispanics with an iden-tifiable first-listed same-sex friend, which is the base sample for the currentstudy. What is most striking here is that the vast majority of Hispanic youthchose Other or No Race as their racial identity. In fact, the No Race Hispanicsconstitute 30% of the Hispanic population compared to 36% for Other, 20%for White, 7% for Black, 4% for Native American, and 2% for Asian. Thesedescriptive tabulations are consistent with the argument that being Hispanicis a meaningful pan-ethnic categorization, rivaling that of White, AfricanAmerican, or Asian American. Most Hispanic adolescents do not have a tra-ditional “racial” identity (i.e., White, Black, Asian) because 66% chose NoRace or Other. Our Hispanic sample closely parallelled that of the generalHispanic population in the United States—about one half of our Hispanicrespondents were Mexican, 9% Cuban, 10% Puerto Rican, and 33% Centraland/or South American or Other ethnicity. These population proportions ofadolescent Hispanics by race and ethnicity with identifiable first-listed same-sex friends are very similar, not significantly different, to the total ofHispanics sampled in Add Health.
In terms of the intersection between race and ethnicity, Mexicans weremore likely to choose No Race or Other; Central and South Americans were
32 Hispanic Journal of Behavioral Sciences
33
Tabl
e 2
Rac
ial a
nd E
thni
c Id
enti
ty o
f R
espo
nden
ts
His
pani
cH
ispa
nic
His
pani
cH
ispa
nic
His
pani
cH
ispa
nic
Rac
e of
Res
pond
ent
Perc
enta
geW
hite
Bla
ckN
o R
ace
Asi
anN
ativ
e A
mer
ican
Oth
er
Eth
nici
ty o
f re
spon
dent
Mex
ican
(n
= 3
064)
47.8
89.
821.
7039
.85
1.17
5.55
41.9
1C
entr
al a
nd/o
rSo
uth
Am
eric
an (n
= 2
085)
32.5
828
.63
15.9
218
.94
4.36
2.45
26.6
9Pu
erto
Ric
an (
n=
701
)10
.95
18.2
67.
4230
.96
3.28
3.14
36.9
5C
uban
(n
= 5
49)
8.58
52.6
41.
6420
.77
1.09
.91
22.9
5N
6,39
91,
315
445
1,94
715
624
82,
288
Perc
enta
ge in
rac
ial g
roup
100
20.5
56.
9530
.43
2.44
3.88
35.7
6
more likely to choose Other and White; Puerto Ricans were more likely tochoose Other and No Race, and Cubans were more likely to choose White. Asizable proportion of all Hispanic ethnic groups chose Other or simply do notmake a choice of any racial group. In fact, if we consider the No Race andOther Hispanics together, they would make up more than two thirds of ourentire Hispanic sample, although important variations occur across groups.
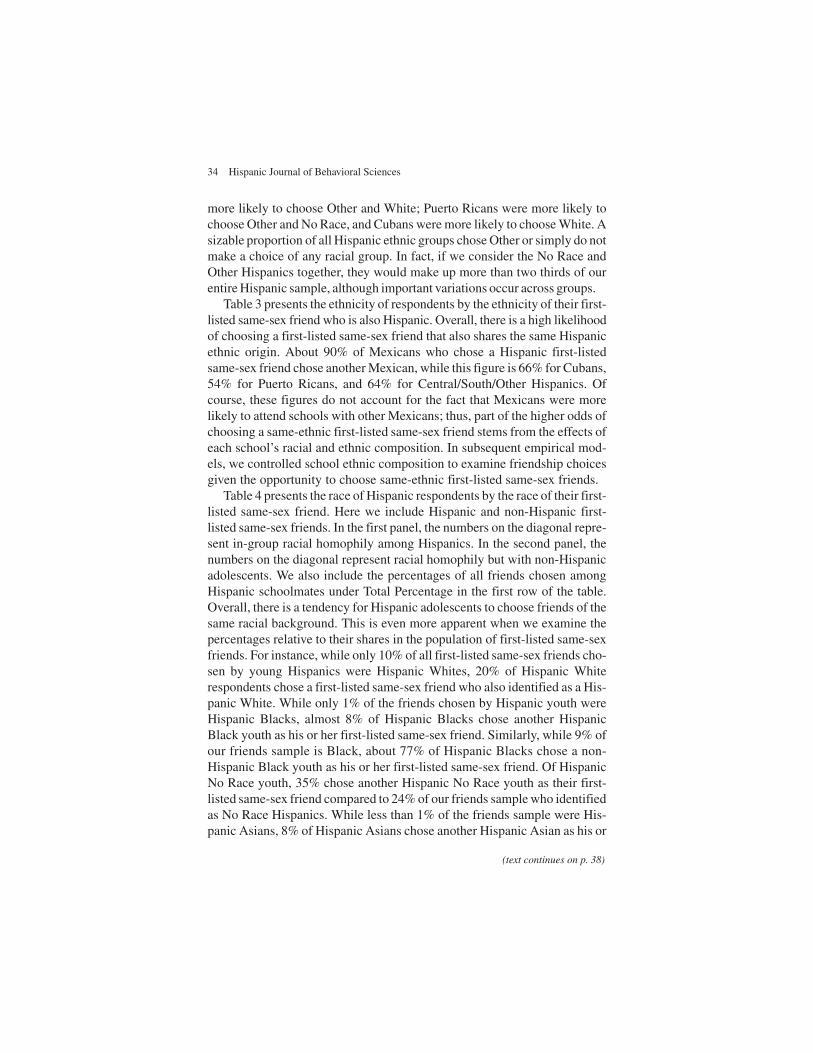
Table 3 presents the ethnicity of respondents by the ethnicity of their first-listed same-sex friend who is also Hispanic. Overall, there is a high likelihoodof choosing a first-listed same-sex friend that also shares the same Hispanicethnic origin. About 90% of Mexicans who chose a Hispanic first-listedsame-sex friend chose another Mexican, while this figure is 66% for Cubans,54% for Puerto Ricans, and 64% for Central/South/Other Hispanics. Ofcourse, these figures do not account for the fact that Mexicans were morelikely to attend schools with other Mexicans; thus, part of the higher odds ofchoosing a same-ethnic first-listed same-sex friend stems from the effects ofeach school’s racial and ethnic composition. In subsequent empirical mod-els, we controlled school ethnic composition to examine friendship choicesgiven the opportunity to choose same-ethnic first-listed same-sex friends.
Table 4 presents the race of Hispanic respondents by the race of their first-listed same-sex friend. Here we include Hispanic and non-Hispanic first-listed same-sex friends. In the first panel, the numbers on the diagonal repre-sent in-group racial homophily among Hispanics. In the second panel, thenumbers on the diagonal represent racial homophily but with non-Hispanicadolescents. We also include the percentages of all friends chosen amongHispanic schoolmates under Total Percentage in the first row of the table.Overall, there is a tendency for Hispanic adolescents to choose friends of thesame racial background. This is even more apparent when we examine thepercentages relative to their shares in the population of first-listed same-sexfriends. For instance, while only 10% of all first-listed same-sex friends cho-sen by young Hispanics were Hispanic Whites, 20% of Hispanic Whiterespondents chose a first-listed same-sex friend who also identified as a His-panic White. While only 1% of the friends chosen by Hispanic youth wereHispanic Blacks, almost 8% of Hispanic Blacks chose another HispanicBlack youth as his or her first-listed same-sex friend. Similarly, while 9% ofour friends sample is Black, about 77% of Hispanic Blacks chose a non-Hispanic Black youth as his or her first-listed same-sex friend. Of HispanicNo Race youth, 35% chose another Hispanic No Race youth as their first-listed same-sex friend compared to 24% of our friends sample who identifiedas No Race Hispanics. While less than 1% of the friends sample were His-panic Asians, 8% of Hispanic Asians chose another Hispanic Asian as his or
34 Hispanic Journal of Behavioral Sciences
(text continues on p. 38)
35
Tabl
e 3
Eth
nici
ty o
f F
irst
-Lis
ted
Sam
e-Se
x F
rien
d, b
y H
ispa
nic
Res
pond
ents
Perc
enta
ge W
ith a
Fri
end
of a
Giv
en E
thni
city
Cen
tral
and
/or
Sout
hE
thni
city
of
Res
pond
ent
n%
Mex
ican
Cub
anPu
erto
Ric
anA
mer
ican
and
Oth
er
Perc
enta
ge3,
549
100.
0054
.04%
12.0
9%7.
19%
26.6
8%M
exic
an1,
905
53.6
889
.40
0.47
1.99
8.14
Cub
an43
412
.23
1.84
66.3
63.
2328
.57
Puer
to R
ican
256
7.21
16.4
16.
2554
.30
23.0
5C
entr
al a
nd/o
r So
uth
Am
eric
an a
nd O
ther
954
26.8
817
.30
12.1
66.
7163
.84

36
Tabl
e 4
Rac
e of
Fir
st-L
iste
d Sa
me-
Sex
Fri
end
by R
ace
of R
espo
nden
ts
Perc
enta
ge w
ith a
Fir
st-L
iste
d Sa
me-
Sex
Frie
nd o
f a
Giv
en R
ace
His
pani
c
Non
-His
pani
cH
ispa
nic
His
pani
cH
ispa
nic
His
pani
cH
ispa
nic
Nat
ive
His
pani
cR
ace
of R
espo
nden
tn
Perc
enta
geW
hite
Bla
ckN
o R
ace
Asi
anA
mer
ican
Oth
erW
hite
Bla
ckA
sian
Tota
l per
cent
age
6,04
810
0.00
.38%
1.14
%24
.19%
.69%
2.22
%25
.31%
23.9
6%9.
41%
3.70
%H
ispa
nic
Whi
te1,
262
20.8
719
.65
.79
12.4
4.4
81.
0314
.58
47.2
31.
742.
06H
ispa
nic
Bla
ck41
16.
80.9
77.
792.
19.2
4.4
92.
436.
8177
.37
1.70
His
pani
c N
o R
ace
1,86
730
.87
7.82
.59
35.5
1.6
42.
0927
.42
17.6
25.
732.
57H
ispa
nic
Asi
an14
72.
433.
401.
366.
128.
161.
367.
4826
.53
8.16
37.4
1H
ispa
nic
Nat
ive
Am
eric
an21
73.
596.
45.4
623
.50
.92
11.5
218
.43
26.7
37.
374.
61H
ispa
nic
Oth
er2,
144
35.4
57.
00.6
126
.77
.42
2.47
36.1
018
.61
4.38
3.64

37
Perc
enta
ge w
ith a
Fri
end
of a
Giv
en R
ace
His
pani
c
His
pani
cN
on-H
ispa
nic
His
pani
cH
ispa
nic
His
pani
cH
ispa
nic
Nat
ive
His
pani
cR
ace
of R
espo
nden
tN
Perc
enta
geW
hite
Bla
ckN
o R
ace
Asi
anA
mer
ican
Oth
erW
hite
Bla
ckA
sian
Perc
enta
geH
ispa
nic
Whi
te1,
262
248
10.0
015
7.00
6.00
13.0
018
4.00
596.
0022
26H
ispa
nic
Bla
ck41
14
32.0
09.
001.
002.
0010
.00
28.0
031
87
His
pani
c N
o R
ace
1,86
714
611
.00
663.
0012
.00
39.0
051
2.00
329.
0010
748
His
pani
c A
sian
147
52.
009.
0012
.00
2.00
11.0
039
.00
1255
His
pani
c N
ativ
e A
mer
ican
217
141.
0051
.00
2.00
25.0
040
.00
58.0
016
10H
ispa
nic
Oth
er2,
144
150
13.0
057
4.00
9.00
53.0
077
4.00
399.
0094
78To
tal
6,04
8.00
her first-listed same-sex friend. In addition, while less than 4% of the first-listed same-sex friend chosen by Hispanic youth were (non-Hispanic)Asians, 37% of Hispanic Asians chose a non-Hispanic Asian as his or herfirst-listed same-sex friend. Hispanic Other youth also were more likely tochoose another Hispanic Other as his or her first-listed same-sex friend thanby chance alone.
Recall that because we directly linked responses of friends to those ofrespondents, there is a smaller likelihood of bias in reports of friend’s race.Note that in most surveys of friends, respondents are asked directly about theracial composition of friends—this leaves much room for error in determin-ing the group of friends who are considered in determining the compositionof friends but also in the determination of racial identification of specificfriends. In other words, the race and ethnicity of the respondents and theirfirst-listed same-sex friends are self-reported by themselves, not assigned bythe other (Smith, 1999). Most previous published research suffers from thismajor caveat. The consequence is that the levels of heterophily reported arehigher than the reality because people want to report racially diverse friend-ship networks to interviewers (Smith, 1999). In the current analysis, therespondents do not respond for their friends and do not necessarily knowhow their first-listed same-sex friends have responded about their own racialand ethnic identifiers.
Table 5 examines the importance of ethnicity in the choices of a first-listedsame-sex friend among Hispanic youth. We estimated the effects of ethnic-ity, parental socioeconomic status (SES), and school characteristics on theodds of choosing a friend of a particular ethnicity. For the sake of brevity, weonly present odds ratios. Values greater than 1 suggest that the backgroundcharacteristic increases the odds of choosing a particular racial identity whilevalues less than 1 suggest that the characteristic decreases the odds of choos-ing that racial identity. The dependent variable in Model 1 is the odds ofchoosing a Mexican first-listed same-sex friend. Similarly, Model 2 exam-ines the odds of choosing a Cuban friend; Model 3 examines the odds ofchoosing a Puerto Rican friend; finally, Model 4 examines the effects ofbackground characteristics on the odds of choosing a Central and/or SouthAmerican friend.
In all of these models, we controlled for the effects of generational status,gender, age, parental education, and school characteristics. Under schoolcharacteristics, we specifically examined the urbanicity, size (measured inhundreds of students), and the ethnic composition of schools. In the predic-tive models, the categories Rural and Suburban were collapsed into onebecause, as we have shown in the descriptive tables, most students are inurban schools. The lack of Hispanic students in rural schools in the Add
38 Hispanic Journal of Behavioral Sciences

Kao, Vaquera / Racial and Ethnic Identification in Friendship Choices 39
Table 5Odds Ratio Estimates for Ethnicity of First-Listed Same-Sex Friend
Model 4Model 1 Model 2 Model 3 Central and/or
Variables Mexican Cuban Puerto Rican South American
EthnicityMexican .— 0.67*** 0.35*** 0.61***
(0.10) (0.02) (0.01)Cuban 0.03*** .— 0.13*** 0.19***
(0.04) (0.04) (0.01)Puerto Rican 0.19*** 0.42*** .— 0.62***
(0.01) (0.05) (0.01)Central and/ 0.23*** 0.32*** 0.32*** .—or South American (0.01) (0.04) (0.01)
Generational statusFirst generation 1.84*** 0.91** 1.22*** 2.79***
(0.01) (0.03) (0.02) (0.01)Second generation 2.02*** 1.39*** 1.65*** 1.99***
(0.01) (0.03) (0.01) (0.01)Third generation (baseline) .— .— .— .—Missing generation 1.08*** 0.69*** 1.13*** 1.61***
(0.02) (0.05) (0.02) (0.01)Female 0.98** 1.10*** 0.73*** 1.05***
(0.01) (0.02) (0.01) (0.01)Age 1.01*** 1.09*** 0.89*** 1.13***
(0.00) (0.01) (0.00) (0.00)Parental background
Most highly educated parent 0.90*** 0.99*** 1.04*** 1.02(0.00) (0.00) (0.00) (0.00)
School characteristicsUrban 0.98* 0.91 1.19*** 0.48***
(0.01) (0.05) (0.01) (0.01)Rural or suburban (baseline) .— .— .— .—Number of students (in 100s) 1.03*** 0.97*** 1.00** 0.98***
(0.00) (0.00) (0.00) (0.00)School racial composition
% Mexican (Model 1 only) 1.06***(0.00)
% Cuban (Model 2 only) 1.17***(0.00)
% Puerto Rican (Model 3 only) 1.10***(0.00)
% Central and/or South 1.09American (Model 4 only) (0.00)***
–2 log likelihood 662,515 116,269 273,915 487,851N 4,528 2,459 4,049 4,253
Note: *p < 0.05. **p < 0.01. ***p < 0.001.
Health sample did not allow for the use of these three categories in our mod-els. For each model, we controlled for the proportion of youth at school whochose the same ethnic identifier. The ethnic identity of other youth at schoolhas significant effects on the likelihood of choosing a friend of the same eth-nicity, controlling for all other individual background characteristics. Schoolracial composition has a large effect on the odds of choosing a first-listedsame-sex friend of any particular ethnic group. However, we found that, ingeneral, there is evidence of a preference for same-ethnic first-listed same-sex friends. In Models 1 through 5, we can observe how each ethnic group isrespectively the most likely to choose friends within the same ethnic group.Even after controlling for all the background characteristics and school racialcomposition, Cuban, Puerto Rican, and Central and/or South Americanrespondents were more likely to choose first-listed same-sex friends withintheir own ethnic group. The corresponding ethnic identity of the respondentthat matches with that of the first-listed same-sex friend is the reference cate-gory in each model. In the odds ratio presented, we invariably observed thatthe other ethnic groups have odds ratios below 1. In other words, respon-dents, after controlling by school opportunity, were still very likely to choosefirst-listed same-sex friends within the same ethnic group.
Generational status matters in the ethnic choice of first-listed same-sexfriend. Because we compared the likelihood of choosing a certain Hispanic-ethnic friend relative to all friends (Hispanic and not Hispanic), we foundthat compared to their third-generation (and beyond) counterparts, first-generation and second-generation youth were more likely to choose anotherHispanic youth as their first-listed same-sex friend. The only exception tothis rule was in Model 2, where first-generation Hispanic adolescents wereless likely than third-generation Hispanics to choose a Cuban friend than anyother friend.
Table 6 presents the odds ratios from logistic regression models that pre-dict the odds of choosing a Hispanic Other (Model 1), Hispanic No Race(Model 2), and a Hispanic White (Model 3) first-listed same-sex friend.There were too few nominations of Hispanic Asians, Hispanic Blacks, andHispanic Native American for us to analyze these groups separately and pro-vide robust statistical results. As in the previous tables, the most striking pre-dictor of the race of one’s first-listed same-sex friend is the proportion of stu-dents that share Hispanic racial group at school. Controlling for all otherindividual background characteristics, racial identity of other youth at schoolhas significant effects on the likelihood of choosing that race. All these mod-els show the tendency toward racial homophily among Hispanic adolescents.This is even true for the Hispanic Other and the Hispanic No Race individu-als; according to their friendship choices, these two were distinct from each
40 Hispanic Journal of Behavioral Sciences
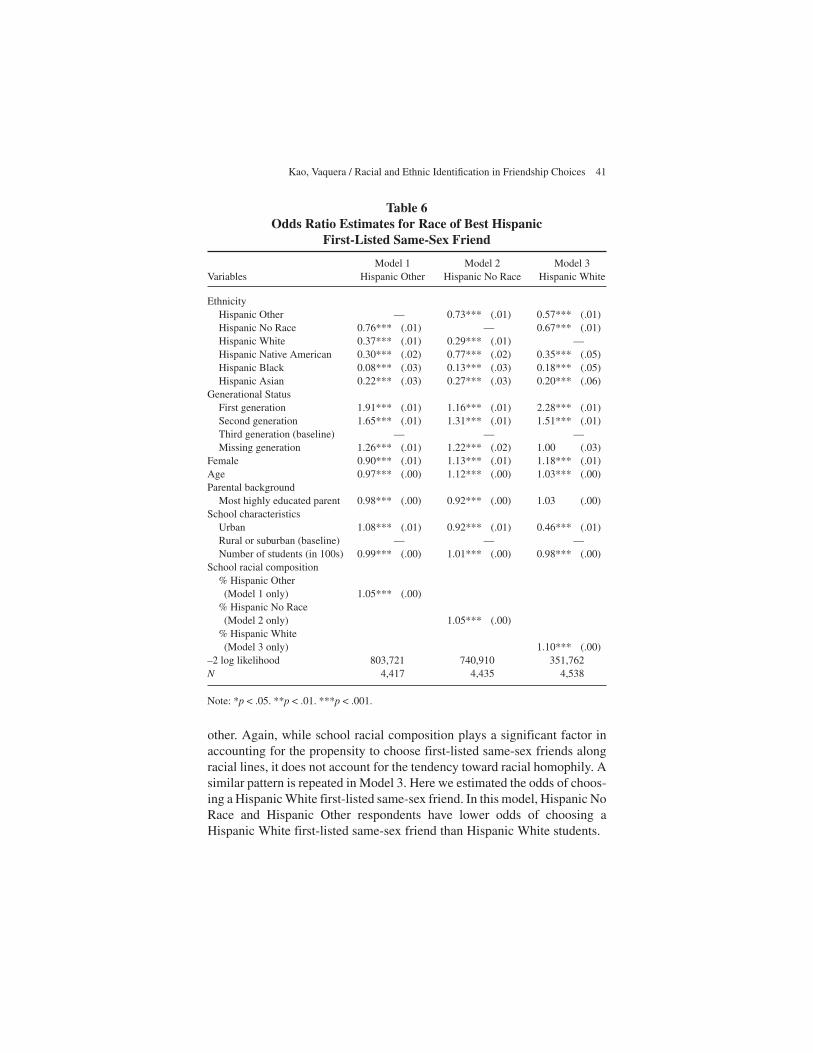
other. Again, while school racial composition plays a significant factor inaccounting for the propensity to choose first-listed same-sex friends alongracial lines, it does not account for the tendency toward racial homophily. Asimilar pattern is repeated in Model 3. Here we estimated the odds of choos-ing a Hispanic White first-listed same-sex friend. In this model, Hispanic NoRace and Hispanic Other respondents have lower odds of choosing aHispanic White first-listed same-sex friend than Hispanic White students.
Kao, Vaquera / Racial and Ethnic Identification in Friendship Choices 41
Table 6Odds Ratio Estimates for Race of Best Hispanic
First-Listed Same-Sex Friend
Model 1 Model 2 Model 3Variables Hispanic Other Hispanic No Race Hispanic White
EthnicityHispanic Other — 0.73*** (.01) 0.57*** (.01)Hispanic No Race 0.76*** (.01) — 0.67*** (.01)Hispanic White 0.37*** (.01) 0.29*** (.01) —Hispanic Native American 0.30*** (.02) 0.77*** (.02) 0.35*** (.05)Hispanic Black 0.08*** (.03) 0.13*** (.03) 0.18*** (.05)Hispanic Asian 0.22*** (.03) 0.27*** (.03) 0.20*** (.06)
Generational StatusFirst generation 1.91*** (.01) 1.16*** (.01) 2.28*** (.01)Second generation 1.65*** (.01) 1.31*** (.01) 1.51*** (.01)Third generation (baseline) — — —Missing generation 1.26*** (.01) 1.22*** (.02) 1.00 (.03)
Female 0.90*** (.01) 1.13*** (.01) 1.18*** (.01)Age 0.97*** (.00) 1.12*** (.00) 1.03*** (.00)Parental background
Most highly educated parent 0.98*** (.00) 0.92*** (.00) 1.03 (.00)School characteristics
Urban 1.08*** (.01) 0.92*** (.01) 0.46*** (.01)Rural or suburban (baseline) — — —Number of students (in 100s) 0.99*** (.00) 1.01*** (.00) 0.98*** (.00)
School racial composition% Hispanic Other(Model 1 only) 1.05*** (.00)
% Hispanic No Race(Model 2 only) 1.05*** (.00)
% Hispanic White(Model 3 only) 1.10*** (.00)
–2 log likelihood 803,721 740,910 351,762N 4,417 4,435 4,538
Note: *p < .05. **p < .01. ***p < .001.
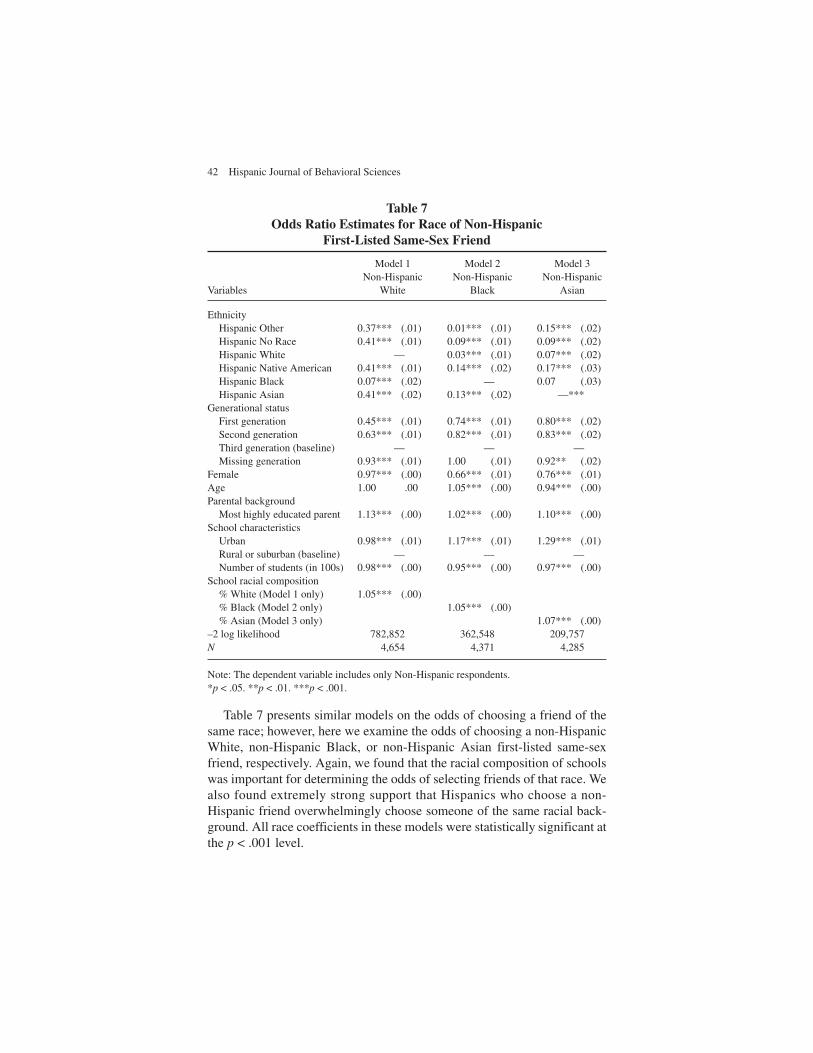
Table 7 presents similar models on the odds of choosing a friend of thesame race; however, here we examine the odds of choosing a non-HispanicWhite, non-Hispanic Black, or non-Hispanic Asian first-listed same-sexfriend, respectively. Again, we found that the racial composition of schoolswas important for determining the odds of selecting friends of that race. Wealso found extremely strong support that Hispanics who choose a non-Hispanic friend overwhelmingly choose someone of the same racial back-ground. All race coefficients in these models were statistically significant atthe p < .001 level.
42 Hispanic Journal of Behavioral Sciences
Table 7Odds Ratio Estimates for Race of Non-Hispanic
First-Listed Same-Sex Friend
Model 1 Model 2 Model 3Non-Hispanic Non-Hispanic Non-Hispanic
Variables White Black Asian
EthnicityHispanic Other 0.37*** (.01) 0.01*** (.01) 0.15*** (.02)Hispanic No Race 0.41*** (.01) 0.09*** (.01) 0.09*** (.02)Hispanic White — 0.03*** (.01) 0.07*** (.02)Hispanic Native American 0.41*** (.01) 0.14*** (.02) 0.17*** (.03)Hispanic Black 0.07*** (.02) — 0.07 (.03)Hispanic Asian 0.41*** (.02) 0.13*** (.02) —***
Generational statusFirst generation 0.45*** (.01) 0.74*** (.01) 0.80*** (.02)Second generation 0.63*** (.01) 0.82*** (.01) 0.83*** (.02)Third generation (baseline) — — —Missing generation 0.93*** (.01) 1.00 (.01) 0.92** (.02)
Female 0.97*** (.00) 0.66*** (.01) 0.76*** (.01)Age 1.00 .00 1.05*** (.00) 0.94*** (.00)Parental background
Most highly educated parent 1.13*** (.00) 1.02*** (.00) 1.10*** (.00)School characteristics
Urban 0.98*** (.01) 1.17*** (.01) 1.29*** (.01)Rural or suburban (baseline) — — —Number of students (in 100s) 0.98*** (.00) 0.95*** (.00) 0.97*** (.00)
School racial composition% White (Model 1 only) 1.05*** (.00)% Black (Model 2 only) 1.05*** (.00)% Asian (Model 3 only) 1.07*** (.00)
–2 log likelihood 782,852 362,548 209,757N 4,654 4,371 4,285
Note: The dependent variable includes only Non-Hispanic respondents.*p < .05. **p < .01. ***p < .001.

These results are particularly striking. All the models support the idea ofracial homophily outside the Hispanic ethnic group. We found that comparedto Hispanic Whites, all the other racial groups among Hispanics were muchless likely to choose a White first-listed same-sex friend. This is true even forHispanic Other and Hispanic No Race youth, which suggest that these identi-ties mark the salience of Hispanics and that Hispanic Whites may be moretightly linked to a non-Hispanic identity. These results suggest that there is ameaningful differentiation between being Hispanic White versus HispanicOther or Hispanic No Race. In Model 2, we can see that compared to His-panic Blacks, all other Hispanic racial groups were also much less likely tochoose a Black friend. It is worth highlighting that the odds ratios for thismodel were smaller than those of the previous one. One interpretation is thatthere is an even greater separation among the racial groups when examiningthe odds that the first-listed same-sex friend is Black. In Table 1, we saw thatHispanic Others, and Hispanic No Races were about 60% less likely thanHispanic Whites to choose a White first-listed same-sex friend. This differ-entiation was even more apparent when comparing groups in their odds ofchoosing a non-Hispanic Black first-listed same-sex friend. In Model 2, weobserved that Hispanic Other and Hispanic No Race were 99% and 91%,respectively, less likely than Hispanic Blacks to choose a non-HispanicBlack first-listed same-sex friend. Model 3, which examined the odds ofchoosing an Asian non-Hispanic first-listed same-sex friend, exhibited asimilar pattern compared to the previous two models. All Hispanic racialgroups were less likely than Hispanic Asian youth to nominate a non-His-panic Asian first-listed same-sex friend.
This table also shows the assimilation of Hispanic youth toward choosingWhite, Black, or Asian friends. Third-generation Hispanics were more likelythan first-generation or second-generation Hispanics to choose a non-Hispanicfirst-listed same-sex friend. We also found that youth with more highlyeducated parents to be more likely to choose a White, Black, or Asian non-Hispanic first-listed same-sex friend. These patterns suggest that higher lev-els of SES and higher generational status promote assimilation in terms offriendship patterns.
Discussion
We found racial identification among Hispanics to be extremely complex.Unlike previous research, we found that there is a substantial number of His-panics who are unhyphenated racially—that is they do not identify as White,Black, Asian, or Native American. The No Race Hispanics constituted one
Kao, Vaquera / Racial and Ethnic Identification in Friendship Choices 43
third of our Hispanic sample. When one combines this group with the His-panics that identify as Other, they total two thirds of the Hispanic populationin Add Health. These findings were consistent with the idea that Hispanic is ameaningful pan-ethnic category—in fact, for the vast majority of Hispanics,it may be more meaningful than other categories such as White Hispanic,Black Hispanic, Native American Hispanic, or Asian Hispanic. Hispanicyouth insist on not being racialized in the usual categories: White, Black, orAsian. As some have argued before, we supported the argument that Hispan-ics make a conscious choice when they say Other. Their answers were not theresult of “confusion” or misunderstanding but an assertion of a meaningfulpan-ethnic label (Rodriguez, 1992). Hispanic youth do not see themselves aspart of the racial groups of White, Black, or Asian as used in the UnitedStates, and their responses also suggest that these racial categories have littlemeaning to them.
Our findings also point to the importance of racial identification and eth-nic identification among Hispanics in determining their friendship choices.While racial and ethnic composition of schools is an important determinantof friendship selection, we still found remnants of ethnic and racial homo-phily among Hispanic youth. Consistently, adolescents choose first-listedsame-sex friends that share their same racial background (even outside theirethnic group); however, they also choose first-listed same-sex friends of thesame ethnic background. These findings support the notion that a pan-ethniclabel is meaningful for the Hispanic group and, at the same time, found evi-dence that racial identification and ethnic identification were significantstratifiers among Hispanic adolescents in and out of their ethnic group. Atleast among Hispanics, ethnicity might be more important than race. Racialdesignations of Hispanics might be especially important in the selection ofnon-Hispanic friends as a first-listed same-sex friend. In other words, will aCuban American, who thinks of herself as a White Hispanic, be most likelyto choose a Cuban American, a White Hispanic, or a non-Hispanic Whiteyouth as her friend? Further research needs to explore this possibility. Themain exception to this rule was Black Hispanics who were far more likely tochoose a Black Hispanic first-listed same-sex friend or non-Hispanic Blackfirst-listed same-sex friend than their non-Black Hispanic counterparts. Thisis also true for Asian Hispanics, and to a lesser extent, White Hispanics.
Our analysis of friendship choices among Hispanics supports the argu-ment that race is to a certain degree ethnic (Rodriguez, 1992). Ethnic differ-ences seem stronger across groups than those of some racial groups used inthis research. For instance, in some of our models, the choices made betweenNo Race Hispanics and Other Hispanics were somewhat similar. We foundthat being an unhyphenated Hispanic may be an increasingly important way
44 Hispanic Journal of Behavioral Sciences
for youth to self-identify. Our data limitations, though, do not allow us toestablish what separates self-identified Hispanics Other from Hispanics NoRace.
While racial categories still seem important for Hispanics, ethnic groupsseem to make more sense to these adolescents. Minimally, ethnicity seems tobe a more concrete and palpable identity than racial categories as they exist inthe United States, and that might explain why youth have fewer problemsusing ethnic identifiers than racial ones. Adolescents seem very aware of theintricate definition of their racial and ethnic identity, and both seem impor-tant to them. How they manage to choose friends of the same ethnicity seemsmore obvious to us; how they do it for racial categories that in principle donot always stem from phenotype differences is more complicated to under-stand. Moreover, because racial categories are social constructions, racialhomophily may simply represent racial identifications after these friendshipsare formed. This is less so for Asian and Black Hispanics, whose identitiesare likely formed by national-group origin (even several generations beforethem) and distinct phenotype differences. Overall, we argue that except forAsian and Black Hispanics, racial identity as defined by social scientists maynot be as meaningful as ethnic identities and a pan-ethnic Hispanic identifi-cation for youth.
Finally, there are a few limitations of the current study. The currentresearch uses cross-sectional data. Friendships during adolescence are likelyto not be stable over time, and thus the friends that we identified in the currentstudy might no longer be best friends of the respondents in another point intime. Moreover, the patterns we found may be specific to this stage of theirlife course, and it is unclear that their friendship choices as adults will followthe same patterns. In addition, we did not examine the extent to which youthwere being rejected by others and whether these friendship choices were theresult of individual choice and acceptance by others. Friends included in thecurrent study were only “in school” friends because of the necessity to iden-tify them. We cannot extrapolate our findings to friendships formed outsideschool so we cannot say whether these rules were exercised for nonschoolfriends. Finally, the racial choices of the adolescents in the current studywere constrained by the options given in the questionnaire. We cannot fur-ther evaluate the meaning of Other and No Race for these adolescents. Thefact that the majority of our respondents fell into this category grants furtheranalysis. The labels Other and No Race are ambiguous terms that may notconstitute any coherent grouping, and thus should be replaced by moremeaningful terms. We encourage qualitative researchers to explore how ageand context affect the relative meanings individuals attach to these labels.
Kao, Vaquera / Racial and Ethnic Identification in Friendship Choices 45
References
Bearman, P., Jones, J., & Udry, J. R. (1997). The National Longitudinal Study of AdolescentHealth: Research design. Available at www.cpc.edu/projects/addhealth/design.html
Blau, P. M. (1977). Inequality and heterogeneity: A primitive theory of social structure. NewYork: Free Press.
Blau, P. M. (1994). Structural contexts of opportunities. Chicago: University of Chicago Press.Bogardus, E. S. (1968). Comparing racial distance in Ethiopia, South Africa and the United
States. Sociology and Social Research, 52, 149-156.Chantala, K. (2002). Introduction to analyzing Add Health data. Chapel Hill: Carolina Popula-
tion Center, University of North Carolina at Chapel Hill.Chantala, K., & Tabor, J. (1999). Strategies to perform a design-based analysis using the Add
Health data. Chapel Hill: Carolina Population Center, University of North Carolina at Cha-pel Hill.
Gans, H. J. (1992). Second-generation decline: Scenarios for the economic and ethnic futures ofthe post-1965 American immigrants. Ethnic and Racial Studies, 15, 173-192.
Hallinan, M. T., & Smith, S. S. (1985). The effects of classroom racial composition on students’interracial friendliness. Social Psychology Quarterly, 48(1), 3-16.
Hallinan, M. T., & Williams, R. A. (1989). Interracial friendship choices in secondary schools.American Sociological Review, 54, 67-78.
Joyner, K., & Kao, G. (2000). School racial composition and adolescent racial homophily. SocialScience Quarterly, 81, 810-825.
Kao, G. (1995). Asian-Americans as model minorities? A look at their academic performance.American Journal of Education, 103, 121-159.
Kao, G. (1999). Psychological well-being and educational achievement among immigrantyouth. In D. J. Hernandez (Ed.), Children of immigrants: Health, adjustment, and publicassistance (pp. 410-477). Washington, DC: National Academy Press.
Laumann, E. O., Gagnon, J. H., Michael, R. T., & Michaels, S. (1994). The social organization ofsexuality. Chicago: University of Chicago Press.
Marsden, P. V. (1990). Network diversity, substructures and opportunities for contact. In C.Calhoun, M. Meyer, & R. S. Scott (Eds.), Structures of power and constraint: Papers inhonor of Peter Blau (pp. 397-410). New York: Cambridge University Press.
Martinez Montiel, L. M. (1981). Asiatic migrations in Latin America. Mexico, DF: El Colegio deMexico.
McPherson, M., Smith-Lovin, L., & Cook, J. M. (2001). Birds of a feather: Homophily in socialnetworks. Annual Review of Sociology, 27, 415-444.
Omi, M., & Winant, H. (1986). Racial formation in the United States: From the 1960s to the1980s. New York: Routledge and Kegan Paul.
Park, R. E. (1928). Human migration and the marginal man. American Journal of Sociology, 33,881-893.
Portes, A., & Rumbaut, R. G. (2001). Legacies: The story of the immigrant second generation.Berkeley: University of California Press.
Qian, Z., Blair, S. L., & Ruf, S. (2001). Asian American interracial and interethnic marriages:Differences by education and nativity. International Migration Review, 32, 557-586.
Quillian, L., & Campbell, M. (2003). Beyond Black and White: The present and future of multi-racial friendship segregation. American Sociological Review, 68, 540-566.
Reskin, B. F., McBrier, D. B., & Kmec, J. A. (1999). The determinants and consequences ofworkplace sex and race composition. Annual Review of Sociology, 25, 335-361.
46 Hispanic Journal of Behavioral Sciences
Rodriguez, C. E. (1992). Race, culture, and Latino “otherness” in the 1980 Census. Social Sci-ence Quarterly, 73(4), 930-937.
Rumbaut, R. G., & Portes, A. (2001). Ethnicities: Children of immigrants in America. Berkeley:University of California Press.
Smith, T. W. (1999). Measuring inter-racial friendships: Experimental comparisons. GeneralSocial Survey Methodological Report No. 91. Retrieved May 23, 2005, from http://cloud9.norc.uchicago.edu/dlib/m-91.htm
Suro, R., & Singer, A. (2002). Latino growth in metropolitan America: Changing patterns, newlocations. Washington, DC: Brookings Institution.
Tourangeau, R., & Shin, H.-C. (1998). National Longitudinal Study of Adolescent Health:Grand sample weight. Chapel Hill: Carolina Population Center, University of NorthCarolina at Chapel Hill.
Urbanski, E. (1972). Hispanoamerica, sus Razas y Civilizaciones. New York: Eliseo Torres andSons.
U.S. Census Bureau. (2001). The Hispanic population: Census 2000 Brief. Available atwww.census.gov/population/www/socdemo/race/factfinder.census.gov
Grace Kao is an associate professor of sociology and the director of the Asian American StudiesProgram at the University of Pennsylvania. She received her Ph.D. in sociology from The Uni-versity of Chicago. She is the principal investigator (with K. Joyner) of the National Institute ofChild Health and Development project, Interracial Friendship and Romance among Adoles-cents. Recent publications include “Interracial Relationships and the Transition to Adulthood” inAmerican Sociological Review (with K. Joyner, 2005) and “Stability of Interracial and IntraracialRomantic Relationships among Adolescents,” in Social Science Research (with H. Wang & K.Joyner, forthcoming). Currently, with support from the Spencer Foundation and Russell SageFoundation, she is examining early childhood outcomes of immigrant youth. In her spare time,she is a film buff and an amateur soap maker.
Elizabeth Vaquera is a Ph.D. candidate in sociology at the University of Pennsylvania. Herresearch interests focus on Hispanics, education, adolescence, and interracial relations. Her dis-sertation analyzes the relationship between friendship choices and racial and ethnic differencesin school outcomes of Hispanic adolescents. She previously published an article titled “Privateand Public Displays of Affection Among Interracial and Intraracial Adolescent Couples” inSocial Science Quarterly (with G. Kao, 2005). Her most recent work examines how friendshipreciprocity affects the academic well-being of students. During her free time she enjoys cooking,especially baking cakes, pies, and other yummy desserts for her friends.
Kao, Vaquera / Racial and Ethnic Identification in Friendship Choices 47