Erythropoiesis stimulating agents and reno-protection: a meta ...
Analysis and Comparison of TCP Reno and Vegas
Jeonghoon Mo, Richard J. La�, Venkat Anantharam, and Jean Walrand
Department of Electrical Engineering and Computer Sciences
University of California at Berkeley
fjhmo, hyongla, wlr, [email protected]
July 13, 1998
Abstract
We propose some improvements of TCP Vegas and compare its performance characteristics
in comparison with TCP Reno. We demonstrate through analysis that TCP Vegas, with its
better bandwidth estimation scheme, uses the network resources more e�ciently and is more
fair than TCP Reno. Simulation results are given and support the results of the analysis.
1 Introduction
Following a series of congestion collapses starting in October of '86, Jacobson and Karels developed
a congestion control mechanism, which was later named TCP Tahoe [9]. Since then, many modi�-
cations have been made to the transmission control protocol (TCP) and several di�erent versions
of TCP have been implemented [9, 10].
Recently Brakmo et al. [2] have proposed a new version of TCP, which is named TCP Vegas,
with a fundamentally di�erent congestion avoidance scheme from that of TCP Reno and claimed
that TCP Vegas achieves 37 to 71 percent higher throughput than TCP Reno. Ahn et al. [1]
have evaluated the performance of TCP Vegas on their wide area emulator and shown that TCP
Vegas does achieve higher e�ciency than TCP Reno and causes much less packet retransmissions.
However, they have observed that TCP Vegas when competing with other TCP Reno connections,
does not receive a fair share of bandwidth, i.e., TCP Reno connections receive about 50 percent
higher bandwidth.
�address all correspondence to the second author
1

Floyd has observed that TCP Reno is biased against the connections with longer delays [5, 7] .
The intuition behind this behavior is as follows. While a source does not detect any congestion, it
continues to increase its window size by one during one round trip time. Obviously the connections
with shorter delay can update their window sizes faster than those with longer delays, and thus
steal higher bandwidths. Based on this observation, Floyd and Jacobson [6] have proposed a
constant rate adjustment algorithm. Henderson et al. [8] have simulated a variation of this scheme
and reported that if the rate of increase of the window size is not excessive, this scheme is not
harmful to the other connections that use a di�erent version of TCP. Moreover, as expected, this
scheme results in better performance for the connections with longer delays. However, choosing
the parameters for such algorithms is still an open problem.
In this paper, we explain the performance characteristics of TCP Vegas such as fairness and
incompatibility with TCP Reno. We also discuss a few problems with the original TCP Vegas.
The rest of the paper is organized as follows. In section 2 we describe the congestion detection and
avoidance schemes of TCP Reno and TCP Vegas. Section 3 presents a few problems intrinsic in the
original TCP Vegas and explains a possible solution to them. In section 4 we discuss the fairness
of TCP Vegas using a simple closed uid model. Section 5 compares TCP Vegas with TCP Reno
and explains the incompatibility between them. We con�rm our analysis with simulation results in
section 6, and �nish with some conclusion and future problems.
2 Congestion Avoidance Mechanism
In order to make an e�cient use of network bandwidth, TCP controls its ow rate using the feedback
from the network. In order to control its ow rate, TCP needs to estimate the available bandwidth in
the network using a bandwidth estimation scheme. Among many new features implemented in TCP
Vegas, the most important di�erence between TCP Vegas and TCP Reno lies in this bandwidth
estimation scheme used to estimate the available bandwidth. As will be shown shortly, TCP Reno
views packet losses as a signal of network congestion, while TCP Vegas uses the di�erence in the
expected and actual rates to adjust its window size. This fundamental di�erence in the bandwidth
estimation schemes enables TCP Vegas to utilize the available bandwidth more e�ciently.
2

2.1 TCP Reno
TCP Reno induces packet losses to estimate the available bandwidth in the network. While there
are no packet losses, TCP Reno continues to increase its window size by one during each round
trip time. When it experiences a packet loss, it reduces its window size to one half of the current
window size. This is called additive increase and multiplicative decrease. Additive increase and
multiplicative decrease algorithm is based on the results given in [3]. They have shown that such
an algorithm leads to a fair allocation of bandwidth. TCP Reno, however, fails to achieve such
fairness because TCP is not a synchronized rate based control scheme, which is necessary for the
convergence.
As can be easily seen, the congestion avoidance mechanism adopted by TCP Reno causes
a periodic oscillation in the window size due to the constant update of the window size. This
oscillation in the window size leads to an oscillation in the round trip delay of the packets. This
oscillation results in larger delay jitter and an ine�cient use of the available bandwidth due to
many retransmissions of the same packets after packet drops occur.
The rate at which each connection updates its window size depends on the round trip delay of
the connection. Hence, the connections with shorter delays can update their window sizes faster
than other connections with longer delays, and thereby steal an unfair share of the bandwidth. As
a result, TCP Reno exhibits an undesirable bias against the connections with longer delays [5, 7].
2.2 TCP Vegas
TCP Vegas adopts a more sophisticated bandwidth estimation scheme. It uses the di�erence
between expected and actual ows rates to estimate the available bandwidth in the network. The
idea is that when the network is not congested, the actual ow rate will be close to the expected
ow rate. Otherwise, the actual ow rate will be smaller than the expected ow rate. TCP Vegas,
using this di�erence in ow rates, estimates the congestion level in the network and updates the
window size accordingly. Note that this di�erence in the ow rates can be easily translated into
the di�erence between the window size and the number of acknowledged packets during the round
trip time, using the equation
Diff = (Expected� Actual) BaseRTT; (1)
where Expected is the expected rate, Actual is the actual rate, and BaseRTT is the minimum round
trip time. The details of the algorithm are as follows:
3

1. First, the source computes the expected ow rate Expected = CWNDBaseRTT
, where CWND is the
current window size and BaseRTT is the minimum round trip time.
2. Second, the source estimates the current ow rate by using the actual round trip time ac-
cording to Actual = CWNDRTT
, where RTT is the actual round trip time of a packet.
3. The source, using the expected and actual ow rates, computes the estimated backlog in the
queue from Di� = (Expected-Actual) BaseRTT.
4. Based on Di�, the source updates its window size as follows.
CWND =
8>>>><>>>>:
CWND + 1 if Diff < �
CWND � 1 if Diff > �
CWND otherwise
Throughput
Window Size
ActualThroughput
Expected Throughput
Linear Increasing
w w + w +
C
Linear Decreasing
/RTT/RTT
a
a β
β
Figure 1: Window control of TCP Vegas
Figure 1 illustrates the behavior of TCP Vegas. Consider a simple network with one connection
and one link with capacity C. Let BaseRTT be the minimum round trip delay. The throughput
of this connection is windowBaseRTT
when window < C � BaseRTT. In the �gure, w corresponds to the
window size where window = C � BaseRTT . When window > w, queue starts to build up and
(Expected - Actual) > 0. TCP Vegas increases the window size by one during the next round trip
time if window < w + � and decreases the window size by one if window > w + �. Otherwise,
it leaves the window size unchanged. In the �gure, Di� is user i's estimated backlogged queue
size in the link. This will be explained in more details in section 3. TCP Vegas tries to keep at
least � packets but no more than � packets in the queues. The reason behind this is that TCP
4

Vegas attempts to detect and utilize the extra bandwidth whenever it becomes available without
congesting the network. Thus, when there is only one connection, the window size of TCP Vegas
converges to a point that lies between w+� and w+�. Note that this mechanism is fundamentally
di�erent from that used by TCP Reno. TCP Reno always updates its window size to guarantee
full utilization of available bandwidth, leading to constant packet losses, whereas TCP Vegas does
not cause any oscillation in window size once it converges to an equilibrium point.
3 TCP Vegas
TCP Vegas has a few problems that have not been discussed before, which could have a serious
impact on the performance. One of the problems is the issue of rerouting. Since TCP Vegas uses
an estimate of the propagation delay, baseRTT, to adjust its window size, it is very important for a
TCP Vegas connection to be able to have an accurate estimation. Rerouting a path may change the
propagation delay of the connection, and this could result in a substantial decrease in throughput.
Another important issue is the stability of TCP Vegas. Since each TCP Vegas connection attempts
to keep a few packets in the network, when their estimation of the propagation delay is o�, this
could lead the connections to inadvertently keep many more packets in the network, causing a
persistent congestion. La et el. [12] have investigated these issues. We summarize the results here.
For more details, refer to [12].
3.1 Rerouting
TCP Vegas that was �rst suggested by Brakmo et el. [2] does not have any mechanism that handles
the rerouting of connection. In this section, we will show that this could lead to strange behavior
for TCP Vegas connections. Recall that in TCP Vegas BaseRTT is the smallest round trip delay,
which is an estimate of the propagation delay of the path .
First, if the route of a connection is changed by a switch, then without an explicit signal from
the switch, the end host cannot directly detect it. If the new route has a shorter propagation
delay, this does not cause any serious problem for TCP Vegas because most likely some packets
will experience shorter round trip delay and BaseRTT will be updated. On the other hand, if the
new route for the connection has a longer propagation delay, the connection will not be able to tell
whether the increase in the round trip delay is due to a congestion in the network or a change in the
route. Without this knowledge the end host will interpret the increase in the round trip delay as a
5

sign of congestion in the network and decrease the window size. This is, however, the opposite of
what the source should do. When the propagation delay of connection i is di, the expected number
of backlogged packets of the connection is wi�ridi, where wi is connection i's window size and ri is
the ow rate. Since TCP Vegas attempts to keep between � and � packets in the switch bu�ers, if
the propagation delay increases, then it should increase the window size to keep the same number
of packets in the bu�er. Because TCP Vegas relies upon delay estimation, this could impact the
performance substantially.
Since the switches in the network do not notify the connections of change in routes, this requires
that the source be able to detect any such change in the route. La et el. [12] have suggested the
following modi�cation. For the �rst K packets, it works the same way as TCP Vegas, where K is a
pre�xed parameter. After the ACK for Kth packet arrives, the source keeps track of the minimum
round trip delay of the N consecutive packets. If the minimum round trip time of the last L �Npackets is much larger than the current baseRTT, the source updates baseRTT to the minimum
round trip time of the last N packets and resets the congestion window size based on this new
baseRTT.
The basic idea behind this mechanism is as follows. If the minimum round trip time computed
forN packets is consistently much higher than baseRTT, then it is likely that the actual propagation
delay is larger than the measured baseRTT, and it makes sense to increase baseRTT. However, it is
possible that the increase is due to a persistent congestion in the network. This problem is brie y
discussed in section 3.2. Since the increase in delay forces the source to decrease its window size, the
round trip delay comes mostly from the propagation delay of the new route. Thus, the minimum
round trip delay of the previous N packets is a good estimate of the new propagation delay, as is
baseRTT for the previous route. The detailed description of the mechanism is given in [12] with
simulation results.
3.2 Persistent Congestion
Since TCP Vegas uses baseRTT as an estimate of the propagation delay of route, its performance
is sensitive to the accuracy of baseRTT. Therefore, if the connections overestimate the propagation
delay due to incorrect baseRTT, it can have a substantial impact on the performance of TCP Vegas.
We �rst consider a scenario where the connections overestimate the propagation delays and possibly
drive the system to a persistently congested state.
Suppose that a connection starts when there are many other existing connections, the network
6

is congested and the queues are backed up. Then, due to the queuing delay from other backlogged
packets, the packets from the new connection may experience round trip delays that are considerably
larger than the actual propagation delay of the path. Hence, the new connection will set the window
size to a value such that it believes that its expected number of backlogged packets lies between �
and �, when in fact it has many more backlogged packets due to the inaccurate estimation of the
propagation delay of the path. This scenario will repeat for each new connection, and it is possible
that this causes the system to remain in a persistent congestion. This is exactly the opposite of a
desirable scenario. When the network is congested, we do not want the new connections to make
the congestion level worse. This same situation may arise with TCP Reno or TCP Tahoe. However,
it is more likely to happen with TCP Vegas due to its �ne-tuned congestion avoidance mechanism.
Once RED gateways are widely deployed, this problem can be handled by the same mechanism
suggested in section 3.1. The intuition behind this solution is as follows. When the network stays
in a persistently congested state, the connections interpret the lasting increase in the round trip
delay as an increase in the propagation delay and updates their baseRTT. This creates a temporary
increase in congestion level in the network, and most connections, if not all, back o� as they detect
the congestion. As connections reduce their window sizes, the congestion level will come down,
which allows the connections to estimate the correct baseRTT. Once most connections have an
accurate measurement of the propagation delay, the congestion level will remain low. Since RED
gateways drop packets independently, the synchronization e�ect will not be a big problem. For
more details and simulation results, see [12].
4 Fairness of TCP Vegas
As we have mentioned before, TCP Reno is biased against the connections with long delays [5, 7, 13].
In this section we show that TCP Vegas does not su�er from this delay bias as TCP Reno does by
analyzing a simple closed uid model, and con�rm the resulting analysis by simulation in section 6.
We assume that the packets are in�nitely divisible, i.e., we use a uid model, and the propagation
delay is deterministic.
Consider the simple network in Figure 2. There are two users with possibly di�erent round trip
delays, which share a single bottleneck link. User i has round trip delay di and exercises window-
based ow control. Without loss of generality we assume that the capacity of the bottleneck link
is normalized to one.
7

q(t)
d
d
w (t)
w (t)S
S
1
1
2
1
22
e (t)
e (t)2
1
Figure 2: Network with two users
Let qi(t) denote the user i's queue size at time t, q(t) = (q1(t); q2(t)), and z(t) =P2
i=1 qi(t),
which is the total backlog at time t. De�ne ui(t) = z(t� ui(t)) + di, which denotes the round trip
delay experienced by user i's packet whose ACK arrives at the source at time t. We assume that
the switch adopts the FIFO service discipline and has in�nite bu�er size. Suppose ei(t) denotes
the rate at which connection i receives ACK as shown in Figure 2 and the capacity is fully utilized,
i.e., e1(t� d1) + e2(t� d2) = 1. Users update their window sizes once during each round trip time.
Since the window size is equal to the sum of the amount of uid in queue and in transit, at
time t we have
wi(t) = qi(t) +Z t+di
t
ei(s)ds: (2)
Note that the second term on the right hand side is the amount of uid in transit at time t. Each
source computes the expected backlog using the product of the propagation delay and the di�erence
between the expected ow rate and the actual ow rate. Thus, the estimated amount of backlogged
uid computed by connection i is
Diffi = wi(t)� diui(t)
Z t
t�ui(t)ei(s)ds: (3)
A heuristic argument for the convergence of window sizes after some time t0 to a point such
that
� � wi(t)� diui(t)
Z t
t�ui(t)ei(s)ds � � (4)
is given in Appendix. Now suppose that window sizes satisfy equation (4). If we substitute (2) in
(4), we have
� � qi(t) +Z t+di
t
ei(s)ds� diui(t)
Z t
t�ui(t)ei(s)ds � �: (5)
8

Once the window sizes satisfy (4), the sources do not change the window size. Suppose that the
system is quasi-static and ei(t) is relatively constant. Then, the second and third terms in (5)
cancel each other out, and it yields
� � qi(t) � �: (6)
Note that under the quasi-static assumption the queue size and the estimated queue size in (3) of
connection i do not depend on di. Since the server exercises the FIFO service discipline, the ow
rate of each connection is proportional to its queue size. Therefore, the throughput of a connection
does not depend on its propagation delay, and there is no bias in favor of connections with short
delays.
If a connection with a larger delay wants to keep the same amount of uid in the queue and
similar throughput as a connection with a much shorter delay, it needs to have a bigger window
size than the connection with a shorter delay because it needs more uid in transit. This can be
easily seen from (2). If both connections have same throughput, then the second term in (2) is
directly proportional to the delay of the connection. Therefore, when all connections are receiving
similar throughput, the window sizes of the connections should be roughly proportional to their
propagation delays.
If we assume that the throughput and the queue size of each connection is relatively constant,
then from (2) we get
wi(t) = qi(t) + ei(t) � di (7)
and
ei(t) =window size
round trip delay=
wi(t)
z(t) + di: (8)
Since we have assumed that the capacity is fully utilized, from (8) we have
w1(t)
z(t) + d1+
w2(t)
z(t) + d2= 1: (9)
Hence, given the window sizes wi(t), we can compute z(t) by solving (9). By substituting the
solution of (9) in (8) we can compute the throughput of each connection. Plugging in the solution
of (8) in (7) yields the queue size of the connection. Thus, under the quasi-static assumption, we
can compute the throughput and queue size of the connections, given the window sizes.
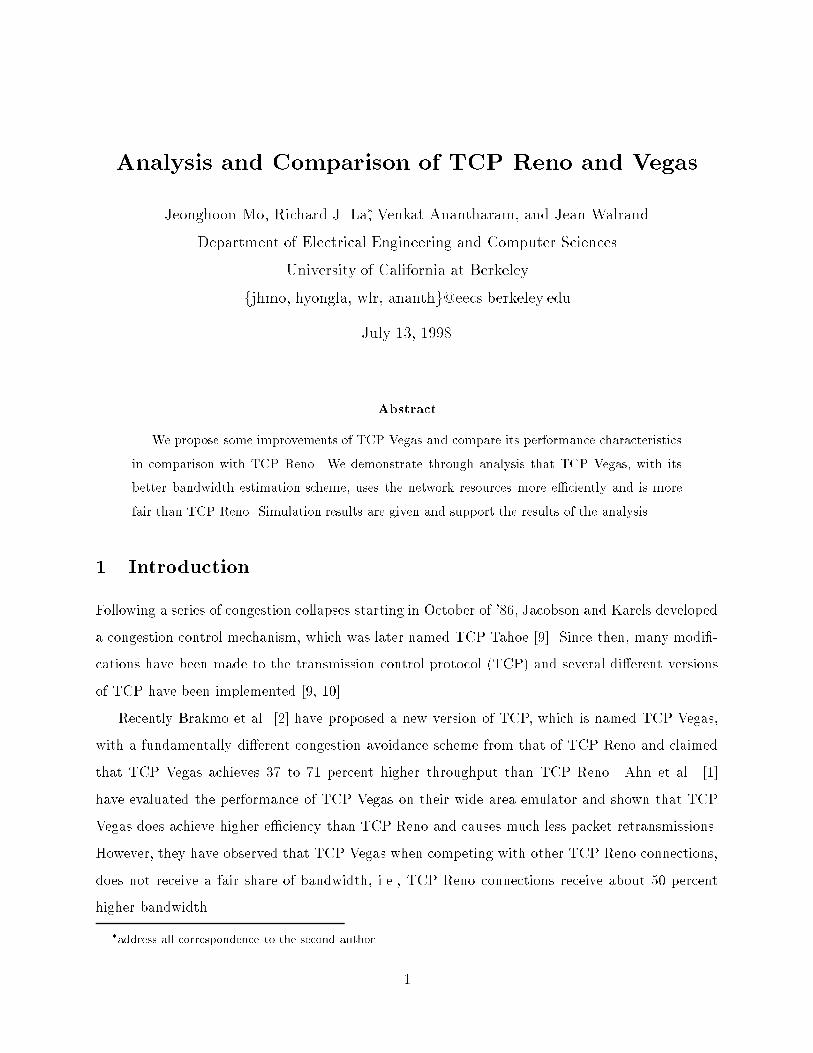
The simulation results show that the window sizes converge to a point such that the queue sizes
computed from (7) - (9) are between � and � for both connections. Figure 4 shows simulation
results and Figure 3 describes how to read the plots in Figure 4. In Figure 3, �i and �i lines for
9

β
β
α
1 1α
2
2
Fairness
w
1
2
w
Figure 3: Convergence region
10 20 30 40 50 60 70 80
10
20
30
40
50
60
70
10 20 30 40 50 60 70 80 90 100 110
10
20
30
40
50
60
70
20 40 60 80 100 120 140 160
10
20
30
40
50
60
70
50 100 150 200 250 300 350 400
10
20
30
40
50
60
70
Figure 4: Converging point of TCP-Vegas with di�erent delays.
user i denote the sets of window size pairs f(w1; w2)jwi � eidi = �g and f(w1; w2)jwi � eidi = �g,respectively, where ei is connection i's throughput computed from (7) - (9). The fairness line is the
set of window size pairs such that the throughputs of the users are the same, i.e.,f(w1; w2)je1 = e2g.In each plot of Figure 4 `+' denotes the converging point of TCP Vegas. As we can see, in each
case it converges to a point (w1; w2) that satis�es
� � qi(w1; w2) � �; i = 1; 2; (10)
where qi(w1; w2) is the queue size of connection i computed using (7) - (9). The numbers on the
X-axis and Y-axis are the window sizes � 10. The delay of connection 1 (Y-axis) is 12.9 ms in all
plots and that of connection 2 (X-axis) is 18.9 ms, 36.9 ms, 66.9 ms, and 186.9 ms, respectively,
from left to right.
10

5 Incompatibility of TCP Vegas with TCP Reno
There has been some previous work that demonstrates that in many cases TCP Vegas performs
better than other implementations of TCP [2, 1]. However, Ahn et al. have observed that when a
TCP Vegas user competes with other users that use TCP Reno, it does not receive a fair share of
bandwidth due to the conservative congestion avoidance mechanism used by TCP Vegas.
TCP Reno continues to increase the window size until a packet is lost. Packet losses occur mainly
due to bu�er over ows. This bandwidth estimation mechanism results in a periodic oscillation of
window size and bu�er-�lling behavior of TCP Reno. Thus, while TCP Vegas tries to maintain
a smaller queue size, TCP Reno keeps many more packets in the bu�er on the average, stealing
higher bandwidth.
Let qv(t) and qr(t) denote the number of Vegas and Reno packets in the bu�er at time t, and
B be the bu�er size. If we assume qv(t) � k � �, qr(t) ranges from [0; B� k]. Assume that qr(t) is
distributed uniformly on the interval [0; B�k]. Then the average queue size of the Reno user �qr(t)
is approximately B�k2 . The ratio of TCP Vegas throughput to TCP Reno throughput is roughly
2kB�k
. When B is relatively large, which is usually the case, then it is obvious that TCP Reno gets
much higher bandwidth than TCP Vegas. We will con�rm this analysis with simulation results in
the next section.
TCP Reno congestion avoidance scheme is aggressive in the sense that it leaves little room in
the bu�er for other connections, while TCP Vegas is conservative and tries to occupy little bu�er
space. When a TCP Vegas connection shares a link with a TCP Reno connection, the TCP Reno
connection uses most of the bu�er space and the TCP Vegas connection backs o�, interpreting this
as a sign of network congestion. This may be one of reasons why TCP Vegas is not widely deployed
despite its many desirable properties.
6 Simulation Results
In order to verify the observations we have made through the analysis of simple networks, we have
run simulations, using real network simulator (ns) developed at Lawrence Berkeley Laboratory [4].
We will discuss the simulation results in this section.
6.1 Fairness of TCP Vegas
11

S1
S2
S310Mbps,1ms
10Mbps,1ms S4
10Mbps,1ms
10Mbps,x ms
1ms1.5MbpsR1 R2
Figure 5: Network Topology
Figure 5 shows the topology of the network that was simulated to demonstrate the fairness of TCP
Vegas. In the �gure, the circles denote �nite-bu�er switches and the squares denote the end hosts.
Connection 1 transmits packets from S1 to S3, and connection 2 from S2 to S4. The links are
labeled with their capacities and propagation delays. We vary the propagation delay of the link
that connects R2 and S4, which is denoted by x in Figure 5, in order to see the e�ect of di�erent
delays on the throughputs.
x w1 w2 ACK1 ACK2max(ACK1;ACK2)min(ACK1;ACK2)
4 3.5 3.5 21,425 16,068 1.33
13 4 7 17,522 19,965 1.14
22 4 7 20,061 17,427 1.15
58 4 13 19,507 17,973 1.09
148 4 30 21,068 16,398 1.29
Table 1: TCP Vegas with varying propagation delays.
x ACK1 ACK2 ACK1=ACK2
4 21,100 15,637 1.35
13 25,460 11,785 2.16
22 25,684 11,672 2.20
58 34,429 2,627 13.11
148 35,598 959 37.12
Table 2: TCP Reno with varying propagation delays.
Connections 1 and 2 start at time 0 second and 0.5 seconds, respectively, and the simulation is
12

run for 200 seconds. Tables 1 and 2 show the simulation results. In each table ACK1 and ACK2 are
the number of packets that have been acknowledged by the corresponding receiver for connections
1 and 2. The last column shows the ratio of max(ACK1; ACK2) to min(ACK1; ACK2).
Tables 1 and 2 clearly show that the delay bias of TCP Reno becomes very noticeable when
the delay di�erence becomes large, while TCP Vegas does not show any such delay bias. The
ratio of throughputs under TCP Vegas ranges from 1.09 to 1.33, whereas throughput ratio under
TCP Reno increases almost linearly with delay ratio. This is consistent with our analysis given in
previous sections and con�rms that TCP Vegas does not su�er from the delay bias as TCP Reno
does. We can also verify that the expected backlog for TCP Vegas connections at the converging
point is between � and � from (7) - (9).
6.2 Incompatibility of Vegas with Reno
In the second part of simulation, we have simulated a network with two connections with same
round trip delay of 24 ms, where one is a TCP Reno connection and the other is a TCP Vegas
connection, in an attempt to verify the incompatibility of TCP Vegas with TCP Reno. We vary
the bu�er size at the switches to see how the relative performance of the TCP Vegas connection
changes with the bu�er size. The simulation results are given in Table 3. The fourth column of
the table is the ratio of throughputs, and the last column is the interval computed from B�k2k as
described in section 4, with k = 1 and 3, since � and � in TCP Vegas are usually set to 1 and 3,
respectively, and k can be any number between � and �.
Bu�er Size ACK of Reno ACK of Vegas Reno/Vegas Interval
4 13,010 24,308 0.535 [0.167, 1.5]
7 16,434 20,903 0.786 [0.667, 3.0]
10 22,091 15,365 1.438 [1.167, 4.5]
15 25,397 12,051 2.107 [2.0, 7.0]
25 30,798 6,621 4.652 [3.667, 12.0]
50 34,443 2,936 11.73 [7.833, 24.5]
Table 3: Throughput of Vegas vs. Reno with drop-tail gateways.
It is clear from Table 3 that TCP Vegas connection does not receive a fair share of bandwidth in
the presence of a TCP Reno connection unless the bu�er sizes are extremely small. Moreover, the
13

ratios of the throughputs fall well within the region computed from the equation B�k2k , con�rming
the validity of our analysis.
6.3 RED Gateways
The simulation results in the previous subsection suggest a way of making TCP Vegas more com-
petitive in the presence of TCP Reno connections. Note in Table 3 that when the bu�er sizes are
small, TCP Vegas outperforms TCP Reno. The intuition behind this is as follows. TCP Reno
needs some room in the switch bu�er for oscillation in order to estimate the available bandwidth.
Without the necessary room in the bu�er, its performance degrades noticeably. TCP Vegas, on
the other hand, quickly adapts to the small bu�er size since it requires enough space for only a few
packets.
This key observation tells us that Random Early Detection (RED) gateways could be used
to make TCP Vegas more compatible with TCP Reno in a competitive environment [7]. RED
gateways are characterized by a set of parameters, two of which are threshold and maxthreshold.
RED gateways maintain an estimate of average queue size. When the average queue size exceeds
threshold but is smaller than maxthreshold, they start dropping packets with certain probability
that is proportional to the average queue size. If the average queue size exceeds maxthreshold, they
drop all packets. Hence, if the threshold values are set low enough, they give the connections an
impression that the switch bu�er size is smaller than it really is. This is discussed in more details
in [11].
Threshold Maxthreshold ACK of Vegas ACK of Reno
3 6 61,069 57,774
4 8 54,259 64,305
5 10 50,823 70,020
7 14 44,469 77,202
10 20 34,081 87,379
Table 4: Throughput of Vegas vs. Reno with RED gateways.
The same network used in section 6.2 is simulated again with RED gateways instead of drop-tail
gateways. Each simulation is run for 100 seconds, and the bu�er size is �xed at 25. The bu�er
size, however, plays only a minor role if maxthreshold value is smaller than the bu�er size. As
14

summarized in Table 4, it is easy to see how the threshold values a�ect the relative performance of
TCP Vegas against TCP Reno. As the threshold values increase, TCP Reno throughput increases
at the cost of a decrease in TCP Vegas throughput. Also note that the total throughput increases
slightly with the threshold values. This is obviously due to the decrease in the number of dropped
packets.
7 Conclusions and Further Problems
In this paper we have analyzed the performance of TCP Vegas in comparison with TCP Reno.
We have shown that TCP Vegas does lead to a fair allocation of bandwidth and explained some
of other characteristics, using the congestion avoidance mechanism adopted by TCP Vegas. We
have demonstrated that TCP Vegas does not su�er from the delay bias as TCP Reno does through
both analysis and simulations. TCP Vegas achieves better performance than TCP Reno since its
bandwidth estimation does not rely on packet losses in order to estimate the available bandwidth
in the network. However, when competing with other TCP Reno connections, TCP Vegas gets
penalized due to the aggressive nature of TCP Reno.
We are currently investigating the possibility of deploying TCP Vegas, adopting gateway control
such as RED gateways. We model the problem both as a single shot game and as an in�nitely
repeated game. We suspect that we can provide the TCP Reno users with a proper incentive to
switch to TCP Vegas by using RED gateways to penalize the users when the average queue sizes
uctuate at the gateways in the presence of TCP Reno users. This problem will be discussed in
another paper.
References
[1] J.S. Ahn, P.B. Danzig, Z. Liu, and L. Yan. Evaluation of TCP Vegas: emulation and experi-
ment. IEEE Transactions on Communications, 25(4):185{95, Oct 1995.
[2] L.S. Brakmo and L.L. Peterson. Tcp vegas: end to end congestion avoidance on a global
internet. IEEE Journal on Selected Areas in Communications, 13(8):1465{80, October 1995.
[3] D. Chiu and R. Jain. Analysis of the Increase and Decrease Algorithms for Congestion Avoid-
ance in Computer Networks. Computer Networks and ISDN Systems, 17:1{14, 1989.
15

[4] K. Fall and S. Floyd. Simulation-based Comparisons of Tahoe, Reno, and SACK TCP. Com-
puter Communication Review, 26(3):5{21, July 1996.
[5] S. Floyd and V. Jacobson. Connection with multiple Congested Gateways in packet-Switched
Networks,Part1: One-way Tra�c". ACM Computer Communication Review, 21(5):30{47,
August 1991.
[6] S. Floyd and V. Jacobson. On Tra�c Phase E�ects in packet Switched Gateways. Internet-
working:Research and Experience, 3(3):115{156, September 1993.
[7] S. Floyd and V. Jacobson. Random Early Detection Gateways for Congestion Avoidance.
IEEE/ACM Transactions on Networking, 1(4):397{413, August 1993.
[8] T. Henderson, E. Sahouria, S McCanne, and R. Katz. Improving Fairness of TCP Congestion
Avoidance . In EECS, UC Berkeley, May '98 (submitted to GLOBECOM '98), August 1998.
[9] V. Jacobson. Congestion avoidance and control . Computer Communication Review, 18(4):314{
29, August 1988.
[10] V. Jacobson. Modi�ed TCP Congestion Avoidance Algorithm. Technical report, April 1990.
[11] Richard J. La, Jeonghoon Mo, Jean Walrand, and Venkat Anantharam. A Case for TCP Vegas
and Gateways using Game Theoretic Approach. Available at http://www.path.berkeley.edu/~
hyongla (submitted to INFOCOM '99), July 1998.
[12] Richard J. La, Jean Walrand, and Venkat Anantharam. Issues in TCP Vegas. Available at
http://www.path.berkeley.edu/~ hyongla, June 1998.
[13] A. Mankin. Random Drop Congestion Control. In Proc. SIGCOMM'90, pages 1{7, Philadel-
phia, PA, September 1990.
A Convergence of Window Sizes
In this appendix, we give a heuristic argument for the convergence of window sizes to a point
(w1; w2) such that
� � Diffi = wi(t)� diui(t)
Z t
t�ui(t)ei(s)ds � � (11)
16

During each round trip time source i computes the estimated backlog
Diffi = wi(t)� diui(t)
Z t
t�ui(t)ei(s)ds; (12)
and uses this estimation of the queue size to adjust its window size. We assume that ei(t) and
qi(t) change slowly and remain steady, and the average converges. This is not an unreasonable
assumption because TCP Vegas updates its window size at most by one during one round trip
time. Therefore, ei(t) and qi(t) do not change too fast. Now suppose that the sources use the
average throughput to adjust their window sizes. For the simplicity of notation, we omit the
dependency on time t. We have the following equations from (12) and the assumption.
Diffi = wi;avg � ei;avg � di (13)
ei;avg � wi;avgzavg + di
(14)
If we assume that the capacity is fully utilized, we get
1 = e1;avg + e2;avg � w1;avg
zavg + d1+
w2;avg
zavg + d2: (15)
Hence, given the window sizes wi;avg we can compute an approximate value for zavg from (15). The
solution of (15) can be used to compute ei;avg and Diffi from (13) and (14). The sources update
their window size based on Diffi.
(4)
(7)
(6)(5)
(3)
(1)(2)
(8) (9)
Fairness
w
β
β
α
w
1α1
2
2
2
1
Figure 6: Convergence region of TCP Vegas
Figure 6 illustrates the convergence region of TCP Vegas. In the �gure, �i and �i lines for user i
denote the sets of window size pairs f(w1; w2)jDiffi = �g and f(w1; w2)jDiffi = �g, respectively,
17

from equations (13) - (15). The fairness line is the set of window size pairs such that the throughputs
of the users are the same, i.e.,f(w1; w2)je1 = e2g. User 1 increases its window size in regions (1),
(4), and (7), and decreases its window size in regions (3), (6), and (9). Similarly, user 2 increases
its window size in regions (7), (8), and (9), and decreases its window size in regions (1), (2), and
(3).
Figure 6 is a typical plot of convergence region for two users, and the same geometric picture can
be easily extended to a case with more than two users. The only region in the �gure where neither
user updates its window size is region (5). The arrows in other regions indicate the directions in
which the window sizes may get updated.
We will show in Theorem 1 that the window sizes converges to a point in region (5) within a �nite
amount of time, assuming that the distance between �i and �i lines is su�ciently large compared
to � > 0, that is the amount by which users update their window sizes. Suppose (w1; w2) =
(w1(0); w2(0)). Let
A = f(w1+ �n1; w2+ �n2) j 0 � w1 + �n1 � w1;max; 0 � w2 + �n2 � w2;max; n1; n2 2 Zg;
where w1;max and w2;max are the maximum congestion window sizes declared by the receivers.
Then, A is the set of all possible window size pairs. If wi;max and w2;max are �nite, then N = j A jis �nite. We will �rst state a lemma that will be used in the proof of Theorem 1. Suppose that the
distance between �i and �i lines is at leastp2�.
Lemma 1 No window size pair outside region (5) can be visited twice.
Proof: Suppose that there exists a window size pair that could be visited twice outside region
(5). Then, this implies that there exists a loop generated by window size updates as shown in
Figure 7. We will now show that no such loop can exist.
In regions (1) through (6), user 2 never increases its window size. Hence, if user 2 updates in
regions (1) through (3), then it is not possible to return to the same windows size pair since we
have assumed that the distance between �2 line and �2 line is larger than �. Moreover, if user 1
updates its window size in either region (1) or (3), then the previous window size pair cannot be
revisited without reaching either region (2) or (5) because user 1 does not update its window size
in opposite direction in the same region. However, once the window sizes reach a point in region
(2) or (5), then for the same reason given above, it is not possible to return to the previous window
size pair because at most only user 2 will update its window size and decrease it. Therefore, it
18

���
���
(4)
(7)
(5)
(1)
(8) (9)
Fairness
w
β
β
α
w
1α1
2
2(6)
(3)(2)
Loop
(w , w )1 2
2
1
Figure 7: An example of a loop
is not possible for a window size pair in region (1) through (3) to be visited more than once. By
symmetry between users 1 and 2, it is not possible to have such a loop for a window size pair in
region (3), (6), and (9).
Similarly, since user 2 does not decrease its window size in region (4) through (9), none of
window size pairs in regions (7) through (9) can be visited twice. Again by symmetry, the same is
true for regions (1), (4), and (7). Therefore, none of the window size pairs outside region (5) can
be visited more than once.
Theorem 1 The window sizes converge to a point in region (5) within a �nite amount of time,
starting from a point in the region bounded by w1;max and w2;max.
Proof: From Lemma 1 we know that no window size pair outside region (5) can be visited
more than once. Therefore, if (w1; w2) = (w1(0); w2(0)) and N = j A j, then assuming that time
between window size updates of each connection is �nite, the window sizes converge to a point in
(5) because there are at most N -1 other pairs the window size pair could take on before it reaches
a point in region (5), and once the window sizes are in region (5), they do not change.
19
Copyright © 2022 FDOKUMEN