What do we mean by school entry age? Conceptual ambiguity ...
23
Full Terms & Conditions of access and use can be found at http://www.tandfonline.com/action/journalInformation?journalCode=cced20 Download by: [IIASA] Date: 27 September 2017, At: 23:09 Comparative Education ISSN: 0305-0068 (Print) 1360-0486 (Online) Journal homepage: http://www.tandfonline.com/loi/cced20 What do we mean by school entry age? Conceptual ambiguity and its implications: the example of Indonesia Bilal Barakat & Stephanie Bengtsson To cite this article: Bilal Barakat & Stephanie Bengtsson (2017): What do we mean by school entry age? Conceptual ambiguity and its implications: the example of Indonesia, Comparative Education, DOI: 10.1080/03050068.2017.1360564 To link to this article: http://dx.doi.org/10.1080/03050068.2017.1360564 © 2017 The Author(s). Published by Informa UK Limited, trading as Taylor & Francis Group Published online: 08 Sep 2017. Submit your article to this journal Article views: 143 View related articles View Crossmark data
-
Upload
khangminh22 -
Category
Documents
-
view
2 -
download
0
Transcript of What do we mean by school entry age? Conceptual ambiguity ...
Full Terms & Conditions of access and use can be found athttp://www.tandfonline.com/action/journalInformation?journalCode=cced20
Download by: [IIASA] Date: 27 September 2017, At: 23:09
Comparative Education
ISSN: 0305-0068 (Print) 1360-0486 (Online) Journal homepage: http://www.tandfonline.com/loi/cced20
What do we mean by school entry age? Conceptualambiguity and its implications: the example ofIndonesia
Bilal Barakat & Stephanie Bengtsson
To cite this article: Bilal Barakat & Stephanie Bengtsson (2017): What do we mean by schoolentry age? Conceptual ambiguity and its implications: the example of Indonesia, ComparativeEducation, DOI: 10.1080/03050068.2017.1360564
To link to this article: http://dx.doi.org/10.1080/03050068.2017.1360564
© 2017 The Author(s). Published by InformaUK Limited, trading as Taylor & FrancisGroup
Published online: 08 Sep 2017.
Submit your article to this journal
Article views: 143
View related articles
View Crossmark data
What do we mean by school entry age? Conceptual ambiguityand its implications: the example of IndonesiaBilal Barakat a,c and Stephanie Bengtsson b,c
aVienna Institute of Demography (VID), Austrian Academy of Sciences, Vienna, Austria; bDepartment ofSocioeconomics, Vienna University of Economics and Business, Vienna, Austria; cWittgenstein Centre forDemography and Global Human Capital (IIASA, VID/ÖAW, WU), Vienna, Austria
ABSTRACTThe age pattern of school entry reflects a complex social andempirical reality that is inadequately captured by a single number.Recognising these complexities in national and internationalresearch and policy discourse raises important but neglectedquestions around the identification of vulnerable groups, therelative value of pre-primary and primary education, as well as thenormative powers and responsibilities of governments vis-à-visparents, and the international educational community vis-à-visboth. This is illustrated by the example of Indonesia, where theofficial age norm for primary school entry is widely disregarded inpractice, with a majority of children starting school one or eventwo years earlier. Crucially, it is the compliant children entering atthe statutory age who tend to be from more disadvantagedhouseholds, and enjoy no benefit in educational outcomes fromtheir greater maturity.
KEYWORDSSchool entry; entry age;Out-Of-School Children;indicators; Indonesia
1. Introduction
What do we mean by a country’s ‘school entry age’, when starting school at the official ageis actually a minority experience, and what are the potential consequences of such a mis-match between the de jure and de facto age of school entry? In the case of Indonesia, forexample, the official age of school entry is seven years, which is also the figure reported ininternational databases and used for the purpose of calculating key standard indicators,including the Net Enrolment Rate (NER). However, empirical evidence from numerousdata sources shows that the overwhelming majority of Indonesian children have in factalready entered school before their seventh birthday, in many cases one or even twoyears earlier. This means that any estimates and indicators based on an official entryage of seven fail to capture the actual situation ‘on the ground’.
AIn countries such as Indonesia, where there is a major misalignment between the dejure and the de facto age of school entry as described, this inability to accurately depictwhat is actually taking place at the local level can have serious consequences for education
© 2017 The Author(s). Published by Informa UK Limited, trading as Taylor & Francis GroupThis is an Open Access article distributed under the terms of the Creative Commons Attribution License (http://creativecommons.org/licenses/by/4.0/), which permits unrestricted use, distribution, and reproduction in any medium, provided the original work is properly cited.
CONTACT Bilal Barakat [email protected] Vienna Institute of Demography (VID), Austrian Academy ofSciences, Welthandelsplatz 2 / Level 2, 1020 Vienna, Austria
COMPARATIVE EDUCATION, 2017https://doi.org/10.1080/03050068.2017.1360564
Dow
nloa
ded
by [
IIA
SA]
at 2
3:09
27
Sept
embe
r 20
17
research, policy, and planning. Disadvantaged groups may appear privileged, for example,and may be overlooked in national education budgets, or a country’s progress towardsuniversal schooling relative to other countries cannot be accurately gauged. Further,while there is growing recognition globally of the importance of early childhood careand education (ECCE) for learning outcomes in primary and secondary school, andnascent research into the relationship between age, school readiness, and school entry,the capacity of researchers to analyse these issues in a rigorous manner, and of policy-makers to act on this research, are constrained by an ambiguity of who is, in fact, an‘under-age’, ‘of-age’, or ‘over-age’ student.
Unfortunately, there is no ‘quick fix’ available to clear up this ambiguity and ‘realign’ thede jure and de facto age of school entry that would enjoy unambiguous legitimacy.However, we would argue that the complex nature and differing rates of child develop-ment (particularly in the early years, from 0 to 8), the interrelated factors influencingschool readiness, and our still limited understanding of the effect of relative age on achild’s schooling, create an absolute necessity to begin to consider more carefully theconcept, definition, and measurement of age at school entry in international educationresearch, policy, and practice. Through a general theoretical analysis of the concept ofschool entry age and using Indonesia as an illustrative case, this paper aims to open upsuch a critical discussion about the ambiguities and potential problems resulting fromthe continued unproblematized use of current school entry age measures.
In Section 2, we approach the issue of age at school entry from various angles, namelyin terms of institutional arrangements, measurement challenges, pedagogical, and familyperspectives. In Section 3, we continue with a brief overview of primary education in Indo-nesia that examines its rapid expansion, the official Indonesian policy relating to schoolentry, and pre-primary education, followed by an empirical analysis of actual entry behav-iour and its ramifications for the Indonesian context. Subsequently, in Section 4 we con-clude with a consideration of the Indonesian example in light of the general questionspreviously raised, and conversely, the argument that seeking a general debate on thesequestions is becoming unavoidable.
2. Problematising the notion of a definitive school entry age
It is easy to assume that the school entry age in a given country represents a rule that iswell-defined, is perceived as legitimate and mostly respected in practice, and reflects theage considered to be appropriate for following a formal curriculum. Indeed, these assump-tions are routinely made, whether explicitly or implicitly, in the compilation of inter-national statistical databases and reports, international and national educationalresearch, and policy debates. However, reality is rather more ambiguous and dynamic.We examine this issue from four different perspectives below, that each focuses on adifferent essential question. From an institutional/policy perspective, given that schoolingis a public institution, who gets to decide which entry timing is legitimate or not, on whatbasis, and to what extent is it enforced? From a statistical and research perspective, given acomplex reality of entry regulations and actual entry behaviour, how do we define a singlenumber that is supposed to capture ‘the’ entry age? From a pedagogical perspective,given the significance of the early years as a period of critical (and rapid) child develop-ment, what is the ‘right’ age for most children to start school (particularly in terms of
2 B. BARAKAT AND S. BENGTSSON
Dow
nloa
ded
by [
IIA
SA]
at 2
3:09
27
Sept
embe
r 20
17
more formal learning opportunities), and how do we recognise those who would benefitfrom an earlier or later start? Finally, from a familial decision-making perspective, given theincreasing emphasis on parental choice in relation to schooling, how do parents/guardiansdetermine the ‘right’ entry age for their own child, not least in light of decisions made bytheir peers?
2.1. The institutional perspective: the power and legitimacy to set the entry age
At one level, the setting of the official school entry age is a generic example of educationalpolicy-making. As such, questions around the process and legitimacy of setting official ageat school entry mirror those concerning issues such as how many years of schoolingshould be compulsory, at what point formal standardised assessments should be adminis-tered, what curriculum should be followed, etc. The answers may differ between settings,with the entry age set nationally, for example, or at the level of province or state, or evenleft to the discretion of individual schools, within certain bounds. However, of concern isnot only: ‘Who has the legitimacy power to determine the school starting age?’, butequally: ‘How is the decision legitimated, with appeal to what norms?’ While educationpolicy-makers may justify their determinations of the starting age for primary school ina range of different ways, including appealing to the ‘best interests’ of the averagechild, or to economic competitiveness, or to international ‘standard practice’, often suchjustifications are not explicitly made, but would need to be inferred.
The reason it becomes particularly important to consider school entry age from an insti-tutional perspective is that the official school entry age is one of the few policy variablesthat directly enter the calculation of international education indicators such as the numberor proportion of Out-Of-School Children, indicators that are otherwise based on empiricalinputs such as the actual enrolments and corresponding population estimates. In principle,therefore, many countries suffering from significant late entry could reduce the number ofOut-Of-School Children ‘at the stroke of a pen’ by formally raising the entry age. While real-life education policy does not, in fact, proceed in such fashion, the point is that it is rathereasier to recognise that such a move would lack legitimacy than to define clear criteria forthis judgement.
It is a relevant part of the global institutional context that the distribution of schoolentry ages across countries has steadily concentrated on six years as standard, a thresholdthat applied in 58% of countries in 1990, 62% in 2000, up to 66% in 2010. Yet it cannotsimply be argued that a policy change towards the globally ‘most typical’ entry age iseasier to justify than a move away from it. Educational policies that are successful inone country context will not necessarily be equally – or at all – successful in another(Steiner-Khamsi 2012). Indeed, it is easy to find examples where naïve applications of‘international benchmarking’ in educational policy were obviously inappropriate. Thequestion is not only whether a ‘World Culture’ in education (Carney, Rappleye, andSilova 2012) is in fact emerging, but also whether it is desirable. From a normative perspec-tive, the notion that national education policy must be justified vis-à-vis international stan-dards is certainly not ideologically neutral (Tikly 2016), and may even be interpreted asrepresenting a neo-colonial mind-set (Brock-Utne 2000).
What to make of this objection when – in the Indonesian case, as briefly describedabove – it is individual parents who appear to be choosing to align themselves with the
COMPARATIVE EDUCATION 3
Dow
nloa
ded
by [
IIA
SA]
at 2
3:09
27
Sept
embe
r 20
17
international standard (of school entry at six years), rather than, or even against, the officialgovernment policy (of school entry at seven years)? There are interesting parallels with thequestion of the language of instruction in the primary cycle: it is not uncommon to see acommunity preference for teaching in the former colonial language from the start, despitea significant increase in evidence that initial mother tongue instruction is likely beneficial –even for competency in foreign language (including former colonial languages) later inlife. The issue is complicated (cf. the range of contributions in Coleman 2011), but it isclear that it is not necessarily in the public interest to let parents drive policy by ‘votingwith their feet’. This has of course been recognised in industrialised countries also, de-seg-regation in the USA being an obvious case in point (Baum-Snow and Lutz 2011).
Similarly, the interpretation of national statistics within the framework of internationaldevelopment statistics requires dialogue in order to be meaningful. For example, theUnited Nations’ operational definition of Out-Of-School Children is that of children whoare not in school but expected to be according to the school-age range defined bynational policy (UIS 2005, 14). However, its agencies recognise that a strictly literal appli-cation of the criterion may fail to capture the substantive phenomenon of interest.Home-schooling is a well-known potential source of discrepancy between national legis-lation (that may allow it, but does not necessarily facilitate the collection of good data onit) and international statistics (that assume that the target value for primary school enrol-ment and attendance is 100%) (UIS 2005; UNESCO 2015). Elsewhere, where primaryschooling is not compulsory (as in Oman, or Nepal, until recently), there is neverthelessa defined ‘school age’ range that serves as the reference for the calculation of internationaleducation indicators. In other words, it is decidedly not a prerequisite for national legis-lation to stipulate a child ‘ought to be’ in school for it to be considered ‘out of school’for the purposes of international monitoring. Indeed, it is possible for certain individuals(such as pregnant or married girls in Tanzania (Human Rights Watch 2017) and elsewhere(Stacki and Baily 2015)) to be officially barred from school, but nonetheless to be con-sidered ‘out of school’ by the international educational development community. All ofthese examples point to the fact that international education statistics are routinelydefined and interpreted with reference not only to national legislation, but also with refer-ence to notions of social equity and justice as framed by international educationframeworks.
2.2. The conceptual and statistical perspective: summarising varied entrybehaviour in a single number
Key education indicators (incl. gross and net intake and enrolment rates, as well as derivedmeasures such as the number of Out-Of-School Children) include the children at the offi-cial entrance age to primary education in the denominator. This ‘official entrance age toprimary education (years)’ is listed in international statistical databases as a singleinteger number.
However, even given perfect compliance with the official rules, the single figure is oftena simplification. As noted above, the entry age may not be defined at the national level,and may vary across sub-national jurisdictions. Any one of these may be defined withrespect to an arbitrary cut-off date that does not necessarily coincide with the beginningof the school year. However, stipulating school entry on 1 September for all children who
4 B. BARAKAT AND S. BENGTSSON
Dow
nloa
ded
by [
IIA
SA]
at 2
3:09
27
Sept
embe
r 20
17
turned six by 30 June, say, means that strictly speaking the entry age 6.25 (i.e. six years andthree months), not 6. If this seems pedantic, note that compared to another country with a31 December cut-off, this already induces half a year’s difference in the average age ofschool entrants in the two systems, and that the expected cognitive differences at sucha scale are already so large as to motivate the PISA sampling design to define thetarget population in terms of the month of birth in order to avoid a substantial bias. Ararer complication is that the entry age may consist of a range exceeding 12 months,especially for entry into a flexible reception grade, or if initial entry is permitted atseveral points during the first academic year.
If already the official rules for school entry can only be approximately represented as asingle integer, the correspondence becomes hazier still when dealing with empirical data.The UIS database notes that: ‘The theoretical entrance age to a given programme or levelis typically, but not always, the most common entrance age.’ However, no guidance isoffered on how to proceed in situations where this is the case, nor is there an in-depthdiscussion of the ramifications of this limitation. Even for individual researchers who areat liberty and willing to abandon the theoretical figure for the empirical one, there is noestablished custom of whether ‘the’ actual entry age should be understood to be themode, median, or mean of the distribution of entry ages, and whether these calculationsshould be performed on, and the result expressed as, age in whole years or exact age. Nordoes there exist a ‘best practice’ consensus on how far the empirical pattern must deviatefrom the official guidelines in order to be granted precedence in the context of scholarlyanalysis.
International learning assessments have not settled on a consensus approach either.PISA notably uses the strict age-based definition of the target population already men-tioned (albeit under the assumption that this guarantees that test-takers will have com-pleted Grade 7), while TIMSS uses an explicitly hybrid definition taking into accountboth grade and (average) age. By contrast, both the Early Grade Reading Assessment(EGRA) and Southern and Eastern Africa Consortium for Monitoring Education Quality(SACMEQ) surveys prefer grade-based target populations. This is due at least partly todifferences in the groups of countries participating in these surveys, and reflects areality of relative late entry (both official and de facto) in many low and middle-incomesettings. This fact is underlined by the fact that the new PISA for Development (PISA-D)initiative, in determining appropriate test content and comparing countries, likewisedrops the assumption that participants will have followed a predictable path of entry ata standard age and regular grade progression (Bloem 2013; Carr-Hill 2015) – as indeedit must given that one of its aims is to include children who are not in school.
2.3. The pedagogical perspective: the relationship between age, early learning,and ‘school readiness’
Empirical research on the effect of entry age on school outcomes can look back on ahistory that extends at least a hundred years (Winch 1911). However, as interest in ECCEincreases in the international community, researchers, and policy-makers in somecountries (particularly the high income group) have re-visited the notion of ‘school readi-ness’, and whether entry to Grade 1 should be decided based on age and/or an assess-ment of a child’s development.
COMPARATIVE EDUCATION 5
Dow
nloa
ded
by [
IIA
SA]
at 2
3:09
27
Sept
embe
r 20
17
Horstschräer and Muehler’s (2014) research on school readiness describes the processin Germany by which developmental school entrance screenings are factored in alongsidea child’s age to determine the best time for a child to enrol in Grade 1. Children who arerecommended to start school are more frequently girls, are older, had a higher birthweight, and longer experience in child care. Further, children who are above officialschool entry age (six years, in the German case) are always recommended, while childrenwith a low social status tend to be recommended less often. This study lends credence tothe idea that a child’s age should be more of an indicative than a normative guidelinewhen considering whether or not that child is ready to begin school, though, as hasbeen previously mentioned, this is not how age at school entry is treated for the purposesof national and international statistics.
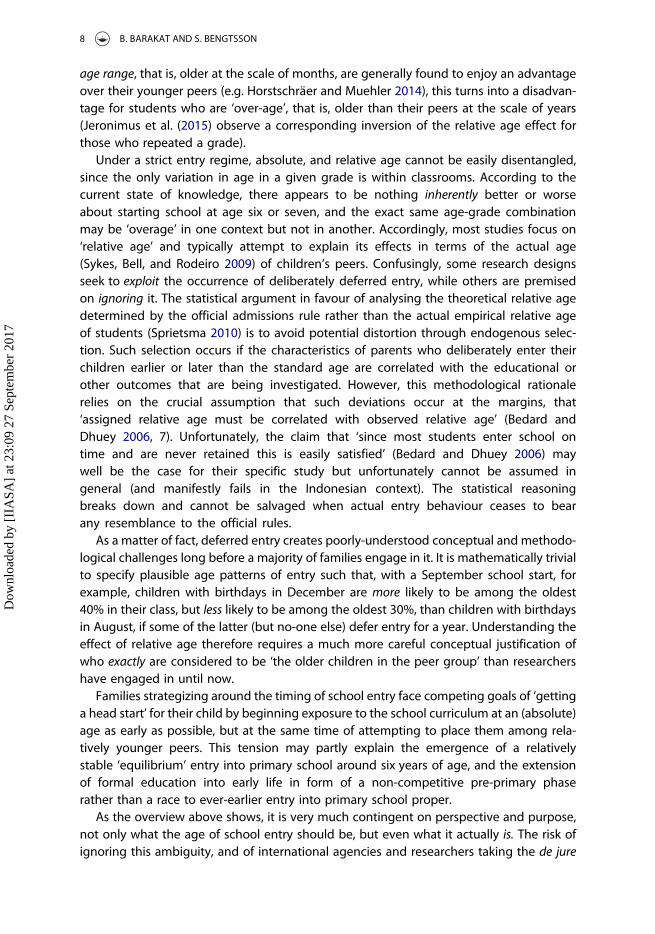
Figure 1 illustrates the recommended timings emerging from the research of essentialEarly Childhood Development (ECD) interventions in the education sector, according tothe age of the child (from conception through to 6 years/72 months). General educationof mothers and specific education on healthy child development for caregivers are twointerventions spanning the entire time period, and will have important implications forthe stimulation and learning of a child from birth. More formalised ECCE and pre-primary programmes are highlighted as key interventions starting from the age ofabout 2 years (24 months). Finally, ensuring continuity between ECCE and pre-primary pro-grammes and quality primary education should be a priority concern starting from the ageof approximately four and a half years (54 months) upwards.
Two relevant observations may be made here: (1) that there is an underlying assump-tion among early education experts that children are likely to start formal primary edu-cation at age six (reflecting the global norm), and (2) that a conscious effort is requiredin the two years leading up to a child’s sixth birthday to help that child prepare forprimary school in order to compensate for differences in readiness and preparednessfor school.
Figure 1. Recommended timing of Early Childhood Development interventions. Adapted fromDenboba et al. (2014).
6 B. BARAKAT AND S. BENGTSSON
Dow
nloa
ded
by [
IIA
SA]
at 2
3:09
27
Sept
embe
r 20
17
While it is clearly true that such differences exist between individuals and families, it isless clear why general differences would exist between countries in terms of the age atwhich its children typically reach a given level of maturity. However, the question is:ready for what? The effective demands that different national school systems place onprimary entrants do indeed differ. This concerns both the complexity of the script andalphabet to be taught, for example, but also the typical distance and transport modalityof the school commute. While we are not aware of any systematic analysis of the extentto which the variation in entry age across countries correlates with such factors, it isclear that in principle there may well be pedagogically reasonable considerations thatwould lead to adoption of different entry norms.
In order to respect individual developmental differences, an alternative to relaxing theentry age threshold is to relax the grouping into age cohorts inside schools, opting, forexample, for a multigrade approach. In fact, emerging research on the Escuela Nueva pro-gramme in Colombia suggests that multigrade teaching may be preferable to monogradeteaching, because it requires greater flexibility and thus allows for more opportunities forboth cooperative and more individualised learning (Luschei and Zubaidah 2012).However, it is still more commonplace to consider multigrade teaching to be a major chal-lenge to positive learning outcomes, particularly in contexts where multigraded classeshave arisen out of necessity rather than by design, such that millions of learners aroundthe world are taught by ‘invisible’ multigrade teachers attempting to teach a curriculumdesigned for monograded classrooms (Little 2007). In resource-poor contexts in particular,where teachers are more likely to miss out on adequate professional development oppor-tunities to learn how to respond to a diverse range of learning needs, it is clear that alimited understanding of school entry age serves to further muddy the waters of edu-cational planning to improve learning outcomes for all.
2.4. The family perspective: absolute age, relative age, and getting ahead
A large body of research literature grapples with the ‘age effect’ on the academic (Sharp1995; Sprietsma 2010; Peña 2017; and many more) and athletic success (Musch andGrondin 2001; Schorer, Wattie, and Baker 2013), as well as psychological well-being(Thompson, Barnsley, and Battle 2004; Matsubayashi and Ueda 2015) of children. Thereis some evidence that older children may outperform their younger peers, but the univers-ality or contingency, magnitude, and persistence of this effect are subject to debate. Thenuance of the research has not stopped the popularisation of selected findings from pro-viding a motivation for some families to exploit any room for manoeuvre with respect toschool entry to maximise their child’s (perceived) chances of educational success.
In fact, there is not one but two ‘age effects’ to consider. The absolute age at whichcertain cognitive tasks are encountered deals with questions such as whether childrenwho learn to read at ages six or seven eventually catch up with children who learned toread at age five, say. By contrast, the question concerning relative age is whether beingyounger or older within their peer group creates an initial (dis)advantage in physicaland cognitive maturity that leads into a self-reinforcing feedback loop of lowered or heigh-tened expectations and self-confidence.
To the extent that there is a benefit to being relatively older, the relationship with age iscertainly non-linear. While those students who are among the older within the appropriate
COMPARATIVE EDUCATION 7
Dow
nloa
ded
by [
IIA
SA]
at 2
3:09
27
Sept
embe
r 20
17
age range, that is, older at the scale of months, are generally found to enjoy an advantageover their younger peers (e.g. Horstschräer and Muehler 2014), this turns into a disadvan-tage for students who are ‘over-age’, that is, older than their peers at the scale of years(Jeronimus et al. (2015) observe a corresponding inversion of the relative age effect forthose who repeated a grade).
Under a strict entry regime, absolute, and relative age cannot be easily disentangled,since the only variation in age in a given grade is within classrooms. According to thecurrent state of knowledge, there appears to be nothing inherently better or worseabout starting school at age six or seven, and the exact same age-grade combinationmay be ‘overage’ in one context but not in another. Accordingly, most studies focus on‘relative age’ and typically attempt to explain its effects in terms of the actual age(Sykes, Bell, and Rodeiro 2009) of children’s peers. Confusingly, some research designsseek to exploit the occurrence of deliberately deferred entry, while others are premisedon ignoring it. The statistical argument in favour of analysing the theoretical relative agedetermined by the official admissions rule rather than the actual empirical relative ageof students (Sprietsma 2010) is to avoid potential distortion through endogenous selec-tion. Such selection occurs if the characteristics of parents who deliberately enter theirchildren earlier or later than the standard age are correlated with the educational orother outcomes that are being investigated. However, this methodological rationalerelies on the crucial assumption that such deviations occur at the margins, that‘assigned relative age must be correlated with observed relative age’ (Bedard andDhuey 2006, 7). Unfortunately, the claim that ‘since most students enter school ontime and are never retained this is easily satisfied’ (Bedard and Dhuey 2006) maywell be the case for their specific study but unfortunately cannot be assumed ingeneral (and manifestly fails in the Indonesian context). The statistical reasoningbreaks down and cannot be salvaged when actual entry behaviour ceases to bearany resemblance to the official rules.
As a matter of fact, deferred entry creates poorly-understood conceptual and methodo-logical challenges long before a majority of families engage in it. It is mathematically trivialto specify plausible age patterns of entry such that, with a September school start, forexample, children with birthdays in December are more likely to be among the oldest40% in their class, but less likely to be among the oldest 30%, than children with birthdaysin August, if some of the latter (but no-one else) defer entry for a year. Understanding theeffect of relative age therefore requires a much more careful conceptual justification ofwho exactly are considered to be ‘the older children in the peer group’ than researchershave engaged in until now.
Families strategizing around the timing of school entry face competing goals of ‘gettinga head start’ for their child by beginning exposure to the school curriculum at an (absolute)age as early as possible, but at the same time of attempting to place them among rela-tively younger peers. This tension may partly explain the emergence of a relativelystable ‘equilibrium’ entry into primary school around six years of age, and the extensionof formal education into early life in form of a non-competitive pre-primary phaserather than a race to ever-earlier entry into primary school proper.
As the overview above shows, it is very much contingent on perspective and purpose,not only what the age of school entry should be, but even what it actually is. The risk ofignoring this ambiguity, and of international agencies and researchers taking the de jure
8 B. BARAKAT AND S. BENGTSSON
Dow
nloa
ded
by [
IIA
SA]
at 2
3:09
27
Sept
embe
r 20
17
definition at face value as a close approximation to manifest de facto entry behaviour, isillustrated by the example of Indonesia, which we discuss in some detail below. There,the gap is both large and largely unrecognised, and, as a result, obscures the fact that for-mally ‘on-time’ students may actually be on their way to becoming a relatively disadvan-taged population deserving of concern. Our case study of Indonesia opens with a briefintroduction to primary and pre-primary education in Indonesia, before we present thethree key quantitative patterns that emerge with regards to school entry age, and con-clude with the implications that these patterns may have on Indonesian children’s learningopportunities.
3. An empirical case study: Indonesia
3.1. Primary and pre-primary education in Indonesia
Indonesia has one of the largest formal school systems worldwide, with around 30 and20 million children enrolled in primary and secondary education respectively, making itthird in size only behind China’s and India’s. This scale results from a large underlyingpopulation size in combination with relatively high rates of educational participation.Given the scale of the education system, the large gap between the de jure and thede facto age at school entry, once recognised, highlights the urgency in making pro-gress towards an integrated approach to the general issues outlined in the previoussection.
Beginning in 1973 with a policy directive to build a primary school in every village, Indo-nesia’s government has taken a number of steps to achieve the expansion of educationalparticipation, including making six and then nine years of education compulsory (in 1984and 1994 respectively), and then implementing a range of decentralisation policies, pro-poor initiatives, and teacher quality improvement programmes (Suharti 2013). As aresult, the gross enrolment ratio (GER) in primary school rose from 79% to 119%between 1974 and 1984 and has remained above 100% in the past two decades (ibid.).In 2005, the Indonesian government put into place legislation that required all primaryschool teachers to have a four-year post-secondary degree by 2015 (Luschei and Zubaidah2012), which may have helped to reassure parents that quality of education wouldimprove alongside access to schooling.1
In 2010, a GER of 112% stood alongside a net enrolment ratio (NER) of 95%. By construc-tion, discrepancies between the GER and NER are due to the enrolment of children outsidethe official school age bracket. But unlike the comparatively more typical concern withoverage enrolment, in Indonesia the size of the gap between the GER and the NER in Indo-nesia can be explained by the large number of officially underage children currentlyenrolled in primary school – close to half of students enrolled in Grade 1 (includingIslamic primary schools) were underage in 2010 (Suharti 2013).
The 2003 Indonesian Education Act protects the right to receive basic education for‘[e]very seven to fifteen years old citizen’ (Article 6, 1), serving as the basis for the officialinterpretation stipulating an entry age of seven. However, this statement is not explicitlyqualified to imply that actual entry is deferred until the beginning of the next school year(when the child is actually aged seven). If this Article is interpreted as conferring animmediate right, it is one that can only be satisfied either by allowing the uncommon
COMPARATIVE EDUCATION 9
Dow
nloa
ded
by [
IIA
SA]
at 2
3:09
27
Sept
embe
r 20
17
practice of entry throughout the school year (to coincide with each child’s seventh birth-day), or by enrolling children at the beginning of the school year during which they willturn seven. The latter option would of course simply amount to an effective entry ageof six. Indeed, the Act also states that ‘[e]very citizen can enrol in a compulsory basic edu-cation programme at the age of six’ (Article 34, 1). In other words, present legislation argu-ably at least allows for an alternative reading in support of a regular entry age of six years,and a large proportion of families does in fact avail itself of this opportunity.
As we will argue later in this paper, learning inequalities begin early and intensify overtime (Rose and Alcott 2015), therefore having a more accurate picture of what happens atthe start of primary school (and indeed, a more complete profile of Grade 1 entrants) iscrucial to understanding and addressing the sources and consequences of inequalitiesboth in learning and attainment, inequalities that remain substantial. As a result ofschool expansion, the average number of years of schooling rose from around 6 toalmost 8 years among members of the Indonesian population aged 15 years and overbetween 1993 and 2010 (Jones and Pratomo 2015), but this increase was uneven. Whilea gender gap of 0.8 years in favour of males remained, it is now far exceeded by spatialand socio-economic inequalities. These inequalities continue to present reasons forconcern. Those in urban areas experience on average 2.7 years more schooling thantheir rural compatriots (Suharti 2013), for example. Further, there are concerns aboutthe quality of education in rural versus urban areas – teaching of heterogeneous classesmay present a challenge for teachers in remote, rural areas, and teacher absenteeism isnearly twice as high in multigrade schools than non-multigrade schools (Luschei andZubaidah 2012).
Indonesia has, since the early 2000s, begun placing some priority on the ECD sector, notleast by including ECD in the 2003 Education Act, and launching its first-ever ECD Censusin 2011 (Denboba, Hasan, and Wodon 2015). This development is reflected in increasinguptake. The GER and NER for pre-primary education in Indonesia were 58.16% and40.45% respectively in 2014, which is a significant increase from 2006 (34.6% and24.71% respectively). Further, the data suggest in 2014, the number of new entrants toGrade 1 with early childhood experience was 61.31%, up from 37.22% in 2004 (butdown from 70.30% in 2012).
However, while ECCE provision is clearly increasing for children aged four to six (includ-ing pre-primary education for five- to six-year-olds), ECCE is not compulsory and levels ofpublic spending on this sector are extremely low (Al-Samarrai and Cerdan-Infantes 2013).Indonesia tends to perform less well than other countries in three areas where the WorldBank’s SABER analytical tool for ECD2 has been applied, including programme coverage,equity, and compliance with standards across the range of ECD services (Denboba,Hasan, and Wodon 2015). The SABER study for Indonesia highlighted low coverage ofpre-primary education enrolment as a particular problem.
While the majority of new Grade 1 students have some early childhood experience,there is a significant proportion of students who do not, potentially putting them at a dis-advantage to their peers. In fact, high returns to early childhood education have beenfound both in Indonesia and globally (Al-Samarrai and Cerdan-Infantes 2013). A recentEarly Grades Reading Assessment (EGRA) conducted with Grade 2 students in Indonesiafound that the largest non-regional difference in oral reading fluency across all demo-graphic variables came from pre-school attendance (Stern and Nordstrum 2014). Jones
10 B. BARAKAT AND S. BENGTSSON
Dow
nloa
ded
by [
IIA
SA]
at 2
3:09
27
Sept
embe
r 20
17
and Pratomo (2015) have demonstrated that current early childhood provision in Indone-sia reinforces the advantage of the better-off, with only 36% of four to six-year-olds fromthe poorest quintile of families attending ECCE programmes in 2010, compared with 68%from the richest quintile.
Following this brief discussion around the provision of primary and pre-primary edu-cation in Indonesia, we will now present our analyses of quantitative data on schoolentry age in Indonesia.
3.2. Quantitative data sources
Multiple data sources are analysed here, for two reasons. Firstly to validate them againsteach other, and secondly because specific variables are available in some surveys, but notothers. This includes the reason for non-entry, for example.
We focus on the three Indonesian Demographic and Health Surveys (DHS) from 2003,2007, and 2012. An additional source of relevant data is provided by the SUPAS intercensalsurvey that has been conducted regularly every five years for several decades and there-fore provides a useful perspective on changes over time. The SUSENAS (Statistics Indonesia(BPS) 2012) is another large-scale multi-purpose survey that has been collected by thenational statistical office of Indonesia with increasing frequency (currently quarterly,with a rotating panel). The Indonesia Family Life Survey (IFLS) (Strauss et al. 2009; RAND Cor-poration 2014) is a longitudinal household survey representative of 13 Indonesian pro-vinces containing about 83% of the national population. It is included in the analysisbecause it contains exact birth dates for all children, as well as reported entry ages.
3.3. Quantitative patterns
The analyses are grouped into three broad areas. The first directly examines the distri-bution of the age of school entry, as well as the question of when and where thepresent patterns emerged. The second relates the responses of parents to the observedentry age in order to shine some light on their understanding of the meaning and impor-tance of the official criterion. The third compares entrants aged six and seven, examiningwhether the former should be considered ‘early’ entrants or the latter ‘late’, in terms of thesocio-economic determinants of their status and of their schooling outcomes.
Multiple data sources are analysed here, for two reasons. The first is to validate themagainst each other, and because specific variables are available in some surveys, butnot others. This includes the
3.3.1. Manifest entry behaviour over time and spaceTo begin with, we can consider simply the percentage of five, six, and seven-year-oldsattending school according to different recent surveys. These are displayed in Table 1.For sources that only record ages in whole years, the timing of the survey is indicatedand should be considered in relation to the beginning of the school year. In thosecases, attendance ratios for those aged 6 at the beginning of the school year are estimatedby regressing on the interview dates (Barakat 2016).
In sum, at least five independent data sources all agree that a substantial majority ofchildren in Indonesia are already in school by the time they turn seven years old. While
COMPARATIVE EDUCATION 11
Dow
nloa
ded
by [
IIA
SA]
at 2
3:09
27
Sept
embe
r 20
17
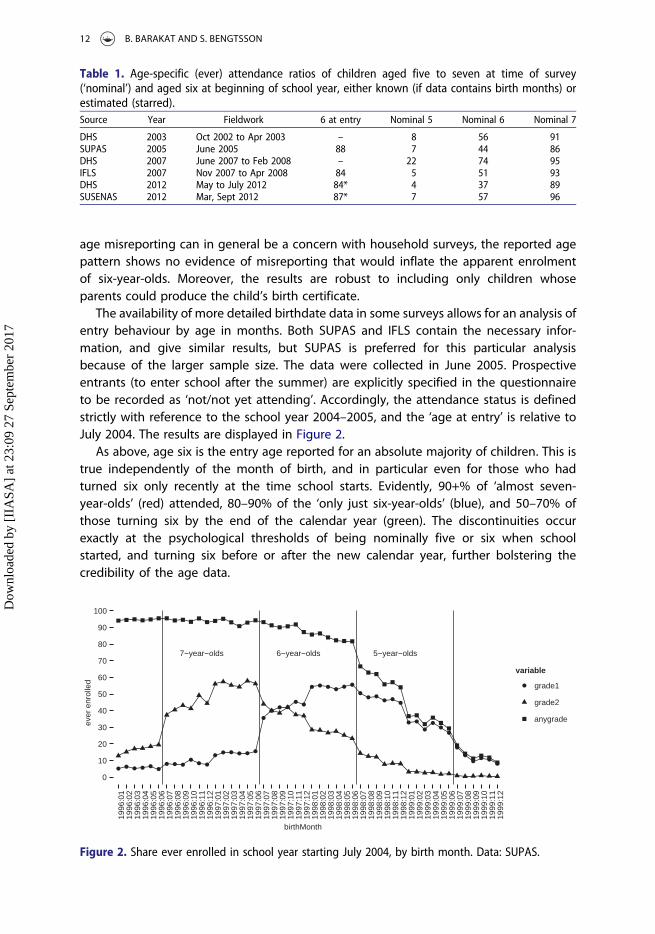
age misreporting can in general be a concern with household surveys, the reported agepattern shows no evidence of misreporting that would inflate the apparent enrolmentof six-year-olds. Moreover, the results are robust to including only children whoseparents could produce the child’s birth certificate.
The availability of more detailed birthdate data in some surveys allows for an analysis ofentry behaviour by age in months. Both SUPAS and IFLS contain the necessary infor-mation, and give similar results, but SUPAS is preferred for this particular analysisbecause of the larger sample size. The data were collected in June 2005. Prospectiveentrants (to enter school after the summer) are explicitly specified in the questionnaireto be recorded as ‘not/not yet attending’. Accordingly, the attendance status is definedstrictly with reference to the school year 2004–2005, and the ‘age at entry’ is relative toJuly 2004. The results are displayed in Figure 2.
As above, age six is the entry age reported for an absolute majority of children. This istrue independently of the month of birth, and in particular even for those who hadturned six only recently at the time school starts. Evidently, 90+% of ‘almost seven-year-olds’ (red) attended, 80–90% of the ‘only just six-year-olds’ (blue), and 50–70% ofthose turning six by the end of the calendar year (green). The discontinuities occurexactly at the psychological thresholds of being nominally five or six when schoolstarted, and turning six before or after the new calendar year, further bolstering thecredibility of the age data.
Table 1. Age-specific (ever) attendance ratios of children aged five to seven at time of survey(‘nominal’) and aged six at beginning of school year, either known (if data contains birth months) orestimated (starred).Source Year Fieldwork 6 at entry Nominal 5 Nominal 6 Nominal 7
DHS 2003 Oct 2002 to Apr 2003 – 8 56 91SUPAS 2005 June 2005 88 7 44 86DHS 2007 June 2007 to Feb 2008 – 22 74 95IFLS 2007 Nov 2007 to Apr 2008 84 5 51 93DHS 2012 May to July 2012 84* 4 37 89SUSENAS 2012 Mar, Sept 2012 87* 7 57 96
7−year−olds 6−year−olds 5−year−olds
0
10
20
30
40
50
60
70
80
90
100
1996
:01
1996
:02
1996
:03
1996
:04
1996
:05
1996
:06
1996
:07
1996
:08
1996
:09
1996
:10
1996
:11
1996
:12
1997
:01
1997
:02
1997
:03
1997
:04
1997
:05
1997
:06
1997
:07
1997
:08
1997
:09
1997
:10
1997
:11
1997
:12
1998
:01
1998
:02
1998
:03
1998
:04
1998
:05
1998
:06
1998
:07
1998
:08
1998
:09
1998
:10
1998
:11
1998
:12
1999
:01
1999
:02
1999
:03
1999
:04
1999
:05
1999
:06
1999
:07
1999
:08
1999
:09
1999
:10
1999
:11
1999
:12
birthMonth
ever
enr
olle
d
variable
grade1
grade2
anygrade
Figure 2. Share ever enrolled in school year starting July 2004, by birth month. Data: SUPAS.
12 B. BARAKAT AND S. BENGTSSON
Dow
nloa
ded
by [
IIA
SA]
at 2
3:09
27
Sept
embe
r 20
17
By necessity, these figures are based on the subsample of children with known birthmonth, which is likely to be biased away from disadvantaged households. This explainswhy the attendance of six-year-olds is at the upper end of the range if we compare differ-ent surveys. However, the proportion of missing birth month data is too small to affect theoverall conclusion.
The results on entry by years of age are further corroborated by the reports on the 2012PISA study. In the PISA sample, too, age six is the modal entry age, and less than 40% ofstudents started school at age seven or older (OECD 2013, Figure IV.2.2.). While this latterfigure is slightly higher than those based on the other sources, the sample is smaller, basedonly on children still in school, and relates to entry at an earlier point in time than most ofthe other surveys.
Different waves of SUPAS show why this issue has not been widely recognised to date.As recently as the mid-1990s, the de jure and de facto entry ages did in fact match. Therehad always been a considerable amount of early entry, and a continuous decline in entry atages seven and above. Indeed, this had been noted with respect to data as early as 1997(UNESCO Division of Statistics 1997, 10). However, the final move to mass entry strictlybefore seven only occurred around the turn of the millennium.
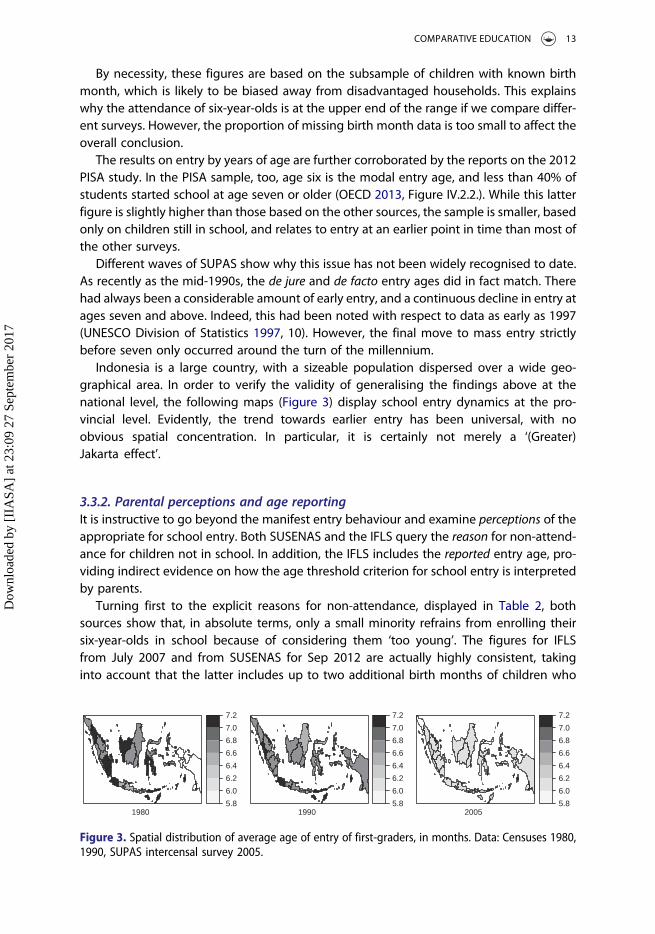
Indonesia is a large country, with a sizeable population dispersed over a wide geo-graphical area. In order to verify the validity of generalising the findings above at thenational level, the following maps (Figure 3) display school entry dynamics at the pro-vincial level. Evidently, the trend towards earlier entry has been universal, with noobvious spatial concentration. In particular, it is certainly not merely a ‘(Greater)Jakarta effect’.
3.3.2. Parental perceptions and age reportingIt is instructive to go beyond the manifest entry behaviour and examine perceptions of theappropriate for school entry. Both SUSENAS and the IFLS query the reason for non-attend-ance for children not in school. In addition, the IFLS includes the reported entry age, pro-viding indirect evidence on how the age threshold criterion for school entry is interpretedby parents.
Turning first to the explicit reasons for non-attendance, displayed in Table 2, bothsources show that, in absolute terms, only a small minority refrains from enrolling theirsix-year-olds in school because of considering them ‘too young’. The figures for IFLSfrom July 2007 and from SUSENAS for Sep 2012 are actually highly consistent, takinginto account that the latter includes up to two additional birth months of children who
19805.8
6.0
6.2
6.4
6.6
6.8
7.0
7.2
19905.8
6.0
6.2
6.4
6.6
6.8
7.0
7.2
20055.8
6.0
6.2
6.4
6.6
6.8
7.0
7.2
Figure 3. Spatial distribution of average age of entry of first-graders, in months. Data: Censuses 1980,1990, SUPAS intercensal survey 2005.
COMPARATIVE EDUCATION 13
Dow
nloa
ded
by [
IIA
SA]
at 2
3:09
27
Sept
embe
r 20
17
only just turned six. The distinction between those who turned six or seven in the calendaryear 2007 is worthwhile. Even among those six-year-olds who did not enter school in July2007, close to a fifth did so for stated reasons other than age; Among those who turnedseven by the end of the year, this share rises to almost a third. More recently, the seven-year-olds in the 2012 SUSENAS sample similarly comprise largely of children who were sixat the beginning of the school year; Nonetheless, not one (!) of them was reported not tohave entered yet on account of being ‘too young’.
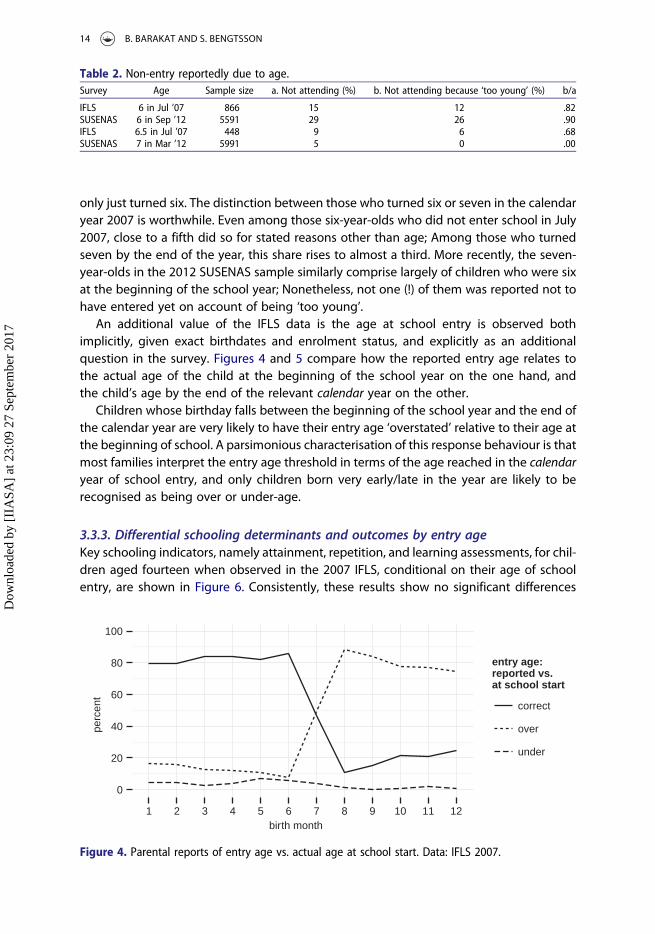
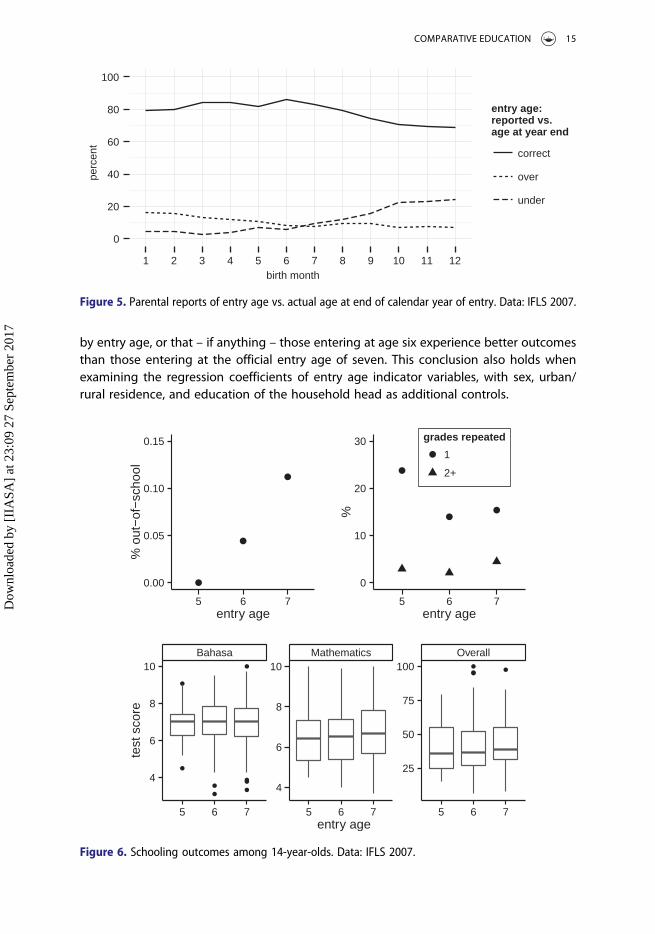
An additional value of the IFLS data is the age at school entry is observed bothimplicitly, given exact birthdates and enrolment status, and explicitly as an additionalquestion in the survey. Figures 4 and 5 compare how the reported entry age relates tothe actual age of the child at the beginning of the school year on the one hand, andthe child’s age by the end of the relevant calendar year on the other.
Children whose birthday falls between the beginning of the school year and the end ofthe calendar year are very likely to have their entry age ‘overstated’ relative to their age atthe beginning of school. A parsimonious characterisation of this response behaviour is thatmost families interpret the entry age threshold in terms of the age reached in the calendaryear of school entry, and only children born very early/late in the year are likely to berecognised as being over or under-age.
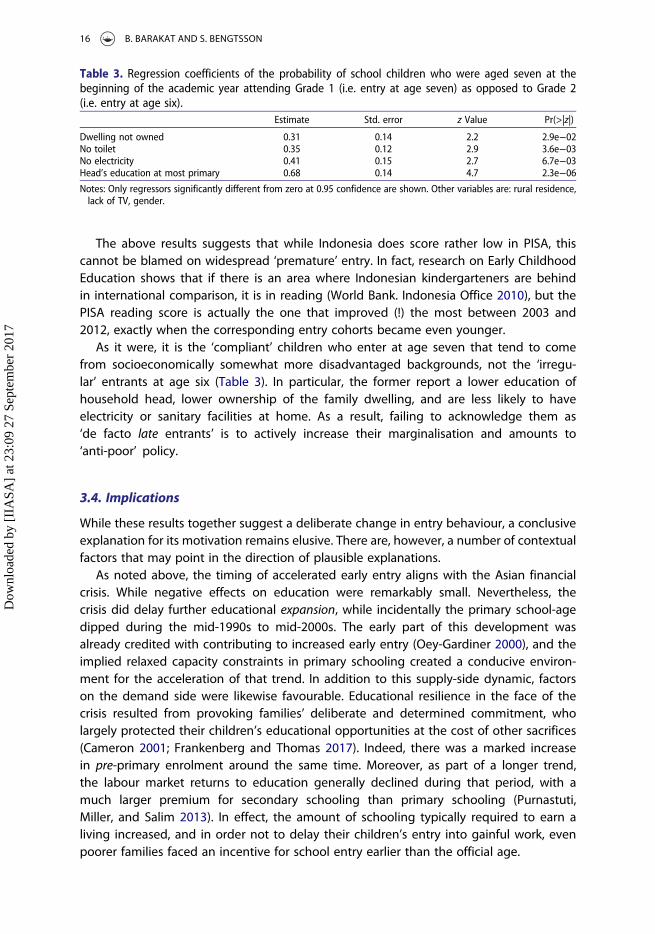
3.3.3. Differential schooling determinants and outcomes by entry ageKey schooling indicators, namely attainment, repetition, and learning assessments, for chil-dren aged fourteen when observed in the 2007 IFLS, conditional on their age of schoolentry, are shown in Figure 6. Consistently, these results show no significant differences
Table 2. Non-entry reportedly due to age.Survey Age Sample size a. Not attending (%) b. Not attending because ‘too young’ (%) b/a
IFLS 6 in Jul ’07 866 15 12 .82SUSENAS 6 in Sep ’12 5591 29 26 .90IFLS 6.5 in Jul ’07 448 9 6 .68SUSENAS 7 in Mar ’12 5991 5 0 .00
0
20
40
60
80
100
1 2 3 4 5 6 7 8 9 10 11 12birth month
perc
ent
entry age:reported vs.at school start
correct
over
under
Figure 4. Parental reports of entry age vs. actual age at school start. Data: IFLS 2007.
14 B. BARAKAT AND S. BENGTSSON
Dow
nloa
ded
by [
IIA
SA]
at 2
3:09
27
Sept
embe
r 20
17
by entry age, or that – if anything – those entering at age six experience better outcomesthan those entering at the official entry age of seven. This conclusion also holds whenexamining the regression coefficients of entry age indicator variables, with sex, urban/rural residence, and education of the household head as additional controls.
0
20
40
60
80
100
1 2 3 4 5 6 7 8 9 10 11 12birth month
perc
ent
entry age:reported vs.age at year end
correct
over
under
Figure 5. Parental reports of entry age vs. actual age at end of calendar year of entry. Data: IFLS 2007.
0.00
0.05
0.10
0.15
5 6 7entry age
% o
ut−
of−
scho
ol
0
10
20
30
5 6 7entry age
%
grades repeated
1
2+
Bahasa Mathematics Overall
4
6
8
10
4
6
8
10
25
50
75
100
5 6 7 5 6 7 5 6 7entry age
test
sco
re
Figure 6. Schooling outcomes among 14-year-olds. Data: IFLS 2007.
COMPARATIVE EDUCATION 15
Dow
nloa
ded
by [
IIA
SA]
at 2
3:09
27
Sept
embe
r 20
17
The above results suggests that while Indonesia does score rather low in PISA, thiscannot be blamed on widespread ‘premature’ entry. In fact, research on Early ChildhoodEducation shows that if there is an area where Indonesian kindergarteners are behindin international comparison, it is in reading (World Bank. Indonesia Office 2010), but thePISA reading score is actually the one that improved (!) the most between 2003 and2012, exactly when the corresponding entry cohorts became even younger.
As it were, it is the ‘compliant’ children who enter at age seven that tend to comefrom socioeconomically somewhat more disadvantaged backgrounds, not the ‘irregu-lar’ entrants at age six (Table 3). In particular, the former report a lower education ofhousehold head, lower ownership of the family dwelling, and are less likely to haveelectricity or sanitary facilities at home. As a result, failing to acknowledge them as‘de facto late entrants’ is to actively increase their marginalisation and amounts to‘anti-poor’ policy.
3.4. Implications
While these results together suggest a deliberate change in entry behaviour, a conclusiveexplanation for its motivation remains elusive. There are, however, a number of contextualfactors that may point in the direction of plausible explanations.
As noted above, the timing of accelerated early entry aligns with the Asian financialcrisis. While negative effects on education were remarkably small. Nevertheless, thecrisis did delay further educational expansion, while incidentally the primary school-agedipped during the mid-1990s to mid-2000s. The early part of this development wasalready credited with contributing to increased early entry (Oey-Gardiner 2000), and theimplied relaxed capacity constraints in primary schooling created a conducive environ-ment for the acceleration of that trend. In addition to this supply-side dynamic, factorson the demand side were likewise favourable. Educational resilience in the face of thecrisis resulted from provoking families’ deliberate and determined commitment, wholargely protected their children’s educational opportunities at the cost of other sacrifices(Cameron 2001; Frankenberg and Thomas 2017). Indeed, there was a marked increasein pre-primary enrolment around the same time. Moreover, as part of a longer trend,the labour market returns to education generally declined during that period, with amuch larger premium for secondary schooling than primary schooling (Purnastuti,Miller, and Salim 2013). In effect, the amount of schooling typically required to earn aliving increased, and in order not to delay their children’s entry into gainful work, evenpoorer families faced an incentive for school entry earlier than the official age.
Table 3. Regression coefficients of the probability of school children who were aged seven at thebeginning of the academic year attending Grade 1 (i.e. entry at age seven) as opposed to Grade 2(i.e. entry at age six).
Estimate Std. error z Value Pr(>|z|)
Dwelling not owned 0.31 0.14 2.2 2.9e−02No toilet 0.35 0.12 2.9 3.6e−03No electricity 0.41 0.15 2.7 6.7e−03Head’s education at most primary 0.68 0.14 4.7 2.3e−06Notes: Only regressors significantly different from zero at 0.95 confidence are shown. Other variables are: rural residence,lack of TV, gender.
16 B. BARAKAT AND S. BENGTSSON
Dow
nloa
ded
by [
IIA
SA]
at 2
3:09
27
Sept
embe
r 20
17
When we consider the quantitative patterns of changing school entry behaviour inrelation to the recent Indonesian EGRA study discussed earlier, which found significantpositive differences in oral reading fluency for being ‘of-age’ (Stern and Nordstrum2014), we begin to understand what is at stake when it comes to conceptual nebulousnessof school entry age. The survey targeted Grade 2 students and was conducted in Marchand April, that is, late in the school year, which starts in July. Nevertheless, ‘of-age’ for pur-poses of the study was taken to mean seven or eight years of age, with no distinctiondrawn between students who had just turned seven, those who were seven turningeight, and those who had turned eight towards the beginning of the academic year.While it is not uncommon to allow for a buffer of one year above the statutory age corre-sponding to a given grade before considering a student ‘over-age’, the above constellationmeans that effectively the bracket was extended downwards instead of upwards. Asnoted, the EGRA operationalisation of ‘of-age’ included seven-year-olds in Grade 2, whomust therefore have enrolled in Grade 1 at an age strictly below seven, and who were‘under-age’ according to official school policy. Conversely, some students who enteredschool at the official age of seven, and turned eight during the course of Grade 1 andturned nine during the course of Grade 2 were effectively classified as ‘over-age’. This pro-vides a salient example of the ambiguity arising from a large difference between the offi-cial age threshold, and the actual distribution of student ages found in classrooms, whichmust be the overriding consideration for studies that aim to investigate the effect of beingolder or younger than your peers.
Results from the Indonesian EGRA show that in addition to students with early child-hood experience and of-age students doing better on the reading assessments, girlstended to outperform boys, and students from better-off communities tended toperform better than those from poorer, more remote communities (Stern and Nordstrum2014). Notably, these characteristics align closely with the selection of students who wouldlikely have received a recommendation for relatively earlier school entry under a formalassessment of school readiness such as the one in Germany.
Further, the generally positive impact on primary school learning outcomes of ECCEexposure in general may mask a negative impact of low quality programmes. Indeed,while the government has succeeded in establishing several important ECD delivery mech-anisms and infrastructure standards, many ECCE teachers are not qualified and only a smallnumber of ECCE centres are actually accredited (Denboba, Hasan, and Wodon 2015).
One of our central arguments is that the equity implications of socioeconomic partici-pation patterns can only be assessed if the age patterns of participation are taken intoaccount. Alatas et al. (2013) note that while different types of ECCE services are intendedto cater to specific age groups, these age groupings are not consistently adhered to inpractice: Local conditions, service availability and family preferences mean that somefour to five-year-olds may still be attending playgroup, rather than kindergarten, andsome six-year-olds may already have started primary school. The present analysis providescomprehensive empirical backing for the contention that the age spread is even largerthan thought, and interacts with socio-economic status.
Given the questions surrounding the quality of ECCE provision, a six-year-old in ECCEmay receive less benefit than a peer in primary school, where there are more trained tea-chers, and more institutionalised standards of quality. If ECCE participation and earlyprimary school entry were in competition, this would tend to reduce inequality, as a
COMPARATIVE EDUCATION 17
Dow
nloa
ded
by [
IIA
SA]
at 2
3:09
27
Sept
embe
r 20
17
seven-year-old enrolled in Grade 2 with no ECCE experience may well be at an advantagein terms of positive child development and learning outcomes compared to a seven-year-old enrolled in Grade 1 with one or even two years of poor quality ECCE experience.However, our findings show that, in fact, the nominal socio-economic differences inECCE participation understate the underlying inequality: four-to-six-year-old children ofmore advantaged groups are more likely to attend ECCE – even though they are alsomore likely to start primary school earlier. In other words, the difference in the overall dur-ation of education is even greater than it seems.
4. Discussion
To summarise the empirical school entry behaviour in Indonesia, multiple independentdata sources conclusively demonstrate that the current official rule for school entry inIndonesia appears to exert little normative pressure and has in fact been consistentlydisregarded for some time now, and throughout the country. A simple re-interpret-ation of existing rules in terms of prescribing entry for those turning seven by theend of the calendar year would align with the popular interpretation, and go partway to legitimising the entry of some six-year-olds (at the beginning of the schoolyear) as being ‘on time’; However, entry rates are so high among those ‘only justsix’, and even among five-year-olds, that this would only partly resolve the issue,and formally ‘early’ entry would still be the majority experience. Standard researchdesigns to study the effects of relative entry age, as well as customary interpretationsof international education statistics, either implicitly or explicitly rely on the statutoryentry age actually representing the majority experience, and are thrown off by theentry pattern just described.
Does this state of affairs amount to a case for changing the official entry age to alignwith actual practice? And do our deliberations on this question with respect to the specificexample of Indonesia lead to a re-assessment of the general issues outlined in Section 2?
As discussed there, alignment with popular demand and international standard prac-tice is not by itself a sufficient justification for a policy change. As demonstrated in ouranalysis, there are, however, other reasons why such a move could be justified: (a) theaverage entry age is so far below the statutory threshold of seven, that it is lower thanthe average entry age in some countries with entry at age six, but a high prevalence ofvoluntary deferred entry, such as Germany; (b) this state of affairs is not a glitch or fad,but a long-term trend has been going on for at least 15 years – in other words, for anentire school generation; (c) finally, this is not merely manifest behaviour, but in additionthere is little effort by parents to pretend their children entered at age seven when theydid not, pointing to a weak normative force of the official entry age. However, while thesefacts strengthen the case for a policy change, they may not be sufficient.
Moreover, whether the official entry age should be changed to reflect actual behaviouris actually too limited a question. Apart from the fact that such a policy change would taketime to enact, it could only affect the future. The extent to which the past and present datashould be re-interpreted by national and international agencies and policy researchers istherefore a separate, and more fundamental question, namely: what is the ‘deep’ defi-nition of Out-Of-School Children, late entrants, overage enrolment and other indicators ofeducational disadvantage and exclusion?
18 B. BARAKAT AND S. BENGTSSON
Dow
nloa
ded
by [
IIA
SA]
at 2
3:09
27
Sept
embe
r 20
17
This way of posing the question draws attention to the fact that the answer is quiteclear. Serving as tools to identify inequity is the raison d’être of these indicators, and thedefinition is most appropriate that best serves this purpose. Arguably then, it is the find-ings regarding the differentials in socio-economic background and schooling outcomesthat are crucial to the interpretation of the prevalence of entry at age six. To recap, entryat age six is not associated with worse outcomes, but entry at age seven is associatedwith general socio-economic disadvantage. It is therefore socially regressive to treatthose entering at age six as ‘early/premature entrants’, instead of treating those enteringat age seven as ‘late entrants’ and deserving of special concern. This concern shouldtrump a strictly legalist reading of the data. Certainly for independent researchers, ana-lysts, and advocates, and perhaps even for international agencies and organisations.Those among the former who are interested in studying the effects of relative agehave no choice but to account for the fact that the official entry age is disregarded inpractice, regardless of whether this is acknowledged by the national administration.Those among the former who study general socio-economic differentials need to doso in order to avoid missing inequities that are otherwise obscured. The latter, finally,face a balancing act between the need for relevance and comparability in their indi-cators and the demands of consistency with the national administrative perspectiveon the other.
While these issues are brought into stark relief by the example of Indonesia, theyare by no means limited to it, or to developing countries. For example, arrange-ments in England possess significant potential for confusion as to the effectiveschool entry age (Sellgren 2015), and in parts of Germany, a direct age-grade corre-spondence is loosened as a matter of policy through a flexible entry phase (Faust2006) based on an entry age bracket rather than simple threshold. It is only amatter of time until there will be no choice but to adapt some of our statisticaland conceptual tools of educational research to such definitional ambiguities. Withregard to statistical measurement, renewed consideration might be given to globalindicators defined in terms of a universal age bracket well clear of entry ambiguity,such as enrolment among those aged 8–12, instead of enrolment of the nationally-defined ‘school-age’ population. The task of coming to conceptual terms with thefact that ‘the school entry age’ is not a single, well-defined number, is likely tobe the greater challenge.
Notes
1. It should be noted, however, that according to Luschei and Zubaidah (2012), in 2006, only 17%of practising teachers had the appropriate degree and more than 1 million would need tohave their qualifications upgraded.
2. The Systems Approach for Better Education Results (SABER) is a World Bank initiative whichevaluates the quality of education policies against evidence-based global standards toproduce comparative data and knowledge on education policies and institutions.
Disclosure statement
No potential conflict of interest was reported by the authors.
COMPARATIVE EDUCATION 19
Dow
nloa
ded
by [
IIA
SA]
at 2
3:09
27
Sept
embe
r 20
17
Funding
This work was supported by the Austrian Science Fund (FWF) [grant Z171-G11].
Notes on contributors
Bilal Barakat is an education researcher and policy analyst affiliated with the Vienna Institute ofDemography (VID) and the International Institute for Applied Systems Analysis (IIASA). Having orig-inally trained as a mathematician at the University of Cambridge, he subsequently obtained his doc-torate at the University of Oxford’s Department of Education. His main research interests and areas ofexpertise include substantive and methodological issues in educational statistics and policy model-ling, especially from a demographic perspective. His research has been published in leading inter-national journals and informed major international reports, including the Intergovernmental Panelon Climate Change (IPCC) and Global Education Monitoring (GEMR) reports. He is also a regular con-sultant for UNESCO and other international organisations.
Stephanie Bengtsson is an educator, social scientist, and development practitioner with a proventrack record in international aid and education and a deep commitment to improving policy andpractice through rigorous research, evaluation, and knowledge sharing. She holds a Master’s fromCambridge in International Perspectives on Inclusive Education and a Doctorate in International Edu-cational Development from Columbia University – Teachers College. She is currently a ResearchScholar with the Wittgenstein Centre for Demography and Global Human Capital in Vienna. Stepha-nie specialises in inclusive education, policy, programming and planning, particularly in crisis, chal-lenging contexts, and situations of forced displacement, teacher training and capacity building, andthe Education for All (EFA) and Sustainable Development Goals (SDG) agendas. Her scholarly workand her work with a range of international partners (including UNICEF, INEE, NGOs, academic insti-tutions, civil society, schools, etc.) has centred around the notion of education as a life-saving andlife-sustaining right.
ORCID
Bilal Barakat http://orcid.org/0000-0002-1420-4405Stephanie Bengtsson http://orcid.org/0000-0002-6476-8495
References
Alatas, H., S. Brinkman, M. Chu Chang, T. Hadiyati, D. Hartono, A. Hasan, M. Hyson, et al. 2013. “EarlyChildhood Education and Development Services in Indonesia.” ISEAS. http://dare.uva.nl/personal/pure/en/publications/early-childhood-education-and-development-services-in-indonesia(fdd38895-5b3c-4eaa-b452-155b7f19d00e).html.X.
Al-Samarrai, S., and P. Cerdan-Infantes. 2013. “Where Did All the Money Go? Financing BasicEducation in Indonesia.” Education in Indonesia.
Barakat, B. 2016. “‘Sorry I Forgot Your Birthday!’: Adjusting Apparent School Participation for SurveyTiming When Age Is Measured in Whole Years.” International Journal of Educational Development49: 300–313. doi:10.1016/j.ijedudev.2016.03.011.X.
Baum-Snow, Nathaniel, and Byron F. Lutz. 2011. “School Desegregation, School Choice, and Changesin Residential Location Patterns by Race.” American Economic Review 101 (7): 3019–3046. doi:10.1257/aer.101.7.3019.X.
Bedard, Kelly, and Elizabeth Dhuey. 2006. “The Persistence of Early Childhood Maturity: InternationalEvidence of Long-Run Age Effects.” The Quarterly Journal of Economics 121 (4): 1437–1472.
Bloem, S. 2013. “PISA in Low and Middle Income Countries”, OECD Education Working Papers, No. 93,OECD Publishing, Paris.doi:10.1787/5k41tm2gx2vd-en.
20 B. BARAKAT AND S. BENGTSSON
Dow
nloa
ded
by [
IIA
SA]
at 2
3:09
27
Sept
embe
r 20
17
Brock-Utne, B. 2000. Whose Education for All? The Recolonization of the African Mind. New York:Falmer.
Cameron, L. A. 2001. “The Impact of the Indonesian Financial Crisis on Children: An Analysis Using the100 Villages Data.” Bulletin of Indonesian Economic Studies 37 (1): 43–64. doi:10.1080/000749101300046492.
Carney, Stephen, Jeremy Rappleye, and Iveta Silova. 2012. “Between Faith and Science: World CultureTheory and Comparative Education.” Comparative Education Review 56 (3): 366–393.
Carr-Hill, R. 2015. “PISA for Development Technical Strand C: Incorporating Out-of-School 15-Year-olds in the Assessment”, OECD Education Working Papers, No. 120, OECD Publishing, Paris.doi:10.1787/5js0bsln9mg2-en.
Coleman, Hywel. 2011. “Dreams and Realities.” Developing Countries and the English Language.British Council.
Denboba, Amina, Amer Hasan, and Quentin Wodon. 2015. Early Childhood Education andDevelopment in Indonesia: An Assessment of Policies Using SABER. Edited by Amina Denboba,Amer Hasan, and Quentin Wodon. The World Bank. doi:10.1596/978-1-4648-0646-9.X.
Denboba, A. D., R. K. Sayre, Q. T. Wodon, and L. K. Elder. 2014. Stepping Up Early ChildhoodDevelopment. The World Bank. https://openknowledge.worldbank.org/bitstream/handle/10986/21094/929880wp0box380cd0oct20140eng0final.pdf?sequence=1.X.
Faust, Gabriele. 2006. “Zum Stand der Einschulung und der neuen Schuleingangsstufe inDeutschland.” Zeitschrift Für Erziehungswissenschaft 9 (3): 328–347. doi:10.1007/s11618-006-0054-8.X.
Frankenberg, E., and D. Thomas. 2017. “Human Capital and Shocks: Evidence on Education, Health,and Nutrition.” Human Capital and Economic Opportunity (HCEO) Working Paper 2017–035,University of Chicago.
Horstschräer, Julia, and Grit Muehler. 2014. “School Entrance Recommendation: A Question of Age orDevelopment?” Education Economics 22 (3): 270–292. doi:10.1080/09645292.2011.645126.X
Human Rights Watch. 2017. “‘I Had a Dream to Finish School’ Barriers to Secondary Education inTanzania.” https://www.hrw.org/sites/default/files/report_pdf/tanzania0217_web.pdf.
Jeronimus, Bertus F, Nikolaos Stavrakakis, René Veenstra, and Albertine J. Oldehinkel. 2015. “RelativeAge Effects in Dutch Adolescents: Concurrent and Prospective Analyses.” PLoS ONE 10 (6):e0128856. doi:10.1371/journal.pone.0128856.X.
Jones, Gavin W., and Devanto Pratomo. 2015. “Education in Indonesia: Trends, Differentials, andImplications for Development.” In Contemporary Demographic Transformations in China, Indiaand Indonesia, edited by Christophe Z. Guilmoto and Gavin W. Jones, 195–214. Cham: SpringerInternational. doi:10.1007/978-3-319-24783-0_12.X.
Little, Angela W., ed. 2007. Education for All and Multigrade Teaching: Challenges and Opportunities.Dordrecht: Springer.
Luschei, Thomas, F., and Ida Zubaidah. 2012. “Teacher Training and Transitions in Rural IndonesianSchools: A Case Study of Bogor, West Java.” Asia Pacific Journal of Education 32 (3): 333–350.doi:10.1080/02188791.2012.711241.X.
Matsubayashi, Tetsuya, and Michiko Ueda. 2015. “Relative Age in School and Suicide Among YoungIndividuals in Japan: A Regression Discontinuity Approach.” PloS One 10 (8): e0135349. doi:10.1371/journal.pone.0135349.
Musch, J., and S. Grondin. 2001. “Unequal Competition as an Impediment to Personal Development:A Review of the Relative Age Effect in Sport.” Developmental Review 21 (2): 147–167. doi:10.1006/drev.2000.0516.
OECD. 2013. PISA 2012 Results: What Makes Schools Successful? Resources, Policies and Practices(Volume IV). OECD. doi:10.1787/9789264201156-en.X.
Oey-Gardiner, M. 2000. “The Value of Education and the Indonesian Economic Crisis.” Economics andFinance in Indonesia 48: 143–172.
Peña, Pablo A. 2017. “Creating Winners and Losers: Date of Birth, Relative Age in School, andOutcomes in Childhood and Adulthood.” Economics of Education Review 56 (February): 152–176.doi:10.1016/j.econedurev.2016.12.001.
COMPARATIVE EDUCATION 21
Dow
nloa
ded
by [
IIA
SA]
at 2
3:09
27
Sept
embe
r 20
17
Purnastuti, L., P. W. Miller, and R. Salim. 2013. “Declining Rates of Return to Education: Evidence forIndonesia.” Bulletin of Indonesian Economic Studies 49 (2): 213–236. doi:10.1080/00074918.2013.809842.
RAND Corporation. 2014. “Indonesia Family Life Survey (IFLS).” http://www.rand.org/labor/FLS/IFLS.html.X.
Rose, Pauline, and Ben Alcott. 2015. “How Can Education Systems Become Equitable by 2030? DFIDThink Pieces: Learning and Equity.” HEART. http://www.heart-resources.org/wp-content/uploads/2015/08/Rose-and-Alcott-2015.pdf.
Schorer, J., N. Wattie, and J. B. Baker. 2013. “A New Dimension to Relative Age Effects: Constant YearEffects in German Youth Handball.” PLoS ONE 8 (4): e60336. doi:10.1371/journal.pone.0060336.
Sellgren, Katherine. 2015. “‘Confusion’ Over Summer-Born School Starting Age.” http://www.bbc.com/news/education-25726538.X.
Sharp, Caroline. 1995. “What’s Age Got to Do with It? A Study of Patterns of School Entry and theImpact of Season of Birth on School Attainment.” Educational Research 37 (3): 251–265. doi:10.1080/0013188950370304.
Sprietsma, Maresa. 2010. “Effect of Relative Age in the First Grade of Primary School on Long-termScholastic Results: International Comparative Evidence Using PISA 2003.” Education Economics18 (1): 1–32.
Stacki, Sandra L, and Supriya Baily. 2015. “Educating Adolescent Girls Around the Globe.” Challengesand Opportunities. Routledge.
Statistics Indonesia (BPS). 2012. “National Socio-Economic Survey (SUSENAS).” http://microdata.bps.go.id/mikrodata/index.php/catalog/SUSENAS.X.
Stern, J. M., and L. E. Nordstrum. 2014. Indonesia 2014: The National Early Grade Reading Assessment(EGRA) and Snapshot of School Management Effectiveness (SSME) Survey Report of Findings. ChevyChase, MD: Global Reading Network.
Strauss, J., F. Witoelar, B. Sikoki, and A. M. Wattie. 2009. “The Fourth Wave of the Indonesian FamilyLife Survey (IFLS4): Overview and Field Report.” WR-675/1-NIA/NICHD.
Suharti, S. 2013. “Trends in Education in Indonesia.” In Education in Indonesia, edited by D.Suryadarma and G. W. Jones, 15–52. Singapore: ISEAS.
Sykes, E. D. A., J. F. Bell, and C. V Rodeiro. 2009. “Birthdate Effects: A Review of the Literature from1990–on.” Cambridge Assessment. http://217.35.77.12/research/england/education/169664_Cambridge_Lit_Review_Birthdate_d3.pdf.X.
Tikly, Leon. 2016. “The Future of Education for All as a Global Regime of Educational Governance.”Comparative Education Review 61 (1): 22–57. doi:10.1086/689700.X.
Thompson, Angus H., R. H. Barnsley, and J. Battle. 2004. “The Relative Age Effect and theDevelopment of Self-esteem.” Educational Research 46 (3): 313–320. doi:10.1080/0013188042000277368.
UIS. 2005. Children Out of School: Measuring Exclusion from Primary Education. Montreal: UNESCOInstitute for Statistics.
UNESCO. 2015. EFA Global Education Monitoring Report 2015. Paris: EDUCATION for All 2000-2015:Achievements and Challenges.
UNESCO Division of Statistics. 1997. Primary and Secondary Education: Age-Specific Enrolment Ratiosby Gender 1960/61–1995/96. Paris: UNESCO.
Winch, W. H. 1911. When Should a Child Begin School? An Inquiry into the Relation Between the Age ofEntry and School Progress. Baltimore: Warwick & York.
World Bank. Indonesia Office. 2010. “A Snapshot of Early Childhood Development in Indonesia.”Knowledge Brief 58379. Washington, DC: World Bank. http://documents.worldbank.org/curated/en/2010/12/13235831/snapshot-early-childhood-development-indonesia.X.
22 B. BARAKAT AND S. BENGTSSON
Dow
nloa
ded
by [
IIA
SA]
at 2
3:09
27
Sept
embe
r 20
17