ETHNIC GENERATIONS: Evolving Ethnic Perceptions among Dominant Groups
http://jfi.sagepub.com/Journal of Family Issues
http://jfi.sagepub.com/content/27/11/1583The online version of this article can be found at:
DOI: 10.1177/0192513X06291498
2006 27: 1583Journal of Family IssuesBrent Berry
Transfers to Adult Children in the United States?What Accounts for Race and Ethnic Differences in Parental Financial
Published by:
http://www.sagepublications.com
can be found at:Journal of Family IssuesAdditional services and information for
http://jfi.sagepub.com/cgi/alertsEmail Alerts:
http://jfi.sagepub.com/subscriptionsSubscriptions:
http://www.sagepub.com/journalsReprints.navReprints:
http://www.sagepub.com/journalsPermissions.navPermissions:
http://jfi.sagepub.com/content/27/11/1583.refs.htmlCitations:
What is This?
- Oct 18, 2006Version of Record >>
at UNIV TORONTO on November 7, 2013jfi.sagepub.comDownloaded from at UNIV TORONTO on November 7, 2013jfi.sagepub.comDownloaded from at UNIV TORONTO on November 7, 2013jfi.sagepub.comDownloaded from at UNIV TORONTO on November 7, 2013jfi.sagepub.comDownloaded from at UNIV TORONTO on November 7, 2013jfi.sagepub.comDownloaded from at UNIV TORONTO on November 7, 2013jfi.sagepub.comDownloaded from at UNIV TORONTO on November 7, 2013jfi.sagepub.comDownloaded from at UNIV TORONTO on November 7, 2013jfi.sagepub.comDownloaded from at UNIV TORONTO on November 7, 2013jfi.sagepub.comDownloaded from at UNIV TORONTO on November 7, 2013jfi.sagepub.comDownloaded from at UNIV TORONTO on November 7, 2013jfi.sagepub.comDownloaded from at UNIV TORONTO on November 7, 2013jfi.sagepub.comDownloaded from at UNIV TORONTO on November 7, 2013jfi.sagepub.comDownloaded from at UNIV TORONTO on November 7, 2013jfi.sagepub.comDownloaded from at UNIV TORONTO on November 7, 2013jfi.sagepub.comDownloaded from at UNIV TORONTO on November 7, 2013jfi.sagepub.comDownloaded from at UNIV TORONTO on November 7, 2013jfi.sagepub.comDownloaded from at UNIV TORONTO on November 7, 2013jfi.sagepub.comDownloaded from at UNIV TORONTO on November 7, 2013jfi.sagepub.comDownloaded from at UNIV TORONTO on November 7, 2013jfi.sagepub.comDownloaded from at UNIV TORONTO on November 7, 2013jfi.sagepub.comDownloaded from at UNIV TORONTO on November 7, 2013jfi.sagepub.comDownloaded from at UNIV TORONTO on November 7, 2013jfi.sagepub.comDownloaded from
What Accounts for Raceand Ethnic Differences inParental FinancialTransfers to Adult Childrenin the United States?Brent BerryUniversity of Toronto, Ontario, Canada
Financial assistance that parents give to their young adult children is part of thebundle of flows that constitutes intergenerational support. Are there racial andethnic differences in this financial assistance, and if so, why? Wave 2 data fromthe Health and Retirement Study (N = 17,996) suggest group differences inboth the incidence and amount of annual support given to nonresident adultchildren. Structural inequalities in the form of economic resources, familystructure, and health account for most group differences, a finding counter torecent research emphasizing culture and behavioral practices. Economicresources most strongly account for less giving in African American familiesthan in other groups. For Latinos, income and parental education are most vital.Parental health and family size are also important predictors of group differ-ences. African American and Latino families help compensate for the differ-ences in financial transfers with coresidence, extended family exchange, andproximity.
Keywords: intergenerational transfers; racial differences; Health andRetirement Study; health; wealth
Financial assistance from parents to their young adult children is animportant part of the bundle of support flows across generations, pro-
viding a direct means through which parents can transmit their wealth tochildren (Altonji & Dunn, 1991). Previous research has made clear that suchassistance in the United States varies significantly by race and ethnicityand that this variation may be due to differences in structural factors (e.g.,parental resources, needs of children, family structure) and cultural orbehavioral practices (Eggebeen, 1992; Jayakody, 1998; Lee & Aytac, 1998).
Journal of Family IssuesVolume 27 Number 11
November 2006 1583-1604© 2006 Sage Publications
10.1177/0192513X06291498http://jfi.sagepub.com
hosted athttp://online.sagepub.com
1583
In this article, I examine group differences in annual measures of intervivos financial assistance given by parents to their young adult children.Short-term annual transfer measures with a low $100 dollar threshold areused because they are both responsive to the changing life circumstancesof young adult children and have a higher prevalence among AfricanAmerican and Latino families, who are more likely to report smaller amountsof assistance (McGarry & Schoeni, 1995). The article concentrates on evalu-ating competing explanations for group differences in giving, focusing on therelative contribution of family-, parent-, and child-level structural factors (i.e.,resources and constraints such as socioeconomic status and family structure).These structural factors fall into five conceptually distinct groups: (1) eco-nomic resources of parents, (2) composition of parental household structureand competing recipients, (3) ideational resources that guide allocation deci-sions, (4) health constraints on the donor, and (5) resources and needs of thechild recipients. The Health and Retirement Study’s (HRS) expanded mea-sures of economic resources and parental health may help account for groupdifferences not accounted for elsewhere (Jayakody, 1998; Lee & Aytac,1998). Furthermore, child-specific measures of needs and resources inviteanalyses that can gauge the relative influence of family, parent, and childcharacteristics. Analyses at the end of the article contextualize the findingsfor financial assistance by considering group differences in support broadlyconceived from measures of coresidence, time assistance, financial assis-tance, and child–parent proximity. To put the core analysis of structural fac-tors into perspective, I also examine to what extent the observed groupdifferences might be due to behavioral rather than structural factors.
Background
Intergenerational assistance is a complex bundle of flows that can takemany forms and can involve both kin and nonkin ties. Despite the importanceof intrafamily financial transfers, it is important to keep this context in mindwhen making race and ethnic comparisons (Cox, 2003). Money also maynot hold the same instrumental and symbolic significance across cultures(Aschenbrenner, 1973). Rather than holding up one group as an ideal to emu-late, this study measures and accounts for any differences to contextualize therole of intergenerational support in stratification more generally.
For financial assistance, research consistently finds that White adultchildren are more likely to receive and receive larger amounts of financialassistance than African American or Latino children (Jayakody, 1998; Lee &
1584 Journal of Family Issues
Aytac, 1998). For example, Rosenzweig and Wolpin (1993) find that Whiteadult children receive, on average, twice the amount of assistance fromparents as African American adult children.
Prior research has considered a variety of reasons for group differences inparents’ financial assistance to adult children and what kinds of support maycompensate for this assistance (Jayakody, 1998; Lee & Aytac, 1998; McGarry& Schoeni, 1995; Rosenzweig & Wolpin, 1993). Lee and Aytac (1998), usingcross-sectional data from the National Survey of Families and Households,find that family structure, income, and education of both the adult child recip-ient and parent donor account for about one third of the difference in netreceipt of support for African Americans and one half for Latinos relativeto Whites. Rosenzweig and Wolpin (1993) examine support to young adultmen, reporting that African American adult children remain 60% less likelyto receive a financial transfer from parents after adjusting for education,income, marital status, and work status of the parents and the son. Jayakody(1998), using cross-sectional data from the 1998 wave of the Panel Study ofIncome Dynamics, found that African American children received assistance19% less often than White children and received amounts that were $733smaller, net of group differences in the needs of children and resourcesof parents. McGarry and Schoeni (1995), using Wave 1 data from the HRS,report that African American adult children remain 20% less likely thanWhite adult children to receive, after controlling for child and parental char-acteristics. Berry (2001) examines race and ethnic differences in transferbehavior and motives for giving using HRS data, finding that groups vary intheir giving to daughters versus sons, children with children versus childrenwithout children, and poor children versus higher income children.
This article focuses on decomposing observed group differences in finan-cial assistance to adult children into that explained by the resources and con-straints of parents and children using a pooled sample. These resources andconstraints are often referred to as structural factors. This analysis improveson prior investigations that consider the role of structural factors in group dif-ferences in financial assistance to adult children. First, explanatory variablessuch as parental health or wealth have rarely been considered despite beinghighly unequal by race and ethnicity (Schoenbaum & Waidman, 1997).Second, some prior studies use the household as the unit of analysis, makingit difficult to adjudicate the relative contribution of child-level, parental-level,and family-level structural variables. Third, there are few systematic effortsto attribute explanatory power to individual structural factors by estimatinglow and high bounds on their influence. Fourth, measures of annual financialassistance, permitting respondents to answer with amounts as low as $100,
Berry / Parental Financial Transfers 1585
are both more responsive to the changing life circumstances of young adultchildren and also more common among African American and Latinofamilies, who have fewer resources to give on average (Soldo & Hill, 1995).
The decomposition of group differences in a pooled sample assumesthat parental motives for giving (i.e., the coefficients) are the same acrossgroups. Estimating separate models for each group is necessary to examinegroup differences in behavioral patterns (see Berry, 2001, for a recentanalysis). Such a focus on group-specific behavioral patterns lends itself toa closer evaluation of theories of parental motives for giving, such as altru-ism (Becker, 1974) and exchange (Cox, 1987). Space limitations precludea full reporting and interpretation of group-specific models. Testing forparental motives has been the focus of a substantial body of work (see Cox,2003, for a review). To put the present analysis of competing structural fac-tors into perspective, I examine the relative contribution of behavioral pat-terns in a condensed fashion using a standardization analysis that examinesthe percentage change in probability of adult children receiving financialassistance from parents among Blacks and Latinos if the same coefficientsor sample characteristics as Whites are assumed.
The core analysis considers the relative influence of five conceptually dis-tinct groups of structural factors on race and ethnic differences in financialassistance to adult nonresident children. The first group is the parentalfamily’s economic resources, which limit the size and prevalence of assis-tance. These resources include household income and net worth, the latter ofwhich has not often been measured in studies of transfers. High levels ofwealth inequality by race and ethnicity may have important influences on dif-ferences in financial assistance to adult children (Schoenbaum & Waidman,1997). The second group is family structure constraints arising from thenumber of competing recipients and donor parents. These constraints areoperationalized as the number of children, the number of poor children,parent’s marital status, and the number of living grandparents. Each of theseconstraints puts limitations on the assistance that can be given to any child.For example, parents may offer less help to nonresident children if they haveliving parents or other children to assist (Soldo & Hill, 1993). The third groupis ideational influences that inform the donor how to distribute resources.Aside from the distinct cultural capital associated with race and ethnicity,ideational variables thought to inform decisions about giving are best opera-tionalized by parent’s education (Cox, 2003). The fourth group is the healthconstraints of donor parents. Indicators of parents’ general health status andwhether they are currently disabled may constrain their ability to providefinancial assistance to children. Health constraints may also encourage
1586 Journal of Family Issues
parents to give more assistance to children whom they can count on for reci-procal support. As with wealth, sizable race and ethnic disparities in thehealth and disability of donor parents may be important structural explana-tions for differences in financial assistance to adult children (Cox, 2003;Schoenbaum & Waidman, 1997). The fifth group is the resources and con-straints of individual children, operationalized with measures of need(child’s income and single-parent status) and capacities (child’s education).Child recipient resources are key variables when testing the donors’ motivesbut also may account in part for overall group differences in giving to theextent that they vary by race and ethnicity. I estimate multivariate models thatevaluate the explanatory power of these competing structural resources andconstraints. The appendix describes these variables.
Method
Sample
The HRS is a U.S. nationally representative panel study of individualsborn 1931 to 1941, and their spouses or partners HRS is an ideal data set forthis study, because parents nearing retirement ages represent the largestsource of financial support to their young adult children (Soldo & Hill, 1993).HRS respondents are the parents of the child recipients, providing informationabout children and assistance given. The unit of analysis is the child–parentdyad, which links nonresident adult children as receivers to a parental house-hold donor.
Families with multiple eligible children contribute multiple observations tothe sample. Wave 2 (1994) data are the focus of the analysis, including infor-mation on 22,537 adult children (aged 18 years or more) from 6,710 house-holds. Nonresponse rates are less than 10% for all the items describing therespondent’s children except reports of child’s income. For the 18% of theparental respondents unable to give the income range for one or more children,income was categorized as missing. See Soldo and Hill (1995) for a descrip-tion of HRS transfer data. Limiting the sample to adult children with completeinformation in Wave 2 reduces the number of parent–child dyads to 19,885 (areduction of 11.8% of the original Wave 2 sample).
I categorize children as Black or Latino if either parent identified as such.Other ethnic groups and biracial parental households could not be examinedseparately because of insufficient data. To see if results were sensitive to howI classify race and ethnicity in mixed households, I first estimated models thatexclude mixed households. The results did not substantially differ from the
Berry / Parental Financial Transfers 1587
reported estimates that include these households. For this reason and alsobecause a similar classification scheme has been used elsewhere (e.g., Wong,Capoferro, & Soldo, 1999), I categorize children as Black or Latino if eitherparent identified as such. Households with one or more Hispanic or Latinospouse are classified as Hispanic or Latino.
Limiting the sample further to nonresident adult children classified asBlack, Latino, or White reduces the number of child–parent dyads to 17,996(a further reduction of 8.4% of the original Wave 2 sample). The respectivenumber of White, Black, and Latino nonresident adult child–parent dyadswith complete information is 12,715, 3,532, and 1,749 (from 4,225, 1,064,and 515 households, respectively). I limit the analyses to nonresident adultchildren because of the difficulty with comparing transfers in a sample thatincludes both coresident and nonresident children (McGarry & Schoeni,1995). For example, in-kind transfers to coresident children would need to begiven a dollar value to be compared with nonresident siblings. Issues such asassigning a rental value for children living with their parents would alsorequire specific information that is not available.
Outcome Variables: Incidence and Amount of Assistance
With few exceptions (Berry, 2001; McGarry, 1999; McGarry & Schoeni,1995; Phillips, 1997; Wilkinson, 2000), scholars using HRS transfer datahave thus far focused on the bequest data rather than inter vivos giving (seeCox, 2003, for a review). Here, the focus is on inter vivos giving. Familieswith children were asked in Wave 2 if any child had been given financialassistance of $100 or more during the past 12 months. This $100 thresholdwas lowered from $500 in Wave 1 to capture more giving in low-incomefamilies (Soldo & Hill, 1995). The annual transfer measures in HRS Wave 2are thought to be more sensitive to short-term situations and needs ofchildren. Financial assistance was defined to include “support, gifts, or loansfor specific expenses such as a down payment on a house or medical care orinsurance as well as unrestricted contributions that might be used for any pur-pose including paying bills or living expenses” (Soldo & Hill, 1995, p. S118).
Respondents who were unable to recall the amount of transfer were routedto a series of three bracketing items (“Was it more than $500?” and if so,“Was it more than $1,000?” “. . . $5,000?”). Completed responses to thesebracketing items produces five categories (≤ $500; $501 to $1,000; $1,001 to$5,000; > $5,000), whereas incomplete responses to these items (because therespondent does not know the response or refuses to respond) produces fourless specific categories (> $500; > $1,000; ≤ $1,000; ≤ $5000). The author
1588 Journal of Family Issues
used a hot-deck imputation method based on these bracketed responses toassign a specific transfer amount.
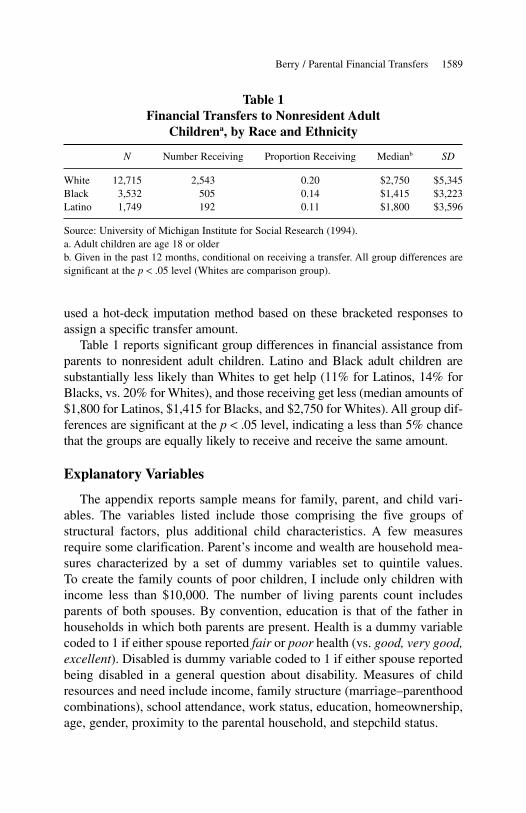
Table 1 reports significant group differences in financial assistance fromparents to nonresident adult children. Latino and Black adult children aresubstantially less likely than Whites to get help (11% for Latinos, 14% forBlacks, vs. 20% for Whites), and those receiving get less (median amounts of$1,800 for Latinos, $1,415 for Blacks, and $2,750 for Whites). All group dif-ferences are significant at the p < .05 level, indicating a less than 5% chancethat the groups are equally likely to receive and receive the same amount.
Explanatory Variables
The appendix reports sample means for family, parent, and child vari-ables. The variables listed include those comprising the five groups ofstructural factors, plus additional child characteristics. A few measuresrequire some clarification. Parent’s income and wealth are household mea-sures characterized by a set of dummy variables set to quintile values.To create the family counts of poor children, I include only children withincome less than $10,000. The number of living parents count includesparents of both spouses. By convention, education is that of the father inhouseholds in which both parents are present. Health is a dummy variablecoded to 1 if either spouse reported fair or poor health (vs. good, very good,excellent). Disabled is dummy variable coded to 1 if either spouse reportedbeing disabled in a general question about disability. Measures of childresources and need include income, family structure (marriage–parenthoodcombinations), school attendance, work status, education, homeownership,age, gender, proximity to the parental household, and stepchild status.
Berry / Parental Financial Transfers 1589
Table 1Financial Transfers to Nonresident Adult
Childrena, by Race and Ethnicity
N Number Receiving Proportion Receiving Medianb SD
White 12,715 2,543 0.20 $2,750 $5,345Black 3,532 505 0.14 $1,415 $3,223Latino 1,749 192 0.11 $1,800 $3,596
Source: University of Michigan Institute for Social Research (1994).a. Adult children are age 18 or olderb. Given in the past 12 months, conditional on receiving a transfer. All group differences aresignificant at the p < .05 level (Whites are comparison group).
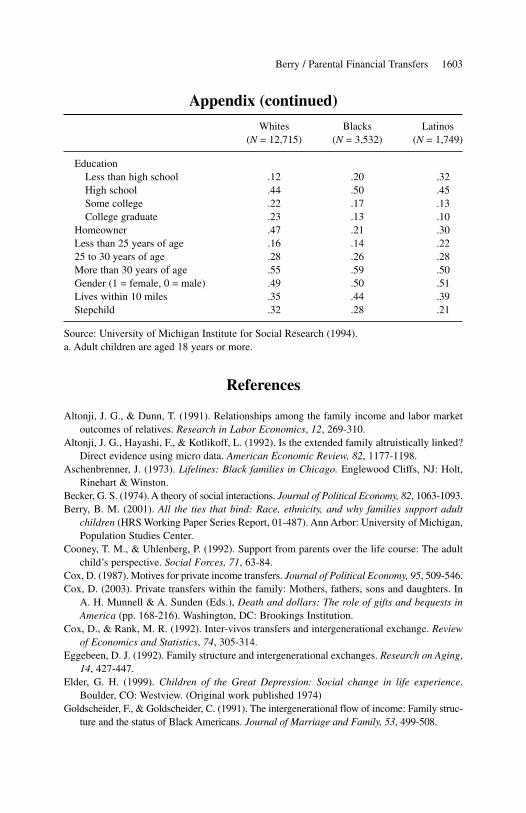
A quick inspection of group differences in the sample means shows ahigher level of disadvantage in Black and Latino families than in Whitefamilies across most categories, including parental income and wealth,number of poor children, parental education, and health and disability. TheBlack and Latino adult children linked to these parental households are alsomore disadvantaged than their White counterparts—they have lower incomes,greater incidence of single parenthood, and lower education. The subsequentanalysis sets out to find which group of structural factors, if any, account forgroup differences in financial assistance to adult nonresident children.
Statistical Models
I decompose the total effect of race or ethnicity by statistically controllingfor the five groups of factors hypothesized to contribute to group differences.In general, the total effect is the magnitude of the coefficient for the Blackor Latino variables in models that include only that variable (Whites are theomitted group). When the indirect effect accounts for a large part of the totaleffect of race or ethnicity on transfers, we attain a good understanding of howthe total effect of race or ethnicity on transfers operates.
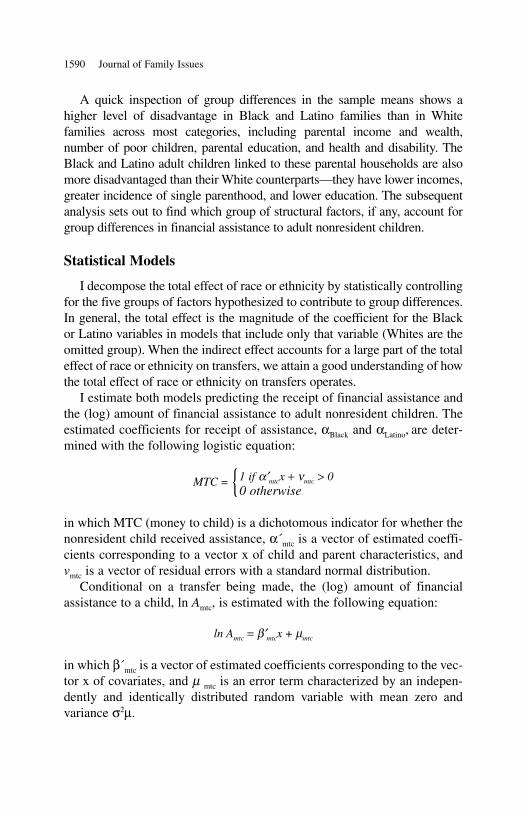
I estimate both models predicting the receipt of financial assistance andthe (log) amount of financial assistance to adult nonresident children. Theestimated coefficients for receipt of assistance, αBlack and αLatino, are deter-mined with the following logistic equation:
MTC = {1 if α′mtcx + νmtc > 00 otherwise
in which MTC (money to child) is a dichotomous indicator for whether thenonresident child received assistance, α´mtc is a vector of estimated coeffi-cients corresponding to a vector x of child and parent characteristics, andvmtc is a vector of residual errors with a standard normal distribution.
Conditional on a transfer being made, the (log) amount of financialassistance to a child, ln Amtc, is estimated with the following equation:
ln Amtc = β′mtcx + µmtc
in which β´mtc is a vector of estimated coefficients corresponding to the vec-tor x of covariates, and µ mtc is an error term characterized by an indepen-dently and identically distributed random variable with mean zero andvariance σ2µ.
1590 Journal of Family Issues
Because the residual term in the “any transfer” equation may be corre-lated with the residual term in the “amount” equation, ignoring self-selectioncan lead to biased estimates in the amount equation. To adjust for this poten-tial self-selection, I use Heckman’s (1979) method of adjusting for sample-selection bias into transfers, which includes as a covariate the correlationbetween the family’s propensity to give and its amount of giving. A positivecorrelation indicates that families who are more likely to give also givelarger amounts. Standard OLS regression estimates that do not include thisadjustment may yield biased results, because the dependent variable (theamount of transfers) is nonrandomly distributed due to censoring. The sam-ple is censored because transfers are not known below the cutoff value of$100. When this exists, a selection model is estimated to yield a correctioncoefficient that is used in the regression equations predicting the amount.Heckman’s two-step procedure first estimates the selection equation (a pro-bit model) to estimate an adjustment coefficient. The amount equation isthen estimated by OLS with the adjustment coefficient as an additionalexplanatory variable representing an omitted selection variable.
Without this correction, OLS estimates, such as those presented byMcGarry and Schoeni (1995), may introduce a bias by excluding nonrecipi-ents (those who did not receive from parents). That is, OLS estimates may bebiased to the extent that the subsample of recipients is not randomly distrib-uted with respect to characteristics influencing the likelihood of receivingassistance. Several previous studies examining transfers have used the tobitmodel (Altonji, Hayashi, & Kotlikoff, 1992; Cox & Rank, 1992; Jayakody,1998). However, the tobit model (a one-equation model) presumes that theselection mechanism is the same for both the incidence and amount equa-tions. This may not be true. For example, because nonfinancial forms of sup-port may be more common substitutes in African American and Latinofamilies, there may be cultural differences in the factors that generate whetherfinancial support is given. Once support is given, a different set of factors,perhaps tied to financial resources, may be more important in determining theamount of financial assistance (McGarry & Schoeni, 1995).
Results
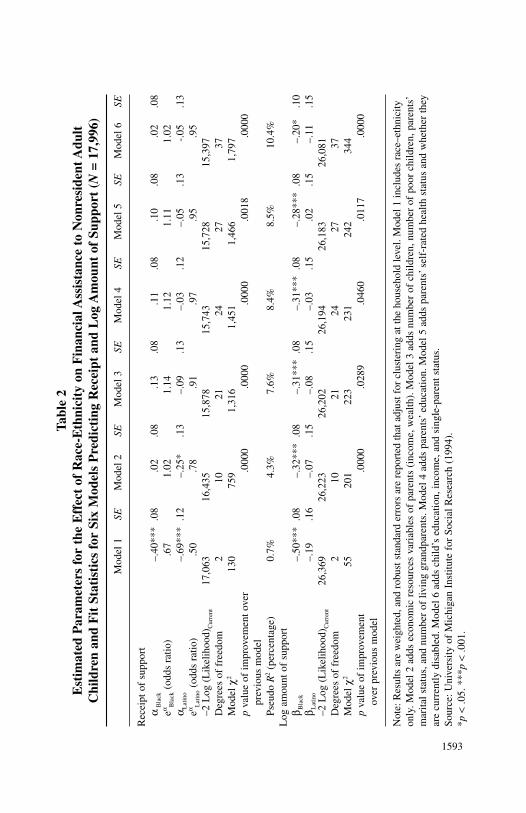
Table 2 summarizes results from six hierarchical models for both “any”and “amount” equations, with a lower numbered specification nested withina higher numbered specification. The variables added in Models 2 through6 reflect the five groups of structural factors. The top half reports logistic
Berry / Parental Financial Transfers 1591
coefficients αBlack and αLatino (and odds ratios) predicting receipt of support.Model 1 includes only the effects for race and ethnicity. African Americanand Latino nonresident children have 33% and 50% lower odds of receiv-ing than White nonresident adult children, respectively. Model 2 adds con-trols for parental income and net worth. These variables account for all thedifferences in receipt of support between African Americans and Whites.The difference in the model χ2 between nested models 1 and 2 is distributedas χ2, with degrees of freedom equal to the number of additional parame-ters in the less restrictive model. In this case, the addition of 8 (10 – 2)covariates significantly improves the explanatory power of the model(∆χ2 = 759 – 130 = 633; p < .0001). The improvement in goodness of fit ismatched by higher values of pseudo R2 in Model 2 than in Model 1, withpseudo R2 defined as the absolute value of 1 – emodel χ2 / N in which N denotesthe sample size (Long, 1997). Model 3 adds the number of children, thenumber of poor children, the parent’s marital status, and the number of liv-ing grandparents. These variables are included as a block because they col-lectively describe extended family structure and the potential competinginterests for financial resources. For Latinos, adding these variables gives asignificant improvement in goodness of fit over Model 2, reducing αLatino toa nonsignificant level (αLatino = –.09). Model 4 adds parent’s education. Theχ2 criterion suggests that parent’s education is a significant predictor of thereceipt of assistance, though the size of αBlack and αLatino does not changewith its addition to the model. The increase in pseudo R2 is small but sig-nificant, rising from 7.6% to 8.4%. Model 5 adds measures of parental self-rated health and disability status. The addition of these two factorsmarginally improves the model fit. Finally, Model 6 adds measures of thenonresident adult child’s income, education, single-parent status, andincome, increasing pseudo R2 from 8.5% to 10.4%.
The bottom of Table 2 investigates group differences in amount of sup-port. Reasons for differences in the amount of support may be different thanfor incidence of support, because other factors, such as financial resources,may be more influential in determining amount once parents have decidedto give to a particular child.
On average, African American children receive 50% fewer dollars thantheir White counterparts, whereas Latino children receive an average amountsimilar to Whites (Model 1). Coefficients for amount models are interpretedas the percentage change in the amount given per unit change in the inde-pendent variable (because the dependent variable is logged). The log trans-formation put Latino children at parity with Whites, because it reducesthe influence of a disproportionate number of large gifts to White children.
1592 Journal of Family Issues
1593
Tabl
e 2
Est
imat
ed P
aram
eter
s fo
r th
e E
ffec
t of
Rac
e-E
thni
city
on
Fin
anci
al A
ssis
tanc
e to
Non
resi
dent
Adu
ltC
hild
ren
and
Fit
Sta
tist
ics
for
Six
Mod
els
Pre
dict
ing
Rec
eipt
and
Log
Am
ount
of
Supp
ort
(N=
17,9
96)
Mod
el 1
SEM
odel
2SE
Mod
el 3
SEM
odel
4SE
Mod
el 5
SEM
odel
6SE
Rec
eipt
of
supp
ort
αB
lack
–.40
***
.08
.02
.08
.13
.08
.11
.08
.10
.08
.02
.08
eα Bla
ck(o
dds
ratio
).6
71.
021.
141.
121.
111.
02α L
atin
o–.
69**
*.1
2–.
25*
.13
–.09
.13
–.03
.12
–.05
.13
-.05
.13
eα Lat
ino
(odd
s ra
tio)
.50
.78
.91
.97
.95
.95
–2 L
og (
Lik
elih
ood)
Cur
rent
17,0
6316
,435
15,8
7815
,743
15,7
2815
,397
Deg
rees
of
free
dom
210
2124
2737
Mod
el χ
213
075
91,
316
1,45
11,
466
1,79
7p
valu
e of
impr
ovem
ent o
ver
.000
0.0
000
.000
0.0
018
.000
0pr
evio
us m
odel
Pseu
do R
2(p
erce
ntag
e)0.
7%4.
3%7.
6%8.
4%8.
5%10
.4%
Log
am
ount
of
supp
ort
β Bla
ck–.
50**
*.0
8–.
32**
*.0
8–.
31**
*.0
8–.
31**
*.0
8–.
28**
*.0
8–.
20*
.10
β Lat
ino
–.19
.16
–.07
.15
–.08
.15
–.03
.15
.02
.15
–.11
.15
–2 L
og (
Lik
elih
ood)
Cur
rent
26,3
6926
,223
26,2
0226
,194
26,1
8326
,081
Deg
rees
of
free
dom
210
2124
2737
Mod
el χ
255
201
223
231
242
344
pva
lue
of im
prov
emen
t.0
000
.028
9.0
460
.011
7.0
000
over
pre
viou
s m
odel
Not
e:R
esul
ts a
re w
eigh
ted,
and
robu
st s
tand
ard
erro
rs a
re r
epor
ted
that
adj
ust f
or c
lust
erin
g at
the
hous
ehol
d le
vel.
Mod
el 1
incl
udes
rac
e–et
hnic
ityon
ly. M
odel
2 a
dds
econ
omic
res
ourc
es v
aria
bles
of
pare
nts
(inc
ome,
wea
lth).
Mod
el 3
add
s nu
mbe
r of
chi
ldre
n,nu
mbe
r of
poo
r ch
ildre
n,pa
rent
s’m
arita
l sta
tus,
and
num
ber
of li
ving
gra
ndpa
rent
s. M
odel
4 a
dds
pare
nts’
educ
atio
n. M
odel
5 a
dds
pare
nts’
self
-rat
ed h
ealth
sta
tus
and
whe
ther
they
are
curr
ently
dis
able
d. M
odel
6 a
dds
child
’s e
duca
tion,
inco
me,
and
sing
le-p
aren
t sta
tus.
Sour
ce:U
nive
rsity
of
Mic
higa
n In
stitu
te f
or S
ocia
l Res
earc
h (1
994)
.*p
<.0
5. *
**p
<.0
01.
Adding parental income and wealth in Model 2 reduces the differencefor African American children to receiving 32% fewer dollars than Whitechildren and significantly improves model goodness of fit (∆χ2 = 201 – 55 =146; p < .0001). The addition of covariates in Models 3, 4, and 5 improvesmodel fit but reduces βBlack by just 10% (from –.31 to –.28). Adding child’seducation, income, and parenthood–marital status in Model 6 reduces βBlack
by 30% to –.20, interpreted as African American nonresident children receiv-ing 20% fewer dollars on average than their White counterparts. This isequivalent to African American children receiving about $2,150 as opposedto $2,750 for Whites. Overall, the variables in Models 1 through 6 accountfor about 60% of the difference in amount of support given to AfricanAmerican and White nonresident adult children.
Decomposition of Explanatory Power
The magnitude of coefficient change in the “any” and “amount” modelsin Table 2 reflects the extent to which explanatory variables included in amodel account for group differences. This common approach gauges theexplanatory power of a model but not the explanatory power of individualfactors in the model, because how much coefficients change depends onwhat other variables are already included in the model.
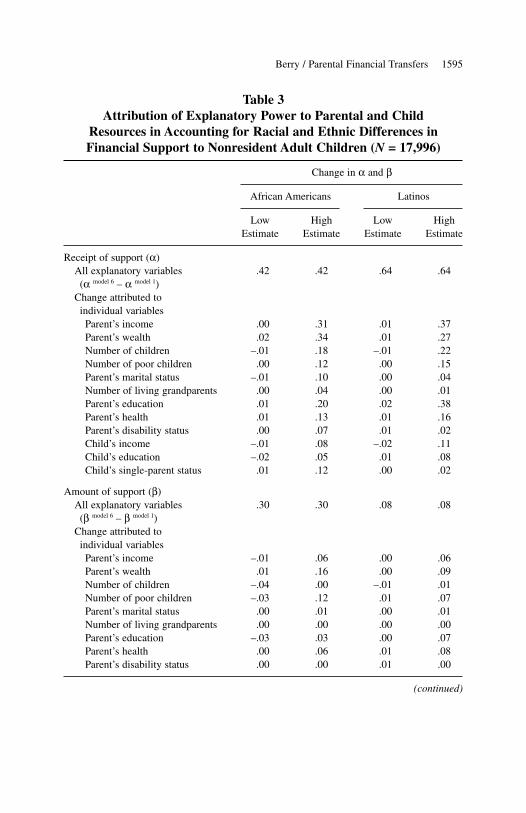
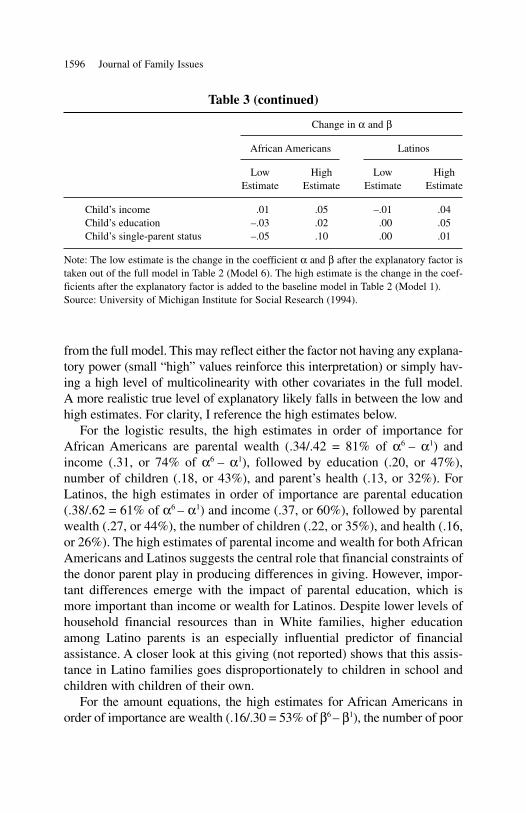
Table 3 illustrates how the inclusion or exclusion of individual factors affectsthe coefficients under two situations, producing liberal and conservative mea-sures of explanatory power. The magnitude of coefficient change between thefull model (Model 6) and the baseline model (Model 1) is (α6 – α1) or (β6 – β1)for the “any” and “amount” models, respectively. The first conservative or lowmeasure (labeled Dlow) is how much of overall change, (α6 – α1) or (β6 – β1),occurs when removing an individual explanatory factor from the full model(Model 6). The second liberal or high measure (labeled Dhigh) is how much ofthe overall change, (α6 – α1) or (β6 – β1), occurs when adding an individualexplanatory factor to the baseline model (Model 1). The values of Dlow and Dhigh
for a well-behaved explanatory factor should vary somewhere between 0 and(α6 – α1) or (β6 – β1).
Several findings emerge from Table 3. First, most of the factors have wideranges of explanatory power. The inclusion of 0 in the range between the lowand high measures makes decomposition of explanatory power more ambigu-ous. Low estimates with values near 0 suggest that group differences in assis-tance remain equally accounted for after the individual factor is removed
1594 Journal of Family Issues
Berry / Parental Financial Transfers 1595
Table 3Attribution of Explanatory Power to Parental and Child
Resources in Accounting for Racial and Ethnic Differences inFinancial Support to Nonresident Adult Children (N = 17,996)
Change in α and β
African Americans Latinos
Low High Low HighEstimate Estimate Estimate Estimate
Receipt of support (α)All explanatory variables .42 .42 .64 .64(α model 6 – α model 1)
Change attributed toindividual variables
Parent’s income .00 .31 .01 .37Parent’s wealth .02 .34 .01 .27Number of children –.01 .18 –.01 .22Number of poor children .00 .12 .00 .15Parent’s marital status –.01 .10 .00 .04Number of living grandparents .00 .04 .00 .01Parent’s education .01 .20 .02 .38Parent’s health .01 .13 .01 .16Parent’s disability status .00 .07 .01 .02Child’s income –.01 .08 –.02 .11Child’s education –.02 .05 .01 .08Child’s single-parent status .01 .12 .00 .02
Amount of support (β)All explanatory variables .30 .30 .08 .08(β model 6 – β model 1)
Change attributed toindividual variablesParent’s income –.01 .06 .00 .06Parent’s wealth .01 .16 .00 .09Number of children –.04 .00 –.01 .01Number of poor children –.03 .12 .01 .07Parent’s marital status .00 .01 .00 .01Number of living grandparents .00 .00 .00 .00Parent’s education –.03 .03 .00 .07Parent’s health .00 .06 .01 .08Parent’s disability status .00 .00 .01 .00
(continued)
from the full model. This may reflect either the factor not having any explana-tory power (small “high” values reinforce this interpretation) or simply hav-ing a high level of multicolinearity with other covariates in the full model.A more realistic true level of explanatory likely falls in between the low andhigh estimates. For clarity, I reference the high estimates below.
For the logistic results, the high estimates in order of importance forAfrican Americans are parental wealth (.34/.42 = 81% of α6 – α1) andincome (.31, or 74% of α6 – α1), followed by education (.20, or 47%),number of children (.18, or 43%), and parent’s health (.13, or 32%). ForLatinos, the high estimates in order of importance are parental education(.38/.62 = 61% of α6 – α1) and income (.37, or 60%), followed by parentalwealth (.27, or 44%), the number of children (.22, or 35%), and health (.16,or 26%). The high estimates of parental income and wealth for both AfricanAmericans and Latinos suggests the central role that financial constraints ofthe donor parent play in producing differences in giving. However, impor-tant differences emerge with the impact of parental education, which ismore important than income or wealth for Latinos. Despite lower levels ofhousehold financial resources than in White families, higher educationamong Latino parents is an especially influential predictor of financialassistance. A closer look at this giving (not reported) shows that this assis-tance in Latino families goes disproportionately to children in school andchildren with children of their own.
For the amount equations, the high estimates for African Americans inorder of importance are wealth (.16/.30 = 53% of β6 – β1), the number of poor
1596 Journal of Family Issues
Table 3 (continued)
Change in α and β
African Americans Latinos
Low High Low HighEstimate Estimate Estimate Estimate
Child’s income .01 .05 –.01 .04Child’s education –.03 .02 .00 .05Child’s single-parent status –.05 .10 .00 .01
Note: The low estimate is the change in the coefficient α and β after the explanatory factor istaken out of the full model in Table 2 (Model 6). The high estimate is the change in the coef-ficients after the explanatory factor is added to the baseline model in Table 2 (Model 1).Source: University of Michigan Institute for Social Research (1994).
children (.12, or 40% of β6 – β1), child’s single-parent status (.10, or 34%),and parental income and health (both at .06, or 20% of β6 – β1). Income andwealth, as well as parental education for Latinos, produces the largestchanges in β. However, these results for Latinos are not relevant, because theamounts of assistance Latinos give are statistically equivalent to Whites.
Overall, parental wealth and income (Group 1 structural factors) accountfor much of the group differences, followed by number of children (Group 2),parent’s education (Group 3), and health (Group 4). Parental education standsout as particularly important for Latinos in accounting for the incidence oftransfers. These additional measures of parental wealth and health in this studycombined with existing structural resources accounts for more of the groupdifferences in transfers than previous studies (Lee & Aytac, 1998; McGarry &Schoeni, 1995; Rosenzweig & Wolpin, 1993). The only persistent differencesafter accounting for structural factors are between African Americans andWhites in the amount of assistance to adult nonresident children.
Standardization Analysis
Despite the importance of structural factors in accounting for group dif-ferences in financial assistance to nonresident adult children, behavioralpatterns may also be important. I compared the relative contribution ofstructural resources and behavior patterns in a condensed fashion with ananalysis that examines the percentage change in probability of receivingfinancial assistance from parents among Black and Latino adult children ifthe same coefficients or sample characteristics as Whites are assumed. Thisstandardization analysis is not intended to reference any group’s pattern ofgiving as ideal but rather to apply a standard demographic technique tomore clearly compare the relative contribution of structural factors andbehavioral practices across groups. All the variables in the appendix wereused in the analysis. Separate logistic models were estimated for eachgroup (12,715 White, 3,532 Black, and 1,749 Latino child–parent dyads).
In results not reported in tabular form, I find that behavioral practices arebetween one half to two thirds as influential as structural factors in account-ing for group differences in financial assistance to adult children. Sub-stituting sample means and estimated multivariate coefficients for eachgroup shows that the likelihood of receiving financial transfers for AfricanAmericans and Latinos increases significantly more if they had the samestructural characteristics (i.e., the same sample means) rather than the samebehavioral patterns (i.e., the same coefficients) as Whites. The probabilityof adult African American children receiving financial assistance increases
Berry / Parental Financial Transfers 1597
77% when substituting White means and 36% when substituting Whitecoefficients. The probability of adult Latino children receiving increases65% when substituting White means and 47% when substituting Whitecoefficients.
The greater comparative importance of structural factors over behavioralpatterns in accounting for group differences contradicts recent findingsby Lee and Aytac (1998) that behavioral variation accounts for a more sub-stantial proportion of the difference. Behavioral reasons suggest that culturemay operate differently for each group, observed by finding group differ-ences in the child and parent characteristics that predict giving (Lee &Aytac, 1998; Mutran, 1985; Stack, 1974). Behavioral differences, throughimportant, may be less consequential than structural factors in accountingfor race and ethnic differences in transfers.
Family Patterns of Coresidence, Time, and Financial Support
Table 4 looks at other forms of support that families offer to compensatefor financial assistance to put the preceding analysis into perspective. HRSmeasures coresidence, financial transfers, and proximity for each child andalso asks parents to report time spent grandparenting for the entire family.Results here consider only child coresidence that parents indicated as beingprimarily for the child’s benefit (in 80% of cases, it is to help the child). I alsoincluded proximity to parents (living within 10 miles), because in many cases,it signifies the availability of assistance from parents and extended family ifthe need arises. Although proximity is not support per se, some research sug-gests that potential for support represented in local supportive social networksis an important part of the mix of intergenerational support (Lima & Allen,2001). Below, I discuss the limitations in interpreting proximity as support.
The table shows group differences in configurations of support measuredfor the sample of all adult children: money, coresidence, and proximity.White adult children are more likely than African American or Latino adultchildren to receive money support only (10.7% vs. 6.4% and 5.3%, respec-tively) but less likely to live near or benefit from living with their parents.With the exception of proximity for Latino adult children, all differencesare statistically significant at the p < .05 level. Compared to White adultchildren, African American adult children may compensate for fewer moneytransfers by deriving benefits from residing with (11%) or living closer totheir parents (32.5%). Latino adult children may be compensated for fewermoney transfers by living with their parents (15%). These findings areconsistent with prior evidence that African American and Latino families
1598 Journal of Family Issues
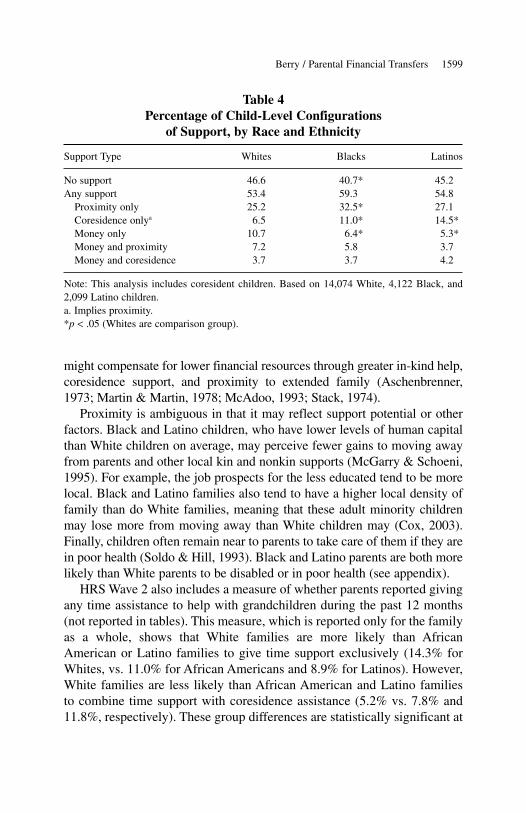
might compensate for lower financial resources through greater in-kind help,coresidence support, and proximity to extended family (Aschenbrenner,1973; Martin & Martin, 1978; McAdoo, 1993; Stack, 1974).
Proximity is ambiguous in that it may reflect support potential or otherfactors. Black and Latino children, who have lower levels of human capitalthan White children on average, may perceive fewer gains to moving awayfrom parents and other local kin and nonkin supports (McGarry & Schoeni,1995). For example, the job prospects for the less educated tend to be morelocal. Black and Latino families also tend to have a higher local density offamily than do White families, meaning that these adult minority childrenmay lose more from moving away than White children may (Cox, 2003).Finally, children often remain near to parents to take care of them if they arein poor health (Soldo & Hill, 1993). Black and Latino parents are both morelikely than White parents to be disabled or in poor health (see appendix).
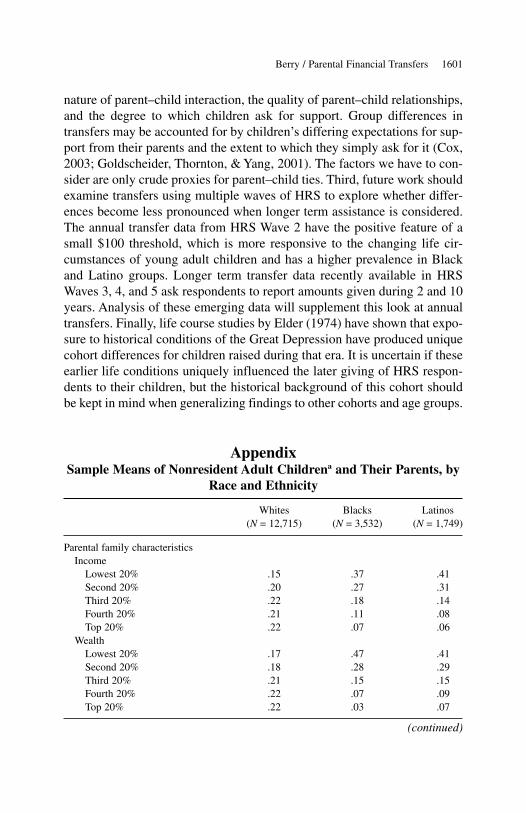
HRS Wave 2 also includes a measure of whether parents reported givingany time assistance to help with grandchildren during the past 12 months(not reported in tables). This measure, which is reported only for the familyas a whole, shows that White families are more likely than AfricanAmerican or Latino families to give time support exclusively (14.3% forWhites, vs. 11.0% for African Americans and 8.9% for Latinos). However,White families are less likely than African American and Latino familiesto combine time support with coresidence assistance (5.2% vs. 7.8% and11.8%, respectively). These group differences are statistically significant at
Berry / Parental Financial Transfers 1599
Table 4Percentage of Child-Level Configurations
of Support, by Race and Ethnicity
Support Type Whites Blacks Latinos
No support 46.6 40.7* 45.2Any support 53.4 59.3 54.8
Proximity only 25.2 32.5* 27.1Coresidence onlya 6.5 11.0* 14.5*Money only 10.7 6.4* 5.3*Money and proximity 7.2 5.8 3.7Money and coresidence 3.7 3.7 4.2
Note: This analysis includes coresident children. Based on 14,074 White, 4,122 Black, and2,099 Latino children.a. Implies proximity.*p < .05 (Whites are comparison group).
the p = .05 level. Overall, these results concur with prior work finding thatAfrican American and Latino children may benefit most from family sup-port when it is considered broadly (Cooney & Uhlenberg, 1992; Eggebeen,1992; Goldscheider & Goldscheider, 1991; Taylor, 1986).
Summary and Conclusion
Inequalities in structural factors of wealth, income, family size and struc-ture, and health account for most of the group differences in parental finan-cial assistance to nonresident adult children. African American and Latinofamilies not only have less wealth to distribute but also have more needychildren to distribute it to and greater constraints arising from health prob-lems of donor parents. Except for the case of amount of assistance givenin African American families, the structural variables added in Models 2through 6 in Table 2 account for all the observed group differences in finan-cial giving to adult children. The importance of these structural variables con-tradicts other findings that point to behavioral practices being more importantthan structural resource differences (Lee & Aytac, 1998). Table 3 used a novelapproach to attribute explanatory power to individual variables, finding thateconomic resources, especially wealth, most strongly account for less givingin African American families compared to other groups. For Latinos, incomeand parental education are most important. The health of donor parents andnumber of children also independently account for group differences.
Results that examine the percentage change in probability of receivingfinancial assistance for Black and Latino children if the same coefficientsor sample characteristics as Whites are assumed also reinforce findingsabout the importance of structural resources. In that analysis, behavioralpatterns account for only one half to two thirds of the group differencesattributable to structural factors.
Finally, I considered configurations of money, coresidence, proximity,and time assistance to put the exclusive focus on financial assistance into abroader perspective of support. African American and Latino parents some-what compensate for giving less financial assistance by allowing their adultchildren to coreside with them.
Several limitations warrant discussion and suggest direction for futureresearch. First, HRS lacks measures of support from other relativesand nonrelatives, a mode of support believed to be more prominent inAfrican American and Latino families (Eggebeen, 1992; Goldscheider &Goldscheider, 1991). Second, we have few direct measures of the level and
1600 Journal of Family Issues
nature of parent–child interaction, the quality of parent–child relationships,and the degree to which children ask for support. Group differences intransfers may be accounted for by children’s differing expectations for sup-port from their parents and the extent to which they simply ask for it (Cox,2003; Goldscheider, Thornton, & Yang, 2001). The factors we have to con-sider are only crude proxies for parent–child ties. Third, future work shouldexamine transfers using multiple waves of HRS to explore whether differ-ences become less pronounced when longer term assistance is considered.The annual transfer data from HRS Wave 2 have the positive feature of asmall $100 threshold, which is more responsive to the changing life cir-cumstances of young adult children and has a higher prevalence in Blackand Latino groups. Longer term transfer data recently available in HRSWaves 3, 4, and 5 ask respondents to report amounts given during 2 and 10years. Analysis of these emerging data will supplement this look at annualtransfers. Finally, life course studies by Elder (1974) have shown that expo-sure to historical conditions of the Great Depression have produced uniquecohort differences for children raised during that era. It is uncertain if theseearlier life conditions uniquely influenced the later giving of HRS respon-dents to their children, but the historical background of this cohort shouldbe kept in mind when generalizing findings to other cohorts and age groups.
AppendixSample Means of Nonresident Adult Childrena and Their Parents, by
Race and Ethnicity
Whites Blacks Latinos(N = 12,715) (N = 3,532) (N = 1,749)
Parental family characteristicsIncome
Lowest 20% .15 .37 .41Second 20% .20 .27 .31Third 20% .22 .18 .14Fourth 20% .21 .11 .08Top 20% .22 .07 .06
WealthLowest 20% .17 .47 .41Second 20% .18 .28 .29Third 20% .21 .15 .15Fourth 20% .22 .07 .09Top 20% .22 .03 .07
Berry / Parental Financial Transfers 1601
(continued)
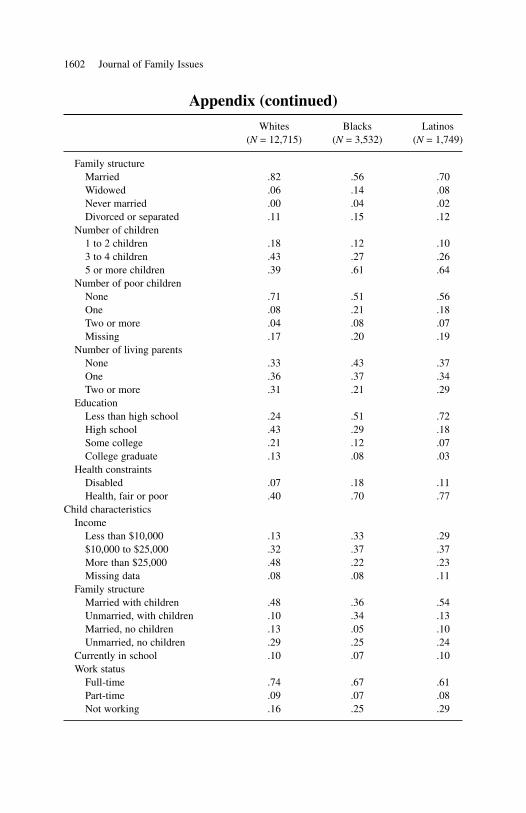
Appendix (continued)
Whites Blacks Latinos(N = 12,715) (N = 3,532) (N = 1,749)
Family structureMarried .82 .56 .70Widowed .06 .14 .08Never married .00 .04 .02Divorced or separated .11 .15 .12
Number of children1 to 2 children .18 .12 .103 to 4 children .43 .27 .265 or more children .39 .61 .64
Number of poor childrenNone .71 .51 .56One .08 .21 .18Two or more .04 .08 .07Missing .17 .20 .19
Number of living parentsNone .33 .43 .37One .36 .37 .34Two or more .31 .21 .29
EducationLess than high school .24 .51 .72High school .43 .29 .18Some college .21 .12 .07College graduate .13 .08 .03
Health constraintsDisabled .07 .18 .11Health, fair or poor .40 .70 .77
Child characteristicsIncome
Less than $10,000 .13 .33 .29$10,000 to $25,000 .32 .37 .37More than $25,000 .48 .22 .23Missing data .08 .08 .11
Family structureMarried with children .48 .36 .54Unmarried, with children .10 .34 .13Married, no children .13 .05 .10Unmarried, no children .29 .25 .24
Currently in school .10 .07 .10Work status
Full-time .74 .67 .61Part-time .09 .07 .08Not working .16 .25 .29
1602 Journal of Family Issues
Appendix (continued)
Whites Blacks Latinos(N = 12,715) (N = 3,532) (N = 1,749)
EducationLess than high school .12 .20 .32High school .44 .50 .45Some college .22 .17 .13College graduate .23 .13 .10
Homeowner .47 .21 .30Less than 25 years of age .16 .14 .2225 to 30 years of age .28 .26 .28More than 30 years of age .55 .59 .50Gender (1 = female, 0 = male) .49 .50 .51Lives within 10 miles .35 .44 .39Stepchild .32 .28 .21
Source: University of Michigan Institute for Social Research (1994).a. Adult children are aged 18 years or more.
References
Altonji, J. G., & Dunn, T. (1991). Relationships among the family income and labor marketoutcomes of relatives. Research in Labor Economics, 12, 269-310.
Altonji, J. G., Hayashi, F., & Kotlikoff, L. (1992). Is the extended family altruistically linked?Direct evidence using micro data. American Economic Review, 82, 1177-1198.
Aschenbrenner, J. (1973). Lifelines: Black families in Chicago. Englewood Cliffs, NJ: Holt,Rinehart & Winston.
Becker, G. S. (1974). A theory of social interactions. Journal of Political Economy, 82, 1063-1093.Berry, B. M. (2001). All the ties that bind: Race, ethnicity, and why families support adult
children (HRS Working Paper Series Report, 01-487). Ann Arbor: University of Michigan,Population Studies Center.
Cooney, T. M., & Uhlenberg, P. (1992). Support from parents over the life course: The adultchild’s perspective. Social Forces, 71, 63-84.
Cox, D. (1987). Motives for private income transfers. Journal of Political Economy, 95, 509-546.Cox, D. (2003). Private transfers within the family: Mothers, fathers, sons and daughters. In
A. H. Munnell & A. Sunden (Eds.), Death and dollars: The role of gifts and bequests inAmerica (pp. 168-216). Washington, DC: Brookings Institution.
Cox, D., & Rank, M. R. (1992). Inter-vivos transfers and intergenerational exchange. Reviewof Economics and Statistics, 74, 305-314.
Eggebeen, D. J. (1992). Family structure and intergenerational exchanges. Research on Aging,14, 427-447.
Elder, G. H. (1999). Children of the Great Depression: Social change in life experience.Boulder, CO: Westview. (Original work published 1974)
Goldscheider, F., & Goldscheider, C. (1991). The intergenerational flow of income: Family struc-ture and the status of Black Americans. Journal of Marriage and Family, 53, 499-508.
Berry / Parental Financial Transfers 1603
Goldscheider, F., Thornton, A., & Yang, L.-S. (2001). Helping out the kids: Expectations aboutparental support in young adulthood. Journal of Marriage and Family, 63, 727-740.
Heckman, J. (1979). Sample selection bias as a specification error. Econometrica, 47, 153-161.Jayakody, R. (1998). Race differences in intergenerational financial assistance: The needs of
children and the resources of parents. Journal of Family Issues, 19, 508-533.Lee, Y. J., & Aytac, I. A. (1998). Intergenerational financial support among Whites, African-
Americans, and Latinos. Journal of Marriage and Family, 60, 426-441.Lima, J., & Allen, S. M. (2001). Targeting risk for unmet need: Not enough help versus no help
at all. Journal of Gerontology: Social Sciences, 56B, S302-S310.Long, J. S. (1997). Regression models for categorical and limited dependent variables.
Thousand Oaks, CA: Sage.Martin, E. P., & Martin, J. M. (1978). The Black extended family. Chicago: University of
Chicago Press.McAdoo, H. P. (Ed.). (1993). Family ethnicity: Strength and diversity. Newbury Park, CA:
Sage.McGarry, K. (1999). Inter vivos transfers and intended bequests. Journal of Public Economics,
73, 321-351.McGarry, K., & Schoeni, R. F. (1995). Transfer behavior: Measurement and the redistribution
of resources within the family. Journal of Human Resources, 30, S184-S226.Mutran, E. (1985). Intergenerational family support among Blacks and Whites: Response to
culture or to socioeconomic differences. Journal of Gerontology, 40, 382-389.Phillips, J. W. (1997). Essays on the accumulation and transfer of wealth at older ages.
Unpublished doctoral dissertation, Syracuse University, New York.Rosenzweig, M. R., & Wolpin, K. I. (1993). Intergenerational support and the life cycle
incomes of young men and their parents: Human capital investments, coresidence, andintergenerational financial transfers. Journal of Labor Economics, 11, 84-112.
Schoenbaum, M., & Waidman, T. (1997). Race, socioeconomic status, and health: Accountingfor race differences in health. Journals of Gerontology, 52B, 61-73.
Soldo, B. J., & Hill, M. S. (1993). Intergenerational transfers: Economic, demographic, and socialperspectives. In G. L. Maddox & M. P. Lawton (Eds.), Annual review of gerontology and geri-atrics: Focus on kinship, aging, and social change (pp. 187-216). New York: Springer.
Soldo, B. J., & Hill, M. S. (1995). Family structure and transfer measures in the Health andRetirement Study. Journal of Human Resources, 30, S109-S137.
Stack, C. B. (1974). All our kin: Strategies for survival in a Black community. New York:Harper & Row.
Taylor, R. J. (1986). Receipt of support from family among Black Americans: Demographicand familial differences. Journal of Marriage and Family, 48, 67-77.
University of Michigan Institute for Social Research. (1994). The health and retirement study,Wave 2. Retrieved July 10, 2006, from http://hrsonline.isr.umich.edu
Wilkinson, J. A. (2000). Intergenerational intervivos transfers: What is the pattern and levelof financial support parents provide their adult children? Unpublished doctoral disserta-tion, Purdue University.
Wong, R., Capoferro, C., & Soldo, B. J. (1999). Financial assistance from middle-aged cou-ples to parents and children: Racial-ethnic differences. Journals of Gerontology: SocialSciences, 54B, S145-S153.
1604 Journal of Family Issues
Copyright © 2022 FDOKUMEN