1965 Budget Analysis: Health Welfare - Legislative Analyst's ...
Upload
khangminh22Category
view
1download
0
Annual Report 2013
Tuarascáil Bhliantúil 2013
i
Western RegionPublic Analyst’s Laboratory
Régiún an Iarthair
Saotharlann an Anailisí Phoiblí
Annual Report 2013Tuarascáil bhliantúil 2013
FOR YEAR ENDED 31ST DECEMBER, 2013

Western Region - Public Analyst’s Laboratory
Saotharlann an Anailisí Phoiblí
ii
CONTENTS ....................................................................................................................................... PAGEAcknowledgements .....................................................................................................1
1. INTRODUCTION.........................................................................................................21.1 Public Analyst’s Laboratory Service ...............................................................................................................21.2 Finance..................................................................................................................................................................21.3 Administration ....................................................................................................................................................22. HUMAN BIOMONITORING & DEMOCOPHES STUDY .......................................32.1 Human Biomonitoring.......................................................................................................................................32.2 Publication of Results ........................................................................................................................................33. FOOD..............................................................................................................................43.1 Service Provided.................................................................................................................................................43.2 HSE Food Safety Laboratory Service: Updates/Developments etc.........................................................43.3 Food Testing (Chemical) Results for 2013....................................................................................................53.4 Food Allergens, Contaminants, etc .................................................................................................................73.5 Nutrition/Composition, Additives, Labelling etc .......................................................................................103.6 Food Complaint Samples ...............................................................................................................................153.7 Food Alerts (RASFF) and Hazard/Contamination Reports ....................................................................164. WATERS/EFFLUENTS..............................................................................................174.1 Introduction ......................................................................................................................................................174.2 Drinking Water Management ........................................................................................................................174.3 Sample Sources 2013 ......................................................................................................................................184.4 Water Quality...................................................................................................................................................184.5 Fluoridation of Public Water Supplies .........................................................................................................184.6 Non-metals in Drinking Water .....................................................................................................................194.7 Metals in Water ................................................................................................................................................244.8 Haemodialysis Water.......................................................................................................................................264.9 Private Samples.................................................................................................................................................264.10 Bathing Waters .................................................................................................................................................264.11 Pool Waters.......................................................................................................................................................274.12 Effluents..............................................................................................................................................................275. AIR POLLUTION MONITORING...........................................................................285.1 European Legislation .......................................................................................................................................285.2 National Legislation.........................................................................................................................................285.3 Laboratory Results ..........................................................................................................................................286. PHARMACEUTICALS & TOXICOLOGY................................................................296.1 Pharmaceutical Laboratory............................................................................................................................296.2 Toxicology Laboratory....................................................................................................................................307 COSMETICS ................................................................................................................317.1 Cosmetics Legislation .....................................................................................................................................317.2 Official Control & Enforcement of Cosmetics Legislation in Ireland...................................................317.3 Results for 2013 ...............................................................................................................................................317.4 Summary of Cosmetics Hazard/Contamination Reports 2013.............................................................347.5 Overall Summary .............................................................................................................................................348. MISCELLANEOUS TESTING ...................................................................................359. QUALITY ASSURANCE ...........................................................................................3510. STAFF TRAINING .....................................................................................................3811. MEETINGS/COMMITTEES etc................................................................................3812. INFORMATION AND COMMUNICATION TECHNOLOGY ..............................38Appendix 1 Food Sampling/Analysis Programme 2013 .................................................................................................39Appendix 2 Food Categories Table of Results – Infringements etc ............................................................................41Appendix 3 Principal Official Surveillance of Foodstuffs ...............................................................................................42Appendix 4 Annual Results 2003 to 2013 – Food Contaminants etc........................................................................43Appendix 5 Fluoride Results................................................................................................................................................44Appendix 6 Pollution Tables & PM10 Results for 2013 ...................................................................................................48Appendix 7 Cosmetics sampling/Analysis Programme 2013........................................................................................49Appendix 8 Staff......................................................................................................................................................................50Glossary of Abbreviations ......................................................................................................................51

Annual Report 2013
Tuarascáil Bhliantúil 2013
1
ACKNOWLEDGEMENTS
This report summarises the work carried out by the Public Analyst’s Laboratory, Galway during theyear 2013.
This year saw the implementation of the Haddington Road Agreement which resulted in an increasein working hours for all staff along with an effective reduction in pay. This was coupled with increasedpressure due to the non filling of staff vacancies.
I would like to commend the forbearance and flexibility demonstrated by staff in the face of thesechallenges, and acknowledge their continued commitment to the highest standards.
Rory Mannion
Public Analyst
August 2014
This report is also available on the HSE website (www.hse.ie) in both Irish and English.
1. INTRODUCTION
1.1 Public Analyst’s Laboratory Service
This laboratory is one of three Public Analyst’sLaboratories in the Republic of Ireland. The other twoare located in Dublin and Cork. The primary role of thelaboratories is in the protection of public health byproviding an independent analytical and advisory serviceto the HSE, various other government agencies and thegeneral public.
The service areas provided by this laboratory are asfollows:
1.1.1 Food
A food surveillance programme is agreed each yearbetween the Public Analyst’s Laboratories, the FoodSafety Authority of Ireland (FSAI), and theEnvironmental Health Service (EHS). The samples aresubmitted to the laboratory by the latter. Samples arealso received from the general public, local industry andother government agencies.
1.1.2 Water
Most of the waters received by the laboratory aredrinking waters. These are received from EHOs onbehalf of Local Authorities, directly from LocalAuthorities, from the general public and from localindustry.
1.1.3 Pharmaceuticals
The Pharmaceutical Section has been appointed anOfficial Medicines Control Laboratory (OMCL) by theIrish Medicines Board (IMB). Pharmaceutical samplesare primarily received from the IMB, the EuropeanDirectorate for the Quality of Medicines andHealthcare Products (EDQM) as well as otherEuropean OMCLs. Samples are also occasionally testedfor the Department of Health and Children,Pharmaceutical Society of Ireland and Galway UniversityHospital.
1.1.4 ToxicologyHospital Pathologists and Physicians as well asVeterinary Surgeons and the general public submitsamples for toxicological analysis.
1.1.5 Air Monitoring
An air pollution monitoring service is provided by thelaboratory to Galway City Council.
1.1.6 Cosmetics
Samples of cosmetics are received from EHOs as partof a nationally agreed surveillance program between theIMB, the EHS and the Public Analyst’s Laboratories.Complaint samples are also received.
1.2 Finance
The laboratory receives a budget to cover both pay andnon-pay costs for the year. The budget received for theyear 2013 was €2.539 million. The income received forthe year was €257,851. The laboratory operated withinbudget. The laboratory is grateful to have benefitedfrom an additional capital allocation for the purchase ofsome essential testing equipment in 2013.
1.3 Administration
The laboratory is administered by the Primary,Community and Continuing Care (PCCC) Directoratewithin the Health Service Executive.
Western Region - Public Analyst’s Laboratory
Saotharlann an Anailisí Phoiblí
2

Annual Report 2013
Tuarascáil Bhliantúil 2013
3
2. HUMAN BIO-MONITORING AND DEMOCOPHES STUDY
2.1 Human Bio-Monitoring (HBM)
Human Bio-Monitoring (HBM) involves thedetermination of the levels of various parameters,contaminants etc, in human tissues (urine, blood, hairetc).
In 2011/2012 Ireland participated in a HBM study calledDEMOCOPHES, involving 17 European Member States.In Ireland the DEMOCOPHES study was performed bythe HSE, http://www.hse.ie/go/democophes/ . The studydetermined levels of mercury in human hair, andcadmium, phthalates and environmental tobacco smoke(via cotinine) in urine. Data from 120 children and theirmothers in each of 17 European countries weregenerated. In Ireland, the testing was performed by thePublic Analysts’ Service, details are contained in the2012 PALG annual report.http://www.hse.ie/eng/services/Publications/corporate/wrpalannualrep.html.
2.2 Publication of the Results
A considerable number of publications arose from theDEMOCOPHES study between 2012 and 2013.
An overview of the study and a summary of the resultsare available in the so-called “Layman’s Report”, seehttp://www.eu-hbm.info/euresult/media-corner/press-kit.
Further details of all aspects of the EU DEMOCOPHESHuman Bio-Monitoring project can be found on thewebsite http://www.eu-hbm.info/democophes.
For details of the Irish results, the “National report onthe implementation of the project including data analysisand integrated interpretation” (Report for Ireland) canbe accessed at:http://www.hse.ie/eng/services/news/newsfeatures/democophes/democophes%20ireland%20results.pdf
2.2.1 Scientific Journal Publications
In addition to the overall reports published above, anumber of papers have been published in scientificjournals including:
• Economic Benefits of Methylmercury exposurecontrol in Europe: Monetary value of neurotoxicityprevention. Environmental Health 2013, 12:3
• Urinary excretion of phthalate metabolites, phenolsand parabens in rural and urban Danish mother–childpairs.Int. J. of Hygiene and Environmental Health, Volume 216,Issue No.6, Nov 2013
• A systematic approach for designing a HBM Pilot Studyfor Europe.Int. J. of Hygiene and Environmental Health, Volume 217,Issues 2-3, March 2014
• Hair mercury and urinary cadmium levels of Belgianchildren and their mothers within the framework of theCOPHES/DEMOCOPHES projects.Science of the Total Environment, Volume 472, Feb 2014
• The COPHES/DEMOCOPHES project: Towardstransnational comparability and reliability of humanbiomonitoring results.Int. J. of Hygiene and Environmental Health, Volume 217,Issue 6, July 2014
In 2014, The Journal of Environmental Research: Amultidisciplinary Journal of Environmental Sciences,Ecology and Public Health are planning to publish aspecial edition on the DemoCophes project.
The articles in this special edition will cover variousaspects of the study, including:
• Mercury Analysis and Quality Assessment;• Communication in HBM studies;• Policy Recommendations and Cost;• Gender Differences (Cd & Cotinine);• Feasibility and Challenges of European-wide HBM
studies ;• Cadmium Exposure;• Tobacco Smoke Exposure;• Exposure to Phthalates;• Interpreting Biomarker Data;• Applying HBM in Small Populations;• Several articles on individual countries’ results for
the Biomarkers will also be included.
3. FOOD
3.1 Service Provided
Food in our region (HSE Western Area) is monitoredfor chemical safety* and legislative compliance. Nationalsurveillance is also performed, in line with thedeveloped national specialisations (see 3.2.2). TheEnvironmental Health Officers (EHOs) of the HSE, andthe Food Safety Authority of Ireland (FSAI, www.fsai.ie)are our main clients, see Table 3.1. The service providedincludes programmed surveillance and also ad-hoctesting (food complaints and alerts, ‘inspection’ samplesetc.) as required. The authorised officers and FSAI, asappropriate, have the responsibility for dealing with theincidents of detected non-compliances referred-to inthis report.
Some applied research projects are carried out inconjunction with safefood, www.safefood.eu
*see Reports of the Food Microbiology Laboratory, UHG for a
summary of the results of Microbiological testing of foods in HSE West
area.
3.2 HSE Food Safety Laboratory Service– Updates/Developments etc.
3.2.1 General/Review
A Food Safety Laboratory Service (FSLS) is provided bythe HSE’s seven Official Food MicrobiologyLaboratories (OFMLs) and three Public Analysts’Laboratories (PALs). In July 2004, a report entitled “AStrategic Developmental Review of Health Board FoodControl Laboratories (safefood 2004)” was published;http://www.safefood.eu/Publications/Research-reports/Strategic-Development-Review-of-Health-Board-Food.aspx.
The Report contains 16 recommendations including,inter alia, combining the Laboratories into a unified,multi-sited Food Safety Laboratory Service. Therecommendations have yet to be officially implemented.
A key recent development within HSE food surveillancehas been the enhanced national co-ordination of foodsampling, with a move to increased sampling fromearlier stages (wholesale, import, manufacturing, etc.) inthe food chain.
3.2.2 Public Analysts’ Laboratory Service
3.2.2.1 New Emphases of Surveillance (Chemical)
Over the past few years, following discussions at FSAI-HSEfood committee level, there has been an increased nationalfocus on surveillance of certain food categories, including:• Infant- & Follow-on Formula, and Weaning Foods
- see Section 3.5• Bottled Waters – see Section 3.4• Allergen-free’ Foods – see Section 3.4.2• Food Contact Materials (Packaging etc….)1
• Meat Products and Cereal Products(for GMO/DNA testing etc)2
• ‘Salted’ Foods (Na/K) – see Section 3.5.1.• Food Supplements (General and Body-building)
- see Section 3.5.2.21Testing in Public Analyst’s Lab, Dublin.2 Testing in Public Analyst’s Lab, Cork.
These food categories were included in the 2013Programme (see Appendix 1). The HSE annual Programmesalso endeavour to incorporate surveys of other food typesnot normally catered-for in the routine surveillance. In2013, some such surveys included in the HSE WestProgramme were: Sea Vegetables (Heavy Metals, Labellingetc); Low-fat Minced Meats (Fat content and adulteration);Hospital Meals (Examination vs product specifications - Fat,Protein etc); Christmas Bakery products (Salt andlabelling/general examination). See results in Tables 3.4, 3.5and 3.6 in Sections 3.4 & 3.5.
3.2.2.2 Specialised Testing in the PA Lab Service
The Public Analysts agreed a specialisation document in2012 which includes all food testing performed by PALs,designated as Specialised or Core. The process isongoing, with updating as required. Some of theprincipal national food specialisations agreed to date areoutlined in Appendix 3.
3.2.2.3 Widened Client base/Authorised Officers
Because of the enhanced national coordination of HSEfood surveillance programmes, each of the regional PublicAnalysts’ Laboratories (PA Labs) now receive foodsamples from authorised officers (EHOs) in all HSE Areas.
Western Region - Public Analyst’s Laboratory
Saotharlann an Anailisí Phoiblí
4

Annual Report 2013
Tuarascáil Bhliantúil 2013
5
In addition, the development of national specialisationswithin the overall food control laboratories in Ireland,means that the PA Labs now have a wider range ofagencies and authorised officers (Food Control) as clients.In particular Veterinary Officers, Sea Fishery ProtectionOfficers and the FSAI are now important clients of theservice, in addition to our traditional, main clients, theEnvironmental Health Officers (EHOs) - see Table 3.1.Under the coordination of the FSAI, the official ‘chemical’surveillance laboratories (from all departments, Health..,DAFM, State Lab etc) have begun to meet nationally.
3.2.2.4 Reporting and Designation of Resultsof Analysis: Consistency Document
The national coordination of the Public Analysts’service, in conjunction with new EU/EFSA reportingrequirements, has demanded that the 3 Public Analysts’Labs report to clients in a highly consistent manner. TestReports must now include, inter alia, Results of analysis,and associated Uncertainty of Measurement (UM),LOD, LOQ etc. All test results are to be designated withrespect to compliance with associated statutory limits(or acceptable ranges) for each test parameter. In thecase of Nutritional Testing, results are compared to theacceptable tolerances set in the “EC Guidance Document
for Competent Authorities …. with regard to the setting of
tolerances for nutrient values declared on a label” (IssuedDec. 2012). To accommodate the new reportingrequirements, the Public Analysts have agreed a NationalReporting Consistency Document covering reportformat, structure and test parameter details. ThisReporting Consistency Document includes a processof consultation with FSAI specialists for an opinionwhen toxicological assessment is needed.
3.3 Food Testing (Chemical) Results for 2013
3.3.1 Regional Chemical Surveillance Programme 2013
Nationally co-ordinated, Regional Food Surveillance(Chemical) Programmes are produced between theHSE (PA Laboratories and Environmental HealthOfficers (EHOs)) in conjunction with the FSAI, drawinglargely on risk-based priorities and samplingrequirements identified by the group. HSE West’sChemical Testing Programme for 2013 is outlined inAppendix 1.
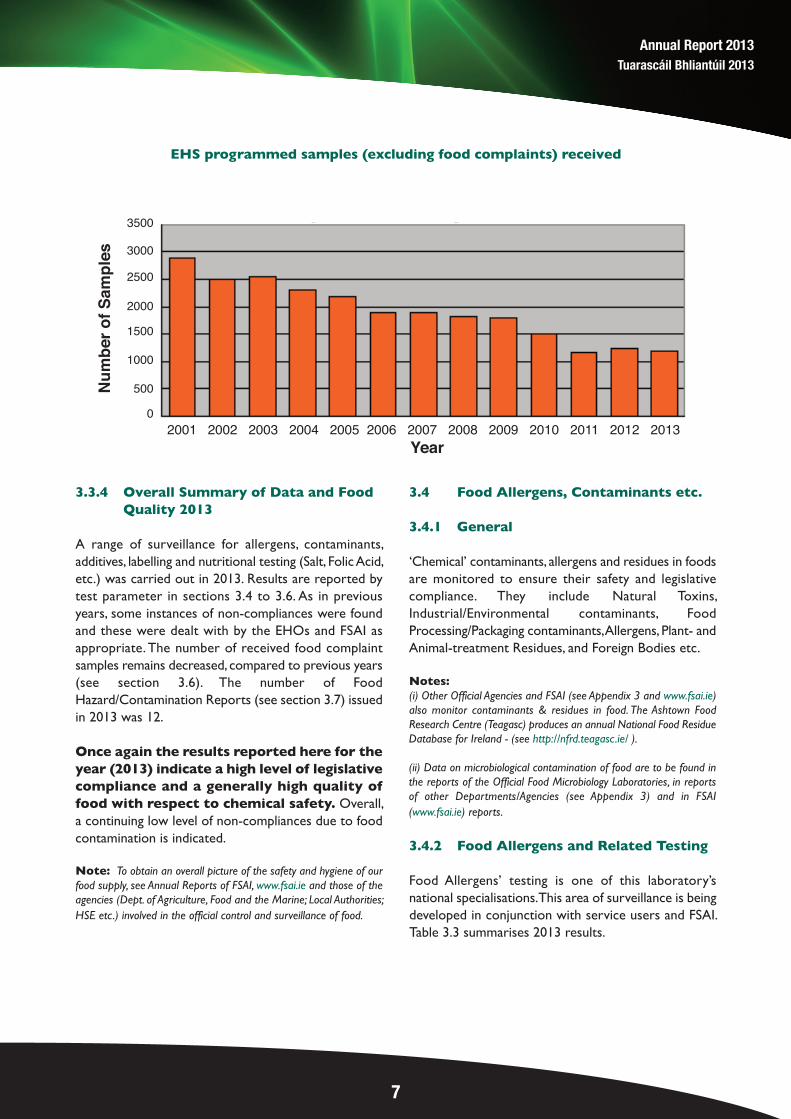
3.3.2 2013 Samples
A total of 2,223 samples was received in 2013. TheFigure below indicates the ‘stage’ at which EHO samples(excluding complaints) were taken in 2013. There hasbeen a decrease in retail-level sampling over the pastnumber of years and a significant increase in samplingfrom further back the food chain.
3.3.3 Statistics for 2013
Tables 3.1 and 3.2 summarise the work for 2013according to the sampling source (all samples). Thesamples consisted of 97 complaints (see section 3.6)and 2,126 others. Out of the 2,126 samples “Non-compliant” reports (i.e. test results indicating non-compliances with standards in Irish Food Law) wereissued on 169 (7.9 %), - see figures for previous yearsbelow: “Non-complying” Reports (as % of samplestested, excluding complaints).
Year20132012
2011201020092008200720062005200420032002
%7.96.46.58.36.47.48.35.44.75.04.55.1

Western Region - Public Analyst’s Laboratory
Saotharlann an Anailisí Phoiblí
6
Of the 169 non-compliances, the majority (117) weredue to labelling deficiencies, many in samples fromethnic, retail premises; it should also be noted that thecategory of labelling deficiencies in non-compliant foodsalso includes foodstuffs where undeclared allergenswere detected as well as discrepancies between thelabelled and analytically determined values for thecomposition of the foodstuff (e.g. salt/sodium content,
fat content etc). The categories of foodstuffs andinfringements for complaints and other samplesreceived from HSE West and the General Public aresummarised in Appendix 2.
Table 3.2 includes a breakdown of EHS samples(excluding complaints) per head of population in eachHSE Community Care Area.
Submitted by / Sample Type No. of SamplesNo. on which AdverseReports were issued
Environmental Health Officers (all regions)
Informal Routine (Sampling Programme)
Public (Food Complaints via EHOs)
Follow-up samples (non-programmed)
General Public
Complaints
Others
Food Safety Authority of Ireland
Sea Fisheries Protection Agency
DAFM & BIP
Local Authority Veterinary Service
Laboratory QA & Method Development etc.
NSAI
OVERALL TOTAL
1,184
86
71
11
448
267
21
37
33
58
7
2,223
146
46
15
5
1
0
5
0
2
Not applicable
0
220
Table 3.1 Food Sample Sources (2013)
*Based on 2011 census and 2011 HSE Community Care data.There has been a decrease in HSE programmed samples submitted in recent years (see figure overleaf), possiblystabilised from 2011.
Community Care County Area E.H.O. Service (all sample types)
Galway
Mayo
Roscommon
Clare
Limerick
North Tipperary/East Limerick
Donegal
Sligo/Leitrim/West Cavan
HSE South
HSE Dublin Mid-Leinster
HSE Dublin North East
Table 3.2 HSE Food Sample Sources (2013)
Number of Samples Submitted(excluding complaints)
Number per1,000 population*
185
124
60
100
139
105
130
104
114
60
63
0.74
0.95
0.94
0.97
0.82
0.99
0.81
1.06
-
-
-
Annual Report 2013
Tuarascáil Bhliantúil 2013
7
3.3.4 Overall Summary of Data and Food Quality 2013
A range of surveillance for allergens, contaminants,additives, labelling and nutritional testing (Salt, Folic Acid,etc.) was carried out in 2013. Results are reported bytest parameter in sections 3.4 to 3.6. As in previousyears, some instances of non-compliances were foundand these were dealt with by the EHOs and FSAI asappropriate. The number of received food complaintsamples remains decreased, compared to previous years(see section 3.6). The number of FoodHazard/Contamination Reports (see section 3.7) issuedin 2013 was 12.
Once again the results reported here for theyear (2013) indicate a high level of legislativecompliance and a generally high quality offood with respect to chemical safety. Overall,a continuing low level of non-compliances due to foodcontamination is indicated.
Note: To obtain an overall picture of the safety and hygiene of our
food supply, see Annual Reports of FSAI, www.fsai.ie and those of the
agencies (Dept. of Agriculture, Food and the Marine; Local Authorities;
HSE etc.) involved in the official control and surveillance of food.
3.4 Food Allergens, Contaminants etc.
3.4.1 General
‘Chemical’ contaminants, allergens and residues in foodsare monitored to ensure their safety and legislativecompliance. They include Natural Toxins,Industrial/Environmental contaminants, FoodProcessing/Packaging contaminants, Allergens, Plant- andAnimal-treatment Residues, and Foreign Bodies etc.
Notes:(i) Other Official Agencies and FSAI (see Appendix 3 and www.fsai.ie)
also monitor contaminants & residues in food. The Ashtown Food
Research Centre (Teagasc) produces an annual National Food Residue
Database for Ireland - (see http://nfrd.teagasc.ie/ ).
(ii) Data on microbiological contamination of food are to be found in
the reports of the Official Food Microbiology Laboratories, in reports
of other Departments/Agencies (see Appendix 3) and in FSAI
(www.fsai.ie) reports.
3.4.2 Food Allergens and Related Testing
Food Allergens’ testing is one of this laboratory’snational specialisations. This area of surveillance is beingdeveloped in conjunction with service users and FSAI.Table 3.3 summarises 2013 results.
EHS programmed samples (excluding food complaints) received
Nu
mb
er
of
Sam
ple
s
Year
3500
3000
2500
2000
1500
1000
500
0
2001 2002 2003 2004 2005 2006 2007 2008 2009 2010 2011 2012 2013

Western Region - Public Analyst’s Laboratory
Saotharlann an Anailisí Phoiblí
8
Gluten: The Gluten proteins contained in wheat,barley, rye and their cross-bred varieties are toxic tocoeliacs. CODEX and EC Commission Regulation No.41/2009 set gluten limits as follows:
• 100 mg/kg for “very low gluten” foods, having one ormore gluten-containing ingredients• 20 mg/kg for naturally gluten-free foods.
In 2013, a diverse range of gluten-free foods frompharmacies, health food shops, supermarkets and localmanufacturers was received. Nine of the HSEprogrammed samples, labelled as gluten-free were non-compliant (with gluten levels > 20 mg/kg) with thelegislative limits (all were bakery products produced insmall quantities by cafés, restaurants etc). In addition,two complaint samples (received via the EHOs) from
the service sector were also found to be non-compliant(a sample of sausages sold as ‘gluten free’ & a sample of‘ordinary’ wheat bread that was sold (verbally) as glutenfree). Follow-up action was taken by the authorisedofficers. The results for mainstream, pre-packagedproduce once again indicate an overall high quality (withrespect to gluten levels) of gluten-free foods availableto the consumer.
Peanut: An ELISA-based analysis for Peanut in foods,based on the use of polyclonal antibodies to theallergenic peanut proteins Ara h1 and Ara h2, is in usein this laboratory. In 2013, 78 samples of foods (mainlychocolate and other types of confectionery) wereanalysed for the presence of Peanut, with an emphasison products labelled as nut- or peanut-free. The testingindicated one non-compliance in a condiment product.
Allergen/Parameter Limit(s) (Legal Source) Sample Types Total ComplyingWith Standard
Non-complyingwith standard
Gluten (EHO sampling)
Gluten (private samples)1
Gluten (DAFM)
Gluten (LAVS)
Peanut protein
Lactose2 (EHO Sampling)
Egg
Casein
Sulphites
20 ppm* (Reg (EC) 41/2009)
20 ppm* (customer specification)
20 ppm* (Reg (EC) 41/2009)
20 ppm* (Reg (EC) 41/2009)
Directive 2003/89/EC
Directives: 2000/13/EC &2006/141/EC
Directive 2003/89/EC
Directive 2003/89/EC
Directive 2003/89/EC
Regulation 1333/2008, &1129/2011
Gluten-free foods
Gluten-free foods
Infant Formula
Gluten-free pork products(sausages, pudding)
Confectionery
Soy desserts, Soy & lactose-free infantformula, confectionery
Various foods labelled as “egg-free”
Various foods labelled as “milk-free”
Meat/Meat products (114), Fruit/veg (26),
Dried Fruit (20), Beers /Wines (14 ), Soft
drinks/juices (2), Confectionery (4),
Prawns/scampi (10), Miscellaneous (5)
11
23
0
0
1
0
3
1
83
184
Table 3.3: Food Allergens and related parameters: Summary of Results for 2013.
*EU Regulation (EC) 41/2009: 20 mg/kg for “Gluten-free” foods and 100 mg/kg for “foods rendered gluten-free”. All foods received in 2013
were labelled as ‘gluten free’ and did not indicate the use of de-glutenised wheat flour.1 These samples were tested for private food business operators, in connection with their listing in the Coeliac Society of Ireland Food List, or
with product development for the gluten-free foods market.2 Lactose is not a legally defined food allergen under EU food law (Directive 2003/89/EC) but is rather a dairy sugar to which some people
(mainly infants) are intolerant.3 These 8 samples contained undeclared Sulphur Dioxide (SO2)4 These 18 samples were non-compliant with the additives legislation (Regulation (EC) No 1333/2008 as amended by Regulation (EC) No
1129/2011, Pre June 1st 2013:Dir 95/2/EC as amended), for excessive SO2 or non-permitted SO2. EU Directives require member states
to monitor their usage and intake of Additives.
187
376
20
14
77
25
44
34
169
198
399
20
14
78
25
47
35
195
Annual Report 2013
Tuarascáil Bhliantúil 2013
9
For information regarding allergens and labelling seedetails of the FSAI survey, -“Food Allergens and Labelling
Survey June 2011”
(http://www.fsai.ie/resources_publications.html).
Designations of all allergen test results (other thanGluten and Sulphur Dioxide) are based on the presenceor absence of detectable allergens as Directive2003/89/EC does not prescribe a permitted level forthese allergens in foods.
Following on from invitations to participate in ring-trialsfor allergen analysis, this laboratory has been invited toattend a number of meetings of large-scale EU fundedfood allergy research projects. Our attendance at thesemeetings was funded by safefood under their Trainingand Mobility programmes for laboratory staff. These
meetings were very informative and useful as they gaveus an insight into the ‘cutting-edge’ of food allergenresearch at all levels, from clinical trials to patienttreatment and risk assessment up to the latestdevelopments in food allergen detection. We have beeninvited to continue our involvement with theseresearchers on a more formal basis into the future andwe hope that this will be possible and also be as usefuland informative as it has been so far.
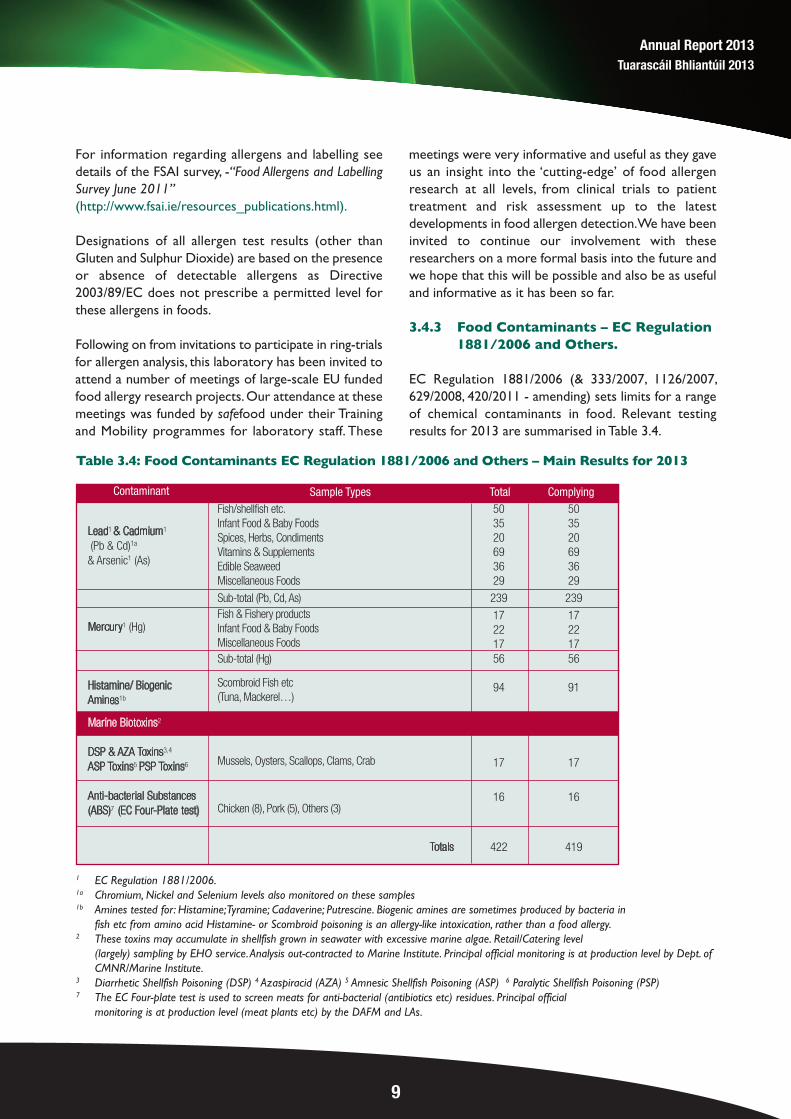
3.4.3 Food Contaminants – EC Regulation 1881/2006 and Others.
EC Regulation 1881/2006 (& 333/2007, 1126/2007,629/2008, 420/2011 - amending) sets limits for a rangeof chemical contaminants in food. Relevant testingresults for 2013 are summarised in Table 3.4.
Table 3.4: Food Contaminants EC Regulation 1881/2006 and Others – Main Results for 2013
1 EC Regulation 1881/2006.1a Chromium, Nickel and Selenium levels also monitored on these samples1b Amines tested for: Histamine; Tyramine; Cadaverine; Putrescine. Biogenic amines are sometimes produced by bacteria in
fish etc from amino acid Histamine- or Scombroid poisoning is an allergy-like intoxication, rather than a food allergy.2 These toxins may accumulate in shellfish grown in seawater with excessive marine algae. Retail/Catering level
(largely) sampling by EHO service. Analysis out-contracted to Marine Institute. Principal official monitoring is at production level by Dept. of
CMNR/Marine Institute.3 Diarrhetic Shellfish Poisoning (DSP) 4 Azaspiracid (AZA) 5 Amnesic Shellfish Poisoning (ASP) 6 Paralytic Shellfish Poisoning (PSP)7 The EC Four-plate test is used to screen meats for anti-bacterial (antibiotics etc) residues. Principal official
monitoring is at production level (meat plants etc) by the DAFM and LAs.
Contaminant Sample Types Total ComplyingFish/shellfish etc.Infant Food & Baby Foods Spices, Herbs, CondimentsVitamins & SupplementsEdible SeaweedMiscellaneous Foods
Sub-total (Pb, Cd, As)Fish & Fishery productsInfant Food & Baby FoodsMiscellaneous FoodsSub-total (Hg)
Scombroid Fish etc(Tuna, Mackerel…)
Mussels, Oysters, Scallops, Clams, Crab
Chicken (8), Pork (5), Others (3)
Totals
503520693629
239
17221756
94
17
16
422
503520693629
239
17221756
91
17
16
419
Lead1 & Cadmium1
(Pb & Cd)1a
& Arsenic1 (As)
Mercury1 (Hg)
Histamine/ BiogenicAmines1b
Marine Biotoxins2
DSP & AZA Toxins3,4
ASP Toxins5 PSP Toxins6
Anti-bacterial Substances(ABS)7 (EC Four-Plate test)

Western Region - Public Analyst’s Laboratory
Saotharlann an Anailisí Phoiblí
10
The HSE Sampling/Analysis Programmes includeincreased surveillance of bottled waters. Thesurveillance is coordinated nationally by the HSE-FSAIfood surveillance group. The testing covers mineralwaters, spring waters, and ‘other’ bottled waters, bothimported and Irish produce.166 samples of bottledwater were examined here in 2013; 141 of these werefrom domestic water bottling plants (Natural MineralWater, Spring Water & ‘other’ bottled ground water) atall stages of production from the well head to finishedproduct.
The intensity of this sampling is related to productionvolumes in the plant in question; all of these sampleswere found to comply with the required compositionalcriteria (S.I. 225 of 2007). 25 samples of importedbottled water (Natural Mineral Water and SpringWater) were analysed here in 2013, these were sampledfrom retail and service sector establishments. 12 ofthese samples were designated as non-compliant withthe relevant legislation, 10 were not labelled in Englishand 2 were food complaints in relation to the presenceof foreign objects/other material.
National testing covers Audit or Check suites (seeSection 4), including chemical and microbiologicalparameters, as set out in S.I. 225 of 2007. In 2013, 109samples were programmed for the HSE, and 166 werereceived and tested here (chemical testing). All bottledwater samples were screened (by ICP-MS) for metals,and none were found to exceed the legislative limits.
94 fish samples were tested here in 2013 for Histamineand 3 other biogenic amines, viz. Putrescine,Cadaverine and Tyramine. These included 10 (10 x 9subsamples) samples submitted by the Sea-FisheriesProtection Authority (SFPA), 4 (4 x 9 subsamples)Border Inspection Post (BIP) samples from TheDepartment of Agriculture, Fisheries and Food (DAFF)and 80 samples from Environmental Health Officers.
3 of the 94 samples had excessive Histamine. 7 Samplescontained elevated (>100 mg/kg) Cadaverine, 1 samplecontained elevated Putrescine (>100mg/kg) and 1sample contained elevated Tyramine (>100mg/kg).
For a general report on Histamine poisoning seehttp://www.fda.gov/downloads/Food/GuidanceRegulation/UCM252400.pdf
Testing for contaminants has decreased substantially inthis laboratory in recent years, in particular as many ofthe established test groups (processing contaminants,mycotoxins etc.) have recently been devolved to theDublin Public Analyst’s Laboratory (as nationalspecialisations). The relatively high level of testing offoods for Lead & Cadmium is performed partly togenerate data for dietary intake.
3.5 Nutrition, Composition, Additives, Labelling etc.
There has been an increase in nutritional/compositionaltesting in the laboratory in recent years, in particular inthe areas of ‘Salt’/Sodium, Folic Acid and generalnutritional labelling.
3.5.1 Sodium/Salt in Food
A considerable international effort is being made toreduce population dietary intakes of ‘Salt’/Sodium, - seee.g. “Salt and Health: Review of the Scientific Evidence and
Recommendations for Public Policy in Ireland”,www.fsai.ie/uploadedFiles/Science_and_Health/salt_report-1.pdf. Data quoted in the report, and applied toIreland, would yield a significant reduction in deaths inIreland per year from strokes and ischemic heartdisease, if recommended reductions in populationintake of salt are achieved. Since 2002, the FSAI hasimplemented a programme, in association with the foodindustry, to reduce salt levels in the major, salt-containing, processed foods, - seehttp://www.fsai.ie/science_and_health/salt_and_health.html for an update. The stated aim was to reduce theaverage intake of salt to 6 grams per day (from 10 gramsper day) by 2010, see 2011 report from IUNA “Report
on Salt Intakes in Irish Adults –Executive Summary” -http://www.fsai.ie/uploadedFiles/Science_and_Health/Salt_and_Health/Salt_exec_summary.pdf
The 2013 results for the FSAI surveys and otherprogrammed HSE surveillance are summarised in Table3.5.

Annual Report 2013
Tuarascáil Bhliantúil 2013
11
Table 3.5 and 3.5a Include Summary of ‘Salt’ (Sodium & Potassium) Testing Results 2013
Food Types etc. SamplesTested
Average Results1
(g/100g)Sodium/Potassium
Ratio
Snack Food SurveyFSAI survey
Soup SurveyFSAI survey
Bread SurveyFSAI survey
Ethnic Foods’ SurveyHSE Regional Survey
Body-Building Supplements SurveyHSE Survey
Bottled Waters Survey2HSE Survey
Low Salt/Reduced Salt Survey3
HSE Regional Survey
Locally Produced FoodsHSE Regional Survey
Christmas Bakery ProductsHSE Regional Survey
Weaning Foods/Infant FormulaeHSE Survey
Sodium
Potassium
Sodium
Potassium
Sodium
Potassium
Sodium
Potassium
Sodium
Potassium
Sodium
Sodium
Potassium
Sodium
Potassium
Sodium
Potassium
Sodium
Potassium
102
102
42
42
123
123
26
26
13
13
139
27
27
29
29
23
23
35
35
0.76
1.09
0.29
0.12
0.43
0.17
1.25
0.34
0.29
0.52
28mg/L
3.67
6.46
0.38
0.26
0.18
0.31
0.05
0.21
0.7
2.4
2.5
3.7
0.56
-
0.57
1.5
0.58
0.24
1 In the calculation of the average result in each category, the value (<0.01g/100g) where present has been replaced
by 0.005g/100g.2 Samples analysed in the Water Section as part of an extended Audit suite of analysis. Samples include Irish and Imported brands of still
and sparkling Natural Mineral Waters, Spring Waters and ‘Other’ Waters.3 11 of these samples are ‘concentrates’, Lo-Salts, Seasonings, Gravy Granules, Stock Cubes etc.
Parameter(s)
‘Salt’
(Sodium & Potassium)
Tables 3.5 and 3.5a include the Sodium/Potassium ratiosfor each food category. Potassium is to be found inmany foods, including fruits, vegetables, pulses, nuts, milk,meats, fish etc. A balanced intake of Sodium andPotassium is recommended, whilst some authoritiesadvocate reducing Sodium and increasing Potassium toachieve lower Sodium/Potassium intake ratios.
FSAI Work: The 2013 surveillance work above for FSAIis a continuation of the work dating from 2003, see FSAIreport “Monitoring of Salt in Processed Foods – September
2003 to July 2014”http://www.fsai.ie/uploadedFiles/Science_and_Health/Salt_and_Health/Salt_Surveys_2003_onwards.pdf
Table 3.5a summarises data from 8 surveys of particularfood categories (most recent surveys only).

Western Region - Public Analyst’s Laboratory
Saotharlann an Anailisí Phoiblí
12
HSE regional Surveys etc: several HSE surveys,including low-salt foods, locally produced foods, Christmasbakery products, weaning foods etc, were carried-out in2013 (Table 3.5). These HSE surveys monitor foodstuffs toensure that manufacturers are complying with their labelledsalt/sodium levels. Just 3 of the samples analysed were foundto be non-compliant, i.e. the Sodium results differedsignificantly from the labelled value.
3.5.2 Other Nutritional Testing
Table 3.6 summarises other nutritional testing carried outhere in 2013.
Food Categories No. ofSamples
Sodium ResultsAverage (g/100g)
Potassium ResultsAverage (g/100g)
Breakfast Cereals (2011 data)
Dairy & Non-Dairy Spreads (2012 data)Processed Meats (2012 data)Cheeses (2012 data)Sauces (2012 data)
Breads (2013 data)Soups (2013 data)Snacks (2013 data)
330
6212756145
12342102
0.21
0.490.930.640.32
0.430.290.76
0.31
0.040.230.080.18
0.170.121.09
Table 3.5a: Summary of Results for most recent Food Surveys for FSAI.
0.68
12.34.08.01.8
2.52.40.7
Sodium/PotassiumRatio
Table 3.6: Other Nutritional/Compositional Testing 2013.
Parameter(s) Food Types etc. Samples Tested Range of Results
Folic Acid
Infant Foods (Dry)-HSE surveyInfant and Follow-on Formulae-HSE survey Infant and Follow-on Formulae-DAFM survey
Folic Acid Supplements, Multi-vitamins etc.
82320
22
<8-28μg/100kcal (73-141% of Labelled)12-59μg/100kcal (75-204% of Labelled)12-33μg/100kcal (75-184% of Labelled)
Range of Results (as % of Labelled value) 45% to 4000%
Fat
SausagesMinced Meat/BeefBurger MeatPrepared DishesBaby FoodCereal-based Infant FormulaFollow-on MilkBody-building SupplementsProcessed Meats (Puddings)Sausages, Minced Meats, Burger Meat,Prepared Dish, Processed Meats (Puddings)
* Tested by Public Analyst’s Laboratory, Cork for equine DNA; bovine, porcine and ovine DNA also included.
** 2 samples designated non-compliant due to disparity between actual and labelled magnesium, copper and molybdenum levels.
Protein
123512212483158
22
8.9 - 25.2 (g/100g)1.5 – 19.7 (g/100g)4 - 18.7 (g/100g)
1.5 – 16.3 (g/100g)<0.4 – 6.9 (g/100g)1 – 12.7 (g/100g)2.9 – 4.3 (g/100g)
<0.4 – 11.6 (g/100g)2.5 – 16.1 (g/100g)
21 Compliant 1 Non-compliant
SausagesMinced Meat/BeefBurger MeatPrepared DishesBaby FoodCereal-based Infant FormulaFollow-on MilkBody-building SupplementsMiscellaneous (Puddings)
75281683166
8.4 – 12.2 (g/100g)17.9 – 20.7 (g/100g)12.6 – 14.3 (g/100g)6.1 – 11.0 (g/100g)2.4 – 12.4 (g/100g)2.5 – 13.9 (g/100g)1.3 – 1.5 (g/100ml)0.1 – 90 (g/100g)7.6 - 10.9 (g/100g)
Parameter(s) Food Types etc. Samples Tested Non-compliant Samples
Boron, Magnesium,Manganese, Iron,
Cobalt, Copper, Zinc,Molybdenum
Vitamins & Supplements 3 2**
DNA*

Annual Report 2013
Tuarascáil Bhliantúil 2013
13
SurveySample
Numbers2
Received
Test Parameters and Non-compliant results1
Folic AcidMinerals/Metals
(Cr, Se, Mg, Fe etc)3 Food Irrad’n4 DMAA5 Fat Protein Salt (Na/K) Labelling6
Irish Manufacturers7
Imported
Body-building
Supplements8
33
28
2/22
N/T
4/33
0/28
1/22
1/28
N/T
0/24
N/T
0/15
N/T
0/16
N/T
0/13
1/2
13/28
Summary of Results for Food Supplements Surveys 2013
1 E.g. “2/22” indicates that 2 samples were non-compliant with standard, out of 22 tested for that parameter.2 Programmed number of samples in each survey was 30.3 Tested parameters: Cr, Se, Mg, Mn, Fe, Cu, Zn, Ni, As, Pb and Cd4 Food Irradiation test (PPSL)5 DMAA = Dimethylamylamine.6 Examination for general, nutritional & PARNUTS labelling……7 All samples taken from premises of 7 x Irish Manufacturers of food supplements.8 Survey targeted Imported food supplements only.
3.5.2.1 Monitoring of Folic Acid:
In 2013, 43 samples of infant formula were tested forfolic acid fortification level. The determined folic acidvalues ranged from 12-34μg/100kcal for standardformulae (S.I. No.852 of 2007 permitted range: 10-50μg/100kcal) and 26-59μg/100kcal for pre-termformula (ESPGHAN (2010) recommended range: 32-90μg/100kcal). The results ranged from 75 to 204% ofthe labelled values; 10 samples within 75-100% of thelabelled value, 26 samples 101-150%, 6 samples 151-200%and 1 sample was 204% of the labelled value. 8 cereal-based weaning foods were tested and found to have arange of <8-28μg folic acid/100kcal (S.I. No. 776 of 2007sets a max. limit of 50μg/100kcal) , corresponding to 73-141% of labelled value. 22 multivitamins/foodsupplements were tested for folic acid content, 2 ofwhich were at significant variance with the labelled value.Further investigation of the highest result (4000% oflabelled value) by the EHS and the company involvedindicated a formulation error at manufacturing level.
3.5.2.2 Food Supplements
Food supplements constitute a food category which hasseen recent increases in consumption in Europe,including Ireland. These foodstuffs, which supplementthe normal diet, are covered in law by Directive2002/46/EC, as amended, transposed in Irish law by theEuropean Communities (Food Supplements)Regulations - SI No 506 of 2007, as amended. Followinga need identified by HSE Environmental Health Officers,
who are authorised officers for the food supplementslegislation, two surveys of food supplements werescheduled into the HSE national surveillanceprogrammes. The range of potential test parameters isenormous and that chosen for 2013 initially was agreedbetween FSAI and HSE, based largely on listedingredients, risk and lab capacity.
HSE National Survey of Food SupplementManufacturers:Environmental Health Officers targeted 7 Irishsupplement manufacturers for the samples in thissurvey (see Table above for results). Overall there were8 detected non-compliances (in 7 samples); two forexcessive folic acid, four for discrepancies between thelabelled value and the determined value for minerals,one failure to declare food irradiation on its label, andone non-compliance with the labelling requirements.
Imported Body-building Supplements1,3-dimethylamylamine (DMAA), also known asgeranamine, methylhexanamine or dimethylpentylamine,is a stimulant related to amphetamine and ephedrine. Itmay occur illegally in some food supplements marketedtypically as performance-enhancing or fat-loss products.In April 2013, the U.S. FDA determined that DMAA waspotentially dangerous and did not qualify as a legaldietary supplement; it warned supplementmanufacturers and consumers of potentially serioushealth risks associated with DMAA-containingproducts. An LC-MSMS literature method wasintroduced to perform testing. No DMAA was found
Western Region - Public Analyst’s Laboratory
Saotharlann an Anailisí Phoiblí
14
(<0.2 mg/kg) in any of the 24 products tested . Thesupplements surveys involved considerable methoddevelopment as the wide range of sample types(powders, oils, capsules etc) created difficulties in someof the test methods. For that reason a number ofsamples had lengthy turnaround times. It is envisagedthat national surveillance of food supplements willcontinue and develop in future years.
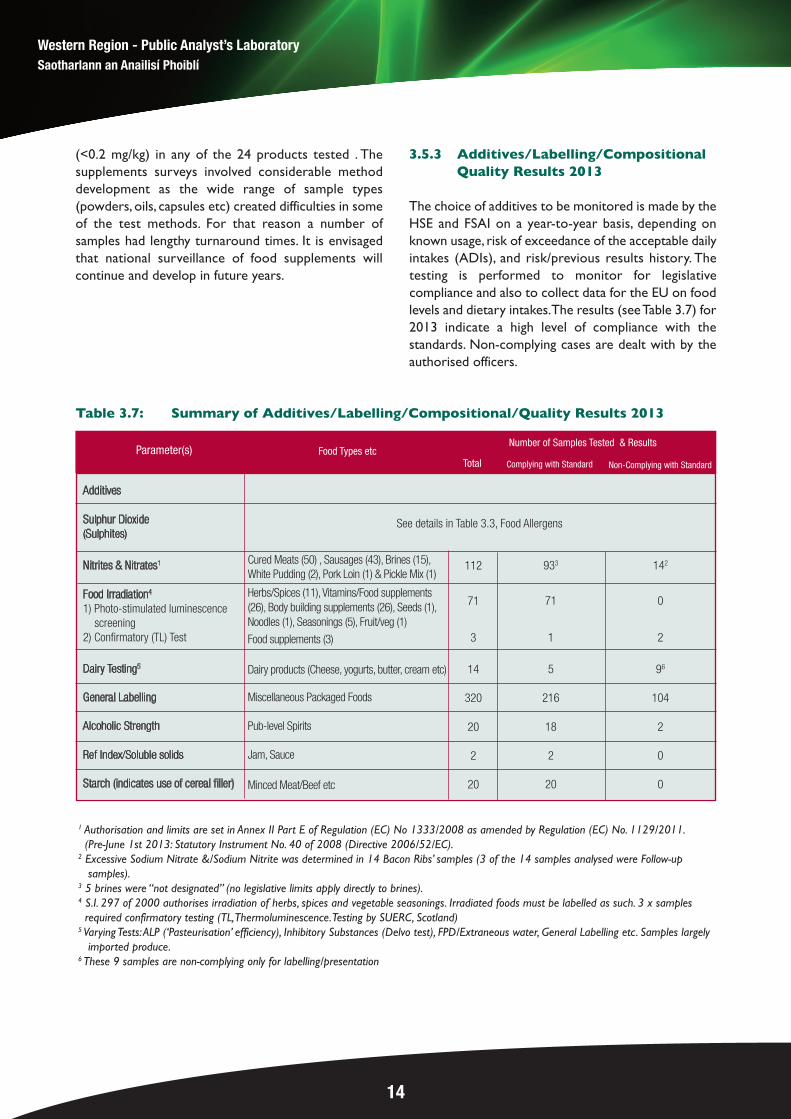
3.5.3 Additives/Labelling/Compositional Quality Results 2013
The choice of additives to be monitored is made by theHSE and FSAI on a year-to-year basis, depending onknown usage, risk of exceedance of the acceptable dailyintakes (ADIs), and risk/previous results history. Thetesting is performed to monitor for legislativecompliance and also to collect data for the EU on foodlevels and dietary intakes. The results (see Table 3.7) for2013 indicate a high level of compliance with thestandards. Non-complying cases are dealt with by theauthorised officers.
Table 3.7: Summary of Additives/Labelling/Compositional/Quality Results 2013
Parameter(s) Food Types etcNumber of Samples Tested & Results
Additives
Sulphur Dioxide(Sulphites)
Nitrites & Nitrates1
Food Irradiation4
1) Photo-stimulated luminescence screening
2) Confirmatory (TL) Test
Dairy Testing5
General Labelling
Alcoholic Strength
Ref Index/Soluble solids
Starch (indicates use of cereal filler)
Cured Meats (50) , Sausages (43), Brines (15),White Pudding (2), Pork Loin (1) & Pickle Mix (1)
Herbs/Spices (11), Vitamins/Food supplements(26), Body building supplements (26), Seeds (1),Noodles (1), Seasonings (5), Fruit/veg (1)
Food supplements (3)
Dairy products (Cheese, yogurts, butter, cream etc)
Miscellaneous Packaged Foods
Pub-level Spirits
Jam, Sauce
Minced Meat/Beef etc
112
71
3
14
320
20
2
20
Total Complying with Standard Non-Complying with Standard
1 Authorisation and limits are set in Annex II Part E of Regulation (EC) No 1333/2008 as amended by Regulation (EC) No. 1129/2011.
(Pre-June 1st 2013: Statutory Instrument No. 40 of 2008 (Directive 2006/52/EC).2 Excessive Sodium Nitrate &/Sodium Nitrite was determined in 14 Bacon Ribs’ samples (3 of the 14 samples analysed were Follow-up
samples).3 5 brines were “not designated” (no legislative limits apply directly to brines).4 S.I. 297 of 2000 authorises irradiation of herbs, spices and vegetable seasonings. Irradiated foods must be labelled as such. 3 x samples
required confirmatory testing (TL, Thermoluminescence. Testing by SUERC, Scotland)5 Varying Tests: ALP (‘Pasteurisation’ efficiency), Inhibitory Substances (Delvo test), FPD/Extraneous water, General Labelling etc. Samples largely
imported produce.6 These 9 samples are non-complying only for labelling/presentation
See details in Table 3.3, Food Allergens
933
71
1
5
216
18
2
20
142
0
2
96
104
2
0
0

Annual Report 2013
Tuarascáil Bhliantúil 2013
15
General LabellingStatutory Instrument No. 483 of 2002 consolidateslegislation on the labelling of foodstuffs in general. Anoverview of labelling legislation and enforcementprocedures etc. is outlined in a FSAI publication (TheLabelling of Food in Ireland – FSAI 2007);http://www.fsai.ie/assets/0/86/204/5dfb809a-7902-4f03-bb6a-6e25a5a09736.pdf
The European Commission carried out a consultationprocess leading to an overhaul of European foodlabelling legislation which was completed in October2011 and led to the publication of Regulation (EC)1169/2011 on “the provision of food information toconsumers”. This is a full re-draft of the EU general andnutritional labelling rules and includes the introductionof certain new labelling requirements to cover, forexample, compulsory nutritional labelling as well as anextension of country-of-origin labelling to meat otherthan bovine meat; it also extends the provisions of the‘old’ labelling rules to “distance” sales (i.e. internet sales)and to temporary advertising (e.g. chalk boards). Thevast majority of the provisions of this legislation are tocome into force on the 13th of December 2014 and itis anticipated that there will need to be an increase inthe monitoring of labelling compliance around that time.The requirements in relation to the labelling of foodsold without pre-packaging regarding the presence ofallergens will come into force on this date. This willrequire a large change in practice for food businesses,and will need domestic legislation to define how thisinformation is to be imparted, as well as how it will beenforced in this country.
In 2013, 320 samples were examined here forcompliance with labelling legislation and 104 weredesignated as being non-compliant. Many of the
problems arise from East European and other ‘ethnic’processed foods with the absence of labelling in Englishor Irish, with Quantitative Ingredients Declaration(QUID) labelling deficiencies, and from issues in relationto the labelling of foodstuffs with nutritional and/orhealth claims that are not permitted under the termsof Regulation (EC) 1924/2006.
3.6 Food Complaints
Complaint samples arise when consumers findcontamination or other defects in foods. Complaintsare generally made to the EHO service or to the FSAI.Some complaints arise from food poisoning incidents(these samples are tested primarily in the FoodMicrobiology laboratories, but may also requirechemical testing). Complaint samples analysed in thislaboratory usually involve the presence of foreignbodies such as insects, metal, unidentified material orabnormal odours/tastes in food. A total of 97 complaintsamples, received from EHO services around thecountry (86) and directly from the public (11), wereinvestigated here in 2013. Of the 97, the number ofadverse reports issued was 51 (52.6%).
Appendix 2 gives a breakdown of food complaintsreceived, by food category, from the HSE EnvironmentalHealth Service (total 86). The number of foodcomplaints received in this laboratory has decreasedfrom a steady average of ca. 230 per annum (1999-2003)to an average of ca. 127 (2004 – 2013). The reason forthis reduction may be related to better handling ofcomplaints by retailers.
The number of food complaints received represents avery small fraction of the total number of food itemsconsumed in our region.
2000 2001 2002 2003 2004 2005 2006 2007 2008 2009 2010 2011 2012 2013
300
250
200
150
100
50
0
Compliant Samples Non-Compliant Samples Year
Num
ber
of S
am
ple
s
Compliant Samples Testing
3.7 Food Alerts (RASFF) and Food Hazard/Contamination Reports
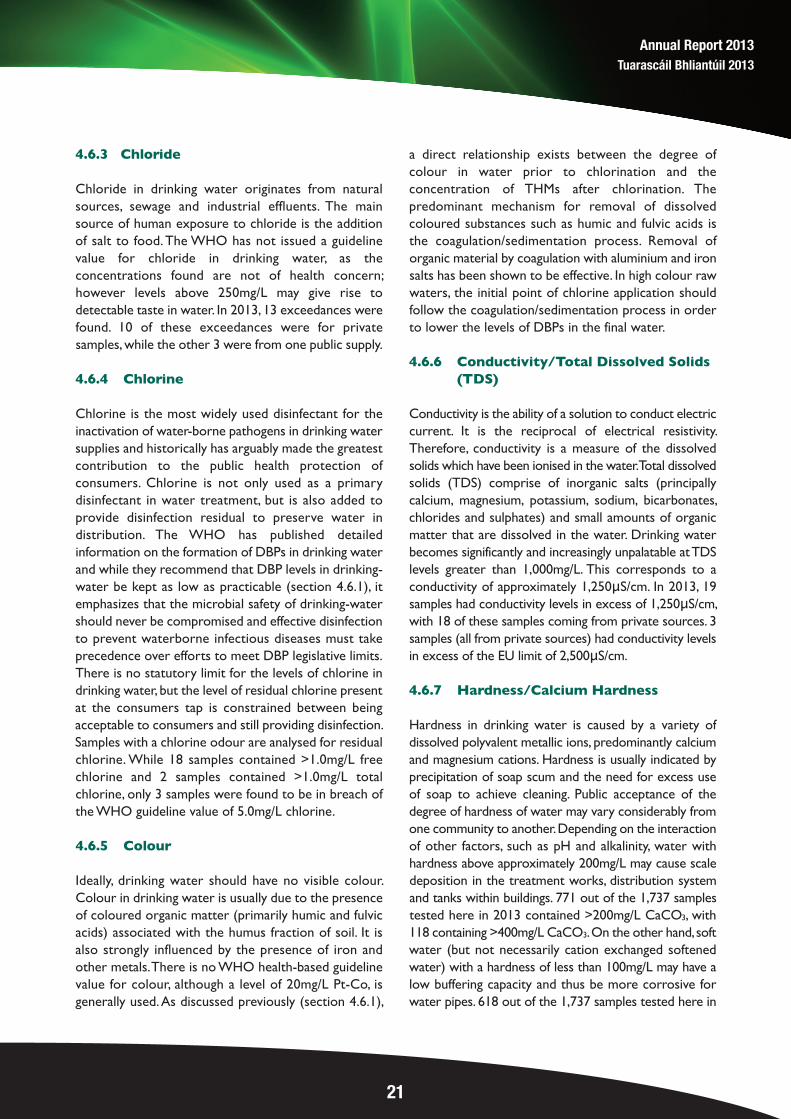
The EU Rapid Alert System for Food and Feed (RASFF) isactivated when a member state reports significantcontamination/risk/legislative issue associated with a batchof food or feed. The EU RASFF Notifications Report for2013 is available onhttp://ec.europa.eu/food/safety/rasff/docs/rasff_annual_report_2013.pdf. A summary of the RASFF notifications for2013 is given by Hazard group below:
The main issues (400+ notifications each) dealt with in 2013were: mycotoxins, pesticide residues and pathogenic micro-organisms, all regular and recurring issues. 2013 did throwup a major RASSF event, the discovery of horse meatcontamination of beef products which led to over 500notifications in 2013 and the introduction of a new EUCommission-launched monitoring programme for foodfraud (Commission Recommendation 2013/99/EU) whichis designed to detect and disseminate information inrelation to food fraud. The contamination of beef productswith horse meat was first discovered via an FSAI survey inlate 2012 of beef products for sale at retail level in Ireland;this analysis was carried out using DNA technology (see:https://www.agriculture.gov.ie/media/migration/publications/2013/EquineDNAreportMarch2013190313.pdf for moredetails)
FSAI Incident Notifications are issued by the laboratory tothe EHO service and the FSAI when ‘significant’contamination/hazard is detected. Upon assessment byFSAI, a Food Alert notification may be issued (to the EU)depending on their evaluation of the risk. In 2013, 11 FoodHazard/Contamination Reports were issued by thelaboratory, relating to: excessive and/or undeclared sulphurdioxide in apple pie filling (1), in sausages (1); in fresh chips(1), non-permitted sulphur dioxide in diced carrot & parsnip(1), excessive sodium nitrite and nitrate in bacon ribs (4);excessive sodium nitrite in bacon ribs (2), Undeclared eggdetected in swiss roll (1).
Numbers of Food Hazard/Contamination Reports issuedfrom this laboratory are outlined below:
Western Region - Public Analyst’s Laboratory
Saotharlann an Anailisí Phoiblí
16
Food: Chemical and Physical Hazards1
Food: Microbiological Hazards2
Food: Other Hazard / Risks3
Animal Feedstuffs Hazards4
Hazard / Risk Group Number ofNotifications 2013
2,153
854
178
14
1 Mycotoxins, Heavy Metals, Pesticides and Veterinary Residues, FoodAdditives & Flavourings, Allergens, Marine biotoxins, GMOs, ForeignBodies, Radiation, Migration from food contact materials, Composition,Contaminants & Biocontaminants, Adulteration & Fraud, etc.2 Pathogenic Micro-organisms, TSEs, Parasites, Other MicrobiologicalContamination.3 Insufficient controls, Absent Labelling etc., Defective Packaging,Organoleptic defects, others.4 Feed additives.
2013
2012
2011
2010
2009
2008
2007
2006
2005
2004
11
12
11
11
14
7
24
26
23
16

Annual Report 2013
Tuarascáil Bhliantúil 2013
17
4. WATERS / EFFLUENTS
4.1 Introduction
The quality of water, whether used for drinking,domestic purposes, food production or recreationalpurposes has an important impact on health. Water ofpoor quality can cause disease outbreaks and it cancontribute to background rates of disease manifestingthemselves on different timescales. Initiatives to managethe safety of water do not only support public health,but often promote socioeconomic development andwell-being.
The European Communities (Drinking Water) No. 2,Regulations, 2007, S.I. 278 of 2007 assign theEnvironmental Protection Agency (EPA) the role ofsupervisory authority over public water supplies andprovides powers of enforcement to ensure actions aretaken where the quality of public drinking water isdeficient. The EPA also coordinates and overseesimplementation of the Water Framework Directive(WFD). The objectives of the WFD are to protect allhigh-status waters, prevent further deterioration of allwaters and to restore degraded surface and groundwaters to good status by 2015.
To ensure that the EU and national drinking waterstandards are met, each water supply must bemonitored on a regular basis. The monitoring frequencyis legally set out in the regulations, and minimummonitoring frequencies for drinking water depend onthe size of the supply in question. Chemical aspects ofwater are only one part of the total safety of water. Theother aspects are microbial and radiological. Furtherinformation on all aspects of drinking water safety canbe found on the EPA website at www.epa.ie.
The health concerns associated with chemicalconstituents in drinking water arise primarily from theability of chemical constituents to cause adverse healtheffects after prolonged periods of exposure. There arefew chemical constituents of water that can lead tohealth problems resulting from a single exposure,except through massive accidental contamination of adrinking water supply. Experience has shown that inmany, but not all, such incidents, the water becomesundrinkable owing to the unacceptable taste, odour orappearance.
4.2 Drinking Water Management
The Water Services Act 2013 and the Water Services(No 2) Act 2013 transfer responsibility for the supplyof water from over 1000 public water supplies fromlocal authorities to Irish Water, the new national waterservices authority, from 1st January 2014. Furtherinformation on Irish water is available at www.water.ie
From 1st January 2014, Irish Water is responsible forthe production, distribution and monitoring of drinkingwater for 82.0% of the population. The remainder of thepopulation (18%) is supplied by group water schemes(6.6%), small private supplies (0.8%) and private wells(10.6%). Responsibility for the quality of water for this18% of the population rests with the manager/operatorof the supply, while monitoring these supplies remainsthe responsibility of the local authorities. Informationon these and other water issues (i.e. charges,conservation etc) can be found on the citizen’sinformation website at www.citizensinformation.ie

Western Region - Public Analyst’s Laboratory
Saotharlann an Anailisí Phoiblí
18
Group Classification
1 Carcinogenic to humans
2A Probably carcinogenic to humans
2B Possibly carcinogenic to humans
3 Not classifiable as to its carcinogenicity to humans
4 Probably not carcinogenic to humans
4.3 Sample Sources 2013
In 2013, the laboratory received a total of 6,994 watersamples. These consisted of drinking waters, bathingwaters, pool waters, effluents, haemodialysis samplesand miscellaneous samples. More than 100,000 testswere carried out on these samples. Most of the samplesanalysed were drinking waters, which are tested forcompliance with the European Communities (DrinkingWater) Regulations 2007, S.I. 278 of 2007. Samples werereceived from a wide variety of sources, as shown inTable 4.1.
Table 4.1 Source of samples received in 2013
4.4 Water Quality
A full appreciation of the overall quality of drinkingwater can only be obtained by also considering thebacteriological quality along with additional chemicalparameters as published by the EPA.
The World Health Organisation (WHO) has publisheda Water Quality and Health Strategy, 2013-2020. Thishas the principal aim of managing water quality with aview to protecting and promoting human health.
The testing by this laboratory indicates, in general, avery high level of compliance for those parameterstested in public supplies, with two thirds of all non-compliant drinking water samples originating from
private sources. In 2013, a total of 1,960 exceedanceswere detected. 250 of these exceedances were due toelevated Trihalomethanes (THMs). As detailed in Table4.4 and 4.5, 940 of these exceedances were due tometals, while the remaining 731were non-metalexceedances. As some samples were found to be non-compliant for more than one parameter, the 1,960exceedances in 2013 were from 1,175 samples, withover half the samples in question coming from privatesources.
Based on scientific studies, the International agency forresearch on cancer (IARC) has classified watercontaminants into 5 groups based on theircarcinogenicity, as shown in Table 4.2. Results fromIARC studies, along with relevant publications can beviewed on www.iarc.fr
The WHO takes the IARC classifications intoconsideration when determining guideline values fordrinking water quality. Further information on the workcarried out on drinking water quality by the WHO canbe viewed on www.who.int
Table 4.2 Classification of water contaminants from the IARC
4.5 Fluoridation of Public Water Supplies
Fluoride accounts for about 0.3% of the earth’s crust. It’swide range of uses include fluoridation of water supplies,and use in most general anaesthetics, anti-reflectivecoatings, antibiotics, refrigeration and air-conditioningsystems. Fluoride may be an essential element for humans;however, this has not been demonstrated unequivocally.
Public water fluoridation was introduced into Ireland in July1964, on the grounds of being a low-cost public healthmeasure considered to be safe to human health and ofbenefit to all sections of society, and not restricted by social
Source NumberGalway (HSE) 552Galway County Council 79Galway City Council 530Mayo 1,151Roscommon 256Donegal 1,675Sligo / Leitrim 346North Tipperary 553Clare 348Limerick 429Haemodialysis (Hospitals) 514Private 546
Miscellaneous 15
TOTAL 6,994

Annual Report 2013
Tuarascáil Bhliantúil 2013
19
boundaries. Surveys have been conducted on a regular basisto measure the effectiveness of water fluoridation in theRepublic of Ireland. These studies include: National Surveyof Children’s Dental Survey 1984; National Survey of Adult’sOral Health 1990; Regional Surveys of Children’s OralHealth 1990-1999; National Survey of Adult’s Oral Health2001 All-Island Survey of Children’s Oral Health 2002(which included a comparison with caries levels inNorthern Ireland) and Cross-Border Study of impact ofwater fluoridation in 16 year olds, 2006.
All of these studies showed a substantial benefit in termsof the reduction in tooth decay. The Irish Expert Body onFluorides and Health is of the opinion that there continuesto be overwhelming evidence that water fluoridationsignificantly benefits dental health. The Expert Body issatisfied, having studied current peer reviewed scientificevidence worldwide, that water fluoridation, at the optimallevel, does not cause any ill effects and continues to be safeand effective in protecting the oral health of all age groups.These views are supported by reputable internationalagencies and valid scientific articles and reviews. The Journalof the Irish Dental Association published a supplementaryFluoride article in June/July 2012, in which it looks back at50 years of Fluoridation in Ireland.
In 1984, the WHO issued a maximum guideline value of1.5mg/L for fluoride in drinking water. This value wasreaffirmed in 1993 and again in 2011. The WHO reportsthat more than 200 million people in 39 countries benefitfrom artificially fluoridated drinking water.
Currently, two separate pieces of legislation are applicableto the levels of fluoride in drinking water; The Fluoridationof Water Supplies Regulations 2007, S.I. No. 42 of 2007,specifies a concentration range of 0.6mg/L to 0.8mg/LFluoride and the European Communities (Drinking Water)Regulations 2007, S.I. 278 of 2007 apply a Parametric Valueof 0.80mg/L to drinking water supplies. These regulationsalso require that water supplies to which Fluoride has beenadded shall be monitored for Fluoride at intervals notexceeding one calendar month. This laboratory carries outthe official monthly fluoride testing on all fluoridatedsupplies in the region. The results can be viewed inAppendix 5. In total, 1,106 drinking water samples wereanalysed for fluoride in 2013.
4.6 Non-Metals in drinking Water
The results for 2013 are summarised in Table 4.3 and 4.4.
4.6.1 Volatile Organic Compounds (VOCs)
Disinfection is a critical part of drinking water treatmentand is fundamental to preventing the spread of waterborneinfectious diseases. The use of disinfectant chemicals canresult in the formation of disinfection by-products (DBPs).Chlorination is the most common disinfection methodused in Ireland and chlorine use is regulated primarily tominimise the formation of DBPs. One class of DBP are theVolatile Organic Compounds (VOCs). These compoundsinclude Trihalomethanes (THMs), Benzene, 1,2Dichloroethane, Trichloroethene and Tetrachloroethene.THMs (Chloroform, Bromodichloromethane,Dibromochloromethane and Bromoform) are not naturallyoccurring compounds, and are formed when chlorine (astrong oxidising agent) reacts with naturally occurringorganic matter in raw water. There is a direct relationshipbetween the degree of colour in water prior tochlorination and the concentration of THMs afterchlorination.
While the DBPs mentioned above are dealt with in the2007 Drinking Water Regulations (S.I. 278 of 2007), afurther group of chlorine associated DBPs, haloacetic acids(HAAs), are of increasing concern but are not included inthe 2007 drinking water regulations, although they may wellbe included in future regulations. Because most watersupplies in Ireland are surface water sources and some ofour groundwater sources may be influenced by surfacewater, raw water is likely to contain high levels of particulateand organic matter. This can be much greater after heavyrainfall or flooding. THMs are formed when there is eitherinadequate pretreatment of the water and/or poor controlover the disinfection process itself. THM formation isdependent on several variables; the concentration andnature of the organic material in the raw water, chlorinecontact time, the residual chlorine concentration in thewater and the pH and temperature of the water. Optimumfiltration and coagulation before disinfection is thereforeimportant in preventing the formation of THMs.
Chlorine is used not only as a primary disinfectant in watertreatment but is also added to provide a stable disinfectantresidual to preserve the quality of the water throughoutthe distribution network. While this characteristic ofchlorine makes it most suitable as a disinfectant it alsomeans that it is more prone to DBP formation because ithas more contact time with organic matter in the waterthat was not removed during treatment. Additional chlorinemay be added in order to maintain an adequate residual

concentration throughout the distribution systemparticularly at end points. Temperature and pH of drinkingwater vary across supplies and from season to season.Optimum control over all of these factors is necessary tokeep THMs to a minimum.
Chloroform is the most common THM and the principaldisinfection by-product in chlorinated drinking water. In thepresence of bromides, brominated THMs are formedpreferentially, and chloroform concentrations decreaseproportionally. Chloroform and bromodichloromethaneare classified as group 2B agents by the IARC. Whilebromoform and dibromochloromethane are classified asgroup 3 agents. The EU has set a health-based parametricvalue of 100μg/L for THMs (S.I. 278 of 2007). The WHOhas issued guideline values of 300μg/L for chloroform,100μg/L for bromoform, 100μg/L for dibromo-chloromethane and 60μg/L for bromodichloromethane.
A summary of results for 2013 is shown in the Table 4.3.The high results can be attributed to a limited number ofwater supplies that were analysed repeatedly.
Table 4.3 Trihalomethane results 2013
Trichloroethene is used primarily in metal degreasing. It isemitted mainly to the atmosphere, but it may also beintroduced into ground water and, to a lesser extent,surface water in industrial effluents. Poor handling andimproper disposal of trichloroethene in landfills have beenthe main causes of ground water contamination.Tetrachloroethene has been used primarily as a solvent inthe dry cleaning industry and to a lesser extent as adegreasing solvent. It is widespread in the environment andis found in trace amounts in water, aquatic organisms, air,foodstuffs and human tissues. In anaerobic ground water,tetrachloroethene may degrade to form more toxiccompounds, including vinyl chloride. 1,2 Dichloroethane isused mainly as an intermediate in the production of vinylchloride and other organic chemicals. Benzene is presentin petrol, and vehicular emissions constitute the mainsource of benzene in the environment. Benzene may beintroduced in drinking water by industrial effluents andatmospheric pollution. Benzene is principally used in theproduction of other organic chemicals. The results for 2013for these parameters can be viewed in Table 4.4.
4.6.2 Ammonium
Ammonia in the environment originates frommetabolic, agricultural and industrial processes and fromdisinfection with chloramines. Natural levels in bothgroundwater and surface water are generally below0.1mg/L. The EU has set a parametric value of 0.50mg/Lin drinking water; a stricter limit of 0.30mg/L is set inIrish Legislation (S.I. 278 of 2007). Ammonia levelsgreater than the parametric value may be an indicatorof possible bacterial, sewage and animal waste pollution.The threshold odour concentration of ammonia atalkaline pH is approximately 1.5mg/L. The WHO has notissued a health-based guideline value for ammonia indrinking water, as toxicological effects are only observedat exposures above 200mg/kg body weight. However,ammonia can compromise disinfection efficiency, resultin nitrite formation in distribution systems, cause thefailure of filters for the removal of manganese and causetaste and odour problems. 93% of the exceedances in2013 were private samples.
Western Region - Public Analyst’s Laboratory
Saotharlann an Anailisí Phoiblí
20
Concentration Range
No. of Samples
≤ 10
Trihalomethane (µg/L).
217 230 124 66 43 17
11-50 51-100 101-150 151-200 201-300 > 300
117
Annual Report 2013
Tuarascáil Bhliantúil 2013
21
4.6.3 Chloride
Chloride in drinking water originates from naturalsources, sewage and industrial effluents. The mainsource of human exposure to chloride is the additionof salt to food. The WHO has not issued a guidelinevalue for chloride in drinking water, as theconcentrations found are not of health concern;however levels above 250mg/L may give rise todetectable taste in water. In 2013, 13 exceedances werefound. 10 of these exceedances were for privatesamples, while the other 3 were from one public supply.
4.6.4 Chlorine
Chlorine is the most widely used disinfectant for theinactivation of water-borne pathogens in drinking watersupplies and historically has arguably made the greatestcontribution to the public health protection ofconsumers. Chlorine is not only used as a primarydisinfectant in water treatment, but is also added toprovide disinfection residual to preserve water indistribution. The WHO has published detailedinformation on the formation of DBPs in drinking waterand while they recommend that DBP levels in drinking-water be kept as low as practicable (section 4.6.1), itemphasizes that the microbial safety of drinking-watershould never be compromised and effective disinfectionto prevent waterborne infectious diseases must takeprecedence over efforts to meet DBP legislative limits.There is no statutory limit for the levels of chlorine indrinking water, but the level of residual chlorine presentat the consumers tap is constrained between beingacceptable to consumers and still providing disinfection.Samples with a chlorine odour are analysed for residualchlorine. While 18 samples contained >1.0mg/L freechlorine and 2 samples contained >1.0mg/L totalchlorine, only 3 samples were found to be in breach ofthe WHO guideline value of 5.0mg/L chlorine.
4.6.5 Colour
Ideally, drinking water should have no visible colour.Colour in drinking water is usually due to the presenceof coloured organic matter (primarily humic and fulvicacids) associated with the humus fraction of soil. It isalso strongly influenced by the presence of iron andother metals. There is no WHO health-based guidelinevalue for colour, although a level of 20mg/L Pt-Co, isgenerally used. As discussed previously (section 4.6.1),
a direct relationship exists between the degree ofcolour in water prior to chlorination and theconcentration of THMs after chlorination. Thepredominant mechanism for removal of dissolvedcoloured substances such as humic and fulvic acids isthe coagulation/sedimentation process. Removal oforganic material by coagulation with aluminium and ironsalts has been shown to be effective. In high colour rawwaters, the initial point of chlorine application shouldfollow the coagulation/sedimentation process in orderto lower the levels of DBPs in the final water.
4.6.6 Conductivity/Total Dissolved Solids (TDS)
Conductivity is the ability of a solution to conduct electriccurrent. It is the reciprocal of electrical resistivity.Therefore, conductivity is a measure of the dissolvedsolids which have been ionised in the water. Total dissolvedsolids (TDS) comprise of inorganic salts (principallycalcium, magnesium, potassium, sodium, bicarbonates,chlorides and sulphates) and small amounts of organicmatter that are dissolved in the water. Drinking waterbecomes significantly and increasingly unpalatable at TDSlevels greater than 1,000mg/L. This corresponds to aconductivity of approximately 1,250μS/cm. In 2013, 19samples had conductivity levels in excess of 1,250μS/cm,with 18 of these samples coming from private sources. 3samples (all from private sources) had conductivity levelsin excess of the EU limit of 2,500μS/cm.
4.6.7 Hardness/Calcium Hardness
Hardness in drinking water is caused by a variety ofdissolved polyvalent metallic ions, predominantly calciumand magnesium cations. Hardness is usually indicated byprecipitation of soap scum and the need for excess useof soap to achieve cleaning. Public acceptance of thedegree of hardness of water may vary considerably fromone community to another. Depending on the interactionof other factors, such as pH and alkalinity, water withhardness above approximately 200mg/L may cause scaledeposition in the treatment works, distribution systemand tanks within buildings. 771 out of the 1,737 samplestested here in 2013 contained >200mg/L CaCO3, with118 containing >400mg/L CaCO3. On the other hand, softwater (but not necessarily cation exchanged softenedwater) with a hardness of less than 100mg/L may have alow buffering capacity and thus be more corrosive forwater pipes. 618 out of the 1,737 samples tested here in
Western Region - Public Analyst’s Laboratory
Saotharlann an Anailisí Phoiblí
22
2013 contained <100mg/L CaCO3. Calcium hardness is aterm for the level of calcium carbonate in water. It is usedin the calculation of the Langelier Index. This is an indexused to determine if a water sample has a tendency todissolve or deposit calcium carbonate. Strictly speaking, itis not a corrosion predictor. There is no corrosionprediction index that applies to all materials, and in factindices related to calcium carbonate saturation, have givenmixed results. In particular, it should be noted that theLangelier Index is not considered a good corrosionprediction model for copper systems. The calcium hardnessresults for 2013 ranged from <10 to 388mg/L CaCO3.
4.6.8 Nitrate and Nitrite
Nitrate and nitrite are naturally occurring ions that arepart of the nitrogen cycle. The nitrate concentration inboth groundwater and surface water is normally low,but can reach high levels as a result of leaching or run-off from agricultural land or contamination from humanor animal wastes as a consequence of the oxidation ofammonia. Nitrite is the intermediate in the oxidation ofammonia to nitrate, and so any water containingappreciable levels of nitrite is of questionable quality. Ingeneral, the most significant source of human exposureto nitrate and nitrite is through vegetables and meat inthe diet (nitrite is used as a preservative in many curedmeats). In the case of bottle-fed infants, drinking watercan be the major external source of exposure to bothnitrate and nitrite. In 2013, the 7 samples with nitrateexceedances and the 11 samples with nitriteexceedances were from private sources.
4.6.9 Odour
To a large extent, consumers have no means of judging thesafety of their drinking water themselves, but their attitudetowards their water will be affected to a large extent bythe aspects of water quality that they are able to perceivewith their own senses (taste, odour and appearance). Theprovision of drinking water that is not only safe, but alsoacceptable in appearance, taste and odour is of high priority.Water that is aesthetically unacceptable will undermine theconfidence of consumers, will lead to complaints and moreimportantly, could lead to the use of water from sourcesthat are less safe. In most cases, aesthetic problems can beprevented by optimizing conventional treatment processessuch as coagulation, sedimentation and chlorination. Thetaste and odour thresholds of hydrogen sulphide in waterare estimated to be between 0.05 and 0.1mg/L. The “rotten
eggs” odour of hydrogen sulphide is a result of oxygendepletion and the subsequent reduction of sulphate bybacterial activity. Hydrogen sulphide in drinking water canbe removed by techniques like aeration, granular activatedcarbon, filtration and oxidation. As it is unlikely that a personcould consume a harmful dose of hydrogen sulphide fromdrinking water, the WHO has not issued a health-basedguideline value for hydrogen sulphide in drinking water. In2013, 173 samples were found to exude an odour otherthan chlorine. The odours were categorised as follows:Objectionable (44), Hydrogen sulphide (18), Sulphur (14),Musty (67), Stale (8), Sweet (12), Earthy (1), Hydrocarbon(6) and Phenol (3). 103 of the non-complying samples werefrom private water sources.
4.5.10 pH
Although pH usually has no direct impact on consumers, itis one of the most important operational water qualityparameters. Careful attention to pH control is necessaryat all stages of water treatment to ensure satisfactory waterclarification and disinfection. For effective disinfection withchlorine, the pH should preferably be less than 8.0, althoughwaters with a pH less than 7.0 are more likely to becorrosive. 94 out of the 102 exceedances were sampleswith a pH < 6.5, with 73% of these samples being fromprivate sources. 5 of the 8 samples with pH values >9.5were private samples.
4.6.11 Sulphate
Sulphates occur naturally in numerous minerals and areused in the chemical industry. They are discharged intowater in industrial wastes and through atmosphericdeposition; however, the highest levels usually occur inground water and are from natural sources. The presenceof elevated sulphate levels in drinking water can causenoticeable taste, and very high levels can cause a laxativeeffect in unaccustomed consumers. The taste threshold forsulphate in drinking water ranges from approximately250mg/L for sodium sulphate to 1,000mg/L for calciumsulphate. The WHO has not issued a health-based guidelinevalue for sulphate in drinking water, as the levels found indrinking water are not of health concern. However, due togastro-intestinal effects resulting from ingestion of highsulphate containing water, the WHO recommend thathealth authorities be notified of sources of drinking watercontaining more than 500mg/L sulphate. 14 samples wereanalysed in 2013, with the results ranging from <10 to220mg/L.

4.6.12 Total Alkalinity
Alkalinity is a measure of the capacity of water or anysolution to neutralize or “buffer” acids. This measure ofacid-neutralizing capacity is important in figuring out how“buffered” the water is against sudden changes in pH.Alkalinity should not be confused with pH. pH is a measureof the hydrogen ion (H+) concentration, and the pH scaleshows the intensity of the acidic or basic character of asolution at a given temperature. The reason alkalinity issometime confused with pH is because the term alkalineis used to describe pH conditions greater than 7 (basic).The most important compounds in water that determinealkalinity include the carbonate and bicarbonate ions.Carbonate ions are able to react with and neutralize 2hydrogen ions and the bicarbonate ions are able toneutralize H+ or hydroxide ions present in water. The abilityto resist changes in pH by neutralizing acids or bases iscalled buffering. Alkalinity is especially important in areaswhere acid rain is a problem. 1,731 samples were analysed
in 2013. The results ranged from <10 to 557mg CaCO3/L.427 samples were found to contain < 100mg CaCO3/L.
4.6.13 Turbidity
Turbidity in water is caused by suspended particles orcolloidal matter that obstructs light transmission throughthe water. Turbidity can seriously interfere with theefficiency of disinfection by providing protection fororganisms, and much of water treatment is directed atremoval of particulate matter before disinfection. Turbidityis measured in nephelometric turbidity units (NTU) andcan generally be noticed by the naked eye above 4 NTU.However, to ensure the effectiveness of disinfection,turbidity should be no more than 1 NTU and preferablymuch lower. Of particular importance is the fact that thiswill be a good indicator that chlorine-resistant pathogenssuch as Cryptosporidium are being removed. 86 % of theexceedances in 2013 were private samples.
Annual Report 2013
Tuarascáil Bhliantúil 2013
23
Parameter IARC Rating Parametric Value(S.I. 278 of 2007)
No. of Samples No. of Exceedance(%)
Benzene
Trichloroethene
Tetrachloroethene
1,2 Dichloroethane
Odour
Colour
Turbidity
pH
Conductivity
Nitrate
Nitrite
Ammonium
Free Chlorine
Chloride
Total Chlorine
Total Hardness
Calcium Hardness
Total Alkalinity
Sulphate
Group 1
Group 2A
Group 2B
n/a
n/a
n/a
n/a
n/a
n/a
n/a
n/a
Group 33
n/a
Group 33
n/a
n/a
n/a
n/a
814
814
814
4,027
4,027
4,023
4,013
4,073
4,022
4,031
4,031
904
102
154
1,737
26
1,731
14
1.0 µg/L
10 µg/L
3.0 µg/L
Acceptable toconsumers and noabnormal change
6.5 – 9.5
2,500 µS/cm
50 mg/L
0.50 mg/L
0.30 mg/L
-
250 mg/L
-
-
-
-
250 mg/L
0
0
01173 (4.3%)2184 (4.6%)2209 (5.2%)
97 (2.4%)
3 (0.1%)
7 (0.2%)
11 (0.3%)
88 (2.1%)53 (0.3%)
13 (12.7%)
0
n/a
n/a
n/a
0
Table 4.4 Summary of Non-Metals in drinking water results for 2013
1 The number of samples not having chlorine or none detected as their odour.2 Although there are no health-based guideline values for colour or turbidity, levels of 20mg/L Pt-Co and 4.0 NTU respectively are generally used as guideline values.
3 This classification refers to hypochlorite (one of the breakdown products of chlorine)4 Guideline value not established as the levels found in drinking water are not of health concern.5 The number of samples having in excess of 5mg/L free chlorine.
10 µg/L
20 µg/L
40 µg/L
30 µg/L
Acceptable to consumers
-4
50 mg/L
3.0 mg/L
-4
5.0 mg/L
-4
5.0 mg/L
-4
-4
-4
WHO Guideline Value

Western Region - Public Analyst’s Laboratory
Saotharlann an Anailisí Phoiblí
24
4.7 Metals in Drinking Water
The results for 2013 are summarised in Table 4.5.
4.7.1 Aluminium
Aluminium is the most abundant metallic element andconstitutes about 8% of the earth’s crust. Aluminiumsalts are widely used in water treatment plants ascoagulants to reduce organic matter, colour, turbidity,and microorganism levels. The Aluminium issubsequently removed, but traces may persist in thetreated water. The parametric value of 200μg/L intreated water is not a health based value, but preventsthe deterioration of water quality (turbidity and colour)in the distribution network due to the deposition ofaluminium hydroxides. The contribution of drinkingwater to the total oral exposure to aluminium is usuallyless than 5% of the total intake.
Currently, there are uncertainties as to the extent ofaluminium absorption from drinking water, whichdepends on a number of parameters, such as thealuminium salt administered, pH (for aluminiumspeciation and solubility), bioavailability and dietaryfactors. In 2013, 37 of the 89 recorded exceedanceswere from private sources.
4.7.2 Antimony
Elemental antimony forms very hard alloys with copper,lead and tin and is often used in solders as areplacement for lead. Total exposure fromenvironmental sources, food and drinking water is verylow compared with occupational exposure. 4 of the1,262 samples analysed for antimony contained>5.0μg/L. 1 of these samples was found to contain>20μg/L (The WHO guideline value). All 4 noncompliant samples were from private sources.
4.7.3 Arsenic
Arsenic and inorganic arsenic compounds are principallyused as alloying agents in the manufacture of transistors,lasers and semi-conductors. Arsenic is usually present innatural waters at concentrations of less than 1 – 2μg/L.However, in waters, particularly ground waters, wherethere are sulphide mineral deposits and sedimentarydeposits deriving from volcanic rocks, the concentrationscan be significantly elevated. To date, arsenic has not been
shown to be essential in humans and its acute toxicity ispredominantly a function of the rate of removal from thebody. The results for the year 2013 are summarised inTable 4.5. It should be pointed out that all 45 of theexceedances were from private samples.
4.7.4 Boron
Boron compounds are used in the manufacture of glass,soaps and detergents and flame retardants. Naturallyoccurring boron is present in groundwater, primarily as aresult of leaching from rocks and soils containing boratesand borosilicates. The borate content of surface water isfrequently a consequence of the discharge of treatedsewage effluent, arising from its use in some detergents.In 2013, 5 samples exceeded the EU Parametric Value(Table 4.5). All 5 were from private sources. In 2011, theWHO revised the Boron Guideline Value from 1.0mg/Lto 2.4mg/L in drinking water. 3 of the 5 non-compliantsamples exceeded the WHO guideline value.
4.7.5 Cadmium and cadmium compounds
Cadmium metal is used in the steel industry and inplastics. Cadmium compounds are widely used inbatteries. Cadmium is released to the environment inwastewater, and diffuse pollution is caused bycontamination from fertilizers and local air pollution.Contamination in drinking water may also be caused byimpurities in the zinc of galvanized pipes and solders andsome metal fittings. In 2013, the 3 non-compliant sampleswere from private sources.
4.7.6 Chromium
Chromium is widely distributed in the earth’s crust. Ithas found a wide range of applications, mainly due to itshardness and resistance to corrosion. It is also knownfor its remarkable magnetic property. It is mainly usedin the manufacture of stainless steel, as it preventscorrosion and discoloration of steel. Chromium (III) ortrivalent chromium is required in the human body, butin very small amounts. It is mainly required for carryingout lipid and sugar metabolism. In 2013, two sampleswere found to be non-compliant with regard tochromium levels.

Annual Report 2013
Tuarascáil Bhliantúil 2013
25
4.7.7 Copper
Copper is an essential human nutrient. It is also used tomake pipes, valves and fittings and is present in alloysand coatings. Copper concentrations in drinking watervary widely, with the primary source most often beingthe corrosion of interior copper plumbing. Thiscorrosion is greater when the water is acidic or verysoft. Copper can stain laundry and sanitary ware atconcentrations above 1mg/L. Although copper can giverise to a taste in water, it should be acceptable at theWHO health-based guideline value of 2.0mg/L. In total,37 exceedances were detected in 2013, of which 21were from private supplies.
4.7.8 Iron
Iron is the second most abundant metal in the earth'scrust, and is an essential element in human nutrition.Elemental iron is rarely found in nature, as the iron ionsFe2+ (ferrous) and Fe3+ (ferric) readily combine withoxygen- and sulphur-containing compounds to formoxides, hydroxides, carbonates, and sulphides. In drinkingwater supplies, ferrous salts are unstable and areprecipitated as insoluble ferric hydroxide, which settlesout as a rust-coloured silt. Anaerobic groundwatersmay contain ferrous iron at concentrations of up toseveral milligrams per litre without discoloration orturbidity in the water when directly pumped from awell. Staining of laundry and plumbing fixtures mayoccur at concentrations above 300μg/L. Iron alsopromotes the growth of “iron bacteria”, which derivetheir energy from the oxidation of ferrous iron to ferriciron and in the process deposit a slimy coating on thepiping. Iron (particularly ferrous iron) is an essentialelement in human nutrition. 366 samples were found tobe non-compliant with regard to iron levels. 132 ofthese samples contained >1,000μg/L, and indeed 18samples contained > 10,000μg/L iron. 242 of these non-complying samples were from private sources.
4.7.9 Lead
Lead is used primarily in the production of lead-acidbatteries, solders and alloys. Lead affects the developingnervous systems and intellectual and behaviouraldevelopments. Consequently, foetuses and childrenunder six years of age are most at risk.Owing to the decreasing use of lead-containingadditives in petrol worldwide and of lead-containing
solder in the food processing industry, concentrationsof lead in the air and food are declining, and intake fromdrinking water constitutes a greater proportion of totalintake. Lead is rarely present in water as a result ofdissolution from natural sources. Its presence isprimarily due to household plumbing systemscontaining lead in pipes, solder, fittings or the serviceconnection to homes. The amount of lead dissolvedfrom the plumbing system depends on several factors,including pH, temperature, water hardness and thestanding time of water in the pipes. “Lead (Pb) inDrinking Water”, a position paper has been jointlydeveloped by the Health Service Executive (HSE) andthe Environmental Protection Agency (EPA). It wasissued in December 2013 and provides a summary ofthe issues in relation to lead in drinking water includinghealth, legislation and interventions. The full documentis available athttp://www.epa.ie/pubs/advice/drinkingwater/leadpositionpaper.html
The parametric value of 25μg/L for lead (S.I. 278 of2007) was reduced to 10μg/L at the end of 2013. Basedon this new Parametric Value, 49 samples analysed in2013 would be non-compliant.
4.7.10 Manganese
Manganese is one of the most abundant metals in theearth’s crust, usually occurring with iron. It is anessential element for humans and other animals. Itsmajor uses include steel production, and as an oxidantfor cleaning, bleaching and disinfection (as potassiumpermanganate). It can also be used as an additive inunleaded petrol, to increase the octane rating andreduce engine knocking. Manganese occurs naturally inmany food sources, and the greatest exposure tomanganese is usually from food. At levels above100μg/L, manganese in water supplies causes anundesirable taste in beverages and stains sanitary wareand laundry.
Although the WHO have not issued a guideline valuefor manganese, as the levels found in drinking water aregenerally not of health concern, a health-based guidelinevalue of 400μg/L has been derived. Over 83% of thesamples which exceeded the EU parametric value of50μg/L in 2013 were from private sources. 92 sampleswere found to contain manganese levels exceeding theWHO health-based guideline value of 400μg/L.
Western Region - Public Analyst’s Laboratory
Saotharlann an Anailisí Phoiblí
26
4.7.11 Nickel
Nickel is used mainly in the production of stainless steeland nickel alloys. Food is the dominant source of nickelexposure in the non-smoking, non-occupationallyexposed population. Nickel is an essential metal forhuman development, although its metabolism is not fullyclear. Allergic contact dermatitis is the most prevalenteffect of nickel in the general population. Of the 1,275samples analysed in 2013, 28 exceeded the EUparametric value of 20μg/L. 3 of these samples alsoexceeded the WHO guideline value of 70μg/L.
4.7.12 Potassium
Potassium is an essential element in humans. It is seldom, ifever found in drinking waters at levels that could be aconcern for healthy humans, thus the WHO has not issueda health-based guideline value for potassium in drinkingwater. The recommended daily requirement of potassiumis about 3g. Potassium occurs widely in the environment,including all natural waters, and can occur in drinking wateras a result of the use of potassium permanganate as anoxidant in water treatment.
4.7.13 Selenium and selenium compounds
Selenium is an essential element for humans, andfoodstuffs such as cereals, meat and fish are the principalsource of selenium for the general population. Seleniumplays a crucial role in controlling the effects of the thyroidhormone on fat metabolism. There are indications thatselenium status may be marginal in many parts of theworld, including Western Europe. Selenium and seleniumcompounds are used principally in glass making and aspigments (colouring agents) for paints, plastics, ceramicsand glazes.
4.7.14 Sodium
Sodium salts (e.g. sodium chloride) are found in virtually allfoods and drinking water. Foods are the main source ofexposure. The WHO has not issued a guideline value, asthe contribution from drinking water to daily intake is small.Although the taste threshold concentration of sodium indrinking water depends on the associated anion and thetemperature of the solution, the average threshold is200mg/L at room temperature. Of the 73 samples foundto exceed the parametric value, 3 were found to contain>1,000mg/L.
4.7.15 Zinc
Zinc is an essential trace element found in virtually allfood and drinking water in the form of salts or organiccomplexes. It is vital for many biological functions suchas disease resistance, wound healing, digestion andreproduction. The major uses of zinc include anti-corrosion coatings on steel (galvanizing), constructionmaterials, brass, pharmaceuticals and cosmetics.
Zinc imparts an undesirable astringent taste to waterat the taste threshold of 3mg/L (as zinc sulphate). Watercontaining zinc at levels above this threshold mayappear opalescent and develop a greasy film on boiling.Although levels of zinc in drinking water normally donot exceed 0.1mg/L, concentrations in tap water can bemuch higher, due to dissolution of zinc from householdplumbing. In 2013, 115 samples contained >0.10mg/Lzinc, although only 2 of these were found to contain>3.0mg/L.
4.8 Haemodialysis Water
Haemodialysis units operate water treatment systemsto produce purified water for use in Dialysis machines.The laboratory performed 8,000 tests on the 512samples submitted in 2013. The parameters analysedinclude pH, conductivity, sodium, potassium, totalhardness, fluoride and a range of metals.
4.9 Private Samples
The laboratory provides a comprehensive testingservice for the general public to investigate concernsor complaints about water quality. These concerns arepredominantly associated with private wells. Thenumber of samples tested for private individuals in 2013was 546.
4.10 Bathing Waters
Bathing waters and inlet streams to bathing areas weretested for compliance with the Quality of Bathing WaterRegulations 1992, (S.I. No. 155 of 1992) and BathingWater Quality Regulations 2008 (S.I. No. 79 of 2008)for the 2013 bathing water season. In 2013, 85 sampleswere analysed. The parameters analysed includedissolved oxygen (where the % oxygen saturationranged from 79 to 111), pH (results ranged from 7.1 to8.7), colour (results ranged from 2.4 to 74.4mg/L Pt-

Annual Report 2013
Tuarascáil Bhliantúil 2013
27
Co), along with presence/absence tests like mineral oils,surface active substances and tarry residues. The vastmajority of samples analysed were in full compliancewith the legislation. Further details and results for bothlocal and national bathing water quality can be found atwww.splash.epa.ie
4.11 Pool Waters
The laboratory analyses chlorine/bromine levels, alongwith total dissolved solids and alkalinity of swimmingpools, jacuzzis, hot tubs and spa pools. In 2013, 244samples were analysed. At present there is no legislationfor the control of these parameters. 14 of the sampleswere found to contain > 5mg/L free chlorine. 5 of these14 were also found to contain > 10mg/L free chlorine.In the case of the total chlorine levels, 26 of the samples
were found to contain > 5mg/L total chlorine, while 10of the 26 also contained > 10mg/L total chlorine. Thetotal dissolved solids varied from 38 to 26,000mg/L,with 10 samples found to contain more than 5,000mg/L.The alkalinity levels varied from <10 to 1,928mg/L.
4.12 Effluents
The laboratory carries out a wide range of analysis oneffluent samples. These samples include samples fordischarge licences and suspected pollution samples. In2013, 18 samples were analysed. The parameters testedinclude Biochemical oxygen demand (BOD), Chemicaloxygen demand (COD), suspended solids, fats, oils andgreases (FOGs), dissolved oxygen, phosphate (bothsoluble and total), nitrate, nitrite, ammonia and a rangeof metals.
Parameter IARC Rating Parametric Value(S.I. 278 of 2007)
No. of Samples No. of Exceedance(%)
Aluminium
Antimony
Arsenic
Boron
Cadmium
Chromium
Copper
Iron
Lead
Manganese
Nickel
Potassium
Selenium
Sodium
Zinc
n/a
Group 2B3
Group 1
n/a
Group 2A
Group 11
n/a
n/a
Group 2A
n/a
Group 2B
n/a
Group 3
n/a
n/a
4,060
1,262
1,271
1,249
1,260
1,260
1,368
4,064
1,556
4,061
1,275
12
1,246
465
1,260
200 µg/L
5.0 µg/L
10 µg/L
1.0 mg/L
5.0 µg/L
50 µg/L
2.0 mg/L
200 µg/L
25 µg/L
50 µg/L
20 µg/L
-
10 µg/L
200 mg/L
-
87 (2.1%)
4 (0.3%)
45 (3.5%)
5 (0.4%)
3 (0.2%)
2 (0.2%)
37 (2.7%)
351 (8.6%)
15 (1.0%)
288 (7.1%)
27 (2.1%)
n/a
1 (0.1%)
73 (15.7%)2 2(0.2%)
Table 4.5 Summary of Metals in drinking water results for 2013
1 Classification refers to hexavalent Chromium2 The number of zinc samples which gave results >3.0mg/L. (There is no health-based guideline value for zinc although a level of >3mg/L may not be acceptable to consumers.)
3 Classification refers to antimony as antimony trioxide.4 Guideline value not established as the levels found in drinking water are not of health concern.
-4
20 µg/L
10 µg/L
2.4 mg/L
3.0 µg/L
50 µg/L
2.0 mg/L
-4
10 µg/L
-4
70 µg/L
-4
40 µg/L
-4
-4
WHO Guideline Value
Western Region - Public Analyst’s Laboratory
Saotharlann an Anailisí Phoiblí
28
5. AIR POLLUTION MONITORING
5.1 European Legislation
The European Commission set out a legislative basis forthe management of air quality in 1996 with the AirQuality Framework Directive. Four daughter directivesset out limits for specific pollutants. The Frameworkdirective along with the first, second and third daughterdirectives were replaced by the Ambient AirQuality and Cleaner Air for Europe (CAFÉ)Directive 2008/50/EC. The fourth daughterdirective (2004/107/EC) will be included in CAFÉ in thefuture. This CAFÉ directive sets out how Air Qualityshould be monitored, assessed and managed, and setslimits for the following parameters. Sulphur dioxide, nitrogen dioxide and oxides ofnitrogen, particulate matter and lead. Benzene, carbon monoxide and ozone.Directive 2004/107/EC sets target limits for thefollowing parameters.Arsenic, cadmium, mercury, nickel Polycyclic aromatic hydrocarbons.
5.2 National Legislation
Directive 2004/107/EC was transposed into IrishLegislation in 2009 by the Arsenic, Cadmium, Mercury,Nickel, and Polycyclic Aromatic Hydrocarbons inAmbient Air Regulations 2009 (S.I. No. 58 of 2009). TheCAFÉ Directive was transposed into Irish Legislationby the Air Quality Standards Regulations 2011, S.I. No.180 of 2011 in May 2011. The country is divided intofour zones for the purpose of assessment andmanagement of air quality. Galway City is in zone Calong with Limerick City, Waterford City and 18 othertowns and urban areas around the country. The numberof monitoring stations within each zone is alsostipulated.
5.3 Laboratory Results
This laboratory operates air monitoring stations at twolocations in the city, near the Bodkin roundabout(adjacent to Currys) and at Terryland Waterworks. Thiswork is performed on behalf of Galway City Council.The parameters monitored are Sulphur Dioxide, BlackSmoke and PM10. Data recorded by the laboratory isreported to and published by the EPA. The EPA hasmade available an “Air Quality Index for Health” ontheir website at http://www.epa.ie/air/quality/.
5.3.1 Sulphur Dioxide
Sulphur Dioxide may enter the air from the naturalenvironment or from the combustion of fuels whichcontain Sulphur. High levels of SO2 can causerespiratory problems and lead to damage to theecosystem. It is a major precursor to acid rain. Theregulations stipulate one SO2 monitor in zone C. TheEPA operates a mobile monitoring station in this zone.The laboratory continues to monitor for SO2 at bothstations in the city. The results for 2013 are shown inAppendix 6. The daily limit value set for the protectionof public health of 125 μg/m3 was not exceeded at anytime during the year.
5.3.2 Black SmokeBlack smoke measurement was the traditional methodfor determining the amount of particulate matter in theair. Legislative guidelines date back to 1980. Since Jan2005, there is no legislative requirement to measure thisparameter; however the laboratory continues toperform this measurement at both monitoring stations.Given the data that has been collected over many years,it is considered useful to continue this measurement tofacilitate the observation of long term trends.
5.3.3 PM10
PM10 is the term used to describe particulate matterwhich is 10μm or less in diameter. These particles mayconsist of a complex mixture of soot, organic, andinorganic matter. There are many sources of PM10s,which include the combustion of diesel and solid fuelsand dust from road traffic. Concern about PM10 levelsrelate to the respiratory problems caused by theirinhalation.
The Air Quality Regulations require monitoring at twolocations in Zone C. The EPA operates one suchmonitoring unit in a mobile facility. The othermonitoring unit is operated by the laboratory at theBodkin roundabout monitoring station. The Regulationsset a 24 hour average limit of 50μg/m3 which is not tobe exceeded more than 35 times a calendar year, and ayearly average limit of 40μg/m3 for PM10s. The 24 houraverage limit was exceeded eleven times during theyear. The highest value recorded was 74μg/m3. The dailyaverage for the year was 21μg/m3. The results for theyear 2013 are shown in Appendix 6.

Annual Report 2013
Tuarascáil Bhliantúil 2013
29
6. PHARMACEUTICALS & TOXICOLOGY
6.1 Pharmaceutical Laboratory
Since 1976, the laboratory has provided an analyticalservice to the Irish Medicines Board (IMB) and itspredecessor, the National Drugs Advisory Board, to testdrug products and medicines, as well as providingtechnical advice and support related to the testing ofmedicines. The Pharmaceutical Section of the PublicAnalyst’s Laboratory, Galway has been appointed anOfficial Medicines Control Laboratory (OMCL) underthe framework of the European Directorate for theQuality of Medicines and Healthcare (EDQM) and theCouncil of Europe.
6.1. Role as an Official Medicines Control Laboratory (OMCL)
The function of the IMB is to protect and enhancepublic and animal health through the regulation ofhuman and veterinary medicines and medical devicesavailable for sale or manufactured in Ireland and toparticipate in systems designed to do the samethroughout the EU.
At a National level, the laboratory contributes to theprotection of public health and the regulatory functionof the IMB by providing independent analytical data andtechnical advice on medicinal products that enable theIMB to make informed decisions on the quality and thecompliance status of medicines.
At a European level, the laboratory actively participatesin activities of the General European OMCL Network(collaboration between regulatory medicine testinglaboratories designed to improve communication,enhance cooperation and to harmonise methods ofwork across the EU and other states). These activitiesinclude the testing of Centrally Authorised MedicinalProducts (CAP), testing of MutuallyRecognised/Decentralised Products (MRP/DCP),Market Surveillance Studies (MSS) and participation inEDQM organised Proficiency Testing Schemes (PTSs).(for more information see http://www.edqm.eu/en/General-european-OMCL-network-46.html))
6.1.2 Analysis
Testing of Pharmaceuticals in the laboratory is carriedout according to the monographs of the EuropeanPharmacopoeia, the British Pharmacopoeia, the UnitedStates Pharmacopoeia and/or company methods. BothActive Pharmaceutical Ingredients and FinishedMedicinal Products are analysed, as well as some herbalproducts.
A wide variety of tests are carried out on each sample.Tests carried out during 2013 included Identificationand Assay by HPLC, Dissolution by UV, Dissolution byHPLC, Identification and Assay by UV-Vis, AppearanceTesting, Packaging Check, Identification by IR, AverageMass, Uniformity of Mass, Subdivision of Tablets, pH,Density, Preservative Content by HPLC, OpticalRotation, Related Substances by HPLC, Ethanol contentby GC, Assay of Iron, Ionic Iron Content, Identificationby TLC, Uniformity of Dosage Units, Water Content byKarl Fischer, Uniformity of Delivered Dose fromMultidose Containers, Extractable Volume, VisualInspection of Vials, Loss on Drying, Manganese by ICP-MS and Melting Point.
Western Region - Public Analyst’s Laboratory
Saotharlann an Anailisí Phoiblí
30
6.1.3 Sample Numbers
The number of samples submitted to the laboratoryduring 2013 was 119. One food complaint sample wasalso tested for the presence of a medicinal product.
A summary of analytical findings may be found in theIMB 2013 Annual Report (see www.imb.ie).
6.1.4 Quality System
To ensure quality and comparability of results withinthe Network, OMCLs must operate to a quality systembased on ISO/IEC 17025. The laboratory has beenaccredited for the analysis of Pharmaceuticals since1991 (EN45001) and, since 2006, to the currentstandard, ISO/IEC 17025:2005. A “Flexible Scope”approach has been applied to a number of tests in thelaboratory. Following an INAB audit in November 2013,the scope of accreditation for the OMCL has beenexpanded to include the tests Uniformity of DosageUnits, Subdivision of Tablets and Uniformity of Dosefrom Multidose Containers. As an OMCL, thelaboratory is also required to operate to QualityManagement Guidelines issued by the EDQM-OMCLNetwork and accepted by the EA (EuropeanAccreditation Cooperation), (seehttp://www.edqm.eu/en/EDQM-Publications-Quality-Management-Guidelines-86.html for more information).
Mutual Joint Audits (MJAs) of OMCLs are carried outby experts from the Network, trained in QualityManagement to ensure that the quality systems of theOMCLs comply with the requirements of ISO/IEC17025 and the OMCL Network Quality ManagementGuidelines. The OMCL has previously undergone a MJA
by auditors from other European countries and onemember of staff has been trained as a MJA auditor.
The OMCL is also audited periodically by the IrishMedicines Board.
6.1.5 Proficiency Testing Schemes (PTSs)
The laboratory regularly takes part in PTSs, such asthose organised by EDQM and LGC-Pharmassure. Themethods covered by PTSs during 2013 included:Identification by IR, Assay by HPLC, Related Substancesby HPLC, Karl Fischer, Specific Optical Rotation, Ethanolby GC, pH, Density, Melting Point, Loss on Drying,Identification by TLC, Uniformity of Mass and UV-Spectrophotometry.
6.1.6 Attendance at Meetings
A member of staff attended the Annual Meeting of theEDQM European Network of OMCLs held in Helsinki inJune 2013 and the Annual CAP and MRP/DCP meetingsheld in Prague in November, as well as a MJA Auditorsmeeting in Strasbourg in March.
Attendances were funded by the Irish Medicines Boardand the Council of Europe.
6.1.7 Student Placement
One 3rd year student from the Forensics Science andAnalysis Course, Galway Mayo Institute of Technologyworked in the OMCL on a six month placement during2013.
6.2 Toxicology Laboratory:
A basic toxicology service is offered to ConsultantPathologists and Physicians, Veterinary Surgeons andmembers of the public, mainly for alcohol (ethanol)testing. Some other parameters are tested for periodicallye.g. Strychnine and Paraquat, as well as solvents such asAcetone, Methanol, Acetaldehyde, Propanol etc.
Irish Medicines Board
EDQM - Centrally Authorised Medicinal Products
Galway University Hospital, HSE West
Proficiency Tests
Food Complaint Sample
101
5
2
11
1

Annual Report 2013
Tuarascáil Bhliantúil 2013
31
6.2.1 Ethanol Testing
The majority of samples submitted for alcohol testing aresubmitted by Consultant Pathologists in HSE West. Bloodand urine “B-samples”, taken under the Road Traffic Act,are also independently analysed for alcohol. The currentlimits for ethanol in drink driving offences are 67 mg/100ml in urine and 50 mg/100 ml in blood for experienceddrivers, with lower limits for new or learner drivers anddrivers of buses, lorries, trailers, work vehicles, taxis andother public service vehicles.
Seventeen samples taken under the Road Traffic Act weretested during 2013, of which 13 (i.e. 76 %) were abovethe legal limit at the time of testing.
The total number of samples tested for ethanol was 223while 51 samples were tested for other volatilecompounds such as methanol, acetone etc. (see tablebelow);
6.2.2 Quality System
The laboratory takes part in a Proficiency Testing Schemecoordinated by the LGC, where samples of blood andurine are each received on a monthly basis and analysedfor ethanol.
7. COSMETICS
7.1 Cosmetics Legislation
The European “Recast” Cosmetics Regulation (EC No.1223/2009) came into effect from 11th July 2013. This‘Recast’ Regulation is the principal EU legislation governingcosmetics safety and quality and it has been transposed intoIrish law by SI 440 of 2013. The Regulation sets outstandards which must be met by the Cosmetics Industry.
7.2 Official Control and Enforcement of Cosmetics Legislation in Ireland
Official control of cosmetics in Ireland is coordinated byThe Irish Medicines Board (IMB) as the national CompetentAuthority for cosmetics legislation, along with theEnvironmental Health Officers and Public Analysts’Laboratories, as authorised officers and official laboratories,respectively. A Cosmetics Surveillance Committee, withmembership from the IMB, EHS and PA Labs has beenestablished to facilitate the planning and coordination ofcontrol and market surveillance activities. Europeancollaboration of the Official Cosmetics ControlLaboratories is facilitated by the OCCL network, of whichwe are a member. This is a network of Official CosmeticsControl Laboratories formed within the EuropeanDirectorate for the Quality of Medicines and HealthCare(EDQM), with cross-functional links to the EuropeanCommission PEMSAC Analytical Methods Group (Platformof European Market Surveillance for Cosmetics).RAPEX is the EU rapid-alert system for notifyinghazards/risks associated with cosmetics and otherconsumer products:http://ec.europa.eu/consumers/safety/rapex/alerts/main/In Ireland the National Consumer Agency (NCA)administers RAPEX. www.consumerconnect.ie
7.3 Results for 2013
Table 7.1 below summarises testing of cosmeticsperformed in this laboratory in 2013 (see Appendix 7 foran outline of the Surveillance Programme for 2013). Theservice is provided to authorised officers (EHOs) from allHSE Regions. Cosmetics samples are submitted by the HSEauthorised officers (Environmental Health Officers) tomonitor compliance with the cosmetics regulations. Non-complying samples are dealt-with by the EHOs, inconjunction with the IMB, as appropriate.
Ethanol in Biological Fluids (Post Mortem)
Ethanol in Biological Fluids (Road Traffic Act)
Ethanol Proficiency Tests
Ethanol (Herbal, Medicines etc.)
Ethanol (Foodstuffs, Cosmetics, Misc.)
Methanol, Acetone, Acetaldehyde, Propanol(Foodstuffs, Cosmetics, Misc.)
110
17
24
21
51
51

Western Region - Public Analyst’s Laboratory
Saotharlann an Anailisí Phoiblí
32
7.3.1 Formaldehyde in Hair-straighteners, etc
General: Formaldehyde, formalin, and methylene glycolsolutions are forms of formaldehyde and can be treated asone in terms of safety and toxicity. These solutions canrelease formaldehyde gas under certain conditions.Formaldehyde has high inhalation toxicity and is also aknown skin ‘sensitiser’. EU cosmetics legislation (see Section7.1) regulates formaldehyde strictly, setting a maximum limitof 0.2% for formaldehyde in general cosmetics products. Allfinished cosmetics products containing formaldehyde (orother preservatives which release formaldehyde) must belabelled with the warning “contains formaldehyde” wherethe concentration of the formaldehyde exceeds 0.05%.
7.3.1.1 Results in 2013:
59 cosmetic samples consisting of various Irishmanufactured cosmetics products (28), hair-straighteners/smoothing products (23), children’s leave-oncosmetics (5), and 3 miscellaneous products were testedin 2013. Formaldehyde results ranged between < 0.04% and2.3%, with just 1 sample (a hair straightening product at
2.3%) exceeding the statutory limit of 0.2%, resulting in asingle Cosmetics Hazard/Contamination Report beingissued to the EHOs and IMB. Two further samples werefound to contain formaldehyde at a level >0.05% (but<0.2%) without a warning label stating that the product“contains formaldehyde”. The problem of usage of excessiveformaldehyde in hair-straighteners has decreased from2010 levels (non-compliances 2010: 52% (16/31), 2011:19%(5/27), 2012: 21% (4*/19), 2013:4% (1/28)*** this includes 3 samples of the one product,
** not including labelling non-compliances
Parameter Cosmetic Types Samples Tested Complying Non-complying
Formaldehyde
LeadCadmiumMercuryArsenicChromiumNickelHydrogen Peroxidep-PhenylenediamineHydroquinoneDioxane2
Methyldibromo glutaronitrile(MDBG)3-Iodo-2-propynylbutylcarbamate (IPBC)Benzene, ChloroformResidual SolventsGeneral Labelling Exam’n
Irish Manufactured Cosmetics, Hair Straighteningproducts, & Children’s ‘leave-on’ CosmeticsFace paints, Children’s & General make up etc.Face paints, Children’s & General make up etc.Creams, Soaps etc. (Whitening)Face paints, Children’s & General make up etc.Face paints, Children’s & General make up etc.Face paints, Children’s & General make up etc.Teeth whitening products, toothpasteHair DyesCreams, Soaps “Lightening”Shampoo & bath gelWipes
Wipes
WipesHair Care ProductsMake up, face paints, soaps, shower gels, hair products,wipes, creams etc
59
61 (128 Subsamples)61 (127 Subsamples)
3156 (124 Subsamples)52 (116 Subsamples)61 (125 Subsamples)
330 (64 Subsamples)
13131
31
3015 (35 Subsamples)
125
Table 7.1 Summary of Cosmetics Testing Results 2013
Note: 79 samples consisting of 213 sub-samples were screened by x-ray fluorescence for lead & cadmium.
1 Including 2 samples with Formaldehyde >0.05%- not labelled with warning “contains formaldehyde”.2 Testing was out-contracted to CVUA, Karlsruhe, Germany; sample contained dioxane but at levels deemed technically unavoidable.3 One sample of baby wipes was designated as ‘Not Determined’.
56
60613056526133013131
303
301585
31
10100000000
0
0040

7.3.2 Heavy Metals
Lead and Cadmium: 61 samples (childrens face paints,childrens general cosmetics, adult products) were tested in2013. Some of these samples were multi-componentcosmetics sets consisting of different sub-sample types andcolours. In all 128 sub-samples were tested by ICPMS and213 sub-samples were screened by XRF.
A Lead (Pb) limit of 20mg/kg and a Cadmium (Cd) limit of5mg/kg (limits developed by BfR/Germany) have beenadopted in HSE as an interim ‘limit’. In 2013 one samplecontained non-compliant levels of lead in three individualportions of a face paint set. In 2013 a number ofsamples/subsamples contained levels of lead between 5 and11mg/kg (20 subsamples). Work is ongoing at a Europeanlevel to determine if the BfR/German limit should bereduced from 20mg/kg. As yet no new limits have beendecided.
The overall results for Lead and Cadmium indicate asignificant decrease in recent years. Metals testing emphasiswill increase from contaminants to allergens/sensitisers infuture work.
61 samples were also tested for Arsenic, Chromium andNickel (or various combinations thereof). Arsenic resultsranged from < 0.5 to 2.95mg/kg. Chromium levels rangedfrom < 0.5 to 28 mg/kg (apart from a single seaweed-basedsample containing almost 5000mg/kg Chromium; this
contained a permitted chromium colourant). Levels ofNickel of up to 70mg/kg were found in some samples in2013, and although observed Nickel levels were lower thanin 2012, this is still of concern. Whereas there are no specificlimits for Nickel in cosmetics, cosmetics products must (a):be safe and (b): must not contain prohibited substancesunless “…technically unavoidable in good manufacturingpractice”. To minimise the risk of sensitisation (to Nickel)in sensitive persons Nickel levels in cosmetics should bekept low. Some studies report 5 mg/kg as a ‘threshold’ forleave-on cosmetics (Basketter et al., Contact Dermatitis,2003 Jul; 49(1):1-7).
7.3.3 Hydroquinone and Mercury in Creams, etc.
Hydroquinone products are popular for their skin-lightening properties in Asian and African cosmeticsmarkets and Hydroquinone is sometimes found in cosmeticproducts sold in “ethnic” shops. RAPEX reports involvinghydroquinone are relatively common (on a European level).Hydroquinone (at any level) is prohibited for use as a skin-lightening agent. Mercury (as various mercury compounds)is also occasionally used in skin-whitening products, eventhough such use is prohibited.
During 2013, none of the 13 ‘whitening/lightening’ samplestested here were found to contain hydroquinone. Theseresults compare to non-compying rates of 47% (23/49),18% (5/28), 0% (0/39), 8.0% (4/49) and 8.5% (4/47) for 2008,2009, 2010, 2011 and 2012 respectively.
31 samples were also tested for mercury, and one wasfound to be non-compliant (freckle cream, 5.2% mercury).Of note is that this product has been tested repeatedlyover the last number of years, both in this laboratory andin other European laboratories and has been found tocontain high levels of mercury. Non-complying mercuryresults for skin-whitening products have been sporadic with0% (0/9), 4.5% (1/22), 0% (0/43), 8.3% (4/48), 0% (0/44) for2008, 2009, 2010, 2011 and 2012 respectively.
Annual Report 2013
Tuarascáil Bhliantúil 2013
33
Year
2008
20092010201120122013
No of Samples Tested
16222626018116161
No of sub components
798946
1,020680635213
No. of Non-complyingcomponents
96344
1201
Western Region - Public Analyst’s Laboratory
Saotharlann an Anailisí Phoiblí
34
7.3.4 para-Phenylenediamine in Hair Dyes
In 2013, 30 samples (64 subsamples) of hair dyes weretested for para-phenylenediamine (PPD), a permittedhair colourant with allergic properties and an upperlimit of 2%. None of the samples exceeded the limit of2% para-phenylenediamine which came into effect onJuly 15th 2010 (Directive 2009/130/EC).
7.3.5 Residual Solvent Testing
30 samples of liquid extracted from wipes (primarilywipes intended for use on children) were tested forresidual benzene and chloroform. However, none of theproducts showed the presence of these solvents. Bothbenzene and chloroform are prohibited in cosmeticproducts. 15 samples (35 subsamples) of hair-careproducts were tested for a number of solvents (ethanol,methanol, acetone, propan-1-ol and propan-2-ol). Nolevels of concern were observed.
7.3.6 Hydrogen Peroxide
“Tooth-whitening” products, toothpastes, gels, etc., andrelated products are currently in widespread use by thepublic. Hydrogen peroxide is permitted in “oral hygieneproducts…available generally to public” up to amaximum limit of 0.1% (see SI 396 of 2012), or up to6.0% for professional use. 3 samples were tested forperoxide content in 2013; all were found to be incompliance.
7.3.7 General Labelling of Cosmetics
125 samples were examined in 2013 for compliancewith the labelling requirements in the CosmeticsRegulations (Regulation No 1223/2009 & S.I. 440 of2013). 40 (32%) samples were found to be non-compliant; these non-compliances related to theomission of some of the following labelling information:Responsible Persons (RP) address, date of minimumdurability (or ‘period after opening’ symbol), batchnumber and list of ingredients.
7.3.8 Other Cosmetics Testing
7.3.8.1 Methyldibromoglutaronitrile (MDBG) and Iodopropynylbutylcarbamate (IPBC)
These compounds are permitted preservatives inCosmetics as per Regulation (EC) No. 1223/2009, atvarying levels depending on the product type andintended use. There are potential allergenic/sensitisationrisks with the use of such preservatives on susceptiblepersons, who may purchase cosmetics labelled as“preservative / allergen free”. 31 samples, primarilywipes for use on children, but also including adulthygiene wipes, were tested. No MDBG was observedin any of the samples. Just one of the 31 samples wasfound to contain a trace of IPBC (0.0005%).
7.4 Summary of Cosmetics Hazard/Contamination Reports issued in 2013
Cosmetics samples are tested to ensure their safety andcompliance with specific or general safety standards.Cosmetics Hazard/Contamination Reports are issuedby the laboratory when the results of analysis indicatea particular hazard. Such reports require risk analysisto assess if the hazard represents a significant risk toconsumers.
In 2013, the laboratory issued 5 CosmeticsHazard/Contamination reports concerning:formaldehyde (1), Mercury (1), Lead (1), MDBG (1) andhydroquinone (1). The MDBG alert related to thematerial being listed as an ingredient, howeversubsequent analysis showed it not to be present at aquantifiable level.
7.5 Overall Summary
The recent surveillance results indicate continuingimprovements in the quality of cosmetics on the Irishmarket. Non-compliances have shown a decrease since2008 for almost all parameters. There continues to be someincidents of non-compliances which are dealt with by theEHOs in conjunction with IMB, as appropriate. The 2013results will inform future surveillance programmes, as willobservation of trends in RAPEX reports, communicationwith other European surveillance authorities etc.
Annual Report 2013
Tuarascáil Bhliantúil 2013
35
8. MISCELLANEOUS TESTING
Thirty seven ‘miscellaneous’ samples were received in2013. These consisted of:• 10 veterinary samples as part of an investigation
into a reported blindness case• 1 foreign object in a kettle• 1 sample of insects for identification• 1 suspected rodent dropping• 1 sample of calcium carbonate powder for export
certification• 1 part of a metal gate as part of an investigation
into lead poisoning• 6 samples of horse hair & blood as part of an
investigation into horse deaths• 1 sample of larvae from water in a paddling pool• 12 private seaweed samples• 2 samples of deposits taken from a water boiler and
from sanitary ware• 1 sample of children’s clothing as part of an
investigation into a reported allergic reaction
9. QUALITY ASSURANCE
The quality of the analysis carried out in the laboratory, andthe reliability of the results supplied to our customers isensured by having a quality assurance system in place whichcovers all aspects of the laboratory’s work. This laboratorycomplies with an International standard for testinglaboratories i.e. - ISO/IEC 17025 'General requirements forthe competence of testing and calibration laboratories'. Thestandard contains detailed requirements for both themanagement of laboratory operations and technical aspectssuch as method validation, measurement traceability andmeasurement uncertainty. The pharmaceuticals section isalso subject to audits by the IMB, and mutual joint auditscarried out by EDQM/OMCL staff.
9.1 Accreditation
Gaining accreditation to the ISO 17025 standard meansthat this laboratory can demonstrate to its customers thatit has been successful in meeting the requirements of aninternational accreditation standard. Member states of theEU have established a network of national accreditationbodies which seeks to ensure that the competence of allEU laboratories are assessed to the same principles. InIreland, the Irish National Accreditation Board (INAB) isthe body with responsibility for awarding accreditation, inaccordance with the relevant ISO 17000 series of standards
and guides. This laboratory has continuously added to itslist of accredited tests, and now is accredited for a widerange of analytes, using a variety of testing procedures inFood, Water, Cosmetic and Pharmaceutical products. A fulllist of our accredited tests is available on the INAB websitehttp://www.inab.ie/directoryofaccreditedbodies/laboratoryaccreditationtesting/009T.pdf
9.2 INAB Surveillance Visit.
The laboratory receives regular surveillance and re-assessment audits from INAB. Their purpose is todetermine whether a laboratory is continuing to complywith the ISO 17025 and INAB Regulations. Our annualINAB surveillance audit took place in November 2013.Once again, we successfully maintained our accreditationstatus and indeed added to our scope of testing in the Foodand Pharmaceuticals sections. Additional testing accreditedin 2013, include the testing of snack foods for Sodium andPotassium and Subdivision of Tablet and Uniformity ofDosage Unit tests for Pharmaceutical samples.
9.3 Proficiency Testing
As part of our external quality control, the laboratoryparticipates in a range of international proficiency testingschemes. Participation in the testing schemes enables thelaboratory to monitor the quality of its measurements anddemonstrates our competence to customers andaccreditation bodies. In 2013 we participated in a largenumber of proficiency testing rounds, covering a wide rangeof parameters, analytical procedures and sample types (seetable). The proficiency testing schemes in which weparticipate include schemes organised by:
• FAPAS: The Food and Environment Research Agency,http://www.fapas.com/• CHEK: Food and Consumer Product Safety Authority, TheNetherlands.• Quasimeme: Quality Assurance of Information for MarineEnvironmental Monitoring in Europe• QDCS: Quality in Dairy Chemistry, Laboratory of theGovernment Chemist (LGC), U.K.• AQUACHECK: Proficiency testing scheme for watertesting, LGC, U.K.http://www.lgcpt.com/productviewnarrow.aspx?SchemeID=77• Pharmassure: Proficiency testing for Pharmaceuticals, LGC, U.K.• EDQM: European Directorate for the Quality of Medicinesand Health Care.• LGC standards proficiency testing.
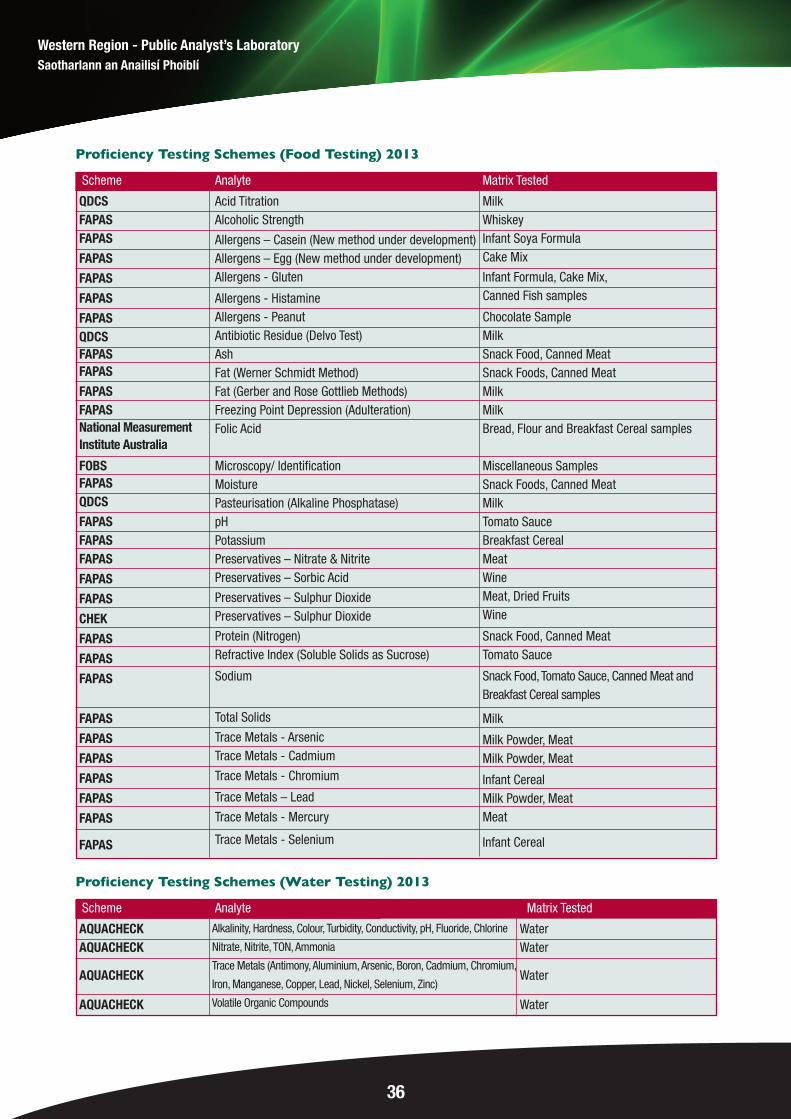
Western Region - Public Analyst’s Laboratory
Saotharlann an Anailisí Phoiblí
36
QDCSFAPASFAPAS
FAPAS
FAPAS
FAPAS
FAPASQDCSFAPASFAPAS
FAPASFAPASNational MeasurementInstitute Australia
FOBSFAPASQDCS
FAPASFAPASFAPAS
FAPAS
FAPAS
CHEK
FAPAS
FAPAS
FAPAS
FAPAS
FAPAS
FAPAS
FAPAS
FAPAS
FAPAS
FAPAS
Acid TitrationAlcoholic Strength
Allergens – Casein (New method under development)Allergens – Egg (New method under development)Allergens - Gluten
Allergens - HistamineAllergens - PeanutAntibiotic Residue (Delvo Test)AshFat (Werner Schmidt Method)Fat (Gerber and Rose Gottlieb Methods)Freezing Point Depression (Adulteration)Folic Acid
Microscopy/ IdentificationMoisturePasteurisation (Alkaline Phosphatase)pHPotassiumPreservatives – Nitrate & NitritePreservatives – Sorbic Acid
Preservatives – Sulphur DioxidePreservatives – Sulphur Dioxide
Protein (Nitrogen)Refractive Index (Soluble Solids as Sucrose)
Sodium
Total Solids
Trace Metals - ArsenicTrace Metals - Cadmium
Trace Metals - Chromium
Trace Metals – Lead
Trace Metals - Mercury
Trace Metals - Selenium
MilkWhiskeyInfant Soya FormulaCake Mix
Infant Formula, Cake Mix,Canned Fish samples
Chocolate SampleMilkSnack Food, Canned MeatSnack Foods, Canned MeatMilkMilkBread, Flour and Breakfast Cereal samples
Miscellaneous SamplesSnack Foods, Canned MeatMilkTomato SauceBreakfast CerealMeatWineMeat, Dried FruitsWine
Snack Food, Canned MeatTomato Sauce
Snack Food, Tomato Sauce, Canned Meat andBreakfast Cereal samples
Milk
Milk Powder, MeatMilk Powder, Meat
Infant CerealMilk Powder, MeatMeat
Infant Cereal
Scheme Analyte Matrix Tested
Proficiency Testing Schemes (Food Testing) 2013
AQUACHECKAQUACHECK
AQUACHECK
AQUACHECK
Alkalinity, Hardness, Colour, Turbidity, Conductivity, pH, Fluoride, Chlorine
Nitrate, Nitrite, TON, Ammonia
Trace Metals (Antimony, Aluminium, Arsenic, Boron, Cadmium, Chromium,
Iron, Manganese, Copper, Lead, Nickel, Selenium, Zinc)
Volatile Organic Compounds
WaterWater
Water
Water
Scheme Analyte Matrix Tested
Proficiency Testing Schemes (Water Testing) 2013

Annual Report 2013
Tuarascáil Bhliantúil 2013
37
PharmassurePharmassure
EDQM &
Pharmassure SchemesPharmassure
PharmassureEDQMPharmassurePharmassurePharmassurePharmassure
Pharmassure
EDQM &
Pharmassure SchemesEDQMLGC Toxicology Scheme
Assay & Identification by HPLCAssay & Identification by UVAssay of Related Substances by HPLC
Average Mass & Uniformity of WeightDensity
Dissolution (Immediate Release and Dissolution Profile)Identification – FT-IR
Identification - Thin Layer ChromatographyLoss on DryingMelting PointOptical RotationpH Testing
Water Content (Karl Fischer Titration)
Alcohol
PharmaceuticalsPharmaceuticalsPharmaceuticals
PharmaceuticalsCod Liver Oil, Sucrose Syrup, Lemon Oil, Rosemary Oil
PharmaceuticalsPharmaceuticalsPharmaceuticalsPharmaceuticals
Urea, Benzoic Acid derivatives, Benzophenone
Sucrose Solution
Solutions
Pharmaceuticals
Blood, Urine
Scheme Analyte Matrix Tested
Proficiency Testing Schemes (Pharmaceutical & Toxicology Testing) 2013
CHEKCHEKCHEKLGC Cosmetic TestingCHEK
FormaldehydeHydroquinoneMetals (Arsenic, Cadmium, Chromium, Lead and Nickel)Metals (Lead, Cadmium, Chromium, Nickel)Hydrogen Peroxide
Finger Paint, Body LotionBody LotionTattoo InkCosmetic PowderWhitening Gel
Scheme Analyte Matrix Tested
Proficiency Testing Schemes (Cosmetic Testing) 2013
Western Region - Public Analyst’s Laboratory
Saotharlann an Anailisí Phoiblí
38
10. STAFF TRAINING
The need for staff training and on-going professionaldevelopment are emphasised in both the Service Contractwith FSAI and various specific legislation relating to foodcontrol. Both internal and external training is offered tostaff in the use of Analytical Methods and Instrumentation,Health & Safety (including Manual Handling & a FireLecture), Information and Communication Technology andtraining organised by HSE (including Data Protection). Staffalso attended seminars on marine contaminants & theapplications of analytical instrumentation such as GC-MS,ICP-MS, LC-MS & UV Spectrometry in the work-place. In-house induction and HSE induction training is provided forall new staff. General management training has also beenundertaken. Due to budgetary constraints staff training hascontinued to be significantly reduced this year. Most of thestaff training received was on a budget neutral basis.Unfortunately, it was not possible to attend otherimportant training courses, which could lead to furtherimprovements and developments in the service, due to thesignificant expense involved.
11. MEETINGS/COMMITTEES
FSAI:• Liaison Meetings with Public Analysts’ Group• Service Contract Meetings with Western Area HSE• Allergen Labelling & Analysis Working Group• EHO-PAL Liaison Group • FSAI-EHO-PAL National Group on Sampling• Programmes• Molluscan Shellfish Safety Committee• Legislation Committee (FSAI-Dept. of Health &• Children…) & Sub-Committees• Bottled Water Guidance Note Drafting Committee• Scientific Sub-committee (Additives, Contaminants..)safefood/HSE: IT system for Laboratory ServiceHSE Regional Food Committee: (HSE West)Cosmetics Control Group HSE andCosmetics Safety Steering Group (IMB,HSE…)OCCL: Organisation of Cosmetics ControlLaboratories (EU EDQM)Zoonoses Committee (Western Region)Fluoridation Committee (HSE West)HSE/County Council Water GroupMeetingsHSE Water Group Meetings
Chemistry Network of AccreditedLaboratories: Forum for Quality Managers fromINAB Accredited Chemistry LaboratoriesIrish Medicines Board: Liaison MeetingsEDQM European Network of OfficialMedicines Control Laboratories: AnnualMeeting, EDQM/OMCL CAP Meeting, MRP/DCPMeeting, MJA Auditors MeetingNSAI: Working group on the revision of IrishStandard 432 (I.S. 432:2009) on bottled ground waterCommunity Services Management Meetings
12. INFORMATION AND COMMUNICATION TECHNOLOGY
The LabWare laboratory information management system(LIMS), funded nationally by safefood has been ‘live’ since01 January 2007. The LIMS is in continuous use in thelaboratory and is undergoing expansion and development.This development has included the integration of variousinstruments, involved in water and pharmaceutical analysis,into the LIMS enabling paperless transfer of results. In 2008,an electronic reporting link was set-up between thislaboratory and the FSAI, using the government VPN (VirtualPrivate Network), whereby summaries of all relevantsample details and results are automatically created andsent to the FSAI for inclusion in a national database of foodtesting. Further development of the LIMS was planned for2010 - 2011 (connection to the EPA Environmental DataExchange Network (EDEN)) but this project was pausedwhile a new national information technology system for theEnvironmental Health Services in the HSE is procured.Once this is in place, it is anticipated that the HSE PublicAnalysts Laboratories and Public Health Microbiologylaboratories will be connected to both the EHS and EDENsystems via the LabWare LIMS.
Due to budgetary constraints the development of otheraspects to the LIMS system (e.g. the connection to the newEnvironmental Health Information System (EHIS)) has beenput on hold.

Annual Report 2013
Tuarascáil Bhliantúil 2013
39
Jan 7 – 14
Jan 14– 31
Feb. 1 – 15
Feb. 15 – 28
Mar. 1 – 15
Mar. 16- 31
Apr. 1- 15
Apr. 16 – 30
May 1 – 15
May 16 – 31
June 1 – 15
June 16 – 30
Sausages(SO2 , NaNO2 & NaNO3)
Various Port-level Fish(Biogenic Amines)
Scombroid fish(Biogenic Amines)
Imported Dairyproducts etc(ALP, Inhibitory Substances,Adulteration….)
Infant Formula, Followon Formula, PrematureInfant Formula (Allergens,Folic Acid, Labelling…..)
Various SulphitedFoodsLocal Processors (SO2)
Lactose- free Foods(Lactose)
LC-MS MethodDevelopment(DMAA)
“Egg-free” Foods(Egg Protein)
Scombroid fish etc(Biogenic Amines)
40
2(x9)
~6
25
20
20
35
75
35
25
Meats & Brine solutions(NaNO2 & NaNO3)
30Irish ManufacturersFood Supplements’National Survey(Folic Acid, Minerals etc)
1(x9)
Various Port-level Fish(Biogenic Amines)
Locally Manufacturedproduce Gluten-free Foods(Gluten, Labelling etc)
35
‘Peanut-free’ Foods(Peanut Protein)
35
Sea Vegetables(Heavy Metals)
30
Imported Seafood(Pb/Cd, Labelling…)
30
Foods Labelled as “Milk-free”(Milk Protein/Casein etc)
35
Low- or Reduced-SaltFoods(Na/K)
30
FSAISalt ReductionProgrammeSoups(Na & K)
150
Appendix 1. Outline Summary of HSE West Food Sampling – Analysis (Chemical) Programme for 2013
Prepared Hospital Mealsetc.(% Protein & %Fat …)
25
Pub-level Spirits(Alcoholic strength)
20
Cured Meats(Sodium Nitrite & SodiumNitrate)
40
Local/Regional Producewith labelled Salt/Sodiumvalues (Na & K, labelling,Gen.Exam.etc)
30
Herbs, Spices,Seasonings, Herbal teas,Seeds, Noodles (FoodIrradiation screening, Pb/Cd…)
40

Western Region - Public Analyst’s Laboratory
Saotharlann an Anailisí Phoiblí
40
July 1 – 15
July 16 – 31
Aug. 1 – 15
Aug. 16 – 31
Sept. 1 – 15
Sept. 16 - 30
Oct. 1 - 15
Oct. 16 – 31
Nov. 1 – 15
Nov. 16 – 30
Dec. 1 – 15
Dec. 16 – 31
Jan - Dec
Various Port-level Fish(Biogenic Amines)
Various Port-level Fish(Biogenic Amines)
Various Port-level Fish(Biogenic Amines)
Food Complaints, Food 'Alerts' etc., 'suspect' samples, Follow-up samples etc
-Bottled waters from manufacturing premises – CHECK or AUDIT suite – approx 104 samples – HSE west production-Food Complaints, Food 'Alerts' etc., 'suspect' samples and tap waters from food premises (where relevant)-'Inspection Support' samples from Manufacturing/ Processing etc. premises when required, and in consultation with lab.
Bottled Waters(Audit suite)
FSAIFolic acid
2(x9)
Brine Solutions(Nitrate & Nitrite)
~6
3(x9)
1x9
Gluten-free produce(Gluten)
35
Various Port-level Fish(Biogenic Amines)
2x9
Body buildingSupplements (Imported)(Proximates, Minerals, Foodirradiation, DMAA)
30
ca. 10
Christmas BakeryProducts(Na/K, General Examination& Labelling….)
20
FSAISalt ReductionProgrammeSnacksNa & K)
50-100
Imported Shellfish(DSP/AZA, ASP, Pb/Cd)
5-10
Shellfish – imports etc(AZA, DSP, ASP)
Various Port-level Fish(Biogenic Amines)
3(x9)
Bottled WatersDW Check/Audit suite
~20
Weaning Foods (Folic Acid, Na/K, Pb/Cd,Other Nutritional Testing,General/Nutritional labelling,etc)
35 10-15
Brine Solutions(Nitrate & Nitrite)
~6
Scombroid Fish(Biogenic Amines)
25
Low Fat SurveyMinced Meats/Beefs(Fat Content, Adulteration)
25
Appendix 1. Outline Summary of HSE West Food Sampling – Analysis (Chemical) Programme for 2013 (continued)
Meat Products(SO2 & Fat)
35
‘Peanut-free’ Foods(Peanut Protein)
35
‘Peanut-free’ Foods(Peanut Protein)
35
Raw, unprocessed meats(ABS)
20
Various Sulphited Foods(SO2)
35
Ethnic Foods(General Exam., Na & K &labelling…)
25
Gluten-free Foods(Gluten)
35
Locally ManufacturedproduceGluten-free Foods(Gluten, Labelling etc)
35
FSAISalt ReductionProgramme Breads((Na & K)
150
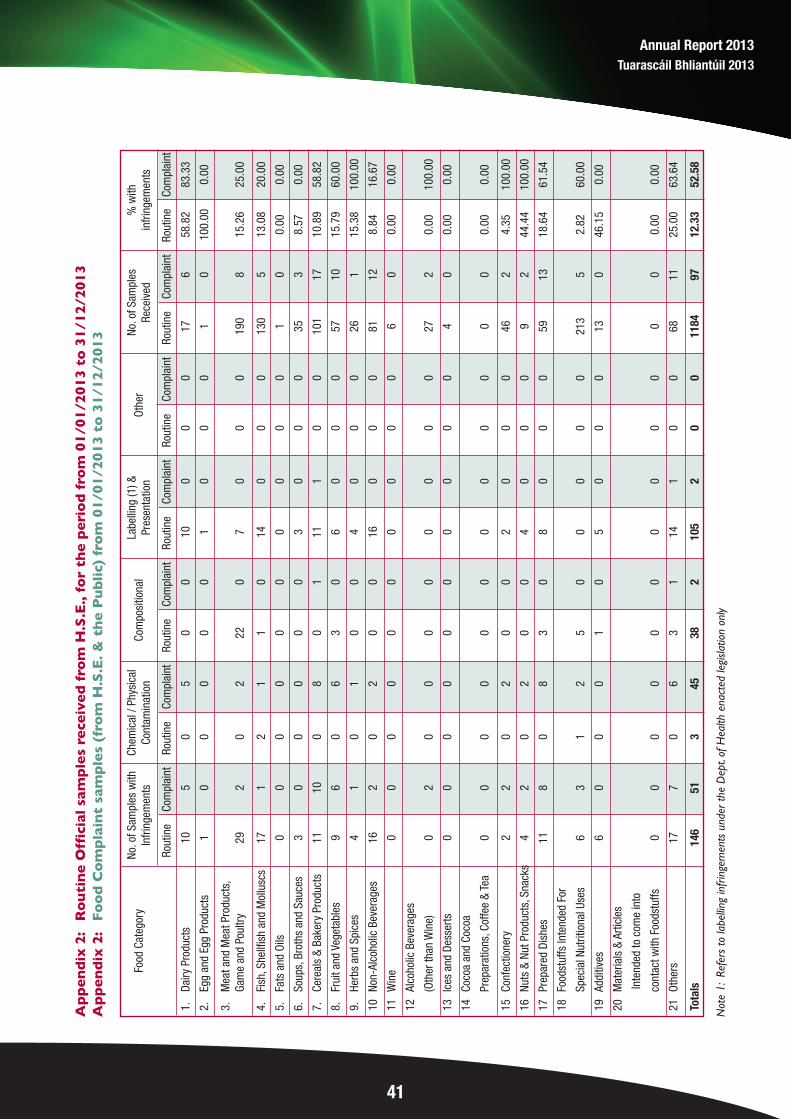
Annual Report 2013
Tuarascáil Bhliantúil 2013
41
No. o
f Sam
ples
with
Infri
ngem
ents
Food
Cat
egor
yCh
emic
al /
Phys
ical
Cont
amin
atio
nCo
mpo
sitio
nal
Labe
lling
(1) &
Pres
enta
tion
Othe
rNo
. of S
ampl
esRe
ceiv
ed%
with
infri
ngem
ents
Rout
ine
Com
plai
ntRo
utin
eCo
mpl
aint
Rout
ine
Com
plai
ntRo
utin
eCo
mpl
aint
Rout
ine
Com
plai
ntRo
utin
eCo
mpl
aint
Rout
ine
Com
plai
nt
1.Da
iry P
rodu
cts
105
05
00
100
00
176
58.8
283
.33
2.Eg
g an
d Eg
g Pr
oduc
ts1
00
00
01
00
01
010
0.00
0.00
3.M
eat a
nd M
eat P
rodu
cts,
Gam
e an
d Po
ultry
292
02
220
70
00
190
815
. 26
25.0
0
4.Fi
sh, S
hellf
ish
and
Mol
lusc
s17
12
11
014
00
013
05
13.0
820
.00
5.Fa
ts a
nd O
ils0
00
00
00
00
01
00.
000.
00
6.So
ups,
Bro
ths
and
Sauc
es3
00
00
03
00
035
38.
570.
00
7.Ce
real
s &
Bake
ry P
rodu
cts
1110
08
01
111
00
101
1710
.89
58.8
2
8.Fr
uit a
nd V
eget
able
s9
60
63
06
00
057
1015
.79
60.0
0
9.He
rbs
and
Spic
es4
10
10
04
00
026
115
.38
100.
00
10No
n-Al
coho
lic B
ever
ages
162
02
00
160
00
8112
8.84
16.6
7
11W
ine
00
00
00
00
00
60
0.00
0.00
12Al
coho
lic B
ever
age s
(Oth
er th
an W
ine)
02
00
00
00
00
272
0.00
100.
00
13Ic
es a
nd D
esse
rts0
00
00
00
00
04
00.
000.
00
14Co
coa
and
Coco
a
Prep
arat
ions
, Cof
fee
& Te
a0
00
00
00
00
00
00.
000.
00
15Co
nfec
tione
ry2
20
20
02
00
046
24.
3510
0.00
16Nu
ts &
Nut
Pro
duct
s, S
nack
s4
20
20
04
00
09
244
.44
100.
00
17Pr
epar
ed D
ishe
s11
80
83
08
00
059
1318
.64
61.5
4
18Fo
odst
uffs
Inte
nded
For
Spec
ial N
utrit
iona
l Use
s6
31
25
00
00
021
35
2.82
60.0
0
19Ad
ditiv
es6
00
01
05
00
013
046
.15
0.00
20M
ater
ials
& A
rticl
e s
Inte
nded
to c
ome
into
cont
act w
ith F
oods
tuffs
00
00
00
00
00
00
0.00
0.00
21Ot
hers
177
06
31
141
00
6811
25.0
063
.64
Totals
146
513
4538
210
52
00
1184
9712
.33
52.58
Ap
pe
nd
ix 2
:R
ou
tin
e O
ffic
ial
sam
ple
s re
ceiv
ed
fro
m H
.S.E
., f
or
the
pe
rio
d f
rom
01
/01/2
013 t
o 3
1/1
2/2
013
Ap
pe
nd
ix 2
:F
oo
d C
om
pla
int
sam
ple
s (f
rom
H.S
.E. &
th
e P
ub
lic)
fro
m 0
1/0
1/2
013 t
o 3
1/1
2/2
013
Not
e 1:
Ref
ers
to la
belli
ng in
frin
gem
ents
und
er t
he D
ept.
of H
ealth
ena
cted
legi
slat
ion
only

Western Region - Public Analyst’s Laboratory
Saotharlann an Anailisí Phoiblí
42
Ap
pe
nd
ix 3
:O
utl
ine
of
Pri
nci
ple
Off
icia
l S
urv
eil
lan
ce o
f F
oo
dst
uff
s in
Ire
lan
d (
RO
I).
1 T
he Irish
Equ
ine
Cen
tre
per
form
s of
ficia
l tes
ting
on b
ehal
f of
DAFM
. So
me
test
ing
is a
lso
per
form
ed b
y th
e Ve
terina
ry L
abor
ator
y Se
rvic
e, in
clud
ing
the
Cen
tral
Vet
erin
ary
Res
earc
h La
bora
tory
,
and
by t
he Int
erim
Sal
mon
ella
Ref
eren
ce L
abor
ator
y, U
CH
G, G
alw
ay.
- se
e D
irec
tory
of Fo
od S
afet
y La
bora
tory
Ser
vice
s, S
afef
ood,
for
mor
e de
tails
on
food
tes
ting
labs
in Ire
land
.
2 T
he P
ublic
Ana
lyst
s’ La
bora
tory
Ser
vice
oper
ates
as
a sing
le, c
o-or
dina
ted
serv
ice,
with
a s
yste
m o
f na
tiona
l Spec
ialis
atio
ns a
nd C
ore
Test
ing
in p
lace
(an
d on
goin
g).
Co
re T
est
ing:
Mic
rosc
opy/
Com
pla
ints
; Gen
eral
Exa
min
atio
n/la
belli
ng e
tc.
Exa
mple
s of
Sp
ecia
lisa
tio
ns
incl
ude:
• D
ub
lin
PA
L:
Myc
otox
ins
(Afla
toxi
ns ,
Och
rato
xin,
DO
N, Z
eara
leno
ne, P
atul
in, E
rgot
Alk
aloi
ds, T
rico
thec
enes
, Fum
onisin
s, C
itrin
in, S
terigm
atoc
yste
in e
tc);
Food
Con
tact
Mat
eria
ls
(Ove
rall
Mig
ratio
n, P
AAs, E
SBO
, Fur
an, A
rom
atic
am
ines
, Mig
rato
ry M
etal
s (P
b, C
d et
c), P
htha
late
s, M
elam
ine,
BPA
, ITX
etc
.); F
ood
Proc
essing
Con
tam
inan
ts
(PAH
s, M
elam
ine,
Fur
an, 3
-MCPD
, Ben
zene
, PFA
S, A
cryl
amid
e, S
olve
nt R
esid
ues
etc…
) et
c
• C
ork
PA
L:
Hea
vy M
etal
s (P
b, C
d, H
g, A
s, S
n, C
u, Z
n…, H
g &
As
spec
iatio
n) ;
Vita
min
s (A
,Bs,
C.D
s, E
...)
and
Oth
er C
ompos
ition
al/N
utritio
nal t
estin
g (N
ucle
otid
es, O
meg
a-3
FAs, C
hole
ster
ol, S
atur
ated
/Uns
at’d
Fat
etc
.);
GM
O Tes
ting; P
estic
ides
(Bot
tled
Wat
ers
& Inf
ant
Form
ulae
..); A
dulte
ratio
n/Fo
od F
raud
(Con
gene
rs (
spirits
etc
.),
Mea
t an
d Fi
sh S
pec
iatio
n,
Oliv
e O
il qu
ality
etc, F
ood
Irra
diat
ion
scre
enin
g;
• G
alw
ay P
AL:
Food
Alle
rgen
s (G
lute
n, L
acto
se, P
eanu
t, M
ilk, E
gg, S
oy p
rote
in e
tc);
‘Sal
t’ (N
a/K
) - na
tiona
l sal
t re
duct
ion
pro
gram
me,
sur
veys
etc
; Fol
ic A
cid;
Oth
er
Com
pos
ition
al/N
utritio
nal t
estin
g; V
OCs
in D
rink
ing
& B
ottle
d W
ater
s; Fo
od Irr
adia
tion-
PSL
scre
enin
g; S
pec
ialis
t La
belli
ng /
Legi
slat
ion
wor
k.
A S
ervi
ce is
pro
vide
d to
HSE
and
incr
easing
ly t
o Age
ncie
s ot
her
than
HSE
, eg
to F
SAI,
SFPA
, DAFM
…
Depa
rtmen
t/Ag
ency
Authority
Principa
l Foo
dCa
tego
ries
FSAI (s
urveys)
Health Service Execu
tive
(HSE
)
Loca
l Autho
rities
Depa
rtmen
t of
Agric
ulture
Food
& th
e Marine
(DAF
M)
Radiolog
ical Protection
Institu
te of Ireland
(RPII)
Any
Food
stuf
f
All f
oods
tuffs
(Foo
d, D
rink,
Food
-con
tact
Mat
eria
ls)
Mea
t, Da
iry, B
rines
....
Mar
ine
prod
ucts
,M
eats
, Oth
ers
Food
s of
Ani
mal
Orig
in(M
eats
, etc
.)
Frui
t/Veg
etab
les,
etc
.
Milk
/Dai
ry, e
tc.
Fish
, She
llfis
h, e
tc.
Principa
l Sam
pling
Stag
e(s)
Any
stag
e
All s
tage
sM
anuf
actu
ring,
who
lesa
le,
Reta
il, C
ater
ing,
Impo
rt et
c.
‘Pro
duct
ion’
pla
nts,
etc
.
Any
stag
e
‘Pro
duct
ion’
Mea
t Pla
nts,
Farm
s, e
tc.
Dairy
Pla
nts,
etc.
Fish
ing
Boat
s,Pr
oces
sing
pla
nts,
Fish
Far
ms,
etc
.
Principa
l Sa
mpling
Offic
ers
FSAI
, etc
.
HSE
Envi
ronm
enta
lHe
alth
Offic
ers
(EHO
s)
Vete
rinar
y Of
ficer
s, e
tc.
Vario
us
DAFM
Vete
rinar
y Of
ficer
s&
Agric
ultu
ral
Offic
ers,
etc
.
Sea
Fish
ery
Offic
ers
etc.
(Sea
Fis
herie
s Pr
otec
tion
Auth
ority
(SFP
A))
Principa
l Official
Labo
ratorie
s1
Depe
nden
t on T
estin
g Pa
ram
eter
(s)an
d lab
orat
ory c
apac
ity
HSE
Food
Mic
robi
olog
y La
bs&
HSE Pu
blic Ana
lysts’ Lab
s2
Loca
l Aut
horit
y La
bs,
Dept
. of A
gric
ultu
re L
abs,
etc
.
Radi
olog
ical
Pro
tect
ion
Inst
itute
of I
rela
nd
Vete
rinar
y Pu
blic
Hea
lthRe
gula
tory
Lab
orat
ory
Asht
own
Food
Rese
arch
Cen
tre L
abs
Stat
e La
bora
tory
Pest
icid
es L
abor
ator
yDa
iry S
cien
ce L
abs
Mar
ine
Inst
itute
(als
o BI
M L
ab)
Test Param
eters
and Grou
ps
‘New
’ Par
amet
ers
of c
once
rn.
Any
Othe
r Par
amet
er.
Mic
robi
olog
yCo
ntam
ina n
ts,
Com
plai
nts,
Com
posi
tiona
l & A
dditi
ves,
Nutri
tiona
l, L
abel
ling,
etc
.
Mic
robi
olog
y,Re
sidu
es, e
tc.
Ioni
sing
Rad
iatio
n
Mic
robi
olog
y &
Vete
rinar
yRe
sidu
es, C
onta
min
ants
, etc
.
Pest
icid
es e
tc.,
Mic
robi
olog
y, Re
sidu
es e
tc.,
Mic
robi
olog
y (in
cl. v
irolo
gy),
Mar
ine
Biot
oxin
s,Re
sidu
es &
Con
tam
inan
ts e
tc.

Annual Report 2013
Tuarascáil Bhliantúil 2013
43
ParameterNon-complying or “Excessive” Samples/Total Samples tested
20112003 2004 2005 2006 2007 2008 2009 20104/250 8/231 6/233 13/220 8/220 1/149 3/115 0/49 1/26 N/T N/T1.6% 3.5% 2.6% 5.9% 3.6% 0.7% 2.6% 0% 3.8%1/86 1/44 0/52 0/51 0/24 1/10 3/40 0/21 N/T N/T N/T1.2% 2.3% 0% 0% 0% 10.0% 7.5% 0%0/83 2/109 1/109 N/T N/T N/T N/T N/T N/T N/T N/T0% 1.8% 0.9%0/4 N/T 0/52 N/T N/T N/T N/T N/T N/T N/T N/T0% 0%
0/170 0/330 1/248 1/143 2/479 2/512 4/422 0/390 0/207 0/128 0/3750% 0% 0.4% 0.7% 0.4% 0.4% 0.9% 0% 0% 0% 0%
0/120 0/273 0/205 0/130 2/403 0/512 1/415 4/381 0/204 0/129 0/3750% 0% 0% 0% 0.5% 0% 0.2% 1.0% 0% 0% 0%
0/96 2/140 0/176 0/74 0/54 0/20 4/169 2/233 0/38% 0/80 0/1050% 1.4% 0% 0% 0% 0% 2.4% 0.9% 0% 0% 0%
0/188 0/154 0/42 0/47 0/163 0/238 0/51 0/67 0/7 0/34 0/3660% 0% 0% 0% 0% 0% 0% 0% 0% 0% 0%
4/282 2/84 2/75 2/98 19/102 0/115 0/65 0/57 N/T N/T N/T1.4% 2.4% 2.7% 2.0% 18.6% 0% 0% 0%0/90 0/62 0/35 2/73 0/96 0/30 N/T 0/18 0/33 N/T N/T0% 0% 0% 2.7% 0% 0% 0% 0%N/T N/T 0/42 0/39 0/35 0/3 N/T N/T N/T N/T N/T
0% 0% 0% 0%0/103 0/99 1/52 0/21 0/11 0/20 1/22 0/14 0/15 0/13 0/17
0% 0% 1.9% 0% 0% 0% 4.5% 0% 0% 0% 0%
0/108 0/108 0/47 0/20 0/29 0/20 1/23 0/14 0/8 0/13 0/170% 0% 0% 0% 0% 0% 4.3% 0% 0% 0% 0%
0/108 0/65 0/41 0/23 0/39 0/36 0/30 0/30 0/18 0/15 0/170% 0% 0% 0% 0% 0% 0% 0% 0% 0% 0%
22/240 11/252 15/134 4/144 1/175 2/102 17/394 4/333 6/270 8/476 34/6319.2% 4.4% 11% 2.8% 0.6% 2.0% 4.3% 1.2% 2.2% 1.7% 5.4%
N/T N/T N/T 3/90 0/64 0/29 0/58 N/T N/T N/T N/T3.3% 0% 0% 0%
0/119 0/69 0/73 0/38 0/37 0/38 0/51 0/32 0/24 0/20 0/160% 0% 0% 0% 0% 0% 0% 0% 0% 0% 0%
14/74 4/62 6/37 2/17 9/32 5/27* N/T N/T N/T N/T N/T18.9% 6.5% 16.2% 11.8% 28.1% (18.5%)
1/297 1/114 6/129 4/139 16/131 2/128 15/320 5/289 1/218 5/204 3/940.3% 0.9% 4.7% 2.9% 12.2% 1.6% 4.7% 1.7% 0.5% 2.5% 3.2%
2/63 18/163 3/46 2/36 2/59 6/72 0/47 0/34 N/T N/T N/T3.2% 11.0% 6.5% 5.6% 3.4% 8.3% 0% 0%
1/120 6/444 7/135 6/198 1/166 8/190 8/206 9/213 6/176 15/160 26/1950.8% 1.4% 5.2% 3.0% 0.6% 4.2% 3.9% 4.2% 3.4% 9.4% 13.3%
7/172 4/282 10/158 13/85 11/94 2/64 0/8 4/32 25/79 7/86 14/1124.1% 1.4% 6.3% 15.3% 11.7% 3.1% 0% 12.5% 31.6% 8.1% 12.5
0/8 1/2 4/208 0/38 N/T 0/41 0/3 N/T N/T N/T N/T0% 50.0% 1.9% 0% 0% 0%
0/115 3/248 19/246 3/291 2/335 0/253 2/136 0/56 0/88 0/55 2/710% 1.2% 7.7% 1.0% 0.6% 0% 1.5% 0% 0% 0% 2.8%
149/241 108/183 84/136 77/122 77/129 69/126 50/100 64/105 62/122 85/139 51/9761.8% 59.0% 61.8% 63.1% 59.7% 54.8% 50% 61.0% 50.8% 61.2% 52.6%
0/67 0/250% 0%
0/27 1/350% 2.9%
1/32 N/T3.1%
0/169 0/34 0/113 1/780% 0% 0% 6.4%
3/476.4%
N/T = Not tested, i.e. discontinued/postponed etc. * Results exceed Dutch DPTGs limit of 15% or Acid value of 4.0 (results not designated as non-
complying)
2012
Appendix 4: Annual Results Summary for Food Contaminants etc. PAL Galway (results for all foods tested)
Aflatoxins
Fumonisins
Ochratoxin A
Patulin
Lead (Pb)
Cadmium (Cd)
Mercury (Hg)
Arsenic (As)
Benzo-[a]-pyrene
3-MCPD
Nitrates
Marine Biotoxins: DSPs
AZAs
ASPs
GlutenGluten Free (GF) Foods
BenzeneAnti-bacterial Substances(ABS) EC 4-Plate Test
AV/DPTGs(Oils)
Histamine/Biogenic Amines
Sorbates/ Benzoates
Sulphites
Nitrites / Nitrates
Artificial Sweeteners (i.e. Acesu-lfame K, Aspartame & Saccharin)
Food Irradiation
Food Complaints
Lactose
Casein
Soya
Peanut
Egg
New testing introduced in 2012
New testing introduced in 2012
New testing introduced in 2012
Testing introduced in 2010
2013
New testing introduced in 2013

Appendix 5: Fluoridation of Water Supplies – HSE West for 2013
FLUORIDATION OF WATER SUPPLIES :- GALWAY
FLUORIDATION OF WATER SUPPLIES :- MAYO
FLUORIDATION OF WATER SUPPLIES :- ROSCOMMON
Western Region - Public Analyst’s Laboratory
Saotharlann an Anailisí Phoiblí
44
BallinasloeCarnaClifdenDunmore/GlenamaddyGalway City
KinvaraLuimnaghMid-Galway RegionalMountbellew
OughterardPortumnaSpiddal
Location Number of Samples Range (mg/L) Median (mg/L)
AchillBallinaErrisKiltimaghLough Mask RegionalShruleSwinfordWestport
Location Number of Samples Range (mg/L) Median (mg/L)
Ballinlough LoughglynnBoyle/ArdcarneCastlerea RegionalCastlerea UrbanMount TalbotNorth East RegionalNorth Roscommon RegionalRoscommon Town (Central)South Roscommon Regional
Location Number of Samples Range (mg/L) Median (mg/L)
119
1111
11812371111121112
0.62 – 0.72< 0.10 – 0.70
<0.10-0.760.62 – 0.700.65 – 0.740.55 – 0.75
0.62 – 0.730.50 – 0.820.55 – 0.92
<0.10 - 0.760.54 - 0.860.47 - 0.71
0.67<0.100.580.660.700.670.650.67
0.700.660.730.63
1224121212121212
0.58 - 0.850.56 - 0.920.60 - 0.710.74 - 0.890.65 - 0.750.61 - 0.690.65 - 0.840.54 - 0.71
0.640.710.650.790.720.660.730.63
121212121212121212
0.13 - 0.750.13 - 0.790.60 - 0.690.63 - 0.780.11 - 0.820.15 - 0.830.48 - 0.800.47 - 0.76
<0.10 - 0.84
0.650.560.670.690.700.780.640.580.13

Appendix 5: Fluoridation of Water Supplies HSE West for 2013
FLUORIDATION OF WATER SUPPLIES :- DONEGAL
FLUORIDATION OF WATER SUPPLIES :- SLIGO/LEITRIM
Annual Report 2013
Tuarascáil Bhliantúil 2013
45
BuncranaBundoranCardonagh MixedCranfordCreeslough/DunfanaghyDonegal/River EskeFalcarragh/GortahorkFrosses/InverGlenties/ArdaraInishowen East
LetterkennyLettermacwardLough MourneMilfordRosses Regional
Location Number of Samples Range (mg/L) Median (mg/L)
KinsellaghLough Gill/ CairnesLough EaskeyLough TaltNorth Leitrim RegionalSouth Leitrim RegionalNorth Sligo Regional SupplySouth Sligo RegionalKillaraght Lough Gill/ Foxes DenKinlough Tullaghan
Location Number of Samples Range (mg/L) Median (mg/L)
171414151915141313183114191537
0.47 - 0.830.67 - 0.770.62 - 0.750.66 - 0.83
<0.10 - 0.730.55 - 0.62
< 0.100.52 - 0.65
<0.100.59 - 0.750.55 - 0.730.62 - 0.70
<0.10 - 0.830.67 - 0.70
<0.10 - 0.69
0.650.690.650.730.670.58
<0.100.64
<0.100.680.640.670.720.68
<0.10
1112121211121312131212
0.65 - 0.700.64 - 0.68
<0.10 - 0.700.61 - 0.73
<0.10 - 0.680.69 - 0.830.65 - 0.880.48 - 0.770.16 - 0.800.49 - 0.670.71 - 0.75
0.670.640.610.660.650.720.730.660.590.640.73

Western Region - Public Analyst’s Laboratory
Saotharlann an Anailisí Phoiblí
46
Appendix 5: Fluoridation of Water Supplies – HSE West for 2013
FLUORIDATION OF WATER SUPPLIES :- LIMERICK
FLUORIDATION OF WATER SUPPLIES :- CLARE
FLUORIDATION OF WATER SUPPLIES :- NORTH TIPPERARY
BallyvaughanEnnis
KildysartRockmountNorth ClareShannonWest Clare New DooloughWest Clare Old Doolough
Location Number of Samples Range (mg/L) Median (mg/L)
BorrisokaneMurroeNenaghRoscreaThurlesTemplemore
Location Number of Samples Range (mg/L) Median (mg/L)
114131312141312
0.680.72 - 0.780.61 - 0.730.60 - 0.940.57 - 0.740.60 - 0.780.54 - 0.800.58 - 0.79
0.680.740.650.740.690.690.640.71
121314142412
0.63 - 0.72<0.10
0.19 - 0.770.58 - 0.73
<0.10 - 1.190.12 - 0.54
0.66<0.100.620.670.670.13
Limerick CityBallyneety
Location Number of Samples Range (mg/L) Median (mg/L)
2312
0.58 - 0.680.59 - 0.69
0.650.66
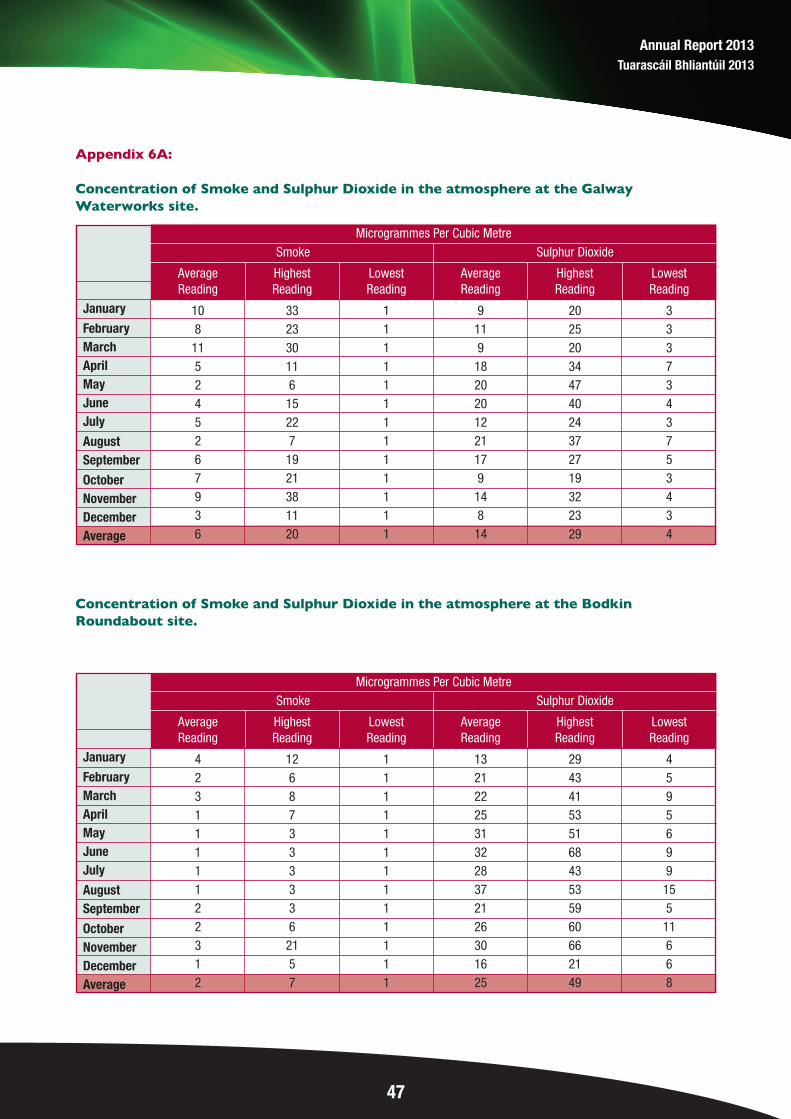
Appendix 6A:
Concentration of Smoke and Sulphur Dioxide in the atmosphere at the GalwayWaterworks site.
Concentration of Smoke and Sulphur Dioxide in the atmosphere at the BodkinRoundabout site.
Annual Report 2013
Tuarascáil Bhliantúil 2013
47
Microgrammes Per Cubic MetreSmoke Sulphur Dioxide
AverageReading
HighestReading
LowestReading
AverageReading
HighestReading
LowestReading
January
FebruaryMarchAprilMayJuneJuly
AugustSeptember
OctoberNovemberDecemberAverage
108
115245267936
332330116
15227
1921381120
1111111111111
9119
1820201221179
148
14
20252034474024372719322329
3337343753434
Microgrammes Per Cubic MetreSmoke Sulphur Dioxide
AverageReading
HighestReading
LowestReading
AverageReading
HighestReading
LowestReading
January
FebruaryMarchAprilMayJuneJuly
AugustSeptember
OctoberNovemberDecemberAverage
4231111122312
12687333336
2157
1111111111111
13212225313228372126301625
29434153516843535960662149
4595699
155
11668

Western Region - Public Analyst’s Laboratory
Saotharlann an Anailisí Phoiblí
48
Appendix 6B:
PM10 RESULTS MASS CONCENTRATION (M.C) µg/m3 2013
Station: Bodkin Roundabout Galway City Council 24 Hour M.C. µg/m3
No. of days exceeding 50μg/m3 for year 2013 = 11 Mean daily value for 2013 =21 μg/m3
Day Jan Feb March April May June July Aug Sept Oct Nov Dec01
020304050607
0809
10111213
141516171819
2021
22232425
2627
28293031MonthlyMeanNo. of Days
exceeding
50µg/m3
18-
621622118
35262418202112181616102532
4435303211121439282529
23
1
1615---
15-
20207
2417141425123722-
44
48334239-
543730
26
1
475656666854-
1719242715129
12149
192233
2112254943362840743226
32
6
3328283328324267614520162041223515171312
2219189
111323181428
26
2
16451719183239129
1919152115317
1388
11
1418222319121516171015
18
0
281211202549642421307
30-
12151915132419
11214814232210<51225
22
1
20119
2025321218191327171711193318202816
-----------
19
0
1019111378
1612111012118
<56
14127
1617
83510115
111019<51231
13
0
451914131078
111711<57
201614189
121926
8111537423448373632
20
0
-15138
107
159
11352823233930162212139
1216181811132210162220
17
0
2511192312141711189
2022192223186
101414
19393427241616272119
19
0
1722141521111021161926141719172015221318
2111172820152310101612
17
0

Annual Report 2013
Tuarascáil Bhliantúil 2013
49
Appendix 7:
Outline Summary of Cosmetics Chemical Surveillance Programme 2013 (HSE West,Dublin Nth East & Mid Leinster)
Survey/SamplesNumber
ofSamples
Chemical TestParameter(s)
Feb 1st-8th Miscellaneous Childrens’ Low-cost Cosmetics 35 Heavy Metals
Mar 1st-8th Miscellaneous Irish-manufactured Cosmetics 20 Formaldehyde, Labelling, Heavy Metals
Apr 1st-5th Hair-straightening Products (Salons etc) 20 Formaldehyde…(Other aldehydes, methanol)
May 1st-10th Miscellaneous Lips’ Cosmetics etc &Ethnic Eye Cosmetics (Kohl , Eye Liners etc) &Tattoo Products 20 Heavy Metals
June 3rd -7th Baby Wipes & Other Wipes 25 Methanol, Others (IPBC), General Exam’n, including labelling etc
June 3rd-7th Hair Dyes , Black Henna Tattoos & Hair Products 20 p-Phenylenediamine, Oxidation Colourants(Pb, Cd, Cr, Ni, As)
July 1st-5th Childrens’‘Leave-on’ Cosmetics 20 Allergens, Methanol, Preservatives
Aug 1st – 9th Infants’ Leave-on Cosmetics, Nappy Area 20 Methanol, Others, General Exam’n, including labelling etc
Sept 2nd-6th Tooth-whitening products 30 Hydrogen peroxide
Sept 2nd-6th Hair Bleaches 15 Peroxide(s)…
Oct 1st-4th Halloween Cosmetics 25 Heavy Metals
Nov 1st-8th Skin-lightening Creams, Lotions & Soaps 20 Hydroquinone & Hg.(also Kojic Acid etc testing in PALCork)
Dec 2nd-6th Christmas Cosmetics 15 Heavy Metals, Others
Total 285General: Non-routine samples (Complaints, RAPEX etc); Some Method development work etc ongoing.Hydroquinone & Hg in Skin-Lightening Creams: testing ongoing; available by prior consultation with Laboratory.General and Labelling examination ongoing.
Period
January -December

Western Region - Public Analyst’s Laboratory
Saotharlann an Anailisí Phoiblí
50
Appendix 8:
Public Analyst: Mr. Rory Mannion
Deputy Public Analyst: Vacant (Since Nov 2009)
Deputy Public Analyst: Dr. Padraig Burke
Quality Manager: Dr. Helena McGrath
Executive Analytical Chemists:Ms. Sharon CroweDr. Michelle CuffeDr. Caroline LardnerDr. Brenda LennonDr. Christopher LaffeyDr. Andrew FlanaganDr. Leonie WallaceDr. Declan CostelloDr. Katie CoyleDr. Gayle Kealy
Chief Technician: Vacant (Since Aug 2007)
Senior Laboratory Technicians: Mr. John CreavenMr. Martin PattenMs. Mary FinanMs. Patricia ThorntonMs. Eithne ClasbyMs. Elaine GoldrickMs. Suzanne Davoren
Laboratory Technicians: Ms. Cecily GilmoreMr. Martin GilliganMs. Noelle BrennanMr. Tom FogartyMr. Eric CostelloMs. Caitriona GreaneyMs. Sylvia O’FlynnMs. Nora MaddenMs. Amanda McCarronMs. Deirdre MuldoonMs. Aileen MaughanMr. Tommy HeneghanMs. Mary RabbitteMs. Caroline LuptonMs. Louise MannionMs. Hilary Hardy
Asst. Staff Officer: Vacant (Since 2010)
Clerical Officers: Ms. Eileen MannionMrs. Attracta LohanMs. Aine MahoneyVacant position (Since Oct 2007)
Housekeeper: Ms. Theola Busch
Student: Ms. Leanne Kelly (Jan- June)

Annual Report 2013
Tuarascáil Bhliantúil 2013
51
Glossary of Abbreviations
ADI Acceptable Daily IntakeBfR German Risk Assessment AuthorityBIP Border Inspection PostsBOD Biochemical Oxygen DemandCAP Centrally Authorised ProductsCOD Chemical Oxygen DemandCODEX Codex Alimentarius CommissionCOPHES Consortium to Perform Human Bio-Monitoring on a European ScaleDAFM Department of Agriculture, Food and the MarineDOH Department of HealthEA European co-operation for AccreditationEDEN Environmental Data Exchange NetworkEDQM European Directorate for the Quality of Medicines and HealthCareEFSA European Food Safety AuthorityEHO Environmental Health OfficerEHS Environmental Health ServiceELISA Enzyme-linked immunosorbent assayEPA Environmental Protection AgencyEQUAS External Quality Assurance SchemeFSAI Food Safety Authority of IrelandFSLS Food Safety Laboratory ServiceHACCP Hazard Analysis and Critical Control PointHBM Human Bio-MonitoringHPLC High Performance Liquid ChromatographyHSE Health Service ExecutiveHVP Hydrolysed Vegetable ProteinIARC International Agency for Research on CancerICIs Inter-laboratory Comparison InvestigationsICP-MS Inductively coupled plasma mass spectrometryIMB Irish Medicines BoardINAB Irish National Accreditation BoardIR Infra-RedLIMS Laboratory Information Management SystemLOD Limit of DetectionLOQ Limit of QuantitationMJA Mutual Joint AuditMRP/DCP Mutually Recognised Products/Decentralised ProductsNCA National Consumer AgencyNMR Nuclear Magnetic ResonanceNRL National Reference LaboratoryNSAI National Standards Authority of IrelandNTU Nephelometric Turbidity UnitsOCCL Official Cosmetic Control LaboratoriesOMCL Official Medicines Control LaboratoriesPAL Public Analyst LaboratoryPCCC Primary Continuing and Community CarePEMSAC Platform of European Market Surveillance Authorities for CosmeticsPTS Proficiency Testing SchemesQA Quality AssuranceRAPEX EU Rapid Alert System for Non-Food ProductsRASFF EU Rapid Alert System for Food and Feedsafefood safefood, The Food Safety Promotions BoardS.I. Statutory InstrumentSOPs Standard Operating ProceduresTHMs TrihalomethanesUV Ultra-violetVOCs Volatile Organic CompoundsVWA Food and Consumer Product Safety Authority of The NetherlandsWHO World Health OrganisationXRF X-Ray Fluorescence

Western Region - Public Analyst’s Laboratory
Saotharlann an Anailisí Phoiblí
52
Notes:
________________________________________________________________________________
________________________________________________________________________________
________________________________________________________________________________
________________________________________________________________________________
________________________________________________________________________________
________________________________________________________________________________
________________________________________________________________________________
________________________________________________________________________________
________________________________________________________________________________
________________________________________________________________________________
________________________________________________________________________________
________________________________________________________________________________
________________________________________________________________________________
________________________________________________________________________________
________________________________________________________________________________
________________________________________________________________________________
Copyright © 2022 FDOKUMEN