Web-Based Interrogation of Large-Scale Geophysical Data Sets and Clustering Analysis of Many...
17
1 Web-Based Interrogation of Large-Scale Geophysical Data Sets from Handheld Devices Zachary A. Garbow 1 , Gordon Erlebacher 3 , David A. Yuen 1 , John M. Boggs 2 , and Fabien W. Dubuffet 1 1 Department of Geology and Geophysics, University of Minnesota Supercomputing Institute, University of Minnesota, Minneapolis, MN 55455-0219, U.S.A. 2 University of Minnesota Supercomputing Institute, University of Minnesota, Minneapolis, MN 55455-0219, U.S.A. 3 School of Computational Science & Information Technology, Florida State Univiversity, Tallahassee, FL 32306-4120, U.S.A. Submitted to Electronic Geosciences, August 2002. Abstract: This paper describes the issues related to using handheld devices to interrogate wirelessly large-scale geophysical data over the web using a client-server configuration. A modification of our current web-based data interrogation program addresses specifically the limitations of current handheld devices with wireless access, such as processor speed, screen size and resolution, memory and network speeds. The system uses a combination of Java, Python and C in order to run remotely from the handheld device, while incorporating the power and memory capacity of a large workstation server. Introduction: The size of datasets in the geosciences is growing at a tremendous pace due to inexpensive memory, increasingly large storage space, fast processors and constantly improving data-collection instruments, including geodetic and satellite campaigns to collect more data. For example, the Earthscope project, slated to begin in the very near future, is expected to generate daily outputs of over 10 terabytes. Unfortunately, although the speed of computers and the affordability of large amounts of onboard memory are both increasing at an incredible pace, the same cannot be said for the available bandwidth. Consequently, the networks cannot keep up with the size of the datasets, and approaches to data analysis other than straight downloading of the datasets must be envisioned and implemented. Users demand the capability to explore and query very large datasets within a simplified framework keeping the transfer of raw data to a minimum. We have previously developed a web-based interactive data interrogation system that allows users to remotely analyze data over the Internet using a client-server paradigm (Garbow et al., 2001). This system promotes portability, dynamic results on-demand, and collaboration among researchers separated by long distances. This data extraction
Transcript of Web-Based Interrogation of Large-Scale Geophysical Data Sets and Clustering Analysis of Many...

1
Web-Based Interrogation of Large-Scale Geophysical Data Sets from Handheld Devices
Zachary A. Garbow1, Gordon Erlebacher3, David A. Yuen1, John M. Boggs2, and Fabien
W. Dubuffet1 1 Department of Geology and Geophysics, University of Minnesota Supercomputing Institute, University of Minnesota, Minneapolis, MN 55455-0219, U.S.A. 2 University of Minnesota Supercomputing Institute, University of Minnesota, Minneapolis, MN 55455-0219, U.S.A. 3 School of Computational Science & Information Technology, Florida State Univiversity, Tallahassee, FL 32306-4120, U.S.A. Submitted to Electronic Geosciences, August 2002. Abstract: This paper describes the issues related to using handheld devices to interrogate wirelessly large-scale geophysical data over the web using a client-server configuration. A modification of our current web-based data interrogation program addresses specifically the limitations of current handheld devices with wireless access, such as processor speed, screen size and resolution, memory and network speeds. The system uses a combination of Java, Python and C in order to run remotely from the handheld device, while incorporating the power and memory capacity of a large workstation server. Introduction: The size of datasets in the geosciences is growing at a tremendous pace due to inexpensive memory, increasingly large storage space, fast processors and constantly improving data-collection instruments, including geodetic and satellite campaigns to collect more data. For example, the Earthscope project, slated to begin in the very near future, is expected to generate daily outputs of over 10 terabytes. Unfortunately, although the speed of computers and the affordability of large amounts of onboard memory are both increasing at an incredible pace, the same cannot be said for the available bandwidth. Consequently, the networks cannot keep up with the size of the datasets, and approaches to data analysis other than straight downloading of the datasets must be envisioned and implemented. Users demand the capability to explore and query very large datasets within a simplified framework keeping the transfer of raw data to a minimum. We have previously developed a web-based interactive data interrogation system that allows users to remotely analyze data over the Internet using a client-server paradigm (Garbow et al., 2001). This system promotes portability, dynamic results on-demand, and collaboration among researchers separated by long distances. This data extraction

2
technique is a form of data mining and provides tools for analyzing data remotely via the World Wide Web. Rather than transfer the full dataset to the several machines where it may be needed, the server becomes a data-vault: a single copy of the dataset need be stored. The interactive graphical user interface (GUI) provides a front-end to the user to facilitate data analysis from anywhere in the world, given a reliable, fast network. To further our idea of interactive data extraction, we have modified our current version to work on handheld devices connected to the Internet via a wireless connection. It is increasingly important to have access to large datasets from anywhere at anytime to test new ideas, share information, check on simulations, etc. Handheld devices such as the Palm, Compaq iPaq, and Hewlett Packard Jornada have become nearly ubiquitous in the everyday world and could ideally provide these services. The extreme portability of these devices has made them very convenient for organizing work and keeping track of information. However, because of their limitations in terms of processing power, screen size, memory and storage, they have not yet become practical vehicles for useful scientific work. Our aim is to successfully overcome the limitations of handheld devices to allow them to be used as a portable scientific research laboratory and to enhance current applications. To do so, we let the server take care of the intensive processing tasks while the handheld device provides the front-end user interface. Additionally, we wish for our system to conform to accepted standards, use common languages such as Java (java.sun.com 2002), C and Python (Lutz 2001; Fehily 2002; Python.org 2002) to maximize portability of the program and allow it to be platform-independent. In this paper we will demonstrate these interrogative capabilities by using data sets taken from high-resolution numerical simulations in mantle convection. Related Work: While there is an abundance of software packages on the market specifically targeted to the visualization of large datasets, there is relatively little effort aimed at coupling data interrogation and visualization, and even less using a client-server framework and specifically aimed at wireless connectivity. Global Positioning System (GPS) (randmcnally.com 2002) software and hardware are available for handheld devices. This lets a PDA acquire functionalities similar to those provided by our system. For example, a user can query pre-loaded maps to obtain detailed information about his/her location. In the case of GPS, the satellites act as servers, connecting to the GPS hardware on the PDA and returning information about the PDA’s location. However, all the maps must be preloaded onto the client (PDA) and therefore the number of maps that can be used at once is limited by the storage space of the PDA. Our system stores all the images on the server and loads them onto the client only when needed, which allows an almost limitless number of images to be used, albeit not simultaneously. Galligani et al. (2002) developed a web-based resource discovery facility for searching and downloading data stored in a geo-data server. Their system uses a high-level

3
interface that allows users to access cartographic and image databases. However, while implementing the client-server architecture, they focus on dataset retrieval, much like a specialized Internet search engine, and do not use a graphical interface for actually interrogating and interacting with the dataset once it is located. More closely related to our work, Andrienko and Andrienko (1999) have produced client-server software for exploring spatially referenced statistical data on maps, such as economical, demographic, or ecological data related to geographical locations. They created a system named Descartes (Andrienko and Andrienko, 1999), which was based on their previous IRIS system (Andrienko and Andrienko, 1999), which allows users to interactively explore data from onscreen maps in Java applets. While similar to our system, the focus of Descartes is to provide an interactive map-generation program to superimpose spatial data on the map in the form of bar charts, pie graphs, or shaded regions, to name a few. They are mainly concerned with displaying the information in a manner that is easily understood by the user. While our system deals with extremely large sets of raw data and how to distribute the processing of such data in an efficient manner between client and server, their system is more focused on displaying smaller structured data in an easy to understand format. They do not focus on or even discuss the client-server setup that they use, whereas that is an integral part of our system. In addition, they do not address the screen size constraints and bandwidth issues associated with wireless handheld devices. Recent work by Chen et al. (2002) on real time video-streaming techniques to handheld devices deals with issues that arise from using wireless access from handheld devices. They discovered that the main performance bottleneck stems from the limited processing power currently available in handheld devices. They also recognized the difficulty in creating systems that work consistently between machines of unique characteristics, including memory, screen size, processing power, network access, storage, etc. These issues are relevant in our current work. Description of the Data Sets: The first four datasets (A-D) refer to a particular run of 1,051,139 data points (2049x513) with Ra = 5x10⁶, variable and constant thermal conductivity, and extended Boussinesq approximation with adiabatic and viscous heating (Dubuffet et al., 2002). A. The temperature dataset (listed as “temperature” in the program’s dataset listing) (Dubuffet et al., 2002) illustrates the branching of the upwellings and downwellings. One can zoom into the branch point and focus on the cold or hot branches, using the histogram and statistics tools to find the relative magnitude of these branches.
B. The stream function (“streamout”) (Dubuffet et al., 2002) associated with this flow shows multi-cellular behavior. The structure and statistics can be analyzed at the interface between two cells with opposite signs.
4
C. In the case of the viscous heating (“visc_heat”)(Dubuffet et al., 2002) one can zoom in and view the histogram showing the strongly localized nature of the heating. D. The adiabatic heating (“adiab_heat”) (Dubuffet et al., 2002) can be interrogated to assess the amount of heat produced in the plume. Contour plots of the adiabatic heating function trace out the plumes. E. The F09_temp dataset (1025x257) has constant thermal conductivity and variable viscosity (Dubuffet et al., 2002). In the presence of finer structures, the use of the interrogator becomes more imperative to enable the temperature inside the small plumes at the bottom boundary layer to be selected in a precise manner. F. The dataset labeled “tp07” (4322x801) has extremely high Rayleigh number Ra = 1011 (Murphy et al., 2000). With over 3 million grid points the resolution is so large that the use of our interrogation tool for interactively viewing and analyzing minute areas is a necessity. By zooming into various sub regions one can see some of the substructures being developed. Only by scrutinizing the boundary layer locally can one hope to improve our understanding of the physics of the small plumes, for instance whether they go up or down. The histogram can be extremely useful in this situation to help accurately determine the local temperature distribution, which is very difficult to do with the naked eye at high resolution. Recent Work: Almost all aspects of the original web-based data interrogation program have changed and improved since the initial paper by Garbow et al. (2001). The following non-inclusive list of new and enhanced capabilities was added to the main program; unfortunately some of the new features could be successfully ported to the handheld device.
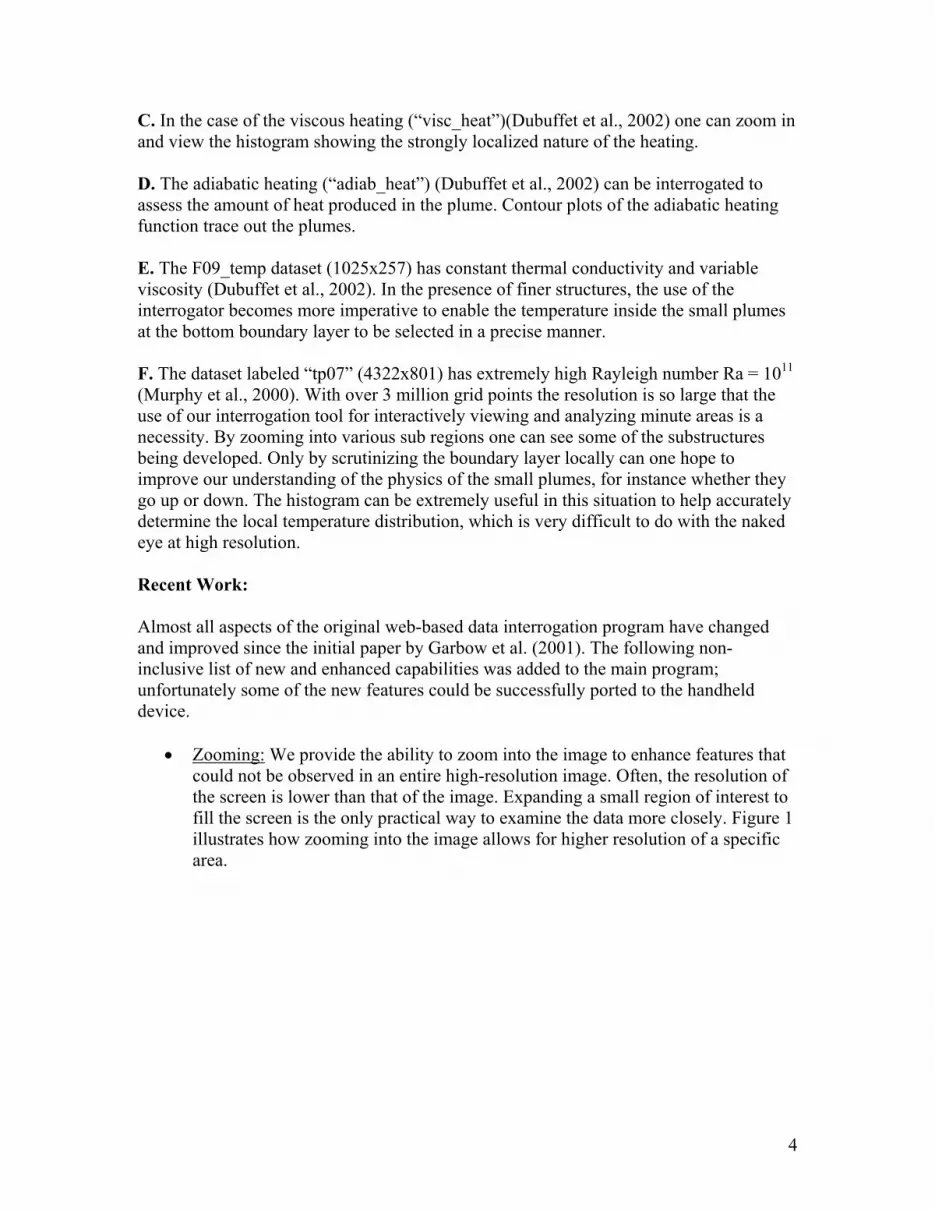
• Zooming: We provide the ability to zoom into the image to enhance features that could not be observed in an entire high-resolution image. Often, the resolution of the screen is lower than that of the image. Expanding a small region of interest to fill the screen is the only practical way to examine the data more closely. Figure 1 illustrates how zooming into the image allows for higher resolution of a specific area.
5
Figure 1. Zooming into the image of thermal conduction in dataset F (see descriptions of data) to see a section at higher resolution. The dataset contains a total of 3,461,922 grid points.
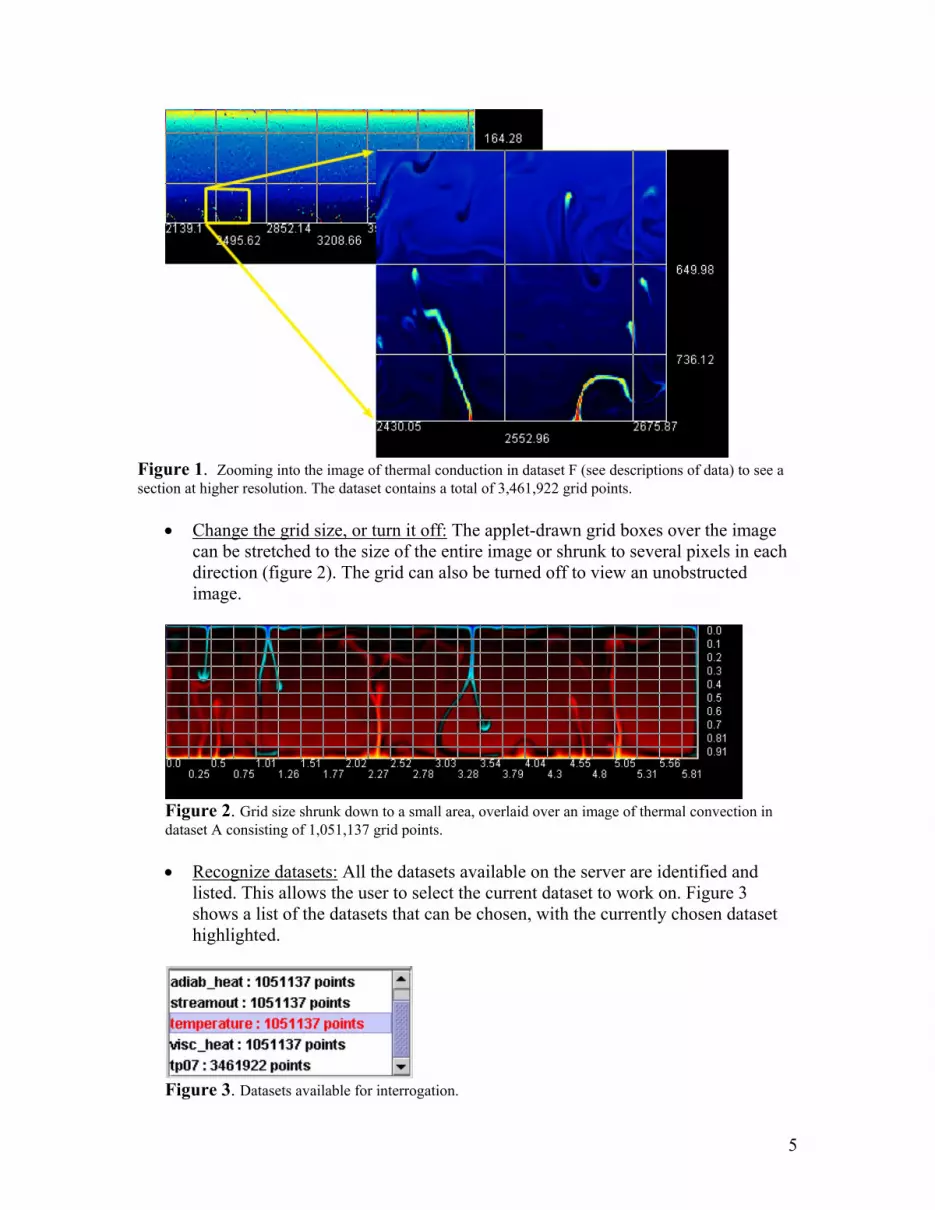
• Change the grid size, or turn it off: The applet-drawn grid boxes over the image
can be stretched to the size of the entire image or shrunk to several pixels in each direction (figure 2). The grid can also be turned off to view an unobstructed image.
Figure 2. Grid size shrunk down to a small area, overlaid over an image of thermal convection in dataset A consisting of 1,051,137 grid points.
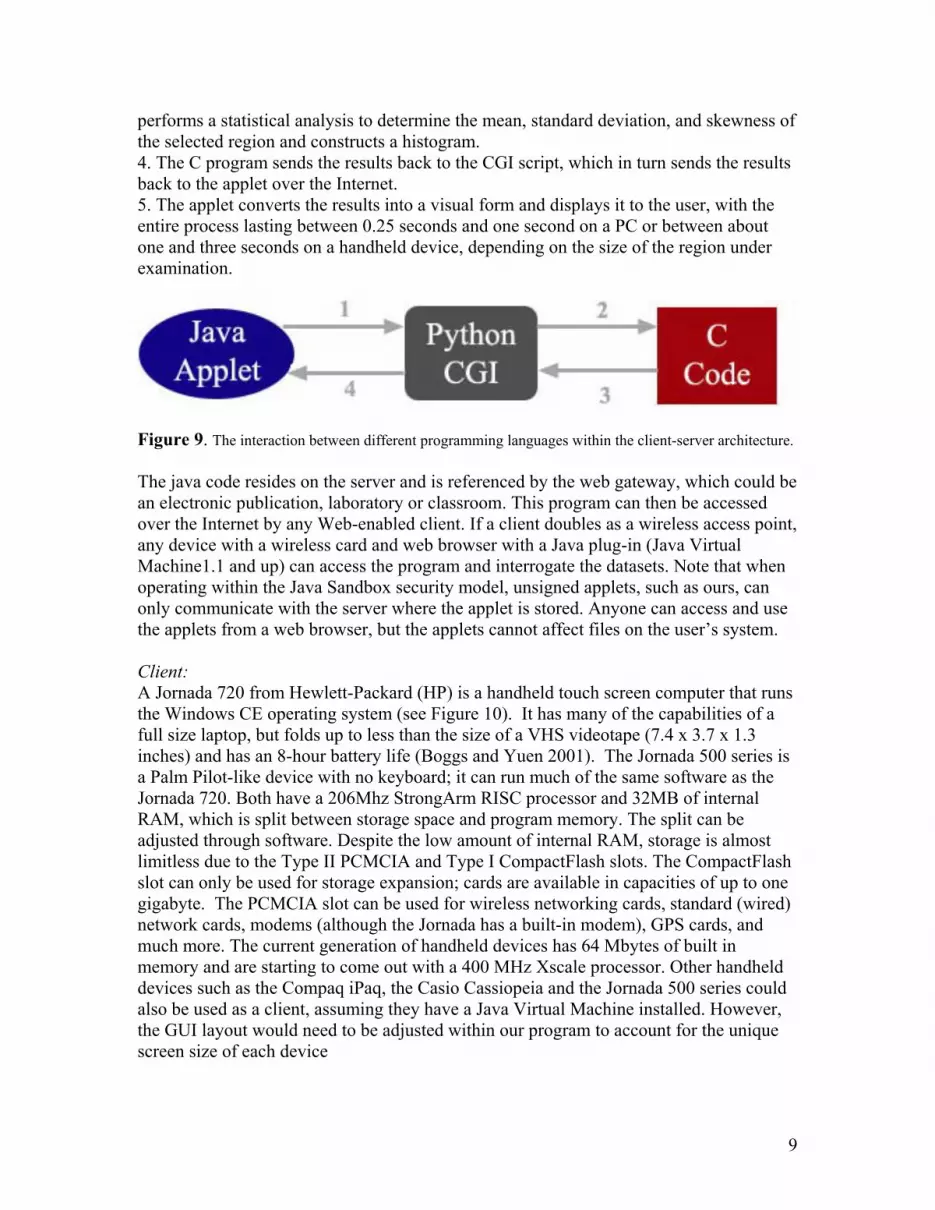
• Recognize datasets: All the datasets available on the server are identified and
listed. This allows the user to select the current dataset to work on. Figure 3 shows a list of the datasets that can be chosen, with the currently chosen dataset highlighted.
Figure 3. Datasets available for interrogation.

6
• Histogram Flexibility: The user can control the number of histogram bins, up to
160, to see fine-grained frequencies in the data. Figure 4 displays the same histogram values with different number of bins.
Figure 4. Histogram with 20 bins (left) and a histogram with 80 bins (right), collected from a small portion of dataset B.
• Copy Data: The results from an interrogation can be copied and compared to
future selections or saved for reference. Figure 5 shows how the information from a selected area appears in a pop-up window. The new window shows the histogram, statistical analysis, and image of the currently selected area.
Figure 5. ‘Copy data’ command copies the current histogram, statistics, and image of the selected area and opens a new window with this information. This window is taken from dataset A.
• Magnification Lens: This lens allows the user to temporarily magnify a small section of the image without fully zooming in. This is useful for scanning an image for salient features and identifying specific interesting areas to zoom into. Figure 6 shows how the magnification lens zooms into an elliptical portion of the

7
image to show that portion at a higher resolution. The size of the lens and magnification factor is adjustable.
Figure 6. Elliptical magnification lens shows a zoomed in portion of the image from dataset F, containing 3,461,922 grid points.
• Overlapping Lens: This lens provides the ability to superimpose another variable
onto the current image with an elliptical lens so that the relationship between two variables can be more easily discerned. For instance, Figure 7 shows how the viscous heating distribution is connected to the temperature field.
Figure 7. The Overlapping Lens superimposes an elliptical section of the viscous heating image from dataset C onto the temperature image from dataset A.
• Python CGI Scripts: The Perl CGI scripts (W3C, 1999) have been replaced with
Python CGI scripts to increase readability and to easily incorporate object oriented code for better scalability and future expansion.
Client-Server Architecture: To implement wireless interrogation of large datasets we use a client-server paradigm, illustrated in Figure 8.

8
Figure 8. Schematic diagram of the client-server setup. In terms of an N-tier model, our system has 3 tiers (Chartier 2002). The server is considered the Data Tier, which contains all the datasets and the appropriate programs to access, manipulate and deliver this data. The web gateway serves as the Presentation Logic Tier, which is the layer that contains the HTML code specifying the applet code base which identifies the applet code location for the browsers. The client itself is the Presentation Tier or GUI, which is the front-end interface through which the user interacts with the application. Platform-independence is helped by combining Java, Python and C in the following way (see Figure 9): 1. The user interacts with the applet from either a wired or wireless client. The applet is written in Java, stored on the server and embedded in a web page using HTML. 2. The applet sends the user-specified parameters as a URL to the CGI script written in Python, located on the server. The Common Gateway Interface (CGI) allows external applications to communicate with information servers, including web servers in our case. This key step allows the applet to interact with the C program over the Internet using the Python CGI script as an intermediary. 3. The CGI script passes the parameters sent by the Java applet to a C program that efficiently analyzes the user-specified area within the selected dataset. The C program
9
performs a statistical analysis to determine the mean, standard deviation, and skewness of the selected region and constructs a histogram. 4. The C program sends the results back to the CGI script, which in turn sends the results back to the applet over the Internet. 5. The applet converts the results into a visual form and displays it to the user, with the entire process lasting between 0.25 seconds and one second on a PC or between about one and three seconds on a handheld device, depending on the size of the region under examination.
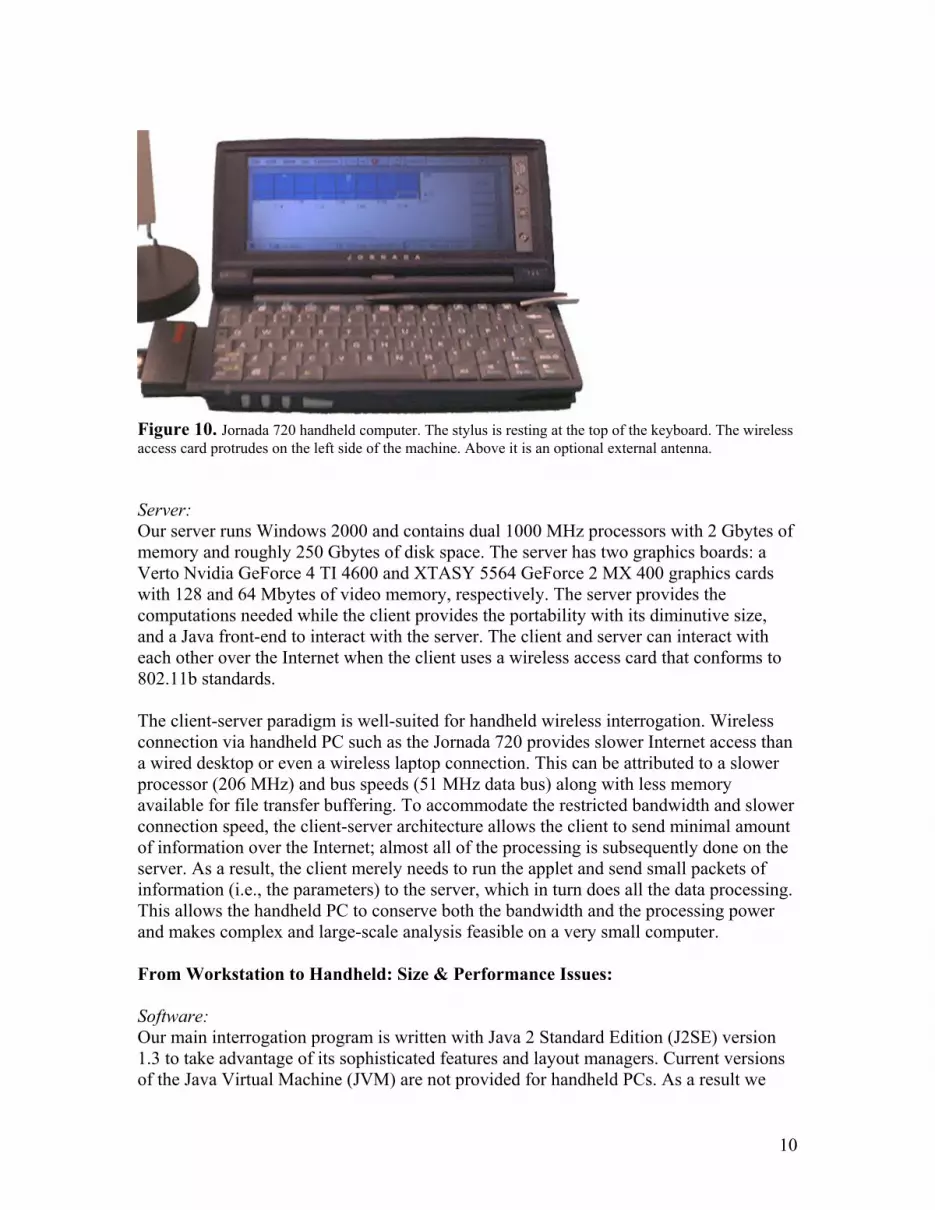
Figure 9. The interaction between different programming languages within the client-server architecture. The java code resides on the server and is referenced by the web gateway, which could be an electronic publication, laboratory or classroom. This program can then be accessed over the Internet by any Web-enabled client. If a client doubles as a wireless access point, any device with a wireless card and web browser with a Java plug-in (Java Virtual Machine1.1 and up) can access the program and interrogate the datasets. Note that when operating within the Java Sandbox security model, unsigned applets, such as ours, can only communicate with the server where the applet is stored. Anyone can access and use the applets from a web browser, but the applets cannot affect files on the user’s system. Client: A Jornada 720 from Hewlett-Packard (HP) is a handheld touch screen computer that runs the Windows CE operating system (see Figure 10). It has many of the capabilities of a full size laptop, but folds up to less than the size of a VHS videotape (7.4 x 3.7 x 1.3 inches) and has an 8-hour battery life (Boggs and Yuen 2001). The Jornada 500 series is a Palm Pilot-like device with no keyboard; it can run much of the same software as the Jornada 720. Both have a 206Mhz StrongArm RISC processor and 32MB of internal RAM, which is split between storage space and program memory. The split can be adjusted through software. Despite the low amount of internal RAM, storage is almost limitless due to the Type II PCMCIA and Type I CompactFlash slots. The CompactFlash slot can only be used for storage expansion; cards are available in capacities of up to one gigabyte. The PCMCIA slot can be used for wireless networking cards, standard (wired) network cards, modems (although the Jornada has a built-in modem), GPS cards, and much more. The current generation of handheld devices has 64 Mbytes of built in memory and are starting to come out with a 400 MHz Xscale processor. Other handheld devices such as the Compaq iPaq, the Casio Cassiopeia and the Jornada 500 series could also be used as a client, assuming they have a Java Virtual Machine installed. However, the GUI layout would need to be adjusted within our program to account for the unique screen size of each device
10
Figure 10. Jornada 720 handheld computer. The stylus is resting at the top of the keyboard. The wireless access card protrudes on the left side of the machine. Above it is an optional external antenna. Server: Our server runs Windows 2000 and contains dual 1000 MHz processors with 2 Gbytes of memory and roughly 250 Gbytes of disk space. The server has two graphics boards: a Verto Nvidia GeForce 4 TI 4600 and XTASY 5564 GeForce 2 MX 400 graphics cards with 128 and 64 Mbytes of video memory, respectively. The server provides the computations needed while the client provides the portability with its diminutive size, and a Java front-end to interact with the server. The client and server can interact with each other over the Internet when the client uses a wireless access card that conforms to 802.11b standards.
The client-server paradigm is well-suited for handheld wireless interrogation. Wireless connection via handheld PC such as the Jornada 720 provides slower Internet access than a wired desktop or even a wireless laptop connection. This can be attributed to a slower processor (206 MHz) and bus speeds (51 MHz data bus) along with less memory available for file transfer buffering. To accommodate the restricted bandwidth and slower connection speed, the client-server architecture allows the client to send minimal amount of information over the Internet; almost all of the processing is subsequently done on the server. As a result, the client merely needs to run the applet and send small packets of information (i.e., the parameters) to the server, which in turn does all the data processing. This allows the handheld PC to conserve both the bandwidth and the processing power and makes complex and large-scale analysis feasible on a very small computer. From Workstation to Handheld: Size & Performance Issues: Software: Our main interrogation program is written with Java 2 Standard Edition (J2SE) version 1.3 to take advantage of its sophisticated features and layout managers. Current versions of the Java Virtual Machine (JVM) are not provided for handheld PCs. As a result we

11
have programmed our handheld software to be compatible with Java Virtual Machine 1.1, which allows it to be used by any device that has any JVM in its web browser. This approach has some limitations: to make the software compatible with as many systems as possible while using Java 1.1, many of the more advanced features that we used in the main program had to be changed or taken out completely in the handheld version. For example, images in the handheld version can only be in gif format, rather than jpg. Action Listeners for the rubberbanding features do not behave consistently across different platforms. Advanced layout managers in the Swing API had to be replaced by harder to use, older AWT managers. In addition, lower-level GUI programming is required when writing a Java program compatible with Java 1.1. Screen Size: The Jornada has a screen resolution of 640x240, whereas a desktop computer often has its monitor set to a resolution around 1280x1024. A comparison of the two screens is shown in Figure 11.

12
Figure 11. Comparison of the Jornada and desktop screen ratios (top), and a comparison of the actual program sizes (bottom). The diminutive screen size of the PDA makes impossible for all the options of the full version to be simultaneously displayed and concessions must be made to maximize the screen real estate. This involves techniques to hide certain options until they are needed, and some results cannot be compared side-to-side. For instance, the visualized data image, the histogram, and the statistical results cannot all be viewed on the screen together and the user must toggle back and forth between them. Figure 12 shows how to toggle between screens. Only one of the screens can be shown at a time. While this hurts the user’s ability to compare results such as the histogram and the statistical analysis to the original image, it allows each component to use the full screen and to be displayed as large as possible.
Figure 12. The view on the handheld must be toggled. Shown here are the image screen selected (top), and the histogram screen selected (bottom), using dataset A. Only one can be shown at a time on the handheld device. Processor Speed/Memory: The Jornada Handheld PC we have been using the past year has a 206 MHz StrongARM processor with up to 32 megabytes of memory (dual partitioned as storage). While these specifications make the Jornada one of the fastest handheld computers on the market, the lack of sufficient processing power still prevents the Jornada from smoothly handling many aspects of the data interrogation program including loading the images, toggling between image and histogram and displaying the histogram immediately. The client-server architecture helps to alleviate the processing load required on each client.

13
However, even with our previous client-server setup for the main version of our data interrogation program, the Jornada struggles with the basic image manipulation. Figure 13 shows the time it takes to load various images of various sizes using a wireless connection. This was tested with both a Jornada and a 700 MHz laptop PC connected to the network wirelessly. The network bandwidth was equal for both the Jornada and the laptop, yet the Jornada loaded the images much slower, indicating that its lack of processing power, memory and its relatively slow bus speed make it struggle to load images. A possible solution to this problem would be to use Java Remote Method Invocation (RMI), which is a distributed-computing architecture similar to CORBA. This would allow the client to send information to the server, requesting the resolution and portion of the image it wishes to display, and have the server send back only the pixels that will displayed. However, the Jornada’s JVM does not support RMI so this technique cannot be used.
0
5
10
15
20
25
30
35
40
0 100 200 300 400 500
Image Size (KB)
Tim
e to
Loa
d Im
age
(s)
Jornada
Laptop
Figure 13. Amount of time it takes to load various sizes of images using a wireless connection on the Jornada and a laptop PC. Network Speed: Our wireless connections operate under the current 802.11b wireless standard with a bandwidth of 11 megabits/second. The newer 802.11a wireless standard operates at a higher frequency and uses a different modulation scheme to allow data speeds as high as 54 Mbps (802.11 Planet.com 2002). Since we require the client to merely send the parameters indicating the area of the data that the user wants queried, this amount of bandwidth should easily satisfy our current needs. Only a small amount of information is

14
being exchanged over the Internet, which allows for fast response times on the client-side. To determine how relevant the network speed is to our program, we interrogated data using our program on the Jornada with various connection qualities and dataset sizes. Figure 14 illustrates these results. The wireless bandwidth is defined qualitatively as marginal, good, and excellent. We see that the quality of the connection makes little or no difference to the speed at which we receive the results. This indicates that even with a marginal connection there is still plenty of bandwidth to spare. This results from the server performing all the calculations based on the minimal amount of information sent by the client over the Internet.
0
0.5
1
1.5
2
2.5
3
0 0.5 1 1.5 2 2.5 3 3.5 4
Datapoints Queried (millions)
Tim
e to
Rec
eive
Res
ults
(s)
Marginal Connection
Good Connection
Excellent Connection
Figure 14. Data Query Times for a Wireless Connection on a Handheld PC (HP Jornada 720). Discussion/Concluding Remarks: Dataset interrogation and data mining are becoming increasingly important because of the immense size of datasets. The datasets themselves are becoming too large to easily move from one machine to another, which necessitates the use of a client-server paradigm. In addition, the images are becoming too large to display in full resolution on a single computer screen so techniques for parsing the results and viewing them in a different manner are needed. Histograms are one method for viewing the data to discover information that was not visible in the image itself. In addition, techniques to easily navigate through the large image are essential for discovering relevant structures within the data.

15
Wavelet techniques are a means of not only data compression, but can also allow the user to exercise finer control over the scales and position of data. Wavelets can be used to identify and isolate features of interest. An example of this includes the Emax/Kmax technique based on local spectra (Bergeron et al., 2001). Wavelets used in conjunction with our data interrogation program would allow a user to analyze the data within particular structures, for example an isolated upwelling or downwelling in 3-D mantle convection. The availability and use of handheld technologies will continue to spread as handheld devices become more powerful and additional software is built for them, including robust operating systems such as Linux and BSD UNIX. The lack of decent handheld software development and support forced us to adopt an old version of Java. This severely limits our programming capabilities and prevents our programs from running as efficiently as they could. A pertinent example relates to the severe restrictions our handheld program faces when dealing with images. The Jornada is not powerful enough to manipulate images quickly, yet solutions to fix this problem cannot yet be supported by the Jornada’s software. Even jpg images cannot be manipulated and displayed yet they offer the best compression! As the hardware speed and software production for handheld devices increases, their use will continue to grow. Handheld devices will effectively be used as a supplement to PCs (Meyers, 2001), in conjunction with servers for scientific research, and they will become prevalent in educational settings. Handhelds are ideal for interaction between students and professors, allowing students to silently submit questions in real-time and to interact simultaneously with the instructor, perhaps even editing the lecturer’s code or manipulating results. There are several small new computers that have been introduced recently. The Sony Vaio PCG-U1 (Sony Japan 2002) and the Fujitsu Loox S Series (FMWorld.net 2002) are subnotebook computers that have been introduced only in Japan. While each of these devices has 256 MB of memory and use a Transmeta Crusoe chip at speeds of 867 MHz and 733 MHz, respectively, they are significantly larger than the Jornada 720 and other handheld and palmtop devices. The Vaio U1 has dimensions of 184.5 x 139 x 46.1mm and the Loox is 231 x 149.5 x 26.5mm, compared to the Jornada at 188 x 94 x 33mm. These two computers also weigh more than the Jornada’s 520g, with the U1 weighing 820g and the Loox weighing 890g. Antelope Technologies (Antelope Technologies 2002) has recently developed a small tablet-like device that can run Windows XP or Linux. It is based on a new PC architecture called “mobile computer core” and contains 256 MB of memory and a 10 GB hard disk all enclosed within dimensions of 126 x 72 x 18.5 mm and weighing a mere 390g. This truly mobile and powerful device will likely replace many of the current handheld and palmtops sold today. In the future we wish to improve on the techniques we have presented by increasing the efficiency of the program. The most glaring need for an improvement is the image

16
manipulation, which we would like to be more server-oriented to take the load off the handheld. In addition, more GUI controls are required to improve the program’s flexibility and functionality. Technologies such as JXTA (jxta.org 2002) for peer-to-peer (P2P) communication would allow 2 or more handheld devices to work together to control the program. For example, one device could handle the GUI controls so that the other device could use its full screen to show the image or histogram. There are many ways we can improve the functionality of our program and as handheld technology continues to advance, so will our ability to turn handheld devices into practical scientific tools. Acknowledgements: This research has been supported by the National Science Foundation and Department of Energy. We thank Erik O. Sevre and Tomo K.B.Yanagawa for their discussions and advice. Bibliography: 802.11 Planet.com, The Source for 802.11 Business and Technology, http://www.80211-planet.com/, INT Media Group, 2002. Andrienko, G.L. and N.V. Andrienko, Interactive Maps for Visual Data Exploration, Int. J. Geographical Information Science, Vol. 13, No. 4, 355-374, 1999. Antelope Technologies, A Revolution in Personal Computing, http://www.antelopetech.com/ 2002. Bergeron, S.Y., Yuen, D.A. and A.P. Vincent, Looking at the Inside of the Earth with 3-D Wavelets: A Pair of New Glasses for Geoscientists, Electronic Geosciences, Vol. 5, 2001. http://link.springer.de/link/service/journals/10069/fpapers/0005001/00050003.htm
1. Boggs, J.M. and D.A. Yuen, Wireless Internet Access Across an American Street, http://www.msi.umn.edu/~boggsj/wireless.htm, 2001. Chartier, R., Application Architecture: An N-Tier Approach, INT Media Group, 2002. http://www.15seconds.com/issue/011023.htm Chen, D., Boisdet, J.F. and G. Erlebacher, Wavelet-based Real Time Video-Streaming to Handheld Devices, 15th International Conference on Computer Applications in Industry and Engineering, San Diego, CA, Nov 7-9, 2002, Submitted. Dubuffet, F., Yuen, D.A. and E.S.G., Rainey, Controlling Thermal Chaos in the Mantle by Positive Feedback From Radiative Thermal Conductivity, Nonlinear Process. Geophys., 129, pp. 359-375, 2002.

17
Earthscope, Earthscope Homepage, http://www.earthscope.org/, 29 July, 2002. Fehily, C., Python, 410 pp., Peachpit Press, 2002. FMWorld.net, Fujitsu Loox S Series, http://www.fmworld.net/product/frame/pcpm0205/biblo_loox/index_loox.html ,2002. Galligani, A. and O. Salvetti, A Web-based Resource Discovery Facility for a Geo-Data Server, Electronic Geosciences, DOI 10.1007/s10069-002-0003-5, http://link.springer.de/link/service/journals/10069/contents/tfirst.htm, 16 July, 2002. Garbow, Z.A., Olson, N.R., Sevre, E.O.D. and D.A. Yuen, Interactive Statistical Analysis of Complex Mantle Flows with the Web, Electronic Geosciences, Vol. 7, 2002. http://link.springer.de/link/service/journals/10069/free/discussion/zgarbow/index.html Garbow, Z.A., Olson, N.R., Yuen, D.A. and J.M Boggs, Interactive Web-Based Map: Applications to Large Data Sets in the Geosciences, Electronic Geosciences, Vol. 6, 2001. http://link.springer.de/link/service/journals/10069/ papers/webbased/index.htm java.sun.com- The Source for Java(TM) Technology, http://java.sun.com/, Sun Microsystems, 2002. Jxta.org, Project JXTA Website, http://www.jxta.org/, 2002. Lutz, M., Programming Python, 1255 pp., O’Reilly and Associates Inc, 2001. Meyers, B., Using Hand-Held Devices and PCs Together, Communications of the ACM, Volume 44, Issue 11, pp. 34-41, November, 2001. Murphy, M.S., Vecsey, L., Sevre, E.O. and D.A. Yuen, Secondary Upwelling Instabilities Developed in High Rayleigh Number Convection: Possible Applications to Hot Spots, Electronic Geosciences, Vol. 5, 2000. http://link.springer.de/link/service/journals/10069/free/discussion/murphy/murphy.html Python.org, The Python Language Website, http://www.python.org/, 2002. Rand McNally Travel Store, http://www.randmcnally.com, 2002. Rodrigues, L.H., Building Imaging Applications with Java Technology, 857 pp., Addison-Wesley, 2001. Sony Japan, Vaio PCG-U1, http://www.sony.jp/products/Consumer/PCOM/PCG-U1/feat1.html, 2002. W3C, CGI: Common Gateway Interface, http://www.w3c.org/CGI, 1999.