We Need to Compare, but How? Measurement Equivalence in Comparative Public Administration
43
Electronic copy available at: http://ssrn.com/abstract=2509963 Please cite as: Jilke, Sebastian, Meuleman, Bart & Steven Van de Walle (forthcoming): 'We need to compare, but how? Measurement Equivalence in Comparative Public Administration'. Public Administration Review, in press.
-
Upload
georgetown -
Category
Documents
-
view
3 -
download
0
Transcript of We Need to Compare, but How? Measurement Equivalence in Comparative Public Administration

Electronic copy available at: http://ssrn.com/abstract=2509963
Please cite as:
Jilke, Sebastian, Meuleman, Bart & Steven Van de Walle (forthcoming): 'We need to compare,
but how? Measurement Equivalence in Comparative Public Administration'. Public
Administration Review, in press.
Electronic copy available at: http://ssrn.com/abstract=2509963
1
We need to compare, but how?
Measurement Equivalence in Comparative Public Administration
Sebastian Jilke ([email protected]),
Bart Meuleman,
Steven Van de Walle
Abstract
There is an increasing interest to study public administrations, public
managers or citizens interactions with, and views towards government from a
comparative perspective in order to put theories to test using cross-national
surveys. However, this will only succeed if we adequately deal with the diverse
ways respondents in different countries, and regions perceive, and respond to
survey measures. In this article, we provide an examination of the concept of
cross-national measurement equivalence in public management, and how to
proceed in establishing equivalence. We examine two different methodologies
that test, and correct for measurement non-equivalence, namely 1) multiple
group confirmatory factor analysis, and 2) item response theory. These
techniques are then used to test, and subsequently establish the cross-national
measurement equivalence of two popular measurement constructs, citizen
satisfaction with public services, and trust in public institutions. Results show
how appropriately dealing with non-equivalence accounts for different forms of
biases, which would otherwise stay undetected. In doing so, this article
contributes to the methodological advancement in studying public administration
beyond domestic borders.
Keywords: Citizen satisfaction, institutional trust, comparative public administration, item
response theory, measurement equivalence, multiple group confirmatory factor analysis
2
Introduction
Consider the following survey item: “Overall, how satisfied are you with your electricity
supplier? Please give me score from 0 to 10 where 0) means that you are not satisfied at all,
and 10) that you are fully satisfied”. This is one out of a battery of items that taps citizens’
satisfaction with public services across a wide range of countries. The underlying assumption
of asking the same set of items to respondents in different national populations is that their
answers are supposed to be comparable. In other words, it is assumed that perceptions of what
satisfaction means, and the way in which people use assigned scales are equivalent across
countries, allowing for meaningful comparisons. But is the general notion of what a satisfactory
public service is really equivalent across countries, regions, (groups of) individuals or even
over time? And are patterns of response styles the same across different cultures? In this article,
we introduce two major techniques for detecting, and correcting non-equivalence into the
field of public administration, and show how these methods can be implemented in applied
research.
Comparing public administrations, public managers or citizens interactions with, and
attitudes towards government across countries is gaining ground in public administration
research (e.g. Jilke 2014; Kim et al. 2013; Pollitt and Bouckaert 2011; Van Ryzin 2011). This is
accompanied by an increase in availability of cross-national surveys that contain questions
relevant for public administration research, such as the International Social Survey Programme,
the Eurobarometer, the COCOPS survey of public managers, or the COBRA survey of
government agencies’ executives, among many others. Making use of such cross-national
survey data gives us the opportunity to test the geographical range of social theories by
assessing them in many different contexts. Moreover, having survey data from numerous

3
countries enables us to investigate various micro-macro relations by utilizing data from the
individual and the country level. Such cross-level interactions permit us to more closely look at
interesting relationships between context and individuals, allowing us to explicitly test
contextual theories.
However, when respondents in different countries regard measurement constructs in a
different manner, or exhibit culturally influenced response patterns, we typically obtain biased
survey measures (Poortinga 1989; Van de Vijver and Leung 1997). Practically speaking, the
response of a person in country A, say to the item on satisfaction we used as an example, may
have the same scale-position than the response of another person in country B, but it could
mean something entirely different if the way respondents interpret or respond to it differs
substantially. By simply looking at mean levels of survey responses, however, we do not know
whether the answers of both respondents can be meaningfully compared. This puts empirical
tests at risk as we cannot confidently claim measurement equivalence, and may end up
comparing apples and oranges. In such a case, results from statistical estimations, so as the
theoretical implications that we draw from cross-national data, are invalid and can lead to
spurious conclusions.
In this article we provide an examination of the concept of cross-national measurement
equivalence in public administration, and how to proceed in establishing the comparability of
survey measures. It is structured as follows: first we introduce the concept of measurement
equivalence and elaborate on the importance of utilizing appropriate techniques to deal with
measurement non-equivalence in comparative public administration research. We report from a
systematic literature review of empirical studies using cross-national surveys in public
administration and investigate if, and how those works haven taken the issue of measurement
(non-)equivalence into account. Consecutively, we introduce two procedures on how to detect,

4
account and even explicitly correct for measurement non-equivalence, namely multiple group
confirmatory factor analysis (MGCFA) and item response theory (IRT). While MGCFA, is
most appropriate for continuous data, IRT modeling is best suited for ordered-categorical (or
binary) items
1
. We, furthermore, illustrate the application of these statistical procedures using
two empirical examples on 1) citizens’ satisfaction with public services, and 2) trust in public
institutions. Our findings indicate how appropriately dealing with non-equivalence accounts for
different forms of biases, which might otherwise stay undetected. We conclude our article by
discussing the implications for cross-national survey research within the discipline. In doing so,
this article contributes to the methodological advancement in studying public administration
beyond domestic borders.
Measurement equivalence in comparative public administration
In order to expand public administration theories to other cultural settings, researchers often
have to rely on secondary data. Thus they have little or no control over survey design
procedures that would help them to establish the cross-national equivalence of their items, for
example, through the use of anchoring vignettes (King et al. 2004). Scholars aiming to utilize
cross-national survey data have to find appropriate ways to make sure that their measurement
constructs are equivalent across countries. If this is not done, cross-national comparisons are
likely to be invalid (cf. Vandenberg and Lance 2000). Thus, measurement non-equivalence can
be considered as a serious threat to comparative public administration survey research.
In recent years there has been a growing awareness in applying post-survey techniques to
assess measurement (non-)equivalence. Several statistical methods have been applied for
testing, including MGCFA, and IRT. This development can be observed across a wide array of
disciplines within the social sciences. However, within public administration research this

5
seems largely ignored. To illustrate this point, we conducted a systematic literature review of
journal articles in public administration that make use of cross-national survey data for the time
period 2001 till 2012. The following Social Science Citation Index listed journals were
consulted: Administration & Society, American Review of Public Administration, International
Review of Administrative Sciences, Public Administration, Public Administration Review and
Journal of Public Administration Research and Theory.
2
The review resulted in a total of 19
articles
3
, with almost 75 per cent (14 articles in total) of the studies being published since 2008
– emphasizing the growing interest in cross-national survey research in the discipline. All
articles were reviewed with regard to 1) acknowledging the possibility of measurement non-
equivalence for the used data, and 2) whether authors have taken any measures to test for non-
equivalence, and/or corrected for it. Only two articles from our review mentioned the
possibility of cross-national non-equivalence of survey items. From those two articles, only one
did test for non-equivalence by means of a MGCFA. These results are worrisome given the
share of studies that have been produced without appropriately dealing with the possible non-
equivalence of their survey measures. It suggests the limited awareness of public administration
scholars about applying post-survey techniques to deal with the possibility of measurement
non-equivalence (see also Kim et al. 2013), and highlights the importance of an accessible
primer on measurement equivalence in comparative public administration.
A conceptual framework linking measurement bias with equivalence
Measurement equivalence refers to an aspect of the validity of survey items that tap into an
underlying latent concept, such as ‘satisfaction’. It means that “[…] under different conditions
of observing and studying phenomena, measurement operations yield measures of the same
attribute” (Horn and McArdle 1992: 117). For measurement constructs to be equivalent, two

6
attributes must be met. First, the unobserved latent trait must share the same meaning across
different groups. Second, the examined latent concept needs to be scaled equally across
countries – meaning that it is measured using the same metric. If one of the two attributes does
not hold, than their exists no measurement equivalence across groups.
Measurement non-equivalence can stem from a variety of different sources, with all of them
being related to different aspects of biases. Conceptually, three major types are distinguished: 1)
construct bias, 2) method bias, and 3) item bias (cf. Van de Vijver and Leung 1997; Van de
Vijver 2003). Construct bias refers to the dissimilarity of latent concepts across countries. It
means that the configuration and interpretation of a hypothetical construct, such as
‘satisfaction’ or ‘trust’, may not be shared among different countries. In such a case, latent
concepts cannot be easily generalized to other cultural settings.
The second type of bias, method bias, refers to all types of biases that come from
methodological procedural aspects of a survey. They include i) the incomparability of national
samples, for example by using different national sampling schemes, ii) cross-cultural
differences in response behaviour, and iii) systematic differences across countries in the survey
communication between interviewer and interviewee. An example in this regard would be
extreme response style behaviour where respondents from certain cultures have the tendency to
select the end point of a given item scale (Johnson et al. 2005). In such cases, respondents
across countries may share the same scale position, but not the same meaning attached to it.
This could potentially lead to a shift in the average mean score suggesting country differences
which are only an artefact of these method effects.
The third type of bias is called item bias, or differential item functioning. It basically means
that different people understand or interpret the very same survey item in a different way. This
kind of bias directly relates to disfunctioning at the item level. An item is said to be biased

7
“[…] if respondents with the same standing on the underlying construct (e.g. they are equally
intelligent), but who come from different cultures, do not have the same mean score on the
item” (Van de Vijver 2003: 148). Common sources of item bias are poor translations and/or
ambiguous items, cultural differences in the connotative meaning of item content, or the
influence of cultural specific nuisance factors such as the involvement of social desirable
answering behaviour towards specific items.
These types of biases are linked to different forms of measurement non-equivalence. In
order to relate bias with measurement non-equivalence, we draw upon the generalized latent
variable framework (Skrondal and Rabe-Hesketh 2004). Here, it is commonly assumed that
theoretical concepts (latent traits), such as trust or satisfaction, are not directly observable, but
are inferred from multiple observed manifestations of the latent trait (Bollen 2002; Davidov et
al. 2014). Say we would measure citizen satisfaction with public services using multiple survey
items across a number of countries; We can now test for measurement equivalence across those
countries by "[...] comparing empirical relations between the latent variable and the indicators
across populations. Similarity of these relationships (as reflected by the measurement
parameters) is taken as evidence supporting the hypothesis of measurement equivalence"
(Davidov et al. 2014: 19).
Using the generalized latent variable framework, cross-national researchers typically
distinguish between three types of non-equivalence: configural, metric and scalar equivalence
(Steenkamp and Baumgartner 1998; Vandenberg and Lance 2000). These types are
hierarchically ordered, meaning that lower levels serve as a prerequisite to establish the next
higher level of equivalence. Configural equivalence means that a measurement model exhibits
the same factorial structure across all groups under investigation. In other words, it has an
equivalent configuration across countries. Configural equivalence is affected by the presence of
8
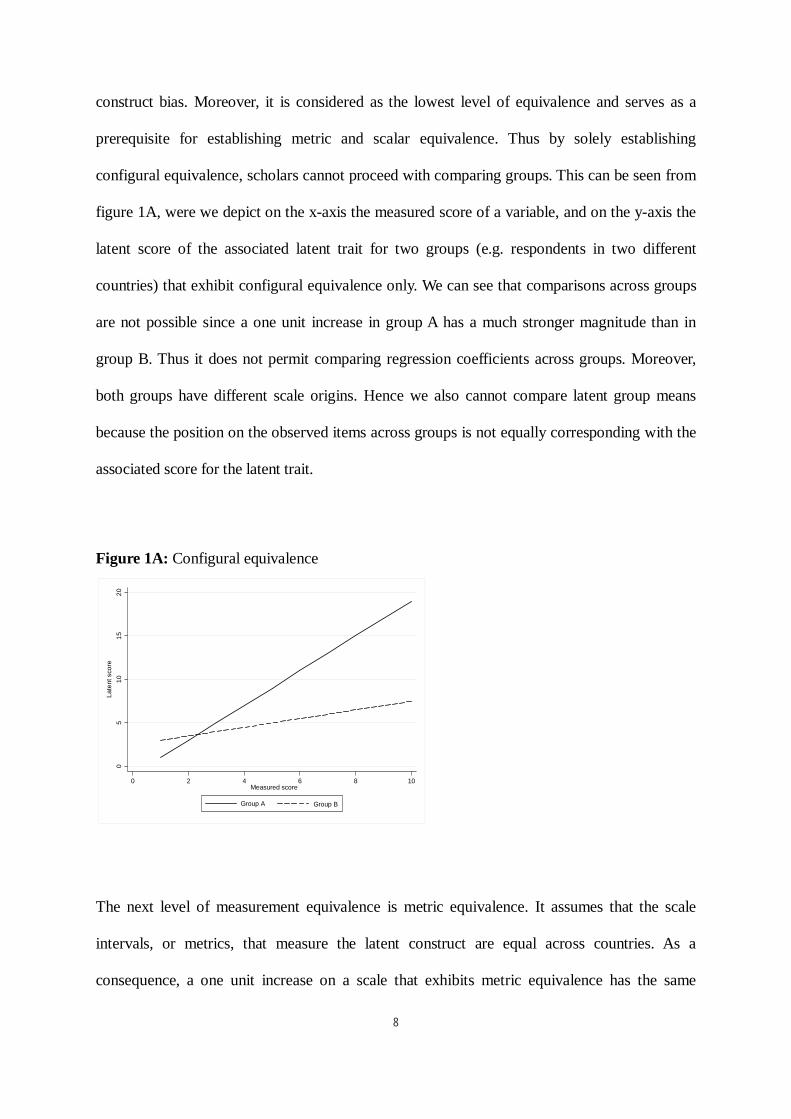
construct bias. Moreover, it is considered as the lowest level of equivalence and serves as a
prerequisite for establishing metric and scalar equivalence. Thus by solely establishing
configural equivalence, scholars cannot proceed with comparing groups. This can be seen from
figure 1A, were we depict on the x-axis the measured score of a variable, and on the y-axis the
latent score of the associated latent trait for two groups (e.g. respondents in two different
countries) that exhibit configural equivalence only. We can see that comparisons across groups
are not possible since a one unit increase in group A has a much stronger magnitude than in
group B. Thus it does not permit comparing regression coefficients across groups. Moreover,
both groups have different scale origins. Hence we also cannot compare latent group means
because the position on the observed items across groups is not equally corresponding with the
associated score for the latent trait.
Figure 1A: Configural equivalence
05
10
15
20
Late
nt sco
re
0 2 4 6 8 10
Measured score
Group A
Group B
The next level of measurement equivalence is metric equivalence. It assumes that the scale
intervals, or metrics, that measure the latent construct are equal across countries. As a
consequence, a one unit increase on a scale that exhibits metric equivalence has the same

9
meaning across groups. It is affected by method and item bias. Figure 1B exemplifies a
hypothetical latent construct that exhibits metric equivalence graphically, using simulated data.
While the scale interval is equivalent across groups, meaning they can be meaningful
compared, both slopes still have different origins. Thus metric equivalence permits group
comparisons of regression coefficients and covariances, but not of latent means (cf. Steenkamp
and Baumgartner 1998).
Figure 1B: Metric equivalence
05
10
15
Late
nt sco
re
0 2 4 6 8 10
Measured score
Group A
Group B
The next form of equivalence, scalar equivalence, suggests that the latent variable has in
addition of being measured using the same metric, the same scale origin across countries.
Scalar equivalence is required when one needs to compare means across different units (cf.
Meredith 1993). This type of equivalence refers to the equality of intercepts across groups and
is affected by method and item bias. If scalar equivalence holds, it shows that respondents
across groups not only share the same scale metrics, but also the same scale origin. This means
that they have the same score on the latent and on the observed variables. It can be illustrated
by looking at figure 1C which now depicts an identical line for both groups - note that the

10
steepness of the slopes can vary. This means that we can now compare regression coefficients,
covariances, and latent means across groups, allowing us to conduct substantial cross-national
analyses.
Figure 1C: Scalar equivalence
02
46
81
0
Late
nt sco
re
0 2 4 6 8 10
Measured score
Group A
Group B
How to detect and deal with measurement non-equivalence?
Operationalizing the concept of measurement equivalence, we introduce two techniques into
the field of public administration of how to detect and deal with measurement non-equivalence
in comparative research: 1) multiple-group confirmatory factor analysis and 2) multilevel
mixture item response theory modeling. In the past, both approaches have enjoyed wide
popularity when it comes to testing for measurement equivalence. While according to
Kankaras, Vermunt and Moors (2011) differences between both techniques lie mainly in the
terminology, model assumptions and procedures in testing for measurement equivalence, they
also share a great deal of conceptual similarities, since both can be easily summarized within a

11
generalized latent variable framework (Skrondal and Rabe Hesketh 2004). But while MGCFA
is most appropriate for continuous data
4
, IRT is specifically designed to deal with data that is of
ordered-categorical nature.
MGCFA primarily aims at testing the equivalence of individual items and subsequently
establishes different levels of measurement equivalence, including non-equivalence and partial
equivalence, in an iterative process
5
. The multilevel mixture IRT model with item bias effects
that is applied in the later part of the study, tests and corrects for measurement non-equivalence
within a single model. Both models can be easily extended to include covariates (see for
example Stegmueller 2011; Davidov et al. 2008).
Multigroup Confirmatory Factor Analysis
The standard, single group, confirmatory factor analysis is designed to test a measurement
model, where observed responses to a set of items are denoted as
i
(where i= 1,…,I), and are
written as linear functions of the latent construct they measure (for example 'satisfaction').
The model typically also includes an intercept
i
and an error term
i
for each item, which can
be written as follows:
iiii
.
(1)
In equation (1),
i
refers to the slopes, or the factor loadings, of the latent construct . It
denotes the change in
i
for a one unit increase in . Or in other words, it displays the
regression coefficients for single items on the unobserved construct that we measure. In turn,
the intercepts
i
indicate the expected values for the observed items when the latent trait is
equal to zero (cf. Steenkamp and Baumgartner 1998).

12
The described factor analytical model has been extended by Jöreskog (1971) to a multi-
group setting. In this MGCFA, the same factor structure is specified for each group k (where
c=1,…,K) simultaneously, yielding an overall model fit. Thus we get
kkkkk
,
(2)
where
k
stands for a matrix of factor loadings, meaning it contains one value for each
combination of items and the latent construct for every country. The remaining letters are
vectors containing the same values like in equation (1), but with one single parameter for each
group unit. Within such a framework, we can assess measurement equivalence by comparing
parameter estimates across different countries. In our empirical examples, the groups are
inhabitants of different countries, but one may also think of comparing different sub-national,
socio-educational or professional groups, or even looking at the same groups of respondents
over time. Regard the needed samples size required to perform a CFA, Kline (2013, pp.179-
180) recommends a 20:1 respondents-parameter ratio of at least 20 respondents per each model
parameter (see also Jackson 2003), with the overall sample size preferred to exceed N=200. In
the context of a MGCFA that would mean that researchers would need at least 20 respondents
per parameter, per group. But in cases were no maximum likelihood estimators are employed,
or items are non-normally distributed, much larger samples are needed.
Assessing different forms of measurement equivalence
6
As we have mentioned earlier, it is commonly differentiated between three major -
hierarchically ordered - forms of measurement equivalence: configural, metric and scalar
equivalence (Steenkamp and Baumgartner 1998). Following an iterative process in testing for
the different forms of equivalence, Meuleman and Billiet (2012) propose a bottom-up strategy
(see also Steenkamp and Baumgartner 1998). This means to start with the lowest level of

13
equivalence, that is the configural model, and then stepwise test the next hierarchical levels,
first metric, and then scalar equivalence.
Practically speaking, configural equivalence means that a measurement model exhibits the
same patterns of salient and nonsalient factor loadings
7
across groups (cf. Horn and McArdle
1992). It can be assessed by running an exploratory factor analysis (EFA) for each country
separately, and subsequently comparing the number of factors where items loaded on, and their
parameter estimates. Furthermore, one may estimate a MGCFA without constraints across
groups and check whether fit indices are within an acceptable range. If configural equivalence
has been established, on this basis, full metric equivalence is tested by constraining the factor
loadings in the measurement model to be equal across groups. Formally, this would mean that:
k
...
21
. (3)
Thus metric equivalence can be assessed by comparing multiple measurement models with
constrained and unconstrained factor loadings across groups. Moreover, by determining which
items’ slopes are not equivalent across countries, scholars are put in the position of being able
to identify non-equivalent survey items.
The lower levels of equivalence, configural and metric, serve as a prerequisite to establish
the next, even stronger, level of equivalence: scalar equivalence. It is tested by additionally
constraining all intercepts to be equal across countries (cf. Meredith 1993), and can be written
as follows:
k
...
21
. (4)
However, the described forms of equivalence may not always hold to full extent. If this is
the case, Byrne, Shavelson and Muthén (1989) have proposed the concept of partial
equivalence. Basically, partial equivalence requires that at least two parameters per country are
equivalent, while others are free to vary. In other words, as long as we have two items with

14
invariant slopes across countries, we can establish partial metric equivalence. Moreover, if we
find two items with equivalent slopes and intercepts, we can establish partial scalar
equivalence. The basic idea behind this approach is that we need one item, the referent, to
identify the scale of the latent variable, and one item to determine the metric of the used scale.
In practice, this would mean that we can release invariant parameters for some items, as long as
we have two calibrating items left which are equivalent across units (see also Steenkamp and
Baumgartner 1989).
Determining a significant and substantial change in model fit
When testing for different levels of measurement equivalence the evaluation of model fit is of
particular interest for researchers who want to determine whether releasing (or constraining)
one additional parameter substantially changes model fit. The evaluation of model fit is
typically based on the chi-square test (Kline 2010). However, in larger samples (more than 300
respondents) chi-square is known to perform overly sensitive, meaning that it reaches statistical
significance also for very trivial model changes (Kline 2011, p. 201). Thus various authors have
recommended to use alternative goodness of fit measures, such as the Root Mean Square Error
of Approximation (RMSEA), or the Comparative Fit Index (CFI), among many others (Chen
2007; Williams, Vandenberg and Edwards 2009). However, while those alternative fit measures
do not possess the same problems of sensitivity to large sample sizes as chi-square does, they
have another problem that is that they do not have known sampling distributions. This makes it
extremely difficult to determine an acceptable cut-off value for a statistically significant change
in model fit when evaluating equivalence hypotheses (cf. Meuleman 2012). Moreover,
simulation studies have produced very different results when it comes to establishing such cut-
off values. For example, Chen (2007) determined cut-off points for global fit indices. However,

15
in a more recent simulation study Hox and colleagues (2012: 95) conclude that the “[…]
reliance on global fit indices is misleading when measurement equivalence is tested” (see also
Saris, Satorra and van der Veld 2009 for similar conclusions).
In line with other authors Hox and colleagues (2012) recommend using more specific
indicators of lack of fit, such as expected parameter changes in combination with their
respective modification indices (Saris, Satorra and Sörbom 1987; Saris, Satorra and van der
Veld 2009; Steenkamp and Baumgartner 1998; Meuleman 2012; Whitaker 2012; see also
Oberski 2014). By this, researchers would not only avoid over-fitting, and a rather data driven
approach, but also be put in the position to determine a statistically significant and substantial
change in model fit. In line with this reasoning, Meuleman and Billiet (2012) recommend using
the following procedure to determine a significant and substantial improvement (or
deterioration) of fit when assessing measurement equivalence: First, one needs to determine the
slope (or intercept) with the highest modification index (MI) score - which reports the change
in
2
when freeing the respective parameter. If this MI is strongly significant
8
, and the
associated standardized (STDYX) expected parameter change is of substantive magnitude, the
respective parameter will be relaxed.
Item response theory multilevel mixture model with item bias effects
While the use of MGCFA to detect measurement non-equivalence is often perceived as the
predominant approach in cross-national research, modern item response theory (IRT) modelling
offers similar advantages, with the particular difference that IRT techniques are specifically
developed to deal with items that are discrete or ordered-categorical. For ordered categorical
items, such as Likert scales, this is the so-called graded response model (Samejima 1969). It

16
models items’ C - 1 thresholds (where c is the item category with c=1,…,C) which are
transformed on a continuous latent response variable. These thresholds are mapped on an
unobserved continuous variable, and, more importantly, they represent transitions from one
category to another (commonly referred to as item difficulty). For example, consider an item
that probes for citizen trust in government with three answer categories. The two thresholds
between categories determine the difficulty of moving from one category to another. If we have
similar respondents in two countries with the same position on the latent trait of trust, but
different thresholds between item categories, then cross-national bias in response behaviour is
present.
Within this framework, we define an item response model for each item: individual
responses j (where j=1,…,J) for choosing category c are predicted using the cumulative
probability
ijkc
for each item i (where i=1,…,I) of a given respondent living in country k
(where k=1,…,K). Thus it is a function of C -1 thresholds
ic
(item difficulty) and the latent
variable
jk
(that is the underlying latent trait we actually measure, for example ‘trust in public
institutions’), with the strength of the relationship between item and latent variable (the so-
called discrimination parameter, or item loading) expressed in the models’ coefficients
i
(cf.
Stegmueller 2011). In other words, individuals’ probability of choosing a higher item category
is expressed as a result of their stronger ‘trust’ minus item difficulty. Hence formally, it can be
expressed as follows:
jkiicijkc
. (5)
The graded response model can be "[...] estimated with 250 respondents, but around 500 are
recommended for accurate parameter estimates [when using a five point Likert scale]" (Reeve

17
and Fayers 2005, p. 70). However, here scholars need to be also aware of the respondents to
parameter ratio; latent traits with many items require more respondents, than short scales.
This conventional graded response model has been extended by Stegmueller (2011) to a
multilevel mixture IRT model with item bias effects. Item bias (denoted as
ik
) is expressed
when item thresholds that are associated with the same score on the latent variable vary across
countries. It would mean that crossing a certain category for similar respondents is more
difficult in country A than in country B. If this is the case, items are not equivalent across
countries. Here, instead of testing and subsequently establishing (partial) equivalence (like one
would do within a MGCFA framework), this approach corrects for measurement non-
equivalence by explicitly modelling it. This is done by introducing discrete random effects for
individual items to vary across mixtures m (where m=1,…,M) – these are groups, or more
precisely latent classes, of countries that share unobserved heterogeneity in country item bias
(denoted as
km
).
9
In such a model, item bias is allowed to vary across country mixtures that
share unobserved heterogeneity in systematic responses behaviour. Or in other words, by
introducing direct effects of these mixtures on items, we are able to explicitly model cross-
national measurement non-equivalence.
Extending the graded response model, one has to make some changes in notation by first
adding subscripts to equation (5), denoting the level of each parameter, with 1) items being
nested in 2) individuals (where the latent concept ‘trust’, is located), nested in 3) countries
(where the unobserved heterogeneity in country item bias is located). This yields a three-level
model where we then also subtract the unobserved country item bias that varies across mixtures
(cf. Stegmueller 2011). Thus we get an unbiased cumulative response probability by specifying
M
m
kmimjkiicijkc
1
)3()1()2()1(
. (6)

18
When estimating this model, first the number of mixtures needs to be determined. This
means that we need to figure out how many latent groups there are across countries that share
common characteristics in systematic country item bias. Hence the model from equation 6
should be estimated with an increasing number of mixtures. In a next step, scholars are able to
compare fit measures (e.g. AICC, BIC; Log likelihood) of the different models to determine
how many mixtures best fit their data.
In such a framework one can test for systematic country item bias by checking whether the
estimates of item bias effects
)1(
i
of single mixtures are significantly different from zero
10
. If
this is the case, we would have strong evidence for the measurement non-equivalence of our
items. Or in other words, this would mean that there exists systematic country item bias in
response probability that stem from non-random threshold shifts across countries (cf.
Stegmueller 2011). Ignoring those differences would potentially yield biased estimates.
Furthermore, this model specification allows us to add covariates to the model in equation (6)
and subsequently estimate the ‘true effects’ of our independent variables of interest. Thus the
introduced IRT approach has the distinct advantage that it puts cross-national researchers in the
position to explicitly correct for measurement equivalence, and estimate cross-national
relationships within a single model.
Measurement non-equivalence in practice
After having introduced both empirical techniques, we will next apply them to real life data.
Our empirical examples come from cross-national public opinion surveys as used within
comparative public administration research. The first example is on citizen satisfaction with
public services, and the second example uses data on trust in public institutions.
19
MGCFA and citizen satisfaction with public services
Recent years have seen an increasing interest in studying citizens’ views and perceptions vis-à-
vis public organizations. At the frontline of this development has been the examination of
citizens’ satisfaction with public services, including the interrelation with individual
expectations (James 2009; Morgeson 2013; Van Ryzin 2006; 2013), its linkage with objective
assessments of performance (Charbonneau and Van Ryzin 2012; Shingler et al. 2008; Favero
and Meier 2013), or its propensity to facilitate citizens’ trust in government (Vigoda-Gadot
2007; Kampen, Van de Walle and Bouckaert 2006). But also methodological considerations in
measuring citizen satisfaction with public services have gathered pace (Herian and Tomkins
2012; Van de Walle and Van Ryzin 2011). Thus it can be seen that the study of citizen
satisfaction with public services is of key interest for public administration scholars. A next
desirable step would be the cross-national examination of theories of satisfaction in order to see
whether they apply to different national contexts. Furthermore, linking individual data on
citizen satisfaction with national, or regional, macro-level characteristics (such as the mode of
delivery) would probe interesting findings regards micro-macro relationships. In pursuing such
a research agenda, however, we first need to test whether citizen satisfaction, indeed, exhibits
cross-national measurement equivalence.
Data
We use data from the European Consumer Satisfaction Survey (ECSS). Implemented on behalf
of the European Commission, the ECSS was fielded in 2006. It covers all EU25 member
countries
11
and a total of 11 different public services, and is thus one of the most
comprehensive surveys on citizen satisfaction in Europe. Based on country stratifications
according to region, urbanisation degree, gender, age and education, the ECSS makes use of a

20
representative random sample for each service sector with a minimum of 500 respondents per
sector and per country. For our example we use data from the electricity sector.
Here, service users have been asked to indicate their levels of satisfaction within this
particular public service sector. More precisely they have been asked four questions that tap
into their general levels of satisfaction with electricity services:
1. Overall satisfaction (Sat Q1): “Overall, to what extent are you satisfied with [supplier
name]? Please give me a score from 1 to 10 where 1) means that you are not satisfied at all,
and 10) means that you are fully satisfied”;
2. Confirmation of expectations (Exp Q2): “If you compare what you expect from an
electricity supplier and what you get from [supplier name], to what extent would you say
that your requirements are met. Please give me a score from 1 to 10 where 1) means that
your expectations are not met at all, and 10) means that your expectations are not only met
but even exceeded”;
3. Satisfaction with service quality (Qual Q3): “I will read out a number of statements and
would like you to give me, for each of them, a score where 1) means that you totally
disagree and 10) means that you totally agree: [supplier name] offers high quality services,
overall”;
4. Price satisfaction (Price Q4): “I will read out a number of statements and would like you to
give me, for each of them, a score where 1) means that you totally disagree, and 10) means
that you totally agree: Overall, [supplier name]’s prices are fair, given the services
provided”.
Assessing cross-national measurement equivalence

21
For our study into citizens’ satisfaction with electricity services, we first need to specify the
model’s factor structure. All four items ought to tap the latent construct of citizens’ satisfaction
with electricity services. The first two items are quite similar, which is evident from their strong
correlation (r=0.803; p<0.000). Thus we allow for a covariance between them. This can also be
theoretically justified, since both items are directly probing for citizens’ general satisfaction.
Moreover, model assessments of individual countries without the covariance between them
indicated that the model(s) would significantly and substantially improve by allowing a
correlation between both items. This brings us to the measurement model as depicted in figure
two. The figure also shows the factor loadings from the configural equivalent MGCFA model
(highest and lowest country value). The model exhibits good measurement properties: all
loadings are significantly different from zero, and load sufficiently strong on the latent trait of
satisfaction.
Figure 2: Measurement model of citizen satisfaction
We test the measurement equivalence of citizens’ satisfaction with their electricity services by
using MGCFA. The measurement models were estimated using Mplus 6. We used a Maximum
Likelihood Robust (MLR) estimator, which accounts for the non-normality of our items
(Muthén and Muthén 2010: 533). Furthermore, we employed an estimation procedure that
Sat Q1
Exp Q2
Qual Q3
Price Q4
Citizen satisfaction
1Q
=1
3Q
=0.563/1.579
4Q
=0.618/1.466
2Q
=0.718/1.090
22
makes use of Full Information Maximum Likelihood (FIML). FIML accounts for item non-
response by taking all available data points into the estimation procedure, regardless whether
there are missing cases, or not (see also Little and Rubin 2002). In our case, item non-response
was slightly above 5%.
For our analyses, we first determined the reference item to identify the scale of the latent
variable. This choice has not been made arbitrarily, but is based on a procedure that sets the
latent variable’s variance to be 1 for all countries instead, and uses unstandardized modification
index estimates to select the “most invariant item” (Sass 2011), that is the item with the lowest
overall modification index estimates – in our case, item Q1.
12
When it comes to the subsequent
order of the test to assess our models’ measurement equivalence, we employed a bottom-up
strategy. This has been exemplified on table 1 where the iterative process in equivalence testing
is displayed. It shows the respective model's fit to the data using the satora-bentler scaled chi-
square, the model's degrees of freedom, and the RMSEA and CFI fit indices. More importantly,
the change in chi square and standardized expected parameter change is displayed (STDYX
EPC).
We start by assessing the configural equivalence of our measurement model, which means
testing whether it has the same factorial structure within each country. We were able to
establish the equivalence of our factor structure for all of the 25 countries under study. This
means that within each country, all four items loaded significantly on a single factor. Moreover,
fit indices of the multiple-group measurement model indicated that it fits the data well (see
table 1, model 0). Next we assessed the model’s metric and scalar equivalence. The full metric
model fits the data well, but it still can be improved substantially by releasing 3 constrained
slopes (factor loadings). We were not able to establish full metric equivalence, since we found
three countries with invariant factor loadings. However, by freeing the factor loadings for items

23
Q3 and Q4, we can establish partial metric equivalence for all 25 countries. We can now
meaningfully compare parameter estimates across all countries.
TABLE 1: Equivalence tests for Citizens Satisfaction with Electricity Services; N = 13,155
Model specifications
2
df RMSEA CFI
2
STDYX EPC
M0 Configural equivalence 29.60 25 0.035 0.999 -- --
M1 Full metric equivalence 233.14 97 0.067 0.981 -- --
M2
NL
Q4
released
219.87 96 0.064 0.983 13.27 -0.236
M3
PL
Q4
released
204.52 95 0.062 0.984 15.35 -0.176
M4
ES
Q4
released
189.35 94 0.059 0.986 15.17 -0.215
M5
LT
Q3
released
170.97 93 0.055 0.988 18.38 0.258
M6 Full scalar equivalence 1028.27 165 0.113 0.907 -- --
M7
SE
Q3
released
960.18 164 0.109 0.914 68.09 0.428
M8
CZ
Q2
released
904.00 163 0.106 0.920 56.18 -0.250
M9
LT
Q1
released
801.29 161 0.099 0.930 102.71 0.176
M10
AT
Q2
released
756.11 160 0.096 0.935 45.18 -0.238
M11
HU
Q2
released
711.41 159 0.093 0.939 44.70 -0.234
M12
DE
Q2
released
670.74 158 0.090 0.943 40.67 -0.228
M13
UK
Q4
released
631.84 157 0.087 0.947 38.91 0.260
M14
LT
Q1
released
598.72 156 0.085 0.951 33.12 0.191
M15
CY
Q2
released
564.50 155 0.082 0.954 34.21 0.155
M16
BE
Q4
released
536.48 154 0.080 0.957 28.02 0.237
M17
FI
Q4
released
509.24 153 0.078 0.959 27.25 0.248
M18
ES
Q3
released
481.46 152 0.075 0.962 27.78 -0.211
M19
MT
Q4
released
461.75 151 0.074 0.964 19.71 -0.219
M20
CZ
Q4
released
441.47 150 0.072 0.966 20.27 -0.213
M21
SK
Q4
released
423.68 149 0.070 0.968 17.79 -0.208
M22
SE
Q4
released
408.10 148 0.069 0.969 15.58 -0.215
M23
IE
Q3
released
391.89 147 0.067 0.971 16.21 -0.165
M24
NL
Q3
released
377.64 146 0.066 0.972 14.25 -0.155
Chi-square refers to the Satorra-Bentler scaled chi-square.

24
The next level of equivalence, full scalar, is much more difficult to satisfy. As depicted in table
1, the full scalar model fits the data badly (model 6). However, it can be improved substantially
by releasing 18 intercepts. After this, there were no further possibilities left for improving
model fit. As we can see from table 1, our final model displays an acceptable fit (model 24),
with no fit index beyond what is generally considered to be an acceptable cut-off value.
However, we are still not able to compare means across countries, since for meaningful
comparisons we would need at least two items with the same invariant slopes and intercepts
across countries (partial scalar equivalence). By freeing slopes and intercepts for items Q2 and
Q4, we can now meaningful compare coefficients and latent country means for 19 countries.
Yet, this excludes Ireland, Latvia, Lithuania, The Netherlands, Spain and Sweden, since they all
have non-equivalent intercepts for items Q1 and Q3, which suggests that it is especially in
those countries where items Q1 and Q3 function differently.
MGCFA: Does it matter?
In order to exemplify the biases comparative researchers may tap into when conducting cross-
national analyses, we compare the results of our partial scalar equivalence model, with the
status-quo in comparative research, simply computing a factor score for the measured concept
form the pooled country data. We estimated simple country fixed effects linear regression
models using 1) factors scores, and 2) the scores from our partial scalar equivalent MGCFA
model. Figure three displays the results (using Austria, the country with the highest satisfaction
scores, as reference). Differences between both approaches are striking. For example, using the
standard factor score approach shows no significant difference between Austria and
Luxembourg, while the results from our MGCFA model suggest that people in Luxembourg are
significantly less likely to be satisfied with the services they receive; the same holds true for
25
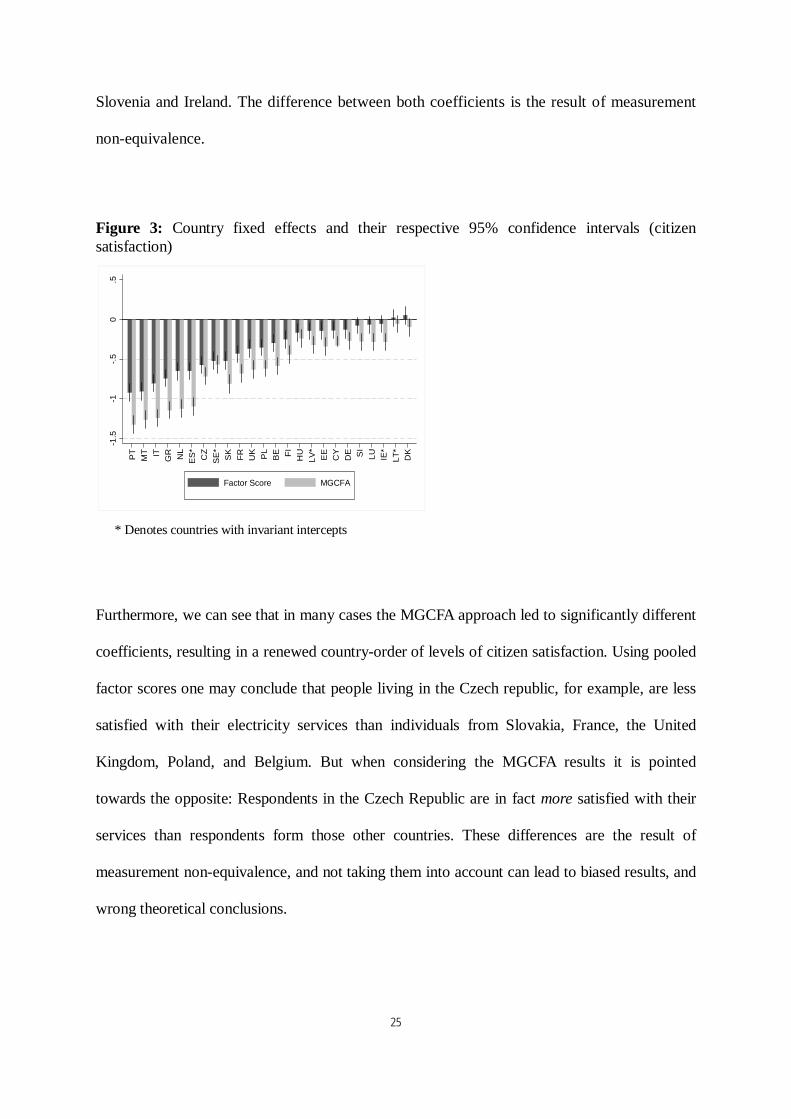
Slovenia and Ireland. The difference between both coefficients is the result of measurement
non-equivalence.
Figure 3: Country fixed effects and their respective 95% confidence intervals (citizen
satisfaction)
-1
.5
-1
-.5
0.5
PT
MT
IT
GR
NL
ES
*
CZ
SE
*
SK
FR
UK
PL
BE
FI
HU
LV
*
EE
CY
DE
SI
LU
IE
*
LT
*
DK
Factor Score MGCFA
* Denotes countries with invariant intercepts
Furthermore, we can see that in many cases the MGCFA approach led to significantly different
coefficients, resulting in a renewed country-order of levels of citizen satisfaction. Using pooled
factor scores one may conclude that people living in the Czech republic, for example, are less
satisfied with their electricity services than individuals from Slovakia, France, the United
Kingdom, Poland, and Belgium. But when considering the MGCFA results it is pointed
towards the opposite: Respondents in the Czech Republic are in fact more satisfied with their
services than respondents form those other countries. These differences are the result of
measurement non-equivalence, and not taking them into account can lead to biased results, and
wrong theoretical conclusions.

26
IRT and trust in public institutions
Trust in public institutions is regarded as an assessment of the performance, and procedural
quality of these institutions. This trust is thought to influence citizens’ willingness to obey or
cooperate, and is as such an indicator of government’s (political) legitimacy (Hooghe and
Marien 2011). Various scholars in public administration research have conducted empirical
analysis into the determinants of institutional trust, and have looked at aspects such as
performance, procedural quality, or transparency (Grimmelikhuijsen and Meijer 2014; Van de
Walle and Bouckaert, 2003; Van Ryzin, 2011). Trust in individual institutions is sometimes
regarded as a reflection of not just specific institution’s individual qualities, but also as a
reflection of a wider propensity to trust public institutions (Mishler and Rose 1997). Various
cross-national analyses have been conducted in this regard, yet whether the concept of trust in
public institutions travels across domestic borders was, to our knowledge, not subject to
analyses. Studies of the longitudinal measurement-equivalence of trust in government in the US
indicate that, indeed, the conception of trust changes over time, so as does people's individual
response behaviour (Poznyak et al. 2013). In the following, we assess the cross-national
measurement properties of citizen trust in public institutions, using the previously introduced
IRT approach.
Data
For this part of our study we us data from the World Value Survey (WVS) 2005. WVS is a
high-quality and well-known cross-national survey, established in 1981. It regularly surveys a
representative sample of national populations across a very broad range of countries. It
encompasses items on various theoretical concepts, including institutional trust. Using the
WVS institutional trust inventory, Newton and Norris (2000) distinguish between trust in

27
private and public institutions. The latter set of items is used for our IRT analysis, including
trust in 1) the police, 2) the justice system, 3) the government, and 4) the civil service. More
specifically, respondents were asked "I am going to name a number of organizations. For each
one, could you tell me how much confidence you have in them: is it a great deal of confidence,
quite a lot of confidence, not very much confidence or none at all?". This yields a set of four
ordinal items that tap into individuals' trust in public institutions. Our analysis was conducted
for the following 14 EU and/or OECD member countries: Bulgaria (BG), Canada (CA), East-
Germany (DE-E), Finland (FI), Italy (IT), Norway (NO), Poland (PL), Romania (RO), Spain
(ES), Slovenia (SI), Sweden (SE), Switzerland (CH), United States of America (US), and West
Germany (DE-W).
Assessing cross-national measurement equivalence
To apply the introduced multilevel mixture IRT model on real-life data of people's trust in
public institutions, we use the statistical software LatentGOLD version 4.5. In order to ease the
estimation process, we draw a 50% random subsample for our analysis (see also Stegmueller
2011 for a similar procedure). The hierarchical conceptualization of our multilevel IRT model
(items nested in individuals, nested in countries), enables us to account for item non-response
in a transparent way. Assuming missingness at random (Little and Rubin 2002), merely resulted
in different cluster sizes at level-1. We found a share of 9% of missing data in our trust
measure, and use a total of 8,317 respondents
13
.
We determined the number of latent classes of countries that share common characteristics
in individuals' response behavior (mixtures), by estimating the IRT model as described in the
previous part of this study (equation 6) with an increasing number of mixtures. In a next step,
we compared the fit measures of different models to determine which number of mixtures best

28
fitted our data (see table 2). We find that the model with a total of 10 mixture components
yielded the best model fit
14
. This can be illustrated by looking at the information theory-based
fit measures, the Bayesian information coefficient (BIC), and the consistent Akaike's
information coefficient (AICC).
15
Table 2: Determining the number of mixture components for multilevel IRT mixture model
Model
No. of mixture
componenets
Log-
Likelihood
No. of
parameters AICC BIC
M1 3 -31,900 26 64,062 64,036
M2 4 -31,817 31 63,945 63,914
M3 5 -31,744 36 63,849 63,813
M4 6 -31,695 41 63,801 63,760
M5 7 -31,652 46 63,765 63,719
M6 8 -31,623 51 63,758 63,707
M7 9 -31,591 56 63,744 63,688
M8 (Final model) 10 -31,553 61 63,717 63,657
M9 11 -31,545 66 63,752 63,686
In a next step the properties of our measurement model are examined. Table three presents an
overview of the actual factor loadings, and their accompanying item thresholds. First, we can
see that our items exhibit good measurement properties: all items load significantly and
strongly on one latent trait, that is trust in public institutions. Moreover, we can see that the
thresholds clearly spread out across a wide range of our latent variable.
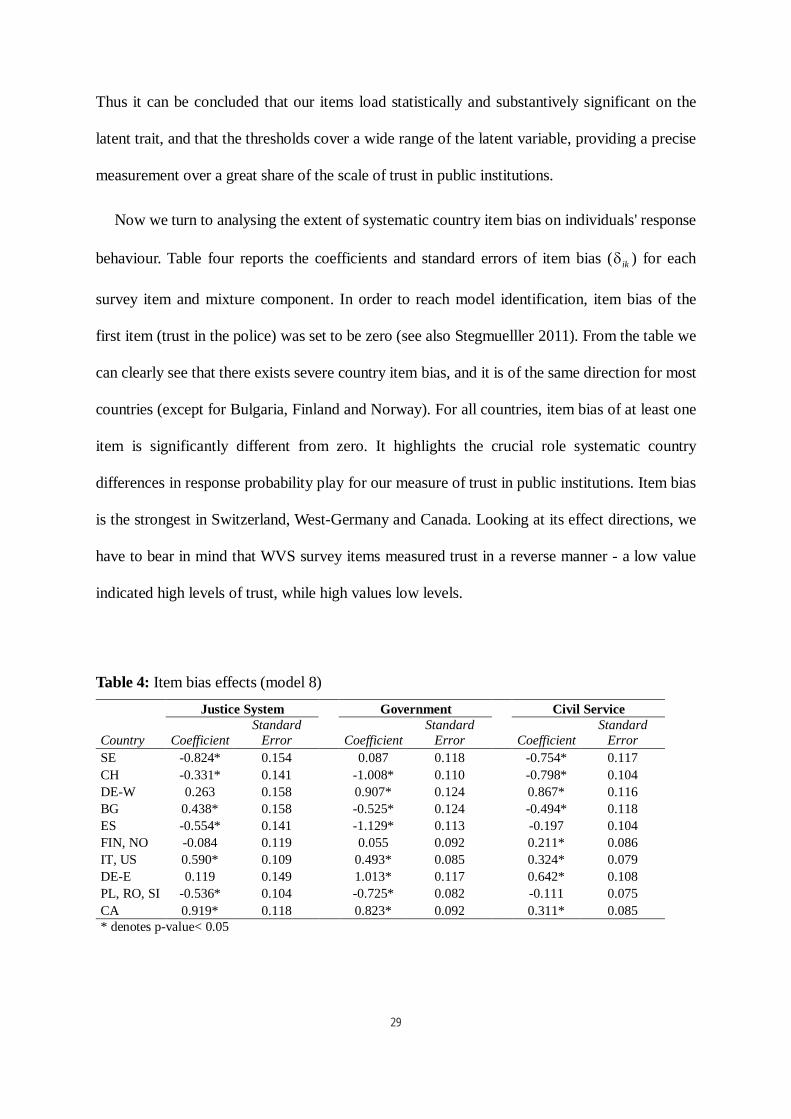
Table 3: Citizen trust in public institutions measurement model (model 8)
Factor loading
)1(
i
Standard
Error
Threshold
1i
Threshold
2i
Threshold
3i
Police 1.989* 0.054 2.777* -1.434* -4.601*
Justice system 2.637* 0.084 3.938* -0.685* -4.516*
Government 1.768* 0.049 4.543* 0.705* -2.620*
Civil service 1.503* 0.043 4.370* 0.227* -3.075*
* denotes p-value< 0.05
29
Thus it can be concluded that our items load statistically and substantively significant on the
latent trait, and that the thresholds cover a wide range of the latent variable, providing a precise
measurement over a great share of the scale of trust in public institutions.
Now we turn to analysing the extent of systematic country item bias on individuals' response
behaviour. Table four reports the coefficients and standard errors of item bias (
ik
) for each
survey item and mixture component. In order to reach model identification, item bias of the
first item (trust in the police) was set to be zero (see also Stegmuelller 2011). From the table we
can clearly see that there exists severe country item bias, and it is of the same direction for most
countries (except for Bulgaria, Finland and Norway). For all countries, item bias of at least one
item is significantly different from zero. It highlights the crucial role systematic country
differences in response probability play for our measure of trust in public institutions. Item bias
is the strongest in Switzerland, West-Germany and Canada. Looking at its effect directions, we
have to bear in mind that WVS survey items measured trust in a reverse manner - a low value
indicated high levels of trust, while high values low levels.
Table 4: Item bias effects (model 8)
Justice System Government Civil Service
Country Coefficient
Standard
Error Coefficient
Standard
Error Coefficient
Standard
Error
SE -0.824* 0.154 0.087 0.118 -0.754* 0.117
CH -0.331* 0.141 -1.008* 0.110 -0.798* 0.104
DE-W 0.263 0.158 0.907* 0.124 0.867* 0.116
BG 0.438* 0.158 -0.525* 0.124 -0.494* 0.118
ES -0.554* 0.141 -1.129* 0.113 -0.197 0.104
FIN, NO -0.084 0.119 0.055 0.092 0.211* 0.086
IT, US 0.590* 0.109 0.493* 0.085 0.324* 0.079
DE-E 0.119 0.149 1.013* 0.117 0.642* 0.108
PL, RO, SI -0.536* 0.104 -0.725* 0.082 -0.111 0.075
CA 0.919* 0.118 0.823* 0.092 0.311* 0.085
* denotes p-value< 0.05

30
Thus we can see that respondents in Switzerland, for example, systematically overreport their
trust in public institutions, while people living in the western part of Germany underreport their
levels of trust. If researchers now simply compare responses from these countries without
correction for country item bias, they will either systematically over- or underestimate peoples'
trust in public institutions.
IRT: Does it matter?
To exemplify the systematic biases comparative scholars may encounter when analysing cross-
national data, we used the results from our IRT model against the standard approach in the
discipline, which is simply computing factor scores from pooled country data. Figure six
reports the coefficients and accompanying 95% confidence intervals from linear regression
models with country fixed effects. Norway - the country with the highest levels of trust - is used
as reference category. From the table we can clearly see that simply ignoring country item bias
in response probability can lead to misleading results. For example, when we look at the factor
score coefficients for Switzerland, we may conclude that Switzerland is not significantly
different from Norway. But when looking at the coefficients from the IRT approach used in this
study, we see that individuals living in Switzerland are trusting their public institutions
significantly less than people living in Norway. The difference between both coefficients is the
result of systematic country item bias in individuals' item response probability. We,
furthermore, find a different country-order of levels of trust. Using pooled factor scores one
may conclude that people living in Spain, for example, are less trusting in public institutions
than individuals from Italy, or East-Germany. The results from the IRT approach, however,
suggests that mean levels of trust are actually higher in Italy compared to those countries.
When looking at the position of Sweden, for example, a similar picture emerges. The pooled
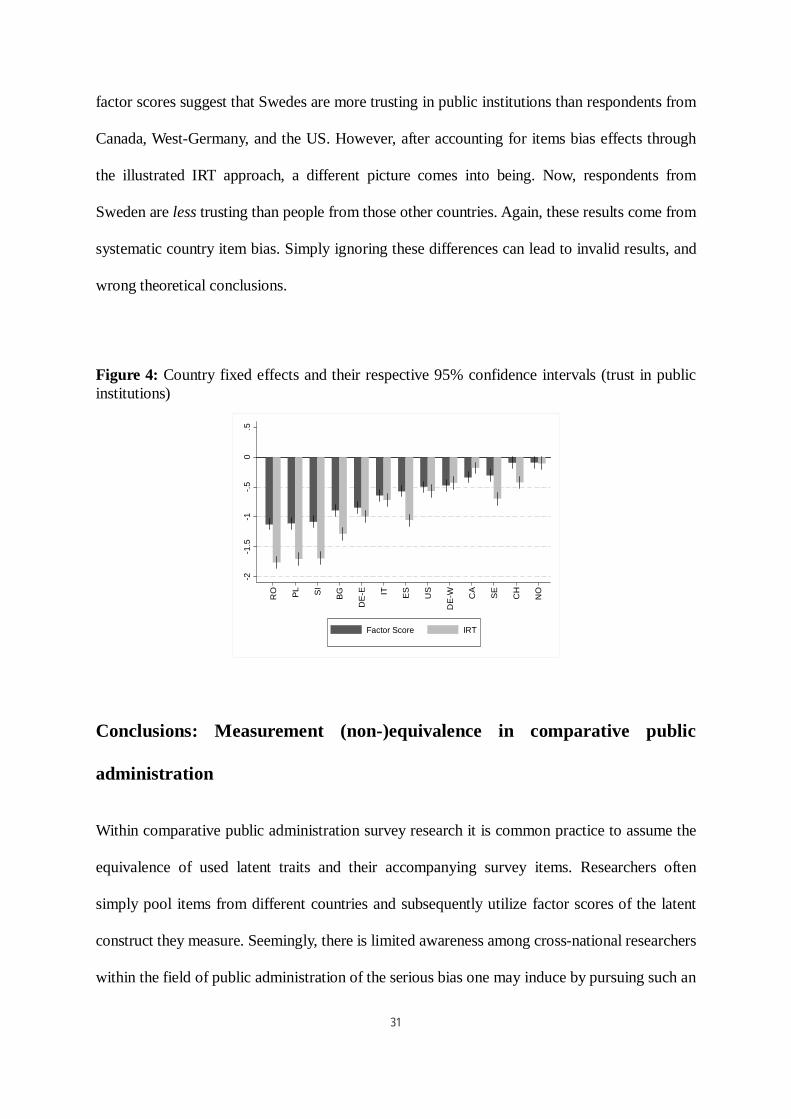
31
factor scores suggest that Swedes are more trusting in public institutions than respondents from
Canada, West-Germany, and the US. However, after accounting for items bias effects through
the illustrated IRT approach, a different picture comes into being. Now, respondents from
Sweden are less trusting than people from those other countries. Again, these results come from
systematic country item bias. Simply ignoring these differences can lead to invalid results, and
wrong theoretical conclusions.
Figure 4: Country fixed effects and their respective 95% confidence intervals (trust in public
institutions)
-2
-1
.5
-1
-.5
0.5
DE
-W
IT
ES
US
CA
NO
SE
CH
DE
-E
PL
BG
RO
SI
Factor Score IRT
Conclusions: Measurement (non-)equivalence in comparative public
administration
Within comparative public administration survey research it is common practice to assume the
equivalence of used latent traits and their accompanying survey items. Researchers often
simply pool items from different countries and subsequently utilize factor scores of the latent
construct they measure. Seemingly, there is limited awareness among cross-national researchers
within the field of public administration of the serious bias one may induce by pursuing such an

32
estimation strategy (see Kim et al. 2013 for a notable exception). Our article has shown that
conducting meaningful cross-national analyses requires to consider the cross-national
equivalence of survey measures. Estimating inferential models from comparative data without
taking into account the possibility of measurement non-equivalence can lead to spurious results
and misleading conclusions.
This article has presented two techniques to test and correct for measurement non-
equivalence of comparative survey data in public administration research. Our empirical
examples, indeed show the biases one may get when pursuing the default approach of simply
assuming the equivalence of measurement constructs. It was also exemplified that both
concepts that we put under test (citizen satisfaction, and trust in public institutions) do not
exhibit cross-national measurement equivalence. Researchers who wish to conduct cross-
national analyses using these concepts are best advised to account for their non-equivalence.
But also comparative scholars who use measurement constructs whose cross-national
measurement properties are unknown should do so, otherwise they risk biased results.
It becomes clear that for obtaining unbiased estimates, public administration scholars
wishing to compare countries, or even regions (like the US states), are advised to test the
equivalence of their measurement constructs. Otherwise they proceed in assuming equivalence,
which can be, as we have shown, a very strong assumption. However, testing the non-
equivalence assumption is straightforward and favourable, as it puts scholars in the position to
test the geographical scope of their theories in a valid manner. This article has outlined two
major techniques for doing so. We are aware of the increased difficulty in estimation this may
bring along, however, the results from the last section have clearly shown that correcting for
measurement non-equivalence is not a matter of fine-tuning estimates only of interest for
methodologists, but of substantial importance when aiming to derive at approximately unbiased

33
results that form the basis of our theoretical implications. Put simply, “[…] doing serious
comparative work entails additional effort” (Pollitt 2011: 124).
1
MGCFA can also be applied to test for measurement equivalence with binary/ordinal items via suitable
estimators (see Millsap & Yun-Tein 2004).
2
With the exception of the International Review of Administrative Sciences, which we added because of its explicit
comparative scope, these journals have been included by previous reviews on research methodology in public
administration, because they are thought to be the mainstream journals within the discipline (see for example
Brower, Abolafia and Carr 2000; Lee, Benoit-Bryan and Johnson 2012; Wright, Manigault and Black 2004).
3
The full list of articles that we included in our review can be found at first authors' website:
http://sebastianjilke.files.wordpress.com/2014/10/listofarticleslitreview1.pdf
4
However, there exist also MGCFA estimators that allow for using items that are ordered-categorical, or binary
(see for example Milsap and Yun-Tein 2004)
5
For a more technical comparison between both techniques, we refer to Kankaras, Vermunt and Moors (2011),
Raju, Lafitte, Byrne (2002); and Reise, Widaman and Pugh (1993).
6
In the CFA literature most authors use the term measurement invariance, instead of measurement equivalence.
However, to remain consistent across introduced techniques and applications, we use the term equivalence
interchangeable with invariance, meaning that our observed items and their factorial structures are not varying
across countries and are thus equivalent.
7
This does not mean that the strength of factor loadings are not allowed to differ, since there are no restrictions for
their magnitude (cf. Steenkamp and Baumgartner, 1998: 80).

34
8
This implies a Bonferroni-type correction to account for the fact that multiple tests are actually conducted at the
same time: 1 test per parameter, per country (Meuleman and Billiet 2012; see also Saris, Satorra and Sörbom
1987). Thus the alpha level may be varied in accordance to the number of used items and country groups.
9
Mixtures are composed of groups of countries that share the same posterior probability of responding (Vermunt
and Magidson 2005). These mixtures are specified to be categorical (using effect coding for model identification)
yielding discrete random effects (Stegmueller 2011).
10
For model identification, one has to set the item bias of one item to be zero – this is comparable to the MGCFA
approach, where one item has to be utilized as the ‘referent’.
11
They include: Austria (AT), Belgium (BE), Cyprus (CY), Czech Republic (CZ), Denmark (DK), Estonia (EE),
Germany (DE), Greece (GR), Finland (FI), France (FR), Hungary (HU), Ireland (IE), Italy (IT), Latvia (LV),
Lithuania (LT), Luxembourg (LU), Malta (MT), Netherlands (NL), Poland (PL), Portugal (PT), Slovakia (SK),
Slovenia (SI), Spain (ES), Sweden (SE), United Kingdom (UK).
12
More specifically, Sass (2011: 354) proposes to set the variance of the unobserved latent variable to be equal to
one for all groups. By this one would not need a referent, as the scale is already identified. On this basis, he
recommends estimating a fully constrained measurement model and then using unstandardized overall
modification indices for items’ slopes and intercepts to select the referent.
13
After deleting those individuals that did not answer any of the trust items (1%).
14
Estimating the same model using continuous random effects clearly provides no better fit to the data than using
discrete random effects - results are available upon request.
15
If we would select the final model merely on the basis of the log likelihood, we would select model 9 with a total
of 11 mixtures. However, for our model we used the information theory-based fit measures, because they explicitly
discriminate against increasing model complexity.
References
Brower, Ralph S., Mitchel Y. Abolafia, and Jered B. Carr. 2000. On Improving Qualitative
Methods in Public Administration Research. Administration & Society 32(4):363-97.
Bollen, Kenneth A. 1989. Structural Equations with Latent Variables. New York: Willey.
Bollen, Kenneth A. 2002. Latent variables in psychology and the social sciences. Annual
Review of Psychology 53: 605-34.
Byrne, Barbara M., Richard J. Shavelson, and Bengt Muthén. 1989. Testing for the Equivalence
of Factor Covariance and Mean structure: The Issue of Partial Measurement Invariance.
Psychological Bulletin 105(3):456-66.
Chen, Fang Fang. 2007. Sensitivity of Goodness of Fit Indexes to Lack of Measurement
Invariance. Structural Equation Modelling 14(3):464-504.
Davidov, Eldad, Peter Schmidt, and Jaak Billiet. 2011. Cross-Cultural Analysis. Methods and
Applications. New York, London: Routledge.
Davidov, Eldad, Bart Meuleman, Jan Cieciuch, Peter Schmidt, and Jaak Billiet. 2014.
Measurement Equivalence in Cross-National Research. Annual Review of Sociology, in
press.
Davidov, Eldad, Bart Meuleman, Jaak Billiet and Peter Schmidt (2008). Values and support for
immigration: A cross-country comparison. European Sociological Review 24(5):583-599.
Favero, Nathan and Kenneth J. Meier. 2013. Evaluating Urban Public Schools: Parents,
Teachers and State assessments. Public Administration Review 73(3):401-12.
1
Grimmelikhuijsen, Stephan G., and Albert J. Meijer. 2014. Effects of Transparency on the
Perceived Trustworthiness of a Government Organization: Evidence from an Online
Experiment. Journal of Public Administration Research and Theory 24(1):137-57.
Little, Roderick J. A., and Donald B. Rubin. 2002. Statistical Analysis with Missing Data. New
Jersey: Wiley.
Herian, Mitchel N., and Alan J. Tomkins 2012. Citizen Satisfaction Survey Data: A Mode
Comparison of the Derived Importance-Performance Approach. The American Review of
Public Administration 42(1):66-86.
Horn, John L., and J. Jack McArdle. 1992. A Practical and Theoretical Guide to Measurement
Invariance in Aging Research. Experimental Aging Research 18(3):117-44.
Hox, Joop J., Edith D. de Leeuw, Matthieu J. S. Brinkhuis, and Jeroen Ooms. 2012. Multigroup
and Mutilevel Apporaches to Measurement Equivalence. In Methods, Theories, and
Empirical Applications in the Social Sciences. Festschrift for Peter Schmidt. eds. Samuel
Salzborn, Eldad Davidov and Jost Reinecke, 91-6. Wiesbaden: Springer Verlag.
Jackson, Dennis L. 2003. Revisiting Sample size and number of parameter estimates: Some
support for the N:q hypothesis. Structural Equation Modelling 10:128-141.
James, Oliver 2009. Evaluating the Expectations disconfirmation and Expectations Anchoring
Approaches to Citizen Satisfaction with Local Services. Journal of Public Administration
Research and Theory 19(1):107-23.
Jilke, Sebastian. 2014. Choice and Equality: Are Vulnerable Citizens Worse-off after
Liberalization reforms? Public Administration, online first.
2
Johnson, Timothy, Patrick Kulesa, Young Ik Cho, and Sharon Shavitt. 2005. The Relation
between Culture and Response Styles: Evidence from 19 Countries. Journal of Cross-
Cultural Psychology 36(2):264-77.
Jöreskog, Karl G. 1971. Simultaneous Factor Analysis in Several Populations. Psychometrika
36(4): 409-26.
Kampen, Jarl K., Steven Van de Walle, and Geert Bouckaert. 2006. Assessing the Relation
Between Satisfaction with Public Service Delivery and Trust in Government: The Impact
of the Predisposition of Citizens Toward Government on Evaluations of Its Performance.
Public Performance & Management Review 29(4):387-404.
Kankaras, Milos, Jeroen K. Vermunt and Guy Moors. 2011. Measurement Equivalence of
Ordinal Items: A Comparison of Factor Analytic, Item Response Theory, and Latent Class
Analysis Approaches. Sociological Methods & Research, doi:10.1177/0049124111405301.
Kim, Sangmook, Wouter Vandenaabeele, Bradley E. Wright, Lotte Bøgh Andersen, Francesco
Paolo Cerase, Robert K. Christensen, Céline Desmarais, Maria Koumenta, Peter Leisink,
Banhcheng Liu, Jolanta Palidauskaite, Lene Holm Petersen, James L. Perry, Adrian Ritz,
Jeanette Taylor, and Paolo De Vivo. 2013. Investigation the Structure and Meaning of
Public Service Motivation across Populations: Developing an International Instrument and
Addressing Issues of Measurement Invariance. Journal of Public Administration Research
and Theory 23(1):79-102.
King, Gary, Christopher J. L. Murray, Joshua A. Salomon, and Ajay Tandon. 2004. Enhancing
the validity and cross-cultural comparability of measurement in survey research. American
Political Science Review 98(1):191-207.
3
Kline Rex B. 2013. Exploratory and confirmatory factors analysis. In: Y. Petscher & C.
Schatsschneider (Eds.), Applied quantitative analysis in the social sciences (pp. 171-
207). New York: Routledge
Kline, Rex B. 2011. Principles and Practice of Structural Equation Modelling. New York,
London: The Guilford Press.
Meredith, William. 1993. Measurement Invariance, Factor Analysis, and Factoral Invariance.
Psychometrika 58(4):525-34.
Meredith, William. 1995. Two Wrongs May Not Make a Right. Multivariate Behavioral
Research 30(1):89-94.
Meuleman, Bart. 2012. When are Item Intercept Differences Substantively Relevant in
Measurement Invariance Testing? In Methods, Theories, and Empirical Applications in the
Social Sciences. Festschrift for Peter Schmidt. eds. Samuel Salzborn, Eldad Davidov and
Jost Reinecke, 97-104. Wiesbaden: Springer Verlag.
Meuleman, Bart and Jaak Billiet. 2012. Measuring Attitudes toward Immigration in Europe:
The Cross-cultural Validity of the ESS Immigration Scales. Research and Methods
21(1):5-29.
Milsap, Roger E. and Jenn Yun-Tein 2004. Assessing Factorial Invariance in Ordered-
Categorical Measures. Multivariate Behavioral Research 39(3):479-515.
Mishler, William and Rose, Richard. 1997. Trust, Distrust and Skepticism: Popular Evaluations
of Civil and Political Institutions in Post-Communist Societies. The Journal of Politics
59(2):418-51.
4
Morgeson, Forrest V. 2013. Expectations, Disconfirmation, and Citizen Satisfaction with US
Federal Government: Testing and Expanding the Model. Journal of Public Administration
Research and Theory 23(2):289-305.
Newton, Kenneth and Pippa Norris. 2000. Confidence in public institutions: faith, culture, or
performance? In Susan J. Pharr and Robert D. Putnam, eds., Disaffected Democracies:
What's Troubling the Trilateral Countries?, pp. 52-73. Princeton, NJ: Princeton
University Press.
Oberski, Daniel L. 2014. Evaluating Sensitivity of Parameters of Interest to Measurement
Invariance in Latent Variable Models. Political Analysis 22(1):45-60.
Pollitt, Christopher, and Geert Bouckaert. 2011. Public Management Reform: A Comparative
Analysis – New Public Management, Governance and the Neo-Weberian State. Oxford:
Oxford University Press.
Pollitt, Christopher. 2011. Not Odious But Onerous: Comparative Public Administration.
Public Administration, online first.
Portinga, Ype H. 1989. Equivalence of Cross-cultural Data: An Overview of Basic Issues.
International Journal of Psychology 24:737-56.
Poznyak, Dimitry, Meuleman, Bart, Abts, Koen, and George F. Bishop. 2013. Trust in
American Government: Longitudinal Measurement Equivalence in the ANES, 1964-2008.
Social Indicators Research, online first.
Raju, Nambury S., Larry J. Laffitte, and Barbara M. Byrne. 2002. Measurement Equivalence: A
Comparison of Methods Based on Confirmatory Factor Analysis and Item Response
Theory. Journal of Applied Psychology 87(3):517-29.
5
Reeve, Bryce. B. and Peter Fayers 2005. Applying item response theory modelling for
evaluating questionnaire item and scale properties. In: Peter Fayers and Ron D. Hayes eds.
Assessing quality of life in clinical trials: Methods of practice (pp. pp.55-73). Oxford:
Oxford University Press.
Reise, Steven P.; Widaman, Keith F. and Robin H. Pugh. 1993. Confirmatory Factor Analysis
and Item Response Theory: Two Approaches for Exploring Measurement Invariance.
Psychological Bulletin 114(3):552-556.
Rensvold, Roger B., and Gordon W. Cheung. 1998. Testing Measurement Models for Factorial
Invariance: A Systematic Approach. Educational and Psychological Measurement
58:1017-34.
Samejima, Fumiko. 1969. Estimation of Latent Ability Using a Response Pattern of Graded
Scores. Richmond: William Byrd Press.
Saris, Willem E., Albert Satorra and Dag Sörbom. 1987. The detection and correction of
specification errors in structural equation models. In Sociological Methodology. Ed.
Clifford C. Clogg, 105-29. San Francisco: Jossey-Bass.
Saris, Willem E., Albert Satorra and William M. van der Veld. 2009. Testing Structural
Equation Models or Detection of Misspecifications? Structural Equation Modelling
16(4):561-82.
Sass, Daniel A. 2011. Testing Measurement Invariance and Comparing Latent Factor Means
Within a Confirmatory Factor Framework. Journal of Psychoeducational Assessment
29(4):347-62.

6
Shingler, John, Mollie E. Van Loon, Theodore R. Alter, and Jeffrey C. Brider. 2008. The
Importance of Subjective Data for Public Agency Performance Evaluation. Public
Administration Review 68(6):1101:11.
Skrondal, Anders and Sophia Rabe-Hesketh. 2004. Generalized Latent Variable Modelling:
Multilevel, Longitudinal and Structural Equation Models. Boca Raton: Chapman & Hall.
Steenkamp, Jan-Benedict E. M., and Hans Baumgartner. 1998. Assessing Measurement
Invariance in Cross-National Consumer Research. Journal of Consumer Research
25(1):78-107.
Stegmueller, Daniel. 2011. Apples and Oranges? The Problem of Equivalence in Comparative
Research. Political Analysis 19(4):471-87.
Thorpe, Geoffrey L. and Andrej Favia 2012. Data Analysis Using Item Response Theory
Methodology: An Introduction to Selected Programs and Applications. Psychology Faculty
Scholarship Paper 20. University of Maine.
Vandenberg, Robert J., and Charles E. Lance. 2000. A Review and Synthesis of the
Measurement Invariance Literature: Suggestions, and Recommendations for
Organizational Research. Organizational Research Methods 3(1):4-69.
Van de Vijver, Fons J.R., and Kwok Leung. 1997. Methods and Data Analysis for Cross-
Cultural Research. Newbury Park: Sage.
Van de Vijver, Fons J.R. 1998. Towards a Theory of Bias and Equivalence. ZUMA Nachrichten
Spezial, January 1998: 41-66.
Van de Vijver, Fons J.R. 2003. Bias and Equivalence: Cross-Cultural Perspectives. In Cross-
Cultural Survey Methods. Eds. Janet A. Harkness, Fons J.R. Van de Vijver and Peter Ph.
Mohler, 143-56. New Jersey: Willey.

7
Van de Walle, Steven and Geert Boukaert. 2003. Public service performance and trust in
government: the problem of causality. International Journal of Public Administration 29(8
& 9):891-913.
Van de Walle, Steven, and Gregg G. Van Ryzin. 2011. The Order of Questions in a Survey on
Citizen Satisfaction with Public Services: Lessons from a Split-Ballot Experiment. Public
Administration 89(4):1436-50.
Van Ryzin, Gregg G. 2006. Testing the Expectancy Disconfirmation Model of Citizen
Satisfaction with Local Government. Journal of Public Administration Research and
Theory 16(4):599-611.
Van Ryzin, Gregg G. 2011. Outcomes, Process and Trust of Civil Servants. Journal of Public
Administration Research and Theory 21(4):745-60.
Van Ryzin, Gregg G. 2013. An Experimental Test of the Expectancy-Disconfirmation Theory of
Citizen Satisfaction. Journal of Policy Analysis and Management 32(3):597-614.
Vigoda-Gadot, Eran. 2007. Citizens’ Perceptions of Politics and Ethics in Public
Administration: A Five-Year National Study of their Relationship to Satisfaction with
Services, Trust in Governance, and Voice Orientation. Journal of Public Administration
Research and Theory 17(2):285-305.
Whittaker, Tiffany A. 2012. Using the modification index and standardized expected
parameter change for model modification. Journal of Experimental Education 80:26–44.
Wright, Bradley E., Lepora J. Manigault, and Tamika R. Black. 2004. Quantitative Research
Measurement in Public Administration: An Assessment of Journal Publications.
Administration & Society, 35(6):747-64.