the global equivalence ratio concept and the formation ...
41
@ Pergamon 0360-1285(95)00004-6 Prog, Energy Combu.o. Sci. Vol.21, pp.197-237, 1995 1995Ekevier Science Ltd Printed inGreatBritain, 0360-1285/9S $2900 THE GLOBAL EQUIVALENCE RATIO CONCEPT AND THE FORMATION MECHANISMS OF CARBON MONOXIDE IN ENCLOSURE FIRES *t William M. Pitts Building and Fire Research Laboratory, National Institute of Stanaizr& and Technology, (iaithersburg, MD 20899, U.S.A. Received 4 May 1995 Abstract-This report summarizes a large number of investigations designed to characterize the formation of carbon monoxide (CO) in enclosure fires-the most important factor in fire deaths. It includes a review analysis of the studies which form the basis for the global equivalence ratio (GER) concept. Past and very reeent (some as yet unpublished) investigations of CO formation in enclosure fires are reviewed.Based on the findings, two completely new mechanisms for the formation of CO, in addition to the quenching of a fire plume by a rich upper layer, which is described by the GER concept, are identified. The first is the result of reaction between rich flame gases and air which is entrained directly into the upper layer of an enclosure fire. Detailed chemical–kinetic modeling studies have demonstrated that CO will be generated by these reactions. The seeond is due to the direct generation of CO during the pyrolysis of oxygenated polymers (such as wood) which are located in highly vitiated, high-temperature upper layers. The findings of these studies form the basis of an analysis that provides the guidelines for when the use of the GER eoneept is appropriate for predicting CO formation in enclosure tires. It is concluded that there are limited conditions for which such use is justified. Unfortunately, these conditions do not include the types of tires which are responsible for the majority of fire deaths in building fires. CONTENTS 1. Introduction 2. CO Formation in Enclosure Fires 3. Hood Experiments and the Global Equivalence Ratio Concept 3.1. Introduction 3.2. Summary of experimental findings 3.3. Conclusions based on the hood experiments 4. Detailed Chemical–K]neticCalculations of Upper-Layer Reaction Behavior 4.1. Summary and discussion of computational results 4.2. Implications of the calculations for the results of hood experiments 4.3. Implications of the calculations for CO formation in upper layers of enclosure fires 5. Studies in Reduced-ScaleEnclosures 5.1. Historical results available in the literature 5.2. Recent experiments at the Virginia Polytechnic Institute and State University (VPISU) 5.3. Summary of recent experimental and modeling investigations of reduced-scale enclosure (RSE) tires at NIST 5.3.1. Experimental findings for natural gas fires in a reduced-scaleenclosure 5.3.2. Experimental findings for the RSE equipped with a narrow door 5.3.3. Experimental findings for natural gas fires in a reduced-scale enclosure with upper walk and ceiling lined with plywood 5.3.4. Field modeling study of flow fields and mixing in the RSE 5.3.5. Conclusions based on the experimental and modeling studies of the RSE 6. Validity of Using the Global Equivalenec Ratio Concept to Predict Carbon Monoxide Production in Enclosure Fires 6.1. Conditions where the GER concept is appropriate for enclosure-fire predictions of CO formation 6.1.1. Fires for which the upper-layer temperature is less than 700K 6.1“.2. Fires for which the upper layer is lean and very hot ( >900 K) 6.1.3. Fires for which the only route for oxygen (air) to enter the upper layer is through the fire plume and the upper layer is very hot ( >900 K) 198 198 199 199 200 209 210 210 213 214 214 214 216 218 218 225 226 228 232 233 233 233 234 234 * This review is based on a National Institute of Stand- ards and Technology Monograph (179, June, 1994)entitled ‘The Global Equivalence Ratio Concept and the Prediction of Carbon Monoxide Formation in Enclosure F]res’. ? OffiCialcontribution ofthe National Institute of Stand- ards and Technology, not subject to copyright in the United States. 197
-
Upload
khangminh22 -
Category
Documents
-
view
0 -
download
0
Transcript of the global equivalence ratio concept and the formation ...

@
Pergamon
0360-1285(95)00004-6
Prog, Energy Combu.o. Sci. Vol.21, pp.197-237,19951995EkevierScienceLtdPrintedinGreatBritain,
0360-1285/9S$2900
THE GLOBAL EQUIVALENCE RATIO CONCEPT AND THEFORMATION MECHANISMS OF CARBON MONOXIDE IN
ENCLOSURE FIRES *t
William M. Pitts
Building and Fire Research Laboratory, National Institute of Stanaizr& and Technology, (iaithersburg,MD 20899, U.S.A.
Received 4 May 1995
Abstract-This report summarizesa large number of investigations designedto characterize the formationof carbon monoxide (CO) in enclosure fires-the most important factor in fire deaths. It includes areview analysis of the studies which form the basis for the global equivalence ratio (GER) concept.Past and very reeent (some as yet unpublished) investigations of CO formation in enclosure fires arereviewed.Based on the findings, two completely new mechanisms for the formation of CO, in addition tothe quenching of a fire plume by a rich upper layer, which is described by the GER concept, areidentified. The first is the result of reaction between rich flame gases and air which is entrained directlyinto the upper layer of an enclosure fire. Detailed chemical–kineticmodeling studies have demonstratedthat CO will be generated by these reactions. The seeond is due to the direct generation of CO during thepyrolysis of oxygenated polymers (such as wood) which are located in highly vitiated, high-temperatureupper layers. The findings of these studies form the basis of an analysis that provides the guidelines forwhen the use of the GER eoneept is appropriate for predicting CO formation in enclosure tires. It isconcluded that there are limited conditions for which such use is justified. Unfortunately, these conditionsdo not include the types of tires which are responsible for the majority of fire deaths in building fires.
CONTENTS
1. Introduction2. CO Formation in Enclosure Fires3. Hood Experiments and the Global Equivalence Ratio Concept
3.1. Introduction3.2. Summary of experimental findings3.3. Conclusions based on the hood experiments
4. Detailed Chemical–K]neticCalculations of Upper-Layer Reaction Behavior4.1. Summary and discussion of computational results4.2. Implications of the calculations for the results of hood experiments4.3. Implications of the calculations for CO formation in upper layers of enclosure fires
5. Studies in Reduced-ScaleEnclosures5.1. Historical results available in the literature5.2. Recent experimentsat the VirginiaPolytechnic Institute and State University (VPISU)5.3. Summary of recent experimental and modeling investigations of reduced-scale enclosure
(RSE) tires at NIST5.3.1. Experimental findingsfor natural gas fires in a reduced-scaleenclosure5.3.2. Experimental findingsfor the RSE equipped with a narrow door5.3.3. Experimental findings for natural gas fires in a reduced-scaleenclosure with upper
walk and ceilinglined with plywood5.3.4. Field modeling study of flowfieldsand mixing in the RSE5.3.5. Conclusions based on the experimental and modeling studies of the RSE
6. Validity of Using the Global Equivalenec Ratio Concept to Predict Carbon MonoxideProduction in Enclosure Fires6.1. Conditions where the GER concept is appropriate for enclosure-fire predictions of CO
formation6.1.1. Fires for which the upper-layer temperature is less than 700K6.1“.2. Fires for which the upper layer is lean and very hot ( >900 K)6.1.3. Fires for which the only route for oxygen (air) to enter the upper layer is through
the fire plume and the upper layer is very hot ( >900 K)
198198199199200209210210213214214214216
218218225
226228232
233
233233234
234
* This review is based on a National Institute of Stand-ards and Technology Monograph (179,June, 1994)entitled‘The Global Equivalence Ratio Concept and the Predictionof Carbon Monoxide Formation in Enclosure F]res’.
? OffiCialcontribution of the National Institute of Stand-ards and Technology, not subject to copyright in the UnitedStates.
197

198 W. M. Pitts
6.2. Conditions where the GER concept is inappropriate for enclosure fire predictions of COformation 234
6.2.1. Fires having ~, >0.5 and intermediate temperatures (70@900K) in the upper layer 2346.2.2. Fires for temperatures >900 K for which oxygen(air) enters a rich upper
layer directly 2346.3. Implications for using the GER concept to model CO formation in enclosure fires where
CO toxicity is important 2347. Additional Discussion and Limitations of Understanding 2358. Summary and Final RemarksAcknowledgementsReferences
1. INTRODUCTION
Roughly two-thirds of all deaths resulting fromenclosure fires can be attributed to the presence ofcarbon monoxide (CO) 1‘2which is known to be thedominant toxicant in fire deaths.3 Historicallyj themechanisms responsible for the generation of highconcentrations of CO in fires have not been wellunderstood. Recently, a number of investigationshave been reported which have provided new andimportant insights into how CO formation occurs inenclosure fires. This work summarizes the results ofa number of these studies and uses the findings toassess the current understanding of the process.Many of the studies discussed have been performedas components of a long-term program at the Na-tional Institute of Standards and Technology (NIST),which is seeking to develop an understanding of andpredictive capability for the generation of CO inenclosure fires.4
The majority of the effort at NIST has focused onproviding answers to two research questions that arecentral to the goal of the effort. 5 These questions canbe summarized as:
1. Does vitiation of the oxygen supply (normallyair) for a diffusion flame lead to the generation ofhigher concentrations of CO than burning in unviti-ated air?
2. Can the generation behavior of CO observedin hood experiments designed to model two-layerburning be extended to predict CO generation inactual enclosure fires?
Vitiation refers to a reduction in the oxygenconcentration as a result of mixing combustion prod-ucts with the air.
The first question has been addressed in earlierwork.6-8 It has been demonstrated that the genera-tion of CO for fully ventilated (i.e. having sufficientoxygen available for complete combustion of thesupplied fuel) fires is only minimally affected byvitiation down to levels sufficient to cause extinctionof the combustion itself. Under these conditions, theconcentrations of CO measured tend to be quite low.On this basis it was concluded that vitiation effectson the generation of CO in enclosure fires would beminimal.
This paper focuses on the answer to the secondquestion. In the following section, the problem ofCO formation in enclosure fires is discussed, and theneed for accurate prediction methods is emphasized.
235236236
In Section 3, the original studies of simplified two-Iayer fires which led to the development of what isnow called the ‘Global Equivalence Ratio (GER)Concept’ are summarized and the emphasis on Ques-tion 2 above is justified. Section 4 discusses thefindings and implications of studies which used de-tailed chemical-kinetic models to predict the reactionbehavior of combustion–gas mixtures observed inthe simplified fires. Section 5 summarizes the findingsof investigations of fire-species production inreduced-scale enclosures. Recent experiments at theVirginia Polytechnic Institute and State University(VPISU) and NEST are emphasized. The flow behav- ,ior for the reduced-scale enclosure fires at NIST hasbeen calculated using a field model. New mechanismsfor the generation of CO in enclosure fires are identi-fied. In Section 6, the results summarized earlierform the basis of an analysis designed to assess theappropriateness of using the GER concept for predict-ing the generation of CO in enclosure fires. TheGER concept appears to be applicable only for veryspecific types of fires which are not typical of thosebelieved to be most life-threatening. Limitations ofthe current work and research areas requiring furthereffort are discussed in Section 7. Finally, Section 8 isa summary of the conchsions.
2. CO FORMATION IN ENCLOSURE FIRES
During the past few years, a number of computerprograms have been developed which are designed toestimate the life-safety hazards associated with enclo-sure fires (e.g. Ref. 9). A major limitation of suchmodels is that the production rates of molecularspecies as a function of fuel-loss rate must generallybe input as parameters. The understanding of themechanisms responsible for the formation of CO infires is far too limited to allow accurate predictionsof generation rates for this species. This is particu-larly true with regard to extremely intense fires,where such high generation rates of gaseous fueloccur (either directly as gas, vaporized liquid, orpyrolyzed solid) that the fire becomes underventi-lated. Temperatures are usually high, and such firestend to be ‘flashed over’. 10 It is hoped that thefindings of the work summarized here will ultimatelylead to a sufficient understanding of CO formationthat accurate engineering estimates can be developedwhich can then be utilized for these models.

Enclosure fires 199
Smoke inhalation has often been cited as the lead-ing cause of death in fires. Over the years, the centralrole of CO in these deaths has been documented.Harwood and Hall 2 have considered the question:“What kills in fires: Smoke Inhalation or Burns?’Based on an analysis of death certificates in theUnited States, they concluded that the ratio of smokeinhalation to burns as the cause of death is roughly2:1. For fires where death occurs beyond the room oforigin for the fire, the ratio is even higher. Omi-nously, they concluded that the fraction of deathsdue to smoke inhalation is increasing as time passes.
The toxicity of CO for humans is a result of thestrong, long-lived bond that forms between the COmolecule and the hemoglobin in blood cells. 11 Thecomplex of CO and hemoglobin is referred to ascarboxyhemoglobin. When CO enters the lungs, it isabsorbed into the bloodstream where it ties up thehemoglobin in red blood cells which would otherwisecarry oxygen through the body. When the percentageof the resulting carboxyhemoglobin is high, insuffi-cient oxygen is available for the body and the victimfirst becomes drowsy, then incapacitated, and if thelevel is sufficiently high, ultimately suffocates todeath. Harland and Anderson considered the car-boxyhemoglobin levels of fire victims.l These authorsconcluded that roughly 55~0 of fire victims have fatalcarboxyhemoglobin levels ( > 50%) and that an addi-tional 13% of the remaining victims had levels suffi-cient to cause some incapacitation. Roughly two-thirds of the fire deaths can therefore be attributedto the effects of CO.
Taken together, the findings of the two studies 1’2cited above suggest that roughly two-thirds of all firedeaths are the result of CO generation in enclosurefires (approximately 2360 of 3540 deaths in theUnited States during 1993).12 Babrauskas et al. haveconsidered the types of fires which are most likely toresult in CO-induced deaths.3 They conclude thatthe most important type of fire, by far, is a post-flashover fire in which products of combustion aretransported away from the room of fire origin. Unfor-tunately, it is this scenario for which the least informat-ion is available concerning the levels and mecha-nisms for the generation of CO.
Until recently, no full-scale experiments had beenreported which were designed to investigate systemati-cally the formation of CO in and transport of COf~om room fires. Alternatively, concentrations of COand other flame gases were recorded routinely,though without a systematic protocol, during full-scale fire tests. Mulholland of the Building and FireResearch Laboratory (BFRL) at NIST reviewed anumber of full-scale fire tests performed at BFRLand reached conclusions concerning the formation ofCO. 13 In a fully ventilated fire prior to flashover, thegeneration of CO is minimal and its toxicity is un-likely to be important. When a fire grows andachieves flashover, there is a rapid increase in COgeneration rates and life-threatening concentrations
of flame gases are achieved quickly. Based on hisreview, Mulholland recommended as a zeroth-orderapproximation that a generation rate of CO equal to0.3 g of CO produced per gram of fuel burned beadopted for underventilated fires.
In 1987, a fire in a duplex townhouse in Sharon,PA, resulted in the deaths of three people. One ofthe victims was reported to have had an extraordi-narily high carboxyhemoglobin level of91 %. 14 Inves-tigators from BFRL visited the site shortly after thefire and were able to learn a great deal about thebuilding and the tire behavior by inspection anddiscussions with firemen and the building owner.The investigators concluded that this fire was a clas-sic example of the fire scenario described above. Thedecision was made to simulate this fire in the NISTfull-scale fire facility. The goal was to characterizethe fire and to test BFRL models designed to predictthe fire behavior. Levine and Nelson have summa-rized the findings of this test. 14
The fire in Sharon was primarily confined to adownstairs kitchen which was panelled with woodand had a cellulosic ceiling. The fuel load was simu-lated using % 185 kg of wood cribs and plywood.The victims were found in upstairs bedrooms. Duringthe fire test, measurements of CO were recorded atthe doorway soffit leading from the room adjacentto the fire room (kitchen) as well as upstairs in thebedrooms. CO concentrations as high as 8.5% (dryvolume) were observed at the doorway of the roomadjacmt to the kitchen, and concentrations greaterthan 5% were observed in the upstairs bedrooms.Such levels of CO will cause death nearly instantane-ously and are consistent with the victims succumbingto smoke inhalation. Mulholland reviewed the resultsof the Sharon fire test and concluded that there wasrough agreement between the measured CO levelsand his zeroth-order model for CO generation infull-scale fire tests, 15
3. HOOD EXPERIMENTS AND THE GLOBALEQUIVALENCE RATIO CONCE~
3.1. Introduction
Due to the lack of a substantial database for COformation in full-scale enclosure fires and a lack ofunderstanding of the physical processes responsiblefor the generation of CO, it has been impossible toprovide an engineering correlation or fundamentalapproach for predicting CO formation for the firescsnario of most interest. However, substantialprogress has been made during the past 10 years.
Much of this progress is built on a series of experi-ments which were performed at Harvard Universityand the California Institute of Technology. The stud-ies are referred to as ‘hood’ experiments for reasonswhich will become obvious. These experiments weredesigned to be idealized analogs of two-layer zonemodels 16being developed to model room-fire behav-ior. Zone models generally divide a room fire into

200 W. M. Pitts
two sections—a relatively cool and mildly vitiatedlower layer and an upper layer containing the com-bustion gases which is generally hot and becomesvitiated for underventilated burning. Of course,during the history of a room fire, the relative sizes,temperatures, and compositions of the two layerschange dramatically.
3.2. Summary of Experimental Findings
In the experiments at Harvard University and theCalifornia Institute of Technology, hoods wereplaced above fires burning in open laboratories. Thevertical position of the flames could be varied suchthat for fully ventilated flames, the combustingregion actually extended into the hood. Combustiongases were trapped in the hood, which eventuallyfilled up, forming an upper layer above the firewhich was hotter than the ambient surroundings.For underventilated burning, the flames werequenched and products of incomplete combustionformed and were trapped in the hood. Experimentsdemonstrated that the gases in the upper layer, awayfrom the fire plume, were well mixed. By varying theburner size and the separation of the fire source andthe base of the upper layer, it was possible to system-atically change the mass ratio of combustion gases inthe hood derived from fuel and from entrained air.Generally, the fires were allowed to bum long enoughfor the temperature and composition of the upperlayer to attain steady-state behavior.
The simple configuration and steady-state natureof the hood experiments allowed detailed measure-ments of species concentrations in the upper layer.From these measurements, it was possible to derivethe ratio of combustion product mass introducedfrom the fuel to the mass introduced from entrainedair. In combustion science, it is customary to dividethis mass ratio by that required for complete burningof the fuel to fully oxidized products (the productsare water and carbon xiodide (C02) for typical hydro-carbons). The resulting parameter is referred to asthe equivalence ratio and is often denoted by theGreek letter phi (~). For lean mixtures, @is less thanone, for stoichiometric mixtures, @equals one, andfor rich mixtures, $ is greater than one. For the hoodexperiments it is possible to define several differentphi, here we will consider two. The plume equivalenceratio (@P)will be defined as the fuel mass-flow ratedivided by the air mass-entrainment rate into theplume below the layer normalized by the stoichiomet-ric ratio for the fuel. The global equivalence ratio(GER, denoted as ~,) will refer to the ratio of themass of gas in the upper layer derived from the fueldivided by that introduced from air normalized by thestoichiometric ratio. Note that for steady-state cases,where no air or fuel enter the upper layer except byway of the fire plume, +P and q$~are identical.
Beyler at Harvard University was the first to at-tempt to correlate his measurements of combustion
gas concentrations in the upper layer with theGER. 17-19Values of 4P were determined by measur-ing the total gas flow into the hood (by balancingextraction of a known amount of gas from the hoodto give a constant layer height) and using the meas-ured fuel flow rate and compositions of the upperlayer. Figures 1 and 2, taken from Ref. 17, are aschematic for the cylindrical hood and the overallexperimental configuration. Beyler found that thebottom of his layer was not well defined due tomixing bet ween the combustion gases and the labora-tory air. He also noted that flaming occurred alongthe bottom of the layer for ~, in the range of 1.4-1.8. This layer interface burning limited the highest~, which could be investigated.’’””
Since the experiments were done for steady-stateconditions, to a very good approximation, q$Pisequal to ~~. Beyler found an excellent correlation ofmajor gas species with $P which was independent ofburner size, upper-layer temperature (range of 470-800 K), and separation of the upper layer and firebase. Figure 3 shows the correlations he observed formajor gas species using propane as fuel.17 Signifi-cantly, similar to enclosure fires, CO levels are lowwhen the fire is overventilated (lP < 1) and rapidlyincrease when the fire becomes underventilated(4P > 1). The implications for predicting CO genera-tion in enclosure fires are obvious.
Several points should be noted concerning Fig. 3.The concentration of CO starts to increase for#, >0.5 while the other products of incomplete com-bustion (hydrogen and total hydrocarbons) begin toincrease at slightly higher 4P. For a 4P of 1 there isroughly 2% 02 remaining in the fire gases, andmeasurable amounts of 02 are present at the highest+, observed. The co-existence of fuel and 0, suggeststhat additional reaction of the fire gases would bepossible if temperatures were increased.
In his dissertation 17 and a subsequent paper, 18Beyler reported results for a number of liquid andgaseous fuels. In each case it was found that theconcentration data collapsed to single curves whenplotted as functions of the GER, but that absoluteconcentrations for a particular combustion productvaned with fuel. The data were reported in twoforms: as volume percentages and as normalizedyields defined to be the ratio of the actual andmaximum theoretical production rates.
Beyler concluded that CO production could becharacterized by two constants---one for lean(+, < 0.7) and one for rich (4P > 1.2) conditionswith a transition region centered about @P= 1. Allfuels, with the exception of toluene, which generatedhigh CO concentrations for overventilated burning,resulted in low CO concentrations in the hood (muchless than 1%) for +, e 0.7. Considerably higher COconcentrations were generated for @P> 1.2. Table 1summarizes the findings for CO in terms of concentra-tions and yields observed for rich conditions. Forlater comparison purposes, Beyler’s normalized

Enclosure fires 201
vL
A
* ~ 102cm >15cm
.1 \48cm
‘: : ‘1
(1.2cm
3.8 cm
b
d
Fig. 1. Schematic of the cylindricalhood used by Beyler to investigate combustion-gas generation by firesin a two-layer environment. Figure reproduced from Ref. 17.
ItlSETTLINGCHAMBER j
Q
BURNER
FLOWCONTROLLERTC‘%-
~ORIFICEPLATEI n n1 /
% -& Y -h’
+
SAMPLINGFLOW STRAIGHTENER
FLANGETAPSPOINT
Fig. 2. Schematic drawing of the hood and exhaust systems used by Beylerto investigatethe formation ofcombustion gases for firesburning in a two-layer environment. Figure reproduced from Ref. 17.
Table 1.Beyler’sfindingsfor CO formation under rich burning conditions
Fuel Formula CO Vol. percent CO YleId (g/g),
Propane C,H8 1.8 0.23Propene C,H, 1.6Hexane
0.20C, HI. 1.6 0.20
TolueneG C,H8 0.7 0.11Methanol CH,OH 4.8 0.24Ethanol C2H$OH 3.6 0.22Isopropanol C,H,OH 2.4 0.17Acetone C3H,0 4.4 0.30Polyethylene -CH,- 1.7 0.18Poly(methylmethacrylate) -C5H,0,- 3.0 0.19Ponderosa Pine CO.95HZ.40 3.2 0.14
yields have been converted to absolute yields. Asshown in Table 1 and noted previously by Beyler,for a range of fuels, the yields of CO for rich burningare nearly constant atO.2 gCO/g fuel burned, whilethe observed concentrations depend strongly on fuel.
Some interesting conclusions concerning fuel ef-fects can be drawn from the results in Table 1.Partially-oxygenated fuels such as alcohols and ke-tones lead to higher concentrations (in volume percent) of CO than alkanes or alkenes. The lowest
concentration of CO was observed for toluene. Beylerattributes this observation to the thermal stability ofthis molecule. For most fuels, the reaction of the OHfree radical with fuel molecules is much faster thanthe corresponding reaction with CO. It is the reactionof OH with CO which is primarily responsible forconverting CO to C02. Due to the unusual stabilityof toluene, its reaction rate with OH is substantiallyreduced compared to other hydrocarbon fuels. As aresult, CO is able to compete successfully with the

202 W. M
2
2 6 10 14 18
Equivalence ratio (x 10’)
L x- C02O- THCo- H2
2 6 10 14 18
Equivalence ratio (x 10’)
Fig. 3. Measured concentrations (in volume pereent) ofcarbon dioxide, oxygen, water, carbon monoxide, totalhydrocarbons, and hydrogen observed in a hood locatedabove a propane flame are plotted as a function of q$w
Figure is reproduced fromBeyler.’7
toluene fuel molecules for OH radicals and is there-fore more efficiently oxidized.
In a later publication, Beyler reported similar hoodmeasurements for three solid fuels: polyethylene,poly(methyl methacrylate) (PMMA), and ponderosapine. 1g The results of these experiments have been
included in Table 1. The solid fuels appear to followthe same trends as the gases and liquids. Polyethyl-ene, which contains only carbon and hydrogen, gener-ates roughly the same concentration of CO as thealkanes and alkynes while the oxygen-containingfuels produce levels roughly comparable to the alco-hols and ketones.
The major conclusions of Beyler’s work concern-ing CO formation in the hood-type experimentsare.
1. Major flame species including CO can be corre-lated in terms of ~~,
2. Relatively constant concentrations of CO aregenerated at low and high ~,.
3. The generation of CO under rich conditions isconsiderably greater than for lean conditions.
4 The concentrations of CO generated for richconditions are fuel dependent, but can be corre-lated with fuel structure. Oxygen-containingfuels generate the highest CO levels while especi-ally thermally stable fuels generate the lowest.
Pitts
Hydrocarbon fuels fall in the middle. CO yieldsdemonstrate considerably less variation.
In an investigation concerned primarily with en-trainment into a buoyancy-driven fire plume, Cete-genz 1 at the California Institute of Technology useda hood system which was a significant modificationof the hood design employed by Beyler. 17 Figure 4shows a schematic for the experiment. It can beobserved that instead of withdrawing gases directlyfrom within the hood, as was done by Beyler, inorder to control the position of the layer interface,the gases were allowed to spill out beneath the innerhood and into a second hood from which they wereexhausted from the laboratory. As a result, the layerinterface was located very close to the bottom of thefirst or catcher hood, which was a cube having 1.2 msides. With this configuration the interface region isthinner and its location is better defined comparedwith the hood experiments of Beyler.
The fuel used by Cetegen was natural gas, which isprimarily methane (x92%). Limited measurementswere made of the concentrations of combustion prod-ucts (with water, i.e. dry measurements, and sootremoved) within the upper layer above the fire. Forrich conditions, upper-layer temperatures were onthe order of 850 K. When plotted as a function of~,, observed mole fractions (equivalent to volumefractions) of CO were negligible for @, <0.6, beganto increase rapidly between 0.5 < q$P< 1.6, and thenremained nearly constant at =0.024 until the highest@,for which measurements were recorded (@P= 2.3).These findings are consistent with the observationsof Beyler 17-19 for a range of other fuels. UnfolW-
nately, oxygen measurements were not reported. In-terestingly, ignition of the layer interface was notobserved until #P was greater than 2.5, suggestingthat the bottom of the layer was defined better thanin the experiments of Beylerl 7’20where ignition wasobserved for 4P > 1.8.
In later work at the California Institute of Technol-ogy, Lim22 used the same experimental faeilit y withnatural gas fuel to make more careful measurementsof concentrations in the upper layer. Concentrationsof C02, CO, 02 and CH4 were measured for gasesextracted from the hood. Similar to the earlier work,the species concentrations were independent of posi-tion for Iocations removed from the fire plume. Byassuming mass balance, approximate concentrationsfor C02, CO, 02, CH4, N2, H2 and H20 werecalculated for the layer and plotted as functions of~, which should equal #, since measurements wererecorded for steady-state burning. Observed upper-layer temperatures were in the range of 450-850 K.Measurements were made while varying both thefuel source–layer interfaee distance and the fuel flowrate.
Figures 5 and 6 show the results for CO and 0,.22The data for CO fall on a well-defined curve whichhas a similar shape to those found earlier byBey1er17-19 and Cetegen. z1 The CO concentration

Enclosure fires
~HOOD [2.4m)
203
$-axHAusTF.N‘ORIFICE FLOW
f\
METER/[
TRAVERSE MECHANIS
HCANALYZER
r
I
b
‘
C02
1000”cDRYER
DETECTORrZi
&
Fig. 4. The experimental arrangement forthehood measurements of Cetegen.2* Combustion gases areallowed to flow from beneath the first hood, thus defining the layer interface location. Limited gasmeasurements were made forgases extracted directly from the layer. Forthese measurements the furnace
shown in the figure was not operated.
0 0.23m 850eK 30sO O.10m 700 60A 0.07m 650 100
0.031- Q O,oltn 550 190
r
— Chemicslequilibrium 800°K
0.02
0.01
0 0.s- 1.0 1.S 2.0 2.5 3.0
4Fig. 5. Mole fractions of CO observedin thehoodexperi-ments of Lim22 are plotted as a function of q$P(whichshould be the same as ~J. The solid lines represent predictedCO concentrations assuming full equilibrium exists amongcombustion products for the temperatures indicated. Figure
reproduced from Ref. 22.
begins to increase for @gs 0.6. As Beyler had alsoobserved, there is a residual concentration of 1-2%02 for#P > 1. In summary, all of the hood experi-mental results discussed up to this point have thesame qualitative behavior, and the quantitative agree-ment is quite good as well.
The solid lines in Figs 5 and 6 correspond toconcentrations of the species which are calculatedassuming natural gas and air mixtures at the givend, are allowed to come into chemical equilibrium
0.20 r
1!0 OA
0.16
0.12
1>: 00.08
=1 Th i rcs—. —o 0.23m 850°K 30sO O.10m 700 60A 0.07m 650 100Cl 0.01 m 550 190
— Chemicalequilibrium
‘“”&o 0.5 1.0 1.5 2.0 2.5
Fig. 6. Mole fractions of02 observed in the hood experi-ments of Lim22 are plotted as a function of q5P(whichshould be the same as @J. The solid line represents thepredicted 02 concentration dependence on ~, assuming fullequilibrium exists among combustion products. Figure
reproduced from Ref. 22.
at the temperatures indicated. It was hypothesizedthat chemical-equilibrium calculations might allowpredictions for the observed concentration dependen-cieson @~.Figure 5demonstrates that agoodpredic-tion of the CO concentration curve would be ob-tained for a temperature between 750 and 800K.Alternatively, the chemical-equilibrium calculationsfail entirely to predict the residual oxygen concentra-tions observed for q~ > 1. The possibility of usingequilibrium approaches to predict CO formation inenclosure fires will be assessed in Section 4.3.
The next improvement in the experimental proce-

204
0.10
0.08
0.06
0.02
●
W. M. Pitts
0.04
0.03.m
mm
*“■
.#’I 8
0 0.5 1.0 1.5 2.0 2.5
$pFig. 7. Mole fractions of methane observed in the hoodexperiments of Toner23 are plotted as a function of #P(which should be the same as #, for these experimental
conditions). Figure reproduced from Ref. 23.
0.25
0.20
0.15
I
*,+ 8
?00.10
●
■
}
\0.05 ■
Io 0.5 1.0 1.5 2.0 2.5
@pFig. 8. Mole fractions of oxygen observed in the hoodexperiments of Toner23 are D]otted as a function of &(w}ich should be the same & ~, for these experiment’~
conditions). Figure reproduced from Ref. 23.
0.10 r
0.08
0.06
0.04
0.02
98
=8
‘=(’-=”.■
●
n
■
m
+-+J_uo 1.5 2.0 2.5
Fig. 9. Mole fractions of carbon dioxide observed in thehood experiments of Toner23 are plotted as a function ofI#p(which should bc the =me as #J, for these experimental
conditions). Figure reproduced from Ref. 23.
dure for the hood experiments was reported byToner. 23 He replaced the individual gas analyzers
used by earlier researchers with a gas chromatogra-
0u 0.02
*
0.01
0
s=
u I I I I0.5 1.0 1.5 2.0 2.s
@pFig. 10. Mole fractions of carbon monoxide observed in thehood experiments of Toner23 are plotted as a function of~, (which should be the same as @I,for these experimental
conditions). Figure reproduced from Ref. 23.
0.05
0.04
[
0.03 –m
>=0.02 –
*
● =m❑mri
0.01 ● %+
8
0 0.5 1.0 1.5 2.0 2.5
@p
Fig. 11. Mole fractions of hydrogen observed in the hoodexperiments of Toner23 are plotted as a function of do(which should be the same as 1, for these experimental
conditions). Figure reproduced from Ref. 23.
phy system, which allowed accurate concentrationmeasurements of a large number of species in theupper layer contained within the hood constructedby Cetegen.z 1 It was possible to record concentra-tions for a sufficient number of species so that bycombining the measurements with appropriate con-servation laws, he was able to report all major speciesconcentrations dhectly without making any assump-tions concerning burning behavior.
Natural gas was the fuel, Concentrations of com-bustion products in the upper layer were uniform forpositions far from the fire plume. Again the fuel flowrate and separation of the fuel source interfacx heightwere varied. Temperatures in the upper layer rangedfrom 500 to 870 K.
Figures 7–1 1 show the results of measurements forCH4, 02, C02, CO and Hz. There are several pointsto note about these figures. All the species concentra-tions are well correlated in terms of +~. The onlyproduct of incomplete combustion observed for~, <1 is CO. H, and CH4 only appear for ~, >1.The CO mole fraction begins to increase for ~, >0.5,

Enclosure fires 205
/
(a) Top view (through ceiling)
(b) Side view (showing injectionorientation)
Fig. 12. Schematic of the tube arrangement used by More-hart to inject air directly into the upper layer above anatural gas fire. Added gas enters the layer through 3651.6mm holes spaced along the tubing. Figure reproduced from
Morehart.24
being on the order of 1% for ~, = 1. CO concentra-tions appear to level off to a mole fraction of 0.019for @, > 1.5. These observations are consistent withthe earlier work discussed above. A major differencefrom the earlier work is that oxygen concentrationsfor +, > 1 approach zero. Earlier experiments hadsuggested significant concentrations of 02 remainedfor rich mixtures in the upper layers. This is the firstindication that the correlations in terms of ~~ maydepend on an uncharacterized (at the time thisworkzs appeared) variable.
The final series of hood experiments to be dis-cussed was performed by Morehart, also workingwith Professors Zukoski and Kubota at the Califor-nia Institute of Technology .2&26 These measure-ments were made in a new hood facility, but utilizedthe same gas analysis procedures developed byToner.23 The new hood was considerably larger (1.8
m square x 1.2 m tall) than the earlier facility eventhough the upper layer was generated in a similarmanner. A series of tubes with holes located withinand near the top of the hood was incorporated suchthat additional gas could be injected directly into theupper layer at positions well removed from the fireplume. Figure 12 shows the arrangement of the tubeswithin the hood.
The new hood allowed 1P and ~, to be variedindependently while maintaining a steady-state condi-tion in the upper layer. For instance, by adding airto the upper layer, it was possible to force qf~to belower than & The experiment was designed to modelthe conditions expected in a developing room fire. Inthe early stages of such a fire, there is sufficientoxygen available, and the upper layer which beginsto form is fuel lean. As the fire grows, its oxygen(air) demands increase, and the fire plume enteringthe upper layer is richer than the combustion gasestrapped above. Eventually, the upper layer becomesrich enough (i.e. the oxygen concentration deereasessufficiently) to quench the fire plume in this layer,and concentrations of products of incomplete com-bustion build-up. A pseudo-steady-state burning maybe reached in which qi, and #g are the same (thecondition modeled by the earlier experiments). Adying fire is expected to go through a reverse process.As the fire size decreases, less oxygen is required,and +P becomes less than +s. It would be possible tomodel this process in the hood experiments by addingfuel to the upper layer. Such measurements were notreported by Morehart.
The outline of a model for incorporating the find-ings of these new measurements into a descriptionfor a developing fire in an enclosure was provided byMorehafi.24 The model was not solved and no com-
parisons with actual fire behaviors were attempted.Cooper of NIST has developed a different approachfor incorporating the observations of the hood experi-ments into a zone model.27-29 Neither of thesemodels are discussed in this paper.
The experimental approach used by Morehart24was to first make steady-state measurements withoutadding air to the upper layer (i.e. @g= 4P). Values of~, and individual species concentrations were deter-mined in the manner introduced by Toner. 23 Thisinitial condition corresponds to the approach of theearlier hood experiments discussed above. Next,while maintaining the same fuel flow rate and fuelsource-layer interface separation (which leaves 4Punaltered), air was added to the upper layer therebyreducing & Values of I#gand hood concentrationswere determined by repeating measurements of themajor combustion gases for the new condition. Thisprocess was then repeated for several ~c Such meas-urements were performed for several ~v
Most of the experiments reported by Morehartused natural gas as fuel, Measurements at variouslocations within the hood demonstrated that molecu-lar concentrations were uniform for positions outside

206 W. M. Pitts
0.10$oP1.m. Z,nterf.c.
0 2.17 10 cmo 1.62 10 cm
&
.
0.16
G>:vac. 0.12k.mm
~
:0.08.-x0.-0
c; 0.04
c
++ ++
+ ++ ++++ +1‘“--a 1.09 iO cmO 0.81 10 cmJ 0.91 23 cm~ 0.50 23 cm
[
.v 1.46 5 cm+ Toner Data
* 2.83 5 cm
18
Open symbols.+
correspond toexperiments -s+
● +without airaddition *0+++ +
.
4+
Z,.tip<..e10 cm10 $In10 cm10 cm23 cm23 cm5 cm5 cm
Data
%.IUU.=0 2.170 1,62A 1.090 0.81J 0.91k 0.50~ 2.83v 1.46+ Toner
1 *#*++ :+ Open symbolscorrespond toexperimentswithout airaddition
0.02
0.00 J
0.00 0.50 1.00 1.50 2.00 2.50 3.000.00 0.50 1.00 1.50 2.00 2.50 3.00Upper Layer Equivalence Ratio
Fig. 13.Methane mass fractions observed by Morehart24 inthe combustion gases trapped in an upper layer abovenatural gas fires are plotted as a function of ~~. Filledsymbols correspond to cases where 4P # q$r The results ofsimilar measurements by Toner23 are included for compari-
Upper Layer Equivalence Ratio --
Fig. 15. Carbon dioxide mass fractions observed by More-hart24 in the combustion gases trapped in an upper layerabove natural gas fires are plotted as a function of q$~.Filled symbols correspond to cases where 4P # ~s, Theresults of similar measurements by Tonerz 3 are included for
son. Figure reproduced from Ref. 24. “ comparison. Figure reproduced from Ref. 24.
[email protected] 2.170 1.62A 1.090 0.81d 0.91~ 0.50M 2.63v 1.46+ Toner
Zhti..f.c.
10 cm10 cm +10 cm10 cm ++23 cm +23 cm ,
5 cm5 cm . +++eo :
Data,E & “
o 2.I7❑ 1.62A 1.090 0.81f p:
~ 2:83v 1.46+ Toner
++ +
+&
.
10 cm10 cm23 cm23 cm5 cm
L
tA 0
● 05 cmData
i1 Open symbols
i
correspond toexperiments
5’without airaddition
■
2$$++
$:.-&2&-J-
0.50 1.00Upper Layer
Open symbolscorrespond toexperimentswithout airaddition
0.000 —0.00
, , I
1.50 2.00 2.50 3.00Equivalence Ratio
0.00 0.50 1.00 1.50 2.00 2.5o 3.00Upper Layer Equivalence Ratio
Fig. 14. Oxygen mass fractions observed by Morehart2’inthe combustion gases trapped in an upper layer abovenatural gas fires are plotted as a function of +s, Filledsymbols correspond to cases where 4P # ~~. Theresuhs ofsimilar measurements by Toner23 areincluded forcompan-
son. Figure reproduced from Ref. 24.
Fig. 16. Carbon monoxide mass fractions observed byMorehart24 m the combustion gases trapped in an upperlayer above natura] gas fires are plotted as a function of ~rFilled symbols correspond to cases where ~, # ~c Theresults of similar measurements by Toner23 are included by
comparison. Figure reproduced from Ref. 24.
of the fire plume and that the temperature increasedslightly from the bottom to the top of the enclosure.Hood temperatures for the results to be summarizedhere were in the 500-600 K range. As is discussedlater in this section, due to the larger volume of thehood and differences in insulation, these tempera-tures are generally lower than observed in the earlierhood experiments.
Figures 13–I 9 show the results of measurementsfor CH4, 02, C02, CO, Hz, C2H6 and C2H2.24These figures contain a great deal of informationwhich requires additional explanation. The open sym-bols are concentration measurements (in terms ofmass fraction) for which no air has been added to
the upper layer (i.e. #P = ~~). Values of 4P have beenvaried by changing the fuel flow rates and fuelsource–layer interface separation. Each 4P is repre-sented by a different symbol. Experiments for whichair has been added to the upper layer (thus loweringthe +~) are represented with corresponding solid sym-bols. The results of Toner* 3 have been included on
the same plots and are represented by the ‘+‘ symbol.From Figs 13-19, it is clear that the major species
concentrations within the hood are well correlatedwhen plotted as a function of sj~. The results for
@, < d, and 4, = ~, lie on the same curve. Theremarkable conclusion which is reached is that theconcentrations of combustion gases in the upper layer

Enclosure fires 207
0.0020
G
:0.0015;e.,m01
SI 0.0010c0M04~o.0005
%1.=,o 2.17a 1.62A 1.090 0.81A 0.91N 0.50M 2..S3V 1.46+ Toner
Z,.ti,f..=10 cm10 cm10 cm10 cm23 Cm
23 cm5 cm5 cm
Data
++
● O
+*
+*O
++
I
..
+-●
90
+**
●9-
● V
. Oven svmbols i
,.OOOo~0.00 0.50 1.00 1.50 2.00 2.50 3.00
Upper Layer Equivalence Ratio
Fig. 17. Hydrogen mass fractions observed by Morehart24in the combustion gases trapped in an upper layer abovenatural gas fires are plotted as a function of @r Filled
. symbols correspond to cases where q$P# & The results ofsimilar measurements by Toner23 are included for compari-
son. Figure reproduced from Ref. 24. -
. 0.003
0.000
.y+.,.==Z,.kf.,=
o 2.17 10 cm .0 1.62 10 cmA 1.09 10 cmO 0.81 10 cmd 0.91 23 cmh 0.50 23 cm *k 2.83 5 cmv 1.46 5 cm+ Toner Data
oOpen symbolscorrespond to +0experiments . ●
without air n+
additionv-
.*.
+++*
++0.00 0.50 1.00 1.50 2.00 2.50 3.00
Upper Layer Equivalence Ratio
Fig. 18. Ethanemass fractions observed by Morehafi24inthe combustion gases trapped in an upper layer above
. natural gas fires are plotted as a function of @r Filledsymbols correspond to cases where@P # ~~. The results ofsimilar measurements by Toner23 are included for compar-
ison. Figure reproduced from Ref. 24.
depend only on the value of~, suggesting that thegeneration rates for the chemical species only dependon this variable. The importance of this observationis great because it implies that steady-state measure-ments of this type could be used to predict instantane-ous concentrations during a developing tire.
Unfortunately, Morehart’s results also revealedanew uncertainty concerning the GER concept. Exami-nation of Figs 13–19 shows that there are significantsystematic differences between the findings of More-hart24 and Toner. 23 These were similar experiments
using the same fuel, yet the differences between theresults of the two studies were varied and complex.Consider the products of incomplete combustion.
0.004
2~ 0.003u:
r.a
:g 0.002
zQ~0c10.001<
0.000
19p1.m.
o 2.17❑ 1.62‘a 1.090 0.81~ 0.91~ 0.50- 2.83v 1.46+ Toner
z<.,.,,..,10 cm10 cm10 cm10 cm23 cm23 cm
5 cm5 cm
Data
+
.
+●
Open symbols+0
correspond to .
experiments s- 0
without air ●:We+addition
● *m+
.
1&
0.00 0.50 1.00 1.50 2.00 2.50 3.00Upper Layer Equivalence Ratio
Fig. 19. Acetylene mass fractions obsewedby Moreh~24in the combustion gases trapped in an upper layer abovenatural gas fires are plotted as a function of & Filledsymbols correspond to cases whereqJ # @r ‘lleresultsofsimilar measurements by Toner23 are included for compari-
son. Figure reproduced from Ref. 24.
Both studies show CO increasing at roughly thesame rate for +~ > 0.5, but CO concentrations for~,> 1.3arehigher in Toner’s hood. Acetylene showsa roughly similar behavior in the two studies. More-hart finds unburned CH4 for 4K>0.5 while it isonly detected for 4g > 1 by Toner. In all cases, theCH4 concentration is lower in the Toner experiments.Finally, measurements for Hz and C2H6 have similarbehaviors in both cases, only beginning to increasefor~, > 1.
The behaviors for C02 and 02 are also different.For lean conditions, the levels of C02 observed byMorehart are greater, but for ~~ > 1 Toner findshigher concentrations. Similar to the work ofBeyler, 17-19 Cetegen21 and Lim,22 Morehat-t findsdecreasing, but significant, concentrations of 02 for4, >1, while, as noted above, Toner’s measure-ments23 indicate very little oxygen is present for richconditions. This last observation suggests clearly thatthe reaction behavior is different in the twoexperiments.
Morehart carefully considered possible reasons forthe differences between his measurements and thoseof Toner. He concluded that the variations were realand were the result of differences in an experimentalparameter. He considered two possibilities: (1) insula-tion included within the Toner hood, and absent inthe new hood, trapped soot and induced reactio~and (2) the higher temperatures observed in theearlier work led to different reaction behavior.24’26
Morehart tested both hypotheses experimentally.The addition of insulation material to the inside ofhis hood did not change the observed reaction prod-ucts. Next he added insulation to the outside of hishood in order to raise the temperature. The insula-tion was added in stages that systematically raisedthe observed hood temperatures. As shown in Fig.

208 W. M. Pitts
d
.1.a: 0.010 ❑ ~ ❑ ❑
2 nn Carbon MonoxideO—. __0____ _____+
W 0~ 0.005
z [9,.,=== 1.04+0 .05 ‘r
0.20
~ o Natural Gas
‘~. EthyleneA Propylene
.; 0.15+:cal
:00.10v
~ 0.060
1~
u
ac Sla
n 19 cm Dia Burner
I
Eo ❑ 50 cm Dia Burner Mn o Toner Data >~ 0.040 ‘an
in:0.05
0.
0.00-----500 600 700 800 900
Upper Layer Temperature (K)
Fig. 20. Upper-layer mass fractions of methane, carbonmonoxide, and oxygen are plotted as a function of upper-layer temperature for natural gas fires. @g= 1.45. Datafrom the investigation of Morehart2’ are compared with
Toner’s results.” Figure reproduced from Ref. 24.
0“030~G0 !-.=4~ 0.025 oh
,,,za ,,,’ ~,b.u ❑:, ,.,c 0,020 : ❑ ,,.’ “ A ,0: i ..-
@A .a~,. - A ,,-
al ,,” ...
; 0.015,4,’ Q-$-.,, ~7y. -t7-----
0 ,?c ?“ ,,?:;:,@% 00= 0.010 ‘ ‘%.’ ,
c2 7,g 0.005
,, 0 Ethylene
0.0000.00 0.50 1.00 1.50 2.00 2.5o 3.00
Upper Layer Equivalence Ratio
Fig. 21. Mole fractions of carbon monoxide observed in thehood experiments of Morehart24 as functions of ~~ areshown for natural gas, ethylene, and propylene. Figure repro-
duced from Ref. 24.
20,which compares results for ~, = 1.45, variationsof mass fractions were observed in the upper layer asthe temperature was changed. These measurementsare compared with the results of Toner23 in thefigure. While not exact, the dependence on tempera-ture agrees closely with Toner’s measurements. Thesefindings conclusively demonstrate that the correla-tions of major combustion products observed in thehood experiments depend on the layer temperatureas well as the fuel type. This point will be discussedin more detail subsequently.
Morehart tried to address the temperature effectby performing detailed chemical–kinetic calculationsof a plug flow reactor for a rich mixture typical ofhis upper layer, Z4 The calculations showed that such
mixtures did become reactive for temperatures
0.00 0.50 1.00 1.50 2.00 2.50 3.00Upper Layer Equivalence Ratio
Fig. 22. Mole fractions of oxygen observed in the hoodexperiments of Morehart24 as functions of @zare shown fornatural gas, ethylene, and propylene. Figure reproduced
from Ref. 24.
greater than 700K in agreement with his findings,but that the calculated changes in upper-layer compo-sition, were not consistent with the differences be-tween the Toner and Morehart experiments. Similarcalculations performed at NIST will be summarizedin Section 4.
Morehart also reported limited measurementsusing ethylene and propylene fuels. Similar toBeyler’s results,l ‘-19variations in upper-layer concen-trations with fuel type were observed. Figures 21 and22 compare measured mole fractions of CO and 02as a function of q$~for the three fuels. While thegeneral behaviors are quite similar (e.g. CO concen-trations begin to rise for #~ >0.5, and significant 02is observed for rich mixtures), large variations areobserved in the concentrations of final products.
Beyler also used propylene as fueLl 7“18Morehartcompared his results for this fuel directly with Bey-Ier’s. Figures 23–26 show these comparisons for 02,CO, CO and H, mole fractions as functions of #s.There are significant differences between the two setsof measurements, but the variations are very similarto those observed when the Morehart24 and Toner23natural gas data were compared. For instance, More-hart observes higher oxygen concentrations for~~ >0.5, and CO and H, concentration behaviorsare similar in both comparisons even though CO isobserved for ~~ > 0.5 while Hz does no start toincrease until the upper layer becomes rich. Thesimilarity of the variations for natural gas and propyl-ene suggests that temperature differences are responsi-ble in both cases. Indeed, upper-layer temperaturesin the Beyler experimental 7 were at least 200 Khigher than in the larger mood of Morehart. Theobservation of such differences for two experimentsin different laboratories greatly strengthens the con-clusion of a temperature effect on correlations ofcombustion gas species as a function of @z.
.

Enclosure fires 209
I
x
%luma LJR.fu.x
A 2.06 5 cmxx ❑ 1.97 1 cm
0 1.66 5 cm5 0 1.60 1 cm
‘x v 1.57 5 cm
%j x Beyler Data.
ax
. . .0.00 0.50 1.00 1.50 2.00 2.50
Upper Layer Equivalence Ratio
Fig. 23. Mole fractions of oxygen as a function of 4,observed in the hood experiments of Beyler17 and More-hart24 are comDared. The fuel was oroovlene in both cases.
0.100
.g 0.050
.-x0
z
c
:0.025$-3
Figure k reproduced f;om’Ref. 24.
x ,Ax x
An.0
nx ❑
o 0“0x
#zx
z!DP,.m= Zi.tcr,.c.
x% A 2.06 5 cm
0 1.97 1 cmx 0 1.66 5 cm
O 1.60 1 cmx v 1.57 5 cm
tx Beyler Data
I ,0.0000.00 0.50 1.00 1.50 2.00 2.50
Upper Layer Equivalence Ratio
Fig. 24. Mole fractions ofcarbon dioxide asa function of~, observed in the hood experimentsofBeyler’7 and More-hart24 are compared. The fuel was propylene in both cases.
Figure is reproduced from Ref. 24.
Morehart also addressed the question as towhether chemical equilibrium calculations could beused to predict concentrations observedin the upperlayer.24 Similar to earlier work, he found that equilib-rium concentrations did not correlate with the experi-mentally observed concentrations.
3.3.Conclusions Based on ~heHood Experiments
The experimental findings discussed above demon-strate that the composition of upper layers in hoodsabove simple fires are well correlated by plotting theconcentrations in terms of @gThis is true even when~, is not the same as Y,. The correlations are insensi-tive to fuel-supply rate and the separation of the fuelsource and the layer interface. However, the correla-
,“’0
x V@”.ne Ziat.rf.e.❑
0 A 2.06 5 cm0 1.97 1 cm
0“ .0 1.66 5 cm
10 1.60 1 cmv 1.57 5 cm
~a=
m x Beyler Data
0.000 - +== ‘ 10.00 0.50 1.00 1.50 2.00 2.50
Upper Layer Equivalence Ratio
Fig. 25. Mole fractions of carbon monoxide as a functionof 4$ observed in the hood experiments of Beylerl 7 andMorehart2’ are compared. The fuel was propylene in both
cases. Figure is reproduced from Ref. 24.
I
pp,.me Z,.titi.c<A 2.06 5 cm0 1.97 1 cm0 1.66 5 cm ❑
o 1.60 1 cmv 1.57 5 cm AA
x Beyler Data0
0v
nx
.x5A ❑
%“
O.OOOLL0.00 0.50 1.00 1.50 2.00 2.50
Upper Layer Equivalence Ratio
Fig. 26. Mole fractions of hydrogen as a function of 4,observed in the hood experiments of Bey1er*7and More-hart24 are compared. The fuel was propylene in both cases.
Figure is reproduced from Ref. 24.
tionsare found to depend on the fuel itself and theupper-layer temperature.
The existence of these correlations has been termedthe global equivalence ratio (GER) concept. Thequestion of whether or not the GER concept can beused to predict combustion gas compositions (particu-larly CO) in enclosure fires is discussed below. Beforethe dependence on temperature was identified, it washoped that these correlations could be used simplyby performing hood experiments for suitable fuelsand using the resulting correlations to predict genera-tion rates for the fires. Even if thk approach werefound to be valid, the temperature dependence of thecorrelations would need to be included which greatlycomplicates the application of the GER concept.
Even though the data are limited, there doesappear to be some consistency in the dependence of

210 W. M. Pitts
the GER correlations on temperature. For upper-layer temperatures lower than 500K, reaction ratesare very slow, and the correlations are independentof temperature. As the temperature is increased inthe range 500-700 K, shifts in the composition of theproducts are observed. The data suggest that thechanges in composition are the result of oxidation ofadditional fuel to produce CO, C02 and H20. Con-centrations of Hz appear to be relatively insensitiveto the temperature effect.
The degree to which oxygen reacts appears to bewell correlated with temperature. Figure 23 showsthat Beyler and Morehart both measured significantlevels of 02 for rich upper layers, but that the concen-trations observed by Beyler were lower as expectedbased on the higher temperatures present in theBeyler hood. The decrease in 02 concentration ex-tends down to ~~ = 0.5 where the first products ofincomplete combustion are observed. Alternatively,the Toner measurements (which had the highestupper-layer temperatures (maximum of 870 K) showthat the layer is nearly depleted of oxygen for richconditions.
The dependence of the upper-layer concentrationsof CO and C02 on temperature is not as clear.Figures 15 and 24 indicate that at higher tempera-tures, the concentrations of C02 increased at richconditions for both Beyler’s and Toner’s data ascompared to the lower temperature results of More-hart. Strangely, the CO measurements at rich condi-tions for Beyler and Morehart (Fig. 25) are in goodagreement, while Toner measured higher concentra-tions of CO for rich conditions (Fig. 16). Theseobservations suggest that shifts in the relative compo-sitions of these partially oxidized species are to beexpected with increasing temperature. A similar de-pendence on temperature is found for comparisonsof CO concentrations under lean upper-layer condl-tions. The data of Beyler and Morehart are in goodagreement while Toner’s results indicate that muchlower CO levels are present.
It should be noted that the focus of the source ofchanges in the upper-layer composition has beentemperature. However, since the modification inconcentration appears to vary slowly with tempera-ture, it might also be expected that the averageresidence time in the upper layer is also an importantvariable.
Considerably more data will be required to fullycharacterize the temperature dependence of upper-layer compositions in the hood experiments. Thetemperature dependence is clearly a difficulty in ap-plying the GER concept to enclosure fires. However,the correlations which are observed are quite robust.The limited hood data available seem to suggest thatas upper-layer temperatures approach 900 K, the 02concentrations in the upper layers will approachzero. If this is the case, it is possible that additionalreactions will not occur, and that unique correlationsof upper-layer composition with ~~ may exist for
rich conditions, which are characteristic of the mostdangerous enclosure fires. Since upper-layer tempera-tures in fully developed enclosure fires tend to behigher than 900 K, it is concluded, based solely onthe results of the hood experiments, that the GERconcept may be applicable to enclosure fires if appro-priate corrections are incorporated for temperatureeffects.
4. DETAILED CHEMICAIrKINETIC CALCULATIONS OFUPPER-LAYER REACTION BEHAVIOR
At least five reports of detailed chemical–kineticcalculations are available where the role of upper-layer chemical reactions on observations in the hoodexperiments have been considered. Phts has per-formed a series of detailed chemical-kinetic calcula-tions designed to characterize the expected reactionbehavior of the upper-layer gases observed in More-hart’s natural gas hood experiments24-26 when intro-duced into reactors having the much higher tempera-tures characteristic of upper layers in fully developedroom fires. A summary of the computational ap-proach and results is available.30 Additional discus-sion is provided in a second publication.31 Thisstudy and its implications for application of theGER concept are summarized here. As noted earlier,a limited study along the same lines was reported byMorehart.24
Gottuksz and Gottuk et al.33 have performed a
similar investigation for the reaction behavior of thecombustion gases observed in the hood experimentof Beylerl7’18 using hexane as fuel. All unburnedhydrocarbons in the layer were assumed to be ethyl-ene. The findings and conclusions are very similar tothose of Pitts. The following discussion is based onthe work of Pltts for natural gas fuel, but the readershould keep in mind that the discussion appliesequally well for hexane-fueled fires.
4.1. Summary and Discussion of Computational
Results
The rationale for all of these investigations wasthat understanding the reaction behavior of gas com-positions typically found in upper layers would aidin the assessment of the possibility of using the GERconcept to predict upper-layer composition in enclo-sure fires. In order for the correlations derived fromthe hood experiments to be valid in the higher tem-perature environments (up to 1300 K) typical ofupper layers in enclosure fires, two minimum require-ments must be fulfilled:
1. the relative generation rates of combustion pro-
ducts by the fire plume entering the upper layerof an enclosure fire must be unaltered from
those characteristic of the hood experiments;and
2. the gases generated by the fire plume must be

Enclosure fires 211
Table 2. Computational matrix for detailed chemical-kinetic calculations
Property Conditions treated
Molecular mixing Infinitely slow (plug-flow reactor) andInfinitely fast (perfectly stirred reactor)
Heat transfer Isothermal and adiabaticbehaviorTemperature 700-1300 Kin steps of 100 KEquivalence ratios @g= 0.50, 0.81, 1.09, 1.30, 1.62, 1.76,
2.04,2.17,2.61 and 2.83Residence time 0-20 sec
non-reactive at the higher temperatures typicalof enclosure fires.
The second of these requirements is tested by thecalculations discussed here. In the previous section,it was noted that the hood experiments had demon-strated that changes in the final product distribu-
. tion of the combustion gases are observed as thehood temperature is increased. The calculations pro-vide insight as to whether the reactions responsibleare taking place in the fire plume or in the gas-mixtures of the upper layer located outside of theplume.
Calculations were performed over a temperaturerange of 700-1300 K. The values of +$schosen for thecalculations were those for which products of incom-plete combustion were observed (0.5-2.83) in thehood experiments of Morehart.2&26 Since the heatloss and mixing behaviors of upper layers are quitecomplicated and difficult to model, idealized casescorresponding to limits for these parameters wereused. Calculations were performed assuming twoconditions: (1) instantaneous heat transfer to or fromthe walls of the enclosure such that the temperatureof the layer remains constant (isothermal case); and(2) no heat transfer occurs to the enclosure (adiabaticcase). Mixing within the upper layer was assumed tobe either infinitely fast [perfectly stirred reactor(PSR) model] or infinitely slow (plug-flow reactor
.model).
Computer codes provided by the Combustion Re-search Facility of Sandia National Laboratory wereused for the calculations.34–36 Following a carefulreview of the literature, a chemical reaction mecha-nism formulated by Dagaut et al. 37 for the oxidationof ethylene was chosen for use in the modeling. Thismechanism was chosen because it included one- andtwo-carbon species, it had been recently updatedwith the latest available rate constants, and wasvalidated by comparison with jet-stirred reactor meas-urements at temperatures (880-1253 K) and equiva-lence ratios (O.154) similar to those of interest here.The mechanism includes 31 chemical species undergo-ing 181 chemical reactions. No species with morethan two carbon atoms are incorporated, and hetero-geneous chemistry is assumed to be unimportant.The latter assumption should be good for naturalgas fires which genetate low levels of soot. Thermody-
JPW321-3-B
namic values required for the calculations were takenfrom tables provided by the Combustion ResearchFacility .38
For the calculations, initial concentrations ofgases for the reactors were taken directly from tabu-lations of combustion products observed in theupper layers of natural gas fires by Morehart.24 Thetime behavior of the reactors for a chosen initialtemperature was then calculated for residence timescovering a range of 0-20 sec. Table 2 summarizesthe ranges of conditions over which calculationswere performed.
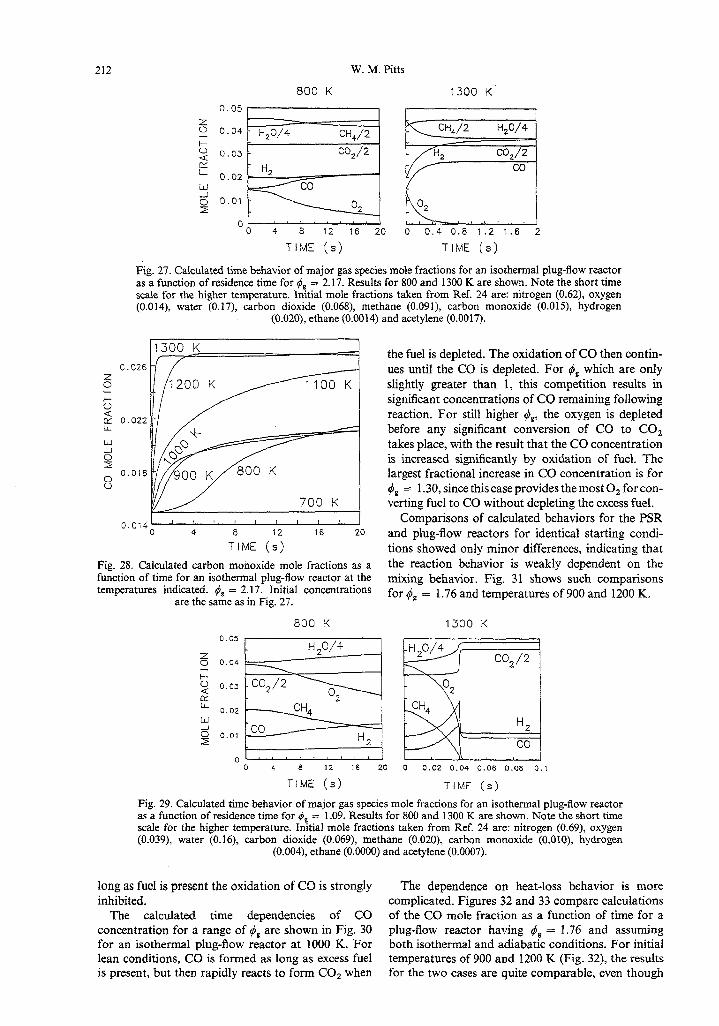
Clearly, the calculations are too extensive to dis-cuss in full detail. Results will be shown which arerepresentative of the calculated behaviors, and themajor trends will be summarized. Fig. 27 showsplots of calculated mole fraction versus time for aplug flow reactor and isothermal conditions. Resultsfor ~, = 2.17 and reactor temperatures of 800 and1300 K are shown. Note the different time scales forthe two cases. The reactions at 800 K occur over aperiod greater than 20 see, while at 1300 K the re-actions are nearly complete in less than one second.
There are significant differences in the reactionbehavior for the two temperatures. In both cases, theC02 levels remain nearly constant while CO in-creases; however, less CO is generated at the lowertemperature. Similarly, the Hz concentration barelychanges at 800 K while it is significantly increased at1300 K. Detailed comparisons of the results showthat for the high-temperature case, more oxygen isavailable for reaction with fuel molecules due to theformation of hydrogen instead of water. The oxida-tion of the organic fuels generates primarily addi-tional CO, and there is very little oxidation of CO toC02 for these rich conditions.
Figure 28 shows the time behavior of CO molefractions calculated over a range of temperatures for
4, = 2.17. The major conclusion from this figure isthat the final concentrations of CO fall into twowell-defined regimes. For temperatures less than 1000K, the increase in CO is =40% while for tempera-tures greater than 1100 K, the increase is %80%.There is a clear transition between 1000 and 1100 K.This transition is caused by the shift in the distribu-tion of products between Hz and H20 as discussedabove.
Figure 29 shows the time behavior of major prod-ucts for d~ = 1.09 and with the other parameters thesame as above. At 800 K, reactions are very slowand significant oxygen and fuel remain after 20 sec.For this nearly stoichiometnc mixture, both CO andC02 are produced while Hz is little changed. Thebehavior is very different at 1300 K. Initially, meth-ane is oxidized to generate primarily CO and Hz asobserved for the high-temperature rich case. Ulti-mately, the methane and other fuel molecules aredepleted, and there is a sudden, rapid reaction of theHz and CO with the remaining 02 to generate H20and C02. This result clearly demonstrates that as
212 W. M. Pitts
800 K
oos~zo 0.04
E
H20/4 CH4/21=~ 0.03 co2/2
IY H2L 0.02Id coJo 0.01z
02
o~048121620
TIME (S)
1300 K
PICH4/2 H20/4
H2 co2/2
co
Lo 0.4 0.8 1.2 1.6 2
TIME (S)
Fig. 27. Calculated time behavior of major gas species mole fractions for an isothermal plug-flow reactoras a function of residence time for @g= 2.17. Results for 800 and 1300 K are shown. Note the short timescale for the higher temperature. Initiai mole fractions taken from Ref. 24 are: nitrogen (0.62), oxygen(0.014), water (0.17), carbon dioxide (0.068), methane (0.091), carbon monoxide (0.015), hydrogen
(0.020), ethane (0.0014) and acetylene (0.0017).
1300 K
0.026 -
5—+o<K 0.022L
w
dz
o0.018
v
700 K
o,014~o 4 8 12 16 20
TIME (S)
Fig. 28. Calculated carbon monoxide mole fractions as afunction of time for an isothermal plug-flow reactor at thetemperatures indicated. ~g = 2.17. Initial concentrations
are the same as in Fig. 27.
0.05
zo 0.04
!=~ 0.03<KL
0.02Ld
800 K
E=3H 20i4
co2/202
CH4
d 0.01co
2 Hz
the fuel is depleted. The oxidation of CO then contin-ues until the CO is depleted. For ~~ which are onlyslightly greater than 1, this competition results insignificant concentrations of CO remaining followingreaction. For still higher +~, the oxygen is depletedbefore any significant conversion of CO to C02takes place, with the result that the CO concentrationis increased significantly by oxidation of fuel. Thelargest fractional increase in CO concentration is for
#, = 1.30, since this case provides the most 02 for con-verting fuel to CO without depleting the excess fuel.
Comparisons of calculated behaviors for the PSRand plug-flow reactors for identical starting condl-tions showed only minor differences, indicating thatthe reaction behavior is weakly dependent on themixing behavior. Fig. 31 shows sttch comparisonsfor ~~ = 1.76 and temperatures of 900 and 1200 K.
o~o 4 8 12 16 20
TIME (S)
1300 K
w&o 0.02 0.04 0.06 0.08 0.1
TIME (S)
Fig. 29. Calculated time behavior of major gas species mole fractions for an isothermal plug-flow reactoras a function of residence time for ~~ = 1.09. Results for 800 and 1300 K are shown. Note the short timescale for the higher temperature. Initial mole fractions taken from Ref. 24 are: nitrogen (0.69), oxygen(0.039), water (0.16), carbon dioxide (0.069), methane (0.020), carbon monoxide (0.010), hydrogen
(0.004), ethane (0.0000) and acetylene (0.0007).
long as fuel is present the oxidation of CO is strongly The dependence on heat-loss behavior is moreinhibited. complicated. Figures 32 and 33 compare calculations
The calculated time dependencies of CO of the CO mole fraction as a function of time for aconcentration for a range of ~~ are shown in Fig. 30 plug-flow reactor having I#g= 1.76 and assumingfor an isothermal plug-flow reactor at 1000 K. For both isothermal and adiabatic conditions. For initiallean conditions, CO is formed as long as excess fuel temperatures of 900 and 1200 K (Fig. 32), the resultsis present, but then rapidly reacts to form C02 when for the two cases are quite comparable, even though

Enclosure fires 213
0.03, i 0.04
0.025 - $=2.61
$=2 .04
0.015
0.01 v’- @=l .09.
0 0.0050
II9=0.81
()~o 4 8 12 16 20
TIME (S)
Fig. 30. Calculated carbon monoxide mole fractions for anisothermal plug-flow reactor at 1000 K as a function oftime for the ~s indicated. Initial concentrations are taken
from Morehart.2*
0.032 _—— ——— ——— ./
//
zo—& 0.026 --1EL
u -/
d
o — PSRu .—. PFR
0.014 , ! [ , ,
0 4 8 12 16 20
TIME (S)
Fig. 31. Comparison of calculated carbon monoxide molefraction as a function of time for a perfectly stirred reactorand a plug-flow reactor having initial temperatures of 900and 1200 K. ~~ = 1.76. Initial concentrations taken from
Morehart.24
0.032 ——— ___ ___
zo— II I
——— ISOTHERMAL
o.o,~ ~o 4 8 12 16 20
TIME (S)
Fig. 32. Comparison of carbon monoxide mole fractionala function oftimefor aplug-flow reactor calculated assure-ing either adiabatic or isothermal heat transfer. Startingtemperatures are900 and 1200 K.+* = l.76. lnitialconccn-
trations for reactor taken from Morehart.’4
zoLu 0.03auIL
20 0.02z
ou
—— __1300K ––––––––
—ADIABATIC
——— ISOTHERMAL
00, ~
o 4 8 12 16 20
TIME (S)
Fig. 33. Comparison ofcarbon monoxide mole fractionala fimction of time for a plug-flow reactor calculated assum-ing either adiabatic or isothermal heat transfer. Startingtemperatures arelOOOand 1300 K.~g= I.76.1nitia1 concen-
trations for reactor taken from Morehart.24
there is a significant increase in temperature for theadiabatic cases, since the oxidation of the fuel toform CO releases heat. Onthe other hand, theulti-mate concentrations of CO are much higher for theadiabatic case when the initial starting temperaturesarelOOOand 1300 K(Fig. 33).
The explanation forincreased COin the 1000 Kcase is straightforward. The heat release raises thetemperature to the point where the transition inreaction behavior, observed between 1000 and 1100K for the isothermal cases, takes place, and theformation of Hz becomes more favorable than H20.Note that the final CO concentration for the adi-abatic calculation with an initial temperature of 1000Kisvery similar totheisothermal case at 1300K.Thereason forthe increase in CO concentration forthe adiabatic calculation with an initial temperatureof 1300 K is more subtle. As the initial adiabaticreaction proceeds, the reaction mixture temperaturerises above 1300 K. Examination of the detailedreaction behavior shows that for temperatures signifi-cantly above 1300 K, the water gas shift reaction,
CO + H20 = C02 + Hz
starts to come into equilibrium slowly. At these hightemperatures, the formation of CO and Hz arestrongly thermodynamically favored; and C02 andH20 are converted to CO and Hz, resulting in theobserved increase in CO while simultaneously coolingthe reaction mixture.
4.2.Implications of the Calculations for the Results ofHood Experimen~s
The calculations summarized here provide impor-tant insights into the experimental observations forthe hood experiments. It is indicated above thatraising the temperature of hood gases in the expen-

214 W. M. Phts
ments led to a depletion of oxygen and increasedconcentrations of CO and C02, even though therelative changes in CO and C02 were not well de-fined. The most important observation is that concen-trations of C02 are significantly increased as thehood temperature becomes higher. This is contraryto the expected behavior if the gas mixtures observedin the low-temperature hood experiments are simplyintroduced into a higher temperature environment.The detailed chemical–kinetic calculations clearly in-dicate that the formation of CO would be highlyfavored, and the concentration of C02 would beexpected to remain nearly constant.
It must be concluded that the higher hood tempera-tures lead to a modification in the generation ratesof chemical species by the fire plume, with the resultthat fuel is more fully oxidized than when tempera-tures in the hood are very low. Since it is currentlyimpossible to model the formation of chemical spe-cies in a quenched fire plume, this result suggeststhat it will not be possible to model the variationsof GER concentration profiles with temperature.Experimentation will be required to characterize theeffect.
It was noted earlier that temperatures in excess of1300 K are required for the water gas shift reactionin the hood gases to start to come into equilibrium.The need for such high temperatures to equilibratethese chemical species explains why attempts to pre-dict concentrations of chemical species in the hoodexperiments using chemical--equilibrium argumentsfailed. The necessary reactions freeze out at tempera-tures much higher than the kinetically-controlled reac-tions discussed up to this point. The final productdistribution must be expected to be far fromequilibrium.
4.3. Implications of the Calculations for CO Formationin Upper Layers of Enclosure Fires
The detailed chemical-kinetic calculations yieldthe expected reaction behavior if oxygen is somehowmixed into a rich upper layer formed by a fire. Sincethese layers typically have temperatures greater than1100 K and are regions of very rapid mixing, COand Hz will be formed very efficiently. From a firetoxicity standpoint, this is the worst possible scenariosince it suggests that if such mixing takes place,significantly higher concentrations of CO will bepresent than would result simply from quenching ofthe fire-plume reactions upon entering the upperlayer.
Nakaya has proposed a model for the formationof CO in enclosure fires based on the assumptionthat combustion gases in the upper layer are in
39 me detailed chemicakki-chemical equilibrium.netic calculations have demonstrated that tempera-tures well in excess of 1300 K are required in orderfor the major combustion products to come into
chemical equilibrium. The highest temperatures gener-ally observed in enclosure fires are on the order of1300 K, suggesting that the assumption of full chemi-cal equilibrium will be inappropriate; except, possi-bly, in the case of extremely hot fires. Such hot fireswould be expected to generate quite high levels ofCO indeed.
5. STUDIES IN REDUCED-SCALE ENCLOSURES
5.1.Historical Results Available in the Literature
As noted in Section 2, there are no systematiclarge(full)-scale investigations that have consideredthe formation of CO in enclosure fires. There is,however, a body of literature dealing with CO inreduced-scale enclosures which will be discussed inthis section. Additional work which is ongoing atVPISU and at NIST will also be summarized in latersubsections.
A very early sttempt to investigate the productionof CO and other combustion gases by underventi-lated burning within an enclosure was the work ofRasbash and Stark.40 These researchers burned cellu-losic fuels within a cube having 0.91 m sides. Mostexperiments were performed using wood wool sus-pended in spherical cages of various diameters at thecenter of the cube. Ventilation was provided by slitsof variable width located along the top edge of onewall. Note that this configuration would be expectedto hinder the development of a well-defined two-layersystem.
Measurements of fuel species at various locationswithin the cube gave the same results, except forlocations directly above the fuel source. In mostexperiments, temperatures were quite low, becominggreater than 700 K for only a few cases. Dry-concen-tration data were well correlated in terms of theparameter Ah*/W where A is the area of the ventila-tion opening, h is the height of the ventilation open-ing, and W is the fuel load. Concentrations as highas 10% CO were observed for small openings andlarge W and decreased to near zero for large openingsand small fuel loadings. Increases in CO were ob-served when the fires became underventilated. Notethat the maximum CO concentrations measured weremany times larger than those observed by Beyler inhis hood experiments burning wood. 19
Oxygen concentrations were also found to be de-pendent on Ah*/W, decreasing from near 21% atlarge values of this parameter to values approaching1% for small values. In the vast majority of exper-iments, mole fractions of 02 were greater than 5%.
Gross and Robertson made experimental measure-ments in three geometrically similar enclosures(width: length: height = 1:2:1) having short sides of0.16, 0.47 and 1.5 m.41”42 Various sizes of woodcribs were used as the fuel. Ventilation was providedby horizontal or vertical windows located in the

Enclosure fires 215
center of a side and extending across the entire wall.Data were correlated in terms of a normalized ventila-tion parameter Ah*/S=, where S is the physical-sizescaling ratio for the different enclosures.
Gas temperature measurements were found to berelatively uniform in the enclosures except in lowerregions where the air entered the vent. Time-averagedtemperatures in the enclosures were very low forsmall ventilation parameters and increased linearlywith ventilation parameter until plateaus werereached for values of Ah*/S2 > E 3000 cms’z. Theplateau temperatures had a strong dependence onscale, increasing from x500 K to 1000 K with in-creasing enclosure size.
Dry concentration measurements for C02, COand 02 as a function of Ah*/S= were reported for thetwo largest enclosures. Oxygen was found to decreasevery rapidly with normalized ventilation parameterand to reach values very close to zero forAh~/Sz > 1000”~W. Carbon dioxide concentrations.showed a similar dependence with asymptotes ofx 19% for the mid-sized enclosure and 17% for thelargest enclosure. CO concentration behavior wasalso different for the two enclosures. In the mid-sized enclosure, CO levels were found to increasewith ventilation parameter, reaching maximumvalues > 12%. In the largest enclosure, the CO con-centration was only mildly dependent on ventilationparameter and attained maximum values of 8%.
The measurements were made by extracting gasesthrough an uncooled copper tube. When Gross andRobertson made similar measurements by exactingupper-layer gases through a water-cooled probe, theymeasured significantly lower concentrations of bothCO and C02 suggesting that additional chemicalreactions took place within the uncooled copperprobe. 41.42 Interestingly, in the cooled probe, the
CO/C02 ratio was higher than for the uncooledcase. Rasbash and Stark have argued that copperand iron tubes may provide a considerably morereactive environment than stainless-steel tubes, sug-gesting that additional probe reactions might be im-portant when copper or iron are used.40 In an experi-mental test, Morehart showed that no reactions oc-curred in a stainless-steel sampling tube for a simu-lated mixture of upper-layer gases heated to hishood temperature, while significant oxidation of COto C02 was observed when a copper tube was used.24He concluded that the copper tubing promoted theoxidation reaction, and that the effect was mostlikely due to catalytic effects on the copper surface.Beyler has hypothesized that Gross and Robertsonextracted gases from a reacting zone within the enclo-sure, and that the gases continued to react in theprobe. 1g Mor~h~@S findings suggest this C0rICh2SiOII
should be considered suspect since reactions werelikely to occur on the metal surface within the probe.It is therefore not necessary to assume reacting gaseswere sampled.
Tewarson investigated the formation of combus-
tion gases in two geometrically similar enclosureshaving 1:2:1 aspect ratios with sides of 0.5 and 1 m,respectively.As Ventilation was provided by dual,
full-width windows located in the walls on either endof the long dimension of the enclosure. Wood cribswere suspended from the ceilings of the enclosuresand were weighed during combustion. The degree ofventilation was varied by changing the heights of thewindows. Dry concentration measurements for CO,CO, and 02 were recorded continuously and combus-tion gases were collected periodically for gas chroma-tographic analysis. A stainless steel probe was usedfor gas extraction.
Gas concentrations, temperatures, and burningrates were averaged and plotted as functions of Ah+for a fuel loading of %3 kg. Results for differentsized enclosures were collapsed in terms of Ah*/Si “9.Note the good agreement with the findings of Grossand Robertson41 ’42 who used an exponent of 2 forS. The results fell into four regimes based on changesin the observed concentrations, temperatures, andburning rates with increasing ventilation parameter.In regime I the temperatures were low (500-600 K).Measured concentrations of 02 were roughly con-stant at 4%, while CO concentrations varied between5 and 9%, and C02 attained values of zz18%. As theventilation parameter was increased, the temperaturebegan to rise, finally reaching an asymptotic value ofx 1000 K. Initially, both CO and 02 concentrationsdropped as the temperature increased with CO failingto a minimum of 3% while 02 became less than 1%.For the largest ventilation parameters investigated,the 02 remained quite low while CO again rose tox11%. The data treatment chosen by Tewarsonmakes comparisons with other work difficult, but itis clear that there are cases for low upper-layertemperatures where fuel and 02 exist together. Thereare also higher temperature cases where very highlevels of CO are found and 02 concentrations areextremely low.
Tewarson has attempted to use the wood-fire datadiscussed above, with other findings, to quantify thegeneration efficiencies of chemical compounds in en-closure fires burning wood cribs.44 This work in-cludes a plot of measured CO yields (g CO generat-ed/g fuel consumed) plotted as a function of the air-to-fuel stoichiometric ratio (note this is the inverse ofthe equivalence ratio used elsewhere in this report).A curve is included suggesting that for rich condi-tions %0.2 grams of CO are produced per gram ofwood consumed, and that the values fall off withincreasing air-to-fuel ratio (decreasing equivalenceratio). Tewarson notes that many data points lieconsiderably above this curve and attributes theseobservations to the following possibilities: (1) experi-mental errors; (2) sampling within flames; (3) ventila-tion effects due to wood-crib construction; (4) gastemperatures and residence time of oxygenated com-pounds in the upper layer; and (5) changes in wooddecomposition mechanisms.

216 W. M. Pitts
152 cmAh
?-37
30.5 cm Dia.(4
u
1
Inlet Duct AirDWitwtiin Plenum●
I ~ 122 cm’+Sectiin A-A
Fiiz. 34. Schematic of the extrerimental svstem develooed bv Gottuk and co-workers at VPISU for the. .investigation of combustion gas generation in enclosure fires having two well-defined layers. Figure
provided by Dan Gottuk.
Beyler considered Tewarson’s conclusions and hasargued that the high readings for CO concentrationscan all be attributed to fires in which samplingdirectly in the fire zone was likely.’9 Beyler concludesthat the dependence he finds for CO concentrationson the global equivalence ratio from his hood experi-mental 9 is in agreement with the enclosure fire resultswhen measurements in fire zones are excluded. Thispoint will be discussed further in Section 5.3.3.
Morikawa and Yanai have studied fires in areduced-scale room (a cube 2 m on a side) in whichcontrolled amounts of air were injected into theenclosure at the bottom and fire gases were exhaustedat the top. 45 The fuel loads consisted of a range of
plastics, fabrics, and wood typical of a furnishedroom. Temperature measurements at various loca-tions in the enclosure along with concentrations (wet)of combustion gases sampled in the exhaust duct bya stainless-steel probe are reported. Observed tem-
peratures were generally in the 900-1300 K range.Concentrations of CO initially rose quite rapidly
and generally reached values greater than 7%, and
occasionally values greater than 10% were observed.Oxygen concentrations tended to clump aroundvalues of 5°/0 during the intense burning phase. Theseresults are somewhat different than others discussedearlier in that high concentrations of fuel moleculesand oxygen were observed simultaneously in fireswhere the combustion gases were at high
temperatures.It is difficult to reach conclusions from the studies
summarized above. Not only were the ventilation
arrangements vastly different in each case, the test
methodologies and measurement techniques werehighly variable. There were clearly cases for whichthe measurements were dependent on sampling proce-dures. Even though there are a number of testsreported, it must be concluded that the production
of CO by these solid-fueled fires in enclosures is notwell characterized.
5.2. Recent Experiments at the Virginia PolytechnicInstitute and State University ( VPISU)
An experimental system especially designed to testthe ability of the GER to correlate the concentrationsof gas species observed in the upper layer of a firelocalized within an enclosure has been developed atVPISU.32’46 Figure 34 shows a schematic for theirexperimental system. The enclosure dimensions arewidth: length: height = 1.2 m: 1.5 m: 1.2 m. It wasdesigned such that air, which was naturally entrainedinto the fire, entered only through an inlet duct anddistribution plenum located beneath the floor of theenclosure. Slits along the length of the floor allowedthe air to enter the enclosure. This configuration hastwo important advantages. First, it was possible tomeasure the air flow in the inlet duct and thereforedirectly characterize the air flow rate into the fire.
Second, the distribution plenum ensured that air
entered the lower layer slowly over a wide area. As aresult, the two-layer structure of the gases within the
enclosure was strongly stabilized.
The exhaust vent for the fire was a single window
located in one of the long sides of the enclosure.
Careful tests demonstrated that there was no air
entrained into the enclosure through this window,
and only combustion products exited the window.
The window size was varied to provide different
ventilation conditions. Products exhausted from the
enclosure were collected in a large exhaust hood and
withdrawn through a duct.
By measuring the mass-loss rate of the fuel and
the rate of air-mass inflow, it was possible to deter-mine 4P simply by dividing their ratio by that re-
.

Enclosure fires 217
5 20y●
-%+. Equivdem Ratio n’❑ . [0,] .ll
0.30~t I I I I I J
1. “ -1L
0.05:
0-o 50 100 150 200 256 -o 0.5 1.0 1.5 2.0 2.5 3.0
Plume Eauivalenca RatioTimeFig. 35. Equivalence ratio and CO and 02 volume per cents(wet) are shown as a function of time for a hexane-fueledfire in the VPISU facility. The development of the fire andthe attainment of a pseudo-steady state are evident. Figure
Fig. 38. Carbon monoxide yields (g CO produced/g fuelconsumed) as a function of @Pfor hexane fuel are plotted.Data from the hood experiments of Beylerl 71s and theenclosure experiments of Gottuk and co-workers 32’46are
pr&ided by Da; Gottuk.
20~
com~ared. Figure provided by Dan Gottuk.
0“30r—————71015
G“
0- HexanO0- PMk!AV.wwdA- Pdyure6mne
0.25I
+ . Baylw
L
0
0 +:+0
++ 1t
‘“”:~o 0.5 1.0 1.5 2.0-o 1 2 3 4
Plume Equivalent Ratio
Fig. 36. Oxygen concentrations observed during steady-state burning in the VPISU facility are plotted as a functionof q$pfor the four fuels investigated. Figure provided by
Dan Gottuk.
Plume Equivalenea Ratio
39 Carbon monoxide yields (g CO produced/g fuelconsumed) as a function of-4P for wood fuel are piotted.Data from the hood experiments of Beylerl 9 and the enclo-sure experiments of Gottuk and co-workers32’46 are com-
pared. Figure provided by Dan Gottuk.
0.5 I I I
00.4- +- Beyler
0
0.3- 00 0
00
0
0.2- ●+ *: A
F“’’i’’’’ l’’’ rl’’’’l’’i’l’’rr+
.
‘:U0 0.5 1.0 1.5 2.0,
Plume Equivalence Ratio
Fig. 40. Carbon monoxide yields (g CO produced/g fuelconsumed) as a function of q$Pfor PMMA fuel are plotted.Data from the hood experiments of Beyler19 and the enclo-sure experiments of Gottuk and co-workers32’46are com-
pared. Figure provided by Dan Gottuk.
measurements were recorded for CO, C02 and 02.Temperatures were recorded at several locationsusing thermocouples.
Four fuels were studied: hexane, PMMA, wood,and a polyurethane foam containing 45% inert fillerby weight. Hexane was burned in pans, PMMA as asheet which melted, wood as fuel-surface-controlled
u“ -- I I I 1
-0 —05 1.0 1.5 2.0 2.5 3.0
Plume Equivalence Ratio
Fig. 37. Carbon monoxide concentrations observed duringsteady-state burning in the VPISU facility are plotted as afunction of 4P for the four fuels investigated. Figure pro-
vided by Dan Gottuk.
quired for stoichiometric burning. During their ex-periments, it was found that most fires eventuallyachieved a pseudo-steady state and that q$P= q$~.
Gases in the upper layer were sampled with anuncooled stainless-steel probe. By moving the probetip to various locations, it was demonstrated thatspecies concentrations were independent of positionfor points outside of the fire plume. Concentration

218 W. M. Pitts
cribs, and the foam as a sheet. All fuels were burnedon a load cell, and the mass loss as a function of timewas recorded.
Figure 35 shows examples of thegasandequiva-lence ratio measurements as a function of time for ahexane burn. Note that concentrations are reportedon a wet basis, despite the fact that water wasremoved prior to the measurements. In order tocorrect for water removal, the assumption was madethat the molar ratio of H20 and C02 at any~P wasthe same as for stoichiometric burning.
A distinct quasi-steady burning behavior can beseen in Fig. 35. By averaging over the quasi-steadyburning periods, concentrations as a function of ~,were obtained. Since the fires are in a pseudo-steadystate, 4P= q$~.Figures 36 and 37 show results for 02and CO for the four fuels. It can be observed thatthe 02 decreases with increasing #P for lean condi-tions and becomes very nearly zero under rich condi-tions for all four fuels. Note that natural ventilationlimited the tests for wood and polyurethane to#, <2. At the same time CO concentrations appearto remain very low until 4P z i, at which point theybegin to rapidly rise to asymptotic values which aredifferent for each fuel with the order being hexane <-wood % polyurethane < PMMA. Observed concen-trations of CO for rich conditions range from 2.6 to4.2%. The CO concentrations for the PMMA fireshave more scatter than observed for the other fuels.This is unexplained at the present time,
Beyler investigated three of the fuels studied atVPISU (C6H14, wood, and PMMA) in his hoodexperiments. 17-19 Figures 38-40 compare the find-ings for CO generation in the enclosure and hoodexperiments for these three fuels. Several points areimportant to note. The CO concentrations in bothexperiments have an ‘S’ shape with low concentra-tions for small 4P. However, the two curves areoffset in g$Pby N 0.5 with the hood results starting toincrease at 4P = 0.5 and the enclosure results atd, = 1.0. For the rich fires, temperatures in theupper layers within the enclosure were all greaterthan 800 K (in a range of 800–1 170 K). These areconsiderably higher than in the hood experiments(470-800 K). The shift in the S curve with increasingtemperature is consistent with the observations andconclusions of Morehart and co-workers24’26 as dis-cussed above.
Morehart’s data was inconclusive concerning theeffects of the shifts in reaction behavior at highertemperatures. The findings shown in Figs 38-40indicate that the CO yields attain asymptotic valuesfor high 4P in both the hood and enclosure experi-ments. The asymptotic yields appear to be slightlyhigher for the enclosure experiments. Comparisonsbetween the hood and enclosure data for the yieldsof 02 and C02 are inconclusive, but suggest thatincreasing the upper-layer temperature has the netresult of depleting the oxygen, which results primarilyin the generation of C02. Comparisons of More-
hart’s24’26 and Toner’s23 hood data lead to the sameconclusion—higher temperatures resulted in the gen-eration of both CO and C02, but the generation ofC02 was favored. A similar comparison of More-hart’s and Beyler’sl’>l 8 results suggests that the addi-tional reaction generated primarily C02.
The results discussed in this section support theidea that the composition of gases measured in thelow-temperature hood experiments is changed whenan upper layer reaches higher temperatures. Thoughthe data are limited, it can also be argued convinc-ingly that the yields of CO are only slightly increasedat high temperatures in the hood and enclosure exper-iments for high @~,and that the high-temperaturedependence of CO formation of ~~ can be estimatedby simply shifting the S curve obtained from thelow-temperature hood experiments to higher ~, by%0.5. Note, that as discussed earlier, this requiresthat the relative species generation rates of the fireplume be altered as the temperature is raised.
As shown by Morehart’s results24’26 and discussedabove, a range of temperatures and upper-layer resi-dence times are to be expected over which the simplifi-cation of two S curves will fail. The findings of theVPISU study suggest that this temperature range iscentered somewhere near 800 K and is narrow. Fortemperatures typical of fully developed enclosurefires, the high-temperature curves for a given fuelshould be adequate.
5.3. Summary of Recent Experimental and ModelingInvestigations of Reduced-Scale Enclosure (RS~
Fires at NIST
A systematic investigation of the behavior of enclo-
sure fires focused on the formation of CO is being
performed at NIsT. The findings up to the present
time have been summarized.47
5.3.1. Experimentaifindings for natural gas>res in areduced-scale enclosure
The enclosure used in these studies is a 2/5s-scalemodel of a room which has been proposed for use inboth ASTM48 and 1S049 standard fire tests. Themodel is referred to as the reduced-scale enclosure(RSE). It has dimensions of 0.98 (width) x 1.46(length) x 0.98 m (height). The standard full-scaleroom contains a single doorway in the short wallwhich is 0.76m wide and 2.03 m high. The standard
scaling law SO-S2 for enclosure ventilation normalized
by burning rate is expressed as Ah+ = CG2 where Ais the area, h the height of the vent, G is the size
ratio for geometrically similar enclosures, and C is aconstant. This scaling law is the same as used byGross and Robertson .41’42 The resulting doorway
dimensions for the RSE are 0.48 x 0.81 m.The RSE was located under a furniture calorim-
eters 3 which collected the combustion gases exciting

Enclosure fires 219
.
.
EAST SIDE
o UPPER 14YER @OOR PROSE)
Nx UPP3R LAWS (WALL PROSE)
❑ LOWER uvER(OOOR PROSE)
\
PROBE 1.
#i OR#2
I
Fig, 41. A schematic of the reduced-scaleenclosure showinglocations where probes were placed to extract gases. Gener-ally, two probes were employed with one being a wallprobe and the second a long probe passing through thedoorway. For some tires the doorway probe was moved to
several positions.
the doorway and allowed measurements of heat re-lease rate (HRR) as well as the relative concentra-tions of CO and C02 for positions far removed fromthe enclosure. Standard instrumentation for RSEfire characterization consisted of arrays of thermocou-
. pies and two banks of analyzers containing a para-magnetic analyzer for oxygen and non-dispersive in-frared (NDIR) analyzers for CO and C02. The ther-mocouple readings were not corrected for radiationor catalytic effects which can lead to substantial,uncharacterized errors in temperature measurements.A vertical array of aspirated thermocouples (thermo-couple tree) Iocated at the doorway along with adifferential ~ressure measurement across the door-way allowed estimates of the entrainment of airthrough the doorway using two approaches describedin the literature. 54’55 The approach developed byJanssens and Tran,55 which uses a mass-balanceapproach to locate the neutral plane at the doorway,yielded more accurate results 47’56and was used forthe measurements of the #, which are discussed laterin the text. A second ther&ocouple tree was locatedin the rear of the enclosure.
For a few tests, additional instrumentation wasutilized. A total hydrocarbon analyzer was used tomeasure unburned fuel. An instrument, dubbed the#-meter, which was designed and built at NIST,57was used to measure the local equivalence ratio of
combustion gases extracted from the enclosure. The+-meter is a prototype instrument which uses a cata-lyst and high-temperature furnace to convert anyexcess fuel and products of incomplete combustionto C02 and H20. For these conditions, a singlemeasurement of the 02 concentration allows thelocal equivalence ratio to be calculated.57
Gas measurements were made for dried and fil-tered samples extracted from various locations in theupper and lower layers within the enclosure. Formost experiments, two 0.94 cm inside-diameterstainless-steel tubes were used to sample gases. Gener-ally, one of these tubes would be passed into theupper layer through the enclosure wall at positionsnear the front or rear of the enclosure. The secondprobe was usually a long probe which was insertedthrough the doorway and could be positioned at thedesired location. Measurements using this secondprobe were recorded at various locations in the upperand lower layers of the fire. For some fires, multiplelocations were sampled during a single burn. Figure41 shows the locations within the RSE for whichprobe measurements were made.
Due to concerns about the possibility of reactionsin the probes (see earlier discussion), a water-cooledstainless-steel probe was constructed and used insome tests. Reaction was a particular concern in thecase of the long probe when used for measurementsin the upper layer. This probe usually passed througha flame zone located at the layer interface, andthrough extensive distances in the hot upper-layergases as well. Comparisons of measurements in com-parable, but different, fires using the long uncooledand cooled probes for the same sampling positionwere in good agreement, suggesting that no signifi-cant reactions were occurring in the uncooled probes.
The fuel for the initial fire tests was natural gassupplied by a 15-cm-diameter burner centered in theRSE and located 15 cm above the floor. This fuelwas chosen since it is easily metered and controlledand because the studies of Morehart 24-26 andToner23 provided an extensive data base of hood-type experimental results for comparison purposes.Nominal heat release rates for the fires (assumingcomplete combustion) ranged from 10 to 670 kW.Gas flow rates were maintained constant for the 15-20 min duration of a fire.
The following qualitative observations concerningburning within the RSE were noted. In all cases, awell-developed upper layer of combustion gases wasobserved within the enclosure, and the lower layerremained clear and unobscured. For overventilatedconditions, all burning took place within the enclo-sure. As the fires first began to become underventi-Iated, occasional burning outside of the enclosurewas observed. For highly underventilated fires, sub-stantial burning was observed outside of the doorwaywhere vitiated, rich upper-layer combustion gasesmixed with air. For the highest fuel flow rates moreheat release occurred outside of than within the

220
10
0
10
$
.
z>
8
6
4
2
0
W. M. Pitts
I 1 1 I \ 25
e co
[
A 02❑ C02 x H2 o
g
20 @
o
Ao
2
x15 ~
zw~
4 ho
~ x 10 -=
!!
d .*
%“o
0 200 400 600 800 1000 1200
25
20
15
10
5
0
o 200 400 600 800 1000 1200
Time, sFiK.42. Carbon monoxide. carbon dioxide, oxwzen. andcalcu]ated water concentrations fwet Dercents).-are plotted as a function of time for a 500 kW natural gas fire in the RSE. Measurementsin the upper
. .
Iayerin the front (solid symbols; 10cmfrom front wall andceiling, 29cmfrom side-wall) andrear (opensymbols: 29 cm from rear and side-walls, 10em from ceiling) are shown.
enclosure. For the underventilated fires, burning wasalso observed along the upper-/Iower-layer interfacewithin the enclosure at locations both in front of andin the rear of the fire plume centered in the room.Note that this latter observation differs from thehood experiments discussed in Section 3 where theexperiments were terminated if combustion along theinterfaee was observed.
The time behaviors of the concentrations of 02,CO and C02 in the front and rear of the enclosureare shown in Fig. 42 for a 500 kW fire. This fire issignificantly underventilated. The concentrationshave been corrected for water removal (i.e. they arewet concentrations and calculated water concentra-tions are included in the figure) using the same
approximation as Gottuk and co-workers ;32+46i.e. itis assumed that water and C02 are in the sameproportions as would be observed for stoichiometricburning. It can be seen from the figure that, after abrief induction period, the concentrations of thegases are relatively constant or change slowly. Byaveraging over the pseudo-steady-state burning peri-ods, concentrations of combustion products typicalof each fire size were obtained.
The time records shown in Fig. 42 display behav-iors which are typical of underventilated fires burnedin the RSE. Note that concentrations of CO in thefront and rear of the enclosure are different, with thefront being roughly 50% higher. There are largerfluctuations in CO and C02 concentrations in the

Enclosure fires 221
0 200 400 600 800 1000 1200
rime, s
Fig. 43. Temperature measurements using a vertical arrayof thermocouples are shown as a function of time for a 500kW natural g& fire. The thermocouple tree was placed 20
cm from the front and side-walls of the RSE.
. ..$!:
600$
E: 400
200
00 200 400 600 800 7000 1200
7ime,s
Fig. 44. Time records of temperature for locations in thefront and rear of the RSE are shown for two 400 kWnatural gas fires (fires differentiated by triangles and cir-cles). The front thermocouples were located at the sameposition (20 cm from the front and side-walls, 18 cm fromthe ceiling) for both fires while the rear thermocouples werelocated at two different positions (20 cm and 30 cm from
the rear and side-walls, 18cm from the ceiling).
4
.0
006. 1
0 *OO 200 300 400 500 600 700
14aat Releasa Rate, IcW
Fig. 45. Carbon monoxide concentrations observed duringpseudo-steady state burning of natural gas fires in the RSEplotted as a function of nominal heat release rate, Measure-ment positions were in the front (1Ocm from front wail andceiling, 29 cm from side wail) and rear (29 cm from side
and rear walls, 10cm from ceiling)of the RSE,
front of the enclosure, and these fluctuations have anegative correlation with each other suggesting thatthey are the result of changes in the reaction behav-ior. For both locations, the 02 concentrations de-
to 1“”’” 1 . $,.”1I
6
s
4
o~o 100 200 300 400 500 600 700
Heat Relesse Rate,kW
Fig. 46. Carbon dioxide concentrations observed duringpseudo-steady state burning of natural gas fires in the RSEplotted as a function of nominal heat release rate. Measure-ment positions were in the front (1Ocm from front wall andceiling, 29 cm from side wall) and rear (29 cm from side
and rear walls, 10cm from ceiling) of the RSE.
l... ~ . ..0
0.0
0 100 200 300 400 500 600 70a
Heat Release Rate, kW
Fig. 47. Oxygen concentrations observed during pseudo-steady state burning of natural gas tires in the RSE plottedas a function of nominal heat release rate. Measurementpositions were in the front (10 cm from front wall andceiling, 29 cm from side wall) and rear (20 cm from side
and rear walls, 10 cm from ceiling) of the RSE.
creased rapidly and remained much less than 0.57(during the test.
Measurements of temperature as a function oftime for various heights near the front of the enclo-sure are shown in Fig. 43 for a 500 kW fire. Theupper layer is located x 60 cm above the floor andhas a relatively uniform temperature varying between1100 and 1300 K. The lower layer is heated byradiation, but is considerably cooler and quite non-uniform. Figure 44 shows pairs of time records ofthermocouple measurements for upper-layer loca-tions in the front and rear of the enclosure for two400 kW fires. The two front thermocouples werelocated at the same position within the RSE whilethe rear thermocouples were located at two differentpositions as indicated. For each general position, themeasurements are in good agreement, but the front
of the enclosure is z 1300 K while the rear is about
300 K cooler, The good agreement between the twosets of measurements indicates the reproducibility of
the fires is good, and, that for the height of the rearmeasurements, horizontal temperature gradients aresmall. Generally, upper-layer temperatures were

222 W. M. Pitts
Time, s
Fig. 48. Time reeords of carbon monoxide concentrationare shown for two probes sampling a 600 kW natural gasfire burning in the RSE. One probe is stationary and ispositioned in the front of the enclosure 29 cm from theside wall and 10 cm from the front wall and ceiling. Thesecond probe is moved during the fire along a horizontalline located 29 em from the side wall and 20 cm from the
ceiling.
RJ
Time, s
Fig. 49. Time records of carbon monoxide concentrationare shown for two probes sampling a 600 kW natural gasfire burning in the RSE. One probe is stationary and ispositioned in the front of the enclosure 29 cm from theside wall and 10 em from the front wall and ceiling. Thesecond probe is moved during the fire along a vertical linelocated 29 cm from the side wall and 10 cm from the front
wall.
higher in the front of the RSE than in the rear for alltests, the absolute differences varied.
Figures 45-47 show averaged steady-state CO,C02 and 02 concentrations as a function of HRRfor two locations—29 cm from the side wall and 10cm from the front wall and ceiling and 29 cm fromthe side and back walls and 10 cm from the ceiling.Concentrations of CO are very nearly zero forHRRs < 100 kW, start to increase for HRRs > 100kW, and approach asymptotic values for HRRs ofx300 kW. For the rear location the asymptoticvalue is x2.0% CO, while for the front location theasymptotic value is x 3.0~0 or roughly 50% larger.Carbon dioxide concentrations initially rise withHRR and are identical for front and rear sampling atHRR <200 kW. For HRR rates >200 kW, the C02concentrations level off and begin to decrease slightly.Values in the rear of the enclosure are slightlyhigher than in the front. Oxygen concentrations fallfrom near-ambient values for small HRR fires to
values less than 1% for HRRs > 300 kW. Both frontand rear locations have very similar behaviors exceptover the narrow range from 200 to 300 kW whereoxygen concentrations in the front are slightly abovezero while those in the rear are very close to zero.The lack of 02 in the upper layer at high HRRs,and the fact that the relative amounts of CO andC02 observed in the front and rear show inversebehavior clearly indicate that combustion is moreefficient in the rear of the enclosure where theconcentration ratio of CO/C02 is lower. The moreefficient combustion in the rear is observed despitethe significantly lower temperatures at this position.
Figure 48 shows measurements of CO con-centration in a 600 kW fire for a probe located29 cm from a side wall and 10 cm from the frontwall and ceiling, along with data recorded by scan-ning a second probe parallel to the side wall along aline positioned 29 cm from the side wall and 20 cmfrom the ceiling. The concentrations of CO measuredfor the stationary probe grow to an asymptotic valueof x 3.5°~, consistent with the earlier measurements.For locations in the rear of the enclosure, the secondprobe recorded CO concentrations which were rela-tively constant at x 1.8%, again consistent withearlier results. However, as the probe approachedthe front of the enclosure (probe located 51 cm fromthe doorway, burner centered 73 cm from the door-way) there was a sudden indrease in COconcentration to that observed at the doorway forthe stationary probe. Concentrations of CO observedby the movable probe then fell off closer to thedoorway, but were still higher than observed in therear. When the two probes were positioned the samedistance from the doorway, the mobile probe, whichwas lower in the layer, recorded a lower CO con-centration. These observations are attributed tovariations in CO concentration with vertical positionin the upper layer as one moves toward the front ofthe enclosure. Note that the final position of themovable probe for the measurements in Fig. 48 wasin the rear of the enclosure and reproduced theinitial measurements quite well.
In the previous paragraph, it was suggested thatCO concentration varies with vertical position in theupper layer. Figure 49 shows measurements for astationary probe and a scanned probe located 29 cmfrom the side wall and 10 cm from the front wall.The stationary probe was 10 cm from the ceiling,and the height of the scanned probe was varied asindicated. It can be seen that the scanned and station-ary probes recorded nearly identical concentrationsfor distances from the ceiling which were less than 10cm. As the distance was increased, however, the COconcentration fell well below that observed by thestationary probe. Interestingly, the CO concentrationappears to have reached a minimum x 25 cm fromthe ceiling before increasing again. At the largestdistance from the ceiling the CO concentrationdropped rapidly as the probe passed through the
---

Enclosure fires 223
.
~~’ I’”’’’’’ r”’””’”””’’”””:’ “’”’’’’’’’’’”’”{
t ....0
. .. 0.
.{“0
... ... ..% . ..*. ,.co . \.
. .+” ‘ “. o “.: ..o %”-. . .
““j$ 0““” ::080
0 1 2 3 4
Global Equivalenea Ratio, $,
Fig. 50. Measured carbon monoxide concentrations ob-served during pseudo-steady state burning are plotted as afunction of global equivalence ratio (@g)calculated usingthe fuel flow rate and an estimated rate of entrainment ‘5”56through the RSE doorway. The fuel was natural gas. Re-sults are shown for positions in the front (10 cm from frontwall and ceiling, 29 cm from side wall) and rear (29 cm
from side and rear walls, 10 cm from ceiling) of the RSE..
*:mo 1 2 3 4
Global Equivalence RatiO, @,
Fig. 51. Measured carbon dioxide concentrations observedduring pseudo-steady state burning are plotted as a functionof global equivalence ratio (@J calculated using the fuelflow rate and an estimated rate of entrainment 55.s6throughthe RSE doorway. The fuel was natural gas. Results areshown for positions in the front (10 cm from front wall and.ceiling, 29 cm from side wall) and rear (29 cm from side
and rear walls, 10 cm from ceiling) of the RSE.
layer interface. These observations show that theupper layer is not well mixed. The variations of COwith height suggest that reactions are taking placewithin the upper layer.
Limited measurements of total hydrocarbon(THC) concentration using a flame ionization detec-tor and hydrogen using grab-bag sampling and gaschromatography were recorded for the RSE fires.Due to the preliminary nature of the data, the resultswill not be discussed in detail. However, it is worth-while noting that values of the THC concentrationbegan to increase for HRR rates >200 kW. Thisvalue is consistent with the HRR for which theoxygen concentration approaches zero in the upperlayer and for which concentrations of CO begin toincrease. Hydrogen was detected in significant con-centrations (1. 1-2.9 dry-volume percent) for fireshaving HRRs in the range 250-600 kW. Thoughlimited, the measurements show that hydrogen can
1
~“:~o 1 2 3 4
Global Equivalence Ratio, 1$,
Fig. 52. Measured oxygen concentrations observed duringpseudo-steady state burning are plotted as a function ofglobal equivalence ratio (4J calculated using the fuel flowrate and an estimated rate of entrainment 55’56through theRSE doorway. The fuel was natural gas. Results are shownfor positions in the front (10 cm from front wall andceiling, 29 cm from side wall) and rare (29 em from side
and rear walls, 10 cm from ceiling) of the RSE.
be a significant product of incomplete combustion inenclosure fires. Hydrogen was also detected in thehood experiments.
Thus far, measured concentrations have been dis-cussed only in terms of the HRR. Clearly, it ispreferable to use a variable such as the GER. Unfor-tunately, the concentration measurements whichwere recorded are not sufficient to allow an equiva-lence ratio to be calculated. However, accurate en-trainment rates into the enclosure were obtained usingthe analysis procedure developed by Janssens andTran.55”56 Using the derived air-entrainment ratesand the measured fuel-flow rates, global equivalenceratios, denoted as q$~could be calculated for the fires.Figures 50-52 show measured CO, C02 and 02concentrations plotted as functions of &. It can beseen that the 02 levels fall to near zero for #~ x 1.0,and that the CO concentration begins to increase forroughly the same ~~. Since the CO and 02 concentra-tions show the behaviors expected for a high-tempera-ture upper layer, these observations indicate thatmeasures values of 48 are fairly accurate.
To confirm further the above conclusion, severaltires were burned in which the @-meter was used todetermine the local equivalence ratio, #1, of gasesextracted from the front of the upper layer. Figure53 shows measured values of @gand ~1 as functionsof HRR. It can be observed that the two sets of dataare in good agreement. Figures 54 and 55 showmeasured CO and 02 concentrations in the front ofthe enclosure plotted as functions of #l. It can beseen that the 02 concentration also falls to zero for~, = 1 and that the CO concentration starts to in-crease at this value. It is clear that the #-metermeasurements yield results which are consistent withthe behaviors of the gas concentrations expected inthe upper layer and with the global phi measure-ments. However, it must be remembered that themeasurements are local in nature and, since values of

224 W. M. Pitts
4
3
2
1
0
0 100 200 300 400 500 600 700
Heat Release Rate, kW
Fig. 53. Measured values of global equivalence ratio (rj~calculated using the method of Janssens and Tran 55’56andlocal equivalence ratio (~,) using the @-meter (10 cm fromfront wall and ceiling, 29 cm from side wall) are plotted asa function of heat release rate for a series of natural gasfires in the RSE. Measurements were for a pseudo-steady
state.
s:“;’’’’,;5”2’ “2;5”’’3”” ,,,
Local Equlvalance Rink., r$,
Fig.54.Measured carbon monoxide concentrations for loca-tions in the front (10 cm from front wall and ceiling, 29 cmfrom side wall) and rear (20 cm from rear and side walls,10 cm from ceiling) of the RSE observed during pseudo-steady-state burning of natural gas are plotted as a functionof the local equivalence ratio (@l).The @meter measurement
is for the front probe location.
25
~
~ “m 1’”’ “ ““’ ‘-””’”jm
- 15:. [ :g
~ <0 ~;
g:
S5
:0 . .
.
0 .%
0 0.5 1 *.5 ‘2 2,5 3 ..5
L.at@! Equivalence Ratio, ~,
Fig. 55. Measured oxygen concentrations for locations inthe front (10 cm from front wall and ceiling, 29 cm fromside wall) and rear (29 cm from rear and side-walls, 10 cmfrom ceiling) of the RSE observed during pseudo-steady-state burning of natural gas are plotted as a function of thelocal equivalence ratio (#l). The ~-meter measurement is for
the front probe location.
41 seem to vary with position in the upper layer ofthe RSE, may not provide a true estimate of ~~.
It is of interest to compare CO, C02 and 02concentrations as functions of ~~ in the rear of theenclosure with those observed by Toner23 in a hood
~ ,.0
..
0
0 1 2 3 4
Global Equivalence Ratio, ~~
Fig. 56. Values of carbon monoxide ccmeetttration observedfor the upper layer in the rear (29 cm from rear ‘and sidewalls, 10 cm from ceiling) of the RSE and in the hoodexperiments of Tonerz 3 are plotted as a function of theglobal equivalence ratios (@ observed in the two experi-ments. Natural gas was the fuel in both cases and measure-
ments were recorded during pseudo-steady-state burning.
D 1 2 3 4
Global Equivalence Ratio, @g
Fig. 57. Values of carbon dioxide concentration observedfor the upper layer in the rear (29 cm from rear and sidewalls, 10 cm from ceiling) of the RSE and in the hoodexperiments of Toner23 are plotted as a function of theglobal equivalence ratios (4,) observed in the two experi-ments. Natural gas was the fuel in both cases and measure-
ments were recorded during pseudo-steady-state burning.
1
o
0 i 2 3 4
Global Equivalence Ratio, 4,
Fig. 58. Values of oxygen concentrations observed for theuPPer laYer in the rear (29 cm from rear and side walls, 10cm from ceiling) of the RSE and in the hood experimentsof Toner23 are plotted as a function of the global equiva-lence ratios (~~) observed in the two experiments. Naturalgas was the fuel in both cases and measurements were
recorded during pseudo-steady-state burning.
experiment. Figures 5658 compare the results forthe two experiments. It is clear that the concentrationbehaviors observed in the rear of the enclosure arevery similar to those measured by Toner in his hood.

Enclosure fires 225
0 200 400 600 800 IODO 1200
Time, s
Fig. 59. Carbon monoxide concentrations measured in theuPper layer of a 25 kW natural gas fire burning within theRSE having a nrrow doorway (1 x 81 cm) are plotted as afunction of time. Measurement positions are both in thefront (1O and 30 cm from the front wall, 10 cm from the
ceiling, and 29 cm from the side wall).
“ 300
:
s ’200
%
;
700
0
0 200 400 600 800 1000 ?200
The, s
Fig. 60. Temperature measurements from a vertical thermo-couple tree located in the front (20 cm from front and side-walis) of the RSE with a narrow doorway (1 x 81 cm) areshown as a function of time. A 25 kW natural gas fire was
used.
It is appropriate at this point to consider some ofthe differences between the RSE experimental con-figuration and an actual fire in an enclosure. TheRSE studies have used natural gas as a fuel. As aresult, it is possible to accurately measure and controlthe fuel-flow rate, but, unlike an actual fire, the fuelmass-generation rate is independent of conditionswithin the compartment (i.e. in contrast to an actualenclosure fire, radiation feedback is unimportant).
In the RSE, the natural gas is released from therelatively small area of the burner with a relativelylarge velocity (maximum of 0.93 m/see for the largestfires). In actual enclosure fires, the fuel is typicallydistributed over a much larger relative area and isgenerally generated by pyrolyzing solids. As a result,the initial velocities of the fuel flows in actual enclo-sure fires are likely to be very small as compared tothe natural gas flow in the RSE. It can be arguedthat the effects of differences in the initial fuel veloc-ity should be relatively minor due to the strongacceleration of flows which occurs as a result of thestrong buoyancy forces generated by the high tem-peratures created by combustion. Typically, buoy-
ancy results in the rapid acceleration of combustionflows to velocities on the order of several m/see. Thisacceleration can be observed clearly in the results ofthe field-modeling calculations discussed in Section5.3.4. Since the velocities resulting from buoyancy-driven flows are higher than the initial velocities ofthe natural gas, the effects of the initial flow velocityare expected to be small. More detailed analysis isrequired to quantify the effects of initial flowmomentum.
5.3.2.Experimentaljindings for the RSE equippedwith a narrow door
A few fires were burned for which the doorwayfor the enclosure was narrowed to a width of 1 cm.For these conditions, the ventilation is severely lim-ited, and much smaller fires can generate rich upper-layer conditions than when the doorway is fullyopen. Due to the much lower HRR values employed,observed upper-layer temperatures were considerablycooler than for the fires discussed up to now. Visualinspection showed that these fires had a well-definedinterface between the upper and lower layers, andthat mixing within the upper layer as well as alongthe interface was less vigorous than in the fires witha full doorway. Based on these observations, it mightbe expected these fires would behave in a mannervery much like the low-temperature hoodexperiments.
No extensive concentration mappings of the upperlayer were performed for these fires. Measurementswere only recorded for two positions (both were 29em from the side wall and 10 em from the ceiling,one was 10 cm and the second 29 cm from the frontwall). The concentration measurements for these twopositions were in good agreement and tracked eachother well. Figure 59 shows the CO concentrationtime record for a 25 kW fire; the fire eventuallyreached a pseudo-steady state.
Temperature records were recorded in the frontand rear of the enclosure. For all fires, the maximumtemperatures were less than 700 K, even though theydid tend to rise slowly with time; presumably as aresult of heating the enclosure walk. There was alsoa distinct gradient in the upper-layer temperatureprofiles with temperature decreasing with distancefrom the ceiling as can be seen in Fig. 60 for a 25kW fire.
During these small fires, it was not possible toestimate @~in the manner used for the larger fires.However, the @-meter was used and values of ~1 areavailable for the sampling position closest to thefront wall. Table 3 contains a tabulation of fireHRR, O,, and CO, C02, and 02 concentrations forthe limited narrow-doorway cases investigated, aswell as results from Morehart’s data24 for hoodexperiments having similar #~.
The results suggest that the CO concentrations areslightly lower in the upper layer for the enclosure

226 W. M. Pitts
Table 3. Combustion-gas concentrations observed in low-temperature reduced-scale enclosure and hoodfires
RSE Hood experiment (Morehart)
RSE Concentration (Wet vol. %) Concentration (Wet vol. %)HRR
(kW) 4, co C02 02 co C02 02
7 0.45 0.003 4.7 10.0 0.00 5.1 9.610 0.68 0.23 6.5 6.5 0.35 6.2 7.015 1.2 0.8 7.1 3.9 1.3 6.9 3.825 1.5 1.0 7.3 2.1 1.5 6.9 2.5
fires, but, given the limited number of data pointsand the variation in measured values as the result ofexperimental uncertainty, the two sets of data are inexcellent agreement. In particular, CO concentrationsfor the enclosure fires start to rise for #1 > x0.5,and there are significant concentrations of 02 meas-ured in the upper layer for 41 > 1.
These findings suggest that the results of the low-temperature hood experiments can be used to predictthe concentrations of combustion gases for caseswhere the upper layer is well defined, no strongmixing of the upper and lower layers occurs, and theupper-layer temperature is <700 K. The close agree-ment also provides indirect collaboration that theprototype ~-meter is providing accurate #lmeasurements.
5.3.3. Experimentaljindings for natural gas fires in areduced-scale enclosure with upper walls and ceilinglined with plywood
Itwas pointed out above that the concentrations
of CO observed both within the upper layer and forpositions removed from wood fires in enclosures(both full- and reduced-scale) are often higher thanmeasured in the hood experiments of Beylerl 9 or inthe enclosure fire experiments of Gottuk and co-work-ers 32’46 where two well-defined layers were present.
Beyler has argued that high concentrations of COare observed in the small-scale experiments as the
result of sampling within fire gases. 19 However, thisdoes not explain the high CO concentrations foundat positions far removed from full-scale enclosurefires such as the Sharon fire test. 14 One must con-clude that another mechanism for the formation ofCO (besides the quenching of a fire plume in a richupper layer located above the fuel) is responsible.
The enclosure experiments discussed earlier havedemonstrated that upper layers in underventilated
fires having temperatures >900 K contain very low
concentrations of oxygen. It has also been arguedthat such oxygen-depleted layers do not react furtheruntil temperatures greater than 1350 K are achieved.This suggests that species produced by the pyrolysisof wood located within an upper layer of an enclo-
sure fire could exit the enclosure unreacted. Sincewood contains oxygen, it was hypothesized that thepyrolysis of wood in a hot upper layer could generateCO directly, which would provide an explanation forthe unexpectedly high (based on the GER concept)CO levels observed in some enclosure fires withwood fuel. Some support for this hypothesis is foundin pyrolysis investigations of wood under helium andnitrogen atmospheres. 58,59These studies have demon-
strated that, for temperatures typical of upper layersin fully developed fires, well over 50~0 of the mass ofwood pyrolyzed generates gases which are primarilyCO, CO, and H,O for high gas temperatures. Theyield of C02 remains nearly constant as the pyrolysisgas temperature is increased, but the CO yield rapidlyincreases. For a temperature of 1100 K, Arpiainenand Lappi found that the pyrolysis of wood barkyielded 0.3 g CO per g wood pyrolyzed.59 The produc-tion of CO was favored in the mole ratio of 5:1 overC02.
In order to test the above hypothesis, test fireswere burned in the RSE for which the ceiling andupper walls (a 36 em wide band around the inside ofenclosure) were covered with 6.4 mm-thick sheets offir pl~ood. 60 Sinm it was desired to investigate
conditions for which the upper-layer concentrationsof 02 were near zero and for which the upper-layertemperatures were high, natural gas fuel flow rateswere set to high nominal HRR values (550 and 600kw). Upper-layer gases were sampled simultaneouslyat the front and rear locations, and the gas composi-tions were measured in the manner discussed earlier.Since the composition of the upper-layer gases isdifficult to assess in the present experiments (therelative amounts of natural gas combustion productsand wood pyrolysis products are unknown), the meas-urements have not been corrected for water removaland are reported on a dry basis.
Figures 61-63 show time records for CO, C02 and02 measured in the front and rear of the enclosurefor a 600 kW fire (based on natural gas flow rate).Different stages in the fire are evident. During theperiod from = 125 to 600 sec the wood remainedattached to the enclosure walls and ceiling; and,presumably, pyrolysis of the wood was taking place
>

Enclosure fires 227
.
Time, s
Fig. 61. Carbon monoxide concentrations for probe loca-tions in the front (1Ocm from front wall and ceiling, 29 cmfrom the side wall) and rear (29 cm from rear and sidewalk, 10 cm from ceiling) are plotted as a function of timefor a burn ith the RSE lined with wood on the ceiling andupper walls. The nominal heat release rate for the natural
gas fuel was 600 kW.
0 200 400 600 800 1000 1200 1400
Time, s
Fig. 62. Carbon dioxide concentrations for probe locationsin the front (10 cm from front wall and wiling, 29 cm fromthe side wall) and rear (29 cm from rear and side walls. 10cm from cefiing) are plotted as a function of time for abum with the RSE lined with wood on the ceiling andupper walls. The nominal heat release rate for the natural
gas fuel was 600 kW.
c [0 “o “ 1:5 00s?
o .0 . “00
‘%a”i&&% .%??~ti”“
o 200 400 600 800 1000 $200 ?400
Time, s
Fig. 63. Oxygen concentrations for probe locations in thefront (10 cm from front wall and ceiling, 29 cm from theside wall) and rear (29 cm from rear and side walls, 10 cmfrom ceiling) are plotted as a function of time for a bumwith the RSE lined with wood on the ceiling and upperwalk. The nominal heat release rate for the natural gas fuel
was 600 kW.
in the upper layer. The pyrolysis of the wood isevident from measurements of the HRR using thefurniture calorimeter. Figure 64 shows that during
1000 1
0
“%0
0 200 400 600 800 1000 1200 1400
Time, sFig. 64. Heat release rates measured by the FurnitureCalorimeter are plotted as a function of time for a burnwith the RSE lined with wood on the ceiling and upperwalls. The nominal heat release rate for the natural gas fuel
was 600 kW.
the period when wood was pyrolyzing, the HRR wassignificantly elevated above the nominal HRR forthe natural gas alone, indicating that the wood pyroly-sis products were burned on exciting the RSE.
At x600 see, the wood was sufficiently structurallyweakened that it could no longer support its ownweight, and it fell in pieces to the floor of theenclosure. When the wood first fell, it did not burstinto flame, but instead appeared to be smoldering.After a short period of time in the highly oxygenatedlower layer, the wood did begin to burn as evidencedby the attachment of flames.
The effect of the wood in the upper layer on thegeneration of CO was dramatic as can be seen bycomparing Fig. 42 (for a 500 kW fire with no wood)and Fig. 61. In the rear of the enclosure, dry concen-trations reached levels > 12% (note that the COconcentration may actually have been higher sincethis is close to the maximum range of the CO ana-lyzer). Increases in CO concentration for the frontwere not as dramatic, but levels approaching 6%were observed. This should be compared with meas-urements of roughly 3.0% (wet) in the front and2.0% (wet) in the rear for fires with natural gas fuelalone.
C02 concentrations were also increased in boththe front and rear of the enclosure compared to thecase with no wood (compare the levels of Fig. 62with those for steady-state burning in Fig. 42). How-ever, the relative increases were much smaller thanfor CO, suggesting that considerably more CO thanC02 was produced as predicted by the pyrolysisstudiesss,sg discussed above. Figure 63 shows that
oxygen concentrations were below 1“~ for both loca-tions in the enclosure, even though the residual leveldid seem to be slightly higher in the rear.
The concentration behaviors changed dramaticallyafter the wood collapsed. In the front of the enclo-sure, CO levels decreased to those typical of a naturalgas-only fire. The rear CO concentration behaviorwas more complicated. First the CO levels droppedto very low values ( c 1%) and then recovered to a
JPfCS 21-3-C

228 W. M. Pitts
800
600
400
200
00 200 400 600 800 1000 $200 1400
Time, s
Fig, 65. Temperature measurements from a vertical thermo-couple tree located in the rear of the RSE (20 cm from therear and side walls) are plotted as a function of time for abum with the RSE lined with wood on the ceiling andupper walls. The nominal heat release rate for the natural
gas fuel was 600 kW.
1000
800
800
400
200
0
Fig. 66. Temperature measurements from a vertical thermo-couple tree located in the front of the RSE (20 cm from thefront and side walls) are plotted as a function of time for abum with the RSE lined with wood on the ceiling andupper walk. The nominal heat release rate for the natural
gas fuel was 600 kW.
value of %1,80/., which isslightly less than found forthe earlier tires. On the other hand, the C02concentration first fell rapidly, but then recovered to%13% which is higher than for natural gas alone.Figure 63 shows that when the wood fell there was alarge increase in 02 concentration suggesting that airwas mixed into the rear upper layer by the fallingwood. Eventually, the 02 level decreased to a residuallevel which was > 2%. These observations suggestthat conditions in the rear of the enclosure are differ-ent when only natural gas is burned. Perhaps thepresence of the wood burning on the floor isresponsible.
Figures 65 and 66 show temperature measurementsfrom thermocouple trees located in the rear andfront of the enclosure, respectively. Close inspectionof Fig. 65 shows some very interesting effects. Firstnote that the thermocouple for the highest position(96.5 cm from the floor) has recorded relatively lowtemperatures during the pyrolysis of the wood, rising
from 600 to 900 K. Most of the remainder of theupper layer seems to have uniform temperatures% 150 K higher. The highest temperatures seem to benear the bottom of the layer. The measured tempera-tures are considerably cooler than observed in therear of the enclosure for natural gas-only fires. Theseobservations suggest that the pyrolysis of the woodis taking place at a surface temperature below theupper-layer gas temperature and that the pyrolysisand subsequent heating of the gases generated re-quires enthalpy extraction from the layer. Followingthe collapse of the wood, the temperature quicklyincreases to levels typical of the natural gas-onlyfires. Note that the thermocouple near the fioor alsorecorded high temperatures during this period due tothe presence of burning wood on the floor.
The effects of the wood pyrolysis on the tempera-tures in the front of the enclosure (Fig. 66) are notnearly as dramatic. The highest location (96.5 cm)does have a temperature significantly lower thanother locations in the upper layer, and it also in-creases during the period of wood pyrolysis. Again,this is taken to be indicative of the wood pyrolysisand heating of pyrolyzate gases requiring a net inputof heat. The other thermocouple measurements arefound to reach relatively constant temperature levelsfairly quickly, suggesting rapid mixing. Followingthe collapse of the wood there are small increases intemperature in this region of the layer.
The findings discussed in this section demonstratethat the presence of wood in an oxygen-depletedupper layer of an enclosure fire can lead to thegeneration of significantly higher concentrations ofCO as suggested by wood pyrolysis investiga-tions. 58.59 The results indicate that, for these condi-
tions, the generation of gaseous fuel by the pyrolysisof wood is an endothermic process. The results of
the wood pyrolysis for locations in the front and .rear of the enclosure are very different. A possible
explanation for these differences is discussed in Sec-tion 5.3.5.
5.3.4. Field modeling study of~owfields and mixingin the RSE
It is evident from the above discussion that theupper layers in RSE fires are far from homogeneousand that reactions which generate CO must be takingplace within the upper layer. Since it has not beenpossible to make experimental measurements of veloc-ity fields or mixing behaviour within the RSE, acomputational effort has been initiated employing athree-dimensional k-e model.6 1
The commercial code used for these calculations isFLOW3D62 which has been developed by HarwellLaboratories, Oxfordshire, U.K. Earlier work atNIST has demonstrated that this model providesreasonable predictions of full-scale room firebehavior.63
The calculations were run using a variable-size,
:

Enclosure fires 229
Q!-.
..’x~”’
800x
600 -
400 -.
x
.
0,xxxx~ “, 1 I
o 20 40 60 80 100
Y (cm)
Fig. 67. Comparison ofvertical temperature profiles meas-ured (& and calculated ( x ) using FLOW3D at a location20 cm from the front and side walls of the RSE for a 400
kW natural gas fire.
7
0.X. ,x. .x,
o 20 40 60 80 100
Y (cm)
Fig. 68. Comparison of vertical temperature profiles meas-ured (A) and calculated ( x ) using FLOW3D at a location20 cm from the rear and side walls of the RSE for a 400
kW natural gas fire.
rectangular 16 x 36 x 18 grid system superimposedon one-half of the enclosure. The symmetry of theenclosure and burner position justified this approach.The burner was modeled by assuming fuel was re-leased at four rectangular grids covering an area of12 x 6 cm (again representing half of the full burnerby symmetry). Flows near the wall were treatedusing standard wall functions. 62
The walls were assumed to remain at a constanttemperature and heat losses were approximated byassuming that a fixed fraction of the heat release waslost by conduction and/or radiation. The remainderof the heat release produced the convective flowswithin the enclosure. Radiation from the hot gasesand walls was ignored. One effect of neglecting radia-tion was that the walls and floor of the enclosure notin contact with the combustion gases were notheated. This approximation is not consistent withthe experiments. Kumar et al. have investigated the
effects of neglecting radiation on calculated fire be-havior using a field model.64 They concluded thatthe changes in calculated behaviors can be quitesignificant.
Combustion was simulated using the eddy breakupmodel,65 where the degree of combustion is control-led solely by the rate of mixing of fuel and oxidizer.Burning was assumed to be complete and to occurinstantaneously when fuel and air were mixed. Notethat this model does not allow modeling of COformation or other products of incomplete com-bustion.
The experimental case modeled was that of a 400kW fire centered in the RSE. As a test of the model,the predicted temperature distributions were com-pared with the experimental results for locationsnear the front (Fig. 67) and rear (Fig. 68) of theenclosure. The agreement for the front position isquite good even though it is evident that some heat-ing of the lower layer does occur in the experiment.In the rear of the enclosure, the agreement of experi-ment and calculation is much poorer. The modeldoes predict a higher temperature within the upperlayer for the front of the enclosure, but significantlyoverestimates the upper-layer temperature in the rearof the room. Significant heating of the lower layer isobserved experimentally in the rear of the enclosure.
Figure 69 shows the calculated velocity profileswithin a vertical plane oriented parallel to the longside of the RSE and located along the centerline.Several features of the flow field can be observed.The plume formed in the center of the enclosure bythe fire is obvious. Note the rapid acceleration of thegases leaving the raised burner. As discussed in Sec-tion 5.3.1, the acceleration due to buoyancy mini-mizes the effects of the initial flow momentum of thenatural gas on the compartment flow field. Thegases in the fire plume rise, hit the ceiling, and forma ceiling jet moving away from the fire plume. Thetwo-layer nature of the tire is revealed by changes inthe direction of the flows. In particular, in the frontof the enclosure, gases in the lower layer are movingtowards the fire, while gases in the upper layer aremoving towards the doorway. In the rear of theenclosure, there is an apparent recirculation zonewithin the upper layer. The hot gases which exit thedoorway are rapidly accelerated by buoyancy forces.
Figure 70 shows velocity components for a planeparallel to that in Fig. 69, but located 24 cm fromthe centerline of the enclosure. Many of the featuresobserved on the centerline are present here as well.The recirculation zone in the rear of the upper layeris defined more clearly. It also appears as if thisrecirculation zone is entraining air directly from thelower layer and ultimately transporting it into theupper layer in the front of the RSE.
The velocity vectors calculated for a horizontalplane located 60 cm above the floor of the RSE areshown in Fig. 71. Only half of the enclosure isrepresented. This vertical position is in the lower half

230 W, M. Pitts
\\ \\\\\\\\\\- -.. .s, ,9 )~~p
1 . . . . . . ..\ \\\ \ \ \\..--/.. ... ,., 11 . . . . . ..\ \\\ ,,, !.. . . . . . . ---, / I’l l.......\ \\\ \\, ,, .---~ ~.-~- , d lJ I,,,-..\\, ,, !,, ---- ---- ---- d if, ,,, ,,,. ..., ,,, ,. ----- _____ - tltll l///. ,/,
! -’’’’ ” - ” --------------------- ‘-’i -- . ’’ ”’ ” ------------- -------------
uFig. 69. Velocity vectors calculated using FLOW3D for a 400 kW tire positioned in the center of the RSEare shown for a vertical plane aligned along the centerline of the enclosure parallel to the long direction.The lengths of the vectors are proportional to the velocity with the longest vector representing 3.94
m/see.
l-- l’//’-/.-- //-/--/ / \. ___ -—-—— --------- \\ \., ,., ,
-.--/////0- ,- /I’ .------* ~------- ‘- .-,
/---/---/---/ / / .. --, ,,, . . . . . . . ,,, ,, ,,,
/-//----/ / --- 0 --~~ ----- --. , f,. . . . . . -.
---/---// / / . ..- ---- ~-—-- -., ,. ---- .$
-/-- / / ---- ..~~- ----- ----- ,--- ..!
~A--- L-L-- ----- .---–-.., ,. ...,
I--------tt --------------”’” -Fig. 70, Velocity vectors calculated using FLOW3D for a 400 kW fire positioned in the center of the RSEare shown for a vertical plane positioned 24 cm from the centerline of the enclosure parallel to the longdirection. The lengths of the vectors are proportional to the velocity with the longest vector representing
1.85 m/see.
of the upper layer. The flow behavior in this plane isquite complex. There appears to be a strong verticalmotion around the fire plume. One of the results ofthis motion is to transport air, which enters theupper layer behind the fire plume, to the front of theupper layer. Gases in the front of the RSE areaccelerated towards the center by the need to exitthrough the doorway. Calculated velocity vectors ina plane located very near the ceiling (90 cm abovethe floor) are shown in Fig. 72. The radial ceiling jet
formed by the plume impinging on the ceiling isquite distinct.
The combustion model incorporated intoFLOW3D is much too simple to allow the prediction
of CO formation, In fact, the only products of com-
bustion allowed are C02 and H20. However, someinsights are provided by considering the calculated
concentrations of 02 for locations within the RSE.Figure 73 shows the results for a horizontal planelocated 63 cm above the floor. This is approximately

.
Enclosure fires
Fig. 71. Velocityvectors calculated using FLOW3D for a 400 kW fire positioned in the center of the RSEare shown for a horizontal plane positioned 60 cm above the floor of the enclosure. Due to the symmetryof the problem, only half of the enclosure is represented. The lengths of the vectors are proportional to
the velocity with the longest vector representing 1.54 m/see.
‘TN!!:,‘ II
E35::-2’9’YA--==——
100
z-g>
50
Fig. 72.Velocity vectors calculated using FLOW3D for a 400 kW fire positioned in the center of the RSEare shown for a horizontal plane positioned 90 cm above the floor of the enclosure. Due to the symmetryof the uroblem, onlv half of the enclosure is remesented. The lerwths of the vectors are mouortional to
the velocity with the longest vector represen~ing 1.26 m/see. ‘ -
Oxygen Mole Fraction
10 20 30 40
X (cm)
Fig. 73. Oxygen concentration contours calculated byFLOW3D for a horizontal ulane located 63 cm above thefloor of the RSE are shown-for a 400 kW natural gas fire.The axis system has its origin in the center of the front ofthe enclosure. y is parallel to the long axis of the enclosureand x lies parallel to the short side. Only half of the shortside is represented since negative values of x are mirrorimages. Positive values of x are truncated as the enclosure
actually extends from Oto 49 cm.
the same height for which velocity vectors are shownin Fig. 71, and it lies in the lower half of the upperlayer. For positions well away from the plume, calcu-lated 02 concentrations are very low ( <0.1 mole or
231
volume percent) in agreement with the experimentalmeasurements within the upper layer of the RSE.
There is a region of relatively high 02 apparent inFig. 73 which lies towards the rear of the enclosureand extends towards the side-walls. This area of high02 is the result of transport of 02, which is entraineddirectly into the upper layer from the lower layer inthe rear of the fire plume as will become obvious inthe next paragraph. The flow patterns responsiblefor the transport of 02 can be seen in Fig. 71.
Calculated 02 concentrations for a vertical cutalong the RSE are shown in Fig. 74 for a position1.5 cm from the centerline. In the lower layer, the airaway from the fire plume is nearly undiluted whichagrees with experimental observations. A region ofentrainment of air (02) into the upper layer behindthe fire plume can be seen in this plane. It is this 02which is ultimately transported to the front of theRSE. In the model, this oxygen reacts to form C02and HZO. The detailed chemical–kinetic modelingdiscussed in Section 4 suggests that such entrained02 would actually react in the upper layer to generateCO, Hz and H20.
The principal findings of the field modeling investi-gation can be summarized as:
1.
2.
There is a recirculation zone within the upperlayer in the rear of the enclosure which consistsprimarily of combustion gases. The residencetime of gases in this region of the RSE is rela-tively long.Since combustion gases are exiting the doorwayat a high rate, the residence times for upper-

232 W. M Pitts
Oxygen Mole Fraction
E-.u_N
80
60
40
20
[!.150 100
Y (cm)
Fig. 74. Oxygen concentration contours calculated byFLOW3D for a vertical plane aligned along the long axisand 1.5cm from the centerline of the RSE are shown for a400 kW natural gas fire. The axis system origin is at thebottom and 1.5 cm from the center of the doorway locatedin the front of the enclosure. z is the vertical direction and yis parallel to the long side of the enclosure. The fuel sourceis located 73 cm from the doorway at the center of the
enclosure.
layer gases in the front of the RSE are consider-ably shorter than in the rear of the enclosure.
3. Combustion within the fire plume depletes mostof the available oxygen entrained by the fireplume from the nearly uncontaminated lower
layer.4. The flow field generated by the fire results in
significant entrainment of unvitiated air from
the lower layer directly into the upper layer atpositions immediately behind the fire plume.
The entrained 02 is transported towards thefront of the RSE by the fire-induced flow. Thisbehavior is supported by the calculated velocitycontours as well as the higher temperatures cal-
culated for regions in the front of the enclosure.
5.3.5. Conclusions based on the experimental andmodeling studies of the RSE
By comparing the modeling and experimental find-ings for the RSE, it is possible to hypothesize causesfor many of the most interesting observations. Ofcourse, careful experimental work will be required toconfirm these hypotheses.
The two most relevant findings from the k-e mod-
eling study are that there is a recirculation zone inthe rear of the enclosure for which the residence timeof combustion gases is relatively long and that signifi-
cant air is mixed directly into the highly vitiatedupper layer from the lower layer.
Residence time arguments can be used to explainthe observed differences in CO concentration be-
tween the rear and front of the enclosure when wood .is present in the upper layer. Based simply on thehigher temperatures in the front of the enclosure, thegeneration rate of gases by pyrolysis of the woodshould be faster in the front of the enclosure. How-ever, the CO levels are considerably higher in therear experimentally. Even though the CO is beingproduced in the rear of the enclosure more slowly,its concentration builds up due to the longer resi-dence time in this part of the enclosure as a result of
.
the recirculation of the gases. In the front of theenclosure, the CO is being generated at a greaterrate, but it is also being swept from the layer and outof the enclosure by the flowing combustion gases.
The experiments with only natural gas fuel havedemonstrated that CO concentrations as a functionof ~~ observed in the rear of the enclosure are verysimilar to those measured by Toner23 in his hoodexperiments (See Figs 5658). Temperatures in therear of the enclosure are high enough that compari-son with Toner’s data is more appropriate than withMorehart’s24 results. The close agreement shows thatthe combustion gases which are trapped in the rearof the enclosure have generation rates for individualspecies which are in the same relative proportions asin Toner’s experiments. This is strong evidence thatthe relative generation rates of combustion gases bythe fire plume are identical in the enclosure andhood experiments. The same conclusion was reachedwhen the experimental findings for the enclosurefires of Gottuk and co-workers32’46 were comparedwith hood experiments of Beyler. 17-19
Significant increases in upper-layer COconcentration have also been observed during thereduced-scale enclosure fires at NIST as one movesfrom the fire plume in the center of the room towardsthe doorway. This observation suggests that reac-tions are occurring in the upper layer. The k-e mod-eling provides an explanation. The modeling showsthat air is mixed directly into the upper layer forthese positions. Two fates can be imagined for thisair when it enters the heated rich gases typical of theupper layer. It could react with rich gases and burnas a normal diffusion flame without rapid mixingand would be expected to produce primarily H20and COZ. A second possibility is that the air becomesrapidly mixed with the rich combustion gases andthe 02 concentration is decreased quickly below theflammability limits for the fuel-air mixture. Under
these conditions, reactions similar to those calculatedin the detailed chemical-kinetic analyses24’30-33 areexpected, and CO should be formed in preferenceto C02. The observation of increases in CO
concentration as one moves toward the front of theenclosure indicates that the latter possibility is thecorrect one. This explains why CO concentrationshigher than predicted by the GER concept arefound.
The RSE experiments have also demonstrated thatthere are significant changes in CO concentration

Enclosure fires 233
with height in the front of the upper layer. The fieldmodeling investigation shows such a dependence onheight is expected due to calculated variations in themixing behavior with position in the upper layer.This dependence on position is sufficient to explainthe experimental observations.
The conclusion that air enters the front of theupper layer by a direct pathway, in addition toentrainment into the fire plume, suggests that forunderventilated burning, values of upper-layer q$larelower in the front of the enclosure than in the rear.Since 02 concentrations are near zero in both thefront and rear, additional chemical reaction mustoccur for gases reaching the upper layer in the frontof the enclosure. These reactions generate heat, thusproviding an explanation for the higher upper-layertemperatures observed in the front of the enclosureas compared to the rear.
Since more air is mixed into the upper layer forthe front of the enclosure, it is expected that valuesof @lwill also be lower in the front than in the rear.Evidence for this behavior can be found in Fig. 52.In the rear of the enclosure, the oxygen concentrationfalls to zero for 48 % 1.0, while for measurements inthe front this occurs for #~ x 1.6 indicating that, fora given ~~, the fuel/air ratio is indeed lower in thefront.
The evidence therefore suggests that the generationrate of CO for a buoyancy-driven fire plume enteringa vitiated upper layer within an enclosure can becorrelated in terms of the upper-layer global equiva-lence ratio if proper account is taken of the tempera-ture effect. This has been demonstrated for the low-and high-temperature limits in the RSE experiments.Two additional mechanisms have been identifiedwhich are capable of increasing the concentration ofCO in the upper layer, and which have not beenexperimentally characterized previously. The first re-quires rapid mixing of very lean gases (i.e. air) di-rectly into a rich, high-temperature upper layer wherereactions similar to those for a flow reactor takeplace. Due to the rich nature of the layer, the princi-pal oxidized product of these reactions is CO inpreference to C02. The second mechanism is thespecial, but common, case of an enclosure fire wherewood, or possibly, other polymeric fuels containingoxygen atoms, is located within the upper layer.When the upper layer is depleted of 02, effectivelywhenever there is a rich upper layer at temperatures>900 K, the pyrolysis of wood will lead to significantincreases in CO concentration.
Earlier, it was noted that burning was observedalong the interface between upper- and lower-levelgases within the RSE during underventilated fires.The importance of such burning on the above conclu-sions is unclear. It is possible that substantial mixingof upper layer gases and the infiowing air occursduring this burning. If so, this would represent asignificant difference from the hood experimentswhere essentially no such mixing was observed. In
the absence of reliable measurements of the relativeamounts of air entering the fire plume and reactingalong the interface, it is not possible to determine theimportance of layer burning. It does seem clear,however, that such burning alone cannot explain theobservation of significantly higher CO concentra-tions in the front of the upper layer as compared tothe rear since layer burning was observed at bothlocations.
Several major differences between the fires studiedin the RSE and actual enclosure fires were discussedin Section 5.3.1. Due to the expected differences ininitial fuel velocities as well as the spatial distributionof fuel, it is certain that flow patterns within theRSE and an actual enclosure fire will differ substan-tially. Such differences would be expected to alterthe relative importance of the mechanisms for COformation discussed in this section. For instance, therelative mass of air mixed directly into a hot highlyvitiated upper layer will probably depend stronglyon the velocity fields generated by the fire and hencethe fuel distribution and its initial velocity. As aresult, the amount of additional CO generated bydirect reaction in the layer will also depend on theseparameters. However, it is clear that if air is intro-duced directly into the layer, that the additional COwill be formed. Such a mechanism for CO formationmight be more or less likely in an actual enclosurefire as compared to the RSE.
6. VALIDI’tl’ OF USING THE GLOBAL EQUIVALENCERATIO CONCEPT TO PREDICT CARBON MONOXIDE
PRODUCTION IN Enclosure FIRES
The experimental and modeling work summarizedabove allows an assessment of the conditions forwhich the use of the GER concept is appropriate forpredicting CO formation in enclosure fires, as well asconditions for which the approach is not expected towork. These different regines are summarized andlisted in order of priority here. Note that this discus-sion assumes that wood or other pyrolyzing solidsare not present in the upper layer. In these cases, theGER concept cannot be applied if the upper layer isrich.
6.1. Conditions where the GER Concept isAppropriate for Enclosure-Fire Predictions of CO
Formation
6.1.1. Fires for which the upper-layer temperature isless than 700 K
The use of the GER concept is most appropriatefor enclosure fires falling into this category. Theupper layers are expected to be non-reactive andboth hood-type and enclosure experiments indicatethat the relative production rates of combustion prod-ucts are very similar for the full range of @~.

234 W. M. Pitts
6.1.2. Fires for which the upper layer is lean and veryhot ( >900 K)
Fires falling into this category are expected to
generate combustion products in amounts very simi-
larto free-burning, fully ventilated fires. ln general,
CO levels are expected to be low unless the fuelgenerates unusually high levels of soot.
6.1.3. Fires for which the only route for oxygen (air)to enter the upper layer is through thefire plume andthe upper layer is very hot ( >900 K)
For this condition, the fires will generate conbus-tion products in the manner typical of hood fireshaving high temperatures over a full range of ~~.With regard to CO, it has been shown that for#, > % 1.5, yields are relatively constant and similar
to those observed in low-temperature hoodexperiments.
6.2. Conditions where the GER Concept is Inappropriatefor Enclosure Fire Predictions of CO Formation
6.2.1. Fires having ~~ >0.5 and intermediatetemperatures (700–900 K) in the upper layer
Hood experiments have demonstrated that for theseconditions, the relative generation rates for combustionproducts in the plume are dependent on the upper-layertemperature. Reactions within the upper layer itself arealso possible and will be dependent on the layerresidence time. The use of the GER concept for theseconditions would be inappropriate without providingsome means to correct for the temperature dependence.
6.2.2. Fires for temperatures >900 K for whichoxygen (air) enters a rich upper layer directly
Both detailed chemical-kinetic analysis and experi-ments indicate that for these conditions, any oxygenwhich reaches the upper layer directly reacts with therich gases to generate primarily CO as opposed toC02. The concentrations of CO observed for thesecases is higher than would be predicted based on theGER concept. It is possible that the GER concept canstill be used to predict the generation rates of combus-tion gases by the fire plume and that an additionalmodel can be employed to predict the changes inconcentration as the result of upper-layer reactions.
6.3. Implications for Using the GER Concept to ModelCO Formation in Enclosure Fires where CO Toxicity
is Important
The most important scenario for which CO forma-tion has been implicated in fire deaths is a fullydeveloped, flashed-over enclosure fire where the vic-
tims are located in compartments remote from thefire. Presumably, toxic gases (primarily CO) are trans-ported from the fire room to locations where thereare people. The discussion above indicates that thesefires burn underventilated and have very high upper-layer temperatures. The GER concept can be used topredict combustion gas concentrations in fires of thistype only for cases meeting the following criteria
1. The fire burns in two well-defined layers, andthe only pathway for air to enter the upperlayer is through the fire plume itself.
2. There are no fuels capable of being pyrolyzedat high temperatures located in the upper layer.In particular, no wood or other fuel capable ofgenerating CO by pyrolysis is present in theupper layer.
The RSE experiments and modeling summarizedabove have demonstrated that a significant mass ofair can enter the upper layer of an enclosure firedirectly, and that much higher concentrations of COare generated than predicted by the GER concept.The amount of direct mixing between the two layersin an intense enclosure fire has not been the subjectof previous investigation, so it is not possible togeneralize the findings of the current investigation.However, it seems likely, based on the RSE results,that such mixing will be characteristic of many realfires in buildings. This is particularly true with regardto the intense fires responsible for most smoke inhala-tion fire deaths.
Rooms in many buildings have ventilation path-ways (such as heating or air conditioning ducts)which can introduce air directly into a rich upperlayer formed by a fire. When mixing is intense in theupper layer, it is likely that air introduced in thismanner will mix rapidly with the rich gases andgenerate CO by the mechanisms already discussed.
Wood and other polymeric materials are oftenfound on the ceilings and upper walls of enclosures.At the present time, it is impossible to predict ‘theCO and other combustion gases generated in thesefires, but it is safe to say that when these materialsare present in significant amounts, the GER conceptwill fail to predict accurately generation rates forcombustion products.
In a recent publication, Babrauskas et al. haverecommended yields to be used for the prediction of
CO generation by fully developed, underventilatedenclosure fires. 3 These recommended yields are de-rived primarily from observations in the hood experi-
ments. Based on the findings summarized here, itmust be concluded that their estimates for CO yieldrepresents a lower limit, and that significantly higheryields of CO are possible for enclosure fires.
To summarize, there are limited conditions forenclosure fires for which the GER concept will allowaccurate predictions of combustion gas generation.There are also likely to be cases for which the GERconcept can be used to calculate generation rates for
a fraction of the upper-layer gases, and that addi-

Enclosure fires 235
tional understanding may allow total generation ratesto be predicted. However, it is clear that the GERconcept, as originally formulated from the hood-typeexperimental findings, cannot be directly extended tothe types of enclosure fires that are most likely toresult in death by smoke inhalation. Additionalunderstanding of very complicated processes (e.g.entrainment of air directly into the upper layer of anintense fire and high temperature pyrolysis of poly-mers) will be required before accurate predictions ofCO can be made for the most relevant enclosurefires.
7. ADDITIONAL DISCUSSION AND LIMITATIONS OFUNDERSTANDING
The formation of CO in enclosure fires has longbeen recognized as a crucial element in fire deaths.However, systematic investigations of CO formationmechanisms and quantification of its generation ratehave only been initiated within the past 15 years.The development of the GER concept was based onresults of the first serious investigations designed toisolate these mechanisms. The simplified approachof investigating combustion-product formation in thehood experiments was not only appropriate, butcrucial, for developing an understanding of CO for-mation in enclosure fires. The GER concept hasprovided the impetus, direction, and framework forlater experiments and analyses. It is disappointing,but in retrospect not surprising, that the hood experi-ments fail to capture the full complexity ofenclosure-fire behavior. By building on the GERconcept, additional mechanisms for the generationof CO in enclosure fires have been identified, and theareas where additional understanding is requiredhave become clearer.
In this report, experimental and theoretical mod-eling investigations have focused on the generationof CO in enclosure fires. It is important to point outthat while significant progress has been made, ourunderstanding of the complete problem is far fromthat required to make confident predictions of theCO reaching a location in a building remote fromthe fire origin. Some of the serious limitations of thecurrent work and areas of uncertainty are summa-rized here in the hope that this work will not be usedin an inappropriate manner to attempt predictionsof CO formation for actual enclosure fires.
All of the recent investigations (both hood-typeand enclosure fires) discussed have been made usingsingle isolated fuel sources in reduced-scale condi-tions, Actual enclosure fires often involve multiplefuel sources of different fuel types which are burningthroughout the enclosure. The mixing and flow be-haviors (which have been shown to be crucial to thegeneration of products of incomplete combustion)are likely to be very different than observed for asingle fire plume. As a result, CO generation ratescould also be very different, It remains to be demon-
strated whether the limited reduced-scale results canbe extrapolated to full-scale enclosures.
There are additional mechanisms for the genera-tion and destruction of CO which have not beenconsidered in the investigations thus far. For in-stance, it is well known that when soot and C02 arepresent together in a high temperature environment,they can react to generate CO. For fuels whichgenerate high soot concentrations, this reaction maycreate even higher concentrations of CO than wouldbe formed by the mechanisms identified so far.
A very important question concerns the mecha-nisms and conditions responsible for quenching ofthe combustion of rich fuel gases exiting an enclosurecontaining a fire. The reduced-scale enclosure investi-gations discussed above have found that levels ofCO in the combustion gases distant from the fire arequite low as the result of additional burning outsideof the enclosure. 32,46,47 In these experiments, the
combustion gases exit into open areas where theymix with air and burn intensely. Gottuk et al. havereported a study of this type of external burning onthe reduction in CO concentration.bb Measurementsin the furniture calorimeter have demonstrated thatthe same is true in the RSE experiments.47 In build-ing fires, the combustion gases often exit into adjoin-ing rooms or corridors. Fire experience and fulI-scalefire tests have demonstrated that high concentrationsof CO can be transported to remote locations indicat-ing that quenching of additional reaction outside ofthe fire room occurred. The quenching process mustbe characterized before predictions of CO for remotelocations can be made. Studies of this type are beinginitiated.
8.SUMMARY AND lTNAL REMARKS
Thk paper has summarized and analyzed the find-ings of a number of investigations designed to charac-terize the formation of CO and other products ofincomplete combustion in enclosure fires. The focushas been on whether or not the GER concept canbe used to predict the generation rates for thesegases.
It has been found that high levels of CO areformed in enclosure fires which are underventilated.One mechanism responsible for the formation of COthat has been identified and characterized in hood-type experiments is the quenching of a fire plumeupon entering an upper layer of rich combustionproducts. The combustion products generated bythis process have been shown to be strordy correlatedwith the upper-layer equivalence ratio, @x Experi-ments indicate that the correlations are dependenton the upper-layer temperature, but that well-definedcorrelations exist for low ( < x700 K) and high( > x900 K) temperatures. The findings suggest thatshifts in combustion gas compositions are primarilythe result of changes in the reaction behavior within

236 W. M. Pitts
the fire plume, despite the fact that the upper layercan also become reactive at the higher temperatures.
Experiments have shown that the GER conceptcan be extended to enclosure fires for conditionswhere the fire burns in a similar manner, or whentemperatures are low enough ( >700 K) to ensurethe upper layer is not reactive. In actual enclosurefires, temperatures are generally such that the upperlayer can be reactive. In this case, the extension ofthe GER concept is appropriate only when there aretwo well-defined layers within the enclosure, no path-ways exist for the introduction of air directly into theupper layer, and there are no solids capable of pyroly-sis located in the upper layer. Analysis indicates thatthe conditions necessary for the application of theGER concept are not typical of the enclosure firesmost likely to result in smoke inhalation deaths.
Mechanisms for the formation of CO in fires in-volving direct entrainment of air into a layer of richcombustion gases and the pyrolysis of wood in arich, high-temperature upper layer have been demon-strated. The generation of CO by the former mecha-nism is consistent with predictions of detailedchemical–kinetic models which indicate the forma-tion of CO will be favored over C02.
Limitations of the current understanding of COformation in and transported from an enclosure firehave been discussed briefly.
Acknowledgments.—This work is the result of efforts of alarge number of researchers who have provided materialhelp as well as ideas. Discussions with Nelson Bryner, BillDavis, Rik Johnsson, and Tom Ohlemiller of NIST weremost helpful. Nelson Bryner carefully read the manuscriptand provided many comments which substantially im-proved the final version. Bill Davis and Rik Johnsson weremost helpful in providing figures and technical details. DanGottuk provided many figures which are included here, aswell as helpful discussions concerning the VPISU researcheffort.
1.
2.3.
4.
5.
6.
7.
8.
9. Peacock, R. D. and Bukowski, R. W., Fire Technol.26,15(1990).
10.Babrauskas, V., J. Fire Sciences 2,5 (1984).11. Smith, R. P., Casarett and Doullk Toxicology—The
Basic Science of Poison. Chav 8. VV. 223-244. C. C.Klassen, M. 0, “Amdur and J.-Dou~l-(Eds), Macmillan,New York, (1986).
2. Karter, Jr, M. J., NFPA J. 88, 57 (September/October1994).
3. Mulholland, G. W., Letter Report to Richard G. Gann,Chie& Fire Measurement and Research Division, Centerfor Fire Research, National Bureau of Standards, unpub-
4.“lished(June 16, 1988).Levine, R. S. and Nelson, H. E., NISTZR 90-4268,National Institute of Standards and Technology
(August. 1990)15.
16.17.18.19.
20.21.
22.
23.
24.
25.REFERENCES
Harland, W. A. and Anderson, R. A., ProceedingsSmoke and Tnxic Gaes from Burning Plastics, pp. 15/1-15/19, Londun (January 6-7, 1982).Harwood, B. and Hall, J. R., Fire J. 83,29 (1989).Babrauskas, V., Levin, B. C., Gann, R. G., Paabo, M.,Harris, Jr, R. H., Peacock, R. D. and Yusa, S., SpecialPublication 827, National Institute of Standards andTechnology (December, 1991).Pitts, W. M., NISTIR 89-418S, National Institute ofStandards and Technology (October, 1989).Pitts, W. M., NLSTZR 89-4094, National Institute ofStandards and Technology (May, 1989).Mulholland, G., Janssens, M., Yusa, S., Twilley, W.and Babrauskas, V., Fire Safety Scierrce-Proceedingsof the Third International Symposium, pp. 585–594, G.Cox and B. Langford (Eds), Elsevier, New York(1991).Morehart, J. H., Zukoski, E. E. and Kubota, T., FireSafety Science—Proceedings of the Third InternationalSymposium, pp. 575–583, G. Cox and B. Langford(Eds), Elsevier, New York (1991).Morehart. J. H.. Zukoski. E. E. and Kubota, T., FireSafety J. i9, 177’(1992).
26.
27.
28.
29.
30.
31.32.
33
ku~ol~and, G. W., Letter Report to William Pitts,Leader, CO Priority Project, National Institute of Stand-ards and Technology, unpublished, (November 1,1989).Quintiere, J. G., J. Fire Protect. Eng. 1,99 (1989).Beyler, C. L. Ph.D. Thesis, Harvard University (1983).Beyler, C. L., Fire Safety J 10,47 (1986).Beyler, C. L., Fire Safety Science—Proceedings of theFirst International Symposium, pp. 431-440, E. Grantand P. J. Pagni (Eds), Hemisphere, New York, (1986).Beyler, C. L., Combust. Sci. Tech. 39,287 (1984).Cetegen, B. M., Ph.D. Thesis, California Institute ofTechnology (1982). Also available as: Cetegen, B. M.,Zukoski, E. E. and Kubota, T., Government Contrac-tor’s Report GCR-82-402, National Bureau of Stand-ards (August, 1982).Lim, C., Masters Thesis, California Institute of Technol-ogy (1984). AISO available as: Zukoski, E. E., Kubota,T. and Lim, C. S., Government Contractor’s ReportGCR-85-493, National Bureau of Standards (May,1985).Toner, S. J., Ph.D. Thesis, California Institute of Tech-nology (1986). Also available as: Toner, S. J., Zukoski,E. E. and Kubota, T., Government Corrlractor’s ReportGCR-87-528, National Bureau of Standards (April,1987).Morehart, J. H. Ph.D. Thesis, California Institute ofTechnology (1990). Also available as: Morehart, J. H.,Zukoski, E. E. and Kubota, T., Government Corrtrac-tor’s Report GCR-90-585, National Institute of Stand-ards and Technology (December, 1990).Zukoski, E. E., Toner, S. J. Morehart, J. H. andKubota, T., Fire Safety Science—Proceedings of theSecond International Symposium, pp. 295-304, C. E.Grant and P. J. Pagni (Eds), Hemisphere, New York,(1989).Zukoski, E. E., Morehart, J. H., Kubota, T. and Toner,S. J., Combust. Flame 83,325 (1991)Cooper, L. Y., NISTIR 4403, National Institute ofStandards and Technology (September, 1990).Cooper, L. Y., NISTIR 4590, National Institute ofStandards and Technology (June, 1991).Cooper, L. Y., Proceedings of the Meeting on Heat andMass Transfer in Fires and Combustion Systems-1991,HTD- Vol. 176, pp. 9–22, S. C. Yao and J. N. Chung(Eds), The American Society of Mechanical Engineers,New York, (1991).Pitts, W. M., 24th Symp. (Int.), Combust., pp. 1737-1746, The Combustion Institute, Pittsburgh (1992).Pitts, W. M., Fire Safety J. 23,271 (1994)Gottuk, D. T., Ph.D. Thesis, Virginia Polytechnic Insti-tute and State University (1992). Also available as:Gottuk, D. T., Government Contractork Report GCR-92-619,National Institute of Standards and Technology(December, 1992).Gottuk, D. T., Roby, R. J. and Beyler, C. L., acceptedfor publication in Fire Safety J.

.
34.
35.
36.
37.
38.
39.40.
41.
42.
43.44.
45.
46.
47.
48.
49.
50.
51.
Enclosure fires 237
Kee, R. J., Miller, J. A. and Jefferson, T. H., SAND80-8003,Sandia National Laboratones (March, 1980).Lutz, A. E., Kee, R. J. and Miller, J. A. SAND87-8248,Sandia National Laboratories (February, 1988).G1arborg,P., Kee, R. J., Grcar, J. F. and Miller, J. A.,SAND86-8209.Sandia National Laboratories (Febru-ary, 1986).Dagaut, P., Boettner, J.-C. and Cathonnet, M., In?. J.Chem. Kin. 22.641 (1990).Kee, R. J., Rupleyj F. M. and Miller, J. A., SAND87-8215,Sandia National Laboratories (April, 1987).Nakaya, I., Fire Materials 11,173 (1987).Rasbash, D. J. and Stark, B. W. V., F.R. Note No.614, Fire Research Station (February, 1966).Gross, D. and Robertson, A. F., Reporr 8147, NationalBureau of Standards (December, 1963).Gross, D. and Robertson, A. F., IOth Symp. (Int.)Combust., pp. 931–942,The Combustion Institute, Pitts-burgh (1965).Tewarson, A., Combust Flame 19, 101 (1972).Tewarson, A., 20th Symp. (In?.) Comb., pp. 1555-1566,The Combustion Institute, Pittsburgh (1984).Monkawa, T. and Yanai, E., J. Fire Sciences 4, 299(1986).Gottuk, D. T., Roby, R. J., Peatross, M. and Beyler,C.L., FireProtectionEng. 4, 133 (1992).Bryner, N. P., Johnsson, E. L. and Pitts, W. M.NISTIR-5568, National Institute of Standards andTechnology (December, 1994).Annual Book of ASTM Standards, Part 18, AmericanSociety for Testing and Materials, Philadelphia (1982).Draft International Stanahrd ISO/DIS 9705, Inter-national Organization for Standardization, Geneve(1990).Kawagoe, K., BRI Report 27, Building Research Insti-tute (September, 1958).Heskestad, G., 14th Symp. (Inf.) Combust., pp. 1021-1030,The Combustion Institute, Pittsburgh (1972).
52.53.54.
55.
56.
57.
58.
59.
60.
61.
62.
63.
64.
65.
66.
Quintiere, J. G., FireSafety J 15,3 (1989).Babrauskas, V., J. Fire Sciences 1,9 (1983).Steckler, K. D., Baum, H. R. and Quintiere, J. G., 20thSymp. (In?.) Comb., pp. 1591-1600, The CombustionInstitute, Pittsburgh (1984).Janssens,M. and Tran, H. C., J. Fire Sciences 10, 528(1992).Johnsson, E. L., Bryner, N. P. and Pitts, W. M.,submitted to Fire Safety J.Babrauskas, V., Parker, W. J., Mulholland, G. andTwilley, W. H., Rev. Sci. Instrunr. 65,2367 (1994).Hileman, F. D., Wojcik, L. H., Futrell, J. H. andEinhorn, I. N., Thermal Uses and Properties of Cabrohy-drates, pp. 49-71, F. Shafizadeh, K. V. Sarkanen andD. A. TMman (Eds), Academic Press, New York(1976).Arpiainen, V. and Lappi, M., J. Anal. Appl. Pyrolysis16.355 (1989).Pitts, W’. M.: Bryner, N. P. and Johnsson, E. L., 25thSymp. (Int.) Combust., pp. 1455–1462, The CombustionInstitute, Pittsburgh (1994).Davis, W. D., to appear as National Institute of Stand-ards and Technology Internal Report.Harwell-FLOW3D Release 2.3: Users Manual, CFDDepartment, AEA Industrial Technology, HarwellLaboratory, Oxfordshire, U.K. (July, 1990).Davis, W. D., Fomey, G. P. and Klote, J. H., NZSTIR-4673, National Institute of Standards and Technology(November, 1991).Kumar, S., Gupta, A. K. and Cox, G., Fire SafetyScience—Proceedings of the Third International Sympo-sium, pp. 345–354, G. Cox and B. Langord (Eds),Elsevier, New York (1991).Spalding, D. B., 16th Symp. (Inr.) Combust., pp. 1657-1663, The Combustion Institute, Pittsburgh (1977).Gottuk, D. T., Roby, R. J. and Beyler, C. L., 24thSymp. (Int.) Combust., pp. 1729-1735, The CombustionInstitute, Pittsburgh (1992).