Water Supply Analysis for Restoring the Colorado River Delta, Mexico
10
Water Supply Analysis for Restoring the Colorado River Delta, Mexico Josué Medellín-Azuara 1 ; Jay R. Lund, M.ASCE 2 ; and Richard E. Howitt 3 Abstract: This paper employs an economic-engineering optimization model to explore water supply options for environmental restora- tion of the Colorado River Delta, Mexico. Potential water sources include reductions in local agricultural and urban water use through water markets, wastewater reuse, and additional Colorado River flows from the United States. For these alternatives, the optimization model estimates operating and water scarcity costs, water scarcity volumes, and marginal economic costs of environmental flows and values of additional Colorado River flows from the United States over a range of required delta environmental flows. Economic values for agricultural and urban water uses were estimated by two ancillary models. The results provide insights into economically promising water supplies for restoration activities. Quantifying the trade-off between agricultural and urban economic valuation and environmental flows provides a framework for decision makers to quantify their valuation of environmental flows. The model also provides a framework for integrating additional knowledge of the system as information becomes available. DOI: 10.1061/ASCE0733-94962007133:5462 CE Database subject headings: Water supply; Restoration; Mexico; Colorado River; Environmental issues. Introduction Providing water for environmental purposes is a difficult issue in many parts of the world. Urban and agricultural users often have first priority in water allocation, for legal and economic reasons. A vast effort has been made to economically value environmental water uses, including revealed preference, expressed preference, value transfer, and meta-analysis approaches Young 2005. This research explores economical sources of water for envi- ronmental restoration within the framework of an economic- engineering optimization model driven by minimizing water scarcity costs for urban and agricultural uses, within infrastruc- ture, hydrologic, regulatory, and environmental constraints. The marginal economic costs of environmental water use are given by the shadow values on minimum environmental flow constraint. Economic scarcity costs for modeled urban and agricultural water users are obtained from water demand curves. The Colorado River Delta of Mexico CRD, surrounded by a major agricultural region and fast-growing border cities, is used as the study case. Policy alternatives for restoration of the delta include various mandated minimum flows, wastewater reuse, and water purchases or trans- fers from local agriculture and outside the region. Valuation of environmental flows is implied when decision makers select their preferred trade-off between environmental flows and economic costs to other water users. This paper first briefly reviews environmental flow valuation techniques. Second, models are proposed to economically value agricultural and urban water uses and integrate this knowledge with local hydrologic, infrastructure, and management con- straints. An application to the Colorado River Delta in the Mexi- cali Valley, Mexico, is then presented. Results and conclusions from the application follow. Valuing Water for Environmental Purposes Literature on valuing water for environmental uses is developed mostly for recreation, aesthetic, and existence value Loomis 1998. Existence value describes the utility individuals derive from knowing a resource exists. Direct market data on willing- ness to pay or prices for environmental uses is very rare, so alternative valuation techniques have been developed. Young 2005 identifies broad techniques for valuation of water as an environmental public good: revealed preference, expressed pref- erence, benefit transfer, and meta-analysis. The first two are the most common in the literature. Revealed preference techniques, such as the travel cost method, indirectly estimate value using observed data from actual environmentally related decisions made by consumers. Expressed stated preference methods e.g., contingent valuation estimate the value of environmental water by questioning individuals about their valuation under different scenarios. Benefit transfer is less common, but suitable when extensive field research is un- available. Benefit transfer valuation methods adapt results from previous studies to a different location and conditions. In meta- analysis, statistical analysis of previous research estimates are used to provide initial information for benefit transfer Young 2005. 1 Postdoctoral Scholar, Dept. of Civil and Environmental Engineering, Univ. of California, Davis, CA 95616 corresponding author. E-mail: [email protected] 2 Professor, Dept. of Civil and Environmental Engineering, Univ. of California, Davis, CA 95616 E-mail: [email protected] 3 Professor, Dept. of Agricultural and Resource Economics, Univ. of California, Davis, CA. E-mail: [email protected] Note. Discussion open until February 1, 2008. Separate discussions must be submitted for individual papers. To extend the closing date by one month, a written request must be filed with the ASCE Managing Editor. The manuscript for this paper was submitted for review and pos- sible publication on August 25, 2006; approved on February 12, 2007. This paper is part of the Journal of Water Resources Planning and Management, Vol. 133, No. 5, September 1, 2007. ©ASCE, ISSN 0733- 9496/2007/5-462–471/$25.00. 462 / JOURNAL OF WATER RESOURCES PLANNING AND MANAGEMENT © ASCE / SEPTEMBER/OCTOBER 2007
-
Upload
independent -
Category
Documents
-
view
2 -
download
0
Transcript of Water Supply Analysis for Restoring the Colorado River Delta, Mexico

Water Supply Analysis for Restoring the Colorado RiverDelta, Mexico
Josué Medellín-Azuara1; Jay R. Lund, M.ASCE2; and Richard E. Howitt3
Abstract: This paper employs an economic-engineering optimization model to explore water supply options for environmental restora-tion of the Colorado River Delta, Mexico. Potential water sources include reductions in local agricultural and urban water use throughwater markets, wastewater reuse, and additional Colorado River flows from the United States. For these alternatives, the optimizationmodel estimates operating and water scarcity costs, water scarcity volumes, and marginal economic costs of environmental flows andvalues of additional Colorado River flows from the United States over a range of required delta environmental flows. Economic values foragricultural and urban water uses were estimated by two ancillary models. The results provide insights into economically promising watersupplies for restoration activities. Quantifying the trade-off between agricultural and urban economic valuation and environmental flowsprovides a framework for decision makers to quantify their valuation of environmental flows. The model also provides a framework forintegrating additional knowledge of the system as information becomes available.
DOI: 10.1061/�ASCE�0733-9496�2007�133:5�462�
CE Database subject headings: Water supply; Restoration; Mexico; Colorado River; Environmental issues.
Introduction
Providing water for environmental purposes is a difficult issue inmany parts of the world. Urban and agricultural users often havefirst priority in water allocation, for legal and economic reasons.A vast effort has been made to economically value environmentalwater uses, including revealed preference, expressed preference,value transfer, and meta-analysis approaches �Young 2005�.
This research explores economical sources of water for envi-ronmental restoration within the framework of an economic-engineering optimization model driven by minimizing waterscarcity costs for urban and agricultural uses, within infrastruc-ture, hydrologic, regulatory, and environmental constraints. Themarginal economic costs of environmental water use are given bythe shadow values on minimum environmental flow constraint.Economic scarcity costs for modeled urban and agricultural waterusers are obtained from water demand curves. The ColoradoRiver Delta of Mexico �CRD�, surrounded by a major agriculturalregion and fast-growing border cities, is used as the study case.Policy alternatives for restoration of the delta include variousmandatedminimum flows, wastewater reuse, and water purchases or trans-
1Postdoctoral Scholar, Dept. of Civil and Environmental Engineering,Univ. of California, Davis, CA 95616 �corresponding author�. E-mail:[email protected]
2Professor, Dept. of Civil and Environmental Engineering, Univ. ofCalifornia, Davis, CA 95616 E-mail: [email protected]
3Professor, Dept. of Agricultural and Resource Economics, Univ. ofCalifornia, Davis, CA. E-mail: [email protected]
Note. Discussion open until February 1, 2008. Separate discussionsmust be submitted for individual papers. To extend the closing date byone month, a written request must be filed with the ASCE ManagingEditor. The manuscript for this paper was submitted for review and pos-sible publication on August 25, 2006; approved on February 12, 2007.This paper is part of the Journal of Water Resources Planning andManagement, Vol. 133, No. 5, September 1, 2007. ©ASCE, ISSN 0733-
9496/2007/5-462–471/$25.00.462 / JOURNAL OF WATER RESOURCES PLANNING AND MANAGEMENT
fers from local agriculture and outside the region. Valuation ofenvironmental flows is implied when decision makers select theirpreferred trade-off between environmental flows and economiccosts to other water users.
This paper first briefly reviews environmental flow valuationtechniques. Second, models are proposed to economically valueagricultural and urban water uses and integrate this knowledgewith local hydrologic, infrastructure, and management con-straints. An application to the Colorado River Delta in the Mexi-cali Valley, Mexico, is then presented. Results and conclusionsfrom the application follow.
Valuing Water for Environmental Purposes
Literature on valuing water for environmental uses is developedmostly for recreation, aesthetic, and existence value �Loomis1998�. Existence value describes the utility individuals derivefrom knowing a resource exists. Direct market data on willing-ness to pay or prices for environmental uses is very rare, soalternative valuation techniques have been developed. Young�2005� identifies broad techniques for valuation of water as anenvironmental public good: revealed preference, expressed pref-erence, benefit transfer, and meta-analysis. The first two are themost common in the literature.
Revealed preference techniques, such as the travel costmethod, indirectly estimate value using observed data from actualenvironmentally related decisions made by consumers. Expressed�stated� preference methods �e.g., contingent valuation� estimatethe value of environmental water by questioning individualsabout their valuation under different scenarios. Benefit transfer isless common, but suitable when extensive field research is un-available. Benefit transfer valuation methods adapt results fromprevious studies to a different location and conditions. In meta-analysis, statistical analysis of previous research estimates areused to provide initial information for benefit transfer �Young
2005�.© ASCE / SEPTEMBER/OCTOBER 2007

This research uses system model results to establish a frame-work for revealed preference estimates of the economic value ofenvironmental flows. Agricultural, environmental, and urbanwater uses exist within a complex hydraulic network. First wateris economically valued for agricultural and urban uses by apply-ing common valuation techniques. Total economic costs for thesystem are the sum of scarcity costs for these uses plus operatingcosts �pumping, treatment, etc.� for the region. Water is assumedto be a scarce resource for the three users.
The opportunity cost of dedicating water to environmentaluses rather than deliveries for the other two uses is then the valueof the shadow costs on the environmental flow constraints in thesystem model. Valuation of environmental flows is then impliedby decision-maker selection of a point of operation on the trade-off curve between environmental flows and other economicperformance. As such, this approach differs from mainstream con-tingent valuation and travel cost method techniques. Shabman andStephenson �2000� review shortcomings of the aforementionedmethods.
For this study, willingness to pay for environmental water is aby-product of a larger, user-interrelated water resources study.One advantage of this approach is that associated opportunitycosts of alternative uses of water and operation costs are explic-itly considered. Although water quantity or minimum environ-mental instream flows �MIFs� are common attributes, waterquality also is important for agriculture and the CRD. However,the scope of this research does not extend to water quality issues.Water quality considerations would not shift the model resultsgreatly since there is an upper bound for Colorado River salinityfrom Treaty Minute 272 of 1973.
Model
The economic-engineering optimization in this study uses theCALVIN model �Jenkins et al. 2001, 2004�, which is built aroundthe HEC-PRM optimization model �USACE 1994�. CALVIN wasdeveloped and successfully applied for strategic water manage-ment in California. The model optimizes and integrates wateroperations and allocation based on costs and economic waterscarcity for urban and agricultural users �Fig. 1�. The CALVINmodel has provided promising insights for water managementregarding water markets, facility expansion, dam removal, con-junctive use, economic costs of environmental restrictions, andusers’ economic willingness to pay for water �Jenkins et al. 2004;
Fig. 1. Data flow schematic in CALVIN �Draper et al. 2003, ASCE�
Lund et al. 2003; Medellín-Azuara and Lund 2006; Null and
JOURNAL OF WATER RESOURCES PLANNING
Lund 2006; Pulido-Velázquez et al. 2004�. Most recent applica-tions of CALVIN include adaptations to climate change for thestate of California �Medellín-Azuara et al. 2006; Tanaka et al.2006�.
CALVIN belongs to the category of generalized network flowoptimization models �Labadie 2004�, which can account for flowlosses and gains. To minimize total operation and scarcity cost ina region, HEC-PRM solves the set of equations below �Jenkinset al. 2001�
Minx�0Z = �m
�n
cmnXmn �1�
�m
Xnm = �m
amnXmn + bn, ∀ n �2�
Xmn � umn ∀ m,n �3�
Xmn � lmn ∀ m,n �4�
where Z�total cost of flows throughout the network; Xmn�flowleaving node m towards node n; cmn�economic cost; bn�externalinflows to node n; amn�gain/loss on flows in arc mn; umn�upperbound on arc mn; and lmn�lower bound on arc mn �Jenkins et al.2001�. Economic costs are assigned to water scarcity for eachagricultural and urban demand location. Each demand locationhas a water delivery target and piecewise linear costs for deliver-ies less than its target.
Both operating costs and economic cost of water scarcity forwater users are required. Water scarcity costs are represented byconvex penalty functions developed from piecewise linear inte-gration of a marginal willingness-to-pay curve for water for eachagricultural and urban water user.
Agricultural Demand Model
Economic values for agricultural water deliveries were estimatedby an inductive valuation technique known as positive math-ematical programming or PMP �Howitt 1995�, extending an ear-lier U.S.-California application of the Statewide AgriculturalProduction Model �SWAP� by Howitt et al. �2003�. Farmers in anarea are assumed to make crop and water use decisions to maxi-mize profits within water and land constraints. SWAP calibrates tohistorically observed values of crop, water, and land use and out-put. Willingness to pay for water is obtained by increasingly re-stricting water availability to farmers and observing the shadowvalues of water use.
A multiregion and multicrop agricultural production modelwas developed for this study following Howitt �2006�. Technol-ogy is represented by a constant elasticity of substitution �CES�production function, which restricts substitution effects amongproduction factors. Constant intertemporal yields are assumed,but spatial variation of yields is allowed to represent heterogene-ity in land quality.
Details of the current PMP model appear in Medellín-Azuara�2006�. The first step in PMP is to obtain marginal values onmodel calibration constraints. In a second step, marginal valuesfrom the previous step are used to calculate parameters needed bya quadratic total cost function and the CES production function.The last step in PMP is to solve a nonlinear constrained profit
maximization program as follows:AND MANAGEMENT © ASCE / SEPTEMBER/OCTOBER 2007 / 463

Maxx�0 � = �g
�i
vgiYgi − �g
�i
�j
��igxgi,land − �igxgi,land2 �
�5�
Ygi = �gi�� j�gijxgij
−��−/��6�
�i
agijxgij � bgj ∀ g, j �7�
xmgm � �i
metgimxgi,water ∀ g,m �8�
�m
xmg,m � availwater · bgj ∀ g and j = water �9�
In Eq. �5�, Ygi and gi represent respectively physical output �as aCES production function of Eq. �6�� and unit price of crop i inarea g. The scale �yield� parameter of the CES production func-tion in Eq. �6� is referred as �gi, whereas the share parameters ofthe production function for each crop are represented by �gij. Thevariable xgij denotes usage of factor j in production of crop i ofregion g. Production factors j include labor, land, water, and anaggregate of supplies such as fertilizer and pesticides. These fac-tors were indexed by land in crop i. The second term in Eq. �5�contains a quadratic PMP cost function with parameters � and ��Howitt 2006�. Eqs. �7� through �9� are constraint sets for produc-tion factors, monthly water use�xmg,m� and available water bgwater
for each region. The variable metgim is the observed fraction ofthe total annual water use xgi,water for crop i in area g.
A derived water demand curve for each area is obtained byincrementally reducing the parameter availwater in Eq. �9� abovefrom 1.0 to 0.6. The program of Eqs. �5� through �9� was coded torun in GAMS �Brooke et al. 1998�. The output of the programprovides shadow values of water from 60 to 100% water avail-ability, which is used to derive water scarcity penalty functionsused in CALVIN �Fig. 1�.
Urban Demand Model
An econometric model was used to estimate the residential price-elasticity of water demand. This model is a hybrid of Billings andAgthe �1980� and Nieswiadomy and Molina �1989�, which in-cludes the quantity demanded �per user�, the marginal price, adifference variable, income and seasonal variables, and instru-mental variables to overcome simultaneity issues. The differencevariable was introduced by Taylor �1975� and refined by Nordin�1976� to overcome the alleged inherent endogeneity in demandmodels under block rate schedules. This explanatory variable isdefined as the difference between the water bill and what wouldbe paid if all consumption were charged at the marginal price.
In this model, water used per metered connection is a proxyfor household consumption in time. Water used by the averagehousehold �Qt� in time t is assumed to be a function of the pricein the last block rate �marginal price, Pt�, Nordin’s differencevariable Dt �Schefter and David 1985�, income Yt, a seasonaldummy variable Wt, average monthly reference evapotranspira-tion ETt, and monthly precipitation Rt. The regression equation is
Qt = �o + �1Pt + �2Dt + �3Yt + �4ETt + �5Rt + �Wt + ut �10�
where ut�error term and Wt�vector of dummy variables forthree out of four quarters in the year. Marginal price Pt and dif-
ference variable Dt are instrumented variables in a first-step re-464 / JOURNAL OF WATER RESOURCES PLANNING AND MANAGEMENT
gression �Nieswiadomy and Molina 1989�. Instruments for mar-ginal price and difference variables are the block rateidentification �1–12�, the fiscal year, and a seasonal variable forthe month at time t.
In this study, nonresidential uses including commerce, govern-ment, and industry are assumed to be fixed. This assumption isless realistic for commercial uses and more realistic for industrialand governmental uses. The contribution of water to industrialend products is minor compared to capital and other productioninputs �Young 2005�.
Case Study and Policy Alternatives
The Mexican portion of the Lower Colorado River Delta �CRD�occupies more than 180,000 ha, which is only 10% of the delta’sarea before upstream water development began beginning in theearly 1900s in the United States and Mexico �Glenn et al. 2001�.The Colorado River �Fig. 2� is the main water source for northernBaja California, whose rainfall averages roughly 200 mm/year.The CRD is the breeding ground for thousands of migratory birdsas part of the Pacific Flyway and home of endangered species,including the Yuma clapper rail and the desert pup fish �Andersonet al. 2003�.
Since the 1930s, upstream diversions for agricultural andurban uses have greatly reduced and altered the pattern of deltaflows, causing severe habitat loss and deterioration of water qual-ity and abetting invasions of exotic species �Glenn et al. 2001�.Migratory birds have suffered reduced wetland and winteringhabitat �Zengel et al. 1995�. Endangered species such as the Yumaclapper rail rely on cattail habitat for breeding. The bird popula-tions are prone to collapse because low flow regimes affect cattailcoverage �Hinojosa-Huerta et al. 2001�. Most of the remainingCRD has been protected since 1993 by the Mexican EnvironmentMinistry �SEMARNAT� as part of the Biosphere Reserve of theGulf of California. Nevertheless, severe droughts, increasing ag-ricultural and urban demands, and institutional constraints arechallenges for CRD restoration.
In 1944 Mexico and the United States signed a water treatythat guaranteed Mexico 1,850 million cubic meters of water peryear �MCM/year� from the Colorado River. Other issues were tobe addressed through the newly created International Boundaryand Water Commission �IBWC�. The initial water treaty did notaddress population growth or water quality. In the early 1960s, as
Fig. 2. Location of cities of Mexicali, San Luis Río Colorado,Irrigation District 014 and major canals
a result of drainage water from Arizona diversions, salinity ex-
© ASCE / SEPTEMBER/OCTOBER 2007
ceeded the historical 1,000 ppm level �Garcıa-Acevedo 2000�.After long rounds of negotiation, in 1973 Minute 242 was signedto amend the water treaty. The U.S. section of the IBWC agreedto deliver water to Mexico with a salinity level less than 130 ppm�±30 ppm� above the salinity observed at the U.S. Imperial Dam.Minute 306 of 2000 sets the framework for binational studies andrecommendations concerning water resources management in theCRD.
Salinity and flow regimes determine vegetation coverage inthe CRD �Zengel et al. 1995�. However, Clinton et al. �2001� andothers �e.g., Zamora-Arroyo et al. �2001�� argue that the maincause of CRD environmental problems is low inflow. Even whenwater exceeding the 1,850 MCM quota reaches the Mexican bor-der, this water has been assigned to agricultural use or aquiferrecharge �Clinton et al. 2001�. Another cause of the low flows tothe CRD is increasing population in northern Baja California.Salinity has increased from drainage flows from upstream diver-sions �Cohen and Henges-Jeck 2001�.
Once invasive species are established, native vegetation can-not recover. Stromberg �2001� discusses the causal relationshipbetween flow regimes and ecosystem functions in the CRD. Sev-eral studies indicate that the riparian corridor of the CRD requiresannual flows of about 40 MCM, with pulse flows of 320 MCMevery 4 years �Luecke et al. 1999; Pitt et al. 2000�. Studies in theregion seem to agree on the amount of water needed for restora-tion and maintenance of the CRD habitat �including the RioHardy, the Cienega de Santa Clara, the riparian corridor in theU.S.–Mexico limitrophe, and south towards the Gulf of Califor-nia�. However, the costs and regional management of dedicatedflows are largely unexplored.
Agriculture and Irrigation Water in Mexicali Valley
Irrigation District 014 is located south of the northern U.S.–Mexico border of the Mexican states of Baja California and So-nora �Fig. 2�, known as the Mexicali Valley. Of its gross area of350,000 ha, 250,000 ha can access irrigation systems. About208,000 ha �roughly 84%� have water rights for irrigation. Ofthese, 26,647 ha are located in the municipality of San Luis RioColorado, Sonora �SLRC�, and the rest in Mexicali, Baja Califor-nia. Being among the most productive regions in Mexico, thepredominantly commercial agriculture in the Mexicali Valleyyielded nearly U.S. $280 million in 2004 �SAGARPA 2006�.
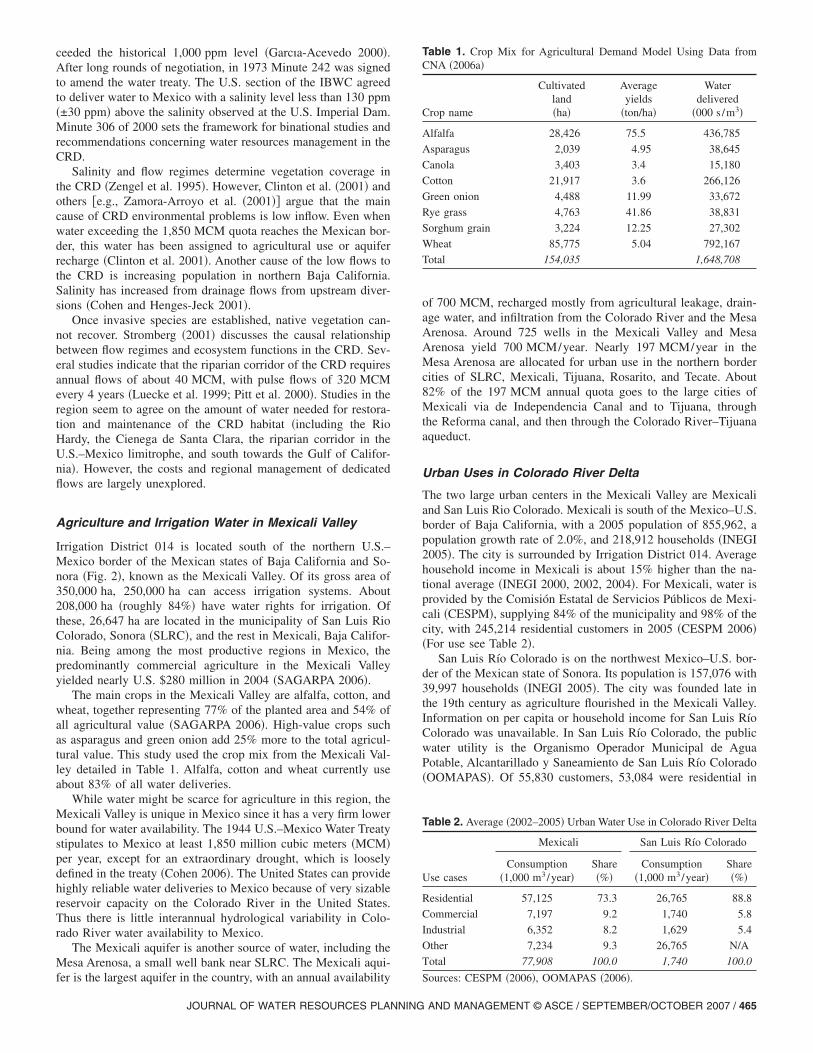
The main crops in the Mexicali Valley are alfalfa, cotton, andwheat, together representing 77% of the planted area and 54% ofall agricultural value �SAGARPA 2006�. High-value crops suchas asparagus and green onion add 25% more to the total agricul-tural value. This study used the crop mix from the Mexicali Val-ley detailed in Table 1. Alfalfa, cotton and wheat currently useabout 83% of all water deliveries.
While water might be scarce for agriculture in this region, theMexicali Valley is unique in Mexico since it has a very firm lowerbound for water availability. The 1944 U.S.–Mexico Water Treatystipulates to Mexico at least 1,850 million cubic meters �MCM�per year, except for an extraordinary drought, which is looselydefined in the treaty �Cohen 2006�. The United States can providehighly reliable water deliveries to Mexico because of very sizablereservoir capacity on the Colorado River in the United States.Thus there is little interannual hydrological variability in Colo-rado River water availability to Mexico.
The Mexicali aquifer is another source of water, including theMesa Arenosa, a small well bank near SLRC. The Mexicali aqui-
fer is the largest aquifer in the country, with an annual availabilityJOURNAL OF WATER RESOURCES PLANNING
of 700 MCM, recharged mostly from agricultural leakage, drain-age water, and infiltration from the Colorado River and the MesaArenosa. Around 725 wells in the Mexicali Valley and MesaArenosa yield 700 MCM/year. Nearly 197 MCM/year in theMesa Arenosa are allocated for urban use in the northern bordercities of SLRC, Mexicali, Tijuana, Rosarito, and Tecate. About82% of the 197 MCM annual quota goes to the large cities ofMexicali via de Independencia Canal and to Tijuana, throughthe Reforma canal, and then through the Colorado River–Tijuanaaqueduct.
Urban Uses in Colorado River Delta
The two large urban centers in the Mexicali Valley are Mexicaliand San Luis Rio Colorado. Mexicali is south of the Mexico–U.S.border of Baja California, with a 2005 population of 855,962, apopulation growth rate of 2.0%, and 218,912 households �INEGI2005�. The city is surrounded by Irrigation District 014. Averagehousehold income in Mexicali is about 15% higher than the na-tional average �INEGI 2000, 2002, 2004�. For Mexicali, water isprovided by the Comisión Estatal de Servicios Públicos de Mexi-cali �CESPM�, supplying 84% of the municipality and 98% of thecity, with 245,214 residential customers in 2005 �CESPM 2006��For use see Table 2�.
San Luis Río Colorado is on the northwest Mexico–U.S. bor-der of the Mexican state of Sonora. Its population is 157,076 with39,997 households �INEGI 2005�. The city was founded late inthe 19th century as agriculture flourished in the Mexicali Valley.Information on per capita or household income for San Luis RíoColorado was unavailable. In San Luis Río Colorado, the publicwater utility is the Organismo Operador Municipal de AguaPotable, Alcantarillado y Saneamiento de San Luis Río Colorado�OOMAPAS�. Of 55,830 customers, 53,084 were residential in
Table 1. Crop Mix for Agricultural Demand Model Using Data fromCNA �2006a�
Crop name
Cultivatedland�ha�
Averageyields
�ton/ha�
Waterdelivered
�000 s /m3�
Alfalfa 28,426 75.5 436,785
Asparagus 2,039 4.95 38,645
Canola 3,403 3.4 15,180
Cotton 21,917 3.6 266,126
Green onion 4,488 11.99 33,672
Rye grass 4,763 41.86 38,831
Sorghum grain 3,224 12.25 27,302
Wheat 85,775 5.04 792,167
Total 154,035 1,648,708
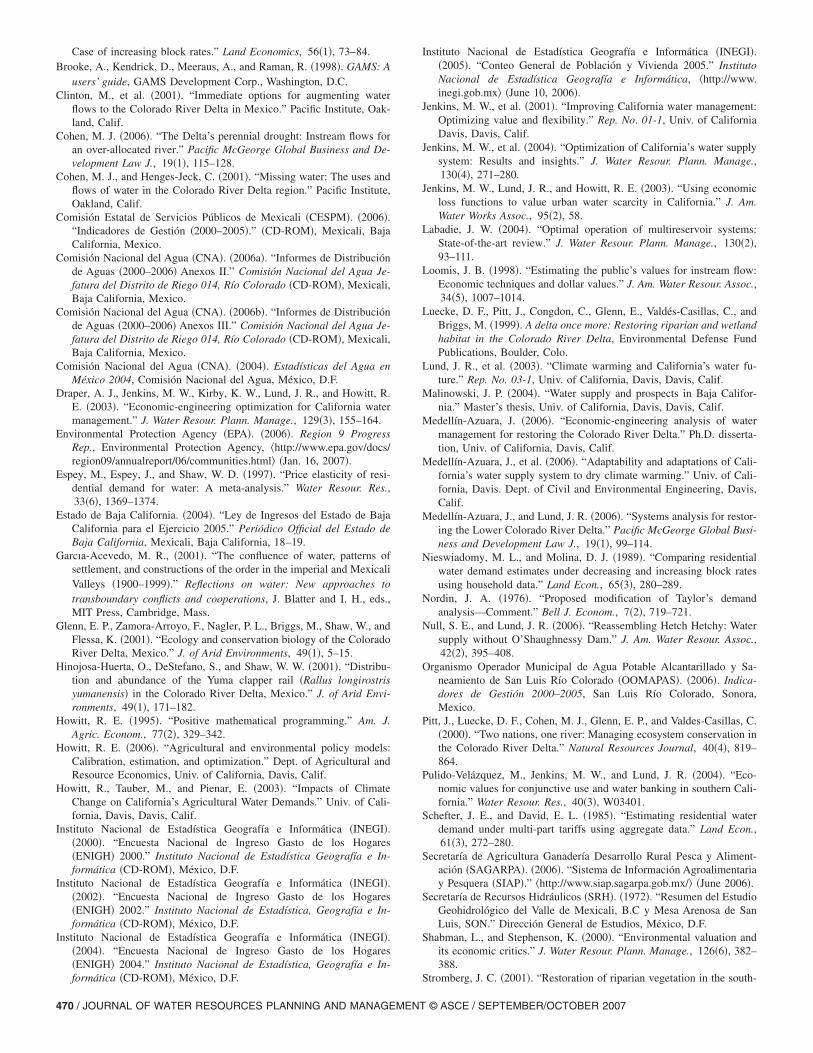
Table 2. Average �2002–2005� Urban Water Use in Colorado River Delta
Mexicali San Luis Río Colorado
Use casesConsumption
�1,000 m3/year�Share�%�
Consumption�1,000 m3/year�
Share�%�
Residential 57,125 73.3 26,765 88.8
Commercial 7,197 9.2 1,740 5.8
Industrial 6,352 8.2 1,629 5.4
Other 7,234 9.3 26,765 N/A
Total 77,908 100.0 1,740 100.0
Sources: CESPM �2006�, OOMAPAS �2006�.
AND MANAGEMENT © ASCE / SEPTEMBER/OCTOBER 2007 / 465

2005. Nearly 2,000 new residential customers ��4% � have beenadded every year in the last 6 years �OOMAPAS 2006�. Water inurban centers is mostly for residential use �Table 1�. For Mexicaliand San Luis Rio Colorado, yearly average residential use �2002–2005� represents roughly 73 and 89%, respectively, of the totaluse shown in Table 2.
Application of CALVIN
Consistent with the research objectives of this study, Region 6�Baja California� of CALVIN, was developed to estimate the eco-nomic cost for agricultural and urban water users of various levelsof CRD restoration flows. Regions 1–5 are in U.S.–California.Water demand levels for agriculture and cities are projected forthe year 2020. The marginal economic costs of environmentalflows for the CRD are given by the shadow value of the minimumflows constraint for the CRD �i.e., Eq. �4��.
Fig. 3 depicts CALVIN Region 6, Baja California. Urban de-mands include the cities of Ensenada, Mexicali, Rosarito, SLRC,Tecate, and Tijuana. Agricultural water uses include the valleys ofGuadalupe, Maneadero, and Mexicali. For this study, the easternside of Region 6 �Mexicali Valley� was used. Demand sites in thissubregion include the cities of Mexicali and SLRC and fouragricultural locations within the Mexicali Valley. Hydraulic infra-structure in the model includes major canals, wastewater treat-ment facilities for Mexicali, and the Colorado River–Tijuanaaqueduct.
Fig. 4 shows a simplified network representation of the CRDportion of CALVIN Region 6. Water supplies for the region arethe Colorado River and the Mexicali aquifer. Data on ColoradoRiver inflows crossing the Mexico-U.S. border are from the Na-tional Water Commission. �Comisión Nacional del Agua or CNA��CNA 2006a�, as are estimates of groundwater usage and rechargefor the Mexicali aquifer. Given the regularity of the predominantwater source �the Colorado River�, the model runs are quasi-steady state, for 5 years with little over-year operation of storage.
Policy Alternatives and Modeling Sets
Modeling sets of this study include year 2020 projected consump-tion in the urban centers and agriculture. The Rio Colorado–Tijuana aqueduct is assumed to have increased capacity to
3
Fig. 3. Coverage of CALVIN Region 6, Baja California �adaptedfrom Malinowski 2004�
5.2 m /s and is operated at this full capacity �164 MCM/year�
466 / JOURNAL OF WATER RESOURCES PLANNING AND MANAGEMENT
to supply growing urban demands in the Tijuana metropolitanarea. Mexicali and SLRC use becomes roughly 100 and42 MCM/year, respectively. Minimum water flows for the CRDfollow current recommendations of 40 MCM/year minimum con-stant flow and pulse flows of 320 MCM every 4 years, averaging10 MCM per month.
Policy alternatives include mandated minimum flows, treatedwastewater reuse, and water markets and transfers. For all policyalternatives, minimum environmental flow constraints for theCRD are varied from 0 to 20 MCM/month to obtain shadowvalues of water for environmental flows at each flow level. Forthe first alternative, the system can supply environmental flows byoperational changes to the Mexicali Valley network and purchas-ing water from agricultural and urban users in the MexicaliValley. The Mexicali Valley already has an active internal watermarket.
The second alternative adds treated wastewater costing $200/TCM to the options available in the first alternative. For this costit is assumed that treated wastewater is sold at the lowest possiblefee published �Estado de Baja California 2004�. Wastewater reuseis limited to about 50% capacity of the future Las Arenitas waste-water treatment plant in Mexicali �15.8 MCM/year� �EPA 2006�,with capacity cost being omitted from the model.
Finally, the third alternative allows water to be purchased fromelsewhere �presumably the United States� at an assumed-to-beinexpensive rate of $30/TCM, in addition to the options availablein the first and second alternatives. While this price is much lessthan water market transfers between the Imperial Valley IrrigationDistrict and the City of San Diego, this price does justify low-value water uses in Imperial, Palo Verde, and the Central Arizonaproject.
Data and Economic Value of Agricultural and UrbanWater
CALVIN uses data on infrastructure capacities, major conveyancefacilities, aquifers, reservoirs, and economic water demands.Water shadow values for agricultural and urban uses arise fromtheir respective water demand models. Information on facilities is
Fig. 4. Simplified schematic of CALVIN Region 6 at Colorado RiverDelta and Mexicali Valley—WWTP refers to wastewater treatmentplants in Mexicali
mainly from CNA and the state utilities CESPM and OOMAPAS.
© ASCE / SEPTEMBER/OCTOBER 2007

Hydrology includes water deliveries from the United Statesthrough the Colorado River and from groundwater recharge. CNAprovided data on Colorado River water deliveries to Mexico�CNA 2006b�. For groundwater, CNA �2004� and the formerWater Resources Secretariat �SRH 1972� estimate an annual re-charge of 700 MCM/year for the Mexicali aquifer. Of these,100 MCM/year is stream recharge from the Colorado River,100 MCM/year is lateral inflow from the Mesa Arenosa aquifer,and 500 MCM/year is percolation of Mexicali Valley irrigationwater.
For the agricultural demand model, CNA’s irrigation districtrecords cover 60 months of water deliveries and cultivated landper crop for each irrigation subdistrict or module. Productioncosts and factor usage other than land and water were obtainedusing statistical information from the Agriculture Ministry �SA-GARPA� and from work in progress by the Veterinary Institute ofthe University of Baja California in Mexicali. Finally, the 22modules were consolidated into four major areas, consideringgeographical location, water sources, and land quality attributes.These four areas are: �1� the main Mexicali Valley; �2� mostlygroundwater-irrigated agriculture; �3� eastside agriculture; and �4�westside agriculture. Irrigation water demand curves for each ir-rigation area were found by systematically limiting water avail-ability from 100% down to 60% of current use in 10% steps, asshown in Table 3 and Fig. 5.
Overall, agriculture in the west of the Mexicali Valley has thelowest marginal value for irrigation water when availability dropsbelow 80%. The main valley has the highest value, whereas theeast side has a shadow value near the average of the four regions.
Table 3. Agricultural Water Shadow Value in Mexicali Valley
Shadow value �US$/000 s /m3�
Wateravailability�%� East Main West Groundwater
100 25 37 21 17
90 30 41 25 23
80 35 46 31 31
70 41 50 38 39
60 47 53 44 50
Fig. 5. Shadow value for agricultural water uses in Mexicali Valley
JOURNAL OF WATER RESOURCES PLANNING
The groundwater area follows a steepest pattern, as seen in Fig. 5,beginning as the lowest water value at full availability and pass-ing valuation in other two regions at the lowest level of availabil-ity. These shadow values of water for agriculture were convertedinto penalty functions following Jenkins et al. �2001, 2003� andwater use was scaled up to represent all agricultural use in theMexicali Valley.
Data sources for residential use in Mexicali include water usereports of CESPM �2006� and INEGI’s household income na-tional surveys �INEGI 2000, 2002, 2004�. Water consumptiondata from CESPM is monthly from January 2000 through Decem-ber 2005. CESPM’s database has water consumption disaggre-gated into 15 price blocks �Estado de Baja California 2004�. Thefirst block �up to 5 m3/month� has a flat rate, followed by 14blocks ranging from 5 to 10 m3, with incrementally increasingunit prices. For each consumption block, the database providestotal use, number of customers, and total revenue raised by theutility. Six years �2000–2005� of monthly observations per con-sumption block were included in the estimations. Currency in theanalysis is set at 2002 pesos using the Mexican Central Bank’sConsumer Price Index �Banco de México 2006�.
Regression results are comparable to those found in the waterdemand literature for residential water demand studies in theUnited States and Europe. Price elasticity was within the range ofmost studies. Espey et al. �1997� conclude from their 24 studiesthat 90% of the price elasticity estimates fall between 0 and−0.75. For Mexicali, price elasticity at mean consumption’s mar-ginal price is −0.76. For the city of SLRC, estimated price elas-ticities were −0.62, explained in part by SLRC not having anincreasing block rate schedule. Cities east of Mexicali are out ofthe scope of econometric estimation for the current study. Instead,Colorado River–Tijuana aqueduct deliveries were constrained atfull capacity.
Model Results
Model runs for each policy alternative and level of minimuminflow requirements were performed by CALVIN. Results includethe overall cost to the Mexicali Valley region, water scarcityquantities for urban and agricultural uses, the marginal cost toagricultural and urban users of environmental outflows �shadowvalues on these constraints�, and the marginal economic value ofadditional inflows of Colorado River water from the UnitedStates. Initially, current recommended minimum water flows intothe CRD were modeled as a lower bound constraint. For this setof modeling runs, outflows to the Colorado River Delta were setat 10 MCM per month.
Table 4 shows a summary of the status quo without mandatedflows for the CRD versus the currently recommended minimumflows. Status quo considered urban growth in the cities of Mexi-cali, SLRC, Tijuana, and Tecate, but no major regional facilityexpansions. Future urban demands for year 2020 may affect ag-ricultural demands, which face an average 66.2 MCM/year inscarcity, reducing agricultural production by close to $1.5 milliondollars per year �second column of Table 4�.
Interestingly, willingness to pay for additional water fromthe Colorado River north of the border is only $13.5/TCM. Forwater year 2004–2005, CNA’s water price to farmers was about$7/TCM. Thus, this willingness to pay for water beyond the watertreaty quota is almost double the current price to farmers. Scarcityis not uniform in the Mexicali Valley; agriculture in the west side
of the valley is the most vulnerable to water shortages. The eastAND MANAGEMENT © ASCE / SEPTEMBER/OCTOBER 2007 / 467

side and the main Mexicali Valley are not expected to experiencescarcities due to higher marginal values for water use.
Scarcity and its cost would grow if the Mexican governmentmandates the current recommended minimum flows for the delta�column 3, Table 4�. If no additional facilities are in place, waterscarcity for agriculture can be as high as 158.4 MCM/year. Thisimplicitly assumes water markets are active, with low transactioncosts to shift the burden of increased environmental flows to thelowest valued uses. Low-value agriculture is expected to forfeit orsell water to other uses. The region already has an active internalwater market. The shadow value of environmental flows averages$52.2/TCM. Willingness to pay for additional water from theUnited States increases with the mandated flows to $23.50/TCM.
When more water is available, even at a high cost, water scar-city and its cost may decrease. Reuse of 15.8 MCM/year fromthe wastewater treatment facility reduces water scarcity to144.3 MCM/year. The shadow value of water for environmentalflows drops slightly to $50.6/TCM. Willingness to pay for addi-tional transboundary water imports remains low at $22.85/TCMon average, but building this water reuse capacity has substantialcapital and operating costs, with water from this facility beingproposed for sale at $200/TCM. At recommended minimum flowsfor the CRD, the net present value of the wastewater reuse facili-ty’s regional water supply benefits are $105.8 million �$5.29million/year reduction in regional water costs discounted at 5%/year over an infinite lifespan�.
Finally, if additional low-cost water is found, the opportunitycosts of environmental water flows drops dramatically. Table 4shows a model run in the last column where water can be bought
Fig. 6. Shadow value of minimum environmental flows in ColoradoRiver delta
Table 4. Annual Water Scarcity, Scarcity Costs, and Opportunity Costs
Values
Status�with
environflow
Annual water scarcity for agriculture �MCM/year� 66
Annual scarcity cost for Agriculture �K$/year� 1,4
Shadow value of environmental flows �$/TCM� N/
Shadow value transboundary flows �$/TCM� 13.
Note: Currency is in U.S. dollars.
468 / JOURNAL OF WATER RESOURCES PLANNING AND MANAGEMENT
in any amount at a rate of $30/TCM at the U.S. border. Even withsuch inexpensive additional water supply, water scarcity remainsfor agriculture in the Mexicali Valley �121.2 MCM/year�, al-though average annual scarcity costs drop by almost a milliondollars per year.
The same policy alternatives were analyzed over a wide rangeof minimum environmental flows. Fig. 6 shows the results ofgradually increasing mandated water flows for the CRD from zeroto 20 MCM/month �zero to 240 MCM/year�. As expected fromTable 4, mandated flows with and without wastewater reuse havesimilar shadow values for environmental flows to the delta. Thiscould be explained in part by the relatively low volumes oftreated wastewater.
For 2005, prices for wastewater range from $200 to 600/TCM�CESPM 2006�, whereas agricultural water price was less than$10/TCM. For larger volumes of dedicated flow, additional low-cost water imports seem to be the best alternative to provide waterto the delta, although the marginal economic value of transbound-ary water imports remains less than $40/TCM for all cases. Op-portunity costs on environmental constraints flatten slightly after10 MCM/month flows if low-cost water is available.
The total annual opportunity costs of delta environmentalflows are depicted in Fig. 7. As expected from Fig. 6, inexpensive�$30/TCM� water imports become the most cost attractive whenminimum flow requirements exceed 180 MCM/year. However,this price is much lower than the values of water in southernCalifornia estimated in other CALVIN studies, which can be ashigh as $80/TCM or as observed in recent long-term water
ironmental Flows to CRD and US–Mexico Transboundary Flows
Mandated minimum average flowsof 10 MCM/month
Watermarkets
Facilities andmarkets
Facilities,Markets, and
U.S. flows
158.4 144.3 121.2
3,830 3,406 2,819
52.21 50.6 48.4
23.5 22.85 21.78
Fig. 7. Total annual opportunity cost of minimum flows in ColoradoRiver delta
for Env
quoout
mentals�
.2
60
A
52
© ASCE / SEPTEMBER/OCTOBER 2007

markets in southern California �over $160/TCM�. Opportunitycosts in the Mexicali Valley for environmental flows rise toalmost $70 /TCM if water import prices are raised to $60 �notshown�.
Given the relatively high economic value of urban water usesin the Mexicali Valley, water scarcity only occurs for agriculturefor all alternatives and levels of environmental flows. The citieswest of the Mexicali Valley �such as Tijuana� also have fixedexports of water from the Mexicali Valley, through the Colorado–Tijuana aqueduct, which could be as high as 164 MCM/year atfull capacity. Since water in Tijuana is more expensive than thatin Mexicali, it is unlikely that Tijuana would reduce imports muchcompared to agricultural use in the Mexicali Valley.
For minimum environmental flows to the delta from 0 to20 MCM/month, scarcity is greater when no alternative watersources are available. Willingness to pay for additional trans-boundary water flows from the United States is quite low for therange of values in the model �Fig. 8�. These results resembleshadow value trends for the minimum flow constraint in the CRD�Fig. 6�.
It is possible to use these model results as a framework forestimating the perceived economic value of environmental resto-ration flows for the Colorado River Delta. Figs. 6 and 7 indicateto policy makers the trade-off of economic costs to agriculturaland urban uses against environmental flows for each alternative,as a unit cost or as a total cost. A decision maker selecting aparticular point on this trade-off curve has implicitly placed aneconomic value on the marginal environmental flow. These resultsalso can provide reasonable estimates of compensation costs foragriculture due to burdens from environmental flows.
Finally, the models and modeling framework developed heresupport the integrated understanding and analysis of this complexsystem. As more details regarding desirable environmental flows,infrastructure options, and cost arise, these can be incorporatedinto the model and their implications can be explored.
Conclusions
Five major conclusions arise from this work:1. Economical sources of water for restoring the Colorado
River delta can be found among existing water uses in the
Fig. 8. Willingness to pay for additional transboundary water flowsfrom the United States
Mexicali Valley. These transfers can be made by expanding
JOURNAL OF WATER RESOURCES PLANNING
existing water markets in the Mexicali Valley. Marginal costsof environmental flows are about $50/TCM for commonlyrecommended restoration flows. However, this cost rises toabout $80/TCM when recommended flows are roughlydoubled.
2. Wastewater reuse facilities have only a small supporting rolein supplementing environmental restoration flows for thedelta, but may have other water quality benefits.
3. The marginal value of additional Colorado River flows fromthe United States is small: $13.50/TCM without environmen-tal flows, rising to $24/TCM with commonly recommendedenvironmental flows, and becoming as high as $35/TCMwhen recommended flows are doubled. Transboundary Colo-rado River water purchases from the United States could notbe supported at these prices. The development of flywayhabitat in the CRD may be more cost-effective than dedicat-ing flows to the Salton Sea, to the extent that these habitatsare substitutable. This could be explored as an additionalvalue for transboundary water transfers.
4. A regional systems model provides the framework for inte-grating our understanding of the system and developinginsights and implications of this understanding. As our un-derstanding improves with greater experience and more de-tailed studies, these improvements can be incorporated intothis framework and their implications can be explored.
5. The trade-off curves developed from this kind of study couldsupport decision making and economic valuation of environ-mental flows by decision makers. Unlike traditional valua-tion techniques for this type of use, water value is estimatedfrom opportunity cost to other uses. One advantage of theapproach proposed here is that water for urban and agricul-tural production is implicit in the valuation. However, eco-nomic welfare measures such as change in consumer surplusfrom different environmental water flow levels could not beevaluated directly, as shadow values of the environmentalflows arise from the supply and not the demand side of theimplicit general equilibrium model for water in a region.
Acknowledgments
The writers are greatly indebted to the Mexican agencies andinstitutions that provided data for this research, in particular to theComisión Nacional del Agua �CNA�, the Universidad Autónomade Baja California, Mexicali �UABC-Mexicali�, and the BajaCalifornia office of the Secretaría de Agricultura, Ganadería, De-sarrollo Rural, Pesca y Alimentación �SAGARPA�. The writersare also thankful for the comments and suggestions of two anony-mous reviewers. This research was made possible through aUCMEXUS-CONACYT collaborative grant.
References
Anderson, D. W., Palacios, E., Mellink, E., and Valdés-Casillas, C.�2003�. “Migratory bird conservation and ecological health on theColorado River Delta region.” Managing for healthy ecosystems, D. J.Rapport, W. L. Lasley, N. O. Nielsen, C. O. Qualset, and A. B. Da-mania, eds., Lewis Publishers, New York, 1091–1109.
Banco de México. �2006�. “Indices de Precios al Consumidor y UDIS.”�http://www.banxico.org.mx �June 2006�.
Billings, R. B., and Agthe, D. E. �1980�. “Price elasticities for water—
AND MANAGEMENT © ASCE / SEPTEMBER/OCTOBER 2007 / 469
Case of increasing block rates.” Land Economics, 56�1�, 73–84.Brooke, A., Kendrick, D., Meeraus, A., and Raman, R. �1998�. GAMS: A
users’ guide, GAMS Development Corp., Washington, D.C.Clinton, M., et al. �2001�. “Immediate options for augmenting water
flows to the Colorado River Delta in Mexico.” Pacific Institute, Oak-land, Calif.
Cohen, M. J. �2006�. “The Delta’s perennial drought: Instream flows foran over-allocated river.” Pacific McGeorge Global Business and De-velopment Law J., 19�1�, 115–128.
Cohen, M. J., and Henges-Jeck, C. �2001�. “Missing water: The uses andflows of water in the Colorado River Delta region.” Pacific Institute,Oakland, Calif.
Comisión Estatal de Servicios Públicos de Mexicali �CESPM�. �2006�.“Indicadores de Gestión �2000–2005�.” �CD-ROM�, Mexicali, BajaCalifornia, Mexico.
Comisión Nacional del Agua �CNA�. �2006a�. “Informes de Distribuciónde Aguas �2000–2006� Anexos II.” Comisión Nacional del Agua Je-fatura del Distrito de Riego 014, Río Colorado �CD-ROM�, Mexicali,Baja California, Mexico.
Comisión Nacional del Agua �CNA�. �2006b�. “Informes de Distribuciónde Aguas �2000–2006� Anexos III.” Comisión Nacional del Agua Je-fatura del Distrito de Riego 014, Río Colorado �CD-ROM�, Mexicali,Baja California, Mexico.
Comisión Nacional del Agua �CNA�. �2004�. Estadísticas del Agua enMéxico 2004, Comisión Nacional del Agua, México, D.F.
Draper, A. J., Jenkins, M. W., Kirby, K. W., Lund, J. R., and Howitt, R.E. �2003�. “Economic-engineering optimization for California watermanagement.” J. Water Resour. Plann. Manage., 129�3�, 155–164.
Environmental Protection Agency �EPA�. �2006�. Region 9 ProgressRep., Environmental Protection Agency, �http://www.epa.gov/docs/region09/annualreport/06/communities.html �Jan. 16, 2007�.
Espey, M., Espey, J., and Shaw, W. D. �1997�. “Price elasticity of resi-dential demand for water: A meta-analysis.” Water Resour. Res.,33�6�, 1369–1374.
Estado de Baja California. �2004�. “Ley de Ingresos del Estado de BajaCalifornia para el Ejercicio 2005.” Periódico Official del Estado deBaja California, Mexicali, Baja California, 18–19.
Garcıa-Acevedo, M. R., �2001�. “The confluence of water, patterns ofsettlement, and constructions of the order in the imperial and MexicaliValleys �1900–1999�.” Reflections on water: New approaches totransboundary conflicts and cooperations, J. Blatter and I. H., eds.,MIT Press, Cambridge, Mass.
Glenn, E. P., Zamora-Arroyo, F., Nagler, P. L., Briggs, M., Shaw, W., andFlessa, K. �2001�. “Ecology and conservation biology of the ColoradoRiver Delta, Mexico.” J. of Arid Environments, 49�1�, 5–15.
Hinojosa-Huerta, O., DeStefano, S., and Shaw, W. W. �2001�. “Distribu-tion and abundance of the Yuma clapper rail �Rallus longirostrisyumanensis� in the Colorado River Delta, Mexico.” J. of Arid Envi-ronments, 49�1�, 171–182.
Howitt, R. E. �1995�. “Positive mathematical programming.” Am. J.Agric. Econom., 77�2�, 329–342.
Howitt, R. E. �2006�. “Agricultural and environmental policy models:Calibration, estimation, and optimization.” Dept. of Agricultural andResource Economics, Univ. of California, Davis, Calif.
Howitt, R., Tauber, M., and Pienar, E. �2003�. “Impacts of ClimateChange on California’s Agricultural Water Demands.” Univ. of Cali-fornia, Davis, Davis, Calif.
Instituto Nacional de Estadística Geografía e Informática �INEGI�.�2000�. “Encuesta Nacional de Ingreso Gasto de los Hogares�ENIGH� 2000.” Instituto Nacional de Estadística Geografía e In-formática �CD-ROM�, México, D.F.
Instituto Nacional de Estadística Geografía e Informática �INEGI�.�2002�. “Encuesta Nacional de Ingreso Gasto de los Hogares�ENIGH� 2002.” Instituto Nacional de Estadística, Geografía e In-formática �CD-ROM�, México, D.F.
Instituto Nacional de Estadística Geografía e Informática �INEGI�.�2004�. “Encuesta Nacional de Ingreso Gasto de los Hogares�ENIGH� 2004.” Instituto Nacional de Estadística, Geografía e In-
formática �CD-ROM�, México, D.F.470 / JOURNAL OF WATER RESOURCES PLANNING AND MANAGEMENT
Instituto Nacional de Estadística Geografía e Informática �INEGI�.�2005�. “Conteo General de Población y Vivienda 2005.” InstitutoNacional de Estadística Geografía e Informática, �http://www.inegi.gob.mx �June 10, 2006�.
Jenkins, M. W., et al. �2001�. “Improving California water management:Optimizing value and flexibility.” Rep. No. 01-1, Univ. of CaliforniaDavis, Davis, Calif.
Jenkins, M. W., et al. �2004�. “Optimization of California’s water supplysystem: Results and insights.” J. Water Resour. Plann. Manage.,130�4�, 271–280.
Jenkins, M. W., Lund, J. R., and Howitt, R. E. �2003�. “Using economicloss functions to value urban water scarcity in California.” J. Am.Water Works Assoc., 95�2�, 58.
Labadie, J. W. �2004�. “Optimal operation of multireservoir systems:State-of-the-art review.” J. Water Resour. Plann. Manage., 130�2�,93–111.
Loomis, J. B. �1998�. “Estimating the public’s values for instream flow:Economic techniques and dollar values.” J. Am. Water Resour. Assoc.,34�5�, 1007–1014.
Luecke, D. F., Pitt, J., Congdon, C., Glenn, E., Valdés-Casillas, C., andBriggs, M. �1999�. A delta once more: Restoring riparian and wetlandhabitat in the Colorado River Delta, Environmental Defense FundPublications, Boulder, Colo.
Lund, J. R., et al. �2003�. “Climate warming and California’s water fu-ture.” Rep. No. 03-1, Univ. of California, Davis, Davis, Calif.
Malinowski, J. P. �2004�. “Water supply and prospects in Baja Califor-nia.” Master’s thesis, Univ. of California, Davis, Davis, Calif.
Medellín-Azuara, J. �2006�. “Economic-engineering analysis of watermanagement for restoring the Colorado River Delta.” Ph.D. disserta-tion, Univ. of California, Davis, Calif.
Medellín-Azuara, J., et al. �2006�. “Adaptability and adaptations of Cali-fornia’s water supply system to dry climate warming.” Univ. of Cali-fornia, Davis. Dept. of Civil and Environmental Engineering, Davis,Calif.
Medellín-Azuara, J., and Lund, J. R. �2006�. “Systems analysis for restor-ing the Lower Colorado River Delta.” Pacific McGeorge Global Busi-ness and Development Law J., 19�1�, 99–114.
Nieswiadomy, M. L., and Molina, D. J. �1989�. “Comparing residentialwater demand estimates under decreasing and increasing block ratesusing household data.” Land Econ., 65�3�, 280–289.
Nordin, J. A. �1976�. “Proposed modification of Taylor’s demandanalysis—Comment.” Bell J. Econom., 7�2�, 719–721.
Null, S. E., and Lund, J. R. �2006�. “Reassembling Hetch Hetchy: Watersupply without O’Shaughnessy Dam.” J. Am. Water Resour. Assoc.,42�2�, 395–408.
Organismo Operador Municipal de Agua Potable Alcantarillado y Sa-neamiento de San Luis Río Colorado �OOMAPAS�. �2006�. Indica-dores de Gestión 2000–2005, San Luis Río Colorado, Sonora,Mexico.
Pitt, J., Luecke, D. F., Cohen, M. J., Glenn, E. P., and Valdes-Casillas, C.�2000�. “Two nations, one river: Managing ecosystem conservation inthe Colorado River Delta.” Natural Resources Journal, 40�4�, 819–864.
Pulido-Velázquez, M., Jenkins, M. W., and Lund, J. R. �2004�. “Eco-nomic values for conjunctive use and water banking in southern Cali-fornia.” Water Resour. Res., 40�3�, W03401.
Schefter, J. E., and David, E. L. �1985�. “Estimating residential waterdemand under multi-part tariffs using aggregate data.” Land Econ.,61�3�, 272–280.
Secretaría de Agricultura Ganadería Desarrollo Rural Pesca y Aliment-ación �SAGARPA�. �2006�. “Sistema de Información Agroalimentariay Pesquera �SIAP�.” �http://www.siap.sagarpa.gob.mx/ �June 2006�.
Secretaría de Recursos Hidráulicos �SRH�. �1972�. “Resumen del EstudioGeohidrológico del Valle de Mexicali, B.C y Mesa Arenosa de SanLuis, SON.” Dirección General de Estudios, México, D.F.
Shabman, L., and Stephenson, K. �2000�. “Environmental valuation andits economic critics.” J. Water Resour. Plann. Manage., 126�6�, 382–388.
Stromberg, J. C. �2001�. “Restoration of riparian vegetation in the south-
© ASCE / SEPTEMBER/OCTOBER 2007

western United States: importance of flow regimes and fluvial dyna-mism.” J. Arid Environments, 49�1�, 17–34.
Tanaka, S. K., et al. �2006�. “Climate warming and water managementadaptation for California.” Clim. Change, 76�3–4�, 361–387.
Taylor, L. D. �1975�. “Demand for electricity—Survey.” Bell J. Econom.,6�1�, 74–110.
U.S. Army Corps of Engineers �USACE�. �1994�. “Hydrologic Enginer-ing Center’s prescriptive reservoir model, program description.” Hy-
drologic Engineering Center, Davis, Calif.JOURNAL OF WATER RESOURCES PLANNING
Young, R. A. �2005�. Determining the economic value of water: Conceptsand methods, Resources for the Future, Washington, D.C.
Zamora-Arroyo, F., et al. �2001�. “Regeneration of native trees in re-sponse to flood releases from the United States into the delta of theColorado River, Mexico.” J. Arid Environments, 49�1�, 49–64.
Zengel, S. A., Meretsky, V. J., Glenn, E. P., Felger, R. S., and Ortiz, D.�1995�. “Cienega-De-Santa-Clara, a Remnant Wetland in the Rio-Colorado Delta �Mexico�—Vegetation distribution and the effects of
water-flow Reduction.” Ecol. Eng., 4�1�, 19–36.AND MANAGEMENT © ASCE / SEPTEMBER/OCTOBER 2007 / 471