Restoring Fiscal Discipline for Poverty Reduction in Peru
303
THE WORLD BANK Restoring Fiscal Discipline for Poverty Reduction in Peru A Public Expenditure Review ISBN 0-8213-5447-7 A WORLD BANK COUNTRY STUDY THE WORLD BANK 1818 H Street, NW Washington, DC 20433 USA Telephone: 202 473-1000 Internet: www.worldbank.org E-mail: [email protected] Restoring Fiscal Discipline for Poverty Reduction in Peru is part of the World Bank Country Study series. These reports are published with the approval of the subject government to communicate the results of the Bank’s work on the economic and related conditions of mem- ber countries to governments and to the development community. This report was done in joint collaboration with the Inter-American Development Bank. Since inauguration in July 2001, President Toledo has proposed a number of important reforms critical to tackling the development challenges facing Peru. The efforts of the Toledo administration to reinvigorate the momentum for reform are facing great social pres- sures for short-term, populist measures. Peru has an urgent need to build momentum for “second-generation” reforms, especially those in the area of public expenditures, which would provide longer-term sustainability to the government’s strategy of poverty reduction and growth. Despite its initial progress, Peru’s chances of meeting its develop- ment goals in the medium term will depend on completion of a pub- lic expenditure management agenda summarized in the seven main themes of this report: restoring fiscal discipline, reorienting the budget toward pro-poor expenditure, improving the efficiency of pub- lic expenditure, addressing the promises and risks of decentraliza- tion, upgrading the civil service, improving governance and reducing corruption, and fine-tuning mining taxation and environmental poli- cies. This study distills the critical lessons and challenges that are rel- evant for policymakers in Peru, Latin America, and other countries embarking on comprehensive public expenditure reforms. World Bank Country Studies are available individually or by subscrip- tion, both in print and on-line. Restoring Fiscal Discipline for Poverty Reduction in Peru THE INTER-AMERICAN DEVELOPMENT BANK THE INTER-AMERICAN DEVELOPMENT BANK 1300 New York Ave., NW Washington, DC 20577 USA Telephone: 202 623-1000 Internet: www.iadb.org Public Disclosure Authorized Public Disclosure Authorized Public Disclosure Authorized Public Disclosure Authorized Public Disclosure Authorized Public Disclosure Authorized Public Disclosure Authorized Public Disclosure Authorized
-
Upload
khangminh22 -
Category
Documents
-
view
3 -
download
0
Transcript of Restoring Fiscal Discipline for Poverty Reduction in Peru

THE WORLD BANK
Restoring FiscalDiscipline for PovertyReduction in PeruA Public Expenditure Review
ISBN 0-8213-5447-7
A W O R L D B A N K C O U N T R Y S T U D Y
THE WORLD BANK
1818 H Street, NW
Washington, DC 20433 USA
Telephone: 202 473-1000
Internet: www.worldbank.org
E-mail: [email protected]
Restoring Fiscal Discipline for Poverty Reduction in Peru is part of the
World Bank Country Study series. These reports are published with
the approval of the subject government to communicate the results
of the Bank’s work on the economic and related conditions of mem-
ber countries to governments and to the development community.
This report was done in joint collaboration with the Inter-American
Development Bank.
Since inauguration in July 2001, President Toledo has proposed a
number of important reforms critical to tackling the development
challenges facing Peru. The efforts of the Toledo administration to
reinvigorate the momentum for reform are facing great social pres-
sures for short-term, populist measures. Peru has an urgent need to
build momentum for “second-generation” reforms, especially those
in the area of public expenditures, which would provide longer-term
sustainability to the government’s strategy of poverty reduction and
growth.
Despite its initial progress, Peru’s chances of meeting its develop-
ment goals in the medium term will depend on completion of a pub-
lic expenditure management agenda summarized in the seven main
themes of this report: restoring fiscal discipline, reorienting the
budget toward pro-poor expenditure, improving the efficiency of pub-
lic expenditure, addressing the promises and risks of decentraliza-
tion, upgrading the civil service, improving governance and reducing
corruption, and fine-tuning mining taxation and environmental poli-
cies. This study distills the critical lessons and challenges that are rel-
evant for policymakers in Peru, Latin America, and other countries
embarking on comprehensive public expenditure reforms.
World Bank Country Studies are available individually or by subscrip-
tion, both in print and on-line.
Restorin
g Fiscal D
isciplin
e for Poverty R
edu
ction in
Peru
THE INTER-AMERICAN DEVELOPMENT BANK
THE INTER-AMERICAN DEVELOPMENT BANK
1300 New York Ave., NW
Washington, DC 20577 USA
Telephone: 202 623-1000
Internet: www.iadb.org
Pub
lic D
iscl
osur
e A
utho
rized
Pub
lic D
iscl
osur
e A
utho
rized
Pub
lic D
iscl
osur
e A
utho
rized
Pub
lic D
iscl
osur
e A
utho
rized
Pub
lic D
iscl
osur
e A
utho
rized
Pub
lic D
iscl
osur
e A
utho
rized
Pub
lic D
iscl
osur
e A
utho
rized
Pub
lic D
iscl
osur
e A
utho
rized
Administrator
26606

A W O R L D B A N K C O U N T R Y S T U D Y
Restoring Fiscal Discipline for Poverty Reduction in PeruA Public Expenditure Review
THE WORLD BANK
Washington, D.C.THE INTER-AMERICAN DEVELOPMENT BANK
Washington, D.C.

Copyright © 2003The International Bank for Reconstruction and Development / The World Bank1818 H Street, N.W.Washington, D.C. 20433, U.S.A.All rights reservedManufactured in the United States of AmericaFirst printing: June 2003
1 2 3 4 05 04 03
World Bank Country Studies are among the many reports originally prepared for internal use aspart of the continuing analysis by the Bank of the economic and related conditions of its develop-ing member countries and to facilitate its dialogues with the governments. This report was pre-pared in joint collaboration with the Inter-American Development Bank. Some of the reports arepublished in this series with the least possible delay for the use of governments, and the academic,business, financial, and development communities. The typescript of this paper therefore has notbeen prepared in accordance with the procedures appropriate to journal printed texts, and theWorld Bank accepts no responsibility for errors. Some sources cited in this paper may be informaldocuments that are not readily available.
The findings, interpretations, and conclusions expressed in this paper are entirely those of theauthor(s) and do not necessarily reflect the views of the Board of Executive Directors of the WorldBank or the governments they represent. The World Bank cannot guarantee the accuracy of thedata included in this work. The boundaries, colors, denominations, and other information shownon any map in this work do not imply on the part of the World Bank any judgment of the legal status of any territory or the endorsement or acceptance of such boundaries.
The material in this publication is copyrighted. The World Bank encourages dissemination of itswork and normally will grant permission for use.
Permission to photocopy items for internal or personal use, for the internal or personal use ofspecific clients, or for educational classroom use, is granted by the World Bank, provided that theappropriate fee is paid. Please contact the Copyright Clearance Center before photocopying items.
Copyright Clearance Center, Inc.222 Rosewood DriveDanvers, MA 01923, U.S.A.Tel: 978-750-8400 • Fax: 978-750-4470.
For permission to reprint individual articles or chapters, please fax your request with completeinformation to the Republication Department, Copyright Clearance Center, fax 978-750-4470.
All other queries on rights and licenses should be addressed to the World Bank at the addressabove, or faxed to 202-522-2422.
ISBN: 0-8213-5447-7eISBN: 0-8213-5448-5ISSN: 0253-2123
Cover Art: Fernando De Szyslo (Peru, 1925), Duino-Nueve (Orrantia/92), 1992, oil on canvas,99.06 cm × 99.06 cm, Inter-American Development Bank Art Collection, Washington, DC, cour-tesy of the IDB Photo Library Unit. Photo of art: Gregory R. Staley Photography.
Library of Congress Cataloging-in-Publication Data
Restoring fiscal discipline for poverty reduction in Peru: a public expenditure review.p. cm. — (A World Bank country study)
Includes bibliographical references.ISBN 0-8213-5447-71. Government spending policy—Peru. 2. Economic assistance, Domestic—Peru. 3. Poverty—
Government policy—Peru. I. World Bank. II. Series.
HJ7742.R48 2003336.3�9�0985—dc21 2003050056

iii
CONTENTS
Abstract . . . . . . . . . . . . . . . . . . . . . . . . . . . . . . . . . . . . . . . . . . . . . . . . . . . . . . . . . . . . . . . . .xiAcknowledgments . . . . . . . . . . . . . . . . . . . . . . . . . . . . . . . . . . . . . . . . . . . . . . . . . . . . . . .xiiiAbbreviations and Acronyms . . . . . . . . . . . . . . . . . . . . . . . . . . . . . . . . . . . . . . . . . . . . . . . .xvI. Executive Summary . . . . . . . . . . . . . . . . . . . . . . . . . . . . . . . . . . . . . . . . . . . . . . . . . .1
Rationale and Organization . . . . . . . . . . . . . . . . . . . . . . . . . . . . . . . . . . . . . . . . . . . . . . . .1
Main Findings and Recommendations. . . . . . . . . . . . . . . . . . . . . . . . . . . . . . . . . . . . . . . .2
II. Peru’s Fiscal Challenges and Vulnerabilities . . . . . . . . . . . . . . . . . . . . . . . . . . . . . .15Long-Run Fiscal Trends . . . . . . . . . . . . . . . . . . . . . . . . . . . . . . . . . . . . . . . . . . . . . . . . .15
The Current Fiscal Disequilibria, 1999–2001 . . . . . . . . . . . . . . . . . . . . . . . . . . . . . . . . .20
The Macroeconomic Consistent Expenditure Envelope, 2002–03 . . . . . . . . . . . . . . . . .23
The Fiscal Adjustment Effort. . . . . . . . . . . . . . . . . . . . . . . . . . . . . . . . . . . . . . . . . . . . . .30
Revamping the Fiscal Rules . . . . . . . . . . . . . . . . . . . . . . . . . . . . . . . . . . . . . . . . . . . . . . .34
III. Reorienting the Budget Toward Pro-Poor Expenditure . . . . . . . . . . . . . . . . . . . . .41Modernizing Financial Management . . . . . . . . . . . . . . . . . . . . . . . . . . . . . . . . . . . . . . . .42
Upgrading the Budget Management System . . . . . . . . . . . . . . . . . . . . . . . . . . . . . . . . . .46
Building a Medium-Term Expenditure Framework . . . . . . . . . . . . . . . . . . . . . . . . . . . . .53
Protecting the Budget as a Medium-Term Social Policy . . . . . . . . . . . . . . . . . . . . . . . . .57
Budget Transparency . . . . . . . . . . . . . . . . . . . . . . . . . . . . . . . . . . . . . . . . . . . . . . . . . . . .60
IV. Improving the Efficiency of Public Expenditure . . . . . . . . . . . . . . . . . . . . . . . . . . .65Does Higher Government Expenditure Buy Better Results in Education and Health Care? . . . . . . . . . . . . . . . . . . . . . . . . . . . . . . . . . . . . . . . . . . . . . .66
Tracing Leakages of Public Funds in Peru—A Public Expenditure Tracking Survey . . . . . . . . . . . . . . . . . . . . . . . . . . . . . . . . . . . . . .70
Enhancing Targeting of Social Programs . . . . . . . . . . . . . . . . . . . . . . . . . . . . . . . . . . . . .88
V. Addressing the Promises and Risks of Decentralization . . . . . . . . . . . . . . . . . . . . .95The Decision to Decentralize: Promises and Risks . . . . . . . . . . . . . . . . . . . . . . . . . . . . . .96
The Deconcentration of Central Government Spending and Transfers to the Municipalities: Intergovernmental Fiscal Relations . . . . . . . . . . . . . . . . .98
The Emerging Legal Framework for Decentralization in Peru . . . . . . . . . . . . . . . . . . .102
Entering a Decentralization Path . . . . . . . . . . . . . . . . . . . . . . . . . . . . . . . . . . . . . . . . . .104
Decentralization in the Education Sector . . . . . . . . . . . . . . . . . . . . . . . . . . . . . . . . . . .107
Decentralization in the Health Sector . . . . . . . . . . . . . . . . . . . . . . . . . . . . . . . . . . . . . .110
VI. Upgrading the Civil Service . . . . . . . . . . . . . . . . . . . . . . . . . . . . . . . . . . . . . . . . . .115The Size and Employment Conditions of the Public Sector . . . . . . . . . . . . . . . . . . . . .116
Reforming the Legal and Institutional Framework . . . . . . . . . . . . . . . . . . . . . . . . . . . .123
Additional Measures for Improving Human Resource Administration . . . . . . . . . . . . .127
The Education Sector . . . . . . . . . . . . . . . . . . . . . . . . . . . . . . . . . . . . . . . . . . . . . . . . . .127
Administrator
xi
Administrator
xiii
Administrator
xv
Administrator
.1
Administrator
.1
Administrator
.2
Administrator
.15
Administrator
.15
Administrator
.20
Administrator
.23
Administrator
.30
Administrator
.34
Administrator
.41
Administrator
.42
Administrator
.46
Administrator
.53
Administrator
.57
Administrator
.60
Administrator
.65
Administrator
.66
Administrator
.70
Administrator
.88
Administrator
.95
Administrator
.96
Administrator
.98
Administrator
.102
Administrator
.104
Administrator
.107
Administrator
.110
Administrator
.115
Administrator
.116
Administrator
.123
Administrator
.127
Administrator
.127

VII. Improving Governance and Reducing Corruption . . . . . . . . . . . . . . . . . . . . . . . .133
The Costs of Weak Governance and Corruption . . . . . . . . . . . . . . . . . . . . . . . . . . . . . .138
Impact on Public Service Delivery . . . . . . . . . . . . . . . . . . . . . . . . . . . . . . . . . . . . . . . . .139
A Policy Agenda for Improving Governance . . . . . . . . . . . . . . . . . . . . . . . . . . . . . . . . .141
VIII. Fine-Tuning Fiscal and Environmental Mining Policies . . . . . . . . . . . . . . . . . . .147
Background . . . . . . . . . . . . . . . . . . . . . . . . . . . . . . . . . . . . . . . . . . . . . . . . . . . . . . . . . .148
The Peruvian Taxation Regime . . . . . . . . . . . . . . . . . . . . . . . . . . . . . . . . . . . . . . . . . . .148
Comparison of Peru’s Tax System to Minerals Tax Systems in Selected Countries . . . . .148
Improving Mining Environment Management . . . . . . . . . . . . . . . . . . . . . . . . . . . . . . .165
Annex A. A Public Debt Sustainability Analysis for Peru . . . . . . . . . . . . . . . . . . . . . . .169
Annex B. The Fiscal Effort Required for a Sustained Structural Deficit . . . . . . . . . . .193
Annex C. Questionnaire on Public Financial Management . . . . . . . . . . . . . . . . . . . . . .199
Annex D. A Public Expenditure Tracking Survey: Methodological Issues . . . . . . . . . .207
Annex E. Public Enterprise Reform in Peru: Introducing Management Contracts at FONAFE . . . . . . . . . . . . . . . . . . . . . . . . . . . . . . . . . . . . . . . . . . .217
Annex F. A Methodology for Functional Reviews and for Analyzing Functional Prospects . . . . . . . . . . . . . . . . . . . . . . . . . . . . . . . . . . .221
Annex G. List of Background Papers . . . . . . . . . . . . . . . . . . . . . . . . . . . . . . . . . . . . . . .223
Statistical Appendix . . . . . . . . . . . . . . . . . . . . . . . . . . . . . . . . . . . . . . . . . . . . . . . . . . . . . .225
Bibliography . . . . . . . . . . . . . . . . . . . . . . . . . . . . . . . . . . . . . . . . . . . . . . . . . . . . . . . . . . .281
Map of Peru . . . . . . . . . . . . . . . . . . . . . . . . . . . . . . . . . . . . . . . . . . . . . . . . . . . . . . . . . . . .285
LIST OF TABLES
2.1 Key Macroeconomic Variables, 1969–89 . . . . . . . . . . . . . . . . . . . . . . . . . . . . . . . . . . .17
2.2 Elasticity to GDP, 1970–2000 . . . . . . . . . . . . . . . . . . . . . . . . . . . . . . . . . . . . . . . . . . .18
2.3 Elasticities and Growth Volatilities for Peru, 1990–2000 . . . . . . . . . . . . . . . . . . . . . . .20
2.4 Key Economic Indicators . . . . . . . . . . . . . . . . . . . . . . . . . . . . . . . . . . . . . . . . . . . . . .24
2.5 Recommendations for Tax Reform . . . . . . . . . . . . . . . . . . . . . . . . . . . . . . . . . . . . . . .27
2.6 Social Expenditures are Pro- or Countercyclical . . . . . . . . . . . . . . . . . . . . . . . . . . . . .35
3.1 Peru: Status of Budget Management Benchmarks . . . . . . . . . . . . . . . . . . . . . . . . . . . .48
3.2 Composition of CG Budget Sources . . . . . . . . . . . . . . . . . . . . . . . . . . . . . . . . . . . . . .50
3.3 Revised Projection of the 2002 Budget . . . . . . . . . . . . . . . . . . . . . . . . . . . . . . . . . . . .52
3.4 Composition of Social Expenditure 1999–02 . . . . . . . . . . . . . . . . . . . . . . . . . . . . . . .55
3.5 Comparing Multiyear Budgets by Sector . . . . . . . . . . . . . . . . . . . . . . . . . . . . . . . . . . .56
3.6 Budget for Protected Social Programs . . . . . . . . . . . . . . . . . . . . . . . . . . . . . . . . . . . . .58
3.7 Budget Transparency Ratings . . . . . . . . . . . . . . . . . . . . . . . . . . . . . . . . . . . . . . . . . . .61
4.1.a Regression Results for Education Indicators: Linear Regressions . . . . . . . . . . . . . . . .67
4.1.b Regression Results for Health Indicators: Log-Log Regressions . . . . . . . . . . . . . . . . .68
4.2 Peru: Efficiency of Public Expenditure in Reaching Social Outcomes, 1990–98 . . . . .69
4.3 Per Capita Transfers to Municipalities in 2001 . . . . . . . . . . . . . . . . . . . . . . . . . . . . . .75
iv CONTENTS
Administrator
.133
Administrator
.138
Administrator
.139
Administrator
.141
Administrator
.147
Administrator
.148
Administrator
.148
Administrator
.148
Administrator
.165
Administrator
.169
Administrator
.193
Administrator
.199
Administrator
.207
Administrator
.217
Administrator
.221
Administrator
.223
Administrator
.225
Administrator
.281
Administrator
.285
Administrator
.17
Administrator
.18
Administrator
.20
Administrator
.24
Administrator
.27
Administrator
.35
Administrator
.48
Administrator
.50
Administrator
.52
Administrator
.55
Administrator
.56
Administrator
.58
Administrator
.61
Administrator
.67
Administrator
.68
Administrator
.69
Administrator
.75
Administrator
LIST OF TABLES

4.4 Municipalities that Do Not Know the Arrival Day of the Transfer . . . . . . . . . . . . . . . .76
4.5 Municipalities that Are Subject to CG Supervision . . . . . . . . . . . . . . . . . . . . . . . . . . .77
4.6 Leakages in FONCOMUN and Canon Minero . . . . . . . . . . . . . . . . . . . . . . . . . . . . .77
4.7 Fraction of Transfers Used for Current Expenditure . . . . . . . . . . . . . . . . . . . . . . . . . .78
4.8 Beneficiary Households that Received Training/Information . . . . . . . . . . . . . . . . . . .80
4.9 VDL Transfer Schedule . . . . . . . . . . . . . . . . . . . . . . . . . . . . . . . . . . . . . . . . . . . . . . . .81
4.10 Leakage Stage 3: Municipality to Local Committees . . . . . . . . . . . . . . . . . . . . . . . . . .82
4.11 Worst Offenders, Leakage Stage 3 . . . . . . . . . . . . . . . . . . . . . . . . . . . . . . . . . . . . . . . .83
4.12 Leakage Stage 4: Vaso de Leche Program (at household level, in percent) . . . . . . . . .85
4.13 Leakage Stage 5: Vaso de Leche Program (at beneficiary household level) . . . . . . . . .86
4.14 Vaso de Leche Leakages (in percent) . . . . . . . . . . . . . . . . . . . . . . . . . . . . . . . . . . . . . .87
4.15 Correlation Expenditure and Poverty by Department . . . . . . . . . . . . . . . . . . . . . . . . .89
4.16 Household Access to Social Programs by Poverty Level, 2000 . . . . . . . . . . . . . . . . . .90
4.17 Targeting by Food Assistance, Health, and Education Programs, 2000 . . . . . . . . . . . .92
5.1 Budgeted Expenditure for the Public Sector for FY02 . . . . . . . . . . . . . . . . . . . . . . . . .99
5.2 Expenditure Coefficients by CTAR, 2001 . . . . . . . . . . . . . . . . . . . . . . . . . . . . . . . . .100
5.3 Expenditure by Department, 2000 . . . . . . . . . . . . . . . . . . . . . . . . . . . . . . . . . . . . . .101
6.1 Number of Employees and the Average Monthly Wage Bill . . . . . . . . . . . . . . . . . . .118
6.2 Urban Public and Private Sector Employment and Average Monthly Earnings, 1997–2001 . . . . . . . . . . . . . . . . . . . . . . . . . . . . . . . . . .120
6.3 Dispersion of Salaries Charged to the PUP by Occupational Group and Salary Grade . . . . . . . . . . . . . . . . . . . . . . . . . . . . . . . . . . .122
6.4 Maximum, Average and Minimum Earnings by Occupational Group and Regimen . . . . . . . . . . . . . . . . . . . . . . . . . . . . . . . . . . . . . .123
6.5 Hourly Earnings by Occupational Groups and Areas, Third Quarter, 1997 (Nuevos Soles) . . . . . . . . . . . . . . . . . . . . . . . . . . . . . . . . . . . . .129
8.1 Mineral Taxes in Peru and Other Countries . . . . . . . . . . . . . . . . . . . . . . . . . . . . . . .152
8.2 Comparative Measures of Profitability and Effective Tax Rate for a Model Base Metal Mine in Selected Jurisdictions . . . . . . . . . . . . . . . . . . . . . . . . . . .153
8.3 Comparative Economic Measures for a Model Gold Metal Mine in Selected Jurisdictions . . . . . . . . . . . . . . . . . . . . . . . . . . . . . . . . . . . . . . . . . . . . . . . . .154
8.4 Copper Model: Peru’s Tax System Sensitivity to Price and Cost Changes . . . . . . . . .154
8.5 Availability of Tax Stability in Selected Jurisdictions . . . . . . . . . . . . . . . . . . . . . . . . .155
8.6 Tax System Sensitivity to Income Tax Rate . . . . . . . . . . . . . . . . . . . . . . . . . . . . . . . .156
8.7 Income Tax Rates Applied to Mining Projects in Selected Jurisdictions . . . . . . . . . .157
8.8 Depreciation Applied to Typical Mining Equipment in Selected Jurisdictions . . . . . .158
8.9 Tax Sensitivity to Building Depreciation Rates . . . . . . . . . . . . . . . . . . . . . . . . . . . . .158
8.10 Loss Carry Forward/Back Policy in Selected Jurisdictions . . . . . . . . . . . . . . . . . . . .159
8.11 Tax Sensitivity to Loss Carry Forward Time Limit . . . . . . . . . . . . . . . . . . . . . . . . . .159
8.12 Tax Sensitivity to Annual Allowed Closure Deduction Over the Mine Life . . . . . . . .160
8.13 Tax Sensitivity to Reinvestment Allowance . . . . . . . . . . . . . . . . . . . . . . . . . . . . . . . .161
CONTENTS v
Administrator
.76
Administrator
.77
Administrator
.77
Administrator
.78
Administrator
.80
Administrator
.81
Administrator
.82
Administrator
.83
Administrator
.85
Administrator
.86
Administrator
.87
Administrator
.89
Administrator
.90
Administrator
.92
Administrator
.99
Administrator
.100
Administrator
.101
Administrator
.118
Administrator
.120
Administrator
.122
Administrator
.123
Administrator
.129
Administrator
.152
Administrator
.153
Administrator
.154
Administrator
.154
Administrator
.155
Administrator
.156
Administrator
.157
Administrator
.158
Administrator
.158
Administrator
.159
Administrator
.159
Administrator
.160
Administrator
.161

8.14 Presence of Mineral Royalty Tax Systems in Selected Jurisdictions . . . . . . . . . . . . . .162
8.15 Tax System Sensitivity to a Royalty Tax . . . . . . . . . . . . . . . . . . . . . . . . . . . . . . . . . . .163
8.16 Tax System Sensitivity to Import Duty . . . . . . . . . . . . . . . . . . . . . . . . . . . . . . . . . . .163
8.17 Tax Sensitivity to Eliminating Import Duty and Imposing a Royalty . . . . . . . . . . . . .164
A.1 Current Macroeconomic and Financial Trends . . . . . . . . . . . . . . . . . . . . . . . . . . . . .171
A.2 Debt Dynamics Non-Financial Public Sector: Scenario With No External Shocks . . .172
A.3 Scenario Without Shocks (Scenario A) . . . . . . . . . . . . . . . . . . . . . . . . . . . . . . . . . . .176
A.4 Scenario With No Shocks (Scenario B) . . . . . . . . . . . . . . . . . . . . . . . . . . . . . . . . . . .178
A.5 Scenario With No Shocks (Scenario C) . . . . . . . . . . . . . . . . . . . . . . . . . . . . . . . . . . .180
A.6 Real Exchange Rate Adjustment in the Event of a “Sudden Stop” . . . . . . . . . . . . . .182
A.7 Public Sector Debt Sustainability With and With No Shocks . . . . . . . . . . . . . . . . . . .185
A.8 Scenarios With Shocks (10% depreciation in real exchange rate and adjustment for contingent liabilities) (Scenario A) . . . . . . . . . . . . . . . . . . . . . . . . . . .186
A.9 Scenarios With Shocks (10% depreciation in real exchange rate and adjustment for contingent liabilities) (Scenario B) . . . . . . . . . . . . . . . . . . . . . . . . . . .188
A.10 Scenarios With Shocks (10% depreciation in real exchange rate and adjustment for contingent liabilities) (Scenario C) . . . . . . . . . . . . . . . . . . . . . . . . . .190
B.1 Required Fiscal Effort for Debt Sustainability . . . . . . . . . . . . . . . . . . . . . . . . . . . . . .196
D.1 Total Transfers to Municipalities in 2001 . . . . . . . . . . . . . . . . . . . . . . . . . . . . . . . . .210
D.2 Volatility of Transfers to Municipalities . . . . . . . . . . . . . . . . . . . . . . . . . . . . . . . . . . .211
E.1 Public Enterprises Target Indicators . . . . . . . . . . . . . . . . . . . . . . . . . . . . . . . . . . . . .218
SA.1 Peru: Combined Public Sector Operations (millions of nuevo soles) . . . . . . . . . . . . .226
SA.2 Peru: Combined Public Sector Operations (percent of GDP) . . . . . . . . . . . . . . . . . .227
SA.3 Peru: Combined Public Sector Operations (millions of 1994 soles) . . . . . . . . . . . . .228
SA.4 Peru: Central Government Operations (millions of nuevo soles) . . . . . . . . . . . . . . . .229
SA.5 Peru: Central Government Operations (percent of GDP) . . . . . . . . . . . . . . . . . . . . .231
SA.6 Peru: Central Government Operations (millions of 1994 soles) . . . . . . . . . . . . . . . .233
SA.7a Peru: Structure of Central Government’s Fixed Capital Formation (millions of nuevo soles) . . . . . . . . . . . . . . . . . . . . . . . . . . . . . . . . . . . . . . . . . . . . . .235
SA.7b Peru: Structure of Central Government’s Fixed Capital Formation (percent of total) . . . . . . . . . . . . . . . . . . . . . . . . . . . . . . . . . . . . . . . . . . . . . . . . . . . .236
SA.8a Peru: Operations of the Non-Financial Public Sector (millions of nuevo soles) . . . . .237
SA.8b Peru: Operations of the Non-Financial Public Sector (percent of GDP) . . . . . . . . . .238
SA.8c Peru: Operations of the Non-Financial Public Sector (millions of 1994 soles) . . . . .239
SA.9 Peru: Local Government Operations . . . . . . . . . . . . . . . . . . . . . . . . . . . . . . . . . . . . .240
SA.10 Peru: Operations of the Non-Financial State Enterprises (millions of nuevo soles) . .241
SA.11 Peru: Operations of the Rest of the Central Government (millions of nuevo soles) . .242
SA.12a Peru: Functional Classification of Central Government Budget Expenditures (millions of nuevo soles) . . . . . . . . . . . . . . . . . . . . . . . . . . . . .243
SA.12b Peru: Functional Classification of Central Government Budget Expenditures (percent of GDP) . . . . . . . . . . . . . . . . . . . . . . . . . . . . . . . . . .244
SA.13 Peru: Central Government Spending by Ministry or Institution . . . . . . . . . . . . . . . .245
vi CONTENTS
Administrator
.162
Administrator
.163
Administrator
.163
Administrator
.164
Administrator
.171
Administrator
.172
Administrator
.176
Administrator
.178
Administrator
.180
Administrator
.182
Administrator
.185
Administrator
.186
Administrator
.188
Administrator
.190
Administrator
.196
Administrator
.210
Administrator
.211
Administrator
.218
Administrator
.226
Administrator
.227
Administrator
.228
Administrator
.229
Administrator
.231
Administrator
.233
Administrator
.235
Administrator
.236
Administrator
.237
Administrator
.238
Administrator
.239
Administrator
.240
Administrator
.241
Administrator
.242
Administrator
.243
Administrator
.244
Administrator
.245

SA.14 Peru: Social Spending by Type . . . . . . . . . . . . . . . . . . . . . . . . . . . . . . . . . . . . . . . . .246
SA.15 Peru: Composition of Social Expenditures (millions of nuevo soles) . . . . . . . . . . . . .247
SA.16 Peru: PESEM: Projected Social Spending by Institution, 2002–06 . . . . . . . . . . . . . .249
SA.17 Peru: Pledges at the 2002 Consultative Group for Peru . . . . . . . . . . . . . . . . . . . . . .250
SA.18 Peru: Privatizations and Concessions, 2001–04 . . . . . . . . . . . . . . . . . . . . . . . . . . . . .251
SA.19 Peru: Current Revenues by Awarded Concessions (millions of US$) . . . . . . . . . . . .252
SA.20 Peru: Comparative Performance in Social Indicators . . . . . . . . . . . . . . . . . . . . . . . . .252
SA.21 Peru: Main Tax Breaks . . . . . . . . . . . . . . . . . . . . . . . . . . . . . . . . . . . . . . . . . . . . . . .253
SA.22 Peru: Alternative Measures for Tax Reform by Sector or Region . . . . . . . . . . . . . . . .253
SA.23a Latin America General Government’s Tax Revenues, 1998 (percent of GDP) . . . . .254
SA.23b Latin American Economies: Outline of Fiscal Policy Rules . . . . . . . . . . . . . . . . . . . .255
SA.24 Peru: Elasticities of Social Spending to Total Spending of the Consolidated Public Sector in Peru (1997–2002) . . . . . . . . . . . . . . . . . . . . . . . . . . .256
SA.25 Peru: Degree of Transparency in the Publication of Institutional Information . . . . . . . . . . . . . . . . . . . . . . . . . . . . . . . . . . . . . . . . . . . . . .257
SA.26 Peru: Published Information of the Budget in 2002 . . . . . . . . . . . . . . . . . . . . . . . . .257
SA.27 Peru: Composite Governance Indicators, International Comparisons, 1998 . . . . . . .258
SA.28 Volatility in Latin America . . . . . . . . . . . . . . . . . . . . . . . . . . . . . . . . . . . . . . . . . . . . .259
SA.29 Economic Distribution of General Government Revenue and Expenditure, Selected Countries . . . . . . . . . . . . . . . . . . . . . . . . . . . . . . . . . . . . . . . . . . . . . . . . . . .260
SA.30 Peru: Distribution of Social Investment by Different Social Programs and by Decile of Poverty Severity . . . . . . . . . . . . . . . . . . . . . . . . . . . . . . . . . . . . . . .261
SA.31a Peru: Average Monthly Per Capital Income of Households, 2000 (US$) . . . . . . . . .262
SA.31b Peru: Household Access to Social Programs by Income Per Capita Deciles, 2000 (percent of total) . . . . . . . . . . . . . . . . . . . . . . . . . . . . . . . . . . . . . . . . . . . . . . .262
SA.31c Peru: Household Access to Social Programs by Income Per Capita Deciles, 2000 (percent of subtotal) . . . . . . . . . . . . . . . . . . . . . . . . . . . . . . . . . . . . . . . . . . . . .262
SA.32 Peru: Mistargeting by Types of Food Assistance, 2000 . . . . . . . . . . . . . . . . . . . . . . .263
SA.33 Peru: Mistargeting by Types of Health Programs, 2000 . . . . . . . . . . . . . . . . . . . . . .263
SA.34 Peru: Mistargeting by Types of Education Programs, 2000 . . . . . . . . . . . . . . . . . . . .264
SA.35 Peru: Evolution of Household Access to Social Programs, 1998–2000 . . . . . . . . . . .264
SA.36 Peru: Annual Private Expenditure on Education by Per Capita Income Decile, 2000 . . . . . . . . . . . . . . . . . . . . . . . . . . . . . . . . . . . . . . . .265
SA.37 Peru: Annual Expenditure on Health by Per Capita Income Decile . . . . . . . . . . . . .266
SA.38 Peru: Definitions of the Consolidated Public Sector (CPS) . . . . . . . . . . . . . . . . . . . .266
SA.39 Peru: Central Government National and Regional Budget Composition, 2002 . . . .267
SA.40 Peru: Main Revenue Sources for Municipalites, 2002 . . . . . . . . . . . . . . . . . . . . . . . .268
SA.41 Peru: Departmental Budget–Education and Health by Expenditure Category, 2002 . . . . . . . . . . . . . . . . . . . . . . . . . . . . . . . . . . . . . . . . . . .269
SA.42 Peru Indexes on Corruption . . . . . . . . . . . . . . . . . . . . . . . . . . . . . . . . . . . . . . . . . . .270
SA.43 Peru: Corruption in the Judiciary, National and Municipal Agencies . . . . . . . . . . . .272
SA.44 Peru: Expenditure by Department, 2001 . . . . . . . . . . . . . . . . . . . . . . . . . . . . . . . . .274
CONTENTS vii
Administrator
.246
Administrator
.247
Administrator
.249
Administrator
.250
Administrator
.251
Administrator
.252
Administrator
.252
Administrator
.253
Administrator
.253
Administrator
.254
Administrator
.255
Administrator
.256
Administrator
.257
Administrator
.257
Administrator
.258
Administrator
.259
Administrator
.260
Administrator
.261
Administrator
.262
Administrator
.262
Administrator
.262
Administrator
.263
Administrator
.263
Administrator
.264
Administrator
.264
Administrator
.265
Administrator
.266
Administrator
.266
Administrator
.267
Administrator
.268
Administrator
.269
Administrator
.270
Administrator
.272
Administrator
.274

SA.45 Peru: Expenditure Coefficients by Department, 2001 . . . . . . . . . . . . . . . . . . . . . . . .275
SA.46 Peru: Decentralization in LAC . . . . . . . . . . . . . . . . . . . . . . . . . . . . . . . . . . . . . . . . .276
SA.47 Peru: Principal Revenue Sources of Subnational Governments . . . . . . . . . . . . . . . . .276
SA.48 Peru: Summary of Mining Taxation Authority for Selected Taxes and Fees . . . . . . . .277
SA.49 Peru: Mining Fiscal Methods and their Amenability to Fiscal Decentralization . . . . . . . . . . . . . . . . . . . . . . . . . . . . . . . . . . . . . . . . . . . . . . .279
SA.50 Total Transfers in Soles . . . . . . . . . . . . . . . . . . . . . . . . . . . . . . . . . . . . . . . . . . . . . . .279
LIST OF FIGURES
2.1 NFPS Fiscal and Primary Balances . . . . . . . . . . . . . . . . . . . . . . . . . . . . . . . . . . . . . . . .16
2.2 Tax Revenue Composition, 1970–2001 . . . . . . . . . . . . . . . . . . . . . . . . . . . . . . . . . . .16
2.3 Procyclical Fiscal Stance . . . . . . . . . . . . . . . . . . . . . . . . . . . . . . . . . . . . . . . . . . . . . . . .19
2.4 Volatility in Fiscal Variables . . . . . . . . . . . . . . . . . . . . . . . . . . . . . . . . . . . . . . . . . . . . .19
2.5 Fiscal Trend Over Time . . . . . . . . . . . . . . . . . . . . . . . . . . . . . . . . . . . . . . . . . . . . . . . .21
2.6 LAC: VAT Effectiveness . . . . . . . . . . . . . . . . . . . . . . . . . . . . . . . . . . . . . . . . . . . . . . .30
2.7 Central Government’s Expenditure Composition . . . . . . . . . . . . . . . . . . . . . . . . . . . .31
2.8 LAC: Capital Expenditure (1998) . . . . . . . . . . . . . . . . . . . . . . . . . . . . . . . . . . . . . . . .32
2.9 Structure of Central Government’s Fixed Capital Formation . . . . . . . . . . . . . . . . . . .32
2.10 Social and Public Spending . . . . . . . . . . . . . . . . . . . . . . . . . . . . . . . . . . . . . . . . . . . . .34
2.11 Growth Rates in Social and Public Spending . . . . . . . . . . . . . . . . . . . . . . . . . . . . . . . .35
2.12 Actual and Potential Output . . . . . . . . . . . . . . . . . . . . . . . . . . . . . . . . . . . . . . . . . . . .38
2.13 Actual Primary Balance (% of GDP) and Structural Primary Balance (% of potential GDP) . . . . . . . . . . . . . . . . . . . . . . . . . . . . . . . . . . . . . . . . . . . . . . . . . .38
3.1 Comparison of Central Government and NFPS Balance . . . . . . . . . . . . . . . . . . . . . . .53
3.2 Share of Social Expenditures to GDP . . . . . . . . . . . . . . . . . . . . . . . . . . . . . . . . . . . . .54
3.3 Sectoral Budget Allocations . . . . . . . . . . . . . . . . . . . . . . . . . . . . . . . . . . . . . . . . . . . . .54
3.4 Index of Budget Transparency . . . . . . . . . . . . . . . . . . . . . . . . . . . . . . . . . . . . . . . . . . .62
3.5 Percent of Government Entities Publishing Information . . . . . . . . . . . . . . . . . . . . . . .63
4.1 Lorenz Curves for Intergovernmental Transfers . . . . . . . . . . . . . . . . . . . . . . . . . . . . .74
4.2 How the Milk Disappears in the Vaso de Leche Program . . . . . . . . . . . . . . . . . . . . . .86
4.3 Lorenz Curves in Selected Social Programs . . . . . . . . . . . . . . . . . . . . . . . . . . . . . . . . .90
4.4 Lorenz Curves for Health Expenditure . . . . . . . . . . . . . . . . . . . . . . . . . . . . . . . . . . . .91
4.5 Lorenz Curves for Education Expenditure . . . . . . . . . . . . . . . . . . . . . . . . . . . . . . . . .91
4.6 Access to Social Programs, 2000 . . . . . . . . . . . . . . . . . . . . . . . . . . . . . . . . . . . . . . . . .92
5.1 Municipal Revenues, 2001 . . . . . . . . . . . . . . . . . . . . . . . . . . . . . . . . . . . . . . . . . . . .102
5.2 Central Government Transfers to Municipals, 2001 . . . . . . . . . . . . . . . . . . . . . . . . .102
6.1 International Government Employment Comparison . . . . . . . . . . . . . . . . . . . . . . . .116
6.2 Corruption in Public Services . . . . . . . . . . . . . . . . . . . . . . . . . . . . . . . . . . . . . . . . . .117
6.3 Employment and Average Earnings of the Private and Public Sector . . . . . . . . . . . . .121
6.4 Permanent and Contractual Average Earnings (Nuevos Soles) . . . . . . . . . . . . . . . . .124
viii CONTENTS
Administrator
.275
Administrator
.276
Administrator
.276
Administrator
.277
Administrator
.279
Administrator
.279
Administrator
.16
Administrator
.16
Administrator
.19
Administrator
.19
Administrator
.21
Administrator
.30
Administrator
.31
Administrator
.32
Administrator
.32
Administrator
.34
Administrator
.35
Administrator
.38
Administrator
.38
Administrator
.53
Administrator
.54
Administrator
.54
Administrator
.62
Administrator
.63
Administrator
.74
Administrator
.86
Administrator
.90
Administrator
.91
Administrator
.91
Administrator
.92
Administrator
.102
Administrator
.102
Administrator
.116
Administrator
.117
Administrator
.121
Administrator
.124
Administrator
LIST OF FIGURES

7.1 Peru’s Governance Indicators, 1998–2001 . . . . . . . . . . . . . . . . . . . . . . . . . . . . . . . .134
7.2 Obstacles to Doing Business . . . . . . . . . . . . . . . . . . . . . . . . . . . . . . . . . . . . . . . . . . .135
7.3 Perceived Level of Corruption in Selected Agencies . . . . . . . . . . . . . . . . . . . . . . . . .135
7.4 Bribes by Type of Activity . . . . . . . . . . . . . . . . . . . . . . . . . . . . . . . . . . . . . . . . . . . . .137
7.5 Corruption in Public Service . . . . . . . . . . . . . . . . . . . . . . . . . . . . . . . . . . . . . . . . . . .138
7.6 Average Percent of Income Paid in Bribes . . . . . . . . . . . . . . . . . . . . . . . . . . . . . . . . .139
7.7 Indexes of Service Quality and Bribery . . . . . . . . . . . . . . . . . . . . . . . . . . . . . . . . . . .140
7.8 Quality of Public Services . . . . . . . . . . . . . . . . . . . . . . . . . . . . . . . . . . . . . . . . . . . . .140
7.9 Quality of Health and Education Services . . . . . . . . . . . . . . . . . . . . . . . . . . . . . . . . .141
7.10 Provision of Public Services—Local Governments vs. Other Government Agencies . . . . . . . . . . . . . . . . . . . . . . . . . . . . . . . . . . . . . . . . . . .142
7.11 National and Municipal Agencies Are Ridden by Different Types of Corruption . . . . . . . . . . . . . . . . . . . . . . . . . . . . . . . . . . . . . . . . .142
7.12 Public Official’s View on Reforms in Public Sector . . . . . . . . . . . . . . . . . . . . . . . . . .144
A.1 Scenario with No Shocks . . . . . . . . . . . . . . . . . . . . . . . . . . . . . . . . . . . . . . . . . . . . . .175
A.2 Scenario with Shocks . . . . . . . . . . . . . . . . . . . . . . . . . . . . . . . . . . . . . . . . . . . . . . . . .182
A.3 Peru Debt Dynamics: Comparison of Scenarios With and With No Shocks . . . . . . .184
D.1 FONCOMUN Transfer Process . . . . . . . . . . . . . . . . . . . . . . . . . . . . . . . . . . . . . . . .212
LIST OF BOXES
2.1 The Fiscal Prudence and Transparency Law . . . . . . . . . . . . . . . . . . . . . . . . . . . . . . . .22
2.2 Tax Regime and Proposed Changes . . . . . . . . . . . . . . . . . . . . . . . . . . . . . . . . . . . . . .25
2.3 Peru: Evaluation of the Transparency Law 2000–01 . . . . . . . . . . . . . . . . . . . . . . . . . .36
3.1 Main IGR/PEM Issues . . . . . . . . . . . . . . . . . . . . . . . . . . . . . . . . . . . . . . . . . . . . . . . .42
3.2 The Integrated Financial Management System (SIAF) of Peru . . . . . . . . . . . . . . . . . .43
3.3 Introducing the SIAF at the Ministries of Defense and National Security (Interior) . . . . . . . . . . . . . . . . . . . . . . . . . . . . . . . . . . . . . . . . . . . . .45
3.4 Peru: Principal Stages of the Budget Formation . . . . . . . . . . . . . . . . . . . . . . . . . . . . .47
3.5 Peru: Institutionalizing a Virtual Poverty Fund: A Look at Best-Practice Uganda . . . . . . . . . . . . . . . . . . . . . . . . . . . . . . . . . . . . . . . . .60
4.1 MEXICO: Integrating Social Programs for Improved Efficiency—The Case of PROGRESA . . . . . . . . . . . . . . . . . . . . . . . . . . . . . . . . . . . . . . . . . . . . . .93
5.1 Lessons from Decentralization Experiences in Latin America . . . . . . . . . . . . . . . . . . .97
5.2 The Decentralization Drive in Education in LAC: Some Cases . . . . . . . . . . . . . . . . .108
5.3 Decentralization of the Health Sector in LAC . . . . . . . . . . . . . . . . . . . . . . . . . . . . . .111
6.1 The Sequencing of Civil Service Reform Measures . . . . . . . . . . . . . . . . . . . . . . . . . .130
7.1 Regulation of Infrastructure in Peru . . . . . . . . . . . . . . . . . . . . . . . . . . . . . . . . . . . . .136
7.2 A Multipronged Strategy for Addressing Corruption and Improving Governance . . . . . . . . . . . . . . . . . . . . . . . . . . . . . . . . . . . . . . . . . . . . . . .143
8.1 Peru: Description of the Existing Mining Fiscal System . . . . . . . . . . . . . . . . . . . . . . .149
8.2 Creating Mining Stabilization Funds: The Ancash Model . . . . . . . . . . . . . . . . . . . . .165
CONTENTS ix
Administrator
.134
Administrator
.135
Administrator
.135
Administrator
.137
Administrator
.138
Administrator
.139
Administrator
.140
Administrator
.140
Administrator
.141
Administrator
.142
Administrator
.142
Administrator
.144
Administrator
.175
Administrator
.182
Administrator
.184
Administrator
.212
Administrator
.22
Administrator
.25
Administrator
.36
Administrator
.42
Administrator
.43
Administrator
.45
Administrator
.47
Administrator
.60
Administrator
.93
Administrator
.97
Administrator
.108
Administrator
.111
Administrator
.130
Administrator
.136
Administrator
.143
Administrator
.149
Administrator
.165
Administrator
LIST OF BOXES


xi
ABSTRACT
Since his inauguration in July 2001, President Toledo has proposed to take actions in the areas ofmacroeconomic stabilization; reopening of country’s access to international financial markets;
budget modernization and State decentralization; social policy; revamping of the armed forces, thepolice, and internal security services; and consolidation of Peru’s democracy and social stabilitythrough consensus-building and transparent and participatory mechanisms. These are all criticaldevelopment challenges faced by Peru. The momentum for reform, which was strong in the early1990s, ran out of steam in the late 1990s, and genuine efforts by the new administration to re-invigorate it are facing great social pressure for short-term, populist measures. There is an urgentneed to build momentum for “second-generation” reforms, especially those in public expenditure,which would provide longer-term sustainability to the government’s strategy of poverty reductionand growth.
Despite its initial progress, Peru is not likely to meet these development goals in the near term.Achieving success in the medium term will depend on completing a public expenditure manage-ment agenda summarized in the seven main themes of this report:
■ Restoring fiscal discipline■ Reorienting the budget toward pro-poor expenditure■ Improving the efficiency of public expenditure■ Addressing the promises and risks of decentralization■ Upgrading the civil service■ Improving governance and reducing corruption■ Fine-tuning mining taxation and environmental policies.
How to address these themes is clear. Significant primary surpluses are fundamental to achiev-ing sustainable fiscal and debt-management policies, and are thus a top priority. Shifting expendi-ture to pro-poor priorities is essential for achieving desired social outcomes in the medium term.Making the most effective use of scarce resources is needed for a country in the midst of fiscalretrenchment. Fiscal discipline also implies resolving fundamental questions of the decentralizationprocess, particularly, what functions must be decentralized, and with what resources, timing, anddesired outcomes? An ill-designed decentralization process, especially if developed through brand-new regional governments, has considerable potential for engendering severe fiscal disarray andmacroeconomic destabilization. Thus there is a need to proceed very cautiously.
The government of Peru also needs to upgrade its human capital. Such reform would con-tribute to improving governance and fighting corruption, thus providing more productive and lessexpensive delivery of public service. Finally, fine-tuning mining taxation and transfers and mining-related environmental policies is needed not only to strengthen the global competitiveness of oneof the main exports of Peru through a stable tax regime, but to enhance budgetary transparencyand minimize environmental damage.
This report is the product of the analytical work of a large number of experts, both Peruvianand non-Peruvian. They distill critical lessons and challenges that are relevant for policymakers inPeru, in Latin America, and in countries that are embarking on comprehensive public expenditurereform. Thus, it is a major contribution to our knowledge and thinking in this area.


xiii
ACKNOWLEDGMENTS
This report is a joint effort of the World Bank and the Inter-American Development Bank. José R. López-Cálix (WB-LCSPE) and Alberto Melo (IDB-RE3/OD5) are the authors and
project managers. The report is an outgrowth of a collective effort including partial contributionsand background papers by Osvaldo Schenone (consultant–section on taxation, Chapter II); CarlosOliva (consultant–section on fiscal patterns, Chapter II); Nelson Shack and Oscar Pajuelo (GeneralBudget Director and Accountant General of Peru–Annex C); Bruno Barletti and Lourdes Cueva (SIAF Coordinator and assistant–section on transparency, Chapter III); Rossana Mostajo(consultant–section on protected programs, Chapter III); Lorena Alcazar, Erik Wachtenheim,Mitchel Seligson (consultants–section on public expenditure tracking survey, Chapter IV andAnnex D); Gillette Hall (WB–Box on PROGRESA, Chapter IV), Juvenal Diaz (FONCODES–section on targeting, Chapter IV); Richard Moore (consultant–section on decentralization of socialsectors, Chapter V and Annex F); Eduardo Fernandez (consultant–municipal debt, Chapter V);Peter Gregory (consultant–civil service, Chapter VI); Francesca Recanatini and Daniel Kauffman(WB–governance and corruption, Chapter VII); José Luis Guasch (WB–box on regulatory agen-cies, Chapter VII); James Otto (consultant–mining taxation, Chapter VIII) and Felix Remy(WB–environment, Chapter VIII); Elaine A. Tinsley (WB–Statistical Appendix and thorough analytical and research assistance); Rashmi Shankar (consultant–research assistance on Annexes Aand B); and Gabriel Ortiz de Zevallos (consultant–Annex E). Peer reviewers were Ritva Reinikkaand William Dorotinsky (both WB), who provided very helpful and detailed input.
The report also received numerous comments from Andrew Wolfe and Mauricio Villafuerte(IMF), Guillermo Perry, Mauricio Carrizosa, Sara Guerschanik Calvo, Yasuhiko Matsuda, GilletteHall, Pierre Werbrouck, Quentin Wodon, Keta Ruiz, Marianne Fay, Harold Adelman, NorbertSchady, Evangeline Javier, Daniel Cotlear, Livia Benavides (all from the WB), and Gonzalo Afcha,Xavier Comas, Rafael de la Cruz, Gonzalo Deustua, Jaime Fernandez, Amanda Glassman, SusanKolodin, Jorge Lamas, and Jaime Enrique Vargas (all from the IDB). It also greatly benefited fromthe field survey work of Instituto Apoyo in Peru, which did a magnificent job. Hazel Vargas pro-vided the main administrative and production support and editorial assistance. Diane Stamm wasthe principal language editor. Also providing production support at various stages were Silvia Marquina de León, Rosalía Rushton, Marianella Rivadeneira and Patricia Chacón Holt. Ana MariaArteaga and Ana Maria Angulo provided excellent support to field research in Lima. The reportbenefited from the active guidance and support of Isabel Guerrero (WB–Director), Ana-MariaArriagada (WB–LCSHD Sector Director), Mauricio Carrizosa (WB–LCSPE Sector Manager),Ernesto May (WB–LCSPR Director), and Ana Maria Rodriguez (IDB, RE3/OD5 Chief).
The team would like to express its sincere gratitude for the excellent cooperation provided byPeruvian officials throughout the process, especially during the team visits in Peru, and includingthe main mission in late November 2001. In particular, the team would like to thank Mr. RobertoDañino, President of the Council of Ministers; Pedro Pablo Kuczynski, Minister; Kurt Burneo,Patricia Teuillet, and Fernando Zavala, Viceministers of Economy and Finance; and Oscar Pajuelo,Accountant General, for their enthusiastic support. Many thanks also go to Veronica Zavala, Nelson Shack, Oscar Blanco, Fernando Lituma, Bruno Barletti, Carlos Ricse, Lourdes Cueva,Waldo Mendoza, Carmen Negron, Javier Abugattas, Lander Aleman, Jorge Estrella, Luis Paz,Pedro Francke, Beatriz Merino and Gustavo Perochena, Gilberto Moncada, and Reynaldo Bringaswho provided timely inputs and responded to numerous requests.
The report has been subject to early and multiple consultation and dissemination efforts inLima, Peru. In December 2001, at the closing of the main mission, draft preliminary conclusionswere discussed with Peruvian officials. In March 2002, a detailed proposal on the revamping of

the Fiscal Prudence and Transparency Law was presented in a Ministry of Economy and Financeseminar on Fiscal Rules. A month later, a framework for decentralization was submitted in theFONCODES/Presidency joint seminar on the Decentralization of the Social Sectors. Finally, inAugust 2002, the full draft report was openly discussed with officials, think tanks, the media,donors, the private sector, and civil society representatives in a seminar on Fiscal Discipline, Pub-lic Expenditure Efficiency, and Decentralization jointly organized with MEF and IDB. Prelimi-nary findings of this report and background papers have also been instrumental in the elaborationof components of the World Bank’s Second Programmatic Social Reform Loan and the CountryAssistance Strategy for Peru.
xiv ACKNOWLEDGMENTS

xv
ABBREVIATIONS AND ACRONYMS
2SLS Two-stage least squaresACE Community educational associationsADEs Areas of Educational DevelopmentAEs Areas of ExecutionBCRP Central Bank of PeruBN Banco de la Nación (Treasury)CEC Consejos Escolares ConsultivosCETICOS Centers for Export, Transportation, Industry, Commercialization and ServicesCG Central GovernmentCIF Cost, insurance & freightCLAS Local Committees of Health AdministrationCONAM Consejo Nacional del Ambiente (National Environmental Council)CONASEV Comisión Nacional Supervisora de Empresas y ValoresCONITE National Commission for Foreign Investment and TechnologyCONSUCODE Consejo Superior de Contrataciones y Adquisiciones del Estado,
(Superior Council of Contractings and Procurements from the State)COOPOP National Office for Popular CooperationCOPRI Commission for Promotion of Private InvestmentCPS Consolidated public sectorCTARs Transitory Councils of Regional AdministrationDGAES Dirección General de Asuntos Económicos y Sociales,
(General Office of Economic and Social Affairs)DGFP General Directorate of Fiscal PolicyDGSP Dirección General de Salud PúblicaDISAs Regional Directorates of HealthDNPP Dirección Nacional del Presupuesto Publico
(National Directorate of the Public Budget)DREs Regional Directorates of EducationEBFs Extra-Budgetary FundsEDUCO Educación ComunitariaEGASA Empresa de Gas Sociedad AnonimaENAHO Encuesta Nacional de Hogares (National Household Survey)ESSALUD Seguro Social de Salud (Health Insurance)ETR Effective tax rateEUs Executing UnitsFEF Fondo de Estabilización FiscalFGT2 Foster, Greer, and Thorbecke 2FIDE Intergovernmental Decentralization FundFLIRB Front-loaded interest reduction Brady bondsFONAFE National Fund for Financing Government Enterprise ActivityFONAHPU National Savings FundFONAVI Fondo Nacional de ViviendaFONCODES Fondo Nacional de Compensación y Desarrollo SocialFONCOMUN Fondo de Compensación MunicipalFONCOR Regional Compensation FundFSF Fiscal Stabilization Fund

FY Fiscal yearGDE General Directorate of the EnvironmentGDP Gross domestic productGFS Government Financial StatisticsGG General governmentGOP Government of PeruHIPCs Highly indebted poor countriesIBRD International Bank for Reconstruction and DevelopmentIDB, IADB Inter-American Development BankIES Extraordinary Solidarity Tax (Impuesto Extraordinario de Solidaridad)IGR Institutional and Governance ReviewIGV Value added taxIMF International Monetary FundINA Iniciativa Nacional Anti-CorrupciónINADE Instituto Nacional de Desarrollo (National Institute for Development)INEI National Institute for Statistics and InformationIRR Internal rates of returnISC Selective tax on consumption or excise taxISPs Institutos superior pedagógicasJNE Junta Nacional ElectoralLAC Latin America and the CaribbeanLIBOR London Interbank Offered RateLPTF Ley de Prudencia y Transparencia FiscalMAB Multiyear BudgetMED Ministry of EducationMEF Ministry of Economy and FinanceMEM Ministry of Energy and MinesMINDEF Ministry of DefenseMINSA Ministry of HealthMMM Marco Macroeconómico Multianual (Multiyear Macroeconomic Framework)Mt/day Metric tons per dayMTBF Medium-term budgeting frameworkMTEF Medium-term expenditure frameworkNA Not applicableNFPS Non-financial public sectorNGOs Nongovernmental organizationsNPS Nonpersonal servicesNS Nuevos SolesODI Investment officeOECD Organization for Economic Cooperation and DevelopmentOLS Ordinary least squaresONP Oficina de Normalización Provisional (Pensions)OSIPTEL Organismo Superior de Inversión Privada en TelecomunicacionesOSITRAN Organismo Superior de la Inversión en Infraestructura de
Transporte de Uso PublicoOUs Operational UnitsPAAG Programa de Administración de Acuerdos de GestiónPAF Poverty Action FundPARSALUD Programa de Apoyo a la Reforma del Sector Salud
(Health Sector Reform Program)PCM Presidencia del Consejo de Ministros (Premier’s Office)
xvi ABBREVIATIONS AND ACRONYMS

PDI Institutional Development ProjectsPEAP Poverty Eradication Action PlanPEM Public expenditure managementPER Public Expenditure ReviewPESEM Plan Estratégico Sectorial Multianual (Multiyear Strategic Sector Plans)PETS Public Expenditure Tracking SurveysPPP Purchasing Power ParityPPS Probability Proportionate to SizePROGRESA Programa de Educación, Salud y AlimentaciónPRONAA Programa Nacional de Asistencia Alimentaria
(National Food Assistance Program)PRONAMACHCS Proyecto Nacional de Mantenimiento de Cuencas Hidrográficas y
Conservación de Suelos (National Project for the Management of Water Sheds)
PSPs Protected Social ProgramsPSRL Programmatic social reform loanPUP Planilla Única de Pagos (Unified Payroll)RENIEC Registro Nacional de Identificación y Estado CivilRER Real exchange rateSEAL South-West Electricity SocietySEDAPAL Lima’s Water and Sewerage ServiceSENSICO National Service for Construction Industry TrainingSEPs Sector Strategy PlansSIAFITO A simplified SIAFSIAF-SP Sistema Integrado de Administración Financiera del Sector Publico
(Integrated Financial Management System)SIMSIP Simulations for Social Indicators and PovertySIS-SMI Integral and Mother and Child Health InsurancesSMI Seguro Materno-Infantil (Mother and Child Health Insurance)SPC Sector Publico ConsolidadoSUNAT Superintendencia Nacional de Administración Tributaria
(Superintendency for Tax Administration)SUR Seemingly unrelated regressionUEs Unidades EjecutorasUIT Unidades de Ingreso TributarioUSEs Unidades de Servicios Educativos (Educational Service Units)USIS Unidades de Seguro Integral de SaludVAT Value added taxVDL Vaso de Leche
CURRENCY EQUIVALENTS: US$1.00 = NS 3.61 (Nuevo Sol exchange rate as of 1 October 2002)GOVERNMENT FISCAL YEAR: January 1–December 31WEIGHTS AND MEASURES: Metric System
ABBREVIATIONS AND ACRONYMS xvii


Rationale and OrganizationFor the World Bank and the Inter-American Development Bank (IDB), it is a welcome privilege to provide the incoming Administration of a member country with joint and comprehensive diag-noses and policy recommendations in those areas that contribute most to enhancing the client’sdevelopment prospects.1 One of these key areas is public expenditure management, which is thepurpose of this report. As the Toledo Administration enters its second year in office, we hope thatthe contents of this Public Expenditure Review (PER) will be useful for Peru to deal with some ofthe formidable challenges the country faces in its development agenda.
This chapter presents a synthesis of Peru’s public expenditure reform agenda from the Banks’perspective. It is based on, and distills, the thematic chapters that make up this report. Chapters II–IVexamine the core functions of public expenditure management: macro fiscal aggregates, resource allocations to strategic sectors, and microeconomic efficiency of public spending. Chapters V–VIIIexplore selected themes, such as the decentralization of public administration and the social sectors;civil service reform; governance and corruption; and fiscal and environmental mining issues. Thesechapters are, in turn, supported by 15 topic-specific background papers, including an innovative public expenditure tracking survey on municipal transfers, and numerous and valuable commentsprovided by Peruvian officials throughout dissemination activities.
1
EXECUTIVE SUMMARYA Comprehensive Reform Agenda of
Public Expenditure Management for Peru
A successful economic policy needs two inputs: sound technical design and strongpolitical support to bring it forward. A common mistake is to believe that both aspectsare substitutes rather than complementary one to each other. In practice, this leads towrongly believe that political power may offset poor technical design permanently.
Juan Carlos de Pablo“Cómo Fracasa Rotundamente un Ministro de Economía, 1988”
1
1. Several sector studies for Peru were published in the last few years by both institutions in the areas ofeducation, health, private sector participation and infrastructure, institutional governance, financial manage-ment, procurement, and country strategy. However, the last World Bank Public Expenditure Review was produced in 1994.

We do not attempt to provide full coverage of all areas affected by public expenditure. Express-ing the strategic coincidence between the World Bank and the IDB around the idea that povertyreduction is the paramount objective of their assistance efforts, the report deliberately focuses onsocial sectors spending and leaves aside infrastructure and other sectors, which have been the sub-ject of more specific sector studies in previous years. This report was finalized in June 2002, anddiscussed with Peruvian officials in mid-August 2002. Policy developments that have taken placeafter that time are not reflected in it.
Main Findings and RecommendationsAt the onset of the new century, Peru faces substantial development challenges. Significant achieve-ments in terms of growth, poverty reduction, and improvements in social indicators up to 1997 havebeen partially set back by ensuing persistent slowdowns in economic activity, fiscal indiscipline, politi-cal uncertainty, institutional weaknesses, and poor governance. The momentum for reform, whichused to be strong in the early 1990s, ran out of steam in the late 1990s, and genuine efforts by thenew Peruvian officials to reinvigorate it are facing strong social pressure for short-term, populist mea-sures.2 Populism might bring palliatives, but is deleterious to the macroeconomic fundamentals of the country and, ultimately, to the standard of living. There is, rather, an urgent need to restore fiscaldiscipline and build momentum for “second-generation” reforms, including those in public expendi-ture, which would provide longer-term sustainability to the strategy of poverty reduction.
The new Administration inherited a fiscal system under severe stress. Since 1999, Peru’s fiscalstance has been fragile due to a combination of adverse external shocks, expansive fiscal policies,elections, and other unfavorable domestic developments accompanying the transition to the post-Fujimori legacy. Led by a primary deficit that for the first time in more than a decade has becomenegative since 1999, the combined fiscal deficit significantly increased from 0.4 percent of GDP in1997 to 3.2 percent of GDP in 2000, only to be slightly reduced to an estimated 2.5 percent ofGDP in 2001. Low, volatile, and procyclical tax revenue combined with a rigid public expenditurefacing popular demands complicate efforts to finance an ambitious poverty-reduction agenda, whileachieving fiscal adjustment. Despite a multiyear pro-poor budgeting framework, social spendingremains underfunded, diverted through multiple leakages, and mistargeted. The concentration ofbudget formulation authority in Lima coupled with discretional and decentralized budget executionthrough Transitory Councils of Regional Administration (CTARs) reduces the impact of socialexpenditure and the efficiency of service delivery.
Since his arrival in July 2001, President Toledo has proposed taking action in the areas ofmacroeconomic stabilization; reopening of country’s access to international financial markets; bud-get modernization and State decentralization; social policy; revamping of the armed forces, policeand internal security services; and consolidation of Peru’s democracy and social stability throughconsensus-building and transparent and participatory mechanisms. Despite its initial progress, Peruis not likely to meet these goals in the near term. Achieving success in the medium term will ratherdepend to a great extent on how quickly it restores fiscal discipline, shifts scarce spending to thegovernment’s priorities, and ensures an efficient delivery of public services under a very complexand politically driven decentralization process. We summarize the public expenditure managementagenda in seven main messages:
■ Restoring fiscal discipline■ Reorienting the budget toward pro-poor expenditure■ Improving the efficiency of public expenditure■ Addressing the promises and risks of decentralization
2 WORLD BANK COUNTRY STUDY
2. In this report, populism is defined as a conception and practice of economic policy that favors unsustain-able expansionary fiscal and monetary polices as the main engine of GDP growth and employment creation.For a discussion of the concept, see Dornbusch and Edwards (1991).

■ Upgrading the civil service■ Improving governance and reducing corruption■ Fine-tuning mining taxation and environmental policies.
The storyline behind these seven themes is a bit long to tell, but is simple. First, significant primary surpluses are the inescapable premise for sustainable fiscal and debt-management policies.They are also needed to lay the basis for viable countercyclical fiscal and social policies in the future.Second, shifting expenditure to pro-poor priorities is essential for achieving desired social outcomesin the medium term. Budget reorientation requires not only enhancing transparency of budget cutsand reallocations during implementation, but reviewing inertial and in-year seasonal spending.Improving budget protection mechanisms of priority social programs is useful to consolidate an effec-tive countercyclical social policy. Third, making most effective use of scarce resources is essential for acountry in the midst of fiscal retrenchment. This implies reducing anti-poor disparities in regionalbudget allocations; eliminating duplications in social and basic infrastructure projects; minimizingleaks of public funds, particularly in food supplementary programs and at the bottom level of servicedelivery and, if feasible, considering their gradual downsizing or replacement by cash-transfer pro-grams; and improving targeting of resources, especially outside Lima, for most social programs, espe-cially those addressing the most vulnerable. Fourth, it is essential promptly to resolve fundamentalquestions of the decentralization process: in particular, what functions must be decentralized? Andwith what timing and outcomes in mind? An ill-designed decentralization process, especially if devel-oped through brand-new regional governments, has considerable potential for provoking severe fiscaldisarray and macroeconomic destabilization. Thus there is a need to proceed very cautiously. Fifth,the government needs to upgrade its human capital in charge of service delivery. The civil serviceregime is in total disarray and needs to be overhauled. An accurate and dependable public registry ofcivil servants must be created. The myriad of salary supplements and benefits in cash and in kind nowprevailing must be consolidated and replaced by a more rational salary system. Sixth, improving gov-ernance and fighting corruption is essential not only to provide a better and less expensive public ser-vice delivery, but to fight income inequality and facilitate business activity and entrepreneurship inPeru. In general, local governments perform much worse than national agencies in the quality ofdelivery of services. In addition, there are more corruption and governance problems at the locallevel. Seventh, fine-tuning mining taxation, mining-canon transfers, and mining-related environmen-tal policies is needed not only to strengthen the global competitiveness of one of the main exportsources of Peru through a stable tax regime, but to enhance transparency of transfers to local govern-ments and minimize environmental damage. Conflicts between mining companies and the local pop-ulations will thereby be minimized, thus contributing to improving the quality of mining investmentactivities, the transparency of intergovernmental relations, and the relationship between foreigninvestors and local communities.
Around the seven organizing themes of this report revolves a set of multiple and detailed diag-noses and policy recommendations, with some suggestions for their prioritization. The reader should,however, keep in mind several limitations. First, there is no magic formula for achieving results. Whatis described here is essentially based on Banks’ best-practice experiences elsewhere in Latin Americaand the rest of the world, and on their informed views of Peru. Second, proposed sequencing ofreforms is itself subject to political constraints. The World Bank and the IDB remain ready to assistthe Government of Peru in implementing the PER’s agenda. Finally, it is important to add thatimplementing these reforms can be achieved only through a new contract between the governmentand citizens, which would elevate standards for government accountability, transparency, and civilsociety participation and oversight.
Restoring Fiscal DisciplineFiscal sustainability is perhaps the most important challenge of the current Administration. Peruneeds to strengthen its structural fiscal position, not only because failure to do so jeopardizes the
RESTORING FISCAL DISCIPLINE FOR POVERTY REDUCTION IN PERU 3

macro framework in the medium term, but also because significant contingent liabilities might arisefrom pensions, the financial sector, and subnational government—registered or nonregistered—debts, and because sudden slowdowns or stops in external financing due to financial contagion fromexternal (or regional) turbulence are not to be excluded in the coming years. Fiscal deficits areexplained by a combination of both structural and cyclical factors. On the structural side, they fea-ture procyclical and volatile patterns, mainly determined by the behavior of tax revenue and publicexpenditure. Over the last 30 years, Peru’s non-financial public sector (NFPS) deficit experiencedfive cycles: 1970–79, 1980–85, 1986–91, 1992–96, and 1997–01, and averaged a high 5.8 percentof GDP. This pattern resulted from long periods of fiscal expansion, followed by increasingly shorterperiods of fiscal adjustment, particularly before the early 1990s. The main component of the deficitwas the Central Government imbalance, which represented about three fourths of the average NFPSdeficit. Most fiscal variables are procyclical: they have significant positive correlation coefficients withthe growth rate, and the cyclical components of the fiscal deficit and GDP growth are almost per-fectly correlated.
In addition, fiscal variables are extremely volatile, and this goes beyond their close correlationto GDP growth. Peru’s growth rate volatility, measured by the standard deviation, is 33 percenthigher than the average for Latin American and Caribbean (LAC) countries, which is itself twice as high as the average in industrial economies. The volatility of fiscal variables, though, is muchhigher than the volatility of GDP growth: almost six times in the case of tax revenues; five times inthe case of public salaries and transfers; more than seven times in the case of capital investments(the critical budget adjustment variable); and 11 times in the case of fiscal deficits. Tax revenuevolatility is also explained by continuous changes in tax policy and administration, the hyperinfla-tion of the late 1980s, and elections in the late 1990s. Expenditure volatility is explained by erraticpolicies affecting the public payroll, transfers, and capital investments.
Recent disequilibria are explained by expansive fiscal policies, and correcting them is a priority.Since 1997, trends in CG real revenue and real public expenditure have decreased and increased,respectively. In 2001, the tax ratio fell below 12 percent of GDP, a dismal level by internationalstandards, and among the lowest in Latin America. As a result, primary balances have become nega-tive since 1999, and fiscal deficits have deteriorated. Resulting public debt has increased as a per-centage of GDP from 42.7 percent in 1998 to a high 46.5 percent in 2001, even though significantamounts of privatization proceeds have been used to finance expenditure and repay public debt.Although the public debt is mostly long term and owed to external creditors, the domestic andshort-term components of it have grown at a rapid pace in the last several years. In this connection,it must be borne in mind that domestic debt is exposed to currency risk and rapidly increasing debtservice, which contributes to tightening of scarce resources in a shrinking budget. Had Peru keptgovernment tax revenue and expenditure constant in real terms during 1998–2001, it would havepreserved a sound fiscal deficit below 1 percent of GDP.
What needs to be done to achieve fiscal discipline and, hence, macro sustainability? Six mainpolicies are essential. First, and most important, Peru needs a comprehensive tax reform. Thisreform should aim at improving the tax system’s equity, neutrality, simplicity, and revenue-yieldingcapacity. Reform should mainly be based on a combination of measures to broaden the tax baseand enhance tax administration. Proposed measures to broaden the tax base suggest removing keytax exemptions (be it sector- or region-specific, or on interest and capital gains, or the exemptionon import duties for Centers for Export, Transportation, Industry, Commercialization and Services[CETICOS]); introducing a presumptive income tax method for the self-employed and a slightlywider three-level income tax rate structure for individuals; and unifying the consumption selectivetax for vehicles. By complementing these measures with the introduction of a royalty tax on mining(offset by the elimination of the sector’s import duties), and/or eventual modification of workers’participation, and the implementation of a major phased improvement in tax administration, thegovernment could raise additional resources approaching 2 percent of GDP within two to threeyears. The fact that the set of measures proposed does not modify the present tax structure and
4 WORLD BANK COUNTRY STUDY

does not establish new taxes, except in the case of the royalty tax, makes it easier to gain politicalconsensus for its enactment. The other pillar of tax reform is a marked improvement of tax admin-istration by SUNAT, the collecting agency. In general, any improvement results from a combina-tion of enhanced taxpayer services (with upgraded technology support), better auditing systemsthat focus on tax evaders, and better human resource staffing.
The second area where a significant effort is required is public expenditure. Because capital investment continues to be the residual adjusting item in the budget, Peru now has one of the lowestcapital expenditure ratios in LAC: less than 2.5 percent of GDP in 2001, and decreasing. Hence,expenditure reform should aim at reverting the present trend toward an increased current expenditureand a decreased capital investment. Excessive current spending could be cut in the area of defense andinternal security in the short term (0.6 percent of GDP in 2002), and in wages and pensions in themedium term, supported by social security and civil service reform. If the proposed increase in fiscalrevenue materializes, then capital investment, especially in the social sectors, should be raised accord-ingly, thus contributing to filling the present gap that Peru has in social expenditure—1.2 percent ofGDP in education and 0.2 percent of GDP in health—with respect to LAC averages.
A third area of policy reform is public debt sustainability. The public debt-to-GDP ratio of 46.5 percent in 2001 is too high for a country the public debt of which is highly exposed to cur-rency risk, and which faces potential contingent liabilities in dollars in the financial sector. Loweringsuch ratio to more sustainable levels is essential to face potential risks in the next decade. Assuming a conservative baseline scenario combining moderate growth and low inflation, a slight increase inexternal interest rates, decreasing, but still significant mixed concessional–multilateral financing, anda fiscal correction lowering the NFPS deficit from 2.5 percent of GDP in 2001 to −1.4 percent ofGDP in 2010, would bring the public debt-to-GDP ratio to a benchmark 36 percent of GDP at theend of the decade.
A fourth area of policy reform relates to fiscal rules through the revamping of the Law of FiscalPrudence and Transparency. Because the Law is not a substitute, but a complementary tool to buildcredibility of a sound fiscal program, a prior condition for its official revamping requires, in the nearterm, thorough compliance with the benchmarks of the 2002–03 macroeconomic program, sup-ported by an IMF Stand-By. Moreover, we do not expect a significant countercyclical policy as longas growth remains moderate and fiscal revenue is stagnant. So, revamping of the Law should proceedgradually, focusing on early credibility gains; prior institutional strengthening required by the Law’stechnical redesign and monitoring; consensus-building exercises led by Peruvian officials; virtualmonitoring indicators and reporting tools, including those for the Comptroller’s and Congress’soversight; and introducing a set of sanctions for noncompliance with numerical benchmarks and pro-cedures. The design of a set of fiscal rules for incoming subnational governments should impose hardbudget constraints on them and justifies upgrading the incoming Law to one of fiscal responsibility.In addition, in the medium term an effective countercyclical fiscal policy could be based on a struc-tural primary balance benchmark. Such policy would require making automatic fiscal savings inbooms and dis-savings in downturns, measured by the differential between estimated actual andstructural balance. Under the baseline scenario described above, achieving a more sustainable publicdebt-to-GDP ratio by 2004–10 would entail a structural primary surplus ranging around 1 percent of GDP (roughly equivalent to around a 1 percent of GDO nonstructural deficit) during such years.Future savings would strengthen the role of the Fiscal Stabilization Fund.
A fifth area of policy reform concerns contingent fiscal liabilities. Peru must start making trans-parent budgetary provisions to deal with their eventual materialization, which would make projectedrestoration of fiscal discipline a more difficult task. This report reviews three main sources of contin-gent risk: bank loans, pension payments, and municipal debt. The Banks’ broad estimates of thepotential fiscal exposure to a systemic banking crisis is 4 percent of GDP, which is considered in thelower bound of comparable—mostly double-digit—world standards. Sound macroeconomic poli-cies, close supervision of the financial sector, and reduced exposure to external financial contagioncan minimize this risk. In addition, pension reform has generated two nonbanking debts with the
RESTORING FISCAL DISCIPLINE FOR POVERTY REDUCTION IN PERU 5

private sector, which are actually paid through annual transfers. Official transfers to social securityrepresent 0.6 percent of GDP in 2002, and conservative projections indicate they will increase toabout 1.0 percent of GDP per year during 2005–07. Pension reform should minimize this liability.Finally, registered municipal debt is not a threat to macroeconomic stability, but it is significant andexplosive, and some local governments will become insolvent and illiquid. These local governmentswill have severe difficulties assuming additional responsibilities with decentralization due to theirfinancial constraints. Nationwide, total registered debt represents a third of the correspondingnational debt (current national liabilities considered as short-term debt). In the short term, identify-ing nonsolvent municipalities and developing a plan for the gradual repayment of their registereddebt, especially on pensions, is essential before these districts assume further responsibilities underthe forthcoming decentralization process. In addition, the Fiscal Prudence and Transparency Lawshould put strict limits on new external and domestic debt, and prohibit subnational governmentsfrom acquiring contingent debts.
Finally, a sixth area concerns public debt financing. Peru must complete its deficit-financingplan by meeting its privatization targets in the nearest term, sustaining its prudent external debtmanagement strategy—including enhanced access to international capital markets—and developinga market for long-term domestic public debt, issued in soles and inflation-indexed.
Reorienting the Budget Toward Pro-Poor ExpenditureThe task of putting the economy on a sustainable, rapid, and poverty-reducing growth path must beto be carried out with the help of modern public expenditure management. Promising steps havebeen taken by Peru over the past few years. They include (a) creation of an Integrated FinancialManagement System (SIAF) in 1998; (b) strengthening of accounting institutions and procedures,compatible with world standards, applied to the entire public sector since 1999; (c) development ofa website Portal de Transparencia in 2000, which includes defense and national security spendingfor the first time starting in 2002; (d) passage of the Law of Fiscal Prudence and Transparency in1999; (e) introduction of performance management contracts for State-owned enterprises under the National Fund for Financing Government Enterprise Activity (FONAFE) in 1999; (f ) adoptionof multiple medium-term expenditure frameworks starting in 2000, based on three-year Macro-economic Frameworks and five-year Multiyear Budget (MAB) plans, and carried out through a par-ticipatory methodology for multiyear budgeting formulation starting in 2002; and (g) adoption ofbudgetary provisions for a set of Protected Social Programs (PSPs) as the main countercyclical socialpolicy starting in 2000.
The trend toward pro-poor spending and enhanced accountability and transparency seemsirreversible, but consolidating these achievements in the medium term means solving five criticalinstitutional weaknesses: (a) excessive budget rigidity, (b) an incomplete SIAF, (c) a disconnectionbetween multiyear and annual budgeting, (d) a fragile institutional framework surrounding itscountercyclical social policy, and (e) inadequate and un-user-unfriendly budget monitoring andreporting that affects public perceptions about the real degree of budget transparency.
Following a budget tracking test of the status of public expenditure management (PEM)jointly developed by the World Bank and the IMF, Peru scores low in the area of budget formula-tion, average in the area of budget execution, and high in the area of budget reporting other thanexternal. In the first area, the assessment recommends that budget classification be made fully con-sistent with the Government Financial Statistics (GFS) definition of General Government, and thequality of budget projections (especially in function and sector composition) be upgraded if socialpriorities are to be sustained in the medium term. The major constraint for budget formulation,though, is inertial expenditure. Peru ranks high among countries with the most inflexible budgetnot only in LAC, but worldwide. In addition to Brazil, India, and a few highly indebted poorcountries (HIPCs), which have above 90 percent of their total expenditure fixed for particularfunctions in 2002, Peru has, respectively, 91 percent and 86 percent of ordinary and total budgetresources assigned to inertial commitments.
6 WORLD BANK COUNTRY STUDY

Budget rigidities originate from different sources, including wage and benefits considered bythe Constitution as inalienable rights; permanent contracts hidden as nonpersonal services (no lessthan 40 percent of the total budget is allocated to such services, according to Peruvian officials’ esti-mates); an inertial payroll under artificially prolonged investment projects; earmarked transfers tomunicipalities and the private sector, such as the Vaso de Leche and Comedores Populares programs;and an earmarked use of the budget “contingency reserve” to fund the March school bonus, andJuly and December salary supplements (aguinaldos). Peru needs to reverse such a pervasive pattern.PER recommendations in this area include (a) an immediate general hiring freeze under the nonper-sonal services category accompanied by strict supervision, on a case-by-case basis, of short-termrenewal of existing temporary contracts, upon their prior revision; (b) an urgent review of presentpolicies regarding pension and wage benefits in a comprehensive civil service reform; (c) streamlin-ing of funds assigned to inefficient social programs—like Vaso de Leche and Comedores Populares; and(d) making fully transparent the use of the contingency reserve, to let it play its true role, which is tofill unpredicted in-year budget needs, thus preventing it from filling recurrent needs.
SIAF core subsystems are incomplete. The lack of a budget module, in particular, is a severehandicap. Contrary to similar systems in Latin America, Peru’s SIAF is neither a budget formula-tion tool nor a budget assignment tool, but fundamentally a virtual payment system. As a result,budget formulation and in-year modifications remain little known externally, centralized anddecided at the Ministry of Economy and Finance’s (MEF’s) discretion, and only known ex post,once they are monthly registered in SIAF. Hence, a user-friendly budget module integrated inSIAF is an urgently needed policy tool to help assess consistency of budget proposals withmacroeconomic conditions in early stages; facilitate monitoring of in-year budget modifications,consistent with inter- and intrasector budget priorities in a participatory and transparent way;and allow Congress’ legally mandated oversight of the budget. SIAF also requires a multiyearbudget submodule too; that is, one with capacity to track Government of Peru (GOP) compli-ance with multiyear budgeting priorities and facilitate production of mandated biannual reportson compliance with MAB targets. Finally, other critical missing modules are the ones on humanresources management, national assets, procurement, the national investment system, contingentliabilities risk, and regional and municipal financial management. The human resource module isessential for civil service reform. The one on national assets should have due registry of stateassets. The module on procurement, the starting point for e-government, is critical for anti-corruption efforts, the most vulnerable area of governance. The module on public investmentshould help prioritize multiyear investment plans. The module on contingent liabilities riskwould help register them and make proper budgetary provisions, while the one on municipalmanagement would prepare SIAF support for an accelerated scheme of fiscal decentralization, as future regional and municipal governments require a tailor-made SIAF, the development ofwhich should take many years.
The budget-tracking test also found that multiyear projections are disconnected from annualbudget priorities and modifications, their quality requires significant improvement, and their moni-toring requires an upgraded and regular reporting system. To such purpose, the creation of a bud-get module and refinement of the existing set of financial and physical indicators in SIAF shouldfacilitate a user-friendly tracking of pro-poor expenditure and an effective results-based control sys-tem in budget execution. Complementary external reporting of budget execution, multiyear bud-geting, and audits should be frequent, timely, and comprehensive. Regarding reporting, the SIAFsubsystem to track financial and physical performance indicators, now being developed, requires athorough conceptual review before completion, because it is a critical tool for an outcome-orientedbudget, and support from monitoring targets and performance management contracts. The presentsubsystem has too many useless and outdated indicators, and the use of the indicators is poor.
The development of new SIAF modules requires detailed prioritization and permanent train-ing. Peruvian officials have good reason to consider creating a university degree in the managementof SIAF systems. Besides, associated systems could be developed outside the SIAF, like a fiscal
RESTORING FISCAL DISCIPLINE FOR POVERTY REDUCTION IN PERU 7

cadastre, or eventually be connected to a broader e-government strategy (like e-procurement or ageo-referenced expenditure map at the district level, for targeting purposes).
These shortcomings have not prevented an important shift in the budget toward pro-poorexpenditure in Peru. In spite of the recession and resulting fiscal adjustment, the share of socialexpenditure to GDP grew from 3.9 percent of GDP in 1990 to 7.0 in 1999, and this share hasremained steadfast until 2002. The fact that the share of social expenditure to GDP has notdeclined is a positive outcome in a fiscally retrenched economy where total expenditure decreasedfrom 19 percent of GDP to 17.8 percent of GDP during 1999–2002 (about one seventh in dollarterms). Likewise, significant inter- and intrasectoral pro-poor spending reallocation began to takeplace between 2000 and 2002. The budget for defense and national security has decreased from2.9 to 2.1 percent of GDP; the budget for education, health, and social assistance has increasedfrom 5.3 to 5.6 percent of GDP; and the Seguro Social de Salud (Health Insurance, ESSALUD)expenditure (nontargeted public health insurance administration) has decreased from 1.5 to 1.3 percent of GDP. In addition, the share of poverty-reduction programs (consisting of both programs with universal coverage spending and programs based on targeted spending) in socialexpenditure increased from 57 percent in 2000 to 60 percent in 2002. Since 2000, poverty bud-geting has also included an innovative effort to protect key social programs (PSPs). This approachhas consisted of assigning global budget allocations to nonsalary current and capital spendinggrouped in 11 programs and distributed among eight social and basic infrastructure sectors. In2001, budget resources equivalent to 12.7 percent of the ordinary budget and 1.9 percent of GDPwere protected and executed.
In 2002, the government decided to change its PSPs policy from merely budget protectionwhen a downturn occurs to sustained spending floors needed to reach millennium developmentgoals. This was accompanied by improvement of their focus and monitoring mechanisms, and fulltransparency in their execution. The ongoing restructuring of PSPs includes expenditure allocationshifts in broad sector functions—education, health and sanitation, and social assistance; a reducednumber (from 11 to 6) of now core PSPs, grouped under three sectors: education (pre-primary, pri-mary, and secondary), health (collective and individual) and social assistance, a reduced budget asthe amount of aggregate earmarked expenditure to this revised set of PSP represents 1.2 percent ofGDP in 2002, down from the previous 1.9 percent of GDP in 2001 (this reduction of 0.7 percentof GDP makes room for increased budget flexibility); a set of monitoring indicators for specific pro-jects grouped under the selected PSPs; and, in a few projects, definition of some performance man-agement contracts to improve their efficiency (for example, the Integral and Mother and ChildMaternal Insurances, SIS-SMI). To introduce further flexibility, the PSP budget also includes escapeclauses to make provisions for budget underexecution or a major budgetary shortfall at the sectorfunction level; and internal reallocations from underperforming to overperforming programs or pro-jects, but maintaining global spending floors at the program and project levels. To institutionalizeand make its countercyclical social policy more transparent, Peru should enhance its de facto “vir-tual” protected budget policy following the example of Uganda. An enhanced mechanism wouldadd two major features: the development of a permanent institutional framework in charge of PSPspolicy, and the introduction of oversight capacity by subnational governments and civil society orga-nizations, and of transparent monitoring and evaluation indicators, into PSPs implementation.
Improving the Efficiency of Public Services DeliveryThe efficiency of Peruvian public expenditure is below the Latin American average for health, butabove average for education, and in relation to world averages, the results are similar. However, theseresults should be viewed with caution. Indeed, Peru’s level of efficiency in reaching health outcomesis below both the Latin American and world averages. This is particularly true in malnutrition–height,under-five mortality, and life expectancy. The range of values found suggests that Peru could andshould do much better in health outcomes. And although outcome indicators for Peru’s net primaryenrollment are on a par with other Latin American countries, and net secondary enrollment is much
8 WORLD BANK COUNTRY STUDY

above the LAC average, its educational shortcomings are too severe in terms of the low quality ofeducation services and poor teacher qualifications, especially in rural areas.
Two major sources of inefficiencies are leakages of public resources and poor targeting of socialprograms, which ultimately contribute to poor governance and a corruption-prone management.
A highly decentralized budget execution such as Peru’s raises the possibility of significantleakages in the flow of resources, thus reducing the extent to which GOP expenditure is able toproduce better outcomes. By applying an innovative Public Expenditure Tracking Survey (PETS),it is possible to show that there are substantial leakages in the resources that municipalities firstreceive under the Vaso de Leche program and later transfer to the ultimate beneficiaries throughseveral intermediaries. The actual amount received by final beneficiaries appears much lower thanthe initial amount sent from the Central Government (CG): on average only 29 cents of each dol-lar initially transferred by the CG actually reach the intended beneficiaries! Surprisingly, the surveyindicates that the leak is much higher at the bottom levels (Vaso de Leche committees and house-holds) than at the top levels (CG and municipalities leaks), which demonstrates not only signifi-cant improvements in the official channeling of resources by the SIAF/MEF, but challenges thepredominant view that local private organizations are more accountable in managing publicresources than official ones. Leakages in municipality-level transfers are compounded by the gen-eralized lack of audit controls, poor transparency, and volatility. Finally, leaks most affect thepoorest urban and provincial municipalities, and their level appears similar among districts of dif-ferent sizes and distances to the province.
Peruvian officials should pursue a twin strategy. In the short term, any effort leading toimproving supervision, accountability, and transparency of the flow of resources should be pur-sued. This includes a regular and user-friendly publication of detailed transfers to municipalities by SIAF, capacity training at the local level in SIAF reporting, proper registration of beneficiaries,and strengthened budget and auditing procedures by the Comptroller’s office. A mini-StabilizationFund for canon minero transfers could contribute to minimizing their annual volatility. In themedium term, however, authorities should consider replacing these programs with a voluntarilyadopted cash-transfer (“grants”) program, following the successful model of the Programa de Educación, Salud y Alimentación (PROGRESA) program in Mexico. Under such a scheme, grantswould be provided to mothers not only for food supplements, but also for basic education and preventive health, which, following a proper registration of beneficiaries, should also improve targeting of resources on beneficiaries at risk.
Poor targeting is another important shortcoming of the multiplicity of social programs in Peru.The general level of spending on targeted extreme poverty-reduction programs increased from 1.1 percent to 1.7 percent of GDP between 1993 and 1998, but then remained constant until2002, which appears adequate due to the fiscal situation and program inefficiencies, and despitepressures to increase it. Poor targeting, however, deviates part of these outlays toward the non-poor.Targeting rates in social programs vary tremendously. Past findings indicate that with the exceptionof the Fondo Nacional de Compensación y Desarrollo Social (FONCODES) and the ProgramaNacional de Asistencia Alimentaria (National Food Assistance Program, PRONAA), which havehad about a 50 percent success rate, most targeted social programs have had rates reaching below40 percent of the intended poorest. More recent findings on the food and nutrition programs con-firm this picture. Targeting among the three main national programs—Desayunos Escolares, Vaso deLeche, and Comedores Populares, also reflects prevailing weaknesses: during 1998–2000, DesayunosEscolares had the highest success rate at 70 percent, followed by Vaso de Leche and Comedores Popu-lares, which had lower rates of 64 and 54 percent, respectively. As a program becomes better tar-geted, the differential between its rural and urban success rates decreases: Desayunos Escolares had a lower range (77 percent compared to 56 percent) than Vaso de Leche (77 percent compared to 50 percent) and Comedores Populares (72 percent compared to 37 percent). Finally, programs oftemporary employment, like A Trabajar Urbano, have not started on the right foot, since they offertoo high a wage rate to attract workers in the poorest deciles.
RESTORING FISCAL DISCIPLINE FOR POVERTY REDUCTION IN PERU 9

Peruvian officials should make intensive use of excellent targeting tools, especially the povertymap, already in their hands. The myriad of multiple social programs in Peru should be ranked, andthose with substantial mistargeting should be redesigned, merged, or closed. Fiscal savings gener-ated from such an exercise should be used to increase coverage of more effective programs. Target-ing criteria should be made more explicit and focused on extremely poor populations. In the caseof A Trabajar Urbano, the immediate solution is to decrease the wage rate paid. A similar policy inA Trabajar Rural is not possible, since the individual income earned by a rural worker is oftenshared with other members of his or her community, and so the self-targeting mechanism does notwork in the same way as it does with urban workers. In both cases, though, authorities should beaware of the countercyclical and short-term nature of these employment-generation programs:once the economy recovers its dynamism with high rates of growth, their budget resources shouldbe phased out.
Addressing the Promises and Risks of DecentralizationIn the past decade, Peru has made irreversible progress toward redefining the role of the State, butthis agenda is unfinished. In the early-to mid-1990s, the size and scope of the public sector werereduced; the nature of government shifted from ownership and intervention to market regulationand provision of social services. However, in the mid-to-late-1990s the State reform process loststeam, and key tasks were not even initiated. Prominent among pending reforms set aside by theauthoritarian leadership of the 1990s was the decentralization of the State.
The current government has decided to reinvigorate the State modernization and decentraliza-tion agenda. This decision must be seen as part of a broader, positive trend toward democracy in theregion. However, State decentralization is pregnant with both potentialities and risks. If appropriatelycarried out, it can, indeed, increase both the efficiency of the delivery of government services and theresponsiveness of government to citizens’ needs. Nonetheless, decentralization also entails seriousmacroeconomic risks. First, CG deficits can worsen if governments are unable to reduce expendituresor increase revenues to make room to accommodate the fiscal cost of additional functions andresponsibilities transferred to subnational governments. The government may find itself decentraliz-ing both revenues and expenditures, but unable to reduce existing levels of CG spending in thosefunctions that have been decentralized. Second, attempts to eliminate rising deficits through highertaxes can fail or take longer than expected to materialize. Third, decentralization can also hamper agovernment’s ability to respond to economic shocks because it reduces central control over aggregatepublic sector revenues and expenditures. Fourth, subnational government debt policies and indebt-edness behavior can undermine overall fiscal discipline. Subnational governments may end up bor-rowing excessively in the expectation that the CG will bail them out.
In sum, decentralization has the potential to be a destabilizing factor for already deterioratedPeruvian public finances and, ultimately, for the country’s overall macroeconomic framework. TheLatin American experience suggests, moreover, that decentralization should not be carried out with-out a coherent overall strategy and without prior technical and institutional preparation at the sub-national levels of government. In the case of Peru, the fact that municipal governments are heavilydependent on central transfers justifies caution in the transfer of responsibilities to them. Takinginto account that the degree of satisfaction in the provision of public services by local governmentsappears to be low, gradualness in the transfer of functions and a sizeable effort to strengthen theadministrative capacity of subnational governments prior to the transfer of responsibilities seem tobe necessary conditions of any reasonable decentralization strategy.
Putting the process of decentralization on a sound path is a critical public policy challenge forthe Toledo Administration. While Peru’s initial efforts toward modernization and decentralizationoffer substantial promise and, for the most part, are headed in the right direction, the latent risk thatfiscal discipline may turn out to be a casualty of the decentralization process will continue to be highuntil a clear framework for intergovernmental public finances is finally enacted and enforced. Theguiding criterion for such a framework has to be the establishment of hard budget constraints for
10 WORLD BANK COUNTRY STUDY

the expenditure and—external and domestic—indebtedness decisions of subnational governments.The immediate agenda includes issues of paramount importance, such as the alternative options forintergovernmental fiscal relations, the budget and indebtedness constraints on subnational govern-ments, the possible functions and competencies to be decentralized, the characteristics and fundingsources of the future Regional Compensation Fund and Intergovernmental Fund for Decentraliza-tion, and any possible changes to the transfers scheme for municipalities. It is also imperative thatthe hard budget constraints for regional and local governments here advocated be an integral part of the future revamped Law of Fiscal Prudence and Transparency. Finally, a complete diagnosis ofthe financial status of municipalities, including its pension liabilities and other registered and non-registered debt, and a plan for both strengthening municipal tax collection and restructuring localgovernment debt, are essential before these are assigned new expenditure powers.
Upgrading the Civil ServiceCivil service reform is the missing link of the outcome- and poverty-reducing-oriented moderniza-tion of the state in Peru, and is in desperate need of a major overhaul. The past decade witnessed asevere deterioration of Peru’s civil service. Hyperinflation of the late 1980s and the beginning of the1990s sharply reduced the real earnings of civil servants. A poorly conceived downsizing of the CGwork force in the early 1990s, which, in the end, amounted to a very modest reduction in the over-all public sector, led, nonetheless, to the departure of the most capable civil servants. There is aninherited disregard for the provisions of the existing civil service law and its associated regulations.Civil servants are employed under a variety of legal regimens with a wide dispersion in salaries forsimilar tasks. The existing formal salary structure has not been revised in over a decade, so basesalaries are increased through resorting to a multiplicity of supplements and benefits in cash and inkind. With the proclamation 10 years ago of a ban on hiring into permanent positions, institutionshave resorted to hiring on a contractual basis, a process that is not subject to any required proce-dures for recruitment and selection, and that has severe fiscal implications.
All these factors have contributed to the existing legacy of a work force that is poorly prepared,poorly trained, poorly supervised, and hence of very low productivity. Consequently, there is anurgent need for a thorough reform to reestablish some semblance of control over the wage bill andto promote the creation of a more efficient government. The current civil service law has majorweaknesses that argue for its replacement by a new framework designed to promote a higher levelof efficiency in the delivery of government services.
Any initiative designed to improve the performance of government must include a major over-haul in the institutional framework that governs public sector employment and the management of its human resources. Four actions are particularly relevant. First, the creation of a Civil ServiceReform Commission should precede the establishment of an autonomous Directorate to administerthe civil service. Second, developing an SIAF module on human resource management would greatlysimplify registry of public servants and would be instrumental in the task of simplifying the remunera-tion package from the myriad of present benefits to a cash-equivalent amount. Third, introducingpilot performance contracts in the health sector seems appropriate, given its recent successful experi-ence with Seguro Materno-Infantil (Mother and Child Health Insurance, SMI), which makes it a nat-ural candidate for later mainstreaming of such practice in the rest of the public sector. Finally, a newlaw and reglamento should place emphasis on merit and specify determinants for compensation.
The education sector also faces serious problems with its civil service. There is general dissatisfac-tion with the quality of instruction and with the allocation of faculty resources among schools. TheMinistry of Education is taking steps to improve the quality of instruction in the country’s schools ofpedagogy. However, the profession continues to attract individuals whose test scores rank at the bot-tom of the distribution of students entering institutions of higher learning. Improvement in the qual-ity of instruction is likely to require a number of reforms. While the current level of salaries appears tobe more than adequate to attract a surplus of candidates with minimal qualifications, the level andearnings trajectory over time are inadequate to attract more promising individuals. In addition, both
RESTORING FISCAL DISCIPLINE FOR POVERTY REDUCTION IN PERU 11

the Ley Magisterial and the Ley General de Educación are too rigid for most forms of decentralizationand should be revised.
Reforms must focus on four aspects. On the institutional side, the current institutional morassin the education sector (financially depending on regional bodies, and normatively depending onsector ministries) should be unified under the decentralization design. On the recruiting policy, newentrants to the profession should be required to qualify by passing a rigorous examination. Success-ful candidates would be hired at a higher salary not much different from the current entry wage, butshould be able to look forward to salary increases similar to those accruing to persons with similarskills and abilities in the private sector as long as performance is evaluated and meets defined stan-dards. On the hiring levels, implementation of a new remuneration policy would be facilitated bymoving to a system of contracting of teaching personnel in place of the currently generalized systemof permanent tenure upon appointment. This would also have obvious fiscal savings. On the legalside, the new Ley del Profesorado and the Reglamento de la Ley del Profesorado should be based onteaching performance and effective attendance, rather than on a range of factors such as seniority,number of training courses attended, papers presented at professional meetings, and so forth, noneof which necessarily have any impact on the quality of teaching.
Improving Governance and Reducing CorruptionPeru’s picture in matters of governance is mixed. In the World Bank’s scoring system for governanceindicators, Peru’s scores in government effectiveness and regulatory quality have dropped significantly,even as the country moved from an authoritarian regime to one with a more vocal and active opposi-tion. The score in corruption has remained approaching the LAC average. Peru’s corruption appearsparticularly high in procurement contracts of public works. To offset such a gloomy picture, Peru’sscores in voice and accountability, political stability, and rule of law have improved, thus reflecting thepolitical opening that is taking place. Significant challenges remain in these areas, however.
Reducing corruption and improving governance requires a multipronged strategy that addressesthe various forms of corruption—from state capture to administrative corruption, enhances politicalaccountability and transparency, promotes a competitive private sector, strengthens institutionalrestraints, improves public sector management, and embraces civil society participation. It is morethan just a matter of law enforcement. The evidence in this report also identified the support of public officials for civil society oversight and merit-based civil service reform as anticorruption mech-anisms. Public officials also favor strengthening public administration through simpler administrativeprocedures. They are also in favor of the introduction of a system of checks and balances and theoversight of public sector activities by the civil society.
The government first needs to build credibility with respect to its intentions to fight corruption.In the survey, there is a significant discrepancy between users and public officials in their perceptionof the government’s commitment to fighting corruption. More than half of users, versus only 20 percent of public officials, reported that the government is not committed at all. This lack oftrust is keenly felt among low-income users of public services. Conversely, the fact that a high pro-portion of public officials report preparedness in the public sector to fight corruption is an encour-aging sign. The government needs to make the fight against corruption a top priority. The churchand the media should be potential contributors in the fight.
As a complement, the government needs to continue enhancing transparency, especially throughSIAF. Transparency is synonymous with openness. Introducing it requires that the government pro-vide the public—civil society organizations, the media, or anyone else who is interested—sufficientinformation about the budget and project activities, to serve as an effective check on abuses by gov-ernment and public officials. Enacting a Freedom of Information Law that requires governments toprovide information to the public unless there is a valid reason for the information to remain secret(such as a threat to national security) would be welcome.
The government needs to be accountable and reduce the potential gains for “captor” firmsand politicians alike. Government officials should consider issuing an Ethics Code Law for public
12 WORLD BANK COUNTRY STUDY

service, with clear prohibitions of conflicts of interest, and effective enforcement of its regulationson both political and civil service positions. This is an essential corruption-deterrence tool. Theyshould also demand transparency of the financing of political parties and campaigns, making clearthe links, both explicit and implicit, between politicians and the interests that support them. Man-dated and publicized detailed reports of the finances of all political organizations, and identificationof contributors and beneficiaries, are tools to reduce the sources of state capture. Another possiblemeasure would include banning the use of State resources for incumbents’ political campaigns,limiting the amount that can be spent on political campaigns, providing public funding, and pro-hibiting certain types of entities from contributing to political campaigns.
The government needs to promote a sound business environment by examining and simplify-ing the number of regulations and inspections. Clear rules defining when a regulation is appropri-ate, and sound analysis of the impact of regulations on firms accompanied by a constant dialoguewith the business community, should be required to make regulatory reform sustainable.
Finally, a high-level steering committee, supported by a professional secretariat, can help bringtogether representatives of government bodies, both central and local, to develop the specificaction plans to implement the governance strategy. By explicitly including representatives fromoutside government, such committees can further build credibility while mobilizing an importantally for reducing corruption.
Fine-Tuning Mining Taxation and Environmental PoliciesGiven its size in the economy and social network, the mining sector is essential for public finance,structural reform, and governance in Peru. The mining industry generates more than 45 percent of export earnings and contributes to 5 to 7 percent of GDP. It employs over one-quarter millionpeople, and its tax exemptions account for about 0.4 percent of GDP, which is nonnegligible. Keystructural and transparency issues have negatively affected the competitiveness and attractiveness ofmining activities with foreign investors and local society, particularly with the local communitiessince the late 1990s. The mining reform brought about the effective opening of the sector to directforeign investment and the shift of the role of the State from owner–operator to lessor–regulator.This was accomplished by reforming the legal and institutional framework, privatizing the miningstate-owned operations, and initiating an environmental management program.
While the first three reforms, legal, institutional, and privatization, have been widely consid-ered successful, the sectoral approach of the environmental reform has proven to be controversialand is considered in need of adjustment. The perception of inadequate environmental control andof widespread conflict between mining companies and local populations is endangering the contri-bution and stability of a key sector of Peru’s economy. In addition, the highly centralized and nontransparent nature of transfers from the CG has created an issue of credibility with the localpopulations. Although the Mining Law establishes that 40 percent of the income tax generated bythe mining operations—the canon minero—should go back to the municipalities (20 percent) andthe regions (20 percent), and the report’s findings show that its overall redistribution has been pro-gressive, there is a widespread perception that the local communities are not benefiting from it.Furthermore, the environmental information that the Ministry of Energy and Mines (MEM) hasreceived from the mining companies has not been adequately released to the public, resulting in afeeling of mistrust against mining activities.
Loss of competitiveness due to the taxation system is also an issue. To the extent that it affectsrates of return on investment, the effective tax rate in a given country is a major factor influencingthe decision of foreign investors about where to invest their capital. The report shows empiricalevidence that supports the view that the current Peruvian mining tax system is among the moreglobally competitive systems in the world, and provides an appropriate balance between investorneeds and government needs. However, there is room for improvement.
Addressing major issues in taxation, environmental regulations, and the transparency of canonminero transfers is very important for preserving international competitiveness. Main tax policy
RESTORING FISCAL DISCIPLINE FOR POVERTY REDUCTION IN PERU 13

changes proposed are (a) introducing a 3-percent royalty tax combined with the elimination ofimport duties and modifications to worker participation; (b) adjusting by a premium increase of 5 percent all future stability agreements; (c) extending the carry-loss forward time limit beyond five years; (d) enhancing the system to register tax deduction of mine contributions to local com-munities and infrastructure; and (e) publishing canon minero monthly transfers to municipalities inSIAF, while providing training at the local level. Agreements on roles and responsibilities in theenvironmental provisions are needed, accompanied by a new regulatory framework of environmen-tal management, a new designated national authority with no conflicting interests and integratedwith regional and local authorities; and with local participation—nongovernmental organizations(NGOs) included—in local environmental monitoring and consultation mechanisms, to allowthem to protect community interests. Given the volatility of fiscal transfers, the creation of smallmining stabilization funds to offset temporary declines in fiscal revenue, and simulating the suc-cessful experience of the Ancash Model, are not to be excluded.
Assembling All the Pieces of the AgendaPeru’s policymakers are well aware of the difficult fiscal situation and the need for discipline. The agenda described above is large and requires prioritization and sequencing, possibly startingwith tax reform and a modern and institutionalized pro-poor budgeting, followed by efficiencyimprovements in social programs and civil service reform—both critical inputs to consolidateexpenditure management reform—and then completed by the decentralization, governance, and anticorruption programs, and by fine-tuned environment and taxation policies in the miningsector. Short-lived aggregate demand boosts, like those advocated by populism, will only delayneeded reforms. Consistent choices have to be made and some efforts will likely have to be post-poned. Most of the PER’s agenda, however, is feasible provided that there is not only commitmentof the Executive, but also support in the Legislature. Peruvian officials are well aware of this. The2001 budget presentation to Congress broadly covered each of the three aspects of public expendi-ture performance. It singled out the paramount need to restore fiscal discipline to preserve pricestability, to readjust the pattern of expenditures toward priority social areas, and to improve servicedelivery with efficiency gains. This report argues that for fiscal policy to become a powerful tool forPeru’s development, designing an outcome-managed, poverty-oriented, and consensus-built bud-geting strategy is necessary. Both the World Bank and the IDB are ready to continue assistingauthorities in marshalling such efforts.
14 WORLD BANK COUNTRY STUDY

At the onset of the new century, Peru faces daunting fiscal challenges due to a combination of adverseexternal shocks, expansive fiscal policies, elections, and other unfavorable domestic developments accom-panying the transition to the post-Fujimori legacy. During the early-to-mid-1990s, volatile and pro-cyclical expenditure accompanying good times made the country’s response to negative shocks moredifficult to manage and vulnerable to a prolonged slowdown, like the ones that have occurred since theend of the decade. Since 1998, the fiscal stance has deteriorated, with successive negative primarydeficits, in part due to a resilient decline in tax revenue, which reached a decade-low 11.9 percent ofGDP in 2001. The ensuing combined fiscal deficit significantly increased from 0.4 percent of GDP in1997 to 3.2 percent of GDP in 2000, only to be slightly reduced to an estimated 2.5 percent of GDP in2001. Rigid and expansionary expenditure has also undermined fiscal stability. Ending privatizationproceeds and high and dollarized public debt offers limited room for financing deficits in the years to come. The prolonged economic slowdown and political uncertainty resulting from external anddomestic factors, including populism, also put additional stress on the fiscal balances. The fiscal rulesenshrined in the Fiscal Prudence and Transparency Law of 1999 have not been fully met. In any case,they are no substitute for sound policy, and require thorough revamping before they become a tool forconsolidating credibility. This chapter analyzes Peru’s main fiscal challenges and vulnerabilities withrespect to restoring fiscal discipline, including tax policy measures and new rules to be considered in arevamped Law.
Long-Run Fiscal TrendsLong-run trends in Peruvian fiscal policy can be broadly split into two contrasting periods: beforeand after the 1990s.1 The average non-financial public sector (NFPS) fiscal deficit was a staggering5.4 percent of GDP during 1970–90, and a much more moderate 2.4 percent of GDP in the1990s. Such outcomes resulted from long periods of fiscal expansion, followed by increasingly
II
PERU’S FISCAL CHALLENGESAND VULNERABILITIES
15
1. This section mainly draws from Oliva (2002).

shorter periods of fiscal adjustment, particularly before the early 1990s. The main component ofthe deficit was the Central Government (CG) imbalance, which represented about three fourths ofthe average NFPS deficit. The first period reflected high deficits resulting from persistent macro-economic disorders, negative primary surpluses with either short-lived or half-hearted efforts at fiscal adjustment. The lower deficits of the second period came from continuous primary surplusesthat became the norm rather than the exception (Figure 2.1).
The impact of a severely deteriorated economy during 1970–90 left a long-lasting memoryamong Peruvians about the paramount need to preserve stabilization. As GDP growth deterioratedafter 1975, the tax ratio ranged from 8 to 16 percent of GDP, with the most striking declineoccurring throughout the late 1980s, reflecting the hyperinflation crisis (Figure 2.2). As a result,the average fiscal deficit increased to 6.0 percent of GDP and stayed high until the end of thedecade. Such high deficits were financed by resorting to either domestic financing, leading tohyperinflation levels in the late 1980s, or to huge increases in external indebtedness, with the ratioof public external debt to GDP increasing from about 14 percent in the mid-1970s to over 56 per-cent in the late 1980s (Table 2.1). The governments’ heavy reliance on debt led to an explosive ris-ing share of interest payments of total CG expenditure from 5 percent in 1970 to 40 percent in
16 WORLD BANK COUNTRY STUDY
FIGURE 2.1: NFPS FISCAL AND PRIMARY BALANCES(% of GDP)
-12%
-8%
-4%
0%
4%
8%
1970 1975 1980 1985 1990 1995 2000Fiscal balance Primary balance
Source: MEF, IMF and World Bank staff estimates.
FIGURE 2.2: TAX REVENUE COMPOSITION, 1970–2001Percent of GDP
0%2%4%6%8%
10%12%14%16%18%
1970 1975 1980 1985 1990 1995 2000
Income Imports ISC IGV Other
Source: MEF, IMF and World Bank staff estimates.

1990. Only after 1990 was the share of interest payments dramatically reduced, following therestoration of normal relations between Peru and the international financial community, promptpayment of arrears to multilateral institutions, and debt restructuring agreements with Paris Clublenders, and other bilateral and private creditors.2 By 2001, the share of interest payments of totalexpenditure had been reduced to 12 percent (Table SA.4).
Long-run changes in the tax revenue structure are relevant. The three most important tax categories3 were the income tax, the general sales tax (VAT), and the excise tax (or selective tax onconsumption, ISC) (Figure 2.2). Four subperiods can be identified according to which of these threecategories dominates. In the first period (1970–75), the income tax matched the VAT; in the secondperiod (1975–85), it was the VAT that played the leading role; in the third period (1985–93) theISC prevailed; and in the fourth period (1994–2000), the VAT recovered its major significance. The declining trend of the income tax—which fell from a dominant share of 35 percent in 1970 to23 percent in 2000—and the exceptional major role that the excise tax played during 1984–92—were the outcome of the excessive number of income tax and VAT deductions and exemptions, andthe serious deficiencies in tax administration.
Long-run trends in public expenditure are determined by two structural factors: the role of the public sector in the economy, and output performance. Three subperiods can be distin-guished. In the first one (1970–78), total expenditure exhibited an increasing trend, rising from15 percent to about 20 percent of GDP, as explained by the steady expansion of the role of theState in the economy during the Velasco government and a strong economic expansion.4 Theaverage ratio of public investment to total investment stood at a high 27.0 percent5 (Paredes andSachs 1991). The second subperiod (1979–91) featured the opposite trend—that is, CG expen-diture declined as a share of GDP, which reflected the severe deterioration of tax collection andthe economy. The third subperiod (1991–2001) reverted to an accelerated expenditure expan-sion: from the deep trough of 14.5 percent of GDP in 1991, CG expenditure increased to anaverage of 17.6 percent of GDP during 1999–2001, close to the high levels reached during theera of strong state intervention, pushed by current spending rather than by capital investment(Table SA.5).
RESTORING FISCAL DISCIPLINE FOR POVERTY REDUCTION IN PERU 17
2. Relations between Peru and the international financial community deteriorated throughout the 1980s.According to Larrain and Sachs (1991), “Peru first partially suspended its debt service in 1983, but the magni-tude of the suspension was small. In 1984, renegotiations failed and the country started to accumulate moresignificant arrears. These increased dramatically after 1985, when President Alan Garcia announced the govern-ment’s unilateral decision to limit the service of foreign debt to 10 percent of export revenues, a restriction thatwould apply in principle to all foreign creditors.”
3. Taxes on foreign trade transactions were excluded from the comparison.4. Peru’s economy grew an average annual rate of 5.5 percent between 1969 and 1975 (Table 2.1).5. Compare with the value of the same indicator in a recent period (1999–2001), which was just 18 percent
(Table SA.2). The difference was the result, of course, of the privatization in the 1990s of about 80 percent ofthe large number of State enterprises that the Velasco government bequeathed to its successors.
TABLE 2.1: KEY MACROECONOMIC VARIABLES 1969–89
Fiscal Balance Average Inflation Public External Period (% GDP) Rate (%) GDP Growth (%) Debt/GDP (%)
1969–75 −3.9 10.6 5.5 14.11976–79 −6.8 48.6 0.7 32.31980–85 −6.0 94.2 0.5 41.51986–89 −5.9 445.8 −1.5 56.2
Source: World Bank staff estimates based on MEF and IMF data.

Fiscal variables were highly procyclical before and during the 1990s. Regression analysis overthe entire period shows that all tax and expenditure categories exhibit an almost unitary elasticitywith respect to GDP (Table 2.2); that is, they were highly procyclical.6 Most fiscal variables alsohave significant correlation coefficients (above 0.5) with the growth rate (Arias and others 2000),and the cyclical components of the primary balance and GDP growth are almost perfectly corre-lated (Figure 2.3).
Fiscal variables were extremely volatile in both periods. The volatility of fiscal variables is associ-ated to Peru’s growth rate volatility (measured by the standard deviation). In the 1990s, it was 33 percent higher than its average for Latin America and the Caribbean (LAC), itself twice as high as in industrial economies (De Ferranti and others 2000). Unstable international export prices andterms of trade, financial shocks, and limited openness in the financial system explain GDP growthvolatility. The volatility of fiscal variables, however, appears much higher than the one for GDPgrowth during 1970–1996: almost six times in the case of tax revenues, five times in the case of pub-lic salaries and transfers, more than seven times in the case of capital investments, and 11 times in the case of fiscal deficits (Figure 2.4). In the 1990s, tax revenue volatility is explained by continuouschanges to tax policy and administration, the external environment,7 the legacy of hyperinflation ofthe late 1980s, and elections in the late 1990s. For its part, public expenditure volatility is explainedby erratic policies affecting capital investment, debt payments, the public payroll, and transfers: Itreflects the continuous use of capital outlays as the typical procyclical adjustment variable (elasticity
18 WORLD BANK COUNTRY STUDY
6. Regressions are estimated with a simple ordinary least squares (OLS) model: nominal revenue andexpenditure from each category was the dependent variable and nominal GDP was the explanatory variable.Variables for 1970–2000 were in logarithms and adjusted by a first-order autocorrelation coefficient to takeinto account serial autocorrelation. R-square exceeded 0.99 and the t-statistics indicated that the coefficientswere different from zero at a significance level of 99 percent.
7. Tax revenue volatility originates in the external sector in a twofold sense: while during 1970–90 theshare of export taxes on total revenue was significant, which made tax collection vulnerable to Peruvian com-modity-export prices in the world markets, in the 1990s, the Peruvian economy became sensitive to capitalinflows surging from the opening of the capital account.
TABLE 2.2: ELASTICITY TO GDP, 1970–2000
Variable Estimated Coefficient
Total tax revenues 0.998Income tax 0.972Import tax (tariffs) 0.972Total VAT 1.007
Internal VAT 0.999Imports VAT 1.024
Total ISC 1.010Gasoline ISC 1.032Other ISC 0.992
Total non-financial expend. 0.962Current 0.965
Wage and salaries 0.926Goods and services 0.995Transfers 1.001
Capital 0.944Investments 0.971
Source: MEF, IMF and World Bank staff estimates.

of almost 2), the high variability of debt interest flows (elasticity of 7.1), and the swinging patterns ofwage policy (it had an elasticity of −1.7) (Table 2.3).
The biggest policy mistake (and lesson) of the early 1990s is not to have taken the opportunityto save the transitory additional revenue generated with the economic boom. Since 1993, strongcapital inflows dominated Peru’s economic performance and brought about a strong economicboom. During 1993–97, GDP grew at an average annual rate of 7.0 percent. Instead of developinga countercyclical fiscal policy, the expansive fiscal stance adopted magnified the boom and increasedthe risks associated with it. Hence, the overall fiscal deficit increased to 3.0 percent of GDP in 1995,prompting the current account deficit in the balance of payments to widen from 5.7 percent in1994 to 7.7 percent of GDP in 1995, which made the country’s external position more vulnerable.In 1996, the government had no choice but to undertake a severe fiscal adjustment: the fiscal deficit
RESTORING FISCAL DISCIPLINE FOR POVERTY REDUCTION IN PERU 19
FIGURE 2.3: PROCYCLICAL FISCAL STANCE(billions of 1994 soles)
-12
-7
-2
3
8
13
1970 1975 1980 1985 1990 1995 20 00
cyclical component of primary balance
cyclical component of output
Source: World Bank staff estimates.
FIGURE 2.4: VOLATILITY IN FISCAL VARIABLES
0.2
0.4
0.6
0.8
1.0
3 5 7 9 11 13 15
Relative Volatility*
Ab
solu
te V
ola
tilit
y
CG Deficit
NFPS
MTK
VATW
Y
TIN
TR - tax revenue VAT - value addedYT - income tax W - wages expenditureMT - import tax IN - interest expenditure KX - capital expenditure*Relative is ratio of standard deviations wrt GDPSource: World Bank staff estimates

was reduced to 1.1 percent of GDP in 1996, and to an average of 0.3 percent of GDP during1997–98, a situation of virtual balance.
The Current Fiscal Disequilibria, 1999–2001In the late 1990s, fiscal difficulties originated from adverse external developments, but were lateraccompanied by expansionary domestic policies. Financial contagion hit the Peruvian economy inmid-1998 as foreign banks drastically curtailed the availability of credit lines to the Peruvian banksin the wake of the Russian crisis of August 1998. The turmoil also affected the stock market,resulting in portfolio outflows and a sharp drop in stock prices. The reduction of foreign creditlines to the Peruvian banks was especially deleterious, as the banks had relied heavily on them tofinance the 1993–97 credit boom. The ensuing credit crunch was a major blow for an economythat was barely recovering from the effects of another shock: the El Niño phenomenon, whichstruck in the first half of the year. The capital outflows episode thus came to a close, and the well-known vicious circle of credit reduction, decline in output and demand, lower sales, rising diffi-culties for firms in servicing their debts, deterioration of bank loan portfolios, and further creditreduction, set in. In 1998, the economy entered into a recession, with private investment signifi-cantly falling, both in real terms and as a percentage of GDP. Declining economic activity led tolower tax revenue and public expenditure, which also deepened the economic contraction. As aresult, the overall fiscal deficit increased to an average of 2.9 percent of GDP during 1999–2001.Three domestic reasons also contributed to this outcome. On the expenditure front, the politicalbusiness cycle deteriorated the fiscal accounts, as in the run-up to the 2000 presidential elections,the CG expanded current noninterest expenditures from 11.8 percent of GDP in 1998 to 12.7percent of GDP in 2000. On the revenue side, the strong decline in tax revenue from an average13.8 percent of GDP during 1995–97 to 12.3 percent during 1999–2001 was mainly associatednot with the cycle, because the deviation of the cyclically adjusted balance with respect to theobserved primary balance was small, which would suggest that the effect of cyclical factors was
20 WORLD BANK COUNTRY STUDY
TABLE 2.3: ELASTICITIES AND GROWTH VOLATILITIES FOR PERU (1990–2000)a
Relative to % of Total Absolute Growth Revenue/Volatility Volatilityb Expenditure Elasticity t-ratio
GDP 5.0 1.0 100.0Central Government
Revenue 8.3 1.7 100.0 1.6 15.3Expenditure 15.7 3.2 100.0 1.0 5.5Current Revenue 7.9 1.6 98.8 1.5 14.5Tax Revenue 8.0 1.6 87.8 1.4 11.6Non-Financial Expenditure 16.8 3.4 80.6 1.7 14.5Current Expenditure 14.8 3.0 61.9 1.7 13.0Capital Expenditure 32.0 6.4 18.7 1.9 3.6Interest Expenditure 27.2 5.5 19.4 7.1 3.9Wages 16.4 3.3 17.0 −1.7 −5.3Subsidies and Current Transfers 10.2 2.1 31.8 1.2 11.7Fiscal Balance 13.6 2.7Primary Balance 20.3 4.1
a. Volatilities are computed as standard deviations over a 10-year period in annual percentage rates of growth.b. Volatility in the rate of growth of the fiscal variable divided by GDP growth volatility.
Source: World Bank staff estimates based on MEF and IMF data.

small, but rather with a structural shift in tax revenue behavior caused by frequent changes to thetax regime.8
Real revenue decreased and real expenditure increased. Fiscal vulnerability becomes moreapparent when tax revenue and CG expenditure are considered in real terms. In 1999, tax rev-enue fell to pre-1995 levels (below 12.5 percent), while expenditure rose considerably (about 19 percent of GDP). As a result, the CG (and combined General Government) primary balancehas been negative since 1999, and fiscal deficits have surged (Figure 2.5). An increased—mainlyshort and domestic—public debt (as a percentage of GDP from 42.7 percent in 1998 to about46.5 percent in 2001) and privatization receipts financed the deficit. Barely 8 percent of publicdebt is short term, and prospects for improving public debt ratios in the medium term are favor-able. However, public debt is exposed to currency risk. Debt service, which already increasedfrom 3 percent of GDP in 1998 to a projected 3.8 percent of GDP in 2002, will contribute totightening scarce resources in a shrinking budget. Had Peru kept government tax and expendi-ture constant in real terms during 1998–2001, it would have preserved a fiscal deficit below 1 percent of GDP.
Peru did not fully comply with its Fiscal Prudence and Transparency Law of 1999. The Lawestablished a set of procedural and numerical fiscal rules (Box 2.1), and established five numericaltargets for (a) the overall deficit; (b) the difference between the inflation rate and the annualgrowth rate of consolidated General Government’s non-financial expenditures; (c) the total debtincrease of the non-financial public sector; (d) the General Government’s non-financial expendi-tures during the first seven months of an election year9 as a percentage of budgeted non-financialexpenditures of the General Government for the entire year; and (e) the overall deficit in the firsthalf of each election year as a percentage of the budgeted deficit for the year. Government compli-ance with numerical targets was mixed, but the main target referring to the overall deficit was not
RESTORING FISCAL DISCIPLINE FOR POVERTY REDUCTION IN PERU 21
8. In a simple framework where tax revenues are a function of income, the cyclical effect can be seen as amovement along the revenue curve in response to a lower level of income. The deterioration of the tax sys-tem, by contrast, should be seen as a downward shift of the entire tax revenue curve, entailing lower revenuesfor any given level of income than in the situation prior to the deterioration. Our quantitative estimates indi-cate that the effect of the business cycle on the primary deficit during 1999–2001 was a worsening of just 0.1 to 0.2 percent of GDP.
9. Due to well-known political events in Peru, both 2000 and 2001 turned out to be election years.
FIGURE 2.5: FISCAL TRENDS OVER TIME
0.0
0.51.0
1.52.02.5
3.0
3.54.0
4.5
1991 1992 1993 1994 1995 1996 1997 1998 1999 2000 2001
% G
DP
8
10
12
14
16
18
20
Bln
s 19
94 S
ole
s
CG Deficit, LHS GG Deficit, LHSReal CG revenue Real CG expenditure
Source: World Bank staff estimates based on MEF and IMF

met, and the Law was suspended in December 2001. Although a case could be made that this wasdue to revenue-growth slowdown-related factors beyond the control of Peruvian officials, the factis that President Fujimori’s late Administration weakened the fiscal balances with new tax exemp-tions and electoral spending. In addition, the increase of non-financial expenditures in 2000 and2001 built on their already high level reached in 1999.10
The present level of public debt needs to be reduced to more sustainable levels. Three years ina row of fiscal disequilibrium has led to an increase in public indebtedness and a reduction of long-term public savings. The accumulated deficit during 1999–2001 amounted to 8.8 percent of GDP.Its financing came from domestic credit (4.6 percent), external credit (2.0 percent), and depletionof privatization proceeds (2.2 percent). The stock of total public debt increased from an alreadyhigh 42.7 percent of GDP in 1998 to 45.8 percent of GDP at the end of 2001. While the net pub-lic external debt ratio increased only slightly,11 the domestic public debt ratio rose from 6.3 percentof GDP to 9.8 percent of GDP. (All domestic debt is in U.S. dollars.) External debt representsaround 70 percent of total public debt and has moderate risk, because virtually all of it is longterm. However, its service rapidly increased from 3 to 4 percent of GDP between 1998 and 2002,amounting to 23 percent of total expenditure in 2002, which is a considerable burden on tight fis-cal balances. Two additional vulnerabilities are the foreign-currency risk exposure of the domesticdebt and the rollover risk to changes in foreign investor confidence. Peru reopened its access tointernational markets with a US$500 million, 10-year bond placement combined with a retirementof Brady Bonds amounting to US$930 million in 2002, which lowered its debt servicing costs,although at the expense of a shorter maturity. Given the low tax revenue situation and expenditurepressures, Peru requires not only a fiscal adjustment, but also a prudent debt management strategy.
22 WORLD BANK COUNTRY STUDY
BOX 2.1: THE FISCAL PRUDENCE AND TRANSPARENCY LAW
The Fiscal Prudence and Transparency Law was approved in December 1999 (Law No. 27245) and its regulationsissued in April 2000 (Supreme Decree No. 039-2000-EF). It was suspended in December 2001 (Law No. 27577).The Fiscal Stabilization Fund was slightly amended through the 2002 Budget Law (Law No. 27573), which hasthree components:
Numerical rules include (a) a zero fiscal deficit in general (over the cycle), but below 2 percent of GDP in 2000,1.5 percent in 2001, and 1 percent in 2002; (b) an increase of the non-financial general government spendingbelow 2 percent in real terms; (c) electoral expenditure ceilings on the non-financial expenditure below 60 per-cent in the first seven months, and a public sector deficit below 50 percent in the first semester. These ruleshave two exceptions allowing for a fiscal deficit below 2 percent of GDP: one for emergency situations andanother for recessions.
Procedural rules require the introduction of transparency criteria established in the IMF Code of Fiscal transparencyfrom 2002, including (a) a Transparency Decree of Acceso Ciudadano, detailing periodic information to be pub-lished in the Portal de Transparencia Económica; (b) a multiyear budgeting framework; (c) a mandated pre-electionfiscal report; (d) an annual review of contingent fiscal risks and tax expenditure to be published in the annual bud-get; and (e) a quarterly report on budget expansions and their implication over the macroeconomic framework.
The Fiscal Stabilization Fund was created from 75 percent of privatization proceeds, 50 percent of concessions,and excess revenue (above 0.3 percent its average of the past the years). Its resources should be mainly dedicatedto poverty-alleviation programs, and activated when current revenue is at least 0.3 percent of GDP below its aver-age in the last three years.
10. In terms of GDP, combined general government non-financial expenditures in 1999 were the highestfor the entire decade of the 1990s (18.9 percent of GDP).
11. From 34.7 percent of GDP in March of 1999 to 35.1 percent in December 2001.

The Macroeconomic Consistent Expenditure Envelope, 2002–03The medium-term outlook for the economy is favorable. Since the focus of this chapter is on analyz-ing expenditure trends, the starting point for such analysis is the determination of an aggregate levelof spending that is consistent with medium-term macroeconomic objectives (that is, a sustainablefiscal deficit and public debt ratio) (Table 2.4). A base-case scenario assumes that real growth ofabout 4 percent a year and low inflation inside the 2 to 3 percent range a year would be achieved onthe basis of the recovery of the mining sector, increased productivity, and increased private sectorinvestment and capital inflows attracted by sound macroeconomic policies, political stability, and theprivatization program. It also assumes the combination of an increased export capacity, continuousimplementation of structural reforms, a managed floating exchange rate regime, and a successful fis-cal adjustment, supported by the IMF program. Mining production should benefit from the firstfull-year operation of the Antamina project. Structural change should lead to completion of the pri-vatization program and improved regulations of private sector activities, developing public sectormodernization and decentralization, strengthening financial supervision, and developing pensionand social sector reform policies. In sum, under a low inflation and moderate growth scenario, pre-sent fiscal imbalances are expected to be gradually corrected provided the Government of Peru(GOP) adopts an urgent tax reform; cuts unnecessary outlays; protects expenditure shifted towardsocial priority needs; minimizes the cost of potentially significant contingent liabilities, like thosefrom pensions, and maintains a prudent debt management strategy.
This macroeconomic scenario is entirely consistent in the short term with the stand-by arrange-ment agreed with the IMF. However, significant constraints remain, including limited policy credi-bility following a long period of political instability and a poor GOP track record in complying withfiscal rules; policy uncertainty due to continuous changes in the tax regime and regulations thataffect prospects for attracting foreign investment; fiscal adjustment delays due to Congress inherit-ing populist-oriented and spending-prone fiscal decentralization measures; weak domestic consensusabout further pension reform and the GOP’s privatization plans; and a poor rule of law due to aninefficient judicial system and poorly managed local government institutions.
Recommendations:Authorities should:
■ Redouble efforts to build credibility before the Law is revamped■ Offset several measures introduced by the transition government that had negative implica-
tions for the fiscal balances with revenue resulting from tax reform■ Set rules to prevent decentralization from increasing transfers to regional and local govern-
ments that are not offset by similar improvements in revenue collection■ Stabilize the regulatory framework for private sector activities and strengthen the rule of law
to diminish uncertainty that erodes the authority of rules and institutions that are essentialto promote domestic and attract foreign investment.
Peru’s most pressing fiscal challenge is to obtain primary surpluses, because negative primaryfiscal balances are unsustainable.
Recommendations:■ In the short term, under the base case, the mid-term revised adjustment program aims at a
gradual reduction in the combined fiscal deficit to 2.3 percent in 2002 and 1.9 percent ofGDP in 2003. Most of the adjustment would be achieved through cuts in public spending,while reorienting and protecting priority social programs; and tax reform, combining taxpolicy measures, changes to the exemptions regime, and an improved tax administration(Box 2.2; Table 2.5). This scenario also assumes that the privatization of energy enterprisesand the granting of a few concessions will materialize during 2002–03, averaging a minimum
RESTORING FISCAL DISCIPLINE FOR POVERTY REDUCTION IN PERU 23

24 WORLD BANK COUNTRY STUDYT
ABL
E2.
4:K
EYEC
ON
OM
ICIN
DIC
AT
OR
S
1996
1997
1998
1999
2000
2001
p20
02e
2003
e
Rea
l GD
P G
row
th2.
56.
7−0
.50.
93.
10.
23.
73.
5–4.
0In
flatio
n (%
CPI
ave
rage
)11
.58.
57.
33.
53.
82.
02.
52–
3
Key
Mac
ro I
ndic
ato
rs (
% o
f GD
P)
Gro
ss D
omes
tic F
ixed
Inve
stm
ent
22.5
23.8
23.5
21.7
20.1
18.3
18.8
19.2
Gov
ernm
ent
inve
stm
ent
4.3
4.4
4.5
4.8
4.0
3.2
3.1
3.0
Priv
ate
inve
stm
ent
18.2
19.4
19.0
16.8
16.2
15.1
15.7
16.4
Gro
ss N
atio
nal S
avin
gs16
.418
.217
.318
.017
.316
.516
.516
.7C
urre
nt A
ccou
nt B
alan
ce−6
.1−5
.2−6
.4−3
.7−3
.0−2
.1−2
.3−2
.5
Cen
tral
Go
vern
men
t (%
of G
DP
)C
urre
nt R
even
ue15
.715
.615
.714
.514
.714
.113
.914
.1T
ax r
even
ue13
.914
.113
.812
.512
.011
.911
.912
.4N
onta
x re
venu
e1.
81.
51.
92.
02.
72.
22.
01.
7C
urre
nt E
xpen
ditu
re13
.913
.113
.714
.614
.914
.714
.414
.1In
tere
st2.
41.
81.
92.
12.
22.
12.
02.
2In
tere
st o
n ex
tern
al d
ebt
2.3
1.7
1.8
2.0
1.9
1.9
1.7
1.9
Inte
rest
on
dom
estic
deb
t0.
10.
10.
10.
10.
30.
20.
30.
3C
urre
nt T
rans
fers
2.9
3.1
2.0
2.8
2.3
2.3
2.4
2.4
Con
sum
ptio
n8.
68.
39.
89.
710
.410
.310
.09.
5Pr
imar
y Ba
lanc
e1.
00.
90.
8−1
.0−0
.5−0
.6−0
.40.
3O
vera
ll Ba
lanc
e−1
.4−0
.8−1
.1−3
.1−2
.7−2
.8−2
.3−1
.9
NF
PS
Bal
ance
(%
of G
DP
)−1
.0−0
.1−0
.8−3
.1−3
.2−2
.5−2
.3−1
.9Pr
ivat
izat
ion
3.9
0.9
0.5
0.8
0.8
0.6
0.6
0.5
NF
PS
Deb
tPu
blic
sec
tor
debt
/GD
P45
.231
.942
.748
.045
.946
.544
.940
.9Pu
blic
sec
t. de
bt s
ervi
ce/G
DP
4.1
3.3
3.4
3.9
3.8
3.9
3.8
4.5
Mem
o:G
DP
Nom
inal
(m
illio
ns N
S)13
6,92
915
7,27
416
6,51
417
4,71
918
6,75
618
9,53
220
0,08
313
,205
Not
e:T
his
tabl
e ha
s m
inor
diff
eren
ces
with
Tab
le S
A.5
, bas
ed o
n C
entr
al B
ank
data
, and
Tab
les
1–6
in A
nnex
A,
base
d on
pre
limin
ary
data
. Tax
rev
enue
is n
et o
f tax
on
asse
ts o
f pub
lic e
nter
pris
es a
nd o
f CG
-IES
paym
ents
.
Sour
ce:
Wor
ld B
ank
staf
f est
imat
es.

RESTORING FISCAL DISCIPLINE FOR POVERTY REDUCTION IN PERU 25
BOX 2.2: TAX REGIME AND PROPOSED CHANGES
Income tax on individuals. This tax is levied on four classes of income: real estate, other capital assets, self-employed labor, and wage labor. The maximum marginal tax rate for net income greater than 54 Unidades deIngreso Tributario (1 UIT = about US$828) is 30 percent. The marginal rate for net income between 7 UITs and54 UITs is 15 percent. Labor income below 7 UITs is exempted. Dividends are not taxed. The interest incomefrom savings with the national financial system and capital gains from the sale of securities and real estate areexempted. During 1997–2000, revenue from the income tax on individuals was, on average, 1.0 percent of GDP(Kopits and others 2000; Schenone 2001). Over 75 percent of this revenue comes from wage-earners’ incomeand only about 10 percent from the self-employed. This is tantamount to the existence of a high degree of hori-zontal inequity. The situation is worsened by underreporting of income from independent professionals’ ser-vices and rents from real estate. The considerable number of exemptions also blunts the intended progressivityof this tax category, which detracts from the system’s claim to vertical equity. The exemption on interestincome from bank deposits is 0.1 percent of GDP (Kopits and others 2000; and Schenone 2001).
Recommendations: (a) Elimination of exemptions on all forms of capital gains including the sale of securities andreal estate, on interest income, and other income from financial assets; (b) introduction of a more gradual structure ofmarginal tax rates (for example, with three rates, 10, 20, and 30 percent) instead of the current two-rate structure; and(c) introduction of presumptive-income methods for self-employed taxpayers.
Income tax on corporate income. The taxable base for the corporate income tax is the worldwide incomeof enterprises legally regarded as domiciled in Peru. The rate is 20 percent. Exemptions are numerous andinclude interest income from savings with the national financial system; interest income from registered instru-ments issued by corporations; capital gains from the sale of securities; “native” agriculture and/or transformationor processing of products described as “native,” and/or alternative crops in the Amazon region; enterprisesoperating in the Centers for Export, Transformation, Industry, Commercialization, and Services (CETICOS); andincome from agricultural enterprises with sales under 50 UIT. Rate reductions and other tax benefits are agricul-ture (a rate of 15 percent); income of enterprises engaged in agriculture, aquaculture, fisheries, tourism, andmanufacturing activities associated with the processing, transformation, and marketing of commodities from theaforementioned activities, the processing of forestry products and forest extraction (a rate of 5 percent if thebusiness is located in the departments of Loreto and Madre de Dios, and in some districts of the Ucayali depart-ment, or 10 percent if it is located anywhere else in the Amazon region); accelerated depreciation is allowed inmining, hydrocarbons, tourism, agriculture and agribusiness; and tax discount for reinvestment in mining, educa-tion, and manufacturing industry, and for enterprises located in the Amazon region. The effects of this type of taxbenefits are well known: the neutrality of the tax system is impaired and the revenue-yielding capacity is dam-aged. Collection from the tax on corporate income fell from 2.2 percent of GDP in the first quarter of 1999 to1.4 percent in the fourth quarter of 2001. The fiscal cost of exemptions on deposits of corporations in the bank-ing system is 0.2 percent of GDP. Moreover, in the case of foreign firms, a part of the benefits granted ends up asa transfer to the treasuries of foreign governments where the firms in question have their headquarters. In manycases, these types of tax incentives are not instrumental in attaining the desired investment objectives and lacktransparency because it is very difficult to quantify the benefits given to a particular sector or region of a country.
Recommendations: (a) An across-the board elimination of sector- and region-specific exemptions is desirable; (b) alternatively, if the authorities want to subsidize specific productive sectors and/or regions of the country, explicittransfers should be included in the national budget; and (c) exemptions on all forms of capital gains from portfolio investments must be eliminated.
Import tariffs. Tariffs are levied on imports of goods on the basis of their CIF value. There are two basic tarifflevels: a 12 percent general tariff (applicable to 5,780 customs items); and a special tariff of 20 percent (applica-ble to 752 items). In addition, there are two types of surcharges: one on agricultural products (surcharge rateof 5 percent) and one on meat products (surcharge rate of 10 percent). Only one exemption raises serious
(continued)

26 WORLD BANK COUNTRY STUDY
BOX 2.2: TAX REGIME AND PROPOSED CHANGES (CONTINUED)
concern: the exemption from tariffs for foreign goods introduced into the CETICOS that do not pay importduties and can be reexported. This exemption impairs the horizontal equity of the tax system in that it providesfor unequal treatment of enterprises that are otherwise equal just because they are located in different places.
Recommendation: The CETICOS regime must be abolished.
The Extraordinary Solidarity Tax. This is a tax on firms’ payroll. The taxable base is the wage compensa-tion to workers classified in tax code categories 4 and 5, excluding national holidays and Christmas bonuses. Ithas long been recognized as a burden on the competitiveness of enterprises and is being phased out. The cur-rent government reduced its rate from 5 percent to 2 percent. The government is seeking congressionalapproval for its complete elimination.
Recommendation: The government’s decision to eliminate the Extraordinary Solidarity Tax is adequate.
The General Sales Tax. The general sales tax (VAT) has a rate of 18 percent and is levied on the domesticsales of movable goods, the provision or use of services in Peru, construction contracts, the first sale of struc-tures by their builders, and imports. The following goods are exempted: fish and seafood, cochinilla, bull semen,whole raw milk, potatoes and other root vegetables, dried vegetables, other vegetables and fruits, cereal seeds,rice, raw coffee, tea, cocoa, unprocessed tobacco, wools and pelts, raw cotton, nonmonetary gold, vehicles fordiplomatic use, books for educational institutions, and the first sale of structures valued at less than 35 UITs.The following services are exempted: financial services, public passenger transportation (except for air trans-port), international cargo transport, live shows declared of cultural value by the National Cultural Institute, saleof beverages and food at snack bars and universities, construction and repair of foreign ships, interest on trans-ferable securities issued by enterprises pursuant to the Securities Market Law, life insurance polices, postal ser-vices intended to complete such services originating abroad, and exports of goods and services. Apart from theaforementioned list of exemptions, there are a few special regimes for the VAT. First, the Hydrocarbons Actexempts the import of goods and inputs required in the exploration phase of oil contracts, and the sale ofpetrol, natural gas, and derivatives, for internal consumption, in the departments of Loreto, Madre de Dios, andUcayali. The Amazon Investment Promotion Act of 1999 exempts from the VAT the sale of all goods and ser-vices for internal consumption and construction contracts in the Amazon region. Furthermore, it allows a fiscalcredit of 25 percent or 50 percent on the VAT for sales to the rest of the country. The Agriculture Actexempts from the VAT agricultural producers the annual sales of which are below 50 UIT. The first sale ofhomes below US$35,000 is also exempted. There is, finally, a special rate for rice (5 percent). In analyzing thefiscal impact of the VAT exemptions we must distinguish between the general exemptions and the specialregimes. Defenders of the general exemptions contend that, by selecting items of popular consumption, theyintroduce a desirable element of progressivity in this tax and hence a positive redistributive effect. It has beendemonstrated, however, that, to the extent that they include items that are also consumed by the rich, exemp-tions to the VAT are, at best, powerless to generate positive redistributive effects and, at worst, deepen thenegative redistributive effects that are an inherent feature of this tax. For their part, the special regimes damagethe VAT’s revenue-yielding capacity. In the case of the Amazon-region exemptions, they not only deprive thenational treasury of revenue in the Amazon region itself, but open the door for VAT evasion on the part of tax-payers from regions other than the Amazon region through the simple expedient of doing their shopping in thelatter region. Finally, the exemption for agricultural producers the annual sales of which are below 50 UITbreaks its universality and neutrality.
Recommendations: (a) VAT exemptions for the Amazon region must be eliminated; (b) VAT exemptionsgranted by the Hydrocarbons Law must be eliminated; and (c) the 50-UIT threshold for agricultural producersmust be eliminated.

of 0.6 percent of GDP a year. Under these assumptions, continuous implementation of amanaged floating exchange rate and an open trade regime, the external current accountdeficit is projected to be about 2.5 in 2003, and the international reserve position is pro-jected to gradually decline to comfortable levels (7.5 months of imports by 2005).
■ In the medium term, our estimates of the potential output and structural fiscal balanceunder the base-case scenario indicate that, in order to stabilize debt indicators, the presentdeficit in the non-financial public sector primary balance should rapidly shift to a surplus of0.9 percent of GDP by 2004. The consolidation of this effort would require NFPS primarysurpluses to reach between 1.0 and 1.3 percent of GDP during the second half of thedecade (Annex B).
Public debt ratios should decrease to more sustainable levels in the medium term and debt cur-rency risk should be reduced. A public debt ratio of 46.5 percent of GDP is too high, especially fora country the balance sheet of which contains a significant currency risk, which exposes it to exter-nal shocks. Such risk originates from the fact that most of Peru’s public debt (external and domes-tic) is in dollars, while the government’s earnings are mostly in soles (trade taxes are the onlyrevenue that is dollar-linked). Existing dollar-denominated debt also actually puts authorities in the
RESTORING FISCAL DISCIPLINE FOR POVERTY REDUCTION IN PERU 27
TABLE 2.5: RECOMMENDATIONS FOR TAX REFORM
Recommended Measure Revenue Impact (% of GDP)
Income TaxElimination of exemptions on interest income and capital gains 0.27Introduction of a three-level structure of rates for individuals 0.10Elimination of sector- and region-specific exemptions 0.60
Value Added TaxElimination of VAT exemptions for Amazon region 0.25Elimination of exemptions granted by Hydrocarbons Act 0.10Elimination of the 50-UIT threshold for agriculture 0.30
Selective Tax on ConsumptionElimination of ISC exemptions for the Amazon region1 –Elimination of exemption on fuels used by power industry2 –Unification of ISC for vehicles at 25-percent rate 0.10
Import TariffsElimination of the CETICOS regime 0.13
Special Regime for MiningIntroduce a system of mining royalties3 0.10
Extraordinary Solidarity Tax (EST)Elimination of the EST −0.20
TOTAL IMPACT 1.65
1. The elimination of both the VAT and ISC exemptions for the Amazon region is estimated to have a total revenue impact of 0.10 percent of GDP. This is the reason why no revenue impact figure is entered in this row of the table.2. The revenue impact of this measure as a percentage of GDP is very small. This is the reason no figure is enteredin this row.3. The revenue impact would depend on the characteristics of the royalties regime (see Chapter VIII).
Source: Schenone (2002) and World Bank staff estimates.

position of being against their own commitment to let their own currency float freely, thus press-ing them to continue intervening to avoid its depreciation.
Recommendations:■ Under a baseline scenario, a debt sustainability analysis estimates the target public debt-to-
GDP ratio to be reached in 2010 is 36.2 (Annex A, Table A.4). Such ratio would require afiscal correlation in the structural primary surplus of 1.6 percent of GDP (cyclically adjusted)between 2001 and 2010 (Annex B, Table B.1). Such estimates take into account the debtexchange of the Peruvian Brady bonds with private creditors in 2002 and its slightly short-ened maturities. If sustained fiscal efforts are promptly developed, the public-debt-to-GDPratio is projected to improve substantially from about 46.5 percent in 2001 to 39.3 percentin 2005, and then decrease until its benchmark ratio in 2010. The resulting path toward sus-tainability in the public external debt service, however, is a longer one. As a percentage toGDP, debt service should increase from about 3.8 to 6.0 percent between 2001 and 2005,and then decrease to 4.6 percent of GDP in 2010.
■ Under the extreme case of a modified baseline scenario with shocks derived from the impactof a sudden financing stop (a real exchange rate depreciation and the materialization of con-tingent liabilities contained in short-term debt), the target public-debt-to-GDP ratio to bereached in 2010 would increase to 40.8 percent. Such ratio would require a fiscal correctionin the structural primary surplus of 2.4 percent of GDP (cyclically adjusted) between 2001and 2010 (Annex A, Table A.4).
■ On public domestic debt. Developing a market for domestic public debt issued in soleswould contribute to reducing its currency risk and bringing more credibility to the infla-tion-targeting policy. Despite being small,12 an inflation-indexed public debt in local cur-rency, hopefully placed beyond the short term, would also contribute to reducinginflationary surprises.
■ On public external debt. The initial focus of the new Peruvian officials has been on reduc-ing rollover costs, widening maturities, and refinancing debt with Paris Club creditors.Increased coordination between the MEF and the Central Bank of Peru (BCRP), andstrengthened management of the maturity and currency composition of external debt,would facilitate debt servicing. Approval of a General Debt Law in 2002 is expected to dealwith debt management issues.
Peru should start making provisions for contingent liabilities. These could materialize in thenear future, thus making more difficult projected recovery of budget discipline. There are at leastthree main sources of contingent risk that could become a government liability: nonperformingbank loans, pension payments, and municipal debt (not counting those that could originate fromBanco Agrario or public enterprises loan guarantees).
■ The World Bank’s broad estimates of the potential fiscal exposure of a banking crisis is 4 per-cent of GDP, which is considered in the lower bound of comparable—mostly double-digit—world standards. Moreover, official estimates put nonperforming loans at about 10 percentof the Bank’s portfolio in 2001, but such a ratio appears to be stabilizing in 2002.
■ The pension system is a potentially significant fiscal liability. Pension reform has generatedtwo nonbanking debts with the private sector that are actually paid through annual trans-
28 WORLD BANK COUNTRY STUDY
12. Internal debt was very small during most of the 1990s, because the GOP associated it to the decadesof large deficits and inflation. Bonds were reissued in 1999 to support a bank merger, the purchase of the badasset portfolio of a bank taken over by the government, and two bond-for-loan swap programs. In 2000 and2001, new bond issues were made under the Financial System Consolidation Program. The BCRP has strictlimits on purchasing government debt.

fers: one is to cover the pension of public employees retiring under the public pension sys-tem, and the other are bonos de reconocimiento of those who already migrated to the privatepension system. Official transfers to social security represent 0.6 percent of GDP in 2002,and conservative projections indicate they might increase to about 0.6 to 1.0 percent ofGDP per year during 2005–07 (IMF data, and Arias and others 2000).
■ Registered municipal debt is not a threat to macroeconomic stability, but this is not an indi-cation that the problem is not very serious at the local level. Indeed, it is significant andexplosive, because some local governments are likely to become nonsolvent and illiquid,like those of Arequipa and La Victoria (Fernandez 2002). These two local governments willhave severe difficulties assuming additional responsibilities with decentralization due tofinancial constraints. Nationwide, total registered debt represents a third of the correspond-ing national debt (current national liabilities considered as short-term debt). Nonregisteredmunicipal debt adds up to such a burden.
Recommendations:■ Peru should start making budgetary provisions for contingent liabilities, so a first step
would be to make a comprehensive assessment of all potential sources and quantify them.■ Financial contingent liabilities should be monitored through an adequate prudential super-
vision. Those eventually arising from a sudden stop of external financing due to contagion,can only be avoided with sound macroeconomic management (Annex A).
■ Reducing contingent liabilities in pensions will likely require more structural solutions.■ Identifying nonsolvent municipalities and their eventually nonregistered short-term debt,
and developing a plan for the gradual repayment of their registered debt are essential stepsbefore districts assume further responsibilities under the forthcoming decentralizationprocess.
■ The revamped Fiscal Prudence and Transparency Law should continue preventing govern-ment officials from resorting to the Central Bank for financing of its own expenditure, andshould add specific prohibition to incoming subnational governments (or ceilings) onacquiring future debts (Chapter V).
There are also additional external and domestic risks to this scenario that would make Peru’sgrowth potential uncertain, increase credit risk, reduce financing needed for a sustained social policy,or weaken the institutional leadership on social reform and fiscal decentralization. On the externalfront, a prolonged slowdown of the global economy, adverse regional developments, or unexpectedshocks in the international capital markets could lead to a significant decline in external demand forPeruvian exports, or in mineral prices, and/or to private capital outflows. This could reduce exportdynamism and growth, destabilize the domestic currency, put strong pressure on both the public andcorporate sectors, which are heavily indebted in foreign currency, and impose additional stress on thebanking sector. On the domestic front, the new Administration and Congress could fail to agree onthe implementation of the necessary policy measures needed for an effective fiscal adjustment and afinancially sound State reform and decentralization process. Lack of consensus could also delay orrevert the comprehensive legislative reform of the tax system to be introduced in 2002. Authoritiesshould be supported in their efforts to:
■ Build a contingent financing plan based on (a) the prompt materialization of external donorfinancing to the incoming Poverty-Reduction Strategy, (b) increased and enhanced accessto international capital markets by further placement of sovereign bonds, and (c) the com-pletion of the privatization process.
■ Develop consensus-building mechanisms on fiscal issues, aimed at reaching a common,shared, medium-term vision with the private sector and civil society. Such consensus shouldbe adequately reflected in the revamping of the Law.
RESTORING FISCAL DISCIPLINE FOR POVERTY REDUCTION IN PERU 29

The Fiscal Adjustment EffortFiscal adjustment requires a certain combination of expenditure-reduction-cum-revenue-increase. In2002, Peru’s required revenue increase will not likely result from a rapid recovery of the economy,because the cyclical component of the fiscal balance is very small (Figure 2.13). Besides, economicrecovery has had limited impact on tax collection due to the prolonged debate that took place inCongress on the desagio tributario (a quasi tax amnesty) and the granting of additional income taxexemptions. This points out the need for a combination of expenditure cuts with structural remedieson the revenue side. A long-lasting fiscal adjustment requires measures to (a) strengthen the taxregime and administration; and (b) revert the trend toward increased current outlays, while curbinginefficient expenditure.
Strengthening the Tax RegimeContinuous changes in the tax regime are weakening the successful tax reform of the 1990s. In 1993,Peru carried out a well-designed reform of its tax system: the reform aimed at simplifying the tax sys-tem, broadening the tax base, and increasing revenue yield (IMF 2000). The number of tax cate-gories was reduced from almost 70 to 4 basic categories: the general sales tax (VAT), the income taxon individuals and corporations, the selective tax on consumption (an excise tax), and tariffs onimported goods. The income tax brackets were reduced from 5 to 3, and business income was taxedat a flat rate of 30 percent. Dividend income was excluded from the tax base and the net-wealth taxwas eliminated. The minimum income tax, based on gross assets, was maintained. The base for thevalue added and excise taxes was broadened and most exemptions eliminated. Later, in 1994, thebase for the income and value added taxes were broadened further.13 However, since 1996 a longseries of exemptions and other preferential regime measures was introduced, which severely erodedtax collection capacity. Despite having a VAT collection effectiveness ratio that is average in LACterms—about 50 percent (Figure 2.6)—the main tax breaks represent a minimum of 2 percent ofGDP of direct tax losses (Table SA.21). Strengthening the tax regime requires a set of specific actions
30 WORLD BANK COUNTRY STUDY
FIGURE 2.6: LAC VAT EFFECTIVENESS
10
20
30
40
50
60
70
80
5 10 15 20 25
Rate
Eff
ecti
ven
ess
Peru
Chile
Dominican Republic
Argentina
Ecuador
Colombia
BrazilVenezuela
Source: Schenone (2002) and IMF (2000).
13. In the institutional domain, the Superintendency for Tax Administration (SUNAT) was created witheffective administrative and budgetary autonomy. Personnel policies were reformed to get highly qualified staffand endow them with up-to-date computational equipment. The tax code was modified to enhance SUNAT’sability to audit taxpayers, increase fines and penalties, simplify procedures, and strengthen tax courts.

to improve the equity, neutrality, simplicity, and revenue-yielding capacity (Box 2.2). A specific set ofensuing tax policy recommendations could generate an estimated potential revenue-generatingcapacity of 1.65 percent of GDP (Table 2.5).14
Reverting Expenditure TrendsCurrent expenditure is increasing explosively. Since the mid-1990s, Peru’s current expenditure hasbeen increasing at an accelerated pace. It rose from about 50 percent of total CG expenditure in1990 to almost 73 percent in the early 2000s (85 percent for the CG in 2001). These very high lev-els by Peruvian standards were characteristic of strong State intervention in the 1970s (Figure 2.7).One could argue that the levels of current and capital expenditure are broadly in line with LACregional averages (Table SA.29); but what is worrisome is its increasing trend and present composi-tion. In 2001, as a share of total expenditure, Peru’s 39 percent wage bill was second highest inLAC, and as a share of GDP, Peru’s 6.6 percent figure was higher than the 6.3 percent LAC aver-age. These ratios suggest an increasing sense of overstaffing and do not include additional “services”hired as temporary contracts under goods and services categories (Chapter VI). It also suggests ahigh level of budget rigidity (Chapter III). Such a rising trend would not have been possible unlesscapital expenditure and interest payments had not decreased their share below 15 percent. Contraryto the early 1990s, interest payments have been below the region’s average. For its part, Peru’s capi-tal expenditure (3 percent of GDP) is among the lowest in LAC (Figure 2.8) and keeps decreasing(see Table SA.5). Indeed the budget priority in the 1990s was not to increase the capital stock.
Recommendation:■ The proposed comprehensive reform of the State should examine proposals to combine a
gradual reduction of current expenditure, especially wages and salaries, while developing amore qualified and efficient labor force under a civil service reform (Chapter V).
Public investment remains low and only recently has given priority to the social sectors. In the1990s, capital expenditure was more volatile and procyclical than all the other expenditures cate-
RESTORING FISCAL DISCIPLINE FOR POVERTY REDUCTION IN PERU 31
FIGURE 2.7: CENTRAL GOVERNMENT’S EXPENDITURE COMPOSITION
0%
20%
40%
60%
80%
1970
1972
1974
1976
1978
1980
1982
1984
1986
1988
1990
1992
1994
1996
1998
2000
% o
f tot
al e
xpen
ditu
res
Interest Current expenditures Capital expenditures
Source: MEF, IMF and World Bank estimates.
14. Both proposals, the tax regime changes and the set of tax policy recommendations, are based onSchenone (2002).

gories (Table 2.3). In addition, the average level of CG capital expenditures as a percentage ofGDP was below 2.8 percent in recession years and 4.0 percent in boom years.
These outcomes reflect the fact that, to a great extent, public investment continues to be theresidual item in the budget—that is, the one that bears the brunt of fiscal adjustment efforts. Thecomposition of fixed capital formation has suffered important changes. Whereas investment in eco-nomic infrastructure played a dominant but declining share as a percentage of total capital invest-ment, falling from 72 percent in 1990 to 54 percent in 2000, the share of investment in socialinfrastructure increased from 12 percent to 19 percent of total expenditure (Figure 2.9). The dis-aggregated analysis of the internal decomposition of investment in economic infrastructure showsthat, by far, the biggest decline was in the share of public investment devoted to agriculture, whichmore than halved, from 46 percent to 19 percent of total capital formation, whereas the energy
32 WORLD BANK COUNTRY STUDY
FIGURE 2.8: LAC: CAPITAL EXPENDITURE (1998)(% of GDP)
0 3 6 9 12 15 18
HaitiArgentina
Trinidad & TobagoCosta Rica
BahamasUruguay
MexicoEl Salvador
PeruParaquay
PanamaGuatemala
BoliviaBarbados
VenezuelaHonduras
EcuadorChile
SurinameJamaica
Dominican RepublicBelize
NicaraguaGuyana
Source: World Bank staff estimates.
FIGURE 2.9: STRUCTURE OF CENTRAL GOVERNMENT’S FIXED CAPITAL FORMATION
2000Multi-sector12%
Economic54%Social
19%
General15%
1991Multi-sector11%
Economic71%
Social12%
General6%
Source: MEF.

and mining sector increased its share from almost nil in 1990 to 10 percent in 2000. For its part,the transport and communication sector essentially maintained its share at roughly a quarter oftotal capital formation (Table SA.7b). The doubling share of investment in social infrastructure is avery positive trend inherited from the 1990s. This effort is also reflected in the pattern of totalsocial expenditure, which seemingly rose from 3.9 percent of GDP in 1990 to 6.9 percent in 2000,and remained steady until 2002 despite the economic slowdown.15
Recommendation:■ Peru has the capacity to gradually fill its financial gap in the social sectors by raising its his-
torically underfunded education and health expenditure ratios of 2.9 and 3 percent ofGDP, respectively, in 2000, to at least the average LAC ratios of 4.1 and 3.2 percent ofGDP, respectively, in the next five years.
The observed increase in fixed capital formation of the “general sectors”—mainly includinggeneral public services like military expenditures—is a matter of concern. As a percentage of totalcapital investment, such share almost tripled from 5.6 percent to 14.8 percent, reflecting, to a con-siderable extent, the leading role assigned to military expenditures within total public expenditures.In a similar vein, during 1998–2000, defense and national security expenditure averaged 2.9 per-cent of GDP. Such a relatively high level of military expenditure no longer seems to be justified bythe needs of a country in the aftermath of the successful peace process with Ecuador, and by acountry now far removed from the civil conflict that afflicted it in the mid-1990s. Moreover, suchexpenditure turned out to be prone to corruption, evidenced by lack of any control.
Recommendations:Authorities should redress this situation by:
■ Reducing resources devoted to military outlays to the budgeted 2.1 percent of GDP in2002, and shifting part of those savings to social expenditure; and
■ Completing the application of SIAF subsystems to military expenditure to make it moretransparent and accountable.
Developing effective countercyclical fiscal and social policies remains a priority, especially in goodtimes. Both policies are, in general, complementary. The most significant increases in total (andsocial) spending took place in the early-to-mid-1990s, when growth was high. Then, in the late1990s, real social spending remained fairly constant even during the economic downturn of 1998and, later, in 2001 (Figures 2.10 and 2.11). How expansive total and social expenditures weredespite fiscal contractions is an empirical question. The percent changes and point elasticities oftotal and social expenditures were negative in 1998 (Table 2.6). During 1991–2002, the level ofsocial expenditure was not protected compared to fiscal adjustments. The elasticity of all categoriesof social expenditure was positive and equal to or higher than unity—which reveals their procyclicalbehavior (Table 2.6). These findings are all supportive of procyclical policies.
■ However, on one hand, Peruvian officials have developed the basic institutional frameworkrequired for a countercyclical fiscal policy with the creation of the Fiscal Stabilization Fundas part of the Law of Fiscal Prudence and Transparency. Short of resources, however, theFund has played a rather marginal countercyclical role.
■ On the other hand, since 2001, and in the midst of another economic downturn, Peru’sgovernment opted for a countercyclical social policy, as can be inferred from the nonnegative
RESTORING FISCAL DISCIPLINE FOR POVERTY REDUCTION IN PERU 33
15. Authorities indicated that such increase could partly be due to a reclassification of line items groupedunder social expenditure.

growth of real social spending, when compared to the actual decrease in real total expendi-ture (Figure 2.11). In a similar pattern, point elasticities for social, health, nutrition, justice,and social security expenditure in 2001 were also negative, indicating that in a year of fiscalcontraction, expenditure in these sectors actually increased.16 These results for fiscal contrac-tion appear robust to period changes.
Revamping the Fiscal RulesPeru needs a fiscal rule to help stabilize its fiscal balances in the medium term, reduce its volatileand procyclical fiscal deficit bias, and consolidate credibility. As mentioned, Peru is under consider-able fiscal stress, with only a mild countercyclical social policy in the early 2000s. Procyclical anddeficit-biased fiscal policies can be explained by the combination of faulty measures, especially dur-ing election years, fiscal conservatism, and weak institutions to attempt (and succeed) in runningsurpluses during the economic boom of the mid-1990s. If respected, a fiscal rule might strengthencredibility because it reverses political incentives for achieving fiscal stabilization in favor of disci-plined compliance, promotes accountability and transparency when supported by sanctions andopen access to information, and tends to eliminate the deficit bias if supported by countercyclical,eventually automatic, stabilizers. Peru’s Law of Fiscal Prudence and Transparency is one of themost comprehensive in Latin America (Table SA.23b). It contains numerical and procedural rules,and a Fiscal Stabilization Fund (Box 2.3).
Compliance with the Law was mixed. The main numerical target was not met, and compliancewith procedural rules was also unsatisfactory, especially with respect to required reporting. How-ever, a multiyear budgeting framework has been established, supported by a Portal de Transparen-
34 WORLD BANK COUNTRY STUDY
FIGURE 2.10: SOCIAL AND PUBLIC SPENDING(1994 min NS)
0
2000
4000
6000
8000
10000
12000
14000
16000
18000
20000
91 92 93 94 95 96 97 98 99 00 01 02
Social Spending Public Spending
Source: MEF.
16. Elasticities were calculated such that ei = Xi/X, where ei is the elasticity of expenditure in the i sector,Xi is the percentage change in real expenditure in the ith sector, and X equals the percentage change in totalreal expenditure. The higher the magnitude of the elasticity, the greater the responsiveness of that category ofexpenditure to variations in total expenditure. Sectors that are favored in periods of fiscal contraction of totalgovernment expenditure have elasticities of less than unity, that is, they would be expected to experiencereductions of a proportionately smaller magnitude than the total expenditure cutback, or even real increases ifthe elasticity is found negative. An elasticity of exactly equal to zero means that the sector is completely pro-tected, and those greater than unity suggest that this is a relevant category of expenditure.

cia, but all mandated reports are missing (Table 3.1): the semiannual progress report of the multi-year framework, the annual report on contingent risk and tax expenditure, and the quarterly reporton budget expansions (Valderrama 2002).
Peru faces four broad dilemmas in revamping its Law. First, adding flexibility versus credibilityfor a more rigid rule would imply higher credibility, if the probability of fulfilling it is high; second,looking for more simplicity versus complexity, since a simpler rule would allow an easier understand-ing by the public; third, adding more procedural versus numerical rules, since numerical rules seemeasier to understand, but harder to comply with; and fourth, opening for participation versus confi-dentiality in the revamping process of the Law, because a consensus-built rule would allow forenhanced credibility, but would delay its approval.
Two LAC best practices seem particularly appealing for revamping Peruvian Fiscal Law: Braziland Chile.
■ On one hand Brazil has a complex, still credible Fiscal Responsibility Law that was builtunder an extremely participatory process and that combines a mix of procedural-cum-numerical-based rules. It is not clear whether adherence to such rigid targets fully eliminates
RESTORING FISCAL DISCIPLINE FOR POVERTY REDUCTION IN PERU 35
FIGURE 2.11: GROWTH RATES IN SOCIAL AND PUBLIC SPENDING
-20
-10
0
10
20
30
40
92 93 94 95 96 97 98 99 00 01 02
Cha
nge
in L
og o
r R
eal
Spe
ndin
g
Social Spending Public Spending
Source: MEF.
TABLE 2.6: SOCIAL EXPENDITURES ARE PRO- OR COUNTERCYCLICAL?a
Percent Point Point Elasticity Change in Elasticity Elasticity
(1991–2002)b 1998 (1998) (2001)
Total Expenditures . . . −0.28 . . . . . .Social Expenditures 1.19 −1.50 −8.32 −0.17Education 0.99 −0.66 5.01 1.78Health 1.15 −5.58 −1.87 −5.83Nutrition 2.35 0.81 13.74 −1.13Justice 1.75 −0.39 58.38 −3.2Social Security 1.47 −0.75 −17.01 −3.34Other Social Investment 1.66 −2.75 −61.87 2.32
a. Elasticities are with respect to total real expenditure of the consolidated public sector.b. Significant at 1 percent.
Source: World Bank staff estimates.

the deficit bias, because an economic slowdown may force authorities to cut public spending,impeding the operation of automatic stabilizers and deepening the downturn (Perry 2002).However, the Law is accompanied by a Fiscal Crimes Law, establishing an extensive list ofsanctions, and a full set of budgetary and financial information, including information aboutcontingent liabilities. Since most intergovernmental transfers in Brazil to subnational govern-ments are automatic, the Fiscal Responsibility Law does not cover them, but discipline insuch accounts is enforced through recent government-led individual debt-restructuring dealsthat have imposed tight indebtedness restrictions and a severely limited ability to borrow incases of economic slowdowns (Gonzalez, Rosenblatt, and Webb 2002).
■ On the other hand, Chile has an extremely simple numerical target of 1 percent of struc-tural annual surplus (after removing the cycle on revenues and variations in copper prices).The fact that the deficit benchmark is set in structural terms forces the government to runsurpluses during booms and high copper prices, and to run moderate deficits during down-turns and low copper prices, thus playing an effective countercyclical policy, curbing politi-cal pressures, and enhancing its credibility in the markets. The Law was also accompaniedby a long institutional process devoted to careful technical design and sensitive political vali-dation, broad coverage of the potential risk of contingent liabilities, and consistency checkswith the monetary program. The Law does not have, however, any clause with respect tosubnational governments.
The Fiscal Stabilization Fund (FSF) is well conceived, but given its limited revenue sources haslittle potential to sustain a meaningful countercyclical policy. In 2001, the FSF barely contributedwith US$59.4 millions to finance 0.1 percent of GDP of the fiscal deficit. Even under a high-caseprivatization scenario that would generate US$1,400 million in privatization proceeds during
36 WORLD BANK COUNTRY STUDY
BOX 2.3: PERU: EVALUATION OF THE TRANSPARENCY LAW 2000–01
2000 2001
Law Actual Law Observed
CPS deficit as % of GDP 2.0% 3.2% 1.5% 2.3%
Difference between annual 2.0% 0.6% 2.0% -5.0%growth rate of general government’s non-financial expenditures and inflation, less than 2%.
CPS debt increase <US$ 5,983 US$ 4,534 <US$ 4,893 US$ 5,978(adjusted) no greater than NFPS deficit
Election year: general <60% 58% <60% 56%government’s non-financial expenditures during the first 7 months no greater than 50% of GG annual budget.
Election year: CPS deficit in <50% 39% <50% 20%the first semester no greater than 50% of budgeted deficit.
CPS = Consolidated Public Sector = NFPS deficit—net result of local government.Source: Central Bank and Ministry of Economy and Finance.

2002–03, the FSF would contribute with resources equivalent to 0.3 to 0.4 percent of GDP ofdeficit financing. Therefore, other possible resources could be collected from excess revenues, buttheir expectations of materializing are unrealistic as long as the government refrains from imple-menting a comprehensive tax reform and recovery does not take a rapid pace. Since there is littleevidence that FSF resources have been effectively applied to poverty-alleviation programs, in prac-tice, the FSF has, rather, played the role of a small contingency fund.
Revamping the Fiscal Prudence and Transparency Law requires work on many fronts. The Law isnot a substitute, but a complement, to building credibility in the overall economic program. Hence,credibility depends, first, on the capacity of Peruvian officials to comply with their previous commit-ments under the 2002–03 macroeconomic program agreed; and, second, on an expected positiveexternal environment that would minimize the external risk of another economic downturn. Earlynoncompliance with a revamped Law would damage the reputation of the macroeconomic program.
Recommendations:■ On previous requirements. Issuing a new law should be preceded by a building process of
(a) institutional strengthening regarding the human and technical inputs required by thedesign and implementation of the Law; (b) consensus-building participatory mechanisms ledby Peruvian officials, with a draft design of the Law being published in advance to receivecomments through the web; (c) enhanced SIAF-supported and user-friendly budget trans-parency (Chapter III), to allow open access by Congress and civil society to monitor imple-mentation of the Law once it is approved; and (d) a comprehensive evaluation of contingentliabilities, so adequate and precautionary budget provisions can be made under the new rule.
■ On procedural norms. From recent experience, it is clear that (a) budget reporting needs—human resources and technical tools—have to be significantly strengthened, (b) the multi-year budgeting framework also requires improvement (Chapter III), (c) introduction of aset of sanctions for noncompliance is unavoidable, and (d) upgraded oversight capacity toevaluate and enforce sanctions by the Comptroller’s office is needed.
■ On numerical targets. Two main measures aimed at simplifying the framework for quantita-tive benchmarking are proposed. The first measure would consist of targeting an estimatedstructural NFPS primary surplus of 1 percent of GDP (Annex B) by 2008–10, which wouldbe roughly equivalent to targeting a structural NFPS deficit close to 1 percent of GDP.These targets are set in structural terms and do not take into account the cyclical compo-nent of the deficit. Progress toward meeting such target should be done through incremen-tal steps. Following Banks’ detailed estimates of the potential output and the structuraldeficit (Figures 2.12 and 2.13) and assuming a prompt recovery under a baseline scenariosince 2002, adjusting for the cyclical component would require primary surpluses of about0.9 as early as 2004, and reaching 1.3 percent of GDP in 2010 (Annex A).17 Althoughbroad convergence exists between the Banks’ and Peruvian officials’ estimates, an eventualofficial benchmark would need to be thoroughly reviewed and published by the officials.18
The second measure would propose eliminating some of the less-important numerical rules.Not only do a few of them overlap with the main rule, but they are ineffective, as happenedto those applied during election years: they did not take into account strong end-year pub-lic spending seasonality.
■ On fiscal rules for subnational governments. Introducing fiscal rules at the subnational level isa critical priority for the revamped Law, given the pace of the decentralization process
RESTORING FISCAL DISCIPLINE FOR POVERTY REDUCTION IN PERU 37
17. The estimated cyclical component of the fiscal deficit is small and varies between 0.1 and 03 percent ofGDP between 2000 and 2002, but might increase a bit, especially if recovery takes place (Annex B).
18. Notice that Banks’ estimates are particularly close to those made by Deutsche Bank (2001) of 0.8 per-cent of GDP, the Central Bank of Peru (2002) of 1.3 percent of GDP, and Jiménez/MEF (2002) of 1.1 per-cent of GDP. None, however, includes any provision for the materialization of contingent liabilities.

under the present Administration, and justify its upgrade to a Responsibility Law. Althoughthere is no consensus on presetting limits or ceilings for specific fiscal indicators at the sub-national level, the vulnerability of the overall fiscal situation requires a hard budget con-straint, in terms of a modified golden rule—to include capital expenditure—or zerooperational deficit. Rules should also be more restrictive during the last year of an adminis-tration to avoid electoral cycles, and be more flexible in the presence of exogenous andunexpected shocks. Tight noncontingent municipal debt restrictions are needed. Finally,because there is little knowledge, but partial evidence (Chapter V) about the existence of a
38 WORLD BANK COUNTRY STUDY
FIGURE 2.12: ACTUAL AND POTENTIAL OUTPUT(billions of 1994 soles)
6 0
70
8 0
9 0
100
110
120
130
140
9 0 9 1 9 2 9 3 9 4 9 5 9 6 9 7 9 8 9 9 0 0 0 1 0 2
Actual Output Potential Output
Source: World Bank staff estimates.
FIGURE 2.13: ACTUAL PRIMARY BALANCE (% OF GDP) ANDSTRUCTURAL PRIMARY BALANCE(% of Potential GDP)
-1.5
-1.0
-0.5
0.0
0.5
1.0
1.5
2.0
2.5
3.0
90 91 92 93 94 95 96 97 98 99 00 01 02
Actual balance Potential balance
Source: World Bank staff estimates.

significant contingent municipal debt, debt restructuring deals (supported by its previouscomprehensive evaluation) should precede the adoption of any local government rule.
■ On the Fiscal Stabilization Fund. There is no sense expecting a significant countercyclicalpolicy as long as growth remains low and fiscal revenue is stagnant.
Additional features of the to-be-revamped Law include (a) redesigning an effective specialclause for election years, because the three past election episodes provoked a clear fiscal deteriora-tion; (b) making room for changes that will affect the structural balance over time, including thoseaffecting the productive capacity of the economy, external prices of main mining exports, and thetaxation structure; and (c) strengthening existing inflation-targeting mechanisms consistent with arevamped fiscal rule, and supported by enhanced coordination mechanisms between the CentralBank and the MEF.
RESTORING FISCAL DISCIPLINE FOR POVERTY REDUCTION IN PERU 39


Reorienting the budget toward effective poverty reduction requires an overall reform effort of publicexpenditure management. Such reform includes a modern financial management system, a pro-poorand performing budgeting system, a clear definition of medium-term social objectives, an effective track-ing system of the shift of budget allocations toward these priorities, and transparent information access toan outcome-oriented budget. Since the late-1990s, Peru has made promising inroads in all these areasand, although remaining challenges are still significant, its implementation record provides a solid foun-dation for further developments. This chapter assesses progress in pro-poor budgeting management.
Tangible progress in public expenditure management (PEM) in Peru over the past few yearsis impressive. It includes:
■ Creation of an Integrated Financial Management System (SIAF) in 1998;■ Development of an upgraded budget management system since 1999, with improved trans-
parency of budget execution supported by the website Portal de Transparencia in 2000,which includes for the first time defense and national security spending and a participatorymethod for budget formulation scheduled from 2002;
■ Passage of the Law of Fiscal Prudence and Transparency and creation of a Fiscal Stabiliza-tion Fund (FSF) in 1999;
■ Strengthening of accounting institutions and procedures, compatible with world standards,applied to the entire public sector since 1999;
■ Introduction of performance management contracts of State-owned enterprises under theNational Fund for Financing Government Enterprise Activity (FONAFE) in 1999;
■ Adoption of a medium-term expenditure framework in 2000, based on a MultiyearMacroeconomic Framework for 2001–03 and a Multiyear Budget (MAB) Plan for2001–05; and
■ Adoption of budgetary provisions for a set of Protected Social Programs (PSPs) in 2000.
III
REORIENTING THEBUDGET TOWARD
PRO-POOR EXPENDITURE
41

In spite of ongoing reforms, persistent weaknesses remain. Some of them were identified in thePeru Institutional and Governance Review (IGR) (Box 3.1) and undermine budgetary trans-parency and accountability. These include:
■ An incomplete SIAF;■ Excessive concentration of budget authority in a few ministries, and budget rigidity
reflected in inertial spending;■ A disconnect between multiyear and annual budgeting, the latter being amended by contin-
uous Presidential decrees;■ A fragile and uneven institutional framework for developing an effective medium-term
social policy and for decentralization; and■ Inadequate and user-unfriendly external budget monitoring and reporting, which does not
facilitate its virtual oversight by authorities themselves, Congress, and civil society.
Modernizing Financial ManagementPeru has developed a well-performing, integrated financial management system. It aims to increasethe control, efficiency, accountability, and transparency of public spending, and to support thefuture decentralization to line ministries and regional and local governments of the primaryresponsibility for managing resources and improving service delivery in Peru (Box 3.2).
At present, it combines efforts in the areas of Treasury, accounting, and debt management.Its role begins once the annual budget is approved and monthly ceilings are authorized by theBudget Office and Cash Oversight committee. The SIAF is linked with Treasury to register alloperations (revenue, expenditure) approved for the budget execution cycle through 580 EUsdependent on the budgetary envelopes (pliegos) of various ministries, Transitory Councils ofRegional Administration (CTARs), and public institutions.1 The SIAF contains three operationalelements: (a) single registry of each EU transaction, and virtual transmission of this information tothe Budget Office, the Treasury Office, and the Accountant General; (b) cash payments manage-ment, but only for those financed by Treasury ordinary resources; and (c) financial reporting. In
42 WORLD BANK COUNTRY STUDY
1. The Peruvian public sector is divided into five categories of entities: the CG with 580 EUs, theNational Fund for Financing Government Enterprise Activity (FONAFE) with 42 entities, the General Direc-torate for the Public Budget (DNPP) with 99 entities, 1,826 municipalities, and 101 public beneficiaries. TheCG has 26 sectors, divided into 141 envelopes (pliegos) comprising 580 EUs, which account for about 60 to65 percent of the public budget.
BOX 3.1: MAIN IGR/PEM ISSUES
The IGR identified several factors affecting financial accountability in PEM (World Bank, 2001b):
■ Excess dominance by the Executive through the use of Presidential Decrees: between 1994 and 2001, Congress passed 1,152 laws or legislative resolutions, while the President issued 870 (86 percent Urgency)Decrees;
■ Concentration of spending authority in a few central ministries—Economy and Finance, and Presidency—to maximize discretionary control of budgetary resources: in 2001, the share of the consolidated budget(excluding debt service) assigned to these two institutions represented 63 percent;
■ Insufficient Congressional oversight of budget execution;■ Local governments still do not have the necessary checks and balances to implement decentralization
properly; and■ Severe institutional disorder in a state in which highly modern institutions coexist with antiquated entities,
and multiple social agencies overlap their service delivery efforts.

three years, the SIAF has consolidated itself as the instrumental financial management tool of thepublic sector.
Overall Efficiency Gains. After three years of reform efforts, quantifiable savings haveemerged from several outcomes: (a) duplication of financial transactions is eliminated as pay-ments are entered once and instantly in a reliable database system; (b) poorly controlled quasi-extra-budgetary funds are significantly reduced; (c) electronic transfers are replacing the use ofchecks, thus reducing payment lags, transaction costs, and risks of fraud or lost or stolen checks;and (d) unused funds are virtually eliminated, since once a payment is authorized by the CashOversight Committee, the banking transfer is executed within 72 hours and remains available foronly one month.
Overall Effectiveness Gains in Budget Management. Outputs arising from a better mix of publicresources consist of (a) the elimination of arrears on floating debt to suppliers, a major budgetarydistortion in the past; (b) an enhanced cash management that prevents shortages of counterpartfunds to external projects; (c) an improved level of budget execution by the Central Government(CG); (d) control for the first time of the previously sensitive spending “black hole” ministries,Defense and National Security, now fully adopting SIAF systems and procedures; (e) enhancedexpenditure control and transparency due to a unique database which offers virtual informationthrough the web; (f) the simplification of the functions of accounting and auditing, which reducesthe scope of fraud and corruption; and (g) an enhanced public debt management, since the systemalso prevents external arrears.
RESTORING FISCAL DISCIPLINE FOR POVERTY REDUCTION IN PERU 43
BOX 3.2: THE INTEGRATED FINANCIAL MANAGEMENT SYSTEM (SIAF) OF PERU
SIAF was created by Vice-Ministerial Resolution No. 029-98-EF/II on 22 October 1998 as the mandatory Internet-based system for the recording of all data related to revenue and expenditure execution carried out by the Executing Units (EUs) of the public sector budget at the national level. According to the procedures andnorms approved by MEF:
■ It covers all Central Government and most decentralized entities: a total of 580 EUs (including Defense andNational Security since 2002), all public enterprises, supervisory bodies (SUNAT, Customs, regulators,municipal enterprises), and 23 municipalities (June 2002).
■ It contains four modules: Treasury, which receives budget ceilings prepared by the commitment calendar ofthe Budget Office and preapproved by the Cash Oversight Committee; Accounting; Financial StatementReporting; and Public Debt, the latter managed as an EU. Public enterprises use only the financial accountingmodule.
■ It has very strict budget execution control mechanisms. Once payments have been previously authorized byTreasury through the system and are daily registered in SIAF, then the Banco de la Nación (BN) proceeds toalert and transfer funds to the EU’s bank accounts or issue checks.
■ The expansion to include financial accounting since 2000 has provided reliable and timely information to theAccountant General, who is now responsible for preparing financial statements. Recording of transactions atthe EUs is organized into two parts: administrative (commitment, accrual, payment, and disbursement), andaccounting (under standard categories). To record a commitment, it is necessary to use a specific expendi-ture classification, a financing source, and an objective corresponding to the expenditure. The system thenverifies that the operation is in accordance with budget limit criteria and the commitment calendar. Anaccrual is done only when a commitment exists and the EU receives verification that the goods or serviceshave been provided according to the “best date” (prompt payment—no later than one month) concept.After full payment, the registry is updated with the correct disbursement information provided by the BN.
■ All expenditures, revenues, and complementary operations use an SIAF Matrix Operations Table that inte-grates budget classifications with the government’s chart of accounts.
Note: This box is based on WB/IADB (2001a).

Despite its impressive progress, Peru’s SIAF still faces significant challenges. SIAF core sub-systems are incomplete. The lack of a budget module, in particular, is a severe handicap forimproving budget efficiency, participation, and transparency. Contrary to similar systems inLatin America, the Peruvian SIAF does not have a budget module, but fundamentally works as avirtual payment system. As a result, Peru’s budget formulation and in-year global budget modifi-cations remain little known externally, centralized, and decided at MEF’s discretion, and knownonly ex post, when they are registered monthly in the SIAF. Despite individual ministries provid-ing inputs to overall budget formulation and same in-year modifications, they do it on a bilateralbasis with MEF and have little control over ex post decisions regarding charges to their globalallocations.
Recommendations:■ A user-friendly budget module is urgently needed to allow virtual access with no restric-
tions. It would help assess consistency of budget proposals with macroeconomic conditionsin early stages, build a stronger link between budget formulation and multiyear strategicpriorities, facilitate monitoring of in-year budget modifications consistency with inter- andintrasector budget priorities in a participatory and transparent way, and allow Congress’legal mandatory oversight of the budget execution.
■ The SIAF’s budget module requires a multiyear submodule too, that is, one with capacityto track the Government of Peru’s (GOPs’) compliance with multiyear budgeting bench-marks. On one hand, the SIAF registers only current-year transactions. On the other hand,the Law of Fiscal Prudence and Transparency requires biannual reports on compliancewith multiyear benchmarks, but such commitment has not been fulfilled. The separatesubmodule should allow a historic database, virtual monitoring of compliance with annualexecuted expenditure, and help produce mandated biannual reports on compliance withMAB targets.
■ Among other possible SIAF modules, the one on human resources management is critical.Others that could gradually be developed are national assets, procurement, a nationalinvestment system, contingent liabilities risk, and regional and municipal financial manage-ment. The human resources module is essential for civil service reform. The one on nationalassets should have due registry of state assets. The module on procurement, the startingpoint for e-government, is critical for anticorruption efforts, the most vulnerable area ofgovernance. The module on public investment should help prioritize multiyear investmentplans. The module on contingent liabilities risk would help to register them and makeproper budgetary provisions, while the one on subnational management would prepareSIAF support for an accelerated scheme of fiscal decentralization, because future regionaland municipal governments require a twin-decentralized SIAF and training. Such develop-ments should take place over many years.
■ The existing SIAF subsystem to track financial and physical performance indicators, a criticaltool for an outcome-oriented budget, supported by benchmarks—final and intermediate—and performance management contracts, requires a thorough conceptual review before com-pletion. The pilot subsystem has too many useless indicators and their inputting and trackingare poor.
■ Due to their complexity and the already overcommitted limited technical and humanresources capacity of the SIAF team at MEF, all development of new SIAF modulesrequires detailed prioritization and permanent training. Authorities should support andoutsource the creation of a superior university degree in management of SIAF systems.
■ Finally, international experience indicates that two important modules, like a fiscal cadastre(essential for a predial municipal tax), or an e-government website (including e-procurementor an e-geo-referenced expenditure map at the district level, for targeting purposes) shouldbe developed outside, but with links to the SIAF.
44 WORLD BANK COUNTRY STUDY

Control of decentralized budget execution by the SIAF is partly diluted beyond EUs throughencargos.2 In 2001, a little less than 35 percent of the budget was not devoted to salaries, financialobligations, or pensions. At least 12 percent (NS/1.4 billion) of this share of the budget was exe-cuted through encargos. The encargo is an ad hoc mechanism. It transfers funds from the EUs to amyriad of at least 50,000 Operational Units (Unidades Operativas, OUs) dispersed nationwide(including schools and health posts), most of which are outside SIAF control. Operationally, itworks like this: Following reception of funds, if the EU decides to commit an encargo to an OU, itregisters it as a transfer in the SIAF. This transfer is endorsed in a bilateral institutional agreementthat has no legal authority. Ensuing budget execution control by the SIAF then faces multiple defi-ciencies: (a) late registration, because the UEs can receive a complete report of the use of thosefunds only by end-year; (b) no direct data entry, because most OUs do not use SIAF software; (c) poor auditing, because not all EUs have adequate administrative capacity to internally audittheir OUs; and (d) misallocation of resources, because there are no expenditure tracking mecha-nisms established to verify that resources have effectively been assigned to the original purpose ofthe transfer. The use of encargos is generalized in the health, transport, agriculture, and defense sec-tors, which use them to speed up execution of their investment program. The abuse of encargos hasobstructed and delayed the proper application of the SIAF Treasury module at the Ministry ofDefense. However, since 2002, it has become the pilot ministry for urgently reengineering encargosregistry by an SIAF2 special module (Box 3.3). Lessons from this pilot ministry should be replicated.
RESTORING FISCAL DISCIPLINE FOR POVERTY REDUCTION IN PERU 45
2. Among other SIAF control failures, only one is significant: internal encargos, also known as anticipos, the2001 amount (NS/1.3 billion) of which was very close to the one of encargos, and are mainly used for traveladvances. Other leaks like petit cash used as a revolving cash fund are less significant and are later registered.
BOX 3.3: INTRODUCING THE SIAF AT THE MINISTRIES OF DEFENSE ANDNATIONAL SECURITY (INTERIOR)
Until December 2000, the five Executing Units (EUs) of the Ministry of Defense (MINDEF) did not register theirtransactions in SIAF. An administrative mechanism, known as libramiento, allowed MINDEF’s UEs to transfer theirbudget resources to about 870 open bank accounts that worked as authentic “black boxes”: Resources in theseaccounts did not belong to Treasury, were neither monitored by the Cash Oversight Committee nor audited, andend-year nonspent funds were never returned to Treasury. In January 2001, however, all MINDEF EUs were sud-denly incorporated into SIAF, and libramientos were eliminated. Because this decision was political, and no previoustechnical preparation was done, all EUs were allowed to operate their new SIAF-registered bank accounts under atransitory mechanism known as encargo to operational units (OUs). But, a few control issues appeared:
■ About half of MINDEF’s EUs operations (Army, Navy, and Air Force) were executed through encargos to OUs;■ OUs did not properly register their direct purchase of goods and services, did not use the SIAF or, in the
case of some located outside Lima, did register them, but manually.
To address these problems, in January 2002, the SIAF moved to:
■ Maintain a limited number of EUs;■ Eliminate OUs operating in the same office of the EU;■ Design and install a tailored-made pilot SIAF2 special module in 100 OUs executing encargos;■ Develop an accelerated training program in SIAF2;■ Reduce the number of OUs located outside Lima and improve criteria to define them; and■ Replicate such exercise at the Ministry of Interior.
As a result, (a) 100 percent of defense and national security expenditure will be managed through SIAF by end-2002; (b) the SIAF2 module will be expanded through all active OUs; (c) an administrative reorganization of theArmy will be implemented to support it; and, (d) also by end-2002, for the first time all five MINDEF EUs willsubmit full and transparent financial statement reports.

Recommendations:■ The SIAF2 special module should be expanded through all active OUs.■ An administrative reorganization of the EUs should be implemented to support it
(see below).■ Quarterly deadlines should be set for all OUs to submit full and transparent financial state-
ment reports.
The SIAF has reproduced the State’s broad institutional disorder in its own internal structuresince no homogeneous criteria for defining an EU exist. Below budget envelopes (pliegos), thereare 580 EUs nationwide. In theory, an EU is the lower level defined by the MEF as the one withfull administrative capacity to register the use of funds into the system.3 In practice, budget size,geographic location, and political affiliation appear to be guiding principles to determine its cre-ation. Becoming an EU is equivalent to having direct control of the checking account, whichmakes it a much-desired milestone to achieve by OUs, Regional Directorates of Ministries, andministerial units like the Unidades de Servicios Educativos (USEs). All nationwide CTARs are con-sidered as budget envelopes (pliegos), and each budget envelope (pliego) has the capacity to pro-pose the creation of an EU and assign its budget. However, no standard minimum requirementsfor the creation of an EU exist, which contributes to their lack of homogeneity, wide dispersion ofthe budget amounts—an average of between NS/14.1M in Uyacali to NS/122.4M in Lima—perunit (Table SA.45), and perhaps unnecessary bureaucracy. For instance, the Ministry of Educationhas 72 EUs, and this includes up to eight different management models in a menu of widely het-erogeneous institutions with different hierarchical responsibilities, like Regional Directorates ofMinistries, Sub-Regional Directorates, and USEs.
Recommendations:■ Taking advantage of the incoming decentralization process, it would be advisable to have a
gradual reordering of EUs, both at the regional and district level. In fact, Supreme DecreeNo. 001-2002-PCM opens the door to their restructuring. This could sound very technical,but it is very important because it shapes incentives faced by those delivering goods and ser-vices, and the oversight/accountability arrangements (checkbooks) of those units below EU status. This is a sensitive matter, though, because new regions could assume that thereordering of EUs is taking away their actual budget resources. Hence, this process could bedemand-driven by the to-be-decentralized social sector ministries at the regional level, and/orsupply-driven by the Executive. In both cases, it would be suitable to examine and enforce aset of standard minimum norms before a unit reaches (or is confirmed as having) EU status.
■ Complementary to the above, multiple types of EUs (and SIAF software) could be consid-ered, depending on their budget size (usually correlated with population), location, andfunctions. SIAF requirements could be stricter as their budget gets larger, as provincial dis-tricts are involved, or as more complex functions are developed. A simplified SIAF-software(it could be called SIAFITO) could be considered in support of small budget or distantEUs. SIAFITOS could be easier to handle by regional and local governments than thestandard SIAF.
Upgrading the Budget Management SystemPeru is upgrading its budget management system at an accelerated pace. Recent innovations inbudget practices include lengthening the time horizon of budgeting from a single year to multiple
46 WORLD BANK COUNTRY STUDY
3. The authority of the EU is significant: Whereas the pliegos are in charge of budget formulation andsector policy norms, the EU has the capacity to make budget commitments, order payments, and executespending. Whereas budget changes between EUs require a resolution from the head of the pliego, authority toapprove changes within an EU (for example, from one program to another or within programs) may be dele-gated from the head of the EU to the OU. The EU is also free to reassign resources among diverse expendi-ture items, except when required for compensation purposes.

years, setting explicit fiscal targets that limit aggregate expenditure, and developing baseline projec-tions for estimating the impact of proposed policy changes on future budgets. The budget processhas four stages: formulation, approval, execution, and evaluation (Box 3.4).
Results following a standard assessment of the Peruvian PEM system, in consultation withcountry authorities, indicate that it requires some upgrading (Table 3.1 and Annex C). The assess-ment covers 15 indicators covering critical elements of PEM systems deemed necessary for trackingexpenditure. Seven of the indicators relate to budget preparation and four each to execution andreporting. The total number of satisfactory benchmarks met, 8 in the case of Peru, can be viewedas an indicator of the quality of a country’s PEM system. According to IMF/WB standards, acountry is deemed to require “little or no upgrading” if at least 11 of the benchmarks were met,“some upgrading” is required if between 8 to 10 benchmarks are met, and “substantial upgrading”is required if less than half (7 or fewer) of the benchmarks were met.
Peru scores unsatisfactory in some areas of budget formulation and execution, and satisfactoryin most areas of budget reporting, other than external.
RESTORING FISCAL DISCIPLINE FOR POVERTY REDUCTION IN PERU 47
BOX 3.4: PERU: PRINCIPAL STAGES OF THE BUDGET FORMATION
Ministry of Economy and Finance
Pliego Others Level of Disaggregation
For
mul
atio
n B
udge
tary
E
valu
atio
n A
ppro
val
Exe
cuti
on
Convey initial ceiling
The head establishes the priorities
The ceiling is distributed among the pliegos1
Congress approves the law (the executive submits
the projects previously approved by the Counsel
of Ministers)
Current and capital expenditures
By target and specified
At all levels of disaggregation
Current and capital expenditures
By target and specified
By pliego and executing unit
By sector and program By generic expense
categories
Convey allocations Trimester of expenses (day 19 of the month before the end of the
trimester) Plan trimester expenses (day 26 of the month before the
end of the trimester)1
Approve calendar of commitments (up to the 5th of the month
being approved) Assign calendar of
commitments among subprograms2
Create Report on Physical Progress and Financing of
Goals
1. Discretion of the Pliego’s Budgetary unit to decide how much to assign to each executing unit.2. Additional discretion when there is no executing unit.
Source: Budgetary norms by MEF

48 WORLD BANK COUNTRY STUDY
TABLE 3.1: PERU: STATUS OF BUDGET MANAGEMENT BENCHMARKS
Status of Compliance: S=Satisfactory; P=Partial;
Budget Management Benchmark U=Unsatisfactory
Formulation–Comprehensiveness1. Composition of the budget entity
2. Limitations on using off-budget transactions
3. Reliability of budget as guide to actual expenditure
4. Data on external financing
Formulation–Classification5. Classification of budget
transactions
6. Identification of poverty-reducing expenditure
Formulation–Projection7. Quality of multiyear projections
Meets IMF–Government FinanceStatistics definition of generalgovernment
Extra or off-budget expenditureis not substantial
Level and composition of actualexpenditure is “quite-close” tobudget
Both capital and current donor-funded spending included
Functional/program informationprovided
Identified through use of a classi-fication system (e.g., a virtualpoverty fund)
Projections are integrated intobudget formulation and close fitto actual numbers
(P) The annual budget coversCentral Government expendi-ture. Coverage of the consoli-dated general governmentbudget has minor discrepanciesand does not include regulatoryagencies, local governments,and social funds.(S) Quasi-extra-budget expendi-ture was about 18 percent in2002, mostly linked to externalcredit, and rapidly declining.(P) The level is close—below 10 percent deviation in 2001—but its composition still showssignificant differences.(S) External credit is duly regis-tered, except for a few donoroff-budget accounts.
(S) The budget contains proper functional and program classification.(P) Broad and detailed (beyondthe usual social sectors) map-ping of budget for poverty-reducing expenditure ispossible, but it is neither virtual,nor user-friendly; and requirescontinuous consistency checksbetween SIAF and the BudgetDirectorate.
(U) Multiyear projections arenot integrated into the budget,are subject to significant modifi-cations each year, and theirexecution has a poor fit toactual numbers.

RESTORING FISCAL DISCIPLINE FOR POVERTY REDUCTION IN PERU 49
TABLE 3.1: PERU: STATUS OF BUDGET MANAGEMENT BENCHMARKS (CONTINUED)
Status of Compliance: S=Satisfactory; P=Partial;
Budget Management Benchmark U=Unsatisfactory
Execution–Internal Control8. Level of payment arrears
9. Quality of internal/external audit
10. Use of tracking1 surveys
Execution–Reconciliation11. Quality of fiscal/banking data
reconciliation
Reporting12. Timeliness of budget reports
13. Classification used for budget tracking.
Reporting–Final Audited Accounts14. Timeliness of accounts closure
15. Timeliness of final audited accounts
1. Tracking is defined here as the identification and reporting of budgeted and executed outlays. Tracking surveysare usually needed when the financial management system does not have the capacity to regularly identify, monitor,and report expenditure at the lowest levels of the government, such as districts (IMF/WB 2002).2. Public Expenditure Tracking Surveys (PETS) are rare in LAC: only Honduras (for service quality) and now Peru(for quantitative leaks and service quality) have developed them (see Chapter IV).
Source: Interviews conducted by project team.
Low level of arrears accumulated
Effective internal/external audit
Surveys used on a regular basis
Reconciliation of fiscal and monetary data carried out onroutine basis
Monthly expenditure reportsprovided within 4 weeks of end-of month
Detailed functional reportingderived from classification system
Accounts closed 2-monthsbefore year-endAudited accounts presented toLegislature within one year
(S) SIAF requires paymentarrears to be cleared within onemonth.(P) Good quality of internalaudit, but infrequent and poorquality (e.g., no program costsare reported) of external audits(WB/IDB 2001).(U) Nonexistent until recently2
(S) Satisfied permanently
(P) Regular internal reports are provided within 4 weeks ofend of the month; but externalreports are annual, 6 monthsafter year-end. MEF hasannounced quarterly budgetreports in the web since mid-2002.(S) Existing functional reportingderives from the classificationsystem. Its program and projectdecomposition could beimproved.
(S) Accounts close one monthafter year-end.(S) Audited accounts submittedon June 30th.

50 WORLD BANK COUNTRY STUDY
Recommendations:■ Budget classification should be made fully consistent with the Government Financial Statis-
tics (GFS) definition of General Government.■ The quality of budget projections (especially in function and sector composition) needs to
be upgraded if social priorities are to be sustained in the medium term.■ Multiyear projections also require significant improvement and adequate integration with
the annual budget process.■ The creation of a budget module and refinement of the existing set of financial and physical
indicators in the SIAF should facilitate a user-friendly tracking of pro-poor expenditure andan effective results-based control system in budget execution.
■ Sector tracking surveys should be developed randomly on a regular basis.■ External reporting of budget execution, multiyear budgeting, and audits should be frequent,
timely, and comprehensive.■ Full adoption of the IMF Code of Fiscal Transparency requires a thoroughly defined and
supported technical assistance program.
This assessment should, however, be used with caution, since not all indicators are of equalimportance. Its bias in favor of process measures (such as audit reports) to the detriment of impactoutcomes (such as questioned audit reports) is usually not optimal in a country context, and maymiss critical issues of PEM, like the ones outlined below.
Although the share of quasi-extra-budgetary funds (EBFs) in Peru is rapidly declining, itsimportance is significant for a single category: external credit (Table 3.2).4 Following the elimina-tion of the Fondo Nacional de Vivienda (FONAVI), the housing EBF, which accounted for about 6 percent of the budget in 1999, the CG budget coverage of all resources increased from 65 percentin 1999 to 82 percent in 2002. Self-raised revenue by local governments, customs proceedings, andgrant funds are now controlled through the single Treasury account managed by the Banco de laNación. However, three main sources of quasi-EBFs remain: (a) external credit accounts (in local
4. In OECD terms, EBFs comprise all government transactions that operate outside the normal bud-getary process. Peruvian “quasi” EBFs are considered as such since they are capped monthly and are reportedin the SIAF as part of the overall budget envelope, which is unusual for such types of resources, but conformto other EBFs features: their effective allocation takes place only if they become available; funds are managedthrough commercial bank accounts separate from the Central Government budget account; and, despite stan-dardization efforts, they still might have separate accounting systems and classification.
TABLE 3.2: COMPOSITION OF CG BUDGET SOURCES
Percent
2001b 2001p 2002b
Ordinary 80.7 70.7 75.1Canon/Sobrecanon* 0.5 0.6 0.6Customs 0.4 0.4 0.0Self-Raised Funds 6.8 6.5 6.9External Credit* 7.7 16.9 13.2Grants 0.4 0.7 0.2Contrib. to Funds 3.5 4.2 3.9Total 100 100 100
*Quasi-EBFs. b = budget. p = preliminary.
Source: MEF.

RESTORING FISCAL DISCIPLINE FOR POVERTY REDUCTION IN PERU 51
currency), which manage salary payments to top-ranked public servants serving external projects andwhose eventual late registration might affect reporting on executed expenditure; (b) contribution tofunds (especially ESSALUD); and (c) the canon/sobrecanon revenues from mining, oil, gas, andother natural resources activities.
Recommendations:■ Total reduction in the number of EBFs would not only improve control over the level and
quality of public expenditure, but would also reduce the cost of sobregiro fees that Treasurypays when seasonal shortages of tax revenue collection by SUNAT lead to insufficient cashavailability to cover all public payments.
■ Other less visible EBFs, like tax expenditures, should continue to be registered from 2003onward.
■ Accounting of external credit should be fully made in the SIAF and have timely and trans-parent reporting.
There is a budget paradox that needs to be addressed: budget formulation remains centralizedin the MEF, while budget execution is decentralized. While budget formulation is centralized anda high proportion of budget expenditure remains under the authority of government agencieslocated in Lima, roughly 56 percent of the CG nonprevisional, nonfinancial budget is executedthrough the regions in a decentralized fashion (Table SA.39). Hence, although larger and decen-tralized entities appear to be tightly controlled politically and may operate as means for distributingpolitical spoils (World Bank 2001a), they preserve enough spending authority to modify the bud-get at their discretion.
Inertial expenditure is a major constraint for budget formulation. Peru is ranked among coun-tries with the most inflexible budget not only in LAC, but also worldwide. In addition to Brazil,India, and a few HIPC countries, which have above 90 percent of their total revenue fixed, Peruhas 91 percent and 86 percent of ordinary and total budget resources, respectively, in 2002,assigned to inertial commitments (Table 3.3). Budget rigidities originate from different sources,including (a) wage and benefits considered as derechos adquiridos by the Constitution; (b) perma-nent contracts hidden as nonpersonal services (NPS)—no less than 40 percent of the total budgetallocated to NPS, according to estimates of Peruvian officials; (c) inertial payroll under prolongedinvestment projects; (d) earmarked transfers to municipalities and the private sector, as the Vaso deLeche and Comedores Populares; and (e) misuse of the budget contingency reserve, which financesthe March school bonus, and the July and December salary supplements (aguinaldos). The highshare of inertial current expenditure explains not only its rapid expansion, but also the complexitythat attempting to reverse such pattern will require.
Recommendations:■ An immediate general hiring freeze under the NPS category is critical, accompanied by a
case-by-case short-term renewal of existing temporary contracts, upon their prior revision.■ Authorities had no option but to review their present policies regarding pension and wage
benefits in a comprehensive civil service reform (Chapter VI).■ Funds assigned to Vaso de Leche and Comedores Populares need to be streamlined
(Chapter IV.■ The use of the contingency reserve requires review to fulfill its true role: filling unpredicted
in-year budget needs.5
End-year excessive seasonal spending is another critical shortcoming of budget execution.Notwithstanding the purpose of the creation of the SIAF—which is to enhance and improve budget
5. Authorities reported that such review was achieved in the formulation of the 2003 budget.

52 WORLD BANK COUNTRY STUDY
control—the persistent pattern of excessive deficits in the last quarter of the last six years, coupledwith small budget surpluses in the first quarter, remains a constant and fiscally damaging seasonalconcern—whether they occur in an election year or not (Figure 3.1). Such budget behavior is notspecific only to Peru. Most public budgets in LAC have such fiscal expansions to cover not onlyend-year cumulative and additional payments, but for building fiscal provisions for the slowly open-ing expenses of the next year’s first quarter. A similar pattern is also typical of the LAC political busi-ness cycle, and Peru is no exception (López-Cálix 2002). However, deficits appear for both the CGand the NFPS, and following SIAF creation, their size is difficult to justify for reasons other than fis-cal indiscipline. In 2000, the quarterly deficit developed since the third quarter, lasting until end-year, while in 2001, it grew with respect to 2000 (in particular the deficit of the CG).
Recommendations:■ Given its persistence throughout so many years, the first step for the GOP (and its Cash
Management Committee) is to assess the deep implications that this seasonal episode is hav-ing on fiscal imbalances and monetary policy (possibly affecting short-term interest rates).
■ A thorough review of cash management and budget planning for the closing fiscal year isneeded to examine structural—revenue and expenditure—factors that might explain end-year cumulative deficits and determine effective measures aimed at smoothing them.
■ Under the present situation, setting and meeting realistic revenue projections and tightquarterly expenditure ceilings looks critical to make room for end-year impulses.
■ Until this seasonal pattern is significantly corrected, meeting midyear tighter expenditureceilings, especially in an election year, is particularly meaningful for fiscal discipline.
As Peruvian PEM modernizes, it will need to adopt further contemporary innovations in bud-get practices, in terms of both rules and procedures that will be required eventually under the newMEF Code of Budget Transparency.
TABLE 3.3: REVISED PROJECTION OF THE 2002 BUDGET(Millions of NS and % of Total Expenditure)
Structure of Expenditures All Sources Ordinary Resources
Expenditures by Category 21,790 59.9% 17,290 3.3%Fixed Component 16,820 46.2% 14,844 4.3%
Goods and Services 3,200 8.8% 2,170 7.9%Investment 1,330 3.7% 868 3.2%Financial Investments 171 0.5% 139 0.5%Other Current Expenditures 1,967 5.4% 1,770 6.5%Other Capital Expenditures 25 0.1% 25 0.1%Personal and Social Obligations 9,272 25.5% 9,016 33.0%Contingency Reserves 856 2.4% 856 3.1%
Flexible Component 4,970 13.7% 2,446 8.9%Goods and Services 1,714 4.7% 1,124 4.1%Investment 2,933 8.1% 1,258 4.6%Other Current Expenditures 36 0.1% 31 0.1%Other Capital Expenditures 288 0.8% 33 0.1%
Structural Obligations 13,982 40.1% 9,438 6.7%Financial Expenditure 7,787 23.1% 4,495 8.7%Previsional Expenditure 6,195 17.0% 4,943 8.1%
TOTAL 35,772 100.0% 26,728 100.0%
Source: MEF.

Recommendations:■ Define procedures for identifying the government’s exposure to contingent liabilities, par-
ticularly those associated to the financial system, pensions and public enterprises guaranteeddebt, and other fiscal risks; and
■ Attempt (cautiously) accrual accounting for certain commitments, at least on the expendi-ture side.6
Building a Medium-Term Expenditure FrameworkIn the past two years there has been an important shift in the budget toward pro-poor expenditure.In spite of the recession and resulting fiscal retrenchment, the share of social expenditure to GDPremained constant between 1999 and 2002 (Figure 3.2). Likewise, significant inter- and intrasectoralpro-poor spending reallocation began to take place between 2000 and 2002. The budget decreasedfor defense and national security from 2.9 to 2.1 percent of GDP; increased for education, health,and social assistance from 5.3 to 5.6 percent of GDP; and decreased for ESSALUD (nontargetedpublic health insurance administration) from 1.5 to 1.3 percent of GDP (Figure 3.3). On the otherhand, the share of poverty-reduction programs in social expenditure (consisting of programs withuniversal coverage—education and health—and targeted spending) increased from 57 percent in2000 to 60 percent in 2002 (Table 3.4).
Peru has taken promising steps toward a medium-term expenditure framework (MTBF). Since2000, as part of the Law of Fiscal Prudence and Transparency, the GOP has published Multiyear Budgets (MABs), themselves based on Multiyear Strategic Sector Plans (PESEMs). MABs have intro-duced the initial framework for a shared strategic vision in the ongoing overhaul of the budgetaryprocess, emphasizing a poverty focus, output-driven program budgeting, transparency in the use of
RESTORING FISCAL DISCIPLINE FOR POVERTY REDUCTION IN PERU 53
FIGURE 3.1: COMPARISON OF CENTRAL GOVERNMENT AND NFPS BALANCE
-6%
-5%
-4%
-3%
-2%
-1%
0%
1%
2%
3%
4%
I.95
III.9
5
I.96
III.9
6
I.97
III.9
7
I.98
III.9
8
I.99
III.9
9
I.00
III.0
0
I.01
III.0
1
CG Balance NFPS Balance
Source: MEF and IMF.
6. The IMF Code of Fiscal Transparency does not require accrual accounting. Countries are allowed toadopt it at their own speed. Its implementation continues to have mixed results, with Australia experiencingparticular difficulties and New Zealand and Brazil claiming to have had a relatively smooth conversion.Among opposing “big bang” and “incremental” approaches, the latter appears closer to the Peruvian way toPEM reform, since the country has, de facto, modified accrual, since it already captures some commitmentsupstream in the expenditure chain. Accrual accounting may confuse the definition of fiscal deficit among civilsociety and other stakeholders and must be developed with caution.
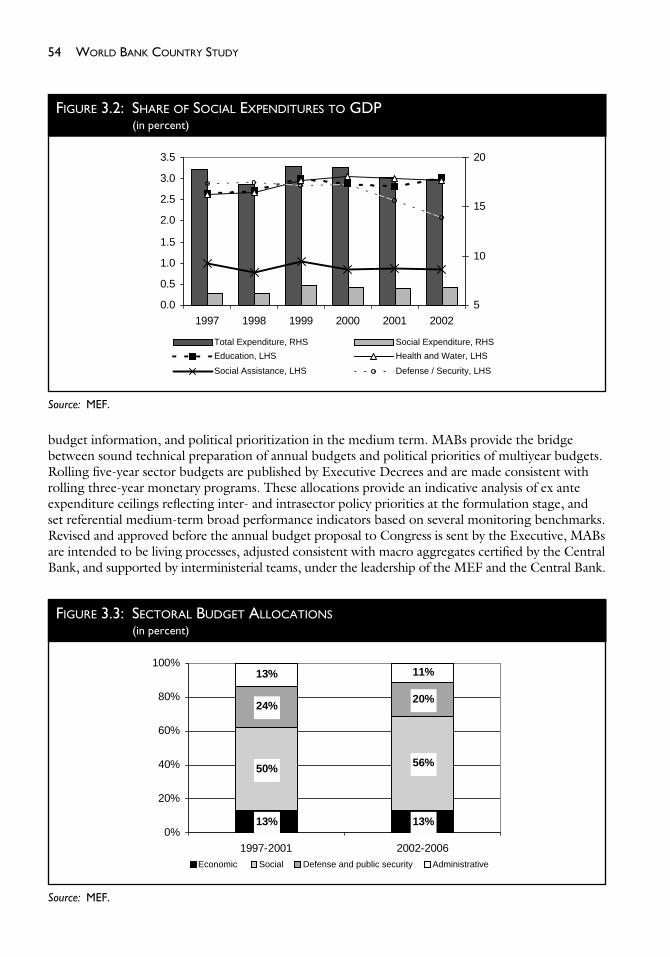
budget information, and political prioritization in the medium term. MABs provide the bridgebetween sound technical preparation of annual budgets and political priorities of multiyear budgets.Rolling five-year sector budgets are published by Executive Decrees and are made consistent withrolling three-year monetary programs. These allocations provide an indicative analysis of ex anteexpenditure ceilings reflecting inter- and intrasector policy priorities at the formulation stage, andset referential medium-term broad performance indicators based on several monitoring benchmarks.Revised and approved before the annual budget proposal to Congress is sent by the Executive, MABsare intended to be living processes, adjusted consistent with macro aggregates certified by the CentralBank, and supported by interministerial teams, under the leadership of the MEF and the Central Bank.
54 WORLD BANK COUNTRY STUDY
FIGURE 3.2: SHARE OF SOCIAL EXPENDITURES TO GDP(in percent)
0.0
0.5
1.0
1.5
2.0
2.5
3.0
3.5
1997 1998 1999 2000 2001 2002
5
10
15
20
Total Expenditure, RHS Social Expenditure, RHS
Education, LHS Health and Water, LHS
Social Assistance, LHS Defense / Security, LHS
Source: MEF.
FIGURE 3.3: SECTORAL BUDGET ALLOCATIONS(in percent)
13% 13%
50% 56%
24%20%
13% 11%
0%
20%
40%
60%
80%
100%
1997-2001 2002-2006Economic Social Defense and public security Administrative
Source: MEF.

Revisions of the 2002–06 budget by the new Peruvian officials also reflect a shift toward pro-poor and decentralized expenditure, and a search for a more efficient safety net system. The first2001–05 MAB was modified to accommodate the difficult transition period during the electoralcycle and reflect the priorities of the Toledo Administration. Major changes in multiyear budgetallocations 2001–05 and 2002–06 were (a) a reduction of about 10 percent in the overall expendi-ture amount; (b) a significant reduction of defense and security outlays; (c) a slight increase inhealth expenditure; (d) a significant increase in the safety net programs grouped under the Presi-dency, supporting the new countercyclical A Trabajar program and the decentralization process;and (e) an election campaign-promised salary bonus of 50 soles to public servants, and a conver-sion from temporary to permanent teacher hiring status. In sum, when compared to 1997–2001,the 2002–06 MAB projects a higher share allocated to social spending (adding up to about 56 per-cent of the budget), offset by lower shares allocated to defense and security (falling to about onefifth of the total budget) and to public administration (falling to 11 percent) (Figure 3.3). Suchpriorities are being revised under the national dialogue, but the intended shift toward pro-poorand decentralized expenditure looks irreversible.
Significant inter- and intrasectoral pro-poor spending reallocation also took place between2000 and 2002. The budget for defense and national security decreased from 2.9 to 2.1 percent ofGDP. The budget for education, health, and social assistance increased from 5.3 to 5.6 percent ofGDP. Complementary to these major shifts, ESSALUD expenditure (nontargeted public healthinsurance administration) decreased from 1.5 to 1.3 percent of GDP. In a similar vein, the share ofpoverty-reduction programs (consisting of programs with universal coverage—education andhealth—spending and targeted spending) to social expenditure increased from 57 percent in 2000to 60 percent in 2002 (Table 3.5).
MABs’ framework, however, has four weaknesses when compared to international standards:
■ Low technical content. The quality of MABs’ projections have two important limitations: (a) they barely project budget sector institutional allocations, but exclude more familiar oneslike economic or functional classifications; and (b) their forecasting horizon—five years—istoo long to be credible, and its consistency with monetary aggregates (and ceilings) pub-lished by the Central bank is too broad.
RESTORING FISCAL DISCIPLINE FOR POVERTY REDUCTION IN PERU 55
TABLE 3.4: COMPOSITION OF SOCIAL EXPENDITURE 1999–02* (millions of nuevos soles)
Categories 1999 2000 2001p 2002e
Universal Coverage—Education & Health—Programs 8,378 8,804 9,113 10,170Targeted Programs (Extreme Poverty) 3,257 3,043 2,979 3,531Nontargeted Social Programs 7,909 8,928 8,960 9,175
ESSALUD 2,489 2,801 2,666 2,695Pensions 5,330 6,127 6,294 6,480FONAVI 90 0 0 0
Total Social Expenditure and Pensions 19,544 20,775 21,051 22,877
Memo:Poverty Reduction Programs (I+II)/Total (%) 59.5 57.0 57.4 59.9Extreme Poverty Reduction Programs (II)/Total (%) 16.7 14.6 14.1 15.4Nontargeted Programs/Total (%) 40.5 43.0 42.6 40.1
*Includes ESSALUD, FONAVI, and pensions.pPreliminary.eEstimated.
Source: MEF.

■ Weak link to the annual budget. MABs are produced three to four months before the draftnew fiscal year budget appears, which should allow time for fine-tuning, yet they are not themain basis for formulating or determining actual modifications to annual budget allocations.Moreover, broad institutional allocations assigned ex ante to strategic priorities per sector aremodified ex post throughout the year, with little consideration of the original priorities;there is no link with the planning function of the Investment Office; and, in fact, their actualbenchmarks are so numerous and inadequate that compliance by public institutions is notregularly evaluated.
■ Fragile institutionalization. MAB’s institutional framework, which was born as part of aFiscal Law that was not totally complied with, is weak and should be strengthened. Becauseit is an internal MEF exercise, it bears fundamental review of such questions as, Why areMABs produced? Who are the users of this information? How is this information relevantto policy design and implementation?
■ Public’s misperception about MAB’s transparency. As an MEF-led exercise and despite thePortal’s existence, MAB’s transparency is also constrained by public misperceptions aboutthe budget. The fact that a module on multiyear budgeting is not yet part of the SIAF, andthat mandated biannual evaluations of the MABs are neither regularly prepared nor pub-lished, contribute to such misperceptions.
In the medium term, MABs should consolidate their role in determining the strategic prioritiesof annual budget allocations. To achieve this, authorities expect to carry out certain improvementsin the MABs’ framework from 2002 onward.
Recommendations:■ The annual budget investment formulation is following an innovative participatory
process and, from 2003 onward, MABs will be broadened to take into considerationregional priorities.
56 WORLD BANK COUNTRY STUDY
TABLE 3.5: COMPARING MULTIYEAR BUDGETS BY SECTOR(Billion NS and %)
Absolute Sector 2001–05 2002–06 Variation
Agriculture 1,085 3.23 1,010 3.37 −74Transport, Communication, & Housing 2,154 6.41 2,062 6.88 −92Mining and Energy 506 1.50 435 1.45 −71Education 8,906* 26.49 4,662 15.56 −4,244*Health 2,863 8.51 3,024 10.09 161Presidency (Social Assistance) 4,701 13.98 6,745 22.51 1,994**Justice 586 1.70 553 1.84 −33Judicial Court 804 2.40 711 2.37 −92Defense 4,476 13.31 3,210 10.71 −1,266Security 4,375 13.01 2,812 9.38 −1,564Others 3,169 9.42 4,744 15.80 1,624TOTAL 33,625 100.00 29,968 100.00 −3,657
*Reflects an overestimation of the education payroll originally budgeted in the multiyear budget, but not approved,to hire teachers outside Lima by the Ministry of Education.**Includes projected support to A Trabajar and to regional and local governments.
Source: MEF.

■ MAB’s five-year horizon should be reduced to three to make it consistent with the three-yearhorizon macroeconomic program.
■ Revenue estimates should be opened to external and hopefully independent review to gaincredibility.
■ MABs’ link to annual budget priorities should be strengthened, and mandated reportsshould be prepared twice a year to correct for deviations.
■ The SIAF should design and implement MAB’s performance-monitoring indicators, andthe Ministries’ budget execution should regularly be monitored against their benchmarks.
■ MABs’s reporting should be regularly published on the web to enable Congress and civilsociety to monitor and oversee expenditures—both programmed and executed—therebyensuring both accountability and compliance with the annual budget. This is especially crit-ical in light of national dialogue.
■ As the SIAF improves its monitoring indicator system, a very basic costing-per-unit-arrangement system could be developed for selected poverty benchmarks.
■ Finally, projected performance-based contracts in the public sector by end-2002—startingwith pilot social ministries, programs, or projects—will require SIAF-monitored benchmarksin accordance with agreements under the MABs.
Protecting the Budget as a Medium-Term Social PolicyPoverty-reduction efforts in the 1990s also included an innovative but hardly known emphasis onprotecting priority social expenditure. In the 1990s, social expenditure in Peru was mostly pro-cyclical, such that their spending rose during periods of economic growth, but fell during economicdownturns when such interventions were most needed. In this context, the fact that the last twoGOPs have actively protected social spending in a fiscally retrenched economy, with total expendi-ture decreasing from 19 percent of GDP to 17.8 percent of GDP during 1999–2002 (about oneseventh in dollar terms), is exceptional. Indeed, the share of social expenditure to GDP, whichevolved from 3.9 percent of GDP in 1990 to 7.0 percent in 1999 and then remained steadfast until2002, is a positive outcome.
Social programs were highly procyclical until 2000, but anticyclical afterward when, as part ofactions leading to an effective social protection strategy, authorities guaranteed floor budget financ-ing for a series of Protected Social Programs (PSPs), initially conceived during periods of recession.7This approach consisted of assigning a global budget allocation to nonsalary current and capitalspending for 11 broadly selected programs, distributed among 8 sectors (functions): education (pre-primary, primary, and secondary); health (collective and individual); social and community assistance;transport; justice and peace; water and sanitation; agriculture; and energy. In 2001, the minimumaggregate budget allocation was about US$1.0 billion, equivalent to 12.7 percent of the ordinarybudget and 1.9 percent of GDP. Preliminary projections for end-2001 budget execution show thatthe GOP complied with such commitment by transferring an aggregate amount of US$1.1 billion,equivalent to 13.1 percent of ordinary budget or 1.9 percent of GDP, and slightly above its targetdespite recessionary trends in 2001. Such anticyclical behavior in social expenditures was atypical inPeru, particularly in light of the significant economic slowdown all year due to unfavorable externaland internal events. Moreover, in 2002, the GOP proposed an aggregate allocation of 2.0 percent ofGDP to the PSPs (Table 3.6).
Meeting PSPs’ expenditure floors was accomplished in 2001, but not without difficulties. Protected expenditure was maintained despite a fiscal retrenchment of about 0.8 percent of GDP.However, a few individual programs exhibited significant variations between target and actual
RESTORING FISCAL DISCIPLINE FOR POVERTY REDUCTION IN PERU 57
7. Other actions include introduction of a countercyclical workfare program; improved targeting andconsolidation of food and nutrition programs; and reduction of the public pension system deficit, whileexploring options for expanding social insurance options for the poor who are currently employed in theinformal sector.

expenditures, for example, underexecution in education and overexecution in health, social, andcommunity assistance, and agriculture. Overexecution was mainly due to a moderate expansion ofrural health programs and school breakfast programs, and unexpected expenses associated withnatural disasters like the Arequipa earthquake, or prevention work required to deal with potentiallyadverse effects of El Niño on agriculture production. Underexecution in education programs wasneeded to make room for converting teachers from contratados to regularizados by the Paniaguatransition government. Because the definition of the set of protected programs was broad, it pre-vented the assessment of the efficiency of individual programs in accomplishing their ultimate outcomes.
The government has agreed to go beyond the initial countercyclical role of the PSPs—that is,providing budget protection when a downturn occurs—to sustain their spending floors in themedium term while improving their focus, efficiency, monitoring mechanisms, and transparency.The ongoing restructuring of PSPs will be accompanied by expenditure shifts in broad sector func-tions, since both will have a central role in a poverty-reduction strategy.
58 WORLD BANK COUNTRY STUDY
TABLE 3.6: BUDGET FOR PROTECTED SOCIAL PROGRAMS(Nonsalary Current and Capital Budget, million soles)
PSRL I PSRL II
Program Target* Executed* Target** Approved* Code Sector 2001 2001p 2002f 2002
026 Pre-Primary Education 132 66 230 160027 Primary Education 467 152 229 255028 Secondary Education 467 107 212 175063 Collective Health 196 420 432 479064 Individual Health 471 660 835 847014 Social & Community Assistance*** 315 414 383 609052 Transport 686 503 NA 385002/022 Justice & Peace 559 583 NA 655052 Water and Sanitation 89 67 NA 79009 Agriculture 85 606 NA 310035 Energy 74 73 NA 54
TOTAL 3,541 3,650 2,321 4,008% of Ordinary Budget 12.7 13.1 8.7 15.0% of National Budget 9.9 10.2 6.5 11.2% of GDP 1.9 1.9 1.2 2.0Memo:GDP 189,800 189,800 201,002 201,002Ordinary Budget 27,812 27,812 26,728 26,728National Budget 35,712 35,712 35,772 35,772
PSRL = Programmatic social reform loan.NA = Not applicable.pPreliminary.fForecast.* Includes ordinary resources.** Includes ordinary and external resources under restructured PSPs.***Vaso de Leche resources are excluded; under restructured PSPs in 2002, those corresponding to Comedores Populares and A Trabajar are excluded, as well.
Source: Bank staff estimates supported by MEF data.

Recommendations:To institutionalize this key social policy, the GOP has announced several intentions:
■ At the sector function level, assigning a broad aggregate amount of earmarked resources toeducation, health and sanitation, and social assistance. This amount is considered not only abudget-protection tool when a downturn occurs, but the sustained floor required to makeprogress toward Peru’s medium-term development goals.8 The aggregate 2002 budgetallocation for the three priority social-sector functions—education, health and sanitation,and social assistance—is at least similar to its 2001 level in real terms, and shows an increasefrom 5.3 percent of GDP in 2001 to 5.6 percent of GDP for these sectors. In addition, in2003, at least a similar aggregate expenditure floor should be agreed, in real terms, in theapproved Budget Law.
■ At the program level, reduce the number of virtually selected PSPs to six (Table 3.6), andgroup under three sectors: education (pre-primary, primary, and secondary), health (collec-tive and individual), and social assistance. The aggregate earmarked expenditure to thisrevised set of PSPs is set at 1.2 percent of GDP in 2002, down from the previous 1.9 per-cent of GDP in 2001.9 This reduction of 0.7 percent of GDP makes room for increasedbudget flexibility. In addition, in 2003, a similar aggregate expenditure floor should beagreed, in real terms, in the approved Budget Law.
■ At the project level, establish monitoring indicators for specific projects grouped underthe selected PSPs and, in a few cases, add performance management contracts to improvetheir efficiency (for example, the Integral and Mother and Child Health Insurances, SIS-SMI).
■ Introduce budget flexibility on executed PSPs expenditure by including escape clauses atthe sector function level to make provisions for budget underexecution or a major bud-getary shortfall; and at the program and project levels, by allowing internal reallocationsfrom underperforming to overperforming programs or projects, but maintaining globalspending floors.10
■ Design and develop a tailor-made and user-friendly SIAF-supported monitoring and evaluation tool.
■ Consider the possibility of converting the de facto “virtually” protected budget into anEnhanced Virtual Poverty Fund. This enhanced mechanism would consist of tagging certain budget lines that meet or approximate the definition of poverty-reducing spending (the so-called “virtual” fund) and draw principally on the experience of Uganda’s PovertyAction Fund (Box 3.5). It is rapidly expanding through highly indebted poor countries(HIPCs).11 In some countries, its creation has also involved making changes to the exist-ing budget and accounting systems (Zambia), introducing new reporting templates totrack spending lines (Mauritania, Mozambique, and Tanzania), or producing additional
RESTORING FISCAL DISCIPLINE FOR POVERTY REDUCTION IN PERU 59
8. Peru has defined a set of about 20 medium-term development goals.9. The revised set of programs, however, increases its global allocation as a percentage of GDP from
1.0 percent in 2001 to 1.2 percent in 2002. The reduced level of protection in the revised set is the directresult of the narrow number of PSPs considered.
10. These ceilings for budget reassignments are required, on one hand, to maximize the effective use ofprotected funds that could be left unused by underperforming projects in priority programs and, on the otherhand, to guarantee a minimum level of budget execution in priority programs.
11. In 1996, the IMF and the World Bank launched the HIPC initiative to reduce the debt stock ofdebt-stressed countries. In 1998, they launched the Enhanced HIPC initiative to provide faster, deeper, andbroader debt relief, and strengthen the links between debt relief and poverty reduction through a poverty-reduction strategy produced by the country. Uganda is committed to channel cash-flow savings on interestpayments resulting from the reduction of the stock of debt under HIPC toward PAF programs.

information on all poverty-reducing spending (Honduras) (IMF 2002). Often, virtualfunds are believed not to be needed in countries that already have a system of programclassification or are well on the way to setting up such systems. However, in the case ofPeru, not only does such a Virtual Fund exist, with the support of the SIAF and the deci-sion of the GOP’s authorities to tag protected spending, but the Fund’s recent successfulexperience proves that virtual tagging is not the only sufficient condition for sustaining pro-poor expenditure in the medium term. An Enhanced Virtual Poverty Fund, tailor-made toPeruvian needs, would essentially require adding two new features: (a) the development ofits institutional framework providing open access and reporting; and (b) the definition ofmonitoring indicators and evaluation mechanisms in a participatory way. Such a proposalwould definitely strengthen a medium-term social policy with one of the finest tools for asolid poverty-reduction strategy, supported by the SIAF’s full development and expansionthroughout the public sector.
Budget TransparencyThere is no question that Peruvian officials have made tremendous progress toward making thebudget process more transparent and accountable to civil society (Table 3.7). In 2000, a few socialprograms were first in posting on the web their district-by-district expenditures. Then, two popular
60 WORLD BANK COUNTRY STUDY
BOX 3.5: PERU: INSTITUTIONALIZING A VIRTUAL POVERTY FUND: A LOOK ATBEST-PRACTICE UGANDA
The virtual Poverty Action Fund (PAF) is focused on implementing the government of Uganda’s highest priori-ties within the Poverty Eradication Action Plan (PEAP). The PAF is funded by a combination of HIPC debt relief,donor—general or sector-earmarked—support, and the government’s own resources. The operational frame-work of the virtual PAF has the following components: (a) budget priorities are defined by a rolling three-yearmedium-term expenditure framework (MTEF); (b) it is not a separate fund, but a subset of the overall budget;(c) the government commits not to cut its funds; (d) all expenditures fall under full Congress and Auditor General oversight; (e) it is managed by sector- and ministerial-level working groups; and (f) PAF programs havea structured and participatory institutional framework that ensures that they are properly planned, budgeted,and implemented. This includes:
Eligibility Criteria: A program qualifies if it meets four criteria: (a) it is part of the PEAP; (b) it directly reducespoverty (with involvement by the poor); (c) it delivers a service to the poorest 20th of the population; and (d) ithas a well-developed implementation plan (with costs, outcome, and output targets clearly identified). Programsare reviewed once a year.
Administration: Five percent of PAF resources are set aside for improving program effectiveness and transparency.
Size: At least a constant proportion of the original budget.
Reporting: An overall quarterly report by central or local governments should be produced by the Ministry ofFinance and distributed countrywide. Biannual sector performance evaluations are also required. Audits shouldcover all Central Government-led programs and at least 60 percent of district-led programs. Sector expendituretracking studies are required when there is inadequate audit information. Civil society independently monitorsreviews.
Safeguards: (a) In case of budgetary shortfalls, underallocation to PAF should be lower than cuts in non-PAF pro-grams; (b) in case of underperformance, funds can be reallocated to other PEAP programs or to PAF programs inthe following fiscal year.

infrastructure programs—Caminos Rurales and Rural Electrification—also posted on the web theareas covered by their work. In February, the MEF launched the Economic Transparency website(Portal de Transparencia Economica), including detailed information on budget execution. Thisprovided citizens and civil society organizations with the necessary tools to begin exercising controlover social and decentralized programs—to verify that expenditure outlays are actually spent asindicated, whether targeting is appropriate, and whether there appears to be any politically moti-vated wrongdoing in the use of public resources. Finally, the rapid expansion of the SIAF through-out the government will allow, in an unprecedented move for LAC countries, full disclosure of thebudget of the ministries of Defense and National Security by end-2002. The SIAF is also gettingready to support decentralization to subnational governments.
RESTORING FISCAL DISCIPLINE FOR POVERTY REDUCTION IN PERU 61
TABLE 3.7: BUDGET TRANSPARENCY RATINGS(November 2001)
Peru LAC Mean* Area/Score A B A–B
General Knowledge (Overall Score) 3.4 3.6 −0.2Formulation
Legislative powers 3.8 3.4 0.4Civil society participation 1.6 1.8 −0.2Budget is inertial 2.1 2.5 −0.4Budget follows M–T priorities 1.6 2.4 −0.8
In-Year ModificationLegislative participation 3.0 2.9 0.1Awareness of the civil society 1.7 2.2 −0.5
ExecutionEnd-year impact evaluation 1.5 2 −0.5Monitoring on physical targets 1.8 2.2 −0.4
Budget Transparency Indexes (General) 2.7 3.0 −0.3Formulation 2.5 2.7 −0.2Approval 2.4 2.6 −0.2Execution 2.4 2.6 −0.2Fiscalization 1.9 2.3 −0.4
Data QualityTrustworthiness of INE data 2.4 3.2 −0.8Independence from executive 2.1 2.7 −0.6
SupervisionOpenness to bidding prices 2.4 2.8 −0.4Knowledge of public salaries 2.4 2.6 −0.2Trustworthiness of internal audits 1.7 2.6 −0.9Comptroller’s office fights corruption 1.9 2.6 −0.7Sanctions for misuse applied 2.7 3.1 −0.4
Reporting TimelinessFormulation 1.9 2.0 −0.1Approval 2.2 2.8 −0.6Execution 1.8 2.3 −0.5Fiscalization 1.5 2.0 −0.5
*Also includes Argentina, Chile, Mexico, and Peru.
Source: Morón (2001).

Despite such efforts, Peru still ranks lowest in LAC in terms of overall budget transparency.Comprehensive national surveys developed in five LAC countries found that Peru ranks fifth belowChile, Argentina, Mexico, and Brazil (Figure 3.4). The survey was developed by the Universidaddel Pacifico (Morón 2001). It approached Congressmen from all political parties, journalists, thinktanks, and NGOs. Why, despite multiple recent efforts, did Peru obtain such a low ranking? A lookat the multinational survey shows detailed features about Peru’s legal framework and, more impor-tant, prevailing perceptions on budget transparency existing in the civil society.
Peru ranks favorably in terms of the legal framework surrounding budget transparency. The sur-vey underscores existing regulations that favor public knowledge of the budget and mechanisms likethe Portal, which promotes a transparent management of public expenditure, or the SIAF, whichimproves budget execution. Budget formulation, though, faces one obstacle: inertial spending,which prevents an adequate fit between budget allocations and priorities. For its part, budget audit-ing is affected by the diminished role of the Comptroller’s Office in controlling public expenditure.Furthermore, this office has no legal authority to issue sanctions against public servants found guiltyof wrongdoing. Finally, the survey also finds that no minimum reporting format requirements existin the SIAF, thus preventing a user-friendly reading of the budget database.
In spite of a positive legal framework, the major obstacle to budget transparency is that thepublic remains skeptical in Peru. The budget transparency ratings allow a detailed reading of theissues found by the survey (Table 3.7), classified per stage: formulation, in-year modifications, andexecution; or per area: overall transparency indexes, data quality, supervision, and reporting timeli-ness. Our analysis of selected perceptions is associated either to a higher differential (gap) betweenPeru and the rest of LAC, or to a low score obtained in the survey:12
■ Budget formulation. Perceptions suggest that the Peruvian Congress has above-averageleverage to be able to influence budget formulation, and others affirm that the budget doesnot follow medium-term priorities. The first finding is surprising since about 69 percent of surveyed responses also think that congressmen do not have the capacity to assess thebudget.
■ In-year modifications. The public’s perception is that the Peruvian Congress has a higherparticipation in budget in-year modifications than is assumed in the rest of LAC, but thatcivil society’s awareness of such adjustments is significantly lower than in other countries.
62 WORLD BANK COUNTRY STUDY
FIGURE 3.4: INDEX OF BUDGET TRANSPARENCYAverage classsification on a scale of 1 to 10
0
1
2
3
4
5
6
7
Chile Brazil Argentina Mexico Peru
Source: Morón (2001).
12. Scores are the average total response in a 1 to 5 rating.

■ Budget execution. Monitoring and evaluation of public expenditure in Peru appears to sig-nificantly lag compared to other LAC countries.
■ Overall transparency indexes. The public’s perception is quite homogeneous with respect tothe gaps perceived in the different stages of the budget process, with the lowest scoreassigned to budget fiscalization.
■ Data quality. The public clearly mistrusts INEI data and its independence from the Execu-tive. INEI ranks low in regional terms.
■ Supervision. The public’s perception assigns the lowest supervision ratings to internal auditsand the Comptroller’s Office. The degree of openness to bidding processes and sanctionsfor misuse of public funds are perceived as requiring improvements.
■ Reporting timeliness. Budget formulation shows a rating that is close to other LAC countries.The public’s perception points to significant gaps in fiscalization, approval, and execution.
In the interim, the GOP is making extraordinary efforts to improve transparency. An internalsurvey developed by the MEF on reporting, and the degree of compliance with directives refer-ring to budget transparency in all public sector entities, shows impressive progress in compliance(Table SA.25 and Figure 3.5). In 2002, the only remaining reports to be published on the webare (a) MEF—the consolidated balance of the public sector, the balance of the Fiscal StabilizationFund, and the evaluation of the financial and physical indicators; (b) FONAFE—audits of finan-cial statements and results of the evaluation of management indicators; and (c) Oficina de Normal-ización Provisional (ONP, Pensions)—consolidated financial statements of both the provisionalreserve and the National Savings Fund (FONAHPU). Regarding the degree of compliance withdirectives, the only common area where generalized weaknesses are found is in the hiring of publicemployees and procurement contracts. For their part, CTARs and most public entities do notreveal their strategic plans, whereas public enterprises still do not reveal economic informationrelated to their investment projects.
RESTORING FISCAL DISCIPLINE FOR POVERTY REDUCTION IN PERU 63
FIGURE 3.5: PERCENT OF GOVERNMENT ENTITIES PUBLISHING INFORMATION
0% 20% 40% 60% 80% 100%
Strategic Plans
Info onContracting and
Acquisitions
Info onInvestment Plans
Executed Budget
Original Budget
Ministries CTARS Superintendencies Public Enterprises
Source: MEF.

Recommendations:A set of additional actions is proposed to enhance transparency.
■ Strengthen training and advice with improved learning tools for budget oversight by Peru-vian Congress and civil society. The recent creation of a joint MEF–Congress Commissionof Economy is a positive step in the right direction.
■ The budget for internal auditing and for the Comptroller’s office should be increased. Lackof due fiscalization and corruption-prone practices are recurrent themes in this report.
■ SIAF reports should be made user-friendly,13 and nationwide capacity building for its useshould be considered a permanent priority.
■ A special effort should be made to develop procedures for outputs to reach populationsoutside Lima, especially in regard to transfers to subnational governments, because they willbe critical in supporting the decentralization process.
■ Complete ongoing official plans to make public sector publications fully available.
64 WORLD BANK COUNTRY STUDY
13. SIAF officials reported to have completed a Portal Amigable (special module) last August.

Does higher public expenditure buy better results in social outcomes? In Peru, there has been littleempirical effort to evaluate the evidence supporting such a common belief and assess the efficiency inthe use of increased resources. However, it is commonly recognized that reducing unproductive out-lays, increasing social expenditure, and improving its efficiency and quality are critical elements ofcountries that have achieved macroeconomic stability and have decided to actively pursue povertyreduction. Leakages and poor targeting are two critical shortcomings that affect the efficiency of pro-poor expenditure. On one hand, a highly decentralized budget execution brings the possibility of significant leakages in the flow of resources to the final beneficiaries of social programs. Leaks mayundermine social policy by their ability to prevent a critical input—public expenditure—from pro-ducing desired social outcomes. The introduction of an innovative tool—a Public Expenditure Track-ing Survey (PETS)—reveals major leakages in revenue transfer mechanisms to local governmentsand downward, in particular for the Vaso de Leche program, the most important food supplemen-tary program in Peru. The same national survey indicates that the most significant leaks are not atthe origins of the chain, between the Central and local governments, which is a very positive achieve-ment for the financial management system, but at the mid- to lowest levels of the chain, as resourcesget closer to beneficiaries. Transfers to local governments are also compounded by insufficient auditcontrol and poor transparency. On the other hand, poor targeting deviates pro-poor outlays to thenon-poor. Targeting rates in social programs vary tremendously in Peru, and their degree of regres-sivity/ progressivity provides a mixed picture. Household-survey-based findings show that targeting isadequate for Desayunos Escolares, but inadequate for others, such as ESSALUD and ComedoresPopulares. This chapter briefly addresses the empirical evidence supporting the rationale for increas-ing expenditure in the education and health sectors, describes the main findings of Peru’s PETS, andassesses the quality of targeting of pro-poor expenditure in Peru.
IV
IMPROVING THE EFFICIENCY OFPUBLIC EXPENDITURE
65

Does Higher Government Expenditure Buy Better Results in Education and Health Care?Increased public expenditure in health and education improves both access to and attainment inschools, and reduces mortality rates for infants and children.1 There is increased recognition thatexpenditure allocations in favor of education and health can boost economic growth while promot-ing equity and reducing poverty. The rationale for higher public spending in education is oftenbased on its impact on individuals’ lifetime incomes (that is, the social rate of return, highest in primary education, then in secondary). Similarly, the rationale for increased spending in health isjustified on the grounds that it reduces the impact of diseases on the productive life years of thepopulation. Empirical evidence, however, has not been conclusive, especially if public resources areused inefficiently and inequitably, and public expenditure crowds out private spending on the socialsectors. Using a model and a cross-sample database developed by Gupta, Verhoeven, and Tiongson(1999), data from Peru are added to a sample of about 50 countries, and ensuing estimation fol-lowed an ordinary least squares (OLS) and two-stage least squares (2SLS) linear regression tech-nique (Tables 4.1a and 4.1b).2 Highly robust results for education and health indicators show that:
■ Total education spending has mixed coefficients—a statistically significant one as a determi-nant of enrollment rates in secondary education, but insignificant ones as a determinant ofenrollment rates in combined gross primary and secondary education. In the 2SLS grosssecondary education regression, the coefficient of combined primary and secondary educa-tion spending is also statistically significant.3 Overall, the F-statistics are significant at the 1 percent level. Other variables the coefficients of which also appear statistically significantare population, child mortality rate, per capita income, and urbanization.
■ Total health spending has a statistically significant effect on both outcomes, infant and childmortality. Its coefficient appears weakly significant in the 2SLS infant and child mortalityregressions. Other variables the coefficient of which appears statistically significant are theadult illiteracy rate and income per capita.
The policy implications of such findings are obvious.
Recommendations:■ The Government of Peru (GOP) has made the right decision in deciding to increase the
share of public resources allocated to education and health. However, caution is required inusing these figures to estimate budgetary resources needed to achieve specific targets insocial areas, because the verified lack of significance for some critical coefficients (that is, forcombined primary and secondary education spending on gross primary and secondary enroll-ment rates) confirms that there are also other important determinants to take into account.
66 WORLD BANK COUNTRY STUDY
1. This section draws on Gupta, Verhoeven, and Tiongson (1999), who kindly shared the IMF databaseand allowed us to include Peru in their consistent dataset in order to facilitate the estimates leading to thefindings submitted here.
2. OLS are corrected for heteroskedasticity and 2SLS is used to address the problem of reverse causality(that is, higher spending on primary education may have a positive effect on enrollment, but a higher demandfor primary education, reflected in higher enrollment rates, may also provide a push for higher spending). Wealso applied a third method of estimation, the seemingly unrelated regression (SUR) procedure, and our find-ings remained robust to changes in specification, instruments, and weights defined. In evaluating the regres-sion results, it should be borne in mind that some degree of multicollinearity among variables affects thestandard errors of coefficients. Fortunately, the variables for overall sectoral spending are generally not cor-related with other independent variables, except health spending with adult illiteracy. White’s technique isused to correct for heteroskedasticity and Sargan’s test is used to assess 2SLS specification.
3. Regressions do not permit drawing conclusions about changes in the level of spending on primary andsecondary education as opposed to the share of such spending in total expenditure.

■ There are mutually reinforced positive implications between social outcomes: that is, ahigher illiteracy rate has a positive impact on health outcomes; ditto for a lower mortalityrate on higher education enrollment.
■ As the study reported on below shows, increasing resources is not enough. Improving effi-ciency through the reduction of leaks and improvements in targeting in order to assurefunds actually reach their intended beneficiaries is critical for achieving desired outcomes.
Further analysis shows that the efficiency of Peru’s public expenditure is below Latin America’saverage for health, but above average for education. Similar results hold true in relation to worldaverages, but these indexes should be taken with a grain of salt.
■ Peru’s level of efficiency in reaching health outcomes is below both Latin American andworld averages. Two indexes—technical and relative—measure the efficiency of publicexpenditure on health among Latin American countries during 1990–98 (Table 4.2). Theseindexes combine five outcomes: life expectancy, infant mortality, under-five mortality,height-for-age malnutrition, and weight-for-age malnutrition. The Technical EfficiencyIndex varies from 76 to 94 percent, well below LAC and world averages in most health
RESTORING FISCAL DISCIPLINE FOR POVERTY REDUCTION IN PERU 67
TABLE 4.1A: REGRESSION RESULTS FOR EDUCATION INDICATORS: LINEAR REGRESSIONSa
Enrollment Rates
Gross Primary and Secondary Gross Secondary
OLS 2SLS OLS 2SLS (weighted)b (weighted)c (weighted)b (weighted)c
Constant 53.81 36.28 23.04 ***31.10(42.65) (27.38) (18.92) (11.25)
Primary and secondary education spending −.19 −.20 .12 *.22(% of total educ. spending) (.30) (.31) (.11) (.11)Education spending (percent of GDP) 1.18 .80 ***2.43 *1.86
(1.47) (1.52) (.95) (1.08)Population aged 0–14 (percent of population) .17 .85 **−.76 ***−.77
(.98) (.77) (.37) (.26)Child mortality rate (per thousand of **−.12 ***−.21 ***−.01 *−.07 children 0–5 years) (−.06) (.07) (.03) (.03)Income per capita in PPP termsd 1.82 −.086 ***3.07 **1.65
(2.20) (1.32) (1.16) (.81)Urbanization (percent of population) .53 **.71 ***.45 ***.45
(.37) (.32) (.15) (.13)Adjusted R-squared 53.78% 48.46% 78.15% 81.05%Number of observations 43 42 44 43F-statistic ***17.45 ***12.29 ***60.40 ***81.64P-value 0.00 0.00 0.00 0.00
a. Robust standard errors are in parenthesis: *** indicates significance at the 1 percent level, ** significance at the 5 percent level, and * significance at the 10 percent level.b. By adult illiteracy.c. Instruments used: aid in percent of government expenditures, military spending in percent of government expenditures, share of unallocated education spending, and total government spending.d. Multiplied by 1,000. PPP = Purchasing Power Parity.
Source: World Bank staff estimates.

indicators, particularly in malnutrition-height, under-five mortality, and life expectancy.The relative efficiency index is below 100 in most cases (except malnutrition-weight), whichreflects that, compared to LAC benchmarks and given its inputs—health spending and atime-trend (a proxy for technological progress)—Peru could do better in improving itshealth outcomes (Jayasuriya and Wodon 2001).4
■ Outcome indicators for Peru’s educational inputs look acceptable compared to LAC andworld averages, but severe quality and equity shortcomings remain. Net enrollment rates inprimary and secondary education are the outcome indicators for the education sector; andeducation spending, adult literacy (which is not an outcome but an input, since we arelooking at performance in primary and secondary education), and a time-trend are inputs.Peru’s Technical Efficiency Index for net primary enrollment is 77 percent, on a par withother Latin American countries, whereas for net secondary enrollment it is 72 percent,much above the LAC average of 51 percent. In spite of this progress, severe educationalshortcomings are still relevant in terms of the very low quality of education services and
68 WORLD BANK COUNTRY STUDY
TABLE 4.1B: REGRESSION RESULTS FOR HEALTH INDICATORS: LOG-LOG REGRESSIONSa
Infant Mortality Child Mortality
2SLS 2SLS OLS (weighted)b OLS (weighted)b
Constant ***5.64 ***5.49 ***6.44 ***6.31 (.89) (.87) (1.13) (1.15)
Health spending (percent of GDP) −.11 *−.14 .11 *−.14 (.09) (.08) (.076) (.07)
Adult illiteracy rate (percent of population ***.35 ***.39 ***.36 ***.39 15 or older) (.07) (.07) (.08) (.08)Income per capita in PPP terms **−.30 **−.34 **−.37 **−.39
(.12) (.13) (.15) (.15)Urbanization (percent of population) −.19 −.12 −.24 −.19
(.18) (.22) (.19) (.20)Access to sanitation (percent of population) .06 .08 .10 .11
(.10) (.11) (.12) (.13)Adjusted R-squared 75.75% 79.89% 77.97% 78.85%Number of observations 31 29 31 29F-statistic 27.49 50.99 46.10 65.00P-value 0.00 0.00 0.00 0.00
PPP = Purchasing Power Paritya. Robust standard errors are in parenthesis: *** indicates significance at the 1 percent level, ** significance at the 5 percent level, and * significance at the 10 percent level.b. Instruments used: aid in percent of government expenditures, military spending in percent of government expen-ditures, and total government spending.
Source: World Bank staff estimates.
4. The Technical Efficiency Index values depict country-level efficiency of spending, with a value of 100indicating that a country has reached the maximum possible outcome given its inputs. The Relative EfficiencyIndex measures each country’s spending efficiency relative to a Latin American regional benchmark efficiency,with the benchmark being the straight average for the countries in the sample. The inputs taken into accountfor the analysis are the level of health spending, adult education levels (as measured by the share of the adultpopulation which is literate), and time. Sensitivity tests have been performed with additional input variables,such as GDP per capita, but the relative ranking of various countries does not change much.

RESTORING FISCAL DISCIPLINE FOR POVERTY REDUCTION IN PERU 69
TA
BLE
4.2:
PER
U: E
FFIC
IEN
CY
OF
PUBL
ICEX
PEN
DIT
UR
EIN
REA
CH
ING
SOC
IAL
OU
TC
OM
ES19
90–9
8
Tec
hnic
alR
elat
ive
toT
echn
ical
Rel
ativ
e to
Tec
hnic
alR
elat
ive
to
Effi
cien
cyL
AC
Wo
rld
Effi
cien
cyL
AC
Wo
rld
Effi
cien
cyL
AC
Wo
rld
HE
AL
TH
Life
Exp
ecta
ncy
Infa
nt M
orta
lity
Und
er-F
ive M
orta
lity
Peru
81.6
97.7
100.
994
.598
.698
.889
.998
.198
.3La
tin A
mer
ica
83.4
103.
295
.910
0.3
91.6
100.
2W
orld
80.9
96.9
95.6
99.7
91.4
99.8
Mal
nutr
ition
-Hei
ght
Mal
nutr
ition
-Wei
ght
Com
bine
d H
ealth
Peru
76.2
89.2
91.5
94.3
101.
310
7.7
87.3
97.1
99.5
Latin
Am
eric
a85
.410
2.5
93.1
106.
389
.910
2.4
Wor
ld83
.397
.687
.694
.187
.897
.6E
DU
CA
TIO
NN
et P
rimar
y En
rollm
ent
Net
Sec
onda
ry E
nrol
lmen
tCo
mbi
ned
Educ
atio
nPe
ru77
.110
0.9
104.
171
.814
1.0
132.
874
.411
6.9
116.
2La
tin A
mer
ica
76.4
103.
150
.994
.263
.799
.4W
orld
74.1
97.0
54.0
106.
264
.110
0.6
Not
e:T
he v
alue
100
refl
ects
the
ave
rage
for
the
LAC
reg
ion.
Sour
ce:
Jaya
suri
ya a
nd W
odon
(20
01.)

teacher qualifications, especially in the rural areas, and in terms of the high inequality ofresources devoted to private and public education (Apoyo Institute 2002b; Wodon 2002).
Tracing Leakages of Public Funds in Peru—A Public Expenditure Tracking SurveyThis section focuses on the leakages of public funds through municipalities (districts) in Peru.5“Leakage” is defined as the portion of public funds that does not reach its ultimate targeted benefi-ciary, but instead is diverted for other purposes, including private gain or other potentially legitimate,but clearly unintended, purposes. This particular study of leakages is different from the study of cor-ruption per se. Studies of corruption examine the bald diversion of public funds and the taking ofbribes by public officials that are both clearly illegal and fraudulent in intent (Rose-Ackerman 1999;Seligson 2002; Treisman 2000). Research on leakages, instead, begins by asking the question: Whydo public expenditures often not produce concomitant increases in social outcome indicators?6 Whilethere are many factors that go into the answer to that question, only recently has it been appreciatedthat part of the explanation lies in the fact that institutional factors, as well as local organization con-straints, or private gain prevent some public funds from ever reaching their intended targets. This“leaking away” of public funds in Peru is the subject of the present investigation.
Work on leakages of public expenditure is in the pioneer stage worldwide. It builds on theseminal work developed by the World Bank in Africa, more particularly in Uganda. Reinikka andSvensson (2002) found that only 13 percent of the nonwage expenditures made by the CG werereceived by the local schools in Uganda. The study of Peru deepens the approach followed in theUganda study, mainly because it is able to trace leakages at each level in the chain, from the firstemission of public funds at the central level, down to the consumer at the household level. TheUganda study looked only at the national/individual leakage, and thus was unable to attributeleakages to each stage in the chain. As a result of this more comprehensive and disaggregatedfocus, surprising findings presented here emerge, especially because it is possible to identify thespecific steps where main leakages occur and to quantify them. Moreover, the Peru PETS, becauseit pinpoints the locus and key causal factors responsible for the leakages, gives policymakers cleardirection for dealing with the problem.7 In doing so, it looks at how resources are procured anddistributed, and examines both provider and household behavior, which allows both identificationof how much the government spent on the wrong goods or wrong people, and inferences aboutthose instances in the chain where a reasonable presumption of corruption could be pinpointed as“worst offenders.” Finally, the Peru PETS is preceded by a thorough discussion of the system ofCG transfers to the municipalities, and its shortcomings.
The approach taken to measure leakages is to employ survey instruments at each level in theprocess of transference of government funds from the central authority down to the household. The study employed data on 120 of the 1,828 municipalities in Peru. Data were obtained from theCG on four transfers to municipalities managed by the GOP: FONCOMUN, Canon Minero,Canon/Sobrecanon Petrolero, and the Vaso de Leche (“Glass of Milk”, VDL) program. Since all butthe last of these programs do not extend below the municipality level, the deepening of the researchon leakages is on the VDL program. It is in tracing the flow of funds in this program that the
70 WORLD BANK COUNTRY STUDY
5. This section draws on the findings of a national survey jointly developed with Apoyo Institute(2002a).
6. A recent parametric model (Simulations for Social Indicators and Poverty, SIMSIP) developed by theWorld Bank (Wodon and Hicks 2001) to estimate the projected impact of fiscal inputs on selected social out-comes, especially the Millennium Goals, does not take into account country differences in leakages of publicspending in its estimates, and assumes them constant in its projections. If developed regularly and in severalcountries, PETS could not only modify SIMSIP results, but set baselines for countries with similar levels ofleakages.
7. The study gets as detailed as identifying the entities presumed as “worst offenders” in producing leak-ages (and their estimated amount).

research attempts to make its most innovative, but not unique, contribution. Using survey data atthe municipality, local milk distribution committee, and beneficiary household levels, it is possible totrace the flow and leakage of central funds from the top of the chain to the last link at the bottom.The methodology is very complex, not only because it involves multilevel comparisons, but becausethe input itself is transformed from cash to commodities as the funds move from the top to the bot-tom, and as “the commodity itself” actually becomes commodities, since the program is not limitedto milk or milk products alone, despite its name. The product is then transformed at the householdlevel, as the food products are mixed with other foods before being served. Yet, despite this com-plexity, it has been possible to determine the relative magnitude of leakages at each level.
The survey findings send an important warning signal: leakages in Peru are significant and farmore pervasive and extensive at the bottom of the chain than at the top. Of the entire amount ofpublic funds intended for the VDL program, barely 29 percent get to their intended beneficiaries.This does not mean that 71 cents of each dollar are fully lost in corruption costs. Rather, the divertedresources get leaked away through a combination of off-budget administrative costs, expenditure onnoneligible products, in-kind deliveries to nonbeneficiaries, fees for overpriced items, and sheer cor-ruption. Results also challenge the predominant view of the last decade that organizations that arecloser to the people necessarily perform better in service delivery. This is not necessarily the case if theprogram does not have a proper design or if the local organizations are not transparent and do notpractice accountability, which seems to be the case of the VDL Committees in Peru.
These are hybrid organizations where both the government and the beneficiaries are repre-sented. They are made up of three government representatives and three representatives of thebeneficiaries of the program, democratically elected by the rank and file. The government represen-tatives are the mayor of the municipality, another municipal official, and a representative of theMinistry of Health. Additionally, a representative of the Association of Agricultural Producers ofthe region is entitled to participate in the committee.
The relationship between these committees and the direct beneficiaries is characterized by atleast two features. First, there is asymmetric information: final beneficiaries have limited access tothe information about the decisions made by the committees. The beneficiaries also have limitedinformation about how much resource they are entitled to receive from the program and whichprocedures they should employ to secure them. Second, there is a lack of transparency andaccountability of the committees vis-à-vis both the beneficiaries and the upper echelons of govern-ment. In addition to these two features there likely is, in many committees, a somewhat low levelof management capacity. The fact of the matter, anyway, is that committees so dominate the run-ning of the program at the local level that they may divert resources from their original purpose,without being held accountable or sanctioned for doing so, since both the higher official authori-ties (the Ministry of Economy and Finance, [MEF], for example) and the intended beneficiaries donot know about it. The committees then dispose of the resources at their own discretion andsometimes end up vitiating, even unwittingly, the program’s expected effects.
This arrangement is, of course, a far cry from the desirable participatory setting where the citizensof a community could directly observe, talk to, and even argue with, those providing them key ser-vices and where they would be able to hold those individuals and institutions accountable for theiractions. On the contrary, in the VDL program we have the case of hybrid committees (made up ofboth government and elected representatives) placed in direct control of a development program,which, due to lack of accountability and transparency, can distort its goals and/or become rent-seekers benefiting not the collectivity, but their own narrow interests. This, of course, points to thefact the program has severe design problems. These committees are beyond the reach of common cit-izens and are frequently dominated by self-serving, rent-seeking, self-styled “representatives” of theprogram beneficiaries. The evidence amassed in this study enables us not only to directly comparediversions (referred to here as “leakages”) of public resources for private gain or for a distorted pur-pose at each level of the public assistance “food chain,” but also to conclude that, in this case, thelower we go “down the chain,” the greater the diversion. Thus the conventional belief that every localbody is necessarily more accountable than the national and public authorities is turned on its head.
RESTORING FISCAL DISCIPLINE FOR POVERTY REDUCTION IN PERU 71

There are some caveats to the anticipated main findings presented above. The survey was con-ducted in a country that in the past three years has undergone a restructuring of the way publicexpenditures are managed and controlled by the Integrated Financial Management System (SIAF)(Chapter III). For that reason, it may be the case that our central finding is one that is not easilyreplicated elsewhere. The SIAF facilitates nearly all CG expenditures getting to the municipalitiesfor which they were intended, and our findings confirm that most arrive without extensive delays,although their volatility and supervision remain somewhat of a problem in some instances. Wherethe leakages are extensive, however, is below the level of the municipality. Thus, in Peru, the leak-ages increase exponentially as central funds move away from the capital and move down to thecommittees and families. Future studies in other countries in which central funds are less well con-trolled may well find that leakages remain extensive at the local level, but perhaps would be fargreater at the upper levels than they are in Peru. In both cases, leakages are extensive and have serious negative implications for development. In addition, a tracking survey is needed because amunicipal SIAF is not yet installed in all municipalities. So, even though transfers from the CG to municipalities are well recorded, there is no further virtual control of what happens inside themunicipality once it receives its transfer and moves it downward. PETS methodology does notallow direct measurement of other types of leaks, such as inflated prices of milk products. However,it does it indirectly through comparison of price variation for the same milk or milk-derived prod-uct, and through the measure of their overprice with respect to supermarket retail prices.
The Significance of Intergovernmental TransfersThe Government of Peru (GOP) has committed itself to improving the efficiency of its social spend-ing and the quality of the provision of social services at the local level, including its nutritional pro-grams. It has recognized that increased social spending needs to be decentralized and that this impliesdelegating more budgetary responsibilities to Regional Units of Ministries (particularly Educationand Health), and efficient mechanisms to transfer resources to local governments. While theseimprovements are important, they may not necessarily translate into actual increases in public fundsreaching their intended destinations. That is because the GOP lacks a solid baseline to evaluate thequality, efficiency, and efficacy of public expenditure below the national level. In fact, very little isknown about how resources are channeled (particularly outside of Lima), and even less is knownabout how much of these resources initially allocated actually gets spent on their original purpose,what percentage really reaches their intended beneficiaries, or what are the magnitudes of transferdelays. Supervision is also very poor. For instance, we found that in 78 percent of the municipalitiesvisited, the CG had not carried out any supervision regarding the use of resources in the VDL pro-gram. Moreover, in rural areas, only 14 percent of the municipalities had any supervision.
This study applies Public Expenditure Tracking Surveys (PETS) to (a) detect, analyze, and quan-tify the leakages and delays in the transfer of public expenditure, and (b) assess their effects on munic-ipal service delivery deficiencies. In this section, we deal with the latter topic. In the next section, aquantitative PETS is developed collecting information currently nonexistent and otherwise very diffi-cult, if not impossible, to obtain systematically. The information is surveyed at the different levelsinvolved: CG, decentralized government unit (if any), final service units, and any intermediate units.
In Peru, public resources are distributed by two mechanisms: those that are centrally allocatedand administered through branch offices of the CG, and those that are transferred to local govern-ments (municipalities). The education budget is an example of the former, while the VDL programis an example of the latter. In both cases, there is a long chain of intermediaries between the origi-nal CG budgeting office and the intended recipient. Findings presented here focus on the lattermechanism, in contrast to the work in Uganda.
It is difficult to overstate the importance of transfers to municipal governments. For the dis-tricts outside of Lima, transfers, on average, represent 72 percent of their total income and, amongthe districts of the poorest stratum, they can represent in excess of 90 percent of total income. TheCG’s four main transfers include the Fondo de Compensación Municipal (FONCOMUN) and VDL
72 WORLD BANK COUNTRY STUDY
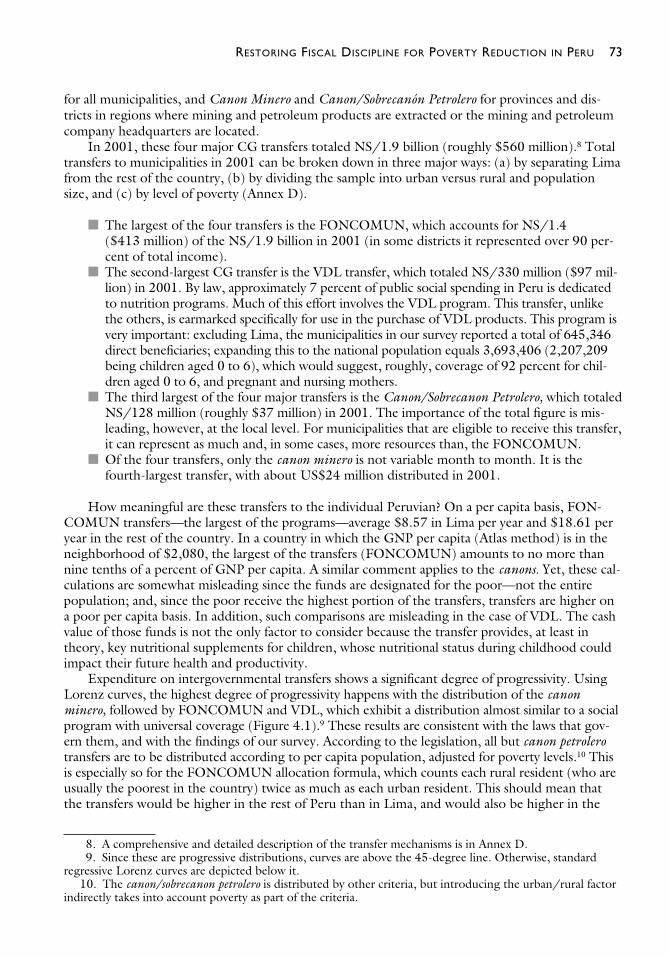
for all municipalities, and Canon Minero and Canon/Sobrecanón Petrolero for provinces and dis-tricts in regions where mining and petroleum products are extracted or the mining and petroleumcompany headquarters are located.
In 2001, these four major CG transfers totaled NS/1.9 billion (roughly $560 million).8 Totaltransfers to municipalities in 2001 can be broken down in three major ways: (a) by separating Limafrom the rest of the country, (b) by dividing the sample into urban versus rural and populationsize, and (c) by level of poverty (Annex D).
■ The largest of the four transfers is the FONCOMUN, which accounts for NS/1.4 ($413 million) of the NS/1.9 billion in 2001 (in some districts it represented over 90 per-cent of total income).
■ The second-largest CG transfer is the VDL transfer, which totaled NS/330 million ($97 mil-lion) in 2001. By law, approximately 7 percent of public social spending in Peru is dedicatedto nutrition programs. Much of this effort involves the VDL program. This transfer, unlikethe others, is earmarked specifically for use in the purchase of VDL products. This program isvery important: excluding Lima, the municipalities in our survey reported a total of 645,346direct beneficiaries; expanding this to the national population equals 3,693,406 (2,207,209being children aged 0 to 6), which would suggest, roughly, coverage of 92 percent for chil-dren aged 0 to 6, and pregnant and nursing mothers.
■ The third largest of the four major transfers is the Canon/Sobrecanon Petrolero, which totaledNS/128 million (roughly $37 million) in 2001. The importance of the total figure is mis-leading, however, at the local level. For municipalities that are eligible to receive this transfer,it can represent as much and, in some cases, more resources than, the FONCOMUN.
■ Of the four transfers, only the canon minero is not variable month to month. It is thefourth-largest transfer, with about US$24 million distributed in 2001.
How meaningful are these transfers to the individual Peruvian? On a per capita basis, FON-COMUN transfers—the largest of the programs—average $8.57 in Lima per year and $18.61 peryear in the rest of the country. In a country in which the GNP per capita (Atlas method) is in theneighborhood of $2,080, the largest of the transfers (FONCOMUN) amounts to no more thannine tenths of a percent of GNP per capita. A similar comment applies to the canons. Yet, these cal-culations are somewhat misleading since the funds are designated for the poor—not the entirepopulation; and, since the poor receive the highest portion of the transfers, transfers are higher ona poor per capita basis. In addition, such comparisons are misleading in the case of VDL. The cashvalue of those funds is not the only factor to consider because the transfer provides, at least in theory, key nutritional supplements for children, whose nutritional status during childhood couldimpact their future health and productivity.
Expenditure on intergovernmental transfers shows a significant degree of progressivity. UsingLorenz curves, the highest degree of progressivity happens with the distribution of the canonminero, followed by FONCOMUN and VDL, which exhibit a distribution almost similar to a socialprogram with universal coverage (Figure 4.1).9 These results are consistent with the laws that gov-ern them, and with the findings of our survey. According to the legislation, all but canon petrolerotransfers are to be distributed according to per capita population, adjusted for poverty levels.10 Thisis especially so for the FONCOMUN allocation formula, which counts each rural resident (who areusually the poorest in the country) twice as much as each urban resident. This should mean thatthe transfers would be higher in the rest of Peru than in Lima, and would also be higher in the
RESTORING FISCAL DISCIPLINE FOR POVERTY REDUCTION IN PERU 73
8. A comprehensive and detailed description of the transfer mechanisms is in Annex D.9. Since these are progressive distributions, curves are above the 45-degree line. Otherwise, standard
regressive Lorenz curves are depicted below it.10. The canon/sobrecanon petrolero is distributed by other criteria, but introducing the urban/rural factor
indirectly takes into account poverty as part of the criteria.

more-impoverished areas than in the less-poor areas. In practice, the FONCOMUN per capita con-tributions are clearly far higher in the rest of the country than in Lima. The same pro-poor povertybias appears in the canon minero and, to a much lesser extent, in the VDL program (Table 4.3).
Recommendations:■ The formula (and criteria) used for determining the canon minero and FONCOMUN
transfers do not need any change and should be kept.■ Since transparency about the amount and timeliness of transfers is the main issue, it is in the
interest of Peruvian officials to have them fully available to the public and the direct benefi-ciaries through the SIAF and the Portal de Transparencia.
Volatility of most transfers is significant. One of the most serious long-term problems faced bylocal governments in Latin America is the consistent lack of reliability of CG transfers. In manycountries, such transfers often result in arrears. Volatility is calculated as the standard deviation ofthe annual percentage changes in the transfer amounts. While volatility is not directly a leakageissue, it does make planning difficult and does cause suffering when milk and other foodstuffs arenot delivered on time. In Peru, using the new financial management system that is now in place,volatility has been reduced, but not eliminated, as the results of our survey show. In the worst case,volatility for the VDL transfer, outside of Lima, often exceeds 10 percent, with the poorest districtsaveraging over 15 percent (Annex D).
Recommendation:■ SIAF expansion among municipalities should continue, but alternatives to diminish the
remaining volatility of transfers should be explored. Structural volatility in the canon minerotransfers (related to international mineral prices) may require a Stabilization Fund (Chapter VIII).
Understanding of the amount of the transfers at the local level is insufficient and knowledgeabout the arrival day of the transfers is poor. Overall, most of the officials interviewed in the munic-
74 WORLD BANK COUNTRY STUDY
FIGURE 4.1: LORENZ CURVES FOR INTERGOVERNMENTAL TRANSFERS
0%
10%
20%
30%
40%
50%
60%
70%
80%
90%
100%
0% 20% 40% 60% 80% 100% Cumulative population (poverty 20-tiles) (poorest=left)
Cu
mu
lativ
e S
har
e o
f Tra
nsf
er
Vaso de Leche Canon Minero FONCOMUN 45 Degrees
Source: World Bank staff estimates.

ipalities surveyed claim to have a reasonable understanding of the various transfer programs. How-ever, the same is not true at the neighborhood level. For example, the survey found that 90 percentof the municipalities in the Lima area and 79 percent in the rest of the country claimed to knowthe allocation criteria used for the FONCOMUN program. Yet, the survey also found that whenquestioned, only 11 percent of the municipal officials in Lima—who earlier claimed to have knowl-edge of the criteria—actually did. Surprisingly, in the rest of Peru the knowledge was higheramong those who claimed to know, since 67 percent actually did. As for the amount of transfersexpected from FONCOMUN, the knowledge base is more reasonable since only 5 percent in Limaand 15 percent in the rest of Peru claimed not to know. In poor and rural areas outside Lima, how-ever, this percentage of uncertainty increased to nearly one third. In the case of Canon/SobrecanonPetrolero transfers, there is considerable uncertainty as to the expected amounts, with the majorityin the rest of Peru districts not knowing. Knowledge of the date of arrival of the transfers was farweaker in Lima, with 40 percent of the municipalities not knowing. In the rest of Peru, 33 percentdid not know. Similar percentages are found for FONCOMUN and canon minero (Table 4.4).
Recommendation:■ The GOP’s decision to include monthly transfers to each municipality in a user-friendly for-
mat in the SIAF from 2002, also including the methodology used for their estimates,should be complemented with adequate permanent training of and information to majorand local authorities (for example, VDL Committees).
Supervision of transfers to municipalities is extremely poor. On average, only 6 out of 10 of themunicipalities are audited with regard to FONCOMUN and canon minero, and barely a third ofthose eligible for the canon/sobrecanon petrolero are supervised by some CG entity. Furthermore, the
RESTORING FISCAL DISCIPLINE FOR POVERTY REDUCTION IN PERU 75
TABLE 4.3: PER CAPITA TRANSFERS TO MUNICIPALITIES IN 2001(in U.S. dollars)
Canon/Sobrecanon FONCOMUN Canon Minero Petrolero Vaso de Leche
PERU 15.35 1.20 12.51 3.73Lima 8.57 0.09 NA 3.99
Urban 8.33 0.09 NA 4.00Rural 25.24 0.19 NA 3.33No. of observations 177 171 NA 177
Rest of Peru 18.61 1.89 12.51 3.60Less poor 14.38 1.55 10.97 2.96Poor 18.94 2.07 11.16 3.54More poor 22.54 1.99 19.47 4.35Urban 15.46 1.54 10.22 3.14Rural 22.73 2.25 17.37 4.21Small 31.97 1.84 48.15 4.37Medium 20.05 1.77 19.40 4.13Large 16.28 1.92 10.62 3.39More accessible 17.33 1.81 9.81 3.39Less accessible 23.72 2.15 20.90 4.47Nonprovincial capital 16.98 1.48 11.95 3.73Provincial capital 21.60 2.69 13.09 3.41No. of observations 1,641 1,296 142 1,641
Source: MEF and World Bank ttaff estimates.

CG audits are reaching only the more accessible districts, while leaving the poorer, midsize, urban,and more remote districts wholly unsupervised (Table 4.5). CG supervision is not only rare, but alsoirregular, since the bulk of audits in about 80 percent of FONCOMUN and canon minero cases (43 percent for the canon petrolero) are done on a yearly basis (Apoyo Institute 2002a).
Recommendation:■ Auditing procedures to districts should be overhauled, including training, management
reform, and more periodic internal and external audits by the Comptroller’s Office. Thisreform is particularly urgent in the case of the canon petrolero.
Leakages in the transfer of FONCOMUN and the canon minero appear to be very small. Thisleak is defined as the percentage of transfer reported by the MEF that is unaccounted for by themunicipality. Leakages amount to 1.5 percent in Lima and 0.5 percent in the rest of Peru forFONCOMUN, which is the largest program, but rise to 7.1 percent in the Canon Minero programin Lima (essentially driven by two outliers), but only 0.7 percent in the rest of Peru for this pro-gram11 (Table 4.6). These so-called small leakages are tolerable and can be safely assumed to bemainly due to reporting errors (round-off) or simply bad recollection due to poor or nonexistentrecords at the municipality level.
Recommendations:■ SIAF-proposed expansion at the municipal level should be able to trace these leaks on a reg-
ular and virtual basis.■ Registry of the canon/sobrecanon petrolero transfers must be overhauled.
76 WORLD BANK COUNTRY STUDY
TABLE 4.4: MUNICIPALITIES THAT DO NOT KNOW THE ARRIVAL DAY OF THE TRANSFER(in percent)
FONCOMUN Canon Minero Canon/Sobrecanon Petrolero
Lima 40Urban 42 NA NARural 38 NA NANo. Observations 20 NA. NA
Rest of Peru 33 35 40Not Poor 27 29 2Poor 49 63 94Extreme Poor 38 30 40Urban 61 87 35Rural 28 28 47Small 30 30 38Medium 39 36 31Large 45 62 44More accessible 18 21 15Less Accessible 66 66 64Nonprovincial capital 34 33 41Provincial capital 28 50 29No. Observations 99 74 32
Source: Instituto Apoyo (2002).
11. Canon/sobrecanon petrolero figures provided by the MEF were not trustworthy and complete, so werenot included, but point out an area of priority reform.

RESTORING FISCAL DISCIPLINE FOR POVERTY REDUCTION IN PERU 77
TABLE 4.5: MUNICIPALITIES THAT ARE SUBJECT TO CG SUPERVISION(in percent)
FONCOMUN Canon Minero Canon/Sobrecanon Petrolero
Rest of Peru 61 61 34Not Poor 75 75 34Poor 27 29 16Extreme Poor 52 42 58Urban 32 31 21Rural 67 65 55Small 67 67 0Medium 30 28 31Large 58 50 51More accessible 78 79 23Less accessible 26 19 46Nonprovincial capital 62 61 30Provincial capital 58 56 65No. Observations 100 73 33
Source: Instituto Apoyo (2002).
TABLE 4.6: LEAKAGES IN FONCOMUN AND CANON MINERO(in percent)
FONCOMUN Canon Minero
LIMA 1.52 7.12Urban 0.15 5.88Rural 3.66 8.90No. of Observations 18.0 17.0
REST OF PERU 0.45 0.70Less Poor 0.00 0.00Poor 1.11 0.03More Poor 1.02 2.47Urban 0.00 0.00Rural 0.89 1.13Small 1.56 2.76Medium 0.35 0.06Large 0.00 0.00More Accessible 0.39 0.40Less Accessible 0.65 1.38Nonprovincial capital 0.83 1.10Provincial capital 0.00 0.00No. of Observations 96 64
Source: Instituto Apoyo (2002).

Important shortcomings surround the lack of evidence available to determine how much of thetransfers of FONCOMUN, Canon Minero, and Canon Petrolero actually go toward current expendi-tures. In 2001, FONCOMUN law required a ceiling of 30 percent devoted to current expenditure(100 percent devoted to capital expenditure and milk products in the cases of canon minero and VDLtransfers). In 2002, FONCOMUN restriction was eliminated, and the GOP allowed each municipal-ity to decide how best to combine its resources. Survey findings show that the percentage assigned tocurrent expenditure from FONCOMUN resources varies between 27 and 41 percent, but such evi-dence is inconclusive because a significant number of respondents (more than half in the case of thecanons) did not know how the transfers were used. Other respondents accounted for more than 100 percent of the transfer, and yet about another one third of respondents could account for onlyless than 70 percent of canon minero/petrolero funds (in implicit violation of the law) (Table 4.7).However, these findings show an important shortcoming in transfer mechanisms—that is, the readi-ness of municipalities for having any idea about the exact use of funds and complying with requiredcurrent expenditure/capital ratios.
Recommendation:■ If current expenditure/capital ratios are to be respected, present procedures for their audit-
ing and accountability should be upgraded; otherwise, due to the lack of the GOP’senforcement capacity, the present ratios should be eliminated and it should be left tomunicipalities to decide how best to allocate their own resources.
Leakages in the Vaso de Leche ProgramThe Vaso de Leche program is the only one of the four main transfers to municipalities that can betraced from the top of the chain to the bottom. It targets as direct beneficiaries children aged 6 oryounger, and pregnant and nursing mothers. However, the law under which the program operatesalso allows for leftover resources to be used for children aged 7 to 13, the elderly, and those suffer-ing from tuberculosis. The transfer criteria from the CG to the municipality are based on per capitapoverty formulas. At the municipal level, the local government is required, via special committeesset up for the purpose, to use 100 percent of the funds for milk products, which must be over-whelmingly produced nationally. These committees are nearly ubiquitous, with 98 percent of theurban municipalities and 95 percent of the rural municipalities having them, according to the sur-vey. The products should be purchased through competitive bidding, which is supposed to helpensure employment of the lowest-price criterion. However, the study found that while bidding waspredominant, 19 percent of the products purchased were done through other mechanisms, andsome excessively high prices were also found.
Despite its name, the Vaso de Leche program in fact includes milk, milk products, or milk sub-stitutes, and other products such as oatmeal, quinua, and other grains. This flexibility in the pro-gram produces the unfortunate effect of reducing both the protein and calcium intake of the
78 WORLD BANK COUNTRY STUDY
TABLE 4.7: FRACTION OF TRANSFERS USED FOR CURRENT EXPENDITURE
Unrestrictive Definitiona Restrictive Definitionb
Percent No. of Observations Percent No. of Observations
FONCOMUN 41 61 27 61Canon/Sobre Canon Petrolero 35 16 29 16Canon minero 8 45 0 45
a. Employee payrolls (white and blue collar), pensions, road maintenance, sanitation, other current expenditures.b. Employee payrolls (white and blue collar), pensions, other current expenditures
Source: Instituto Apoyo (2002).

beneficiaries, since milk and milk products contain the highest levels of these nutrients comparedto grains. The fieldwork determined that only 15 percent of all municipalities distribute milk alone,with the vast majority “diluting” the milk with the distribution of cereal, a combination of milkand cereal, or distributing cereal only. Once these products are purchased, they are transferred tothe next level down the chain; that is, to the local committees or clubs comprised of mothers,which are neighborhood or village-based volunteer groups. These local groups then distribute the“milk” on some sort of regular cycle (daily, weekly, monthly, bimonthly) depending on local cir-cumstances, presumably based on the legal criteria mentioned above, and on locally determinedcriteria for need. Within the recipient household, presumably the “milk” is then fed to the childrenand mothers for whom it was designated. As we shall see, much of the above is more theoreticalthan real, as the fieldwork for this research determined.
Leakages in the VDL program occur at many levels, but measurement of these leakages is anextremely complex task. Perhaps the major complexity emerges from the law itself. According tothe law, the foods can be distributed to beneficiaries in prepared form. This could mean, for exam-ple, mixing of powered milk into a cereal or other cooked product. It would be virtually impossiblefor any study to then measure with exactitude how a given amount of milk input arrives in thestomach of the beneficiary. But, more important, from a practical point of view, distribution com-mittees often cannot reasonably prepare the food, since the beneficiaries are preschool childrenwhose parents cannot transport them on a daily basis to a central distribution point. Consider themother who is nursing two preschoolers, and whose partner works outside the home. She cannotreasonably be expected to visit a central kitchen each day to feed her children.
In addition, and more important according to our findings, the overhead costs of preparing thefood, including distance, time, materials, and spoilage for unconsumed food, deter many commit-tees from attempting to follow the law. As a result, 60 percent of the committees in the sample donot prepare the food, and distribute it unprepared. For the purposes of the study, this is a plus, sinceit allows us to more precisely measure the distribution, since we can more easily count cans of milk,pounds of cereal, and so forth. However, it brings an additional challenge in that many of theseproducts are marketed in units that are not easily divisible. For example, if a household is entitled to1.5 cans of milk based on the number of children, the committee could not reasonably be expectedto open a can and divide it and pour the remainder into a glass for another beneficiary family. Theresult is that individual families will receive more or less than their exact ration of milk and otherproducts, a factor which makes calculation of leakages at the household level even more complex.
The problem of food distribution and preparation is exacerbated by the widespread absence ofknowledge of the municipalities about the program, (and committees), and no effective training ofthe mothers. The survey found, for example, that only 20 percent of the municipalities in the restof the country (and 43 percent in Lima) were familiar with the CG criteria for allocation of the“milk.” At the level of the committee, barely 2 percent in the rest of the country outside of Limahave knowledge of the allocation criteria used by municipalities (and 5 percent in Lima). And, atthe level of the mothers, only 27 percent reported having received training in the preparation ofthe “milk,” and 26 percent reported receiving training on its proper allocation within the house-hold. Most disturbing was that the level of training declined as poverty levels increased (Table 4.8),so that training was lowest where it was needed the most.
“Milk” Leakage Stage 1: Central Government to MunicipalityA first and very small leakage occurs during the transfer of the CG to the municipalities.12 It repre-sents on average 0.06 percent in Lima and 0.02 percent in the rest of Peru, which could be deter-mined by rounding and recording errors. Thus, at the top level, where one often assumes the greatestlevel of corruption (and therefore the greatest leakage), the leakage is virtually nonexistent. This is a
RESTORING FISCAL DISCIPLINE FOR POVERTY REDUCTION IN PERU 79
12. See Annex D for the exact formulas applied to estimate each leakage.

major accomplishment for the SIAF system. However, considerable volatility remains in VDL trans-fers outside Lima. Volatility in 2001, calculated as the standard deviation of monthly percent changesof VDL transfers, was virtually zero in Lima, but in the rest of Peru it averaged 11.6 percent, with ahigh of 15.4 percent in the poorest areas. Hence, the less accessible the area, the more volatility therewas at that level. Despite this volatility, none of the municipalities in Lima and only 1.7 percent in therest of the country were unsure of the amount of VDL funds they would be receiving. However, inthe municipalities of Lima, 40 percent have no knowledge of the date on which they will receive theirVDL transfer, while 31 percent of the districts outside of Lima claim the same problem, a surprisingresult given the relative simplicity of the transfer mechanism at the CG level. In Lima, 21 percent ofthe municipalities suffered delays of seven or more days, while in the rest of Peru this level reached 25 percent. Furthermore, given that these delays imply that children and other beneficiaries are keptexpecting food, a major basic need, the large percentage of municipalities the arrival time variation ofwhich is more than seven days is quite serious (Table 4.9).
“Milk” Leakage Stage 2: Unaccounted for Conversion of Transfer to ProductsOnce the transfer reaches the municipality, a second leakage occurs when the funds are converted toproducts to be given to the local committees. From the municipal level onward, the transfer ofresources for the VDL program becomes in-kind transfers such that no subsequent stages of execu-tion receive money, but rather receive the transfer in-kind. Our fieldwork team was instructed to getprices and quantities of VDL product purchases made by the municipality in December 2001 and toverify this information through signed contracts, purchase orders, or receipts. The quantities were inmost cases obtained from the municipality’s distribution roster (padrón municipal), which includesthe amounts allocated and distributed to each mother’s committee within the municipality’s juris-diction. This leak is defined as the percentage of the amount transferred to the municipality fromthe CG for the month of December 2001 that is unaccounted for by the total expenses of themunicipality for that month (in terms of products purchased for the VDL program).
Leakages found at this stage were also quite small. In Lima, they appear to have amounted to3.03 percent of the totals transfer, whereas in the rest of Peru they amounted to 0.63 percent. Wesay “appear” because of the larger urban districts surveyed in the province of Lima—which all havepopulations exceeding 200,000—most refused to provide our team with any price information orprice-related documentation. This refusal supports the qualitative information collected by ourteam at later stages of the execution path that suggest there is considerable misuse of funds at themunicipal level within these districts. We were, however, able to document a number of worst-caseoffenders. We found one municipality in Lima in which this leak was 18 percent of the transfers,and another where it was 15 percent, again keeping in mind that most larger municipalities refused
80 WORLD BANK COUNTRY STUDY
TABLE 4.8: BENEFICIARY HOUSEHOLDS THAT RECEIVED TRAINING/INFORMATION(in percent)
Urban/Rural Yes No
Urban 34 66Rural 20 80StratumLeast poor 36 64Poor 20 80Most poor 19 81AccessibleLess accessible 15 85More accessible 32 68
Source: Instituto Apoyo (2002).

to cooperate with us on obtaining this data. In the rest of Peru, we found 4 municipalities out of76 surveyed in which the leakage at this stage was over 10 percent, with one reaching 15.5 percent.Thus, although the national averages are low, these isolated cases in which the leakage at this pointexceeds 10 percent of the total transfer amount are serious.
Without taking into consideration any of the leakages at subsequent transfer stages, the beneficiaries—mainly children aged 0 to 6—already are receiving less than 90 cents on the dollar.About one tenth of all municipalities surveyed were found to have leaks higher than 5 percent. Inaddition, one would have to consider the possibility of overpricing reflected in two facts: the highprice variability found among districts for purchasing similar products, and the premium paidwhen comparing those prices to leading retail supermarket prices, even when adjusting them forquality and transportation costs. For instance, (a) the price of generic Enriquecido Lácteo, a milksubstitute, distributed in 32 out of 100 districts visited, varies from NS/.1 to NA/15 per kilo-gram; and (b) in some cases, the registered price of cans of milk outside Lima was twice as high asin a Lima supermarket!
Private gains are not the only possible reason for these leaks. One explanation for the leakages atthis stage could be a diversion of VDL funds to cover the program’s operating expenses (personnel,bookkeeping materials, transportation costs, and warehousing costs). Although prohibited by law,this kind of leak is not a result of a corrupt act. Indeed, the leakages at this stage are found more sig-nificant in small, rural, and less-accessible districts. In many cases, it was found that in small ruraldistricts, there are severe budget and personnel limitations that make the operating costs of the pro-gram prohibitive. Moreover, given the large and organized network of VDL mothers representing aunified and powerful faction of the constituency that exerts considerable pressure on the mayor, it isno surprise that there may exist many cases in which the municipality supplements the CG transferwith municipal resources. Indeed, we find that often, leak 2 turns out to be negative, that is, themunicipality spent more in December 2001 than the amount allocated to it by the MEF.
RESTORING FISCAL DISCIPLINE FOR POVERTY REDUCTION IN PERU 81
TABLE 4.9: VASO DE LECHE TRANSFER SCHEDULE
Municipalities with No Knowledge of
Next Arrival Date (%) 1–2 Days 2–7 Days 7+Days
Lima 40 26 53 21Urban 42 27 55 18Rural 37 25 50 25No. Observations 20 20 20 20
Rest of Peru 31 43 32 25Not poor 25 0 29 71Poor 45 49 51 0Extreme poor 35 45 23 33Urban 57 0 43 57Rural 26 47 31 21Small 29 58 0 42Medium 30 47 43 10Large 42 17 64 18More accessible 67 45 33 22Less accessible 13 41 32 27Nonprovincial Capital 31 42 32 26Provincial capital 32 48 33 19
No. Observations 100 NA NA NA
Arrival Time Variations

“Milk” Leakage Stage 3: Transfer from the Municipality to the Local CommitteesLeakages found from the municipality to local committees were more significant. In Lima, theyaveraged over 10 percent, but were far lower—only 2.6 percent—in the rest of Peru (Table 4.10).However, it is obvious from the results that the poorer, more remote areas have far higher leakagesat this level. Every municipality has an allocation formula based almost entirely on the size of thetarget population that each VDL committee services. Thus, criteria of relative poverty do not play arole here; only the number of poor counts. The roster of beneficiaries is centralized at the munici-pal level and provides detailed information on the quantities distributed to each committee withinthe district. This roster was used to randomly select four VDL committees in order to verify theveracity of the municipal distribution roster. This information was compared to the quantities thatthe committees visited declared to have received from the municipality in the same period for everyproduct distributed. This allowed us to calculate leakages associated with the transfer from themunicipality to each of four randomly selected committees. This leak was defined as the percentageof the amount registered as delivered by the municipality, not accounted for by the VDL commit-tee, but estimated using municipal and committee data computed at the committee level.
A clearer picture of the magnitude of the leakage problem that occurs in the transfer from localgovernment to civil society is obtained by examining the worst offenders. The national averages doindeed hide very important information (Table 4.11). There are 27 districts/VDL committee pairs(about a tenth of the total surveyed) with leakages in excess of 20 percent, and 10 pairs that exceed40 percent. In the case of such top-ranked worst offenders, the beneficiaries receive 36 cents ofevery dollar without taking into consideration all the leakages in prior segments of the chain of dis-tribution!13 A possible explanation of these very high leakages is that in some cases municipalities
82 WORLD BANK COUNTRY STUDY
TABLE 4.10: LEAKAGE STAGE 3: MUNICIPALITY TO LOCAL COMMITTEES(in percent)
Leak 3
Lima 10.06Urban 6.83Rural 18.77No. of Observations 37.0
Rest of Peru 2.59Less poor 0.54Poor 5.67More poor 5.22Urban 1.26Rural 4.52Small 2.83Medium 4.23Large 2.25More accessible 2.31Less accessible 3.70Nonprovincial capital 3.10Provincial capital 1.97No. of Observations 320
Source: Instituto Apoyo (2002).
13. It is important to note that this leakage was computed at the committee level with 320 observations. Alot of committees had zero leakage, which was much lower than that of the worst offenders. A complete list ofworst offenders is found in Instituto Apoyo (2002).

may make changes to the allocations to every committee, keeping one product already assigned forlater distribution. Such an informal arrangement significantly diminishes the transparency of theprogram and should be prohibited.
“Milk” Leakage Stage 4: Committee to Beneficiary/HouseholdA fourth leakage occurs between committees and beneficiaries. Estimation at this step became verydifficult because when evaluating the situation inside the committee, we found that it is very difficultto quantify what happens to the products distributed to beneficiaries. This is because the committee
RESTORING FISCAL DISCIPLINE FOR POVERTY REDUCTION IN PERU 83
TABLE 4.11: WORST OFFENDERS, LEAKAGE STAGE 3(in percent)
Rank Leak 3
Lima1 84.52 57.43 48.24 44.85 43.86 24.4
Rest of Peru1 63.72 55.13 53.24 49.65 47.46 47.27 41.78 40.19 40.0
10 40.011 38.912 34.813 34.014 34.015 31.816 29.417 28.618 27.819 27.220 26.721 25.422 24.323 23.524 23.025 22.626 22.327 20.7
Source: Instituto Apoyo (2002).

representatives do not follow the criteria established by program regulations. Instead, they make deci-sions at their discretion as to how to proceed regarding the distribution of the product. In most cases,the committee representatives have been democratically elected and mostly rely on the approval ofthe population of their communities. So, our methodology originally contemplated the comparisonof per-beneficiary rations at the household level with the total per-beneficiary rations at the commit-tee level. This was complicated, however, due to the fact that multiple products get distributed tobeneficiaries and the only way to aggregate them was to use a common measurable indicator. To fur-ther complicate matters, in the cases of distribution of “prepared” products, there was no way togauge whether the servings-per-container directive was followed, and therefore there was no way tomeasure the amount of raw product a household was actually receiving. Therefore, we eliminatedfrom the sample the cases in which the product was not distributed in raw form.
Estimation of this leakage was done by calculating the monetary values of each product (usingmunicipal price figures) and adding them up. This allowed a comparison of the monetary value ofthe amount of all the products received by the VDL committee per beneficiary with the monetaryvalue of the amount received by the individual households per beneficiary (excluding the commit-tees that distribute prepared products). The first variable would be obtained from the quantitiesdeclared by the mothers’ committee representative in the VDL committee survey (in the four com-mittees surveyed in each municipality). The second variable would be obtained from the quantitiesdeclared by the beneficiaries’ household representative in the beneficiary household survey (in thefour households surveyed for each VDL committee). Although implementation of the proposedformula faced several operational problems, it provided very important insights into the distribu-tion process to individual households. Some of the problems that made it impossible to quantifythe rations received by the beneficiaries are due to the very large variation of types, units, and fre-quencies of the distribution and products—which makes the program less transparent and thusmore difficult to evaluate and supervise—and to products distributed already prepared (approxi-mately 40 percent of the committee cases). Although the municipality reported (in most cases) thenumber of rations that could be obtained by each package of product, the VDL committee did notnecessarily follow the recommended recipe. Many committee representatives indicated that theirobjective is to try to service the largest possible number of recipients. Furthermore, the householdsreceive a ration in a large variety of ways—as a cup, a glass, a handful, or just a ration. So, we stan-dardized frequencies, units, and products, and eliminated all cases in which the products were dis-tributed in prepared form by the committee or in committees with unclear target beneficiaries.
Leakage at this level is quite high. On average, over a quarter of the product is lost at this stageoutside of the Lima area (for which we have no data, as shown in Table 4.12). Leaks are markedlymore serious in urban districts (34 percent), in provincial capitals (40 percent), and in large dis-tricts (29 percent). To further understand the subtleties of the program, which made this leakagedifficult to quantify, one must look at the law itself, which provides for an unnecessarily broad defi-nition of its target beneficiaries. According to the law, indirect beneficiaries need not be exclusivelyyoung children, but may include children aged 7 to 13, the elderly, and others in need—but only ifthere are enough resources left. The result is that this open-ended definition allows such a broadinterpretation of eligibility that leakages seem bound to occur, which causes confusion in the com-mittees and in the population in general as to who are the intended beneficiaries. This problem isfurther complicated by the indivisibility of the formula chosen and the ad hoc decisions made atthe discretion of committee representatives as to the criteria of distribution. These include numberof household members, number of children, equal quantity for each household, or other criteriathat the study was unable to identify, many of which alter the originally estimated quantities perbeneficiary in each household of the same committee and municipality.
“Milk” Leakage Stage 5: Within the Household (dilution of the ration)A fifth leakage happens at the household level. This leakage was estimated using household-leveldata. As a final stage, the fieldwork team visited four households per committee in order to quantify
84 WORLD BANK COUNTRY STUDY

the amounts of the in-kind VDL transfers that actually reach the intended beneficiaries. Because ofthe complications concerning the “target population” mentioned in the previous section, the analy-sis is restricted to direct beneficiaries only: children aged 0 to 6, pregnant women, and breastfeedingmothers. The leak attributed to “beneficiary dilution” is defined at the household level as one minusthe percentage of household members who consume VDL products who are official direct benefi-ciaries (Table 4.13).
Results make clear that, upon reaching the households, there is considerable dilution. On aver-age, target beneficiaries receive only 41 percent of the ration that arrives at the household (not takinginto account all the losses associated with earlier leakages). This dilution effect is possible because inmost cases the beneficiaries do not receive their rations directly from the committee, but the childrenreceive the rations filtered through their mothers (and in some cases the fathers), who pick up thetotal rations allocated to her or his household for later distribution. Consistent with evidence in studies of other nutritional assistance programs worldwide, the official distribution criteria are verydifficult if not impossible to enforce at this level. In most cases, it is impossible to exclude non-targeted members of the household. Furthermore, in about 60 percent of the committees visited, the products are distributed in nonprepared forms. As noted above, this is understandable, since thetransaction costs of receiving daily prepared rations could be too high, but nonprepared forms frequently result in mixing the nutrition ration with the families’ overall food intake. In these cases,considerable variation appears in their final use.
In sum, the PETS survey reveals that targeted beneficiaries get on average 29 cents of eachdollar initially transferred by the Central Government. The survey indicates, surprisingly, that theleak is much higher at the bottom (VDL committees and households leaks 4 and 5) levels than atthe top (CG and municipalities, leaks 1–3) levels of the ladder. This not only demonstrates signifi-cant improvements in the official financial management of resources by the SIAF/MEF, but alsochallenges the predominant view that local private organizations are more accountable in manag-
RESTORING FISCAL DISCIPLINE FOR POVERTY REDUCTION IN PERU 85
TABLE 4.12: LEAKAGE STAGE 4: VASO DE LECHE PROGRAM(at household level, in percent)
Leak 4
LIMA NAUrban NARural NANo. of Observations NAREST OF PERU 26.70Less poor 26.67Poor 19.21More poor 32.91Urban 34.53Rural 25.01Small 24.41Medium 22.83Large 29.63More accessible 25.71Less accessible 28.32Nonprovincial capital 22.72Provincial capital 40.31No. of Observations 488
Source: Instituto Apoyo (2002).

ing resources than official organizations (Figure 4.2). Transfers appear also compounded by thegeneralized lack of audit controls, poor transparency, and volatility. Finally, leaks clearly affect thepoorest, urban, and provincial municipalities more than others, but their level appears similaramong districts of different sizes and distances to the province (Table 4.14).
Recommendations based on the PETS findings can be grouped into two areas: those referringto accountability of transfers and municipal management issues, and those referring to the VDL.
86 WORLD BANK COUNTRY STUDY
TABLE 4.13: LEAKAGE STAGE 5(at beneficiary household level)
Leak 5
LIMA NAUrban NARural NANo. Observations NA
REST OF PERU 58.89%Not poor 59.93%Poor 57.89%Extreme poor 59.15%Urban 59.26%Rural 58.70%Small 59.01%Medium 61.46%Large 57.90%More accessible 60.75%Less accessible 56.11%Nonprovincial capital 58.69%Provincial capital 59.32%No. Observations 985
Source: Instituto Apoyo (2002).
FIGURE 4.2: HOW THE MILK DISAPPEARS IN THE VASO DE LECHE PROGRAM
100.00% 99.98% 99.92% 97.33%
71.37%
29.25%
0%
20%
40%
60%
80%
100%
Initial amount CG toMunicipalities
WithinMunicipalities
Municipalitiesto
Committees
Committeesto
Households
WithinHouseholds
Source: Instituto Apoyo (2002).

Recommendations:■ On financial management accountability. There is a need to (a) increase the transparency
of transfers to municipalities through a monthly report by the SIAF, accompanied by thor-ough dissemination of their redistribution criteria; (b) build local capacity to manage them;(c) reduce their volatility, particularly among poorest recipient municipalities; (d) as a prior-ity, upgrade auditing procedures of municipal governments not only by the Comptroller’sOffice, but also by means of internal audits of the municipal administrations themselves;and (e) overhaul the registration of the canon/sobrecanon petrolero.
■ On the Vaso de Leche program. A major lesson of the VDL experience is that a poorly designedsocial program, with a presumed high degree of participation of community leaders groupedin a committee, can be inefficient—voluntarily or involuntarily—and unaccountable to bothits agents (constituent beneficiaries) and its principal (municipal authorities), thereby missingthe original purpose or intention of the program. Further, although there is a need to recog-nize that the dilution effect allows households to reach indirect beneficiaries, and thus over-come rigidities in CG guidelines, the nutritional impact on direct beneficiaries is, however,diminished.
Suggested priority actions are:In the short term, focus on amending regulations to enforce accountability of the municipalities
and committees: (a) review VDL regulations, particularly regarding products to be distributed andthe form of distribution, to make the list of selected milk derivatives shorter and more homoge-neous, and thus raise chances of improving the nutritional impact of the program; (b) establish aproper registry of VDL beneficiaries, if possible supported by the SIAF; (c) undertake informationcampaigns and training sessions for VDL committees and individual beneficiaries to raise theirawareness of new information available and the rules; (d) undertake surprise audits of worst offend-
RESTORING FISCAL DISCIPLINE FOR POVERTY REDUCTION IN PERU 87
TABLE 4.14: VASO DE LECHE LEAKAGES(in percent)
Leak 1 Leak 2 Leak 3 Leak 4 Leak 5 Combined
Lima 0.06 3.03 10.06 NA NA NAUrban 0.03 2.73 6.83 NA NA NARural 0.11 3.58 18.77 NA NA NANo. Observations 20 14 37 NA NA NARest of Peru 0.02 0.63 2.59 26.70 58.89 70.84Not poor 0.00 0.13 0.54 26.67 59.93 70.81Poor 0.00 1.36 5.67 19.21 57.89 68.34Extreme poor 0.12 1.30 5.22 32.91 59.15 74.39Urban 0.00 0.42 1.26 34.53 59.26 73.77Rural 0.05 0.85 4.52 25.01 58.70 70.70Small 0.11 0.05 2.83 24.41 59.01 69.94Medium 0.00 0.59 4.23 22.83 61.46 71.68Large 0.00 0.84 2.25 29.63 57.90 71.29Accessible 0.00 0.54 2.31 25.71 60.75 71.67Remote 0.09 0.82 3.70 28.32 56.11 69.98Municipal 0.04 0.87 3.10 22.72 58.69 69.35Provincial capital 0.00 0.21 1.97 40.31 59.32 76.25No. Observations 95 76 320 488 985 N/A
Source: Instituto Apoyo (2002).

ers (municipalities and committees) in the near term, to eliminate major deviations; and (e) establisha policy of no budget increase in real terms of the VDL annual budget. Implementation of theseactions requires a significant overhaul of the system, and should be accompanied by the design of anew comprehensive framework for food supplementary programs in Peru (discussed below).
In the medium term, given its failures and defective design, the question is, should the VDLprogram be transformed into a cash-transfer program? The answer could be yes. Mexico’s Programade Educación, Salud y Alimentación (PROGRESA), which successfully moved its food supplementprogram to an integrated and better-targeted model of social assistance, is a good example. How-ever, since this proposal goes beyond the sole issue of leakages and also addresses targeting, we willreturn to this subject at the end of the chapter (Box 4.1).
Enhancing Targeting of Social ProgramsThe GOP’s policy of programs targeted to the poor has been fundamental in the poverty-reductionachievements of recent years.14 As a percent of GDP, total social spending increased from 3.6 per-cent in 1993 to 6.9 percent in 2002. Commitment by Peruvian officials to a set of comprehensivesafety net programs has been reflected in a multiplicity of safety net programs specializing in devel-opment and relief components. The development component provides permanent access to improvinghuman capital accumulation of the poor in the form of health, education, and basic infrastructureservices. The relief component provides a consumption floor for the poor through two types ofmechanisms: temporary employment or cash programs, like A Trabajar—Urban and Rural—anddirect transfer programs usually in the form of food or basic services.
As a point of departure, the new authorities are not increasing resources to existing safety netprograms, but rather are attempting to improve the efficiency in their administration and targeting.The budget share assigned to extreme-poverty-reduction programs as a percentage of GDP increasedfrom 1.1 percent in 1994 to about 1.7 percent in 1998, and has remained constant until 2002. This level is considered adequate for existing needs (World Bank 2000). Striking the right balancebetween the two types of safety nets, however, requires further assessment of their performance.Indeed, until the creation of A Trabajar in 2002, direct transfers dominated the landscape of reliefand safety net programs in Peru. At present, however, such a temporary employment program com-petes for scarce resources. Furthermore, ongoing unification of rural infrastructure projects underone administration—Proyecto Nacional de Mantenimiento de Cuencas Hidrográficas y Conservación de Suelos (National Project for the Water Management of Sheds, PRONAMACHCS), InstitutoNacional de Dessarollo (National Institute for Development, INADE)—is an initial step to reduceadministrative costs and overlaps and gaps in coverage.15 This leaves targeting as a major issue requir-ing efficiency improvements. Fortunately, Peru already has a well-developed poverty map.16
Broad geographic regional targeting remains regressive in Peru. While adequate targeting ofsocial programs is a critical component to optimize scarce resources and deal with prevailing hetero-geneity in program resources to reach the poor, it is also needed to offset broad mistargeting inregional public expenditure. Simple correlation coefficients between per capita spending by depart-ment (and by CTAR) and poverty and extreme-poverty rates produce negative results, whereas theyshould have been positive, had they been allocated to the department with the highest poverty rates.
88 WORLD BANK COUNTRY STUDY
14. This section partly draws from the work done by Diaz (2001).15. Gaps in other infrastructure projects, like the National Office for Popular Cooperation (COOPOP),
Caminos Rurales, and others from the Ministry of the Presidency, remain.16. Peru has an excellent FGT2-based poverty measure, which takes into account both the number of
people below the poverty line, and the severity of their poverty (the gap between their incomes and thepoverty line). The MEF map combined information from the 1993 census with a household survey conductedby the National Institute for Statistics and Information (INEI) in 2000 to “impute” the consumption ofhouseholds in the census. This, in turn, was aggregated up to the district level, and combined with informa-tion on the poverty line to estimate the number of households in each district below the poverty line (theheadcount index), the poverty gap, and the FGT2 (square poverty gap).

Furthermore, correlation coefficients are positive between per capita spending by department andpoverty rankings, ordered from poorest to richest, whereas they should be negative (Table 4.15).Such severe misallocation is explained by the rigid components of the budget, particularly in currentexpenditure.
Recommendation:■ Broad geographic targeting of public expenditure should carefully be reviewed, particularly
in light of the incoming process or regional decentralization, giving greatest weight todepartments with the poorest populations.
Access by the poor to social programs is in general progressive, but important differences remainamong individual programs. Poor household access to social programs is high. A total of 82 percent of poor households have access to social programs (84 percent for those in extremepoverty), and 69 percent have access to at least two social programs (73 percent for extreme poverty)(Table 4.16). Poor rural households have proportionally been more adequately reached by social pro-grams than urban households. Among major social programs, FONCODES (excluding A TrabajarPESP-Urbano), joined by Caminos Rurales, has the best record in progressive spending, adequatelyreaching poor beneficiaries (Figure 4.3). The Programa Nacional de Asistencia Alimentaria(National Food Assistance Program, PRONAA), however, has lost ground and joined the VDL pro-gram in the mild progressivity of its programs. No doubt, their targeting has worsened. Finally, theprogram Trabajar Urbano has started on the wrong foot. Its overall progressivity, particularly at thefirst four poorest levels of the population (which goes beyond the population in extreme poverty),reveals that self-targeting of the most needy beneficiaries is failing. The reason for this is to be foundin the seemingly too-high wage rate being paid to attract workers from only the poorest deciles.17
RESTORING FISCAL DISCIPLINE FOR POVERTY REDUCTION IN PERU 89
TABLE 4.15: CORRELATION EXPENDITURE AND POVERTY BY DEPARTMENT
Expected Direction if Correlation Poverty Targeted
Dept. Expenditure Per Capita to Poverty, by DefinitionPoverty rate −0.522 PositiveExtreme poverty rate −0.463 PositiveMEF poverty ranking 0.265 NegativeINEI poverty ranking 0.458 NegativeINEI extreme poverty ranking 0.507 Negative
CTAR Expenditure Per Capita to Poverty, by DefinitionPoverty rate −0.207 PositiveExtreme poverty rate −0.130 PositiveMEF poverty ranking 0.397 NegativeINEI poverty ranking 0.202 NegativeINEI extreme poverty ranking 0.135 Negative
Source: World Bank staff estimates.
17. The current wage rate appears even more generous in the A Trabajar Rural program, but this is lessalarming because of the sharing income mechanism often employed de facto by the rural communities, withmembers being assigned to a project but actually sharing the working time, or the monthly wage, or both.Therefore, the wage rate does not work as a tool for individual self-targeting the way it does in urban areas.Notice that the success of the program is not measured only by the share of beneficiaries found in the poorestincome quintiles, but also by the income gains received as a result of participating in the program and the cov-erage of the program with a proportion of unemployed poor having access to the program, and the efficiencywith which it operates (ratio of wages to administrative costs and material inputs) (Schady 2002).

Recommendation:■ A Trabajar should offer a wage rate that makes it attractive only to poor households. To do
this, the GOP should undertake an evaluation study, including assessment of household tar-geting outcomes, and lower the wage should the study indicate poor urban targeting out-comes. A similar study should be done regarding A Trabajar Rural. The study should bewidely disseminated to support the GOP’s decisions.
The main social sector programs also reflect a mixed picture in terms of the progressivity/regressivity of their resources allocated nationwide. On one hand, health expenditure appears with
90 WORLD BANK COUNTRY STUDY
TABLE 4.16: HOUSEHOLD ACCESS TO SOCIAL PROGRAMS BY POVERTY LEVEL, 2000Extreme Nonextreme
Geographic Area Total Poverty Poverty Total Poverty Non-Poor
TOTAL 5,632,815 1,161,588 845,355 2,006,943 3,625,872Beneficiaries 59.1% 83.9% 79.7% 82.1% 46.4%
One program 13.4% 10.5% 17.2% 13.3% 13.5%More than one 45.7% 73.4% 62.5% 68.8% 32.9%
Nonbeneficiaries 40.9% 16.1% 20.3% 17.9% 53.6%URBAN 3,607,764 266,243 607,221 873,464 2,734,300
Beneficiaries 50.8% 81.9% 78.8% 79.7% 41.6%One program 14.9% 19.1% 19.1% 19.1% 13.5%More than one 36.0% 62.7% 59.7% 60.6% 28.1%
Nonbeneficiaries 49.2% 18.1% 21.2% 20.3% 58.4%RURAL 2,025,051 895,345 238,134 1,133,478 891,573
Beneficiaries 73.9% 84.5% 81.9% 84.0% 61.1%One program 10.8% 7.9% 12.3% 8.9% 13.3%More than one 63.1% 76.6% 69.6% 75.1% 47.8%
Nonbeneficiaries 26.1% 15.5% 18.1% 16.0% 38.9%
Source: Diaz (2001).
FIGURE 4.3: LORENZ CURVES IN SELECTED SOCIAL PROGRAMS
0
10
20
30
40
50
60
70
80
90
100
10 20 30 40 50 60 70 80 90 100
PRONAA Perfect EqualityFONCODES VASO DE LECHECAMINOS RURALES REFERENTIAL PESP-URBANO
Source: Diaz (2001).

significant regressivity, much exceeded by ESSALUD, the services of which clearly focus on thepopulation located in the non-poor deciles, but offset by Ministry of Health (MINSA) programs,which show mild progressivity thanks to a few local service delivery programs that clearly targetmost needy beneficiaries (Figure 4.4). On the other hand, education expenditure shows somedegree of progressivity, certainly reflecting a similar feature in primary education, barely offset bythe mild regressivity of expenditure in secondary education (Figure 4.5).
In general, safety net programs reach less than 40 percent of their intended extreme povertybeneficiaries. This is the case of the VDL and Comedores Populares programs (Table 4.17).Desayuno Escolar and School Text and Materials, however, are the exceptions, with an acceptable51 percent and 44 percent of their beneficiaries, respectively, belonging to the three poorestdeciles. Seguro Escolar (School Health Insurance) ranks relatively better among health programs,whereas Planificación Familiar (Family Planning) is found among the worst-targeted programs.This ranking also broadly corresponds to the level of access—measured by the ratio of beneficiariesto the total population—that these programs have, with Comedores Populares and PlanificaciónFamiliar having the lowest targeting scores (Figure 4.6).
RESTORING FISCAL DISCIPLINE FOR POVERTY REDUCTION IN PERU 91
FIGURE 4.4: LORENZ CURVES FOR HEALTH EXPENDITURE
0
20
40
60
80
100
10 20 30 40 50 60 70 80 90 100
Minsa ESSALUD Perfect equality Total health
Source: Diaz (2001).
FIGURE 4.5: LORENZ CURVES FOR EDUCATION EXPENDITURE
0
10
20
30
40
50
60
70
80
90
100
10 20 30 40 50 60 70 80 90 100
Perfect equality Total educationPrimary education Secondary education
Source: Diaz (2001).

Recommendations:■ In the short term, application of a common poverty-targeting methodology and criteria—
based on the Foster, Greer, and Thorbecke 2 (FGT2) poverty map updated every threeyears—in all social programs should be made more explicit, transparent, and focused onpopulations that are extremely poor, and should be accompanied by complementary train-ing, information campaigns, community mobilization, or nutrition education.
■ Programs with substantial mistargeting should be redesigned, merged, or closed. To regu-larly evaluate this, benchmarks in terms of the share of expenditure reaching extreme-poorbeneficiaries (the lowest 4 quintiles) should be established explicitly for at least the 10 mainsocial programs, and progress toward meeting such benchmarks should also be monitoredon an annual basis, with SIAF and INEI support. If their evaluation indicates that programsoverlap or do not meet their objectives, their immediate restructuring will be necessary.
92 WORLD BANK COUNTRY STUDY
TABLE 4.17: TARGETING BY FOOD ASSISTANCE, HEALTH, AND EDUCATION PROGRAMS, 2000
No. of Total Extreme Nonextreme Total Non-Poor Social Program Beneficiaries (%) Poverty (%) Poverty (%) Poverty (%) (%)
Food AssistanceDesayuno Escolar 2,972,859 100 51.1 18.7 69.8 30.2Vaso de Leche 2,283,919 100 40.1 24.1 64.2 35.8Comedor Popular 746,134 100 40.2 14.5 54.7 45.3
HealthRegulating child 1,729,899 100 33.7 18.4 52.1 47.9growthSchool health 1,157,912 100 36.8 20.6 57.4 42.6insuranceFamily planning 870,942 100 22.1 24.8 46.8 53.2
EducationSchool text and 2,970,567 100 44.4 19.7 64.1 35.9materials
Source: Diaz (2001).
FIGURE 4.6: ACCESS TO SOCIAL PROGRAMS, 2000 (% with respect to total population)
0 2 4 6 8 10 12 14
School breakfast/food
Vaso de Leche
Comedor Popular
Checking child's growth
School insurance
Family planning
School text & materials
Source: Diaz (2001).

Some of them, like VDL, already showing significant leakages and not meeting nutritionalobjectives, require immediate major restructuring.
■ In the medium term, a comprehensive restructuring of the main social programs dealing withextreme poverty is necessary, perhaps following the example of PROGRESA (Box 4.1) inMexico. Given very limited fiscal resources, budget rigidities, and low levels of efficiency fora substantial amount of resources already devoted to extreme poverty programs, this seems arather urgent task. The restructuring of social programs in Peru should aim at several goals:(a) improving the quality of service delivery; (b) expanding the coverage of social programs,particularly among the most vulnerable rural groups; and (c) generating fiscal savings thatcould be used to increase coverage of the most effective programs at the local level.18
■ Restructuring Peru’s feeding programs into a unified intervention along the lines of PRO-GRESA (or, more ambitiously, folding other programs into this unified structure) is a veryviable option that Peru might consider. This offers a broad coverage of the poor under asingle program structure, with proper targeting and very powerful positive impacts on poorfamilies. Rough calculations based on PROGRESA’s costs per beneficiary ($80 per year)indicate that to cover the entire rural poor population of Peru (4.5 million people) with asimilar unified intervention (primary education, basic preventive health, and food supple-ment) would entail a maximum cost of $360 million—or NS/1,200 million (0.6 percent ofGDP). Interestingly, this amount represents about a third of total budget expendituredevoted to extreme-poverty programs, just over three times the current cost of the VDLprogram, or the combined sum of the VDL, Comedores Populares, Desayunos Escolares, andSeguro Materno-Infantil programs. Obviously, if the selected target population were theextreme poor, the cost would be considerably lower.
RESTORING FISCAL DISCIPLINE FOR POVERTY REDUCTION IN PERU 93
18. A recent study found that the educational impact of Desayunos Escolares in terms of rate of attendance,rate of repetition, and drop-out rates is small, but not negligible: about 10 percent in attendance, between a 1 and 3 percent drop in repetition, and a 0.3 to 1.6 percent reduction in drop-out rate.
BOX 4.1: MEXICO: INTEGRATING SOCIAL PROGRAMS FOR IMPROVED EFFICIENCY—THE CASE OF PROGRESA
In 1996, the Mexican government designed and successfully implemented the Programa de Educación, Salud y Alimentación (PROGRESA), a single and integrated social assistance intervention replacing a series of disparatefood subsidies, and education, health, and other social programs. PROGRESA’s unified approach providesimmediate financial transfers to the rural poor, while at the same time promoting investment in children’shuman capital (future earnings) through increased schooling and improved health and nutrition status. The program provides cash transfers to selected poor rural families, selected with household surveys updated everythree years, conditional on keeping children in school and providing them with basic preventive health care andnutrition. A key feature of the program is the provision of the cash transfer to registered mothers, a mechanismdesigned to ensure that the money is well invested in children and as an incentive to empower women in ruralcommunities. In 2001, the program covered 3.2 million rural families (well over half of the rural poor), at a costof 2.3 percent of the government’s social expenditures, or 0.2 percent of GDP. The program is highly efficient,with administrative costs of about 4 percent; therefore, over 95 percent of its expenditure is transferred ascash directly to poor households.
Six years later, an independent evaluation confirmed PROGRESA’s impressive results: (a) an increase of about 1 percent in the primary enrollment rates for girls, and an increase of 8 percent for girls and 5 percent for boysin the secondary enrollment rates; (b) an increase of about 10 percent in children’s educational achievement,which would represent an increase of 8 percent in their future earnings; (c) an increase of 8 percent in prenatalcare in the first trimester of pregnancy; and (d) a decrease of 12 percent in the incidence of disease among chil-dren under 5, and a decrease in the probability of malnutrition among children aged 12 months to 36 months.


In the past decade, Peru made considerable progress toward redefining the role of the State, but thereform process remains unfinished. In the early-to-mid-1990s, the size and scope of the public sectorwas reduced to more manageable proportions; the nature of government shifted from ownership ofproductive firms and excessive intervention to market regulation and provision of social services;and many State enterprises were privatized or closed. However, in the mid-to-late-1990s, the Statereform process lost steam and some key tasks of State reform were not even initiated. Instead, author-itarian tendencies and open hostility to any democratization or deepening of State modernizationgained the upper hand. Not surprisingly, public service delivery, governance, and corruption indica-tors deteriorated toward the end of the decade. Prominent among the reforms that were set aside bythe authoritarian leadership were decentralization of the State and public administration, restruc-turing of the civil service, implementation of progovernance and anticorruption policies, and thedesign of sound mining fiscal and environment policy agendas. These pending reforms are the sub-jects of the next four chapters.
This chapter is devoted to the issue of decentralization. Its point of departure is the fact that, in Peru, there is a consensus among both the political leadership and civil society about the need todecentralize political power and the management of public resources. It points out both the promis-ing potentialities and the serious risks entailed in the decision to decentralize, drawing on the lessonslearned from other Latin American experiences with decentralization. It concludes with an exami-nation of the issues raised by the decentralization of education and health as key social services. Themain message of the chapter is that the Peruvian resolve to decentralize has both promises and risks.If appropriately executed decentralization can increase both the efficiency of the delivery of govern-ment services and the responsiveness of government to the needs of citizens. However, decentraliza-tion also poses formidable risks to fiscal discipline, and thereby to macroeconomic stability, in theform of recurring central government deficits, an overexpanded public sector, and the inability touse fiscal policy to adjust to economic shocks.
V
ADDRESSING THE PROMISESAND RISKS OF
DECENTRALIZATION
95

The Decision to Decentralize: Promises and RisksFollowing almost a decade-long centralized authoritarianism, Peru is a relative latecomer to decen-tralization in Latin America. The decision to decentralize initially was motivated more by the rejec-tion of the political and social consequences of centralization than in an explicit message as to thepurposes, content, and goals of decentralization. A number of recent decisions by the new Admin-istration are evidence that there is a growing consciousness about the scope of, and the potentialadvantages and serious risks entailed in, the decision to decentralize. In the meantime, the decisionto decentralize has been taking shape in a number of initiatives, such as:
■ The passage of a framework Law for State Modernization and the introduction of a frame-work Law for Decentralization in January 2002;
■ The decision to hold regional elections next November;■ The recent creation of the Public Management Secretariat at the Presidency of the Council
of Ministers, charged with formulating a strategy for both CG modernization and Statedecentralization;
■ The Ministry of Economy and Finance’s (MEF’s) decision to implement regional and par-ticipatory budgeting;
■ The Executive decision to create Regional Coordination Councils, integrating TransitoryCouncils of Regional Administration with social sector ministries representatives;
■ The legal acknowledgment by the Legislature of the departmental Mesas de Concertación(Dialogue Roundtables) as consultative bodies of the regional governments; and
■ The passage in late June 2002, of the Law to Lay the Bases of Decentralization.
The dominant force behind decentralization is political. The current government’s decision todecentralize is part of a broader, positive trend toward democracy in the LAC region (Burki, Perry,and Dillinger 1999). However, there is no single regional paradigm for decentralization, and expe-riences vary greatly (Box 5.1). In the particular case of Peru, the decentralization process is seen bythe political leadership as an integral component of State reform, and there is a basic convergenceof views between Congress and the Administration. In the view of one of its leading congressionalproponents, the process aims at devolving power to the regions and the local citizenry, promotingautonomous and sustainable regional development, fostering citizen participation in public affairsand citizen control of elected officials, and improving efficiency and efficacy of the local publicadministration. For its part, the Executive branch’s view emphasizes seven principles: efficiency inservice provision, macroeconomic stability, gradualism, heterogeneity, equity, participation of civilsociety, and political independence.
The decision to decentralize contains big promises and risks. If appropriately carried out,decentralization can, indeed, increase both the efficiency of the delivery of government services andthe responsiveness of government to citizen needs. This is because devolving resource-allocationdecisions to locally elected leaders can improve the match between the mix of services produced bythe public sector and the preferences of the local population. Local officials have better knowledgeof local conditions and are more accessible to their constituents. This gives them both the meansand the incentive to be responsive. Decentralization may also improve public-resource managementsince, through sheer proximity, local officials can be held more accountable for their performance.Where the population is mobile and citizens can “vote with their feet,” decentralization may alsoresult in local governments competing with each other better to satisfy the wishes of citizens.Decentralization may, however, pose serious risks in the political sphere, in the area of service provision, and for macroeconomic stability. The risks in the political sphere have to do with thepossibility that the local administration can be captured by local power elites and be put to the service of special interests. The risks in the area of public service provision have to do with the pos-sibility that, because of the small size of some communities and hence insufficient scale in service
96 WORLD BANK COUNTRY STUDY

1. An important caveat is that following cross-section analysis for several decentralized countries, thesteady state level of subnational borrowing does not appear associated with higher CG spending or deficits.However, when subnational borrowing increases, the CG seems to have to spend and borrow more in thesubsequent periods, which points to an intertemporal macroeconomic management problem that not manycountries, certainly none in LAC, have adequately prevented (Burki, Perry, and Dillinger 1999).
BOX 5.1: LESSONS FROM DECENTRALIZATION EXPERIENCES IN LATIN AMERICA
There is no single paradigm for decentralization in LAC. Decentralization experiences in LAC arehighly varied in their political, functional, and fiscal dimension, be it for multitier countries (Argentina, Brazil,Colombia, Mexico, and Venezuela) or single-tier countries (Bolivia, Chile, and Guatemala) (Table SA.46). At thepolitical level, some countries introduced elected authorities at the regional or municipal level; others did not.At the functional level, some countries were explicit in reallocating functions at the level of regional govern-ments; others did it at the level of municipal authorities, and others did not do it explicitly, but in an incrementalway. At the fiscal level, increased revenue sharing or earmarked transfers accompanied new functions of statesor municipalities (Table SA.47).
Why decentralize? In theory, three main reasons have been argued in LAC: (a) to promote territo-rial deconcentration of productive activities and generate employment; (b) to increase efficiency inthe delivery of public service; and (c) to raise local participation in the generation of fiscal revenue.For the most part, however, outcomes in LAC have been disappointing (CEPAL 2001).
■ The reduction of territorial concentration of productive activities does not appear positively correlated withdecentralization processes. Two highly decentralized countries, Argentina and Brazil, showed higher territor-ial disparities after decentralization than before. In Colombia, territorial disparities increased as decentraliza-tion advanced. Chile, a country with a low level of decentralization, is the exception, with regional disparitiesdecreasing only temporarily as a result of decentralization.
■ On the expected increased efficiency in service delivery, the experience is mixed. Decentralization appearsto decrease efficiency in education and primary health services in seven LAC countries: Argentina, Bolivia,Brazil, Chile, Colombia, Mexico, and Nicaragua (CEPAL 1998). Exceptions in education are Colombia atimproving the allocation of resources, and Chile and Nicaragua, due to the increased participation of parentsin school financing and management. In Bolivia and Colombia, however, the cost per student increased andquality decreased following decentralization. Exceptions in health are Argentina and Colombia, and this isexplained by the existence of enhanced demand–subsidy mechanisms that have also slightly reduced theacceleration in sector spending levels that usually accompanies the decentralization of health services.
■ On the expected increased participation of local government in generating additional fiscal revenue, LAC empir-ical evidence has been disappointing. It shows, rather, a persistent trend in local expenditure to increase fasterthan local revenue as decentralization proceeds. Being mostly based on increased transfers from the center,decentralization tends to increase the size of the total government sector (Burki, Perry, and Dillinger 1999). Suchwidening subnational deficits not only had increased national expenditure, but threatened macroeconomic stabil-ity in the short term, and aggravated the sustainability of subnational debt in the medium term, thus adding newpressures to already fragile fiscal stances. This was the case in Argentina, Bolivia, Brazil, Chile, and Mexico.1
Where does the greatest risk lie? The Latin American experience clearly shows that it lies in the potentialthat decentralization harbors for fiscal instability. Brazil’s 1988 Constitution, for example, required a majorincrease in federal tax sharing by the subnational governments, without providing for any devolution of federalspending responsibilities. This threatened to provoke recurrent deficits at the federal level. Colombia decentral-ized both revenues and expenditures, but ended up maintaining and even increasing CG spending on education andhealth several years after those functions were transferred to the subnational governments. Mexico substantiallyincreased transfers to municipalities without a reciprocal reduction of spending at the federal level. As a result,Colombia and Mexico have been forced to maintain preexisting levels of spending while funding and expanding vol-ume of intergovernmental transfers. This has contributed to significant CG deficits. Attempts to eliminate suchdeficits by raising taxes may lead to overexpansion of the public sector. Brazil’s mismatch between revenues andexpenditures, for example, was ultimately resolved not by reducing CG expenditures, but by increasing federaltaxes. Finally, decentralization can reduce a country’s ability to respond to adverse economic shocks. Govern-ments in Brazil and Colombia, for instance, which must share nearly half of their tax revenues with subnationalgovernments, find it difficult to raise taxes sufficiently to compensate for revenue shortfalls.

provision, or due to institutional weakness of the local governments, the services rendered mayturn out to be of lesser quality or more inefficiently provided.
The macroeconomic risks are especially troublesome. They may take the form of recurringCG deficits, an overexpanded public sector, or the inability to use fiscal policy to adjust to eco-nomic shocks. First, CG deficits can worsen if subnational governments are unable to reduceexpenditures or increase revenues to finance the cost of assuming new responsibilities. Second,governments may find themselves decentralizing both revenues and expenditures, but beingunable to reduce existing levels of CG spending in those functions that have been decentralized.Third, decentralization can hamper a government’s ability to respond to economic shocks if itreduces central control over aggregate public sector revenues and expenditures. This is generallythe case in countries with high budget rigidity, like Peru. In addition, subnational governmentprodebt policies and indebtedness behavior can also undermine overall fiscal discipline. Sub-national governments may end up borrowing excessively in the expectation that the CG will bailthem out.
In the case of Peru, the decentralization challenge is compounded by several factors: a vulnera-ble fiscal stance, at both the aggregate and local level; multiple governance issues afflicting localgovernments; and the incredible institutional fragmentation in the social sectors in the delivery ofservices. A variety of vertical programs resulting from years of gradual “add-ons” respond to partic-ular needs with little internal coordination, multiple and overlapping levels, and partial coveragethrough a variety of institutions. In the health and education sectors, the absence of a unified regu-latory structure or regular evaluation and monitoring systems based on results compounds theproblem of both quality control and the assurance of productivity.
The Deconcentration of Central Government Spending and Transfers tothe Municipalities: Intergovernmental Fiscal RelationsThe current system of expenditure allocation to the regional and local levels rests on two pillars:deconcentrated spending by the CG and budget transfers to the municipalities. Peru has 25 states(called departamentos, or departments). Unlike most countries in Latin America, however, in Peruthere are no intermediate-level governments, because the departamentos are not administrativeentities but merely geographical divisions of the national territory toward which the population hashistorical and cultural attachments. In contrast, the local level of government is fully established.There are two types of municipalities: the provincial municipalities and the districts. Sizewise, therelationship between the two types of municipalities is hierarchical in that each provincial munici-pality consists of a (variable) number of districts. Provincial municipalities are hence bigger thanthe districts nested by them. In the absence of an intermediate level of government, the CG exe-cutes its department-level spending through the deconcentrated organs known as TransitoryCouncils of Regional Administration (CTARs) and through the regional directorates of the CGministries. The other pillar in the current system of expenditure allocation is based on the transferof resources from the CG to the provincial and district governments.
Region-level expenditures by the CG are a significant share of the national budget. More thanhalf of the CG budget is executed through the deconcentrated organs at the department level. Thisamounts to a substantial 6.0 percent of GDP (Table 5.1). The role of CTARs is quite importantbecause they execute over 42 percent of the total expenditure outside Lima (Table 5.2). The rela-tive significance of region-level spending (outside Lima) is much higher if we exclude debt serviceand pensions from the budget: in 2002, regional allocations accounted for about half of CG cur-rent expenditure and 81 percent of CG capital investments (Table SA.39), which means thatapproximately 4 out of every 5 dollars of public investment in Peru is executed outside Lima. Thedownside of this is that regional and CTAR expenditures are particularly punished when, as a resultof an economic downturn, there are cuts in public investment outlays. For instance, in 2000, whiletotal expenditure outside Lima was reduced to 88.4 percent of its budgeted amount, the executedbudget for capital investment was much less reduced—to 67.5 percent of its respective approved
98 WORLD BANK COUNTRY STUDY

amount (Table 5.3). Hence, if budget autonomy is conceded to future regional governments, theCG would have much less capacity to invest nationwide, and much less freedom (due to budgetrigidity) to reduce expenditure when needed.
Region-level expenditure in health and education represents a very high share of total regionalbudgets. In 2002, education and health expenditures represented 50 percent and 27 percent,respectively, of total budgeted regional expenditure by the CG (Tables SA.39 and SA.40). Theseratios show that a future decentralization of both sectors could be tantamount to a de facto trans-fer to the future regional governments of up to about three fourths of current region-level budgetresources. In fact, if we deduct current expenditure from total regional expenditure, education andhealth budgeted capital outlays jointly represent a very high 95 percent of the total regional budgetdevoted to investment (Tables SA.39 and SA.40). This share underscores the fact that the burdenof budget cuts over regional investment is borne by these two sectors.
Transfers to local governments are small when compared to region-level expenditures, but con-stitute the bulk of municipal government revenues. The transfers to local governments amount to15.8 percent of the CG budget (1.8 percent of GDP). However, in the case of municipalities otherthan Lima, they are the most important source of revenue. As a percentage of total municipal rev-enue, CG transfers represented 48 percent in 2001, and a high 73 percent when Lima is excluded(Figure 5.1). CG transfers are concentrated in the four most important ones: Fondo de Compen-sación Municipal (FONCOMUN), Vaso de Leche (VDL), petroleum canon, and mining canon, with67, 17, 7, and 4 percent, respectively, of total budgeted transfers in 2002 (Figure 5.2). When itcomes to the locally based sources of revenue, the main revenue items are fees (tasas)—which in2002 represented 45 percent; taxes—which barely represented a low 25 percent; fines, with 11 per-cent; public service fees, with 6 percent; and real estate income—which barely represented a low 5 percent (Table SA.40). No doubt, these sources of revenue will have to be strengthened througha municipal tax reform if municipal autonomy is to be strengthened.
Local government finance is additionally constrained by severe liability problems. The munic-ipal debt is not a serious threat for macroeconomic stability, but that is not an indication that theproblem is not serious or generally significant, and even explosive, for some municipalities thatface severe liquidity and solvency problems. Municipal debt explains a third of the correspondingnational registered debt—short-term current liabilities—but this varies widely by municipality.Solvency at the local level can be a serious concern. A World Bank survey of nine municipalities2
shows that four of them had a current liability/revenue ratio above 1, meaning that they requiremore than a one-year income to cover their present debts (in some cases, the ratio is above 3).Debts have been growing at a rapid annual rate (13 percent on average during 1997–2000) and
RESTORING FISCAL DISCIPLINE FOR POVERTY REDUCTION IN PERU 99
TABLE 5.1: BUDGETED EXPENDITURE FOR THE PUBLIC SECTOR FOR FY02
Sector Percent of GDP
National government 11.4Regional level 6.0Local government 1.8Public entities 1.2Firms (Fonate) 6.7
TOTAL 27.5US$ millions 15,686
Source: MEF.
2. The sample consisted of three provincial municipalities (Arequipa, Lima, and Trujillo) and six districtmunicipalities (Characato, Jacobo Hunter, La Esperanza, La Victoria, Poroto, and San Juan del Lurigancho).

100 WORLD BANK COUNTRY STUDYT
ABL
E5.
2:EX
PEN
DIT
UR
EC
OEF
FIC
IEN
TS
BYC
TA
R, 2
001
Coe
ffici
ent
CT
AR
Exp
d./
Bud
gete
d A
ctua
l of
Act
ual
Dep
tN
o. o
f E
xpen
ditu
re
Exp
endi
ture
E
xpen
ditu
re
Diff
eren
ce
CT
AR
Exp
d.E
xpen
ditu
reD
epar
tmen
tsE
Us
Pop
ulat
ion
(Mln
s of
NS
)by
CT
AR
(i)
by C
TA
R (
ii)(i
)–(i
i)by
Pop
.(%
)
Am
azon
as12
420,
606
215.
389
.610
0.4
(10.
8)23
.946
.6A
ncas
h27
1,09
2,66
259
1.4
277.
528
4.1
(6.6
)26
.048
.0A
puri
mac
1445
5,63
729
9.0
125.
512
9.2
(3.7
)28
.343
.2A
requ
ipa
191,
067,
469
913.
826
1.7
275.
0(1
3.3)
25.8
30.1
Aya
cuch
o20
541,
427
465.
116
3.5
187.
3(2
3.8)
34.6
40.3
Caj
amar
ca20
1,48
0,69
054
7.0
250.
926
4.9
(13.
9)17
.948
.4C
alla
o13
774,
604
547.
013
3.4
71.0
62.5
9.2
13.0
Cus
co17
1,19
4,27
571
6.6
264.
027
5.2
(11.
3)23
.038
.4H
uanc
avel
ica
1143
5,59
621
5.6
105.
310
8.0
(2.7
)24
.850
.1H
uánu
co12
800,
543
322.
014
8.1
151.
2(3
.1)
18.9
47.0
Ica
1467
6,24
946
4.6
181.
618
4.6
(3.0
)27
.339
.7Ju
nín
201,
232,
343
660.
227
8.9
286.
0(7
.1)
23.2
43.3
La L
iber
tad
321,
483,
681
741.
127
7.6
287.
3(9
.7)
19.4
38.8
Lam
baye
que
141,
110,
129
553.
517
3.6
185.
2(1
1.6)
16.7
33.5
Lim
a19
47,
617,
193
23,7
47.2
9.3
9.5
(0.2
)0.
10.
0Lo
reto
1889
4,30
751
1.7
314.
833
1.4
(16.
6)37
.164
.8M
adre
de
Dio
s8
96,7
0380
.042
.542
.7(0
.2)
44.2
53.4
Moq
uegu
a6
153,
383
147.
761
.566
.9(5
.4)
43.6
45.3
Pasc
o8
259,
137
172.
772
.175
.4(3
.4)
29.1
43.7
Piur
a16
1,61
1,57
378
8.1
350.
837
6.6
(25.
8)23
.447
.8Pu
no33
1,24
7,49
465
1.2
304.
932
3.7
(18.
7)25
.949
.7Sa
n M
artín
2374
6,20
244
5.1
177.
317
6.1
1.2
23.6
39.6
Tac
na9
286,
539
222.
293
.099
.8(6
.8)
34.8
44.9
Tum
bes
819
7,60
517
9.1
81.1
90.3
(9.2
)45
.750
.4U
caya
li16
450,
693
225.
614
9.0
158.
5(9
.5)
35.2
70.2
To
tal
584
26,3
26,7
4034
,422
.69
4,38
7.54
4,54
0.29
(152
.75)
17.2
13.2
w/o
Lim
a39
018
,709
,547
10,6
75.5
04,
378.
254,
530.
79(1
52.5
4)24
.242
.4
Sour
ce:
MEF
.

RESTORING FISCAL DISCIPLINE FOR POVERTY REDUCTION IN PERU 101
TA
BLE
5.3:
EXPE
ND
ITU
RE
BYD
EPA
RT
MEN
T, 2
000
(MLN
NS)
To
tal E
xpen
ditu
res
Cap
ital
Inv
estm
ents
Go
ods
and
Ser
vice
s
Exe
cute
d/E
xecu
ted/
Exe
cute
d/D
epar
tmen
tsB
udge
ted
Exe
cute
dB
udge
ted
Bud
gete
dE
xecu
ted
Bud
gete
dB
udge
ted
Exe
cute
dB
udge
ted
Am
azon
as33
8.5
206.
260
.915
4.9
77.9
50.3
70.8
26.8
37.9
Anc
ash
641.
259
8.2
93.3
203.
515
8.6
77.9
70.4
57.5
81.8
Apu
rim
ac36
7.2
292.
779
.718
2.4
124.
168
.048
.135
.874
.3A
requ
ipa
917.
088
1.2
96.1
300.
923
1.8
77.0
104.
493
.789
.8A
yacu
cho
553.
048
1.3
87.0
259.
920
8.8
80.3
70.0
56.5
80.7
Caj
amar
ca64
0.7
494.
377
.226
3.1
116.
344
.261
.952
.785
.2C
alla
o44
8.1
407.
791
.014
8.5
106.
571
.710
8.8
122.
811
2.8
Cus
co81
9.1
698.
085
.234
2.3
237.
869
.511
6.6
103.
788
.9H
uanc
avel
ica
278.
124
0.5
86.5
109.
987
.379
.441
.034
.884
.9H
uanu
co34
6.2
313.
290
.411
7.6
79.3
67.4
42.9
38.9
90.7
Ica
471.
745
3.0
96.0
68.2
57.0
83.6
55.2
47.4
86.0
Juní
n69
5.8
613.
388
.216
2.9
83.0
51.0
86.6
72.8
84.0
La L
iber
tad
782.
276
6.6
98.0
193.
813
8.2
71.3
79.7
69.4
87.0
Lam
baye
que
583.
557
4.3
98.4
136.
196
.570
.965
.959
.790
.6Li
ma
24,2
97.4
17,8
89.1
73.6
2,42
7.6
1,71
8.0
70.8
4,34
1.8
2,75
9.7
63.6
Lore
to53
8.4
505.
994
.017
5.0
125.
871
.980
.269
.987
.2M
adre
de
Dio
s10
6.2
79.4
74.8
59.6
33.2
55.6
14.4
12.0
83.2
Moq
uegu
a13
8.9
124.
289
.448
.331
.164
.316
.513
.783
.1Pa
sco
206.
816
5.7
80.1
42.7
20.0
46.7
27.3
24.5
89.6
Piur
a91
9.3
781.
885
.037
9.7
221.
558
.392
.097
.210
5.7
Puno
815.
873
1.6
89.7
323.
024
4.3
75.6
89.6
79.0
88.2
San
Mar
tín46
9.6
408.
286
.920
6.8
141.
568
.452
.145
.387
.0T
acna
253.
423
1.6
91.4
74.9
63.7
85.0
33.4
33.7
101.
1T
umbe
s19
5.9
152.
477
.869
.138
.255
.219
.315
.982
.3U
caya
li26
0.4
219.
084
.181
.246
.857
.747
.239
.283
.2
To
tal
36,0
84.4
28,3
09.1
78.5
6,53
2.0
4,48
7.0
68.7
5,83
6.0
4,06
2.7
69.6
w/o
Lim
a11
,787
.010
,420
.088
.44,
104.
52,
768.
967
.51,
494.
21,
303.
087
.2
Sour
ce:
MEF
.

the debt situation appears to be deteriorating faster in large provincial municipalities (Arequipa)and urban districts (La Victoria in Lima). Debt dynamics are explained essentially by two factors:arrears (cuentas por pagar) with suppliers and public utility companies (about 55 percent), andnonregistered pensions with former municipal employees (21 percent). The municipalities are alsobecoming increasingly illiquid as all but two had a current-revenue/current-expenditure ratiobelow 1, reflecting that their present current revenues are hardly enough to cover their presentcurrent expenses. The problem is becoming explosive, since contingent liabilities are threateningto materialize, mainly because of resolution of labor disputes, the amount of which is projected to grow 25 percent in the next few years (Fernandez 2002). Municipalities like Arequipa and LaVictoria, in particular, are not going to be able to assume additional responsibilities under decen-tralization if they do not solve their debt problems. The Government of Peru (GOP) seems tohave neither an adequate regulatory framework nor an appropriate institutional arrangement forassessing and controlling growth of municipal debt.
The Emerging Legal Framework for Decentralization in PeruBoth the government of President Toledo and the Congressional leadership are committed to lay-ing the political and legal bases for the decentralization process. As a result, in late January, the legis-lature approved the Framework Law for the Modernization of State Management (Law 27658). TheLaw is an effort to provide the legal base and principles for initiating the process of implementingmodernization reforms. It promotes six objectives: (a) a service-provider state, (b) effective access for
102 WORLD BANK COUNTRY STUDY
FIGURE 5.1: MUNICIPAL REVENUES, 2001(excluding Lima)
Transfersfrom centralgovernment
73%
Own revenues27%
Source: MEF.
FIGURE 5.2: CENTRAL GOVT TRANSFERS TO MUNICIPALS, 2001
FONCOMUN67%
Canon andSobrecanon
Petrol7%
CanonMinero
4%
Vasode Leche
17%
Other5%
Source: MEF.

participation, (c) decentralization and deconcentration, (d) transparency, (e) a new civil service—well qualified and remunerated, and (f ) fiscal balance. The Law focuses strongly on the need to redimension the State both in its role and in its size. The State is then perceived less as an actor thanas a regulator of actions, while retaining basic human-need-attention functions in health and educa-tion. To accomplish this paradigm shift, the Law offers three principal tools: (a) fusion of State enti-ties to reduce duplication; (b) introduction of Management Contracts (Convenios de Gestion) inconjunction with Multiyear Strategic Sector Plans (PESEM) in the context of the Multiyear Macro-economic Framework (MMM) objectives and goals; and (c) pilot programs for modernizationthrough the gradual introduction of convenios. The initial pilot programs will be carried out at theMinistry of Transportation and the Presidency of the Council of Ministers.
The Law also defines three lines of action for the CG in terms of the need to (a) clarify functionsand structures, (b) introduce a system of management contracts based on results, and (c) modernizeadministrative systems. As a framework document, the new Law was a step in the right direction. Itprovided objectives to aim at while remaining flexible. It also opened the door for sector ministries to pursue different avenues of action. By virtue of this Law, the newly created Public ManagementSecretariat at the Presidencia del Consejo de Ministros (Premier’s Office, PCM) was rightly given aleading role.
In late June 2002, the Peruvian Congress overwhelmingly approved the Ley de Bases de Decen-tralization. The Law defines the purpose, principles and objectives, regulations, and transitionmeasures guiding the decentralization process. It distinguishes two sets of principles on which it isbased: general principles and specific principles for fiscal decentralization.
■ The general principles include (a) decentralization is a permanent State policy, of a manda-tory character for all the constitutional branches of the State, the autonomous constitu-tional entities, and the government as a whole; (b) the process of decentralization is definedas dynamic and requires a constant monitoring and evaluation of its ends and objectives; (c) it is irreversible; (d) it is democratic in that it promotes equality of opportunity; (e) it isintegral in that it encompasses the whole State in the national territory and calls for carryingout the process in a gradual manner, so that a sequence of steps must be followed; and (f ) the process is premised on the principle of subsidiarity, implying that functions andcompetencies must be assigned to the level of government closest to the citizens that canefficiently perform a given public service.
■ The specific principles are next: (a) a clear definition of competencies, (b) transparency andpredictability, (c) fiscal neutrality to avoid any transfers of resources that are not accompaniedby a transfer of responsibilities, (d) public sector indebtedness is an exclusive competency ofthe national government, and regional and local governments can contract debt only with CG guarantee, (e) fiscal responsibility is to be materialized in fiscal rules for the subnationalgovernments, which must include rules on indebtedness and limits on annual expenditures of the subnational governments so that the decentralization process can be sustainable.Prominent among the objectives defined by the Law are (a) institutionalization of theregional and local governments; (b) economic development and competitiveness of the different circumscriptions, according to their productive potential; (c) modernization andsimplification of administrative systems and processes; and (d) citizen participation in all formsof organization and social control. The Law creates intermediate-level governments—theregional governments—and mandates that regional government officials be directly elected.
■ The normative foundations are also considered. On this account, the Law defines (a) threetypes of competencies: exclusive competencies, shared competencies, and delegatory compe-tencies; (b) a Constitutional Tribunal is called for resolving conflicts of jurisdiction; (c) thecreation of a Regional Compensation Fund (FONCOR), which will finance regional invest-ment projects to be executed by the regional governments; and (d) new sources of revenuein the national budget and as a percentage of privatization proceeds.
RESTORING FISCAL DISCIPLINE FOR POVERTY REDUCTION IN PERU 103

■ The Law also creates the National Council for Decentralization to lead the decentralizationprocess. The Council will be composed of representatives from the CG, the regional gov-ernments, the provincial municipalities, and the district-level municipalities. The Council’smain responsibility is to oversee the process of transfer of competencies from the CG to thesubnational governments, and manage an Intergovernmental Decentralization Fund(FIDE) to promote cofinancing of projects by subnational governments. The transferprocess will be carried out gradually over several years, in successive stages that initiallyaffect sectors like transport and housing, and at a later stage education and health. TheCouncil will also discharge functions of coordination, technical support, and training forthe subnational governments.
■ Finally, the Law includes transition measures of utmost importance, including the elimina-tion of the Ministry of the Presidency and the CTARs by 31 December 2002.
This emerging legal framework will be completed with forthcoming laws. These include theOrganic Law for the Executive Power, the Law on Regional Governments, the Law of Municipali-ties, the Law on Fiscal Decentralization, the Law to Create the Regional Compensation Fund, andthe Law of Economic and Productive Decentralization.
Entering a Decentralization PathPeru’s recent efforts toward modernization and decentralization offer the general principles that willguide the transition process, while complementary laws will apply them to specific components ofsuch a process. Because decentralization is the result of political will and consensus—not simply oftechnical expertise—a broad and participatory dialogue (and patient persuasion), supported by theNational Dialogue and the Concertation Roundtables, has taken place in the past eight months.Since decentralization should be demand-driven, the binding thread for the process must be theidea that its ultimate purpose is to increase the coverage and improve the quality of public servicesso that the citizenry assumes ownership of both the process and its results.
The latent risk that fiscal discipline may turn out to be a casualty of the decentralizationprocess will continue to be high until a clear framework for intergovernmental public finances isfinally enacted and enforced. The guiding criterion for such a framework must be the establish-ment of hard budget constraints for the expenditure and indebtedness decisions of subnationalgovernments. The road ahead must then be carefully trodden if the appropriate framework for fiscal discipline of the subnational governments is to be attained. Some critical actions that will help secure that outcome seem to be in order.
The issues of substance relate to the rules of the game in the process of decentralization. Fiveissues deserve special consideration: (a) the degree of autonomy to be given to the subnationalgovernments in their future provision of social services, (b) the kind and extent of expenditureresponsibilities to be transferred to the subnational governments, (c) the rules and institutionalmechanisms for transferring resources from the CG to the subnational governments, (d) the alloca-tion of taxing powers to the subnational governments, and (e) the rules subnational governmentsmust follow in contracting debt.
A higher degree of autonomy is desirable. The higher the autonomy subnational governmentscan enjoy, the higher the likelihood that the potential benefits of decentralization will be realized.Both the ability of the local governments to respond to the demands of the local population and theparticipation of the citizenry in local political life will be enhanced if a high degree of autonomy isallowed. However, for the decentralization not to be a travesty of local democracy, higher degreesof autonomy must be accompanied buy higher accountability on the part of subnational govern-ments vis-à-vis the local population. But autonomy has its risks as well. Autonomous subnationalgovernments may end up spending irresponsibly and accumulating unsustainable debts if they arenot subject to stringent budget and indebtedness rules.
104 WORLD BANK COUNTRY STUDY

There are no hard and fast rules on the kind and extent of expenditure responsibilities to beassigned to subnational governments. The extent to which expenditure and service-provisionresponsibilities are to be transferred depends mainly on the institutional strength and administra-tive capability of regional and local governments. In this respect, two broad facts in the Peruviansituation are of compelling importance. First, regional governments are yet to be constituted afterthe November 2002 elections. There is no reason to expect that the soon-to-be-born regional gov-ernments will quickly become capable and efficient administrative apparatuses. Quite to the con-trary, there is every reason to predict that the constitution of truly capable regional governmentswill take some time. Second, with the exception of a few provincial municipalities and even fewerdistrict municipalities, local governments are weak. In light of these two facts, it stands to reasonthat the transfer of responsibilities must be gradual.
In designing the transfer of responsibilities, due account must be taken of the markedly differ-ent degrees of development of administrative capability in the subnational governments. In addi-tion, in the Peruvian case, the difficulties of any transfer process are compounded by the sheerexistence of the two levels of municipalities, the provincial municipalities, and the district munici-palities. This implies that, unlike most countries, after the implementation of the regional govern-ment, Peru will have four levels of government rather than three. Most district municipalities arevery small to assume responsibility for the more demanding public services, and can discharge onlythe relatively less complex tasks and, in any case, only those where economies of scale are not cru-cial. Assignment of responsibilities to the two levels of municipalities must be carefully designed,keeping in mind size and human-resource and administrative-capacity constraints at the two levels.Finally, the one mistake that should be avoided at all costs is the lack of clarity and precision in thedistribution of functions between the CG, the regional governments, the provincial municipalities,and the district municipalities. Legal and institutional confusion about the distribution of functionsis likely to lead either to situations of duplication and overlapping of effort, or to some public ser-vices being left unattended and underinvested.
The GOP intends to change the way decisions are made about the amount of resources trans-ferred from the CG to the subnational governments. In the past, these transfers have been (a) tied tovariable sources; (b) to a certain extent, subject to discretional decisions at the central level, some-times under the guise of formulas that have not been very transparent; and (c) procyclical. It isexpected that, in the new legal framework, both procedures that are more transparent and decision-making criteria, will be established. From the standpoint of transfer policy, the two key institutionalpieces in the new framework are going to be the Compensation Funds and the FIDE.3 Defining theirlong-term financing mechanisms and criteria for accessing their resources is a short-term priority.Both types of funds will follow explicit formulas in the calculation of the transfers to a given regionalor local government. As is customary, these formulas will take into account the size of the populationand income and poverty indicators. There is, however, an important difference between the two typesof funds. Whereas transfers from the Compensation Funds will be applied in an unconditional man-ner, that is, regardless of the particular local government’s fiscal and service-delivery performance,FIDE’s transfers will be conditional on each subnational government’s meeting predefined targets ofperformance in public service provision and on its adhering to explicit standards of fiscally disciplinedperformance.
There must be a close connection between the transfer of responsibilities and the transfer ofresources. The double golden rule to be followed is that (a) the transfer of resources must beaccompanied by the transfer of responsibilities, and (b) responsibilities must not be transferredunless an adequate level of resources to discharge them is available at the subnational level in mostcases as a result of a combination of resource transfers from the CG and the subnational govern-ment’s own tax revenue.
RESTORING FISCAL DISCIPLINE FOR POVERTY REDUCTION IN PERU 105
3. We showed the degree of progressivity of FONCOMUN and saw little reason to modify its redistribu-tion criteria.

Subnational governments must be given powers of taxation within appropriate boundaries. Itwould be a monumental mistake were Peru to decide that the subnational governments are to relyonly on the resource transfers from the CG. The experience of other countries teaches that an insti-tutional scheme where local governments do not have the power to collect taxes weakens account-ability at the local level; reduces incentives to pay any kind of taxes, including taxes to the nationalgovernment; and weakens the CG’s willingness and commitment to refrain from bailing out thesubnational governments when and if they incur insurmountable financial difficulties stemmingfrom lack of fiscal discipline. It is therefore fundamentally healthy that subnational governmentshave their own sources of tax revenue and make an effort of their own to optimize their tax rev-enue, taking into account both issues of incentives to entrepreneurial efforts and issues of redistrib-utive justice, and the need for local public goods.
In this respect, the Law already defines a procedure by assigning to the Executive the soleresponsibility for submitting regional tax proposals—the management of which will be undertakenby regional governments—to Congress. The menu of taxes that can be imposed on the popula-tions of the subnational entities by their governments must be unambiguously defined by law, andany tax that is outside that menu will be illegal. The types of taxes that are appropriate at the sub-national levels are a matter of considerable consensus in both the literature and practical experi-ence. Real estate taxes and taxes on industry and commerce are the most common at the municipallevel. Excise taxes on specific consumption goods such as tobacco products, liquor, and beer arethe most frequent at the intermediate, regional level. Within the confines of the tax menu definedby national legislation, subnational governments must be given a fair degree of autonomy to definethe bases and rates for their tax systems.
Subnational government indebtedness must be subject to stringent rules and procedures.There are good reasons to allow subnational governments to use debt as a source of finance. As away of spending anticipating future income, the resort of subnational governments to debt makesas much sense as it does for any other economic agent. The issue then is not whether debt shouldbe allowed. Rather, the issue is to which constraints must subnational government indebtedness besubject, to prevent these constraints from becoming a source of national instability and local ruin.A related issue is how to avoid the moral hazard that becomes rampant when and if subnationalgovernments are given (implicit or explicit) assurance that they will be bailed out. Since neither themarket nor the spontaneous workings of the political system enforces debt discipline, it is necessaryto impose limits on subnational indebtedness. A positive initial step is that the Law already specifiesthat external debt is an exclusive competence of the national government and its amount must beconsistent with the overall public sector debt ceilings. It also states that subnational governmentscan contract only new debt supported by a State guarantee. However, domestic and contingent—registered and unregistered—debts are not mentioned directly, and should be addressed in theupcoming reform of the Law of Fiscal Prudence and Transparency.
Recommendations:■ There is an immediate agenda of urgent issues that must be addressed. The agenda includes
issues of paramount importance such as designing alternatives for intergovernmental fiscalrelations, hard budget and indebtedness constraints on subnational governments, the spe-cific functions and competencies to be decentralized by sector (see Annex F), the character-istics and funding sources of the future Regional Compensation Fund, and any possiblechanges in the transfers scheme for municipalities. As the Law of Fiscal Prudence andTransparency gets revamped, adding a section on subnational fiscal responsibility would be a positive development (Chapter II).
■ A critical goal of decentralization is to develop an increased local revenue-generating capacity, based on local governments’ own tax systems. Measures to be taken may include(a) increasing the real estate tax in the short term and upgrading it with a new system (a territorial-based tax on property extension) in the medium term with the support of a
106 WORLD BANK COUNTRY STUDY

fiscal cadastre, initially piloted in a few municipalities; (b) transferring the proceedings ofgasoline taxes to subnational governments; (c) abolishing obsolete taxes; and (d) promot-ing horizontal technical assistance on the basis of best-practice municipalities.
■ The issue of local governments’ already existing—domestic and external, registered andnonregistered—debt must be urgently tackled. A curative approach would include a fulldiagnosis of all municipalities and design of a transparent program for the restructuring ofthe existing debt. Its implementation would be another essential precondition for assumingnew functions and administrative responsibilities. A preventive approach would establishprior conditions for contracting further debt and limits to its size.4 Ditto for future regionalgovernments.
■ The building of institutional capacity both in the current local governments and in thefuture regional governments is critical for the success of decentralization, especially regard-ing the development of integrated financial management systems at the regional and locallevels in advance of, and as a prior condition for, decisions about transfers of expenditureresponsibilities. The resulting local and regional systems must be linked to the nationalSIAF to have consolidated accounts for all levels of government.
■ The use of performance contracts has proved useful and should be promoted. Peru’s experi-ence with the National Fund for Financing Government Enterprise Activity (FONAFE) indeveloping management contracts with public enterprises is a success story for the LACregion (Annex E). The experience can be applied, under a pilot approach, to deconcen-trated ministerial units and subnational governments. Special incentives can be given tosuch units and governments to entice them to enter into management contracts. FON-AFE’s success would provide important lessons and examples because, in the end, decen-tralization and reform place a premium on accountability. This is not simply probity,transparency, and internal efficiency in the use of resources. It is also an emphasis on results,performance, and social accountability. Success breeds success, and the demonstrative effectof carefully monitored successful pilot experiences can prove fruitful and critical in the pub-lic’s support for the process.
Decentralization in the Education SectorSpecialists have noted that public education in Perú remains among the most centralized in LatinAmerica5 (Box 5.2). During the decade of the 1990s, the effort to decentralize public educationwas limited to a series of “on-again, off-again” initiatives driven more by political interests thantechnical reasons (Ortiz de Zevallos and others 1999). These initiatives were also short-lived.Opposition of municipalities and labor unions, and the fear of the loss of free public education,doomed these efforts from the outset. As a result, few efforts had any major impact on either adeconcentration or decentralization of the educational system. Further, even as recent (2001) policy directives with strategic objectives have been formulated, there is little consensus as to themechanisms or organizational units that should be the agents of the process.6 What is not clear iswhether the agent of decentralization should be the future regional governments, the existingEducational Service Units (Unidades de Servicios Educativos, USEs), the municipalities, or theschools, and what is the appropriate role of the community in the process. Worst of all, the
RESTORING FISCAL DISCIPLINE FOR POVERTY REDUCTION IN PERU 107
4. Two interesting examples of good subnational risk monitoring are Brazil and Colombia. In the for-mer, complementary limits are established in the Brazilian Fiscal Responsibility Law. In the latter, rules areembedded in the Colombian “traffic light system” that links each subnational government’s debt to its pay-ment capacity and uses indicators as traffic lights to alert the CG about potentially excessive subnational debt(Ma 2002).
5. The next two sections partly draw from the mimeograph prepared by Richard Moore (2002).6. These directives provide an ambitious set of measures and goals. Three objectives are noted: (a) quality
basic education for all; (b) strengthening at the school level with increased autonomy, participation, and qual-ity learning; and (c) dramatic improvements in the condition and qualifications of teachers (MED 2001).

institutional framework for the delivery and administration of educational services has become asort of labyrinth of fragmented units.
The first element of this fragmentation stems from the creation of CTARs. They are directlyresponsible to the Ministry of the Presidency and charged with responsibilities over the bulk of theregional recurrent budget in both health and education. Under the current scheme, the Ministry ofEducation has little control over the allocation of resources within its own sector at the regionallevel. In addition, even at the central level, the confusion of authority between the Ministry of thePresidency and sector ministries remains.
The second element of this fragmentation is the myriad of institutions exercising administra-tive and/or decisional responsibility at the regional level. The result is a high degree of overlap andduplication of responsibilities and authority. The responsibility for providing educational servicesresides in Regional Directorates of Education (DREs), yet these entities depend fully on transfersfrom the CG. The DREs exercise their functions (normative, financial, regulatory, and supervisory)in a very partial manner and contingent upon the relationship of any individual Director with theMinistry of Education (MED). At the regional and subregional level, institutional fragmentation is
108 WORLD BANK COUNTRY STUDY
BOX 5.2: THE DECENTRALIZATION DRIVE IN EDUCATION IN LAC: SOME CASES
In the case of the state of Paraná in Brazil, the decentralization effort has aimed at the municipalization ofbasic education. Recent efforts in Ecuador have focused on the extension of networks, both for pedagogicaland administrative reasons and on a model of voluntary municipalization of education. That municipalizationprocess is incipient and not subject to any evaluative criteria (Moore and Rosales 2001). In rural Mexico, par-ents have been authorized to certify teacher attendance under national jurisdiction, while transfers to state edu-cation boards have been extended since 1998. Municipalization combined with direct decisional control hasbeen a successful model in Nicaragua. School autonomy in Nicaragua is based on three elements: fiscal trans-fers to schools based on both technical and equity criteria (formula based), parental control of fiscal resourcesthrough Parent Councils, and complete local authority over hiring and firing decisions. While the effort hasbeen successful in the transfer of decisional control and in the encouragement of community and parentinvolvement in the educational process, educational quality has not been noticeably affected (Arcia and Belli1999). In the Dominican Republic, recent reforms and training efforts aim at increasing the role of parentassociations in monitoring teacher attendance, receiving the transfer of some funds for local operating costs,and exercising a more participatory role in local schools. In Venezuela, a current decentralization effortfocuses on the transfer of management authority to the school level (“the school as the center of basic educa-tion”) and introducing and certifying (vocational) educational training at the level of the workplace (cadaempresa una escuela). In Chile, a variety of efforts have been attempted, including where parents have beengiven the option to select among publicly financed schools (Winkler and Moore 1996). In El Salvador, ruralparents associations have been reinforced and have been empowered to enter into contracts to successfullymanage schools. Educación Comunitaria (EDUCO) schools lie outside the purview of the Ministry of Education’sregular school system. They are located in remote rural areas principally, and were/are intended as a means ofextending coverage. The management of financial resources is the responsibility of community educational asso-ciations (ACEs) based on annual plans. The transfer of funds to the ACEs is based on these annual plans andthese are received monthly as earmarked funds (salaries, operations). Personnel decisions are the responsibilityof the ACE, but pay scales are Ministry responsibilities. The ACE has clear governance responsibilities, althoughthe Ministry names the director. Pedagogical concerns and standards remain ministerial responsibilities. The evi-dence to date suggests that, as a means for increasing community participation and parental involvement, themodel has been successful, but as a means for improving educational quality, there is no clear evidence thatEDUCO has accomplished much. Finally, in Guatemala, four different models of decentralization have beenpursued simultaneously: local management autonomy and control (PRONADE), limited decisional authority atthe school level (Juntas Escolares), the decentralization of a competitive system of teacher recruitment andselection, and the deconcentration of finance and supervision to departmental governments.

even more pronounced due to the existence of a variety of institutions exercising some functions,yet the roles of which in the process of deconcentration or decentralization are unclear. No fewerthan five organizational units play a role at this level: DREs, CTARs, AEs, USEs, and ADEs.Under the DREs, there exist no less than three units or levels of action. Areas of Execution (AEs)and Educational Service Units (USEs) are administrative units charged with purely administrativefunctions. The USEs are line units with responsibilities for exercising budget functions, yet theyreceive large portions of that budget from the CTAR. They are responsible for the management of58,000 schools and 18,000 nonformal educational programs. In some cases, there are regions withsub-DREs with essentially the same administrative functions as USEs. In addition, under theDREs, there exist educational supervisory bodies, the Areas of Educational Development (ADEs).The sector fragmentation is further evidenced in the extreme degree of confusing, poorly coordi-nated, and overlapping jurisdictions, particularly in the case of the 82 USEs and 189 AEs.
Historically, relations between Regional Directorates and both the central level of the Ministryof Education (MED) and the local level have been conflictive, mainly due to MED-limited bud-getary control, and poor regulatory and managerial capacity. While, theoretically, MED exercisesregulatory authority over DREs, in fact appropriate control is not exercised. This regulatory weak-ness on the part of the MED over its own bureaucratic apparatus is in part a function of the sheersize of the sector, and in part a function of limited budgetary control. There are more than300,000 teachers in the public sector, and budgetary control over the labor force rests with theCTAR. The weak managerial capacity, in turn, is a function of several factors, including the lowquality of functionaries of MED, high rotation among ministers and regional directors, and limitedcommunication between those charged with educational planning and execution.
Finally, the triplication of authority between the Ministry of the Presidency, the MED, and theCTARs affects capacity and coordination. The first—through transfers to the CTARs—transfersfunds to executing units and exercises control over payroll. The MED has, in theory, educationalquality as its principal concern, but also exercises control over hiring of teachers. CTARs have adiscretional focus on nonpersonnel budget austerity and control. Perhaps the most fundamentalmanifestation of the lack of coordination resides in the area of payroll and personnel policy, alsoreflected by the absence of a generalized information system, or even an inventory of personnel(Chapter VI).7 This historical multiplicity of functions also affects the quality and supervision ofeducation. At the same time, inadequate regional supervisory capacity and quality results in asupervisory function that is virtually bereft of a concern for pedagogical quality in the face ofadministrative and bureaucratic demands.
The legal framework for the sector is not particularly propitious for decentralization. Both theTeachers’ Law (Ley Magisterial) and the General Education Law are rigid in terms of preventingthe conditions for flexible response at either the school level or in terms of local functions thatmight be exercised.
However, a promising beginning toward a redefinition of the legal framework for decentraliza-tion is evident in the Executive Decree promulgated in February 2001. This decree (a) expandedand fortified the role and functions of the school director; (b) created Consejos Escolares Consultivos(CEC) at the local level; (c) strengthened the role of Parents Associations, intensifying relationsamong MED, teachers, and the community; and (d) mandated the introduction of planning andparticipation at the local level for the formulation of Institutional Development Projects (PDI) atthe school level and to do this through the (optional) creation of the CEC.
A 2001 pilot exercise in the creation of the CEC in some 467 schools has been positive, but isstill far from expectations. In November 2001, the incoming director of the program made a very
RESTORING FISCAL DISCIPLINE FOR POVERTY REDUCTION IN PERU 109
7. Currently, there is an effort to create this information system. However, to date only Lima-Callao isincluded in the system and there are pressures not to implement it at the regional level for fear of loss ofregional discretionary authority. In the effort to link the information system to a system of payroll, a problemthat needs to be addressed in the near term is the inconsistency in the definitions of benefits (bonificaciones).

cursory evaluation of the experience as follows: (a) the experience has been positive and should beexpanded; (b) there is a need to create a baseline for monitoring and evaluating the program; (c) theprincipal limitation of the effort to date is its voluntary character and the fact that the functions ofthe CEC are limited to advise and consult; (d) the CEC has no resources and its leveraging capabili-ties are weak; (e) support from USEs, DREs, or the MED in the formation, training, and capacity toevaluate on the part of the CEC has been extremely limited; and (f ) little promotion of the programhas occurred. As a result, there is little incentive to participate in or even create the CEC at theschool level.
Recommendations:■ Both the Teachers’ Law and the General Education Law need to be revised in this context.
They are too rigid for most forms of decentralization.■ Decentralization should follow a sequential process. CG reorganization prior to decentral-
ization, but with an eye to decentralization, needs to be first. The suggested model fordefining functions and structure in Annex F should be carried out within the central min-istry and with the participation of key personnel from the various structural units.
■ The current institutional morass of jurisdictional levels needs to be integrated. The decisionto transfer funds and functions from CTARs to DREs is only a partial move. The proposedLaw of Decentralization offers broad guidelines for jurisdictional levels (regions, municipal-ities), but the nonexclusive nature of which level promotes, develops, and regulates activi-ties of education (and health) leaves gaps for defining these functional differences.8 What isclear is that the creation of multiple levels of intermediation may not be an appropriatestrategy, and may well inhibit deeper forms of decentralization to the provider level. There-fore, as the process of redefinition of roles and functions progresses, there must be a simpli-fication of administrative units and a clarification of responsibilities at the intermediary level.
■ The introduction of management or performance contracts should wait for a more advancedstage of the decentralization of the education sector. Once the institutional morass is simpli-fied and monitoring indicators are agreed, they could serve as an agent for culture change,for the transformation from an organizational culture based on norms, bureaucracy, proce-dures, and inputs to an organizational culture founded on transparency, individual and insti-tutional responsibility and authority, and results. Performance agreements must beaccompanied by individual performance agreements evaluating teachers regularly.
■ The new legislation should clarify the role of service providers and local councils. Much ofthe current move to decentralize in education focuses on direct transfers authority, finance,and accountability mechanisms to educational providers: schools and their communities.
■ The CEC model should be expanded, but with strengthened functions. Examples fromLAC countries would encourage greater school autonomy and the use of tools of social/legal accountability, such as institutional development plans and management agreements.
■ Authorities need to create political “space” for the introduction of modalities of decentral-ization with a reasonable level of consensus. Such consensus does not exist in the educa-tional sector today. The National Consultation on Education is a good beginning.
Decentralization in the Health SectorThe public provision of health services is characterized by the ministerial absorption of multiplevertical programs, fragmentation, inefficiency, and limited programmatic integrity, driven by thesupply of programs for health care rather than the demand for health services (Box 5.3). In addi-
110 WORLD BANK COUNTRY STUDY
8. During the Public Expenditure Review (PER) main mission, a brief seminar was held with the techni-cal leadership of the MED. It practiced a methodology for initiating the dialogue on functions and structures,based on technical workshops led by key technical personnel at the central level (central restructuring) andparticipation from regional directors and their technical staff.

tion, there is limited focus on preventive health care and the promotion of health care, becausethe supply of curative health services dominates the terrain. Today, there exist no fewer than 23 vertically controlled programs administered from the center, each with its own disconnectedset of norms, procedures, supervision system, evaluation, databases, training, and mechanisms foraccessing local-level participation. The result is an incredible fragmentation of policy and adminis-tration in the national system.9 Further, at the regional level many of these vertical programsmaintain their own coordinators for administration, monitoring, data collection, and training, virtually independent of the regional directorate. Here, too, the result is fragmentation in thefinancing of health services and little coordinated control over policy direction or planning. TheRegional Directorates for Health (DISA) suffer from a minimum of authority, the inability toprogram in a coordinated fashion, and a high degree of fragmentation. As is true in the case ofeducation, the financing functions that reside in the CTAR further erode any authority that theDISA might have. DISAs have very little programming authority and receive mostly prepro-grammed funds, including earmarked entrusted funds (Altobelli 2001). Finally, barely 20 percentof the health expenditure budget is devoted to preventive health care, which reflects its lower pri-ority compared to curative health.
Ironically, while the health care system has become increasingly centralized, the central lineministry has minimal control over any attempt to integrate the health care system. Rather, there arethree areas or initiatives that favor decentralization in the health care system, and these should bepromoted: (a) the Performance-Contracts Administration Program (Programa de Administraciónde Acuerdos de Gestión, PAAG); (b) the Regional Directorates of Health (DISA); and (c) therecently created Unidades de Seguro Integral de Salud (USIS).
The Programa de Administración de Acuerdos de Gestión/Local Committees of HealthAdministration (PAAG-CLAS) Program is a very useful model for health decentralization thatshould be strengthened. PAAG already executes some 17 percent of the Ministry of Health(MINSA) budget under financial management rules of its own. There are approximately 550 CLAS and some 1,200 health establishments (approximately 20 percent of total health
RESTORING FISCAL DISCIPLINE FOR POVERTY REDUCTION IN PERU 111
BOX 5.3: DECENTRALIZATION OF THE HEALTH SECTOR IN LAC
A review of decentralization efforts in the health sector in six countries of Latin America shows that the resultshave been very uneven (Burki, Perry, and Dillinger 1999). Efforts to reform the health sector invariably aim atthe separation of financing from service delivery, a split between purchaser and provider, and often the intro-duction of management or performance contracts. Decentralization involves the transfer of parts of the publicsector health institutions from the central to subnational governments. Central governments retain policymak-ing, overall financing, and highly specialized operations, and subnational governments have been given primary(often municipal), secondary, and tertiary hospital care (states and provinces). More often than not, efforts todecentralize have generally failed at either improving coverage or efficiency, and when successful have oftenincluded some form of contractual agreement, such as management contracts.
In Nicaragua, for instance, there is an ongoing effort to decentralize a number of basic institutional character-istics (provision and acquisitions, finance, personnel management) to both hospitals and to regional/local units(SILAIS) through the introduction of management contracts. The experience of two years with managementcontracts in hospitals has not been successful, although the learning curve has improved the quality of thesecontracts, particularly in terms of moving from input-based criteria to output- and outcome-based criteria for contractual agreement.
9. Recent documents provide excellent diagrammatic representations of the institutional disorder in thehealth sector. They offer dismaying evidence of the chaos in the sector. See World Bank (2001a) and Cortez(2001).

establishments) under the system. It was created in 1994 as a means of improving the quality ofhealth care expenditures, to bring transparency to the system, to improve the cost-effectivenessof service delivery, and to promote (private) community participation in health care manage-ment. The CLAS model builds on the existing local and community organization, and essentiallywas designed to increase coverage in rural and periurban communities, in areas where existinghealth services were weak or absent. Similar to Convenios de Gestión Institucional, the CLASmodel provides for a management contract. However, one fundamentally different characteristicof the contract is that the model applies private law to the use of public resources, and by doingso proffers greater flexibility in the management and use of public resources. CLAS not onlycombines community and public health services in the planning process, but also gives CLASdirect control over hiring and firing of contracted health personnel and assures a unique degreeof social accountability.
In its initial stages, the formation of CLAS was very localized: each CLAS managed a singleestablishment or health center. It became apparent that this approach was less than ideal in termsof the potential coverage of the system, and gradually the CLAS became a management contractover a group of establishments in a network. While this change in scope and structure seems to bemore effective in terms of economies of scale, there is a danger that increasing scale reduces “local”social control at the community level, in favor of control at the site of the center of the network.CLAS has shown to be an effective model of comanagement in the financing and provision of ser-vices. It has increased the “capture” of local resources (because fee-for-services remains at the locallevel) and the sense of local accountability. However, CLAS should not be seen as a means forreducing government expenditures on local health care. Further, CLAS has not proven to be aseffective in the supervision of the quality of services. By its very nature, members of CLAS are notcompetent to supervise quality.
Recommendations:■ Expand the number of CLAS, possibly to attain about 25 percent of health establish-
ments, but this should be done without increasing their size of the CLAS to maintain thesense of local social accountability. Also, the ratio of CLAS to establishments should notbe increased.
■ Strengthen other entities within the health care system to make them more capable of qual-ity assurance and supervision.
For CLAS to function well requires the reinforcement of Regional Directorates of Health(DISA). The DISA suffers from fragmented authority, which further fragments the coordination offinancing in the sector and in the supervision of the quality of health provision. In addition, executionby the DISA is driven as much or more by the supply of services rather than demand for services, andintroduces a certain rigidity in the use of funds. However, despite norms and regulations, DISAs haveplayed an important role in the health sector, since they are able to manage financial accounts to theirown benefit and to the advantage of the CLAS model if they enjoy a larger role in planning, technicalassistance, administrative control supervision, and evaluation of management agreements with variousservice providers (Altobelli 2001). A positive relationship between DISA and CLAS would allowDISA to ensure that the appropriate transfers of funds to CLAS takes place. The proposed Law ofDecentralization correctly provides a legislative framework to strengthen DISA.
Recommendations:■ The relationship between CTARs and DISAs should change by removing CTARs from
sector-driven purposes. This implies a need for the immediate strengthening of the institu-tional and human resources capacity within DISA.
■ DISA’s ability and authority to supervise and control the quality of service delivery shouldimprove. The current nature of the finance mechanism and the lack of control over financ-ing at the DISA level have affected it.
112 WORLD BANK COUNTRY STUDY

■ The renewed efforts to consolidate and integrate vertical and virtually autonomous pro-grams implies the need to rethink the planning, administration, supervision, and financingroles for DISA, and to restructure these units in an integrative fashion. Further, DISAsshould be increasingly demand driven, relying on local diagnostics of needs.
Another initiative that needs strengthening is the radical transformation of health insurancewith the creation of the Integral Health Insurance Unit (USIS) in 2001. The USIS lies outsideMINSA and is an ambitious effort to integrate Maternal Infant Insurance (SMI) and the GeneralSchool Insurance (SEG) programs under one roof. While currently the two program fundsremain separate, there is a drive to consolidate them and universalize coverage, separate financ-ing from service provision, and strengthen the decentralization process. The model incorporatesa variety of service providers, ranging from public health centers to management contracts withCLAS or private local service providers. There are several concerns. First is the legal status ofUSIS. Because of the absence of legal autonomous status, USIS cannot act as an executing unitto provide direct financing for services. Rather, most financing by USIS is channeled through theDISA, creating yet another administrative level in financing. Further, the use of DISA as directadministrator of USIS funds generates delays in transfers to providers (and CLAS) and has frag-mented the capacity to supervise the cost-effectiveness of service provision.10 The control andevaluation functions over what is financed and who is providing it rests within the DISA and not in USIS. A second concern is the potential for increased fragmentation in financing local services. Various financing entities provide resources to a local health establishment, and thepotential for duplication of payments for the same service is real. A third concern is the limitedinstitutional capacity of the USIS. Currently, USIS is incapable of providing the necessary tech-nical capacity to supervise or evaluate. In addition, quality control over providers (accreditation)is weak or nonexistent.
Recommendations:■ The solution to the dilemma of indirect financier can be resolved through the granting of
legal status to USIS as a Public Decentralized Organism (OPD). It would remove onelevel of unnecessary administration in financing services, provide strong impetus to thestrengthening and extension of the CLAS model, and allow for the separation of finance(USIS) from provision (CLAS, public health centers, private providers) and finance fromsupervision (DISA).
■ Fragmentation should be reduced through the consolidation of existing vertical programswithin MINSA.
■ The strengthening of the supervisory role of DISA, and of USIS itself, would improve themonitoring, evaluation, and supervision of both the quality of service and of financialaccountability.
In recent months, there has been a strong focus on attempting to bring some order to thepublic health system. This focus can be summarized as an effort to consolidate some of the verticaland somewhat isolated programs within the Dirección General de Salud Pública (DGSP), simplifi-cation of the CG structure through the reduction of Executive Directorates to three, and renewedinterest in decentralization.
Recommendations:■ It is equally imperative that while pursuing decentralization policies and initiatives, reform of
the core of the Ministry of Health also takes place. Until now, the principal focus of efforts
RESTORING FISCAL DISCIPLINE FOR POVERTY REDUCTION IN PERU 113
10. Not only have there been complaints from CLAS over delays in transfers, but also that, in some cases,the DISA simply has not made the transfers to CLAS (Moore 2002).

has been on restructuring of the central level, and less on decentralization, but both avenuesshould be pursued simultaneously. There would be a notable improvement in internal com-munication, whereas previously each vertical program was much an island unto itself.
■ Central ministerial restructuring has been initiated, but must continue, with a greater eye to decentralization. Again, the functional matrix model offered in Annex F is an example of how such an identification of structures and functions can be a useful tool.
■ The work of the Commission on a Decentralized Health Care System (Sistema Coordinado yDescentralizado de Salud) is of paramount importance. Its main responsibility is to (a) clarifythe roles of the various entities involved in the health care system—MINSA at the centrallevel, DISA, the Programa de Apoyo a la Reforma del Sector Salud (Health Sector ReformProgram, PARSALUD), municipalities, CLAS, and local health centers; and (b) integrateprograms and projects, ending the multiplication of vertical programs and the creation ofparallel bureaucracies virtually removed from the core of the MINSA.
■ Prior review, strengthening the regulatory functions of the central and intermediate levels,is increasingly imperative. CLAS is the answer for decentralization of service delivery tolocally accountable providers in Peru, and provides the key for longer-term models ofdecentralization. A program of expansion over the next several years without altering theratio of CLAS to individual health establishments should be pursued, perhaps at a rate ofsome 5 to 10 percent per year.
114 WORLD BANK COUNTRY STUDY

Civil service reform is the missing link of an outcome- and poverty-reducing-oriented modernization ofthe State in Peru. The past decade witnessed a severe deterioration of Peru’s civil service, with deep impli-cations for the fiscal accounts and the costs of the pensions regime. Hyperinflation of the late 1980s and thebeginning of the 1990s sharply reduced the real earnings of civil servants. A poorly conceived downsizingof the Central Government work force in the early 1990s, which, by the end of the decade was reversed, led,however, to the departure of the most capable civil servants. The fiscal burden of the surviving public laborforce is very high and unsustainable. There is an entrenched disregard for the provisions of the existingCivil Service Law and its associated regulations. Civil servants are employed under a variety of legalregimes with a wide disparity in salaries for similar tasks. The existing formal salary structure has notbeen revised in over a decade, so base salaries are increased through resort to a variety of supplements andbenefits in cash and in kind.
With the proclamation of a ban on hiring into permanent positions 10 years ago, institutions haveresorted to hiring on a contractual basis, a process that is not subject to any required procedures for recruit-ment and selection and that has severe fiscal implications. All these factors have contributed to the existinglegacy of a work force that is poorly prepared, poorly trained, poorly supervised, and therefore of very lowproductivity. Consequently, there is an urgent need for a thorough reform to reestablish some semblance of control over the wage bill and to promote the creation of a more efficient government. Any initiativedesigned to improve the performance of government must include a major overhaul of the institutionalframework that governs public sector employment and of the management of its human resources. The cur-rent Civil Service Law has major weaknesses that argue for its replacement by a new legal frameworkdesigned to promote a higher level of efficiency in the delivery of government services. A sequencing path ofreforms is suggested, starting with a modest, but valuable, pilot effort to rationalize human resources man-agement on a ministry-by-ministry basis and supported by an SIAF-controlled payroll, to the ultimate cre-ation of an autonomous institution or Directorate with the responsibility of administering the civil servicesystem, with normative and enforcement functions.1
VI
UPGRADING THE CIVIL SERVICE
115
1. This mostly draws from the mimeograph prepared by Gregory (2002).

The Size and Employment Conditions of the Public SectorThere is no sure estimate of the size of public sector employment in Peru. The range varies between616,200 and 890,728, the latter number including members of the armed forces and police, whichrepresents 7.9 percent of the employed labor force.2 If we accept the most conservative estimate of616,200, it represents approximately 2.4 percent of the estimated population for 2000. This ratioclosely resembles the average proportion for middle-income countries, 2.5 percent. If total govern-ment employment, including police and the armed services, is considered, the ratio to populationfor Peru is 3.5 percent, which compares favorably to the group of middle-income countries the ratioof which is 4.3 percent (Figure 6.1).3 Similarly, as a percentage of GDP, the wage bill4 is lower thanthe average in LAC or middle-income countries, 6.2 percent. While Peru would compare favorablywith other countries, it should be kept in mind that these are poor indicators of whether govern-ment employment or remunerations are excessive or inadequate. Such a judgment is made only aftertaking into account the range of obligations assumed by different governments and the efficiencywith which they are carried out.
The fiscal costs of the public servants and the associated pension regimes are very high, bring-ing rigidity to the budget and absorbing a significant share of it. On one hand, Peru’s wage bill,equivalent to 39 percent of total expenditure and 6.6 percent of GDP, is the second highest inLAC, and this ratio does not include public servants hired under other categories. This suggestsoverstaffing (Figure 6.1). On the other hand—and this is very relevant for a country undergoingfiscal retrenchment—the budgetary cost of the public pension system amounted to a minimum ofabout 0.6 percent of GDP in 2002, and is projected to peak at at least 1 percent of GDP by 2010.(The public pension system has three components: (a) recognition bonds issued to workers thatswitched to the private system, (b) unfunded liabilities under the Oficina de Normalización Previ-sional of both current and future workers, and (c) special regimes.)
Furthermore, a negative public perception prevails on the overall performance of the publicwork force. A World Bank Institute survey on governance and corruption in Peru (Chapter VII)reveals that public servants in Peru rank unfavorably when compared to Honduras and Colombia,
116 WORLD BANK COUNTRY STUDY
FIGURE 6.1: INTERNATIONAL GOVERNMENT EMPLOYMENT COMPARISON
3.5 4.3
6.6 6.3 8.5
39 .133 .6
21.6
0
5
10
15
20
25
30
35
40
Peru Latin America Middle-Income Countries
Total Govt Empt (% of pop) Wage bill (% of GDP)
Wage bill (% of govt exp.)
Source: Gregory (2002).
2. Encuesta Nacional de Hogares, op. cit., p.113. The information for international comparisons is drawn from the World Bank database on Public
Sector Employment and Wages.4. Such a wage bill is significantly underestimated, as explained below.

in terms of bribes paid for obtaining public contracts and services, bad administration of publicfunds, and the practice of buying positions in public entities (which favor capture of the State bydetermined groups). Peru ranked better, however, in frequent reporting of corruption in the pub-lic administration (Figure 6.2).
Public employment conditions in Peru’s public sector are governed by a legal framework thathas rarely been fully applied. The 1979 Constitution mandated that a law be enacted that ought toestablish merit as the governing principle in defining conditions of employment, and set up a singlestructure of remunerations and fringe benefits for all covered employments. Hence, the Civil Ser-vice Law and the Ley de Bases de la Carrera Administrativa y de Remuneraciones del Sector Públicowere enacted in 1984.5 Both Laws are basically a statement of principles underlying the employ-ment relationship. The specific norms and procedures regulating that relationship were left to bedefined in the Laws’ implementing regulations (or Reglamento). The initial Reglamento was pub-lished in 1985 and was superseded by a far more detailed Reglamento in 1990. However, for allpractical purposes, both Laws have been a dead letter for the better part of their life. Concomitantwith a partial reduction in employment between 1991 and 1993, a ban on hiring for permanentpositions was decreed. Presumably, all hiring since then has been on a contractual basis and has notbeen subject to any statutory procedures. Other provisions of the Law, such as the creation of a tri-bunal to hear appeals by public servants from disciplinary actions, have never been fulfilled.
RESTORING FISCAL DISCIPLINE FOR POVERTY REDUCTION IN PERU 117
FIGURE 6.2: CORRUPTION IN PUBLIC SERVICES
0 10 20 30 40 50 60 70 80
% of firms reporting bribes for obtainingpublic contracts
% of users reporting bribes demanded toreceive service
% of firms reporting bribes demanded toreceive service
% of civil servants reporting corruptionin public admin. is frequent
% of civil servants reporting the buyingof positions in their institution
% of civil servants reporting badadministration of public funds
% of firms reporting capture by the State
Peru Honduras Colombia
Source: World Bank (2001c).
5. Note that the Constitution of 1993 omits any reference to a civil service law or to the principle ofmerit in public employment.

The present legal framework is weak and the status of civil service is chaotic. The Laws did notcreate a centralized agency with normative and enforcement functions. Nor did they provide forthe creation and maintenance of an employee database. Therefore, there exists no source withinthe Government of Peru (GOP) that can provide exact and systematic information about the num-ber of government employees, their employment status or histories, and their remuneration. Theexisting formal salary structure has not been revised in years and is hopelessly inadequate. In short,there is no reliable way to trace the evolution of government employment and remuneration overthe past decade. Because of this vacuum, a Multisectoral Commission to Study the Situation of theCentral Public Administration Personnel (henceforth the Commission) was created in 2001 andwas charged with examining the issues related to public sector employment. The Commission’sFinal Report provides preliminary information that is available on the state of the government’semployment as of the first half of 2001.
Public Sector Employment and EarningsThere are four classes of public servants:
■ Those who entered under the legal provisions of the existing Civil Service Law (Regime 276).■ Those hired under contracts; since the hiring ban was instituted a decade ago, supposedly
no appointments to permanent positions have been made. Instead, ministries have resortedto hiring employees under contracts that are also governed by provisions of Regime 276.
■ Those subject to no regime and financed from diverse sources, but largely from the budgetarycategory of goods and nonpersonal services (NPS).
■ Those covered under the labor code that applies to the private sector; because of the restric-tive provisions of Regime 276, some decentralized agencies have opted for coverage underthe labor code that applies to the private sector (Regime 728).
The Commission’s preliminary major findings concerning employment and salaries in the public sector are:
■ If the two first classes of public employees are aggregated into a single category referred toas Regime 276 public employees, the monthly average salaries under the three regimes areNS/1,439, NS/1,796, and NS/1,775, respectively, for an overall average of NS/1,500.Earnings of employees under Regime 728 would exceed, on average, those of statutoryemployees by 25 percent, while those under NPS would enjoy a 23 percent premium.
■ The high concentration of employees in Regime 276 (82.2 percent of the public workforce) is heavily influenced by the inclusion of public servants that do not form part of theadministrative ranks of the government (Table 6.1). In fact, if we were to deduct from thetotal employment appearing in the table, teachers, health professionals, judges, and attor-
118 WORLD BANK COUNTRY STUDY
TABLE 6.1: NUMBER OF EMPLOYEES AND THE AVERAGE MONTHLY WAGE BILL
Number of Employees Monthly Wage Bill
Regimen Thousands Percent Millions of Soles Percent
Regimen 276 506.8 82.2 729.4 78.9Regimen 728 49.5 8.0 88.9 9.6NPS 59.9 9.7 106.3 11.5Total 616.2 100.0 924.6 100.0
Source: Comisión Multisectorial Encargada de Estudiar la Situación del Personal de la Administración Pública Central (2002).

neys in the Attorney General’s office, the remaining employees would, for the most part,represent the staff of line ministries. When these deductions are carried out, it turns out thatonly 45.3 percent of the work force within the line ministries is employed under Regimen276, while almost as many, 40.2 percent, represent contract employees under NPS. So,NPS introduces major distortions to the wage bill and overall budgetary flexibility.
Contrary to common belief, the current employment level is higher than in the early 1990s.The number of public servants accounted for by the Commission, 616,200, is slightly higher thanthat in 1990. The number of employees ascribed to the national government was 591,498 in 1990(World Bank 1994). An alternative measure of urban employment in public administration,obtained from third-quarter household surveys and data available for 1997–2001, reports a totalpublic employment of 707,000 (Table 6.2).6
Household surveys confirm that the ban on new hiring of public employment proved ineffec-tive because a very significant increase in government employment took place during 1997–2001.All but one category increased their number of public servants. In total, public employment isbelieved to have significantly increased by over 25 percent; but if we correct this number by thelikely overestimation of the number of teachers in 2001 (reducing them to approximately the levelof 2000), growth in total public employment would still be significant at about 20 percent.
There is also a considerable divergence between the Commission’s estimate of earnings andthose reported by the household survey for 2001. The former are significantly higher, ranging from33 to 66 percent greater than the average public sector earnings reported by the household surveyfor 2001. This is an uncomfortably large difference that cannot easily be explained, except by thefrequent tendency of survey respondents to understate their real revenues. However, another differ-ence appears in reported average earnings for all employees, which advanced by almost 40 percentduring 1997–2001. Those in central administration reported an increase of almost 52 percent, whileeducators reported a more modest increase of almost 27 percent. Since the consumer price indexrose by only 15.5 percent between the two endpoints of the series, public employees realized realpercentage increases in double digits on average earnings during this period.
Comparison of Public and Private Sector EarningsThe earnings of civil servants in the central administration gained significantly in relation to those ofprivate sector employees7 during 1997–2001. According to household surveys, in 1997, averageearnings in the central administration were 87 percent of those in the private formal sector. Earningsreached virtual parity in 2000 and surpassed central administration earnings by about 7 percent in2001. Average earnings for permanent teachers also surpassed average earnings for the private sectorin 2001. Average earnings in the total government also increased, but remained below average earn-ings for formal private employment and above average earnings for informal employment during thesame period (Figure 6.3). These findings differ from the Commission’s estimates; public sector aver-age earnings, including those of educators, appear to range between 30 and 66 percent above those
RESTORING FISCAL DISCIPLINE FOR POVERTY REDUCTION IN PERU 119
6. It should be kept in mind that the survey’s measure of public employment is not limited to only theCG, but includes municipalities. However, it would seem that the large difference between the two measuresof employment is to be attributed to the inflated number of educators reported by the household survey.Whereas government sources estimate the number of teachers to be on the order of 280,000, the surveyreports some 377,000 in 2001. No other source comes close to reporting numbers as large as these. Anotherreference point is provided by a census of schools undertaken in 1999. It reported the existence of 309,000teachers, of whom 235,000 were public school employees. This compares with the survey’s measure of almost340,000 public school teachers in that same year. Furthermore, the variations in this number during1997–2001 are larger than one would expect, and the increase of about 45,000 reported for 2001 over 2000certainly is unlikely to reflect reality (Saavedra, Melzi, and Miranda 2001).
7. The data for the private sector employees is for firms with 10 or more employees.

120 WORLD BANK COUNTRY STUDY
TA
BLE
6.2:
UR
BAN
PUBL
ICA
ND
PRIV
AT
ESE
CT
OR
EMPL
OY
MEN
TA
ND
AV
ERA
GE
MO
NT
HLY
EAR
NIN
GS,
1997
–200
1(N
uevo
s So
les)
% C
hang
e 19
9719
9819
9920
0020
0119
97–2
001
No
. A
vera
ge
No
. A
vera
ge
No
. A
vera
ge
No
. A
vera
ge
No
. A
vera
ge
No
. A
vera
ge
‘000
sE
arni
ng‘0
00s
Ear
ning
‘000
sE
arni
ng‘0
00s
Ear
ning
‘000
sE
arni
ng‘0
00s
Ear
ning
Publ
ic T
otal
561.
677
161
9.7
820
662.
594
164
8.6
1030
707.
010
7825
.939
.8Pe
rman
ent
339.
890
339
7.1
851
399.
410
4238
9.1
1120
433.
911
7527
.730
.1Fi
xed-
Ter
m C
ontr
act
131.
866
712
7.4
881
156.
888
815
6.6
950
145.
011
3410
.070
Oth
er90
.042
295
.260
910
6.3
638
102.
981
212
8.1
685
42.3
62.3
Priv
ate
Info
rmal
1001
.948
211
49.6
521
1147
.952
110
89.0
523
1223
.644
322
.1−8
.1Pr
ivat
e Fo
rmal
1217
.110
4213
73.6
1288
1279
.913
6913
05.8
1246
1255
.312
853.
123
.3
Sour
ce:
Gre
gory
(20
02).
in the private sector. The Commission’s number, however, has a larger margin than one would findin most other countries of similar or higher incomes.8
A third more accurate but conflicting measure of private sector earnings is derived from estab-lishment surveys that extract data from payrolls. In June 2001 average monthly earnings werereported to be NS/1,854, compared to the NS/1,285 reported for private formal sector employeesby the household surveys.9 Relative to this value, the average monthly earnings of public employeesreported in Table 6.2 are only six tenths.
In view of the conflicting data, it is very risky to make definitive pronouncements regarding theactual earnings of civil servants and their relationship to those from the private sector. The safeststatement that can be made is that public sector earnings appear to have gained relative to those inthe private sector during 1997–2001. Since the establishment surveys are a more accurate source ofinformation regarding private sector earnings, it can be concluded that while the gap between thetwo sectors has narrowed, public sector earnings are probably still somewhat below their privatesector counterparts.10
Earnings by Occupational Category of Public EmployeesThe salary payroll is highly inconsistent and fragmented; the official payroll barely covers less than halfthe real one. The formal payroll of the central administration for employees covered by Regimen 276
RESTORING FISCAL DISCIPLINE FOR POVERTY REDUCTION IN PERU 121
8. A note of caution is needed in evaluating these findings. Household surveys of income and expendi-tures typically fail to capture all income actually received. Aggregate incomes reported generally fall short ofthose recorded in the aggregate national income accounts by 15 to 20 percent, and in the case of Peru may beunderstated by as much as 30 percent. It is reasonable to believe that private sector incomes are more likely tobe understated than those of salaried public servants. If so, the reported margin by which public earningsexceed private earnings may be exaggerated.
9. Ministerio de Trabajo y Promoción Social, Encuesta Nacional de Sueldos y Salarios as reported inInforme Estadístico Mensual, Agosto 2001, p. 39.
10. The importance of the level of public sector remunerations relative to the private sector should not beunderestimated. According to the World Bank’s 1997 World Development Report (p. 8), there is a clear andstrong inverse relationship between public sector wages relative to those in manufacturing and the incidenceof corruption. The higher public sector salaries are relative to those in manufacturing, the lower the incidenceof corruption. Regardless of whether one refers to the Encuesta Nacional de Hogares’s (National HouseholdSurvey, ENAHO) average monthly earnings in the central administration in 2001, NS/1,379, or the Com-mission’s average, NS/1,500, both fall far short of the average monthly wage in urban manufacturing in June 2001 of NS/2,337.
FIGURE 6.3: EMPLOYMENT AND AVERAGE EARNINGS OF THE PRIVATE AND PUBLIC SECTOR
0
400
800
1200
1600
97 98 99 00 01
Em
plo
ymen
t, 0
00s
0
400
800
1200
1600
Avg
Ear
nin
gs,
NS
Public Emp. Informal Emp. Formal Emp.
Public, RHS Informal, RHS Formal, RHS
Source: Gregory (2002).

is called the Unified Payroll (Planilla Unica de Pagos, PUP). The Commission’s study reports thatonly 41 percent of all salary payments are charged to the PUP. The rest of the payments are made byresorting to over 40 different salary supplements in cash and in kind, such as incentive payments,vacation bonuses, birthday bonuses, consumption subsidies, family food baskets, monthly bonuses,transportation, schooling subsidies, and uniforms. The result of these ad hoc arrangements is a totalloss of transparency and coherence in the formal salary structure. Employees in the same salary gradeor performing the same tasks receive widely disparate salaries, and the salary relationships existingamong the different levels of the salary structure obey no consistent or transparent relationship to theskills required to perform the assigned tasks, as reflected by the minimum and maximum salaries ineach salary grade that are financed out of the PUP (Table 6.3).
■ The ratios of the highest to the lowest salary within grades vary greatly. For example, the maximum salary in grade F1 is 5.55 times greater than the minimum, while in F7 theratio is 1.36.
■ There is no perceptible order in which this ratio moves along salary grades from the mini-mum to the maximum, and the overlap of salaries is extreme. For example, the maximum
122 WORLD BANK COUNTRY STUDY
TABLE 6.3: DISPERSION OF SALARIES CHARGED TO THE PUP BY OCCUPATIONAL GROUPAND SALARY GRADE(Nuevos Soles)
Salary Maximum Minimum Ratio of Occupational Group Grade Value Value Max/Min
F8 2,594 1,326 1.96UPPER MANAGEMENT F7 1,574 1,154 1.36
F6 1,651 1,059 1.56F5 1,928 1,005 1.92F4 1,458 964 1.51
MIDDLE MANAGEMENT F3 2,695 906 2.97F2 2,934 669 4.39F1 3,805 686 5.55
SP A 2,670 651 4.10SP B 1,608 620 2.59SP C 1,798 600 3.00
PROFESSIONALS SP D 2,469 576 4.29SP E 1,382 551 2.51SP F 1,158 598 1.94ST A 1,960 526 3.73ST B 1,725 518 3.30
TECHNICAL ST C 816 520 1.57ST D 788 508 1.55ST E 778 507 1.53SA A 1,765 502 3.52SA B 1,555 500 3.11
AUXILIARY SA C 1,748 491 3.56SA D 1,052 498 2.11SA E 1,803 480 3.76
Note: Grade F8 does not include the President of the Council of Ministers.Some Secretaries General (F6) have a rank of Vice-Minister (F7).Source: Comisión Multisectoral, op. cit., p. 2.

salary in the bottom grade (SA-E) is greater than the maximum salary in 10 of the next 11higher grades.11 Indeed, it is greater than the maximum recorded for vice-ministers and sec-retary general.
On average, contracted personnel earn more than permanent personnel, except for auxiliarypersonnel, but salary dispersion is high (Table 6.4 and Figure 6.4). Peru’s civil service regimeappears to offer higher-than-market rates of pay for employees at the bottom of the occupationalhierarchy, while paying less-than-market salaries to highly skilled employees. Managerial personnelwith permanent status under Regime 276 appear to earn less, on average, than do those contractedunder the same regime, but the Commission’s report says that more disaggregated data by salarygrade reveal that the permanent managers actually earn more.
A wholesale reform of employment and remuneration practices in the public sector is in order.Public employment is growing rapidly and uncontrollably. Salary levels are being assigned withoutreference to any benchmarks. There is no mechanism for assuring that individuals performing simi-lar tasks at similar levels of productivity receive similar pay.
Reforming the Legal and Institutional FrameworkNeither the Laws, nor the Reglamento establish procedures and offer benefits to employees that aremore likely to discourage rather than encourage efficiency:
■ A glaring omission of the Laws is the absence of any entity responsible for enforcement. The1985 Reglamento leaves enforcement to the human resources offices at the ministry level.12
This is a weak reed on which to place such a responsibility. Typically, the human resourcesoffices are poorly staffed and exercise little authority. To the extent that their directors serveat the pleasure of the higher authorities, there would be little disposition to oppose theauthorities should they wish to bypass procedures outlined in the law or regulations.
■ Upon appointment to a post, a civil servant immediately acquires tenure, since the 1990Reglamento expressly rejects the use of probationary periods.
■ The Reglamento seems to reflect a determination to move employees upward through theoccupational and salary structure as quickly as possible. It calls for setting annual quotas forpromotions based on either existing vacancies or by the reclassification of a civil servant’s
RESTORING FISCAL DISCIPLINE FOR POVERTY REDUCTION IN PERU 123
TABLE 6.4: MAXIMUM, AVERAGE, AND MINIMUM EARNINGS BY OCCUPATIONALGROUP AND REGIMEN(Nuevos Soles)
Permanent Contract
Min Avg Max Min Avg Max
Upper Mgmt 13,634 23,360 43,083Middle Mgmt 700 3,377 12,438 932 4,047 5,016Professionals 684 1,943 5,554 764 2,246 6,770Technical 679 1,373 3,816 579 1,499 3,488Auxiliary 498 1,209 3,779 578 1,106 2,416
Source: Gregory (2002).
11. However, the Commission report notes that this particular anomaly is not normally observed withininstitutions.
12. Reglamento Inicial del Decreto Legislativo No. 276, Decreto Supremo No. 018-85 PCM, DisposicionesGenerales, 2.

existing post. Rather than restricting access to promotion to maintain a strong incentive forexcellent performance, it creates a mechanism that risks converting the promotion into apro forma event. Since the Reglamento seeks to fill all vacancies above the entry level froman occupational group from within the existing personnel pool, this limits the flexibilityrequired to ensure that the best possible candidate is selected.
The procedures outlined for the recruitment and selection of new employees conform to stan-dard practice in theory, but prove ineffective. Vacancies at the entry level must be advertised, andselection follows a competitive process in which applicants’ backgrounds are evaluated and examina-tions may be required. But there are loopholes. For example, individuals hired on a contractual basisare not required to undergo a competitive selection process, and after one year may be granted per-manent status if a vacancy exists. Then, after three years on contract an individual acquires a right tobecome permanent if the institution decides it needs to retain the position (Art. 40). Clearly, theseprovisions are inconsistent with procedures to ensure that the best candidates are hired into tenuredpositions.
Monetary rewards are merely a function of tenure. Article 51 grants a 5-percent increase in thebasic salary after each five years of service. Article 52 provides for bonuses that are a function offamily size. Both provisions violate the principle of equal pay for equal work and certainly have nolink to performance. Article 53a provides for a bonus to be paid to those occupying positions ofresponsibility or supervision. No definition of “responsibility” appears either in the Laws or in the Reglamento, so it obviously lies within an area of discretion of the institution’s authorities.13
Moreover, Articles 140–46 of the Reglamento oblige all government institutions to provide a vari-ety of welfare benefits extending to the employee and his or her family. Among the benefits to beprovided are meals; transportation; in-house medical services; housing; nurseries and educationalsubsidies; cultural, social, and recreational activities; and subsidized credit.
124 WORLD BANK COUNTRY STUDY
FIGURE 6.4: PERMANENT AND CONTRACTUAL AVERAGE EARNINGS(Nuevo Soles)
0 5000 10000 15000 20000 25000
Upper Mgmt
Middle Mgmt
Professionals
Technical
Auxiliary
Permanent Contract
Source: Gregory (2002).
13. Why a salary supplement should be necessary is not clear. After all, the job evaluation process is sup-posed to take account of the duties and responsibilities that characterize each post and assign it to the appro-priate salary category. No further supplement should be required. But even less understandable is the grantingof a permanent bonus in recognition of past supervisory services after one moves to a nonsupervisory position.The Reglamento provides for this salary supplement for those serving in a managerial position for at least threeyears, though it does not specify what proportion of the bonus becomes permanent (Art. 124).

The Need for a Civil Service DirectoratePeru intends to enact a new Civil Service Law and Reglamento designed not only to protect thelegitimate rights of employees, but also to create the incentives for a higher level of efficiency andimproved quality of services to the public.
Recommendations:It is advisable for a new Civil Service Law to establish a central entity—a Directorate—with author-ity for normative and enforcement functions. Ideally, the Directorate must be autonomous fromthe executive power. The person who heads the Directorate should be viewed as apolitical andhave had professional experience in the area of human resources management. The qualificationsfor the position should be clearly set forth in the law.14 The Directorate could be assigned a varietyof functions designed to ensure a measure of consistency in the administration of human resourcesacross the various institutions of government. Among these could be to:
■ Prepare the Reglamento of the new Civil Service Law.■ Prepare a model Reglamento, (subject to the approval of the Council of Ministers), which
would serve as a basis for institution-level Reglamentos.■ Create and maintain a database containing personnel information of all government
employees.■ Design of a single system of job description and evaluation that could be applied across all
government agencies.■ Design and implement the training program of the personnel assigned to the human
resources offices in the public entities.■ Provide technical assistance to the institutional human resources offices.■ Assist ministries in assessing training needs and training programs, maintaining a listing of
qualified sources of training.■ Design an appropriate wage structure that permits government to recruit and retain
employees of the desired quality.■ Perform periodic surveys of the labor market to identify salary trends on the basis of which
it could offer policy recommendations to the executive designed to maintain public salariesin the desired relation to the market.
■ Perform technical analyses of public sector employment.
Personnel ManagementThe procedures outlined in the existing Reglamento are, for the most part, adequate, but could beimproved. They prevent opening all vacancies to competitive qualification by both internal andexternal candidates. Some greater degree of regulation of the process of contracting would appearto be desirable, since it is an area that could give rise to abuse. Currently, an institution can con-tract anyone it wishes without resort to a competitive process of qualification.
Recommendations:■ For contracts with a duration of less than one year, the current practice can be followed,
but contracts should be nonrenewable to prevent avoidance of the competitive process.
RESTORING FISCAL DISCIPLINE FOR POVERTY REDUCTION IN PERU 125
14. The appointment process to be followed is of the utmost importance. One possible appointment mech-anism is the constitution by law of a nominating panel with representation from Congress, civil society organi-zations, and the business sector, which would forward a short list of approved candidates to the President fromwhich he or she would make the appointment. The Director (Rector) should enjoy a rank equivalent to that of a minister and hold such position for a term longer than that of the President. Removal from the positionwould require a demonstration of incompetence. In the absence of such a demonstration, renewal of the direc-tor’s term would be expected.

■ Contracts of longer duration should be filled through a competitive process. Holders oflonger-term contracts should also be entitled to all other benefits, such as paid vacationsand participation in a pension plan.
■ Consideration must be given to employing occupants of all professional and managerialpositions on a contractual basis rather than on a permanent basis. To compensate for theincreased risk of separation, a premium could be offered over the position’s salary grade, say 10 percent, to those choosing the contract option. The increase in flexibility afforded by the contractual arrangement could well be worth such a premium.
Remunerations and Other Incentives to Perform. The Directorate should be made responsiblefor developing a single market-oriented salary structure designed to accommodate the full range ofservices employed in government, from the unskilled service worker to the minister.
Recommendations:■ Budgetary provisions should be made for payment of bonuses to employees as rewards for
superior performance.■ The budget should allocate to each institution some proportion of its wage bill for the dis-
tribution of such bonuses. Each institution would be responsible for administration of thebonuses.
■ Permanent payments that are unrelated to performance, such as length-of-service supple-ments, should be avoided. If it is desired to grant some recognition for length of service, itwould be preferable to grant a lump-sum award when recognition is due rather than tomake a permanent addition to the basic salary, as the current law provides.
■ The new Civil Service Law should provide that salary increases mandated for all employeesbe made in proportional form, that is, an equal percentage increase for all. The commonpractice of awarding the same absolute increase to all employees has the unfortunate conse-quence of reducing relative differentials among salary grades, leading to a compression ofthe salary structure and to future difficulties in the recruitment of highly skilled employees.It also reduces the incentives to perform in order to better qualify for promotion.
■ All new employees should be subject to a probationary period during which they may bedischarged without payment of an indemnity.
Implementation of a New Civil Service Regime. The new Law and salary structure should notbe extended to the whole Central Government (CG) immediately upon its enactment, except forthe general provisions governing recruitment and selection. Rather, it should start with modesthuman resources management reform pilot exercises, developed on a ministry-by-ministry basis.The government ought to use accession to the Law and the new salary structure as an incentive for each institution to undergo a careful review of its mission and structures and their adequacy for meeting future institutional needs.
Recommendations:■ A basic human resources restructuring process would include (a) the discontinuation of
activities that do not fit within the newly defined mission of the institution; (b) the elimina-tion of duplications and consolidation of units; (c) the re-engineering of processes and pro-cedures to simplify the delivery of services, and completion of new job titles, descriptions,and evaluations; and (d) a commitment to the professionalization of management.
■ Pilot institutions should be required to prepare a detailed plan of action and a calendar forits completion to qualify for coverage under the Law.
■ An appeals procedure is needed for any disciplinary system. The Ley de la Carrera Adminis-trativa provided for the creation of a body to hear appeals (Tribunal del Servicio Civil).However, it was never established, so it is a priority. Such an entity should lie outside theinstitution.
126 WORLD BANK COUNTRY STUDY

The Scope of a Civil Service Law and Decentralization. A final note concerns the desirable scopeof a new Civil Service Law. The CG is committed to the process of deconcentration of administra-tive functions of ministries to regional or local political entities. At the same time there is a poten-tial devolution of functions and resources to regional or municipal governments.
Recommendation:■ It is imperative that the staffing of subnational units of government be subject to the same
rigorous standards and procedures advocated for the CG, if decentralization is to result inbetter economic and social services to the public.
Additional Measures for Improving Human Resources AdministrationThere are additional features that an overhauled human resources administration would require:
■ A virtual database integrated into the SIAF system would support the main urgent task ofdeveloping a unified payroll system to establish the exact number of public workers andeliminate ghost workers. Any high-performing system of personnel administration requiresit also contain a full profile of each employee, including a public sector employment historythat records date of entry, positions held, disciplinary actions, classification, salary, supple-ments, and so forth.
■ Gradual simplification of the remunerations package to cash payments; every effort should bemade to avoid in-kind supplements. Resorting to a wide assortment of supplements to thebasic wage gives rise to difficulties in accounting for the full cost of the remunerations pack-age. Typically, individual welfare or satisfaction is maximized when an individual receives all ofhis or her income in cash and can allocate it according to his or her consumption preferences.
■ The current variety of payment practices should gradually be replaced by a wage structurethat provides for a single basic salary for grade and assures that pay differences amongemployees performing the same tasks are minimized.
■ Pension regimes require an ad hoc solution. If a new salary structure were to result inincreases in salaries, the government would be faced with an immediate increase in its liabil-ities to the pensioned population and to its employed work force. Currently, there are some225,000 beneficiaries of the pension system established by DL-20530 whose pensions areautomatically adjusted by the current salary of the positions they occupied prior to retire-ment, the cedula viva arrangement.
■ A true system of performance evaluation has yet to be established. The current Ley de laCarrera Administrativa adopts merit as a criterion for promotion and for granting perfor-mance bonuses, but it has been ignored. Depending on the nature of the tasks, a perfor-mance bonus is desirable.
■ A prior condition to the introduction of performance contracts is the professionalization ofmanagement. Indeed, the introduction of trained managers can lead to improvements inproductivity even in the absence of performance bonuses. Able managers can raise produc-tivity by improving the organization of their units, modifying and simplifying work proce-dures, and motivating employees to perform. It is desirable to make a clear distinctionbetween the policymaking and the executive functions of the ministerial hierarchy. TheGeneral Director and all lower-level directors and supervisors would constitute the back-bone of the permanent professional management structure.
The Education SectorThe education sector is a major destination of government resources, and public school teachersconstitute, by far, the largest group of public employees. The education sector accounts for about15 percent of total expenditures and deserves special attention because teachers are not covered bythe Civil Service Law that applies to administrative employees, but are governed by their own legal
RESTORING FISCAL DISCIPLINE FOR POVERTY REDUCTION IN PERU 127

128 WORLD BANK COUNTRY STUDY
regimen. The institutional framework is defined by two basic documents, the Ley del Profesorado,enacted in 1984, and the Reglamento de la Ley del Profesorado, enacted in 1990.
There are various categories of teachers defined by the nature and amount of education and/ortraining that they possess. Those who hold diplomas in pedagogy from one of the teacher traininginstitutes (institutos superior pedagógicos, ISPs) occupy the highest category. In addition, there arefive categories of teachers who do not hold a teaching title.15 In 1997, 62 percent of the approxi-mately 248,000 primary and secondary-school teachers held pedagogic degrees (World Bank2001b:47). The distribution among schools of teachers with different qualifications is hardly ran-dom. The more rural and distant from urban areas a school is, the greater the likelihood that it willemploy a larger proportion of untitled and poorly prepared teachers.
Teachers’ salaries have shown huge variations in real terms over the past few decades. Salariesattained their peak during the 1970s, declined precipitously during the 1980s, and recovered dur-ing the 1990s. By the end of the 1990s, teachers’ earnings, in real terms, had recovered to a signifi-cant level. Their salary structure had also been severely compressed.
The present assignment mechanisms for teachers engender misallocations because the assign-ment of a teacher to a post vests an ownership right to the post. As enrollments shift from oneschool district to another as a result of population changes, schools in districts losing students findthemselves with a surplus of teachers, but the surplus cannot be reassigned and the teacher mayretain his or her post as long as he or she wishes.
Promotion procedures are inoperative, since they were suspended a decade ago. The result isthat most teachers are found in the bottom two levels of the career structure.16
The current salary structure does not provide adequate incentives to elicit more efficient teacherperformance. Consider, for instance, one of the categories that is likely to encompass a substantialnumber of teachers—the category that includes those under Pension Regimen 19990 and who areappointed for 30 hours of classroom time. The difference between the salary in Level I and thesalary in Level V is only NS/67.75, or barely 10 percent of the starting salary in Level I.17 The dif-ferentials for the other categories are of a similar magnitude.18
The adequacy of teachers’ salaries is a controversial issue. Comparing the remunerationsreceived by teachers and professionals in the private sector using several different measures of payfor 1997 (Table 6.5) shows that if no allowance is made for hours worked at home by teachers, thehourly earnings of teachers fall short of those of private sector professionals but exceeds those ofnonprofessional workers with a university education. The disadvantaged position of teachers rela-tive to the labor market is mainly due to the higher earnings reported in Lima. In the rest of urbanareas, teacher’s earnings exceed those of other workers with advanced education. If it is assumedthat teachers spend an extra 40 percent of classroom hours in school-related work at home, the dis-
15. These are (a) individuals who have completed their pedagogic studies but have not completed thedegree requirements, (b) those who hold degrees in nonpedagogic fields from institutions of higher learningother than the ISPs, (c) those who have not completed pedagogic studies at a higher level of education, (d) those with incomplete university training, and (e) those with only secondary school education.
16. In theory, teachers with pedagogy degrees have a defined career path consisting of five levels, each ofwhich has a salary associated with it. A teacher must spend at least five years in a level prior to becoming eligi-ble for promotion to the next level. The passage from Level I to Level II is automatic at the end of five years.From then on, promotion depends on the evaluation of the teacher. The evaluation is based on three cate-gories of factors: (a) education and degrees obtained, the number of training courses attended, papers pre-sented at professional meetings, length of service, and posts held; (b) an evaluation of services that is based onattendance and punctuality and participation in joint faculty activities; and (c) meritorious recognition as evi-denced by opinions from the State, parent organizations, or intellectual production.
17. The discussion of salary differentials is based on the salary structure in effect in 1999 and does notreflect the 16-percent increases instituted since then (World Bank 2001b).
18. Last year, a 50-soles increase was extended to all teachers, the first of similar increases promised overthree years. This practice of granting equal absolute increases across the board to all teachers leads to an evengreater compression of the salary structure.

advantaged position of teachers is accentuated in Lima, though in other urban areas the differencesare small.19
Whether teachers are earning salaries that approximate or exceed their opportunity cost is aninadequate guide to the salary policy to be pursued in the educational sector. If the goal is toimprove the quality of education, one would think that the first objective should be to improve thequality of the teachers entering the profession. To the extent that a higher-quality teacher has ahigher opportunity cost than the current cadres, it will be necessary to offer higher salaries in orderto attract him or her. However, it makes little sense to raise all existing teacher salaries to the levelsrequired to attract a more promising teacher. What this suggests is that the remunerations policy ofthe Ministry should be tailored to more closely fit the opportunity costs of those entering theteaching profession.
A New Institutional Framework for Human Resources in the Education SectorTaking a closer look at other provisions of the Ley del Profesorado and the Reglamento provides theopportunity to offer suggestions that might be incorporated in a new legal framework.
Recommendations:■ The Ministry of Economy and Finance needs to establish a central employment registry
integrated into the SIAF, similar to the one advocated for the civil service sector. Thiswould establish a general single payroll management system, supported by bank transfers.
RESTORING FISCAL DISCIPLINE FOR POVERTY REDUCTION IN PERU 129
TABLE 6.5: HOURLY EARNINGS BY OCCUPATIONAL GROUPS AND AREAS, THIRD QUARTER, 1997 (Nuevos Soles)
Teachers’ Teachers’ Earnings Earnings
Earnings (Assuming (Assuming Weekly Adjusted 20 Hours 40 Hours
Area and Hours Hourly for Weeks Worked at Worked at Occupation Worked Earnings Worked Home) Home)
Urban PeruTeachers 26.7 5.7 7.2 6.0 5.2Professionals 42.2 8.1 8.2 8.2 8.2Univ. Educated 42.3 6.8 7.0 7.0 7.0
LimaTeachers 25.4 5.8 7.3 6.1 5.2Professionals 42.1 10.0 10.2 10.2 10.2Univ. Educated 42.3 8.3 8.5 8.5 8.5
Other UrbanTeachers 27.2 5.6 7.2 6.0 5.1Professionals 42.4 5.8 5.9 5.9 5.9Univ. Educated 42.3 5.1 5.2 5.2 5.2
Source: Saavedra, Melzi, and Miranda (2001).
19. The Reglamento provides for a monthly bonus equal to 30 percent of total remuneration for classpreparation, and it is assumed that the earnings figures reported include this bonus.

■ The remunerations package should be simplified because it would be more transparentand equitable for the sums expended on fringe benefits to be distributed in the form ofsalary, and should allow employees to purchase the benefits or services they want. Thecurrent Ley and Reglamento are replete with a wide variety of fringe benefits and bonuses.There are 10 provisions for leave with pay; discounts available on public transport and forstate-sponsored cultural events; 20 percent of all publicly financed housing is reserved forteachers; there is preferential access to mortgage credit; an automatic annual 2-percentincrease in basic pay; family allowances; bonuses for length of service; payments upon thedeath of a teacher or his or her spouse, parent, or offspring; funeral benefits; upon retire-ment, a bonus in recognition of years of service; a 30 percent monthly bonus for classpreparation; a 5 percent bonus for directors and university professors for performing theirtasks; funds for the construction of facilities for the delivery of social services; and for cul-tural and entertainment purposes, among others. However, the value of these benefits toemployees is positive only to the extent that they receive them. Not all employees receivethem in equal amounts and, therefore, the compensation package has a different value fordifferent individuals.
130 WORLD BANK COUNTRY STUDY
BOX 6.1: THE SEQUENCING OF CIVIL SERVICE REFORM MEASURES
Stage Institutional Actions Civil Service Actions
I.II.
III.IV.V.
VI.
VII.
VIII.
IX.
X.
XI.
XII.
XIII.
Creation of a Reform Commission.Issuance of invitations to pilot individual institutions to prepare and submit plans forhuman resources management reform.Preparation of institutional reform plans.Review and approval of reform plans.Creation of management structures in to-be-reformed institutions.Management training. Start integrating payrollinto SIAF by pilot institutions.Begin the institutional restructuring process.
Identify the positions and job contentrequired to meet programmatic objective.Prepare internal Reglamento.
Perform job descriptions and evaluations;specify qualifications for filling each post; formalize in manuals.Staff decisions followed by retraining orrecruitment of new personnel. Separation ofredundant personnel with severance payments.Personnel training.
Full integration of payroll into the SIAF.
Preparation of new Civil Service Law.
Submission of law to Congress.Enactment of Civil Service Law.Creation and staffing of Civil Service Directorate.
Preparation of internal Reglamento.
Prepare model Reglamento for adaptation toinstitutions.Upgrading directors and staff of institutionalhuman resources offices. Training.Select methodology for job description to beapplied throughout the government and traininstitutional human resources department personnel in application of methodology.Prepare model salary structure that reflects market rates of pay.
Apply Civil Service Law provisions to reformedinstitutions.
Design a personnel information system with stan-dard personnel forms and the networking of insti-tutional information systems with a Directorate’scentralized database.

■ A new law should also place a heavy emphasis on merit as a condition for entry into the pro-fession and as a determinant of compensation. If committees are viewed as desirable toreview the salary recommendations of principals or supervisors, these should be composedof persons of similar rank, perhaps with the participation of parent associations. Union offi-cers tend not to be appropriate members of such committees.
■ A more intensive use of contracting of teacher services is bound to provide greater flexibilityin the allocation of posts. Contracting would permit the reallocation of positions fromschools with declining enrollments to those districts with expanding student bodies. Itwould also facilitate the process of relieving ineffective teachers of their duties. If, however,contracting of teachers were not to become the standard form of employment, then the pro-cedures for hiring teachers and granting tenure ought to be reformed. Because the removalof ineffective teachers is more difficult under a system that grants tenure, it becomes impera-tive to place greater emphasis on the way teachers are selected and evaluated. The presentpractice of holding qualifying exams for entry into the field should be made a legal require-ment. Given the large number of potential applicants, the Ministry of Education can affordto establish high standards for entry into the field. We believe it is important that tenure notbe granted upon entry to the profession, but rather every new teacher should be subject to aprobationary period during which performance can be evaluated.
■ A new law should redefine the rationale of a new salary structure for the profession andavoid bonuses or other payments that are unrelated to performance. For example, the cur-rent provision of automatic yearly increases rewards good and the poor teachers equallyand, therefore, provides no incentive to improve performance. Attendance should also betaken into account to prevent teacher absenteeism.
A suggested sequencing of reform is depicted in Box 6.1.
RESTORING FISCAL DISCIPLINE FOR POVERTY REDUCTION IN PERU 131


The collapse of the Fujimori Administration in the middle of corruption scandals raised awareness inthe country about the need for a long-term progovernance and anticorruption strategy. President Fujimori’s third term was short-lived: mounting evidence of corruption by close associates forced him toresign, and a Constitutional transition took place. Mr. Valentin Paniagua was converted from Presi-dent of Congress to Interim President until July 2001, when Mr. Alejandro Toledo was inauguratedas the elected President. In April 2001, the Government of Peru (GOP) established the IniciativaNacional Anti-Corrupcion (INA), a committee with the task of promoting a national workshop withrepresentatives of major agencies in charge of the fight against corruption and developing an anti-corruption strategy. With the support of the World Bank and other international donors, the GOPrequested a diagnostic study of corruption in Peru, the results of which follow.1
Peru’s most recent scores on governance are mixed. There is strong evidence of a causal relation-ship between good governance and better development outcomes, including higher per capitaincomes, lower income mortality, and higher literacy. World Bank researchers recently com-
piled a massive cross-country database of some 300 governance indicators, yielding six clusters ofcomposite measures: voice and accountability, political instability, government efficiency, regulatory
VII
IMPROVING GOVERNANCE ANDREDUCING CORRUPTION
133
1. This section summarizes the World Bank Institute’s study on governance, rule of law, and corruption forPeru (World Bank 2001c). The study was carried out during February and March 2001 and, although currentPeruvian officials have indeed taken actions to address some of the issues identified below, their persistenceallows change to take place only slowly. The main objective of the study is to support the anticorruption effortand the GOP’s commitment in Peru. The rich survey data collected facilitate the unbundling of the many facesof corruption across governmental agencies and regions, from administrative corruption associated to laws,rules, and regulations, to state capture by vested interests affecting their actual design and implementation.Overall, Peruvian citizens (1,696 public service users), 401 enterprises, and 1,123 public officials responded.The refusal rates for each of the three surveys were low and, particularly among public officials, very low: barely11.3 percent of interviewees did not complete the survey.

burden, rule of law, and corruption for two years, 1998 and 2001. Peru’s scores in government effectiveness and regulatory quality have dropped significantly as the country has moved from anauthoritarian-like regime to one with a more vocal and active opposition (Figure 7.1). Its overallscore in corruption remains approaching the LAC average, but some scores are at the upper end,appearing particularly high—close to 60 percent—in procurement contracts of public works. To off-set such a gloomy picture, Peru’s scores in voice and accountability, political stability, and rule of lawhave improved, thus reflecting the political opening that is taking place. Yet, significant challengesremain in these areas, too.
Survey evidence indicates that Peru faces serious corruption challenges (Figures 7.2 and 7.3).More than 85 percent of managers of enterprises interviewed rated corruption as the most seriousproblem they face. The uncertainty surrounding the decisions regarding the judicial system, thelow quality and inefficiency of public administration, unstable economic policies, and the continu-ous changes in tax regulations are also perceived as very serious problems by more than half theenterprises. Comparing various dimensions of governance and quality of service delivery across fourregions (Lima, Resto de Costa, Selva, and Sierra), governance appears uneven across Peru, with theSelva region ranking systematically higher than the other three regions. How costly bribery is forthe competitive enterprise sector is suggested by the fact that most enterprises are prepared tomaterially contribute to controlling corruption. Enterprises report that they are willing to offer onaverage 6.8 percent of their gross revenues in order to eradicate corruption. This figure is higheronly to improve the administration of the fiscal system. This large potential tax contribution is anindicator not only of how costly corruption is financially for many competitive businesses, but isalso indicative of the fiscal losses to the Treasury if a more transparent system were to exist. Perfor-mance by regulatory agencies is generally well perceived (Box 7.1).
While Congress and the administration of justice are particularly afflicted, other governmentinstitutions appear to exhibit good governance and are highly regarded. In all three types of sur-veys and respondents, it is reported that Congress and rule-of-law institutions rate among the mostcorrupt state agencies as well as core public security institutions, such as the Police, the Army, and
134 WORLD BANK COUNTRY STUDY
FIGURE 7.1: PERU’S GOVERNANCE INDICATORS, 1998/2001Global Ranking Out of 140 countries—Lower is Better
0
20
40
60
80
100
120
140
Voice andAccountability
PoliticalInstability
GovernmentEffectiveness
RegulatoryQuality
Rule of Law Corruption
1998 2001
Source: World Bank (2001c).

RESTORING FISCAL DISCIPLINE FOR POVERTY REDUCTION IN PERU 135
FIGURE 7.2: OBSTACLES TO DOING BUSINESS
0 10 20 30 40 50 60 70 80 90 100
Regulations fo r fo reign exchange tr ansactionsLegal procedures to establ ish an enterprise
Requirements to process exterior commercial operations
Inadequate infrastr uctureTerro rism
Cost of regulations and transact ionsDiff iculti es in "c ompetiti veness"
Tax administrationInfl ation
Mo nopo lies
Financial access and costLow levels of technological development
Tributary instabilit y
Frequent changes in publ ic po liciesUnstable economic policies
Low level of effi ciency and qualit y of bureaucracyUncert ainty generated by the Judicial Power
Smuggl ingInsecurity - delinquency
Corrupti on
Share of Respondents Considering It a Very Serious Obstacle
Source: World Bank (2001c).
FIGURE 7.3: PERCEIVED LEVEL OF CORRUPTION IN SELECTED AGENCIES(as ranked by users)
0 10 20 30 40 50 60 70 80
Banco de la NacionUniversidades Publicas
Co nasevBanco de Ma teriales
Local author ity (Province)Defensor ia del pueblo
Regist ros PublicosRENIEC
Mi nisterio de SaludLocal author ity (M unicipal)
PrefecturaONPE
Mi nisterio de la PresidenciaCo nsejo Nacional de la Ma gist ratura
JNEFuerzas Armadas
Po licia Nacional del PeruMi nisterio de Just icia
Po der JudicialCo ngreso de la Republica
% Reporting that the Agency Is Very Corrupt
Officials Users Firms
Source: World Bank (2001c).

136 WORLD BANK COUNTRY STUDY
BOX 7.1: REGULATION OF INFRASTRUCTURE IN PERU
Any evaluation of the effectiveness of a regulatory framework would need to be based more on input than out-put measures. An evaluation based on output measures, although more appropriate, has nontrivial measure-ment and interpretation problems. On the input side, however, the evaluation is based on the legal, institutional,organizational, and procedural elements.
In Peru, the legal and institutional elements of the regulatory framework are good and above average in theRegion. Regulation is grounded on sector-specific laws and complemented by concession contracts. The institu-tional component is good, with separate sector agencies; a single regulator but an advisory board, staffed bymostly professionals and not politicians; a budget financed by sector firms’ contributions/fees; pay scales compa-rable to the private sector; and all the modes of transport regulated by a single agency, a most desirable structureand a rarity in the Region. A problem, however, is security of employment for the regulator, which could bestronger, and the appeal process that relies on the judiciary—but that is also the case practically everywhere else.The agencies also score well on the organizational element. They are well structured by functions and sectors,and staffed by competent professionals. Perhaps their major weakness is on the procedural side, in the sense thatthe framework does not give enough guidance on the process to inspire confidence and transparency. For exam-ple, there is little to compel the agency to explain or justify its timing and process to reach decisions, and checksand balances are scarce.
The sector is evolving to improve those components. A number of deficient structural elements have been cor-rected, such as eliminating operators from the regulatory board at Organismo Superior de Inversión Privada en Tele-comunicaciones (OSIPTEL) and merging the institutional and the tariff agencies in the energy sector. Clarifying theroles of the antitrust agency and the regulatory agency, at least on energy issues, is needed. One weakness identi-fied has been the managerial instability of the transport regulatory agency, Organismo Superior de la Inversión enInfraestructura de Transporte de Uso Publico (OSITRAN), which has had five presidents in four years. The agenciesscore rather well on implementation or outcome measures. They used level of conflicts, delays, price levels, qual-ity of service, compliance with contract, and so forth, as evaluators. The agencies have increased their administra-tive capacity, trained their personnel, and developed appropriate regulatory instruments.
Regarding their financial and operative autonomy, Peru’s regulatory agencies still have to be improved. The insti-tutional base of their autonomy is fragile. This is, fundamentally, because of the absence of effective checks onpossible decisions coming from the Executive branch, which undermine their effective independence. In previousgovernments, when presidential objectives shifted away from efficient, fair, and predictable regulation and towardother priorities, the funding of these agencies declined and their scope narrowed. This has to do with two flawsin their institutional design. First, they enjoy only limited budget independence. Second, these agencies’ chiefexecutive officers and board members are vulnerable to being removed by the President or by members of theministerial cabinet for virtually any reason. They have potential powers to be very effective, if the regulatorwishes it to be, and they have shown in general that they do. An indication of their autonomy has been the con-tinuous claims and complaints by the Peruvian Executive and Congress, since 1996, that regulatory agencies havetoo much power, too many resources, and are accountable to no one. The limited autonomy these agencies haveis fragile. The current government was initially inclined to reduce it. Yet it is to be commended for havingadopted an open and competitive process for the selection of the heads of the regulatory agencies.
All in all, the perception about the performance of regulations in Peru remains above average in the region.The rankings for the World Economic Forum’s 2002 Global Competitiveness Report placed Peru among the topfour countries in the LAC Region. This framework, however, remains fragile to eventual institutional and legalchanges, and can be improved, but future changes need to be done with transparency and predictability, hon-oring procedures established in the contracts, so as not to increase investor concerns about changing therules of the game.

the Judiciary (Figure 7.3). About 90 percent of enterprises and users of public services neitherbelieve that the Judiciary is independent from the government or political groups, nor that justiceis administered in a fair, just, and transparent manner. In addition, enterprise managers report thatbribes are used predominantly to facilitate judicial proceedings. In contrast, the Ombudsman,National Bank, Comisión Nacional Supervisora de Empresas y Valores (CONASEV), and provincialauthorities are not regarded as misgoverned in general—with the notable exception of municipalfiscal/tax collection services, which were not viewed positively.
Bribes are used by firms predominantly to obtain public contracts, deal with the Judiciary, andobtain licenses and permits. Enterprises pay bribes at least twice as often to facilitate judicial proce-dures and obtain licenses as for import/export documents and other procedures (Figure 7.4).About half of all enterprises always pay bribes to win public contracts (Figure 7.5). This numberrises to around 67 percent among foreign enterprises. Not only does this estimate of public con-tracts tainted by bribery reflect widespread and large-scale corruption, but the reported percentagebribe “fee” expected to secure such contracts is also rather large: enterprises report that on average,regardless of their ownership structure, 17 percent of the value of the contract is paid as a bribe.Further, in terms of time spent dealing with the public administration, foreign enterprises appearto spend more time than domestic firms. The poor performance of the Judiciary leads to the use ofalternative mechanisms for conflict resolution. In addition, both managers and public officialsreport that bribes are paid to judicial authorities significantly more frequently than to guaranteecontracts or obtain public services.
State Capture. Some key “institutions” outside of the public sector appear to also fuel mis-governance by exercising undue influence over the State (hint at modicum of “State capture”).
RESTORING FISCAL DISCIPLINE FOR POVERTY REDUCTION IN PERU 137
FIGURE 7.4: BRIBES BY TYPE OF ACTIVITY(Based on enterprise survey)
0 20 40 60 80 100
To obtain import andexport permits
To obtain publicservices
To update tributarystatus
To obtain contract withstate companies
To obtain licenses andpermits
To expedite judiciaryproceedings
To obtain publiccontracts
% Reporting that Bribes Are Very Frequent
Foreign
Domestic
Note: The thin lines represent margins of errors (or the 95 percent confidence intervals) for each value. Theyshow the range where the true (population) proportion would lie with probability 0.95 if we had drawn a randomsample from this population.
Source: World Bank (2001c).

■ Both drug cartels and large financial and economic groups are perceived as wielding enor-mous influence in shaping laws, policies, and regulations, in contrast with associations ofprofessionals, trade unions, and so forth, which are not seen as wielding excessive or undueinfluence.
■ Bribes are used to shape key government functions (high-level judiciary, legislative, andexecutive) much more often than to obtain public contracts or services.
■ Bribes are also linked to political funding. Nearly 30 percent of enterprises surveyed reportthat very often firms in Peru make political contributions to affect the political process.Though the majority of managers deny providing campaign contributions during the lastelections, one third of firms report that bribe revenues are very often used to finance politi-cal campaigns, suggesting the existence of a tight, nontransparent link between governmentofficials and the private sector.
■ Illicit payments are made to secure public administration positions. Thirteen percent of pub-lic officials report that this practice exists for some higher-level positions as a “private invest-ment,” while this number (and amount) declines significantly for lower-level positions.
The Costs of Weak Governance and CorruptionCorruption increases inequality. Bribery is a significant and regressive “tax” on public service users.Users report major bribe expenditures extorted from institutions in charge of drivers’ licenses andpassports, construction permits, taxes, school enrollment, and so forth. Furthermore, the poorergroups are disproportionately affected by corruption, with lower-income users spending three timesthe percentage of their income on bribe payments that wealthier households spend (Figure 7.6).
138 WORLD BANK COUNTRY STUDY
FIGURE 7.5: CORRUPTION IN PUBLIC SERVICE(as reported by public officials, users, and managers)
0.48
0.134
0.15
0.45
0.201
0.15
0 0.1 0.2 0.3 0.4 0.5 0.6
Corruption in public administration (% of publicofficials reporting it is very frequent)
Purchasing of positions (% of public officials reportingit is a very frequent practice)
Misuse and mismanagement of public funds (% publicofficials reporting it is very frequent)
Bribes paid to obtain public contracts (public officialsreported the estimated % of cases in which bribes are
necessary, average)
Average % of managers that were asked to pay a bribewhile trying to obtain a public service
Average % of users that were asked to pay a bribewhile trying to obtain a public service
% of Respondents Who Report ed the Presence ofCorruption/o r Average Across Al l Responses
Source: World Bank (2001c).

Businesses are also affected negatively by corruption. Enterprises spend more on bribes thanon security, and this bribery “tax” is regressive. On average, 5.2 percent of monthly gross revenueof enterprises goes to bribes. For smaller enterprises, the bribery tax is particularly onerous: itaccounts for 8.9 percent of their revenue, compared to the 2.5 percent large enterprises pay. Andthere is evidence that much of the onerous bribery tax on enterprise is indeed extorted, in the sensethat on balance the firms do not benefit from it.
Bribes contribute to the lack of effective access to public services by the poor. Users, especiallythe poorest, are often discouraged by bureaucratic inefficiencies and choose not to seek a publicservice. Users cite government agencies like Seguro Social de Salud (ESSALUD, health services),Empresa de Agua y Desague, and the Superintendency for Tax Administration (SUNAT) as theones where they are more likely not to attempt to obtain a service or complete a procedure becausethey do not provide effective service.
Impact on Public Service DeliveryRegression analysis shows that, on average, paying more bribes does not result in higher-quality service delivery for the users and firms, and that the opposite might be true, with poor quality andbribery going hand in hand (Figure 7.7). Users report the highest levels of service quality in the officesdevoted to issuing identity cards and passports, the real estate registry, and public schools. Usersreport the lowest levels of service quality in the offices handling national taxation (SUNAT), construc-tion permits, real estate duties, and public health and social security (Figure 7.8). Enterprises reporthighest levels of service quality by utility companies and the lowest levels by municipal authorities.
Health and Education Services. Except in Lima, the quality of education by public schools is fair(more than 50 percent of users rate such service high), somewhat more homogeneous across thecountry than that of other social services, and bribes are not very frequent (7 percent) (Figure 7.9).However, user survey data also suggest that the most pressing issues of the education system are thequality of the personnel, especially since teacher promotion is very significantly influenced by politi-cal power, the high access costs to school, and the poor quality of school equipment. Conversely,the delivery and quality of health services are quite poor and very uneven across regions. Whilerespondents report that they do not pay bribes for health care quite as often as for other services,they are very often discouraged from seeking health care due to its internal inefficiencies.
RESTORING FISCAL DISCIPLINE FOR POVERTY REDUCTION IN PERU 139
FIGURE 7.6: AVERAGE PERCENT OF INCOME PAID IN BRIBES
0.6 0.8
2.9
0.0
0.5
1.0
1.5
2.0
2.5
3.0
3.5
Low Medium High
Income
% o
f inc
ome
paid
in b
ribe
s
Note: Average percentage of income paid in bribes was computed for all respondents that used any public serviceand reported that they were or were not asked to pay a bribe.
Source: World Bank (2001c).

There is wide geographical heterogeneity in the quality of public service delivery. The qualityof public services appears, on average, to be higher in the Selva region and Lima than in the rest ofthe country, and significantly greater in the case of offices handling drivers’ licenses, judicial docu-ments, basic health services, and schools.
There is also extremely varied service delivery performance across public institutions in Peru.Such variance permits a rigorous analysis to distill the key governance elements that influence ser-
140 WORLD BANK COUNTRY STUDY
FIGURE 7.7: INDEXES OF SERVICE QUALITY AND BRIBERY(based on public officials’ responses in 57 government agencies, 2001)
0
10
20
30
40
50
60
70
80
40 50 60 70 80 90 100
Index of Service Quality
Inde
x of
Brib
ery
Source: World Bank (2001c).
FIGURE 7.8: QUALITY OF PUBLIC SERVICES(as ranked by users, 2001)
0 20 40 60 80
National taxation
Co nstruction permits
Real estate duties
Social security
Health care
Drivers' licenses
Judicial certifications
Vehicle regist ration
Acces s to elect ricity
Permits of the National Bank
Education
Real estate regist ry
Passpor ts
Identity cards
% Reporting High Quality of Service
Se lv a
Li ma
Re st o
Si e rra
Source: World Bank (2001c).

vice delivery. This analysis between governance structures (as rated by users, enterprises, and publicofficials) suggests that the following factors may be important for improving governance:
■ Voice. Simple and partial correlation analyses suggest that corruption-reporting mechanismsare associated with lower levels of corruption. Complaint mechanisms deter corruption.
■ Transparency. The relationship between levels of corruption and transparency is statisticallysignificant: agencies with more transparent procedures are less likely to display corruption.
■ Quality of Rules. When rules and regulations over personnel are clearly specified, there arefewer incentives for corruption.
■ Social Inclusion and Collective Action. Agencies with employees supporting civil society par-ticipation reforms in the public sector display lower levels of corruption.
■ Meritocracy. Agencies in which personnel decisions are based on merit and performance arenot associated with lower frequency of corruption.
Local governments perform much worse than national agencies in service delivery. The surveyfindings support the extent and seriousness of corruption and governance problems within munici-pal governments, when compared to national agencies. Overall, the degree of satisfaction in the pro-vision of public services by local governments appears much below other government agencies interms of quality, low cost, degree of satisfaction with the service expected, and accessibility to thepoorest (Figure 7.10). Corruption levels in local governments also appear much higher than thosein national agencies (except with respect to bribes paid to obtain a public service (Figure 7.11).
A Policy Agenda for Improving GovernanceReducing corruption and improving governance is more than just a matter of law enforcement—itrequires a societywide set of institutional reforms. A multipronged strategy that addresses the variousforms of corruption—from state capture to administrative corruption—must address political account-ability and transparency, promote a competitive private sector, strengthen institutional restraints,improve public sector management, and embrace civil society participation. It is important toemphasize that while the comprehensive approach described in Box 7.2 applies generally, the detailedcomponents described within each box can lead to the determination of reform priorities in Peru.
RESTORING FISCAL DISCIPLINE FOR POVERTY REDUCTION IN PERU 141
FIGURE 7.9: QUALITY OF HEALTH AND EDUCATION SERVICES(as reported by users)
0
10
20
30
40
50
60
70
Health Services Social Security EducationResto de Co sta Sierra Selva Lima
% o
f Res
pond
ents
that
Rep
ort
Hig
h Q
ualit
y of
Ser
vice
Source: World Bank (2001c).

The strategy needs to center on fundamental public sector reforms, while at the same timestrengthening civil society participation and constructively engaging the competitive segments of theprivate business sector—within a coalition-building approach of shared responsibility. The evidencesuggests that public institutions characterized by effective voice and accountability mechanisms, efficient corruption-reporting mechanisms, clear and well-defined rules, and a reform-minded staff,perform better and are able to control corruption more effectively. The evidence also identified the
142 WORLD BANK COUNTRY STUDY
FIGURE 7.10 PROVISION OF PUBLIC SERVICES—LOCAL GOVERNMENTS VSOTHER GOVERNMENT AGENCIES(based on public officials’ responses)
0
10
20
30
40
50
60
70
80
90
Is of high quality Is prov ided atrelatively low
co sts
Satisf iesco mpletely thedemand of the
users
Is access ible tothe poor
Per
cen
t
Local Government
Other
Source: World Bank (2001c).
FIGURE 7.11: NATIONAL AND MUNICIPAL AGENCIES ARE RIDDEN BYDIFFERENT TYPES OF CORRUPTION(based on public officials’ responses)
0
5
10
15
20
25
30
35
Irregular use ofpublic reso urces
Br ibes to ob tainpublic co ntracts
Br ibes to changea legal decision
Br ibes to ob tainpublic services
Per
cen
t
Municipal Agencies
National Agencies
Source: World Bank (2001c).

support of public officials for civil society oversight and meritocracy reform as anticorruption mecha-nisms. The survey evidence underscores the importance of implementing reforms to enhance trans-parency and public oversight.
Design of an anticorruption strategy is facilitated when there is a good understanding of thelevels of resistance that are likely to be encountered. Public officials were asked about their levels ofsupport for various reforms. Public officials favor strengthening public administration, in terms ofboth merit-based promotions and simpler administrative procedures. They are also in favor of theintroduction of a system of checks and balances and the oversight of public sector activities by civilsociety (Figure 7.12).
The government needs to build credibility. There is a significant discrepancy between users andpublic officials on the official commitment to fight corruption. More than half of users, comparedto only 20 percent of public officials, reported that the government is not committed at all in thefight against corruption. This lack of trust toward government’s commitment to eradicating cor-ruption is especially felt among low-income users of public services. Conversely, the fact that ahigh proportion of public officials report preparedness of the public sector to fight corruption isan encouraging sign that not only the challenge is recognized within the public sector, but thatthere would be support among civil servants for an anticorruption and governance improvementprogram.
Recommendations:■ The government needs to make the fight against corruption a top priority. The majority of
citizens (users, public officials, and firms) would support it.
RESTORING FISCAL DISCIPLINE FOR POVERTY REDUCTION IN PERU 143
BOX 7.2: A MULTIPRONGED STRATEGY FOR ADDRESSING CORRUPTION ANDIMPROVING GOVERNANCE
Anticorruption
Institutional Restraints: • Independent and effective judiciary • Legislative oversight • Independent prosecution, enforcement
Civil Society Participation:
• Freedom of information • Public hearings on draft laws • Role for media/NGOs
Political Accountability: • Political competition, credible political parties • Transparency in party financing • Disclosure of parliamentary votes • Asset declaration, conflict-of-interest rules
Competitive Private Sector: • Economic policy reform • Competitive restructuring of monopolies • Regulatory simplification for entry • Transparency in corporate governance • Collective business associations
Public Sector Management: • Meritocratic civil service with monetized, adequate pay • Budget management (coverage, treasury, procurement, audit) • Tax and customs • Sectoral service delivery (health, education, energy) • Decentralization with accountability
Source: Anticorruption in Transition—A Contribution to the Policy Debate, World Bank (2000).

■ The church and the media should be integrated as potential contributors in the fight againstcorruption: all respondents indicate they are key players in developing an anticorruptionstrategy. Low-income users exhibit high confidence in the media.
The government needs to continue enhancing transparency. Transparency in government is syn-onymous with openness. Introducing transparency requires that officials provide the public—civilsociety organizations, the media, or anyone else who is interested—sufficient information about thebudget and its activities in order for the public to serve as an effective check on abuses (Chapter III).
Recommendations:■ The government should consider issuing a freedom of information law that requires gov-
ernments, national and subnational, to provide information to the public unless there is avalid reason (such as threat to national security) for the information to remain secret.
■ Sufficient investment in training civil servants producing and handling potential publicinformation is essential to prevent misunderstandings.
■ A proactive approach that invites open oversight by Congress, civil society, and the media,for example, with respect to large privatizations or important tenders, is usually effective.
The government needs to be accountable. Separation of political and economic interests is a chal-lenge facing governments everywhere. Building accountability into political life helps reduce thepotential gains for “captor” firms and politicians alike.
Recommendations:■ The GOP should improve its civil service recruiting system and migrate toward a merit-ori-
ented promotion system, while guaranteeing insulation of the civil service from politicalchanges (Chapter VI).
144 WORLD BANK COUNTRY STUDY
FIGURE 7.12: PUBLIC OFFICIALS’ VIEW ON REFORMS IN PUBLIC SECTOR(% of respondents)
0% 20% 40% 60% 80% 100%
Pr ivatization of public services
Reduct ion in number of public of ficials
Decentralization of State administ ration
Greater supervision of civil so ciety ov er publicsector activities
Free and bette r access to state inform ation
Bette r supervision of po litical party financing
Introduction of a system of checks andbalances fo r public sector
Introduction of merito cratic system in thepublic sector
Clearer proc edural guidelines
Simplification of administ ration
In Favo r Indifferent Against
Source: World Bank (2001c).

■ The GOP should issue an Ethics Code Law for public service, with clear prohibitions of con-flicts of interest, and an effective enforcement for both political and civil service positions.This is an essential corruption-deterrence tool. Since income and assets of high-rankingpoliticians in Peru are already publicly disclosed, the media and the general public may act asallies in uncovering conflicts of interest and questioning politicians who cannot explain theirwealth. Such measure should also reach members of Congress, incoming regional presidents,and municipal authorities.
■ The GOP should demand transparency of the financing of political parties. Campaignsshould make clear the links, both explicit and implicit, between politicians and the intereststhey support. The GOP should mandate and publicize detailed reports on the finances of allpolitical organizations, identifying contributors and beneficiaries, and providing civil soci-ety, the media, and the general public with tools they can use to identify the sources ofState capture.
■ Other possible measures by the GOP include banning the use of State resources for politicalcampaigns, limiting the amount that can be spent on political campaigns, providing publicfunding, and prohibiting certain types of entities from contributing to political campaigns.
The government needs to promote a sound business environment. Since every bureaucratic andregulatory intervention creates an opportunity for corruption, reducing the regulatory burden onfirms is a key element of the strategy.
Recommendation:■ The GOP should examine and consider reducing the number of regulations and inspec-
tions. Clear rules defining when regulation is appropriate, sound analysis of a regulation’simpact on firms, and a constant, mandated dialogue with the business community wouldincreasingly be required to make regulatory reform sustainable.
In sum, the government needs a comprehensive and inclusive approach to deal with governance.Peru is at a crossroad in governance matters and it is crucial to implement a series of institutionalreforms in key areas to improve transparency and accountability of government agencies. Byaddressing the systematic institutional weaknesses within key public sectors and agencies in Peru,that progress would be possible. Survey results show that reducing corruption is not just a matterof strong enforcement, but also hinges directly on the incentives facing public officials, enterprises,and households. Many reforms that are important in their own right—State and regulatory reform,judicial system reform, civil service development, and openness in government, to name a few—should now be viewed as part of a progovernance agenda. Although there is no single recipe forsuccess, several countries have followed a three-pronged approach focusing on enforcement of anti-corruption statutes, education of the population about their rights when dealing with the publicsector and the harm corruption causes, and prevention of corruption by improving public sectorgovernance. A sustainable strategy also endorses an inclusive approach with governmental and non-governmental leaders.
Recommendation:■ Creating a high-level steering committee, supported by a professional secretariat, can help
bring together representatives of governmental bodies, both central and local, to develop aspecific action plan to implement the governance strategy. By explicitly including represen-tatives from outside government, the steering committees can further build credibility whilemobilizing an important ally for reducing corruption.
RESTORING FISCAL DISCIPLINE FOR POVERTY REDUCTION IN PERU 145


While the Peruvian mining sector reform in the early 1990s resulted in the attraction of substantialexploration and development investment and the subsequent increase in mineral production andexports, since the late 1990s, key fiscal and environmental issues have negatively affected the competi-tiveness and level of acceptance of mining activities by foreign investors and local society, particularlywith the local communities. The mining reform brought about the effective opening of the sector todirect foreign investment and the shift of the role of the State from owner-operator to lessor-regulator.This was accomplished by reforming the legal and institutional framework, privatizing the miningState-owned operations, and initiating an environmental management program. While the threereforms have been widely considered successful, three issues remain controversial and in need ofadjustment.
First, the taxation system might be producing a certain loss of competitiveness. To the extent that itaffects rates of return on investment, the effective tax rate in a given country is a major factor influenc-ing the decision of foreign investors about where to invest their capital. Nations the mining fiscal systemsof which impose high levels of overall taxation should expect to see lower levels of foreign investment intheir mining sectors than countries with lower tax levels. Thus, as the world moves forward in the newcentury, there is a clear trend for mining taxation systems to become increasingly similar. Second, poortransparency is eroding the business climate. The highly centralized and nontransparent nature of thePeruvian governments of the 1990s created an issue of credibility with the local populations around themining transfers from the Central Government to municipalities. Although the Mining Law establishesthat 40 percent of the income tax generated by the mining operations—the canon minero—should goback to the municipalities (20 percent) and the regions (20 percent), and Bank findings show that itsoverall redistribution has been progressive, management of the canon has not been transparent, andthere is a widespread perception that the local communities are not benefiting from it. Third, the percep-tion of inadequate environmental control and of widespread conflict between mining companies andlocal populations is endangering the contribution and stability of a key sector of the Peruvian economy.Furthermore, the environmental information that the Ministry of Energy and Mines (MEM) has
VIII
FINE-TUNING FISCALAND ENVIRONMENTAL
MINING POLICIES
147

received from the mining companies has not been adequately released to the public, resulting in a feelingof mistrust toward mining activities.
This chapter offers empirical evidence that supports the view that the current Peruvian mining tax regime is among the most globally competitive systems in the world, and provides an appropriatebalance between investor needs and government needs. However, room for improvement is constrainedby the need for additional fiscal resources. Finally, it reviews other structural issues and offers detailedrecommendations.
BackgroundThe mining sector is essential for growth and development in Peru.1 The sector generates more than45 percent of the country’s export earnings and contributes 5 to 7 percent of GDP.2 The miningindustry has long been Peru’s most prosperous sector, with growth rates between 6.6 percent and15.2 percent, during 1994–99, attracting a total of US$6.3 billion in investments during 1992—2001, and peaking in 2001 at US$1.3 billion. Potential tax revenues from the sector would be highlyrelevant to achieving its macroeconomic–financial projections. Tax expenditure associated to miningbenefits is estimated at 0.4 percent of GDP (IMF 2000). The canon minero accounts for about 4 per-cent of total transfers to municipalities. Over one-quarter million people depend on formal miningfor their livelihood, and it is estimated that this could double given the sector’s potential. Mining isparticularly relevant in some of the mountainous areas of the country, which are among the poorestregions. Attracting and sustaining mining investment in these areas would contribute to reducing thewidening inequalities between the coastal areas and the lagging interior. However, investor interest inthe sector has recently dropped dramatically, resulting in moderate investment projections of about$500 million per year between 2003 and 2005. The key question for Peru is whether it can institutereforms that will return the sector to its role as an engine of growth like, for example, in Chile.
Past reforms were left incomplete. The Peruvian General Mining Law provided a sound basis forthe modernization of the sector. Results of mining reforms in the early 1990s were impressive: Whileglobal exploration investment went up 90 percent and grew fourfold in Latin America, between1990 and 1997 in Peru it grew twentyfold. Since 1997, as a consequence of drastically lower metalcommodity prices, the share of exploration investment of most developing countries was reducedsubstantially, as most international mining companies retreated to their traditional exploration areas.Yet Peru was able to keep its share of the total. This increased investment during the 1990s doubledthe mineral production and mineral exports value of Peru. However, structural—taxation and environment—issues and low transparency of revenue transfers have negatively affected the competi-tiveness and credibility of the mining regime, expanded the perception of inadequate environmentalcontrol, and failed to prevent conflict between the government and the local populations, thusendangering the contribution and required stability of this critical source of growth.
The Peruvian Taxation RegimeThe existing Peruvian mining tax system is complex (Box 8.1). The term “tax” is defined as anylevy imposed by the government on a productive agent, regardless of whether it takes the form of an explicit tax, a fee, or any other payment that is paid to the government or to another partybecause the taxpayer is required to do so by the government.
Comparison of Peru’s Tax System to Minerals Tax Systems in Selected CountriesMany of the major tax types of the mineral sector are already applied by Peru. Comparison of min-ing tax systems among different countries endowed with mineral resources is relevant from thestandpoint of determining how attractive a particular country is to foreign investors in a world
148 WORLD BANK COUNTRY STUDY
1. The sections on taxation mainly draw on Otto (2002).2. Peru’s main mineral exports are iron, silver, zinc, copper, lead, platinum, and gold.

RESTORING FISCAL DISCIPLINE FOR POVERTY REDUCTION IN PERU 149
BOX 8.1: PERU: DESCRIPTION OF THE EXISTING MINING FISCAL SYSTEM
Income tax:■ Distribution: Fifty percent of income tax paid by a mine to the Central Government is to be remitted back to
the canon where the mine is located.■ Rate: Twenty-seven percent under the general tax regime. If the taxpayer has elected to enter into a Stability
Agreement or Mining Contract, the rate is 29 percent. An additional 4.1 percent tax is applied to net profitsremitted (see withholding tax description below).
Deductions for computing taxable income:■ Feasibility studies: There are two possible interpretations: (a) treated as a development cost; may either be
expensed in the year costs were incurred, or costs may be amortized over a period of three years from theyear the minimum production is achieved; or (b) treated as a preoperative cost; may either be expensed inthe year the cost is incurred, or costs may be amortized over a period of 10 years from the year in whichminimum production is achieved.
■ Preproduction exploration costs: Costs may either be expensed in the year they were incurred or amortizedfrom the year the minimum production is achieved, over a period determined based on the life of the mine.
■ Development expenses: Costs may either be expensed in the year they were incurred, or may be amortizedover a period of three years from the year the minimum production is achieved.
■ Capital costs: Taxpayer can select the rate of straight-line depreciation up to the allowed maximum; mostmining, processing, and power equipment has a maximum of 20 percent per year; roads and buildings have amaximum of 3 percent unless a stability agreement (15 years) is in effect, in which case a 5-percent maximumapplies; costs incurred for government-approved infrastructure such as a school, hospital, or recreationalfacility can be expensed as incurred.
■ Costs qualifying for depreciation or amortization may be adjusted for inflation using the whole price index;however, adjustment is not allowed if (a) there is a stability agreement, and (b) the taxpayer has elected tokeep its books in U.S. dollars.
The following types of costs may be deducted for computing net taxable income: preproduction explorationexpenses, mine site development costs, feasibility study costs, operating costs, capital costs, qualifying loaninterest, withholding tax on interest, property tax, fee based on land area, payroll taxes, workers’ profit share,value added tax (when the VAT is not used as a credit).
Excess profits type tax: None.
Royalties: There are no royalties or similar taxes.
Withholding tax on loan interest paid to foreign lenders: 4.99 percent is applied to loans from abroadprovided monies are sent into Peru, and the maximum interest is less than prime + 6 points or LIBOR + 7 points.Thirty percent is applied for the excess of interest exceeding the maximum limit, in cases where loans areentered into between related partners, and if the lender is a resident of a tax haven.
Withholding tax on dividends remitted abroad: None by that name. However, an additional rate of 4.1 percent on income tax is applicable when dividends are distributed.
Withholding tax on salaries and fees paid to foreign consultants: Thirty percent tax rate is applied on80 percent of gross income (thus, in practice, the effective rate is 24 percent) if technical services are renderedin Peru. If technical services are rendered partly abroad and partly in Peru, a 30 percent tax rate is applied on40 percent gross income (thus, in practice, the effective rate is 12 percent). Services totally rendered abroadare not subject to withholding tax.
Import duty on foreign equipment: Rates are generally 12 to 20 percent. The average rate for miningequipment is 12 percent. Import duties are not immediately deductible; rather, they are added to the assetacquisition cost and depreciated at the asset’s depreciation rate.
(continued )

150 WORLD BANK COUNTRY STUDY
BOX 8.1: PERU: DESCRIPTION OF THE EXISTING MINING FISCAL SYSTEM (CONTINUED)
Export duties on minerals: None.
Sales tax on equipment: None
Value added tax on purchased goods or services: Eighteen percent VAT is levied on sales of goods andservices, imports of goods, construction contracts, sales of real property by construction concerns, and servicesrendered abroad, but used in Peru; VAT may be reimbursed by means of assignable credit notes based on exportsales; can offset VAT against income tax, or obtain a refund check. If minerals are sold locally, VAT applies tosales except for gold. The amount of VAT that may be credited is restricted to 18 percent of export sales, andany amount exceeding this may be carried forward as a credit against future export sales. VAT paid during explo-ration is refundable.
Time to claim back value added tax: Three to 6 months.
Education tax: None.
Property tax: Applies only to operations located in urban areas.
Local development requirement: None. If a taxpayer voluntarily contributes to local development and thatlocal development project is approved by the proper government ministry, the costs may be expensed asincurred. In practice, approval is difficult or time consuming.
Land use fees: A validity tax, also called a good standing fee, is calculated based on the area in mining concessionfrom the moment the claim is filed. The fee is US$3 per hectare per year and is deductible. Seventy-five percent isdistributed by the Central Government to the canon where the mine is located.
Stamp tax: None.
Payroll taxes paid by employer: Extraordinary solidarity tax: 2 percent of salaries paid; health service(ESSALUD): 9 percent of salaries paid; national technical industrial training service, if more than 20 workers:0.75 percent of salaries paid.
National Service for Construction Industry Training: 0.2 percent of total incomes comprised of materials,workmanship, general expenditures, technical direction, profits, or any other item that might be invoiced to thecompany’s clients.
Workers’ profit sharing: It is obligatory to pay a workers’ participation of 8 percent on the net profits; ofthis amount up to 18 times monthly salary goes to the worker, with the remainder going to a special educa-tional, social, and recreational fund. Disbursements are decided by a Board comprised of representatives ofmining companies, government, and workers. The amount paid is allowed as a tax deduction. Not all foreigngovernments recognize this as a creditable tax, and double taxation can occur.
Tax incentives:■ Loss carry-forward: Four years.■ Loss carry-back: None.■ Tax credits: Income tax paid abroad in respect to income of foreign source taxable in Peru, may be
deducted against Peruvian income tax within certain limits; qualifying VAT may be credited (see above).■ Tax stability: Titleholders of mining activities may enter into several types of tax stability agreements. Two
types are defined under the Foreign Investment Law and two others under the General Mining Law. They arenot mutually exclusive and a company can have both (one under the Foreign Investment Law and anotherunder the General Mining Law). If an agreement is in place under the Mining Law, the income tax is increasedby 2 percent.
Under the Foreign Investment Law, a Stability Agreement (as an investee—the company which received theinvestment) granted by the National Commission for Foreign Investment and Technology guarantees for
(continued )

where investment in mining depends on, among other things, decision criteria such as after-taxprofitability, the investor’s ability to predetermine the applicable tax liabilities, the stability of thetax regime, and the level and method of tax levies (Box 8.1).
Comparisons of mine taxation in different taxing jurisdictions are a complex matter (Table 8.1).An isolated comparison of any one type of taxing mechanism may lead to certain insights, but takenalone may not provide a useful indication of how mine taxation in one jurisdiction compares to thatin another. To gain a broader understanding of how overall tax systems compare, it is necessary toanalyze them in a holistic manner. Both to facilitate and formalize such an analysis, it is a commonpractice to define a hypothetical pre-feasibility-type model mine and then apply different taxation sys-tems to that mine and compare the results. In the background work for this chapter, model mineswere specified and various measures of taxation and profitability calculated to allow comparisonbetween Peru and other countries.3
The current tax system in Peru is globally competitive for mining. When countries are rankedfrom the standpoint of the foreign investors’ internal rates of return (IRR), Peru ranked 11th out of23 (base metal) and 7th out of 23 (gold), and in the second-lowest quartile (Tables 8.2 and 8.3).
RESTORING FISCAL DISCIPLINE FOR POVERTY REDUCTION IN PERU 151
BOX 8.1: PERU: DESCRIPTION OF THE EXISTING MINING FISCAL SYSTEM (CONTINUED)
10 years stability concerning income tax regime, currency exchange regime, free availability of foreign cur-rency, and nondiscrimination). To qualify, the investor must invest a minimum of US$10,000,000 within two years of the Stability Agreement.
Under the General Mining Law, an investor can enter into a Mining Contract. The agreements can be for aperiod of 10 or 15 years: 10-year—the investment must equal US$2 million and be destined to either start upan operation with a production capacity of 350 metric tons per day (Mt/day) to 5,000Mt/day; and 15-year—this agreement targets production of at least 5,000Mt/day and requires an investment of US$20 million for astart-up operation, or US$50 million to capitalize an existing operation. A Mining Contract guarantees the fol-lowing: free marketing of mineral products for export or domestic sale; free disposal within the country andabroad of foreign currency generated by exports; free convertibility into foreign exchange of local currencygenerated by mineral sales; nondiscrimination in exchange matters; depreciation rates of 20 percent for miningand processing equipment and 5 percent for buildings (15-year agreements); the electable option to keepbooks in U.S. dollars (15-year agreements); general tax stability including income tax, regime, compensationand/or tax refunds, customs duties, municipal taxes, and validity fee; nondiscrimination in exchange matters;and freedom to remit profits, dividends, financial resources.
Tax reduction in Selva regions: Special tax rules and rates apply to VAT, income tax, and excise tax.
Requirement to use local goods and services: None.
Local equity requirement: None.
Government equity requirement: None.
No ring fencing principles apply (may consolidate books).
Foreign external accounts: Allowed for receipt of revenues.
Exchange controls: No significant restrictions.
Source: Otto (2002).
3. Yet, this is not the only possible approach. Another familiar one is to analyze competitiveness by level ofinvestments in new deposits and expansion in already existing ones. The model mines used in the backgroundwork for this chapter were based on the standard base metal (copper) mine model and gold mine modeldeveloped at the Institute for Global Resources Policy and Management at the Colorado School of Mines.Description of the model, its methodology, attributes, and limitations can be found in Otto (2002). Themodel’s estimates are particularly sensitive to price assumptions.

152 WORLD BANK COUNTRY STUDY
TABLE 8.1: MINERAL TAXES IN PERU AND OTHER COUNTRIES
Does Peru Impose this Levy? Comments
Tax typeIncome taxExcess profits taxRoyaltiesWithholding tax on remitted dividends
Withholding tax on remitted loan interestImport duties on equipment
Export duties on mineralsSales tax on purchased equipmentSales tax on minerals paid by mineVAT on services
VAT on equipment
VAT on mineral salesProperty tax/fee
Education tax/fee
Local development tax/feeFees based on land areaStamp taxPayroll taxesExcise tax on fuel
Source: Otto (*2002).
YesX
X
X
X
X
X
X
XX
No
XXX
XX
X
X
X
X
X
An additional rate of 4.1 percent (income typetax) is applicable when dividends are distributed(similar to a dividend withholding tax, but it is nottechnically termed a withholding tax).
Equipment imported for temporary use, such asfor exploration work, may be imported withoutpayment of import duties if such equipment isreexported within a year.
Fully refundable during exploration (as of the dateof this report, refund is not applied because theprocedural rules are pending).Fully refundable during exploration (as of the dateof this report, refund is not applied because theprocedural rules are pending).VAT does not apply if the mineral is sold for export.A property tax applies only to mines locatedwithin urban areas.An education tax is not applied; however, an 8 per-cent profit-based, profit-sharing requirement isapplied, and a portion may go to a special educa-tional, social, and recreational fund.
Called a “validity tax” or “good standing fee.”
Exempted during exploration (the exemption is notapplied because the procedural rules are pending).
Sensitivity of the Peruvian Tax System to Prices and CostsUsing a standard copper mine model, Peru’s mining tax system is quite neutral to changes inprices, operating costs, and capital costs, except when prices become low (Table 8.4). The impactof a tax system on a mine can vary according to its profitability. If the overall effective tax rate(ETR) goes up as profitability goes up, the system is said to be progressive. If the ETR decreases as

profitability goes up, it is said to be regressive. Progressive tax systems tax more profitable mines ata higher effective rate than mines with lower profits. Most economists agree that neutral or slightlyprogressive tax systems are better than regressive systems.
Comparing Tax Stability Across CountriesIn a global survey of mining companies, over 50 percent of the respondents listed tax stability asa “very important” factor in investment decisionmaking. Out of a list of 60 investor criteria, taxsystem stability ranked 10th in importance. In the mining business the investment horizon is long,and companies are usually reassured by tax systems that reduce tax payment uncertainty and vul-nerability, particularly during the loan and project payback periods. However, many governmentsare hesitant to resort to tax stability agreements. This is because there is a basic tenet that one gen-eration of lawmakers should not be able to tie the hands of future lawmakers. Another relevantconsideration is that tax stability is desired by all productive sectors because it reduces uncertainty.Then, if stability is offered to one sector, other sectors will also seek it.
The government faces a tradeoff. On one hand, stability agreements enhance the potentialfor mineral sector investment, but, on the other hand, they complicate the tax system and raise
RESTORING FISCAL DISCIPLINE FOR POVERTY REDUCTION IN PERU 153
TABLE 8.2: COMPARATIVE MEASURES OF PROFITABILITY AND EFFECTIVE TAX RATE FOR AMODEL BASE METAL MINE IN SELECTED JURISDICTIONS
Country Foreign Investor’s IRR (%) Total Effective Tax Rate (%)
Lowest Taxing QuartileSweden 15.7 28.6W. Australia 12.7 36.4Chile 15.0 36.6Zimbabwe 13.5 39.8Argentina 13.9 40.0China 12.7 41.7
Second-Lowest Taxing QuartileBolivia 11.4 43.1South Africa 13.5 45.0Philippines 13.5 45.3Kazakstan 12.9 46.1Peru 11.7 46.5Tanzania 12.4 47.8
Second-Highest Taxing QuartileIndonesia 12.2 48.6Poland 11.0 49.6U.S. (Arizona) 12.6 49.9Mexico 11.3 49.9Greenland 13.0 50.2Ghana 11.9 54.4
Highest Taxing QuartilePapua New Guinea 10.8 57.8Uzbekistan 9.3 62.9Ivory Coast 8.9 62.4Ontario Canada 10.1 63.8Burkina Faso 3.3 83.9
Source: Otto (2002).

TABLE 8.3: COMPARATIVE ECONOMIC MEASURES FOR A MODEL I GOLD METAL MINE INSELECTED JURISDICTIONS
Foreign Investor’s Internal Country Rate of Return (%) Total Effective Tax Rate (%)
Lowest-Taxing QuartileSweden 19.2 29.1South Africa 18.8 32.6Chile 18.3 36.8Philippines 18.4 38.2Argentina 16.6 42.5W. Australia 15.2 43.1
Second-Lowest Taxing QuartilePeru 14.7 43.3Zimbabwe 15.7 45.9U.S. (Nevada) 15.1 49.3Bolivia 12.2 52.4Kazakstan 13.5 54.4Greenland 14.7 54.9
Second-Highest Taxing QuartileGhana 13.6 56.7Tanzania 12.7 57.9Indonesia 11.4 60.4Uzbekistán 11.2 62.0Mexico 10.4 62.9Ontario Canada 10.7 68.3
Highest Taxing QuartileIvory Coast 9.1 69.1Papua New Guinea 8.7 72.3China 7.1 73.9Poland 3.0 90.2Burkina Faso −1.6 106.0
Source: Otto (2002).
TABLE 8.4: COPPER MODEL: PERU’S TAX SYSTEM SENSITIVITY TO PRICE ANDCOST CHANGES
Effective Tax Rate (%) System Effect
Price Sensitivity:US$0.80/lb 126 RegressiveUS$1.10/lb (base case) 47US$1.50/lb 39
Operating Cost Sensitivity:US$0.40/lb 45 Fairly NeutralUS$0.45/lb (base case) 47US$0.50/lb 49
Capital Cost Sensitivity:US$550,000,000 43 Fairly NeutralUS$610,000,000 (base case) 47US$650,000,000 48
Note: A rate higher than 100 percent indicates that the mine is paying taxes in excess of its net income.
Source: Otto (2002)

administrative costs. In addition, if taxes are stabilized for various mines, then an administrativechallenge can arise over time. As the underlying tax laws change, each stabilized mine will have a tax regime dating to the time the stability agreement was entered into. This means that, overtime, there will be multiple tax regimes and the government agency charged with tax administra-tion will increasingly face a more complicated situation monitoring and enforcing each. Thisentails costs. (See Table 8.5 for the availability of tax stability in selected jurisdictions.)
Currently, in Peru, there are hundreds of mining concessions with stability agreements. How-ever, because these agreements stabilize taxes for only around 10 to 15 years, over time the affectedmines will revert to the general tax system in the future. Stability also carries a price for companies—an additional 2 percent rate is applied to the 27 percent income tax. Stability is, indeed, importantto investors—witness the number of mining concession holders who have agreed to pay the pre-mium. One option open to the Peruvian government is to raise the amount of this premium. Theeffect of raising the stability premium is shown in Table 8.6. As can be seen in the table, for thetwo model mines a premium of 5 percent on the regular income tax rate of 27 percent reduces the
RESTORING FISCAL DISCIPLINE FOR POVERTY REDUCTION IN PERU 155
TABLE 8.5: AVAILABILITY OF TAX STABILITY IN SELECTED JURISDICTIONS
Some Form of Tax Country Stability Available? Description
Argentina
BoliviaBurkina FasoCanada (Ontario)ChileChinaGhanaGreenlandIndonesia
Ivory CoastKazakhstanMexicoPeru
PhilippinesPolandSouth AfricaSwedenTanzaniaU.S. (Arizona)Uzbekistan
W. AustraliaZimbabwe
Source: Otto (2002).
Yes
NoYesNoYesNoNoNoYes
NoYesNoYes
NoNoNoNoNoNoYes
NoNo
30 years, provincial & municipal taxes, import duties, exchangerules.
–During the term of the contract; except mining taxes and fees.
–10 years, if mine elects a higher income tax rate (42%).
–––
Tax stabilized for life of mining agreement or a shorter period(Contract of Work).
–Taxes stabilized for life of mining agreement.
–Two systems of tax stability: mining contracts (10 to 15 yearstax stability), and 10-year Legal Stability Agreements that fixthe income tax regime and certain other fiscal imposts; 2%additional rate.
––––––
Most major taxes may be frozen for 10 years from date ofestablishment; tax experts warn that there may be difficultieswith the practical implementation.
––

investor’s rate of return by about 1 percent, and the effective tax rate remains at about 50 percent or lower.
Recommendation:■ Companies find tax stability very attractive, and Peru’s stability agreements are an incentive
to investors. Therefore, it is recommended that tax stability agreements be retained but thatthe premium for all future such agreements be raised to 5 percent. The disadvantages ofsuch agreements (sector discrimination and administrative burden) are more than offset bythe increased tax base that may be created in the future by higher levels of investment, andthe higher levels of tax paid based on the 2-percent premium. Investors would probably bewilling to pay a higher premium for tax stability.
The income tax rate of 27 percent in Peru is somewhat lower than in some nations (Table 8.7).In addition, a 4.1 percent additional income tax is applied to remitted dividends. The net effect formany foreign companies is a rate of around 30 percent. If a taxpayer desires a stability agreement,and many miners probably would, the base rate is 29 percent.
Recommendation:■ The current income tax rate should be retained.
Peru uses a form of accelerated depreciation for most mine equipment (20 percent straight-line method). The most common form of tax-base incentive for mining is accelerated depreciation.Most nations provide the mining industry with some sort of accelerated depreciation (Table 8.8).Until recently, Peru also provided a form of accelerated depreciation on mine buildings at a rate of 20 percent (straight-line). After tax reform, this was extended to a 3 percent depreciation rate,which is in line with depreciation periods allowed by many other nations.
Unlike most industries, when a mine closes, its buildings usually have no future function—thatis, no market value. Thus, mines the duration of which is less than the depreciable life of theirbuildings will never be able to fully depreciate these buildings. For this reason, some nations allowa shorter depreciation period, or an alternative depreciation method (such as life of the mine).
156 WORLD BANK COUNTRY STUDY
TABLE 8.6: TAX SYSTEM SENSITIVITY TO INCOME TAX RATE
Govt Revenue: Effective All Taxes & Fees
Income Tax Rate Tax Rate (%) Investor IRR (%) (US$ millions)
Copper Model25% 45 11.9 45127% (current) 47 11.7 47127 + 2 = 29% (stabilized) rate) 48 11.5 49127 + 3 = 30% 49 11.4 50127 + 5 = 32% 51 11.1 521Gold Model:25% 42 15.0 7327% (current) 43 14.7 7627 + 2 = 29% (stabilized) rate) 45 14.4 7927 + 3 = 30% 46 14.3 8027 + 5 = 32% 48 13.9 83
Source: Otto (2002).

Table 8.9 shows the impact of a 3 percent versus a 20 percent depreciation rate. The effect is con-siderable for the short-lived gold model mine, but there is less of an impact on the longer-livedcopper model mine.
Recommendation:■ A longer period of depreciation (8 to 10 years) should be considered and the previous sys-
tem of 20 percent depreciation should be reinstated for buildings; a 3 percent rate yields adepreciation period of over 33 years (longer than the life of most mines).
Peru has an exceptionally short loss carry forward time limit of four years. One of the mostcommon tax incentives is to allow taxpayers the ability to carry forward losses from one year to off-set taxable income in the succeeding years. For capital-intensive industries and for industries excep-tionally prone to commodity price fluctuation, criteria that are no doubt met by the mining, losscarry forward is an important issue. For a sample of countries, a loss carry forward time limit as of2000 shows that, of the 22 nations, all had a longer time limit than Peru (Table 8.10). Table 8.11shows the effect of lengthening the loss carry forward time limit.
Recommendation:■ The loss carry forward time limit should be extended to at least 10 years, or preferably, no
time limit should be imposed. While a short period is adequate for most small, short-livedmines, it is not conducive to attracting investment for larger mines.
RESTORING FISCAL DISCIPLINE FOR POVERTY REDUCTION IN PERU 157
TABLE 8.7: INCOME TAX RATES APPLIED TO MINING PROJECTS IN SELECTED JURISDICTIONS
Country Corporate Income Tax Rate
Argentina 35%Bolivia 25% (a surtax may also apply in some cases)Burkina Faso 35% (0.5% of previous year turnover is the minimum tax)Canada (Newfoundland) Federal: effectively 29.12%, including 4% surtax); provincial: 14%Chile 15% (two elective regimes are available)China 33% (30% to Central Gov’t, 3% to provincial gov’t)Ghana 35%Greenland 35%Indonesia 30% (previous rates range from 221/2–48%)Ivory Coast 35%Kazakhstan 30% (excess profits tax may apply)Mexico 35%Papua New Guinea 35% for large (SML) mines, 25% for most other minesPeru 27% (29% for taxpayer with stability agreement)Poland 2000, 30%; 2000–01, 28%; 2003, 24%; 2004+, 22South Africa 30% for other than gold; formula > 30% for gold minesSweden 28%Tanzania 30%U.S. (Arizona) Progressive based on income (profit level)Uzbekistan 33%W. Australia 2000–01, 34; 2001+, 30%Zimbabwe 35%
Source: Otto (2002).

158 WORLD BANK COUNTRY STUDY
TABLE 8.8: DEPRECIATION APPLIED TO TYPICAL MINING EQUIPMENT INSELECTED JURISDICTIONS
Accelerated Method Available for Some Capital Equipment
Country (Yes or No) Example
Argentina Yes 3-year straight-lineBolivia Yes 8-year straight-lineBurkina Faso Yes Useful life minus one yearCanada Yes Up to 100% in year incurred for new mine or 25% declining poolChile Yes 3-year straight-lineChina Yes 10 yearsGhana Yes 75% in 1st year, then 50% declining balanceGreenland Yes The company may decide the rate and periodIndonesia Yes 10-year straight-line or 20% declining balanceIvory Coast Yes Method of acceleration depends on life of equipmentKazakhstan Yes 25% declining balance methodMexico NoPeru Yes 5-year straight-line (20%), except for mine buildingsPhilippines Yes Twice the normal straight-line ratePoland Yes 5-year straight-line (20%)South Africa Yes Expensed in 1st year of productionSweden Yes 5-year straight-line (20%)Tanzania Yes 12.5% straight-lineU.S. (Arizona) NoUzbekistan No 8% straight-lineW. Australia Yes Prime cost or diminishing value methods (less than effective life)Zimbabwe Yes Expensed in year incurred or 1st year of production
Source: Otto (2002).
TABLE 8.9: TAX SENSITIVITY TO BUILDING DEPRECIATION RATES
Government Revenue: Loss Carry Effective All Taxes & Fees Forward Time Limit Tax Rate (%) Investor IRR (%) (US$ millions)
Copper Model:3% rate (current system) 47 11.7 47120% rate 46 11.9 461Gold Model:3% rate (current system) 43 14.7 7620% rate 41 15.2 72
Source: Otto (2002).

RESTORING FISCAL DISCIPLINE FOR POVERTY REDUCTION IN PERU 159
TABLE 8.10: LOSS CARRY FORWARD/BACK POLICY IN SELECTED JURISDICTIONS
Loss Carry Loss Carry-Back Country Forward Time Limit (yrs) Available Time Limit (yrs)
Argentina Yes 5 No –Bolivia Yes None No –Burkina Faso Yes 5 No –Canada (Ontario) Yes 7 Yes 3Chile Yes None Yes NoneChina Yes 5 No –Ghana Yes None No –Greenland Yes None Yes 5Indonesia Yes 8 No –Ivory Coast Yes 5 No –Kazakhstan Yes 7 No –Mexico Yes 10 Yes NonePeru Yes 4 No –Philippines Yes 5 No –Poland Yes 5 No –South Africa Yes None No –Sweden Yes None No –Tanzania Yes None No –U.S. (Arizona) Yes 15 Yes 3Uzbekistan No – No –W. Australia Yes None No –Zimbabwe Yes None No –
Source: Otto (2002).
TABLE 8.11: TAX SENSITIVITY TO LOSS CARRY FORWARD TIME LIMIT
Government Revenue: Loss Carry Effective All Taxes & Fees Forward Time Limit Tax Rate (%) Investor IRR (%) (U$ millions)
Copper Model:4 years (current system) 47 11.7 4715 years 45 12.1 4517 years 45 12.1 450No time limit 45 12.1 450Gold Model:4 years (current system) 43 14.7 765 years 43 14.7 767 years 43 14.7 76No time limit 43 14.7 76
Source: Otto (2002.)

Peru does not have a provision for mining closure. Of increasing concern to governments is theissue of mine reclamation and closure. These costs are primarily incurred by the miner late in theproject at a time when production is falling off or close to nil. Thus, companies cannot recover thecosts involved with closure unless the tax system is adjusted to take these into account while cashflows are still being generated. It is in the government’s interest to see that the company does planand set aside funds for this activity, because at the end of the mine life, funds will not be generated.One way to encourage companies to fund closure is to require an annual setaside over the life of the mine and to allow this setaside as a tax deduction. Table 8.12 indicates the effect of allowing adeduction for such costs spread equally over the life of the mine.
Recommendation:■ The tax system should be modified so that money set aside for this purpose can be
deducted straight-line as amortization over the productive life of the mine.
Peru’s current tax system recognizes the importance of mine contributions to local communi-ties and infrastructure and allows a deduction for such expenditures. There is intense interest bymany stakeholders in furthering the concept of sustainable development. One way to foster this isto invest in communities impacted by mining so that when the mine closes, the affected communi-ties will be able to carry on with social and alternative economic activities. Deductions are allowedonly if the expenditure is approved by the government, and companies have found it extremely dif-ficult to get such approval from the relevant ministries.
Recommendations:■ The current practice of allowing government-approved, miner-paid-for investment in com-
munities and infrastructure to be tax deductible should continue. Deductions should applynot only to hard investment (transport, power), but also to soft investment in local infra-structure/capacity building by community groups (training, education).
■ However, the current system of approval does not work well, if at all, and needs reform.Such approval authority should vest in a single ministry, not with the ministry responsiblefor the particular type of infrastructure.
■ The relevant law should also state that if the ministry does not give its approval for such taxstatus on the proposed investment within a reasonable time period, say 60 days, the requestwill be deemed to have been approved.
Until recently, Peru offered mining investors an incentive to increase the company’s produc-tion with a reinvestment provision, but this benefit was eliminated in a recent tax reform. Before
160 WORLD BANK COUNTRY STUDY
TABLE 8.12: TAX SENSITIVITY TO ANNUAL ALLOWED CLOSURE DEDUCTIONOVER THE MINE LIFE
Government Revenue: Effective All Taxes & Fees
Closure Deduction Tax Rate (%) Investor IRR (%) (US$ millions)
Copper Model:No deduction (current system) 47 11.7 471Annual life of mine deduction 46 11.8 463Gold Model:No deduction (current system) 43 14.7 76Annual life of mine deduction 42 15.1 73
Source: Otto (2002.)

reform, the company was not subject to paying income tax on the profits it reinvested, providedthese sums were in accordance with an investment program approved by the mining authority. Theperiod of validity was four years, but could be extended for another three. However, the benefitwas capped at 80 percent of the total profits, with the balance being subject to income tax. A rein-vestment incentive such as this is extremely uncommon globally. Most governments use the“penalty” approach to encourage reinvestment rather than the “incentive” approach, that is, theyimpose a foreign-dividend withholding tax. To assess the impact of such an incentive, the coppermine model was modified (Table 8.13).4
A critical policy question when assessing a proposed tax incentive is whether the incentive(which, presumably, will lead to a short-term tax decrease) will lead to increased tax revenues overthe long run. There are two ways to look at this: (a) will government returns from an individualproject be increased over the life of the project, and (b) will government revenue increase becauseother potential investors (who would not have invested had there been no incentive) invest? Withregard to (a), for the particular mine model used here, the table shows that the government willend up with less revenue. Even though there will be more metal sold over the life of the mine andvarious taxes will be applied to those sales, the additional revenue does not equal the amount ofrevenue lost in the four tax-incentive years. With regard to (b), it is doubtful that such an incentivewould attract new investors. In practice, the incentive might further reduce government revenue ifcompanies purposefully underbuild initial capacity in order to take advantage of the liberal capacityincrease allowance in later years.
Recommendation:■ The decision to eliminate the reinvestment tax allowance should not be reversed.
Peru is one of the mining countries in the world that do not impose a traditional royalty-typetax. The theory of optimal taxation of nonrenewable natural resources states that, under suitableassumptions, a government can tax away the pure rents generated in the extraction of thoseresources with no loss of allocation efficiency. This justifies the imposition of special taxes on non-renewable-resource producers over and beyond the taxes levied on firms operating in the other sec-tors of the economy. It is widely acknowledged that the simplest special tax to administer is thegross royalty, and this helps explain why 60 percent of the countries in the reference sample imposeroyalties on mining producers (Table 8.14).
RESTORING FISCAL DISCIPLINE FOR POVERTY REDUCTION IN PERU 161
4. It allows for a four-year, phased 20 percent mine capacity expansion commencing in the eighth year afterproduction began. The cost was assumed to be $80 million for the expansion. It was assumed that an 80 percentprofit exemption cap is applicable. The economic measures for the expanded project were assessed with andwithout the tax incentives to determine its effect on government revenue and company rate of return.
TABLE 8.13: TAX SENSITIVITY TO REINVESTMENT ALLOWANCE
Government Revenue: Effective All Taxes & Fees
Scenario Tax Rate (%) Investor IRR (%) (US$ millions)
Copper Model:20% expansion, no reinvestment 46 12.1 533allowance (current system)20% expansion, 80% reinvestment 44 12.5 506allowance
Source: Otto (2002).

In the Peruvian context, a decision on royalty taxes must be made taking into account the min-ing taxation system as a whole. One of the simpler forms of royalty is a tax-deductible gross salesrevenue ad valorem tax. The impact of such a tax was assessed on the model mines (Table 8.15).Taking into account the rest of the system, it is relevant to point out that Peru already imposes substantial input taxes (import duty, VAT). On the other hand, whereas a royalty tax is assessed only in years during which there are commercial revenues, an input tax, such as import duty, entails collection during the project startup period, before there is any mine income. Companieswould much prefer to pay taxes during years when production has begun rather than during construction.
Recommendation:■ A reasonable royalty should be imposed, provided that the import duty is eliminated by
exemption or zero-rating, or that workers’ participation is modified in a process affectingthe entire public sector.5 The royalty tax should (a) be based on gross mineral sales rev-enues, (b) not exceed a rate of 3 percent, (c) have a uniform rate for all mineral types, and(d) be offset by the elimination of the import duty.
162 WORLD BANK COUNTRY STUDY
TABLE 8.14: PRESENCE OF MINERAL ROYALTY TAX SYSTEMS IN SELECTED JURISDICTIONS
Country Mineral Royalty Type Tax on Most Minerals?
Argentina YesBolivia YesBurkina Faso YesCanada (Ontario) NoChile NoChina YesGhana YesGreenland NoIndonesia YesIvory Coast YesKazakhstan YesMexico NoPapua New Guinea YesPhilippines YesPeru NoPoland YesSouth Africa NoSweden NoTanzania YesU.S. NoUzbekistan YesW. Australia YesZimbabwe No
Source: Otto (2002).
5. There is a negative impact on mining competitiveness of the 8 percent workers’ participation since itincreases the real income tax rate burden of firms from about 30 percent to about 38 percent. Authorities indi-cated that this participation could be diminished and unified across all similar activities in an upcoming initiative.

Peru does impose substantial import duties, and the rates vary according to the item. How-ever, import duty is allowed as a depreciable deduction against income subject to income tax.Mining is capital intensive and uses specialized equipment that is usually imported. This meansthat an import duty on equipment has a direct impact on project economics in the project’s earlyyears. Project feasibility studies calculate various projections of profitability, such as discountedrate of return, and such measures are very sensitive to large costs in the early years of a project.Even modest levels of equipment import duties can sink a marginal project. Competition for mineral sector investment worldwide is fierce, and many countries have either eliminated importduties on mine equipment or have found ways to exempt projects or their equipment from such duties. The effect of eliminating the import duty is shown in Table 8.16. The impact ofimport duty is high on both government and taxpayer.
RESTORING FISCAL DISCIPLINE FOR POVERTY REDUCTION IN PERU 163
TABLE 8.15: TAX SYSTEM SENSITIVITY TO A ROYALTY TAX
Government Revenue: Royalty Tax on Effective All Taxes & Fees Gross Sales Revenue Tax Rate (%) Investor IRR (%) (US$ millions)
Copper Model0% (current) 47 11.7 4711% 49 11.3 4932% 51 11.0 5162.5% 52 10.8 5273% 53 10.6 538Gold Model:0% (current) 43 14.7 761% 47 13.9 822% 51 13.0 882.5% 53 12.5 923% 54 12.1 95
Source: Otto (2002).
TABLE 8.16: TAX SYSTEM SENSITIVITY TO IMPORT DUTY
Representative Mining Government Revenue: Equipment Import Effective All Taxes & Fees Duty Rate Tax Rate (%) Investor IRR (%) (US$ millions)
Copper Model:15% 48 11.2 48412% (current) 47 11.7 4715% 44 12.9 4380% 41 13.9 413Gold Model:15% 45 14.1 7812% (current) 43 14.7 765% 40 16.3 690% 37 17.5 65
Source: Otto (2002).
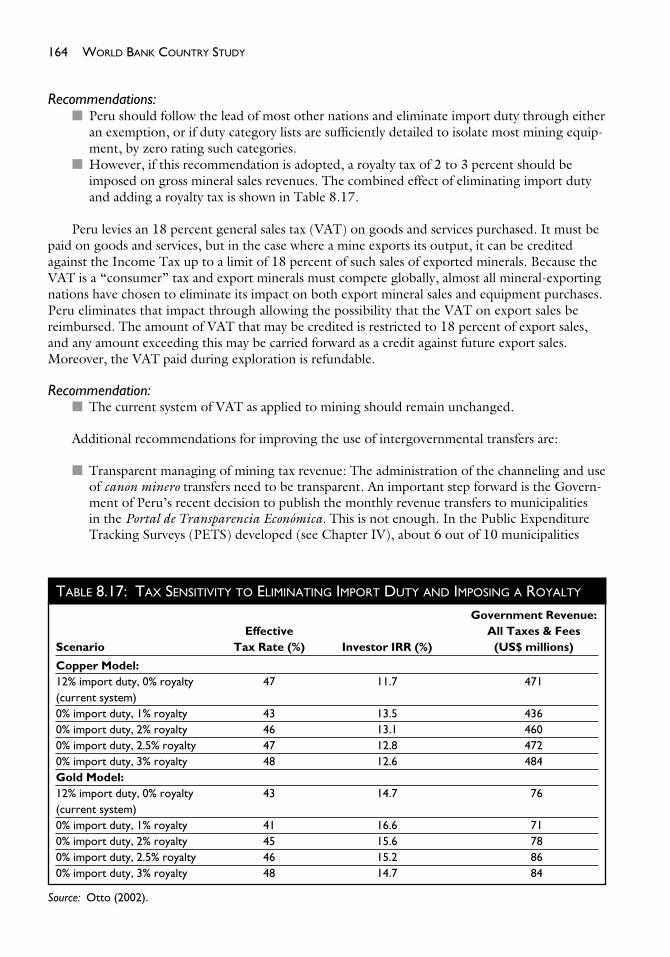
Recommendations:■ Peru should follow the lead of most other nations and eliminate import duty through either
an exemption, or if duty category lists are sufficiently detailed to isolate most mining equip-ment, by zero rating such categories.
■ However, if this recommendation is adopted, a royalty tax of 2 to 3 percent should beimposed on gross mineral sales revenues. The combined effect of eliminating import dutyand adding a royalty tax is shown in Table 8.17.
Peru levies an 18 percent general sales tax (VAT) on goods and services purchased. It must bepaid on goods and services, but in the case where a mine exports its output, it can be creditedagainst the Income Tax up to a limit of 18 percent of such sales of exported minerals. Because theVAT is a “consumer” tax and export minerals must compete globally, almost all mineral-exportingnations have chosen to eliminate its impact on both export mineral sales and equipment purchases.Peru eliminates that impact through allowing the possibility that the VAT on export sales bereimbursed. The amount of VAT that may be credited is restricted to 18 percent of export sales,and any amount exceeding this may be carried forward as a credit against future export sales.Moreover, the VAT paid during exploration is refundable.
Recommendation:■ The current system of VAT as applied to mining should remain unchanged.
Additional recommendations for improving the use of intergovernmental transfers are:
■ Transparent managing of mining tax revenue: The administration of the channeling and useof canon minero transfers need to be transparent. An important step forward is the Govern-ment of Peru’s recent decision to publish the monthly revenue transfers to municipalities in the Portal de Transparencia Económica. This is not enough. In the Public ExpenditureTracking Surveys (PETS) developed (see Chapter IV), about 6 out of 10 municipalities
164 WORLD BANK COUNTRY STUDY
TABLE 8.17: TAX SENSITIVITY TO ELIMINATING IMPORT DUTY AND IMPOSING A ROYALTY
Government Revenue: Effective All Taxes & Fees
Scenario Tax Rate (%) Investor IRR (%) (US$ millions)
Copper Model:12% import duty, 0% royalty 47 11.7 471(current system)0% import duty, 1% royalty 43 13.5 4360% import duty, 2% royalty 46 13.1 4600% import duty, 2.5% royalty 47 12.8 4720% import duty, 3% royalty 48 12.6 484Gold Model:12% import duty, 0% royalty 43 14.7 76(current system)0% import duty, 1% royalty 41 16.6 710% import duty, 2% royalty 45 15.6 780% import duty, 2.5% royalty 46 15.2 860% import duty, 3% royalty 48 14.7 84
Source: Otto (2002).

outside Lima claiming that they knew how their transfers were estimated, actually did notknow, and in the poor and extremely poor municipalities, the number decreased to 3 out of10. Transfers also show high volatility and unpredictability, and are subject to limited audit-ing capacity by the Central Government (Apoyo Institute 2002a). The emphasis of newregulations and their subsequent administration should be on ensuring that the local com-munities are well-trained and informed as to how and when these transfers are estimated.
■ Ways to stabilize the annual flows of mining transfers (Stabilization Fund) should beexplored,6 because the cyclical behavior of international prices affect income tax revenueand, therefore, canon minero flows (Box 8.2).
■ Local administration capacity needs to be strengthened. Municipalities should be supportedin learning how to make optimal use of these resources. They should develop capacity formanaging them: taking investment decisions, and eventually managing their new assetsobtained. Local administration officials and local community representatives would need tobe enabled to participate in local economic development programs that might be initiatedtogether with or by mining companies.
Improving Mining Environment ManagementThe mining environment is cause for heated social and political concern in Peru. Complex politi-cal debates have emerged around existing and newly planned mining operations, typically in thecontext of criticisms that local communities and regions do not gain much from mining opera-tions, the marginal employment these mines create for unskilled indigenous workers, the oftennegative social consequences on the communities living close to the mines (import of prostitutesand alcoholism are often mentioned as major social concerns), and the lack of genuine interest of some mining companies in promoting regional development and respecting environmentalprovisions.
Three weaknesses in Peru’s environmental management are conflicts of interest, credibility,and capacity concerns. The mining sector, in general, has complied better with the environmentalinstitutional assessment requirements, and with territorial environmental assessments. However,there are several instances of potential conflicts of interest.
■ A conflicting case occurs between core technical groups within the Ministry of Mines andEnergy (MEM), that wish to promote mining, and the environmental unit within theMEM, the mandate of which is to prevent environmental damage.
RESTORING FISCAL DISCIPLINE FOR POVERTY REDUCTION IN PERU 165
BOX 8.2: CREATING MINING STABILIZATION FUNDS. THE ANCASH MODEL.
Given the unpredictability of fiscal transfers, a Mining Stabilization Fund is desirable. It could be created with private sector participation and have a long-term view to finance: local infrastructure projects prepared bymunicipalities under participatory plans and capacity-building activities. The Fund could be supervised by a Mesa de Concertación and be subject to strengthened auditing procedures by the official authorities.
A pilot case, though not based on government transfers, has already been created with the Ancash Fund. ThisFund contains about US$110 million of payments, which the firm Antamina still had to pay in the context of itsprivatization. Rather than paying those straight to the Treasury, the company and the involved mayors haveproposed a “Fund model”: The Treasury, upon collecting from Antamina, puts the entire revenue into thisFund, which then finances infrastructure projects in the region (13 projects making up about 60 percent of avail-able funds are already identified, including roads, assessments, and electrification). Resources of the Fund couldalso regularly be replenished with part of canon minero transfers.
6. Once the annual amount is defined, the monthly transfers of the canon minero are constant.

■ Another conflicting case is the inspection of the Environmental Compliance and Manage-ment Programs in the energy and mining sectors. Aside from potentially presenting techni-cal deficiencies, such inspection is under the responsibility of the General Directorates(electricity, hydrocarbon, and mining) with the help of independent experts contracted bythe respective enterprises being evaluated, again in a clear conflict of interest.
■ The reform of the early 1990s had approached the environmental issue from a sectoral per-spective, that is, one where each sectoral ministry has a General Directorate of the Environ-ment (in the case of the MEM it would be the GDE-MEM), which in effect regulates andmonitors environmental compliance. The only entity resembling a national environmentalauthority—the National Environmental Council (CONAM)—is limited to a very weak,intersectoral coordinating role. This has resulted in a perception by local communities of a conflict of interest at the MEM, which plays a twofold role of promoting mining invest-ment and implementing environmental control, and the fear that environmental control istoo lax at the expense of the health of the locals. This situation is aggravated by the fact thatGDE-MEM does not release environmental information to the public.
■ The institutional structure is geographically centralized at the Lima-based GDE-MEM asthe only responsible entity (the regional offices of the GDE-MEM are quite weak). Localpopulations participate only in consultations and do not form part of the institutional struc-ture of the process.
The mining industry’s environmental record has begun to impede private sector investments,even if in practice it is better than in some other sectors. Even when controls exist on paper, theyare seldom implemented. Social and political conflicts that have been mainly triggered by accidentsimpacting the environment or the social fabric of the local community, such as spills or resettle-ment issues, have threatened the ability of companies to pursue mining permits or to continue torun their already existing operations. For example, Tambogrande in Piura, a medium-sized goldmining project awarded to Canadian Manhatten Minerals, is unlikely to go ahead, because the“Tambogrande Defense Committee” has successfully mobilized public opinion, including theCatholic Church, staging demonstrations and boycotts serious enough to cause the company toabandon completion of its environmental impact analysis. Other examples of such conflicts caus-ing interruptions of ongoing project development or operations are the mines of Yanacocha andAntamina. Both were involved in massive community protests, one in the context of a mercuryspill, the other in the context of a resettlement program that halted their operations temporarilyand threatened to stop further expansion.
Current enforcement by the State entities responsible for the environment is inadequate.The National Environmental Council is a small organization lacking political power. In practice,it is the Ministry of Energy and Mines that has most influence over investment decisions. How-ever, the team at the ministry responsible for environmental controls lacks the personnel or budget to properly carry out its functions. Naturally, given its mandate, rather than impose burdensome environmental controls, the ministry’s main priority is to maximize investment and eventual output.
The Role of the Private SectorFrom an environmental perspective, the worst offenders tend not to be the large multinationalmining companies, but rather the (Peruvian) owners of older and smaller mines, less sensitive thanmultinationals to allegations of disregarding environmental norms. Most multinationals have madeserious efforts to comply with the environmental code and invest in technologies to reduce pollu-tion and to create a good working relationship with surrounding communities. Only legal obliga-tions, enforced by competent and credible institutions, will be able to influence the large numberof Peruvian-owned mining firms to control water pollution, spills, and air pollution, and to appro-priately solve conflicts over land rights.
166 WORLD BANK COUNTRY STUDY

Recommendations:■ A new national and independent environmental authority that is structured geographically
and supported by local monitoring needs to be created. Such authority should regulate allsectors and be integrated with future regional authorities, which will be responsible for themonitoring and control of all environmental aspects.
■ As part of the decentralization process, an agreement on roles and responsibilities in theenvironmental provisions of the mining sector is also needed to foster further private invest-ment. This agreement should define a certain level of inter- and intraprovincial coordina-tion to organize environmental controls smoothly and to promote cooperation.
■ New roles and responsibilities will require the buildup of institutional capacity, especially at the subnational level.
■ The regulatory framework of environmental management also needs to be reviewed toensure that stricter environmental regulations are well designed and introduced.
■ Local interest groups, supported by nongovernmental organizations, should be integratedinto environmental monitoring and consultation. These groups will certainly continue topressure the government to protect community interests from mining projects.
RESTORING FISCAL DISCIPLINE FOR POVERTY REDUCTION IN PERU 167


We estimate the level of Peru’s public debt that would improve its sustainability in themedium term.1 Authorities have shown their intention to develop a prudent debt man-agement strategy. The 2000 debt exchange with private creditors slightly worsened the
maturity profile of debt payments,2 but authorities believe that the present value of public debt fell.Our baseline medium-term scenario indicates some external vulnerability over the medium term,conditional on low inflation, and moderate real GDP growth (average 4 percent) per year, which in turn would depend on recovery of private sector and foreign investment, increased productivity,and sound macroeconomic policies. Our debt sustainability model assumes the absence of majorterms of trade shocks that would negatively affect the current account deficit, and no private capitaloutflows that would require a tighter monetary policy to avoid currency depreciation.
We examine the sensitivity of key public debt ratios to alternative assumptions about financingterms and growth rates. Our central premise is that both foreign financing and adjustment to fiscalfundamentals are necessary to ensure more sustainable public debt ratios. The path toward sustain-ability is estimated, with annual target primary balances consistent with non-financial public sector(NFPS) debt and debt-servicing requirements. The analysis concludes that the Government ofPeru (GOP) could reach a public-debt-to-GDP sustainable ratio of 40 percent in 2004 and 36.2 in2010, provided it builds primary balances close to 0.9 percent of GDP in 2004 and 1.3 percent ofGDP in 2010. Nonetheless, the government would face a sizable debt-service burden that wouldpeak at about 36 percent of exports and 44 percent of tax revenue in 2004 and decrease thereafter,
Annex A
A PUBLICDEBT SUSTAINABILITY
ANALYSIS FOR PERU
169
1. This Annex was prepared with the research assistance of Rashmi Shankar, numerous comments on earlydrafts and data support from IMF staff, and a very timely suggestion from Sara Calvo, who motivated itsextension to shocks and provided enthusiastic advise on its development.
2. New government 10-year bonds with bullet payment at maturity exchanged for front-loaded interestreduction Brady bonds or FLIRBs, which were selling at a discount of 28.5 percent, at end 2001. These carrylow interest rates, and the principal is to be amortized gradually from 2005 to 2017.

the latter result being a direct reflection of the fiscal deficits and low tax ratios that Peru has fea-tured in past years. Faster growth accompanied by tight control of expenditure and additional for-eign financing would be essential to bring the GOP to a high case scenario, to channel moreresources to a poverty-reduction strategy, while reducing its debt-servicing burden. A comprehen-sive tax reform is needed to improve such prospects.
This Annex is divided into two sections. The first section is a conventional debt sustainabilityanalysis as described above. The second section considers the impact of two hypothetical shocks.The first shock consists of a slowing down of capital inflows (sudden stop) resulting in realexchange rate (RER) depreciation. The second shock reflects the materialization of the govern-ment’s contingent liabilities, arising from an eventual failure of the private sector to fulfill itsshort-term external debt obligations.
Peru’s Macroeconomic BackgroundWhile economic activity remains weak, the macroeconomic situation has been stabilizing since2000, with inflation decreasing from 7.3 percent in 1998 to 2 percent in 2001. The combined fis-cal deficit reversed its upward trend, but still was significant at 2.5 percent of GDP. The currentaccount as a percent of GDP improved significantly between 1998 and 2001, from −6.4 percent to−2.1 percent. Measures to strengthen the banking system are reflected in improvements in someindicators of bank soundness. Loan quality has improved, as measured by the ratio of nonperform-ing to total loans (excluding restructured and refinanced loans), and liquidity and capital adequacyratios have risen.
While the total (public and private, short-, medium-, and long-term) debt-to-GDP ratioremains high at 52.3 percent, adverse developments in the region have had little effect on Peru’sfinancial indicators. Yet, the external public debt represents around 70 percent of total debt, andvirtually all is long term. Around 60 percent of this debt is with multilateral and bilateral creditors.Because of the high degree of dollarization of domestic debt, it is vulnerable to currency risk, mak-ing fiscal and monetary policy lose some degree of freedom.
For illustrative purposes, a comparison of Argentina’s (before the crisis) and Peru’s fiscaldeficits, public-debt-to-GDP ratio, public debt-servicing-exports ratio, and current account bal-ance is contained in Table A.1. Peru has a lower NFPS deficit and a lower current account deficit.Argentina’s public debt and public debt-servicing burden is higher than Peru’s, but the rising trendin the public debt service/exports ratio in the latter is worrisome. Strengthening of the export per-formance, the banking sector, and particularly the fiscal position, will play a significant role in keep-ing Peru’s public debt manageable. In a base case, inflation remains low at approximately 2 percent,which would allow the government to relax somewhat monetary policy in the face of weak economicactivity. A managed floating exchange rate regime is preserved and the international reserves positionwould remain comfortable.
The Target Fiscal Adjustment Under a Baseline and Alternative Scenarios With No External ShocksWe present alternative scenarios of growth and interest rates, multilateral financing, and the sensi-tivity of key public debt ratios to the assumptions made. The dynamic is detailed in Table A.2. Ineach case, the target primary balance needed to sustain the public debt outcome is estimated.
General Assumptions■ Receipts from privatization are US$600 million for 2002 and 2003, and fall to less than
$50 million per year thereafter.■ Inflation in the GDP deflator (US$ terms) increases from 0.9 percent in 2002, to approxi-
mately 2 percent during 2003–10.■ Continued rollover of short-term debt during 2002–10.
170 WORLD BANK COUNTRY STUDY

RESTORING FISCAL DISCIPLINE FOR POVERTY REDUCTION IN PERU 171
TA
BLE
A.1
:C
UR
REN
TM
AC
RO
ECO
NO
MIC
AN
DFI
NA
NC
IAL
TR
END
S
1998
1999
2000
2001
*
(% o
f GD
P)
Arg
enti
naP
eru
Arg
enti
naP
eru
Arg
enti
naP
eru
Arg
enti
naP
eru
Cur
rent
Acc
ount
−4.8
0−6
.37
−4.3
0−3
.50
−3.2
0−3
.00
−2.8
0−2
.10
Publ
ic D
ebt
Serv
ice
(% o
f Exp
orts
)56
.80
27.4
673
.50
32.6
570
.50
42.8
078
.20
43.3
0Pu
blic
Deb
t Se
rvic
e (%
of R
even
ue)
31.4
025
.26
36.8
031
.89
38.9
033
.53
48.3
028
.89
Publ
ic D
ebt
37.6
042
.70
43.0
048
.00
44.9
045
.90
51.0
46.5
0N
FPS
Budg
et D
efici
t−2
.40
−0.7
0−4
.40
−3.1
0−3
.80
−3.2
0−3
.50
−2.5
0
*Pre
swap
est
imat
e fo
r A
rgen
tina.
Sour
ce:
Wor
ld B
ank
staf
f est
imat
es.

172 WORLD BANK COUNTRY STUDYT
ABL
EA
.2:
DEB
TD
YN
AM
ICS
NO
N-F
INA
NC
IAL
PUBL
ICSE
CT
OR: S
CEN
AR
IOW
ITH
NO
EXT
ERN
AL
SHO
CK
S(in
per
cent
of G
DP)
2000
2001
2002
2003
2004
2005
2006
2007
2008
2009
2010
1.B
asel
ine:
Sce
nari
o A
Prim
ary
bala
nce
−0.5
−0.6
0.2
0.4
0.9
1.1
1.1
1.2
1.3
1.3
1.3
Publ
ic d
ebt
to G
DP
45.9
46.5
44.9
40.9
40.0
39.3
38.7
38.2
37.5
36.9
36.2
Publ
ic e
xter
nal d
ebt
serv
ice/
expo
rts
25.0
23.3
27.4
31.5
36.1
38.1
30.9
28.7
26.7
25.6
23.7
Publ
ic d
ebt
serv
ice/
GD
P3.
83.
93.
84.
55.
36.
05.
25.
04.
94.
84.
6Pu
blic
deb
t se
rvic
e/ta
x re
venu
e27
.426
.132
.136
.143
.550
.043
.743
.343
.143
.642
.4M
emor
andu
m it
ems
Fisc
al b
alan
ce (
perc
ent
of G
DP)
−3.2
−2.5
−1.9
−1.8
−1.8
−1.7
−1.7
−1.6
−1.5
−1.5
−1.4
GD
P (m
illio
ns o
f US$
)53
513
5398
356
816
6006
863
033
6680
070
861
7517
079
740
8467
189
819
Expo
rts
(mill
ions
of U
S$)
7028
7132
7915
8525
9325
1054
811
833
1310
714
568
1598
417
402
2.S
cena
rio
BPr
imar
y ba
lanc
e−0
.5−0
.60.
20.
40.
81.
01.
01.
01.
01.
01.
0Pu
blic
deb
t to
GD
P45
.946
.544
.940
.839
.438
.237
.136
.034
.833
.632
.2Pu
blic
ext
erna
l deb
t se
rvic
e/ex
port
s25
.023
.327
.431
.235
.236
.729
.026
.424
.222
.720
.5Pu
blic
deb
t se
rvic
e/G
DP
3.8
3.9
3.8
4.4
5.2
5.7
4.7
4.4
4.2
4.0
3.7
Publ
ic d
ebt
serv
ice/
tax
reve
nue
27.4
26.1
32.1
35.7
42.0
47.3
40.0
38.4
37.2
36.5
34.3
Mem
oran
dum
item
sFi
scal
bal
ance
(pe
rcen
t of
GD
P)−3
.2−2
.5−1
.9−1
.8−1
.7−1
.5−1
.4−1
.3−1
.2−1
.1−1
.0G
DP
(mill
ions
of U
S$)
5351
353
983
5681
660
068
6363
968
091
7292
578
103
8364
889
675
9604
2Ex
port
s (m
illio
ns o
f US$
)70
2871
3279
1585
2593
2510
548
1183
313
107
1456
815
984
1740
23.
Sce
nari
o C
Prim
ary
bala
nce
−0.5
−0.6
−0.3
0.0
0.7
1.1
1.3
1.6
1.9
2.1
2.2
Publ
ic d
ebt
to G
DP
45.9
46.5
45.4
41.3
41.4
41.7
42.0
42.4
42.6
42.7
42.7
Publ
ic e
xter
nal d
ebt
serv
ice/
expo
rts
25.0
23.3
27.4
32.2
37.9
40.8
34.3
32.6
31.1
30.3
28.7
Publ
ic d
ebt
serv
ice/
GD
P3.
83.
93.
84.
65.
76.
66.
06.
06.
16.
26.
2Pu
blic
deb
t se
rvic
e/ta
x re
venu
e27
.426
.132
.136
.846
.355
.050
.752
.153
.856
.256
.7M
emor
andu
m it
ems
Fisc
al b
alan
ce (
perc
ent
of G
DP)
−3.2
−2.5
−2.4
−2.3
−2.3
−2.2
−2.1
−2.1
−2.0
−2.0
−1.9
GD
P (m
illio
ns o
f US$
)53
513
5398
356
816
6006
862
124
6488
767
839
7092
674
153
7760
381
134
Expo
rts
(mill
ions
of U
S$)
7028
7132
7915
8525
9325
1054
811
833
1310
714
568
1598
417
402
Sour
ce:
Wor
ld B
ank
staf
f est
imat
es.

■ The terms of new multilateral financing depend on Peru’s classification as a Category IVcountry. The loan period is on average 17 years, with a five-year grace period, and the interest is the London Interbank Offered Rate (LIBOR) (World Bank forecast of 4 percent)plus a 70-basis-point spread, on average.
■ The NFPS elasticities of revenues and expenditures with respect to GDP remain constant at0.98 and 0.95, respectively. Elasticities are estimated for 1994–2002.
Scenario A. This is the baseline scenario. It incorporates the preliminary figures for the Brady buy-back under which all outstanding front-loaded interest reduced bonds (FLIRBs) have beenexchanged. The baseline assumptions are:
■ Moderate growth: 3.7 percent in 2002, followed by 4 percent during 2003–10;■ Moderate average international interest rates: 10 percent throughout the period;■ Moderate cut in fiscal deficits: tapering off from −1.9 percent of GDP to −1.4 percent of
GDP over the period.
Results: Under the baseline assumptions, the public-debt-to-GDP ratio would fall to 36.2 per-cent in 2010, from 44.9 percent in 2002. The primary balance required to cover interest liabilitiesincreases from 0.2 percent to 1.3 percent over the period. The public debt-servicing ratio would fallfrom 27.4 percent to 23.7 percent as a proportion of exports, would rise from 3.8 percent to 4.6 per-cent as a proportion of GDP, and would rise from 32.1 percent to 42.4 percent as a proportion ofCentral Government (CG) tax revenues, over the period. The assumption on mixed concessional-multilateral (reduced balance-of-payments support from 2003, partly offset by sector investment disbursements) and limited commercial borrowing, results in an implicit average interest rate on the total stock of NFPS debt between 6.7 percent and 7.9 percent during 2004–10.
Scenario B. This is the best-case scenario, which presents a sensitivity analysis of the public-debt-to-GDP ratio to higher growth and strengthened fiscal discipline. The assumptions are:
■ High growth: 3.7 percent in 2002 followed by 5 percent during 2003–10;■ Low average international interest rates: the interest rate on new public debt is 7.5 percent
over the period;■ Low fiscal deficits: tapering off, as a proportion of GDP, from −1.9 percent in 2002,
to −1.8 percent in 2003, −1.3 percent in 2007, and −1 percent by 2010. This is based onthe assumption of higher revenue, tighter expenditure, and faster growth. The revenue elasticity remains .98, but the expenditure elasticity is constrained to remain at .88, to capexpenditures at 18.3 percent of GDP in this scenario, in contrast to 18.7 percent of GDP inthe baseline.
Results: Under this scenario, the public-debt-GDP ratio would fall lower, to 32.2 percent in2010 from 44.9 percent in 2002. The primary balance required for reaching sustainability wouldalso be lower than in the baseline, due to faster growth and better financial conditions. To coverdebt-service liabilities it increases from −0.5 percent in 2000 to 1 percent in 2005, and remains sta-ble at that proportion of GDP until the end of the forecast horizon. The public debt-servicing ratiofalls from 27.4 percent in 2002 to 20.5 percent as a proportion of exports, remains constant at 3.7 percent as a proportion of GDP, and increases slightly from 32.1 percent to 34.3 percent as aproportion of CG tax revenue, over the same period. The assumption on mixed concessional-multilateral (full balance-of-payments support) and commercial borrowing results in an implicitaverage interest rate on total NFPS debt of around 6.4 percent during 2004–10, which is lowerthan in the baseline due to a higher share of multilateral financing and better placement conditionsin international markets.
RESTORING FISCAL DISCIPLINE FOR POVERTY REDUCTION IN PERU 173

Scenario C. This is the worst-case scenario, reflecting the sensitivity of the public-debt-to-GDPratio to low growth and poor fiscal discipline. The assumptions are:
■ Low growth: growth rate of 2.5 percent is assumed over the entire period;■ High fiscal deficit: the fiscal deficit falls from −2.4 percent to only −1.9 percent of GDP
over the entire period;■ High average international interest rate: the interest rate on public debt is 12 percent over
the period.
Results: Under this scenario, the public-debt-to-GDP ratio would fall slightly, to 42.7 percentin 2010 from 45.4 percent in 2002. However, the primary balance required to cover debt-serviceliabilities increases to 2.2 percent in 2010 from −0.5 percent in 2000. The public-debt-servicingratio increases from 27.4 percent to 28.7 percent as a proportion of exports, rises from 3.8 percentto 6.2 percent as a proportion of GDP, and rises from 32.1 percent to 56.7 percent as a proportionof CG tax revenue, during 2002–10. The implicit average interest rate on total NFPS debt increasesto between 7.3 percent and 9.9 percent during 2004–2010 because of the increased reliance oncommercial borrowing following from the previous assumption of reduced multilateral financingand worst bond placement conditions in international markets. Thus external financing is moreexpensive in this scenario. It is assumed that there is reduced multilateral financing and no fast-disbursing loans.
Summary:Table A.2 and the figures (Figure A.1) present details of the dynamics of public debt financingtoward medium-term sustainability. It is important to note that in the worst-case scenario, theimplication of a required government primary surplus of 2.2 percent of GDP merely reflects that abigger fiscal effort would be required in a deteriorated scenario for Peru to honor its payments (see Tables A3–A.5).
The Target Fiscal Adjustment Under a “Sudden Stop” Scenario:Accounting for a Real Exchange Rate and Contingent Liability ShocksMotivationThe recent literature on crises identifies a combination of fiscal sustainability and RER misalignmentas a likely cause of rapidly growing public debt and a loss of access to international credit markets.One perspective stresses that unexpected stops in capital flows of a permanent nature can in itselfgenerate substantial swings in the RER (Table A.6). Our purpose here is to identify the RER adjust-ment necessary to close the current account in the event of Peru being the victim of such a shock,that is, a sudden stop in capital inflows, and to assess its impact on debt sustainability.
Computing the Real Exchange Rate AdjustmentA sudden stop in capital inflow is typically accompanied by large contractions in international reservesand a decline in the relative price of nontradables with respect to tradables (or a depreciation in theRER). This follows from the current account identity: a relative price adjustment is necessary toabsorb the demand for tradables in order for the current account deficit to be reduced in line withthe fall in capital flows. Calvo, Izquierdo, and Talvi (2002) demonstrate that the necessary RERadjustment is given by a percentage fall in the resource imbalance necessary to reduce the currentaccount deficit to the required extent (current account deficit/imports), divided by the elasticity ofdemand for nontradables with respect to p (the relative price of nontradables to that of tradables).Based on their model, we compute the following RER adjustments for Peru, Bolivia, and Ecuador:
It must be emphasized that these numbers are extreme values based on the assumption thatcapital flows will cease completely, and the current account deficit will have to be closed. A morereasonable assumption, that is, a 10-percent depreciation in the RER, would capture the idea that
174 WORLD BANK COUNTRY STUDY

FIGURE A.1: SCENARIO WITH NO SHOCKS
Primary Balance (% of GDP)
-0.5
0.0
0.5
1.0
1.5
2.0
2.5
2002 2003 2004 2005 2006 2007 2008 2009 2010
Scenario A Scenario B Scenario C
Public Debt-GDP Ratios (% of GDP)
0.0 5.0
10.0 15.0 20.0 25.0 30.0 35.0 40.0 45.0 50.0
2002 2003 2004 2005 2006 2007 2008 2009 2010
Scenario A Scenario B Scenario C
Public Debt Service/Exports
0.0 5.0
10.0 15.0 20.0 25.0 30.0 35.0 40.0 45.0
2002 2003 2004 2005 2006 2007 2008 2009 2010
Scenario A Scenario B Scenario C
Public Debt Service/GDP
0.0 1.0 2.0 3.0 4.0 5.0 6.0 7.0
2002 2003 2004 2005 2006 2007 2008 2009 2010
Scenario A Scenario B Scenario C
Public Sector Financing Need/GDP
-1.00 0.00 1.00 2.00 3.00 4.00 5.00 6.00
2002 2003 2004 2005 2006 2007 2008 2009 2010
Scenario A Scenario B Scenario C
Baseline: Composition of Primary Surplus
-3 -2 -1 0 1 2 3 4
2002 2003 2004 2005 2006 2007 2008 2009 2010
Primary Balance Interest Payments Fiscal Balance
Public Debt Service/Tax Revenues
0.0 10.0 20.0
30.0
40.0 50.0
60.0
2002 2003 2004 2005 2006 2007 2008 2009 2010
Scenario A Scenario B Scenario C
Fiscal Balance/GDP
-2.5
-2.0
-1.5
-1.0
-0.5
0.0 2002 2003 2004 2005 2006 2007 2008 2009 2010
Scenario A Scenario B Scenario C
Source: World Bank staff estimates.

176 WORLD BANK COUNTRY STUDY
TA
BLE
A.3
:SC
ENA
RIO
WIT
HO
UT
S HO
CK
SSc
enar
io A
: Bas
elin
e (in
mill
ions
of U
S$)
2002
20
03
2004
20
05
2006
20
07
2008
20
09
2010
P
roj.
Pro
j.P
roj.
Pro
j.P
roj.
Pro
j.P
roj.
Pro
j.P
roj.
Nom
inal
GD
P56
,816
60,0
6863
,033
66,8
0070
,861
75,1
7079
,740
84,6
7189
,819
Rea
l Gro
wth
3.7
4.0
4.0
4.0
4.0
4.0
4.0
4.0
4.0
Defl
ator
0.9
1.9
2.0
2.0
2.0
2.1
2.0
Ave
rage
Int
eres
t P
aid
on
New
Deb
t10
1010
1010
1010
10Pr
imar
y ba
lanc
e94
225
551
719
773
892
1007
1106
1208
Pri
mar
y B
alan
ce a
s %
of G
DP
0.16
0.37
0.87
1.08
1.09
1.19
1.26
1.31
1.35
Inte
rest
pay
men
ts11
6013
1816
7218
6819
4920
9822
4223
7025
03Ex
istin
g de
bt11
6012
3314
3914
6813
5713
2112
6711
7910
80D
omes
tic19
420
017
615
654
4126
179
Fore
ign
(incl
. new
mul
ti- a
nd b
ilate
ral
966
1033
1263
1312
1303
1280
1241
1162
1071
disb
urse
men
ts)
New
ly is
sued
com
mer
cial
deb
t0
8523
340
059
277
797
511
9114
23In
tere
st p
aym
ents
as
% o
f GD
P2.
02.
22.
72.
82.
82.
82.
82.
82.
8O
vera
ll fis
cal b
alan
ce−1
066
−109
3−1
121
−114
8−1
177
−120
6−1
235
−126
5−1
295
Rev
enue
s11
376
1182
212
286
1276
713
268
1378
814
328
1489
015
474
Rev
enue
s as
% o
f GD
P20
.019
.719
.519
.118
.718
.318
.017
.617
.2T
ax r
even
ues
(IMF
proj
ectio
ns fo
r 20
02–0
3)67
6174
4877
4080
4483
5986
8790
2793
8197
49Ex
pend
iture
s12
443
1291
613
406
1391
614
445
1499
315
563
1615
516
768
Expe
nditu
res
as %
of G
DP
21.9
21.5
21.3
20.8
20.4
19.9
19.5
19.1
18.7
Ove
rall
Fis
cal B
alan
ce a
s %
of G
DP
�1.
9�
1.8
�1.
8�
1.7
�1.
7�
1.6
�1.
5�
1.5
�1.
4Pr
ivat
izat
ion
rece
ipts
600
600
400
4745
4540
4040
Priv
atiz
atio
n as
% o
f GD
P1.
11.
00.
60.
10.
10.
10.
10.
00.
0A
mor
tizat
ion
of e
xist
ing
debt
1009
1371
1693
2153
1706
1662
1653
1716
1629
Dom
estic
deb
t14
831
654
986
330
518
813
212
854
Fore
ign
debt
873
1078
1179
1334
1445
1528
1575
1676
1696
Mul
tilat
eral
410
419
445
515
589
600
601
650
651
On
new
add
ition
al m
ultil
ater
al d
isbur
sem
ents
00
00
00
029
54Pa
ris C
lub
429
592
633
686
723
762
808
815
793

RESTORING FISCAL DISCIPLINE FOR POVERTY REDUCTION IN PERU 177
Brad
y Bo
nds
3467
101
133
133
166
166
182
198
PDI
3467
101
101
101
101
101
101
101
FLIR
B0
00
3232
6565
8197
New
fore
ign
disb
urse
men
ts12
5010
9611
5611
7410
6390
580
966
052
4M
ultil
ater
al c
redi
tors
1071
740
808
771
713
635
586
514
422
Bila
tera
l cre
dito
rs22
935
634
840
335
027
022
314
610
2Fi
nanc
ing
need
(is
suan
ce o
f new
com
mer
cial
deb
t)−2
7526
812
5820
8017
7519
1720
3922
8123
60D
omes
tic0
Fore
ign
(res
idua
l)−2
75T
otal
deb
t se
rvic
e21
6926
8933
6540
2136
5537
6038
9540
8741
32D
ebt
serv
ice/
tax
reve
nue
32.0
836
.10
43.4
749
.98
43.7
343
.28
43.1
443
.56
42.3
9T
otal
deb
t se
rvic
e as
% o
f GD
P3.
84.
55.
36.
05.
25.
04.
94.
84.
6Im
plic
it A
vera
ge I
nter
est
Rat
e5.
395.
266.
727.
277.
277.
487.
657.
757.
86D
omes
tic6.
20Fo
reig
n5.
14T
ota
l Deb
t as
% o
f GD
P44
.92
40.8
839
.95
39.2
538
.70
38.1
637
.52
36.8
636
.16
Tot
al d
ebt
2552
424
557
2518
326
222
2742
128
685
2992
231
208
3247
8St
ock
of n
ew c
omm
erci
al d
ebt
1155
1698
2956
5036
6811
8728
1076
713
048
1540
8T
otal
exi
stin
g de
bt24
369
2285
922
227
2118
620
610
1995
719
155
1816
017
069
Exi
stin
g S
tock
ML
T E
xter
nal D
ebt
of
1857
617
382
1729
917
121
1685
016
385
1571
514
848
1381
1th
e N
on-
Fin
anci
al P
ublic
Sec
tor
(A +
D)
Buy
-Bac
k O
pera
tio
nEu
robo
nd is
sue
1430
FLIR
B Br
ady
Out
stan
ding
pri
ncip
al (
nom
inal
)12
12D
isco
unt
rate
77M
arke
t va
lue
in p
erce
nt o
f nom
inal
930
Add
ition
al fi
nanc
ing
500
Deb
t se
rvic
ing
2.17
2.69
3.36
4.02
3.66
3.76
3.89
4.09
4.13
Expo
rts
7.92
8.53
9.33
10.5
511
.83
13.1
114
.57
15.9
817
.40
TD
S/ex
port
0.27
0.32
0.36
0.38
0.31
0.29
0.27
0.26
0.24
TD
S/G
DP
0.04
0.04
0.05
0.06
0.05
0.05
0.05
0.05
0.05
Fina
ncin
g ne
ed/G
DP
0.00
0.00
0.02
0.03
0.03
0.03
0.03
0.03
0.03
Deb
t se
rvic
ing/
reve
nue
19.0
722
.74
27.3
931
.49
27.5
527
.27
27.1
827
.44
26.7
0
Sour
ce:
Wor
ld B
ank
staf
f est
imat
es.

178 WORLD BANK COUNTRY STUDY
TA
BLE
A.4
:SC
ENA
RIO
WIT
HN
OSH
OC
KS
Scen
ario
B (
in m
illio
ns o
f US$
)
2002
20
03
2004
20
05
2006
20
07
2008
20
09
2010
P
roj.
Pro
j.P
roj.
Pro
j.P
roj.
Pro
j.P
roj.
Pro
j.P
roj.
Nom
inal
GD
P56
,816
60,0
6863
,639
68,0
9172
,925
78,1
0383
,648
89,6
7596
,042
Rea
l gro
wth
3.7
5.0
5.0
5.0
5.0
5.0
5.0
5.0
5.0
Defl
ator
0.9
1.9
2.0
2.0
2.0
2.1
2.0
Ave
rage
inte
rest
pai
d o
n ne
w d
ebt
7.5
7.5
7.5
7.5
7.5
7.5
7.5
7.5
7.5
Prim
ary
bala
nce
9423
053
567
970
179
387
794
110
05P
rim
ary
bala
nce
as %
of G
DP
0.2
0.4
0.8
1.0
1.0
1.0
1.0
1.0
1.0
Inte
rest
pay
men
ts11
6012
9115
8917
2117
3018
0418
6719
0519
39Ex
istin
g de
bt11
6012
4014
5314
8913
8513
5713
1012
2911
36D
omes
tic19
420
017
615
654
4126
179
Fore
ign
(incl
. new
mul
ti- a
nd b
ilate
ral
966
1040
1277
1333
1331
1316
1284
1212
1127
disb
urse
men
ts)
New
ly is
sued
com
mer
cial
deb
t0
5113
623
234
544
855
767
680
3In
tere
st p
aym
ents
as
% o
f GD
P2.
02.
12.
52.
52.
42.
32.
22.
12.
0O
vera
ll fis
cal b
alan
ce−1
066
−106
1−1
054
−104
3−1
029
−101
1−9
89−9
64−9
33R
even
ues
1137
611
934
1251
913
132
1377
514
450
1515
815
901
1668
0R
even
ues
as %
of G
DP
20.0
19.9
19.7
19.3
18.9
18.5
18.1
17.7
17.4
Tax
rev
enue
s (IM
F pr
ojec
tions
for
2002
–03)
6761
7448
7813
8196
8598
9019
9461
9925
1041
1Ex
pend
iture
s12
443
1299
513
572
1417
514
804
1546
116
148
1686
517
614
Expe
nditu
res
as %
of G
DP
21.9
21.6
21.3
20.8
20.3
19.8
19.3
18.8
18.3
Ove
rall
fisc
al b
alan
ce a
s %
of G
DP
�1.
9�
1.8
�1.
7�
1.5
�1.
4�
1.3
�1.
2�
1.1
�0.
97Pr
ivat
izat
ion
rece
ipts
600
600
400
4745
4540
4040
Priv
atiz
atio
n as
% o
f GD
P1.
11.
00.
60.
10.
10.
10.
00.
00.
0A
mor
tizat
ion
of e
xist
ing
debt
1009
1371
1693
2153
1706
1662
1653
1716
1629
Dom
estic
deb
t14
831
654
986
330
518
813
212
854
Fore
ign
debt
873
1078
1179
1334
1445
1528
1575
1694
1732
Mul
tilat
eral
410
419
445
515
589
600
601
650
651
On
new
add
ition
al m
ultil
ater
al d
isbur
sem
ents
00
00
00
047
90Pa
ris C
lub
429
592
633
686
723
762
808
815
793

RESTORING FISCAL DISCIPLINE FOR POVERTY REDUCTION IN PERU 179
Brad
y Bo
nds
3467
101
133
133
166
166
182
198
PDI
3467
101
101
101
101
101
101
101
FLIR
B0
00
3232
6565
8197
New
fore
ign
disb
ursm
ents
1250
1396
1456
1474
1363
1205
1109
960
824
Mul
tilat
eral
cre
dito
rs10
7110
4011
0810
7110
1393
588
681
472
2Bi
late
ral c
redi
tors
229
356
348
403
350
270
223
146
102
Fina
ncin
g ne
ed (
issu
ance
of n
ew c
omm
erci
al d
ebt)
−275
−64
891
1675
1327
1423
1493
1680
1699
Dom
estic
0Fo
reig
n (r
esid
ual)
−275
Tot
al d
ebt
serv
ice
2169
2662
3282
3874
3436
3466
3520
3621
3568
Deb
t se
rvic
e/ta
x re
venu
e32
.08
35.7
442
.00
47.2
739
.96
38.4
337
.20
36.4
934
.27
Tot
al d
ebt
serv
ice
as %
of G
DP
3.8
4.4
5.2
5.7
4.7
4.4
4.2
4.0
3.7
Impl
icit
ave
rage
inte
rest
rat
e5.
395.
166.
416.
746.
526.
546.
526.
436.
35D
omes
tic6.
20Fo
reig
n5.
14T
ota
l deb
t as
% o
f GD
P44
.92
40.8
339
.42
38.2
137
.12
36.0
334
.82
33.5
632
.25
Tot
al d
ebt
2552
424
525
2508
426
018
2706
828
138
2913
030
097
3097
0St
ock
of n
ew c
omm
erci
al d
ebt
1155
1366
2257
3932
5258
6681
8175
9855
1155
3T
otal
exi
stin
g de
bt24
369
2315
922
827
2208
621
810
2145
720
955
2024
219
417
Exi
stin
g do
mes
tic
debt
sto
ck (
incl
. BR
)57
9354
7749
2840
6537
6035
7234
4033
1232
58E
xist
ing
sto
ck M
LT
Ext
erna
l Deb
t o
f 18
576
1768
217
899
1802
118
050
1788
517
515
1693
016
159
the
No
n-F
inan
cial
Pub
lic S
ecto
r (A
�D
)B
uy-B
ack
Ope
rati
on
Euro
bond
issu
e14
30FL
IRB
Brad
yO
utst
andi
ng p
rinc
ipal
(no
min
al)
1212
Dis
coun
t ra
te77
Mar
ket
valu
e in
per
cent
of n
omin
al93
0A
dditi
onal
fina
ncin
g50
0D
ebt
serv
icin
g2.
172.
663.
283.
873.
443.
473.
523.
623.
57Ex
port
s7.
928.
539.
3310
.55
11.8
313
.11
14.5
715
.98
17.4
TD
S/ex
port
0.27
0.31
0.35
0.37
0.29
0.26
0.24
0.23
0.21
TD
S/G
DP
0.04
0.04
0.05
0.06
0.05
0.04
0.04
0.04
0.04
Fina
ncin
g ne
ed/G
DP
0.00
0.00
0.01
0.02
0.02
0.02
0.02
0.02
0.02
Deb
t se
rvic
ing/
reve
nue
19.1
22.3
26.2
29.5
24.9
24.0
23.2
22.8
21.4
Sour
ce:
Wor
ld B
ank
staf
f est
imat
es.

180 WORLD BANK COUNTRY STUDY
TA
BLE
A.5
:SC
ENA
RIO
WIT
HN
OSH
OC
KS
Scen
ario
C (
in m
illio
ns o
f US$
)
2002
20
03
2004
20
05
2006
20
07
2008
20
09
2010
P
roj.
Pro
j.P
roj.
Pro
j.P
roj.
Pro
j.P
roj.
Pro
j.P
roj.
Nom
inal
GD
P56
,816
60,0
6862
,124
64,8
8767
,839
70,9
2674
,153
77,6
0381
,134
Rea
l gro
wth
3.7
2.5
2.5
2.5
2.5
2.5
2.5
2.5
2.5
Defl
ator
0.9
1.9
2.0
2.0
2.0
2.1
2.0
Ave
rage
inte
rest
pai
d o
n ne
w d
ebt
1212
1212
1212
1212
12Pr
imar
y ba
lanc
e−1
90−1
441
728
904
1143
1377
1597
1822
Pri
mar
y ba
lanc
e as
% o
f GD
P−0
.30.
00.
71.
11.
31.
61.
92.
12.
2In
tere
st p
aym
ents
1160
1373
1839
2151
2351
2614
2874
3120
3371
Exis
ting
debt
1160
1229
1434
1461
1347
1306
1246
1151
1042
Dom
estic
194
200
176
156
5441
2617
9Fo
reig
n (in
cl. n
ew m
ulti-
and
bila
tera
l 96
610
2912
5813
0512
9312
6512
2011
3410
33di
sbur
sem
ents
)N
ewly
issu
ed c
omm
erci
al d
ebt
014
440
668
910
0413
0816
2819
6923
29In
tere
st p
aym
ents
as
% o
f GD
P2.
02.
33.
03.
33.
53.
73.
94.
04.
2O
vera
ll fis
cal b
alan
ce−1
350
−137
4−1
398
−142
2−1
447
−147
2−1
497
−152
3−1
549
Rev
enue
s11
376
1193
412
519
1313
213
775
1445
015
158
1590
116
680
Rev
enue
s as
% o
f GD
P20
.019
.919
.719
.318
.918
.518
.117
.717
.4T
ax r
even
ues
(IMF
proj
ectio
ns 2
002–
03)
6761
7448
7813
8196
8598
9019
9461
9925
1041
1Ex
pend
iture
s12
443
1299
513
572
1417
514
804
1546
116
148
1686
517
614
Expe
nditu
res
as %
of G
DP
21.9
21.6
21.3
20.8
20.3
19.8
19.3
18.8
18.3
Ove
rall
fisc
al b
alan
ce a
s %
of G
DP
�2.
4�
2.3
�2.
3�
2.2
�2.
1�
2.1
�2.
0�
2.0
�1.
9Pr
ivat
izat
ion
rece
ipts
600
600
400
4745
4540
4040
Priv
atiz
atio
n as
% o
f GD
P1.
11.
00.
60.
10.
10.
10.
10.
10.
0A
mor
tizat
ion
of e
xist
ing
debt
1009
1371
1693
2153
1706
1662
1653
1716
1629
Dom
estic
deb
t14
831
654
986
330
518
813
212
854
Fore
ign
debt
873
1078
1179
1334
1445
1528
1575
1666
1684
Mul
tilat
eral
410
419
445
515
589
600
601
650
651
On
new
add
ition
al m
ultil
ater
al d
isbur
sem
ents
00
00
00
019
41Pa
ris C
lub
429
592
633
686
723
762
808
815
793

RESTORING FISCAL DISCIPLINE FOR POVERTY REDUCTION IN PERU 181
Brad
y Bo
nds
3467
101
133
133
166
166
182
198
PDI
3467
101
101
101
101
101
101
101
FLIR
B0
00
3232
6565
8197
New
fore
ign
disb
urse
men
ts12
5067
473
475
264
148
338
723
810
2M
ultil
ater
al c
redi
tors
1071
318
386
349
291
213
164
920
Bila
tera
l cre
dito
rs22
935
634
840
335
027
022
314
610
2Fi
nanc
ing
need
(is
suan
ce o
f new
com
mer
cial
deb
t)9
971
1957
2776
2467
2606
2723
2961
3036
Dom
estic
0Fo
reig
n (r
esid
ual)
9T
otal
deb
t se
rvic
e21
6927
4435
3243
0440
5742
7645
2748
3650
00D
ebt
serv
ice/
tax
reve
nue
32.0
836
.83
46.2
955
.05
50.6
552
.11
53.8
556
.15
56.6
7T
otal
deb
t se
rvic
e as
% o
f GD
P3.
84.
65.
76.
66.
06.
06.
16.
26.
2Im
plic
it a
vera
ge in
tere
st r
ate
5.39
5.42
7.27
8.15
8.46
8.93
9.33
9.65
9.95
Dom
estic
6.20
Fore
ign
5.14
To
tal d
ebt
as %
of G
DP
45.4
241
.35
41.4
341
.69
42.0
442
.37
42.5
542
.66
42.7
0T
otal
deb
t25
808
2483
825
741
2705
428
522
3005
331
552
3310
734
643
Stoc
k of
new
com
mer
cial
deb
t14
3924
0143
5871
3496
0112
206
1492
917
890
2092
6T
otal
exi
stin
g de
bt24
369
2243
721
383
1992
018
922
1784
716
623
1521
713
717
Exi
stin
g do
mes
tic
debt
sto
ck (
incl
. BR
)57
9354
7749
2840
6537
6035
7234
4033
1232
58E
xist
ing
sto
ck M
LT
Ext
erna
l Deb
t o
f 18
576
1696
016
455
1585
515
162
1427
513
183
1190
510
459
the
No
n-F
inan
cial
Pub
lic S
ecto
r (A
�D
)B
uy-B
ack
Ope
rati
on
Euro
bond
issu
e14
30FL
IRB
Brad
yO
utst
andi
ng p
rinc
ipal
(no
min
al)
1212
Dis
coun
t ra
te77
Mar
ket
valu
e in
per
cent
of n
omin
al93
0A
dditi
onal
fina
ncin
g50
0D
ebt
serv
icin
g2.
172.
743.
534.
304.
064.
284.
534.
835.
00Ex
port
s7.
928.
539.
3310
.55
11.8
313
.11
14.5
715
.98
17.4
0T
DS/
expo
rt0.
270.
320.
380.
410.
340.
330.
310.
300.
29T
DS/
GD
P0.
040.
050.
060.
070.
060.
060.
060.
060.
06Fi
nanc
ing
need
/GD
P0.
000.
020.
030.
040.
040.
040.
040.
040.
04D
ebt
serv
icin
g/re
venu
e19
.07
23.5
429
.58
35.1
832
.37
33.3
034
.41
35.8
936
.21
Sour
ce:
Wor
ld B
ank
staf
f est
imat
es.

182 WORLD BANK COUNTRY STUDY
TABLE A.6: REAL EXCHANGE RATE ADJUSTMENT IN THE EVENT OF A “SUDDEN STOP”
Peru Bolivia Ecuador
Elasticity of demand for nontradables with respect to p (x) 0.40 0.40 0.40w = 1 − (current account deficit/imports) 0.79 0.72 0.68Real exchange rate depreciation 34% 41% 45%
Source: World Bank staff calculations based on Calvo, Izquierdo, and Talvi (2002).
in the event of a shock, capital inflows may slow down, but not cease completely. Figure A.2 pre-sents a graphic representation of the implication of 10-percent RER adjustments for public debtsustainability in Peru. In the sensitivity exercises (based on the same assumptions as in the previoussection), we are therefore accounting for a shock that leads to a slowing down, but not completecessation, of capital inflows.
Additionally, we account for the impact on public debt dynamics of the contingent liabilities aris-ing from a possible failure of the private sector to meet its short-term contractual debt obligations. We
FIGURE A.2: SCENARIO WITH SHOCKS
Primary Balance (RER adjusted) (% of GDP)
-0.5
0.0
0.5
1.0
1.5
2.0
2.5
3.0
2002 2003 2004 2005 2006 2007 2008 2009 2010
Scenario A Scenario B Scenario C
Primary Balance (RER adjusted and incl. contingent liabilities)
(% of GDP)
0.0
0.5
1.0
1.5
2.0
2.5
3.0
3.5
2002 2003 2004 2005 2006 2007 2008 2009 2010
Scenario A Scenario B Scenario C
Public Debt (RER adjusted and incl. contingent liabilities)
(% of GDP)
0
10
20
30
40
50
60
2002 2003 2004 2005 2006 2007 2008 2009 2010
Scenario A Scenario B Scenario C
Public Debt (RER adjusted) to GDP Ratios(% of GDP)
0.0
10.0
20.0
30.0
40.0
50.0
60.0
2002 2003 2004 2005 2006 2007 2008 2009 2010
Scenario A Scenario B Scenario C
Source: World Bank staff estimates.

compute contingent liabilities as the share of foreign credit to the private sector that is allocated tonontradable activities. In Peru’s case, the nontradables share is roughly two thirds of the economy(that is, 1 − (trade/GDP) = .67). Short-term private sector liabilities are roughly US$3.9 billion, thatis, nearly 45 percent of the total private sector debt, reported to be US$8.7 billion.
Sensitivity Analysis and the Target Fiscal Adjustment (if the RER adjustsby 10 percent and contingent liabilities are accounted for)Scenario A: Under the baseline scenario, incorporating an RER adjustment of 10 percent(assumed to occur in 2002) results in a higher public-debt-to-GDP ratio of 37.8 percent in 2010,compared to the unadjusted figure of 36.2 percent. Similarly, the required primary balance rises to 1.5 percent of GDP from 1.3 percent. Once we add the contingent liabilities, the public-debt-to-GDP ratio increases to 40.8 percent in 2010, while the required primary surplus increases to 1.8 percent of GDP.
Scenario B: Under the best-case scenario, incorporating an RER adjustment of 10 percent(assumed to occur in 2002) results in a higher public-debt-to-GDP ratio of 33.5 percent in 2010,compared to the unadjusted figure of 32.2 percent. Similarly, the required primary balance rises to1.3 percent of GDP from 1 percent. Once we add the contingent liabilities, public-debt-to-GDPratio increases to 36.4 percent in 2010, while the required primary surplus increases to 1.5 percentof GDP.
Scenario C: Under the worst-case scenario, incorporating an RER adjustment of 10 percent(assumed to occur in 2003) results in a higher public-debt-to-GDP ratio of 44.9 percent in 2010,compared to the unadjusted figure of 42.7 percent. Similarly, the required primary balance rises to 2.6 percent of GDP from 2.2 percent. Once we add the contingent liabilities, the public-debt-to-GDP ratio increases to 48.4 percent in 2010, while the required primary surplus increases to 3.0 percent of GDP.
Summary:Figure A.3 presents a comparison of public-debt-to-GDP ratios and required primary surplus as apercent of GDP, under the three scenarios with and with no shocks. Table A.7 presents a summaryof these results under alternative assumptions (see Tables A.8–A.10).
RESTORING FISCAL DISCIPLINE FOR POVERTY REDUCTION IN PERU 183

184 WORLD BANK COUNTRY STUDY
FIGURE A.3: PERU DEBT DYNAMICS: COMPARISON OF SCENARIOS WITH ANDWITH NO SHOCKS
Baseline: Public Debt to GDP Ratios
0
10
20
30
40
50
60
2000 2001 2002 2003 2004 2005 2006 2007 2008 2009 2010
Public Debt to GDP (unadjusted)
Public Debt to GDP (real exchange rate adj.)
Public Debt to GDP (contingent liab. adj.)
Baseline: Primary Balance(percent of GDP)
-1.0
0.0
1.0
2.0
2000 2001 2002 2003 2004 2005 2006 2007 2008 2009 2010
Primary Balance (unadjusted)
Primary Balance (real exchange rate adj.)
Primary Balance (incl. contingent liabilities)
Best case: Public Debt to GDP Ratios
0
10
20
30
40
50
60
2000 2001 2002 2003 2004 2005 2006 2007 2008 2009 2010
Public Debt to GDP (unadjusted)
Public Debt to GDP (real exchange rate adj.)
Public Debt to GDP (contingent liab.adj.)
Best Case: Primary Balance(percent of GDP)
-1.0
-0.5
0.0
0.5
1.0
1.5
2.0
2000 2001 2002 2003 2004 2005 2006 2007 2008 2009 2010
Primary Balance (unadjusted)
Primary Balance (real exchange rate adj.)
Primary Balance (incl. contingent liabilities)
Worst Case: Public Debt to GDP Ratios
0
10
20
30
40
50
60
2000 2001 2002 2003 2004 2005 2006 2007 2008 2009 2010
Public Debt to GDP (unadjusted)
Public Debt to GDP (real exchange rate adj.)
Public Debt to GDP (contingent liab. adj.)
Worst Case: Primary Balance(percent of GDP)
-1
0
1
2
3
4
2000 2001 2002 2003 2004 2005 2006 2007 2008 2009 2010
Primary Balance (unadjusted)
Primary Balance (real exchange rate adj.)
Primary Balance (incl. contingent liabilities)
Source: World Bank staff estimates.

RESTORING FISCAL DISCIPLINE FOR POVERTY REDUCTION IN PERU 185
TA
BLE
A.7
:PU
BLIC
SEC
TO
RD
EBT
SUST
AIN
ABI
LIT
YW
ITH
AN
DW
ITH
NO
SHO
CK
S(in
per
cent
of G
DP)
2000
2001
2002
2003
2004
2005
2006
2007
2008
2009
2010
1.B
asel
ine:
Sce
nari
o A
Prim
ary
bala
nce
(una
djus
ted)
−0.5
−0.6
0.2
0.4
0.9
1.1
1.1
1.2
1.3
1.3
1.3
Prim
ary
bala
nce
(rea
l exc
hang
e ra
te a
dj.)
−0.5
−0.6
0.3
0.5
1.0
1.3
1.3
1.4
1.4
1.5
1.5
Prim
ary
bala
nce
incl
. con
tinge
nt li
abili
ties
−0.5
−0.6
0.8
1.0
1.5
1.7
1.7
1.7
1.8
1.8
1.8
Publ
ic d
ebt
to G
DP
(una
djus
ted)
45.9
46.5
44.9
40.9
40.0
39.3
38.7
38.2
37.5
36.9
36.2
Publ
ic d
ebt
to G
DP
(rea
l exc
hang
e ra
te a
dj.)
45.9
46.5
47.3
43.3
42.2
41.4
40.7
40.1
39.3
38.6
37.8
Publ
ic d
ebt
to G
DP
(con
tinge
nt li
ab.a
dj.)
45.9
46.5
52.1
47.9
46.6
45.5
44.6
43.8
42.8
41.8
40.8
2.S
cena
rio
BPr
imar
y ba
lanc
e (u
nadj
uste
d)−0
.5−0
.60.
20.
40.
81.
01.
01.
01.
01.
01.
0Pr
imar
y ba
lanc
e (r
eal e
xcha
nge
rate
adj
.)−0
.5−0
.60.
30.
51.
01.
21.
11.
21.
21.
31.
3Pr
imar
y ba
lanc
e in
cl. c
ontin
gent
liab
ilitie
s−0
.5−0
.60.
60.
81.
31.
51.
41.
51.
51.
51.
5Pu
blic
deb
t to
GD
P (u
nadj
uste
d)45
.946
.544
.940
.839
.438
.237
.136
.034
.833
.632
.2Pu
blic
deb
t to
GD
P (r
eal e
xcha
nge
rate
adj
.)45
.946
.547
.342
.941
.340
.038
.837
.636
.334
.933
.5Pu
blic
deb
t to
GD
P (c
ontin
gent
liab
.adj
.)45
.946
.552
.147
.545
.644
.042
.541
.139
.538
.036
.43.
Sce
nari
o C
Prim
ary
bala
nce
(una
djus
ted)
−0.5
−0.6
−0.3
0.0
0.7
1.1
1.3
1.6
1.9
2.1
2.2
Prim
ary
bala
nce
(rea
l exc
hang
e ra
te a
dj.)
−0.5
−0.6
−0.2
0.2
0.9
1.4
1.6
1.9
2.2
2.4
2.6
Prim
ary
bala
nce
incl
. con
tinge
nt li
abili
ties
−0.5
−0.6
0.4
0.7
1.5
1.9
2.1
2.4
2.6
2.8
3.0
Publ
ic d
ebt
to G
DP
(una
djus
ted)
45.9
46.5
45.4
41.3
41.4
41.7
42.0
42.4
42.6
42.7
42.7
Publ
ic d
ebt
to G
DP
(rea
l exc
hang
e ra
te a
dj.)
45.9
46.5
47.8
44.4
44.3
44.4
44.7
44.9
45.0
45.0
44.9
Publ
ic d
ebt
to G
DP
(con
tinge
nt li
ab.a
dj.)
45.9
46.5
52.6
49.1
48.9
48.8
48.8
48.9
48.8
48.6
48.4
Sour
ce:
Wor
ld B
ank
staf
f est
imat
es.

186 WORLD BANK COUNTRY STUDY
TA
BLE
A.8
:SC
ENA
RIO
SW
ITH
SHO
CK
S(1
0% D
EPR
ECIA
TIO
NIN
REA
LEX
CH
AN
GE
RA
TE
AN
DA
DJU
STM
ENT
FOR
CO
NT
ING
ENT
LIA
BILI
TIE
S)Sc
enar
io A
: Bas
elin
e (in
mill
ions
of l
cu)
2002
20
03
2004
20
05
2006
20
07
2008
20
09
2010
P
roj.
Pro
j.P
roj.
Pro
j.P
roj.
Pro
j.P
roj.
Pro
j.P
roj.
lcu$
3.77
3.77
3.77
3.77
3.77
3.77
3.77
3.77
3.77
Nom
inal
GD
P20
3,28
021
3,31
422
3,84
323
7,22
025
1,64
326
6,94
328
3,17
330
0,68
431
8,96
6R
eal g
row
th3.
74.
04.
04.
04.
04.
04.
04.
04.
0D
eflat
or0.
90.
90.
91.
92.
02.
02.
02.
12.
0A
vera
ge in
tere
st p
aid
on
new
deb
t10
1010
1010
1010
1010
Prim
ary
bala
nce
incl
. con
t. lia
b. %
of G
DP
0.8
1.0
1.5
1.7
1.7
1.7
1.8
1.8
1.8
Pri
mar
y ba
lanc
e as
% o
f GD
P0.
280.
511.
041.
251.
261.
361.
441.
481.
52In
tere
st p
aym
ents
incl
udin
g co
nt. l
iab
5362
.56
5957
.89
7292
.80
8032
.01
8340
.58
8901
.37
9444
.04
9928
.14
1042
9.15
New
ly is
sued
com
mer
cial
deb
t0
320
878
1508
2235
2931
3678
4493
5368
Inte
rest
pay
men
ts a
s %
of G
DP
incl
. con
t. lia
b.2.
62.
83.
33.
43.
33.
33.
33.
33.
3O
vera
ll fi
scal
bal
ance
as
% o
f GD
P�
1.9
�1.
8�
1.8
�1.
7�
1.7
�1.
6�
1.5
�1.
5�
1.4
Priv
atiz
atio
n re
ceip
ts22
6422
6415
0917
717
017
015
115
115
1A
mor
tizat
ion
of e
xist
ing
debt
3807
5173
6387
8123
6437
6270
6236
6476
6148
Dom
estic
deb
t55
811
9220
7132
5611
5170
949
848
320
4Fo
reig
n de
bt32
9240
6844
4750
3454
5357
6459
4163
2564
01M
ultil
ater
al15
4715
8116
7919
4322
2222
6422
6824
5224
56O
n ne
w a
dditi
onal
mul
tilat
eral
disb
urse
men
ts0
00
00
00
111
205
Paris
Clu
b16
1922
3423
8825
8827
2828
7530
4930
7529
92Br
ady
Bond
s12
725
338
050
350
362
562
568
674
8PD
I12
725
338
038
038
038
038
038
038
0FL
IRB
00
012
312
324
524
530
636
8

RESTORING FISCAL DISCIPLINE FOR POVERTY REDUCTION IN PERU 187
New
fore
ign
disb
urse
men
ts47
1641
3543
6244
3040
1134
1530
5224
9019
77M
ultil
ater
al c
redi
tors
4041
2792
3049
2909
2690
2396
2211
1939
1592
Bila
tera
l cre
dito
rs86
413
4313
1315
2113
2110
1984
155
138
5Fi
nanc
ing
need
(is
suan
ce o
f new
com
mer
cial
deb
t)−1
244
769
4496
7595
6435
6967
7418
8326
8617
Dom
estic
0Fo
reig
n (r
esid
ual)
−124
4T
otal
deb
t se
rvic
e81
8410
145
1269
415
169
1379
214
186
1469
515
418
1559
1T
otal
deb
t se
rvic
e as
% o
f GD
P4.
04.
85.
76.
45.
55.
35.
25.
14.
9Im
plic
it a
vera
ge in
tere
st r
ate
5.39
5.28
6.75
7.31
7.33
7.56
7.75
7.87
7.99
Dom
estic
6.20
Fore
ign
5.14
To
tal d
ebt
as %
of G
DP
(R
ER
adj
uste
d)47
.27
43.3
242
.23
41.3
940
.71
40.0
739
.32
38.5
537
.75
To
tal d
ebt
as %
of G
DP
(R
ER
adj
uste
d �
52.1
247
.94
46.6
345
.55
44.6
343
.76
42.8
041
.83
40.8
4co
ntin
gent
liab
.)T
otal
deb
t96
095
9241
194
524
9819
010
2451
1069
5611
1349
1159
1912
0422
Stoc
k of
new
com
mer
cial
deb
t41
5161
6510
661
1825
624
691
3165
839
076
4740
256
019
Tot
al e
xist
ing
debt
9194
486
246
8386
379
934
7776
075
298
7227
368
517
6440
3E
xist
ing
dom
esti
c de
bt s
tock
(in
cl. B
R)
2185
720
665
1859
315
337
1418
613
477
1297
912
496
1229
2E
xist
ing
cont
inge
nt li
ab. (
1998
)98
5998
5998
5998
5998
5998
5998
5998
5998
59E
xist
ing
sto
ck M
LT
Ext
erna
l Deb
t o
f the
70
087
6558
265
270
6459
763
574
6182
059
294
5602
152
111
No
n-F
inan
cial
Pub
lic S
ecto
r (A
�D
)
Sour
ce:
Wor
ld B
ank
staf
f est
imat
es.

188 WORLD BANK COUNTRY STUDY
TA
BLE
A.9
:SC
ENA
RIO
SW
ITH
SHO
CK
S(1
0% D
EPR
ECIA
TIO
NIN
REA
LEX
CH
AN
GE
RA
TE
AN
DA
DJU
STM
ENT
FOR
CO
NT
ING
ENT
LIA
BILI
TIE
S)Sc
enar
io B
(in
mill
ions
of l
cu)
2002
20
03
2004
20
05
2006
20
07
2008
20
09
2010
P
roj.
Pro
j.P
roj.
Pro
j.P
roj.
Pro
j.P
roj.
Pro
j.P
roj.
lcu$
3.77
3.77
3.77
3.77
3.77
3.77
3.77
3.77
3.77
Nom
inal
GD
P20
3,28
021
5,36
522
8,16
824
4,12
926
1,46
228
0,02
629
9,90
832
1,51
634
4,34
4R
eal g
row
th3.
75.
05.
05.
05.
05.
05.
05.
05.
0D
eflat
or0.
90.
90.
91.
92.
02.
02.
02.
12.
0A
vera
ge in
tere
st p
aid
on
new
deb
t7.
57.
57.
57.
57.
57.
57.
57.
57.
5Pr
imar
y ba
lanc
e %
of G
DP
incl
. con
t. lia
b.0.
60.
81.
31.
51.
41.
51.
51.
51.
5P
rim
ary
bala
nce
as %
of G
DP
0.28
0.50
0.98
1.15
1.12
1.19
1.24
1.26
1.28
Inte
rest
pay
men
ts in
cl. c
ont.
liab.
5116
.09
5616
.71
6757
.11
7285
.79
7361
.52
7699
.34
8008
.82
8243
.33
8480
.38
Inte
rest
pay
men
ts a
s %
of G
DP
2.2
2.3
2.6
2.7
2.5
2.5
2.4
2.3
2.2
Inte
rest
pay
men
ts a
s %
of G
DP
incl
. con
t. lia
b.2.
52.
63.
03.
02.
82.
72.
72.
62.
5O
vera
ll fi
scal
bal
ance
as
% o
f GD
P�
1.9
�1.
8�
1.7
�1.
5�
1.4
�1.
3�
1.2
�1.
1�
1.0
Priv
atiz
atio
n re
ceip
ts22
6422
6415
0917
717
017
015
115
115
1A
mor
tizat
ion
of e
xist
ing
debt
3807
5173
6387
8123
6437
6270
6236
6476
6148
Dom
estic
deb
t55
811
9220
7132
5611
5170
949
848
320
4Fo
reig
n de
bt32
9240
6844
4750
3454
5357
6459
4163
9165
34M
ultil
ater
al15
4715
8116
7919
4322
2222
6422
6824
5224
56O
n ne
w a
dditi
onal
mul
tilat
eral
disb
urse
men
ts0
00
00
00
178
338
Paris
Clu
b16
1922
3423
8825
8827
2828
7530
4930
7529
92Br
ady
Bond
s12
725
338
050
350
362
562
568
674
8PD
I12
725
338
038
038
038
038
038
038
0FL
IRB
00
012
312
324
524
530
636
8

RESTORING FISCAL DISCIPLINE FOR POVERTY REDUCTION IN PERU 189
New
fore
ign
disb
urse
men
ts47
1652
6754
9355
6151
4345
4641
8436
2231
09M
ultil
ater
al c
redi
tors
4041
3924
4180
4041
3822
3528
3343
3071
2724
Bila
tera
l cre
dito
rs86
413
4313
1315
2113
2110
1984
155
138
5Fi
nanc
ing
need
(is
suan
ce o
f new
com
mer
cial
deb
t)−1
244
−439
3162
6123
4813
5179
5449
6158
6234
Dom
estic
0Fo
reig
n (r
esid
ual)
−124
4T
otal
deb
t se
rvic
e81
8410
050
1240
514
670
1305
913
230
1350
613
980
1388
9T
otal
deb
t se
rvic
e as
% o
f GD
P4.
04.
75.
46.
05.
04.
74.
54.
34.
0Im
plic
it a
vera
ge in
tere
st r
ate
5.39
5.18
6.45
6.83
6.66
6.74
6.80
6.79
6.80
Dom
estic
6.20
Fore
ign
5.14
To
tal d
ebt
as %
of G
DP
47.2
742
.87
41.3
039
.97
38.7
637
.56
36.2
634
.90
33.4
9T
ota
l deb
t as
% o
f GD
P (
RE
R a
djus
ted
�52
.12
47.4
545
.63
44.0
142
.53
41.0
939
.55
37.9
736
.36
cont
inge
nt li
ab.)
Tot
al d
ebt
9609
592
334
9424
597
572
1013
4210
5190
1087
4611
2214
1153
32St
ock
of n
ew c
omm
erci
al d
ebt
4151
4956
8118
1424
219
054
2423
329
682
3584
042
074
Tot
al e
xist
ing
debt
9194
487
378
8612
783
330
8228
880
957
7906
476
374
7325
9E
xist
ing
dom
esti
c de
bt s
tock
(in
cl. B
R)
2185
720
665
1859
315
337
1418
613
477
1297
912
496
1229
2E
xist
ing
cont
inge
nt li
ab. (
1998
)98
5998
5998
5998
5998
5998
5998
5998
5998
59E
xist
ing
sto
ck M
LT
Ext
erna
l Deb
t o
f the
70
087
6671
467
533
6799
368
101
6748
066
085
6387
860
966
No
n-F
inan
cial
Pub
lic S
ecto
r (A
�D
)
Sour
ce:
Wor
ld B
ank
staf
f est
imat
es.

190 WORLD BANK COUNTRY STUDY
TA
BLE
A.1
0:SC
ENA
RIO
SW
ITH
SHO
CK
S(1
0% D
EPR
ECIA
TIO
NIN
REA
LEX
CH
AN
GE
RA
TE
AN
DA
DJU
STM
ENT
FOR
CO
NT
ING
ENT
LIA
BILI
TIE
S)Sc
enar
io C
(in
mill
ions
of l
cu)
2002
20
03
2004
20
05
2006
20
07
2008
20
09
2010
P
roj.
Pro
j.P
roj.
Pro
j.P
roj.
Pro
j.P
roj.
Pro
j.P
roj.
lcu$
3.77
3.77
3.77
3.77
3.77
3.77
3.77
3.77
3.77
Nom
inal
GD
P20
3,28
021
0,23
721
7,43
322
7,10
323
7,43
624
8,23
925
9,53
427
1,60
928
3,96
7R
eal g
row
th3.
72.
52.
52.
52.
52.
52.
52.
52.
5D
eflat
or0.
90.
90.
91.
92.
02.
02.
02.
12.
0A
vera
ge in
tere
st p
aid
on
new
deb
t12
1212
1212
1212
1212
Prim
ary
bala
nce
% o
f GD
P in
cl. c
ont.
liab.
0.4
0.7
1.5
1.9
2.1
2.4
2.6
2.8
3.0
Pri
mar
y ba
lanc
e as
% o
f GD
P+0
.22
0.18
0.94
1.38
1.60
1.90
2.16
2.37
2.57
Inte
rest
pay
men
ts in
cl. c
ont.
liab.
5559
.74
6361
.91
8122
.52
9296
.92
1005
3.35
1104
7.14
1202
6.63
1295
3.96
1390
0.42
Inte
rest
pay
men
ts a
s %
of G
DP
incl
. con
t. lia
b.2.
73.
03.
74.
14.
24.
54.
64.
84.
9O
vera
ll fi
scal
bal
ance
as
% o
f GD
P�
2.4
�2.
3�
2.3
�2.
2�
2.1
�2.
1�
2.0
�2.
0�
1.9
Priv
atiz
atio
n re
ceip
ts22
6422
6415
0917
717
017
015
115
115
1A
mor
tizat
ion
of e
xist
ing
debt
3807
5173
6387
8123
6437
6270
6236
6476
6148
Dom
estic
deb
t55
811
9220
7132
5611
5170
949
848
320
4Fo
reig
n de
bt32
9240
6844
4750
3454
5357
6459
4162
8463
52M
ultil
ater
al15
4715
8116
7919
4322
2222
6422
6824
5224
56O
n ne
w a
dditi
onal
mul
tilat
eral
disb
urse
men
ts0
00
00
00
7115
6Pa
ris C
lub
1619
2234
2388
2588
2728
2875
3049
3075
2992
Brad
y Bo
nds
127
253
380
503
503
625
625
686
748
PDI
127
253
380
380
380
380
380
380
380
FLIR
B0
00
123
123
245
245
306
368

RESTORING FISCAL DISCIPLINE FOR POVERTY REDUCTION IN PERU 191
New
fore
ign
disb
urse
men
ts47
1625
4327
6928
3724
1818
2214
6089
838
5M
ultil
ater
al c
redi
tors
4041
1200
1456
1317
1098
804
619
347
0Bi
late
ral c
redi
tors
864
1343
1313
1521
1321
1019
841
551
385
Fina
ncin
g ne
ed (
issu
ance
of n
ew c
omm
erci
al d
ebt)
−228
3288
7001
1008
689
1294
2998
6510
757
1103
2D
omes
tic0
Fore
ign
(res
idua
l)−2
28T
otal
deb
t se
rvic
e81
8410
351
1332
716
237
1530
716
134
1708
018
247
1886
5T
otal
deb
t se
rvic
e as
% o
f GD
P4.
04.
96.
17.
16.
46.
56.
66.
76.
6Im
plic
it a
vera
ge in
tere
st r
ate
5.39
5.44
7.32
8.23
8.57
9.07
9.51
9.86
10.1
9D
omes
tic6.
20Fo
reig
n5.
14T
ota
l deb
t as
% o
f GD
P47
.77
44.4
044
.32
44.4
444
.67
44.9
044
.96
44.9
744
.91
To
tal d
ebt
as %
of G
DP
(R
ER
adj
uste
d �
52.6
249
.09
48.8
548
.78
48.8
348
.87
48.7
648
.60
48.3
8co
ntin
gent
liab
.)T
otal
deb
t97
112
9333
896
363
1009
2910
6075
1114
4911
6697
1221
4612
7520
Stoc
k of
new
com
mer
cial
deb
t51
6786
8415
685
2577
134
683
4411
253
977
6473
475
766
Tot
al e
xist
ing
debt
9194
484
654
8067
875
158
7139
167
337
6272
057
412
5175
4E
xist
ing
dom
esti
c de
bt s
tock
(in
cl. B
R)
2185
720
665
1859
315
337
1418
613
477
1297
912
496
1229
2E
xist
ing
cont
inge
nt li
ab. (
1998
)98
5998
5998
5998
5998
5998
5998
5998
5998
59E
xist
ing
sto
ck M
LT
Ext
erna
l Deb
t o
f the
70
087
6398
962
085
5982
057
205
5385
949
740
4491
639
462
No
n-F
inan
cial
Pub
lic S
ecto
r (A
+ D
)
Sour
ce:
Wor
ld B
ank
staf
f est
imat
es.


We estimate the required fiscal adjustment that is necessary to achieve the more sustainabledebt-to-GDP ratios calculated in Annex A.1 Fears of excessive fiscal deficits stem fromthe likelihood that they might be unsustainable in the long run. The fiscal effort in ques-
tion is calculated in terms of the path that the structural deficit (as opposed to the actual deficitthat incorporates a cyclically adjusted component) must follow to be consistent with debt anddebt-service sustainability. Therefore, first, a structural primary balance is calculated, consistentwith maintaining and even reducing the overall non-financial public sector (NFPS) debt as a ratioof GDP, in terms of both principal and servicing requirements. Second, we estimate the fiscaladjustment required to achieve sustainability on the assumption that the cyclical component of theprimary balance will approach zero over the 10-year forecast period. The fiscal effort is estimatedunder three alternative scenarios and its sensitivity is analyzed according to alternative interest rate,financing, and output growth assumptions. The underlying assumptions, target debt-to-GDP andprimary-surplus-to-GDP ratios, and the implicit average interest rates on total debt follow from theanalysis in Annex A.
Rationale for Using the Structural Balance and Methodology to Calculate ItIt has long been recognized2 that the nominal budget balance is an imperfect indicator of the gov-ernment’s true fiscal stance. The problem is that, in general, the fiscal balance depends not only onofficials’ tax and expenditure decisions, but also on the extent to which autonomous spending deci-sions by the private sector reflect themselves on the country’s output and national income levels,and thereby on tax collection. Thus, if the economy enters a recession because of, say, a reduction inprivate investment, tax revenue automatically declines, irrespective of the officials’ fiscal stance, andthe fiscal balance worsens. Conversely, if an autonomous increase in private spending leads to an
Annex B
THE FISCAL EFFORTREQUIRED FOR A SUSTAINED
STRUCTURAL DEFICIT
193
1. This Annex was prepared with technical assistance from Rashmi Shankar.2. See, for instance, Dornbusch and Fischer (1990).

increase in national income, tax revenue increases and the fiscal balance improves. These changes inthe fiscal balance take place automatically for a given tax structure. This implies that, as its stands,the nominal fiscal balance is a distorted measure of whether government fiscal policy is expansionaryor contractionary. A given fiscal stance is consistent with a worsening or an improvement in thenominal balance, depending on whether private spending decreases or increases.
To address the issue of the need to have a measure of fiscal policy that is independent of theparticular position of the economy in the business cycle, the concept of cyclically adjusted or struc-tural budget balance has been developed in the macroeconomics literature.3 The basic idea is tocarry out a simple decomposition of the nominal budget balance (B) into two unobservable components—the structural component (SB) and the cyclical component (CB)—in such a way that the following equation holds for period t:
Under the admittedly inaccurate, simplifying assumption that government spending is not afunction of the state of the business cycle, the structural component is defined by:
where SR(t), the structural revenue, is the fiscal revenue that would be collected if actual output int were the level of output determined by the long-run trend, which will be called trend output.G(t) is total government spending. SR is estimated by means of the following equation:
where R(t) is the observed value for the government revenue; TY(t) is the economy’s trend output,Y(t) the actual level of output, and ß is the income elasticity of total government revenue. Comple-tion of the calculations implied by equations (B2) and (B3) requires that estimates for both trendoutput and the income elasticity of revenue be generated. These two issues are addressed below.
The revenue elasticity of the cyclical component during 1970–2001 was estimated. It wasfound to be 1.14.4
For the purpose of estimation trend output, the estimation method proposed by Hodrick andPrescott (1997) is used. In terms of this method, if the logarithm of Y(t) is denoted y(t), the timeseries for y(t) can be decomposed in its trend component ty(t) and its cyclical component cy(t):
then the Hodrick-Prescott (HP) trend output, hpy (t), is the series that minimizes the expression:
where the sums are carried out from t = 1 to t = T and λ is a parameter that determines howsmooth the trend line will be. The method’s idea is to minimize the sum of two terms where thefirst term is the sum of squares of the cyclical component and the second term is the sum of squaresof the trend component’s second differences. While the first term in (B.5) penalizes large residuals
cy ty ty ty tyt t t t t (B.5)( ) + ( ) − −( )[ ] − −( ) − −( )[ ]{ }∑∑ 2 21 1 2λ
y t t t for t T (B.4)( ) = ( ) + ( ) =ty cy ; , ,1 K
SR TYt R t t Y t (B.3)( ) = ( ) ( ) ( )[ ]β
SB SRt t G t (B.2)( ) = ( ) − ( )
B t t t (B.1)( ) = ( ) + ( )SB CB
194 WORLD BANK COUNTRY STUDY
3. See, for instance, Brown (1956); de Leeuw and others (1980); and Hagemann (1999). For a criticismof this approach, see Fellner (1982).
4. This is different from the revenue elasticity of 0.98 assumed for the main debt sustainability analysis fora shorter period, since what is considered here is the elasticity of cyclical tax revenues with respect to cyclicaloutput.

(that is, poor fit),5 the second term penalizes lack of smoothness in the trend. If λ is zero, the trendwill simply equal the original series for all t; but, if λ is very large, changes in the slope of the trendare avoided, and, in the limit, the trend will simply be a straight line. For quarterly data there is aconsensus among practitioners around the value of λ = 1600, originally proposed by Hodrick andPrescott (1980). There is no consensus, however, for data of other frequencies, and originallyDolado, Sebastián, and Vallés (1993) used λ = 400, and Backus and Kehoe (1992), Giorno andothers (1995), and the European Central Bank (2002) use λ = 100 for the structural deficit of theEuropean Union countries. Econometric software like Eviews also uses the latter value. Hence, avalue of λ = 100 is assumed.
Figure 2.12 (see Chapter II) shows actual output and estimated structural or cyclically adjustedoutput for Peru during 1990–2002. Figure 2.13 shows actual and estimated fiscal balance.
Calculation of the structural balance allows us to carry out the next steps in the simulationexercise. They are:
1. Estimation of the required primary surplus consistent with the target debt-to-GDP ratio inperiod “t+n” where n is the number of forecast periods. This requires a forecast of futurereal interest and growth rates.
2. Estimation of the structural primary surplus in “t+n”, the present value of which mustequal the present value of the primary surpluses over the n periods in the forecast horizon.
3. Estimation of the fiscal effort required: Here a time horizon of nine years is assumed sincethe purpose of the exercise is to capture the transition dynamics in terms of the permanent,or long-run, fiscal adjustment required. The issue is then explored of how the debt-to-GDPratio would evolve under alternative assumptions on interest rates, growth, and financing.The purpose is to capture the impact of changes in the assumptions regarding the valuestaken by key parameters on the target permanent primary surplus that is consistent withsustainable debt and debt servicing.
Scenarios and AssumptionsFollowing the above indicated methodological steps, three simulation scenarios are run for 2002–10.The assumptions defining each scenario are similar to those in Annex A and are summarized in whatfollows.6
The baseline scenario assumes a moderate growth rate of 4.0 percent, which is slightly higherthan the average growth rate of Peru’s economy in the 1990s (3.6 percent). This scenario incorpo-rates the preliminary figures for the Brady buy-back under which all outstanding front-loaded inter-est reduced Brady bonds have been exchanged. It is assumed that maintains moderate levels. Theaverage interest rate on new debt is fixed at 10 percent throughout the period. It is also assumedthat there will be reduced balance-of-payment support from the multilaterals (being phased out in2003), but that this reduction will be partly offset by sector investment. There is limited resort tocommercial borrowing. The financing mix is such that the implicit average interest rate on the totalstock of NFPS debt grows gradually from 5.4 percent to 7.9 percent during 2002–10.
RESTORING FISCAL DISCIPLINE FOR POVERTY REDUCTION IN PERU 195
5. The cy(t) values are deviations from trend and the conceptual framework implies that, for a good fit toexist, their average over long time periods must be close to zero.
6. There is a set of assumptions common to all scenarios. They are (a) by 2010, automatic stabilizers willensure that the cyclical component of the primary balance is close to zero; (b) the permanent primary balanceis −43 percent in 2001; (c) receipts from privatization will be US$600 million for 2002 and 2003, and will fallto less than $50 million per year thereafter; (d) inflation in the GDP deflator (US$ terms) will increase from0.9 percent in 2002 to approximately 2 percent during 2006–10; (e) continued rollover of short-term debtover the entire period 2002–10; (f) the permanent primary surplus grows “smoothly” to the required level;and (g) the NFPS elasticities of actual unadjusted revenues and expenditures with respect to GDP remain con-stant at 0.98 and 0.95, respectively. Elasticities are estimated for 1994–2002.

196 WORLD BANK COUNTRY STUDY
TABLE B.1: REQUIRED FISCAL EFFORT FOR DEBT SUSTAINABILITY
Diagonal Elements Corresponding to Main DSA (as a percentage of GDP) Est. Projections
2001 2002 2003 2004 2005 2006 2007 2008 2009 2010Primary surplus −0.6Permanent primary −0.4surplusCyclical component of −0.3primary surplusScenario A: BaselineInterest rate (implicit 6.6 5.4 5.3 6.7 7.3 7.3 7.5 7.7 7.8 7.9averageon NFPS debt)Rate of growth of 3.7 4.0 4.0 4.0 4.0 4.0 4.0 4.0 4.0 4.0potential output (annual, %)Target debt stock 36.2(% of GDP)Target permanent primary −0.4 −0.2 0.0 0.2 0.4 0.5 0.7 0.9 1.1 1.2surplus (% of GDP)Fiscal correction 1.6(% of GDP)Scenario B: Best CaseInterest rate (implicit 6.6 5.4 5.1 6.3 6.6 6.4 6.4 6.3 6.2 6.1average on NFPS debt)Rate of growth of 3.7 5.0 5.0 5.0 5.0 5.0 5.0 5.0 5.0 5.0potential output (annual, %)Target debt stock 34.0(% of GDP)Target permanent primary −0.4 −0.3 −0.2 −0.1 0.0 0.0 0.1 0.2 0.3 0.3surplus (% of GDP)Fiscal correction 0.7(% of GDP)Scenario C: Worst CaseInterest rate (implicit 6.6 5.4 5.4 7.3 8.2 8.5 9.0 9.4 9.7 10.1average on NFPS debt)Rate of growth of 3.7 2.5 2.5 2.5 2.5 2.5 2.5 2.5 2.5 2.5potential output (annual, %)Target debt stock 42.7(% of GDP)Target permanent primary −0.4 0.0 0.4 0.7 1.1 1.4 1.8 2.2 2.5 3.0surplus (% of GDP)Fiscal correction 3.3(% of GDP)
Source: World Bank staff estimates.

RESTORING FISCAL DISCIPLINE FOR POVERTY REDUCTION IN PERU 197
A second, optimistic best-case scenario assumes a higher average growth rate of GDP (5.0 per-cent). The interest rate on new debt will be 7.5 percent over the simulation period. The multi-laterals are assumed to provide full balance-of-payments support. The mix of multilateral financingand (limited) commercial borrowing is such that the implicit average interest rate on total NFPSdebt stays at lower levels than in the other two scenarios, growing slowly from 5.4 percent to 6.1 percent during 2002–10.
Finally, a pessimistic worst-case scenario assumes both a low average growth rate (2.5 percent)and an even higher implicit interest rate on debt. The latter is the result of (a) reduced multilateralfinancing (no fast-disbursing loans and reduced new commitments from 2003 onward), and (b) theinterest rate on new commercial debt is assumed to be 12.0 percent and the country has to relymore on this type of debt.
ResultsFor the baseline scenario a substantial fiscal effort is required. The primary balance will have to besteadily increased from the 2001 deficit of −0.4 percent of GDP to a surplus of 1.2 percent of GDPby 2010, for a net fiscal correction of 1.6 percent of GDP (Table B.1).
In the optimistic scenario a lighter but still considerable fiscal effort in its own right will berequired. The goal would be to reach a surplus of 0.3 percent of GDP by 2009–10, for a net fiscalcorrection of 0.7 percent of GDP. This is consistent with higher growth and fiscal discipline.
Not surprisingly, the pessimistic scenario would entail an extremely demanding fiscal effort.The (structural) primary balance would have to be reduced to zero immediately. With no delay,increasingly high primary surpluses would have to be attained and the net fiscal correction in thenine-year period through 2010 would amount to 3.4 percent of GDP.


NOTE: Nelson Shack, Budget General Director, and Oscar Pajuelo, Accountant General of Peru,responded to this questionnaire.
Aggregate Fiscal DisciplineBudget Preparation and Approval1a. Are there formal constraints (constitutional or legislatively mandated) on aggregatespending and/or deficits? Yes. The objective of the Law of Fiscal Prudence and Transparency isto establish the guidelines for better management of the public finances in order to contribute tothe economic stability, an essential condition to obtaining sustained economic growth and socialwelfare. At the same time, the Law establishes macro fiscal rules for the General Government, theConsolidated Public Sector, and it creates the Fiscal Stabilization Fund. Besides discipline on theexpenditure side, the support of the fiscal equilibrium needs to generate fiscal savings in booms inorder to face negative internal or external situations. It is necessary to establish fiscal goals for themedium term. In this way, the law contributes to the formation of expectations for the economicagents, in a period of three years. For that reason, the Law establishes ceilings for the levels ofexpenditures and debt.
1b. Is the government required to publish actual figures relative to these constraints? Yes.The Ministry of Economy and Finance (MEF) is in charge of the elaboration of the MultiyearMacroeconomic Framework (MMM) and the evaluation of its execution and publication. TheMMM includes the Declaration of Principles of Fiscal Policy, the goals of fiscal policy over the nextthree years, and the targets for macroeconomic indicators in the next three years. It also containsthe projection of fiscal revenue and expenditure, the sum of public investment, and the level ofpublic debt.
1c. Are these constraints imposed and monitored by donors? No, they are not, but all eco-nomic agents observe the fiscal performance.
Annex C
QUESTIONNAIRE ON PUBLICFINANCIAL MANAGEMENT
199

2a. Are there formal constraints (constitutional or legislatively mandated) on public debtand domestic/external borrowing by (a) the Central Government, (b) subnational govern-ments, and (c) public enterprises? The Law mandates that the public debt in the medium termshould be consistent with the principle of fiscal equilibrium. It is necessary to establish limits to thelevels of expenditures and debt. There are no formal restrictions on the components of public debt,but there are limits under the Annual Law of Public Debt.
2b. Is this monitored by the Central Bank? Yes. Debt ceilings are established in the projectionsof the MMM and are coordinated with the General Direction of Public Credit at the MEF.
2c. Are these constraints imposed and monitored by donors? No, but all economic agentsobserve fiscal performance.
2d. Is the government required to publish actual figures relative to these borrowing con-straints? Yes. They are in the MMM.
3a. Is there a medium-term expenditure framework that projects an aggregate expenditureceiling over a three-to-five-year horizon, consistent with the macroeconomic targets? TheMMM has a horizon of three years and the Sector Strategy Plans (SEPs) have a horizon of five years.
3b. Is this published? Yes, the MMM and the SEPs are published in El Diario Oficial and in theMEF’s Portal de Transparencia website.
3c. What is the percent difference between the aggregate spending in the projection andthe annual budget? It is very small, because the annual budget is elaborated as a function of thelevels of expenses and incomes, consistent with the revised fiscal projections that the MMM real-izes every year.
4a. What is the percent deviation between the aggregate spending in the budget as proposedby the central agencies (that is, Ministry of Finance in the Budget Call Circular) and thatapproved by cabinet at the end of budget discussions? No response.
4b. What is the percent deviation between aggregate spending proposed by the Cabinet andthe Legislature? There is no deviation. Congress cannot alter the level of aggregate expenditureproposed by the Executive.
Budget Execution and Monitoring1a. Are there formal rules that guard against overspending by agencies relative to budgetedamounts (for example, central agencies, chief accountants, or banks having the authority torefuse expenditures if there are insufficient funds in the ministerial account)? Yes. No agencycan spend more than the budget authorized by the National Directorate of the Public Budget(DNPP). Moreover, the Integrated Financial Management System (SIAF) contributes to respectfor those rules.
1b. Is there a published reconciliation of actual expenditures versus budgeted amounts? Yes.The monthly Treasury report, the quarterly and annual reports from the DNPP, and the annualreport from the General Office of Economic and Social Affairs (DGAES). All are available on thewebsite.
1c. Is there punitive action taken against overspending by agencies? Yes, but on a case-by-casebasis. There are administrative, civil, and penal responsibilities. The system of authorization in theSIAF allows a permanent and continuing evaluation of the authorizations of commitments andpayments of checks. In this way, there is an efficient control of expenditure.
2a. Is there a formal or informal requirement to report on aggregate fiscal outcomes relativeto targets? Yes. The report about the MMM’s execution must be published semiannually. The
200 WORLD BANK COUNTRY STUDY

MEF goes to Congress annually to report about the execution of the budget. On the other hand,it is legally consistent with the revised fiscal projections that the MMM realizes every year.
2b. Are these published? Yes, on the website.
2c. With what lags? The access of information in the SIAF is virtual and has information aggre-gated up to the last month.
2d. What is the percent deviation between the aggregate spending in the annual budget andthe total amount actually spent at the end of the fiscal year? No response.
Expenditure Priorization and Allocative EfficiencyBudget Preparation and Approval Breadth of Consultations1a. What percent of expenditures is allocated by the Central Government (as opposed tosubnational governments)? Approximately 90 percent.
1b. Which of these activities do subnational governments have constitutional responsibilityfor in allocating their budgetary expenditures: (a) primary education, (b) secondary educa-tion, (c) university education, (d) hospitals, (e) health clinics? Check only those that apply.There exist the Transitory Councils of the Regional Administration (CTARs), in which one canfind the Regional Offices of Health and Education. The local government, at the provincial or dis-trict levels, does not have the responsibility of providing education and health services.
2a. Are there explicit pre-budget consultations about budgetary priorities between thegovernment and the following groups in the private sector: (a) the business community,(b) public interest groups (for example, NGOs), (c) labor unions, and (d) farmers associa-tions? Check only those that apply. The budget is formulated internally in the public sector.There is not a framework that involves the participation of other sectors of the society yet.
2b. How large a change vis-à-vis existing priorities in the current budget have emergedfrom such consultations: negligible, modest, or large? It is not applicable but incoming pilotparticipatory budgeting will address investment expenditure.
2c. Are there post-budget consultations with the same group, which attempt to reconcilepre-budget understandings with actual allocations? No, there are not.
3a. At the start of budget preparation, is there a session in the Legislature about budgetpriorities? No.
3b. How large a change vis-à-vis existing priorities in the current budget have emergedfrom such a session: negligible, modest, or large? Not applicable.
4a. Rank the following in terms of relative influence in deciding on broad priorities for thecomposition of expenditures: (a) Ministry of Finance/Planning, (b) the Cabinet, (c) theLegislature, (d) Donors, (e) private sector–government consultation committees. That rank-ing is okay.
4b. What is the average percent deviation in the allocation for the major sectors and pro-grams between (a) the budget as proposed by the central ministries and that by the Cabinet,and (b) the budget as proposed by the Cabinet and that approved by the legislature? Range:negligible (0 to 10 percent), modest (10 to 30 percent), high (more than 30 percent). Negli-gible (0 to 10 percent).
5a. Does the government publish expenditure priorities corresponding to the following lev-els of disagreegation: (a) sector expenditures, (b) programs, (c) projects? Check only thosethat apply. Yes, it does, but at the level of sectors and programs. These priorites are included inthe MMM.
RESTORING FISCAL DISCIPLINE FOR POVERTY REDUCTION IN PERU 201

5b. If so, are these expressed in terms of outcomes (that is, impact on beneficiaries, such asinfant mortality) or outputs (that is, goods and services produced, such as number of healthclinics or immunizations provided)? No, they are not.
5c. Are actual achievements of sector expenditures published? Yes, on the website.
5d. If so, is there a public or published reconciliation with the targets? Yes.
6a. What percentage of public spending is financed by donors? It is less than 2 percent of thebudget.
6b. Is there a prior agreement among donors about the composition of expenditures thatare being collectively financed? No.
6c. If so, is this agreement induced by the leadership of a central donor? Not applicable.
Budget Preparation and Approval Allocation Rules and Criteria1a. Are expenditure allocations across ministries and programs increased or decreased in thesame proportion across-the-board? The variations, which could happen in the different assign-ments of expenses, are not proportional. They depend on the level of the expenditure priority.
1b. Are there formulas or rules that earmark funds for specific expenditures? What propor-tion of total expenditures do they constitute? No.
2a. Are there formal or informal rules that require explicit consideration of whether individ-ual programs or projects that are to be funded by the budget can be undertaken by the privatesector? No.
2b. For which sectors is this done? For what percentage of programs/projects is this actuallydone (100 percent, 50 to 99 percent, 20 to 49 percent, less than 20 percent)? Not applicable.
3a. Is there a requirement to conduct an ex ante quantitative analysis of costs and benefitsbefore a new program/project is initiated? Yes, in the case of projects, the Law of National System of Public Inversion requires such analysis.
3b. For which sectors is this done? Indicate the percentage of programs/projects for whichthis is actually done (100 percent, 50 to 99 percent, 20 to 49 percent, less than 20 percent)?Since 2001, it is 100 percent.
4a. Is the distributional impact of public spending explicitly quantified and considered inallocating resources among programs and projects? No.
4b. For which sectors is this done? Indicate the percentage of programs/projects for whichthis is actually done (100 percent, 50 to 99 percent, 20 to 49 percent, less than 20 percent)?Not applicable.
Budgeting Preparation and Approval Norms1a. Is there a system of forward estimates that projects the future cost implications of exist-ing and proposed programs and projects? No.
1b. Are these automatically rolled over into the next budget, adjusted only for key nationalparameters such as inflation rate? Not applicable.
1c. Are these forward estimates published? Not applicable.
1d. Does the government publish a reconciliation statement explaining any significant devi-ations in the composition of expenditures between the original forward estimates and theannual budget? Not applicable.
202 WORLD BANK COUNTRY STUDY

2a. Are line agencies required to identify cuts in their existing programs to match newspending proposals? No.
2b. Are various new spending proposals and offsetting cuts discussed systematically at aCabinet or sub-Cabinet level? Yes.
Budgeting Preparation and Approval of Capital/Recurrent Budgeting1a. Are there separate budgets for capital and recurrent expenditures? Yes.
1b. Is there a requirement to estimate the recurrent cost implications of new capital invest-ments? Yes.
1c. Are there different ministries responsible for preparing capital budgets (for example,Ministry of Planning) and recurrent budgets (for example, MEF)? The investment office(ODI) at MEF does it.
1d. What percent of public investments is donor financed? Not available.
Budget Preparation and Approval of Donor Rules1a. Is there a donor conditionality on the overall composition of expenditures? No.
1b. Has expenditure composition been changed in accordance with this conditionality? Notapplicable.
1c. What percent of donor-financed expenditures is earmarked for particual programs andprojects? Not available.
Budgeting Execution and Monitoring1a. What is the average percent deviation between the composition of expenditures asapproved in the annual budget and the actual allocation at the end of the budget year? Notavailable.
1b. On what basis was the composition changed: (a) arbitrary/ad hoc, (b) related to spe-cific problems? It was changed in relation of specific problems such as internal shocks of naturalcharacter (El Niño phenomenon), and political and external shocks (financial crisis and the worldrecession).
1c. What was the relative role of the following in inducing these changes: (a) Ministry ofFinance/Planning, (b) the Cabinet, (c) the Legislature, (d) private sector–government con-sultation committees? Rank these in order of importance, with 1 for the least influence and4 for the most. Not available.
2a. Is there a requirement for carrying out ex post evaluation of programs/projects? Bywhom: central agencies, line agencies, or by independent external agencies? Check all thosethat apply. They are done by the ODI, Special Programs, MEF.
2b. Are the results used in expenditure allocations for the next budget? Yes.
3. Are client surveys routinely carried out as part of these evaluations? No.
Accountability1a. Is there a clear specification of the output to be produced by (a) a ministry, (b) a depart-ment within a ministry, and (c) a division, program, or project unit within a department?Yes, there is, financially for the ministry ruled by the norms issued by the Nation Public Auditor’sOffice and they are in agreement with the Principles of “Generally Accepted Accounting,” whichincludes, according to the case, the development of the International Norms.
RESTORING FISCAL DISCIPLINE FOR POVERTY REDUCTION IN PERU 203

1b. If so, are these outputs published? They are published, with limited distribution to theExecutive and the Legislative bodies. They are available at the National Public Accountant’sOffice website.
2a. Are performance indicators specifically linked to senior manager (a) tenure, (b) promo-tion, and (c) compensation? No.
2b. Are these performance indicators based on the achievement of outputs (that is, goodsand services produced, such as number of immunizations of health clinics) or outcomes(that is, impact of beneficiaries, such as lower infant mortality)? They are collected by theNational Office of Public Budget with few details.
2c. Have chief executives been fired on account of nonperformance? No.
3a. What is the percentage deviation between public and private pay for different grade levels?It is 5 to 1 in proportion to staff.
3b. Is there an explicit link between pay and performance? No.
4a. Is competitive bidding required for the procurement of major expenditure items? Yes,procedures are under standard. The Superior Council of Contractings and Procurements from theState (CONSUCODE) supervises the process.
4b. Are the rules for bidding made public? Yes. When the bidding amount is larger, the publi-cation is larger, too.
5a. When are financial accounts of line agencies prepared: (a) quarterly during the budgetyear, (b) semestral during the budget year, (c) within six months from the end of the fiscalyear, (d) more than six months but less than one year, (e) between one and three years, (f) more than three years. Yes, for (a) and (b). Yes. The budget program is reconciled with thenumbers rendered by the entities of accounts, the National Office of Public Budget, and theNation Public Auditor’s Office. No for (c) (d) (e) and (f ).
5b. Are there punitive actions taken against (a) delays, and (b) discrepancies? Under the law,there are actions, but in practice it depends on the actions of the Republic General Auditor’sOffice, which is the entity in charge of that. It is not frequent to see actions by the GeneralAccount of the Republic.
5c. Are these accounts tabled before a separate session of the Legislature? The procedure dic-tates that the General Account of the Republic is forwarded to the Republic General Auditor’sOffice in order to create the Auditor’s report. After that, it is forwarded to the Presidency of theRepublic, to the MEF, and to the Review Commission of the General Accounts of Congress.
5d. Are they made public? They are distributed to the Executive and Congress. They are on thePublic Auditor’s Office website for the fiscal year. They are divulged in the training, local, domes-tic, or international competitions.
6a. Are the agency accounts audited? In the majority of cases, especially those of public enter-prise entities of the Central Government, the Republic General Auditor’s Office is in charge ofauditing the General Account from the Republic.
6b. If so, by whom: internal agency auditor, the government auditor within the Executive,independent auditor? No response.
6c. When are audits of agency accounts undertaken: (a) quarterly during the budget year,(b) semestral during the budget year, (c) within six months from the end of the fiscal year,(d) more than six months but less than one year, (e) between one and three years, (f ) morethan three years. Once per year.
204 WORLD BANK COUNTRY STUDY
6d. What percent of programs have been audited in the last five years? As a percentage of thenumber of entities, approximately 20 percent. In budget amounts, approximately 80 percent.
6e. What percent are financial audits as opposed to performance audits? Approximately 35 percent.
6f. Are the results published? No.
6g. Has there been punitive action or promotion based on these audits? Yes, there has been.The Republic General Auditor Office, with the help of the Attorney General’s Office, is in chargeof that.
7a. Are there client surveys undertaken? Depends on each case. Part of the control of proce-dures includes actions with the providers and clients.
7b. How frequently? There is not an established schedule. It depends on the Control Plans.
7c. Are the results published? No.
7d. Do these surveys measure satisfaction with service delivery (that is, outputs), or withsuccess of the program (that is, outcomes), or both? No.
8a. How many major donors provide project financing? There are no data available.
8b. Do these projects specify the amount and type of expenditures on which projectresources will be spent? There are no data available.
8c. Does each donor have its own rules about disbursement, procurement, accounting, andauditing of projects funds? Yes. We are working on adapting those requirements with the Inte-grated Financial Management System in the area of functional and operational competence.
8d. Do these rules match those of the government? Yes.
RESTORING FISCAL DISCIPLINE FOR POVERTY REDUCTION IN PERU 205


Sample DesignMeasuring leakages in transfers to subnational governments, local organizations, and program ben-eficiaries is not an easy task since it involves two central problems. First, none of the parties affectedby the leak have an interest in having it revealed. Second, leakages can occur at so many levels thattracing them all requires a complex methodology. Those are the two challenges that this reportfaced and, to a considerable degree, overcame.
The core of our methodology was to collect data at each stage in the transference of publicfunds from the top of the chain, the Central Government (CG), to the bottom of the chain, thebeneficiary. In order to gather data on each of these levels, the study carried out in Peru involvedan extensive amount of fieldwork based on a series of questionnaires. The questionnaires them-selves are attached to Apoyo Institute (2002a). In this Annex, we briefly describe how we wentabout gathering the data.
The project began with a pilot study in Lima, Peru. The objectives of the pilot included anassessment of the duration of the fieldwork and a test of its effectiveness for the purposes of thestudy (for example, to explore whether the information collected in the fieldwork would be suffi-cient to rigorously estimate leakages). The pilot consisted of 20 districts of the department of Lima(out of a total of 177 districts). Each district included a survey for the municipality; 3, 4, or 5 sur-veys1 for the Vaso de Leche (VDL) mother’s committees; and 16 surveys for beneficiary households2
Annex D
A PUBLIC EXPENDITURETRACKING SURVEY:
METHODOLOGICAL ISSUES
207
1. For the pilot the following rule was established: 3 Vaso de Leche committees if there were less than 30 committees total, 4 if the number of committees were between 30 and 70, and 5 if there were more than70 committees.
2. When the pilot was carried out, the project had not yet formally included surveys to household benefi-ciaries. A tentative instrument was tested on households to evaluate the importance and viability of includingbeneficiaries. Therefore, the pilot survey was shorter than and different from the survey applied to beneficiariesduring the final fieldwork.
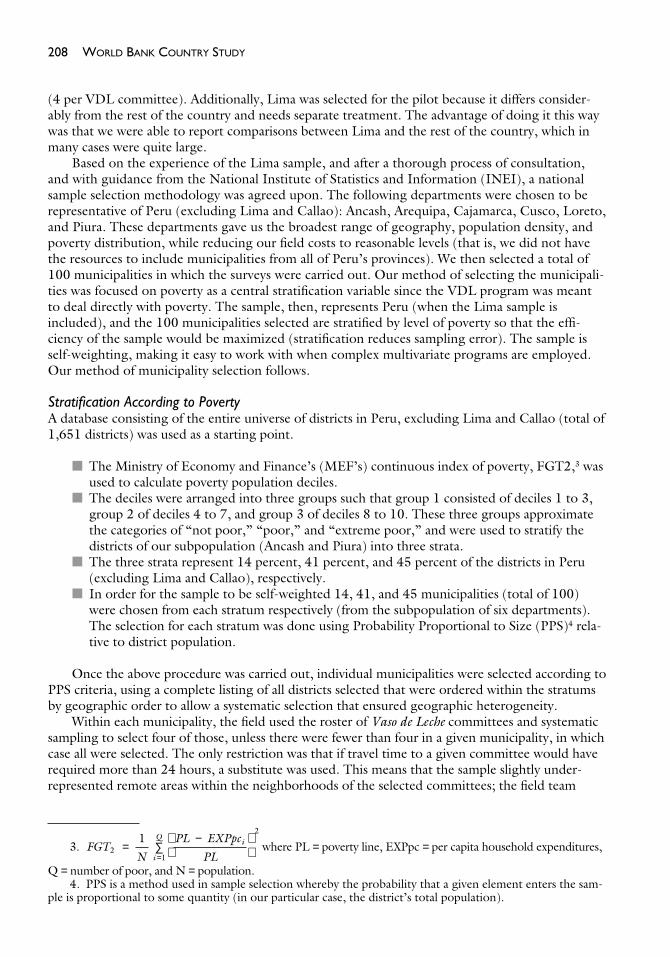
(4 per VDL committee). Additionally, Lima was selected for the pilot because it differs consider-ably from the rest of the country and needs separate treatment. The advantage of doing it this waywas that we were able to report comparisons between Lima and the rest of the country, which inmany cases were quite large.
Based on the experience of the Lima sample, and after a thorough process of consultation,and with guidance from the National Institute of Statistics and Information (INEI), a nationalsample selection methodology was agreed upon. The following departments were chosen to berepresentative of Peru (excluding Lima and Callao): Ancash, Arequipa, Cajamarca, Cusco, Loreto,and Piura. These departments gave us the broadest range of geography, population density, andpoverty distribution, while reducing our field costs to reasonable levels (that is, we did not havethe resources to include municipalities from all of Peru’s provinces). We then selected a total of100 municipalities in which the surveys were carried out. Our method of selecting the municipali-ties was focused on poverty as a central stratification variable since the VDL program was meantto deal directly with poverty. The sample, then, represents Peru (when the Lima sample isincluded), and the 100 municipalities selected are stratified by level of poverty so that the effi-ciency of the sample would be maximized (stratification reduces sampling error). The sample isself-weighting, making it easy to work with when complex multivariate programs are employed.Our method of municipality selection follows.
Stratification According to PovertyA database consisting of the entire universe of districts in Peru, excluding Lima and Callao (total of1,651 districts) was used as a starting point.
■ The Ministry of Economy and Finance’s (MEF’s) continuous index of poverty, FGT2,3 wasused to calculate poverty population deciles.
■ The deciles were arranged into three groups such that group 1 consisted of deciles 1 to 3,group 2 of deciles 4 to 7, and group 3 of deciles 8 to 10. These three groups approximatethe categories of “not poor,” “poor,” and “extreme poor,” and were used to stratify thedistricts of our subpopulation (Ancash and Piura) into three strata.
■ The three strata represent 14 percent, 41 percent, and 45 percent of the districts in Peru(excluding Lima and Callao), respectively.
■ In order for the sample to be self-weighted 14, 41, and 45 municipalities (total of 100)were chosen from each stratum respectively (from the subpopulation of six departments).The selection for each stratum was done using Probability Proportional to Size (PPS)4 rela-tive to district population.
Once the above procedure was carried out, individual municipalities were selected according toPPS criteria, using a complete listing of all districts selected that were ordered within the stratumsby geographic order to allow a systematic selection that ensured geographic heterogeneity.
Within each municipality, the field used the roster of Vaso de Leche committees and systematicsampling to select four of those, unless there were fewer than four in a given municipality, in whichcase all were selected. The only restriction was that if travel time to a given committee would haverequired more than 24 hours, a substitute was used. This means that the sample slightly under-represented remote areas within the neighborhoods of the selected committees; the field team
208 WORLD BANK COUNTRY STUDY
3. where PL = poverty line, EXPpc = per capita household expenditures,
Q = number of poor, and N = population.4. PPS is a method used in sample selection whereby the probability that a given element enters the sam-
ple is proportional to some quantity (in our particular case, the district’s total population).
FGTN
PL EXPpc
PLi
i
Q
21
21
=−
∑
=

selected four households from the beneficiary lists that are maintained by each committee. Recallswere not made, but the next household on the list was used as a substitute when blanks wereencountered.
The survey was conducted February 3–17, 2002. Descriptive statistics for the samples are pro-vided in the full report. Within each municipality we interviewed the mayor, obtained municipal-level data from him or her, and also obtained the municipal roster of committees participating inthe Vaso de Leche program. The committees were selected from the roster using a systematic selec-tion. Once we met with at least one committee member and interviewed that individual with oursurvey instrument, we obtained from that member a list of individual beneficiary households andinterviewed four households in each committee catchments area, using the survey instrumentintended for households.
Description of Transfers from Central Government to Municipalities and DownwardMunicipal resources come from two primary sources: Central Government (CG) transfers and localrevenues. CG transfers are a very important source of revenue, particularly for small and ruralmunicipalities, which have very little income-collection capacity. CG transfers include Fondo deCompensación Municipal (FONCOMUN) and Vaso de Leche (VDL) for all municipalities, andCanon Minero and Canon/Sobrecanón Petrolero for some of them. CG transfers represent animportant percentage of total district-level income, (for the districts outside of Lima in our sample,transfers, on average, represent 72 percent of total income, and among the districts of the extremepoor stratum they can represent over 90 percent of total income).
In 2001, these four major CG transfers totaled, at the national level, NS/1.9 billion (roughly$560 million) (Table D.1).5 For these reasons the leakages, delays, volatilities, and inefficienciesassociated with the execution process of these transfers have considerable impact on municipal-level finances, and their understanding is, consequently, of paramount importance.
Of these four transfers, only the Canon Minero is not variable month to month. In theory, theVDL transfer should not be variable month to month either, but as Table D.2 shows, this is not truein practice. FONCOMUN and the Canon/Sobrecanon Petrolero are percentages of a variable quantity(primarily the national sales tax in the case of FONCOMUN and the ad valorem tax on petroleumproduction in the case of the Canon/Sobrecanon Petrolero). The implicit volatility in these two trans-fers is a source of hardship for municipalities, the budgets of which depend heavily on them.
Month-to-month percentage changes in amounts for each of the four major transfers were calcu-lated. The volatility of the transfers was defined as the standard deviation of these month-to-monthchanges. Table D.2 details the volatilities of FONCOMUN, Canon/Sobrecanon Petrolero, and Vasode Leche in 2001.6 The measure of dispersion is the degree to which the volatilities vary within each ofthese subclassified categories. The volatility of the Canon/Sobrecanon Petrolero transfers is the combi-nation of the variations in world petroleum prices and the variability of local production, and is, onaverage, twice as high as that of the FONCOMUN transfer. FONCOMUN’s volatility is not consid-erably different between urban/rural districts or between poverty strata, but is twice as high in largerdistricts (as measured by their projected 2001 populations). The volatility of the Canon/SobrecanonPetrolero, on the other hand, is quite a bit higher in poor, rural, remote districts of Peru. The formerfinding is quite interesting given that the assignment formula does not vary within the year.
Therefore, a percentage change in the sales tax revenue (and/or any other component of theFONCOMUN) should imply an equal percentage change in the amounts allocated to the districtsacross the board. However, we see that the standard deviations of the monthly percentage changesare not equivalent. This is partly due to the fact that these transfers have a built-in floor (NS/15,600)and therefore their variations are asymmetrical. Surprisingly, the VDL transfer also suffered from
RESTORING FISCAL DISCIPLINE FOR POVERTY REDUCTION IN PERU 209
5. Using MEF statistics at the national level.6. The volatilities are estimated by calculating the standard deviation of the rate of change of the monthly
amounts for each of the three transfers.

considerable volatility in 2001 in the districts outside the department of Lima. The poorest districtswere the most affected, with a standard deviation of percentage changes on the order of 15 percentfor the year. This figure is in sharp contrast to the average volatility of 0.3 percent experienced by the177 districts of Lima and Callao (Table D.2).
FONCOMUNThe Fondo de Compensación Municipal (FONCOMUN) is mentioned in subsection 4 of article193 of the Constitution of the Republic of Peru. It is comprised of 2 percent of the federal salestax (the VAT), 8 percent of gasoline sales, 5 percent of recreational embarkations, and 25 percentof the net income generated by casinos and other gambling establishments. The contribution fromthe VAT accounts for approximately 93 percent of FONCOMUN revenues, and therefore consti-tutes its main source of variability. The law that permits the redirection of a portion of the VATunder the name of Impuesto de Promoción Municipal is dictated by Article 86 of Legislative Decree776 of the Law of Municipal Taxes.
The Fund is calculated on a monthly basis and is distributed monthly to all the municipalities,based on a predefined allocation formula of the Ministry of Economy and Finance (MEF). Theprocess for disbursing the transfer from the CG to the municipalities is the following. The collec-tion of funds is centralized at the Banco de la Nación (BN, the Treasury). Within the first five daysof each month, the BN informs the National Directorate for the Public Budget (DNPP) of theMEF regarding the amount collected. This office in turn informs the General Directorate of FiscalPolicy (DGPF) of the MEF, which is in charge of estimating the amount to be distributed to each
210 WORLD BANK COUNTRY STUDY
TABLE D.1: TOTAL TRANSFERS TO MUNICIPALITIES IN 2001(in U.S. dollars)
Canon/Canon Sobrecanon
FONCOMUN Minero Petrolero Vaso de Leche TOTAL
Peru 400,023,180 23,765,654 37,461,817 97,148,245 558,398,895Lima 72,466,783 714,003 N.A. 33,753,411 106,934,197
Urban 69,482,021 691,650 N.A. 33,359,639 103,533,311Rural 2,984,762 22,353 N.A. 393,772 3,400,887No. Observations 177 171 N.A. 177 N.A.
Rest of Peru 327,556,397 23,051,651 37,461,817 63,394,833 451,464,698Not Poor 76,066,085 5,692,301 9,924,653 15,642,446 107,325,483Poor 132,062,598 8,603,523 17,670,749 24,705,129 183,041,999Extreme Poor 119,427,714 8,755,827 9,866,416 23,047,259 161,097,216Urban 152,245,705 9,629,748 20,840,016 30,939,959 213,655,428Rural 175,310,692 13,421,902 16,621,801 32,454,874 237,809,270Small 65,758,919 3,206,004 3,916,796 8,990,266 81,871,986Medium 50,188,784 3,515,896 5,744,644 10,333,395 69,782,718Large 211,608,694 16,329,751 27,800,377 44,071,173 299,809,994More Accessible 239,125,681 17,287,765 22,227,123 46,727,882 325,368,452Less Accessible 88,430,716 5,763,885 15,234,694 16,666,951 126,096,246Nonprovincial Capital 188,468,161 11,999,547 18,319,805 41,422,875 260,210,387Provincial Capital 139,088,236 11,052,104 19,142,013 21,971,958 191,254,311No. Observations 1,641 1,296 142 1,641 N.A.
Note: Information based on national official statistics.
Source: MEF.

municipality. Once the distribution is determined, the DGFP informs the DNPP, which issues thetransfer order to the BN. Finally, the BN deposits the money in the account of each municipalityon the 13th to 15th day of the month (Figure D.1).
According to the MEF personnel our team interviewed, the process is automatic and should takeno longer than the terms established.7 The distribution criteria do not change frequently, althoughthere are certain minimums established which require a complicated reallocation if there is a down-turn in resources for a given month. Nonetheless, as the results of the fieldwork indicate, the munici-palities do face some delays. In principle, the transfer process funds from the CG to the municipalitiesis straightforward and does not suggest ex ante that there will exist a leakage in this segment of thechain. At this stage, the process is quite systematic and the BN serves a limited function—that of elec-tronically transferring funds from one account to another and issuing arrival notifications.
The DGFP office of the MEF uses a formula to calculate the way it will distribute the totalamount of funds to each municipality. For the districts outside of Lima and Callao, the formula allo-cates amounts to each province based on the infant mortality rate and the total population of theprovince. The formula further assigns amounts to the districts based on district-level populations,with a bias toward rural populations (rural inhabitants count twice as much as urban inhabitants do).
RESTORING FISCAL DISCIPLINE FOR POVERTY REDUCTION IN PERU 211
TABLE D.2: VOLATILITY OF TRANSFERS TO MUNICIPALITIES1
(in percent)
Canon/Sobrecanon FONCOMUN Petrolero Vaso de Leche
Volatility Dispersion Volatility Dispersion Volatility Dispersion
Lima 4.9 4.1 N.A.2 N.A. 0.3 1.6Urban 5.5 4.2 N.A. N.A. 0.2 1.2Rural 2.9 3.2 N.A. N.A. 0.5 2.6No. Observations 177 N.A. 177
Rest of Peru 6.3 3.4 13.4 6.9 11.6 30.3Not Poor 6.1 3.8 9.2 3.1 10.0 56.8Poor 6.0 3.6 11.6 4.7 8.1 22.2Extreme Poor 6.5 3.2 18.8 8.4 15.4 23.9Urban 5.7 3.8 10.4 4.1 5.2 19.5Rural 6.5 3.2 15.7 7.7 14.7 33.9Small 4.0 3.1 13.2 5.0 10.7 34.9Medium 8.2 1.7 15.5 9.4 15.3 26.3Large 9.4 0.8 12.4 5.7 10.5 21.7More Accessible 6.8 3.3 10.3 5.0 9.5 27.5Less Accessible 5.5 3.5 16.4 7.2 14.2 33.3Nonprovincial Capital 5.8 3.4 13.4 6.8 12.1 28.9Provincial Capital 9.6 0.5 13.8 7.4 7.7 39.7No. Observations 1,642 142 1,642
1. Standard deviation of the percent changes month-over-month 2001.2. The department of Lima does not receive Canon/Sobrecanon Petrolero.
Source: National Official Statistics, MEF.
7. The FONCOMUN transfer, and the other municipality transfers and finances in general, are still notincorporated into the SIAF. At the time this report was being prepared, the SIAF was working with a pilotsample of at least 25 municipalities to integrate them (see Chapter III).

For Lima and Callao the objective is to prioritize urban marginal districts. The allocation criteria con-sidered are the following: population, illiteracy rate for those older than age 15, households with atleast one child attending school, households without a water connection in the home, householdswithout sewerage, households without electricity, households that occupy makeshift homes, andhouseholds with three or more inhabitants per room. All these indicators are provided by the INEIand are based on the 1993 census. Until December 2001 (December 29th), the law established thatonly up to 30 percent of FONCOMUN could be used for current expenditures. At least 70 percentof the fund had to go toward capital expenditures. Since January 2002, the FONCOMUN no longerhas been subject to the 70 to 30 ratio, and can be freely used as the municipalities best see fit.
Canon MineroDictated by supreme decrees 88-95-EF and 041-97-EF, the Canon Minero is a CG transfer that dis-tributes a portion of the mining sales to the localities in which the mineral ore was extracted. Twentypercent of the income tax paid by the mining companies is distributed among the municipalities inthe following manner: 40 percent for provinces and districts in the region or regions8 in which theore was extracted or in which the mining company’s economic headquarters are located; and 60 per-cent for provinces and districts in the department or departments in which the ore was extracted or inwhich the mining company’s economic headquarters are located (in addition to the 40 percent).
212 WORLD BANK COUNTRY STUDY
FIGURE D.1: FONCOMUN TRANSFER PROCESS
Bank of the Nation (BN)
Centralizes Tax Collection
Municipality Receives the
Transfer on the 13th or 15th of the
Month Within first 5 days of the month BN informs DNPP of the amount collected
DNPP requests BN to deposit the transfer into municipality account
National Direction of Public Budget
(DNPP)
DNPP informs DGPF of the total amount available for distribution to the municipalities
DGFP informs the transfer amount that corresponds to each municipality
General Direction of Fiscal Policies
(DGPF)
Source: MEF.
8. Under the administration of President Alan Garcia regions (several adjacent departments) were created.

The total amount allocated to a set of municipalities is then distributed by the MEF accordingto a formula similar to the one used for FONCOMUN. Within a region, the allocation to provincesis based on the infant mortality rate and the total population of the province. Of that amount, 20 percent remains at the provincial municipality (provincial capital) and the remaining 80 percent is distributed among the municipalities of the province based on their respective populations (onceagain giving a two-to-one preference to rural populations). For Lima and Callao, where the objec-tive is to give priority to the urban-marginal districts, the additional criteria used in the distributionof the FONCOMUN are also used for the Canon Minero. The process of disbursement of theCanon Minero is simple. The tax agency, SUNAT, deposits the taxes collected in a special account atthe BN. The DNPP then distributes the total amount among municipalities (following the criteriamentioned above) in 12 equal monthly installments made by the BN through electronic deposits.There is a restriction in place governing the usage of the Canon Minero funds: municipalities areauthorized to use the resources obtained through this transfer only to cover capital expenditures.
Canon y Sobrecanon PetroleroThese transfers were established by Law Decree 21678 in November 1976 and are comprised of a percentage of the ad valorem petroleum production. The Canon is 10 percent of the ad valorempetroleum production and is distributed among the districts within the department where thepetroleum was extracted. The Sobrecanon is 5 percent of ad valorem petroleum production and isdistributed among the districts that are not within a department that produces petroleum, but arewithin the same region. The Canon/Sobrecanon is distributed equally among the provinces9 in thedepartment, and then distributed to the district level based on criteria such as10 population, geo-graphic area, whether it is a provincial or departmental capital, and whether the population isgreater than 100,000.
Vaso de Leche ProgramThe Vaso de Leche (Glass of Milk, VDL) program was started by the Mayor of Lima in 1984 for themetropolitan area, and as its name reflects, it originally consisted of distributing glasses of milk toschool-aged children. Since then, the program has grown to national coverage (in 1985), and is notrestricted to milk products. It has become one of the most significant transfers from the central tolocal governments (second only to FONCOMUN). It achieved its current form under Law 24059and Article 7 of Law 27470 (2001). Although the spirit of the program remains the same, its orga-nization has undergone considerable changes due to increased coverage. By Law, the intended pri-mary beneficiaries are children aged 6 or younger, and pregnant and breastfeeding mothers. Priorityis given to those showing clear signs of malnutrition or tuberculosis. The Law also establishes that ifthere are resources left over after attending to the needs of the primary beneficiaries, then attentionmay be provided to secondary beneficiaries, that is, children aged 7 and 13, the elderly, and thosesuffering from tuberculosis.
The main goal of the program is to improve the nutritional level of infants, small children, andpregnant or breastfeeding mothers, and to improve the quality of life of the poorest segments ofthe population. Given the empirical evidence, which identifies milk as an important nutritionalsource, a decision was made to distribute milk and milk-related products. Unfortunately, organiza-tional hurdles, inefficiencies, leakages, and low nutritional value of the products chosen for distrib-ution are aspects that limit the ability of the VDL program to achieve its original goals. Because ofthe program’s flawed design organization and the way in which it functions, there are no effectivemechanisms that enforce its priorities.
RESTORING FISCAL DISCIPLINE FOR POVERTY REDUCTION IN PERU 213
9. For the departments of Loreto and Ucayali, the distribution at the province level is in proportion totheir share of production. In Piura and Tumbes the distribution makes no distinction between the provinces.
10. In the case of the province of Puerto Inca, Huánuco, the distribution among districts is simply inequal parts.

Currently, the MEF makes monthly transfers to municipalities for use in the VDL program.The transfer amounts are calculated by the MEF using distribution indexes that are based primarilyon poverty and demographic indicators supplied by the National Institute of Statistics. Local gov-ernments are solely responsible for the operation of the VDL program in their jurisdiction, andhave autonomy, except for the definition of the beneficiaries, from the CG as far as the productthey wish to distribute and other operational details. However, three additional restrictions areplaced on the municipalities by the CG. First, 100 percent of the VDL funds must go toward thepurchase of the product(s) to be distributed. Second, the product(s) should have a minimum of 90 percent of national inputs (up to 100 percent in the areas in which the local supply can coverthe entire demand). The products distributed can be milk in any form and/or milk substitutes,and/or other products such as soybean, oatmeal, quinua, and kiwicha.11 Third, the CG requiresthat each municipality create an Administrative Committee with a certain membership composi-tion: the mayor, a municipal employee, a representative from the Ministry of Health, three repre-sentatives of the Mother’s Associations (elected by the mothers following the rules established intheir own statutes), and a representative of the local agriculture/farming association duly accred-ited by the Ministry of Agriculture.
By law, the municipalities or committees cannot charge the beneficiaries for the products dis-tributed. However, some municipalities and many committees charge some money (or require thatin-kind contributions be made) to cover some of the expenses that the program incurs. Requests forcontributions are more common in poor municipalities that need to cover distribution expenses,and in committees that prepare the product onsite and need to pay for things such as fuel and otherinputs. In general, larger districts have an entire office dedicated to the VDL program, including adirector and other full-time employees. Often, in smaller districts, the mayor himself or one of hisregidores (municipal council members) administers and directs the program. It is noteworthy thatbeneficiaries (the mothers) organize themselves into Comités/Clubs de Madres (Mother’s Associa-tions), which have noticeably increased the social capital of the communities. These Mothers’ Asso-ciations span the entire country, including the most remote areas, and together form a huge nationalnetwork. The social network that results from the Mother’s Associations has become a way for theserural and impoverished communities to gain a voice at the local level even on matters unrelated tothe VDL program.
Details of the transfer process are:
■ The municipality receives the transfer from the CG. A monthly transfer is deposited in theBN local branch office and the municipality is notified. The monthly amount does not varyin a given year, except in very particular situations, and the transfer usually arrives aroundthe same day each month.
■ The product is chosen and, in most cases, a public bidding process is used to select a provider,normally for a year and for the whole municipality jurisdiction. The selection of the productor products is done differently in different districts. In some cases, mothers have a direct say inthe choice of product via surveys or direct vote. In other cases, the Administrative Committeemakes the decision. Finally, in some cases it is the mayor’s decision.
■ A roster of all direct beneficiaries in each committee by category (children aged 0 to 6 yearsand pregnant or breastfeeding mothers) is prepared. The mothers’ committees normallyconduct this process, which is supposedly closely supervised by the municipality. This rostershould also be frequently revised. However, in most cases these rosters are not updated andthe municipality does not supervise the process. Using these registers, the municipalitydetermines the product allocation to each of the mothers’ committees in its jurisdiction.
214 WORLD BANK COUNTRY STUDY
11. Recently, a new law was passed that requires that distributed products have a minimum of 207 calo-ries. Mothers, however, are not pleased with this requirement because it implies that milk substitutes will bedistributed, and they do not like them. Mothers protested in the streets, demanding evaporated or fresh milk.

■ The municipality (or the provider) distributes the product to the Mothers’ Associations.These usually cover a given neighborhood and can have a variable number of beneficiaries.A president, a vice-president, treasurer, and secretary usually lead them. The officers arevoted into office for extended periods of time, and they are rarely voted out of office unlessproblems arise. Depending normally on the size of the municipality, the products aredirectly distributed to the committees or to intermediate entities: groups of committees orcentros de acopio (special locations where the products are collected by areas and from wherethe committees pick up their allocations). The mothers’ committees should follow the ros-ters of beneficiaries to determine the allocation per household or beneficiary, but in mostcases, rosters are only “referential” and follow other criteria.
■ The mothers (or the intended beneficiary) pick up their ration(s) at the Mothers’ Associa-tion headquarters. Usually the headquarters is the house of the president of the Mothers’Association and there is a certain time of the day/week/month that the distribution ismade depending on the frequency with which the product is distributed. The committeesdistribute to the beneficiaries a product already prepared or in its raw form. The decisionmay depend on the type of product, the resources’ availability, or the geographic dispersionof the beneficiaries. In the cases in which the products are not prepared by the committee,mothers use them at theirs home at their total discretion (usually distributing the productsamong all children or household members).
Technical Definitions of Leakages in the Vaso de Leche ProgramLeak 1. From the Central Government to the Municipalities. Leak 1 is defined as the percent-age of the transfer reported by the MEF that is unaccounted for by the municipality. We comparethe amount the MEF reports as outgoing with the amount the municipality reports to havereceived. This leakage is estimated with municipal-level data of December 2001.
Leak 2. Within Municipality. Leak 2 is defined as the percentage of the amount transferred tothe municipality “i” from the CG for the month of December 2001 that is unaccounted for by thetotal expenses of the municipality for that month (in terms of products purchased for the VDLprogram). Leak 2 is zero if the municipality spends the entirety of the resources available inDecember 2001 under the VDL program on products to be distributed by the program. This leak-age is estimated based on municipal-level data.
Leak 3. From Municipality to VDL Committees. Leak 3 is defined as the percentage of theamount listed in the municipality not accounted for by the VDL committee. This leakage is esti-mated using municipal and committee data and is computed at the committee level. This leakageindicates how much is lost in this segment of distribution, but does not allow one to attribute it toone of the two parties involved at this stage. In other words, we estimate the leakage from themunicipality to the individual VDL committees, but do not know if the leakage is a result of mis-appropriation or inefficiencies of the municipality, the Advisory Committee, or both.
LeakAmount Received
Amount listed in Municipal RosterCOMCOM
COM
3 1= −
LeakQuantity Price
Transfer AmountMUN
i i
MUN
2 1= −×( )
∑i
LeakAmt. Municipality Reported
Amt. MEF Reported1 = −
1
RESTORING FISCAL DISCIPLINE FOR POVERTY REDUCTION IN PERU 215

Leak 4: From VDL Committees to Beneficiaries/Households. Leak 4 is the loss due to the dif-ference between what VDL committees receive according to beneficiaries registered and what theyactually distribute to households. The estimation of the leakage at this level is done by calculatingthe monetary value of each of the products (using municipal price figures) and adding these up.This allows a comparison of the monetary value of the amount of all the products received by theVDL committee per beneficiary with the monetary value of the amount received by the individualhouseholds per beneficiary (excluding the committees that distribute prepared products). The firstvariable is obtained from the quantities declared by the mothers’ committee representative in theVDL committee survey (in the four committees surveyed in each municipality). The second vari-able is obtained from the quantities declared by the beneficiaries’ household representative in abeneficiary household survey (on four households surveyed for each VDL committee).
Leak 5: Inside the Household. Leak 5 is attributed to beneficiary dilution at the household level.It is defined as one minus the percentage of household members who consume Vaso de Leche prod-ucts, who are direct beneficiaries. This leakage is estimated using household-level data.
LeakBeneficiariesConsumersHH
HH
HH
5 1= −
Leak
Quantity Price
BeneficiaryQuantity Price
Beneficiary
4
i i
HH
i i
COM
= −
×( )
×( )
∑
∑1
i
i
216 WORLD BANK COUNTRY STUDY

In 1999, as part of several isolated efforts of state modernization in Peru, the National Fundfor Financing Government Enterprise Activity (FONAFE), an institution with no more than30 employees, became a useful instrument to increase public savings and improve the effi-
ciency and effectiveness of public enterprises.1 FONAFE is the public entity assigned to the Min-istry of Economy and Finance (MEF), which is in charge of directing the entrepreneurial activityof the State. It has temporarily extended its management instruments to regulatory and revenue-collecting agencies in Peru’s public sector. Enterprises under FONAFE’s control include those inwhich the State owns either the total of the social capital or the majority of shares. In those casesin which the state is a minor partner, FONAFE exercises only stockholder options correspondingto its shares. Its main functions are to (a) approve the consolidated budget of the enterprises inwhich it holds the majority of shares, (b) approve management norms for those enterprises, (c) exercise stockholder options and administer resources resulting from its shareholder status,and (d) name representatives to the boards of those enterprises in which it is a shareholder (inthose cases in which the State holds all the shares, FONAFE names a board of five members).
Upon introducing reform, FONAFE developed and implemented four basic management tools:
■ An Integrated Expenditure on Personnel, which sets a global amount that enterprises andother public entities under its supervision are authorized to use for this purpose, whileallowing management flexibility within that limit.
■ A Maximum Salary Limit, which establishes the maximum annual salary any employee canreceive, excluding the productivity bonus.
■ A Productivity Bonus, an annual monetary incentive to personnel, which can add up to 6 per-cent of the payroll and that is granted only if 90 percent or more of the annual objectives areachieved.
Annex E
PUBLIC ENTERPRISEREFORM IN PERU:
INTRODUCING MANAGEMENTCONTRACTS AT FONAFE
217
1. This Annex was prepared by Gabriel Ortiz de Zevallos.

■ A Management Contract that establishes the specific terms of the agreement between FONAFE and the enterprise or public entity under its supervision.
These instruments have shifted management from being focused on inputs and procedures tooutcomes and results.
A key element of the system is the capability to develop adequate indicators in the areas ofcost, quality, coverage, and internal efficiency. FONAFE’s approach has been to let each enterprisedevelop its own indicators based on its strategic planning processes, which are then analyzed andvalidated by FONAFE. According to its key officials, this allows for greater legitimacy and applica-bility. Indicators proposed by each entity need to fulfill usually recommended requirements:
■ Appropriateness. They should be the expression of the processes and products of the institu-tion in order to properly reflect the fulfillment of the institutional objectives.
■ Independence. They should be independent of each other and respond to the actions devel-oped by the institution. When possible, indicators depending on external factors should beavoided (such as situation of the country, demand variations, third-party decisions, tariffchanges, and so forth).
■ Measurement. Availability of data and methodological issues should be considered in theproposal.
■ Control. Basic data should be part of a system that can be audited.■ Cost. Information for the management indicators should be collected and processed within
reasonable limits of cost and time.
Introducing these instruments has not been easy. Preliminary results have been very positive(see Table E.1). However, some difficulties encountered are:
■ Reactions to implementing change have been uneven and diverse. Enterprises under FONAFE operate in different sectors, can be old or relatively new, may or may not havedata easily available, have different levels of managerial capabilities, and their personnel maynot have the same willingness to be part of this kind of change.
218 WORLD BANK COUNTRY STUDY
TABLE E.1: PUBLIC ENTERPRISES TARGET INDICATORS
Year GoalCharacteristics 1999 2000 2001 2002
Enterprise SEDAPAL (Lima’s Water and Sewerage Service)
Indicator: Service continuity (in hours) 15.9 17.6 19.3 22.0Enterprise SEAL (South-West Electricity Society)Indicator: Energy loses in the distribution system 21.7% 21.25% 18.12% 16.40%Entity OSIPTEL (Telecommunications
Regulation Agency)Indicator: Supervision in the delivery of the 364 524 – –
telecommunications public service (supervision actions)
Note: Starting in 2001, OSIPTEL is no longer under the scope of FONAFE, but management instruments continue tobe negotiated directly with the MEF.
Source: FONAFE.

■ Managers have often started with unrealistic goals. In the first year of their implementation,most enterprises overestimated the results they would be able to achieve. After the first year,during which most targets were not met, managers changed to more modest, realistic goals.
Besides political will, leadership and a strong technical team, two factors have been key tosuccess:
■ Its legal and administrative status has allowed FONAFE not to be burdened by administra-tive procedures. FONAFE was created as a line unit of the MEF budget, so its budget doesnot have to be approved by Congress, but by the Council of Ministers. It has sufficientauthority to dictate its norms, including budgetary issues, and the legal capacity to controlmanagement of the enterprises under its supervision.
■ Its approach to transition has been incremental and case by case, enabling it to adapt tospecific difficulties. For instance, FONAFE’s 1999 agreement with the Empresa de GasSociedad Anonima (EGASA), the electricity-generating company of Arequipa, establishedas its initial performance indicator the development of a strategic plan for the next decade.Subsequent goals and indicators have been based on the implementation of new systemsand plans.
FONAFE has extended management contracts to other public agencies, both regulatory andrevenue collecting. Although desirable, extending them to the Central Government (CG) impliesnew difficulties:
■ Productivity bonuses come from savings, but generating surpluses to finance bonuses through theimprovement of management is easier in State-owned enterprises than in ministries. The Min-istry of Education, for example, spends almost 90 percent of its budget on payroll, makingit much harder to maneuver and generate savings to reward thousands of teachers. How-ever, the current administration is barely tackling the very difficult issue of identifying howmany “ghosts” are currently part of the teacher payroll.
■ Different personnel regimes coexist within the public sector. While in public enterprises thereare very few cases of workers not registered in the payroll, CG agencies tend to have largenumbers of employees contracted as professional service staff outside the payroll. Legally, itis hard to justify a bonus in those cases.
■ Reliable data are fundamental, but extremely scare. The need for quality administrative sys-tems that generate and constantly update data is central for the success of management con-tracts. A recent study of 20 social programs that implied a budget of US$ 770 million in2000, found that only 3 of those programs, accounting for US$17 million, have institution-alized proper monitoring and evaluation systems in manuals.
RESTORING FISCAL DISCIPLINE FOR POVERTY REDUCTION IN PERU 219


The absence of an implementation strategy in the Framework Law for Modernization mayresult in rather haphazard efforts to apply it to specific ministerial or sectoral contexts. Suchan implementation strategy is imperative. Below, Moore (2002) proposes some initial ele-
ments for conducting functional reviews as part of this implementation strategy. The basic questionthat guides the methodology is how are these functions currently organized in the structure of theministry or sector, and how can or should they be organized in the future—by units or by levels ofthe ministry? Its central premise is that to be efficient, any organization must fulfill seven basicfunctional subsystems. The strategic management of the organization requires an analysis of howthese are structured and how they interact. Each of these functions consists of sets of activities thatcan be identified, and several levels of the organization may exercise each of these activities eitherexclusively or concurrently. A matrix for identifying functions, activities, levels, and exclusivity canbe designed for application to the organizational structure. These subsystems include:
■ The programmatic function that provides the why of the organization and its vision andmission. This function defines the substance of the institution and explains its purpose andlinkages to other sectors or institutions.
■ The planning function that provides the how for carrying out the institutional vision andcombines activities related to policy formulation and planning, and their budgetary expres-sion. At the same time, the function incorporates those activities related to investigation(for strategic planning).
■ The financial administration function that provides for the identification of the processesrelated to what resources (financial) are needed and used to carry out the how. This functionis delimited by financial analysis, the administration of resource generation, budget execu-tion, and the control of the use of financial resources.
■ The human resources administration function that provides for the management of whatresources (human) are necessary to carry out the activities of the institution and relates to
Annex F
A METHODOLOGY FORFUNCTIONAL REVIEWSAND FOR ANALYZING
FUNCTIONAL PROSPECTS
221

the various subsystems of human resource management (recruitment, selection, promotion,development, evaluation, and so forth).
■ The management control, supervision, and evaluation function(s) that determine how theinstitution is regulated, how supervision takes place, and how resource execution of projectsand plans is carried out to assure accountability in policy execution.
■ The administrative support function that guarantees the acquisition of goods and services,assures the capacity to carry out institutional actions, and includes those activities related toacquisition, maintenance, construction, and their organization.
■ The information function for producing, processing, distributing, and consolidating theinformation requirements to guarantee opportune and efficient decisionmaking, manage-ment and execution, and the appropriate diffusion of information.
Each of these consists of activities that can be identified (current, future) by units and levels in the form of a matrix of activities. Such an initial matrix for identification was recently used inEcuador’s Ministry of Education.1 In real terms, the carrying out of the exercise is organized in aseries of workshops or seminars of relevant (primarily internal) persons to arrive at the completedmatrix. The matrix is then applied to a reorganization strategy.
222 WORLD BANK COUNTRY STUDY
1. See Annex 3 in Moore (2002) for a full description of details of the Ecuadorian experience.

Alcazar, Lorena and Erik Wachtenheim. “A PETS in Central Government Transfers to Municipali-ties in Peru: A Detailed Look at the Vaso de Leche Program.”
Alcazar, Lorena and Erik Wachtenheim. “Public Expenditure Tracking Surveys (PETS)—ExecutiveSummary.”
Alcazar, Lorena and Erik Wachtenheim. “Public Expenditure Tracking Surveys (PETS)—The Education Sector in Peru.”
Apoyo Institute. “Seguimiento del Desembolso de Recursos en el Sistema Educativo.”Díaz, Juvenal. “Grado de Focalización de Algunos Programas Sociales, 1998–2000.”Eduardo Fernández. “La Deuda Corriente de los Municipios Peruanos.”Gregory, Peter. “Public Sector Employment in Peru.”López-Cálix, José R. and Rashmi Shankar. “Peru: Fiscal Trends and the Fiscal Sustainability Issue.”Moore, Richard. “Applying a Functional Analysis to Ministries’ Decentralization, An Example.”Moore, Richard. “Prospects for the Decentralization of Health and Education in Peru.”Mostajo, Rossana. “¿Protección Presupuestaria? Los Programas Sociales Protegidos En El Perú.”Otto, James. “Position of the Peruvian Taxation System as Compared to Mining Taxation Systems
in Other Nations.”Recanatini, Francesca. “Voices of the Misgoverned and Misruled: An Empirical Diagnostic Study
on Governance, Rule of Law and Corruption for Peru.”Schenone, Osvaldo. “Exoneraciones y Regímenes Tributarios Especiales en Perú.”Valderrama, José. “Perú—Propuesta de Reforma a las Reglas Fiscales.”Wodon, Quentin. “The Efficiency of Public Spending in Peru.”
Annex G
LIST OF BACKGROUND PAPERS
223


STATISTICAL APPENDIX
225

226 WORLD BANK COUNTRY STUDY
TA
BLE
SA.1
:C
OM
BIN
EDPU
BLIC
SEC
TO
RO
PER
AT
ION
(mill
ions
of N
uevo
Sol
es)
1991
1992
1993
1994
1995
1996
1997
1998
1999
2000
2001
1/
I.C
urre
nt R
even
ues
4 11
57
485
11 4
7417
025
21 4
7025
288
29 7
1231
261
30 6
5333
077
32 3
82II.
Non
-fina
ncia
l exp
endi
ture
s3
682
7 26
810
915
16 8
2421
335
24 1
3627
795
29 7
2832
956
34 4
2533
620
1.C
urre
nt e
xpen
ditu
res
2 93
25
475
7 90
311
671
15 2
8917
813
20 5
2322
614
25 3
9627
610
27 7
552.
Cap
ital e
xpen
ditu
res
750
1 79
43
011
5 15
36
046
6 32
37
272
7 11
57
560
6 81
55
864
III.
Oth
ers
3357
−28
357
329
613
224
571
577
554
316
IV.
Prim
ary
Bala
nce
466
273
531
558
463
1 76
52
141
2 10
4−1
726
−793
−922
V.
Inte
rest
1 04
22
007
2 90
83
588
4 06
43
332
2 84
43
174
3 72
94
120
4 12
2V
I.O
vera
ll Ba
lanc
e−5
77−1
734
−2 3
77−3
031
−3 6
01−1
567
−704
−1 0
70−5
455
−4 9
13−5
044
VII.
Net
Fin
anci
ng57
71
734
2 37
73
031
3 60
11
567
704
1 07
05
455
4 91
35
044
1.Ex
tern
al95
41
426
2 14
12
453
2 87
81
081
1256
1−3
132
097
1 98
02.
Dom
estic
−379
239
−64
−4 4
54−1
428
−4 7
92−8
00−
255
4 44
91
389
1 93
03.
Priv
atiz
atio
n1
6930
05
032
2 15
15
279
1 49
276
41
318
1 42
71
134
1/ P
relim
inar
y.
Sour
ce:
MEF
, Ban
co d
e la
Nac
ión,
BC
RP,
Sun
at, A
duan
as, E
SSA
LUD
, pub
lic b
enefi
ciar
y so
ciet
ies,
loca
l gov
ernm
ent
and
publ
ic in
stitu
tions
.
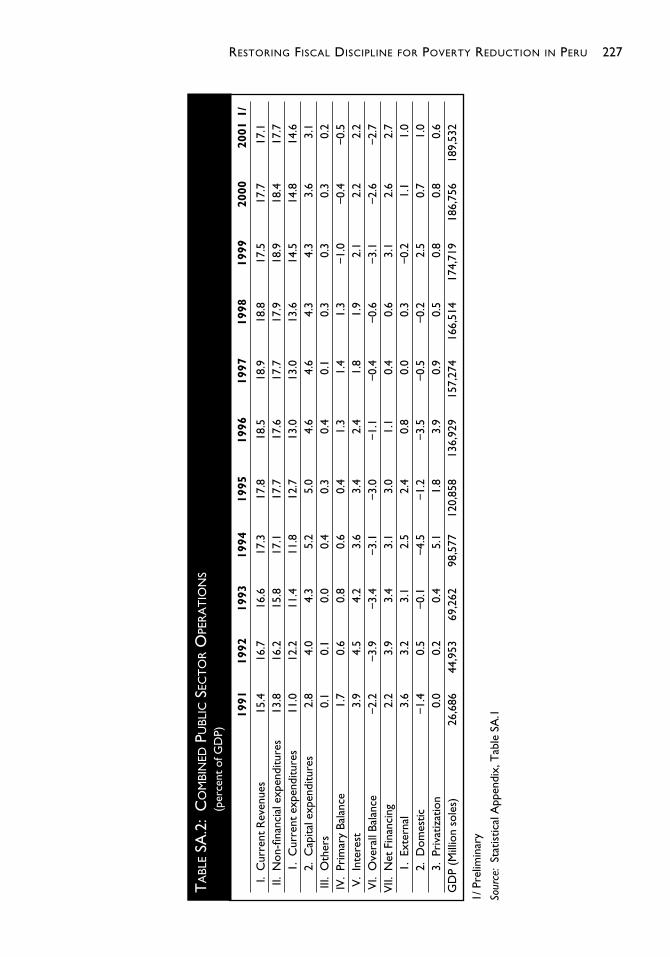
RESTORING FISCAL DISCIPLINE FOR POVERTY REDUCTION IN PERU 227
TA
BLE
SA.2
:C
OM
BIN
EDPU
BLIC
SEC
TO
RO
PER
AT
ION
S(p
erce
nt o
f GD
P)
1991
1992
1993
1994
1995
1996
1997
1998
1999
2000
2001
1/
I.C
urre
nt R
even
ues
15.4
16.7
16.6
17.3
17.8
18.5
18.9
18.8
17.5
17.7
17.1
II.N
on-fi
nanc
ial e
xpen
ditu
res
13.8
16.2
15.8
17.1
17.7
17.6
17.7
17.9
18.9
18.4
17.7
1.C
urre
nt e
xpen
ditu
res
11.0
12.2
11.4
11.8
12.7
13.0
13.0
13.6
14.5
14.8
14.6
2.C
apita
l exp
endi
ture
s2.
84.
04.
35.
25.
04.
64.
64.
34.
33.
63.
1III
.O
ther
s0.
10.
10.
00.
40.
30.
40.
10.
30.
30.
30.
2IV
.Pr
imar
y Ba
lanc
e1.
70.
60.
80.
60.
41.
31.
41.
3−1
.0−0
.4−0
.5V
.In
tere
st3.
94.
54.
23.
63.
42.
41.
81.
92.
12.
22.
2V
I.O
vera
ll Ba
lanc
e−2
.2−3
.9−3
.4−3
.1−3
.0−1
.1−0
.4−0
.6−3
.1−2
.6−2
.7V
II.N
et F
inan
cing
2.2
3.9
3.4
3.1
3.0
1.1
0.4
0.6
3.1
2.6
2.7
1.Ex
tern
al3.
63.
23.
12.
52.
40.
80.
00.
3−0
.21.
11.
02.
Dom
estic
−1.4
0.5
−0.1
−4.5
−1.2
−3.5
−0.5
−0.2
2.5
0.7
1.0
3.Pr
ivat
izat
ion
0.0
0.2
0.4
5.1
1.8
3.9
0.9
0.5
0.8
0.8
0.6
GD
P (M
illio
n so
les)
26,6
8644
,953
69,2
6298
,577
120,
858
136,
929
157,
274
166,
514
174,
719
186,
756
189,
532
1/ P
relim
inar
y
Sour
ce:
Stat
istic
al A
ppen
dix,
Tab
le S
A.1

228 WORLD BANK COUNTRY STUDY
TA
BLE
SA.3
:C
OM
BIN
EDPU
BLIC
SEC
TO
RO
PER
AT
ION
S(m
illio
ns o
f 199
4 N
uevo
Sol
es)
1991
1992
1993
1994
1995
1996
1997
1998
1999
2000
2001
1/
I.C
urre
nt R
even
ues
1312
713
761
1419
717
025
1931
920
399
2208
121
661
2052
721
348
2049
5II.
Non
-fina
ncia
l exp
endi
ture
s11
746
1336
313
505
1682
419
198
1947
020
656
2059
922
069
2221
821
278
1.C
urre
nt e
xpen
ditu
res
9352
1006
597
7911
671
1375
814
370
1525
215
669
1700
717
819
1756
72.
Cap
ital e
xpen
ditu
res
2394
3298
3726
5153
5441
5101
5404
4930
5062
4398
3712
III.
Oth
ers
105
104
−35
357
296
495
167
395
387
358
200
IV.
Prim
ary
Bala
nce
1486
502
657
558
417
1424
1591
1458
−115
6−5
12−5
83V
.In
tere
st33
2636
8935
9835
8836
5726
8821
1421
9924
9726
5926
09V
I.O
vera
ll Ba
lanc
e−1
839
−318
7−2
941
−303
1−3
240
−126
4−5
23−7
41−3
653
−317
1−3
192
VII.
Net
Fin
anci
ng18
3931
8729
4130
3132
4012
6452
374
136
5331
7131
921.
Exte
rnal
3045
2621
2649
2453
2590
872
938
9−2
0913
5412
532.
Dom
estic
−121
043
9−8
0−4
454
−128
5−3
866
−595
−177
2979
896
1222
3.Pr
ivat
izat
ion
512
737
150
3219
3542
5811
0952
988
392
171
7A
vera
ge C
PI D
eflat
or31
5481
100
111
124
135
144
149
155
158
1/ P
relim
inar
y.
Sour
ce:
Stat
istic
al A
ppen
dix,
Tab
le S
A.1
.

RESTORING FISCAL DISCIPLINE FOR POVERTY REDUCTION IN PERU 229
TA
BLE
SA.4
:C
ENT
RA
LG
OV
ERN
MEN
TO
PER
AT
ION
SM
illio
ns o
f Nue
vos
Sole
s
1991
1992
1993
1994
1995
1996
1997
1998
1999
2000
2001
1/20
022/
I.C
urre
nt r
even
ues
3 19
36
059
9 42
414
386
18 3
1921
522
25 0
0126
174
25 3
3427
515
26 7
3328
341
I.a.
TA
X R
EVEN
UES
2 95
85
416
8 47
812
866
16 2
1219
036
22 1
2222
995
21 8
7322
663
23 3
8323
919
1.In
com
e ta
x25
074
91
406
2 52
63
462
4 98
15
710
5 86
15
072
5 13
05
630
6 03
02.
Prop
erty
tax
177
201
254
8530
33
111
03.
Expo
rt t
ax4.
Impo
rt t
ax33
665
01
228
1 70
02
144
2 30
82
471
2 89
12
848
2 91
32
738
3 01
55.
Val
ue a
dded
tax
765
1 70
23
534
5 95
47
646
8 57
810
344
11 0
4011
029
11 9
9611
806
12 4
62-D
omes
tic43
791
11
992
3 56
34
217
4 72
35
929
6 38
46
470
7 00
46
866
7 03
5-I
mpo
rts
328
791
1 54
32
391
3 42
93
856
4 41
54
655
4 55
94
993
4 94
05
427
6.Ex
cise
tax
1 19
61
743
1 61
12
267
2 48
62
761
3 36
53
427
3 44
63
421
3 53
33
417
-Fue
l78
199
599
11
288
1 49
31
599
1 93
12
000
2 09
22
118
2 31
82
211
-Oth
ers
415
748
620
979
993
1 16
21
434
1 42
61
354
1 30
31
215
1 20
67.
Oth
er t
ax r
even
ues
312
442
528
834
1 16
01
268
1 73
71
569
1 56
81
873
2 50
72
412
8.T
ax r
efun
d−7
8−7
1−8
4−4
99−7
15−8
63−1
509
−1 7
94−2
101
−2 6
69−2
832
−3 4
17I.b
.N
ON
-TA
X R
EVEN
UES
236
643
946
1 52
02
108
2 48
52
879
3 17
93
460
4 85
13
350
4 34
2II
.N
on-
inte
rest
exp
endi
ture
s2
842
5 83
98
992
14 2
7018
575
20 7
2923
729
25 3
7927
697
28 9
8928
253
29 4
261.
Cur
rent
exp
endi
ture
s2
319
4 40
16
448
9 92
913
545
15 6
8017
934
19 7
5621
797
23 7
5723
857
25 0
04a.
Wag
es a
nd s
alar
ies
911
1 77
02
659
3 86
65
098
5 43
36
397
6 97
97
774
8 18
08
389
8 64
3b.
Goo
ds a
nd s
ervi
ces
552
966
1 41
32
570
3 92
85
129
5 31
96
022
6 21
07
068
7 06
87
236
c.T
rans
fers
856
1 66
52
375
3 49
34
518
5 11
86
217
6 75
67
813
8 50
88
400
9 04
52.
Cap
ital e
xpen
ditu
res
523
1 43
82
544
4 34
15
031
5 04
85
795
5 62
35
900
5 23
24
396
4 42
2a.
Cap
ital f
orm
atio
n50
41
115
2 15
03
342
3 95
53
921
4 44
84
964
5 65
24
749
3 90
14
221
b.T
rans
fers
412
245
410
916
00
025
4c.
Oth
ers
1520
034
999
596
71
111
1 34
765
924
822
949
420
1II
I.O
ther
s3/
2328
−58
324
274
578
192
533
539
530
291
503
(con
tinue
d)

230 WORLD BANK COUNTRY STUDY
TA
BLE
SA.4
:C
ENT
RA
LG
OV
ERN
MEN
TO
PER
AT
ION
S(C
ON
TIN
UED
)M
illio
ns o
f Nue
vos
Sole
s
1991
1992
1993
1994
1995
1996
1997
1998
1999
2000
2001
1/20
022/
IV.
Pri
mar
y ba
lanc
e37
524
837
344
018
1 37
11
465
1 32
7−1
825
−94
4−1
229
−603
V.
Inte
rest
1 03
51
998
2 88
83
560
4 02
33
289
2 78
93
119
3 67
44
074
4 06
23
819
1.D
omes
tic d
ebt
8691
6110
790
7611
617
623
854
346
63
417
2.Ex
tern
al d
ebt
949
1 90
72
827
3 45
33
933
3 21
32
673
2 94
43
436
3 53
23
596
603
VI.
Ove
rall
bala
nce
�66
0�
1 75
0�
2 51
5�
3 12
0�
4 00
5�
1 91
8�
1 32
4�
1 79
2�
5 49
9�
5 01
9�
5 29
1�
4 42
2V
II.
Net
fina
ncin
g66
01
750
2 51
53
120
4 00
51
918
1 32
41
792
5 49
95
019
5 29
14
422
1.Ex
tern
al95
41
426
2 14
12
453
2 87
81
077
1256
1−3
132
097
1 98
01
407
2.D
omes
tic−2
9625
674
−4 3
65−1
023
−4 4
38−1
8046
74
493
1 49
42
177
603
3.Pr
ivat
izat
ion
169
300
5 03
22
151
5 27
91
492
764
1 31
81
427
1 13
42
412
1/ P
relim
inar
y.2/
Est
imat
e.3/
Les
s pa
ymen
ts t
o A
mer
ican
Inte
rnat
iona
l Gro
up a
nd C
onve
nio
Perú
-Ale
man
ia.
Sour
ce:
MEF
, Ban
co d
e la
Nac
ión,
BC
RP,
Sun
at, C
usto
ms,
Em
pres
a N
acio
nal d
e C
omer
cial
izac
ión
de In
sum
os S
.A. (
Enci
). Em
pres
a C
omer
cial
izad
ora
de A
limen
tos
S.A
.(E
casa
); an
d Pe
trop
erú.
IMF
and
Wor
ld B
ank
staf
f est
imat
es fo
r 20
02.

RESTORING FISCAL DISCIPLINE FOR POVERTY REDUCTION IN PERU 231
TA
BLE
SA.5
:C
ENT
RA
LG
OV
ERN
MEN
TO
PER
AT
ION
SPe
rcen
t of
GD
P
1991
1992
1993
1994
1995
1996
1997
1998
1999
2000
2001
1/20
022/
I.C
urre
nt r
even
ues
12.0
13.5
13.6
14.6
15.2
15.7
15.9
15.7
14.5
14.7
14.1
14.1
I.a.
TA
X R
EVEN
UES
11.1
12.0
12.2
13.1
13.4
13.9
14.1
13.8
12.5
12.1
12.3
11.9
1.In
com
e ta
x0.
91.
72.
02.
62.
93.
63.
63.
52.
92.
73.
03.
02.
Prop
erty
tax
0.7
0.4
0.4
0.1
0.0
0.0
0.0
0.0
0.0
0.0
0.0
0.0
3.Ex
port
tax
4.Im
port
tax
1.3
1.4
1.8
1.7
1.8
1.7
1.6
1.7
1.6
1.6
1.4
1.5
5.V
alue
add
ed t
ax2.
93.
85.
16.
06.
36.
36.
66.
66.
36.
46.
26.
2-D
omes
tic1.
62.
02.
93.
63.
53.
43.
83.
83.
73.
83.
63.
5-I
mpo
rts
1.2
1.8
2.2
2.4
2.8
2.8
2.8
2.8
2.6
2.7
2.6
2.7
6.Ex
cise
tax
4.5
3.9
2.3
2.3
2.1
2.0
2.1
2.1
2.0
1.8
1.9
1.7
-Fue
l2.
92.
21.
41.
31.
21.
21.
21.
21.
21.
11.
21.
1-O
ther
s1.
61.
70.
91.
00.
80.
80.
90.
90.
80.
70.
60.
67.
Oth
er t
ax r
even
ues
1.2
1.0
0.8
0.8
1.0
0.9
1.1
0.9
0.9
1.0
1.3
1.2
8.T
ax r
efun
d−0
.3−0
.2−0
.1−0
.5−0
.6−0
.6−1
.0−1
.1−1
.2−1
.4−1
.5−1
.7I.b
.N
ON
-TA
X R
EVEN
UES
0.9
1.4
1.4
1.5
1.7
1.8
1.8
1.9
2.0
2.6
1.8
2.2
II.
No
n-in
tere
st e
xpen
ditu
res
10.6
13.0
13.0
14.5
15.4
15.1
15.1
15.2
15.9
15.5
14.9
14.6
1.C
urre
nt e
xpen
ditu
res
8.7
9.8
9.3
10.1
11.2
11.5
11.4
11.9
12.5
12.7
12.6
12.4
a.W
ages
and
sal
arie
s3.
43.
93.
83.
94.
24.
04.
14.
24.
44.
44.
44.
3b.
Goo
ds a
nd s
ervi
ces
2.1
2.1
2.0
2.6
3.3
3.7
3.4
3.6
3.6
3.8
3.7
3.6
c.T
rans
fers
3.2
3.7
3.4
3.5
3.7
3.7
4.0
4.1
4.5
4.6
4.4
4.5
2.C
apita
l exp
endi
ture
s2.
03.
23.
74.
44.
23.
73.
73.
43.
42.
82.
32.
2a.
Cap
ital f
orm
atio
n1.
92.
53.
13.
43.
32.
92.
83.
03.
22.
52.
12.
1b.
Tra
nsfe
rs0.
00.
30.
10.
00.
10.
00.
00.
00.
00.
1c.
Oth
ers
0.1
0.4
0.5
1.0
0.8
0.8
0.9
0.4
0.1
0.1
0.3
0.1
III.
Oth
ers
3/0.
10.
1−0
.10.
30.
20.
40.
10.
30.
30.
30.
20.
3
(con
tinue
d)

232 WORLD BANK COUNTRY STUDY
TA
BLE
SA.5
:C
ENT
RA
LG
OV
ERN
MEN
TO
PER
AT
ION
S(C
ON
TIN
UED
)Pe
rcen
t of
GD
P
1991
1992
1993
1994
1995
1996
1997
1998
1999
2000
2001
1/20
022/
IV.
Pri
mar
y ba
lanc
e1.
40.
60.
50.
40.
01.
00.
90.
8−1
.0−0
.5−0
.6−0
.3V
.In
tere
st3.
94.
44.
23.
63.
32.
41.
81.
92.
12.
22.
11.
91.
Dom
estic
deb
t0.
30.
20.
10.
10.
10.
10.
10.
10.
10.
30.
21.
72.
Exte
rnal
deb
t3.
64.
24.
13.
53.
32.
31.
71.
82.
01.
91.
90.
3V
I.O
vera
ll ba
lanc
e−2
.5−3
.9−3
.6−3
.2−3
.3−1
.4−0
.8−1
.1−3
.1−2
.7−2
.8−2
.2V
II.
Net
Fin
anci
ng2.
53.
93.
63.
23.
31.
40.
81.
13.
12.
72.
82.
21.
Exte
rnal
3.6
3.2
3.1
2.5
2.4
0.8
0.0
0.3
−0.2
1.1
1.0
0.7
2.D
omes
tic−1
.10.
60.
1−4
.4−0
.8−3
.2−0
.10.
32.
60.
81.
10.
33.
Priv
atiz
atio
n0.
00.
20.
45.
11.
83.
90.
90.
50.
80.
80.
61.
2G
DP
(Mill
ion
sole
s)26
,686
44,9
5369
,262
98,5
7712
0,85
813
6,92
915
7,27
416
6,51
417
4,71
918
6,75
618
9,53
220
1,00
0
1/ P
relim
inar
y.2/
Est
imat
e.3/
Les
s pa
ymen
ts t
o A
mer
ican
Inte
rnat
iona
l Gro
up a
nd C
onve
nio
Perú
-Ale
man
ia.
Sour
ce:
MEF
, Ban
co d
e la
Nac
ión,
BC
RP,
Sun
at, C
usto
ms,
Em
pres
a N
acio
nal d
e C
omer
cial
izac
ión
de In
sum
os S
.A. (
Enci
). Em
pres
a C
omer
cial
izad
ora
de A
limen
tos
S.A
.(E
casa
); an
d Pe
trop
erú.
IMF
and
Wor
ld B
ank
staf
f est
imat
es fo
r 20
02.

RESTORING FISCAL DISCIPLINE FOR POVERTY REDUCTION IN PERU 233
TA
BLE
SA.6
:C
ENT
RA
LG
OV
ERN
MEN
TO
PER
AT
ION
SIn
Mill
ions
199
4 So
les
1991
1992
1993
1994
1995
1996
1997
1998
1999
2000
2001
1/20
022/
I.C
urre
nt r
even
ues
1018
711
139
1166
114
386
1648
517
361
1858
018
136
1696
517
758
1692
017
620
I.a.
TA
X R
EVEN
UES
9435
9957
1049
112
866
1458
815
356
1644
015
933
1464
814
627
1479
914
871
1.In
com
e ta
x79
613
7717
4025
2631
1540
1842
4340
6133
9633
1135
6437
492.
Prop
erty
tax
565
370
315
8527
22
17
03.
Expo
rt t
ax4.
Impo
rt t
ax10
7011
9515
2017
0019
2918
6218
3620
0319
0718
8017
3318
745.
Val
ue a
dded
tax
2441
3128
4373
5954
6880
6920
7688
7649
7386
7742
7472
7748
-Dom
estic
1395
1674
2465
3563
3795
3810
4406
4424
4333
4520
4346
4374
-Im
port
s10
4514
5419
0923
9130
8531
1032
8132
2630
5332
2231
2733
746.
Exci
se t
ax38
1632
0519
9422
6722
3722
2825
0123
7423
0822
0822
3621
24-F
uel
2493
1829
1227
1288
1343
1290
1435
1386
1401
1367
1467
1375
-Oth
ers
1323
1375
767
979
893
937
1066
988
907
841
769
750
7.O
ther
tax
rev
enue
s99
681
365
483
410
4410
2312
9110
8710
5012
0915
8715
008.
Tax
ref
und
−249
−131
−104
−499
−643
−696
−112
1−1
243
−140
7−1
723
−179
2−2
124
I.b.
NO
N-T
AX
REV
ENU
ES75
211
8211
7015
2018
9720
0521
4022
0323
1731
3121
2026
99II
.N
on-
inte
rest
exp
endi
ture
s90
6610
734
1112
714
270
1671
516
721
1763
417
585
1854
818
710
1788
218
295
1.C
urre
nt e
xpen
ditu
res
7398
8092
7978
9929
1218
812
649
1332
813
689
1459
715
333
1510
015
546
a.W
ages
and
sal
arie
s29
0632
5432
9138
6645
8743
8347
5448
3552
0652
8053
1053
74b.
Goo
ds a
nd s
ervi
ces
1761
1776
1749
2570
3535
4137
3953
4172
4159
4562
4474
4499
c.T
rans
fers
2731
3061
2939
3493
4066
4129
4620
4681
5232
5491
5316
5623
2.C
apita
l exp
endi
ture
s16
6726
4331
4843
4145
2740
7243
0738
9639
5133
7727
8227
49a.
Cap
ital f
orm
atio
n16
0920
5026
6133
4235
5931
6333
0534
3937
8530
6524
6926
24b.
Tra
nsfe
rs12
224
554
9813
00
016
4c.
Oth
ers
4736
943
299
587
089
610
0145
616
614
831
312
5II
I.O
ther
s3/
7551
−72
324
246
466
143
369
361
342
184
312
(con
tinue
d)

234 WORLD BANK COUNTRY STUDY
TA
BLE
SA.6
:C
ENT
RA
LG
OV
ERN
MEN
TO
PER
AT
ION
S(C
ON
TIN
UED
)In
Mill
ions
199
4 So
les
1991
1992
1993
1994
1995
1996
1997
1998
1999
2000
2001
1/20
022/
IV.
Pri
mar
y ba
lanc
e11
9645
546
244
016
1106
1089
920
−122
2−6
09−7
78−3
75V
.In
tere
st33
0236
7335
7335
6036
2026
5320
7321
6124
6026
3025
7123
741.
Dom
estic
deb
t27
516
675
107
8162
8612
215
935
029
521
242.
Exte
rnal
deb
t30
2735
0734
9834
5335
3925
9219
8720
4023
0122
7922
7637
5V
I.O
vera
ll ba
lanc
e−2
106
−321
8−3
111
−312
0−3
604
−154
7−9
84−1
242
−368
2−3
239
−334
9−2
749
VII
.N
et fi
nanc
ing
2106
3218
3111
3120
3604
1547
984
1242
3682
3239
3349
2749
1.Ex
tern
al30
4526
2126
4924
5325
9086
99
389
−209
1354
1253
875
2.D
omes
tic−9
4447
191
−436
5−9
21−3
580
−134
323
3009
964
1378
375
3.Pr
ivat
izat
ion
512
737
150
3219
3542
5811
0952
988
392
171
715
00C
PI D
eflat
or31
5481
100
111
124
135
144
149
155
158
161
1/ P
relim
inar
y.2/
Est
imat
e.3/
Les
s pa
ymen
ts t
o A
mer
ican
Inte
rnat
iona
l Gro
up a
nd C
onve
nio
Perú
-Ale
man
ia.
Sour
ce:
MEF
, Ban
co d
e la
Nac
ión,
BC
RP,
Sun
at, C
usto
ms,
Em
pres
a N
acio
nal d
e C
omer
cial
izac
ión
de In
sum
os S
.A. (
Enci
). Em
pres
a C
omer
cial
izad
ora
de A
limen
tos
S.A
.(E
casa
); an
d Pe
trop
erú.
IMF
and
Wor
ld B
ank
staf
f est
imat
es fo
r 20
02.
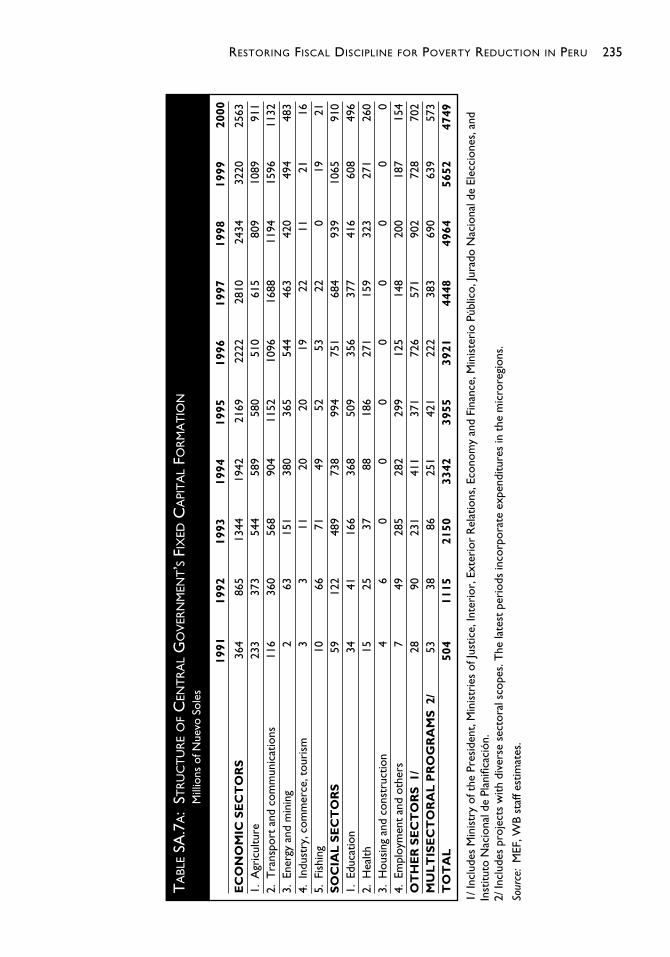
RESTORING FISCAL DISCIPLINE FOR POVERTY REDUCTION IN PERU 235
TA
BLE
SA.7
A:
STR
UC
TU
RE
OF
CEN
TR
AL
GO
VER
NM
ENT’S
FIX
EDC
API
TA
LFO
RM
AT
ION
Mill
ions
of N
uevo
Sol
es
1991
1992
1993
1994
1995
1996
1997
1998
1999
2000
EC
ON
OM
IC S
EC
TO
RS
364
865
1344
1942
2169
2222
2810
2434
3220
2563
1.A
gric
ultu
re23
337
354
458
958
051
061
580
910
8991
12.
Tra
nspo
rt a
nd c
omm
unic
atio
ns11
636
056
890
411
5210
9616
8811
9415
9611
323.
Ener
gy a
nd m
inin
g2
6315
138
036
554
446
342
049
448
34.
Indu
stry
, com
mer
ce, t
ouri
sm3
311
2020
1922
1121
165.
Fish
ing
1066
7149
5253
220
1921
SO
CIA
L S
EC
TO
RS
5912
248
973
899
475
168
493
910
6591
01.
Educ
atio
n34
4116
636
850
935
637
741
660
849
62.
Hea
lth15
2537
8818
627
115
932
327
126
03.
Hou
sing
and
con
stru
ctio
n4
60
00
00
00
04.
Empl
oym
ent
and
othe
rs7
4928
528
229
912
514
820
018
715
4O
TH
ER
SE
CT
OR
S1/
2890
231
411
371
726
571
902
728
702
MU
LT
ISE
CT
OR
AL
PR
OG
RA
MS
2/53
3886
251
421
222
383
690
639
573
TO
TA
L50
411
1521
5033
4239
5539
2144
4849
6456
5247
49
1/ In
clud
es M
inis
try
of t
he P
resi
dent
, Min
istr
ies
of Ju
stic
e, In
teri
or, E
xter
ior
Rel
atio
ns, E
cono
my
and
Fina
nce,
Min
iste
rio
Públ
ico,
Jura
do N
acio
nal d
e El
ecci
ones
, and
Inst
ituto
Nac
iona
l de
Plan
ifica
ción
.2/
Incl
udes
pro
ject
s w
ith d
iver
se s
ecto
ral s
cope
s. T
he la
test
per
iods
inco
rpor
ate
expe
nditu
res
in t
he m
icro
regi
ons.
Sour
ce:
MEF
, WB
staf
f est
imat
es.

236 WORLD BANK COUNTRY STUDY
TA
BLE
SA.7
B:ST
RU
CT
UR
EO
FC
ENT
RA
LG
OV
ERN
MEN
T’S
FIX
EDC
API
TA
LFO
RM
AT
ION
Perc
ent
of T
otal
1991
1992
1993
1994
1995
1996
1997
1998
1999
2000
EC
ON
OM
IC S
EC
TO
RS
72.1
77.6
62.5
58.1
54.8
56.7
63.2
49.0
57.0
54.0
1.A
gric
ultu
re46
.133
.425
.317
.614
.713
.013
.816
.319
.319
.22.
Tra
nspo
rt a
nd c
omm
unic
atio
ns23
.132
.326
.427
.029
.128
.037
.924
.128
.223
.83.
Ener
gy a
nd m
inin
g0.
35.
77.
011
.49.
213
.910
.48.
58.
710
.24.
Indu
stry
, com
mer
ce, t
ouri
sm0.
50.
30.
50.
60.
50.
50.
50.
20.
40.
35.
Fish
ing
2.0
5.9
3.3
1.5
1.3
1.3
0.5
0.0
0.3
0.4
SO
CIA
L S
EC
TO
RS
11.8
10.9
22.7
22.1
25.1
19.2
15.4
18.9
18.8
19.2
1.Ed
ucat
ion
6.7
3.7
7.7
11.0
12.9
9.1
8.5
8.4
10.8
10.4
2.H
ealth
3.0
2.2
1.7
2.6
4.7
6.9
3.6
6.5
4.8
5.5
3.H
ousi
ng a
nd C
onst
ruct
ion
0.8
0.6
0.0
0.0
0.0
0.0
0.0
0.0
0.0
0.0
4.Em
ploy
men
t an
d ot
hers
1.4
4.4
13.3
8.4
7.5
3.2
3.3
4.0
3.3
3.2
OT
HE
R S
EC
TO
RS
1/5.
68.
110
.712
.39.
418
.512
.818
.212
.914
.8M
UL
TIS
EC
TO
RA
L P
RO
GR
AM
S2/
10.5
3.4
4.0
7.5
10.7
5.7
8.6
13.9
11.3
12.1
TO
TA
L10
010
010
010
010
010
010
010
010
010
0
1/ In
clud
es M
inis
try
of t
he P
resi
dent
, Min
istr
ies
of Ju
stic
e, In
teri
or, E
xter
ior
Rel
atio
ns, E
cono
my
and
Fina
nce,
Min
iste
rio
Públ
ico,
Jura
do N
acio
nal d
e El
ecci
ones
, and
Inst
ituto
Nac
iona
l de
Plan
ifica
ción
.2/
Incl
udes
pro
ject
s w
ith d
iver
se s
ecto
ral s
cope
s. T
he la
test
per
iods
inco
rpor
ate
expe
nditu
res
in t
he m
icro
regi
ons.
Sour
ce:
MEF
, WB
staf
f est
imat
es.

RESTORING FISCAL DISCIPLINE FOR POVERTY REDUCTION IN PERU 237
TA
BLE
SA.8
A:
OPE
RA
TIO
NS
OF
TH
EN
ON
-FIN
AN
CIA
LPU
BLIC
SEC
TO
RM
illio
ns o
f Nue
vo S
oles
1991
1992
1993
1994
1995
1996
1997
1998
1999
2000
2001
1/
I.P
rim
ary
Bal
ance
480
546
1 03
897
246
12
113
3 21
01
946
�1
675
�1
706
�59
31.
Pri
mar
y B
alan
ce o
f the
CG
375
248
373
440
181
371
1 46
51
327
�1
825
�94
4�
1 22
9a.
Cur
rent
rev
enue
s3
193
6 05
99
424
14 3
8618
319
21 5
2225
001
26 1
7425
334
27 5
1526
733
i.T
ax r
even
ues
2 95
85
416
8 47
812
866
16 2
1219
036
22 1
2222
995
21 8
7322
663
23 3
83ii.
Non
-tax
rev
enue
s23
664
394
61
520
2 10
82
485
2 87
93
179
3 46
04
851
3 35
0b.
Non
-fina
ncia
l exp
endi
ture
s2
842
5 83
98
992
14 2
7018
575
20 7
2923
729
25 3
7927
697
28 9
8928
253
i.C
urre
nt2
319
4 40
16
448
9 92
913
545
15 6
8017
934
19 7
5621
797
23 7
5723
857
ii.C
apita
l52
31
438
2 54
44
341
5 03
15
048
5 79
55
623
5 90
05
232
4 39
6c.
Oth
ers
2/23
28−5
832
427
457
819
253
353
953
029
12.
Pri
mar
y B
alan
ce o
f the
Res
t10
529
966
553
244
374
31
745
618
150
�76
263
6a.
Res
t of
Cen
tral
Gov
ernm
ent
7557
9710
737
140
967
965
923
310
914
3b.
Loca
l Gov
ernm
ents
16−3
261
1174
−15
−311
7−1
3442
154
c.St
ate
Ente
rpri
ses
1427
350
741
4−2
349
1 06
9−1
5851
−913
377
II.
Inte
rest
1 22
52
302
3 15
93
727
4 26
13
507
2 95
73
275
3 80
74
236
4 23
1a.
Exte
rnal
deb
t95
61
919
2 84
43
486
3 94
63
220
2 69
72
972
3 46
93
582
3 66
6b.
Dom
estic
deb
t26
938
331
424
131
428
725
930
233
865
456
4II
I.O
vera
ll B
alan
ce (
I-II
)�
745
�1
755
�2
121
�2
756
�3
800
�1
394
253
�1
329
�5
482
�5
942
�4
823
IV.
Net
Fin
anci
ng74
51
755
2 12
12
756
3 80
01
394
�25
31
329
5 48
25
942
4 82
3a.
Exte
rnal
Net
Fin
anci
ng1
106
1 44
72
107
2 38
33
048
1 09
2−5
9164
2−1
112
280
1 75
5(M
illons
of U
S$)
1372
1052
1063
1090
1341
443
−229
224
−21
654
498
i.D
isbur
sem
ents
3/87
432
013
8849
662
838
215
6665
781
212
9913
18ii.
Amor
tizat
ions
3/10
3277
093
194
183
284
273
579
988
363
577
8iii.
Oth
ers
3/15
3115
0260
615
3515
4590
4−1
060
365
50−1
0−4
3b.
Net
Dom
estic
Fin
anci
ng−3
6323
9−2
86−4
660
−1 3
98−4
976
−1 1
55−7
74
274
2 23
51
935
c.Pr
ivat
izat
ion
Rev
enue
s1
6930
05
032
2 15
15
279
1 49
276
41
318
1 42
71
134
1/ P
relim
inar
y.2/
Les
s pa
ymen
t to
Am
eric
an In
tern
atio
nal G
roup
and
to
Con
veni
o Pe
rú-A
lem
ania
.3/
Incl
udes
exc
eptio
nal a
nd s
hort
-ter
m fi
nanc
ing.
Sour
ce:
MEF
, Ban
co d
e la
Nac
ión,
BC
RP,
Sun
at, C
usto
ms,
ESS
ALU
D, p
ublic
ben
efici
ary
soci
etie
s, lo
cal g
over
nmen
t, st
ate
ente
rpri
ses
and
publ
ic in
stitu
tions
.

238 WORLD BANK COUNTRY STUDY
TA
BLE
SA.8
B:O
PER
AT
ION
SO
FT
HE
NO
N-F
INA
NC
IAL
PUBL
ICSE
CT
OR
Perc
ent
of G
DP
1991
1992
1993
1994
1995
1996
1997
1998
1999
2000
2001
1/
I.P
rim
ary
Bal
ance
1.8
1.2
1.5
1.0
0.4
1.5
2.0
1.2
−1.0
−0.9
−0.3
1.P
rim
ary
Bal
ance
of t
he C
G1.
40.
60.
50.
40.
01.
00.
90.
8−1
.0−0
.5−0
.6a.
Cur
rent
rev
enue
s12
.013
.513
.614
.615
.215
.715
.915
.714
.514
.714
.1i.
Tax
rev
enue
s11
.112
.012
.213
.113
.413
.914
.113
.812
.512
.112
.3ii.
Non
-tax
rev
enue
s0.
91.
41.
41.
51.
71.
81.
81.
92.
02.
61.
8b.
Non
-fina
ncia
l exp
endi
ture
s10
.613
.013
.014
.515
.415
.115
.115
.215
.915
.514
.9i.
Cur
rent
8.7
9.8
9.3
10.1
11.2
11.5
11.4
11.9
12.5
12.7
12.6
ii.C
apita
l2.
03.
23.
74.
44.
23.
73.
73.
43.
42.
82.
3c.
Oth
ers
2/0.
10.
1−0
.10.
30.
20.
40.
10.
30.
30.
30.
22.
Pri
mar
y B
alan
ce o
f the
Res
t0.
40.
71.
00.
50.
40.
51.
10.
40.
1−0
.40.
3a.
Res
t of
Cen
tral
Gov
ernm
ent
0.3
0.1
0.1
0.1
0.3
0.3
0.4
0.4
0.1
0.1
0.1
b.Lo
cal G
over
nmen
ts0.
1−0
.10.
10.
00.
10.
00.
00.
1−0
.10.
00.
1c.
Stat
e En
terp
rise
s0.
10.
60.
70.
40.
00.
30.
7−0
.10.
0−0
.50.
2II
.In
tere
st4.
65.
14.
63.
83.
52.
61.
92.
02.
22.
32.
2a.
Exte
rnal
deb
t3.
64.
34.
13.
53.
32.
41.
71.
82.
01.
91.
9b.
Dom
estic
deb
t1.
00.
90.
50.
20.
30.
20.
20.
20.
20.
40.
3II
I.O
vera
ll B
alan
ce (
I-II
)−2
.8−3
.9−3
.1−2
.8−3
.1−1
.00.
2−0
.8−3
.1−3
.2−2
.5IV
.N
et F
inan
cing
2.8
3.9
3.1
2.8
3.1
1.0
−0.2
0.8
3.1
3.2
2.5
a.Ex
tern
al N
et F
inan
cing
4.1
3.2
3.0
2.4
2.5
0.8
−0.4
0.4
−0.1
1.2
0.9
i.D
isbur
sem
ents
3/3.
30.
72.
00.
50.
50.
31.
00.
40.
50.
70.
7ii.
Amor
tizat
ions
3/3.
91.
71.
31.
00.
70.
60.
50.
50.
50.
30.
4iii.
Oth
ers
3/5.
73.
30.
91.
61.
30.
7−0
.70.
20.
00.
00.
0b.
Net
Dom
estic
Fin
anci
ng−1
.40.
5−0
.4−4
.7−1
.2−3
.6−0
.70.
02.
41.
21.
0c.
Priv
atiz
atio
n R
even
ues
0.0
0.2
0.4
5.1
1.8
3.9
0.9
0.5
0.8
0.8
0.6
GD
P (M
illio
n so
les)
26,6
8644
,953
69,2
6298
,577
120,
858
136,
929
157,
274
166,
514
174,
719
186,
756
189,
532
1/ P
relim
inar
y.2/
Les
s pa
ymen
t to
Am
eric
an In
tern
atio
nal G
roup
and
to
Con
veni
o Pe
rú-A
lem
ania
.3/
Incl
udes
exc
eptio
nal a
nd s
hort
-ter
m fi
nanc
ing.
Sour
ce:
MEF
, Ban
co d
e la
Nac
ión,
BC
RP,
Sun
at, C
usto
ms,
ESS
ALU
D, p
ublic
ben
efici
ary
soci
etie
s, lo
cal g
over
nmen
t, st
ate
ente
rpri
ses
and
publ
ic in
stitu
tions
.

RESTORING FISCAL DISCIPLINE FOR POVERTY REDUCTION IN PERU 239
TA
BLE
SA.8
C:
OPE
RA
TIO
NS
OF
TH
EN
ON
-FIN
AN
CIA
LPU
BLIC
SEC
TO
RIn
Mill
ions
199
4 So
les
1991
1992
1993
1994
1995
1996
1997
1998
1999
2000
2001
1/
I.P
rim
ary
Bal
ance
1531
1004
1284
972
415
1705
2385
1348
−112
2−1
101
−375
1.P
rim
ary
Bal
ance
of t
he C
G11
9645
546
244
016
1106
1089
920
−122
2−6
09−7
78a.
Cur
rent
rev
enue
s10
187
1113
911
661
1438
616
485
1736
118
580
1813
616
965
1775
816
920
i.T
ax r
even
ues
9435
9957
1049
112
866
1458
815
356
1644
015
933
1464
814
627
1479
9ii.
Non
-tax
rev
enue
s75
211
8211
7015
2018
9720
0521
4022
0323
1731
3121
20b.
Non
-fina
ncia
l exp
endi
ture
s90
6610
734
1112
714
270
1671
516
721
1763
417
585
1854
818
710
1788
2i.
Cur
rent
7398
8092
7978
9929
1218
812
649
1332
813
689
1459
715
333
1510
0ii.
Cap
ital
1667
2643
3148
4341
4527
4072
4307
3896
3951
3377
2782
c.O
ther
s2/
7551
−72
324
246
466
143
369
361
342
184
2.P
rim
ary
Bal
ance
of t
he R
est
335
549
823
532
399
599
1297
428
100
−492
403
a.R
est
of C
entr
al G
over
nmen
t23
810
612
010
733
433
050
445
715
670
91b.
Loca
l Gov
ernm
ents
52−5
875
1167
−12
−281
−90
2797
c.St
ate
Ente
rpri
ses
4550
262
741
4−2
281
794
−110
34−5
8923
9II
.In
tere
st39
0742
3239
0837
2738
3428
2921
9722
6925
4927
3426
78a.
Exte
rnal
deb
t30
5135
2835
2034
8635
5125
9820
0520
5923
2323
1223
21b.
Dom
estic
deb
t85
770
438
924
128
323
219
320
922
642
235
7II
I.O
vera
ll B
alan
ce (
I-II
)−2
376
−322
7−2
624
−275
6−3
419
−112
418
8−9
21−3
671
−383
5−3
053
IV.
Net
Fin
anci
ng23
7632
2726
2427
5634
1911
24−1
8892
136
7138
3530
53a.
Exte
rnal
Net
Fin
anci
ng35
3026
6126
0723
8327
4288
1−4
3944
5−7
414
7111
11i.
Disb
urse
men
ts3/
2787
589
1718
496
566
308
1164
455
544
838
834
ii.Am
ortiz
atio
ns3/
3292
1416
1152
941
749
679
546
554
591
410
492
iii.O
ther
s3/
4883
2761
749
1535
1390
729
−788
253
33−7
−27
b.N
et D
omes
tic F
inan
cing
−115
844
0−3
54−4
660
−125
8−4
014
−858
−53
2862
1443
1225
c.Pr
ivat
izat
ion
Rev
enue
s5
127
371
5032
1935
4258
1109
529
883
921
717
Ave
rage
CPI
Defl
ator
3154
8110
011
112
413
514
414
915
515
8
1/ P
relim
inar
y.2/
Les
s pa
ymen
t to
Am
eric
an In
tern
atio
nal G
roup
and
to
Con
veni
o Pe
rú-A
lem
ania
.3/
Incl
udes
exc
eptio
nal a
nd s
hort
-ter
m fi
nanc
ing.
Sour
ce:
MEF
, Ban
co d
e la
Nac
ión,
BC
RP,
Sun
at, C
usto
ms,
ESS
ALU
D, p
ublic
ben
efici
ary
soci
etie
s, lo
cal g
over
nmen
t, st
ate
ente
rpri
ses
and
publ
ic in
stitu
tions
.

240 WORLD BANK COUNTRY STUDY
TA
BLE
SA.9
:LO
CA
LG
OV
ERN
MEN
TO
PER
AT
ION
SM
illio
ns o
f Nue
vo S
oles 19
9119
9219
9319
9419
9519
9619
9719
9819
9920
0020
01
I.C
urre
nt R
even
ues
495
825
1 33
81
713
2 17
02
539
3 14
43
454
3 27
93
549
3 75
4II.
Non
-fina
ncia
l exp
endi
ture
s48
888
61
307
1 73
52
151
2 58
83
175
3 37
43
451
3 78
43
832
1.C
urre
nt e
xpen
ditu
res
317
582
920
1 08
61
285
1 48
31
840
2 02
22
079
2 23
92
289
2.C
apita
l exp
endi
ture
s17
230
338
764
986
61
106
1 33
51
352
1 37
21
545
1 54
3III
.O
ther
s9
2930
3355
3528
3838
278
233
IV.
Prim
ary
Bala
nce
16−3
261
1174
−15
−311
7−1
3442
154
V.
Inte
rest
29
1928
4042
5353
5445
59V
I.O
vera
ll B
alan
ce14
�40
42�
1734
�56
�56
64�
188
�2
95
Sour
ce:
Loca
l gov
ernm
ents
and
Con
tadu
ría
Públ
ica
de la
Nac
ión.

RESTORING FISCAL DISCIPLINE FOR POVERTY REDUCTION IN PERU 241T
ABL
ESA
.10:
OPE
RA
TIO
NS
OF
TH
EN
ON
-FIN
AN
CIA
LST
AT
EEN
TER
PRIS
ESM
illio
ns o
f Nue
vo S
oles
1991
1992
1993
1994
1995
1996
1997
1998
1999
2000
2001
I.C
urre
nt R
even
ues
4 08
36
105
8 91
711
272
12 4
8612
304
11 3
889
524
10 7
0012
914
11 5
811.
Petr
oper
ú1
691
2 71
63
867
5 15
45
861
6 18
75
216
4 28
55
370
7 72
46
797
2.El
ectr
oper
ú23
835
661
886
91
108
1 39
01
386
1 45
01
265
1 21
41
221
3.R
egio
nale
s de
Ele
ctri
cida
dna
nana
na73
682
597
51
197
1 45
41
568
1 33
94.
Seda
pal
6613
320
835
641
850
762
158
162
664
366
55.
Cen
trom
in31
151
573
810
1813
3614
4015
5460
354
625
820
26.
Oth
ers
1 77
82
386
3 48
63
875
3 02
71
953
1 63
51
408
1 43
81
507
1 35
8II
.N
on-
fina
ncia
l Cur
rent
Exp
endi
ture
s3
833
5 50
37
826
9 98
511
575
10 9
329
450
8 30
89
047
12 5
8810
495
1.Pe
trop
erú
1 69
42
685
3 75
44
878
5 77
45
828
4 78
24
212
5 34
47
823
6 34
32.
Elec
trop
erú
124
254
391
591
755
899
1 01
91
126
675
782
858
3.R
egio
nale
s de
Ele
ctri
cida
dna
nana
na60
861
965
289
31
122
1 50
995
84.
Seda
pal
5511
613
624
630
033
139
137
935
744
740
05.
Cen
trom
in33
345
668
489
912
0513
2311
6960
636
550
720
36.
Otr
os1
628
1 99
22
861
3 37
12
934
1 93
21
436
1 09
21
184
1 52
01
732
III.
Gas
tos
de C
apit
al28
045
968
495
41
115
1 36
71
571
2 02
51
711
1 31
278
51.
Petr
oper
ú35
4812
415
044
918
223
4129
3240
2.El
ectr
oper
ú95
106
127
157
7745
010
152
853
345
315
03.
Reg
iona
les
de E
lect
rici
dad
nana
nana
9611
422
920
442
636
724
44.
Seda
pal
2438
9112
488
170
371
426
453
264
196
5.C
entr
omin
217
2823
3961
6546
2842
86.
Oth
ers
105
260
315
500
366
389
783
779
241
154
147
IV.
Oth
ers
4412
910
082
202
344
703
650
108
7375
V.
Pri
mar
y B
alan
ce (
I-II
-III
�IV
)14
273
507
414
�2
349
1 06
9�
158
51�
913
377
VI.
Inte
rest
182
295
251
139
197
175
112
101
7811
510
7V
II.
Ove
rall
Bal
ance
�16
8�
2225
627
5�
199
173
957
�25
9�
27�
1 02
827
01.
Petr
oper
ú−8
7−5
9−5
397
−464
9038
57
−18
−154
398
2.El
ectr
oper
ú−1
−36
9910
226
322
241
−220
56−2
121
43.
Reg
iona
les
de E
lect
rici
dad
nana
nana
2686
8818
2−
96−
333
182
4.Se
dapa
l−8
−9−2
0−1
948
37−5
6−6
4−1
57−1
0927
5.C
entr
omin
−57
35−7
8069
4130
8−6
014
4−2
98−1
56.
Oth
ers
−15
4623
614
−141
−103
−9−1
0344
−114
−536
na: n
ot a
vaila
ble.
Sour
ce:
Stat
e en
terp
rise
s, F
ondo
Nac
iona
l de
Fina
ncia
mie
nto
de la
Act
ivid
ad E
mpr
esar
ial d
el E
stad
o (F
ON
AFE
).
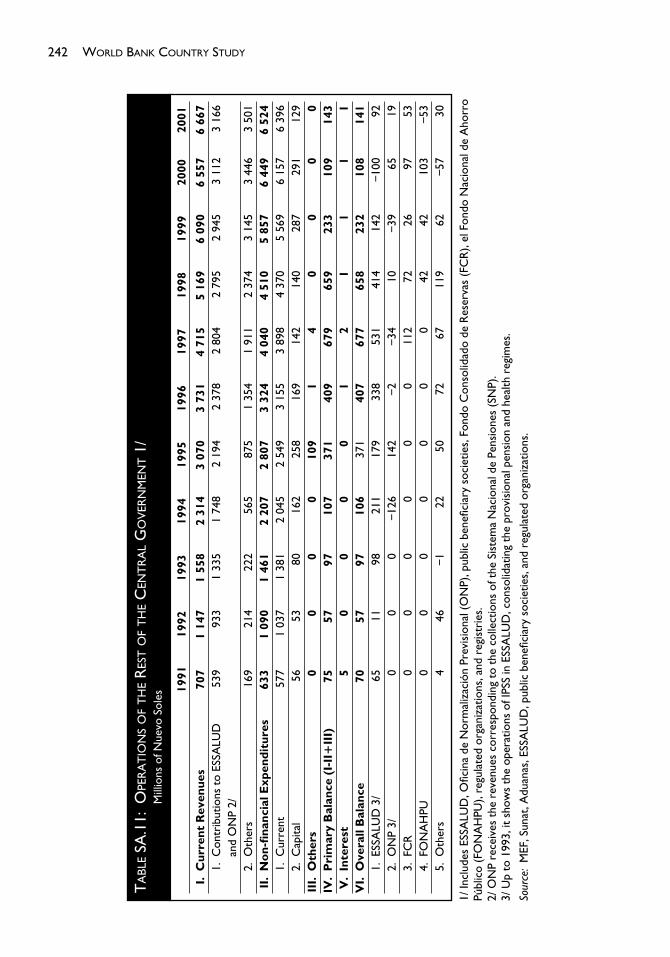
242 WORLD BANK COUNTRY STUDY
TA
BLE
SA.1
1:O
PER
AT
ION
SO
FT
HE
RES
TO
FT
HE
CEN
TR
AL
GO
VER
NM
ENT
1/M
illio
ns o
f Nue
vo S
oles
1991
1992
1993
1994
1995
1996
1997
1998
1999
2000
2001
I.C
urre
nt R
even
ues
707
1 14
71
558
2 31
43
070
3 73
14
715
5 16
96
090
6 55
76
667
1.C
ontr
ibut
ions
to
ESSA
LUD
53
993
31
335
1 74
82
194
2 37
82
804
2 79
52
945
3 11
23
166
and
ON
P 2/
2.O
ther
s16
921
422
256
587
51
354
1 91
12
374
3 14
53
446
3 50
1II
.N
on-
fina
ncia
l Exp
endi
ture
s63
31
090
1 46
12
207
2 80
73
324
4 04
04
510
5 85
76
449
6 52
41.
Cur
rent
577
1 03
71
381
2 04
52
549
3 15
53
898
4 37
05
569
6 15
76
396
2.C
apita
l56
5380
162
258
169
142
140
287
291
129
III.
Oth
ers
00
00
109
14
00
00
IV.
Pri
mar
y B
alan
ce (
I-II
�II
I)75
5797
107
371
409
679
659
233
109
143
V.
Inte
rest
50
00
01
21
11
1V
I.O
vera
ll B
alan
ce70
5797
106
371
407
677
658
232
108
141
1.ES
SALU
D 3
/65
1198
211
179
338
531
414
142
−100
922.
ON
P 3/
00
0−1
2614
2−2
−34
10−3
965
193.
FCR
00
00
00
112
7226
9753
4.FO
NA
HPU
00
00
00
042
4210
3−5
35.
Oth
ers
446
−122
5072
6711
962
−57
30
1/ In
clud
es E
SSA
LUD
, Ofic
ina
de N
orm
aliz
ació
n Pr
evis
iona
l (O
NP)
, pub
lic b
enefi
ciar
y so
ciet
ies,
Fon
do C
onso
lidad
o de
Res
erva
s (F
CR
), el
Fon
do N
acio
nal d
e A
horr
oPú
blic
o (F
ON
AH
PU),
regu
late
d or
gani
zatio
ns, a
nd r
egis
trie
s.2/
ON
P re
ceiv
es t
he r
even
ues
corr
espo
ndin
g to
the
col
lect
ions
of t
he S
iste
ma
Nac
iona
l de
Pens
ione
s (S
NP)
.3/
Up
to 1
993,
it s
how
s th
e op
erat
ions
of I
PSS
in E
SSA
LUD
, con
solid
atin
g th
e pr
ovis
iona
l pen
sion
and
hea
lth r
egim
es.
Sour
ce:
MEF
, Sun
at, A
duan
as, E
SSA
LUD
, pub
lic b
enefi
ciar
y so
ciet
ies,
and
reg
ulat
ed o
rgan
izat
ions
.

RESTORING FISCAL DISCIPLINE FOR POVERTY REDUCTION IN PERU 243T
ABL
ESA
.12A
:FU
NC
TIO
NA
LC
LASS
IFIC
AT
ION
OF
CEN
TR
AL
GO
VER
NM
ENT
BUD
GET
EXPE
ND
ITU
RES
Mill
ions
of N
uevo
s So
les
1997
1998
1999
2000
2001
2002
1/
Plan
ning
and
Adm
inis
trat
ion
8,84
76,
601
8,24
69,
253
8,70
19,
514
Pens
ions
and
Soc
ial A
ssis
tanc
e5,
593
5,88
57,
149
7,71
77,
931
8,19
6Pe
nsio
ns4,
041
4,57
55,
330
6,12
76,
294
6,48
0So
cial
Ass
ista
nce
1,55
21,
310
1,81
91,
590
1,63
71,
716
Educ
atio
n4,
172
4,52
95,
230
5,40
35,
323
6,06
7Pr
e-pr
imar
y30
338
245
544
841
561
2Pr
imar
y1,
518
1,59
81,
910
1,95
71,
818
2,04
8Se
cond
ary
1,13
01,
134
1,30
81,
400
1,42
41,
676
Ter
tiary
743
836
970
955
965
1,03
9O
ther
s47
857
958
764
270
069
2D
efen
se a
nd N
atio
nal S
ecur
ity4,
523
4,85
84,
958
5,36
64,
709
4,18
9H
ealth
and
Wat
er2,
258
2,46
52,
709
2,91
43,
052
3,32
8W
ater
and
Sew
age
283
271
269
333
207
159
Hea
lthca
re1,
975
2,19
42,
440
2,58
12,
845
3,16
9T
rans
port
atio
n1,
709
1,53
21,
752
1,38
31,
286
1,31
8A
gric
ultu
re96
81,
205
1,28
91,
255
1,04
996
1Ju
stic
e55
662
167
870
373
386
2En
ergy
and
Nat
ural
Res
ourc
es26
931
133
826
625
729
7O
ther
2/
691
808
1,00
81,
109
1,03
41,
039
TO
TA
L29
,586
28,8
1533
,357
35,3
6934
,075
35,7
72M
emor
andu
m it
ems:
Tot
al S
ocia
l Exp
endi
ture
+Pe
nsio
ns14
,937
15,4
5117
,667
18,8
3518
,972
20,2
86T
otal
Soc
ial E
xpen
ditu
re10
,896
10,8
7612
,337
12,7
0812
,678
13,8
06Bu
dget
Soc
ial E
xpen
ditu
re 3
/7,
982
8,30
49,
758
9,90
710
,012
11,1
11ES
SALU
D 4
/1,
735
2,02
52,
489
2,80
12,
666
2,69
5FO
NA
VI 5
/1,
179
547
90Ex
chan
ge R
ate
3.49
3.43
3.54
1/ B
udge
t.2/
Incl
udes
fore
ign
rela
tions
, leg
isla
tive,
hou
sing
and
urb
an d
evel
opm
ent,
indu
stry
, com
mer
ce a
nd s
ervi
ces,
fish
ing,
com
mun
icat
ions
, and
em
ploy
men
t.3/
Incl
udes
edu
catio
n, h
ealth
, and
san
itatio
n an
d ot
her
soci
al a
ssis
tanc
e.4/
Tot
al e
xpen
ditu
re b
y Es
salu
d, t
he p
ublic
hea
lth in
sura
nce
adm
inis
trat
ion
5/ In
clud
es n
et o
pera
tions
of t
he n
atio
nal h
ousi
ng fu
nd (
FON
AV
I)—lo
an d
isbu
rsem
ents
and
am
ortiz
atio
ns r
ecei
ved.
Sour
ce:
MEF
, IM
F.

244 WORLD BANK COUNTRY STUDYT
ABL
ESA
.12B
:FU
NC
TIO
NA
LC
LASS
IFIC
AT
ION
OF
CEN
TR
AL
GO
VER
NM
ENT
BUD
GET
EXPE
ND
ITU
RES
Perc
ent
of G
DP
1997
1998
1999
2000
2001
2002
/1
Plan
ning
and
Adm
inis
trat
ion
5.6
4.0
4.7
5.0
4.6
4.7
Pens
ions
and
Soc
ial A
ssis
tanc
e3.
63.
54.
14.
14.
24.
1Pe
nsio
ns2.
62.
73.
13.
33.
33.
2So
cial
Ass
ista
nce
1.0
0.8
1.0
0.9
0.9
0.9
Educ
atio
n2.
72.
73.
02.
92.
83.
0Pr
e-pr
imar
y0.
20.
20.
30.
20.
20.
3Pr
imar
y1.
01.
01.
11.
01.
01.
0Se
cond
ary
0.7
0.7
0.7
0.7
0.8
0.8
Ter
tiary
0.5
0.5
0.6
0.5
0.5
0.5
Oth
ers
0.3
0.3
0.3
0.3
0.4
0.3
Def
ense
and
Nat
iona
l Sec
urity
2.9
2.9
2.8
2.9
2.5
2.1
Hea
lth a
nd W
ater
1.4
1.5
1.6
1.6
1.6
1.7
Wat
er a
nd S
ewag
e0.
20.
20.
20.
20.
10.
1H
ealth
care
1.3
1.3
1.4
1.4
1.5
1.6
Tra
nspo
rtat
ion
1.1
0.9
1.0
0.7
0.7
0.7
Agr
icul
ture
0.6
0.7
0.7
0.7
0.6
0.5
Just
ice
0.4
0.4
0.4
0.4
0.4
0.4
Ener
gy a
nd N
atur
al R
esou
rces
0.2
0.2
0.2
0.1
0.1
0.1
Oth
er /2
0.4
0.5
0.6
0.6
0.5
0.5
TO
TA
L18
.817
.319
.118
.918
.017
.8M
emor
andu
m it
ems:
Tot
al S
ocia
l Exp
endi
ture
6.9
6.5
7.1
6.8
6.7
6.9
Budg
et S
ocia
l Exp
endi
ture
/35.
15.
05.
65.
35.
35.
5ES
SALU
D /4
1.1
1.2
1.4
1.5
1.4
1.3
FON
AV
I /5
0.7
0.3
0.1
Exch
ange
Rat
e3.
493.
433.
54
1/ B
udge
t.2/
Incl
udes
fore
ign
rela
tions
, leg
isla
tive,
hou
sing
and
urb
an d
evel
opm
ent,
indu
stry
, com
mer
ce a
nd s
ervi
ces,
fish
ing,
com
mun
icat
ions
, and
em
ploy
men
t.3/
Incl
udes
edu
catio
n, h
ealth
, and
san
itatio
n an
d ot
her
soci
al a
ssis
tanc
e.4/
Tot
al e
xpen
ditu
re b
y Es
salu
d, t
he p
ublic
hea
lth in
sura
nce
adm
inis
trat
ion
5/ In
clud
es n
et o
pera
tions
of t
he n
atio
nal h
ousi
ng fu
nd (
FON
AV
I)—lo
an d
isbu
rsem
ents
and
am
ortiz
atio
ns r
ecei
ved.
Sour
ce:
MEF
, IM
F.

RESTORING FISCAL DISCIPLINE FOR POVERTY REDUCTION IN PERU 245
TA
BLE
SA.1
3:C
ENT
RA
LG
OV
ERN
MEN
TSP
END
ING
BYM
INIS
TR
YO
RIN
STIT
UT
ION
Mill
ions
of N
uevo
s So
les
1999
2000
2001
Sec
tors
Bud
gete
dA
ctua
lD
iff. %
Bud
gete
dA
ctua
lD
iff. %
Bud
gete
dA
ctua
lD
iff. %
Pres
iden
cy o
f the
Cou
ncil
of M
inis
ters
268
292
8.8
360
399
10.9
368
279
−24.
2Ju
dica
l Pow
er41
345
49.
945
947
73.
847
148
22.
4Ju
stic
e30
726
9−1
2.7
310
392
26.6
381
362
−4.8
Inte
rior
2,42
42,
891
19.3
2,77
63,
029
9.1
2,93
12,
888
−1.5
Exte
rior
Rel
atio
ns29
334
618
.134
138
212
.036
637
42.
3Ec
onom
y an
d Fi
nanc
e10
,362
10,0
09−3
.412
,126
12,5
333.
413
,382
12,7
41−4
.8Ed
ucat
ion
2,71
33,
040
12.1
2,53
42,
625
3.6
2,47
82,
154
−13.
1H
ealth
1,62
31,
664
2.5
1,82
81,
728
−5.5
1,85
91,
939
4.3
Labo
r an
d So
cial
Ass
ista
nce
126
51−5
9.3
2550
98.9
3638
5.4
Agr
icul
ture
648
827
27.6
749
810
8.1
664
787
18.5
Indu
stry
, Tou
rism
, Int
egra
tion
and
Inte
rnat
iona
l 79
812.
793
951.
410
385
−16.
8C
omm
erci
al N
egot
iatio
nsT
rans
port
, Com
mun
icat
ions
, Hou
sing
1,
817
1,79
3−1
.41,
599
1,34
8−1
5.7
1,49
61,
196
−20.
1an
d C
onst
ruct
ion
Ener
gy a
nd M
inin
g49
032
5−3
3.7
359
259
−27.
928
125
4−9
.7Fi
sher
ies
9015
066
.683
9716
.610
211
08.
1G
ener
al C
ompt
rolle
r52
49−6
.052
48−7
.448
493.
3O
ffice
of t
he P
eopl
e’s
Om
buds
pers
on12
1952
.116
2233
.917
2125
.9N
atio
nal C
ounc
il of
the
Mag
istr
ate
33
−6.8
34
15.9
57
44.8
Min
istr
y of
the
Pub
lic15
615
81.
216
015
2−4
.815
717
913
.8C
onst
itutio
nal T
ribu
nal
77
3.2
88
−0.9
98
−2.9
Min
istr
y of
the
Pre
side
ncy
6,38
46,
698
4.9
5,96
16,
122
2.7
6,07
55,
802
−4.5
Def
ense
2,77
33,
398
22.5
3,22
83,
684
14.1
3,48
63,
148
−9.7
Con
gres
s24
723
6−4
.428
228
82.
029
930
41.
9N
atio
nal E
lect
ion
Body
1215
28.0
1026
157.
011
4127
2.9
Nat
iona
l Offi
ce o
f the
Ele
ctor
al P
roce
ss9
3429
0.0
1214
110
60.3
1428
118
57.1
Nat
iona
l Reg
istr
y of
Iden
tifica
tion
and
Civ
il St
ate
112
72−3
6.0
7511
349
.587
79−9
.2A
dvan
cem
ent
of W
omen
and
Hum
an D
evel
opm
ent
524
474
−9.5
597
539
−9.8
588
466
−20.
7T
OT
AL
31,9
4733
,357
4.4
34,0
4635
,368
3.9
35,7
1234
,075
−4.6
Sour
ce:
MEF
, SIA
F fo
r 20
01.

246 WORLD BANK COUNTRY STUDY
TA
BLE
SA.1
4:SO
CIA
LSP
END
ING
BYT
YPE
Mill
ions
of N
uevo
s So
les
1991
1992
1993
1994
1995
1996
1997
1998
1999
2000
Educ
atio
n57
81,
037
1,94
43,
310
4,25
54,
287
5,01
15,
300
4,82
75,
657
Soci
al S
ecur
ity40
382
71,
524
1,93
33,
161
3,43
04,
712
5,30
04,
603
5,30
5N
utri
tion
4476
155
359
677
587
817
843
776
964
Hea
lth26
445
963
41,
037
1,54
71,
814
2,20
02,
372
2,21
52,
143
Just
ice
3770
170
194
194
374
547
498
586
622
Oth
er S
ocia
l Inv
estm
ent
9024
381
51,
111
1,28
11,
480
1,68
22,
144
2,13
21,
783
Tot
al1,
416
2,71
25,
242
7,94
411
,116
11,9
7114
,968
16,4
5715
,139
16,4
74Pe
rcen
t of
GD
P5.
3%6.
0%7.
6%8.
1%9.
2%8.
7%9.
5%9.
9%8.
7%8.
8%
Sour
ce:
MEF
. Not
e: t
his
tabl
e ha
s m
inor
inco
nsis
tenc
ies
with
the
oth
er t
able
s.

RESTORING FISCAL DISCIPLINE FOR POVERTY REDUCTION IN PERU 247
TABLE SA.15: COMPOSITION OF SOCIAL EXPENDITURES(Millions of Nuevo Soles)
1999 2000 20011/ 2002 2/
I. UNIVERSAL SOCIAL EXPENDITURE 6 821 7 207 7 448 8 439EDUCATION 4 552 4 812 5 042 5 797HEALTH 2 268 2 395 2 405 2 643
II. EXTREME POVERTY PROGRAMS 3 257 3 043 2 979 3 531FONCODES 758 469 350 537
Apoyo Social 2/ 232 184 19Strengthening Social Programs 42 56 32 38Social Investment/Productive Development 483 228 207 179Programa de Emergencia Social Productiva na na 92 320
EDUCATION 377 315 163 355Improving Primary Education 260 219 102 55Improving Education at Other Levels 116 96 61 271Literacy 29
HEALTH 126 136 205 291Lucha Contra Epidemias 8 39 42 43Family Planning 32 11 20 9Seguro Escolar/Materno Infantil (Prog. Apoyo 87 86 143 239Reforma Sector Salud—SALUD)
AGRICULTURE 317 293 416 276Agricultural Support in Emergency Zones 62 74 257 40Pronamachs 1/ 191 185 143 219Land Titling 64 34 15 17
PRONAA 237 258 221 216Food Assistance/Support in Emergency Cases 211 233 201 195Proyectos de Asistencia Alimentaria 26 25 20 21
PROG. APOYO REPOBLACION Y 22 29 21 17DESARROLLO ZONA DE EMERG.
Programa de Apoyo a la Repoblación 22 29 21 17ECONOMY AND FINANCE 338 350 357 363
Vaso de Leche (Gobiernos Locales) 305 325 332 343Apoyo Social—PL 480 33 25 25 20
ENERGY AND MINING 77 96 108 111Distribution Infrastructure for Energy 77 96 108 111
TRANSPORT AND COMMUNICATIONS 190 112 59 160Rural Roads 190 112 59 160
MIPRE 102 336 312 329Prog. Nacional de Agua Potable y Alcantarillado 92 63 89 102Targeted Investment to Reduce Extreme Poverty 10 8 14 20Prog. Equipamiento Básico Municipal na 256 209 207Water for All na 9
COOPOP 8 6 12 9Multisectoral Projects 8 6 12 9
INIED/INFES 77 50 31 50Education Infrastructure 77 50 31 50
(continued )

248 WORLD BANK COUNTRY STUDY
TABLE SA.15: COMPOSITION OF SOCIAL EXPENDITURES (CONTINUED)(Millions of Nuevo Soles)
1999 2000 20011/ 2002 2/
COMISION DE FORMALIZACIÓN DE LA 86 76 49 61PROP. INFORMALPROMUDEH 70 84 68 42
Literacy/Educational Development 70 84 68 42BASIC SOCIAL EXPENDITURE 472 433 606 713
Education 39 34 33 59Health 305 264 255 316Instituto Nacional de Salud 83 93 268 300Others 45 42 50 38
III NON-TARGETED SOCIAL PROGRAMS 9,466 10,526 10,625 10,906ESSALUD 2489 2801 2666 2695FONAVI 90Tertiary and Other Education 1557 1597 1665 1731Pensions 5330 6127 6294 6480
TOTAL 19 544 20 775 21 051 22 877Memo items:Total budgeted social expenditure as (% of GDP) 3/ 6.7% 6.3% 6.4% 6.8%Total social expenditure and pensions as (% of GDP) 11.2% 11.1% 11.1% 11.4%Total poverty-reduction programs (% of GDP) 5.8% 5.5% 5.5% 6.0%Poverty reduction (% of total budgeted 86.6% 86.5% 86.2% 87.4%social expenditure)Non-targeted social programs (% of total social 48.4% 50.7% 50.5% 47.7%expenditure and pension)
1/ Preliminary.2/ Estimated.3/ Budgeted social expenditure excludes ESSALUD, FONAVI, and pensions.
Source: MEF.

RESTORING FISCAL DISCIPLINE FOR POVERTY REDUCTION IN PERU 249
TABLE SA.16: PESEM: PROJECTED SOCIAL SPENDING BY INSTITUTION, 2002–06
2002 2003 2004 2005 2006
Nominal Million NSSocial Sectors 11898 12554 13224 14307 15260
Education 6068 6662 7457 8232 9062Justice 356 386 416 452 491Health 3224 3377 3580 3776 3978President 1788 1653 1223 1256 1093Woman and Human Development 462 476 548 592 636
Defense and Interior 5346 5573 5573 5720 5881Total 35991 38034 39026 40861 42781Percent of Budget
Social Sectors 33.1 33.0 33.9 35.0 35.7Education 16.9 17.5 19.1 20.1 21.2Justice 1.0 1.0 1.1 1.1 1.1Health 9.0 8.9 9.2 9.2 9.3President 5.0 4.3 3.1 3.1 2.6Woman and Human Development 1.3 1.3 1.4 1.4 1.5
Defense and Interior 14.9 14.7 14.3 14.0 13.7Total 100.0 100.0 100.0 100.0 100.0Percent of GDP
Social Sectors 5.9 5.8 5.7 5.8 5.7Education 3.0 3.1 3.2 3.3 3.4Justice 0.2 0.2 0.2 0.2 0.2Health 1.6 1.6 1.5 1.5 1.5President 0.9 0.8 0.5 0.5 0.4Woman and Human Development 0.2 0.2 0.2 0.2 0.2
Defense and Interior 2.7 2.6 2.4 2.3 2.2Total 17.9 17.6 16.8 16.4 16.1GDP Nominal 201000 216300 232523 248799 266215
Source: MEF and World Bank staff estimates, based on multiyear sectoral programs (PESEM).

250 WORLD BANK COUNTRY STUDY
TABLE SA.17: PLEDGES AT THE 2002 CONSULTATIVE GROUP FOR PERU
Pledges
Country Grants Concessional Debt Swaps Loans Total
Spain 49.6 212.4 9.0 – 271.0Belgium 20.5 – – – 20.5Canada 32.7 – – – –Denmark – – – – –Finland 1.4 – – – 1.4France – – – – –Germany 13.6 – 22.5 – 36.1Italy 10.0 14.0 127.0 – –Japan – – – – –Luxemburg – – – – –Norway – – – – –Sweden – – – – –Switzerland 20.0 – – – –TheNetherlands 10.0 – – – –UnitedKingdom 21.0 –UnitedStates 330.0 – – – –TOTAL 508.8 226.4 158.5 – 329.0Institution:IADB – – – 400.0 –WorldFoodProg 15.0 – – – –EuropeanCommission 90.0 – – – 90.0WB – – – 120.0 –EuropeanInvestBank – – – 20.0 –IFAD – – – 25.0 –CAF 1.5 – – 321.0 –TOTAL 106.5 – – 886.0 90.0GRAND TOTAL 615.3 226.4 158.5 886.0 419.0
Source: IDB.

TABLE SA.18: PRIVATIZATIONS AND CONCESSIONS, 2001–04Millions of US$
2001 2002 2003 2004
Sale of Participatory Stocks 145 100 0 0Edelnor stocks (36%) 80Relapasa stocks (32%) 88Iscaycruz stocks (25%) 18Elevensa stocks (38%) 39Emp. Electrica Piura stocks (40%) 20
Electric Distributors 0 220 160 0EE RR Electricity (JORBSA) 220Other distributors (100%): Puno, Oriente, Sur, etc. 160
Electric Generators 220 0 350 300Complete Mantaro (CH 1008 Mw): Concession (up front) 300ElectroAndes (CH 183 Mw) 220Egasa (CT 154 Mw and CH 165 Mw) 200Egesur (CT 28.6 Mw and CH 35 Mw) 30Egemsa (CH 70 Mw) 60San Gaban (CH 110) 60
Electric Transmission: Etecen and Etesur 0 330 0 0Elecen (LT 3000 km) 240Etesur (LT 880 km) 90
Petroperu 0 0 35 0Talara refinery (62 TBD): Concession (up front) 15Conchan refinery (12 TDB) and Iquitos (10.5 TBD) 20
Concessions 10 0 55 0Telephone: Fixed lines 10Regional ports and from Callao 45Telephonia Multimedios (other bands) 10
Sale of Buildings 0 0 45 0Earlier Sales and Other Privatizations 85 50 55 50
TOTAL 460 700 700 350Memo 1: Revenues of the Public Treasury and FonahpuA. Public Treasury 328 600 316 350
Privatization revenues 90 50 201 50Deducted for the assumption of debt 238 550 115 300
B. FONAHPU 127 100 0 0C. Revenue FEF 5 0 384 0
TOTAL 460 700 700 350Memo 2: Deduction for assuming debt
Iscaycruz (by Minero Peru) 18Electro Andes (by Centromin) 220EE RR Electricidad: JORBSA (by Electroperu) 220Etecen and Etesur (by Electroperu) 330Complejo Mantaro (by Electroperu) 300Egasa and Egesur (by Electroperu) 80Cochan and Iquitos Refineries (by Electroperu) 35TOTAL1/ 238 550 115 300
Notes: CT = Central Térmica, CH = Central Hidraúlica, Mw = Megawatts, LT = Transmission line, TBD = thous.barrels a day.1/ The deductions for debt assumed from and capitalization of Electroperu are for a total of $930 mln.
Source: Copri (August 2001).

252 WORLD BANK COUNTRY STUDY
TABLE SA.19: CURRENT REVENUES BY AWARDED CONCESSIONSMillions of US$
2001 2002 2003 2004
Jorge Chavez airport 1/ 0 35 40 50Camisea 0 0 0 90Complejo Mantaro (15%) 2/ 0 0 0 40Ports (15%) 0 0 0 15
TOTAL 0 35 40 195Government 0 23 40 155Enterprises 0 12 0 0FONAHPU 0 0 0 40
TOTAL 0 35 40 195
1/ In 2002, $12 mln was destined to Coipac and $23 mln to the government.2/ Revenues of FONAHPU.
Source: Copri (August 2001).
TABLE SA.20: COMPARATIVE PERFORMANCE IN SOCIAL INDICATORS
Life Expectancy Net Primary Enrollment
Country- Divided Divided Country- Divided Divided Level by Region by World Level by Region by World
Efficiency Avg. Avg. Efficiency Avg. Avg.
Latin America/Caribbean 83.5 103.2 76.4 103.1Argentina 85.3 102.2 105.5 84.8 110.9 114.4Bahamas, The 85.0 101.8 105.1Bolivia 73.6 88.1 91.0 80.6 105.5 108.8Brazil 80.6 96.6 99.7 76.8 100.5 103.7Chile 89.3 106.9 110.4 72.2 94.5 97.5Colombia 84.1 100.7 104.0 65.7 85.9 88.6Costa Rica 91.0 109.0 112.5 72.6 95.0 98.0Ecuador 82.1 98.4 101.6 77.7 101.7 104.8El Salvador 83.6 100.1 103.3 69.8 91.3 94.2Guatemala 79.1 94.8 97.9 69.6 91.1 93.9Guyana 76.2 91.3 94.3Haiti 69.4 83.1 85.8Honduras 84.7 101.5 104.8 83.5 109.3 112.7Jamaica 90.3 108.2 111.7 83.2 108.9 112.3Mexico 86.0 104.0 106.3 85.5 111.9 115.4Nicaragua 83.1 99.5 102.7 74.1 97.0 100.0Panama 88.3 105.7 109.2 77.5 101.3 104.5Paraguay 83.2 99.7 102.9 77.0 100.7 103.9Peru 81.6 97.7 100.9 77.1 100.9 104.1Trinidad & Tobago 86.5 103.6 107.0Uruguay 86.8 104.0 107.4 75.3 98.5 101.6Venezuela, RB 87.0 104.2 107.5 72.8 95.3 98.2
Source: Wodon et al. (2001).

TABLE SA.21: MAIN TAX BREAKS
Estimated Cost Sector Types of Tax Breaks (% of GDP)
Mining
Hydrocarbons
Agriculture
Industry (forest and frontier)
Housing
Tourism and Hotels
Public Works and Concessions
Education
CETICOS
Amazonia
Other SectorsTOTAL
Source: SUNAT, IMF calculations, IMF (2000).
Reinvestment of profits; accelerated depreciation; agree-ments on tax stability; advanced recovery of IGV/IVM;reduced tariffs extended on capital good imports.Accelerated depreciation; agreements on tax stability;advance recovery of IGV/IVM; exemption of IGV/IPM andISC for imports of inputs during exploration; exemption ofIGV/IPM and ISC on fuel in three regions in the country.Exemption of IR for small producers (50 UIT) and reducedtariffs of 15% for the sector; reinvestment of profits (up to20%); accelerated depreciation for irrigation infrastruc-ture; exoneration from IES; issuance of documents can-celling taxes for the imports of certain inputs and capitalgoods for agro-industry; IGV of 5% for rice producers.Exoneration from IR for industrial enterprises; reinvest-ment of profits; exoneration from IGV/IPM and Peru-Colombia protocol duties; agreements on tax stability;reduced tariffs on capital good imports.Exoneration of IGV/IPM on the first housing sale of lessthan $35,000; exemption of IGV on construction con-tracts and housing sales in the Amazonia.Accelerated depreciation; exemption from IGV/IPM forservices borrowed in favor of external operators.Agreements on tax stability; advanced recovery ofIGV/IPM; exemption from IES.Reinvestment of profits (up to 50%); accelerated depre-ciation; exemption from IGV/IPM; exemption from IES.Exoneration of IR, IGV/IPM, ISC, tariffs; duties of 8% forlocal commercialization; exoneration of IES and othernational and municipal taxes and tariffs.Reduced IR tarif (0, 5, and 10%); reinvestment of profits;exemption from IGV/IPM; fiscal credit of 25 and 50% forIGV on sales in the interior; IES exemption.Agreements on tax stability.
0.4
0.1
0.4
<0.05
<0.05
<0.05
<0.05
<0.05
0.1
0.9
<0.052.0
TABLE SA.22: ALTERNATIVE MEASURES FOR TAX REFORM BY SECTOR OR REGION
Collection Sector or Region Impact the Privileges of which
Proposed Measures (% of GDP) Will Be Affected
Eliminate exemption of goods in Appendix 1, of the IGV law 0.25 AgricultureEliminate exoneration to financial profits 0.27 FinancialEliminate zero-rate tax regime in the Amazonia 0.25 AmazoniaEliminate exoneration of IGV and ISC to fuels 0.10 AmazoniaEliminate CETICOS regime 0.13 CETICOSUnify income tax rates 0.05 Agriculture and Amazonia
Source: Schenone (2002).

254 WORLD BANK COUNTRY STUDY
TA
BLE
SA.2
3A:
LAT
INA
MER
ICA
GEN
ERA
LG
OV
ERN
MEN
T’S
TA
XR
EVEN
UES
, 199
8 1/
Perc
ent
of G
DP
Uru
guay
Bra
zil
Arg
enti
naC
hile
Mex
ico
Co
lom
bia
Ven
ezue
laE
cuad
or
Per
u
TO
TA
L27
.824
.523
.520
.420
.318
.818
.418
.114
.8R
esou
rces
0
nana
1.1
4.3
1.6
7.6
4.5
0.1
Non
-ren
ewab
le 2
/R
est o
f Tax
Rev
enue
s 27
.824
.523
.519
.316
17.2
10.8
13.6
14.7
Dir
ect
Tax
es 3
/5.
14.
83.
43.
94.
65.
02.
01.
83.
5So
cial
Sec
urity
6.5
5.1
41.
51.
73.
40.
72.
21.
7V
AT
8.5
8.4
7.1
8.9
3.3
4.5
4.3
4.2
6.1
Spec
ial T
axes
41.
82.
32.
22.
33.
11.
20.
61.
9T
rade
Tax
es1.
20.
71.
01.
80.
61.
22
3.1
1.4
Oth
er R
even
ues
2.5
3.7
5.7
1.0
3.5
00.
61.
70.
1M
emor
andu
m:
Prod
uctiv
ity o
f VA
T 4
/0.
37na
0.34
0.49
0.22
0.28
0.26
0.42
0.34
na =
not
appl
icab
le.
1/ In
clud
es t
ax r
even
ues
and
non-
tax
reve
nues
of n
on-r
enew
able
res
ourc
es. F
or M
exic
o an
d Pe
ru, d
ata
is fo
r 19
99.
2/ E
xclu
des
VA
T, t
ariff
s, a
nd s
peci
al t
axes
on
petr
ol d
eriv
ativ
es. I
n C
hile
incl
udes
pay
men
ts n
et o
f tax
es b
y C
OD
ELC
O (
the
stat
e en
terp
rise
tha
t ex
trac
ts a
nd e
xpor
tsco
pper
) w
hich
is 0
.4%
of G
DP;
the
est
imat
ed p
aym
ents
of t
he r
est
of t
he m
inin
g co
mpa
nies
is a
bout
0.7
% o
f GD
P.3/
In P
eru
incl
udes
tax
es a
la p
lani
lla (
IES)
.4/
Col
lect
ion
as a
per
cent
age
of G
DP,
div
ided
by
the
lega
l rat
e.
Sour
ce:
IMF.

RESTORING FISCAL DISCIPLINE FOR POVERTY REDUCTION IN PERU 255
TABLE SA.23B: LATIN AMERICAN ECONOMIES: OUTLINE OF FISCAL POLICY RULES1
Effective Basic Escape Additional Rule/Country Date Coverage2 Rule3 Clause3 Rule3 Statute4 Sanction5
Budget RuleArgentina 2000 NG6 OB/DL CF EL L JBrazil 2001 NG, SG CB WL C, L JColombia 2001 SG CB WL L JEcuador proposal NG OB CF/MY L JMexico 1917 SG CB C RMexico proposal NG OB MY C JPeru 2000 NG OB/DL CF EL L JVenezuela 2000 NG CB CF/MY TL C, L R
Debt RuleBrazil 2001 NG, SG SL C, L JColombia 1997 SG FL L FEcuador proposal NG, SG PL L J
1/ Encompasses permanent restrictions on aggregate fiscal performance indicators. Table excludes prohibition orlimits on financing from specific sources, notably from the Central Bank.2/ General government (GG), or limited to national (central, federal) government (NG) or subnational (includinglocal) government (SG).3/ Budget rules consist of overall balance (OB) or current balance (CB), subject to a prescribed limit on deficit(DL) as a proportion of GDP. An alternative rule calls for prohibition on domestic financing of deficits (DF). Allthese rules are applied on an annual basis, except if specified on a multiyear (MY) basis; alternatively, a contingencyfund (CF) is provided in some cases. Additional rules consist of limits on total expenditure (TL), primary expendi-ture (EL), or wage bill (WL). Debt rules are specified as a debt limit for a given year (SL), permanently (PL), or ondebt service (FL), as a proportion of GDP or of government revenue.4/ Constitution (C), legal provision (L), or policy guideline (P).5/ Sanctions for noncompliance: reputational (R), judicial (J), or financial (F).6/ Refers to the national nonfinancial public sector.
Source: Kopits (2002).

256 WORLD BANK COUNTRY STUDY
TA
BLE
SA.2
4:EL
AST
ICIT
IES
OF
SOC
IAL
SPEN
DIN
GT
OT
OT
AL
SPEN
DIN
GO
FT
HE
CO
NSO
LID
AT
EDPU
BLIC
SEC
TO
RIN
PER
U(1
997–
2002
) 1/ Ave
rage
E
last
icit
y to
an
Sha
re
Ela
stic
ity
to a
In
crea
se in
To
tal
Po
int
of
Po
int
of
of T
ota
l C
hang
e in
To
tal
Lev
el o
f P
ublic
Spe
ndin
g L
evel
of
Ela
stic
ity
Ela
stic
ity
Spe
ndin
g C
ateg
ory
Spe
ndin
gP
ublic
Spe
ndin
gS
igni
fica
nce
(199
8–20
00)
Sig
nifi
canc
ein
199
8in
200
1
Plan
ning
and
Adm
inis
trat
ion
25.7
2.05
**0.
051.
82**
0.05
3.76
1.43
Pens
ions
and
Soc
ial A
ssis
tanc
e21
.46
1.37
0.16
1.43
***
0.01
0.20
−0.1
4Pe
nsio
ns16
.57
1.32
0.31
1.44
0.17
−0.5
6−0
.13
Soci
al A
ssis
tanc
e4.
891.
410.
161.
360.
542.
48−0
.17
Educ
atio
n15
.56
0.92
0.22
0.84
0.13
−0.1
30.
61Pr
e-pr
imar
y1.
321.
120.
550.
810.
36−1
.68
1.68
Prim
ary
5.5
1.03
*0.
081.
020.
170.
191.
64Se
cond
ary
4.08
1.21
0.18
0.99
***
0.01
0.69
0.05
Ter
tiary
2.79
0.56
0.41
0.60
0.46
−0.5
00.
16O
ther
s1.
860.
680.
940.
150.
75−1
.26
−1.1
7H
ealth
and
Wat
er8.
470.
740.
360.
670.
13−0
.18
−0.4
7W
ater
and
Sew
age
0.78
−0.2
40.
940.
550.
711.
188.
73H
ealth
care
7.69
0.77
0.51
0.64
***
0.01
−0.3
6−1
.37
Oth
er /2
2.87
1.38
0.27
1.69
**0.
05−0
.90
1.57
To
tal S
oci
al E
xpen
ditu
re37
.21
0.73
**0.
040.
630.
190.
750.
39
* in
dica
tes
sign
ifica
nce
at 1
0%; *
* in
dica
tes
sign
ifica
nce
at 5
%; *
** in
dica
tes
sign
ifica
nce
at 1
%.
1/ E
stim
ate.
2/ In
clud
es fo
reig
n re
latio
ns, l
egis
lativ
e, h
ousi
ng a
nd u
rban
dev
elop
men
t, in
dust
ry c
omm
erce
and
ser
vice
s, fi
shin
g, c
omm
unic
atio
ns, a
nd e
mpl
oym
ent.
Sour
ce:
Tab
le S
A.1
2a a
nd W
B St
aff e
stim
ates
.

RESTORING FISCAL DISCIPLINE FOR POVERTY REDUCTION IN PERU 257
TABLE SA.25: DEGREE OF TRANSPARENCY IN THE PUBLICATION OFINSTITUTIONAL INFORMATION
Type of Information Published
MEFConsolidated Public Sector Balance Available from 2002Revenues and Expenditures of the Central Government and Decentralized requests YesPlans of the Budgetary Law, Indebtedness and Financial Equilibrium YesBalance and Profile of the Domestic and External Public Debt YesDisbursements and Amortizations of the Domestic and External Debt YesMajor Public Investment Plans of the 1,200 UITs YesBalance of the Fiscal Stabilization Fund Available from 2002Evaluation Results of Applicable Indicators Available from 2002FONAFEConsolidated Budget YesGeneral Balance YesStatement of Financial Audits Available from 2002Progress Indicators to be applied YesResults of the Evaluation of the Progress Indicators Available from 2002ONPFinancial Statement of the Fondo Consolidado de Reserva Previsional (FRC) Available from 2002audited by 2001Financial Statement of the Fondo Nacional de Ahorro Publico (FONAHPU) Available from 2002audited by 2001Financial Assets of FONAHPU and FRC invested YesCONSUCODEMajor Acquisitions and Contracting of the 50 UITs Yes
Source: MEF.
TABLE SA.26: PUBLISHED INFORMATION OF THE BUDGET IN 2002
Public Ministries CTARS Superintendencies Enterprises
Original Budget 100% 100% 83% 100%Executed Budget 100% 100% 83% 100%Economic Information on Investment Plans 100% 100% 33% 100%Info on Contracting and Acquisitions 63% 88% 33% 25%Strategic Plans 100% 0% 83% 100%
Source: MEF.

258 WORLD BANK COUNTRY STUDY
TA
BLE
SA.2
7:C
OM
POSI
TE
GO
VER
NA
NC
EIN
DIC
AT
OR
S, IN
TER
NA
TIO
NA
LC
OM
PAR
ISO
NS,
1998
(Glo
bal r
anki
ngs—
low
er is
mor
e po
sitiv
e)
Vo
ice
and
Po
litic
al
Go
vern
men
t R
egul
ato
ry
Acc
oun
tabi
lity
Inst
abili
tyE
ffec
tive
ness
Qua
lity
Rul
e o
f Law
Co
rrup
tio
n
1998
2001
1998
2001
1998
2001
1998
2001
1998
2001
1998
2001
Per
u12
570
112
9554
9337
6111
110
974
72A
rgen
tina
5956
4851
4866
3870
5966
8188
Boliv
ia63
6788
122
8410
122
3998
100
9611
9Br
azil
5757
9657
8389
8884
8887
5670
Chi
le54
5251
3023
2318
1324
2425
17C
olom
bia
9111
214
114
974
9569
9312
913
210
389
Ecua
dor
6692
109
131
111
129
6195
122
130
125
140
Mex
ico
9073
101
8152
5942
4610
810
182
82V
enez
uela
6810
693
100
133
124
9211
511
813
611
610
7N
o. o
f Cou
ntrie
s17
317
315
516
115
615
916
616
916
617
015
516
1L
AC
Med
ian
6460
9169
8487
4666
105
9887
86Pe
ru R
ank
in L
AC
25/2
617
/26
20/2
417
/25
8/24
16/2
510
/26
13/2
615
/26
16/2
610
/24
9/25
Sour
ce:
Kau
fman
n, K
raay
, and
Zoi
do-L
obát
on (
Janu
ary
2002
).

RESTORING FISCAL DISCIPLINE FOR POVERTY REDUCTION IN PERU 259
TABLE SA.28: VOLATILITY IN LATIN AMERICA(Standard deviations of growth rates by decade, percent)
GDP PRIVATE
Country 1980s 1990s 1980s 1990s
Argentina 5.6 5.5 5.9 5.7Bolivia 2.9 1.0 3.3 0.5Brazil 4.6 3.0 4.4 4.9Chile 6.4 3.5 9.4 3.4Colombia 1.5 3.3 1.2 1.9Costa Rica 4.5 2.4 6.1 3.2Dominican Republic 2.7 4.4 4.5 8.7Ecuador 4.5 3.4 2.5 0.3El Salvador 5.7 1.9 6.0 6.9Guatemala 2.7 0.8 2.4 1.0Honduras 2.5 2.5 3.1 1.9Haiti 2.9 6.4 4.4 –Jamaica 4.3 2.2 7.6 16.5Mexico 4.4 3.6 4.9 5.1Nicaragua 5.4 2.3 15.8 14.4Panama 6.5 2.6 11.3 10.2Peru 8.4 5.2 8.3 4.6Paraguay 5.3 1.5 11.2 12.5Trinidad and Tobago 5.7 6.8 14.0 17.6Uruguay 6.6 2.8 9.4 5.4Venezuela 4.8 5.0 3.5 4.7Unweighted average 4.7 3.3 6.6 6.5Overall median 4.6 3.0 5.9 5.0Weighted average 4.6 3.5 4.9 4.7
Source: WB staff estimates.

TA
BLE
SA.2
9:EC
ON
OM
ICD
IST
RIB
UT
ION
OF
GEN
ERA
LG
OV
ERN
MEN
TR
EVEN
UE
AN
DEX
PEN
DIT
UR
E, S
ELEC
TED
CO
UN
TR
IES
Bo
livia
A
rgen
tina
B
razi
l C
hile
C
olo
mbi
a C
ost
a R
ica
Gua
tem
ala
Mex
ico
P
anam
a P
arag
uay
Per
u V
enez
uela
L
AC
(1
998)
(199
8)(1
997)
(199
7)(1
997)
(199
7)(1
997)
(199
7)(1
997)
(199
7)(2
001)
(199
7)(8
5–99
)
Per
cent
of
GD
PT
otal
Rev
enue
24.0
19.4
29.2
25.6
27.4
24.8
11.5
nana
18.7
14.2
32.2
Tax
rev
enue
19.0
17.8
24.5
19.7
19.7
23.5
8.9
na16
.111
.811
.810
.2T
otal
Exp
endi
ture
27.4
21.9
29.3
23.4
26.7
28.0
12.9
22.8
26.8
20.2
16.8
30.3
20.4
Cur
rent
Exp
endi
ture
21.7
20.2
26.8
19.0
18.6
25.6
8.1
19.1
23.0
14.8
14.6
21.8
17.6
Inte
rest
1.9
1.9
2.5
0.6
3.0
5.3
0.9
4.3
3.1
0.5
2.1
2.9
3.6
Oth
er7.
11.
68.
48.
42.
10.
81.
8–
–2.
03.
70.
83.
7T
rans
fers
4.1
4.4
1.0
5.3
6.9
3.4
2.1
6.7
1.7
0.5
3.3
3.2
4.0
Wag
es a
nd S
alar
ies
8.3
7.3
11.9
4.5
6.6
5.8
3.4
2.6
10.2
8.5
6.6
4.2
6.3
Cap
ital E
xpen
ditu
re6.
01.
72.
54.
47.
82.
44.
83.
73.
85.
42.
28.
53.
0P
erce
nt o
f to
tal
Tot
al R
even
ue10
0.0
100.
010
0.0
100.
010
0.0
100.
010
0.0
100.
010
0.0
100.
010
0.0
100.
010
0.0
Tax
rev
enue
79.2
91.8
83.9
77.0
71.8
94.8
77.4
––
63.1
87.4
31.7
Tot
al E
xpen
ditu
re10
0.0
100.
010
0.0
100.
010
0.0
100.
010
0.0
100.
010
0.0
100.
010
0.0
100.
010
0.0
Cur
rent
Exp
endi
ture
79.2
92.2
91.5
81.2
69.5
91.4
62.8
83.9
85.8
73.3
84.5
71.9
86.3
Inte
rest
6.9
8.7
8.5
2.6
11.4
18.9
7.0
18.9
11.7
2.5
10.9
9.6
15.6
Oth
er25
.97.
228
.735
.98.
12.
914
.0–
–9.
921
.52.
616
.1T
rans
fers
15.0
20.1
3.4
22.6
25.7
12.1
15.9
29.4
6.3
2.5
13.0
10.6
19.8
Wag
es a
nd S
alar
ies
30.3
33.3
40.6
19.2
24.7
20.7
26.0
11.6
38.1
42.1
39.1
13.9
33.6
Cap
ital E
xpen
ditu
re21
.97.
88.
518
.829
.38.
637
.216
.114
.226
.713
.628
.114
.3
Not
e:D
ata
corr
espo
nds
to t
he c
entr
al g
over
nmen
t
Sour
ce:
Wor
ld B
ank
Boliv
ia P
ER, S
taff
estim
ates
.

RESTORING FISCAL DISCIPLINE FOR POVERTY REDUCTION IN PERU 261
TA
BLE
SA.3
0:D
IST
RIB
UT
ION
OF
SOC
IAL
INV
EST
MEN
TBY
DIF
FER
ENT
SOC
IAL
PRO
GR
AM
SA
ND
BYD
ECIL
EO
FPO
VER
TY
SEV
ERIT
Y
Inve
stm
ent
(S/.)
, 200
1A
mo
unt
US
$A
ssig
ned
Dec
ileP
opu
lati
on
2001
PR
ON
AA
FO
NC
OD
ES
*V
AS
O D
E L
EC
HE
RU
RA
L R
OA
DS
**P
ES
P-U
RB
AN
O
Poor
est
2,63
6,58
421
,976
,075
93,1
59,7
7239
,915
,361
53,9
32,2
150.
035
Dec
ile 2
2,61
6,10
820
,682
,281
69,5
30,7
2837
,123
,636
40,2
56,6
850.
018
Dec
ile 3
2,64
5,99
918
,493
,705
39,6
63,4
9133
,902
,357
34,4
83,3
050.
049
Dec
ile 4
2,64
5,12
312
,976
,223
16,2
99,4
4331
,566
,264
21,2
25,7
350.
178
Dec
ile 5
2,63
1,77
012
,823
,801
8,01
3,72
130
,507
,673
8,08
1,10
00.
190
Dec
ile 6
2,65
5,52
419
,120
,704
3,45
1,02
935
,518
,612
1,78
5,90
00.
150
Dec
ile 7
2,65
5,53
918
,153
,031
1,97
4,64
238
,062
,931
240,
000
0.14
3D
ecile
82,
607,
142
13,4
21,8
991,
577,
795
39,7
03,3
9116
0,20
00.
118
Dec
ile 9
2,61
6,69
49,
699,
637
3,98
3,92
529
,057
,248
1,52
8,75
50.
085
Leas
t po
or2,
636,
362
6,67
5,46
63,
025,
690
16,8
89,5
27–
0.03
5T
OT
AL
26,3
46,8
4515
4,02
2,82
224
0,68
0,23
633
2,24
7,00
016
1,69
3,89
51.
000
Per
cent
Poor
est
1014
.27
38.7
112
.01
33.3
53.
50D
ecile
210
13.4
328
.89
11.1
724
.90
1.80
Dec
ile 3
1012
.01
16.4
810
.20
21.3
34.
85D
ecile
410
8.42
6.77
9.50
13.1
317
.75
Dec
ile 5
108.
333.
339.
185.
0019
.00
Dec
ile 6
1012
.41
1.43
10.6
91.
1015
.00
Dec
ile 7
1011
.79
0.82
11.4
60.
1514
.30
Dec
ile 8
108.
710.
6611
.95
0.10
11.8
0D
ecile
910
6.30
1.66
8.75
0.95
8.50
Leas
t po
or10
4.33
1.26
5.08
–3.
50T
OT
AL
100
100
100
100
100
100
*Inc
lude
s th
e PE
SP-R
UR
AL.
**A
ccum
ulat
ed t
o 20
01. P
relim
inar
y da
te. (
Estim
atio
n ba
sed
on U
S$ 1
5,00
0/km
.)
Sour
ce:
INEI
.

262 WORLD BANK COUNTRY STUDY
TABLE SA.31A: AVERAGE MONTHLY PER CAPITA INCOME OF HOUSEHOLDS, 2000 (US$)
Geographic Area Total I II III IV V VI VII VIII XI X
TOTAL 95.8 13.7 25.0 34.7 44.6 53.9 64.3 81.1 103.9 151.6 385.4Urban 129.1 18.6 35.7 48.1 60.7 72.9 86.3 108.4 139.9 203.2 518.2Rural 38.1 4.5 7.9 11.5 16.4 20.6 25.9 33.3 42.2 61.6 156.8
Source: Diaz (2001) based on ENAHO 2000-II.
TABLE SA.31B: HOUSEHOLD ACCESS TO SOCIAL PROGRAMS BY INCOME PERCAPITA DECILES, 2000Percent of Total
Geographic Area Total I II III IV V VI VII VIII XI X
Total 5,632,815 7.4 8.6 8.9 9.1 9.0 9.6 9.8 11.0 12.1 14.5Beneficiaries 3,330,760 10.6 12.2 11.9 11.1 10.0 10.6 9.9 8.7 8.3 6.8Non-beneficiaries 2,302,055 2.7 3.4 4.6 6.4 7.5 8.1 9.6 14.3 17.7 25.6Urban 3,607,764 7.8 8.5 9.0 9.3 8.9 9.5 10.4 11.3 12.2 13.1Beneficiaries 184,157 12.2 13.9 13.6 11.6 10.8 10.2 10.7 7.3 6.1 3.7Non-beneficiaries 1,773,607 3.2 2.9 4.1 7.0 7.0 8.7 10.1 15.4 18.6 22.9Rural 2,025,051 6.7 8.8 8.8 8.8 9.1 9.8 8.6 10.5 12.0 16.8Beneficiaries 1,496,602 8.7 10.1 9.8 10.4 9.0 11.2 8.9 10.4 10.9 10.5Non-beneficiaries 528,449 1.0 5.1 6.0 4.3 9.2 6.1 7.8 10.6 14.9 34.8
Source: Diaz (2001) based on ENAHO 2000-II.
TABLE SA.31C: HOUSEHOLD ACCESS TO SOCIAL PROGRAMS BY INCOME PERCAPITA DECILES, 2000Percent of Subtotal
Geographic Area Total I II III IV V VI VII VIII XI X
Monthly Income/ 95.8 13.7 25.0 34.7 44.6 53.9 64.3 81.1 103.9 151.6 385.4Capita US$Total 100.0 100.0 100.0 100.0 100.0 100.0 100.0 100.0 100.0 100.0 100.0Beneficiaries 59.1 85.2 83.8 79.1 71.6 65.8 65.4 59.8 46.8 40.2 27.6Non-beneficiaries 40.9 14.8 16.2 20.9 28.4 34.2 34.6 40.2 53.2 59.8 72.4Urban 100.0 100.0 100.0 100.0 100.0 100.0 100.0 100.0 100.0 100.0 100.0Beneficiaries 50.8 79.9 83.2 77.3 63.3 61.4 54.6 52.2 32.8 25.3 14.3Non-beneficiaries 49.2 20.1 16.8 22.7 36.7 38.6 45.4 47.8 67.2 74.7 85.7Rural 100.0 100.0 100.0 100.0 100.0 100.0 100.0 100.0 100.0 100.0 100.0Beneficiaries 73.9 96.0 84.8 82.3 87.2 73.4 83.7 76.2 73.6 67.5 46.1Non-beneficiaries 26.1 4.0 15.2 17.7 12.8 26.6 16.3 23.8 26.4 32.5 53.9
Source: Diaz (2001) based on ENAHO 2000-II.

RESTORING FISCAL DISCIPLINE FOR POVERTY REDUCTION IN PERU 263
TABLE SA.32: MISTARGETING BY TYPES OF FOOD ASSISTANCE, 2000
No. of Poverty
Social Program Beneficiaries Total Extreme Not Extreme Total Non-Poor
TOTALDesayuno Escolar 2,972,859 100.0 51.1 18.7 69.8 30.2Vaso de Leche 2,283,919 100.0 40.1 24.1 64.2 35.8Comedor Popular 746,134 100.0 40.2 14.5 54.7 45.3URBANDesayuno Escolar 1,000,349 100.0 21.3 34.5 55.9 44.1Vaso de Leche 1,104,018 100.0 15.7 34.6 50.2 49.8Comedor Popular 363,769 100.0 18.3 18.6 36.9 63.1RURALDesayuno Escolar 1,972,510 100.0 66.2 10.7 76.9 23.1Vaso de Leche 1,179,901 100.0 63.0 14.2 77.2 22.8Comedor Popular 382,365 100.0 61.1 10.6 71.7 28.3
Source: Diaz (2001) based on ENAHO 2000-II.
TABLE SA.33: MISTARGETING BY TYPES OF HEALTH PROGRAMS, 2000 Poverty
No. of Poverty
Social Program Beneficiaries Total Extreme Not Extreme Total Non-Poor
TOTALRegulating child growth 1,729,899 100.0 33.7 18.4 52.1 47.9School health insurance 1,157,912 100.0 36.8 20.6 57.4 42.6Family planning 870,947 100.0 22.1 24.8 46.8 53.2URBANRegulating child growth 908,742 100.0 9.2 24.5 33.7 66.3School health insurance 636,888 100.0 15.8 31.6 47.4 52.6Family planning 585,964 100.0 11.7 26.0 37.7 62.3RURALRegulating child growth 821,157 100.0 60.8 11.8 72.5 27.5School health insurance 521,024 100.0 62.5 7.1 69.6 30.4Family planning 284,984 100.0 43.4 22.3 65.6 34.4
Source: Diaz (2001) based on ENAHO 2000-II.

264 WORLD BANK COUNTRY STUDY
TABLE SA.35: EVOLUTION OF HOUSEHOLD ACCESS TO SOCIAL PROGRAMS, 1998–2000
1998 1999 2000 Var. %
thousands thousands thousands 99/98 2000/99 2000/98
TOTAL 5,408 5,490 5,633 1.5 2.6 4.2Beneficiaries 2,848 3,279 3,331 15.1 1.6 17.0
One program 1,004 937 755 −6.7 −19.3 −24.8More than one 1,843 2,342 2,575 27.1 10.0 39.7
Non-beneficiaries 2,561 2,211 2,302 �13.6 4.1 �10.1URBAN 3,546 3,572 3,608 0.7 1.0 1.7
Beneficiaries 1,624 1,915 1,834 17.9 �4.2 12.9One program 669 633 536 −5.4 −15.3 −19.8More than one 955 1,282 1,298 34.2 1.2 35.8
Non-beneficiaries 1,921 1,657 1,774 �13.7 7.0 �7.7RURAL 1,863 1,918 2,025 3.0 5.6 8.7
Beneficiaries 1,223 1,364 1,497 11.5 9.7 22.3One program 335 304 219 −9.4 −27.9 −34.7More than one 888 1,060 1,278 19.4 20.5 43.9
Non-beneficiaries 639 554 528 �13.3 �4.6 �17.3
Source: Diaz (2001) based on ENAHO 2000-II.
TABLE SA.34: MISTARGETING BY TYPES OF EDUCATION PROGRAMS, 2000
No. of Poverty
Social Program Beneficiaries Total Extreme Not Extreme Total Non-Poor
TOTALRegulating child growth 1,729,899 100.0 33.7 18.4 52.1 47.9TOTALSchool text and materials 2,970,567 100.0 44.4 19.7 64.1 35.9URBANSchool text and materials 1,513,755 100.0 22.3 28.7 51.0 49.0RURALSchool text and materials 1,456,812 100.0 67.3 10.4 77.6 22.4
Source: Diaz (2001) based on ENAHO 2000-II.

RESTORING FISCAL DISCIPLINE FOR POVERTY REDUCTION IN PERU 265
TABLE SA.36: ANNUAL PRIVATE EXPENDITURE ON EDUCATION BYPER CAPITA INCOME DECILE, 2000By type and level of education attending, Millions of US$
Deciles of Per Capita Income
Education Level Total I II III IV V VI VII VIII XI X
TOTAL 4445.4 2.0 2.4 2.5 3.6 5.7 5.5 7.6 10.3 16.8 43.5Initial 459.7 0.9 1.6 0.9 2.5 3.9 1.1 1.3 7.4 14.6 65.8Primary 967.1 4.5 3.5 5.2 4.7 3.6 6.4 7.2 13.4 10.5 41.0Secondary 762.1 3.3 3.0 4.1 3.7 9.0 11.9 8.7 12.6 15.1 28.5Bachillerato 6.1 24.8 7.9 5.8 10.2 4.9 11.9 8.4 26.1 0.0Supplemental 588.4 1.3 3.0 2.9 6.0 3.6 5.7 19.7 11.3 23.6 23.0Non-Univ.Supplemental Univ. 1476 0.4 1.8 0.7 2.8 4.6 3.6 5.4 8.5 21.1 51.2Post-graduate 185.9 23.5 3.6 6.1 66.8
PUBLIC 1099 5.3 5.7 7.0 8.1 6.5 10.1 9.5 10.3 17.5 20.0Initial 53.6 3.5 13.4 4.3 6.9 9.7 5.0 7.0 14.8 18.9 16.6Primary 298.7 11.0 10.8 11.3 9.2 7.1 9.7 8.3 13.9 8.3 10.4Secondary 260.8 7.7 6.3 11.3 7.2 10.5 15.2 9.5 10.8 13.2 8.5Bachillerato 6.1 24.8 7.9 5.8 10.2 4.9 11.9 8.4 26.1 0.0Supplemental 98.6 2.3 2.3 5.1 10.7 8.0 10.2 31.0 15.2 12.6 2.5Non-Univ.Supplemental Univ. 286.8 1.4 2.1 9.8 3.2 10.5 6.9 4.6 37.2 24.3Post-graduate 94.5 7.0 3.0 90.0
PRIVATE 3346.3 0.9 1.4 1.1 2.2 5.5 4.0 7.0 10.3 16.5 51.2Initial 406.1 0.6 0.0 0.4 1.9 3.1 0.6 0.6 6.5 14.0 72.3Primary 668.4 1.6 0.2 2.5 2.7 2.1 4.9 6.7 13.2 11.5 54.7Secondary 501.3 1.1 1.3 0.4 2.0 8.2 10.1 8.4 13.6 16.0 38.9Supplemental Univ. 489.8 1.0 3.1 2.4 5.1 2.7 4.8 17.5 10.4 25.8 27.2Supplemental Non-Univ. 1189.3 0.5 1.9 0.4 1.1 4.9 1.9 5.1 9.4 17.2 57.7Post-graduate 91.4 47.9 9.4 42.8
Note: Exchange rate of US$1=Nuevo Soles 3.50.Source: Diaz (2001) based on ENAHO 2000-II.

266 WORLD BANK COUNTRY STUDY
TABLE SA.37: ANNUAL EXPENDITURE ON HEALTH BY PER CAPITA INCOME DECILEBy place of consultation, Millions of US$ and respective percentage of total
Deciles of Per Capita Income
Place of Treatment Total I II III IV V VI VII VIII XI X
Total Expenditure 742 2.6 5.7 8.8 6.0 7.0 7.6 10.9 11.2 13.2 27.1Puesto, Central Minsa 137 5.4 16.5 8.7 11.3 9.6 9.0 11.7 11.4 13.4 3.0Posta, Policlinico IPSS 16 0.2 20.3 5.5 1.9 0.7 7.9 0.4 48.3 9.0 5.9Hospital MINSA 196 3.4 6.5 21.5 4.7 10.5 8.9 15.9 10.1 4.3 14.3Hospital ESSALUD 58 0.3 0.9 4.1 5.4 5.2 13.6 5.0 8.2 23.1 34.2Hospital FF.AA. 27 3.0 0.2 0.7 1.0 0.2 4.4 0.0 15.0 18.7 56.7Policia Nac.Consultorio Medico 148 0.7 8.0 0.5 5.3 5.1 6.1 15.3 13.0 20.2 25.8Part.Various clinics 146 1.1 0.4 2.6 3.1 3.4 0.6 2.5 9.3 11.1 65.8Pharmacy 18 6.0 7.6 14.6 13.1 9.8 8.6 16.8 6.3 7.5 9.6Home 23 2.7 2.2 8.5 0.1 1.4 9.3 21.5 22.9 18.2 13.1Indigenous treatment 12 2.9 7.0 7.6 2.4 15.8 9.9 6.6 9.0 34.1 4.7Others 20 0.7 5.6 1.9 23.4 11.0 13.2 17.5 3.8 8.3 14.7Self-treatment 38 1.1 7.5 5.6 1.4 17.0 10.7 7.4 4.6 27.6 17.1
Source: Diaz (2001) based on ENAHO 2000-II.
TABLE SA.38: DEFINITIONS OF THE CONSOLIDATED PUBLIC SECTOR (CPS)
Consolidated Public Sector
Ministries, Regional Governments, Public Institutions, Universities and General GovernmentONP (without funds)Organized Supervisors of Special Funds (FCR, FEF, FONAHPU and Fondo Mivivienda), Beneficiary SocietiesESSALUD, Public companies, Regulatory bodies Rest of Public SectorLocal government and their companies Local Government
Source: MEF.

RESTORING FISCAL DISCIPLINE FOR POVERTY REDUCTION IN PERU 267
TABLE SA.39: CENTRAL GOVERNMENT NATIONAL AND REGIONAL BUDGETCOMPOSITION, 2002
I. Current and Capital Expenditures 61%
National Mln NS Regional Mln NSCongress 265 Amazonas 250CNM 9 Ancash 637General Comptroller 53 Apurimac 448Defense 2,226 Arequipa 583Public Defense 18 Ayacucho 411Economy and Finance 1,688 Cajamarca 618Interior 2,117 Callao 225JNE 12 Cusco 666Justice 341 Huancavelica 322Public Ministry 228 Huánuco 381ONPE 13 Ica 325Judicial Power 467 Junín 526PCM 260 La Libertad 530RENIEC 90 Lambayeque 397Exterior Relations 616 Lima 2,408Constitutional Tribunal 10 Loreto 520National Administration 1,220 Madre de Dios 100
Moquegua 121Pasco 160Piura 739Puno 713San Martín 452Tacna 200Tumbes 167Ucayali 256
TOTAL 9633 TOTAL 12,152Mlns US$ Mlns US$
Current expenditure 2,468 Current expenditure 2,342Capital expenditure 253 Capital expenditure 1,091
44% 56%II. Structural Obligation Mlns US$ 39%Debt Service 2,200Previsional obligations 1,752
Source: MEF.

268 WORLD BANK COUNTRY STUDY
TABLE SA.40: MAIN REVENUE SOURCES FOR MUNICIPALITIES, 2002
NS Percent
Total General 1865 100Current Revenues 1835 98Taxes 520 28
Capital 433Production/Consumption 41Others 45
Rates 834 45General Administration 34Education 6Health 308Housing and Construction 131Agroindustry and Mineral Resources 1Industry, Mining, and Commerce 67Tranport and Communications 149Others 138
Contributions 12 1For Pensions 1For Public Works 7Others 3
Sale of Goods 56 3Agroindustry and Mineral Resources 25Industries 22Transport, Communication and Storage 0.1Education, Recreation, and Culture 0.1Health 2Others 7
Service Contributions 115 6Transport, Communication and Storage 10Education, Recreation, and Culture 3Health 15Others 86
Property Income 99 5Real Estate 90Financial 1Others 8
Fines, Sanctions and Others 199 11Fines 135Sanctions 54Others 11
Capital Revenues 30 2Sale of Assets 30 2
Buildings (except land) 7Urban and rural land 15Vehicles, Equipment and Machines (used) 0.3Others 8
Source: MEF.

RESTORING FISCAL DISCIPLINE FOR POVERTY REDUCTION IN PERU 269
TABLE SA.41: DEPARTMENTAL BUDGET—EDUCATION AND HEALTH BYEXPENDITURE CATEGORY, 2002Millions of NS
Department Education Health
Regional Distribution (Percent)Lima 34.4 50.9Puno 4.9 3.9Piura 4.7 3.8Loreto 4.4 3.6La Libertad 4.3 3.6Cusco 4.3 3.5Cajamarca 4.3 2.9Arequipa 4.2 2.8Ancash 4.2 2.7Junin 4.1 2.6Lambayeque 3.0 2.3Ayacucho 2.8 2.0Ica 2.8 1.9San Martin 2.5 1.9Huanuco 2.5 1.7Ucayali 1.8 1.6Huancavelica 1.8 1.4Apurimac 1.6 1.4Amazonas 1.4 1.2Pasco 1.4 1.1Tacna 1.4 0.9Tumbes 1.3 0.7Moquegua 0.8 0.6Callao 0.7 0.5Madre de Dios 0.4 0.5
TOTAL 100 100By Expenditure Category (Mlns NS)
Goods and Services 892.1 1510.0Investment 576.6 461.6Personal and Social Obligations 4388.4 1076.7Others 210.0 279.8
TOTAL 6067.2 3328.1By Expenditure Category (Percent)
Goods and Services 14.7 45.4Investment 9.5 13.9Personal and Social Obligations 72.3 32.4Others 3.5 8.4
TOTAL 100.0 100.0
Source: MEF.

270 WORLD BANK COUNTRY STUDY
TABLE SA.42: INDEXES ON CORRUPTION
Wage
Trans- Enforce- Satis-
Agency parency Rules ment Merit Political faction Voice Mission
Consejo Sup. 69.5 71.7 72.0 60.4 16.4 60.4 79.1 68.2
Corte Suprema 41.4 56.5 69.7 58.5 33.7 19.3 67.3 68.7
Corte Superior 42.2 57.4 55.2 53.9 46.9 25.0 70.3 60.8
Juzgados 41.6 54.4 61.3 60.6 41.6 19.4 60.6 69.7
Jueces de Paz 21.0 68.5 75.3 67.8 34.2 57.1 59.4 83.1
Sede Min. de Ju 62.0 65.0 71.0 74.6 30.2 22.2 65.9 70.9
Inst. Nac. Pen. 45.4 61.1 64.1 65.1 39.0 17.9 62.3 74.7
Inst. Nac. de Des. 57.3 69.7 62.4 57.0 16.9 25.0 63.2 78.4
Comisión de For. 67.2 76.5 78.4 71.9 26.4 50.0 78.3 87.0
Registro Pred. 51.1 70.9 73.5 74.7 24.5 36.9 76.4 75.4
Sup. Nac. de Reg. 76.1 75.6 82.8 74.9 13.3 63.0 74.7 86.5
Ministerio del Int 53.3 67.7 70.3 66.2 28.9 27.9 71.6 87.0
Sede Min. de Econ. 51.4 55.7 72.1 16.6 35.8 12.5 85.7 43.4
Programa del Vaso 62.9 69.2 72.7 63.4 36.9 26.1 67.7 80.2
Comedor popular 85.4 94.4 96.5 76.3 30.5 33.7 89.5 91.1
ONP 86.7 78.4 93.3 94.3 3.3 75.0 82.8 88.2
SUNAT 66.2 72.1 79.7 66.9 20.9 73.8 68.9 85.6
Sup. Nac. de Adua 60.0 74.2 79.8 66.4 29.5 59.3 79.3 85.2
OSIPTEL 75.0 73.4 82.5 83.6 3.8 40.0 87.6 90.2
Gobiernos loc. 54.9 61.8 59.2 64.4 34.7 36.9 58.2 65.8
SEDAPAL 65.1 71.8 75.0 70.9 27.9 41.1 74.6 85.4
Sede Min. de Edu 59.7 70.5 71.8 74.5 39.9 41.3 65.6 71.7
DRE 73.5 78.2 82.3 81.8 19.0 18.5 75.3 81.4
USE/ADE 49.6 68.3 77.6 70.2 41.3 13.2 69.2 80.5
Colegios 56.3 62.4 64.2 64.9 35.7 23.1 56.6 70.5
Inst. Nac. de Cul 46.8 59.1 59.6 73.5 45.4 15.6 63.2 47.6
Univer. Publicas 50.5 66.2 64.1 59.6 45.6 26.6 59.5 71.1
Sede Min. de Salud 13.7 48.6 45.7 40.3 76.6 0.0 33.2 41.4
Hospitales 35.0 58.8 60.5 56.8 51.6 19.0 59.4 71.6
Postas médicas 36.0 57.6 53.9 48.4 40.0 30.0 66.1 76.8
ESSALUD 56.8 70.3 73.2 66.0 44.2 34.3 70.9 76.4
Min. de Trabajo 69.2 66.8 73.3 73.2 25.6 27.9 73.8 82.0
Min. de agricul 53.2 62.0 65.9 63.9 30.8 22.9 59.0 63.3
Inst. de Recurso 57.9 56.9 69.2 67.4 33.6 37.5 57.9 69.7
MITINCI 45.6 66.6 65.3 53.8 29.3 39.3 50.3 70.4
Indecopi 75.3 84.2 85.4 80.5 9.9 47.7 93.1 91.1
Min. de Transp 50.3 67.4 66.8 59.7 45.2 42.1 67.9 74.7
Consejo Nacional 78.3 91.3 93.6 86.7 5.6 42.5 91.3 91.5
Min. de Energia 58.8 68.2 70.4 70.5 28.5 34.6 68.4 81.0
Reg. Púb. de Mineria 56.2 75.8 74.5 65.9 28.6 68.1 83.4 84.9
Min. de Pesqueria 51.6 65.5 81.6 60.7 41.4 47.9 61.7 78.4
Caja de Beneficios 57.9 72.4 71.1 68.6 35.1 41.7 79.0 89.0
Defensoria del Pueb 63.3 63.9 62.9 69.6 14.6 55.0 85.9 84.5

RESTORING FISCAL DISCIPLINE FOR POVERTY REDUCTION IN PERU 271
Corruption in Corruption
Quality of State Personnel in Budget Overall
Service Access Resource Audit Capture Policy Mgmt Corruption
65.3 50.0 60.2 88.4 87.6 17.0 0.0 49.3
60.2 46.6 49.2 55.4 80.8 42.6 33.8 60.7
55.8 46.1 44.5 51.9 75.5 25.4 27.1 50.8
50.8 31.3 36.4 54.2 72.0 44.9 50.0 58.2
57.7 67.9 35.6 52.6 83.0 40.4 25.0 60.9
64.5 68.1 52.2 56.2 61.6 14.8 20.8 37.0
54.1 60.1 36.9 57.1 79.5 38.4 41.4 58.1
74.7 80.0 55.1 64.8 71.8 9.1 3.1 39.3
78.4 90.6 69.0 79.4 76.8 21.3 13.0 46.6
69.7 78.6 59.2 72.2 70.9 24.6 22.3 45.1
76.0 64.6 74.8 79.8 74.0 18.5 3.8 44.0
69.5 85.4 42.4 62.9 66.3 38.7 21.5 50.4
66.7 87.5 74.7 77.2 60.2 19.6 12.5 42.4
66.4 79.3 47.6 71.1 73.3 46.2 30.8 57.5
77.0 93.0 49.0 92.1 85.2 28.2 24.2 53.9
70.4 91.7 70.8 91.7 65.6 3.3 0.0 32.7
66.6 69.0 73.3 64.7 67.8 19.1 9.9 40.4
73.1 63.0 70.2 70.5 77.4 22.6 22.2 48.8
73.1 67.5 74.1 86.9 53.1 9.7 0.0 26.6
57.0 58.3 50.1 62.5 69.6 31.5 28.6 50.0
73.8 78.6 55.5 78.5 69.8 10.7 16.4 40.5
61.7 61.4 61.5 68.9 69.1 29.2 30.0 48.2
66.7 74.0 66.3 81.4 61.0 11.2 14.1 36.0
60.9 74.3 50.0 65.2 70.8 32.2 28.8 50.2
61.6 77.8 45.0 62.1 86.2 41.2 34.6 61.8
55.2 59.4 32.2 54.5 90.6 41.5 31.3 65.0
65.1 58.6 50.9 62.0 79.5 29.6 34.8 54.8
48.4 18.8 59.5 21.1 90.7 15.2 50.0 59.9
64.5 58.8 46.8 43.7 83.1 35.7 47.9 59.9
56.0 58.8 33.8 49.8 74.6 45.5 41.3 58.4
62.9 52.9 58.3 74.0 75.9 39.9 19.3 54.2
70.9 82.0 55.1 68.3 63.4 22.8 10.5 40.3
57.3 68.8 45.6 61.5 80.2 25.0 20.8 51.8
60.3 47.5 52.3 68.9 70.6 21.1 12.5 43.5
66.4 53.6 55.7 67.2 18.2 25.0 41.8
77.3 79.0 63.1 87.1 79.7 16.8 1.2 45.2
59.9 52.7 61.1 60.2 70.6 32.8 27.1 50.9
76.0 78.1 73.5 90.6 70.2 24.6 3.1 44.1
69.9 78.6 59.1 65.5 69.0 20.7 21.2 44.0
75.1 65.3 80.8 75.9 82.7 26.9 14.1 51.2
70.9 62.5 74.6 68.8 62.2 23.1 65.0 45.2
58.1 52.1 59.5 69.4 87.0 49.6 31.3 65.3
71.6 88.8 56.2 75.4 78.6 18.1 7.9 45.3
(continued )

272 WORLD BANK COUNTRY STUDY
TABLE SA.43: CORRUPTION IN THE JUDICIARY, NATIONAL AND MUNICIPAL AGENCIESBased on public officials’ responses
National Municipal Judiciary Variable Agencies Mean Agencies Mean Mean
Index of Corruption 47.3 55.1 53.6Index of State Capture 73.1 79.2 77.2Index of Corruption in Personnel Administration 24.0 34.3 31.9Index of Corruption in Budget Administration 20.5 28.9 28.3Index of Transparency 57.9 51.8 46.2Index of Quality of Rules 68.1 69.9 62.1Index of Enforcement 71.5 71.4 66.9Extent of Meritocracy 66.6 65.7 63.0Degree of Politicization 30.3 34.8 34.6Wage Satisfaction 39.0 36.0 31.6Index of Voice 71.1 70.0 66.4Index of Mission 75.8 78.8 70.9(Perceived) Quality of Service 66.3 64.3 58.3Service Access 68.2 69.7 52.9Availability of Resources 60.6 50.1 45.0Existence of Internal Audit Mechanisms 68.6 65.5 59.4
Source: World Bank (2001c).
TABLE SA.42: INDEXES ON CORRUPTION (CONTINUED)
Wage
Trans- Enforce- Satis-
Agency parency Rules ment Merit Political faction Voice Mission
Ministerio publico 53.4 69.8 72.1 70.3 25.5 38.8 74.8 77.7
FONCODES 67.4 76.3 79.1 81.3 29.8 70.5 86.4 86.5
Insts Nac. de desar 91.1 88.6 93.6 97.4 11.6 62.5 81.7 89.0
Inst. de Infraestr 75.9 72.8 88.0 79.3 18.5 31.9 78.5 79.0
Corporacion de Desar 45.2 68.1 74.1 55.1 51.5 34.2 62.7 73.4
Ministerio de Defensa 55.8 75.5 66.4 72.1 27.8 24.0 79.2 85.8
Consejo de Just. Mil 65.8 79.4 79.0 73.1 12.6 27.5 80.9 83.7
Congreso de la Repub 55.0 56.3 40.9 57.3 58.3 37.5 74.0 74.2
RENIEC 74.7 83.7 88.0 89.4 10.4 59.2 79.2 88.9
Promudeh 27.1 61.6 62.5 40.0 44.0 41.7 71.3 67.7
INABIF 50.3 62.2 67.0 58.6 34.0 46.3 60.4 72.4
PRONAA 34.3 74.1 84.4 39.5 55.2 56.4 74.6 82.9
Programa de Apoyo 49.3 58.8 63.9 55.3 47.9 31.3 59.0 71.2
Oficina Nac. de Coop 50.1 71.3 73.2 49.9 39.7 37.5 76.9 80.9
Averages:
National 57.9 68.1 71.5 66.6 30.3 39.0 71.1 75.8
Municipal 51.8 69.9 71.4 65.7 34.8 36.0 70.0 78.8
Judiciary 46.2 62.1 66.9 63.0 34.6 31.6 66.4 70.9
Source: World Bank (2001c).

RESTORING FISCAL DISCIPLINE FOR POVERTY REDUCTION IN PERU 273
Corruption in Corruption
Quality of State Personnel in Budget Overall
Service Access Resource Audit Capture Policy Mgmt Corruption
70.6 79.4 63.8 58.6 77.7 28.0 20.3 51.2
72.2 96.8 79.1 86.2 85.4 13.0 17.7 48.7
70.4 84.4 74.9 98.6 57.6 35.7 0.0 41.0
69.6 94.4 81.6 90.3 68.4 4.1 6.9 36.7
63.7 73.0 58.4 63.3 72.9 30.0 32.4 50.2
63.8 71.6 63.7 63.8 70.0 36.5 36.4 51.6
61.5 78.1 70.2 76.1 77.5 13.8 0.0 43.5
80.1 62.5 57.6 64.9 75.5 10.8 12.5 42.7
81.2 87.5 76.4 84.4 82.1 18.9 5.8 47.5
58.3 65.3 45.1 44.0 67.7 26.6 48.2 48.2
62.8 74.4 56.6 59.9 77.6 29.1 30.2 52.7
63.9 84.1 67.9 56.0 77.5 29.3 42.6 53.5
57.7 72.9 54.7 59.8 68.0 33.2 32.5 50.1
60.7 84.4 55.4 53.4 80.3 34.9 35.9 56.0
66.3 68.2 60.6 68.6 73.1 24.0 20.5 47.3
64.3 69.7 50.1 65.5 79.2 34.3 28.9 55.1
58.3 52.9 45.0 59.4 77.2 31.9 28.3 53.6

TA
BLE
SA.4
4:EX
PEN
DIT
UR
EBY
DEP
AR
TM
ENT, 2
001
Mill
ions
of N
uevo
Sol
es
TO
TA
L E
XP
EN
DIT
UR
ES
CA
PIT
AL
IN
VE
ST
ME
NT
SG
OO
DS
AN
D S
ER
VIC
ES
No
. of
Exe
cute
d/E
xecu
ted/
Exe
cute
d/D
epar
tmen
tsU
Es
Po
pula
tio
nB
udge
ted
Exe
cute
dB
udge
ted
Bud
gete
dE
xecu
ted
Bud
gete
dB
udge
ted
Exe
cute
dB
udge
ted
1A
maz
onas
1242
0,60
622
8.7
215.
394
.197
.485
.687
.830
.123
.778
.82
Anc
ash
271,
092,
662
619.
259
1.4
95.5
166.
212
7.3
76.6
78.5
62.8
80.0
3A
puri
mac
1445
5,63
730
0.1
299.
099
.612
7.8
125.
698
.341
.933
.579
.94
Are
quip
a19
1,06
7,46
981
1.5
913.
811
2.6
208.
024
8.1
119.
310
2.8
101.
198
.35
Aya
cuch
o20
541,
427
413.
846
5.1
112.
413
9.8
188.
813
5.0
66.8
49.9
74.8
6C
ajam
arca
201,
480,
690
522.
954
7.0
104.
614
1.3
154.
710
9.5
63.8
51.2
80.3
7C
alla
o13
774,
604
421.
754
7.0
129.
712
4.9
63.6
50.9
119.
612
0.1
100.
48
Cus
co17
1,19
4,27
570
2.9
716.
610
1.9
250.
125
0.7
100.
211
5.2
90.6
78.7
9H
uanc
avel
ica
1143
5,59
622
7.1
215.
694
.963
.259
.994
.840
.728
.970
.910
Huá
nuco
1280
0,54
334
6.3
322.
093
.011
0.2
79.6
72.2
46.9
39.3
83.9
11Ic
a14
676,
249
448.
246
4.6
103.
760
.943
.571
.354
.347
.387
.112
Juní
n20
1,23
2,34
389
8.3
660.
273
.518
1.5
108.
559
.825
7.9
72.3
28.0
13La
Lib
erta
d32
1,48
3,68
168
6.7
741.
110
7.9
93.9
87.7
93.4
84.0
71.2
84.7
14La
mba
yequ
e14
1,11
0,12
951
8.2
553.
510
6.8
72.8
65.3
89.6
72.3
58.6
81.0
15Li
ma
194
7,61
7,19
324
,829
.023
,747
.295
.61,
696.
41,
291.
876
.24,
643.
74,
672.
710
0.6
16Lo
reto
1889
4,30
750
6.4
511.
710
1.0
127.
811
5.8
90.6
83.1
72.7
87.6
17M
adre
de
Dio
s8
96,7
0388
.980
.090
.039
.427
.670
.015
.414
.493
.318
Moq
uegu
a6
153,
383
139.
814
7.7
105.
649
.651
.310
3.4
15.7
13.9
88.4
19Pa
sco
825
9,13
719
1.7
172.
790
.131
.423
.374
.329
.322
.677
.120
Piur
a16
1,61
1,57
379
8.3
788.
198
.726
7.9
216.
280
.710
9.3
100.
191
.621
Puno
331,
247,
494
648.
365
1.2
100.
418
2.2
170.
293
.493
.274
.179
.522
San
Mar
tín23
746,
202
405.
244
5.1
109.
914
8.8
185.
912
5.0
58.2
40.2
69.0
23T
acna
928
6,53
922
7.1
222.
297
.963
.651
.681
.232
.028
.187
.724
Tum
bes
819
7,60
517
1.3
179.
110
4.6
58.5
58.2
99.4
18.2
17.9
98.6
25U
caya
li16
450,
693
237.
422
5.6
95.1
66.0
57.5
87.1
46.0
35.2
76.4
To
tal
584
26,3
26,7
4035
,389
.334
,422
.797
.34,
569.
73,
938.
286
.26,
319.
05,
942.
594
.0T
otal
w/o
Lim
a39
018
,709
,547
10,5
60.2
10,6
75.5
101.
12,
873.
32,
646.
492
.11,
675.
31,
269.
875
.8
Sour
ce:
MEF
.

RESTORING FISCAL DISCIPLINE FOR POVERTY REDUCTION IN PERU 275
TA
BLE
SA.4
5:EX
PEN
DIT
UR
EC
OEF
FIC
IEN
TS
BYD
EPA
RT
MEN
T, 2
001
Po
vert
y R
anki
ngs
by D
efini
tio
n
Co
effi
cien
t o
f C
oef
fici
ent
of
Ext
rem
e IN
EI
No
. of
Exp
endi
ture
E
xpen
ditu
re
Exp
endi
ture
P
ove
rty
Po
vert
y IN
EI
Ext
rem
e D
epar
tmen
tU
Es
Po
pula
tio
n(M
lns
of N
S)
by U
Es
by P
opu
lati
on
Rat
eR
ate
ME
FP
ove
rty
Po
vert
y
1A
maz
onas
1242
0,60
621
5.29
17.9
51.2
74.5
41.1
97
102
Anc
ash
271,
092,
662
591.
4121
.954
.161
.133
.33
1512
3A
puri
mac
1445
5,63
729
8.97
21.4
65.6
78.0
47.4
54
54
Are
quip
a19
1,06
7,46
991
3.80
48.1
85.6
44.1
14.5
1519
185
Aya
cuch
o20
541,
427
465.
1223
.385
.972
.545
.44
88
6C
ajam
arca
201,
480,
690
546.
9827
.336
.977
.450
.86
54
7C
alla
o13
774,
604
546.
9842
.170
.68
Cus
co17
1,19
4,27
571
6.58
42.2
60.0
75.3
51.3
116
39
Hua
ncav
elic
a11
435,
596
215.
5819
.649
.588
.074
.42
11
10H
uánu
co12
800,
543
321.
9726
.840
.278
.961
.97
22
11Ic
a14
676,
249
464.
6033
.268
.741
.78.
620
2020
12Ju
nín
201,
232,
343
660.
2333
.053
.657
.524
.310
1614
13La
Lib
erta
d32
1,48
3,68
174
1.07
23.2
49.9
52.1
18.3
817
1714
Lam
baye
que
141,
110,
129
553.
5039
.549
.963
.019
.917
1416
15Li
ma
194
7,61
7,19
323
,747
.19
122.
431
1.8
33.4
3.1
1622
2416
Lore
to18
894,
307
511.
6928
.457
.270
.047
.213
106
17M
adre
de
Dio
s8
96,7
0379
.99
10.0
82.7
36.7
11.5
2321
1918
Moq
uegu
a6
153,
383
147.
7224
.696
.329
.67.
621
2421
19Pa
sco
825
9,13
717
2.66
21.6
66.6
66.1
33.2
1812
1320
Piur
a16
1,61
1,57
378
8.08
49.3
48.9
63.3
21.4
1413
1521
Puno
331,
247,
494
651.
2019
.752
.278
.046
.11
37
22Sa
n M
artín
2374
6,20
244
5.11
19.4
59.7
66.9
36.2
1211
1123
Tac
na9
286,
539
222.
2424
.777
.632
.85.
224
2323
24T
umbe
s8
197,
605
179.
0822
.490
.646
.87.
422
1822
25U
caya
li16
450,
693
225.
6514
.150
.170
.544
.919
99
To
tal
584
26,3
26,7
4034
,422
.69
58.9
130.
8T
otal
w/o
Lim
a39
018
,709
,547
10,6
75.5
027
.457
.1
Sour
ce:
MEF
.

276 WORLD BANK COUNTRY STUDY
TABLE SA.46: DECENTRALIZATION IN LAC
Political Functional Fiscal
FEDERAL COUNTRIES
Argentina
Brazil
Colombia
Venezuela
Mexico
UNITARY COUNTRIESChile
Bolivia
Guatemala
Source: Burki, Perry, and Dillinger (1999).
Federal country reverts totypeFederal country reverts totype, with new constitutionalguarantees for municipalitiesIntroduces election of mayors and governors
Introduces election of governors, direct election ofmayorsConcedes opposition victo-ries in states, municipalities
Reverts to elected mayors in small municipalities, intro-duces election of mayors in citiesIntroduces election of mayors
Reverts to elected mayors
Secondary education andhealth transferred to provincesNo explicit reallocation offunctions
Transfers primary education,health to provinces
Introduces optional decentral-ization of social services, infra-structure to statesTransfers education and healthto states; water supply, paving,public security to municipalities
Transfers primary education,health to municipalities
Transfers primary schools,clinics (physical assets only) tomunicipalities
—
Minor adjustments in revenue sharingIncrease in revenue shar-ing to municipalities
Increases earmarkedtransfers for social serviceexpenditures in provinces,general revenue sharingto municipalitiesIncrease in funding is tofollow decentralization offunctionsIncreases earmarkedtransfers for social services in states
Increases earmarkedtransfers for social ser-vices to municipalities
Increases general revenuesharing to municipalities
Increases general revenuesharing
TABLE SA.47: PRINCIPAL REVENUE SOURCES OF SUBNATIONAL GOVERNMENTS
Municipal Government
Argentina Varying shares of provincial taxes and transfer revenues, feesBrazil Fixed shares of state VAT and central income and excise taxes, property and service taxesColombia Fixed shares of total Central Government taxes; property tax; industry and commerce tax;
gasoline surchargesMexico Fixed shares of federal taxes (passed through states), property tax, business licensesPeru Shares of Central Government revenues, property tax, mining cannonVenezuela Fixed shares of state revenue-sharing receipts, taxes on property, vehicle taxChile Earmarked capitation grants for education, health, property taxEcuador Fixed shares of Central Government oil revenue, taxes on property, business assets,
vehicles, business registrationGuatemala Fixed shares of total Central Government revenue, miscellaneous local taxesBolivia Fixed shares of total central government revenues, taxes on vehicles and property
Source: Burki, Perry, and Dillinger (1999).

RESTORING FISCAL DISCIPLINE FOR POVERTY REDUCTION IN PERU 277
TA
BLE
SA.4
8:SU
MM
AR
YO
FM
ININ
GT
AX
AT
ION
AU
TH
OR
ITY
FOR
SELE
CT
EDT
AX
ESA
ND
FEES
Exc
ise/
Sal
es
Div
iden
d T
ax o
n V
AT
on
Fee
Bas
ed
Co
rpo
rate
M
iner
al
Wit
hho
ldin
g E
quip
. and
Im
port
ed
Pro
pert
y o
n L
and
Co
untr
yIn
com
e T
axR
oya
lty
Tax
Ser
vice
sE
quip
men
tT
axA
rea
Sta
mp
Tax
NP
LN
PL
NP
LN
PL
NP
LN
PL
NP
LN
PL
Arg
entin
aX
XX
XX
XX
Boliv
iaX
XX
X1
1Bu
rkin
a Fa
soX
XX
XX
XC
anad
a (O
nt.)
XX
XX
Chi
leX
XX
XX
XX
Chi
naX
XX
XX
Gha
naX
XX
XX
XX
Gre
enla
ndX
XX
Indo
nesi
a 2/
XX
XX
3Iv
ory
Coa
stX
XX
XX
XX
Kaz
akhs
tan
XX
XX
XX
Mex
ico
XX
X4
44
44
4Pa
pua
NG
5/
XX
XX
XX
XX
Per
uX
XX
XPh
ilipp
ines
XX
6X
XX
XX
Pola
ndX
77
XX
X
(con
tinue
d)
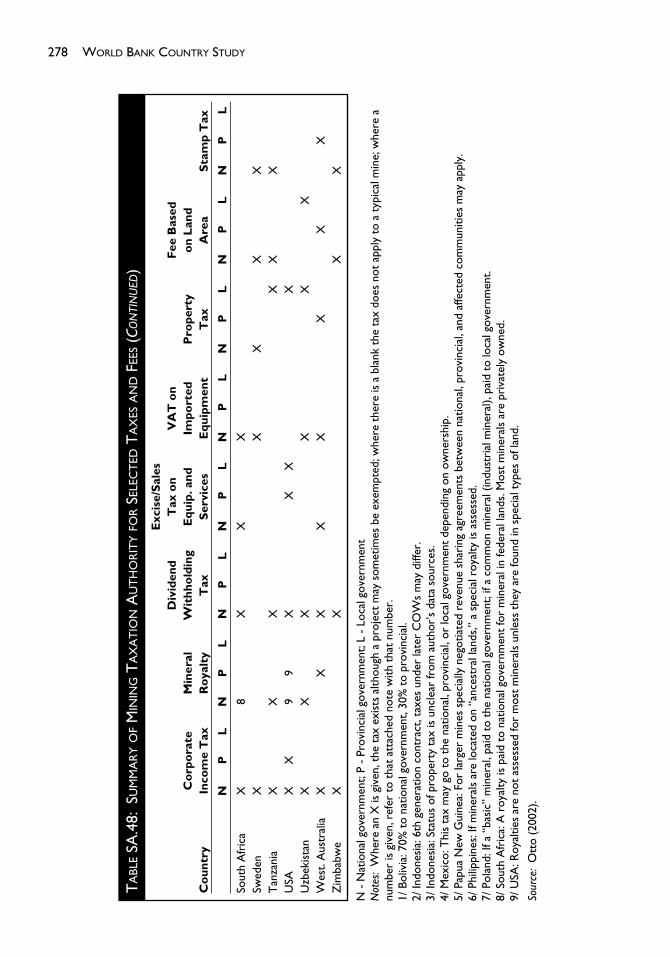
278 WORLD BANK COUNTRY STUDY
TA
BLE
SA.4
8:SU
MM
AR
YO
FM
ININ
GT
AX
AT
ION
AU
TH
OR
ITY
FOR
SELE
CT
EDT
AX
ESA
ND
FEES
(CO
NTI
NU
ED)
Exc
ise/
Sal
es
Div
iden
d T
ax o
n V
AT
on
Fee
Bas
ed
Co
rpo
rate
M
iner
al
Wit
hho
ldin
g E
quip
. and
Im
port
ed
Pro
pert
y o
n L
and
Co
untr
yIn
com
e T
axR
oya
lty
Tax
Ser
vice
sE
quip
men
tT
axA
rea
Sta
mp
Tax
NP
LN
PL
NP
LN
PL
NP
LN
PL
NP
LN
PL
Sout
h A
fric
aX
8X
XX
Swed
enX
XX
XX
Tan
zani
aX
XX
XX
XU
SAX
X9
9X
XX
XU
zbek
ista
nX
XX
XX
XW
est.
Aus
tral
iaX
XX
XX
XX
XZ
imba
bwe
XX
XX
N -
Nat
iona
l gov
ernm
ent;
P -
Prov
inci
al g
over
nmen
t; L
- Lo
cal g
over
nmen
tN
otes
:W
here
an
X is
giv
en, t
he t
ax e
xist
s al
thou
gh a
pro
ject
may
som
etim
es b
e ex
empt
ed; w
here
the
re is
a b
lank
the
tax
doe
s no
t ap
ply
to a
typ
ical
min
e; w
here
anu
mbe
r is
giv
en, r
efer
to
that
att
ache
d no
te w
ith t
hat
num
ber.
1/ B
oliv
ia: 7
0% t
o na
tiona
l gov
ernm
ent,
30%
to
prov
inci
al.
2/ In
done
sia:
6th
gen
erat
ion
cont
ract
, tax
es u
nder
late
r C
OW
s m
ay d
iffer
.3/
Indo
nesi
a: S
tatu
s of
pro
pert
y ta
x is
unc
lear
from
aut
hor’
s da
ta s
ourc
es.
4/ M
exic
o: T
his
tax
may
go
to t
he n
atio
nal,
prov
inci
al, o
r lo
cal g
over
nmen
t de
pend
ing
on o
wne
rshi
p.5/
Pap
ua N
ew G
uine
a: F
or la
rger
min
es s
peci
ally
neg
otia
ted
reve
nue
shar
ing
agre
emen
ts b
etw
een
natio
nal,
prov
inci
al, a
nd a
ffect
ed c
omm
uniti
es m
ay a
pply
.6/
Phi
lippi
nes:
If m
iner
als
are
loca
ted
on “
ance
stra
l lan
ds,”
a s
peci
al r
oyal
ty is
ass
esse
d.7/
Pol
and:
If a
“ba
sic”
min
eral
, pai
d to
the
nat
iona
l gov
ernm
ent;
if a
com
mon
min
eral
(in
dust
rial
min
eral
), pa
id t
o lo
cal g
over
nmen
t.8/
Sou
th A
fric
a: A
roy
alty
is p
aid
to n
atio
nal g
over
nmen
t fo
r m
iner
al in
fede
ral l
ands
. Mos
t m
iner
als
are
priv
atel
y ow
ned.
9/ U
SA: R
oyal
ties
are
not
asse
ssed
for
mos
t m
iner
als
unle
ss t
hey
are
foun
d in
spe
cial
typ
es o
f lan
d.
Sour
ce:
Ott
o (2
002)
.

TABLE SA.49: MINING FISCAL METHODS AND THEIR AMENABILITY TOFISCAL DECENTRALIZATION
National Provincial Local Tax type Government Government Government
Income or profits-based tax Y P NImport duty Y N NExport duty Y N NRoyalty (profits-based type) Y P NRoyalty (ad valorem type) Y Y PRoyalty tax (unit type) Y Y YRoyalty tax collected nationally and % distributed Y Y YLicensing fees Y Y YSurface rental or land use fees Y Y YWithholding taxes on loan interest, dividends, services Y N NVAT on goods and services Y P NSales & excise tax Y P PStamp duty Y Y YProperty tax (on book or assessed value) Y Y YPayroll-based taxes Y P NSurtaxes Y Y YUser fees Y Y Y
Source: Otto (2002).
TABLE SA.50: TOTAL TRANSFERS IN SOLES(by poverty quantile)
Poverty quantile Vaso de Leche Canon Minero FONCOMUN
Poorest 20,740,034 4,506,219 106,413,06019 19,067,753 5,411,235 103,179,58018 18,685,593 7,590,344 100,253,07917 18,545,614 8,705,941 88,758,65816 18,320,393 10,719,708 99,828,18215 17,343,102 8,497,593 94,686,50914 15,464,843 8,564,754 86,423,87313 14,205,007 3,133,694 70,217,23612 14,694,335 2,562,790 71,139,43911 17,086,913 4,805,701 78,724,57510 15,225,805 1,599,191 58,443,4089 19,317,850 536,952 55,406,9238 18,394,082 2,992,030 38,575,6617 14,362,596 613,003 46,552,7026 20,370,958 899,337 47,543,9075 24,174,523 1,432,527 32,616,1054 13,518,762 2,052,245 44,596,6543 15,839,307 1,833,122 33,461,0902 11,384,530 849,128 82,591,765Richest 5,504,997 3,973,021 28,666,869TOTAL 332,246,997 81,278,535 1,368,079,275
Source: Apoyo Institute (2002).


Altobelli, L. 2001. “Decentralization to Improve Health Care for the Poor.” Background Paperfor World Bank (2001a).
Apel, M., J. Hansen, and H. Lindberg. 1996. “Potential Output and Output Gap.” QuarterlyReview of the Bank of Sweden, 3 :24–35.
Apoyo Institute. 2002a. “A Public Expenditure Tracking Survey (PETS): Central GovernmentTransfers to Municipalities in Peru.” Background Paper for the Public Expenditure Review.
______. 2002b. “PETS-The Education Sector in Peru.” Background Paper for the Public Expenditure Review.
Arcia, Gustavo, and Humberto Belli. 1999. “Rebuilding the Social Contract: School Autonomy inNicaragua.” LCSHD Working Paper Series, Department of Human Development. Washington,D.C.: World Bank, April.
Arias, Luis, and others. 2000. “Ajuste Fiscal Ex-Ante o Ex-Post: Déficit Cíclicos en Perú.” In E. Talvi and C. Vega, Como Armar el Rompecabezas Fiscal. Washington, D.C.: Inter-AmericanDevelopment Bank.
Backus, D. K., and P. J. Kehoe. 1992. “International Evidence on the Historical Properties ofBusiness Cycles.” The American Economic Review, 82 :864–88.
Banco Central de la República de Perú. 2002. “Sostenibilidad de la Política Fiscal.” Jorge Estrella,Seminar on Fiscal Rules, Lima.
Brown, E. Cary. 1956. “Fiscal Policies in the Thirties: A Reappraisal.” The American EconomicReview, 46 :857–79.
Burki, S., G. Perry, and W. Dillinger. 1999. Beyond the Center: Decentralizing the State. Washington,D.C.: World Bank.
Calvo, Guillermo, Alejandro Izquierdo, and Ernesto Talvi. 2002. “Sudden Stops, the RealExchange Rate and Fiscal Sustainability: Argentina’s Lessons.” Inter-American DevelopmentBank Research Department. Washington, D.C.
BIBLIOGRAPHY
281

Central Bank of Peru. 2002. “Estimando el Balance Estructural de Perú.” Presentación al Seminariosobre Reglas Fiscales, Lima.
CEPAL. 1998. “La Descentralización de la Educación y la Salud.” Santiago de Chile.______. 2001. Decentralización en América Latina: Teoría y Práctica. Iván Finot (CEPAL LC/L
1521), Santiago de Chile.Cortez, R. 1998. “Equidad y Calidad de los servicios de Salud: El Caso de los CLAS.” Universidad
del Pacífico/Ministerio de Salud, Lima.______. 2001. “Capítulo de Salud.” Universidad del Pacífico, Lima.De Ferranti, David, Guillermo E. Perry, Indermit S. Gill, and Luis Servén. 2000. Securing Our
Future in a Global Economy. Washington D.C.: World Bank.De Leeuw, Frank, Thomas M. Holloway, Darwin G. Johnson, David S. McClain, and Charles A.
Waite. 1980. “The High Employment Budget: New Estimates, 1955–80.” Survey of CurrentBusiness, 60 :13–43.
Deutsche Bank. 2001. “Public Debt Sustainability in Selected Emerging Markets.”Díaz, J. 2001. “Grado de Focalización de Algunos Programas Sociales, 1998–2000.” Ministerio de
Economía y Finanzas, Dirección de Asuntos Económicos y Financieros, Lima.Dolado, J. J., M. Sebastián, and J. Vallés. 1993. “Cyclical Patterns of the Spanish Economy.”
Investigaciones Económicas, XVII :445–73.Dornbusch, R., and S. Edwards. 1991. The Macroeconomics of Populism. National Bureau of
Economic Research. Chicago: The University of Chicago Press.Dornbusch, R., and S. Fischer. 1990. Macroeconomics. New York: McGraw-Hill.European Central Bank. 2000. “Potential Output Growth and Output Gaps: Concept, Uses and
Estimates.” ECB Monthly Bulletin, October :37–47.Fellner, William. 1982. “The High Employment Budget and Potential Output: A Critique.”
Survey of Current Business, 62 November :25–33.Fernández, E. 2002. “La Deuda Corriente de los Municipios Peruanos.” Background Paper for
the Performance Expenditure Review. Washington, D.C.Finot, Ivan. 2001. “Descentralización en América Latina: teoría y práctica.” Instituto
Latinoamericano y del Caribe de Planificación Económica y Social–ILPES.Giorno, C., P. Richardson, D. Roseveare, and P. van den Noord. 1995. “Estimating Potential
Output, Ouput, Output Gaps, and Structural Budget Balances.” Organization for Economic Cooperation and Development Economics Department, Working Papers, No. 152. Paris.
Gonzalez C., D. Rosenblatt, and S. Webb. 2002. “Stabilizing Intergovernmental Transfers inLatin America: A Complement to National/Subnational Fiscal Rules.” Paper for the Seminaron Fiscal Rules, Lima.
Gregory P. 2002. “Public Sector Employment in Perú.” Background Paper for the PerformanceExpenditure Review, Washington, D.C.
Gupta, Sanjeev, Marijn Venhoeven, and Erwin Tiongson. 1999. “Does Higher GovernanceSpending Buy Better Results in Education and Health Care?” International Monetary FundWorking Papers WP/99/21, Fiscal Affairs Department. Washington, D.C.
Hagemann, Robert. 1999. “The Structural Budget Balance: The IMF’s Methodology.” WorkingPaper. International Monetary Fund, Washington, D.C., July.
Hodrick, Robert, and Edward Prescott. 1997. “Postwar U.S. Business Cycles.” Journal of Money,Credit and Banking, 29(1) :1–16.
IMF (International Monetary Fund). 2000. “Peru: Racionalización del Sistema Tributario.” G. Kopits, J. P. Ley, and J. Córdova. Departament of Public Finance. Washington, D.C.
IMF/WB. 2001. “Tracking of Poverty Reducing Spending in Heavily Indebted Poor Countries(HIPC).” Washington, D.C: International Monetary Fund.
______. 2002. “Actions to Strengthen the Tracking of Poverty Reducing Spending in HeavilyIndebted Poor Countries (HIPC).” Washington, D.C.: International Monetary Fund.
282 WORLD BANK COUNTRY STUDY

Instituto Apoyo. 2002. “Central Government Transfers to Municipalities in Peru: A Detailed Lookat the Vaso de Leche Program.” Public Expenditure Tracking Survey. Report to the PublicExpenditure Review of Peru.
Jayasuriya R., and Q. Wodon. 2001. “Explaining Country Efficiency in Improving Health andEducation Indicators: The Role of Urbanization.” Background Paper to World DevelopmentReport 2003. Washington, D.C.: World Bank.
Jiménez F. 2002. “Perú: Sostenibilidad, Balance Estructural y Propuesta de Regla Fiscal.” Seminaron Fiscal Rules, Lima.
Kaufmann, Daniel, Aart Kraay, and Pablo Zoido-Lobatón. 2002. “Governance Matters II:Updated Indicators for 2000/01.” Washington, D.C.: World Bank.
Kopits, George. 2002. “Una Vista Panorámica de las Reglas Macro Fiscales.” Paper of the Seminaron Fiscal Rules, Lima.
Kopits, George; Juan Pablo Córdoba, Eduardo Ley, and Juan Toro. 2000. “Perú: Racionalizacióndel Sistema Tributario.” Fondo Monetario Internacional.
Larrain, F., and J. Sachs. 1991. Macroeconomics in the Global Economy. New Jersey: Prentice Hall.López-Cálix, José R. 2002. “Guatemala: La Macroeconomía del Ciclo Electoral.” Banca Central,
40, Enero-Abril. Guatemala City.Ma, J. 2002. “Monitoring Fiscal Risks of Subnational Governments.” In H. Polackova and
A. Schick, Government at Risk. Washington, D.C.: World Bank.Matsuda, Yasuhiko, and Geoffrey Shepherd. 2000. “Peru’s Public Administration and the Delivery
of Public Services.” Background Paper to the Peru IGR. Washington, D.C.MED. 2001. “Principales Lineamientos de Política Educativa.” Lima.Moore, Richard. 2002. “Decentralization in the Social Sectors: Prospects for the Decentralization of
Health and Education in Peru.” Background Paper to the Public Expenditure Review of Peru.Moore, Richard, and Eugenia Rosales. 2001. “Estudio de Organización, Estructura y Funciones
del Ministerio de Educación del Ecuador.” Report prepared for the Human DevelopmentNetwork. Washington D.C.: World Bank.
Morón, Eduardo. 2001. “El Debate de la Transparencia.” Lima: Universidad del Pacífico.Mostajo, Rossana. 2002a. ¿“Protección Presupuestaria?–Los Programas Sociales Protegidos en el
Perú.” Background Paper to the Public Expenditure Review of Peru.______. 2002b. “El Sistema Presupuestario en el Perú.” Serie: Gestión Pública, Instituto
Latinoamericano y del Caribe de Planificación Económica y Social–ILPES.Oliva, C. 2002. “Fiscal Trends and the Fiscal Sustainability Issue.” Background Paper to the Public
Expenditure Review of Peru.Ortiz de Zevallos, Gabriel. 1999. “La Economía Política de las reformas Institucionales en Perú:
los Casos de Educación, Salud y Pensiones.” Prepared for the Inter-American DevelopmentBank, Documento de Trabajo R-348. Washington, D.C.
Otto, M. James. 2002. “Position of the Peruvian Taxation System as Compared to Mining TaxationSystems in Other Nations.” Ministry of Economy and Finance. Report to the Public Expendi-ture Review of Peru.
Paredes, Carlos, and Jeffrey Sachs. 1991. Stabilization and Growth in Peru. Washington D.C.: The Brookings Institution.
PCM. 2002. “The Strategy of Decentralization.” Mimeo. Lima.Perry, G. 2002. “Can Fiscal Rules Help Reduce Macroeconomic Volatility in LAC?” Paper
presented at a Seminar in Oaxaca, Mexico.Reinikka, R., and J. Svensson. 2002. “Assessing Frontline Service Delivery.” Draft. World Bank.Rose-Ackerman, David. 1999. Corruption and Government: Causes, Consequences and Reform.
Cambridge: Cambridge University Press.Saavedra, Jaime, Roberto Melzi, and Arturo Miranda. 2001. “El Financiamiento de la Educación
Pública en el Perú: El Rol de las Familias.” Lima: GRADE.Schady, N. 2002. “Notes on A Trabajar Program.” Mimeo. Washington, D.C.: World Bank.
RESTORING FISCAL DISCIPLINE FOR POVERTY REDUCTION IN PERU 283

Schenone, Osvaldo H. 2002. “Exoneraciones y Regímenes Tributarios Especiales en Perú.” Background Paper to the Public Expenditure Review of Peru.
Seligson, M. 2002. “The Impact of Corruption on Regime Legitimacy: A Comparison Study ofFour Latin American Countries.” Journal of Politics, 64 :408–33.
Treisman, D. 2000. “The Causes of Corruption: A Cross National Study.” Journal of Public Economics, 3 :399–458.
Valderrama J. 2002. “Perú: Propuesta de Reforma a las Reglas Fiscales.” Paper for the Seminar onFiscal Rules in Lima.
Winkler, Donald, and Richard Moore. 1996. “Best Practices in Education Decentralization inLatin America.” Paper prepared for Seminar on Decentralization in LAC, Caracas, Venezuela.
Wodon, Quentin. 2002. “The Efficiency of Public Spending in Peru.” Background Paper to thePublic Expenditure Review of Peru.
Wodon, Quentin, and Norman Hicks. 2001. “SIMSIP: A Simulation Tool.” Draft. Washington,D.C.: World Bank.
World Bank. 1994. “Peru: Public Expenditure Review.” Washington, D.C.______. 1999. “Peru: Improving Health Care for the Poor.” Washington, D.C.______. 2000. “Peru: Policy Notes.” Washington, D.C.______. 2001a. “Peru: Institutional and Governance Review.” Poverty Reduction and Economic
Management Unit, Latin America and the Caribbean.______. 2001b. Peruvian Education at a Crossroads: Challenges and Opportunities for the 21st Cen-
tury. Washington, D.C.______. 2001c. “Voices of the Misgoverned and Misruled: An Empirical Diagnostic Study on
Governance, Rule of Law and Corruption for Peru. A Survey.” Washington D.C.: World BankInstitute.
World Bank and Inter-American Development Bank. 2001a. “Peru: Country Financial Account-ability Assessment.” Draft. Washington, D.C.
______. 2001b. “Peru: Country Procurement Report.” Draft. Washington, D.C.
284 WORLD BANK COUNTRY STUDY