Restoring paradise in the Caribbean - Organization of ...
311
-
Upload
khangminh22 -
Category
Documents
-
view
0 -
download
0
Transcript of Restoring paradise in the Caribbean - Organization of ...


Restoring Paradise in the Caribbean
Combatting Violence with Numbers
Heather Sutton and Inder Ruprah, Editors

Cataloging-in-Publication data provided by theInter-American Development BankFelipe Herrera Library
Restoring paradise in the Caribbean: combatting violence with numbers / editors, Heath-er Sutton, Inder Ruprah.
p. cm. — (IDB Monograph ; 513)
Includes bibliographic references.
1. Crime-Caribbean Area. 2. Crime prevention- Caribbean Area. 3. Violence- Caribbe-an Area. 4. Violence-Prevention-Caribbean Area. I. Sutton, Heather. II. Ruprah, Inder.
III. Inter-American Development Bank. Country Department Caribbean Group. IV. Series.
IDB-MG-513
JEL Codes: I39, Y80, J13, K14, K42
Keywords: Caribbean, victimisation, crime, violence, prevention, citizen security,
evidence-based policy, cost of crime.
Inter-American Development Bank
1300 New York Avenue, NW
Washington, DC 20577
Copyright © 2017 Inter-American Development Bank. This work is licensed under a Cre-ative Commons IGO 3.0 Attribution-NonCommercial-NoDerivatives (CC-IGO BY-NC-ND
3.0 IGO) license (http://creativecommons.org/licenses/by-nc-nd/3.0/igo/legalcode)
and may be reproduced with attribution to the IDB and for any non-commercial purpose.
No derivative work is allowed.
Any dispute related to the use of the works of the IDB that cannot be settled amicably
shall be submitted to arbitration pursuant to the UNCITRAL rules. The use of the IDB’s
name for any purpose other than for attribution, and the use of IDB’s logo shall be sub-ject to a separate written license agreement between the IDB and the user and is not
authorized as part of this CC-IGO license.
Note that link provided above includes additional terms and conditions of the license.
The opinions expressed in this publication are those of the authors and do not necessar-ily reflect the views of the Inter-American Development Bank, its Board of Directors, or
the countries they represent.

iii
Contents
Foreword . . . . . . . . . . . . . . . . . . . . . . . . . . . . . . . . . . . . . . . . . . . . . . . . . . . . . . v
Acknowledgments . . . . . . . . . . . . . . . . . . . . . . . . . . . . . . . . . . . . . . . . . . . . . . vii
Introduction: Combatting Crime and Restoring Paradise . . . . . . . . . . . . . ix
Section One—Describing the Problem
Chapter 1: How Do We Measure Crime? . . . . . . . . . . . . . . . . . . . . . . . . . . . .1Heather Sutton and Lucciana Alvarez
Chapter 2: The Size and Dimensions of Victimization in the Caribbean . . . . . . . . . . . . . . . . . . . . . . . . . . . . . . . . . . . . . . . 17Heather Sutton, Jan van Dijk, and John van Kesteren
Chapter 3: Who Is Most Likely to Be a Victim of Crime? . . . . . . . . . . . . 33Heather Sutton and Lucciana Alvarez
Section Two—Where Can Policymakers Intervene?
Chapter 4: Violence Against Women and Children: How Big Is the Problem and Is It Connected to Other Violence? . . . . 59Heather Sutton and Lucciana Alvarez
Chapter 5: Youth Violence and Delinquency: Reducing Risk and Enhancing Protection . . . . . . . . . . . . . . . . . . . . . . . . . . . . 81Heather Sutton and Inder Ruprah
Chapter 6: How Do Neighbourhood Characteristics Affect Crime? . .99Heather Sutton and Lucciana Alvarez
Chapter 7: Gangs and Victimization . . . . . . . . . . . . . . . . . . . . . . . . . . . . . . 111Heather Sutton, Lucciana Alvarez, and Luisa Godinez

iv
RESTORING PARADISE IN THE CARIBBEAN: COMBATTING VIOLENCE WITH NUMBERS
Chapter 8: Guns—The Tools of Violence . . . . . . . . . . . . . . . . . . . . . . . . . 125Heather Sutton and Lucciana Alvarez
Chapter 9: The Police and Criminal Justice System . . . . . . . . . . . . . . . . 141Heather Sutton and Lucciana Alvarez
Section Three—Costs and Consequences
Chapter 10: Crime and the Private Sector . . . . . . . . . . . . . . . . . . . . . . . . 163Heather Sutton, Inder Ruprah, and Lucciana Alvarez
Chapter 11: The Cost of Crime in the Caribbean: The Accounting Method . . . . . . . . . . . . . . . . . . . . . . . . . . . . . . 181Laura Jaitman and Ivan Torre
Chapter 12: The Effects of Crime on Economic Growth, Tourism, Fear, Emigration, and Life Satisfaction . . . . . . . . 197Heather Sutton, Inder Ruprah, and Camilo Pecha
Section Four—Policy Implications and Recommendations
Chapter 13: What the Caribbean Is Doing to Reduce Crime Compared to the Evidence of What Works Internationally . . . . . . . . . . . . . . . . . . . . . . . . . . . . . . . . . . . . . . . 211Heather Sutton and Luisa Godinez
Chapter 14: Conclusions and Recommendations . . . . . . . . . . . . . . . . . . 251Heather Sutton
References . . . . . . . . . . . . . . . . . . . . . . . . . . . . . . . . . . . . . . . . . . . . . . . . . . . . 267

v
Foreword
Crime and violence are serious obstacles to long-term growth and development.
They lead to injury and the loss of human life, erode confidence in government,
reduce the competitiveness of industries and services, negatively alter the in-
vestment climate, contribute to emigration, and can lead to the loss of skilled and
educated citizens. Consequently, improving citizen security has become a priority of
the Inter-American Development Bank in its efforts to support the governments and
citizens of Latin America and the Caribbean.
While citizen security has become an ever-increasing concern for many Caribbean
countries, the magnitude of the problem has not been matched with an equally robust
response in terms of research. Cross-national studies on the prevalence, causes, and
effects of violence in the region are few. Empirical studies showing which policies have
worked to reduce crime in the Caribbean are even scarcer.
This volume analyses new data collected in household and business victimization
surveys. These surveys allow us to understand crime from a primary source—the vic-
tims themselves. As such, this study goes beyond much of the existing literature, which
relies primarily on police data. It contributes new information to our understanding of
crime patterns, victim profiles, determinants of particular types of crime, and direc-
tions for crime reduction in the region.
While the crime situation varies among countries, broadly speaking the Caribbean
suffers from uniquely high levels of violent crime. After providing an overview of crime
in five Caribbean capital cities, this volume addresses several factors associated with
violent crime. These include youth, violence against women and children, neighbour-
hood characteristics, gangs, guns, and the police and criminal justice systems. The
cost of this crime and violence to the Caribbean—about 3 percent of GDP—is sig-
nificant. The study finds that victimization has negative ramifications for businesses,
economic growth, tourism arrivals, emigration, and life satisfaction.
However, perhaps the most unique aspect of this study is that it has been written
with the specific intention of informing policy and programme design. The authors’
optimism, and ours, about the potential to restore paradise in the Caribbean rests on
the growing base of evidence on what we have already learned about crime prevention

vi
RESTORING PARADISE IN THE CARIBBEAN: COMBATTING VIOLENCE WITH NUMBERS
worldwide. The authors recognize the gaps in knowledge and data collection that exist
in the Caribbean, but wisely argue that countries need not wait for further studies to
begin to reduce violence. Making use of the risk and protective factors identified here,
policymakers can adapt evidence-based programmes that have been successful in
other settings, while monitoring and evaluating their results in the Caribbean context.
There is much work in the region that is promising and much that is ineffective.
This report helps to identify both, and urges that rigorous evaluations of the more
promising programmes be conducted. National strategies should include policies and
interventions based on sound knowledge of what actually works, and not on what
might or should work.
Therese Turner-Jones, General Manager
Country Department Caribbean Group
Inter-American Development Bank
Ana María Rodríguez-Ortiz, Manager
Institutions for Development
Inter-American Development Bank

vii
Acknowledgments
This report was prepared by members of the Citizen Security Cluster (ICS/IFD)
and the Caribbean Economics Team (CCB/CCB) of the Inter-American Develop-
ment Bank. The editors wish to thank several members of both teams for their
input and support, including Nathalie Alvarado, Diether Beuermann, Rogelio Granguill-
home Ochoa, Laura Jaitman, Camilo Pecha, Arnaldo Posadas, and Ricardo Sierra. The
editors also thank Jan van Dijk and John van Kesteren for integrating the Caribbean
Crime Victimization Survey (CCVS 2014/2015) data into the International Crime Vic-
timization Survey (ICVS) database and for their valuable input on how the Caribbean
compares to the rest of the world.
This report was reviewed by Dr. Anthony Harriott and Mary Vriniotis. The report
would not have been possible without the IDB Citizen Security Fund, which financed
the CCVS (2014/2015), and Compete Caribbean, which financed the Productivity,
Technology, and Innovation (PROTEqIN) Survey (2014). Mary Vriniotis coordinated the
design and execution of the CCVS. The PROTEqIN Survey was coordinated by Musheer
Kamau. Anna Alvazzi del Frate, Jan van Dijk, Michael Rand, and Edgar Vielma provided
valuable input into the design of the CCVS questionnaire and sampling methodology.
The CCVS module was attached to the Latin American Public Opinion Poll (LAPOP)
and implemented by Nicole Hinton, Mitchell Seligson, and Elizabeth Zechmeister.
The editors would also like to acknowledge Dana Payne, who coordinated the pro-
duction of this report, David Einhorn, who edited the manuscript, and Word Express,
which provided the typesetting and production services.


ix
Introduction: Combatting Crime and Restoring Paradise
Heather Sutton and Inder Ruprah
Crime is undoubtedly an issue of concern for policymakers and citizens in the
Caribbean region. An average of 40 percent of the Caribbean population iden-
tifies crime and security-related issues as the main problem facing their country,
even above poverty, the economy, or inequality. In several Caribbean countries, crime
has increased over the last decade, with homicide rates more than doubling and the
countries concurrently becoming more violent.
However, there is great intra-regional variance. Jamaica, for example, stands out for
its extraordinarily high rates of homicide since 2000. And while Jamaica and Trinidad
and Tobago have generally dominated regional attention in this regard, homicide rates
generally have significantly declined in both countries since 2009. Homicide rates in
The Bahamas surpassed Trinidad and Tobago in 2011 and are now nearing those of
Jamaica. On the other hand, homicide rates in Barbados and Suriname have remained
fairly constant at much lower levels over time.
This report tackles the following questions. What are the size and dimensions of the
crime problem? How is the Caribbean similar to or different from the rest of the world?
Who are the victims? What are the drivers of crime, and hence the areas that provide
the best opportunities for intervention? What are the societal costs?
The answers to these questions support our central hypothesis that the Caribbean
suffers from particularly high levels of interpersonal violence relative to the rest of the
world. This interpersonal violence is related to a number of factors, including experi-
ences of and attitudes toward violence in the home, early experiences with violence
and risky behaviours among youth, gang activity, community violence, and the use
of guns, which makes violence more lethal. These are issues that cannot be solved
through arrests alone, but instead are best addressed through a balance of targeted
prevention and smarter criminal justice systems.

x
RESTORING PARADISE IN THE CARIBBEAN: COMBATTING VIOLENCE WITH NUMBERS
Crime is a complex social problem that evades simple solutions. It requires a clear
diagnosis of the problem and approaches that are data-driven, monitored, and tested
for effectiveness. However, understanding the problem, its consequences, and possible
solutions to it has been limited by the lack of adequate and reliable data in the region.
Even recent studies by international organizations (UNODC and World Bank 2007;
UNDP 2012) relied largely on police data or citizen security surveys. These sources
not only are dated but present at best a partial understanding of victimization. Police
data suffer from under-reporting (as we examine in Chapter 1). Additionally, because
definitions of crimes are based on national legislation, police statistics do not allow
for cross-regional or international comparisons to understand where the Caribbean
stands relative to the rest of the world. Victimization surveys in the Caribbean have
been few and infrequent, and the limited data produced are not widely available to
academics and the public. Further, different survey sample sizes, sampling methods,
and wording of questions can lead to vastly different estimates for the same countries
in the same time frame and have reduced comparability across countries.
This report aims to provide a more complete picture of crime and violence and
their covariates in the region based on newly generated data. The data used in this
report come predominantly from two primary data-generation initiatives undertaken
in 2014/2015 by the Inter-American Development Bank (IDB): (1) A Caribbean Crime
Victimization Survey (CCVS) module attached to the Latin American Public Opinion
Project (LAPOP) Survey; and (2) a business victimization module attached to the 2014
Productivity, Technology and Innovation (PROTEqIN) Survey and applied to a represen-
tative sample of firms in Caribbean countries. The central analysis of the victimization
of citizens is focused on the capital city metropolitan areas—where crime is gener-
ally higher—in five Caribbean countries: New Providence, The Bahamas; Bridgetown,
Barbados; Kingston, Jamaica; Paramaribo, Suriname; and Port of Spain, Trinidad and
Tobago. Throughout the volume we refer to these five countries as the C5. International
comparisons are made against countries where the International Crime Victimization
Survey (ICVS) has been implemented. Inter-regional variance is also addressed.
However, some key topics are not covered in this report. The topics of drug trafficking
and organized crime are clear omissions that are undoubtedly important for under-
standing the dynamics of crime, but are not easily measured and understood through
victimization surveys. While these topics are the focus of much discussion in the Carib-
bean, accurately measuring and understanding them requires innovative approaches
and data that are beyond the scope of this report. Furthermore, like all other research
based on cross-sectional survey data, this report is limited to exploring factors related
to crime, but is unable to statistically explore and untangle the direction of causality.
The report is divided into four sections. Section One is dedicated to measuring
and describing the problem. Chapter 1 discusses how to measure crime and explains

xi
INTRODUCTION: COMBATTING CRIME AND RESTORING PARADISE
the problems with existing crime data in the Caribbean. It explores the level and char-
acteristics of crimes that go unreported to the police, the problem with surveys on
crime in the region, and the new data generated for this report. Based on victimiza-
tion surveys in the five Caribbean countries (C5), Chapter 2 presents the prevalence
rates for property and violent crimes compared to the rest of the world. It finds that
the violent crimes committed in victims’ neighbourhood and by someone they know
are particularly acute. Chapter 3 examines the victims by socio-demographic char-
acteristics for different types of crime. Here we find that the Caribbean is not unlike
most places in the world—victims of common street crimes tend to be young (ages
18–25) and low-income males.
Section Two explores key risk and protective factors associated with violence that
are examined in the international literature, and then looks at their relevance in the
Caribbean. Extensive and robust international studies find evidence that cycles of
violence begin in the home when children witness and experience violence. While
little reliable data are available on intimate partner violence and child abuse in the
region, Chapter 4 examines attitudes on violence in the home in the Caribbean and
finds tolerance of violence to be significantly higher than elsewhere in Latin America.
Chapter 5 examines victimization of youth and the perpetration of violence by youth,
as well as risk and protective factors associated with youth violence and delinquency.
Much of the recent literature in criminology shows that crime is highly concentrated
in specific neighbourhoods and street segments. Chapter 6 explores the characteris-
tics of neighbourhoods associated with higher victimization rates, as well as potential
mitigating factors that help reduce crime in vulnerable neighbourhoods. Chapter 7
looks at the prevalence of gangs in Caribbean neighbourhoods and their association
with victimization. Chapter 8 examines the tools of violence—specifically firearms—
and their use in and relationship with violent crime. Finally, Chapter 9 looks at the
institutions of the criminal justice system.
Section Three is dedicated to understanding the costs and consequences of
crime. Chapter 10 explores victimization of businesses and the impact of crime on
the private sector. Chapter 11 applies the accounting approach to estimate the dollar
amount of the direct costs of crime in the Caribbean and explores its impact on tour-
ism arrivals and GDP growth. Finally, Chapter 12 looks at some specific costs such
as the impact of crime on economic growth, tourism, life satisfaction, and intentions
to emigrate.
Section Four discusses the potential gains from prioritizing effective policy inter-
ventions in the areas explored in the previous sections: violence in the home, youth,
neighbourhoods, gangs, guns, and the criminal justice system. Chapter 13 examines
current legislation and programmes in the Caribbean in these areas and compares
them to model legislation and evidence of what works in other contexts around the

xii
RESTORING PARADISE IN THE CARIBBEAN: COMBATTING VIOLENCE WITH NUMBERS
globe. We find evidence of many promising initiatives, but a fundamental lack of
testing and evaluating their impact. Among the key recommendations in Chapter 14
is that the Caribbean invest heavily in monitoring and evaluation to build the under-
standing and evidence base of what works to reduce crime in the region. National
strategies should be clearly based on ensuring that targeted individuals, communi-
ties, and institutions have access to the programmes that work.

1
How Do We Measure Crime?Heather Sutton and Lucciana Alvarez
“If you cannot measure it, you cannot improve it.”—Lord Kelvin
Accurately measuring the size and dimensions of crime and violence in the Ca-
ribbean is essential for designing effective crime prevention and reduction
policies. But how do we measure and understand crime? Police crime statis-
tics can be a fairly inaccurate measure of actual crime levels in the Caribbean due to
under-reporting by the public and under-recording of crimes by the police. This can
lead policymakers to make poor decisions regarding prevention policies and the allo-
cation of resources. Victimization surveys enable us to measure the phenomenon of
crime from a primary source—the victims themselves—but such surveys are conduct-
ed less frequently in the Caribbean than in many other world regions.
This chapter begins by explaining some of the problems with police data generally,
and then explores the under-reporting of crime to law enforcement in the Caribbean
specifically. We compare crime reporting in the region with that of other capital cities
across the world, and we further identify the types of crime and the characteristics of
victims of unreported crimes. We then examine the victimization and citizen security
surveys that have been conducted in the region to date. Finally, we summarize the main
differences between the data source used for this publication—the Inter-American
Development Bank’s Caribbean Crime Victimization Survey (CCVS)—and previous
surveys, highlighting the distinct contributions of the CCVS.
1.1 Police Crime StatisticsThe police are normally considered the first source of information about crimes that
have been committed. Police-recorded crime data do present some benefits: (1) they
may provide the ability to study crime location via Geographic Information System
1

2
RESTORING PARADISE IN THE CARIBBEAN: COMBATTING VIOLENCE WITH NUMBERS
(GIS) codes; and (2) they are produced with regular frequency and often provide de-
tails on the characteristics of both the victim and offender. However, police crime
statistics are only the tip of the iceberg when it comes to measuring and understand-
ing crime. According to International Crime Victimization Surveys from 1990–2005, it
is estimated globally that less than half of common crimes are reported to the police.
For some crimes (i.e., assault and sexual crimes) the percentage is even lower than
half—sometimes 10 percent lower or more.
At best, police statistics give a partial view of what is happening in a country; at
worst, they distort our understanding of the actual problem. When police crime sta-
tistics rise or fall, this does not necessarily mean that actual crime is increasing or
decreasing. It is possible that more or fewer citizens are reporting crime, or that the
police are more or less thorough in recording crime data. Entire groups at risk of
victimization may be unknown. The most problematic crimes may not be those that
appear in police statistics.
Additionally, police data are notoriously difficult to compare from one country to
the next, so understanding regional crime is more difficult. There have been some at-
tempts to create uniform international statistics on crime and violence for comparing
between nations.1 However, even the commonly used United Nations Crime Statistics
are derived from national police figures and still subject to under-reporting by the
public or gaps in recording by the police. Police-reported data can be so unreliable for
comparative analysis that Interpol and some criminologists have suggested a “global
moratorium” on their publication and use in comparative studies (Van Dijk 2008).
1.1.1 Reporting of Crime in the CaribbeanThe CCVS asked respondents who have been crime victims whether they reported the
incident to the police. Figure 1.1 depicts the reporting rates of victims in five Caribbean
capital city metropolitan areas and the average rate for the C5. On average, 53 percent
of crimes were reported and 47 percent of crimes went unreported. The lowest overall
reporting rates were found in Kingston, Jamaica (39 percent) and Bridgetown, Bar-
bados (43 percent). Reporting rates were highest in New Providence, The Bahamas,
which is consistent with high levels of trust in the police further examined in Chapter 9.
When excluding car theft (given universally higher reporting rates), the C5’s 51 per-
cent crime reporting rate stands very close to the international average (49 percent).
Reporting is significantly higher than in Latin American capital cities (35 percent) for
all five crimes examined here (car theft, burglary, robbery, theft of personal property,
1 Interpol and UN Crime Survey data reflect broad categories of “common crimes” (theft, burglary, rape, and murder) that are reported by national police agencies via a standardized questionnaire. The World Health Organization is a further source of standardized information on violence, particularly homicides.

3
HOW DO WE MEASURE CRIME?
and assaults and threats) and is comparable to New York (57 percent) and the Eu-
ropean Union (60 percent).2 Reporting levels are particularly high relative to Latin
American cities for violent crimes such as robbery (23 percent in Latin America versus
63 percent in the C5) and assault (25 percent in Latin America versus 44 percent in
the C5). The results indicate that Caribbean victims likely have more confidence in the
police than victims in Latin America. This hypothesis is further supported in Chapter 9.
Regarding crimes against businesses, according to responses to the 2013/2014 Pro-
ductivity, Technology, and Innovation (PROTEqIN) Survey, only 46 percent of these
crimes were reported to the police (Figure 1.2). The pattern for reporting of crime
Figure 1.1: Percentage of Five Crimes Reported to the Police in Five Caribbean Capital City Metropolitan Areas
0
10
20
30
40
50
60
80
70
New Providence GreaterBridgetown Area
KingstonMetropolitian Area
Paramaribo Port of SpainMetropolitan Area
C5 capitalcity average
67
43 39
55 57 53
Source: Prepared by the authors using data from the IDB Caribbean Crime Victimization Survey module attached to the 2014/2015 Latin American Public Opinion Project Survey.Note: The five crimes cited in the figure are car theft, burglary, robbery, theft of personal property, and assaults and threats.
2 Comparative results on reporting rates from the International Crime Victimization Survey database per world region are provided in Appendix 1.2.
Figure 1.2: Percentage of Crimes against Businesses Reported to the Police, by Caribbean Country
0
10
20
30
40
50
60
80
70
Ant
igua
and
Bar
buda
Bah
amas
Bar
bado
s
Bel
ize
Dom
inic
a
Gre
nada
Guy
ana
Jam
aica
St.
Kitt
s an
d N
evis
Sai
nt L
ucia
St.
Vin
cent
and
the
Gre
nadi
nes
Sur
inam
e
Trin
idad
and
Tob
ago
Car
ibbe
an a
vera
ge(1
3 co
untri
es)
Source: Prepared by the authors using data from Productivity, Technology, and Innovation (PROTEqIN) Survey, 2014.

4
RESTORING PARADISE IN THE CARIBBEAN: COMBATTING VIOLENCE WITH NUMBERS
by businesses in C5 countries fol-
lows that of individuals, with lower
reporting in Barbados (24 percent)
and Jamaica (46 percent). Figure 1.3
indicates that there is a significant
correlation between the percentage
of crimes reported to the police and
the percentage of crimes reported to
insurance companies.
1.1.2 Which Crimes Get Reported?An extensive amount of literature ex-
amines levels and predictors of police
notification by crime victims (Finkel-
hor and Ormrod 1999; Fisher et al.
2003; Hindelang 1976; Lizotte 1985; Ruback, Greenberg, and Westcott 1984; Tjaden
and Thoennes 2000; Zawitz et al. 1993). While the degree to which crimes are report-
ed to the police varies widely by country and type of crime, there does seem to be a
general pattern: the more serious the offence, the more likely it is to be reported (Al-
vazzi del Frate 1998; Van Dijk 2008).
Similar to other countries around the world where victimization surveys have been
conducted, we find that in the C5 crime reporting is highest for car theft (84 per-
cent) and burglary (70 percent) and lower for assaults (48 percent) and threats (37
percent).3 Crime reporting in nearly all crime categories was lower in Kingston and
Bridgetown (Table 1.1). More severe crimes that involved a weapon, or where medical
services were sought, were more likely to be reported. Violent crimes were also more
likely to be reported if there were two offenders and if the offender was a stranger
rather than someone known to the victim (Table 1.2).
1.1.3 Who Is Less Likely to Report?Victim characteristics also are associated with police notification. Table 1.3 shows that
for violent crimes (robbery, assault and threat) in the five Caribbean capital cities, fe-
males are overall less likely than males to report violent crime, as are youth and those
who are single or cohabitating but not married. Reporting rates across income quin-
tiles vary by country.
Figure 1.3: Correlation between Reporting to the Police and Filing an Insurance Claim, by Caribbean Country
0
10
20
30
40
Num
ber o
f firm
s th
atre
porte
d to
insu
ranc
e
Number of firms that reported to the police
50
60
70
0 10
TTOR2 = 0.74445
JAM
KNA
GUY
SURBLZBRB
LCA
BHSDOM
VCT
ATG
GRD
20 30 40 50 60 70
Source: Prepared by the authors using data from Productivity, Technology, and Innovation (PROTEqIN) Survey, 2014.
3 For details on both the percentage and number of individuals reporting for the five types of crime, see Appendix 1.1.

5
HOW DO WE MEASURE CRIME?
Table 1.1: Percentage of Crimes Reported by Type and Seriousness in Five Caribbean Capital City Metropolitan Areas
New Providence
Greater Bridgetown
Area
Kingston Metropolitan
Area Paramaribo
Port of Spain Metropolitan
Area
C5 Capital City
Average
Type of Crime
Four crimes (excl. car theft)
63 42 37 54 54 51
Car theft 84 77 92 67 85 84
Theft 63 40 36 55 52 50
Burglary 84 69 46 73 77 70
Loss of property
87 68 48 76 82 73
Household member intimidated
94 67 79 92 86 87
Robbery 70 56 47 65 71 63
With a weapon 81 54 53 75 83 71
Victim required medical services
95 90 85 80 82 88
Assault 54 36 47 49 51 48
With a weapon 74 51 55 57 63 61
Victim required medical services
90 83 87 92 73 84
Threat of assault
50 28 28 41 42 37
Source: Prepared by the authors using data from the IDB Caribbean Crime Victimization Survey module attached to the 2014/2015 Latin American Public Opinion Project Survey.Note: Cells with gray shading should be interpreted with caution because they are based on 10 or fewer cases.
Table 1.2: Percentage of Violent Crimes (Robbery and Assaults and Threats) Reported to the Police by Characteristics of the Offenders in Five Caribbean Capital City Metropolitan Areas
Offender Characteristics
New Providence
Greater Bridgetown
Area
Kingston Metropolitan
Area Paramaribo
Port of Spain Metropolitan
Area
C5 Capital City
Average
Number of offenders
One 52 29 38 45 45 41
Two 69 55 59 59 67 64
Three or more 65 31 34 39 51 45
Relation to victim
Stranger 67 58 41 62 65 58
Non-stranger 58 29 41 40 47 44
Source: Prepared by the authors using data from the IDB Caribbean Crime Victimization Survey module attached to the 2014/2015 Latin American Public Opinion Project Survey.

6
RESTORING PARADISE IN THE CARIBBEAN: COMBATTING VIOLENCE WITH NUMBERS
1.2 The Alternative Measure of Crime: Victimization SurveysVictimization surveys are an alternative way of studying crime. Essentially a sample
of the population is surveyed and respondents are asked if they have recently been
a victim of a set of concretely defined types of crime. Because many victims do not
report crimes to the police, estimates from victimization surveys are typically far high-
er than those generated using police records (Alvazzi del Frate 1998; Van Dijk, Van
Kesteren, and Smit 2007; Zawitz et al. 1993) and may not even correlate with police
Table 1.3: Percentage of Violent Crimes (Robbery and Assaults and Threats) Reported to Police, by Characteristics of the Victim, in Five Caribbean Capital City Metropolitan Areas
Victim Characterestics
New Providence
Greater Bridgetown
Area
Kingston Metropolitian
Area Paramaribo
Port of Spain Metropolitan
Area
C5 Capital City
Average
Gender
Male 57 47 44 57 64 54
Female 62 31 38 44 46 45
Age
18–24 47 32 32 34 58 41
25–34 64 38 37 46 51 49
35–49 68 32 52 64 44 52
50–64 72 45 53 68 65 61
65+ 100 64 31 25 82 59
Household Income (quintile)
1 72 35 39 47 56 50
2 62 42 45 52 46 51
3 63 24 43 53 65 51
4 78 33 51 36 42 45
5 30 42 47 48 77 48
Marital Status
Single 55 36 41 37 54 45
Married 75 43 44 64 54 60
Living together 88 27 37 57 48 46
Divorced 75 57 67 67 67 66
Separated 65 50 60 — 75 64
Widowed 50 50 75 83 71 68
Civil union — — — — — —
Source: Prepared by the authors using data from the IDB Caribbean Crime Victimization Survey module attached to the 2014/2015 Latin American Public Opinion Project Survey.Note: Cells with gray shading should be interpreted with caution because they are based on 10 or fewer cases.

7
HOW DO WE MEASURE CRIME?
crime statistics.4 They may also include questions on perceptions (fear of crime, trust
in police, neighbourhood conditions, etc.). While victimization surveys can be more reli-
able than police statistics, these surveys also have limitations. Under-reporting can be a
function of memory lapse, trauma, fear of reprisal, cultural sensitivities, or the exclusion of
hard-to-reach communities. Over-reporting can result from the temptation to include an
incident that does not belong in the survey time frame,5 or from the chance that victims
rather than non-victims choose to respond to the survey (Alvazzi del Frate, Zvekic, and
van Dijk 1993).
Countries around the world have been implementing National Victimiza-
tion Surveys (NCVS) for over four decades.6 These surveys typically use a large
nationally representative sample (> 30,000) that can be analysed at the subna-
tional level. Unfortunately, the results of these surveys are often not comparable
between countries due to differences in questionnaire wording, sample size, and
design.7 The International Crime Victimization Survey (ICVS) collects small samples
(1,000–2,000) from countries around the world, using a less detailed set of questions.8
It has been conducted in 90 countries and is useful for making international compari-
sons of national crime rates. The ICVS serves a very narrow (but important) purpose, as
many details of national surveys make them very difficult to compare with each other.
1.2.1 Victimization Surveys in the CaribbeanVictimization surveys in the Caribbean have been few and infrequent, and the limited
data produced are not widely available to academics or the public. Only three of the
five countries examined in this report have conducted dedicated national victimization
surveys: Jamaica (2006, 2009, 2012–2013), Barbados (2002, 2009), and Trinidad and
Tobago (2015).
The Barbados Crime Survey used the same questionnaire as the ICVS and is there-
fore comparable to other countries. It found that in 2001, Barbados had one of the
lowest victimization rates (15 percent for 10 common crimes) among countries where
4 Van Dijk (2008) found no correlation between the actual measures of victimization (measured via the ICVS) and the rates of police-recorded crime in 39 countries (r = 0.212). Positive correlations were found only for robbery and auto theft.5 This can be largely corrected through survey techniques designed to correct for “telescoping,” which is the inclusion of incidents that happened before or after the survey time period.6 The first pilot victimization survey was conducted in the United States in 1967 and later developed into the routinely conducted U.S. NCVS, which is a main source of crime data in the United States. The British Crime Survey, now known as the Crime Survey for England and Wales, has also been a source of data on crime and public attitudes towards crime since 1982.7 For an overview on some of the challenges and some guidelines on designing and implementing victimiza-tion surveys, see Vriniotus (2015).8 The ICVS is run by researchers affiliated with the University of Lausanne in Switzerland.

8
RESTORING PARADISE IN THE CARIBBEAN: COMBATTING VIOLENCE WITH NUMBERS
the ICVS was implemented, with a relatively higher rate only for burglary (6.3 percent,
compared to the 3.3 percent average for industrialized countries the same year) (Nut-
tall et al. 2003).
The Jamaican National Crime Victimization Survey is not comparable with other
victimization surveys. It found that between 2006 and 2009, one-year victimization
prevalence for any crime increased in Jamaica (from 23.7 to 30.2 percent), but then
significantly declined between 2009 and 2012–2013 (from 30.2 to 27.2 percent) (Wort-
ley and Seepersad 2013). The drop was observed for both violent and property crimes.
In Trinidad and Tobago, the Ministry of National Security’s Citizen Security Pro-
gramme conducted a survey including some victimization questions in 2007 in 19
communities. The survey was expanded in 2015 to be nationally representative.
In The Bahamas, the Ministry of National Security conducted a survey that con-
tained several victimization questions in 2014. However, the survey was administered
by police officers themselves (introducing potential barriers for respondents to truth-
fully report victimization) and only in certain neighbourhoods.
In Suriname, a question regarding being a victim of a crime was added for the first
time to the 2012 national census. However, no national victimization survey has ever
been carried out.
At the regional level, the United Nations Development Programme (UNDP) con-
ducted a regional Citizen Security Survey in the Caribbean in 2010. Using a catch-all
question asking if respondents had experienced any crime in the last year (referring to
2009), the UNDP estimated a seven-country Caribbean average victimization rate of
9.3 percent (including, among the countries examined here, 5.6 percent in Jamaica, 10.2
percent in Trinidad and Tobago, 10.8 percent in Barbados, and 9.7 percent in Suriname).9
The far-lower victimization rates compared to national victimization surveys are likely
a function of the small sample sizes and differences in question wording and order.
Similarly, the Latin American Public Opinion Poll (LAPOP), which was conducted in Ja-
maica, Trinidad and Tobago, Guyana, and Suriname from 2010 to 2013, also uses a single
question on crime and offers results that are comparable between countries. Table 1.4
illustrates how different survey sample sizes, sampling methods, and question wording
can lead to vastly different estimates for the same countries in the same time frame.
1.2.2 The IDB Caribbean Crime Victimization Survey Data and MethodologyThe CCVS data analysed for this report were obtained by including some of the core
questions of the ICVS in a victimization module that was attached to the LAPOP Sur-
vey on democracy and civic engagement. Of the 10 types of crime covered by the
9 The other three Caribbean countries surveyed were Antigua and Barbuda, Guyana, and Saint Lucia.

9
HOW DO WE MEASURE CRIME?
standard ICVS instrument, five were included (car theft, burglary, robbery, other per-
sonal theft, and assaults and threats).10 Also included were follow-up questions on the
details of crimes experienced (number of perpetrators, place of crime, etc.), report-
ing to the police, satisfaction with the treatment received, fear of crime, and firearm
ownership.
As in past survey years, the LAPOP Survey collected data from national samples of
1,500 respondents. As a condition for the CCVS module, an additional 3,000 respon-
dent oversample was used in each of the five capital cities, where crime is typically
higher. This was in order to obtain the most reliable estimates and have the statisti-
cal power to draw conclusions about the victims and their experiences. The survey
followed commonly adopted techniques applied in vetted victimization survey instru-
ments.11 For additional information on the methodology of the CCVS see Appendix 1.3.
In addition to the importance of sample size and sampling methodology (Table 1.4),
the questionnaire wording and techniques used in the CCVS are very important. Given
that the LAPOP Survey maintained its own questions on crime used in previous sur-
vey editions,12 together with the CCVS module we were able to compare the effect of
these techniques on estimates of victimization. LAPOP-designed questions produced
significantly lower prevalence estimates (ranging from 1 to 12 percentage points lower)
than those captured by the CCVS module (Appendix 1.4).
1.3 ConclusionsAbout half of common crimes in the Caribbean (C5) went unreported to the police.
The problem of under-reporting of crimes to the police is not unique to the Caribbean.
Table 1.4: Range of Victimization Prevalence Estimates Found through Different Surveys in Jamaica
LAPOP 2010 UNDP 2010 JNCVS 2009Sample size 1,500 2,000 3,556
Sampling Quota Multi-stage probability Multi-stage probability
Total victimization 10 percent 5.6 percent 30 percent
Sources: Prepared by the authors using findings from the Latin American Public Opinion Poll (LAPOP); United Nations Development Programme (UNDP) Citizen Security Survey; and the Jamaican National Crime Victimization Survey (JNCVS).
10 In the Caribbean version, the screener question on assaults and threats was split into two separate screener questions, while the ICVS reports on only the combined assault and threat results.11 Some of these techniques include the use of screener questions, ordering, and standard vetted question wording (including crime definitions).12 These include the VIC series (VIC1EXT, VICEXTA, VIC2AA and VIC1HOGAR).

10
RESTORING PARADISE IN THE CARIBBEAN: COMBATTING VIOLENCE WITH NUMBERS
In fact, reporting rates in the region are on par with the international average and high-
er than in Latin America. Consistent with international findings, violent crimes such as
assault and threat are less frequently reported than other crimes. This is particularly
problematic given that these are precisely the crimes that are most prevalent in the
Caribbean (as we will see in the next chapter). More severe violent crimes where a
weapon was used or that resulted in injury were more likely to be reported. Women,
youth, and single individuals were all less likely to report violent crimes to the police,
especially when the victim was known to the offender.
Police notification rates can be indicators of public confidence in the police and
the legitimacy of the criminal justice system. These topics are further addressed in
Chapter 9. Information on changes in the likelihood that crime is reported to the po-
lice can provide some insight into broader trends in police–community relations. This
is important considering that public communication is a key goal of strategies such
as community-oriented policing, which aim to improve trust and reduce the fear of
crime. Finally, a lack of reporting might worsen public safety and the quality of life in
neighbourhoods where residents cannot or are unwilling to call on law enforcement
for assistance. In this manner, “non-reporting subverts our interest in the goal of equity
in the criminal justice system” (Skogan 1984, 116).
Furthermore, while levels of crime reporting to the police are high in the Caribbean
compared to Latin America, still at least half of common crimes are not captured in
police statistics. Given the limitations of police data due to under-reporting, victimiza-
tion surveys can be particularly useful. Unfortunately, their use in the Caribbean has
been limited. In this sense, this publication fills an important gap in helping to under-
stand the crime problem in the Caribbean.

11
HOW DO WE MEASURE CRIME?
App
endi
x 1.1
. C
rimes
Rep
orte
d to
the
Polic
e in
Fiv
e C
arib
bean
Cap
ital C
ity M
etro
polit
an A
reas
Five
Cri
mes
(i
nclu
ding
car
th
eft)
Four
Cri
mes
(e
xclu
ding
car
th
eft)
Car
The
ftB
urgl
ary
Rob
bery
Thef
t of
Per
sona
l Pr
oper
tyA
ssau
lt a
nd
Thre
at
%N
%N
%N
%N
%N
%N
%N
New
P
rovi
den
ce67
417
6334
184
118
8411
570
8363
126
5514
7
Gre
ater
B
rid
get
own
Are
a
43
157
42
152
7710
6966
5632
40
4132
59
Kin
gst
on
Met
rop
olit
an
Are
a
3919
337
175
9233
46
5647
4136
6038
96
Par
amar
ibo
5518
454
174
6712
7399
6530
5555
45
67
Por
t of
Sp
ain
Met
rop
olit
an
Are
a
5726
754
231
8564
7798
7174
5277
48
84
Ave
rag
e 53
1,218
511,0
7384
237
704
3463
260
5035
94
44
53
Sou
rce:
Pre
par
ed b
y th
e au
tho
rs u
sing
dat
a fr
om
the
IDB
Car
ibb
ean
Cri
me
Vic
tim
izat
ion
Sur
vey
mo
dul
e at
tach
ed t
o t
he 2
014
/20
15 L
atin
Am
eric
an P
ublic
Op
inio
n P
roje
ct S
urve
y,
IVO
L d
atas
et s
erie
s (q
uest
ions
iden
tifie
d b
y IV
OL
num
ber
).

12
RESTORING PARADISE IN THE CARIBBEAN: COMBATTING VIOLENCE WITH NUMBERS
Appendix 1.2. Percentage of Victims Who Have Notified the Police, by World Region
Four Crimes (excluding car theft) Car Theft Burglary Robbery
Theft of Personal Property
Assault and Threat
Africa (10 cities)
49 89 63 37 22 28
Asia (Six cities) 35 78 43 38 16 28
Caribbean (Five cities)
51 84 70 63 50 44
Eastern Europe (18 cities)
48 83 64 36 23 25
Latin America (Seven cities)
35 90 36 23 13 25
United States (New York)
57 97 77 52 36 35
Western Europe (15 cities)
60 89 78 55 54 32
World average 49 87 65 44 31 31
Source: Van Dijk and Van Kesteren (2015) based on data from the IDB Caribbean Crime Victimization Survey module attached to the 2014/2015 Latin American Public Opinion Project Survey and the 1990–2005 International Crime Victimization Survey.Note: The five capital cities in the Caribbean are New Providence, The Bahamas; Greater Bridgetown Area, Barbados; Kingston Metropolitan Area, Jamaica; Paramaribo, Suriname; and Port of Spain Metropolitan Area, Trinidad and Tobago.

13
HOW DO WE MEASURE CRIME?
Appendix 1.3. Caribbean Crime Victimization Survey Methodology Note
As in regular ICVS surveys carried out in developing or middle-income countries, all
CCVS interviews were conducted using face-to-face interviews. The surveys were
conducted among samples from the national populations as well as among booster
samples from the populations of the capital cities. This sampling design was, as pre-
viously stated, also used in the 2004/2005 ICVS (Van Dijk, Van Kesteren, and Smit
2008). In order to secure sufficient numbers of identified victims for further analysis,
the net total sample sizes were 3,000 or more. The booster samples allow for the
calculation of separate rates for the five capitals. Since victimization rates tend to be
significantly higher in capital cities than elsewhere, the booster sample has the addi-
tional advantage that more victims of crime can be identified with the same amount of
interviews, allowing for more detailed analyses of results. In the calculation of the na-
tional results, the booster samples were weighted down proportionately. The national
sample sizes were 3,429 in The Bahamas, 3,999 in Barbados, 4,511 in Jamaica, 4,206 in
Trinidad and Tobago, and 3,998 in Suriname. These sample sizes include boosters of
3,000 per city that were drawn from capital city populations. With total sample sizes
varying between 4,000 and 7,000, the Caribbean surveys are among the largest ICVS-
based surveys ever conducted. Field work was conducted in the course of 2014 in The
Bahamas, Jamaica, Trinidad and Tobago, and Suriname, and in 2015 in Barbados. The
table below provides an overview of the sample sizes.
National Surveys Number Main City Number
Bahamas 3,429 New Providence 3,011
Barbados 3,999 Greater Bridgetown Area
3,004
Jamaica 1,506 Kingston Metropolitan Area
3,005
Suriname 3,998 Paramaribo 3,004
Trinidad and Tobago 4,206 Port of Spain Metropolitan Area
3,011
Total 17,138 Total 15,036
Response rates were generally low (below 50 percent), especially in Barbados. All
five surveys were carried out through face-to-face personal interviews. For a summary
of the methodology of the LAPOP Surveys, we refer to the field work reports and
methodological notes available for download together with the complete datasets
and questionnaires available at:

14
RESTORING PARADISE IN THE CARIBBEAN: COMBATTING VIOLENCE WITH NUMBERS
Jamaica: https://mydata.iadb.org/Citizen-Security/Latin-American-Public-
Opinion-Project-Victimization/gcdp-egct
The Bahamas: https://mydata.iadb.org/Citizen-Security/Latin-American-Public-
Opinion-Project-Victimization/wvqg-mskf
Suriname: https://mydata.iadb.org/Citizen-Security/Latin-American-Public-
Opinion-Project-Victimization/b9hm-5fk2
Barbados: https://mydata.iadb.org/Citizen-Security/
Latin-American-Public-Opinion-Project-Victimization/b5c5-tz6z
Trinidad and Tobago: https://mydata.iadb.org/Citizen-Security/
Latin-American-Public-Opinion-Project-Victimization/ckk5–3fah

15
HOW DO WE MEASURE CRIME?
App
endi
x 1.4
. Co
mpa
rison
of P
reva
lenc
e Es
timat
es O
btai
ned
Usi
ng R
ecog
nize
d Vi
ctim
izat
ion
Tech
niqu
es
(CC
VS)
vers
us N
on-s
tand
ard
Tech
niqu
es (
LAPO
P)
LAPO
P V
icti
m o
f A
ny C
rim
e (1
)
CC
VS
Vic
tim
of
Fiv
e C
omm
on
Cri
mes
(2
)
Perc
enta
ge
Poin
t D
iffer
ence
LAPO
P A
ssau
lt
(3)
CC
VS
Ass
ault
(4
)
Perc
enta
ge
Poin
t D
iffer
ence
LAPO
P Th
eft
(5
)C
CV
S Th
eft
(6)
Perc
enta
ge
Poin
t D
iffer
ence
The
Bah
amas
9.83
%18
.30
%–0
.08*
**1.8
0%
5.13
%–0
.03*
**1.3
4%
6.27
%–0
.05*
**
Bar
bad
os6.
77%
9.25
%–0
.02*
**0
.90
%3.
10%
–0.0
2***
1.30
%2.
68%
–0.0
1***
Jam
aica
6.64
%19
.06%
–0.12
***
0.8
0%
5.91
%–0
.05*
**2.
26%
8.90
%–0
.07*
**
Suri
nam
e9.
37%
11.9
5%–0
.03*
**0
.51%
3.0
2%–0
.03*
**2.
14%
3.54
%–0
.01*
**
Trin
idad
and
Tob
ago
9.50
%11
.09%
–0.0
2**
0.5
3%2.
79%
–0.0
2***
2.72
%3.
66%
–0.0
1**
New
Pro
vid
ence
10.6
9%20
.69%
–0.1*
**2.
19%
6.0
4%
–0.0
4**
*1.1
3%6.
64%
–0.0
6***
Gre
ater
Bri
dg
etow
n A
rea
8.75
%12
.28%
–0.0
4**
*1.0
3%3.
20%
–0.0
2***
1.43%
3.4
3%–0
.02*
**
Kin
gst
on
Met
rop
olit
an A
rea
8.18
%16
.32%
–0.0
8***
0.9
6%5.
32%
–0.0
4**
*2.
49%
5.62
%–0
.03*
**
Par
amar
ibo
10.7
8%11
.05%
00
.60
%2.
46%
–0.0
2***
2.20
%3.
33%
–0.0
1***
Por
t of
Sp
ain
Met
rop
olit
an A
rea
13.2
2%15
.54
%–0
.02*
*1.3
3%4
.05%
–0.0
3***
2.23
%4
.95%
–0.0
3***
Sou
rce:
Pre
par
ed b
y th
e au
tho
rs u
sing
dat
a fr
om
the
IDB
Car
ibb
ean
Cri
me
Vic
tim
izat
ion
Sur
vey
(CC
VS
) m
od
ule
atta
ched
to
the
20
14/2
015
Lat
in A
mer
ican
Pub
lic O
pin
ion
Pro
ject
(LA
PO
P)
Sur
vey,
IVO
L d
atas
et s
erie
s (q
uest
ions
iden
tifie
d b
y IV
OL
num
ber
).N
ote:
***
, **,
* :
sig
nific
ant
at t
he .0
1, .0
5 an
d .1
leve
ls.


17
The Size and Dimensions of Victimization in the Caribbean
Heather Sutton, Jan van Dijk, and John van Kesteren
How big is the Caribbean’s crime problem? As we highlighted in the Introduction
to this volume, the Caribbean has one of the highest regional homicide rates
in the world. However, given the data limitations described in Chapter 1, it has
been difficult to accurately determine the size and dimensions of the overall crime
scenario and to study the risk and protective factors involved. By using universally
common definitions of the main types of crime, developed for the International Crime
Victimization Survey (ICVS), this volume offers an understanding of crime as per-
ceived by ordinary people and not domestic legal definitions. For the first time, crime
data are directly comparable not only between countries in the Caribbean region, but
also with the rest of the world. This is not possible using police data, or other previous
surveys, given the challenges identified in Chapter 1.
This chapter presents the key findings of victimization surveys conducted in
2014 and 2015 across five Caribbean countries identified here as the C5: The Baha-
mas, Barbados, Jamaica, Suriname, and Trinidad and Tobago.1 The prevalence and
incidence of victimization are estimated for five specific types of common crime
(car theft, burglary, robbery, personal theft, and assault and threat of assault) in the
capital city metropolitan areas of the five countries. We place the Caribbean on the
global map by comparing our survey findings with those of previous rounds of the
ICVS around the world. Finally, we examine crime specifics about offenders (their
numbers and their relationships to their victims), where crimes take place, and the
consequences for the victims. The final section presents conclusions and policy
implications.
2
1 For further information on the methodology see Chapter 1.

18
RESTORING PARADISE IN THE CARIBBEAN: COMBATTING VIOLENCE WITH NUMBERS
2.1 How Much Crime Is There?2.1.1 Prevalence RatesUsing responses from victimization surveys, we can calculate prevalence rates, which
are estimates of the percentage of the population that was a victim of a crime. Figure
2.1 shows the one-year prevalence estimates for victimization for at least one of the
five types of crime mentioned above. The gray shading in the figure represents the
margin of error; in other words, we can say with 95 percent confidence that rates lie
within the gray shading. On average, 13 percent of the Caribbean population was a vic-
tim of at least one of the five common crimes in a one-year period.2 This rate increased
to 15 percent for residents of capital city metropolitan areas.
A tentative ranking of the five countries according to their overall lower-bound victim-
ization rates shows Barbados as most secure, followed in declining order by Suriname,
Trinidad and Tobago, Jamaica, and The Bahamas. At the national level of the five coun-
tries, Barbados seems clearly the least affected by common crime. It has the lowest rates
of victimization for all five types of crime. Nevertheless, even in Barbados the level of
assaults and threats is considerable by international comparison, as will be discussed
further in the chapter.
As expected, the prevalence of victimization is generally higher in capital city
metropolitan areas. Exceptions were Jamaica, where national and capital rates are not com-
parable due to differences in survey questionnaires, and Suriname, where the difference
2 Since most interviews were conducted in the summer of 2014, the reference period for the one-year victim-ization rates is 2013/2014 (2014/2015 for Barbados). Links to the data and the complete questionnaire used in the surveys can be found in Appendix 1.3 in Chapter 1.
Figure 2.1: One-Year Victimization Prevalence Rate for at Least One of Five Types of Crime in Five Caribbean Countries and Capital City Metropolitan Areas (percent)
Per
cent
National NewProvidence
National GBA National* KMA National Paramaribo National PSMA
The Bahamas Barbados Jamaica Suriname Trinidad and Tobago
0
5
10
15
20
25
Source: Prepared by the authors using data from the IDB Caribbean Crime Victimization Survey module attached to the 2014/2015 Latin American Public Opinion Project Survey.Note: The five capital cities listed are New Providence, The Bahamas; GBA: Greater Bridgetown Area, Barbados; KMA: Kingston Metropolitan Area, Jamaica; Paramaribo, Suriname; and PSMA: Port of Spain Metropolitan Area, Trinidad and Tobago. The five types of crime are car theft, burglary, robbery, personal theft, and assaults and threats of assaults.* Jamaica’s calculation of national prevalence does not include crimes of car theft or burglary.

19
THE SIZE AND DIMENSIONS OF VICTIMIZATION IN THE CARIBBEAN
is insignificant. The concentration of crime in the capital cities seems somewhat less pro-
nounced in the Caribbean than in other world regions (Van Dijk and Van Kesteren 2015).
This may be largely due to the relatively high proportion of the Caribbean population that
lives in capital metropolitan areas (i.e., 70 percent of Bahamians live in New Providence).
Differences between capital and national rates are larger in countries with a larger popula-
tion (Jamaica and Trinidad and Tobago) and smaller in countries with smaller populations.
2.1.2 Incidence RatesWhile prevalence rates are based on the number of persons who were victimized
during a 12-month period, incidence rates measure the number of victimizations that
took place within that period. For example, a person who experienced two robberies
on separate occasions within the past year would be counted twice in the incidence
rate, but counted once in the prevalence rate. Since respondents are asked how often
they have been victimized by the five types of crime during the year, the incidence
rates can be calculated.3 Incidence rates are significantly higher than prevalence rates,
as seen below. The ranking of the five Caribbean countries in terms of incidence rates
is very similar to that of prevalence rates (Table 2.1). A complete table of incidence
rates by type of crime can be found in Appendix 2.2.
2.1.3 Repeat VictimizationMost crime victims in the Caribbean reported being victimized only once (average of
52 percent) (Table 2.2) in one year. Nearly one in three victims was victimized two or
3 The key distinction between victimization incidence rates and prevalence rates is whether the numerator consists of the number of victimizations or the number of victims. Incidence rates are estimated by dividing the number of victimizations that occur during a 12-month period by the population at risk for those victim-izations and multiplying by 100.
Table 2.1: One-Year Incidence Rates and Prevalence Rates in Five Caribbean Capital City Metropolitan Areas (percent)
Incidence (all 5 crimes)
Prevalence (all 5 crimes)
New Providence (The Bahamas) 40.9 20.7
Kingston Metropolitan Area (Jamaica) 38.8 16.3
Port of Spain Metropolitan Area (Trinidad and Tobago) 32.3 15.5
Paramaribo (Suriname) 29.2 11.0
Greater Bridgetown Area (Barbados) 27.4 12.3
Caribbean average (C5) 33.7 15.2
Source: Prepared by the authors using data from the IDB Caribbean Crime Victimization Survey module attached to the 2014/2015 Latin American Public Opinion Project Survey.Note: The five types of crime are car theft, burglary, robbery, personal theft, and assaults and threats of assaults.

20
RESTORING PARADISE IN THE CARIBBEAN: COMBATTING VIOLENCE WITH NUMBERS
three times (33 percent). More than one in seven was victimized four times or more
(15 percent). The relatively high number of repeat victimizations is worthy of attention.
This suggests that a small percentage of the population is disproportionately the tar-
get of crime in the region.
It is worth noting that while New Providence has the highest overall prevalence and
incidence rates, its percentage for those who have been victimized four or more times
(9.2 percent) is notably lower than the other cities examined. This suggests that crime
is more widespread and affects more individuals in The Bahamas. On the other hand,
Paramaribo, Kingston, and Bridgetown show above-average rates of high-frequency
repeat victimization (more than four times in a year).4 This signals that victimization is
likely more concentrated among specific groups of individuals. We explore the charac-
teristics of groups more vulnerable to crime in the following chapters.
2.1.4 Indirect VictimizationThe Caribbean crime victimization surveys also ask respondents about experiences
of indirect victimization. The data indicate that one in four (24.8 percent) Caribbean
adults have lost someone they felt close to due to violence in their lifetime (Figure 2.2).
This rate increases to nearly one in three (31.3 percent) for residents of capital city
metropolitan areas. The highest rate is found in Kingston, where nearly half the popu-
lation (48.8 percent) reported having lost someone close to violence, followed by New
Providence (39.4 percent). This information should be interpreted with caution given
the small size of Caribbean countries. Nevertheless, the implications are staggering
Table 2.2: Frequency of Victimization, Five Types of Crime, by Caribbean Capital City Metropolitan Area During One Year (percent)
1 time 2–3 times 4–5 times 6+ times
New Providence (The Bahamas) 55.7 35.2 7.8 1.4
Greater Bridgetown Area (Barbados) 53.1 30.2 9.5 7.2
Kingston Metropolitan Area (Jamaica) 50.9 31.2 10.7 7.2
Paramaribo (Suriname) 47.4 34.7 11.6 6.4
Port of Spain Metropolitan Area (Trinidad and Tobago)
52.7 32.6 11.2 3.4
Caribbean average (C5) 52.0 32.8 10.2 5.1
Source: Prepared by the authors using data from the IDB Caribbean Crime Victimization Survey module attached to the 2014/2015 Latin American Public Opinion Project Survey.Note: The five types of crime are car theft, burglary, robbery, personal theft, and assaults and threats of assaults.
4 Note that, unlike some national victimization surveys (such as the U.S. National Crime Victimization Sur-vey), this survey does not allow the interviewer to code for series victimizations (victimizations that occur with such frequency that a victim is unable to recall each individual event).

21
THE SIZE AND DIMENSIONS OF VICTIMIZATION IN THE CARIBBEAN
and may reflect a ripple effect where-
by each homicide has wide traumatic
effects on small, tightly connected
populations.
Similar results were found when re-
spondents were asked if they have, in
their lifetime, “ever witnessed a serious
attack, shooting, or beating in which
another person was badly injured
or killed?” Among the national-level
samples, one in four (25.7 percent)
had witnessed such an attack (Fig-
ure 2.3). This rate increased to one in
three (30.2 percent) among residents
of capital city metropolitan areas.
2.2 For Which Crimes Are Prevalence Rates Highest in Caribbean Capital Cities?
This section looks at prevalence by
type of crime in Caribbean capital city
metropolitan areas (see complete table
in Appendix 2.1).5 When breaking down
the victimization prevalence rates by
type of crime, several observations
can be made. As shown in Figure 2.4,
assault and threat as well as personal
theft were the most common types of
victimization reported in the region.
The combined measure of assault
and threat was the most commonly
reported crime in the region. Further,
compared to international averages for
Figure 2.2: Lifetime Prevalence of Losing Someone Close to Violence, Five Caribbean Capital City Metropolitan Areas (percent)
KingstonMetropolitan
Area
NewProvidence
Port ofSpain
MetropolitanArea
GreaterBridgetown
Area
Paramaribo
48.8
39.4
31.728.2
8.6
Caribbean average (C5)
0
20
10
30
40
50
60
Per
cent
Source: Prepared by the authors using data from the IDB Caribbean Crime Victimization Survey module attached to the 2014/2015 Latin American Public Opinion Project Survey.Note: The survey question asked (identified as IVOL 8) was: In your lifetime, has anyone you felt very close to been killed by violence?
Figure 2.3: Lifetime Prevalence of Witnessing a Serious Attack, Five Caribbean Capital City Metropolitan Areas (percent)
KingstonMetropolitan
Area
NewProvidence
Port ofSpain
MetropolitanArea
GreaterBridgetown
Area
Paramaribo
Caribbean average (C5)
42.035.6
32.8 30.6
13.2
Per
cent
0
20
10
30
40
50
60
Source: Prepared by the authors using data from the IDB Caribbean Crime Victimization Survey module attached to the 2014/2015 Latin American Public Opinion Project Survey.Note: The survey question asked (identified as IVOL 8) was: In your lifetime, has anyone you felt very close to been killed by violence?
5 More accurate prevalence rates can be determined in capital city metropolitan areas where an oversample of 3,000 respondents was drawn.

22
RESTORING PARADISE IN THE CARIBBEAN: COMBATTING VIOLENCE WITH NUMBERS
capital cities recorded in the ICVS, this
crime was significantly higher in the
Caribbean (Table 2.3). This supports
the conclusion that the region suffers
predominantly and disproportionately
from high levels of violent crime, and
specifically assaults and threats.
When burglary rates are included,
there is a relatively wide variance in lev-
els of crime within the region between
cities. New Providence stands out as
having the highest rate of car theft,
simple theft, robbery, and assaults.
Port of Spain has a relatively high rate
of car thefts, robberies, and assaults.
Kingston shows medium-to-high rates
for all categories except for assaults
and threats, which are higher.
Bridgetown and Paramaribo show
comparatively low rates for most
types of common crime.
2.2.1 Property CrimeTheft of personal property (without
the use of force, including pickpock-
eting) typically has the highest rate of
prevalence around the world, accord-
ing to past ICVS data. At 4.8 percent of
the population, the average prevalence
of theft in the Caribbean is the second
highest of the five crimes, but consid-
erably below the international average
of 8 percent (Figure 2.5). Theft was
above the regional average in New
Providence (6.6 percent), Kingston
(5.6 percent), and Port of Spain (4.9
percent) and below the regional aver-
age in Bridgetown (3.4 percent) and
Paramaribo (3.3 percent).
Figure 2.4: Comparison of Victimization Prevalence Rates for Five Crimes in Five Caribbean Capital City Metropolitan Areas (percent)
0
2
4
6
8
10 Auto theft
Burglary
TheftRobbery
Assault and threat
New Providence Greater Bridgetown Area Kingston Metropolitan Area Paramaribo Port of Spain Metropolitan Area
Source: Prepared by the authors using data from the IDB Caribbean Crime Victimization Survey module attached to the 2014/2015 Latin American Public Opinion Project Survey.
Figure 2.5: One-Year Prevalence Rates for Theft in Five Caribbean Capital City Metropolitan Areas (percent)
Per
cent
of p
opul
atio
nvi
ctim
ized
KingstonMetropolitan
Area
NewProvidence
Port ofSpain
MetropolitanArea
GreaterBridgetown
Area
Paramaribo
6.6
5.64.9
3.4 3.3
Caribbean average (C5)Global ICVS average (1990–2005)
0
54321
6789
Source: Prepared by the authors using data from the IDB Caribbean Crime Victimization Survey module attached to the 2014/2015 Latin American Public Opinion Project Survey.Note: The survey questions asked were: IVOL4—Excluding thefts by using force or threat, there are many other types of theft of personal property, such as pick-pocketing or theft of a purse, wallet, clothing, jewelry, mobile phone, and mp3 player, or sports equipment. In the last five years (that is, since 2009) have you personally been victim of any of these incidents? IVOL4A—When this happened was it within the last 12 months, or was it before this, or both? ICVS: International Crime Victimization Survey.

23
THE SIZE AND DIMENSIONS OF VICTIMIZATION IN THE CARIBBEAN
On average 1.9 percent of the pop-
ulation in capital city metropolitan
areas was a victim of vehicle theft in
2014/2015. Levels of car theft were
particularly high in New Providence
(4.7 percent of the population) and
relatively high in Port of Spain (2.5
percent) as compared with the rest
of the region (Figure 2.6). Auto theft
is typically higher in countries where
car ownership is highest. The high
rates in The Bahamas and Trinidad
and Tobago are partially explained by
relatively high levels of car ownership
(Figure 2.7).
The Caribbean Crime Victimiza-
tion Survey (CCVS) asked individuals
if someone had actually entered their
home without permission to steal or
try to steal something in the last 12
months. On average, 4.1 percent of
Caribbean households in the five cit-
ies have seen their homes burglarized.
This is about on par with the ICVS av-
erage for cities (Figure 2.8). Inter-city
variation for burglary is considerably
less than for other crimes. Burglary is
the most common of the five crimes
in Paramaribo. Regardless of the value
of what is actually stolen (or not), bur-
glaries involve a violation of the privacy
of one’s home and are therefore crimes
with high psychological impact.
Home invasions, where burglars
enter occupied houses using force or
threat of force, combine elements of
burglary with robbery and may be re-
corded in various ways by the police
in different countries (e.g., as burglary,
Figure 2.6: One-Year Prevalence of Vehicle Theft in Five Caribbean Capital City Metropolitan Areas (percent)
Per
cent
KingstonMetropolitan
Area
NewProvidence
Port ofSpain
MetropolitanArea
GreaterBridgetown
Area
Paramaribo
Caribbean average (C5)Global average capital cities(ICVS 1990–2005)
4.7
2.5
1.20.6 0.4
0
4
1
2
3
5
6
7
8
Source: Prepared by the authors using data from the IDB Caribbean Crime Victimization Survey module attached to the 2014/2015 Latin American Public Opinion Project Survey.Note: The survey questions asked were: IVOL1—In the last five years, have you or anyone else in your household had a car, van, SUV or pick-up truck that belonged to you or another household member, stolen or driven away without permission? IVOL1A—When this happened was it within the last 12 months, or was it before this, or both? ICVS: International Crime Victimization Survey.
Figure 2.7: Victimization by Vehicle Theft versus Car Ownership in Five Caribbean Capital City Metropolitan Areas (percent)
Vic
tims
of v
ehic
leth
eft (
perc
ent)
Household owns at least one vehicle (percent)
30 40 50 60 70 80 900
1
2
3
4
5
New Providence
KMA
PSMA
ParamariboGBA
Source: Prepared by the authors using data from the IDB Caribbean Crime Victimization Survey module attached to the 2014/2015 Latin American Public Opinion Project Survey.Note: The five capital cities listed are New Providence, The Bahamas; GBA: Greater Bridgetown Area, Barbados; KMA: Kingston Metropolitan Area, Jamaica; Paramaribo, Suriname; and PSMA: Port of Spain Metropolitan Area, Trinidad and Tobago.

24
RESTORING PARADISE IN THE CARIBBEAN: COMBATTING VIOLENCE WITH NUMBERS
robbery in a residence, home invasion
robbery, assault, etc.). CCVS respon-
dents who reported that someone
had entered their home without per-
mission to steal something (burglary)
were then asked if anyone was home
and was intimidated. Where force or
threat was used, these crimes could be
recoded as home invasion robberies.
We thus indicate the adjusted burglary
prevalence rates with an upper bound
(including home invasions)6 and lower
bound (excluding home invasion es-
timates). Home invasion prevalence
rates are discussed in Section 2.4.
2.2.2 Violent CrimeDefinitions of robbery vary widely
from one jurisdiction to another. This
often makes comparisons between
countries problematic. The Caribbean
victimization survey solves this prob-
lem by applying a uniform definition
consistent with the ICVS: “stealing,
or trying to steal something using or threatening force.” Robbery is different from
general theft in that it involves the use of force or threat of the use of force. For this
reason robbery is often considered a violent crime. In the Caribbean, during the one-
year reference period, 2.7 percent (lower bound) to 2.9 percent (upper bound) of the
population was a victim of robbery (Figure 2.9). Lower-bound estimates are mea-
sured consistent with the ICVS. Upper-bound estimates, shown by the gray shading in
Figure 2.9, also include home invasion burglaries recoded as robberies. The Caribbe-
an average was again on par with the international average from the ICVS. However,
robbery was notably highest in New Providence (4 to 4.4 percent), followed by Port
of Spain (3.5 to 4 percent) and Kingston (2.9 to 3.2 percent). Similar to other crimes
measured, robbery was significantly lower in Bridgetown (1.9 percent) and Paramaribo
(1.5 to 1.8 percent).
Figure 2.8: One-Year Prevalence of Burglary in Five Caribbean Capital City Metropolitan Areas (percent)
KingstonMetropolitan
Area
NewProvidence
Port ofSpain
MetropolitanArea
GreaterBridgetown
Area
Paramaribo
Caribbean average (C5)Global ICVS average(1990–2005)
BurglaryBurglary (excludinghome invasion)
4.0 4.1 3.5 3.6 3.1
0.5 0.4 0.7 0.5 0.1
0
4
3
2
1
5
6
7
8
Per
cent
Source: Prepared by the authors with data from the IDB Caribbean Crime Victimization Survey module attached to the 2014/2015 Latin American Public Opinion Project Survey.Note: The survey questions asked were: IVOL2—In the past five years (that is, since 2009), did anyone actually get into your main home without permission and steal or try to steal something? I am not including here thefts from the garden, garage, shed or lock-up or from a second home. IVOL2A—When did this happen? Was it within the last 12 months or was it before this, or both? Consideration for home invasion was not stipulated in past rounds of the International Crime Victimization Survey (ICVS); therefore, in order to compare with the international average, upper bound estimates should be used. The Caribbean average for the C5 is the average of upper-bound estimates.
6 Note that upper-bound estimates are consistent with the same measures for burglary prevalence regis-tered in the ICVS.

25
THE SIZE AND DIMENSIONS OF VICTIMIZATION IN THE CARIBBEAN
Assault and threat of assault are
typically measured as one crime in
crime victimization surveys.7 The av-
erage prevalence of assault and threat
in the five Caribbean cities is 6.8 per-
cent (Figure 2.10). This is considerably
above the ICVS average for cities. In
fact, Caribbean cities ranked as some
of the highest ever measured for this
type of crime. When disaggregated,
4.2 percent of individuals in the region
were victims of actual physical assault
and 4.1 percent were victims of threats.
Note that these prevalence rates ex-
plicitly exclude incidents related to
domestic and sexual violence, which
require their own dedicated surveys to
be accurately measured.8
The combined measure of as-
sault and threat is particularly high
in New Providence (8.8 percent)
and Kingston (8.3 percent), followed
by Bridgetown (6.1 percent), Port of
Spain (5.8 percent), and Paramaribo (4.9 percent). In the capitals with the highest
assault and threat prevalence, completed physical assaults were more common than
mere threats. New Providence had the highest assault prevalence rate (6 percent as-
sault rate compared to 4.6 percent threat rate), followed by Kingston (5.3 percent
assault rate versus 5.1 percent threat rate) and Port of Spain (4.1 percent assault rate
versus 3.2 percent threat rate). In Bridgetown and Paramaribo, the relationship was
reversed—fewer actual assaults were reported compared to threats of assault.
Figure 2.9: One-Year Prevalence of Robbery in Five Caribbean Capital City Metropolitan Areas (percent)
KingstonMetropolitan
Area
NewProvidence
Port ofSpain
MetropolitanArea
GreaterBridgetown
Area
Paramaribo
4.0 3.5 2.9 1.9 1.5
Caribbean average (C5)Global ICVS average (1990–2005)
Robbery (upper bound)*Robbery (lower bound)*
Per
cent
0
4
3
2
1
5
6
7
8
Source: Prepared by the authors using data from the IDB Caribbean Crime Victimization Survey module attached to the 2014/2015 Latin American Public Opinion Project Survey.Note: The survey questions asked were: IVOL3—In the last five years, has anyone stolen, or tried to steal something from you by using force or threatening you with force? IVOL3A—When this happened was it within the last 12 months, or was it before this, or both? ICVS: International Crime Victimization Survey.*Lower-bound estimates reflect persons who reported being a victim of a robbery, consistent with the ICVS. Upper-bound estimates include the percentage of burglaries that included use of force, recoded as robberies.
7 The specific meaning of assault varies between countries, but the definitions of assault and threat used here are provided in the survey questions identified as IVOL3 (see Figure 2.8) and IVOL5 (see Figure 2.10). In common law, the crime of assault is defined as when “an assault is carried out by a threat of bodily harm coupled with an apparent, present ability to cause the harm.”8 Surveys on crime do not take the extra steps needed in terms of survey design and implementation to address the barriers to accurately record these crimes, leading to significant under-estimation of the preva-lence of the problem. Experts on violence against women agree the best data come not from police or crime surveys, but instead from surveys on women’s health. The IDB is currently supporting the implementation of such surveys in the Caribbean region.

26
RESTORING PARADISE IN THE CARIBBEAN: COMBATTING VIOLENCE WITH NUMBERS
2.3 How Does the Caribbean Compare to Other Regions?
The results in Table 2.3 confirm the rel-
atively high average level of car theft
in the Caribbean region, given the
high rates in New Providence and Port
of Spain. In fact, the car theft rates in
these two cities of 4.7 percent and 2.5
percent, respectively, are among the
highest ever measured in the ICVS,
which were 2.9 percent in Rio de Ja-
neiro in 1996 and 3.4 percent in cities
in Italy in 2005. Rates of burglary and
robbery are significantly lower in the
Caribbean than in Africa and Latin
America. The average rate of theft of
personal property is lower than in any
other region. In contrast, the rate of
victimization by assault and threat is
significantly higher than in any other
world region, including Latin America.
Figure 2.10: One-Year Prevalence of Assaults and Threats in Five Caribbean Capital City Metropolitan Areas (percent)
KingstonMetropolitan
Area
NewProvidence
Port ofSpain
MetropolitanArea
GreaterBridgetown
Area
Paramaribo
Caribbean average (C5)Global ICVS average (1990–2005)
8.88.3
6.1 5.84.9
0
54321
6789
10
Per
cent
Source: Prepared by the authors using data from the IDB Caribbean Crime Victimization Survey module attached to the 2014/2015 Latin American Public Opinion Project Survey.Note: The survey questions asked were: IVOL5—In the past five years, has anyone slapped you, hit or punched you, kicked you, thrown something at you, or attacked you with a weapon in a way that really upset or angered you? Do NOT include horseplay, and do not include incidents of a sexual nature or incidents of domestic violence. IVOL6—In the past five years (that is, since 2009), has anyone seriously threatened to slap, hit, punch or kick you, threatened to throw something at you or otherwise injure you, or threatened you with a weapon in a way that really upset or angered you? Do NOT include threats made as jokes, and do not include incidents of a sexual nature or incidents of domestic violence. ICVS: International Crime Victimization Survey.
Table 2.3: Percentage of the Public Victimized by Crime Over a One-Year Period, by World Region
Car Theft Burglary Robbery
Theft of Personal Property
Assault and
ThreatAfrica (10 cities) 1.5 8.0 4.0 11.6 5.2
Asia (five cities) 0.2 4.8 0.8 8.1 2.6
Caribbean (five cities) 1.9 4.1 2.7 4.8 6.8
Eastern Europe (20 cities) 0.8 4.4 1.8 8.2 2.9
Latin America (seven cities) 1.4 5.9 7.8 11.0 4.7
United States (New York) 1.6 1.9 2.3 7.7 5.1
Western Europe (18 cities) 1.2 2.3 1.4 5.4 4.1
World average 1.2 4.5 3.0 8.1 4.5
Source: Prepared by the authors using data from the IDB Caribbean Crime Victimization Survey module attached to the 2014/2015 Latin American Public Opinion Project Survey, and from the 1990–2005 International Crime Victimization Survey.Note: The five Caribbean capital cities are New Providence, The Bahamas; Greater Bridgetown Area, Barbados; Kingston Metropolitan Area, Jamaica; Paramaribo, Suriname; and Port of Spain Metropolitan Area, Trinidad and Tobago.

27
THE SIZE AND DIMENSIONS OF VICTIMIZATION IN THE CARIBBEAN
2.4 Where Do Crimes Take Place and What Are the Consequences?
In the capital city metropolitan areas
of the C5, 62.1 percent of robberies
and 66.2 percent of assaults happened
within the victims’ own neighbour-
hood or their own homes. On average,
less than 10 percent of assaults and
robberies took place outside the vic-
tim’s city of residence (“elsewhere in
the country”). Respondents also re-
ported very few instances of violence
within the workplace (on average
6 percent of all assaults and less than
4 percent of robberies).
The relatively high amount of assaults taking place at the victim’s home
(Figure 2.11), despite explicit instructions for the respondent not to include inci-
dents of domestic violence, may indicate a high degree of assaults resulting from
disputes among neighbours and/or close acquaintances that end violently. Such an
explanation is supported by literature indicating the intensification of interpersonal
conflict and the growth of a “sub-culture of violence” in the region (Harriott 2008).
Conversely, it could also be possible that some of these assaults occurred during a
break-in or robbery of the home.9 Finally, a third option is that incidents of domestic
violence were reported as assaults due to the somewhat ambiguous nature, or lack
of understanding, of the term.
Home invasion robberies, where robbers enter occupied homes and use force or
intimidation, are a growing concern in many countries and can generate considerable
feelings of insecurity. On average in the Caribbean (C5), home invasions represented
nearly half of all robberies (44.9 percent). Figure 2.12 shows the prevalence rates, or
the percentage of the population that reported being a victim, of robberies outside
versus inside the home.10 Prevalence estimates for home invasion robbery were highest
in New Providence (2.2 percent) and Port of Spain (1.6 percent) followed by Kingston
Figure 2.11: Location of Assault, in the Last Year, in Five Caribbean Capital City Metropolitan Areas (percent)
New Providence Greater Bridgetown Area Kingston Metropolitan Area Paramaribo
Port of Spain Metropolitan Area
0
10
20
30
40
50
At your own home
In yourneighbourhood
At your workplace Elsewhere in the city
or local area
Elsewhere inthe country
Source: Prepared by the authors using data from the IDB Caribbean Crime Victimization Survey module attached to the 2014/2015 Latin American Public Opinion Project Survey.
9 Burglary occurs when an individual enters a structure in the absence of permission with the intent to com-mit a crime. However, the proceeding offence after a burglary or break-in could include several other offences such as assault or homicide.10 Note that rates for home invasion robberies include the combined measure of burglaries where force or threat were used and robberies that were reported to have taken place in the home.
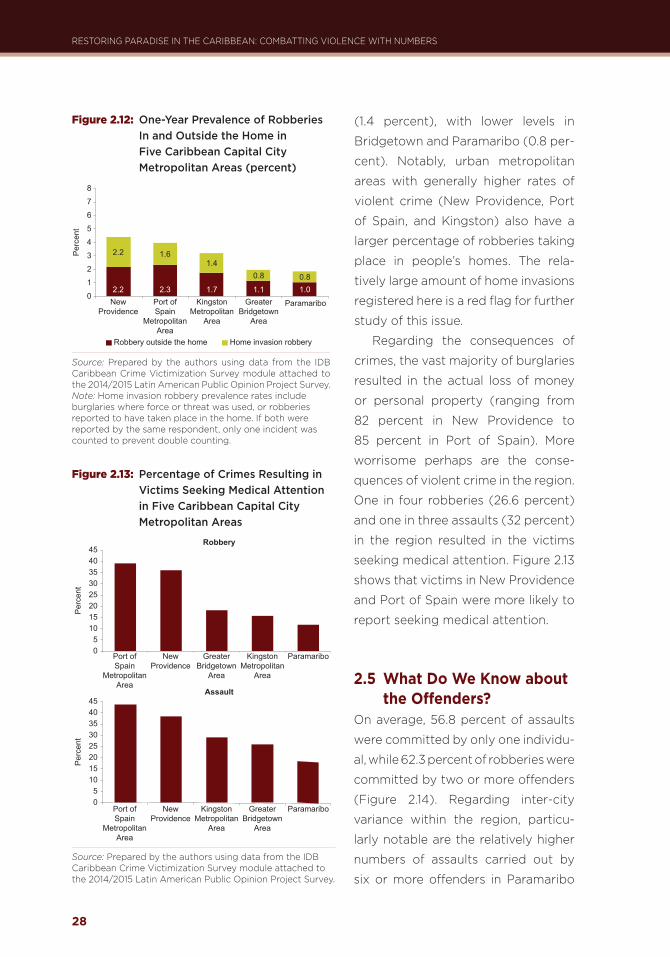
28
RESTORING PARADISE IN THE CARIBBEAN: COMBATTING VIOLENCE WITH NUMBERS
(1.4 percent), with lower levels in
Bridgetown and Paramaribo (0.8 per-
cent). Notably, urban metropolitan
areas with generally higher rates of
violent crime (New Providence, Port
of Spain, and Kingston) also have a
larger percentage of robberies taking
place in people’s homes. The rela-
tively large amount of home invasions
registered here is a red flag for further
study of this issue.
Regarding the consequences of
crimes, the vast majority of burglaries
resulted in the actual loss of money
or personal property (ranging from
82 percent in New Providence to
85 percent in Port of Spain). More
worrisome perhaps are the conse-
quences of violent crime in the region.
One in four robberies (26.6 percent)
and one in three assaults (32 percent)
in the region resulted in the victims
seeking medical attention. Figure 2.13
shows that victims in New Providence
and Port of Spain were more likely to
report seeking medical attention.
2.5 What Do We Know about the Offenders?
On average, 56.8 percent of assaults
were committed by only one individu-
al, while 62.3 percent of robberies were
committed by two or more offenders
(Figure 2.14). Regarding inter-city
variance within the region, particu-
larly notable are the relatively higher
numbers of assaults carried out by
six or more offenders in Paramaribo
Figure 2.13: Percentage of Crimes Resulting in Victims Seeking Medical Attention in Five Caribbean Capital City Metropolitan Areas
Per
cent
Per
cent
05
1015202530354045
KingstonMetropolitan
Area
NewProvidence
Port ofSpain
MetropolitanArea
GreaterBridgetown
Area
Robbery
Assault
Paramaribo
05
1015202530354045
KingstonMetropolitan
Area
NewProvidence
Port ofSpain
MetropolitanArea
GreaterBridgetown
Area
Paramaribo
Source: Prepared by the authors using data from the IDB Caribbean Crime Victimization Survey module attached to the 2014/2015 Latin American Public Opinion Project Survey.
Figure 2.12: One-Year Prevalence of Robberies In and Outside the Home in Five Caribbean Capital City Metropolitan Areas (percent)
KingstonMetropolitan
Area
NewProvidence
Port ofSpain
MetropolitanArea
GreaterBridgetown
Area
Paramaribo
2.2 2.3 1.7 1.1 1.0
2.2 1.61.4
0.8 0.8
Robbery outside the home Home invasion robbery
0
4
3
2
1
5
6
7
8
Per
cent
Source: Prepared by the authors using data from the IDB Caribbean Crime Victimization Survey module attached to the 2014/2015 Latin American Public Opinion Project Survey.Note: Home invasion robbery prevalence rates include burglaries where force or threat was used, or robberies reported to have taken place in the home. If both were reported by the same respondent, only one incident was counted to prevent double counting.

29
THE SIZE AND DIMENSIONS OF VICTIMIZATION IN THE CARIBBEAN
and Bridgetown (9.4 percent and
8.6 percent, respectively). As could
be expected, robbery victims most
often did not know the offender(s)
by name or by sight (59.6 percent),
while the opposite is true for vic-
tims of assault—74.5 percent knew
the offender(s) at least by sight
(Figure 2.15). Across the region the
proportions of assault victims who
knew the offender were 86 percent
in Bridgetown, 80 percent in Kings-
ton, 75 percent in New Providence,
63 percent in Port of Spain and
60 percent in Paramaribo.
2.6 Conclusions and Policy Implications
The defining characteristic of crime
in the region is the uniquely high
level of violent crime, including ho-
micide and victimization by threats
and assaults (often with the use of
guns; see Chapter 8). The fact that
one in three Caribbean adults has
lost someone close to violence in
their lifetime has significant implications in terms of the trauma experienced by
these populations. On the other hand, the region experiences medium to low rates
of victimization in terms of property crime, with the exception of car thefts, which
are relatively common in New Providence and Port of Spain. The high levels of re-
peat victimization in the region are worthy of further study and suggest that a small
percentage of the population is disproportionately the target of crime.
Regarding inter-regional variance, New Providence and Kingston stand out with the
highest levels of assault and threat. They have some of the highest levels ever measured
in the ICVS. In New Providence and Port of Spain, the level of robbery is compara-
tively high, as is the number of victims seeking medical care after experiencing robbery
or assault. Levels of violent crime are lowest in Paramaribo and Bridgetown. Preva-
lence of property crime such as burglary is remarkably similar between the countries
Figure 2.14: Number of Offenders in Assault and Robbery in Five Caribbean Capital City Metropolitan Areas (percentage of victims)
Per
cent
of a
ssau
lt vi
ctim
sP
erce
nt o
f rob
bey
vict
ims
0Kingston
MetropolitanArea
NewProvidence
Port ofSpain
MetropolitanArea
GreaterBridgetown
Area
Paramaribo
102030405060708090
100
0Kingston
MetropolitanArea
NewProvidence
Port ofSpain
MetropolitanArea
GreaterBridgetown
Area
Paramaribo
102030405060708090
100
1 2 3 4 5 6+
Assault
Robbery
Source: Prepared by the authors using data from the IDB Caribbean Crime Victimization Survey module attached to the 2014/2015 Latin American Public Opinion Project Survey.

30
RESTORING PARADISE IN THE CARIBBEAN: COMBATTING VIOLENCE WITH NUMBERS
of the region and aligned with the
international average. Car theft was
particularly high in New Providence
and Port of Spain. However, this is at
least in part a reflection of the higher
levels of car ownership in these cities.
Overall, most violent crimes were
committed within victims’ neigh-
bourhoods or homes. Home invasion
robbery has been the subject of very
little research, and this chapter sug-
gests it is worthy of further study.
Most victims were robbed by strang-
ers, while assaults were committed
by someone the victim knew. How-
ever, given the high prevalence of
assault and threat in the region, res-
idents are more likely to be attacked
or threatened by someone they
know than robbed by a stranger.
The policy implications here are that
more efforts and resources ought to
be directed towards addressing in-
terpersonal assaults, which may be
more effectively tackled via preven-
tion than deterrence. In most cases
assaults were carried out by only
one individual, while robberies were
likely to be committed in groups of two or more. It is notable that in Paramaribo and
New Providence close to 1 in 10 robberies was committed by a group of six or more.
Some of the drivers of the crime problem in the Caribbean are further explored
in subsequent chapters, with targeted policy discussions for each contributing
factor. Specific factors include individual socio-economic characteristics and early
experiences of violence in the home or with peers among youth; neighbourhood
characteristics; country-level macro characteristics; gang activity; and the avail-
ability of firearms. Other factors cited in the literature that are not addressed in
this publication include drug trafficking and deportation of ex-convicts from the
United States.
Figure 2.15: Relationship of Victim to Offender for Robbery and Assault in Five Caribbean Capital City Metropolitan Areas (percentage of victims)
Per
cent
age
of ro
bber
y vi
ctim
sP
erce
ntag
e of
ass
ault
vict
ims
0Kingston
MetropolitanArea
NewProvidence
Port ofSpain
MetropolitanArea
GreaterBridgetown
Area
Paramaribo
20
40
60
80
100
0Kingston
MetropolitanArea
NewProvidence
Port ofSpain
MetropolitanArea
GreaterBridgetown
Area
Paramaribo
20
40
60
80
100
I did not know an/the offender(s) by name or by sightI knew an/the offender(s) by sight onlyI knew an/the offender(s) by name
Robbery
Assault
Source: Prepared by the authors using data from the IDB Caribbean Crime Victimization Survey module attached to the 2014/2015 Latin American Public Opinion Project Survey.

31
THE SIZE AND DIMENSIONS OF VICTIMIZATION IN THE CARIBBEAN
App
endi
x 2.
1. V
ictim
izat
ion
Prev
alen
ce fo
r Fiv
e C
rimes
by
Car
ibbe
an C
ount
ry a
nd C
apita
l City
M
etro
polit
an A
rea
(per
cent
)
Cou
ntry
All
5 C
rim
es+/
–A
uto
Thef
t+/
–B
urgl
ary
+/–
Rob
bery
+/–
Hom
e In
vasi
on+/
–Th
eft
+/–
Ass
ault
+/–
Thre
at+/
–A
ssau
lt+
Thre
at+/
–
The
Bah
amas
18.3
1.33.
70
.63.
70
.63.
50
.61.7
0.4
6.3
0.8
5.1
0.7
3.9
0.6
7.4
0.9
Bar
bado
s9.
30
.90
.40
.21.7
0.4
1.20
.30
.50
.22.
70
.53.
10
.53.
40
.65.
10
.7
Jam
aica
19.1
2.0
5.2
1.12.
00
.78.
91.4
5.9
1.28.
01.4
10.9
1.6
Surin
ame
11.9
1.00
.70
.24
.40
.61.9
0.4
0.5
0.2
3.5
0.6
3.0
0.5
3.8
0.6
5.6
0.7
Trin
idad
and
To
bago
11.1
0.9
1.30
.32.
90
.51.7
0.4
0.8
0.3
3.7
0.6
2.8
0.5
1.70
.43.
90
.6
Car
ibbe
an
aver
age
(C5)
13.0
0.5
1.30
.22.
90
.22.
30
.20
.90
.14
.40
.33.
70
.33.
60
.35.
90
.4
Cap
ital
met
ro a
rea
Cap
ital
C
ity
Met
ropo
litan
A
rea
All
5 C
rim
es+/
–A
uto
Thef
t+/
–B
urgl
ary
+/–
Rob
bery
+/–
Hom
e In
vasi
on+/
–Th
eft
+/–
Ass
ault
+/–
Thre
at+/
–A
ssau
lt+
Thre
at+/
–
New
Pr
ovid
ence
20.7
1.44
.70
.84
.00
.74
.30
.72.
20
.56.
60
.96.
00
.94
.60
.78.
81.0
Gre
ater
B
ridge
tow
n A
rea
12.3
1.20
.40
.23.
10
.61.9
0.5
0.8
0.3
3.4
0.7
3.2
0.6
4.3
0.7
6.1
0.9
Kin
gsto
n M
etro
polit
an
Are
a
16.3
1.31.2
0.4
3.6
0.7
3.2
0.6
1.40
.45.
60
.85.
30
.85.
10
.88.
31.0
Para
mar
ibo
11.0
1.10
.60
.34
.10
.71.8
0.5
0.8
0.3
3.3
0.6
2.5
0.6
3.5
0.7
4.9
0.8
Port
of S
pain
M
etro
polit
an
Are
a
15.5
1.32.
50
.63.
50
.73.
90
.71.6
0.5
4.9
0.8
4.1
0.7
3.2
0.6
5.8
0.8
Car
ibbe
an
aver
age
(C5)
15.2
0.6
1.90
.23.
70
.33.
00
.31.4
0.2
4.8
0.3
4.2
0.3
4.1
0.3
6.8
0.4
Sou
rce:
Pre
par
ed b
y th
e au
tho
rs u
sing
dat
a fr
om
the
IDB
Car
ibb
ean
Cri
me
Vic
tim
izat
ion
Sur
vey
mo
dul
e at
tach
ed t
o t
he 2
014
/20
15 L
atin
Am
eric
an P
ublic
Op
inio
n P
roje
ct S
urve
y.

32
RESTORING PARADISE IN THE CARIBBEAN: COMBATTING VIOLENCE WITH NUMBERS
App
endi
x 2.
2. V
ictim
izat
ion
Inci
denc
e Ra
tes
for F
ive
Crim
es b
y C
arib
bean
Cou
ntry
and
Cap
ital C
ity
Met
ropo
litan
Are
a an
d Ty
pe o
f Crim
e
Cou
ntry
Tota
l+/
–A
uto
Thef
t+/
–B
urgl
ary
+/–
Rob
bery
+/–
Thef
t+/
–A
ssau
lt+/
–Th
reat
+/–
Ass
ault
+ Th
reat
+/–
The
Bah
amas
31.6
1.64
.40
.75.
30
.73.
90
.67.
30
.96.
20
.84
.50
.710
.71.0
Bar
bad
os22
.11.3
0.5
0.2
3.0
0.5
1.40
.43.
50
.65.
90
.77.
80
.813
.71.1
Jam
aica
48.
12.
50
.00
.00
.00
.08.
01.4
14.6
1.89.
61.5
15.9
1.825
.52.
2
Suri
nam
e28
.11.4
0.7
0.3
6.7
0.8
2.5
0.5
5.3
0.7
5.6
0.7
7.2
0.8
12.8
1.0
Trin
idad
and
To
bag
o20
.31.2
1.40
.45.
30
.71.9
0.4
4.6
0.6
3.9
0.6
3.3
0.5
7.2
0.8
Car
ibb
ean
aver
age
(C5)
27.2
0.7
1.60
.25.
10
.32.
90
.25.
90
.45.
70
.36.
60
.412
.30
.5
Cap
ital
met
ro a
rea
Cap
ital
Cit
y M
etro
polit
an
Are
aTo
tal
+/–
Aut
o Th
eft
+/–
Bur
glar
y+/
–R
obbe
ry+/
–Th
eft
+/–
Ass
ault
+/–
Thre
at+/
–A
ssau
lt+
Thre
at+/
–
New
P
rovi
den
ce4
0.9
1.85.
50
.86.
40
.95.
20
.88.
71.0
8.5
1.06.
50
.915
.01.3
Gre
ater
B
rid
get
own
Are
a
27.4
1.60
.50
.25.
20
.82.
80
.64
.60
.75.
60
.88.
71.0
14.3
1.3
Kin
gst
on
Met
rop
olit
an
Are
a
38.8
1.71.7
0.5
6.0
0.9
4.7
0.8
8.0
1.08.
51.0
9.9
1.118
.41.4
Par
amar
ibo
29.2
1.60
.80
.38.
91.0
2.4
0.5
5.5
0.8
4.3
0.7
7.4
0.9
11.7
1.1
Por
t of
Sp
ain
Met
rop
olit
an
Are
a
32.3
1.72.
80
.66.
10
.94
.90
.86.
90
.96.
30
.95.
30
.811
.61.1
Car
ibb
ean
aver
age
(C5)
33.7
0.8
2.2
0.2
6.5
0.4
4.0
0.3
6.7
0.4
6.6
0.4
7.6
0.4
14.2
0.6
Sou
rce:
Pre
par
ed b
y th
e au
tho
rs u
sing
dat
a fr
om
the
IDB
Car
ibb
ean
Cri
me
Vic
tim
izat
ion
Sur
vey
mo
dul
e at
tach
ed t
o t
he 2
014
/20
15 L
atin
Am
eric
an P
ublic
Op
inio
n P
roje
ct S
urve
y.

33
Who Is Most Likely to Be a Victim of Crime?
Heather Sutton and Lucciana Alvarez
Identifying risk and protective factors that make individuals more or less likely to
be a victim of a crime is an important step towards evidence-based crime preven-
tion policy. Knowing who is more likely to be a victim can help target interventions
for prevention and protection. However, the lack of reliable data on crime in the Ca-
ribbean, and particularly on the characteristics of crime victims, has been a major
constraint, as explained in the previous chapter.
Results of victim surveys can be used to determine which groups in the population
are more or less at risk of being victims of crime than others. This chapter will analyse the
statistical significance of individual characteristics associated with the likelihood of being
a victim of a crime in five Caribbean countries. We begin with an overview of the literature
internationally and from the region. Next, the chapter presents a profile of crime victims in
the Caribbean by type of crime, focusing particularly on assaults and threats, which were
identified in Chapter 2 as the most problematic in the region. We then turn to a multivari-
ate logistic regression showing the statistically significant characteristics of crime victims.
3.1 BackgroundVictimization can be analysed from a number of perspectives. Routine activities theo-
ry suggests that individual-level factors account for aggregate crime differences over
time. This theory posits that individuals spending more time outside of the home, and
with increased availability of portable luxury goods, become better targets and create
increased opportunities for criminals (Cohen and Felson 1979).
3.1.1 Urban ResidenceWorldwide, city residents are more likely than rural residents to be victims of a crime
(Alvazzi del Frate 1998; Hinton et al. 2014; Van Dijk, Van Kesteren, and Smit 2008).
3

34
RESTORING PARADISE IN THE CARIBBEAN: COMBATTING VIOLENCE WITH NUMBERS
This is particularly true in Latin America and the Caribbean. Urban residence was the
most significant predictor of victimization in the 28 countries where the Latin Amer-
ican Public Opinion Project (LAPOP) Survey was conducted in 2014/2015. Hinton et
al. (2014) found urban residents were twice as likely to be victims of a crime as those
living in rural areas. This chapter controls for urban residence by focusing the analysis
exclusively on the metropolitan areas of Caribbean capital cities.
Multivariate analysis of International Crime Victimization Survey (ICVS) data con-
firms that countries with higher proportions of citizens living in urban areas have
higher national victimization rates, regardless of other characteristics (Van Dijk 1999,
2008). The degree of overall crime was weakly correlated with urbanization, but
significant (r = .34, p < 0.05, n = 25). However, the degree of urbanization was more
strongly correlated with levels of violent crime (r = .59, p > 0.05, n = 28) (van Dijk
2008, 94). This can be partially explained by both strain theory and routine activities
theory, since cities bring together a confluence of motivated offenders (large pools
of unemployed, male youth) and criminal opportunities (good targets, i.e., affluent
individuals in the public domain). Other potential contributors to higher levels of
crime in cities are weakened family ties and other types of social cohesion, along
with high levels of residential turnover. Finally, luxury goods are more abundant and
less “socially” guarded.
3.1.2 Young, Single MalesBased on routine activities theory, Hindelang, Gottfredson, and Garofolo (1978) sug-
gest that some socio-demographic groups would have higher victimization levels.
They argue that those in the public domain and who share characteristics with the
most common offenders are more likely to be targets. Single, young men who are
routinely away from the home are more likely to be victims of street crime because
they are more likely to meet offenders who are over-represented in their social circles.
Equally, because they are away from home, their homes are more vulnerable to being
burglarized (Cohen and Cantor 1981).
Empirical evidence supports this. Most offenders, as well as victims of crimes, are
young males between the ages of 15 and 30 (Adler, Mueller, and Laufer 1998; Beato
and Andrade 2004; Carvalho and Lavor 2008; Cole and Gramajo 2009; Truman and
Langton 2014; Van Dijk 2008). Specifically, young men who are unemployed and have
a low level of education are more likely to be victims of violent crime. On the other
hand, young men who have more education and higher income levels are more likely to
be victims of property crime (Bergman 2006). Findings on offending show generally
similar age-sex profiles for victims and offenders. Self-reported delinquency surveys
from many countries show that young men significantly reduce involvement in crime
and delinquency as they enter adulthood (Bartelet 2004).

35
WHO IS MOST LIKELY TO BE A VICTIM OF CRIME?
3.1.3 Wealth and EducationAt the individual level, some evidence suggests that more affluent and more educated
individuals have a higher likelihood of being a victim, particularly of property crime
(Anderson 2009; Felson and Clarke 1998; Hinton et al. 2014). Some studies have found
the relationship is not linear—at a certain level of wealth, the likelihood of victimization
may diminish (Justus and Kassouf 2007). Other studies find that, specifically in Latin
America, as wealth quintiles increase so does the likelihood of being a victim of any
crime (Hinton et al. 2014). On the other hand, the same has not been found for violent
crime (homicide, shooting, assault). In fact, homicides often tend to be concentrated
among disadvantaged youth.
Economic development has not, by itself, led to reductions in crime by eliminating
its root causes. This is particularly true in Latin America and the Caribbean, where
over the last decade economies have continued to grow and crime has continued to
increase. Trends in crime over time are positively related to increasing levels of afflu-
ence in the medium term. Routine activities theory offers an explanation given that
increased wealth leads to increased consumption of luxury goods, increasing target
attractiveness and opportunities for criminals (through increased urbanization and
weakening of social ties). In the medium term, the fact that fewer people are driven to
offend by income deprivation is outweighed by the fact that there are increased and
more profitable opportunities for crime, often with impunity. Some scholars argue that
it is only when the societal cost of crime outweighs the cost of prevention and criminal
justice that sufficient resources will be invested to bring about a crime reduction—as
has been the case of Western Europe and the United States (Van Dijk 2008; Van Dijk,
Tseloni, and Farrell 2012).
3.1.4 Ethnicity/Race and ImmigrantsResearch suggests that race may play an important role in crime. While the relation-
ship between crime and race has been well studied, particularly in the United States,
the association is less explored in Caribbean literature. Henry, Dawkins, and Gibson
(2012) point out that perpetrators of homicide in Jamaica have been predominantly
black, although this is among a population that is predominantly black (Figure 3.1). In
Trinidad and Tobago the homicide rate is high in Afro-Trinidadian communities, while
Indo-Trinidadians and people of mixed race are less likely to be victims and perpetra-
tors of homicides (Johnson and Kochel 2012). Theory suggests that this may stem
from African slaves having suffered high levels of violence during the era of slavery
and now constituting a large portion of marginalized and poor communities (Kalunta -
Crumpton 2012). On the other hand, communities of voluntary immigrants (white,
East-Indian, or Chinese) who were originally introduced to the country as contract
workers are less likely today to be involved in crime and violence. Much of this may be

36
RESTORING PARADISE IN THE CARIBBEAN: COMBATTING VIOLENCE WITH NUMBERS
attributed to the fact that black communities and communities of recent immigrants
have historically been poor and subject to urban segregation. The links between crime
and marginalized communities have been greatly studied in the international criminol-
ogy literature. Contrary to popular belief, international studies, mostly from the United
States, indicate that immigration does not increase crime. To the contrary, intensified
laws and enforcement practices against immigration may make these communities
more vulnerable to being victimized (Nunziata 2014; Zatz and Smith 2012). Figure 3.1
Figure 3.1: Distribution of Population by Ethnicity by Country (percent)
The Bahamas Barbados
Jamaica
Trinidad and Tobago
2.71%
1.33% 3.11%
Black White Oriental East Indian Middle Eastern Mixed Other Not stated
Black East Indian Chinese White Mixed Other Not stated
Suriname
Natives/Indians Maroon Creole African/Surinamese Hindustani Javanese Chinese Caucasian Mixed Remainder Do not know
15.68%
3.76%
27.41%
13.66%
1.46% 13.36%
1.32%
21.71%
African CaucasianChinese
East Indian
IndigenousMixed—African/East Indian Mixed—Other
PortugueseSyrian/Lebanese Other ethnic group
Not stated
90.62%
2.10% 4.72%
92.45%
0.75% 5.97% 0.68%
92.20%
34.22%
35.43%
7.66%
15.16%
6.22%
Black Black and white Black and other White White and other Asian East Indian Other races Not stated
Source: Census data from The Bahamas (2010), Barbados (2010), Jamaica (2011), Suriname (2012), and Trinidad and Tobago (2011).

37
WHO IS MOST LIKELY TO BE A VICTIM OF CRIME?
shows the distribution of ethnicity in
the five countries studied here.
3.2 Facts and Figures3.2.1 GenderA preliminary look at the crime sur-
vey data shows that for five common
crimes measured in Caribbean capital
city metropolitan areas,1 the overall
percentage of male victims was higher
than that of female victims (Figure 3.2).
This is of little surprise given that this
survey does not measure the types of
violence where women are dispropor-
tionately victims (i.e., intimate partner
and sexual violence).
Figure 3.3 shows victimization
prevalence rates disaggregated
by gender and type of crime. Property crimes (auto theft, burglary, and theft) are
delineated by the black lines and violent crimes (robbery, assaults and threats) are
delineated by the gray lines. There was no significant difference between men and
women for property crimes. However, assaults and threats were significantly higher
for men than women in all capital cities except Kingston. On average, prevalence rates
for men for assaults and threats were nearly twice as high as for women (11 percent
versus 6.6 percent). Robbery was slightly higher for men in some capitals, but not
significantly.
3.2.2 AgeThe data show that most victims of all five crimes combined are youths between
18 and 24 years old (Figure 3.4). In New Providence specifically, we see the highest
one-year prevalence rates for 18–24 year-olds who are victims of a crime (29 percent
versus 20 percent of the overall population), but also high levels of victimization in
the category of 25–34 year olds (25 percent). The notable exception is Port of Spain,
where a higher percentage of the elderly (15.4 percent) reported being victimized than
in other countries. Youth victimization is further discussed in detail in Chapter 5.
Figure 3.2: Victimization Prevalence for Five Crimes by Gender in Five Caribbean Capital City Metropolitan Areas (percent)
0Kingston
MetropolitanArea
NewProvidence
Port ofSpain
MetropolitanArea
GreaterBridgetown
Area
Paramaribo
5
10
15
20
25
FemaleMale
Source: Prepared by the authors using data from the IDB Caribbean Crime Victimization Survey module attached to the 2014/2015 Latin American Public Opinion Project Survey.Note: The five crimes are auto theft, burglary, theft, robbery, and assaults and threats.
1 The five crimes are auto theft, burglary, theft, robbery, and assaults and threats.

38
RESTORING PARADISE IN THE CARIBBEAN: COMBATTING VIOLENCE WITH NUMBERS
3.2.3 Income and WealthFigure 3.5 shows that, generally, as income quintiles increase, the likelihood of being
a victim of any crime decreases, with a slight increase between quintiles 4 and 5. This
is particularly true for violent crimes of assault and threat, while burglary and theft
appear to have a somewhat curvilinear relationship with income. The explanation
is that young and opportunistic burglars and thieves tend to operate on their own
in poor neighbourhoods, while professional burglars pursue high-income targets.
Car theft increases significantly in the highest income quintile, while robbery is
Figure 3.3: Victimization Rates by Type of Crime and Gender in Five Caribbean
0
FemaleOverall Male
2
4
6
8
Auto theft Burglary Theft Robbery Assault Threat
Kingston Metropolitan Area-JA
0
2
4
6
Auto theft Burglary Theft Robbery Assault Threat
Greater Bridgetown Area-BA
0
2
4
6
8
Auto theft Burglary Theft Robbery Assault Threat
New Providence-BH
0
2
4
6
Auto theft Burglary Theft Robbery Assault Threat
Paramaribo-SU
0
2
4
6
Auto theft Burglary Theft Robbery Assault Threat
Port of Spain Metropolitan Area-TT
Source: Prepared by the authors using data from the IDB Caribbean Crime Victimization Survey module attached to the 2014/2015 Latin American Public Opinion Project SurveyNote: Black lines delineate property crimes and gray lines delineate violent crimes.

39
WHO IS MOST LIKELY TO BE A VICTIM OF CRIME?
somewhat consistent across in-
come quintiles. Given the relatively
high non-response rate regarding
household income, we also present
the victimization rates by wealth
quintiles, which capture the entire
sample and show a similar dynamic
(Figure 3.6).2 The prevalence of
assaults and threats in the lowest
wealth quintile was consistently the
highest across the region, but was
particularly acute in Kingston (11 per-
cent versus 8.3 percent for the total
population) and in New Providence
(11.5 percent versus 8.8 percent for
the total population).
3.2.4 Ethnicity, Race, and Immigration Status
Among the five countries exam-
ined here, Trinidad and Tobago and
Suriname have the most hetero-
geneous populations, while in The
Bahamas, Barbados, and Jamaica
over 90 percent of the population is
Afro-Caribbean (Figure 3.1). There
was some variation in victimization
levels by ethnicity, but results should
be interpreted with caution given the
small numbers of victims in each eth-
nicity category (Appendix 3.1). White
or Caucasian prevalence rates for be-
ing victimized by one of the five types
of crime were generally lower than the
Figure 3.5: Victimization Prevalence Rate by Income Quintile in Five Caribbean Capital City Metropolitan Areas (percent)
0
1214
10
1618
2468
20
1 2 3 4 5Auto theftAny crime BurglaryTheftRobbery Assault or Threat
Source: Prepared by the authors using data from the IDB Caribbean Crime Victimization Survey module attached to the 2014/2015 Latin American Public Opinion Project Survey.Note: The five capital cities listed are New Providence, The Bahamas; Greater Bridgetown Area, Barbados; Kingston Metropolitan Area, Jamaica; Paramaribo, Suriname; and Port of Spain Metropolitan Area, Trinidad and Tobago.
Figure 3.4: Prevalence Rates for Five Common Crimes by Age in Five Caribbean Capital City Metropolitan Areas (percent)
0% 5%
10% 15% 20% 25% 30%
18–24
25–34
35–49 50–64
65 or older
New Providence Greater Bridgetown Area Kingston Metropolitan Area Paramaribo Port of Spain Metropolitan Area
Source: Prepared by the authors using data from the IDB Caribbean Crime Victimization Survey module attached to the 2014/2015 Latin American Public Opinion Project Survey.Note: The five crimes are auto theft, burglary, theft, robbery, and assaults and threats.
2 Research has shown that expenditure-based economic status indicators are more reliable than indices that are income-based (Deaton 1997). As a result, the LAPOP Surveys also collect information on household assets with the aim of obtaining more precise measures of economic well-being. See Appendix 3.2 for an explanation of the way wealth quintiles were constructed.

40
RESTORING PARADISE IN THE CARIBBEAN: COMBATTING VIOLENCE WITH NUMBERS
mean (except in Kingston and Par-
amaribo), while black or mixed-race
individuals were slightly higher or on
par with city averages. Box 3.1 further
explores the statistical significance
of race and ethnicity as predictors of
victimization for Trinidad and Tobago.
3.2.5 Correlates of VictimizationTo further examine which individual
characteristics determine increased
risk of victimization in Caribbean cap-
ital metropolitan areas, each of the
variables discussed at the beginning
of the chapter were included in a mul-
tivariate logistic regression analysis.3
Figure 3.7 shows the results for the
Figure 3.6: Victimization Prevalence Rate by Wealth Quintile (Assets Index) in Five Caribbean Capital City Metropolitan Areas (percent)
0
161412
18
108
Vic
timiz
atio
n pr
eval
ence
46
2
20
1 2 3 4 5
Auto theftAny of five crimes BurglaryTheftRobbery Assault or threat
Wealth quintiles
Source: Prepared by the authors using data from the IDB Caribbean Crime Victimization Survey module attached to the 2014/2015 Latin American Public Opinion Project Survey.Note: The five capital cities listed are New Providence, The Bahamas; Greater Bridgetown Area, Barbados; Kingston Metropolitan Area, Jamaica; Paramaribo, Suriname; and Port of Spain Metropolitan Area, Trinidad and Tobago.
3 See results table in Appendix 3.3.
Figure 3.7: Individual-Level Correlates of Victimization in Five Caribbean Capital Cities (logit coefficient, 95 percent confidence interval; n = 14,025)
Young (16–24)
Young adult (25–34)
Middle aged (35–49)
Senior (50–64)
Single
Years of schooling
Wealth index
Gun ownership
Migrant
Skin colour
Male
–1 0 1 2
Property crime Violent crime Witnessed an attack Lost someone to violence
Source: Prepared by the authors using the IDB Caribbean Crime Victimization Survey module attached to the 2014/2015 Latin American Public Opinion Project Survey.Note: The five capital cities listed are New Providence, The Bahamas; Greater Bridgetown Area, Barbados; Kingston Metropolitan Area, Jamaica; Paramaribo, Suriname; and Port of Spain Metropolitan Area, Trinidad and Tobago.

41
WHO IS MOST LIKELY TO BE A VICTIM OF CRIME?
variables of interest (individual characteristics). The figure displays regression coeffi-
cients as dots and their 95 percent confidence intervals as horizontal lines. When the
horizontal line does not cross the gray vertical line at zero, the variable is statistically
significant.4
Box 3.1. Race/Ethnicity and Crime in Trinidad and Tobago
Trinidad and Tobago police records are unique in the region because they capture
data on the ethnicity of both the victim and perpetrator of a crime. Analysis of police
records shows an over-representation of Afro-Trinidadians and mixed-race individu-
als among crime victims when compared to their representation in the population.
Afro-Trinidadians were twice as likely to be homicide victims (Odds Ratio 2.2) or perpe-
trators (OR 2.0) when compared to their representation in the population. Mixed-race
individuals were over-represented among victims of robbery (OR 1.7), larceny (OR 1.8),
burglary (OR 1.7), and sexual assault (OR 2.5).
Box Table 3.1: Crime Victims and Perpetrators by Ethnicity in Trinidad and Tobago
Perc
ent
of
Popu
lati
on
Perc
ent
of
Hom
icid
e V
icti
ms
Perc
ent
of
Hom
icid
e Pe
rpet
rato
rs
Perc
ent
of
Rob
bery
V
icti
ms
Perc
ent
of
Larc
eny
/ La
rcen
cy M
otor
Ve
hicl
e V
icti
ms
Perc
ent
of
Bur
glar
yVic
tim
s
Perc
ent
of
Sexu
al O
ffen
ce
Vic
tim
s
Afro-Trinadadians 34.2 73.7 66.9 40.4 43 46 43.9
East Indian 35.4 17.7 26.1 38.2 35.4 32.1 26.2
Mixed 7.7 6.6 6.3 13.3 14.2 13.4 19.5
Other 22.7 2 0.7 5.2 7.4 8.5 10.4
Odds Ratio
Afro-Trinadadians 2.2 2.0 1.2 1.3 1.3 1.3
East Indian 0.5 0.7 1.1 1.0 0.9 0.7
Mixed 0.9 0.8 1.7 1.8 1.7 2.5
Other 0.1 0.0 0.2 0.3 0.4 0.5
Source: Authors’ calculations based on data from the Crime and Problem Analysis Branch of the Trinidad and Tobago Police Force.Note: Homicide data are for 2001–2013; data for other crimes are for 2010–2014.
4 The analysis controls for macro-level differences between cities by using city fixed effects. Additionally, it controls for neighbourhood conditions as reported by the respondent (i.e., signs of disorder, social cohesion, and informal social control). The relationship between victimization and neighbourhood conditions will be discussed in Chapter 6.

42
RESTORING PARADISE IN THE CARIBBEAN: COMBATTING VIOLENCE WITH NUMBERS
The regression tests the significance of each of the variables in relation to victim-
ization, when controlling for the other variables. Figure 3.7 depicts the main regression
results with regards to four outcomes: (1) being a victim of violent crime (assault and
threat) in the last year, (2) being a victim of property crime (theft) in the last year,
(3) witnessing a shooting or violent attack in one’s lifetime, and (4) having lost some-
one close to violence in one’s lifetime.
The results of Figure 3.7 show that:
• Being male was significantly associated with increased risk of victimization for vi-
olent crime (OR 1.44, p > .01) and indirect victimization (OR 1.87, p > .01), but not
property crime (theft, burglary).
• Youth and young adults were significantly more likely to be victims of violent crime
(youth 16–24 = OR 4.83, p > .01), but not property crime (theft).
• Being single was weakly but significantly associated with being a victim of violent
and property crime (OR 1.16 and 1.18, p < .01).
• Increased education was associated with a very slight increased risk of property
crime (theft), however, the effect is very small (OR 1.02, p < .01). There were no
significant associations between education and being a victim of violent crime.
• Individuals in households with guns were significantly more likely to have been vic-
tims of violent crime (OR 1.61, p < .01) and indirect victims of violence (witnessed
an attack = OR 1.86, p < .01 or lost someone to violence = OR 1.84, p < .01). Gun
ownership had no significant relation with theft.
• The Wealth Index was weakly but significantly correlated with reduced victimiza-
tion by violent crime (OR 0.93, p < .01) and indirect victimization (OR 0.95 and OR
0.93, p < .01). Household income seems to have a protective effect (reducing risk of
victimization) for violent crime (OR 0.49, p < .01) and losing someone to violence
(OR 0.68, p < .01).5 Different from the literature, household income was not a signif-
icant factor in the likelihood of being a victim of property crime.6
• Being an immigrant and skin col our had significant but generally weak associations
with victimization. Migrants were slightly less likely to have witnessed an attack
(OR 0.92, p < .05) and darker skin colour was associated with slightly higher levels
of property crime (OR 1.07, p < .01), witnessing an attack, and having lost someone to
5 In one regression model, we used a Household Income Index. This significantly reduced the sample size (7,955). We tested for a relationship between those who did not provide information on household income and victimization, but found no relation.6 Note that the same regression was run with the Wealth Index replacing the Household Income Index in order to use the complete sample (including those who did not answer the question on income). All other variables remained largely unchanged in their significance and logit coefficients. The Wealth Index was not significant when controlling for other variables. Therefore we can conclude that the sub-sample after includ-ing income is not biased towards a particular income group.

43
WHO IS MOST LIKELY TO BE A VICTIM OF CRIME?
violence (OR 1.05, p < .01). This finding may reflect differences in victimization among
different ethnic and immigrant groups and may be attributed to other factors that were
captured in the model (i.e., wealth, age, neighbourhood, etc.).
Regressions were also run for each individual capital city (see Appendix 3.4). The
specific ethnic groups (which represent 10 percent or more of the population) were
also included as dummy independent variables.7 Some noteworthy differences be-
tween capital cities included the following:
• Being male was not a significant predictor of victimization by assault and threat in
Kingston after controlling for other factors, but was associated with witnessing an
attack.
• Household gun ownership was a significant predictor of having witnessed an at-
tack or having lost someone to violence in every capital city except Kingston.
• Regarding race, the only statistically significant differences found were for Port
of Spain and Bridgetown. In Port of Spain, black and mixed-race individuals were
more likely to have witnessed an attack or shooting resulting in injury or death. In
Bridgetown, black individuals were less likely to be victims of theft.
3.3 Do Socio-demographic Factors Explain National Crime Rates?
Given the correlations noted above, at
the aggregate level we might expect
that countries with greater young ur-
ban male populations would be likely
to experience higher violent crime
rates. This correlation has been not-
ed in international studies that find
that urbanization and age structure
of a country can explain about half
of the variation in national victimiza-
tion rates (Van Dijk 1999). Figure 3.8
shows the moderately strong relation-
ship between the homicide rate and
Figure 3.8: Percentage of the Population That is Young and Male versus National Homicide Rates
0
10
20
30
40
Hom
icid
e ra
te p
er 1
00,0
00 p
opul
atio
n
Percent of the population that is male and 15–24 years old
50
60
100
70
90
80
0.10 0.12 0.14 0.16 0.18 0.20 0.22 0.24 0.26
Other The Caribbean Latin America
ATG ABW
BHS
BRB
BLZ
CUB
DOM
GRD
GUY
HTI
JAM
PRI
TTO
Sources: Prepared by the authors using homicide data for 2010 from the United Nations Office on Drugs and Crime data; and United Nations <Population Estimates> (2010).
7 Full regression results by country can be found in Appendices 3.3 and 3.4.

44
RESTORING PARADISE IN THE CARIBBEAN: COMBATTING VIOLENCE WITH NUMBERS
the percentage of the population that
is young and male worldwide (Spear-
man’s rho = 0.47, p > 0.05, n = 145)
for the year of most recently available
data (2010). However, it is notable that
the entire Latin America and Caribbe-
an region has higher homicide rates
than countries in other parts of the
world (burgundy), even at the same
levels of young male populations.
Similar observations can be made
about the relationship between the
percentages of the population resid-
ing in urban areas and GDP growth
compared to homicide rates (Figures
3.9 and 3.10), Latin America and the
Caribbean continues to stand out
with higher levels of homicide than
other countries with similarly urban-
ized populations and GDP growth
rates. This suggests that the region
is still more violent than it should be
for the level of economic growth and
age, gender, and urban composition
of the population. We address some
of the other potential risk and pro-
tective factors contributing to high
violent crime rates in the Caribbean
in Section Two of this report.
3.4 Conclusions and Policy ImplicationsResults of victimization surveys can be used to determine which groups in the pop-
ulation are more or less at risk of being victims of crime than others. Burglary rates
are household crimes and therefore evenly distributed across gender and age. Victim-
ization by other property crimes, such as theft, shows little differentiation across the
various groups.
Chapter 2 showed that that the risk of being assaulted or threatened is uniquely
high in the Caribbean. This risk is most elevated among young, low-income males.
Figure 3.9: Percentage of the Population That Is Urban versus National Homicide Rates
010203040
Hom
icid
e ra
te p
er10
0,00
0 po
pula
tion
Percent of population living in urban areas
5060
100
70
9080
Other The Caribbean Latin America
0 10 20 30 40 50 60 70 80 90 100
ATG
BHS
BRB
BLZ
DOM GRD GUY HTI
JAN
PRI
SUR
TTO
Sources: Prepared by the authors using data from the World Bank, World Development Indicators; and United Nations Office on Drugs and Crime homicide data for 2012.
Figure 3.10: GDP Growth versus National Homicide Rates
010203040
Hom
icid
e ra
te p
er10
0,00
0 po
pula
tion
GDP growth
5060
100
70
9080
Rest of the world The Caribbean Latin America
Relationship between GDP Growth and Homicide Rate
–8 –6 –4 –2 0 2 4 6 8 10 12 14 16
ATG
BHS
BRB
DOM
GRD GUY HTI
JAM
KNA LUC
VCT
SUR
TTO
Sources: Prepared by the authors with data from the World Bank, World Development Indicators; and United Nations Office on Drugs and Crime homicide data for 2012.

45
WHO IS MOST LIKELY TO BE A VICTIM OF CRIME?
The profile of the victims mirrors that of the offenders and is in line with global find-
ings. The under-representation of females among the victims is caused by the survey’s
purposeful exclusion of domestic and sexual violence, which are better measured via
other dedicated instruments and further discussed in Chapter 4.
So what are policymakers to do with this information? Obviously they are unlikely
to be able to influence factors such as urbanization and the age and gender com-
position of the population. Even if they could, these factors alone do not explain the
uniquely high levels of violent crime in the Caribbean compared to the rest of the
world. However, knowing the profile of victims and perpetrators for the most serious
crimes in the region (homicide and assault) can help in the design of victim sup-
port services and prevention interventions. Scarce resources should be devoted to the
types of prevention programmes that have worked in international contexts, targeting
some of the risk and protective factors addressed in the following chapters in Section
Two, including early experiences of violence in the home, early youth delinquency and
violence, neighbourhood conditions, gangs, and guns.

46
RESTORING PARADISE IN THE CARIBBEAN: COMBATTING VIOLENCE WITH NUMBERS
App
endi
x 3.
1. O
ne-Y
ear V
ictim
izat
ion
Prev
alen
ce b
y Et
hnic
Gro
up (
perc
ent)
Whi
teIn
dige
nous
Bla
ckM
ixed
Oth
er
Ethn
icit
yTo
tal
New
P
rovi
den
ceN
on-v
icti
m83
6481
8292
81
Vic
tim
1736
1918
819
Whi
teB
lack
Mix
edIn
dian
Oth
er
Ethn
icit
yTo
tal
GB
AN
on-v
icti
m10
089
8689
100
89
Vic
tim
011
1411
011
Whi
teB
lack
Mix
edIn
dian
Chi
nese
Oth
er
ethn
icit
yTo
tal
KM
AN
on-v
icti
m80
8487
7883
6785
Vic
tim
2016
1322
1733
15
Whi
teA
mer
indi
anA
fro-
Suri
nam
ese
Mix
edC
hine
seH
indu
stan
iJa
vane
seM
aroo
nJe
wis
hO
ther
Et
hnic
ity
Tota
l
Par
amar
ibo
Non
-vic
tim
8397
9090
100
9093
8810
079
90
Vic
tim
173
1010
010
712
021
10
Whi
teM
ixed
Indi
geno
usB
lack
Indi
anC
hine
seSy
rian
/Le
bane
seO
ther
Et
hnic
ity
Tota
l
PSM
AN
on-v
icti
m98
8586
8685
7578
100
86
Vic
tim
215
1414
1525
220
14
Sou
rce:
Pre
par
ed b
y th
e au
tho
rs u
sing
dat
a fr
om
the
IDB
Car
ibb
ean
Cri
me
Vic
tim
izat
ion
Sur
vey
mo
dul
e at
tach
ed t
o t
he 2
014
/20
15 L
atin
Am
eric
an P
ublic
Op
inio
n P
roje
ct S
urve
y.

47
WHO IS MOST LIKELY TO BE A VICTIM OF CRIME?
Appendix 3.2. Methodological Note: Wealth IndexThe Wealth Index has been calculated using Principal Components Analysis (PCA)
based on the first principal component. This methodology computes non-arbitrary
weights (factor scores) for each of the 10 household assets indicators listed in the
table below. The weights were generated separately for each city so that they express
the distribution of assets in a specific city. The Wealth Index y for household i estab-
lished in city c is the result of the following linear combination (Córdova 2009):
yx x
sx x
si c cc c
cc
c c
c, ,
, ,
,,
, ,
,
=−
+
−α α1
1 1
12
2 2
2
+
+−
αk c
k c k c
k c
x xs,
, ,
,
,
where
yx x
sx x
si c cc c
cc
c c
c, ,
, ,
,,
, ,
,
=−
+
−α α1
1 1
12
2 2
2
+
+−
αk c
k c k c
k c
x xs,
, ,
,
, and
yx x
sx x
si c cc c
cc
c c
c, ,
, ,
,,
, ,
,
=−
+
−α α1
1 1
12
2 2
2
+
+−
αk c
k c k c
k c
x xs,
, ,
,
, represent the mean and the standard deviation of asset xi,c in city
c. Also, ak,c is the weight calculated for each variable xi,c of city c.
Dichotomous Variable Description LAPOP Question
Television r1
Refrigerator r3
Conventional telephone r4
Cellular phone r4a
No vehicle r5
One vehicle
Two vehicles
Three vehicles
Washing machine r6
Microwave r7
Computer r15
Indoor bathroom r14
Drinking water r12
Source: Prepared by the authors.Note: LAPOP: Latin American Public Opinion Project Survey.
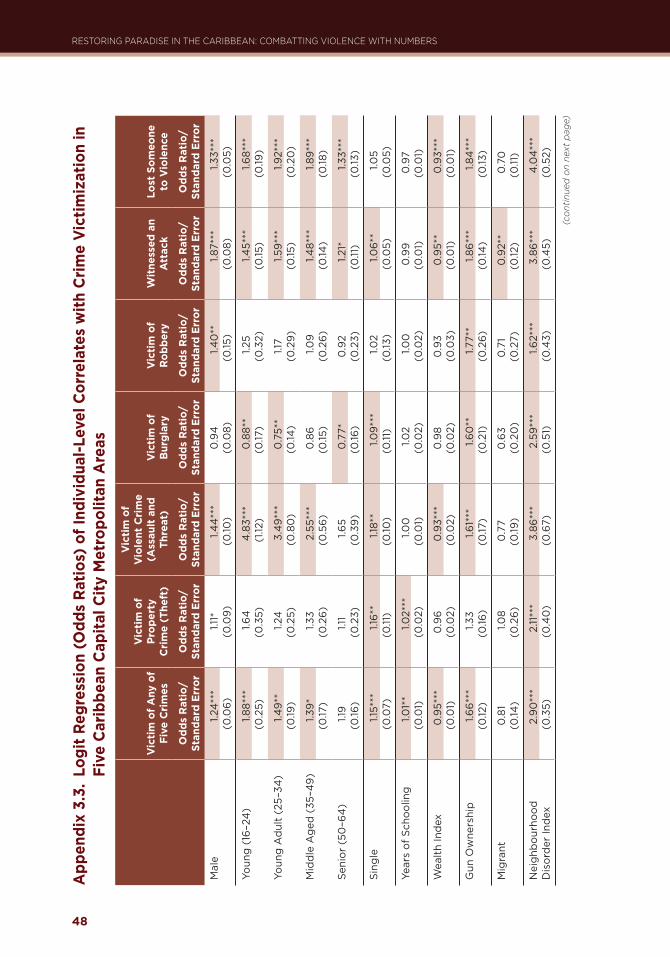
48
RESTORING PARADISE IN THE CARIBBEAN: COMBATTING VIOLENCE WITH NUMBERS
App
endi
x 3.
3. L
ogit
Regr
essi
on (O
dds
Ratio
s) o
f Ind
ivid
ual-L
evel
Cor
rela
tes
with
Crim
e Vi
ctim
izat
ion
in
Five
Car
ibbe
an C
apita
l City
Met
ropo
litan
Are
as
Vic
tim
of A
ny o
f Fi
ve C
rim
es
Vic
tim
of
Prop
erty
C
rim
e (T
heft
)
Vic
tim
of
Vio
lent
Cri
me
(Ass
ault
and
Th
reat
)V
icti
m o
f B
urgl
ary
Vic
tim
of
Rob
bery
Wit
ness
ed a
n A
ttac
kLo
st S
omeo
ne
to V
iole
nce
Odd
s R
atio
/St
anda
rd E
rror
Odd
s R
atio
/St
anda
rd E
rror
Odd
s R
atio
/St
anda
rd E
rror
Odd
s R
atio
/St
anda
rd E
rror
Odd
s R
atio
/St
anda
rd E
rror
Odd
s R
atio
/St
anda
rd E
rror
Odd
s R
atio
/St
anda
rd E
rror
Mal
e1.2
4**
*(0
.06)
1.11*
(0.0
9)1.4
4**
*(0
.10)
0.9
4(0
.08)
1.40
**(0
.15)
1.87*
**(0
.08)
1.33*
**(0
.05)
Youn
g (
16–2
4)
1.88*
**(0
.25)
1.64
(0.3
5)4
.83*
**(1
.12)
0.8
8**
(0.17
)1.2
5(0
.32)
1.45*
**(0
.15)
1.68*
**(0
.19)
Youn
g A
dul
t (2
5–34
)1.4
9**
(0.19
)1.2
4(0
.25)
3.4
9***
(0.8
0)
0.7
5**
(0.14
)1.1
7(0
.29)
1.59*
**(0
.15)
1.92*
**(0
.20
)
Mid
dle
Ag
ed (
35–4
9)1.3
9*(0
.17)
1.33
(0.2
6)2.
55**
*(0
.56)
0.8
6(0
.15)
1.09
(0.2
6)1.4
8***
(0.14
)1.8
9***
(0.18
)
Seni
or (
50–6
4)
1.19
(0.16
)1.1
1(0
.23)
1.65
(0.3
9)0
.77*
(0.16
)0
.92
(0.2
3)1.2
1*(0
.11)
1.33*
**(0
.13)
Sing
le1.1
5***
(0.0
7)1.1
6**
(0.11
)1.1
8**
(0.10
)1.0
9***
(0.11
)1.0
2(0
.13)
1.06*
*(0
.05)
1.05
(0.0
5)
Year
s of
Sch
oolin
g1.0
1**
(0.0
1)1.0
2***
(0.0
2)1.0
0(0
.01)
1.02
(0.0
2)1.0
0(0
.02)
0.9
9(0
.01)
0.9
7(0
.01)
Wea
lth
Ind
ex0
.95*
**(0
.01)
0.9
6(0
.02)
0.9
3***
(0.0
2)0
.98
(0.0
2)0
.93
(0.0
3)0
.95*
*(0
.01)
0.9
3***
(0.0
1)
Gun
Ow
ners
hip
1.66*
**(0
.12)
1.33
(0.16
)1.6
1***
(0.17
)1.6
0**
(0.2
1)1.7
7**
(0.2
6)1.8
6***
(0.14
)1.8
4**
*(0
.13)
Mig
rant
0.8
1(0
.14)
1.08
(0.2
6)0
.77
(0.19
)0
.63
(0.2
0)
0.7
1(0
.27)
0.9
2**
(0.12
)0
.70
(0.11
)
Nei
ghb
ourh
ood
D
isor
der
Ind
ex2.
90**
*(0
.35)
2.11
***
(0.4
0)
3.86
***
(0.6
7)2.
59**
*(0
.51)
1.62*
**(0
.43)
3.86
***
(0.4
5)4
.04
***
(0.5
2)
(con
tinu
ed o
n ne
xt p
age)

49
WHO IS MOST LIKELY TO BE A VICTIM OF CRIME?
App
endi
x 3.
3. L
ogit
Regr
essi
on (O
dds
Ratio
s) o
f Ind
ivid
ual-L
evel
Cor
rela
tes
with
Crim
e Vi
ctim
izat
ion
in
Five
Car
ibbe
an C
apita
l City
Met
ropo
litan
Are
as
Vic
tim
of A
ny o
f Fi
ve C
rim
es
Vic
tim
of
Prop
erty
C
rim
e (T
heft
)
Vic
tim
of
Vio
lent
Cri
me
(Ass
ault
and
Th
reat
)V
icti
m o
f B
urgl
ary
Vic
tim
of
Rob
bery
Wit
ness
ed a
n A
ttac
kLo
st S
omeo
ne
to V
iole
nce
Odd
s R
atio
/St
anda
rd E
rror
Odd
s R
atio
/St
anda
rd E
rror
Odd
s R
atio
/St
anda
rd E
rror
Odd
s R
atio
/St
anda
rd E
rror
Odd
s R
atio
/St
anda
rd E
rror
Odd
s R
atio
/St
anda
rd E
rror
Odd
s R
atio
/St
anda
rd E
rror
Info
rmal
Soc
ial C
ontr
ol
Ind
ex0
.91
(0.11
)0
.83
(0.17
)1.1
9(0
.20
)1.0
2(0
.22)
0.6
9(0
.18)
1.27*
(0.15
)1.1
8(0
.15)
Soci
al C
ohes
ion
Ind
ex0
.54
***
(0.0
9)0
.75*
(0.2
2)0
.37*
**(0
.09)
0.3
3***
(0.10
)1.4
8(0
.54
)0
.63*
**(0
.09)
0.8
8(0
.12)
Gan
g P
rese
nce
1.54
***
(0.0
9)1.4
9***
(0.13
)1.4
9***
(0.12
)1.6
5***
(0.17
)1.8
9***
(0.2
4)
2.18
***
(0.12
)2.
02*
**(0
.11)
Skin
Col
our
1.04
***
(0.0
2)1.0
7***
(0.0
3)1.0
5*(0
.02)
1.08*
**(0
.03)
1.07
(0.0
3)1.0
5**
(0.0
2)1.0
5***
(0.0
2)
Por
t of
Sp
ain
0.9
3*(0
.09)
0.8
4(0
.11)
0.7
3(0
.10)
1.00
(0.15
)1.0
2(0
.17)
0.5
1***
(0.0
6)0
.41*
**(0
.04
)
Par
amar
ibo
0.7
0*
(0.0
6)0
.60
**(0
.09)
0.7
0(0
.09)
1.29*
**(0
.19)
0.4
8***
(0.10
)0
.20
***
(0.0
2)0
.09*
**(0
.01)
New
Pro
vid
ence
1.40
*(0
.12)
1.20
(0.14
)1.1
8(0
.13)
1.17
(0.17
)1.2
9(0
.21)
0.7
2***
(0.0
5)0
.65*
**(0
.05)
GB
A0
.82*
(0.0
7)0
.63*
**(0
.09)
0.8
9(0
.11)
0.9
0(0
.14)
0.6
8*(0
.13)
0.8
2(0
.06)
0.4
9***
(0.0
3)
Num
ber
of
obse
rvat
ions
14,0
42
14,0
42
14,0
42
14,0
42
14,0
42
14,0
42
14,0
42
Sou
rce:
Pre
par
ed b
y th
e au
tho
rs u
sing
dat
a fr
om
the
IDB
Car
ibb
ean
Cri
me
Vic
tim
izat
ion
Sur
vey
mo
dul
e at
tach
ed t
o t
he 2
014
/20
15 L
atin
Am
eric
an P
ublic
Op
inio
n P
roje
ct S
urve
y.N
ote:
GB
A: G
reat
er B
rid
get
own
Are
a. *
**, *
*, *
: sig
nific
ant
at t
he .0
1, .0
5, a
nd .1
leve
ls. L
ight
bur
gun
dy
shad
ing
ind
icat
es s
igni
fican
ce a
bov
e a
.05
leve
l.
(con
tinu
ed)

50
RESTORING PARADISE IN THE CARIBBEAN: COMBATTING VIOLENCE WITH NUMBERS
App
endi
x 3.
4. L
ogit
Regr
essi
on (O
dds
Ratio
s) o
f Ind
ivid
ual-L
evel
Cor
rela
tes
with
Crim
e Vi
ctim
izat
ion
for
Five
Car
ibbe
an C
apita
l City
Met
ropo
litan
Are
as
Kin
gsto
n M
etro
polit
an A
rea
Any
Cri
me
Thef
tA
ssau
lt a
nd
Thre
atB
urgl
ary
Rob
bery
Wit
ness
ed A
ttac
kLo
st S
omeo
ne
Odd
s R
atio
(St
anda
rd E
rror
)
Mal
e(0
.119)
1.254
(0.2
06)
1.14
8(0
.171)
0.9
96(0
.187)
1.756
**(0
.423
)2.
031
***
(0.17
0)
1.387
***
(0.11
0)
Youn
g (
16–2
4)
1.576
*(0
.415
)1.7
32(0
.698
)6.
104
***
(3.3
49)
0.6
10(0
.238
)0
.610
(0.2
38)
1.190
(0.2
36)
1.881
***
(0.3
42)
Youn
g A
dul
t (2
5–34
)1.2
86(0
.334
)1.1
50(0
.450
)4
.90
6***
(2.6
39)
0.5
23*
(0.2
04
)0
.613
(0.2
90)
1.74
5***
(0.3
34)
2.69
9***
(0.4
70)
Mid
dle
Ag
ed (
35–4
9)1.1
32(0
.287
)1.0
15(0
.380
)3.
584
**(1
.891
)0
.559
(0.2
11)
0.6
53(0
.273
)1.6
05*
**(0
.288
)2.
687*
**(0
.461
)
Seni
or (
50–6
4)
0.8
33(0
.226
)0
.870
(0.3
49)
1.74
9(0
.997
)0
.24
4**
*(0
.112)
0.4
38*
(0.2
11)
1.462
**(0
.281
)1.6
24**
*(0
.30
2)
Sing
le1.1
52(0
.130
)1.0
65(0
.198)
1.139
(0.17
0)
1.384
(0.3
06)
1.138
(0.2
82)
1.156
*(0
.101)
0.8
92(0
.079
)
Year
s of
Sch
oolin
g1.0
12(0
.024
)0
.996
(0.0
41)
0.9
93(0
.032
)1.0
36(0
.052
)1.0
60(0
.054
)0
.988
(0.0
16)
0.9
70*
(0.0
16)
Wea
lth
Ind
ex0
.935
**(0
.027
)0
.94
0(0
.04
3)0
.90
8***
(0.0
33)
0.9
65(0
.054
)0
.958
(0.0
60)
0.9
36**
*(0
.024
)0
.874
***
(0.0
23)
Gun
Ow
ners
hip
1.40
0(0
.332
)1.2
91(0
.481
)1.0
88(0
.375
)1.6
21(0
.684
)1.4
51(0
.699
)1.3
38(0
.275
)1.6
14**
(0.3
51)
Imm
igra
nt— —
— —— —
— —— —
1.095
(0.5
03)
0.4
44
(0.2
21)
Nei
ghb
ourh
ood
D
isor
der
Ind
ex1.7
77**
(0.4
86)
0.9
55(0
.425
)3.
817*
**(1
.350
)1.0
91(0
.573
)2.
243
(1.2
20)
2.26
6***
(0.4
75)
2.82
3***
(0.5
57)
Soci
al C
ontr
ol In
dex
0.8
82(0
.226
)1.0
05
(0.4
44
)1.5
25(0
.537
)0
.455
(0.2
27)
0.4
15*
(0.2
10)
1.365
(0.2
76)
1.233
(0.2
64)
(con
tinu
ed o
n ne
xt p
age)
(con
tinu
ed)

51
WHO IS MOST LIKELY TO BE A VICTIM OF CRIME?
Soci
al C
ohes
ion
Ind
ex0
.523
**(0
.171)
0.5
64(0
.312
)0
.267
***
(0.11
5)0
.757
(0.4
70)
1.959
(1.4
59)
0.4
94**
*(0
.132)
1.367
(0.3
33)
Gan
g P
rese
nce
1.224
(0.15
1)1.3
42*
(0.2
36)
1.231
(0.2
02)
1.585
**(0
.34
2)1.1
01
(0.3
00
)2.
760
***
(0.2
61)
2.4
36**
*(0
.229
)
Bla
ck0
.616
(0.19
8)0
.495
(0.2
27)
0.6
19(0
.282
)0
.64
2(0
.366
)0
.723
(0.4
52)
0.8
66(0
.24
2)0
.839
(0.2
14)
Mix
ed0
.50
1*(0
.180
)0
.482
(0.2
41)
0.5
05
(0.2
48)
0.4
75(0
.30
2)0
.498
(0.3
53)
0.7
36(0
.213
)0
.863
(0.2
41)
Ind
ian
— —— —
— —— —
— —— —
— —
Num
ber
of
obse
rvat
ions
2,87
12,
871
2,87
12,
871
2,87
12,
889
2,88
9
Port
of S
pain
Met
ropo
litan
Are
a
Any
Cri
me
Thef
tA
ssau
lt a
nd
Thre
atB
urgl
ary
Rob
bery
Wit
ness
ed A
ttac
kLo
st S
omeo
ne
Odd
s R
atio
(St
anda
rd E
rror
)
Mal
e1.2
42*
(0.13
8)1.2
06
(0.2
26)
1.418
*(0
.267
)0
.781
(0.16
6)1.0
67(0
.223
)1.4
89**
*(0
.172)
1.180
*(0
.110
)
Youn
g (
16–2
4)
1.084
(0.3
05)
0.8
40
(0.4
11)
2.71
8**
(1.2
58)
0.4
77*
(0.19
7)1.4
22(0
.786
)1.2
08
(0.3
33)
2.0
40
**(0
.689
)
Youn
g A
dul
t (2
5–34
)0
.868
(0.2
26)
0.6
98(0
.294
)1.6
72(0
.70
9)0
.468
**(0
.163)
0.9
37(0
.510
)1.2
18(0
.259
)2.
00
3**
(0.6
00
)
Mid
dle
Ag
ed (
35–4
9)0
.967
(0.2
25)
0.7
99(0
.299
)1.7
17(0
.660
)0
.666
(0.18
3)1.1
14(0
.54
8)1.1
05
(0.2
54)
1.870
**(0
.469
)
App
endi
x 3.
4. L
ogit
Regr
essi
on (O
dds
Ratio
s) o
f Ind
ivid
ual-L
evel
Cor
rela
tes
with
Crim
e Vi
ctim
izat
ion
for
Five
Car
ibbe
an C
apita
l City
Met
ropo
litan
Are
as
Kin
gsto
n M
etro
polit
an A
rea
Any
Cri
me
Thef
tA
ssau
lt a
nd
Thre
atB
urgl
ary
Rob
bery
Wit
ness
ed A
ttac
kLo
st S
omeo
ne
Odd
s R
atio
(St
anda
rd E
rror
)
(con
tinu
ed)
(con
tinu
ed o
n ne
xt p
age)

52
RESTORING PARADISE IN THE CARIBBEAN: COMBATTING VIOLENCE WITH NUMBERS
Seni
or (
50–6
4)
0.9
38(0
.241
)1.0
21(0
.390
)0
.665
(0.2
90)
0.7
97(0
.351
)1.2
51(0
.677
)0
.972
(0.2
04
)1.2
76(0
.276
)
Sing
le0
.921
(0.12
2)1.6
34**
(0.3
84)
0.8
00
(0.18
1)0
.814
(0.2
20)
0.9
54(0
.263
)1.0
03
(0.10
5)1.1
02
(0.15
9)
Year
s of
Sch
oolin
g1.0
07
(0.0
17)
1.00
0(0
.028
)0
.986
(0.0
26)
1.014
(0.0
30)
0.9
98(0
.034
)0
.953
*(0
.024
)0
.932
**(0
.026
)
Wea
lth
Ind
ex0
.956
(0.0
34)
0.9
93(0
.050
)0
.897
**(0
.04
6)1.0
36(0
.067
)0
.971
(0.0
59)
0.9
83(0
.031
)1.0
24(0
.04
3)
Gun
Ow
ners
hip
2.21
7***
(0.3
18)
1.560
*(0
.367
)2.
782*
**(0
.566
)1.2
93(0
.474
)2.
760
***
(0.6
70)
2.51
0**
*(0
.411
)2.
157*
**(0
.295
)
Imm
igra
nt0
.813
(0.3
22)
1.268
(0.5
92)
0.8
27(0
.441
)0
.588
(0.4
25)
0.8
72(0
.50
9)1.2
54(0
.364
)0
.871
(0.2
71)
Nei
ghb
ourh
ood
D
isor
der
Ind
ex2.
319*
**(0
.54
9)1.5
69(0
.555
)3.
728*
**(1
.547
)2.
643*
**(0
.933
)1.3
21(0
.784
)4
.360
***
(1.3
04
)8.
485
***
(2.8
62)
Soci
al C
ontr
ol In
dex
1.360
(0.3
75)
1.412
(0.6
23)
2.25
6**
(0.9
27)
2.18
6**
(0.8
61)
0.9
68(0
.524
)1.8
24*
(0.5
73)
1.716
(0.6
06)
Soci
al C
ohes
ion
Ind
ex0
.856
(0.3
67)
0.6
10(0
.418
)0
.761
(0.4
94)
0.16
5**
(0.12
0)
0.9
21(0
.712
)0
.356
***
(0.13
8)0
.855
(0.2
59)
Gan
g P
rese
nce
1.878
***
(0.2
17)
1.862
***
(0.3
45)
1.431
**(0
.247
)1.9
64**
*(0
.426
)2.
724
***
(0.9
39)
1.655
***
(0.19
4)
1.989
***
(0.2
55)
(con
tinu
ed o
n ne
xt p
age)
App
endi
x 3.
4. L
ogit
Regr
essi
on (O
dds
Ratio
s) o
f Ind
ivid
ual-L
evel
Cor
rela
tes
with
Crim
e Vi
ctim
izat
ion
for
Five
Car
ibbe
an C
apita
l City
Met
ropo
litan
Are
as
Port
of S
pain
Met
ropo
litan
Are
a
Any
Cri
me
Thef
tA
ssau
lt a
nd
Thre
atB
urgl
ary
Rob
bery
Wit
ness
ed A
ttac
kLo
st S
omeo
ne
Odd
s R
atio
(St
anda
rd E
rror
)
(con
tinu
ed)

53
WHO IS MOST LIKELY TO BE A VICTIM OF CRIME?
Bla
ck1.2
10(0
.474
)0
.636
(0.2
98)
4.2
45
(4.4
20)
1.74
6(1
.224
)0
.462
(0.2
56)
1.94
4**
(0.5
78)
1.747
*(0
.565
)
Mix
ed1.6
50(0
.672
)0
.972
(0.4
78)
5.4
67(5
.722
)1.5
45
(1.0
84)
0.4
03
(0.2
36)
1.888
**(0
.555
)1.6
71(0
.523
)
Ind
ian
1.441
(0.6
03)
1.176
(0.5
52)
2.21
9(2
.50
7)1.9
12(1
.530
)0
.496
(0.3
23)
1.639
(0.5
17)
1.399
(0.4
70)
Num
ber
of
obse
rvat
ions
2,77
72,
777
2,77
72,
777
2,77
72,
777
2,77
7
Para
mar
ibo
Any
Cri
me
Thef
tA
ssau
lt a
nd
Thre
atB
urgl
ary
Rob
bery
Wit
ness
ed A
ttac
kLo
st S
omeo
ne
Odd
s R
atio
(St
anda
rd E
rror
)
Mal
e1.3
07*
*(0
.170
)1.3
26(0
.299
)1.9
92**
*(0
.379
)0
.74
2(0
.140
)0
.990
(0.3
43)
1.70
3***
(0.19
7)1.2
12(0
.170
)
Youn
g (
16–2
4)
2.27
1**
(0.7
60)
0.9
97(0
.447
)6.
115*
**(3
.756
)1.0
43
(0.5
35)
4.5
62(4
.84
3)1.7
31*
(0.5
45)
0.6
65(0
.256
)
Youn
g A
dul
t (2
5–34
)1.4
18(0
.44
4)
0.6
37(0
.287
)3.
222*
(1.9
47)
1.20
9(0
.552
)3.
301
(3.4
99)
1.773
**(0
.516
)1.2
24(0
.418
)
Mid
dle
Ag
ed (
35–4
9)1.2
09
(0.3
82)
0.8
00
(0.3
42)
1.420
(0.9
15)
1.326
(0.5
94)
4.13
3(4
.30
0)
1.760
**(0
.50
5)1.5
34(0
.516
)
Seni
or (
50–6
4)
1.573
(0.4
97)
0.6
07
(0.2
97)
2.11
8(1
.299
)1.6
95(0
.780
)3.
181
(3.4
48)
1.391
(0.4
46)
1.437
(0.4
88)
Sing
le1.0
15(0
.160
)1.1
35(0
.264
)1.0
18(0
.211
)0
.855
(0.2
01)
0.5
92(0
.229
)0
.914
(0.13
3)1.0
95(0
.169)
Year
s of
Sch
oolin
g0
.989
(0.0
21)
0.9
98(0
.039
)0
.979
(0.0
29)
1.015
(0.0
31)
0.9
68(0
.04
8)1.0
03
(0.0
18)
0.9
89(0
.022
)
App
endi
x 3.
4. L
ogit
Regr
essi
on (O
dds
Ratio
s) o
f Ind
ivid
ual-L
evel
Cor
rela
tes
with
Crim
e Vi
ctim
izat
ion
for
Five
Car
ibbe
an C
apita
l City
Met
ropo
litan
Are
as
Port
of S
pain
Met
ropo
litan
Are
a
Any
Cri
me
Thef
tA
ssau
lt a
nd
Thre
atB
urgl
ary
Rob
bery
Wit
ness
ed A
ttac
kLo
st S
omeo
ne
Odd
s R
atio
(St
anda
rd E
rror
)
(con
tinu
ed)
(con
tinu
ed o
n ne
xt p
age)

54
RESTORING PARADISE IN THE CARIBBEAN: COMBATTING VIOLENCE WITH NUMBERS
Wea
lth
Ind
ex0
.954
(0.0
33)
0.9
59(0
.056
)0
.983
(0.0
52)
0.9
31(0
.04
9)0
.90
9(0
.080
)0
.894
***
(0.0
28)
0.9
51(0
.035
)
Gun
Ow
ners
hip
1.615
***
(0.2
39)
1.541
*(0
.391
)1.2
46
(0.2
98)
2.16
8***
(0.4
81)
1.193
(0.4
98)
2.0
33**
*(0
.297
)2.
320
***
(0.3
59)
Imm
igra
nt1.2
93(0
.356
)1.6
24(0
.654
)1.1
07
(0.4
19)
1.016
(0.4
47)
0.9
42
(0.7
11)
0.9
38(0
.234
)0
.911
(0.2
95)
Nei
ghb
ourh
ood
D
isor
der
Ind
ex6.
943*
**(2
.027
)5.
925*
**(3
.070
)8.
801*
**(3
.375
)7.
362*
**(3
.320
)2.
258
(1.4
92)
5.95
6***
(1.7
36)
2.72
2***
(0.8
74)
Soci
al C
ontr
ol In
dex
1.20
4(0
.333
)1.2
70(0
.60
6)0
.862
(0.3
41)
1.186
(0.5
03)
0.6
70(0
.391
)1.1
66(0
.331
)1.2
11(0
.417
)
Soci
al C
ohes
ion
Ind
ex0
.491
(0.2
44
)0
.961
(0.8
43)
0.2
56*
(0.17
8)0
.472
(0.3
24)
15.3
68*
(23.
028
)0
.786
(0.3
60)
0.8
81(0
.454
)
Gan
g P
rese
nce
1.74
6***
(0.2
52)
1.676
**(0
.40
5)1.6
17**
(0.3
23)
2.10
8***
(0.4
57)
1.573
(0.6
26)
1.867
***
(0.2
60)
1.281
(0.2
15)
Bla
ck1.0
84(0
.222
)1.2
33(0
.439
)1.0
40
(0.3
41)
1.335
(0.4
70)
1.617
(0.9
31)
1.179
(0.2
39)
1.436
*(0
.30
3)
Mix
ed1.0
85(0
.225
)1.1
48
(0.4
35)
1.159
(0.3
86)
1.125
(0.4
14)
0.9
72(0
.685
)1.0
84(0
.233
)1.0
50(0
.258
)
Ind
ian
1.216
(0.2
86)
1.30
3(0
.533
)1.2
99(0
.454
)1.2
88(0
.492
)1.4
73(0
.852
)0
.872
(0.2
03)
0.7
79(0
.188)
Num
ber
of
obse
rvat
ions
2,79
72,
797
2,79
72,
797
2,79
72,
797
2,79
7
(con
tinu
ed o
n ne
xt p
age)
App
endi
x 3.
4. L
ogit
Regr
essi
on (O
dds
Ratio
s) o
f Ind
ivid
ual-L
evel
Cor
rela
tes
with
Crim
e Vi
ctim
izat
ion
for
Five
Car
ibbe
an C
apita
l City
Met
ropo
litan
Are
as
Para
mar
ibo
Any
Cri
me
Thef
tA
ssau
lt a
nd
Thre
atB
urgl
ary
Rob
bery
Wit
ness
ed A
ttac
kLo
st S
omeo
ne
Odd
s R
atio
(St
anda
rd E
rror
)
(con
tinu
ed)

55
WHO IS MOST LIKELY TO BE A VICTIM OF CRIME?
Mal
e1.2
37**
(0.12
1)0
.914
(0.13
3)1.5
06*
**(0
.20
4)
1.076
(0.18
7)1.2
87(0
.275
)1.8
16**
*(0
.157)
1.34
5***
(0.11
0)
Youn
g (
16–2
4)
2.79
4**
*(0
.90
0)
2.68
2**
(1.2
51)
6.98
6***
(4.6
61)
2.13
5(1
.418
)7.
432
*(7
.966
)1.6
17**
(0.3
67)
1.352
(0.3
08)
Youn
g A
dul
t (2
5–34
)2.
789*
**(0
.887
)1.9
19(0
.892
)5.
559*
**(3
.64
5)1.6
26(1
.04
4)
8.0
21**
(8.4
49)
1.252
(0.2
69)
0.9
77(0
.218
)
Mid
dle
Ag
ed (
35–4
9)2.
40
2***
(0.7
48)
2.0
42
(0.9
52)
3.52
0**
(2.2
27)
2.0
80(1
.223
)5.
269
(5.6
10)
1.273
(0.2
72)
1.051
(0.2
21)
Seni
or (
50–6
4)
1.860
*(0
.627
)1.4
77(0
.765
)2.
558
(1.6
93)
1.380
(0.8
97)
4.3
06
(4.6
82)
1.211
(0.2
59)
1.041
(0.2
33)
Sing
le1.5
48*
**(0
.181)
1.047
(0.18
1)1.6
68**
(0.3
41)
1.873
**(0
.458
)1.3
00
(0.3
17)
1.386
***
(0.14
5)1.4
77**
*(0
.154
)
Year
s of
Sch
oolin
g1.0
10(0
.028
)1.0
39(0
.04
0)
0.9
43
(0.0
35)
1.020
(0.0
75)
0.9
53(0
.04
4)
0.9
94(0
.023
)0
.998
(0.0
21)
Wea
lth
Ind
ex0
.954
(0.0
32)
0.9
00
**(0
.039
)0
.947
(0.0
38)
0.9
36(0
.047
)0
.878
***
(0.0
43)
1.04
3(0
.032
)0
.982
(0.0
28)
Gun
Ow
ners
hip
1.437
**(0
.20
5)1.4
42*
(0.3
02)
1.463
**(0
.278
)1.7
41**
(0.3
90)
1.447
(0.3
99)
1.327
**(0
.172)
1.663
***
(0.2
17)
Imm
igra
nt0
.635
(0.2
17)
0.5
35(0
.320
)0
.678
(0.3
41)
0.6
10(0
.454
)0
.333
(0.3
46)
0.6
22(0
.180
)0
.40
9***
(0.12
1)
Nei
ghb
ourh
ood
D
isor
der
Ind
ex2.
699*
**(0
.671
)1.8
97*
(0.7
08)
2.25
7**
(0.8
15)
1.510
(0.6
16)
0.8
31(0
.420
)4
.386
***
(1.0
76)
3.28
0**
*(0
.796
)
Soci
al C
ontr
ol In
dex
0.7
13(0
.195)
0.4
91*
(0.2
04
)0
.819
(0.3
20)
0.6
05
(0.2
97)
1.566
(0.9
14)
1.363
(0.3
53)
1.536
*(0
.382
)
Soci
al C
ohes
ion
Ind
ex0
.50
2*(0
.20
7)0
.615
(0.3
66)
0.6
29(0
.380
)0
.223
**(0
.154
)0
.379
(0.2
53)
0.5
68(0
.221
)0
.397
***
(0.13
6)
App
endi
x 3.
4. L
ogit
Regr
essi
on (O
dds
Ratio
s) o
f Ind
ivid
ual-L
evel
Cor
rela
tes
with
Crim
e Vi
ctim
izat
ion
for
Five
Car
ibbe
an C
apita
l City
Met
ropo
litan
Are
as
New
Pro
vide
nce
Any
Cri
me
Thef
tA
ssau
lt a
nd
Thre
atB
urgl
ary
Rob
bery
Wit
ness
ed A
ttac
kLo
st S
omeo
ne
Odd
s R
atio
(St
anda
rd E
rror
)
(con
tinu
ed)
(con
tinu
ed o
n ne
xt p
age)

56
RESTORING PARADISE IN THE CARIBBEAN: COMBATTING VIOLENCE WITH NUMBERS
Gan
g P
rese
nce
1.54
9***
(0.17
4)
1.298
(0.2
13)
1.74
3***
(0.2
83)
1.064
(0.2
40
)2.
135*
**(0
.453
)2.
225*
**(0
.273
)1.9
65**
*(0
.217
)
Bla
ck0
.924
(0.16
8)1.4
77(0
.521
)0
.882
(0.19
5)0
.586
*(0
.172)
1.134
(0.4
52)
0.9
90(0
.171)
1.322
*(0
.219
)
Mix
ed
Ind
ian
— —— —
— —— —
— —— —
— —
Num
ber
of
obse
rvat
ions
2,71
42,
714
2,71
42,
714
2,71
42,
714
2,71
4
Gre
ater
Bri
dget
own
Are
a
Any
Cri
me
Thef
tA
ssau
lt a
nd
Thre
atB
urgl
ary
Rob
bery
Wit
ness
ed A
ttac
kLo
st S
omeo
ne
Odd
s R
atio
(St
anda
rd E
rror
)
Mal
e1.3
58**
(0.16
5)1.0
83(0
.24
3)1.6
13**
*(0
.255
)1.1
45
(0.2
57)
2.54
1***
(0.8
19)
2.34
5***
(0.18
9)1.5
49*
**(0
.143)
Youn
g (
16–2
4)
2.50
6***
(0.7
18)
4.4
26**
(3.2
91)
4.9
99**
*(2
.294
)1.0
07
(0.4
58)
0.9
71(0
.529
)1.8
78**
*(0
.382
)2.
168*
**(0
.453
)
Youn
g A
dul
t (2
5–34
)1.7
14*
(0.5
00
)4
.576
**(3
.257
)3.
639*
**(1
.753
)0
.725
(0.3
15)
0.6
54(0
.325
)2.
300
***
(0.4
22)
3.0
17**
*(0
.563
)
Mid
dle
Ag
ed (
35–4
9)1.7
94**
(0.5
03)
5.4
51**
(3.9
94)
3.20
0**
(1.4
96)
0.8
24(0
.334
)0
.584
(0.2
87)
1.926
***
(0.3
45)
2.58
4**
*(0
.482
)
Seni
or (
50–6
4)
1.064
(0.3
21)
2.87
3(2
.226
)2.
281*
(1.0
57)
0.6
26(0
.299
)0
.385
(0.2
40
)0
.969
(0.19
0)
1.24
2(0
.24
2)
(con
tinu
ed)
(con
tinu
ed o
n ne
xt p
age)
App
endi
x 3.
4. L
ogit
Regr
essi
on (O
dds
Ratio
s) o
f Ind
ivid
ual-L
evel
Cor
rela
tes
with
Crim
e Vi
ctim
izat
ion
for
Five
Car
ibbe
an C
apita
l City
Met
ropo
litan
Are
as
New
Pro
vide
nce
Any
Cri
me
Thef
tA
ssau
lt a
nd
Thre
atB
urgl
ary
Rob
bery
Wit
ness
ed A
ttac
kLo
st S
omeo
ne
Odd
s R
atio
(St
anda
rd E
rror
)

57
WHO IS MOST LIKELY TO BE A VICTIM OF CRIME?
Sing
le1.1
09
(0.15
6)1.1
50(0
.321
)1.2
12(0
.24
6)0
.913
(0.2
34)
1.033
(0.4
05)
0.8
14**
(0.0
84)
0.8
20**
(0.0
80)
Year
s of
Sch
oolin
g1.0
63**
*(0
.021
)1.1
01*
**(0
.038
)1.0
57**
(0.0
30)
1.070
**(0
.036
)1.0
33(0
.04
5)1.0
39**
(0.0
16)
0.9
84(0
.014
)
Wea
lth
Ind
ex0
.947
(0.0
32)
1.04
2(0
.067
)0
.913
**(0
.037
)1.0
15(0
.066
)1.0
19(0
.080
)0
.891
***
(0.0
23)
0.8
77**
*(0
.022
)
Gun
Ow
ners
hip
1.70
7**
(0.3
97)
0.4
68(0
.30
2)1.7
71*
(0.5
22)
0.9
94(0
.465
)1.7
81(0
.866
)3.
323*
**(0
.710
)1.9
62**
*(0
.40
5)
Imm
igra
nt0
.594
(0.2
88)
1.353
(0.8
57)
0.4
94(0
.380
)— —
0.9
89(0
.986
)0
.991
(0.2
82)
1.097
(0.3
49)
Nei
ghb
ourh
ood
D
isor
der
Ind
ex3.
681*
**(1
.189)
5.97
1***
(2.9
99)
3.95
0**
*(1
.887
)4
.229
**(2
.412
)3.
40
5(2
.630
)3.
906*
**(0
.94
4)
3.0
91**
*(0
.793
)
Soci
al C
ontr
ol In
dex
0.6
74(0
.188)
0.5
67(0
.299
)1.0
40
(0.3
93)
1.478
(0.8
88)
0.2
96*
(0.2
15)
0.9
87(0
.20
7)0
.741
(0.16
5)
Soci
al C
ohes
ion
Ind
ex0
.358
***
(0.11
3)0
.90
4(0
.665
)0
.235
***
(0.10
3)0
.161*
**(0
.097
)2.
031
(1.9
32)
0.9
34(0
.272
)0
.867
(0.2
23)
Gan
g P
rese
nce
1.529
***
(0.2
31)
1.637
*(0
.437
)1.3
43
(0.2
66)
2.0
47**
*(0
.527
)2.
173*
*(0
.760
)2.
067
***
(0.2
99)
1.655
***
(0.2
18)
Bla
ck0
.859
(0.19
9)0
.499
**(0
.145)
1.490
(0.5
97)
0.7
34(0
.288
)0
.712
(0.3
68)
1.20
2(0
.20
9)0
.957
(0.15
6)M
ixed
Ind
ian
— —— —
— —— —
— —— —
— —
Num
ber
of
obse
rvat
ions
2,83
82,
838
2,83
82,
776
2,83
82,
838
2,83
8
Sou
rce:
Pre
par
ed b
y th
e au
tho
rs u
sing
dat
a fr
om
the
IDB
Car
ibb
ean
Cri
me
Vic
tim
izat
ion
Sur
vey
mo
dul
e at
tach
ed t
o t
he 2
014
/20
15 L
atin
Am
eric
an P
ublic
Op
inio
n P
roje
ct S
urve
y.N
ote:
***
, **,
*: s
igni
fican
t at
the
.01,
.05,
and
.1 le
vels
.
App
endi
x 3.
4. L
ogit
Regr
essi
on (O
dds
Ratio
s) o
f Ind
ivid
ual-L
evel
Cor
rela
tes
with
Crim
e Vi
ctim
izat
ion
for
Five
Car
ibbe
an C
apita
l City
Met
ropo
litan
Are
as
Gre
ater
Bri
dget
own
Are
a
Any
Cri
me
Thef
tA
ssau
lt a
nd
Thre
atB
urgl
ary
Rob
bery
Wit
ness
ed A
ttac
kLo
st S
omeo
ne
Odd
s R
atio
(St
anda
rd E
rror
)
(con
tinu
ed)


59
Violence Against Women and Children: How Big Is the Problem and Is It Connected to Other Violence?
Heather Sutton and Lucciana Alvarez
Chapter 3 found that young men are significantly more likely to be the victims of
homicide and assault, and Chapter 5 will explore the risk and protective factors
surrounding youth violence. If youth violence is the root of the Caribbean crime
problem, then why devote this chapter to women and children? The answer is two-fold.
First, police and victimization survey data do not accurately capture the impact
of violence on different gender and age groups (men, women, boys, and girls). Liter-
ature on crime and violence in the Caribbean often places greatest emphasis on the
number of homicides, which tends to overshadow violence suffered by women and
children because they are not the majority of homicide victims. While there are signs
of increasing recognition of the problem of violence in the home, the region has often
failed to consider violence against women and children as “serious” citizen security
issues. Rather, this type of violence is often seen as “soft” or a “private” family issue
separate from State security concerns. We include this chapter to reinforce that vio-
lence against women and children is indeed a crime.
Second, beyond being a violation of the fundamental human rights of women and
children, early exposure to violence—whether children are victims of abuse themselves or
witness violence against other family members—increases the chances of victims devel-
oping emotional problems, becoming aggressive, and perpetrating violence themselves.
Different types of violence—notably violence by young people and violence against women
and children—are interconnected. Similarly, communities where risk factors are present
(i.e., high levels of crime, poverty, or unemployment) are more likely to concentrate other
types of violence, including violence against women and children (Wilkins et al. 2014).
4

60
RESTORING PARADISE IN THE CARIBBEAN: COMBATTING VIOLENCE WITH NUMBERS
This chapter examines the few existing studies on violence against women and
children in the Caribbean. Box 4.1 starts by providing definitions of the fundamental
terms involved in examining this issue. The chapter then lays out the data from police
sources on homicides related to intimate partner and family violence. Given the lack
of nationally representative surveys to measure the prevalence of violence against
women, we analyse data from the Latin American Public Opinion Project (LAPOP)
Survey on attitudes towards intimate partner violence. We also explore beliefs and
experiences regarding physical discipline of children and its connection to the accep-
tance of intimate partner violence. Conclusions and policy recommendations focus on
the existing body of evidence-based interventions to interrupt the cycle of violence in
the home and how they can be adapted to the Caribbean.
Box 4.1. Definitions
Violence against women: Any act of gender-based violence that results in, or is likely
to result in, physical, sexual, or mental harm or suffering to women, including threats of
such acts, coercion, or arbitrary deprivation of liberty, whether occurring in public or in
private life (United Nations 1993)
Gender-based violence: Violence that is directed at a person on the basis of gender or
sex. It includes acts that inflict physical, mental, or sexual harm or suffering, threat of
such acts, coercion, and other deprivations of liberty (UNHCR 2003).
Intimate partner violence: Behaviour by an intimate partner or ex-partner that causes
physical, sexual, or psychological harm, including physical aggression, sexual coercion,
psychological abuse, and controlling behaviours (WHO 2005).
Sexual violence: Any sexual act, attempt to obtain a sexual act, unwanted sexual com-
ments or advances, or acts to traffic, or otherwise directed against, a person’s sexuality
using coercion, by any person regardless of their relationship to the victim, in any set-
ting, including but not limited to home and work (WHO 2002).
Physical abuse: Slapping, beating, arm twisting, stabbing, strangling, burning, chok-
ing, kicking, threats with an object or weapon, and murder. It also includes traditional
practices harmful to women such as female genital mutilation and wife inheritance
(the practice of passing on a widow, and her property, to her dead husband’s brother)
(UNICEF 2000).
Child abuse: Any form of physical and/or emotional ill-treatment, sexual abuse, ne-
glect or negligent treatment, or commercial or other exploitation resulting in actual or
potential harm to the child’s health, survival, development, or dignity in the context of
a relationship of responsibility, trust, or power (WHO 2006).

61
VIOLENCE AGAINST WOMEN AND CHILDREN: HOW BIG IS THE PROBLEM AND IS IT CONNECTED TO OTHER VIOLENCE?
4.1 Background: What Do Existing Studies in the Region Tell Us?4.1.1 Violence against WomenData to measure the size and dimension of the problem of violence against women re-
main limited. Experts agree that the best estimates of the prevalence of such violence
come from population-based surveys of women’s health.1 Despite their widespread
use around the world, very few surveys have been conducted in the Caribbean, leaving
us with a limited understanding of the extent of the problem in the sub-region.2 Exist-
ing studies have focused mainly on specific groups of high-risk women (i.e., women
treated in hospital emergency rooms or at crisis centres, etc.) or other sub-groups
(college or secondary students). The 2008 Jamaica Reproductive Health Survey, al-
though not exclusively focused on violence against women or children, may be the
only study in the region that used a nationally representative sample (Box 4.2). The
survey contained several questions on intimate partner and sexual violence using a
similar methodology.
In Barbados, Jordan (1986) analysed hospital data on victims of intimate partner
violence and found that in most cases the violence was committed by boyfriends,
followed by fathers and brothers.3 Also in Barbados, Heise, Pitanguay, and Germain
(1994) illustrated the regularity with which women were abused in intimate rela-
tionships: 30 percent of the women they studied had been victimized.4 In Trinidad
and Tobago, Rawlins (2000) observed that 27 percent of women from two different
communities had witnessed domestic violence in their homes and 8 percent had
been victims.5 Finally, in the same country, Anyanwu (2011) analysed the extent to
which women were victims of nine different abusive acts by their male partners.6
Among other findings, 17.6 percent of the women reported lifetime prevalence of
being attacked with a weapon; 26.2 percent reported being threatened with vio-
lence; 33 percent punched/shoved; 34.6 percent hit; and 16.5 percent forced to
have sex.
1 Such as those used in the WHO (2010) multi-country study. See Garcia-Moreno et al. (2005).2 A forthcoming study from the IDB, in collaboration with UN Women and CARICOM, aims to provide quality data on violence against women in the Caribbean by conducting household surveys of women’s health in several countries in the region. The surveys will follow the protocol used in WHO (2005) and will also measure United Nations statistical indicators on violence against women.3 Jordan (1986) studied 78 cases of victims of intimate partner violence at a hospital in Barbados.4 From a sample of 264 women, Heise, Pitanguay, and Germain (1994) found that 30 percent were beaten as adults. The study also found that 50 percent of the sample (men and women) reported that their mothers were battered women.5 Rawlins (2000) sampled 200 women in two communities in Trinidad, Barataria and Chaguanas.6 Anyanwu (2011) used a survey instrument that was administered via face-to-face interviews by a female doctor in a women’s clinic in Trinidad and Tobago. The study collected data from a sample of 176 women between the ages of 18 and 61.

62
RESTORING PARADISE IN THE CARIBBEAN: COMBATTING VIOLENCE WITH NUMBERS
Box 4.2. Jamaica Reproductive Health Survey
What? Household survey of a nationally representative sample of 8,259 women ages
15–49 plus 2,775 men ages 15–24.
When? 2008.
How? The survey employed a three-stage stratified cluster sample design based on the
628 census sectors and stratified by the 14 parishes.
Key Findings
• One in five Jamaican women (under age 15) witnessed physical abuse between par-
ents and two in three were physically abused themselves by their parents.
• Methods of discipline of children reported included hitting the child with an object
(36 percent) or a hand or fist (34 percent), cuffing or spanking (23 percent), or
locking the child away (9.8 percent).
• 12 percent of female respondents reported being physically forced to have sexual
intercourse, half of them before age 20. However, far more (46 percent) described
their first experience as “Did not want it but it happened anyway.”
• One in three women (ages 15–49) experienced intimate partner violence in their
lifetime and 17 percent experienced it in the last 12 months.
• The three strongest risk predictors of violence against women are childhood experi-
ence of violence, controlling behaviour of husband/partner, and alcohol use.
Source: Serrbanescu, Ruiz, and Suchdev (2010).
7 The study involved seven countries from the Caribbean, including Jamaica, Suriname, and Trinidad and Tobago.
The United Nations Development Programme (UNDP) 2010 Citizen Security Sur-
vey may be the only cross-national data collected in the region (Figure 4.1).7 However,
Figure 4.1: Self-Reported Victimization of Women by Intimate Partners, by Type of Action (percent)
Antigua andBarbuda
Barbados Saint Lucia Guyana Trinidad andTobago
Suriname Jamaica Regionalaverage
24%
29%
22%
31%
25%
19%
16%
23%
12%
17%
12%
20%
14% 17
%
9%
14%
10% 12
%
10%
18%
11% 12
%
6%
11%
8%
14%
9%
16%
11%
9%
7%
11%
Was threatened by spouse Was insulted Violence used Was injured
Source: Authors’ analysis using data from the United Nations Development Programme 2010 Citizen Security Survey.

63
VIOLENCE AGAINST WOMEN AND CHILDREN: HOW BIG IS THE PROBLEM AND IS IT CONNECTED TO OTHER VIOLENCE?
these percentages are still likely to be far under-representative of actual prevalence,
given that surveys on crime do not take the extra steps needed in terms of survey
design and implementation to address the barriers to reporting intimate partner vio-
lence, leading to significant under-estimation of the prevalence of the problem.8
4.1.2 Violence against ChildrenThe negative effects of children witnessing violence have been well established in the
international literature.9 However, empirical data on this subject are also sparse in the
Caribbean. The few studies available seem to suggest high tolerance for physical dis-
cipline of children. In Jamaica, for instance, Smith and Mosby (2003) reviewed a body
of literature on child-rearing practices and found that a high percentage of Jamaican
children were subjected to at least one form of psychological or physical punishment,
ranging from aggression to severe means of discipline and punishment.10
In analysing a sample of juvenile cases before a court in Barbados, Marshall-Harris
(2011) found that nearly 30 percent of them came from violent homes. The vast ma-
jority witnessed a sibling or a parent being physically, emotionally, verbally, and/or
sexually abused by another parent, a parent’s lover, or by another sibling.
Similarly, a study conducted by researchers at the College of The Bahamas found that
violence against children was regarded as abuse only when it resulted in severe physical
harm to the victim (Brennen et al. 2010). The 2011 Bahamas Secondary School Drug
Prevalence Survey also showed that 43.8 percent of all students surveyed self-reported
having been emotionally or verbally abused in the past, 21.2 percent reported being
physically abused, and 9 percent sexually abused. Moreover, female students were sig-
nificantly more likely than male students to have been emotionally, physically, or sexually
abused (National-Anti Drug Secretariat and Ministry of National Security 2012, 23).
4.2 Facts and Figures4.2.1 Intimate Partner and Family-Related HomicideWhile there have been notable efforts by police departments and key ministries to col-
lect administrative data on violence against women and children, lack of comprehensive
8 According to the UN Department of Economic and Social Affairs in its Guidelines for Producing Statistics on Violence Against Women 2013, “Surveys on violence against women are most effective when conducted as dedicated surveys, that is, surveys designed primarily, if not exclusively, to gather detailed information on the extent of different forms of violence against women. Such surveys have the potential to produce high-quality statistics, since they use interviewers who are trained specifically for that purpose and who are well equipped to deal with this sensitive topic” (United Nations 2013, 6).9 See Durrant et al. (1994) and Schwartz and Proctor (2000).10 Seventy-one percent of rural parents and 55 percent of urban parents reported flogging as the most fre-quent response to perceived misbehaviour in their children.

64
RESTORING PARADISE IN THE CARIBBEAN: COMBATTING VIOLENCE WITH NUMBERS
and systematic nationally-owned data remains a serious problem. Recording methods
and definitions of crimes vary, even within the same country. Perhaps more impor-
tantly, official statistics are generally far under-representative of the actual levels of
violence because women and child victims may not reach out for help due to fear of
retaliation or because of cultural perceptions of acceptance of violence.11
Administrative data on recorded homicides, however, are generally considered to
be less affected by variations in reporting rates and recording practices than other
types of crime. Throughout the region victims of murder are predominantly male.
However, Figure 4.2 shows that females are considerably more likely to be killed by an
intimate partner or family member than men. These figures should be interpreted with
caution and should not be used for cross-country comparison.12
4.2.2 Acceptance of Intimate Partner Violence against WomenWhile little is known about the prevalence of intimate partner violence across the
sub-region, there is evidence of tolerance of violence that is often linked to higher
levels of violence against women in societies. Using data from the 2014/2015 LAPOP
Survey, this chapter explores the level of acceptance of intimate partner violence
against women and children in six Caribbean countries.
Figure 4.3 shows the tolerance among Caribbean adults of a husband hitting his
wife if she neglects the household chores. One in four respondents (27.5 percent
of males and 22.6 percent of females) would approve or understand. On average,
Caribbean respondents were statistically more likely than Latin American respon-
dents (a difference of 10.9 percentage points) and U.S. respondents (a difference of
13.3 percentage points) to approve of or understand hitting a women under these
circumstances.
Tolerance for hitting a woman is higher if she is unfaithful—one in three Caribbean
residents would approve of or understand (39 percent of males and 30 percent of
females) hitting a woman for this reason. Acceptance is highest in Suriname, where
nearly half (46.3 percent) of adults would approve of or understand hitting a woman
under these circumstances. Again, Caribbean adults were significantly more likely than
Latin American and U.S. respondents to tolerate violence against women if they are
11 Even though administrative data on assault and sexual violence are not comparable between countries, data on these crimes are available in several IDB publications (Bailey 2016; Harriott and Jones 2016; Seeper-sad 2016; Sutton 2016).12 Accurately determining the cause of death is still a challenge in many countries that may have scarce time and resources to conduct crime scene investigations and autopsies. As a result, the numbers shown here could possibly be significantly higher if deaths from intimate partner violence are categorized as “unknown” or “undetermined.” Differences between countries may also be due to more or less accuracy in capturing the cause of death.

65
VIOLENCE AGAINST WOMEN AND CHILDREN: HOW BIG IS THE PROBLEM AND IS IT CONNECTED TO OTHER VIOLENCE?
unfaithful (5.7 and 8.2 percentage point differences, respectively). Outright approval
was highest in Guyana (10.2 percent), Suriname (8.3 percent), and The Bahamas (7.7
percent). “Understanding,” which might be interpreted as tacit acceptance, was high-
est in Suriname (38 percent), followed by The Bahamas (29.5 percent) and Guyana
(25.4 percent) (Figure 4.4).
It is not surprising that Caribbean males were significantly more likely than females to
approve of a man hitting his wife for being unfaithful (7.9 percent of males versus 4.9 percent
Figure 4.2: Percentages of Female and Male Victims of Homicides by Intimate Partners or Family Members as a Percentage of Overall Homicides, 2006–2011
Female Male
Bahamas
Female Male
Jamaica
Female Male
Trinidad and Tobago
Homicide from IPV or family Homicides for other reasons
67.5%
32.5%
81.2%
67.2%
18.8%
32.8%
89.5%
3.4%
96.6%
3.0%
97.0%
10.5%
Source: Prepared by the authors using data from the United Nations Office on Drugs Annual Crime Trends Surveys of national law enforcement, March 2016.Note: No information was available for Barbados or Suriname. IPV: intimate partner violence.

66
RESTORING PARADISE IN THE CARIBBEAN: COMBATTING VIOLENCE WITH NUMBERS
of females) (Figure 4.5). Males were also more likely to understand (31 percent of males ver-
sus 25.1 percent of females). One interesting exception is Suriname, where women were as
likely as men to approve and only slightly less likely to understand. The starkest contrasts
between men and women are apparent in Trinidad and Tobago, Jamaica, and Barbados.
The socio-demographic characteristics of survey respondents who tolerate (ap-
prove or understand) and do not tolerate intimate partner violence are described in
Appendix 4.1.
Figure 4.3: His Wife Neglects the Household Chores: Would You Approve of the Husband Hitting His Wife, or Would You Not Approve but Understand, or Would You Neither Approve Nor Understand? (percent)
Per
cent
age
of p
opul
atio
n
Would approve Would not approve but understand Would not approve or understand
Bahamas Barbados Guyana Jamaica Trinidad andTobago
Suriname Caribbeanaverage*
LatinAmerica**
UnitedStates
0102030405060708090
100
2.4 0.8 4.4 3.2 1.9 3.3 2.6 1.5 4.5 20.5 13.0
26.4 21.2 10.7
40.4 22.5 12.7 7.3
Source: Authors’ analysis of data from the 2014/2015 Latin American Public Opinion Project Survey.*The Caribbean average includes Jamaica, Guyana, Trinidad and Tobago, Suriname, The Bahamas, and Barbados.**The Latin American average includes Mexico, El Salvador, Nicaragua, Colombia, Ecuador, Paraguay, Venezuela, and the Dominican Republic.
Figure 4.4: His Wife Is Unfaithful: Would You Approve of the Husband Hitting His Wife, or Would You Not Approve but Understand, or Would You Neither Approve Nor Understand? (percent)
Per
cent
age
of p
opul
atio
n
Would approve Would not approve but understand Would not approve or understand
Bahamas Barbados Guyana Jamaica Trinidad andTobago
Suriname Caribbeanaverage*
LatinAmerica**
UnitedStates
0102030405060708090
100
7.7 2.7 10.2 5.6 4.2 8.3 6.4 4.0 2.6
29.5 26.5 20.0 24.7 23.6 25.4 25.6
38.0 28.0
Source: Authors’ analysis of data from the 2014/2015 Latin American Public Opinion Project Survey.*The Caribbean average includes Jamaica, Guyana, Trinidad and Tobago, Suriname, The Bahamas, and Barbados.**The Latin American average includes Mexico, El Salvador, Nicaragua, Colombia, Ecuador, Paraguay, Venezuela, and the Dominican Republic.

67
VIOLENCE AGAINST WOMEN AND CHILDREN: HOW BIG IS THE PROBLEM AND IS IT CONNECTED TO OTHER VIOLENCE?
Ordinary least squares regression
(Appendix 4.2) reveals that statistically
significant factors associated with tol-
erance of intimate partner violence
among men included age (younger),
income (lower), and a history of physi-
cal punishment as a child. Women were
statistically more likely to have tolerant
attitudes if they were younger, had
lower income, and received govern-
ment assistance. Significant protective
factors (negatively associated with
tolerance) included living in an urban
area (for women) and completion of
secondary school (for men).
When focusing on only those
who explicitly approved of intimate
partner violence, we find that most
of the same correlates continue to
be significant for men: younger age,
lower income (+), and urban resi-
dence (–). For both men and women,
completion of secondary school is a
significant protective factor. Other
cross-country studies have found
that the completion of secondary
education has a protective effect
against the risk of intimate partner
violence that primary school alone
does not provide (Abramsky et al. 2011). Our findings on tolerant attitudes towards
intimate partner violence appear to be consistent with this literature.
4.2.3 Acceptance and Use of Corporal Discipline on ChildrenThe Caribbean has a unique history with respect to children’s rights and corporal disci-
pline. Some regional studies suggest that the legacy of slavery may help to explain the
social and cultural traditions that support the use of physical punishment of children
(UNICEF 2006a). It has also been suggested that an acceptance of corporal punish-
ment in families and institutions can be traced to both British cultural influences and
religious influences (UNICEF 2006a).
Figure 4.5: Male versus Female Responses—His Wife Is Unfaithful: Would You Approve of the Husband Hitting His Wife, or Would You Not Approve but Understand, or Would You Neither Approve Nor Understand? (percent)
Bahamas
Barbados
Guyana
Jamaica
Trinidad and Tobago
Suriname
Caribbean average*
6.3
1.4
8.6
3.4
1.2
8.5
4.9
27.9
19.5
26.1
20.1
16.9
35.6
25.1
Bahamas
Barbados
Guyana
Jamaica
Trinidad and Tobago
Suriname
Caribbean average*
0 10 20 30 40 50
Percentage of population
Male
Female
60 70 80 90 100
Would approve Would not approve but understand
Would not approve or understand
0 10 20 30 40 50
Percentage of population
60 70 80 90 100
9.1
4.0
11.9
7.9
7.2
8.1
7.9
31.1
33.7
24.7
31.0
23.1
40.4
31.0
Source: Authors’ analysis of data from the 2014/2015 Latin American Public Opinion Project Survey.*The Caribbean average includes Jamaica, Guyana, Trinidad and Tobago, Suriname, The Bahamas, and Barbados.

68
RESTORING PARADISE IN THE CARIBBEAN: COMBATTING VIOLENCE WITH NUMBERS
Most Caribbean respondents (a total of 67 percent, including 65 percent of males
and 68 percent of females) say that it is necessary to physically discipline a child who
misbehaves. Caribbean respondents were significantly more likely to believe it is nec-
essary to use physical punishment on children than Latin Americans, with Caribbean
respondents 2.7 percent more likely to say always, 5.9 percent more likely to say most
often, and 26.3 percent more likely to say sometimes) (Figure 4.6).
Of those who support the use of physical punishment in the Caribbean, 91 per-
cent (93 percent of males and 89 percent of females) admit to suffering corporal
punishment themselves as children (Figure 4.7). Only 13 percent of those who
Figure 4.6: Do You Think That to Correct a Child Who Misbehaves It Is Necessary to Hit or Physically Punish Them? (percent)
Per
cent
age
of p
opul
atio
n
Always Most often Sometimes Almost never Never
Bahamas Barbados Guyana Jamaica Trinidad andTobago
Suriname Caribbeanaverage*
LatinAmerica**
UnitedStates
0102030405060708090
100
6.1 2.7 2.4 4.2 5.4 1.0 3.8 1.1 3.3 7.0 9.1 6.6 5.1 13.3
3.0 7.7 1.8 6.4
62.9 67.9 56.7 61.5
61.0
32.8
55.1
28.8
40.0
9.4 12.6
13.0 13.0
10.9
11.7
11.4
19.2
31.7
Source: Authors’ analysis of data from the 2014/2015 Latin American Public Opinion Project Survey.*The Caribbean average includes Jamaica, Guyana, Trinidad and Tobago, Suriname, The Bahamas, and Barbados.**The Latin American average includes Mexico, El Salvador, Nicaragua, Colombia, Ecuador, Paraguay, Venezuela, and the Dominican Republic.
Figure 4.7: When You Were a Child, Would Your Parents or Guardians Hit or Physically Punish You in Some Way to Correct Your Misbehaviour? (percent)
Per
cent
age
of p
opul
atio
n
Always Most often Sometimes Almost never Never
Bahamas Barbados Guyana Jamaica Trinidad andTobago
Suriname Caribbeanaverage*
LatinAmerica**
UnitedStates
0102030405060708090
100
10.2 11.5 11.2 19.4 15.5 5.7 11.6 7.9 11.9
10.7 20.6 17.8
15.4 20.9
16.1 16.9
10.2 15.0
57.5 56.2 56.0 51.4 50.9
40.7
51.0
42.2 35.5
8.1 8.4 7.4 8.4 7.2
9.9
8.3
18.1 19.2
Source: Authors’ analysis of data from the 2014/2015 Latin American Public Opinion Project Survey.*The Caribbean average includes Jamaica, Guyana, Trinidad and Tobago, Suriname, The Bahamas, and Barbados.**The Latin American average includes Mexico, El Salvador, Nicaragua, Colombia, Ecuador, Paraguay, Venezuela, and the Dominican Republic.

69
VIOLENCE AGAINST WOMEN AND CHILDREN: HOW BIG IS THE PROBLEM AND IS IT CONNECTED TO OTHER VIOLENCE?
suffered physical punishment themselves considered corporal punishment to be
unacceptable.
There was little difference between men and women in their experiences with, and
attitudes towards, physical discipline of children. The difference between males and
females was significant only among those who believed corporal punishment was al-
ways necessary (1 percent higher for men). Likewise, there was a slight difference
between men and women (3.5 percent higher for men) who were physically punished
“most often.” In all other categories the difference was insignificant. This is generally
consistent with findings from other surveys in the Caribbean (UNICEF 2006a).13
Of course, there is a fine line between discipline and abuse that is highly contested
between different cultural settings. Unfortunately, the LAPOP Survey data do not
allow for exploring the means and severity of physical discipline. However, UNICEF
Multiple Indicator Cluster Survey data indicate that the percentage of households with
at least one child 2–14 years of age who was subjected to severe physical punishment
in the last year was 4.4 percent in Trinidad and Tobago (2006), 5.7 percent in Jamaica
(2011), 6.1 percent in Barbados (2012), 6 percent in Guyana (2014), and 11.8 percent
in Suriname (2010) (Table 4.1).14 The Jamaican Reproductive Health Survey found
that an alarmingly high amount of parents—41.6 percent of men and 36.2 percent of
13 See also publications with UNICEF’s Multiple Indicator Cluster Survey 2010–2016 datasets for Jamaica, Barbados, Guyana, Trinidad and Tobago, and Suriname, available at http://mics.unicef.org/surveys (accessed on 13 November 2016).14 Involves interviews of women ages 15–49 and children ages 2–14. Severe physical punishment includes hit-ting or slapping the child in the face, head, or ears, and beating the child up with an implement (hit over and over as hard as one could). See UNICEF (2010b, 15).
Table 4.1: Percentage of Children Ages 2–14 Who Experienced Any Physical Punishment, Severe Physical Punishment, or Any Violent Discipline Method in the Past Month
Country YearAny Physical Punishment
Severe Physical Punishment*
Any Violent Discipline Method**
Barbados 2012 55.7 6.1 72.1
Guyana 2014 44 6 70
Jamaica 2011 68.4 5.7 84.5
Suriname 2010 59.8 11.8 86.1
Trinidad and Tobago 2006 51.4 4.4 75.1
Source: UNICEF, Multiple Indicator Cluster Survey (MICS4) dataset for Barbados, Guyana, Jamaica, Suriname, and Trinidad and Tobago.* Includes hitting or slapping the child in the face, head, or ears, beating the child up with an implement, and hitting the child over and over as hard as one can.** Includes psychological aggression or physical punishment.

70
RESTORING PARADISE IN THE CARIBBEAN: COMBATTING VIOLENCE WITH NUMBERS
women—reported hitting a child with a belt, stick, or other object as punishment (Ser-
rbanescu, Ruiz, and Suchdev 2010, 340–41).
4.2.4 Use of Corporal Discipline in SchoolsThe Caribbean’s tolerance of the use of physical punishment on children can also be per-
ceived through the use of corporal discipline in schools. Although corporal discipline is
increasingly banned, most of the countries still condone a few of its variations. In Barba-
dos, for example, the Barbados Education Act allows for corporal punishment to be used
by the school principal or someone designated by the principal. Moreover, the Ministry of
Education’s Student Code of Discipline (2011) outlines a number of disciplinary options,15
some of which include the use of corporal punishment. While these policies remain in
force, the ministry has also implemented UNICEF’s positive behaviour management pro-
gramme in some schools, which promotes non-violent educational methods.
In The Bahamas, the Penal Code also allows for corporal punishment,16 and the
Child Protection Act of 2006 does not forbid it. The Safe Schools Protocol, developed
by the Ministry of Education, regulates the use of corporal punishment by teachers.
While it promotes the use of non-violent punishments first, it also permits the prin-
cipal or administrator to use physical punishment (Department of Education of The
Bahamas 2012, 30). In fact, a 2012 survey conducted in The Bahamas indicated that
15.3 percent of the teachers surveyed still believed they were authorized to use phys-
ical punishment and 4.3 percent were not sure.17 When separated by grade level, the
survey revealed that corporal punishment was used much more frequently in grades
1–3 (nearly 50 percent of the time) (Fielding 2012).
Corporal punishment is lawful in Jamaican homes and only partially prohibited in
Jamaica’s educational institutions. Although legislation does exist to prohibit corpo-
ral punishment in day care, primary schools, penal institutions, and alternative care
settings,18 the Education Act is silent on the matter. While the Ministry of Education
15 The code of discipline is labelled as a draft. However, the planning officer consulted indicated that it is in use by the ministry.16 Article 110 of the Penal Code of 1873.17 The survey of 482 school teachers revealed that most teachers knew about the protocol (91.4 percent) and 64 percent claimed that their classroom rules were aligned with it.18 Specifically, S. 16(1) of the Early Childhood Act prohibits corporal punishment against a child in an early childhood institution. Section 62 (d) of the Child Care and Protection Act (2004) provides that a child in a place of safety, children’s home, or in the care of a fit person shall have the right to be free from corporal pun-ishment. Instead of being addressed through legal means, the Ministry of Education’s directives have been “formally introduced to some educators through workshops and brochures.” And in partnership with UNICEF, the Ministry of Education has “embraced a comprehensive range of interventions for quality education that includes alternatives to corporal punishment.”

71
VIOLENCE AGAINST WOMEN AND CHILDREN: HOW BIG IS THE PROBLEM AND IS IT CONNECTED TO OTHER VIOLENCE?
has issued a directive prohibiting corporal punishment in all schools,19 it has also main-
tained that Jamaica was not ready for anti-beating laws.20
The Children (Amendment) Act of Trinidad and Tobago was passed in 2015 despite
numerous calls from teachers, parents, and teachers’ unions to reintroduce corporal
punishment into schools. According to its section 10A, for teachers “reasonable pun-
ishment” does not include corporal punishment.
4.2.5 Connecting Different Types of ViolenceThere are several parallels between violence against women and violence against chil-
dren. Both stem from norms that justify the use of violence in order to educate or
correct misbehaviour. Co-occurrence of intimate partner violence and child abuse is
frequently documented in the literature (Herrenkohl et al. 2008). Both women and
children who are beaten often do not seek help due to social norms that see such
behaviour as a private matter.21 Both types of violence are severely under-estimated
because they are under-reported, and legal protections are generally under-enforced.
This is especially true where social norms are not in step with legal protection. Finally,
there are intergenerational consequences for both violence against women and vio-
lence against children.
According to data from the 2014/15 LAPOP Survey in the Caribbean, among adults
who approve of or understand a man hitting his wife if she is unfaithful, 86 percent
(88 percent of males and 82 percent of females) also reported having been physically
disciplined themselves as children. Of course, not all those who are physically disci-
plined as children display tolerant attitudes towards intimate partner violence. However,
when controlling for other individual characteristics (Appendix 4.1), men were statisti-
cally more likely to display tolerant attitudes regarding violence against women if they
were exposed to frequent physical discipline themselves as children.22 The connection
is consistent with international literature that suggests that children who experience or
witness violence are more likely than those who do not to perpetrate violence later in
life (Capaldi and Clark 1998; Capaldi et al. 2003; Fulu et al. 2013; Kishor and Johnson
2004). Violent discipline has also been found to be more common in households af-
fected by intimate partner violence than in households that are not (Bott et al. 2012).
19 See “Holness Wants Parents to Abandon Violent Disciplinary Practices,” Jamaica Observer, May 21, 2010 (http://www.jamaicaobserver.com/news/Holness-wants-parents-to-abandon-violent-disciplinary-practices_7633618); and Ministry of Education School Bulletin 94/8.20 Jovan Johnson, “Jamaica Is Not Ready for Anti-beating Law, Says Education Minister,” Jamaica Gleaner, February 11, 2015. Available at: http://jamaica-gleaner.com/latest/article.php?id=58289.21 In fact, in 2014, only 14 percent of women in Latin America and the Caribbean formally reported violence against them. See World Bank (2014).22 Frequent physical discipline was defined as when it was used always, most often, or sometimes.

72
RESTORING PARADISE IN THE CARIBBEAN: COMBATTING VIOLENCE WITH NUMBERS
Longitudinal studies in high-income countries have established childhood experi-
ences of violence as a causal factor for intimate partner violence (Capaldi and Clark
1998; Ehrensaft et al. 2003; Magdol et al. 1998; Swinford et al. 2000). While no such
studies have been completed in low- and middle-income countries, cross-sectional
studies find a strong and consistent association between partner violence by men who
experienced harsh physical punishment as a child and witnessed violence at home
(Heise 2011).
International studies connect violence in the home with other types of violence in
society. For example, research suggests that child survivors of abuse are more likely
to display different types of violence later in life, including violence against their peers
(Logan, Leeb, and Barker 2009), bullying and teen dating violence (Duke et al. 2010),
child or elder abuse and intimate partner violence (American Psychological Associa-
tion 1996), and sexual violence (Jewkes 2012). Some slightly less robust studies have
also suggested links between intimate partner violence, violence against children, and
other types of violence in the Caribbean. In The Bahamas, for example, Plumridge and
Fielding (2009) showed that the presence of domestic violence in a household was as-
sociated with risks of deviant behaviour, including sexual abuse of household members.
In Barbados, a study revealed that a considerable percentage of youngsters (79 of 274)
presented to a court were documented as coming from violent homes (Marshall-Harris
2011). A similar study by Fielding (2012) also reported high percentages of prison in-
mates in The Bahamas who had been brought up in homes with high levels of violence.23
4.3 Conclusions and Policy ImplicationsThere appears to be relatively high tolerance for both intimate partner violence against
women and violence against children in the Caribbean. Collecting more accurate data
on the prevalence of violence against women and children by using internationally
vetted methodologies is an important next step for Caribbean governments. However,
many studies have found that the degree to which both wife beating and physical
discipline of children are accepted is one of the strongest and most consistent factors
to predict differences in prevalence across sites and countries.24 Therefore it is not un-
precedented to use these norms as proxies for levels of intimate partner violence and
violence against children within a country.
23 In fact, of 310 inmates who responded to a questionnaire, 112 (36 percent) said they were victims of abuse and 49.2 percent said they had observed violence in their homes. Although this sample was not necessarily representative of the inmate population of The Bahamas, other data from the region have shown similar re-sults (Fielding 2012).24 See Abramsky et al. (2011) on acceptance of intimate partner violence and UNICEF (2006b) on acceptance of violence against children.

73
VIOLENCE AGAINST WOMEN AND CHILDREN: HOW BIG IS THE PROBLEM AND IS IT CONNECTED TO OTHER VIOLENCE?
4.3.1 LegislationCaribbean countries have generally begun to expand their legislation on violence
against women and children. However, more efforts are needed to fully tailor regula-
tions to protect potential victims and prevent violence against women and children.
Worldwide, it is increasingly recognized that domestic violence encompasses several
types of violence, including sexual, emotional, and/or psychological violence, as well as
patrimonial and/or economic violence (UN Women 2011). Globally, many countries have
moved towards expanding the scope of the definition of domestic violence victims
by including not only spouses, but also individuals who are or have been in intimate
relationships, including non-marital, same-sex, and non-cohabiting relationships; indi-
viduals with family relationships with one another; and members of the same household
(United Nations 2010a). Even though some of these changes in legislation have been
adopted by Caribbean countries, many holes in current legislation still exist, particularly
criminalization of marital rape and definitions that incorporate an inclusive scope of
types of abuse and victims (for an overview of existing legislation see Appendix 4.2).
Trinidad and Tobago, The Bahamas, and Suriname have fairly comprehensive defi-
nitions of domestic violence that go beyond simple physical violence. Jamaica and
Barbados, on the other hand, have no such clear definitions whatsoever. In terms of
victims, Trinidad and Tobago, The Bahamas, and Jamaica include spouses, children,
members of the same household, dependents, and partners in the spectrum of po-
tential victims. Barbados, however, does not cover dependents or partners. Across
these countries, same-sex couples have limited or no access to relief services as com-
pared to heterosexual couples. Moreover, very few countries are ahead with regards
to sexual crimes: only Suriname and Trinidad and Tobago have legislation that ex-
plicitly criminalizes marital rape and only The Bahamas regulates sexual harassment.
Protection orders for victims of domestic violence exist in all five countries. Those
orders can remove the perpetrator from the home and are granted to any person
falling under the definition of being a victim of domestic violence. Unfortunately, in
practice the process may be more complicated, often compelling the seeker to meet
a high burden of proof. In The Bahamas, for instance, the aggressor must have already
committed one or more acts of domestic violence. A lawyer is not required by law, but
the complicated nature of the process can make it difficult without one.25 The Family
Court’s high volume and long backlog of cases also create major obstacles to the pro-
cess. The other countries, particularly Barbados, have little information on requisites to
apply for a protection order, other than notifying the aggressor. Jamaica and Trinidad
25 “The Law and Domestic Violence,” Guardian, March 2, 2014. Available at: http://www.thenassauguardian. com/index.php?option=com_content&view=article&id=45604:the-law-and-domestic-violence-&catid=35:health-a-wellness.

74
RESTORING PARADISE IN THE CARIBBEAN: COMBATTING VIOLENCE WITH NUMBERS
and Tobago indicate guidelines for the court to grant protection orders that may be
too general and difficult to prove for the victim. These include showing proof that the
aggressor has used or threatened to use violence or cause physical or mental injury.
Violence against children is regulated both in domestic violence acts as well as in
further specific legislation on child abuse/protection across the sub-region. Unfortu-
nately, even in those countries with more advanced laws on violence against children,
the line between abuse and permitted discipline remains a nebulous issue, particularly
because enforcement and implementation of laws is often not completely effective.
It is important to continue to monitor implementation of these laws, identify gaps
between the intention and practice, and identify the barriers that continue to impede
women and children from accessing the rights these laws provide.
While policymakers are likely to be much more wary about legally interfering with
a “parent’s right” to discipline their children, a recent comparative study of the effects
of banning corporal punishment in five European countries suggests that it does shift
what people define as violence and facilitate reductions in the use of violence. Longi-
tudinal studies from Germany and Switzerland also show that acceptance and use of
physical violence have declined over time (Bussmann, Erthal, and Schroth 2011).
4.3.2 Support Services for VictimsMost of the countries have also created special governmental units and/or programmes
in charge of preventing and alleviating violence. However, even though these units
usually provide an array of services, there are very few shelters available for women or
children and those that exist have limited resources.26
In Jamaica, victims of gender-based violence receive support from public insti-
tutions such as the Centre for Investigation of Sexual Offences and Child Abuse, as
well as from nongovernmental organizations (NGOs) such as the Women’s Resource
Outreach Centre, which provides shelter services. Although very little information is
available on institutional efforts and programmes on violence against women and chil-
dren in Suriname, the Department of General Social Work of the Ministry of Social
Affairs is in charge of providing services for victims of domestic violence.
In The Bahamas, awareness of the high incidence of domestic violence led to the
opening of The Bahamas Crisis Centre in 1982. Moreover, the National Task Force on
Gender-Based Violence includes a National Five-Year Strategic Plan for Reducing
26 The following agencies are in charge of enforcement against violence in the home in the respective police forces/units: in The Bahamas, the inter-agency Gender-Based Violence Task Force at the Royal Bahamas Police Force; in Barbados, the Family Conflict Intervention Unit from the Royal Barbados Police Force; and in Jamaica, the Centre for the Investigation of Sexual Offences and Child Abuse of the Jamaica Constab-ulary Force.

75
VIOLENCE AGAINST WOMEN AND CHILDREN: HOW BIG IS THE PROBLEM AND IS IT CONNECTED TO OTHER VIOLENCE?
Domestic Violence. A second initiative in the country is a joint project with UN Women
called Strengthening State Accountability and Community Action for Ending
Gender-Based Violence in the Caribbean. Finally, a National Child Abuse Hotline was
also instituted to provide advice and assistance to child victims of violence.
In Trinidad and Tobago, the Ministry of Gender, Youth and Child Development
drafted a number of initiatives in 2015 that focus on domestic violence, youth, and
family services, including a campaign on gender-based/domestic violence, a regis-
try on domestic violence data, a domestic violence hotline, and a shelter for abused
women. A number of NGOs also provide services to victims of crime or persons who
have an elevated risk of victimization. For example, the Rape Crisis Society provides
counselling and training to victims of sexual and domestic violence and attempts to
empower them so that they become less vulnerable and more self-sufficient. Similarly,
Madinah House provides accommodation and support to women and children who
have been victims of domestic violence.
Finally, the Family Conflict Intervention Unit of Barbados was given the responsibil-
ity to record data and respond to family matters. Although there is no government-run
shelter for victims of domestic violence in the country, the Business and Professional
Women’s Club operates as a shelter for women seeking refuge from violence in the home.
4.3.3 Family and Parenting InterventionsInternational evidence suggests that parenting programmes are central to preventing
violence against children and eventually other types of violence that are incubated
during childhood and/or adolescence. The next chapter on youth presents further ev-
idence on the effects of parenting in breaking these cycles of violence.
Providing early intervention for families at risk via home visits and parenting pro-
grammes not only can reduce childhood exposure to violence, but may also reduce
future perpetration of intimate partner violence (Krug et al. 2002). There is strong ev-
idence from high-income countries that parenting programmes can reduce harsh and
abusive punishment and reduce behaviour problems in children that are predictive of
future perpetration of violence (Gilbert et al. 2009; Kane, Wood, and Barlow 2007;
Mikton and Butchart 2009). Emerging studies from low- and middle-income countries
are showing similar results (Eshel et al. 2006; Knerr, Gardner, and Cluver 2010). One
particular programme that has been evaluated in a number of countries and cultural
contexts is the Positive Parenting Program (“Triple P”).27
27 The programme, developed by the University of Queensland and currently used in 25 countries, has been shown to work across cultures, socio-economic groups, and family structures. The body of evidence is the most extensive of any parenting programme and includes more than 250 published papers, including eight meta-anal-yses, 68 randomized clinical trials, 51 effectiveness and service-based evaluations, and 13 single-case studies.

76
RESTORING PARADISE IN THE CARIBBEAN: COMBATTING VIOLENCE WITH NUMBERS
Government-run national parenting programmes are currently in place in a number
of Caribbean countries. In The Bahamas, the Ministry of Social Services and Commu-
nity Development implemented a National Parenting Programme to guide parents in
their daily roles. Similarly, the Ministry of Justice/Victim Support Unit in Jamaica offers
useful information on positive parenting best practices through its “The Parent’s Place”
programme. Finally, Trinidad and Tobago established a National Parenting Strategy
coupled with a National Parenting Programme to transmit competencies to meaning-
fully address common parenting challenges. However, these programmes consistently
omit having an evaluation or monitoring component, so while they may be promising,
reaching any firm conclusions about their direct impact on violence is not possible. It is
important that further analysis of these programmes take place in order to determine
what is working or what should be adjusted.
4.3.4 Changing Social NormsFinally, there is evidence that interventions to change social norms can have a pos-
itive effect on reducing levels of intimate partner violence. While many one-off
awareness-raising and advocacy campaigns have shown no evidence of impact, there
are two strategies that have been more rigorously evaluated and demonstrated mod-
est changes in reported attitudes. These include small group/community participatory
workshops and larger-scale educational entertainment campaigns using various media
sources (Ellsberg et al. 2014; Heise 2011). For example, a randomized control trial found
that applying the South African programme “Sisters for Life” curriculum to small groups
of women, combined with an existing microfinance programme,28 reduced partner vi-
olence by 51 percent over two years. A second study of the same programme found
that the positive impact on violence was more a function of the training than the mi-
crocredit component (Kim et al. 2009, 824). Other small-scale community mobilization
programmes working with both men and women have also shown promising results.29
Educational entertainment interventions, which develop and deliver radio and tele-
vision programmes to change norms, have been less rigorously evaluated, but seem to
28 The programme combined the introduction of a poverty-targeted microfinance component and a partici-patory learning and action gender-focused curriculum (Sisters for Life) for clients. The two components had, among many objectives, the aim to reinforce and improve household well-being, communications, and power relations. Qualitative data indicate that the reduction in violence experienced by the women was the result of their being able to challenge the acceptability of violence, accept better treatment, leave violent behaviour, and raise awareness on the issue in their communities. See Kim et al. (2009).29 These include a cluster randomized controlled trial on the SASA programme in Uganda (Abramsky et al. 2014), quasi-experimental evaluation of the Tostan Programme in Senegal (Diop et al. 2004), and a cluster randomized controlled trial of the SHARE Programme, also in Uganda (Wagman et al. 2014). For an overview, see Ellsberg et al. (2014).

77
VIOLENCE AGAINST WOMEN AND CHILDREN: HOW BIG IS THE PROBLEM AND IS IT CONNECTED TO OTHER VIOLENCE?
show promise.30 Additionally, because social hierarchies (men over women and parents
over children) are often considered to be justified in religious texts in the Caribbean, it
might be important to consider finding faith leaders willing to challenge these social
norms.
Interventions to change norms and reduce intimate partner violence are most ef-
fective when they target individuals and communities displaying key risk factors. This
chapter has shown that the factors associated with having a tolerant attitude toward
intimate partner violence in the Caribbean are similar to the risk factors for perpetrat-
ing and being a victim of intimate partner violence found in the international literature.
Lower income, young age, receiving government assistance (for women), rural res-
idence, and incomplete secondary schooling were all significantly associated with
tolerance of intimate partner violence.
Prioritizing programmes that aim to stop violence in the home before it occurs may
also have a broader long-term impact on overall societal violence and criminality in
the Caribbean. After all, preventing violence in the home against women and children
can stop children from growing up with increased aggression and emotional problems,
which may in turn prevent them from delinquency and violence later in life.
30 Such is the case of programmes implemented by the Soul City Institute for Health and Development (South Africa), the NGO Breakthrough in India, and Puntos de Encuentro in Nicaragua. These interventions have all attempted to measure their impact, though through imperfect evaluation designs. Highlights of these evalu-ations are summarized in Heise (2011, 24–27).

78
RESTORING PARADISE IN THE CARIBBEAN: COMBATTING VIOLENCE WITH NUMBERS
Appendix 4.1. Individual Characteristics of Respondents
Sample Males Females
Variable
Approves or understands (frequency
[percent] or mean of X)
Does not approve or understand (frequency
[percent] or mean of X)
Approves or understands (frequency
[percent] or mean of X)
Does not approve or understand (frequency
[percent] or mean of X)
Age 38.8 40.3 38.5 39.8
Occupation outside the home
42% 45% 33% 40%
Income group (1–16)* 8 9 7 8
Children (number) 1.99 1.93 2.21 2.04
Marital status
Married 26% 31% 28% 31%
Common law (living together)
16% 14% 18% 15%
Civil union 0% 0% 0% 0%
Single 49% 46% 43% 43%
Divorced 3% 3% 3% 3%
Separated 3% 2% 2% 2%
Widowed 3% 3% 5% 6%
Years of education 10.5 10.9 10.5 11.0
Urban residence 78% 79% 73% 81%
Receives government assistance
14% 10% 18% 12%
Number 3,180 4,907 2,397 5,750
Source: Prepared by the authors using data from the 2014/2015 Latin American Public Opinion Project (LAPOP) Survey for Caribbean countries including Jamaica, Guyana, Trinidad and Tobago, Suriname, The Bahamas, and Barbados.* In LAPOP Surveys, individuals are asked which income range their household fits into. Possible household income categories go from 1–16, with 1 being the lowest group and 16 being the highest. The corresponding range for each category is based on local currency and represents different amounts in each country.

79
VIOLENCE AGAINST WOMEN AND CHILDREN: HOW BIG IS THE PROBLEM AND IS IT CONNECTED TO OTHER VIOLENCE?
Appendix 4.2. Ordinary Least Squares Regression Using 2014/2015 Latin American Public Opinion Project Survey Data for The Bahamas, Barbados, Guyana, Jamaica, Trinidad and Tobago, and Suriname (question dvw2 as outcome variable)
Outcome
Male Female Male Female
Approves and Does Not Approve but Understands
Approves and Does Not Approve but Understands Approves Approves
Age –0.00238* –0.00138* –0.000917* –0.000202
(–0.001) (–0.0006) (–0.000406) (–0.000132)
Occupation outside the home
–0.00908 –0.0285 –0.000517 –0.0122
(–0.022) (–0.0174) (–0.0122) (–0.00813)
Household income –0.00374** –0.00567** –0.00331*** –0.00201
(–0.00128) (–0.00128) (–0.000439) (–0.001)
Children (number) 0.00369 0.00328 0.00121 –0.000626
(–0.00767) (–0.00669) (–0.00399) (–0.00228)
Single 0.00517 0.0505 0.00644 –0.014
(–0.0219) (–0.0352) (–0.013) (–0.0131)
Married 0.0159 0.00641 0.00597 –0.0218
(–0.011) (–0.0379) (–0.0166) (–0.0143)
Common law 0.00644 0.0383 0.00653 –0.00954
(–0.0111) (–0.0501) (–0.0205) (–0.0134)
Divorced –0.0187 0.0902 –0.0288 –0.00236
(–0.0394) (–0.0883) (–0.0221) (–0.0274)
Separated 0.0136 0.0539 –0.00413 0.000849
(–0.0293) (–0.0414) (–0.0323) (–0.0334)
Secondary education –0.0456* –0.00858 –0.0324* –0.0241*
(–0.0194) (–0.0186) (–0.016) (–0.0106)
Urban residence –0.00421 –0.0891** –0.0141** –0.0402**
(–0.0231) (–0.0282) (–0.00423) (–0.0151)
Government assistance 0.0529 0.0407** 0.00895 0.0175
(–0.0304) (–0.0146) (–0.0187) (–0.00925)
Physical punishment 0.0393** –0.019 0.00259 –0.0119
(–0.0108) (–0.0142) (–0.00606) (–0.0116)
Country fixed effects Yes Yes Yes Yes
Number 4,647 4,638 4,647 4,638
Source: Authors’ analysis of data from the 2014/2015 Latin American Public Opinion Project Survey.Note: Standard errors in parentheses. * p < 0.10,** p < 0.05, *** p < 0.001.


81
Youth Violence and Delinquency: Reducing Risk and Enhancing Protection
Heather Sutton and Inder Ruprah
Youth are frequent victims and perpetrators of many types of violence and crime,
including homicides, gang violence, school violence, and bullying. Youth are also
in a unique period of their lives when early problem behaviours can become
established patterns, affecting perpetration of violence and delinquency in later life.
This places youth in a particularly important position as a key target group for focused
interventions to protect against both victimization from and perpetration of violence.1
This chapter begins with an overview of existing studies on youth violence in the re-
gion and internationally. Next we examine data available from the Caribbean on youth
as victims of homicide, bullying, and other violent crime. Conversely, we also examine
the evidence on youth as perpetrators using data on arrests and prison admissions.
We conclude that, similar to other countries around the world, youth are dispropor-
tionately represented among victims as well as among those arrested and imprisoned.
This is followed by an analysis of early problem behaviours in the Caribbean that are
associated in international literature with later aggression and delinquency. We ex-
amine risk and protective factors associated with these problem behaviours. Lastly,
policy implications are examined in light of evidence-based interventions that have
been proven to work internationally to reduce youth violence (individual, family, and
community-based interventions). Box 5.1 provides definitions of some of the key terms
involved in the examination of youth violence.
5
1 Note that the age range of youth violence depends on data availability. The World Health Organization, for example, largely uses the 10–29 age range, while the official United Nations definition of youth is 15–24 years old. Because data from the Caribbean Crime Victimization Survey were not collected for youth under the age of 18, and given the administrative data available, the age range referred to here for youth is 18–25. We also include the age range of 26–35 as young adults.

82
RESTORING PARADISE IN THE CARIBBEAN: COMBATTING VIOLENCE WITH NUMBERS
5.1 BackgroundWorldwide studies have found that delinquent behaviour is not constant through-
out the life cycle of an individual, but tends to be strongly concentrated during
youth.2 Numerous international studies examine the overwhelming presence of
youth on both sides of the equation, as both victims and perpetrators of crime.3
The United Nations Development Programme’s Caribbean Human Development Re-
port 2012 makes the important distinction that while youth are more likely to be both
victims and perpetrators of certain types of violence, only a minority of the youth
population is involved in violent crime (UNDP 2012). Through self-reported responses
by youth to the 2010 Citizen Security Survey,4 the report finds that:
2 Thornberry (1996) finds empirical evidence that delinquent behaviour begins at ages 12–13, peaks around 17, and usually ends by age 30.3 See Graham and Bowling (1995) and Flood-Page et al. (2000).4 The countries included in their study were Antigua and Barbuda, Barbados, Guyana, Jamaica, Saint Lucia, Suriname, and Trinidad and Tobago.
Box 5.1. Definitions
Youth violence: Violence occurring between people ages 10–29. This violence often
occurs among youths who are not relatives and who may not know each other, and
generally takes place outside of the home. It includes harmful behaviours that may
start early and continue into adulthood. Some violent acts—such as assault—can lead
to serious injury or death. Others, such as bullying, slapping, or hitting, may result more
in emotional than physical harm (WHO 2014).
Bullying: A student is being bullied when he or she is exposed repeatedly over time
to aggressive behaviour that intentionally inflicts injury or discomfort through physical
contact, verbal attacks, fighting, or psychological manipulation. Bullying involves an
imbalance of power and can include teasing, taunting, the use of hurtful nicknames,
physical violence, or social exclusion (UNESCO 2011).
School violence: Violence perpetrated by teachers and other school staff that in-
cludes corporal punishment, cruel and humiliating forms of psychological punishment,
sexual and gender-based violence, and bullying. Violence in schools in the form of
playground fighting and bullying of students also occurs. Sexual and gender-based
violence also occurs in educational settings (UNICEF 2006b).
Risk factor: Risk factors are considerations that make it more likely that people will
experience violence (Wilkins et al. 2014).
Protective factor: Factors that make it less likely that people will experience violence
or that increase their resilience when they are faced with risk factors (Wilkins et al. 2014).

83
YOUTH VIOLENCE AND DELINQUENCY: REDUCING RISK AND ENHANCING PROTECTION
• Youth are involved in some serious crimes, but most of their delinquent activities
are neither serious nor violent. Only 1.6 percent of youths between the ages of 18
and 24 reported being accused of or arrested for violent crimes with a weapon and
2.2 percent of a violent crime without a weapon.
• There is increasing concern over school violence, but not enough evidence to sup-
port empirical analysis.5
• Youth violence, especially related to the formation of school gangs, is often in re-
sponse to threats and fear of victimization.
• Youth are traumatized by community violence, with 48.7 percent of youth express-
ing fear of being a victim of crime and many experiencing anxiety, fear, and trauma
as a result of exposure to community violence.
• Youth are victimized mostly by peers, but also by adults, including police, teachers,
parents, and family.
A robust body of international literature also finds connections between early
adolescent problem behaviours and a later propensity to offend or commit further vi-
olence. For example, several studies connect early antisocial and risky behaviour—such
as greater use of tobacco, alcohol, and other drugs—to subsequent increased violence
and delinquent behaviour (Barnes et al. 2000; Dishion and McMahon 1998; Fletcher et
al. 1995). In the Caribbean, Ohene, Ireland, and Blum (2005) find evidence of a cluster-
ing of these risk behaviours among youth. Specifically they find that early initiation of
sexual activity was a significant predictor of gang involvement and weapon-carrying
among young adolescents and other risk behaviours in older adolescents. Blum and
Ireland (2004) found that Caribbean teens who reported having experienced abuse,
those who skip school, and those who indicate that they almost always think about
hurting or killing someone are much more likely to report involvement with violence,
sexual intercourse, cigarette use, and alcohol use.
Studies indicate that decreasing certain risk factors while increasing protective
factors can help prevent problem behaviours and their negative consequences. By
definition, a risk factor is a variable that predicts increased probability of subsequent
offending or violence. Conversely, protective factors are the opposite of risk factors
(reducing the probability of offending), that is, they are moderators that help counter
risk factors. While any one risk factor alone may not predict delinquency, a combi-
nation of many of them increases the likelihood of offending later in life. Outside the
5 Adequate data on the phenomenon of school violence are not available across the region, since in most countries authorities do not collect information on school violence on a regular basis. The few studies avail-able on the subject, however, indicate that violence is present in schools. See Marshall-Harris (2011) on Barba-dos and Lall (2007) on Trinidad and Tobago.

84
RESTORING PARADISE IN THE CARIBBEAN: COMBATTING VIOLENCE WITH NUMBERS
Caribbean, the most rigorous studies have identified prominent individual, family, and
peer-level risk and protective factors (for an overview of this literature see Farrington
and Welsh 2007 and WHO 2010). Individual factors identified are low intelligence, low
empathy, and impulsivity. These are often combined with family and community fac-
tors proven to increase the propensity to offend—families with weak parenting skills,
that are abusive, and that live in socially deprived areas. Finally, the most prominent
peer/school factors found in the international literature include associating with delin-
quent peers and attending schools with high levels of delinquency.
While there have been no robust longitudinal studies in the Caribbean on risk and
protective factors associated with later offending per se, cross-sectional studies have
examined many adolescent problem behaviours and their correlates.6 At the individual
level, Caribbean studies highlight that biological, psychological, and behavioural risk fac-
tors are directly associated with high levels of aggression (for a summary, see Maharaj,
Nunes, and Renwick, 2009).7 Within the family sphere, parental monitoring of adolescents
has been recognized as an important protective factor (Blum and Ireland 2004; Maguire
2012; Ohene, Ireland, and Blum 2005). At the macro level, the communities where young
people live are also important determinants of families’ interactions, the nature of peer
relationships among young people, and the way youth are exposed to violence.8 Extreme
economic deprivation, conflict in the family, a family history of behavioural problems, and
a lack of a protective environment are common risk factors for most adolescent delin-
quency and dropping out of school (Maharaj, Nunes, and Renwick 2009).9
5.2 Facts and Figures5.2.1 Youth VictimizationThe profiles of homicide victims based on police data indicate that they are dispropor-
tionately young males between the ages of 18 and 35. Table 5.1 shows the percentage
of youth in the population versus their representation among homicide victims. The
6 See Maharaj, Nunes, and Renwick (2009) for a review and a summary of research on the prevalence of health risk behaviours and their outcomes, as well as risk and protective factors, among adolescents in the English-speaking Caribbean. See Maguire, Wells, and Katz (2011) for a study in Trinidad and Tobago that concluded that existing measures of risk and protective factors from the United States cannot necessarily be transplanted to developing nations without being adapted to the socio-cultural background of the country.7 This research highlighted 14 studies on links between health risk behaviours and violence and delinquency, in-cluding Meeks Gardner (2003), Samms-Vaughn, Jackson, and Ashley (2004), Soyibo (2000), and Whittle (1994).8 Studies show that social integration affects youth violence. By studying poor urban communities in Jamai-ca, Moser and Holland (1997), for instance, found links between violence and lower employment, less educa-tional opportunities and fewer investments in the community.9 The presence of gangs in communities or schools also increases the likelihood of violence in a community. See Chapter 7.

85
YOUTH VIOLENCE AND DELINQUENCY: REDUCING RISK AND ENHANCING PROTECTION
odds ratio is an expression of how many more times a group is represented in vic-
timization, compared to its representation in the population.10 Although those under
18 years old represent nearly 30 percent of the population (of the four countries), they
are collectively less than 5 percent of all homicide victims. However, those between
the ages of 18–25 and 25–35 are over-represented among homicide victims given their
percentage of the population. Homicide rates for these two groups are in many cases
double the national rates. In The Bahamas and Barbados, homicide rates were higher
for youth (18–25) than for young adults (25–35), while the opposite is true for Trinidad
and Tobago and Jamaica.
10 An odds ratio of 1 implies equal representation, while an odds ratio of more than 1 implies that a group is over-represented in the particular type of victimization.
Table 5.1: Youth Population, Percentage of Homicide Victims, and Homicide Rate by Age Group
Country Percent of Population
Percent of Homicide Victims
Homicide Rate by Age Group (per
100,000 population)
Homicide Rate for the Total Population
(per 100,000 population) Odds Ratio1
Under 18 years old
The Bahamas 32.3 5.0 5.3 33.3 0.2
Barbados 23.9 4.2 1.9 10.6 0.2
Jamaica 31.9 4.0 6.3 47.3 0.1
Trinidad and Tobago 24.8 6.1 8.6 34.8 0.2
18–25 years old
The Bahamas 12.4 32.0 84.8 33.3 2.0
Barbados 10.7 25.0 24.6 10.6 2.3
Jamaica 15.3 20.0 64.0 47.3 1.3
Trinidad and Tobago 13.8 20.9 52.8 34.8 1.5
26–35 years old
The Bahamas 15.4 30.0 64.7 33.3 1.9
Barbados 13.7 29.2 22.6 10.6 2.1
Jamaica 14.8 27.0 90.8 47.3 1.8
Trinidad and Tobago 16.7 33.4 69.6 34.8 2.0
Source: Homicide data are for 2013 and were provided by the Royal Bahamas Police Force, Strategic Policy and Planning Unit; the Royal Barbados Police Force; the Economic and Social Survey of Jamaica; and the Crime and Problem Analysis Branch of the Trinidad and Tobago Police Service. The youth population and homicide rates were calculated using The Bahamas 2010 Population and Housing Census; the Barbados 2010 Population and Housing Census; the Jamaica 2011 Population and Housing Census; and the Trinidad and Tobago 2011 Population and Housing Census.Note: Suriname is not included in this table because the data were not available.1 The odds ratio is computed as the percentage of the specified crime involving a particular ethnic group divided by the group’s percentage of the population.

86
RESTORING PARADISE IN THE CARIBBEAN: COMBATTING VIOLENCE WITH NUMBERS
As reported in Chapter 2, young age is also significantly associated with increased
risk of victimization for other violent crimes (including robbery and assaults and
threats), but has no significant correlation with property crime (theft). Youth prev-
alence rates for assault were particularly high in Kingston (8.6 percent) and New
Providence (12.1 percent). When we compare the victimization rates for the overall
population to those of youth (18–24), we find that youth are twice as likely to be vic-
tims of assault in New Providence (12 percent versus 6 percent) and one-and-a-half
times as likely to be victims of assault in Kingston (8.6 percent versus 5.3 percent)
Figure 5.1: Prevalence of Victimization among Youth versus the Overall Population, by Type of Crime, in Five Caribbean Capital City Metropolitan Areas (percent)
0% 2% 4% 6% 8%
10% 12% 14% Auto theft
Burglary
Robbery
Theft
Assault
Threat
Total population
0% 2% 4% 6% 8%
10% 12% 14% Auto theft
Burglary
Robbery
Theft
Assault
Threat
Population ages 18–24
0% 2% 4% 6% 8%
10% 12% 14%
Auto theft
Burglary
Robbery
Theft
Assault
Threat
Population ages 25–34
0% 2% 4% 6% 8%
10% 12% 14%
Auto theft
Burglary
Robbery
Theft
Assault
Threat
Population ages 35–49
New Providence Greater Bridgetown Area Kingston Metropolitan Area
Paramaribo Port of Spain Metropolitan Area
Source: Prepared by the authors using data from the IDB Caribbean Crime Victimization Survey module attached to the 2014/2015 Latin American Public Opinion Project Survey.

87
YOUTH VIOLENCE AND DELINQUENCY: REDUCING RISK AND ENHANCING PROTECTION
5.2.2 BullyingBullying is another particular type
of violence to which youth and chil-
dren are exposed. It consists of the
repeated abuse of power, includ-
ing deliberate physical or verbal
aggression such as name calling,
making threats, and, more recent-
ly, cyber-aggression. Bullying differs
from fighting in that it is used to as-
sert dominance where there is an
imbalance in social or physical power.
International literature has found cor-
relates between bullying, long-term
psychological damage, and potential
problem behaviour.11
Data from the most recent Global
School Health Surveys (GSHS)12 in the
Caribbean show that nearly 30 per-
cent of youth had been victims of
bullying in the past 30 days before
the survey (Figures 5.2 and 5.3). Ja-
maica and Guyana have prevalence
rates higher than the world and Ca-
ribbean averages. Ruprah and Sierra
(2014) found youth lacking enough
food at home (a proxy for poverty)
were on average 5 percent more
prone to be bullied than their peers.
Victims of bullying were more often
11 See Wolke et al. (2013) for an analysis of the medium-term consequences of bullying and cyberbullying on different outcomes (e.g., depression, likelihood of smoking, drinking, life satisfaction); see Copeland et al. (2013) for a comparison of behaviours between victims of bullying and non-victims (compared to non-victims of bullying, victims had four times the prevalence of agoraphobia, generalized anxiety, and panic disorder when they became adults).12 The GSHS is a self-administered questionnaire given primarily to students 13–17 years old during one reg-ular class period. The survey uses a standardized scientific sample selection process as well as a common school-based methodology, and it features core questionnaire modules, core-expanded questions, and country-specific questions.
Figure 5.2: Prevalence of Bullying in the Past 30 Days (percent)
Caribbean average
0
10
20
30
40
50
JA GY VCT SU LCA KNA TT
Sources: Ruprah and Sierra (2014); and Global School Health Survey Data.Note: The countries included above are: GY: Guyana, JA: Jamaica, LCA: St. Lucia, SU: Suriname, KNA: St. Kitts and Nevis, TT: Trinidad and Tobago, VCT: St. Vincent and the Grenadines.
Figure 5.3: Composition of Frequency of Bullying in the Past 30 Days (percent)
0JAGY VCTSU LCA KNATT
102030405060708090
100
All 30 days 20 to 29 days 10 to 19 days 6 to 9 days
3 to 5 days 1 or 2 days 0 days
Sources: Ruprah and Sierra (2014); and Global School Health Survey Data.Note: The countries included above are: GY: Guyana, JA: Jamaica, LCA: St. Lucia, SU: Suriname, KNA: St. Kitts and Nevis, TT: Trinidad and Tobago, VCT: St. Vincent and the Grenadines.

88
RESTORING PARADISE IN THE CARIBBEAN: COMBATTING VIOLENCE WITH NUMBERS
boys than girls, and on average were lonelier, slept less, and had fewer friends than
their non-bullied peers.
5.2.3 Youth as PerpetratorsAdministrative data on the age of perpetrators are significantly more limited than
those for the victims of crime and violence. Some evidence, however, suggests that
large portions of those arrested for homicides (Table 5.3) and imprisoned for crimes
(Table 5.2) are disproportionately youth and young adults. In The Bahamas, for in-
stance, prison data indicate that 69 percent of total admissions to the country’s only
Table 5.2: Youth as a Percentage of the Population versus Prison Admissions, The Bahamas and Jamaica
The Bahamas
Percent of Population Percent of Prison
Admissions Odds Ratio
Ages 18–25 12.4 36.9 3.0
Ages 26–35 15.4 31.8 2.1
Jamaica
Percent of Population Percent of Prison
Admissions Odds Ratio
Ages 17–25 17.2 21.4 1.2
Ages 26–35 14.8 33.7 2.3
Sources: Bahamas Correctional Department, 2013; and the 2014 Economic and Social Survey of Jamaica and most recent census data.Note: Includes both sentenced and remanded admissions. Table should not be used for cross-country comparison, since age categories provided are slightly different.
Table 5.3: Youth as a Percentage of the Population versus Homicide Arrests, Trinidad and Tobago and Barbados
Trinidad and Tobago
Percent of PopulationPercent of Homicide
Arrests Odds Ratio
Ages 15–24 16.1 24.4 1.5
Ages 25–34 18.7 35.6 1.9
Barbados
Percent of Population Percent of Homicide
Arrests Odds Ratio
Ages 18–25 10.8 33.3 3.1
Ages 26–35 13.7 16.7 1.2
Sources: Royal Barbados Police Force; and the Crime and Problem Analysis Unit of the Trinidad and Tobago Police Service arrest data 2013 and most recent census data.Note: Table should not be used for cross-country comparison since age categories provided are slightly different.

89
YOUTH VIOLENCE AND DELINQUENCY: REDUCING RISK AND ENHANCING PROTECTION
prison in 2013 were between the ages of 18 and 35. The odds ratio of 3 for Bahami-
ans ages 18–25 indicates that this age group is three times as likely to be imprisoned
compared to their representation in the population. In Jamaica (2014), odds ratios for
being imprisoned compared to their representation in the population were 1.2 and 2.3
for youth (17–25) and young adults (26–35), respectively.
Similarly, in Barbados (2013), the largest proportion of homicide arrests fell into the
age groups of 18–25 and 26–35, with odds ratios of 3.1 and 1.2, respectively.13 Finally, in
Trinidad and Tobago most arrests for homicide in 2013 were between 15 and 24 years
of age (24.4 percent) and 25 and 34 years of age (35.6 percent), with odds ratios of
1.5 and 1.9.14
5.2.4 Early Problem Behaviours, Risk, and Protective FactorsWhile adolescents under age 18 are a small percentage of victims and perpetrators
of serious violent crimes (i.e., homicide), early problem behaviours in adolescents are
often linked to later perpetration of violence and offending. A recent IDB study using
data from the GSHS investigated the prevalence of five problem behaviours among
adolescents ages 13–17—sexual intercourse, drinking, drug use, fighting, and getting in
trouble after drinking—in Latin America and the Caribbean (Ruprah, Sierra, and Sutton
2016). Figure 5.4 shows that levels of problem behaviours were generally higher in
the Caribbean countries than in the Latin American countries surveyed. Differences
between the Caribbean and Latin America were particularly stark for drug use. Finally,
similar to previous studies, a clustering of problem behaviours was observed.
Using individual logit regressions for each country, the five problem behaviours
were found to be associated with the following risk factors: skipping school, suicidal
thoughts, and going hungry (proxy for poverty), with some variation between coun-
tries (Appendix 5.1). Protective factors tested included having close friends (social)
and engaged parents (measured using a parental supervision index). While having
friends was insignificant in many cases, having less engaged parents was significantly
associated with problem behaviours in nearly all cases (Figure 5.5 and Appendix 5.1).
The prevalence of risk and protective factors in each country is shown in Figure 5.5. A
general observation is that risk factors tend to be higher and protective factors lower
in Caribbean countries compared to Latin America.
13 Homicide perpetrators between 18 and 25 years old were prevalent in the group: 45 percent in 2010, 59 percent in 2011, 38 percent in 2012, and 33 percent in 2013.14 Note that data are derived from both convicted and accused persons who have been arrested and charged with a homicide. The available data do not allow for disaggregation into those who have been convicted and those who have been charged but not convicted (some of whom may be innocent). It should also be noted that data on the perpetrator are not available for a large proportion of homicides that occur because in many cases the perpetrators are not identified.

90
RESTORING PARADISE IN THE CARIBBEAN: COMBATTING VIOLENCE WITH NUMBERS
Parenting appears to be one of the most important and significant protective
factors for both reducing early problem behaviours and victimization from bullying
among youth. Engaged parents were associated with significantly reduced problem
behaviours among adolescents in the Caribbean and Latin America (Ruprah, Sierra,
and Sutton 2016). While the Caribbean had fewer engaged parents than Latin America,
Figure 5.4: Prevalence of Health Risk Behaviours Among Teenagers in the Caribbean and Latin America (percent)
ARBA
CH
UR
EC
GY JASUTT
ATGC
R
GR
D
LCAPE
VC
T
0
ARBA
CH
UR
EC
GY JASUTT
ATGC
R
GR
D
LCAPE
VC
T
Sexual intercourse Drinking
0 0
AR BA
CH
UR
EC
GY JASU TT
ATGC
R
GR
D
LCAPE
VC
T
ARBA
CH
UR
EC
GY JASU TT
ATGC
R
GR
D
LCAPE
VC
T
Getting in trouble Fighting
0
15
10
5
20
25
30
AR BA
CH
UR
EC
GYJASU TT
ATGC
R
GR
D
LCAPE
VC
T
Drug use Clustering of health risk behaviours
No risky behaviour 1 risky behaviour 2 risky behaviours 3 risky behaviours 4 risky behaviours 5 risky behaviours
0102030405060708090
100
AR
ATG B
A
CH
CR
EC
GR
D
GY JA
LCA PE
SU TT UR
VC
T
39 33 40 4257
4435 41
30 3349 49 49 41
29
24 3228 29
2329
2929
30 29
29 30 2926
32
10
20
30
40
50
60
15
10
5
20
25
15105
2025
4540
3035
0
15
10
5
20
25
35
30
Source: Ruprah, Sierra, and Sutton (2016); and Global School Health Survey data.Note: The horizontal lines are the unweighted average of the 15 Latin American and Caribbean countries. Green bars indicate Latin American countries and burgundy bars indicate Caribbean countries. The countries included above are: AR: Argentina, ATG: Antigua and Barbuda, BA: Barbados, CH: Chile (Metropolitan), CR: Costa Rica, EC: Ecuador (Quito), GRD: Grenada, GY: Guyana, JÁ: Jamaica, LCA: St. Lucia, PE: Peru, SU: Suriname, TT: Trinidad and Tobago, UR: Uruguay, VCT: St. Vincent and the Grenadines.

91
YOUTH VIOLENCE AND DELINQUENCY: REDUCING RISK AND ENHANCING PROTECTION
and the impact of good parenting was weaker in the Caribbean, engaged parenting
made a significant difference for both groups of countries (Appendix 5.1).15 The con-
nection between good parenting and fewer bullying cases is also clear: the regional
Figure 5.5: Prevalence of Risk and Protective Factors Among Teenagers in the Caribbean and Latin America
0.1
0.2
0.3
0.4
0.5
ARBA
CH
UR
EC
GY JASU TT
ATG C
R
GR
D
LCA PE
VC
T
0
0.1
0.2
0.3
AR BA
CH
UR
EC
GY JASU TT
ATGC
R
GR
D
LCA PE
VC
T
Skipping school Suicidal thoughts
0
0.05
0.10
0.15
0.20
AR BA
CH
UR
EC
GY JASUTT
ATGC
R
GR
D
LCAPE
VC
T
0.3
0.4
0.5
0.8
0.7
0.6
ARBA
CH
UR
EC
GY JASU TT
ATG C
R
GR
D
LCA PE
VC
T
Poverty (hunger) Friendships
0.1
0.3
0.2
0.4
0.5
0.6
ARBA
CH
UR
EC
GYJA SU TT
ATG C
R
GR
D
LCA PE
VC
T
Engaged parents
Source: Ruprah, Sierra, and Sutton (2016); and Global School Health Survey data.Note: The vertical bars represent the 95 percent confidence intervals. The gray horizontal band represents the average for the 15 Latin American and Caribbean countries within a 95 percent confidence interval. The countries included above are: AR: Argentina, ATG: Antigua and Barbuda, BA: Barbados, CH: Chile (Metropolitan), CR: Costa Rica, EC: Ecuador (Quito), GRD: Grenada, GY: Guyana, JÁ: Jamaica, LCA: St. Lucia, PE: Peru, SU: Suriname, TT: Trinidad and Tobago, UR: Uruguay, VCT: St. Vincent and the Grenadines.
15 See Ruprah, Sierra, and Sutton (2016) for further specifications about the study and its methodology.

92
RESTORING PARADISE IN THE CARIBBEAN: COMBATTING VIOLENCE WITH NUMBERS
victimization rate of teenagers whose parents used better parenting practices was half
the rate of those whose parents did not (Ruprah and Sierra 2014).
These findings are consistent with international literature that shows that strong
and replicable predictors of offending in later life can include poor parental supervi-
sion, criminal parents, parental conflict, and disrupted families (Farrington and Welsh
2007). In fact, longitudinal studies find that poor parental supervision typically pre-
dicts double the risk of delinquency (Farrington and Loeber 1999; McCord 1979; Smith
and Stern 1997). While more research is needed in the Caribbean on risk factors in
other spheres (school, peer, and community), it is clear that family-based programmes
that target parental management and supervision have great potential to prevent the
development of early problem behaviours, victimization from bullying, and potential
subsequent offending, as well as physical abuse and development of aggression.
5.3 Conclusions and Policy ImplicationsYouth violence is a considerable health and public safety issue in the Caribbean. Youth
are over-represented as victims of homicide and other crimes (particularly violent
crimes), and they are also over-represented among those arrested and imprisoned in
Caribbean countries. This is consistent with much of the international literature that
finds that youth is a particularly vulnerable time for individuals who may become
involved in early delinquent activity and/or victimized by their peers. Furthermore,
youth violence can damage societies at the macro level in a number of ways, includ-
ing through increased likelihood of participation in criminal organizations, including
gangs, a subject that is further discussed in Chapter 7.
There are important gaps in national and regional data on youth violence in the Ca-
ribbean, particularly data on its perpetrators. Having better, more reliable, and routine
collection methods for information on youth violence both by schools and govern-
ments would represent a first step towards effective prevention programmes. While
robust longitudinal studies on factors related to later offending are ideal, policymakers
in the Caribbean countries need not wait for these studies to be able to reduce youth
violence. Making use of the risk and protective factors identified in this chapter and
the international literature, policymakers can adapt evidence-based programmes that
have been successful in other settings. Programmes should be focused on specific
at-risk groups (families and youth displaying a combination of risk factors presented
here). The continual testing and evaluation of the impact of these programmes can
lead to equally valuable information for reducing crime and violence in the region.
For example, this chapter has highlighted the importance of family as an area of
focus for prevention programmes. There are significant potential benefits of improving
parenting practices within the Caribbean region. At the international level there are

93
YOUTH VIOLENCE AND DELINQUENCY: REDUCING RISK AND ENHANCING PROTECTION
many parenting programmes that have promising results, such as the Positive Parent-
ing Program (“Triple P”), which has been successful across cultures, socio-economic
groups, and various family structures.16 There are already government-run national
parenting programmes in a number of Caribbean countries (including The Bahamas,
Jamaica, and Trinidad and Tobago). However, it is not clear what level of resources
they receive, to what extent they incorporate evidence-based and data-driven ap-
proaches, or how successful they have been. Efforts and resources should be focused
on evaluating such interventions so that they may be redesigned, strengthened, or
scaled up.
Other programmes targeting at-risk youth can also have an impact on crime and
violence, and many are currently being implemented in Caribbean countries. It is im-
portant to keep in mind, however, that while some prevention programmes are proven
to reduce the likelihood of offending, some are ineffective, and some may be promis-
ing but have not been tested adequately. Most of the initiatives in the Caribbean fall
into the latter category. Not every social programme will have a direct impact on crime
and violence, and it is important that policy in this area be driven by what works, and
not by what might work or ought to work.
While an array of other youth programmes have gained popularity—such as
military-style boot camps and drug resistance classes taught by the police—the in-
ternational evidence shows that they do not tend to make much of a difference. On
the other hand, a number of programmes targeting risk and protective factors at the
individual and family levels have had much success internationally. Social skills training
and cognitive-behavioural therapy approaches target risk factors of impulsivity, anger,
low empathy, and self-control. They have been found to produce significantly positive
results in terms of problem behaviours and subsequent propensity to offend. Early
preschool intellectual development programmes directed towards disadvantaged or
at-risk children have also shown impressive results in the prevention of subsequent
offending and antisocial behaviour. Results of these programmes are not limited to
reducing delinquency, but have considerable spinoffs for other life outcomes such as
continuing education, employment, family stability, and lower rates of substance abuse.
Fortunately, many of the programmes that have already been evaluated worldwide
have been held to high scientific standards and the body of evidence is surprisingly
accessible for non-experts.17
16 The body of evidence of this programme is the most extensive of any parenting programme and is com-prised of more than 250 published papers, including eight meta-analyses, 68 randomized clinical trials, 51 effectiveness and service-based evaluations, and 13 single-case studies.17 Several websites and interactive tools have been developed to facilitate searches for evidence-based pro-grammes. For examples, see www.crimesolutions.gov, www.blueprintsprograms.com, www.who.int, and www.campbellcollaboration.org.

94
RESTORING PARADISE IN THE CARIBBEAN: COMBATTING VIOLENCE WITH NUMBERS
App
endi
x 5.
1. Re
gres
sion
Res
ults
: Odd
s Ra
tios
Arg
enti
naA
ntig
ua a
nd B
arbu
daB
arba
dos
Sex
Dri
nkin
gTr
oubl
eFi
ghti
ngD
rugs
Sex
Dri
nkin
gTr
oubl
eFi
ghti
ngD
rugs
Sex
Dri
nkin
gTr
oubl
eFi
ghti
ngD
rugs
(1)
(2)
(3)
(4)
(5)
(1)
(2)
(3)
(4)
(5)
(1)
(2)
(3)
(4)
(5)
Ag
e2.
034
***
1.64
6***
1.387
***
1.00
21.4
52**
*1.5
26**
*1.3
16**
1.14
40
.84
6*1.5
77**
*1.9
73**
*1.0
320
.819
*0
.827
**1.3
72**
*
(0.16
)(0
.10)
(0.0
9)(0
.06)
(0.19
)(0
.19)
(0.15
)(0
.15)
(0.0
8)(0
.25)
(0.16
)(0
.08)
(0.0
9)(0
.06)
(0.12
)
Pov
erty
(h
ung
er)
1.215
1.318
1.912
*2.
724
***
2.26
1**
0.9
641.3
901.9
97**
1.726
**0
.899
0.3
30**
*1.3
230
.784
1.321
1.237
(0.4
3)(0
.54
)(0
.68)
(0.8
9)(0
.80
)(0
.26)
(0.3
3)(0
.67)
(0.4
4)
(0.2
7)(0
.12)
(0.4
3)(0
.39)
(0.3
4)
(0.4
1)
Gen
der
(m
ale)
2.32
7***
1.411
***
1.210
3.24
5***
1.90
3***
2.50
6***
1.461
**1.5
86*
1.94
5***
1.836
**2.
270
***
1.732
***
1.837
**2.
411*
**1.9
96**
*
(0.3
2)(0
.16)
(0.18
)(0
.40
)(0
.36)
(0.5
2)(0
.24
)(0
.39)
(0.3
7)(0
.44
)(0
.35)
(0.2
4)
(0.4
4)
(0.3
3)(0
.26)
Soci
al
(fri
end
s)1.0
141.1
01
1.325
*1.1
180
.80
41.0
42
1.196
0.9
04
1.223
1.096
1.127
0.7
93*
0.5
47**
*0
.850
0.7
85
(0.14
)(0
.14)
(0.2
1)(0
.15)
(0.2
0)
(0.17
)(0
.22)
(0.2
7)(0
.16)
(0.2
1)(0
.16)
(0.0
9)(0
.12)
(0.0
9)(0
.12)
Skip
pin
g
scho
ol2.
072
***
2.65
9***
2.75
5***
1.60
6***
2.85
0**
*2.
031
***
1.70
5***
2.39
4**
*2.
384
***
2.54
9***
1.582
***
1.970
***
4.5
36**
*1.6
26**
*2.
346*
**
(0.2
1)(0
.34
)(0
.49)
(0.2
4)
(0.6
2)(0
.37)
(0.2
8)(0
.53)
(0.5
2)(0
.50
)(0
.24
)(0
.29)
(0.8
9)(0
.23)
(0.3
8)
Suic
idal
th
oug
hts
2.0
90**
*2.
587*
**2.
086
***
1.670
***
2.16
5***
2.0
60**
*2.
40
4**
*1.8
92**
*1.5
65**
2.47
5***
——
——
—
(0.3
7)(0
.44
)(0
.33)
(0.2
9)(0
.58)
(0.2
9)(0
.50
)(0
.41)
(0.2
8)(0
.43)
——
——
—
Eng
aged
p
aren
ting
0.9
470
.579
***
0.5
67**
*0
.619
***
0.5
76**
0.8
730
.747
0.7
890
.759
**0
.624
**0
.70
5**
0.6
37**
0.5
26**
*0
.84
90
.816
(0.10
)(0
.08)
(0.0
9)(0
.07)
(0.15
)(0
.14)
(0.14
)(0
.22)
(0.10
)(0
.14)
(0.11
)(0
.11)
(0.13
)(0
.10)
(0.13
)
Ob
s1,8
981,8
661,8
781,8
981,8
671,1
151,0
941,0
841,1
151,1
00
1,599
1,528
1,554
1,599
1,54
3
(con
tinu
ed o
n ne
xt p
age)

95
YOUTH VIOLENCE AND DELINQUENCY: REDUCING RISK AND ENHANCING PROTECTION
App
endi
x 5.
1. Re
gres
sion
Res
ults
: Odd
s Ra
tios
Chi
leC
osta
Ric
aEc
uado
r
Sex
Dri
nkin
gTr
oubl
eFi
ghti
ngD
rugs
Sex
Dri
nkin
gTr
oubl
eFi
ghti
ngD
rugs
Sex
Dri
nkin
gTr
oubl
eFi
ghti
ngD
rugs
(1)
(2)
(3)
(4)
(5)
(1)
(2)
(3)
(4)
(5)
(1)
(2)
(3)
(4)
(5)
Ag
e1.8
92**
*1.7
28**
*1.5
62**
*0
.860
**2.
104
***
2.29
2***
1.953
***
1.64
4**
*0
.938
1.517
***
1.572
***
1.593
***
1.283
***
1.118
*1.4
50**
*
(0.18
)(0
.10)
(0.0
7)(0
.06)
(0.15
)(0
.25)
(0.16
)(0
.18)
(0.0
5)(0
.13)
(0.10
)(0
.07)
(0.0
7)(0
.06)
(0.13
)
Pov
erty
(h
ung
er)
1.190
1.176
1.685
1.161
0.3
120
.70
61.4
152.
113*
1.171
0.7
970
.721
0.9
971.3
650
.968
2.74
1***
(0.3
6)(0
.40
)(0
.67)
(0.3
8)(0
.25)
(0.3
6)(0
.51)
(0.9
3)(0
.52)
(0.4
1)(0
.26)
(0.2
3)(0
.53)
(0.2
3)(0
.55)
Gen
der
(m
ale)
3.0
25**
*1.2
51**
1.052
3.72
4**
*1.3
06
1.517
***
1.186
1.574
*4
.235
***
2.64
8***
3.30
5***
1.490
***
1.180
4.4
31**
*1.5
52**
(0.4
9)(0
.12)
(0.10
)(0
.55)
(0.2
8)(0
.20
)(0
.16)
(0.3
6)(0
.51)
(0.3
6)(0
.72)
(0.16
)(0
.12)
(0.7
4)
(0.2
3)
Soci
al
(fri
end
s)0
.852
0.9
820
.891
1.126
1.031
1.020
1.078
0.8
860
.90
41.7
52**
*1.5
18**
1.457
***
1.159
1.337
**1.4
98*
(0.11
)(0
.09)
(0.14
)(0
.09)
(0.19
)(0
.12)
(0.13
)(0
.15)
(0.12
)(0
.31)
(0.2
6)(0
.16)
(0.12
)(0
.15)
(0.2
9)
Skip
pin
g
scho
ol1.5
58**
*2.
00
1***
1.870
***
1.675
***
2.4
21**
*2.
012
***
2.0
93**
*2.
865*
**1.6
02*
**2.
115*
**2.
150
***
2.54
2***
3.15
9***
1.984
***
2.79
1***
(0.19
)(0
.25)
(0.2
3)(0
.23)
(0.4
1)(0
.34
)(0
.24
)(0
.53)
(0.17
)(0
.37)
(0.3
7)(0
.40
)(0
.37)
(0.3
1)(0
.76)
Suic
idal
th
oug
hts
2.30
3***
2.53
0**
*2.
341*
**1.6
77**
*1.9
42*
*1.8
80**
*2.
568*
**3.
080
***
2.0
24**
*2.
302*
**2.
034
***
2.29
6***
2.79
8***
1.54
3***
1.590
*
(0.4
3)(0
.34
)(0
.29)
(0.2
1)(0
.47)
(0.2
5)(0
.45)
(0.6
9)(0
.32)
(0.5
6)(0
.30
)(0
.28)
(0.4
1)(0
.22)
(0.3
5)
Eng
aged
p
aren
ting
0.5
95**
0.6
07*
**0
.480
***
0.6
19**
*0
.438
***
0.6
16**
*0
.550
***
0.3
63**
*0
.579
***
0.3
63**
*0
.695
*0
.630
***
0.5
56**
*0
.74
3***
0.3
91**
*
(0.11
)(0
.08)
(0.0
4)
(0.0
6)(0
.09)
(0.0
6)(0
.07)
(0.0
7)(0
.07)
(0.0
6)(0
.14)
(0.0
7)(0
.07)
(0.0
6)(0
.08)
Ob
s2,
078
2,0
632,
064
2,0
782,
054
2,61
12,
588
2,54
52,
611
2,60
52,
149
2,13
92,
137
2,14
92,
140
(con
tinu
ed)
(con
tinu
ed o
n ne
xt p
age)

96
RESTORING PARADISE IN THE CARIBBEAN: COMBATTING VIOLENCE WITH NUMBERS
App
endi
x 5.
1. Re
gres
sion
Res
ults
: Odd
s Ra
tios
Gre
nada
Guy
ana
Jam
aica
Sex
Dri
nkin
gTr
oubl
eFi
ghti
ngD
rugs
Sex
Dri
nkin
gTr
oubl
eFi
ghti
ngD
rugs
Sex
Dri
nkin
gTr
oubl
eFi
ghti
ngD
rugs
(1)
(2)
(3)
(4)
(5)
(1)
(2)
(3)
(4)
(5)
(1)
(2)
(3)
(4)
(5)
Ag
e1.5
55**
*1.3
40
***
1.194
**1.0
06
1.584
***
1.671
***
1.160
**1.0
970
.864
**—
—1.0
44
0.8
380
.90
91.0
33
(0.10
)(0
.07)
(0.0
8)(0
.05)
(0.16
)(0
.13)
(0.0
6)(0
.06)
(0.0
5)—
—(0
.11)
(0.12
)(0
.11)
(0.11
)
Pov
erty
(h
ung
er)
0.9
991.4
07*
*1.4
44
0.9
511.2
170
.74
60
.936
1.659
***
1.962
***
——
1.80
2***
2.90
8***
1.793
***
1.999
*
(0.2
5)(0
.23)
(0.3
8)(0
.19)
(0.3
0)
(0.18
)(0
.15)
(0.2
7)(0
.37)
——
(0.3
1)(0
.69)
(0.2
7)(0
.72)
Gen
der
(m
ale)
2.70
4**
*1.9
08*
**1.7
26**
*2.
879*
**3.
293*
**2.
858*
**1.5
96**
*1.4
85**
2.86
3***
——
2.0
48*
**2.
141*
**2.
04
8***
1.54
2**
(0.3
9)(0
.24
)(0
.29)
(0.4
5)(0
.52)
(0.3
9)(0
.16)
(0.2
6)(0
.30
)—
—(0
.32)
(0.2
7)(0
.45)
(0.2
8)
Soci
al
(fri
end
s)1.6
09*
**1.1
42
1.114
0.9
750
.711
**1.2
02*
1.135
0.9
911.0
93—
—0
.821
0.5
35**
0.8
580
.84
8
(0.2
3)(0
.16)
(0.2
7)(0
.14)
(0.10
)(0
.13)
(0.12
)(0
.14)
(0.0
8)—
—(0
.23)
(0.11
)(0
.08)
(0.12
)
Skip
pin
g
scho
ol1.2
392.
00
4**
*2.
40
5***
1.586
**2.
206*
**1.4
77**
*1.6
96**
*2.
202*
**1.7
71**
*—
—1.7
56**
*2.
018
***
1.755
**1.3
13**
*
(0.16
)(0
.28)
(0.3
3)(0
.27)
(0.3
9)(0
.17)
(0.19
)(0
.39)
(0.2
2)—
—(0
.21)
(0.3
1)(0
.35)
(0.11
)
Suic
idal
th
oug
hts
1.594
***
1.824
***
1.666
**1.3
12*
2.0
85**
*1.5
61**
*1.9
14**
*2.
281*
**1.4
96**
*—
—2.
273*
1.34
01.3
351.8
15**
*
(0.2
3)(0
.30
)(0
.32)
(0.18
)(0
.42)
(0.19
)(0
.21)
(0.3
4)
(0.15
)—
—(1
.00
)(0
.25)
(0.2
7)(0
.23)
Eng
aged
p
aren
ting
0.7
25*
0.7
00
*0
.715
*0
.720
*0
.647
*0
.776
0.6
77**
*0
.695
***
0.6
99**
*—
—0
.829
*0
.774
0.8
260
.518
***
(0.14
)(0
.13)
(0.13
)(0
.12)
(0.16
)(0
.12)
(0.0
7)(0
.09)
(0.0
7)—
—(0
.08)
(0.2
0)
(0.0
9)(0
.06)
Ob
s1,4
111,3
821,3
841,4
111,3
852,
288
2,17
72,
202
2,28
8—
—1,4
131,4
131,4
751,4
46
(con
tinu
ed)
(con
tinu
ed o
n ne
xt p
age)

97
YOUTH VIOLENCE AND DELINQUENCY: REDUCING RISK AND ENHANCING PROTECTION
App
endi
x 5.
1. Re
gres
sion
Res
ults
: Odd
s Ra
tios
Sain
t Lu
cia
Peru
Suri
nam
e
Sex
Dri
nkin
gTr
oubl
eFi
ghti
ngD
rugs
Sex
Dri
nkin
gTr
oubl
eFi
ghti
ngD
rugs
Sex
Dri
nkin
gTr
oubl
eFi
ghti
ngD
rugs
(1)
(2)
(3)
(4)
(5)
(1)
(2)
(3)
(4)
(5)
(1)
(2)
(3)
(4)
(5)
Ag
e1.5
45*
**1.1
52**
1.065
0.7
93**
*1.3
39**
*1.4
46*
**1.4
64**
*1.3
30**
*0
.958
1.253
**2.
244
***
1.371
***
1.099
0.9
311.4
84**
*
(0.10
)(0
.06)
(0.0
7)(0
.04
)(0
.10)
(0.10
)(0
.10)
(0.0
8)(0
.04
)(0
.12)
(0.16
)(0
.12)
(0.12
)(0
.04
)(0
.17)
Pov
erty
(h
ung
er)
1.339
1.166
1.738
0.8
141.1
800
.988
1.122
1.20
81.2
961.1
820
.770
**1.0
261.4
811.2
751.1
91
(0.3
6)(0
.35)
(0.5
7)(0
.18)
(0.3
6)(0
.24
)(0
.35)
(0.4
1)(0
.32)
(0.5
0)
(0.0
8)(0
.19)
(0.3
6)(0
.21)
(0.2
6)
Gen
der
(m
ale)
2.59
1***
1.730
***
1.121
2.17
2***
2.38
3***
3.55
4**
*2.
129*
**1.8
84**
*4
.24
2***
2.94
6***
1.938
***
2.4
01*
**2.
257*
*3.
171*
**2.
102*
*
(0.5
0)
(0.2
6)(0
.16)
(0.3
5)(0
.39)
(0.5
1)(0
.38)
(0.2
4)
(0.5
0)
(0.6
9)(0
.26)
(0.4
1)(0
.76)
(0.3
4)
(0.5
7)
Soci
al
(fri
end
s)0
.919
0.8
360
.838
1.112
1.015
1.219
*1.5
70**
*1.2
501.4
86**
*1.3
310
.74
6**
0.9
890
.675
0.8
110
.675
(0.17
)(0
.15)
(0.2
1)(0
.15)
(0.2
1)(0
.13)
(0.2
3)(0
.18)
(0.17
)(0
.28)
(0.0
9)(0
.13)
(0.2
0)
(0.11
)(0
.19)
Skip
pin
g
scho
ol1.8
26**
*2.
719*
**2.
462
***
2.16
3***
2.4
92**
*1.7
75**
*2.
00
4**
*2.
494
***
1.632
***
1.635
**1.8
38**
*2.
479*
**2.
722*
**1.7
81**
*2.
608*
**
(0.3
2)(0
.48)
(0.4
4)
(0.3
1)(0
.37)
(0.2
3)(0
.23)
(0.3
0)
(0.16
)(0
.31)
(0.2
5)(0
.54
)(0
.53)
(0.19
)(0
.52)
Suic
idal
th
oug
hts
1.458
*1.8
09*
**1.7
06*
*1.3
29*
1.94
9***
2.27
3***
2.89
3***
2.55
7***
1.633
***
2.74
0**
*1.7
72**
*2.
267*
**2.
740
***
2.0
31**
*1.1
69
(0.2
7)(0
.26)
(0.3
8)(0
.21)
(0.3
3)(0
.32)
(0.4
2)(0
.35)
(0.15
)(0
.59)
(0.2
7)(0
.28)
(0.7
5)(0
.28)
(0.4
1)
Eng
aged
p
aren
ting
0.6
24**
*0
.435
***
0.5
56**
*0
.70
2***
0.4
50**
*0
.711
**0
.653
***
0.5
75**
*0
.721
***
0.5
45*
*0
.780
**0
.795
0.7
140
.873
0.6
23
(0.0
8)(0
.08)
(0.12
)(0
.09)
(0.10
)(0
.09)
(0.0
9)(0
.09)
(0.0
5)(0
.15)
(0.0
7)(0
.11)
(0.14
)(0
.10)
(0.2
1)
Ob
s1,2
261,2
05
1,220
1,226
1,196
2,83
22,
804
2,68
72,
832
2,75
81,6
411,5
871,5
731,6
411,6
31
(con
tinu
ed)
(con
tinu
ed o
n ne
xt p
age)

98
RESTORING PARADISE IN THE CARIBBEAN: COMBATTING VIOLENCE WITH NUMBERS
App
endi
x 5.
1. Re
gres
sion
Res
ults
: Odd
s Ra
tios
Trin
idad
and
Tob
ago
Uru
guay
St. V
ince
nt a
nd G
rena
dine
s
Sex
Dri
nkin
gTr
oubl
eFi
ghti
ngD
rugs
Sex
Dri
nkin
gTr
oubl
eFi
ghti
ngD
rugs
Sex
Dri
nkin
gTr
oubl
eFi
ghti
ngD
rugs
(1)
(2)
(3)
(4)
(5)
(1)
(2)
(3)
(4)
(5)
(1)
(2)
(3)
(4)
(5)
Ag
e1.7
55**
*1.6
45*
**1.3
26**
*1.0
03
1.589
***
1.941
***
1.674
***
1.428
***
0.9
06*
*1.6
23**
*1.4
13**
*1.2
69**
*1.0
900
.831
**1.4
77**
*
(0.13
)(0
.08)
(0.10
)(0
.03)
(0.10
)(0
.08)
(0.0
8)(0
.06)
(0.0
4)
(0.11
)(0
.10)
(0.0
6)(0
.06)
(0.0
7)(0
.14)
Pov
erty
(h
ung
er)
0.8
661.2
471.3
971.5
20**
1.088
0.8
761.3
45
2.4
90**
*1.6
651.0
540
.929
1.40
71.5
970
.863
1.094
(0.2
1)(0
.40
)(0
.35)
(0.2
8)(0
.42)
(0.3
0)
(0.4
7)(0
.81)
(0.5
3)(0
.36)
(0.2
4)
(0.2
9)(0
.49)
(0.2
1)(0
.30
)
Gen
der
(m
ale)
2.22
9***
1.970
***
1.516
2.67
2***
2.47
1***
2.32
3***
1.099
1.383
**3.
687*
**1.4
20*
5.29
3***
1.582
***
1.370
**2.
270
***
2.51
5***
(0.3
8)(0
.43)
(0.3
9)(0
.36)
(0.5
2)(0
.19)
(0.11
)(0
.17)
(0.4
1)(0
.28)
(0.7
7)(0
.21)
(0.2
1)(0
.26)
(0.4
3)
Soci
al
(fri
end
s)1.1
871.0
150
.799
**1.0
900
.996
0.8
931.1
941.1
740
.768
***
0.9
141.2
120
.987
1.30
71.2
01
1.089
(0.16
)(0
.14)
(0.0
8)(0
.10)
(0.0
6)(0
.11)
(0.15
)(0
.16)
(0.0
8)(0
.17)
(0.2
5)(0
.16)
(0.2
4)
(0.14
)(0
.18)
Skip
pin
g
scho
ol0
.873
1.283
*1.3
500
.995
1.094
2.15
1***
2.0
25**
*1.8
22**
*1.9
01*
**2.
784
***
1.762
***
1.865
***
2.57
1***
2.17
1***
1.793
**
(0.14
)(0
.18)
(0.2
7)(0
.10)
(0.18
)(0
.25)
(0.19
)(0
.18)
(0.17
)(0
.35)
(0.3
0)
(0.2
1)(0
.42)
(0.3
1)(0
.43)
Suic
idal
th
oug
hts
2.39
4**
*1.3
15**
2.35
5***
1.790
***
2.94
7***
——
——
—1.9
50**
*1.7
06*
**1.6
58**
1.74
3***
1.985
***
(0.4
0)
(0.15
)(0
.51)
(0.11
)(0
.50
)—
——
——
(0.4
0)
(0.2
5)(0
.34
)(0
.25)
(0.4
2)
Eng
aged
p
aren
ting
0.5
37**
*0
.716
*0
.54
2***
0.6
14**
*0
.44
6***
0.8
14**
0.5
97**
*0
.483
***
0.6
38**
*0
.475
***
0.7
66*
0.7
52*
0.8
300
.790
*0
.469
***
(0.0
9)(0
.13)
(0.10
)(0
.05)
(0.0
9)(0
.08)
(0.0
5)(0
.05)
(0.0
5)(0
.08)
(0.10
)(0
.11)
(0.11
)(0
.11)
(0.0
9)
Ob
s2,
680
2,56
42,
600
2,68
02,
568
3,37
33,
328
3,36
33,
373
3,32
51,2
40
1,20
21,2
211,2
40
1,188
Sou
rce:
Rup
rah,
Sie
rra,
and
Sut
ton
(20
16).
Not
e: E
stim
ated
sta
ndar
d e
rro
rs, r
epo
rted
in p
aren
thes
es, a
re c
lust
ered
at
the
clas
sro
om
leve
l. S
igni
fican
ce a
t th
e 1,
5, a
nd 10
per
cent
leve
ls is
ind
icat
ed b
y **
*, *
*, a
nd *
, res
pec
tive
ly.
(con
tinu
ed)

99
How Do Neighbourhood Characteristics Affect Crime?
Heather Sutton and Lucciana Alvarez
The idea that social problems including crime are concentrated disproportionate-
ly in certain highly localized geographical locations (i.e., specific municipalities,
neighbourhoods, street blocks, etc.) has been the focus of a large body of in-
ternational literature. What is interesting about these studies is that they focus on
places rather than individuals in terms of predicting the likelihood of victimization or
perpetration of crime. The extensive literature has led to a better understanding of
the tangled web of interaction between neighbourhood socio-economic conditions,
physical disorder (trash, graffiti, abandoned buildings, etc.), fear, crime, and social
functioning (informal social control, social cohesion, etc.).
The findings on collective efficacy offer potential to explain why some neighbour-
hoods continue to have lower crime rates despite their unfortunate socio-economic
conditions (Sampson 2004). More importantly, they offer hope that concentrated dis-
advantage in neighbourhoods can be mitigated through bottom-up approaches that
help strengthen neighbourhood informal social control and interpersonal trust. Other
research on crime hot spots (Braga, Papachristos and Hureau 2014; Sherman and
Weisburd 1995; Weisburd 2015) offers evidence that crimes are committed dispropor-
tionately in a very small number of street segments and that increasing police presence
in these areas can drastically reduce crime. Although studies on how community char-
acteristics affect crime have been primarily conducted in the United States and other
developed countries, a few studies have begun to investigate the applicability of these
concepts in developing countries. Still, the literature on the implications in the devel-
oping world—where violence, poverty, and inequality are typically far greater—is in its
infancy. Furthermore, few studies to date have provided a cross-national analysis, and
even fewer have analysed how these concepts apply to the Caribbean.
This chapter examines how neighbourhood structural factors and social rela-
tions help predict crime. After a review of the international literature, we examine the
6

100
RESTORING PARADISE IN THE CARIBBEAN: COMBATTING VIOLENCE WITH NUMBERS
differences between neighbourhoods of victims and non-victims. In order to examine
the relationship between neighbourhood conditions (disorder, social cohesion, and
informal social control) and victimization, we apply a logistic regression controlling for
the factors addressed in other chapters in this report. An example of analysis of geo-
coded police data in Port of Spain in Trinidad and Tobago offers further evidence of the
concentration of crime in micro-territories within neighbourhoods. We wrap up with
a discussion on the limitations of this analysis, conclusions, and policy implications.
6.1 Background and Literature ReviewMore than 30 years of criminological work in the United States and other developed
countries has been devoted to a now-familiar theme: social and physical disorder in
urban neighbourhoods and their connection to serious crime.1 Social disorganization
scholars have concentrated on the structural socio-economic factors (concentrated
disadvantage, urbanization, ethnic homogeneity, residential instability, etc.) associated
with crime and violence. Others have focused on tying physical disorder and incivili-
ties to crime. The reasoning was made famous by Kelling and Wilson’s (1982) broken
window hypothesis, which held that minor public incivilities can escalate into preda-
tory crime because prospective offenders assume that area residents are indifferent
to what happens in their neighbourhood. Skogan’s disorder and decline hypothesis,
which he cemented with empirical research, expands upon the broken windows hy-
pothesis to explore the linkage between public signs of disorder (vacant housing, litter,
vandalism) and more serious crime (Skogan 1984, 1990). Sherman (1998) adds that
the social rejection of some communities can then lead them to reject common values
of society and develop “oppositional sub-cultures” where respect is gained through
violence. Over time these problems feed upon one another, threatening to push neigh-
bourhoods deeper down a spiral of decline. An overview of findings over the last 30
years (Skogan 2015; Welsh, Braga, and Bruinsma 2015) reveals empirical evidence that
disorder is strongly linked with higher crime levels.
One protective factor examined in the community context is “collective efficacy,”
defined as trust in neighbours (social cohesion) and willingness to intervene (infor-
mal social control). Sampson, Raudenbush, and Earls (1997), using data from Chicago,
found that the presence of neighbourhood collective efficacy was associated with a
30 percent lower risk of victimization. More importantly, when collective efficacy was
controlled for, the impact of concentrated disadvantage and residential instability on
1 Many researchers have sub-divided these into social disorder (begging, youth congregating on street cor-ners, public drinking, selling drugs, etc.) and physical disorder (graffiti, broken windows, abandoned cars and buildings, etc.).

101
HOW DO NEIGHBOURHOOD CHARACTERISTICS AFFECT CRIME?
victimization was reduced to non-significance. In an extension of this analysis, more
recent work has consistently shown that collective efficacy is predictive of crime and
disorder levels in cities across the United States and other developed countries.2 Addi-
tionally, collective efficacy has been negatively associated with youth carrying firearms
(Molnar et al. 2004), dating violence (Jain et al. 2010), substance abuse, and violence
following exposure to violence (Wright, Fagan, and Pinchevsky 2013).
In the developing world, an increasing number of studies are analysing the influence
of neighbourhood characteristics on crime. Some have found that concepts explored
by Sampson, Raudenbush, and Earls (1997) and others seem to be applicable to
developing-country urban city contexts (Cuesta, Alda, and Lamas 2007; Olavarría-Gambi
and Allende-González 2014). Others raise potential questions about the limitations of
collective efficacy. Villarreal and Silva (2006) found that disadvantaged neighbourhoods
in Belo Horizonte, Brazil, had greater levels of social cohesion that were not significantly
associated with lower victimization. Similarly, Cerdá et al. (2008) found that in Medellín,
Colombia, collective efficacy was more pronounced in contexts of high disadvantage
and associated with higher levels of violence. Morris (2010) presents similar findings
regarding homicide in Jamaica—homicides were higher in neighbourhoods with high
levels of informal social control and social cohesion. This is explained by the phenome-
non of closed garrison communities controlled by organized crime.
Beyond neighbourhoods, there has also been a wave of studies examining police
data on “micro-places” (blocks or street segments) where crime is concentrated. As
a result of technological advances (including Global Positioning System–coded ad-
dresses), the literature on detection and analysis of crime hot spots has steadily grown
(Braga, Papachristos, and Hureau 2014; Sherman and Weisburd 1995; Weisburd and
Braga 2003). Weisburd (2015) reviews all the findings to date that support the exis-
tence of a “law of crime concentration at place.” According to this law, a very large
proportion of crime is concentrated in a very small proportion of street segments. More
precisely, for eight urban and suburban cities, less than 5 percent of street segments
generate more than 50 percent of crime in a given year (Weisburd 2015). Jaitman and
Ajzenman (2016) validate this law with similar findings from nine Latin American cities:
50 percent of crimes are concentrated in 3 to 7 percent of street segments.
All of the aforementioned research suggests that in the Caribbean it is worth in-
vestigating the geographical locations where victimization and crime occur. Knowing
where crime and violence are concentrated, as well as neighbourhood characteris-
tics that might mitigate them, offers potential solutions for targeting these areas with
2 For the United States, see Ahern et al. (2013); Maxwell, Garner, and Skogan (2011); Reisig and Cancino (2004); Sampson (2004); and Uchida et al. (2014). For other developed countries see Mazerolle, Wickes, and McBroom (2010); and Sampson and Wikstrom (2007).

102
RESTORING PARADISE IN THE CARIBBEAN: COMBATTING VIOLENCE WITH NUMBERS
practical crime control and prevention interventions. This chapter explores the appli-
cability of this research to the Caribbean capital cites covered in this publication.
6.2 Facts and Figures6.2.1 Neighbourhood Characteristics and Victimization in Caribbean CitiesRespondents to the Caribbean Crime Victimization Survey (CCVS) module attached
to the Latin American Public Opinion Project (LAPOP) Survey were asked a series of
questions to gauge their perceptions of neighbourhood disorder (physical disorder),
social cohesion (trust among neighbours), and informal social control (willingness of
neighbours to intervene for the common good).3 The survey questions used were sim-
ilar to those used in previous studies (see the methodological note in Appendix 6.1).
Index variables were created to measure each of the three concepts.
Figure 6.1 shows the average scores of the neighbourhood indexes, recoded on a
scale of 0–100, comparing victims and non-victims. Individuals who were victimized in
the Caribbean described their neighbourhoods as having higher disorder (8 average
points higher), lower social cohesion (3.6 average points lower), and slightly lower in-
formal social control (1.8 average points lower). Differences were even larger between
victims of violent crime (assault and threat) and non-victims: disorder (10.3 points
higher) and social cohesion (5.3 points lower). It is notable that differences in informal
social control were very small and only significant with respect to burglary (T-test,
difference 2.3, p < .05), but not violent crime (T-test, difference 1.2, p = .08).
But could these perceptions of neighbourhood characteristics be capturing the
effect of other individual socio-economic characteristics? In order to isolate the rela-
tionship between victimization and neighbourhood characteristics, we performed a
logit regression controlling for individual characteristics discussed in Chapter 3 (age,
sex, marital status, education, and wealth). We also control for gang presence in neigh-
bourhoods, which is covered in Chapter 7. The full regression results are shown in
Appendix 3.3 in Chapter 3.
The results show that, even while controlling for other individual characteristics,
perception of neighbourhood disorder was the strongest predictor of victimization
(Figure 6.2). High perception of neighbourhood disorder was strongly and positively
associated with being a victim of any of the five crimes in the last year (Odds Ratio
3 Previous studies have combined social cohesion and informal social control to form a single variable, “col-lective efficacy” (Sampson, Raudenbush, and Earls 1997). This was based on the finding that they were closely correlated (r = 80, p < 0.001). However, as in the case of others who suggest that these are separate but relat-ed constructs that should be measured separately (Uchida et al. 2014), we found a much weaker correlation (r = 0.27, p < 0.001 at the individual level and r = 0.22 at the district level) and thus maintain the two separate measures.

103
HOW DO NEIGHBOURHOOD CHARACTERISTICS AFFECT CRIME?
2.9, p < 0.01). When tested for its relationship to each specific crime type, disorder
was associated with property crimes (theft = OR 2.11, p < .01; burglary = OR 2.59,
p < .01). However, the correlation was strongest for violent crime—specifically assault
and threat (OR 3.86, p < .01), having witnessed an attack where someone was injured
or killed (OR 3.86, p < .01), and having lost someone to violence (OR 4.04, p < .01). This
was true for all of the individual capital city metropolitan areas examined.
Social cohesion (trust among neighbours) appears to serve as a protective factor
against victimization by violent crime (Figure 6.2). High perception of social cohesion
in one’s neighbourhood was strongly and negatively associated with being a victim of
Figure 6.1: Average Score on Neighbourhood Indexes by Victims versus Non-victims, for Five Crimes, in Five Caribbean Capital City Metropolitan Areas (scale 0–100)
0
Kin
gsto
nM
etro
polit
an A
rea
Neighbourhood Disorder Social Cohesion
New
Pro
vide
nce
Por
t of S
pain
Met
ropo
litan
Are
a
Gre
ater
Brid
geto
wn
Are
a
Par
amar
ibo
Kin
gsto
nM
etro
polit
an A
rea
New
Pro
vide
nce
Por
t of S
pain
Met
ropo
litan
Are
a
Gre
ater
Brid
geto
wn
Are
a
Par
amar
ibo
0
10
20
30
40
50
60
70
Car
ibbe
anav
erag
e—C
5
51015202530354045
Informal Social Control
Kin
gsto
nM
etro
polit
an A
rea
New
Pro
vide
nce
Por
t of S
pain
Met
ropo
litan
Are
a
Gre
ater
Brid
geto
wn
Are
a
Par
amar
ibo
0
10
20
30
40
50
60
80
70
Car
ibbe
anav
erag
e—C
5
Non-victims Victims (any of five crimes)
Assault/threat victims
Source: Prepared by the authors with data from the IDB Caribbean Crime Victimization Survey module attached to the 2014/2015 Latin American Public Opinion Project (LAPOP) Survey.Note: The values shown represent the mean score on the relevant index for each group (non-victims, victims of five crimes, victims of assault and threat) on a scale of 0–100. The five types of crime are car theft, burglary, robbery, personal theft, and assaults and threats of assaults.

104
RESTORING PARADISE IN THE CARIBBEAN: COMBATTING VIOLENCE WITH NUMBERS
assaults and threats (OR 0.37, p < .01) and having witnessed an attack where someone
was injured or killed (OR 0.63, p < .05). Regarding property crime, it was predictive of
lower odds of being burglarized (OR 0.33, p < .05), but had no significant association
with theft. Results varied slightly for each of the individual capital city metropolitan
areas examined (see Appendix 3.4 in Chapter 3).
Interestingly, informal social control had an insignificant and positive relationship
with crime. We would expect that higher informal social control—neighbours being
willing to get involved for the common good—would be associated with lower crime
levels. However, this factor was only found to be significant in Port of Spain, where it
was positively related to prevalence of assaults and threats (OR 2.26, p < .05). This is
the opposite effect of what is found in much of the international literature. It may be
that in circumstances with high levels of violence, and particularly in neighbourhoods
with a strong presence of gangs, informal social control is either (1) tapping into the
coercive forms of social control exhibited by gangs, and/or (2) not working because
neighbourhood efforts to “look out for kids” or intervene may be ineffective against
the types of violence perpetuated in these contexts.4
Figure 6.2: Perceptions of Neighbourhood Characteristics Associated with Victimization in Five Caribbean Capital City Metropolitan Areas (logit coefficient, 95 percent confidence interval, n = 14,042)
Neighbourhood disorder index
Social control index
Social cohesion index
Gang presence
–2 –1 0 1 2
Property crime Violent crime Witnessed an attack Lost someone to violence
Source: Prepared by the authors using data from the IDB Caribbean Crime Victimization Survey module attached to the 2014/2015 Latin American Public Opinion Project (LAPOP) Survey.Note: The figure displays regression coefficients as dots and their 95 percent confidence intervals as horizontal lines. When a horizontal line does not cross the black vertical line at zero, the variable is statistically significant. The five capital cities are New Providence, The Bahamas; Greater Bridgetown Area, Barbados; Kingston Metropolitan Area, Jamaica; Paramaribo, Suriname; and Port of Spain Metropolitan Area, Trinidad and Tobago.
4 Similar suggestions have been made by Cerdá et al. (2008) in their study of collective efficacy in Medellín, Colombia.

105
HOW DO NEIGHBOURHOOD CHARACTERISTICS AFFECT CRIME?
6.3 Conclusions and Policy ImplicationsChapter 2 found that most of the crimes that are most acute in the Caribbean—assaults
and threat—occur overwhelmingly within the victim’s own neighbourhood. So what
are some of the characteristics of these neighbourhoods? This chapter has shown that
those victimized in the Caribbean reported their neighbourhoods as having higher
disorder, lower social cohesion, and generally lower informal social control compared
to the neighbourhoods of non-victims. Differences were even larger between victims
of violent crime and non-victims. High perception of social cohesion, or trust among
neighbours, seems to be a protective factor against victimization by violent crime
and burglary. Interestingly, informal social control had an insignificant relationship with
crime when controlling for other factors. Finally, as illustrated by the example of Port
of Spain (Box 6.1), crime is also highly concentrated in certain street segments within
neighbourhoods.
These findings provide reasonably strong support for concentrating both suppres-
sion and prevention initiatives in specific areas where more crimes occur, but also
where low social cohesion and high neighbourhood disorder are concentrated. Much
research in developed countries (Braga and Bond 2008; Taylor, Koper, and Woods
2011) and some preliminary research in Trinidad and Tobago (Sherman 2013) suggest
that focusing attention on highly localized problems can significantly reduce violence
and property crime without necessarily displacing crime to other areas.
Hot spot policing, for example, offers potential long- and short-term benefits for
the Caribbean. Recent studies indicate that even “soft” policing at hot spots by uni-
formed civilian police (with few powers and no weapons) can have significant crime
reduction effects (Ariel, Weinborn, and Sherman 2016). However, there are a few im-
portant factors to keep in mind regarding implementation of hot spot policing in the
Caribbean. Quality crime data (with Geographic Information System coordinates) and
effective crime analysis is a requirement. Hot spots should also be analysed over the
long term. Effective hot spot policing requires what Sherman (2013) describes as the
“Triple T approach”: Targeting the right places, Testing if interventions are reducing
crime, and Tracking whether officers are actually patrolling where they should be. Fur-
thermore, Sherman et al. (2014) present valuable lessons from the Hot Spot Patrol
Strategy in Trinidad and Tobago regarding scaling up from specific hot spot locations
to a district-wide focus, and feeding back to the constables on the effects in regular
district-level “COP-stat” meetings.
Beyond hot spot policing, community policing and problem-oriented policing can
also focus on reducing disorder and increasing social cohesion. In their Campbell Col-
laboration review report based on 30 randomized experimental and quasi-experimental
tests, Braga, Welsh, and Schnell (2015) found that policing disorder was associated
with modest reductions in crime. However, police-led problem-solving interventions to

106
RESTORING PARADISE IN THE CARIBBEAN: COMBATTING VIOLENCE WITH NUMBERS
Box 6.1. Crime Concentration in the Port of Spain Metropolitan Area in Trinidad and Tobagoa
An examination of geo-coded
crime data from Port of Spain finds
three important features that are
illustrated in Box Map 6.1.1. First,
crime occurs primarily in only a few
street segments. Analysing crime
incidents recorded by the police
in 2014, only 26 percent of the
street segments had occurrences
of crime. This means that only
one in four street segments had
a recorded crime in 2014. Second,
crime is highly concentrated in the
city. Only 3 percent of the street
segments concentrate 50 percent
of all recorded crime. Third, within
most of the neighbourhoods there
are safe and dangerous street segments. This is contrary to the idea that there are bad
and good neighbourhoods in terms of recorded crime. As can be seen on the map, the
street segments in red had many crime incidents (11 to 18), as did segments in orange
(7 to 10) in 2014. Not only are these segments scattered in different parts of the city,
they are also adjacent to street segments with no or few crime incidents.
It is important to note that this map is based on police crime records, and that it
represents only a portion of the incidents reported in victimization surveys. It is critically
important to improve police statistical systems in order to geo-code crime events. Where
crime tends to disproportionately occur, how these clustered units evolve, and whether
they are stable or sensitive to specific policing interventions are extremely relevant is-
sues to better target policing and, more broadly, crime prevention and control strategies.
a This box was prepared by Laura Jaitman.
Box Map 6.1.1: Number of Crime Incidents in 2014, by Street Segment, in Port of Spain
change social and physical disorder in specific locations generated the largest impact.
Disorder policing should be rooted in community and problem-oriented policing and
include community beautification and mobilization components. On the other hand,
aggressive approaches such as “zero tolerance” policing do not seem to be effective

107
HOW DO NEIGHBOURHOOD CHARACTERISTICS AFFECT CRIME?
and can distance police from the community and have negative impacts (Meares
2015). An interesting Caribbean initiative in this regard is The Bahamas Urban Renewal
Programme (Box 6.2). Unfortunately, no evaluations or data have been made available
to determine potential programme effects.
Beyond law enforcement, other strategies can be used to build community social
cohesion and informal social control. Although the link with violence is significant,
little literature exists on effective ways of building social cohesion within communi-
ties (Sampson 2004). Some potential steps that could be considered by Caribbean
policymakers include (1) educating police, community organizations, social workers,
etc., about social cohesion and its importance relative to crime prevention, (2) con-
tinuing to fund further research at the neighbourhood level, and (3) developing and
implementing community-based strategies. First, it is important to translate these
concepts for a larger audience. Continued research can help to identify “strongholds”
Box 6.2. The Bahamas Urban Renewal Programme
Urban Renewal 2.0 is the flagship public safety initiative spearheaded by the Office of
the Prime Minister of The Bahamas and administered under the Department of Public
Works. The initiative is intended to be a multi-faceted, inter-agency approach to crime
prevention and urban deterioration.
From 2002 to 2007, Urban Renewal Centres in high-crime areas in New Providence
(nine districts), Grand Bahama, and Abaco (seven districts) provided integrated ser-
vices through community police officers, social workers, health care professionals, and
housing/public works officials. During 2007, the police were removed from the cen-
tres, but returned in June 2012. Currently the centres are headed by community police
officers.
Generally, centres were reported to have five community police officers (including
the head inspector) and one social worker. Other staff—including a nurse, an environ-
mental health inspector, and a housing specialist—may be stationed at one centre or
rotate between two or three different centres. Each centre makes its own plan of activ-
ities, but some standard activities offered at centres include:
• Boys and girls clubs (after-school activities)
• Youth musical bands
• Programmes for youth suspended from school
• Computer classes (for youth, seniors, and adults)
Source: Sutton (2016).

108
RESTORING PARADISE IN THE CARIBBEAN: COMBATTING VIOLENCE WITH NUMBERS
and “sinkholes” of social cohesion and social control within neighbourhoods. Com-
munity-level strategies can be designed to “build up” existing strongholds and/or “fill
in” the sinkholes (Uchida et al. 2014). Based on this identification process, community
plans should include strengthening the willingness to do something about commu-
nity problems, increasing a sense of trust and shared community ownership, reducing
incivilities and litter, improving levels of satisfaction with police, and reducing fear.
Beck, Ohmer, and Warner (2012) offer several practical examples of how social work
practices can be used to build community trust and social control, including through
components of restorative justice that work by involving communities in the justice
process (discussed further in Chapter 13).
Finally, it is important to recognize that there are limitations to the aforementioned
approaches in communities with high levels of violence, gangs, and organized crime.
Under such circumstances, communities may in fact already show high levels of inter-
nal social cohesion given that they are more closed off and isolated from mainstream
society. Residents may develop an oppositional sub-culture that condones violence,
and social control may often be determined by gangs providing vigilante justice. In
fact, this appears to be the case in several neighbourhoods in Jamaica and Trinidad and
Tobago where gangs and organized crime provide policing and welfare services that
State institutions can no longer supply. In such circumstances a balanced approach of
suppression, intervention, and prevention is critical. Some international programmes,
such as the Brazilian UPP (Police Pacification Units) or the U.S. Weed and Seed Pro-
gram, target intensive police operations to take out high-level criminals in specific
territories. This is then followed by intensive investment in community social devel-
opment in these same areas and a continued community policing presence. These
programmes have had mixed results (Lilley 2015; Magaloni, Franco, and Melo 2015;
O’Connell, Perkins, and Zepp 2004; Oosterbaan and van Wijk 2015), but in some cases
they have been associated with reductions in crime and some improvements in social
development and the reintegration of high-crime communities. However, important
lessons learned include that when social investment in the community is delayed or
fails to occur, community resentment and mistrust builds. Also, the use of lethal force,
and corruption involving police forces, are central concerns in the Caribbean context
given the history of police invasions in some countries.5 The topic of gangs is covered
further in the following chapter.
5 For example, in Jamaica hundreds of people were killed in crackdowns on gangs in 2009/2010. In Trinidad and Tobago, the Gang/Repeat Offender Task Force was disbanded after it was discovered that it had been involved in kidnappings, tipping off gangs before invasions, and numerous extrajudicial killings.

109
HOW DO NEIGHBOURHOOD CHARACTERISTICS AFFECT CRIME?
Appendix 6.1. Methodological Note: Neighbourhood IndexesThis study analyses three neighbourhood indexes: Informal Social Control, Social
Cohesion, and Disorder. In order to develop these indexes we selected questions from
the CVVS/LAPOP Survey modules that are shown in Table 6A1.1. The index y for house-
hold i established in city c has been constructed as a sum of the scores of the questions
xi,c divided by the maximum value that a household could obtain for each index X.
y .i,c =x
X
1,c x2,c xk,c+ ...+ +
For example, if an interviewed household answered that it is very unlikely that the
neighbours intervene if children are spray-painting or if there is a fight in the neigh-
bourhood, then the Informal Social Control Index will be the sum of the scores, which
is 2, divided by the maximum value that a respondent could obtain, equal to 10. As a
result, the Informal Social Control Index in this case is 0.2.
Table 6A1.1: Neighbourhood Indexes
Disorder Index
LAPOP Question Variable Description Score Label Values
IVOL 20 Amount of Litter in Neighbourhood 1–3 None – A lot
IVOL 21 Amount of Graffiti in Neighbourhood
IVOL 22 Number of Vacant Lots in Neighbourhood
Social Control index
LAPOP Question Dichotomous Variable Description Score Label Values
IVOL 18 Likelihood Neighbours Would Intervene if Children Were Spray-Painting
1–5 Very unlikely – Very likely
IVOL 19 Likelihood Neighbours Would Intervene in a Fight
Social Cohesion Index
LAPOP Question Dichotomous Variable Description Score Label Values
IVOL 16 Neighbours Willing to Help Each Other 1–5 Very unlikely – Very likely
IVOL 17 Neighbours Get Along
Source: Prepared by the authors.Note: IVOL refers to the series or questions that are part of the IDB Caribbean Crime Victimization Survey module attached to the 2014/2015 Latin American Public Opinion Project (LAPOP) Survey.


111
Gangs and VictimizationHeather Sutton, Lucciana Alvarez, and Luisa Godinez
The appearance of gangs in the Caribbean dates to before the 1970s in Jamaica,
Trinidad and Tobago, and The Bahamas, but their proliferation has been espe-
cially pervasive since 2000 in the region overall. Some attribute the origin of
the early organized violence in Jamaica to the divided electoral disputes of the late
1940s between the founders of the People’s National Party and the Jamaica Labour
Party. However, during the 1980s and 1990s, most gang violence deviated from politi-
cal agendas, and began to be related to other types of organized crime including the
drug trade (Leslie 2010). Gangs began to develop in The Bahamas in the late 1970s as
territorial groups of youths joined together for protection and a sense of group identi-
ty. The first violent youth gang in Nassau was named the “Syndicate” and grew out of
the East Street area. One of the largest and most well-known gangs, the “Rebellion,”
developed as a splinter group, but eventually outgrew the Syndicate in membership
and territory (Sutton 2016). In Trinidad and Tobago, gangs multiplied after Sean “Bill”
Francis—a community activist and gang leader—was shot 50 times and killed. After
that period, police records indicate that both the number of gangs and the number of
killings tripled in Trinidad and Tobago (Townsend 2009).
Even though gangs pose a significant problem for the region, data on gangs are,
unfortunately, still very limited. Police units have few resources and capabilities to col-
lect and analyse gang information, and very few sound studies have been conducted
on the subject in the Caribbean (Harriott and Katz 2015). A marked tendency in leg-
islation and law enforcement, for instance, is to confuse the concepts of organized
crime and gangs, which prevents a thorough understanding of each issue. A widely
accepted definition of a gang is “any durable street-oriented youth group whose in-
volvement in illegal activity is part of their group identity” (Klein and Maxson 2006,
2). Organized crime, on the other hand, is connected to “enterprise activities, nor-
mally drug trafficking, the use of violence, the use of corruption as typical means
7

112
RESTORING PARADISE IN THE CARIBBEAN: COMBATTING VIOLENCE WITH NUMBERS
and exploitable relationships, and is characterized by its organizational sophistication”
(Harriott 2011, 6). Recent scholarly work (Harriott and Katz 2015) has dedicated signif-
icant effort to distinguishing between the two. This is important because addressing
each may require different approaches.
More attention has recently been directed toward gangs in the region,1 but in-
creased efforts still need to be made to understand the issue and provide long-term
solutions. Currently, police records and self-reported data from gang-involved youth
(mainly from school surveys) are the most widely used sources of information on the
subject in the Caribbean. This chapter seeks to contribute with yet a new source—
nationally representative data comparable among countries on gang presence and
activity in individuals’ neighbourhoods. We explore the prevalence of the problem, the
characteristics of gang-ridden neighbourhoods, and the connection between gangs
and victimization in the Caribbean. The final section of the chapter offers some con-
cluding remarks and policy recommendations.
7.1 BackgroundGangs are present in most of the Caribbean, but their power and level of organization
varies in each country (Box 7.1). Among the the five Caribbean capital metropolitan
areas (C5), Jamaica and Trinidad and Tobago are countries with larger gang problems
and where some gangs are more structured. Much less data are available for The Ba-
hamas, Barbados, and Suriname.
7.1.1 U.S. DeporteesCentral America and the Caribbean face a somewhat similar situation in terms of
the involvement of foreign deportees and/or native returnees in gangs. Following
the Los Angeles riots in 1992, the United States began implementing new immigra-
tion rules, including repatriation and deportation of non-citizens who had served
their prison terms in the United States, most of whom were involved in gangs in the
United States. Consequently, between 1998 and 2004, an estimated 31,000 convict-
ed criminals were deported back to countries they barely knew in the Caribbean
(UNODC and World Bank 2007). While these numbers have surely fluctuated over
time, it is understood that these deportations have continued to occur since the
1990s. Caribbean governments, however, have no idea who the new citizens are: the
new U.S. immigration rules banned the disclosing of the criminal backgrounds of the
1 Harriott and Katz (2015) have recently made a major contribution to the field by providing detailed de-scriptions of the scope and nature of gangs in the region, as well as thorough discussions on policies and programmes designed to respond to them.

113
GANGS AND VICTIMIZATION
Box 7.1. Gangs in the Caribbeana
Jamaica:
• 238 gangs operating in 2013 were responsible for 79 percent of all murders during
that year, according to the Jamaican Constabulary Force.
• More mature gangs may operate within a hierarchy and have a division of labour
(Harriott and Katz 2015), and members of some gangs use symbols and undergo
initiation rituals (UNDP 2012).
• Most gangs are concentrated in Kingston (52 percent) and in the larger southern
costal con-urban area from Kingston to Clarendon (68 percent).
Trinidad and Tobago:
• 102 gangs operating in 2012 were often linked with illegal activities such as
firearm-related offences, drug trafficking, property offences, and sexual offences.
• Katz and Fox (2010) found that many gangs had one or more of the following or-
ganizational qualities: name, territory, regular meetings, rules, punishment, special
signs, symbols, clothing, drug sale, and other crimes.
The Bahamas:
• The Royal Bahamas Police Force had no official estimates on gang-related crimes
in the country as of 2014.
• Around 18 different gangs have been identified unofficially by the Ministry of Secu-
rity as operating in The Bahamas. They vary in size, structure, membership, and the
extent of involvement with illegal activities.
• Estimates of the number of youth involved in gangs in the country range from
6,000 to 10,000 (Duba and Jencius 2004; OAS 2010).
Barbados:
• Data on gang involvement in Barbados are severely limited, and the Royal Barbados
Police Force is unable to estimate the number of gangs or youths involved in gangs.
• Gang violence is not included among the category of motives for criminal activity
collected by the police.
• There is an emerging phenomenon of street gangs associated with blocks located
in areas with high-rise apartment buildings and districts with State housing. The
names of blocks have mimicked names in Jamaica and other societies.
• According to official records, the criminal activities associated with these groups
are carried out in a distinctly informal manner and without much organizational
structure (Bailey 2016).
a No data were provided or could be found on gangs in Suriname.
114
RESTORING PARADISE IN THE CARIBBEAN: COMBATTING VIOLENCE WITH NUMBERS
deportees. Upon being extradited back to their country, many of the deportees are
reported to have laid the groundwork for the spread of gangs in the region (Black
2004; Duffy and Gillig 2004). While there has been little research on the issue, a joint
report by the UNODC and World Bank (2007) found that only a small percentage of
deportees were involved in crime, but this small number can be responsible for much
gang violence. For example, 224 convicted murderers were deported to Jamaica
between 2001 and 2004. Relative to Jamaica’s small population, this small group
could have had a large impact on crime rates, even if only a small percentage of them
participated in crime.
7.1.2 Gang Membership and StructureSelf-reported data from 15,695 school-aged youth surveyed in Antigua and Barbuda,
The Bahamas, Barbados, British Virgin Islands, Dominica, Grenada, Guyana, Jamaica,
and Saint Lucia show that 17–24 percent of males and 11–16 percent of females report-
ed having been involved in gangs (Ohene, Ireland, and Blum 2005). There is increasing
evidence of female participation in gangs. In a national school survey in Trinidad and
Tobago, females made up more than 40 percent of self-reported youth gang members
in secondary schools (Harriott and Katz 2015) and there is also evidence of a female
presence in Jamaican gangs (Meeks 2009). However, female gang members are less
likely to come to the attention of the police because they do not generally engage in
as many violent acts, or carry a firearm (Small Arms Survey 2010). The role of females
in gangs ranges from taking care of the male members to drug transportation, since
females get less attention from the police (Small Arms Survey 2010).
The organizational characteristics of Caribbean gangs vary greatly both by country
and within countries. Some youth gangs are very loose networks with low-level of-
fending (primarily drug use and fighting). For example, in Trinidad and Tobago, Pyrooz
et al. (2011) found that self-identified school-aged gang members reported their gangs
to have relatively low levels of organization. Conversely in Jamaica, Leslie (2010) re-
ported that more established street gangs were much more organized. Differentiating
between unstructured, low-offending youth gangs and more highly organized street
gangs or organized crime is important. This is particularly important when using
self-reported secondary school survey data.
7.1.3 Risk and Protective Factors for Joining GangsMuch international research, some of it in the Caribbean, has centred on the risk and
protective factors associated with gang membership, including individual, family, and
community-level factors. Ohene, Ireland, and Blum (2005) found that early initiation
of sexual activity was associated with gang involvement and weapon carrying among
young adolescents. Katz and Fox (2010) found gang involvement in Trinidad and

115
GANGS AND VICTIMIZATION
Tobago was associated with perceived availability of handguns, residential mobility,
having parents who favour antisocial behaviour, early initiation of antisocial behaviour,
intention to use drugs, having antisocial peers, and having peers who use drugs. Those
with social skills, belief in moral order, and interactions with prosocial peers were sig-
nificantly less likely to self-report gang membership. Additionally, the probability of
gang involvement increased as the number of risk factors increased. Although risk
factors associated with gang involvement were present in all four domains (individual,
family, community, and peer), peer-individual risk factors were disproportionately like-
ly to be associated with gang status. It is important to note the differences in risk and
protective factors from one context to another so that programmes can be carefully
tailored accordingly (see Box 7.2).
Box 7.2. Similarities and Differences between Street Gangs in Trinidad and Tobago and Arizona (United States)
Data Method: Self-reported data obtained from school-aged youth in Arizona and
Trinidad.
Key Results:
• Youth in Trinidad and Tobago were more likely to report having ever been a member
of a gang (12.5 percent versus 7.6 percent in Arizona).
• First gang involvement was significantly older in Trinidad and Tobago (between 11
and 14 years old in Trinidad and Tobago versus 10 to 13 years old in Arizona).
• Gang members in the United States reported significantly higher levels of property
crime, drug sales, and marijuana use than in Trinidad and Tobago.
• Most frequently cited reason for joining a gang:
• Arizona: protection or safety
• Trinidad and Tobago: friendship
• Strongest risk factors in Arizona: high community disorganization, academic failure,
and antisocial peers.
• Strongest risk factors in Trinidad and Tobago: perceived high availability of hand-
guns, high intention to use drugs, low perceived risk involved in drug use, and high
sensation seeking.
Conclusion: Researchers and policymakers need to examine the particular sources of
membership, risk, and protective factors in different contexts to tailor programmes to
each country.
Source: Harriott and Katz (2015).

116
RESTORING PARADISE IN THE CARIBBEAN: COMBATTING VIOLENCE WITH NUMBERS
7.2 Facts and Figures7.2.1 Prevalence of the ProblemAmong respondents to the Carib-
bean Crime Victimization Survey
(CCVS) across the five Caribbean
countries examined in this report, one
in five (21 percent) reported living in
a neighbourhood with a gang pres-
ence (Figure 7.1). It is worth noting
this is nearly double the percentage
found in the United Nations Devel-
opment Programme’s (UNDP) 2010
Citizen Security Survey (12.5 percent
across seven Caribbean countries).
Specifically, among the same coun-
tries included in the UNDP survey, the
CCVS found prevalence to be signifi-
cantly higher in Jamaica (15 percent
versus 10.8 percent), Trinidad and
Tobago (21 percent versus 13.9 per-
cent), Suriname (23 percent versus
10.3 percent), and Barbados (12 per-
cent versus 9.2 percent).
The percentage of residents living in
areas with a gang presence was higher
(28 percent) within the five capital city
metropolitan areas in the CCVS survey
(Kingston, New Providence, Paramar-
ibo, Port of Spain, and Bridgetown).
Gang presence was highest in Port
of Spain, where nearly half of the re-
spondents (49 percent) believed that
a gang was active in their neighbour-
hood. Gangs were also believed to be
common in New Providence (39 per-
cent) and Kingston (32 percent).
Residents who reported having
a gang in their neighbourhood were asked whether they believed that gangs were
more of a problem than a year ago, less of a problem, or about the same (Figure 7.2).
Figure 7.1: Percentage of Respondents Who Say There Is a Gang Presence in Their Neighbourhood, by Country and Capital City (percent)
0102030405060708090
100
15
32 3339
23 2721
49
1218
Nat
iona
l
KM
A
Nat
iona
l
NP
Nat
iona
l
Par
amar
ibo
Nat
iona
l
PS
MA
Nat
iona
l
GB
A
Jamaica Bahamas Suriname BarbadosTrinidadand Tobago
Source: Prepared by the authors using data from the IDB Caribbean Crime Victimization Survey module attached to the 2014/2015 Latin American Public Opinion Project Survey.Note: The five capital cities listed are KMA: Kingston Metropolitan Area, Jamaica; NP: New Providence, The Bahamas; Paramaribo, Suriname; PSMA: Port of Spain Metropolitan Area, Trinidad and Tobago; and GBA: Greater Bridgetown Area, Barbados.
Figure 7.2: Are Gangs More or Less of a Problem in Your Neighbourhood Compared to One Year Ago? (percent)
KingstonMetropolitan Area
New Providence
Paramaribo
Port of SpainMetropolitan Area
GreaterBridgetown Area
0 10 20 30 40 50 60 70 80 90 100
More of a problem About the same Less of a problem
25
33
38
42
27
27
36
27
38
54
48
31
34
20
19
Source: Prepared by the authors using data from the IDB Caribbean Crime Victimization Survey module attached to the 2014/2015 Latin American Public Opinion Project Survey.Note: Base: respondents who answered that there was a gang presence in their neighbourhood (N = 3,538).

117
GANGS AND VICTIMIZATION
In Kingston, almost a majority (48 percent) believed that gangs were less of a problem,
while the opposite was true in Port of Spain, where 42 percent believed the problem
was worse. The perception of gangs being less of a problem in Kingston may be a re-
flection of interventions in recent years (Box 7.3).
Box 7.3. Jamaica Case Study: Gang Reduction Community Model—The Example of the Operation against Presidential Click
What is the Presidential Click? It is one of the oldest and most resilient criminal groups
in Jamaica.
What are its characteristics? Greatly embedded in its host community, stable leader,
use of violence as a disciplinary tool, creates violent conflicts with other groups and
law enforcement, and uses violence to extract protection fees.
What were the components of the operation against Presidential Click?
• Requested extradition of Christopher “Dudas” Coke, the leader of the gang.
• Military operation in Tivoli Gardens community to maintain status quo after begin-
ning of operation.
• A national anti-gang campaign.
• Attempted to consolidate Tivoli Gardens as a stronger community.
What is the Gang Prevention Control Strategy that Jamaica has put in place? It is a
community-based approach to gang reduction.
What were its components? ENFORCEMENT to bring gang members into the judicial
system and SOCIAL PROGRAMMES to develop community prevention through inter-
vention, social prevention, and law enforcement.
What happened after both the strategy and operation against Presidential Click
were put in place?
• Homicide rates declined from 62/100,000 in 2009 to 40.3/100,000 in 2012, partic-
ularly in Western Kingston, the area where Presidential Click is active.
• Even though no thorough impact evaluation has been performed, reductions in ho-
micide rates have been attributed to the decline in gang-related violence (Harriott
and Katz 2015).
• There has been gang fragmentation, reflected by an increase in the number of
gangs.
• Presidential Click’s capabilities and organizational capacity were weakened.
Source: Harriott and Katz (2015).

118
RESTORING PARADISE IN THE CARIBBEAN: COMBATTING VIOLENCE WITH NUMBERS
Among the same respondents, a
total of 59 percent said that gangs get
in the way of everyday life activities
like going to the store or going out
at night (Figure 7.3): 9 percent said
gangs get in the way a lot, 22 percent
said some, and 28 percent said a little.
The impact of gangs on everyday life
is most severe in Port of Spain (75 per-
cent say it gets in the way) and New
Providence (67 percent say it gets
in the way). Interestingly, while gang
presence in Kingston was far higher
than in Paramaribo, gangs were per-
ceived to be more of an obstacle in
Paramaribo. This suggests perhaps a
higher threshold for tolerance of gangs
in areas where they are more entrenched and have operated for longer (Kingston).
7.2.2 Gangs and CommunitiesIn many Caribbean communities where State institutions have a limited capacity to
control criminal groups, the relationship between the community and gangs has to be
considered. Some gangs may act as protectors of the community, others may pose a
threat to the community, and some even may do both (Small Arms Survey 2010). For
example, it has been reported that citizens in Jamaica often seek justice from local dons
(leaders of organized groups) rather than through the country’s legal system. Some
dons rule by charismatic authority. In some cases they are said to display qualities of
individual leadership that inspire loyalty and confidence, and can take on the political
administration of territory, seeking the approval of the citizens (Harriott and Katz 2015).
The 2012 UNDP Citizen Security Survey in the Caribbean examined the feelings of
the residents towards gangs in their neighbourhoods. While most respondents stated
that gangs made their communities less safe, a surprisingly large share of respon-
dents in Barbados (14.3 percent) and Jamaica (14.9 percent) stated that gangs made
their neighbourhoods safer. Harriott (2008) notes that leaders of street gangs in Ja-
maica often become role models in some communities, perpetuating an impression
that these criminal organizations bring positive contributions. This belief may also be
fuelled by negative perceptions of the police within gang communities.
Residents of gang communities are more disenfranchised from law enforcement. Re-
spondents to the CCVS living in gang neighbourhoods rated police performance lower
Figure 7.3: How Much Do Neighbourhood Gangs Get in the Way of You Being Able to Do Everyday Things, Like Going to the Store or Going Out at Night? (percent)
KingstonMetropolitan Area
New Providence
Paramaribo
Port of SpainMetropolitan Area
GreaterBridgetown
Area
0 20 40 60 80 100
A lot Some A little
Source: Prepared by the authors using data from the IDB Caribbean Crime Victimization Survey module attached to the 2014/2015 Latin American Public Opinion Project Survey.Note: Base: respondents who answered that there was a gang presence in their neighbourhood (N = 3,474).

119
GANGS AND VICTIMIZATION
(Figure 7.4), and reported police ha-
rassment to be far more problematic
(Figure 7.5), than residents in neigh-
bourhoods without a gang presence.
The greatest discrepancies regarding
satisfaction with the police between
gang and non-gang neighbourhoods
were in Port of Spain (difference of
16.7 points) followed by Paramaribo
(8.1 points) Bridgetown (7.1 points),
Kingston (5.7 points), and New Prov-
idence (3.1 points). It is notable that
even in gang neighbourhoods in New
Providence the average performance
score for police is relatively high. The
opposite is true for Kingston, where
scores are relatively low among res-
idents of both gang and non-gang
neighbourhoods. This is consistent
with findings in Chapter 9 regard-
ing generally high levels of trust in
the police in The Bahamas and lower
levels in Jamaica. Police harassment
was particularly acute among re-
spondents in gang neighbourhoods
in cities with the highest levels of vi-
olent crime—Port of Spain, Kingston,
and New Providence.
The previous chapter showed that
social cohesion, informal social con-
trol, and neighbourhood disorder
are all related to victimization levels.
These three concepts are also highly
associated with gang presence (Fig-
ure 7.6).2 In gang neighbourhoods,
residents feel more isolated and less
2 To measure these three concepts, one index was created for each concept. See Appendix 6.1 in Chapter 6.
Figure 7.4: Evaluation of Police Performance in Neighbourhoods with and without a Gang Presence in Five Caribbean Capital City Metropolitan Areas (average score, scale from 0–100)
KingstonMetropolitan Area
New Providence
Paramaribo
Port of SpainMetropolitan Area
GreaterBridgetown Area
0 20 40 60Police performance score (0–100)
80 100
Non-gang neighbourhood Gang neighbourhood
62.4
71.1
64.9
53.0
63.3
68.1
74.2
73.0
69.7
70.4
Source: Prepared by the authors using data from the IDB Caribbean Crime Victimization Survey module attached to the 2014/2015 Latin American Public Opinion Project Survey.Note: The question (identified as IVOL14) was: Taking everything into account, how good do you think the police in your neighbourhood are in controlling crime? Average scores for respondents from each capital city run from 0–100.
Figure 7.5: To What Extent Is Police Harassment a Problem in Your Neighbourhood? (scale from 1–100)
KingstonMetropolitan Area
New Providence
Paramaribo
Port of SpainMetropolitan Area
GreaterBridgetown Area
0 10 20 30Police harassment score (0–100)
40 6050
Non-gang neighbourhood Gang neighbourhood
44.8
47.0
27.9
52.3
38.0
30.7
28.4
25.7
26.3
27.7
Source: Prepared by the authors using data using data from the IDB Caribbean Crime Victimization Survey module attached to the 2014/2015 Latin American Public Opinion Project Survey.Note: The question (identified as IVOL15) was: To what extent is police harassment a problem in your neighbourhood? Average scores for respondents from each capital city run from 0–100.

120
RESTORING PARADISE IN THE CARIBBEAN: COMBATTING VIOLENCE WITH NUMBERS
trustful of neighbours (lower social
cohesion). They are less willing to in-
tervene for the common good of the
neighbourhood (informal social con-
trol). Finally, they report higher levels
of physical disorder (trash, graffiti,
abandoned buildings, etc.)
7.2.3 Gang Violence and Victimization
The way gang-related violence is
measured is crucial to accurately
understand the amount and dynam-
ics of this unique type of violence.
Unfortunately, in the Caribbean, law
enforcement often does not have
a uniform way of accounting for
crimes that are gang-related.3 Most
of the literature, however, accepts
that the lifestyle of a gang member
often creates more opportunities for
committing a crime and/or being
victimized (Harriott and Katz 2015;
Higginson et al. 2014; Small Arms
Survey 2010). Most gang violence oc-
curs between and within gangs. It is
often a response to a threat, real or
perceived (Small Arms Survey 2010).
Gang members have been found to
be more likely than non-gang mem-
bers to commit property crimes, drug
offences, and violent crimes with
firearms (Katz and Fox 2013; UNDP
2012). Gang members have also been
3 Law enforcement typically uses two main approaches to classify acts of gang-related violence. First is a member-based approach, which defines a gang-related offence as one that occurs when a gang member is an offender in or a victim of a violent crime. Second is a motive-based approach, which considers the motiva-tion for the crime and if the act of violence was driven by gang interests (Maxson, Whitlock, and Klein 1998).
Figure 7.6: Neighbourhood Indexes in Gang versus Non-gang Neighbourhoods in Five Caribbean Capital City Metropolitan Areas
Soc
ial c
ohes
ion
scor
e (0
–100
)In
form
al s
ocia
lco
ntro
l sco
re (0
–100
)N
eigh
bour
hood
diso
rder
sco
re (0
–100
)
0Kingston
MetropolitanArea
NewProvidence
Port ofSpain
MetropolitanArea
GreaterBridgetown
Area
Paramaribo
20
10
30
40
50
60
70
80Social Cohesion
Informal Social Control
Neighborhood Disorder
0
20
30
10
40
50
60
70
80
0
20
10
40
30
60
50
70
80
Gang No gang
KingstonMetropolitan
Area
NewProvidence
Port ofSpain
MetropolitanArea
GreaterBridgetown
Area
Paramaribo
KingstonMetropolitan
Area
NewProvidence
Port ofSpain
MetropolitanArea
GreaterBridgetown
Area
Paramaribo
Source: Prepared by the authors using data using data from the IDB Caribbean Crime Victimization Survey module attached to the 2014/2015 Latin American Public Opinion Project Survey.Note: Average scores for respondents from each capital city run from 0 to 100.

121
GANGS AND VICTIMIZATION
found to use drugs more frequent-
ly than non-gang members, which
may increase involvement in crime to
finance their addiction (Duffy and Gil-
lig 2004). Finally, gang-related crimes
are more likely to occur in public plac-
es and involve young offenders and
firearms (Small Arms Survey 2010;
Spergel 1986).
Victims of crime were about 1.6
times as likely to report a gang pres-
ence in their neighbourhood (42
percent) compared to non-victims (26
percent) (Figure 7.7). Victimization
prevalence for five common crimes
among residents in gang neighbour-
hoods was 8.3 percentage points
higher than the overall population in
capital city metropolitan areas (23.5
percent versus 15.2 percent) (Figure
7.8). With respect to violent crimes,
one-year prevalence of assaults and
threats in gang neighbourhoods was
4.4 percentage points higher than the
prevalence among the overall popula-
tion (11.2 percent versus 6.8 percent).
Two measures of the prevalence of
indirect victimization, that is, hav-
ing ever witnessed a violent attack
or having lost someone to violence,
were 17.7 and 17.8 percentage points
higher, respectively, for respondents
with a gang in their neighbourhoods
(Figure 7.9). The most drastic case
is Kingston, where 49 percent of the
population has lost someone close
to violence, and this percentage in-
creases to 69 percent among those
living in gang neighbourhoods.
Figure 7.7: Percentage of Victims of Any of Five Crimes and Non-victims with a Gang Presence in Their Neighbourhood in Five Caribbean Capital City Metropolitan Areas
Per
cent
with
a g
ang
in th
eir
neig
hbou
rhoo
d
0Kingston
MetropolitanArea
NewProvidence
Port ofSpain
MetropolitanArea
GreaterBridgetown
Area
Paramaribo
20
10
30
40
50
60
70
Victims Non-victims
Source: Prepared by the authors using data using data from the IDB Caribbean Crime Victimization Survey module attached to the 2014/2015 Latin American Public Opinion Project Survey.
Figure 7.8: Victimization Prevalence Rates in Gang Neighbourhoods versus the Overall Survey Population in Five Caribbean Capital City Metropolitan Areas (percent of population affected)
Vic
timiz
atio
n pr
eval
ence
rate
0
5
10
15
20
25
Gang neighbourhoods Overall population
5 crimes(12 months)
Threat andAssault
(12 months)
Theft(12 months)
Burglary(12 months)
Robbery(12 months)
Source: Prepared by the authors using data from the IDB Caribbean Crime Victimization Survey module attached to the 2014/2015 Latin American Public Opinion Project Survey.Note: The five capital cities are the Kingston Metropolitan Area, Jamaica; New Providence, The Bahamas; Paramaribo, Suriname; the Port of Spain Metropolitan Area, Trinidad and Tobago; and the Greater Bridgetown Area, Barbados. The five crimes are theft, vehicle theft, burglary, robbery and assault and threat.

122
RESTORING PARADISE IN THE CARIBBEAN: COMBATTING VIOLENCE WITH NUMBERS
To examine if gang presence in
the neighbourhood continues to be
a statistically significant predictor
of higher victimization even after
controlling for other factors, we ex-
amine the results of a multivariate
logistic regression. We control for the
individual characteristics of respon-
dents (see Chapter 3), as well as their
reported neighbourhood character-
istics (disorder, social cohesion, and
social control—see Chapter 6). Figure
7.10 shows that, even after controlling
for these factors, living in a gang
neighbourhood has a significant and
positive relationship with being a
victim of crime. Specifically, a gang
presence in the neighbourhood was
associated with higher victimization
by any of the five crimes (Odds Ratio 1.54, p < .01), property crime (theft) (OR 1.48, p
< .01), violent crime (assault and threat) (OR 1.49, p < .01), having witnessed a violent
attack (OR 2.18, p < .01), and having lost someone to violence (OR 2.02, p < .01).
Figure 7.9: Prevalence of Indirect Victimization in Gang Neighbourhoods versus the Overall Survey Population in Five Caribbean Capital City Metropolitan Areas (percent of population affected)
Pre
vale
nce
rate
0
20
10
30
40
50
60
Gang neighbourhoods Overall population
48.5 49.1
30.8 31.3
Witnessed an attack(in lifetime)
Lost someone to violence(in lifetime)
Source: Prepared by the authors using data using data from the IDB Caribbean Crime Victimization Survey module attached to the 2014/2015 Latin American Public Opinion Project Survey.Note: The five capital cities are the Kingston Metropolitan Area, Jamaica; New Providence, The Bahamas; Paramaribo, Suriname; the Port of Spain Metropolitan Area, Trinidad and Tobago; and the Greater Bridgetown Area, Barbados.
Figure 7.10: Neighbourhood Correlates of Victimization in Five Caribbean Capital City Metropolitan Areas (logit coefficient, 95 percent confidence interval)
Neighbourhood disorder index
Social control index
Social cohesion index
Gang presence
–2 –1 0 1 2
Property crime Violent crime Witnessed an attack Lost someone to violence
Source: Prepared by the authors based on the Latin American Public Opinion Project Survey 2016 dataset.Note: Determinants to the left of the vertical black line have negative impacts on victimization, while those to the right have positive impacts on victimization. Determinants with confidence intervals that do not cross the vertical black line are considered significant. The five capital cities are the Kingston Metropolitan Area, Jamaica; New Providence, The Bahamas; Paramaribo, Suriname; the Port of Spain Metropolitan Area, Trinidad and Tobago; and the Greater Bridgetown Area, Barbados.

123
GANGS AND VICTIMIZATION
7.3 Conclusions and Policy ImplicationsEven though their prevalence and power vary by country, gangs are greatly respon-
sible for crime and violence in the Caribbean. Of CCVS respondents in capital city
metropolitan areas, 28 percent reported a gang presence in their neighbourhood (sig-
nificantly higher than findings of previous surveys). Among respondents with gangs in
their neighbourhood, more than half said gangs get in the way of everyday activities.
Gang neighbourhoods are associated with lower levels of social cohesion and infor-
mal social control and with higher levels of physical disorder. While the direction of
causality is unclear, it is likely that gang presence both exacerbates and is fuelled by
these neighbourhood characteristics. Finally, it is clear that those living in gang neigh-
bourhoods are statistically more likely to be victims of crime and exposed to violence.
Legally defining what constitutes a gang and gang violence is an important first
step. The Bahamas advanced in the right direction by enacting new legislation to this
effect in 2015. In Barbados, legislation still treats organized crime and gangs as the
same. Trinidad and Tobago has enacted specific gang legislation that criminalizes any
participation in or contact with gangs. Yet, its guidelines and principles are vague;
they do not limit police or court discretion enough, which may ultimately lead to un-
intended consequences.4
Most gang intervention strategies are varied and multidimensional, and ought to
be tailored to the specific risk and protective factors that influence individual gang
involvement in each country and community (see Box 7.3 for the case of Jamaica).
More efforts need to be made not only to strengthen data collection methods by po-
lice units, but also to conduct research to identify specific risk and protective factors
that influence gang involvement in each country. Responses that balance legislative
actions, suppression, and prevention initiatives appear to be the most effective way
forward.
Tougher and more suppressive legal treatment has characterized gang strategies
in the Caribbean in the past. As has already been discussed in prior chapters, research
indicates that tougher responses to crime are not always the most effective. Investing
in police training and developing operational and analytical capacity on gang violence
is thus crucial to better shape suppression interventions and to turn away from un-
structured reactions to gangs (Harriott and Katz 2015). Increasing specialized police
presence in communities with high gang presence is one way to go about it. Removing
access to illegal weapons has also been proven to reduce gang violence. Operation
Ceasefire, which was implemented in Boston, is an example of a collaborative and
4 Too-aggressive suppression strategies may have the unintended result of increasing power and cohesion between gang members (Klein 1995).

124
RESTORING PARADISE IN THE CARIBBEAN: COMBATTING VIOLENCE WITH NUMBERS
comprehensive strategy to address escalating gang activity and the use of guns. It
combines law enforcement and prosecution efforts aimed at recovering illegal hand-
guns, prosecuting dangerous felons, increasing public awareness, and promoting
public safety and anti-violence measures.
The use of street outreach workers and counselling to help individuals exit gangs
has proven successful in reducing gang violence in some contexts.5 Locally adapted
versions of “outreach workers” and “violence interrupters” are being implemented in
several Caribbean communities, including Jamaica (Peace Management Initiative),
Trinidad and Tobago (Project REASON), and The Bahamas (Operation Ceasefire).
The important next step will be testing these programmes to understand their ef-
fectiveness and fine-tune them. Even though there has been no impact evaluation
of faith-based interventions, there are also potential benefits from including the faith
community in the response against gangs. See Harriott and Katz (2015) for an exam-
ple of a faith-based intervention in the community of Gonzales in Trinidad and Tobago.
Primary prevention strategies are crucial to achieve longer-term goals such as dis-
couraging youth from joining gangs in the first place. Research shows that focusing
on at-risk individuals and specific risk and protective factors can help direct the life
trajectories of youth towards more productive and appealing futures. Finally, focus-
ing on vulnerable neighbourhoods, building a sense of community cohesiveness, and
improving public services and the institutional presence can be effective in deterring
gang membership and growth. Many of these potential approaches are examined in
more detail in the final section of this publication.
5 For example, a small body of research evidence is now available on the effectiveness of the “Cure Violence” strategy and related strategies. Some communities have experienced the hypothesized reductions in violence (see http://cureviolence.org/results/scientific-evaluations/). Others have experienced either no change in vio-lence or even increased violence (Butts et al. 2015).

125
Guns—The Tools of ViolenceHeather Sutton and Lucciana Alvarez
Firearms are a defining feature of violence across the Caribbean. For many years
in the region, assaults and homicides were committed mainly with blunt or sharp
weapons. However, the rise of crime and violence has been characterized, among
other things, by an increased use of guns. While in Jamaica this trend began in the
1970s, Trinidad and Tobago saw an increase in gun use in 2000, followed by the other
countries of the Caribbean (UNODC and World Bank 2007). Firearms are now respon-
sible for most murders and many injuries resulting from assaults or armed robberies in
the region, especially in Jamaica, Trinidad and Tobago, and The Bahamas. On the other
hand, the overall lower levels of homicide with a firearm in crime in the capital cities
of Barbados and Suriname are likely related to less frequent use of firearms in violent
crimes in these two countries.
This chapter briefly examines the international literature on firearms and violent
crime as well as the particular literature regarding the use of guns in crime in the
region. We inspect the data from the Caribbean Crime Victimization Survey (CCVS)
on the use of guns in crime compared to other countries around the world that have
participated in the International Crime Victimization Survey (ICVS). We then turn to
determining the levels of gun ownership in the region, the types of guns owned, and
the reasons for owning them. Regression analysis used to explore the factors asso-
ciated with gun ownership finds that the most significant predictors are the belief
that guns make you safer and the perception of high levels of gun ownership in one’s
neighbourhood.
8.1 Review of Literature on Guns, Violence, and CrimeIn many countries around the world, including those in the Caribbean, firearms are the
“tools” of choice for serious crimes. Globally, firearms were used in 46.3 percent of all
8

126
RESTORING PARADISE IN THE CARIBBEAN: COMBATTING VIOLENCE WITH NUMBERS
homicides from 2007 to 2011. The Caribbean falls just below Central America as the
sub-region with the second-highest average rate (65 percent) of homicides commit-
ted with a firearm (Geneva Declaration Secretariat 2015). This is in stark contrast to
Asia and Europe, where only 22 percent and 24 percent of homicides were carried out
with firearms, respectively. Within the Latin America and Caribbean region, statistical
analysis for 23 countries over 1995–2010 reveals a positive correlation between overall
homicide rates and the percentage of homicides committed with firearms (Gilgen,
Aguirre, and Nowak 2102).
One of the ongoing debates in evidence-based crime prevention involves the rela-
tionship between gun ownership and violent crime. International cross-sectional and
panel studies have found that gun ownership is associated with higher overall homicide
rates (Cerqueira 2014; Hepburn and Hemenway 2004; Kilias 1993; Van Kesteren 2013)
and particularly with higher rates of female homicides by intimate partners (Small
Arms Survey 2004).1 Similarly, analysis of individual data on victimization and aggre-
gate rates at the country level has found positive relationships between gun ownership
and crimes committed with firearms (rates of robbery and assault or threats with
guns) (Van Dijk 2008).2 This relationship is particularly strong for handguns (Van Kes-
teren 2013). While some scholars have argued that violent crime has decreased in
areas where citizens are allowed to carry weapons (Lot 1998), there seems to be little
supporting empirical evidence for this (Wellford, Pepper, and Petrie 2004). Further-
more, a recent meta-analysis of evidence from 130 studies in 10 countries suggests
that in certain nations the simultaneous implementation of laws targeting multiple
firearms restrictions is associated with reductions in firearm deaths (Santaella-Tenorio
et al. 2016). In the Caribbean context it is worth noting that many countries have very
rigorous legislation and controls over legal firearm owners and severe penalties for
illegal ownership (see Appendix 8.4). Registering a legal firearm is a lengthy and often
unsuccessful process (Townsend 2009). Yet, as this chapter will show, firearm use in
the commission of violent crime is extraordinarily high. Thus the rise in the availability
of guns does not seem to have come about predominantly via legal routes.
Caribbean scholars have examined the evidence of increasing use of firearms in ho-
micides and robberies in Jamaica during the 1990s (Harriott 2002), followed somewhat
later by similar trends in Trinidad and Tobago (Agozino et al. 2009). In describing the
“weaponization” of civil society connected to illicit drug trafficking in the Caribbean,
1 Much of this research has been criticized for using inadequate proxies for measuring gun ownership and not using suitable methods to determine causality (i.e., the possibility of crime rates affecting gun rates, in-stead of the reverse) (Kleck 1991; Wellford, Pepper, and Petrie 2004).2 Using ICVS data from 1996–2000, Van Dijk (2008) finds that countries where firearm ownership is higher have more firearm-related assaults (r = .26, p < 0.05, n = 56). That relationship was confirmed in the most recent (2005) ICVS (r = .62, p < 0.05, n = 30).

127
GUNS—THE TOOLS OF VIOLENCE
Agozino et al. (2009) noted several consequences of increased drug smuggling
through the region: (1) guns became required to protect stockpiles of cash and drugs,
(2) the increased availability of guns led to higher levels of violent crime, and (3) once
guns permeated local communities, they were often used for interpersonal conflicts not
related to the drug market. In Jamaica and Trinidad and Tobago, studies find that the
use of guns in homicides is particularly pronounced in gang-related homicides (Leslie
2010; Townsend 2009). Wells, Katz, and Kim (2010), one of the few studies on firearm
ownership among offenders, find ownership was greater among arrestees involved in
gangs and drug selling. However, Agozino et al. (2009) make it clear that the epidemic
of gun violence documented in the West Indies cannot simply be reduced to gang ac-
tivity, but also involves the broader use of guns in interpersonal conflict.
There is no domestic manufacturing of firearms in the English-speaking Caribbean,
although weapons can be imported and sold legally by relatively few local venders.
Few studies investigate the origins of Caribbean guns, but existing information sug-
gests that both legal and illegal guns are obtained in a number of ways. These include
being diverted from legal owners in the country and being purchased overseas, legally
or illegally, then brought into the country. Diverted weapons can come from both pri-
vate owners and the protective services. Army and police guns, as well as stockpiles
of seized weapons, at times are stolen or go missing (UNODC and World Bank 2007).
While there have been few studies on the issue, there is some compelling evidence
that many, if not most, of the weapons used in crime are from overseas. Weapons
manufactured in the United States, Venezuela, Brazil, Mexico, and the Dominican Re-
public are both sold legally (for domestic sale to law enforcement and to licensed
owners) and smuggled illegally into Caribbean countries (Agozino et al. 2009; UNODC
and World Bank 2007). A 2014 report by the U.S. Bureau of Alcohol Tobacco and Fire-
arms (ATF) estimates that, of guns seized in crimes in the Caribbean, the percentages
that originated in the United States were 97.9 percent in The Bahamas, 82.6 percent
in St. Kitts and Nevis, 57 percent in Jamaica, 46 percent in Trinidad and Tobago, and
40.3 percent in the Dominican Republic.3 Other documented smuggling routes run
from South America through Suriname and Guyana to Trinidad and Tobago via fishing
vessels and private pleasure boats (UNODC and World Bank 2007).
Firearms procured from the above-mentioned sources, and by the various mecha-
nisms, contribute to the stockpile of circulating firearms. However, due to low capacity
to investigate firearm-related crimes and track guns back to their point of origin, it is
not possible to know what contribution each of these sources makes to the problem of
3 U.S. Department of Justice, Bureau of Alcohol Tobacco and Firearms, Firearms Tracing System, March 10, 2015. Available at https://www.atf.gov/resource-center/docs/caribbeancy14152492pdf/download.

128
RESTORING PARADISE IN THE CARIBBEAN: COMBATTING VIOLENCE WITH NUMBERS
gun violence and criminality. Additionally, there is little evidence regarding the amount
of crimes that are committed with legally registered or once-legally registered weap-
ons versus those that have been smuggled illegally into the country. This is certainly
a worthy area of research for the Caribbean that should be further explored beyond
the confines of this report and may be better tackled with administrative data on guns
seized in the commission of a crime.
This chapter makes two unique contributions to the existing literature. Firstly, we
examine the amount of violent crimes committed with a firearm in the five Caribbean
capital metropolitan areas (C5). Because these figures come from the CCVS, they
capture crimes not reported to the police and are comparable to other capital cities
around the world in the ICVS database. Secondly, we provide (as far as we know) the
first-ever estimate of gun ownership for the C5 based on survey data. While profes-
sional criminals are unlikely to have reported illegal firearms in this survey, it is very
possible that we have captured information on some firearms that are unregistered
for various reasons (they were inherited, registration lapsed and was not renewed,
they were purchased informally from a friend or acquaintance for protection, etc.).
These are likely not the weapons of organized crime, but they may be weapons
used in homicides and assaults that are the result of interpersonal conflict where a
deadly weapon was present. Far more research is required to understand the pro-
portion of violent acts that correspond to this type of violence. We also examine the
motivations and experiences associated with gun ownership in the region. This con-
tributes to a discussion on the insecurities and anxieties that may be driving some
gun ownership.
8.2 Facts and Figures8.2.1 How Often Are Guns Used in Crime?Within the sub-region, firearms continue to be involved in the vast majority of homi-
cides, including in Jamaica (73.4 percent), Trinidad and Tobago (72.6 percent), and
The Bahamas (82.4 percent).4 However, the story is different for Barbados and Su-
riname. In fact, the use of knives in homicides has been more or equally as common
in Barbados and Suriname over the last few years for which information is available
(Figure 8.1).5 One hypothesis for explaining the overall lower homicide rates in these
4 Data from 2013 provided by the Jamaican Constabulary Force, Trinidad and Tobago Police Service, and the Royal Bahamas Police Force.5 It is important to note, however, that homicides by firearm may be under-represented by the categories established in official reports. In fact, when looking at homicides and violent deaths of undetermined intent together, we see that homicides by firearms could be significantly higher.

129
GUNS—THE TOOLS OF VIOLENCE
two countries is that there are fewer crimes/attacks committed with guns (Figure 8.2),
which are more likely to be lethal.
In the five Caribbean capital city metropolitan areas studied here—Bridgetown,
Barbados; Kingston, Jamaica; New Providence, The Bahamas; Paramaribo, Suriname;
and Port of Spain, Trinidad and Tobago—a gun was present in 35 percent of all robber-
ies and in 17 percent of all threats and assaults (Figure 8.2). This is twice as high as the
average for other capital cities recorded in the ICVS (Appendix 8.1).
Figure 8.1: Percentage of Murders by Weapon by Country
2012 20142010 2011 2013
The Bahamas, 2010–2014 Barbados, 2009–2013>
Jamaica, 2009–2013 Suriname, 2012–2014
0102030405060708090
100
2011 20132009 2010 20120
102030405060708090
100
2011 20132009 2010 20120
102030405060708090
100
2013 2014
Gun
20120
102030405060708090
100
Knife Other Gun and knife
Trinidad and Tobago, 2009-–2013
2011 20132009 2010 20120
102030405060708090
100
Sources: Prepared by the authors using data from the Royal Bahamas Police Force, Strategic Policy and Planning Unit; Jamaica Constabulary Force; Crime and Problem Analysis Branch of the Trinidad and Tobago Police Service; Suriname Police Corps; and Royal Barbados Police Force.

130
RESTORING PARADISE IN THE CARIBBEAN: COMBATTING VIOLENCE WITH NUMBERS
Again, inter-regional variance is
significant. Gun use in assaults and
threats was highest in Port of Spain
(31 percent) and New Providence (19
percent). Other cities recorded in
the ICVS database with high assault
and threats at gunpoint include only
Rio de Janeiro (39 percent in 2002).
Use of guns in robbery was most
common in Kingston (44 percent),
Port of Spain (40 percent), and New
Providence (33 percent). Other cities
where the ICVS has been conducted
with similarly high percentages of
gun involvement in robbery included
Phnom Penh (66 percent in 2001),
Rio de Janeiro (56 percent in 2002),
Johannesburg (47 percent in 2004),
and New York (27 percent in 2004).
8.2.2 Prevalence Rates for Assault and Robbery at Gunpoint
The percentage of the total popula-
tion assaulted or threatened with a
gun in a 12-month period was three
times higher in the Caribbean (1.2 per-
cent) than the world average for the
ICVS (0.4 percent). In no other world
region has that prevalence been as
high as in the Caribbean.6 However,
residents are more than twice as likely to be attacked with a gun in New Providence
(1.9 percent), Port of Spain (1.8 percent), and Kingston (1.1 percent) than in Bridgetown
and Paramaribo, which are closer to the international average (0.6 percent and 0.5
percent, respectively). Also uniquely high in the Caribbean are the one-year preva-
lence rates of assaults and threats with knives (1 percent versus the ICVS average of
0.5 percent).
6 See Appendix 8.2 for a breakdown by region.
Figure 8.2: Percentages of Crimes Committed by Weapon Type in Five Caribbean Capital City Metropolitan Areas
13 29
10 19 16
22
15
14 10
16
7
15
44 37 23 30 22
33
17 20 29 16
24
19
Kin
gsto
nM
etro
polit
an A
rea
New
Pro
vide
nce
Por
t of S
pain
Met
ropo
litan
Are
a
Gre
ater
Brid
geto
wn
Are
a
Par
amar
ibo
01020304050
Per
cent
age
of a
ssau
lt an
d th
reat
s
60708090
100
Car
ibbe
anca
pita
l city
aver
age—
C5
Kin
gsto
nM
etro
polit
an A
rea
New
Pro
vide
nce
Por
t of S
pain
Met
ropo
litan
Are
a
Gre
ater
Brid
geto
wn
Are
a
Par
amar
ibo
01020304050
Per
cent
age
of ro
bber
ies
60708090
100
Car
ibbe
anca
pita
l city
aver
age—
C5
Other weapon Glass bottle Knife Long gun Handgun
Source: Prepared by the authors using data from the IDB Caribbean Crime Victimization Survey module attached to the 2014/2015 Latin American Public Opinion Project Survey.

131
GUNS—THE TOOLS OF VIOLENCE
Prevalence of robbery at gunpoint in the last year was also high (1 percent). This is
nearly twice the world average (ICVS) of 0.6 percent.7 Again there was great variation
within the region, with high rates in Port of Spain and New Providence (both 1.4 per-
cent) and Kingston (1.3 percent), and much lower rates in Bridgetown and Paramaribo
(0.4 percent). Higher percentages in the ICVS were found only in some other cities in
Latin America.
8.2.3 How Common Is Gun Ownership?The respondents to the CCVS were asked whether they or someone else in the house-
hold owned a firearm and what type. Table 8.1 shows the percentage of households
with guns by type at national levels and in capital city metropolitan areas. Note that
people are more likely to declare legal guns, and thus these numbers are likely to rep-
resent predominantly legal firearms.
On average, 9.1 percent of households in capital city metropolitan areas own a gun.
Gun ownership was higher in capital city metropolitan areas than at national levels
in all cases except Suriname, where the national rate (19.4 percent) was significantly
7 See Appendix 8.2 for a breakdown by region.
Table 8.1: Percentage of Households That Own a Firearm, by Type, in Five Caribbean Countries and Capital City Metropolitan Areas
Country Firearm Owner Handgun Long Gun Rifle
Jamaica n.a. n.a. n.a. n.a.
Trinidad and Tobago 9.5 4.2 2.6 0.7
Suriname 19.4 6.5 12.9 0.5*
Bahamas 10.9 1.8 4.8 1.0
Barbados 4.1 2.6 0.2* 0.6*
Average 11.1 3.9 5.2 0.7
Capital City Metropolitan Area Firearm Owner Handgun Long Gun Rifle
Kingston, Jamaica 4.1 2.9 0.5 0.3*
Port of Spain, Trinidad and Tobago 10.1 5.4 1.0 1.2
Paramaribo, Suriname 14.5 8.0 5.7 0.7*
New Providence, The Bahamas 12.3 2.2 5.2 0.9
Bridgetown, Barbados 4.7 3.1 0.1* 0.7*
Average 9.1 4.3 2.5 0.7
Source: Prepared by the authors using data from the IDB Caribbean Crime Victimization Survey module attached to the 2014/2015 Latin American Public Opinion Project Survey.Note: The question asked (identified as IVOL28) was: Do you or does anyone else in your household own a firearm, either for self-protection or for another reason? n.a.: not available.* Values are based on 10 or fewer observations and should be interpreted with caution.

132
RESTORING PARADISE IN THE CARIBBEAN: COMBATTING VIOLENCE WITH NUMBERS
higher than in Paramaribo (14.5 percent). This is to be expected given that hunting
and having a gun for protection from wild animals is common in Suriname’s rural in-
terior. Within the region, firearm ownership was highest in Paramaribo (14.5 percent),
New Providence (12.3 percent), and Port of Spain (10.1 percent) and lower in Kingston
(4.1 percent) and Bridgetown (4.7 percent).
Handgun ownership far outweighs any other type of firearm in Caribbean capital
city metropolitan areas. From an international perspective, a handgun ownership rate
of 4.3 percent in these cities is relatively high. Rates of other regions and cities are 4.4
percent in Latin America, 7.3 percent in Africa, 3.8 percent in New York, 2.2 percent in
Western Europe, and 3.4 percent in Eastern Europe. Ownership of long guns (mainly
used for hunting) was more common in The Bahamas and Suriname.
8.2.4 Reasons for OwnershipAround half (52.2 percent) of firearm owners in Caribbean capitals have a gun for
protection, 28.1 percent have a gun “in connection to work for army or police,”8 and
18.5 percent have a gun for hunting. A relatively high percentage of owners in the re-
gion mention crime prevention/protection as a main reason compared to other capital
cities in the ICVS database. Having a gun for protection was mentioned as frequently in
Latin American capital cities (56 percent), but less often in Asia (44 percent), Eastern
Europe (31 percent), Africa (18 percent), and Western Europe (13 percent). The reasons
for owning a gun by capital city metropolitan area are shown in Table 8.2. In Paramaribo,
8 Survey questions do not allow us to distinguish if these weapons are privately owned or government owned and kept at home.
Table 8.2: Reasons for Firearm Ownership in Five Caribbean Capital City Metropolitan Areas (percent)
Kingston Metropolitan
AreaNew
Providence Paramaribo
Port of Spain Metropolitan
Area
Greater Bridgetown
Metropolitan Area
Caribbean Average—
C5
Hunting 5.2 32.7 37.7 13.4 3.3 18.5
Sport 5.2 16.0 3.1 2.2 8.2 6.9
Collector’s item
3.5 1.6 0.2 2.6 3.3 2.2
Protection 63.5 50.3 21.6 64.5 62.3 52.4
Work* 33.9 11.9 47.8 15.6 31.1 28.1
Family property
7.0 2.2 1.9 9.1 9.8 6.0
Source: Prepared by the authors using data from the IDB Caribbean Crime Victimization Survey module attached to the 2014/2015 Latin American Public Opinion Project Survey.*Armed forces, police, private security.

133
GUNS—THE TOOLS OF VIOLENCE
relatively few owners have a gun for protection (21.6 percent), with most of those who
own a gun doing so for work (47.8 percent) and hunting (37.7 percent). This could help
explain the high levels of gun ownership, but lower levels of gun violence and crime.
8.2.5 Factors Associated with Gun OwnershipIn Chapter 3, the results of a multivariate regression showed that owning a gun is
significantly and positively associated with having been indirectly victimized—that is,
having someone close die due to violence or witnessing a serious attack, shooting, or
beating. In fact, controlling for other variables mentioned in Chapter 1 (individual and
neighbourhood characteristics), we find that having a gun in the home is associated
with a 5 percent increase of being a victim of one of the five types of crime examined
here in the last year, a 4 percent increase in being a victim of assault or threat in the
last year, an 11 percent increase in having witnessed a violent attack in one’s lifetime,
and a 12 percent increase in having lost someone to violence (see Appendix 3.3 for
all control variables included in the multivariate regression). Unfortunately, as in all
cross-sectional analysis, with only one year of data it is difficult to determine the time
order and sequence of events. In other words, we cannot determine whether these
guns were acquired before or after a victimization experience. Victimization may be
contributing to increased ownership, or the other way around.
In order to better understand the predictors of households with guns, we tested
a regression model including several potential explanations for gun ownership found
in the literature with relation to households with any gun, households with handguns,
and households where a gun is owned for protection.9
The covariates tested included:
• Economic resources (household income).
• Fear and experiences of victimization by household members (afraid of walking
alone at night in your neighbourhood, burglary in the last year, or having lost some-
one to violence).
• Beliefs about safety (does having a gun make you safer?).
• Perceptions of collective security (confidence in the police, perceptions of one’s
neighbourhood disorder, social cohesion, informal social control, gang presence,
and availability of guns).
The most important statistically significant predictors of household gun ownership
and ownership for protection were the belief that a gun makes you safer. Interestingly,
9 See regression results in Appendix 8.3.

134
RESTORING PARADISE IN THE CARIBBEAN: COMBATTING VIOLENCE WITH NUMBERS
neither the home having been burglarized in the last five years, nor the experience of
losing someone close to violence, was significantly associated with handgun owner-
ship or having a gun for protection. Confidence in the police, perceived neighbourhood
conditions, and the presence of gangs were also not significantly associated with gun
ownership.
8.3 Conclusions and Policy ImplicationsGuns are used in the overwhelming majority of homicides in the Caribbean. Guns are
also used about twice as often in robbery and three times as often in assault as the
global average. Handgun ownership is relatively high (on par with the average for
Latin America and below the average for Africa, but above all other regions) The most
common reason reported for owning a gun is for protection (52.2 percent). The best
predictor of gun ownership is the belief that having a gun makes you safer, over and
above experiences of actual household burglary (in the last five years), fear (being
afraid to walk alone in your neighbourhood), neighbourhood conditions, and lack of
trust in the police, none of which were significant predictors.
It is clear, particularly from the case of Paramaribo (where gun ownership is high
and gun crime low), that firearm availability by itself does not completely explain levels
of violent crime. Additionally, in many cases legislation controlling legal gun owner-
ship in Caribbean countries is rigorous. (Appendix 8.4 presents an overview of key
components present or missing in Caribbean country legislation.) Legally owned fire-
arms may present different problems from illegally owned firearms. In some countries
where ordinary criminal violence is facilitated primarily by access to illegal firearms,
tighter control of access to legal firearms may not have a significant impact on ho-
micides. In many Caribbean countries the problem of the illegal arms trade may have
to be more effectively tackled. More research is desperately needed on the origins of
guns used in crime, smuggling routes, and tactics used. However, the findings of this
report are supportive of efforts to continue to implement existing legislation (and
identify gaps between the laws on paper and in practice) on legal firearm ownership,
while also focusing on reducing illegal movement of firearms in the region.10 This can
be done through a combination of regional and global initiatives, strong national leg-
islation (and its implementation), and police and community initiatives. At the country
level the implementation of regulations governing vendors and purchasers of firearms
can be a starting point, including background checks and an index of “suspicious”
purchasers.
10 Interventions that act upon factors that predispose individuals to involvement in gun-related crime are discussed in more detail in the chapters on youth violence and policy/programme options.

135
GUNS—THE TOOLS OF VIOLENCE
At the global and regional levels, several initiatives have been undertaken in recent
years. These include adoption and ratification of the Arms Trade Treaty. Implementa-
tion of national regulations and protocols to implement the Arms Trade Treaty include
tighter control of importing, exporting and transhipment among the producing, sell-
ing, and destination States that have ratified. Preventing the illicit trafficking in light
arms is a responsibility to be shared among all these actors. Some regional initiatives
have been undertaken by the Caribbean Community and Organization of American
States, with assistance from the United Nations Regional Centre for Peace, Disarma-
ment and Development in Latin America and the Caribbean, to improve marking and
tracing of firearms and to destroy surplus weapons deposits. There has also been
increased cooperation with the U.S. ATF to trace the origin of firearms used in crimes
and apprehended by the police. Given that the illegal movement of firearms is global-
ized, more international, regional, and bilateral initiatives are necessary.
Furthermore, initiatives such as increased emphasis on the seizure of illegal weap-
ons by police, destruction of stockpiles of seized weapons, and strong protection of
police and military weapons stockpiles are key to reducing gun crime. Recommen-
dations have been put forth by the United Nations Programme of Action on Small
Arms and Light Weapons in this regard. Chapter 13 examines the evidence related to
legislation and programmes that have worked to reduce gun violence internationally.

136
RESTORING PARADISE IN THE CARIBBEAN: COMBATTING VIOLENCE WITH NUMBERS
Appendix 8.1. Percentages of Use of Knives and Guns in Robberies and Threats/Assaults in Five Caribbean Capital City Metropolitan Areas, the Region, and the World
Percentage of Robberies That Involved a:
Percentage of Assaults and Threats That Involved a:
Knife Gun Knife Gun
Greater Bridgetown Area, Barbados 24 22 16 8
Kingston Metropolitan Area, Jamaica 15 44 23 13
New Providence, The Bahamas 16 36 9 22
Paramaribo, Suriname 29 26 13 13
Port of Spain Metropolitan Area, Trinidad and Tobago
16 40 11 32
Average for the Caribbean Capitals—C5 20 33 14 18
Average for capital cities of ICVS world regions
21 15 11 8
Sources: Van Dijk and Van Kesteren (2015) based on the IDB Caribbean Crime Victimization Survey module attached to the 2014/2015 Latin American Public Opinion Project Survey; and the International Crime Victimization Surveys (ICVS), 1990–2005.

137
GUNS—THE TOOLS OF VIOLENCE
Appendix 8.2. One-Year Prevalence Rates of Robberies with Knives, Guns, and Overall, and of Assaults/Threats with Knives, Guns, and Overall, for Six World Regions (percent)
One-year prevalence rates
Robberies with knife involved
Robberies with gun involved
All robberies
Assaults and threats with
knife involved
Assaults and threats
with gun involved
All assaults
and threats
Africa (10 cities) 1.0 0.6 4.4 0.8 0.4 6.0
Asia (six cities) 0.3 0.2 1.4 0.2 0.1 2.5
Caribbean (five cities)
0.5 1.0 2.7 1.0 1.2 6.8
Eastern Europe (18 cities)
0.3 0.1 1.9 0.3 0.1 3.3
Latin America (seven cities)
1.7 1.7 6.7 0.6 0.6 4.5
United States (New York)
0.5 0.6 2.3 0.8 0.6 5.1
Western Europe (15 cities)
0.3 0.1 1.4 0.4 0.1 4.0
Average for six world regions
0.7 0.6 3.1 0.5 0.4 4.5
Sources: Van Dijk and Van Kesteren (2015) based on the IDB Caribbean Crime Victimization Survey module attached to the 2014/2015 Latin American Public Opinion Project Survey; and the International Crime Victimization Surveys, 1990–2005.Note: The five cities in the Caribbean are the Kingston Metropolitan Area, Jamaica; New Providence, The Bahamas; Paramaribo, Suriname; the Port of Spain Metropolitan Area, Trinidad and Tobago; and the Greater Bridgetown Area, Barbados.

138
RESTORING PARADISE IN THE CARIBBEAN: COMBATTING VIOLENCE WITH NUMBERS
Appendix 8.3. Ordinary Least Squares Regression Model 1: Factors Associated with Household Gun Ownership in Five Caribbean Capital Cities
(1) Gun
(2) Handgun
(3) Protection
Economic Resources
Household income 0.00614* 0.0038 0.00329*
(0.00250) (0.00234) (0.00142)
Experience and Fear of Victimization
Victim of burglary (last five years) 0.0254 0.0103 0.0209
(0.0208) (0.0165) (0.0193)
Someone close killed by violence 0.0443* 0.0108 0.0077
(0.0199) (0.0104) (0.00921)
Afraid in neighbourhood at night –0.0225** –0.00927 –0.00753
Beliefs
Having a gun makes you safer 0.129** 0.0670* 0.0897**
(0.0261) (0.0274) (0.0202)
Conservative crime ideology –0.00682 –0.0161 0.00247
(0.0110) (0.00795) (0.0126)
Perceptions of Collective Security
Confidence in the police index –0.0186 –0.00923 –0.013
(0.0113) (0.00581) (0.00789)
Neighbourhood disorder index –0.0641 –0.0702 –0.0399*
(0.0394) (0.0343) (0.0164)
Neighbourhood social cohesion index –0.0091 –0.019 –0.0157
(0.0408) (0.0304) (0.0289)
Neighbourhood informal social control index –0.0554* –0.03 –0.0105
(0.0252) (0.0324) (0.0177)
Perception of gun ownership in neighbourhood 0.00141** 0.00104** 0.00108**
(0.000304) (0.000220) (0.000231)
Perception of gang presence 0.0076 –0.0114 –0.00734
(0.0107) (0.00930) (0.00596)
_cons 0.167** 0.150** 0.0813
(0.0447) (0.0440) (0.0436)
Number 4,188 4,226 4,243
Source: Prepared by the authors using data from the IDB Caribbean Crime Victimization Survey module attached to the 2014/2015 Latin American Public Opinion Project Survey.Note: Standard errors in parentheses. * p < 0.10, ** p < 0.05, and *** p < 0.001. The five capital cities are the Kingston Metropolitan Area, Jamaica; New Providence, The Bahamas; Paramaribo, Suriname; the Port of Spain Metropolitan Area, Trinidad and Tobago; and the Greater Bridgetown Area, Barbados.

139
GUNS—THE TOOLS OF VIOLENCE
Appendix 8.4. Analysis of Existing Gun Control LawsThe
Bahamas Barbados Jamaica SurinameTrinidad
and Tobago
Licenses: Only licensed gun owners may lawfully acquire, possess, or transfer a firearm or ammunition
Yes Yes Yes Yes Yes
Minimum age for firearm possession
18 years old, or 14 years old under the
supervision of a person
over the age of 21
25 years old
17 years old None 25 years old
Background checks include:
Criminal, mental health,
addiction, and various
other records
Criminal, mental health,
and addiction
Criminal and mental
health
None Criminal, mental health,
domestic violence,
and addiction
Domestic violence: Where a past history, or likelihood of family violence exists, does the law stipulate that a gun license should be denied or revoked?
No No No No Yes
Firearm safety: Is an understanding of firearm safety and the law tested in a theoretical and/or practical training course that is required for a firearm license?
No No Yes No Yes
Licensing period: Gun owners must re-apply and re-qualify for their firearm license how often?
Every year Every year Every 4–5 years
Every year Every 3 years
Limit on number of guns an individual can posses
No No No One firearm per
license
No
(continued on next page)

140
RESTORING PARADISE IN THE CARIBBEAN: COMBATTING VIOLENCE WITH NUMBERS
Appendix 8.4. Analysis of Existing Gun Control LawsThe
Bahamas Barbados Jamaica SurinameTrinidad
and Tobago
Limit on quantity of ammunition
A quantity of
ammunition authorized
by the licensing authority
None 50 rounds of ammunition
per year
Up to 100 cartridges for small firearms and no more
than 25 cartridges
for handguns (pistols,
revolvers)
Only the quantity of ammunition indicated in the license
Private gun sales: Are private gun sales allowed?
No No Yes, with a special permit
No Yes
Licensing of dealers: Are dealers required to be licensed?
Yes Yes Yes Yes Yes
Waiting period: Is there a minimum waiting period for purchasing a gun?
No No No No information
No
Marking: Is a unique identifying mark on each firearm required by law?
Yes No Yes No Yes
Firearm tracing: Do State authorities carry out recognized arms tracing and tracking procedures?
No Yes Yes No Yes
Ballistic records: Are ballistic records of firearms and ammunitions required?
No No Yes No information
Yes
Carrying: Is carrying a gun openly in public permitted?
Yes, subject to a valid
permit
No No information
No No information
Illicit firearms possession: What is the maximum penalty for illegal firearms possession?
7 years in prison and a
fine
2 years in prison and/or a $5,000
fine
15 years in prison and a
fine
4 years in prison and
a fine
15 years in prison
Source: Prepared by the authors using data from gunpolicy.org and the most recent available legislation in each country.
(continued)

141
The Police and Criminal Justice System
Heather Sutton and Lucciana Alvarez
The structure and effectiveness of criminal justice institutions can have an im-
portant impact on citizen security. If citizens perceive the police and justice
system as legitimate and competent, they will be more willing to report crimes
and work with the authorities to enhance their effectiveness. Conversely, these institu-
tions can generate unintended increases in crime and a lower sense of security if they
are not transparent, fair, and accountable. Trust in these institutions is important.
Compared to the average for 17 countries in the Latin America and Caribbean region,
Caribbean countries have responded to crime with some of the lowest expenditure on
the administration of justice and the highest expenditure on the police (Jaitman and
Torre 2016). Specifically, The Bahamas, Barbados, and Jamaica are among those that
spend the least on justice administration—about 0.06 percent of GDP. Jamaica has
the highest percentage of crime-related police expenditures—2.04 percent of GDP
in upper-bound estimates—followed by The Bahamas, with police expenditures of
1.59 percent of GDP (upper bound).1
Using the data available, this chapter examines the effectiveness of and trust in
the police and the judicial system. The chapter begins with a review of some of the
indicators of police capacity and efficiency: police density, estimated response time,
and detection rates. We further explore responses from respondents to the Caribbean
Crime Victimization Survey (CCVS) regarding four components of perceived police
legitimacy: (1) perception of police performance, (2) victim satisfaction with treatment
of their cases, (3) experiences with police corruption, and (4) perceptions of police
abuse of power. Where possible, the responses are compared to Latin America (using
the 2015 Latin American Public Opinion Project Survey—LAPOP) and other capital
cities around the world (using the International Crime Victimization Survey—ICVS).
1 For more details see Chapter 11.
9

142
RESTORING PARADISE IN THE CARIBBEAN: COMBATTING VIOLENCE WITH NUMBERS
The extent to which these components influence trust in the police is also explored.
We then turn to the available evidence regarding the capacity and effectiveness of
the courts and prison and corrections agencies. Case processing delays, backlogs, low
conviction rates, high pre-trial detention and prison overcrowding are all examined.
Some promising Caribbean initiatives to disrupt this cycle are examined. We finish the
chapter with conclusions and policy implications.
9.1 Police9.1.1 Capacity, Responsiveness, and EffectivenessAdequate police size and density are necessary but not sufficient conditions for pro-
viding citizen security. Relatively high investment in the police (see Chapter 11), coupled
with small populations in the Caribbean, has resulted in a high police-to-population
density compared to the average for Latin America and around the world (Table 9.1).
This suggests that in general cover-
age is not a particularly critical issue.
The more challenging elements would
seem to be adequate training and ef-
fective use of human resources.
High police density has not nec-
essarily resulted in rapid police
response or greater police effective-
ness in investigating crime. Of those
polled in the CCVS in capital city
metropolitan areas in five Caribbean
countries, an average of 56 percent
said that if someone were entering
their home, it would take the police
more than 30 minutes to arrive on a
typical day around noon. Nine per-
cent said that it would take more than
three hours, while 2.5 percent said
there are no police in their area. Fig-
ure 9.1 shows the survey respondents’
perception of police response time
by capital city metropolitan area. The
quickest perceived response times
were in Paramaribo and the slowest
in Bridgetown. At the national level,
Table 9.1: Police Density in Four Caribbean Nations and World Regions
Country
Rate of Police Personnel per
100,000 Population
Jamaica 424
The Bahamas 846
Trinidad and Tobago 477
Barbados 504
World average 366
Regional averages
Latin America and Caribbean
436
East Asia and Pacific (all income levels)
340
Europe and Central Asia (all income levels)
361
Middle East and North Africa (all income levels)
325
North America 206
South Asia 520
Sub-Saharan Africa (all income levels)
159
Source: Prepared by the authors using United Nations Office on Drugs and Crime criminal justice data for 2014 or the latest available year. Note: World and regional averages are for the year with the highest amount of countries reporting (2012).

143
THE POLICE AND CRIMINAL JUSTICE SYSTEM
survey responses show perceived po-
lice response times in the Caribbean
are better than the Latin American
average (Latin America Public Opin-
ion Project—LAPOP), but far below
Canada, the United States, Argentina,
and Uruguay (Figure 9.2).
When it comes to investigation of
crimes, police detection rates2 for the
most violent crimes (i.e., homicide)
are generally low (Table 9.2). For the
year with the most recent available
data, we see that roughly half or less
of all homicides were resolved by the
police in The Bahamas (51 percent de-
tection), Jamaica (40 percent), and
Trinidad and Tobago (14 percent).
Clearance rates for homicide in some
other countries, where available, in-
clude 64 percent in the United States
(2013), 75 percent in Canada (2010), and 90 percent in the United Kingdom (2013).3 De-
tection rates for other crimes are generally even lower than for homicide: for the year of
most recent available data, the average detection rate for all Category 1 Serious Crimes
in Jamaica was 32.1 percent (2014) and for Major Crimes in Trinidad and Tobago was 31.7
percent (2015).4
Notably, in Trinidad and Tobago detection rates are extremely low and have been
declining since 2000 (Figure 9.3). In the case of murder, detection rates averaged
64.8 percent between 1990 and 1999, and then plummeted to 14 percent by 2015.
The number of crimes and detections began to diverge substantially in 2000 when
crimes began to increase, but clearances did not follow (see the example of homicides
2 Police forces in these three Caribbean countries use the term “detection rates” instead of clearance rates, but the definition is equivalent.3 The sources for the three countries mentioned are as follows: the U.S. FBI Unified Crime Reports 2013 and Statistics; the Canadian Centre for Justice Statistics, Homicide Survey 1961–2010; and the Home Office Statis-tical Bulletin, Crimes Detected in England and Wales 2012/13.4 Category 1 serious crimes in Jamaica include murder, shooting, rape, aggravated assault, robbery, and break-in and larceny from a person, dwelling or motor vehicle. Major crimes in Trinidad and Tobago include murder, woundings and shootings, rapes, incest sexual offences, serious indecency, kidnapping, burglaries and break-ins, robberies, fraud offences, larceny and larceny of motor vehicles, and larceny from a dwelling house. Data were available only for Jamaica and Trinidad and Tobago.
Figure 9.1: Estimated Police Response Time in Five Caribbean Capital City Metropolitan Areas (percent)
0102030405060708090
100
< 10 minutes 10–30 minutes 30 minutes–1 hour 1 hour–3 hours > 3 hours There are no police
KingstonMetropolitan
Area
NewProvidence
Port ofSpain
MetropolitanArea
GreaterBridgetown
Area
Paramaribo
Source: Prepared by the authors using data from the IDB Caribbean Crime Victimization Survey module attached to the 2014/2015 Latin American Public Opinion Project Survey.Note: The question asked (identified as INFRAX) was: Suppose someone enters your home to burglarize it and you call the police. How long do you think it would take the police to arrive at your house on a typical day around noon?.

144
RESTORING PARADISE IN THE CARIBBEAN: COMBATTING VIOLENCE WITH NUMBERS
in Figure 9.4). Changes in the vol-
ume and nature of crimes (armed
and gang-related), combined with
insufficient organizational capac-
ity to detect and respond to these
changes, may explain the declining
rates (Maguire, Wells, and Katz 2011).
9.1.2 Perceptions of Police Competence and Performance
The public’s perception of the perfor-
mance of the police and their ability
to control crime goes to the heart
of perceptions of police legitimacy.
The 2014/2015 CCVS included two
questions to gauge public perception
of police competency and perfor-
mance. Respondents were asked how
satisfied they felt with police perfor-
mance in their neighbourhood, as
well as how good a job they believed
the police were doing in controlling
crime. Most respondents from the
five capital city metropolitan areas
surveyed (72 percent) were satisfied
with the police. However, more than
one in four were dissatisfied or very
dissatisfied (28 percent). Figure 9.5
shows the breakdown for each city.
Satisfaction was notably highest in
New Providence and Paramaribo, and
lowest in Port of Spain. In Chapter 7
we saw that satisfaction was lower
for respondents who reported a gang
presence in their neighbourhood.
The results of satisfaction were
mirrored in the responses regarding
the perception of how well police are controlling crime (Figure 9.6). Less than half (44
percent) of respondents in Port of Spain felt the police are doing a very good or fairly
Figure 9.2: Estimated Average Police Response Time by Country in the Americas (Average score 0–100; higher score indicates longer police response time)
Venezuela
Haití
Nicaragua
Guyana
Bolivia
Honduras
Belize
Dominican Republic
Peru
Guatemala
Brazil
Barbados
Latin America average
Mexico
Caribbeanaverage
Jamaica
El Salvador
Colombia
Trinidad and Tobago
Paraguay
Bahamas
Chile
Panama
Costa Rica
Ecuador
Suriname
Argentina
Uruguay
United States
Canada
0 10 20 30 40 50 60 70
Source: Prepared by the authors using data from the IDB Caribbean Crime Victimization Survey module attached to the 2014/2015 Latin American Public Opinion Project Survey.Note: The question asked (identified as INFRAX) was: Suppose someone enters your home to burglarize it and you call the police. How long do you think it would take the police to arrive at your house on a typical day around noon?.

145
THE POLICE AND CRIMINAL JUSTICE SYSTEM
good job. Conversely, in New Providence 75 percent rated the police as doing a very
good or fairly good job.
To put these findings into international perspective, it is worth comparing them with
other countries in the Americas polled by LAPOP in 2014 and other capital cities in
Figure 9.3: Crime Detection Rates in Trinidad and Tobago (percent)
2012 201320101990 1991 1992 1993 1994 1995 1996 1997 1998 1999 2000 2001 2002 2003 2004 2005 2006 2007 2008 2009 20110
102030405060708090
100
Murder Woundings and shootings Kidnapping Burglaries and break-ins Robberies Larceny and larceny of motor vehicles
Source: Prepared by the authors using data provided by the Crime and Problem Analysis Branch of the Trinidad and Tobago Police Service.
Figure 9.4: Murders Reported versus Murders Detected in Trinidad and Tobago
2012 20152014201320101990 1991 1992 1993 1994 1995 1996 1997 1998 1999 2000 2001 2002 2003 2004 2005 2006 2007 2008 2009 20110
100
200
300
400
500
600
Murders reported Murders detected
Source: Prepared by the authors using data provided by the Crime and Problem Analysis Branch of the Trinidad and Tobago Police Service.
Table 9.2: Percentage of Homicides Resulting in Charging of a Suspect, Jamaica, The Bahamas, and Trinidad and Tobago (percent)
2010 2011 2012 2013 2014 2015 Average
Jamaica — 42 39 41 40 — 40
The Bahamas 70 50 71 51 — — 61
Trinidad and Tobago 22 22 16 13 17 14 18
Source: Prepared by the authors. Homicide detection rates were calculated using data from the Jamaica Constabulary Force, Statistics and Information Management Unit; Royal Bahamas Police Force, Strategic Policy and Planning Unit; and the Crime and Problem Analysis Branch of the Trinidad and Tobago Police Service. Data were not provided for Barbados and Suriname.

146
RESTORING PARADISE IN THE CARIBBEAN: COMBATTING VIOLENCE WITH NUMBERS
the ICVS database. Figure 9.7 shows
that in response to the same question,
Caribbean respondents were more
satisfied than those in Latin Ameri-
can countries. In fact, respondents in
The Bahamas ranked the police on
par with respondents from the United
States and just below Canada. When
comparing Caribbean capital cities to
other cities in the ICVS (Table 9.3), the
results show that the Caribbean public
assesses police performance relatively
favourably, and significantly so in
comparison with Latin American or
Eastern European countries. However
performance ratings are still below
those in capital cities of the United
States, Asia, and Western Europe.
The hypothesis that the police in
the Caribbean are perhaps more service-oriented towards reporting victims than their
peers in Latin America can be tested by looking at the percentages of victims who re-
ported the crime to the police and are
satisfied by their treatment. Table 9.4
shows that, on average, less than half
of victims who reported their crimes
to the police were satisfied with treat-
ment of their case. While this may
seem low, satisfaction is on par with
the international average. Although
lower than satisfaction in New York or
in the European Union countries, sat-
isfaction in the Caribbean was again
higher than in Latin America, Africa,
and Eastern Europe (Appendix 9.1).
9.1.3 Abuse of Power and Respect for Citizens’ Rights
Abuse of power by police forces and
disregard for citizens’ rights can also
Figure 9.5: Satisfaction with Police Performance in Neighbourhoods in Five Caribbean Capital City Metropolitan Areas (percent)
0102030405060708090
100
Very dissatisfied Dissatisfied Satisfied Very satisfied
KingstonMetropolitan
Area
NewProvidence
Port ofSpain
MetropolitanArea
GreaterBridgetown
Area
Paramaribo
Source: Prepared by the authors using data from the IDB Caribbean Crime Victimization Survey module attached to the 2014/2015 Latin American Public Opinion Project Survey.Note: The question asked (identified as Pole2n) was: In general, are you very satisfied, satisfied, dissatisfied, or very dissatisfied with the performance of the police in your neighbourhood?
Figure 9.6: How Good of a Job Are the Police Doing Controlling Crime? (percent)
0102030405060708090
100
Very good job Fairly good job Neither good nor poor jobFairly poor job Very poor job No response/don't know
KingstonMetropolitan
Area
NewProvidence
Port ofSpain
MetropolitanArea
GreaterBridgetown
Area
Paramaribo
Source: Prepared by the authors using data from the IDB Caribbean Crime Victimization Survey module attached to the 2014/2015 Latin American Public Opinion Project Survey.Note: The question asked (identified as IVOL14) was: Taking everything into account, how good do you think the police in your neighbourhood are in controlling crime?

147
THE POLICE AND CRIMINAL JUSTICE SYSTEM
erode the perceived legitimacy of the
police. Across the Caribbean, abuse of
the use of force by law enforcement
varies, with some accounts indicat-
ing that there are more violations in
countries with more violent crime, par-
ticularly related to extrajudicial killings
(UNDP 2012).5 Governments and po-
lice from the region have responded in
recent years by attempting to improve
accountability and community-police
relations, often through community
policing initiatives. Has this led to less
abuse of power?
CCVS respondents were asked to
what extent police harassment is a
problem in their neighbourhood (Fig-
ure 9.8). Nearly one in four (23 percent)
respondents felt that police harass-
ment was at least a small problem,
with 9 percent saying it was a big or
very big problem. Notably, police ha-
rassment was perceived as a bigger
problem in Port of Spain and Kingston,
but less so in Paramaribo and Bridge-
town. Respondents in neighbourhoods
with a gang presence reported police
harassment as being a far more severe
problem (see Chapter 7).
9.1.4 Perceptions of Integrity: Is Corruption a Problem?
Integrity is also tied to citizens’
perceptions of legitimacy and will-
ingness to work with the police.
Corruption is particularly detrimental
5 For example, over more than two decades, national and international organizations, such as Americas Watch (1986) and Amnesty International (2000), have consistently identified high levels of police brutali-
Figure 9.7: Satisfaction with Police Performance in Neighbourhoods in Latin American and Caribbean Countries (percent)
0 10 20 30 40 50 60 8070
Bolivia
Venezuela
Peru
Haití
Mexico
Guyana
Brazil
Belize
Dominican Republic
Guatemala
Latin America average
Colombia
Argentina
El Salvador
Costa Rica
Honduras
Nicaragua
Ecuador
Uruguay
Chile
Paraguay
Panama
Caribbean average
Jamaica
Trinidad and Tobago
Suriname
Barbados
United States
Bahamas
Canada
Source: Prepared by the authors using data from the IDB Caribbean Crime Victimization Survey module attached to the 2014/2015 Latin American Public Opinion Project Survey.Note: The question asked (identified as Pole2n) was: In general, are you very satisfied, satisfied, dissatisfied, or very dissatisfied with the performance of the police in your neighbourhood? (average score 0–100, higher = more satisfied).

148
RESTORING PARADISE IN THE CARIBBEAN: COMBATTING VIOLENCE WITH NUMBERS
to the public’s trust in the police
force, as well as to law enforcement’s
ability to effectively control crime.
Experiences of being asked to pay a
bribe, for example, can lead the pop-
ulation to feel mistrust and alienation.
The 2014/2015 LAPOP Survey asked
respondents about their personal
experience with being asked to pay
a bribe to a police officer in the last
year. On average, 7 percent of indi-
viduals from the Caribbean reported
being approached to pay a bribe by a
police officer (Figure 9.9). Barbados
and Suriname reported low levels of
corruption (1 percent and 3 percent,
respectively, were asked for bribes),
ty and extrajudicial killings in Jamaica. The UN Special Rapporteur—Mission to Jamaica found evidence of excessive use of force by the police and also raised concerns about the outcome of the June 2002 West Kingston Commission of Enquiry. Similar concerns have been raised with respect to law enforcement activ-ities during the May–June 2010 police operations in Tivoli Gardens and the subsequent state of emergency (Amnesty International 2011).
Table 9.3: Assessment of Police Performance in the Caribbean, Latin America, and World Regions
Africa (10 cities) 2.5*
Asia (six cities) 2.9*
Caribbean (5 cities) 2.7
Eastern Europe (18 cities) 2.1
Latin America (seven cities) 2.0*
United States (New York) 3.1
Western Europe (15 cities) 2.8*
Source: Van Dijk and Van Kesteren (2015) based on the 2014/15 Caribbean Crime Victimization Survey and International Crime Victimization Surveys from 1990–2005.Note: The scores are averages on a four-point scale. A higher score is a better assessment of police performance. The five cities in the Caribbean are the Kingston Metropolitan Area, Jamaica; New Providence, The Bahamas; Paramaribo, Suriname; the Port of Spain Metropolitan Area, Trinidad and Tobago; and the Greater Bridgetown Area, Barbados.* The format of this item in the International Crime Victimization Survey has changed over time; categories are matched to obtain better comparisons
Table 9.4: Victims Satisfied by the Treatment of their Complaint by the Police in Five Caribbean Capital City Metropolitan Areas (percent)
Percent Satisfied
Three Crimes Combined Burglary Robbery Assault
Kingston Metropolitan Area 52 55 37 51
New Providence 51 48 53 42
Greater Bridgetown Area 49 52 59 37
Paramaribo 32 31 23 39
Port of Spain Metropolitan Area 30 21 34 47
Five-City Average 43 40 42 44
World Average (ICVS 1990–2005) 42 40 40 44
Sources: Prepared by the authors using data from the IDB Caribbean Crime Victimization Survey module attached to the 2014/2015 Latin American Public Opinion Project Survey. The world average is based on International Crime Victimization Surveys from 1990–2005.Note: ICVS: International Crime Victimization Survey.

149
THE POLICE AND CRIMINAL JUSTICE SYSTEM
while The Bahamas and Guyana re-
ported higher levels (11 percent and
12 percent, respectively).
9.1.5 Trust in the PolicePerceptions of police performance,
abuse of power, and corruption all
contribute to assessing the public’s
trust in the police. Trust in the police
is essential for the rule of law and
for the police to be effective in con-
trolling and preventing crime. Using
data from the CCVS, this section ex-
amines two measures of trust in law
enforcement: (1) the self-reported
level of trust in the police, and (2) the
percentage of crimes reported to the
police. We then examine which fac-
tors most influence public trust in the police force using multivariate regression.
Figure 9.10 shows the inter-regional variance of self-reported trust in the police in
the CCVS on a scale of 1 (not at all) to 7 (a lot). Trust was lowest in Jamaica and Trinidad
and Tobago, where 37 percent and 25 percent of the population, respectively, said they
don’t trust the police at all. Conversely, respondents in The Bahamas and Suriname (35
percent and 27 percent, respectively) said they trust the police a lot. Figure 9.11 shows
how the Caribbean compares to other countries in the Americas. Again we observe
that police in Suriname and The Bahamas are some of the most trusted in the Americas,
ranking close to Canada and Chile. Barbados lies around the Caribbean average, while
Trinidad and Tobago, Jamaica, and Guyana display some of the lowest levels of trust.
The percentage of crimes reported can also be seen as a measure of the public
image of police forces, with low reporting rates suggesting low trust. As reported in
Chapter 1, in the Caribbean 53 percent of the five measured crimes (as listed in Table
9.5) were reported to the police. Table 9.5 shows that reporting rates in the Carib-
bean are significantly higher than in Latin America and Eastern Europe, but lower than
those in New York and Western Europe.
9.1.6 What Factors Account for Higher Trust in the Police?In order to better untangle the factors that significantly influence Caribbean residents’
trust in the police, we apply an ordinary least squares multivariate regression (for de-
tails see Appendix 9.2). The outcome variable was constructed on a scale of 1 to 7 at the
Figure 9.8: To What Extent Is Police Harassment a Problem in Your Neighbourhood? (percent)
KingstonMetropolitan Area
New Providence
Paramaribo
Port of SpainMetropolitan Area
GreaterBridgetown Area
0 20 40 60 80 100
A very big problem A big problemNeither a big nor small problem A small problemNo problem
Source: Prepared by the authors using data from the IDB Caribbean Crime Victimization Survey module attached to the 2014/2015 Latin American Public Opinion Project Survey.Note: The question asked (identified as IVOL15) was: To what extent is police harassment a problem in your neighbourhood?

150
RESTORING PARADISE IN THE CARIBBEAN: COMBATTING VIOLENCE WITH NUMBERS
individual level using the question “To
what extent do you trust the National
Police?” Independent variables includ-
ed perceptions of the police, personal
experiences with crime, and individual
and neighbourhood characteristics.
Perceptions of the police includ-
ed (1) competence in crime control,
(2) response time, (3) harassment was
a problem, and (4) having paid a bribe
to an officer in the last 12 months. Per-
sonal experience with crime included
(1) having been victim of a crime in
the last year, (2) having lost someone
to violence, and (3) having witnessed
a violent attack. Individual and neigh-
bourhood characteristics controlled
for were consistent with previous
chapters. Country fixed effects were
used to control for variation between
countries.
The results show that, over-
whelmingly, the strongest significant
predictor of trust in the police is the
perception of police competence in
controlling crime. This was stronger
than any other variable in the model.
Police response time, perception
that harassment was a problem, and
having paid a bribe were also signifi-
cantly and negatively associated with
trust in the police. Interestingly, hav-
ing been a victim of a crime in the last
year was insignificant, although hav-
ing witnessed a violent attack was
negatively related to trust. Men were
significantly less likely to trust the police, and older age predicted higher trust. Those
in neighbourhoods with higher trust among neighbours (social cohesion) were also
more likely to have more trust in the police. Overall, the results suggest that the best
Figure 9.9: Percentage of Respondents Who Report Being Asked to Pay a Bribe in the Last Year in Latin American and Caribbean Countries (percent)
0 5 10 15 20 25
12
11
11
7
6
4
3
1
Bolivia
Mexico
Paraguay
Peru
Dominican Republic
Honduras
Ecuador
Belize
Guatemala
Venezuela
Guyana
Latin America average
Panama
Bahamas
Nicaragua
Colombia
Haiti
Argentina
Caribbean average
Jamaica
El Salvador
Costa Rica
Brazil
Trinidad and Tobago
Canada
Uruguay
United States
Suriname
Barbados
Chile
Source: Prepared by the authors using data from the IDB Caribbean Crime Victimization Survey module attached to the 2014/2015 Latin American Public Opinion Project Survey.Note: The question asked (identified as EXC2) was: Has a police officer asked you for a bribe in the last twelve months?

151
THE POLICE AND CRIMINAL JUSTICE SYSTEM
way to increase trust in the police is
to prioritize increasing competence
of the police to control crime.
9.2 The Judicial SystemCrime and violence prevention and
reduction are also affected by the ef-
ficiency and effectiveness of judicial
systems, as well as by the level of public
confidence in them. The most com-
mon performance measure of criminal
justice systems is the extent to which
cases are processed fairly and effi-
ciently. Unfortunately, even the most
basic data on the flow of cases through
criminal justice systems are not con-
sistently available in the Caribbean.
However, some special commissions and governmental task force reports have identified
specific concerns. For example, the Justice Reform Task Force in 2007 found that Jamai-
ca’s justice system is inefficient and identified a number of issues that contribute to the
problem, including delays, disrespect of individuals before the court, poor infrastructure,
underfunding, outdated and inefficient procedures, and unequal treatment, benefits, and
protection. Scattered evidence from each country suggests similar problems plague many
Caribbean judicial systems. Low crime detection rates are compounded by long case pro-
cessing delays and low conviction rates for those who are arrested. Significant delays in
one part of the system often have a ripple effect through other parts of the system. This
section considers some of these challenges.
9.2.1 Capacity and EffectivenessChapter 11 will show that Caribbean countries spend relatively little on the administration
of justice compared to what they spend on the police. In a study of 17 countries in Latin
America and the Caribbean, Jaitman and Torre (2016) show that countries from the
Caribbean sub-region spend the least amount of GDP on administration of justice. This
underpins the limited administrative capacity of the judicial system. While little compa-
rable data are available on the amount of key personnel within the justice system (i.e.,
lawyers, public defenders, and prosecutors), Table 9.6 shows that the number of judges
per population is relatively low in the Caribbean compared to the international average.
Anecdotal evidence (Bailey 2016; Harriott and Jones 2016; Seepersad 2016; Sutton 2016)
Figure 9.10: Self-Reported Trust in the Police in Five Caribbean Countries (percent)
Not at all
Jamaica Trinidad and Tobago SurinameThe Bahamas Barbados
05
10152025303540
2
3
45
6
A lot
Source: Prepared by the authors using data from the IDB Caribbean Crime Victimization Survey module attached to the 2014/2015 Latin American Public Opinion Project Survey.Note: The question asked (identified as B18) was: To what extent do you trust the National Police? Answers are on a scale of 1 (not at all) to 7 (a lot).

152
RESTORING PARADISE IN THE CARIBBEAN: COMBATTING VIOLENCE WITH NUMBERS
shows that judicial systems are strug-
gling with caseloads that far exceed
the processing capacity.
Part of the challenge in studying
the problem is that case processing
delays make it difficult to measure
conviction rates. Data on case pro-
cessing and conviction rates are
not available in a systematic way
throughout the Caribbean, but the
available evidence paints a disturbing
picture. For example, in May 2014 in
The Bahamas, the court calendar was
already full through 2016, according
to the Office of the Attorney General.
In 2014 there were 568 backlogged
cases set for trial in the six criminal
courts and another 491 cases yet to
be scheduled (Sutton 2016). In 2013,
only 141 total cases were tried. Of
those, 44 percent resulted in con-
victions, 38 percent in not guilty
verdicts, and 18 percent were dis-
missed (due to a mistrial or lack of
evidence, among other reasons) (Sut-
ton 2015). According to Hanna (2011),
from 2005–2009 only 5.1 percent of
murder cases resulted in convictions.
Due to the significant backlog, some
case delays are reported to last up to
five years.
In Barbados, the Office of the At-
torney General has also long been constrained in its ability to quickly and effectively
conclude cases, leading to what some have referred to as a 20-year court backlog. It
was estimated in 2012 that the backlog consisted of more than 3,000 cases (Bailey
2016). In Jamaica, case clearance rates in resident Magistrates’ Courts increased to
94 percent in 2010, up from 80.1 percent in 2009 (Harriott and Jones 2016). However,
most other indicators of effective governance showed little or no improvement during
the period (PIOJ 2012).
Figure 9.11: How Much Do You Trust the Police?
0 10 20 30 40 50 60 70 80
Bolivia
Mexico
Paraguay
Peru
Dominican Republic
Honduras
Ecuador
Belize
Guatemala
Venezuela
Guyana
Latin America average
Panama
Bahamas
Nicaragua
Colombia
Haiti
Argentina
Caribbean average
Jamaica
El Salvador
Costa Rica
Brazil
Trinidad and Tobago
Canada
Uruguay
United States
Suriname
Barbados
Chile
Source: Prepared by the authors using data from the IDB Caribbean Crime Victimization Survey module attached to the 2014/2015 Latin American Public Opinion Project Survey.Note: The question asked (identified as B18) was: To what extent do you trust the National Police? Answers on a scale of 1 (not at all) to 7 (a lot). Average scores for each country were recorded on a scale of 0–100.

153
THE POLICE AND CRIMINAL JUSTICE SYSTEM
Table 9.6: Number of Professional Judges per 100,000 Population, Four Caribbean Countries and World Region
CountryNumber of Professional Judges per
100,000 Population
Jamaica 3
The Bahamas 12
Trinidad and Tobago 7
Barbados 8
World average 18
Regional averages
Latin America and Caribbean 9
East Asia and Pacific (all income levels) 6
Europe and Central Asia (all income levels) 27
Middle East and North Africa (all income levels) 11
North America 1
South Asia
Sub-Saharan Africa (all income levels) 3
Source: Prepared by the authors using United Nations Office on Drugs and Crime criminal justice data for 2014 or latest available year.Note: World and Latin American averages are for the year with the highest amount of countries reporting (2012).
Table 9.5: Percentage of Victims Who Have Notified the Police, by World Region
Four Crimes (excluding car theft) Car Theft Burglary Robbery
Theft of Personal Property
Assault and
Threat
Africa (10 cities)
49 89 63 37 22 28
Asia (six cities)
35 78 43 38 16 28
Caribbean (five cities)
51 84 70 63 50 44
Eastern Europe (18 cities)
48 83 64 36 23 25
Latin America (seven cities)
35 90 36 23 13 25
United States (New York)
57 97 77 52 36 35
Western Europe (15 cities)
60 89 78 55 54 32
World average 48 87 62 44 31 31
Source: Van Dijk and Van Kesteren (2015) based on the 2014/15 Caribbean Crime Victimization Survey and International Crime Victimization Surveys from 1990–2005.Note: The five cities in the Caribbean are the Kingston Metropolitan Area, Jamaica; New Providence, The Bahamas; Paramaribo, Suriname; the Port of Spain Metropolitan Area, Trinidad and Tobago; and the Greater Bridgetown Area, Barbados.

154
RESTORING PARADISE IN THE CARIBBEAN: COMBATTING VIOLENCE WITH NUMBERS
While there is convincing evidence that these delays and backlogs exist, understand-
ing the causes is more difficult. One explanation for the low conviction rates has been the
increase in case dismissals, which are common because of poor preparation by police
and prosecutors, witness intimidation, lack of victim participation, and attorney absen-
teeism. In some circumstances overlapping cases are scheduled at the same time with
the same attorney (which inhibits one of the cases from proceeding), or other court per-
sonnel (i.e., court reporters) are not available when the case is to be presented. Finally,
an additional problem may be the lack of plea bargaining. For example, authorities in
The Bahamas commented that plea bargaining is rare because defendants believe that
either they can drag out a case for years before being tried, or count on the weaknesses
of the police and prosecution in producing sufficient evidence (Sutton 2016). This means
that nearly all cases must go to trial, creating an even longer backlog.
9.2.2 Trust in the CourtsGiven the aforementioned scenario, it is relatively unsurprising that trust in the courts
to provide a fair trial is relatively low. One in five (20 percent) persons polled in the
Caribbean countries say they have no trust at all in the courts to provide a fair trial.
Figure 9.12 shows the breakdown by country. Once again, trust is lowest in Jamaica
and Trinidad and Tobago, where 34 percent and 27 percent of respondents, respec-
tively, have no trust at all in the courts. Bahamians have relatively higher trust in the
courts, as they do in the police.
9.2.3 Promising InitiativesThere have been recent attempts
to create task forces to tackle long
backlogs and improve the adminis-
tration of cases by instituting case
management systems. In Barbados,
Chief Justice Sir Marston Gibson in
2013 proposed restarting the Backlog
Reduction Project, with steps tak-
en to have dead cases removed and
live cases put back on track (Cum-
berbatch 2013). In August 2015, the
Attorney General announced plans
to continue the Backlog Reduction
Project with the possible hiring of
additional judges as an option to be
considered (Barbados Nation 2015).
Figure 9.12: Trust in the Courts to Provide a Fair Trial in Five Caribbean Countries
Not at all
Jamaica Trinidad and Tobago SurinameThe Bahamas Barbados
2
3
45
6
A lot
05
101520253035
Source: Prepared by the authors using data from the IDB Caribbean Crime Victimization Survey module attached to the 2014/2015 Latin American Public Opinion Project Survey.Note: The question asked (identified as B1) was: To what extent do you think the courts to guarantee a fair trial? Answers on a scale of 1 (not at all) to 7 (a lot).

155
THE POLICE AND CRIMINAL JUSTICE SYSTEM
In The Bahamas, under the Swift Justice Initiative a case management system is
being put in place and other issues associated with the backlog are being targeted for
improvement, including changes to the Court Reporting Unit responsible for transcripts
and a universal case scheduling system to avoid overlaps with the same attorneys.
Progress achieved under the Jamaican Justice Reform Agenda during 2009–2012
includes establishment of the Court Management Service to facilitate more efficient op-
erations of the court system; introduction of the Criminal Case Management System;
construction of new courthouses and improvements to physical structures; establishment
of the Office of the Special Coroner; development of restorative justice; and an increase
in judicial personnel (PIOJ 2013, 9). New units established to advance the justice agenda
include the Independent Commission of Investigation, which was put in place pursuant to
the 2010 Independent Commission of Investigation Act. These initiatives, among others,
have the potential to improve the functioning of the judicial process, but only if they are
accompanied by sufficient resources and close monitoring of their effectiveness in terms
of attaining the desired outcomes and addressing the bottlenecks that remain.
9.3 Correctional Systems9.3.1 Capacity and EffectivenessLong case processing times and backlogs have also resulted in a profound crisis for
Caribbean correctional systems (Table 9.7). The crisis is reflected in (1) high prison pop-
ulations, with prisoner-to-population rates in the region oscillating between 145 and
379 per 100,000 population, which surpasses the world average of 140 per 100,000
inhabitants; (2) overcrowding, with prisoner volume exceeding prison capacity by
more than 70 percent; and (3) high pre-trial detention rates, with a regional average
of 40 percent of prisoners detained still pending trial. Correctional facilities across the
region are operating significantly beyond their built capacity, and many individuals in
pre-trial detention sometimes await sentencing for years (see previous section).
Most prison populations in the Caribbean are not primarily comprised of violent of-
fenders. In recent years, those convicted of violent crimes represented 15 percent, 37
percent, and 32 percent of prison admissions in The Bahamas (2013), Barbados (2013),
and Jamaica (2014), respectively.6 Prisoners sentenced or remanded for murder and man-
slaughter represented 2 percent of admissions in The Bahamas, 4 percent in Jamaica,
and 19 percent in Barbados over the same years. In Barbados, the largest proportion of
6 The calculations use the crime categories provided by the respective corrections departments and include any crime with the use, or threat of use, of force (i.e., murder, manslaughter, robbery, rape, sexual offences, as-sault, shooting, wounding, etc.). Because crime categories are not consistent across countries, cross-country comparison should be avoided. Data were not provided by Trinidad and Tobago or Suriname.

156
RESTORING PARADISE IN THE CARIBBEAN: COMBATTING VIOLENCE WITH NUMBERS
offenders was incarcerated for burglary (20 percent) followed by drug possession (18 per-
cent).7 In Jamaica, the categories with highest proportions of admissions were larceny (22
percent) and drug offences (13 percent).8 In The Bahamas, the crimes that represented
the largest portion of remanded and sentenced prisoners were drug offences (16 percent)
and stealing (11 percent).9 In summary, while we have seen that the Caribbean suffers from
particularly from high levels of violent crime, the prison population is made up largely of
individuals who have committed drug offences or burglary/theft. Given the situation of
prison overcrowding, it would seem to warrant investigation as to whether many of these
offenders could not be serving probation or alternative sentences (i.e., halfway houses,
electronic monitoring, substance-abuse treatment and rehabilitation).
Substance abuse and mental illness are important areas for examination with re-
lation to the corrections and criminal justice systems. Using a sample of imprisoned
adults in Trinidad and Tobago, Seepersad (2013) indicated that there was a strong
linkage between drug use and criminal offences, and that a large proportion of of-
fenders are habitual drug users. This implies that successful drug treatment within
prisons could lead to a reduction in recidivism rates, and ultimately a reduction in
crime rates in the wider society. Some Caribbean countries have also begun to investi-
gate or experiment with the use of Drug Courts,10 which aim to reduce the number of
Table 9.7: Prison Statistics, Six Caribbean Countries
Num
ber
of
Pris
ons
Fem
ale
Faci
litie
s
Mal
e Fa
cilit
ies
Juve
nile
Fa
cilit
ies
Prison Population
Offi
cial
C
apac
ity
Popu
lati
on
Den
sity
(p
erce
nt)
Num
ber
Rat
e*
Rem
and/
Pr
e-Tr
ial
(p
erce
nt)
The Bahamas 1 — — 2 1,396 363 42 1,348 97.8
Barbados 1 — — — 924 322 42.3 1,250 72.6
Guyana 5 1 4 — 1,967 259 35.6 1,580 126.5
Jamaica 12 1 6 4 4,050 145 16.9 4,690 87.7
Suriname 5 4 1 1,000 183 50 1,330 78.9
Trinidad and Tobago 9 1 8 1 3,700 272 60 4,886 71.2
Source: Prepared by the authors using data from World Prison Brief, International Center for Prison Studies, 2016 or latest available year.*Rate refers to the amount of incarcerated individuals per 100,000 population in each country.
7 Authors’ calculations based on data provided by Her Majesty’s Prison Barbados for 2013.8 Authors’ calculations based on data from the Economic and Social Survey of Jamaica for 2014.9 Authors’ calculations based on data provided by The Bahamas Department of Corrections for 2013.10 One example is a Drug Treatment Court that was set up in Trinidad and Tobago in February 2015 with the assistance of the Organization of American States (Seepersad 2016).

157
THE POLICE AND CRIMINAL JUSTICE SYSTEM
drug-addicted individuals incarcerated and focus on treatment rather than incarcer-
ation. This strategy involves judicially supervised court-ordered treatment that would
include therapeutic approaches and rigid scrutiny in terms of drug testing to ensure
that the addict abstains from further drug use.
Similarly, the mentally ill may make up a portion of prison populations. Corrections
departments often lack appropriate facilities and are short of resources and trained
personnel to effectively treat mentally ill inmates. Consequently, there are many cases
of mentally ill inmates in jails without adjudication of their cases. For example, in 2014
in Jamaica, of 105 incarcerated persons designated unfit to plead (awaiting trial), sev-
eral had been detained since 1960 without being tried and sentenced (Campbell 2014).
9.3.2 Promising InitiativesParole and probation are potential alternatives to reduce overcrowding that also give
individuals, especially youth, a chance to turn their lives around. However, their use var-
ies throughout the region, as does the capacity of the agencies that run them and the
quality of the services provided (UNDP 2012). While there are no systematic and com-
parable data available on probation throughout the region, most evidence suggests
that only a small share of individuals are diverted from prison systems using this method
(UNDP 2012). The recent adoption of electronic ankle-bracelet monitoring of individ-
uals on probation (or in some cases out on bail) offers potential for helping reduce
prison populations, but will not be sufficient unless other needed services and monitor-
ing are provided to beneficiaries. Many probation departments struggle with resources,
particularly in terms of their capacity to refer clients to adequate rehabilitation and
support services. Some countries, such as Jamaica and Barbados, have experimented
with connecting probation to community corrections strategies (community service,
community-based rehabilitation programmes, appointment of community members to
parole boards, etc.). However, such programmes often come and go and shift in times
of budget crises or changing political environments. In 2014, The Bahamas approved
and Trinidad and Tobago proposed new legislation regarding installing functioning
parole systems.11 In both cases, significant work remains to identify, develop, and imple-
ment suitable systems and procedures, establish the required infrastructure to select
those eligible for parole, and prepare and monitor them prior to and after release.
Another area that should be a priority for policymakers, but often is largely aban-
doned, is the reintegration of ex-offenders into society after they have served their
time. Many of these individuals are at high risk for re-offending and are often given
11 The Bahamas Corrections Services Act 2014 and the Trinidad and Tobago Administration of Justice (Pa-role) Bill 2014.

158
RESTORING PARADISE IN THE CARIBBEAN: COMBATTING VIOLENCE WITH NUMBERS
little or no support after release to prevent them from returning to a life of crime. In
the Caribbean, programmes for rehabilitation, assisted re-entry, and reintegration of
former inmates are incipient, small in scale, and often run by nongovernmental organi-
zations, when they exist at all (Bailey 2016; Harriott and Jones 2016; Seepersad 2016;
Sutton 2016; UNDP 2012). Some recent positive steps have been made in this regard.
In Barbados, a Reintegration Unit was created in 2011 to reduce recidivism. Within the
unit there are programmes aimed at drug rehabilitation, behavioural management,
and job opportunity. In Trinidad and Tobago, the Prison Service is currently putting
into place a Level of Service/Case Management Inventory (LS/CMI), which is a risk/
need assessment system for offender treatment planning, placement, and case man-
agement. The LS/CMI is a comprehensive measure of risk and need factors, as well
as a fully functional case management tool that includes integrated general and spe-
cific risk/need components, and addresses other client issues (e.g., social, health, and
mental health) and responsivity concerns (e.g., cultural concerns or communication
difficulties). As of 2014, the Prison Service had already begun to use the diagnostic
instrument and was in the process of training personnel in its usage.
9.4 Conclusions and Policy ImplicationsBudget allocation speaks volumes about government priorities. As will be shown in
Chapter 11, despite increasing attention to the importance of prevention, Caribbean
governments are still overwhelmingly responding to rising crime by investing most
resources in the police. Low resource allocation to prevention not only minimizes the
potential to avert many crimes from happening in the first place; it also overlooks the
current strain on judicial and corrections systems.
Police density in the Caribbean is relatively high, but police capacity to respond
quickly to citizens and investigate and identify perpetrators of the most severe violent
crimes is low. A cursory look at the prison population reveals that most offenders are
imprisoned for non-violent crimes, specifically drug offences and theft.
One in four Caribbean residents considered police harassment to be a problem, with
significant inter-regional variation and greater concern expressed in neighbourhoods
with a gang presence. About 7 percent of individuals reported being asked to pay a
bribe in the last year, which is low compared to Latin America, but high compared to
the United States, Canada, Uruguay, and Chile. Caribbean residents’ trust in the police
varies widely by country, with high levels of trust in The Bahamas and Suriname and
low levels in Jamaica and Trinidad and Tobago. Trust in the police in the Caribbean is, on
average, higher than in Latin America and Eastern Europe, but lower than in the United
States, Canada, and Western Europe. One hypothesis could be that higher victimization
is responsible for low levels of trust in the police. However, we find through multiple

159
THE POLICE AND CRIMINAL JUSTICE SYSTEM
regression analysis that the factor most strongly associated with trust in the police is
the perception of the competence of the police in controlling crime. Thus, increasing
police effectiveness and efficiency, while maintaining integrity and respect for citizens’
rights, is the best way to increase trust in the police. Some interesting initiatives in the
Caribbean and internationally regarding policing are discussed in Chapters 13 and 14.
Limited data were offered in this chapter regarding the functioning and capacity of
the criminal justice system as a whole—including the police, courts, and prisons. The
partial view of these institutions presented suggests that the judicial and corrections
systems suffer from severe constraints that have led to long case backlogs, large num-
bers of pre-trial detentions, and prison overcrowding. Trust in the courts to provide
a fair trial is low. However, this view is incomplete and insufficient for determining
the specific bottlenecks that are impeding a well-functioning system. Metrics of ad-
ministrative capacity and effectiveness of criminal justice institutions, such as those
provided by some countries for the criminal justice statistics of the United Nations
Office on Drugs and Crime, are not readily available in the Caribbean. Building the sta-
tistical infrastructure in Caribbean countries for measuring crime and the responses to
it is crucial. Chapter 14 will further discuss this recommendation.
Finally, many promising initiatives exist to divert low-level crimes away from the courts,
pay adequate attention to drug offences, and begin to invest in the rehabilitation of of-
fenders. Some of these are mentioned in this chapter, including improving probation and
parole, using electronic monitoring, and establishing Drug Treatment Courts. Others, such
as the restorative justice approaches being explored by Jamaica and Trinidad and Tobago,
are further addressed in Chapters 13 and 14. It is important that these initiatives be given
adequate resources, sufficient time to succeed, and continuity across changing political
landscapes. They should be closely monitored in their implementation and their results
meaningfully evaluated. Policymakers need to continue to emphasize rehabilitation and
alternative sanctions, and to construct a regional knowledge base of good practices.

160
RESTORING PARADISE IN THE CARIBBEAN: COMBATTING VIOLENCE WITH NUMBERS
Appendix 9.1. Percentage of Victims Satisfied by the Treatment of Their Complaint by the Police, by World Region
Three Crimes Combined Burglary Robbery
Assault and Threat
Africa (10 cities) 31 28 33 41
Asia (six cities) 45 40 49 48
Caribbean (five cities) 43 42 42 44
Eastern Europe (18 cities) 30 30 28 34
Latin America (seven cities) 29 24 30 39
United States (New York) 54 47 43 69
Western Europe (15 cities) 63 67 58 56
World average 42 40 40 47
Source: Van Dijk and Van Kesteren (2015) based on the 2014/15 Caribbean Crime Victimization Survey and International Crime Victimization Surveys from 1990–2005.Note: The five cities in the Caribbean are the Kingston Metropolitan Area, Jamaica; New Providence, The Bahamas; Paramaribo, Suriname; the Port of Spain Metropolitan Area, Trinidad and Tobago; and the Greater Bridgetown Area, Barbados.

161
THE POLICE AND CRIMINAL JUSTICE SYSTEM
Appendix 9.2. Ordinary Least Squares Regression: Trust in the Police
Trust in the Police (B18, scale 1–7)Coefficient (standard error)
Perception of policePolice competence (IVOL14) 0.305***
(0.040)
Police response time (INFRAX) –0.164**(0.041)
Harassment is a problem (IVOL15) –0.099***(0.020)
Paid a bribe to police (EXC2) –0.056**(0.013)
Personal experience with crimeVictim any crime 0.006
(0.010)
Lost someone to violence –0.026*(0.012)
Witnessed a violent attack –0.036***(0.008)
Individual characteristicsMale –0.026***
(0.005)
Age (years) 0.002***(0.001)
Years of schooling 0.003(0.002)
Neighbourhood characteristicsNeighbourhood Disorder Index 0.022
(0.014)
Neighbourhood Informal Social Control Index –0.004(0.044)
Neighbourhood Social Cohesion Index 0.077**(0.023)
Gang presence in neighbourhood 0.039(0.024)
Country fixed effectsNumber of observations 12,534
Adjusted R2 0.305
Source: Prepared by the authors using data from the IDB Caribbean Crime Victimization Survey module attached to the 2014/2015 Latin American Public Opinion Project Survey.Note: *** .01, ** .05, and * .1.


163
Crime and the Private SectorHeather Sutton, Inder Ruprah, and Lucciana Alvarez
In addition to individual citizens, businesses are also frequent targets of crime. The
level of crime in society can strongly affect the business environment (Ruprah and
Sierra 2016). In 2014, an average of 84 percent of Caribbean businesses reported that
crime was an obstacle to doing business (Figure 10.1). Yet, despite the vast body of
literature on crime, there is relatively little research—particularly in the Caribbean—on
how crime affects businesses. The cost of doing business in a high-crime environment
involves not only the direct losses from crime, but also the costs of security measures
taken to protect against crime.
10
Figure 10.1: Are Crime, Theft, and Disorder an Obstacle to Doing Business? (percent)
Ant
igua
and
Bar
buda
The
Bah
amas
Bar
bado
s
Bel
ize
Dom
inic
a
Gre
nada
Guy
ana
Jam
aica
St.
Kitt
san
d N
evis
Sai
nt L
ucia
St.
Vin
cent
and
the
Gre
nadi
nes
Sur
inam
e
Trin
idad
and
Toba
go
Very severe obstacle Major obstacle Moderate obstacle Minor obstacle No obstacle
0
10
20
30
40
50
60
70
80
90
100
Source: Productivity, Technology, and Innovation (PROTEqIN) Survey, 2014.Note: Survey respondents were asked: Please rate each one of these factors as obstacles that can affect the current operations of your establishment.

164
RESTORING PARADISE IN THE CARIBBEAN: COMBATTING VIOLENCE WITH NUMBERS
This chapter focuses on understanding crime against firms, an issue that has been
the focus of little research primarily because of data limitations. In 2013/2014, the
IDB developed a business victimization survey module that was attached to the 2014
Productivity, Technology, and Innovation (PROTEqIN) Survey and applied to a repre-
sentative sample of firms in 13 Caribbean countries. The module was developed as a
panel survey to follow the World Bank’s Enterprise Surveys conducted in the region
in 2010, which contained more limited questions on crime. Using data from both sur-
veys, we estimate the prevalence and incidence of victimization from various types of
common crime that affect businesses in each country. We then examine when, where,
and how these crimes occur, as well as the profile of perpetrators and the weapons
involved. The chapter then looks at the factors associated with firm victimization such
as firm size and investment in private security. In the final section we offer some con-
clusions and policy recommendations.
10.1 BackgroundBusiness victimization surveys are a fundamental tool to better understand how
crime affects businesses. Similar to crimes against individuals, crimes against firms
are often not well captured in police statistics. Besides providing information about
the business environment in countries, some surveys of businesses inform about the
types of crime that most affect firms, the impact on firms, and which firms are most
affected, among other factors (Box 10.1). The surveys can also provide information on
crimes such as racketeering, extortion, and cyber-crime, which are poorly measured
via other sources.
Victimization prevalence rates for businesses are generally higher than for private
citizens (Van Dijk 2008). This is especially true for theft and burglary. Country rank-
ings based on victimization rates for individuals often correspond closely to the level
of victimization against businesses (Van Dijk and Terlouw 1996). One global study by
Ernst & Young (2004) found that half of crimes globally were committed by company
insiders and 6 percent of crimes (where the perpetrator was identified) were related
to organized crime.
World Bank Enterprise Survey data from 2010 show that Latin America and the
Caribbean had the highest levels of firm victimization (25 percent of businesses) and
the second-highest percentage of firms (62 percent) paying for security (Amin 2014).
Crime and security costs impose a heavier burden on firms in Latin America and the
Caribbean than do other impediments to doing business, such as power outages.
Amin (2009) finds that large firms are more likely to experience crime than small
firms. However, the losses due to crime, as a percentage of annual sales, are higher for
smaller firms.

165
CRIME AND THE PRIVATE SECTOR
10.2 Facts and Figures10.2.1 How Many Firms Are Victimized?In 2013/2014, nearly one in five Caribbean businesses (23 percent) reported experi-
encing losses due to theft, robbery, vandalism, or arson during the fiscal year. This is
higher than the average prevalence rate for individuals (13 percent) for five common
crimes, as shown in Chapter 2. It is also slightly higher than the world average for the
Box 10.1. Surveys of Firms with Questions on Crime
World Bank Enterprise Surveys
• Firm-level survey of a representative sample of an economy’s private sector.
• Includes questions on losses due to crime and security expenses.
• Covers 130,000 firms in 135 countries.
• Latin American and Caribbean sample: interviewed 12,855 enterprises in 30 coun-
tries in the region, including The Bahamas, Barbados, Jamaica, Suriname, and
Trinidad and Tobago.
• Latest year of survey for the region: 2010.
International Crime Business Survey
• Firm-level survey of experiences with victimization, perceptions, and attitudes.
• Sample: Firms in nine Central and Eastern European countries.
• Latest year: 2000.
PROductivity, TEchnology and INnovation (PROTEqIN) Survey
• Panel survey of the Caribbean Enterprise and Indicator Survey 2011 (CES 2011).
• Sample: 1,680 firms in the Caribbean.
• Year: 2013/2014.
• Caribbean countries: Barbados, Belize, Jamaica, Guyana, Suriname, Antigua and
Barbuda, Dominica, Grenada, St. Kitts and Nevis, Saint Lucia, St. Vincent and the
Grenadines, The Bahamas, and Trinidad and Tobago.
World Economic Forum Executive Opinion Survey
• What is it? Tool for capturing information on a nation’s economic and business
environment.
• Sample: 15,000 surveys.
• Year: Has been conducted for over 30 years (latest in 2014).
• Countries: In 2011, the survey included 142 economies, including Barbados, Jamaica,
Suriname, and Trinidad and Tobago.

166
RESTORING PARADISE IN THE CARIBBEAN: COMBATTING VIOLENCE WITH NUMBERS
World Bank’s Enterprise Survey (19.4 percent). The Latin America and Caribbean re-
gion has the highest levels of firm victimization of any region in the world.1
In 2013, prevalence of victimization ranged from 8 percent of firms in Belize to
33 percent in Guyana. Levels of victimization were above average in Guyana, St. Kitts
and Nevis, Suriname, Grenada, and Dominica, while Belize showed relatively low levels
compared to the rest of the region (Figure 10.2). The ranking of Caribbean countries
according to levels of crime against individuals and businesses is somewhat different,
with Jamaica showing lower levels and Suriname higher levels of crimes against firms.
10.2.2 What Type of Crime?Figure 10.3 shows that among businesses that experienced losses related to crime,
the most common types of crime reported were theft (66 percent) and vandalism
(62 percent),2 with 56 percent experiencing attempted robbery, 48 percent attempted
1 Using all World Bank Enterprise Surveys conducted as of March 2016, regional averages for firms experi-encing losses from crime were as follows: Latin America and the Caribbean, 27.1 percent; sub-Saharan Africa, 22.1 percent; East Asia and Pacific, 17.1 percent; Eastern Europe and Central Asia, 11.2 percent; South Asia, 10.5 percent; and the Middle East and North Africa, 9.6 percent.2 Victimization prevalence rates are likely under-estimated because only businesses that confirmed having suffered losses as a result of crime were asked about the specific types of crime they experienced. Also, definitions of crimes were not supplied within the survey question, as is typical practice in victimization sur-veys. This reduces the accuracy of results, given potential respondent confusion over what is robbery versus burglary, or what constitutes an assault.
Figure 10.2: Firms That Experienced Losses as a Result of Theft, Vandalism, Robbery, or Arson in the Previous Fiscal Year, 13 Caribbean Countries (percent)
0
5
10
15
20
25
30
35
Bel
ize
Bar
bado
s
Jam
aica
Ant
igua
and
Bar
buda
Sai
nt L
ucia
The
Bah
amas
Trin
idad
and
Toba
go
St.
Vin
cent
and
the
Gre
nadi
nes
Dom
inic
a
Gre
nada
Sur
inam
e
St.
Kitt
s an
dN
evis
Guy
ana
2013 Caribbean average World Bank Enterprise Survey world average (latest available year)
Source: Prepared by the authors using data from the Productivity, Technology, and Innovation (PROTEqIN) Survey, 2014.Note: The question asked was: In the last fiscal year, did this establishment experience losses as a result of theft, robbery, vandalism or arson?.

167
CRIME AND THE PRIVATE SECTOR
burglary, 46 percent burglary, 45 percent robbery, and 35 percent assault or threat of
assault. For individual victimization rates by country and crime see Appendix 10.1.
10.2.3 Cyber-crime and KidnappingOverall, 17 percent of firms surveyed in the 13 Caribbean countries reported Internet fraud.
Cyber-crime appears to be a bigger problem in The Bahamas and Trinidad and Tobago,
with 41 percent and 33 percent of all businesses, respectively, reporting Internet fraud in
the last year (Appendix 10.2). No businesses reported this crime in Jamaica and Barba-
dos and only 4 percent (five firms) experienced Internet fraud in Suriname. Kidnapping
also does not appear to be a major impediment to firms in the region. With the excep-
tions of The Bahamas and Trinidad and Tobago (both reporting two cases), the other
countries reported no cases of paying ransom for kidnapping victims (Appendix 10.3).
10.2.4 Frequency of VictimizationSixty percent of Caribbean businesses that experienced losses from crime during the
year were targeted more than once (Figure 10.4), and 22 percent were victimized four
times or more in the same year. It is notable that Barbados and Jamaica both have
overall lower prevalence of victimization, but higher levels of repeat victimization (4+
times in one year). In other words, fewer firms in these countries experience losses due
to crime, but those that do experience losses are targeted more often. Firms experi-
enced theft, vandalism, and robbery with the highest frequency—an average of 2.8,
2.2, and 1.6 times in one year, respectively (Appendix 10.4).
Figure 10.3: Type of Crime Experienced in the Previous Fiscal Year by Businesses with Losses Due to Crime, Average of 13 Caribbean Countries (percent)
Burglary 0
10
20
30
40
50
60
70
Attemptedburglary
Robbery Attemptedrobbery
Vandalism Theft Assaultand threats
46 48 45
56
62 66
35
Source: Prepared by the authors using data from the Productivity, Technology, and Innovation (PROTEqIN) Survey, 2014.Note: The figure shows the percentage of firms experiencing each crime out of those that experienced losses and that answered the question (N = 433). The question asked was: In the last fiscal year, did anyone commit or try to commit the following crimes in the premises of this establishment? Burglary, attempted burglary, robbery, attempted robbery, vandalism, theft, assault and threat. The 13 countries are Antigua and Barbuda, The Bahamas, Barbados, Belize, Dominica, Grenada, Guyana, Jamaica, St. Kitts and Nevis, Saint Lucia, St. Vincent and the Grenadines, Suriname, and Trinidad and Tobago.

168
RESTORING PARADISE IN THE CARIBBEAN: COMBATTING VIOLENCE WITH NUMBERS
10.2.5 When, Who, and with What Weapon?Crimes occur fairly equally during working hours (49 percent) and outside of working
hours (51 percent), with very little variation between countries (Table 10.1). Theft and
robbery occur more frequently during working hours, while vandalism occurs more
frequently outside of working hours.
Where respondents answered questions regarding the perpetrator, most perpetra-
tors were thought to be gang-affiliated (36 percent) (Figure 10.5). Within the region,
The Bahamas, Trinidad and Tobago, and Jamaica stand out with higher reports of
gang-related perpetrators (52 percent, 45 percent, and 28 percent, respectively). In
Figure 10.4: Frequency of Victimization of Firms Experiencing Losses Due to Crime (percent)
0
10
20
30
40
50
60
70
80
90
100
The Bahamas Barbados Guyana Jamaica Suriname Trinidad andTobago
Caribbeanaverage (C13)
1 time 2–3 times 4–5 times 6+ times
Source: Prepared by the authors using data from the Productivity, Technology, and Innovation (PROTEqIN) Survey, 2014.Note: The figure shows the percentage of firms out of the total that experienced losses and that answered the question (N = 433). The question asked was: How many times have you been victimized? The 13 countries that constitute the Caribbean average are Antigua and Barbuda, The Bahamas, Barbados, Belize, Dominica, Grenada, Guyana, Jamaica, St. Kitts and Nevis, Saint Lucia, St. Vincent and the Grenadines, Suriname, and Trinidad and Tobago.
Table 10.1: When Crimes Occurred, 13 Caribbean Countries (percent of firms)
During Working Hours Outside Working Hours
Burglary 15 85
Attempted burglary 14 86
Robbery 70 30
Attempted robbery 73 27
Deliberate damage/vandalism 32 68
Theft 51 49
Assaults and threats 49 51
Source: Prepared by the authors using data from the Productivity, Technology, and Innovation (PROTEqIN) Survey, 2014.Note: The table shows the percent of firms out of the total that experienced losses and that answered the question (N = 433). The 13 countries are Antigua and Barbuda, The Bahamas, Barbados, Belize, Dominica, Grenada, Guyana, Jamaica, St. Kitts and Nevis, Saint Lucia, St. Vincent and the Grenadines, Suriname, and Trinidad and Tobago.

169
CRIME AND THE PRIVATE SECTOR
nearly one in five cases (21 percent), the perpetrators were thought to be a criminal
group. Roughly the same amount (19 percent) was reported to be someone known to
the firm (customer, supplier, employee, or former employee).
Respondents reported a weapon being used in nearly half of the reported crimes
(46 percent) in the region (Figure 10.6). Guns were reportedly used in 16 percent of
crimes, while knives were used 13 percent of the time. The use of guns was highest in
The Bahamas, Jamaica, and Trinidad and Tobago.
Figure 10.5: Perpetrators of Crimes Reported by Businesses (percent)
0
10
20
30
40
50
60
70
80
90
100
The Bahamas Barbados Guyana Jamaica Suriname Trinidadand Tobago
Caribbeanaverage (C13)
Group of criminals Gang related Someone working alone A fellow employee
A customer A supplier A former employee Other
Source: Prepared by the authors using data from the Productivity, Technology, and Innovation (PROTEqIN) Survey, 2014.Note: The figure shows the percent of firms, out of the total, that experienced losses and that answered the question (N = 433). The 13 countries that constitute the Caribbean average are Antigua and Barbuda, The Bahamas, Barbados, Belize, Dominica, Grenada, Guyana, Jamaica, St. Kitts and Nevis, Saint Lucia, St. Vincent and the Grenadines, Suriname, and Trinidad and Tobago.
Figure 10.6: Percentage of Firms Victimized with a Weapon, by Country and Type of Weapon
0
5
10
20
15
25
The Bahamas Barbados Guyana Jamaica Suriname Trinidad andTobago
Caribbeanaverage (C13)
Knife Gun Other
Source: Prepared by the authors using data from the Productivity, Technology, and Innovation (PROTEqIN) Survey, 2014.Note: The question asked was: What weapons were used? Percentages are calculated as the number of firms victimized with each weapon, out of the total number of firms surveyed. The countries that constitute the Caribbean average are Antigua and Barbuda, The Bahamas, Barbados, Belize, Dominica, Grenada, Guyana, Jamaica, St. Kitts and Nevis, Saint Lucia, St. Vincent and the Grenadines, Suriname, and Trinidad and Tobago.

170
RESTORING PARADISE IN THE CARIBBEAN: COMBATTING VIOLENCE WITH NUMBERS
10.2.6 Security Costs and Financial LossesNearly 70 percent of firms in the region reported spending money on security, in-
cluding expenditures on equipment, insurance, personnel, or professional security
services. This compares with the world average of 55.6 percent in the World Bank’s
Enterprise Survey (latest available year for each country). The percentage of firms
paying for security in the Caribbean ranged from 85 percent in Trinidad and Tobago
to 44 percent in Saint Lucia (Figure 10.7). Most firms (63 percent) reported spending
on alarm systems, security cameras, and gates. However, the percentage of firms pay-
ing for protective windows and door measures was particularly high in Guyana (77
percent) and Suriname (63 percent). Expenditure on security guards or receptionists
was prevalent in Guyana (66 percent), Suriname (61 percent), Barbados (54 percent),
and Jamaica (56 percent). Some businesses also reported spending money on insur-
ance coverage against theft, especially in Barbados, Guyana, Jamaica, and Suriname
(Figure 10.8).
For those companies that spend on security, on average these expenses ac-
counted for 2.4 percent of annual sales.3 Countries with the highest expenditure on
security included Suriname, Guyana, and The Bahamas (5.9 percent, 5 percent, and
3.8 percent of annual sales, respectively) (Figure 10.9). Belize and Barbados reported
3 The country figures were 1 percent of total annual sales spent by firms in Barbados and Belize; 2 percent in Anti-gua and Barbuda, Dominica, Jamaica, St. Kitts and Nevis, Saint Lucia, St. Vincent and the Grenadines, and Trinidad and Tobago; 3 percent in Grenada; 4 percent in The Bahamas; 5 percent in Guyana; and 6 percent in Suriname.
Figure 10.7: Percentage of Businesses That Spent Money on Security, by Country
Bel
ize
Bar
bado
s
Jam
aica
Ant
igua
and
Bar
buda
Sai
nt L
ucia
The
Bah
amas
Trin
idad
and
Toba
go
St.
Vin
cent
and
the
Gre
nadi
nes
Dom
inic
a
Gre
nada
Sur
inam
e
St.
Kitt
s an
dN
evis
Guy
ana0
10
20
30
40
50
60
70
80
90
100
Caribbean average World average (World Bank Enterprise survey, most recent year)
Sources: Prepared by the authors using data from the World Bank Enterprise Survey, 2010; and the Productivity, Technology, and Innovation (PROTEqIN) Survey, 2013/2014.Note: The question asked was: In the last fiscal year, did this establishment spend money for security, for example, equipment, insurance, personnel, or professional security services?

171
CRIME AND THE PRIVATE SECTOR
lower than average security expen-
diture (1.4 percent and 1.5 percent
of annual sales, respectively). For
firms that experienced losses due
to theft, robbery, arson, and vandal-
ism, the percentage of annual sales
lost fluctuated between 1.3 percent
in Barbados and 5.7 percent in Suri-
name, with a regional average of 2.3
percent (Figure 10.10).4
10.2.7 What Factors Are Associated with Firm Victimization?
SizeRuprah and Sierra (2016) find that
in 2010 larger firms suffered higher
rates of crime, supporting the hy-
pothesis that larger firms (usually
Figure 10.8: Percentage of Businesses That Spent Money on Security by Country and Security Measure
Alarm system, security camera, or gates Protective window and door measures Security guard or receptionist Anti-theft devices in its products/equipment/inventory Insurance coverage against theft and/or losses
0% 10% 20% 30% 40% 50% 60% 70% 80% 90%
Antigua and Barbuda
The Bahamas
Barbados
Belize
Dominica
Grenada
Guyana
Jamaica St. Kitts and Nevis
Saint Lucia
St. Vincent andthe Grenadines
Suriname
Trinidad and Tobago
Caribbean average
Sources: Prepared by the authors using data from the using the Productivity, Technology, and Innovation (PROTEqIN) Survey, 2013/2014.
Figure 10.9: Average Security Costs If the Firm Pays for Security (percent of annual sales)
Bel
ize
Bar
bado
s
Jam
aica
Ant
igua
and
Bar
buda
Sai
nt L
ucia
The
Bah
amas
Trin
idad
and
Toba
go
St.
Vin
cent
and
the
Gre
nadi
nes
Dom
inic
a
Gre
nada
Sur
inam
e
St.
Kitt
s an
dN
evis
Guy
ana
0
1
2
3
4
5
6
7
Caribbean average World average (World Bank Enterprise Survey, most recent year)
Sources: Prepared by the authors using data from the World Bank Enterprise Survey, 2010; and the Productivity, Technology, and Innovation (PROTEqIN) Survey, 2013/2014.Note: The question asked was: What percentage of this establishment’s total annual sales was paid for security?
4 Please note that only six firms answered this question in Barbados and only three in Belize, which may alter the results.

172
RESTORING PARADISE IN THE CARIBBEAN: COMBATTING VIOLENCE WITH NUMBERS
with higher sales) could be targeted because of higher potential returns. In 2014,
larger firms were again found to be more likely to be victims of crime. The percent-
ages of firms suffering losses from crime in the Caribbean were 23 percent for small
firms, 21 percent for medium-sized firms, and 25 percent for large firms (for details by
country see Appendix 10.5).
Private SecurityHow does spending on private security affect victimization of firms? In order to an-
swer this question we present the results of an ordinary least squares regression to
assess the relationship between firm spending on private security measures in 2010
and their reporting of losses in 2014 (see full results in Appendix 10.6). The covari-
ates tested included those found to be related to annual sales growth in Ruprah and
Sierra (2016).
We find that firms that spent on private security in 2010 actually had an increased
likelihood (6.33 percentage points) of reporting losses due to crime in 2014 (low signif-
icance p < .10). This indicated that crime is a complex problem that affects businesses,
but cannot be tackled with investment in private security alone. If the private sector
truly wants to reduce crime affecting its operating environment, it should seek to
partner with government and nongovernmental organizations (NGOs) in one of many
ways described in the conclusions and policy implications that follow.
Figure 10.10: If There Were Losses, What Were the Average Losses Due to Theft and Vandalism (percent of annual sales)
Bel
ize
Bar
bado
s
Jam
aica
Ant
igua
and
Bar
buda
Sai
nt L
ucia
The
Bah
amas
Trin
idad
and
Toba
go
St.
Vin
cent
and
the
Gre
nadi
nes
Dom
inic
a
Gre
nada
Sur
inam
e
St.
Kitt
s an
dN
evis
Guy
ana
0
1
2
3
4
5
6
Caribbean average World average (World Bank Enterprise Survey, most recent year)
Sources: Prepared by the authors using data from the World Bank Enterprise Survey data, 2010, and the Productivity, Technology, and Innovation (PROTEqIN) Survey, 2013/2014.Note: The question asked was: (If the firm experienced losses), what was the amount of the losses due to theft and vandalism (percent of annual sales)?

173
CRIME AND THE PRIVATE SECTOR
10.3 Conclusions and Policy ImplicationsData from the survey show that the private sector in the Caribbean is hit considerably
by crime: both the costs as well as the losses attributed to crime and violence are
high. Even though there have been some recent investments in crime prevention in the
region, data show that the private sector relies more on and is more willing to invest
in private security than it is to participate in public programmes against crime and vi-
olence. However, there are no studies showing a connection between private security
and a reduction of crime. On the contrary, we find that expenditure on private security
in 2010 was associated with higher victimization in 2014. On the other hand, many of
the broader strategies that have been shown to reduce crime in general would also
benefit businesses and the private sector. Therefore, the private sector together with
government and civil society would be well served by turning their attention to the
following approaches:
1. Invest in an improved understanding of crime against businesses
The first step to reduce crime against businesses in the Caribbean is to invest in
understanding all relevant aspects of the phenomenon.5 Some international studies,
reports, and surveys have begun to address this gap in the literature.6 This can be
accomplished by conducting frequent specialized surveys for the private sector, such
as the one used for this chapter or the International Crime Business Survey (Box 10.1).
2. Invest in evidence-based programmes focused on potential offenders, their families,
and communities that affect businesses
Caribbean policymakers should provide individuals identified as most at risk of per-
petrating crime, along with their families, access to programmes that have been proven
to reduce involvement in criminal activity. The private sector is uniquely qualified to
partner with government to provide some of these programmes, such as mentoring, em-
ployment, and vocational training (see more about public-private partnerships below).
3. Invest in transforming the physical environment in communities to be less condu-
cive to crime
Commercial burglars and thieves are thought to prefer targets that receive little
surveillance (Crowe 1991). Situational crime prevention entails changing the landscape
and design of urban areas with the aim of making it more difficult to commit a crime.
Although few programmes have been evaluated under experimental conditions, some
of the interventions that have modest evidence of affecting crime include installing
5 Goldberg, Kim, and Ariano (2014, 27) conclude that despite the growing concern about the impact of crime and violence on businesses and the economy, studies on crime “often lack a strong private sector perspective.”6 For an overview see Capobianco (2005).

174
RESTORING PARADISE IN THE CARIBBEAN: COMBATTING VIOLENCE WITH NUMBERS
closed-circuit television (CCTV) cameras (Welsh and Farrington 2008a)7 and improv-
ing street lighting (Welsh and Farrington 2008b).8
4. Increase private sector involvement in public-private partnerships focused on in-
creasing security at the community level (government can stimulate this via local
ordinances, tax incentives, government grants, etc.)
The private sector is now emerging as one of the new contributors to community
safety. Over the last decade, interest has grown in public-private partnerships (PPPs)
to prevent crime and violence. The private sector creates employment and helps to
support social and economic progress in communities. It can also provide innovation,
resources, and skills to local communities. Many of the social prevention initiatives (i.e.,
work programmes for youth), situational prevention initiatives (changes to the physi-
cal environment of commercial areas), and smart crime controls (through partnerships
between businesses, police, and residents and by assisting with reintegration of of-
fenders) can be achieved through PPPs. Policymakers can take actions to encourage
private sector involvement in crime prevention PPPs via:
• Indirect involvement, where firms donate resources (money, space, equipment, or
services) for projects executed by the public sector, NGOs, or a group of firms.
• Direct involvement, where firms directly manage activities such as jobs or train-
ing courses, help evaluate projects, or participate in public policy and community
meetings on crime and violence prevention. The jobs and training courses are
sometimes offered to prisoners, former prisoners, and high-risk youth.
• Mixed involvement, where firms both donate resources and actively participate in
projects (ICPC, World Bank, and the Sou da Paz Institute 2011).
Private sector involvement can be encouraged by policymakers:
• At the national level: Examples include the National Platform for Crime Control
set up in 1992 to combat crime problems affecting the business sector in the
7 By aggregating the results of 41 studies, the authors found an overall effect of 1.19, meaning that CCTV was associated with a 16 percent reduction in overall crime. However, a systematic review by the IDB of the evidence from 11 studies in four developed countries found results from CCTV to be mixed and not highly encouraging (Pousadela 2014). Some important differences were noted related to where cameras were in-stalled, the ways they were monitored (real-time versus videotaping), and the speed of police response.8 The study analysed 13 improved street lighting evaluations carried out in two countries (the United States and the United Kingdom) and found that crimes increased by 27 percent in control areas compared with experimental areas, or, conversely, crimes decreased by 21 percent in experimental areas compared with control areas (a weight-ed mean of 1.27 [95 percent confidence interval 1.09–1.47, p = .0008]). Pousadela (2014) reviewed eight studies (but none at the highest methodological quality) that evaluated street lighting programmes and other situational measures such as alley-gating, target hardening, property marking, buildings constructed along the principles of defensible space, and a crime awareness project. They all yielded noticeable but modest decreases in crime.

175
CRIME AND THE PRIVATE SECTOR
Netherlands; and the Business Network on Crime Prevention created in 1999 in
Canada. Both initiatives were undertaken by the national governments. In South
Africa, Business Against Crime was established in 1996. A wide range of NGOs also
are dedicated to combatting crime and violence and have developed partnerships
with national governments and private sectors (e.g., NACRO and Crime Concern in
the United Kingdom, and the National Council for Crime Prevention in the United
States) (ICPC, World Bank, and the Sou da Paz Institute 2011).
• At the community level: Two examples of PPPs at the community level in the United
States that have completed evaluations and shown promise are Target’s Safe City
Program and Business Improvement Districts. Results of Safe City—which brings
together local police, businesses, and community leaders to address criminal activ-
ity in retail stores—were found to be linked to the level of collaboration in analysing
problems and the shared development of a response plan. Positive changes were
observed in perceptions of safety of personnel in the communities, as well as in
reductions in crime in two of the four areas studied (La Vigne, Owens, and Hetrick
2009). A Business Improvement District (BID) is a nonprofit organization created
by neighbourhood property owners or merchants to provide services, activities,
and programmes to promote local improvements and public safety. The district is a
discrete geographical area, and all property owners or merchants within that area
are charged an assessment to fund BID-determined services and activities. Crime
reductions in BIDs have been confirmed across multiple locations and in multiple
studies.9
In Latin America and the Caribbean, there is relatively little information about the
outcomes of PPPs, but promising examples include Ciudad Juarez, Mexico. In this
case, public-private sector forums and social networks have been used to promote
collaboration between businesses and the police to report crimes and transform
neighbourhoods into safe areas for businesses. In the Caribbean, although several
private sector initiatives exist (including those of the Private Sector Organization of
Jamaica, Sandals Foundation, Digicel Foundation, and the Grace Kennedy Foundation
in Jamaica), no evaluations of these initiatives have been conducted.
9 In Philadelphia, Hoyt (2005) found that property crimes and thefts were significantly lower in BID areas than in non-BID areas (5 percent reduction in BID areas compared with 2.3 percent in control areas). In Los Angeles, using a quasi-experimental design, Brooks (2008) found that, compared to control groups formed in a variety of ways, treatment areas experienced reductions in serious crime, less serious crime, and overall crime (declines of 6–10 percent). Crime reductions in BIDs were confirmed by Cook and MacDonald (2011), who also examined whether the reductions in crime and arrests were sustained or whether they quickly wore off by examining the impact on crime over time. The results suggest that the crime reduction effect may increase over time. For an overview of these studies see https://www.crimesolutions.gov.

176
RESTORING PARADISE IN THE CARIBBEAN: COMBATTING VIOLENCE WITH NUMBERS
Appendix 10.1. Percentage of Victimization by Type of Crime
The Bahamas Barbados Guyana Jamaica Suriname
Trinidad and
Tobago
Caribbean average
(C13)
Burglary 11 8 9 9 15 10 10
Attempted burglary
10 7 7 13 13 11 11
Robbery 13 9 7 14 8 9 10
Attempted robbery
13 12 5 18 6 12 13
Vandalism 17 7 4 10 13 18 14
Theft 15 12 21 18 21 14 15
Assaults and threats
6 10 3 14 5 8 8
Source: Prepared by the authors using data from the Productivity, Technology, and Innovation (PROTEqIN) Survey, 2013/2014.Note: The Caribbean average is the average of 13 countries: Antigua and Barbuda, The Bahamas, Barbados, Belize, Dominica, Grenada, Guyana, Jamaica, St. Kitts and Nevis, Saint Lucia, St. Vincent and the Grenadines, Suriname, and Trinidad and Tobago.
Appendix 10.2. Prevalence of Victimization from Internet Fraud
AnswerThe
Bahamas Barbados Guyana Jamaica Suriname
Trinidad and
Tobago
Caribbean average
(C13)
Percent of Firms
Yes 41 0 4 0 4 33 17
No 59 100 96 100 96 67 83
Number of Firms
Yes 52 0 5 0 5 111 341
No 75 123 115 242 115 229 1,625
Source: Prepared by the authors using data from the Productivity, Technology, and Innovation (PROTEqIN) Survey, 2013/2014.Note: The question asked was: In the last fiscal year, did the establishment experience any kind of Internet fraud? The Caribbean average is the average of 13 countries: Antigua and Barbuda, The Bahamas, Barbados, Belize, Dominica, Grenada, Guyana, Jamaica, St. Kitts and Nevis, Saint Lucia, St. Vincent and the Grenadines, Suriname, and Trinidad and Tobago.

177
CRIME AND THE PRIVATE SECTOR
Appendix 10.3. Prevalence of Firms Paying for Ransoms from Kidnapping
AnswerThe
Bahamas Barbados Guyana Jamaica Suriname
Trinidad and
Tobago
Caribbean average
(C13)
Percent of Firms
Yes 1.6 0.0 0.0 0.0 0.0 0.6 0.5
No 98.4 100.0 100.0 100.0 100.0 99.4 99.5
Number of Firms
Yes 2 0 0 0 0 2 9
No 125 123 120 242 120 338 1,957
Source: Prepared by the authors using data from the Productivity, Technology, and Innovation (PROTEqIN) Survey, 2013/2014.Note: The question asked was: In the last fiscal year, has any employee or a member of their household been exchanged for a ransom to be paid by this establishment? The Caribbean average is the average of 13 countries: Antigua and Barbuda, The Bahamas, Barbados, Belize, Dominica, Grenada, Guyana, Jamaica, St. Kitts and Nevis, Saint Lucia, St. Vincent and the Grenadines, Suriname, and Trinidad and Tobago.
Appendix 10.4. Frequency of Victimization
AnswerThe
Bahamas Barbados Guyana Jamaica Suriname
Trinidad and
Tobago
Caribbean average
(C13)
Percent of Firms
1 time 41 34 36 38 30 40 40
2–3 times 44 32 33 29 30 43 39
4–5 times 15 34 18 33 23 17 20
6+ times 0 0 13 0 18 0 2
Source: Prepared by the authors using data from the Productivity, Technology, and Innovation (PROTEqIN) Survey, 2013/2014.Note: The Caribbean average is the average of 13 countries: Antigua and Barbuda, The Bahamas, Barbados, Belize, Dominica, Grenada, Guyana, Jamaica, St. Kitts and Nevis, Saint Lucia, St. Vincent and the Grenadines, Suriname, and Trinidad and Tobago.
Appendix 10.5. Victimization by Size of Firm
The Bahamas Barbados Guyana Jamaica Suriname
Trinidad and
Tobago
Caribbean average
(C13)
Percent of Firms
Small 22 5 18 22 32 30 23
Medium 25 11 50 13 23 17 21
Large 20 24 67 20 46 20 25
Source: Prepared by the authors using data from the Productivity, Technology, and Innovation (PROTEqIN) Survey, 2013/2014.Note: The size of firms was defined as small (< 20 employees), medium (20–99 employees), or large (100 and over) using question 12A: Number of employees at the end of last fiscal year. The Caribbean average is the average of 13 countries: Antigua and Barbuda, The Bahamas, Barbados, Belize, Dominica, Grenada, Guyana, Jamaica, St. Kitts and Nevis, Saint Lucia, St. Vincent and the Grenadines, Suriname, and Trinidad and Tobago.

178
RESTORING PARADISE IN THE CARIBBEAN: COMBATTING VIOLENCE WITH NUMBERS
Appendix 10.6. Ordinary Least Squares Regression Results for Factors Related to Crime Losses among Caribbean Firms, 2013/2014
Losses Due to crime (dummy equal to one if the firm reported losses from crime in 2013/2014)
Paid for security in 2010: Dummy equal to one if firm reported spending on private security in 2010
0.0633*(0.0330)
New product: Dummy equal to one if firm introduced significantly improved products
0.0248(0.0344)
New process: Dummy equal to one if firm introduced a significantly improved process for producing or supplying products
0.00976(0.0725)
Labour constraint: Dummy equal to one if firm identified labour as a major problem and provided training to its employees
0.105*(0.0581)
Credit constraint: Dummy equal to one if firm application for credit was rejected
0.00767(0.0437)
Age: Firm age in years 0.00333(0.00197)
Age2: Firm age in years squared –0.0000313(0.0000200)
Foreign owned: Dummy equal to one if firm is predominately foreign owned
0.0299(0.0362)
Joint owned: Dummy equal to one if firm is owned jointly by local and foreign entities
0.0105(0.0699)
Female owned: Dummy equal to one if firm is owned by a female
0.0326(0.0209)
Female manager: Dummy equal to one if firm is managed by a female
–0.0171(0.0412)
Size: Number of employees 0.000585**(0.000172)
Size2: Number of employees squared –0.000000298*(0.000000165)
Privately held: Dummy equal to one if firm is a private limited liability company
–0.392(0.219)
Sole proprietorship: Dummy equal to one if firm is a sole proprietorship
–0.416*(0.228)
Partnerships: Dummy equal to one if firm is a partnership –0.310(0.300)
Limited partnership: Dummy equal to one if firm is a limited partnership
–0.371(0.246)
Exporter: Dummy equal to one if firm is an exporter –0.0197(0.0326)
Importer: Dummy equal to one if firm is an importer –0.0430(0.0311)
GIFT Index: share of transactions with informal payments –0.00391(0.413)
Corruption Perception Index: Dummy equal to one if firm belongs to a country with a Corruption Perception Index value less than 6. The Corruption Perception Index ranges from 1 to 10 (highly clean)
–0.0870(0.383)
(continued on next page)

179
CRIME AND THE PRIVATE SECTOR
Appendix 10.6. Ordinary Least Squares Regression Results for Factors Related to Crime Losses among Caribbean Firms, 2013/2014
Losses Due to crime (dummy equal to one if the firm reported losses from crime in 2013/2014)
Outages: Dummy equal to one if firm reported power outages
0.105*(0.0519)
Outages-generator: Interaction term, which account for firms that experienced an outages and owned or shared a generator
0.0863*(0.0408)
SectorOther manufacturing 0
(.)Food 0.0402
(0.0317)Textiles –0.119*
(0.0570)Garments –0.107
(0.0967)Chemicals –0.0272
(0.0836)Plastics and rubber –0.216**
(0.0855)Non-metallic mineral products –0.173*
(0.0813)Basic metals 0.229
(0.154)Fabricated metal products –0.223**
(0.0600)Machinery and equipment –0.0264
(0.0815)Electronics (31–32) 0.118
(0.0682)Construction –0.00380
(0.0280)Services of motor vehicles 0.135
(0.114)Wholesale –0.0547
(0.0338)Retail –0.00331
(0.0319)Hotel and restaurants –0.0656
(0.0529)Transport (60–64) 0.0271
(0.0508)Information technology 0.0397
(0.0792)Country fixed effectsNumber 1,742
Source: Prepared by the authors using data from the Productivity, Technology, and Innovation (PROTEqIN) Survey, 2013/2014.Note: Standard errors in parentheses. * p < 0.10, ** p < 0.05, *** p < 0.001.
(continued)


181
The Cost of Crime in the Caribbean: The Accounting Method
Laura Jaitman and Ivan Torre1
What exactly are the social costs of crime and how can we measure them?
These costs certainly include the direct costs as a result of crime: injury,
damage, and loss. There are also costs in anticipation of crime, such as
public and private expenditure on security. And there are costs in response to crime,
such as the cost of the criminal justice system. We should also take into account other
indirect or intangible costs such as changes in behaviour due to the fear of crime or
the costs to families of victims. Indeed, there are probably many other consequences
of crime that are costly and should be considered, including the possibility that what
people are willing to pay to reduce crime may sometimes even be much higher than
the aggregate costs of crime to society actually turn out to be. The incidence of crime,
as well as the fear of crime and violence, thus induces many distortions in the econo-
my (Jaitman 2015).
In the literature on the costs of crime, there is a distinction between “external costs”
and “social costs.” External costs are those imposed by one person on another, where
the latter person does not voluntarily accept this negative consequence. For example,
the external costs associated with a mugging include stolen property, medical costs,
lost wages, and pain and suffering endured by the victim. The victim neither asked for,
nor voluntarily accepted, compensation for enduring these losses. Moreover, society
has deemed that imposing these external costs is morally wrong and against the law,
so the aggressor will be charged with a crime and sentenced accordingly. Social costs
11
1 The authors would like to thank Heather Sutton for her help and guidance, and Rogelio Granguillhome for providing excellent research assistance.

182
RESTORING PARADISE IN THE CARIBBEAN: COMBATTING VIOLENCE WITH NUMBERS
are those that reduce the aggregate well-being of society. In this case, medical costs
and lost wages are clearly social costs because they are resources that could have
been spent elsewhere in the economy on a socially productive activity. Although pain
and suffering costs are not actual commodities or services exchanged in the market-
place, individuals are willing to pay to avoid the pain, suffering, and consequent lost
quality of life associated with being a crime victim. Thus, to the extent that society
cares about the well-being of crime victims, these costs should also be considered
social costs of victimization.
The aim of this chapter is to provide comparable estimates of the welfare costs of
crime and violence in four countries of the Caribbean using the accounting method
(of losses and expenditures). The countries included are The Bahamas, Barbados,
Jamaica, and Trinidad and Tobago.2 The focus of the study is on the costs, valued
monetarily, that crime and violence impose on society. More specifically, this analytical
perspective encompasses the costs, expenditures, losses, and investments incurred by
households, firms, and the State in relation to the phenomenon of crime. The crimes
analysed are those committed against persons and property, with a particular focus
on homicides, rapes, robberies, and assaults.
The cost studies do not aim to establish exact amounts, but rather to identify or-
ders of magnitude of crime and violence in a given country or community. The reason
for this is because, on the one hand, crime in practice is an evolving and dynamic
phenomenon, which makes the task of identifying monetary measures and their
consequences more difficult. On the other hand, it is important to note that the infor-
mation necessary to estimate the cost of crime is complex and difficult to obtain, often
leading to significant data-cleaning efforts and the use of indirect estimation methods.
To the best of our knowledge this is the first attempt to make a systematic study
of the costs of crime for a group of Caribbean countries. We hope this conservative
estimate serves as a benchmark to raise awareness about the severity of this problem
and to support future crime prevention and crime control interventions.
11.1 An Accounting Classification of Crime-Related CostsAccounting is the most commonly used strategy to estimate the welfare costs of
crime (Soares 2015). It is, in short, a straightforward application of the logic of com-
parison between the “no-crime” and “crime” scenarios. Its basic justification can be
summarized in two points: (1) there are costs incurred by and losses experienced in
2 This is a sample of the countries in the Caribbean. We did not include all the countries due to lack of the data necessary for these estimates or because the data are not public and/or were not made available to the IDB, as in the cases of Suriname and Guyana.

183
THE COST OF CRIME IN THE CARIBBEAN: THE ACCOUNTING METHOD
economies that would not be observed in the absence of crime; and (2) these repre-
sent direct welfare losses that should not occur and resources that potentially could
be used for other purposes. The specific dimensions considered in each study using
the accounting methodology vary widely. In our study, which focuses on The Baha-
mas, Barbados, Jamaica, and Trinidad and Tobago, we will classify the costs of crime in
three different categories that will provide a conservative estimate given the available
information:
• Costs incurred by the government, which include the costs of the judiciary system,
the provision of police services, and the administration of prisons.
• Costs incurred by the private sector, which include expenditure by firms and house-
holds on crime prevention, namely, spending on security services. Given the data
available for the Caribbean, we will only estimate the costs incurred by firms, not by
households. It would be important to collect information on the costs incurred by
households in household expenditure surveys and also to be able to estimate other
costs as a consequence of crime, such as medical expenditures.
• Social costs of crime, which include foregone income from homicides, from other
non-fatal crimes, and from persons in jail.
Other costs usually included in the estimates of the accounting methodology are
the value of stolen goods. It is important to point out that in this analysis we do not
include the value of stolen goods because stolen goods represent a transfer from the
legal to the illegal owner. Although there are necessarily efficiency losses involved—
the stolen good does not have the same value in the hands of the illegitimate owner
as it does in hands of the legitimate one—we do not have sufficient information to
estimate these costs. For a formal framework on the stolen goods market, see Galiani,
Jaitman, and Weinschelbaum (forthcoming).
11.1.1 Costs Incurred by the GovernmentConcerning crime-related costs incurred by the government, we collected data on
three different concepts: administration of justice, police services, and prison admin-
istration. The main source of information was official government budgets. In order to
calculate the exact amount spent, we used the executed amounts, not the approved
amounts, which are generally modified during the fiscal year.
The second step consisted of attributing a portion of this budget to our estimation
of the costs of crime. The administration of justice, for instance, includes many activ-
ities that are not in response to any crime. Costs associated with commercial, family,
labour, and other non-criminal disputes should be excluded from the welfare costs of
crime estimations. Given the available information, it is not easy to calculate the costs

184
RESTORING PARADISE IN THE CARIBBEAN: COMBATTING VIOLENCE WITH NUMBERS
associated with criminal disputes in the total budget related to the administration of
justice. Our proxy indicator consists of the percentage of cases filed in courts that cor-
respond to criminal cases. We attributed a share of 23 to 30 percent using information
from the Judicial Council of Barbados as a proxy.3 Similarly, we have to determine the
share of the police services budget to include in the costs of crime.
There are many activities carried out by the police that are not necessarily related
to criminal cases, the most important of them being traffic control. However, many
operations related to traffic control also have an impact on crime rates, either by
preventing the occurrence of crime simply by way of the police presence, or by the
capture of suspects during routine traffic stops. In this sense, it is difficult to separate
the costs associated with crime prevention and repression from other non-criminal
costs incurred by the police. Based on estimates for other countries of the region
(Jaitman and Torre 2016), we provide a lower-bound estimate of crime-related police
costs—which consists of 50 percent of the budget allocated to police services—and an
upper-bound estimate—which consists of 100 percent of that same budget.
Finally, in the case of prison administration, we include 100 percent of the budget in our
estimates. The number of non-criminal cases resulting in imprisonment is very limited and,
according to the U.S. State Department’s Country Human Rights Reports, there are no
political prisoners in any of the four countries under analysis.4 Appendix 11.1 provides a de-
tailed summary of the budget allocations we are including in our study for each country.
Figure 11.1 shows public spending on citizen security as a percentage of GDP. In the
selected countries the averages of upper-bound and lower-bound estimates range be-
tween 1.5 and 2.1 percent and include prison administration, police expenditure, and justice
expenditure. Jamaica spends between 1.42 and 2.44 percent of GDP on crime-related
costs incurred by the government. Barbados spends between 1.36 and 2 percent, Trini-
dad and Tobago between 1 and 1.6, and The Bahamas between 1.15 and 1.94 percent. It is
noteworthy that although Barbados has significantly lower crime rates, its government
expenditure on citizen security is higher than in Trinidad and Tobago and The Bahamas,
mainly due to the large share spent on prison administration.
Public spending on citizen security in the Caribbean (1.5 to 2.1 percent of GDP) was
above the average for Latin America and the Caribbean (1.14 to 1.5 percent of GDP).5
3 The 2008 Report of the Judicial Council of Barbados indicates that about 23 percent of the cases filed in the lower courts of the country that year corresponded to criminal cases. For our estimates of the cost of crime in Barbados we will thus include 23 percent of the total budget of the administration of justice. For the remaining three countries, for which we did not have access to similar information, we will consider a slightly higher figure of 30 percent of the budget, out of caution.4 For further methodological details, see Jaitman and Torre (2016).5 Average for 17 countries (Jaitman and Torre 2016): Argentina, The Bahamas, Barbados, Brazil, Chile, Co-lombia, Costa Rica, Ecuador, El Salvador, Guatemala, Honduras, Jamaica, Mexico, Paraguay, Peru, Trinidad and Tobago, and Uruguay.

185
THE COST OF CRIME IN THE CARIBBEAN: THE ACCOUNTING METHOD
Caribbean countries have some of the
lowest expenditure on administration of
justice and the highest expenditure on
police compared to the average for the
Latin America and Caribbean region.
The Bahamas, Barbados, and Jamaica,
for example, are among the countries
that spend the least on justice admin-
istration—about 0.06 percent of GDP.
Conversely, Jamaica is the country with
the highest percentage of crime-related
police expenditures at 2.04 percent of
GDP, which is in our upper-bound esti-
mates. It is followed by The Bahamas,
with police expenditure of 1.59 percent
of GDP (upper bound).
Figure 11.2 gives an idea of the
amount the government spends on
citizen security in comparison with
other important sectors such as ed-
ucation and health. Although there is
a relatively small variance in security
spending, there is a larger one in the
other two sectors analysed. In The
Bahamas, citizen security spending
is two-thirds as high as spending on
education or health. In Jamaica, pub-
lic spending on security is as high as
spending on health, but less than half
of what is spent on education, while
in Barbados and Trinidad and Tobago
the share of spending on security is
much lower than that spent on the
other sectors.
11.1.2 Costs Incurred by the Private Sector
Estimates of crime-related costs of
the private sector will be limited to
Figure 11.1: Public Spending on Citizen Security (percent of GDP)
Panel A. Lower-Bound Estimates
Per
cent
age
of G
DP
0
0.5
1.0
1.5
2.0
2.5
3.0
Jamaica(2014)
Barbados(2014)
The Bahamas(2013)
Trinidadand Tobago
(2013)
Justice Police (lower bound) Prisons
Panel B. Upper-Bound Estimates
Per
cent
age
of G
DP
0
0.5
1.0
1.5
2.0
2.5
3.0
Barbados(2014)
The Bahamas(2013)
Justice Police (upper bound) Prisons
Jamaica(2014)
Trinidadand Tobago
(2013)
Source: Authors’ estimates based on official budget data.
Figure 11.2: Public Spending on Security and Other Sectors (percent of GDP)
Per
cent
age
of G
DP
0
2.0
1.0
3.0
4.0
5.0
6.0
7.0
Barbados(2014)
The Bahamas(2013)
Security (upper bound) Education Health
Jamaica(2014)
Trinidadand Tobago
(2013)
Source: Authors’ estimates based on official budget data, WHO, and UNESCO.

186
RESTORING PARADISE IN THE CARIBBEAN: COMBATTING VIOLENCE WITH NUMBERS
crime prevention costs. In particular, we will only be able to estimate the cost for firms,
since there is no household data on crime-related expenditures in the Caribbean. Loss-
es resulting from crime activities are not taken into account for two reasons. First, as
mentioned earlier, we are not including the value of stolen goods in our analysis be-
cause these goods are not actually destroyed but merely transferred to other agents.
Second, we have no satisfactory way of estimating the efficiency costs for private firms
of robberies and other crimes. Doing so would require precise information on each
firm’s activities, which exceeds the scope of this work. The main source of information
on crime prevention costs incurred by private firms is the Business Environment and
Enterprise Performance Survey (BEEPS) carried out by the World Bank in 2010 across
many countries worldwide, including several in the Caribbean. In particular, the survey
asks firms how much money they spend on security costs, expressed as a percentage
of their annual sales. This percentage, estimated at the firm level, can be aggregated
to the sector level by using gross output as a proxy for sales and will be our measure
of crime prevention costs incurred by the private sector.
The BEEPS is intended to provide representative figures for the whole private sector
of every country. However, not all economic sectors are included in the survey sample:
agriculture, mining, utilities, and financial services are excluded. Taking this into ac-
count, we will present two estimates of the crime prevention costs of the private sector.
The first, understood as a lower bound, will only estimate those costs for the economic
sectors included in the BEEPS. The second, understood as an upper bound, will extrap-
olate those figures to the whole private economy, including those sectors not surveyed
in the BEEPS (Figure 11.3). In both cases we will take into account the size of the formal
economy. BEEPS numbers are not representative of the informal sector and we are
thus not able to estimate figures for
informal firms. In our analysis we use
the percentage of GDP correspond-
ing to formal activities as estimated
by Vuletin (2008). More details on our
estimates are presented in Jaitman
and Torre (2016).
In order to complement the infor-
mation we obtained from the BEEPS
on security costs, we also collected
data on the size of the private security
sector in each country. This figure will
also allow us to check for the accu-
racy of our BEEPS-based estimates,
since expenditures on private security
Figure 11.3: Private Spending on Security (percent of GDP)
Per
cent
age
of G
DP
0
1.00.80.60.40.2
1.21.41.61.82.0
Barbados(2014)
The Bahamas(2013)
Private cost of crime(lower bound)
Private cost of crime(upper bound)
Jamaica(2014)
Trinidadand Tobago
(2013)
Source: Authors’ estimates based on the World Bank’s Business Environment and Enterprise Performance Survey and national accounts data.

187
THE COST OF CRIME IN THE CARIBBEAN: THE ACCOUNTING METHOD
are included in the amount firms reported spending on security. The main data sources
for the size of the private security sector are the national census (for the number of
employed persons) and annual labour force surveys (for the wages of people employed
in that sector). Appendix 11.3 details the exact method of calculation for each coun-
try. Data limitations prevent us from providing estimates for Trinidad and Tobago. We
report two estimates for the size of the private security sector. The first is the annual
wage bill of people employed as security guards, and the second is the annual wage
bill of those reporting to work in private security companies. The difference between
these two figures comes from the fact that many security guards are not employed by
a private security company, but by the company for which they provide their security
services. For reasons of simplicity we are not taking into account in these estimates the
provision of unmanned security services such as remote monitoring of alarm systems.
11.1.3 Social Costs of CrimeIn this chapter the social costs of crime refer to a variety of costs that affect the overall
economy as a consequence of crime. The most important of these are victimization
costs, which are interpreted as the income foregone by individuals affected by crime. An-
other set of social costs corresponds to the income foregone by imprisoned individuals.
The estimate of income foregone as a result of victimization uses the human capital
methodology and health burden studies. By way of the information provided by these
studies, it is possible to identify the years of healthy life lost (DALYs) due to premature
death or to becoming disabled from the set of causes that affect health and that have
been identified by the World Health Organization (World Bank 1993). The estimates of
DALYs already include a social discount rate, which is necessary in order to calculate the
present value of future losses. This is useful to calculate the foregone income of crime
victims. Dolan et al. (2005) estimate the DALYs for a series of crime events that include
murder, rape, robbery, and assault, which are the four types of crimes we will take into
account in our analysis. In order to produce a monetary value for these estimates, we
value a healthy year of life as the average annual income of a person with the same age
and gender as the victim. For the case of non-fatal events like rape, robbery, and assault,
this is straightforward. For the case of homicide victims, given the life cycle of income,
this calculation may over-estimate the income foregone by older victims (whose annual
income at the moment of their premature death is probably higher than what they
would have earned in the following years), and may under-estimate the income fore-
gone by younger victims (whose annual income at the moment of their premature death
is probably lower than what they would have earned in the following years).6
6 For more details on the calculations see Jaitman and Torre (2016).

188
RESTORING PARADISE IN THE CARIBBEAN: COMBATTING VIOLENCE WITH NUMBERS
We combine three different sources
for the estimate of foregone income
due to victimization (Figure 11.4).
The first set of sources consists of
the victimization figures reported by
the Caribbean Crime Victimization
Survey (CCVS), which reports victim-
ization rates by age and gender for a
series of crimes that include robbery
and assault, two of the four crimes
we analyse. For the case of homicide
and rapes we use official administra-
tive data, which represent our second
source of data. Lastly, in order to give a
monetary value to DALYs due to these
four crimes, we estimate the annual income by age and gender using the labour force
surveys of the four countries under analysis.
Annual income foregone by imprisoned individuals, the other set of social costs we
analyse in this study, is estimated in a similar manner (Figure 11.5). We assign to every
prisoner the average annual income of a person of the same age and gender that is
estimated from the labour force surveys of each country. We take into account the
entire prison population of the four countries analysed, since, according to the U.S.
Department of State’s Country Human Rights Reports, there are no political prisoners
in any of them (these prisoners would have had to be excluded from our analysis be-
cause their imprisonment is not crime-related).
11.2 Cost EstimatesThe main estimates of crime-related
costs are presented in Table 11.1. Over-
all, crime-related costs seem to hover
around 3 percentage points of GDP
for the whole region. The country
that emerges as having the highest
amount of crime-related costs is The
Bahamas, where our lower-bound es-
timate for 2013 indicates that those
costs represent about 3.09 percent of
the country’s GDP. The upper-bound
Figure 11.4: Social Costs of Crime as a Percentage of GDP
Per
cent
age
of G
DP
0
0.4
0.2
0.1
0.3
0.5
0.6
Barbados(2014)
The Bahamas(2013)
Homicides Other crimes
Jamaica(2014)
Trinidadand Tobago
(2013)
Source: Authors’ estimates based on the Caribbean Crime Victimization Survey, official police data, and labour force surveys. See Appendix 11.4.
Figure 11.5: Foregone Annual Income of Those Imprisoned (percent of GDP)
Per
cent
age
of G
DP
0
0.2
0.1
0.3
0.4
Barbados(2014)
The Bahamas(2013)
Jamaica(2014)
Trinidadand Tobago
(2013)
Source: Authors’ estimates based on official data and labour force surveys. See Appendix 11.4.

189
THE COST OF CRIME IN THE CARIBBEAN: THE ACCOUNTING METHOD
estimate is 4.8 percent. In fact, The Bahamas has the third-highest cost among 17
countries where the same methodology was applied (Jaitman and Torre 2016), com-
ing just under Honduras (4.8 percent lower/6.5 percent upper) and El Salvador (4.9
percent upper/6.2 percent lower). The lowest figures are reported for Barbados, where
our lower-bound estimate for 2014 shows that crime-related costs amount to 1.84 per-
cent of GDP, while our upper estimate amounts to 2.7 percent, almost 2 percentage
points lower than The Bahamas’ upper estimate. Jamaica and Trinidad and Tobago fall
in between.
Figure 11.6 also presents the results of our estimates expressed as a percentage of
GDP for each country broken down by government, private, and social costs. It can
be seen that between the three categories of crime-related costs, costs incurred by
the government are the highest in every country, ranging between 1.5 and 2 percent
of GDP. Only the upper estimate of the costs incurred by the private sector in The
Bahamas exceeds the costs incurred by the government. In fact, private costs are the
Table 11.1: Crime-Related Costs (millions of U.S. dollars)
CostsThe Bahamas
(2013)Barbados
(2014)Jamaica(2014)
Trinidad and Tobago(2013)
Costs incurred by the government
Lower bound 98.80 59.27 197.31 285.44
Upper bound 167.15 87.03 339.44 461.28
Costs incurred by the private sector
Lower bound 84.39 7.21 88.07 228.44
Upper bound 161.36 16.45 142.05 398.81
Social costs
Homicides 41.02 3.93 49.56 64.35
Other crimes 8.82 1.06 11.18 6.36
Imprisoned 30.27 9.62 12.55 33.81
Total 80.11 14.61 73.30 104.52
Total (lower bound) 268.31 81.09 358.78 618.66
Percent of GDP 3.09% 1.84% 2.58% 2.26%
Total (upper bound) 408.62 118.09 554.79 964.99
Percent of GDP 4.79% 2.68% 3.99% 3.52%
Private security wage bill
Occupation-based 94.95 35.50 79.18
Activity-based 46.15 14.50 61.79
Source: Authors’ estimates based on the Caribbean Crime Victimization Survey, the World Bank’s Business Environment and Enterprise Performance Survey, official data, and labour force surveys.Note: Other crimes include rapes, robberies, and assaults.

190
RESTORING PARADISE IN THE CARIBBEAN: COMBATTING VIOLENCE WITH NUMBERS
highest in that country, and lowest in
Barbados.
Note that Table 11.1 also provides
our estimates of the size of private
sector security. In The Bahamas and
Jamaica, that figure is within the es-
timated costs incurred by the private
sector and represents about 60 per-
cent of those costs. In Barbados, the
private security wage bill exceeds the
estimated private costs. This may be
an indication that our calculations for
private costs in that country actu-
ally under-estimate the real amount.
In any case, costs incurred by the
private sector have the greatest vari-
ation across countries, moving from
as low as 0.2 percent for Barbados to
1.9 percent in The Bahamas. The esti-
mates for Jamaica vary between 0.6
and 1 percent of GDP, while those for Trinidad and Tobago are slightly higher at be-
tween 0.8 and 1.5 percent of GDP.
Social costs also show considerable variation across countries, although they
are below costs incurred by the private sector in all countries except Barbados.
Social costs are the highest in The Bahamas, where they represent almost 0.9
percent of GDP, and lowest in Barbados and Trinidad and Tobago, where they fall
between 0.3 and 0.4 percent of GDP. Social costs of crime in Jamaica are about
0.5 percent of GDP.
Concerning our social cost estimates, homicides are by far the largest contribu-
tors to social costs in all countries except Barbados. Income foregone because of
homicides represents almost 0.5 percent of GDP in The Bahamas. The second most
important item among social costs is the foregone income of the imprisoned pop-
ulation. Again, the value is highest in The Bahamas at about 0.35 percent of GDP.
Barbados has the second-highest value: slightly more than 0.2 percent of GDP is lost
there every year due to the income foregone by prison inmates. Trinidad and Tobago
and Jamaica have values that are close to 0.1 percent of GDP. The income foregone for
the rest of the crimes taken into account in our analysis is very low, except for the case
of robberies in Jamaica, where it represents about 0.05 percent of GDP.
Figure 11.6: Crime-Related Costs as a Percentage of GDP Broken Down by Government, Private, and Social Costs
Per
cent
age
of G
DP
0
4.5
3.02.52.01.51.00.5
4.03.5
5.0
Barbados(2014)
The Bahamas(2013)
Government costs (lower bound)
Jamaica(2014)
Trinidadand Tobago
(2013)
Government costs (upper bound)Private costs (lower bound)Private costs (upper bound)Social costsTotal costs (mean; black bars are upper and lower bounds)
Source: Authors’ estimates based on the Caribbean Crime Victimization Survey, the World Bank’s Business Environment and Enterprise Performance Survey, official data, and labour force surveys.

191
THE COST OF CRIME IN THE CARIBBEAN: THE ACCOUNTING METHOD
11.3 Conclusions and Policy ImplicationsThis chapter has provided the first estimates of the cost of crime in the Caribbean
in a systematic way that allows for comparisons between countries. By using an ac-
counting method, we have estimated that the welfare costs of crime and violence
are around 3 percent of GDP of the region, with Barbados being the country least
affected and The Bahamas the most. This is a conservative estimate, as it does not in-
clude other direct and indirect costs such as violence prevention programmes, health
expenses due to violence, or the impact of crime on other outcomes like property
prices. Costs incurred by the government appear to be the largest component of the
overall cost of crime, representing between 1.5 and 2 percent of GDP. This contrasts
with our estimates for private and social costs, which show a great deal of variation
across countries. The fact that private costs partly mimic the behaviour of social costs,
though at different magnitudes, suggests that private agents may react more quickly
to changes in the crime environment, or that the private sector is crowding out public
investments to prevent crime. This suggests that there is space for more cost-effective
policies led by the government.
To put the 3 percent in context, it is slightly lower than the average welfare costs of
crime for Latin America. This is a considerable amount, as it is comparable to what the
region spends annually on infrastructure and is roughly equal to the income share of
the poorest 30 percent in the region.
Moreover, in institutional terms, the need to improve the production, develop-
ment, and quality of official indicators to estimate the costs of crime points to the
importance of building the capacity of the State and civil society. This would provide
sustainability to, for example, crime observatories and other collective efforts in terms
of the transfer of knowledge as well as monitoring, communications and cooperation,
and promotion and transformation of public policies at the local and regional levels.
These efforts help to identify priority areas for intervention and, importantly, to accu-
mulate lessons and experiences on how to reduce crime and its negative effects on
the citizenry.

192
RESTORING PARADISE IN THE CARIBBEAN: COMBATTING VIOLENCE WITH NUMBERS
Appendix 11.1. Costs Incurred by the Government—Budget DetailThis appendix describes the budget allocations we included in estimating the three
concepts of costs incurred by the government: administration of justice, provision of
police services, and prison administration. The names of government agencies indicat-
ed correspond to the allocations as stated in each country’s budget.
The BahamasAdministration of Justice: Recurring and capital expenditures of the Judicial Depart-
ment, Court of Appeal, and Magistrates Court.
Police Services: Recurring and capital expenditures of the Ministry of National Security
and the Royal Bahamas Police Force.
Prison Administration: Recurring and capital expenditures of the Prisons Department,
the Simpson Penn Centre for Boys, and the Willamae Pratt Centre for Girls.
BarbadosAdministration of Justice: Budget for the Judiciary, Public Prosecution, and Admin-
istration of Justice, and Treasury allocations to Judges, Public Prosecution, Forensic
Services, Supreme Court, and Magistrates Court.
Police Services: Budget for Police Services, and Treasury allocations to Police Head-
quarters and Management and General Police Services.
Prison Administration: Budget for Corrective and Rehabilitative Services and Treasury
allocations to the Prisons Department, Probation Department, and Industrial Schools.
JamaicaAdministration of Justice: Recurrent and capital expenditures of the Court of Appeal,
Director of Public Prosecution, Resident Magistrates’ Court, Supreme Court, Attorney
General, and Court Management Services.
Police Services: Recurrent and capital expenditures for Police Services.
Prison Administration: Recurrent and capital expenditures of the Department of Cor-
rectional Services.
Trinidad and TobagoAdministration of Justice: Budget of the Judiciary and the part of the budget of the
Ministry of Justice not allocated to the Prison Service.
Police Services: Budget of the Trinidad and Tobago Police Service.
Prison Administration: Budget of the Prison Service.

193
THE COST OF CRIME IN THE CARIBBEAN: THE ACCOUNTING METHOD
Appendix 11.2. Crime-Related Costs of the Private SectorTo estimate the crime-related costs of the private sector, our main source was the
2010 round of the Business Environment and Enterprise Performance Survey (BEEPS)
carried out by the World Bank.
Gross output by sector was obtained in the following manner for each country:
The BahamasThe Department of Statistics of The Bahamas’ annual National Accounts report pro-
vides the figures for the gross output by sector.
BarbadosCaribbean Community statistics provide the gross value added by sector for Bar-
bados. Gross output was obtained by applying the inverse productivity ratio (gross
output/gross value added) at the sector level for the average of The Bahamas (aver-
age 2010–2014) and for Jamaica (2007).
JamaicaThe gross output by sector for 2014 was obtained by applying the inverse productivity
ratio (gross output/gross value added) at the sector level that was presented in the
2007 National Accounts report to the gross value-added figures reported by sector
for 2014.
Trinidad and TobagoCaribbean Community statistics provide the gross value added by sector for Trinidad
and Tobago. Gross output was obtained by applying the inverse productivity ratio
(gross output/gross value added) at the sector level for the average of The Bahamas
(average 2010–2014) and for Jamaica (2007).

194
RESTORING PARADISE IN THE CARIBBEAN: COMBATTING VIOLENCE WITH NUMBERS
Appendix 11.3. Size of the Private Security SectorThe BahamasThe annual labour force survey reports the occupation and the employer’s main ac-
tivity of all surveyed individuals. The survey, however, is not intended to provide a
representative sample of individuals working in each occupation or in each industry;
thus, all figures at the occupation or activity level have a very high level of disper-
sion. To compensate for this fact, we estimate averages across the three labour force
surveys that took place during 2010–2014. In particular, for each labour force survey
we use the survey-provided weights to estimate the number of people employed in
occupation 5414 or employed in firms whose main activity is 8010, and we use those
same weights to estimate the average wage for those same groups of people. We then
report the averages across 2010–2014 after adjusting for inflation. The annual wage bill
is simply the product of the number of people employed and their annual wage.
BarbadosThe 2010 population census provides the occupation and the employer’s main ac-
tivity for all the employed population of Barbados. The number of people employed
in occupation 5414 and in sector 8010 are obtained from this source. Since this is a
census-based number, we prefer to stick to it rather than using the more volatile es-
timates coming from the labour force survey. The annual wage of those employed in
occupation 5414 is obtained as the average across 2010–2013 of that figure from the
labour force survey, after adjusting for inflation. As in the case of The Bahamas, the av-
erage across the whole time period is used because of the high dispersion of data. The
annual wage of people employed in sector 8010 is obtained from the 2010 population
census. The labour force survey doesn’t allow us to identify those employed in sector
8010. We adjust the 2010 census value to prices in 2013. The annual wage bill is simply
the product of the number of people employed and their annual wage.
JamaicaThe 2011 population census provides the occupation and the employer’s main activ-
ity for all the employed population of Jamaica. The number of people employed in
occupation 5414 and in sector 80107 are obtained from this source. Since this is a
census-based number, we prefer to stick to it rather than using the more volatile es-
timates coming from the labour force survey. The annual wage of those employed in
occupation 5414 and in sector 8010 is obtained as the average across 2010–2014 of
that figure from the labour force survey, after adjusting for inflation. The annual wage
bill is simply the product of the number of people employed and their annual wage.
7 The 2011 Census uses ISIC rev. 3. In this case private security activities correspond to code 7492.

195
THE COST OF CRIME IN THE CARIBBEAN: THE ACCOUNTING METHOD
Appendix 11.4. Social Costs of CrimeThe BahamasGiven the availability of data, the year of our estimates is 2013. For homicides, rapes,
and robberies, we use gender and age characteristics of the victims provided by the
Royal Bahamas Police Force. These data are only available for 2013. For assaults we
use data on the prevalence rate by age and gender estimated by the Caribbean Crime
Victimization Survey (CCVS) for 2014, since there are no official data for 2013. The age
and gender characteristics of the imprisoned population were obtained from a study
by Minnis et al. (2011) that surveyed the age and profile of inmates at the Fox Hill pris-
on in Nassau in 2010. The age-gender profile was extrapolated to the total number of
prisoners in 2013 that was reported in the U.S. Department of State Bahamas Human
Rights Report of that year. The annual income for all age and gender groups was ob-
tained from the 2013 labour force survey.
BarbadosGiven the availability of data, the year of our estimates is 2014. For homicides, we
use gender and age characteristics of the victims provided by the Royal Barbados
Police Force. For rapes, we only had access to the total number of rapes committed
in the country. We applied the age-gender profile of rape victims in The Bahamas to
this number. For robbery and assaults we use data on the prevalence rate by age and
gender estimated by the CCVS. The prevalence rates were converted into absolute
numbers by applying them to the actual population estimates by age and gender pub-
lished by the Barbados Statistical Service. The age and gender characteristics of the
imprisoned population were obtained from the Annual Report of the Barbados Prison
Service. The annual income for all age and gender groups was obtained from the 2014
labour force survey.
JamaicaGiven the availability of data, the year of our estimates is 2014. For homicides and
rapes, we use gender and age characteristics of the victims provided by the Jamai-
ca Constabulary Force. For robbery and assaults, we use data on the prevalence
rate by age and gender estimated by the CCVS. The prevalence rates were con-
verted into absolute numbers by applying them to the actual population estimates
by age and gender published by the Statistical Institute of Jamaica. The age and
gender characteristics of the imprisoned population were obtained from a study
on education and crime commissioned in 2012 by the Jamaica Constabulary Force.
The age and gender profile was applied to the prisoner figure reported in 2014. The
annual income for all age and gender groups was obtained from the 2014 labour
force survey.
196
RESTORING PARADISE IN THE CARIBBEAN: COMBATTING VIOLENCE WITH NUMBERS
Trinidad and TobagoGiven the availability of data, the year of our estimates is 2013. For homicides, we use
gender and age characteristics from precise microdata provided by the Trinidad and
Tobago Police Service. The dataset is comprised of the period 2001–2013, but for the
purpose of our study we only use the 2013 data. For rapes, only the total number of
offences is reported. We applied the age-gender profile of rape victims in Jamaica to
this number. For robbery and assaults, we use data on the prevalence rate by age and
gender estimated by the CCVS. The prevalence rates were converted into absolute
numbers by applying them to the actual population estimates by age and gender
published by the Trinidad and Tobago Central Statistical Office. Since the CCVS was
carried out in 2014, in order to estimate the values of 2013 we took several steps.
First we estimated the degree of under-reporting of official figures for robberies and
assaults in 2014 with respect to the CCVS. We then estimated the actual number of
robberies and assaults in 2013 by augmenting the official values of 2013 with the in-
verse of the under-reporting ratio of 2014. The age and gender characteristics of the
imprisoned population were obtained from the Locking-Up Report of the Prison Ser-
vice as reported in 2014. The age and gender profile was applied to the prisoner figure
reported in 2013. The annual income for all age and gender groups was obtained from
the 2013 Continuous Sample Survey of Population.

197
The Effects of Crime on Economic Growth, Tourism, Fear, Emigration, and Life Satisfaction
Heather Sutton, Inder Ruprah, and Camilo Pecha
The first chapter in this section addressed the costs of crime to businesses, and
the next one used the accounting method to consolidate the various costs of
crime into a single monetary figure for each country. A single number is indeed
useful for summarizing the myriad costs involved. It provides a comparison point to
other countries, and it communicates the magnitude of the crime problem to those
accustomed to thinking in monetary terms. On the other hand, no single measure can
capture all imaginable costs, and sometimes it is useful to examine specific costs of
crime to certain sectors (i.e., tourism) or indirect costs that may not be easily captured
by other methods.
This chapter drills down to understand and identify some specific costs of crime,
including lower economic growth, lower tourism arrivals, fear and insecurity, higher in-
tentions to emigrate, and lower life satisfaction. We begin with a review of the literature
on these topics and then explore these costs through a variety of methods. We find that
in the Caribbean, crime, and particularly violent crime, has pervasively negative costs
to society. Conclusions and policy implications are explored at the end of the chapter.
12.1 Background and LiteratureWhile a number of methodologies can be employed to assess the cost of crime,1 us-
ing panel regressions to estimate the effects of crime on growth provides a summary
1 For an overview see Jaitman (2015).
12

198
RESTORING PARADISE IN THE CARIBBEAN: COMBATTING VIOLENCE WITH NUMBERS
measure of effects through many channels.2 This method was used by the UNODC
and World Bank (2007) to analyse the impact of homicide rates on GDP growth in
Jamaica, Guyana, Haiti, and the Dominican Republic from 1975 to 2000. Employing a
similar method, we simulate the effect of decreasing the homicide rate in the region.
Tourism is of particular concern because of the key role it plays in many Caribbean
economies. The few studies that examine the relationship between crime and tourism
in the region find that it mainly involves property crime that tends to be directed at
tourists (De Albuquerque and McElroy 1999). While the odds of being victimized as a
tourist in the Caribbean are low (especially for violent crime), perceptions of crime—
driven by media coverage in the sending country rather than actual dangers—do
affect tourism (King 2003). Alleyne and Boxill (2003) found that crime has discour-
aged tourism to Jamaica, particularly from European countries. They posit that the
negative effect of crime has been mitigated by an increased number of all-inclusive
hotels where tourists never need to venture into the streets. However, these hotels do
not foster significant backward linkages to the rest of the local economy.
Other societal costs are related not just to the direct experience of victimization,
but to the general fear related to high crime levels. The discrepancy between actual
risk of victimization and people’s feelings of insecurity has brought increased atten-
tion to the topic of fear of crime. Fear of crime affects far more individuals than crime
itself, and there are good reasons for treating the two as separate problems. While fear
of crime is related to actual crime, the connection is less direct than might be assumed
(Van Dijk, Van Kesteren, and Smit 2008; Van Kesteren, Mayhew, and Nieuwbeerta
2000; Van Kesteren, Van Dijk, and Mayhew 2013). In many cities where crime levels
have fallen, fear of crime has not. The most fearful individuals are not necessarily those
who have suffered the most or are most at risk. Similarly, the most fearful communities
are not necessarily the ones with the most crime.
Nonetheless, fear of crime has come to be seen as a problem in its own right be-
cause of the way it can constrain people’s lives, restrict their use of public space, and
sometimes in the process make those places more dangerous. An immense body of in-
ternational literature finds that fear of crime disrupts neighbourhood cohesion (Nasar
1993), fractures the sense of community and neighbourhood (Box, Hale, and Andrews
1988; Ross and Mirowsky 2000), creates interpersonal distrust (Garofalo 1981), breaks
down social relations and attachment (Spelman 2004), leads to social isolation (Doek-
sen 1997; Ross and Mirowsky 2000), and adds to an erosion of social control and social
order (Ross and Mirowsky 2000). When individuals adopt protective or avoidance
2 Causality can run in both directions: violence affects growth, but growth—by influencing opportunities for gainful employment—also affects violence. Here, we focus on the causal arrow running from violence to growth.

199
THE EFFECTS OF CRIME ON ECONOMIC GROWTH, TOURISM, FEAR, EMIGRATION, AND LIFE SATISFACTION
behaviours, it can lead to a lower quality of life, mistrust, loss of neighbourhood co-
hesion, neighbourhood decay, and possibly (although contested by some scholars)
increased levels of actual crime (Jacobs 1961; Millie and Herrington 2005; Painter 1996;
Samuels and Judd 2002).
Finally, another cost of crime and violence is the effect it has on the victims’ qual-
ity of life and intentions to leave their current residence. Research has consistently
found that crime and feelings of insecurity have negative consequences for personal
well-being. Some authors have tested this effect in Latin America, and to a limited
extent in the Caribbean, using data from the Latin American Public Opinion Project
(LAPOP) Survey (Maldonado and Rodríguez 2014; UNODC and World Bank 2007).
The connection between crime and emigration from Central America has also received
a great deal of attention.3 Using the more precise victimization data collected via the
IDB Caribbean Crime Victimization Survey (CCVS) module attached to the 2014/2015
LAPOP Survey, we examine the effect of victimization on both life satisfaction and
intentions to emigrate in five Caribbean capital city metropolitan areas: Bridgetown,
Barbados; Kingston, Jamaica; New Providence, The Bahamas; Paramaribo, Suriname;
and Port of Spain, Trinidad and Tobago.
12.2 Facts and Figures12.2.1 Impact of Violent Crime on Economic GrowthBy employing panel regressions to estimate the effects of crime on growth, we can
simulate the effect of decreasing the homicide rate in the region to match the world
average for the period 1995–2011.4 The results show that GDP growth for the region
would have been 1.14 percent higher annually (moving from 3.105 to 3.140 percentage
points each year within the period). This can be compared to the rest of the small
economies (ROSE) of the world, which would have had an overall change of 0.09 per-
cent annually over the same period.5
3 See Hiskey, Malone, and Orcé (2014) on violence and migration in Central America. See Azpuru (2014) on factors related to the migration of unaccompanied minors out of Central America.4 For a methodological note see Appendix 12.1. The period 1995–2011 was the period of most data for homi-cide rates worldwide (UNODC).5 These sets of countries are formed as follows: • Caribbean: Antigua and Barbuda, The Bahamas, Barbados, Dominica, Grenada, Guyana, Jamaica, St. Kitts
and Nevis, Saint Lucia, St. Vincent and the Grenadines, Suriname, and Trinidad and Tobago.• ROSE: Belize, Bhutan, Botswana, Cabo Verde, Comoros, Djibouti, Equatorial Guinea, Fiji, Gabon, The
Gambia, Guinea-Bissau, Iceland, Kiribati, Lesotho, Luxembourg, Maldives, Mauritius, Montenegro, Namibia, Qatar, Samoa, São Tomé and Príncipe, Seychelles, Solomon Islands, Swaziland, Timor-Leste, Tonga, Tuvalu, and Vanuatu.

200
RESTORING PARADISE IN THE CARIBBEAN: COMBATTING VIOLENCE WITH NUMBERS
Figure 12.1 shows the potential boost in annual economic growth by country if ho-
micides were reduced to the global average. The country that would have the largest
benefit from the reduction in homicides is Dominica (5.3 percent increase in annual
GDP growth). GDP growth in Trinidad and Tobago could have been 2.1 percent higher
per year (3.88 instead of 3.8 percentage points). Because the estimated effects are
on annual growth, they are cumulative and could have a substantial impact over time.
12.2.2 Impact of Violent Crime on TourismUsing a similar model as described previously under economic growth (see Appen-
dix 12.2), we found that an increase in one homicide per 100,000 is correlated with a
reduction of 3.26 percentage points in the growth in tourism arrivals.6 In other words,
if the homicide rate were reduced to the global average, this would imply an increase
of 2.14 percent in annual tourism arrival growth from 3.42 to 5.54 percentage points.
Figure 12.2 shows that, again, Dominica would have the most to gain from reducing
homicide rates. Trinidad and Tobago would also have high gains (moving from 5.3 to
5.54 percentage points).
12.2.3 Fear and InsecurityAnother cost of crime that is difficult to measure in monetary terms is the fear and inse-
curity associated with crime. On average, one in five (21 percent) Caribbean respondents
Figure 12.1: Potential Increase in Annual Economic Growth Rate for Caribbean Countries from Reducing the Homicide Rate to the Global Average, 1995–2011
0
1
2
3
Per
cent
cha
nge
in a
nnua
l GD
P g
row
th
4
5
6
0.2 0.4 0.4
0.7 0.7
1.6 1.6 2.1 2.1
5.3
Caribbean regionChange in annual GDP growth (1995–2011) ROSE
Barbados Antigua andBarbuda
Guyana St. Vincentand
the Grenadines
TheBahamas
Saint Lucia Jamaica St. Kittsand Nevis
Trinidadand Tobago
Dominica
Source: Authors’ analysis of World Bank World Development Indicators data on GDP and United Nations Office on Drugs and Crime data on homicide rates for 1995–2011.Note: ROSE: rest of the small economies of the world.
6 See Appendix 12.1 for methodological note.
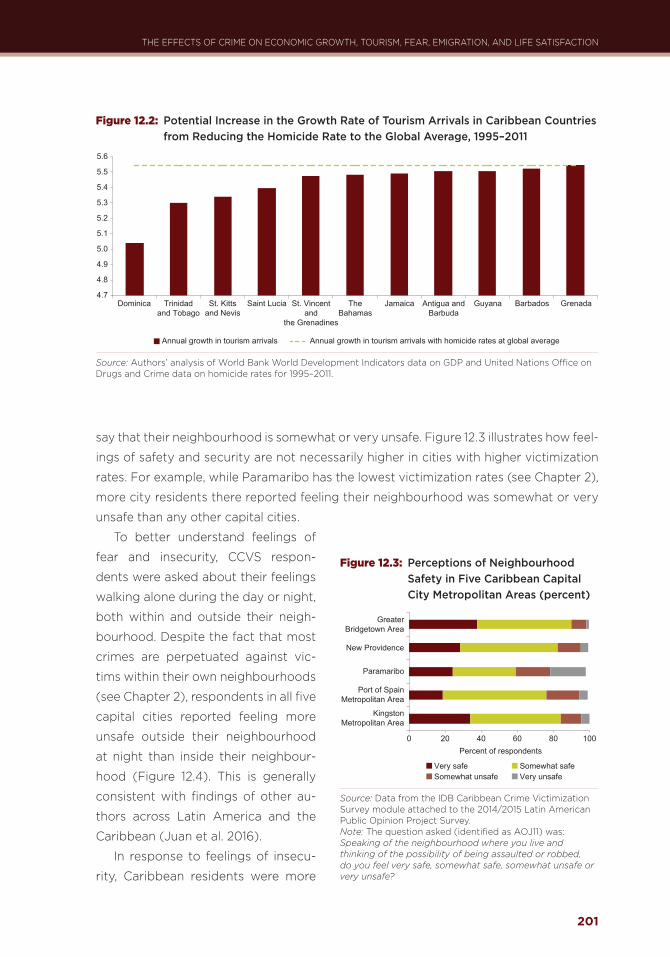
201
THE EFFECTS OF CRIME ON ECONOMIC GROWTH, TOURISM, FEAR, EMIGRATION, AND LIFE SATISFACTION
say that their neighbourhood is somewhat or very unsafe. Figure 12.3 illustrates how feel-
ings of safety and security are not necessarily higher in cities with higher victimization
rates. For example, while Paramaribo has the lowest victimization rates (see Chapter 2),
more city residents there reported feeling their neighbourhood was somewhat or very
unsafe than any other capital cities.
To better understand feelings of
fear and insecurity, CCVS respon-
dents were asked about their feelings
walking alone during the day or night,
both within and outside their neigh-
bourhood. Despite the fact that most
crimes are perpetuated against vic-
tims within their own neighbourhoods
(see Chapter 2), respondents in all five
capital cities reported feeling more
unsafe outside their neighbourhood
at night than inside their neighbour-
hood (Figure 12.4). This is generally
consistent with findings of other au-
thors across Latin America and the
Caribbean (Juan et al. 2016).
In response to feelings of insecu-
rity, Caribbean residents were more
Figure 12.2: Potential Increase in the Growth Rate of Tourism Arrivals in Caribbean Countries from Reducing the Homicide Rate to the Global Average, 1995–2011
4.7
4.8
4.9
5.0
5.1
5.2
5.3
5.4
5.5
5.6
Annual growth in tourism arrivals Annual growth in tourism arrivals with homicide rates at global average
BarbadosAntigua andBarbuda
GuyanaSt. Vincentand
the Grenadines
TheBahamas
Saint Lucia JamaicaSt. Kittsand Nevis
Trinidadand Tobago
GrenadaDominica
Source: Authors’ analysis of World Bank World Development Indicators data on GDP and United Nations Office on Drugs and Crime data on homicide rates for 1995–2011.
Figure 12.3: Perceptions of Neighbourhood Safety in Five Caribbean Capital City Metropolitan Areas (percent)
KingstonMetropolitan Area
New Providence
Paramaribo
Port of SpainMetropolitan Area
GreaterBridgetown Area
0 20 40 60Percent of respondents
80 100
Very safe Somewhat safeSomewhat unsafe Very unsafe
Source: Data from the IDB Caribbean Crime Victimization Survey module attached to the 2014/2015 Latin American Public Opinion Project Survey.Note: The question asked (identified as AOJ11) was: Speaking of the neighbourhood where you live and thinking of the possibility of being assaulted or robbed, do you feel very safe, somewhat safe, somewhat unsafe or very unsafe?

202
RESTORING PARADISE IN THE CARIBBEAN: COMBATTING VIOLENCE WITH NUMBERS
likely to restrict their activities to
places or times perceived to be safe
(25 percent) than to organize within
the neighbourhood (8.5 percent)
(Figure 12.5). It is also noteworthy
that the percentage of Caribbean
respondents who reported having or-
ganized with neighbours (out of fear
of crime) was almost half that of the
28 countries polled by the LAPOP
Survey across the Americas region
(17.8 percent) in 2014. Organizing
with neighbours to combat insecu-
rity requires more effort than simply
avoiding certain neighbourhood ar-
eas. Unfortunately, avoidance can
contribute to the further breakdown
of informal social control, more fear,
and eventually more crime itself.
12.2.4 Victimization, Emigration, and Life Satisfaction
Across all five capital city metropoli-
tan areas, 13.8 percent of respondents
reported feeling dissatisfied with
their lives.7 Higher proportions of vic-
tims were dissatisfied with their lives
(20 percent) than non-victims (12.7
percent). Figure 12.6 shows that this
difference is further intensified when
we look at those who were victims
twice or more in the last year (23.1
percent). Dissatisfaction with life was
particularly high among those who had
been victims of a crime twice or more
Figure 12.4: Feelings of Insecurity within versus Outside One’s Neighbourhood during the Day/Night, Five Caribbean Capital City Metropolitan Areas (scale from 0–100)
KingstonMetropolitan Area
New Providence
Paramaribo
Port of SpainMetropolitan Area
GreaterBridgetown Area
0Percent of respondents
Fear outside neighbourhood/night Fear in neighbourhood/night Fear outside neighbourhood/day Fear in neighbourhood/day
10 20 30 40 50 60 70 80
39.0
40.9
39.4
44.6
33.0
65.8
60.7
60.9
70.7
61.8
Source: Data from the IDB Caribbean Crime Victimization Survey module attached to the 2014/2015 Latin American Public Opinion Project Survey.Note: The question asked (identified as IVOL11, IVOL12, IVOL13) was: Walking alone (in/outside) your neighbourhood (during the day/after dark), do you feel: very safe, safe, neither, unsafe, very unsafe? Responses were recoded on a scale of 0–100 with zero being very safe and 100 very unsafe.
Figure 12.5: Actions Taken in the Last 12 Months Because of Fear of Crime, Five Caribbean Capital City Metropolitan Areas (percent)
KingstonMetropolitan Area
New Providence
Paramaribo
Port of SpainMetropolitan Area
GreaterBridgetown Area
0Percent of respondents
Have organized with the neighbours of the community Avoid walking through some areas in their neighbourhood
105 2015 25 30 35 40
Source: Data from the IDB Caribbean Crime Victimization Survey module attached to the 2014/2015 Latin American Public Opinion Project Survey.Note: The questions asked were: (FEAR10) In order to protect yourself from crime, in the last 12 months, have you taken any measures such as avoiding walking through some areas in your neighbourhood because they are dangerous? (VIC44) In the last 12 months, out of fear of crime, have you organized with the neighbours of your community?
7 Overall, for the 28 countries in the Americas polled by the LAPOP Survey in 2014, 12.5 per-cent claimed to be dissatisfied with their lives.

203
THE EFFECTS OF CRIME ON ECONOMIC GROWTH, TOURISM, FEAR, EMIGRATION, AND LIFE SATISFACTION
in Kingston (37.7 percent for victims
versus 25 percent for non-victims).
Overall 24.4 percent of Caribbean
capital city metropolitan area resi-
dents reported intentions to live or
work abroad in the next three years.
This is well above national intentions
to emigrate in 2014 for Uruguay or
Chile (7.9 percent and 8.1 percent,
respectively), far lower than Haiti
(61.1 percent), and closest to Central
America (23 percent for Nicaragua,
28.4 percent for El Salvador, and 31.8
percent for Honduras).8 Figure 12.7
shows that the highest intentions to
emigrate in the Caribbean are among
residents of Kingston and the low-
est in Paramaribo. The percentage
of crime victims intending to emi-
grate (31.9 percent) is higher than
the percentage among non-victims
(21.6 percent). The highest intentions
to emigrate are among victims of a
crime twice or more in the last year
(37.1 percent). In Kingston, the inten-
tion to move abroad among victims
of a crime twice or more in the last
year (62.6 percent) was comparable
to that of Haiti (61.1 percent).
However, it is possible that differ-
ences in life satisfaction and intentions
to emigrate are not derived from a
causal effect of victimization, but
rather from the fact that victims and
Figure 12.6: Percentage of Respondents Who Feel Somewhat or Very Dissatisfied with Their Lives: Victims versus Non-victims in Five Caribbean Capital City Metropolitan Areas
KMA
New Providence
Paramaribo
PSMA
GBA
0Percent dissatisfied or very disatissfied
Non-victim Victim of any crime once Victim twice or more
105 2015 25 30 35 40
Source: Data from the IDB Caribbean Crime Victimization Survey module attached to the 2014/2015 Latin American Public Opinion Project Survey.Note: The question asked (identified as LS3) was: To begin, in general how satisfied are you with your life? Would you say that you are: very satisfied, somewhat satisfied, somewhat dissatisfied or very dissatisfied? The five capital cities listed are GBA: Greater Bridgetown Area, Barbados; New Providence, The Bahamas; Paramaribo, Suriname; PSMA: Port of Spain Metropolitan Area, Trinidad and Tobago; and KMA: Kingston Metropolitan Area, Jamaica.
Figure 12.7: Percentage of Respondents Who Intend to Emigrate: Victims versus Non-victims in Five Caribbean Capital City Metropolitan Areas
KMA
New Providence
Paramaribo
PSMA
GBA
0Percent that intend to emigrate
Non-victim Victim of any crime once Victim twice or more
10 20 30 7050 6040
Source: Data from the IDB Caribbean Crime Victimization Survey module attached to the 2014/2015 Latin American Public Opinion Project Survey.Note: The question asked (identified as Q14) was: Do you have any intention of going to live or work in another country in the next three years? The five capital cities listed are GBA: Greater Bridgetown Area, Barbados; New Providence, The Bahamas; Paramaribo, Suriname; PSMA: Port of Spain Metropolitan Area, Trinidad and Tobago; and KMA: Kingston Metropolitan Area, Jamaica.
8 The percentage of persons with intentions to emigrate in countries outside the Caribbe-an was calculated using the LAPOP Survey merged dataset for 28 countries in 2014.

204
RESTORING PARADISE IN THE CARIBBEAN: COMBATTING VIOLENCE WITH NUMBERS
non-victims differ along other lines per-
taining to personal, socio-economic,
and neighbourhood characteristics. To
examine the extent to which experi-
ences with crime shape life satisfaction
and the intention to emigrate in the
region, Figure 12.8 displays the results
of a multivariate logistic regression.
The model includes the demographic
controls accounted for in previous
regression models in this publication.
Additionally we include variables that
have been found to be related to em-
igration and life satisfaction (fear of
crime, being a homeowner, number
of children, receiving remittances, and
religion). Full results from the analysis
are shown in Appendix 12.1.
Controlling for the aforemen-
tioned characteristics, those who
have been victimized (or had family
members victimized) are more likely
to be dissatisfied with life and intend
to emigrate (Figure 12.8). Violent crime victimization is positively and significantly
related to intentions to emigrate, holding other factors constant. Odds that one in-
tends to emigrate in the next three years increase 34.9 percent for victims of assault
and threat, 36.4 percent for those who witnessed a violent attack, and 37.3 percent
for those who have lost someone to violence. The results with respect to life satis-
faction are less conclusive: simply being a victim of a crime in the last 12 months,
even a violent one, was not enough to make a significant difference in happiness.
However, being victimized twice or more in a year or witnessing a violent attack was
significantly associated with lower life satisfaction (Odds Ratio = .84 and OR = .83,
p < .05). Fear (believing your neighbourhood is somewhat or very unsafe) was also
associated with significantly lower life satisfaction (OR = 0.80, p < .01) but not inten-
tions to emigrate.
Figure 12.8: Factors Associated with Life Satisfaction (ordinal logit coefficient) and Intentions to Emigrate (logit coefficient), Five Caribbean Capital City Metropolitan Areas
Victim of any crime
Threat or assault
Witness
Close killed
Victim of a crimetwice or more
–0.5 0 0.5
Life satisfaction Emigration
Source: Data from the IDB Caribbean Crime Victimization Survey module attached to the 2014/2015 Latin American Public Opinion Project Survey.Note: Ordinal logit (life satisfaction) and logit (intentions to emigrate) coefficients with 95 percent confidence intervals. N = 14,009. The five capital cities are Greater Bridgetown Area, Barbados; New Providence, The Bahamas; Paramaribo, Suriname; Port of Spain Metropolitan Area, Trinidad and Tobago; and Kingston Metropolitan Area, Jamaica.

205
THE EFFECTS OF CRIME ON ECONOMIC GROWTH, TOURISM, FEAR, EMIGRATION, AND LIFE SATISFACTION
12.3 Conclusions and Policy ImplicationsThis chapter has examined some of the specific costs related to crime in the Caribbe-
an. We find that homicide rates are directly associated with lower economic growth
and tourism arrivals in Caribbean countries. Furthermore, fear of crime is an additional
cost, though this may be more related to factors other than direct experiences of
victimization. Caribbean residents are more fearful of walking outside their own neigh-
bourhoods, although our data show that crimes are more likely to occur within their
neighbourhood or their home. One in five individuals reports having avoided walking
through certain areas of their neighbourhood because they thought they were dan-
gerous. On the other hand, less than 10 percent organized with neighbours to fight
crime—a percentage far lower than other countries in the Americas. The trauma from
being victimized also significantly impacts overall feelings of life satisfaction and in-
creases intentions to emigrate.
The policy implications here are that there are significant economic and social
welfare gains from reducing crime in the Caribbean. Security-related expenses are a
significant portion of the government budgets (see previous chapter), and wise in-
vestment of these resources could lead to real crime reduction, have a significantly
positive effect on the economy, slow the drain of skilled workers from the countries,
and improve life satisfaction of residents. The important next step is for policymakers
to invest in evidence-based and data-driven interventions tailored to the crime sce-
nario that is specific to their country. New efforts and resources should be invested in
smarter crime control, evidence-based prevention, and improved data collection and
evaluation for existing initiatives. Chapter 13 will provide an overview of the evidence
on programmes that work to confront some of these scenarios.
Additionally, this chapter finds that reducing fear (making people feel safer) should
also be considered as a common goal among public safety and security initiatives.
However, since fear of crime is not highly correlated with actual crime, it should not
be assumed that policies to reduce crime will also reduce fear. Dedicated policies to
increase confidence in law enforcement and the justice system and decrease misin-
formation about crime can help. Reducing such misinformation could be achieved by
providing the public with reliable information about crime, including information about
the risk of victimization for different criminal offences, the likelihood of error in these
estimates, and the nature of victimization events.

206
RESTORING PARADISE IN THE CARIBBEAN: COMBATTING VIOLENCE WITH NUMBERS
Appendix 12.1. Methodology for Calculating the Impact of Homicide Rate Growth on GDP GrowthA regression approach was used to test the relationship between homicides and GDP
growth. Using information regarding intentional homicides per 100,000 population
and constant GDP, we performed a regression analysis where we found that an in-
crease of 1 percentage point in the homicide rate would reduce GDP by 0.7 percentage
point. The data (World Bank, World Development Indicators) contain information from
the above-mentioned variables for 213 countries between 1960 and 2014, but with
several gaps, especially for the homicide rate. We tested if the response attrition for
the homicide rate was correlated with GDP growth and found no evidence for such
relation. We separate the analysis between Caribbean countries and the rest of the
small economies (ROSE) of the world.9
We used difference-in-log variables to test the hypothesis that homicides negatively
affect growth. Two variables were constructed: the Delta-log GDP (Log(GDPt) –
Log(GDPt–1)), and the Delta-log Homicide rate (Log(HRt) – Log(HRt–1)), which were used
to run the regression:
∆log(GDPit) = a + β • ∆log(GDPit–1) + δ • ∆log(HRit) + εit. (12A1.1)
Table 12A1.1 shows that, irrespec-
tive of the model, the parameter of
interest, δ, is negative and statistically
significant. Thus, after an increase of 1
percentage point in the homicide rate,
GDP growth will decline about 0.8
percentage point when controlling
for country characteristics (country
fixed effects and error clusters at the
country level). With these parame-
ters we predicted the potential GDP
growth for the period with the most
information (1995–2011).
Table 12A1.1: Regression Results
(1)dlog_gdp
(2)dlog_gdp
dlog_gdp_t_1 0.451***(0.0223)
0.275***(0.0352)
dhomicide_rate –0.00837***(0.00303)
–0.00789*(0.00468)
_cons 0.0188***(0.00123)
0.0251***(0.00124)
Country fixed effect No Yes
Number 1,584 1,584
Adjusted R-squared 0.207 0.270
Source: Prepared by the authors.Note: Standard errors in parentheses in model 1 and clustered at the country level in model 2. * p < 0.1, ** p < 0.05, *** p < 0.01.
9 These sets of countries are as follows: Caribbean: Antigua and Barbuda, The Bahamas, Barbados, Domini-ca, Grenada, Guyana, Jamaica, St. Kitts and Nevis, Saint Lucia, St. Vincent and the Grenadines, Suriname, and Trinidad and Tobago. ROSE: Belize, Bhutan, Botswana, Cabo Verde, Comoros, Djibouti, Equatorial Guinea, Fiji, Gabon, The Gambia, Guinea-Bissau, Iceland, Kiribati, Lesotho, Luxembourg, Maldives, Mauritius, Montenegro, Namibia, Qatar, Samoa, São Tomé and Príncipe, Seychelles, Solomon Islands, Swaziland, Timor-Leste, Tonga, Tuvalu, and Vanuatu.

207
THE EFFECTS OF CRIME ON ECONOMIC GROWTH, TOURISM, FEAR, EMIGRATION, AND LIFE SATISFACTION
Appendix 12.2. Methodology for Calculating the Impact of Homicide Rate Growth on Tourism ArrivalsUsing a panel regression, we estimated a model with the endogenous variable given
by the difference in logs of tourism arrivals to the country. The model is as follows:
∆log(Tour_arrit) = a + δ • ∆log(HRit) + εit. (12A2.1)
Table 12A2.1 presents the results for this estimation. As can be seen, an increase of
1 percentage point in the homicide rate growth is correlated with a reduction of 3.26
percentage points in the tourism arrival growth.
Table 12A2.1: Regression Tourism Results
(1)dTourism arrivals
(2)dTourism arrivals
dhomicide_rate –0.0341**(0.0158)
–0.0326**(0.0150)
_cons 0.0552***(0.00493)
0.0552***(0.000116)
Country fixed effect No Yes
Number 1,387 1,387
Adjusted R-squared 0.003 0.039
Source: Prepared by the authors.Note: Standard errors in parentheses in model 1 and clustered at the country level in model 2. * p < 0.1, ** p < 0.05, *** p < 0.01.

208
RESTORING PARADISE IN THE CARIBBEAN: COMBATTING VIOLENCE WITH NUMBERS
Appendix 12.3. Odds Ratios for Life Satisfaction (Ordinal Logit) and Emigration (Logit)
Life Satisfaction Index (ordinal 1–4)
Emigration (1 if intention to
emigrate, 0 otherwise)
Victim of any of five crimes (12 months) 0.95 1.12
Victim of assault or threat (12 months) 0.98 1.35***
Witness to violent attack (lifetime) 0.83** 1.36***
Lost someone to violence (lifetime) 0.94 1.37***
Victim of a crime twice or more 0.84** 1.15**
Male 0.89*** 1.09
Age
Young (16–24) 0.74 10.38***
Middle1 (25–34) 0.62** 7.59***
Middle2 (35–49) 0.64*** 4.92***
Senior (50–64) 0.67*** 2.62***
Marital status
Single 0.80** 1.53***
Common law 0.83*** 1.40***
Divorced 0.95 1.17
Separated 0.89 1.23
Widowed 1.22 0.81
Education level
Primary complete 0.74* 1.04
Secondary incomplete 0.88 1.04
Secondary complete 0.76*** 1.11
Tertiary incomplete 0.79** 1.38
Tertiary complete 0.96 1.40*
Wealth Index quartile
Quartile 2 1.22*** 0.96
Quartile 3 1.32*** 0.97
Quartile 4 1.58*** 0.98
Homeowner 1.12 0.85*
Children 0.98 0.93**
Receives remittances 1.15** 2.23***
Importance of religion in life 1.08** 1.05
Neighbourhood Disorder Index 0.83 1.45***
Neighbourhood Informal Social Control Index 1.32** 1.22*
Neighbourhood Social Cohesion Index 2.31*** 0.70***
(continued on next page)

209
THE EFFECTS OF CRIME ON ECONOMIC GROWTH, TOURISM, FEAR, EMIGRATION, AND LIFE SATISFACTION
Appendix 12.3. Odds Ratios for Life Satisfaction (Ordinal Logit) and Emigration (Logit)
Life Satisfaction Index (ordinal 1–4)
Emigration (1 if intention to
emigrate, 0 otherwise)
Gang presence in neighbourhood 0.96 1.05
Feels unsafe in neighbourhood 0.81*** 1.09
Capital city dummies
Port of Spain 1.36*** 0.23***
Paramaribo 3.19*** 0.18***
New Providence 3.01*** 0.20***
Bridgetown 1.98*** 0.36***
Number of observations 13,937 14,009
Source: Prepared by the authors.Note: .01 – ***; .05 – **; .1 – *.
(continued)


211
What the Caribbean Is Doing to Reduce Crime Compared to the Evidence of What Works Internationally
Heather Sutton and Luisa Godinez
Over the past 10 years, a number of programmes have been directed towards
reducing crime and violence in the Caribbean. Although these initiatives re-
flect greater awareness of the problem, the added value of any one policy
or programme varies widely. Most new laws and legal amendments focus on sup-
pression of crime rather than on improvement of prosecutorial capabilities or crime
prevention, even though evidence supporting a link between suppression and vi-
olence reduction is lacking. In parallel with legislative efforts, however, a variety of
initiatives targeting both crime suppression and prevention have been designed and
implemented through programmes operated either by governments or nongovern-
mental organizations (NGOs). While many of these programmes may be promising,
most have not been rigorously evaluated. Too little research has been conducted
using rigorous evaluation methods, and most available research is descriptive and
qualitative, based on untested assertions, and lacking an experimental component.
As a result, the policymaking process in the region has not been adequately in-
formed by data from methodologically sound programme evaluations. As a result,
policies are implemented in the absence of solid information regarding their expect-
ed impact on crime and public safety.
Globally, some prevention policies and programmes have been shown to be effec-
tive in reducing certain types of crime in certain contexts through multiple experimental
and quasi-experimental evaluations. Others show promise, but have mixed findings or
too little evidence to be considered successful as yet. A last group has been found to
be ineffective, either because the programmes had little impact or even because they
had the opposite effect of what was intended.
13

212
RESTORING PARADISE IN THE CARIBBEAN: COMBATTING VIOLENCE WITH NUMBERS
These internationally recognized interventions have not been tested or demon-
strated as to whether they would work in the Caribbean. So how can we be sure these
interventions are relevant for the region? The extent to which the results of a study can
be generalized to other situations and other people is always of concern. However, as a
starting point, it is worth examining what has been effective in other regions. If a certain
programme hasn’t been effective somewhere else, we would think twice about replicat-
ing it in the Caribbean. Conversely, if a programme demonstrates efficacy elsewhere, we
should have clear reasons for not piloting it in the region. Clearly, discussion of the valid-
ity and implementation of these interventions in the Caribbean should be encouraged.
This section begins with a review of some of the most noticeable legislative trends
in recent years by highlighting improvements made and identifying legislative gaps
that remain.1 Subsequently, the chapter presents a tentative framework of internation-
ally successful, promising, and unsuccessful programmes, which are assessed vis-à-vis
some of the programmes that already exist in the Caribbean.
13.1 Legislative Trends in the Caribbean: Improvements, Setbacks and Gaps
At the international level, Caribbean countries have generally joined the major treaties
and conventions on crime, especially with regard to organized crime, drugs, and fire-
arms.2 Regionally, the Caribbean Community recently launched a Crime and Security
Strategy that stipulates, among other objectives, the harmonization and standardiza-
tion of criminal legislation in the region.3 Even though the results of this specific strategy
remain to be seen, certain legislative trends can already be perceived in the Caribbean
(see Appendix 13.1 for a thorough description of recent amendments by country).
13.1.1 Criminal LawAn examination of legislation in the last 10 years indicates that there is a strong focus
on increasing penalties for criminal activity (Table 13.1).4 In many cases these include
1 This section does not contain an exhaustive explanation of all the laws and amendments implemented in each country. Rather, it aims to show those changes that have been most important in shaping the definitions of the specific crimes addressed in this publication and the adequate response to them.2 Examples include the Caribbean Mutual Legal Assistance Treaty in Serious Criminal Matters in 2000; sever-al other Mutual Legal Assistance Treaties between the countries in this study and the United States or Latin American countries; the United Nations Convention Against Transnational Organized Crime in 2000; and the Arms Trade Treaty.3 See Strategic Goal 3 of the plan “Establishing Appropriate Legal Instruments While Ratifying Existing Agreements.”4 This holds true in The Bahamas, where magistrates’ power to decide the time and severity of sentences has been increased. In Jamaica, amendments also triggered stricter sentences, particularly with respect to

213
WHAT THE CARIBBEAN IS DOING TO REDUCE CRIME COMPARED TO WHAT WORKS INTERNATIONALLY
mandatory minimum sentences for certain crimes. Given the challenges widely faced
by criminal justice systems in the region—including significant obstacles to efficiently
processing criminal trials and the overcrowding of prison systems—it is worth asking if
longer and more severe sentences are truly viable solutions to the perceived problem
of criminal impunity in the Caribbean.
In recent years, these stricter sentencing policy initiatives have often been enacted
with the goal to deter future recidivism. However, while increasing sentencing may
contribute to incapacitation, research has also shown that stricter and/or longer sen-
tences are not necessarily associated with deterrence. In fact, the consequences of
adopting “tougher” measures may be generally more negative than positive from a so-
cietal standpoint. First, excessive use of incarceration has enormous cost implications
for a country (Gendreau, Goggin, and Cullen 1999; Travis and Western 2014; Wright
2010). Most importantly, and contrary to popular belief, increased prison time may
slightly increase recidivism for high-risk offenders, but also produce negative effects
on lower-risk delinquents (Travis and Western 2014). Research suggests that it is by
increasing the certainty of punishment, rather than its severity, that governments are
more likely to produce deterrent effects (Travis and Western 2014; Wright 2010).
13.1.2 Procedural LawIn addition to implementing stricter sentences, the Caribbean is adopting more re-
strictive procedural rules. In Barbados, for instance, an amendment to the Criminal
Appeal Act (2009) abolished certain rights of appeal, making the process less flexible
shootings and sentences for perpetrators of sexual violence against children. Following the same patterns, Trinidad and Tobago toughened penalties for kidnapping, offences related to firearms, ammunition, and sex-ual offences.
Table 13.1: Summary of Recent Legislative Trends in the Caribbean on Crime since 2010
The Bahamas Barbados Jamaica Suriname
Trinidad and Tobago
Increased and more severe sentences?
Yes No Yes Yes Yes
Introduction of new types of evidence?
Yes Yes No Insufficient information
Yes
Amendments to firearm legislation?
Yes No No No No
Regulations for gang involvement?
Yes No Yes No Yes
New regulations for organized crime?
Yes Yes Yes Yes Yes
Source: Authors’ review of legislation since 2010.
214
RESTORING PARADISE IN THE CARIBBEAN: COMBATTING VIOLENCE WITH NUMBERS
than before. In Trinidad and Tobago (2013) as well as in The Bahamas (2011), increased
requirements for bail have been added in recent years. Beyond the fact that the use
of money in the pre-trial process disproportionately impacts vulnerable communities,
bail fees that are too high are more likely to keep people in jail who could otherwise
remain safely in the community during their judicial process. Moreover, the financial
impact of these detentions may also be considerable, especially in terms of prison
costs and social costs due to loss of employment.
On the positive side, there is a sustained trend to accept new types of evidence in
trials. Trinidad and Tobago, for example, created a whole legal framework on DNA use
(DNA Act 2012). The Bahamas has implemented a variety of procedural amendments,
including the inclusion of new types of evidence such as videos, previous convictions,
and data from electronic devices (Evidence Act 2011). In Jamaica, the Independent
Commission of Investigations Act (2010) was implemented to undertake investiga-
tions concerning actions by security forces and other agents of the State that result
in death or injury to a person, the abuse of the rights of persons, and related issues.
Among the matters that fall within the remit of the Independent Commission of In-
vestigations (INDECOM) are police-civilian fatalities. Confessions and admissions may
now be recorded in Barbados, and in very specific cases it is accepted to use visual
identification evidence adduced by the prosecutor (Evidence Act 2014). While these
efforts are certainly conducive to stronger prosecution capabilities, further regulating
their implementation will be critical, especially considering that visual or recorded ev-
idence may be extremely misleading when taken out of context.
13.1.3 Police and Criminal System LegislationThere have been minimal changes to improve the functioning of criminal systems
as a whole, but those changes that have been made are quite positive. The Baha-
mas incorporated several amendments, including a cap of 10 years for the police
commissioner’s tenure and the possibility of imprisonment for police officers using
unnecessary violence (Police Act 2009); a new amendment to its Justice Protection
Act (2014) regulating matters of obstruction of justice; and a new Correctional Ser-
vices Act (2014). The Barbados Prison Act Cap (2014) prohibits the use of corporal
punishment in prisons. Trinidad and Tobago created a special panel of attorneys to
provide legal representation for minors and persons detained on suspicion of capital
offences (Legal Aid and Advice Act 2012), and the Children Act 2012 provides for the
establishment of a specific Juvenile Court (which is still in the planning phase). Howev-
er, with the exception of scattered amendments, very few legislative efforts have been
directed towards improving the effective functioning of the system, the overall trust
of the population towards the institutions of each country, and cooperation between
different government entities.

215
WHAT THE CARIBBEAN IS DOING TO REDUCE CRIME COMPARED TO WHAT WORKS INTERNATIONALLY
13.1.4 Organized Crime, Gang, Drug, and Firearm LegislationCaribbean countries have joined and ratified several international agreements on or-
ganized crime, drugs, and firearms that may influence the legislative agenda of each
country. After the ratification of the Arms Trade Treaty,5 which regulates international
trade of conventional weapons, The Bahamas amended its Firearms Act in 2011 and
2014, and Trinidad and Tobago amended its Firearms Act in 2011. The 2000 United
Nations Convention against Transnational Organized Crime is another example of in-
ternational cooperation.6 In 2008, the International Organization for Migration also
launched model legislation for Caribbean countries on counter-trafficking, but since
then only Jamaica has implemented comprehensive legislation on the subject. Nev-
ertheless, all countries have ratified the 1988 United Nations Convention against Illicit
Traffic in Narcotic Drugs and Psychotropic Substances. Beyond the adoption of these
agreements, the countries have generally created new legislation or amendments with
respect to organized crime, gangs, drugs, and firearms.
In response to the proliferation of gangs in the region (see Chapter 7), most
countries, with the exception of Barbados, have implemented provisions to define,
suppress, and in some cases prevent the formation of these groups. In the lead on
these changes were Trinidad and Tobago and Jamaica, two countries where the ef-
fects of gang-related activities have been substantial. In 2011, Trinidad and Tobago
created an Anti-Gang Act that codified a series of gang-related offences. Unfortu-
nately, while the act was proclaimed in August 2011, no convictions had been recorded
through 2015 (Seepersad 2016).7 Jamaica also established legislation that criminalized
any activity or conduct related to these gangs (the Criminal Justice [Suppression of
Criminal Organisations] Act 2014).8 The Bahamas amended its Penal Code by includ-
ing definitions for gangs and creating offences related to them, and also included new
anti-gang offences in its Justice Protection Act 2014 (for more detail on these laws
see Appendix 13.1).
In recent years, organized crime in a more general sense has been consistently ad-
dressed throughout the Caribbean. Jamaica in particular has had an active legislative
agenda to combat organized crime and its related activities by regulating the tracing
of cash transactions and tax payments, amending the regime on trafficking of persons,
and creating new offences for fraudulent transactions. Trinidad and Tobago created
5 Ratified by all countries except Suriname.6 Barbados signed the convention but did not ratify it.7 No person had been convicted at the time this information was received in 2014.8 Although no official information has been received, newspaper articles indicate that there have been con-victions for organized crime in Jamaica. See “No glory for GANGSTERS—Police use anti-gang legislation to arrest and charge almost 170 suspects,” Jamaica Gleaner, August 23, 2015. Available at: http://jamaica-gleaner.com/article/news/20150823/no-glory-gangsters-police-use-anti-gang-legislation-arrest-and-charge-almost.

216
RESTORING PARADISE IN THE CARIBBEAN: COMBATTING VIOLENCE WITH NUMBERS
an act for trafficking in persons as well as provisions on money laundering. Barbados
regulated transnational organized crime, and the legislative branch in The Bahamas
clearly defined organized crime and classified it as an offence.
Regulations on drugs have remained unchanged in recent years for most of the Ca-
ribbean, with the exception of an amendment in The Bahamas that recently increased
sentences for possession of drugs with intent to supply. What these regulations estab-
lish, however, varies by country, from provisions on drug trafficking (in Barbados and
Trinidad and Tobago) to regulations of specific drugs (in Jamaica).
Finally, there has been a legislative wave with respect to firearms in the region
since 2010. Barbados established specific firearms offences, as well as stricter condi-
tions to hold firearms. In Jamaica, legislation in 2010 established new conditions and
penalties for firearm licenses, as well as regulations on imports and exports of weap-
ons. In The Bahamas and Trinidad and Tobago, recent amendments have focused on
increased penalties for unlawful firearms possession. While legislation is one part of
adequate firearms controls, strict legislation without adequate implementation can
be an obstacle. There is no evidence that increased or harsher sentences for fire-
arm crimes have resulted or will result in deterrence. In fact, part of the problem in
some countries has been excessive police discretion in the implementation of the law
and thus opportunities for corruption and unfair practices of differential access to
firearms.
Some studies analysing the connections between firearm legislation and reductions
in firearm-related injuries indicate that the simultaneous implementation of different
firearms regulations has positive effects on gun violence; some specific restrictions, for
example, have been associated with a reduction of firearm crime in certain contexts
(firearm storage regulations, permits for ownership, firearm bans for those with men-
tal illness), while others have been unsuccessful (laws restricting the sales of certain
firearms, laws for voluntary rendition of firearms, laws establishing sentences and pun-
ishments for gun offenders) (Kapusta et al. 2007; Rosengart et al. 2005).
13.1.5 Gender-Based Violence and Child Abuse LegislationOver the past two decades many countries around the world have adopted compre-
hensive legislation with gender-neutral and -encompassing definitions that specifically
address intimate partner violence, sexual violence, and child abuse. These changes
have in part been influenced by international treaties such as the Convention on the
Elimination of All Forms of Discrimination against Women and the Convention on the
Rights of the Child. Caribbean countries are no exception: they are part of these in-
ternational agreements, and the region has started to adopt specific legislation to
address violence against women and children. Unfortunately, it is often the case that
the region is still behind vis-à-vis international standards.

217
WHAT THE CARIBBEAN IS DOING TO REDUCE CRIME COMPARED TO WHAT WORKS INTERNATIONALLY
At the international level it is increasingly recognized that violence against women
and violence against children encompass several types of violence, including sexual,
emotional, and/or psychological violence as well as patrimonial and/or economic vio-
lence (UN Women 2011). However, not all Caribbean countries have recognized this as
yet (Table 13.2). There have been some initiatives to increase the severity and time of
sentences related to violence against women and sexual violence,9 but it remains to
be seen if harsher penalties have led or will lead to any deterrent effect. Additionally,
implementation is a serious problem (further discussed in Chapter 4). Most domes-
tic violence laws are not accompanied by budget allocations and there continue to
be severe obstacles for women to access the justice system. While there is little ex-
perimental research on the subject, there is quantitative evidence from developed
countries (Post et al. 2010) and qualitative research in low- to medium-income coun-
tries (Ellsberg et al. 2014) which suggests that training and improved legislation alone
do not improve outcomes for women or reduce violence at a community level, and
that system-wide changes are needed to improve the enforcement of laws.
There have also been other isolated legal efforts to reduce sexual violence in the
countries of the region. Jamaica, for instance, changed the definition of “carnal abuse”
(sexual violence) to create a more gender-neutral provision. Both The Bahamas and
Jamaica recently established a registry of sexual offenders.10 Yet, research shows that
Table 13.2: Legal Regulation of Violence against Women
The Bahamas Barbados Jamaica Suriname
Trinidad and Tobago
Clear and comprehensive definition that goes beyond simple physical violence
X X
Victims include spouses, children, members of the same household, and dependents
X X —
Same-sex couples have access to relief services X X X X X
Legislation explicitly criminalizes marital rape X X X Regulation of sexual harassment X X X XProtection orders for victims of domestic violence, removal of perpetrator from home
Source: Prepared by the authors.
9 The Bahamas increased penalties for rape and serious sexual offences. Jamaica increased penalties for perpetrators of sexual violence against children.10 The Bahamas also established a registry of sexual offenders toward children.

218
RESTORING PARADISE IN THE CARIBBEAN: COMBATTING VIOLENCE WITH NUMBERS
these types of registries are not necessarily effective tools to combat sexual offences,
mostly because they do not reduce offending, might only function as a means for
penal segregation, and have high costs to society (Letourneau et al. 2010). Effectively
reintegrating offenders into society, on the other hand, can be more effective in de-
creasing the likelihood of recidivism (Petrunik 2002).
Finally, although legislation to address domestic violence in the Caribbean includes
provisions on child abuse, the countries have also adopted specific legislation for chil-
dren.11 Trinidad and Tobago has developed the most comprehensive definition of child
abuse that includes physical and non-physical acts, penetrative or non-penetrative
acts, activities that expose children to inappropriate sexual material, and activities of
prostitution or pornography of children. The Bahamas also passed its Child Protection
Act (2007), which, inter alia, increased the punishment for child abuse and created
a mandate for a sex offender registry. Subsequent amendments included laws for
the implementation of the Marco alert system for missing children. In Barbados child
abuse can be categorized as a misdemeanour or major offence depending on the case.
Interestingly, only The Bahamas has recently established an obligation to report child
abuse. Jamaica and Barbados recently enacted new legislation on child pornography.
13.2 Programmes and Interventions to Reduce Violence and CrimeLegislative efforts in the region have been coupled with government and NGO-run
initiatives and programmes targeting the prevention and suppression of crime and
violence. This section reviews the evidence on some programmes from other countries
and regions around the world,12 and compares them with some of the programmes
that have been implemented in the Caribbean. We have organized this comparison
by eight different problem areas identified in this report: (1) violence in the home,
(2) youth violence, (3) gangs, guns, and drugs, (4) situational/neighbourhood, (5) crim-
inal justice system, (6) police, (7) prison, and (8) the private sector. We do not mean to
suggest that all the evidence-based programmes examined are universally applicable
and portable to any country context. Not all positively evaluated programmes have
been evaluated in a wide range of settings including developing countries of different
types. Virtually none have been tested and robustly evaluated in the Caribbean. How-
ever, as a starting point, it is worth examining what has been effective in other regions.
If a certain programme hasn’t been effective somewhere else, we would think twice
11 See Appendix 13.1 for further details on specific legislation on child abuse.12 A thorough review was made of evidence from the following sources: Crimesolutions.gov, Blue Prints Pro-grams for Positive Youth Development (http://www.blueprintsprograms.com/), systematic reviews undertak-en by the Campbell Collaboration, research on violence prevention by the World Health Organization, and previous IDB reviews (including Jaitman and Guerrero Compeán 2015, and Pousadela 2014).

219
WHAT THE CARIBBEAN IS DOING TO REDUCE CRIME COMPARED TO WHAT WORKS INTERNATIONALLY
about replicating it in the Caribbean. Conversely, if a programme demonstrates effica-
cy elsewhere, we should have clear reasons for not piloting it in the region. This is not
meant to be an exhaustive framework, but rather an initial review of effective, promis-
ing, and ineffective initiatives of which Caribbean policymakers should be aware.
We categorize programmes into three categories: effective (green), promising (yellow), and those that are either ineffective or have no evidence (red). Effec-tive programmes have the highest-quality evidence (generally a meta-evaluation
of experimental or quasi-experimental designs in multiple cites) with a statistically
significant average effect size favouring the practice. Promising programmes have
moderate-quality evidence with a statistically significant average effect size favouring
the practice (these may use less rigorous quasi-experimental designs or may have
only been tested in one location). The last group—ineffective or no-evidence pro-grammes—are programmes that have received negative evaluations, either because
they have had little impact, their design lacks evaluation components, or they actually
triggered the opposite effect of what they intended.
Each section also includes a table with projects implemented in the Caribbean. Ap-
pendixes 13.2–13.4 expand on the relevant publications on international programmes
mentioned in the chapter.
13.2.1 Family Violence and Violence against WomenThe relationship between violence against women and cultural and social beliefs is in-
tricate, particularly because certain cultural and social norms, including the traditional
belief that men have a right to control or discipline women, are often at the base of
different types of violence. Many promising programmes designed to prevent violence
against women are thus centred around the promotion of gender equality. Interven-
tions aimed at changing social norms, such as the Mentors in Violence Prevention
Program, through which students participate in role-playing exercises, have been rat-
ed as positive initiatives to identify sexist attitudes and prevent violence (Ward 1999).
The use of media, although less studied, is becoming a popular alternative for increas-
ing knowledge, challenging attitudes, and modifying behaviours regarding violence
against women and gender equality (Goldstein et al. 2005).13
Figure 13.1 categorizes the effectiveness of programmes to reduce violence in
the home, while Table 13.3 provides examples of programmes implemented in the
Caribbean.
Community programmes, including microfinance interventions, are used to increase
women’s economic and social power, which has been related to a reduction of violence.
13 The Soul City programme in South Africa, which consisted of a series of radio and television episodes, man-aged to trigger modest changes in knowledge and attitudes towards intimate partner violence.

220
RESTORING PARADISE IN THE CARIBBEAN: COMBATTING VIOLENCE WITH NUMBERS
These interventions are particularly
successful when implemented to-
gether with educational sessions and
skill-building workshops to change so-
cial norms. A good illustration is South
Africa’s Intervention with Microfinance
for AIDS and Gender Equity (IMAGE).
A study of the programme confirmed
that acts of violence by participants’
intimate partners decreased by half
after just two years of the programme
(Pronyk et al. 2006).
Improving the crime control system
of each country through such actions
as creating care centres for women is
crucial to reduce the likelihood of do-
mestic violence and is a definite need
for victims (Waller 2014). These mea-
sures include shelters for battered
women dedicated to providing health
care, psychological support, counsel-
ling, and/or social support. In the United States, the presence of Sexual Assault Nurse
Examiners (SANE) in each state has been fundamental in responding to victims’ needs
(Campbell et al. 2014). Even though most Caribbean countries have created special
governmental units and/or programmes in charge of preventing and alleviating vio-
lence in recent years, there are still very few shelters dedicated to women or children.
Those that exist have very limited resources or are often nongovernmental institutions.14
School-based interventions, including safe dating programmes, have had positive
results in combatting violence against women in certain contexts. Safe Dates in the
United States (Foshee et al. 2005) and the Youth Relationship Project (Sherin et al.
1998) in Canada, for example, showed changes in attitudes and reductions in rape and
sexual violence among youth. These types of programmes often include training and
life-skill interventions aimed at reducing sexual violence. While it has become very
popular to target both men and women, or to create programmes that only target
Figure 13.1: Categorization of Programmes to Reduce Violence in the Home
Programmestargetingonly male
perpetrators
Trainingand skill
interventionsto reduce
sexualviolence
Datingviolence
programmes Use ofmedia
Violenceagainstwomen
Changingsocialnorms
Microfinanceinterventions
Carecentres for
women
Effective types of programs: Highest-quality evidence with statistically significant average effect size favoring the practicePromising types of programs: Moderate-quality evidence with statistically significant average effect size favoring the practicePrograms with no proven effects: Moderate- to high-quality evidence with statistically significant average effect size in the opposite direction of the intended effect for the practice/Moderate- to high-quality evidence and the average effect size is not different with statistical significance from the comparison group/Insufficient evidence
Source: Prepared by the authors.Note: Programmes are described by colour: effective (green), promising (yellow), ineffective or have no evidence (red).
14 The following agencies are in charge of violence in the home in the respective police forces/units: In The Bahamas, the inter-agency Gender-Based Violence Task Force at the Royal Bahamas Police Force; in Barba-dos, the Family Conflict Intervention Unit of the Royal Barbados Police Force; and in Jamaica, the Centre for Investigation of Sexual Offences and Child Abuse of the Jamaica Constabulary Force.

221
WHAT THE CARIBBEAN IS DOING TO REDUCE CRIME COMPARED TO WHAT WORKS INTERNATIONALLY
men, there is little evidence that these types of initiatives actually reduce violence
against women at all (Ellsberg et al. 2014).
13.2.2 Youth ViolenceEvidence suggests that developing life skills in young people reduces their chances of
being aggressive, namely by improving their social and emotional competency while
teaching them to deal constructively with conflict. These approaches have proven to
be most effective when combined with academic/preschool enrichment programmes,
social development programmes, or cognitive behavioural therapy, along with some
sort of vocational training component.
Table 13.3: Examples of Programmes to Prevent Violence against Women Implemented in the Caribbean
The Bahamas Barbados Jamaica Suriname Trinidad and Tobago
Government-Run Programmes
• Suspected Child Abuse and Neglect (SCAN) (Ministry of Health)
• Partnership for Peace (Ministry of Social Care, Constituency Empowerment, and Community Development)
• Overcomers in Action (Ministry of Justice/Victim Support Unit – VSU)
— • Break the Silence (Ministry of Gender, Youth and Child Development, UNICEF, and the Institute of Gender and Development Studies)
• Defining Masculine Excellence Programme (Ministry of Gender, Youth and Child Development)
NGO-Run Programmes
• Victim Support Centre (The Bahamas Crisis Centre)
• Champions of Change (The Caribbean Male Action Network –CARIMAN/ UN Women)
• Shelter for Battered Women (The Business and Professional Women’s Club of Barbados)
• Women’s Crisis Centre (Women Inc. Women’s Crisis Centre)
• Building for Gender Justice Project (SISTREN Theatre Collective)
• Capacity Strengthening of Female (Micro)-Entrepreneurs Programme (NGO Caribbean Development Foundation)
• Our Story: Women, Peace and Security in Trinidad and Tobago (Women’s Institute for Alternative Development – WINAD)
• Break the Silence (Ministry of Gender, Youth and Child Development, UNICEF, and the Institute of Gender and Development Studies)
Source: Prepared by the authors.
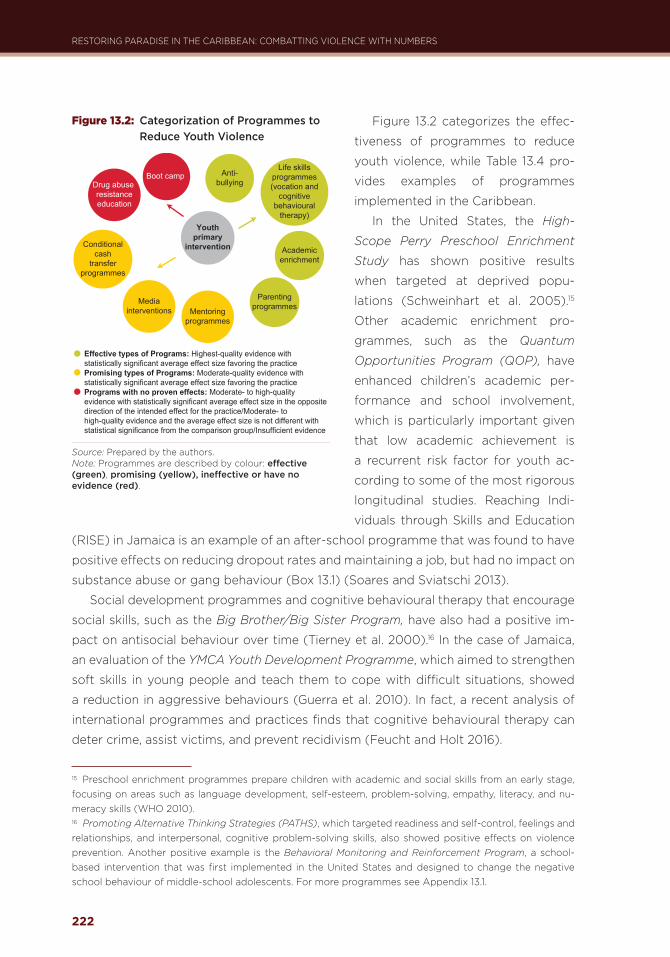
222
RESTORING PARADISE IN THE CARIBBEAN: COMBATTING VIOLENCE WITH NUMBERS
Figure 13.2 categorizes the effec-
tiveness of programmes to reduce
youth violence, while Table 13.4 pro-
vides examples of programmes
implemented in the Caribbean.
In the United States, the High-
Scope Perry Preschool Enrichment
Study has shown positive results
when targeted at deprived popu-
lations (Schweinhart et al. 2005).15
Other academic enrichment pro-
grammes, such as the Quantum
Opportunities Program (QOP), have
enhanced children’s academic per-
formance and school involvement,
which is particularly important given
that low academic achievement is
a recurrent risk factor for youth ac-
cording to some of the most rigorous
longitudinal studies. Reaching Indi-
viduals through Skills and Education
(RISE) in Jamaica is an example of an after-school programme that was found to have
positive effects on reducing dropout rates and maintaining a job, but had no impact on
substance abuse or gang behaviour (Box 13.1) (Soares and Sviatschi 2013).
Social development programmes and cognitive behavioural therapy that encourage
social skills, such as the Big Brother/Big Sister Program, have also had a positive im-
pact on antisocial behaviour over time (Tierney et al. 2000).16 In the case of Jamaica,
an evaluation of the YMCA Youth Development Programme, which aimed to strengthen
soft skills in young people and teach them to cope with difficult situations, showed
a reduction in aggressive behaviours (Guerra et al. 2010). In fact, a recent analysis of
international programmes and practices finds that cognitive behavioural therapy can
deter crime, assist victims, and prevent recidivism (Feucht and Holt 2016).
Figure 13.2: Categorization of Programmes to Reduce Youth Violence
Boot camp Drug abuse resistanceeducation
Conditionalcash
transferprogrammes
Mediainterventions Mentoring
programmes
Youthprimary
intervention
Anti-bullying
Academicenrichment
Life skillsprogrammes(vocation and
cognitivebehavioural
therapy)
Parentingprogrammes
Effective types of Programs: Highest-quality evidence with statistically significant average effect size favoring the practicePromising types of Programs: Moderate-quality evidence with statistically significant average effect size favoring the practicePrograms with no proven effects: Moderate- to high-quality evidence with statistically significant average effect size in the opposite direction of the intended effect for the practice/Moderate- to high-quality evidence and the average effect size is not different with statistical significance from the comparison group/Insufficient evidence
Source: Prepared by the authors.Note: Programmes are described by colour: effective (green), promising (yellow), ineffective or have no evidence (red).
15 Preschool enrichment programmes prepare children with academic and social skills from an early stage, focusing on areas such as language development, self-esteem, problem-solving, empathy, literacy, and nu-meracy skills (WHO 2010).16 Promoting Alternative Thinking Strategies (PATHS), which targeted readiness and self-control, feelings and relationships, and interpersonal, cognitive problem-solving skills, also showed positive effects on violence prevention. Another positive example is the Behavioral Monitoring and Reinforcement Program, a school-based intervention that was first implemented in the United States and designed to change the negative school behaviour of middle-school adolescents. For more programmes see Appendix 13.1.
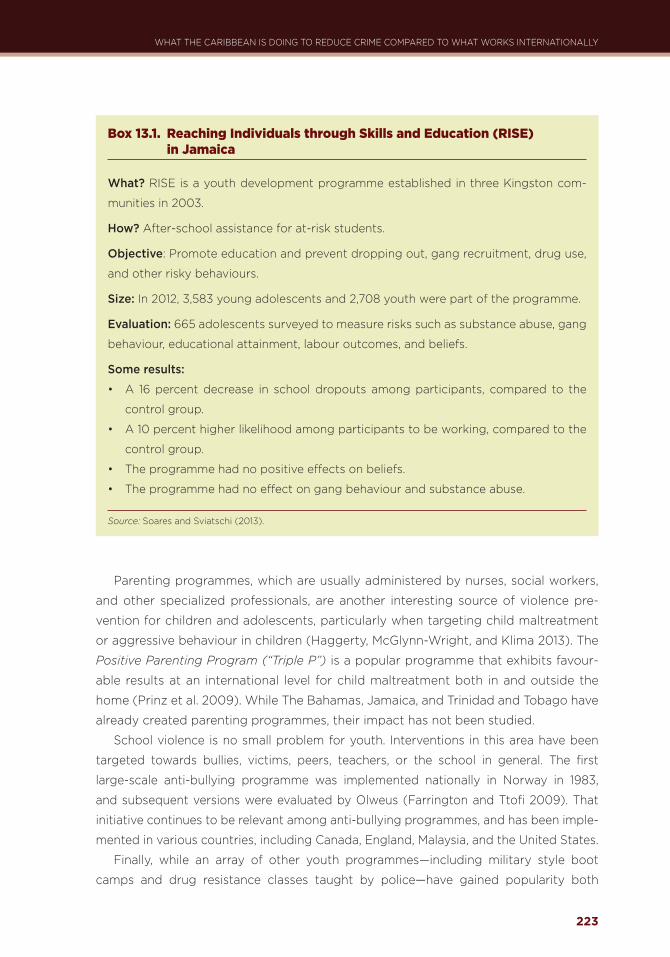
223
WHAT THE CARIBBEAN IS DOING TO REDUCE CRIME COMPARED TO WHAT WORKS INTERNATIONALLY
Parenting programmes, which are usually administered by nurses, social workers,
and other specialized professionals, are another interesting source of violence pre-
vention for children and adolescents, particularly when targeting child maltreatment
or aggressive behaviour in children (Haggerty, McGlynn-Wright, and Klima 2013). The
Positive Parenting Program (“Triple P”) is a popular programme that exhibits favour-
able results at an international level for child maltreatment both in and outside the
home (Prinz et al. 2009). While The Bahamas, Jamaica, and Trinidad and Tobago have
already created parenting programmes, their impact has not been studied.
School violence is no small problem for youth. Interventions in this area have been
targeted towards bullies, victims, peers, teachers, or the school in general. The first
large-scale anti-bullying programme was implemented nationally in Norway in 1983,
and subsequent versions were evaluated by Olweus (Farrington and Ttofi 2009). That
initiative continues to be relevant among anti-bullying programmes, and has been imple-
mented in various countries, including Canada, England, Malaysia, and the United States.
Finally, while an array of other youth programmes—including military style boot
camps and drug resistance classes taught by police—have gained popularity both
Box 13.1. Reaching Individuals through Skills and Education (RISE) in Jamaica
What? RISE is a youth development programme established in three Kingston com-
munities in 2003.
How? After-school assistance for at-risk students.
Objective: Promote education and prevent dropping out, gang recruitment, drug use,
and other risky behaviours.
Size: In 2012, 3,583 young adolescents and 2,708 youth were part of the programme.
Evaluation: 665 adolescents surveyed to measure risks such as substance abuse, gang
behaviour, educational attainment, labour outcomes, and beliefs.
Some results:
• A 16 percent decrease in school dropouts among participants, compared to the
control group.
• A 10 percent higher likelihood among participants to be working, compared to the
control group.
• The programme had no positive effects on beliefs.
• The programme had no effect on gang behaviour and substance abuse.
Source: Soares and Sviatschi (2013).

224
RESTORING PARADISE IN THE CARIBBEAN: COMBATTING VIOLENCE WITH NUMBERS
globally and in the region, the international evidence shows that they do not tend to
make much of a difference.17 Although little research has been done on media inter-
ventions, some programmes have presented promising results, such as the Play Nicely
Program, which consisted of a video programme for parents (Sanders, Montgomery,
and Brechman-Toussaint 2000). Evidence on mentoring has been mixed; only some
studies find that it fosters self-control and resilience among youth (Chandler, Levitt, and
List 2011; Cohen and Piquero 2010; Klevens et al. 2009; Taft et al. 2011). Programmes
targeting fatherhood have not been well studied, but could potentially reduce child
physical discipline and promote fathers’ involvement with their children (see the Early
Head Start Program evaluation by Fergusson, Horwood, and Ritter 2005). Finally, condi-
tional cash transfer programmes may also be promising in increasing household income
17 For a study on drug resistance, see D’Amico et al. (2012); for a study on boot camps, see Wilson, MacKenzie, and Ngo Mitchell (2003).
Table 13.4: Examples of Youth Programmes Implemented in the Caribbean
The Bahamas Barbados Jamaica Trinidad and Tobago
Government-Run Programmes
• National Parenting Programme (Ministry of Social Services and Community Development)
• Barbados Youth Service (Ministry of Culture, Sports and Youth)
• Endless Possibilities (Ministry of Culture, Sports and Youth)
• Juvenile Liaison Scheme (RBPF)
• Health and Family Life Education Programme (Ministry of Education)
• Safe Schools Programme (Ministries of National Security, Health, Education, and Youth; and several NGOs)
• The Parents’ Place (Ministry of Justice/Victim Support Unit – VSU)
• Special Intervention Project for Schools (Ministry of Justice/Victim Support Unit – VSU)
• National Parenting Programme (Ministry of Gender, Youth and Child Development)
• The Gatekeeper Programme (Ministry of Gender, Youth and Child Development and the Toco Foundation)
• Youth Micro-Entrepreneur-ship Programme (Youth Business Trinidad and Tobago)
• National Mentorship Programme (Ministry of Gender, Youth and Child Development)
NGO-Run Programmes
• Hope Centre Mentoring and Basketball (Youth Against Violence)
• Schools Positive Behavioural Management Programme (UNICEF)
• Youth Development Programme Behavior Modification Project (YMCA)
• The Gatekeeper Programme (Ministry of Gender, Youth and Child Development and the Toco Foundation)
Source: Prepared by the authors.

225
WHAT THE CARIBBEAN IS DOING TO REDUCE CRIME COMPARED TO WHAT WORKS INTERNATIONALLY
and mitigating the impact of income shocks, which may ultimately contribute to a re-
duction of crime and violence by young people (Camacho and Mejía 2013). However, the
ultimate success of these programmes will depend on the specific conditions of each
country and how well tailored the programmes are to local risk and protective factors.
13.2.3 Gangs, Guns, and DrugsAs we have seen, gangs, guns, and drug violence are three intimately linked issues.
Addressing them is often associated with the prevention of other types of violence,
particularly youth violence. There is not much evidence associating a reduction of gun
ownership with a reduction in violence. However, there is research showing that con-
trolling access to firearms through legislation can help reduce levels of violent crime
(Kapusta et al. 2007; Rosengart et al. 2005).
Gun violence and gang violence reduction programmes often also target other
specific types of violence or risk factors, such as drugs or street violence. Operation
Ceasefire from Boston and Cure Violence (Braga et al. 2001; Skogan et al. 2008) are
good illustrations of initiatives targeting both gangs and gun violence that include
smarter policing and social outreach services. The evaluation of Operation Ceasefire,
a randomized controlled experimental approach,18 found reductions of 63 percent in
the number of monthly youth homicides in Boston, 32 percent in city-wide shots-fired
calls, and 25 percent in the number of city-wide all-age gun assault incidents.19
A small body of research evidence on Cure Violence in multiple contexts has been
generally positive yet inconclusive (Butts et al. 2015). Some communities have ex-
perienced reductions in violence while others experienced either no change or even
increases in violence. Unfortunately, the research has not yet been able to identify
the conditions under which the programme is most likely to succeed. One strong
possibility is that depth of implementation may be associated with the degree of ef-
fectiveness, thus reinforcing the need for detailed measures of implementation depth
across communities ((Whitehill, Webster, and Varnick 2013). Cure Violence is currently
being implemented in 16 urban communities in the Port of Spain metropolitan area
(Project REASON) and a similar project has been implemented in Jamaica (Peace
Management Initiative), but the results are still unclear due to the lack of evaluation or
the programmes’ recent implementation.
18 The impact analysis in Boston associated with Operation Ceasefire followed a basic one-group time series design. It also used a non-randomized quasi-experiment to compare youth homicide trends in Boston to youth homicide trends in other large U.S. cities.19 To determine if Operation Ceasefire was associated with this decline, the study team conducted a rigorous evaluation of the intervention’s effects on youth violence in the city using carefully constructed, generalized linear models that controlled for trends and seasonal variations.

226
RESTORING PARADISE IN THE CARIBBEAN: COMBATTING VIOLENCE WITH NUMBERS
Two strategies have been successfully evaluated for reducing gun crime and vio-
lence. The first is uniformed police patrols in gun crime hot spots looking for illegally
carried guns (McGarrell, Chermak, and Weiss 1999; Sherman 2000; Sherman and Ro-
gan 1995; Villaveces et al. 2000). The second is background checks for gun owners
(Manson, Guillard, and Lauver 1999; McDowall, Loftin, and Wiersema 1995; Wright,
Wintemute, and Rivara 1999). While gun bans show some promise at reducing gun
violence (Loftin et al. 1991; McDowall, Loftin, and Wiersema 1996), no thorough
field studies have been performed to prove their success. While gun buyback pro-
grammes, on their own, have shown no reduction in gun crime in several studies
(Callaghan, Rivara, and Koepsell 1995; Rosenfeld 1995), such programmes can rep-
resent a way for civilians to legally and safely get rid of guns they no longer want,
have inherited from family, or want to dispose of for other reasons. Other initiatives
such as destroying/reducing stockpiles of unused weapons (i.e., those confiscated
by police) and better controls against diversion from State stockpiles (police and
army) can also be important.
In terms of drug violence, international research suggests that drug courts and cor-
rectional rehabilitation treatment are good alternatives (Rempel et al. 2003; Rossman
et al. 2011). The first creates a type of sentence for those guilty of minor offences and
a potentially good method to reduce recidivism, treat a drug addiction, and/or reduce
criminal acts (see the sections on criminal justice systems and prisons). In the Carib-
bean, there are several government and NGO-run projects that focus on inmate drug
rehabilitation—Inmate Drug Rehabilitation Counselling in Barbados, Program for Drug
and Violence Prevention, Treatment and Rehabilitation in The Bahamas, the Back2Life
Rehabilitation Project in Jamaica, and the Program for Drug and Violence Prevention,
Treatment and Rehabilitation in Trinidad and Tobago (Table 13.5). However, more re-
search is needed to understand the capacity and impact of these programmes.
13.2.4 Situational/NeighbourhoodSituational crime prevention entails changing the landscape and design of urban ar-
eas with the aim of making it more difficult, more risky, or less rewarding to commit
a crime (for example, by improving street-lighting, installing closed-circuit television
cameras, using alley gating, target hardening. etc.).20 Despite the widespread pop-
ularity of these strategies among policymakers, there is limited evidence that they
are actually effective. A growing body of literature shows, however, that implement-
ing urban renewal and neighbourhood improvement programmes can reduce crime
and violence. Owens and Freedman (2011) showed that building affordable housing in
20 For an overview of situational crime prevention evaluations see Pousadela (2014).

227
WHAT THE CARIBBEAN IS DOING TO REDUCE CRIME COMPARED TO WHAT WORKS INTERNATIONALLY
Table 13.5: Examples of Programmes on Gangs, Guns, and Drugs Implemented in the Caribbean
The Bahamas Barbados Jamaica Trinidad and Tobago
Government-Run Programmes
Gangs • Operation Ceasefire (Ministry of National Security)
— • Peace Management Initiative – PMI (Ministry of National Security)
• Criminal Gang and Intelligence Unit (Trinidad and Tobago Police Service)
• Project REASON – Cure Violence adaptation (Citizen Security Programme)
Guns • Firearms Marking and Destruction (Ministry of National Security)
• Operation Ceasefire (Ministry of National Security)
— • Firearm Marking and Stockpile Management (Jamaica Constabulary Force – JCF)
• Counter Trafficking Unit (CTU), Trinidad and Tobago Police Service
Drugs — • Inmate Drug Rehabilitation Counselling (Reintegration Unit of the Barbados Prison Service)
• Caribbean Basin Security Initiative – CBSI (Government of Jamaica/ United States)
• Program for Drug and Violence Prevention, Treatment, and Rehabilitation (PROCCER)
NGO-Run Programmes
Gangs • Hope Center Mentoring and Basketball (Youth Against Violence)
• Justice Improvement Programme (Pinelands Creative Workshop)
— —
Guns — — — • Arms Trade Treaty (Women’s Institute for Alternative Development – WINAD)
Drugs • Program for Drug and Violence Prevention, Treatment, and Rehabilitation (PROCCER); Inter-American Drug Abuse Control Commission – CICAD
• Program for Drug and Violence Prevention, Treatment, and Rehabilitation – PROCCER; Inter-American Drug Abuse Control Commission – CICAD
• Back2Life Rehabilitation Project (Rotary Club )
• Resistance Education Against Drugs (R.E.A.D.) (National Council on Drug Abuse)
—
Source: Prepared by the authors.

228
RESTORING PARADISE IN THE CARIBBEAN: COMBATTING VIOLENCE WITH NUMBERS
low-income communities reduced robberies and assaults by 3 percent and aggravated
assaults by 3 percent for each new unit located in a poor neighbourhood.
International literature indicates that increasing communities’ cohesiveness also
increases what Waller (2014) refers to as a “sense of belonging,” which in turn con-
tributes to neighbours’ feelings of ownership of their community. This has also been
studied by Felston Earls (Hurley 2004) in Chicago in a project for which he proved
that ownership was associated with lower crime rates in certain neighbourhoods.
The Neighborhood Watch Program in Seattle in the 1970s demonstrated a 50 per-
cent reduction in burglaries after implementation (Waller 1982). However, subsequent
implementations in other cities/countries have not all been that successful, mostly be-
cause they did not follow the exact model (Waller 2014). The Bahamas, Barbados, and
Jamaica have also implemented such programmes, again with no evaluation, which
impedes any assessment of their success.
Very few situational prevention programmes have been evaluated under controlled,
experimental conditions, and those that have been examined have shown mixed re-
sults. Welsh and Farrington (2008b) found that closed circuit television (CCTV) had a
modest, though significant, impact on crime. A systematic review of studies on street
lighting also found that improved street lighting had a significant effect on crime, but
unfortunately these results only reflected effectiveness in the United States and the
United Kingdom (Welsh and Farrington 2008a).21 The Caribbean is already moving
towards using CCTV and augmenting street lighting (Table 13.6).
13.2.5 Criminal Justice SystemThere are not many evaluations on the effectiveness of courts to stop crime. However,
many studies have looked into factors that directly shape or affect the criminal justice sys-
tem, such as the creation of specialized courts, including community courts, drug courts,
and mental health courts. Community courts are a relatively new creation focused on
neighbourhoods that look to reduce harm to future victims. Even though their benefits
are still incipient, the specific example of the Midtown Community Court in New York, one
of the first community courts ever created in the United States, confirmed an initial reduc-
tion of re-offending over time (Henry and Kralstein 2011). Drug courts are among the most
successful and studied specialized courts and have been useful in encouraging treatment
programmes for offenders and preventing their re-involvement with drugs (Mitchell et
al. 2012). Evaluations of mental health courts are still very tentative, but they too seem
21 The study analysed 13 improved street lighting evaluations carried out in the United States and the United Kingdom. The study found that crimes increased by 27 percent in control areas compared with experimental areas, or, conversely, crimes decreased by 21 percent in experimental areas compared with control areas (a weighted mean of 1.27; 95 percent confidence interval 1.09–1.47, p = .0008).

229
WHAT THE CARIBBEAN IS DOING TO REDUCE CRIME COMPARED TO WHAT WORKS INTERNATIONALLY
to indicate a potential for reducing
re-offending, particularly when of-
fenders also receive services from
community treatment centres (Sartes-
chi, Vaughn, and Kim 2011).
Figure 13.3 categorizes the effec-
tiveness of programmes to support
criminal justice systems, while Table
13.7 provides examples of programmes
implemented in the Caribbean.
The creation of specialized courts
is part of a popular alternative to
solve crime problems with the use
of diversion methods to avoid get-
ting non-violent offenders involved
with the court system. Other such
strategies include the use of for-
mal and informal cautioning by the
police, such as one-day fines or
Table 13.6: Examples of Situational Programmes Implemented in the Caribbean
The Bahamas Barbados Jamaica Trinidad and TobagoGovernment-Run Programmes
• Urban Renewal 2.0 (Ministry of Public Works/Royal Bahamas Police Force)
• Closed Circuit Television Project (Royal Bahamas Police Force)
• Neighbourhood Watch (Royal Barbados Police Force)
• Operation Safe Homes (Royal Barbados Police Force)
• Kingston Urban Renewal• Closed-Circuit Television
Project (Ministry of National Security/Jamaica Constabulary Force)
• Community Renewal Programme (Prevention) (Ministry of National Security/Planning Institute of Jamaica)
• Neighbourhood Watch (Jamaica Constabulary Force)
• The Gatekeeper Programme (Ministry of Gender, Youth and Child Development and the Toco Foundation)
NGO-Run Programmes• Bahamas
Against Crime Civil Society Movement (Bahamas Against Crime)
— • Jamaica Violence Prevention, Peace and Sustainable Development Programme (multi-agency)
• The Gatekeeper Programme (Ministry of Gender, Youth and Child Development and the Toco Foundation)
Source: Prepared by the authors.
Figure 13.3: Categorization of Programmes to Support Criminal Justice Systems
Otherspecialized
courts
Diversionprogrammes
Boot campsfor adults and
juvenilesLengthyprison
sentences
Criminaljusticesystem
Drug courts and mental
health courts
Cognitivebehavioural
therapy
Restorativejustice
programmes
Effective types of Programs: Highest-quality evidence with statistically significant average effect size favoring the practicePromising types of Programs: Moderate-quality evidence with statistically significant average effect size favoring the practicePrograms with no proven effects: Moderate- to high-quality evidence with statistically significant average effect size in the opposite direction of the intended effect for the practice/Moderate- to high-quality evidence and the average effect size is not different with statistical significance from the comparison group/Insufficient evidence
Source: Prepared by the authors.Note: Programmes are described by colour: effective (green), promising (yellow), ineffective or have no evidence (red).

230
RESTORING PARADISE IN THE CARIBBEAN: COMBATTING VIOLENCE WITH NUMBERS
detentions—although these have not yet been evaluated—or the use of restorative
justice programmes. The latter help victims work through their feelings and reach a
solution, together with offenders, outside of the courts. An international review of the
research on restorative justice programmes (Sherman and Strang 2007) found that
victims were more satisfied, taxpayers saved money, and re-offending rates for some
offences were lower than for those who were incarcerated. A 2008 study by the British
government (Shapland et al. 2008) found that restorative justice reduced reconvic-
tion by an average of 27 percent. Both Jamaica and Trinidad and Tobago have begun
studying the wider application of restorative justice programmes in recent years. It will
be important to monitor the implementation and results of these programmes.
Several hundred studies over the last three decades have looked at what works best
to reduce an inmate’s likelihood of re-offending. Two meta-analyses examined a vari-
ety of the most popular approaches to reducing re-offending (cognitive-behavioural
therapy, social-skills training, academic training, vocational training, etc.).22 Both
found cognitive-behavioural therapy, which targets thought processes and aims to
change decision-making related to crime, to be the most successful of correctional
approaches. Lipsey and Howell (2012) highlight two clear approaches to rehabilitat-
ing offenders: the first aims at personal development through skills, relationships, and
growth (cognitive-behavioural therapy, social skills, academic skills, and vocational).
The second approach includes focusing on deterrence through discipline (i.e., boot
camp), fear of consequences (i.e., Scared Straight), and surveillance (i.e., intensive pro-
bation, electronic monitoring). The interventions using the first approach were found
to be successful, while those using the second approach were not. A promising pro-
gramme applying cognitive behavioural therapy in the Caribbean is the Thinking and
Living Skills Programme of Barbados, but no monitoring of it has been carried out.
The use of electronic methods, including tagging of offenders, is also an incipient
field that presents some promise in preventing relapse into criminal behaviour (Marklund
and Holmberg 2009). The Bahamas is already exploring this method through the elec-
tronic monitoring of persons on bail, while other Caribbean countries including Jamaica
and Trinidad and Tobago are also exploring the possibility of such measures. It will be
important to monitor the implementation and effects of such initiatives.
Finally the literature on fear, shock, incarceration, punishment, or military discipline
identifies no appreciable impact on recidivism. For instance, the Scared Straight inter-
vention, which aims at deterring youth from crime and violence by scaring them away
from prison life, showed no effect on reducing recidivism (Petrosino, Turpin-Petrosino,
and Buehler 2003).
22 Mackenzie (2006) examines 25 independent studies since 1970 and Lipsey and Howell (2012) examine 548 independent studies.

231
WHAT THE CARIBBEAN IS DOING TO REDUCE CRIME COMPARED TO WHAT WORKS INTERNATIONALLY
13.2.6 PoliceCommon knowledge tells us that a police presence can deter crime and disorder
through various mechanisms, but there are many misconceptions about what actual-
ly works and what doesn’t. A one-year study conducted in Kansas City, for example,
showed that random preventive patrols had no real impact on the frequency of crime
(Kelling et al. 1974). Small prevention sections in police departments that have unclear
crime prevention programmes are also highly unsuccessful in lowering crime and vi-
olence rates. For example, Drug Abuse Resistance Education (DARE), developed by
the Los Angeles Police Department, showed no beneficial impact on drug use (Telep
and Weisburd 2012).
Figure 13.4 categorizes the effectiveness of programmes to support the police,
while Table 13.8 provides examples of programmes implemented in the Caribbean.
Hot spot policing, on the other hand, has been quite effective as a law enforcement
strategy to reduce crime and violence. In fact, two decades’ worth of studies have re-
vealed that hot spot policing has been associated with a reduction of crime. A Campbell
systematic review by Braga et al. (2012) found that although not every hot spot study
has shown statistically significant findings, the vast majority have (20 of 25 tests from 19
experimental or quasi-experimental evaluations reported noteworthy crime or disorder
Table 13.7: Examples of Programmes for the Criminal Justice System Implemented in the Caribbean
The Bahamas Barbados Jamaica SurinameTrinidad and Tobago
Government-Run Programmes
• Remand Court (Ministry of National Security)
• Electronic monitoring of persons on bail (Ministry of National Security)
• Swift Justice Initiative (SJI) (Office of the Attorney General)
• The Juvenile Liaison Scheme (Royal Barbados Police Force)
• Thinking and Living Skills Programme (Reintegration Unit of the Barbados Prison Service)
• Diversion Programme (Ministry of Education)
• Peace Management Initiative (Ministry of National Security)
• Justice, Security, Accountability and Transparency Project (Ministry of Justice/ Ministry of National Security)
• Women’s Parliament Forum (VPF)
• Citizen Security Programme (CSP) (Ministry of National Security)
Source: Prepared by the authors.

232
RESTORING PARADISE IN THE CARIBBEAN: COMBATTING VIOLENCE WITH NUMBERS
reductions). This suggests that when
police focus on crime hot spots, they
can have a significant beneficial impact
on crime in these areas. This strategy is
already being implemented in Trinidad
and Tobago and includes a systematic
monitoring/testing of implementation
and results. Problem-oriented po-
licing entails proactively identifying
problems within the community and
developing thoughtful, tailored re-
sponses to address underlying causes
of the problems to develop meaning-
ful and effective solutions (Goldstein
1990). Boston’s Operation Ceasefire is
a successful example of focused-de-
terrence, problem-oriented policing
that has brought about statistically
significant reductions in crime (Braga
et al. 2001).
Crime analysis and crime mapping
are becoming integral parts of some
of the most promising policing strate-
gies. Trinidad and Tobago has adopted
several new initiatives in this direction, including the implementation of Geographic In-
formation System (GIS) geo-coding of police data, weekly crime strategy (COMSTATT)
meetings, and hot spot policing.
Although focusing on repeat victimization requires considerable cooperation be-
tween the police and other government agencies, important improvements can also be
achieved by focusing on the victims, particularly when implementing problem-oriented
policing (Waller 2014).
There is a wide array of other promising programmes whose effectiveness has not
yet been fully proven, but that have yielded positive results in certain contexts. Com-
munity policing programmes, for instance, have been effective in certain contexts,
including door-to-door visits by the police, neighbourhood watch programmes, and
local community participation (Bennett, Holloway, and Farrington 2008; Evans and
Owens 2007; García, Mejía, and Ortega 2013; Sherman et al. 1997). Drug awareness pro-
grammes, community meetings, storefront offices, and newsletters have not yielded
positive results (Santos 2014; Telep and Weisburd 2012; Weisburd and Eck 2004).
Figure 13.4: Categorization of Programmes to Support the Police
Standardmodel,reactivepolicing
Randompatrols
Generalincreases in
arrests
Drug AbuseResistanceEducationtaught byofficers inschools
Repeatoffender
Hotproducts
Communitypolicing
Brokenwindowspolicing
Police
Problem-OrientedPolicing(POP)
Focus onrepeat
victims andoffenders
Directedpatrols for
gun violence
DNAfor police
investigations
Hot spotpolicing
Effective types of Programs: Highest-quality evidence with statistically significant average effect size favoring the practicePromising types of Programs: Moderate-quality evidence with statistically significant average effect size favoring the practicePrograms with no proven effects: Moderate- to high-quality evidence with statistically significant average effect size in the opposite direction of the intended effect for the practice/Moderate- to high-quality evidence and the average effect size is not different with statistical significance from the comparison group/Insufficient evidence
Source: Prepared by the authors.Note: Programmes are described by colour: effective (green), promising (yellow), ineffective or have no evidence (red).

233
WHAT THE CARIBBEAN IS DOING TO REDUCE CRIME COMPARED TO WHAT WORKS INTERNATIONALLY
13.2.7 PrisonsThere is forceful proof showing that correctional rehabilitation treatments can provide
inmate well-being and stability in a prison environment and deter recidivism. Two me-
ta-analyses examine a variety of the most popular approaches to reducing re-offending
(cognitive-behavioural therapy, social-skills training, academic training, vocational train-
ing, etc.).23 Both found cognitive-behavioural therapy—which targets thought processes
and aims to change decision-making related to crime—to be the most successful of
correctional approaches (Lipsey and Howell 2012; MacKenzie 2006).
Figure 13.5 categorizes the effectiveness of programmes for prison systems, while
Table 13.9 provides examples of programmes implemented in the Caribbean.
There are few robust studies on re-entry programmes, although some, such
as the Post-Release Employment Project in the United States, indicate positive ef-
fects on recidivism (Saylor and Gaes 1997). Halfway houses that have social, health,
mentoring, and counselling services have also been shown to reduce recidivism (Say-
lor and Gaes 1997). Barbados, Jamaica, and Trinidad and Tobago have all created
23 MacKenzie (2006) examines 25 independent studies since 1970 and Lipsey and Howell (2012) examine 548 independent studies.
Table 13.8: Examples of Police Programmes Implemented in the Caribbean
The Bahamas Barbados Jamaica Trinidad and Tobago
Government-Run Programmes
• CompStat (Royal Bahamas Police Force) Hot spot policing (Royal Bahamas Police Force)
• Community Policing (Royal Barbados Police Force)
• Neighbourhood Watch (Royal Barbados Police Force)
• Jamaica Community Empowerment and Transformation Project (COMET I, II) (Ministry of National Security/Jamaica Constabulary Force)
• Citizen Security and Justice Programme II, III (Ministry of National Security/ Ministry of Justice)
• Jamaica Constabulary Force Accountability Programme (Ministry of Justice)
• Citizen Security Programme
• Increased police presence (Trinidad and Tobago Police Service – TTPS )
• Criminal Gang and Intelligence Unit (TTPS)
• Hot spot policing (TTPS)• COMSTATT meetings at
the national, divisional, and local levels (TTPS)
• Hemostatic Bandage Initiative (TTPS)
• Body-work camera pilot (TTPS)
• Military-Led Academic Training Programme (Ministry of National Security/Trinidad and Tobago Defence Force)
• Caribbean Basin Security Initiative (U.S. government)
Source: Prepared by the authors.

234
RESTORING PARADISE IN THE CARIBBEAN: COMBATTING VIOLENCE WITH NUMBERS
different rehabilitation treatments
implemented at correctional facilities
or after release. However, the lack of
evaluation impedes any assessment
of their effectiveness.
13.2.8 How Can the Private Sector Contribute?
The private sector is often impact-
ed by crime and violence, but it has
also recently become a new agent
in the fight against these problems.
Although not much evidence exists,
interest in public-private partner-
ships (PPPs) in the area of crime and
violence prevention is growing. This
type of cooperation may take sev-
eral forms, including joint responses
to crimes in progress between police
and the private sector, joint gathering of crime intelligence, joint planning and policing
of special events, and sharing of expert knowledge and training. Involvement can be
Table 13.9: Examples of Prison and Rehabilitation Programmes Implemented in the Caribbean
The Bahamas Barbados Jamaica Trinidad and Tobago
Government-Run Programmes
• Juvenile Aftercare (Ministry of Social Services and Community Development)
• Thinking and Living Skills Programme (Reintegration Unit of the Barbados Prison Service)
• Offender Psychological Counselling (Her Majesty’s Prison)
• Jamaica Reducing Re-Offending Action Plan (Ministry of National Security/ Department of Correctional Services)
• Rehabilitation Programmes (Trinidad and Tobago Prison Service)
• Thinking for a Change Programme (Ministry of the People and Social Development)
NGO-Run Programmes
• Project Re-Entry Bahamas (National L.E.A.D. Institute)
• Prison Fellowship (Prison Fellowship)
— • Female Prisoner Welfare Project (Hibiscus)
—
Source: Prepared by the authors.
Figure 13.5: Categorization of Programmes for Prison Systems
Privateconfinement
Longersentences
Re-entryprogrammes
Prison
Cognitivebehavioural
therapy
Correctionalrehabilitation
Effective types of Programs: Highest-quality evidence with statistically significant average effect size favoring the practicePromising types of Programs: Moderate-quality evidence with statistically significant average effect size favoring the practicePrograms with no proven effects: Moderate- to high-quality evidence with statistically significant average effect size in the opposite direction of the intended effect for the practice/Moderate- to high-quality evidence and the average effect size is not different with statistical significance from the comparison group/Insufficient evidence
Source: Prepared by the authors.Note: Programmes are described by colour: effective (green), promising (yellow), ineffective or have no evidence (red).

235
WHAT THE CARIBBEAN IS DOING TO REDUCE CRIME COMPARED TO WHAT WORKS INTERNATIONALLY
direct, indirect, or mixed, and at either the national level—like the National Platform
for Crime Control in the Netherlands or the Business Network on Crime Prevention
in Canada—or at the community level—such as Target’s Safe City Program (La Vigne,
Owens, and Hetrick 2009) and Business Improvement Districts (BIDs) (Brooks 2008;
Cook and MacDonald 2011; Hoyt 2005). Chapter 10 explores PPPs in more detail.
The Crime Stop Partnership in Jamaica is one example of cooperation between the
media, private sector, police, and community that was established to counter crime.
The programme awarded persons providing anonymous information leading to the
arrest of criminals and the recovery of stolen property, illegal firearms, and illegal nar-
cotics (Goldberg, Kim, and Ariano 2014).24
13.3 ConclusionsA number of legislative initiatives on crime and violence have been undertaken by the
countries in the Caribbean in the past few years. Some positive trends are noticeable
in the region, especially the inclusion of new types of evidence and the ratification
of important international agreements. Several foundational laws have also been ap-
proved throughout the region. They have helped to better define certain types of
crimes and violent behaviours, and provided tools and protection for victims, includ-
ing children and juveniles, within the justice system. Unfortunately, the region is still in
need of better legal definitions of crime with more targeted categories, especially with
respect to domestic violence, sexual harassment, and child abuse.
Although recent signs of a paradigm shift are beginning to be noticeable in the
Caribbean, there has been a marked tendency to adopt “tougher” judicial measures,
including stricter and longer sentences that might prove too costly for the countries
and that have overall negative effects on the levels of crime and violence in the region.
Some of these laws, such as the denial of bail, are especially contentious for their
rights-abrogating effects. Overall, more and continuous work is needed to prepare
and effectively implement laws that increase the prosecution capabilities of the sys-
tem, while targeting and (most importantly) preventing prevalent crimes in the region.
The effective implementation of laws also depends on the complementary policies
and programmes that accompany them.
In this sense, there have been recent investments in crime and violence prevention
in the Caribbean. However, the limited budget allocated to programmes against crime
and violence in comparison to more traditional and reactive law enforcement exposes
the continual favouring of policies and programmes that aim to counter crime with
24 From 1989 to 2009, information from the partnership led to 1,942 arrests, recovered about $2 million in property, and destroyed narcotics worth $5 million. See Goldberg, Kim, and Ariano (2014, 61).

236
RESTORING PARADISE IN THE CARIBBEAN: COMBATTING VIOLENCE WITH NUMBERS
more repression, rather than with preventive initiatives. More worrisome is the fact
that very rarely do programmes contain evaluation and monitoring components. This
makes it impossible to assess the successful or failed implementation of any initiative.
This chapter has provided an initial framework of what has worked in other contexts
and can potentially be implemented in the Caribbean.

237
WHAT THE CARIBBEAN IS DOING TO REDUCE CRIME COMPARED TO WHAT WORKS INTERNATIONALLY
App
endi
x 13
.1. L
egis
latio
n an
d A
men
dmen
ts o
n C
rime
and
Viol
ence
by
Coun
try
The
Bah
amas
Bar
bado
sJa
mai
caSu
rina
me
Trin
idad
and
Tob
ago
Proc
edur
al
law
Bai
l Act
Am
endm
ents
, 20
11:
• St
rict
er r
equi
rem
ents
for
bai
l
Pena
l Cod
e A
men
dmen
ts, 2
011
:•
Incr
ease
d s
ente
ncin
g p
ower
fo
r m
agis
trat
es•
Incr
ease
d p
enal
ties
incl
udin
g
dea
th p
enal
ty•
Min
ors
can
be
conv
icte
d
up u
ntil
20 y
ears
of
imp
riso
nmen
t
Evid
ence
Act
, 20
11 (
2013
, 20
14):
• P
ossi
bili
ty t
o us
e vi
deo
as
evid
ence
in c
erta
in c
ases
• P
ossi
bili
ty t
o us
e p
revi
ous
conv
icti
ons
as e
vid
ence
• G
ive
evid
ence
by
way
of
live
tele
visi
on•
Pos
sib
ility
to
use
dat
a fr
om
elec
tron
ic d
evic
e
Cou
rt o
f App
eals
Am
endm
ent,
20
11:
• P
ossi
bili
ty f
or p
rose
cuti
on t
o ap
pea
l a r
ulin
g t
o up
hold
a
“no
case
sub
mis
sion
” or
to
wit
hdra
w t
he c
ase
from
jury
Proc
eeds
of C
rim
e (A
men
dmen
t):
• In
clus
ion
of t
he p
ossi
bili
ty t
o se
ize
per
sona
l pro
per
ty b
y p
olic
e offi
cers
Mut
ual A
ssis
tanc
e in
Cri
min
al
Mat
ters
Act
Cap
. 140
A:
• M
akes
pro
visi
ons
to
faci
litat
e m
utua
l ass
ista
nce
in c
rim
inal
mat
ters
wit
hin
the
Com
mon
wea
lth
Pris
ons
Act
Cap
. 168
, 20
14:
• A
bol
itio
n of
the
use
of
corp
oral
pun
ishm
ent
in
pri
sons
• C
ond
itio
nal r
elea
se o
f p
riso
ners
Pena
l Sys
tem
Ref
orm
Act
Cap
. 13
9, 2
010
:•
Pos
sib
ility
to
awar
d
com
pen
sati
on f
or p
erso
nal
inju
ry, l
oss
or d
amag
e
Evid
ence
Act
, Cap
. 121
, 20
14:
• C
onfe
ssio
ns o
r ad
mis
sion
s ar
e so
und
rec
ord
ed•
Vis
ual i
den
tific
atio
n ev
iden
ce a
dd
uced
by
the
pro
secu
tor
is o
nly
adm
issi
ble
in v
ery
spec
ific
case
s
Cri
min
al A
ppea
l Act
Cap
. 11
3A:
• P
ossi
bili
ty t
o d
etai
n a
per
son
in a
men
tal h
osp
ital
w
hen
app
licab
le•
Ab
olis
hmen
t of
cer
tain
ri
ght
s of
ap
pea
l
Off
ence
s ag
ains
t th
e Pe
rson
(A
men
dmen
t)
Act
, 20
10:
• In
crea
sed
sen
tenc
e fo
r sh
ooti
ng w
ith
inte
nt
Mis
cella
neou
s Pr
ovis
ions
(K
idna
ppin
g an
d B
ail)
Act
, 20
11:
• In
crea
sed
pen
alti
es f
or
kid
nap
pin
g
Bai
l (A
men
dmen
t) B
ill,
2013
:•
Incr
ease
s th
e d
ifficu
lty
of r
ecei
ving
bai
l for
re
pea
t off
end
ers
for
spec
ific
offen
ces
Am
endm
ent
of t
he
Adm
inis
trat
ion
of J
usti
ce-
Deo
xyri
bonu
clei
c A
cid
Act
N
o. 5
of 2
012
(D
NA
Act
):•
Leg
al f
ram
ewor
k w
ithi
n w
hich
for
ensi
c D
NA
ev
iden
ce c
an b
e us
ed
in t
he in
vest
igat
ion
and
p
rose
cuti
on o
f cr
imin
al
mat
ters
(con
tinu
ed o
n ne
xt p
age)

238
RESTORING PARADISE IN THE CARIBBEAN: COMBATTING VIOLENCE WITH NUMBERS
App
endi
x 13
.1. L
egis
latio
n an
d A
men
dmen
ts o
n C
rime
and
Viol
ence
by
Coun
try
The
Bah
amas
Bar
bado
sJa
mai
caSu
rina
me
Trin
idad
and
Tob
ago
Proc
edur
al
law
(con
tinue
d)
Juri
es (
Am
endm
ent)
:•
Qua
lifica
tion
s fo
r ju
ry s
ervi
ce•
Reg
ulat
ion
on ju
ry li
sts
• R
egul
atio
n on
ap
plic
atio
ns t
o re
mov
e na
me
from
ap
pro
ved
lis
t•
Reg
ulat
ion
of m
etho
dol
ogy
to d
raw
juro
rs•
Reg
ulat
ion
on t
he s
ervi
ce o
f su
mm
ons
• R
egul
atio
n on
rep
eal a
nd
rep
lace
men
t o
f ju
rors
Bai
l (A
men
dmen
t):
• G
ives
the
bur
den
of
pro
of t
o ap
plic
ant
for
bai
l
Prec
ious
Met
als
and
Seco
nd
Han
d M
etal
s A
ct, 2
013
:•
Mea
sure
s to
con
trol
the
tr
ade
of p
reci
ous
met
als
and
sec
ond
-han
d m
etal
s
Off
ence
s ag
ains
t th
e Pe
rson
(A
men
dmen
t B
ill),
20
14:
• A
bol
ish
the
man
dat
ory
imp
osit
ion
of t
he p
enal
ty
of d
eath
for
the
off
ence
of
mur
der
and
mak
e it
op
tion
al
Pena
l Sys
tem
Ref
orm
(A
men
dmen
t) B
ill, 2
014
:•
Gui
del
ines
for
mit
igat
ing
a
sent
ence
• Se
nten
cing
gui
del
ines
Just
ice
syst
em
legi
slat
ion
200
9 Po
lice
Act
:•
Ad
ds
a m
axim
um o
f 10
yea
rs
for
pol
ice
com
mis
sion
er
tenu
re•
Pos
sib
ility
of
imp
riso
nmen
t fo
r p
olic
e offi
cers
who
use
un
nece
ssar
y vi
olen
ce
Just
ice
Prot
ecti
on A
ct
(Am
endm
ent)
, 20
14:
• R
egul
ates
ag
ains
t ob
stru
ctio
n of
just
ice
Prev
enti
on o
f Bri
bery
Act
(A
men
dmen
t), 2
014
:•
Bri
bes
to
fore
ign/
loca
l pub
lic
offici
als
Lega
l Aid
and
Adv
ice
(Am
endm
ent)
Act
, 20
12:
• C
reat
ion
of p
anel
of
att
orne
ys-a
t-la
w
who
pro
vid
e le
gal
re
pre
sent
atio
n fo
r m
inor
s an
d p
erso
ns
det
aine
d o
n su
spic
ion
of
cap
ital
off
ence
(con
tinu
ed o
n ne
xt p
age)
(con
tinu
ed)

239
WHAT THE CARIBBEAN IS DOING TO REDUCE CRIME COMPARED TO WHAT WORKS INTERNATIONALLY
App
endi
x 13
.1. L
egis
latio
n an
d A
men
dmen
ts o
n C
rime
and
Viol
ence
by
Coun
try
The
Bah
amas
Bar
bado
sJa
mai
caSu
rina
me
Trin
idad
and
Tob
ago
Just
ice
syst
em
legi
slat
ion
(con
tinue
d)
Cor
rect
iona
l Ser
vice
s A
ct, 2
014
:•
Reg
ulat
ion
of le
gal
cus
tod
y of
per
son
• R
egul
atio
n of
ad
min
istr
atio
n an
d f
unct
ions
of
corr
ecti
onal
fa
cilit
ies
and
hol
din
g f
acili
ties
• E
stab
lishm
ent
of C
orre
ctio
nal
Serv
ices
Rev
iew
Boa
rd•
Reg
ulat
ion
of e
mp
loym
ent
and
ear
ning
of
inm
ates
• R
egul
atio
n of
rem
oval
and
d
isch
arg
e of
inm
ates
• R
elea
se o
f in
mat
es o
n lic
ense
• R
egul
atio
n of
off
ence
s co
mm
itte
d b
y in
mat
es
Gan
g le
gisl
atio
nPe
nal C
ode
Am
endm
ent,
20
14:
• D
efini
tion
of
gan
g•
Par
tici
pat
ion
in u
nlaw
ful g
ang
is
an
offen
ce
Just
ice
Prot
ecti
on A
ct
(Am
endm
ent)
, 20
14:
• A
nti-
gan
g o
ffen
ces
The
Cri
min
al J
usti
ce
(Sup
pres
sion
of
Cri
min
al
Org
aniz
atio
ns)
Act
, 20
14:
• O
ffen
ce o
f b
eing
p
art
of c
rim
inal
or
gan
izat
ion
and
co
llab
orat
ing
w
ith
crim
inal
or
gan
izat
ions
• C
rim
inal
izes
a
bro
ad r
ang
e of
b
ehav
iour
link
ed
to g
ang
s, in
clud
ing
g
ang
mem
ber
ship
, fa
cilit
atin
g
gan
g-r
elat
ed
crim
inal
act
ivit
ies,
ad
visi
ng g
ang
s,
and
rec
ruit
ing
for
g
ang
s
Ant
i-G
ang
Act
, 20
11:
• C
reat
ion
of g
ang
-rel
ated
off
ence
s
(con
tinu
ed o
n ne
xt p
age)
( con
tinu
ed)

240
RESTORING PARADISE IN THE CARIBBEAN: COMBATTING VIOLENCE WITH NUMBERS
App
endi
x 13
.1. L
egis
latio
n an
d A
men
dmen
ts o
n C
rime
and
Viol
ence
by
Coun
try
The
Bah
amas
Bar
bado
sJa
mai
caSu
rina
me
Trin
idad
and
Tob
ago
Org
aniz
ed
crim
e le
gisl
atio
n
Pena
l Cod
e A
men
dmen
t, 2
014
:•
Defi
niti
on o
f or
gan
ized
cri
me
gro
up•
Par
tici
pat
ion
in o
rgan
ized
cr
ime
is a
n off
ence
Ant
i-Ter
rori
sm A
ct
(Am
endm
ent)
:•
Reg
ulat
es t
erro
rist
ent
itie
s
Tran
snat
iona
l Org
aniz
ed
Cri
me
(Pre
vent
ion
and
Con
trol
) A
ct, 2
011
:•
Forc
ed la
bou
r, ex
plo
itat
ion
or t
he p
rost
itut
ion
of
per
sons
or
any
sexu
al
exp
loit
atio
n is
an
offen
ce
Proc
eeds
of C
rim
e (A
men
dmen
t) A
ct,
2013
:•
Pos
sib
ility
to
trac
e ta
x p
aym
ents
• Im
pos
itio
n of
lim
it o
n ca
sh
tran
sact
ions
w
ith
finan
cial
in
stit
utio
ns•
Ove
rsig
ht r
egim
e fo
r d
esig
nate
d
non-
finan
cial
b
usin
esse
s an
d
pro
fess
ions
Traffi
ckin
g in
Pe
rson
s (P
reve
ntio
n,
Supp
ress
ion
and
Puni
shm
ent)
(A
men
dmen
t) A
ct,
2013
:•
Incr
ease
d
sent
ence
s fo
r tr
affick
ing
of
per
sons
• A
gg
rava
ting
fa
ctor
s fo
r tr
affick
ing
of
per
sons
• P
ossi
bili
ty t
o re
que
st t
he
pay
men
t of
re
stit
utio
n
Traffi
ckin
g in
Per
sons
Act
, 20
11:
• A
ims
to p
resc
rib
e m
easu
res
to fi
ght
and
co
ntro
l tra
ffick
ing
in
per
sons
incl
udin
g
child
ren
Mis
cella
neou
s Pr
ovis
ions
(P
roce
eds
of C
rim
e,
Ant
i-Ter
rori
sm, F
inan
cial
In
telli
genc
e U
nit
of
Trin
idad
and
Tob
ago)
Act
, 20
14:
• In
clud
es m
oney
la
und
erin
g a
s off
ence
• R
equi
rem
ent
for
finan
cial
inst
itut
ions
to
inve
stig
ate
susp
icio
us
tran
sact
ions
(con
tinu
ed o
n ne
xt p
age)
( con
tinu
ed)

241
WHAT THE CARIBBEAN IS DOING TO REDUCE CRIME COMPARED TO WHAT WORKS INTERNATIONALLY
App
endi
x 13
.1. L
egis
latio
n an
d A
men
dmen
ts o
n C
rime
and
Viol
ence
by
Coun
try
The
Bah
amas
Bar
bado
sJa
mai
caSu
rina
me
Trin
idad
and
Tob
ago
Org
aniz
ed
crim
e le
gisl
atio
n(c
ontin
ued)
Law
Ref
orm
(F
raud
ulen
t Tr
ansa
ctio
ns)
(Spe
cial
Pro
visi
ons)
A
ct, 2
014
:•
Seve
ral f
raud
ulen
t tr
ansa
ctio
ns a
re
esta
blis
hed
as
offen
ces
incl
udin
g
obta
inin
g p
rop
erty
by
fal
se p
rete
nce
or u
sing
an
acce
ss
dev
ice
to t
rans
fer
or t
rans
por
t m
oney
Cri
min
al J
usti
ce
(Sup
pres
sion
of
Cri
min
al
Org
aniz
atio
ns)
Act
, 20
14:
• A
dd
ress
es c
rim
inal
or
gan
izat
ions
an
d c
rim
inal
izes
co
nduc
t re
late
d t
o cr
imin
al a
ctiv
ity
Dru
g le
gisl
atio
nD
ange
rous
Dru
gs A
ct
Am
endm
ent,
20
11:
• In
crea
sed
sen
tenc
es f
or
pos
sess
ion
wit
h in
tent
to
sup
ply
and
for
sup
ply
ing
d
rug
s to
min
ors
Dru
g A
buse
(Pr
even
tion
and
C
ontr
ol)
Cap
. 13,
199
1D
ange
rous
Dru
gs A
ct,
1996
Dan
gero
us D
rugs
Act
, 199
1
(con
tinu
ed o
n ne
xt p
age)
(con
tinu
ed)

242
RESTORING PARADISE IN THE CARIBBEAN: COMBATTING VIOLENCE WITH NUMBERS
App
endi
x 13
.1. L
egis
latio
n an
d A
men
dmen
ts o
n C
rime
and
Viol
ence
by
Coun
try
The
Bah
amas
Bar
bado
sJa
mai
caSu
rina
me
Trin
idad
and
Tob
ago
Fire
arm
le
gisl
atio
nFi
rear
ms
Act
Am
endm
ents
, 20
11 a
nd 2
014
:•
Incr
ease
d s
ente
nces
• In
clus
ion
of d
efini
tion
s of
am
mun
itio
n, il
licit
tra
ffick
ing
an
d il
licit
man
ufac
turi
ng•
Exp
orti
ng o
r tr
ansf
er o
f fir
earm
s w
itho
ut li
cens
e p
rohi
bit
ed
Fire
arm
s C
ap. 1
79, 2
00
3Fi
rear
ms
Act
A
men
dmen
t, 2
010
:•
Incr
ease
d
sent
ence
s (m
and
ator
y 15
ye
ar m
inim
um)
for
imp
orti
ng,
exp
orti
ng,
tran
ship
men
t w
itho
ut a
lice
nse,
m
anuf
actu
ring
/ d
ealin
g/
pur
chas
ing
/se
lling
pro
hib
ited
w
eap
ons
wit
hout
p
erm
it, u
se o
f a
firea
rm in
co
mm
issi
on o
f a
felo
ny
Fire
arm
s (A
men
dmen
t)
Act
, 20
11:
• In
crea
sed
pen
alti
es
Dom
esti
c vi
olen
ceTh
e 20
07
Dom
esti
c V
iole
nce
(Pro
tect
ion
Ord
ers)
Act
:•
Bro
ader
defi
niti
on o
f d
omes
tic
viol
ence
(in
clud
ing
p
hysi
cal,
sexu
al, e
mot
iona
l or
psy
chol
ogic
al, a
nd fi
nanc
ial
abus
e)•
Incl
udes
in t
he d
efini
tion
re
lati
onsh
ips
othe
r th
an
mar
riag
e•
Allo
ws
for
pro
tect
ion
ord
ers
to b
e is
sued
by
the
cour
t to
p
rote
ct a
vic
tim
fro
m t
he
per
pet
rato
r
Dom
esti
c V
iole
nce
(Pro
tect
ion
Ord
ers)
, Act
, 199
2D
omes
tic
Vio
lenc
e (A
men
dmen
t) A
ct,
200
4:•
Pos
sib
ility
to
gra
nt
pro
tect
ion
ord
ers
Act
C
omba
ting
D
omes
tic
Vio
lenc
e,
200
9
Dom
esti
c V
iole
nce
Act
, 19
99
(con
tinu
ed o
n ne
xt p
age)
(con
tinu
ed)

243
WHAT THE CARIBBEAN IS DOING TO REDUCE CRIME COMPARED TO WHAT WORKS INTERNATIONALLY
App
endi
x 13
.1. L
egis
latio
n an
d A
men
dmen
ts o
n C
rime
and
Viol
ence
by
Coun
try
The
Bah
amas
Bar
bado
sJa
mai
caSu
rina
me
Trin
idad
and
Tob
ago
Sexu
al
viol
ence
Sexu
al O
ffen
ces
Act
A
men
dmen
ts, 2
011
:•
Incr
ease
d p
enal
ty f
or r
ape
Sexu
al O
ffen
ces
Act
A
men
dmen
ts, 2
014
:•
Cre
atio
n of
sex
off
end
er
reg
istr
y
The
1991
Sex
ual O
ffen
ces
and
Dom
esti
c V
iole
nce
Act
, A
men
ded
200
8:•
Incr
ease
d p
enal
ty f
or s
erio
us
sexu
al o
ffen
ces
• In
clus
ion
of c
rim
es o
f vo
yeur
ism
and
ele
ctro
nic
per
secu
tion
Sexu
al O
ffen
ces
Act
, 20
02
Sexu
al O
ffen
ces
Act
, 20
09:
• R
epla
cem
ent
of
cate
gor
y of
“ca
rnal
ab
use”
wit
h ne
w
gen
der
-neu
tral
ca
teg
ory
“sex
wit
h p
erso
ns u
nder
16”
• In
crea
sed
pen
alti
es
for
per
pet
rato
rs
of s
exua
l vio
lenc
e ag
ains
t ch
ildre
n
Sexu
al O
ffen
ces
(Reg
istr
atio
n of
Se
x O
ffen
ders
) R
egul
atio
ns, 2
012
:•
Est
ablis
hmen
t of
se
xual
off
ence
s re
gis
try
Sexu
al O
ffen
ces
Act
, 198
6 A
men
ded
200
0:
• In
crea
se p
enal
ties
for
se
xual
off
ence
s
Chi
ld
abus
eM
arco
’s L
aw, 2
013
and
20
14:
• Im
ple
men
tati
on o
f al
ert
for
mis
sing
chi
ldre
n•
Incl
usio
n of
sex
ual o
ffen
der
s re
gis
try
• R
ules
to
the
Mar
co a
lert
sy
stem
for
mis
sing
chi
ldre
n
The
200
7 C
hild
Pro
tect
ion
Act
:•
Incr
ease
d p
enal
ties
for
chi
ld
abus
e•
Ob
ligat
ion
to r
epor
t ch
ild
abus
e•
Sup
ervi
sion
ord
ers
are
issu
ed
first
bef
ore
child
ren
are
sent
to
det
enti
on c
entr
es•
Cha
nge
to a
ge
of c
hild
to
18,
det
enti
on a
ge
also
18
Prev
enti
on o
f Cru
elty
to
Chi
ldre
n A
ct, 1
985
Chi
ld C
are
and
Prot
ecti
on A
ct, 2
00
4:•
Est
ablis
hmen
t of
ch
ild r
egis
try
• P
rovi
sion
s on
chi
ld
crue
lty,
tra
ffick
ing
• E
stab
lishm
ent
of
pro
visi
ons
for
care
an
d p
rote
ctio
n of
ch
ildre
n
Chi
ld P
orno
grap
hy
(Pre
vent
ion)
Act
, 20
09:
• In
crea
sed
pen
alti
es
for
per
pet
rato
rs
of s
exua
l vio
lenc
e ag
ains
t ch
ildre
n
Chi
ldre
n A
ct, 2
012
:•
Reg
ulat
ion
of a
bus
e of
chi
ldre
n th
roug
h p
rost
itut
ion
and
ot
her
sexu
al o
ffen
ces,
em
plo
ymen
t of
you
ng
per
sons
, and
off
ence
s re
lati
ng t
o d
ang
erou
s d
rug
s, t
obac
co, a
nd
alco
hol
• Ju
veni
le C
ourt
whe
n ch
arg
es a
gai
nst
child
ren
(con
tinu
ed o
n ne
xt p
age)
(con
tinu
ed)

244
RESTORING PARADISE IN THE CARIBBEAN: COMBATTING VIOLENCE WITH NUMBERS
App
endi
x 13
.1. L
egis
latio
n an
d A
men
dmen
ts o
n C
rime
and
Viol
ence
by
Coun
try
The
Bah
amas
Bar
bado
sJa
mai
caSu
rina
me
Trin
idad
and
Tob
ago
Oth
er
legi
slat
ion
Priv
ate
Secu
rity
Indu
stry
, B
ill, 2
014
:•
Issu
e, r
evok
e, s
usp
end
, ca
ncel
, and
diff
eren
tiat
e p
riva
te s
ecur
ity
licen
ses
• E
stab
lish
trai
ning
and
p
ract
ical
sta
ndar
ds
for
the
cert
ifica
tion
of
secu
rity
offi
cers
• E
stab
lish
pub
lic r
egis
ter
of h
old
ers’
lice
nses
(con
tinu
ed)

245
WHAT THE CARIBBEAN IS DOING TO REDUCE CRIME COMPARED TO WHAT WORKS INTERNATIONALLY
App
endi
x 13
.2.
Effec
tive
Prog
ram
mes
by
Topi
cEff
ecti
ve P
rogr
amm
es: H
ighe
st-q
ualit
y ev
iden
ce (
met
a-ev
alua
tion
or
rand
om c
ontr
olle
d tr
ial)
wit
h st
atis
tica
lly s
igni
fican
t av
erag
e eff
ect
size
fa
vour
ing
the
prac
tice
, gen
eral
ly in
mor
e th
an o
ne lo
cati
on.
Subj
ect
Evid
ence
-Bas
ed P
rogr
amm
es
Vio
lenc
e ag
ains
t w
omen
• A
dvo
cacy
inte
rven
tion
s fo
r w
omen
who
exp
erie
nce
inti
mat
e p
artn
er v
iole
nce
(Ram
say
et a
l. 20
09)
• C
hang
ing
soc
ial n
orm
s: –
Men
tors
in V
iole
nce
Pre
vent
ion
(War
d 1
999)
• M
icro
finan
ce:
–So
uth
Afr
ica’
s In
terv
enti
on w
ith
Mic
rofin
ance
for
AID
S an
d G
end
er E
qui
ty (
IMA
GE
) (P
rony
k et
al.
200
6)•
Cen
tres
for
wom
en:
–V
iole
nce
pre
vent
ion
and
car
e ce
ntre
s fo
r w
omen
(K
iely
et
al. 2
010
) –
Shel
ters
for
bat
tere
d w
omen
(E
llesb
erg
et
al. 2
014
) –
Sexu
al A
ssau
lt N
urse
Exa
min
ers
(SA
NE
) (C
amp
bel
l et
al. 2
014
)•
Med
ia in
terv
enti
ons:
–So
ul C
ity
Sout
h A
fric
a (G
old
stei
n et
al.
200
5)•
Four
th R
(W
olf
et a
l. 20
09)
Yout
h p
rim
ary
pre
vent
ion
• M
ento
ring
: –
Big
Bro
ther
/Big
Sis
ter
Pro
gra
m (
Tier
ney,
Bal
dw
in G
ross
man
, and
Res
ch 2
00
0)
• Sk
ill t
rain
ing
: –
Voc
atio
nal t
rain
ing
for
you
th (
JOB
STA
RT
– C
ave
et a
l. 19
93)
–Li
fe s
kills
tra
inin
g (
Lose
l and
Bee
lman
20
06)
• P
rog
ram
mes
for
chi
ld a
bus
e: –
Fam
ily t
hera
peu
tic
inte
rven
tion
s ag
ains
t ch
ild a
bus
e (C
urti
s, R
onan
, and
Bor
dui
n 20
04
)•
Ag
gre
ssio
n R
epla
cem
ent
Trai
ning
(A
RT)
(G
und
erse
n an
d S
vart
dal
20
06)
• C
ogni
tive
-beh
avio
ural
the
rapy
(C
BT)
pro
gra
mm
es:
–B
ecom
ing
a M
an (
BA
M)
Inte
rven
tion
Pro
gra
m (
Hel
ler
et a
l. 20
15)
• A
dol
esce
nt c
omm
unit
y re
info
rcem
ent
app
roac
h (G
odle
y et
al.
200
6; S
lesn
ick
et a
l. 20
07)
• M
ore
qua
lity
educ
atio
n (C
ulle
n, J
acob
, and
Lev
itt
200
6; D
emin
g 2
011
; Loc
hner
and
Mor
etti
20
04
)•
Par
enti
ng p
rog
ram
mes
: –
Pos
itiv
e P
aren
ting
Pro
gra
m –
Nur
se F
amily
Par
tner
ship
(P
rinz
et
al. 2
00
9) –
Par
ent
and
chi
ld p
rog
ram
mes
(E
arly
Hea
d S
tart
– S
ure
Star
t –
Ferg
usso
n, H
orw
ood
, and
Rit
ter
200
5) –
Fun
ctio
nal F
amily
Tra
inin
g (
Mih
alic
et
al. 2
00
4)
• So
cial
sup
por
t (P
aren
ts A
nony
mou
s –
Circ
le o
f F
rien
ds
– B
udd
e an
d S
chen
e 20
04
)
(con
tinu
ed o
n ne
xt p
age)

246
RESTORING PARADISE IN THE CARIBBEAN: COMBATTING VIOLENCE WITH NUMBERS
App
endi
x 13
.2.
Effec
tive
Prog
ram
mes
by
Topi
cEff
ecti
ve P
rogr
amm
es: H
ighe
st-q
ualit
y ev
iden
ce (
met
a-ev
alua
tion
or
rand
om c
ontr
olle
d tr
ial)
wit
h st
atis
tica
lly s
igni
fican
t av
erag
e eff
ect
size
fa
vour
ing
the
prac
tice
, gen
eral
ly in
mor
e th
an o
ne lo
cati
on.
Subj
ect
Evid
ence
-Bas
ed P
rogr
amm
es
Yout
h p
rim
ary
pre
vent
ion
(con
tinu
ed)
• P
resc
hool
enr
ichm
ent
pro
gra
mm
es:
–H
ighS
cop
e P
erry
Pre
scho
ol S
tud
y (S
chw
einh
art
et a
l. 20
05)
–C
hica
go
Chi
ld-P
aren
t C
ente
r st
udy
(Rey
nold
s, O
u, a
nd T
opit
zes
200
4)
• So
cial
dev
elop
men
t p
rog
ram
mes
: –
Pro
mot
ing
Alt
erna
tive
Thi
nkin
g S
trat
egie
s (P
ATH
S) C
ond
uct
Pro
ble
ms
Pre
vent
ion
Res
earc
h G
roup
• N
urse
Fam
ily P
artn
ersh
ip (
2012
)•
Stop
Now
and
Pla
n (S
NA
P)
(Aug
imer
i et
al. 2
00
7)
Yout
h se
cond
ary
pre
vent
ion
• F
unct
iona
l Fam
ily T
hera
py (
FF
T) (
Gor
don
et
al. 1
988;
Sex
ton
and
Tur
ner
2010
; Cel
insk
a, F
urre
r, an
d C
heng
20
13)
• R
educ
ed P
rob
atio
n C
asel
oad
Siz
e p
rog
ram
in Io
wa
and
Okl
ahom
a (J
alb
ert
et a
l. 20
11)
• Yo
uth
Bui
ld U
SA O
ffen
der
Pro
ject
(Lu
rig
io e
t al
. 20
00
)•
Ad
oles
cent
Div
ersi
on P
roje
ct (
Mic
hig
an S
tate
Uni
vers
ity)
(D
avid
son
et a
l. 19
87; S
mit
h et
al.
200
4)
–B
ecom
ing
a M
an In
terv
enti
on P
rog
ram
(H
elle
r et
al.
2015
)
Gan
gs
• B
osto
n’s
Op
erat
ion
Cea
sefir
e (B
rag
a et
al.
200
1)•
Op
erat
ion
Cul
-de-
sac
(Jam
es L
asle
y)•
Op
erat
ion
Pea
ceke
eper
(R
alp
h W
omac
k)
Gun
s•
Bos
ton’
s O
per
atio
n C
ease
fire
(Bra
ga
et a
l. 20
01)
• C
ure
Vio
lenc
e (S
kog
an e
t al
. 20
08)
• Im
ple
men
tati
on o
f la
ws
targ
etin
g fi
rear
ms
(pur
chas
e, a
cces
s an
d u
se)
(Ros
enfe
ld 1
995)
• U
nifo
rmed
gun
pat
rols
(Sh
erm
an 2
00
0)
• C
rim
inal
his
tory
che
cks
(She
rman
20
00
)
Dru
gs
• D
rug
cou
rts
– B
ronx
(N
Y)
Trea
tmen
t C
ourt
(R
emp
el e
t al
. 20
03)
• H
igh
Poi
nt D
rug
Mar
ket
Inte
rven
tion
(C
orsa
ro e
t al
. 20
12)
Situ
atio
nal/
neig
hbou
rhoo
d•
Safe
r C
omm
une
Pro
gra
m C
hile
(R
upra
h 20
08)
• Sa
fer
Cit
ies
(Pau
l Ekb
lom
)
(con
tinu
ed o
n ne
xt p
age)
( con
tinu
ed)

247
WHAT THE CARIBBEAN IS DOING TO REDUCE CRIME COMPARED TO WHAT WORKS INTERNATIONALLY
App
endi
x 13
.2.
Effec
tive
Prog
ram
mes
by
Topi
cEff
ecti
ve P
rogr
amm
es: H
ighe
st-q
ualit
y ev
iden
ce (
met
a-ev
alua
tion
or
rand
om c
ontr
olle
d tr
ial)
wit
h st
atis
tica
lly s
igni
fican
t av
erag
e eff
ect
size
fa
vour
ing
the
prac
tice
, gen
eral
ly in
mor
e th
an o
ne lo
cati
on.
Subj
ect
Evid
ence
-Bas
ed P
rogr
amm
es
Cri
min
al ju
stic
e sy
stem
• Yo
uth
pro
gra
mm
es:
–A
dol
esce
nt D
iver
sion
Pro
ject
(St
ates
of
Mic
hig
an a
nd N
ew Y
ork)
–D
iver
sion
pro
gra
mm
es f
or ju
veni
le o
ffen
der
s (S
chw
alb
e et
al.
2012
)•
Spec
ializ
ed c
ourt
s: –
Dru
g c
ourt
s (M
itch
ell e
t al
. 20
12)
–M
enta
l hea
lth
cour
ts –
Com
mun
ity
cour
ts (
Mid
tow
n C
omm
unit
y C
ourt
)•
DN
A t
esti
ng (
Rom
an e
t al
. 20
08)
• R
esto
rati
ve ju
stic
e p
rog
ram
mes
(Sh
erm
an a
nd S
tran
g 2
00
7; S
hap
land
et
al. 2
00
8)•
Cal
iforn
ia’s
Pro
pos
itio
n 36
(E
valu
atio
n of
the
Sub
stan
ce A
bus
e an
d C
rim
e P
reve
ntio
n A
ct, 2
00
7)
Pol
ice
• P
rob
lem
-ori
ente
d p
olic
ing
(P
OP
) (B
rag
a an
d B
ond
20
08;
Wei
sbur
d e
t al
. 20
08;
Bra
ga
et a
l. 20
01)
• H
ot S
pot
Pol
icin
g (
Bra
ga,
Pap
achr
isto
s, a
nd H
urea
u 20
12; M
itch
ell e
t al
. 20
12; S
herm
an a
nd W
eisb
urd
199
5)•
Jers
ey C
ity
Dru
g M
arke
t A
naly
sis
Exp
erim
ent
(Dav
id W
eisb
urd
)
Pri
son
Cor
rect
iona
l reh
abili
tati
on (
Lip
sey
and
Cul
len
200
7)
.
(con
tinu
ed)

248
RESTORING PARADISE IN THE CARIBBEAN: COMBATTING VIOLENCE WITH NUMBERS
App
endi
x 13
.3.
Prom
isin
g Pr
ogra
mm
es b
y To
pic
Prom
isin
g Pr
ogra
mm
es: M
oder
ate-
qual
ity
evid
ence
wit
h st
atis
tica
lly s
igni
fican
t eff
ect
size
favo
urin
g th
e pr
acti
ce.
Subj
ect
Evid
ence
-Bas
ed P
rogr
amm
es
Vio
lenc
e ag
ains
t w
omen
• In
terv
enti
ons
for
dom
esti
c vi
olen
ce o
ffen
der
s (D
ulut
h M
odel
): –
Trai
ning
and
life
ski
ll in
terv
enti
ons
to r
educ
e se
xual
vio
lenc
e (B
and
iera
et
al. 2
012
; Sar
nqui
st e
t al
. 20
14)
• In
itia
tive
s to
ad
dre
ss d
atin
g v
iole
nce:
–Sa
fe D
ates
pro
gra
m –
Uni
ted
Sta
tes
(Fos
hee
et a
l. 20
05)
–Yo
uth
Rel
atio
nshi
p P
roje
ct in
Ont
ario
(Sh
erin
et
al. 1
998)
Yout
h p
rim
ary
pre
vent
ion
• M
ento
ring
, ski
lls a
nd jo
b r
elat
ed p
rog
ram
mes
—Yo
uthB
uild
USA
Off
end
er P
roje
ct (
Coh
en a
nd P
ique
ro 2
010
; Kle
vens
et
al.
200
9; T
aft
et a
l. 20
11; C
hand
ler,
Levi
tt, a
nd L
ist
2011
)•
Skill
pro
gra
mm
es a
nd jo
b-r
elat
ed in
terv
enti
ons
(Sch
oche
t, B
urg
hard
t, an
d M
cCon
nell
200
8)•
Con
dit
iona
l cas
h tr
ansf
er p
rog
ram
mes
: –
Fam
ilias
en
Acc
ión
(Cam
acho
and
Mej
ía 2
013
)•
Aca
dem
ic e
nric
hmen
t p
rog
ram
mes
: –
Los
Ang
eles
’ BE
ST p
rog
ram
(G
old
schm
idt,
Hua
ng, a
nd C
hine
n 20
07)
–Q
uant
um O
pp
ortu
niti
es P
rog
ram
(Q
OP
) (H
ahn,
Lea
vitt
, and
Aar
on 1
994
)•
Med
ia in
terv
enti
ons
(TV
ser
ies
“Fam
ilies
” –
Sand
ers,
Mon
tgom
ery,
and
Bre
chm
an-T
ouss
aint
20
00
; and
Pla
y N
icel
y)
Gan
gs
• G
RE
AT
– G
ang
Res
ista
nce
Ed
ucat
ion
and
Tra
inin
g
Gun
s•
Gun
ban
• F
irear
m le
gis
lati
on (
Ros
eng
art
et a
l. 20
05;
Kap
usta
et
al. 2
00
7)
Dru
gs
• A
dul
t tr
eatm
ent
dru
g c
ourt
s (m
ulti
-sit
e) (
Urb
an In
stit
ute;
Ros
sman
et
al. 2
011
)
Situ
atio
nal/
Nei
ghb
ourh
ood
• N
eig
hbou
rhoo
d w
atch
(B
enne
tt, H
ollo
way
, and
Far
ring
ton
200
8)•
Com
mun
ity
pol
icin
g:
–Sã
o P
aulo
com
mun
ity
pol
icin
g (
Frü
hlin
g e
t al
. 20
04
)•
Pub
lic s
pac
e su
rvei
llanc
e, s
ecur
ity
gua
rds,
saf
ety
hous
ing
cer
tific
atio
n, r
esid
enti
al a
larm
s (J
aitm
an a
nd G
uerr
ero
Com
peá
n 20
15)
• U
rban
ren
ewal
and
nei
ghb
ourh
ood
imp
rove
men
t p
rog
ram
mes
(K
ling
, Lud
wig
, and
Kat
z 20
05;
Ow
ens
and
Fre
edm
an 2
011
)•
Soci
al in
teg
rati
on o
f in
form
al u
rban
nei
ghb
ourh
ood
s (C
erd
á et
al.
2012
)•
Clo
sed
circ
uit
tele
visi
on s
urve
illan
ce (
Wel
sh a
nd F
arri
ngto
n 20
08b
)•
Imp
rove
d s
tree
t lig
htin
g (
Wel
sh a
nd F
arri
ngto
n 20
08a
)
(con
tinu
ed o
n ne
xt p
age)

249
WHAT THE CARIBBEAN IS DOING TO REDUCE CRIME COMPARED TO WHAT WORKS INTERNATIONALLY
App
endi
x 13
.3.
Prom
isin
g Pr
ogra
mm
es b
y To
pic
Prom
isin
g Pr
ogra
mm
es: M
oder
ate-
qual
ity
evid
ence
wit
h st
atis
tica
lly s
igni
fican
t eff
ect
size
favo
urin
g th
e pr
acti
ce.
Subj
ect
Evid
ence
-Bas
ed P
rogr
amm
es
Cri
min
al ju
stic
e sy
stem
• Lo
cal l
aws
(Bid
erm
an, D
eMel
lo, a
nd S
chne
ider
20
09;
Gro
nqvi
st a
nd N
ikna
mi 2
014
; Hea
ton
2012
)•
Low
fine
s in
Mar
icop
a C
ount
y, A
rizo
na (
Turn
er a
nd P
eter
silia
199
6)•
Div
ersi
on p
rog
ram
mes
: –
Pet
rosi
no, T
urp
in-P
etro
sino
, and
Guc
kenb
urg
(20
10)
• Sp
ecia
lized
cou
rts:
–M
enta
l hea
lth
cour
ts (
Sart
esch
i, V
aug
hn, a
nd K
im 2
011
) –
Com
mun
ity
cour
ts (
Hen
ry a
nd K
rals
tein
20
11)
• E
lect
roni
c m
onit
orin
g in
Bue
nos
Aire
s P
rovi
nce
(Di T
ella
and
Sch
arg
rod
sky
2013
)•
Com
mun
ity
serv
ice
wor
k (W
erm
ink
et a
l. 20
10)
• H
alfw
ay h
ouse
s –
Bos
ton
re-e
ntry
init
iati
ve (
Sayl
or a
nd G
aes
1997
)•
Rel
ocat
ion
to d
iffer
ent
city
of
offen
der
s (K
irk
200
9)
Pol
ice
• C
omm
unit
y p
olic
ing
• N
atio
nal P
lan
for
Com
mun
ity
Pol
icin
g A
reas
of
Col
omb
ia (
Gar
cia,
Mej
ia, a
nd O
rteg
a 20
13)
• C
omm
unit
y-O
rien
ted
Pol
icin
g S
ervi
ces
(CO
PS)
(E
vans
and
Ow
ens
200
7) –
loca
l eff
ects
• M
ore
pol
ice
(Lev
itt
1997
)•
Pro
gra
m o
f In
teg
rati
on a
nd M
anag
emen
t in
Pub
lic S
afet
y, B
razi
l (So
ares
and
Viv
eiro
s 20
10)
• In
form
atio
n te
chno
log
ies
on p
olic
e or
gan
izat
ion
and
pro
duc
tivi
ty (
Gar
ican
o an
d H
eato
n 20
10)
• D
oor-
to-d
oor
visi
ts b
y p
olic
e (S
herm
an e
t al
. 199
7; W
eisb
urd
and
Eck
20
04
)•
Stop
and
fri
sk (
Sher
man
199
8)•
Rep
eat
offen
der
s (A
rizo
na –
Ab
raha
mse
et
al. 1
991)
• Fo
cusi
ng o
n re
pea
t off
end
ers
(Wal
ler
2014
)•
Focu
sing
on
rep
eat
vict
imiz
atio
n (W
alle
r 20
14)
• “H
ot p
rod
ucts
” (B
rag
a 20
07)
Pri
son
• Lo
nger
sen
tenc
es –
Pro
pos
itio
n 8
(Bel
l, Ja
itm
an, a
nd M
achi
n 20
14; D
rag
o, G
alb
iati
, and
Ver
tova
20
09;
Kes
sler
and
Lev
itt
1999
; Phi
lipp
e 20
13; L
ee a
nd M
cCra
ry 2
00
9)•
Cal
iforn
ia’s
thr
ee-s
trik
es le
gis
lati
on (
Hel
land
and
Tab
arro
k 20
07;
Iyen
gar
20
08)
• C
ogni
tive
-beh
avio
ural
the
rapy
(Li
pse
y an
d H
owel
l 20
12)
Pri
vate
sec
tor
• B
usin
ess
Imp
rove
men
t D
istr
icts
(B
IDs)
(H
oyt
200
5)•
Targ
et’s
Saf
e C
ity
Pro
gra
m (
La V
igne
, Ow
ens,
and
Het
rick
20
09)
(con
tinu
ed)

250
RESTORING PARADISE IN THE CARIBBEAN: COMBATTING VIOLENCE WITH NUMBERS
Appendix 13.4. Programmes with No Evidence or Proven IneffectiveProgrammes with no evidence or proven ineffective: Moderate- to high-quality evidence with statistically significant average effect size in the opposite direction of the intended effect for the practice. Moderate- to high-quality evidence and the average effect size is not is not different with statistical significance from the comparison group.
Subject Evidence-Based Programmes
Violence against women
• Programmes that target male perpetrators or consist of school-based group training sessions (Ellsberg et al. 2014)
Youth primary prevention
• Drug Abuse Resistance Education (DARE) (Clayton, Cattarello, and Johnstone 1996; Ennett et al. 1994)
• CHOICE (D’Amico et al. 2012)
Youth secondary prevention
• Serious and Violent Offender Re-entry Initiative (SVORI) (Lattimore and Visher 2009)
• Juvenile drug courts (Blair, Sullivan, Latessa, and Sullivan 2015)• Youth diversion programmes (Wilson and Hoge 2013)
Gangs • Gang Reduction Program (Richmond, VA) (Cahill et al. 2008; Hayeslip and Cahill 2009)
Guns • Gun buyback programmes (Ronconi, Lenis, and Schargrodsky 2011)
Drugs • Pennsylvania Department of Corrections (PADOC) Therapeutic Community (Welsh and Zajac 2013)
Criminal justice system • New York Integrated Domestic Violence Courts (Katz and Rempel 2011)
• Pennsylvania Department of Corrections (PADOC) Therapeutic Community (Welsh and Zajac 2013)
• Boot camps for adults and juveniles (Wilson, MacKenzie, and Ngo Mitchell 2008)
• Increases in lengthy prison sentences (Travis and Western 2014)
Police • Random patrol and unfocused enforcement (Sherman and Eck 2002)• Neighbourhood Watch, Child Print (Bennett, Holloway, and Farrington
2008)• DARE Drug Prevention Program (Clayton, Cattarello, and Johnstone
1996; Ennett et al. 1994)
Prison • Private prison confinement (Minnesota) (Duwe and Clark 2013)

251
14Conclusions and Recommendations
Heather Sutton
This final chapter presents the conclusions of this report followed by recom-
mendations rooted in the analysis of the data and the review of successful
international initiatives in the previous chapter. While each individual chap-
ter includes specific policy implications, the final recommendations are collected
and synthesized here. We first make four overarching recommendations to be
incorporated within national strategies to reduce and prevent violence. The rec-
ommendations are that (1) there be a balance between prevention and control,
(2) specific target populations be prioritized, (3) interventions be evidence-based
and evaluated, and (4) interventions incorporate macro-level monitoring of key
indicators of the criminal justice system (police, courts, and prisons). This is fol-
lowed by detailed, topic-specific recommendations that might be incorporated
into national strategies based on a country’s crime profile. These detailed rec-
ommendations are grouped by the thematic areas addressed in this publication:
(1) violence against women and children, (2) youth violence and delinquency,
(3) neighbourhoods, (4) gangs, (5) guns, (6) the private sector, and (7) the police
and criminal justice system.
Some recommendations are not new. In fact, the United Nations Development Pro-
gramme’s 2012 Caribbean Human Development Report on citizen security highlights
some similar themes (UNDP 2012). Some recommendations may already be embodied
in current ongoing projects in some countries. Where this is the case, we include them
to emphasize that they require continued support, fine-tuning, and resources. Other
recommendations are new and further supported by more recent evidence from the
international community.

252
RESTORING PARADISE IN THE CARIBBEAN: COMBATTING VIOLENCE WITH NUMBERS
We hope that governments will find these recommendations useful in forming policy
agendas, that practitioners and civil society will use them in designing programmes and
advocacy platforms, and that researchers will follow up where this report leaves off.
14.1 ConclusionsThis publication fills an important gap in helping understand the crime problem in the
Caribbean by analysing data from victimization surveys of individuals and businesses
in 2014/2015. Most existing studies on crime and violence in the region have relied
upon police data. However, we find that only 53 percent of crimes measured in the
Caribbean Crime Victimization Survey (CCVS) were reported to the police. This high-
lights the fact that police data can show an incomplete view of the problem. Precisely
the crimes that are most prevalent in the Caribbean (assaults and threats) were the
least likely to be reported, and women, youth, and single individuals were all less likely
to report violent crimes.
On average, 15 percent of individuals in Caribbean capital city metropolitan areas
were victims of one of five types of crime in a 12-month period—vehicle theft, theft,
robbery, burglary, or assaults and threats. Among the cities, New Providence (The
Bahamas) and Kingston (Jamaica) stand out with the highest levels of assaults and
threats. In New Providence and in Port of Spain (Trinidad and Tobago), the level of
robbery is also comparatively high. Levels of crime are the lowest in Paramaribo (Suri-
name) and Bridgetown (Barbados).
Despite inter-regional variation, the defining characteristic of crime in the Carib-
bean is the uniquely high level of violent crime, including homicides and assaults and
threats, often with the use of firearms. This type of crime is higher in the Caribbean
than in any other region registered in the International Crime Victimization Survey
(ICVS) database. Moreover, Caribbean residents are living a collective trauma from
years of violence. Nearly one in three reported having lost someone close to violence
and/or having witnessed a violent attack ending in injury or death in his/her lifetime.
Among the five crimes measured, individuals are at highest risk of being victimized
by assault or threat within their own neighbourhood and by someone they know. This
risk is most elevated among young, low-income males. Youth (18–24) and young adults
(25–30) are over-represented among victims and perpetrators of violent crime when
compared to their proportion of the population overall. However, women and children
are more likely to be victimized by family or intimate partner violence, which is not well
captured in police statistics or crime victimization surveys. The relatively high tolerance
for violence against women and physical discipline of children found in the Caribbean
is likely predictive of high levels of actual violence in the home. Experiencing violence

253
CONCLUSIONS AND RECOMMENDATIONS
at an early age has been established in international literature as a strong risk factor
linked to later perpetration of violence and delinquency.
Those victimized by violent crime in the Caribbean, whether directly or indirectly,
live in neighbourhoods with higher physical disorder (graffiti, trash, abandoned build-
ings) and lower social cohesion (trust among neighbours) compared to non-victims.
Similarly, living in a neighbourhood with a gang presence is associated with higher
odds of victimization. Guns are used in the overwhelming majority of homicides
and are used twice as often in assaults and robberies in the Caribbean than the
international average. Individuals in households with guns are more likely to have
witnessed a shooting or violent attack and to have lost someone close to violence.
Interestingly, individuals who have been victims of one of the five crimes do not have
significantly lower trust in the police. The key factors influencing trust in the police
are perceptions of police competence in fighting crime, the estimated time it would
take for police to arrive if called, perceptions of police harassment, and having paid
a bribe to the police. This suggests that improving trust and community police re-
lations should be possible despite high crime levels, and that such an improvement
depends more upon perceptions of police efficiency and professionalism than per-
sonal victimization.
Finally, the cost of crime for the region is high. Applying the accounting method,
we estimate that crime costs the region 3 percent of GDP, with Barbados being the
country least affected and The Bahamas the most. To put the cost into context, 3
percent of GDP is about on par with the average for Latin America and the Caribbean
and is roughly equal to the income of the poorest 30 percent of the population in the
region. In other words, if crime were to be extinguished completely we could double
the income of the poorest 30 percent of individuals.
Crime takes a toll on the private sector, where 23 percent of firms have experienced
losses as a result of crime and nearly 70 percent spend money on private security
measures. Although a large amount of firms spend on private security, this spending
is not associated with a reduction in being victimized by crime.
Finally, increased homicide rates over time are correlated with lower economic
growth and lower tourism arrivals, and being a victim of violence or witnessing vio-
lence is associated with lower life satisfaction and higher intentions to emigrate.
14.1.1 Existing Efforts versus Evidence of What WorksFor too long, public policy officials and legislators, backed by public opinion in the
Caribbean and elsewhere, have adhered to inefficient policies and practices to im-
prove public safety and reduce crime. Although there are recent signs of an incipient
paradigm shift in the Caribbean (UNDP 2012), security policies are still predominantly

254
RESTORING PARADISE IN THE CARIBBEAN: COMBATTING VIOLENCE WITH NUMBERS
reactive and rely heavily on law enforcement and tough deterrence. While there have
been some recent investments in prevention, the limited budget allocated to these
programmes in comparison to more traditional and reactive law enforcement expos-
es the continual favouring of policies that aim to counter crime with more repression,
stiffer sentences, and more incarceration. Numerous studies have shown that this
model is not effective. State investments in harsher penal laws, new prison construc-
tion, and the non-strategic expansion of police forces have had limited impact on
reducing violence and have failed to discourage new crimes from occurring. Although
it may seem politically popular to be tough on crime, one of the biggest problems
of this reactive approach is that it does not place value on understanding and taking
appropriate steps to tackle the underlying causes of crime and violence.
This problem is compounded by the fact that the existing, and potentially prom-
ising, prevention-focused initiatives in the Caribbean have generally not been
rigorously evaluated to determine their impact. In fact, prevention programmes typ-
ically lack the resources and planning necessary to effectively monitor and evaluate
their success.
14.2 Broad RecommendationsIn light of these findings, national strategies for violence prevention and reduction
should be developed (or reassessed where they already exist) to be comprehensive
and actionable, risk-focused, and evidence-based. Each strategy should address four
overarching recommendations.
Balance Prevention and ControlA one-size-fits-all approach to crime is doomed to failure. While there are some perpe-
trators who cannot be safely integrated into society, and some crimes that are rightfully
responded to with detention, suppression must be applied thoughtfully and strategi-
cally to avoid making matters worse. An impoverished child jailed for years, with and
especially without a trial, with violent adults for a more minor infraction (such as steal-
ing food) is at high risk for serious victimization while detained and re-entering society
as a greater threat than when he was imprisoned. This is not a worthwhile expense
for taxpayers or a humane approach to treating youth who have likely been exposed
to severe trauma by the time of a first offence. A balanced approach is required that
includes both smart prevention and smart crime control. “Smart” means that both
types of initiatives must be targeted, evidence-based, and effectively monitored and
evaluated. The media in particular have an important role to play in changing public
dialogue to focus more on prevention than suppression.

255
CONCLUSIONS AND RECOMMENDATIONS
Currently, prevention programmes tend to be understaffed and under-resourced,1
while law enforcement has expanded to levels above the international average and
among the highest in the Americas (an average of 560 officers per 100,000 population
in the Caribbean, versus 360 officers internationally). Law enforcement continues to
dominate national budgets for public safety. Therefore, achieving a balance in the Carib-
bean effectively means politically, administratively, and financially bolstering prevention
programmes and recognizing them as a proven means to effectively reduce violence.
Target Interventions to Key Individuals and/or Geographical AreasCrime is not random and it is not everywhere: a small number of high-risk individuals per-
petrate the overwhelming majority of crimes in concentrated geographic areas. We have
shown in this publication, as have other authors, that there are specific risk and protective
factors that make some individuals more likely to become offenders. With good data on
these factors, we can identify high-risk individuals before they perpetrate a crime and
offer them resources and interventions that can reduce their risk of offending. Prevention
and crime control strategies alike should be targeted to specific populations. Scarce re-
sources should be invested where they stand to make the most difference.
This may not always be politically easy. Would-be beneficiaries who do not meet
criteria for inclusion in certain programmes may be unsatisfied. Taxpayers in low-crime
areas may demand more protection. It’s not always well understood that by targeting
areas or individuals most at risk, there is a bigger benefit for society overall—including
lower-crime areas. Explaining this, and sticking to a truly targeted strategy, requires
skilled communication and leadership.
Employ Evidence-Based and Tested InterventionsEven more than elsewhere, too little research has been conducted in the Caribbe-
an using rigorous evaluation methods. The reasons for this are many, including data
limitations, potential lack of familiarity with experimental or quasi-experimental de-
sign in policy evaluations, the costs involved in conducting experimental studies, the
preference for punitive rather than preventive measures, and the political and cultural
sensitivities surrounding the topic.
Many of the evidence-based interventions examined in the previous chapter
have not been tested in the Caribbean context. Still, we recommend that the in-
ternational evidence be taken into consideration by encouraging research on the
1 See the Inter-American Development Bank’s Technical Note Series on Crime and Violence in the Caribbean, which covers an inventory of programmes and interventions in four countries (Jamaica, Bahamas, Barbados, and Trinidad and Tobago).

256
RESTORING PARADISE IN THE CARIBBEAN: COMBATTING VIOLENCE WITH NUMBERS
validity and adaption challenges of these interventions for the Caribbean. Equally,
there are many promising and uniquely Caribbean initiatives under way that need
further evaluation. However, in order to improve the evidence base the following will
be necessary:
• Improved data collection, data sharing, and transparency. Improving data is not
only a matter of investing in technology. It also requires ensuring that those
who record the data (i.e., police, courts, prisons, hospitals, schools, nonprofits)
understand and value its importance. It requires openness to data sharing be-
tween agencies, researchers, and the public. In many ways this is more a matter of
changing the institutional and political culture around data than it is a matter of
the actual hardware or data collection systems. Data sharing should be rewarded
with public praise for confronting difficult problems. It is important for institutions
not to be attacked if and when they reveal that, for instance, homicide rates are
increasing. The media should pressure institutions for signs of collaboration and
minimize finger-pointing when it does occur.
• Funding evaluation and the continual testing of interventions. The most robust
tests of the effectiveness of prevention interventions (i.e., experimental evalu-
ations) can be costly. However, not knowing what works and continuing to let
crime increase can be more costly (see Chapters 10–12). The only way to deter-
mine the effectiveness of crime prevention is to put it to the test in real-world
conditions. The best definition of a test is a comparison of crime outcomes
(across similar units and conditions) with and without the intervention. The units
can be offenders, victims, places, or days of the week. The practice tested can
be compared with another practice or with doing nothing. The use of a control
group in an experiment is for the comparison of outcomes. To say that an im-
pact evaluation shows that a practice works requires a comparison, by definition.
Some see having a control group as denial of resources to those in need. But
if we do not have evidence a programme is beneficial, we do clients a disser-
vice by foisting programmes on them that offer no restitution. There is a moral
imperative in a resource-scarce environment to have an evidence base for pro-
grammes and services offered. Interventions can be piloted and evaluated in a
small population before investing resources in a large-scale intervention. This
requires a willingness to accept that evaluations might find some programmes
did not work. This should not be viewed as wasted programmatic resources;
rather, it should be viewed as warding off large-scale waste and giving innovative
programmes a chance where others have failed.
• Mechanisms for marrying evidence with policy. This concern focuses on the effec-
tiveness of the feedback mechanisms between research and policy, and vice versa.

257
CONCLUSIONS AND RECOMMENDATIONS
Too often, both in and outside the Caribbean, policymakers fail to make decisions
based on the strongest evidence. This can be for many reasons, but perhaps the
first solution is to address the lack of sustained interaction between policymakers
and researchers. Governments should seek to sponsor presentations of research
findings to policymakers and continuous dialogues with researchers. Research-
ers need to work closely with local practitioners to ascertain the feasibility of
implementing an intervention that was successful in one country in another one.
Research findings need to be communicated more widely to the public, outside
of academic circles. Civil society organizations must have a voice in determining
the most promising policies and programmes for their communities.
Monitor Key Indicators of the Criminal Justice System as a WholeIn order to have an improved understanding of the functioning of the criminal
justice system as a whole (from police to the courts and prisons), Ministries of
National Security and related agencies should develop a dashboard of key metrics
to be frequently monitored (monthly, bi-monthly). These metrics should include
indicators that give policymakers the big picture of how the system is functioning
overall. In other words, they should tell policymakers who is being arrested (or not)
and for what types of crime (violent, property, drug offences); the percentage of
arrests that were made on the spot or involved investigation; the percentage of
arrests that resulted in court cases, and whether those cases had enough evidence
to go to trial; the amount of cases that resulted in mistrial, conviction, or not guilty
verdicts; and a breakdown of the prison population by type of crime and pre-trial
versus convicted detainees, numbers of prisoners involved in rehabilitation pro-
grammes, numbers of prisoners released, and recidivism rates. Such a monitoring
system would allow policymakers to understand where the system is breaking
down, who is being arrested and incarcerated, and why.
The indicators/metrics used should be a product of discussion and acceptance by
the heads of the key agencies involved (police, courts, and prisons).2 Indicators should
be clearly defined and key agencies should feed in the required information at spec-
ified time intervals. The regular review of such metrics should include academia and
civil society, as well as these agencies. Ministries will need to designate a particular unit
to be responsible, upon receipt of sufficient resources, for maintaining and updating
the indicator dashboard. There are a number of software platforms that allow for this
type of feed-in and monitoring by multiple agencies.
2 Some key indicators could follow those developed by the United Nations Office on Drugs and Crime to create the international criminal justice statistics (UNODC 2003).

258
RESTORING PARADISE IN THE CARIBBEAN: COMBATTING VIOLENCE WITH NUMBERS
14.3 Detailed Recommendations by TopicFramed by these key recommendations above, national strategies can then focus on
incorporating the detailed recommendations by topic that are most relevant to their
country context (i.e., gangs and guns may be more relevant in some countries than
others, etc.).
Violence against Women and Children• Adapt legislation: Numerous changes still need to be made to update national
legislation in many countries, particularly those that have not criminalized marital
rape, for example. Definitions of “domestic violence” should be re-evaluated and
expanded to incorporate a wide and inclusive scope of types of abuse and catego-
ries of victims.
• Promote national studies: More robust nationally representative studies are needed
to understand the prevalence and severity of violence against women and children
on a national scale. In addition to understanding the scope of the problem and the
risk and protective factors, studies should also examine coping mechanisms used
by victims, as well as obstacles to accessing support services and justice.
• Include a line item in national budgets specifically for victim support services and
prevention of violence against women and children: Support services and preven-
tion initiatives for these types of violence are highly under-resourced in Caribbean
countries. Providing shelter and economic, emotional, and legal support for women
and children in abusive relationships or households should be considered a priority
and obligation of governments. Prioritizing these services requires steady and con-
sistent dedication of adequate resources.
• Focus on changing societal acceptance of violence against women and children: Small group/community participatory workshops, interventions in schools, and
larger-scale educational entertainment campaigns (using various media sources)
have shown promising results for changing attitudes about violence against women
and children (for details see Chapters 4 and 13).
• Implement and evaluate parenting programmes and family visits from nurses and
social workers trained in identifying signs of abuse and connecting people to sup-
port services: Providing early intervention for families at risk via home visits and
parenting programmes can reduce childhood exposure to violence and may also
reduce future perpetration of violence.
Youth Victimization and Delinquency• Provide individuals identified as most at risk, and their families, with access to best
practices for reducing victimization and delinquency while strengthening protective
factors. Longitudinal studies have shown that a small group of children born each year

259
CONCLUSIONS AND RECOMMENDATIONS
will account for a disproportionate amount of criminal offences in the future.3 This
small sub-group can become chronic re-offenders responsible for a large portion of
crimes. Youth are also disproportionately victimized by violent crimes such as assault
and threat of assault. Fortunately, many of the programmes have already been evalu-
ated worldwide and the body of evidence is surprisingly accessible for non-experts.4
In order to implement this recommendation the following steps are necessary:
• Develop and implement risk-assessment tools: These tools should be developed
and used in all youth interventions to help target the communities and individ-
ual youths that need them most.5 Certain negative life experiences (risk factors)
predispose some people to offend and be victimized, while other experiences
(protective factors) are associated with reduced offending and victimization. Geo-
graphic Information System coding of crime data can also be used to determine
geographically which communities have the highest rates of violent crime. Us-
ing this information, risk-assessment tools should be used to determine which
individuals are at highest risk, and which programmes they could benefit from.
Prevention programmes should use these tools to target young, socially disadvan-
taged males in high-risk communities within urban areas that are at greatest risk.
• Avoid what doesn’t work: An array of youth programmes—including mili-
tary-style boot camps, “scared straight” tactics, and drug resistance classes
taught by police—have gained popularity, but the international evidence shows
that they do not make a positive impact on youth offending. On the other hand,
a number of programmes targeting risk and protective factors at the individual
and family levels have had more success internationally. Scarce resources should
be diverted away from programmes that have not worked in other contexts.
• Strengthen family counselling/parenting programmes, especially in areas with
high levels of violence: Violence is often learned at home, so there are signif-
icant potential benefits to improving parenting practices in the Caribbean. At
the international level, there are several parenting programmes that have proved
educational, such as the Positive Parenting Program (“Triple P”), which has been
successful across cultures, socio-economic groups, and various family structures.6
There are already government-run national parenting programmes in a number
3 One such study finds that 5–10 percent of children will account for 50–70 percent of all crime (Farrington 2010).4 Several websites and interactive tools have been developed to facilitate searches for evidence-based pro-grammes. For examples, see www.crimesolutions.gov, www.blueprintsprograms.com, www.who.int, and www.campbellcollaboration.org.5 There are a number of risk-assessment instruments that have been developed internationally for youth programmes (i.e., YSET, HCR-20, and others) and can be studied and adapted to the local context.6 The body of evidence of this programme is the most extensive of any parenting programme and is com-prised of more than 250 published papers, including eight meta-analyses, 68 randomized clinical trials, 51 effectiveness and service-based evaluations, and 13 single-case studies.

260
RESTORING PARADISE IN THE CARIBBEAN: COMBATTING VIOLENCE WITH NUMBERS
of Caribbean countries (including The Bahamas, Jamaica, and Trinidad and To-
bago). However, they are generally under-resourced and it is unclear to what
extent they incorporate evidence-based and data-driven approaches, or how
successful they have been. Efforts and resources should be focused on evaluating
such interventions so that they may be redesigned, strengthened, or scaled up.
• Improve the evidence base for skills/job training, combined with cognitive be-
havioural therapy (CBT) approaches: While many Caribbean countries have some
form of job/vocational training programmes for youth, the evidence of their im-
pact on preventing or reducing offending is weak. The international literature
has specifically shown that job programmes that incorporate elements of CBT
tend to be more effective, but no such studies were found in the Caribbean. In
addition to job training, these approaches target risk factors of impulsivity, anger,
low empathy, and low self-control. They have been found to produce significantly
positive results in terms of problem behaviours and later propensity to offend.
While job training for young people is certainly important in its own right, existing
programmes in the Caribbean may or may not be helping to reduce violence and
crime. The evidence base for this type of programme in the Caribbean needs to
be strengthened by investing in more robust monitoring and evaluation.
Stronger Neighbourhoods• Use Geographic Information Systems (GIS) for mapping of crime and community
assets: Geospatial technologies such as GIS and Global Positioning Systems (GPS)
can be used in mapping crime, improving policing (e.g., determining if the police
are where they are needed most), mapping physical disorder, and tracking social
infrastructure data (assets). Asset mapping can include positive assets (schools,
churches, parks, etc.) and negative assets (vacant lots, gang borders, abandoned
buildings, etc.). These maps can be used by law enforcement and by the commu-
nities themselves. For example, the Ministry of Health in Jamaica and the Jamaican
Social Investment Fund have completed a comprehensive mapping of the assets of
many Jamaican communities (Lyew-Ayee and Greene 2013). Such information can
be used by law enforcement for intelligence in its operations and to identify areas
of disorder that may attract crime. The latter can inform community policing and
urban renewal strategies. Community action committees can be given the chance
to validate and use such maps to increase prevention initiatives.
• Identify areas with a surplus or deficit of social cohesion: In addition to mapping
crime and physical assets, continued research can help to identify “strongholds” and
“sinkholes” of important socio-cultural traits such as social cohesion and informal
social control within neighbourhoods. Community-level strategies can be designed
to “build up” existing strongholds and/or “fill in” the sinkholes (Uchida et al. 2014).

261
CONCLUSIONS AND RECOMMENDATIONS
• Increase residents’ willingness to do something about community problems, in-
crease the sense of trust and shared community ownership, reduce incivilities, and
increase satisfaction with local public service and reduce fear: Beck, Ohmer, and
Warner (2012) offer several practical examples of how social work practices can be
used to build community cohesion, including through components of restorative
justice that work by involving communities in the justice process.
• Reduce physical disorder: Problem-solving interventions to reduce physical disor-
der in specific locations can increase community cohesion and reduce fear. These
initiatives can include towing broken-down cars, community beautification and
mobilization, and community and problem-oriented policing. On the other hand,
aggressive approaches by law enforcement to maintaining order, such as “zero
tolerance” policing, do not seem to be effective and can distance police from the
community.
Gangs• Continue to better understand the scope and nature of the problem: More effort
needs to be invested not only in strengthening gang-related data collection and
analysis by police units, but also in research to identify specific risk and protective
factors that influence gang entry and exit in each country. Because the nature of
gang violence and gang affiliation in each country is unique, solutions should pay
close attention to the local dynamics of gangs. Harriott and Katz (2015) have ini-
tiated an important examination of risk and resilience factors for joining gangs in
the region. Using this research as a basis, more can be done to understand the
differences between countries and the pathways to joining gangs, and to test the
conclusions in different countries. Not only national research but also cross-country
comparative work is necessary to understand gangs in the region. More studies
are necessary to understand the relationship between communities’ characteristics
and gang formation. Similarly, research on gang adaptations to police intervention
and prevention strategies would be useful.
• Prevent gang membership: Many of the recommendations above regarding re-
ducing violence in the home, reducing risk and increasing protective factors for
youth, and strengthening communities may go a long way to preventing youth
from joining gangs. However, it is important to also understand specific drivers in
the Caribbean that are correlated with joining a gang (such as a sense of identity
and belonging and for protection). Prevention initiatives should be developed or
adapted to address these specific risk and protective factors.
• Intervene to reduce gang violence and help members exit gangs: Gangs are re-
sponsible for a large amount of violence, particularly lethal violence (homicide), in
some Caribbean countries. The use of street outreach workers and counselling to

262
RESTORING PARADISE IN THE CARIBBEAN: COMBATTING VIOLENCE WITH NUMBERS
help individuals exit gangs has shown promise in reducing gang violence in some
contexts. Additionally, mediators (sometimes called “violence interrupters”) can be
helpful in de-escalating potentially explosive conflicts between gangs. Similar ap-
proaches are being used in several Caribbean countries, including Jamaica (Peace
Management Initiative), Trinidad and Tobago (Project REASON), and The Bahamas
(Operation Ceasefire). An important next step is evaluating these programmes to un-
derstand their effectiveness and fine-tune them. Finally, even though there has been
no impact evaluation of faith-based interventions, there are also potential benefits of
including the faith community in the response against gangs. (See Harriott and Katz
2015 for an example of a faith-based intervention in the community of Gonzales in
Trinidad and Tobago.)
• Suppress gang violence and crime: If the rule of law and formal social control mech-
anisms break down, gangs or organized crime can fill the void and become more
entrenched. In addition to prevention and intervention, suppression is also nec-
essary in some contexts. Gang members who engage in illegal activities should
be arrested and convicted. Caribbean countries should cautiously investigate the
potential of targeted operations or of increasing specialized police forces in gang
neighbourhoods. However, when such operations are unstructured reactions with
no longer-term plan, they are likely to backfire. Therefore, saturation operations
by law enforcement should be followed up with intensive investment in commu-
nity social development and a continued community policing presence. Similar
international initiatives have had mixed results. However, important lessons learned
include that when social investment in the community is delayed or fails to occur,
community resentment and mistrust builds. Power vacuums that are left may be
filled again by other gangs or gang members. The use of lethal violence involving
police forces is also a central concern. There is a clear need to invest in police train-
ing and to develop operational and analytical capacity on gang violence to better
shape suppression interventions. Removing access to illegal weapons has also been
proven to reduce the increasing rate of gang violence. Operation Ceasefire, which
was implemented in Boston, is an example of a collaborative and comprehensive
strategy to address escalating gang activity and the use of guns (Braga et al. 2001).
GunsAttention should be placed on the factors that make violence more lethal. This is
particularly true for the Caribbean, where firearms are the main weapons used in
homicides and are used twice as often in assaults and threats as the international
average.
• Stem the illegal flow of firearms to and from the region: Border controls, firearm
tracing, and regional and bilateral cooperation should be explored to reduce the
263
CONCLUSIONS AND RECOMMENDATIONS
flow of illegal weapons within the region. The United Nations International Small
Arms Control Standards (ISACS) offer detailed recommendations in this regard.7
• Assess gaps in legislation: Firearm legislation should be examined (see Appendix
8.4) and reviewed to ensure that restrictions on owning and carrying adequately
protect the public. Licensing and registration of legal firearms and related protocols
should be transparent and robust. The ISACS also offer detailed recommendations
in this regard.8
• Directed police patrols to reduce gun violence: Multiple quasi-experimental studies
suggest that intensive patrols in high-gun-crime areas can lead to reductions in
gun carrying and gun-related violence. These strategies represent a kind of “hot
spot” approach that involves “assigning additional officers to high-crime areas at
high-risk times and allowing them to focus on proactive investigation and enforce-
ment (e.g., intensified traffic enforcement and field interrogations of suspicious
persons) rather than answer calls for service” (Koper and Mayo-Wilson 2012, 14).
• Reduce diversion of firearms from State stockpiles: Stockpile management pro-
cedures for police and defence forces should be investigated to determine if they
adequately impede guns from being stolen or diverted to the illegal market. Again,
multiple suggestions for ensuring good stockpile management procedures can be
found in the ISACS.9 This should include the frequent destruction of seized or sur-
plus firearms.
• Gun buybacks and public gun destruction: While gun buybacks have shown no
statistical evidence of reducing gun violence, they can be combined with the pub-
lic destruction of weapons and have a symbolic value in mobilizing the population
against gun violence (which could have a positive effect on community cohesion).
Private Sector InvolvementPolicymakers can take actions to encourage private sector involvement in reduc-
ing crime, and businesses can take the initiative themselves in crime prevention
public-private partnerships (PPPs) in the following ways:
• Indirect involvement: Firms can donate resources (money, space, equipment, or
services) for projects executed by the public sector, by nongovernmental organiza-
tions, or by a group of firms.
• Direct involvement: Firms can directly manage activities, such as job or training
courses, help to evaluate projects, and/or participate in public policy and community
7 See the Operational Support section at http://www.smallarmsstandards.org/isacs/.8 See the Legislative and Regulatory section at http://www.smallarmsstandards.org/isacs/.9 Ibid.

264
RESTORING PARADISE IN THE CARIBBEAN: COMBATTING VIOLENCE WITH NUMBERS
meetings on crime and violence prevention. The job and training courses are some-
times offered to prisoners, former prisoners, and high-risk youth.
• Mixed involvement: Firms can both donate resources and actively participate in
projects (ICPC, World Bank, and the Sou da Paz Institute 2011).
Police and Criminal Justice SystemThe dashboard of key criminal justice system indicators mentioned in the broad rec-
ommendations would be a major contribution to dissecting how the criminal justice
system functions as a whole in each country. In addition, we present the following
recommendations for each area involved:
• Smart, accountable policing: Compared to the rest of the world, the Carib-
bean has some of the largest police-to-population ratios. The largest portion
of national budgets that are dedicated to crime and violence is spent on law
enforcement. In fact, Caribbean governments spend even more of their budgets
on police than Central American countries with similar or higher crime rates.
Investment in law enforcement is essential, but Caribbean governments should
focus on re-orienting and re-tooling police forces to be less reactive and more
proactive and accountable. In Chapter 9, we saw that citizens’ trust in the police
was more influenced by whether they thought the police were doing a good job
controlling crime than by other factors. Therefore, increasing police efficiency is
likely to also increase trust.
Crime is not spread evenly across all places, people, or times, and police efforts
should be directed to where crime is concentrated. Evidence shows that standard
model policing (random police patrols, increasing the number of officers, and
general reactive strategies) have no effect on crime.10 Problem-oriented policing,
on the other hand, entails proactively identifying problems within the commu-
nity and developing thoughtful, tailored responses to address underlying causes
of the problems and devise meaningful and effective solutions (Goldstein 1990).
Although more rigorous research needs to be conducted on problem-oriented
policing, the international evidence so far shows that it is the most promising of
the police strategies.11 Focused policing efforts on hot spots,12 repeat offenders
(focused deterrence strategies), and directed patrols for gun violence are proac-
tive ways of preventing future crime.
10 See Pousadela (2014), Sherman et al. (1997), Skogan and Frydl (2004), Telep and Weisburd (2012), and Weisburd and Eck (2004).11 See Skogan and Frydl (2004), Weisburd and Eck (2004), and Weisburd et al. (2008).12 See Braga, Papachristos, and Hureau (2012), Telep and Weisburd (2012), and Weisburd and Eck (2004).

265
CONCLUSIONS AND RECOMMENDATIONS
Quality crime data (with GIS coordinates) and effective crime analysis are re-
quirements for hot spot policing. Hot spots should also be analysed over the long
term, including understanding possible migration of crime to other areas (displace-
ment). Effective hot spot policing requires what Sherman (2013) describes as the
“Triple T” approach: Targeting the right places, Testing if interventions are reducing
crime, and Tracking whether officers are actually patrolling where they should be.
Furthermore, Sherman et al. (2014) present valuable lessons from the Hot Spot
Patrol Strategy in Trinidad and Tobago regarding scaling up from specific hot spot
locations to a district-wide focus, and feeding back to the constables on the effects
in regular district-level crime strategy “COP-stat” meetings.
Finally, for these focused initiatives to be successful, they must also be a part
of a wider internal culture and structural shift that values professionalism, account-
ability, and transparency. The communities that law enforcement serves should be
valued as co-producers of security. Caribbean countries need to examine ways of
promoting this type of internal culture through training, internal and external over-
sight, leadership, and incentives.
• Alternatives to incarceration that reduce re-offending: Much of the literature sug-
gests it is best to avoid getting non-violent offenders involved with the court
system to begin with. Diverting minor crimes away from the courts and correc-
tions system and towards alternative sentences or treatment programmes (drug,
alcohol, trauma, or mental health) can save resources and reduce re-offending.
Restorative justice programmes aim to help victims work through their feelings
and reach a solution, together with offenders, outside of the courts. An interna-
tional review of the research on these programmes (Sherman and Strang 2007)
found that victims were more satisfied, taxpayers saved money, and re-offending
rates for some offences were lower than for those who were incarcerated. These
programmes can also expand access to justice by bypassing some of the cost and
logistical obstacles to the courts. Both Jamaica and Trinidad and Tobago have
begun studying the wider application of restorative justice programmes in recent
years. It will be important to follow the development of these programmes and
their impact.
• Smarter, stronger courts: Courts in many Caribbean countries are under-resourced
and have low management capacity in the face of increasing criminal caseloads.
This can result in large backlogs and long bouts of pre-trial detention. The UNDP’s
2012 Caribbean Human Development Report makes an important recommendation
in this regard that has yet to be fully implemented in most Caribbean countries: to
develop and implement a judicial management system and strategy that seeks to
minimize delays through (1) improved witness management, (2) better case prepa-
ration, and (3) reduced double booking by lawyers (UNDP 2012).

266
RESTORING PARADISE IN THE CARIBBEAN: COMBATTING VIOLENCE WITH NUMBERS
In addition, Caribbean countries should study the possibility of implementing
problem-solving courts that aim to prevent re-offending while meeting the needs
of victims and society. Two types of problem-solving courts that have strong evi-
dence to support them are drug courts13 and mental health courts.14
• Smarter corrections and rehabilitation: Several hundred studies over the last three de-
cades have looked at what works best to reduce an inmate’s likelihood of re-offending
after release. As shown in the previous chapter, the strongest evidence is for cogni-
tive-behavioural therapy (CBT), which targets thought processes and aims to change
decision-making related to crime. Approaches that focus on personal development
through skills, relationships, and growth (CBT, social skills, academic skills, and voca-
tional skills) are more effective than those that focus on deterrence through discipline
(i.e., boot camp), fear of consequences (i.e., “Scared Straight”), and surveillance (i.e.,
intensive probation, electronic monitoring). In addition, isolated life skills and work
programmes that are not combined with cognitive and relationship skills have not
been shown to achieve significant reductions in re-offending.
14.4 Final RemarksThe recommendations in this chapter are many and cover a wide scope, but complex
problems require multi-faceted and complex solutions. Violence in the Caribbean
is a problem, and problems require focused attention by multiple stakeholders and
resources. The size of the violence problem in the Caribbean merits an equally ro-
bust response, and from other sectors beyond criminal justice. These measures will
require financial and political support in the face of restricted budgets. However, in
many cases we do not have a clear picture of how existing budgets are actually con-
tributing to violence reduction. By focusing on initiatives that are evidence-based,
targeted, and evaluated, governments can more easily determine what is working
and where scarce resources should continue to be allocated. The recommendations
are also far more likely to be implemented if they are taken up and advocated by
the international community in its interactions with the region. While the challenge is
great, the Caribbean is capable of restoring paradise by combatting violence intelli-
gently and strategically.
13 A recent systematic review of the evidence identified 154 independent, eligible evaluations, including 92 evaluations of adult drug courts, 34 evaluations of juvenile drug courts, and 28 evaluations of drunk-driving courts. The findings most strongly support the effectiveness of adult drug courts, consistently finding reduc-tions that generally persist for at least three years (Mitchell et al. 2012).14 For an overview of the evidence, see “Specialized and Problem Solving Courts” on the National Institute of Justice website at www.crimesolutions.gov.

267
References
Abrahamse, A., P. Ebener, P. Greenwood, N. Fitzgerald, and T. Kosin. 1991. An Exper-
imental Evaluation of the Phoenix Repeat Offender Program. Justice Quarterly
8(2): 141–68.
Abramsky, T., K. Devries, L. Kiss, J. Nakuti, N. Kyegombe, E. Starmann, B. Cundill,
L. Francisco, D. Kaye, T. Musuya, L. Michau, and C. Watts. 2014. Findings from the
SASA! Study: A Cluster Randomized Controlled Trial to Assess the Impact of a
Community Mobilization Intervention to Prevent Violence against Women and
Reduce HIV Risk in Kampala, Uganda. BMC Medicine 12(122).
Abramsky, T., C.H. Watts, C. Garcia-Moreno, K. Devries, L. Kiss, M. Ellsberg, H. Jansen,
and L. Heise. 2011. What Factors Are Associated with Recent Intimate Partner
Violence? Findings from the WHO Multi-country Study on Women’s Health and
Domestic Violence. Biomed Central Public Health 11(109): 1–17.
Adler, F., G. Mueller, and W. Laufer. 1998. Criminology. New York: McGraw-Hill.
Agozino, B., B. Bowling, E. Ward, and G. St. Bernard. 2009. Guns, Crime and Social Or-
der in the West Indies. Criminology and Criminal Justice 9: 287–305.
Ahern J., M. Cerda, S.A. Lippman, K.J. Tardiff, D. Vlahov, and S. Galea. 2013. Navigating
Non-positivity in Neighbourhood Studies: An Analysis of Collective Efficacy and
Violence. Journal of Epidemiology and Community Health 67(2): 159–65.
Alleyne, D., and I. Boxill. 2003. The Impact of Crime on Tourist Arrivals in Jamaica. In-
ternational Journal of Tourism Research 5(5): 381–91.
Alvazzi del Frate, A. 1998. Victims of Crime in the Developing Countries. United Na-
tions International Crime and Justice Research Institute Publication No. 57.
Rome. Available at: http://www.unicri.it/services/library_documentation/publi-
cations/icvs/publications/n57.htm.
Alvazzi del Frate, A., U. Zvekic, and J.M. van Dijk, editors. 1993. Understanding Crime,
Experiences of Crime and Crime Control, Acts of the International Conference.
United Nations International Crime and Justice Research Institute Publication No.
491993. Rome.

268
RESTORING PARADISE IN THE CARIBBEAN: COMBATTING VIOLENCE WITH NUMBERS
American Psychological Association. 1996. Violence and the Family: Report of the
American Psychological Association Presidential Task Force on Violence and the
Family. American Psychological Association. Washington, DC.
Americas Watch. 1986. Human Rights in Jamaica. Americas Watch Committee, New
York.
Amin, M. 2009. Who Suffers More From Crime? World Bank (November). Washington, DC.
Amin, M. 2014. Avoiding Crime in Latin America and the Caribbean. World Bank Group
Latin America and the Caribbean Series Note 7. World Bank, Washington, DC.
Amnesty International. 2000. Killings and Violence by Police: How Many More Victims?
London, Amnesty International. Available at: http://www.amnesty-caribbean.org/
Jamaica/AMR3800101/KillingsandViolencebyPolice.pdf.
Amnesty International. 2011. Jamaica: A Long Road to Justice? Human Rights Viola-
tions under the State of Emergency. Available at: http://www.amnesty.org/en/
documents/AMR38/002/2011/en/.
Anderson, D.M. 2009. The Effects of Poverty on the Susceptibility to Crime in South
Africa. SSRN Scholarly Paper No. 1289648. Social Science Research Network.
Available at: http://papers.ssrn.com/abstract=1289648.
Anyanwu, E. 2011. Exploring Domestic Violence against Women in Trinidad and Toba-
go: Analysis of the Barriers That May Hinder Abused Women from Seeking Help.
Master of Science Thesis, Criminology Unit, University of the West Indies, St. Au-
gustine, Trinidad.
Ariel, B., C. Weinborn, and L.W. Sherman. 2016. “Soft” Policing at Hot Spots—Do Police
Community Support Officers Work? A Randomized Controlled Trial. Journal of
Experimental Criminology 12(3): 277–317.
Augimeri, L., D. Farrington, C. Koegl, and D.M. Day. 2007. The SNAP Under 12 Outreach
Project: Effects of a Community-Based Program for Children with Conduct Prob-
lems. Journal of Child and Family Studies 16: 799–807.
Azpuru, D. 2014. Beyond the Blame Game: Visualizing the Complexity of the Border.
Americas Quarterly (August 6). Available at: http://www.americasquarterly.org/
content/beyond-blame-game-visualizing-complexity-border-crisis.
Bailey, C. 2016. Crime and Violence in Barbados. IDB Technical Note Series on Crime
and Violence in the Caribbean. Inter-American Development Bank, Washington,
DC. Available at: https://publications.iadb.org/handle/11319/7774.
Bandiera, O., N. Buehren, R. Burgess, M. Goldstein, S. Gulesci, I. Rasul, and M. Sulaiman.
2012. Empowering Adolescent Girls: Evidence from a Randomized Control Trial
in Uganda. World Bank, Washington, DC.
Barbados Nation. 2015. Another Bid to Cut Backlog. Daily Nation, 26 August.

269
REFERENCES
Barnes, G.M., A.S. Reifman, M.P. Farrell, and B.A. Dintcheff. 2000. The Effects of Par-
enting on the Development of Adolescent Alcohol Misuse: A Six-Wave Latent
Growth Model. Journal of Marriage and Family 62(1): 175–86.
Bartelet, R. 2004. Self-Reported Juvenile Delinquency in England and Wales, The Neth-
erlands and Spain. European Institute for Crime Prevention and Control (HEUNI),
Helsinki.
Beato, P., and M.V. Andrade. 2004. Crime, Oportunidade e Vitimização. Revista Brasile-
ira De Ciências Sociais 19: 73–90.
Beck, E., M. Ohmer, and B. Warner. 2012. Strategies for Preventing Neighborhood Vio-
lence: Toward Bringing Collective Efficacy into Social Work Practice. Journal of
Community Practice 20: 225–40.
Bell, B., L. Jaitman, and S. Machin. 2014. Crime Deterrence: Evidence from the London
2011 Riots. Economic Journal 124(576): 480–506.
Bennett, T., K. Holloway, and D. Farrington. 2008. The Effectiveness of Neighborhood
Watch. Campbell Systematic Reviews 18. Available at http://campbellcollaboration.
org/lib/project/50/.
Bergman, M. 2006. Crime and Citizen Security in Latin America: The Challenges for
New Scholarship. Latin American Research Review 41: 213–27.
Biderman, C.J., J.M.P. De Mello, and A. Schneider. 2009. Dry Laws and Homicides: Evi-
dence from the São Paulo Metropolitan Area. Economic Journal 120(543): 157–82.
Black, L. 2014. Jamaica Teen Gangs. In Teen Gangs: A Global View, edited by M. Duffy
and E. Gillig. Westport, CT: Greenwood Press.
Blair, L., C. Sullivan, E. Latessa, and C.J. Sullivan. 2015. Juvenile Drug Courts: A Process,
Outcome, and Impact Evaluation. U.S. Department of Justice Office of Juvenile
Justice and Delinquency Prevention. Juvenile Justice Bulletin (May).
Blum, R., and M. Ireland. 2004. Reducing Risk, Increasing Protective Factors: Findings
from the Caribbean Youth Health Survey. Journal of Adolescent Health 35(6):
493–500.
Bott, S., A. Guedes, M. Goodwin, and J.A. Mendoza. 2012. Violence against Women in
Latin America and the Caribbean: A Comparative Analysis of Population-Based
Data from 12 Countries. Pan American Health Organization, Washington, DC.
Available at: www.paho.org/violence.
Box, S., C. Hale, and G. Andrews. 1988. Explaining Fear of Crime. British Journal of
Criminology 28: 340–56.
Braga, A., 2007. The Effects of Hot Spots Policing on Crime. Campbell Systematic Re-
view 8. Available at: https://campbellcollaboration.org/media/k2/attachments/
Braga_Hot_Spots_Policing_Review.pdf.

270
RESTORING PARADISE IN THE CARIBBEAN: COMBATTING VIOLENCE WITH NUMBERS
Braga, A., and B.J. Bond. 2008. Policing Crime and Disorder Hot Spots: A Randomized
Controlled Trial. Criminology 46(3): 577–607.
Braga, A., D.M. Kennedy, E.J. Waring, and A.M. Piehl. 2001. Problem-Oriented Policing,
Deterrence, and Youth Violence: An Evaluation of Boston’s Operation Ceasefire.
Journal of Research in Crime and Delinquency 38(3): 195–225.
Braga, A., A. Papachristos, and D. Hureau. 2012. Hot Spots Policing Effects on Crime.
Campbell Systematic Reviews 8.
Braga, A., A. Papachristos, and D. Hureau. 2014. The Effects of Hot Spots Policing on
Crime: An Updated Systematic Review and Meta-Analysis. Justice Quarterly 31(4).
Braga, A., B.C. Welsh, and C. Schnell. 2015. Can Policing Disorder Reduce Crime? A
Systematic Review and Meta-Analysis. Journal of Research in Crime and Delin-
quency 52: 567–88.
Brennen, S., M. Carroll, W. Fielding, and M. Thompson. 2010. A Preliminary Investigation
of the Prevalence of Corporal Punishment of Children and Selected Co-occurring
Behaviours in Households on New Providence, The Bahamas. The International
Journal of Bahamian Studies 16: 1–18.
Brooks, L. 2008. Volunteering to Be Taxed: Business Improvement Districts and the
Extra-governmental Provision of Public Safety. Journal of Public Economics 92(1–
2): 388–406.
Budde, S., and P. Schene. 2004. Informal Social Support Interventions and Their Role in
Violence Prevention: An Agenda for Future Evaluation. Journal of Interpersonal
Violence 19: 341–55.
Bussmann, K.D., C. Erthal, and A. Schroth. 2011. Effects of Banning Corporal Punish-
ment in Europe: A Five Nation Comparison. In Global Pathways to Abolishing
Physical Punishment: Realizing Children’s Rights, edited by J. Durrant and A.B.
Smith. New York: Routledge.
Butts, J.A., C.A. Gouvis Roman, L. Bostwick, and J.R. Porter. 2015. Cure Violence: A Public
Health Model to Reduce Gun Violence. Annual Review of Public Health 36: 39–53.
Cahill, M., M. Coggeshall, D. Hayeslip, A. Wolff, E. Lagerson, M. Scott, E. Davies, K. Ro-
land, and S. Decker. 2008. Community Collaboratives Addressing Youth Gangs:
Interim Findings from the Gang Reduction Program. Urban Institute Justice Pol-
icy Center, Washington, D.C.
Callaghan, C., F. Rivara, and T. Koepsell. 1995. Money for Guns: Evaluation of the Seattle
Gun Buy-Back Program. In Under Fire: Gun Buy-Backs, Exchanges, and Amnes-
ty Programs, edited by M. Plotkin. Washington, DC: Police Executive Research
Forum.
Camacho, A., and D. Mejía. 2013. Las externalidades de los programas de transferen-
cias condicionadas sobre el crimen. El caso de Familias en Acción en Bogotá. IDB
Working Paper No. 406. Inter-American Development Bank, Washington, DC.

271
REFERENCES
Campbell, E. 2014. Medium-Risk Prisoners to Be Transferred. Jamaica Gleaner, November
27. Available at: http://m.jamaica-gleaner.com/gleaner/20141127/news/news2.php.
Campbell, R., D. Bybee, S.M. Townsend, J. Shaw, N. Karim, and J. Markowitz. 2014. The
Impact of Sexual Assault Nurse Examiner Programs on Criminal Justice Case
Outcomes: A Multisite Replication Study. Violence against Women 20(5): 607–25.
Capaldi, D., and S. Clark. 1998. Prospective Family Predictors of Aggression Toward Fe-
male Partners for At-Risk Young Men. Developmental Psychology 34(6): 1175–188.
Capaldi, D., K.C. Pears, G.R. Patterson, and L.D. Owen. 2003. Continuity of Parenting Prac-
tices across Generations in an At-Risk Sample: A Prospective Comparison of Direct
and Mediated Associations. Journal of Abnormal Child Psychology 331(2): 127–42.
Capobianco, L. 2005. Sharpening the Lens: Private Sector Involvement in Crime Pre-
vention, ICPC Background Paper. International Centre for the Prevention of
Crime. Available at: http://www.ocpa-oh.org/Private%20Security/Private%20
Sector%20Involvement%20in%20Crime%20Prevention.pdf.
Carvalho, J.R., and S.C. Lavor. 2008. Repeat Property Criminal Victimization and In-
come Inequality in Brazil. Revista Economia 9: 87–110.
Cave, G., H. Bos, F. Doolittle, and C. Toussaint. 1993. JOBSTART: Final Report on a
Program for School Dropouts. Manpower Demonstration Research Corporation,
New York.
Celinska, K., S. Furrer, and C.-C. Cheng. 2013. An Outcome-Based Evaluation of Func-
tional Family Therapy for Youth with Behavioral Problems. U.S. Department of
Justice Office of Juvenile Justice and Delinquency Prevention. Journal of Juvenile
Justice 2(2): 23–36.
Cerdá, M., J. Morenoff, L.F. Duque, and S.L. Buka. 2008. The Limits of Collective Efficacy:
Investigating the Influence of Neighborhood Context on Levels of Violence. Paper
presented at the American Sociological Association Annual Meeting, Boston (De-
cember 1). Available at: http://citation.allacademic.com/meta/p241636_index.html.
Cerdá, M., J.D. Morenoff, B.B. Hansen, K.J. Tessari Hicks, L.F. Duque, A. Restrepo, and
A.V. Diez-Roux. 2012. Reducing Violence by Transforming Neighborhoods: A Nat-
ural Experiment in Medellín, Colombia. American Journal of Epidemiology 175(10):
1045–053.
Cerqueira, D. 2014. Causas e consequências do crime no Brasil. Banco Nacional de
Desenvolvimento Econômico e Social. Available at: https://web.bndes.gov.br/
bib/jspui/handle/1408/1922.
Chandler, D., S.D. Levitt, and J.A. List. 2011. Predicting and Preventing Shootings among
At-Risk Youth. American Economic Review 101(3): 288–92.
Clayton, R.R., A.M. Cattarello, and B.M. Johnstone. 1996. The Effectiveness of Drug
Abuse Resistance Education (Project DARE): 5-Year Follow-Up Results. Preven-
tive Medicine 25: 307–18.
272
RESTORING PARADISE IN THE CARIBBEAN: COMBATTING VIOLENCE WITH NUMBERS
Cohen, L.E., and D. Cantor. 1981. Residential Burglary in the United States: Life-style
and Demographic Factors Associated with the Probability of Victimisation. Jour-
nal of Research in Crime and Delinquency 18(1): 113–27.
Cohen, L.E., and M. Felson. 1979. Social Change and Crime Rate Trends: A Routine Ac-
tivity Approach. American Sociological Review 44: 588–608.
Cohen, M.A. and A.R. Piquero. 2010. An Outcome Evaluation of the YouthBuild USA
Offender Project. Youth Violence and Juvenile Justice 8(4): 373–85.
Cole, J., and A. Gramajo. 2009. Homicide Rates in a Cross-Section of Countries: Evi-
dence and Interpretations. Population and Development Review 35: 749–76.
Cook, P., and J. MacDonald. 2011. Public Safety Through Private Action: An Economic
Assessment of BIDs. The Economic Journal 121(552): 445–62.
Copeland, W.E., D. Wolke, A. Angold, and E.J. Costello. 2013. Adult Psychiatric Out-
comes of Bullying and Being Bullied by Peers in Childhood and Adolescence.
JAMA Psychiatry 70(4): 419–26.
Córdova, A. 2009. Methodological Note: Measuring Relative Wealth Using Household
Asset Indicators. Latin American Public Opinion Project Insights Series No. 6.
Corsaro, N., E.D. Hunt, N.K. Hipple, and E.F. McGarrell. 2012. The Impact of Drug Market
Pulling Levers Policing on Neighborhood Violence: An Evaluation of the High
Point Drug Market Intervention. Criminology and Public Policy 11(2):167–99.
Crowe, T.D. 1991. Crime Prevention Through Environmental Design: Applications of Ar-
chitectural Design and Space Management Concepts. Boston: National Crime
Prevention Institute, Butterworth-Heinemann.
Cuesta, J.A., E. Alda, and J. Lamas. 2007. Social Capital, Violence and Public Interven-
tion: The Case of Cali. Washington, DC: Inter-American Development Bank.
Cullen, J.B., B.A. Jacob, and S.D. Levitt. 2006. The Effect of School Choice on Partici-
pants: Evidence from Randomized Lotteries. Econometrica 74(5): 1191–230.
Cumberbatch, S. 2013. Move to Ease Court Backlog. Barbados Today, March 11. Available
at: http://www.barbadostoday.bb/2013/03/11/move-to-ease-court-backlog/.
Curtis, N.M., K.R. Ronan, and C.M. Borduin. 2004. Multisystemic Treatment: A
Meta-analysis of Outcome Studies. Journal of Family Psychology 18(3): 411–19.
D’Amico, E. J., J.S. Tucker, J.N.V. Miles, A.J. Zhou, R.A. Shih, and H.D. Green. 2012. Pre-
venting Alcohol Use with a Voluntary After-School Program for Middle School
Students: Results from a Cluster Randomized Controlled Trial of CHOICE. Pre-
vention Science 13: 415–25.
Davidson, W.S., R. Redner, C.H. Blakely, J.G. Ernshoff, and C.M. Mitchell. 1987. Diversion
of Juvenile Offenders: An Experimental Comparison. Journal of Consulting and
Clinical Psychology 55(1): 68–75.
De Albuquerque, K., and J. McElroy. 1999. Tourism and Crime in the Caribbean. Annals
of Tourism Research 26: 968–84.

273
REFERENCES
Deaton, A. 1997. The Analysis of Household Surveys: A Micro-econometric Approach to
Development Policy. Baltimore: Johns Hopkins University Press for the World Bank.
Deming, D. 2011. Better Schools, Less Crime? Quarterly Journal of Economics 126(4):
2063–115.
Department of Education of The Bahamas. 2012. Safe Schools Protocol: Manual for
Public Schools. Fourth Revision (December). Available at: http://www.baha-
maseducation.com/PDF/Publications/ManualforStudents.pdf.
Diop, N.J, M.M. Faye, A. Moreau, J. Cabral, and H. Benga. 2004. The TOSTAN Program:
Evaluation of a Community-Based Education Program in Senegal. Washington,
DC: Population Council.
Dishion, T.J., and R. J. McMahon. 1998. Parental Monitoring and the Prevention of Child
and Adolescent Problem Behavior: A Conceptual and Empirical Formulation.
Clinical Child Family Psychology Review 1(1): 61–75.
Di Tella, R., and E. Schargrodsky. 2013. Criminal Recidivism after Prison and Electronic
Monitoring. Journal of Political Economy 121(1): 28–73.
Doeksen, H. 1997. Reducing Crime and the Fear of Crime by Reclaiming New Zealand’s
Suburban Street. Landscape and Urban Planning 39(2–3): 243–52.
Dolan, P., G. Loomes, T. Peasgood, and A. Tsuchiya. 2005. Estimating the Intangible
Victim Costs of Violent Crime. British Journal of Criminology 45(6): 958–76.
Drago, F., R. Galbiati, and P. Vertova. 2009. The Deterrent Effects of Prison: Evidence
from a Natural Experiment. Journal of Political Economy 117(2): 257–80.
Duba, J., and M. Jencius. 2004. The Bahamas. In Teen Gangs: A Global View, edited by
M. Duffy and E. Gillig. Westport, CT: Greenwood Press.
Duffy, M., and E. Gillig, editors. 2004. Teen Gangs: A Global View. Westport, CT: Green-
wood Press.
Duke, N.N., S.L. Pettingell, B.J. McMorris, and I.W. Borowsky. 2010. Adolescent Violence
Perpetration: Associations with Multiple Types of Adverse Childhood Experienc-
es. Pediatrics 125(4): e778–e786.
Durrant, R., C. Cadenhead, R. Pendergrast, G. Slavens, and C. Linder. 1994. Factors
Associated with the Use of Violence among Urban Black Adolescents. American
Journal of Public Health 84: 612–17.
Duwe, G., and V. Clark. 2013. The Effects of Private Prison Confinement on Offender
Recidivism: Evidence from Minnesota. Criminal Justice Review 38(3): 375–94.
Ehrensaft, M.K., P. Cohen, J. Brown, E. Smailes, H. Chen, and J.G. Johnson. 2003. In-
tergenerational Transmission of Partner Violence: A 20-Year Prospective Study.
Journal of Consulting and Clinical Psychology 71(4): 741–53.
Ellsberg, M., J.D. Arango, M. Morton, F. Gennari, S. Kiplesund, M. Contreras, and C.
Watts. 2014. Prevention of Violence against Women and Girls: What Does the
Evidence Say? The Lancet 385: 1555–566.

274
RESTORING PARADISE IN THE CARIBBEAN: COMBATTING VIOLENCE WITH NUMBERS
Ennett, S.T., D.P. Rosenbaum, R.L. Flewelling, G.S. Bieler, C.L. Ringwalt, and S.L. Bailey.
1994. Long-Term Evaluation of Drug Abuse Resistance Education. Addictive Be-
haviors 19: 113–25.
Ernst & Young. 2004. Fraud, the Unmanaged Risk. 8th Global Survey. Ernst & Young
Global Investigations and Dispute Advisory Services.
Eshel, N., B. Daelmans, M. Cabral de Mello, and J. Martines. 2006. Responsive Par-
enting: Interventions and Outcomes. Bulletin of the World Health Organization
84(12): 991–98.
Evans, W.N., and E.G. Owens. 2007. COPS and Crime. Journal of Public Economics
91(1): 181–201.
Farrington, D.P. 2010. Criminal Careers. In The Cambridge Handbook of Forensic
Psychology, edited by J.M. Brown and E.A. Campbell. New York: Cambridge Uni-
versity Press.
Farrington, D.P., and R. Loeber. 1999. Transatlantic Replicability of Risk Factors in the
Development of Delinquency. In Historical and Geographical Influences on Psy-
chopathology, edited by P. Cohen, C. Slomkowsky, and L.N. Robins. Mahwah, NJ:
Lawrence Erlbaum Associates.
Farrington, D.P., and M. Ttofi. 2009. School-Based Programs to Reduce Bullying and
Victimization. Campbell Systematic Reviews 6.
Farrington, D.P., and B. Welsh. 2007. Save Children from a Life of Crime. Criminology
and Public Policy 6: 871–76.
Felson, M., and R.V. Clarke. 1998. Opportunity Makes the Thief: Practical Theory for
Crime Prevention. London: Policing and Reducing Crime Unit, Home Office Re-
search, Development and Statistics Directorate.
Fergusson, D.M., L.J. Horwood, and E.M. Ridder. 2005. Randomized Trial of the Early
Start Program of Home Visitation. Pediatrics 116: e803–e809.
Feucht, T., and T. Holt. 2016. Does Cognitive Behavioral Therapy Work in Criminal
Justice? A New Analysis from crimesolutions.gov. National Institute of Justice
Journal 27.
Fielding, W.J. 2012. Violence in the Life of an Inmate Prior to Conviction and Its Associa-
tion with Crimes against Persons. Paper presented at the Criminality Colloquium,
College of The Bahamas, September.
Finkelhor, D., and R. Ormrod. 1999. Reporting Crimes Against Juveniles. U.S. Depart-
ment of Justice Office of Juvenile Justice and Delinquency Prevention. Juvenile
Justice Bulletin (November).
Fisher, B.S., L.E. Daigle, F.T. Cullen, and M.G. Turner. 2003. Reporting Sexual Victim-
ization to the Police and Others: Results from a National-Level Study of College
Women. Criminal Justice and Behavior 30(1): 6–38.

275
REFERENCES
Fletcher, A.C., L. Darling, N.E. Steinberg, and S.M. Dornbusch. 1995. The Company
They Keep: Relation of Adolescents’ Adjustment and Behavior to Their Friends’
Perceptions of Authoritative Parenting in the Social Network. Developmental
Psychology 31(2): 300–10.
Flood-Page, C., S. Campbell, V. Harrington, and J. Miller. 2000. Youth Crime: Findings
from 1998/99 Youth Lifestyles Survey. Home Office Research Study 209. Home
Office Research, Development and Statistics Directorate Crime and Criminal Jus-
tice Unit, London.
Foshee, V.A., K.E. Bauman, S.T. Ennett, C. Suchindran, T. Benefield, and G.F. Linder. 2005.
Assessing the Effects of the Dating Violence Prevention Program “Safe Dates”
Using Random Coefficient Regression Modeling. Prevention Science 6: 245–57.
Frühling, H., M. Chinchilla, M.V. Llorente, P. de Mesquita Neto, and C.C. Beato. 2004.
Calles más seguras: Estudios de policía comunitaria en América Latina. Washing-
ton, DC: Inter-American Development Bank.
Fulu, E., X. Warner, S. Miedema, R. Jewkes, T. Roselli, and J. Lange. 2013. Why Do Some
Men Use Violence Against Women and How Can We Prevent It? Quantitative Find-
ings from the United Nations Multi-country Study on Men and Violence in Asia
and the Pacific. United Nations Development Programme, United Nations Pop-
ulation Fund, UN Women, and United Nations Volunteers, Bangkok. Available at:
www.partners4prevention.org/resource/why-do-some-men-use-violence-against-
women-and-how-can-we-prevent-it-quantitative-findings.
Galiani, S., L. Jaitman, and F. Weinschelbaum. Forthcoming. Crime and Durable Goods.
Inter-American Development Bank..
García, J., D. Mejía, and D. Ortega. 2013. Police Reform, Training and Crime: Experimental
Evidence from Colombia’s Plan Cuadrantes. CAF Document. Available at: www.
caf.com/media/4243/police_reform_training_crime_experimental_evidence_
colombia.pdf.
Garcia-Moreno, C., H. Jansen, M. Ellsberg, L. Heise, and C.H. Watts. 2005. WHO
Multi-country Study on Women’s Health and Domestic Violence against Women:
Initial Results on Prevalence, Health Outcomes and Women’s Responses. World
Health Organization, Geneva. Available at: http://www.who.int/gender/violence/
who_multicountry_study/en/.
Garicano, L., and P. Heaton. 2010. Information Technology, Organization, and Produc-
tivity in the Public Sector: Evidence from Police Departments. Journal of Labor
Economics 28(1): 167–201.
Garofalo, J. 1981. The Fear of Crime: Causes and Consequences. The Journal of Criminal
Law and Criminology 72(2): 839–57.
Gendreau, P., C. Goggin, and F. Cullen. 1999. The Effects of Prison Sentences on Recid-
ivism. Public Works and Government Services Canada, Ottawa.

276
RESTORING PARADISE IN THE CARIBBEAN: COMBATTING VIOLENCE WITH NUMBERS
Geneva Declaration Secretariat. 2015. Global Burden of Armed Violence 2015: Every
Body Counts.
Gilbert, R., A. Kemp, J. Thoburn, P. Sidebotham, L. Radford, D. Glaser, and H.L. MacMillan.
2009. Recognsing and Responding to Child Maltreatment. Lancet 373: 167–80.
Gilgen, E., K. Aguirre, and M. Nowak. 2012. A Fatal Relationship: Guns and Deaths in
Latin America and the Caribbean. In Small Arms Survey 2012. Oxford, UK: Oxford
University Press.
Godley, M.D., S.H. Godley, M.L. Dennis, R.R. Funk, and L.L. Passetti. 2006. The Effect
of Assertive Continuing Care on Continuing Care Linkage, Adherence, and Ab-
stinence Following Residential Treatment for Adolescents with Substance Use
Disorders. Addiction 102(1): 81–93.
Goldberg, M., K.W. Kim, and M. Ariano. 2014. How Firms Cope with Violence: Experienc-
es from around the World. Washington, DC: World Bank.
Goldschmidt, P., D. Huang, and M. Chinen. 2007. The Long-Term Effects of After-School
Programming on Educational Adjustment and Juvenile Crime: A Study of the
LA’s BEST After-school Program. UCLA/CRESST, Los Angeles. Available at:
http://www.lasbest.org/resourcecenter/LASBEST_DOJ_Study_Brief.pdf.
Goldstein, H. 1990. Problem-Oriented Policing. Philadelphia: McGraw-Hill.
Goldstein, S., G. Japhet, S. Usdin, and E. Scheepers. 2005. Achieving Social Change on
Gender-Based Violence: A Report on the Impact Evaluation of Soul City’s Fourth
Series. Social Science and Medicine 61(11).
Gordon, D.A., J. Arbuthnot, K.E. Gustafson, and P. McGreen. 1988. Home-Based
Behavioral-Systems Family Therapy with Disadvantaged Juvenile Delinquents.
American Journal of Family Therapy 16(3): 243–55.
Graham, J., and B. Bowling. 1995. Young People and Crime. United Kingdom Home
Office, Research and Statistics Department.
Grönqvist, H., and S. Niknami. 2014. Alcohol Availability and Crime: Lessons from Liber-
alized Week-End Sales Restrictions. Journal of Urban Economics 81: 77–84.
Guerra, N.G., K.R. Williams, J.M. Meeks-Gardner, and I. Walker. 2001. The Kingston
YMCA Positive Youth Development Programme: An Effective Anti-violence In-
tervention for Inner-City Youth in Jamaica. In Beyond Suppression: International
Perspectives on Youth Violence Prevention, edited by J. Hoffman, L. Knox, and R.
McMahon. Kingston, Jamaica: Guilford Press.
Gundersen, K.K., and F. Svartdal. 2006. Aggression Replacement Training in Norway:
Outcome Evaluation of 11 Norwegian Student Projects. Scandinavian Journal of
Education Research 50(1): 63–81.
Haggerty, K.P., A. McGlynn-Wright, and T. Klima. 2013. Promising Parenting Programs
for Reducing Adolescent Problem Behaviors. Journal of Children’s Services 8(4).

277
REFERENCES
Hahn, A., T. Leavitt, and O. Aaron. 1994. Evaluation of the Quantum Opportunities Pro-
gram: Did the Program Work? A Report on the Post-secondary Outcomes and
Cost-Effectiveness of the QOP Program (1989–1993). Heller Graduate School,
Center for Human Resources, Brandeis University, Waltham, MA.
Hanna, C.A. 2011. Reducing Murders in The Bahamas: A Strategic Plan Based on Em-
pirical Research. Royal Bahamas Police Force, Nassau. Available at: http://www.
bahamaslocal.com/files/Reducing_Murders_in_The_Bahamas.pdf.
Harriott, A. 2002. Crime Trends in the Caribbean and Responses. Unpublished report
submitted to the United Nations Office on Drugs and Crime.
Harriott, A. 2008. Bending the Trend Line: The Challenge of Controlling Violence in
Jamaica and the High Violence Societies of the Caribbean. Professorial Inaugural
Lecture (July), University of the West Indies, Kingston, Jamaica.
Harriott, A. 2011. The Emergence and Evolution of Organized Crime in Jamaica. Univer-
sity of the West Indies, Kingston, Jamaica. Unpublished.
Harriott, A., and M. Jones. 2016. Crime and Violence in Jamaica. IDB Series on Crime and
Violence in the Caribbean. Inter-American Development Bank, Washington, DC.
Harriott, A., and C.M. Katz. 2015. Gangs in the Caribbean: Responses of State and So-
ciety. Kingston, Jamaica: University of the West Indies Press.
Hayeslip, D., and M. Cahill. 2009. Community Collaboratives Addressing Youth Gangs:
Final Evaluation Findings from the Gang Reduction Program. Urban Institute Jus-
tice Policy Center, Washington, DC.
Heaton, P. 2012. Sunday Liquor Laws and Crime. Journal of Public Economics 96(1–2):
42–52.
Heise, L. 2011. What Works to Prevent Partner Violence: An Evidence Overview. Policy Divi-
sion of the UK Department for International Development. Available at: http://strive.
lshtm.ac.uk/resources/what-works-prevent-partner-violence-evidence-overview.
Heise, L., J. Pitanguay, and A. Germain. 1994. Violence against Women: The Hidden
Health Burden. World Bank Discussion Paper 255. World Bank, Washington, DC.
Helfer, M.E., R.S. Kempe, and R.D. Krugman, editors. 1997. The Battered Child. Chicago:
University of Chicago Press.
Helland, E., and A. Tabarrok. 2007. Does Three Strikes Deter? A Nonparametric Estima-
tion. Journal of Human Resources 42(2): 309–30.
Heller, S., A. Shah, J. Guryan, J. Ludwig, S. Mullainatha, and H. Pollack. 2015. Thinking,
Fast and Slow? Some Field Experiments to Reduce Crime and Dropout in Chica-
go. Cambridge, MA: National Bureau of Economic Research.
Henry, K., and D. Kralstein. 2011. Community Courts: The Research Literature. New York:
Center for Court Innovation. Available at: http://www.courtinnovation.org/sites/
default/files/documents/Community%20Courts%20Research%20Lit.pdf.

278
RESTORING PARADISE IN THE CARIBBEAN: COMBATTING VIOLENCE WITH NUMBERS
Henry, L., M. Dawkins, and C. Gibson. 2012. Race, Ethnicity, Crime and Criminal Justice
in Jamaica. In Race, Ethnicity, Crime and Criminal Justice in the Americas, edited
by A. Kalunta-Crumpton. New York: Palgrave Macmillan.
Hepburn, L.M., and D. Hemenway. 2004. Firearm Availability and Homicide: A Review
of the Literature. Aggression and Violent Behavior 9(4): 417–40.
Herrenkohl, T.I., C. Sousa, E.A. Tajima, R.C. Herrenkohl, and C.A. Moylan. 2008. Inter-
section of Child Abuse and Children’s Exposure to Domestic Violence. Trauma,
Violence & Abuse 9: 84–99.
Higginson, A., K. Benier, Y. Shenderovich, L. Bedford, L. Mazerolle, and J. Murray. 2014.
Protocol: Predictors of Youth Gang Membership in Low- and Middle-Income
Countries: A Systematic Review. Campbell Systematic Review.
Hindelang, M. 1976. Criminal Victimization in Eight American Cities: A Descriptive Anal-
ysis of Common Theft and Assault. Cambridge, MA: Ballinger.
Hindelang, M., M.R. Gottfredson, and J. Garofalo. 1978. Victims of Personal Crime: An
Empirical Foundation for a Theory of Personal Victimization. Cambridge, MA:
Ballinger.
Hinton, N., D. Montalvo, A. Maldonado, M. Moseley, and D. Zizumbo-Colunga. 2014.
Crime and Violence across the Americas. In The Political Culture of Democracy in
the Americas, 2014: Democratic Governance across 10 Years of the AmericasBa-
rometer, edited by E.J. Zechmeister. Nashville: Vanderbilt University.
Hiskey, J., M. Malone, and D. Orcé. 2014. Violence and Migration in Central America.
AmericasBarometer Insights 101. Available at: http://www.vanderbilt.edu/lapop/
insights/IO901en.pdf.
Hoyt, L.M. 2005. Do Business Improvement District Organizations Make a Difference?
Crime in and around Commercial Areas in Philadelphia. Journal of Planning Edu-
cation and Research 25: 185–99.
Hurley, D. 2004. Felton Earls: On Crime as Science (A Neighbor at a Time), The New
York Times. January 6. Available at: http://www.nytimes.com/2004/01/06/
science/scientist-at-work-felton-earls-on-crime-as-science-a-neighbor-at-a-time.
html?_r=0.
International Centre for the Prevention of Crime (ICPC), World Bank, and Sou da Paz In-
stitute. 2011. Public-Private Partnerships and Community Safety: Guide to Action.
Iyengar, R. 2008. I Would Rather Be Hanged for a Sheep than a Lamb: The Unintended
Consequences of California’s Three Strikes Law. NBER Working Paper No. 13784.
National Bureau of Economic Research, Cambridge, MA.
Jacobs, J. 1961. The Life and Death of Great American Cities. New York: Vintage Books.
Jain, S., S.L. Buka, S.V. Subramanian, and B. Mulnar. 2010. Neighborhood Predictors of
Dating Violence Victimization and Perpetration in Young Adulthood: A Multilevel
Study. American Journal of Public Health 100: 1737–744.

279
REFERENCES
Jaitman, L., editor. 2015. The Welfare Costs of Crime and Violence in Latin America and
the Caribbean. Washington, DC: Inter-American Development Bank. Available at:
https://publications.iadb.org/handle/11319/7246.
Jaitman, L., and N. Ajzenman. 2016. Crime Concentration and Hot Spot Dynamics in
Latin America. IDB Working Paper No. IDB-WP-699. Inter-American Develop-
ment Bank, Washington, DC.
Jaitman, L., and R. Guerrero Compeán. 2015. Closing Knowledge Gaps: Toward Ev-
idence-Based Crime Prevention Policies in Latin America and the Caribbean.
Washington, DC: Inter-American Development Bank.
Jaitman, L., and I. Torre. 2016. How Large Are the Costs of Crime in Latin America and
the Caribbean? A Systematic Estimation of 15 Countries. Inter-American Devel-
opment Bank, Washington, DC.
Jalbert, S.K., W. Rhodes, M. Kane, E. Clawson, B. Bogue. C. Flygare, R. Kling, and M.
Guevara. 2011. A Multisite Evaluation of Reduced Probation Caseload Size in an
Evidence-Based Practice Setting. U.S. Department of Justice, National Institute
of Justice, Washington, D.C. Available at: https://www.ncjrs.gov/pdffiles1/nij/
grants/234596.pdf.
Jamaica Observer. 2010. Holness Wants Parents to Abandon Violent Disciplinary
Practices. May 21. Available at: http://www.jamaicaobserver.com/news/
Holness-wants-parents-to-abandon-violent-disciplinary-practices_7633618.
Jewkes, R. 2012. Rape Perpetration 2012: A Review. Sexual Violence Research Initiative,
Pretoria, South Africa.
Johnson, D., and T. Rinhart Kochel. 2012. Race, Ethnicity and Criminal Justice in Trini-
dad and Tobago. In Race, Ethnicity, Crime and Criminal Justice in the Americas,
edited by A. Kalunta-Crumpton. New York: Palgrave Macmillan.
Johnson, J. 2015. Jamaica Is Not Ready for Anti-beating Law, Says Education Minister.
Jamaica Gleaner, February 11. Available at: http://jamaica-gleaner.com/latest/
article.php?id=58289.
Jordan, M. 1986. Physical Violence Against Women in Barbados 1977–1985. Bridgetown:
Bureau of Women’s Affairs.
Juan, E.J., H. Terraza, M. Soulier Faure, B. Deregibus, I. Ramírez, A. Schwint, and G.
Moscoso. 2016. Voces emergentes: Percepciones sobre la calidad de vida ur-
bana en América Latina y el Caribe. Available at: https://publications.iadb.org/
handle/11319/7672?locale-attribute=es#sthash.awwrWpcx.dpuf.
Justus, M., and A. Kassouf. 2007. Uma investigação dos determinantes socioeco-
nômicos da depressão mental no Brasil com ênfase nos efeitos da educação.
Economia Aplicada 11(1): 5–26.
Kalunta-Crumpton, A., editor. 2012. Race, Ethnicity, Crime and Criminal Justice in the
Americas. New York: Palgrave Macmillan.

280
RESTORING PARADISE IN THE CARIBBEAN: COMBATTING VIOLENCE WITH NUMBERS
Kane, G.A., V.A. Wood, and J. Barlow. 2007. Parenting Programmes: A Systematic Re-
view and Synthesis of Qualitative Research. Child Care, Health and Development
33(6): 784–93.
Kapusta, N.D., E. Etzersdorfer, C. Krall, and G. Sonneck. 2007. Firearm Legislation Re-
form in the European Union: The Impact on Firearm Availability, Firearm Suicide
and Homicide Rates in Austria. British Journal of Psychiatry 191(3): 253–57.
Katz, C.M., and A.M. Fox. 2010. Risk and Protective Factors Associated with Gang
Involved Youth in Trinidad and Tobago. Pan-American Journal of Public Health
27(3): 187–202.
Katz C.M., and A.M. Fox. 2013. Differences in Delinquency, Victimization, and Risk and
Protective Factors for Gang and Non-gang Youth from Trinidad and Tobago and
the United States.
Katz, S., and M. Rempel. 2011. The Impact of Integrated Domestic Violence Courts on
Case Outcomes: Results for Nine New York State Courts. Center for Court In-
novation, New York. Available at: http://www.courtinnovation.org/sites/default/
files/documents/Nine_IDV.pdf.
Kelling, G., T. Pate, D. Dieckman, and C.E. Brown. 1974. The Kansas City Preventive Pa-
trol Experiment: A Summary Report. Police Foundation, Washington, DC.
Kelling, G., and J.Q. Wilson. 1982. Broken Windows: The Police and Neighborhood Safe-
ty. Atlantic Monthly 249(3): 29–38. Available at: http://www.theatlantic.com/
magazine/archive/1982/03/broken-windows/4465/?single_page=true.
Kessler, D., and S.D. Levitt. 1999. Using Sentence Enhancements to Distinguish be-
tween Deterrence and Incapacitation. Journal of Law and Economics 52: 343–63.
Kiely, M., A.A. El-Mohandes, M.N. El-Khorazaty, S.M. Blake, and M.G. Gantz. 2010. An
Integrated Intervention to Reduce Intimate Partner Violence in Pregnancy: A
Randomized Controlled Trial. Obstetrics and Gynecology 115: 273–83.
Kilias, M. 1993. International Correlations between Gun Ownership and Rates of Homi-
cide and Suicide. Canadian Medical Association Journal 148(5): 1721–725.
Kim, J., G. Ferrari, T. Abramsky, C. Watts, J. Hargreaves, L. Morison, G. Phetla, J. Porter,
and P. Pronyk. 2009. Assessing the Incremental Effects of Combining Economic
and Health Interventions: The IMAGE Study in South Africa. Bulletin of the World
Health Organization 87: 824–32.
King, J.W. 2003. Perceptions of Crime and Safety among Tourists Visiting the Caribbe-
an. In Understanding Crime in Jamaica: New Challenges for Public Policy, edited
by A. Harriott. University of West Indies Press.
Kirk, D.S. 2009. A Natural Experiment on Residential Change and Recidivism: Lessons
from Hurricane Katrina. American Sociological Review 74(3): 484–505.
Kishor, S., and K. Johnson. 2004. Profiling Domestic Violence: A Multi-country Study.
ORC Macro. Available at: http://dhsprogram.com/pubs/pdf/od31/od31.pdf.

281
REFERENCES
Kleck, G.D. 1991. Point Blank: Guns and Violence in America. New York: Aldine de
Gruyter.
Klein, M. 1995. The American Street Gang. New York: Oxford University Press.
Klein, M., and C. Maxson. 2006. Street Gang Patterns and Policies. New York: Oxford
University Press.
Klevens, J., J.W. Martínez, B. Lea, C. Rojas, A. Duque, and R. Tovar. 2009. Evaluation
of Two Interventions to Reduce Aggressive and Antisocial Behavior in First and
Second Graders in a Resource-Poor Setting. International Journal of Educational
Research 48(5): 307–19.
Kling, J.R., J. Ludwig, and L.F. Katz. 2005. Neighborhood Effects on Crime for Female
and Male Youth: Evidence from a Randomized Housing Voucher Experiment.
Quarterly Journal of Economics 120(1): 87–130.
Knerr, W., F. Gardner, and L. Cluver. 2011. Parenting and the Prevention of Child Maltreat-
ment in Low and Middle Income Countries: A Systematic Review of Interventions
and a Discussion of Prevention of the Risks of Future Violence Behavior among
Boys. Sexual Violence Research Initiative, Pretoria, South Africa.
Koper, C.S., and E. Mayo-Wilson. 2012. Police Strategies to Reduce Illegal Possession
and Carrying of Firearms: Effects on Gun Crime. Campbell Systematic Reviews 11.
Krug, E., L. Dahlberg, J. Mercy, A. Zwi, and R. Lozano. 2002. World Report on Violence and
Health. Geneva: WHO. Available at: http://www.who.int/violence_injury_prevention/
violence/world_report/en/.
Lall, V. 2007. Bullying, Victimization and Delinquency in Primary Schools in Trinidad
and Tobago: Some Preliminary Results. Caribbean Journal of Criminology and
Social Psychology 12(1–2): 155–76.
Lattimore, P.K., and C.A. Visher. 2009. The Multisite Evaluation of SVORI: Summary
and Synthesis. RTI International, Research Triangle Park, NC. Available at: https://
www.ncjrs.gov/pdffiles1/nij/grants/230421.pdf.
La Vigne, N.G., C. Owens, and S.S. Hetrick. 2009. Evaluation of Target’s Safe City Ini-
tiative: Implementing Public-Private Partnerships to Address Crime in Retail
Settings. U.S. Department of Justice, Washington, DC. Available at: https://www.
ncjrs.gov/pdffiles1/nij/grants/237917.pdf.
Lee, D.S., and J. McCrary. 2009. The Deterrence Effect of Prison: Dynamic Theo-
ry and Evidence. Industrial Relations Section Working Paper 550. Princeton
University.
Leslie, D. 2010. Confronting the Don: The Political Economy of Gang Violence in Ja-
maica. Small Arms Survey Graduate Institute of International and Development
Studies Occasional Paper. Geneva.
Letourneau, E., J.S. Levenson, D. Bandyopadhyay, D. Sinha, and K.S. Armstrong. 2010.
Evaluating the Effectiveness of Sex Offender Registration and Notification

282
RESTORING PARADISE IN THE CARIBBEAN: COMBATTING VIOLENCE WITH NUMBERS
Policies for Reducing Sexual Violence against Women. Research Report submit-
ted to the U.S. Department of Justice.
Levitt, S. 1997. Using Electoral Cycles in Police Hiring to Estimate the Effect of Police
on Crime. The American Economic Review 87(3): 270–90.
Lilley, D. 2015. The Weed and Seed Program: A Nationwide Analysis of Crime Out-
comes. Criminal Justice Policy Review 26: 423–47.
Lipsey, M.W., and F.T. Cullen. 2007. The Effectiveness of Correctional Rehabilitation: A Re-
view of Systematic Reviews. Annual Review of Law and Social Science 3: 297–320.
Lipsey, M.W., and J. Howell. 2012. Research-Based Guidelines for Juvenile Justice Pro-
grams. Justice Research and Policy 4.
Lizotte, A. J. 1985. The Uniqueness of Rape: Reporting Assaultive Violence to the Po-
lice. Crime and Delinquency 31: 169–90.
Lochner, L., and E. Moretti. 2004. The Effect of Education on Crime: Evidence from
Prison Inmates, Arrests and Self-Reports. American Economic Review 94(1):
155–89.
Loftin, C., D. McDowall, B. Wiersema, and T. Cottey. 1991. Effects of Restrictive Licensing
of Handguns on Homicide and Suicide in the District of Columbia. New England
Journal of Medicine 325(23): 1615–620.
Logan, J.E., R.T. Leeb, and L.E. Barker. 2009. Gender-Specific Mental and Behavior-
al Outcomes among Physically Abused High-Risk Seventh-Grade Youths. Public
Health Reports 124(2): 234–45.
Losel, F., and A. Beelman. 2006. Child Social Skills Training. In Preventing Crime: What
Works for Children, Offenders, Victims and Places, edited by B. Welsh and D.
Farrington. New York: Springer.
Lot, J. 1998. More Guns, Less Crime: Understanding Crime and Gun Control Laws. Chi-
cago: University of Chicago Press.
Lurigio, A., G. Bensinger, S.R.Thompson, K. Elling, D. Poucis, J. Selvaggio, and M. Spoon-
er. 2000. A Process and Outcome Evaluation of Project BUILD: Years 5 and 6.
Loyola University, Chicago. Unpublished.
Lyew-Ayee, P.L., and L.G. Greene. 2013. Geospatial Technologies and Crime: The Jamai-
can Experience. Small Arms Survey Issue Brief No. 3.
MacKenzie, D. 2006. What Works in Corrections: Reducing the Criminal Activities of
Offenders and Delinquents. New York: Cambridge University Press.
Magaloni, B., E. Franco, and V. Melo. 2015. Killing in the Slums: An Impact Evaluation
of Police Reform in Rio de Janeiro. Working Paper No. 556. Stanford Center for
International Development.
Magdol, L., T.E. Moffitt, A. Caspi, and P.A. Silva. 1998. Developmental Antecedents of
Partner Abuse: A Prospective Longitudinal Study. Journal of Abnormal Psychol-
ogy 107(3): 375–89.

283
REFERENCES
Maguire, E. 2012. Exploring Family Risk and Protective Factors for Adolescent Problem
Behaviors in the Caribbean. Maternal and Child Health Journal 17(8): 1488–498. Avail-
able at: http://rd.springer.com/article/10.1007%2Fs10995–012–1156-y#page-1.
Maguire, E., W. Wells, and C. Katz. 2011. Measuring Community Risk and Protective
Factors for Adolescent Problem Behaviors: Evidence from a Developing Nation.
Journal of Research in Crime and Delinquency 8(4): 594–620.
Maharaj, R., P. Nunes, and S. Renwick. 2009. Health Risk Behaviors among Adolescents
in the English-Speaking Caribbean: A Review. Child and Adolescent Psychiatry
and Mental Health 3(10).
Maldonado, A., and M. Rodriguez. 2014. Safety and Security as Influences on Everyday
Life. In The Political Culture of Democracy in the Americas, edited by E. Zechmei-
er. Washington, DC: U.S. Agency for International Development.
Manson, D.A., D.K. Guillard, and G. Lauver. 1999. Presale Gun Checks: The Brady Interim
Period, 1994–98. Washington, DC.
Marklund, F., and S. Holmberg. 2009. Effects of Early Release from Prison Using Elec-
tronic Tagging in Sweden. Journal of Experimental Criminology 5: 41–61.
Marshall-Harris, F. 2011. District “A” Juvenile Court: Report on the Factors and Trends in
Juvenile Justice in Barbados. UNICEF Caribbean Area Office.
Maxson, C.L., M.L. Whitlock, and M.W. Klein. 1998. Vulnerability to Street Gang Member-
ship: Implications for Practice. Social Service Review 3: 70–91.
Maxwell, C.D., J.H. Garner, and W.G. Skogan. 2011. Collective Efficacy and Criminal Be-
havior in Chicago, 1995–2004. Joint Center for Justice Studies.
Mazerolle, L., R. Wickes, and J. McBroom. 2010. Community Variations in Violence: The
Role of Social Ties and Collective Efficacy in Comparative Context. Journal of
Research on Crime and Delinquency 47: 3–30.
McCord, J. 1979. Some Child-Rearing Antecedents of Criminal Behaviour in Adult Men.
Journal of Personality and Social Psychology 37: 1477–486.
McDowall, D., C. Loftin, and B. Wiersema. 1995. Easing Concealed Firearms Laws: Ef-
fects on Homicides in Three States. Journal of Criminal Law and Criminology 86:
193–206.
McDowall, D., C. Loftin, and B. Wiersema. 1996. Using Quasi-Experiments to Evaluate
Firearm Laws: Comment on Britt et al.’s Reassessment of the D.C. Gun Law. Law
& Society Review 30(2): 381–91.
McGarrell, E., S. Chermak, and A. Weiss. 1999. Targeting Firearms Violence through
Directed Police Patrol. Indianapolis: Hudson Institute.
Meares, T.L. 2015. Broken Windows, Neighborhoods, and the Legitimacy of Law En-
forcement or Why I Fell in and out of Love with Zimbardo. Journal of Research in
Crime and Delinquency 52: 609–25.

284
RESTORING PARADISE IN THE CARIBBEAN: COMBATTING VIOLENCE WITH NUMBERS
Meeks, J. 2009. Caribbean Children’s Involvement in Gangs. Paper presented at the
Teleconference on Research Activities, University of West Indies Open Campus,
Kingston, Jamaica.
Meeks Gardner, J. 2003. Perceptions and Experience of Violence among Secondary
School Students in Urban Jamaica. Pan-American Journal of Public Health 14(2):
97–103.
Mihalic, S., A. Fagan, K. Irwin, D. Ballard, and D. Elliot. 2004. Blueprints for Violence
Prevention. Washington, DC: U.S. Department of Justice.
Mikton, C., and A. Butchart. 2009. Child Maltreatment Prevention: A Systematic Re-
view of Reviews. Bulletin of the World Health Organization 87: 353–73.
Millie, A., and V. Herrington. 2005. Bridging the Gap: Understanding Reassurance Po-
licing. The Howard Journal of Crime and Justice 44(1): 41–56.
Minnis, J., E. Symonette, M. Stevenson, Y. Pintard Newry, and T. Gibson. 2011. Profile of
the Sentenced Inmates at Her Majesty’s Prison Fox Hill, Nassau, The Bahamas.
Presentation at the College of The Bahamas Violence Symposium.
Mitchell, O., D. Wilson, A. Eggers, and D. MacKenzie. 2012. Drug Courts’ Effects on
Criminal Offending for Juveniles and Adults. Campbell Systematic Reviews 4.
Molnar, B.E., M.J. Miller, D. Azrael, and S.L. Buka. 2004. Neighborhood Predictors of
Concealed Firearm Carrying among Children and Adolescents: Results from the
Project on Human Development in Chicago Neighborhoods. Pediatric and Ado-
lescent Medicine 158: 657–64.
Morris, P. 2010. An Analysis of Homicide in Urban Jamaica. Rutgers University Doctoral
Dissertation.
Moser, C., and J. Holland. 1997. Urban Poverty and Violence in Jamaica. Latin American
and Caribbean Studies: Viewpoints. World Bank, Washington, DC.
Nasar, J.L. 1993. “Hot Spots” of Fear and Crime: A Multi-method Investigation. Journal
of Environmental Psychology 13(3): 187–206.
National Anti Drug Secretariat and Ministry of National Security. 2012. Bahamas Sec-
ondary School Drug Prevalence Survey 2011. Unpublished.
Nunziata, L. 2014. Immigration and Crime: New Empirical Evidence from European Vic-
timization Data. IZA Discussion Paper No. 8632. Institute of Study of Labor, Bonn.
Nuttall, C., D. Eversley, I. Rudder, and J. Ramsay. 2003. The Barbados Crime Survey
2002: Views and Beliefs about Crime and Criminal Justice. Barbados Attorney
General and Statistical Department. Available at: http://s3.amazonaws.com/
zanran_storage/www.barbados.gov.bb/ContentPages/17699060.pdf.
O’Connell, J., M. Perkins, and J. Zepp. 2004. Weed and Seed Crime Pattern Data Anal-
ysis. Prepared by Justice Research and Statistics Association for the Office of
Weed and Seed Community Capability Development Office, Office of Justice
Programs, U.S. Department of Justice, Washington, DC.

285
REFERENCES
Ohene, S., M. Ireland, and R. Blum. 2005. Clustering of Risk Behaviors among Caribbe-
an Youth. Maternal and Child Health Journal 9(1): 97–100.
Olavarría-Gambi, M., and C. Allende-González. 2014. Crime in Neighborhoods: Evidence
from Santiago, Chile. Crime Prevention and Community Safety 16(3): 205–26.
Oosterbaan, S., and J. van Wijk. 2015. Pacifying and Integrating the Favelas of Rio de
Janeiro: An Evaluation of the Impact of the UPP Program on Favela Residents.
International Journal of Comparative and Applied Criminal Justice 39(3): 179–98.
Organization of American States (OAS). 2010. Inputs for the Development of a Re-
gional Strategy to Promote Inter-American Cooperation in Dealing with Criminal
Gangs (Bahamas). Document CSH/GT/PD – 28/10. OAS, Washington, DC.
Owens, E., and M. Freedman. 2011. Low-Income Housing and Crime. Journal of Urban
Economics 70(2–3): 115–31.
Painter, K. 1996. The Influence of Street Lighting Improvements on Crime, Fear and Pe-
destrian Street Use, after Dark. Landscape and Urban Planning 35(2–3): 193–201.
Petrosino, A., C. Turpin-Petrosino, and J. Buehler. 2003. Scared Straight and Other
Juvenile Awareness Programs for Preventing Juvenile Delinquency: A System-
atic Review of the Randomized Experimental Evidence. Annals of the American
Academy of Political and Social Science 589(1): 41–62.
Petrosino, A., C. Turpin-Petrosino, and S. Guckenburg. 2010. The Impact of Juvenile
Court Processing and Further System Penetration on Subsequent Delinquency.
Campbell Systematic Reviews 6. Available at: http://www.campbellcollaboration.
org/lib/project/81/.
Petrunik, M.G. 2002. Managing Unacceptable Risk: Sex Offenders, Community Re-
sponse, and Social Policy in the United States and Canada. International Journal
of Offender Therapy and Comparative Criminology 46(4): 483–511.
Philippe, A. 2013. The Deterrent Effect of an Increase in Sentence Time: Evidence
from French Peines Planchers. Université de Paris 1 Panthéon-Sorbonne/CREST.
Unpublished.
Planning Institute of Jamaica (PIOJ). 2012. Vision 2030 MTF 2-Year Progress Report
(2009–2011). Available at: http://www.vision2030.gov.jm/Portals/0/Progress_
Reports/MTF%202-Year%20Progress%20Report%20%28February%20
2012%29.pdf.
Planning Institute of Jamaica (PIOJ). 2013. Vision 2030 Jamaica Medium-Term
Socio-Economic Framework (MTF) 2012–2015: Towards Inclusive Growth and
Sustainable Development. Available at: http://www.vision2030.gov.jm/Portals/0/
MTF/Vision%202030%20Jamaica%20MTF%202012–2015%20.pdf.
Plumridge, S.J., and W.J. Fielding. 2009. Domestic Violence in College Student House-
holds, New Providence, The Bahamas. College of The Bahamas Research Journal
15: 45–54. Available at: http://journals.sfu.ca/cob/index.php/files/issue/view/23.

286
RESTORING PARADISE IN THE CARIBBEAN: COMBATTING VIOLENCE WITH NUMBERS
Post, L.A., J. Klevens, C.D. Maxwell, G.A. Shelley, and E. Ingram. 2010. An Examination of
Whether Coordinated Community Responses Affect Intimate Partner Violence.
Journal of Interpersonal Violence 25(1): 75–93.
Pousadela, I.M. 2014. What Works in the Criminal Justice System (and What Doesn’t): A
2000–11 Update on Policing, Courts, and Corrections. IDB Policy Brief 227. Inter-
American Development Bank, Washington, DC. Available at: https://publications.
iadb.org/handle/11319/6544#sthash.1YTUUuG9.dpuf.
Prinz, R.J., M.R. Sanders, D.J. Whitaker, and J.R. Lutzker. 2009. Population-Based
Prevention of Child Maltreatment: The US Triple P System Population Trial. Pre-
vention Science 10(1).
Pronyk, P., J.R. Hargreaves, J.C. Kim, L.A. Morison, G. Phetla, C. Watts, J. Busza, and
J.D.H. Porter. 2006. Effect of a Structural Intervention for the Prevention of
Intimate Partner Violence and HIV in Rural South Africa: Results of a Cluster Ran-
domized Trial. The Lancet 368: 1973–983.
Pyrooz, D., A.M. Fox, C.M. Katz, and S.H. Decker. 2011. Gang Organization, Offending,
and Victimization: A Cross-National Analysis. In Youth Gangs in International
Perspective Results from the Eurogang Program of Research, edited by F.A. Es-
bensen and C. Maxson. Springer.
Ramsay, J., Y. Carter, L. Davidson, D. Dunne, S. Eldridge, G. Feder, K. Hegarty, C. Rivas,
and A. Taft. 2009. Advocacy Interventions to Reduce or Eliminate Violence and
Promote the Physical and Psychosocial Well-Being of Women Who Experience
Intimate Partner Abuse. Campbell Systematic Reviews 5.
Rawlins, J. 2000. Domestic Violence in Trinidad: A Family and Public Health Problem.
Caribbean Journal of Criminology and Social Psychology 5(1–2): 165–80.
Reisig, M.D., and J.M. Cancino. 2004. Incivilities in Nonmetropolitian Communities: The
Effects of Structural Constraints, Social Conditions, and Crime. Journal of Crimi-
nal Justice 32: 15–29.
Rempel, M., D. Fox Kralstein, A. Cissner, R. Cohen, M. Labriola, D. Farole, A. Bader, and M.
Magnani. 2003. The New York State Adult Drug Court Evaluation: Policies, Partic-
ipants, and Impacts. Center for Court Innovations, New York. Available at: http://
www.courts.state.ny.us/whatsnew/pdf/NYSAdultDrugCourtEvaluation.pdf.
Reynolds, A.J., S.R. Ou, and J.W. Topitzes. 2004. Paths of Effects of Early Childhood In-
tervention on Educational Attainment and Delinquency: A Confirmatory Analysis
of the Chicago Child-Parent Centers. Child Development 75: 1299–328.
Roman, J., S. Reid, J. Reid, A. Chalfin, W. Adams, and C. Knight. 2008. The DNA Field
Experiment: Cost-Effectiveness Analysis of the Use of DNA in the Investiga-
tion of High-Volume Crimes. Washington, DC: Urban Institute, Justice Policy
Center.

287
REFERENCES
Ronconi, L., D. Lenis, and E. Schargrodsky. 2011. Evaluación del Programa de Entrega
Voluntaria de Armas de Fuego en Argentina. Perspectivas sobre el Desarrollo 9(1):
14–36.
Rosenfeld, R. 1995. Gun Buybacks: Crime Control or Community Mobilization. In Under
Fire: Gun Buy-Backs, Exchanges, and Amnesty Programs, edited by M. Plotkin.
Washington, DC: Police Executive Research Forum.
Rosengart, M., P. Cummings, A. Nathens, P. Heagerty, R. Maier, and F. Rivara. 2005. An
Evaluation of State Firearm Regulations and Homicide and Suicide Death Rates.
Injury Prevention 11: 77–83
Ross, C.E., and J. Mirowsky. 2000. Disorder and Decay: The Concept and Measurement
of Perceived Neighborhood Disorder. Urban Affairs Review 34(3): 412–33.
Rossman, S.B., M. Rempel, J.K. Roman, J.M. Zweig, C.H. Lindquist, M. Green, P. Mitchell
Downey, J. Yahner, A. Singh Bhati, and D.J. Farole, Jr. 2011. The Multi-site Adult
Drug Court Evaluation: The Impact of Drug Courts. Final Report: Volume 4. Ur-
ban Institute, Washington, DC. Available at: https://www.ncjrs.gov/pdffiles1/nij/
grants/237112.pdf.
Ruback, B.R., M.S. Greenberg, and D.R. Westcott. 1984. Social Influence and Crime-Victim
Decision Making. Journal of Social Issues 40: 51–76.
Ruprah, I. 2008. An Impact Evaluation of a Neighbourhood Crime Prevention Program:
Does Safer Commune Make Chileans Safer? Inter-American Development Bank,
Washington, DC.
Ruprah, I., and R. Sierra. 2014. Mothers Are Right: Eat Your Vegetables and Keep Away
from the Girls (Boys): Bullying Victimization Profile in the Caribbean. Washington,
DC: Inter-American Development Bank.
Ruprah, I., and R. Sierra. 2016. Engine of Growth? The Caribbean Private Sector Needs
More Than an Oil Change. Washington, DC: Inter-American Development Bank.
Ruprah, I., R. Sierra, and H. Sutton. 2016. Sex, Violence, and Drugs among Latin American
and Caribbean Adolescents: Do Engaged Parents Make a Difference? Washing-
ton, DC: Inter-American Development Bank.
Samms-Vaughn, M.E., M.A. Jackson, and D.E. Ashley. 2004. Urban Jamaican Children’s
Exposure to Community Violence. West Indian Medical Journal 54(1): 14–21.
Sampson, R.J. 2004. Neighborhood and Community: Collective Efficacy and Commu-
nity Safety. New Economy 11: 106–13.
Sampson, R.J., S.W. Raudenbush, and F. Earls. 1997. Neighborhoods and Violent Crime:
A Multilevel Study of Collective Efficacy. Science 277: 918–24.
Sampson, R.J., and P.O. Wikstrom. 2007. The Social Order of Violence in Chicago and Stock-
holm Neighborhoods: A Comparative Inquiry. In Order, Conflict, and Violence, edited
by I. Shapiro, S. Kalyvas, and T. Masoud. New York: Cambridge University Press.

288
RESTORING PARADISE IN THE CARIBBEAN: COMBATTING VIOLENCE WITH NUMBERS
Samuels, R., and B. Judd. 2002. Public Housing Estate Renewal: Interventions and the
Epidemiology of Victimisation. Presentation at the Housing, Crime and Strong
Communities Conference, Melbourne, Australian Institute of Criminology and
Australian Housing and Urban Research Institute.
Sanders, M.R., D.T. Montgomery, and M.L. Brechman-Toussaint. 2000. The Mass Media
and the Prevention of Child Behavior Problems: The Evaluation of a Television
Series to Promote Positive Outcomes for Parents and Their Children. Journal of
Child Psychology and Psychiatry 41: 939–48.
Santaella-Tenorio, J., M. Cerdá, A. Villaveces, and S. Galea. 2016. What Do We Know
about the Association between Firearm Legislation and Firearm-Related Inju-
ries? Epidemiologic Reviews 38.
Santos, R.B. 2014. The Effectiveness of Crime Analysis for Crime Reduction: Cure or
Diagnosis? Journal of Contemporary Criminal Justice 30(2): 147–68.
Sarnquist, C., B. Omondi, J. Sinclair, C. Gitau, L. Paiva, M. Mulinge, D.N. Cornfield, and Y.
Maldonado. 2014. Rape Prevention through Empowerment of Adolescent Girls.
Pediatrics 133.
Sarteschi, C., M. Vaughn, and K. Kim. 2011. Assessing the Effectiveness of Mental Health
Courts: A Quantitative Review. Journal of Criminal Justice 39(12).
Saylor, W.G., and G.G. Gaes. 1997. Training Inmates through Industrial Work Partici-
pation and Vocational and Apprenticeship Instruction. Corrections Management
Quarterly 1(2): 32–43.
Schochet, P.Z., J. Burghardt, and S. McConnell. 2008. Does Job Corps Work? Impact
Findings from the National Job Corps Study. American Economic Review 98(5):
1864–886.
Schwalbe, C.S., R.E. Gearing, M.J. MacKenzie, K.B. Brewer, and R.W. Ibrahim. 2012. A
Meta-analysis of Experimental Studies of Diversion Programs for Juvenile Of-
fenders. Clinical Psychology Review 32: 26–33.
Schwartz, D., and L. Proctor. 2000. Community Violence Exposure and Children’s
Social Adjustment in the School Peer Group: The Mediating Role of Emotion
Regulation and Social Cognition. Journal of Consulting and Clinical Psychology
68: 670–82.
Schweinhart, L.J., J. Montie, Z. Xiang, W.S. Barnett, C.R. Belfield, and M. Nores. 2005.
Lifetime Effects: The HighScope Perry Preschool Study through Age 40. Mono-
graphs of the HighScope Educational Research Foundation, No. 14. Ypsilanti, MI:
HighScope Press.
Seepersad, R. 2013. Drug Use and Criminal Behaviour among the Prison Population in
Trinidad and Tobago. Organization of American States, Washington, DC.
Seepersad, R. 2016. Crime and Violence in Barbados. IDB Series on Crime and Violence
in the Caribbean. Inter-American Development Bank, Washington, DC.

289
REFERENCES
Serrbanescu, F., A. Ruiz, and D. Suchdev. 2010. Reproductive Health Survey Jamaica:
2008 Final Report. National Family Planning Board, Kingston, Jamaica.
Sexton, T.L., and C.W. Turner. 2010. The Effectiveness of Functional Family Therapy
for Youth with Behavioral Problems in a Community Practice Setting. Journal of
Family Psychology 24(3): 339–48.
Shapland, J., A. Atkinson, H. Atkinson, J. Dignan, L. Edwards, J. Hibbert, M. Howes, J.
Johnstone, G. Robinson, and A. Sorsby. 2008. Does Restorative Justice Affect
Reconviction? The Fourth Report from the Evaluation of Three Scheme. Ministry
of Justice Research Series Working Paper. London.
Shapland, J., and J. Vagg. 1988. Policing by the Public. New York: Routledge.
Sherin, K.M., J.M. Sinacre, X.Q. Li, R.E. Zitter, and A. Shakil. 1998. HITS: A Short Domestic
Violence Screening Tool for Use in a Family Practice Setting. Family Medicine 30:
508–12.
Sherman, L.W. 1998. Evidence-Based Policing. Washington, DC: Police Foundation.
Sherman, L.W. 2000. Gun Carrying and Homicide Prevention. Journal of the American
Medical Association 283: 1193–195.
Sherman, L.W. 2013. The Rise of Evidence-Based Policing: Targeting, Testing, and
Tracking. Crime and Justice 42(1): 377–451.
Sherman, L.W., and J.E. Eck. 2002. Policing for Crime Prevention. In Evidence-Based
Crime Prevention, edited by L.W. Sherman. New York: Routledge.
Sherman, L.W., D. Gottfredson, D. MacKenzie, P. Reuter, and S. Bushway. 1997. Pre-
venting Crime: What Works, What Doesn’t, What’s Promising. A Report to the
Attorney General of the United States. U.S. Department of Justice, Office of Jus-
tice Programs, Washington, DC.
Sherman, L.W., and D. Rogan. 1995. Effects of Gun Seizures on Gun Violence: Hot Spots
Patrol in Kansas City. Justice Quarterly 12: 673–93.
Sherman, L.W, and H. Strang. 2006. Restorative Justice to Reduce Victimization. In
Preventing Crime, edited by B.C. Welsh and D.P. Farrington. New York: Springer.
Sherman, L.W., and H. Strang. 2007. Restorative Justice: The Evidence. London: The
Smith Institute.
Sherman, L.W., and D. Weisburd. 1995. General Deterrent Effects of Police Patrol in
Crime “Hot Spots”: A Randomized, Controlled Trial. Justice Quarterly 12(4):
625–48.
Sherman, L.W., S. Williams, B. Ariel, L. Strang, N. Wain, M. Slothower, and A. Norton.
2014. An Integrated Theory of Hot Spots Patrol Strategy: Implementing Preven-
tion by Scaling Up and Feeding Back. Journal of Contemporary Criminal Justice
30 (May): 95–122.
Skogan, W. 1984. Reporting Crimes to the Police: The Status of World Research. Jour-
nal of Research in Crime and Delinquency 21: 113–37.

290
RESTORING PARADISE IN THE CARIBBEAN: COMBATTING VIOLENCE WITH NUMBERS
Skogan, W. 1990. Disorder and Decline: Crime and the Spiral of Decay in American
Cities. New York: Free Press.
Skogan, W. 2015. Disorder and Decline: The State of Research. Journal of Research in
Crime and Delinquency 52(4): 464–85.
Skogan, W., and K. Frydl, editors. 2004. Fairness and Effectiveness in Policing: The Evi-
dence. Committee to Review Research on Police Policy and Practices. Committee
on Law and Justice, Division of Behavioral and Social Sciences and Education.
The National Academies Press, Washington, DC.
Skogan, W., S.M. Hartnett, N. Bump, and J. Dubois. 2008. Evaluation of CeaseFire—Chi-
cago. National Institute of Justice, Office of Justice Programs, U.S. Department
of Justice, Washington, DC. Available at: https://www.ncjrs.gov/pdffiles1/nij/
grants/227181.pdf.
Slesnick, N., J.L. Prestopnik, R.J. Meyers, and M. Glassman. 2007. Treatment Outcome
for Street-Living, Homeless Youth. Addictive Behaviors 32: 1237–251.
Small Arms Survey. 2004. Small Arms Survey 2004: Rights at Risk. Oxford, UK: Oxford
University Press. Available at: http://www.smallarmssurvey.org/publications/by-
type/yearbook/small-arms-survey-2004.html.
Small Arms Survey. 2010. Small Arms Survey 2010: Gangs, Groups, and Guns. Ox-
ford, UK: Oxford University Press. Available at: http://www.smallarmssurvey.
org/?id=286.
Smith, C.A., and S.B. Stern. 1997. Delinquency and Anti-social Behavior: A Review of
Family Processes and Intervention Research. Social Service Review 71: 382–420.
Smith, D.E., and G. Mosby. 2003. Jamaican Child-Rearing Practices: The Role of Corpo-
ral Punishment. Adolescence 38 (150): 369–81.
Smith, E.P., A.M. Wolf, D.M. Cantillon, O. Thomas, and W.S. Davison. 2004. The Ad-
olescent Diversion Project: 25 Years of Research on an Ecological Model of
Intervention. Prevention and Intervention in the Community 27(2): 29–47.
Smith, L., and G. Hill. 1994. Victimization and Fear of Crime. Criminal Justice and
Behavior 18(2): 217–39.
Soares, R. 2015. A Conceptual Framework for Interpreting the Welfare Costs of Crime.
In The Welfare Costs of Crime and Violence in Latin America and the Caribbean,
edited by L. Jaitman. Washington, DC: Inter-American Development Bank.
Soares, R., and I. Viveiros. 2010. Organization and Information in the Fight against
Crime: An Evaluation of the Integration of Police Forces in the State of Minas
Gerais, Brazil. IZA Discussion Paper No. 5270. Institute for the Study of Labor,
Bonn.
Soares, Y., and M.M. Sviatschi. 2013. Assessing the Impact of Eliminating an After-School
Program. Paper for The Fifth Bolivian Conference on Development Econom-
ics, Institute for Advanced Development Studies (INESAD), Santa Cruz de la

291
REFERENCES
Sierra, 14–15 November. Available at: http://www.inesad.edu.bo/bcde2013/pa-
pers/BCDE2013–37.pdf.
Soyibo, K. 2000. Domestic and School Violence among High School Students in Ja-
maica. West Indian Medical Journal 49(3): 232–36.
Spelman, W. 2004. Optimal Targeting of Incivility-Reduction Strategies. Journal of
Quantitative Criminology 20(1): 63–88.
Spergel, I.A. 1986. The Violent Gang Problem in Chicago: A Local Community Ap-
proach. Social Services Review 60(1): 94–131.
Sutton, H. 2016. Crime and Violence in The Bahamas. IDB Series on Crime and Violence
in the Caribbean. Inter-American Development Bank, Washington, DC.
Swinford, S., A. Demaris, S.A. Cernovicch, and P.C. Giordono. 2000. Harsh Physical Dis-
cipline in Childhood and Violence in Later Romantic Involvements: The Mediating
Role of Problem Behaviors. Journal of Marriage and the Family 62(2): 508–19.
Taft, A.J., R. Small, K.L. Hegarty, L.F. Watson, L. Gold, and J.A. Lumley. 2011. Mothers’
Advocates In the Community (MOSAIC)—Non-professional Mentor Support to
Reduce Intimate Partner Violence and Depression in Mothers: A Cluster Ran-
domised Trial in Primary Care. BMC Public Health 11(178).
Taylor, B., C.S. Koper, and D.J. Woods. 2011. A Randomized Controlled Trial of Different
Policing Strategies at Hot Spots of Violent Crime. Journal of Experimental Crim-
inology 7(2): 149–81.
Telep, C., and D. Weisburd. 2012. What Is Known about the Effectiveness of Police
Practices in Reducing Crime and Disorder? Police Quarterly 15(331).
Thornberry, T.P. 1996. Crime Policy in America Today. Criminal Law Bulletin 32: 470–73.
Tierney, J.P., J. Baldwin Grossman, and N.L. Resch. 2000. Making a Difference: An Im-
pact Study of Big Brothers/Big Sisters. Public/Private Ventures, Philadelphia.
Available at: http://ppv.issuelab.org/resource/making_a_difference_an_impact_
study_of_big_brothers_big_sisters_re_issue_of_1995_study.
Tjaden, P., and N. Thoennes. 2000. Extent, Nature, and Consequences of Intimate
Partner Violence: Finding from the National Violence against Women Survey. Na-
tional Institute of Justice, Washington, DC.
Townsend, D. 2009. No Other Life: Gangs, Guns, and Governance in Trinidad and Toba-
go. Graduate Institute of International and Development Studies Working Paper 8.
Travis, J., and B. Western. 2014. The Growth of Incarceration in the United States, Ex-
ploring Causes and Consequences. Washington, DC: National Academy Press.
Truman, J., and L. Langton. 2014. Criminal Victimization 2014. U.S. Department of Jus-
tice Bureau of Justice Statistics Document No. NCJ 248973 (September 29).
Available at: http://www.bjs.gov/content/pub/pdf/cv14.pdf.
Turner, S., and J. Petersilia. 1996. Day Fines in Four U.S. Jurisdictions. Santa Monica, CA:
The RAND Corporation.

292
RESTORING PARADISE IN THE CARIBBEAN: COMBATTING VIOLENCE WITH NUMBERS
Uchida, C.D, M.L. Swatt, S. Salmon, and S. Verano. 2014. Neighborhoods and Crime:
Collective Efficacy and Social Cohesion in Miami-Dade County. Research report
submitted to the U.S. Department of Justice.
United Nations. 1993. General Assembly Resolution 48/104 Declaration on the Elimina-
tion of Violence against Women 1993.
United Nations. 2010a. Handbook for Legislation on Violence against Women. The
Division for the Advancement of Women in the Department of Economic and
Social Affairs of the United Nations Secretariat. Available at: http://www.un.org/
womenwatch/daw/vaw/handbook/Handbook%20for%20legislation%20on%20
violence%20against%20women.pdf.
United Nations. 2010b. World Population Prospects: The 2015 Revision. Department of
Economic and Social Affairs Population Division.
United Nations. 2013. Guidelines for Producing Statistics on Violence against Women
2013. Department of Economic and Social Affairs.
United Nations Children’s Fund (UNICEF). 2000. Domestic Violence against Women
and Girls. UNICEF, Florence, Italy. Available at: http://www.unicef-irc.org/
publications/pdf/digest6e.pdf.
United Nations Children’s Fund (UNICEF). 2006a. Violence against Children in the Ca-
ribbean Region: Regional Assessment. UN Secretary General’s Study on Violence
against Children. Regional Office for Latin America and the Caribbean. Available
at: http://www.unicef.org/lac/Caribe_web(1).pdf.
United Nations Children’s Fund (UNICEF). 2006b. World Report on Violence against
Children. Geneva: UNICEF. Available at: http://www.unicef.org/lac/full_tex(3).pdf.
United Nations Children’s Fund (UNICEF). 2010a. Multiple Indicator Cluster Survey.
Suriname: MICS. Available at: http://www.childinfo.org/files/MICS4_Suriname_
FinalReport_Eng.pdf.
United Nations Children’s Fund (UNICEF). 2010b. Child Disciplinary Practices at Home,
Evidence of Low- and Middle- income Countries. Available at: http://www.unicef.
org/protection/Child_Disciplinary_Practices_at_Home.pdf.
United Nations Development Programme (UNDP). 2012. Caribbean Human Devel-
opment Report: Human Development and the Shift to Better Citizen Security.
New York: UNDP. Available at: http://www.undp.org/content/dam/undp/library/
corporate/HDR/Latin%20America%20and%20Caribbean%20HDR/C_bean_
HDR_Jan25_2012_3MB.pdf.
United Nations Education, Scientific and Cultural Organization (UNESCO). 2011. Stop-
ping Violence in Schools: A Guide for Teachers. Paris: UNESCO.
United Nations High Commissioner for Refugees (UNHCR). 2003. Sexual and Gen-
der-Based Violence against Refugees, Returnees and Internally Displaced
Persons. Available at: http://www.unicef.org/emerg/files/gl_sgbv03.pdf.

293
REFERENCES
United Nations Office on Drugs and Crime (UNODC). 2003. Manual for the Devel-
opment of a System of Criminal Justice Statistics. Available at: http://unstats.
un.org/unsd/publication/SeriesF/SeriesF_89E.pdf.
United Nations Office on Drugs and Crime (UNODC). 2013. Global Study on Homicide.
Trends, Context, Data. Vienna: UNODC.
United Nations Office on Drugs and Crime (UNODC) and World Bank. 2007. Crime,
Violence, and Development: Trends, Costs, and Policy Options in the Caribbe-
an. Report No. 37820. World Bank, Washington DC. Available at: http://web.
worldbank.org/WBSITE/EXTERNAL/COUNTRIES/LACEXT/0,,contentMDK:
21320803~pagePK:146736~piPK:226340~theSitePK:258554,00.html and https://
www.unodc.org/documents/data-and-analysis/Caribbean-study-en.pdf.
UN Women. 2011. Progress of the World’s Women: In Pursuit of Justice.
Available at: http://www.unwomen.org/en/digital-library/publications/2011/7/
progress-of-the-world-s-women-in-pursuit-of-justice#view.
Van Dijk, J.J.M. 1999. The Experience of Crime and Justice. In Global Report on Crime
and Justice, edited by G. Newman. New York: Oxford University Press.
Van Dijk, J.J.M. 2008. The World of Crime: Breaking the Silence on Problems of Se-
curity, Justice, and Development across the World. Thousand Oaks, CA: Sage
Publications.
Van Dijk, J.J.M., and G.J. Terlouw. 1996. An International Perspective of the Business
Community as Victims of Fraud and Crime. Security Journal 7: 157–67.
Van Dijk, J.J.M., and J.V. Van Kesteren. 2015. Caribbean Crime in International Per-
spective: Key Findings of Comparative Victimization Surveys in the Bahamas,
Barbados, Jamaica, Suriname and Trinidad and Tobago. Discussion paper pre-
pared for the Inter-American Development Bank. Unpublished.
Van Dijk, J.J.M., A. Tseloni, and G. Farrell. 2012. The International Crime Drop. New Di-
rections in Research. London: Palgrave Macmillan.
Van Dijk, J.J.M., J.N. Van Kesteren, and P. Smit. 2007. Criminal Victimization in Interna-
tional Perspective: Key Findings from the 2004–2005 ICVS and EU ICS. Ministry
of Justice, WODC, The Hague.
Van Dijk, J.J.M., J.N. Van Kesteren, and P. Smit. 2008. Criminal Victimisation in Interna-
tional Perspective, Key Findings from the 2004–2005 ICVS and EU ICS. Boom
Juridische Uitgever, The Hague. Available at http://www3.unil.ch/wpmu/icvs/
files/2012/11/ICVS2004_051.pdf.
Van Kesteren, J.V. 2013. Revisiting the Gun Ownership and Violence Link: A Multi-level
Analysis of Victimization Survey Data. The British Journal of Criminology 54:
53–72.
Van Kesteren, J.V., P. Mayhew, and P. Nieuwbeerta. 2000. Criminal Victimization in
Seventeen Industrialized Countries. WODC.

294
RESTORING PARADISE IN THE CARIBBEAN: COMBATTING VIOLENCE WITH NUMBERS
Van Kesteren, J.V., J.J.V. Van Dijk, and P. Mayhew. 2013. The International Crime Victims
Surveys: A Retrospective. International Review of Victimology 20(49).
Villarreal, A., and B.F.A. Silva. 2006. Social Cohesion, Criminal Victimization and Per-
ceived Risk of Crime in Brazilian Neighborhoods. Social Forces 84: 1725–753.
Villaveces, A., P. Cummings, V. Espitia, T. Koepsell, B. Mcknight, and A.L. Kellerman.
2000. Effect of a Ban on Carrying Firearms on Homicide Rates in Two Colombian
Cities. Journal of the American Medical Association 283: 1205–209.
Vriniotus, M. 2015. Victimization Survey 101: So You Want to Do a Victimization Survey.
IDB Technical Note TN-866. Inter-American Development Bank, Washington, DC.
Available at: https://publications.iadb.org/bitstream/handle/11319/7225/IDB_
TN_866_Victimization%20Surveys%20101_final.pdf?sequence=1.
Vuletin, G. 2008. Measuring the Informal Economy in Latin America and the Caribbe-
an. IMF Working Paper 08/102. International Monetary Fund, Washington, DC.
Wagman, J.A., R.H. Gray, J. Campbell, M. Thoma, A. Ndyanabo, J. Ssekasanvu, F. Nalugo-
da, J. Kagaayi, G. Nakigozi, D. Serwadda, and H. Brahmbhatt. 2014. Effectiveness
of an Integrated Intimate Partner Violence and HIV Prevention Intervention: A
Cluster Randomized Trial in Rakai, Uganda. Lancet Global Health 3(1): e23–e33.
Waller, I. 1982. What Reduces Residential Burglary: Action and Research in Seattle
and Toronto. In The Victim in International Perspective, edited by Hans Joachim
Schneider. New York.
Waller, I. 2014. Smarter Crime Control: A Guide to a Safer Future for Citizen Communi-
ties and Politicians. London: Rowman and Littlefield Publishers Inc.
Ward, K.J. 1999. MVP Evaluation 1999/2000. Center for the Study of Sport in Society,
Boston. Available at: http://www.sportinsociety.org/vpd/mvp.php.
Weisburd, D. 2015. The Law of Crime Concentration and the Criminology of Place.
Criminology 53(2): 133–57.
Weisburd, D., and A.A. Braga. 2003. Hot Spots Policing. In Crime Prevention: New
Approaches, edited by H. Kury and J. Obergfell-Fuchs. Mainz, Germany: Weisser
Ring.
Weisburd, D., and J.E. Eck. 2004. What Can Police Do to Reduce Crime, Disorder and
Fear? Annals of the American Academy of Political and Social Science 593: 42–65.
Weisburd, D., C.W. Telep, J.C. Hinkle, and J.E. Eck. 2008. The Effects of Problem-Oriented
Policing on Crime and Disorder. Campbell Systematic Reviews 14.
Wellford, C.F., J.V. Pepper, and C.V. Petrie. 2004. Firearms and Violence: A Critical Re-
view. Washington, DC: The National Academies Press.
Wells, W., C. Katz, and J. Kim. 2010. Firearm Possession among Arrestees in Trinidad
and Tobago. Injury Prevention 16(5): 337–42.
Welsh, B.C., A.A. Braga, and G. Bruinsma. 2015. Reimagining Broken Windows: From
Theory to Policy. Journal of Research in Crime and Delinquency 52(4): 447–63.

295
REFERENCES
Welsh, B.C., and D.P. Farrington. 2008a. Effects of Improved Street Lighting on Crime.
Campbell Systematic Reviews 13. Available at: http://www.campbellcollaboration.
org/lib/download/223/Welsh_Streetlight_review+corrected.pdf.
Welsh, B.C., and D.P. Farrington. 2008b. Effect of Closed Circuit Television
Surveillance on Crime. Campbell Systematic Reviews 17. Available at: http://www.
campbellcollaboration.org/news_/CCTV_modest_impact_on_crime.php.
Welsh, W.N., and G. Zajac. 2013. A Multisite Evaluation of Prison-Based Drug Treat-
ment: 4-Year Follow-Up Results. Prison Journal 93: 251–71.
Wermink, H., A. Blokland, P. Nieuwbeerta, D. Nagin, and N. Tollenaar. 2010. Comparing
the Effects of Community Service and Short-Term Imprisonment on Recidivism: A
Matched Samples Approach. Journal of Experimental Criminology 6(3): 325–49.
Whitehill, J.M., D. Webster, and J. Vernick. 2013. Street Conflict Mediation to Prevent
Youth Violence: Conflict Characteristics and Outcomes. Injury Prevention 19(3):
204–09.
Whittle, S. 1994. Knowledge about Causes, Effects, Attitudes towards and Experiences
with Violent Acts among Students in Secondary Schools, Jamaica. Master’s the-
sis. The University of the West Indies, Kingston, Jamaica.
Wilkins, N., B. Tsao, M. Hertz, R. Davis, and J. Klevens. 2014. Connecting the Dots: An
Overview of the Links among Multiple Forms of Violence. First edition. Atlanta:
National Center for Injury Prevention and Control, Centers for Disease Control
and Prevention.
Wilson, D., D. MacKenzie, and F. Ngo Mitchell. 2003. Effects of Correctional Boot
Camps on Offending. Campbell Systematic Reviews 1.
Wilson, H.A., and R.D. Hoge. 2013. The Effect of Youth Diversion Programs on Recidi-
vism: A Meta-analytic Review. Criminal Justice and Behavior 40(5): 497–518.
Wolf, D.A., C.V. Crookes, P. Jaffe, D. Chiodo, R. Hughes, W. Ellis, L. Stitt, and A. Donner.
2009. A Universal School-Based Program to Prevent Adolescent Dating Vio-
lence: A Cluster Randomized Trial. Archives of Pediatric and Adolescent Medicine
163: 693–99.
Wolke, D., W. Copeland, A. Angold, and J. Costello. 2013. Impact of Bullying in Child-
hood on Adult Health, Wealth, Crime, and Social Outcomes. Psychological
Science 24(10): 1958–970.
World Bank. 1993. World Development Report. Washington, DC: World Bank.
World Bank. 2014. Voice and Agency, Empowering Women and Girls for Shared
Prosperity. Available at: http://www.worldbank.org/content/dam/Worldbank/
document/Gender/Voice_and_agency_LOWRES.pdf.
World Health Organization (WHO). 2002. World Report on Violence and
Health. Geneva: WHO. Available at: http://apps.who.int/iris/bitstream/
10665/42495/1/9241545615_eng.pdf.

296
RESTORING PARADISE IN THE CARIBBEAN: COMBATTING VIOLENCE WITH NUMBERS
World Health Organization (WHO). 2005. WHO Multi-country Study on Women’s
Health and Domestic Violence against Women. Geneva: WHO. Available at: http://
www.who.int/gender/violence/who_multicountry_study/summary_report/sum-
mary_report_English2.pdf.
World Health Organization (WHO). 2006. Preventing Child Maltreatment: A Guide to
Taking Action and Generating Evidence. Available at: http://apps.who.int/iris/
bitstream/10665/43499/1/9241594365_eng.pdf.
World Health Organization (WHO). 2010. Violence Prevention: The Evidence. Geneva:
WHO.
World Health Organization (WHO). 2014. Global Status Report on Violence Prevention
2014. Geneva: WHO. Available at: http://www.who.int/violence_injury_prevention/
violence/status_report/2014/en/.
Wortley, S., and R. Seepersad. 2013. The 2012–13 Jamaican National Crime Victimization
Survey Final Report. Ministry of National Security, Government of Jamaica. Avail-
able at: https://www.mns.gov.jm/sites/default/files/documents/files/JNCVS%20
FINAL%20REPORT.pdf.
Wright, E.M., A.A. Fagan, and G.M. Pinchevsky. 2013. The Effects of Exposure to Vio-
lence and Victimization across Life Domains on Adolescent Substance Use. Child
Abuse & Neglect 37(11): 899–909.
Wright, M.A., G.J. Wintemute, and F.A. Rivara. 1999. Effectiveness of Denial of Handgun
Purchase to Persons Believed to Be at High Risk for Firearm Violence. American
Journal of Public Health 89(1): 88–90.
Wright, V.. 2010. Deterrence in Criminal Justice: Evaluating Certainty vs. Severity of
Punishment. The Sentencing Project Report, Washington, DC.
Zatz, M., and H. Smith. 2012. Immigration, Crime, and Victimization: Rhetoric and Real-
ity. Annual Review of Law and Social Science 8: 141–59.
Zawitz, M.W., P.A. Klaus, R. Bachman, L.D. Bastian, M.M. DeBerry, M.R. Rand, and B.M.
Taylor. 1993. Highlights from 20 Years of Surveying Crime Victims. The National
Crime Victimization Survey, 1973–92. Bureau of Justice Statistics Special Report
NCJ-144525. U.S. Government Printing Office, Washington, DC.
http://www.who.int/gender/violence/who_multicountry_study/summary_report/summary_report_English2.pdf
http://www.who.int/gender/violence/who_multicountry_study/summary_report/summary_report_English2.pdf