Water quality decline in coastal aquifers under anthropic pressure: the case of a suburban area of...
18
Environ Monit Assess (2011) 172:605–622 DOI 10.1007/s10661-010-1359-x Water quality decline in coastal aquifers under anthropic pressure: the case of a suburban area of Dakar (Senegal) Viviana Re · Seynabou Cissé Faye · Abdoulaye Faye · Serigne Faye · Cheikh Becaye Gaye · Elisa Sacchi · Gian Maria Zuppi Received: 3 April 2009 / Accepted: 11 February 2010 / Published online: 19 March 2010 © Springer Science+Business Media B.V. 2010 Abstract In recent years, the unregulated in- crease of the population in coastal areas of de- veloping countries has become source of concern for both water supply and quality control. In the region of Dakar (Senegal), approximately 80% of water resources come from groundwater reser- voirs, which are increasingly affected by anthro- pogenic pressures. The identification of the main sources of pollution, and thus the aquifer vul- nerability, is essential to provide a sound basis V. Re (B ) Dipartimento di Scienze Ambientali, Università Cà Foscari, Calle Larga Santa Marta- Dorsoduro 2137, 30123 Venezia, Italy e-mail: [email protected] S. Cissé Faye · A. Faye · S. Faye · C. B. Gaye Département de Géologie, Faculté des Sciences et Techniques, Université Cheich Anta Diop, B.P. 5005 Dakar-Fann, Senegal E. Sacchi Dipartimento di Scienze della Terra, Università di Pavia, Via Ferrata 1, Pavia 27100, Italy E. Sacchi CNR-IGG, Sezione di Pavia, Via Ferrata 1, 27100, Pavia, Italy G. M. Zuppi Istituto di Geologia Ambientale e Geoingegneria CNR, Area della Ricerca di Roma 1, Via Salaria Km 29,300, C.P. 10-00015 Monterotondo, Italy for the implementation of long-term geochemi- cally based water management plans in this sub- Saharan area. With this aim, a hydrochemical and isotopic survey on 26 wells was performed in the so-called Peninsula of Cap-Vert. Results show that seawater intrusion represents the main process affecting groundwater chemical character- istics. Nitrates often exceed the World Health Or- ganization drinking water limits: stable isotopes of dissolved nitrate (δ 15 N and δ 18 O) indicate urban sewage and fertilizers as a major source of con- tamination. Results depict a complex situation in which groundwater is affected by direct and indi- rect infiltration of effluents, mixing with seawater and freshening processes from below. Besides the relevance of the investigation at a regional level, it represents a basis for decision-making processes in an integrated water resources management and in the planning of similar monitoring strategies for other urban coastal regions. Keywords Urban and coastal aquifers · Groundwater quality · Hydrochemistry · Environmental isotopes Introduction Water shortages, droughts, and groundwater pol- lution due to human activities are increasingly be- coming a worldwide source of concern. Although
Transcript of Water quality decline in coastal aquifers under anthropic pressure: the case of a suburban area of...

Environ Monit Assess (2011) 172:605–622DOI 10.1007/s10661-010-1359-x
Water quality decline in coastal aquifers under anthropicpressure: the case of a suburban area of Dakar (Senegal)
Viviana Re · Seynabou Cissé Faye · Abdoulaye Faye ·Serigne Faye · Cheikh Becaye Gaye ·Elisa Sacchi · Gian Maria Zuppi
Received: 3 April 2009 / Accepted: 11 February 2010 / Published online: 19 March 2010© Springer Science+Business Media B.V. 2010
Abstract In recent years, the unregulated in-crease of the population in coastal areas of de-veloping countries has become source of concernfor both water supply and quality control. In theregion of Dakar (Senegal), approximately 80%of water resources come from groundwater reser-voirs, which are increasingly affected by anthro-pogenic pressures. The identification of the mainsources of pollution, and thus the aquifer vul-nerability, is essential to provide a sound basis
V. Re (B)Dipartimento di Scienze Ambientali,Università Cà Foscari, Calle Larga SantaMarta- Dorsoduro 2137, 30123 Venezia, Italye-mail: [email protected]
S. Cissé Faye · A. Faye · S. Faye · C. B. GayeDépartement de Géologie, Faculté des Scienceset Techniques, Université Cheich Anta Diop,B.P. 5005 Dakar-Fann, Senegal
E. SacchiDipartimento di Scienze della Terra,Università di Pavia, Via Ferrata 1, Pavia 27100, Italy
E. SacchiCNR-IGG, Sezione di Pavia,Via Ferrata 1, 27100, Pavia, Italy
G. M. ZuppiIstituto di Geologia Ambientale e GeoingegneriaCNR, Area della Ricerca di Roma 1, Via SalariaKm 29,300, C.P. 10-00015 Monterotondo, Italy
for the implementation of long-term geochemi-cally based water management plans in this sub-Saharan area. With this aim, a hydrochemicaland isotopic survey on 26 wells was performedin the so-called Peninsula of Cap-Vert. Resultsshow that seawater intrusion represents the mainprocess affecting groundwater chemical character-istics. Nitrates often exceed the World Health Or-ganization drinking water limits: stable isotopes ofdissolved nitrate (δ15N and δ18O) indicate urbansewage and fertilizers as a major source of con-tamination. Results depict a complex situation inwhich groundwater is affected by direct and indi-rect infiltration of effluents, mixing with seawaterand freshening processes from below. Besides therelevance of the investigation at a regional level,it represents a basis for decision-making processesin an integrated water resources management andin the planning of similar monitoring strategies forother urban coastal regions.
Keywords Urban and coastal aquifers ·Groundwater quality · Hydrochemistry ·Environmental isotopes
Introduction
Water shortages, droughts, and groundwater pol-lution due to human activities are increasingly be-coming a worldwide source of concern. Although

606 Environ Monit Assess (2011) 172:605–622
the world is not yet experiencing a global watershortage, more than 1.2 billion people live un-der conditions of physical water scarcity, whichoccurs when more than 75% of the river flowsare withdrawn (WHO/UNICEF 2006). Another1.6 billion people live in areas of economic waterscarcity, where human, institutional, and financialcapital limits access to water. These conditions areprevalent in much of sub-Saharan Africa, and atcontinental level, there is an alarming trend inartificially created scarcity, even in areas wherewater is apparently abundant (IWMI 2006). Dur-ing the past century, water use has increased at adouble rate if compared to the one of populationgrowth (IWMI 2006), with consequent impacts inwater availability and contamination. Symptomsoften include lack of adequate water infrastruc-ture, high vulnerability to short- and long-termdroughts, and difficult access to reliable watersupplies, especially for rural people. For this rea-son, groundwater resources have been increas-ingly used to rectify the supply backlogs, andmany urban areas rely on groundwater as funda-mental part of the drinking water supply (Xu andUsher 2006).
As many African urban and rural areas lack ad-equate and accurate information on both qualityand quantity of water resources (Showers 2002),and as the demand on freshwater resources israpidly growing, there is an urgent need to linkresearch with improved water management. Pro-vision of safe water, access to water, and sustain-able water use need to be assessed in order toavoid water crisis, and this should be achievedonly by applying science-based long-term man-agement projects. Better monitoring, assessment,and forecasting of water resources will help al-locate water more efficiently among competingneeds. Without protection, there is a serious riskof an irreversible decline of water, with a severeimpact on ecosystems and human health. How-ever, under need to rapidly develop new watersupplies, there is rarely adequate attention to, andinvestment in, the maintenance, protection, andlonger-term sustainability of groundwater.
Groundwater use is dominated by threefeatures:
1. Depletion due to overexploitation
2. Salinization and waterlogging due mostly toinadequate drainage and insufficient conjunc-tive use or to seawater intrusion linked to thecostal aquifer overdraft
3. Pollution due to agricultural, industrial, andother human activities
The three aforementioned points summarizethree key areas: water scarcity, water quality, andwater-related disasters, linked reciprocally, whichoften create serious and irreversible problemsto underground resources in many coastal areas(Abramovitz 2001).
The region of Dakar (Senegal), collectivelycalled Peninsula of Cap-Vert, is a classic exam-ple of these problems. As several other Africancities, the peninsula has seen a rapid populationgrowth increased by movements of refugees fromnearby countries in conflict (Deme et al. 2006).At present, the urban population of Dakar and itssuburb zone accounts for 23% of the total popula-tion of Senegal and only 0.3% of the surface area.This fast population growth has resulted in anincrease in water requirements and is putting evenmore pressure on already insufficient sanitationinfrastructures.
As many other coastal African cities (Showers2002), Dakar’s water supply depends upon ground-water for its daily function, and the populationuses pit latrines and dumps waste increasing pollu-tant loads on water resources already threatenedby seawater intrusion. Both point and nonpointsources of chemical contamination contribute togroundwater quality decline. Therefore, the ap-portioning of the relative loads in groundwater,with a focus on anthropogenic inputs of nitro-gen and occurrence of saline water intrusion, isrequired.
The lack of use and diffusion of sewagedrainage infrastructures can be considered as oneof the main sources of groundwater pollutionin this area, as in most developing countries.These considerations are not limited to Dakarand its outskirts but can be applied to all citiesand villages in the peninsula. Thiaroye, Pikine,Yeumbeul, and Keur Massar are only few exam-ples of cities in which most houses are equippedwith improper septic tanks, seeping from belowinto the groundwater (Cisse Faye et al. 2004).
Environ Monit Assess (2011) 172:605–622 607
In addition to this social situation, 90% of thelocal industries located in this region (includ-ing agribusiness, textile and fertilizer production)are recognized as the main drivers of the se-vere groundwater pollution by nitrate in the re-gion (Collin and Salem 1989; Tandia et al. 1999).Despite the rising awareness and attention to suchproblems (SONES 1986; Diop and Tandia 1997;Cisse Faye et al. 2004; Faye et al. 2005; Demeet al. 2006), the region is still strongly affectedby nitrogenous pollution, and the quality of thewater has diminished over the last few years with aconsiderable increase in nitrate content. Concen-trations close to 300 mg/L have been measured,while the World Health Organization (WHO) rec-ommends 50 mg/L as a limit for the drinking watersupply. In fact, the deterioration in groundwaterquality can be primarily explained by the proxim-ity of confirmed sources of pollution to the wells(Cisse Faye et al. 2004).
On the other hand, the continuous overex-ploitation of coastal aquifers increases the ground-water mineralization and produces a decline inthe water quality, with important drawbacks onagricultural development and on the population’shealth. Groundwater salinization is a commonproblem for both developing and developed coun-tries (Ghassemi et al. 1995; Foster and Chilton2003).
The use of isotopic tracers has been recognizedto be useful in terms of providing new insightsinto hydrologic processes (Girard and Hillaire-Marcel 1997; Kellman and Hillaire-Marcel 2002;Fukada et al. 2004). In fact, tracers permit toencompass the small-scale variability and providea description of catchment-scale processes (McDonnell and Kendall 1992). The development ofeffective management strategies to preserve waterquality, and remediation plans for sites with sus-pected contamination, requires the identificationof the pollutant sources and understanding of theeffective processes affecting local nitrate concen-trations (Kendall 1998). An integrated, holisticapproach is therefore required to tackle the bigchallenge of sustainable water management. Inorder to implement and integrate equitable poli-cies and projects, a sound knowledge of both thenatural and human-induced phenomena occurringin the aquifer is required.
This work tries to deal with the need for thedevelopment of an integrated management, con-cerning both groundwater and wastewater, byproviding a sound data basis related to the ma-jor processes occurring in shallow aquifers of theDakar region. The studied area is a classical exam-ple of several key problems and can be used as areference case study representative for groundwa-ter management in urban and coastal areas in bothdeveloped and developing countries. Moreover,the present study has to be considered not onlyfor its relevance at the local level, as a basis fordecision-making processes in integrated water re-sources management, but also for the value of theused approach for broad applications to similarurban coastal areas in Africa.
This work can contribute at the provision ofgeochemical and isotopic data in the frameworkof the assessment of groundwater quality at theregional level and as a basis for constructing geo-chemical and isotopic-based programs for watermanagement and international level.
Site description
The region of Dakar is located in the mid-westernpart of Senegal between 14◦24′ and 15◦5′ N andbetween 16◦55′ and 17◦32′ W (Fig. 1). It is char-acterized by a rocky headland, the peninsula ofCap-Vert, and is linked to the continent by theisthmus of Thiaroye. The morphology of thepeninsula is formed by two units: the extremewestward unit, characterized by an uplift of thesedimentary deposits in relation to the Dakarquaternary volcanism, and the eastward depres-sion zone located in the Thiaroye suburban area(Hebrard and Elouard 1976).
In this area, it is possible to distinguish:
• The northern coast, where the dune zone isseparated from the ocean by a continuouslittoral strip. The Quaternary sand dunes areoriented SW–NE, while the “Niayes” consti-tute the main surface features along the oceanfacade. In this zone, some lakes occur besidethe dune deposits; most of them are dry exceptfor the hypersaline Lake Retba (Seck 1988).

608 Environ Monit Assess (2011) 172:605–622
Fig. 1 The region of Dakar and localization of the wells in the studied area
• The southern coast, where the pre-Quaternarybasement, essentially marly, outcrops inRufisque and Bargny as a plateau relief of30 m high.
Dakar climate is controlled by the dual influenceof oceanic and continental processes forced bythe relative position of the Azores anticyclone,the North African anticyclone, the Saharan ther-mal low, and the Saint Helena anticyclone (Fallet al. 2006). It is governed by the position ofthe intertropical front, which regulates the rainfallmechanism in this region (Lebel and Le Barbe1997). As a consequence, in the region of Dakar,the dry season (October–June) occurs when theintertropical convergence zone (ITCZ) migratessouthward and the area is out of reach fromthe moist monsoonal flow. The migration of theITCZ determines the duration of the wet season
(June–July), also called “hivernage” (Fontaine1991; Leroux 2001).
The mean annual rainfall rate is 350 mm/year(mean for the period 1980–2005, Agence pour laSécurité de la Navigation Aérienne en Afriqueet à Madagascar, unpublished internal report),the mean annual air temperature (1980–2005) is24.7◦C, and the annual potential evapotranspira-tion (Turc’s method) is 1,830 mm/year. The rela-tive humidity varies little during the day or in thecourse of the year. It stays higher than 70% andreaches 98% in June. The real evapotranspirationis estimated at about 700 mm/year. The present-day infiltration rate is assumed to vary from yearto year between 40 and 60 mm with a mean valueof 48 mm/year (Travi et al. 1987, 1991; Tandia2000).
The geology of Dakar is mainly dominated byTertiary igneous rocks and overlying Quaternarysediments. The geology of this region is charac-

Environ Monit Assess (2011) 172:605–622 609
terized by a long period of volcanic activity fromTertiary (southern horst) to Quaternary (northernhorst) and by cycles of transgression/regression ofthe Atlantic Ocean. The southern horst forms theDakar plateau, some 50 m above sea level, whichconsists mainly of Tertiary volcanic products. Thenorthern horst reaches a height of 105 m and ismainly formed of Quaternary volcanic deposits.From the Mesozoic to the Quaternary, the gen-eral evolution of the area is marked by deepfaults (Bellion 1980, 1987) that delimit two horsts,the Dakar and Ndiass horsts, and the Rufisquegraben. The effect of this tectonic control is high-lighted by the presence of only Tertiary sediments:marls and limestones from the Eocene, karsticlimestones from the Paleocene, and sandstonesand limestones from the Maestrichtian periods.The entire area is covered by eolian sands datingfrom the Quaternary.
Quaternary phreatic aquifer is composed of un-consolidated sands. The sediments consist largelyof fine- and medium-grained sands with a poros-ity value of about 20%. The aquifer overliesPaleocene and Maestrichtian limestone aquifers(Martin 1970).
Recharge to the phreatic aquifer is yearly pro-vided by direct rainfall infiltration. Outflows aredue to evaporation, occurring during the dry sea-son in the Niayes, direct flow into the sea, and,in recent years, human exploitation through wells(Audibert 1971).
The flows are usually from south-east tonorth-west, hence from the sea to inner zones(Forkasiewicz 1982; Cisse Faye 2001).
The presence of two piezometric domes (thefirst located at the north-east, among Mbawanelake and Tanma lake, and the second sited in thesouth-west in proximity of the Niayes of Pikine)allowed the isolation of the studied reservoir as anindependent hydrodynamic system.
The western zone is marked by the catchmentbasin of Thiaroye, characterized by a depressiongenerated from its exploitation. East of this basin,the hydraulic gradient is generally important, withan order of 1–3%.
Aquifers in the Cap-Vert peninsula have beenover-exploited since 1952, when they first startedbeing used in response to Dakar’s water demand(SONES 1986). This has resulted in some en-
croachment of salt water (Faye et al. 2005). Itappears that the encroachment of the salt water iscontinuing, albeit slowly, in the southern area. Thechloride contents of some piezometers have in-creased considerably since 1985 (increasing from35 to 300 mg/L; Cisse Faye 2001). Therefore, thegroundwater is still slightly over-exploited andmaintaining the current level of chloride. How-ever, it should be observed that the quality of thewater has degraded over the last few years witha considerable increase in nitrate content up to300 mg/L (Diop and Tandia 1997; Cisse Faye et al.2004).
Materials and methods
In order to discriminate between different sourcesof contamination in the region of Dakar, ground-water has been sampled in 26 wells (13 drilledwells and 13 dug wells) spread across the Qua-ternary aquifer. Water sampling was conductedduring the dry season (March and April 2006) inan area of approximately 300 km2 in the Cap-Vertpeninsula, from Dakar Yoff to Kayar (Fig. 1).
Different isotopic techniques associated withthe hydrochemistry of major and trace elementshave been applied in order to investigate the pol-lution sources affecting groundwater quality.
The hydrochemistry of minor elements,namely, boron (B), strontium (Sr), and bromide(Br), together with the environmental stableisotopes (δ18O and δ2H) and the major-ionchemistry (chloride, sodium, and calcium) hasbeen used to restrict the sources and the processesof salinization in the Quaternary sand aquifer.Stable isotopes of oxygen-18 and deuterium arecommonly used in regional groundwater studiesto identify flow regimes mixing and sources ofrecharge (Fritz and Fontes 1980). In addition,the use of δ13C in dissolved inorganic carbon(DIC) can be important to trace carbon sourcesin groundwater (Clark and Fritz 1997).
The basis for the identification of NO −3 is the
use of a natural abundance of δ15N because itallows to distinguish between synthetic and nat-ural fertilizers (Clark and Fritz 1997). The analy-sis of nitrogen isotope composition permits theidentification of the occurrence of contamination

610 Environ Monit Assess (2011) 172:605–622
by septic effluents apart from agricultural sourcesand to verify the expected correlation betweengroundwater pollution and land use. The δ18Ocomposition of nitrate provides further informa-tion on the processes affecting NO −
3 , namely, onthe occurrence of nitrification and denitrificationphenomena.
Sampling was performed by pumping waterfrom wells until electrical conductivity (EC) be-came constant. Pumping was performed using aGrundfos pump, BMP/MPI-230 V, with an outputflux of 0.4 L/s.
During the sampling phase, chemical–physicalparameters were measured: water level, tempera-ture, pH, EC, and Eh using 340/SET-WTW, whiledissolved oxygen was measured with an electrodeEh (SenTix ORP).
Samples for major ion analysis were collectedin polyethylene bottles, filtered in the laboratorythrough 0.45-μm cellulose nitrate membrane filterpapers, stored in 500-mL PE bottles, and pre-served with HgCl2 except those for Cl− analysis.These samples were analyzed at the Départe-ment de Géologie (Université Cheich Anta Diop,Dakar) by ion chromatography. Alkalinity wasdetermined by titration immediately after thesampling campaign. All reported values have ionicbalance within 5%.
Trace elements analyses (B, Li, and Sr) wereperformed at the Dipartimento di Scienze dellaTerra (Università di Pavia), using an inductivelycoupled plasma–atomic emission spectroscopy.Br analyses were performed at the Istituto diGeoscienze e Georisorse, Consiglio Nazionaledelle Ricerche (Pisa), using ionic chromatography(Dionex 100) with an accuracy of 3%.
Samples for stable isotope analysis were col-lected according to the procedures described byClark and Fritz (1997). Hydrogen isotope com-position was measured by water reduction overmetallic zinc (Coleman et al. 1982), while δ18Owas analyzed by water–CO2 equilibration at 25◦C(Epstein and Mayeda 1953); both results areexpressed in Vienna standard mean ocean wa-ter (Gonfiantini 1978; Gonfiantini et al. 1995).The analytical errors are ±1 and ±0.1‰, respec-tively. The δ13C of DIC was analyzed by directacidification of the water sample with phosphoric
acid (Kroopnick 1974), and the released CO2
recuperated in vacuum line for further analysisthrough the dual inlet of the mass spectrometer.Results are expressed in per mill Vienna Pee Deebelemnite (Gonfiantini 1978; Gonfiantini et al.1995). Analytical errors are ±0.3. δ15NNO3 andδ18NNO3 of dissolved nitrate were analyzed fol-lowing the procedures described by Kendall andGrim (1990) and by Silva et al. (2000) and referto V-AIR (Gonfiantini et al. 1995). The analyt-ical error is ±0.5‰ and ±1‰, respectively. Allgases were analyzed on a Finnigan MAT 250 MassSpectrometer at ISO4 s.s. (Pavia, Italy).
Results
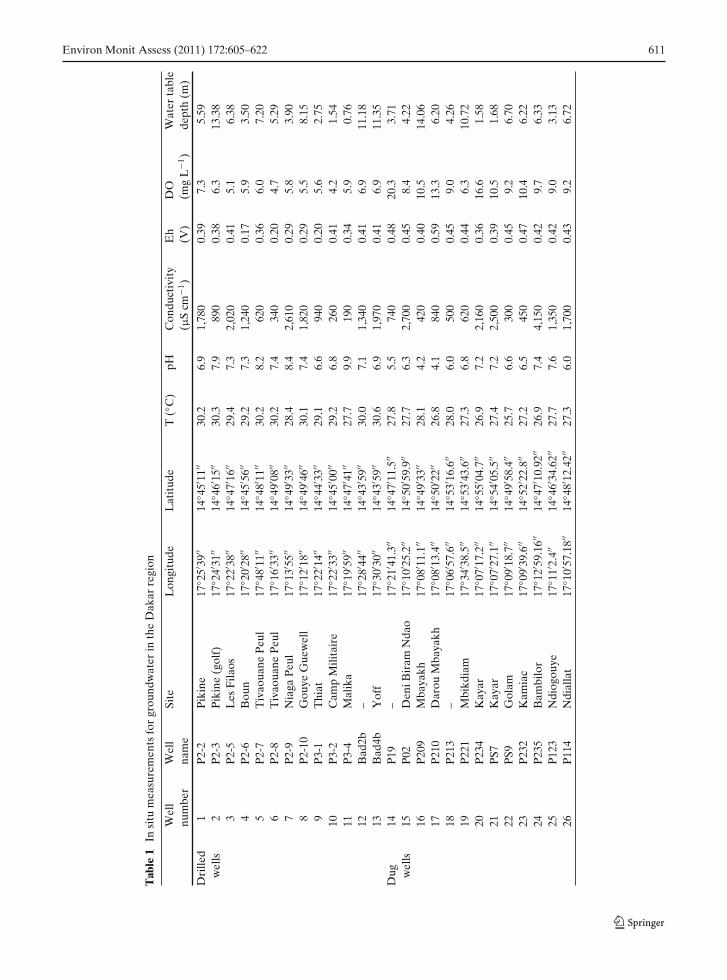
Water temperature varies between 27◦C and31◦C, with an average of 28.4◦C. pH has a meanvalue of 6.9 and a standard deviation of 1.2(Table 1). Waters from wells number 16 (DarouMbayakh) and number 17 (Mbayakh) are stronglyacidic (4.1 and 4.2, respectively) and are locatedin the eastern part of the Cap-Vert peninsula; onthe contrary, waters from well 11-Malika are verybasic (pH of 9.9).
Eh and dissolved oxygen (Table 2) vary sig-nificantly between drilled wells (with a mean of+0.33 V and 5.8 mg/L) and dug wells (+0.44 Vand 11 mg/L), respectively. Electrical conductivitysuggests the presence of exceedingly mineralizedwaters, with an average of 1,325 μS/cm and amaximum of 4,150 μS/cm in well 24 (Bambilor).
Dominant major ions are sodium and chloride.Mineralization processes are relevant and concernareas where farming and rural or urban life canaffect groundwater quality. Data indicate highcation content and low alkalinity values, togetherwith an increase in dissolved nitrate and chlo-ride. In particular, the content of nitrate is veryhigh, and for 50% of wells, the concentrationsexceed the WHO regulatory limit of 50 mg/L, witha maximum value of 790 mg/L in dug well 24.Lithium is the least abundant, with an averageconcentration of 11 μg/L, and only two wells (20and 22) reach strontium concentrations exceeding1 mg/L. Boron concentration, higher than 1 mg/L,
Environ Monit Assess (2011) 172:605–622 611
Tab
le1
Insi
tum
easu
rem
ents
for
grou
ndw
ater
inth
eD
akar
regi
on
Wel
lW
ell
Site
Lon
gitu
deL
atit
ude
T(◦
C)
pHC
ondu
ctiv
ity
Eh
DO
Wat
erta
ble
num
ber
nam
e(μ
Scm
−1)
(V)
(mg
L−1
)de
pth
(m)
Dri
lled
1P
2-2
Pik
ine
17◦ 2
5′39
′′14
◦ 45′
11′′
30.2
6.9
1,78
00.
397.
35.
59w
ells
2P
2-3
Pik
ine
(gol
f)17
◦ 24′
31′′
14◦ 4
6′15
′′30
.37.
989
00.
386.
313
.38
3P
2-5
Les
Fila
os17
◦ 22′
38′′
14◦ 4
7′16
′′29
.47.
32,
020
0.41
5.1
6.38
4P
2-6
Bou
n17
◦ 20′
28′′
14◦ 4
5′56
′′29
.27.
31,
240
0.17
5.9
3.50
5P
2-7
Tiv
aoua
neP
eul
17◦ 4
8′11
′′14
◦ 48′
11′′
30.2
8.2
620
0.36
6.0
7.20
6P
2-8
Tiv
aoua
neP
eul
17◦ 1
6′33
′′14
◦ 49′
08′′
30.2
7.4
340
0.20
4.7
5.29
7P
2-9
Nia
gaP
eul
17◦ 1
3′55
′′14
◦ 49′
33′′
28.4
8.4
2,61
00.
295.
83.
908
P2-
10G
ouye
Gue
wel
l17
◦ 12′
18′′
14◦ 4
9′46
′′30
.17.
41,
820
0.29
5.5
8.15
9P
3-1
Thi
at17
◦ 22′
14′′
14◦ 4
4′33
′′29
.16.
694
00.
205.
62.
7510
P3-
2C
amp
Mili
tair
e17
◦ 22′
33′′
14◦ 4
5′00
′′29
.26.
826
00.
414.
21.
5411
P3-
4M
alik
a17
◦ 19′
59′′
14◦ 4
7′41
′′27
.79.
919
00.
345.
90.
7612
Bad
2b–
17◦ 2
8′44
′′14
◦ 43′
59′′
30.0
7.1
1,34
00.
416.
911
.18
13B
ad4b
Yof
f17
◦ 30′
30′′
14◦ 4
3′59
′′30
.66.
91,
970
0.41
6.9
11.3
5D
ug14
P19
–17
◦ 21′
41.3
′′14
◦ 47′
11.5
′′27
.85.
574
00.
4820
.33.
71w
ells
15P
02D
eniB
iram
Nda
o17
◦ 10′
25.2
′′14
◦ 50′
59.9
′′27
.76.
32,
700
0.45
8.4
4.22
16P
209
Mba
yakh
17◦ 0
8′11
.1′′
14◦ 4
9′33
′′28
.14.
242
00.
4010
.514
.06
17P
210
Dar
ouM
baya
kh17
◦ 08′
13.4
′′14
◦ 50′
22′′
26.8
4.1
840
0.59
13.3
6.20
18P
213
–17
◦ 06′
57.6
′′14
◦ 53′
16.6
′′28
.06.
050
00.
459.
04.
2619
P22
1M
bikd
iam
17◦ 3
4′38
.5′′
14◦ 5
3′43
.6′′
27.3
6.8
620
0.44
6.3
10.7
220
P23
4K
ayar
17◦ 0
7′17
.2′′
14◦ 5
5′04
.7′′
26.9
7.2
2,16
00.
3616
.61.
5821
PS7
Kay
ar17
◦ 07′
27.1
′′14
◦ 54′
05.5
′′27
.47.
22,
500
0.39
10.5
1.68
22P
S9G
olam
17◦ 0
9′18
.7′′
14◦ 4
9′58
.4′′
25.7
6.6
300
0.45
9.2
6.70
23P
232
Kam
iac
17◦ 0
9′39
.6′′
14◦ 5
2′22
.8′′
27.2
6.5
450
0.47
10.4
6.22
24P
235
Bam
bilo
r17
◦ 12′
59.1
6′′
14◦ 4
7′10
.92′
′26
.97.
44,
150
0.42
9.7
6.33
25P
123
Ndi
ogou
ye17
◦ 11′
2.4′
′14
◦ 46′
34.6
2′′
27.7
7.6
1,35
00.
429.
03.
1326
P11
4N
dial
lat
17◦ 1
0′57
.18′
′14
◦ 48′
12.4
2′′
27.3
6.0
1,70
00.
439.
26.
72

612 Environ Monit Assess (2011) 172:605–622
Tab
le2
Che
mic
alco
mpo
siti
onof
grou
ndw
ater
inth
eD
akar
regi
on
Wel
lW
ells
CO
− 3H
CO
− 3C
l−N
O− 3
SO2− 4
Na+
K+
Mg2+
Ca2+
Br−
BL
i+Sr
2+N
a/C
lC
l/Br
num
ber
(mg
L−1
)(m
gL
−1)
(mg
L−1
)(m
gL
−1)
(mg
L−1
)(m
gL
−1)
(mg
L−1
)(m
gL
−1)
(mg
L−1
)(m
gL
−1)
(mg
L−1
)(m
gL
−1)
(mg
L−1
)D
rille
d1
P2-
2–
7338
226
717
221
1040
600.
520.
030.
010.
660.
673
3.8
wel
ls2
P2-
3–
9212
111
925
8214
1744
0.43
0.04
0.00
0.33
0.7
281.
23
P2-
5–
214
241
439
7215
18
1421
80.
610.
030.
010.
710.
639
4.3
4P
2-6
–73
212
205
2411
323
3160
0.64
0.02
0.01
0.49
0.5
330.
95
P2-
7–
134
5241
5237
1513
52<
0.1
0.04
0.02
0.42
0.7
–6
P2-
8–
122
362
317
27
310.
270.
030.
010.
380.
513
4.8
7P
2-9
–12
228
0–
761
440
4853
380.
781.
150.
020.
321.
635
8.6
8P
2-10
–18
341
415
142
190
618
146
0.88
0.06
0.01
0.84
0.5
470.
89
P3-
1–
9819
13
4670
435
410.
530.
030.
000.
170.
436
0.3
10P
3-2
–85
3112
321
36
23<
0.1
0.02
0.00
0.17
0.7
–11
P3-
44
339
63
192
29
<0.
10.
020.
010.
090.
5–
12B
ad2h
–12
113
115
1969
1611
291.
230.
090.
000.
820.
691
.613
Bad
4b–
348
385
2754
170
1868
960.
525.
000.
010.
700.
474
0.4
Dug
14P
19–
250
180
200
2878
1328
135
0.30
0.04
0.00
0.26
0.4
600.
1w
ells
15P
02–
3141
356
215
631
375
4614
20.
650.
140.
020.
660.
863
4.8
16P
209
–11
657
220
263
1338
<0.
10.
030.
010.
300.
5–
17P
210
–6
9315
189
553
2047
<0.
10.
050.
020.
380.
6–
18P
213
–31
5913
9735
411
31<
0.1
0.04
0.00
0.21
0.6
–19
P22
1–
6170
102
2346
510
36<
0.1
0.03
0.02
0.27
0.7
–20
P23
4–
348
401
289
233
210
6551
208
0.72
0.23
0.03
1.20
0.5
557.
621
PS7
–40
933
22
533
194
2942
317
0.47
0.33
0.02
1.24
0.6
707.
322
PS9
–37
303
3623
35
18<
0.1
0.02
0.01
0.21
0.8
–23
P23
2–
2479
7613
605
815
<0.
10.
030.
010.
130.
8–
24P
235
–22
054
979
067
837
264
8441
50.
790.
090.
003.
280.
769
5.3
25P
123
–98
107
357
5445
2513
166
<0.
10.
080.
010.
560.
4–
26P
114
–12
204
471
6713
149
5481
0.27
0.03
0.02
0.64
0.6
756.
3

Environ Monit Assess (2011) 172:605–622 613
Table 3 Isotopiccomposition (δ‰) ofgroundwater in the Dakarregion
Well Wells δ15N−NO3 δ18O−NO3 δ18O δ2H δ13Cnumber
Drilled 1 P2-2 14.0 9.4 −4.75 −34.0 −10.4wells 2 P2-3 10.9 8.5 −5.44 −37.6 −8.3
3 P2-5 11.1 8.5 −5.20 – −10.14 P2-6 15.1 11.8 −4.98 – −10.55 P2-7 15.2 15.6 −4.96 – −13.86 P2-8 – – −5.73 – −12.27 P2-9 – – −4.99 −35.1 −7.58 P2-10 11.3 – −5.39 −36.3 −11.39 P3-1 – – −5.29 −34.8 −9.5
10 P3-2 19.3 15.1 −5.73 −38.5 −12.411 P3-4 7.3 11.7 – – –12 Bad2h 14.75 14.7 −5.40 – −13.313 Bad4b 11.0 11.9 −5.14 – −12.3
Dug 14 P19 8.4 12.2 −4.65 – −14.3wells 15 P02 14.2 12.6 −3.82 −26.3 −12.0
16 P209 – – −5.11 −35.2 −13.417 P210 – – −4.79 – −15.618 P213 – 10.6 −4.89 – −19.319 P221 12.3 10.1 −5.09 – −14.120 P234 17.3 – −3.89 – −10.421 PS7 – – −4.54 – −12.922 PS9 – – −4.22 – −18.923 P232 8.3 13.4 −4.33 −32.5 −14.824 P235 11.9 11.7 −4.07 −30.8 −11.225 P123 11.1 – −3.85 −27.8 −9.826 P114 13.1 10.0 −4.51 – −14.5
is significant only in well number 7, drilled nearRetba Lake.
The δ15N−NO3 values (Table 3) range from ap-proximately +7‰ to +19‰ and are in the range ofsignatures for manure and septic systems (Kendall1998). δ18N−NO3 varies between +10‰ and +16‰,while the mean value for δ13C of DIC is −12‰.Mean δ18O and δ2H are −4.8 and −33.5, respec-tively, corresponding to expected values for mete-oric waters in the region (Travi 1988).
Discussion
The extreme pH values observed in groundwatercould be controlled both by the aquifer miner-alogical matrix and by the dissociation of dis-solved carbon dioxide mostly originated in the soil(Tandia 2000). In the case of acidic pH, thehydrosystem might be considered hydrologicallyphreatic and geochemically open to the at- Fig. 2 Eh–pH diagram (modif. from NIAIST 2005)

614 Environ Monit Assess (2011) 172:605–622
Fig. 3 Dissolved oxygen content versus water table depthbelow ground surface
mosphere. On the contrary, waters with higherpH values circulate in a confined aquifer and thusin a geochemically closed system, where CO2 isconsumed by the active interaction with aquifermatrix. These waters are limited to the basalticaquifer located dominantly in the western part.
In the Eh–pH diagram (Fig. 2), waters definea trend progressively leading from an open hy-
drosystem (dug wells), characterized by a moreoxidizing environment, to a closed hydrosystem(drilled wells) where the environment is morereducing.
These observations are in agreement with thesignificant levels of dissolved oxygen relativelymore present in waters from shallower wells, fromeither phreatic or confined aquifers, than in thewaters from deeper wells (Fig. 3).
On the basis of the anion distribution (Fig. 4),it is possible to recognize two main trends: on theone hand, a progressive enrichment in chloride,associated with very low nitrate concentrations,and on the other, a significant enrichment in ni-trate affecting both drilled and dug wells.
These two trends could be considered as themajor processes controlling groundwater decline,in the region of Dakar: seawater intrusion andanthropogenic pollution.
The coexistence of these two sources of conta-mination adds complexity to the system, in whichdirect and indirect infiltration of effluent, andsaline or fresh water flushing, work together, lim-iting the detection of representative end membersfor each phenomenon.
Salinization
The hydrochemistry of trace elements boron (B),strontium (Sr), lithium (Li), and bromide (Br)
Fig. 4 Distribution ofnitrate versus chloridecontents. The black lineindicates the main trendof mixing with seawater.Starting form this process,a progressive enrichmentin the load of pollutants isshowed by the dashedlines
Environ Monit Assess (2011) 172:605–622 615
and environmental isotopes of water molecule(2H and 18O) together with major ion chemistry(mainly Na and Cl) has been used to investigatethe occurrence of saline water encroachment.
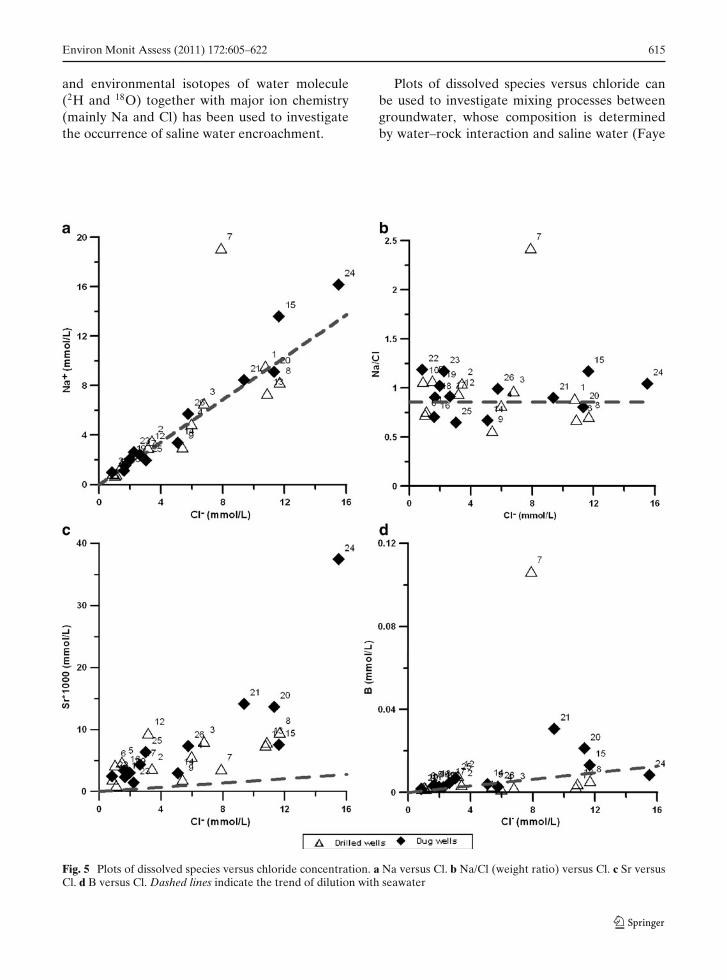
Plots of dissolved species versus chloride canbe used to investigate mixing processes betweengroundwater, whose composition is determinedby water–rock interaction and saline water (Faye
Fig. 5 Plots of dissolved species versus chloride concentration. a Na versus Cl. b Na/Cl (weight ratio) versus Cl. c Sr versusCl. d B versus Cl. Dashed lines indicate the trend of dilution with seawater

616 Environ Monit Assess (2011) 172:605–622
et al. 2005). Thus, waters with low salinity (i.e.,less than 100 mg/L of chloride) were assumedas representative of fresh groundwater or morediluted salty waters.
By plotting Na versus Cl (Fig. 5a), it is possibleto point out the process of progressive mixing withsaline water.
Some wells (7, 15, and 24) show an excess in Na:in particular, well number 7 is characterized bya great enrichment, due to its location in respectto the hypersaline Retba Lake, mainly composedof sodium carbonate. This enrichment in sodium,with respect to calcium, is dominant in this part ofthe aquifer, as groundwater flows from the RetbaLake south-eastward.
Nevertheless, in the Na/Cl ratio versus Cl(Fig. 5b) diagram, evidence of depletion or enrich-ment of Na appears, which seem to result fromother processes rather than mixing with salinewater.
Waters with a Na/Cl weight ratio higher thanthe reference seawater value (0.858) may be de-rived by the mixing of fresh waters, whose chemi-cal composition is close the one of deep ground-water, and seawater. Indeed, according to Fayeet al. (2005), deep groundwater flowing through-out sandstones shows a Na/Cl ratio of 1.6, dueto the presence of Quaternary evaporitic deposits
Fig. 6 Sr versus Ca
Fig. 7 Br versus Cl
mainly composed of Na2CO3 (Garnier 1978) orof glauberite-rich sediments [Na2Ca(SO4)2]. Onthe other hand, enrichment in chloride suggests apossible contribution from anthropogenic sources,in association to nitrate (Fig. 4).
The detection of traces of dissolved carbonatesin wells 7, 15, and 24 is supported by the enrich-ment of strontium (Figs. 5c and 6). In general,the increase in the Sr concentration, parallel tothat of Cl, is largely due to the saltwater intrusionprocesses (Faye et al. 2005).
Figure 6 shows enrichment in Sr indicative ofcarbonate dissolution. In fact, the incongruentdissolution of carbonates readily increases the Srconcentration of the solution because the largeSr2+ ions are rejected from recrystallized calcite(Hem 1985; Edmunds et al. 1987; Chou et al. 1989;Drever 1997). This typically occurs in the pres-ence of paleolacustrine systems in warm regions,where the alternation of clays, carbonate–clays,and clays–carbonates is dominant (Mees 1999).
The trend of progressive mixing with salinewaters can also be pointed out considering borondistribution with respect to chloride (Fig. 5d).Apart from sea–water mixing, boron in groundwa-ter can be derived by the leaching of clay minerals(Vengosh et al. 2004; Bouchaou et al. 2008), aspossibly in the case of well number 7. The high Bconcentrations of wells 20 and 21, however, may
Environ Monit Assess (2011) 172:605–622 617
derive from fertilizers and detergents, due to thelocation of these wells (orchard and barnyard).
The analysis of bromine content in ground-water has been used to distinguish between sali-nization and anthropogenic pollution (Barroset al. 2008). Figure 7 shows that although theBr concentration is partly controlled by seawaterintrusion, as already evidenced by Faye et al.(2005), an enrichment of chloride can be ob-served. This confirms an anthropogenic input ofchloride.
The carbon isotopic composition for the sam-ples range from approximately −7‰ to −15‰ in-dicating a significant difference in the δ13C valuesof DIC. The most negative δ13C values correspondto water in shallow sandy aquifers (open systemconditions) and are controlled by the isotopiccomposition of soil CO2 and microbial activityaffecting organic matter, which is usually quitenegative (−15‰ to −22‰; Clark and Fritz 1997).The shift in δ13C composition of DIC toward morenegative values is indicative of an involvement ofan isotopically light carbon into the DIC phase,which may be derived from the oxidation of or-ganic carbon to carbon dioxide.
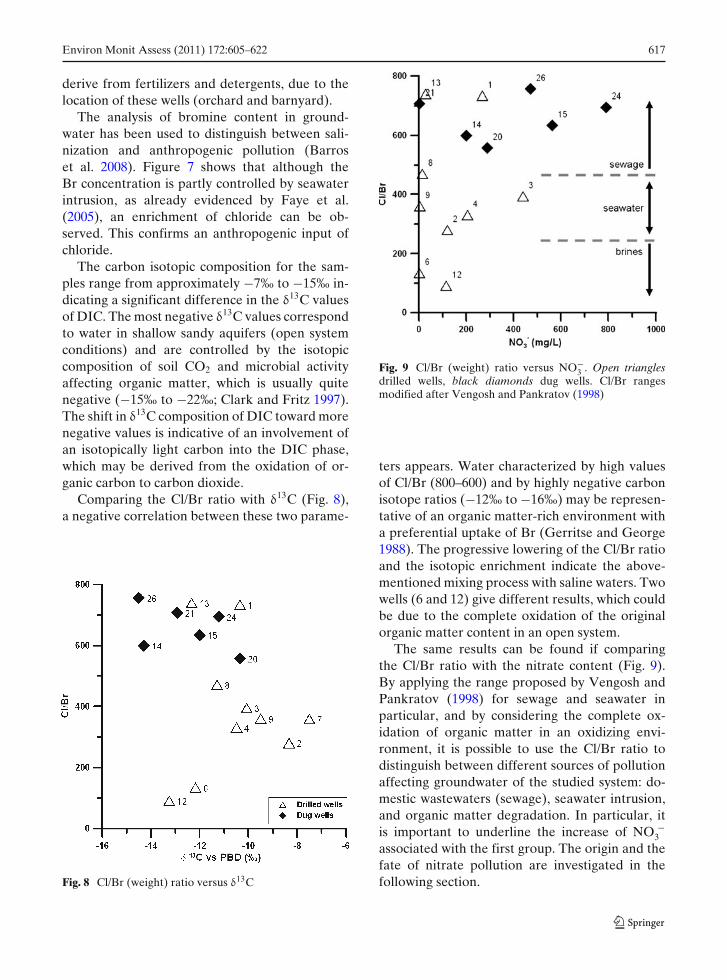
Comparing the Cl/Br ratio with δ13C (Fig. 8),a negative correlation between these two parame-
Fig. 8 Cl/Br (weight) ratio versus δ13C
Fig. 9 Cl/Br (weight) ratio versus NO−3 . Open triangles
drilled wells, black diamonds dug wells. Cl/Br rangesmodified after Vengosh and Pankratov (1998)
ters appears. Water characterized by high valuesof Cl/Br (800–600) and by highly negative carbonisotope ratios (−12‰ to −16‰) may be represen-tative of an organic matter-rich environment witha preferential uptake of Br (Gerritse and George1988). The progressive lowering of the Cl/Br ratioand the isotopic enrichment indicate the above-mentioned mixing process with saline waters. Twowells (6 and 12) give different results, which couldbe due to the complete oxidation of the originalorganic matter content in an open system.
The same results can be found if comparingthe Cl/Br ratio with the nitrate content (Fig. 9).By applying the range proposed by Vengosh andPankratov (1998) for sewage and seawater inparticular, and by considering the complete ox-idation of organic matter in an oxidizing envi-ronment, it is possible to use the Cl/Br ratio todistinguish between different sources of pollutionaffecting groundwater of the studied system: do-mestic wastewaters (sewage), seawater intrusion,and organic matter degradation. In particular, itis important to underline the increase of NO −
3associated with the first group. The origin and thefate of nitrate pollution are investigated in thefollowing section.

618 Environ Monit Assess (2011) 172:605–622
Fig. 10 Delta deuterium and oxygen-18 variations ingroundwater from the Dakar area. Solid line LMWLdefined by Travi et al. (1987) (δ2H = 7.93 δ18O + 10.09),dashed line mixing with seawater
Finally, in addition to these minor elements, en-vironmental isotopes (18O and 2H) were also usedfor supporting evidence of the mixing processes(Fig. 10). The groundwater isotope compositionfalls below the local meteoric water line (LMWL;Travi et al. 1987), which appears to be veryclose to the global meteoric water line (Craig1961; Gonfiantini 1998). Deviations from this linereflect an enrichment of heavy isotope concentra-tion, with a slope of 5.49, confirming once morethe mixing process with seawater.
Nitrogen pollution
Intensive anthropic activity in this area resultsin nitrate concentrations in groundwater oftenexceeding drinking water standards. In order toidentify the different sources of nitrate and theprocesses affecting its concentration in groundwa-ter (nitrification and denitrification), the isotopiccomposition of nitrogen and oxygen in dissolvednitrates was investigated.
Most of the samples lay within the range con-sistent with an origin from animal wastes, ma-nure, and septic system effluents
(δ15N−NO3 =
+10‰ to + 150‰); this result is consistent with
the position and the social situation of the regionof Dakar (Fig. 11). In fact, in both rural areas andsuburban areas, the main impact on groundwateris represented by organic fertilizers and septiceffluents.
The second registered trend involves threewells (11, 14, and 23), all located in areas ofintensive agriculture (Niayes), and is compati-ble with the signature of soil organic matter(δ15N−NO3 = +4‰ to + 90‰
), therefore indicat-
ing that nitrates are derived from soil organicnitrogen by mineralization and nitrification (Clarkand Fritz 1997).
In other words, on one side, nitrates are di-rectly derived from septic effluents (point source),and on the other, infiltration of organic matterspreads on soils that provide an additional non-point source input. In the latter case, groundwatertakes the same δ15N−NO3 composition of soil or-ganic matter, as a consequence of mixing effects(Kendall 1998). Both direct and indirect inputscause the processes of oxidation or nitrification insandy media, as found in the shallow drilled anddug wells (Reynaud and Roger 1981).
On the other hand, denitrification is observedin the deepest wells, specifically where they drainwater from aquifers located underneath clay lay-
Fig. 11 Dissolved nitrate content versus δ15N

Environ Monit Assess (2011) 172:605–622 619
Fig. 12 δ18O versus δ15Nof dissolved nitrates ingroundwater from theDakar region (modifiedafter Kendall 1998). Grayand black circlesrepresent drilled and dugwells, respectively, theirradius being proportionalto the nitrate content (seescale in the right handcorner)
ers in closed system conditions. Both the extentand rate of denitrification vary depending on thegroundwater flow path. While little or no den-itrification occurs in much of the upland por-tions of the aquifer, a gradual redox gradient isobserved as aerobic upland groundwater movesdeeper in the aquifer (Fig. 2).
A loss of nitrate provides evidence that deni-trification occurs as groundwater enters deep lay-ers. Electron and mass balance calculations sug-gest that organic matter oxidation is the primarysource of electrons for denitrification. Therefore,the major presence of anthropic contributions tothe shallow systems and the presence of iron andaluminum species in a confined aquifer explainthese observations (Fall 1986). Indeed, the re-moval rate of dissolved oxygen is strongly depen-dent on the presence of electron donors such asdissolved organic matter or Fe+2 (Clark and Fritz1997; Edmunds and Shand 2008).
This is also confirmed by the δ15N and δ18Odiagram (Fig. 12). Indeed, the oxygen isotopecomposition of dissolved nitrates is not governedby the relative proportions of atmospheric andgroundwater oxygen (Clark and Fritz 1997) but isrelated to the electron donors involved in the ox-idation processes affecting the organic products.This is more evident in samples collected fromsand-point wells, more vulnerable to septic-wastecontamination spread at the surface. Results alsoindicate that groundwater under clayey soil orclose to septic drain fields are clearly affected bydenitrification processes as indicated by the trendobserved in δ18O versus δ15N.
Conclusion
Dakar, as well as other African coastal capitalslike Abidjan, Lomè, Lagos, or Dar Es Salaam,is characterized by an increase of nitrates andother contaminants in groundwater (Abiodun1997; Showers 2002; Oga Yei et al. 2007; Akouviet al. 2008), strongly associated with seawater in-trusion processes.
This underlines the fact that problems associ-ated with rapid urbanization, inadequate sanita-tion, lack of alternative water supplies, and lack ofpublic awareness and implementation require ur-gent addressing. In particular, action is no longerpossible without a clear understanding on thephysical and geochemical processes occurring innatural groundwater.
The abundance of major ions, especially of ni-trate, chloride, and sulfate, suggests an elevatedundesirable evolution of physical–chemical prop-erties of freshwater resources and thus an in-creased risk for public health.
Anthropogenic inputs of nitrogen from humanactivities are a central concern in urban watershedmanagement. However, identifying the locationsof these inputs, in particular if represented by im-properly functioning or ill-maintained septic tanksor from leaking sewer lines, is difficult (Steffy andKilham 2004).
The hydrochemistry of major and trace ele-ments, coupled with environmental isotopes, shednew light on the geochemical processes affectinggroundwater quality in the suburban area ofDakar. They have shown that groundwater from

620 Environ Monit Assess (2011) 172:605–622
drilled and dug wells in near-coastal aquifers ischaracterized by relatively high chloride content,due to the seawater intrusion related to the ex-cessive exploitation of the aquifer. The high ni-trate concentration is evidence of the presenceof several point and nonpoint pollution sources,principally linked to sewage and septic effluents.This type of pollution provides a supplementaryinput of chloride.
These two phenomena affecting water qualityare not separated but representative of a complexsituation in which groundwater is affected by bothdirect and indirect infiltration of contaminants,mixing with seawater and the freshening processfrom below.
All these processes have significant conse-quences on groundwater quality and pose seriousthreats to the health conditions of the inhabi-tants in the region of Dakar (Gaye et al. 1998;Tandia et al. 1999; Cisse Faye 2001). In addition tothe mentioned pollutants, other substances strictlyconnected with human activities, i.e., bacteria,parasites, and heavy metals, which are liable todeteriorate groundwater quality, should be takeninto account and be actively monitored in thefuture.
To better understand the aquifer vulnerability,and to provide a sound basis for the implementa-tion of groundwater and wastewater managementplans in this coastal and urban areas, it is impor-tant to distinguish:
• Geochemically and hydrologically closed sys-tems, laying underneath clay strata, oftenaffected by denitrification processes con-trolled by the organic matter degradation
• Systems that are geochemically and hydro-logically open to deep inputs, affected bygroundwater freshening and dissolution ofcarbonates
• Systems that are geochemically and hydrolog-ically open to surface inputs, affected by thedirect infiltration of pollutants
Acknowledgements Authors wish to thank Mr. Demeand Mr. Diaw from the Hydrogeology unit of theUniversité Cheich Anta Diop, for the support duringfield activities and analytical determinations. We thank
Dr. Enrico Allais and ISO4 s.s. for the help in isotopeanalysis and interpretation. The quality of this paper wasgreatly improved by the critical review of Prof. MikeEdmunds.
References
Abiodun, J. O. (1997). The challenges of growth anddevelopment in Metropolitan Lagos. In C. Rakodi(Ed.), The urban challenge in Africa: Growth and man-agement of it’s largest cities. Tokyo: United NationsUniversity Press.
Abramovitz, J. (2001). Unnatural disasters. WorldwatchPaper 158. Washington: Worldwatch Institute. http://www.worldwatch.org/node/832. Access 15 February2007.
Akouvi, A., Dray, M., Violette, S., de Marsily, G., & Zuppi,G. M. (2008). The sedimentary coastal basin of Togo:example of a multilayered aquifer still influenced bya palaeo-seawater intrusion. Hydrogeology Journal,16(3), 419–436.
Audibert, M. (1971). Etude hydrogéologique de la nappeprofonde du Sénégal (Nappe Maestrichtienne). Fonc-tionnement hydraulique du système. Rapport BRGM,Orléans, 71 RME 035: 49–65.
Barros, G. V., Mas-Pla, J., Oliveira Novais, T., Sacchi,E., & Zuppi, G. M. (2008). Hydrological mixing andgeochemical processes characterization in an estu-arine mangrove system using environmental tracersin Babitonga Bay (Santa Catarina, Brazil). Conti-nental Shelf Research, 28, 682–695. doi:10.1016/j.csr.2007.12.006.
Bellion, Y. J. C. (1980). Première contribution à la connais-sance de la tectonique cassante de la région du Cap-Vert (Sénégal). Ann. Fac. Sci. Dakar., 32, 97–101.
Bellion, Y. J. C. (1987). Histoire géodynamique post-paléozoïque de l’Afrique de l’Ouest d’après l’étudede quelque bassin sédimentaires (Sénégal, Taoidéni,Tullemmden, Tchad). Thèse Science, Universitéd’Avignon et des pais Vaucluse.
Bouchaou, L., Michelot, J. L., Vengosh, A., Hsissou, Y.,Qurtobi, M., Gaye, C. B., et al. (2008). Applicationof multiple isotopic and geochemical tracers for inves-tigation of recharge, salinization, and residence timeof water in the Souss–Massa aquifer, southwest ofMorocco. Journal of Hydrology, 352, 267–287.
Chou, L., Garrels, R. M., & Wollast, R. (1989). Compara-tive study of the kinetics and mechanisms of disslutionof carbonate minerals. Chemical Geology, 78, 269–282.
Cisse Faye, S. (2001). Nappe libre des sables QuaternairesThiaroye/ Beer Thialane (Dakar, Sénégal). Etude surla contamination par le nitrates sur la base d’un Sys-tème d’information Géographique (PC ARC/INFO).Reihe B, Heft 12 XXVII, Munchner GeologischeHefte, Munich.
Cisse Faye, S., Faye, S., Wohnlich, S., & Gaye, C. B. (2004).An assessment of the risk associated with urban devel-

Environ Monit Assess (2011) 172:605–622 621
opment in the Thiaroye area (Senegal). Environmen-tal Geology, 45, 312–322.
Clark, I., & Fritz, P. (1997). Environmental isotopes inhydrogeology. New York: Lewis Publishers.
Coleman, M. L., Sheppard, T. J., Durham, J. J., Rouse,J. E., & Moore, G. R. (1982). Reduction of water withzinc for hydrogen isotope analysis. Analytical Chem-istry, 54, 993–995.
Collin, J. J., & Salem, G. (1989). Pollution des eaux souter-raines par les nitrates dans les banlieues non assainiesdes pays en développement. Cas de Pikine (Sénégal).Note technique BRGM SGN/3E, 89/27, 1–11.
Craig, H. (1961). Isotopic variations in meteoric waters.Science, 133, 1702–1703.
Deme, I., Tandia, A. A., Faye, A., Malou, R., Dia, I.,Diallo, M. S., et al. (2006). Management of nitratepollution of groundwater in African cities: the caseof Dakar, Senegal. In Y. Xu, & B. H. Usher (Eds.),Groundwater pollution in Africa (pp. 181–192). Taylor& Francis.
Diop, E. S., & Tandia, A. A. (1997). Qualité de l’eau de lanappe phréatique à Yeumbeul, Sénégal. Étude sur leterrain, CSI info N◦ 3, UNESCO, Paris. 27, 1–35.
Drever, J. I. (1997). The geochemistry of natural waters.New Jersey: Prentice Hall.
Edmunds, W. M., & Shand, P. (2008). Natural groundwaterquality. Oxford: Blackwells.
Edmunds, W. M., Cook, J. M., Darling, W. G.,Kinniburgh, D. G., Miles, D. L., Bath, A. H.,et al. (1987). Baseline geochemical conditions in thechalk aquifer, Berkshire, UK: a basis for groundwaterquality management. Applied Geochemistry, 2, 251–274.
Epstein, S., & Mayeda, T. K. (1953). Variations of the18O/16O ratio in natural waters. Geochimica Cos-mochimica Acta, 4, 213–224.
Fall, M. (1986). Environnements sédimentaires quater-naires et actuels des tourbières des Niayes de lagrande côte du Sénégal. Thèse de 3ème cycle UCAD,ORSTOM, 1986, 130 pp. Fonds IRD [F A27625],Dakar.
Fall, M., Azzam, R., & Noubactep, C. (2006). A multi-method approach to study the stability of naturalslopes and landslide susceptibility mapping. Engineer-ing Geology, 82, 241–263.
Faye, S., Maloszewsky, P., Stichler, W., Trimborn, P., CisseFaye, S., & Gaye, C. B. (2005). Groundwater salin-ization in the Saloum (Senegal) delta aquifer: minorelements and isotopic indicators. Science of the TotalEnvironment, 343, 243–259.
Fontaine, B. (1991). Variations pluviométriques et con-nexions climatiques: L’exemple des aires de moussonsindienne et ouest-africaine. Sécheresse, 4, 259–264.
Forkasiewicz, J. (1982). Aquifère du Maestrichtien dubassin sédimentaire Sénéglo-Mauritanien. Bulletindu Bureau de Recherches Geologiques et Minieres, 3,185–196.
Foster, S. S. D., & Chilton, P. J. (2003). Ground-water: the processes and global significance ofaquifer degradation. Philosophical Transactions of the
Royal Society B: Biological Sciences, 358, 1957–1972.doi:10.1098/rstb.2003.1380.
Fritz, P., & Fontes, J. C. (Eds.). (1980). Handbook of envi-ronmental isotope geochemistry (Vol. 1). The terrestrialenvironment: A. Amsterdam: Elsevier Science Pub-lishers B.V..
Fukada, T., Hiscock, K. M., & Dennis, P. F. (2004). A dual-isotope approach to the nitrogen hydrochemistry of anurban aquifer. Applied Geochemistry, 19, 709–719.
Garnier, J. M. (1978). Evolution géochimique d’un milieuconfiné: le lac Retba (Cap-Vert), Sénégal. Revue deGéographie Physique et de Géologie Dynamique, 20,43–58.
Gaye, C. B., Faye, A., Gelinas, P. J., & Thierrien, P.(1998). Analyse de l’intrusion saline dan les aquifèresde la presqu’île du Cap-Vert, analyse des processus deminéralisation et de dégradation de la qualité de l’eaudans les nappes infrabasaltiques et des sables quater-naires. Rapt. GGL-89-CRDI-80 CREGI, UniversitéLaval et UCAD.
Gerritse, R., & George, R. (1988). The role of soil organicmatter in the geochemical cycling of chloride and bro-mide. Journal of Hydrology, 101, 83–95.
Ghassemi, F., Jakeman, A. J., & Nix, H. A. (1995). Salin-ization of land and water resources: Human causes, ex-tent, management and case studies. Sydney: New SouthWales Press.
Girard, P., & Hillaire-Marcel, C. (1997). Determining thesource of nitrate pollution in the Niger discontinuousaquifers using the natural 15N/14N ratios. Journal ofHydrology, 199, 239–251.
Gonfiantini, R. (1978). Standards for stable isotope mea-surements in natural compounds. Nature, 271, 534–536.
Gonfiantini, R. (1998). On the isotopic composition of pre-cipitation. In: C. Causse & F. Gasse (Eds.), Hydrologieet géochimie isotopique (pp. 3–22). Paris: ORSTOM.
Gonfiantini, R., Stichler, W., & Rozanski, K. (1995). Stan-dards and intercomparison materials distributed byinternational atomic energy agency for stable isotopemeasurements: reference and intercomparison materi-als for stable isotopes of light elements. In Proceedingsof a consultants meeting held in Vienna, 1–3 December,1993, IAEA-TECDOC 825.
Hebrard, L., & Elouard, P. (1976). Note explicative de lacarte géologique de la presqu’île du Cap-Vert. Labo-ratoire de Géologie, Université Cheikh Anta Diop deDakar Faculté de Science.
Hem, J. D. (1985). Study and interpretation of the chemicalcharacteristics of natural water (3rd ed.). US Geologi-cal Survey Water-Supply Paper 2254.
IWMI (2006). Water for food, water for life Insights fromthe Comprehensive Assessment of Water Manage-ment in Agriculture. Publ. Stockholm World WaterWeek, 2006.
Kellman, L. M., & Hillaire-Marcel, C. (2002). Evaluationof nitrogen isotopes as indicators of nitrate contamina-tion sources in an agricultural watershed. Agriculture,Ecosystems and Environment, 95, 87–102.
Kendall, C. (1998). Tracing nitrogen sources and cyclingin catchments, Chap. 16. In C. Kendall, & J. J.

622 Environ Monit Assess (2011) 172:605–622
McDonnell (Eds.), Isotope tracers in catchmenthydrology (pp. 519–576). Amsterdam: Elsevier. http://wwwrcamnl.wr.usgs.gov/isoig/isopubs/itchch16.html.Accessed 15 February 2007.
Kendall, C., & Grim, E. (1990). Combustion tube methodfor measurement of nitrogen isotope ratios using cal-cium oxide for total removal of carbon dioxide andwater. Analytical Chemistry, 62, 526-529.
Kroopnick, P. (1974). The dissolved O2–CO2–13C systemin the eastern equatorial Pacific. Deep-Sea Research,21, 211–227.
Lebel, T., & Le Barbe, L. (1997). Rainfall monitoring dur-ing HAPEX-Sahel. 2. Point and areal estimation at theevent and seasonal scales. Journal of Hydrology, 188–189, 97–122.
Leroux, M. (2001). The meteorology and climate of tropicalAfrica. Chichester: Springer/Praxis Publishing.
Martin, A. (1970). Les nappes de la Presqu’île du CapVert (République du Sénégal). Leur utilisation purl’alimentation en eau de Dakar. Pub. Bureau deRecherches Géologiques et Minières.
Mc Donnell, J. J., & Kendall, C. (1992). Stable isotopesin catchment hydrology. EOS, Transactions AmericanGeophysical Union, 73, 260–261.
Mees, F. (1999). Textural features of Holocene perennialsaline lake deposits of the Taoudenni–Agorgott basin,northern Mali. Sedimentary Geology, 127, 65–84.
NIAIST (National Institute of Advanced Industrial Sci-ence and Technology) (2005). Atlas of Eh-pH dia-grams. Geological Survey of Japan Open File ReportNo. 419
Oga Yei, M. S., Sacchi, E., & Zuppi, G. M. (2007). Ori-gin and effects of nitrogen pollution in groundwa-ter traced by the case of Abidjan (Ivory Coast). InInt. symp. on advances in isotope hydrology and itsrole in sustainable water resources management, IAEA,Vienna, 21–25 May 2007. IAEA-CN-151/31, 1, 139–147.
Reynaud, P. A., & Roger, P. A. (1981). Variations saison-nières de la flore algale et de l’activité fixatrice d’azotedans un sol engorgé de bas de dune. Revue d’Ecologieet de Biologie du Sol, 18, 9–27.
Seck, A. A. (1988). Synthèse hydrogéologiques de la nappedes sables quaternaires. Géométrie et structure duréservoir. Thèse de D.E.A de Géologie appliquée,Université Cheikh Anta Diop de Dakar, Faculté dessciences.
Showers, K. B. (2002). Water scarcity and urban Africa: Anoverview of urban–rural water linkages. World Devel-opment, 30(4), 621–648.
Silva, S. R., Kendall, C., Wilkinson, D. H., Ziegler, A. C.,Chang, C. C. Y., & Avanzino, R. J. (2000). A newmethod for collection of nitrate from fresh water andthe analysis of nitrogen and oxygen isotope ratios.Journal of Hydrology, 228, 22–36.
SONES (1986). Renforcement de l’approvisionnement eneau de la région de Dakar (1986–1991) phase intéri-maire. Rapport définitif, tome I.
Steffy, L. Y., & Kilham, S. S. (2004). Elevated δ15Nin stream biota in areas with septic tank systemsin an urban watershed. Ecological Applications, 14,637–641.
Tandia, A. A. (2000). Origine, évolution et migration desformes de l’azote minéral dans les aquifères situéssous environnement péri-urbain non assaini: cas de lanappe des sables quaternaires de la région de Dakar(Sénégal). Thèse d’état, Univ. de Dakar.
Tandia, A. A., Diop, E. S., & Gaye, C. B. (1999). Pollutionpar les nitrates des nappes phréatiques sous environ-nement semi-urbain non assaini: exemple de la nappede Yeumbeul, Sénégal. Journal of African Earth Sci-ences, 29(4), 809–822.
Travi, Y. (1988). Hydrogéochimie et hydrologie isotopiquedes aquifères fluorurés du bassin du Sénégal. Orig-ine et conditions de transport du fluor dans les eauxsouterraines. Thesis, Mém. Sci. Géol, Strasbourg.
Travi, Y., Gac, J. Y., Fontes, J. C., & Fritz, B. (1987).Reconnaissance chimique et isotopique des eaux depluie au Sénégal. Géodynamique, 2, 43–53.
Travi, Y., Gac, J. Y., Gibert, E., Leroux, M., & Fontes, J. C.(1991). Composition isotopique et genèse des précip-itations sur Dakar pendant les saisons des pluies 1982et 1984. In Proceedings of an international symposiumon isotope techniques in water resources development(pp. 495–497). IAEA, Vienna. STI/PUB/875.
Vengosh, A., & Pankratov, I. (1998). Chloride/bromideand chloride/fluoride ratios of domestic sewageeffluents and associated contaminated groundwater.Groundwater, 28, 815–824.
Vengosh, A., Weinthal, E., & Kloppmann, E. (2004). TheBOREMED team. Natural boron contamination inMediterranean groundwater. Geotimes (pp. 20–25).
WHO/UNICEF (2006). Meeting the MDG drinking waterand sanitation target: The urban and rural challenge ofthe decade, WA 675.
Xu, Y., & Usher, B. H. (2006). Issues of groundwaterpollution in Africa. In Y. Xu, & B. H. Usher (Eds.),Groundwater pollution in Africa (pp. 3–13). Taylor &Francis.