Water-Quality Characteristics of Montana Streams in a ...
160
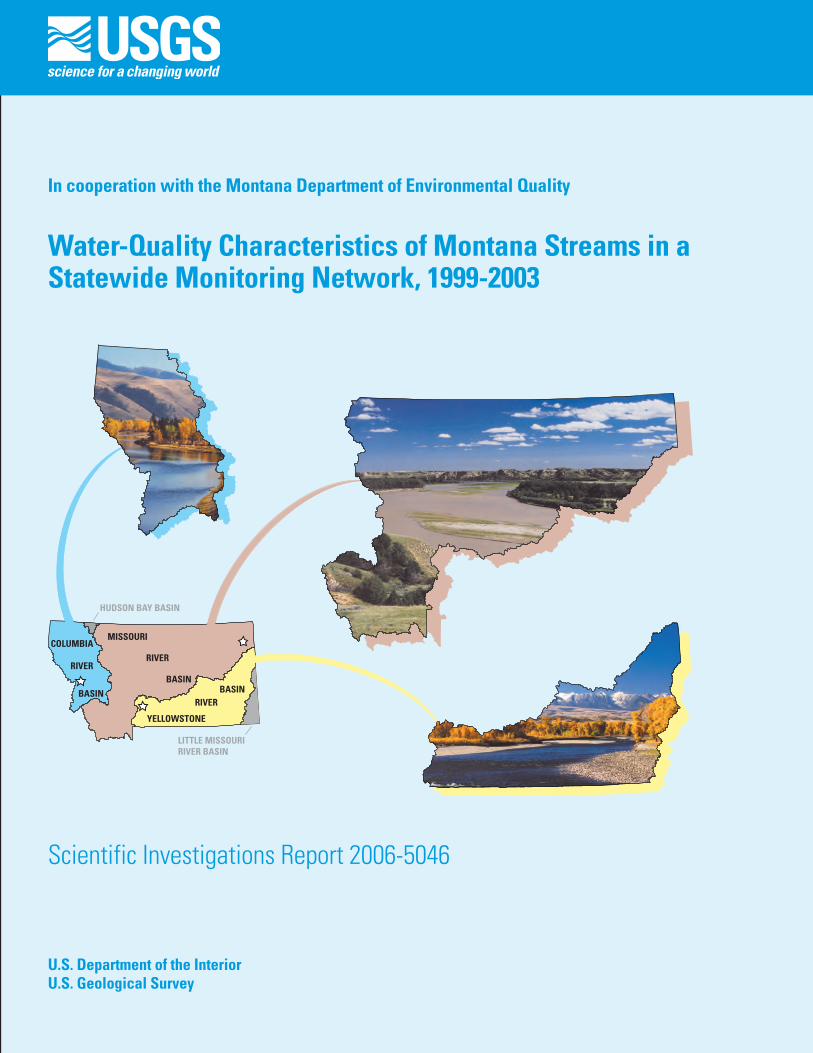
RIVER YELLOWSTONE COLUMBIA HUDSON BAY BASIN RIVER BASIN BASIN RIVER BASIN MISSOURI LITTLE MISSOURI RIVER BASIN U.S. Department of the Interior U.S. Geological Survey Scientific Investigations Report 2006-5046 In cooperation with the Montana Department of Environmental Quality Water-Quality Characteristics of Montana Streams in a Statewide Monitoring Network, 1999-2003
-
Upload
khangminh22 -
Category
Documents
-
view
0 -
download
0
Transcript of Water-Quality Characteristics of Montana Streams in a ...
RIVER
YELLOWSTONE
COLUMBIA
HUDSON BAY BASIN
RIVERBASINBASIN
RIVERBASIN
MISSOURI
LITTLE MISSOURI RIVER BASIN
U.S. Department of the InteriorU.S. Geological Survey
Scientific Investigations Report 2006-5046
In cooperation with the Montana Department of Environmental Quality
Water-Quality Characteristics of Montana Streams in aStatewide Monitoring Network, 1999-2003

COVER PHOTOGRAPHS: View to the south showing the Bitterroot River near Missoula, Montana, taken in 2002 (upper left); view to the east showing the Missouri River near Culbertson, Montana, taken in 2001 (upper right); and view to the southwest showing the Yellowstone River near Livingston, Montana, taken in 2002 (lower right). Photographs by John Lambing, used by permission. , indicates location of photograph site in basin.
Water-Quality Characteristics of Montana Streams in a Statewide Monitoring Network, 1999-2003
By John H. Lambing and Thomas E. Cleasby
Prepared in cooperation with the Montana Department of Environmental Quality
Scientific Investigations Report 2006-5046
U.S. Department of the InteriorU.S. Geological Survey
U.S. Department of the InteriorDirk Kempthorne, Secretary
U.S. Geological SurveyP. Patrick Leahy, Acting Director
U.S. Geological Survey, Reston, Virginia: 2006
For product and ordering information: World Wide Web: http://www.usgs.gov/pubprod Telephone: 1-888-ASK-USGS
For more information on the USGS--the Federal source for science about the Earth, its natural and living resources, natural hazards, and the environment: World Wide Web: http://www.usgs.gov Telephone: 1-888-ASK-USGS
Any use of trade, product, or firm names is for descriptive purposes only and does not imply endorsement by the U.S. Government.
Although this report is in the public domain, permission must be secured from the individual copyright owners to reproduce any copyrighted materials contained within this report.
Suggested citation:Lambing, J.H., and Cleasby, T.E., 2006, Water-quality characteristics of Montana streams in a statewide monitoring network, 1999-2003: U.S. Geological Survey Scientific Investigations Report 2006-5046, 149 p.

iii
Contents
Abstract ...........................................................................................................................................................1Introduction.....................................................................................................................................................2
Purpose and Scope ..............................................................................................................................4Description of Study Area ...................................................................................................................4
Missouri River Basin ..................................................................................................................4Yellowstone River Basin .............................................................................................................7Columbia River Basin ..................................................................................................................7
Data Collection and Analysis .......................................................................................................................8Design of Sampling Program ..............................................................................................................8
Methods of Sample Collection, Processing, and Analysis .................................................10Quality Assurance......................................................................................................................11
Streamflow Characteristics .......................................................................................................................14Water-Quality Characteristics ...................................................................................................................17
Stream Properties ...............................................................................................................................18pH........ .........................................................................................................................................18Specific Conductance ...............................................................................................................20Water Temperature ...................................................................................................................22
Nutrients ...............................................................................................................................................24Dissolved Nitrite plus Nitrate ...................................................................................................24Total Ammonia Plus Organic Nitrogen ...................................................................................26Total Nitrogen .............................................................................................................................28Dissolved Orthophosphate .......................................................................................................30Total Phosphorus .......................................................................................................................30
Suspended Sediment .........................................................................................................................33Major Ions ............................................................................................................................................35
Dissolved Solids .........................................................................................................................36Sodium Adsorption Ratio ..........................................................................................................36
Trace Elements ....................................................................................................................................38Total-Recoverable Arsenic .......................................................................................................40Total-Recoverable Cadmium ....................................................................................................42Total-Recoverable Chromium ..................................................................................................44Total-Recoverable Copper ........................................................................................................44Total-Recoverable Lead ............................................................................................................46Total-Recoverable Nickel .........................................................................................................48Total-Recoverable Zinc .............................................................................................................50
Estimated Annual Loads ....................................................................................................................53Computational Methods for Estimating Annual Loads ........................................................54Nutrients ......................................................................................................................................55
Total Ammonia Plus Organic Nitrogen ..........................................................................55Total Nitrogen ....................................................................................................................59Total Phosphorus ..............................................................................................................63
Suspended Sediment ................................................................................................................67
.
iv
Dissolved Solids .........................................................................................................................71Trace Elements ...........................................................................................................................75
Total-Recoverable Arsenic ..............................................................................................75Total-Recoverable Copper ...............................................................................................79
Summary and Conclusions .........................................................................................................................82References Cited..........................................................................................................................................86Data ...........................................................................................................................................................89
Figures 1. Map showing location of sampling sites in the statewide monitoring network,
Montana, water years 1999-2003. ..............................................................................................3 2. Annual hydrographs of mean daily streamflow during water years 1999-2003 and
long-term mean daily streamflow for Missouri River at Toston,Yellowstone River near Sidney, and Clark Fork at St. Regis, Montana. ..............................................................17
3–27. Graphs showing: 3. Statistical distribution of pH values at network sites in Montana, water years
1999-2003. ..............................................................................................................................19 4. Statistical distribution of specific-conductance values at network sites in
Montana, water years 1999-2003. .....................................................................................21 5. Statistical distribution of summer daily mean water temperatures at selected
network sites with continuous temperature recorders in Montana, water years 1999-2003. .......................................................................................................23
6. Statistical distribution of concentrations of dissolved nitrite plus nitrate at network sites in Montana, water years 1999-2003. .......................................................25
7. Statistical distribution of concentrations of total ammonia plus organic nitrogen at network sites in Montana, water years 1999-2003. ...................................27
8. Statistical distribution of estimated concentrations of total nitrogen at network sites in Montana, water years 1999-2003. .......................................................29
9. Statistical distribution of concentrations of dissolved orthophosphate at network sites in Montana, water years 1999-2003. .......................................................31
10. Statistical distribution of concentrations of total phosphorus at network sites in Montana, water years 1999-2003. .......................................................................32
11. Statistical distribution of concentrations of suspended sediment at network sites in Montana, water years 1999-2003. .......................................................34
12. Statistical distribution of concentrations of dissolved solids at network sites in Montana, water years 1999-2003. ................................................................................37
13. Statistical distribution of sodium adsorption ratio (SAR) at network sites in Montana, water years 1999-2003. ....................................................................................39
14. Statistical distribution of concentrations of total-recoverable arsenic at network sites in Montana, water years 1999-2003. .......................................................41
15. Statistical distribution of concentrations of total-recoverable cadmium at network sites in Montana, water years 1999-2003. .......................................................43
Contents—Continued
.....
v
16. Statistical distribution of concentrations of total-recoverable chromium at network sites in Montana, water years 1999-2003. .......................................................45
17. Statistical distribution of concentrations of total-recoverable copper at network sites in Montana, water years 1999-2003. ..............................................................47
18. Statistical distribution of concentrations of total-recoverable lead at network sites in Montana, water years 1999-2003. ..............................................................49
19. Statistical distribution of concentrations of total-recoverable nickel at network sites in Montana, water years 1999-2003. ..............................................................51
20. Statistical distribution of concentrations of total-recoverable zinc at network sites in Montana, water years 1999-2003. ..............................................................52
21. Range and mean of estimated annual loads of total ammonia plus organic nitrogen at network sites in Montana, water years 1999-2003 ..........................................58
22. Range and mean of estimated annual loads of total nitrogen at network sites in Montana, water years 1999-2003. .......................................................................................62
23. Range and mean of estimated annual loads of total phosphorus at network sites in Montana, water years 1999-2003. .............................................................................66
24. Range and mean of estimated annual loads of suspended sediment at network sites in Montana, water years 1999-2003. ..............................................................70
25. Range and mean of estimated annual loads of dissolved solids at network sites in Montana, water years 1999-2003. .............................................................................74
26. Range and mean of estimated annual loads of total-recoverable arsenic at network sites in Montana, water years 1999-2003. ..............................................................78
27. Range and mean of estimated annual loads of total-recoverable copper at network sites in Montana, water years 1999-2003. ..............................................................82
Tables 1. Type and period of data collection at sampling sites in the statewide monitoring
network, Montana. .......................................................................................................................5 2. Selected stream properties measured onsite and constituents analyzed in water
samples. .........................................................................................................................................9 3. Precision of analytical results for replicate samples, water years 1999-2003. ................13 4. Streamflow characteristics for sites in the statewide monitoring network in
Montana, water years 1999-2003 and long-term period of record. ....................................14 5. General aquatic-life standards calculated from average hardness for groups of
network sites with similar hardness, Montana. ...................................................................40 6. Equations for estimating daily loads of total ammonia plus organic nitrogen and
summaries of the range and mean of estimated annual loads at network sites in Montana, water years 1999-2003. ............................................................................................56
7. Equations for estimating daily loads of total nitrogen and summaries of the range and mean of estimated annual loads at network sites in Montana, water years 1999-2003. .....................................................................................................................................60
8. Equations for estimating daily loads of total phosphorus and summaries of the range and mean of estimated annual loads at network sites in Montana, water years 1999-2003. ..........................................................................................................................64
Figures—Continued
vi
9. Equations for estimating daily loads of suspended sediment and summaries of the range and mean of estimated annual loads at network sites in Montana, water years 1999-2003. ..........................................................................................................................68
10. Equations for estimating daily loads of dissolved solids and summaries of the range and mean of estimated annual loads at network sites in Montana, water years 1999-2003. .....................................................................................................................................72
11. Equations for estimating daily loads of total-recoverable arsenic and summaries of the range and mean of estimated annual loads at network sites in Montana, water years 1999-2003. ..........................................................................................................................76
12. Equations for estimating daily loads of total-recoverable copper and summaries of the range and mean of estimated annual loads at network sites in Montana, water years 1999-2003. ..........................................................................................................................80
13. Analytical results for replicate samples from sites in the statewide monitoring network in Montana, water years 1999-2003. ........................................................................90
14. Analytical results for blank samples from sites in the statewide monitoring network in Montana, water years 1999-2003. ........................................................................................99
15. Statistical summary of water-quality data for periodically collected samples from sites in the statewide monitoring network in Montana, water years 1999-2003. ...........101
Conversion Factors and Datums
Multiply By To obtainacre-foot (acre-ft) 1,233 cubic meter (m3)cubic foot per second (ft3/s) 0.02832 cubic meter per second (m3/s)foot (ft) 0.3048 meter (m)gallon (gal) 3.785 liter (L) gallon per minute (gal/min) 0.06309 liter per second (L/s)inch (in.) 25.4 millimeter (mm)mile (mi) 1.609 kilometer (km)square mile (mi2) 2.590 square kilometer (km2)ton, short (2,000 pounds) 0.9072 megagram (Mg)ton per day (ton/d) 0.9072 megagram per day (Mg/d)ton per year (ton/yr) 0.9072 metric ton per year (ton/yr)
Temperature in degrees Celsius (°C) may be converted to degrees Fahrenheit (°F) as follows:
°F=(1.8× °C)+32
Vertical coordinate information is referenced to the National Geodetic Vertical Datum of 1929 (NGVD 29).
Horizontal coordinate information is referenced to the North American Datum of 1927 (NAD 27).
Altitude, as used in this report, refers to distance above the vertical datum (NGVD 29).
Water year is the 12-month period from October 1 through September 30 of the following calendar year. The water year is designated by the calendar year in which it ends. For example, water year 2005 is the period from October 1, 2004, through September 30, 2005.
Tables—Continued
vii
Abbreviated Units and Acronyms
Abbreviated units used in this report:
µg/L micrograms per liter
µm micrometer
µS/cm microsiemens per centimeter at 25 degrees Celsius
mg/L milligrams per liter
mm millimeter
Acronyms and definitions used in this report:
DI deionized water
LRL laboratory reporting level
LT-MDL long-term method detection limit
MDEQ Montana Department of Environmental Quality
MRL minimum reporting level
N nitrogen
NWIS National Water Information System
NWQL National Water Quality Laboratory
P phosphorus
p significance level
R2 coefficient of determination
RSD relative standard deviation
SAR sodium adsorption ratio
SE standard error
TDS total-dissolved solids
TKN total kjeldahl nitrogen
USDA U.S. Department of Agriculture
USEPA U.S. Environmental Protection Agency
USGS U.S. Geological Survey

Water-Quality Characteristics of Montana Streams in a Statewide Monitoring Network, 1999-2003
By John H. Lambing and Thomas E. Cleasby
AbstractA statewide monitoring network of 38 sites was operated
during 1999-2003 in cooperation with the Montana Depart-ment of Environmental Quality to provide a broad geographic base of water-quality information on Montana streams. The purpose of this report is to summarize and describe the water-quality characteristics for those sites. Samples were collected at U.S. Geological Survey streamflow-gaging stations in the Missouri, Yellowstone, and Columbia River basins for stream properties, nutrients, suspended sediment, major ions, and selected trace elements. Mean annual streamflows were below normal during the period, which likely influenced water qual-ity.
Continuous water-temperature monitors were operated at 26 sites. The median of daily mean water temperatures for the June-August summer period ranged from 12.5 °C at Kootenai River below Libby Dam to 23.0 °C at Poplar River near Poplar and Tongue River at Miles City. In general, sites in the Mis-souri River basin commonly had the highest water tempera-tures. Median daily mean summer water temperatures at four sites (Jefferson River near Three Forks, Missouri River at Tos-ton, Judith River near Winifred, and Poplar River near Poplar) classified as supporting or marginally supporting cold-water biota exceeded the general guideline of 19.4 °C for cold-water biota. Median daily mean temperatures at sites in the network classified as supporting warm-water biota did not exceed the guideline of 26.7 °C for warm-water biota, although several sites exceeded the warm-water guideline on several days dur-ing the summer.
Nutrient concentrations generally were lower in the Columbia River basin compared to the Missouri and Yellow-stone River basins. Dissolved nitrite plus nitrate concentrations did not exceed the State of Montana human-health standard for drinking water of 10 milligrams per liter (mg/L) nitrate as nitrogen (N) at any site in the network. Total nitrogen concen-trations at network sites ranged from 0.043 to 31.6 mg/L as N and exceeded the ecoregion guideline of 1.50 mg/L for the prevention of eutrophication at several sites in the Missouri and Yellowstone River basins. In the Columbia River basin, concentrations of total nitrogen exceeded the State of Montana seasonal numeric standard of 0.300 mg/L in about 25 per-cent of the samples from two sites on the Clark Fork. Total
phosphorus concentrations ranged from <0.01 to 15.4 mg/L; concentrations at most sites in the Missouri and Yellowstone River basins occasionally to frequently exceeded both the general and ecoregion eutrophication guideline concentra-tions of 0.10 and 0.075 mg/L, respectively. Total phosphorus concentrations at sites in the Columbia River basin only infre-quently exceeded the general eutrophication guidelines. About 75 percent of the samples collected at Clark Fork at Turah Bridge and about 25 percent of the samples collected at Clark Fork at St. Regis exceeded the seasonal reach-specific numeric standards of 0.020 mg/L and 0.039 mg/L, respectively, for total phosphorus.
Suspended-sediment concentrations varied widely at indi-vidual sites and among sites, ranging from 1 to 25,400 mg/L. Suspended-sediment concentrations commonly were lower in the Columbia River basin compared to the Missouri and Yellowstone River basins. Median suspended-sediment concentrations exceeded 100 mg/L at several sites in the Mis-souri and Yellowstone River basins; median concentrations in the Columbia River basin generally were less than 10 mg/L. Overall, Powder River near Locate had the highest suspended-sediment concentrations in the network, with concentrations exceeding 2,000 mg/L in 25 percent of the samples.
Dissolved-solids concentrations ranged from 23 to 6,200 mg/L across the network. Samples from several sites in the Missouri and Yellowstone River basins had distinctly elevated concentrations relative to other sites and occasion-ally to frequently exceeded a general irrigation guideline of 1,000 mg/L. Three sites (Musselshell River at Mosby, Rosebud Creek near Rosebud, and Powder River near Locate) exceeded the guideline in more than 75 percent of the samples. Three other sites (Peoples Creek near Dodson, Milk River at Nashua, and Poplar River near Poplar) exceeded the guideline in 25 to 50 percent of the samples. No other sites exceeded the general irrigation guideline for dissolved solids. Sodium adsorption ratio (SAR) values ranged from <0.1 to 12 across the network and exceeded a general irrigation guideline of 7 at several sites in the Missouri and Yellowstone River basins. SAR values at Rosebud Creek near Rosebud commonly exceeded and Powder River near Locate occasionally exceeded the numeric standards of 4.5 and 7.5, respectively, established for SAR in those watersheds during the irrigation season.
State of Montana human-health standards for drinking water for total-recoverable cadmium, chromium, and nickel were exceeded only infrequently by concentrations in samples from across the network; standards for copper and zinc were not exceeded. One or more sites in each of the three major river basins had sample concentrations that occasionally exceeded the human-health standard of 18 micrograms per liter (µg/L) for arsenic. The arsenic standard was exceeded in almost all samples from Missouri River at Toston and in about one-half of the samples from Yellowstone River near Livingston. Both sites receive geothermal waters enriched in arsenic from Yellowstone National Park. Concentrations of total-recoverable lead in one or more samples from each major river basin occasionally exceeded the human-health standard of 15 µg/L for lead; concentrations exceeded the standard in about 25 percent or more of the samples from Prickly Pear Creek near Clancy and Powder River near Locate.
Comparisons of trace-element concentrations to general aquatic-life standards (based on average hardness) indicate that chronic standards were exceeded infrequently at many of the network sites and acute standards were rarely exceeded. Aquatic-life standards for arsenic and chromium were not exceeded; chronic and acute standards for cadmium, nickel, and zinc were occasionally exceeded. In contrast, about one-half of the sites in the network had one or more samples with concentrations that exceeded either chronic or acute aquatic-life standards for copper. Chronic and acute standards for copper were exceeded most commonly in samples from Clark Fork at Turah Bridge. About one-half of the sites had one or more samples with concentrations exceeding the chronic standard for lead; Prickly Pear Creek near Clancy exceeded the standard in about 50 percent of the samples.
General estimates of mean annual loads of selected constituents transported during 1999-2003 were used to assess relative contributions from upstream source areas compared to the load at the most downstream site on the mainstem. The largest mean annual loads of total ammonia plus organic nitro-gen from upstream source areas in the Missouri, Yellowstone, and Columbia River basins, respectively, were transported past Missouri River at Toston (1,400 tons), Bighorn River near Bighorn (1,260 tons), and Clark Fork at St. Regis (1,290 tons). A similar pattern occurred for loads of total nitrogen. The largest mean annual loads of total phosphorus from upstream sources in each major river basin were transported past Mis-souri River at Toston (239 tons), Yellowstone River near Livingston (572 tons), and Clark Fork at St. Regis (183 tons). Suspended-sediment loads varied substantially among sites, with the largest mean annual loads from upstream sources in each major river basin transported past Milk River at Nashua (319,000 tons), Powder River near Locate (1,400,000 tons), and Clark Fork at St. Regis (146,000 tons). Dissolved-solids loads also varied widely among network sites, with the largest mean annual loads from upstream sources in each major river basin transported past Missouri River at Toston (682,000 tons), Bighorn River near Bighorn (1,410,000 tons), and Kootenai River below Libby Dam (1,230,000 tons).
Annual loads of trace elements were estimated for total-recoverable arsenic and copper, except for sites where a large number of samples had concentrations less than the laboratory reporting level. The largest mean annual arsenic loads from upstream sources in the Missouri, Yellowstone, and Colum-bia River basins, respectively, were transported past Missouri River at Toston (109 tons), Yellowstone River near Livingston (62.1 tons), and Clark Fork at St. Regis (9.53 tons). The Mis-souri River at Toston had a notably larger arsenic load than any other network site, with more than 90 percent being con-tributed by the Madison River basin, which receives large vol-umes of arsenic-enriched geothermal waters from Yellowstone National Park. Similarly, a large arsenic load was estimated for Yellowstone River near Livingston, which also receives geo-thermal waters from the Park. The largest mean annual copper loads from upstream sources in each major river basin were transported past Missouri River at Toston (13.6 tons), Yellow-stone River near Livingston (18.8 tons), and Flathead River at Perma (34.8 tons).
IntroductionStreams are vital to Montana’s economic and social way
of life. Demands on the water resources of Montana increase over time as the population grows and associated resource development expands. The increased use of land and water can affect both the quantity and quality of water, including the ability of water supplies to support beneficial uses such as drinking water, agriculture, aquatic life, and recreation. As water-quality issues arise, the State will need a comprehensive base of information from which to evaluate conditions and make resource-management decisions regarding use and pro-tection of the water resources. Such information can allow for the development and implementation of effective management plans for maintaining long-term beneficial uses of Montana streams.
To address the need for a general characterization of water quality in Montana streams, a statewide monitoring network of 38 sites (fig. 1) was established in May 1999 by the U.S. Geological Survey (USGS), in cooperation with the Montana Department of Environmental Quality (MDEQ). The network represented the three major river basins in Montana—Missouri, Yellowstone, and Columbia—and included sites on mainstems and major tributaries. Water samples were collected periodically at these sites to document water-quality condi-tions, indicate seasonal and annual variations in water quality, identify exceedances of water-quality guidelines or standards, and establish a reference database for future assessments of long-term trends in water quality. The network was conceptu-ally designed to be operated on a long-term and ongoing basis, pending availability of funding. However, because of funding limitations, data were collected only during water years 1999-2003 (October 1, 1998 through September 30, 2003).
2 Water-Quality Characteristics of Montana Streams in a Statewide Monitoring Network, 1999-2003

Figu
re 1
. Lo
catio
n of
sam
plin
g si
tes
in th
e st
atew
ide
mon
itorin
g ne
twor
k, M
onta
na, w
ater
yea
rs 1
999-
2003
.
105o
Cr
ForkTw
o
Redwate
r
River
SouthFork
River
YaakRiv
er
Koo
tena
i
River
Cla
rk
Fork
Fla
thea
d
L
akeFlathead River
Middle
Cut
Ban
k
Creek
Med
icin
eR
iver
Mar
ias
Riv
er
Birc
h
Milk
Riv
erLodge
Creek
BattleCreek
Milk
Riv
er
Poplar
River
Mis
sour
iR
iver
Med
icin
e
Lak
e
Rive
r
Fort
Pec
kR
eser
voir
BigD
ryC
reek
Boxel
der
Creek
River
Judi
th
Miss
ouri
Rive
r
Sun
Riv
er
Smith River
Riv
er
Teto
n
RiverSwan
Fla
thea
d
R
BitterrootRiver
Bla
ckfo
otR
iver
Creek
Rock
Clark
Fork
Mus
sels
hell
River
Yello
wstone
Powder
River
River
Tongue
Bighorn
River
Big
horn
L
ake
LittleBighorn R
Yello
wst
one
BoulderRiver
ClarksFork
GallatinRiver
Madison
River
Ruby River
Riv
er
Jeffe
rson
R
Beaver
head
Big
Hole River
N. Frk.
020
4060
MIL
ES
020
60 K
ILOM
ETER
S40
106o
107o
108o
109o
110o
111o
112o
113o
114o
115o
116o
49o
48o
47o
46o
45o
Peop
les
Cre
ek
Rose
bud
Cre
ek
Hol
ter
Lak
e
Hau
ser
Lak
e
Can
yon
Fe
rry
L
ake
Lak
eK
ooca
nusa
Kalis
pell
Mis
soul
a
Butte
Hele
na
Billi
ngs
Grea
tFa
lls
Sidn
ey
Glen
dive
Havr
e
Mile
s Ci
ty
Boze
man
Dillo
n
Lew
isto
wn
Milk
Riv
er
M
Fork
Mon
tana
Sask
atch
ewan
Briti
shAl
berta
CAN
ADA
UNIT
ED S
TATE
S
North DakotaSouth Dakota
Wyo
min
g
Idah
o
2534
38
3230
29
28
31
4
24
10
7
6
35
33
8
27
26
36 37
1
1516
23
17
18
19
20
21
12
13 2322
9
5
11
Base
mod
ified
from
U.S
. Geo
logi
cal S
urve
ySt
ate
base
map
, 196
8. N
orth
Am
eric
anDa
tum
of 1
927
(NAD
27)
NAT
ION
AL
PARK
GLAC
IER
PARK
YELL
OWST
ONE
CONTINEN
TAL
DIVIDE
DIVI
DECO
NTINEN
TAL
NAT
ION
AL
HUDS
ON B
AY B
ASIN
14
LITT
LEM
ISSO
URI
RIVE
R BA
SIN
Koot
enai
Rive
r
subb
asin
Clar
k
Fork
subb
asin
Flat
head
Rive
r subb
asin
Culb
erts
onPo
plar
Nas
hua
Dods
on
Lom
a
Win
ifred
Vaug
hn
Crai
g
Dea
rbor
n
River
Loca
teRo
sebu
d
Bigh
orn
Edga
r
Absa
roke
e
Big
Tim
ber
Stillwater
Rive
r
Livi
ngst
on
Shields River
Tost
on
Thre
eFo
rks
Loga
n
Twin
Brid
ges
Mos
by
Clan
cy
Prickly Pear Cree
k
Garr
ison
Littl
eB
lack
-fo
otR
iver
Clin
ton
Bonn
er
Perm
a
St.
Regi
s
Troy
Libb
y
Fisher Rive
r
Bigf
ork
Colu
mbi
a Fa
lls
Wes
t G
laci
er
Whitefish
River
19
EXPL
AN
ATIO
N
MIS
SOUR
I RIV
ER B
ASIN
YELL
OWST
ONE
RIVE
R BA
SIN
COLU
MBI
A RI
VER
BASI
N
SAM
PLIN
G SI
TE A
ND
SITE
NUM
BER
(Si
te n
umbe
r sho
wn
afte
r sta
tion
nam
e o
n fig
ures
3-2
7)
BOUN
DARY
OF
SELE
CTED
SUB
BASI
N A
ND
NAM
E
Clar
k Fo
rk
1 B
eave
rhea
d Ri
ver n
ear T
win
Brid
ges
2 J
effe
rson
Riv
er n
ear T
hree
For
ks3
Gal
latin
Riv
er a
t Log
an4
Mis
sour
i Riv
er a
t Tos
ton
5 P
rickl
y Pe
ar C
reek
nea
r Cla
ncy
6 D
earb
orn
Rive
r nea
r Cra
ig7
Sun
Riv
er n
ear V
augh
n8
Tet
on R
iver
at L
oma
9 J
udith
Riv
er n
ear m
outh
, nea
r Win
ifred
10
Mus
sels
hell
Rive
r at M
osby
11
Peop
les
Cree
k be
low
Kuh
r Cou
lee,
nea
r Dod
son
12
Milk
Riv
er a
t Nas
hua
13Po
plar
Riv
er n
ear P
opla
r 14
M
isso
uri R
iver
nea
r Cul
berts
on
15
Yello
wst
one
Rive
r nea
r Liv
ings
ton
28
Littl
e Bl
ackf
oot R
iver
nea
r Gar
rison
29
Rock
Cre
ek n
ear C
linto
n30
Cl
ark
Fork
at T
urah
Brid
ge, n
ear B
onne
r31
Bl
ackf
oot R
iver
nea
r Bon
ner
32
Bitte
rroot
Riv
er n
ear M
isso
ula
33
Clar
k Fo
rk a
t St.
Regi
s34
N
orth
For
k Fl
athe
ad R
iver
nea
r Col
umbi
a Fa
lls35
M
iddl
e Fo
rk F
lath
ead
Rive
r nea
r Wes
t Gla
cier
36
Whi
tefis
h Ri
ver n
ear K
alis
pell
37
Swan
Riv
er n
ear B
igfo
rk38
Fl
athe
ad R
iver
at P
erm
a
SITE
NUM
BER
AND
NAM
E
Colu
mbi
a
16
Shie
lds
Rive
r nea
r Liv
ings
ton
17
Boul
der R
iver
at B
ig T
imbe
r18
St
illw
ater
Riv
er n
ear A
bsar
okee
19
Clar
ks F
ork
Yello
wst
one
Rive
r at E
dgar
21
Rose
bud
Cree
k at
mou
th, n
ear R
oseb
ud22
To
ngue
Riv
er a
t Mile
s Ci
ty23
Po
wde
r Riv
er n
ear L
ocat
e24
Ye
llow
ston
e Ri
ver n
ear S
idne
y25
Ko
oten
ai R
iver
bel
ow L
ibby
Dam
, nea
r Lib
by26
Fi
sher
Riv
er n
ear L
ibby
27
Yaak
Riv
er n
ear T
roy
20
Bigh
orn
Rive
r abo
ve Tu
llock
Cre
ek, n
ear B
igho
rn
Hun
gry
Hor
seR
eser
voir
Yello
wstone
R
Introduction 3
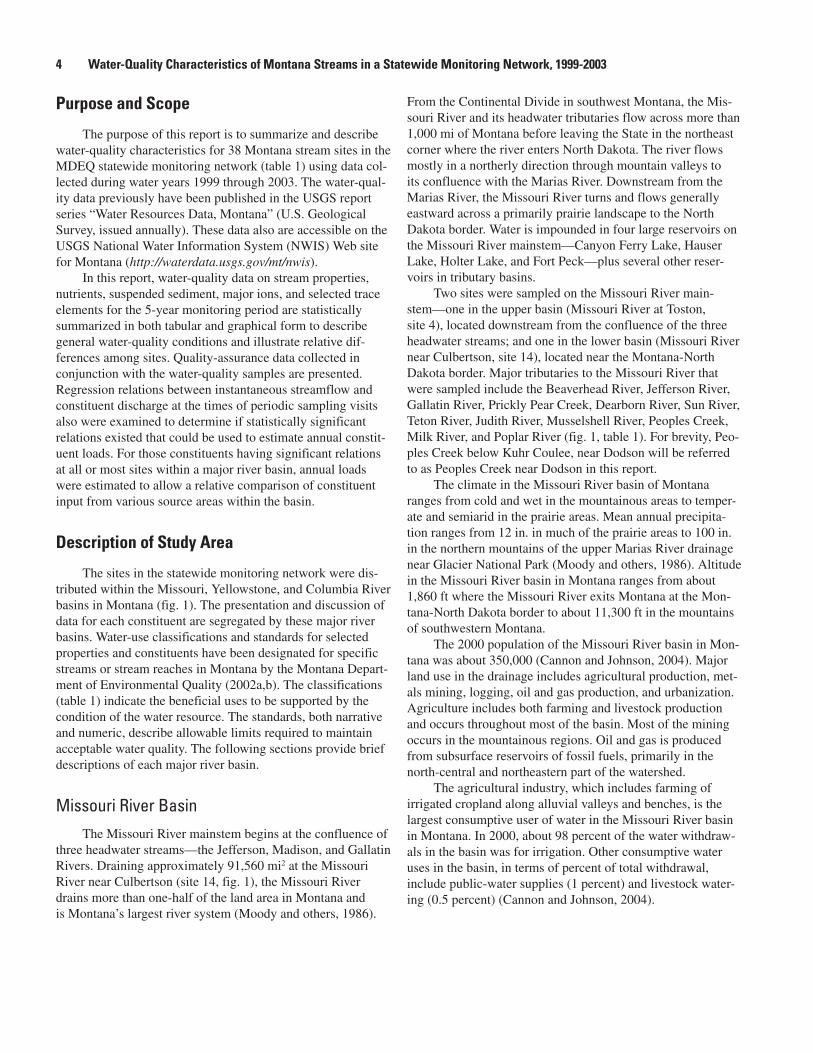
Purpose and Scope
The purpose of this report is to summarize and describe water-quality characteristics for 38 Montana stream sites in the MDEQ statewide monitoring network (table 1) using data col-lected during water years 1999 through 2003. The water-qual-ity data previously have been published in the USGS report series “Water Resources Data, Montana” (U.S. Geological Survey, issued annually). These data also are accessible on the USGS National Water Information System (NWIS) Web site for Montana (http://waterdata.usgs.gov/mt/nwis).
In this report, water-quality data on stream properties, nutrients, suspended sediment, major ions, and selected trace elements for the 5-year monitoring period are statistically summarized in both tabular and graphical form to describe general water-quality conditions and illustrate relative dif-ferences among sites. Quality-assurance data collected in conjunction with the water-quality samples are presented. Regression relations between instantaneous streamflow and constituent discharge at the times of periodic sampling visits also were examined to determine if statistically significant relations existed that could be used to estimate annual constit-uent loads. For those constituents having significant relations at all or most sites within a major river basin, annual loads were estimated to allow a relative comparison of constituent input from various source areas within the basin.
Description of Study Area
The sites in the statewide monitoring network were dis-tributed within the Missouri, Yellowstone, and Columbia River basins in Montana (fig. 1). The presentation and discussion of data for each constituent are segregated by these major river basins. Water-use classifications and standards for selected properties and constituents have been designated for specific streams or stream reaches in Montana by the Montana Depart-ment of Environmental Quality (2002a,b). The classifications (table 1) indicate the beneficial uses to be supported by the condition of the water resource. The standards, both narrative and numeric, describe allowable limits required to maintain acceptable water quality. The following sections provide brief descriptions of each major river basin.
Missouri River Basin The Missouri River mainstem begins at the confluence of
three headwater streams—the Jefferson, Madison, and Gallatin Rivers. Draining approximately 91,560 mi2 at the Missouri River near Culbertson (site 14, fig. 1), the Missouri River drains more than one-half of the land area in Montana and is Montana’s largest river system (Moody and others, 1986).
From the Continental Divide in southwest Montana, the Mis-souri River and its headwater tributaries flow across more than 1,000 mi of Montana before leaving the State in the northeast corner where the river enters North Dakota. The river flows mostly in a northerly direction through mountain valleys to its confluence with the Marias River. Downstream from the Marias River, the Missouri River turns and flows generally eastward across a primarily prairie landscape to the North Dakota border. Water is impounded in four large reservoirs on the Missouri River mainstem—Canyon Ferry Lake, Hauser Lake, Holter Lake, and Fort Peck—plus several other reser-voirs in tributary basins.
Two sites were sampled on the Missouri River main-stem—one in the upper basin (Missouri River at Toston, site 4), located downstream from the confluence of the three headwater streams; and one in the lower basin (Missouri River near Culbertson, site 14), located near the Montana-North Dakota border. Major tributaries to the Missouri River that were sampled include the Beaverhead River, Jefferson River, Gallatin River, Prickly Pear Creek, Dearborn River, Sun River, Teton River, Judith River, Musselshell River, Peoples Creek, Milk River, and Poplar River (fig. 1, table 1). For brevity, Peo-ples Creek below Kuhr Coulee, near Dodson will be referred to as Peoples Creek near Dodson in this report.
The climate in the Missouri River basin of Montana ranges from cold and wet in the mountainous areas to temper-ate and semiarid in the prairie areas. Mean annual precipita-tion ranges from 12 in. in much of the prairie areas to 100 in. in the northern mountains of the upper Marias River drainage near Glacier National Park (Moody and others, 1986). Altitude in the Missouri River basin in Montana ranges from about 1,860 ft where the Missouri River exits Montana at the Mon-tana-North Dakota border to about 11,300 ft in the mountains of southwestern Montana.
The 2000 population of the Missouri River basin in Mon-tana was about 350,000 (Cannon and Johnson, 2004). Major land use in the drainage includes agricultural production, met-als mining, logging, oil and gas production, and urbanization. Agriculture includes both farming and livestock production and occurs throughout most of the basin. Most of the mining occurs in the mountainous regions. Oil and gas is produced from subsurface reservoirs of fossil fuels, primarily in the north-central and northeastern part of the watershed.
The agricultural industry, which includes farming of irrigated cropland along alluvial valleys and benches, is the largest consumptive user of water in the Missouri River basin in Montana. In 2000, about 98 percent of the water withdraw-als in the basin was for irrigation. Other consumptive water uses in the basin, in terms of percent of total withdrawal, include public-water supplies (1 percent) and livestock water-ing (0.5 percent) (Cannon and Johnson, 2004).
� Water-Quality Characteristics of Montana Streams in a Statewide Monitoring Network, 1999-2003
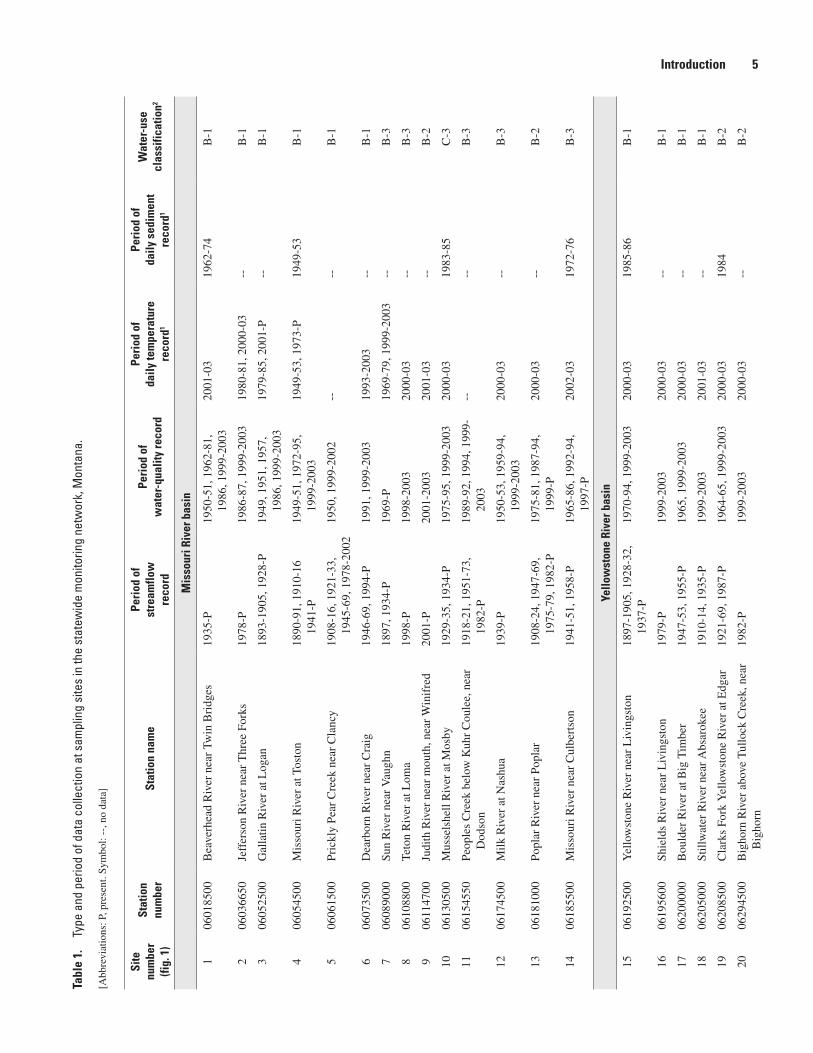
Tabl
e 1.
Ty
pe a
nd p
erio
d of
dat
a co
llect
ion
at s
ampl
ing
site
s in
the
stat
ewid
e m
onito
ring
netw
ork,
Mon
tana
.
[Abb
revi
atio
ns: P
, pre
sent
. Sym
bol:
--, n
o da
ta]
Site
nu
mbe
r (fi
g. 1
)
Stat
ion
num
ber
Stat
ion
nam
ePe
riod
of
stre
amflo
w
reco
rd
Peri
od o
f w
ater
-qua
lity
reco
rd
Peri
od o
f da
ily te
mpe
ratu
re
reco
rd1
Peri
od o
f da
ily s
edim
ent
reco
rd1
Wat
er-u
se
clas
sific
atio
n2
Mis
sour
i Riv
er b
asin
106
0185
00B
eave
rhea
d R
iver
nea
r Tw
in B
ridg
es19
35-P
1950
-51,
196
2-81
, 19
86, 1
999-
2003
2001
-03
1962
-74
B-1
206
0366
50Je
ffer
son
Riv
er n
ear
Thr
ee F
orks
1978
-P19
86-8
7, 1
999-
2003
1980
-81,
200
0-03
--B
-1
306
0525
00G
alla
tin R
iver
at L
ogan
1893
-190
5, 1
928-
P19
49, 1
951,
195
7,
1986
, 199
9-20
0319
79-8
5, 2
001-
P--
B-1
406
0545
00M
isso
uri R
iver
at T
osto
n18
90-9
1, 1
910-
16
1941
-P19
49-5
1, 1
972-
95,
1999
-200
319
49-5
3, 1
973-
P19
49-5
3B
-1
506
0615
00Pr
ickl
y Pe
ar C
reek
nea
r C
lanc
y19
08-1
6, 1
921-
33,
1945
-69,
197
8-20
0219
50, 1
999-
2002
----
B-1
606
0735
00D
earb
orn
Riv
er n
ear
Cra
ig19
46-6
9, 1
994-
P19
91, 1
999-
2003
1993
-200
3--
B-1
706
0890
00Su
n R
iver
nea
r V
augh
n18
97, 1
934-
P19
69-P
1969
-79,
199
9-20
03--
B-3
806
1088
00Te
ton
Riv
er a
t Lom
a19
98-P
1998
-200
320
00-0
3--
B-3
906
1147
00Ju
dith
Riv
er n
ear
mou
th, n
ear
Win
ifre
d20
01-P
2001
-200
320
01-0
3--
B-2
1006
1305
00M
usse
lshe
ll R
iver
at M
osby
1929
-35,
193
4-P
1975
-95,
199
9-20
0320
00-0
319
83-8
5C
-3
1106
1545
50Pe
ople
s C
reek
bel
ow K
uhr
Cou
lee,
nea
r D
odso
n19
18-2
1, 1
951-
73,
1982
-P19
89-9
2, 1
994,
199
9-20
03--
--B
-3
1206
1745
00M
ilk R
iver
at N
ashu
a19
39-P
1950
-53,
195
9-94
, 19
99-2
003
2000
-03
--B
-3
1306
1810
00Po
plar
Riv
er n
ear
Popl
ar19
08-2
4, 1
947-
69,
1975
-79,
198
2-P
1975
-81,
198
7-94
, 19
99-P
2000
-03
--B
-2
1406
1855
00M
isso
uri R
iver
nea
r C
ulbe
rtso
n19
41-5
1, 1
958-
P19
65-8
6, 1
992-
94,
1997
-P20
02-0
319
72-7
6B
-3
Yello
wst
one
Rive
r bas
in
1506
1925
00Y
ello
wst
one
Riv
er n
ear
Liv
ings
ton
1897
-190
5, 1
928-
32,
1937
-P19
70-9
4, 1
999-
2003
2000
-03
1985
-86
B-1
1606
1956
00Sh
ield
s R
iver
nea
r L
ivin
gsto
n19
79-P
1999
-200
320
00-0
3--
B-1
1706
2000
00B
ould
er R
iver
at B
ig T
imbe
r19
47-5
3, 1
955-
P19
65, 1
999-
2003
2000
-03
--B
-1
1806
2050
00St
illw
ater
Riv
er n
ear
Abs
arok
ee19
10-1
4, 1
935-
P19
99-2
003
2001
-03
--B
-1
1906
2085
00C
lark
s Fo
rk Y
ello
wst
one
Riv
er a
t Edg
ar19
21-6
9, 1
987-
P19
64-6
5, 1
999-
2003
2000
-03
1984
B-2
2006
2945
00B
igho
rn R
iver
abo
ve T
ullo
ck C
reek
, nea
r B
igho
rn19
82-P
1999
-200
320
00-0
3--
B-2
Introduction �

Site
nu
mbe
r (fi
g. 1
)
Stat
ion
num
ber
Stat
ion
nam
ePe
riod
of
stre
amflo
w
reco
rd
Peri
od o
f w
ater
-qua
lity
reco
rd
Peri
od o
f da
ily te
mpe
ratu
re
reco
rd1
Peri
od o
f da
ily s
edim
ent
reco
rd1
Wat
er-u
se
clas
sific
atio
n2
Yello
wst
one
Rive
r bas
in—
Cont
inue
d
2106
2960
03R
oseb
ud C
reek
at m
outh
, nea
r R
oseb
ud19
74-P
1975
-86,
198
8-93
, 19
99-2
003
----
C-3
2206
3085
00To
ngue
Riv
er a
t Mile
s C
ity19
38-4
2, 1
946-
P19
49-9
4, 1
999-
P20
00-0
319
78-8
6B
-3
2306
3265
00Po
wde
r R
iver
nea
r L
ocat
e19
38-P
1948
-63,
197
5-94
, 19
99-P
--
1975
-84
C-3
2406
3295
00Y
ello
wst
one
Riv
er n
ear
Sidn
ey19
10-3
1, 1
933-
P19
48-P
--19
72-8
1,19
83-P
B-3
Colu
mbi
a Ri
ver b
asin
Koot
enai
Riv
er s
ubba
sin
2512
3019
33K
oote
nai R
iver
bel
ow L
ibby
Dam
, nea
r L
ibby
1972
-P19
67-2
004
2001
-03
1968
-76
B-1
2612
3020
55Fi
sher
Riv
er n
ear
Lib
by19
67-P
1967
-76,
199
9-20
0319
68-8
519
68-7
6B
-1
2712
3045
00Y
aak
Riv
er n
ear
Tro
y19
10-1
6, 1
956-
P19
99-2
003
1963
-85,
200
0-03
--B
-1
Clar
k Fo
rk s
ubba
sin
2812
3245
90L
ittle
Bla
ckfo
ot R
iver
nea
r G
arri
son
1973
-P19
63, 1
985-
P20
00-0
3--
B-1
2912
3345
10R
ock
Cre
ek n
ear
Clin
ton
1972
-P19
85-P
1979
-83,
199
5-20
03--
B-1
3012
3345
50C
lark
For
k at
Tur
ah B
ridg
e, n
ear
Bon
ner
1985
-P19
85-P
1992
-98
1985
-PB
-1
3112
3400
00B
lack
foot
Riv
er n
ear
Bon
ner
1898
-99,
190
1, 1
903-
05, 1
939-
P19
63, 1
985-
P20
00-0
319
86-9
5B
-1
3212
3525
00B
itter
root
Riv
er n
ear
Mis
soul
a18
98-1
901,
190
3-04
, 19
89-P
1997
-P20
00-0
3--
B-1
3312
3545
00C
lark
For
k at
St.
Reg
is19
10-P
1999
-200
320
02-0
3--
B-1
Flat
head
Riv
er s
ubba
sin
3412
3555
00N
orth
For
k Fl
athe
ad R
iver
nea
r C
olum
bia
Falls
1910
-17,
192
9-P
1950
, 197
0, 1
976-
79,
1999
-200
319
76-2
003
1976
-79
A-1
3512
3585
00M
iddl
e Fo
rk F
lath
ead
Riv
er n
ear
Wes
t G
laci
er19
39-P
1949
-50,
197
0, 1
998-
2003
1999
-200
3--
A-1
3612
3660
00W
hite
fish
Riv
er n
ear
Kal
ispe
ll19
28-5
0, 1
972-
P19
99-2
003
----
B-2
3712
3700
00Sw
an R
iver
nea
r B
igfo
rk19
10-1
1, 1
922-
P19
99-2
003
2000
-03
--B
-1
3812
3887
00Fl
athe
ad R
iver
at P
erm
a19
84-P
1971
-73,
198
4-92
, 19
97-2
003
2000
-03
-- B
-1
1 Dai
ly r
ecor
d of
wat
er te
mpe
ratu
re o
r su
spen
ded
sedi
men
t is
seas
onal
at s
ome
site
s.
2 Sta
te o
f M
onta
na w
ater
-use
cla
ssif
icat
ions
are
des
crib
ed in
Mon
tana
Dep
artm
ent o
f E
nvir
onm
enta
l Qua
lity
(200
2a).
For
gen
eral
ref
eren
ce to
the
type
of
aqua
tic li
fe s
uppo
rted
by
the
vari
ous
clas
ses
of
stre
ams,
A-1
and
B-1
rep
rese
nt “
cold
-wat
er”
and
B-2
rep
rese
nts
“col
d-w
ater
mar
gina
l” s
alm
onid
fis
heri
es; B
-3 a
nd C
-3 r
epre
sent
“w
arm
-wat
er”
non-
salm
onid
fis
heri
es.
Tabl
e 1.
Ty
pe a
nd p
erio
d of
dat
a co
llect
ion
at s
ampl
ing
site
s in
the
stat
ewid
e m
onito
ring
netw
ork,
Mon
tana
.—Co
ntin
ued
� Water-Quality Characteristics of Montana Streams in a Statewide Monitoring Network, 1999-2003
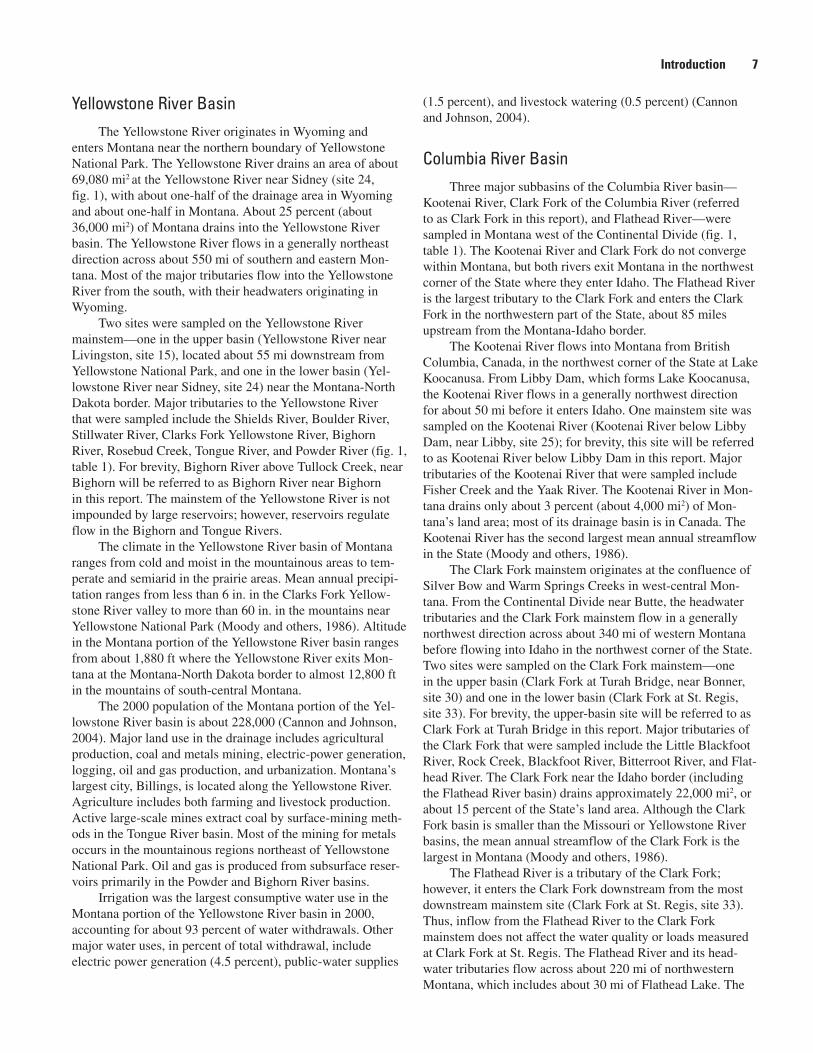
Yellowstone River BasinThe Yellowstone River originates in Wyoming and
enters Montana near the northern boundary of Yellowstone National Park. The Yellowstone River drains an area of about 69,080 mi2 at the Yellowstone River near Sidney (site 24, fig. 1), with about one-half of the drainage area in Wyoming and about one-half in Montana. About 25 percent (about 36,000 mi2) of Montana drains into the Yellowstone River basin. The Yellowstone River flows in a generally northeast direction across about 550 mi of southern and eastern Mon-tana. Most of the major tributaries flow into the Yellowstone River from the south, with their headwaters originating in Wyoming.
Two sites were sampled on the Yellowstone River mainstem—one in the upper basin (Yellowstone River near Livingston, site 15), located about 55 mi downstream from Yellowstone National Park, and one in the lower basin (Yel-lowstone River near Sidney, site 24) near the Montana-North Dakota border. Major tributaries to the Yellowstone River that were sampled include the Shields River, Boulder River, Stillwater River, Clarks Fork Yellowstone River, Bighorn River, Rosebud Creek, Tongue River, and Powder River (fig. 1, table 1). For brevity, Bighorn River above Tullock Creek, near Bighorn will be referred to as Bighorn River near Bighorn in this report. The mainstem of the Yellowstone River is not impounded by large reservoirs; however, reservoirs regulate flow in the Bighorn and Tongue Rivers.
The climate in the Yellowstone River basin of Montana ranges from cold and moist in the mountainous areas to tem-perate and semiarid in the prairie areas. Mean annual precipi-tation ranges from less than 6 in. in the Clarks Fork Yellow-stone River valley to more than 60 in. in the mountains near Yellowstone National Park (Moody and others, 1986). Altitude in the Montana portion of the Yellowstone River basin ranges from about 1,880 ft where the Yellowstone River exits Mon-tana at the Montana-North Dakota border to almost 12,800 ft in the mountains of south-central Montana.
The 2000 population of the Montana portion of the Yel-lowstone River basin is about 228,000 (Cannon and Johnson, 2004). Major land use in the drainage includes agricultural production, coal and metals mining, electric-power generation, logging, oil and gas production, and urbanization. Montana’s largest city, Billings, is located along the Yellowstone River. Agriculture includes both farming and livestock production. Active large-scale mines extract coal by surface-mining meth-ods in the Tongue River basin. Most of the mining for metals occurs in the mountainous regions northeast of Yellowstone National Park. Oil and gas is produced from subsurface reser-voirs primarily in the Powder and Bighorn River basins.
Irrigation was the largest consumptive water use in the Montana portion of the Yellowstone River basin in 2000, accounting for about 93 percent of water withdrawals. Other major water uses, in percent of total withdrawal, include electric power generation (4.5 percent), public-water supplies
(1.5 percent), and livestock watering (0.5 percent) (Cannon and Johnson, 2004).
Columbia River BasinThree major subbasins of the Columbia River basin—
Kootenai River, Clark Fork of the Columbia River (referred to as Clark Fork in this report), and Flathead River—were sampled in Montana west of the Continental Divide (fig. 1, table 1). The Kootenai River and Clark Fork do not converge within Montana, but both rivers exit Montana in the northwest corner of the State where they enter Idaho. The Flathead River is the largest tributary to the Clark Fork and enters the Clark Fork in the northwestern part of the State, about 85 miles upstream from the Montana-Idaho border.
The Kootenai River flows into Montana from British Columbia, Canada, in the northwest corner of the State at Lake Koocanusa. From Libby Dam, which forms Lake Koocanusa, the Kootenai River flows in a generally northwest direction for about 50 mi before it enters Idaho. One mainstem site was sampled on the Kootenai River (Kootenai River below Libby Dam, near Libby, site 25); for brevity, this site will be referred to as Kootenai River below Libby Dam in this report. Major tributaries of the Kootenai River that were sampled include Fisher Creek and the Yaak River. The Kootenai River in Mon-tana drains only about 3 percent (about 4,000 mi2) of Mon-tana’s land area; most of its drainage basin is in Canada. The Kootenai River has the second largest mean annual streamflow in the State (Moody and others, 1986).
The Clark Fork mainstem originates at the confluence of Silver Bow and Warm Springs Creeks in west-central Mon-tana. From the Continental Divide near Butte, the headwater tributaries and the Clark Fork mainstem flow in a generally northwest direction across about 340 mi of western Montana before flowing into Idaho in the northwest corner of the State. Two sites were sampled on the Clark Fork mainstem—one in the upper basin (Clark Fork at Turah Bridge, near Bonner, site 30) and one in the lower basin (Clark Fork at St. Regis, site 33). For brevity, the upper-basin site will be referred to as Clark Fork at Turah Bridge in this report. Major tributaries of the Clark Fork that were sampled include the Little Blackfoot River, Rock Creek, Blackfoot River, Bitterroot River, and Flat-head River. The Clark Fork near the Idaho border (including the Flathead River basin) drains approximately 22,000 mi2, or about 15 percent of the State’s land area. Although the Clark Fork basin is smaller than the Missouri or Yellowstone River basins, the mean annual streamflow of the Clark Fork is the largest in Montana (Moody and others, 1986).
The Flathead River is a tributary of the Clark Fork; however, it enters the Clark Fork downstream from the most downstream mainstem site (Clark Fork at St. Regis, site 33). Thus, inflow from the Flathead River to the Clark Fork mainstem does not affect the water quality or loads measured at Clark Fork at St. Regis. The Flathead River and its head-water tributaries flow across about 220 mi of northwestern Montana, which includes about 30 mi of Flathead Lake. The
Introduction �
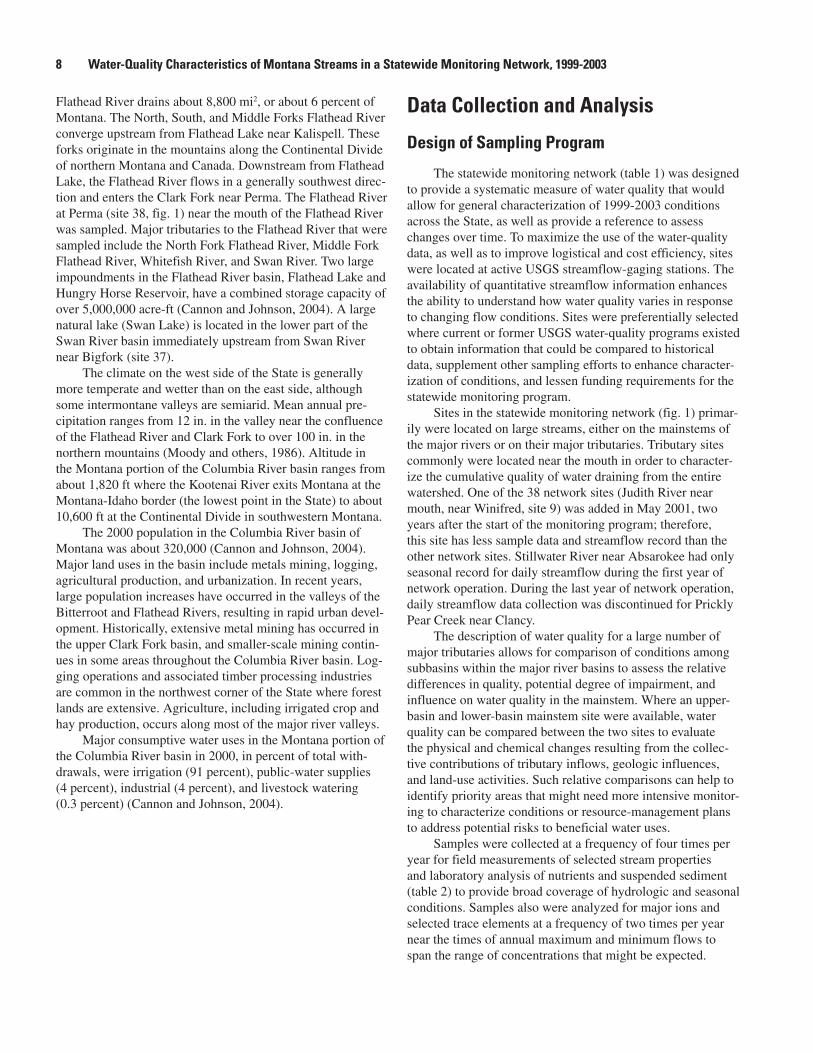
Flathead River drains about 8,800 mi2, or about 6 percent of Montana. The North, South, and Middle Forks Flathead River converge upstream from Flathead Lake near Kalispell. These forks originate in the mountains along the Continental Divide of northern Montana and Canada. Downstream from Flathead Lake, the Flathead River flows in a generally southwest direc-tion and enters the Clark Fork near Perma. The Flathead River at Perma (site 38, fig. 1) near the mouth of the Flathead River was sampled. Major tributaries to the Flathead River that were sampled include the North Fork Flathead River, Middle Fork Flathead River, Whitefish River, and Swan River. Two large impoundments in the Flathead River basin, Flathead Lake and Hungry Horse Reservoir, have a combined storage capacity of over 5,000,000 acre-ft (Cannon and Johnson, 2004). A large natural lake (Swan Lake) is located in the lower part of the Swan River basin immediately upstream from Swan River near Bigfork (site 37).
The climate on the west side of the State is generally more temperate and wetter than on the east side, although some intermontane valleys are semiarid. Mean annual pre-cipitation ranges from 12 in. in the valley near the confluence of the Flathead River and Clark Fork to over 100 in. in the northern mountains (Moody and others, 1986). Altitude in the Montana portion of the Columbia River basin ranges from about 1,820 ft where the Kootenai River exits Montana at the Montana-Idaho border (the lowest point in the State) to about 10,600 ft at the Continental Divide in southwestern Montana.
The 2000 population in the Columbia River basin of Montana was about 320,000 (Cannon and Johnson, 2004). Major land uses in the basin include metals mining, logging, agricultural production, and urbanization. In recent years, large population increases have occurred in the valleys of the Bitterroot and Flathead Rivers, resulting in rapid urban devel-opment. Historically, extensive metal mining has occurred in the upper Clark Fork basin, and smaller-scale mining contin-ues in some areas throughout the Columbia River basin. Log-ging operations and associated timber processing industries are common in the northwest corner of the State where forest lands are extensive. Agriculture, including irrigated crop and hay production, occurs along most of the major river valleys.
Major consumptive water uses in the Montana portion of the Columbia River basin in 2000, in percent of total with-drawals, were irrigation (91 percent), public-water supplies (4 percent), industrial (4 percent), and livestock watering (0.3 percent) (Cannon and Johnson, 2004).
Data Collection and Analysis
Design of Sampling Program
The statewide monitoring network (table 1) was designed to provide a systematic measure of water quality that would allow for general characterization of 1999-2003 conditions across the State, as well as provide a reference to assess changes over time. To maximize the use of the water-quality data, as well as to improve logistical and cost efficiency, sites were located at active USGS streamflow-gaging stations. The availability of quantitative streamflow information enhances the ability to understand how water quality varies in response to changing flow conditions. Sites were preferentially selected where current or former USGS water-quality programs existed to obtain information that could be compared to historical data, supplement other sampling efforts to enhance character-ization of conditions, and lessen funding requirements for the statewide monitoring program.
Sites in the statewide monitoring network (fig. 1) primar-ily were located on large streams, either on the mainstems of the major rivers or on their major tributaries. Tributary sites commonly were located near the mouth in order to character-ize the cumulative quality of water draining from the entire watershed. One of the 38 network sites (Judith River near mouth, near Winifred, site 9) was added in May 2001, two years after the start of the monitoring program; therefore, this site has less sample data and streamflow record than the other network sites. Stillwater River near Absarokee had only seasonal record for daily streamflow during the first year of network operation. During the last year of network operation, daily streamflow data collection was discontinued for Prickly Pear Creek near Clancy.
The description of water quality for a large number of major tributaries allows for comparison of conditions among subbasins within the major river basins to assess the relative differences in quality, potential degree of impairment, and influence on water quality in the mainstem. Where an upper-basin and lower-basin mainstem site were available, water quality can be compared between the two sites to evaluate the physical and chemical changes resulting from the collec-tive contributions of tributary inflows, geologic influences, and land-use activities. Such relative comparisons can help to identify priority areas that might need more intensive monitor-ing to characterize conditions or resource-management plans to address potential risks to beneficial water uses.
Samples were collected at a frequency of four times per year for field measurements of selected stream properties and laboratory analysis of nutrients and suspended sediment (table 2) to provide broad coverage of hydrologic and seasonal conditions. Samples also were analyzed for major ions and selected trace elements at a frequency of two times per year near the times of annual maximum and minimum flows to span the range of concentrations that might be expected.
� Water-Quality Characteristics of Montana Streams in a Statewide Monitoring Network, 1999-2003
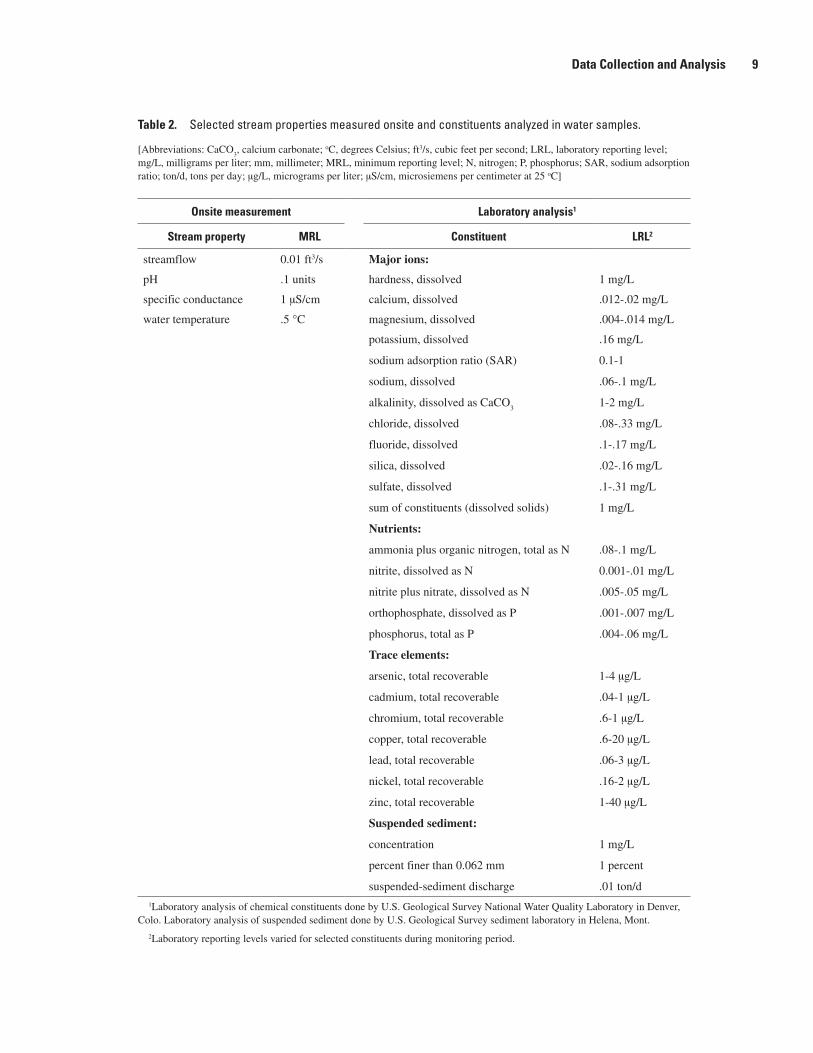
Table 2. Selected stream properties measured onsite and constituents analyzed in water samples.
[Abbreviations: CaCO3, calcium carbonate; oC, degrees Celsius; ft3/s, cubic feet per second; LRL, laboratory reporting level;
mg/L, milligrams per liter; mm, millimeter; MRL, minimum reporting level; N, nitrogen; P, phosphorus; SAR, sodium adsorption ratio; ton/d, tons per day; µg/L, micrograms per liter; µS/cm, microsiemens per centimeter at 25 oC]
Onsite measurement Laboratory analysis1
Stream property MRL Constituent LRL2
streamflow 0.01 ft3/s Major ions:
pH .1 units hardness, dissolved 1 mg/L
specific conductance 1 µS/cm calcium, dissolved .012-.02 mg/L
water temperature .5 °C magnesium, dissolved .004-.014 mg/L
potassium, dissolved .16 mg/L
sodium adsorption ratio (SAR) 0.1-1
sodium, dissolved .06-.1 mg/L
alkalinity, dissolved as CaCO3
1-2 mg/L
chloride, dissolved .08-.33 mg/L
fluoride, dissolved .1-.17 mg/L
silica, dissolved .02-.16 mg/L
sulfate, dissolved .1-.31 mg/L
sum of constituents (dissolved solids) 1 mg/L
Nutrients:
ammonia plus organic nitrogen, total as N .08-.1 mg/L
nitrite, dissolved as N 0.001-.01 mg/L
nitrite plus nitrate, dissolved as N .005-.05 mg/L
orthophosphate, dissolved as P .001-.007 mg/L
phosphorus, total as P .004-.06 mg/L
Trace elements:
arsenic, total recoverable 1-4 µg/L
cadmium, total recoverable .04-1 µg/L
chromium, total recoverable .6-1 µg/L
copper, total recoverable .6-20 µg/L
lead, total recoverable .06-3 µg/L
nickel, total recoverable .16-2 µg/L
zinc, total recoverable 1-40 µg/L
Suspended sediment:
concentration 1 mg/L
percent finer than 0.062 mm 1 percent
suspended-sediment discharge .01 ton/d1Laboratory analysis of chemical constituents done by U.S. Geological Survey National Water Quality Laboratory in Denver,
Colo. Laboratory analysis of suspended sediment done by U.S. Geological Survey sediment laboratory in Helena, Mont.
2Laboratory reporting levels varied for selected constituents during monitoring period.
Data Collection and Analysis 9
The four samples per year typically were collected dur-ing:
Late winter or early spring to describe conditions during ice breakup or low-elevation snowmelt runoff (rising limb of annual hydrograph);
Late spring or early summer to describe conditions during increased runoff from rainfall and high-elevation snow-melt (peak flow of annual hydrograph);
Midsummer to describe the period of medium-flow condi-tions and warm-weather increases in stream biological productivity (falling limb of annual hydrograph); and
Late summer or fall to describe base-flow conditions predominated largely by ground-water inflow (minimum flow of annual hydrograph).
Sites where other USGS sampling programs were already in operation either satisfied the sampling requirements of the statewide monitoring program, required extra laboratory analyses to match the constituents for the statewide program, or supplemented the program with additional data. At sev-eral sites, other USGS programs were either discontinued or reduced in scale during the monitoring period, which resulted in some data not being collected. In addition, extended periods of no flow prevented collection of scheduled samples at some sites. All available USGS data for sites in the monitoring net-work during water years 1999-2003 were used to characterize water-quality conditions.
An attempt was made to balance the need to obtain data at many sites over a broad geographic area while main-taining a sampling intensity that was generally adequate to describe seasonal and hydrologic variability of water quality. A sampling frequency of four per year (two per year for major ions and trace elements) limits the ability to document water-quality variations, define relations with hydrologic variables, and assess processes that might cause variations in water quality. However, this level of data collection, if conducted systematically in an ongoing manner over time, can be useful for establishing baseline conditions to use as a reference for comparison to future water-quality conditions and to serve as a general measure of the ongoing status of conditions. As additional years of data are collected, the persistence of condi-tions can confirm either suitable water quality or an impaired status that might warrant resource-management actions. Also, with additional data, the ability to identify relations among various hydrologic variables might improve and allow better estimation of constituent loads or prediction of concentrations for a given flow condition or season. Ultimately, if systematic sampling continues for an extended number of years (10 or more), the data can be analyzed to detect statistically signifi-cant trends over time that might be attributable to factors such as climate or changing land- and water-use activities.
In addition to the periodic collection of water-qual-ity samples, a subset of 26 sites was selected to provide a continuous record of water temperature during the warm-
1.
2.
3.
4.
weather season (typically April through September). Because water temperature can vary substantially on both a daily and seasonal basis, measurements of temperature at the time of sample collection might not describe the full range of tem-perature that biota are exposed to in the stream. Continuous water-temperature data were considered important to assess the presence of potential thermal stress to aquatic biota, espe-cially during low-flow conditions induced by either drought or irrigation withdrawals.
Methods of Sample Collection, Processing, and Analysis
Cross-sectional water samples were collected from multiple verticals across the stream using depth- and width-integration methods described by Ward and Harr (1990), U.S. Geological Survey (variously dated), and Edwards and Glys-son (1999). These methods provide a vertically and laterally discharge-weighted sample that is representative of the entire flow passing through the cross section of a stream. Sampling equipment consisted of standard USGS depth-integrating suspended-sediment samplers (DH-48, DH-81, D-74, D-77, and D-95). Samplers equipped with nylon nozzles and coated with a non-metallic epoxy paint or constructed of plastic were used to collect samples for analysis of trace elements. All samplers are designed to sample the water column isokineti-cally, whereby velocity flow paths are not distorted within the nozzle, thus allowing suspended particles to enter the sample-collection bottle at the same concentration as in the surround-ing water.
Instantaneous streamflow at the time of sampling was determined at all stations, either by direct measurement or from stage-discharge rating tables (Rantz and others, 1982). Onsite measurements of pH, specific conductance, and water temperature also were made during all sampling visits. Onsite sample processing, including withdrawal of representative subsamples from the composite cross-section sample, filtration of samples for dissolved constituents, and preservation of sam-ples to prevent degradation prior to analysis, was performed according to procedures described by Ward and Harr (1990), Horowitz and others (1994), and U.S. Geological Survey (vari-ously dated). Selected sample types were stabilized for analy-sis, using either acid preservative or chilling. Sample bottles, filters, and preservatives underwent systematic quality-control checks to verify cleanliness of material adequate to support analysis of environmental samples at low concentrations (such as µg/L, also referred to as “parts per billion”).
Water samples were analyzed for chemical constituents (table 2) by the U.S. Geological Survey National Water Qual-ity Laboratory (NWQL) in Denver, Colo. Dissolved concentra-tions of constituents were analyzed from filtered subsamples obtained by pumping the original sample water through a filter having a pore size of 0.45 µm to remove particulate material. Total-recoverable concentrations of trace elements were deter-mined from an unfiltered subsample that was digested in the
10 Water-Quality Characteristics of Montana Streams in a Statewide Monitoring Network, 1999-2003

laboratory with a solution of weak acid to liberate adsorbed and acid-soluble constituents from particulate material (Hoff-man and others, 1996). Methods used by the NWQL to ana-lyze samples from network sites are described by Fishman and Friedman (1989), Fishman (1993), McLain (1993), Garbarino and Struzeski (1998), and Jones and Garbarino (1999).
During 1999, the NWQL began implementing a new, statistically based convention for establishing reporting levels and for reporting low-concentration data (Childress and others, 1999). Quality-control data are collected at the laboratory on a continuing basis to determine long-term method detection levels (LT-MDLs) and laboratory reporting levels (LRLs). These values are reevaluated each year and, consequently, can change from year to year. The methods are designed to limit the possible occurrence of a false positive or false negative error to 1 percent or less. Accordingly, concentrations are reported as “less than”(<) the LRL for samples in which the analyte either was not detected or did not pass identification criteria. Analytes that are detected at concentrations between the LT-MDL and LRL and that pass identification criteria are “estimated” and remarked with an “E” preceding the value. These values have less certainty than that for values reported without the “E” remark code.
Cross-sectional water samples of suspended sediment were analyzed for concentration and percent of suspended sed-iment finer than 0.062 mm in diameter (silt size and smaller) by the USGS sediment laboratory in Helena, Mont. (table 2). The methods for analysis of suspended sediment are described by Guy (1969) and Lambing and Dodge (1993).
A continuous record of water temperature was obtained at selected sites by use of an electronic temperature sensor that was placed in the stream where depth and velocity were adequate to generally represent the average temperature in the cross section. The temperature monitors were inspected on every visit to the site and checked for accuracy and drift according to methods described in Wagner and others (2000). Water-temperature data were transmitted by satellite telemetry and displayed in near real-time on the USGS NWIS Web site for Montana (http://waterdata.usgs.gov/mt/nwis/��. This same Web site also displays real-time streamflow data for USGS gaging stations.
Quality AssuranceProcedures for sample collection and analysis used in this
program incorporated practices designed to control, verify, and assess the quality of sample data. Methods and associ-ated quality control for collection and field processing of water-quality samples are described by Ward and Harr (1990), Knapton and Nimick (1991), Horowitz and others (1994), U.S. Geological Survey (variously dated), and Edwards and Glysson (1999). Standard procedures used by the NWQL for internal sample handling and quality assurance are described by Friedmann and Erdmann (1982), Jones (1987), and Pritt and Raese (1995). Quality-assurance procedures used by the
Montana District sediment laboratory are described by Lamb-ing and Dodge (1993).
The quality of analytical results reported for water-qual-ity samples was evaluated by quality-control samples that were submitted from the field and analyzed concurrently in the laboratory with routine samples. These quality-control samples consisted of replicate stream samples and blank samples of certified trace-element-free deionized (DI) water, which provide information on the precision and contamina-tion bias of the overall field and laboratory process. Each type of quality-control sample was submitted at a proportion of about 5 percent of the sample load, resulting in quality-control samples representing about 10 percent of the total number of water-quality samples.
In addition to quality-control samples submitted from the field, internal quality-assurance practices at the NWQL are performed systematically to provide quality control of analytical procedures (Pritt and Raese, 1995). These internal practices include use of calibration standards and analysis of standard reference water samples, replicate samples, DI-water blanks, or spiked samples at a proportion equivalent to about 10 percent of the sample load. The NWQL also participates in a blind-sample program administered by the USGS Branch of Quality Systems and in external evaluation studies with the U.S. Environmental Protection Agency (USEPA).
Replicate samples were used to identify the level of preci-sion (reproducibility) of analytical results. Replicate samples are two or more samples considered essentially identical in composition. Precision of analytical results for replicate sam-ples is affected by numerous sources of variability potentially introduced by both field and laboratory processes, including sample collection, sample processing and handling, and labo-ratory preparation and analysis. Analyses of replicate samples, therefore, can indicate the reproducibility of environmental data and provide information on the adequacy of procedures to produce consistent results. For chemical analyses, repli-cate samples were obtained in the field by splitting a single composite sample into two separate samples, which were each analyzed by the NWQL. Suspended-sediment replicates were obtained in the field by concurrently collecting two inde-pendent cross-sectional samples, which were then analyzed separately by the USGS sediment laboratory.
The precision of analytical results for a constituent can be determined by estimating a standard deviation of the differences in multiple sets of replicate sample pairs. The differences in concentration between each pair can be used to estimate a standard deviation according to the following equa-tion (Taylor, 1987):
d2
2k---------=S
where S is the standard deviation of the difference in concentration between replicate analyses,
(1)
Data Collection and Analysis 11
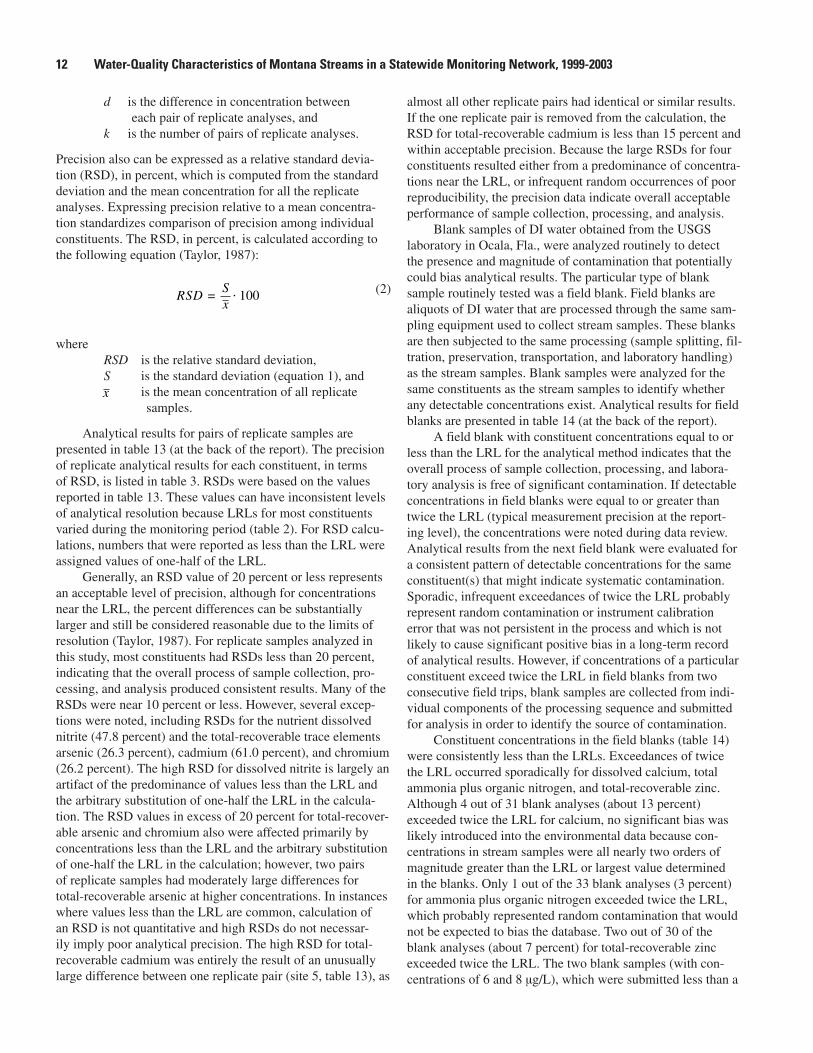
d is the difference in concentration between each pair of replicate analyses, and k is the number of pairs of replicate analyses.
Precision also can be expressed as a relative standard devia-tion (RSD), in percent, which is computed from the standard deviation and the mean concentration for all the replicate analyses. Expressing precision relative to a mean concentra-tion standardizes comparison of precision among individual constituents. The RSD, in percent, is calculated according to the following equation (Taylor, 1987):
RSDSx
100=
where RSD is the relative standard deviation, S is the standard deviation (equation 1), and x is the mean concentration of all replicate samples.
Analytical results for pairs of replicate samples are presented in table 13 (at the back of the report). The precision of replicate analytical results for each constituent, in terms of RSD, is listed in table 3. RSDs were based on the values reported in table 13. These values can have inconsistent levels of analytical resolution because LRLs for most constituents varied during the monitoring period (table 2). For RSD calcu-lations, numbers that were reported as less than the LRL were assigned values of one-half of the LRL.
Generally, an RSD value of 20 percent or less represents an acceptable level of precision, although for concentrations near the LRL, the percent differences can be substantially larger and still be considered reasonable due to the limits of resolution (Taylor, 1987). For replicate samples analyzed in this study, most constituents had RSDs less than 20 percent, indicating that the overall process of sample collection, pro-cessing, and analysis produced consistent results. Many of the RSDs were near 10 percent or less. However, several excep-tions were noted, including RSDs for the nutrient dissolved nitrite (47.8 percent) and the total-recoverable trace elements arsenic (26.3 percent), cadmium (61.0 percent), and chromium (26.2 percent). The high RSD for dissolved nitrite is largely an artifact of the predominance of values less than the LRL and the arbitrary substitution of one-half the LRL in the calcula-tion. The RSD values in excess of 20 percent for total-recover-able arsenic and chromium also were affected primarily by concentrations less than the LRL and the arbitrary substitution of one-half the LRL in the calculation; however, two pairs of replicate samples had moderately large differences for total-recoverable arsenic at higher concentrations. In instances where values less than the LRL are common, calculation of an RSD is not quantitative and high RSDs do not necessar-ily imply poor analytical precision. The high RSD for total-recoverable cadmium was entirely the result of an unusually large difference between one replicate pair (site 5, table 13), as
(2)
almost all other replicate pairs had identical or similar results. If the one replicate pair is removed from the calculation, the RSD for total-recoverable cadmium is less than 15 percent and within acceptable precision. Because the large RSDs for four constituents resulted either from a predominance of concentra-tions near the LRL, or infrequent random occurrences of poor reproducibility, the precision data indicate overall acceptable performance of sample collection, processing, and analysis.
Blank samples of DI water obtained from the USGS laboratory in Ocala, Fla., were analyzed routinely to detect the presence and magnitude of contamination that potentially could bias analytical results. The particular type of blank sample routinely tested was a field blank. Field blanks are aliquots of DI water that are processed through the same sam-pling equipment used to collect stream samples. These blanks are then subjected to the same processing (sample splitting, fil-tration, preservation, transportation, and laboratory handling) as the stream samples. Blank samples were analyzed for the same constituents as the stream samples to identify whether any detectable concentrations exist. Analytical results for field blanks are presented in table 14 (at the back of the report).
A field blank with constituent concentrations equal to or less than the LRL for the analytical method indicates that the overall process of sample collection, processing, and labora-tory analysis is free of significant contamination. If detectable concentrations in field blanks were equal to or greater than twice the LRL (typical measurement precision at the report-ing level), the concentrations were noted during data review. Analytical results from the next field blank were evaluated for a consistent pattern of detectable concentrations for the same constituent(s) that might indicate systematic contamination. Sporadic, infrequent exceedances of twice the LRL probably represent random contamination or instrument calibration error that was not persistent in the process and which is not likely to cause significant positive bias in a long-term record of analytical results. However, if concentrations of a particular constituent exceed twice the LRL in field blanks from two consecutive field trips, blank samples are collected from indi-vidual components of the processing sequence and submitted for analysis in order to identify the source of contamination.
Constituent concentrations in the field blanks (table 14) were consistently less than the LRLs. Exceedances of twice the LRL occurred sporadically for dissolved calcium, total ammonia plus organic nitrogen, and total-recoverable zinc. Although 4 out of 31 blank analyses (about 13 percent) exceeded twice the LRL for calcium, no significant bias was likely introduced into the environmental data because con-centrations in stream samples were all nearly two orders of magnitude greater than the LRL or largest value determined in the blanks. Only 1 out of the 33 blank analyses (3 percent) for ammonia plus organic nitrogen exceeded twice the LRL, which probably represented random contamination that would not be expected to bias the database. Two out of 30 of the blank analyses (about 7 percent) for total-recoverable zinc exceeded twice the LRL. The two blank samples (with con-centrations of 6 and 8 µg/L), which were submitted less than a
12 Water-Quality Characteristics of Montana Streams in a Statewide Monitoring Network, 1999-2003
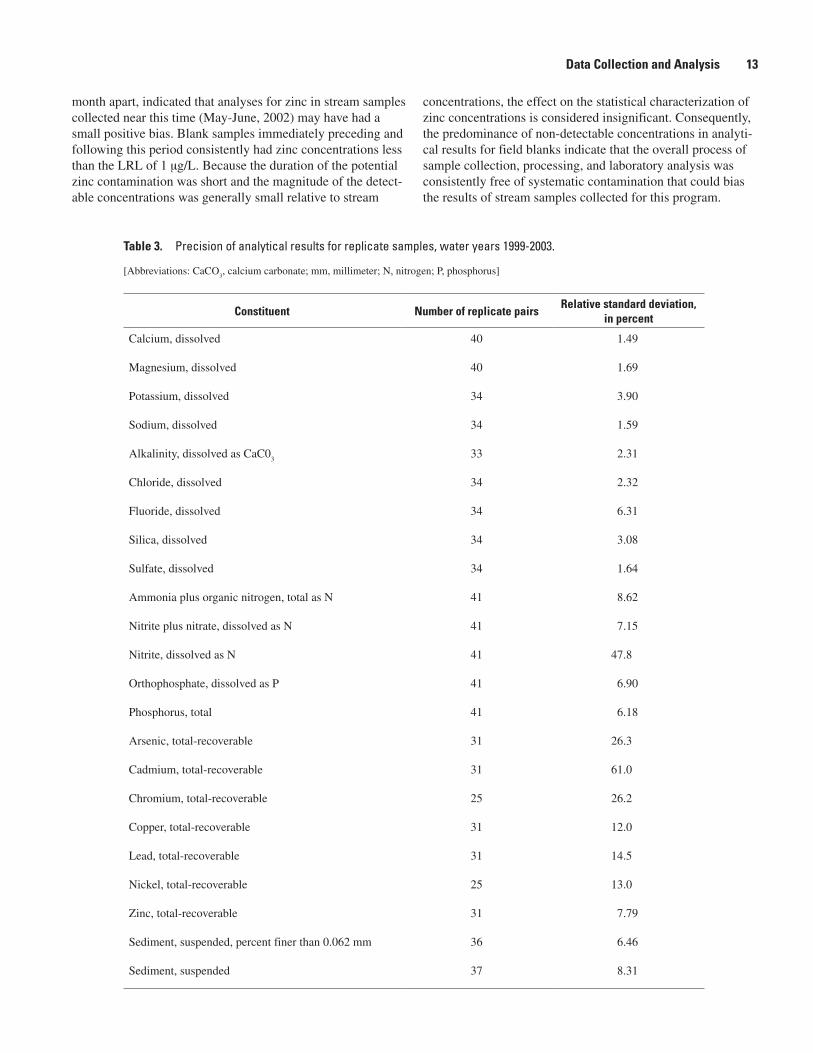
month apart, indicated that analyses for zinc in stream samples collected near this time (May-June, 2002) may have had a small positive bias. Blank samples immediately preceding and following this period consistently had zinc concentrations less than the LRL of 1 µg/L. Because the duration of the potential zinc contamination was short and the magnitude of the detect-able concentrations was generally small relative to stream
concentrations, the effect on the statistical characterization of zinc concentrations is considered insignificant. Consequently, the predominance of non-detectable concentrations in analyti-cal results for field blanks indicate that the overall process of sample collection, processing, and laboratory analysis was consistently free of systematic contamination that could bias the results of stream samples collected for this program.
Table 3. Precision of analytical results for replicate samples, water years 1999-2003.
[Abbreviations: CaCO3, calcium carbonate; mm, millimeter; N, nitrogen; P, phosphorus]
Constituent Number of replicate pairsRelative standard deviation,
in percent
Calcium, dissolved 40 1.49
Magnesium, dissolved 40 1.69
Potassium, dissolved 34 3.90
Sodium, dissolved 34 1.59
Alkalinity, dissolved as CaC03
33 2.31
Chloride, dissolved 34 2.32
Fluoride, dissolved 34 6.31
Silica, dissolved 34 3.08
Sulfate, dissolved 34 1.64
Ammonia plus organic nitrogen, total as N 41 8.62
Nitrite plus nitrate, dissolved as N 41 7.15
Nitrite, dissolved as N 41 47.8
Orthophosphate, dissolved as P 41 6.90
Phosphorus, total 41 6.18
Arsenic, total-recoverable 31 26.3
Cadmium, total-recoverable 31 61.0
Chromium, total-recoverable 25 26.2
Copper, total-recoverable 31 12.0
Lead, total-recoverable 31 14.5
Nickel, total-recoverable 25 13.0
Zinc, total-recoverable 31 7.79
Sediment, suspended, percent finer than 0.062 mm 36 6.46
Sediment, suspended 37 8.31
Data Collection and Analysis 13

Streamflow CharacteristicsStreamflow conditions can substantially affect processes
that control water quality and the rate of constituent trans-port through the surface-water system. The large variability of streamflow, both day-to-day and year-to-year, can greatly affect the magnitude and duration of various water-quality conditions. Recognition of how streamflow characteristics during the sampling period compare to long-term hydrologic conditions can give insight to the reliability of water-quality assessments based on data collected during short-term moni-toring periods. One means of obtaining a long-term perspec-tive is by comparing streamflow statistics of the monitoring period with long-term statistics, if available, from streamflow-gaging records.
Table �. Streamflow characteristics for sites in the statewide monitoring network in Montana, water years 1999-2003 and long-term period of record.
[Abbreviation: ft3/s, cubic feet per second. Symbol: --, no data]
Site number (fig. 1)
Station name
Drainage area
(square miles)
Mean annual streamflow
for long-term period of record1 (ft3/s)
Mean annual streamflow, water years
1999-2003 (ft3/s)
Percentage of long-term mean annual
streamflow for water years
1999-2003
Range in daily mean streamflow, water years
1999-2003 (ft3/s)
Range in sampled
instantaneous streamflow, water years
1999-2003 (ft3/s)
Missouri River basin
1 Beaverhead River near Twin Bridges
3,619 2423 283 67 29-935 60-806
2 Jefferson River near Three Forks
9,532 2,020 1,440 71 110-11,300 125-11,200
3 Gallatin River at Logan 1,795 1,070 815 76 190-5,480 272-4,470
4 Missouri River at Toston 14,669 5,220 3,740 72 958-19,700 1,060-19,000
5 Prickly Pear Creek near Clancy
192 47.0 324.7 53 4.3-209 4.8-201
6 Dearborn River near Craig
325 206 120 58 11-1,610 13-799
7 Sun River near Vaughn 1,859 687 447 65 58-5,360 170-3,550
8 Teton River at Loma 2,010 -- 28.8 -- 0-1,740 2.4-314
9 Judith River near mouth, near Winifred
2,731 -- 3250 -- 58-6,860 62-616
10 Musselshell River at Mosby
7,846 268 30.9 12 0-1,330 .03-180
11 Peoples Creek below Kuhr Coulee, near Dobson
675 27.4 4.41 16 0-640 .01-70
12 Milk River at Nashua 22,332 647 341 53 0-6,970 30-5,380
13 Poplar River near Poplar 3,174 120 94.4 79 2.8-6,510 3.2-1,080
Of the 38 sites in the statewide network, 36 had stream-flow records of 10 years or more (table 1). At most sites hav-ing at least 10 years of record, mean annual streamflow was determined for the entire period of record (table 4) to represent long-term streamflow conditions. The long-term period of record for several sites that are downstream from large dams was limited to the period of record following dam completion in order to better represent the regulated streamflow pat-terns. The mean annual streamflow for the 5-year monitoring period (water years 1999-2003) at each site was determined to allow comparisons to long-term conditions. Mean annual streamflows at network sites during the 1999-2003 monitoring period, in percent of long-term mean annual streamflow, also are presented in table 4.
1� Water-Quality Characteristics of Montana Streams in a Statewide Monitoring Network, 1999-2003
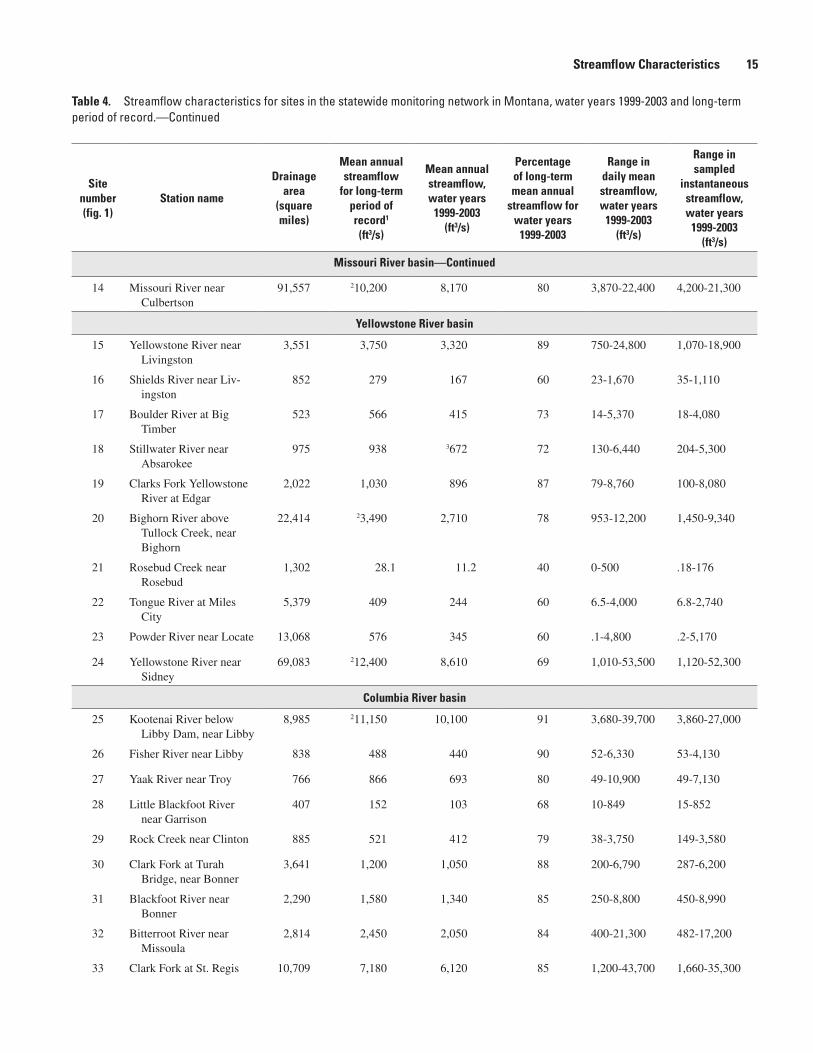
Site number (fig. 1)
Station name
Drainage area
(square miles)
Mean annual streamflow
for long-term period of record1 (ft3/s)
Mean annual streamflow, water years
1999-2003 (ft3/s)
Percentage of long-term mean annual
streamflow for water years
1999-2003
Range in daily mean streamflow, water years
1999-2003 (ft3/s)
Range in sampled
instantaneous streamflow, water years
1999-2003 (ft3/s)
Missouri River basin—Continued
14 Missouri River near Culbertson
91,557 210,200 8,170 80 3,870-22,400 4,200-21,300
Yellowstone River basin
15 Yellowstone River near Livingston
3,551 3,750 3,320 89 750-24,800 1,070-18,900
16 Shields River near Liv-ingston
852 279 167 60 23-1,670 35-1,110
17 Boulder River at Big Timber
523 566 415 73 14-5,370 18-4,080
18 Stillwater River near Absarokee
975 938 3672 72 130-6,440 204-5,300
19 Clarks Fork Yellowstone River at Edgar
2,022 1,030 896 87 79-8,760 100-8,080
20 Bighorn River above Tullock Creek, near Bighorn
22,414 23,490 2,710 78 953-12,200 1,450-9,340
21 Rosebud Creek near Rosebud
1,302 28.1 11.2 40 0-500 .18-176
22 Tongue River at Miles City
5,379 409 244 60 6.5-4,000 6.8-2,740
23 Powder River near Locate 13,068 576 345 60 .1-4,800 .2-5,170
24 Yellowstone River near Sidney
69,083 212,400 8,610 69 1,010-53,500 1,120-52,300
Columbia River basin
25 Kootenai River below Libby Dam, near Libby
8,985 211,150 10,100 91 3,680-39,700 3,860-27,000
26 Fisher River near Libby 838 488 440 90 52-6,330 53-4,130
27 Yaak River near Troy 766 866 693 80 49-10,900 49-7,130
28 Little Blackfoot River near Garrison
407 152 103 68 10-849 15-852
29 Rock Creek near Clinton 885 521 412 79 38-3,750 149-3,580
30 Clark Fork at Turah Bridge, near Bonner
3,641 1,200 1,050 88 200-6,790 287-6,200
31 Blackfoot River near Bonner
2,290 1,580 1,340 85 250-8,800 450-8,990
32 Bitterroot River near Missoula
2,814 2,450 2,050 84 400-21,300 482-17,200
33 Clark Fork at St. Regis 10,709 7,180 6,120 85 1,200-43,700 1,660-35,300
Table �. Streamflow characteristics for sites in the statewide monitoring network in Montana, water years 1999-2003 and long-term period of record.—Continued
Streamflow Characteristics 1�

Site number (fig. 1)
Station name
Drainage area
(square miles)
Mean annual streamflow
for long-term period of record1 (ft3/s)
Mean annual streamflow, water years
1999-2003 (ft3/s)
Percentage of long-term mean annual
streamflow for water years
1999-2003
Range in daily mean streamflow, water years
1999-2003 (ft3/s)
Range in sampled
instantaneous streamflow, water years
1999-2003 (ft3/s)
Columbia River basin—Continued
34 North Fork Flathead River near Columbia Falls
1,548 3,000 2,670 89 270-21,800 495-19,700
35 Middle Fork Flathead River near West Glacier
1,128 2,880 2,530 88 207-21,700 406-20,500
36 Whitefish River near Kalispell
170 187 146 78 24-809 31-717
37 Swan River near Bigfork 671 1,160 935 81 250-5,220 289-3,580
38 Flathead River at Perma 8,795 11,610 10,100 87 3,600-47,200 4,090-40,400
1Long-term period of record is presented in table 1.
2Mean annual streamflow was calculated for period of record after construction of large dam on mainstem or major tributary.
3Mean annual streamflow is based on fewer than 5 years.
Table �. Streamflow characteristics for sites in the statewide monitoring network in Montana, water years 1999-2003 and long-term period of record.—Continued
During water years 1999-2003, most of Montana had less than average precipitation (U.S. Geological Survey, issued annually). This persistent pattern of below-normal precipita-tion resulted in below-normal streamflows across the network. The mean annual streamflow for the 5-year monitoring period compared to long-term periods of record ranged from about 12 percent at Musselshell River at Mosby to 91 percent at Kootenai River below Libby Dam (table 4). Streamflows at sites in the Missouri River basin were the most depleted relative to long-term conditions, with the 5-year mean annual streamflows ranging from 12 to 80 percent of long-term means. In the Yellowstone River basin, the 5-year mean annual streamflows ranged from about 40 to 89 percent of long-term means. The least-affected sites were those in the Columbia River basin, with 5-year mean annual streamflows ranging from about 68 to 91 percent of long-term means.
In addition to a general assessment of mean annual streamflow, the magnitudes of peak flows that occurred during the sampling period are important for characterizing water quality because they represent the condition during which most of the suspended sediment and associated chemical constituents typically are transported through a river system. Climatic conditions not only affect the volume of streamflow annually discharged from a river basin, but also the duration and magnitude of peak flows. To illustrate general differences in daily streamflow patterns between short-term and long-term periods (fig. 2), annual hydrographs are shown depicting mean daily streamflows for both the 5-year monitoring period and
the long-term period of record for representative sites in each of the three major river basins.
Mean daily streamflow during water years 1999-2003 at selected sites in the Missouri River basin (Missouri River at Toston) and Yellowstone River basin (Yellowstone River near Sidney) show that peak flows, on average, occurred earlier in the year and were substantially less in both magnitude and duration than long-term mean daily peak flows. The repre-sentative site for the Columbia River basin (Clark Fork at St. Regis) indicates that the magnitude of peak flow during 1999-2003 was slightly greater than the long-term mean; how-ever, the duration of the 1999-2003 peak flow was less than the long-term mean. Overall, the hydrologic conditions during 1999-2003 were more similar to long-term conditions in the Columbia River basin than in the Missouri and Yellowstone River basins.
The implications of less-than-normal streamflow on water quality during the monitoring period cannot be directly quantified. However, relative comparisons between short-term and long-term streamflow conditions can provide some perspective when evaluating water-quality characteristics. For example, constituents associated with erosional processes, such as suspended sediment, can exhibit relatively low con-centrations in short-term sampling programs conducted during years of below-normal streamflow. This under-representation of long-term sediment transport also could result in relatively lower concentrations for sediment-associated constituents, such as nutrients and trace elements, than might be expected
1� Water-Quality Characteristics of Montana Streams in a Statewide Monitoring Network, 1999-2003
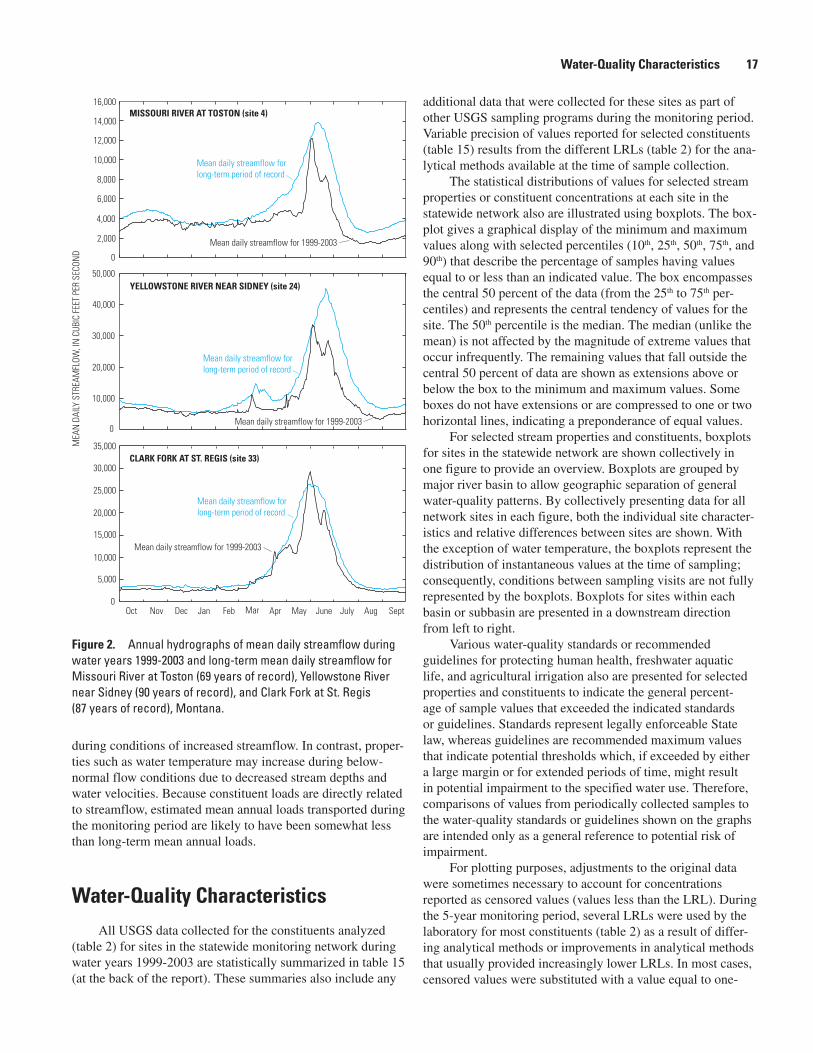
Figure 2. Annual hydrographs of mean daily streamflow during water years 1999-2003 and long-term mean daily streamflow for Missouri River at Toston (69 years of record), Yellowstone River near Sidney (90 years of record), and Clark Fork at St. Regis (87 years of record), Montana.
MEA
N D
AILY
STR
EAM
FLOW
, IN
CUB
IC F
EET
PER
SECO
ND
Oct Nov Dec Jan Feb Mar Apr May June July Aug Sept
5,000
10,000
15,000
20,000
25,000
30,000
35,000
0
10,000
30,000
20,000
40,000
50,000
0
2,000
4,000
0
6,000
8,000
10,000
12,000
14,000
16,000
Mean daily streamflow for 1999-2003
Mean daily streamflow for long-term period of record
Mean daily streamflow for 1999-2003
Mean daily streamflow for long-term period of record
Mean daily streamflow for long-term period of record
Mean daily streamflow for 1999-2003
MISSOURI RIVER AT TOSTON (site 4)
YELLOWSTONE RIVER NEAR SIDNEY (site 24)
CLARK FORK AT ST. REGIS (site 33)
during conditions of increased streamflow. In contrast, proper-ties such as water temperature may increase during below-normal flow conditions due to decreased stream depths and water velocities. Because constituent loads are directly related to streamflow, estimated mean annual loads transported during the monitoring period are likely to have been somewhat less than long-term mean annual loads.
Water-Quality CharacteristicsAll USGS data collected for the constituents analyzed
(table 2) for sites in the statewide monitoring network during water years 1999-2003 are statistically summarized in table 15 (at the back of the report). These summaries also include any
additional data that were collected for these sites as part of other USGS sampling programs during the monitoring period. Variable precision of values reported for selected constituents (table 15) results from the different LRLs (table 2) for the ana-lytical methods available at the time of sample collection.
The statistical distributions of values for selected stream properties or constituent concentrations at each site in the statewide network also are illustrated using boxplots. The box-plot gives a graphical display of the minimum and maximum values along with selected percentiles (10th, 25th, 50th, 75th, and 90th) that describe the percentage of samples having values equal to or less than an indicated value. The box encompasses the central 50 percent of the data (from the 25th to 75th per-centiles) and represents the central tendency of values for the site. The 50th percentile is the median. The median (unlike the mean) is not affected by the magnitude of extreme values that occur infrequently. The remaining values that fall outside the central 50 percent of data are shown as extensions above or below the box to the minimum and maximum values. Some boxes do not have extensions or are compressed to one or two horizontal lines, indicating a preponderance of equal values.
For selected stream properties and constituents, boxplots for sites in the statewide network are shown collectively in one figure to provide an overview. Boxplots are grouped by major river basin to allow geographic separation of general water-quality patterns. By collectively presenting data for all network sites in each figure, both the individual site character-istics and relative differences between sites are shown. With the exception of water temperature, the boxplots represent the distribution of instantaneous values at the time of sampling; consequently, conditions between sampling visits are not fully represented by the boxplots. Boxplots for sites within each basin or subbasin are presented in a downstream direction from left to right.
Various water-quality standards or recommended guidelines for protecting human health, freshwater aquatic life, and agricultural irrigation also are presented for selected properties and constituents to indicate the general percent-age of sample values that exceeded the indicated standards or guidelines. Standards represent legally enforceable State law, whereas guidelines are recommended maximum values that indicate potential thresholds which, if exceeded by either a large margin or for extended periods of time, might result in potential impairment to the specified water use. Therefore, comparisons of values from periodically collected samples to the water-quality standards or guidelines shown on the graphs are intended only as a general reference to potential risk of impairment.
For plotting purposes, adjustments to the original data were sometimes necessary to account for concentrations reported as censored values (values less than the LRL). During the 5-year monitoring period, several LRLs were used by the laboratory for most constituents (table 2) as a result of differ-ing analytical methods or improvements in analytical methods that usually provided increasingly lower LRLs. In most cases, censored values were substituted with a value equal to one-
Water-Quality Characteristics 1�
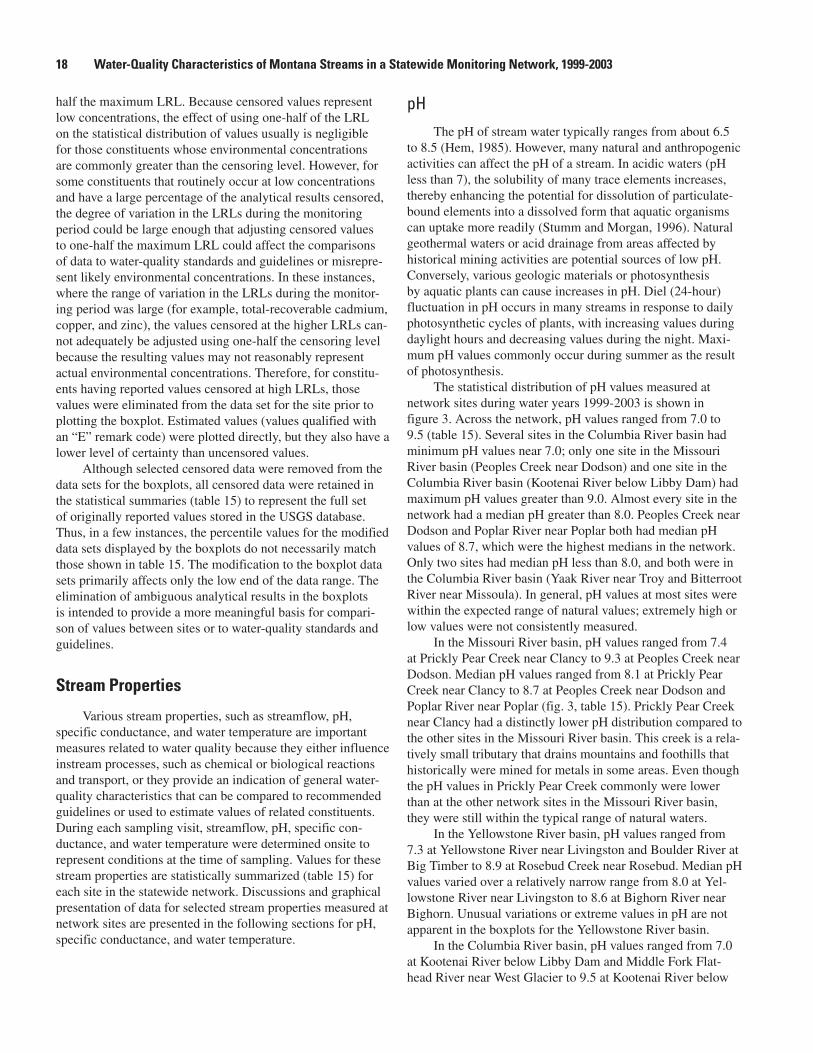
half the maximum LRL. Because censored values represent low concentrations, the effect of using one-half of the LRL on the statistical distribution of values usually is negligible for those constituents whose environmental concentrations are commonly greater than the censoring level. However, for some constituents that routinely occur at low concentrations and have a large percentage of the analytical results censored, the degree of variation in the LRLs during the monitoring period could be large enough that adjusting censored values to one-half the maximum LRL could affect the comparisons of data to water-quality standards and guidelines or misrepre-sent likely environmental concentrations. In these instances, where the range of variation in the LRLs during the monitor-ing period was large (for example, total-recoverable cadmium, copper, and zinc), the values censored at the higher LRLs can-not adequately be adjusted using one-half the censoring level because the resulting values may not reasonably represent actual environmental concentrations. Therefore, for constitu-ents having reported values censored at high LRLs, those values were eliminated from the data set for the site prior to plotting the boxplot. Estimated values (values qualified with an “E” remark code) were plotted directly, but they also have a lower level of certainty than uncensored values.
Although selected censored data were removed from the data sets for the boxplots, all censored data were retained in the statistical summaries (table 15) to represent the full set of originally reported values stored in the USGS database. Thus, in a few instances, the percentile values for the modified data sets displayed by the boxplots do not necessarily match those shown in table 15. The modification to the boxplot data sets primarily affects only the low end of the data range. The elimination of ambiguous analytical results in the boxplots is intended to provide a more meaningful basis for compari-son of values between sites or to water-quality standards and guidelines.
Stream Properties
Various stream properties, such as streamflow, pH, specific conductance, and water temperature are important measures related to water quality because they either influence instream processes, such as chemical or biological reactions and transport, or they provide an indication of general water-quality characteristics that can be compared to recommended guidelines or used to estimate values of related constituents. During each sampling visit, streamflow, pH, specific con-ductance, and water temperature were determined onsite to represent conditions at the time of sampling. Values for these stream properties are statistically summarized (table 15) for each site in the statewide network. Discussions and graphical presentation of data for selected stream properties measured at network sites are presented in the following sections for pH, specific conductance, and water temperature.
pHThe pH of stream water typically ranges from about 6.5
to 8.5 (Hem, 1985). However, many natural and anthropogenic activities can affect the pH of a stream. In acidic waters (pH less than 7), the solubility of many trace elements increases, thereby enhancing the potential for dissolution of particulate-bound elements into a dissolved form that aquatic organisms can uptake more readily (Stumm and Morgan, 1996). Natural geothermal waters or acid drainage from areas affected by historical mining activities are potential sources of low pH. Conversely, various geologic materials or photosynthesis by aquatic plants can cause increases in pH. Diel (24-hour) fluctuation in pH occurs in many streams in response to daily photosynthetic cycles of plants, with increasing values during daylight hours and decreasing values during the night. Maxi-mum pH values commonly occur during summer as the result of photosynthesis.
The statistical distribution of pH values measured at network sites during water years 1999-2003 is shown in figure 3. Across the network, pH values ranged from 7.0 to 9.5 (table 15). Several sites in the Columbia River basin had minimum pH values near 7.0; only one site in the Missouri River basin (Peoples Creek near Dodson) and one site in the Columbia River basin (Kootenai River below Libby Dam) had maximum pH values greater than 9.0. Almost every site in the network had a median pH greater than 8.0. Peoples Creek near Dodson and Poplar River near Poplar both had median pH values of 8.7, which were the highest medians in the network. Only two sites had median pH less than 8.0, and both were in the Columbia River basin (Yaak River near Troy and Bitterroot River near Missoula). In general, pH values at most sites were within the expected range of natural values; extremely high or low values were not consistently measured.
In the Missouri River basin, pH values ranged from 7.4 at Prickly Pear Creek near Clancy to 9.3 at Peoples Creek near Dodson. Median pH values ranged from 8.1 at Prickly Pear Creek near Clancy to 8.7 at Peoples Creek near Dodson and Poplar River near Poplar (fig. 3, table 15). Prickly Pear Creek near Clancy had a distinctly lower pH distribution compared to the other sites in the Missouri River basin. This creek is a rela-tively small tributary that drains mountains and foothills that historically were mined for metals in some areas. Even though the pH values in Prickly Pear Creek commonly were lower than at the other network sites in the Missouri River basin, they were still within the typical range of natural waters.
In the Yellowstone River basin, pH values ranged from 7.3 at Yellowstone River near Livingston and Boulder River at Big Timber to 8.9 at Rosebud Creek near Rosebud. Median pH values varied over a relatively narrow range from 8.0 at Yel-lowstone River near Livingston to 8.6 at Bighorn River near Bighorn. Unusual variations or extreme values in pH are not apparent in the boxplots for the Yellowstone River basin.
In the Columbia River basin, pH values ranged from 7.0 at Kootenai River below Libby Dam and Middle Fork Flat-head River near West Glacier to 9.5 at Kootenai River below
1� Water-Quality Characteristics of Montana Streams in a Statewide Monitoring Network, 1999-2003
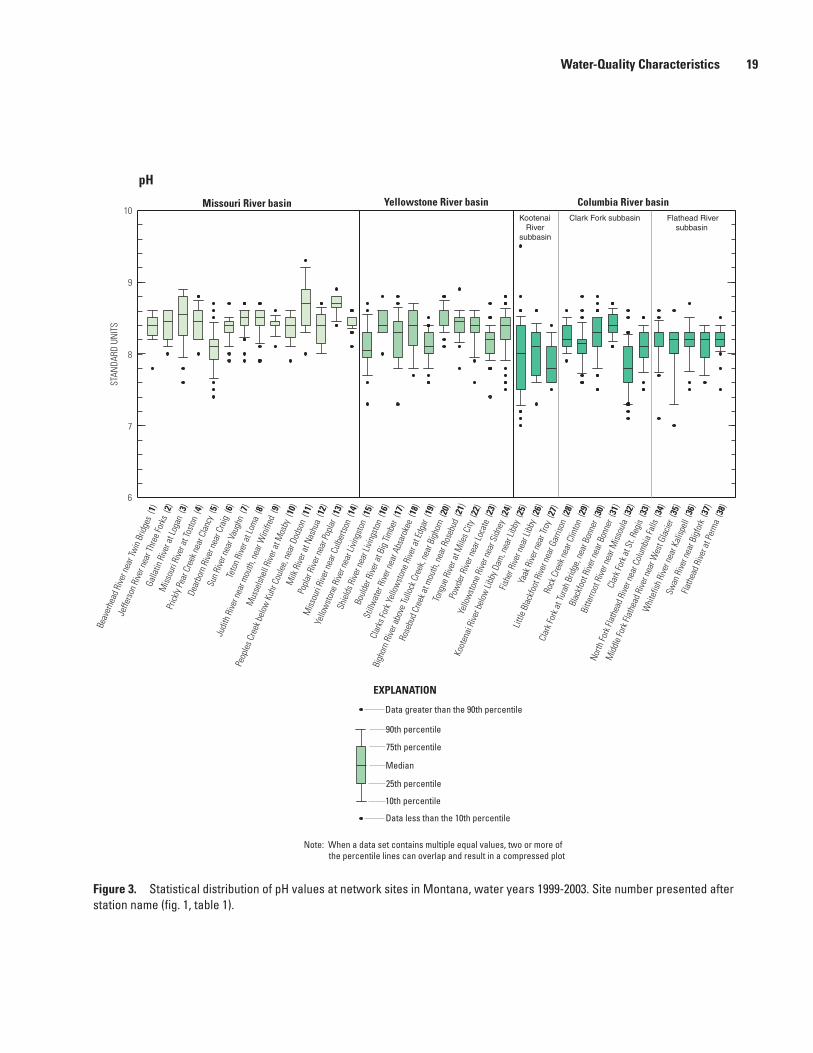
Figure 3. Statistical distribution of pH values at network sites in Montana, water years 1999-2003. Site number presented after station name (fig. 1, table 1).
pH
STAN
DARD
UN
ITS
7
8
9
10
6
Missouri River basin Yellowstone River basin Columbia River basinKootenai Riversubbasin
Flathead River subbasin
Clark Fork subbasin
Beav
erhe
ad R
iver n
ear T
win
Brid
ges
(1)
Jeffe
rson
Rive
r nea
r Thr
ee Fo
rks
(2)
Galla
tin R
iver a
t Log
an (
3)
Miss
ouri
Rive
r at T
osto
n (4
)
Prick
ly Pe
ar C
reek
nea
r Cla
ncy
(5)
Dear
born
Rive
r nea
r Cra
ig (
6)
Sun
Rive
r nea
r Vau
ghn
(7)
Teto
n Ri
ver a
t Lom
a (8
)
Judi
th R
iver n
ear m
outh
, nea
r Win
ifred
(9)
Mus
selsh
ell R
iver a
t Mos
by (
10)
Peop
les C
reek
bel
ow K
uhr C
oule
e, n
ear D
odso
n (1
1)
Milk
Rive
r at N
ashu
a (1
2)
Popl
ar R
iver n
ear P
opla
r (13
)
Miss
ouri
Rive
r nea
r Cul
berts
on (
14)
Yello
wst
one
Rive
r nea
r Livi
ngst
on (
15)
Shie
lds R
iver n
ear L
iving
ston
(16
)
Boul
der R
iver a
t Big
Tim
ber
(17)
Still
wat
er R
iver n
ear A
bsar
okee
(18
)
Clar
ks Fo
rk Y
ello
wst
one
Rive
r at E
dgar
(19
)
Bigh
orn
Rive
r abo
ve Tu
llock
Cre
ek, n
ear B
igho
rn (
20)
Rose
bud
Cree
k at m
outh
, nea
r Ros
ebud
(21
)
Tong
ue R
iver a
t Mile
s City
(22
)
Pow
der R
iver n
ear L
ocat
e (2
3)
Yello
wst
one
Rive
r nea
r Sid
ney
(24)
Koot
enai
Rive
r bel
ow Li
bby D
am, n
ear L
ibby
(25
)
Fishe
r Rive
r nea
r Lib
by (
26)
Yaak
Rive
r nea
r Tro
y (27
)
Little
Bla
ckfo
ot R
iver n
ear G
arris
on (
28)
Rock
Cre
ek n
ear C
linto
n (2
9)
Clar
k For
k at T
urah
Brid
ge, n
ear B
onne
r (30
)
Blac
kfoo
t Rive
r nea
r Bon
ner
(31)
Bitte
rroot
Rive
r nea
r Miss
oula
(32
)
Clar
k For
k at S
t. Re
gis
(33)
North
Fork
Flat
head
Rive
r nea
r Col
umbi
a Fa
lls (
34)
Mid
dle
Fork
Flat
head
Rive
r nea
r Wes
t Gla
cier
(35)
Whi
tefis
h Ri
ver n
ear K
alisp
ell
(36)
Swan
Rive
r nea
r Big
fork
(37
)
Flath
ead
Rive
r at P
erm
a (3
8)
EXPLANATION
Data greater than the 90th percentile
90th percentile
75th percentile
Median
25th percentile
10th percentile
Data less than the 10th percentile
Note: When a data set contains multiple equal values, two or more of the percentile lines can overlap and result in a compressed plot
Water-Quality Characteristics 19
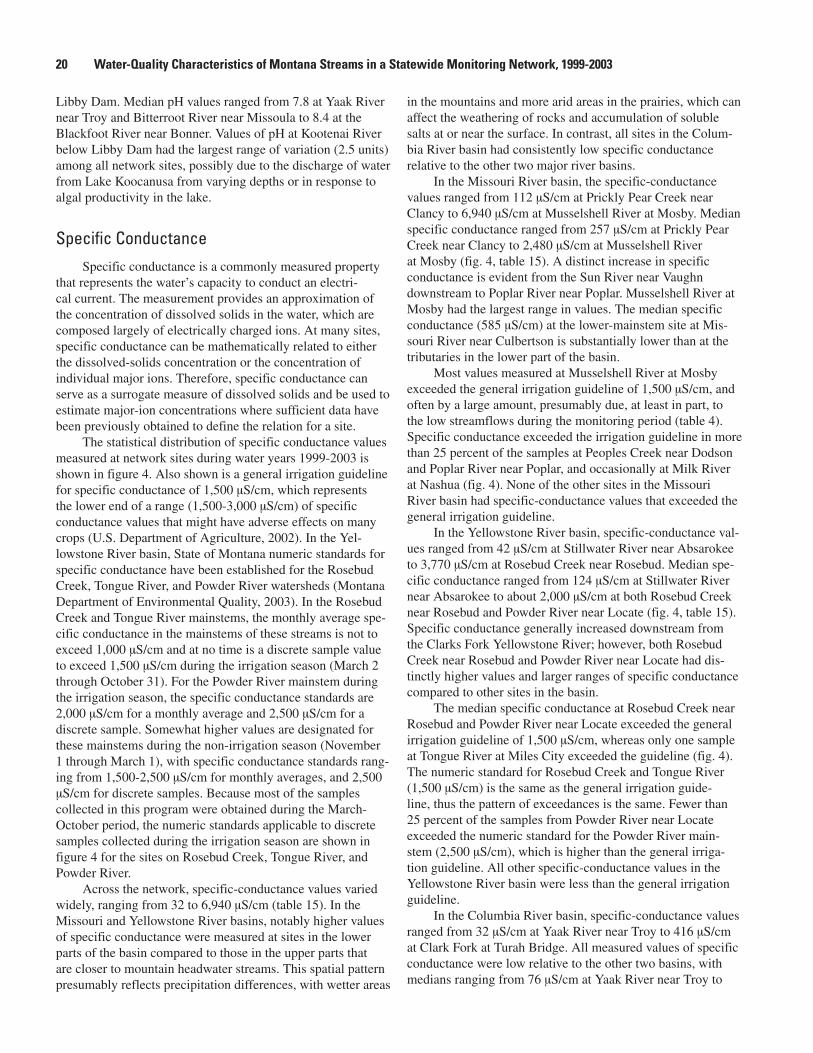
Libby Dam. Median pH values ranged from 7.8 at Yaak River near Troy and Bitterroot River near Missoula to 8.4 at the Blackfoot River near Bonner. Values of pH at Kootenai River below Libby Dam had the largest range of variation (2.5 units) among all network sites, possibly due to the discharge of water from Lake Koocanusa from varying depths or in response to algal productivity in the lake.
Specific ConductanceSpecific conductance is a commonly measured property
that represents the water’s capacity to conduct an electri-cal current. The measurement provides an approximation of the concentration of dissolved solids in the water, which are composed largely of electrically charged ions. At many sites, specific conductance can be mathematically related to either the dissolved-solids concentration or the concentration of individual major ions. Therefore, specific conductance can serve as a surrogate measure of dissolved solids and be used to estimate major-ion concentrations where sufficient data have been previously obtained to define the relation for a site.
The statistical distribution of specific conductance values measured at network sites during water years 1999-2003 is shown in figure 4. Also shown is a general irrigation guideline for specific conductance of 1,500 µS/cm, which represents the lower end of a range (1,500-3,000 µS/cm) of specific conductance values that might have adverse effects on many crops (U.S. Department of Agriculture, 2002). In the Yel-lowstone River basin, State of Montana numeric standards for specific conductance have been established for the Rosebud Creek, Tongue River, and Powder River watersheds (Montana Department of Environmental Quality, 2003). In the Rosebud Creek and Tongue River mainstems, the monthly average spe-cific conductance in the mainstems of these streams is not to exceed 1,000 µS/cm and at no time is a discrete sample value to exceed 1,500 µS/cm during the irrigation season (March 2 through October 31). For the Powder River mainstem during the irrigation season, the specific conductance standards are 2,000 µS/cm for a monthly average and 2,500 µS/cm for a discrete sample. Somewhat higher values are designated for these mainstems during the non-irrigation season (November 1 through March 1), with specific conductance standards rang-ing from 1,500-2,500 µS/cm for monthly averages, and 2,500 µS/cm for discrete samples. Because most of the samples collected in this program were obtained during the March-October period, the numeric standards applicable to discrete samples collected during the irrigation season are shown in figure 4 for the sites on Rosebud Creek, Tongue River, and Powder River.
Across the network, specific-conductance values varied widely, ranging from 32 to 6,940 µS/cm (table 15). In the Missouri and Yellowstone River basins, notably higher values of specific conductance were measured at sites in the lower parts of the basin compared to those in the upper parts that are closer to mountain headwater streams. This spatial pattern presumably reflects precipitation differences, with wetter areas
in the mountains and more arid areas in the prairies, which can affect the weathering of rocks and accumulation of soluble salts at or near the surface. In contrast, all sites in the Colum-bia River basin had consistently low specific conductance relative to the other two major river basins.
In the Missouri River basin, the specific-conductance values ranged from 112 µS/cm at Prickly Pear Creek near Clancy to 6,940 µS/cm at Musselshell River at Mosby. Median specific conductance ranged from 257 µS/cm at Prickly Pear Creek near Clancy to 2,480 µS/cm at Musselshell River at Mosby (fig. 4, table 15). A distinct increase in specific conductance is evident from the Sun River near Vaughn downstream to Poplar River near Poplar. Musselshell River at Mosby had the largest range in values. The median specific conductance (585 µS/cm) at the lower-mainstem site at Mis-souri River near Culbertson is substantially lower than at the tributaries in the lower part of the basin.
Most values measured at Musselshell River at Mosby exceeded the general irrigation guideline of 1,500 µS/cm, and often by a large amount, presumably due, at least in part, to the low streamflows during the monitoring period (table 4). Specific conductance exceeded the irrigation guideline in more than 25 percent of the samples at Peoples Creek near Dodson and Poplar River near Poplar, and occasionally at Milk River at Nashua (fig. 4). None of the other sites in the Missouri River basin had specific-conductance values that exceeded the general irrigation guideline.
In the Yellowstone River basin, specific-conductance val-ues ranged from 42 µS/cm at Stillwater River near Absarokee to 3,770 µS/cm at Rosebud Creek near Rosebud. Median spe-cific conductance ranged from 124 µS/cm at Stillwater River near Absarokee to about 2,000 µS/cm at both Rosebud Creek near Rosebud and Powder River near Locate (fig. 4, table 15). Specific conductance generally increased downstream from the Clarks Fork Yellowstone River; however, both Rosebud Creek near Rosebud and Powder River near Locate had dis-tinctly higher values and larger ranges of specific conductance compared to other sites in the basin.
The median specific conductance at Rosebud Creek near Rosebud and Powder River near Locate exceeded the general irrigation guideline of 1,500 µS/cm, whereas only one sample at Tongue River at Miles City exceeded the guideline (fig. 4). The numeric standard for Rosebud Creek and Tongue River (1,500 µS/cm) is the same as the general irrigation guide-line, thus the pattern of exceedances is the same. Fewer than 25 percent of the samples from Powder River near Locate exceeded the numeric standard for the Powder River main-stem (2,500 µS/cm), which is higher than the general irriga-tion guideline. All other specific-conductance values in the Yellowstone River basin were less than the general irrigation guideline.
In the Columbia River basin, specific-conductance values ranged from 32 µS/cm at Yaak River near Troy to 416 µS/cm at Clark Fork at Turah Bridge. All measured values of specific conductance were low relative to the other two basins, with medians ranging from 76 µS/cm at Yaak River near Troy to
20 Water-Quality Characteristics of Montana Streams in a Statewide Monitoring Network, 1999-2003
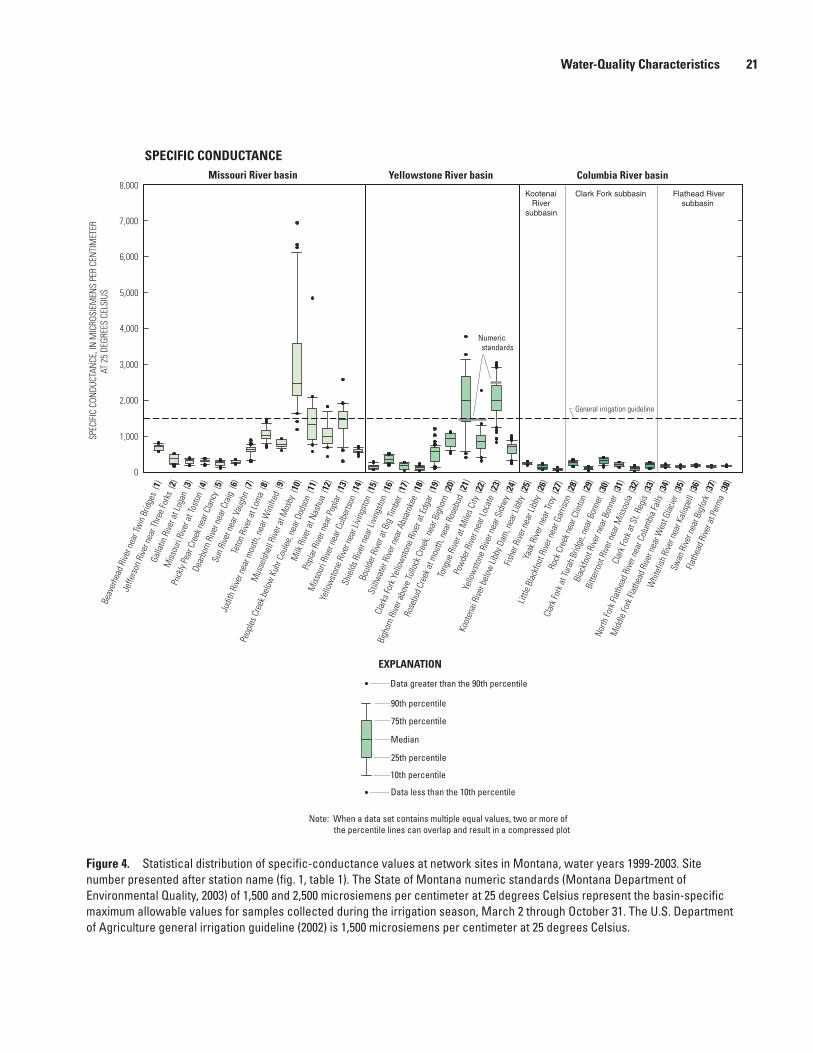
Figure �. Statistical distribution of specific-conductance values at network sites in Montana, water years 1999-2003. Site number presented after station name (fig. 1, table 1). The State of Montana numeric standards (Montana Department of Environmental Quality, 2003) of 1,500 and 2,500 microsiemens per centimeter at 25 degrees Celsius represent the basin-specific maximum allowable values for samples collected during the irrigation season, March 2 through October 31. The U.S. Department of Agriculture general irrigation guideline (2002) is 1,500 microsiemens per centimeter at 25 degrees Celsius.
General irrigation guideline
SPEC
IFIC
CON
DUCT
ANCE
, IN
MIC
ROSI
EMEN
S PE
R CE
NTI
MET
ER
AT
25 D
EGRE
ES C
ELSI
US
4,000
6,000
2,000
0
3,000
5,000
1,000
8,000
7,000
Numeric standards
SPECIFIC CONDUCTANCEMissouri River basin Yellowstone River basin Columbia River basin
Kootenai Riversubbasin
Flathead River subbasin
Clark Fork subbasin
EXPLANATION
Data greater than the 90th percentile
90th percentile
75th percentile
Median
25th percentile
10th percentile
Data less than the 10th percentile
Note: When a data set contains multiple equal values, two or more of the percentile lines can overlap and result in a compressed plot
Beav
erhe
ad R
iver n
ear T
win
Brid
ges
(1)
Jeffe
rson
Rive
r nea
r Thr
ee Fo
rks
(2)
Galla
tin R
iver a
t Log
an (
3)
Miss
ouri
Rive
r at T
osto
n (4
)
Prick
ly Pe
ar C
reek
nea
r Cla
ncy
(5)
Dear
born
Rive
r nea
r Cra
ig (
6)
Sun
Rive
r nea
r Vau
ghn
(7)
Teto
n Ri
ver a
t Lom
a (8
)
Judi
th R
iver n
ear m
outh
, nea
r Win
ifred
(9)
Mus
selsh
ell R
iver a
t Mos
by (
10)
Peop
les C
reek
bel
ow K
uhr C
oule
e, n
ear D
odso
n (1
1)
Milk
Rive
r at N
ashu
a (1
2)
Popl
ar R
iver n
ear P
opla
r (13
)
Miss
ouri
Rive
r nea
r Cul
berts
on (
14)
Yello
wst
one
Rive
r nea
r Livi
ngst
on (
15)
Shie
lds R
iver n
ear L
iving
ston
(16
)
Boul
der R
iver a
t Big
Tim
ber
(17)
Still
wat
er R
iver n
ear A
bsar
okee
(18
)
Clar
ks Fo
rk Y
ello
wst
one
Rive
r at E
dgar
(19
)
Bigh
orn
Rive
r abo
ve Tu
llock
Cre
ek, n
ear B
igho
rn (
20)
Rose
bud
Cree
k at m
outh
, nea
r Ros
ebud
(21
)
Tong
ue R
iver a
t Mile
s City
(22
)
Pow
der R
iver n
ear L
ocat
e (2
3)
Yello
wst
one
Rive
r nea
r Sid
ney
(24)
Koot
enai
Rive
r bel
ow Li
bby D
am, n
ear L
ibby
(25
)
Fishe
r Rive
r nea
r Lib
by (
26)
Yaak
Rive
r nea
r Tro
y (27
)
Little
Bla
ckfo
ot R
iver n
ear G
arris
on (
28)
Rock
Cre
ek n
ear C
linto
n (2
9)
Clar
k For
k at T
urah
Brid
ge, n
ear B
onne
r (30
)
Blac
kfoo
t Rive
r nea
r Bon
ner
(31)
Bitte
rroot
Rive
r nea
r Miss
oula
(32
)
Clar
k For
k at S
t. Re
gis
(33)
North
Fork
Flat
head
Rive
r nea
r Col
umbi
a Fa
lls (
34)
Mid
dle
Fork
Flat
head
Rive
r nea
r Wes
t Gla
cier
(35)
Whi
tefis
h Ri
ver n
ear K
alisp
ell
(36)
Swan
Rive
r nea
r Big
fork
(37
)
Flath
ead
Rive
r at P
erm
a (3
8)
Water-Quality Characteristics 21
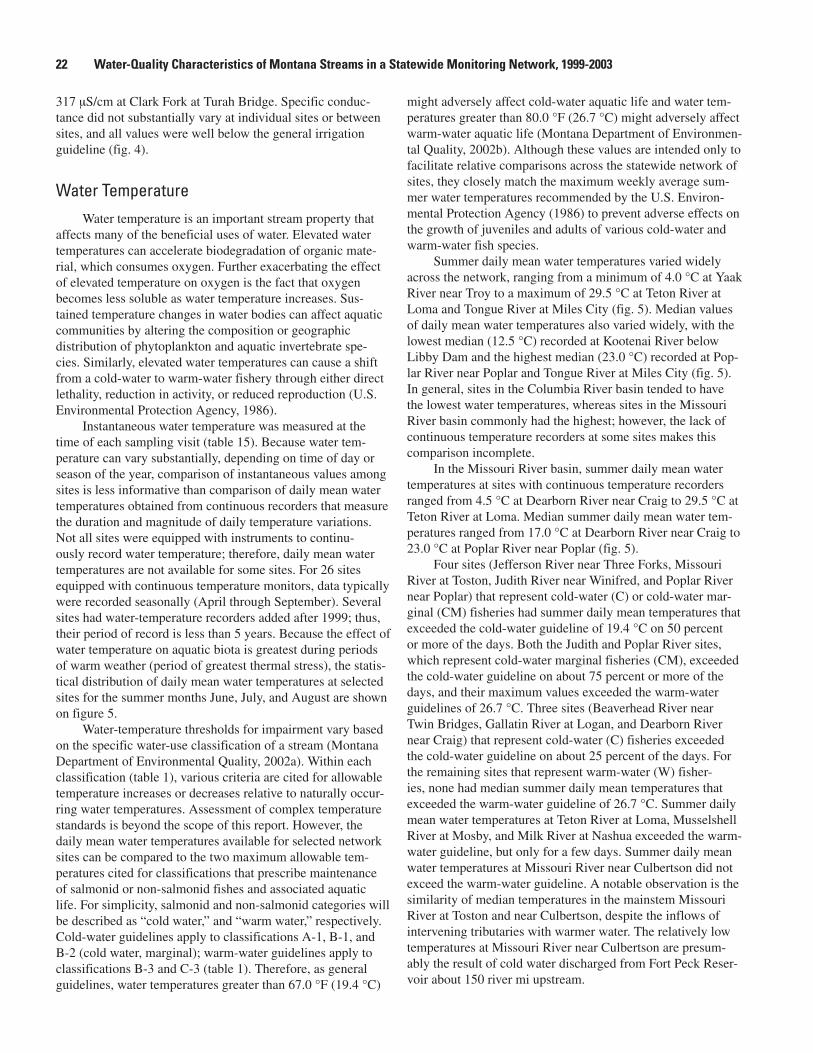
317 µS/cm at Clark Fork at Turah Bridge. Specific conduc-tance did not substantially vary at individual sites or between sites, and all values were well below the general irrigation guideline (fig. 4).
Water TemperatureWater temperature is an important stream property that
affects many of the beneficial uses of water. Elevated water temperatures can accelerate biodegradation of organic mate-rial, which consumes oxygen. Further exacerbating the effect of elevated temperature on oxygen is the fact that oxygen becomes less soluble as water temperature increases. Sus-tained temperature changes in water bodies can affect aquatic communities by altering the composition or geographic distribution of phytoplankton and aquatic invertebrate spe-cies. Similarly, elevated water temperatures can cause a shift from a cold-water to warm-water fishery through either direct lethality, reduction in activity, or reduced reproduction (U.S. Environmental Protection Agency, 1986).
Instantaneous water temperature was measured at the time of each sampling visit (table 15). Because water tem-perature can vary substantially, depending on time of day or season of the year, comparison of instantaneous values among sites is less informative than comparison of daily mean water temperatures obtained from continuous recorders that measure the duration and magnitude of daily temperature variations. Not all sites were equipped with instruments to continu-ously record water temperature; therefore, daily mean water temperatures are not available for some sites. For 26 sites equipped with continuous temperature monitors, data typically were recorded seasonally (April through September). Several sites had water-temperature recorders added after 1999; thus, their period of record is less than 5 years. Because the effect of water temperature on aquatic biota is greatest during periods of warm weather (period of greatest thermal stress), the statis-tical distribution of daily mean water temperatures at selected sites for the summer months June, July, and August are shown on figure 5.
Water-temperature thresholds for impairment vary based on the specific water-use classification of a stream (Montana Department of Environmental Quality, 2002a). Within each classification (table 1), various criteria are cited for allowable temperature increases or decreases relative to naturally occur-ring water temperatures. Assessment of complex temperature standards is beyond the scope of this report. However, the daily mean water temperatures available for selected network sites can be compared to the two maximum allowable tem-peratures cited for classifications that prescribe maintenance of salmonid or non-salmonid fishes and associated aquatic life. For simplicity, salmonid and non-salmonid categories will be described as “cold water,” and “warm water,” respectively. Cold-water guidelines apply to classifications A-1, B-1, and B-2 (cold water, marginal); warm-water guidelines apply to classifications B-3 and C-3 (table 1). Therefore, as general guidelines, water temperatures greater than 67.0 °F (19.4 °C)
might adversely affect cold-water aquatic life and water tem-peratures greater than 80.0 °F (26.7 °C) might adversely affect warm-water aquatic life (Montana Department of Environmen-tal Quality, 2002b). Although these values are intended only to facilitate relative comparisons across the statewide network of sites, they closely match the maximum weekly average sum-mer water temperatures recommended by the U.S. Environ-mental Protection Agency (1986) to prevent adverse effects on the growth of juveniles and adults of various cold-water and warm-water fish species.
Summer daily mean water temperatures varied widely across the network, ranging from a minimum of 4.0 °C at Yaak River near Troy to a maximum of 29.5 °C at Teton River at Loma and Tongue River at Miles City (fig. 5). Median values of daily mean water temperatures also varied widely, with the lowest median (12.5 °C) recorded at Kootenai River below Libby Dam and the highest median (23.0 °C) recorded at Pop-lar River near Poplar and Tongue River at Miles City (fig. 5). In general, sites in the Columbia River basin tended to have the lowest water temperatures, whereas sites in the Missouri River basin commonly had the highest; however, the lack of continuous temperature recorders at some sites makes this comparison incomplete.
In the Missouri River basin, summer daily mean water temperatures at sites with continuous temperature recorders ranged from 4.5 °C at Dearborn River near Craig to 29.5 °C at Teton River at Loma. Median summer daily mean water tem-peratures ranged from 17.0 °C at Dearborn River near Craig to 23.0 °C at Poplar River near Poplar (fig. 5).
Four sites (Jefferson River near Three Forks, Missouri River at Toston, Judith River near Winifred, and Poplar River near Poplar) that represent cold-water (C) or cold-water mar-ginal (CM) fisheries had summer daily mean temperatures that exceeded the cold-water guideline of 19.4 °C on 50 percent or more of the days. Both the Judith and Poplar River sites, which represent cold-water marginal fisheries (CM), exceeded the cold-water guideline on about 75 percent or more of the days, and their maximum values exceeded the warm-water guidelines of 26.7 °C. Three sites (Beaverhead River near Twin Bridges, Gallatin River at Logan, and Dearborn River near Craig) that represent cold-water (C) fisheries exceeded the cold-water guideline on about 25 percent of the days. For the remaining sites that represent warm-water (W) fisher-ies, none had median summer daily mean temperatures that exceeded the warm-water guideline of 26.7 °C. Summer daily mean water temperatures at Teton River at Loma, Musselshell River at Mosby, and Milk River at Nashua exceeded the warm-water guideline, but only for a few days. Summer daily mean water temperatures at Missouri River near Culbertson did not exceed the warm-water guideline. A notable observation is the similarity of median temperatures in the mainstem Missouri River at Toston and near Culbertson, despite the inflows of intervening tributaries with warmer water. The relatively low temperatures at Missouri River near Culbertson are presum-ably the result of cold water discharged from Fort Peck Reser-voir about 150 river mi upstream.
22 Water-Quality Characteristics of Montana Streams in a Statewide Monitoring Network, 1999-2003
Figure �. Statistical distribution of summer (June-August) daily mean water temperatures at selected network sites with continuous temperature recorders in Montana, water years 1999-2003. Site number presented after station name (fig. 1, table 1). Letters at base of the graph represent abbreviations for the type of aquatic biota supported by the streams (Montana Department of Environmental Quality, 2002a) based on water-use classifications: C, cold water (class A-1 and B-1); CM, cold water, marginal (class B-2); and W, warm water (class B-3 and C-3). The State of Montana water-temperature guidelines (Montana Department of Environmental Quality, 2002b) of 19.4 degrees Celsius (67.0 degrees Fahrenheit) and 26.7 degrees Celsius (80.0 degrees Fahrenheit) represent the maximum temperature recommended for salmonid (C and CM) and non-salmonid (W) fisheries, respectively.
DEGR
EES
CELS
IUS
0
5
10
15
20
25
30
35
Aquatic-life warm water guideline
Aquatic-life cold water guideline
C C C C C C C C C CC C C C CWWW W CM CM CM CMW
SUMMER DAILY MEAN WATER TEMPERATUREMissouri River basin Yellowstone River basin Columbia River basin
Kootenai Riversubbasin
Flathead River subbasin
Clark Fork subbasin
WC
EXPLANATION
Data greater than the 90th percentile
90th percentile
75th percentile
Median
25th percentile
10th percentile
Data less than the 10th percentile
Note: When a data set contains multiple equal values, two or more of the percentile lines can overlap and result in a compressed plot
Beav
erhe
ad R
iver n
ear T
win
Brid
ges
(1)
Jeffe
rson
Rive
r nea
r Thr
ee Fo
rks
(2)
Galla
tin R
iver a
t Log
an (
3)
Miss
ouri
Rive
r at T
osto
n (4
)De
arbo
rn R
iver n
ear C
raig
(6)
Sun
Rive
r nea
r Vau
ghn
(7)
Teto
n Ri
ver a
t Lom
a (8
)
Judi
th R
iver n
ear m
outh
, nea
r Win
ifred
(9)
Mus
selsh
ell R
iver a
t Mos
by (
10)
Milk
Rive
r at N
ashu
a (1
2)
Popl
ar R
iver n
ear P
opla
r (13
)
Miss
ouri
Rive
r nea
r Cul
berts
on (
14)
Yello
wst
one
Rive
r nea
r Livi
ngst
on (
15)
Shie
lds R
iver n
ear L
iving
ston
(16
)
Boul
der R
iver a
t Big
Tim
ber
(17)
Still
wat
er R
iver n
ear A
bsar
okee
(18
)
Clar
ks Fo
rk Y
ello
wst
one
Rive
r at E
dgar
(19
)
Bigh
orn
Rive
r abo
ve Tu
llock
Cre
ek, n
ear B
igho
rn (
20)
Tong
ue R
iver a
t Mile
s City
(22
)
Koot
enai
Rive
r bel
ow Li
bby D
am, n
ear L
ibby
(25
)Ya
ak R
iver n
ear T
roy
(27)
Little
Bla
ckfo
ot R
iver n
ear G
arris
on (
28)
Blac
kfoo
t Rive
r nea
r Bon
ner
(31)
Bitte
rroot
Rive
r nea
r Miss
oula
(32
)
Swan
Rive
r nea
r Big
fork
(37
)
Flath
ead
Rive
r at P
erm
a (3
8)
Water-Quality Characteristics 23
In the Yellowstone River basin, summer daily mean water temperatures at sites with continuous temperature recorders ranged from 6.5 °C at Boulder River at Big Timber to 29.5 °C at Tongue River at Miles City. Median summer daily mean water temperatures ranged from 16.0 °C at Boulder River at Big Timber to 23.0 °C at Tongue River at Miles City (fig. 5). Water temperatures were distinctly higher in three tributaries (Clarks Fork Yellowstone, Bighorn, and Tongue Rivers). The four most upstream sites (Yellowstone River near Livingston, Shields River near Livingston, Boulder River at Big Tim-ber, and Stillwater River near Absarokee), which represent cold-water (C) fisheries, exceeded the cold-water guideline of 19.4 °C on 10 percent or fewer days. Summer daily mean water temperatures at Clarks Fork Yellowstone River at Edgar and Bighorn River near Bighorn, which represent cold-water marginal (CM) fisheries, exceeded the cold-water guideline on about 50 percent of the days. Summer daily mean water temperatures at Tongue River at Miles City, which represents warm-water (W) fisheries, exceeded the warm-water guideline on about 10 percent of the days.
In the Columbia River basin, only about one-half of the sites were equipped with continuous water-temperature record-ers. Summer daily mean water temperatures ranged from 4.0 °C at Yaak River near Troy to 25.0 °C at Flathead River at Perma. Median summer daily mean temperatures ranged from 12.5 °C at Kootenai River below Libby Dam to 20.5 °C at Flathead River at Perma. All of the sites in the Columbia River basin represent cold-water (C) fisheries. Flathead River at Perma was the only site in the Columbia River basin having a median summer daily mean water temperature that exceeded the cold water guideline of 19.4 °C, although every other site, except Kootenai River below Libby Dam, had occasional to moderately frequent exceedances of the cold-water guideline. Summer daily mean water temperatures at Yaak River near Troy, Bitterroot River near Missoula, and Swan River near Bigfork exceeded the cold-water guideline on about 25 percent of the days during the summer months of 1999-2003.
Nutrients
Nutrients were a primary constituent group analyzed in every sample collected for the statewide monitoring program. Although nutrients are essential to plant growth, elevated concentrations of nitrogen or phosphorus can be detrimental to the health of an aquatic system by promoting excessive plant growth. Nutrient enrichment in streams can lead to eutrophica-tion, which is a condition characterized by increased biologi-cal productivity and associated decomposition of organic material that can lead to nuisance levels of algae, accumula-tion of organic material on streambeds, or depletion of dis-solved oxygen. In addition to effects on aquatic plants, human health can be adversely affected by high concentrations of nitrate by impairing oxygen transport in the circulatory system of infants (U.S. Environmental Protection Agency, 1986). In general, concentrations of nutrients in unfiltered samples (total
ammonia plus organic nitrogen and total phosphorus) tend to increase during conditions of runoff and high suspended-sedi-ment concentrations as the result of adsorption of these com-pounds to sediment particles. Concentrations of nutrients in filtered samples (dissolved nitrite plus nitrate, dissolved nitrite, and dissolved orthophosphate) have a more variable response to differing hydrologic conditions, possibly responding to instream biological processes or seasonal land-use practices.
Nutrients sampled for this program were compounds of nitrogen (N) or phosphorus (P) that are essential for the growth of aquatic plants. The nutrient compounds analyzed included dissolved nitrite plus nitrate, dissolved nitrite, total ammonia plus organic nitrogen, dissolved orthophosphate, and total phosphorus (table 2). To provide an approximate measure of total nitrogen concentrations, the concentrations of dissolved nitrite plus nitrate and total ammonia plus organic nitrogen were summed. The statistical distributions of nutrient concentrations at network sites during water years 1999-2003 are summarized in table 15.
Dissolved Nitrite plus NitrateThe statistical distribution of dissolved nitrite plus nitrate
concentrations as N at network sites during water years 1999-2003 is shown in figure 6. Concentrations of nitrate as N exceeding 10 mg/L may cause methemoglobinemia in small children (U.S. Environmental Protection Agency, 1986). This value has been adopted as a State of Montana human-health standard for drinking water (Montana Department of Environmental Quality, 2004). Because nitrate tends to be the predominant form of inorganic nitrogen in surface waters (Allen and Kramer, 1972), a general eutrophication guideline of 0.30 mg/L also is used as a reference concentration for inor-ganic nitrogen that could potentially stimulate algal growth in the presence of adequate phosphorus (Mackenthun, 1969).
Across the network, concentrations of dissolved nitrite plus nitrate ranged from <0.005 to 3.80 mg/L as N. Consistent spatial patterns were not evident, although the lowest concen-trations of dissolved nitrite plus nitrate in the statewide net-work generally were measured in the Columbia River basin. Dissolved nitrite concentrations consistently were low (less than 0.01 mg/L) or less than the LRL; therefore, boxplots are not presented for dissolved nitrite. Because dissolved nitrite concentrations were low, the combined nitrite plus nitrate concentrations were used as a reference for comparison to the human-health standard for nitrate and the general eutrophica-tion guideline. None of the sites in the statewide network had samples with dissolved nitrite plus nitrate concentrations that exceeded the human-health standard of 10 mg/L for nitrate as N.
In the Missouri River basin, concentrations of dissolved nitrite plus nitrate ranged from <0.005 mg/L at several sites to 3.80 mg/L at Sun River near Vaughn and were mostly less than 1 mg/L. Many analyses were less than the LRL. Median concentrations of dissolved nitrite plus nitrate in the Missouri River basin ranged from <0.013 mg/L as N at Poplar River
2� Water-Quality Characteristics of Montana Streams in a Statewide Monitoring Network, 1999-2003
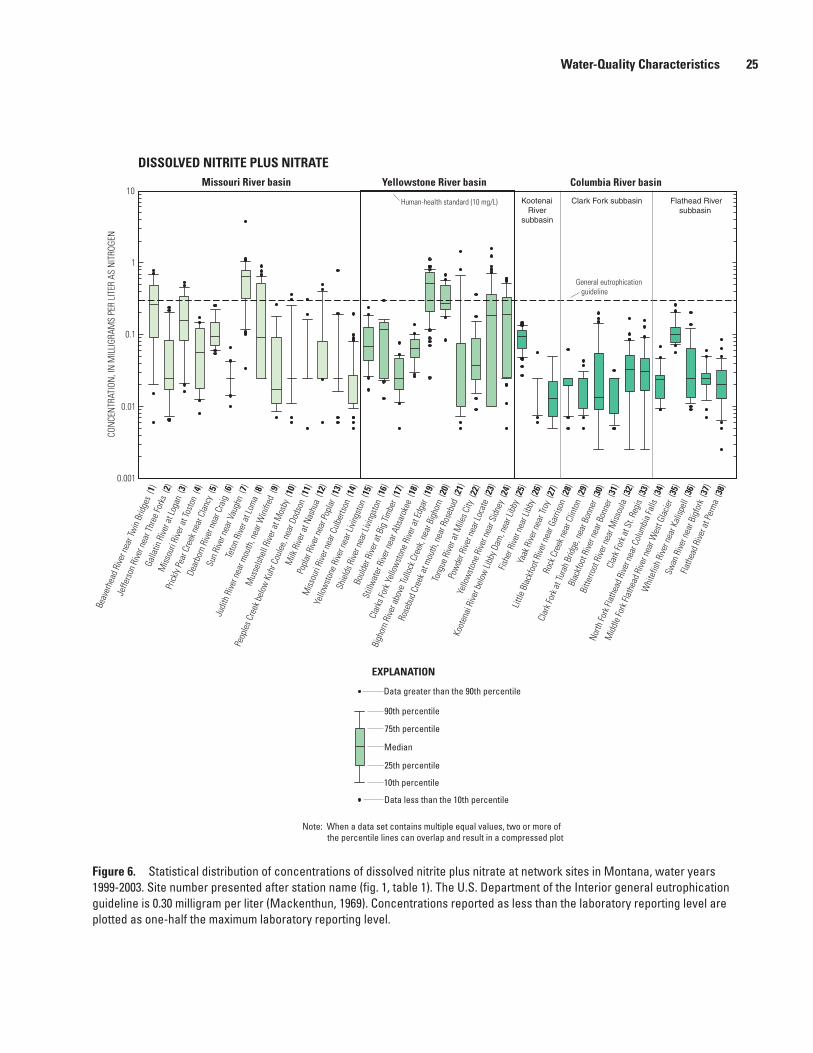
Figure �. Statistical distribution of concentrations of dissolved nitrite plus nitrate at network sites in Montana, water years 1999-2003. Site number presented after station name (fig. 1, table 1). The U.S. Department of the Interior general eutrophication guideline is 0.30 milligram per liter (Mackenthun, 1969). Concentrations reported as less than the laboratory reporting level are plotted as one-half the maximum laboratory reporting level.
CON
CEN
TRAT
ION
, IN
MIL
LIGR
AMS
PER
LITE
R AS
NIT
ROGE
N
0.001
0.01
0.1
1
10
General eutrophication guideline
Human-health standard (10 mg/L)
DISSOLVED NITRITE PLUS NITRATEMissouri River basin Yellowstone River basin Columbia River basin
Kootenai Riversubbasin
Flathead River subbasin
Clark Fork subbasin
EXPLANATION
Data greater than the 90th percentile
90th percentile
75th percentile
Median
25th percentile
10th percentile
Data less than the 10th percentile
Note: When a data set contains multiple equal values, two or more of the percentile lines can overlap and result in a compressed plot
Beav
erhe
ad R
iver n
ear T
win
Brid
ges
(1)
Jeffe
rson
Rive
r nea
r Thr
ee Fo
rks
(2)
Galla
tin R
iver a
t Log
an (
3)
Miss
ouri
Rive
r at T
osto
n (4
)
Prick
ly Pe
ar C
reek
nea
r Cla
ncy
(5)
Dear
born
Rive
r nea
r Cra
ig (
6)
Sun
Rive
r nea
r Vau
ghn
(7)
Teto
n Ri
ver a
t Lom
a (8
)
Judi
th R
iver n
ear m
outh
, nea
r Win
ifred
(9)
Mus
selsh
ell R
iver a
t Mos
by (
10)
Peop
les C
reek
bel
ow K
uhr C
oule
e, n
ear D
odso
n (1
1)
Milk
Rive
r at N
ashu
a (1
2)
Popl
ar R
iver n
ear P
opla
r (13
)
Miss
ouri
Rive
r nea
r Cul
berts
on (
14)
Yello
wst
one
Rive
r nea
r Livi
ngst
on (
15)
Shie
lds R
iver n
ear L
iving
ston
(16
)
Boul
der R
iver a
t Big
Tim
ber
(17)
Still
wat
er R
iver n
ear A
bsar
okee
(18
)
Clar
ks Fo
rk Y
ello
wst
one
Rive
r at E
dgar
(19
)
Bigh
orn
Rive
r abo
ve Tu
llock
Cre
ek, n
ear B
igho
rn (
20)
Rose
bud
Cree
k at m
outh
, nea
r Ros
ebud
(21
)
Tong
ue R
iver a
t Mile
s City
(22
)
Pow
der R
iver n
ear L
ocat
e (2
3)
Yello
wst
one
Rive
r nea
r Sid
ney
(24)
Koot
enai
Rive
r bel
ow Li
bby D
am, n
ear L
ibby
(25
)
Fishe
r Rive
r nea
r Lib
by (
26)
Yaak
Rive
r nea
r Tro
y (27
)
Little
Bla
ckfo
ot R
iver n
ear G
arris
on (
28)
Rock
Cre
ek n
ear C
linto
n (2
9)
Clar
k For
k at T
urah
Brid
ge, n
ear B
onne
r (30
)
Blac
kfoo
t Rive
r nea
r Bon
ner
(31)
Bitte
rroot
Rive
r nea
r Miss
oula
(32
)
Clar
k For
k at S
t. Re
gis
(33)
North
Fork
Flat
head
Rive
r nea
r Col
umbi
a Fa
lls (
34)
Mid
dle
Fork
Flat
head
Rive
r nea
r Wes
t Gla
cier
(35)
Whi
tefis
h Ri
ver n
ear K
alisp
ell
(36)
Swan
Rive
r nea
r Big
fork
(37
)
Flath
ead
Rive
r at P
erm
a (3
8)
Water-Quality Characteristics 2�
near Poplar to 0.610 mg/L as N at Sun River near Vaughn (fig. 6, table 15). The median concentration (0.610 mg/L as N) at Sun River near Vaughn was more than two times greater than the next highest median concentration in the basin.
About one-half of the sites had one or more samples with dissolved nitrite plus nitrate concentrations exceeding the general eutrophication guideline of 0.30 mg/L (fig. 6). The guideline was most frequently exceeded (about 75 percent of the samples) at Sun River near Vaughn; the guideline also was exceeded (more than 25 percent of the samples) at Beaverhead River near Twin Bridges, Gallatin River at Logan, and Teton River at Loma.
In the Yellowstone River basin, dissolved nitrite plus nitrate concentrations ranged from <0.005 mg/L at Rosebud Creek near Rosebud and Yellowstone River near Sidney to 1.58 mg/L at Powder River near Locate and also were mostly less than 1 mg/L. Many analyses were less than the LRL. Median concentrations of dissolved nitrite plus nitrate ranged from 0.024 mg/L as N at Boulder River at Big Tim-ber to 0.525 mg/L as N at Clarks Fork Yellowstone River at Edgar. The median dissolved nitrite plus nitrate concentration (0.525 mg/L) at Clarks Fork Yellowstone River at Edgar was substantially higher than the other sites in the Yellowstone River basin.
About one-half the sites in the Yellowstone River basin had one or more samples with dissolved nitrite plus nitrate concentrations exceeding the general eutrophication guide-line. The guideline was most frequently exceeded (more than 50 percent of the samples) at Clarks Fork Yellowstone River near Edgar. The general eutrophication guideline was exceeded in about 25 to 50 percent of the samples at Bighorn River near Bighorn, Powder River near Locate, and Yellow-stone River near Sidney.
In the Columbia River basin, concentrations of dissolved nitrite plus nitrate ranged from <0.005 mg/L at several sites to 0.260 mg/L at Middle Fork Flathead River at West Glacier and commonly were less than 0.05 mg/L. Many analyses were less than the LRL. Median concentrations of dissolved nitrite plus nitrate ranged from <0.022 mg/L as N at Fisher Creek near Libby and Yaak River near Troy to 0.102 mg/L as N at Middle Fork Flathead River near West Glacier (fig. 6, table 15). Maximum concentrations at all sites in the basin were less than 0.30 mg/L. The general eutrophication guideline was not exceeded at any of the sites in the Columbia River basin.
Total Ammonia Plus Organic NitrogenThe statistical distribution of total ammonia plus organic
nitrogen (commonly referred to as total kjeldahl nitrogen, or TKN) concentrations at network sites during water years 1999-2003 is shown in figure 7. Across the network, concen-trations of total ammonia plus organic nitrogen ranged from <0.08 to 30 mg/L as N (table 15). Concentrations of total ammonia plus organic nitrogen commonly increased during conditions of high streamflow and suspended-sediment con-centrations. Similar to dissolved nitrite plus nitrate, the total
ammonia plus organic nitrogen values measured at sites in the Columbia River basin generally were lower than at most sites in the Missouri or Yellowstone River basins. Median concen-trations varied among sites to a greater degree in the Missouri and Yellowstone River basins compared to the Columbia River basin, but no clear spatial pattern was evident. The highest concentrations in the Missouri and Yellowstone River basins were measured in tributaries in the lower parts of the basins.
In the Missouri River basin, concentrations of total ammonia plus organic nitrogen ranged from <0.08 mg/L at Dearborn River near Craig to 5.2 mg/L at Teton River near Loma and most analyses were greater than the LRL. Median concentrations of total ammonia plus organic nitrogen ranged from 0.10 mg/L as N at Dearborn River near Craig to 0.88 mg/L as N at Milk River at Nashua (fig. 7, table 15). Four tributary sites (Musselshell River at Mosby, Peoples Creek near Dodson, Milk River at Nashua, and Poplar River near Poplar) in the lower part of the Missouri River basin had ele-vated median concentrations compared to the rest of the sites in the basin. The two mainstem sites (Missouri River at Toston and Missouri River near Culbertson) had very similar distribu-tions of total ammonia plus organic nitrogen concentrations, with nearly identical values for the median concentration.
In the Yellowstone River basin, total ammonia plus organic nitrogen concentrations ranged from E0.04 mg/L at Yellowstone River near Sidney to 30 mg/L at Powder River near Locate and generally were similar to those at sites in the Missouri River basin (fig. 7). The maximum concentration (30 mg/L as N) measured in a sample collected at Powder River near Locate also was the highest concentration of total ammonia plus organic nitrogen measured in the statewide net-work. The second highest maximum concentration (17 mg/L as N) was measured at Rosebud Creek near Rosebud (fig. 7).
Median concentrations for total ammonia plus organic nitrogen ranged from 0.16 mg/L as N at Boulder River at Big Timber to 0.74 mg/L as N at Rosebud Creek near Rosebud (table 15). Two sites (Boulder River at Big Timber and Still-water River near Absarokee) had notably lower median con-centrations of total ammonia plus organic nitrogen compared to the other sites in the Yellowstone River basin. Both streams drain headwater areas of mountainous terrain and forest with relatively little urban development. At the mainstem sites, the median concentration of total ammonia plus organic nitrogen at Yellowstone River near Sidney was about double that of the median concentration at Yellowstone River near Livingston, and the maximum concentration was nearly three times higher.
In the Columbia River basin, total ammonia plus organic nitrogen concentrations ranged from <0.08 mg/L at North Fork Flathead River near Columbia Falls and Middle Fork Flathead River near West Glacier to 1.7 mg/L at Flathead River at Perma and generally were lower than at most sites in the Missouri or Yellowstone River basins (fig. 7). Median concentrations ranged from 0.07 mg/L as N at Middle Fork Flathead River near West Glacier to 0.28 mg/L as N at Little Blackfoot River near Garrison (table 15). The highest con-centration (1.7 mg/L as N) measured in a sample collected at
2� Water-Quality Characteristics of Montana Streams in a Statewide Monitoring Network, 1999-2003

Figure �. Statistical distribution of concentrations of total ammonia plus organic nitrogen at network sites in Montana, water years 1999-2003. Site number presented after station name (fig. 1, table 1). Concentrations reported as less than the laboratory reporting level are plotted as one-half the maximum laboratory reporting level.
CON
CEN
TRAT
ION
, IN
MIL
LIGR
AMS
PER
LITE
R AS
NIT
ROGE
N
0.01
0.1
10
100
1
TOTAL AMMONIA PLUS ORGANIC NITROGENMissouri River basin Yellowstone River basin Columbia River basin
Kootenai Riversubbasin
Flathead River subbasin
Clark Fork subbasin
EXPLANATION
Data greater than the 90th percentile
90th percentile
75th percentile
Median
25th percentile
10th percentile
Data less than the 10th percentile
Note: When a data set contains multiple equal values, two or more of the percentile lines can overlap and result in a compressed plot
Beav
erhe
ad R
iver n
ear T
win
Brid
ges
(1)
Jeffe
rson
Rive
r nea
r Thr
ee Fo
rks
(2)
Galla
tin R
iver a
t Log
an (
3)
Miss
ouri
Rive
r at T
osto
n (4
)
Prick
ly Pe
ar C
reek
nea
r Cla
ncy
(5)
Dear
born
Rive
r nea
r Cra
ig (
6)
Sun
Rive
r nea
r Vau
ghn
(7)
Teto
n Ri
ver a
t Lom
a (8
)
Judi
th R
iver n
ear m
outh
, nea
r Win
ifred
(9)
Mus
selsh
ell R
iver a
t Mos
by (
10)
Peop
les C
reek
bel
ow K
uhr C
oule
e, n
ear D
odso
n (1
1)
Milk
Rive
r at N
ashu
a (1
2)
Popl
ar R
iver n
ear P
opla
r (13
)
Miss
ouri
Rive
r nea
r Cul
berts
on (
14)
Yello
wst
one
Rive
r nea
r Livi
ngst
on (
15)
Shie
lds R
iver n
ear L
iving
ston
(16
)
Boul
der R
iver a
t Big
Tim
ber
(17)
Still
wat
er R
iver n
ear A
bsar
okee
(18
)
Clar
ks Fo
rk Y
ello
wst
one
Rive
r at E
dgar
(19
)
Bigh
orn
Rive
r abo
ve Tu
llock
Cre
ek, n
ear B
igho
rn (
20)
Rose
bud
Cree
k at m
outh
, nea
r Ros
ebud
(21
)
Tong
ue R
iver a
t Mile
s City
(22
)
Pow
der R
iver n
ear L
ocat
e (2
3)
Yello
wst
one
Rive
r nea
r Sid
ney
(24)
Koot
enai
Rive
r bel
ow Li
bby D
am, n
ear L
ibby
(25
)
Fishe
r Rive
r nea
r Lib
by (
26)
Yaak
Rive
r nea
r Tro
y (27
)
Little
Bla
ckfo
ot R
iver n
ear G
arris
on (
28)
Rock
Cre
ek n
ear C
linto
n (2
9)
Clar
k For
k at T
urah
Brid
ge, n
ear B
onne
r (30
)
Blac
kfoo
t Rive
r nea
r Bon
ner
(31)
Bitte
rroot
Rive
r nea
r Miss
oula
(32
)
Clar
k For
k at S
t. Re
gis
(33)
North
Fork
Flat
head
Rive
r nea
r Col
umbi
a Fa
lls (
34)
Mid
dle
Fork
Flat
head
Rive
r nea
r Wes
t Gla
cier
(35)
Whi
tefis
h Ri
ver n
ear K
alisp
ell
(36)
Swan
Rive
r nea
r Big
fork
(37
)
Flath
ead
Rive
r at P
erm
a (3
8)
Water-Quality Characteristics 2�
Flathead River at Perma was almost two times greater than the next highest concentration (0.90 mg/L as N) measured at Clark Fork at Turah Bridge.
The six sites in the Clark Fork subbasin (sites 28-32, fig. 7) had distinctly higher median concentrations of total ammonia plus organic nitrogen compared to sites in the Koo-tenai and Flathead River subbasins. The generally consistent medians and ranges of concentrations among the six sites might indicate that the predominant sources of total ammonia plus organic nitrogen in this part of the basin are similar and widespread.
Total NitrogenConcentrations of total nitrogen were not analyzed
directly because the analytical method was not available dur-ing the 1999-2003 monitoring period. However, total nitrogen concentrations were estimated by adding concentrations of dissolved nitrite plus nitrate and total ammonia plus organic nitrogen. These estimated concentrations are intended only for general comparisons among sites or to water-quality standards or guidelines. The Montana Department of Environmental Quality (2002b) has established a stream-specific numeric standard of 0.300 mg/L for total nitrogen as N for the main-stem reach of the Clark Fork that encompasses Clark Fork at Turah Bridge and Clark Fork at St. Regis. This standard is applicable seasonally during June 21–September 21. In addi-tion to this seasonal standard for the Clark Fork, the U.S. Envi-ronmental Protection Agency (2001a,b) provides an ecoregion guideline concentration of 1.50 mg/L for total nitrogen to prevent eutrophication within applicable areas of central and eastern Montana.
The statistical distribution of estimated concentrations of total nitrogen at network sites during water years 1999-2003 is shown in figure 8. Across the network, estimated concen-trations of total nitrogen ranged from 0.043 to 31.6 mg/L (table 15). The magnitudes and spatial patterns of total nitro-gen concentrations were very similar to those of total ammo-nia plus organic nitrogen. Estimated total nitrogen concentra-tions at sites in the Columbia River basin generally were lower than at most of the sites in the Missouri or Yellowstone River basins.
In the Missouri River basin, estimated total nitrogen con-centrations ranged from 0.043 mg/L at Dearborn River near Craig to 5.80 mg/L at Teton River at Loma. Median estimated concentrations of total nitrogen ranged from 0.119 mg/L at Dearborn River near Craig to the very similar medians of 0.922 and 0.937 mg/L at Sun River near Vaughn and Milk River at Nashua (fig. 8, table 15) , respectively. Two other streams in the lower Missouri River basin (Musselshell River at Mosby and Poplar River near Poplar) also had median con-centrations of total nitrogen (0.727 and 0.851 mg/L, respec-tively) that were somewhat elevated compared to other sites in the basin. The two mainstem sites (Missouri River at Toston and near Culbertson) had similar median concentrations of total nitrogen of 0.388 and 0.333 mg/L, respectively. The
negligible difference in median total-nitrogen concentrations between the two mainstem sites, even though most tributaries contribute water having higher concentrations, may result from nutrient uptake or deposition within the mainstem reservoirs between the two sites.
The only site in the Missouri River basin where most of the estimated total nitrogen concentrations were substantially higher than that of total ammonia plus organic nitrogen was Sun River near Vaughn, which indicates that dissolved nitrite plus nitrate composed a relatively large percentage of the total nitrogen at this site. With the exception of Judith River near Winifred, concentrations in one or more samples from all of the sites in the lower basin (Teton River and downstream) exceeded the ecoregion eutrophication guideline of 1.50 mg/L.
In the Yellowstone River basin, estimated total nitrogen concentrations ranged from 0.098 mg/L at Boulder River near Big Timber to 31.6 mg/L at Powder River near Locate. The highest concentration measured at Powder River near Locate also was the highest in the statewide network. Median estimated concentrations of total nitrogen ranged from 0.173 mg/L at Boulder River at Big Timber to very simi-lar medians ranging from 0.84 to 0.885 mg/L at three sites (Clarks Fork Yellowstone River at Edgar, Bighorn River near Bighorn, and Powder River near Locate). Three other sites with somewhat elevated median concentrations were Rose-bud Creek near Rosebud (0.744 mg/L), Yellowstone River near Sidney (0.690 mg/L), and Tongue River near Miles City (0.578 mg/L).
Unlike the Missouri River basin, the lower mainstem site at Yellowstone River near Sidney had a median total nitrogen concentration (0.690 mg/L) that was about twice as high as the upper mainstem site at Yellowstone River near Livingston (0.383 mg/L). The Yellowstone River does not have main-stem reservoirs; thus, concentrations of total nitrogen in the mainstem may more closely reflect simple mixing of tributary inflows and be less affected by biological productivity and nutrient cycling that can occur in lakes and reservoirs. The only site in the Yellowstone River basin where most of the total nitrogen concentrations were substantially higher than that of total ammonia plus organic nitrogen was Clarks Fork Yellowstone River at Edgar, which indicates that dissolved nitrite plus nitrate composed a relatively large percentage of the total nitrogen in samples from this site (figs. 7 and 8). Concentrations in samples from all of the sites in the lower part of the basin (Clarks Fork Yellowstone River at Edgar and downstream) exceeded the ecoregion eutrophication guide-line of 1.50 mg/L, although only infrequently at five of the six sites (fig. 8). Concentrations at Powder River near Locate exceeded the ecoregion guideline in more than 25 percent of the samples.
In the Columbia River basin, total nitrogen concentra-tions ranged from 0.050 mg/L at North Fork Flathead River near Columbia Falls to 1.72 mg/L at Flathead River near Perma (fig. 8, table 15). Median estimated concentrations of total nitrogen ranged from 0.098 mg/L at Swan River near Bigfork to 0.293 mg/L at Little Blackfoot River near Garrison.
2� Water-Quality Characteristics of Montana Streams in a Statewide Monitoring Network, 1999-2003
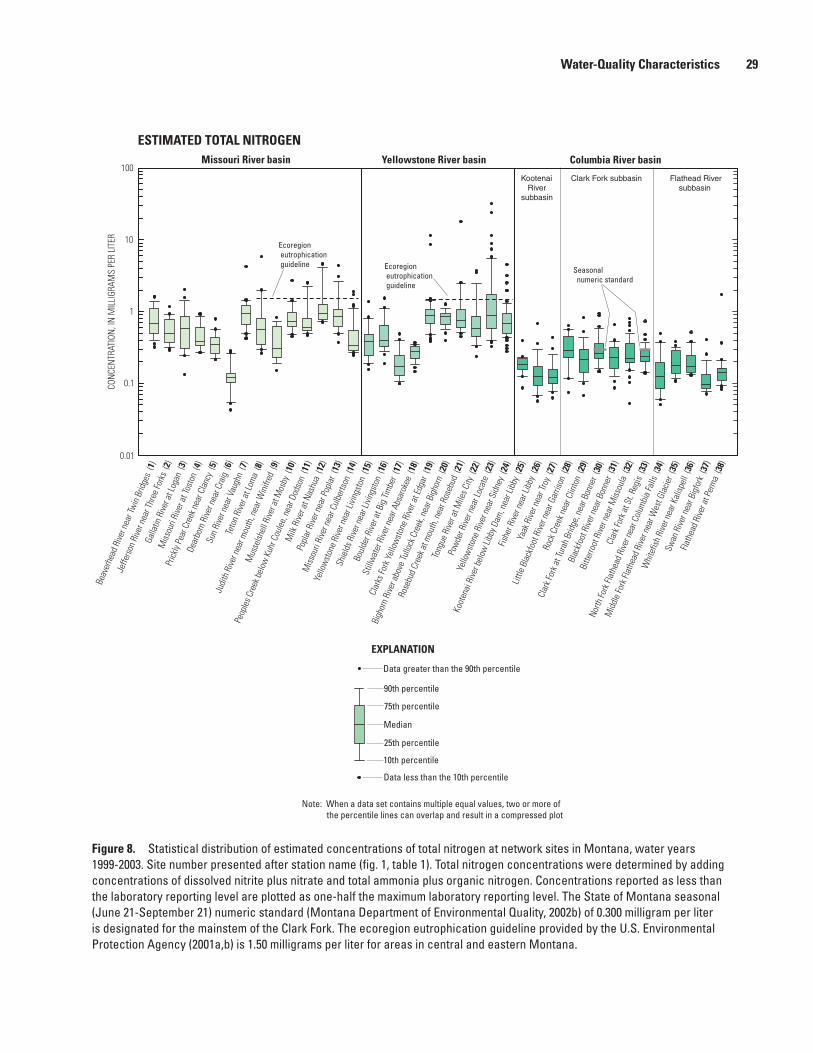
Figure �. Statistical distribution of estimated concentrations of total nitrogen at network sites in Montana, water years 1999-2003. Site number presented after station name (fig. 1, table 1). Total nitrogen concentrations were determined by adding concentrations of dissolved nitrite plus nitrate and total ammonia plus organic nitrogen. Concentrations reported as less than the laboratory reporting level are plotted as one-half the maximum laboratory reporting level. The State of Montana seasonal (June 21-September 21) numeric standard (Montana Department of Environmental Quality, 2002b) of 0.300 milligram per liter is designated for the mainstem of the Clark Fork. The ecoregion eutrophication guideline provided by the U.S. Environmental Protection Agency (2001a,b) is 1.50 milligrams per liter for areas in central and eastern Montana.
CON
CEN
TRAT
ION
, IN
MIL
LIGR
AMS
PER
LITE
R
0.01
0.1
1
10
100
Ecoregion eutrophication guideline
Seasonal numeric standard
Ecoregion eutrophication guideline
ESTIMATED TOTAL NITROGENMissouri River basin Yellowstone River basin Columbia River basin
Kootenai Riversubbasin
Flathead River subbasin
Clark Fork subbasin
EXPLANATION
Data greater than the 90th percentile
90th percentile
75th percentile
Median
25th percentile
10th percentile
Data less than the 10th percentile
Note: When a data set contains multiple equal values, two or more of the percentile lines can overlap and result in a compressed plot
Beav
erhe
ad R
iver n
ear T
win
Brid
ges
(1)
Jeffe
rson
Rive
r nea
r Thr
ee Fo
rks
(2)
Galla
tin R
iver a
t Log
an (
3)
Miss
ouri
Rive
r at T
osto
n (4
)
Prick
ly Pe
ar C
reek
nea
r Cla
ncy
(5)
Dear
born
Rive
r nea
r Cra
ig (
6)
Sun
Rive
r nea
r Vau
ghn
(7)
Teto
n Ri
ver a
t Lom
a (8
)
Judi
th R
iver n
ear m
outh
, nea
r Win
ifred
(9)
Mus
selsh
ell R
iver a
t Mos
by (
10)
Peop
les C
reek
bel
ow K
uhr C
oule
e, n
ear D
odso
n (1
1)
Milk
Rive
r at N
ashu
a (1
2)
Popl
ar R
iver n
ear P
opla
r (13
)
Miss
ouri
Rive
r nea
r Cul
berts
on (
14)
Yello
wst
one
Rive
r nea
r Livi
ngst
on (
15)
Shie
lds R
iver n
ear L
iving
ston
(16
)
Boul
der R
iver a
t Big
Tim
ber
(17)
Still
wat
er R
iver n
ear A
bsar
okee
(18
)
Clar
ks Fo
rk Y
ello
wst
one
Rive
r at E
dgar
(19
)
Bigh
orn
Rive
r abo
ve Tu
llock
Cre
ek, n
ear B
igho
rn (
20)
Rose
bud
Cree
k at m
outh
, nea
r Ros
ebud
(21
)
Tong
ue R
iver a
t Mile
s City
(22
)
Pow
der R
iver n
ear L
ocat
e (2
3)
Yello
wst
one
Rive
r nea
r Sid
ney
(24)
Koot
enai
Rive
r bel
ow Li
bby D
am, n
ear L
ibby
(25
)
Fishe
r Rive
r nea
r Lib
by (
26)
Yaak
Rive
r nea
r Tro
y (27
)
Little
Bla
ckfo
ot R
iver n
ear G
arris
on (
28)
Rock
Cre
ek n
ear C
linto
n (2
9)
Clar
k For
k at T
urah
Brid
ge, n
ear B
onne
r (30
)
Blac
kfoo
t Rive
r nea
r Bon
ner
(31)
Bitte
rroot
Rive
r nea
r Miss
oula
(32
)
Clar
k For
k at S
t. Re
gis
(33)
North
Fork
Flat
head
Rive
r nea
r Col
umbi
a Fa
lls (
34)
Mid
dle
Fork
Flat
head
Rive
r nea
r Wes
t Gla
cier
(35)
Whi
tefis
h Ri
ver n
ear K
alisp
ell
(36)
Swan
Rive
r nea
r Big
fork
(37
)
Flath
ead
Rive
r at P
erm
a (3
8)
Water-Quality Characteristics 29
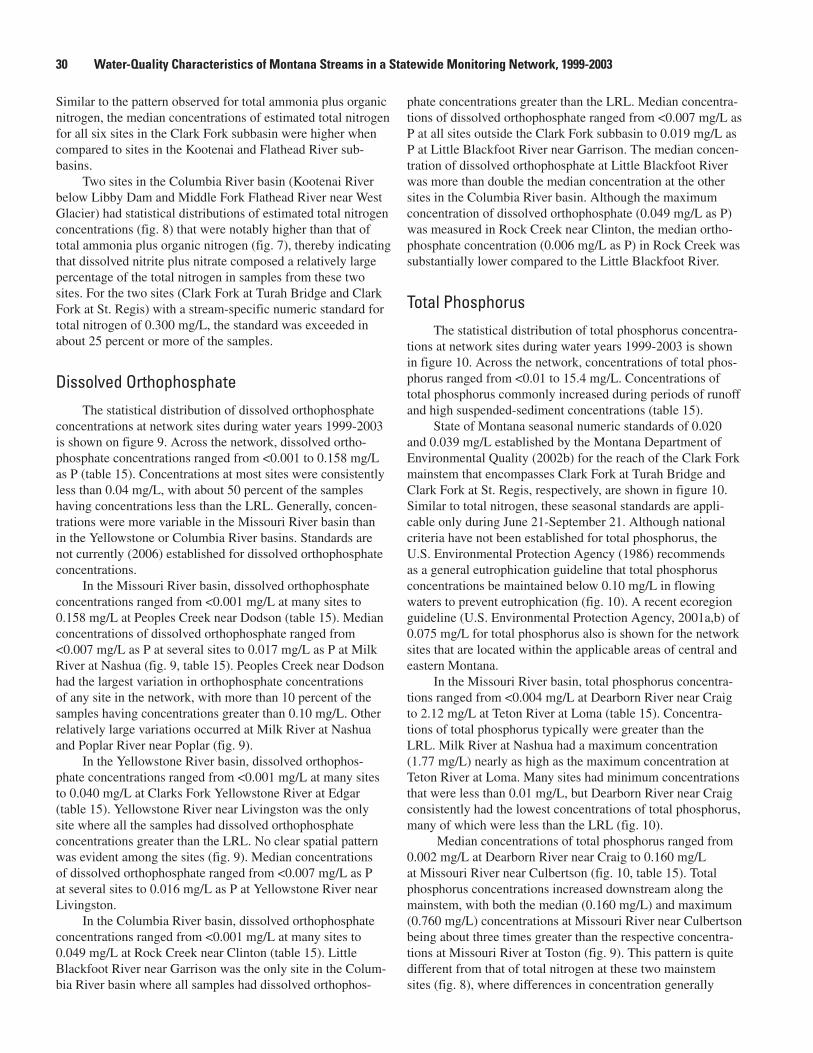
Similar to the pattern observed for total ammonia plus organic nitrogen, the median concentrations of estimated total nitrogen for all six sites in the Clark Fork subbasin were higher when compared to sites in the Kootenai and Flathead River sub-basins.
Two sites in the Columbia River basin (Kootenai River below Libby Dam and Middle Fork Flathead River near West Glacier) had statistical distributions of estimated total nitrogen concentrations (fig. 8) that were notably higher than that of total ammonia plus organic nitrogen (fig. 7), thereby indicating that dissolved nitrite plus nitrate composed a relatively large percentage of the total nitrogen in samples from these two sites. For the two sites (Clark Fork at Turah Bridge and Clark Fork at St. Regis) with a stream-specific numeric standard for total nitrogen of 0.300 mg/L, the standard was exceeded in about 25 percent or more of the samples.
Dissolved OrthophosphateThe statistical distribution of dissolved orthophosphate
concentrations at network sites during water years 1999-2003 is shown on figure 9. Across the network, dissolved ortho-phosphate concentrations ranged from <0.001 to 0.158 mg/L as P (table 15). Concentrations at most sites were consistently less than 0.04 mg/L, with about 50 percent of the samples having concentrations less than the LRL. Generally, concen-trations were more variable in the Missouri River basin than in the Yellowstone or Columbia River basins. Standards are not currently (2006) established for dissolved orthophosphate concentrations.
In the Missouri River basin, dissolved orthophosphate concentrations ranged from <0.001 mg/L at many sites to 0.158 mg/L at Peoples Creek near Dodson (table 15). Median concentrations of dissolved orthophosphate ranged from <0.007 mg/L as P at several sites to 0.017 mg/L as P at Milk River at Nashua (fig. 9, table 15). Peoples Creek near Dodson had the largest variation in orthophosphate concentrations of any site in the network, with more than 10 percent of the samples having concentrations greater than 0.10 mg/L. Other relatively large variations occurred at Milk River at Nashua and Poplar River near Poplar (fig. 9).
In the Yellowstone River basin, dissolved orthophos-phate concentrations ranged from <0.001 mg/L at many sites to 0.040 mg/L at Clarks Fork Yellowstone River at Edgar (table 15). Yellowstone River near Livingston was the only site where all the samples had dissolved orthophosphate concentrations greater than the LRL. No clear spatial pattern was evident among the sites (fig. 9). Median concentrations of dissolved orthophosphate ranged from <0.007 mg/L as P at several sites to 0.016 mg/L as P at Yellowstone River near Livingston.
In the Columbia River basin, dissolved orthophosphate concentrations ranged from <0.001 mg/L at many sites to 0.049 mg/L at Rock Creek near Clinton (table 15). Little Blackfoot River near Garrison was the only site in the Colum-bia River basin where all samples had dissolved orthophos-
phate concentrations greater than the LRL. Median concentra-tions of dissolved orthophosphate ranged from <0.007 mg/L as P at all sites outside the Clark Fork subbasin to 0.019 mg/L as P at Little Blackfoot River near Garrison. The median concen-tration of dissolved orthophosphate at Little Blackfoot River was more than double the median concentration at the other sites in the Columbia River basin. Although the maximum concentration of dissolved orthophosphate (0.049 mg/L as P) was measured in Rock Creek near Clinton, the median ortho-phosphate concentration (0.006 mg/L as P) in Rock Creek was substantially lower compared to the Little Blackfoot River.
Total PhosphorusThe statistical distribution of total phosphorus concentra-
tions at network sites during water years 1999-2003 is shown in figure 10. Across the network, concentrations of total phos-phorus ranged from <0.01 to 15.4 mg/L. Concentrations of total phosphorus commonly increased during periods of runoff and high suspended-sediment concentrations (table 15).
State of Montana seasonal numeric standards of 0.020 and 0.039 mg/L established by the Montana Department of Environmental Quality (2002b) for the reach of the Clark Fork mainstem that encompasses Clark Fork at Turah Bridge and Clark Fork at St. Regis, respectively, are shown in figure 10. Similar to total nitrogen, these seasonal standards are appli-cable only during June 21-September 21. Although national criteria have not been established for total phosphorus, the U.S. Environmental Protection Agency (1986) recommends as a general eutrophication guideline that total phosphorus concentrations be maintained below 0.10 mg/L in flowing waters to prevent eutrophication (fig. 10). A recent ecoregion guideline (U.S. Environmental Protection Agency, 2001a,b) of 0.075 mg/L for total phosphorus also is shown for the network sites that are located within the applicable areas of central and eastern Montana.
In the Missouri River basin, total phosphorus concentra-tions ranged from <0.004 mg/L at Dearborn River near Craig to 2.12 mg/L at Teton River at Loma (table 15). Concentra-tions of total phosphorus typically were greater than the LRL. Milk River at Nashua had a maximum concentration (1.77 mg/L) nearly as high as the maximum concentration at Teton River at Loma. Many sites had minimum concentrations that were less than 0.01 mg/L, but Dearborn River near Craig consistently had the lowest concentrations of total phosphorus, many of which were less than the LRL (fig. 10).
Median concentrations of total phosphorus ranged from 0.002 mg/L at Dearborn River near Craig to 0.160 mg/L at Missouri River near Culbertson (fig. 10, table 15). Total phosphorus concentrations increased downstream along the mainstem, with both the median (0.160 mg/L) and maximum (0.760 mg/L) concentrations at Missouri River near Culbertson being about three times greater than the respective concentra-tions at Missouri River at Toston (fig. 9). This pattern is quite different from that of total nitrogen at these two mainstem sites (fig. 8), where differences in concentration generally
30 Water-Quality Characteristics of Montana Streams in a Statewide Monitoring Network, 1999-2003
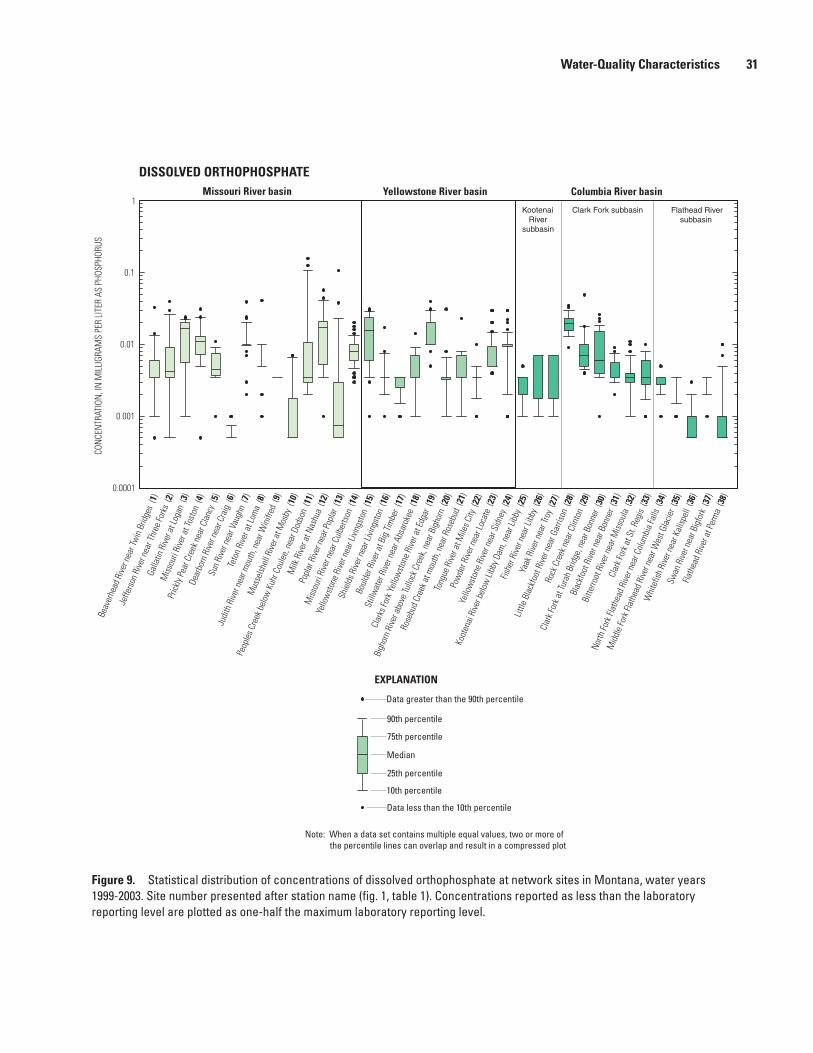
Figure 9. Statistical distribution of concentrations of dissolved orthophosphate at network sites in Montana, water years 1999-2003. Site number presented after station name (fig. 1, table 1). Concentrations reported as less than the laboratory reporting level are plotted as one-half the maximum laboratory reporting level.
CON
CEN
TRAT
ION
, IN
MIL
LIGR
AMS
PER
LITE
R AS
PHO
SPHO
RUS
0.0001
0.001
0.01
0.1
1
DISSOLVED ORTHOPHOSPHATEMissouri River basin Yellowstone River basin Columbia River basin
Kootenai Riversubbasin
Flathead River subbasin
Clark Fork subbasin
EXPLANATION
Data greater than the 90th percentile
90th percentile
75th percentile
Median
25th percentile
10th percentile
Data less than the 10th percentile
Note: When a data set contains multiple equal values, two or more of the percentile lines can overlap and result in a compressed plot
Beav
erhe
ad R
iver n
ear T
win
Brid
ges
(1)
Jeffe
rson
Rive
r nea
r Thr
ee Fo
rks
(2)
Galla
tin R
iver a
t Log
an (
3)
Miss
ouri
Rive
r at T
osto
n (4
)
Prick
ly Pe
ar C
reek
nea
r Cla
ncy
(5)
Dear
born
Rive
r nea
r Cra
ig (
6)
Sun
Rive
r nea
r Vau
ghn
(7)
Teto
n Ri
ver a
t Lom
a (8
)
Judi
th R
iver n
ear m
outh
, nea
r Win
ifred
(9)
Mus
selsh
ell R
iver a
t Mos
by (
10)
Peop
les C
reek
bel
ow K
uhr C
oule
e, n
ear D
odso
n (1
1)
Milk
Rive
r at N
ashu
a (1
2)
Popl
ar R
iver n
ear P
opla
r (13
)
Miss
ouri
Rive
r nea
r Cul
berts
on (
14)
Yello
wst
one
Rive
r nea
r Livi
ngst
on (
15)
Shie
lds R
iver n
ear L
iving
ston
(16
)
Boul
der R
iver a
t Big
Tim
ber
(17)
Still
wat
er R
iver n
ear A
bsar
okee
(18
)
Clar
ks Fo
rk Y
ello
wst
one
Rive
r at E
dgar
(19
)
Bigh
orn
Rive
r abo
ve Tu
llock
Cre
ek, n
ear B
igho
rn (
20)
Rose
bud
Cree
k at m
outh
, nea
r Ros
ebud
(21
)
Tong
ue R
iver a
t Mile
s City
(22
)
Pow
der R
iver n
ear L
ocat
e (2
3)
Yello
wst
one
Rive
r nea
r Sid
ney
(24)
Koot
enai
Rive
r bel
ow Li
bby D
am, n
ear L
ibby
(25
)
Fishe
r Rive
r nea
r Lib
by (
26)
Yaak
Rive
r nea
r Tro
y (27
)
Little
Bla
ckfo
ot R
iver n
ear G
arris
on (
28)
Rock
Cre
ek n
ear C
linto
n (2
9)
Clar
k For
k at T
urah
Brid
ge, n
ear B
onne
r (30
)
Blac
kfoo
t Rive
r nea
r Bon
ner
(31)
Bitte
rroot
Rive
r nea
r Miss
oula
(32
)
Clar
k For
k at S
t. Re
gis
(33)
North
Fork
Flat
head
Rive
r nea
r Col
umbi
a Fa
lls (
34)
Mid
dle
Fork
Flat
head
Rive
r nea
r Wes
t Gla
cier
(35)
Whi
tefis
h Ri
ver n
ear K
alisp
ell
(36)
Swan
Rive
r nea
r Big
fork
(37
)
Flath
ead
Rive
r at P
erm
a (3
8)
Water-Quality Characteristics 31
Figure 10. Statistical distribution of concentrations of total phosphorus at network sites in Montana, water years 1999-2003. Site number presented after station name (fig. 1, table 1). The State of Montana seasonal (June 21-September 21) numeric standards (Montana Department of Environmental Quality, 2002b) of 0.020 and 0.039 milligram per liter are designated for specific mainstem reaches of the Clark Fork. The general eutrophication guideline provided by the U.S. Environmental Protection Agency (1986) is 0.10 milligram per liter. The ecoregion eutrophication guideline provided by the U.S. Environmental Protection Agency (2001a,b) is 0.075 milligram per liter for areas in central and eastern Montana. Concentrations reported as less than the laboratory reporting level are plotted as one-half the maximum laboratory reporting level.
CON
CEN
TRAT
ION
, IN
MIL
LIGR
AMS
PER
LITE
R
0.1
1
10
100
0.001
0.01
General eutrophication guideline
Seasonal numeric standards
Ecoregion eutrophication guideline
Ecoregion eutrophication guideline
TOTAL PHOSPHORUSMissouri River basin Yellowstone River basin Columbia River basin
Kootenai Riversubbasin
Flathead River subbasin
Clark Fork subbasin
EXPLANATION
Data greater than the 90th percentile
90th percentile
75th percentile
Median
25th percentile
10th percentile
Data less than the 10th percentile
Note: When a data set contains multiple equal values, two or more of the percentile lines can overlap and result in a compressed plot
Beav
erhe
ad R
iver n
ear T
win
Brid
ges
(1)
Jeffe
rson
Rive
r nea
r Thr
ee Fo
rks
(2)
Galla
tin R
iver a
t Log
an (
3)
Miss
ouri
Rive
r at T
osto
n (4
)
Prick
ly Pe
ar C
reek
nea
r Cla
ncy
(5)
Dear
born
Rive
r nea
r Cra
ig (
6)
Sun
Rive
r nea
r Vau
ghn
(7)
Teto
n Ri
ver a
t Lom
a (8
)
Judi
th R
iver n
ear m
outh
, nea
r Win
ifred
(9)
Mus
selsh
ell R
iver a
t Mos
by (
10)
Peop
les C
reek
bel
ow K
uhr C
oule
e, n
ear D
odso
n (1
1)
Milk
Rive
r at N
ashu
a (1
2)
Popl
ar R
iver n
ear P
opla
r (13
)
Miss
ouri
Rive
r nea
r Cul
berts
on (
14)
Yello
wst
one
Rive
r nea
r Livi
ngst
on (
15)
Shie
lds R
iver n
ear L
iving
ston
(16
)
Boul
der R
iver a
t Big
Tim
ber
(17)
Still
wat
er R
iver n
ear A
bsar
okee
(18
)
Clar
ks Fo
rk Y
ello
wst
one
Rive
r at E
dgar
(19
)
Bigh
orn
Rive
r abo
ve Tu
llock
Cre
ek, n
ear B
igho
rn (
20)
Rose
bud
Cree
k at m
outh
, nea
r Ros
ebud
(21
)
Tong
ue R
iver a
t Mile
s City
(22
)
Pow
der R
iver n
ear L
ocat
e (2
3)
Yello
wst
one
Rive
r nea
r Sid
ney
(24)
Koot
enai
Rive
r bel
ow Li
bby D
am, n
ear L
ibby
(25
)
Fishe
r Rive
r nea
r Lib
by (
26)
Yaak
Rive
r nea
r Tro
y (27
)
Little
Bla
ckfo
ot R
iver n
ear G
arris
on (
28)
Rock
Cre
ek n
ear C
linto
n (2
9)
Clar
k For
k at T
urah
Brid
ge, n
ear B
onne
r (30
)
Blac
kfoo
t Rive
r nea
r Bon
ner
(31)
Bitte
rroot
Rive
r nea
r Miss
oula
(32
)
Clar
k For
k at S
t. Re
gis
(33)
North
Fork
Flat
head
Rive
r nea
r Col
umbi
a Fa
lls (
34)
Mid
dle
Fork
Flat
head
Rive
r nea
r Wes
t Gla
cier
(35)
Whi
tefis
h Ri
ver n
ear K
alisp
ell
(36)
Swan
Rive
r nea
r Big
fork
(37
)
Flath
ead
Rive
r at P
erm
a (3
8)
32 Water-Quality Characteristics of Montana Streams in a Statewide Monitoring Network, 1999-2003
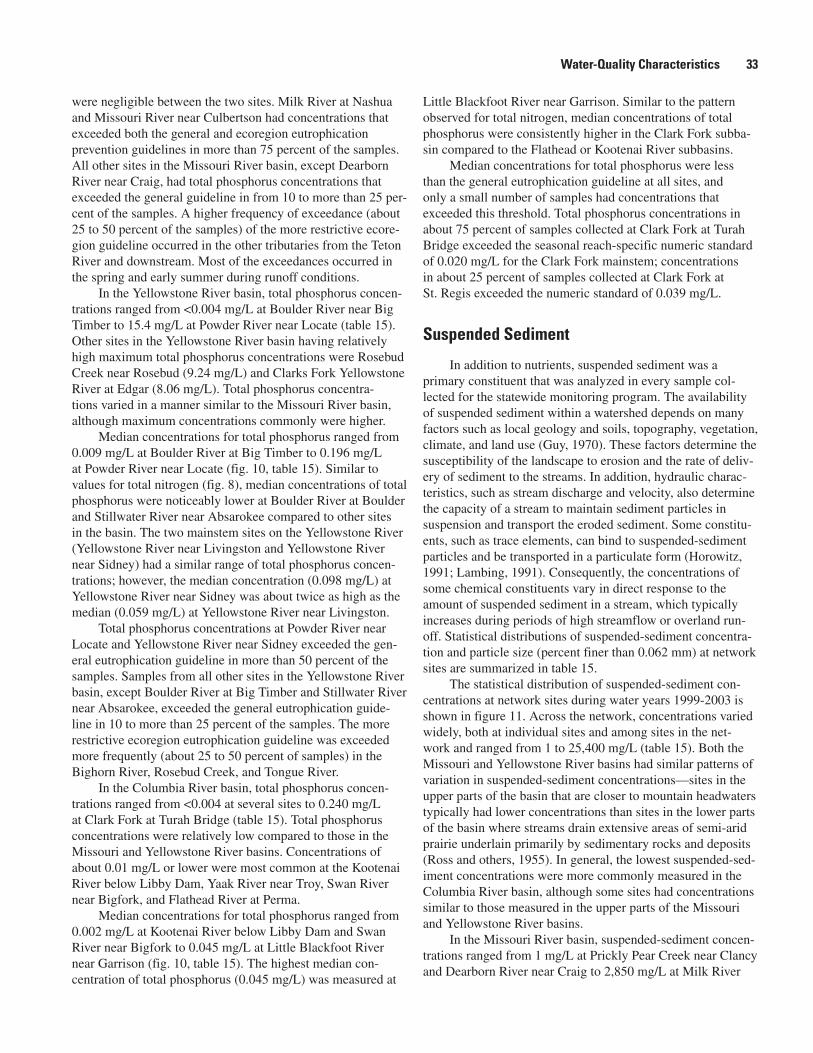
were negligible between the two sites. Milk River at Nashua and Missouri River near Culbertson had concentrations that exceeded both the general and ecoregion eutrophication prevention guidelines in more than 75 percent of the samples. All other sites in the Missouri River basin, except Dearborn River near Craig, had total phosphorus concentrations that exceeded the general guideline in from 10 to more than 25 per-cent of the samples. A higher frequency of exceedance (about 25 to 50 percent of the samples) of the more restrictive ecore-gion guideline occurred in the other tributaries from the Teton River and downstream. Most of the exceedances occurred in the spring and early summer during runoff conditions.
In the Yellowstone River basin, total phosphorus concen-trations ranged from <0.004 mg/L at Boulder River near Big Timber to 15.4 mg/L at Powder River near Locate (table 15). Other sites in the Yellowstone River basin having relatively high maximum total phosphorus concentrations were Rosebud Creek near Rosebud (9.24 mg/L) and Clarks Fork Yellowstone River at Edgar (8.06 mg/L). Total phosphorus concentra-tions varied in a manner similar to the Missouri River basin, although maximum concentrations commonly were higher.
Median concentrations for total phosphorus ranged from 0.009 mg/L at Boulder River at Big Timber to 0.196 mg/L at Powder River near Locate (fig. 10, table 15). Similar to values for total nitrogen (fig. 8), median concentrations of total phosphorus were noticeably lower at Boulder River at Boulder and Stillwater River near Absarokee compared to other sites in the basin. The two mainstem sites on the Yellowstone River (Yellowstone River near Livingston and Yellowstone River near Sidney) had a similar range of total phosphorus concen-trations; however, the median concentration (0.098 mg/L) at Yellowstone River near Sidney was about twice as high as the median (0.059 mg/L) at Yellowstone River near Livingston.
Total phosphorus concentrations at Powder River near Locate and Yellowstone River near Sidney exceeded the gen-eral eutrophication guideline in more than 50 percent of the samples. Samples from all other sites in the Yellowstone River basin, except Boulder River at Big Timber and Stillwater River near Absarokee, exceeded the general eutrophication guide-line in 10 to more than 25 percent of the samples. The more restrictive ecoregion eutrophication guideline was exceeded more frequently (about 25 to 50 percent of samples) in the Bighorn River, Rosebud Creek, and Tongue River.
In the Columbia River basin, total phosphorus concen-trations ranged from <0.004 at several sites to 0.240 mg/L at Clark Fork at Turah Bridge (table 15). Total phosphorus concentrations were relatively low compared to those in the Missouri and Yellowstone River basins. Concentrations of about 0.01 mg/L or lower were most common at the Kootenai River below Libby Dam, Yaak River near Troy, Swan River near Bigfork, and Flathead River at Perma.
Median concentrations for total phosphorus ranged from 0.002 mg/L at Kootenai River below Libby Dam and Swan River near Bigfork to 0.045 mg/L at Little Blackfoot River near Garrison (fig. 10, table 15). The highest median con-centration of total phosphorus (0.045 mg/L) was measured at
Little Blackfoot River near Garrison. Similar to the pattern observed for total nitrogen, median concentrations of total phosphorus were consistently higher in the Clark Fork subba-sin compared to the Flathead or Kootenai River subbasins.
Median concentrations for total phosphorus were less than the general eutrophication guideline at all sites, and only a small number of samples had concentrations that exceeded this threshold. Total phosphorus concentrations in about 75 percent of samples collected at Clark Fork at Turah Bridge exceeded the seasonal reach-specific numeric standard of 0.020 mg/L for the Clark Fork mainstem; concentrations in about 25 percent of samples collected at Clark Fork at St. Regis exceeded the numeric standard of 0.039 mg/L.
Suspended Sediment
In addition to nutrients, suspended sediment was a primary constituent that was analyzed in every sample col-lected for the statewide monitoring program. The availability of suspended sediment within a watershed depends on many factors such as local geology and soils, topography, vegetation, climate, and land use (Guy, 1970). These factors determine the susceptibility of the landscape to erosion and the rate of deliv-ery of sediment to the streams. In addition, hydraulic charac-teristics, such as stream discharge and velocity, also determine the capacity of a stream to maintain sediment particles in suspension and transport the eroded sediment. Some constitu-ents, such as trace elements, can bind to suspended-sediment particles and be transported in a particulate form (Horowitz, 1991; Lambing, 1991). Consequently, the concentrations of some chemical constituents vary in direct response to the amount of suspended sediment in a stream, which typically increases during periods of high streamflow or overland run-off. Statistical distributions of suspended-sediment concentra-tion and particle size (percent finer than 0.062 mm) at network sites are summarized in table 15.
The statistical distribution of suspended-sediment con-centrations at network sites during water years 1999-2003 is shown in figure 11. Across the network, concentrations varied widely, both at individual sites and among sites in the net-work and ranged from 1 to 25,400 mg/L (table 15). Both the Missouri and Yellowstone River basins had similar patterns of variation in suspended-sediment concentrations—sites in the upper parts of the basin that are closer to mountain headwaters typically had lower concentrations than sites in the lower parts of the basin where streams drain extensive areas of semi-arid prairie underlain primarily by sedimentary rocks and deposits (Ross and others, 1955). In general, the lowest suspended-sed-iment concentrations were more commonly measured in the Columbia River basin, although some sites had concentrations similar to those measured in the upper parts of the Missouri and Yellowstone River basins.
In the Missouri River basin, suspended-sediment concen-trations ranged from 1 mg/L at Prickly Pear Creek near Clancy and Dearborn River near Craig to 2,850 mg/L at Milk River
Water-Quality Characteristics 33
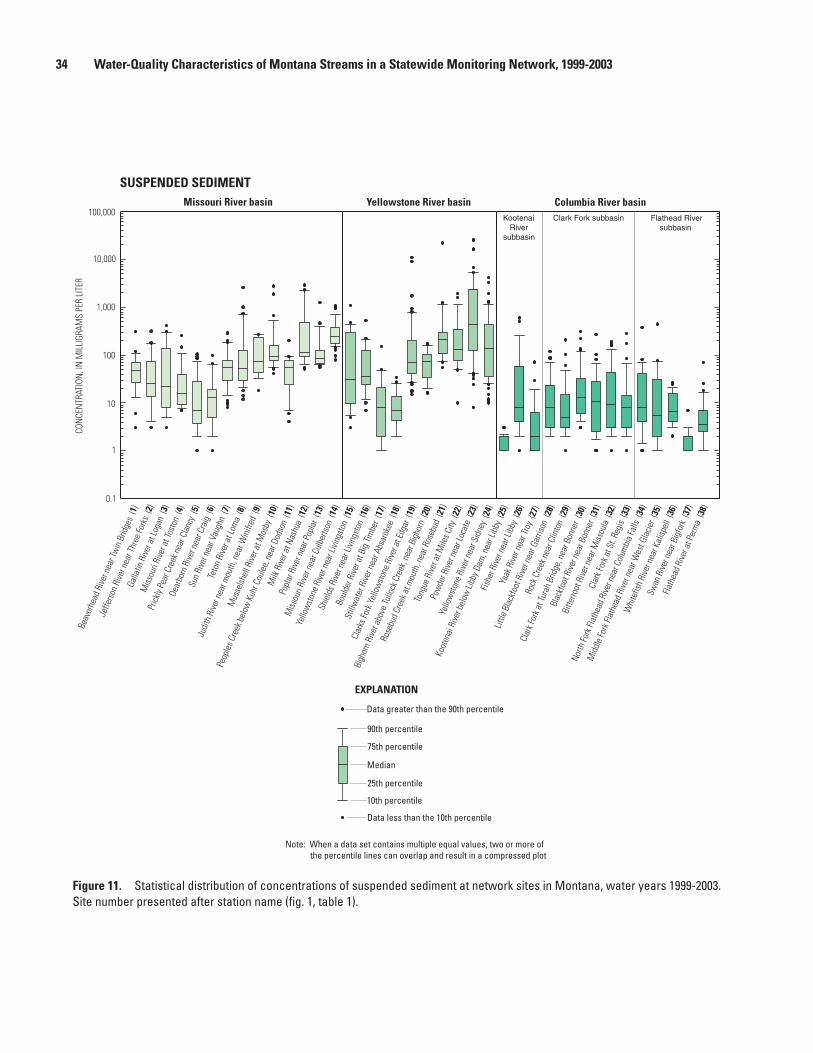
Figure 11. Statistical distribution of concentrations of suspended sediment at network sites in Montana, water years 1999-2003. Site number presented after station name (fig. 1, table 1).
CON
CEN
TRAT
ION
, IN
MIL
LIGR
AMS
PER
LITE
R
0.1
1
10
100
1,000
10,000
100,000
SUSPENDED SEDIMENTMissouri River basin Yellowstone River basin Columbia River basin
Kootenai Riversubbasin
Flathead River subbasin
Clark Fork subbasin
EXPLANATION
Data greater than the 90th percentile
90th percentile
75th percentile
Median
25th percentile
10th percentile
Data less than the 10th percentile
Note: When a data set contains multiple equal values, two or more of the percentile lines can overlap and result in a compressed plot
Beav
erhe
ad R
iver n
ear T
win
Brid
ges
(1)
Jeffe
rson
Rive
r nea
r Thr
ee Fo
rks
(2)
Galla
tin R
iver a
t Log
an (
3)
Miss
ouri
Rive
r at T
osto
n (4
)
Prick
ly Pe
ar C
reek
nea
r Cla
ncy
(5)
Dear
born
Rive
r nea
r Cra
ig (
6)
Sun
Rive
r nea
r Vau
ghn
(7)
Teto
n Ri
ver a
t Lom
a (8
)
Judi
th R
iver n
ear m
outh
, nea
r Win
ifred
(9)
Mus
selsh
ell R
iver a
t Mos
by (
10)
Peop
les C
reek
bel
ow K
uhr C
oule
e, n
ear D
odso
n (1
1)
Milk
Rive
r at N
ashu
a (1
2)
Popl
ar R
iver n
ear P
opla
r (13
)
Miss
ouri
Rive
r nea
r Cul
berts
on (
14)
Yello
wst
one
Rive
r nea
r Livi
ngst
on (
15)
Shie
lds R
iver n
ear L
iving
ston
(16
)
Boul
der R
iver a
t Big
Tim
ber
(17)
Still
wat
er R
iver n
ear A
bsar
okee
(18
)
Clar
ks Fo
rk Y
ello
wst
one
Rive
r at E
dgar
(19
)
Bigh
orn
Rive
r abo
ve Tu
llock
Cre
ek, n
ear B
igho
rn (
20)
Rose
bud
Cree
k at m
outh
, nea
r Ros
ebud
(21
)
Tong
ue R
iver a
t Mile
s City
(22
)
Pow
der R
iver n
ear L
ocat
e (2
3)
Yello
wst
one
Rive
r nea
r Sid
ney
(24)
Koot
enai
Rive
r bel
ow Li
bby D
am, n
ear L
ibby
(25
)
Fishe
r Rive
r nea
r Lib
by (
26)
Yaak
Rive
r nea
r Tro
y (27
)
Little
Bla
ckfo
ot R
iver n
ear G
arris
on (
28)
Rock
Cre
ek n
ear C
linto
n (2
9)
Clar
k For
k at T
urah
Brid
ge, n
ear B
onne
r (30
)
Blac
kfoo
t Rive
r nea
r Bon
ner
(31)
Bitte
rroot
Rive
r nea
r Miss
oula
(32
)
Clar
k For
k at S
t. Re
gis
(33)
North
Fork
Flat
head
Rive
r nea
r Col
umbi
a Fa
lls (
34)
Mid
dle
Fork
Flat
head
Rive
r nea
r Wes
t Gla
cier
(35)
Whi
tefis
h Ri
ver n
ear K
alisp
ell
(36)
Swan
Rive
r nea
r Big
fork
(37
)
Flath
ead
Rive
r at P
erm
a (3
8)
3� Water-Quality Characteristics of Montana Streams in a Statewide Monitoring Network, 1999-2003

at Nashua (fig. 11, table 15). Minimum concentrations were less than 10 mg/L at all sites from the Sun River and upstream. Maximum concentrations of suspended sediment at five sites in the lower part of the Missouri River basin (Teton River near Loma, Musselshell River at Mosby, Milk River at Nashua, Poplar River near Poplar, and Missouri River near Culbertson) exceeded 1,000 mg/L.
Median suspended-sediment concentrations ranged from 7 mg/L at Prickly Pear Creek near Clancy to 237 mg/L at Missouri River near Culbertson (fig. 11, table 15). In gen-eral, suspended-sediment concentrations increased notably in the lower part of the basin from the Sun River downstream to Missouri River near Culbertson, where large portions of those basins drain semi-arid prairie areas and soils formed from sedimentary rocks and deposits. Three sites in the lower basin (Musselshell River at Mosby, Milk River at Nashua, and Missouri River near Culbertson) had median concentrations near or exceeding 100 mg/L. Suspended-sediment concentra-tions at the two mainstem sites (Missouri River at Toston and Missouri River near Culbertson) were substantially different. The Missouri River near Toston had one of the lowest median concentrations (16 mg/L) among all the Missouri River basin sites, whereas Missouri River near Culbertson had the highest median concentration (237 mg/L) in the basin, representing about a 15-fold increase over that of the upper mainstem site.
In the Yellowstone River basin, suspended-sediment concentrations ranged from 1 mg/L at Boulder River at Big Timber to 25,400 mg/L at Powder River near Locate (fig. 11, table 15). The spatial pattern of suspended-sediment concen-trations at sites in the Yellowstone River basin was similar to that in the Missouri River basin, where concentrations less than 10 mg/L most commonly occurred in the upper part of the basin (Stillwater River and upstream). The maximum suspended-sediment concentrations of 21,600 mg/L at Rose-bud Creek near Rosebud was nearly as high as the maximum concentration (25,400 mg/L) at Powder River near Locate. Overall, suspended-sediment concentrations at Powder River near Locate were the highest in the statewide network, with more than 25 percent of the samples exceeding 2,000 mg/L.
Median suspended-sediment concentrations ranged from 7 and 8 mg/L at Stillwater River near Absarokee and Boulder River at Big Timber, respectively, to 426 mg/L at Powder River near Locate (fig. 11, table 15). Similar to the Missouri River, sites in the lower part of the Yellowstone River basin generally had the highest distribution of suspended-sediment concentrations, with four sites (Rosebud Creek near Rosebud, Tongue River at Miles City, Powder River near Locate, and Yellowstone River near Sidney) having median concentra-tions exceeding 100 mg/L. Concentrations in the mainstem increased in a downstream direction from Yellowstone River near Livingston to Yellowstone River near Sidney, with the lower-mainstem site near Sidney having a median concentra-tion (137 mg/L) more than 4-times greater than the upper-mainstem site near Livingston (32 mg/L).
In the Columbia River basin, suspended-sediment con-centrations ranged from 1 mg/L at many sites to 588 mg/L
at Fisher River near Libby. Two sites, Kootenai River below Libby Dam and Swan River near Bigfork, had consistently low suspended-sediment concentrations due to their loca-tion downstream from large lakes or reservoirs. Minimum suspended-sediment concentrations at all sites in the Colum-bia River basin were 3 mg/L or less, with 11 of the 14 sites having minimum concentrations of 1 mg/L. Maximum suspended-sediment concentrations ranged from 3 mg/L at Kootenai River below Libby Dam to 588 mg/L at Fisher River near Libby. Suspended-sediment concentrations exceeded 100 mg/L at only 9 of the 14 sites in the Columbia River basin. Median suspended-sediment concentrations were low relative to most sites in the Missouri and Yellowstone River basin and ranged from 2 mg/L at three sites (Kootenai River below Libby Dam, Yaak River near Troy, and Swan River near Bigfork) to 13 mg/L at Clark Fork at Turah Bridge (fig. 11, table 14); most median concentrations were less than 10 mg/L.
Major Ions
Major ions were a secondary constituent group that were analyzed only two times per year for the statewide monitoring program. The small number of samples limits the characteriza-tion of seasonal or hydrologic variations of concentrations. Generally, data were obtained that span the potential range of concentrations by sampling during high-flow and low-flow periods each year when annual minimum and maximum concentrations typically occur. Major ions that were analyzed include calcium, magnesium, sodium, potassium, alkalinity (an index of the sum of bicarbonate and carbonate), chloride, fluoride, silica, and sulfate (table 2). Statistical summaries of the individual major-ion concentrations measured in samples collected at network sites during water years 1999-2003 are presented in table 15.
Major ions constitute most of the dissolved constituents in water (Hem, 1985). Several water-quality indicators can be calculated from major-ion concentrations, such as hardness, dissolved solids, and sodium adsorption ratio (SAR). Hardness is calculated from calcium and magnesium concentrations and converted to an equivalent concentration of calcium carbonate (Fishman and Friedman, 1989). Hardness is used to determine aquatic-life toxicity standards for several trace elements (cad-mium, chromium, copper, lead, nickel, and zinc) whose degree of toxicity varies with water hardness. An increase in hardness decreases metal toxicity because cations, such as calcium and magnesium, compete with metals for binding sites on biologi-cal membranes (Playle, 2004). Dissolved solids (also com-monly referred to as total-dissolved solids, or TDS) represent the concentration of all dissolved material in water. Typically, the dissolved solids are composed almost entirely of the major ions. The concentration of dissolved solids can either be measured directly as a gravimetric analysis of the mass of an evaporated filtered sample, or it can be estimated by sum-ming the individual major-ion concentrations, after converting alkalinity to an equivalent calcium carbonate concentration
Water-Quality Characteristics 3�
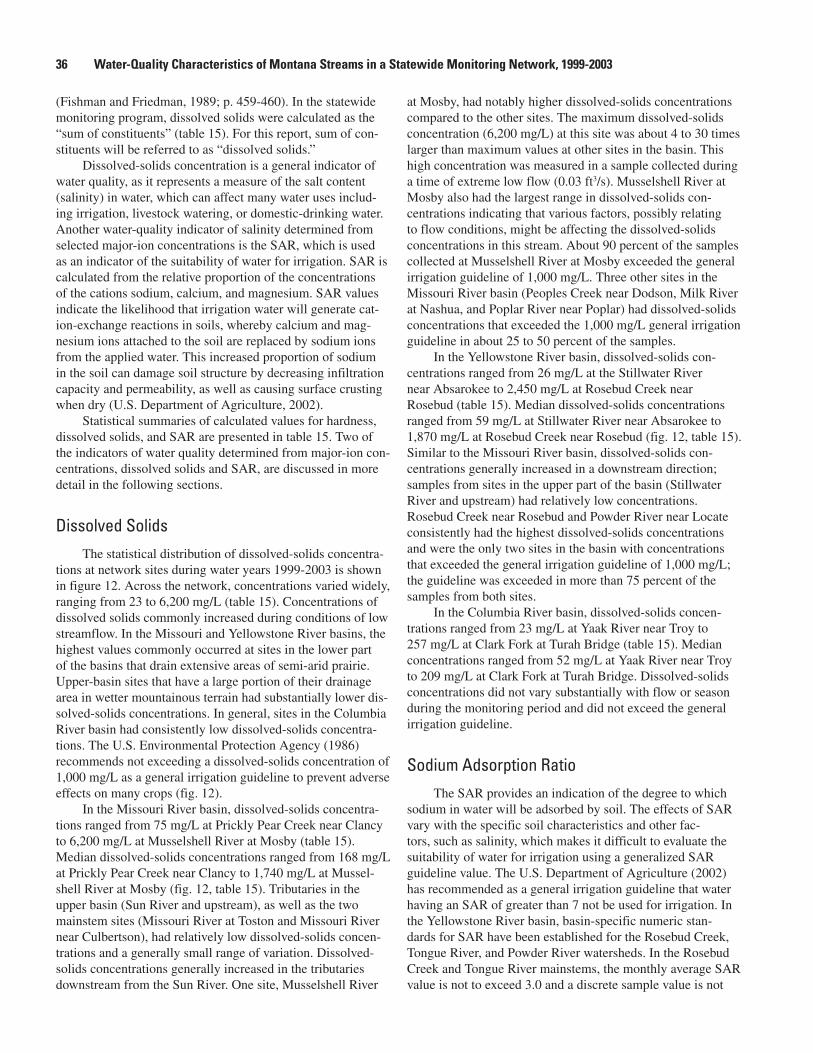
(Fishman and Friedman, 1989; p. 459-460). In the statewide monitoring program, dissolved solids were calculated as the “sum of constituents” (table 15). For this report, sum of con-stituents will be referred to as “dissolved solids.”
Dissolved-solids concentration is a general indicator of water quality, as it represents a measure of the salt content (salinity) in water, which can affect many water uses includ-ing irrigation, livestock watering, or domestic-drinking water. Another water-quality indicator of salinity determined from selected major-ion concentrations is the SAR, which is used as an indicator of the suitability of water for irrigation. SAR is calculated from the relative proportion of the concentrations of the cations sodium, calcium, and magnesium. SAR values indicate the likelihood that irrigation water will generate cat-ion-exchange reactions in soils, whereby calcium and mag-nesium ions attached to the soil are replaced by sodium ions from the applied water. This increased proportion of sodium in the soil can damage soil structure by decreasing infiltration capacity and permeability, as well as causing surface crusting when dry (U.S. Department of Agriculture, 2002).
Statistical summaries of calculated values for hardness, dissolved solids, and SAR are presented in table 15. Two of the indicators of water quality determined from major-ion con-centrations, dissolved solids and SAR, are discussed in more detail in the following sections.
Dissolved SolidsThe statistical distribution of dissolved-solids concentra-
tions at network sites during water years 1999-2003 is shown in figure 12. Across the network, concentrations varied widely, ranging from 23 to 6,200 mg/L (table 15). Concentrations of dissolved solids commonly increased during conditions of low streamflow. In the Missouri and Yellowstone River basins, the highest values commonly occurred at sites in the lower part of the basins that drain extensive areas of semi-arid prairie. Upper-basin sites that have a large portion of their drainage area in wetter mountainous terrain had substantially lower dis-solved-solids concentrations. In general, sites in the Columbia River basin had consistently low dissolved-solids concentra-tions. The U.S. Environmental Protection Agency (1986) recommends not exceeding a dissolved-solids concentration of 1,000 mg/L as a general irrigation guideline to prevent adverse effects on many crops (fig. 12).
In the Missouri River basin, dissolved-solids concentra-tions ranged from 75 mg/L at Prickly Pear Creek near Clancy to 6,200 mg/L at Musselshell River at Mosby (table 15). Median dissolved-solids concentrations ranged from 168 mg/L at Prickly Pear Creek near Clancy to 1,740 mg/L at Mussel-shell River at Mosby (fig. 12, table 15). Tributaries in the upper basin (Sun River and upstream), as well as the two mainstem sites (Missouri River at Toston and Missouri River near Culbertson), had relatively low dissolved-solids concen-trations and a generally small range of variation. Dissolved-solids concentrations generally increased in the tributaries downstream from the Sun River. One site, Musselshell River
at Mosby, had notably higher dissolved-solids concentrations compared to the other sites. The maximum dissolved-solids concentration (6,200 mg/L) at this site was about 4 to 30 times larger than maximum values at other sites in the basin. This high concentration was measured in a sample collected during a time of extreme low flow (0.03 ft3/s). Musselshell River at Mosby also had the largest range in dissolved-solids con-centrations indicating that various factors, possibly relating to flow conditions, might be affecting the dissolved-solids concentrations in this stream. About 90 percent of the samples collected at Musselshell River at Mosby exceeded the general irrigation guideline of 1,000 mg/L. Three other sites in the Missouri River basin (Peoples Creek near Dodson, Milk River at Nashua, and Poplar River near Poplar) had dissolved-solids concentrations that exceeded the 1,000 mg/L general irrigation guideline in about 25 to 50 percent of the samples.
In the Yellowstone River basin, dissolved-solids con-centrations ranged from 26 mg/L at the Stillwater River near Absarokee to 2,450 mg/L at Rosebud Creek near Rosebud (table 15). Median dissolved-solids concentrations ranged from 59 mg/L at Stillwater River near Absarokee to 1,870 mg/L at Rosebud Creek near Rosebud (fig. 12, table 15). Similar to the Missouri River basin, dissolved-solids con-centrations generally increased in a downstream direction; samples from sites in the upper part of the basin (Stillwater River and upstream) had relatively low concentrations. Rosebud Creek near Rosebud and Powder River near Locate consistently had the highest dissolved-solids concentrations and were the only two sites in the basin with concentrations that exceeded the general irrigation guideline of 1,000 mg/L; the guideline was exceeded in more than 75 percent of the samples from both sites.
In the Columbia River basin, dissolved-solids concen-trations ranged from 23 mg/L at Yaak River near Troy to 257 mg/L at Clark Fork at Turah Bridge (table 15). Median concentrations ranged from 52 mg/L at Yaak River near Troy to 209 mg/L at Clark Fork at Turah Bridge. Dissolved-solids concentrations did not vary substantially with flow or season during the monitoring period and did not exceed the general irrigation guideline.
Sodium Adsorption RatioThe SAR provides an indication of the degree to which
sodium in water will be adsorbed by soil. The effects of SAR vary with the specific soil characteristics and other fac-tors, such as salinity, which makes it difficult to evaluate the suitability of water for irrigation using a generalized SAR guideline value. The U.S. Department of Agriculture (2002) has recommended as a general irrigation guideline that water having an SAR of greater than 7 not be used for irrigation. In the Yellowstone River basin, basin-specific numeric stan-dards for SAR have been established for the Rosebud Creek, Tongue River, and Powder River watersheds. In the Rosebud Creek and Tongue River mainstems, the monthly average SAR value is not to exceed 3.0 and a discrete sample value is not
3� Water-Quality Characteristics of Montana Streams in a Statewide Monitoring Network, 1999-2003
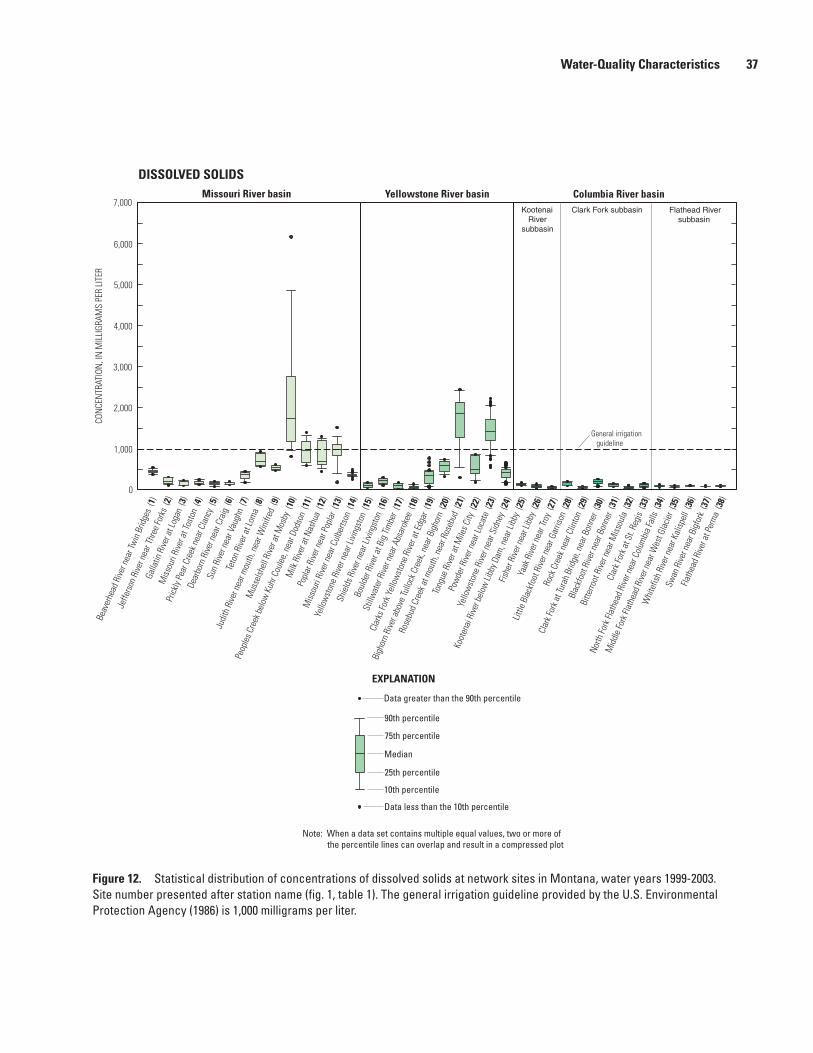
Figure 12. Statistical distribution of concentrations of dissolved solids at network sites in Montana, water years 1999-2003. Site number presented after station name (fig. 1, table 1). The general irrigation guideline provided by the U.S. Environmental Protection Agency (1986) is 1,000 milligrams per liter.
CON
CEN
TRAT
ION
, IN
MIL
LIGR
AMS
PER
LITE
R
4,000
5,000
6,000
7,000
3,000
2,000
1,000
0
General irrigation guideline
DISSOLVED SOLIDSMissouri River basin Yellowstone River basin Columbia River basin
Kootenai Riversubbasin
Flathead River subbasin
Clark Fork subbasin
EXPLANATION
Data greater than the 90th percentile
90th percentile
75th percentile
Median
25th percentile
10th percentile
Data less than the 10th percentile
Note: When a data set contains multiple equal values, two or more of the percentile lines can overlap and result in a compressed plot
Beav
erhe
ad R
iver n
ear T
win
Brid
ges
(1)
Jeffe
rson
Rive
r nea
r Thr
ee Fo
rks
(2)
Galla
tin R
iver a
t Log
an (
3)
Miss
ouri
Rive
r at T
osto
n (4
)
Prick
ly Pe
ar C
reek
nea
r Cla
ncy
(5)
Dear
born
Rive
r nea
r Cra
ig (
6)
Sun
Rive
r nea
r Vau
ghn
(7)
Teto
n Ri
ver a
t Lom
a (8
)
Judi
th R
iver n
ear m
outh
, nea
r Win
ifred
(9)
Mus
selsh
ell R
iver a
t Mos
by (
10)
Peop
les C
reek
bel
ow K
uhr C
oule
e, n
ear D
odso
n (1
1)
Milk
Rive
r at N
ashu
a (1
2)
Popl
ar R
iver n
ear P
opla
r (13
)
Miss
ouri
Rive
r nea
r Cul
berts
on (
14)
Yello
wst
one
Rive
r nea
r Livi
ngst
on (
15)
Shie
lds R
iver n
ear L
iving
ston
(16
)
Boul
der R
iver a
t Big
Tim
ber
(17)
Still
wat
er R
iver n
ear A
bsar
okee
(18
)
Clar
ks Fo
rk Y
ello
wst
one
Rive
r at E
dgar
(19
)
Bigh
orn
Rive
r abo
ve Tu
llock
Cre
ek, n
ear B
igho
rn (
20)
Rose
bud
Cree
k at m
outh
, nea
r Ros
ebud
(21
)
Tong
ue R
iver a
t Mile
s City
(22
)
Pow
der R
iver n
ear L
ocat
e (2
3)
Yello
wst
one
Rive
r nea
r Sid
ney
(24)
Koot
enai
Rive
r bel
ow Li
bby D
am, n
ear L
ibby
(25
)
Fishe
r Rive
r nea
r Lib
by (
26)
Yaak
Rive
r nea
r Tro
y (27
)
Little
Bla
ckfo
ot R
iver n
ear G
arris
on (
28)
Rock
Cre
ek n
ear C
linto
n (2
9)
Clar
k For
k at T
urah
Brid
ge, n
ear B
onne
r (30
)
Blac
kfoo
t Rive
r nea
r Bon
ner
(31)
Bitte
rroot
Rive
r nea
r Miss
oula
(32
)
Clar
k For
k at S
t. Re
gis
(33)
North
Fork
Flat
head
Rive
r nea
r Col
umbi
a Fa
lls (
34)
Mid
dle
Fork
Flat
head
Rive
r nea
r Wes
t Gla
cier
(35)
Whi
tefis
h Ri
ver n
ear K
alisp
ell
(36)
Swan
Rive
r nea
r Big
fork
(37
)
Flath
ead
Rive
r at P
erm
a (3
8)
Water-Quality Characteristics 3�
to exceed 4.5 during the irrigation season of March 2 through October 31 (Montana Department of Environmental Quality, 2003). For the Powder River mainstem during the irrigation season, the SAR standards are 5.0 for a monthly average and 7.5 for a discrete sample. Somewhat higher values are des-ignated for all of these mainstems during the non-irrigation season (November 1 through March 1), with SAR standards ranging from 5.0 to 6.5 for monthly averages, and from 7.5 to 9.75 for discrete samples. Basin-specific numeric standards established for irrigation-season discrete samples are shown in figure 13 because these standards represent the season when most of the samples were collected.
The statistical distribution of SAR values for network sites during water years 1999-2003 is shown in figure 13. Across the network, SAR values ranged from <0.1 to 12 among all the sites (table 15). Several sites in the lower Missouri and Yellowstone River basins had SAR values that exceeded the general irrigation guideline of 7. All of the sites in the Columbia River basin had consistently low SAR values (0.4 or less) that were less than the general irrigation guide-line.
In the Missouri River basin, SAR ranged from <0.1 at Dearborn River near Craig to 11 at Poplar River near Poplar (fig. 13, table 15). Median SAR values ranged from 0.1 at Dearborn River near Craig to 8 at Poplar River near Poplar. Tributaries in the upper part of the basin (Judith River and upstream) and both mainstem sites (Missouri River at Toston and Missouri River near Culbertson), typically had relatively low SAR values of 2 or less. SAR values at four tributaries in the lower Missouri River basin (Musselshell River at Mosby, Peoples Creek near Dodson, Milk River at Nashua, and Poplar River near Poplar) were elevated relative to the other sites in the basin, with median SAR values ranging from 4 to 8.
The general irrigation guideline of 7 was exceeded in more than 25 percent of the samples at Musselshell River at Mosby and Peoples Creek near Dodson, and in more than 50 percent of the samples at Poplar River near Poplar (fig. 13). Consequently, the sodium content of the water in these three lower-basin tributaries could potentially be detrimental to soils if fields were irrigated during periods of high SAR in the streams.
In the Yellowstone River basin, SAR ranged from 0.1 at Boulder River at Big Timber and Stillwater River near Absa-rokee to 12 at Rosebud Creek near Rosebud (fig. 13, table 15). Median SAR values ranged from 0.2 at Boulder River at Big Timber and Stillwater River near Absarokee to 6 at Rosebud Creek near Rosebud. SAR values at most tributaries and both Yellowstone River mainstem sites were relatively low (typi-cally about 2 or less). Three tributaries in the lower part of the basin (Rosebud Creek near Rosebud, Tongue River at Miles City, and Powder River near Locate) had SAR values that were elevated relative to other sites in the basin. Seventy-five per-cent of the samples collected at Rosebud Creek near Rosebud had SAR values that exceeded the irrigation-season numeric standard of 4.5 for discrete samples (fig. 13). The same SAR numeric standards for Rosebud Creek apply to Tongue River at
Miles City, but none of the samples collected at Tongue River at Miles City exceeded the irrigation-season SAR numeric standard of 4.5 for discrete samples. SAR values at Powder River near Locate occasionally exceeded the irrigation-sea-son numeric standard of 7.5 for discrete samples. Because SAR values in Rosebud Creek and Powder River periodically exceeded the numeric standards, the sodium content of the water in these two streams could potentially be detrimental to soils if fields were irrigated during periods of high SAR in the streams. Even though no samples collected at Tongue River at Miles City exceeded the numeric standard of 4.5, the maxi-mum value (4) approached the standard and some caution may be warranted.
In the Columbia River basin, SAR values ranged from 0.1 or less at several sites to 0.4 at Clark Fork at Turah Bridge and Clark Fork at St. Regis. Median SAR values were equal to or less than 0.3 (fig. 13, table 15). SAR values were well below the general irrigation guideline; consequently, water used for irrigation from these streams would not pose a sodium risk to soil.
Trace Elements
Similar to major ions, trace elements were a secondary constituent group that were analyzed only two times per year for the statewide monitoring program. The small number of samples limits the characterization of seasonal and hydrologic variations of concentrations. Generally, data were obtained that span the potential range of concentrations by sampling during high-flow and low-flow periods each year when annual minimum and maximum concentrations typically occur. Total-recoverable concentrations of arsenic, cadmium, chromium, copper, lead, nickel, and zinc were analyzed for this monitor-ing program (table 2). Statistical summaries of trace-element concentrations measured in samples collected at network sites during water years 1999-2003 are presented in table 15.
Elevated trace-element concentrations can have detri-mental effects on both aquatic and terrestrial biota, including humans (U.S. Environmental Protection Agency, 1986). Both natural and anthropogenic sources can contribute to elevated trace-element concentrations in streams (Hem, 1985). Natural sources can include geothermal water that discharges to the surface, or ground water that drains through mineralized rocks and deposits. Mining, which can generate mine wastes such as tailings or create acidic drainage, also can lead to elevated trace-element concentrations in streams. Examples of elevated trace-element concentrations and geochemical processes resulting from mining in Montana are described in Kimball and others (1999) and Nimick and others (2004). In general, due to the tendency for many trace elements to adsorb onto sediment particles (Horowitz, 1991; Lambing, 1991), concen-trations of total-recoverable trace elements tend to increase when suspended-sediment concentrations increase, which is most common during periods of increased streamflow during rainfall or snowmelt runoff.
3� Water-Quality Characteristics of Montana Streams in a Statewide Monitoring Network, 1999-2003
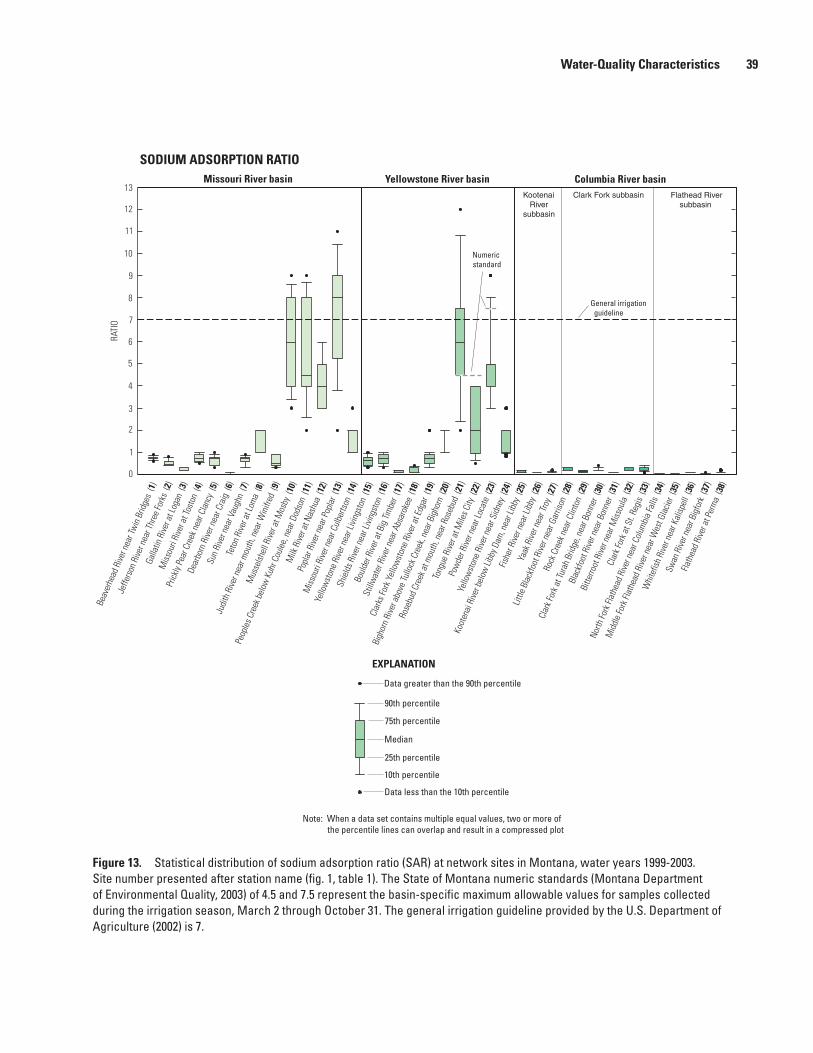
Figure 13. Statistical distribution of sodium adsorption ratio (SAR) at network sites in Montana, water years 1999-2003. Site number presented after station name (fig. 1, table 1). The State of Montana numeric standards (Montana Department of Environmental Quality, 2003) of 4.5 and 7.5 represent the basin-specific maximum allowable values for samples collected during the irrigation season, March 2 through October 31. The general irrigation guideline provided by the U.S. Department of Agriculture (2002) is 7.
RATI
O
10
11
12
13
9
8
7
0
6
5
4
3
2
1
General irrigation guideline
Numericstandard
SODIUM ADSORPTION RATIOMissouri River basin Yellowstone River basin Columbia River basin
Kootenai Riversubbasin
Flathead River subbasin
Clark Fork subbasin
EXPLANATION
Data greater than the 90th percentile
90th percentile
75th percentile
Median
25th percentile
10th percentile
Data less than the 10th percentile
Note: When a data set contains multiple equal values, two or more of the percentile lines can overlap and result in a compressed plot
Beav
erhe
ad R
iver n
ear T
win
Brid
ges
(1)
Jeffe
rson
Rive
r nea
r Thr
ee Fo
rks
(2)
Galla
tin R
iver a
t Log
an (
3)
Miss
ouri
Rive
r at T
osto
n (4
)
Prick
ly Pe
ar C
reek
nea
r Cla
ncy
(5)
Dear
born
Rive
r nea
r Cra
ig (
6)
Sun
Rive
r nea
r Vau
ghn
(7)
Teto
n Ri
ver a
t Lom
a (8
)
Judi
th R
iver n
ear m
outh
, nea
r Win
ifred
(9)
Mus
selsh
ell R
iver a
t Mos
by (
10)
Peop
les C
reek
bel
ow K
uhr C
oule
e, n
ear D
odso
n (1
1)
Milk
Rive
r at N
ashu
a (1
2)
Popl
ar R
iver n
ear P
opla
r (13
)
Miss
ouri
Rive
r nea
r Cul
berts
on (
14)
Yello
wst
one
Rive
r nea
r Livi
ngst
on (
15)
Shie
lds R
iver n
ear L
iving
ston
(16
)
Boul
der R
iver a
t Big
Tim
ber
(17)
Still
wat
er R
iver n
ear A
bsar
okee
(18
)
Clar
ks Fo
rk Y
ello
wst
one
Rive
r at E
dgar
(19
)
Bigh
orn
Rive
r abo
ve Tu
llock
Cre
ek, n
ear B
igho
rn (
20)
Rose
bud
Cree
k at m
outh
, nea
r Ros
ebud
(21
)
Tong
ue R
iver a
t Mile
s City
(22
)
Pow
der R
iver n
ear L
ocat
e (2
3)
Yello
wst
one
Rive
r nea
r Sid
ney
(24)
Koot
enai
Rive
r bel
ow Li
bby D
am, n
ear L
ibby
(25
)
Fishe
r Rive
r nea
r Lib
by (
26)
Yaak
Rive
r nea
r Tro
y (27
)
Little
Bla
ckfo
ot R
iver n
ear G
arris
on (
28)
Rock
Cre
ek n
ear C
linto
n (2
9)
Clar
k For
k at T
urah
Brid
ge, n
ear B
onne
r (30
)
Blac
kfoo
t Rive
r nea
r Bon
ner
(31)
Bitte
rroot
Rive
r nea
r Miss
oula
(32
)
Clar
k For
k at S
t. Re
gis
(33)
North
Fork
Flat
head
Rive
r nea
r Col
umbi
a Fa
lls (
34)
Mid
dle
Fork
Flat
head
Rive
r nea
r Wes
t Gla
cier
(35)
Whi
tefis
h Ri
ver n
ear K
alisp
ell
(36)
Swan
Rive
r nea
r Big
fork
(37
)
Flath
ead
Rive
r at P
erm
a (3
8)
Water-Quality Characteristics 39
Human-health standards for drinking-water supplies and numeric standards for the protection of freshwater aquatic life have been established by the State of Montana for several trace elements (Montana Department of Environmental Qual-ity, 2004). Aquatic-life standards are represented by two levels of toxicity effects—chronic and acute (U.S. Environmental Protection Agency, 1986). Chronic toxicity is commonly a long-term effect where functional impairment can occur to biota exposed to concentrations that exceed chronic standards for extended periods of time (96 hours or more). Chronic tox-icity generally does not cause death directly, but can affect the growth, reproduction, or other biological activities necessary to sustain a healthy population of aquatic organisms. Acute toxicity commonly is manifested by death within a relatively short time as the result of exposure to concentrations that exceed acute standards for periods as brief as 1 hour. Acute toxicity can sometimes affect large numbers of the aquatic population.
The degree of toxicity to aquatic life from cadmium, chromium, copper, lead, nickel, and zinc varies with the ambi-ent hardness of the water; therefore, aquatic-life standards are calculated on a site-specific and sample-specific basis to allow for direct comparison of sample concentrations to standards (Montana Department of Environmental Quality, 2004). How-ever, to summarize analytical results for all samples collected at a site, a general aquatic-life standard was used for com-parison to the overall distribution of trace-element concentra-tions. Thus, general hardness-dependent standards (chronic and acute) were calculated for each trace element using the average hardness for groups of sites having generally similar hardness values (table 5). The general standards, which vary among sites, are intended only to provide a reference for com-parison of sample data to approximate thresholds of potential
toxicity and to illustrate relative differences among groups of sites. Such relative measures of comparison cannot be used to identify when standards are exceeded, but they can be use-ful to indicate if concentrations persistently pose a potential risk to aquatic biota. Determination of actual exceedances would require that aquatic-life standards be calculated for each sample.
Total-Recoverable ArsenicThe statistical distribution of total-recoverable arsenic
concentrations at network sites during water years 1999-2003 is shown in figure 14. The State of Montana human-health standard of 18 µg/L for arsenic (Montana Department of Environmental Quality, 2004) is shown in the figure as a general reference to potential toxicity. Aquatic-life standards for arsenic are not shown because all sample concentrations were substantially lower than the chronic aquatic-life standard of 150 µg/L (Montana Department of Environmental Quality, 2004).
Across the network, concentrations ranged from <1 to 48 µg/L (fig. 14, table 15). In general, water from most sites in the network had arsenic concentrations less than the State of Montana human-health standard. At one or more sites in each of the three major river basins, arsenic concentrations exceeded the human-health standard (fig. 14). At some of those sites, arsenic concentrations exceeded the standard in only a few samples. However, at two sites arsenic concentra-tions commonly exceeded the standard: Missouri River at Tos-ton and Yellowstone River near Livingston. Geothermal water from Yellowstone National Park contributes large quantities of arsenic to the headwaters of the Missouri and Yellowstone Rivers (Nimick and others, 1998).
Table �. General aquatic-life standards calculated from average hardness for groups of network sites with similar hardness, Montana.
[Abbreviations: CaCO3, calcium carbonate; µg/L, micrograms per liter; mg/L, milligrams per liter]
Site numbers for groups
of sites with similar hardness
(table 1 and fig. 1)
Average hardness,
mg/L as CaCO3
General aquatic-life standards (µg/L) for average hardness1
(chronic/acute)
Cadmium Chromium Copper Lead Nickel Zinc
1-6 168 0.37/3.2 120/2,500 13/20 5.3/140 74/660 170/170
7-14 303 .63/6.7 220/4,500 24/41 13/340 140/1,200 310/310
15-18 104 .24/1.8 76/1,600 8.2/12 2.6/67 46/410 100/100
19-24 337 .67/7.4 230/4,900 26/44 15/390 150/1,300 340/340
25-38 112 .26/2.0 81/1,700 8.8/13 2.9/74 49/440 110/1101General aquatic-life standards are calculated from equations in Montana Department of Environmental Quality (2004) using average hardness
for each group. General aquatic-life standards are not legally enforceable values, but are presented to provide a basis to illustrate relative differences among groups of sites (figs. 15-20). The first number is the calculated standard for chronic toxicity; the second number is the calculated standard for acute toxicity.
�0 Water-Quality Characteristics of Montana Streams in a Statewide Monitoring Network, 1999-2003
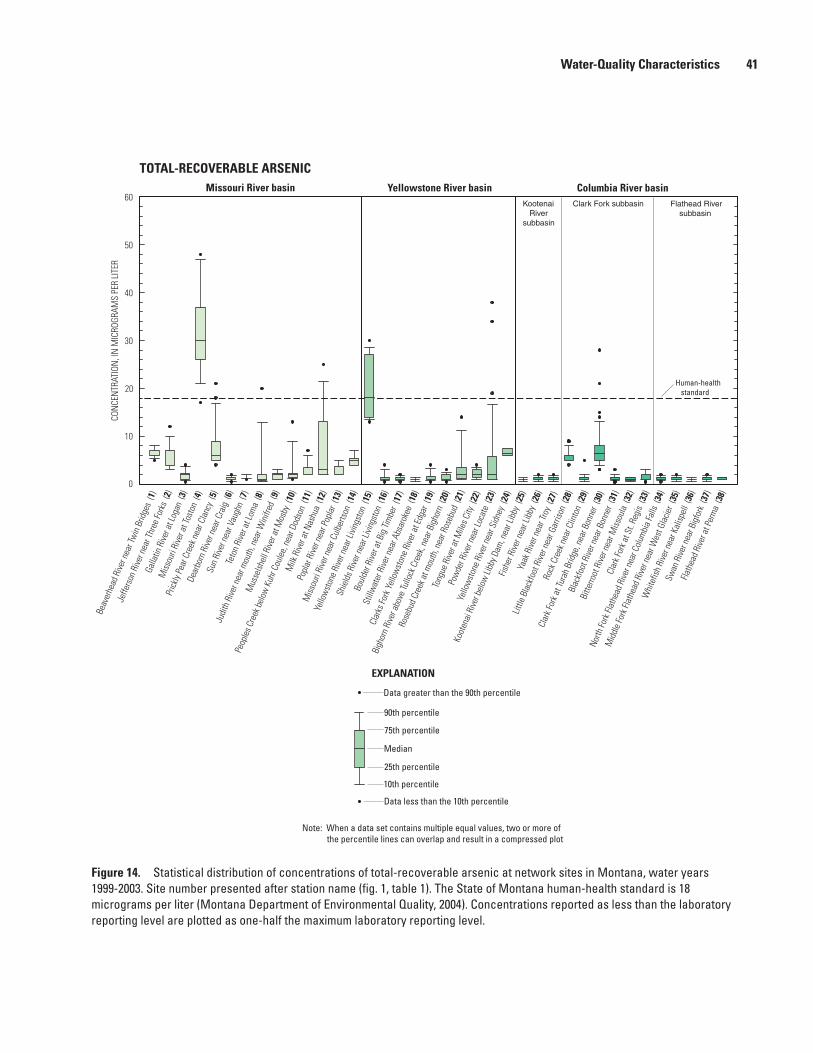
Figure 1�. Statistical distribution of concentrations of total-recoverable arsenic at network sites in Montana, water years 1999-2003. Site number presented after station name (fig. 1, table 1). The State of Montana human-health standard is 18 micrograms per liter (Montana Department of Environmental Quality, 2004). Concentrations reported as less than the laboratory reporting level are plotted as one-half the maximum laboratory reporting level.
CON
CEN
TRAT
ION
, IN
MIC
ROGR
AMS
PER
LITE
R
0
10
20
30
40
50
60
Human-health standard
TOTAL-RECOVERABLE ARSENICMissouri River basin Yellowstone River basin Columbia River basin
Kootenai Riversubbasin
Flathead River subbasin
Clark Fork subbasin
EXPLANATION
Data greater than the 90th percentile
90th percentile
75th percentile
Median
25th percentile
10th percentile
Data less than the 10th percentile
Note: When a data set contains multiple equal values, two or more of the percentile lines can overlap and result in a compressed plot
Beav
erhe
ad R
iver n
ear T
win
Brid
ges
(1)
Jeffe
rson
Rive
r nea
r Thr
ee Fo
rks
(2)
Galla
tin R
iver a
t Log
an (
3)
Miss
ouri
Rive
r at T
osto
n (4
)
Prick
ly Pe
ar C
reek
nea
r Cla
ncy
(5)
Dear
born
Rive
r nea
r Cra
ig (
6)
Sun
Rive
r nea
r Vau
ghn
(7)
Teto
n Ri
ver a
t Lom
a (8
)
Judi
th R
iver n
ear m
outh
, nea
r Win
ifred
(9)
Mus
selsh
ell R
iver a
t Mos
by (
10)
Peop
les C
reek
bel
ow K
uhr C
oule
e, n
ear D
odso
n (1
1)
Milk
Rive
r at N
ashu
a (1
2)
Popl
ar R
iver n
ear P
opla
r (13
)
Miss
ouri
Rive
r nea
r Cul
berts
on (
14)
Yello
wst
one
Rive
r nea
r Livi
ngst
on (
15)
Shie
lds R
iver n
ear L
iving
ston
(16
)
Boul
der R
iver a
t Big
Tim
ber
(17)
Still
wat
er R
iver n
ear A
bsar
okee
(18
)
Clar
ks Fo
rk Y
ello
wst
one
Rive
r at E
dgar
(19
)
Bigh
orn
Rive
r abo
ve Tu
llock
Cre
ek, n
ear B
igho
rn (
20)
Rose
bud
Cree
k at m
outh
, nea
r Ros
ebud
(21
)
Tong
ue R
iver a
t Mile
s City
(22
)
Pow
der R
iver n
ear L
ocat
e (2
3)
Yello
wst
one
Rive
r nea
r Sid
ney
(24)
Koot
enai
Rive
r bel
ow Li
bby D
am, n
ear L
ibby
(25
)
Fishe
r Rive
r nea
r Lib
by (
26)
Yaak
Rive
r nea
r Tro
y (27
)
Little
Bla
ckfo
ot R
iver n
ear G
arris
on (
28)
Rock
Cre
ek n
ear C
linto
n (2
9)
Clar
k For
k at T
urah
Brid
ge, n
ear B
onne
r (30
)
Blac
kfoo
t Rive
r nea
r Bon
ner
(31)
Bitte
rroot
Rive
r nea
r Miss
oula
(32
)
Clar
k For
k at S
t. Re
gis
(33)
North
Fork
Flat
head
Rive
r nea
r Col
umbi
a Fa
lls (
34)
Mid
dle
Fork
Flat
head
Rive
r nea
r Wes
t Gla
cier
(35)
Whi
tefis
h Ri
ver n
ear K
alisp
ell
(36)
Swan
Rive
r nea
r Big
fork
(37
)
Flath
ead
Rive
r at P
erm
a (3
8)
Water-Quality Characteristics �1
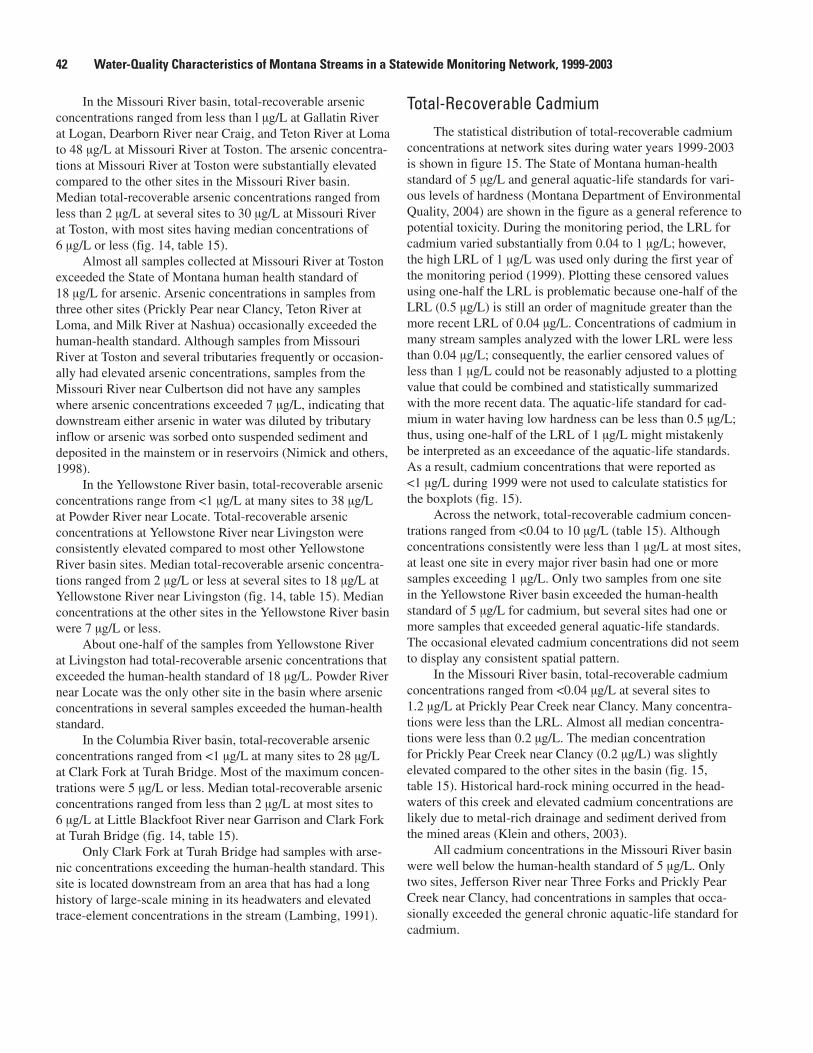
�2 Water-Quality Characteristics of Montana Streams in a Statewide Monitoring Network, 1999-2003
In the Missouri River basin, total-recoverable arsenic concentrations ranged from less than l µg/L at Gallatin River at Logan, Dearborn River near Craig, and Teton River at Loma to 48 µg/L at Missouri River at Toston. The arsenic concentra-tions at Missouri River at Toston were substantially elevated compared to the other sites in the Missouri River basin. Median total-recoverable arsenic concentrations ranged from less than 2 µg/L at several sites to 30 µg/L at Missouri River at Toston, with most sites having median concentrations of 6 µg/L or less (fig. 14, table 15).
Almost all samples collected at Missouri River at Toston exceeded the State of Montana human health standard of 18 µg/L for arsenic. Arsenic concentrations in samples from three other sites (Prickly Pear near Clancy, Teton River at Loma, and Milk River at Nashua) occasionally exceeded the human-health standard. Although samples from Missouri River at Toston and several tributaries frequently or occasion-ally had elevated arsenic concentrations, samples from the Missouri River near Culbertson did not have any samples where arsenic concentrations exceeded 7 µg/L, indicating that downstream either arsenic in water was diluted by tributary inflow or arsenic was sorbed onto suspended sediment and deposited in the mainstem or in reservoirs (Nimick and others, 1998).
In the Yellowstone River basin, total-recoverable arsenic concentrations range from <1 µg/L at many sites to 38 µg/L at Powder River near Locate. Total-recoverable arsenic concentrations at Yellowstone River near Livingston were consistently elevated compared to most other Yellowstone River basin sites. Median total-recoverable arsenic concentra-tions ranged from 2 µg/L or less at several sites to 18 µg/L at Yellowstone River near Livingston (fig. 14, table 15). Median concentrations at the other sites in the Yellowstone River basin were 7 µg/L or less.
About one-half of the samples from Yellowstone River at Livingston had total-recoverable arsenic concentrations that exceeded the human-health standard of 18 µg/L. Powder River near Locate was the only other site in the basin where arsenic concentrations in several samples exceeded the human-health standard.
In the Columbia River basin, total-recoverable arsenic concentrations ranged from <1 µg/L at many sites to 28 µg/L at Clark Fork at Turah Bridge. Most of the maximum concen-trations were 5 µg/L or less. Median total-recoverable arsenic concentrations ranged from less than 2 µg/L at most sites to 6 µg/L at Little Blackfoot River near Garrison and Clark Fork at Turah Bridge (fig. 14, table 15).
Only Clark Fork at Turah Bridge had samples with arse-nic concentrations exceeding the human-health standard. This site is located downstream from an area that has had a long history of large-scale mining in its headwaters and elevated trace-element concentrations in the stream (Lambing, 1991).
Total-Recoverable CadmiumThe statistical distribution of total-recoverable cadmium
concentrations at network sites during water years 1999-2003 is shown in figure 15. The State of Montana human-health standard of 5 µg/L and general aquatic-life standards for vari-ous levels of hardness (Montana Department of Environmental Quality, 2004) are shown in the figure as a general reference to potential toxicity. During the monitoring period, the LRL for cadmium varied substantially from 0.04 to 1 µg/L; however, the high LRL of 1 µg/L was used only during the first year of the monitoring period (1999). Plotting these censored values using one-half the LRL is problematic because one-half of the LRL (0.5 µg/L) is still an order of magnitude greater than the more recent LRL of 0.04 µg/L. Concentrations of cadmium in many stream samples analyzed with the lower LRL were less than 0.04 µg/L; consequently, the earlier censored values of less than 1 µg/L could not be reasonably adjusted to a plotting value that could be combined and statistically summarized with the more recent data. The aquatic-life standard for cad-mium in water having low hardness can be less than 0.5 µg/L; thus, using one-half of the LRL of 1 µg/L might mistakenly be interpreted as an exceedance of the aquatic-life standards. As a result, cadmium concentrations that were reported as <1 µg/L during 1999 were not used to calculate statistics for the boxplots (fig. 15).
Across the network, total-recoverable cadmium concen-trations ranged from <0.04 to 10 µg/L (table 15). Although concentrations consistently were less than 1 µg/L at most sites, at least one site in every major river basin had one or more samples exceeding 1 µg/L. Only two samples from one site in the Yellowstone River basin exceeded the human-health standard of 5 µg/L for cadmium, but several sites had one or more samples that exceeded general aquatic-life standards. The occasional elevated cadmium concentrations did not seem to display any consistent spatial pattern.
In the Missouri River basin, total-recoverable cadmium concentrations ranged from <0.04 µg/L at several sites to 1.2 µg/L at Prickly Pear Creek near Clancy. Many concentra-tions were less than the LRL. Almost all median concentra-tions were less than 0.2 µg/L. The median concentration for Prickly Pear Creek near Clancy (0.2 µg/L) was slightly elevated compared to the other sites in the basin (fig. 15, table 15). Historical hard-rock mining occurred in the head-waters of this creek and elevated cadmium concentrations are likely due to metal-rich drainage and sediment derived from the mined areas (Klein and others, 2003).
All cadmium concentrations in the Missouri River basin were well below the human-health standard of 5 µg/L. Only two sites, Jefferson River near Three Forks and Prickly Pear Creek near Clancy, had concentrations in samples that occa-sionally exceeded the general chronic aquatic-life standard for cadmium.

Figure 1�. Statistical distribution of concentrations of total-recoverable cadmium at network sites in Montana, water years 1999-2003. Site number presented after station name (fig. 1, table 1). The State of Montana human-health standard is 5 micrograms per liter. The general aquatic-life standards for acute and chronic toxicity (table 5) were calculated using applicable equations (Montana Department of Environmental Quality, 2004) and average water hardness. Variable aquatic-life standards result from differences in the average water hardness among groups of sites. Cadmium values with a high laboratory reporting level of 1 microgram per liter during 1999 at 34 sites were not used to calculate statistics for this figure. Concentrations reported as less than lower laboratory reporting levels are plotted as one-half the maximum laboratory reporting level.
CON
CEN
TRAT
ION
, IN
MIC
ROGR
AMS
PER
LITE
R
0.1
1
10
100
0.01
General chronic aquatic-life standard
General acute aquatic-life standard
Human-health standard
TOTAL-RECOVERABLE CADMIUMMissouri River basin Yellowstone River basin Columbia River basin
Kootenai Riversubbasin
Flathead River subbasin
Clark Fork subbasin
EXPLANATION
Data greater than the 90th percentile
90th percentile
75th percentile
Median
25th percentile
10th percentile
Data less than the 10th percentile
Note: When a data set contains multiple equal values, two or more of the percentile lines can overlap and result in a compressed plot
Beav
erhe
ad R
iver n
ear T
win
Brid
ges
(1)
Jeffe
rson
Rive
r nea
r Thr
ee Fo
rks
(2)
Galla
tin R
iver a
t Log
an (
3)
Miss
ouri
Rive
r at T
osto
n (4
)
Prick
ly Pe
ar C
reek
nea
r Cla
ncy
(5)
Dear
born
Rive
r nea
r Cra
ig (
6)
Sun
Rive
r nea
r Vau
ghn
(7)
Teto
n Ri
ver a
t Lom
a (8
)
Judi
th R
iver n
ear m
outh
, nea
r Win
ifred
(9)
Mus
selsh
ell R
iver a
t Mos
by (
10)
Peop
les C
reek
bel
ow K
uhr C
oule
e, n
ear D
odso
n (1
1)
Milk
Rive
r at N
ashu
a (1
2)
Popl
ar R
iver n
ear P
opla
r (13
)
Miss
ouri
Rive
r nea
r Cul
berts
on (
14)
Yello
wst
one
Rive
r nea
r Livi
ngst
on (
15)
Shie
lds R
iver n
ear L
iving
ston
(16
)
Boul
der R
iver a
t Big
Tim
ber
(17)
Still
wat
er R
iver n
ear A
bsar
okee
(18
)
Clar
ks Fo
rk Y
ello
wst
one
Rive
r at E
dgar
(19
)
Bigh
orn
Rive
r abo
ve Tu
llock
Cre
ek, n
ear B
igho
rn (
20)
Rose
bud
Cree
k at m
outh
, nea
r Ros
ebud
(21
)
Tong
ue R
iver a
t Mile
s City
(22
)
Pow
der R
iver n
ear L
ocat
e (2
3)
Yello
wst
one
Rive
r nea
r Sid
ney
(24)
Koot
enai
Rive
r bel
ow Li
bby D
am, n
ear L
ibby
(25
)
Fishe
r Rive
r nea
r Lib
by (
26)
Yaak
Rive
r nea
r Tro
y (27
)
Little
Bla
ckfo
ot R
iver n
ear G
arris
on (
28)
Rock
Cre
ek n
ear C
linto
n (2
9)
Clar
k For
k at T
urah
Brid
ge, n
ear B
onne
r (30
)
Blac
kfoo
t Rive
r nea
r Bon
ner
(31)
Bitte
rroot
Rive
r nea
r Miss
oula
(32
)
Clar
k For
k at S
t. Re
gis
(33)
North
Fork
Flat
head
Rive
r nea
r Col
umbi
a Fa
lls (
34)
Mid
dle
Fork
Flat
head
Rive
r nea
r Wes
t Gla
cier
(35)
Whi
tefis
h Ri
ver n
ear K
alisp
ell
(36)
Swan
Rive
r nea
r Big
fork
(37
)
Flath
ead
Rive
r at P
erm
a (3
8)
Water-Quality Characteristics �3
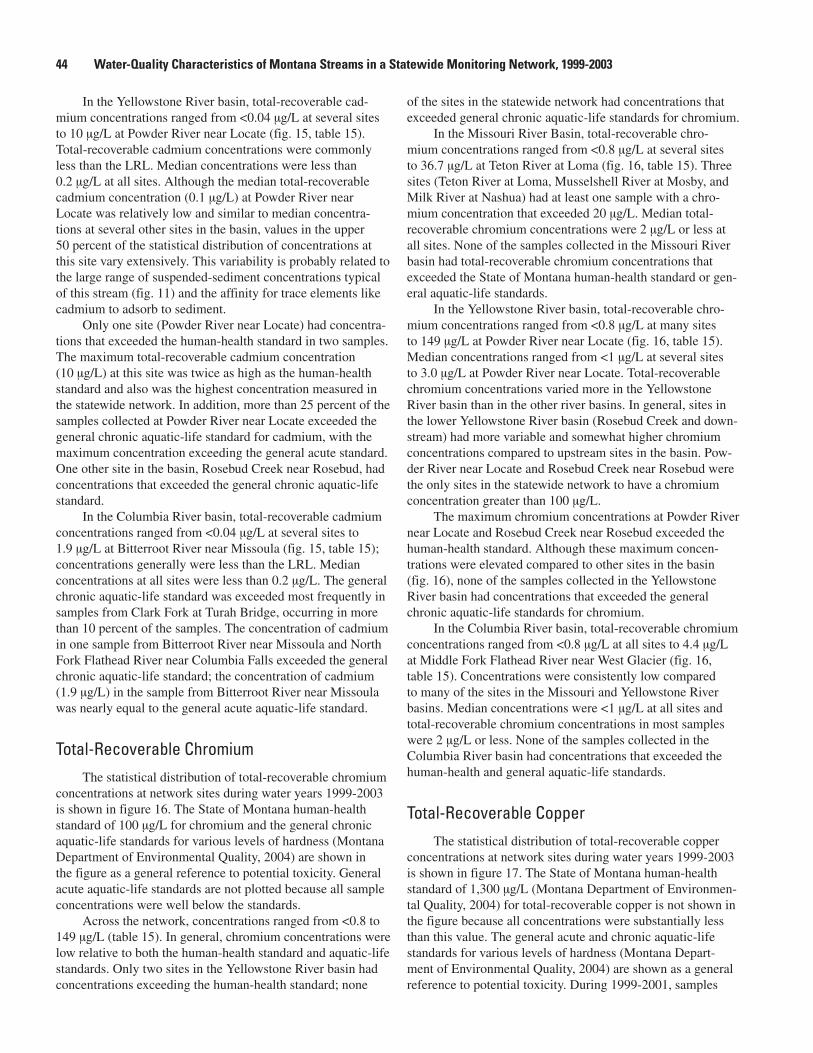
In the Yellowstone River basin, total-recoverable cad-mium concentrations ranged from <0.04 µg/L at several sites to 10 µg/L at Powder River near Locate (fig. 15, table 15). Total-recoverable cadmium concentrations were commonly less than the LRL. Median concentrations were less than 0.2 µg/L at all sites. Although the median total-recoverable cadmium concentration (0.1 µg/L) at Powder River near Locate was relatively low and similar to median concentra-tions at several other sites in the basin, values in the upper 50 percent of the statistical distribution of concentrations at this site vary extensively. This variability is probably related to the large range of suspended-sediment concentrations typical of this stream (fig. 11) and the affinity for trace elements like cadmium to adsorb to sediment.
Only one site (Powder River near Locate) had concentra-tions that exceeded the human-health standard in two samples. The maximum total-recoverable cadmium concentration (10 µg/L) at this site was twice as high as the human-health standard and also was the highest concentration measured in the statewide network. In addition, more than 25 percent of the samples collected at Powder River near Locate exceeded the general chronic aquatic-life standard for cadmium, with the maximum concentration exceeding the general acute standard. One other site in the basin, Rosebud Creek near Rosebud, had concentrations that exceeded the general chronic aquatic-life standard.
In the Columbia River basin, total-recoverable cadmium concentrations ranged from <0.04 µg/L at several sites to 1.9 µg/L at Bitterroot River near Missoula (fig. 15, table 15); concentrations generally were less than the LRL. Median concentrations at all sites were less than 0.2 µg/L. The general chronic aquatic-life standard was exceeded most frequently in samples from Clark Fork at Turah Bridge, occurring in more than 10 percent of the samples. The concentration of cadmium in one sample from Bitterroot River near Missoula and North Fork Flathead River near Columbia Falls exceeded the general chronic aquatic-life standard; the concentration of cadmium (1.9 µg/L) in the sample from Bitterroot River near Missoula was nearly equal to the general acute aquatic-life standard.
Total-Recoverable ChromiumThe statistical distribution of total-recoverable chromium
concentrations at network sites during water years 1999-2003 is shown in figure 16. The State of Montana human-health standard of 100 µg/L for chromium and the general chronic aquatic-life standards for various levels of hardness (Montana Department of Environmental Quality, 2004) are shown in the figure as a general reference to potential toxicity. General acute aquatic-life standards are not plotted because all sample concentrations were well below the standards.
Across the network, concentrations ranged from <0.8 to 149 µg/L (table 15). In general, chromium concentrations were low relative to both the human-health standard and aquatic-life standards. Only two sites in the Yellowstone River basin had concentrations exceeding the human-health standard; none
of the sites in the statewide network had concentrations that exceeded general chronic aquatic-life standards for chromium.
In the Missouri River Basin, total-recoverable chro-mium concentrations ranged from <0.8 µg/L at several sites to 36.7 µg/L at Teton River at Loma (fig. 16, table 15). Three sites (Teton River at Loma, Musselshell River at Mosby, and Milk River at Nashua) had at least one sample with a chro-mium concentration that exceeded 20 µg/L. Median total-recoverable chromium concentrations were 2 µg/L or less at all sites. None of the samples collected in the Missouri River basin had total-recoverable chromium concentrations that exceeded the State of Montana human-health standard or gen-eral aquatic-life standards.
In the Yellowstone River basin, total-recoverable chro-mium concentrations ranged from <0.8 µg/L at many sites to 149 µg/L at Powder River near Locate (fig. 16, table 15). Median concentrations ranged from <1 µg/L at several sites to 3.0 µg/L at Powder River near Locate. Total-recoverable chromium concentrations varied more in the Yellowstone River basin than in the other river basins. In general, sites in the lower Yellowstone River basin (Rosebud Creek and down-stream) had more variable and somewhat higher chromium concentrations compared to upstream sites in the basin. Pow-der River near Locate and Rosebud Creek near Rosebud were the only sites in the statewide network to have a chromium concentration greater than 100 µg/L.
The maximum chromium concentrations at Powder River near Locate and Rosebud Creek near Rosebud exceeded the human-health standard. Although these maximum concen-trations were elevated compared to other sites in the basin (fig. 16), none of the samples collected in the Yellowstone River basin had concentrations that exceeded the general chronic aquatic-life standards for chromium.
In the Columbia River basin, total-recoverable chromium concentrations ranged from <0.8 µg/L at all sites to 4.4 µg/L at Middle Fork Flathead River near West Glacier (fig. 16, table 15). Concentrations were consistently low compared to many of the sites in the Missouri and Yellowstone River basins. Median concentrations were <1 µg/L at all sites and total-recoverable chromium concentrations in most samples were 2 µg/L or less. None of the samples collected in the Columbia River basin had concentrations that exceeded the human-health and general aquatic-life standards.
Total-Recoverable CopperThe statistical distribution of total-recoverable copper
concentrations at network sites during water years 1999-2003 is shown in figure 17. The State of Montana human-health standard of 1,300 µg/L (Montana Department of Environmen-tal Quality, 2004) for total-recoverable copper is not shown in the figure because all concentrations were substantially less than this value. The general acute and chronic aquatic-life standards for various levels of hardness (Montana Depart-ment of Environmental Quality, 2004) are shown as a general reference to potential toxicity. During 1999-2001, samples
�� Water-Quality Characteristics of Montana Streams in a Statewide Monitoring Network, 1999-2003
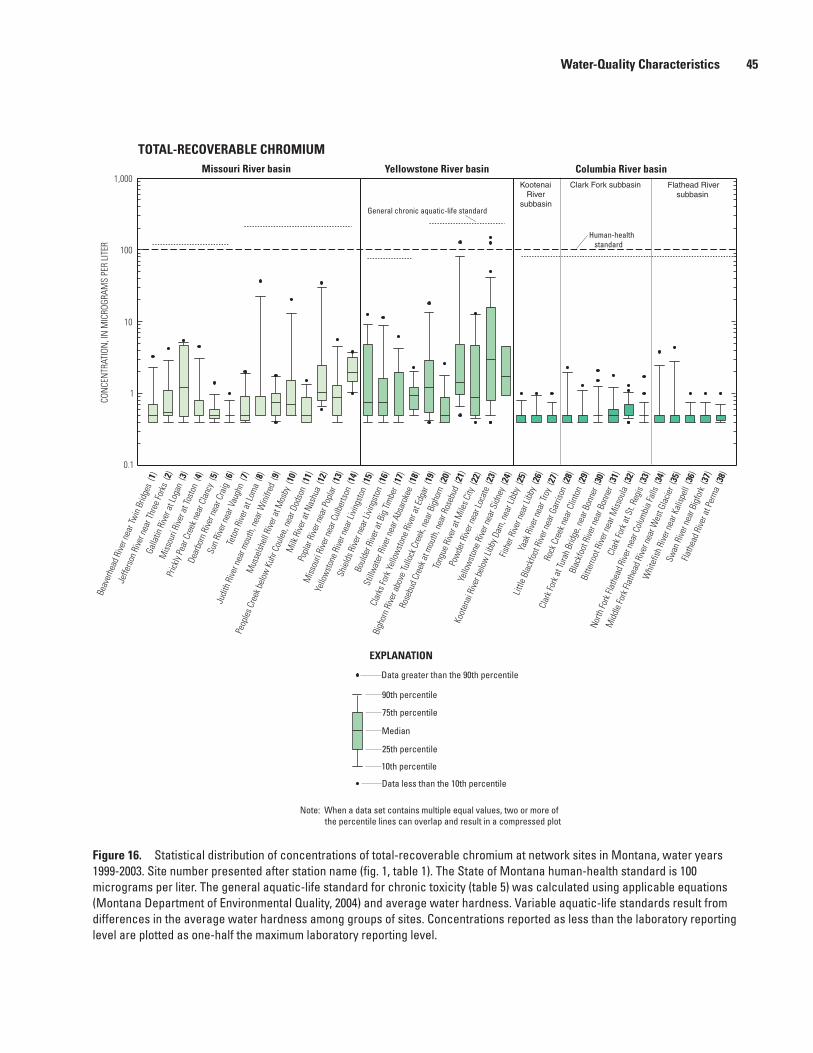
Figure 1�. Statistical distribution of concentrations of total-recoverable chromium at network sites in Montana, water years 1999-2003. Site number presented after station name (fig. 1, table 1). The State of Montana human-health standard is 100 micrograms per liter. The general aquatic-life standard for chronic toxicity (table 5) was calculated using applicable equations (Montana Department of Environmental Quality, 2004) and average water hardness. Variable aquatic-life standards result from differences in the average water hardness among groups of sites. Concentrations reported as less than the laboratory reporting level are plotted as one-half the maximum laboratory reporting level.
CON
CEN
TRAT
ION
, IN
MIC
ROGR
AMS
PER
LITE
R
0.1
1
10
100
1,000
General chronic aquatic-life standard
Human-health standard
TOTAL-RECOVERABLE CHROMIUMMissouri River basin Yellowstone River basin Columbia River basin
Kootenai Riversubbasin
Flathead River subbasin
Clark Fork subbasin
EXPLANATION
Data greater than the 90th percentile
90th percentile
75th percentile
Median
25th percentile
10th percentile
Data less than the 10th percentile
Note: When a data set contains multiple equal values, two or more of the percentile lines can overlap and result in a compressed plot
Beav
erhe
ad R
iver n
ear T
win
Brid
ges
(1)
Jeffe
rson
Rive
r nea
r Thr
ee Fo
rks
(2)
Galla
tin R
iver a
t Log
an (
3)
Miss
ouri
Rive
r at T
osto
n (4
)
Prick
ly Pe
ar C
reek
nea
r Cla
ncy
(5)
Dear
born
Rive
r nea
r Cra
ig (
6)
Sun
Rive
r nea
r Vau
ghn
(7)
Teto
n Ri
ver a
t Lom
a (8
)
Judi
th R
iver n
ear m
outh
, nea
r Win
ifred
(9)
Mus
selsh
ell R
iver a
t Mos
by (
10)
Peop
les C
reek
bel
ow K
uhr C
oule
e, n
ear D
odso
n (1
1)
Milk
Rive
r at N
ashu
a (1
2)
Popl
ar R
iver n
ear P
opla
r (13
)
Miss
ouri
Rive
r nea
r Cul
berts
on (
14)
Yello
wst
one
Rive
r nea
r Livi
ngst
on (
15)
Shie
lds R
iver n
ear L
iving
ston
(16
)
Boul
der R
iver a
t Big
Tim
ber
(17)
Still
wat
er R
iver n
ear A
bsar
okee
(18
)
Clar
ks Fo
rk Y
ello
wst
one
Rive
r at E
dgar
(19
)
Bigh
orn
Rive
r abo
ve Tu
llock
Cre
ek, n
ear B
igho
rn (
20)
Rose
bud
Cree
k at m
outh
, nea
r Ros
ebud
(21
)
Tong
ue R
iver a
t Mile
s City
(22
)
Pow
der R
iver n
ear L
ocat
e (2
3)
Yello
wst
one
Rive
r nea
r Sid
ney
(24)
Koot
enai
Rive
r bel
ow Li
bby D
am, n
ear L
ibby
(25
)
Fishe
r Rive
r nea
r Lib
by (
26)
Yaak
Rive
r nea
r Tro
y (27
)
Little
Bla
ckfo
ot R
iver n
ear G
arris
on (
28)
Rock
Cre
ek n
ear C
linto
n (2
9)
Clar
k For
k at T
urah
Brid
ge, n
ear B
onne
r (30
)
Blac
kfoo
t Rive
r nea
r Bon
ner
(31)
Bitte
rroot
Rive
r nea
r Miss
oula
(32
)
Clar
k For
k at S
t. Re
gis
(33)
North
Fork
Flat
head
Rive
r nea
r Col
umbi
a Fa
lls (
34)
Mid
dle
Fork
Flat
head
Rive
r nea
r Wes
t Gla
cier
(35)
Whi
tefis
h Ri
ver n
ear K
alisp
ell
(36)
Swan
Rive
r nea
r Big
fork
(37
)
Flath
ead
Rive
r at P
erm
a (3
8)
Water-Quality Characteristics ��
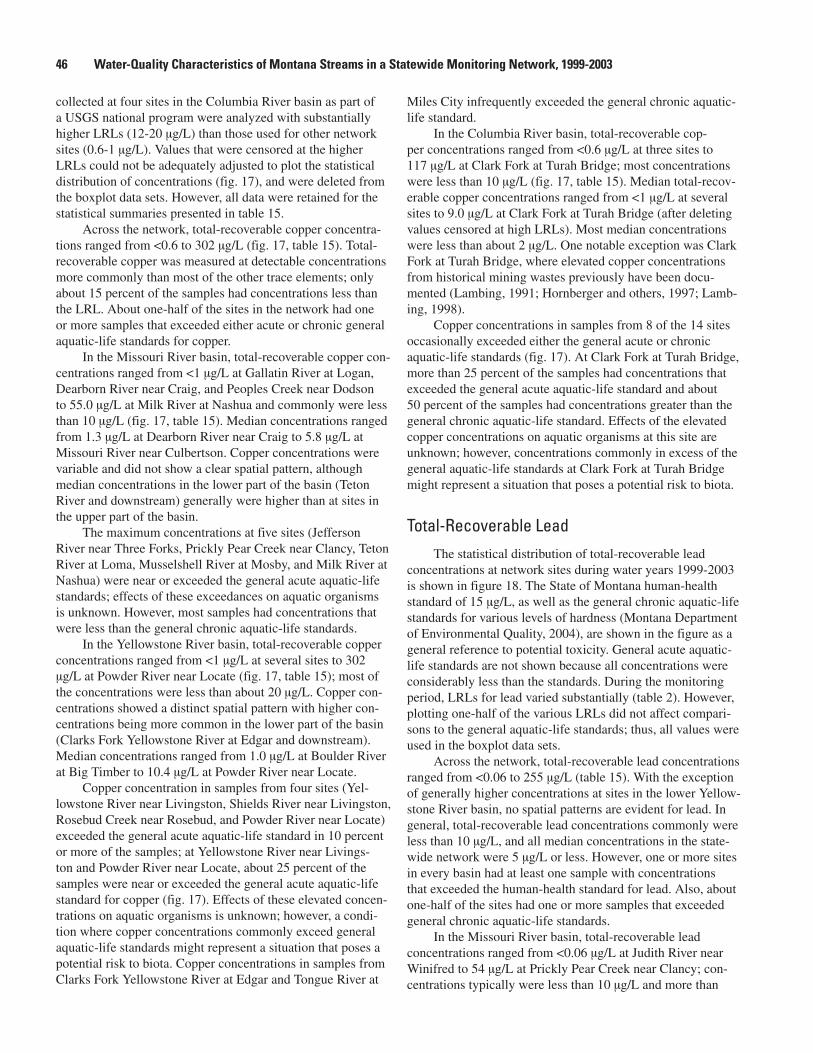
collected at four sites in the Columbia River basin as part of a USGS national program were analyzed with substantially higher LRLs (12-20 µg/L) than those used for other network sites (0.6-1 µg/L). Values that were censored at the higher LRLs could not be adequately adjusted to plot the statistical distribution of concentrations (fig. 17), and were deleted from the boxplot data sets. However, all data were retained for the statistical summaries presented in table 15.
Across the network, total-recoverable copper concentra-tions ranged from <0.6 to 302 µg/L (fig. 17, table 15). Total-recoverable copper was measured at detectable concentrations more commonly than most of the other trace elements; only about 15 percent of the samples had concentrations less than the LRL. About one-half of the sites in the network had one or more samples that exceeded either acute or chronic general aquatic-life standards for copper.
In the Missouri River basin, total-recoverable copper con-centrations ranged from <1 µg/L at Gallatin River at Logan, Dearborn River near Craig, and Peoples Creek near Dodson to 55.0 µg/L at Milk River at Nashua and commonly were less than 10 µg/L (fig. 17, table 15). Median concentrations ranged from 1.3 µg/L at Dearborn River near Craig to 5.8 µg/L at Missouri River near Culbertson. Copper concentrations were variable and did not show a clear spatial pattern, although median concentrations in the lower part of the basin (Teton River and downstream) generally were higher than at sites in the upper part of the basin.
The maximum concentrations at five sites (Jefferson River near Three Forks, Prickly Pear Creek near Clancy, Teton River at Loma, Musselshell River at Mosby, and Milk River at Nashua) were near or exceeded the general acute aquatic-life standards; effects of these exceedances on aquatic organisms is unknown. However, most samples had concentrations that were less than the general chronic aquatic-life standards.
In the Yellowstone River basin, total-recoverable copper concentrations ranged from <1 µg/L at several sites to 302 µg/L at Powder River near Locate (fig. 17, table 15); most of the concentrations were less than about 20 µg/L. Copper con-centrations showed a distinct spatial pattern with higher con-centrations being more common in the lower part of the basin (Clarks Fork Yellowstone River at Edgar and downstream). Median concentrations ranged from 1.0 µg/L at Boulder River at Big Timber to 10.4 µg/L at Powder River near Locate.
Copper concentration in samples from four sites (Yel-lowstone River near Livingston, Shields River near Livingston, Rosebud Creek near Rosebud, and Powder River near Locate) exceeded the general acute aquatic-life standard in 10 percent or more of the samples; at Yellowstone River near Livings-ton and Powder River near Locate, about 25 percent of the samples were near or exceeded the general acute aquatic-life standard for copper (fig. 17). Effects of these elevated concen-trations on aquatic organisms is unknown; however, a condi-tion where copper concentrations commonly exceed general aquatic-life standards might represent a situation that poses a potential risk to biota. Copper concentrations in samples from Clarks Fork Yellowstone River at Edgar and Tongue River at
Miles City infrequently exceeded the general chronic aquatic-life standard.
In the Columbia River basin, total-recoverable cop-per concentrations ranged from <0.6 µg/L at three sites to 117 µg/L at Clark Fork at Turah Bridge; most concentrations were less than 10 µg/L (fig. 17, table 15). Median total-recov-erable copper concentrations ranged from <1 µg/L at several sites to 9.0 µg/L at Clark Fork at Turah Bridge (after deleting values censored at high LRLs). Most median concentrations were less than about 2 µg/L. One notable exception was Clark Fork at Turah Bridge, where elevated copper concentrations from historical mining wastes previously have been docu-mented (Lambing, 1991; Hornberger and others, 1997; Lamb-ing, 1998).
Copper concentrations in samples from 8 of the 14 sites occasionally exceeded either the general acute or chronic aquatic-life standards (fig. 17). At Clark Fork at Turah Bridge, more than 25 percent of the samples had concentrations that exceeded the general acute aquatic-life standard and about 50 percent of the samples had concentrations greater than the general chronic aquatic-life standard. Effects of the elevated copper concentrations on aquatic organisms at this site are unknown; however, concentrations commonly in excess of the general aquatic-life standards at Clark Fork at Turah Bridge might represent a situation that poses a potential risk to biota.
Total-Recoverable LeadThe statistical distribution of total-recoverable lead
concentrations at network sites during water years 1999-2003 is shown in figure 18. The State of Montana human-health standard of 15 µg/L, as well as the general chronic aquatic-life standards for various levels of hardness (Montana Department of Environmental Quality, 2004), are shown in the figure as a general reference to potential toxicity. General acute aquatic-life standards are not shown because all concentrations were considerably less than the standards. During the monitoring period, LRLs for lead varied substantially (table 2). However, plotting one-half of the various LRLs did not affect compari-sons to the general aquatic-life standards; thus, all values were used in the boxplot data sets.
Across the network, total-recoverable lead concentrations ranged from <0.06 to 255 µg/L (table 15). With the exception of generally higher concentrations at sites in the lower Yellow-stone River basin, no spatial patterns are evident for lead. In general, total-recoverable lead concentrations commonly were less than 10 µg/L, and all median concentrations in the state-wide network were 5 µg/L or less. However, one or more sites in every basin had at least one sample with concentrations that exceeded the human-health standard for lead. Also, about one-half of the sites had one or more samples that exceeded general chronic aquatic-life standards.
In the Missouri River basin, total-recoverable lead concentrations ranged from <0.06 µg/L at Judith River near Winifred to 54 µg/L at Prickly Pear Creek near Clancy; con-centrations typically were less than 10 µg/L and more than
�� Water-Quality Characteristics of Montana Streams in a Statewide Monitoring Network, 1999-2003

Figure 1�. Statistical distribution of concentrations of total-recoverable copper at network sites in Montana, water years 1999-2003. Site number presented after station name (fig. 1, table 1). The general aquatic-life standards for acute and chronic toxicity (table 5) were calculated using applicable equations (Montana Department of Environmental Quality, 2004) and average water hardness. Variable aquatic-life standards result from differences in the average water hardness among groups of sites. Copper values with a high laboratory reporting level of 12-20 micrograms per liter during 1999-2001 at four sites were not used to calculate statistics for this figure. Concentrations reported as less than lower laboratory reporting levels are plotted as one-half the maximum laboratory reporting level.
CON
CEN
TRAT
ION
, IN
MIC
ROGR
AMS
PER
LITE
R
0.1
1
10
100
1,000
General chronic aquatic-life standard
General acute aquatic-life standard
TOTAL-RECOVERABLE COPPERMissouri River basin Yellowstone River basin Columbia River basin
Kootenai Riversubbasin
Flathead River subbasin
Clark Fork subbasin
EXPLANATION
Data greater than the 90th percentile
90th percentile
75th percentile
Median
25th percentile
10th percentile
Data less than the 10th percentile
Note: When a data set contains multiple equal values, two or more of the percentile lines can overlap and result in a compressed plot
Beav
erhe
ad R
iver n
ear T
win
Brid
ges
(1)
Jeffe
rson
Rive
r nea
r Thr
ee Fo
rks
(2)
Galla
tin R
iver a
t Log
an (
3)
Miss
ouri
Rive
r at T
osto
n (4
)
Prick
ly Pe
ar C
reek
nea
r Cla
ncy
(5)
Dear
born
Rive
r nea
r Cra
ig (
6)
Sun
Rive
r nea
r Vau
ghn
(7)
Teto
n Ri
ver a
t Lom
a (8
)
Judi
th R
iver n
ear m
outh
, nea
r Win
ifred
(9)
Mus
selsh
ell R
iver a
t Mos
by (
10)
Peop
les C
reek
bel
ow K
uhr C
oule
e, n
ear D
odso
n (1
1)
Milk
Rive
r at N
ashu
a (1
2)
Popl
ar R
iver n
ear P
opla
r (13
)
Miss
ouri
Rive
r nea
r Cul
berts
on (
14)
Yello
wst
one
Rive
r nea
r Livi
ngst
on (
15)
Shie
lds R
iver n
ear L
iving
ston
(16
)
Boul
der R
iver a
t Big
Tim
ber
(17)
Still
wat
er R
iver n
ear A
bsar
okee
(18
)
Clar
ks Fo
rk Y
ello
wst
one
Rive
r at E
dgar
(19
)
Bigh
orn
Rive
r abo
ve Tu
llock
Cre
ek, n
ear B
igho
rn (
20)
Rose
bud
Cree
k at m
outh
, nea
r Ros
ebud
(21
)
Tong
ue R
iver a
t Mile
s City
(22
)
Pow
der R
iver n
ear L
ocat
e (2
3)
Yello
wst
one
Rive
r nea
r Sid
ney
(24)
Koot
enai
Rive
r bel
ow Li
bby D
am, n
ear L
ibby
(25
)
Fishe
r Rive
r nea
r Lib
by (
26)
Yaak
Rive
r nea
r Tro
y (27
)
Little
Bla
ckfo
ot R
iver n
ear G
arris
on (
28)
Rock
Cre
ek n
ear C
linto
n (2
9)
Clar
k For
k at T
urah
Brid
ge, n
ear B
onne
r (30
)
Blac
kfoo
t Rive
r nea
r Bon
ner
(31)
Bitte
rroot
Rive
r nea
r Miss
oula
(32
)
Clar
k For
k at S
t. Re
gis
(33)
North
Fork
Flat
head
Rive
r nea
r Col
umbi
a Fa
lls (
34)
Mid
dle
Fork
Flat
head
Rive
r nea
r Wes
t Gla
cier
(35)
Whi
tefis
h Ri
ver n
ear K
alisp
ell
(36)
Swan
Rive
r nea
r Big
fork
(37
)
Flath
ead
Rive
r at P
erm
a (3
8)
Water-Quality Characteristics ��
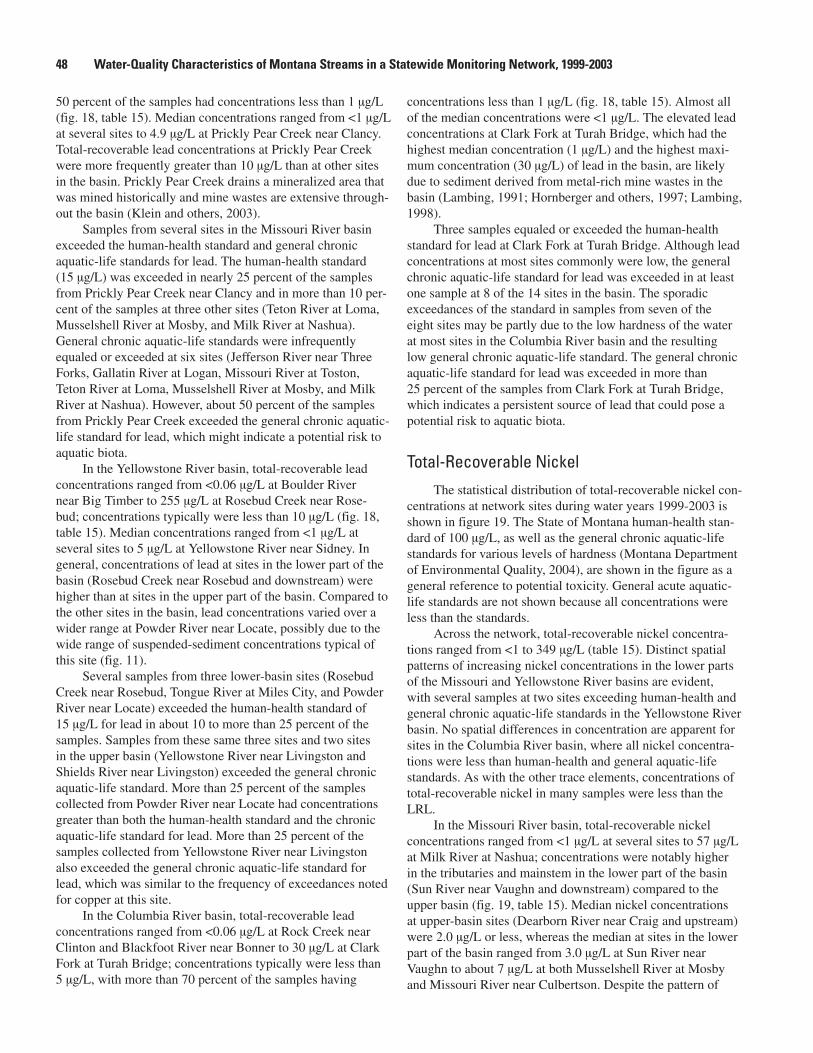
50 percent of the samples had concentrations less than 1 µg/L (fig. 18, table 15). Median concentrations ranged from <1 µg/L at several sites to 4.9 µg/L at Prickly Pear Creek near Clancy. Total-recoverable lead concentrations at Prickly Pear Creek were more frequently greater than 10 µg/L than at other sites in the basin. Prickly Pear Creek drains a mineralized area that was mined historically and mine wastes are extensive through-out the basin (Klein and others, 2003).
Samples from several sites in the Missouri River basin exceeded the human-health standard and general chronic aquatic-life standards for lead. The human-health standard (15 µg/L) was exceeded in nearly 25 percent of the samples from Prickly Pear Creek near Clancy and in more than 10 per-cent of the samples at three other sites (Teton River at Loma, Musselshell River at Mosby, and Milk River at Nashua). General chronic aquatic-life standards were infrequently equaled or exceeded at six sites (Jefferson River near Three Forks, Gallatin River at Logan, Missouri River at Toston, Teton River at Loma, Musselshell River at Mosby, and Milk River at Nashua). However, about 50 percent of the samples from Prickly Pear Creek exceeded the general chronic aquatic-life standard for lead, which might indicate a potential risk to aquatic biota.
In the Yellowstone River basin, total-recoverable lead concentrations ranged from <0.06 µg/L at Boulder River near Big Timber to 255 µg/L at Rosebud Creek near Rose-bud; concentrations typically were less than 10 µg/L (fig. 18, table 15). Median concentrations ranged from <1 µg/L at several sites to 5 µg/L at Yellowstone River near Sidney. In general, concentrations of lead at sites in the lower part of the basin (Rosebud Creek near Rosebud and downstream) were higher than at sites in the upper part of the basin. Compared to the other sites in the basin, lead concentrations varied over a wider range at Powder River near Locate, possibly due to the wide range of suspended-sediment concentrations typical of this site (fig. 11).
Several samples from three lower-basin sites (Rosebud Creek near Rosebud, Tongue River at Miles City, and Powder River near Locate) exceeded the human-health standard of 15 µg/L for lead in about 10 to more than 25 percent of the samples. Samples from these same three sites and two sites in the upper basin (Yellowstone River near Livingston and Shields River near Livingston) exceeded the general chronic aquatic-life standard. More than 25 percent of the samples collected from Powder River near Locate had concentrations greater than both the human-health standard and the chronic aquatic-life standard for lead. More than 25 percent of the samples collected from Yellowstone River near Livingston also exceeded the general chronic aquatic-life standard for lead, which was similar to the frequency of exceedances noted for copper at this site.
In the Columbia River basin, total-recoverable lead concentrations ranged from <0.06 µg/L at Rock Creek near Clinton and Blackfoot River near Bonner to 30 µg/L at Clark Fork at Turah Bridge; concentrations typically were less than 5 µg/L, with more than 70 percent of the samples having
concentrations less than 1 µg/L (fig. 18, table 15). Almost all of the median concentrations were <1 µg/L. The elevated lead concentrations at Clark Fork at Turah Bridge, which had the highest median concentration (1 µg/L) and the highest maxi-mum concentration (30 µg/L) of lead in the basin, are likely due to sediment derived from metal-rich mine wastes in the basin (Lambing, 1991; Hornberger and others, 1997; Lambing, 1998).
Three samples equaled or exceeded the human-health standard for lead at Clark Fork at Turah Bridge. Although lead concentrations at most sites commonly were low, the general chronic aquatic-life standard for lead was exceeded in at least one sample at 8 of the 14 sites in the basin. The sporadic exceedances of the standard in samples from seven of the eight sites may be partly due to the low hardness of the water at most sites in the Columbia River basin and the resulting low general chronic aquatic-life standard. The general chronic aquatic-life standard for lead was exceeded in more than 25 percent of the samples from Clark Fork at Turah Bridge, which indicates a persistent source of lead that could pose a potential risk to aquatic biota.
Total-Recoverable NickelThe statistical distribution of total-recoverable nickel con-
centrations at network sites during water years 1999-2003 is shown in figure 19. The State of Montana human-health stan-dard of 100 µg/L, as well as the general chronic aquatic-life standards for various levels of hardness (Montana Department of Environmental Quality, 2004), are shown in the figure as a general reference to potential toxicity. General acute aquatic-life standards are not shown because all concentrations were less than the standards.
Across the network, total-recoverable nickel concentra-tions ranged from <1 to 349 µg/L (table 15). Distinct spatial patterns of increasing nickel concentrations in the lower parts of the Missouri and Yellowstone River basins are evident, with several samples at two sites exceeding human-health and general chronic aquatic-life standards in the Yellowstone River basin. No spatial differences in concentration are apparent for sites in the Columbia River basin, where all nickel concentra-tions were less than human-health and general aquatic-life standards. As with the other trace elements, concentrations of total-recoverable nickel in many samples were less than the LRL.
In the Missouri River basin, total-recoverable nickel concentrations ranged from <1 µg/L at several sites to 57 µg/L at Milk River at Nashua; concentrations were notably higher in the tributaries and mainstem in the lower part of the basin (Sun River near Vaughn and downstream) compared to the upper basin (fig. 19, table 15). Median nickel concentrations at upper-basin sites (Dearborn River near Craig and upstream) were 2.0 µg/L or less, whereas the median at sites in the lower part of the basin ranged from 3.0 µg/L at Sun River near Vaughn to about 7 µg/L at both Musselshell River at Mosby and Missouri River near Culbertson. Despite the pattern of
�� Water-Quality Characteristics of Montana Streams in a Statewide Monitoring Network, 1999-2003
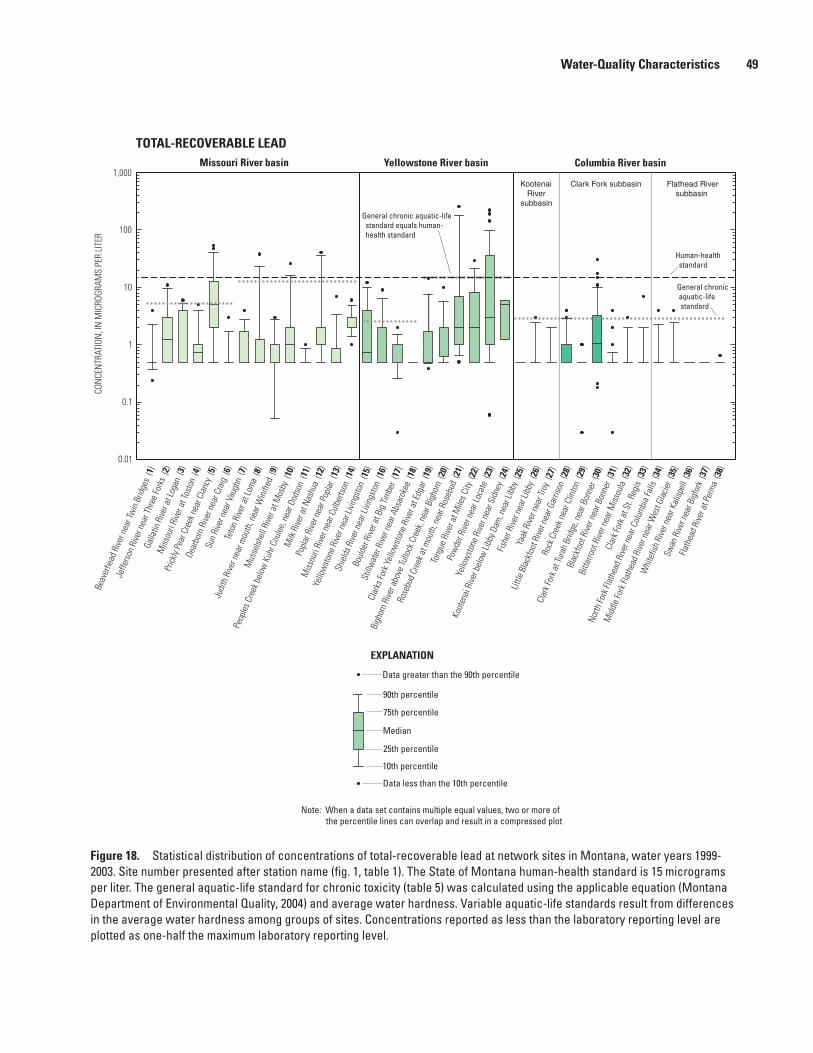
Figure 1�. Statistical distribution of concentrations of total-recoverable lead at network sites in Montana, water years 1999-2003. Site number presented after station name (fig. 1, table 1). The State of Montana human-health standard is 15 micrograms per liter. The general aquatic-life standard for chronic toxicity (table 5) was calculated using the applicable equation (Montana Department of Environmental Quality, 2004) and average water hardness. Variable aquatic-life standards result from differences in the average water hardness among groups of sites. Concentrations reported as less than the laboratory reporting level are plotted as one-half the maximum laboratory reporting level.
CON
CEN
TRAT
ION
, IN
MIC
ROGR
AMS
PER
LITE
R
0.1
1
10
100
1,000
General chronic aquatic-life standard equals human- health standard
Human-health standard
0.01
TOTAL-RECOVERABLE LEADMissouri River basin Yellowstone River basin Columbia River basin
Kootenai Riversubbasin
Flathead River subbasin
Clark Fork subbasin
General chronic aquatic-life standard
EXPLANATION
Data greater than the 90th percentile
90th percentile
75th percentile
Median
25th percentile
10th percentile
Data less than the 10th percentile
Note: When a data set contains multiple equal values, two or more of the percentile lines can overlap and result in a compressed plot
Beav
erhe
ad R
iver n
ear T
win
Brid
ges
(1)
Jeffe
rson
Rive
r nea
r Thr
ee Fo
rks
(2)
Galla
tin R
iver a
t Log
an (
3)
Miss
ouri
Rive
r at T
osto
n (4
)
Prick
ly Pe
ar C
reek
nea
r Cla
ncy
(5)
Dear
born
Rive
r nea
r Cra
ig (
6)
Sun
Rive
r nea
r Vau
ghn
(7)
Teto
n Ri
ver a
t Lom
a (8
)
Judi
th R
iver n
ear m
outh
, nea
r Win
ifred
(9)
Mus
selsh
ell R
iver a
t Mos
by (
10)
Peop
les C
reek
bel
ow K
uhr C
oule
e, n
ear D
odso
n (1
1)
Milk
Rive
r at N
ashu
a (1
2)
Popl
ar R
iver n
ear P
opla
r (13
)
Miss
ouri
Rive
r nea
r Cul
berts
on (
14)
Yello
wst
one
Rive
r nea
r Livi
ngst
on (
15)
Shie
lds R
iver n
ear L
iving
ston
(16
)
Boul
der R
iver a
t Big
Tim
ber
(17)
Still
wat
er R
iver n
ear A
bsar
okee
(18
)
Clar
ks Fo
rk Y
ello
wst
one
Rive
r at E
dgar
(19
)
Bigh
orn
Rive
r abo
ve Tu
llock
Cre
ek, n
ear B
igho
rn (
20)
Rose
bud
Cree
k at m
outh
, nea
r Ros
ebud
(21
)
Tong
ue R
iver a
t Mile
s City
(22
)
Pow
der R
iver n
ear L
ocat
e (2
3)
Yello
wst
one
Rive
r nea
r Sid
ney
(24)
Koot
enai
Rive
r bel
ow Li
bby D
am, n
ear L
ibby
(25
)
Fishe
r Rive
r nea
r Lib
by (
26)
Yaak
Rive
r nea
r Tro
y (27
)
Little
Bla
ckfo
ot R
iver n
ear G
arris
on (
28)
Rock
Cre
ek n
ear C
linto
n (2
9)
Clar
k For
k at T
urah
Brid
ge, n
ear B
onne
r (30
)
Blac
kfoo
t Rive
r nea
r Bon
ner
(31)
Bitte
rroot
Rive
r nea
r Miss
oula
(32
)
Clar
k For
k at S
t. Re
gis
(33)
North
Fork
Flat
head
Rive
r nea
r Col
umbi
a Fa
lls (
34)
Mid
dle
Fork
Flat
head
Rive
r nea
r Wes
t Gla
cier
(35)
Whi
tefis
h Ri
ver n
ear K
alisp
ell
(36)
Swan
Rive
r nea
r Big
fork
(37
)
Flath
ead
Rive
r at P
erm
a (3
8)
Water-Quality Characteristics �9

downstream increases, nickel concentrations generally were less than 10 µg/L in the Missouri River basin. A few samples from sites in the lower part of the basin had concentrations notably higher than 10 µg/L, but total-recoverable nickel concentrations at all sites in the Missouri River basin were less than either the human-health or general chronic aquatic-life standards.
In the Yellowstone River basin, total-recoverable nickel concentrations ranged from <1 µg/L at several sites to 349 µg/L at Powder River near Locate; concentrations were higher at sites in the lower part of the basin (Clarks Fork Yel-lowstone River at Edgar and downstream) compared to the upper basin (fig. 19, table 15). Median concentrations of total-recoverable nickel were less than 2 µg/L at all of the upper-basin sites; at tributary and mainstem sites in the lower part of the basin, median concentrations ranged from 2.4 to 9.6 µg/L. More than 10 percent of the samples from Rosebud Creek near Rosebud and Powder River near Locate exceeded the human-health standard of 100 µg/L. Several samples from Rosebud Creek near Rosebud and Powder River near Locate had total-recoverable nickel concentrations greater than 200 µg/L, which exceeded the general chronic aquatic-life standard.
In the Columbia River basin, total-recoverable nickel concentrations ranged from <1 µg/L at all sites to 10.3 µg/L at Clark Fork at Turah Bridge; concentrations were consistently low at all sites relative to most sites in the Missouri and Yel-lowstone River basins (fig. 19, table 15). Median concentra-tions were less than 2 µg/L at all sites; no spatial patterns were evident. All total-recoverable nickel concentrations were con-siderably less than both the human-health and general chronic aquatic-life standards.
Total-Recoverable ZincThe statistical distribution of total-recoverable zinc con-
centrations at network sites during water years 1999-2003 is shown in figure 20. The State of Montana human-health stan-dard of 2,000 µg/L and general aquatic-life standards for vari-ous levels of hardness (Montana Department of Environmental Quality, 2004) are shown in the figure as general references to potential toxicity. For zinc, the acute and chronic aquatic-life standards are equal. Similar to copper, a wide range of LRLs were used during the monitoring period (table 2). During the first 2 years of the monitoring period (1999 and 2000), the LRLs for zinc were 40 and 31 µg/L, respectively. After a much lower LRL (1 µg/L) was available (2001-03), results of analyses showed that many stream samples had concentrations near or less than the lower censoring level. Using one-half of the LRLs from 1999-2000 (15-20 µg/L) would artificially introduce much higher concentrations into the boxplot data sets than were likely to have actually occurred. Consequently, because the data censored at the higher LRLs could not be adequately adjusted to plot the statistical distribution of con-centrations, the censored values were deleted from the boxplot data sets. However, all data were retained for the statistical summaries presented in table 15.
Across the network, total-recoverable zinc concentrations ranged from <1 to 1,110 µg/L (fig. 20, table 15). In general, zinc concentrations varied widely among the sites, with some sites having a small range of values, while other sites exhib-ited a wide range of values. Similar to lead, the only apparent spatial pattern is that higher zinc concentrations generally occurred at sites in the lower part of the Yellowstone River basin (Clarks Fork Yellowstone River at Edgar and down-stream) compared to sites in the upper basin. The general aquatic-life standards for zinc were exceeded infrequently across the network.
In the Missouri River basin, total-recoverable zinc concentrations ranged from <1 µg/L at Dearborn River near Craig to 216 µg/L at Prickly Pear Creek near Clancy (fig. 20, table 15); concentrations did not indicate any clear spatial pattern. Median concentrations ranged from 1 µg/L at Bea-verhead River near Twin Bridges and Dearborn River near Craig to 78 µg/L at Prickly Pear Creek near Clancy; medians at most sites were less than 5 µg/L. The human-health standard of 2,000 µg/L for zinc was not exceeded in any samples. The general aquatic-life standards for zinc were exceeded occa-sionally in samples from one site (Prickly Pear Creek near Clancy). As with other trace elements, these elevated zinc con-centrations in Prickly Pear Creek are likely due to metal-rich wastes from upstream areas where historical mining occurred (Klein and others, 2003). Three sites in the lower basin (Teton River at Loma, Musselshell River at Mosby, and Milk River at Nashua) had one or more samples with concentrations greater than 100 µg/L, but the general aquatic-life standards were not exceeded.
In the Yellowstone River basin, total-recoverable zinc concentrations ranged from <1 µg/L at several sites to 1,110 µg/L at Powder River near Locate (fig. 20, table 15); concentrations generally were higher in the lower part of the basin (Clarks Fork Yellowstone River and downstream). Median concentrations of zinc in the Yellowstone River basin ranged from 2 µg/L at Stillwater River near Absarokee to 26 µg/L (after deleting values censored at high LRLs) at Powder River near Locate. The human-health standard of 2,000 µg/L for zinc was not exceeded in any samples. About 10 percent or more of the samples from Rosebud Creek near Rosebud and Powder River near Locate had concentrations that exceeded the general aquatic-life standards for zinc.
In the Columbia River basin, total-recoverable zinc concentrations ranged from <1 µg/L at many sites to 236 µg/L at Clark Fork at Turah Bridge (fig. 20, table 15). Zinc con-centrations in the Columbia River basin generally were lower than in the Missouri and Yellowstone River basins, with many samples having concentrations less than the LRL. Clark Fork at Turah Bridge had notably higher zinc concentrations com-pared to the other sites in the Columbia River basin. Median concentrations of total-recoverable zinc ranged from 1 µg/L at several sites to 18 µg/L (after deleting censored values with high LRLs) at Clark Fork at Turah Bridge. The human-health standard of 2,000 µg/L for zinc was not exceeded in any
�0 Water-Quality Characteristics of Montana Streams in a Statewide Monitoring Network, 1999-2003
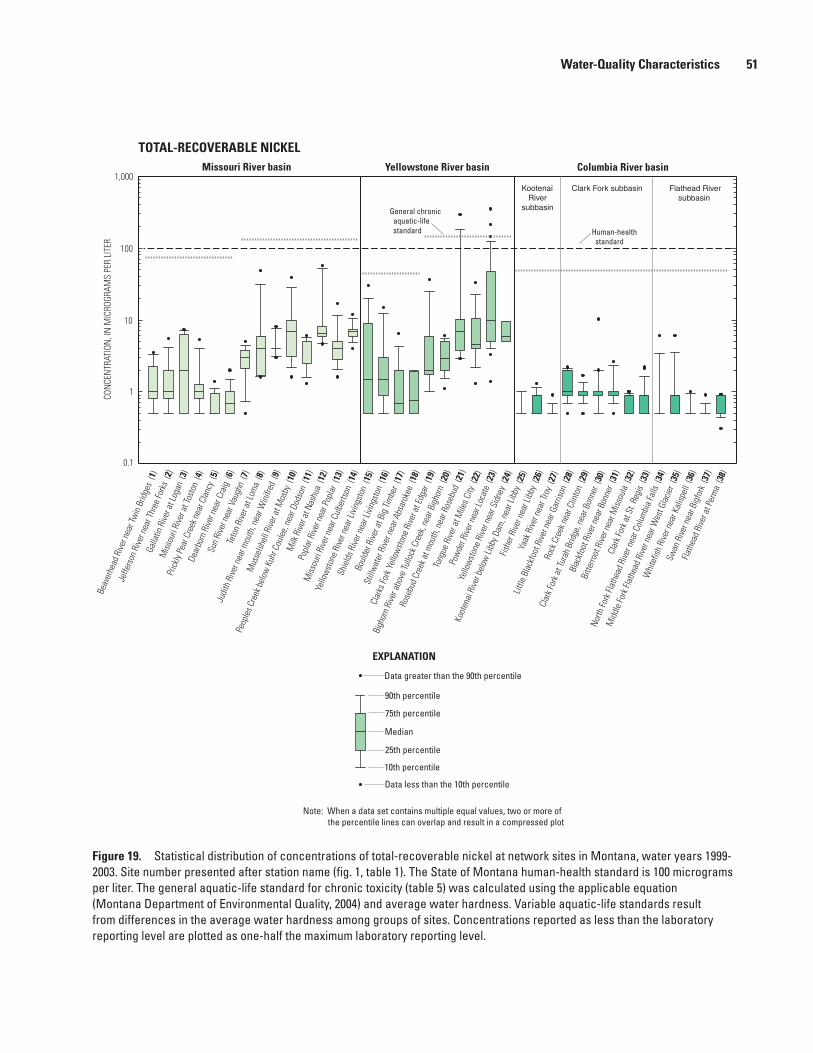
Figure 19. Statistical distribution of concentrations of total-recoverable nickel at network sites in Montana, water years 1999-2003. Site number presented after station name (fig. 1, table 1). The State of Montana human-health standard is 100 micrograms per liter. The general aquatic-life standard for chronic toxicity (table 5) was calculated using the applicable equation (Montana Department of Environmental Quality, 2004) and average water hardness. Variable aquatic-life standards result from differences in the average water hardness among groups of sites. Concentrations reported as less than the laboratory reporting level are plotted as one-half the maximum laboratory reporting level.
CON
CEN
TRAT
ION
, IN
MIC
ROGR
AMS
PER
LITE
R
0.1
1
10
100
1,000
General chronic aquatic-life standard Human-health
standard
TOTAL-RECOVERABLE NICKELMissouri River basin Yellowstone River basin Columbia River basin
Kootenai Riversubbasin
Flathead River subbasin
Clark Fork subbasin
EXPLANATION
Data greater than the 90th percentile
90th percentile
75th percentile
Median
25th percentile
10th percentile
Data less than the 10th percentile
Note: When a data set contains multiple equal values, two or more of the percentile lines can overlap and result in a compressed plot
Beav
erhe
ad R
iver n
ear T
win
Brid
ges
(1)
Jeffe
rson
Rive
r nea
r Thr
ee Fo
rks
(2)
Galla
tin R
iver a
t Log
an (
3)
Miss
ouri
Rive
r at T
osto
n (4
)
Prick
ly Pe
ar C
reek
nea
r Cla
ncy
(5)
Dear
born
Rive
r nea
r Cra
ig (
6)
Sun
Rive
r nea
r Vau
ghn
(7)
Teto
n Ri
ver a
t Lom
a (8
)
Judi
th R
iver n
ear m
outh
, nea
r Win
ifred
(9)
Mus
selsh
ell R
iver a
t Mos
by (
10)
Peop
les C
reek
bel
ow K
uhr C
oule
e, n
ear D
odso
n (1
1)
Milk
Rive
r at N
ashu
a (1
2)
Popl
ar R
iver n
ear P
opla
r (13
)
Miss
ouri
Rive
r nea
r Cul
berts
on (
14)
Yello
wst
one
Rive
r nea
r Livi
ngst
on (
15)
Shie
lds R
iver n
ear L
iving
ston
(16
)
Boul
der R
iver a
t Big
Tim
ber
(17)
Still
wat
er R
iver n
ear A
bsar
okee
(18
)
Clar
ks Fo
rk Y
ello
wst
one
Rive
r at E
dgar
(19
)
Bigh
orn
Rive
r abo
ve Tu
llock
Cre
ek, n
ear B
igho
rn (
20)
Rose
bud
Cree
k at m
outh
, nea
r Ros
ebud
(21
)
Tong
ue R
iver a
t Mile
s City
(22
)
Pow
der R
iver n
ear L
ocat
e (2
3)
Yello
wst
one
Rive
r nea
r Sid
ney
(24)
Koot
enai
Rive
r bel
ow Li
bby D
am, n
ear L
ibby
(25
)
Fishe
r Rive
r nea
r Lib
by (
26)
Yaak
Rive
r nea
r Tro
y (27
)
Little
Bla
ckfo
ot R
iver n
ear G
arris
on (
28)
Rock
Cre
ek n
ear C
linto
n (2
9)
Clar
k For
k at T
urah
Brid
ge, n
ear B
onne
r (30
)
Blac
kfoo
t Rive
r nea
r Bon
ner
(31)
Bitte
rroot
Rive
r nea
r Miss
oula
(32
)
Clar
k For
k at S
t. Re
gis
(33)
North
Fork
Flat
head
Rive
r nea
r Col
umbi
a Fa
lls (
34)
Mid
dle
Fork
Flat
head
Rive
r nea
r Wes
t Gla
cier
(35)
Whi
tefis
h Ri
ver n
ear K
alisp
ell
(36)
Swan
Rive
r nea
r Big
fork
(37
)
Flath
ead
Rive
r at P
erm
a (3
8)
Water-Quality Characteristics �1
Figure 20. Statistical distribution of concentrations of total-recoverable zinc at network sites in Montana, water years 1999-2003. Site number presented after station name (fig. 1, table 1). The State of Montana human-health standard is 2,000 micrograms per liter. The general aquatic-life standards for acute and chronic toxicity (table 5) were calculated using applicable equations (Montana Department of Environmental Quality, 2004) and average water hardness. Variable aquatic-life standards result from differences in the average water hardness among groups of sites. Zinc values with a high laboratory reporting level of 31-40 micrograms per liter during 1999-2000 at 33 sites were not used to calculate statistics for this figure. Concentrations reported as less than lower laboratory reporting levels are plotted as one-half the maximum laboratory reporting level.
CON
CEN
TRAT
ION
, IN
MIC
ROGR
AMS
PER
LITE
R
0.1
1
10
100
1,000 General acute and chronic aquatic-life standard (both standards are equal)
10,000
Human-health standard
TOTAL-RECOVERABLE ZINCMissouri River basin Yellowstone River basin Columbia River basin
Kootenai Riversubbasin
Flathead River subbasin
Clark Fork subbasin
EXPLANATION
Data greater than the 90th percentile
90th percentile
75th percentile
Median
25th percentile
10th percentile
Data less than the 10th percentile
Note: When a data set contains multiple equal values, two or more of the percentile lines can overlap and result in a compressed plot
Beav
erhe
ad R
iver n
ear T
win
Brid
ges
(1)
Jeffe
rson
Rive
r nea
r Thr
ee Fo
rks
(2)
Galla
tin R
iver a
t Log
an (
3)
Miss
ouri
Rive
r at T
osto
n (4
)
Prick
ly Pe
ar C
reek
nea
r Cla
ncy
(5)
Dear
born
Rive
r nea
r Cra
ig (
6)
Sun
Rive
r nea
r Vau
ghn
(7)
Teto
n Ri
ver a
t Lom
a (8
)
Judi
th R
iver n
ear m
outh
, nea
r Win
ifred
(9)
Mus
selsh
ell R
iver a
t Mos
by (
10)
Peop
les C
reek
bel
ow K
uhr C
oule
e, n
ear D
odso
n (1
1)
Milk
Rive
r at N
ashu
a (1
2)
Popl
ar R
iver n
ear P
opla
r (13
)
Miss
ouri
Rive
r nea
r Cul
berts
on (
14)
Yello
wst
one
Rive
r nea
r Livi
ngst
on (
15)
Shie
lds R
iver n
ear L
iving
ston
(16
)
Boul
der R
iver a
t Big
Tim
ber
(17)
Still
wat
er R
iver n
ear A
bsar
okee
(18
)
Clar
ks Fo
rk Y
ello
wst
one
Rive
r at E
dgar
(19
)
Bigh
orn
Rive
r abo
ve Tu
llock
Cre
ek, n
ear B
igho
rn (
20)
Rose
bud
Cree
k at m
outh
, nea
r Ros
ebud
(21
)
Tong
ue R
iver a
t Mile
s City
(22
)
Pow
der R
iver n
ear L
ocat
e (2
3)
Yello
wst
one
Rive
r nea
r Sid
ney
(24)
Koot
enai
Rive
r bel
ow Li
bby D
am, n
ear L
ibby
(25
)
Fishe
r Rive
r nea
r Lib
by (
26)
Yaak
Rive
r nea
r Tro
y (27
)
Little
Bla
ckfo
ot R
iver n
ear G
arris
on (
28)
Rock
Cre
ek n
ear C
linto
n (2
9)
Clar
k For
k at T
urah
Brid
ge, n
ear B
onne
r (30
)
Blac
kfoo
t Rive
r nea
r Bon
ner
(31)
Bitte
rroot
Rive
r nea
r Miss
oula
(32
)
Clar
k For
k at S
t. Re
gis
(33)
North
Fork
Flat
head
Rive
r nea
r Col
umbi
a Fa
lls (
34)
Mid
dle
Fork
Flat
head
Rive
r nea
r Wes
t Gla
cier
(35)
Whi
tefis
h Ri
ver n
ear K
alisp
ell
(36)
Swan
Rive
r nea
r Big
fork
(37
)
Flath
ead
Rive
r at P
erm
a (3
8)
�2 Water-Quality Characteristics of Montana Streams in a Statewide Monitoring Network, 1999-2003
samples. The general aquatic-life standards for zinc were exceeded occasionally only at Clark Fork at Turah Bridge.
Estimated Annual Loads
An additional objective of the statewide monitoring program was to examine the data obtained during water years 1999-2003 for adequacy in estimating annual constitu-ent loads. Loads represent the mass of a constituent that is discharged past a point in the basin (the sampling site) during a specified period of time. Loads can be computed for instan-taneous, daily, or annual time increments. However, estimates of annual loads are more informative than instantaneous loads measured at the time of sampling because annual loads are useful for comparisons of sustained constituent transport among sites. Therefore, loads in this report were estimated on an annual basis and descriptions of the relative differ-ences in loads among sites are primarily based on the mean of estimated annual loads for the 5-year monitoring period. The range of estimated annual loads at each site during the 5-year period also is presented to demonstrate the degree of vari-ability in annual loads that can result from varying hydrologic conditions.
The benefit of having an estimate of annual loads trans-ported past a network of sites in a basin is to identify what parts of the watershed are contributing the largest quanti-ties of a constituent to the receiving streams. An example of such a network assessment is the description of constituent loads transported out of tributary basins and discharged to the mainstem of the major river, which can reveal the magnitude of loads from individual tributaries relative to the total load at the downstream end of the mainstem. An accounting of load inputs can identify source areas in a watershed that are deliver-ing disproportionate amounts of constituents relative to other source areas or relative to the streamflow contributed from the source area. This type of assessment cannot be determined solely by concentration data. If the network of sites is suffi-cient to provide detailed spatial resolution, specific parts of the basin contributing excessive quantities of constituent can be identified. Resource-management agencies can use this infor-mation to more effectively evaluate conditions, investigate possible localized sources of large loads, consider manage-ment actions that might decrease loads, and establish priorities for addressing particular areas within the basin.
In many instances, the quantity of streamflow is the major factor that determines the mass of a constituent trans-ported, especially when constituent concentrations are low or relatively constant. Because streamflows can vary greatly between sites and from day to day at the same site, the mass load of constituents discharged over time from each source area may be as much a function of streamflow characteristics as it is of water-quality characteristics. In many basins, most of a stream’s annual constituent load can be transported during the relatively short period of high flow (fig. 2). Consequently, annual load estimates provide an additional perspective from
which to evaluate the relative influence of an inflow on the water quality in the receiving stream. Although beyond the scope of this report, detailed information on constituent loads and streamflow can be incorporated into mixing models, whereby the combined quantities of water and constituent from multiple inputs can be used to estimate the resulting concentration in the receiving stream.
Annual loads can be estimated if a statistically significant relation exists between the constituent that is to be estimated and a hydrologically related characteristic that is frequently measured. Streamflow commonly is used as the explanatory variable in constituent-discharge relations because of the gen-erally strong association with water quality. Also, the continu-ous streamflow records from streamflow-gaging stations at the sampling sites provide a daily measure of variation in the explanatory variable that can be used to estimate a time series of daily constituent loads. In some cases, daily loads can be estimated without a relation if constituent concentrations are generally constant throughout the range of streamflow. Other variables, such as concentrations of suspended sediment or other constituents, may provide stronger relations with the constituent to be estimated but they are either typically not measured on a frequent basis or their use requires a multi-step computational process that is only warranted when sufficient data exist to characterize a wide range of conditions. Ideally, an adequate number of samples would be available by which to characterize a broad range of hydrologic and water-quality conditions, both within years and between years. In addition, sufficient seasonal data are needed to account for possible effects of variable land-use practices on the delivery of con-stituents to the streams.
As a result of the low sampling frequency used in the statewide monitoring program, especially for constituents sampled only two times per year, the amount of data at most sites is considered only marginally adequate to provide gross estimates of annual load. Some constituents do not have ade-quate data to make load estimates due to the excessive number of analytical results having censored concentrations less than the LRL. Therefore, this effort represents an exploratory tool to provide, where possible, generalized estimates of annual loads. Because the annual loads estimated in this report rep-resent only gross approximations due to modest sample size, the primary use of these data is to illustrate relative differences among sites, rather than to represent quantitative measures of loads. In addition, because of the prevalence of below-normal streamflow at many of the sites during the monitoring period, annual loads estimated for 1999-2003 are assumed to be smaller than long-term mean annual loads.
Relative assessments of annual loads can be made by comparing loads at individual sites to the load at the down-stream end of the mainstem. The load transported past each upstream sampling site can be described as a percentage of the total load at the downstream end of the mainstem to indicate the relative magnitude of load contributions from upstream source areas. The loads from individual upstream source areas also can be summed to determine if the combined load reason-
Water-Quality Characteristics �3

ably matches the load at the downstream end of the main-stem (basin total load). In the absence of major sinks, such as mainstem reservoirs, the cumulative load from upstream source areas would be expected to be generally similar to the load at the downstream end of the mainstem, assuming that all of the major tributaries are sampled. A reasonably close match indicates a conservative downstream routing of loads, whereby loads are additive and do not decrease due to deposition or other processes. A combined load from upstream sources that is much greater than the load at the downstream end of the mainstem indicates non-conservative transport, presumably due to loss of constituent by deposition or other processes. A combined load from upstream sources that is much less than the load at the downstream end of the mainstem indicates that additional, unmeasured sources are contributing substantial quantities of constituent to the mainstem. Because all loads are subject to estimation error, minor differences in loads between sites are assumed to be negligible for purposes of relative comparison.
An additional assessment of relative inputs can be made by comparing the proportionality of load and streamflow. Sites that contribute a large percentage of the basin’s total load, but only a small percentage of the total streamflow, can be assumed to have elevated concentrations relative to other sites where load and streamflow percentages are similar. Although disproportionate contributions of load and streamflow can result from natural conditions that reflect precipitation, geol-ogy, or soils characteristics, they may also indicate the effects of land use. Such cause-and-effect assessments are beyond the scope of this report.
In the Missouri River basin, major sources of load not accounted for by the sampling network include large tributar-ies such as the Smith and Marias Rivers (fig. 1). In addition, several large reservoirs on the Missouri River mainstem (Can-yon Ferry, Hauser, Holter, and Fort Peck) presumably trap a large percentage of the incoming load, especially for constitu-ents that are adsorbed to sediment derived from the upstream part of the basin. Because 63 percent of the drainage area at Missouri River near Culbertson is upstream from Fort Peck Reservoir (U.S. Geological Survey, issued annually), a large portion of the loads transported from the upper basin may be deposited either in this reservoir or other upstream reservoirs on the mainstem. Therefore, a substantial portion of constitu-ent load passing the Missouri River near Culbertson that is not accounted for by the combined loads from the Milk and Poplar Rivers (which enter the mainstem downstream from Fort Peck Reservoir) may be derived from unmeasured sources downstream from Fort Peck Reservoir, such as tributaries and channel erosion. The load contributed by these unmeasured sources cannot be quantified, however, because the load pass-ing through Fort Peck Reservoir is unknown.
All of the major tributaries in the Yellowstone River basin were sampled for this program; thus, combined loads from network sites presumably account for most of the major sources of constituent load contributed to the Yellowstone River mainstem. Also, the absence of reservoirs on the main-
stem where loads could be deposited enables a fairly straight-forward assessment of load contributions as a percentage of the mean annual load passing the Yellowstone River near Sidney.
Unlike the Missouri and Yellowstone River basins, the Columbia River basin does not have a single mainstem sta-tion that represents the total load transported from the entire Montana portion of the Columbia River basin. A partial assessment of load percentages can be done for the Clark Fork subbasin by using the Clark Fork at St. Regis as the down-stream index site. The Flathead River enters the Clark Fork downstream from this site (fig. 1) so the contribution from this subbasin is not included in the loads estimated for the Clark Fork at St. Regis. However, the combined loads of the Clark Fork at St. Regis plus Flathead River at Perma can be used as a more comprehensive downstream index of total load for the Clark Fork and Flathead River subbasins for assessing relative contributions from upstream source areas. The Kootenai River subbasin does not have an equivalent downstream index sta-tion for total basin load. Thus, the loads in the Kootenai River subbasin are only generally described.
Annual loads can vary substantially between years, depending on the prevailing hydrologic conditions (such as drought or floods). This large degree of annual variation can have implications for the ability of short-term monitoring pro-grams to adequately characterize the full range of constituent transport from source areas. The 5-year mean of the estimated annual loads for water years 1999-2003 provides the most rep-resentative measure available from the statewide monitoring program to compare transport characteristics for a common time period among all the network sites. Mean annual loads are the primary basis for comparisons among sites; however, it is useful to understand the degree to which annual loads can vary in order to recognize that the load transported in any indi-vidual year may not adequately characterize long-term average conditions. To illustrate the variability during the 5-year monitoring period, the range in estimated annual loads is presented to indicate the dynamic response of streams to either the supply of constituents in source areas or to the magnitude of runoff available to transport the constituent supply.
Computational Methods for Estimating Annual Loads
Regression analysis was used to examine the relation between constituent discharge and instantaneous streamflow for the 38 sites in the statewide monitoring program. Where possible, an ordinary least squares regression analysis was used to develop equations to estimate constituent loads. Streamflow was used as the explanatory variable because it was continuously determined at all sites and thereby could provide a quantitative measure of daily variations in hydro-logic conditions.
Regression analysis generally was not used when the number of samples with uncensored values was less than eight
�� Water-Quality Characteristics of Montana Streams in a Statewide Monitoring Network, 1999-2003
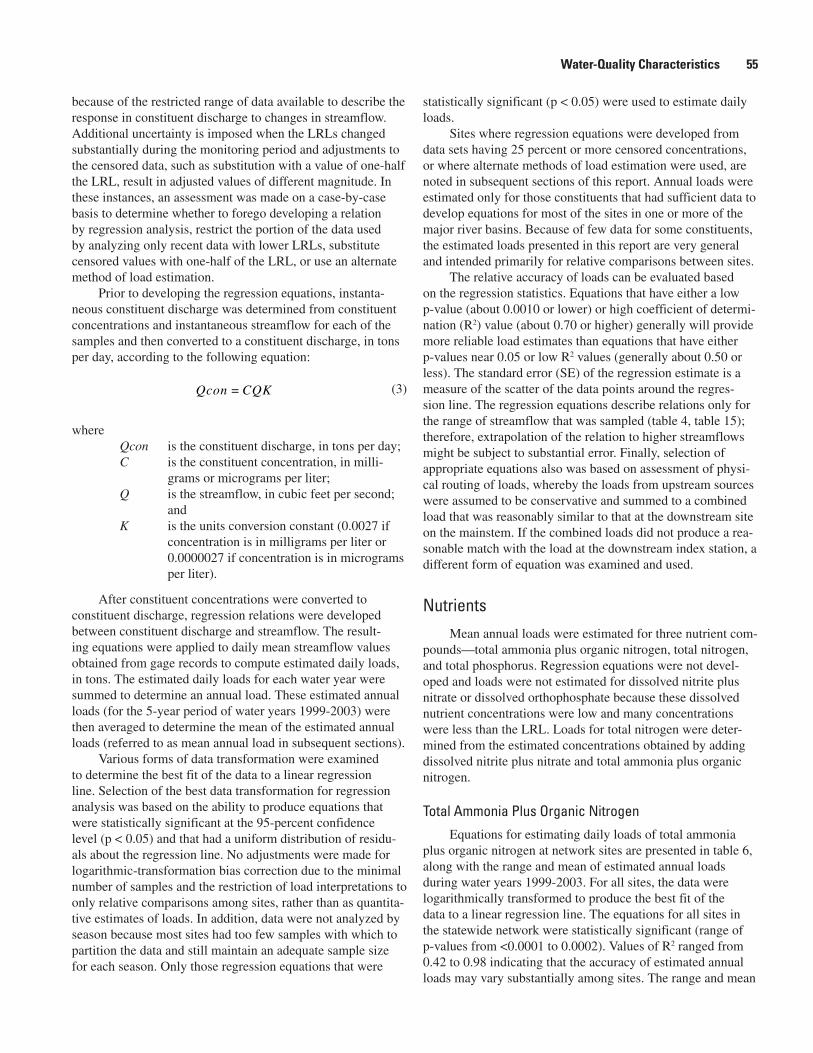
because of the restricted range of data available to describe the response in constituent discharge to changes in streamflow. Additional uncertainty is imposed when the LRLs changed substantially during the monitoring period and adjustments to the censored data, such as substitution with a value of one-half the LRL, result in adjusted values of different magnitude. In these instances, an assessment was made on a case-by-case basis to determine whether to forego developing a relation by regression analysis, restrict the portion of the data used by analyzing only recent data with lower LRLs, substitute censored values with one-half of the LRL, or use an alternate method of load estimation.
Prior to developing the regression equations, instanta-neous constituent discharge was determined from constituent concentrations and instantaneous streamflow for each of the samples and then converted to a constituent discharge, in tons per day, according to the following equation:
Qcon CQK=
where Qcon is the constituent discharge, in tons per day; C is the constituent concentration, in milli- grams or micrograms per liter; Q is the streamflow, in cubic feet per second; and K is the units conversion constant (0.0027 if concentration is in milligrams per liter or 0.0000027 if concentration is in micrograms per liter).
After constituent concentrations were converted to constituent discharge, regression relations were developed between constituent discharge and streamflow. The result-ing equations were applied to daily mean streamflow values obtained from gage records to compute estimated daily loads, in tons. The estimated daily loads for each water year were summed to determine an annual load. These estimated annual loads (for the 5-year period of water years 1999-2003) were then averaged to determine the mean of the estimated annual loads (referred to as mean annual load in subsequent sections).
Various forms of data transformation were examined to determine the best fit of the data to a linear regression line. Selection of the best data transformation for regression analysis was based on the ability to produce equations that were statistically significant at the 95-percent confidence level (p < 0.05) and that had a uniform distribution of residu-als about the regression line. No adjustments were made for logarithmic-transformation bias correction due to the minimal number of samples and the restriction of load interpretations to only relative comparisons among sites, rather than as quantita-tive estimates of loads. In addition, data were not analyzed by season because most sites had too few samples with which to partition the data and still maintain an adequate sample size for each season. Only those regression equations that were
(3)
statistically significant (p < 0.05) were used to estimate daily loads.
Sites where regression equations were developed from data sets having 25 percent or more censored concentrations, or where alternate methods of load estimation were used, are noted in subsequent sections of this report. Annual loads were estimated only for those constituents that had sufficient data to develop equations for most of the sites in one or more of the major river basins. Because of few data for some constituents, the estimated loads presented in this report are very general and intended primarily for relative comparisons between sites.
The relative accuracy of loads can be evaluated based on the regression statistics. Equations that have either a low p-value (about 0.0010 or lower) or high coefficient of determi-nation (R2) value (about 0.70 or higher) generally will provide more reliable load estimates than equations that have either p-values near 0.05 or low R2 values (generally about 0.50 or less). The standard error (SE) of the regression estimate is a measure of the scatter of the data points around the regres-sion line. The regression equations describe relations only for the range of streamflow that was sampled (table 4, table 15); therefore, extrapolation of the relation to higher streamflows might be subject to substantial error. Finally, selection of appropriate equations also was based on assessment of physi-cal routing of loads, whereby the loads from upstream sources were assumed to be conservative and summed to a combined load that was reasonably similar to that at the downstream site on the mainstem. If the combined loads did not produce a rea-sonable match with the load at the downstream index station, a different form of equation was examined and used.
NutrientsMean annual loads were estimated for three nutrient com-
pounds—total ammonia plus organic nitrogen, total nitrogen, and total phosphorus. Regression equations were not devel-oped and loads were not estimated for dissolved nitrite plus nitrate or dissolved orthophosphate because these dissolved nutrient concentrations were low and many concentrations were less than the LRL. Loads for total nitrogen were deter-mined from the estimated concentrations obtained by adding dissolved nitrite plus nitrate and total ammonia plus organic nitrogen.
Total Ammonia Plus Organic NitrogenEquations for estimating daily loads of total ammonia
plus organic nitrogen at network sites are presented in table 6, along with the range and mean of estimated annual loads during water years 1999-2003. For all sites, the data were logarithmically transformed to produce the best fit of the data to a linear regression line. The equations for all sites in the statewide network were statistically significant (range of p-values from <0.0001 to 0.0002). Values of R2 ranged from 0.42 to 0.98 indicating that the accuracy of estimated annual loads may vary substantially among sites. The range and mean
Water-Quality Characteristics ��
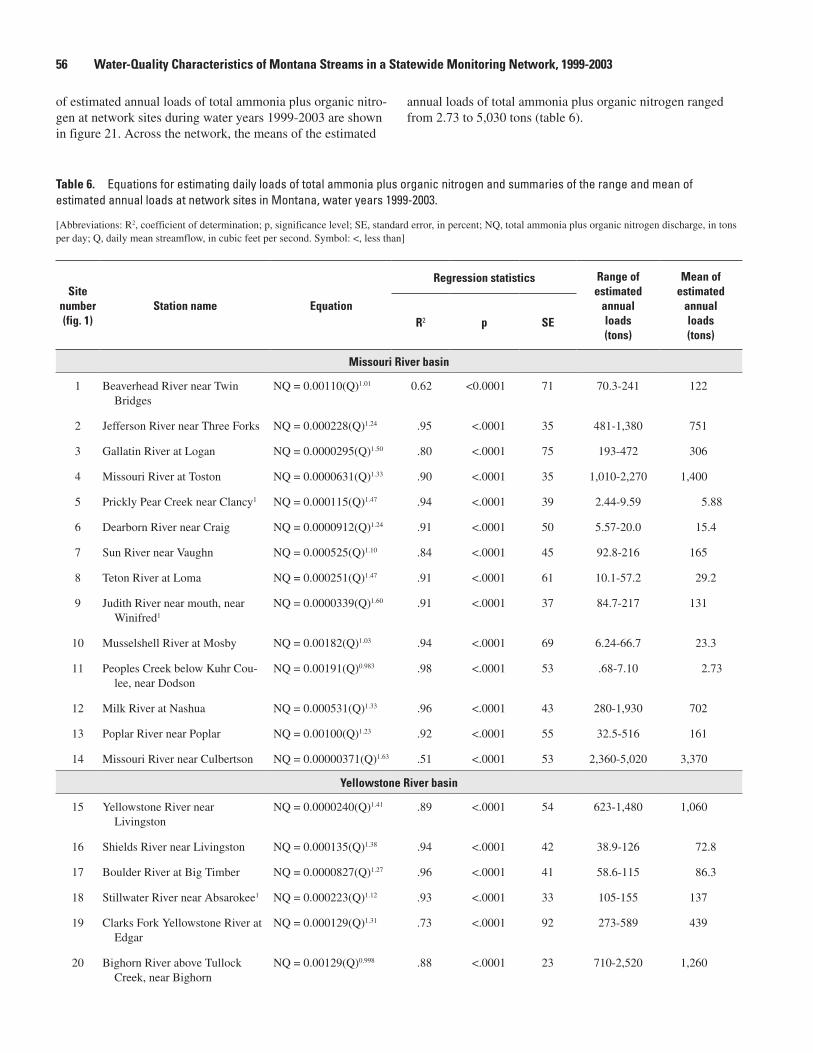
of estimated annual loads of total ammonia plus organic nitro-gen at network sites during water years 1999-2003 are shown in figure 21. Across the network, the means of the estimated
Table �. Equations for estimating daily loads of total ammonia plus organic nitrogen and summaries of the range and mean of estimated annual loads at network sites in Montana, water years 1999-2003.
[Abbreviations: R2, coefficient of determination; p, significance level; SE, standard error, in percent; NQ, total ammonia plus organic nitrogen discharge, in tons per day; Q, daily mean streamflow, in cubic feet per second. Symbol: <, less than]
Site number (fig. 1)
Station name Equation
Regression statistics Range of estimated
annual loads (tons)
Mean of estimated
annual loads (tons)
R2 p SE
Missouri River basin
1 Beaverhead River near Twin Bridges
NQ = 0.00110(Q)1.01 0.62 <0.0001 71 70.3-241 122
2 Jefferson River near Three Forks NQ = 0.000228(Q)1.24 .95 <.0001 35 481-1,380 751
3 Gallatin River at Logan NQ = 0.0000295(Q)1.50 .80 <.0001 75 193-472 306
4 Missouri River at Toston NQ = 0.0000631(Q)1.33 .90 <.0001 35 1,010-2,270 1,400
5 Prickly Pear Creek near Clancy1 NQ = 0.000115(Q)1.47 .94 <.0001 39 2.44-9.59 5.88
6 Dearborn River near Craig NQ = 0.0000912(Q)1.24 .91 <.0001 50 5.57-20.0 15.4
7 Sun River near Vaughn NQ = 0.000525(Q)1.10 .84 <.0001 45 92.8-216 165
8 Teton River at Loma NQ = 0.000251(Q)1.47 .91 <.0001 61 10.1-57.2 29.2
9 Judith River near mouth, near Winifred1
NQ = 0.0000339(Q)1.60 .91 <.0001 37 84.7-217 131
10 Musselshell River at Mosby NQ = 0.00182(Q)1.03 .94 <.0001 69 6.24-66.7 23.3
11 Peoples Creek below Kuhr Cou-lee, near Dodson
NQ = 0.00191(Q)0.983 .98 <.0001 53 .68-7.10 2.73
12 Milk River at Nashua NQ = 0.000531(Q)1.33 .96 <.0001 43 280-1,930 702
13 Poplar River near Poplar NQ = 0.00100(Q)1.23 .92 <.0001 55 32.5-516 161
14 Missouri River near Culbertson NQ = 0.00000371(Q)1.63 .51 <.0001 53 2,360-5,020 3,370
Yellowstone River basin
15 Yellowstone River near Livingston
NQ = 0.0000240(Q)1.41 .89 <.0001 54 623-1,480 1,060
16 Shields River near Livingston NQ = 0.000135(Q)1.38 .94 <.0001 42 38.9-126 72.8
17 Boulder River at Big Timber NQ = 0.0000827(Q)1.27 .96 <.0001 41 58.6-115 86.3
18 Stillwater River near Absarokee1 NQ = 0.000223(Q)1.12 .93 <.0001 33 105-155 137
19 Clarks Fork Yellowstone River at Edgar
NQ = 0.000129(Q)1.31 .73 <.0001 92 273-589 439
20 Bighorn River above Tullock Creek, near Bighorn
NQ = 0.00129(Q)0.998 .88 <.0001 23 710-2,520 1,260
�� Water-Quality Characteristics of Montana Streams in a Statewide Monitoring Network, 1999-2003
annual loads of total ammonia plus organic nitrogen ranged from 2.73 to 5,030 tons (table 6).

Site number (fig. 1)
Station name Equation
Regression statistics Range of estimated
annual loads (tons)
Mean of estimated
annual loads (tons)
R2 p SE
Yellowstone River basin—Continued
21 Rosebud Creek at mouth, near Rosebud
NQ = 0.00190(Q)1.16 .92 <.0001 90 1.14-46.7 15.2
22 Tongue River at Miles City NQ = 0.00120(Q)1.08 .86 <.0001 81 42.4-375 174
23 Powder River near Locate NQ = 0.000550(Q)1.31 .88 <.0001 124 123-1,580 550
24 Yellowstone River near Sidney NQ = 0.0000126(Q)1.51 .76 <.0001 72 2,880-9,450 5,030
Columbia River basin
25 Kootenai River below Libby Dam, near Libby
NQ = 0.0000126(Q)1.32 .64 <.0001 81 486-1,230 970
26 Fisher River near Libby NQ = 0.0000256(Q)1.41 .85 <.0001 88 18.6-107 61.8
27 Yaak River near Troy NQ = 0.0000860(Q)1.21 .96 <.0001 35 32.6-137 96.7
28 Little Blackfoot River near Gar-rison
NQ = 0.000141(Q)1.32 .94 <.0001 43 12.2-46.8 31.1
29 Rock Creek near Clinton NQ = 0.0000323(Q)1.42 .93 <.0001 42 43.6-125 81.1
30 Clark Fork at Turah Bridge, near Bonner
NQ = 0.0000242(Q)1.46 .87 <.0001 47 150-390 267
31 Blackfoot River near Bonner NQ = 0.0000750(Q)1.26 .91 <.0001 44 175-357 275
32 Bitterroot River near Missoula NQ = 0.000144(Q)1.18 .86 <.0001 56 305-600 478
33 Clark Fork at St. Regis NQ = 0.000110(Q)1.18 .88 <.0001 42 808-1,690 1,290
34 North Fork Flathead River near Columbia Falls
NQ = 0.0000105(Q)1.41 .85 <.0001 62 165-562 364
35 Middle Fork Flathead River near West Glacier
NQ = 0.0000324(Q)1.24 .90 <.0001 47 139-264 240
36 Whitefish River near Kalispell NQ = 0.000550(Q)0.955 .89 <.0001 33 14.4-28.4 23.0
37 Swan River near Bigfork NQ = 0.0000933(Q)1.13 .82 <.0001 42 63.7-92.0 81.6
38 Flathead River at Perma NQ = 0.000533(Q)0.950 .42 .0002 72 876-1,450 1,230
1Less than 5 years of either sample data or daily mean streamflow record were available for load calculations.
Table �. Equations for estimating daily loads of total ammonia plus organic nitrogen and summaries of the range and mean of estimated annual loads at network sites in Montana, water years 1999-2003.—Continued
Water-Quality Characteristics ��
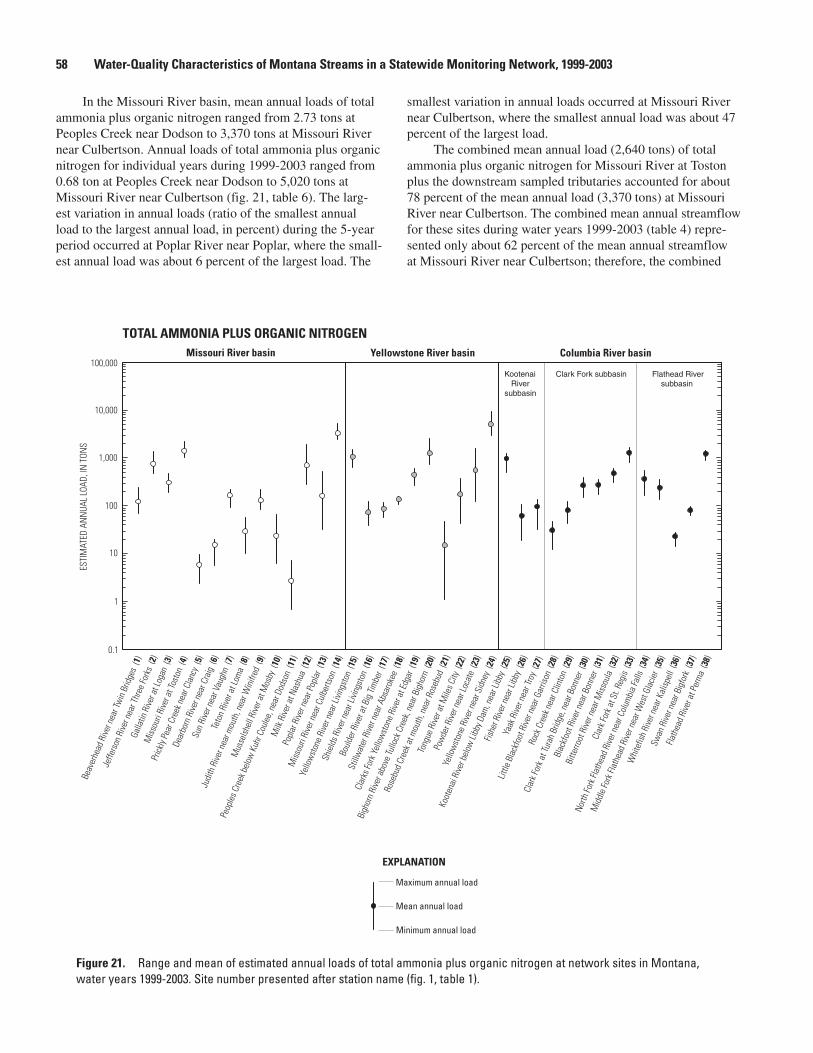
Figure 21. Range and mean of estimated annual loads of total ammonia plus organic nitrogen at network sites in Montana, water years 1999-2003. Site number presented after station name (fig. 1, table 1).
ESTI
MAT
ED A
NN
UAL
LOAD
, IN
TON
S
1
10
100
1,000
10,000
100,000
0.1
TOTAL AMMONIA PLUS ORGANIC NITROGENMissouri River basin Yellowstone River basin Columbia River basin
Kootenai Riversubbasin
Flathead River subbasin
Clark Fork subbasin
Maximum annual load
Mean annual load
Minimum annual load
EXPLANATION
Beav
erhe
ad R
iver n
ear T
win
Brid
ges
(1)
Jeffe
rson
Rive
r nea
r Thr
ee Fo
rks
(2)
Galla
tin R
iver a
t Log
an (
3)
Miss
ouri
Rive
r at T
osto
n (4
)
Prick
ly Pe
ar C
reek
nea
r Cla
ncy
(5)
Dear
born
Rive
r nea
r Cra
ig (
6)
Sun
Rive
r nea
r Vau
ghn
(7)
Teto
n Ri
ver a
t Lom
a (8
)
Judi
th R
iver n
ear m
outh
, nea
r Win
ifred
(9)
Mus
selsh
ell R
iver a
t Mos
by (
10)
Peop
les C
reek
bel
ow K
uhr C
oule
e, n
ear D
odso
n (1
1)
Milk
Rive
r at N
ashu
a (1
2)
Popl
ar R
iver n
ear P
opla
r (13
)
Miss
ouri
Rive
r nea
r Cul
berts
on (
14)
Yello
wst
one
Rive
r nea
r Livi
ngst
on (
15)
Shie
lds R
iver n
ear L
iving
ston
(16
)
Boul
der R
iver a
t Big
Tim
ber
(17)
Still
wat
er R
iver n
ear A
bsar
okee
(18
)
Clar
ks Fo
rk Y
ello
wst
one
Rive
r at E
dgar
(19
)
Bigh
orn
Rive
r abo
ve Tu
llock
Cre
ek, n
ear B
igho
rn (
20)
Rose
bud
Cree
k at m
outh
, nea
r Ros
ebud
(21
)
Tong
ue R
iver a
t Mile
s City
(22
)
Pow
der R
iver n
ear L
ocat
e (2
3)
Yello
wst
one
Rive
r nea
r Sid
ney
(24)
Koot
enai
Rive
r bel
ow Li
bby D
am, n
ear L
ibby
(25
)
Fishe
r Rive
r nea
r Lib
by (
26)
Yaak
Rive
r nea
r Tro
y (27
)
Little
Bla
ckfo
ot R
iver n
ear G
arris
on (
28)
Rock
Cre
ek n
ear C
linto
n (2
9)
Clar
k For
k at T
urah
Brid
ge, n
ear B
onne
r (30
)
Blac
kfoo
t Rive
r nea
r Bon
ner
(31)
Bitte
rroot
Rive
r nea
r Miss
oula
(32
)
Clar
k For
k at S
t. Re
gis
(33)
North
Fork
Flat
head
Rive
r nea
r Col
umbi
a Fa
lls (
34)
Mid
dle
Fork
Flat
head
Rive
r nea
r Wes
t Gla
cier
(35)
Whi
tefis
h Ri
ver n
ear K
alisp
ell
(36)
Swan
Rive
r nea
r Big
fork
(37
)
Flath
ead
Rive
r at P
erm
a (3
8)
In the Missouri River basin, mean annual loads of total ammonia plus organic nitrogen ranged from 2.73 tons at Peoples Creek near Dodson to 3,370 tons at Missouri River near Culbertson. Annual loads of total ammonia plus organic nitrogen for individual years during 1999-2003 ranged from 0.68 ton at Peoples Creek near Dodson to 5,020 tons at Missouri River near Culbertson (fig. 21, table 6). The larg-est variation in annual loads (ratio of the smallest annual load to the largest annual load, in percent) during the 5-year period occurred at Poplar River near Poplar, where the small-est annual load was about 6 percent of the largest load. The
smallest variation in annual loads occurred at Missouri River near Culbertson, where the smallest annual load was about 47 percent of the largest load.
The combined mean annual load (2,640 tons) of total ammonia plus organic nitrogen for Missouri River at Toston plus the downstream sampled tributaries accounted for about 78 percent of the mean annual load (3,370 tons) at Missouri River near Culbertson. The combined mean annual streamflow for these sites during water years 1999-2003 (table 4) repre-sented only about 62 percent of the mean annual streamflow at Missouri River near Culbertson; therefore, the combined
�� Water-Quality Characteristics of Montana Streams in a Statewide Monitoring Network, 1999-2003
Fork at St. Regis (fig. 21, table 6). Year-to-year variation in annual loads during the 5-year monitoring period generally was not as variable at sites in the Columbia River basin as in the other two major river basins. The largest variation in annual loads of total ammonia plus organic nitrogen occurred at Fisher River near Libby, where the smallest load was about 17 percent of the largest load. The smallest variation in annual loads occurred at Swan River near Bigfork, where the smallest annual load was about 69 percent of the largest annual load.
In the Kootenai River portion of the Columbia River basin, the largest mean annual load of total ammonia plus organic nitrogen (970 tons) was transported past Kootenai River below Libby Dam (table 6). The much larger load at this site compared to Yaak or Fisher Rivers is a function of the substantially greater streamflow (table 4) because concentra-tions of ammonia plus organic nitrogen were relatively low at Kootenai River below Libby Dam when compared to concen-trations in samples from the Yaak and Fisher Rivers (fig. 7). In the Clark Fork and Flathead River subbasins of the Columbia River basin, similar mean annual loads of total ammonia plus organic nitrogen were transported past Clark Fork at St. Regis (1,290 tons) and Flathead River at Perma (1,230 tons) (table 6). These loads represented about 51 and 49 percent, respectively, of the combined mean annual load (2,520 tons) for Clark Fork at St. Regis plus Flathead River at Perma. The mean annual load from the Clark Fork (51 percent) was proportionally higher than the mean annual streamflow con-tribution of about 38 percent. The largest mean annual load of total ammonia plus organic nitrogen from sources in the Clark Fork subbasin upstream from St. Regis was transported past Bitterroot River near Missoula (478 tons), which accounted for about 37 percent of the mean annual load at Clark Fork at St. Regis (table 6). The load from the Bitterroot River was proportional to the streamflow contribution of about 33 per-cent. The combined mean annual load of total ammonia plus organic nitrogen (1,020 tons) for Clark Fork at Turah Bridge, Blackfoot River near Bonner, and Bitterroot River near Mis-soula represented about 79 percent of the mean annual load (1,290 tons) at Clark Fork at St. Regis, which is only slightly higher than the combined mean annual streamflow contribu-tion of about 73 percent.
Total NitrogenEquations for estimating daily loads of total nitrogen at
network sites are presented in table 7, along with the range and mean of estimated annual loads during water years 1999-2003. For all sites, the data were logarithmically transformed to produce the best linear fit of the regression line. The total nitrogen loads were calculated using regression equations that were developed from estimated sample concentrations of total nitrogen obtained by adding concentrations of dissolved nitrite plus nitrate and total ammonia plus organic nitrogen. The equations for all sites in the statewide network were statisti-cally significant (p-values <0.0001). Values of R2 ranged from 0.42 to 0.98, indicating that the accuracy of estimated annual
load from upstream sources is proportionally high relative to the combined streamflow. The largest mean annual load of total ammonia plus organic nitrogen from upstream sources was transported past Missouri River at Toston (1,400 tons), which accounted for about 42 percent of the mean annual load at Missouri River near Culbertson (table 6). The load from the basin above Toston was generally proportional relative to the streamflow contribution of about 46 percent. The next largest mean-annual load from upstream sources was transported past Milk River at Nashua (702 tons), which accounted for about 21 percent of the mean annual load at Missouri River near Culbertson; the load from the Milk River was proportionally high relative to the streamflow contribution of only about 4 percent.
In the Yellowstone River basin, mean annual loads of total ammonia plus organic nitrogen ranged from 15.2 tons at Rosebud Creek near Rosebud to 5,030 tons at Yellowstone River near Sidney. Annual loads of total ammonia plus organic nitrogen for individual years during 1999-2003 ranged from 1.14 tons at Rosebud Creek near Rosebud to 9,450 tons at Yel-lowstone River near Sidney (fig. 21, table 6). The largest varia-tion in annual loads occurred at Rosebud Creek near Rosebud, where the smallest annual load was about 2 percent of the largest load. The smallest variation in annual loads occurred at Stillwater River near Absarokee, where the smallest annual load was about 68 percent of the largest load.
The combined mean annual load (3,790 tons) of total ammonia plus organic nitrogen for Yellowstone River near Livingston plus downstream sampled tributaries accounted for about 75 percent of the mean annual load (5,030 tons) at Yellowstone River near Sidney (table 6). The combined mean annual streamflow for these sites during water years 1999-2003 (table 4) was within 2 percent of the flow at Yel-lowstone River near Sidney, thereby indicating that no major hydrologic source was unsampled. However, the proportional difference between load and streamflow contributions indi-cates that unmeasured sources are contributing about 25 per-cent of the total ammonia plus organic nitrogen load to the Yellowstone River near Sidney. The largest mean annual load of total ammonia plus organic nitrogen from upstream sources was transported past Bighorn River near Bighorn (1,260 tons), which accounted for about 25 percent of the mean annual load at Yellowstone River near Sidney (table 6). The load from the Bighorn River is proportional to the streamflow contribution of about 31 percent. The next largest mean annual load from upstream sources was transported past Yellowstone River near Livingston (1,060 tons), which accounted for about 21 percent of the mean annual load at Yellowstone River near Sidney; however, the load from this source area was small relative to the streamflow contribution of 39 percent.
In the Columbia River basin, mean annual loads of total ammonia plus organic nitrogen ranged from 23.0 tons at Whitefish River near Kalispell to 1,290 tons at Clark Fork at St. Regis. Annual loads of total ammonia plus organic nitrogen for individual years during 1999-2003 ranged from 12.2 tons at Little Blackfoot River near Garrison to 1,690 tons at Clark
Water-Quality Characteristics �9
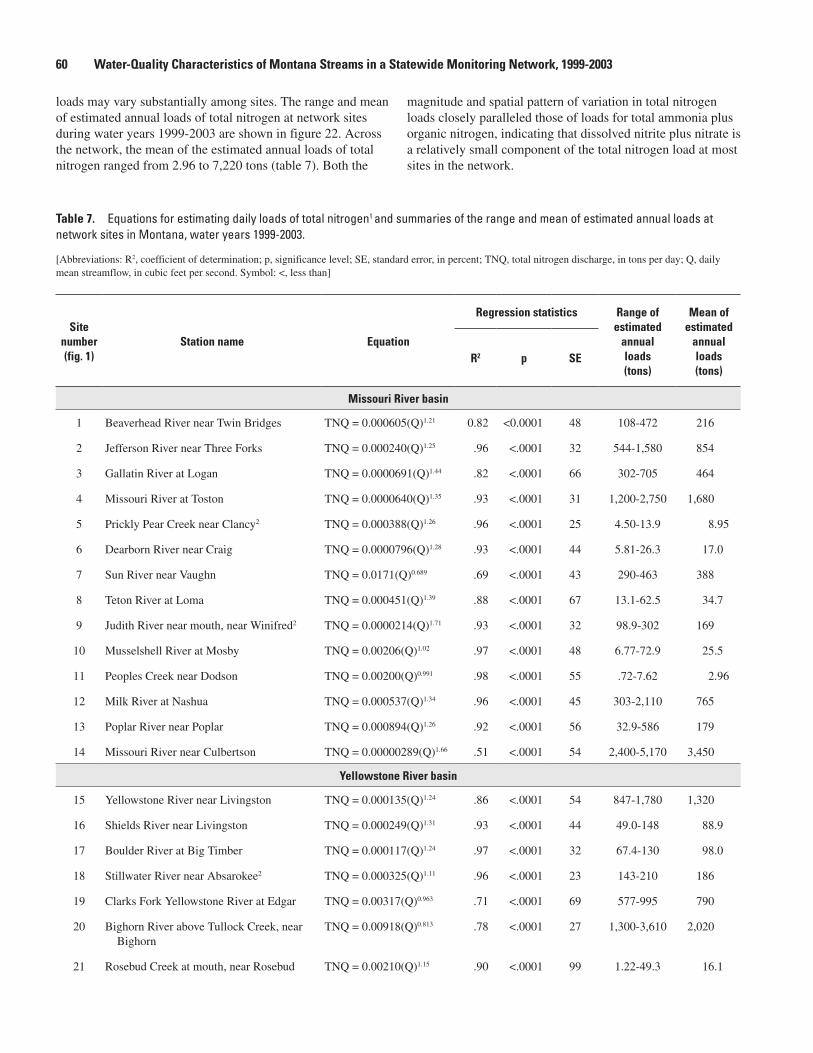
loads may vary substantially among sites. The range and mean of estimated annual loads of total nitrogen at network sites during water years 1999-2003 are shown in figure 22. Across the network, the mean of the estimated annual loads of total nitrogen ranged from 2.96 to 7,220 tons (table 7). Both the
Table �. Equations for estimating daily loads of total nitrogen1 and summaries of the range and mean of estimated annual loads at network sites in Montana, water years 1999-2003.
[Abbreviations: R2, coefficient of determination; p, significance level; SE, standard error, in percent; TNQ, total nitrogen discharge, in tons per day; Q, daily mean streamflow, in cubic feet per second. Symbol: <, less than]
Site number (fig. 1)
Station name Equation
Regression statistics Range of estimated
annual loads (tons)
Mean of estimated
annual loads (tons)
R2 p SE
Missouri River basin
1 Beaverhead River near Twin Bridges TNQ = 0.000605(Q)1.21 0.82 <0.0001 48 108-472 216
2 Jefferson River near Three Forks TNQ = 0.000240(Q)1.25 .96 <.0001 32 544-1,580 854
3 Gallatin River at Logan TNQ = 0.0000691(Q)1.44 .82 <.0001 66 302-705 464
4 Missouri River at Toston TNQ = 0.0000640(Q)1.35 .93 <.0001 31 1,200-2,750 1,680
5 Prickly Pear Creek near Clancy2 TNQ = 0.000388(Q)1.26 .96 <.0001 25 4.50-13.9 8.95
6 Dearborn River near Craig TNQ = 0.0000796(Q)1.28 .93 <.0001 44 5.81-26.3 17.0
7 Sun River near Vaughn TNQ = 0.0171(Q)0.689 .69 <.0001 43 290-463 388
8 Teton River at Loma TNQ = 0.000451(Q)1.39 .88 <.0001 67 13.1-62.5 34.7
9 Judith River near mouth, near Winifred2 TNQ = 0.0000214(Q)1.71 .93 <.0001 32 98.9-302 169
10 Musselshell River at Mosby TNQ = 0.00206(Q)1.02 .97 <.0001 48 6.77-72.9 25.5
11 Peoples Creek near Dodson TNQ = 0.00200(Q)0.991 .98 <.0001 55 .72-7.62 2.96
12 Milk River at Nashua TNQ = 0.000537(Q)1.34 .96 <.0001 45 303-2,110 765
13 Poplar River near Poplar TNQ = 0.000894(Q)1.26 .92 <.0001 56 32.9-586 179
14 Missouri River near Culbertson TNQ = 0.00000289(Q)1.66 .51 <.0001 54 2,400-5,170 3,450
Yellowstone River basin
15 Yellowstone River near Livingston TNQ = 0.000135(Q)1.24 .86 <.0001 54 847-1,780 1,320
16 Shields River near Livingston TNQ = 0.000249(Q)1.31 .93 <.0001 44 49.0-148 88.9
17 Boulder River at Big Timber TNQ = 0.000117(Q)1.24 .97 <.0001 32 67.4-130 98.0
18 Stillwater River near Absarokee2 TNQ = 0.000325(Q)1.11 .96 <.0001 23 143-210 186
19 Clarks Fork Yellowstone River at Edgar TNQ = 0.00317(Q)0.963 .71 <.0001 69 577-995 790
20 Bighorn River above Tullock Creek, near Bighorn
TNQ = 0.00918(Q)0.813 .78 <.0001 27 1,300-3,610 2,020
21 Rosebud Creek at mouth, near Rosebud TNQ = 0.00210(Q)1.15 .90 <.0001 99 1.22-49.3 16.1
magnitude and spatial pattern of variation in total nitrogen loads closely paralleled those of loads for total ammonia plus organic nitrogen, indicating that dissolved nitrite plus nitrate is a relatively small component of the total nitrogen load at most sites in the network.
�0 Water-Quality Characteristics of Montana Streams in a Statewide Monitoring Network, 1999-2003
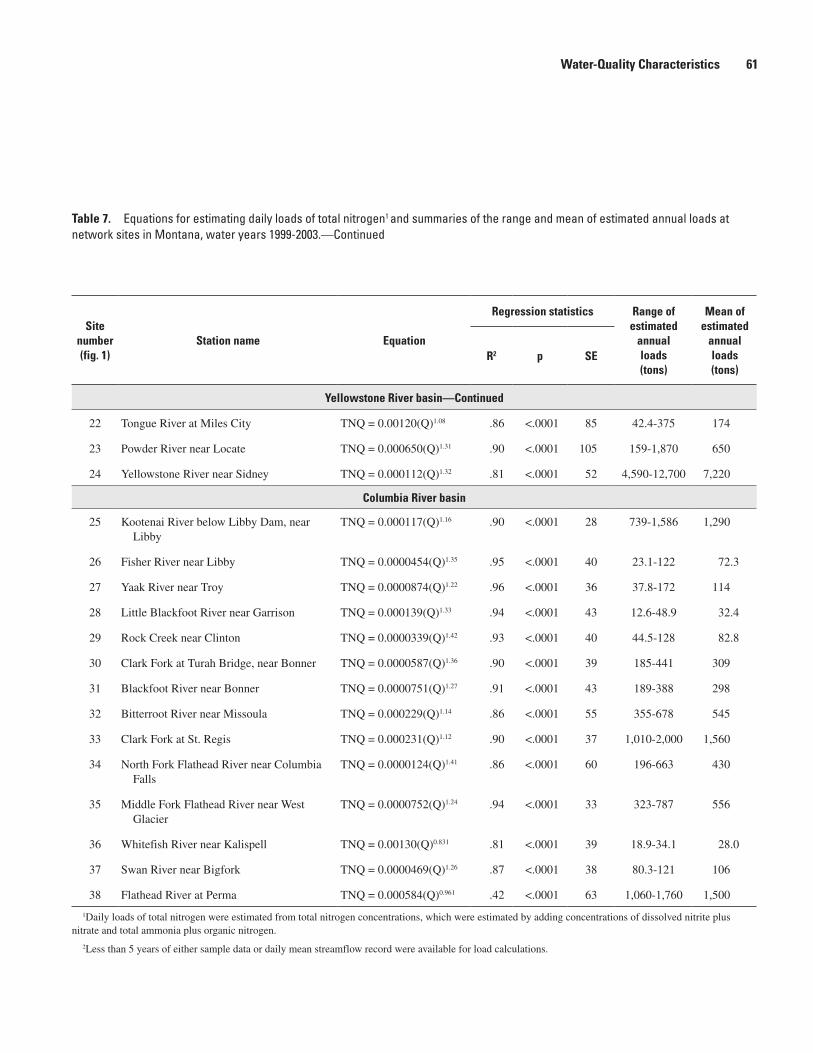
Site number (fig. 1)
Station name Equation
Regression statistics Range of estimated
annual loads (tons)
Mean of estimated
annual loads (tons)
R2 p SE
Yellowstone River basin—Continued
22 Tongue River at Miles City TNQ = 0.00120(Q)1.08 .86 <.0001 85 42.4-375 174
23 Powder River near Locate TNQ = 0.000650(Q)1.31 .90 <.0001 105 159-1,870 650
24 Yellowstone River near Sidney TNQ = 0.000112(Q)1.32 .81 <.0001 52 4,590-12,700 7,220
Columbia River basin
25 Kootenai River below Libby Dam, near Libby
TNQ = 0.000117(Q)1.16 .90 <.0001 28 739-1,586 1,290
26 Fisher River near Libby TNQ = 0.0000454(Q)1.35 .95 <.0001 40 23.1-122 72.3
27 Yaak River near Troy TNQ = 0.0000874(Q)1.22 .96 <.0001 36 37.8-172 114
28 Little Blackfoot River near Garrison TNQ = 0.000139(Q)1.33 .94 <.0001 43 12.6-48.9 32.4
29 Rock Creek near Clinton TNQ = 0.0000339(Q)1.42 .93 <.0001 40 44.5-128 82.8
30 Clark Fork at Turah Bridge, near Bonner TNQ = 0.0000587(Q)1.36 .90 <.0001 39 185-441 309
31 Blackfoot River near Bonner TNQ = 0.0000751(Q)1.27 .91 <.0001 43 189-388 298
32 Bitterroot River near Missoula TNQ = 0.000229(Q)1.14 .86 <.0001 55 355-678 545
33 Clark Fork at St. Regis TNQ = 0.000231(Q)1.12 .90 <.0001 37 1,010-2,000 1,560
34 North Fork Flathead River near Columbia Falls
TNQ = 0.0000124(Q)1.41 .86 <.0001 60 196-663 430
35 Middle Fork Flathead River near West Glacier
TNQ = 0.0000752(Q)1.24 .94 <.0001 33 323-787 556
36 Whitefish River near Kalispell TNQ = 0.00130(Q)0.831 .81 <.0001 39 18.9-34.1 28.0
37 Swan River near Bigfork TNQ = 0.0000469(Q)1.26 .87 <.0001 38 80.3-121 106
38 Flathead River at Perma TNQ = 0.000584(Q)0.961 .42 <.0001 63 1,060-1,760 1,500
1Daily loads of total nitrogen were estimated from total nitrogen concentrations, which were estimated by adding concentrations of dissolved nitrite plus nitrate and total ammonia plus organic nitrogen.
2Less than 5 years of either sample data or daily mean streamflow record were available for load calculations.
Table �. Equations for estimating daily loads of total nitrogen1 and summaries of the range and mean of estimated annual loads at network sites in Montana, water years 1999-2003.—Continued
Water-Quality Characteristics �1
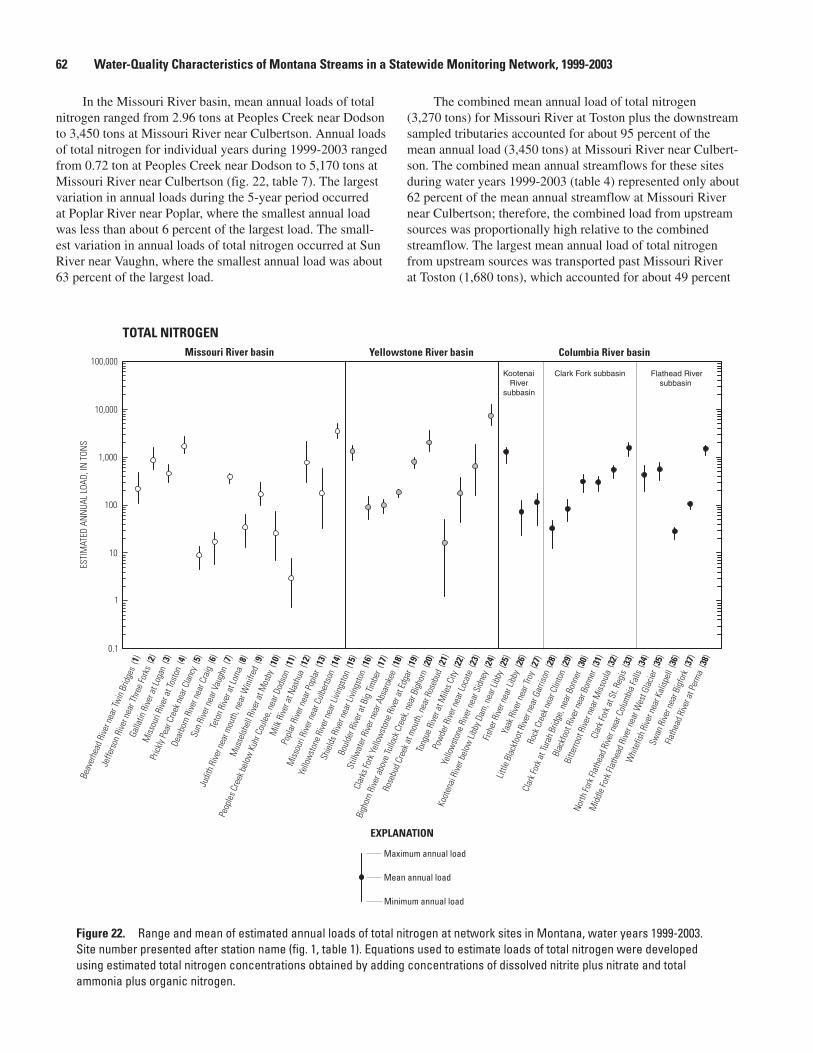
Figure 22. Range and mean of estimated annual loads of total nitrogen at network sites in Montana, water years 1999-2003. Site number presented after station name (fig. 1, table 1). Equations used to estimate loads of total nitrogen were developed using estimated total nitrogen concentrations obtained by adding concentrations of dissolved nitrite plus nitrate and total ammonia plus organic nitrogen.
ESTI
MAT
ED A
NN
UAL
LOAD
, IN
TON
S
0.1
1
10
100
1,000
10,000
100,000
TOTAL NITROGENMissouri River basin Yellowstone River basin Columbia River basin
Kootenai Riversubbasin
Flathead River subbasin
Clark Fork subbasin
Maximum annual load
Mean annual load
Minimum annual load
EXPLANATION
Beav
erhe
ad R
iver n
ear T
win
Brid
ges
(1)
Jeffe
rson
Rive
r nea
r Thr
ee Fo
rks
(2)
Galla
tin R
iver a
t Log
an (
3)
Miss
ouri
Rive
r at T
osto
n (4
)
Prick
ly Pe
ar C
reek
nea
r Cla
ncy
(5)
Dear
born
Rive
r nea
r Cra
ig (
6)
Sun
Rive
r nea
r Vau
ghn
(7)
Teto
n Ri
ver a
t Lom
a (8
)
Judi
th R
iver n
ear m
outh
, nea
r Win
ifred
(9)
Mus
selsh
ell R
iver a
t Mos
by (
10)
Peop
les C
reek
bel
ow K
uhr C
oule
e, n
ear D
odso
n (1
1)
Milk
Rive
r at N
ashu
a (1
2)
Popl
ar R
iver n
ear P
opla
r (13
)
Miss
ouri
Rive
r nea
r Cul
berts
on (
14)
Yello
wst
one
Rive
r nea
r Livi
ngst
on (
15)
Shie
lds R
iver n
ear L
iving
ston
(16
)
Boul
der R
iver a
t Big
Tim
ber
(17)
Still
wat
er R
iver n
ear A
bsar
okee
(18
)
Clar
ks Fo
rk Y
ello
wst
one
Rive
r at E
dgar
(19
)
Bigh
orn
Rive
r abo
ve Tu
llock
Cre
ek, n
ear B
igho
rn (
20)
Rose
bud
Cree
k at m
outh
, nea
r Ros
ebud
(21
)
Tong
ue R
iver a
t Mile
s City
(22
)
Pow
der R
iver n
ear L
ocat
e (2
3)
Yello
wst
one
Rive
r nea
r Sid
ney
(24)
Koot
enai
Rive
r bel
ow Li
bby D
am, n
ear L
ibby
(25
)
Fishe
r Rive
r nea
r Lib
by (
26)
Yaak
Rive
r nea
r Tro
y (27
)
Little
Bla
ckfo
ot R
iver n
ear G
arris
on (
28)
Rock
Cre
ek n
ear C
linto
n (2
9)
Clar
k For
k at T
urah
Brid
ge, n
ear B
onne
r (30
)
Blac
kfoo
t Rive
r nea
r Bon
ner
(31)
Bitte
rroot
Rive
r nea
r Miss
oula
(32
)
Clar
k For
k at S
t. Re
gis
(33)
North
Fork
Flat
head
Rive
r nea
r Col
umbi
a Fa
lls (
34)
Mid
dle
Fork
Flat
head
Rive
r nea
r Wes
t Gla
cier
(35)
Whi
tefis
h Ri
ver n
ear K
alisp
ell
(36)
Swan
Rive
r nea
r Big
fork
(37
)
Flath
ead
Rive
r at P
erm
a (3
8)
In the Missouri River basin, mean annual loads of total nitrogen ranged from 2.96 tons at Peoples Creek near Dodson to 3,450 tons at Missouri River near Culbertson. Annual loads of total nitrogen for individual years during 1999-2003 ranged from 0.72 ton at Peoples Creek near Dodson to 5,170 tons at Missouri River near Culbertson (fig. 22, table 7). The largest variation in annual loads during the 5-year period occurred at Poplar River near Poplar, where the smallest annual load was less than about 6 percent of the largest load. The small-est variation in annual loads of total nitrogen occurred at Sun River near Vaughn, where the smallest annual load was about 63 percent of the largest load.
The combined mean annual load of total nitrogen (3,270 tons) for Missouri River at Toston plus the downstream sampled tributaries accounted for about 95 percent of the mean annual load (3,450 tons) at Missouri River near Culbert-son. The combined mean annual streamflows for these sites during water years 1999-2003 (table 4) represented only about 62 percent of the mean annual streamflow at Missouri River near Culbertson; therefore, the combined load from upstream sources was proportionally high relative to the combined streamflow. The largest mean annual load of total nitrogen from upstream sources was transported past Missouri River at Toston (1,680 tons), which accounted for about 49 percent
�2 Water-Quality Characteristics of Montana Streams in a Statewide Monitoring Network, 1999-2003
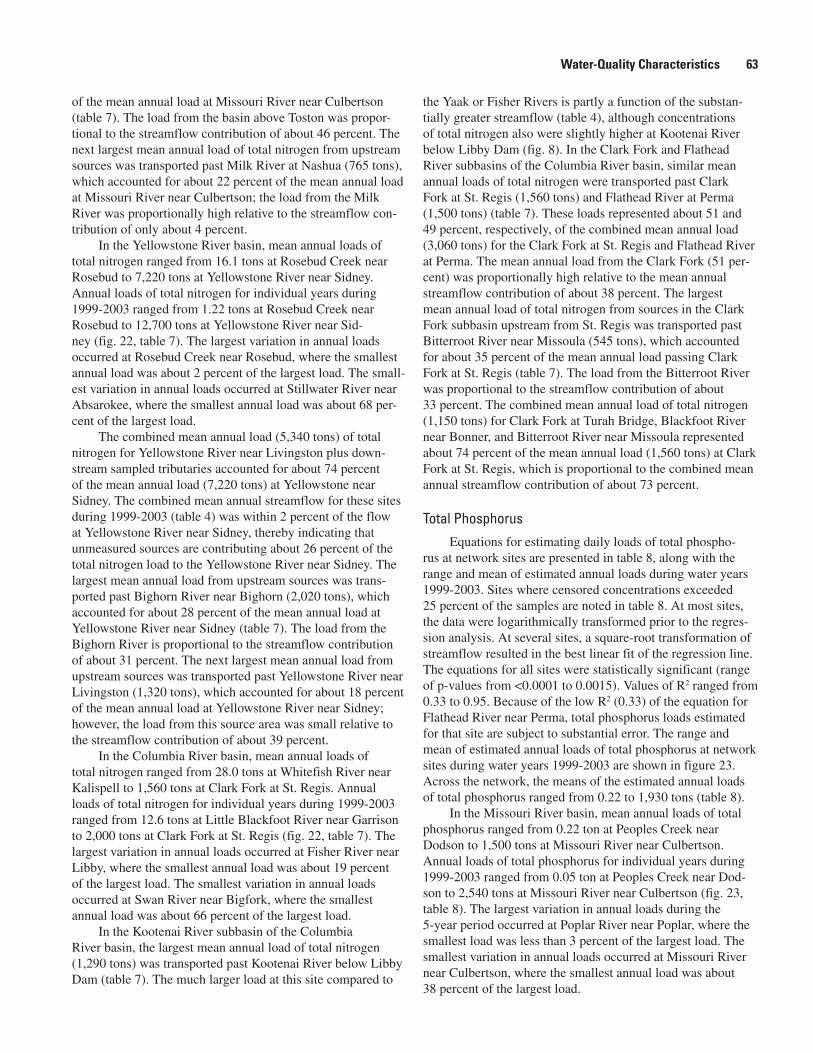
of the mean annual load at Missouri River near Culbertson (table 7). The load from the basin above Toston was propor-tional to the streamflow contribution of about 46 percent. The next largest mean annual load of total nitrogen from upstream sources was transported past Milk River at Nashua (765 tons), which accounted for about 22 percent of the mean annual load at Missouri River near Culbertson; the load from the Milk River was proportionally high relative to the streamflow con-tribution of only about 4 percent.
In the Yellowstone River basin, mean annual loads of total nitrogen ranged from 16.1 tons at Rosebud Creek near Rosebud to 7,220 tons at Yellowstone River near Sidney. Annual loads of total nitrogen for individual years during 1999-2003 ranged from 1.22 tons at Rosebud Creek near Rosebud to 12,700 tons at Yellowstone River near Sid-ney (fig. 22, table 7). The largest variation in annual loads occurred at Rosebud Creek near Rosebud, where the smallest annual load was about 2 percent of the largest load. The small-est variation in annual loads occurred at Stillwater River near Absarokee, where the smallest annual load was about 68 per-cent of the largest load.
The combined mean annual load (5,340 tons) of total nitrogen for Yellowstone River near Livingston plus down-stream sampled tributaries accounted for about 74 percent of the mean annual load (7,220 tons) at Yellowstone near Sidney. The combined mean annual streamflow for these sites during 1999-2003 (table 4) was within 2 percent of the flow at Yellowstone River near Sidney, thereby indicating that unmeasured sources are contributing about 26 percent of the total nitrogen load to the Yellowstone River near Sidney. The largest mean annual load from upstream sources was trans-ported past Bighorn River near Bighorn (2,020 tons), which accounted for about 28 percent of the mean annual load at Yellowstone River near Sidney (table 7). The load from the Bighorn River is proportional to the streamflow contribution of about 31 percent. The next largest mean annual load from upstream sources was transported past Yellowstone River near Livingston (1,320 tons), which accounted for about 18 percent of the mean annual load at Yellowstone River near Sidney; however, the load from this source area was small relative to the streamflow contribution of about 39 percent.
In the Columbia River basin, mean annual loads of total nitrogen ranged from 28.0 tons at Whitefish River near Kalispell to 1,560 tons at Clark Fork at St. Regis. Annual loads of total nitrogen for individual years during 1999-2003 ranged from 12.6 tons at Little Blackfoot River near Garrison to 2,000 tons at Clark Fork at St. Regis (fig. 22, table 7). The largest variation in annual loads occurred at Fisher River near Libby, where the smallest annual load was about 19 percent of the largest load. The smallest variation in annual loads occurred at Swan River near Bigfork, where the smallest annual load was about 66 percent of the largest load.
In the Kootenai River subbasin of the Columbia River basin, the largest mean annual load of total nitrogen (1,290 tons) was transported past Kootenai River below Libby Dam (table 7). The much larger load at this site compared to
the Yaak or Fisher Rivers is partly a function of the substan-tially greater streamflow (table 4), although concentrations of total nitrogen also were slightly higher at Kootenai River below Libby Dam (fig. 8). In the Clark Fork and Flathead River subbasins of the Columbia River basin, similar mean annual loads of total nitrogen were transported past Clark Fork at St. Regis (1,560 tons) and Flathead River at Perma (1,500 tons) (table 7). These loads represented about 51 and 49 percent, respectively, of the combined mean annual load (3,060 tons) for the Clark Fork at St. Regis and Flathead River at Perma. The mean annual load from the Clark Fork (51 per-cent) was proportionally high relative to the mean annual streamflow contribution of about 38 percent. The largest mean annual load of total nitrogen from sources in the Clark Fork subbasin upstream from St. Regis was transported past Bitterroot River near Missoula (545 tons), which accounted for about 35 percent of the mean annual load passing Clark Fork at St. Regis (table 7). The load from the Bitterroot River was proportional to the streamflow contribution of about 33 percent. The combined mean annual load of total nitrogen (1,150 tons) for Clark Fork at Turah Bridge, Blackfoot River near Bonner, and Bitterroot River near Missoula represented about 74 percent of the mean annual load (1,560 tons) at Clark Fork at St. Regis, which is proportional to the combined mean annual streamflow contribution of about 73 percent.
Total PhosphorusEquations for estimating daily loads of total phospho-
rus at network sites are presented in table 8, along with the range and mean of estimated annual loads during water years 1999-2003. Sites where censored concentrations exceeded 25 percent of the samples are noted in table 8. At most sites, the data were logarithmically transformed prior to the regres-sion analysis. At several sites, a square-root transformation of streamflow resulted in the best linear fit of the regression line. The equations for all sites were statistically significant (range of p-values from <0.0001 to 0.0015). Values of R2 ranged from 0.33 to 0.95. Because of the low R2 (0.33) of the equation for Flathead River near Perma, total phosphorus loads estimated for that site are subject to substantial error. The range and mean of estimated annual loads of total phosphorus at network sites during water years 1999-2003 are shown in figure 23. Across the network, the means of the estimated annual loads of total phosphorus ranged from 0.22 to 1,930 tons (table 8).
In the Missouri River basin, mean annual loads of total phosphorus ranged from 0.22 ton at Peoples Creek near Dodson to 1,500 tons at Missouri River near Culbertson. Annual loads of total phosphorus for individual years during 1999-2003 ranged from 0.05 ton at Peoples Creek near Dod-son to 2,540 tons at Missouri River near Culbertson (fig. 23, table 8). The largest variation in annual loads during the 5-year period occurred at Poplar River near Poplar, where the smallest load was less than 3 percent of the largest load. The smallest variation in annual loads occurred at Missouri River near Culbertson, where the smallest annual load was about 38 percent of the largest load.
Water-Quality Characteristics �3
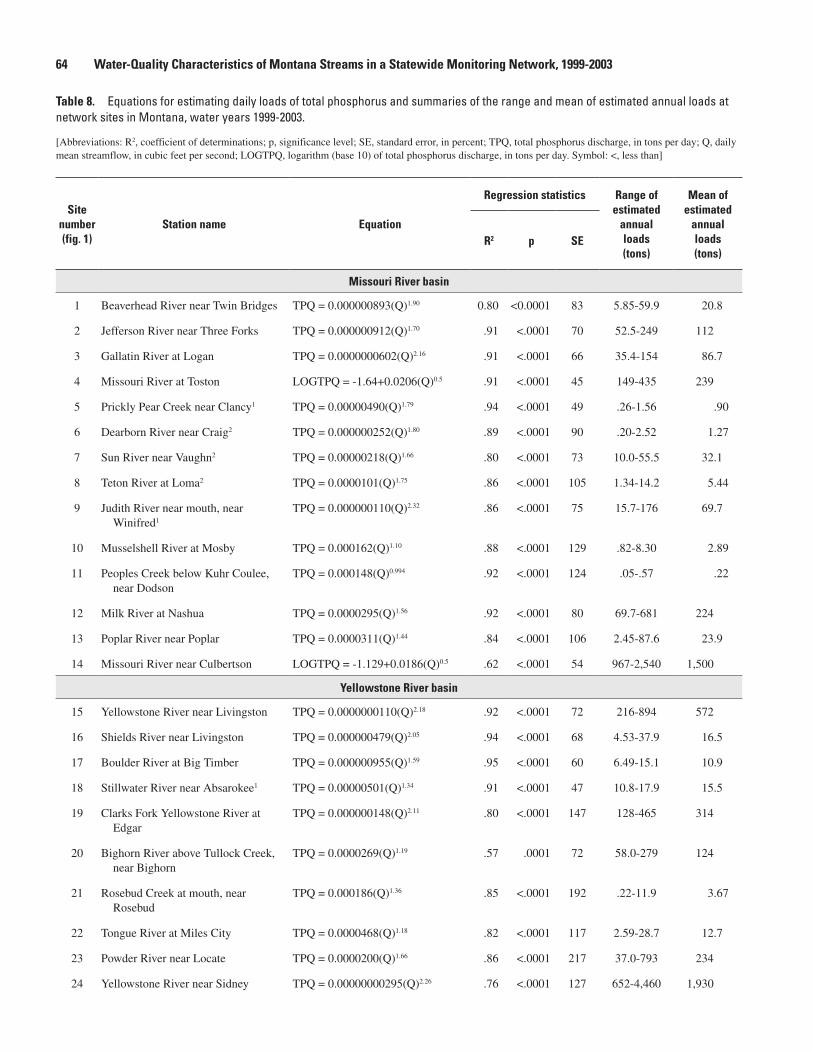
Table �. Equations for estimating daily loads of total phosphorus and summaries of the range and mean of estimated annual loads at network sites in Montana, water years 1999-2003.
[Abbreviations: R2, coefficient of determinations; p, significance level; SE, standard error, in percent; TPQ, total phosphorus discharge, in tons per day; Q, daily mean streamflow, in cubic feet per second; LOGTPQ, logarithm (base 10) of total phosphorus discharge, in tons per day. Symbol: <, less than]
Site number (fig. 1)
Station name Equation
Regression statistics Range of estimated
annual loads (tons)
Mean of estimated
annual loads (tons)
R2 p SE
Missouri River basin
1 Beaverhead River near Twin Bridges TPQ = 0.000000893(Q)1.90 0.80 <0.0001 83 5.85-59.9 20.8
2 Jefferson River near Three Forks TPQ = 0.000000912(Q)1.70 .91 <.0001 70 52.5-249 112
3 Gallatin River at Logan TPQ = 0.0000000602(Q)2.16 .91 <.0001 66 35.4-154 86.7
4 Missouri River at Toston LOGTPQ = -1.64+0.0206(Q)0.5 .91 <.0001 45 149-435 239
5 Prickly Pear Creek near Clancy1 TPQ = 0.00000490(Q)1.79 .94 <.0001 49 .26-1.56 .90
6 Dearborn River near Craig2 TPQ = 0.000000252(Q)1.80 .89 <.0001 90 .20-2.52 1.27
7 Sun River near Vaughn2 TPQ = 0.00000218(Q)1.66 .80 <.0001 73 10.0-55.5 32.1
8 Teton River at Loma2 TPQ = 0.0000101(Q)1.75 .86 <.0001 105 1.34-14.2 5.44
9 Judith River near mouth, near Winifred1
TPQ = 0.000000110(Q)2.32 .86 <.0001 75 15.7-176 69.7
10 Musselshell River at Mosby TPQ = 0.000162(Q)1.10 .88 <.0001 129 .82-8.30 2.89
11 Peoples Creek below Kuhr Coulee, near Dodson
TPQ = 0.000148(Q)0.994 .92 <.0001 124 .05-.57 .22
12 Milk River at Nashua TPQ = 0.0000295(Q)1.56 .92 <.0001 80 69.7-681 224
13 Poplar River near Poplar TPQ = 0.0000311(Q)1.44 .84 <.0001 106 2.45-87.6 23.9
14 Missouri River near Culbertson LOGTPQ = -1.129+0.0186(Q)0.5 .62 <.0001 54 967-2,540 1,500
Yellowstone River basin
15 Yellowstone River near Livingston TPQ = 0.0000000110(Q)2.18 .92 <.0001 72 216-894 572
16 Shields River near Livingston TPQ = 0.000000479(Q)2.05 .94 <.0001 68 4.53-37.9 16.5
17 Boulder River at Big Timber TPQ = 0.000000955(Q)1.59 .95 <.0001 60 6.49-15.1 10.9
18 Stillwater River near Absarokee1 TPQ = 0.00000501(Q)1.34 .91 <.0001 47 10.8-17.9 15.5
19 Clarks Fork Yellowstone River at Edgar
TPQ = 0.000000148(Q)2.11 .80 <.0001 147 128-465 314
20 Bighorn River above Tullock Creek, near Bighorn
TPQ = 0.0000269(Q)1.19 .57 .0001 72 58.0-279 124
21 Rosebud Creek at mouth, near Rosebud
TPQ = 0.000186(Q)1.36 .85 <.0001 192 .22-11.9 3.67
22 Tongue River at Miles City TPQ = 0.0000468(Q)1.18 .82 <.0001 117 2.59-28.7 12.7
23 Powder River near Locate TPQ = 0.0000200(Q)1.66 .86 <.0001 217 37.0-793 234
24 Yellowstone River near Sidney TPQ = 0.00000000295(Q)2.26 .76 <.0001 127 652-4,460 1,930
�� Water-Quality Characteristics of Montana Streams in a Statewide Monitoring Network, 1999-2003
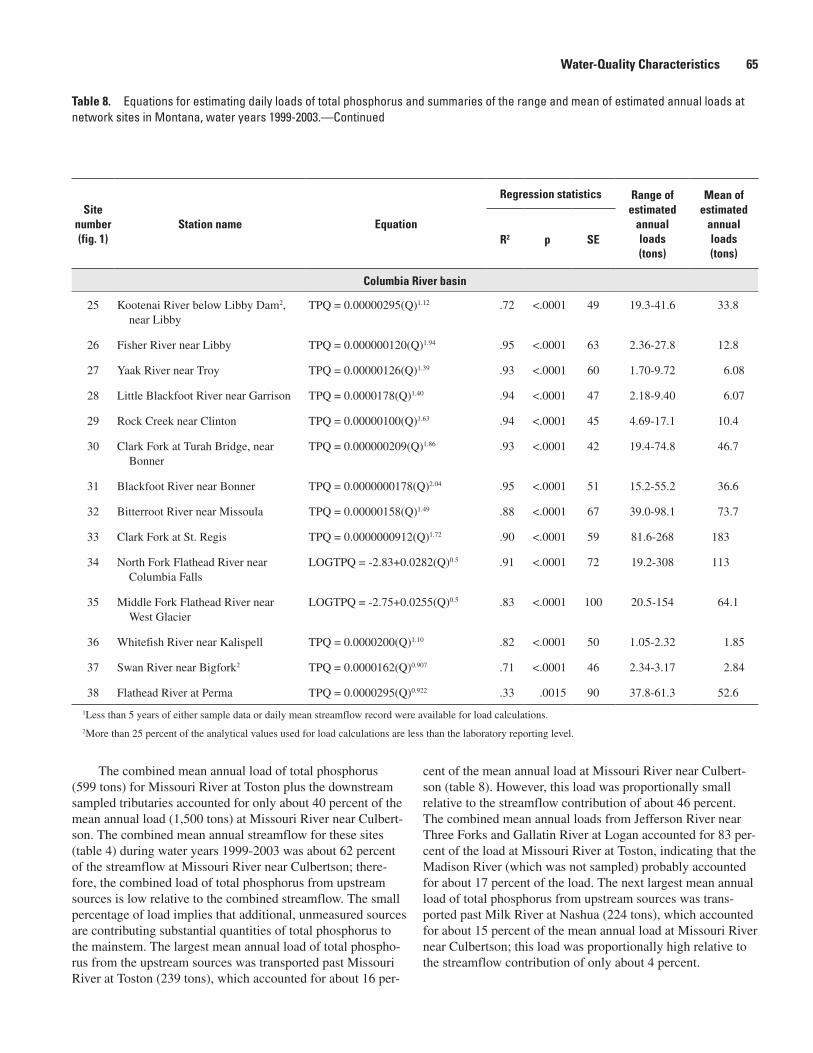
Site number (fig. 1)
Station name Equation
Regression statistics Range of estimated
annual loads (tons)
Mean of estimated
annual loads (tons)
R2 p SE
Columbia River basin
25 Kootenai River below Libby Dam2, near Libby
TPQ = 0.00000295(Q)1.12 .72 <.0001 49 19.3-41.6 33.8
26 Fisher River near Libby TPQ = 0.000000120(Q)1.94 .95 <.0001 63 2.36-27.8 12.8
27 Yaak River near Troy TPQ = 0.00000126(Q)1.39 .93 <.0001 60 1.70-9.72 6.08
28 Little Blackfoot River near Garrison TPQ = 0.0000178(Q)1.40 .94 <.0001 47 2.18-9.40 6.07
29 Rock Creek near Clinton TPQ = 0.00000100(Q)1.63 .94 <.0001 45 4.69-17.1 10.4
30 Clark Fork at Turah Bridge, near Bonner
TPQ = 0.000000209(Q)1.86 .93 <.0001 42 19.4-74.8 46.7
31 Blackfoot River near Bonner TPQ = 0.0000000178(Q)2.04 .95 <.0001 51 15.2-55.2 36.6
32 Bitterroot River near Missoula TPQ = 0.00000158(Q)1.49 .88 <.0001 67 39.0-98.1 73.7
33 Clark Fork at St. Regis TPQ = 0.0000000912(Q)1.72 .90 <.0001 59 81.6-268 183
34 North Fork Flathead River near Columbia Falls
LOGTPQ = -2.83+0.0282(Q)0.5 .91 <.0001 72 19.2-308 113
35 Middle Fork Flathead River near West Glacier
LOGTPQ = -2.75+0.0255(Q)0.5 .83 <.0001 100 20.5-154 64.1
36 Whitefish River near Kalispell TPQ = 0.0000200(Q)1.10 .82 <.0001 50 1.05-2.32 1.85
37 Swan River near Bigfork2 TPQ = 0.0000162(Q)0.907 .71 <.0001 46 2.34-3.17 2.84
38 Flathead River at Perma TPQ = 0.0000295(Q)0.922 .33 .0015 90 37.8-61.3 52.6
1Less than 5 years of either sample data or daily mean streamflow record were available for load calculations.
2More than 25 percent of the analytical values used for load calculations are less than the laboratory reporting level.
Table �. Equations for estimating daily loads of total phosphorus and summaries of the range and mean of estimated annual loads at network sites in Montana, water years 1999-2003.—Continued
The combined mean annual load of total phosphorus (599 tons) for Missouri River at Toston plus the downstream sampled tributaries accounted for only about 40 percent of the mean annual load (1,500 tons) at Missouri River near Culbert-son. The combined mean annual streamflow for these sites (table 4) during water years 1999-2003 was about 62 percent of the streamflow at Missouri River near Culbertson; there-fore, the combined load of total phosphorus from upstream sources is low relative to the combined streamflow. The small percentage of load implies that additional, unmeasured sources are contributing substantial quantities of total phosphorus to the mainstem. The largest mean annual load of total phospho-rus from the upstream sources was transported past Missouri River at Toston (239 tons), which accounted for about 16 per-
cent of the mean annual load at Missouri River near Culbert-son (table 8). However, this load was proportionally small relative to the streamflow contribution of about 46 percent. The combined mean annual loads from Jefferson River near Three Forks and Gallatin River at Logan accounted for 83 per-cent of the load at Missouri River at Toston, indicating that the Madison River (which was not sampled) probably accounted for about 17 percent of the load. The next largest mean annual load of total phosphorus from upstream sources was trans-ported past Milk River at Nashua (224 tons), which accounted for about 15 percent of the mean annual load at Missouri River near Culbertson; this load was proportionally high relative to the streamflow contribution of only about 4 percent.
Water-Quality Characteristics ��
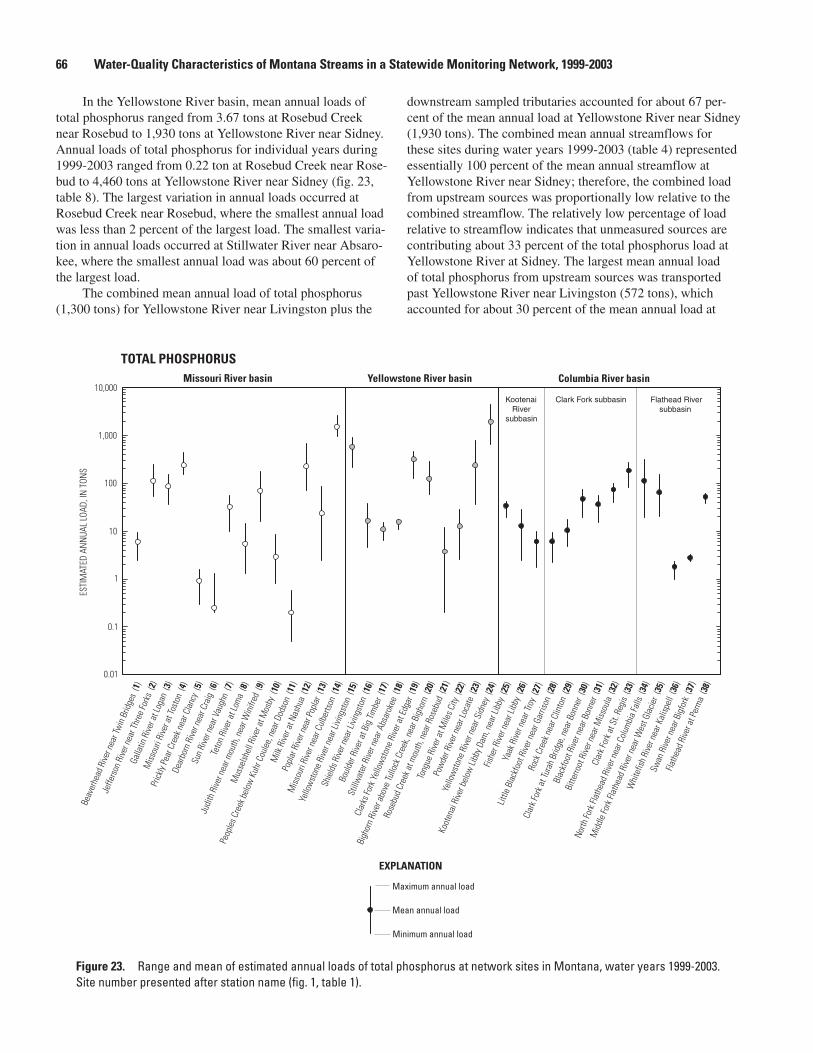
Figure 23. Range and mean of estimated annual loads of total phosphorus at network sites in Montana, water years 1999-2003. Site number presented after station name (fig. 1, table 1).
ESTI
MAT
ED A
NN
UAL
LOAD
, IN
TON
S
0.1
1
10
100
1,000
10,000
0.01
TOTAL PHOSPHORUSMissouri River basin Yellowstone River basin Columbia River basin
Kootenai Riversubbasin
Flathead River subbasin
Clark Fork subbasin
Maximum annual load
Mean annual load
Minimum annual load
EXPLANATION
Beav
erhe
ad R
iver n
ear T
win
Brid
ges
(1)
Jeffe
rson
Rive
r nea
r Thr
ee Fo
rks
(2)
Galla
tin R
iver a
t Log
an (
3)
Miss
ouri
Rive
r at T
osto
n (4
)
Prick
ly Pe
ar C
reek
nea
r Cla
ncy
(5)
Dear
born
Rive
r nea
r Cra
ig (
6)
Sun
Rive
r nea
r Vau
ghn
(7)
Teto
n Ri
ver a
t Lom
a (8
)
Judi
th R
iver n
ear m
outh
, nea
r Win
ifred
(9)
Mus
selsh
ell R
iver a
t Mos
by (
10)
Peop
les C
reek
bel
ow K
uhr C
oule
e, n
ear D
odso
n (1
1)
Milk
Rive
r at N
ashu
a (1
2)
Popl
ar R
iver n
ear P
opla
r (13
)
Miss
ouri
Rive
r nea
r Cul
berts
on (
14)
Yello
wst
one
Rive
r nea
r Livi
ngst
on (
15)
Shie
lds R
iver n
ear L
iving
ston
(16
)
Boul
der R
iver a
t Big
Tim
ber
(17)
Still
wat
er R
iver n
ear A
bsar
okee
(18
)
Clar
ks Fo
rk Y
ello
wst
one
Rive
r at E
dgar
(19
)
Bigh
orn
Rive
r abo
ve Tu
llock
Cre
ek, n
ear B
igho
rn (
20)
Rose
bud
Cree
k at m
outh
, nea
r Ros
ebud
(21
)
Tong
ue R
iver a
t Mile
s City
(22
)
Pow
der R
iver n
ear L
ocat
e (2
3)
Yello
wst
one
Rive
r nea
r Sid
ney
(24)
Koot
enai
Rive
r bel
ow Li
bby D
am, n
ear L
ibby
(25
)
Fishe
r Rive
r nea
r Lib
by (
26)
Yaak
Rive
r nea
r Tro
y (27
)
Little
Bla
ckfo
ot R
iver n
ear G
arris
on (
28)
Rock
Cre
ek n
ear C
linto
n (2
9)
Clar
k For
k at T
urah
Brid
ge, n
ear B
onne
r (30
)
Blac
kfoo
t Rive
r nea
r Bon
ner
(31)
Bitte
rroot
Rive
r nea
r Miss
oula
(32
)
Clar
k For
k at S
t. Re
gis
(33)
North
Fork
Flat
head
Rive
r nea
r Col
umbi
a Fa
lls (
34)
Mid
dle
Fork
Flat
head
Rive
r nea
r Wes
t Gla
cier
(35)
Whi
tefis
h Ri
ver n
ear K
alisp
ell
(36)
Swan
Rive
r nea
r Big
fork
(37
)
Flath
ead
Rive
r at P
erm
a (3
8)
In the Yellowstone River basin, mean annual loads of total phosphorus ranged from 3.67 tons at Rosebud Creek near Rosebud to 1,930 tons at Yellowstone River near Sidney. Annual loads of total phosphorus for individual years during 1999-2003 ranged from 0.22 ton at Rosebud Creek near Rose-bud to 4,460 tons at Yellowstone River near Sidney (fig. 23, table 8). The largest variation in annual loads occurred at Rosebud Creek near Rosebud, where the smallest annual load was less than 2 percent of the largest load. The smallest varia-tion in annual loads occurred at Stillwater River near Absaro-kee, where the smallest annual load was about 60 percent of the largest load.
The combined mean annual load of total phosphorus (1,300 tons) for Yellowstone River near Livingston plus the
downstream sampled tributaries accounted for about 67 per-cent of the mean annual load at Yellowstone River near Sidney (1,930 tons). The combined mean annual streamflows for these sites during water years 1999-2003 (table 4) represented essentially 100 percent of the mean annual streamflow at Yellowstone River near Sidney; therefore, the combined load from upstream sources was proportionally low relative to the combined streamflow. The relatively low percentage of load relative to streamflow indicates that unmeasured sources are contributing about 33 percent of the total phosphorus load at Yellowstone River at Sidney. The largest mean annual load of total phosphorus from upstream sources was transported past Yellowstone River near Livingston (572 tons), which accounted for about 30 percent of the mean annual load at
�� Water-Quality Characteristics of Montana Streams in a Statewide Monitoring Network, 1999-2003
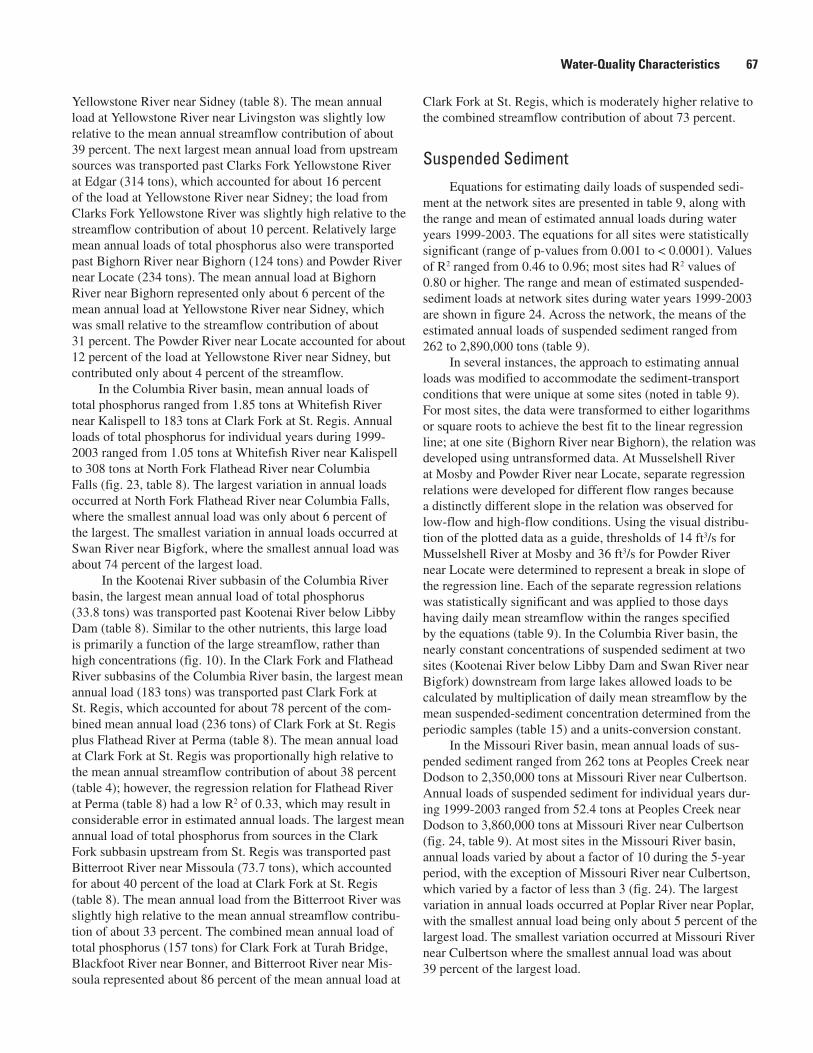
Yellowstone River near Sidney (table 8). The mean annual load at Yellowstone River near Livingston was slightly low relative to the mean annual streamflow contribution of about 39 percent. The next largest mean annual load from upstream sources was transported past Clarks Fork Yellowstone River at Edgar (314 tons), which accounted for about 16 percent of the load at Yellowstone River near Sidney; the load from Clarks Fork Yellowstone River was slightly high relative to the streamflow contribution of about 10 percent. Relatively large mean annual loads of total phosphorus also were transported past Bighorn River near Bighorn (124 tons) and Powder River near Locate (234 tons). The mean annual load at Bighorn River near Bighorn represented only about 6 percent of the mean annual load at Yellowstone River near Sidney, which was small relative to the streamflow contribution of about 31 percent. The Powder River near Locate accounted for about 12 percent of the load at Yellowstone River near Sidney, but contributed only about 4 percent of the streamflow.
In the Columbia River basin, mean annual loads of total phosphorus ranged from 1.85 tons at Whitefish River near Kalispell to 183 tons at Clark Fork at St. Regis. Annual loads of total phosphorus for individual years during 1999-2003 ranged from 1.05 tons at Whitefish River near Kalispell to 308 tons at North Fork Flathead River near Columbia Falls (fig. 23, table 8). The largest variation in annual loads occurred at North Fork Flathead River near Columbia Falls, where the smallest annual load was only about 6 percent of the largest. The smallest variation in annual loads occurred at Swan River near Bigfork, where the smallest annual load was about 74 percent of the largest load.
In the Kootenai River subbasin of the Columbia River basin, the largest mean annual load of total phosphorus (33.8 tons) was transported past Kootenai River below Libby Dam (table 8). Similar to the other nutrients, this large load is primarily a function of the large streamflow, rather than high concentrations (fig. 10). In the Clark Fork and Flathead River subbasins of the Columbia River basin, the largest mean annual load (183 tons) was transported past Clark Fork at St. Regis, which accounted for about 78 percent of the com-bined mean annual load (236 tons) of Clark Fork at St. Regis plus Flathead River at Perma (table 8). The mean annual load at Clark Fork at St. Regis was proportionally high relative to the mean annual streamflow contribution of about 38 percent (table 4); however, the regression relation for Flathead River at Perma (table 8) had a low R2 of 0.33, which may result in considerable error in estimated annual loads. The largest mean annual load of total phosphorus from sources in the Clark Fork subbasin upstream from St. Regis was transported past Bitterroot River near Missoula (73.7 tons), which accounted for about 40 percent of the load at Clark Fork at St. Regis (table 8). The mean annual load from the Bitterroot River was slightly high relative to the mean annual streamflow contribu-tion of about 33 percent. The combined mean annual load of total phosphorus (157 tons) for Clark Fork at Turah Bridge, Blackfoot River near Bonner, and Bitterroot River near Mis-soula represented about 86 percent of the mean annual load at
Clark Fork at St. Regis, which is moderately higher relative to the combined streamflow contribution of about 73 percent.
Suspended SedimentEquations for estimating daily loads of suspended sedi-
ment at the network sites are presented in table 9, along with the range and mean of estimated annual loads during water years 1999-2003. The equations for all sites were statistically significant (range of p-values from 0.001 to < 0.0001). Values of R2 ranged from 0.46 to 0.96; most sites had R2 values of 0.80 or higher. The range and mean of estimated suspended-sediment loads at network sites during water years 1999-2003 are shown in figure 24. Across the network, the means of the estimated annual loads of suspended sediment ranged from 262 to 2,890,000 tons (table 9).
In several instances, the approach to estimating annual loads was modified to accommodate the sediment-transport conditions that were unique at some sites (noted in table 9). For most sites, the data were transformed to either logarithms or square roots to achieve the best fit to the linear regression line; at one site (Bighorn River near Bighorn), the relation was developed using untransformed data. At Musselshell River at Mosby and Powder River near Locate, separate regression relations were developed for different flow ranges because a distinctly different slope in the relation was observed for low-flow and high-flow conditions. Using the visual distribu-tion of the plotted data as a guide, thresholds of 14 ft3/s for Musselshell River at Mosby and 36 ft3/s for Powder River near Locate were determined to represent a break in slope of the regression line. Each of the separate regression relations was statistically significant and was applied to those days having daily mean streamflow within the ranges specified by the equations (table 9). In the Columbia River basin, the nearly constant concentrations of suspended sediment at two sites (Kootenai River below Libby Dam and Swan River near Bigfork) downstream from large lakes allowed loads to be calculated by multiplication of daily mean streamflow by the mean suspended-sediment concentration determined from the periodic samples (table 15) and a units-conversion constant.
In the Missouri River basin, mean annual loads of sus-pended sediment ranged from 262 tons at Peoples Creek near Dodson to 2,350,000 tons at Missouri River near Culbertson. Annual loads of suspended sediment for individual years dur-ing 1999-2003 ranged from 52.4 tons at Peoples Creek near Dodson to 3,860,000 tons at Missouri River near Culbertson (fig. 24, table 9). At most sites in the Missouri River basin, annual loads varied by about a factor of 10 during the 5-year period, with the exception of Missouri River near Culbertson, which varied by a factor of less than 3 (fig. 24). The largest variation in annual loads occurred at Poplar River near Poplar, with the smallest annual load being only about 5 percent of the largest load. The smallest variation occurred at Missouri River near Culbertson where the smallest annual load was about 39 percent of the largest load.
Water-Quality Characteristics ��
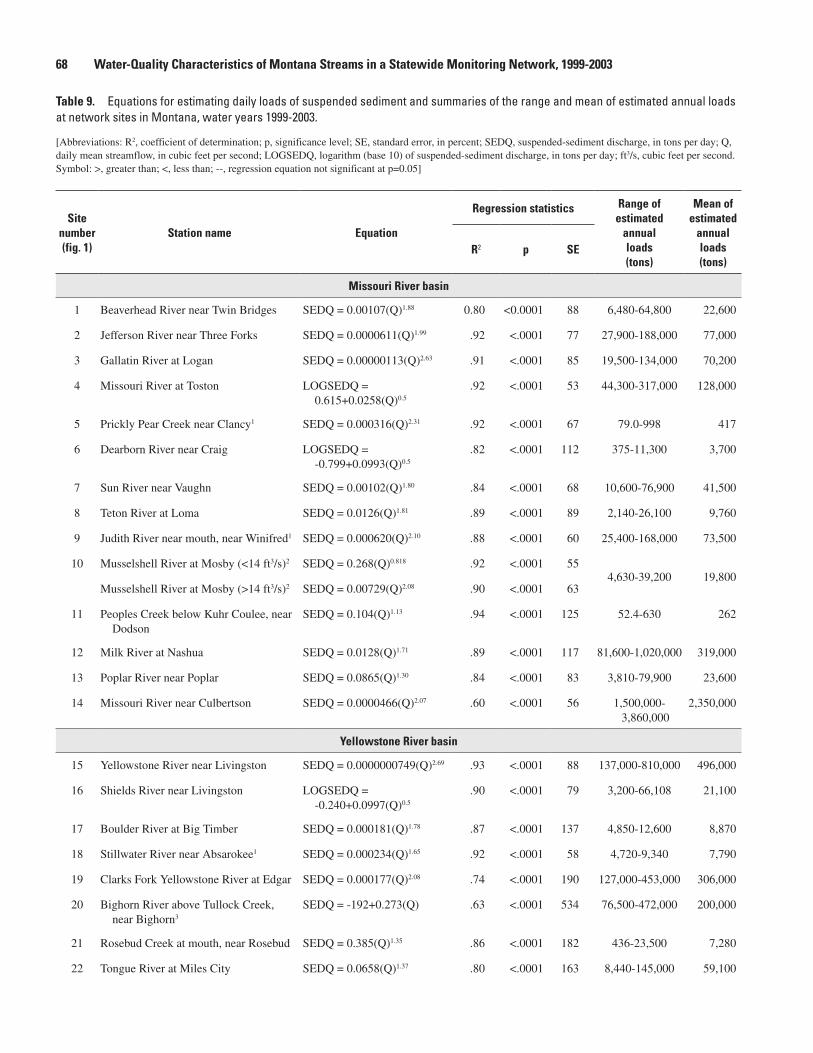
Table 9. Equations for estimating daily loads of suspended sediment and summaries of the range and mean of estimated annual loads at network sites in Montana, water years 1999-2003.
[Abbreviations: R2, coefficient of determination; p, significance level; SE, standard error, in percent; SEDQ, suspended-sediment discharge, in tons per day; Q, daily mean streamflow, in cubic feet per second; LOGSEDQ, logarithm (base 10) of suspended-sediment discharge, in tons per day; ft3/s, cubic feet per second. Symbol: >, greater than; <, less than; --, regression equation not significant at p=0.05]
Site number (fig. 1)
Station name Equation
Regression statistics Range of estimated
annual loads (tons)
Mean of estimated
annual loads (tons)
R2 p SE
Missouri River basin
1 Beaverhead River near Twin Bridges SEDQ = 0.00107(Q)1.88 0.80 <0.0001 88 6,480-64,800 22,600
2 Jefferson River near Three Forks SEDQ = 0.0000611(Q)1.99 .92 <.0001 77 27,900-188,000 77,000
3 Gallatin River at Logan SEDQ = 0.00000113(Q)2.63 .91 <.0001 85 19,500-134,000 70,200
4 Missouri River at Toston LOGSEDQ = 0.615+0.0258(Q)0.5
.92 <.0001 53 44,300-317,000 128,000
5 Prickly Pear Creek near Clancy1 SEDQ = 0.000316(Q)2.31 .92 <.0001 67 79.0-998 417
6 Dearborn River near Craig LOGSEDQ = -0.799+0.0993(Q)0.5
.82 <.0001 112 375-11,300 3,700
7 Sun River near Vaughn SEDQ = 0.00102(Q)1.80 .84 <.0001 68 10,600-76,900 41,500
8 Teton River at Loma SEDQ = 0.0126(Q)1.81 .89 <.0001 89 2,140-26,100 9,760
9 Judith River near mouth, near Winifred1 SEDQ = 0.000620(Q)2.10 .88 <.0001 60 25,400-168,000 73,500
10 Musselshell River at Mosby (<14 ft3/s)2 SEDQ = 0.268(Q)0.818 .92 <.0001 554,630-39,200 19,800
Musselshell River at Mosby (>14 ft3/s)2 SEDQ = 0.00729(Q)2.08 .90 <.0001 63
11 Peoples Creek below Kuhr Coulee, near Dodson
SEDQ = 0.104(Q)1.13 .94 <.0001 125 52.4-630 262
12 Milk River at Nashua SEDQ = 0.0128(Q)1.71 .89 <.0001 117 81,600-1,020,000 319,000
13 Poplar River near Poplar SEDQ = 0.0865(Q)1.30 .84 <.0001 83 3,810-79,900 23,600
14 Missouri River near Culbertson SEDQ = 0.0000466(Q)2.07 .60 <.0001 56 1,500,000-3,860,000
2,350,000
Yellowstone River basin
15 Yellowstone River near Livingston SEDQ = 0.0000000749(Q)2.69 .93 <.0001 88 137,000-810,000 496,000
16 Shields River near Livingston LOGSEDQ = -0.240+0.0997(Q)0.5
.90 <.0001 79 3,200-66,108 21,100
17 Boulder River at Big Timber SEDQ = 0.000181(Q)1.78 .87 <.0001 137 4,850-12,600 8,870
18 Stillwater River near Absarokee1 SEDQ = 0.000234(Q)1.65 .92 <.0001 58 4,720-9,340 7,790
19 Clarks Fork Yellowstone River at Edgar SEDQ = 0.000177(Q)2.08 .74 <.0001 190 127,000-453,000 306,000
20 Bighorn River above Tullock Creek, near Bighorn3
SEDQ = -192+0.273(Q) .63 <.0001 534 76,500-472,000 200,000
21 Rosebud Creek at mouth, near Rosebud SEDQ = 0.385(Q)1.35 .86 <.0001 182 436-23,500 7,280
22 Tongue River at Miles City SEDQ = 0.0658(Q)1.37 .80 <.0001 163 8,440-145,000 59,100
�� Water-Quality Characteristics of Montana Streams in a Statewide Monitoring Network, 1999-2003
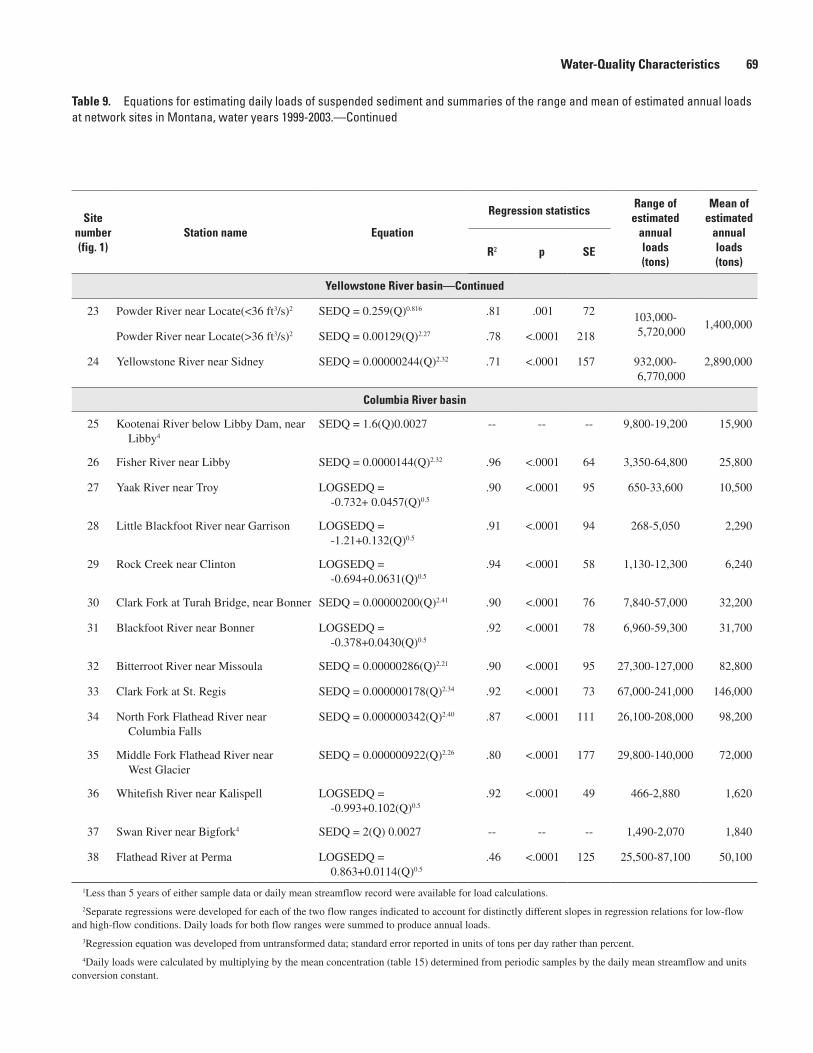
Site number (fig. 1)
Station name Equation
Regression statistics Range of estimated
annual loads (tons)
Mean of estimated
annual loads (tons)
R2 p SE
Yellowstone River basin—Continued
23 Powder River near Locate(<36 ft3/s)2 SEDQ = 0.259(Q)0.816 .81 .001 72 103,000-5,720,000
1,400,000Powder River near Locate(>36 ft3/s)2 SEDQ = 0.00129(Q)2.27 .78 <.0001 218
24 Yellowstone River near Sidney SEDQ = 0.00000244(Q)2.32 .71 <.0001 157 932,000-6,770,000
2,890,000
Columbia River basin
25 Kootenai River below Libby Dam, near Libby4
SEDQ = 1.6(Q)0.0027 -- -- -- 9,800-19,200 15,900
26 Fisher River near Libby SEDQ = 0.0000144(Q)2.32 .96 <.0001 64 3,350-64,800 25,800
27 Yaak River near Troy LOGSEDQ = -0.732+ 0.0457(Q)0.5
.90 <.0001 95 650-33,600 10,500
28 Little Blackfoot River near Garrison LOGSEDQ = -1.21+0.132(Q)0.5
.91 <.0001 94 268-5,050 2,290
29 Rock Creek near Clinton LOGSEDQ = -0.694+0.0631(Q)0.5
.94 <.0001 58 1,130-12,300 6,240
30 Clark Fork at Turah Bridge, near Bonner SEDQ = 0.00000200(Q)2.41 .90 <.0001 76 7,840-57,000 32,200
31 Blackfoot River near Bonner LOGSEDQ = -0.378+0.0430(Q)0.5
.92 <.0001 78 6,960-59,300 31,700
32 Bitterroot River near Missoula SEDQ = 0.00000286(Q)2.21 .90 <.0001 95 27,300-127,000 82,800
33 Clark Fork at St. Regis SEDQ = 0.000000178(Q)2.34 .92 <.0001 73 67,000-241,000 146,000
34 North Fork Flathead River near Columbia Falls
SEDQ = 0.000000342(Q)2.40 .87 <.0001 111 26,100-208,000 98,200
35 Middle Fork Flathead River near West Glacier
SEDQ = 0.000000922(Q)2.26 .80 <.0001 177 29,800-140,000 72,000
36 Whitefish River near Kalispell LOGSEDQ = -0.993+0.102(Q)0.5
.92 <.0001 49 466-2,880 1,620
37 Swan River near Bigfork4 SEDQ = 2(Q) 0.0027 -- -- -- 1,490-2,070 1,840
38 Flathead River at Perma LOGSEDQ = 0.863+0.0114(Q)0.5
.46 <.0001 125 25,500-87,100 50,100
1Less than 5 years of either sample data or daily mean streamflow record were available for load calculations.
2Separate regressions were developed for each of the two flow ranges indicated to account for distinctly different slopes in regression relations for low-flow and high-flow conditions. Daily loads for both flow ranges were summed to produce annual loads.
3Regression equation was developed from untransformed data; standard error reported in units of tons per day rather than percent.
4Daily loads were calculated by multiplying by the mean concentration (table 15) determined from periodic samples by the daily mean streamflow and units conversion constant.
Table 9. Equations for estimating daily loads of suspended sediment and summaries of the range and mean of estimated annual loads at network sites in Montana, water years 1999-2003.—Continued
Water-Quality Characteristics �9
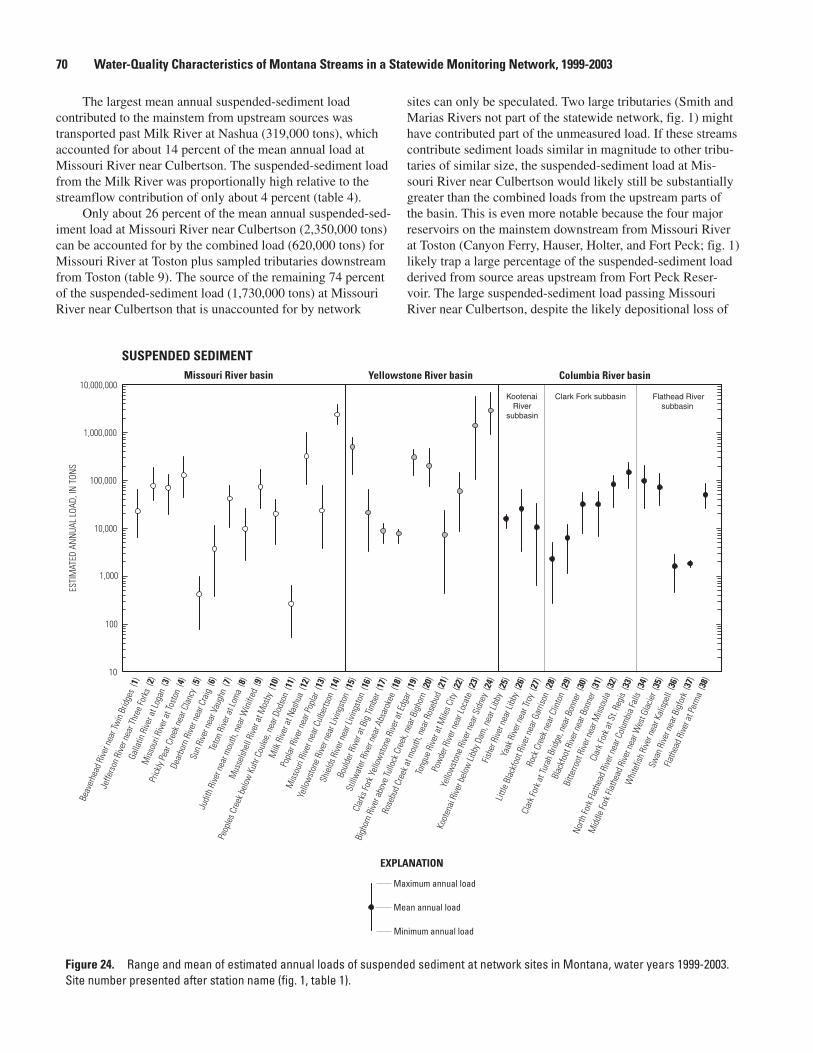
Figure 2�. Range and mean of estimated annual loads of suspended sediment at network sites in Montana, water years 1999-2003. Site number presented after station name (fig. 1, table 1).
ESTI
MAT
ED A
NN
UAL
LOAD
, IN
TON
S
100
1,000
10,000
100,000
1,000,000
10,000,000
10
SUSPENDED SEDIMENTMissouri River basin Yellowstone River basin Columbia River basin
Kootenai Riversubbasin
Flathead River subbasin
Clark Fork subbasin
Maximum annual load
Mean annual load
Minimum annual load
EXPLANATION
Beav
erhe
ad R
iver n
ear T
win
Brid
ges
(1)
Jeffe
rson
Rive
r nea
r Thr
ee Fo
rks
(2)
Galla
tin R
iver a
t Log
an (
3)
Miss
ouri
Rive
r at T
osto
n (4
)
Prick
ly Pe
ar C
reek
nea
r Cla
ncy
(5)
Dear
born
Rive
r nea
r Cra
ig (
6)
Sun
Rive
r nea
r Vau
ghn
(7)
Teto
n Ri
ver a
t Lom
a (8
)
Judi
th R
iver n
ear m
outh
, nea
r Win
ifred
(9)
Mus
selsh
ell R
iver a
t Mos
by (
10)
Peop
les C
reek
bel
ow K
uhr C
oule
e, n
ear D
odso
n (1
1)
Milk
Rive
r at N
ashu
a (1
2)
Popl
ar R
iver n
ear P
opla
r (13
)
Miss
ouri
Rive
r nea
r Cul
berts
on (
14)
Yello
wst
one
Rive
r nea
r Livi
ngst
on (
15)
Shie
lds R
iver n
ear L
iving
ston
(16
)
Boul
der R
iver a
t Big
Tim
ber
(17)
Still
wat
er R
iver n
ear A
bsar
okee
(18
)
Clar
ks Fo
rk Y
ello
wst
one
Rive
r at E
dgar
(19
)
Bigh
orn
Rive
r abo
ve Tu
llock
Cre
ek, n
ear B
igho
rn (
20)
Rose
bud
Cree
k at m
outh
, nea
r Ros
ebud
(21
)
Tong
ue R
iver a
t Mile
s City
(22
)
Pow
der R
iver n
ear L
ocat
e (2
3)
Yello
wst
one
Rive
r nea
r Sid
ney
(24)
Koot
enai
Rive
r bel
ow Li
bby D
am, n
ear L
ibby
(25
)
Fishe
r Rive
r nea
r Lib
by (
26)
Yaak
Rive
r nea
r Tro
y (27
)
Little
Bla
ckfo
ot R
iver n
ear G
arris
on (
28)
Rock
Cre
ek n
ear C
linto
n (2
9)
Clar
k For
k at T
urah
Brid
ge, n
ear B
onne
r (30
)
Blac
kfoo
t Rive
r nea
r Bon
ner
(31)
Bitte
rroot
Rive
r nea
r Miss
oula
(32
)
Clar
k For
k at S
t. Re
gis
(33)
North
Fork
Flat
head
Rive
r nea
r Col
umbi
a Fa
lls (
34)
Mid
dle
Fork
Flat
head
Rive
r nea
r Wes
t Gla
cier
(35)
Whi
tefis
h Ri
ver n
ear K
alisp
ell
(36)
Swan
Rive
r nea
r Big
fork
(37
)
Flath
ead
Rive
r at P
erm
a (3
8)
The largest mean annual suspended-sediment load contributed to the mainstem from upstream sources was transported past Milk River at Nashua (319,000 tons), which accounted for about 14 percent of the mean annual load at Missouri River near Culbertson. The suspended-sediment load from the Milk River was proportionally high relative to the streamflow contribution of only about 4 percent (table 4).
Only about 26 percent of the mean annual suspended-sed-iment load at Missouri River near Culbertson (2,350,000 tons) can be accounted for by the combined load (620,000 tons) for Missouri River at Toston plus sampled tributaries downstream from Toston (table 9). The source of the remaining 74 percent of the suspended-sediment load (1,730,000 tons) at Missouri River near Culbertson that is unaccounted for by network
sites can only be speculated. Two large tributaries (Smith and Marias Rivers not part of the statewide network, fig. 1) might have contributed part of the unmeasured load. If these streams contribute sediment loads similar in magnitude to other tribu-taries of similar size, the suspended-sediment load at Mis-souri River near Culbertson would likely still be substantially greater than the combined loads from the upstream parts of the basin. This is even more notable because the four major reservoirs on the mainstem downstream from Missouri River at Toston (Canyon Ferry, Hauser, Holter, and Fort Peck; fig. 1) likely trap a large percentage of the suspended-sediment load derived from source areas upstream from Fort Peck Reser-voir. The large suspended-sediment load passing Missouri River near Culbertson, despite the likely depositional loss of
�0 Water-Quality Characteristics of Montana Streams in a Statewide Monitoring Network, 1999-2003
upstream sediment load in mainstem reservoirs, indicates that large quantities of sediment are being derived from sources downstream from Fort Peck Reservoir. Although the sus-pended-sediment load passing through Fort Peck Reservoir is unknown, the load is presumably much less than the load entering the reservoir due to deposition within the reservoir. The combined load (342,600 tons) of the two major tributar-ies (Milk and Poplar Rivers) discharging to the mainstem downstream from Fort Peck Reservoir only accounts for about 15 percent of the load at the Missouri River near Culbertson. If it is assumed that the outflow from Fort Peck Reservoir is not accounting for the remaining 85 percent of load, then a substantial portion of the suspended-sediment load at Missouri River near Culbertson might be derived from either unsampled tributaries or channel erosion downstream from Fort Peck Reservoir.
In the Yellowstone River basin, mean annual suspended-sediment loads ranged from 7,280 tons at Rosebud Creek near Rosebud to 2,890,000 tons at Yellowstone River near Sidney. Annual loads of suspended sediment for individual years dur-ing 1999-2003 in the Yellowstone River basin ranged from 436 tons at Rosebud Creek near Rosebud to 6,770,000 tons at Yellowstone River near Sidney (fig. 24, table 9). The larg-est variation in annual loads occurred at Rosebud Creek near Rosebud and Powder River near Locate, where the smallest loads were less than 2 percent of the largest loads. The small-est variation in annual loads occurred at Stillwater River near Absarokee, where the smallest annual load was about 51 per-cent of the largest load.
The combined mean annual load of suspended sediment (2,510,000 tons) for Yellowstone River near Livingston plus downstream sampled tributaries accounted for about 87 per-cent of the mean annual load (2,890,000 tons) at Yellowstone River near Sidney (table 9), which was proportionally slightly lower than the combined streamflow contribution of about 100 percent (table 4). The largest mean annual load of sus-pended sediment from upstream sources was transported past Powder River near Locate (1,400,000 tons), which accounted for nearly one-half (about 48 percent) of the mean annual load at Yellowstone River near Sidney. The suspended-sediment load from the Powder River was proportionally very large rela-tive to the mean annual streamflow contribution of only about 4 percent. Other relatively large mean annual loads were trans-ported past Yellowstone River near Livingston (496,000 tons) and Clarks Fork Yellowstone River at Edgar (306,000 tons). The mean annual load at Yellowstone River near Livingston represented only about 17 percent of the load at Yellowstone River near Sidney, which was proportionally small relative to the mean annual streamflow contribution of about 39 percent. Clarks Fork Yellowstone River contributed proportionally similar amounts of suspended-sediment load (about 11 per-cent) and streamflow (about 10 percent).
In the Columbia River basin, mean annual loads of suspended sediment ranged from 1,620 tons at Whitefish River near Kalispell to 146,000 tons at Clark Fork at St. Regis. Annual loads of suspended-sediment for individual years
during 1999-2003 ranged from 268 tons at Little Blackfoot River near Garrison to 241,000 tons at Clark Fork at St. Regis (fig. 24, table 9). Yaak River near Troy had the largest varia-tion in annual loads, with the smallest annual load being only about 2 percent of the largest annual load. The smallest variation in annual loads occurred at Swan River near Bigfork, where the smallest annual load was about 72 percent of the largest load.
In the Kootenai River subbasin of the Columbia River basin, the largest mean annual load of suspended-sediment (25,800 tons) was transported past Fisher River near Libby (table 9). In the Clark Fork and Flathead River subbasins of the Columbia River basin, the largest mean annual load was transported past Clark Fork at St. Regis (146,000 tons), accounting for about 74 percent of the combined mean annual load (196,000 tons) of Clark Fork at St. Regis plus Flat-head River at Perma. The mean annual load at Clark Fork at St. Regis was proportionally high relative to the mean annual streamflow contribution of 38 percent (table 4); however, the regression relation for Flathead River at Perma (table 9) had a low R2 of 0.46, which may result in considerable error in estimated annual loads. In the Clark Fork subbasin upstream from St. Regis, the largest mean annual load of suspended sediment was transported past Bitterroot River near Mis-soula (82,800 tons), which accounted for about 57 percent of the load at Clark Fork at St. Regis. The mean annual load from the Bitterroot River proportionally was substantially larger than the mean annual streamflow contribution of about 33 percent. The combined mean annual load of suspended sediment (146,700 tons) for Clark Fork at Turah Bridge, Blackfoot River near Bonner, and Bitterroot River near Mis-soula represented essentially 100 percent of the mean annual load (146,000 tons) at Clark Fork at St. Regis, which is high relative to the combined streamflow contribution of about 73 percent.
Dissolved SolidsEquations for estimating daily loads of dissolved solids
at network sites are presented in table 10, along with the range and mean of estimated annual loads during water years 1999-2003. Dissolved solids (calculated as the sum of constituents, table 15) were analyzed at a frequency of only two times per year, thereby minimizing the extent of seasonal and hydrologic characterization available for developing regression relations. For all sites, the data were logarithmically transformed to produce the best linear fit of the regression line. All equations were highly significant (p < 0.0001). Values of R2 ranged from 0.71 to 0.99, indicating that estimated annual loads of dissolved solids likely are reasonably accurate. The range and mean of estimated dissolved-solids loads are shown in figure 25. Across the network, the means of the estimated annual loads of dissolved solids ranged from 2,830 to 2,970,000 tons (table 10).
Water-Quality Characteristics �1
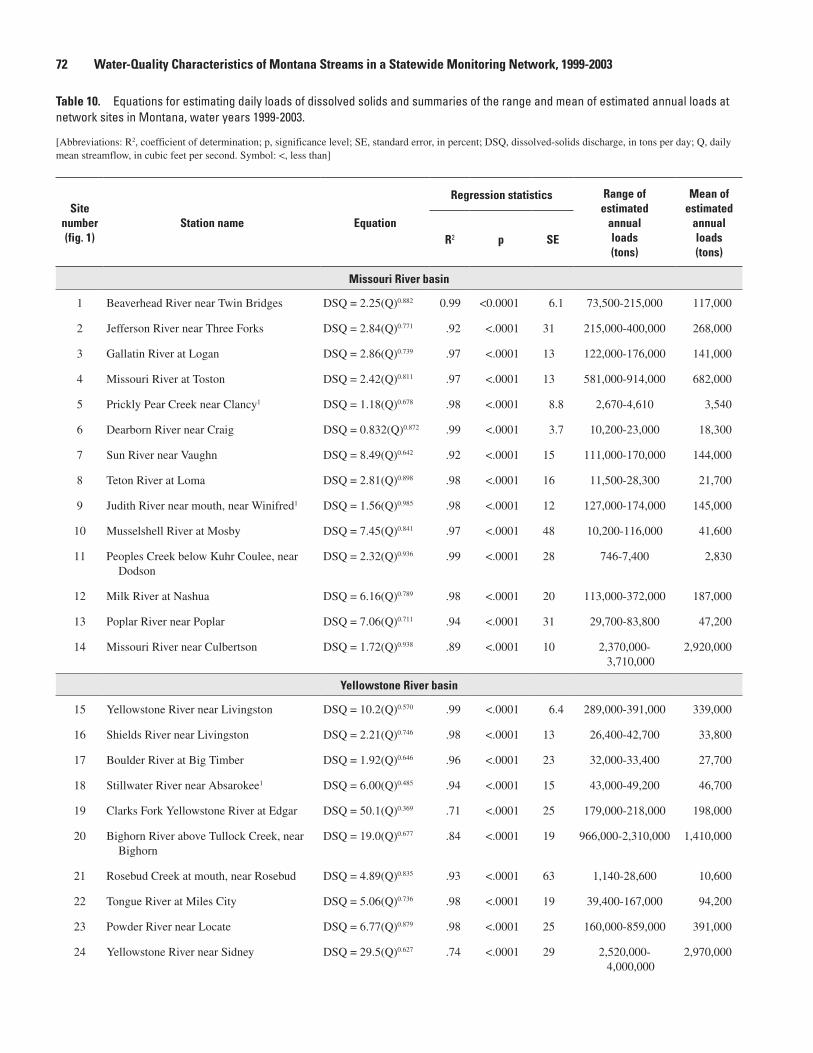
Table 10. Equations for estimating daily loads of dissolved solids and summaries of the range and mean of estimated annual loads at network sites in Montana, water years 1999-2003.
[Abbreviations: R2, coefficient of determination; p, significance level; SE, standard error, in percent; DSQ, dissolved-solids discharge, in tons per day; Q, daily mean streamflow, in cubic feet per second. Symbol: <, less than]
Site number (fig. 1)
Station name Equation
Regression statistics Range of estimated
annual loads (tons)
Mean of estimated
annual loads (tons)
R2 p SE
Missouri River basin
1 Beaverhead River near Twin Bridges DSQ = 2.25(Q)0.882 0.99 <0.0001 6.1 73,500-215,000 117,000
2 Jefferson River near Three Forks DSQ = 2.84(Q)0.771 .92 <.0001 31 215,000-400,000 268,000
3 Gallatin River at Logan DSQ = 2.86(Q)0.739 .97 <.0001 13 122,000-176,000 141,000
4 Missouri River at Toston DSQ = 2.42(Q)0.811 .97 <.0001 13 581,000-914,000 682,000
5 Prickly Pear Creek near Clancy1 DSQ = 1.18(Q)0.678 .98 <.0001 8.8 2,670-4,610 3,540
6 Dearborn River near Craig DSQ = 0.832(Q)0.872 .99 <.0001 3.7 10,200-23,000 18,300
7 Sun River near Vaughn DSQ = 8.49(Q)0.642 .92 <.0001 15 111,000-170,000 144,000
8 Teton River at Loma DSQ = 2.81(Q)0.898 .98 <.0001 16 11,500-28,300 21,700
9 Judith River near mouth, near Winifred1 DSQ = 1.56(Q)0.985 .98 <.0001 12 127,000-174,000 145,000
10 Musselshell River at Mosby DSQ = 7.45(Q)0.841 .97 <.0001 48 10,200-116,000 41,600
11 Peoples Creek below Kuhr Coulee, near Dodson
DSQ = 2.32(Q)0.936 .99 <.0001 28 746-7,400 2,830
12 Milk River at Nashua DSQ = 6.16(Q)0.789 .98 <.0001 20 113,000-372,000 187,000
13 Poplar River near Poplar DSQ = 7.06(Q)0.711 .94 <.0001 31 29,700-83,800 47,200
14 Missouri River near Culbertson DSQ = 1.72(Q)0.938 .89 <.0001 10 2,370,000-3,710,000
2,920,000
Yellowstone River basin
15 Yellowstone River near Livingston DSQ = 10.2(Q)0.570 .99 <.0001 6.4 289,000-391,000 339,000
16 Shields River near Livingston DSQ = 2.21(Q)0.746 .98 <.0001 13 26,400-42,700 33,800
17 Boulder River at Big Timber DSQ = 1.92(Q)0.646 .96 <.0001 23 32,000-33,400 27,700
18 Stillwater River near Absarokee1 DSQ = 6.00(Q)0.485 .94 <.0001 15 43,000-49,200 46,700
19 Clarks Fork Yellowstone River at Edgar DSQ = 50.1(Q)0.369 .71 <.0001 25 179,000-218,000 198,000
20 Bighorn River above Tullock Creek, near Bighorn
DSQ = 19.0(Q)0.677 .84 <.0001 19 966,000-2,310,000 1,410,000
21 Rosebud Creek at mouth, near Rosebud DSQ = 4.89(Q)0.835 .93 <.0001 63 1,140-28,600 10,600
22 Tongue River at Miles City DSQ = 5.06(Q)0.736 .98 <.0001 19 39,400-167,000 94,200
23 Powder River near Locate DSQ = 6.77(Q)0.879 .98 <.0001 25 160,000-859,000 391,000
24 Yellowstone River near Sidney DSQ = 29.5(Q)0.627 .74 <.0001 29 2,520,000-4,000,000
2,970,000
�2 Water-Quality Characteristics of Montana Streams in a Statewide Monitoring Network, 1999-2003

In the Missouri River basin, mean annual loads of dis-solved solids ranged from 2,830 tons at Peoples Creek near Dodson to 2,920,000 tons at Missouri River near Culbertson. Annual loads of dissolved solids for individual years dur-ing 1999-2003 ranged from 746 tons at Peoples Creek near Dodson to 3,710,000 tons at Missouri River near Culbert-son (fig. 25, table 10). The largest variation in annual loads occurred at Musselshell River at Mosby, where the smallest annual load was only about 9 percent of the largest load. The smallest variation occurred at Judith River near Winifred, where the smallest annual load was about 73 percent of the largest load. With the exception of Musselshell River at Mosby and Peoples Creek near Dodson, the variation in loads between years generally was small, with most differences between the smallest and largest maximum annual loads repre-senting only about a 2- to 3-fold difference.
The combined mean annual load of dissolved solids (about 1,290,000 tons) for Missouri River at Toston plus downstream sampled tributaries accounted for only about 44 percent of the mean annual load (2,920,000 tons) at Mis-souri River near Culbertson. This combined load is small rela-tive to the combined mean annual streamflow contribution of about 62 percent (table 4), indicating that unmeasured sources in the Missouri River basin in the intervening reach from Toston to Culbertson are contributing substantial loads of dis-solved solids to the mainstem. The largest mean annual load of dissolved solids from upstream sources was transported past Missouri River at Toston (682,000 tons), accounting for about 23 percent of the load at Missouri River near Culbert-son. However, this load was proportionally small relative to the mean annual streamflow contribution of about 46 percent. Other relatively large mean annual loads of dissolved solids
Water-Quality Characteristics �3
Site number (fig. 1)
Station name Equation
Regression statistics Range of estimated
annual loads (tons)
Mean of estimated
annual loads (tons)
R2 p SE
Columbia River basin
25 Kootenai River below Libby Dam, near Libby
DSQ = 1.90(Q)0.815 .98 <.0001 7.1 845,000-1,440,000 1,230,000
26 Fisher River near Libby DSQ = 1.49(Q)0.664 .98 <.0001 12 15,800-32,500 26,000
27 Yaak River near Troy DSQ = 0.572(Q)0.762 .98 <.0001 16 13,700-33,800 26,300
28 Little Blackfoot River near Garrison DSQ = 0.936(Q)0.827 .98 <.0001 6.7 33,300-89,200 68,100
29 Rock Creek near Clinton DSQ = 1.23(Q)0.693 .99 <.0001 3.8 22,300-32,700 26,700
30 Clark Fork at Turah Bridge, near Bonner DSQ = 7.09(Q)0.628 .85 <.0001 20 165,000-231,000 195,000
31 Blackfoot River near Bonner DSQ = 1.70(Q)0.752 .99 <.0001 5.1 103,000-149,000 128,000
32 Bitterroot River near Missoula DSQ = 3.26(Q)0.603 .98 <.0001 11 87,400-117,000 104,000
33 Clark Fork at St. Regis DSQ = 6.60(Q)0.641 .97 <.0001 12 477,000-677,000 586,000
34 North Fork Flathead River near Columbia Falls
DSQ = 0.887(Q)0.843 .99 <.0001 3.7 145,000-287,000 231,000
35 Middle Fork Flathead River near West Glacier
DSQ = 0.510(Q)0.888 .99 <.0001 7.6 121,000-229,000 183,000
36 Whitefish River near Kalispell DSQ = 2.85(Q)0.947 .99 <.0001 3.0 71,800-141,000 118,000
37 Swan River near Bigfork DSQ = 0.315(Q)0.958 .99 <.0001 6.5 64,800-89,100 79,500
38 Flathead River at Perma DSQ = 0.386(Q)0.956 .99 <.0001 3.4 669,000-1,110,000 946,000
1Less than 5 years of either sample data or daily mean streamflow record were available for load calculations.
Table 10. Equations for estimating daily loads of dissolved solids and summaries of the range and mean of estimated annual loads at network sites in Montana, water years 1999-2003.—Continued
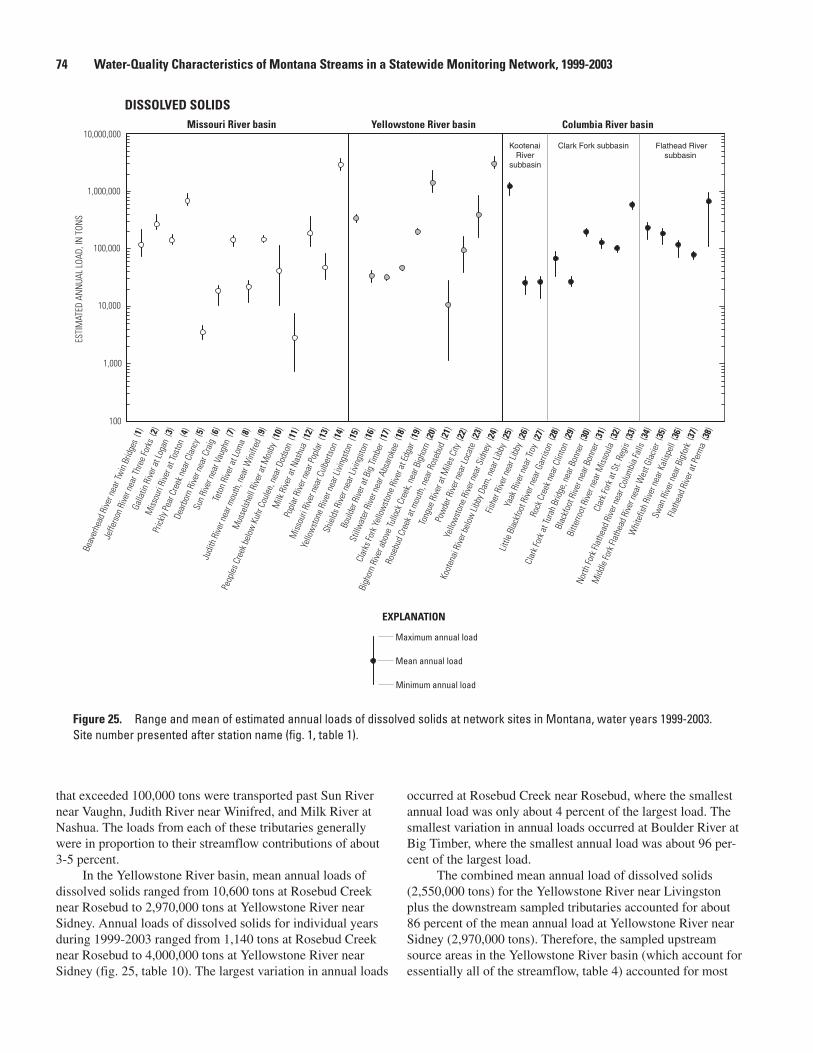
Figure 2�. Range and mean of estimated annual loads of dissolved solids at network sites in Montana, water years 1999-2003. Site number presented after station name (fig. 1, table 1).
EST
IMAT
ED A
NN
UAL
LOAD
, IN
TON
S
100
1,000
10,000
100,000
1,000,000
10,000,000
DISSOLVED SOLIDSMissouri River basin Yellowstone River basin Columbia River basin
Kootenai Riversubbasin
Flathead River subbasin
Clark Fork subbasin
Maximum annual load
Mean annual load
Minimum annual load
EXPLANATION
Beav
erhe
ad R
iver n
ear T
win
Brid
ges
(1)
Jeffe
rson
Rive
r nea
r Thr
ee Fo
rks
(2)
Galla
tin R
iver a
t Log
an (
3)
Miss
ouri
Rive
r at T
osto
n (4
)
Prick
ly Pe
ar C
reek
nea
r Cla
ncy
(5)
Dear
born
Rive
r nea
r Cra
ig (
6)
Sun
Rive
r nea
r Vau
ghn
(7)
Teto
n Ri
ver a
t Lom
a (8
)
Judi
th R
iver n
ear m
outh
, nea
r Win
ifred
(9)
Mus
selsh
ell R
iver a
t Mos
by (
10)
Peop
les C
reek
bel
ow K
uhr C
oule
e, n
ear D
odso
n (1
1)
Milk
Rive
r at N
ashu
a (1
2)
Popl
ar R
iver n
ear P
opla
r (13
)
Miss
ouri
Rive
r nea
r Cul
berts
on (
14)
Yello
wst
one
Rive
r nea
r Livi
ngst
on (
15)
Shie
lds R
iver n
ear L
iving
ston
(16
)
Boul
der R
iver a
t Big
Tim
ber
(17)
Still
wat
er R
iver n
ear A
bsar
okee
(18
)
Clar
ks Fo
rk Y
ello
wst
one
Rive
r at E
dgar
(19
)
Bigh
orn
Rive
r abo
ve Tu
llock
Cre
ek, n
ear B
igho
rn (
20)
Rose
bud
Cree
k at m
outh
, nea
r Ros
ebud
(21
)
Tong
ue R
iver a
t Mile
s City
(22
)
Pow
der R
iver n
ear L
ocat
e (2
3)
Yello
wst
one
Rive
r nea
r Sid
ney
(24)
Koot
enai
Rive
r bel
ow Li
bby D
am, n
ear L
ibby
(25
)
Fishe
r Rive
r nea
r Lib
by (
26)
Yaak
Rive
r nea
r Tro
y (27
)
Little
Bla
ckfo
ot R
iver n
ear G
arris
on (
28)
Rock
Cre
ek n
ear C
linto
n (2
9)
Clar
k For
k at T
urah
Brid
ge, n
ear B
onne
r (30
)
Blac
kfoo
t Rive
r nea
r Bon
ner
(31)
Bitte
rroot
Rive
r nea
r Miss
oula
(32
)
Clar
k For
k at S
t. Re
gis
(33)
North
Fork
Flat
head
Rive
r nea
r Col
umbi
a Fa
lls (
34)
Mid
dle
Fork
Flat
head
Rive
r nea
r Wes
t Gla
cier
(35)
Whi
tefis
h Ri
ver n
ear K
alisp
ell
(36)
Swan
Rive
r nea
r Big
fork
(37
)
Flath
ead
Rive
r at P
erm
a (3
8)
that exceeded 100,000 tons were transported past Sun River near Vaughn, Judith River near Winifred, and Milk River at Nashua. The loads from each of these tributaries generally were in proportion to their streamflow contributions of about 3-5 percent.
In the Yellowstone River basin, mean annual loads of dissolved solids ranged from 10,600 tons at Rosebud Creek near Rosebud to 2,970,000 tons at Yellowstone River near Sidney. Annual loads of dissolved solids for individual years during 1999-2003 ranged from 1,140 tons at Rosebud Creek near Rosebud to 4,000,000 tons at Yellowstone River near Sidney (fig. 25, table 10). The largest variation in annual loads
occurred at Rosebud Creek near Rosebud, where the smallest annual load was only about 4 percent of the largest load. The smallest variation in annual loads occurred at Boulder River at Big Timber, where the smallest annual load was about 96 per-cent of the largest load.
The combined mean annual load of dissolved solids (2,550,000 tons) for the Yellowstone River near Livingston plus the downstream sampled tributaries accounted for about 86 percent of the mean annual load at Yellowstone River near Sidney (2,970,000 tons). Therefore, the sampled upstream source areas in the Yellowstone River basin (which account for essentially all of the streamflow, table 4) accounted for most
�� Water-Quality Characteristics of Montana Streams in a Statewide Monitoring Network, 1999-2003
tion of about 73 percent. The nearly identical proportionality between the relative contributions of dissolved-solids loads and streamflow at sites in the Columbia River basin indicates that streamflow magnitude predominates the load calculations, which typically happens when concentrations are low and generally constant (fig. 12).
Trace ElementsTrace elements were analyzed at a frequency of only two
times per year. Consequently, the small number of samples collected during the monitoring period limits the extent of sea-sonal and hydrologic characterization available for developing regression relations. In addition, a large percentage of trace-element concentrations (table 15) were less than the LRL, which further restricts characterization of how trace-element discharge varies with streamflow. Annual loads were estimated for only two of the trace elements analyzed (total-recoverable arsenic and copper), which occurred at concentrations greater than the LRL in most samples from one or more of the major river basins. For several sites, the data were only marginally adequate for load estimation. Therefore, it is emphasized that the estimated loads are presented primarily for relative comparisons between sites and do not necessarily represent quantitative estimates.
Total-Recoverable ArsenicTotal-recoverable arsenic concentrations greater than the
LRL were measured more frequently in samples from the Mis-souri River basin than in samples from the other two basins. For most sites in the Missouri River basin, the same type of regression analysis was used to estimate annual loads as was used for other constituent loads; however, samples from several sites had consistently uniform concentrations (typically less than the LRL or varied by no more than several micro-grams per liter) over the range of flow conditions that were sampled. Where concentrations are nearly constant, the load is essentially controlled by the magnitude of the streamflow and differences in annual loads between sites primarily reflect differences in flow. At those sites where concentrations were consistently uniform, an alternate method of load estimation was used. The daily mean streamflows were multiplied by the mean concentration determined from the periodic samples (table 15) and a units conversion constant to compute daily loads of total recoverable arsenic.
Arsenic concentrations less than the LRL were common at sites in the Yellowstone River basin. Typically, these low concentrations preclude annual load calculations; however, to provide a complete set of estimated annual loads for arsenic at all sites in the Yellowstone River basin, generalized estimates of loads for sites where regression relations were not statisti-cally significant were calculated using the alternate method of load estimation. Where mean concentrations were less than the LRL, a value equal to one-half the LRL was used. General-ized estimates of total-recoverable arsenic loads are presented
of the load of dissolved solids at the Yellowstone River near Sidney. The largest mean annual load of dissolved solids from upstream sources was transported past Bighorn River near Bighorn (1,410,000 tons), which accounted for about 47 per-cent of the mean annual load at Yellowstone River near Sidney (table 10). The mean annual load from the Bighorn River was proportionally large relative to the mean annual streamflow contribution of about 31 percent (table 4). Other large mean annual loads of dissolved solids that exceeded 300,000 tons were transported past Yellowstone River near Livingston and Powder River near Locate. The loads at these two sites represented similar percentages (about 11 and 13 percent, respectively) of the load at Yellowstone River near Sidney, but the streamflow contributions relative to load contributions were notably different. Whereas the Yellowstone River near Livingston contributed only a proportionally small amount of dissolved solids (11 percent) relative to its streamflow contribution of about 39 percent, Powder River near Locate contributed a proportionally large amount of dissolved solids (13 percent) relative to its small streamflow contribution of only about 4 percent.
In the Columbia River basin, mean annual loads of dis-solved solids ranged from about 26,000 tons at Fisher River near Libby to 1,230,000 tons at Kootenai River below Libby Dam. Annual loads of dissolved solids for individual years during 1999-2003 ranged from 13,700 tons at Yaak River near Troy to 1,440,000 tons at Kootenai River below Libby Dam (fig. 25, table 10). Most sites in the Columbia River basin dis-played only small variation in annual dissolved-solids loads. The largest variation in annual loads occurred at Flathead River at Perma, where the smallest annual load was about 60 percent of the largest load. The smallest variation in annual loads occurred at Bitterroot River near Missoula, where the smallest annual load was about 75 percent of the largest load.
In the Kootenai River portion of the Columbia River basin, the largest mean annual load of dissolved solids (1,230,000 tons) was transported past Kootenai River below Libby Dam (table 10). In the Clark Fork and Flathead River subbasins of the Columbia River basin, the largest mean annual load (946,000 tons) was transported past Flathead River at Perma, which accounted for about 62 percent of the combined mean annual load (1,530,000 tons) of Clark Fork at St. Regis plus Flathead River at Perma. This load contribution from the Flathead River is the same as the streamflow con-tribution of 62 percent. In the Clark Fork subbasin upstream from St. Regis, the largest mean annual load of dissolved solids (195,000 tons) was transported past Clark Fork at Turah Bridge, which accounted for about 33 percent of the mean annual load (586,000 tons) at Clark Fork at St. Regis. This load contribution is proportionally large relative to the streamflow contribution of about 17 percent. The combined mean annual load (427,000 tons) for Clark Fork at Turah Bridge, Blackfoot River near Bonner, and Bitterroot River near Missoula represented about 73 percent of the mean annual load (586,000 tons) at Clark Fork at St. Regis. The combined loads are proportional to the combined streamflow contribu-
Water-Quality Characteristics ��
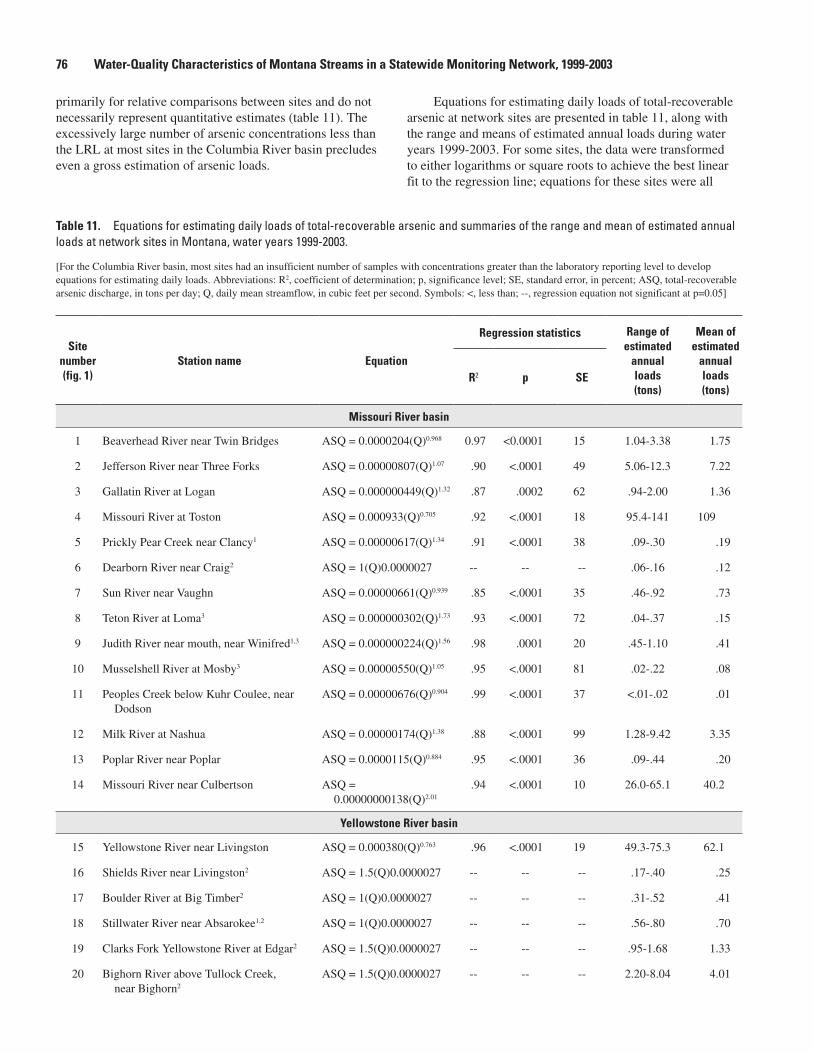
primarily for relative comparisons between sites and do not necessarily represent quantitative estimates (table 11). The excessively large number of arsenic concentrations less than the LRL at most sites in the Columbia River basin precludes even a gross estimation of arsenic loads.
Equations for estimating daily loads of total-recoverable arsenic at network sites are presented in table 11, along with the range and means of estimated annual loads during water years 1999-2003. For some sites, the data were transformed to either logarithms or square roots to achieve the best linear fit to the regression line; equations for these sites were all
�� Water-Quality Characteristics of Montana Streams in a Statewide Monitoring Network, 1999-2003
Table 11. Equations for estimating daily loads of total-recoverable arsenic and summaries of the range and mean of estimated annual loads at network sites in Montana, water years 1999-2003.
[For the Columbia River basin, most sites had an insufficient number of samples with concentrations greater than the laboratory reporting level to develop equations for estimating daily loads. Abbreviations: R2, coefficient of determination; p, significance level; SE, standard error, in percent; ASQ, total-recoverable arsenic discharge, in tons per day; Q, daily mean streamflow, in cubic feet per second. Symbols: <, less than; --, regression equation not significant at p=0.05]
Site number (fig. 1)
Station name Equation
Regression statistics Range of estimated
annual loads (tons)
Mean of estimated
annual loads (tons)
R2 p SE
Missouri River basin
1 Beaverhead River near Twin Bridges ASQ = 0.0000204(Q)0.968 0.97 <0.0001 15 1.04-3.38 1.75
2 Jefferson River near Three Forks ASQ = 0.00000807(Q)1.07 .90 <.0001 49 5.06-12.3 7.22
3 Gallatin River at Logan ASQ = 0.000000449(Q)1.32 .87 .0002 62 .94-2.00 1.36
4 Missouri River at Toston ASQ = 0.000933(Q)0.705 .92 <.0001 18 95.4-141 109
5 Prickly Pear Creek near Clancy1 ASQ = 0.00000617(Q)1.34 .91 <.0001 38 .09-.30 .19
6 Dearborn River near Craig2 ASQ = 1(Q)0.0000027 -- -- -- .06-.16 .12
7 Sun River near Vaughn ASQ = 0.00000661(Q)0.939 .85 <.0001 35 .46-.92 .73
8 Teton River at Loma3 ASQ = 0.000000302(Q)1.73 .93 <.0001 72 .04-.37 .15
9 Judith River near mouth, near Winifred1,3 ASQ = 0.000000224(Q)1.56 .98 .0001 20 .45-1.10 .41
10 Musselshell River at Mosby3 ASQ = 0.00000550(Q)1.05 .95 <.0001 81 .02-.22 .08
11 Peoples Creek below Kuhr Coulee, near Dodson
ASQ = 0.00000676(Q)0.904 .99 <.0001 37 <.01-.02 .01
12 Milk River at Nashua ASQ = 0.00000174(Q)1.38 .88 <.0001 99 1.28-9.42 3.35
13 Poplar River near Poplar ASQ = 0.0000115(Q)0.884 .95 <.0001 36 .09-.44 .20
14 Missouri River near Culbertson ASQ = 0.00000000138(Q)2.01
.94 <.0001 10 26.0-65.1 40.2
Yellowstone River basin
15 Yellowstone River near Livingston ASQ = 0.000380(Q)0.763 .96 <.0001 19 49.3-75.3 62.1
16 Shields River near Livingston2 ASQ = 1.5(Q)0.0000027 -- -- -- .17-.40 .25
17 Boulder River at Big Timber2 ASQ = 1(Q)0.0000027 -- -- -- .31-.52 .41
18 Stillwater River near Absarokee1,2 ASQ = 1(Q)0.0000027 -- -- -- .56-.80 .70
19 Clarks Fork Yellowstone River at Edgar2 ASQ = 1.5(Q)0.0000027 -- -- -- .95-1.68 1.33
20 Bighorn River above Tullock Creek, near Bighorn2
ASQ = 1.5(Q)0.0000027 -- -- -- 2.20-8.04 4.01

Site number (fig. 1)
Station name Equation
Regression statistics Range of estimated
annual loads (tons)
Mean of estimated
annual loads (tons)
R2 p SE
Yellowstone River basin—Continued
21 Rosebud Creek at mouth, near Rosebud ASQ = 0.00000447(Q)1.18 .93 <.0001 98 <.01-.12 .04
22 Tongue River at Miles City3 ASQ = 0.00000295(Q)1.12 .94 <.0001 48 .12-1.21 .55
23 Powder River near Locate ASQ = 0.00000186(Q)1.34 .93 <.0001 105 .54-6.68 2.29
24 Yellowstone River near Sidney ASQ = 0.00000479(Q)1.16 .95 <.0001 25 46.7-113 67.7
Columbia River basin
28 Little Blackfoot River near Garrison ASQ = 0.00000100(Q)1.09 .98 <.0001 16 .32-.90 .65
30 Clark Fork at Turah Bridge, near Bonner ASQ = 0.00000199(Q)1.31 .92 <.0001 36 2.67-6.11 4.33
33 Clark Fork at St. Regis ASQ = 0.00000355(Q)1.02 .86 <.0001 53 6.50-12.0 9.53
1Less than 5 years of either sample data or daily mean streamflow record were available for load calculations.
2Daily loads were calculated by multiplying the mean concentration (table 15) determined from periodic samples by the daily mean streamflow and units conversion constant.
3More than 25 percent of the analytical values used for load calculations are less than the laboratory reporting level.
Table 11. Equations for estimating daily loads of total-recoverable arsenic and summaries of the range and mean of estimated annual loads at network sites in Montana, water years 1999-2003.—Continued
highly significant (p <0.0001). At other sites, the mean con-centration from periodic samples (table 15) and daily mean streamflow was used (table 11). The range and mean of estimated annual loads of total-recoverable arsenic above are shown in figure 26. Across the network, the means of the esti-mated annual loads of total-recoverable arsenic ranged from 0.01 to 109 tons (table 11).
In the Missouri River basin, mean annual loads of total-recoverable arsenic ranged from 0.01 ton at Peoples Creek near Dodson to 109 tons at Missouri River at Toston. Annual loads of arsenic for individual years during 1999-2003 ranged from less than 0.01 ton at Peoples Creek near Dodson to 141 tons at Missouri River at Toston (fig. 26, table 11). The mean annual load at Missouri River at Toston (109 tons) was much larger than at any of the other sites in the Missouri River basin. The combined mean annual load of arsenic (8.58 tons) contributed by the Jefferson and Gallatin Rivers accounted for only about 8 percent of the arsenic load at Missouri River at Toston; consequently, most (92 percent) of the arsenic load originates in the Madison River basin. Although this head- water tributary was not sampled as part of the statewide network, a study by Nimick and others (1998) has shown that the Madison River transports a large quantity of arsenic that is derived from geothermal sources within Yellowstone National Park.
Water-Quality Characteristics ��
Arsenic transport is generally conservative in the upper part of the Missouri River basin, but becomes non-conserva-tive in the lower part of the basin where suspended-sediment concentrations increase; suspended sediment provides sorp-tion sites for dissolved arsenic, which binds to the sediment particles (Nimick and others, 1998). After sorbing to sediment, a substantial portion of the arsenic load likely settles out in the mainstem reservoirs. The combined mean annual load (114 tons) at the Missouri River at Toston plus the downstream sampled tributaries was greater than the mean annual load (40.2 tons) at Missouri River at Culbertson showing that about 65 percent of the arsenic load contributed to the Missouri River mainstem was deposited before reaching Culbertson. Tributaries downstream from Missouri River at Toston added only 5.24 tons of arsenic (table 11), indicating that these tributary basins are not a substantial source of arsenic relative to the Madison River. The approximately 74 tons of arsenic deposited annually in the bottom sediments of mainstem res-ervoirs could possibly represent a significant source of arsenic if geochemical processes occurred that mobilized arsenic back into solution in the water column or local ground water.
In the Yellowstone River basin, mean annual loads of total-recoverable arsenic ranged from 0.04 ton at Rosebud Creek near Rosebud to 67.7 tons at Yellowstone River near Sidney. Annual loads of arsenic for individual years during 1999-2003 ranged from less than 0.01 ton at Rosebud Creek
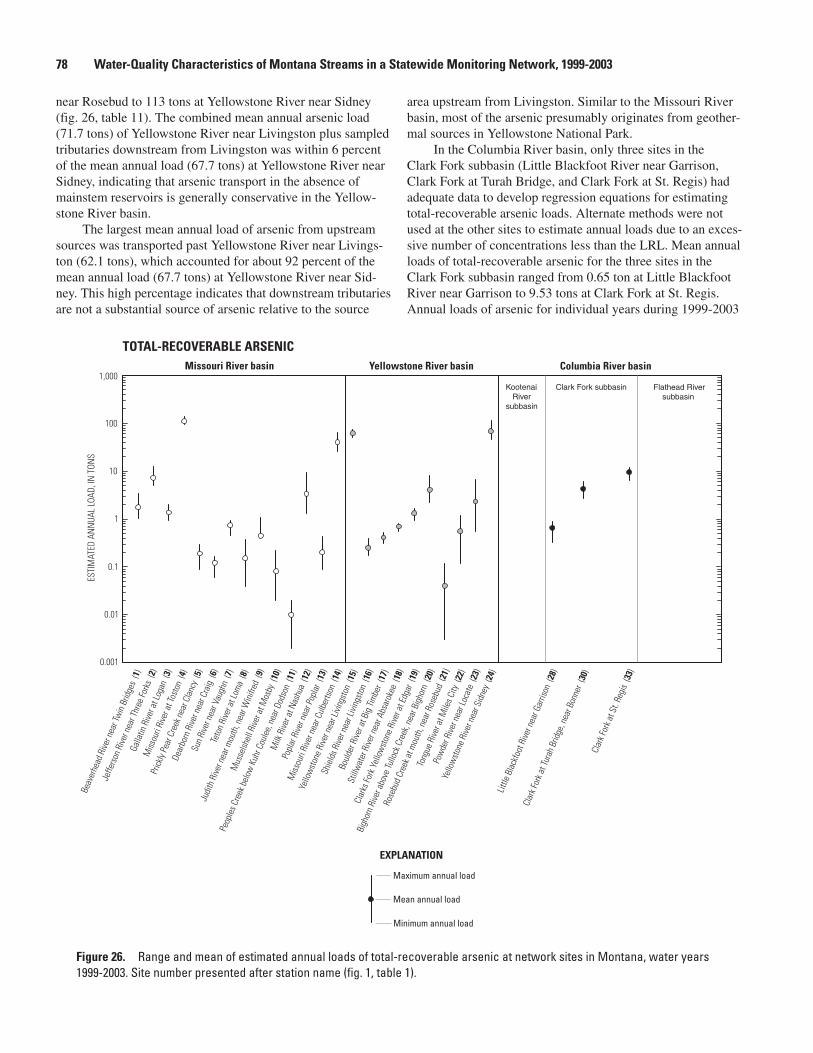
EST
IMAT
ED A
NN
UAL
LOAD
, IN
TON
S
0.001
0.01
1
10
100
1,000
0.1
TOTAL-RECOVERABLE ARSENICMissouri River basin Yellowstone River basin Columbia River basin
Kootenai Riversubbasin
Flathead River subbasin
Clark Fork subbasin
Maximum annual load
Mean annual load
Minimum annual load
EXPLANATION
Beav
erhe
ad R
iver n
ear T
win
Brid
ges
(1)
Jeffe
rson
Rive
r nea
r Thr
ee Fo
rks
(2)
Galla
tin R
iver a
t Log
an (
3)
Miss
ouri
Rive
r at T
osto
n (4
)
Prick
ly Pe
ar C
reek
nea
r Cla
ncy
(5)
Dear
born
Rive
r nea
r Cra
ig (
6)
Sun
Rive
r nea
r Vau
ghn
(7)
Teto
n Ri
ver a
t Lom
a (8
)
Judi
th R
iver n
ear m
outh
, nea
r Win
ifred
(9)
Mus
selsh
ell R
iver a
t Mos
by (
10)
Peop
les C
reek
bel
ow K
uhr C
oule
e, n
ear D
odso
n (1
1)
Milk
Rive
r at N
ashu
a (1
2)
Popl
ar R
iver n
ear P
opla
r (13
)
Miss
ouri
Rive
r nea
r Cul
berts
on (
14)
Yello
wst
one
Rive
r nea
r Livi
ngst
on (
15)
Shie
lds R
iver n
ear L
iving
ston
(16
)
Boul
der R
iver a
t Big
Tim
ber
(17)
Still
wat
er R
iver n
ear A
bsar
okee
(18
)
Clar
ks Fo
rk Y
ello
wst
one
Rive
r at E
dgar
(19
)
Bigh
orn
Rive
r abo
ve Tu
llock
Cre
ek, n
ear B
igho
rn (
20)
Rose
bud
Cree
k at m
outh
, nea
r Ros
ebud
(21
)
Tong
ue R
iver a
t Mile
s City
(22
)
Pow
der R
iver n
ear L
ocat
e (2
3)
Yello
wst
one
Rive
r nea
r Sid
ney
(24)
Little
Bla
ckfo
ot R
iver n
ear G
arris
on (
28)
Clar
k For
k at T
urah
Brid
ge, n
ear B
onne
r (30
)Cl
ark F
ork a
t St.
Regi
s (33
)
Figure 2�. Range and mean of estimated annual loads of total-recoverable arsenic at network sites in Montana, water years 1999-2003. Site number presented after station name (fig. 1, table 1).
near Rosebud to 113 tons at Yellowstone River near Sidney (fig. 26, table 11). The combined mean annual arsenic load (71.7 tons) of Yellowstone River near Livingston plus sampled tributaries downstream from Livingston was within 6 percent of the mean annual load (67.7 tons) at Yellowstone River near Sidney, indicating that arsenic transport in the absence of mainstem reservoirs is generally conservative in the Yellow-stone River basin.
The largest mean annual load of arsenic from upstream sources was transported past Yellowstone River near Livings-ton (62.1 tons), which accounted for about 92 percent of the mean annual load (67.7 tons) at Yellowstone River near Sid-ney. This high percentage indicates that downstream tributaries are not a substantial source of arsenic relative to the source
area upstream from Livingston. Similar to the Missouri River basin, most of the arsenic presumably originates from geother-mal sources in Yellowstone National Park.
In the Columbia River basin, only three sites in the Clark Fork subbasin (Little Blackfoot River near Garrison, Clark Fork at Turah Bridge, and Clark Fork at St. Regis) had adequate data to develop regression equations for estimating total-recoverable arsenic loads. Alternate methods were not used at the other sites to estimate annual loads due to an exces-sive number of concentrations less than the LRL. Mean annual loads of total-recoverable arsenic for the three sites in the Clark Fork subbasin ranged from 0.65 ton at Little Blackfoot River near Garrison to 9.53 tons at Clark Fork at St. Regis. Annual loads of arsenic for individual years during 1999-2003
�� Water-Quality Characteristics of Montana Streams in a Statewide Monitoring Network, 1999-2003
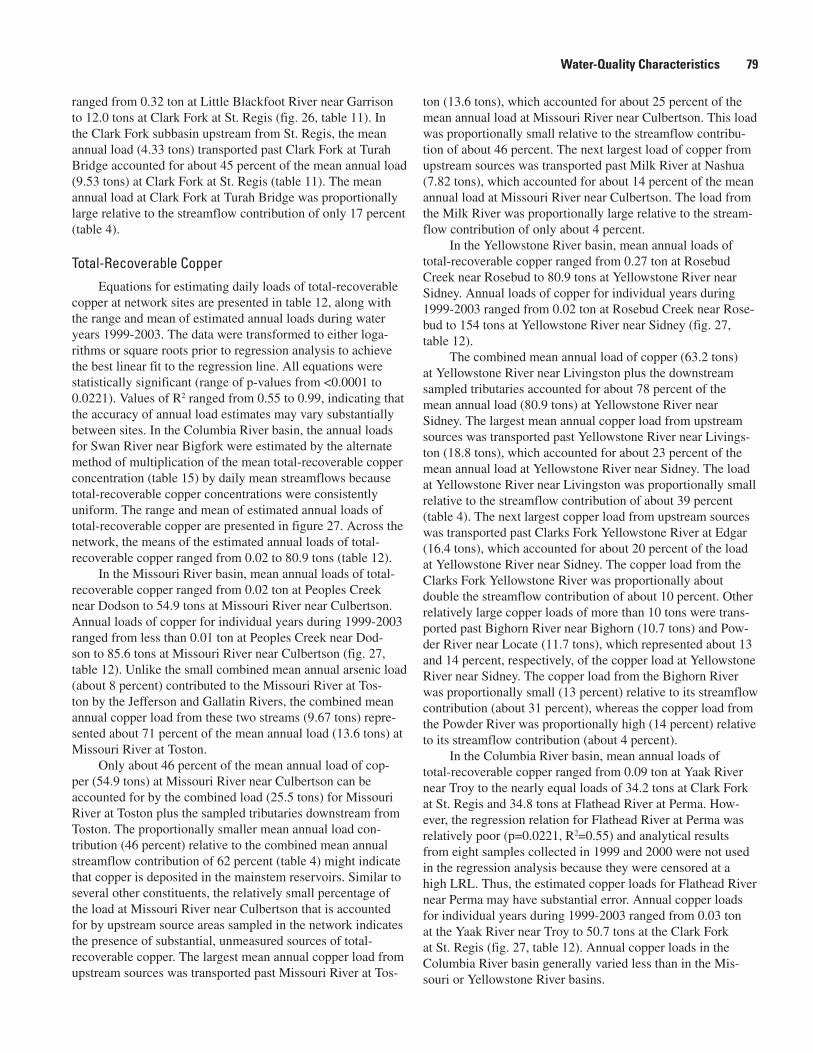
ranged from 0.32 ton at Little Blackfoot River near Garrison to 12.0 tons at Clark Fork at St. Regis (fig. 26, table 11). In the Clark Fork subbasin upstream from St. Regis, the mean annual load (4.33 tons) transported past Clark Fork at Turah Bridge accounted for about 45 percent of the mean annual load (9.53 tons) at Clark Fork at St. Regis (table 11). The mean annual load at Clark Fork at Turah Bridge was proportionally large relative to the streamflow contribution of only 17 percent (table 4).
Total-Recoverable CopperEquations for estimating daily loads of total-recoverable
copper at network sites are presented in table 12, along with the range and mean of estimated annual loads during water years 1999-2003. The data were transformed to either loga-rithms or square roots prior to regression analysis to achieve the best linear fit to the regression line. All equations were statistically significant (range of p-values from <0.0001 to 0.0221). Values of R2 ranged from 0.55 to 0.99, indicating that the accuracy of annual load estimates may vary substantially between sites. In the Columbia River basin, the annual loads for Swan River near Bigfork were estimated by the alternate method of multiplication of the mean total-recoverable copper concentration (table 15) by daily mean streamflows because total-recoverable copper concentrations were consistently uniform. The range and mean of estimated annual loads of total-recoverable copper are presented in figure 27. Across the network, the means of the estimated annual loads of total-recoverable copper ranged from 0.02 to 80.9 tons (table 12).
In the Missouri River basin, mean annual loads of total-recoverable copper ranged from 0.02 ton at Peoples Creek near Dodson to 54.9 tons at Missouri River near Culbertson. Annual loads of copper for individual years during 1999-2003 ranged from less than 0.01 ton at Peoples Creek near Dod-son to 85.6 tons at Missouri River near Culbertson (fig. 27, table 12). Unlike the small combined mean annual arsenic load (about 8 percent) contributed to the Missouri River at Tos-ton by the Jefferson and Gallatin Rivers, the combined mean annual copper load from these two streams (9.67 tons) repre-sented about 71 percent of the mean annual load (13.6 tons) at Missouri River at Toston.
Only about 46 percent of the mean annual load of cop-per (54.9 tons) at Missouri River near Culbertson can be accounted for by the combined load (25.5 tons) for Missouri River at Toston plus the sampled tributaries downstream from Toston. The proportionally smaller mean annual load con-tribution (46 percent) relative to the combined mean annual streamflow contribution of 62 percent (table 4) might indicate that copper is deposited in the mainstem reservoirs. Similar to several other constituents, the relatively small percentage of the load at Missouri River near Culbertson that is accounted for by upstream source areas sampled in the network indicates the presence of substantial, unmeasured sources of total-recoverable copper. The largest mean annual copper load from upstream sources was transported past Missouri River at Tos-
ton (13.6 tons), which accounted for about 25 percent of the mean annual load at Missouri River near Culbertson. This load was proportionally small relative to the streamflow contribu-tion of about 46 percent. The next largest load of copper from upstream sources was transported past Milk River at Nashua (7.82 tons), which accounted for about 14 percent of the mean annual load at Missouri River near Culbertson. The load from the Milk River was proportionally large relative to the stream-flow contribution of only about 4 percent.
In the Yellowstone River basin, mean annual loads of total-recoverable copper ranged from 0.27 ton at Rosebud Creek near Rosebud to 80.9 tons at Yellowstone River near Sidney. Annual loads of copper for individual years during 1999-2003 ranged from 0.02 ton at Rosebud Creek near Rose-bud to 154 tons at Yellowstone River near Sidney (fig. 27, table 12).
The combined mean annual load of copper (63.2 tons) at Yellowstone River near Livingston plus the downstream sampled tributaries accounted for about 78 percent of the mean annual load (80.9 tons) at Yellowstone River near Sidney. The largest mean annual copper load from upstream sources was transported past Yellowstone River near Livings-ton (18.8 tons), which accounted for about 23 percent of the mean annual load at Yellowstone River near Sidney. The load at Yellowstone River near Livingston was proportionally small relative to the streamflow contribution of about 39 percent (table 4). The next largest copper load from upstream sources was transported past Clarks Fork Yellowstone River at Edgar (16.4 tons), which accounted for about 20 percent of the load at Yellowstone River near Sidney. The copper load from the Clarks Fork Yellowstone River was proportionally about double the streamflow contribution of about 10 percent. Other relatively large copper loads of more than 10 tons were trans-ported past Bighorn River near Bighorn (10.7 tons) and Pow-der River near Locate (11.7 tons), which represented about 13 and 14 percent, respectively, of the copper load at Yellowstone River near Sidney. The copper load from the Bighorn River was proportionally small (13 percent) relative to its streamflow contribution (about 31 percent), whereas the copper load from the Powder River was proportionally high (14 percent) relative to its streamflow contribution (about 4 percent).
In the Columbia River basin, mean annual loads of total-recoverable copper ranged from 0.09 ton at Yaak River near Troy to the nearly equal loads of 34.2 tons at Clark Fork at St. Regis and 34.8 tons at Flathead River at Perma. How-ever, the regression relation for Flathead River at Perma was relatively poor (p=0.0221, R2=0.55) and analytical results from eight samples collected in 1999 and 2000 were not used in the regression analysis because they were censored at a high LRL. Thus, the estimated copper loads for Flathead River near Perma may have substantial error. Annual copper loads for individual years during 1999-2003 ranged from 0.03 ton at the Yaak River near Troy to 50.7 tons at the Clark Fork at St. Regis (fig. 27, table 12). Annual copper loads in the Columbia River basin generally varied less than in the Mis-souri or Yellowstone River basins.
Water-Quality Characteristics �9
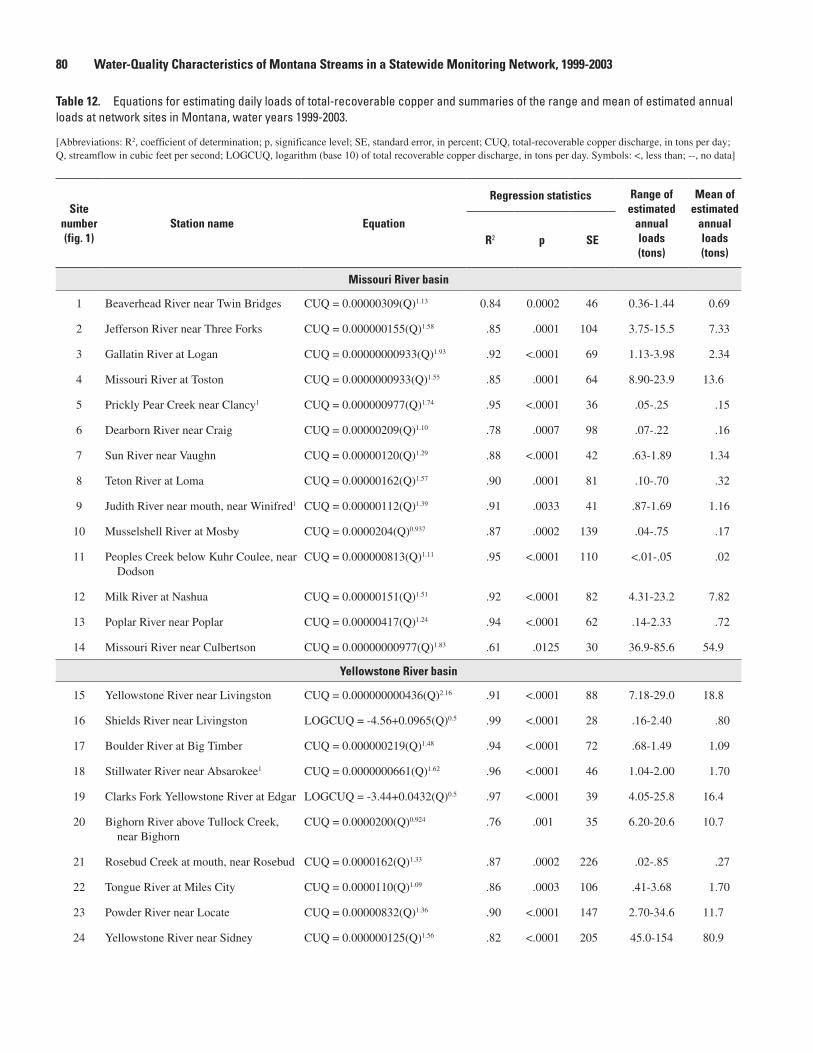
Table 12. Equations for estimating daily loads of total-recoverable copper and summaries of the range and mean of estimated annual loads at network sites in Montana, water years 1999-2003.
[Abbreviations: R2, coefficient of determination; p, significance level; SE, standard error, in percent; CUQ, total-recoverable copper discharge, in tons per day; Q, streamflow in cubic feet per second; LOGCUQ, logarithm (base 10) of total recoverable copper discharge, in tons per day. Symbols: <, less than; --, no data]
�0 Water-Quality Characteristics of Montana Streams in a Statewide Monitoring Network, 1999-2003
Site number (fig. 1)
Station name Equation
Regression statistics Range of estimated
annual loads (tons)
Mean of estimated
annual loads (tons)
R2 p SE
Missouri River basin
1 Beaverhead River near Twin Bridges CUQ = 0.00000309(Q)1.13 0.84 0.0002 46 0.36-1.44 0.69
2 Jefferson River near Three Forks CUQ = 0.000000155(Q)1.58 .85 .0001 104 3.75-15.5 7.33
3 Gallatin River at Logan CUQ = 0.00000000933(Q)1.93 .92 <.0001 69 1.13-3.98 2.34
4 Missouri River at Toston CUQ = 0.0000000933(Q)1.55 .85 .0001 64 8.90-23.9 13.6
5 Prickly Pear Creek near Clancy1 CUQ = 0.000000977(Q)1.74 .95 <.0001 36 .05-.25 .15
6 Dearborn River near Craig CUQ = 0.00000209(Q)1.10 .78 .0007 98 .07-.22 .16
7 Sun River near Vaughn CUQ = 0.00000120(Q)1.29 .88 <.0001 42 .63-1.89 1.34
8 Teton River at Loma CUQ = 0.00000162(Q)1.57 .90 .0001 81 .10-.70 .32
9 Judith River near mouth, near Winifred1 CUQ = 0.00000112(Q)1.39 .91 .0033 41 .87-1.69 1.16
10 Musselshell River at Mosby CUQ = 0.0000204(Q)0.937 .87 .0002 139 .04-.75 .17
11 Peoples Creek below Kuhr Coulee, near Dodson
CUQ = 0.000000813(Q)1.11 .95 <.0001 110 <.01-.05 .02
12 Milk River at Nashua CUQ = 0.00000151(Q)1.51 .92 <.0001 82 4.31-23.2 7.82
13 Poplar River near Poplar CUQ = 0.00000417(Q)1.24 .94 <.0001 62 .14-2.33 .72
14 Missouri River near Culbertson CUQ = 0.00000000977(Q)1.83 .61 .0125 30 36.9-85.6 54.9
Yellowstone River basin
15 Yellowstone River near Livingston CUQ = 0.000000000436(Q)2.16 .91 <.0001 88 7.18-29.0 18.8
16 Shields River near Livingston LOGCUQ = -4.56+0.0965(Q)0.5 .99 <.0001 28 .16-2.40 .80
17 Boulder River at Big Timber CUQ = 0.000000219(Q)1.48 .94 <.0001 72 .68-1.49 1.09
18 Stillwater River near Absarokee1 CUQ = 0.0000000661(Q)1.62 .96 <.0001 46 1.04-2.00 1.70
19 Clarks Fork Yellowstone River at Edgar LOGCUQ = -3.44+0.0432(Q)0.5 .97 <.0001 39 4.05-25.8 16.4
20 Bighorn River above Tullock Creek, near Bighorn
CUQ = 0.0000200(Q)0.924 .76 .001 35 6.20-20.6 10.7
21 Rosebud Creek at mouth, near Rosebud CUQ = 0.0000162(Q)1.33 .87 .0002 226 .02-.85 .27
22 Tongue River at Miles City CUQ = 0.0000110(Q)1.09 .86 .0003 106 .41-3.68 1.70
23 Powder River near Locate CUQ = 0.00000832(Q)1.36 .90 <.0001 147 2.70-34.6 11.7
24 Yellowstone River near Sidney CUQ = 0.000000125(Q)1.56 .82 <.0001 205 45.0-154 80.9

Site number (fig. 1)
Station name Equation
Regression statistics Range of estimated
annual loads (tons)
Mean of estimated
annual loads (tons)
R2 p SE
Columbia River basin
25 Kootenai River below Libby Dam, near Libby
CUQ = 0.000000436(Q)1.21 .79 .0006 47 5.79-13.3 10.7
26 Fisher River near Libby CUQ = 0.0000000812(Q)1.62 .95 <.0001 48 .40-1.64 .86
27 Yaak River near Troy CUQ = 0.0000000812(Q)1.62 .93 <.0001 53 .03-.14 .09
28 Little Blackfoot River near Garrison CUQ = 0.000000891(Q)1.36 .95 <.0001 39 .09-.40 .24
29 Rock Creek near Clinton CUQ = 0.0000000316(Q)1.70 .95 <.0001 40 .23-.90 .54
30 Clark Fork at Turah Bridge, near Bonner
CUQ = 0.0000000398(Q)1.95 .91 <.0001 61 6.80-28.9 17.7
31 Blackfoot River near Bonner CUQ = 0.0000000109(Q)1.78 .94 <.0001 50 1.26-3.77 2.62
32 Bitterroot River near Missoula CUQ = 0.00000000977(Q)1.78 .96 <.0001 46 2.56-8.14 5.81
33 Clark Fork at St. Regis CUQ = 0.0000000105(Q)1.77 .95 <.0001 46 14.8-50.7 34.2
34 North Fork Flathead River near Columbia Falls
CUQ = 0.0000000135(Q)1.73 .90 <.0001 82 3.18-14.4 8.31
35 Middle Fork Flathead River near West Glacier2
CUQ = 0.0000000229(Q)1.65 .95 <.0001 54 3.34-10.7 6.58
36 Whitefish River near Kalispell CUQ = 0.000000794(Q)1.21 .95 <.0001 33 .07-.18 .14
37 Swan River near Bigfork2,3 CUQ = 2.48(Q)0.0000027 -- -- -- .37-.52 .46
38 Flathead River at Perma4 CUQ = 0.000000670(Q)1.28 .55 .0221 115 21.2-45.4 34.8
1Less than 5 years of either sample data or daily mean streamflow record were available for load calculations.
2More than 25 percent of the analytical values used for load calculations are less than the laboratory reporting level.
3Daily loads were calculated by multiplying the mean concentration (table 15) determined from periodic samples by daily mean streamflow and units conver-sion constant.
4Analytical results for several samples from 1999 and 2000 that were censored at high laboratory reporting levels were not used in regression analysis.
Table 12. Equations for estimating daily loads of total-recoverable copper and summaries of the range and mean of estimated annual loads at network sites in Montana, water years 1999-2003.—Continued
38 percent (table 4). In the Clark Fork subbasin upstream from St. Regis, the largest mean annual load of copper (17.7 tons) was transported past Clark Fork at Turah Bridge, which was about 3-7 times larger than the mean annual loads contributed by the Blackfoot (2.62 tons) and Bitterroot Rivers (5.81 tons), and represented about 52 percent of the mean annual load at Clark Fork at St. Regis. The copper load at Clark Fork at Turah Bridge was proportionally much larger than the stream-flow contribution of 17 percent. The combined mean annual load of copper (26.1 tons) for Clark Fork at Turah Bridge,
Water-Quality Characteristics �1
In the Kootenai River subbasin of the Columbia River basin, the largest annual load of copper (10.7 tons) was trans-ported past Kootenai River below Libby Dam. In the Clark Fork and Flathead River subbasins of the Columbia River basin, the combined mean annual load (69.0 tons) for Clark Fork at St. Regis plus Flathead River at Perma was contributed in nearly equal amounts by each river (34.2 and 34.8 tons, respectively). The copper load from the Clark Fork at St. Regis of about 50 percent of the combined load was proportion-ally large compared to the streamflow contribution of about
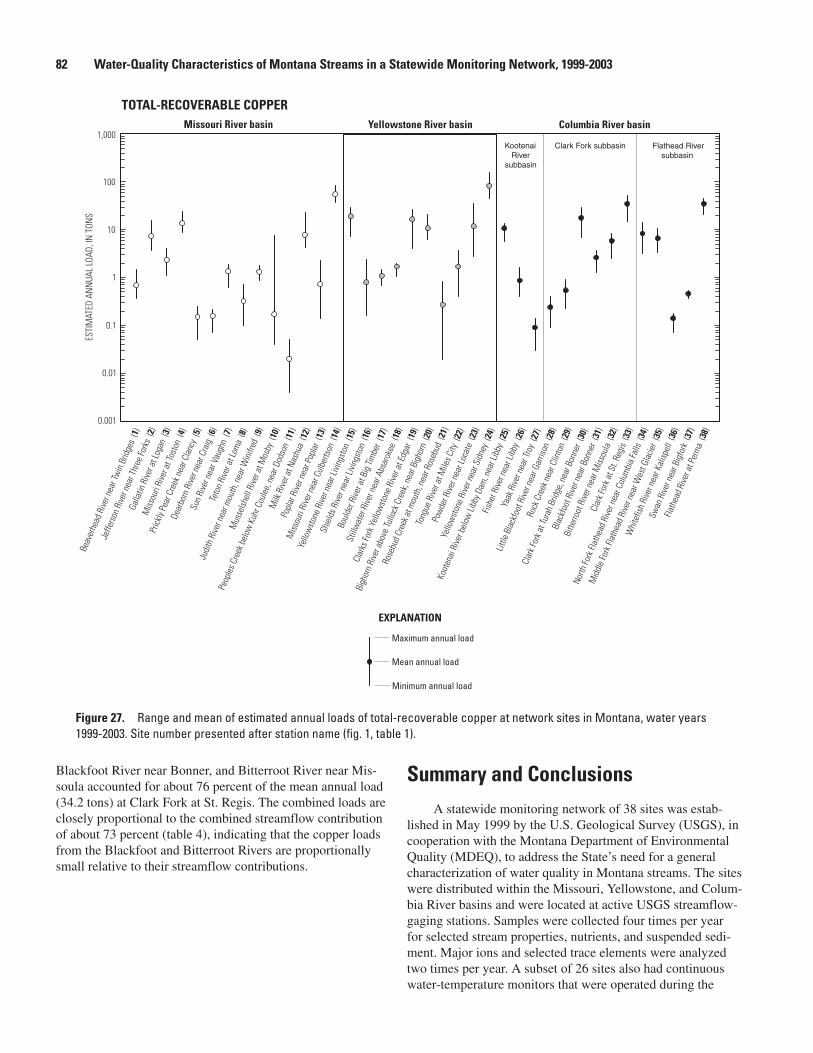
Figure 2�. Range and mean of estimated annual loads of total-recoverable copper at network sites in Montana, water years 1999-2003. Site number presented after station name (fig. 1, table 1).
ESTI
MAT
ED A
NN
UAL
LOAD
, IN
TON
S
0.001
0.01
1
10
100
1,000
0.1
TOTAL-RECOVERABLE COPPERMissouri River basin Yellowstone River basin Columbia River basin
Kootenai Riversubbasin
Flathead River subbasin
Clark Fork subbasin
Maximum annual load
Mean annual load
Minimum annual load
EXPLANATION
Beav
erhe
ad R
iver n
ear T
win
Brid
ges
(1)
Jeffe
rson
Rive
r nea
r Thr
ee Fo
rks
(2)
Galla
tin R
iver a
t Log
an (
3)
Miss
ouri
Rive
r at T
osto
n (4
)
Prick
ly Pe
ar C
reek
nea
r Cla
ncy
(5)
Dear
born
Rive
r nea
r Cra
ig (
6)
Sun
Rive
r nea
r Vau
ghn
(7)
Teto
n Ri
ver a
t Lom
a (8
)
Judi
th R
iver n
ear m
outh
, nea
r Win
ifred
(9)
Mus
selsh
ell R
iver a
t Mos
by (
10)
Peop
les C
reek
bel
ow K
uhr C
oule
e, n
ear D
odso
n (1
1)
Milk
Rive
r at N
ashu
a (1
2)
Popl
ar R
iver n
ear P
opla
r (13
)
Miss
ouri
Rive
r nea
r Cul
berts
on (
14)
Yello
wst
one
Rive
r nea
r Livi
ngst
on (
15)
Shie
lds R
iver n
ear L
iving
ston
(16
)
Boul
der R
iver a
t Big
Tim
ber
(17)
Still
wat
er R
iver n
ear A
bsar
okee
(18
)
Clar
ks Fo
rk Y
ello
wst
one
Rive
r at E
dgar
(19
)
Bigh
orn
Rive
r abo
ve Tu
llock
Cre
ek, n
ear B
igho
rn (
20)
Rose
bud
Cree
k at m
outh
, nea
r Ros
ebud
(21
)
Tong
ue R
iver a
t Mile
s City
(22
)
Pow
der R
iver n
ear L
ocat
e (2
3)
Yello
wst
one
Rive
r nea
r Sid
ney
(24)
Koot
enai
Rive
r bel
ow Li
bby D
am, n
ear L
ibby
(25
)
Fishe
r Rive
r nea
r Lib
by (
26)
Yaak
Rive
r nea
r Tro
y (27
)
Little
Bla
ckfo
ot R
iver n
ear G
arris
on (
28)
Rock
Cre
ek n
ear C
linto
n (2
9)
Clar
k For
k at T
urah
Brid
ge, n
ear B
onne
r (30
)
Blac
kfoo
t Rive
r nea
r Bon
ner
(31)
Bitte
rroot
Rive
r nea
r Miss
oula
(32
)
Clar
k For
k at S
t. Re
gis
(33)
North
Fork
Flat
head
Rive
r nea
r Col
umbi
a Fa
lls (
34)
Mid
dle
Fork
Flat
head
Rive
r nea
r Wes
t Gla
cier
(35)
Whi
tefis
h Ri
ver n
ear K
alisp
ell
(36)
Swan
Rive
r nea
r Big
fork
(37
)
Flath
ead
Rive
r at P
erm
a (3
8)
Blackfoot River near Bonner, and Bitterroot River near Mis-soula accounted for about 76 percent of the mean annual load (34.2 tons) at Clark Fork at St. Regis. The combined loads are closely proportional to the combined streamflow contribution of about 73 percent (table 4), indicating that the copper loads from the Blackfoot and Bitterroot Rivers are proportionally small relative to their streamflow contributions.
Summary and ConclusionsA statewide monitoring network of 38 sites was estab-
lished in May 1999 by the U.S. Geological Survey (USGS), in cooperation with the Montana Department of Environmental Quality (MDEQ), to address the State’s need for a general characterization of water quality in Montana streams. The sites were distributed within the Missouri, Yellowstone, and Colum-bia River basins and were located at active USGS streamflow-gaging stations. Samples were collected four times per year for selected stream properties, nutrients, and suspended sedi-ment. Major ions and selected trace elements were analyzed two times per year. A subset of 26 sites also had continuous water-temperature monitors that were operated during the
�2 Water-Quality Characteristics of Montana Streams in a Statewide Monitoring Network, 1999-2003

warm-weather season (typically April through September). Data collected during the 5-year monitoring period of water years 1999-2003 were statistically summarized to describe general water-quality conditions and illustrate relative differ-ences among sites. In addition, annual loads were estimated for selected constituents to allow relative comparison of input from various source areas.
Mean annual streamflows during water years 1999-2003 were below normal compared to long-term periods of record, ranging from about 12 percent at Musselshell River at Mosby to 91 percent at Kootenai River below Libby Dam. Stream-flows at sites in the Missouri River basin were the most depleted relative to long-term conditions; sites in the Columbia River basin were the least affected. Peak flows in the Missouri River and Yellowstone River basins during 1999-2003 gener-ally occurred earlier in the year and were substantially less in magnitude and duration than long-term peak flows; peak flows in the Columbia River basin were more similar to long-term conditions. The less-than-normal streamflow presumably affected both constituent concentrations and annual loads.
The pH values across the State ranged from 7.0 to 9.5, with almost every site having a median pH greater than 8.0. Only two sites in the Columbia River basin had a median pH less than 8.0 (Yaak River near Troy and Bitterroot River near Missoula). Extremely high or low pH was not consistently measured at any site.
Specific conductance varied widely across the net-work, ranging from 32 µS/cm at Yaak River near Troy to 6,940 µS/cm at Musselshell River at Mosby. Median specific conductance ranged from 76 µS/cm at Yaak River near Troy to 2,480 µS/cm at Musselshell River at Mosby. Rosebud Creek near Rosebud and Powder River near Locate also had relatively high specific conductance values, with both sites having medians near 2,000 µS/cm. Samples from several sites across the network had specific conductance that occasion-ally exceeded the general irrigation guideline of 1,500 µS/cm; more than 50 percent of the samples from Musselshell River at Mosby, Rosebud Creek near Rosebud, and Powder River near Locate exceeded the general guideline. The State of Montana numeric standard for the Powder River mainstem (2,500 µS/cm) is substantially higher than the general irriga-tion guideline; thus, fewer than 25 percent of the samples from Powder River near Locate exceeded the standard.
Daily mean water temperatures for the 3-month summer period (June, July, and August) varied widely at the 26 sites with continuous temperature monitors, ranging from 4.0 °C at Yaak River near Troy to 29.5 °C at Teton River at Loma and Tongue River at Miles City. The lowest median (12.5 °C) occurred at Kootenai River below Libby Dam and the highest median (23.0 °C) occurred at Poplar River near Poplar and Tongue River at Miles City. In general, sites in the Columbia River basin had the lowest water temperatures, whereas sites in the Missouri River basin had the highest. Four sites in the Missouri River basin that represent cold-water or cold-water marginal fisheries (Jefferson River near Three Forks, Missouri River at Toston, Judith River near Winifred, and Poplar River
near Poplar) had summer daily mean water temperatures that exceeded the general guideline of 67.0 °F (19.4 °C) for the protection of cold-water aquatic life on 50 percent or more of the days. Three sites in the Missouri River basin (Beaver-head River near Twin Bridges, Gallatin River at Logan, and Dearborn River near Craig) that represent cold-water fisheries exceeded the cold-water guideline on about 25 percent of the days. In the Yellowstone River basin, two sites that represent cold-water marginal fisheries (Clarks Fork Yellowstone River at Edgar and Bighorn River near Bighorn) exceeded the cold-water guideline on about 50 percent of the days. In the Colum-bia River basin, the cold-water guideline was exceeded on more than 50 percent of the days at Flathead River at Perma and on about 25 percent of the days at Yaak River near Troy, Bitterroot River near Missoula, and Swan River near Bigfork. The warm-water guideline of 80.0 °F (26.7 °C) was exceeded infrequently across the network.
Dissolved nitrite plus nitrate concentrations across the network ranged from <0.005 mg/L as N at many sites to 3.80 mg/L as N at Sun River near Vaughn. None of the sites had samples with concentrations that exceeded the human-health standard for nitrate of 10 mg/L as N. About one-half of the sites in the Missouri and Yellowstone River basins had one or more samples with dissolved nitrite plus nitrate concentra-tions that exceeded the general eutrophication guideline of 0.30 mg/L. Concentrations of total ammonia plus organic nitrogen varied widely, ranging from <0.08 mg/L at many sites to 30 mg/L at Powder River near Locate. The magnitudes and spatial patterns of total nitrogen concentrations were very similar to those of total ammonia plus organic nitrogen. For nitrogen compounds, concentrations in the Columbia River basin generally were lower than in the Missouri or Yellow-stone River basins. The six sites in the Clark Fork subbasin of the Columbia River basin had distinctly higher median concentrations of total ammonia plus organic nitrogen and total nitrogen compared to sites in the Kootenai and Flathead River subbasins. The ecoregion eutrophication guideline of 1.50 mg/L for total nitrogen was exceeded infrequently at most sites within applicable areas of eastern and central Mon-tana, but was exceeded in more than 25 percent of the samples at Powder River near Locate. The seasonal numeric standards of 0.300 mg/L for total nitrogen in the Clark Fork mainstem was exceeded in about 25 percent or more of the samples at Clark Fork at Turah Bridge and Clark Fork at St. Regis.
Dissolved orthophosphate concentrations were consis-tently low across the network, ranging from <0.001 mg/L as P at many sites to 0.158 mg/L as P at Peoples Creek near Dodson; standards are not currently (2006) established. Total phosphorus concentrations varied from <0.01 mg/L as P at many sites to 15.4 mg/L as P at Powder River near Locate. A general guideline concentration of 0.10 mg/L for total phos-phorus to prevent eutrophication was exceeded by the median total phosphorus concentrations at several sites in the Missouri and Yellowstone River basins (Milk River at Nashua, Missouri River near Culbertson, Powder River near Locate, and Yel-lowstone River near Sidney). The more restrictive ecoregion
Summary and Conclusions �3

guideline of 0.075 mg/L for total phosphorus was exceeded in about 25 to more than 75 percent of samples at all the sites within the applicable areas of eastern and central Montana. Although medians did not exceed the general eutrophica-tion guideline concentration of 0.10 mg/L in the Columbia River basin, the median concentrations of total phosphorus were consistently higher at sites in the Clark Fork subbasin, similar to the spatial pattern observed for total nitrogen. About 75 percent of the samples collected at Clark Fork at Turah Bridge and about 25 percent of the samples collected at Clark Fork at St. Regis exceeded the seasonal reach-specific numeric standards of 0.020 mg/L and 0.039 mg/L, respectively, for total phosphorus.
Suspended-sediment concentrations varied widely across the network and ranged from 1 to 25,400 mg/L. In both the Missouri and Yellowstone River basins, sites in the upper parts of the basins that are closer to the mountain headwaters typi-cally had lower concentrations than at sites in the lower parts of the basin that drain extensive areas of semi-arid prairie. Median suspended-sediment concentrations were near or exceeded 100 mg/L in the Missouri River basin at Musselshell River at Mosby, Milk River at Nashua, and Missouri River near Culbertson. Median concentrations exceeded 100 mg/L in the Yellowstone River basin at Rosebud Creek at Rosebud, Tongue River at Miles City, Powder River near Locate, and Yellowstone River near Sidney. The maximum suspended-sed-iment concentration of 25,400 mg/L was measured at Powder River near Locate. Overall, suspended-sediment concentra-tions at Powder River near Locate were the highest in the network, with more than 25 percent of the samples exceeding 2,000 mg/L. The lowest concentrations commonly were mea-sured at sites in the Columbia River basin.
Dissolved-solids concentrations varied widely across the network, ranging from 23 to 6,200 mg/L. In the Missouri and Yellowstone River basins, the highest values commonly occurred at sites in the lower parts of the basins. In the Mis-souri River basin, the Musselshell River at Mosby had notably higher concentrations relative to the other sites in the basin, and also had the highest concentration (6,200 mg/L) measured in the statewide network. About 90 percent of the samples from Musselshell River at Mosby exceeded the general irrigation guideline of 1,000 mg/L. Concentrations of three other sites in the Missouri River basin (Peoples Creek near Dodson, Milk River at Nashua, and Poplar River near Poplar) exceeded the irrigation guideline in about 25 to 50 percent of the samples. In the Yellowstone River basin, two sites (Rosebud Creek near Rosebud and Powder River near Locate) consistently had the highest dissolved-solids concentrations, exceeding the 1,000 mg/L irrigation guideline concentration in more than 75 percent of the samples. Sites in the Columbia River basin commonly had low dissolved-solids concentra-tions compared to the other two basins and concentrations did not vary substantially with flow or season. None of the sites in the Columbia River basin had dissolved-solids concentrations that exceeded the general irrigation guideline.
SAR values, which can be used to indicate the suitability of water for irrigation, ranged from <0.1 to 12 across the net-work. Several sites in the lower parts of the Missouri and Yel-lowstone River basins had SAR values that were elevated rela-tive to other sites in the basin. The general irrigation guideline of 7 was exceeded in more than 25 percent of the samples at Musselshell River at Mosby and Peoples Creek near Dodson, and in more than 50 percent of the samples at Poplar River near Poplar. Numeric standards for SAR have been established for the Rosebud Creek, Tongue River, and Powder River watersheds. Sites in these three streams had SAR values that were elevated relative to other sites in the Yellowstone River basin. Rosebud Creek near Rosebud had the maximum SAR value (12) measured in the network. SAR values at Rosebud Creek near Rosebud commonly exceeded and at Powder River near Locate occasionally exceeded the irrigation-season SAR standards of 4.5 and 7.5 for each stream, respectively. None of the samples from Tongue River at Miles City exceeded the Tongue River irrigation-season SAR standard of 4.5. SAR values in the Columbia River basin were low at all sites, with no exceedances of the irrigation guideline.
Total-recoverable concentrations of selected trace ele-ments were compared to the State of Montana human-health standards for drinking-water supplies. Human-health standards for cadmium, chromium, and nickel were exceeded only infre-quently in samples from network sites; no exceedances were measured for copper and zinc. Samples from most sites in the network had arsenic concentrations less than the human-health standard of 18 µg/L; however, arsenic concentrations com-monly exceeded the standard at two sites which receive geo-thermal waters enriched in arsenic from Yellowstone National Park. Arsenic concentrations in almost all samples collected at Missouri River at Toston, and about one-half the samples collected at Yellowstone River near Livingston, exceeded the human-health standard. The maximum arsenic concentration in the network (48 µg/L) was measured at Missouri River at Toston. Lead concentrations in samples from one to several sites in each major river basin exceeded the human-health standard of 15 µg/L. Four sites in the Missouri River basin (Prickly Pear Creek near Clancy, Teton River at Loma, Mus-selshell River at Mosby, and Milk River at Nashua) had con-centrations that exceeded the human-health standard for lead in more than 10 percent of the samples. Similarly, concentra-tions at three sites in the Yellowstone River basin (Rosebud Creek near Rosebud, Tongue River at Miles City, and Pow-der River near Locate) exceeded the human-health standard for lead in about 10 to more than 25 percent of the samples; Rosebud Creek near Rosebud had the highest lead concentra-tion (255 µg/L) in the network. In the Columbia River basin, concentrations at only one site (Clark Fork at Turah Bridge) infrequently exceeded the human-health standard for lead.
Total-recoverable concentrations of selected trace ele-ments also were compared to general numeric standards for the protection of aquatic life. Aquatic-life standards for chronic and acute toxicity vary with water hardness for several trace elements. General hardness-dependent aquatic-life
�� Water-Quality Characteristics of Montana Streams in a Statewide Monitoring Network, 1999-2003
standards for chronic and acute toxicity were calculated using average hardness for groups of sites having similar water qual-ity to provide a reference comparison of sample concentra-tions to approximate thresholds of potential toxicity. Overall, exceedances of general chronic aquatic-life standards were infrequent at most sites throughout the network, and exceed-ances of general acute aquatic-life standards were rare. How-ever, elevated trace-element concentrations were relatively common at some sites.
Arsenic and chromium concentrations did not exceed general aquatic-life standards at any of the network sites. Cadmium concentrations only sporadically exceeded chronic standards at a few sites. However, more than 25 percent of the samples from Powder River near Locate exceeded the chronic standard for cadmium; the maximum concentration (10 µg/L) exceeded the acute standard. Copper concentrations in most samples were less than general aquatic-life standards, although about one-half of the sites in the statewide network had one or more samples that exceeded either acute or chronic standards for copper. Persistent exceedances of chronic and acute standards for copper were most common (between 25 and 50 percent of the samples) at Clark Fork at Turah Bridge and, to a lesser degree (about 25 percent or more of the samples), at Yellowstone River near Livingston and Pow-der River near Locate. Lead concentrations at all sites were less than the acute standards; however, about one-half of the sites had one or more samples exceeding chronic standards. Six sites in the Missouri River basin infrequently equaled or exceeded the chronic standards for lead, but one site (Prickly Pear Creek near Clancy) exceeded the chronic standard in about 50 percent of the samples. Six sites in the Yellowstone River basin had samples that exceeded the chronic standards for lead; concentrations at two of the sites (Yellowstone River near Livingston and Powder River near Locate) exceeded the chronic standard in more than 25 percent of the samples. Although eight sites in the Columbia River basin had one or more samples that equaled or exceeded the chronic standard for lead, only the Clark Fork at Turah Bridge persistently exceeded the chronic standard in more than 25 percent of the samples. With the exception of two sites in the Yellowstone River basin (Rosebud Creek near Rosebud and Powder River near Locate), all sites in the network had nickel concentrations less than aquatic-life standards. Only four sites (Prickly Pear Creek near Clancy, Rosebud Creek near Rosebud, Powder River near Locate, and Clark Fork at Turah Bridge) occasion-ally exceeded aquatic-life standards for zinc.
Annual loads were estimated for selected constituents to illustrate relative differences among sites in order to identify upstream source areas contributing the largest proportion of the load at the most downstream site on the mainstem. Due to the low sampling frequency, the amount of data available at most sites is considered only marginally adequate to provide gross estimates of annual load.
Mean annual loads of nutrients were estimated for total ammonia plus organic nitrogen, total nitrogen, and total phosphorus. Mean annual loads of total ammonia plus organic
nitrogen across the statewide network ranged from 2.73 tons at Peoples Creek near Dodson to 5,030 tons at Yellowstone River near Sidney. The largest mean annual loads of total ammonia plus organic nitrogen from upstream sources were transported past Missouri River at Toston (1,400 tons) in the Missouri River basin, Bighorn River near Bighorn (1,260 tons) in the Yellowstone River basin, and Clark Fork at St. Regis (1,290 tons) in the Columbia River basin. Mean annual loads for total nitrogen closely paralleled those of total ammonia plus organic nitrogen in both magnitude and spatial pat-terns. Mean annual loads for total phosphorus across the network ranged from 0.22 ton at Peoples Creek near Dodson to 1,930 tons at Yellowstone River near Sidney. The largest mean annual loads of total phosphorus from upstream sources were transported past Missouri River at Toston (239 tons) in the Missouri River basin, Yellowstone River near Livingston (572 tons) in the Yellowstone River basin, and Clark Fork at St. Regis (183 tons) in the Columbia River basin.
Mean annual loads of suspended sediment across the network ranged from 262 tons at Peoples Creek near Dod-son to 2,890,000 tons at Yellowstone River near Sidney. The largest mean annual loads of suspended sediment from upstream sources were transported past Milk River at Nashua (319,000 tons) in the Missouri River basin, Powder River near Locate (1,400,000 tons) in the Yellowstone River basin, and Clark Fork at St. Regis (146,000 tons) in the Columbia River basin. One notable observation was that the combined mean annual load for the upper mainstem site Missouri River at Tos-ton plus downstream tributaries accounted for only 26 percent of the mean annual suspended-sediment load at Missouri River near Culbertson. The large load passing the lower mainstem site, despite the likely deposition of much of the upstream sediment load in mainstem reservoirs, might indicate that other unmeasured sources, such as unsampled tributaries or channel erosion, are contributing large quantities of sediment to the Missouri River mainstem downstream from Fort Peck Reservoir.
Mean annual loads of dissolved solids ranged from 2,830 tons at Peoples Creek near Dodson to 2,970,000 tons at Yellowstone River near Sidney. The largest mean annual loads of dissolved solids from upstream sources were transported past Missouri River at Toston (682,000 tons) in the Missouri River basin, Bighorn River near Bighorn (1,410,000 tons) in the Yellowstone River basin, and Kootenai River below Libby Dam (1,230,000 tons) in the Columbia River basin.
Mean annual loads of total-recoverable arsenic ranged from 0.01 ton at Peoples Creek near Dodson to 109 tons at Missouri River at Toston. The largest source of arsenic in the Missouri River basin was an unsampled tributary basin (Madison River) upstream from Missouri River at Toston that previous studies have shown to transport large quantities of arsenic derived from geothermal sources in Yellowstone National Park. The Madison River basin supplied, by indirect estimation, about 92 percent of the arsenic load (109 tons) at Missouri River at Toston. The smaller arsenic load at Mis-souri River near Culbertson (40.2 tons) indicates that about
Summary and Conclusions ��
65 percent of the combined arsenic load for Missouri River at Toston plus downstream tributaries presumably was deposited in mainstem reservoirs before reaching Culbertson. The largest mean annual arsenic load from upstream sources in the Yellow-stone River basin was transported past Yellowstone River near Livingston (62.1 tons), which accounted for about 92 percent of the arsenic load at Yellowstone River near Sidney. Arsenic transport is generally conservative in the Yellowstone River basin owing to the absence of mainstem reservoirs, as indi-cated by the similarity of loads estimated for the Yellowstone River near Sidney and the combined loads from the upstream sampling sites. Arsenic loads were not estimated for most sites in the Columbia River basin due to a large number of con-centrations less than the LRL. In the Clark Fork subbasin, the mean annual arsenic load (4.33 tons) transported past Clark Fork at Turah Bridge accounted for about 45 percent of the mean annual load (9.53 tons) at the Clark Fork at St. Regis.
Mean annual loads of total-recoverable copper ranged from 0.02 ton at Peoples Creek near Dodson to 80.9 tons at Yellowstone River near Sidney. The largest mean annual loads of copper from upstream sources were transported past Missouri River at Toston (13.6 tons) in the Missouri River basin, Yellowstone River near Livingston (18.8 tons) in the Yellowstone River basin, and Clark Fork at St. Regis and Flathead River at Perma (34.2 and 34.8 tons, respectively) in the Columbia River basin. In the Clark Fork subbasin, the larg-est mean annual copper load (17.7 tons) was transported past Clark Fork at Turah Bridge and accounted for about 52 percent of the mean annual load (34.2 tons) at Clark Fork at St. Regis.
References Cited
Allen, H.E., and Kramer, J.R., eds., 1972, Nutrients in natural waters: New York, Wiley, Environmental Science and Tech-nology Series, 457 p.
Cannon, M.R., and Johnson, D.R., 2004, Estimated water use in Montana in 2000: U.S. Geological Survey Scientific Investigations Report 2004-5223, 50 p.
Childress, C.J.O., Foreman, W.T., Connor, B.F., and Malo-ney, T.J., 1999, New reporting procedures based on long-term method detection levels and some considerations for interpretations of water-quality data provided by the U.S. Geological Survey National Water Quality Laboratory: U.S. Geological Survey Open-File Report 99-193, 19 p.
Edwards, T.K., and Glysson, G.D., 1999, Field methods for measurement of fluvial sediment: U.S. Geological Survey Techniques of Water-Resources Investigations, book 3, chap. C2, 89 p.
Fishman, M.J., ed., 1993, Methods of analysis by the U.S. Geological Survey National Water Quality Laboratory—Determination of inorganic and organic constituents in water and fluvial sediments: U.S. Geological Survey Open-File Report 93-125, 217 p.
Fishman, M.J., and Friedman, L.C., eds., 1989, Methods for determination of inorganic substances in water and fluvial sediments: U.S. Geological Survey Techniques of Water-Resources Investigations, book 5, chap. A1, 545 p.
Friedman, L.C., and Erdmann, D.E., 1982, Quality assurance practices for the chemical and biological analyses of water and fluvial sediment: U.S. Geological Survey Techniques of Water-Resources Investigations, book 5, chap. A6, 181 p.
Garbarino, J.R., and Struzeski, T.M., 1998, Methods of analy-sis by the U.S. Geological Survey National Water Quality Laboratory—Determination of elements in whole-water digests using inductively coupled plasma-optical emission spectrometry and inductively coupled plasma-mass spec-trometry: U.S. Geological Survey Open-File Report 98-165, 101 p.
Guy, H.P., 1969, Laboratory theory and methods for sediment analysis: U.S. Geological Survey Techniques of Water-Resources Investigations, book 5, chap. C1, 58 p.
Guy, H.P., 1970, Fluvial sediment concepts: U.S. Geologi-cal Survey Techniques of Water-Resources Investigations, book 3, chap. C1, 55 p.
Helsel, D.R., and Cohn, T.A., 1988, Estimation of descriptive statistics for multiply censored water quality data: Water Resources Research, v. 24, no. 12, p. 1997-2004.
Hem, J.D., 1985, Study and interpretation of the chemical characteristics of natural water (3d ed.): U.S. Geological Survey Water-Supply Paper 2254, 63 p.
Hoffman, G.L., Fishman, M.J., and Garbarino, J.R., 1996, Methods of analysis by the U.S. Geological Survey National Water Quality Laboratory—In-bottle acid digestion of whole-water samples: U.S. Geological Survey Open-File Report 96-225, 28 p.
Hornberger, M.I., Lambing, J.H., Luoma, S.N., and Axtmann, E.V., 1997, Spatial and temporal trends of trace metals in surface water, bed sediment, and biota of the upper Clark Fork basin, Montana, 1985-95: U.S. Geological Survey Open-File Report 97-669, 84 p.
Horowitz, A.J., 1991, A primer on sediment-trace element chemistry, 2nd ed.: Chelsea, Mich., Lewis Publishers, Inc., 136 p.
�� Water-Quality Characteristics of Montana Streams in a Statewide Monitoring Network, 1999-2003
Horowitz, A.J., Demas, C.R., Fitzgerald, K.K., Miller, T.L., and Rickert, D.A., 1994, U.S. Geological Survey protocol for the collection and processing of surface-water samples for the subsequent determination of inorganic constituents in filtered water: U.S. Geological Survey Open-File Report 94-539, 57 p.
Jones, B.E., 1987, Quality control manual of the U.S. Geo-logical Survey’s National Water Quality Laboratory: U.S. Geological Survey Open-File Report 87-457, 17 p.
Jones, S.R., and Garbarino, J.R., 1999, Methods of analysis by the U.S. Geological Survey National Water Quality Labora-tory—Determination of arsenic and selenium in water and sediment by graphite furnace-atomic absorption spectrome-try: U.S. Geological Survey Open-File Report 98-639, 39 p.
Kimball, B.A., Nimick, D.A., Gerner, L.J., and Runkel, R.L., 1999, Quantification of metal loading in Fisher Creek by tracer injection and synoptic sampling, Park County, Montana, August, 1997: U.S. Geological Survey Water-Resources Investigations Report 99-4119, 40 p.
Klein, T.L., Thamke, J.N., Harper, D.D., Farag, A.M., Nimick, D.A., and Fey, D.L., 2003, Water-quality, bed-sediment, and biological data for streams in the upper Prickly Pear Creek watershed, Montana, 2001: U.S. Geological Survey Open-File Report 03-032, version 1.1, 103 p.
Knapton, J.R., and Nimick, D.A., 1991, Quality assurance for water-quality activities of the U.S. Geological Survey in Montana: U.S. Geological Survey Open-File Report 91-216, 41 p.
Lambing, J.H., 1991, Water-quality and transport characteris-tics of suspended sediment and trace elements in streamflow of the upper Clark Fork basin from Galen to Missoula, Montana, 1985-90: U.S. Geological Survey Water-Resources Investigations Report 91-4139, 73 p.
Lambing, J.H., 1998, Estimated 1996-97 and long-term aver-age annual loads for suspended sediment and selected trace metals in streamflow of the upper Clark Fork basin from Warm Springs to Missoula, Montana: U.S. Geological Sur-vey Water-Resources Investigations Report 98-4137, 35 p.
Lambing, J.H., and Dodge, K.A., 1993, Quality assurance for laboratory analysis of suspended-sediment samples by the U.S. Geological Survey in Montana: U.S. Geological Survey Open-File Report 93-131, 34 p.
Mackenthun, K.M., 1969, The practice of water pollution biology: U.S. Department of the Interior, Federal Water Pollution Control Administration, Division of Technical Support, 281 p.
McLain, Betty, 1993, Methods of analysis by the U.S. Geo-logical Survey National Water Quality Laboratory—Deter-mination of chromium in water by graphite furnace-atomic absorption spectrophotometry: U.S. Geological Survey Open-File Report 93-449, 16 p.
Montana Department of Environmental Quality, 2002a, Water-use classifications: Administrative Rules of Montana 17.30.607 to 17.30.611, p. 17-2697 to 17-2707.
Montana Department of Environmental Quality, 2002b, Classification standards: Administrative Rules of Montana 17.30.621 to 17.30.629, p. 17-2711 to 17-2736.
Montana Department of Environmental Quality, 2003, Numeric standards for electrical conductivity (EC) and sodium adsorption ratio (SAR): Administrative Rules of Montana 17.30.670, p. 17-2757 to 17-2758.
Montana Department of Environmental Quality, 2004, Mon-tana numeric water quality standards: Administrative Rules of Montana 17.30.619, Circular WQB-7, 38 p.
Moody, D.W., Chase, E.B., and Aronson, D.A., 1986, National Water Summary 1985—Hydrologic events and surface-water resources: U.S. Geological Survey Water-Supply Paper 2300, 506 p.
Nimick, D.A., Church, S.E., and Finger, S.E., eds., 2004, Inte-grated investigation of environmental effects of historical mining in the Basin and Boulder mining districts, Boulder River watershed, Jefferson County, Montana: U.S. Geologi-cal Survey Professional Paper 1652, 523 p.
Nimick, D.A., Moore, J.N., Dalby, C.E., and Savka, M.W., 1998, The fate of geothermal arsenic in the Madison and Missouri Rivers, Montana and Wyoming: Water Resources Research, v. 34, no. 11, p. 3051-3067.
Playle, R.C., 2004, Using multiple metal-gill binding models and the toxic unit concept to help reconcile multiple-metal toxicity results: Aquatic Toxicology, v. 67, p. 359-370.
Pritt, J.W., and Raese, J.W., eds., 1995, Quality assurance/quality control manual—National Water Quality Labora-tory: U.S. Geological Survey Open-File Report 95-443, 35 p.
Rantz, S.E., and others, 1982, Measurement and computation of streamflow: U.S. Geological Survey Water-Supply Paper 2175, 2 v., 631 p.
Ross, C.P., Andrews, D.A., and Witkind, I.J., 1955, Geologic map of Montana: U.S. Geological Survey, scale 1:500,000.
Stumm, Werner, and Morgan, J.J., eds., 1996, Aquatic chemistry—Chemical equilibria and rates in natural waters (3d ed.): New York, Wiley, 1,022 p.
References Cited ��
Taylor, J.K., 1987, Quality assurance of chemical measure-ments: Chelsea, Mich., Lewis Publishers, 328 p.
U.S. Department of Agriculture, 2002, Natural Resources Conservation Service, Assessing water quality for agri-culture and aquatic life uses: Environment Technical Note No. MT-1, 27 p.
U.S. Environmental Protection Agency, 1986, Quality criteria for water 1986: Washington, D.C., Office of Water Regula-tions and Standards, EPA 440/5-86-001, unpaged.
U.S. Environmental Protection Agency, 2001a, Ambient water quality criteria recommendations—Rivers and streams in nutrient ecoregion 4: EPA 822-B-01-013, 30 p.
U.S. Environmental Protection Agency, 2001b, Ambient water quality criteria recommendations—Rivers and streams in nutrient ecoregion 5: EPA 822-B-01-014, 29 p.
U.S. Geological Survey, issued annually, Water resources data, Montana: U.S. Geological Survey Water-Data Report.
U.S. Geological Survey, variously dated, National field manual for the collection of water-quality data: U.S. Geological Survey Techniques of Water-Resources Investigations, book 9, chap. A1-A9, available online at http://pubs.water.usgs.gov/twri9A/
Wagner, R.J., Mattraw, H.C., Ritz, G.F., and Smith, B.A., 2000, Guidelines and standard procedures for continuous water-quality monitors—Site selection, field operation, cali-bration, record computation, and reporting: U.S. Geological Survey Water-Resources Investigations Report 00-4252, 53 p.
Ward, J.R., and Harr, C.A., eds., 1990, Methods for collection and processing of surface-water and bed-material samples for physical and chemical analyses: U.S. Geological Survey Open-File Report 90-140, 71 p.
�� Water-Quality Characteristics of Montana Streams in a Statewide Monitoring Network, 1999-2003

Data
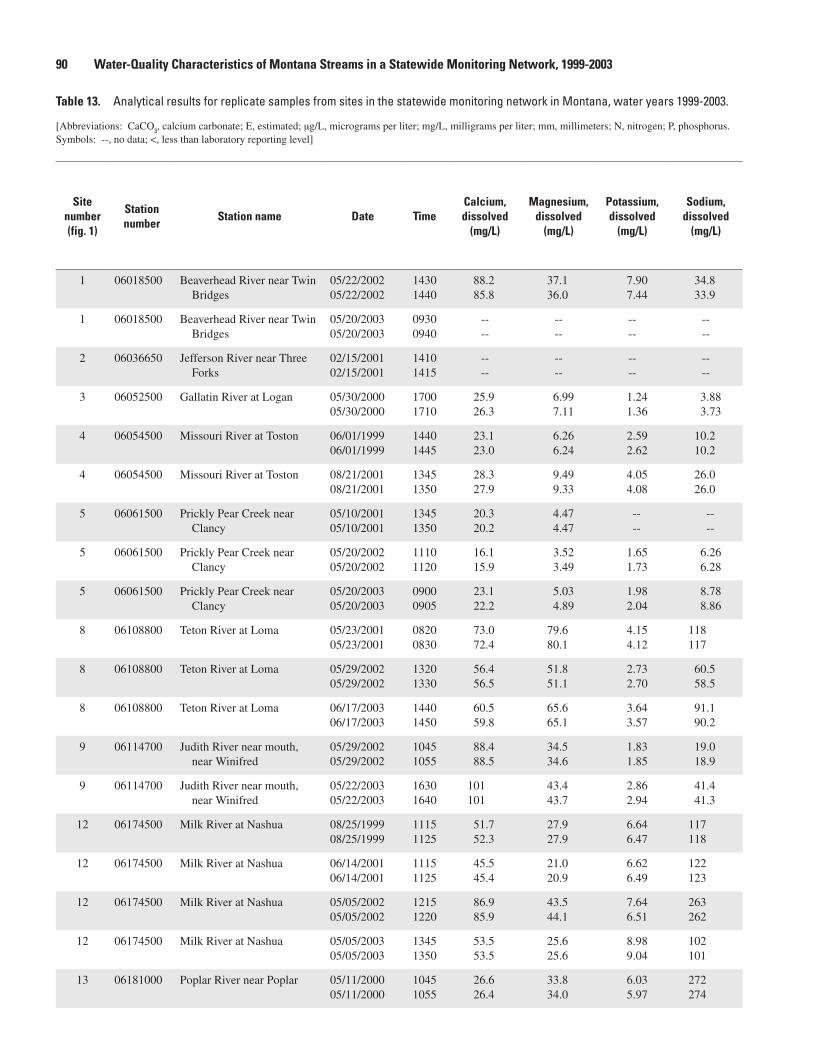
Table 13. Analytical results for replicate samples from sites in the statewide monitoring network in Montana, water years 1999-2003.
[Abbreviations: CaCO3, calcium carbonate; E, estimated; µg/L, micrograms per liter; mg/L, milligrams per liter; mm, millimeters; N, nitrogen; P, phosphorus. Symbols: --, no data; <, less than laboratory reporting level]
Site number (fig. 1)
Station number
Station name Date TimeCalcium, dissolved
(mg/L)
Magnesium, dissolved
(mg/L)
Potassium, dissolved
(mg/L)
Sodium, dissolved
(mg/L)
1 06018500 Beaverhead River near Twin Bridges
05/22/200205/22/2002
14301440
88.285.8
37.136.0
7.907.44
34.833.9
1 06018500 Beaverhead River near Twin Bridges
05/20/200305/20/2003
09300940
----
----
----
----
2 06036650 Jefferson River near Three Forks
02/15/200102/15/2001
14101415
----
----
----
----
3 06052500 Gallatin River at Logan 05/30/200005/30/2000
17001710
25.926.3
6.997.11
1.241.36
3.883.73
4 06054500 Missouri River at Toston 06/01/199906/01/1999
14401445
23.123.0
6.266.24
2.592.62
10.210.2
4 06054500 Missouri River at Toston 08/21/200108/21/2001
13451350
28.327.9
9.499.33
4.054.08
26.026.0
5 06061500 Prickly Pear Creek near Clancy
05/10/200105/10/2001
13451350
20.320.2
4.474.47
----
----
5 06061500 Prickly Pear Creek near Clancy
05/20/200205/20/2002
11101120
16.115.9
3.523.49
1.651.73
6.266.28
5 06061500 Prickly Pear Creek near Clancy
05/20/200305/20/2003
09000905
23.122.2
5.034.89
1.982.04
8.788.86
8 06108800 Teton River at Loma 05/23/200105/23/2001
08200830
73.072.4
79.680.1
4.154.12
118117
8 06108800 Teton River at Loma 05/29/200205/29/2002
13201330
56.456.5
51.851.1
2.732.70
60.558.5
8 06108800 Teton River at Loma 06/17/200306/17/2003
14401450
60.559.8
65.665.1
3.643.57
91.190.2
9 06114700 Judith River near mouth, near Winifred
05/29/200205/29/2002
10451055
88.488.5
34.534.6
1.831.85
19.018.9
9 06114700 Judith River near mouth, near Winifred
05/22/200305/22/2003
16301640
101101
43.443.7
2.862.94
41.441.3
12 06174500 Milk River at Nashua 08/25/199908/25/1999
11151125
51.752.3
27.927.9
6.646.47
117118
12 06174500 Milk River at Nashua 06/14/200106/14/2001
11151125
45.545.4
21.020.9
6.626.49
122123
12 06174500 Milk River at Nashua 05/05/200205/05/2002
12151220
86.985.9
43.544.1
7.646.51
263262
12 06174500 Milk River at Nashua 05/05/200305/05/2003
13451350
53.553.5
25.625.6
8.989.04
102101
13 06181000 Poplar River near Poplar 05/11/200005/11/2000
10451055
26.626.4
33.834.0
6.035.97
272274
90 Water-Quality Characteristics of Montana Streams in a Statewide Monitoring Network, 1999-2003
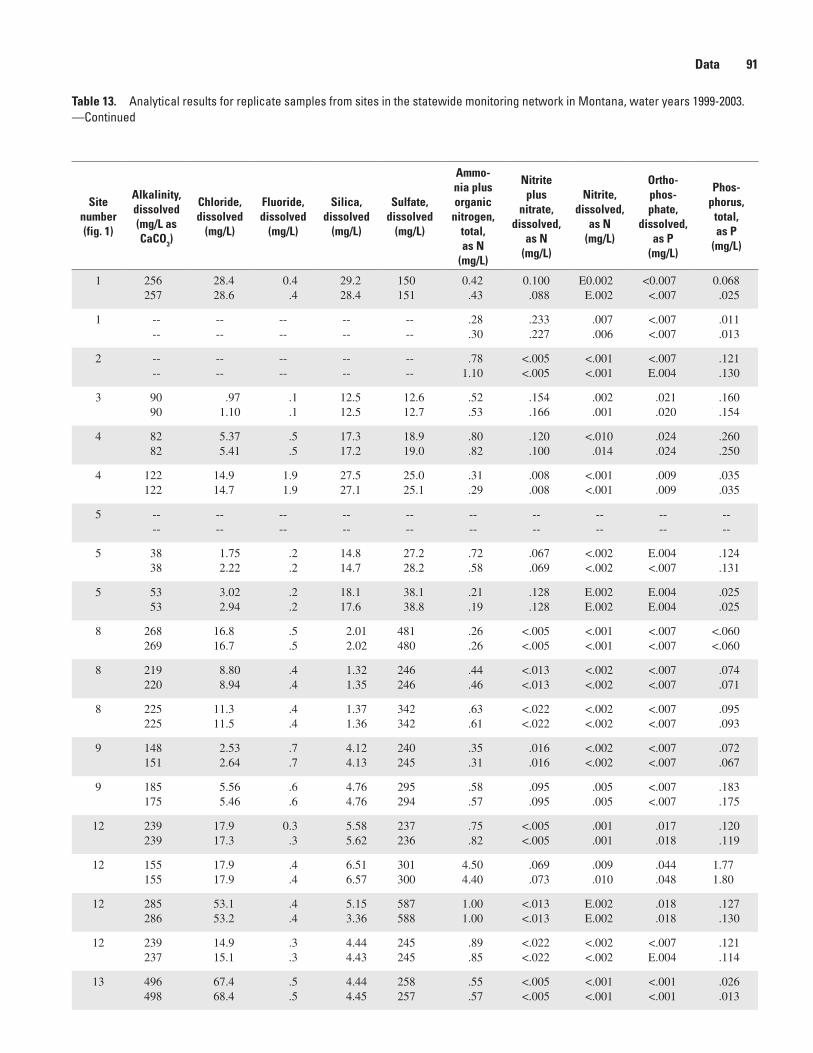
Site number (fig. 1)
Alkalinity, dissolved (mg/L as CaCO3)
Chloride, dissolved
(mg/L)
Fluoride, dissolved
(mg/L)
Silica, dissolved
(mg/L)
Sulfate, dissolved
(mg/L)
Ammo-nia plus organic
nitrogen, total, as N
(mg/L)
Nitrite plus
nitrate, dissolved,
as N (mg/L)
Nitrite, dissolved,
as N (mg/L)
Ortho- phos- phate,
dissolved, as P
(mg/L)
Phos- phorus,
total, as P
(mg/L)
1 256257
28.428.6
0.4.4
29.228.4
150151
0.42.43
0.100.088
E0.002E.002
<0.007<.007
0.068.025
1 ----
----
----
----
----
.28
.30.233.227
.007
.006<.007<.007
.011
.013
2 ----
----
----
----
----
.781.10
<.005<.005
<.001<.001
<.007E.004
.121
.130
3 9090
.971.10
.1
.112.512.5
12.612.7
.52
.53.154.166
.002
.001.021.020
.160
.154
4 8282
5.375.41
.5
.517.317.2
18.919.0
.80
.82.120.100
<.010.014
.024
.024.260.250
4 122122
14.914.7
1.91.9
27.527.1
25.025.1
.31
.29.008.008
<.001<.001
.009
.009.035.035
5 ----
----
----
----
----
----
----
----
----
----
5 3838
1.752.22
.2
.214.814.7
27.228.2
.72
.58.067.069
<.002<.002
E.004<.007
.124
.131
5 5353
3.022.94
.2
.218.117.6
38.138.8
.21
.19.128.128
E.002E.002
E.004E.004
.025
.025
8 268269
16.816.7
.5
.52.012.02
481480
.26
.26<.005<.005
<.001<.001
<.007<.007
<.060<.060
8 219220
8.808.94
.4
.41.321.35
246246
.44
.46<.013<.013
<.002<.002
<.007<.007
.074
.071
8 225225
11.311.5
.4
.41.371.36
342342
.63
.61<.022<.022
<.002<.002
<.007<.007
.095
.093
9 148151
2.532.64
.7
.74.124.13
240245
.35
.31.016.016
<.002<.002
<.007<.007
.072
.067
9 185175
5.565.46
.6
.64.764.76
295294
.58
.57.095.095
.005
.005<.007<.007
.183
.175
12 239239
17.917.3
0.3.3
5.585.62
237236
.75
.82<.005<.005
.001
.001.017.018
.120
.119
12 155155
17.917.9
.4
.46.516.57
301300
4.504.40
.069
.073.009.010
.044
.0481.771.80
12 285286
53.153.2
.4
.45.153.36
587588
1.001.00
<.013<.013
E.002E.002
.018
.018.127.130
12 239237
14.915.1
.3
.34.444.43
245245
.89
.85<.022<.022
<.002<.002
<.007E.004
.121
.114
13 496498
67.468.4
.5
.54.444.45
258257
.55
.57<.005<.005
<.001<.001
<.001<.001
.026
.013
Table 13. Analytical results for replicate samples from sites in the statewide monitoring network in Montana, water years 1999-2003. —Continued
Data 91
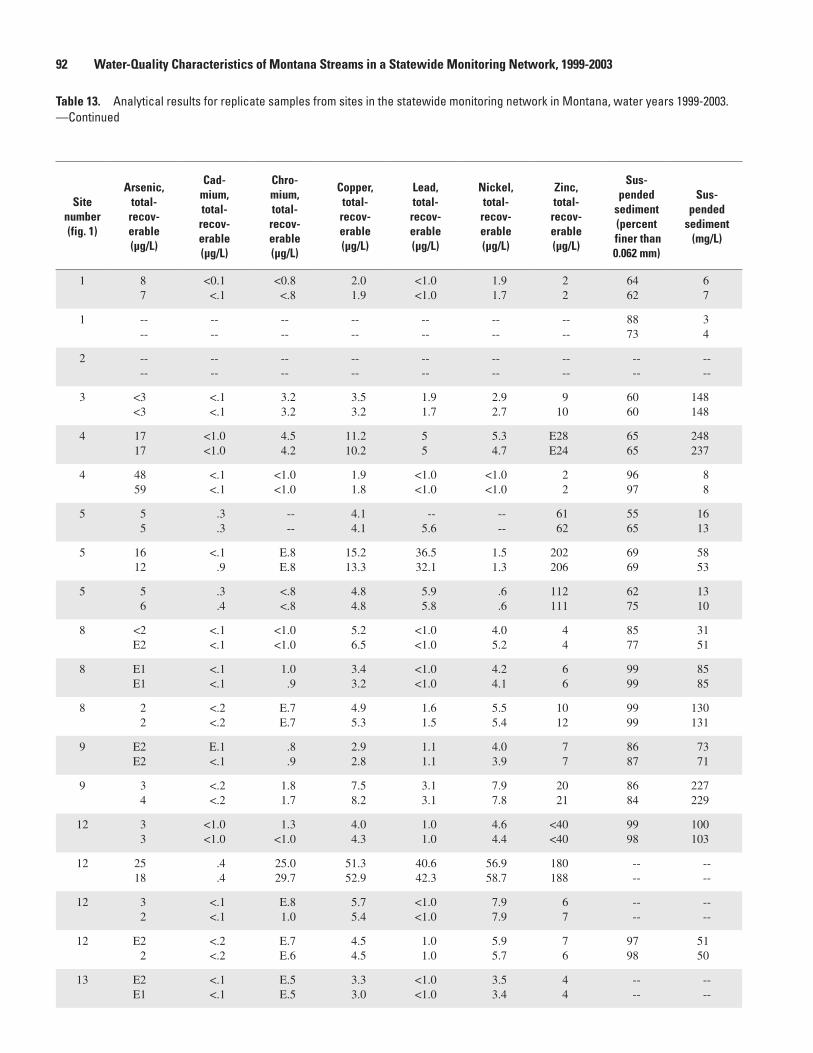
Site number (fig. 1)
Arsenic, total- recov- erable (µg/L)
Cad- mium, total- recov- erable (µg/L)
Chro- mium, total- recov- erable (µg/L)
Copper, total- recov- erable (µg/L)
Lead, total- recov- erable (µg/L)
Nickel, total- recov- erable (µg/L)
Zinc, total- recov- erable (µg/L)
Sus- pended
sediment (percent
finer than 0.0�2 mm)
Sus- pended
sediment (mg/L)
1 87
<0.1<.1
<0.8<.8
2.01.9
<1.0<1.0
1.91.7
22
6462
67
1 ----
----
----
----
----
----
----
8873
34
2 ----
----
----
----
----
----
----
----
----
3 <3<3
<.1<.1
3.23.2
3.53.2
1.91.7
2.92.7
910
6060
148148
4 1717
<1.0<1.0
4.54.2
11.210.2
55
5.34.7
E28E24
6565
248237
4 4859
<.1<.1
<1.0<1.0
1.91.8
<1.0<1.0
<1.0<1.0
22
9697
88
5 55
.3
.3----
4.14.1
--5.6
----
6162
5565
1613
5 1612
<.1.9
E.8E.8
15.213.3
36.532.1
1.51.3
202206
6969
5853
5 56
.3
.4<.8<.8
4.84.8
5.95.8
.6
.6112111
6275
1310
8 <2E2
<.1<.1
<1.0<1.0
5.26.5
<1.0<1.0
4.05.2
44
8577
3151
8 E1E1
<.1<.1
1.0.9
3.43.2
<1.0<1.0
4.24.1
66
9999
8585
8 22
<.2<.2
E.7E.7
4.95.3
1.61.5
5.55.4
1012
9999
130131
9 E2E2
E.1<.1
.8
.92.92.8
1.11.1
4.03.9
77
8687
7371
9 34
<.2<.2
1.81.7
7.58.2
3.13.1
7.97.8
2021
8684
227229
12 33
<1.0<1.0
1.3<1.0
4.04.3
1.01.0
4.64.4
<40<40
9998
100103
12 2518
.4
.425.029.7
51.352.9
40.642.3
56.958.7
180188
----
----
12 32
<.1<.1
E.81.0
5.75.4
<1.0<1.0
7.97.9
67
----
----
12 E22
<.2<.2
E.7E.6
4.54.5
1.01.0
5.95.7
76
9798
5150
13 E2E1
<.1<.1
E.5E.5
3.33.0
<1.0<1.0
3.53.4
44
----
----
92 Water-Quality Characteristics of Montana Streams in a Statewide Monitoring Network, 1999-2003
Table 13. Analytical results for replicate samples from sites in the statewide monitoring network in Montana, water years 1999-2003. —Continued

Site number (fig. 1)
Station number
Station name Date TimeCalcium, dissolved
(mg/L)
Magnesium, dissolved
(mg/L)
Potassium, dissolved
(mg/L)
Sodium, dissolved
(mg/L)
14 06185500 Missouri River near Culbertson
05/18/199905/18/1999
11001110
41.641.3
18.918.7
3.973.98
67.967.7
14 06185500 Missouri River near Culbertson
05/01/200005/01/2000
12151225
49.850.1
19.419.4
3.523.41
39.640.5
14 06185500 Missouri River near Culbertson
06/04/200106/04/2001
12301240
49.450.2
18.919.2
3.503.58
40.140.6
14 06185500 Missouri River near Culbertson
09/04/200109/04/2001
10301040
49.649.9
19.519.8
3.673.72
42.642.0
14 06185500 Missouri River near Culbertson
05/28/200205/28/2002
10301040
48.350.2
20.019.3
3.603.59
39.541.6
14 06185500 Missouri River near Culbertson
05/19/200305/19/2003
11151125
48.948.9
20.620.6
4.614.48
57.957.6
15 06192500 Yellowstone River near Livingston
08/18/199908/18/1999
08000810
12.912.5
4.494.35
2.702.89
11.911.4
16 06195600 Shields River near Livings-ton
08/09/200008/09/2000
10151020
----
----
----
----
17 06200000 Boulder River at Big Timber 08/23/200108/23/2001
11001110
----
----
----
----
18 06205000 Stillwater River near Absarokee
10/25/200110/25/2001
13401350
----
----
----
----
18 06205000 Stillwater River near Absarokee
09/08/200309/08/2003
08450855
----
----
----
----
19 06208500 Clarks Fork Yellowstone River at Edgar
05/21/200205/21/2002
10201030
14.314.4
3.343.34
.54
.545.055.08
19 06208500 Clarks Fork Yellowstone River at Edgar
06/05/200306/05/2003
08450855
15.515.4
3.873.84
.72
.715.925.89
20 06294500 Bighorn River near Bighorn 05/17/200105/17/2001
10001010
80.982.1
29.830.1
3.473.49
74.175.7
21 06296003 Rosebud Creek at mouth, near Rosebud
06/16/200006/16/2000
11251135
71.272.2
124126
25.125.6
340342
22 06308500 Tongue River at Miles City 06/15/199906/15/1999
09000910
27.627.7
13.813.9
2.212.28
14.014.0
23 06326500 Powder River near Locate 12/12/200212/12/2002
08300835
186190
84.787.0
9.339.43
352360
24 06329500 Yellowstone River near Sidney
06/10/199906/10/1999
08000810
32.032.4
11.611.7
2.352.34
32.332.5
24 06329500 Yellowstone River near Sidney
06/05/200006/05/2000
12001210
25.224.9
8.768.70
1.781.87
20.520.7
Data 93
Table 13. Analytical results for replicate samples from sites in the statewide monitoring network in Montana, water years 1999-2003. —Continued
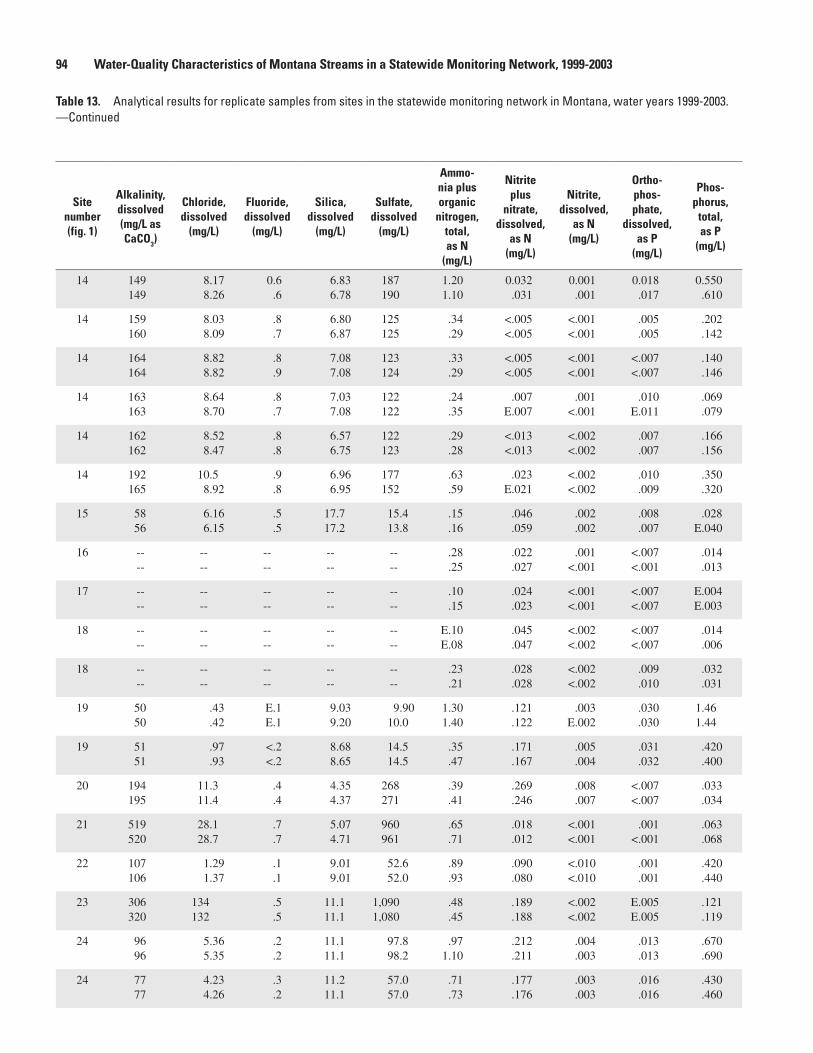
Site number (fig. 1)
Alkalinity, dissolved (mg/L as CaCO3)
Chloride, dissolved
(mg/L)
Fluoride, dissolved
(mg/L)
Silica, dissolved
(mg/L)
Sulfate, dissolved
(mg/L)
Ammo-nia plus organic
nitrogen, total, as N
(mg/L)
Nitrite plus
nitrate, dissolved,
as N (mg/L)
Nitrite, dissolved,
as N (mg/L)
Ortho- phos- phate,
dissolved, as P
(mg/L)
Phos- phorus,
total, as P
(mg/L)
14 149149
8.178.26
0.6.6
6.836.78
187190
1.201.10
0.032.031
0.001.001
0.018.017
0.550.610
14 159160
8.038.09
.8
.76.806.87
125125
.34
.29<.005<.005
<.001<.001
.005
.005.202.142
14 164164
8.828.82
.8
.97.087.08
123124
.33
.29<.005<.005
<.001<.001
<.007<.007
.140
.146
14 163163
8.648.70
.8
.77.037.08
122122
.24
.35.007
E.007.001
<.001.010
E.011.069.079
14 162162
8.528.47
.8
.86.576.75
122123
.29
.28<.013<.013
<.002<.002
.007
.007.166.156
14 192165
10.58.92
.9
.86.966.95
177152
.63
.59.023
E.021<.002<.002
.010
.009.350.320
15 5856
6.166.15
.5
.517.717.2
15.413.8
.15
.16.046.059
.002
.002.008.007
.028E.040
16 ----
----
----
----
----
.28
.25.022.027
.001<.001
<.007<.001
.014
.013
17 ----
----
----
----
----
.10
.15.024.023
<.001<.001
<.007<.007
E.004E.003
18 ----
----
----
----
----
E.10E.08
.045
.047<.002<.002
<.007<.007
.014
.006
18 ----
----
----
----
----
.23
.21.028.028
<.002<.002
.009
.010.032.031
19 5050
.43
.42E.1E.1
9.039.20
9.9010.0
1.301.40
.121
.122.003
E.002.030.030
1.461.44
19 5151
.97
.93<.2<.2
8.688.65
14.514.5
.35
.47.171.167
.005
.004.031.032
.420
.400
20 194195
11.311.4
.4
.44.354.37
268271
.39
.41.269.246
.008
.007<.007<.007
.033
.034
21 519520
28.128.7
.7
.75.074.71
960961
.65
.71.018.012
<.001<.001
.001<.001
.063
.068
22 107106
1.291.37
.1
.19.019.01
52.652.0
.89
.93.090.080
<.010<.010
.001
.001.420.440
23 306320
134132
.5
.511.111.1
1,0901,080
.48
.45.189.188
<.002<.002
E.005E.005
.121
.119
24 9696
5.365.35
.2
.211.111.1
97.898.2
.971.10
.212
.211.004.003
.013
.013.670.690
24 7777
4.234.26
.3
.211.211.1
57.057.0
.71
.73.177.176
.003
.003.016.016
.430
.460
9� Water-Quality Characteristics of Montana Streams in a Statewide Monitoring Network, 1999-2003
Table 13. Analytical results for replicate samples from sites in the statewide monitoring network in Montana, water years 1999-2003. —Continued
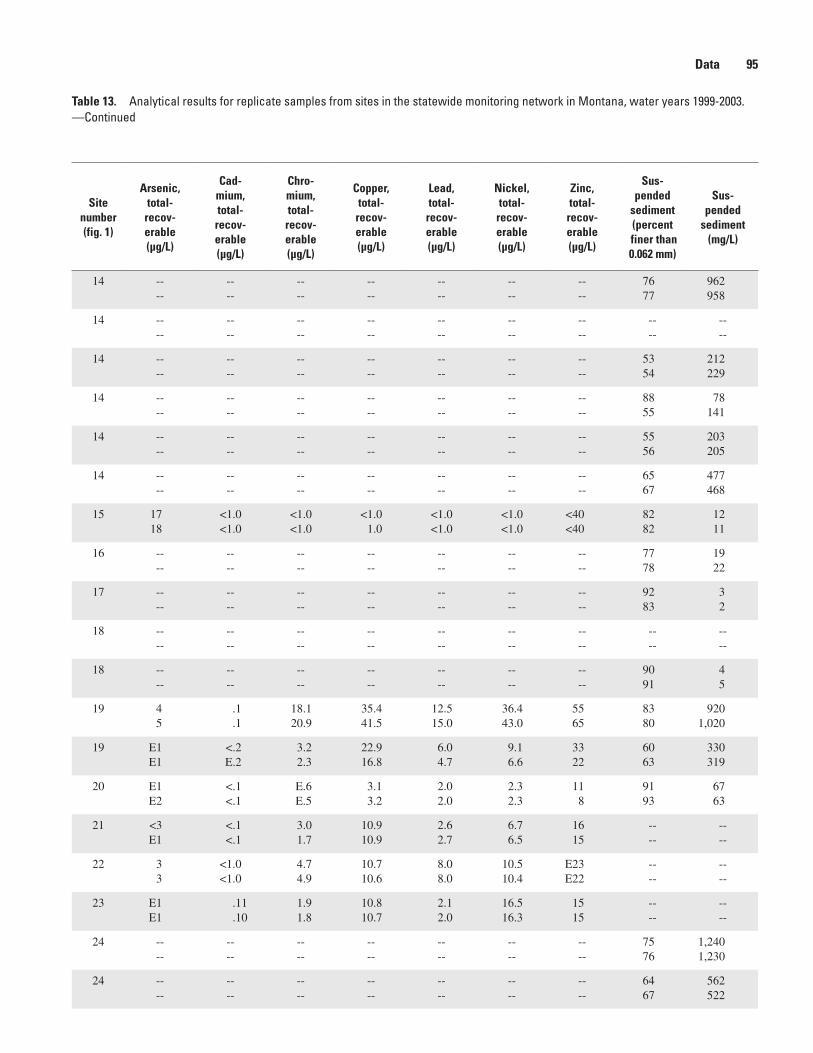
Site number (fig. 1)
Arsenic, total- recov- erable (µg/L)
Cad- mium, total- recov- erable (µg/L)
Chro- mium, total- recov- erable (µg/L)
Copper, total- recov- erable (µg/L)
Lead, total- recov- erable (µg/L)
Nickel, total- recov- erable (µg/L)
Zinc, total- recov- erable (µg/L)
Sus- pended
sediment (percent
finer than 0.0�2 mm)
Sus- pended
sediment (mg/L)
14 ----
----
----
----
----
----
----
7677
962958
14 ----
----
----
----
----
----
----
----
----
14 ----
----
----
----
----
----
----
5354
212229
14 ----
----
----
----
----
----
----
8855
78141
14 ----
----
----
----
----
----
----
5556
203205
14 ----
----
----
----
----
----
----
6567
477468
15 1718
<1.0<1.0
<1.0<1.0
<1.01.0
<1.0<1.0
<1.0<1.0
<40<40
8282
1211
16 ----
----
----
----
----
----
----
7778
1922
17 ----
----
----
----
----
----
----
9283
32
18 ----
----
----
----
----
----
----
----
----
18 ----
----
----
----
----
----
----
9091
45
19 45
.1
.118.120.9
35.441.5
12.515.0
36.443.0
5565
8380
9201,020
19 E1E1
<.2E.2
3.22.3
22.916.8
6.04.7
9.16.6
3322
6063
330319
20 E1E2
<.1<.1
E.6E.5
3.13.2
2.02.0
2.32.3
118
9193
6763
21 <3E1
<.1<.1
3.01.7
10.910.9
2.62.7
6.76.5
1615
----
----
22 33
<1.0<1.0
4.74.9
10.710.6
8.08.0
10.510.4
E23E22
----
----
23 E1E1
.11
.101.91.8
10.810.7
2.12.0
16.516.3
1515
----
----
24 ----
----
----
----
----
----
----
7576
1,2401,230
24 ----
----
----
----
----
----
----
6467
562522
Data 9�
Table 13. Analytical results for replicate samples from sites in the statewide monitoring network in Montana, water years 1999-2003. —Continued
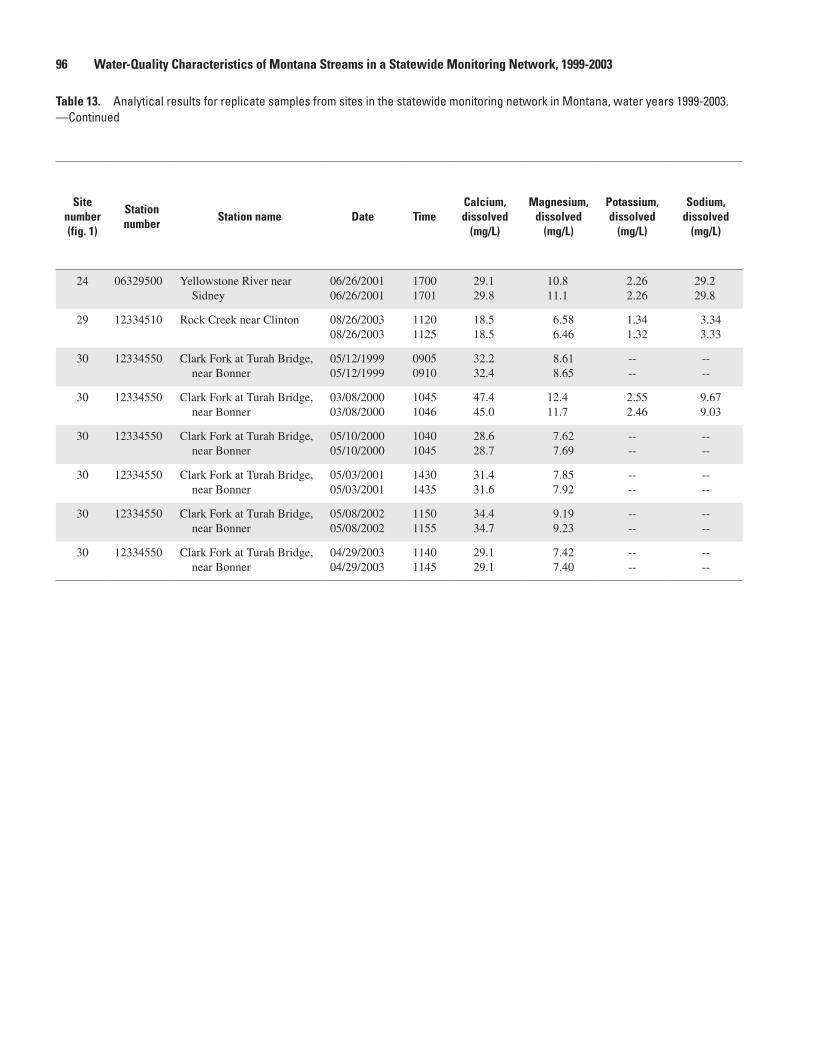
Site number (fig. 1)
Station number
Station name Date TimeCalcium, dissolved
(mg/L)
Magnesium, dissolved
(mg/L)
Potassium, dissolved
(mg/L)
Sodium, dissolved
(mg/L)
24 06329500 Yellowstone River near Sidney
06/26/200106/26/2001
17001701
29.129.8
10.811.1
2.262.26
29.229.8
29 12334510 Rock Creek near Clinton 08/26/200308/26/2003
11201125
18.518.5
6.586.46
1.341.32
3.343.33
30 12334550 Clark Fork at Turah Bridge, near Bonner
05/12/199905/12/1999
09050910
32.232.4
8.618.65
----
----
30 12334550 Clark Fork at Turah Bridge, near Bonner
03/08/200003/08/2000
10451046
47.445.0
12.411.7
2.552.46
9.679.03
30 12334550 Clark Fork at Turah Bridge, near Bonner
05/10/200005/10/2000
10401045
28.628.7
7.627.69
----
----
30 12334550 Clark Fork at Turah Bridge, near Bonner
05/03/200105/03/2001
14301435
31.431.6
7.857.92
----
----
30 12334550 Clark Fork at Turah Bridge, near Bonner
05/08/200205/08/2002
11501155
34.434.7
9.199.23
----
----
30 12334550 Clark Fork at Turah Bridge, near Bonner
04/29/200304/29/2003
11401145
29.129.1
7.427.40
----
----
9� Water-Quality Characteristics of Montana Streams in a Statewide Monitoring Network, 1999-2003
Table 13. Analytical results for replicate samples from sites in the statewide monitoring network in Montana, water years 1999-2003. —Continued

Site number (fig. 1)
Alkalinity, dissolved (mg/L as CaCO3)
Chloride, dissolved
(mg/L)
Fluoride, dissolved
(mg/L)
Silica, dissolved
(mg/L)
Sulfate, dissolved
(mg/L)
Ammo-nia plus organic
nitrogen, total, as N
(mg/L)
Nitrite plus
nitrate, dissolved,
as N (mg/L)
Nitrite, dissolved,
as N (mg/L)
Ortho- phos- phate,
dissolved, as P
(mg/L)
Phos- phorus,
total, as P
(mg/L)
24 9898
5.055.00
0.3.3
8.438.71
85.783.6
0.56.51
<0.050<.050
<0.006<.006
<0.02<.02
0.161.152
29 7474
.82
.80<.2<.2
10.010.1
4.204.20
.13
.12<.022<.022
<.002<.002
<.007<.007
.010
.010
30 ----
----
----
----
----
----
----
----
----
----
30 ----
3.623.68
.3
.414.513.6
53.854.0
.28
.28.028.025
.001<.001
.013
.013.043.043
30 ----
----
----
----
----
----
----
----
----
----
30 ----
----
----
----
----
----
----
----
----
----
30 ----
----
----
----
----
.22
.23<.013<.013
<.002<.002
E.006.007
.028
.026
30 ----
----
----
----
----
----
----
----
----
----
Data 9�
Table 13. Analytical results for replicate samples from sites in the statewide monitoring network in Montana, water years 1999-2003. —Continued

Site number (fig. 1)
Arsenic, total- recov- erable (µg/L)
Cad- mium, total- recov- erable (µg/L)
Chro- mium, total- recov- erable (µg/L)
Copper, total- recov- erable (µg/L)
Lead, total- recov- erable (µg/L)
Nickel, total- recov- erable (µg/L)
Zinc, total- recov- erable (µg/L)
Sus- pended
sediment (percent
finer than 0.0�2 mm)
Sus- pended
sediment (mg/L)
24 ----
----
----
----
----
----
----
----
241242
29 E1<2
<0.04<.04
<0.8<.8
0.8E.4
<0.06<.06
0.89.94
<2<2
8083
22
30 66
<1.0<1.0
----
12.612.4
2.02.0
----
<40<40
8482
1819
30 66
<.1<.1
<1.0<1.0
<20E10
2.02.0
<1.8<1.8
E22E28
8285
1413
30 34
<.1<.1
----
3.93.9
<1.0<1.0
----
67
7877
56
30 88
.1E.1
----
23.524.3
4.54.4
----
3635
7778
4446
30 44
<.1<.1
----
5.85.8
<1.0<1.0
----
99
8077
1011
30 77
.1
.1----
17.617.7
3.23.0
----
2726
6867
3129
9� Water-Quality Characteristics of Montana Streams in a Statewide Monitoring Network, 1999-2003
Table 13. Analytical results for replicate samples from sites in the statewide monitoring network in Montana, water years 1999-2003. —Continued

Table 1�. Analytical results for blank samples from sites in the statewide monitoring network in Montana, water years 1999-2003.
[Constituent concentrations that equal or exceed twice the laboratory reporting level are in bold print. Abbreviations: CaCO3, calcium carbonate; µg/L,
micrograms per liter; mg/L milligrams per liter; N, nitrogen; P, phosphorus. Symbols: <, less than laboratory reporting level; --, no data]
Date Time
Calcium, dis-
solved (mg/L)
Magne-sium, dis-
solved (mg/L)
Potas-sium, dis-
solved (mg/L)
Sodium, dis-
solved (mg/L)
Alka-linity,
labora-tory
(mg/L as
CaCO3)
Chloride, dis-
solved (mg/L)
Fluoride, dis-
solved (mg/L)
Silica, dis-
solved (mg/L)
Sulfate, dis-
solved (mg/L)
Ammo-nia plus organic
nitrogen, total, as N
(mg/L)
05/31/1999 1620 0.03 <0.004 <0.1 <0.06 1 <0.1 <0.1 <0.05 <0.1 0.1
06/22/1999 1730 <.02 .005 <.1 <.06 2 <.1 <.1 <.05 <.1 <.1
06/23/1999 0700 <.02 <.004 <.1 <.06 2 <.1 <.1 <.05 <.1 <.1
08/12/1999 0750 .07 .004 <.1 <.06 2 <.1 <.1 <.05 <.1 <.1
08/18/1999 1315 <.02 <.004 <.1 <.06 2 <.1 <.1 <.1 <.1 <.1
10/21/1999 0940 <.02 <.014 <.24 <.09 2 <.29 <.1 <.09 <.3 .35
11/03/1999 1700 .04 <.014 <.24 <.09 3 <.29 <.1 <.09 <.3 <.1
05/17/2000 0900 <.02 <.014 <.24 <.09 2 <.29 <.1 <.1 <.3 <.1
02/27/2001 1115 .02 <.008 <.09 <.06 2 <.08 <.2 <.5 <.1 <.08
06/05/2001 0630 <.02 <.008 <.09 <.06 1 <.08 <.2 <.09 <.1 <.08
06/11/2001 0945 <.01 <.008 <.09 <.06 <1 <.08 <.2 <.09 <.1 <.08
07/18/2001 0800 <.01 <.008 <.09 <.06 <1 .13 <.2 <.09 <.1 <.08
07/27/2001 0830 <.02 <.008 <.09 <.06 2 <.08 <.2 <.5 <.1 <.08
08/20/2001 1045 <.02 <.008 <.09 <.06 2 <.08 <.2 <.5 <.1 <.08
10/24/2001 1305 <.01 <.008 <.09 <.09 <1 <.3 <.1 <.13 <.1 <.08
04/09/2002 1500 <.01 <.008 <.1 <.09 <1 <.3 <.1 <.13 <.1 <.1
05/02/2002 1040 .01 <.008 <.1 <.09 <1 <.3 <.1 <.2 <.1 <.1
05/29/2002 1230 .05 <.008 <.1 <.09 1 .44 <.1 <.2 <.1 <.1
06/06/2002 1115 .06 .011 <.1 <.09 2 <.3 <.1 <.2 <.1 <.1
06/13/2002 0755 <.02 <.008 <.1 <.09 <1 <.3 <.1 <.2 <.1 <.1
07/17/2002 0815 .04 <.008 <.1 <.09 2 <.3 <.1 <.2 <.1 <.1
09/30/2002 1015 .02 <.008 <.1 <.09 2 <.3 <.1 <.2 <.1 <.1
03/13/2003 0915 <.02 <.008 -- -- -- -- -- -- -- <.1
04/01/2003 1152 .02 <.008 <.1 <.09 <2 <.2 .1 <.2 <.2 <.1
04/23/2003 0715 <.01 <.008 <.16 <.09 <2 <.2 .1 <.2 <.2 <.1
05/07/2003 1345 <.02 <.008 .1 <.09 2 <.2 <.17 <.2 <.2 <.1
05/13/2003 1300 -- -- -- -- -- -- -- -- -- <.1
05/20/2003 1510 <.01 <.008 <.16 <.09 <2 <.2 <.2 <.13 <.2 <.1
05/26/2003 2000 .02 <.008 <.16 <.09 <2 <.2 <.2 <.13 <.2 <.1
06/12/2003 1440 -- -- -- -- -- -- -- -- -- <.1
07/10/2003 0925 .02 <.008 <.16 <.1 <2 <.2 <.2 <.2 <.2 <.1
07/15/2003 1010 <.01 <.008 <.16 <.1 <2 <.2 <.2 <.2 <.2 <.1
09/03/2003 0830 .02 <.008 <.16 <.1 <2 <.2 <.2 <.2 <.2 <.1
Data 99
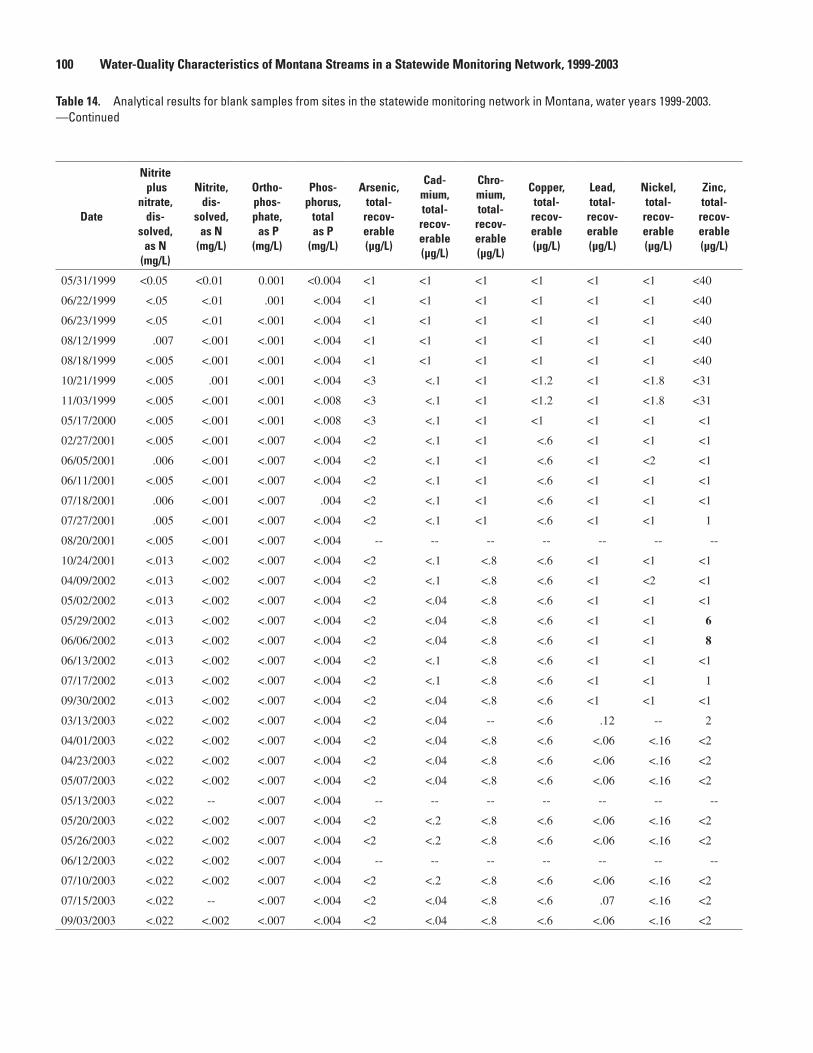
Date
Nitrite plus
nitrate, dis-
solved, as N
(mg/L)
Nitrite, dis-
solved, as N
(mg/L)
Ortho- phos- phate, as P
(mg/L)
Phos- phorus,
total as P
(mg/L)
Arsenic, total- recov- erable (µg/L)
Cad-mium, total- recov- erable (µg/L)
Chro-mium, total- recov- erable (µg/L)
Copper, total- recov- erable (µg/L)
Lead, total- recov- erable (µg/L)
Nickel, total- recov- erable (µg/L)
Zinc, total- recov- erable (µg/L)
05/31/1999 <0.05 <0.01 0.001 <0.004 <1 <1 <1 <1 <1 <1 <40
06/22/1999 <.05 <.01 .001 <.004 <1 <1 <1 <1 <1 <1 <40
06/23/1999 <.05 <.01 <.001 <.004 <1 <1 <1 <1 <1 <1 <40
08/12/1999 .007 <.001 <.001 <.004 <1 <1 <1 <1 <1 <1 <40
08/18/1999 <.005 <.001 <.001 <.004 <1 <1 <1 <1 <1 <1 <40
10/21/1999 <.005 .001 <.001 <.004 <3 <.1 <1 <1.2 <1 <1.8 <31
11/03/1999 <.005 <.001 <.001 <.008 <3 <.1 <1 <1.2 <1 <1.8 <31
05/17/2000 <.005 <.001 <.001 <.008 <3 <.1 <1 <1 <1 <1 <1
02/27/2001 <.005 <.001 <.007 <.004 <2 <.1 <1 <.6 <1 <1 <1
06/05/2001 .006 <.001 <.007 <.004 <2 <.1 <1 <.6 <1 <2 <1
06/11/2001 <.005 <.001 <.007 <.004 <2 <.1 <1 <.6 <1 <1 <1
07/18/2001 .006 <.001 <.007 .004 <2 <.1 <1 <.6 <1 <1 <1
07/27/2001 .005 <.001 <.007 <.004 <2 <.1 <1 <.6 <1 <1 1
08/20/2001 <.005 <.001 <.007 <.004 -- -- -- -- -- -- --
10/24/2001 <.013 <.002 <.007 <.004 <2 <.1 <.8 <.6 <1 <1 <1
04/09/2002 <.013 <.002 <.007 <.004 <2 <.1 <.8 <.6 <1 <2 <1
05/02/2002 <.013 <.002 <.007 <.004 <2 <.04 <.8 <.6 <1 <1 <1
05/29/2002 <.013 <.002 <.007 <.004 <2 <.04 <.8 <.6 <1 <1 6
06/06/2002 <.013 <.002 <.007 <.004 <2 <.04 <.8 <.6 <1 <1 8
06/13/2002 <.013 <.002 <.007 <.004 <2 <.1 <.8 <.6 <1 <1 <1
07/17/2002 <.013 <.002 <.007 <.004 <2 <.1 <.8 <.6 <1 <1 1
09/30/2002 <.013 <.002 <.007 <.004 <2 <.04 <.8 <.6 <1 <1 <1
03/13/2003 <.022 <.002 <.007 <.004 <2 <.04 -- <.6 .12 -- 2
04/01/2003 <.022 <.002 <.007 <.004 <2 <.04 <.8 <.6 <.06 <.16 <2
04/23/2003 <.022 <.002 <.007 <.004 <2 <.04 <.8 <.6 <.06 <.16 <2
05/07/2003 <.022 <.002 <.007 <.004 <2 <.04 <.8 <.6 <.06 <.16 <2
05/13/2003 <.022 -- <.007 <.004 -- -- -- -- -- -- --
05/20/2003 <.022 <.002 <.007 <.004 <2 <.2 <.8 <.6 <.06 <.16 <2
05/26/2003 <.022 <.002 <.007 <.004 <2 <.2 <.8 <.6 <.06 <.16 <2
06/12/2003 <.022 <.002 <.007 <.004 -- -- -- -- -- -- --
07/10/2003 <.022 <.002 <.007 <.004 <2 <.2 <.8 <.6 <.06 <.16 <2
07/15/2003 <.022 -- <.007 <.004 <2 <.04 <.8 <.6 .07 <.16 <2
09/03/2003 <.022 <.002 <.007 <.004 <2 <.04 <.8 <.6 <.06 <.16 <2
100 Water-Quality Characteristics of Montana Streams in a Statewide Monitoring Network, 1999-2003
Table 1�. Analytical results for blank samples from sites in the statewide monitoring network in Montana, water years 1999-2003. —Continued

Tabl
e 1�
. St
atis
tical
sum
mar
y of
wat
er-q
ualit
y da
ta fo
r per
iodi
cally
col
lect
ed s
ampl
es fr
om s
ites
in th
e st
atew
ide
mon
itorin
g ne
twor
k in
Mon
tana
, wat
er y
ears
199
9-20
03.
[Num
ber
afte
r st
atio
n na
me
refe
rs to
site
num
ber
on f
igur
e 1.
Abb
revi
atio
ns:
ft3 /
s, c
ubic
fee
t per
sec
ond;
o C, d
egre
es C
elsi
us; E
, est
imat
ed; µ
g/L
, mic
rogr
ams
per
liter
; µS/
cm, m
icro
siem
ens
per
cent
imet
er a
t 25
o C; m
g/L
, mill
igra
ms
per
liter
; mm
, mill
imet
er.
Sym
bols
: <
, les
s th
an la
bora
tory
rep
ortin
g le
vel;
--, i
ndic
ates
insu
ffic
ient
dat
a gr
eate
r th
an th
e la
bora
tory
rep
ortin
g le
vel t
o co
mpu
te s
tatis
tic.
Not
e: A
ll da
ta
wer
e us
ed in
this
sta
tistic
al s
umm
ary;
sel
ecte
d ce
nsor
ed v
alue
s w
ith h
igh
labo
rato
ry r
epor
ting
leve
ls w
ere
rem
oved
fro
m s
ome
boxp
lot d
ata
sets
to p
rovi
de m
ore
repr
esen
tativ
e co
mpa
riso
ns a
mon
g si
tes.
Con
se-
quen
tly, s
ome
perc
entil
e va
lues
in b
oxpl
ots
do n
ot m
atch
thos
e in
this
tabl
e. V
aryi
ng p
reci
sion
of
perc
entil
e va
lues
for
som
e co
nstit
uent
s re
sults
fro
m v
aryi
ng la
bora
tory
rep
ortin
g le
vels
dur
ing
1999
-200
3]
Stre
am p
rope
rtie
s, c
onst
ituen
ts, a
nd u
nits
of m
easu
re
Des
crip
tive
stat
istic
sPe
rcen
t of s
ampl
es in
whi
ch v
alue
s w
ere
le
ss th
an o
r equ
al to
thos
e sh
own
Num
ber
of s
ampl
esM
axim
umM
inim
umM
ean
(Med
ian)
9���
�02�
�
Mis
sour
i Riv
er b
asin
060
1850
0 Be
aver
head
Riv
er n
ear T
win
Brid
ges
(site
1)
Stre
amfl
ow, i
nsta
ntan
eous
(ft
3 /s)
2080
660
257
798
387
170
104
61
pH, o
nsite
(st
anda
rd u
nits
)20
8.6
7.8
8.4
8.6
8.5
8.4
8.2
7.8
Spec
ific
con
duct
ance
, ons
ite (
µS/c
m)
2081
657
069
781
674
670
861
657
1
Tem
pera
ture
, wat
er o C
2021
.52.
512
.521
.516
.012
.59.
02.
5
Har
dnes
s, to
tal (
mg/
L a
s C
aCO
3)10
370
250
321
370
362
315
298
250
Cal
cium
, dis
solv
ed (
mg/
L)
1088
.262
.375
.488
.278
.375
.271
.862
.3
Mag
nesi
um, d
isso
lved
(m
g/L
)10
43.5
23.0
31.8
43.5
37.2
31.4
27.4
23.0
Pota
ssiu
m, d
isso
lved
(m
g/L
)10
8.89
4.84
7.13
8.89
7.97
7.20
6.42
4.84
Sodi
um a
dsor
ptio
n ra
tio10
.9.6
.7.9
.8.7
.7.6
Sodi
um, d
isso
lved
(m
g/L
)10
38.0
23.1
30.6
38.0
33.1
30.2
28.3
23.1
Alk
alin
ity, d
isso
lved
(m
g/L
as
CaC
O3)
1026
420
323
426
424
923
022
120
3
Chl
orid
e, d
isso
lved
(m
g/L
)10
30.3
15.6
23.1
30.3
26.4
23.7
18.8
15.6
Fluo
ride
, dis
solv
ed (
mg/
L)
10.6
.4.5
.6.6
.5.4
.4
Silic
a, d
isso
lved
(m
g/L
)10
30.4
18.5
24.3
30.4
29.0
24.6
20.0
18.5
Sulf
ate,
dis
solv
ed (
mg/
L)
1015
087
.812
015
014
212
294
.187
.8
Dis
solv
ed s
olid
s (s
um o
f co
nstit
uent
s) (
mg/
L)
1053
637
545
453
649
245
141
237
5
Am
mon
ia p
lus
orga
nic
nitr
ogen
, tot
al (
mg/
L a
s ni
trog
en)
201.
3<
.11 .5
0.9
0.5
0.4
0.4
0<
.1
Nitr
ite p
lus
nitr
ate,
dis
solv
ed (
mg/
L a
s ni
trog
en)
20.7
84.0
06.3
00.7
80.4
79.2
67.0
86.0
06
Nitr
ite, d
isso
lved
(m
g/L
as
nitr
ogen
)20
.013
<.0
011 .0
05.0
11.0
06.0
04.0
02<
.001
Nitr
ogen
, tot
al (
mg/
L, c
alcu
late
d)20
1.60
.320
.796
1.59
1.08
.682
.504
.353
Ort
hoph
osph
ate,
dis
solv
ed (
mg/
L a
s ph
osph
orus
)20
.033
<.0
011 .0
05.0
14.0
06<
.007
<.0
07<
.001
Phos
phor
us, t
otal
(m
g/L
)19
.280
.007
.057
.280
.068
.041
.018
.007
Ars
enic
, tot
al-r
ecov
erab
le (
µg/L
)10
85
68
76
65
Data 101
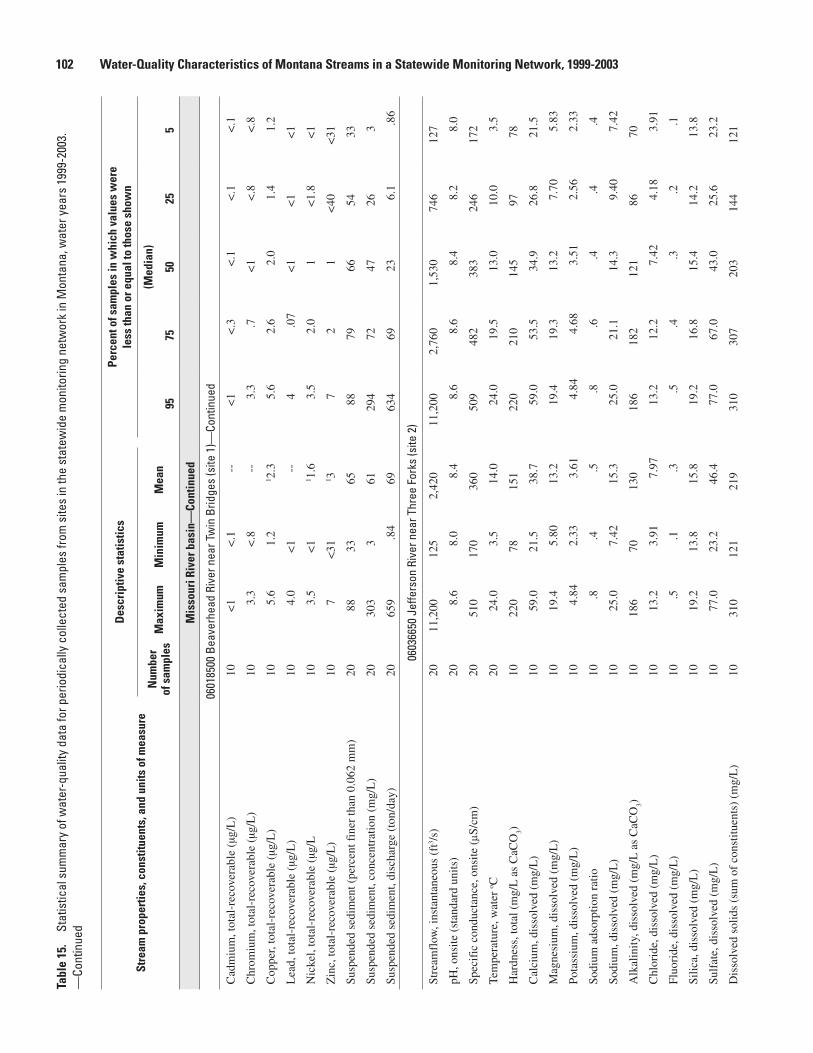
Stre
am p
rope
rtie
s, c
onst
ituen
ts, a
nd u
nits
of m
easu
re
Des
crip
tive
stat
istic
sPe
rcen
t of s
ampl
es in
whi
ch v
alue
s w
ere
le
ss th
an o
r equ
al to
thos
e sh
own
Num
ber
of s
ampl
esM
axim
umM
inim
umM
ean
(Med
ian)
9���
�02�
�
Mis
sour
i Riv
er b
asin
—Co
ntin
ued
060
1850
0 Be
aver
head
Riv
er n
ear T
win
Brid
ges
(site
1)—
Cont
inue
d
Cad
miu
m, t
otal
-rec
over
able
(µg
/L)
10<
1<
.1--
<1
<.3
<.1
<.1
<.1
Chr
omiu
m, t
otal
-rec
over
able
(µg
/L)
103.
3<
.8--
3.3
.7<
1<
.8<
.8
Cop
per,
tota
l-re
cove
rabl
e (µ
g/L
)10
5.6
1.2
1 2.3
5.6
2.6
2.0
1.4
1.2
Lea
d, to
tal-
reco
vera
ble
(µg/
L)
104.
0<
1--
4.0
7<
1<
1<
1
Nic
kel,
tota
l-re
cove
rabl
e (µ
g/L
103.
5<
11 1
.63.
52.
01
<1.
8<
1
Zin
c, to
tal-
reco
vera
ble
(µg/
L)
107
<31
1 37
21
<40
<31
Susp
ende
d se
dim
ent (
perc
ent f
iner
than
0.0
62 m
m)
2088
3365
8879
6654
33
Susp
ende
d se
dim
ent,
conc
entr
atio
n (m
g/L
)20
303
361
294
7247
263
Susp
ende
d se
dim
ent,
disc
harg
e (t
on/d
ay)
2065
9.8
469
634
6923
6.1
.86
0603
6650
Jef
fers
on R
iver
nea
r Thr
ee F
orks
(site
2)
Stre
amfl
ow, i
nsta
ntan
eous
(ft
3 /s)
2011
,200
125
2,42
011
,200
2,76
01,
530
746
127
pH, o
nsite
(st
anda
rd u
nits
)20
8.6
8.0
8.4
8.6
8.6
8.4
8.2
8.0
Spec
ific
con
duct
ance
, ons
ite (
µS/c
m)
2051
017
036
050
948
238
324
617
2
Tem
pera
ture
, wat
er o C
2024
.03.
514
.024
.019
.513
.010
.03.
5
Har
dnes
s, to
tal (
mg/
L a
s C
aCO
3)10
220
7815
122
021
014
597
78
Cal
cium
, dis
solv
ed (
mg/
L)
1059
.021
.538
.759
.053
.534
.926
.821
.5
Mag
nesi
um, d
isso
lved
(m
g/L
)10
19.4
5.80
13.2
19.4
19.3
13.2
7.70
5.83
Pota
ssiu
m, d
isso
lved
(m
g/L
)10
4.84
2.33
3.61
4.84
4.68
3.51
2.56
2.33
Sodi
um a
dsor
ptio
n ra
tio10
.8.4
.5.8
.6.4
.4.4
Sodi
um, d
isso
lved
(m
g/L
)10
25.0
7.42
15.3
25.0
21.1
14.3
9.40
7.42
Alk
alin
ity, d
isso
lved
(m
g/L
as
CaC
O3)
1018
670
130
186
182
121
8670
Chl
orid
e, d
isso
lved
(m
g/L
)10
13.2
3.91
7.97
13.2
12.2
7.42
4.18
3.91
Fluo
ride
, dis
solv
ed (
mg/
L)
10.5
.1.3
.5.4
.3.2
.1
Silic
a, d
isso
lved
(m
g/L
)10
19.2
13.8
15.8
19.2
16.8
15.4
14.2
13.8
Sulf
ate,
dis
solv
ed (
mg/
L)
1077
.023
.246
.477
.067
.043
.025
.623
.2
Dis
solv
ed s
olid
s (s
um o
f co
nstit
uent
s) (
mg/
L)
1031
012
121
931
030
720
314
412
1
102 Water-Quality Characteristics of Montana Streams in a Statewide Monitoring Network, 1999-2003Ta
ble
1�.
Stat
istic
al s
umm
ary
of w
ater
-qua
lity
data
for p
erio
dica
lly c
olle
cted
sam
ples
from
site
s in
the
stat
ewid
e m
onito
ring
netw
ork
in M
onta
na, w
ater
yea
rs 1
999-
2003
. —
Cont
inue
d
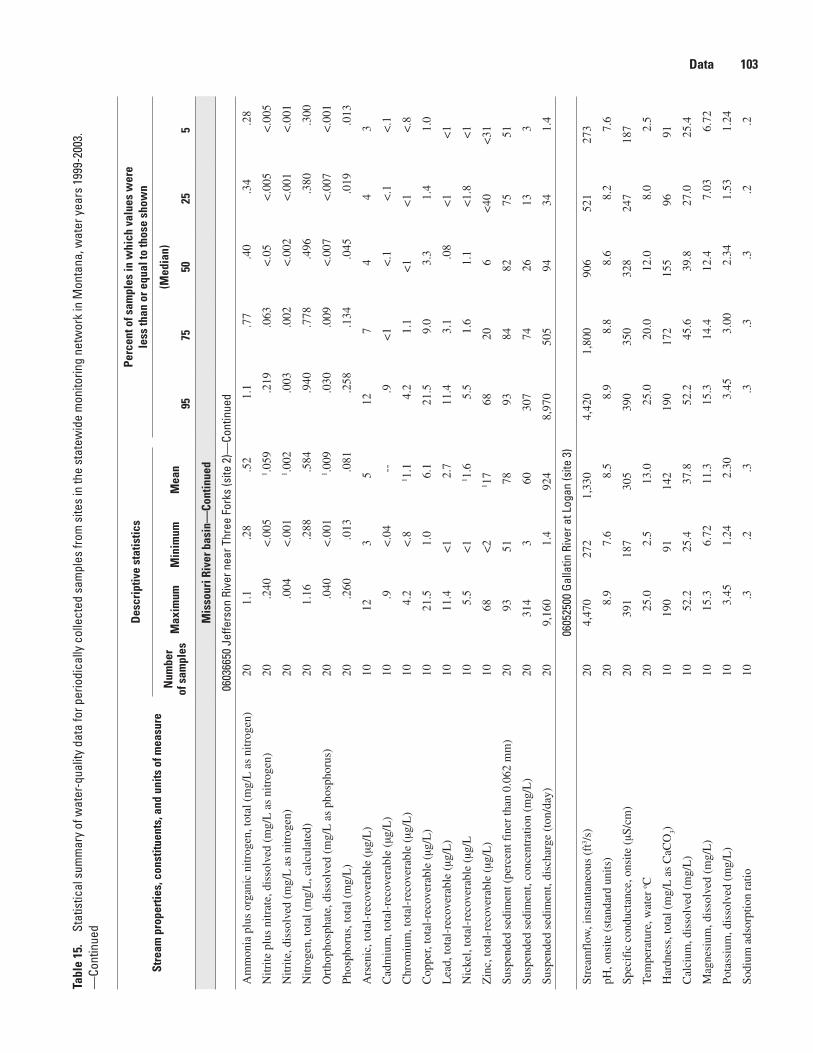
Stre
am p
rope
rtie
s, c
onst
ituen
ts, a
nd u
nits
of m
easu
re
Des
crip
tive
stat
istic
sPe
rcen
t of s
ampl
es in
whi
ch v
alue
s w
ere
le
ss th
an o
r equ
al to
thos
e sh
own
Num
ber
of s
ampl
esM
axim
umM
inim
umM
ean
(Med
ian)
9���
�02�
�
Mis
sour
i Riv
er b
asin
—Co
ntin
ued
0603
6650
Jef
fers
on R
iver
nea
r Thr
ee F
orks
(site
2)—
Cont
inue
d
Am
mon
ia p
lus
orga
nic
nitr
ogen
, tot
al (
mg/
L a
s ni
trog
en)
201.
1.2
8.5
21.
1.7
7.4
0.3
4.2
8
Nitr
ite p
lus
nitr
ate,
dis
solv
ed (
mg/
L a
s ni
trog
en)
20.2
40<
.005
1 .059
.219
.063
<.0
5<
.005
<.0
05
Nitr
ite, d
isso
lved
(m
g/L
as
nitr
ogen
)20
.004
<.0
011 .0
02.0
03.0
02<
.002
<.0
01<
.001
Nitr
ogen
, tot
al (
mg/
L, c
alcu
late
d)20
1.16
.288
.584
.940
.778
.496
.380
.300
Ort
hoph
osph
ate,
dis
solv
ed (
mg/
L a
s ph
osph
orus
)20
.040
<.0
011 .0
09.0
30.0
09<
.007
<.0
07<
.001
Phos
phor
us, t
otal
(m
g/L
)20
.260
.013
.081
.258
.134
.045
.019
.013
Ars
enic
, tot
al-r
ecov
erab
le (
µg/L
)10
123
512
74
43
Cad
miu
m, t
otal
-rec
over
able
(µg
/L)
10.9
<.0
4--
.9<
1<
.1<
.1<
.1
Chr
omiu
m, t
otal
-rec
over
able
(µg
/L)
104.
2<
.81 1
.14.
21.
1<
1<
1<
.8
Cop
per,
tota
l-re
cove
rabl
e (µ
g/L
)10
21.5
1.0
6.1
21.5
9.0
3.3
1.4
1.0
Lea
d, to
tal-
reco
vera
ble
(µg/
L)
1011
.4<
12.
711
.43.
1.0
8<
1<
1
Nic
kel,
tota
l-re
cove
rabl
e (µ
g/L
105.
5<
11 1
.65.
51.
61.
1<
1.8
<1
Zin
c, to
tal-
reco
vera
ble
(µg/
L)
1068
<2
1 17
6820
6<
40<
31
Susp
ende
d se
dim
ent (
perc
ent f
iner
than
0.0
62 m
m)
2093
5178
9384
8275
51
Susp
ende
d se
dim
ent,
conc
entr
atio
n (m
g/L
)20
314
360
307
7426
133
Susp
ende
d se
dim
ent,
disc
harg
e (t
on/d
ay)
209,
160
1.4
924
8,97
050
594
341.
4
0605
2500
Gal
latin
Riv
er a
t Log
an (s
ite 3
)
Stre
amfl
ow, i
nsta
ntan
eous
(ft
3 /s)
204,
470
272
1,33
04,
420
1,80
090
652
127
3
pH, o
nsite
(st
anda
rd u
nits
)20
8.9
7.6
8.5
8.9
8.8
8.6
8.2
7.6
Spec
ific
con
duct
ance
, ons
ite (
µS/c
m)
2039
118
730
539
035
032
824
718
7
Tem
pera
ture
, wat
er o C
2025
.02.
513
.025
.020
.012
.08.
02.
5
Har
dnes
s, to
tal (
mg/
L a
s C
aCO
3)10
190
9114
219
017
215
596
91
Cal
cium
, dis
solv
ed (
mg/
L)
1052
.225
.437
.852
.245
.639
.827
.025
.4
Mag
nesi
um, d
isso
lved
(m
g/L
)10
15.3
6.72
11.3
15.3
14.4
12.4
7.03
6.72
Pota
ssiu
m, d
isso
lved
(m
g/L
)10
3.45
1.24
2.30
3.45
3.00
2.34
1.53
1.24
Sodi
um a
dsor
ptio
n ra
tio10
.3.2
.3.3
.3.3
.2.2
Data 103Ta
ble
1�.
Stat
istic
al s
umm
ary
of w
ater
-qua
lity
data
for p
erio
dica
lly c
olle
cted
sam
ples
from
site
s in
the
stat
ewid
e m
onito
ring
netw
ork
in M
onta
na, w
ater
yea
rs 1
999-
2003
. —
Cont
inue
d
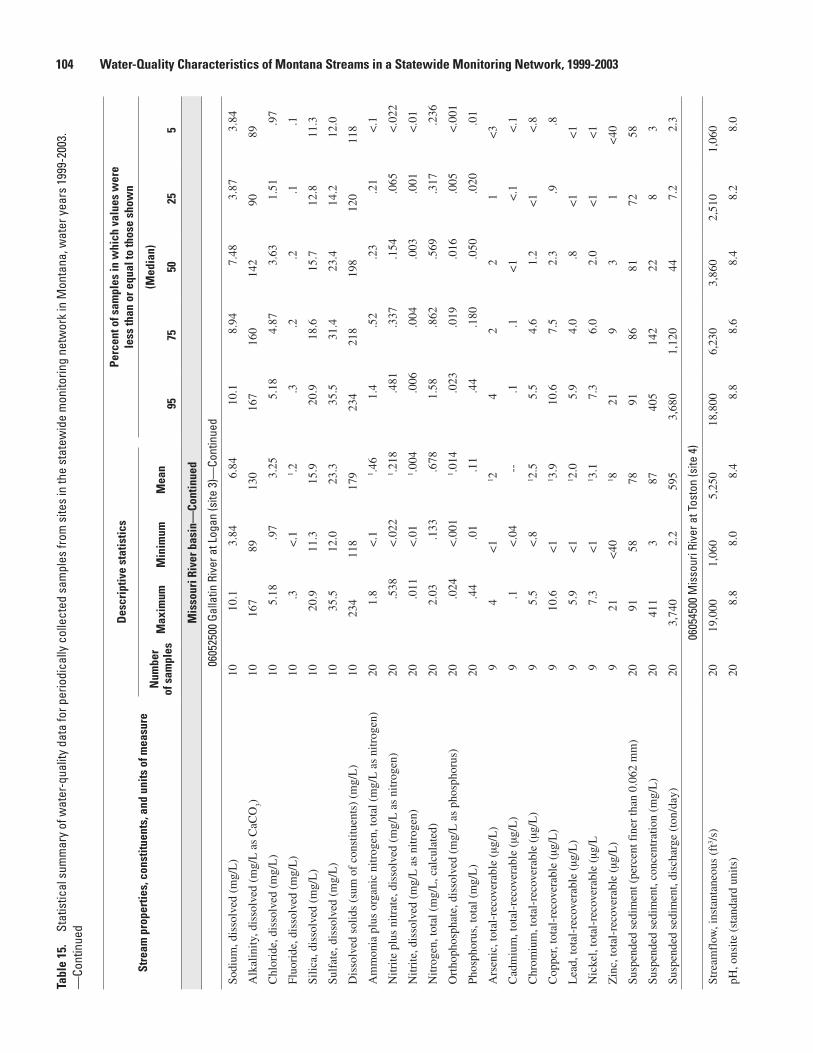
Stre
am p
rope
rtie
s, c
onst
ituen
ts, a
nd u
nits
of m
easu
re
Des
crip
tive
stat
istic
sPe
rcen
t of s
ampl
es in
whi
ch v
alue
s w
ere
le
ss th
an o
r equ
al to
thos
e sh
own
Num
ber
of s
ampl
esM
axim
umM
inim
umM
ean
(Med
ian)
9���
�02�
�
Mis
sour
i Riv
er b
asin
—Co
ntin
ued
0605
2500
Gal
latin
Riv
er a
t Log
an (s
ite 3
)—Co
ntin
ued
Sodi
um, d
isso
lved
(m
g/L
)10
10.1
3.84
6.84
10.1
8.94
7.48
3.87
3.84
Alk
alin
ity, d
isso
lved
(m
g/L
as
CaC
O3)
1016
789
130
167
160
142
9089
Chl
orid
e, d
isso
lved
(m
g/L
)10
5.18
.97
3.25
5.18
4.87
3.63
1.51
.97
Fluo
ride
, dis
solv
ed (
mg/
L)
10.3
<.1
1 .2.3
.2.2
.1.1
Silic
a, d
isso
lved
(m
g/L
)10
20.9
11.3
15.9
20.9
18.6
15.7
12.8
11.3
Sulf
ate,
dis
solv
ed (
mg/
L)
1035
.512
.023
.335
.531
.423
.414
.212
.0
Dis
solv
ed s
olid
s (s
um o
f co
nstit
uent
s) (
mg/
L)
1023
411
817
923
421
819
812
011
8
Am
mon
ia p
lus
orga
nic
nitr
ogen
, tot
al (
mg/
L a
s ni
trog
en)
201.
8<
.11 .4
61.
4.5
2.2
3.2
1<
.1
Nitr
ite p
lus
nitr
ate,
dis
solv
ed (
mg/
L a
s ni
trog
en)
20.5
38<
.022
1 .218
.481
.337
.154
.065
<.0
22
Nitr
ite, d
isso
lved
(m
g/L
as
nitr
ogen
)20
.011
<.0
11 .0
04.0
06.0
04.0
03.0
01<
.01
Nitr
ogen
, tot
al (
mg/
L, c
alcu
late
d)20
2.03
.133
.678
1.58
.862
.569
.317
.236
Ort
hoph
osph
ate,
dis
solv
ed (
mg/
L a
s ph
osph
orus
)20
.024
<.0
011 .0
14.0
23.0
19.0
16.0
05<
.001
Phos
phor
us, t
otal
(m
g/L
)20
.44
.01
.11
.44
.180
.050
.020
.01
Ars
enic
, tot
al-r
ecov
erab
le (
µg/L
)9
4<
11 2
42
21
<3
Cad
miu
m, t
otal
-rec
over
able
(µg
/L)
9.1
<.0
4--
.1.1
<1
<.1
<.1
Chr
omiu
m, t
otal
-rec
over
able
(µg
/L)
95.
5<
.81 2
.55.
54.
61.
2<
1<
.8
Cop
per,
tota
l-re
cove
rabl
e (µ
g/L
)9
10.6
<1
1 3.9
10.6
7.5
2.3
.9.8
Lea
d, to
tal-
reco
vera
ble
(µg/
L)
95.
9<
11 2
.05.
94.
0.8
<1
<1
Nic
kel,
tota
l-re
cove
rabl
e (µ
g/L
97.
3<
11 3
.17.
36.
02.
0<
1<
1
Zin
c, to
tal-
reco
vera
ble
(µg/
L)
921
<40
1 821
93
1<
40
Susp
ende
d se
dim
ent (
perc
ent f
iner
than
0.0
62 m
m)
2091
5878
9186
8172
58
Susp
ende
d se
dim
ent,
conc
entr
atio
n (m
g/L
)20
411
387
405
142
228
3
Susp
ende
d se
dim
ent,
disc
harg
e (t
on/d
ay)
203,
740
2.2
595
3,68
01,
120
447.
22.
3
0605
4500
Mis
sour
i Riv
er a
t Tos
ton
(site
4)
Stre
amfl
ow, i
nsta
ntan
eous
(ft
3 /s)
2019
,000
1,06
05,
250
18,8
006,
230
3,86
02,
510
1,06
0
pH, o
nsite
(st
anda
rd u
nits
)20
8.8
8.0
8.4
8.8
8.6
8.4
8.2
8.0
10� Water-Quality Characteristics of Montana Streams in a Statewide Monitoring Network, 1999-2003Ta
ble
1�.
Stat
istic
al s
umm
ary
of w
ater
-qua
lity
data
for p
erio
dica
lly c
olle
cted
sam
ples
from
site
s in
the
stat
ewid
e m
onito
ring
netw
ork
in M
onta
na, w
ater
yea
rs 1
999-
2003
. —
Cont
inue
d

Tabl
e 1�
. St
atis
tical
sum
mar
y of
wat
er-q
ualit
y da
ta fo
r per
iodi
cally
col
lect
ed s
ampl
es fr
om s
ites
in th
e st
atew
ide
mon
itorin
g ne
twor
k in
Mon
tana
, wat
er y
ears
199
9-20
03.
—Co
ntin
ued
Stre
am p
rope
rtie
s, c
onst
ituen
ts, a
nd u
nits
of m
easu
re
Des
crip
tive
stat
istic
sPe
rcen
t of s
ampl
es in
whi
ch v
alue
s w
ere
le
ss th
an o
r equ
al to
thos
e sh
own
Num
ber
of s
ampl
esM
axim
umM
inim
umM
ean
(Med
ian)
9���
�02�
�
Mis
sour
i Riv
er b
asin
—Co
ntin
ued
0605
4500
Mis
sour
i Riv
er a
t Tos
ton
(site
4)—
Cont
inue
d
Spec
ific
con
duct
ance
, ons
ite (
µS/c
m)
2038
919
331
038
934
731
328
219
4
Tem
pera
ture
, wat
er o C
2024
.52.
514
.524
.521
.513
.010
.02.
5
Har
dnes
s, to
tal (
mg/
L a
s C
aCO
3)10
160
8411
416
014
011
091
84
Cal
cium
, dis
solv
ed (
mg/
L)
1042
.123
.130
.542
.135
.428
.825
.423
.1
Mag
nesi
um, d
isso
lved
(m
g/L
)10
12.3
6.26
9.29
12.3
12.1
8.98
6.94
6.26
Pota
ssiu
m, d
isso
lved
(m
g/L
)10
4.25
2.38
3.27
4.25
3.78
3.24
2.63
2.38
Sodi
um a
dsor
ptio
n ra
tio10
1.5
.81
.9.7
.6.5
Sodi
um, d
isso
lved
(m
g/L
)10
26.3
10.2
18.9
26.3
25.6
18.4
14.3
10.2
Alk
alin
ity, d
isso
lved
(m
g/L
as
CaC
O3)
1014
782
117
147
138
118
9582
Chl
orid
e, d
isso
lved
(m
g/L
)10
15.3
5.37
10.3
15.3
14.5
9.3
7.78
5.37
Fluo
ride
, dis
solv
ed (
mg/
L)
101.
9.5
1.2
1.9
1.6
1.0
.9.5
Silic
a, d
isso
lved
(m
g/L
)10
27.5
17.3
22.3
27.5
24.8
22.1
19.7
17.3
Sulf
ate,
dis
solv
ed (
mg/
L)
1037
.816
.025
.737
.833
.324
.618
.816
.0
Dis
solv
ed s
olid
s (s
um o
f co
nstit
uent
s) (
mg/
L)
1024
413
419
224
421
920
015
313
4
Am
mon
ia p
lus
orga
nic
nitr
ogen
, tot
al (
mg/
L a
s ni
trog
en)
20.8
7.2
3.4
1.8
7.5
6.3
2.2
5.2
3
Nitr
ite p
lus
nitr
ate,
dis
solv
ed (
mg/
L a
s ni
trog
en)
19.1
72<
.05
1 .070
.172
.121
.057
.014
.008
Nitr
ite, d
isso
lved
(m
g/L
as
nitr
ogen
)19
.005
<.0
011 .0
02.0
05.0
02.0
02<
.01
<.0
01
Nitr
ogen
, tot
al (
mg/
L, c
alcu
late
d)19
.942
.265
.485
.922
.586
.388
.339
.265
Ort
hoph
osph
ate,
dis
solv
ed (
mg/
L a
s ph
osph
orus
)19
.031
<.0
011 .0
12.0
31.0
13.0
11.0
07.0
05
Phos
phor
us, t
otal
(m
g/L
)20
.260
.021
.070
.257
.102
.045
.030
.021
Ars
enic
, tot
al-r
ecov
erab
le (
µg/L
)10
4817
3248
3930
2617
Cad
miu
m, t
otal
-rec
over
able
(µg
/L)
10.1
<.0
4--
.1<
1<
.1<
.1<
.1
Chr
omiu
m, t
otal
-rec
over
able
(µg
/L)
104.
5<
.81 1
.14.
5.8
<1
<1
<.8
Cop
per,
tota
l-re
cove
rabl
e (µ
g/L
)10
11.2
1.5
4.1
11.2
6.2
2.6
1.7
1.5
Lea
d, to
tal-
reco
vera
ble
(µg/
L)
105
<1
1 15
1<
1<
1<
1
Nic
kel,
tota
l-re
cove
rabl
e (µ
g/L
105.
3<
11 1
.45.
31.
21.
1<
1.8
<1
Data 10�
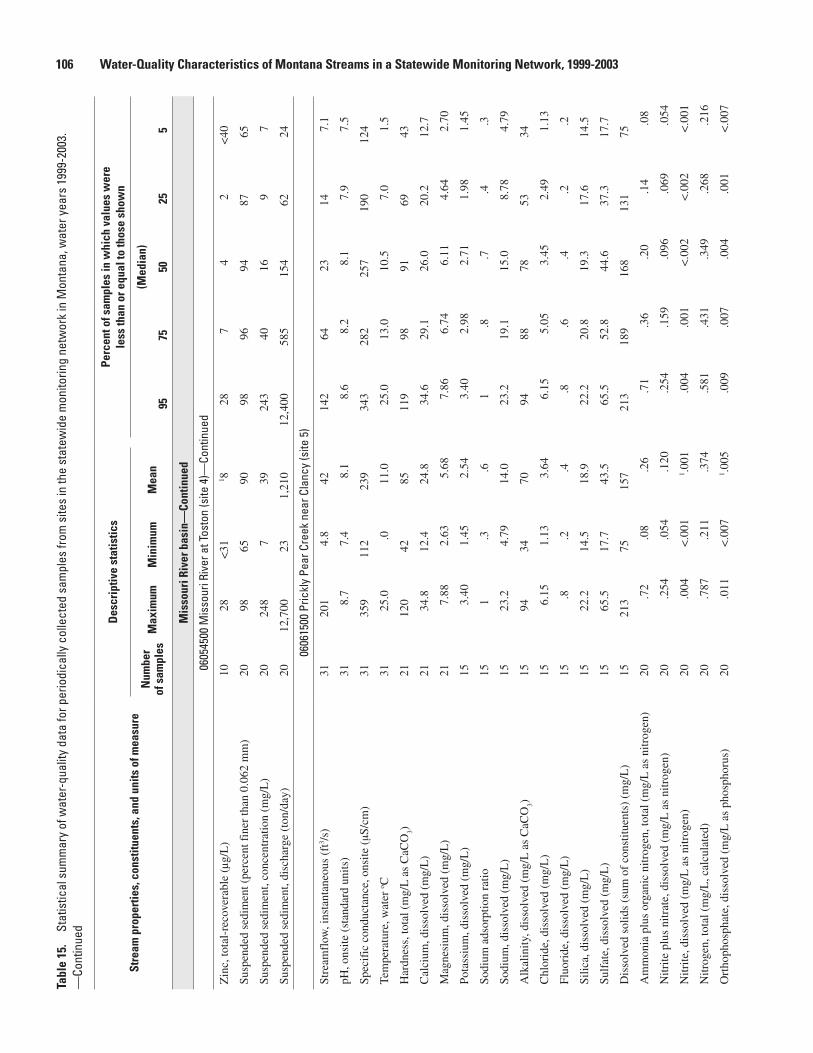
Stre
am p
rope
rtie
s, c
onst
ituen
ts, a
nd u
nits
of m
easu
re
Des
crip
tive
stat
istic
sPe
rcen
t of s
ampl
es in
whi
ch v
alue
s w
ere
le
ss th
an o
r equ
al to
thos
e sh
own
Num
ber
of s
ampl
esM
axim
umM
inim
umM
ean
(Med
ian)
9���
�02�
�
Mis
sour
i Riv
er b
asin
—Co
ntin
ued
0605
4500
Mis
sour
i Riv
er a
t Tos
ton
(site
4)—
Cont
inue
d
Zin
c, to
tal-
reco
vera
ble
(µg/
L)
1028
<31
1 828
74
2<
40
Susp
ende
d se
dim
ent (
perc
ent f
iner
than
0.0
62 m
m)
2098
6590
9896
9487
65
Susp
ende
d se
dim
ent,
conc
entr
atio
n (m
g/L
)20
248
739
243
4016
97
Susp
ende
d se
dim
ent,
disc
harg
e (t
on/d
ay)
2012
,700
231,
210
12,4
0058
515
462
24
0606
1500
Pric
kly
Pear
Cre
ek n
ear C
lanc
y (s
ite 5
)
Stre
amfl
ow, i
nsta
ntan
eous
(ft
3 /s)
3120
14.
842
142
6423
147.
1
pH, o
nsite
(st
anda
rd u
nits
)31
8.7
7.4
8.1
8.6
8.2
8.1
7.9
7.5
Spec
ific
con
duct
ance
, ons
ite (
µS/c
m)
3135
911
223
934
328
225
719
012
4
Tem
pera
ture
, wat
er o C
3125
.0.0
11.0
25.0
13.0
10.5
7.0
1.5
Har
dnes
s, to
tal (
mg/
L a
s C
aCO
3)21
120
4285
119
9891
6943
Cal
cium
, dis
solv
ed (
mg/
L)
2134
.812
.424
.834
.629
.126
.020
.212
.7
Mag
nesi
um, d
isso
lved
(m
g/L
)21
7.88
2.63
5.68
7.86
6.74
6.11
4.64
2.70
Pota
ssiu
m, d
isso
lved
(m
g/L
)15
3.40
1.45
2.54
3.40
2.98
2.71
1.98
1.45
Sodi
um a
dsor
ptio
n ra
tio15
1.3
.61
.8.7
.4.3
Sodi
um, d
isso
lved
(m
g/L
)15
23.2
4.79
14.0
23.2
19.1
15.0
8.78
4.79
Alk
alin
ity, d
isso
lved
(m
g/L
as
CaC
O3)
1594
3470
9488
7853
34
Chl
orid
e, d
isso
lved
(m
g/L
)15
6.15
1.13
3.64
6.15
5.05
3.45
2.49
1.13
Fluo
ride
, dis
solv
ed (
mg/
L)
15.8
.2.4
.8.6
.4.2
.2
Silic
a, d
isso
lved
(m
g/L
)15
22.2
14.5
18.9
22.2
20.8
19.3
17.6
14.5
Sulf
ate,
dis
solv
ed (
mg/
L)
1565
.517
.743
.565
.552
.844
.637
.317
.7
Dis
solv
ed s
olid
s (s
um o
f co
nstit
uent
s) (
mg/
L)
1521
375
157
213
189
168
131
75
Am
mon
ia p
lus
orga
nic
nitr
ogen
, tot
al (
mg/
L a
s ni
trog
en)
20.7
2.0
8.2
6.7
1.3
6.2
0.1
4.0
8
Nitr
ite p
lus
nitr
ate,
dis
solv
ed (
mg/
L a
s ni
trog
en)
20.2
54.0
54.1
20.2
54.1
59.0
96.0
69.0
54
Nitr
ite, d
isso
lved
(m
g/L
as
nitr
ogen
)20
.004
<.0
011 .0
01.0
04.0
01<
.002
<.0
02<
.001
Nitr
ogen
, tot
al (
mg/
L, c
alcu
late
d)20
.787
.211
.374
.581
.431
.349
.268
.216
Ort
hoph
osph
ate,
dis
solv
ed (
mg/
L a
s ph
osph
orus
)20
.011
<.0
071 .0
05.0
09.0
07.0
04.0
01<
.007
10� Water-Quality Characteristics of Montana Streams in a Statewide Monitoring Network, 1999-2003Ta
ble
1�.
Stat
istic
al s
umm
ary
of w
ater
-qua
lity
data
for p
erio
dica
lly c
olle
cted
sam
ples
from
site
s in
the
stat
ewid
e m
onito
ring
netw
ork
in M
onta
na, w
ater
yea
rs 1
999-
2003
. —
Cont
inue
d
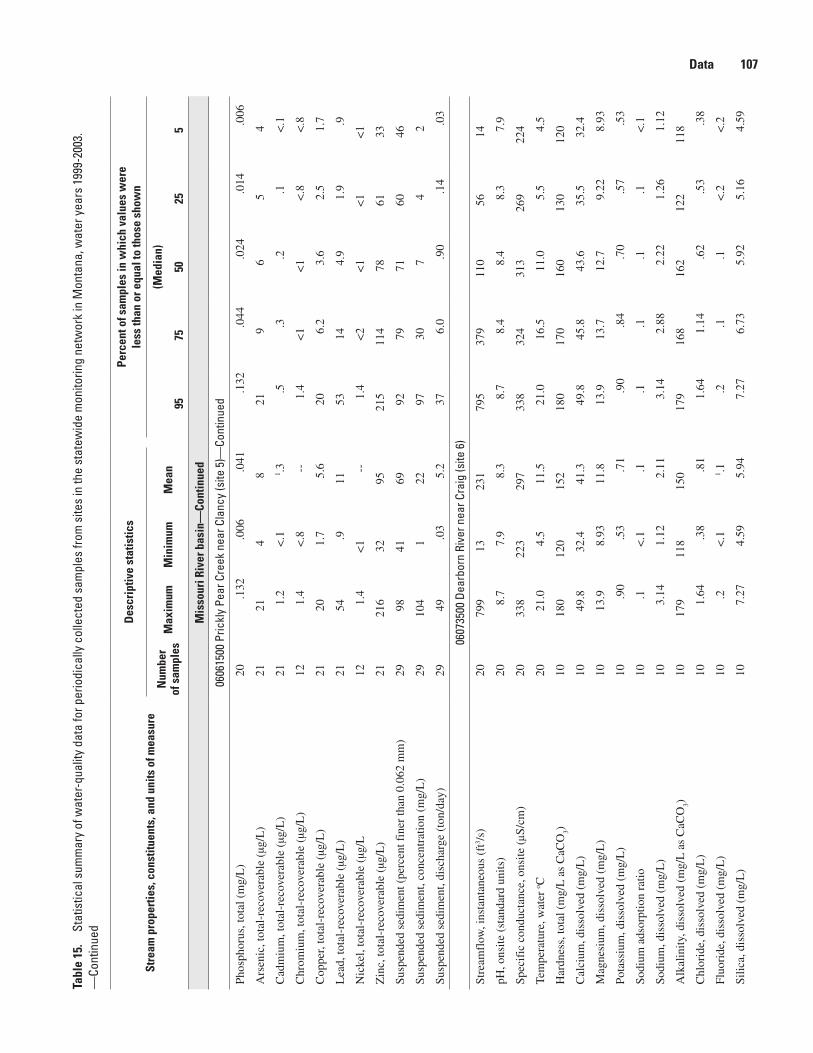
Stre
am p
rope
rtie
s, c
onst
ituen
ts, a
nd u
nits
of m
easu
re
Des
crip
tive
stat
istic
sPe
rcen
t of s
ampl
es in
whi
ch v
alue
s w
ere
le
ss th
an o
r equ
al to
thos
e sh
own
Num
ber
of s
ampl
esM
axim
umM
inim
umM
ean
(Med
ian)
9���
�02�
�
Mis
sour
i Riv
er b
asin
—Co
ntin
ued
0606
1500
Pric
kly
Pear
Cre
ek n
ear C
lanc
y (s
ite 5
)—Co
ntin
ued
Phos
phor
us, t
otal
(m
g/L
)20
.132
.006
.041
.132
.044
.024
.014
.006
Ars
enic
, tot
al-r
ecov
erab
le (
µg/L
)21
214
821
96
54
Cad
miu
m, t
otal
-rec
over
able
(µg
/L)
211.
2<
.11 .3
.5.3
.2.1
<.1
Chr
omiu
m, t
otal
-rec
over
able
(µg
/L)
121.
4<
.8--
1.4
<1
<1
<.8
<.8
Cop
per,
tota
l-re
cove
rabl
e (µ
g/L
)21
201.
75.
620
6.2
3.6
2.5
1.7
Lea
d, to
tal-
reco
vera
ble
(µg/
L)
2154
.911
5314
4.9
1.9
.9
Nic
kel,
tota
l-re
cove
rabl
e (µ
g/L
121.
4<
1--
1.4
<2
<1
<1
<1
Zin
c, to
tal-
reco
vera
ble
(µg/
L)
2121
632
9521
511
478
6133
Susp
ende
d se
dim
ent (
perc
ent f
iner
than
0.0
62 m
m)
2998
4169
9279
7160
46
Susp
ende
d se
dim
ent,
conc
entr
atio
n (m
g/L
)29
104
122
9730
74
2
Susp
ende
d se
dim
ent,
disc
harg
e (t
on/d
ay)
2949
.03
5.2
376.
0.9
0.1
4.0
3
0607
3500
Dea
rbor
n Ri
ver n
ear C
raig
(site
6)
Stre
amfl
ow, i
nsta
ntan
eous
(ft
3 /s)
2079
913
231
795
379
110
5614
pH, o
nsite
(st
anda
rd u
nits
)20
8.7
7.9
8.3
8.7
8.4
8.4
8.3
7.9
Spec
ific
con
duct
ance
, ons
ite (
µS/c
m)
2033
822
329
733
832
431
326
922
4
Tem
pera
ture
, wat
er o C
2021
.04.
511
.521
.016
.511
.05.
54.
5
Har
dnes
s, to
tal (
mg/
L a
s C
aCO
3)10
180
120
152
180
170
160
130
120
Cal
cium
, dis
solv
ed (
mg/
L)
1049
.832
.441
.349
.845
.843
.635
.532
.4
Mag
nesi
um, d
isso
lved
(m
g/L
)10
13.9
8.93
11.8
13.9
13.7
12.7
9.22
8.93
Pota
ssiu
m, d
isso
lved
(m
g/L
)10
.90
.53
.71
.90
.84
.70
.57
.53
Sodi
um a
dsor
ptio
n ra
tio10
.1<
.1.1
.1.1
.1.1
<.1
Sodi
um, d
isso
lved
(m
g/L
)10
3.14
1.12
2.11
3.14
2.88
2.22
1.26
1.12
Alk
alin
ity, d
isso
lved
(m
g/L
as
CaC
O3)
1017
911
815
017
916
816
212
211
8
Chl
orid
e, d
isso
lved
(m
g/L
)10
1.64
.38
.81
1.64
1.14
.62
.53
.38
Fluo
ride
, dis
solv
ed (
mg/
L)
10.2
<.1
1 .1.2
.1.1
<.2
<.2
Silic
a, d
isso
lved
(m
g/L
)10
7.27
4.59
5.94
7.27
6.73
5.92
5.16
4.59
Data 10�Ta
ble
1�.
Stat
istic
al s
umm
ary
of w
ater
-qua
lity
data
for p
erio
dica
lly c
olle
cted
sam
ples
from
site
s in
the
stat
ewid
e m
onito
ring
netw
ork
in M
onta
na, w
ater
yea
rs 1
999-
2003
. —
Cont
inue
d
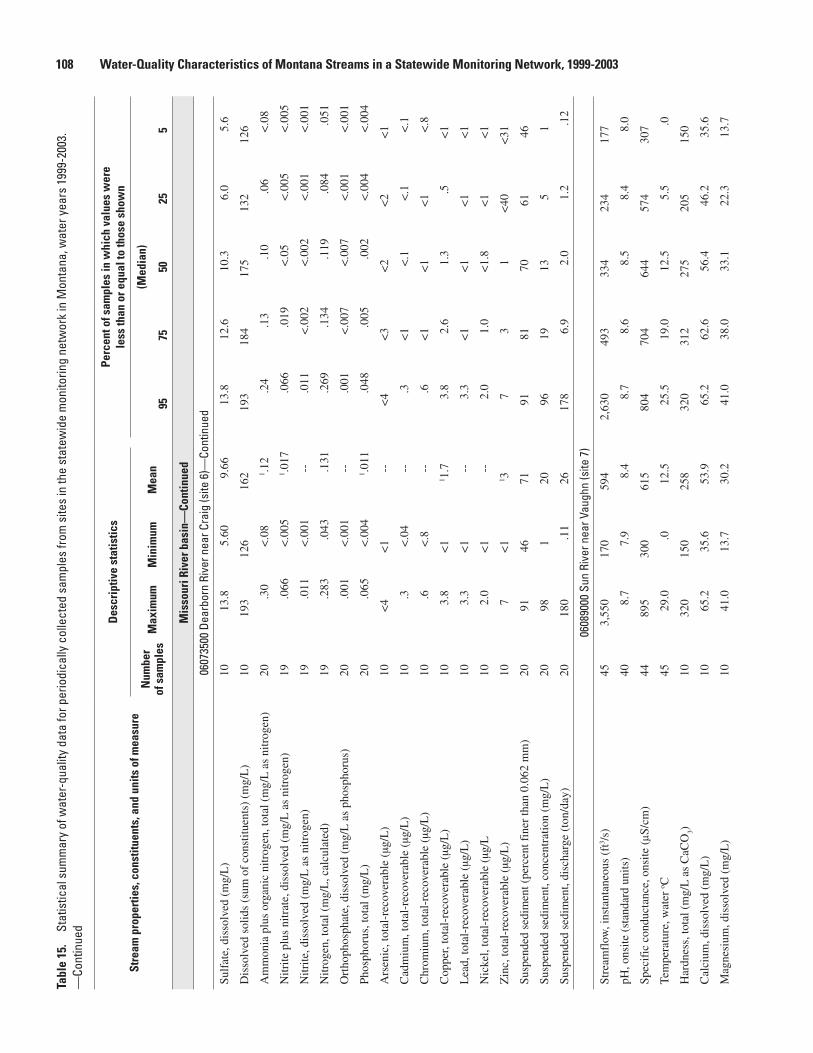
Stre
am p
rope
rtie
s, c
onst
ituen
ts, a
nd u
nits
of m
easu
re
Des
crip
tive
stat
istic
sPe
rcen
t of s
ampl
es in
whi
ch v
alue
s w
ere
le
ss th
an o
r equ
al to
thos
e sh
own
Num
ber
of s
ampl
esM
axim
umM
inim
umM
ean
(Med
ian)
9���
�02�
�
Mis
sour
i Riv
er b
asin
—Co
ntin
ued
0607
3500
Dea
rbor
n Ri
ver n
ear C
raig
(site
6)—
Cont
inue
d
Sulf
ate,
dis
solv
ed (
mg/
L)
1013
.85.
609.
6613
.812
.610
.36.
05.
6
Dis
solv
ed s
olid
s (s
um o
f co
nstit
uent
s) (
mg/
L)
1019
312
616
219
318
417
513
212
6
Am
mon
ia p
lus
orga
nic
nitr
ogen
, tot
al (
mg/
L a
s ni
trog
en)
20.3
0<
.08
1 .12
.24
.13
.10
.06
<.0
8
Nitr
ite p
lus
nitr
ate,
dis
solv
ed (
mg/
L a
s ni
trog
en)
19.0
66<
.005
1 .017
.066
.019
<.0
5<
.005
<.0
05
Nitr
ite, d
isso
lved
(m
g/L
as
nitr
ogen
)19
.011
<.0
01--
.011
<.0
02<
.002
<.0
01<
.001
Nitr
ogen
, tot
al (
mg/
L, c
alcu
late
d)19
.283
.043
.131
.269
.134
.119
.084
.051
Ort
hoph
osph
ate,
dis
solv
ed (
mg/
L a
s ph
osph
orus
)20
.001
<.0
01--
.001
<.0
07<
.007
<.0
01<
.001
Phos
phor
us, t
otal
(m
g/L
)20
.065
<.0
041 .0
11.0
48.0
05.0
02<
.004
<.0
04
Ars
enic
, tot
al-r
ecov
erab
le (
µg/L
)10
<4
<1
--<
4<
3<
2<
2<
1
Cad
miu
m, t
otal
-rec
over
able
(µg
/L)
10.3
<.0
4--
.3<
1<
.1<
.1<
.1
Chr
omiu
m, t
otal
-rec
over
able
(µg
/L)
10.6
<.8
--.6
<1
<1
<1
<.8
Cop
per,
tota
l-re
cove
rabl
e (µ
g/L
)10
3.8
<1
1 1.7
3.8
2.6
1.3
.5<
1
Lea
d, to
tal-
reco
vera
ble
(µg/
L)
103.
3<
1--
3.3
<1
<1
<1
<1
Nic
kel,
tota
l-re
cove
rabl
e (µ
g/L
102.
0<
1--
2.0
1.0
<1.
8<
1<
1
Zin
c, to
tal-
reco
vera
ble
(µg/
L)
107
<1
1 37
31
<40
<31
Susp
ende
d se
dim
ent (
perc
ent f
iner
than
0.0
62 m
m)
2091
4671
9181
7061
46
Susp
ende
d se
dim
ent,
conc
entr
atio
n (m
g/L
)20
981
2096
1913
51
Susp
ende
d se
dim
ent,
disc
harg
e (t
on/d
ay)
2018
0.1
126
178
6.9
2.0
1.2
.12
0608
9000
Sun
Riv
er n
ear V
augh
n (s
ite 7
)
Stre
amfl
ow, i
nsta
ntan
eous
(ft
3 /s)
453,
550
170
594
2,63
049
333
423
417
7
pH, o
nsite
(st
anda
rd u
nits
)40
8.7
7.9
8.4
8.7
8.6
8.5
8.4
8.0
Spec
ific
con
duct
ance
, ons
ite (
µS/c
m)
4489
530
061
580
470
464
457
430
7
Tem
pera
ture
, wat
er o C
4529
.0.0
12.5
25.5
19.0
12.5
5.5
.0
Har
dnes
s, to
tal (
mg/
L a
s C
aCO
3)10
320
150
258
320
312
275
205
150
Cal
cium
, dis
solv
ed (
mg/
L)
1065
.235
.653
.965
.262
.656
.446
.235
.6
Mag
nesi
um, d
isso
lved
(m
g/L
)10
41.0
13.7
30.2
41.0
38.0
33.1
22.3
13.7
10� Water-Quality Characteristics of Montana Streams in a Statewide Monitoring Network, 1999-2003Ta
ble
1�.
Stat
istic
al s
umm
ary
of w
ater
-qua
lity
data
for p
erio
dica
lly c
olle
cted
sam
ples
from
site
s in
the
stat
ewid
e m
onito
ring
netw
ork
in M
onta
na, w
ater
yea
rs 1
999-
2003
. —
Cont
inue
d
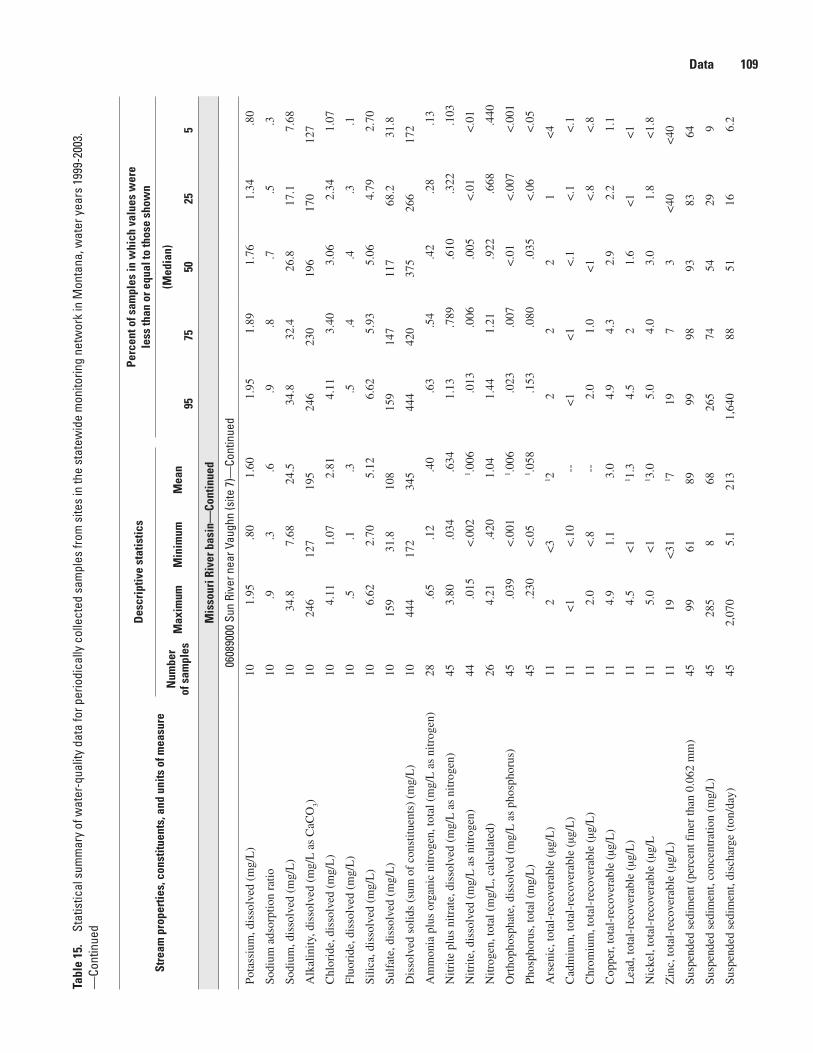
Stre
am p
rope
rtie
s, c
onst
ituen
ts, a
nd u
nits
of m
easu
re
Des
crip
tive
stat
istic
sPe
rcen
t of s
ampl
es in
whi
ch v
alue
s w
ere
le
ss th
an o
r equ
al to
thos
e sh
own
Num
ber
of s
ampl
esM
axim
umM
inim
umM
ean
(Med
ian)
9���
�02�
�
Mis
sour
i Riv
er b
asin
—Co
ntin
ued
0608
9000
Sun
Riv
er n
ear V
augh
n (s
ite 7
)—Co
ntin
ued
Pota
ssiu
m, d
isso
lved
(m
g/L
)10
1.95
.80
1.60
1.95
1.89
1.76
1.34
.80
Sodi
um a
dsor
ptio
n ra
tio10
.9.3
.6.9
.8.7
.5.3
Sodi
um, d
isso
lved
(m
g/L
)10
34.8
7.68
24.5
34.8
32.4
26.8
17.1
7.68
Alk
alin
ity, d
isso
lved
(m
g/L
as
CaC
O3)
1024
612
719
524
623
019
617
012
7
Chl
orid
e, d
isso
lved
(m
g/L
)10
4.11
1.07
2.81
4.11
3.40
3.06
2.34
1.07
Fluo
ride
, dis
solv
ed (
mg/
L)
10.5
.1.3
.5.4
.4.3
.1
Silic
a, d
isso
lved
(m
g/L
)10
6.62
2.70
5.12
6.62
5.93
5.06
4.79
2.70
Sulf
ate,
dis
solv
ed (
mg/
L)
1015
931
.810
815
914
711
768
.231
.8
Dis
solv
ed s
olid
s (s
um o
f co
nstit
uent
s) (
mg/
L)
1044
417
234
544
442
037
526
617
2
Am
mon
ia p
lus
orga
nic
nitr
ogen
, tot
al (
mg/
L a
s ni
trog
en)
28.6
5.1
2.4
0.6
3.5
4.4
2.2
8.1
3
Nitr
ite p
lus
nitr
ate,
dis
solv
ed (
mg/
L a
s ni
trog
en)
453.
80.0
34.6
341.
13.7
89.6
10.3
22.1
03
Nitr
ite, d
isso
lved
(m
g/L
as
nitr
ogen
)44
.015
<.0
021 .0
06.0
13.0
06.0
05<
.01
<.0
1
Nitr
ogen
, tot
al (
mg/
L, c
alcu
late
d)26
4.21
.420
1.04
1.44
1.21
.922
.668
.440
Ort
hoph
osph
ate,
dis
solv
ed (
mg/
L a
s ph
osph
orus
)45
.039
<.0
011 .0
06.0
23.0
07<
.01
<.0
07<
.001
Phos
phor
us, t
otal
(m
g/L
)45
.230
<.0
51 .0
58.1
53.0
80.0
35<
.06
<.0
5
Ars
enic
, tot
al-r
ecov
erab
le (
µg/L
)11
2<
31 2
22
21
<4
Cad
miu
m, t
otal
-rec
over
able
(µg
/L)
11<
1<
.10
--<
1<
1<
.1<
.1<
.1
Chr
omiu
m, t
otal
-rec
over
able
(µg
/L)
112.
0<
.8--
2.0
1.0
<1
<.8
<.8
Cop
per,
tota
l-re
cove
rabl
e (µ
g/L
)11
4.9
1.1
3.0
4.9
4.3
2.9
2.2
1.1
Lea
d, to
tal-
reco
vera
ble
(µg/
L)
114.
5<
11 1
.34.
52
1.6
<1
<1
Nic
kel,
tota
l-re
cove
rabl
e (µ
g/L
115.
0<
11 3
.05.
04.
03.
01.
8<
1.8
Zin
c, to
tal-
reco
vera
ble
(µg/
L)
1119
<31
1 719
73
<40
<40
Susp
ende
d se
dim
ent (
perc
ent f
iner
than
0.0
62 m
m)
4599
6189
9998
9383
64
Susp
ende
d se
dim
ent,
conc
entr
atio
n (m
g/L
)45
285
868
265
7454
299
Susp
ende
d se
dim
ent,
disc
harg
e (t
on/d
ay)
452,
070
5.1
213
1,64
088
5116
6.2
Data 109Ta
ble
1�.
Stat
istic
al s
umm
ary
of w
ater
-qua
lity
data
for p
erio
dica
lly c
olle
cted
sam
ples
from
site
s in
the
stat
ewid
e m
onito
ring
netw
ork
in M
onta
na, w
ater
yea
rs 1
999-
2003
. —
Cont
inue
d

Stre
am p
rope
rtie
s, c
onst
ituen
ts, a
nd u
nits
of m
easu
re
Des
crip
tive
stat
istic
sPe
rcen
t of s
ampl
es in
whi
ch v
alue
s w
ere
le
ss th
an o
r equ
al to
thos
e sh
own
Num
ber
of s
ampl
esM
axim
umM
inim
umM
ean
(Med
ian)
9���
�02�
�
Mis
sour
i Riv
er b
asin
—Co
ntin
ued
0610
8800
Tet
on R
iver
at L
oma
(site
8)
Stre
amfl
ow, i
nsta
ntan
eous
(ft
3 /s)
3531
42.
455
.624
878
2813
3.7
pH, o
nsite
(st
anda
rd u
nits
)30
8.7
7.9
8.4
8.7
8.6
8.5
8.4
7.9
Spec
ific
con
duct
ance
, ons
ite (
µS/c
m)
351,
470
687
1,05
01,
410
1,18
01,
030
926
720
Tem
pera
ture
, wat
er o C
3531
.0.0
12.0
28.5
19.0
13.0
.0.0
Har
dnes
s, to
tal (
mg/
L a
s C
aCO
3)8
510
350
429
510
495
415
375
350
Cal
cium
, dis
solv
ed (
mg/
L)
884
.156
.466
.684
.171
.864
.460
.856
.4
Mag
nesi
um, d
isso
lved
(m
g/L
)8
83.0
40.0
64.0
83.0
78.7
61.8
53.3
40.0
Pota
ssiu
m, d
isso
lved
(m
g/L
)8
5.94
2.73
3.87
5.94
4.30
3.90
2.93
2.73
Sodi
um a
dsor
ptio
n ra
tio8
21
12
22
11
Sodi
um, d
isso
lved
(m
g/L
)8
124
56.8
88.0
124
115
85.5
62.2
56.8
Alk
alin
ity, d
isso
lved
(m
g/L
as
CaC
O3)
827
714
923
327
726
324
122
014
9
Chl
orid
e, d
isso
lved
(m
g/L
)8
16.8
8.01
11.4
16.8
14.8
10.6
8.76
8.01
Fluo
ride
, dis
solv
ed (
mg/
L)
8.5
.3.4
.5.5
.42
.37
.3
Silic
a, d
isso
lved
(m
g/L
)8
5.07
.87
2.10
5.07
2.50
1.72
1.33
.87
Sulf
ate,
dis
solv
ed (
mg/
L)
848
122
835
648
146
136
324
922
8
Dis
solv
ed s
olid
s (s
um o
f co
nstit
uent
s) (
mg/
L)
893
655
973
393
688
770
559
455
9
Am
mon
ia p
lus
orga
nic
nitr
ogen
, tot
al (
mg/
L a
s ni
trog
en)
225.
2.1
5.7
24.
7.6
4.3
8.2
9.1
6
Nitr
ite p
lus
nitr
ate,
dis
solv
ed (
mg/
L a
s ni
trog
en)
35.9
04<
.005
1 .250
.770
.520
.090
<.0
22<
.005
Nitr
ite, d
isso
lved
(m
g/L
as
nitr
ogen
)34
.021
<.0
011 .0
05.0
15.0
05<
.01
<.0
02<
.001
Nitr
ogen
, tot
al (
mg/
L, c
alcu
late
d)22
5.80
.263
.918
1.98
.783
.554
.362
.297
Ort
hoph
osph
ate,
dis
solv
ed (
mg/
L a
s ph
osph
orus
)35
.041
<.0
011 .0
03.0
10<
.020
<.0
1<
.007
<.0
01
Phos
phor
us, t
otal
(m
g/L
)35
2.12
<.0
51 .1
51.7
50.0
81.0
30<
.06
<.0
5
Ars
enic
, tot
al-r
ecov
erab
le (
µg/L
)9
20<
11 3
202
1<
2<
1
Cad
miu
m, t
otal
-rec
over
able
(µg
/L)
9<
1<
.1--
<1
<1
<.2
<.1
<.1
Chr
omiu
m, t
otal
-rec
over
able
(µg
/L)
936
.7<
1.0
--36
.7.9
<1
<1
<1
Cop
per,
tota
l-re
cove
rabl
e (µ
g/L
)9
44.4
1.7
8.2
44.4
5.7
3.6
2.0
1.7
110 Water-Quality Characteristics of Montana Streams in a Statewide Monitoring Network, 1999-2003Ta
ble
1�.
Stat
istic
al s
umm
ary
of w
ater
-qua
lity
data
for p
erio
dica
lly c
olle
cted
sam
ples
from
site
s in
the
stat
ewid
e m
onito
ring
netw
ork
in M
onta
na, w
ater
yea
rs 1
999-
2003
. —
Cont
inue
d
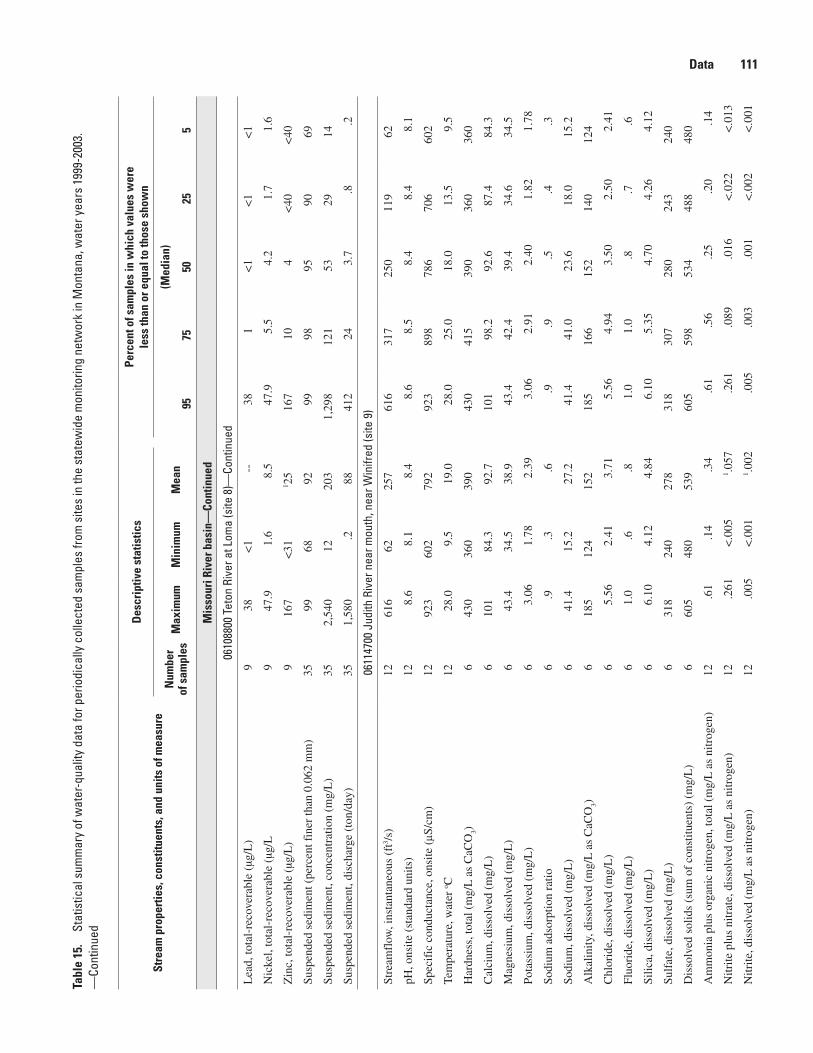
Stre
am p
rope
rtie
s, c
onst
ituen
ts, a
nd u
nits
of m
easu
re
Des
crip
tive
stat
istic
sPe
rcen
t of s
ampl
es in
whi
ch v
alue
s w
ere
le
ss th
an o
r equ
al to
thos
e sh
own
Num
ber
of s
ampl
esM
axim
umM
inim
umM
ean
(Med
ian)
9���
�02�
�
Mis
sour
i Riv
er b
asin
—Co
ntin
ued
0610
8800
Tet
on R
iver
at L
oma
(site
8)—
Cont
inue
d
Lea
d, to
tal-
reco
vera
ble
(µg/
L)
938
<1
--38
1<
1<
1<
1
Nic
kel,
tota
l-re
cove
rabl
e (µ
g/L
947
.91.
68.
547
.95.
54.
21.
71.
6
Zin
c, to
tal-
reco
vera
ble
(µg/
L)
916
7<
311 2
516
710
4<
40<
40
Susp
ende
d se
dim
ent (
perc
ent f
iner
than
0.0
62 m
m)
3599
6892
9998
9590
69
Susp
ende
d se
dim
ent,
conc
entr
atio
n (m
g/L
)35
2,54
012
203
1,29
812
153
2914
Susp
ende
d se
dim
ent,
disc
harg
e (t
on/d
ay)
351,
580
.288
412
243.
7.8
.2
0611
4700
Jud
ith R
iver
nea
r mou
th, n
ear W
inifr
ed (s
ite 9
)
Stre
amfl
ow, i
nsta
ntan
eous
(ft
3 /s)
1261
662
257
616
317
250
119
62
pH, o
nsite
(st
anda
rd u
nits
)12
8.6
8.1
8.4
8.6
8.5
8.4
8.4
8.1
Spec
ific
con
duct
ance
, ons
ite (
µS/c
m)
1292
360
279
292
389
878
670
660
2
Tem
pera
ture
, wat
er o C
1228
.09.
519
.028
.025
.018
.013
.59.
5
Har
dnes
s, to
tal (
mg/
L a
s C
aCO
3)6
430
360
390
430
415
390
360
360
Cal
cium
, dis
solv
ed (
mg/
L)
610
184
.392
.710
198
.292
.687
.484
.3
Mag
nesi
um, d
isso
lved
(m
g/L
)6
43.4
34.5
38.9
43.4
42.4
39.4
34.6
34.5
Pota
ssiu
m, d
isso
lved
(m
g/L
)6
3.06
1.78
2.39
3.06
2.91
2.40
1.82
1.78
Sodi
um a
dsor
ptio
n ra
tio6
.9.3
.6.9
.9.5
.4.3
Sodi
um, d
isso
lved
(m
g/L
)6
41.4
15.2
27.2
41.4
41.0
23.6
18.0
15.2
Alk
alin
ity, d
isso
lved
(m
g/L
as
CaC
O3)
618
512
415
218
516
615
214
012
4
Chl
orid
e, d
isso
lved
(m
g/L
)6
5.56
2.41
3.71
5.56
4.94
3.50
2.50
2.41
Fluo
ride
, dis
solv
ed (
mg/
L)
61.
0.6
.81.
01.
0.8
.7.6
Silic
a, d
isso
lved
(m
g/L
)6
6.10
4.12
4.84
6.10
5.35
4.70
4.26
4.12
Sulf
ate,
dis
solv
ed (
mg/
L)
631
824
027
831
830
728
024
324
0
Dis
solv
ed s
olid
s (s
um o
f co
nstit
uent
s) (
mg/
L)
660
548
053
960
559
853
448
848
0
Am
mon
ia p
lus
orga
nic
nitr
ogen
, tot
al (
mg/
L a
s ni
trog
en)
12.6
1.1
4.3
4.6
1.5
6.2
5.2
0.1
4
Nitr
ite p
lus
nitr
ate,
dis
solv
ed (
mg/
L a
s ni
trog
en)
12.2
61<
.005
1 .057
.261
.089
.016
<.0
22<
.013
Nitr
ite, d
isso
lved
(m
g/L
as
nitr
ogen
)12
.005
<.0
011 .0
02.0
05.0
03.0
01<
.002
<.0
01
Data 111Ta
ble
1�.
Stat
istic
al s
umm
ary
of w
ater
-qua
lity
data
for p
erio
dica
lly c
olle
cted
sam
ples
from
site
s in
the
stat
ewid
e m
onito
ring
netw
ork
in M
onta
na, w
ater
yea
rs 1
999-
2003
. —
Cont
inue
d

Stre
am p
rope
rtie
s, c
onst
ituen
ts, a
nd u
nits
of m
easu
re
Des
crip
tive
stat
istic
sPe
rcen
t of s
ampl
es in
whi
ch v
alue
s w
ere
le
ss th
an o
r equ
al to
thos
e sh
own
Num
ber
of s
ampl
esM
axim
umM
inim
umM
ean
(Med
ian)
9���
�02�
�
Mis
sour
i Riv
er b
asin
—Co
ntin
ued
0611
4700
Jud
ith R
iver
nea
r mou
th, n
ear W
inifr
ed (s
ite 9
)—Co
ntin
ued
Nitr
ogen
, tot
al (
mg/
L, c
alcu
late
d)12
.831
.151
.398
.745
.628
.302
.227
.179
Ort
hoph
osph
ate,
dis
solv
ed (
mg/
L a
s ph
osph
orus
)12
<.0
07<
.007
--<
.007
<.0
07<
.007
<.0
07<
.007
Phos
phor
us, t
otal
(m
g/L
)12
.183
<.0
61 .0
79.1
83.1
63.0
28.0
22.0
06
Ars
enic
, tot
al-r
ecov
erab
le (
µg/L
)6
3<
2--
22
1<
2<
1
Cad
miu
m, t
otal
-rec
over
able
(µg
/L)
6.1
<.0
4--
.1<
.2<
.1<
.1<
.1
Chr
omiu
m, t
otal
-rec
over
able
(µg
/L)
61.
8<
.8--
1.8
.8<
1<
1<
.8
Cop
per,
tota
l-re
cove
rabl
e (µ
g/L
)6
7.5
2.3
3.5
7.5
4.8
2.6
2.3
2.3
Lea
d, to
tal-
reco
vera
ble
(µg/
L)
63.
1<
.06
--3.
11
<1
<1
<1
Nic
kel,
tota
l-re
cove
rabl
e (µ
g/L
67.
92.
94.
47.
95.
13.
83.
42.
9
Zin
c, to
tal-
reco
vera
ble
(µg/
L)
620
27
2010
53
2
Susp
ende
d se
dim
ent (
perc
ent f
iner
than
0.0
62 m
m)
1298
6785
9889
8682
67
Susp
ende
d se
dim
ent,
conc
entr
atio
n (m
g/L
)12
268
1811
726
823
872
4318
Susp
ende
d se
dim
ent,
disc
harg
e (t
on/d
ay)
1237
83.
011
237
822
839
163.
0
0613
0500
Mus
sels
hell
Rive
r at M
osby
(site
10)
Stre
amfl
ow, i
nsta
ntan
eous
(ft
3 /s)
3118
0.0
340
154
6329
2.6
.03
pH, o
nsite
(st
anda
rd u
nits
)19
8.6
7.9
8.3
8.6
8.5
8.4
8.2
7.9
Spec
ific
con
duct
ance
, ons
ite (
µS/c
m)
316,
940
1,19
03,
060
6,57
03,
600
2,48
02,
130
1,32
0
Tem
pera
ture
, wat
er o C
3125
.0.0
14.0
24.0
21.0
16.0
7.5
.5
Har
dnes
s, to
tal (
mg/
L a
s C
aCO
3)9
2,50
034
081
72,
500
900
580
460
340
Cal
cium
, dis
solv
ed (
mg/
L)
939
755
.813
639
713
510
390
.055
.8
Mag
nesi
um, d
isso
lved
(m
g/L
)9
375
49.1
117
375
136
68.7
56.2
49.1
Pota
ssiu
m, d
isso
lved
(m
g/L
)9
10.3
2.37
6.96
10.3
9.66
6.21
5.12
2.37
Sodi
um a
dsor
ptio
n ra
tio9
93
69
86
43
Sodi
um, d
isso
lved
(m
g/L
)9
1,00
014
840
61,
000
546
332
200
148
Alk
alin
ity, d
isso
lved
(m
g/L
as
CaC
O3)
940
712
021
840
726
420
514
912
0
Chl
orid
e, d
isso
lved
(m
g/L
)9
79.1
10.4
31.9
79.1
47.0
26.0
12.6
10.4
112 Water-Quality Characteristics of Montana Streams in a Statewide Monitoring Network, 1999-2003Ta
ble
1�.
Stat
istic
al s
umm
ary
of w
ater
-qua
lity
data
for p
erio
dica
lly c
olle
cted
sam
ples
from
site
s in
the
stat
ewid
e m
onito
ring
netw
ork
in M
onta
na, w
ater
yea
rs 1
999-
2003
. —
Cont
inue
d
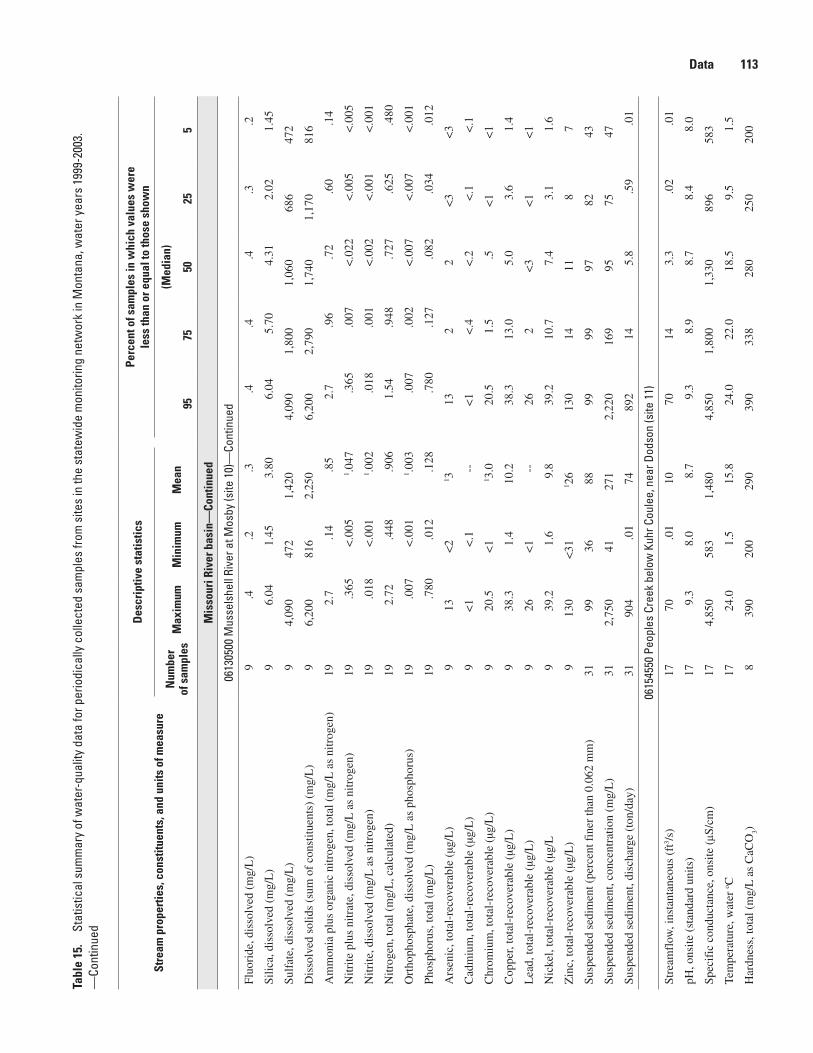
Stre
am p
rope
rtie
s, c
onst
ituen
ts, a
nd u
nits
of m
easu
re
Des
crip
tive
stat
istic
sPe
rcen
t of s
ampl
es in
whi
ch v
alue
s w
ere
le
ss th
an o
r equ
al to
thos
e sh
own
Num
ber
of s
ampl
esM
axim
umM
inim
umM
ean
(Med
ian)
9���
�02�
�
Mis
sour
i Riv
er b
asin
—Co
ntin
ued
0613
0500
Mus
sels
hell
Rive
r at M
osby
(site
10)
—Co
ntin
ued
Fluo
ride
, dis
solv
ed (
mg/
L)
9.4
.2.3
.4.4
.4.3
.2
Silic
a, d
isso
lved
(m
g/L
)9
6.04
1.45
3.80
6.04
5.70
4.31
2.02
1.45
Sulf
ate,
dis
solv
ed (
mg/
L)
94,
090
472
1,42
04,
090
1,80
01,
060
686
472
Dis
solv
ed s
olid
s (s
um o
f co
nstit
uent
s) (
mg/
L)
96,
200
816
2,25
06,
200
2,79
01,
740
1,17
081
6
Am
mon
ia p
lus
orga
nic
nitr
ogen
, tot
al (
mg/
L a
s ni
trog
en)
192.
7.1
4.8
52.
7.9
6.7
2.6
0.1
4
Nitr
ite p
lus
nitr
ate,
dis
solv
ed (
mg/
L a
s ni
trog
en)
19.3
65<
.005
1 .047
.365
.007
<.0
22<
.005
<.0
05
Nitr
ite, d
isso
lved
(m
g/L
as
nitr
ogen
)19
.018
<.0
011 .0
02.0
18.0
01<
.002
<.0
01<
.001
Nitr
ogen
, tot
al (
mg/
L, c
alcu
late
d)19
2.72
.448
.906
1.54
.948
.727
.625
.480
Ort
hoph
osph
ate,
dis
solv
ed (
mg/
L a
s ph
osph
orus
)19
.007
<.0
011 .0
03.0
07.0
02<
.007
<.0
07<
.001
Phos
phor
us, t
otal
(m
g/L
)19
.780
.012
.128
.780
.127
.082
.034
.012
Ars
enic
, tot
al-r
ecov
erab
le (
µg/L
)9
13<
21 3
132
2<
3<
3
Cad
miu
m, t
otal
-rec
over
able
(µg
/L)
9<
1<
.1--
<1
<.4
<.2
<.1
<.1
Chr
omiu
m, t
otal
-rec
over
able
(µg
/L)
920
.5<
11 3
.020
.51.
5.5
<1
<1
Cop
per,
tota
l-re
cove
rabl
e (µ
g/L
)9
38.3
1.4
10.2
38.3
13.0
5.0
3.6
1.4
Lea
d, to
tal-
reco
vera
ble
(µg/
L)
926
<1
--26
2<
3<
1<
1
Nic
kel,
tota
l-re
cove
rabl
e (µ
g/L
939
.21.
69.
839
.210
.77.
43.
11.
6
Zin
c, to
tal-
reco
vera
ble
(µg/
L)
913
0<
311 2
613
014
118
7
Susp
ende
d se
dim
ent (
perc
ent f
iner
than
0.0
62 m
m)
3199
3688
9999
9782
43
Susp
ende
d se
dim
ent,
conc
entr
atio
n (m
g/L
)31
2,75
041
271
2,22
016
995
7547
Susp
ende
d se
dim
ent,
disc
harg
e (t
on/d
ay)
3190
4.0
174
892
145.
8.5
9.0
1
0615
4550
Peo
ples
Cre
ek b
elow
Kuh
r Cou
lee,
nea
r Dod
son
(site
11)
Stre
amfl
ow, i
nsta
ntan
eous
(ft
3 /s)
1770
.01
1070
143.
3.0
2.0
1
pH, o
nsite
(st
anda
rd u
nits
)17
9.3
8.0
8.7
9.3
8.9
8.7
8.4
8.0
Spec
ific
con
duct
ance
, ons
ite (
µS/c
m)
174,
850
583
1,48
04,
850
1,80
01,
330
896
583
Tem
pera
ture
, wat
er o C
1724
.01.
515
.824
.022
.018
.59.
51.
5
Har
dnes
s, to
tal (
mg/
L a
s C
aCO
3)8
390
200
290
390
338
280
250
200
Data 113Ta
ble
1�.
Stat
istic
al s
umm
ary
of w
ater
-qua
lity
data
for p
erio
dica
lly c
olle
cted
sam
ples
from
site
s in
the
stat
ewid
e m
onito
ring
netw
ork
in M
onta
na, w
ater
yea
rs 1
999-
2003
. —
Cont
inue
d

Stre
am p
rope
rtie
s, c
onst
ituen
ts, a
nd u
nits
of m
easu
re
Des
crip
tive
stat
istic
sPe
rcen
t of s
ampl
es in
whi
ch v
alue
s w
ere
le
ss th
an o
r equ
al to
thos
e sh
own
Num
ber
of s
ampl
esM
axim
umM
inim
umM
ean
(Med
ian)
9���
�02�
�
Mis
sour
i Riv
er b
asin
—Co
ntin
ued
0615
4550
Peo
ples
Cre
ek b
elow
Kuh
r Cou
lee,
nea
r Dod
son
(site
11)
—Co
ntin
ued
Cal
cium
, dis
solv
ed (
mg/
L)
870
.937
.952
.370
.967
.549
.438
.937
.9
Mag
nesi
um, d
isso
lved
(m
g/L
)8
53.8
24.5
38.7
53.8
46.6
38.2
30.3
24.5
Pota
ssiu
m, d
isso
lved
(m
g/L
)8
9.33
2.31
6.84
9.33
8.45
7.16
6.00
2.31
Sodi
um a
dsor
ptio
n ra
tio8
92
69
84
42
Sodi
um, d
isso
lved
(m
g/L
)8
351
88.1
210
351
306
187
124
88.1
Alk
alin
ity, d
isso
lved
(m
g/L
as
CaC
O3)
839
814
627
939
837
626
520
214
6
Chl
orid
e, d
isso
lved
(m
g/L
)8
25.2
6.27
14.8
25.2
21.3
12.3
9.92
6.27
Fluo
ride
, dis
solv
ed (
mg/
L)
8.7
.4.5
.7.7
.5.4
.4
Silic
a, d
isso
lved
(m
g/L
)8
11.7
2.22
6.22
11.7
7.24
6.16
4.16
2.22
Sulf
ate,
dis
solv
ed (
mg/
L)
873
127
545
373
155
148
029
027
5
Dis
solv
ed s
olid
s (s
um o
f co
nstit
uent
s) (
mg/
L)
81,
400
589
950
1,40
01,
210
966
616
589
Am
mon
ia p
lus
orga
nic
nitr
ogen
, tot
al (
mg/
L a
s ni
trog
en)
172.
5.4
6.8
22.
5.7
8.6
0.5
3.4
6
Nitr
ite p
lus
nitr
ate,
dis
solv
ed (
mg/
L a
s ni
trog
en)
17.3
13<
.005
--.3
13<
.05
<.0
22<
.013
<.0
05
Nitr
ite, d
isso
lved
(m
g/L
as
nitr
ogen
)17
.024
<.0
011 .0
03.0
24.0
01<
.006
<.0
02<
.001
Nitr
ogen
, tot
al (
mg/
L, c
alcu
late
d)17
2.51
.463
.864
2.50
.791
.605
.537
.481
Ort
hoph
osph
ate,
dis
solv
ed (
mg/
L a
s ph
osph
orus
)17
.158
<.0
071 .0
23.1
58.0
09.0
02<
.007
<.0
07
Phos
phor
us, t
otal
(m
g/L
)17
.510
.018
.092
.510
.088
.044
.027
.018
Ars
enic
, tot
al-r
ecov
erab
le (
µg/L
)8
72
37
42
22
Cad
miu
m, t
otal
-rec
over
able
(µg
/L)
8<
1<
.1--
<1
<.2
<.1
<.1
<.1
Chr
omiu
m, t
otal
-rec
over
able
(µg
/L)
81.
5<
.8--
1.5
<1
<1
<.8
<.8
Cop
per,
tota
l-re
cove
rabl
e (µ
g/L
)8
8.3
<1
1 3.7
8.3
3.8
3.5
1.1
1.1
Lea
d, to
tal-
reco
vera
ble
(µg/
L)
81.
5<
1--
1.5
<1
<1
<1
<1
Nic
kel,
tota
l-re
cove
rabl
e (µ
g/L
85.
81.
33.
85.
84.
74.
52.
41.
3
Zin
c, to
tal-
reco
vera
ble
(µg/
L)
88
<31
1 48
43
<40
<40
Susp
ende
d se
dim
ent (
perc
ent f
iner
than
0.0
62 m
m)
1799
5685
9998
9276
56
Susp
ende
d se
dim
ent,
conc
entr
atio
n (m
g/L
)17
199
454
199
7654
184
Susp
ende
d se
dim
ent,
disc
harg
e (t
on/d
ay)
1717
<.0
12.
517
2.6
.29
<.0
1<
.01
11� Water-Quality Characteristics of Montana Streams in a Statewide Monitoring Network, 1999-2003Ta
ble
1�.
Stat
istic
al s
umm
ary
of w
ater
-qua
lity
data
for p
erio
dica
lly c
olle
cted
sam
ples
from
site
s in
the
stat
ewid
e m
onito
ring
netw
ork
in M
onta
na, w
ater
yea
rs 1
999-
2003
. —
Cont
inue
d

Stre
am p
rope
rtie
s, c
onst
ituen
ts, a
nd u
nits
of m
easu
re
Des
crip
tive
stat
istic
sPe
rcen
t of s
ampl
es in
whi
ch v
alue
s w
ere
le
ss th
an o
r equ
al to
thos
e sh
own
Num
ber
of s
ampl
esM
axim
umM
inim
umM
ean
(Med
ian)
9���
�02�
�
Mis
sour
i Riv
er b
asin
—Co
ntin
ued
0617
4500
Milk
Riv
er a
t Nas
hua
(site
12)
Stre
amfl
ow, i
nsta
ntan
eous
(ft
3 /s)
205,
380
3072
45,
350
464
215
6830
pH, o
nsite
(st
anda
rd u
nits
)20
8.7
8.0
8.4
8.7
8.6
8.4
8.1
8.0
Spec
ific
con
duct
ance
, ons
ite (
µS/c
m)
201,
820
435
1,08
01,
820
1,23
599
876
444
8
Tem
pera
ture
, wat
er o C
2026
.51.
516
.026
.523
.017
.07.
51.
0
Har
dnes
s, to
tal (
mg/
L a
s C
aCO
3)10
440
130
289
440
402
260
230
130
Cal
cium
, dis
solv
ed (
mg/
L)
1092
.530
.563
.292
.585
.958
.050
.230
.5
Mag
nesi
um, d
isso
lved
(m
g/L
)10
51.9
13.5
32.0
51.9
44.8
28.6
24.2
13.5
Pota
ssiu
m, d
isso
lved
(m
g/L
)10
8.98
4.89
7.17
8.98
8.48
7.38
6.23
4.89
Sodi
um a
dsor
ptio
n ra
tio10
63
46
54
33
Sodi
um, d
isso
lved
(m
g/L
)10
271
85.2
163
271
248
136
110
85.2
Alk
alin
ity, d
isso
lved
(m
g/L
as
CaC
O3)
1037
283
.024
637
230
324
319
383
.0
Chl
orid
e, d
isso
lved
(m
g/L
)10
69.3
5.64
31.4
69.3
54.5
22.1
16.4
5.64
Fluo
ride
, dis
solv
ed (
mg/
L)
10.5
.3.4
.5.4
.4.3
.3
Silic
a, d
isso
lved
(m
g/L
)10
8.29
3.77
5.77
8.29
6.95
5.58
4.40
3.77
Sulf
ate,
dis
solv
ed (
mg/
L)
1058
723
736
758
756
829
024
623
7
Dis
solv
ed s
olid
s (s
um o
f co
nstit
uent
s) (
mg/
L)
101,
300
443
818
1,30
01,
220
690
605
443
Am
mon
ia p
lus
orga
nic
nitr
ogen
, tot
al (
mg/
L a
s ni
trog
en)
204.
5.6
91.
44.
51.
1.8
8.7
5.6
9
Nitr
ite p
lus
nitr
ate,
dis
solv
ed (
mg/
L a
s ni
trog
en)
20.5
01<
.005
1 .093
.427
.069
<.0
22<
.005
<.0
05
Nitr
ite, d
isso
lved
(m
g/L
as
nitr
ogen
)20
.012
<.0
011 .0
03.0
10.0
04<
.010
<.0
02<
.001
Nitr
ogen
, tot
al (
mg/
L, c
alcu
late
d)20
4.63
.693
1.53
4.57
1.21
.937
.805
.715
Ort
hoph
osph
ate,
dis
solv
ed (
mg/
L a
s ph
osph
orus
)20
.057
<.0
071 .0
18.0
44.0
21.0
17.0
01<
.007
Phos
phor
us, t
otal
(m
g/L
)20
1.77
.063
.423
1.76
.339
.148
.120
.063
Ars
enic
, tot
al-r
ecov
erab
le (
µg/L
)10
252
825
143
22
Cad
miu
m, t
otal
-rec
over
able
(µg
/L)
10.4
<.1
--.4
<1
<.2
<.1
<.1
Chr
omiu
m, t
otal
-rec
over
able
(µg
/L)
1034
.6.6
6.8
34.6
8.1
1.0
.78
.60
Cop
per,
tota
l-re
cove
rabl
e (µ
g/L
)10
55.0
4.0
14.5
55.0
17.1
5.1
4.4
4.0
Data 11�Ta
ble
1�.
Stat
istic
al s
umm
ary
of w
ater
-qua
lity
data
for p
erio
dica
lly c
olle
cted
sam
ples
from
site
s in
the
stat
ewid
e m
onito
ring
netw
ork
in M
onta
na, w
ater
yea
rs 1
999-
2003
. —
Cont
inue
d
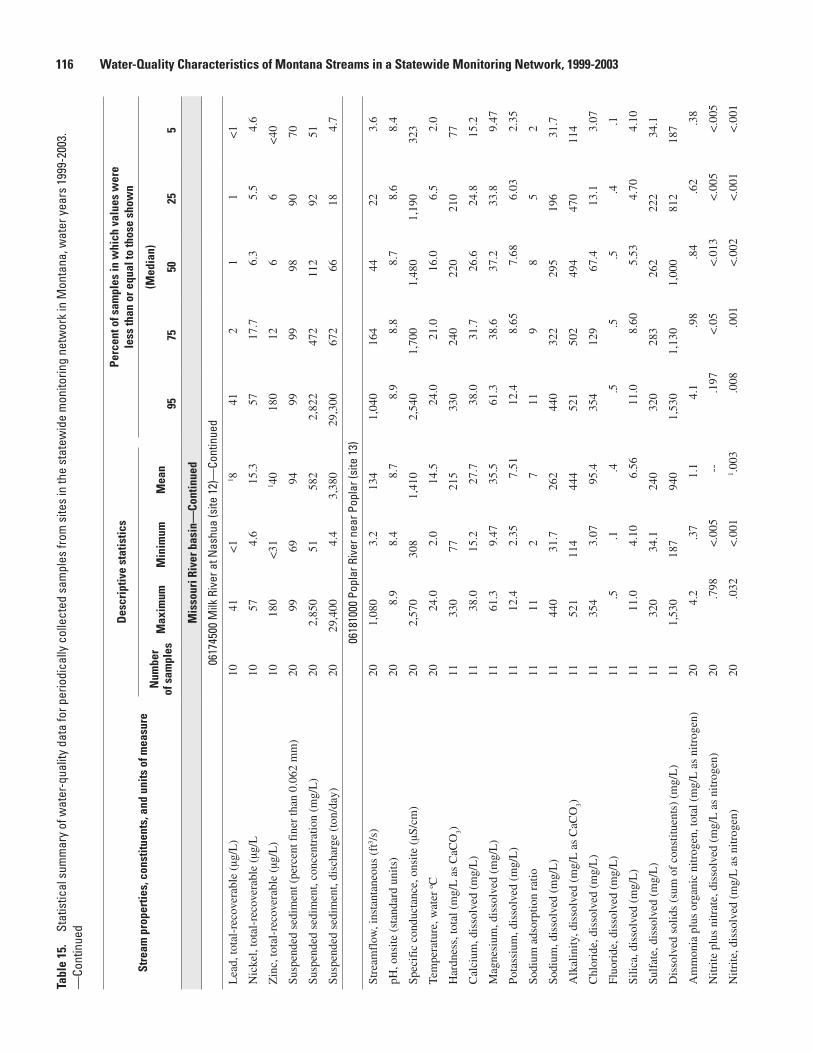
Stre
am p
rope
rtie
s, c
onst
ituen
ts, a
nd u
nits
of m
easu
re
Des
crip
tive
stat
istic
sPe
rcen
t of s
ampl
es in
whi
ch v
alue
s w
ere
le
ss th
an o
r equ
al to
thos
e sh
own
Num
ber
of s
ampl
esM
axim
umM
inim
umM
ean
(Med
ian)
9���
�02�
�
Mis
sour
i Riv
er b
asin
—Co
ntin
ued
0617
4500
Milk
Riv
er a
t Nas
hua
(site
12)
—Co
ntin
ued
Lea
d, to
tal-
reco
vera
ble
(µg/
L)
1041
<1
1 841
21
1<
1
Nic
kel,
tota
l-re
cove
rabl
e (µ
g/L
1057
4.6
15.3
5717
.76.
35.
54.
6
Zin
c, to
tal-
reco
vera
ble
(µg/
L)
1018
0<
311 4
018
012
66
<40
Susp
ende
d se
dim
ent (
perc
ent f
iner
than
0.0
62 m
m)
2099
6994
9999
9890
70
Susp
ende
d se
dim
ent,
conc
entr
atio
n (m
g/L
)20
2,85
051
582
2,82
247
211
292
51
Susp
ende
d se
dim
ent,
disc
harg
e (t
on/d
ay)
2029
,400
4.4
3,38
029
,300
672
6618
4.7
0618
1000
Pop
lar R
iver
nea
r Pop
lar (
site
13)
Stre
amfl
ow, i
nsta
ntan
eous
(ft
3 /s)
201,
080
3.2
134
1,04
016
444
223.
6
pH, o
nsite
(st
anda
rd u
nits
)20
8.9
8.4
8.7
8.9
8.8
8.7
8.6
8.4
Spec
ific
con
duct
ance
, ons
ite (
µS/c
m)
202,
570
308
1,41
02,
540
1,70
01,
480
1,19
032
3
Tem
pera
ture
, wat
er o C
2024
.02.
014
.524
.021
.016
.06.
52.
0
Har
dnes
s, to
tal (
mg/
L a
s C
aCO
3)11
330
7721
533
024
022
021
077
Cal
cium
, dis
solv
ed (
mg/
L)
1138
.015
.227
.738
.031
.726
.624
.815
.2
Mag
nesi
um, d
isso
lved
(m
g/L
)11
61.3
9.47
35.5
61.3
38.6
37.2
33.8
9.47
Pota
ssiu
m, d
isso
lved
(m
g/L
)11
12.4
2.35
7.51
12.4
8.65
7.68
6.03
2.35
Sodi
um a
dsor
ptio
n ra
tio11
112
711
98
52
Sodi
um, d
isso
lved
(m
g/L
)11
440
31.7
262
440
322
295
196
31.7
Alk
alin
ity, d
isso
lved
(m
g/L
as
CaC
O3)
1152
111
444
452
150
249
447
011
4
Chl
orid
e, d
isso
lved
(m
g/L
)11
354
3.07
95.4
354
129
67.4
13.1
3.07
Fluo
ride
, dis
solv
ed (
mg/
L)
11.5
.1.4
.5.5
.5.4
.1
Silic
a, d
isso
lved
(m
g/L
)11
11.0
4.10
6.56
11.0
8.60
5.53
4.70
4.10
Sulf
ate,
dis
solv
ed (
mg/
L)
1132
034
.124
032
028
326
222
234
.1
Dis
solv
ed s
olid
s (s
um o
f co
nstit
uent
s) (
mg/
L)
111,
530
187
940
1,53
01,
130
1,00
081
218
7
Am
mon
ia p
lus
orga
nic
nitr
ogen
, tot
al (
mg/
L a
s ni
trog
en)
204.
2.3
71.
14.
1.9
8.8
4.6
2.3
8
Nitr
ite p
lus
nitr
ate,
dis
solv
ed (
mg/
L a
s ni
trog
en)
20.7
98<
.005
--.1
97<
.05
<.0
13<
.005
<.0
05
Nitr
ite, d
isso
lved
(m
g/L
as
nitr
ogen
)20
.032
<.0
011 .0
03.0
08.0
01<
.002
<.0
01<
.001
11� Water-Quality Characteristics of Montana Streams in a Statewide Monitoring Network, 1999-2003Ta
ble
1�.
Stat
istic
al s
umm
ary
of w
ater
-qua
lity
data
for p
erio
dica
lly c
olle
cted
sam
ples
from
site
s in
the
stat
ewid
e m
onito
ring
netw
ork
in M
onta
na, w
ater
yea
rs 1
999-
2003
. —
Cont
inue
d
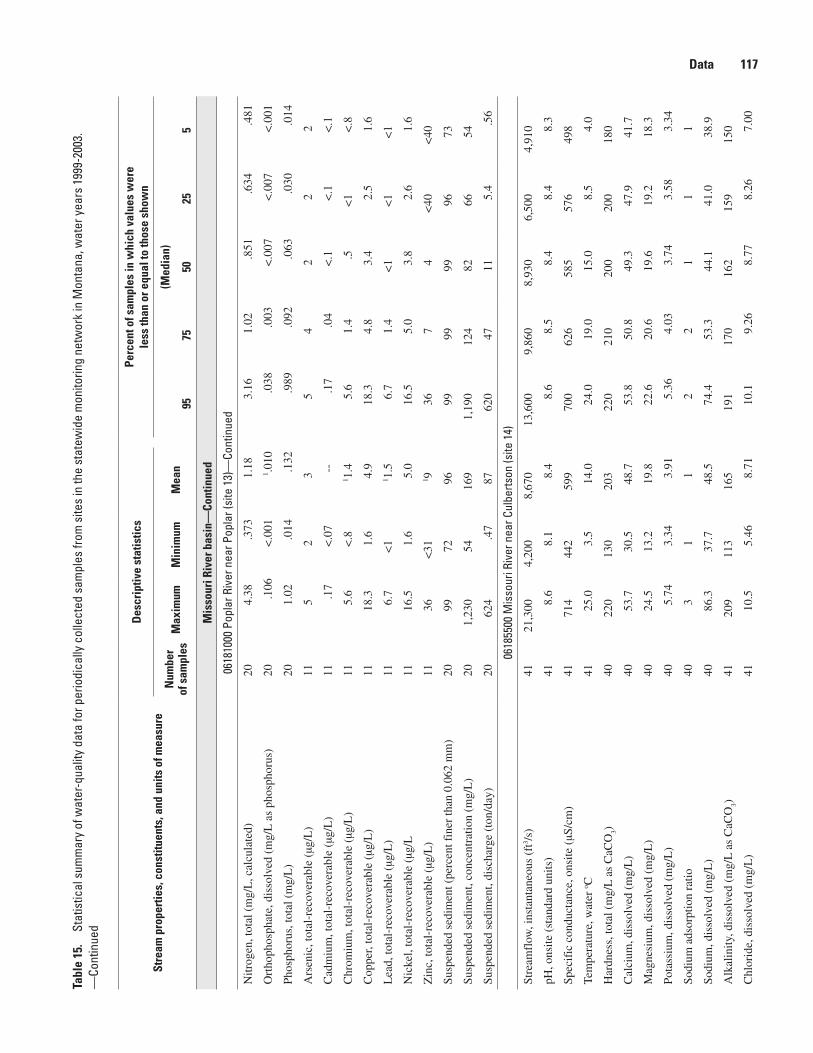
Stre
am p
rope
rtie
s, c
onst
ituen
ts, a
nd u
nits
of m
easu
re
Des
crip
tive
stat
istic
sPe
rcen
t of s
ampl
es in
whi
ch v
alue
s w
ere
le
ss th
an o
r equ
al to
thos
e sh
own
Num
ber
of s
ampl
esM
axim
umM
inim
umM
ean
(Med
ian)
9���
�02�
�
Mis
sour
i Riv
er b
asin
—Co
ntin
ued
0618
1000
Pop
lar R
iver
nea
r Pop
lar (
site
13)
—Co
ntin
ued
Nitr
ogen
, tot
al (
mg/
L, c
alcu
late
d)20
4.38
.373
1.18
3.16
1.02
.851
.634
.481
Ort
hoph
osph
ate,
dis
solv
ed (
mg/
L a
s ph
osph
orus
)20
.106
<.0
011 .0
10.0
38.0
03<
.007
<.0
07<
.001
Phos
phor
us, t
otal
(m
g/L
)20
1.02
.014
.132
.989
.092
.063
.030
.014
Ars
enic
, tot
al-r
ecov
erab
le (
µg/L
)11
52
35
42
22
Cad
miu
m, t
otal
-rec
over
able
(µg
/L)
11.1
7<
.07
--.1
7.0
4<
.1<
.1<
.1
Chr
omiu
m, t
otal
-rec
over
able
(µg
/L)
115.
6<
.81 1
.45.
61.
4.5
<1
<.8
Cop
per,
tota
l-re
cove
rabl
e (µ
g/L
)11
18.3
1.6
4.9
18.3
4.8
3.4
2.5
1.6
Lea
d, to
tal-
reco
vera
ble
(µg/
L)
116.
7<
11 1
.56.
71.
4<
1<
1<
1
Nic
kel,
tota
l-re
cove
rabl
e (µ
g/L
1116
.51.
65.
016
.55.
03.
82.
61.
6
Zin
c, to
tal-
reco
vera
ble
(µg/
L)
1136
<31
1 936
74
<40
<40
Susp
ende
d se
dim
ent (
perc
ent f
iner
than
0.0
62 m
m)
2099
7296
9999
9996
73
Susp
ende
d se
dim
ent,
conc
entr
atio
n (m
g/L
)20
1,23
054
169
1,19
012
482
6654
Susp
ende
d se
dim
ent,
disc
harg
e (t
on/d
ay)
2062
4.4
787
620
4711
5.4
.56
0618
5500
Mis
sour
i Riv
er n
ear C
ulbe
rtson
(site
14)
Stre
amfl
ow, i
nsta
ntan
eous
(ft
3 /s)
4121
,300
4,20
08,
670
13,6
009,
860
8,93
06,
500
4,91
0
pH, o
nsite
(st
anda
rd u
nits
)41
8.6
8.1
8.4
8.6
8.5
8.4
8.4
8.3
Spec
ific
con
duct
ance
, ons
ite (
µS/c
m)
4171
444
259
970
062
658
557
649
8
Tem
pera
ture
, wat
er o C
4125
.03.
514
.024
.019
.015
.08.
54.
0
Har
dnes
s, to
tal (
mg/
L a
s C
aCO
3)40
220
130
203
220
210
200
200
180
Cal
cium
, dis
solv
ed (
mg/
L)
4053
.730
.548
.753
.850
.849
.347
.941
.7
Mag
nesi
um, d
isso
lved
(m
g/L
)40
24.5
13.2
19.8
22.6
20.6
19.6
19.2
18.3
Pota
ssiu
m, d
isso
lved
(m
g/L
)40
5.74
3.34
3.91
5.36
4.03
3.74
3.58
3.34
Sodi
um a
dsor
ptio
n ra
tio40
31
12
21
11
Sodi
um, d
isso
lved
(m
g/L
)40
86.3
37.7
48.5
74.4
53.3
44.1
41.0
38.9
Alk
alin
ity, d
isso
lved
(m
g/L
as
CaC
O3)
4120
911
316
519
117
016
215
915
0
Chl
orid
e, d
isso
lved
(m
g/L
)41
10.5
5.46
8.71
10.1
9.26
8.77
8.26
7.00
Data 11�Ta
ble
1�.
Stat
istic
al s
umm
ary
of w
ater
-qua
lity
data
for p
erio
dica
lly c
olle
cted
sam
ples
from
site
s in
the
stat
ewid
e m
onito
ring
netw
ork
in M
onta
na, w
ater
yea
rs 1
999-
2003
. —
Cont
inue
d
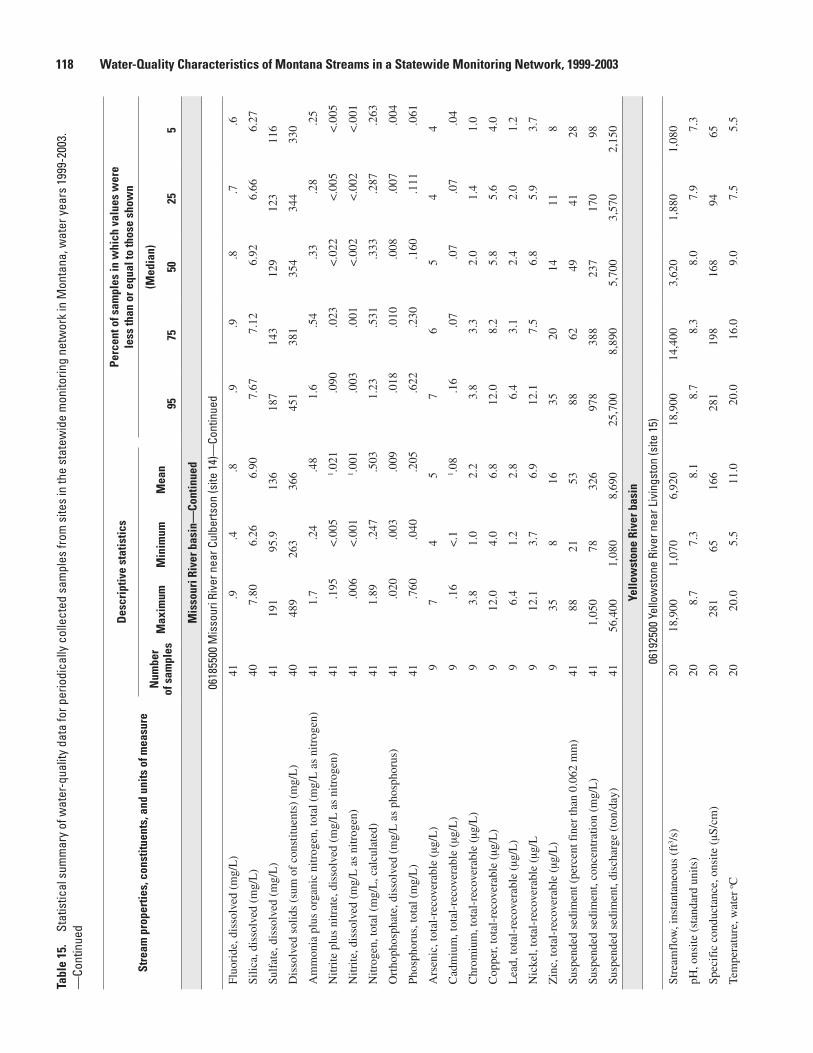
Stre
am p
rope
rtie
s, c
onst
ituen
ts, a
nd u
nits
of m
easu
re
Des
crip
tive
stat
istic
sPe
rcen
t of s
ampl
es in
whi
ch v
alue
s w
ere
le
ss th
an o
r equ
al to
thos
e sh
own
Num
ber
of s
ampl
esM
axim
umM
inim
umM
ean
(Med
ian)
9���
�02�
�
Mis
sour
i Riv
er b
asin
—Co
ntin
ued
0618
5500
Mis
sour
i Riv
er n
ear C
ulbe
rtson
(site
14)
—Co
ntin
ued
Fluo
ride
, dis
solv
ed (
mg/
L)
41.9
.4.8
.9.9
.8.7
.6
Silic
a, d
isso
lved
(m
g/L
)40
7.80
6.26
6.90
7.67
7.12
6.92
6.66
6.27
Sulf
ate,
dis
solv
ed (
mg/
L)
4119
195
.913
618
714
312
912
311
6
Dis
solv
ed s
olid
s (s
um o
f co
nstit
uent
s) (
mg/
L)
4048
926
336
645
138
135
434
433
0
Am
mon
ia p
lus
orga
nic
nitr
ogen
, tot
al (
mg/
L a
s ni
trog
en)
411.
7.2
4.4
81.
6.5
4.3
3.2
8.2
5
Nitr
ite p
lus
nitr
ate,
dis
solv
ed (
mg/
L a
s ni
trog
en)
41.1
95<
.005
1 .021
.090
.023
<.0
22<
.005
<.0
05
Nitr
ite, d
isso
lved
(m
g/L
as
nitr
ogen
)41
.006
<.0
011 .0
01.0
03.0
01<
.002
<.0
02<
.001
Nitr
ogen
, tot
al (
mg/
L, c
alcu
late
d)41
1.89
.247
.503
1.23
.531
.333
.287
.263
Ort
hoph
osph
ate,
dis
solv
ed (
mg/
L a
s ph
osph
orus
)41
.020
.003
.009
.018
.010
.008
.007
.004
Phos
phor
us, t
otal
(m
g/L
)41
.760
.040
.205
.622
.230
.160
.111
.061
Ars
enic
, tot
al-r
ecov
erab
le (
µg/L
)9
74
57
65
44
Cad
miu
m, t
otal
-rec
over
able
(µg
/L)
9.1
6<
.11 .0
8.1
6.0
7.0
7.0
7.0
4
Chr
omiu
m, t
otal
-rec
over
able
(µg
/L)
93.
81.
02.
23.
83.
32.
01.
41.
0
Cop
per,
tota
l-re
cove
rabl
e (µ
g/L
)9
12.0
4.0
6.8
12.0
8.2
5.8
5.6
4.0
Lea
d, to
tal-
reco
vera
ble
(µg/
L)
96.
41.
22.
86.
43.
12.
42.
01.
2
Nic
kel,
tota
l-re
cove
rabl
e (µ
g/L
912
.13.
76.
912
.17.
56.
85.
93.
7
Zin
c, to
tal-
reco
vera
ble
(µg/
L)
935
816
3520
1411
8
Susp
ende
d se
dim
ent (
perc
ent f
iner
than
0.0
62 m
m)
4188
2153
8862
4941
28
Susp
ende
d se
dim
ent,
conc
entr
atio
n (m
g/L
)41
1,05
078
326
978
388
237
170
98
Susp
ende
d se
dim
ent,
disc
harg
e (t
on/d
ay)
4156
,400
1,08
08,
690
25,7
008,
890
5,70
03,
570
2,15
0
Yello
wst
one
Rive
r bas
in
061
9250
0 Ye
llow
ston
e Ri
ver n
ear L
ivin
gsto
n (s
ite 1
5)
Stre
amfl
ow, i
nsta
ntan
eous
(ft
3 /s)
2018
,900
1,07
06,
920
18,9
0014
,400
3,62
01,
880
1,08
0
pH, o
nsite
(st
anda
rd u
nits
)20
8.7
7.3
8.1
8.7
8.3
8.0
7.9
7.3
Spec
ific
con
duct
ance
, ons
ite (
µS/c
m)
2028
165
166
281
198
168
9465
Tem
pera
ture
, wat
er o C
2020
.05.
511
.020
.016
.09.
07.
55.
5
11� Water-Quality Characteristics of Montana Streams in a Statewide Monitoring Network, 1999-2003Ta
ble
1�.
Stat
istic
al s
umm
ary
of w
ater
-qua
lity
data
for p
erio
dica
lly c
olle
cted
sam
ples
from
site
s in
the
stat
ewid
e m
onito
ring
netw
ork
in M
onta
na, w
ater
yea
rs 1
999-
2003
. —
Cont
inue
d

Stre
am p
rope
rtie
s, c
onst
ituen
ts, a
nd u
nits
of m
easu
re
Des
crip
tive
stat
istic
sPe
rcen
t of s
ampl
es in
whi
ch v
alue
s w
ere
le
ss th
an o
r equ
al to
thos
e sh
own
Num
ber
of s
ampl
esM
axim
umM
inim
umM
ean
(Med
ian)
9���
�02�
�
Yello
wst
one
Rive
r bas
in—
Cont
inue
d
061
9250
0 Ye
llow
ston
e Ri
ver n
ear L
ivin
gsto
n (s
ite 1
5)—
Cont
inue
d
Har
dnes
s, to
tal (
mg/
L a
s C
aCO
3)10
8628
5286
7650
3028
Cal
cium
, dis
solv
ed (
mg/
L)
1022
.57.
1413
.522
.519
.912
.88.
067.
14
Mag
nesi
um, d
isso
lved
(m
g/L
)10
7.28
2.37
4.39
7.28
6.50
4.32
2.46
2.37
Pota
ssiu
m, d
isso
lved
(m
g/L
)10
5.16
1.25
2.69
5.16
4.18
2.50
1.41
1.25
Sodi
um a
dsor
ptio
n ra
tio10
1.3
.61
.8.6
.4.3
Sodi
um, d
isso
lved
(m
g/L
)10
21.0
3.87
10.9
21.0
17.6
10.4
5.01
3.87
Alk
alin
ity, d
isso
lved
(m
g/L
as
CaC
O3)
1094
.032
.055
.994
.080
.554
.034
.232
.0
Chl
orid
e, d
isso
lved
(m
g/L
)10
11.6
1.56
5.39
11.6
9.29
5.03
1.74
1.56
Fluo
ride
, dis
solv
ed (
mg/
L)
10.8
.2.5
.8.8
.4.2
.17
Silic
a, d
isso
lved
(m
g/L
)10
24.6
14.2
18.1
24.6
20.8
17.6
14.4
14.2
Sulf
ate,
dis
solv
ed (
mg/
L)
1034
.04.
9015
.234
.026
.013
.85.
404.
90
Dis
solv
ed s
olid
s (s
um o
f co
nstit
uent
s) (
mg/
L)
1018
455
105
184
153
102
6055
Am
mon
ia p
lus
orga
nic
nitr
ogen
, tot
al (
mg/
L a
s ni
trog
en)
201.
3.1
1.3
51.
3.4
5.2
6.1
6.1
1
Nitr
ite p
lus
nitr
ate,
dis
solv
ed (
mg/
L a
s ni
trog
en)
20.2
38<
.05
1 .089
.191
.127
.069
.042
<.0
5
Nitr
ite, d
isso
lved
(m
g/L
as
nitr
ogen
)20
.010
<.0
011 .0
03.0
06.0
04.0
02<
.010
<.0
01
Nitr
ogen
, tot
al (
mg/
L, c
alcu
late
d)20
1.37
.157
.442
.865
.459
.383
.245
.183
Ort
hoph
osph
ate,
dis
solv
ed (
mg/
L a
s ph
osph
orus
)20
.031
.001
.016
.031
.024
.016
.005
.001
Phos
phor
us, t
otal
(m
g/L
)20
1.18
.012
.181
1.14
.252
.059
.028
.012
Ars
enic
, tot
al-r
ecov
erab
le (
µg/L
)10
3013
1930
2718
1413
Cad
miu
m, t
otal
-rec
over
able
(µg
/L)
10.1
0<
.04
--.1
<1
<.1
<.1
<.1
Chr
omiu
m, t
otal
-rec
over
able
(µg
/L)
1012
.7<
.81 3
.012
.74.
8<
1<
1<
.8
Cop
per,
tota
l-re
cove
rabl
e (µ
g/L
)10
30.5
<1
1 7.5
30.5
9.9
3.9
1.0
.6
Lea
d, to
tal-
reco
vera
ble
(µg/
L)
1012
<1
1 312
41
<1
<1
Nic
kel,
tota
l-re
cove
rabl
e (µ
g/L
1030
<1
1 5.8
309
1<
1<
1
Zin
c, to
tal-
reco
vera
ble
(µg/
L)
1043
<1
1 943
13<
40<
30<
1
Susp
ende
d se
dim
ent (
perc
ent f
iner
than
0.0
62 m
m)
2098
3872
9887
7860
38
Data 119Ta
ble
1�.
Stat
istic
al s
umm
ary
of w
ater
-qua
lity
data
for p
erio
dica
lly c
olle
cted
sam
ples
from
site
s in
the
stat
ewid
e m
onito
ring
netw
ork
in M
onta
na, w
ater
yea
rs 1
999-
2003
. —
Cont
inue
d
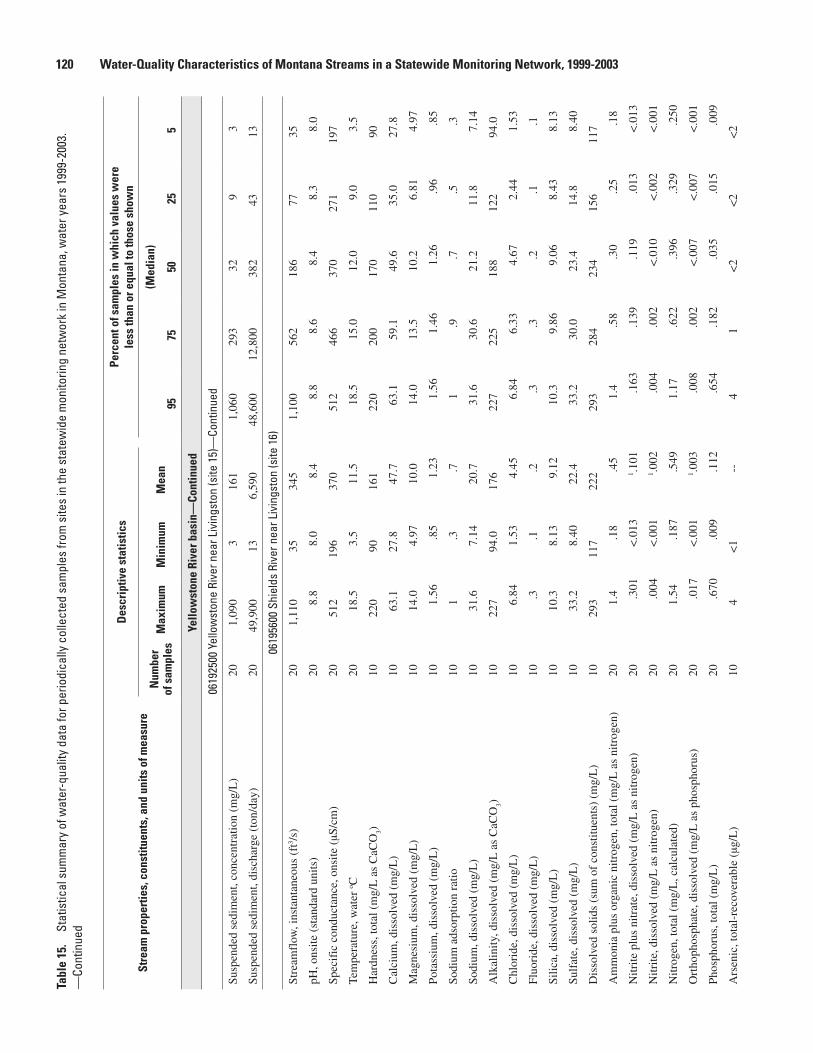
Stre
am p
rope
rtie
s, c
onst
ituen
ts, a
nd u
nits
of m
easu
re
Des
crip
tive
stat
istic
sPe
rcen
t of s
ampl
es in
whi
ch v
alue
s w
ere
le
ss th
an o
r equ
al to
thos
e sh
own
Num
ber
of s
ampl
esM
axim
umM
inim
umM
ean
(Med
ian)
9���
�02�
�
Yello
wst
one
Rive
r bas
in—
Cont
inue
d
061
9250
0 Ye
llow
ston
e Ri
ver n
ear L
ivin
gsto
n (s
ite 1
5)—
Cont
inue
d
Susp
ende
d se
dim
ent,
conc
entr
atio
n (m
g/L
)20
1,09
03
161
1,06
029
332
93
Susp
ende
d se
dim
ent,
disc
harg
e (t
on/d
ay)
2049
,900
136,
590
48,6
0012
,800
382
4313
0619
5600
Shi
elds
Riv
er n
ear L
ivin
gsto
n (s
ite 1
6)
Stre
amfl
ow, i
nsta
ntan
eous
(ft
3 /s)
201,
110
3534
51,
100
562
186
7735
pH, o
nsite
(st
anda
rd u
nits
)20
8.8
8.0
8.4
8.8
8.6
8.4
8.3
8.0
Spec
ific
con
duct
ance
, ons
ite (
µS/c
m)
2051
219
637
051
246
637
027
119
7
Tem
pera
ture
, wat
er o C
2018
.53.
511
.518
.515
.012
.09.
03.
5
Har
dnes
s, to
tal (
mg/
L a
s C
aCO
3)10
220
9016
122
020
017
011
090
Cal
cium
, dis
solv
ed (
mg/
L)
1063
.127
.847
.763
.159
.149
.635
.027
.8
Mag
nesi
um, d
isso
lved
(m
g/L
)10
14.0
4.97
10.0
14.0
13.5
10.2
6.81
4.97
Pota
ssiu
m, d
isso
lved
(m
g/L
)10
1.56
.85
1.23
1.56
1.46
1.26
.96
.85
Sodi
um a
dsor
ptio
n ra
tio10
1.3
.71
.9.7
.5.3
Sodi
um, d
isso
lved
(m
g/L
)10
31.6
7.14
20.7
31.6
30.6
21.2
11.8
7.14
Alk
alin
ity, d
isso
lved
(m
g/L
as
CaC
O3)
1022
794
.017
622
722
518
812
294
.0
Chl
orid
e, d
isso
lved
(m
g/L
)10
6.84
1.53
4.45
6.84
6.33
4.67
2.44
1.53
Fluo
ride
, dis
solv
ed (
mg/
L)
10.3
.1.2
.3.3
.2.1
.1
Silic
a, d
isso
lved
(m
g/L
)10
10.3
8.13
9.12
10.3
9.86
9.06
8.43
8.13
Sulf
ate,
dis
solv
ed (
mg/
L)
1033
.28.
4022
.433
.230
.023
.414
.88.
40
Dis
solv
ed s
olid
s (s
um o
f co
nstit
uent
s) (
mg/
L)
1029
311
722
229
328
423
415
611
7
Am
mon
ia p
lus
orga
nic
nitr
ogen
, tot
al (
mg/
L a
s ni
trog
en)
201.
4.1
8.4
51.
4.5
8.3
0.2
5.1
8
Nitr
ite p
lus
nitr
ate,
dis
solv
ed (
mg/
L a
s ni
trog
en)
20.3
01<
.013
1 .101
.163
.139
.119
.013
<.0
13
Nitr
ite, d
isso
lved
(m
g/L
as
nitr
ogen
)20
.004
<.0
011 .0
02.0
04.0
02<
.010
<.0
02<
.001
Nitr
ogen
, tot
al (
mg/
L, c
alcu
late
d)20
1.54
.187
.549
1.17
.622
.396
.329
.250
Ort
hoph
osph
ate,
dis
solv
ed (
mg/
L a
s ph
osph
orus
)20
.017
<.0
011 .0
03.0
08.0
02<
.007
<.0
07<
.001
Phos
phor
us, t
otal
(m
g/L
)20
.670
.009
.112
.654
.182
.035
.015
.009
Ars
enic
, tot
al-r
ecov
erab
le (
µg/L
)10
4<
1--
41
<2
<2
<2
120 Water-Quality Characteristics of Montana Streams in a Statewide Monitoring Network, 1999-2003Ta
ble
1�.
Stat
istic
al s
umm
ary
of w
ater
-qua
lity
data
for p
erio
dica
lly c
olle
cted
sam
ples
from
site
s in
the
stat
ewid
e m
onito
ring
netw
ork
in M
onta
na, w
ater
yea
rs 1
999-
2003
. —
Cont
inue
d
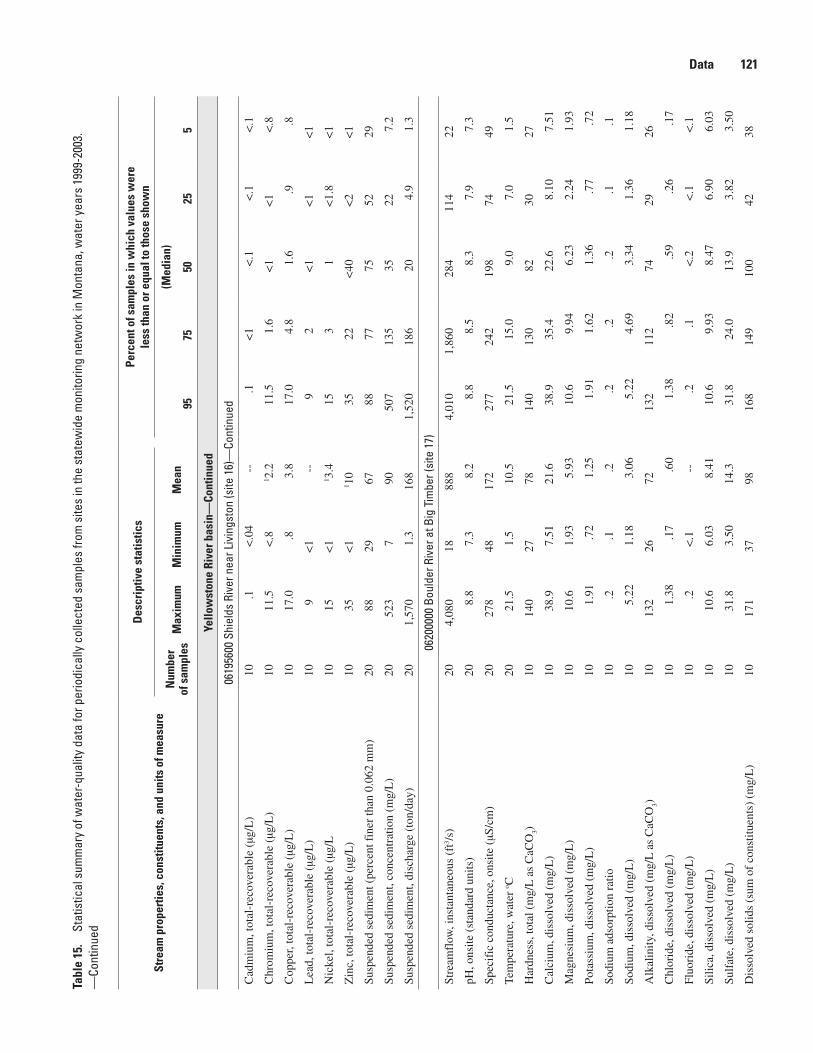
Stre
am p
rope
rtie
s, c
onst
ituen
ts, a
nd u
nits
of m
easu
re
Des
crip
tive
stat
istic
sPe
rcen
t of s
ampl
es in
whi
ch v
alue
s w
ere
le
ss th
an o
r equ
al to
thos
e sh
own
Num
ber
of s
ampl
esM
axim
umM
inim
umM
ean
(Med
ian)
9���
�02�
�
Yello
wst
one
Rive
r bas
in—
Cont
inue
d
0619
5600
Shi
elds
Riv
er n
ear L
ivin
gsto
n (s
ite 1
6)—
Cont
inue
d
Cad
miu
m, t
otal
-rec
over
able
(µg
/L)
10.1
<.0
4--
.1<
1<
.1<
.1<
.1
Chr
omiu
m, t
otal
-rec
over
able
(µg
/L)
1011
.5<
.81 2
.211
.51.
6<
1<
1<
.8
Cop
per,
tota
l-re
cove
rabl
e (µ
g/L
)10
17.0
.83.
817
.04.
81.
6.9
.8
Lea
d, to
tal-
reco
vera
ble
(µg/
L)
109
<1
--9
2<
1<
1<
1
Nic
kel,
tota
l-re
cove
rabl
e (µ
g/L
1015
<1
1 3.4
153
1<
1.8
<1
Zin
c, to
tal-
reco
vera
ble
(µg/
L)
1035
<1
1 10
3522
<40
<2
<1
Susp
ende
d se
dim
ent (
perc
ent f
iner
than
0.0
62 m
m)
2088
2967
8877
7552
29
Susp
ende
d se
dim
ent,
conc
entr
atio
n (m
g/L
)20
523
790
507
135
3522
7.2
Susp
ende
d se
dim
ent,
disc
harg
e (t
on/d
ay)
201,
570
1.3
168
1,52
018
620
4.9
1.3
0620
0000
Bou
lder
Riv
er a
t Big
Tim
ber (
site
17)
Stre
amfl
ow, i
nsta
ntan
eous
(ft
3 /s)
204,
080
1888
84,
010
1,86
028
411
422
pH, o
nsite
(st
anda
rd u
nits
)20
8.8
7.3
8.2
8.8
8.5
8.3
7.9
7.3
Spec
ific
con
duct
ance
, ons
ite (
µS/c
m)
2027
848
172
277
242
198
7449
Tem
pera
ture
, wat
er o C
2021
.51.
510
.521
.515
.09.
07.
01.
5
Har
dnes
s, to
tal (
mg/
L a
s C
aCO
3)10
140
2778
140
130
8230
27
Cal
cium
, dis
solv
ed (
mg/
L)
1038
.97.
5121
.638
.935
.422
.68.
107.
51
Mag
nesi
um, d
isso
lved
(m
g/L
)10
10.6
1.93
5.93
10.6
9.94
6.23
2.24
1.93
Pota
ssiu
m, d
isso
lved
(m
g/L
)10
1.91
.72
1.25
1.91
1.62
1.36
.77
.72
Sodi
um a
dsor
ptio
n ra
tio10
.2.1
.2.2
.2.2
.1.1
Sodi
um, d
isso
lved
(m
g/L
)10
5.22
1.18
3.06
5.22
4.69
3.34
1.36
1.18
Alk
alin
ity, d
isso
lved
(m
g/L
as
CaC
O3)
1013
226
7213
211
274
2926
Chl
orid
e, d
isso
lved
(m
g/L
)10
1.38
.17
.60
1.38
.82
.59
.26
.17
Fluo
ride
, dis
solv
ed (
mg/
L)
10.2
<.1
--.2
.1<
.2<
.1<
.1
Silic
a, d
isso
lved
(m
g/L
)10
10.6
6.03
8.41
10.6
9.93
8.47
6.90
6.03
Sulf
ate,
dis
solv
ed (
mg/
L)
1031
.83.
5014
.331
.824
.013
.93.
823.
50
Dis
solv
ed s
olid
s (s
um o
f co
nstit
uent
s) (
mg/
L)
1017
137
9816
814
910
042
38
Data 121Ta
ble
1�.
Stat
istic
al s
umm
ary
of w
ater
-qua
lity
data
for p
erio
dica
lly c
olle
cted
sam
ples
from
site
s in
the
stat
ewid
e m
onito
ring
netw
ork
in M
onta
na, w
ater
yea
rs 1
999-
2003
. —
Cont
inue
d

Stre
am p
rope
rtie
s, c
onst
ituen
ts, a
nd u
nits
of m
easu
re
Des
crip
tive
stat
istic
sPe
rcen
t of s
ampl
es in
whi
ch v
alue
s w
ere
le
ss th
an o
r equ
al to
thos
e sh
own
Num
ber
of s
ampl
esM
axim
umM
inim
umM
ean
(Med
ian)
9���
�02�
�
Yello
wst
one
Rive
r bas
in—
Cont
inue
d
0620
0000
Bou
lder
Riv
er a
t Big
Tim
ber (
site
17)
—Co
ntin
ued
Am
mon
ia p
lus
orga
nic
nitr
ogen
, tot
al (
mg/
L a
s ni
trog
en)
20.4
6E
.05
.17
.45
.21
.16
.10
.05
Nitr
ite p
lus
nitr
ate,
dis
solv
ed (
mg/
L a
s ni
trog
en)
20.0
77<
.005
1 .031
.053
.045
.024
.012
<.0
5
Nitr
ite, d
isso
lved
(m
g/L
as
nitr
ogen
)20
.001
<.0
01--
.001
<.0
02<
.002
<.0
01<
.001
Nitr
ogen
, tot
al (
mg/
L, c
alcu
late
d)20
.485
.098
.205
.411
.233
.173
.130
.098
Ort
hoph
osph
ate,
dis
solv
ed (
mg/
L a
s ph
osph
orus
)20
.003
<.0
011 .0
02.0
02.0
01<
.007
<.0
07<
.001
Phos
phor
us, t
otal
(m
g/L
)20
.115
<.0
041 .0
20.0
52.0
21.0
09.0
04<
.004
Ars
enic
, tot
al-r
ecov
erab
le (
µg/L
)10
2<
1--
2<
3<
2<
2<
2
Cad
miu
m, t
otal
-rec
over
able
(µg
/L)
10<
1<
.04
--<
1<
.2<
.1<
.1<
.1
Chr
omiu
m, t
otal
-rec
over
able
(µg
/L)
106.
2<
.81 1
.66.
22.
0<
1<
1<
.8
Cop
per,
tota
l-re
cove
rabl
e (µ
g/L
)10
7.2
<1
1 2.5
7.2
5.3
1.0
.7.6
Lea
d, to
tal-
reco
vera
ble
(µg/
L)
102
<.0
6--
21
<1
<1
<1
Nic
kel,
tota
l-re
cove
rabl
e (µ
g/L
106.
5<
11 1
.66.
52.
0.7
<1
<1
Zin
c, to
tal-
reco
vera
ble
(µg/
L)
104
<1
1 24
4<
40<
31<
2.0
Susp
ende
d se
dim
ent (
perc
ent f
iner
than
0.0
62 m
m)
2096
5174
9685
7066
51
Susp
ende
d se
dim
ent,
conc
entr
atio
n (m
g/L
)20
150
119
145
238
21
Susp
ende
d se
dim
ent,
disc
harg
e (t
on/d
ay)
201,
650
.15
131
1,58
013
52.
8.6
4.1
6
0620
5000
Stil
lwat
er R
iver
nea
r Abs
arok
ee (s
ite 1
8)
Stre
amfl
ow, i
nsta
ntan
eous
(ft
3 /s)
205,
300
204
1,45
05,
270
2,10
01,
040
349
204
pH, o
nsite
(st
anda
rd u
nits
)20
8.7
7.7
8.3
8.7
8.6
8.4
8.1
7.7
Spec
ific
con
duct
ance
, ons
ite (
µS/c
m)
2024
542
120
245
170
124
6542
Tem
pera
ture
, wat
er o C
2020
.0.0
9.5
20.0
13.5
10.0
5.0
.0
Har
dnes
s, to
tal (
mg/
L a
s C
aCO
3)10
110
1751
110
7744
2317
Cal
cium
, dis
solv
ed (
mg/
L)
1029
.44.
5713
.729
.420
.611
.76.
224.
57
Mag
nesi
um, d
isso
lved
(m
g/L
)10
8.52
1.45
4.00
8.52
6.13
3.42
1.79
1.45
Pota
ssiu
m, d
isso
lved
(m
g/L
)10
1.79
.56
.98
1.79
1.27
.88
.64
.56
Sodi
um a
dsor
ptio
n ra
tio10
.4.1
.2.4
.3.2
.1.1
122 Water-Quality Characteristics of Montana Streams in a Statewide Monitoring Network, 1999-2003Ta
ble
1�.
Stat
istic
al s
umm
ary
of w
ater
-qua
lity
data
for p
erio
dica
lly c
olle
cted
sam
ples
from
site
s in
the
stat
ewid
e m
onito
ring
netw
ork
in M
onta
na, w
ater
yea
rs 1
999-
2003
. —
Cont
inue
d
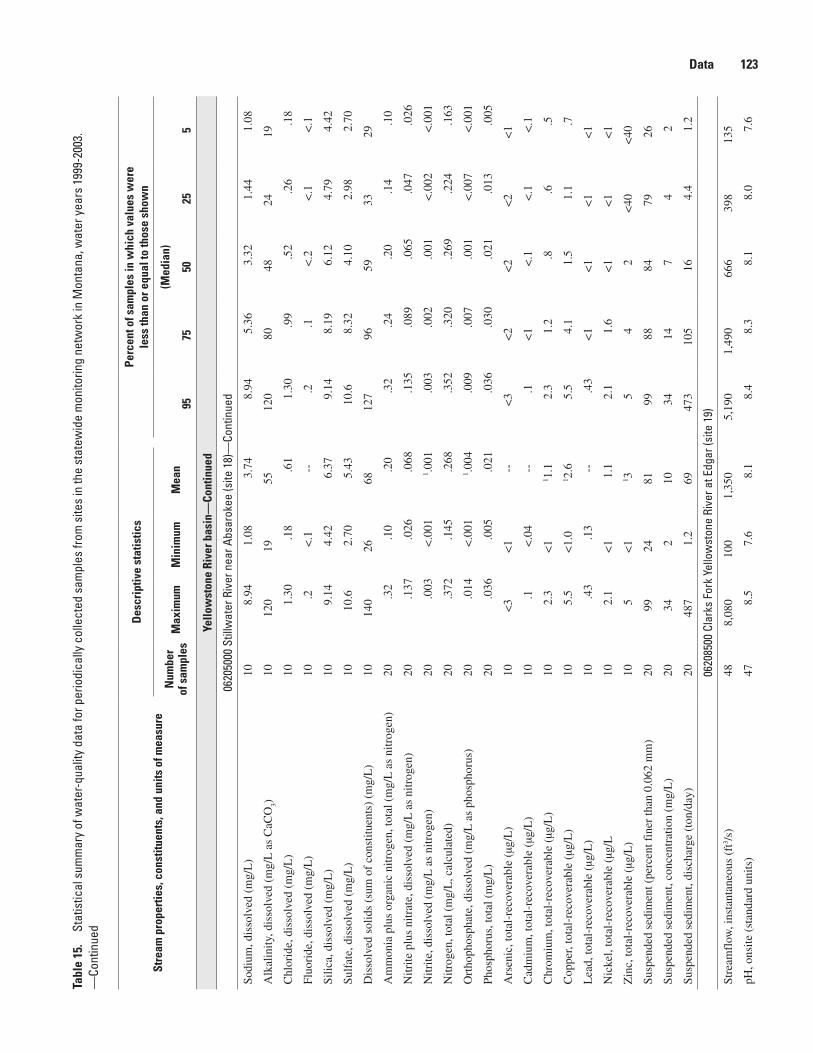
Stre
am p
rope
rtie
s, c
onst
ituen
ts, a
nd u
nits
of m
easu
re
Des
crip
tive
stat
istic
sPe
rcen
t of s
ampl
es in
whi
ch v
alue
s w
ere
le
ss th
an o
r equ
al to
thos
e sh
own
Num
ber
of s
ampl
esM
axim
umM
inim
umM
ean
(Med
ian)
9���
�02�
�
Yello
wst
one
Rive
r bas
in—
Cont
inue
d
0620
5000
Stil
lwat
er R
iver
nea
r Abs
arok
ee (s
ite 1
8)—
Cont
inue
d
Sodi
um, d
isso
lved
(m
g/L
)10
8.94
1.08
3.74
8.94
5.36
3.32
1.44
1.08
Alk
alin
ity, d
isso
lved
(m
g/L
as
CaC
O3)
1012
019
5512
080
4824
19
Chl
orid
e, d
isso
lved
(m
g/L
)10
1.30
.18
.61
1.30
.99
.52
.26
.18
Fluo
ride
, dis
solv
ed (
mg/
L)
10.2
<.1
--.2
.1<
.2<
.1<
.1
Silic
a, d
isso
lved
(m
g/L
)10
9.14
4.42
6.37
9.14
8.19
6.12
4.79
4.42
Sulf
ate,
dis
solv
ed (
mg/
L)
1010
.62.
705.
4310
.68.
324.
102.
982.
70
Dis
solv
ed s
olid
s (s
um o
f co
nstit
uent
s) (
mg/
L)
1014
026
6812
796
5933
29
Am
mon
ia p
lus
orga
nic
nitr
ogen
, tot
al (
mg/
L a
s ni
trog
en)
20.3
2.1
0.2
0.3
2.2
4.2
0.1
4.1
0
Nitr
ite p
lus
nitr
ate,
dis
solv
ed (
mg/
L a
s ni
trog
en)
20.1
37.0
26.0
68.1
35.0
89.0
65.0
47.0
26
Nitr
ite, d
isso
lved
(m
g/L
as
nitr
ogen
)20
.003
<.0
011 .0
01.0
03.0
02.0
01<
.002
<.0
01
Nitr
ogen
, tot
al (
mg/
L, c
alcu
late
d)20
.372
.145
.268
.352
.320
.269
.224
.163
Ort
hoph
osph
ate,
dis
solv
ed (
mg/
L a
s ph
osph
orus
)20
.014
<.0
011 .0
04.0
09.0
07.0
01<
.007
<.0
01
Phos
phor
us, t
otal
(m
g/L
)20
.036
.005
.021
.036
.030
.021
.013
.005
Ars
enic
, tot
al-r
ecov
erab
le (
µg/L
)10
<3
<1
--<
3<
2<
2<
2<
1
Cad
miu
m, t
otal
-rec
over
able
(µg
/L)
10.1
<.0
4--
.1<
1<
.1<
.1<
.1
Chr
omiu
m, t
otal
-rec
over
able
(µg
/L)
102.
3<
11 1
.12.
31.
2.8
.6.5
Cop
per,
tota
l-re
cove
rabl
e (µ
g/L
)10
5.5
<1.
01 2
.65.
54.
11.
51.
1.7
Lea
d, to
tal-
reco
vera
ble
(µg/
L)
10.4
3.1
3--
.43
<1
<1
<1
<1
Nic
kel,
tota
l-re
cove
rabl
e (µ
g/L
102.
1<
11.
12.
11.
6<
1<
1<
1
Zin
c, to
tal-
reco
vera
ble
(µg/
L)
105
<1
1 35
42
<40
<40
Susp
ende
d se
dim
ent (
perc
ent f
iner
than
0.0
62 m
m)
2099
2481
9988
8479
26
Susp
ende
d se
dim
ent,
conc
entr
atio
n (m
g/L
)20
342
1034
147
42
Susp
ende
d se
dim
ent,
disc
harg
e (t
on/d
ay)
2048
71.
269
473
105
164.
41.
2
0620
8500
Cla
rks
Fork
Yel
low
ston
e Ri
ver a
t Edg
ar (s
ite 1
9)
Stre
amfl
ow, i
nsta
ntan
eous
(ft
3 /s)
488,
080
100
1,35
05,
190
1,49
066
639
813
5
pH, o
nsite
(st
anda
rd u
nits
)47
8.5
7.6
8.1
8.4
8.3
8.1
8.0
7.6
Data 123Ta
ble
1�.
Stat
istic
al s
umm
ary
of w
ater
-qua
lity
data
for p
erio
dica
lly c
olle
cted
sam
ples
from
site
s in
the
stat
ewid
e m
onito
ring
netw
ork
in M
onta
na, w
ater
yea
rs 1
999-
2003
. —
Cont
inue
d
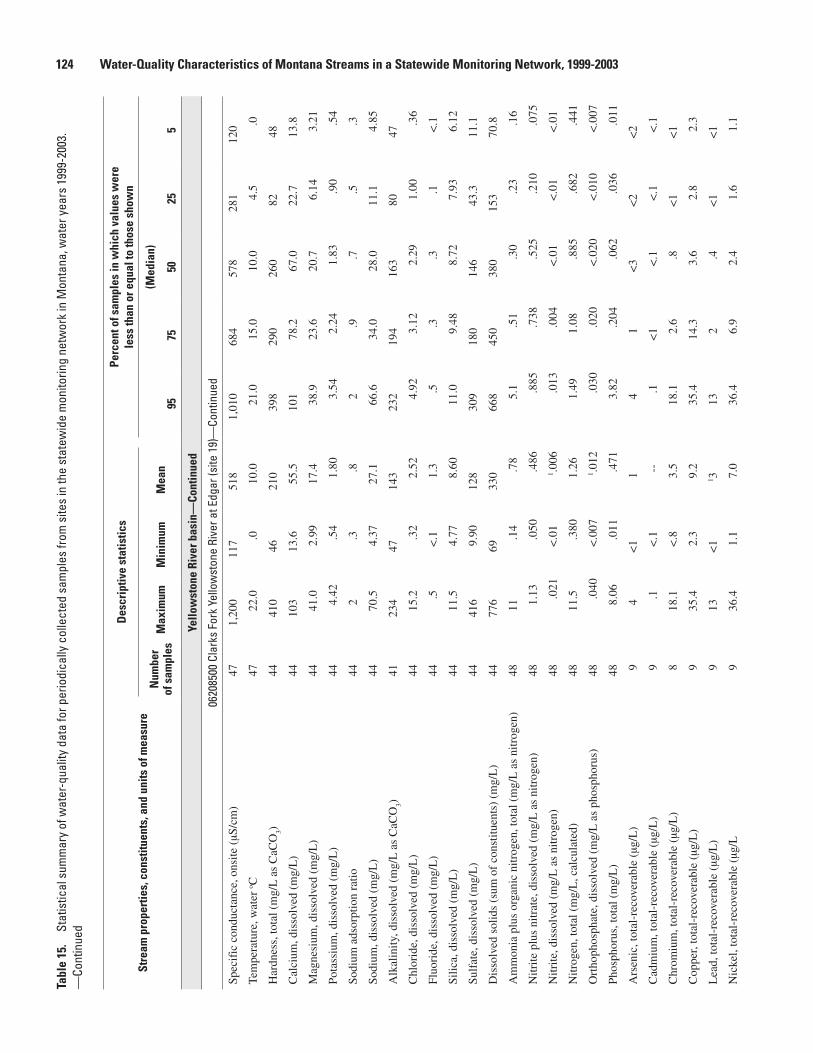
Stre
am p
rope
rtie
s, c
onst
ituen
ts, a
nd u
nits
of m
easu
re
Des
crip
tive
stat
istic
sPe
rcen
t of s
ampl
es in
whi
ch v
alue
s w
ere
le
ss th
an o
r equ
al to
thos
e sh
own
Num
ber
of s
ampl
esM
axim
umM
inim
umM
ean
(Med
ian)
9���
�02�
�
Yello
wst
one
Rive
r bas
in—
Cont
inue
d
0620
8500
Cla
rks
Fork
Yel
low
ston
e Ri
ver a
t Edg
ar (s
ite 1
9)—
Cont
inue
d
Spec
ific
con
duct
ance
, ons
ite (
µS/c
m)
471,
200
117
518
1,01
068
457
828
112
0
Tem
pera
ture
, wat
er o C
4722
.0.0
10.0
21.0
15.0
10.0
4.5
.0
Har
dnes
s, to
tal (
mg/
L a
s C
aCO
3)44
410
4621
039
829
026
082
48
Cal
cium
, dis
solv
ed (
mg/
L)
4410
313
.655
.510
178
.267
.022
.713
.8
Mag
nesi
um, d
isso
lved
(m
g/L
)44
41.0
2.99
17.4
38.9
23.6
20.7
6.14
3.21
Pota
ssiu
m, d
isso
lved
(m
g/L
)44
4.42
.54
1.80
3.54
2.24
1.83
.90
.54
Sodi
um a
dsor
ptio
n ra
tio44
2.3
.82
.9.7
.5.3
Sodi
um, d
isso
lved
(m
g/L
)44
70.5
4.37
27.1
66.6
34.0
28.0
11.1
4.85
Alk
alin
ity, d
isso
lved
(m
g/L
as
CaC
O3)
4123
447
143
232
194
163
8047
Chl
orid
e, d
isso
lved
(m
g/L
)44
15.2
.32
2.52
4.92
3.12
2.29
1.00
.36
Fluo
ride
, dis
solv
ed (
mg/
L)
44.5
<.1
1.3
.5.3
.3.1
<.1
Silic
a, d
isso
lved
(m
g/L
)44
11.5
4.77
8.60
11.0
9.48
8.72
7.93
6.12
Sulf
ate,
dis
solv
ed (
mg/
L)
4441
69.
9012
830
918
014
643
.311
.1
Dis
solv
ed s
olid
s (s
um o
f co
nstit
uent
s) (
mg/
L)
4477
669
330
668
450
380
153
70.8
Am
mon
ia p
lus
orga
nic
nitr
ogen
, tot
al (
mg/
L a
s ni
trog
en)
4811
.14
.78
5.1
.51
.30
.23
.16
Nitr
ite p
lus
nitr
ate,
dis
solv
ed (
mg/
L a
s ni
trog
en)
481.
13.0
50.4
86.8
85.7
38.5
25.2
10.0
75
Nitr
ite, d
isso
lved
(m
g/L
as
nitr
ogen
)48
.021
<.0
11 .0
06.0
13.0
04<
.01
<.0
1<
.01
Nitr
ogen
, tot
al (
mg/
L, c
alcu
late
d)48
11.5
.380
1.26
1.49
1.08
.885
.682
.441
Ort
hoph
osph
ate,
dis
solv
ed (
mg/
L a
s ph
osph
orus
)48
.040
<.0
071 .0
12.0
30.0
20<
.020
<.0
10<
.007
Phos
phor
us, t
otal
(m
g/L
)48
8.06
.011
.471
3.82
.204
.062
.036
.011
Ars
enic
, tot
al-r
ecov
erab
le (
µg/L
)9
4<
11
41
<3
<2
<2
Cad
miu
m, t
otal
-rec
over
able
(µg
/L)
9.1
<.1
--.1
<1
<.1
<.1
<.1
Chr
omiu
m, t
otal
-rec
over
able
(µg
/L)
818
.1<
.83.
518
.12.
6.8
<1
<1
Cop
per,
tota
l-re
cove
rabl
e (µ
g/L
)9
35.4
2.3
9.2
35.4
14.3
3.6
2.8
2.3
Lea
d, to
tal-
reco
vera
ble
(µg/
L)
913
<1
1 313
2.4
<1
<1
Nic
kel,
tota
l-re
cove
rabl
e (µ
g/L
936
.41.
17.
036
.46.
92.
41.
61.
1
12� Water-Quality Characteristics of Montana Streams in a Statewide Monitoring Network, 1999-2003Ta
ble
1�.
Stat
istic
al s
umm
ary
of w
ater
-qua
lity
data
for p
erio
dica
lly c
olle
cted
sam
ples
from
site
s in
the
stat
ewid
e m
onito
ring
netw
ork
in M
onta
na, w
ater
yea
rs 1
999-
2003
. —
Cont
inue
d

Stre
am p
rope
rtie
s, c
onst
ituen
ts, a
nd u
nits
of m
easu
re
Des
crip
tive
stat
istic
sPe
rcen
t of s
ampl
es in
whi
ch v
alue
s w
ere
le
ss th
an o
r equ
al to
thos
e sh
own
Num
ber
of s
ampl
esM
axim
umM
inim
umM
ean
(Med
ian)
9���
�02�
�
Yello
wst
one
Rive
r bas
in—
Cont
inue
d
0620
8500
Cla
rks
Fork
Yel
low
ston
e Ri
ver a
t Edg
ar (s
ite 1
9)—
Cont
inue
d
Zin
c, to
tal-
reco
vera
ble
(µg/
L)
955
<40
1 14
556
54
3
Susp
ende
d se
dim
ent (
perc
ent f
iner
than
0.0
62 m
m)
898
6084
9893
8579
60
Susp
ende
d se
dim
ent,
conc
entr
atio
n (m
g/L
)47
11,0
0015
597
5,98
020
371
4017
Susp
ende
d se
dim
ent,
disc
harg
e (t
on/d
ay)
4761
,400
8.6
4,06
014
,100
640
107
4418
0629
4500
Big
horn
Riv
er a
bove
Tul
lock
Cre
ek, n
ear B
igho
rn (s
ite 2
0)
Stre
amfl
ow, i
nsta
ntan
eous
(ft
3 /s)
209,
340
1,45
03,
210
9,34
03,
880
2,26
01,
540
1,45
0
pH, o
nsite
(st
anda
rd u
nits
)20
8.8
8.1
8.5
8.8
8.6
8.6
8.4
8.1
Spec
ific
con
duct
ance
, ons
ite (
µS/c
m)
201,
120
517
880
1,12
01,
070
931
709
520
Tem
pera
ture
, wat
er o C
2022
.03.
513
.022
.019
.012
.58.
53.
5
Har
dnes
s, to
tal (
mg/
L a
s C
aCO
3)10
380
170
302
380
358
320
250
170
Cal
cium
, dis
solv
ed (
mg/
L)
1095
.145
.375
.395
.187
.778
.863
.745
.3
Mag
nesi
um, d
isso
lved
(m
g/L
)10
35.7
14.8
27.6
35.7
33.2
30.2
21.5
14.8
Pota
ssiu
m, d
isso
lved
(m
g/L
)10
4.79
2.37
3.72
4.79
4.42
3.89
2.91
2.37
Sodi
um a
dsor
ptio
n ra
tio10
21
22
22
21
Sodi
um, d
isso
lved
(m
g/L
)10
101
39.4
75.0
101
96.7
79.4
57.4
39.4
Alk
alin
ity, d
isso
lved
(m
g/L
as
CaC
O3)
1021
412
418
321
420
218
817
112
4
Chl
orid
e, d
isso
lved
(m
g/L
)10
15.4
5.52
10.6
15.4
12.9
11.4
6.92
5.52
Fluo
ride
, dis
solv
ed (
mg/
L)
10.6
.3.4
.6.5
.4.4
.3
Silic
a, d
isso
lved
(m
g/L
)10
8.57
1.54
5.49
8.57
8.10
5.58
2.83
1.54
Sulf
ate,
dis
solv
ed (
mg/
L)
1036
013
226
736
034
528
019
413
2
Dis
solv
ed s
olid
s (s
um o
f co
nstit
uent
s) (
mg/
L)
1074
832
357
774
870
360
145
632
3
Am
mon
ia p
lus
orga
nic
nitr
ogen
, tot
al (
mg/
L a
s ni
trog
en)
20.6
8.3
1.4
6.6
8.5
0.4
2.4
0.3
1
Nitr
ite p
lus
nitr
ate,
dis
solv
ed (
mg/
L a
s ni
trog
en)
20.6
79.0
84.3
51.6
74.4
85.2
76.2
20.0
88
Nitr
ite, d
isso
lved
(m
g/L
as
nitr
ogen
)20
.010
<.0
11 .0
05.0
08.0
05.0
04.0
02<
.01
Nitr
ogen
, tot
al (
mg/
L, c
alcu
late
d)20
1.26
.394
.810
1.25
.925
.844
.657
.495
Ort
hoph
osph
ate,
dis
solv
ed (
mg/
L a
s ph
osph
orus
)20
.031
<.0
071 .0
04.0
08.0
03<
.007
<.0
07<
.007
Data 12�Ta
ble
1�.
Stat
istic
al s
umm
ary
of w
ater
-qua
lity
data
for p
erio
dica
lly c
olle
cted
sam
ples
from
site
s in
the
stat
ewid
e m
onito
ring
netw
ork
in M
onta
na, w
ater
yea
rs 1
999-
2003
. —
Cont
inue
d
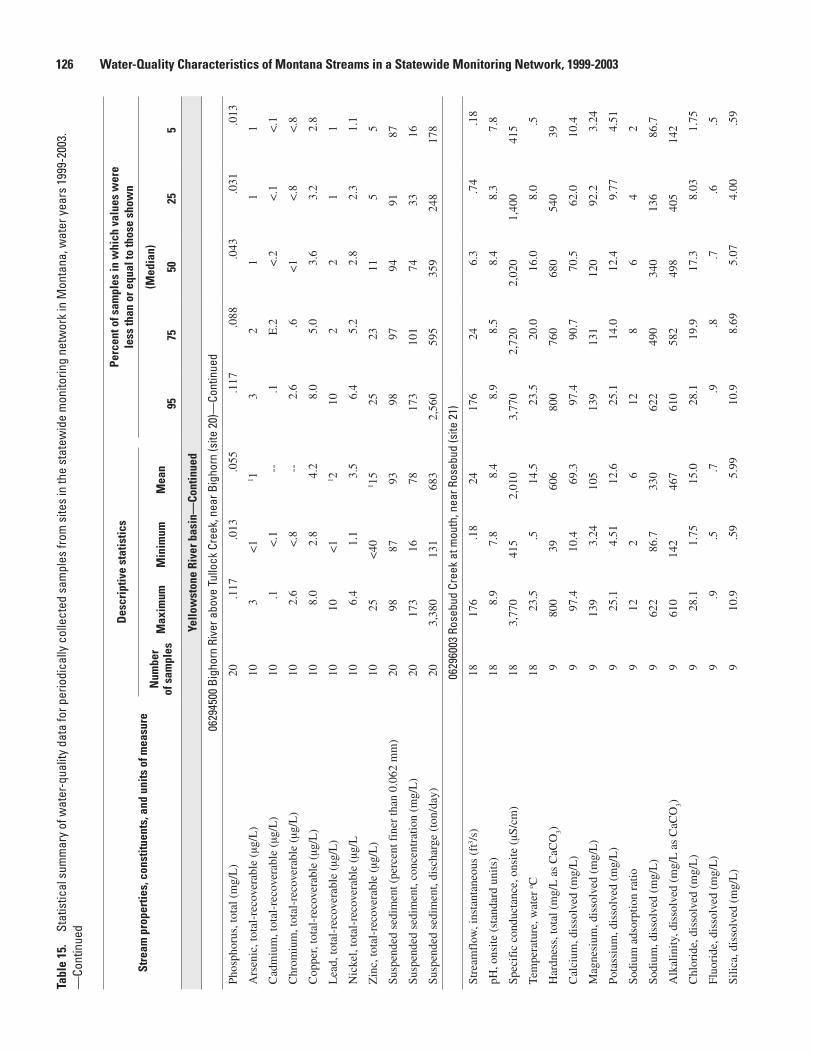
Stre
am p
rope
rtie
s, c
onst
ituen
ts, a
nd u
nits
of m
easu
re
Des
crip
tive
stat
istic
sPe
rcen
t of s
ampl
es in
whi
ch v
alue
s w
ere
le
ss th
an o
r equ
al to
thos
e sh
own
Num
ber
of s
ampl
esM
axim
umM
inim
umM
ean
(Med
ian)
9���
�02�
�
Yello
wst
one
Rive
r bas
in—
Cont
inue
d
0629
4500
Big
horn
Riv
er a
bove
Tul
lock
Cre
ek, n
ear B
igho
rn (s
ite 2
0)—
Cont
inue
d
Phos
phor
us, t
otal
(m
g/L
)20
.117
.013
.055
.117
.088
.043
.031
.013
Ars
enic
, tot
al-r
ecov
erab
le (
µg/L
)10
3<
11 1
32
11
1
Cad
miu
m, t
otal
-rec
over
able
(µg
/L)
10.1
<.1
--.1
E.2
<.2
<.1
<.1
Chr
omiu
m, t
otal
-rec
over
able
(µg
/L)
102.
6<
.8--
2.6
.6<
1<
.8<
.8
Cop
per,
tota
l-re
cove
rabl
e (µ
g/L
)10
8.0
2.8
4.2
8.0
5.0
3.6
3.2
2.8
Lea
d, to
tal-
reco
vera
ble
(µg/
L)
1010
<1
1 210
22
11
Nic
kel,
tota
l-re
cove
rabl
e (µ
g/L
106.
41.
13.
56.
45.
22.
82.
31.
1
Zin
c, to
tal-
reco
vera
ble
(µg/
L)
1025
<40
1 15
2523
115
5
Susp
ende
d se
dim
ent (
perc
ent f
iner
than
0.0
62 m
m)
2098
8793
9897
9491
87
Susp
ende
d se
dim
ent,
conc
entr
atio
n (m
g/L
)20
173
1678
173
101
7433
16
Susp
ende
d se
dim
ent,
disc
harg
e (t
on/d
ay)
203,
380
131
683
2,56
059
535
924
817
8
0629
6003
Ros
ebud
Cre
ek a
t mou
th, n
ear R
oseb
ud (s
ite 2
1)
Stre
amfl
ow, i
nsta
ntan
eous
(ft
3 /s)
1817
6.1
824
176
246.
3.7
4.1
8
pH, o
nsite
(st
anda
rd u
nits
)18
8.9
7.8
8.4
8.9
8.5
8.4
8.3
7.8
Spec
ific
con
duct
ance
, ons
ite (
µS/c
m)
183,
770
415
2,01
03,
770
2,72
02,
020
1,40
041
5
Tem
pera
ture
, wat
er o C
1823
.5.5
14.5
23.5
20.0
16.0
8.0
.5
Har
dnes
s, to
tal (
mg/
L a
s C
aCO
3)9
800
3960
680
076
068
054
039
Cal
cium
, dis
solv
ed (
mg/
L)
997
.410
.469
.397
.490
.770
.562
.010
.4
Mag
nesi
um, d
isso
lved
(m
g/L
)9
139
3.24
105
139
131
120
92.2
3.24
Pota
ssiu
m, d
isso
lved
(m
g/L
)9
25.1
4.51
12.6
25.1
14.0
12.4
9.77
4.51
Sodi
um a
dsor
ptio
n ra
tio9
122
612
86
42
Sodi
um, d
isso
lved
(m
g/L
)9
622
86.7
330
622
490
340
136
86.7
Alk
alin
ity, d
isso
lved
(m
g/L
as
CaC
O3)
961
014
246
761
058
249
840
514
2
Chl
orid
e, d
isso
lved
(m
g/L
)9
28.1
1.75
15.0
28.1
19.9
17.3
8.03
1.75
Fluo
ride
, dis
solv
ed (
mg/
L)
9.9
.5.7
.9.8
.7.6
.5
Silic
a, d
isso
lved
(m
g/L
)9
10.9
.59
5.99
10.9
8.69
5.07
4.00
.59
12� Water-Quality Characteristics of Montana Streams in a Statewide Monitoring Network, 1999-2003Ta
ble
1�.
Stat
istic
al s
umm
ary
of w
ater
-qua
lity
data
for p
erio
dica
lly c
olle
cted
sam
ples
from
site
s in
the
stat
ewid
e m
onito
ring
netw
ork
in M
onta
na, w
ater
yea
rs 1
999-
2003
. —
Cont
inue
d
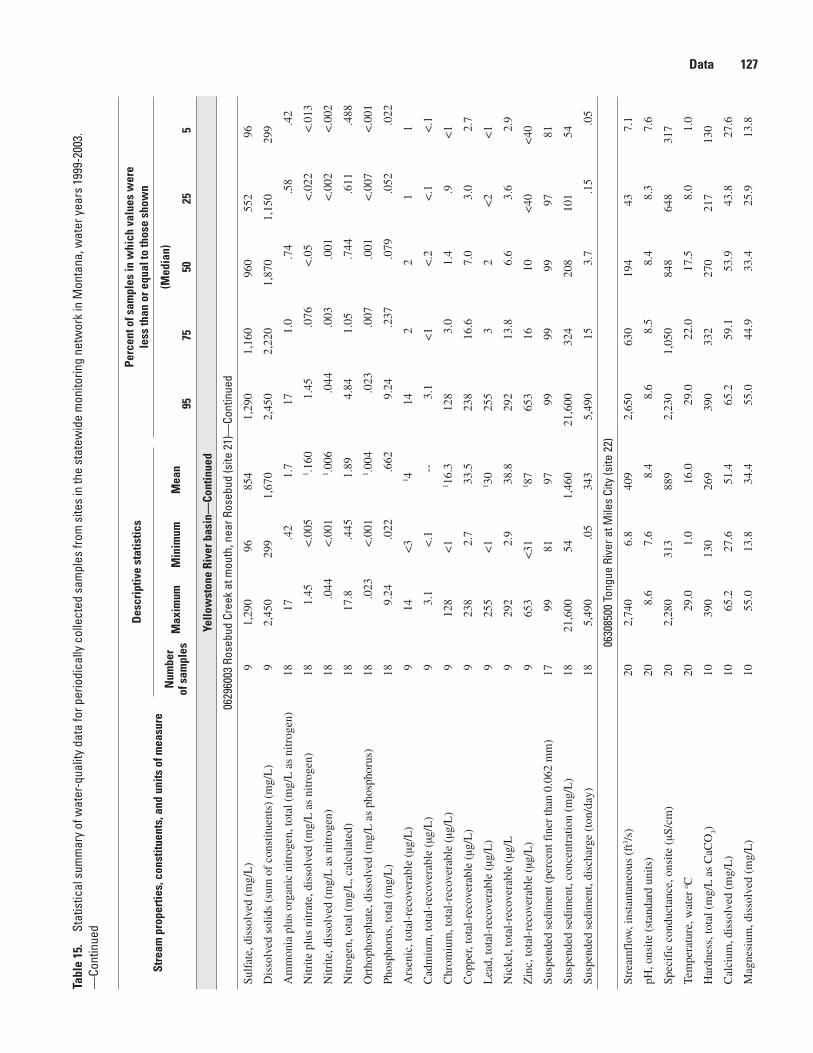
Stre
am p
rope
rtie
s, c
onst
ituen
ts, a
nd u
nits
of m
easu
re
Des
crip
tive
stat
istic
sPe
rcen
t of s
ampl
es in
whi
ch v
alue
s w
ere
le
ss th
an o
r equ
al to
thos
e sh
own
Num
ber
of s
ampl
esM
axim
umM
inim
umM
ean
(Med
ian)
9���
�02�
�
Yello
wst
one
Rive
r bas
in—
Cont
inue
d
0629
6003
Ros
ebud
Cre
ek a
t mou
th, n
ear R
oseb
ud (s
ite 2
1)—
Cont
inue
d
Sulf
ate,
dis
solv
ed (
mg/
L)
91,
290
9685
41,
290
1,16
096
055
296
Dis
solv
ed s
olid
s (s
um o
f co
nstit
uent
s) (
mg/
L)
92,
450
299
1,67
02,
450
2,22
01,
870
1,15
029
9
Am
mon
ia p
lus
orga
nic
nitr
ogen
, tot
al (
mg/
L a
s ni
trog
en)
1817
.42
1.7
171.
0.7
4.5
8.4
2
Nitr
ite p
lus
nitr
ate,
dis
solv
ed (
mg/
L a
s ni
trog
en)
181.
45<
.005
1 .160
1.45
.076
<.0
5<
.022
<.0
13
Nitr
ite, d
isso
lved
(m
g/L
as
nitr
ogen
)18
.044
<.0
011 .0
06.0
44.0
03.0
01<
.002
<.0
02
Nitr
ogen
, tot
al (
mg/
L, c
alcu
late
d)18
17.8
.445
1.89
4.84
1.05
.744
.611
.488
Ort
hoph
osph
ate,
dis
solv
ed (
mg/
L a
s ph
osph
orus
)18
.023
<.0
011 .0
04.0
23.0
07.0
01<
.007
<.0
01
Phos
phor
us, t
otal
(m
g/L
)18
9.24
.022
.662
9.24
.237
.079
.052
.022
Ars
enic
, tot
al-r
ecov
erab
le (
µg/L
)9
14<
31 4
142
21
1
Cad
miu
m, t
otal
-rec
over
able
(µg
/L)
93.
1<
.1--
3.1
<1
<.2
<.1
<.1
Chr
omiu
m, t
otal
-rec
over
able
(µg
/L)
912
8<
11 1
6.3
128
3.0
1.4
.9<
1
Cop
per,
tota
l-re
cove
rabl
e (µ
g/L
)9
238
2.7
33.5
238
16.6
7.0
3.0
2.7
Lea
d, to
tal-
reco
vera
ble
(µg/
L)
925
5<
11 3
025
53
2<
2<
1
Nic
kel,
tota
l-re
cove
rabl
e (µ
g/L
929
22.
938
.829
213
.86.
63.
62.
9
Zin
c, to
tal-
reco
vera
ble
(µg/
L)
965
3<
311 8
765
316
10<
40<
40
Susp
ende
d se
dim
ent (
perc
ent f
iner
than
0.0
62 m
m)
1799
8197
9999
9997
81
Susp
ende
d se
dim
ent,
conc
entr
atio
n (m
g/L
)18
21,6
0054
1,46
021
,600
324
208
101
54
Susp
ende
d se
dim
ent,
disc
harg
e (t
on/d
ay)
185,
490
.05
343
5,49
015
3.7
.15
.05
0630
8500
Ton
gue
Rive
r at M
iles
City
(site
22)
Stre
amfl
ow, i
nsta
ntan
eous
(ft
3 /s)
202,
740
6.8
409
2,65
063
019
443
7.1
pH, o
nsite
(st
anda
rd u
nits
)20
8.6
7.6
8.4
8.6
8.5
8.4
8.3
7.6
Spec
ific
con
duct
ance
, ons
ite (
µS/c
m)
202,
280
313
889
2,23
01,
050
848
648
317
Tem
pera
ture
, wat
er o C
2029
.01.
016
.029
.022
.017
.58.
01.
0
Har
dnes
s, to
tal (
mg/
L a
s C
aCO
3)10
390
130
269
390
332
270
217
130
Cal
cium
, dis
solv
ed (
mg/
L)
1065
.227
.651
.465
.259
.153
.943
.827
.6
Mag
nesi
um, d
isso
lved
(m
g/L
)10
55.0
13.8
34.4
55.0
44.9
33.4
25.9
13.8
Data 12�Ta
ble
1�.
Stat
istic
al s
umm
ary
of w
ater
-qua
lity
data
for p
erio
dica
lly c
olle
cted
sam
ples
from
site
s in
the
stat
ewid
e m
onito
ring
netw
ork
in M
onta
na, w
ater
yea
rs 1
999-
2003
. —
Cont
inue
d
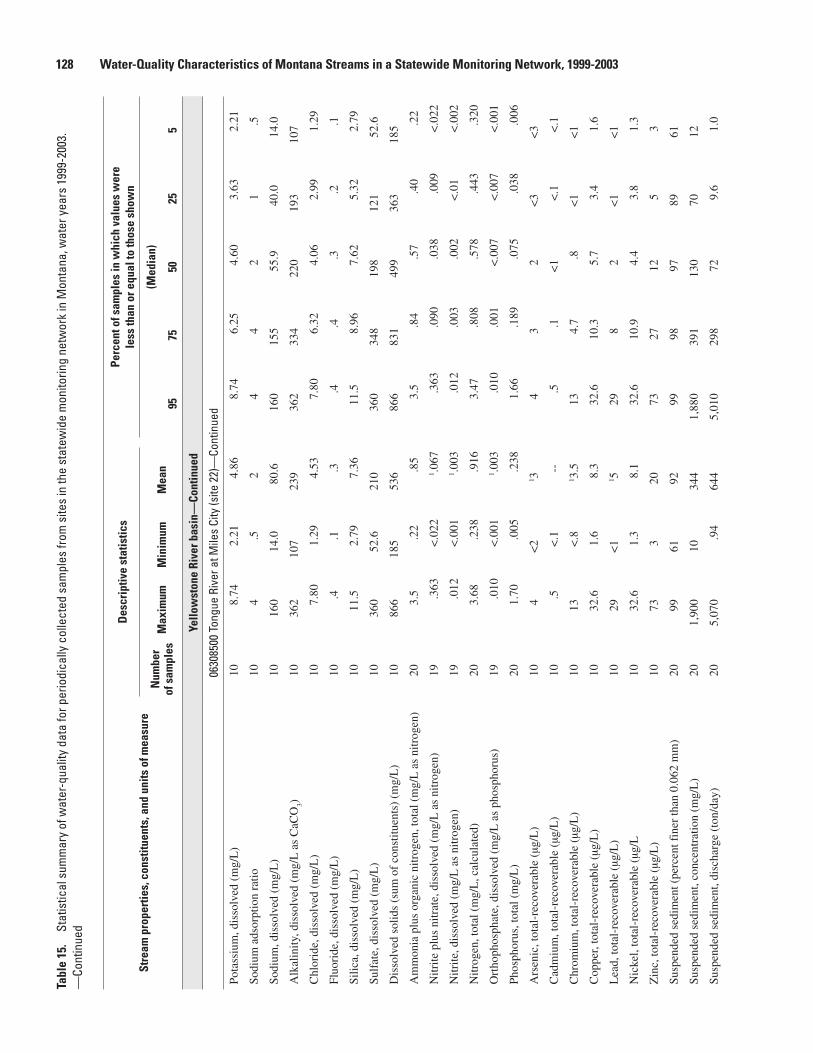
Stre
am p
rope
rtie
s, c
onst
ituen
ts, a
nd u
nits
of m
easu
re
Des
crip
tive
stat
istic
sPe
rcen
t of s
ampl
es in
whi
ch v
alue
s w
ere
le
ss th
an o
r equ
al to
thos
e sh
own
Num
ber
of s
ampl
esM
axim
umM
inim
umM
ean
(Med
ian)
9���
�02�
�
Yello
wst
one
Rive
r bas
in—
Cont
inue
d
0630
8500
Ton
gue
Rive
r at M
iles
City
(site
22)
—Co
ntin
ued
Pota
ssiu
m, d
isso
lved
(m
g/L
)10
8.74
2.21
4.86
8.74
6.25
4.60
3.63
2.21
Sodi
um a
dsor
ptio
n ra
tio10
4.5
24
42
1.5
Sodi
um, d
isso
lved
(m
g/L
)10
160
14.0
80.6
160
155
55.9
40.0
14.0
Alk
alin
ity, d
isso
lved
(m
g/L
as
CaC
O3)
1036
210
723
936
233
422
019
310
7
Chl
orid
e, d
isso
lved
(m
g/L
)10
7.80
1.29
4.53
7.80
6.32
4.06
2.99
1.29
Fluo
ride
, dis
solv
ed (
mg/
L)
10.4
.1.3
.4.4
.3.2
.1
Silic
a, d
isso
lved
(m
g/L
)10
11.5
2.79
7.36
11.5
8.96
7.62
5.32
2.79
Sulf
ate,
dis
solv
ed (
mg/
L)
1036
052
.621
036
034
819
812
152
.6
Dis
solv
ed s
olid
s (s
um o
f co
nstit
uent
s) (
mg/
L)
1086
618
553
686
683
149
936
318
5
Am
mon
ia p
lus
orga
nic
nitr
ogen
, tot
al (
mg/
L a
s ni
trog
en)
203.
5.2
2.8
53.
5.8
4.5
7.4
0.2
2
Nitr
ite p
lus
nitr
ate,
dis
solv
ed (
mg/
L a
s ni
trog
en)
19.3
63<
.022
1 .067
.363
.090
.038
.009
<.0
22
Nitr
ite, d
isso
lved
(m
g/L
as
nitr
ogen
)19
.012
<.0
011 .0
03.0
12.0
03.0
02<
.01
<.0
02
Nitr
ogen
, tot
al (
mg/
L, c
alcu
late
d)20
3.68
.238
.916
3.47
.808
.578
.443
.320
Ort
hoph
osph
ate,
dis
solv
ed (
mg/
L a
s ph
osph
orus
)19
.010
<.0
011 .0
03.0
10.0
01<
.007
<.0
07<
.001
Phos
phor
us, t
otal
(m
g/L
)20
1.70
.005
.238
1.66
.189
.075
.038
.006
Ars
enic
, tot
al-r
ecov
erab
le (
µg/L
)10
4<
21 3
43
2<
3<
3
Cad
miu
m, t
otal
-rec
over
able
(µg
/L)
10.5
<.1
--.5
.1<
1<
.1<
.1
Chr
omiu
m, t
otal
-rec
over
able
(µg
/L)
1013
<.8
1 3.5
134.
7.8
<1
<1
Cop
per,
tota
l-re
cove
rabl
e (µ
g/L
)10
32.6
1.6
8.3
32.6
10.3
5.7
3.4
1.6
Lea
d, to
tal-
reco
vera
ble
(µg/
L)
1029
<1
1 529
82
<1
<1
Nic
kel,
tota
l-re
cove
rabl
e (µ
g/L
1032
.61.
38.
132
.610
.94.
43.
81.
3
Zin
c, to
tal-
reco
vera
ble
(µg/
L)
1073
320
7327
125
3
Susp
ende
d se
dim
ent (
perc
ent f
iner
than
0.0
62 m
m)
2099
6192
9998
9789
61
Susp
ende
d se
dim
ent,
conc
entr
atio
n (m
g/L
)20
1,90
010
344
1,88
039
113
070
12
Susp
ende
d se
dim
ent,
disc
harg
e (t
on/d
ay)
205,
070
.94
644
5,01
029
872
9.6
1.0
12� Water-Quality Characteristics of Montana Streams in a Statewide Monitoring Network, 1999-2003Ta
ble
1�.
Stat
istic
al s
umm
ary
of w
ater
-qua
lity
data
for p
erio
dica
lly c
olle
cted
sam
ples
from
site
s in
the
stat
ewid
e m
onito
ring
netw
ork
in M
onta
na, w
ater
yea
rs 1
999-
2003
. —
Cont
inue
d

Stre
am p
rope
rtie
s, c
onst
ituen
ts, a
nd u
nits
of m
easu
re
Des
crip
tive
stat
istic
sPe
rcen
t of s
ampl
es in
whi
ch v
alue
s w
ere
le
ss th
an o
r equ
al to
thos
e sh
own
Num
ber
of s
ampl
esM
axim
umM
inim
umM
ean
(Med
ian)
9���
�02�
�
Yello
wst
one
Rive
r bas
in—
Cont
inue
d
0632
6500
Pow
der R
iver
nea
r Loc
ate
(site
23)
Stre
amfl
ow, i
nsta
ntan
eous
(ft
3 /s)
585,
170
.20
479
1,99
055
124
878
1.5
pH, o
nsite
(st
anda
rd u
nits
)58
8.7
7.4
8.2
8.5
8.3
8.2
8.0
7.8
Spec
ific
con
duct
ance
, ons
ite (
µS/c
m)
583,
050
832
2,03
02,
980
2,44
02,
000
1,72
092
8
Tem
pera
ture
, wat
er o C
5828
.0.0
11.0
26.5
19.0
10.5
1.0
.0
Har
dnes
s, to
tal (
mg/
L a
s C
aCO
3)58
810
220
528
693
610
555
468
240
Cal
cium
, dis
solv
ed (
mg/
L)
5818
649
.812
017
013
812
410
656
.7
Mag
nesi
um, d
isso
lved
(m
g/L
)58
84.7
22.4
55.4
78.2
66.2
58.4
47.0
23.8
Pota
ssiu
m, d
isso
lved
(m
g/L
)58
15.9
1.90
7.54
12.6
8.94
6.94
5.85
4.16
Sodi
um a
dsor
ptio
n ra
tio58
93
59
54
43
Sodi
um, d
isso
lved
(m
g/L
)58
481
90.4
260
478
308
236
201
99.6
Alk
alin
ity, d
isso
lved
(m
g/L
as
CaC
O3)
5338
393
227
333
278
219
183
122
Chl
orid
e, d
isso
lved
(m
g/L
)58
158
16.3
79.9
131
98.0
80.7
62.2
22.4
Fluo
ride
, dis
solv
ed (
mg/
L)
58.7
.2.4
.6.5
.4.3
.3
Silic
a, d
isso
lved
(m
g/L
)58
30.0
5.60
9.76
14.4
11.1
8.70
7.76
6.37
Sulf
ate,
dis
solv
ed (
mg/
L)
581,
250
290
766
1,20
095
875
163
429
8
Dis
solv
ed s
olid
s (s
um o
f co
nstit
uent
s) (
mg/
L)
582,
230
538
1,43
02,
140
1,73
01,
420
1,20
059
1
Am
mon
ia p
lus
orga
nic
nitr
ogen
, tot
al (
mg/
L a
s ni
trog
en)
5830
.22
2.3
121.
6.6
8.3
8.2
6
Nitr
ite p
lus
nitr
ate,
dis
solv
ed (
mg/
L a
s ni
trog
en)
581.
58<
.013
1 .276
.819
.360
.177
<.0
5<
.013
Nitr
ite, d
isso
lved
(m
g/L
as
nitr
ogen
)58
.014
<.0
021 .0
03.0
07<
.01
<.0
1<
.006
<.0
02
Nitr
ogen
, tot
al (
mg/
L, c
alcu
late
d)58
31.6
.325
2.58
9.24
1.71
.868
.574
.380
Ort
hoph
osph
ate,
dis
solv
ed (
mg/
L a
s ph
osph
orus
)57
.030
<.0
071 .0
08.0
30.0
09<
.020
<.0
10<
.007
Phos
phor
us, t
otal
(m
g/L
)57
15.4
.008
1.09
6.57
.735
.196
.045
.012
Ars
enic
, tot
al-r
ecov
erab
le (
µg/L
)31
38<
21 6
346
21
<2
Cad
miu
m, t
otal
-rec
over
able
(µg
/L)
3110
<.0
71 1
.16.
11.
2.1
<1
<.0
7
Chr
omiu
m, t
otal
-rec
over
able
(µg
/L)
3114
9<
.81 1
6.8
125
18.3
3.0
.8<
.8
Cop
per,
tota
l-re
cove
rabl
e (µ
g/L
)31
302
1.3
38.7
240
50.8
10.4
5.4
2.4
Data 129Ta
ble
1�.
Stat
istic
al s
umm
ary
of w
ater
-qua
lity
data
for p
erio
dica
lly c
olle
cted
sam
ples
from
site
s in
the
stat
ewid
e m
onito
ring
netw
ork
in M
onta
na, w
ater
yea
rs 1
999-
2003
. —
Cont
inue
d

Stre
am p
rope
rtie
s, c
onst
ituen
ts, a
nd u
nits
of m
easu
re
Des
crip
tive
stat
istic
sPe
rcen
t of s
ampl
es in
whi
ch v
alue
s w
ere
le
ss th
an o
r equ
al to
thos
e sh
own
Num
ber
of s
ampl
esM
axim
umM
inim
umM
ean
(Med
ian)
9���
�02�
�
Yello
wst
one
Rive
r bas
in—
Cont
inue
d
0632
6500
Pow
der R
iver
nea
r Loc
ate
(site
23)
—Co
ntin
ued
Lea
d, to
tal-
reco
vera
ble
(µg/
L)
3122
2<
.12
2919
143
3<
2<
1
Nic
kel,
tota
l-re
cove
rabl
e (µ
g/L
3134
91.
443
.226
753
.19.
65.
42.
5
Zin
c, to
tal-
reco
vera
ble
(µg/
L)
311,
110
<31
1 120
554
167
187
<40
Susp
ende
d se
dim
ent (
perc
ent f
iner
than
0.0
62 m
m)
1999
3784
9999
9672
37
Susp
ende
d se
dim
ent,
conc
entr
atio
n (m
g/L
)56
25,4
008
2,58
017
,600
2,42
042
612
431
Susp
ende
d se
dim
ent,
disc
harg
e (t
on/d
ay)
5622
8,00
0.0
610
,600
51,4
002,
560
351
30.4
8
0632
9500
Yel
low
ston
e Ri
ver n
ear S
idne
y (s
ite 2
4)
Stre
amfl
ow, i
nsta
ntan
eous
(ft
3 /s)
8852
,300
1,12
011
,500
41,5
0012
,900
7,09
04,
620
2,42
0
pH, o
nsite
(st
anda
rd u
nits
)70
8.8
7.4
8.3
8.7
8.5
8.3
8.2
7.6
Spec
ific
con
duct
ance
, ons
ite (
µS/c
m)
851,
920
202
648
923
782
700
475
235
Tem
pera
ture
, wat
er o C
8726
.5.0
12.5
25.5
19.0
14.0
3.0
.0
Har
dnes
s, to
tal (
mg/
L a
s C
aCO
3)51
300
7920
128
825
022
015
095
Cal
cium
, dis
solv
ed (
mg/
L)
5170
.720
.348
.568
.560
.351
.237
.224
.1
Mag
nesi
um, d
isso
lved
(m
g/L
)51
31.2
6.84
19.4
29.0
24.4
21.4
13.5
8.18
Pota
ssiu
m, d
isso
lved
(m
g/L
)51
5.11
1.65
3.31
4.88
3.86
3.45
2.83
1.82
Sodi
um a
dsor
ptio
n ra
tio51
3.8
22
22
1.9
Sodi
um, d
isso
lved
(m
g/L
)51
101
15.9
54.7
91.9
68.3
60.0
38.0
19.6
Alk
alin
ity, d
isso
lved
(m
g/L
as
CaC
O3)
6721
264
147
200
177
158
121
70
Chl
orid
e, d
isso
lved
(m
g/L
)69
20.1
2.93
9.76
16.6
12.0
9.98
7.02
3.30
Fluo
ride
, dis
solv
ed (
mg/
L)
49.6
.2.4
.5.5
.4.3
.2
Silic
a, d
isso
lved
(m
g/L
)51
12.3
2.76
9.01
11.7
10.7
9.85
8.01
4.25
Sulf
ate,
dis
solv
ed (
mg/
L)
6933
936
.717
028
821
218
712
045
.0
Dis
solv
ed s
olid
s (s
um o
f co
nstit
uent
s) (
mg/
L)
5167
414
239
762
349
243
228
616
8
Am
mon
ia p
lus
orga
nic
nitr
ogen
, tot
al (
mg/
L a
s ni
trog
en)
703.
9E
.04
.66
2.4
.74
.46
.30
.18
Nitr
ite p
lus
nitr
ate,
dis
solv
ed (
mg/
L a
s ni
trog
en)
70.6
6<
.005
1 .236
.600
.400
.191
.020
<.0
05
Nitr
ite, d
isso
lved
(m
g/L
as
nitr
ogen
)70
.015
<.0
011 .0
04.0
10.0
06.0
02<
.008
<.0
06
130 Water-Quality Characteristics of Montana Streams in a Statewide Monitoring Network, 1999-2003Ta
ble
1�.
Stat
istic
al s
umm
ary
of w
ater
-qua
lity
data
for p
erio
dica
lly c
olle
cted
sam
ples
from
site
s in
the
stat
ewid
e m
onito
ring
netw
ork
in M
onta
na, w
ater
yea
rs 1
999-
2003
. —
Cont
inue
d
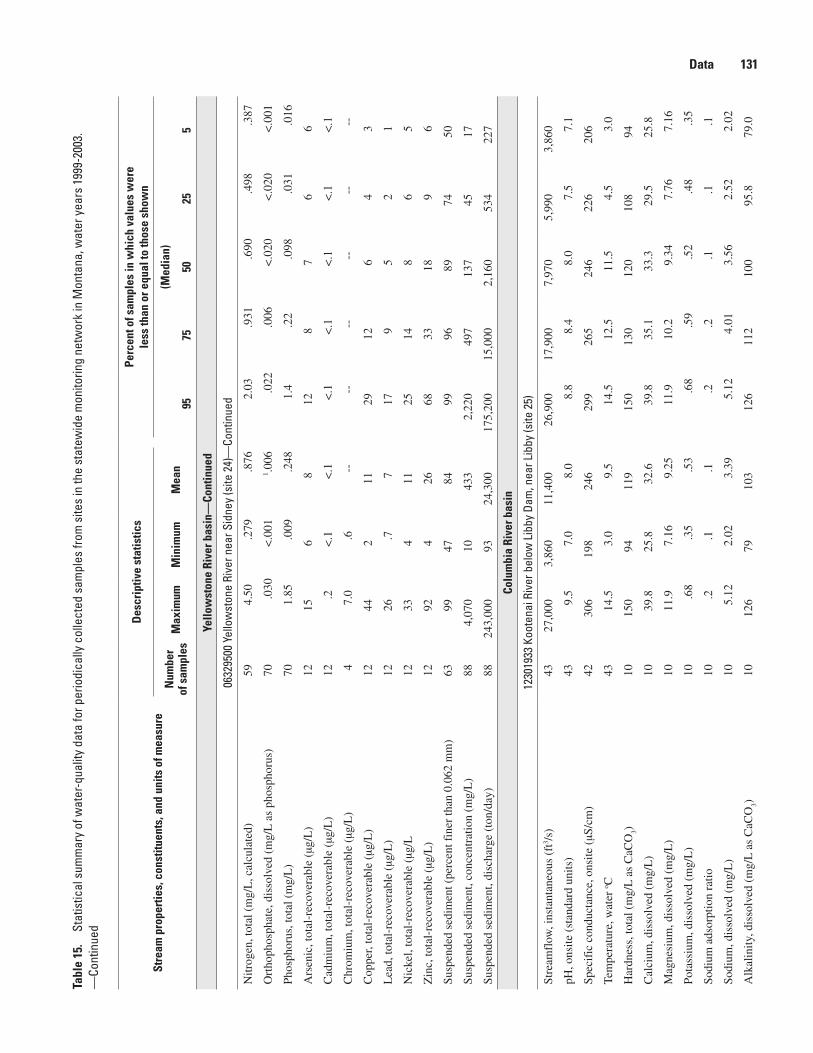
Stre
am p
rope
rtie
s, c
onst
ituen
ts, a
nd u
nits
of m
easu
re
Des
crip
tive
stat
istic
sPe
rcen
t of s
ampl
es in
whi
ch v
alue
s w
ere
le
ss th
an o
r equ
al to
thos
e sh
own
Num
ber
of s
ampl
esM
axim
umM
inim
umM
ean
(Med
ian)
9���
�02�
�
Yello
wst
one
Rive
r bas
in—
Cont
inue
d
0632
9500
Yel
low
ston
e Ri
ver n
ear S
idne
y (s
ite 2
4)—
Cont
inue
d
Nitr
ogen
, tot
al (
mg/
L, c
alcu
late
d)59
4.50
.279
.876
2.03
.931
.690
.498
.387
Ort
hoph
osph
ate,
dis
solv
ed (
mg/
L a
s ph
osph
orus
)70
.030
<.0
011 .0
06.0
22.0
06<
.020
<.0
20<
.001
Phos
phor
us, t
otal
(m
g/L
)70
1.85
.009
.248
1.4
.22
.098
.031
.016
Ars
enic
, tot
al-r
ecov
erab
le (
µg/L
)12
156
812
87
66
Cad
miu
m, t
otal
-rec
over
able
(µg
/L)
12.2
<.1
<.1
<.1
<.1
<.1
<.1
<.1
Chr
omiu
m, t
otal
-rec
over
able
(µg
/L)
47.
0.6
----
----
----
Cop
per,
tota
l-re
cove
rabl
e (µ
g/L
)12
442
1129
126
43
Lea
d, to
tal-
reco
vera
ble
(µg/
L)
1226
.77
179
52
1
Nic
kel,
tota
l-re
cove
rabl
e (µ
g/L
1233
411
2514
86
5
Zin
c, to
tal-
reco
vera
ble
(µg/
L)
1292
426
6833
189
6
Susp
ende
d se
dim
ent (
perc
ent f
iner
than
0.0
62 m
m)
6399
4784
9996
8974
50
Susp
ende
d se
dim
ent,
conc
entr
atio
n (m
g/L
)88
4,07
010
433
2,22
049
713
745
17
Susp
ende
d se
dim
ent,
disc
harg
e (t
on/d
ay)
8824
3,00
093
24,3
0017
5,20
015
,000
2,16
053
422
7
Colu
mbi
a Ri
ver b
asin
1230
1933
Koo
tena
i Riv
er b
elow
Lib
by D
am, n
ear L
ibby
(site
25)
Stre
amfl
ow, i
nsta
ntan
eous
(ft
3 /s)
4327
,000
3,86
011
,400
26,9
0017
,900
7,97
05,
990
3,86
0
pH, o
nsite
(st
anda
rd u
nits
)43
9.5
7.0
8.0
8.8
8.4
8.0
7.5
7.1
Spec
ific
con
duct
ance
, ons
ite (
µS/c
m)
4230
619
824
629
926
524
622
620
6
Tem
pera
ture
, wat
er o C
4314
.53.
09.
514
.512
.511
.54.
53.
0
Har
dnes
s, to
tal (
mg/
L a
s C
aCO
3)10
150
9411
915
013
012
010
894
Cal
cium
, dis
solv
ed (
mg/
L)
1039
.825
.832
.639
.835
.133
.329
.525
.8
Mag
nesi
um, d
isso
lved
(m
g/L
)10
11.9
7.16
9.25
11.9
10.2
9.34
7.76
7.16
Pota
ssiu
m, d
isso
lved
(m
g/L
)10
.68
.35
.53
.68
.59
.52
.48
.35
Sodi
um a
dsor
ptio
n ra
tio10
.2.1
.1.2
.2.1
.1.1
Sodi
um, d
isso
lved
(m
g/L
)10
5.12
2.02
3.39
5.12
4.01
3.56
2.52
2.02
Alk
alin
ity, d
isso
lved
(m
g/L
as
CaC
O3)
1012
679
103
126
112
100
95.8
79.0
Data 131Ta
ble
1�.
Stat
istic
al s
umm
ary
of w
ater
-qua
lity
data
for p
erio
dica
lly c
olle
cted
sam
ples
from
site
s in
the
stat
ewid
e m
onito
ring
netw
ork
in M
onta
na, w
ater
yea
rs 1
999-
2003
. —
Cont
inue
d
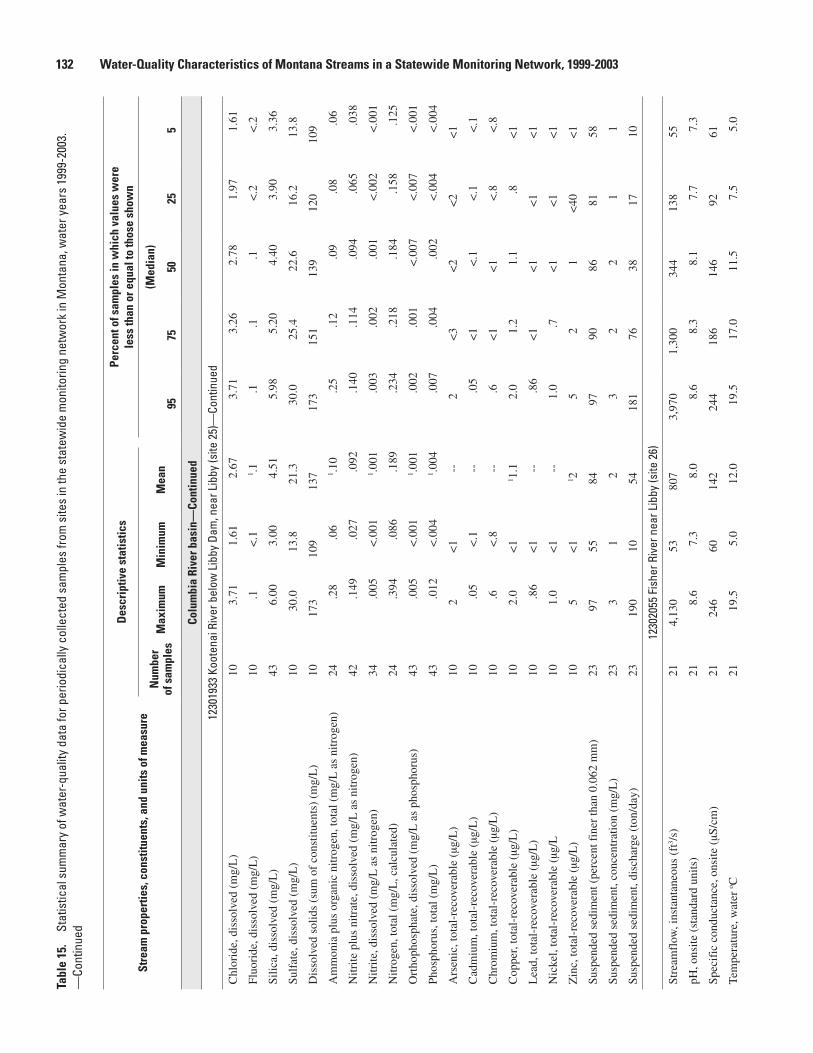
Stre
am p
rope
rtie
s, c
onst
ituen
ts, a
nd u
nits
of m
easu
re
Des
crip
tive
stat
istic
sPe
rcen
t of s
ampl
es in
whi
ch v
alue
s w
ere
le
ss th
an o
r equ
al to
thos
e sh
own
Num
ber
of s
ampl
esM
axim
umM
inim
umM
ean
(Med
ian)
9���
�02�
�
Colu
mbi
a Ri
ver b
asin
—Co
ntin
ued
1230
1933
Koo
tena
i Riv
er b
elow
Lib
by D
am, n
ear L
ibby
(site
25)
—Co
ntin
ued
Chl
orid
e, d
isso
lved
(m
g/L
)10
3.71
1.61
2.67
3.71
3.26
2.78
1.97
1.61
Fluo
ride
, dis
solv
ed (
mg/
L)
10.1
<.1
1 .1.1
.1.1
<.2
<.2
Silic
a, d
isso
lved
(m
g/L
)43
6.00
3.00
4.51
5.98
5.20
4.40
3.90
3.36
Sulf
ate,
dis
solv
ed (
mg/
L)
1030
.013
.821
.330
.025
.422
.616
.213
.8
Dis
solv
ed s
olid
s (s
um o
f co
nstit
uent
s) (
mg/
L)
1017
310
913
717
315
113
912
010
9
Am
mon
ia p
lus
orga
nic
nitr
ogen
, tot
al (
mg/
L a
s ni
trog
en)
24.2
8.0
61 .1
0.2
5.1
2.0
9.0
8.0
6
Nitr
ite p
lus
nitr
ate,
dis
solv
ed (
mg/
L a
s ni
trog
en)
42.1
49.0
27.0
92.1
40.1
14.0
94.0
65.0
38
Nitr
ite, d
isso
lved
(m
g/L
as
nitr
ogen
)34
.005
<.0
011 .0
01.0
03.0
02.0
01<
.002
<.0
01
Nitr
ogen
, tot
al (
mg/
L, c
alcu
late
d)24
.394
.086
.189
.234
.218
.184
.158
.125
Ort
hoph
osph
ate,
dis
solv
ed (
mg/
L a
s ph
osph
orus
)43
.005
<.0
011 .0
01.0
02.0
01<
.007
<.0
07<
.001
Phos
phor
us, t
otal
(m
g/L
)43
.012
<.0
041 .0
04.0
07.0
04.0
02<
.004
<.0
04
Ars
enic
, tot
al-r
ecov
erab
le (
µg/L
)10
2<
1--
2<
3<
2<
2<
1
Cad
miu
m, t
otal
-rec
over
able
(µg
/L)
10.0
5<
.1--
.05
<1
<.1
<.1
<.1
Chr
omiu
m, t
otal
-rec
over
able
(µg
/L)
10.6
<.8
--.6
<1
<1
<.8
<.8
Cop
per,
tota
l-re
cove
rabl
e (µ
g/L
)10
2.0
<1
1 1.1
2.0
1.2
1.1
.8<
1
Lea
d, to
tal-
reco
vera
ble
(µg/
L)
10.8
6<
1--
.86
<1
<1
<1
<1
Nic
kel,
tota
l-re
cove
rabl
e (µ
g/L
101.
0<
1--
1.0
.7<
1<
1<
1
Zin
c, to
tal-
reco
vera
ble
(µg/
L)
105
<1
1 25
21
<40
<1
Susp
ende
d se
dim
ent (
perc
ent f
iner
than
0.0
62 m
m)
2397
5584
9790
8681
58
Susp
ende
d se
dim
ent,
conc
entr
atio
n (m
g/L
)23
31
23
22
11
Susp
ende
d se
dim
ent,
disc
harg
e (t
on/d
ay)
2319
010
5418
176
3817
10
1230
2055
Fis
her R
iver
nea
r Lib
by (s
ite 2
6)
Stre
amfl
ow, i
nsta
ntan
eous
(ft
3 /s)
214,
130
5380
73,
970
1,30
034
413
855
pH, o
nsite
(st
anda
rd u
nits
)21
8.6
7.3
8.0
8.6
8.3
8.1
7.7
7.3
Spec
ific
con
duct
ance
, ons
ite (
µS/c
m)
2124
660
142
244
186
146
9261
Tem
pera
ture
, wat
er o C
2119
.55.
012
.019
.517
.011
.57.
55.
0
132 Water-Quality Characteristics of Montana Streams in a Statewide Monitoring Network, 1999-2003Ta
ble
1�.
Stat
istic
al s
umm
ary
of w
ater
-qua
lity
data
for p
erio
dica
lly c
olle
cted
sam
ples
from
site
s in
the
stat
ewid
e m
onito
ring
netw
ork
in M
onta
na, w
ater
yea
rs 1
999-
2003
. —
Cont
inue
d
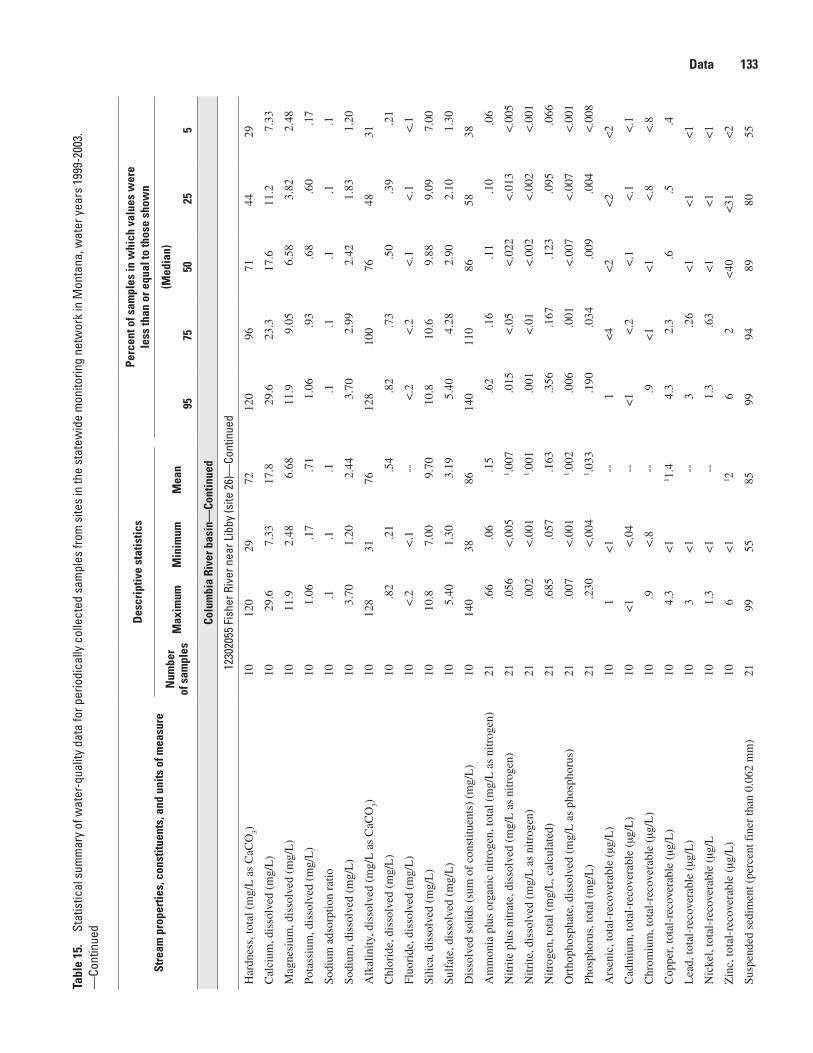
Stre
am p
rope
rtie
s, c
onst
ituen
ts, a
nd u
nits
of m
easu
re
Des
crip
tive
stat
istic
sPe
rcen
t of s
ampl
es in
whi
ch v
alue
s w
ere
le
ss th
an o
r equ
al to
thos
e sh
own
Num
ber
of s
ampl
esM
axim
umM
inim
umM
ean
(Med
ian)
9���
�02�
�
Colu
mbi
a Ri
ver b
asin
—Co
ntin
ued
1230
2055
Fis
her R
iver
nea
r Lib
by (s
ite 2
6)—
Cont
inue
d
Har
dnes
s, to
tal (
mg/
L a
s C
aCO
3)10
120
2972
120
9671
4429
Cal
cium
, dis
solv
ed (
mg/
L)
1029
.67.
3317
.829
.623
.317
.611
.27.
33
Mag
nesi
um, d
isso
lved
(m
g/L
)10
11.9
2.48
6.68
11.9
9.05
6.58
3.82
2.48
Pota
ssiu
m, d
isso
lved
(m
g/L
)10
1.06
.17
.71
1.06
.93
.68
.60
.17
Sodi
um a
dsor
ptio
n ra
tio10
.1.1
.1.1
.1.1
.1.1
Sodi
um, d
isso
lved
(m
g/L
)10
3.70
1.20
2.44
3.70
2.99
2.42
1.83
1.20
Alk
alin
ity, d
isso
lved
(m
g/L
as
CaC
O3)
1012
831
7612
810
076
4831
Chl
orid
e, d
isso
lved
(m
g/L
)10
.82
.21
.54
.82
.73
.50
.39
.21
Fluo
ride
, dis
solv
ed (
mg/
L)
10<
.2<
.1--
<.2
<.2
<.1
<.1
<.1
Silic
a, d
isso
lved
(m
g/L
)10
10.8
7.00
9.70
10.8
10.6
9.88
9.09
7.00
Sulf
ate,
dis
solv
ed (
mg/
L)
105.
401.
303.
195.
404.
282.
902.
101.
30
Dis
solv
ed s
olid
s (s
um o
f co
nstit
uent
s) (
mg/
L)
1014
038
8614
011
086
5838
Am
mon
ia p
lus
orga
nic
nitr
ogen
, tot
al (
mg/
L a
s ni
trog
en)
21.6
6.0
6.1
5.6
2.1
6.1
1.1
0.0
6
Nitr
ite p
lus
nitr
ate,
dis
solv
ed (
mg/
L a
s ni
trog
en)
21.0
56<
.005
1 .007
.015
<.0
5<
.022
<.0
13<
.005
Nitr
ite, d
isso
lved
(m
g/L
as
nitr
ogen
)21
.002
<.0
011 .0
01.0
01<
.01
<.0
02<
.002
<.0
01
Nitr
ogen
, tot
al (
mg/
L, c
alcu
late
d)21
.685
.057
.163
.356
.167
.123
.095
.066
Ort
hoph
osph
ate,
dis
solv
ed (
mg/
L a
s ph
osph
orus
)21
.007
<.0
011 .0
02.0
06.0
01<
.007
<.0
07<
.001
Phos
phor
us, t
otal
(m
g/L
)21
.230
<.0
041 .0
33.1
90.0
34.0
09.0
04<
.008
Ars
enic
, tot
al-r
ecov
erab
le (
µg/L
)10
1<
1--
1<
4<
2<
2<
2
Cad
miu
m, t
otal
-rec
over
able
(µg
/L)
10<
1<
.04
--<
1<
.2<
.1<
.1<
.1
Chr
omiu
m, t
otal
-rec
over
able
(µg
/L)
10.9
<.8
--.9
<1
<1
<.8
<.8
Cop
per,
tota
l-re
cove
rabl
e (µ
g/L
)10
4.3
<1
1 1.4
4.3
2.3
.6.5
.4
Lea
d, to
tal-
reco
vera
ble
(µg/
L)
103
<1
--3
.26
<1
<1
<1
Nic
kel,
tota
l-re
cove
rabl
e (µ
g/L
101.
3<
1--
1.3
.63
<1
<1
<1
Zin
c, to
tal-
reco
vera
ble
(µg/
L)
106
<1
1 26
2<
40<
31<
2
Susp
ende
d se
dim
ent (
perc
ent f
iner
than
0.0
62 m
m)
2199
5585
9994
8980
55
Data 133Ta
ble
1�.
Stat
istic
al s
umm
ary
of w
ater
-qua
lity
data
for p
erio
dica
lly c
olle
cted
sam
ples
from
site
s in
the
stat
ewid
e m
onito
ring
netw
ork
in M
onta
na, w
ater
yea
rs 1
999-
2003
. —
Cont
inue
d

Stre
am p
rope
rtie
s, c
onst
ituen
ts, a
nd u
nits
of m
easu
re
Des
crip
tive
stat
istic
sPe
rcen
t of s
ampl
es in
whi
ch v
alue
s w
ere
le
ss th
an o
r equ
al to
thos
e sh
own
Num
ber
of s
ampl
esM
axim
umM
inim
umM
ean
(Med
ian)
9���
�02�
�
Colu
mbi
a Ri
ver b
asin
—Co
ntin
ued
1230
2055
Fis
her R
iver
nea
r Lib
by (s
ite 2
6)—
Cont
inue
d
Susp
ende
d se
dim
ent,
conc
entr
atio
n (m
g/L
)21
588
172
579
668
41
Susp
ende
d se
dim
ent,
disc
harg
e (t
on/d
ay)
216,
560
.21
538
6,24
024
211
1.6
.22
1230
4500
Yaa
k Ri
ver n
ear T
roy
(site
27)
Stre
amfl
ow, i
nsta
ntan
eous
(ft
3 /s)
217,
130
491,
450
6,91
02,
380
585
182
52
pH, o
nsite
(st
anda
rd u
nits
)21
8.4
7.5
7.9
8.4
8.1
7.8
7.6
7.5
Spec
ific
con
duct
ance
, ons
ite (
µS/c
m)
2112
532
8112
510
676
5633
Tem
pera
ture
, wat
er o C
2119
.53.
511
.019
.516
.011
.56.
03.
5
Har
dnes
s, to
tal (
mg/
L a
s C
aCO
3)10
5614
3856
5238
2714
Cal
cium
, dis
solv
ed (
mg/
L)
1016
.24.
2211
.216
.215
.311
.58.
004.
22
Mag
nesi
um, d
isso
lved
(m
g/L
)10
3.74
.91
2.44
3.74
3.26
2.43
1.71
.91
Pota
ssiu
m, d
isso
lved
(m
g/L
)10
.95
.16
.65
.95
.85
.66
.51
.16
Sodi
um a
dsor
ptio
n ra
tio10
.2.1
.1.2
.1.1
.1.1
Sodi
um, d
isso
lved
(m
g/L
)10
3.00
.84
1.75
3.00
2.33
1.62
1.20
.84
Alk
alin
ity, d
isso
lved
(m
g/L
as
CaC
O3)
1062
1642
6258
4230
16
Chl
orid
e, d
isso
lved
(m
g/L
)10
.67
.14
.36
.67
.59
.28
.23
.14
Fluo
ride
, dis
solv
ed (
mg/
L)
10<
.2<
.1--
<.2
<.2
<.1
<.1
<.1
Silic
a, d
isso
lved
(m
g/L
)10
11.0
7.11
9.60
11.0
10.5
9.86
8.92
7.11
Sulf
ate,
dis
solv
ed (
mg/
L)
101.
90.6
01.
221.
901.
681.
10.8
8.6
0
Dis
solv
ed s
olid
s (s
um o
f co
nstit
uent
s) (
mg/
L)
1073
2351
7267
5241
26
Am
mon
ia p
lus
orga
nic
nitr
ogen
, tot
al (
mg/
L a
s ni
trog
en)
21.3
9.0
6.1
3.3
8.1
3.1
1.0
9.0
6
Nitr
ite p
lus
nitr
ate,
dis
solv
ed (
mg/
L a
s ni
trog
en)
21.0
50<
.005
1 .009
.044
.008
<.0
22<
.013
<.0
05
Nitr
ite, d
isso
lved
(m
g/L
as
nitr
ogen
)21
.002
<.0
011 .0
01.0
01<
.01
<.0
02<
.002
<.0
01
Nitr
ogen
, tot
al (
mg/
L, c
alcu
late
d)21
.440
.063
.146
.304
.155
.121
.101
.075
Ort
hoph
osph
ate,
dis
solv
ed (
mg/
L a
s ph
osph
orus
)21
.003
<.0
01--
.002
<.0
07<
.007
<.0
07<
.001
Phos
phor
us, t
otal
(m
g/L
)21
.040
<.0
041 .0
08.0
31.0
06.0
04.0
03<
.008
Ars
enic
, tot
al-r
ecov
erab
le (
µg/L
)10
<4
<1
--<
4<
3<
2<
2<
1
13� Water-Quality Characteristics of Montana Streams in a Statewide Monitoring Network, 1999-2003Ta
ble
1�.
Stat
istic
al s
umm
ary
of w
ater
-qua
lity
data
for p
erio
dica
lly c
olle
cted
sam
ples
from
site
s in
the
stat
ewid
e m
onito
ring
netw
ork
in M
onta
na, w
ater
yea
rs 1
999-
2003
. —
Cont
inue
d
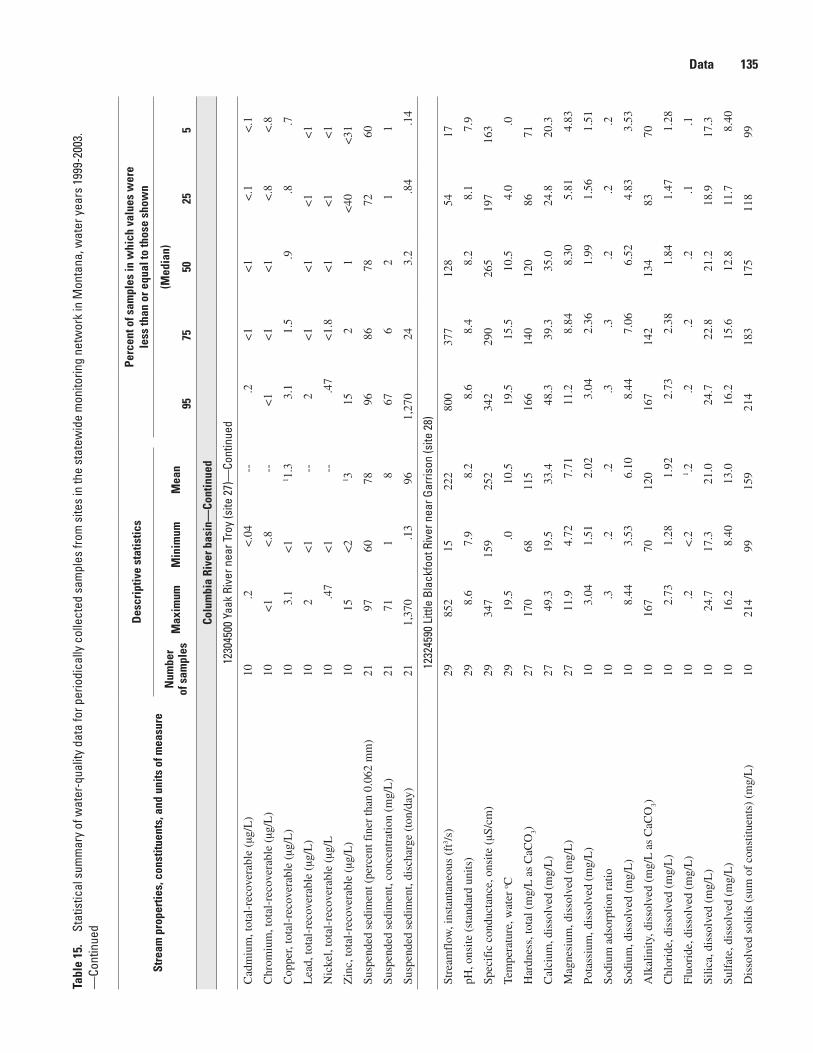
Stre
am p
rope
rtie
s, c
onst
ituen
ts, a
nd u
nits
of m
easu
re
Des
crip
tive
stat
istic
sPe
rcen
t of s
ampl
es in
whi
ch v
alue
s w
ere
le
ss th
an o
r equ
al to
thos
e sh
own
Num
ber
of s
ampl
esM
axim
umM
inim
umM
ean
(Med
ian)
9���
�02�
�
Colu
mbi
a Ri
ver b
asin
—Co
ntin
ued
1230
4500
Yaa
k Ri
ver n
ear T
roy
(site
27)
—Co
ntin
ued
Cad
miu
m, t
otal
-rec
over
able
(µg
/L)
10.2
<.0
4--
.2<
1<
1<
.1<
.1
Chr
omiu
m, t
otal
-rec
over
able
(µg
/L)
10<
1<
.8--
<1
<1
<1
<.8
<.8
Cop
per,
tota
l-re
cove
rabl
e (µ
g/L
)10
3.1
<1
1 1.3
3.1
1.5
.9.8
.7
Lea
d, to
tal-
reco
vera
ble
(µg/
L)
102
<1
--2
<1
<1
<1
<1
Nic
kel,
tota
l-re
cove
rabl
e (µ
g/L
10.4
7<
1--
.47
<1.
8<
1<
1<
1
Zin
c, to
tal-
reco
vera
ble
(µg/
L)
1015
<2
1 315
21
<40
<31
Susp
ende
d se
dim
ent (
perc
ent f
iner
than
0.0
62 m
m)
2197
6078
9686
7872
60
Susp
ende
d se
dim
ent,
conc
entr
atio
n (m
g/L
)21
711
867
62
11
Susp
ende
d se
dim
ent,
disc
harg
e (t
on/d
ay)
211,
370
.13
961,
270
243.
2.8
4.1
4
1232
4590
Litt
le B
lack
foot
Riv
er n
ear G
arris
on (s
ite 2
8)
Stre
amfl
ow, i
nsta
ntan
eous
(ft
3 /s)
2985
215
222
800
377
128
5417
pH, o
nsite
(st
anda
rd u
nits
)29
8.6
7.9
8.2
8.6
8.4
8.2
8.1
7.9
Spec
ific
con
duct
ance
, ons
ite (
µS/c
m)
2934
715
925
234
229
026
519
716
3
Tem
pera
ture
, wat
er o C
2919
.5.0
10.5
19.5
15.5
10.5
4.0
.0
Har
dnes
s, to
tal (
mg/
L a
s C
aCO
3)27
170
6811
516
614
012
086
71
Cal
cium
, dis
solv
ed (
mg/
L)
2749
.319
.533
.448
.339
.335
.024
.820
.3
Mag
nesi
um, d
isso
lved
(m
g/L
)27
11.9
4.72
7.71
11.2
8.84
8.30
5.81
4.83
Pota
ssiu
m, d
isso
lved
(m
g/L
)10
3.04
1.51
2.02
3.04
2.36
1.99
1.56
1.51
Sodi
um a
dsor
ptio
n ra
tio10
.3.2
.2.3
.3.2
.2.2
Sodi
um, d
isso
lved
(m
g/L
)10
8.44
3.53
6.10
8.44
7.06
6.52
4.83
3.53
Alk
alin
ity, d
isso
lved
(m
g/L
as
CaC
O3)
1016
770
120
167
142
134
8370
Chl
orid
e, d
isso
lved
(m
g/L
)10
2.73
1.28
1.92
2.73
2.38
1.84
1.47
1.28
Fluo
ride
, dis
solv
ed (
mg/
L)
10.2
<.2
1 .2.2
.2.2
.1.1
Silic
a, d
isso
lved
(m
g/L
)10
24.7
17.3
21.0
24.7
22.8
21.2
18.9
17.3
Sulf
ate,
dis
solv
ed (
mg/
L)
1016
.28.
4013
.016
.215
.612
.811
.78.
40
Dis
solv
ed s
olid
s (s
um o
f co
nstit
uent
s) (
mg/
L)
1021
499
159
214
183
175
118
99
Data 13�Ta
ble
1�.
Stat
istic
al s
umm
ary
of w
ater
-qua
lity
data
for p
erio
dica
lly c
olle
cted
sam
ples
from
site
s in
the
stat
ewid
e m
onito
ring
netw
ork
in M
onta
na, w
ater
yea
rs 1
999-
2003
. —
Cont
inue
d

Stre
am p
rope
rtie
s, c
onst
ituen
ts, a
nd u
nits
of m
easu
re
Des
crip
tive
stat
istic
sPe
rcen
t of s
ampl
es in
whi
ch v
alue
s w
ere
le
ss th
an o
r equ
al to
thos
e sh
own
Num
ber
of s
ampl
esM
axim
umM
inim
umM
ean
(Med
ian)
9���
�02�
�
Colu
mbi
a Ri
ver b
asin
—Co
ntin
ued
1232
4590
Litt
le B
lack
foot
Riv
er n
ear G
arris
on (s
ite 2
8)—
Cont
inue
d
Am
mon
ia p
lus
orga
nic
nitr
ogen
, tot
al (
mg/
L a
s ni
trog
en)
20.6
1.0
7.3
0.6
1.4
1.2
8.2
2.0
7
Nitr
ite p
lus
nitr
ate,
dis
solv
ed (
mg/
L a
s ni
trog
en)
19.0
62<
.005
1 .011
.062
.018
<.0
5<
.013
<.0
05
Nitr
ite, d
isso
lved
(m
g/L
as
nitr
ogen
)20
.003
<.0
011 .0
01.0
02.0
01<
.002
<.0
01<
.001
Nitr
ogen
, tot
al (
mg/
L, c
alcu
late
d)19
.635
.075
.320
.575
.436
.293
.237
.112
Ort
hoph
osph
ate,
dis
solv
ed (
mg/
L a
s ph
osph
orus
)20
.035
.009
.020
.035
.024
.019
.015
.009
Phos
phor
us, t
otal
(m
g/L
)20
.147
.019
.061
.147
.075
.045
.033
.019
Ars
enic
, tot
al-r
ecov
erab
le (
µg/L
)27
94
69
66
54
Cad
miu
m, t
otal
-rec
over
able
(µg
/L)
27.1
<.0
41 .0
3.1
<1
<.1
<.1
<.1
Chr
omiu
m, t
otal
-rec
over
able
(µg
/L)
102.
3<
.8--
2.3
<1
<1
<.8
<.8
Cop
per,
tota
l-re
cove
rabl
e (µ
g/L
)27
6.0
.82.
25.
62.
71.
71.
1.8
Lea
d, to
tal-
reco
vera
ble
(µg/
L)
274
<1
1 14
1<
1<
1<
1
Nic
kel,
tota
l-re
cove
rabl
e (µ
g/L
102.
4<
1--
2.4
2.0
<2
<1.
8<
1.8
Zin
c, to
tal-
reco
vera
ble
(µg/
L)
2715
<1
1 38
41
<31
<1
Susp
ende
d se
dim
ent (
perc
ent f
iner
than
0.0
62 m
m)
2995
3277
9487
8468
42
Susp
ende
d se
dim
ent,
conc
entr
atio
n (m
g/L
)29
120
221
103
268
32
Susp
ende
d se
dim
ent,
disc
harg
e (t
on/d
ay)
2927
6.1
427
225
203.
9.3
8.1
4
1233
4510
Roc
k Cr
eek
near
Clin
ton
(site
29)
Stre
amfl
ow, i
nsta
ntan
eous
(ft
3 /s)
293,
580
149
936
3,31
01,
340
489
209
166
pH, o
nsite
(st
anda
rd u
nits
)29
8.8
7.6
8.1
8.7
8.2
8.2
8.0
7.6
Spec
ific
con
duct
ance
, ons
ite (
µS/c
m)
2916
053
111
159
147
113
8254
Tem
pera
ture
, wat
er o C
2916
.03.
59.
516
.012
.59.
56.
04.
0
Har
dnes
s, to
tal (
mg/
L a
s C
aCO
3)27
7423
5174
6753
3723
Cal
cium
, dis
solv
ed (
mg/
L)
2719
.05.
9413
.018
.817
.313
.49.
355.
95
Mag
nesi
um, d
isso
lved
(m
g/L
)27
6.58
1.93
4.38
6.50
5.86
4.84
3.06
1.94
Pota
ssiu
m, d
isso
lved
(m
g/L
)10
1.34
.84
1.06
1.34
1.18
1.08
.91
.84
Sodi
um a
dsor
ptio
n ra
tio10
.2.1
.2.2
.2.2
.1.1
13� Water-Quality Characteristics of Montana Streams in a Statewide Monitoring Network, 1999-2003Ta
ble
1�.
Stat
istic
al s
umm
ary
of w
ater
-qua
lity
data
for p
erio
dica
lly c
olle
cted
sam
ples
from
site
s in
the
stat
ewid
e m
onito
ring
netw
ork
in M
onta
na, w
ater
yea
rs 1
999-
2003
. —
Cont
inue
d
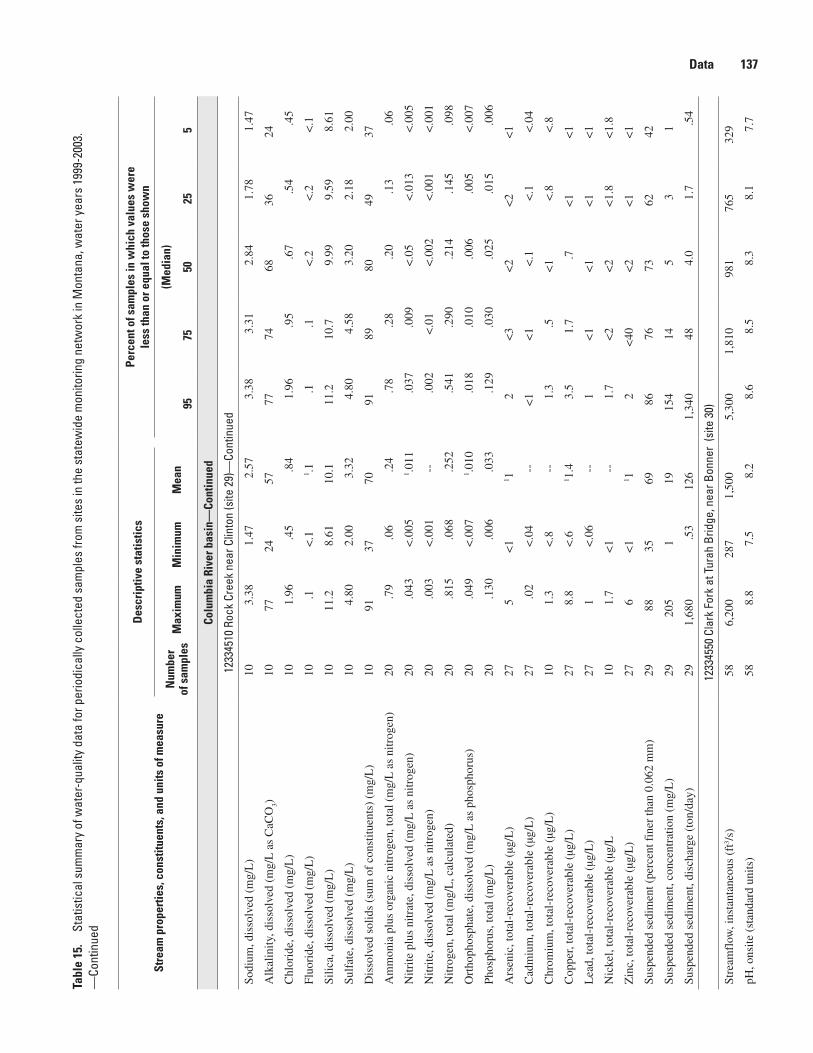
Stre
am p
rope
rtie
s, c
onst
ituen
ts, a
nd u
nits
of m
easu
re
Des
crip
tive
stat
istic
sPe
rcen
t of s
ampl
es in
whi
ch v
alue
s w
ere
le
ss th
an o
r equ
al to
thos
e sh
own
Num
ber
of s
ampl
esM
axim
umM
inim
umM
ean
(Med
ian)
9���
�02�
�
Colu
mbi
a Ri
ver b
asin
—Co
ntin
ued
1233
4510
Roc
k Cr
eek
near
Clin
ton
(site
29)
—Co
ntin
ued
Sodi
um, d
isso
lved
(m
g/L
)10
3.38
1.47
2.57
3.38
3.31
2.84
1.78
1.47
Alk
alin
ity, d
isso
lved
(m
g/L
as
CaC
O3)
1077
2457
7774
6836
24
Chl
orid
e, d
isso
lved
(m
g/L
)10
1.96
.45
.84
1.96
.95
.67
.54
.45
Fluo
ride
, dis
solv
ed (
mg/
L)
10.1
<.1
1 .1.1
.1<
.2<
.2<
.1
Silic
a, d
isso
lved
(m
g/L
)10
11.2
8.61
10.1
11.2
10.7
9.99
9.59
8.61
Sulf
ate,
dis
solv
ed (
mg/
L)
104.
802.
003.
324.
804.
583.
202.
182.
00
Dis
solv
ed s
olid
s (s
um o
f co
nstit
uent
s) (
mg/
L)
1091
3770
9189
8049
37
Am
mon
ia p
lus
orga
nic
nitr
ogen
, tot
al (
mg/
L a
s ni
trog
en)
20.7
9.0
6.2
4.7
8.2
8.2
0.1
3.0
6
Nitr
ite p
lus
nitr
ate,
dis
solv
ed (
mg/
L a
s ni
trog
en)
20.0
43<
.005
1 .011
.037
.009
<.0
5<
.013
<.0
05
Nitr
ite, d
isso
lved
(m
g/L
as
nitr
ogen
)20
.003
<.0
01--
.002
<.0
1<
.002
<.0
01<
.001
Nitr
ogen
, tot
al (
mg/
L, c
alcu
late
d)20
.815
.068
.252
.541
.290
.214
.145
.098
Ort
hoph
osph
ate,
dis
solv
ed (
mg/
L a
s ph
osph
orus
)20
.049
<.0
071 .0
10.0
18.0
10.0
06.0
05<
.007
Phos
phor
us, t
otal
(m
g/L
)20
.130
.006
.033
.129
.030
.025
.015
.006
Ars
enic
, tot
al-r
ecov
erab
le (
µg/L
)27
5<
11 1
2<
3<
2<
2<
1
Cad
miu
m, t
otal
-rec
over
able
(µg
/L)
27.0
2<
.04
--<
1<
1<
.1<
.1<
.04
Chr
omiu
m, t
otal
-rec
over
able
(µg
/L)
101.
3<
.8--
1.3
.5<
1<
.8<
.8
Cop
per,
tota
l-re
cove
rabl
e (µ
g/L
)27
8.8
<.6
1 1.4
3.5
1.7
.7<
1<
1
Lea
d, to
tal-
reco
vera
ble
(µg/
L)
271
<.0
6--
1<
1<
1<
1<
1
Nic
kel,
tota
l-re
cove
rabl
e (µ
g/L
101.
7<
1--
1.7
<2
<2
<1.
8<
1.8
Zin
c, to
tal-
reco
vera
ble
(µg/
L)
276
<1
1 12
<40
<2
<1
<1
Susp
ende
d se
dim
ent (
perc
ent f
iner
than
0.0
62 m
m)
2988
3569
8676
7362
42
Susp
ende
d se
dim
ent,
conc
entr
atio
n (m
g/L
)29
205
119
154
145
31
Susp
ende
d se
dim
ent,
disc
harg
e (t
on/d
ay)
291,
680
.53
126
1,34
048
4.0
1.7
.54
1233
4550
Cla
rk F
ork
at T
urah
Brid
ge, n
ear B
onne
r (s
ite 3
0)
Stre
amfl
ow, i
nsta
ntan
eous
(ft
3 /s)
586,
200
287
1,50
05,
300
1,81
098
176
532
9
pH, o
nsite
(st
anda
rd u
nits
)58
8.8
7.5
8.2
8.6
8.5
8.3
8.1
7.7
Data 13�Ta
ble
1�.
Stat
istic
al s
umm
ary
of w
ater
-qua
lity
data
for p
erio
dica
lly c
olle
cted
sam
ples
from
site
s in
the
stat
ewid
e m
onito
ring
netw
ork
in M
onta
na, w
ater
yea
rs 1
999-
2003
. —
Cont
inue
d

Stre
am p
rope
rtie
s, c
onst
ituen
ts, a
nd u
nits
of m
easu
re
Des
crip
tive
stat
istic
sPe
rcen
t of s
ampl
es in
whi
ch v
alue
s w
ere
le
ss th
an o
r equ
al to
thos
e sh
own
Num
ber
of s
ampl
esM
axim
umM
inim
umM
ean
(Med
ian)
9���
�02�
�
Colu
mbi
a Ri
ver b
asin
—Co
ntin
ued
1233
4550
Cla
rk F
ork
at T
urah
Brid
ge, n
ear B
onne
r (s
ite 3
0)—
Cont
inue
d
Spec
ific
con
duct
ance
, ons
ite (
µS/c
m)
5841
613
930
541
137
231
723
915
6
Tem
pera
ture
, wat
er o C
5821
.5.1
9.0
18.5
13.5
9.0
5.0
.5
Har
dnes
s, to
tal (
mg/
L a
s C
aCO
3)58
190
5413
719
017
014
010
768
Cal
cium
, dis
solv
ed (
mg/
L)
5854
.314
.938
.353
.248
.739
.129
.219
.7
Mag
nesi
um, d
isso
lved
(m
g/L
)58
13.6
3.97
10.0
13.5
12.5
10.4
7.60
4.80
Pota
ssiu
m, d
isso
lved
(m
g/L
)30
3.38
1.39
2.31
3.09
2.71
2.46
1.79
1.44
Sodi
um a
dsor
ptio
n ra
tio30
.4.2
.3.3
.3.3
.3.2
Sodi
um, d
isso
lved
(m
g/L
)30
10.8
3.34
8.03
10.7
10.2
8.64
6.48
3.64
Alk
alin
ity, d
isso
lved
(m
g/L
as
CaC
O3)
3015
546
112
145
132
125
8854
Chl
orid
e, d
isso
lved
(m
g/L
)30
7.09
1.45
3.72
6.38
4.68
3.60
2.86
1.48
Fluo
ride
, dis
solv
ed (
mg/
L)
30.5
.1.3
.4.4
.3.2
.1
Silic
a, d
isso
lved
(m
g/L
)30
17.7
10.3
14.1
17.4
15.8
14.5
12.6
10.8
Sulf
ate,
dis
solv
ed (
mg/
L)
3067
.512
.644
.767
.260
.648
.831
.015
.0
Dis
solv
ed s
olid
s (s
um o
f co
nstit
uent
s) (
mg/
L)
3025
782
191
254
241
209
149
85
Am
mon
ia p
lus
orga
nic
nitr
ogen
, tot
al (
mg/
L a
s ni
trog
en)
34.9
0.0
8.2
8.8
7.3
4.2
4.1
6.0
8
Nitr
ite p
lus
nitr
ate,
dis
solv
ed (
mg/
L a
s ni
trog
en)
34.2
00<
.005
1 .041
.167
.055
.013
.009
<.0
05
Nitr
ite, d
isso
lved
(m
g/L
as
nitr
ogen
)34
.003
<.0
011 .0
01.0
03.0
01.0
01<
.001
<.0
01
Nitr
ogen
, tot
al (
mg/
L, c
alcu
late
d)34
.940
.145
.322
.706
.347
.261
.225
.147
Ort
hoph
osph
ate,
dis
solv
ed (
mg/
L a
s ph
osph
orus
)34
.026
<.0
011 .0
10.0
23.0
15.0
06.0
04<
.007
Phos
phor
us, t
otal
(m
g/L
)34
.240
.011
.048
.189
.055
.031
.019
.012
Ars
enic
, tot
al-r
ecov
erab
le (
µg/L
)54
283
716
86
53
Cad
miu
m, t
otal
-rec
over
able
(µg
/L)
541
<.1
1 .1.5
.1<
1<
.1<
.1
Chr
omiu
m, t
otal
-rec
over
able
(µg
/L)
202.
1<
.8--
1.5
<1
<1
<1
<.8
Cop
per,
tota
l-re
cove
rabl
e (µ
g/L
)54
117
<10
1 18.
868
.820
.87.
03.
6<
20
Lea
d, to
tal-
reco
vera
ble
(µg/
L)
5430
<1
1 315
31
<1
<1
Nic
kel,
tota
l-re
cove
rabl
e (µ
g/L
2010
.3<
11 1
.12.
0<
2<
1.8
<1.
8<
1
13� Water-Quality Characteristics of Montana Streams in a Statewide Monitoring Network, 1999-2003Ta
ble
1�.
Stat
istic
al s
umm
ary
of w
ater
-qua
lity
data
for p
erio
dica
lly c
olle
cted
sam
ples
from
site
s in
the
stat
ewid
e m
onito
ring
netw
ork
in M
onta
na, w
ater
yea
rs 1
999-
2003
. —
Cont
inue
d
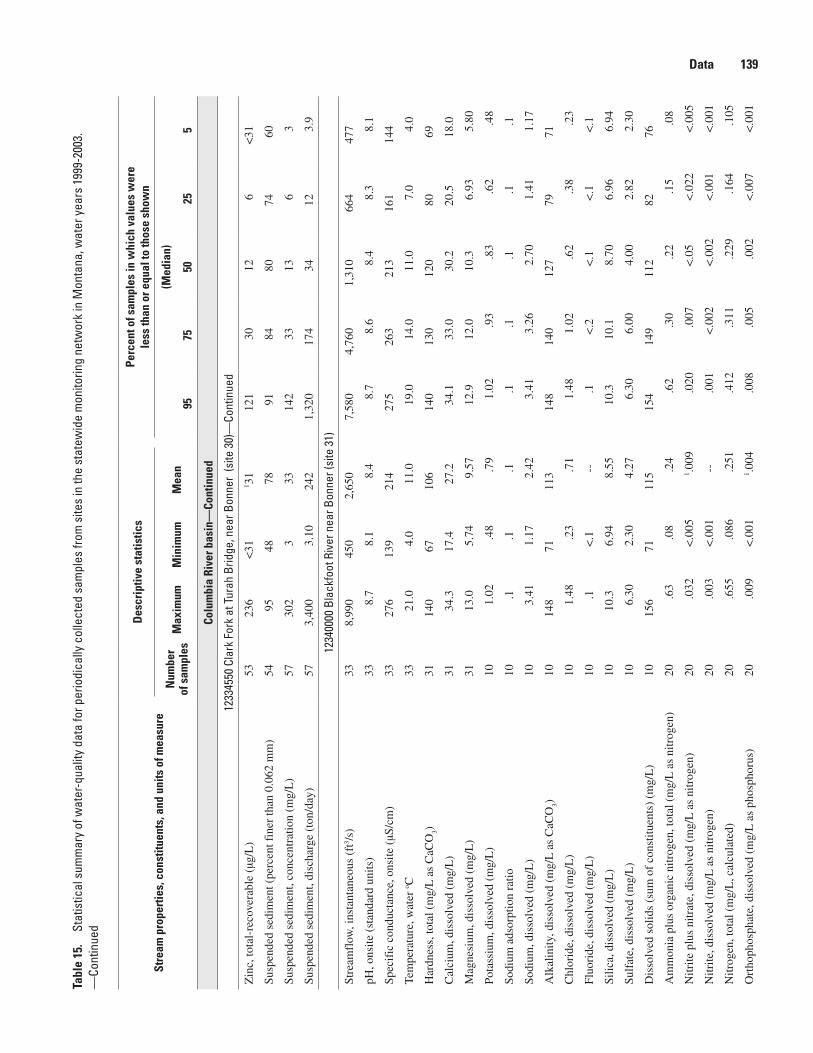
Stre
am p
rope
rtie
s, c
onst
ituen
ts, a
nd u
nits
of m
easu
re
Des
crip
tive
stat
istic
sPe
rcen
t of s
ampl
es in
whi
ch v
alue
s w
ere
le
ss th
an o
r equ
al to
thos
e sh
own
Num
ber
of s
ampl
esM
axim
umM
inim
umM
ean
(Med
ian)
9���
�02�
�
Colu
mbi
a Ri
ver b
asin
—Co
ntin
ued
1233
4550
Cla
rk F
ork
at T
urah
Brid
ge, n
ear B
onne
r (s
ite 3
0)—
Cont
inue
d
Zin
c, to
tal-
reco
vera
ble
(µg/
L)
5323
6<
311 3
112
130
126
<31
Susp
ende
d se
dim
ent (
perc
ent f
iner
than
0.0
62 m
m)
5495
4878
9184
8074
60
Susp
ende
d se
dim
ent,
conc
entr
atio
n (m
g/L
)57
302
333
142
3313
63
Susp
ende
d se
dim
ent,
disc
harg
e (t
on/d
ay)
573,
400
3.10
242
1,32
017
434
123.
9
1234
0000
Bla
ckfo
ot R
iver
nea
r Bon
ner (
site
31)
Stre
amfl
ow, i
nsta
ntan
eous
(ft
3 /s)
338,
990
450
2,65
07,
580
4,76
01,
310
664
477
pH, o
nsite
(st
anda
rd u
nits
)33
8.7
8.1
8.4
8.7
8.6
8.4
8.3
8.1
Spec
ific
con
duct
ance
, ons
ite (
µS/c
m)
3327
613
921
427
526
321
316
114
4
Tem
pera
ture
, wat
er o C
3321
.04.
011
.019
.014
.011
.07.
04.
0
Har
dnes
s, to
tal (
mg/
L a
s C
aCO
3)31
140
6710
614
013
012
080
69
Cal
cium
, dis
solv
ed (
mg/
L)
3134
.317
.427
.234
.133
.030
.220
.518
.0
Mag
nesi
um, d
isso
lved
(m
g/L
)31
13.0
5.74
9.57
12.9
12.0
10.3
6.93
5.80
Pota
ssiu
m, d
isso
lved
(m
g/L
)10
1.02
.48
.79
1.02
.93
.83
.62
.48
Sodi
um a
dsor
ptio
n ra
tio10
.1.1
.1.1
.1.1
.1.1
Sodi
um, d
isso
lved
(m
g/L
)10
3.41
1.17
2.42
3.41
3.26
2.70
1.41
1.17
Alk
alin
ity, d
isso
lved
(m
g/L
as
CaC
O3)
1014
871
113
148
140
127
7971
Chl
orid
e, d
isso
lved
(m
g/L
)10
1.48
.23
.71
1.48
1.02
.62
.38
.23
Fluo
ride
, dis
solv
ed (
mg/
L)
10.1
<.1
--.1
<.2
<.1
<.1
<.1
Silic
a, d
isso
lved
(m
g/L
)10
10.3
6.94
8.55
10.3
10.1
8.70
6.96
6.94
Sulf
ate,
dis
solv
ed (
mg/
L)
106.
302.
304.
276.
306.
004.
002.
822.
30
Dis
solv
ed s
olid
s (s
um o
f co
nstit
uent
s) (
mg/
L)
1015
671
115
154
149
112
8276
Am
mon
ia p
lus
orga
nic
nitr
ogen
, tot
al (
mg/
L a
s ni
trog
en)
20.6
3.0
8.2
4.6
2.3
0.2
2.1
5.0
8
Nitr
ite p
lus
nitr
ate,
dis
solv
ed (
mg/
L a
s ni
trog
en)
20.0
32<
.005
1 .009
.020
.007
<.0
5<
.022
<.0
05
Nitr
ite, d
isso
lved
(m
g/L
as
nitr
ogen
)20
.003
<.0
01--
.001
<.0
02<
.002
<.0
01<
.001
Nitr
ogen
, tot
al (
mg/
L, c
alcu
late
d)20
.655
.086
.251
.412
.311
.229
.164
.105
Ort
hoph
osph
ate,
dis
solv
ed (
mg/
L a
s ph
osph
orus
)20
.009
<.0
011 .0
04.0
08.0
05.0
02<
.007
<.0
01
Data 139Ta
ble
1�.
Stat
istic
al s
umm
ary
of w
ater
-qua
lity
data
for p
erio
dica
lly c
olle
cted
sam
ples
from
site
s in
the
stat
ewid
e m
onito
ring
netw
ork
in M
onta
na, w
ater
yea
rs 1
999-
2003
. —
Cont
inue
d
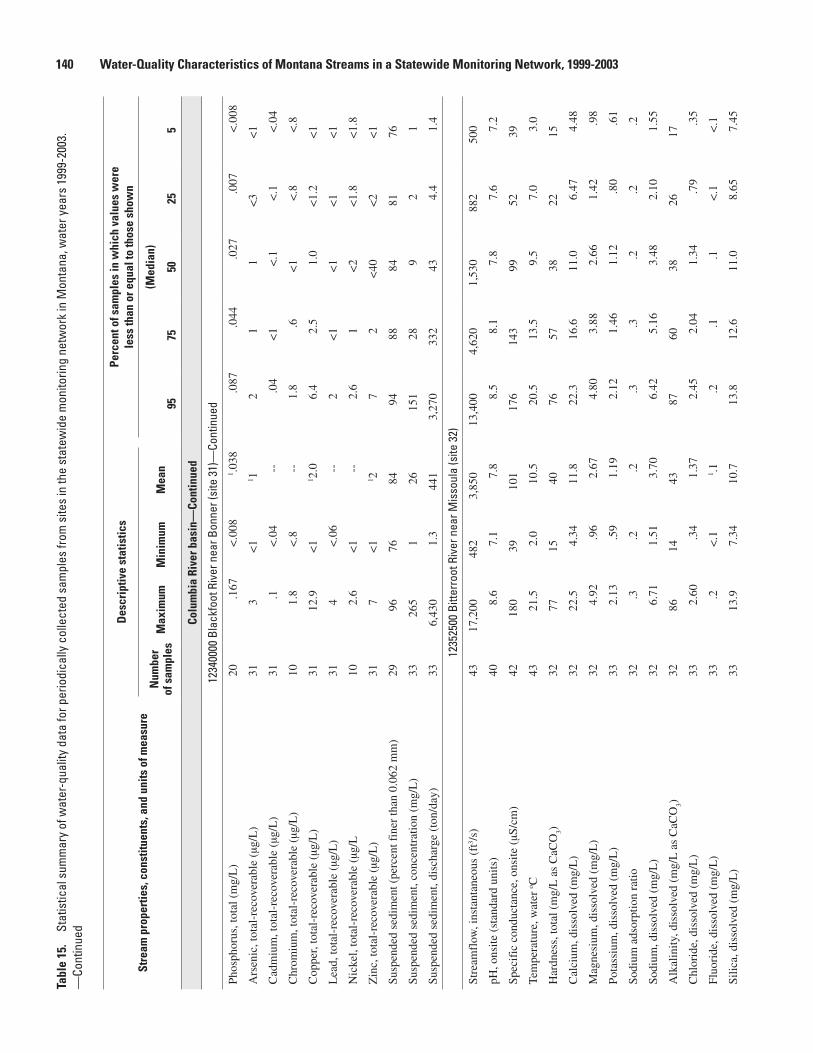
Stre
am p
rope
rtie
s, c
onst
ituen
ts, a
nd u
nits
of m
easu
re
Des
crip
tive
stat
istic
sPe
rcen
t of s
ampl
es in
whi
ch v
alue
s w
ere
le
ss th
an o
r equ
al to
thos
e sh
own
Num
ber
of s
ampl
esM
axim
umM
inim
umM
ean
(Med
ian)
9���
�02�
�
Colu
mbi
a Ri
ver b
asin
—Co
ntin
ued
1234
0000
Bla
ckfo
ot R
iver
nea
r Bon
ner (
site
31)
—Co
ntin
ued
Phos
phor
us, t
otal
(m
g/L
)20
.167
<.0
081 .0
38.0
87.0
44.0
27.0
07<
.008
Ars
enic
, tot
al-r
ecov
erab
le (
µg/L
)31
3<
11 1
21
1<
3<
1
Cad
miu
m, t
otal
-rec
over
able
(µg
/L)
31.1
<.0
4--
.04
<1
<.1
<.1
<.0
4
Chr
omiu
m, t
otal
-rec
over
able
(µg
/L)
101.
8<
.8--
1.8
.6<
1<
.8<
.8
Cop
per,
tota
l-re
cove
rabl
e (µ
g/L
)31
12.9
<1
1 2.0
6.4
2.5
1.0
<1.
2<
1
Lea
d, to
tal-
reco
vera
ble
(µg/
L)
314
<.0
6--
2<
1<
1<
1<
1
Nic
kel,
tota
l-re
cove
rabl
e (µ
g/L
102.
6<
1--
2.6
1<
2<
1.8
<1.
8
Zin
c, to
tal-
reco
vera
ble
(µg/
L)
317
<1
1 27
2<
40<
2<
1
Susp
ende
d se
dim
ent (
perc
ent f
iner
than
0.0
62 m
m)
2996
7684
9488
8481
76
Susp
ende
d se
dim
ent,
conc
entr
atio
n (m
g/L
)33
265
126
151
289
21
Susp
ende
d se
dim
ent,
disc
harg
e (t
on/d
ay)
336,
430
1.3
441
3,27
033
243
4.4
1.4
1235
2500
Bitt
erro
ot R
iver
nea
r Mis
soul
a (s
ite 3
2)
Stre
amfl
ow, i
nsta
ntan
eous
(ft
3 /s)
4317
,200
482
3,85
013
,400
4,62
01,
530
882
500
pH, o
nsite
(st
anda
rd u
nits
)40
8.6
7.1
7.8
8.5
8.1
7.8
7.6
7.2
Spec
ific
con
duct
ance
, ons
ite (
µS/c
m)
4218
039
101
176
143
9952
39
Tem
pera
ture
, wat
er o C
4321
.52.
010
.520
.513
.59.
57.
03.
0
Har
dnes
s, to
tal (
mg/
L a
s C
aCO
3)32
7715
4076
5738
2215
Cal
cium
, dis
solv
ed (
mg/
L)
3222
.54.
3411
.822
.316
.611
.06.
474.
48
Mag
nesi
um, d
isso
lved
(m
g/L
)32
4.92
.96
2.67
4.80
3.88
2.66
1.42
.98
Pota
ssiu
m, d
isso
lved
(m
g/L
)33
2.13
.59
1.19
2.12
1.46
1.12
.80
.61
Sodi
um a
dsor
ptio
n ra
tio32
.3.2
.2.3
.3.2
.2.2
Sodi
um, d
isso
lved
(m
g/L
)32
6.71
1.51
3.70
6.42
5.16
3.48
2.10
1.55
Alk
alin
ity, d
isso
lved
(m
g/L
as
CaC
O3)
3286
1443
8760
3826
17
Chl
orid
e, d
isso
lved
(m
g/L
)33
2.60
.34
1.37
2.45
2.04
1.34
.79
.35
Fluo
ride
, dis
solv
ed (
mg/
L)
33.2
<.1
1 .1.2
.1.1
<.1
<.1
Silic
a, d
isso
lved
(m
g/L
)33
13.9
7.34
10.7
13.8
12.6
11.0
8.65
7.45
1�0 Water-Quality Characteristics of Montana Streams in a Statewide Monitoring Network, 1999-2003Ta
ble
1�.
Stat
istic
al s
umm
ary
of w
ater
-qua
lity
data
for p
erio
dica
lly c
olle
cted
sam
ples
from
site
s in
the
stat
ewid
e m
onito
ring
netw
ork
in M
onta
na, w
ater
yea
rs 1
999-
2003
. —
Cont
inue
d
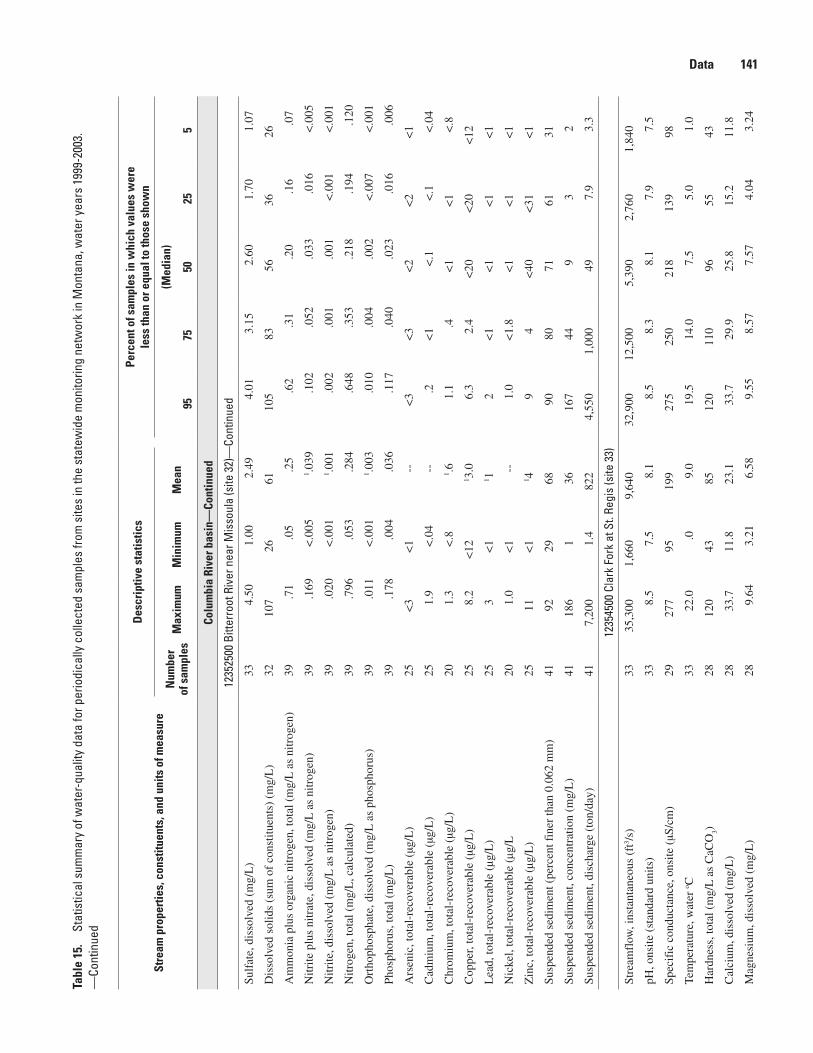
Stre
am p
rope
rtie
s, c
onst
ituen
ts, a
nd u
nits
of m
easu
re
Des
crip
tive
stat
istic
sPe
rcen
t of s
ampl
es in
whi
ch v
alue
s w
ere
le
ss th
an o
r equ
al to
thos
e sh
own
Num
ber
of s
ampl
esM
axim
umM
inim
umM
ean
(Med
ian)
9���
�02�
�
Colu
mbi
a Ri
ver b
asin
—Co
ntin
ued
1235
2500
Bitt
erro
ot R
iver
nea
r Mis
soul
a (s
ite 3
2)—
Cont
inue
d
Sulf
ate,
dis
solv
ed (
mg/
L)
334.
501.
002.
494.
013.
152.
601.
701.
07
Dis
solv
ed s
olid
s (s
um o
f co
nstit
uent
s) (
mg/
L)
3210
726
6110
583
5636
26
Am
mon
ia p
lus
orga
nic
nitr
ogen
, tot
al (
mg/
L a
s ni
trog
en)
39.7
1.0
5.2
5.6
2.3
1.2
0.1
6.0
7
Nitr
ite p
lus
nitr
ate,
dis
solv
ed (
mg/
L a
s ni
trog
en)
39.1
69<
.005
1 .039
.102
.052
.033
.016
<.0
05
Nitr
ite, d
isso
lved
(m
g/L
as
nitr
ogen
)39
.020
<.0
011 .0
01.0
02.0
01.0
01<
.001
<.0
01
Nitr
ogen
, tot
al (
mg/
L, c
alcu
late
d)39
.796
.053
.284
.648
.353
.218
.194
.120
Ort
hoph
osph
ate,
dis
solv
ed (
mg/
L a
s ph
osph
orus
)39
.011
<.0
011 .0
03.0
10.0
04.0
02<
.007
<.0
01
Phos
phor
us, t
otal
(m
g/L
)39
.178
.004
.036
.117
.040
.023
.016
.006
Ars
enic
, tot
al-r
ecov
erab
le (
µg/L
)25
<3
<1
--<
3<
3<
2<
2<
1
Cad
miu
m, t
otal
-rec
over
able
(µg
/L)
251.
9<
.04
--.2
<1
<.1
<.1
<.0
4
Chr
omiu
m, t
otal
-rec
over
able
(µg
/L)
201.
3<
.81 .6
1.1
.4<
1<
1<
.8
Cop
per,
tota
l-re
cove
rabl
e (µ
g/L
)25
8.2
<12
1 3.0
6.3
2.4
<20
<20
<12
Lea
d, to
tal-
reco
vera
ble
(µg/
L)
253
<1
1 12
<1
<1
<1
<1
Nic
kel,
tota
l-re
cove
rabl
e (µ
g/L
201.
0<
1--
1.0
<1.
8<
1<
1<
1
Zin
c, to
tal-
reco
vera
ble
(µg/
L)
2511
<1
1 49
4<
40<
31<
1
Susp
ende
d se
dim
ent (
perc
ent f
iner
than
0.0
62 m
m)
4192
2968
9080
7161
31
Susp
ende
d se
dim
ent,
conc
entr
atio
n (m
g/L
)41
186
136
167
449
32
Susp
ende
d se
dim
ent,
disc
harg
e (t
on/d
ay)
417,
200
1.4
822
4,55
01,
000
497.
93.
3
1235
4500
Cla
rk F
ork
at S
t. Re
gis
(site
33)
Stre
amfl
ow, i
nsta
ntan
eous
(ft
3 /s)
3335
,300
1,66
09,
640
32,9
0012
,500
5,39
02,
760
1,84
0
pH, o
nsite
(st
anda
rd u
nits
)33
8.5
7.5
8.1
8.5
8.3
8.1
7.9
7.5
Spec
ific
con
duct
ance
, ons
ite (
µS/c
m)
2927
795
199
275
250
218
139
98
Tem
pera
ture
, wat
er o C
3322
.0.0
9.0
19.5
14.0
7.5
5.0
1.0
Har
dnes
s, to
tal (
mg/
L a
s C
aCO
3)28
120
4385
120
110
9655
43
Cal
cium
, dis
solv
ed (
mg/
L)
2833
.711
.823
.133
.729
.925
.815
.211
.8
Mag
nesi
um, d
isso
lved
(m
g/L
)28
9.64
3.21
6.58
9.55
8.57
7.57
4.04
3.24
Data 1�1Ta
ble
1�.
Stat
istic
al s
umm
ary
of w
ater
-qua
lity
data
for p
erio
dica
lly c
olle
cted
sam
ples
from
site
s in
the
stat
ewid
e m
onito
ring
netw
ork
in M
onta
na, w
ater
yea
rs 1
999-
2003
. —
Cont
inue
d

Stre
am p
rope
rtie
s, c
onst
ituen
ts, a
nd u
nits
of m
easu
re
Des
crip
tive
stat
istic
sPe
rcen
t of s
ampl
es in
whi
ch v
alue
s w
ere
le
ss th
an o
r equ
al to
thos
e sh
own
Num
ber
of s
ampl
esM
axim
umM
inim
umM
ean
(Med
ian)
9���
�02�
�
Colu
mbi
a Ri
ver b
asin
—Co
ntin
ued
1235
4500
Cla
rk F
ork
at S
t. Re
gis
(site
33)
—Co
ntin
ued
Pota
ssiu
m, d
isso
lved
(m
g/L
)28
2.00
.64
1.28
1.90
1.64
1.34
.90
.65
Sodi
um a
dsor
ptio
n ra
tio28
.4.1
.3.4
.3.3
.2.1
Sodi
um, d
isso
lved
(m
g/L
)28
10.2
2.1
5.89
9.80
8.37
6.01
3.26
2.12
Alk
alin
ity, d
isso
lved
(m
g/L
as
CaC
O3)
2812
041
8311
810
395
5943
Chl
orid
e, d
isso
lved
(m
g/L
)28
4.34
.89
2.56
4.29
3.38
2.72
1.45
.94
Fluo
ride
, dis
solv
ed (
mg/
L)
28.2
<.1
1 .1.2
.2.1
<.1
<.1
Silic
a, d
isso
lved
(m
g/L
)28
11.7
5.91
9.45
11.6
10.8
9.37
8.40
6.62
Sulf
ate,
dis
solv
ed (
mg/
L)
2825
.63.
7013
.124
.720
.011
.86.
303.
74
Dis
solv
ed s
olid
s (s
um o
f co
nstit
uent
s) (
mg/
L)
2816
057
112
160
144
126
7857
Am
mon
ia p
lus
orga
nic
nitr
ogen
, tot
al (
mg/
L a
s ni
trog
en)
32.6
6.0
6.2
2.4
9.2
5.2
0.1
5.0
9
Nitr
ite p
lus
nitr
ate,
dis
solv
ed (
mg/
L a
s ni
trog
en)
32.1
59<
.005
1 .041
.128
.046
.028
.016
<.0
05
Nitr
ite, d
isso
lved
(m
g/L
as
nitr
ogen
)32
.003
<.0
011 .0
02.0
03.0
02.0
01<
.002
<.0
01
Nitr
ogen
, tot
al (
mg/
L, c
alcu
late
d)32
.734
.138
.258
.436
.280
.239
.202
.141
Ort
hoph
osph
ate,
dis
solv
ed (
mg/
L a
s ph
osph
orus
)32
.010
<.0
011 .0
04.0
08.0
06.0
02<
.007
<.0
01
Phos
phor
us, t
otal
(m
g/L
)32
.183
.004
.027
.099
.032
.021
.010
.004
Ars
enic
, tot
al-r
ecov
erab
le (
µg/L
)26
3<
11 2
32
21
<1
Cad
miu
m, t
otal
-rec
over
able
(µg
/L)
26.0
3<
.04
--.0
2<
1<
.1<
.1<
.04
Chr
omiu
m, t
otal
-rec
over
able
(µg
/L)
201.
7<
.8--
<1
<1
<1
<1
<.8
Cop
per,
tota
l-re
cove
rabl
e (µ
g/L
)26
21<
121 4
.512
.02.
8<
20<
20<
12
Lea
d, to
tal-
reco
vera
ble
(µg/
L)
267
<1
1 12
<1
<1
<1
<1
Nic
kel,
tota
l-re
cove
rabl
e (µ
g/L
202.
2<
1--
2.2
<1.
8<
1.8
<1
<1
Zin
c, to
tal-
reco
vera
ble
(µg/
L)
2640
<31
1 820
5<
40<
31<
31
Susp
ende
d se
dim
ent (
perc
ent f
iner
than
0.0
62 m
m)
3198
3077
9686
7970
45
Susp
ende
d se
dim
ent,
conc
entr
atio
n (m
g/L
)31
280
127
216
158
32
Susp
ende
d se
dim
ent,
disc
harg
e (t
on/d
ay)
3126
,700
5.7
1,98
010
,700
440
8034
9.5
1�2 Water-Quality Characteristics of Montana Streams in a Statewide Monitoring Network, 1999-2003Ta
ble
1�.
Stat
istic
al s
umm
ary
of w
ater
-qua
lity
data
for p
erio
dica
lly c
olle
cted
sam
ples
from
site
s in
the
stat
ewid
e m
onito
ring
netw
ork
in M
onta
na, w
ater
yea
rs 1
999-
2003
. —
Cont
inue
d
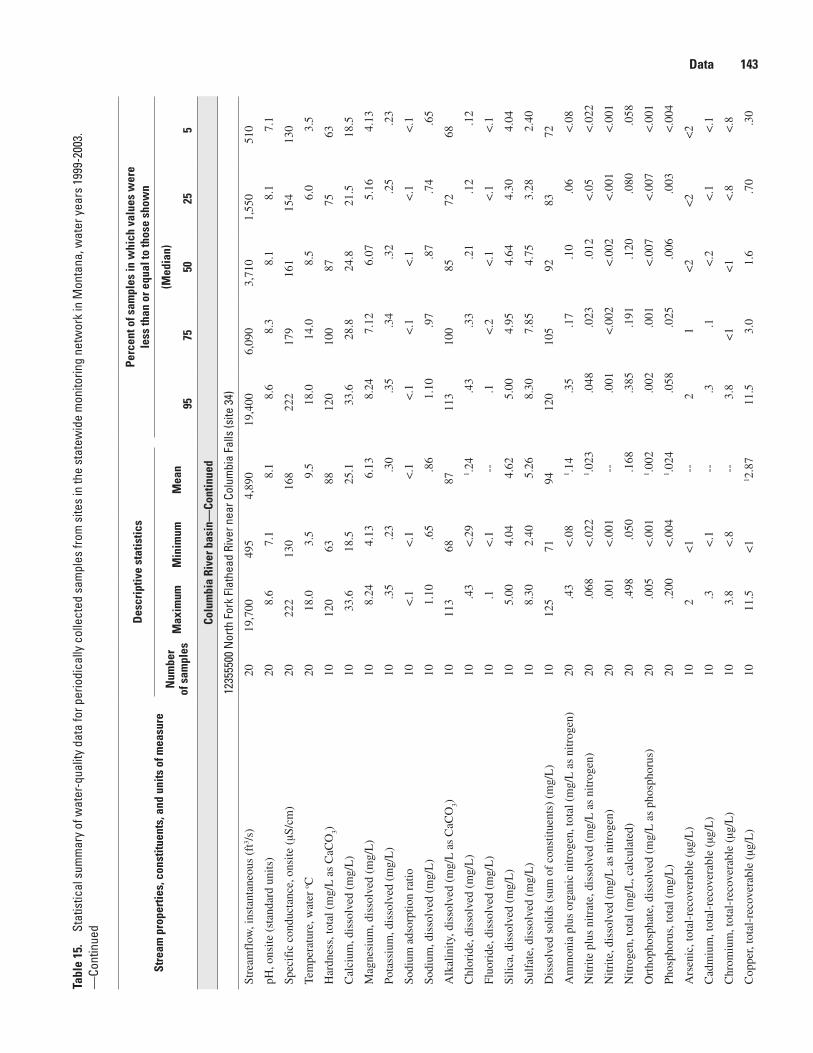
Stre
am p
rope
rtie
s, c
onst
ituen
ts, a
nd u
nits
of m
easu
re
Des
crip
tive
stat
istic
sPe
rcen
t of s
ampl
es in
whi
ch v
alue
s w
ere
le
ss th
an o
r equ
al to
thos
e sh
own
Num
ber
of s
ampl
esM
axim
umM
inim
umM
ean
(Med
ian)
9���
�02�
�
Colu
mbi
a Ri
ver b
asin
—Co
ntin
ued
1235
5500
Nor
th F
ork
Flat
head
Riv
er n
ear C
olum
bia
Falls
(site
34)
Stre
amfl
ow, i
nsta
ntan
eous
(ft
3 /s)
2019
,700
495
4,89
019
,400
6,09
03,
710
1,55
051
0
pH, o
nsite
(st
anda
rd u
nits
)20
8.6
7.1
8.1
8.6
8.3
8.1
8.1
7.1
Spec
ific
con
duct
ance
, ons
ite (
µS/c
m)
2022
213
016
822
217
916
115
413
0
Tem
pera
ture
, wat
er o C
2018
.03.
59.
518
.014
.08.
56.
03.
5
Har
dnes
s, to
tal (
mg/
L a
s C
aCO
3)10
120
6388
120
100
8775
63
Cal
cium
, dis
solv
ed (
mg/
L)
1033
.618
.525
.133
.628
.824
.821
.518
.5
Mag
nesi
um, d
isso
lved
(m
g/L
)10
8.24
4.13
6.13
8.24
7.12
6.07
5.16
4.13
Pota
ssiu
m, d
isso
lved
(m
g/L
)10
.35
.23
.30
.35
.34
.32
.25
.23
Sodi
um a
dsor
ptio
n ra
tio10
<.1
<.1
<.1
<.1
<.1
<.1
<.1
<.1
Sodi
um, d
isso
lved
(m
g/L
)10
1.10
.65
.86
1.10
.97
.87
.74
.65
Alk
alin
ity, d
isso
lved
(m
g/L
as
CaC
O3)
1011
368
8711
310
085
7268
Chl
orid
e, d
isso
lved
(m
g/L
)10
.43
<.2
91 .2
4.4
3.3
3.2
1.1
2.1
2
Fluo
ride
, dis
solv
ed (
mg/
L)
10.1
<.1
--.1
<.2
<.1
<.1
<.1
Silic
a, d
isso
lved
(m
g/L
)10
5.00
4.04
4.62
5.00
4.95
4.64
4.30
4.04
Sulf
ate,
dis
solv
ed (
mg/
L)
108.
302.
405.
268.
307.
854.
753.
282.
40
Dis
solv
ed s
olid
s (s
um o
f co
nstit
uent
s) (
mg/
L)
1012
571
9412
010
592
8372
Am
mon
ia p
lus
orga
nic
nitr
ogen
, tot
al (
mg/
L a
s ni
trog
en)
20.4
3<
.08
1 .14
.35
.17
.10
.06
<.0
8
Nitr
ite p
lus
nitr
ate,
dis
solv
ed (
mg/
L a
s ni
trog
en)
20.0
68<
.022
1 .023
.048
.023
.012
<.0
5<
.022
Nitr
ite, d
isso
lved
(m
g/L
as
nitr
ogen
)20
.001
<.0
01--
.001
<.0
02<
.002
<.0
01<
.001
Nitr
ogen
, tot
al (
mg/
L, c
alcu
late
d)20
.498
.050
.168
.385
.191
.120
.080
.058
Ort
hoph
osph
ate,
dis
solv
ed (
mg/
L a
s ph
osph
orus
)20
.005
<.0
011 .0
02.0
02.0
01<
.007
<.0
07<
.001
Phos
phor
us, t
otal
(m
g/L
)20
.200
<.0
041 .0
24.0
58.0
25.0
06.0
03<
.004
Ars
enic
, tot
al-r
ecov
erab
le (
µg/L
)10
2<
1--
21
<2
<2
<2
Cad
miu
m, t
otal
-rec
over
able
(µg
/L)
10.3
<.1
--.3
.1<
.2<
.1<
.1
Chr
omiu
m, t
otal
-rec
over
able
(µg
/L)
103.
8<
.8--
3.8
<1
<1
<.8
<.8
Cop
per,
tota
l-re
cove
rabl
e (µ
g/L
)10
11.5
<1
1 2.8
711
.53.
01.
6.7
0.3
0
Data 1�3Ta
ble
1�.
Stat
istic
al s
umm
ary
of w
ater
-qua
lity
data
for p
erio
dica
lly c
olle
cted
sam
ples
from
site
s in
the
stat
ewid
e m
onito
ring
netw
ork
in M
onta
na, w
ater
yea
rs 1
999-
2003
. —
Cont
inue
d

Stre
am p
rope
rtie
s, c
onst
ituen
ts, a
nd u
nits
of m
easu
re
Des
crip
tive
stat
istic
sPe
rcen
t of s
ampl
es in
whi
ch v
alue
s w
ere
le
ss th
an o
r equ
al to
thos
e sh
own
Num
ber
of s
ampl
esM
axim
umM
inim
umM
ean
(Med
ian)
9���
�02�
�
Colu
mbi
a Ri
ver b
asin
—Co
ntin
ued
1235
5500
Nor
th F
ork
Flat
head
Riv
er n
ear C
olum
bia
Falls
(site
34)
—Co
ntin
ued
Lea
d, to
tal-
reco
vera
ble
(µg/
L)
104
<1
--4
<1
<1
<1
<1
Nic
kel,
tota
l-re
cove
rabl
e (µ
g/L
106
<1
--6
<1
<1
<1
<1
Zin
c, to
tal-
reco
vera
ble
(µg/
L)
1024
<1
1 524
5<
40<
31<
1
Susp
ende
d se
dim
ent (
perc
ent f
iner
than
0.0
62 m
m)
2097
7183
9788
8377
71
Susp
ende
d se
dim
ent,
conc
entr
atio
n (m
g/L
)20
371
136
356
408
31
Susp
ende
d se
dim
ent,
disc
harg
e (t
on/d
ay)
2019
,700
1.3
1,33
018
,900
530
8315
1.4
1235
8500
Mid
dle
Fork
Fla
thea
d Ri
ver n
ear W
est G
laci
er (s
ite 3
5)
Stre
amfl
ow, i
nsta
ntan
eous
(ft
3 /s)
2020
,500
406
4,69
020
,100
6,23
03,
260
1,38
041
3
pH, o
nsite
(st
anda
rd u
nits
)20
8.6
7.0
8.0
8.6
8.3
8.2
8.0
7.0
Spec
ific
con
duct
ance
, ons
ite (
µS/c
m)
2019
311
914
919
316
214
613
011
9
Tem
pera
ture
, wat
er o C
2015
.05.
09.
515
.012
.08.
07.
05.
0
Har
dnes
s, to
tal (
mg/
L a
s C
aCO
3)10
9458
7594
8474
6558
Cal
cium
, dis
solv
ed (
mg/
L)
1025
.916
.220
.725
.923
.020
.818
.216
.2
Mag
nesi
um, d
isso
lved
(m
g/L
)10
7.23
4.14
5.56
7.23
6.31
5.53
4.73
4.14
Pota
ssiu
m, d
isso
lved
(m
g/L
)10
.34
.22
.28
.34
.32
.28
.24
.22
Sodi
um a
dsor
ptio
n ra
tio10
<.1
<.1
<.1
<.1
<.1
<.1
<.1
<.1
Sodi
um, d
isso
lved
(m
g/L
)10
.99
.54
.75
.99
.84
.74
.64
.54
Alk
alin
ity, d
isso
lved
(m
g/L
as
CaC
O3)
1097
6275
9782
7364
62
Chl
orid
e, d
isso
lved
(m
g/L
)10
.36
<.1
01 .1
7.3
6.2
1.1
4<
.30
<.2
9
Fluo
ride
, dis
solv
ed (
mg/
L)
10<
.2<
.1--
<.2
<.2
<.1
<.1
<.1
Silic
a, d
isso
lved
(m
g/L
)10
4.38
3.31
3.92
4.38
4.15
3.90
3.76
3.31
Sulf
ate,
dis
solv
ed (
mg/
L)
106.
601.
803.
586.
604.
623.
202.
751.
80
Dis
solv
ed s
olid
s (s
um o
f co
nstit
uent
s) (
mg/
L)
1010
464
8010
284
7872
65
Am
mon
ia p
lus
orga
nic
nitr
ogen
, tot
al (
mg/
L a
s ni
trog
en)
20.2
3<
.08
1 .10
.18
.11
.07
<.1
0<
.08
Nitr
ite p
lus
nitr
ate,
dis
solv
ed (
mg/
L a
s ni
trog
en)
20.2
60.0
56.1
16.2
58.1
28.1
02.0
77.0
57
Nitr
ite, d
isso
lved
(m
g/L
as
nitr
ogen
)20
.002
<.0
01--
.002
<.0
10<
.002
<.0
01<
.001
1�� Water-Quality Characteristics of Montana Streams in a Statewide Monitoring Network, 1999-2003Ta
ble
1�.
Stat
istic
al s
umm
ary
of w
ater
-qua
lity
data
for p
erio
dica
lly c
olle
cted
sam
ples
from
site
s in
the
stat
ewid
e m
onito
ring
netw
ork
in M
onta
na, w
ater
yea
rs 1
999-
2003
. —
Cont
inue
d
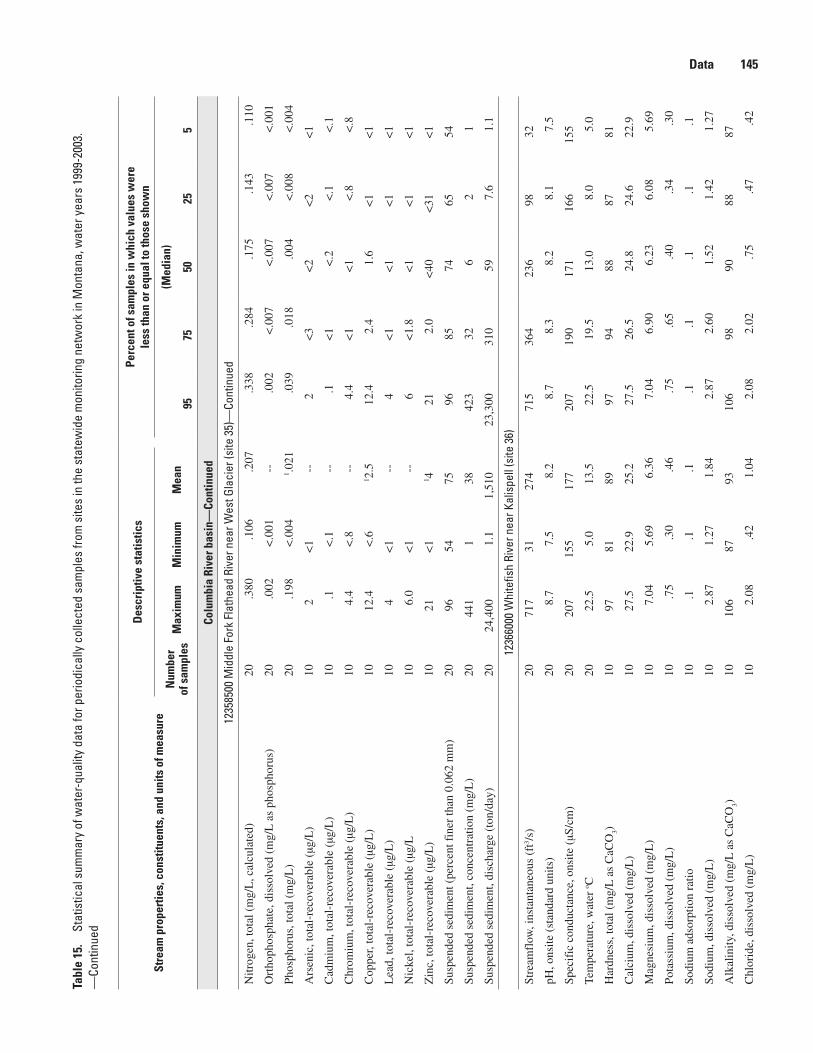
Stre
am p
rope
rtie
s, c
onst
ituen
ts, a
nd u
nits
of m
easu
re
Des
crip
tive
stat
istic
sPe
rcen
t of s
ampl
es in
whi
ch v
alue
s w
ere
le
ss th
an o
r equ
al to
thos
e sh
own
Num
ber
of s
ampl
esM
axim
umM
inim
umM
ean
(Med
ian)
9���
�02�
�
Colu
mbi
a Ri
ver b
asin
—Co
ntin
ued
1235
8500
Mid
dle
Fork
Fla
thea
d Ri
ver n
ear W
est G
laci
er (s
ite 3
5)—
Cont
inue
d
Nitr
ogen
, tot
al (
mg/
L, c
alcu
late
d)20
.380
.106
.207
.338
.284
.175
.143
.110
Ort
hoph
osph
ate,
dis
solv
ed (
mg/
L a
s ph
osph
orus
)20
.002
<.0
01--
.002
<.0
07<
.007
<.0
07<
.001
Phos
phor
us, t
otal
(m
g/L
)20
.198
<.0
041 .0
21.0
39.0
18.0
04<
.008
<.0
04
Ars
enic
, tot
al-r
ecov
erab
le (
µg/L
)10
2<
1--
2<
3<
2<
2<
1
Cad
miu
m, t
otal
-rec
over
able
(µg
/L)
10.1
<.1
--.1
<1
<.2
<.1
<.1
Chr
omiu
m, t
otal
-rec
over
able
(µg
/L)
104.
4<
.8--
4.4
<1
<1
<.8
<.8
Cop
per,
tota
l-re
cove
rabl
e (µ
g/L
)10
12.4
<.6
1 2.5
12.4
2.4
1.6
<1
<1
Lea
d, to
tal-
reco
vera
ble
(µg/
L)
104
<1
--4
<1
<1
<1
<1
Nic
kel,
tota
l-re
cove
rabl
e (µ
g/L
106.
0<
1--
6<
1.8
<1
<1
<1
Zin
c, to
tal-
reco
vera
ble
(µg/
L)
1021
<1
1 421
2.0
<40
<31
<1
Susp
ende
d se
dim
ent (
perc
ent f
iner
than
0.0
62 m
m)
2096
5475
9685
7465
54
Susp
ende
d se
dim
ent,
conc
entr
atio
n (m
g/L
)20
441
138
423
326
21
Susp
ende
d se
dim
ent,
disc
harg
e (t
on/d
ay)
2024
,400
1.1
1,51
023
,300
310
597.
61.
1
1236
6000
Whi
tefis
h Ri
ver n
ear K
alis
pell
(site
36)
Stre
amfl
ow, i
nsta
ntan
eous
(ft
3 /s)
2071
731
274
715
364
236
9832
pH, o
nsite
(st
anda
rd u
nits
)20
8.7
7.5
8.2
8.7
8.3
8.2
8.1
7.5
Spec
ific
con
duct
ance
, ons
ite (
µS/c
m)
2020
715
517
720
719
017
116
615
5
Tem
pera
ture
, wat
er o C
2022
.55.
013
.522
.519
.513
.08.
05.
0
Har
dnes
s, to
tal (
mg/
L a
s C
aCO
3)10
9781
8997
9488
8781
Cal
cium
, dis
solv
ed (
mg/
L)
1027
.522
.925
.227
.526
.524
.824
.622
.9
Mag
nesi
um, d
isso
lved
(m
g/L
)10
7.04
5.69
6.36
7.04
6.90
6.23
6.08
5.69
Pota
ssiu
m, d
isso
lved
(m
g/L
)10
.75
.30
.46
.75
.65
.40
.34
.30
Sodi
um a
dsor
ptio
n ra
tio10
.1.1
.1.1
.1.1
.1.1
Sodi
um, d
isso
lved
(m
g/L
)10
2.87
1.27
1.84
2.87
2.60
1.52
1.42
1.27
Alk
alin
ity, d
isso
lved
(m
g/L
as
CaC
O3)
1010
687
9310
698
9088
87
Chl
orid
e, d
isso
lved
(m
g/L
)10
2.08
.42
1.04
2.08
2.02
.75
.47
.42
Data 1��Ta
ble
1�.
Stat
istic
al s
umm
ary
of w
ater
-qua
lity
data
for p
erio
dica
lly c
olle
cted
sam
ples
from
site
s in
the
stat
ewid
e m
onito
ring
netw
ork
in M
onta
na, w
ater
yea
rs 1
999-
2003
. —
Cont
inue
d
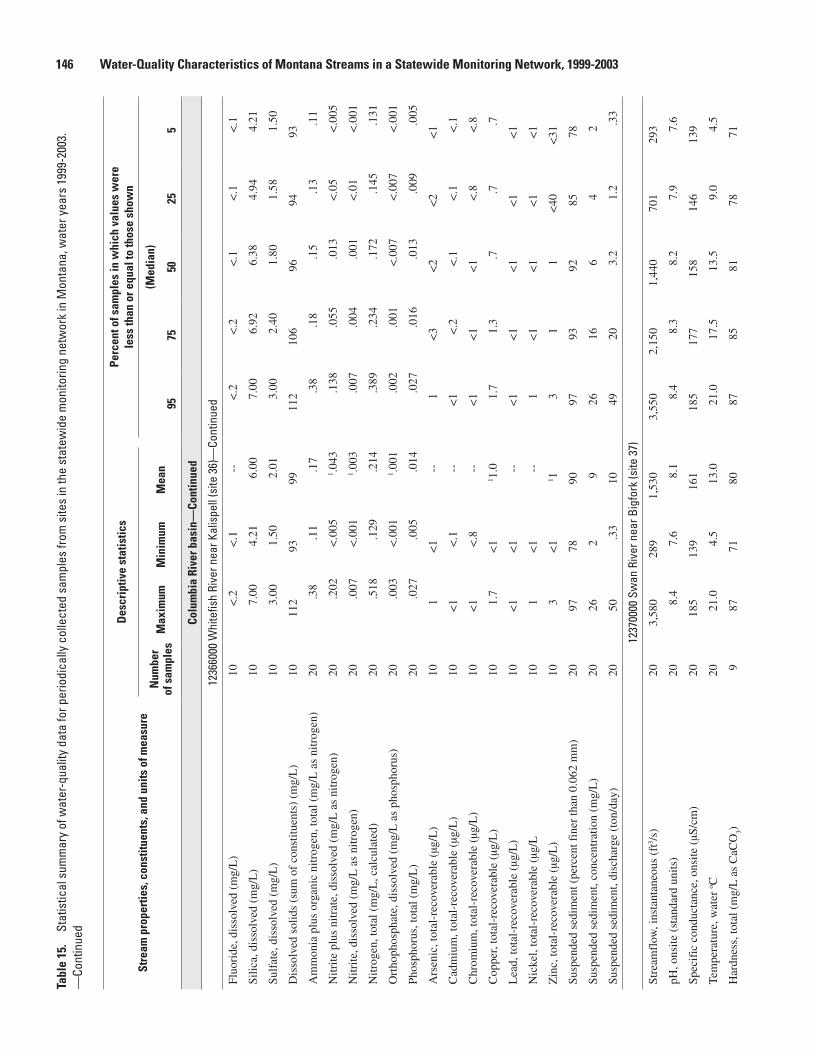
Stre
am p
rope
rtie
s, c
onst
ituen
ts, a
nd u
nits
of m
easu
re
Des
crip
tive
stat
istic
sPe
rcen
t of s
ampl
es in
whi
ch v
alue
s w
ere
le
ss th
an o
r equ
al to
thos
e sh
own
Num
ber
of s
ampl
esM
axim
umM
inim
umM
ean
(Med
ian)
9���
�02�
�
Colu
mbi
a Ri
ver b
asin
—Co
ntin
ued
1236
6000
Whi
tefis
h Ri
ver n
ear K
alis
pell
(site
36)
—Co
ntin
ued
Fluo
ride
, dis
solv
ed (
mg/
L)
10<
.2<
.1--
<.2
<.2
<.1
<.1
<.1
Silic
a, d
isso
lved
(m
g/L
)10
7.00
4.21
6.00
7.00
6.92
6.38
4.94
4.21
Sulf
ate,
dis
solv
ed (
mg/
L)
103.
001.
502.
013.
002.
401.
801.
581.
50
Dis
solv
ed s
olid
s (s
um o
f co
nstit
uent
s) (
mg/
L)
1011
293
9911
210
696
9493
Am
mon
ia p
lus
orga
nic
nitr
ogen
, tot
al (
mg/
L a
s ni
trog
en)
20.3
8.1
1.1
7.3
8.1
8.1
5.1
3.1
1
Nitr
ite p
lus
nitr
ate,
dis
solv
ed (
mg/
L a
s ni
trog
en)
20.2
02<
.005
1 .043
.138
.055
.013
<.0
5<
.005
Nitr
ite, d
isso
lved
(m
g/L
as
nitr
ogen
)20
.007
<.0
011 .0
03.0
07.0
04.0
01<
.01
<.0
01
Nitr
ogen
, tot
al (
mg/
L, c
alcu
late
d)20
.518
.129
.214
.389
.234
.172
.145
.131
Ort
hoph
osph
ate,
dis
solv
ed (
mg/
L a
s ph
osph
orus
)20
.003
<.0
011 .0
01.0
02.0
01<
.007
<.0
07<
.001
Phos
phor
us, t
otal
(m
g/L
)20
.027
.005
.014
.027
.016
.013
.009
.005
Ars
enic
, tot
al-r
ecov
erab
le (
µg/L
)10
1<
1--
1<
3<
2<
2<
1
Cad
miu
m, t
otal
-rec
over
able
(µg
/L)
10<
1<
.1--
<1
<.2
<.1
<.1
<.1
Chr
omiu
m, t
otal
-rec
over
able
(µg
/L)
10<
1<
.8--
<1
<1
<1
<.8
<.8
Cop
per,
tota
l-re
cove
rabl
e (µ
g/L
)10
1.7
<1
1 1.0
1.7
1.3
.7.7
.7
Lea
d, to
tal-
reco
vera
ble
(µg/
L)
10<
1<
1--
<1
<1
<1
<1
<1
Nic
kel,
tota
l-re
cove
rabl
e (µ
g/L
101
<1
--1
<1
<1
<1
<1
Zin
c, to
tal-
reco
vera
ble
(µg/
L)
103
<1
1 13
11
<40
<31
Susp
ende
d se
dim
ent (
perc
ent f
iner
than
0.0
62 m
m)
2097
7890
9793
9285
78
Susp
ende
d se
dim
ent,
conc
entr
atio
n (m
g/L
)20
262
926
166
42
Susp
ende
d se
dim
ent,
disc
harg
e (t
on/d
ay)
2050
.33
1049
203.
21.
2.3
3
1237
0000
Sw
an R
iver
nea
r Big
fork
(site
37)
Stre
amfl
ow, i
nsta
ntan
eous
(ft
3 /s)
203,
580
289
1,53
03,
550
2,15
01,
440
701
293
pH, o
nsite
(st
anda
rd u
nits
)20
8.4
7.6
8.1
8.4
8.3
8.2
7.9
7.6
Spec
ific
con
duct
ance
, ons
ite (
µS/c
m)
2018
513
916
118
517
715
814
613
9
Tem
pera
ture
, wat
er o C
2021
.04.
513
.021
.017
.513
.59.
04.
5
Har
dnes
s, to
tal (
mg/
L a
s C
aCO
3)9
8771
8087
8581
7871
1�� Water-Quality Characteristics of Montana Streams in a Statewide Monitoring Network, 1999-2003Ta
ble
1�.
Stat
istic
al s
umm
ary
of w
ater
-qua
lity
data
for p
erio
dica
lly c
olle
cted
sam
ples
from
site
s in
the
stat
ewid
e m
onito
ring
netw
ork
in M
onta
na, w
ater
yea
rs 1
999-
2003
. —
Cont
inue
d
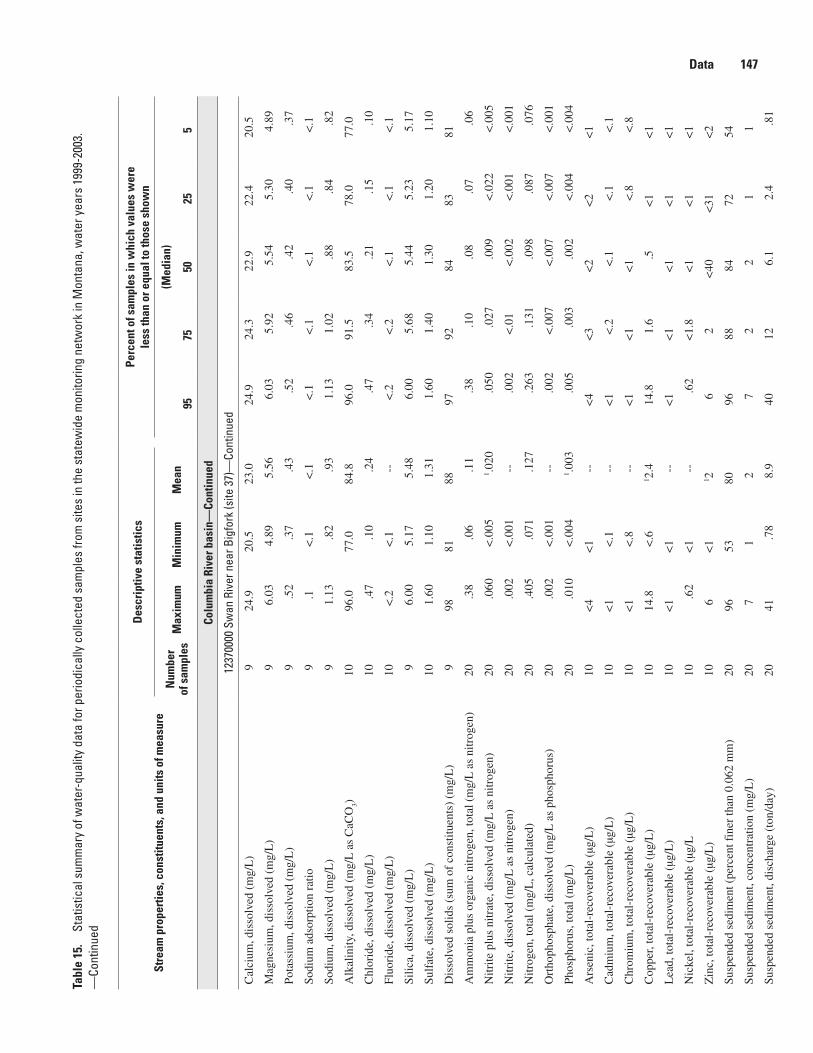
Stre
am p
rope
rtie
s, c
onst
ituen
ts, a
nd u
nits
of m
easu
re
Des
crip
tive
stat
istic
sPe
rcen
t of s
ampl
es in
whi
ch v
alue
s w
ere
le
ss th
an o
r equ
al to
thos
e sh
own
Num
ber
of s
ampl
esM
axim
umM
inim
umM
ean
(Med
ian)
9���
�02�
�
Colu
mbi
a Ri
ver b
asin
—Co
ntin
ued
1237
0000
Sw
an R
iver
nea
r Big
fork
(site
37)
—Co
ntin
ued
Cal
cium
, dis
solv
ed (
mg/
L)
924
.920
.523
.024
.924
.322
.922
.420
.5
Mag
nesi
um, d
isso
lved
(m
g/L
)9
6.03
4.89
5.56
6.03
5.92
5.54
5.30
4.89
Pota
ssiu
m, d
isso
lved
(m
g/L
)9
.52
.37
.43
.52
.46
.42
.40
.37
Sodi
um a
dsor
ptio
n ra
tio9
.1<
.1<
.1<
.1<
.1<
.1<
.1<
.1
Sodi
um, d
isso
lved
(m
g/L
)9
1.13
.82
.93
1.13
1.02
.88
.84
.82
Alk
alin
ity, d
isso
lved
(m
g/L
as
CaC
O3)
1096
.077
.084
.896
.091
.583
.578
.077
.0
Chl
orid
e, d
isso
lved
(m
g/L
)10
.47
.10
.24
.47
.34
.21
.15
.10
Fluo
ride
, dis
solv
ed (
mg/
L)
10<
.2<
.1--
<.2
<.2
<.1
<.1
<.1
Silic
a, d
isso
lved
(m
g/L
)9
6.00
5.17
5.48
6.00
5.68
5.44
5.23
5.17
Sulf
ate,
dis
solv
ed (
mg/
L)
101.
601.
101.
311.
601.
401.
301.
201.
10
Dis
solv
ed s
olid
s (s
um o
f co
nstit
uent
s) (
mg/
L)
998
8188
9792
8483
81
Am
mon
ia p
lus
orga
nic
nitr
ogen
, tot
al (
mg/
L a
s ni
trog
en)
20.3
8.0
6.1
1.3
8.1
0.0
8.0
7.0
6
Nitr
ite p
lus
nitr
ate,
dis
solv
ed (
mg/
L a
s ni
trog
en)
20.0
60<
.005
1 .020
.050
.027
.009
<.0
22<
.005
Nitr
ite, d
isso
lved
(m
g/L
as
nitr
ogen
)20
.002
<.0
01--
.002
<.0
1<
.002
<.0
01<
.001
Nitr
ogen
, tot
al (
mg/
L, c
alcu
late
d)20
.405
.071
.127
.263
.131
.098
.087
.076
Ort
hoph
osph
ate,
dis
solv
ed (
mg/
L a
s ph
osph
orus
)20
.002
<.0
01--
.002
<.0
07<
.007
<.0
07<
.001
Phos
phor
us, t
otal
(m
g/L
)20
.010
<.0
041 .0
03.0
05.0
03.0
02<
.004
<.0
04
Ars
enic
, tot
al-r
ecov
erab
le (
µg/L
)10
<4
<1
--<
4<
3<
2<
2<
1
Cad
miu
m, t
otal
-rec
over
able
(µg
/L)
10<
1<
.1--
<1
<.2
<.1
<.1
<.1
Chr
omiu
m, t
otal
-rec
over
able
(µg
/L)
10<
1<
.8--
<1
<1
<1
<.8
<.8
Cop
per,
tota
l-re
cove
rabl
e (µ
g/L
)10
14.8
<.6
1 2.4
14.8
1.6
.5<
1<
1
Lea
d, to
tal-
reco
vera
ble
(µg/
L)
10<
1<
1--
<1
<1
<1
<1
<1
Nic
kel,
tota
l-re
cove
rabl
e (µ
g/L
10.6
2<
1--
.62
<1.
8<
1<
1<
1
Zin
c, to
tal-
reco
vera
ble
(µg/
L)
106
<1
1 26
2<
40<
31<
2
Susp
ende
d se
dim
ent (
perc
ent f
iner
than
0.0
62 m
m)
2096
5380
9688
8472
54
Susp
ende
d se
dim
ent,
conc
entr
atio
n (m
g/L
)20
71
27
22
11
Susp
ende
d se
dim
ent,
disc
harg
e (t
on/d
ay)
2041
.78
8.9
4012
6.1
2.4
.81
Data 1��Ta
ble
1�.
Stat
istic
al s
umm
ary
of w
ater
-qua
lity
data
for p
erio
dica
lly c
olle
cted
sam
ples
from
site
s in
the
stat
ewid
e m
onito
ring
netw
ork
in M
onta
na, w
ater
yea
rs 1
999-
2003
. —
Cont
inue
d
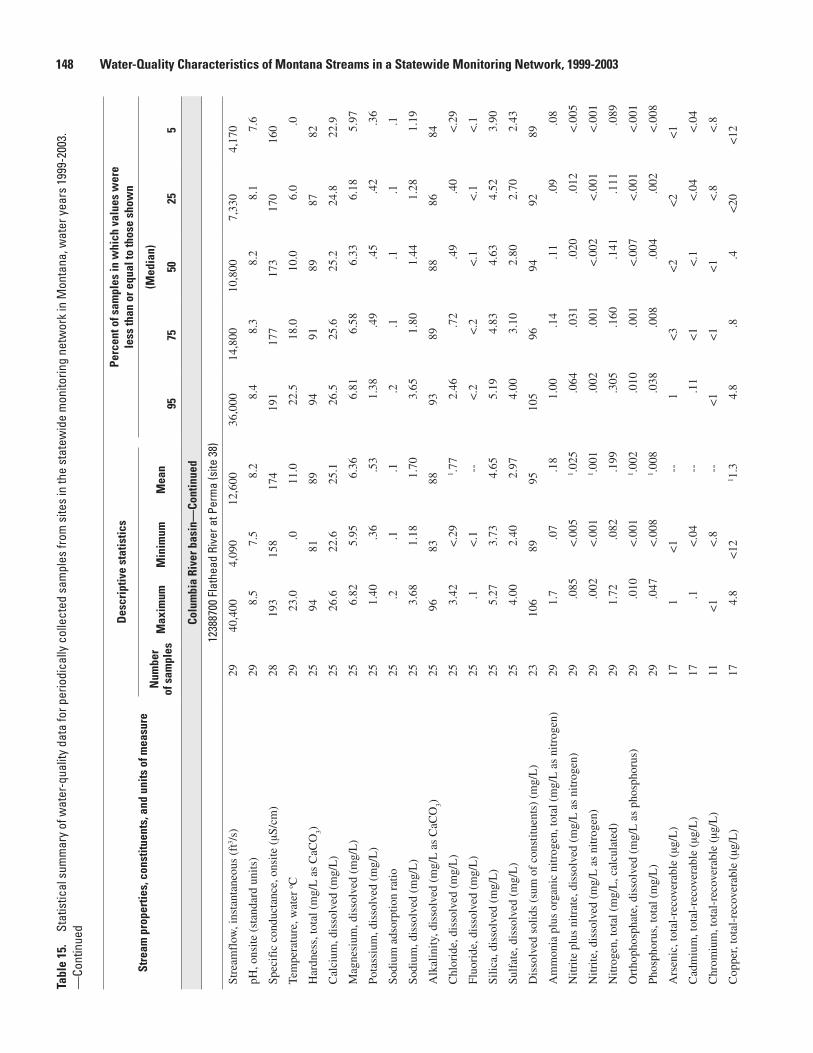
Stre
am p
rope
rtie
s, c
onst
ituen
ts, a
nd u
nits
of m
easu
re
Des
crip
tive
stat
istic
sPe
rcen
t of s
ampl
es in
whi
ch v
alue
s w
ere
le
ss th
an o
r equ
al to
thos
e sh
own
Num
ber
of s
ampl
esM
axim
umM
inim
umM
ean
(Med
ian)
9���
�02�
�
Colu
mbi
a Ri
ver b
asin
—Co
ntin
ued
1238
8700
Fla
thea
d Ri
ver a
t Per
ma
(site
38)
Stre
amfl
ow, i
nsta
ntan
eous
(ft
3 /s)
2940
,400
4,09
012
,600
36,0
0014
,800
10,8
007,
330
4,17
0
pH, o
nsite
(st
anda
rd u
nits
)29
8.5
7.5
8.2
8.4
8.3
8.2
8.1
7.6
Spec
ific
con
duct
ance
, ons
ite (
µS/c
m)
2819
315
817
419
117
717
317
016
0
Tem
pera
ture
, wat
er o C
2923
.0.0
11.0
22.5
18.0
10.0
6.0
.0
Har
dnes
s, to
tal (
mg/
L a
s C
aCO
3)25
9481
8994
9189
8782
Cal
cium
, dis
solv
ed (
mg/
L)
2526
.622
.625
.126
.525
.625
.224
.822
.9
Mag
nesi
um, d
isso
lved
(m
g/L
)25
6.82
5.95
6.36
6.81
6.58
6.33
6.18
5.97
Pota
ssiu
m, d
isso
lved
(m
g/L
)25
1.40
.36
.53
1.38
.49
.45
.42
.36
Sodi
um a
dsor
ptio
n ra
tio25
.2.1
.1.2
.1.1
.1.1
Sodi
um, d
isso
lved
(m
g/L
)25
3.68
1.18
1.70
3.65
1.80
1.44
1.28
1.19
Alk
alin
ity, d
isso
lved
(m
g/L
as
CaC
O3)
2596
8388
9389
8886
84
Chl
orid
e, d
isso
lved
(m
g/L
)25
3.42
<.2
91 .7
72.
46.7
2.4
9.4
0<
.29
Fluo
ride
, dis
solv
ed (
mg/
L)
25.1
<.1
--<
.2<
.2<
.1<
.1<
.1
Silic
a, d
isso
lved
(m
g/L
)25
5.27
3.73
4.65
5.19
4.83
4.63
4.52
3.90
Sulf
ate,
dis
solv
ed (
mg/
L)
254.
002.
402.
974.
003.
102.
802.
702.
43
Dis
solv
ed s
olid
s (s
um o
f co
nstit
uent
s) (
mg/
L)
2310
689
9510
596
9492
89
Am
mon
ia p
lus
orga
nic
nitr
ogen
, tot
al (
mg/
L a
s ni
trog
en)
291.
7.0
7.1
81.
00.1
4.1
1.0
9.0
8
Nitr
ite p
lus
nitr
ate,
dis
solv
ed (
mg/
L a
s ni
trog
en)
29.0
85<
.005
1 .025
.064
.031
.020
.012
<.0
05
Nitr
ite, d
isso
lved
(m
g/L
as
nitr
ogen
)29
.002
<.0
011 .0
01.0
02.0
01<
.002
<.0
01<
.001
Nitr
ogen
, tot
al (
mg/
L, c
alcu
late
d)29
1.72
.082
.199
.305
.160
.141
.111
.089
Ort
hoph
osph
ate,
dis
solv
ed (
mg/
L a
s ph
osph
orus
)29
.010
<.0
011 .0
02.0
10.0
01<
.007
<.0
01<
.001
Phos
phor
us, t
otal
(m
g/L
)29
.047
<.0
081 .0
08.0
38.0
08.0
04.0
02<
.008
Ars
enic
, tot
al-r
ecov
erab
le (
µg/L
)17
1<
1--
1<
3<
2<
2<
1
Cad
miu
m, t
otal
-rec
over
able
(µg
/L)
17.1
<.0
4--
.11
<1
<.1
<.0
4<
.04
Chr
omiu
m, t
otal
-rec
over
able
(µg
/L)
11<
1<
.8--
<1
<1
<1
<.8
<.8
Cop
per,
tota
l-re
cove
rabl
e (µ
g/L
)17
4.8
<12
1 1.3
4.8
.8.4
<20
<12
1�� Water-Quality Characteristics of Montana Streams in a Statewide Monitoring Network, 1999-2003Ta
ble
1�.
Stat
istic
al s
umm
ary
of w
ater
-qua
lity
data
for p
erio
dica
lly c
olle
cted
sam
ples
from
site
s in
the
stat
ewid
e m
onito
ring
netw
ork
in M
onta
na, w
ater
yea
rs 1
999-
2003
. —
Cont
inue
d
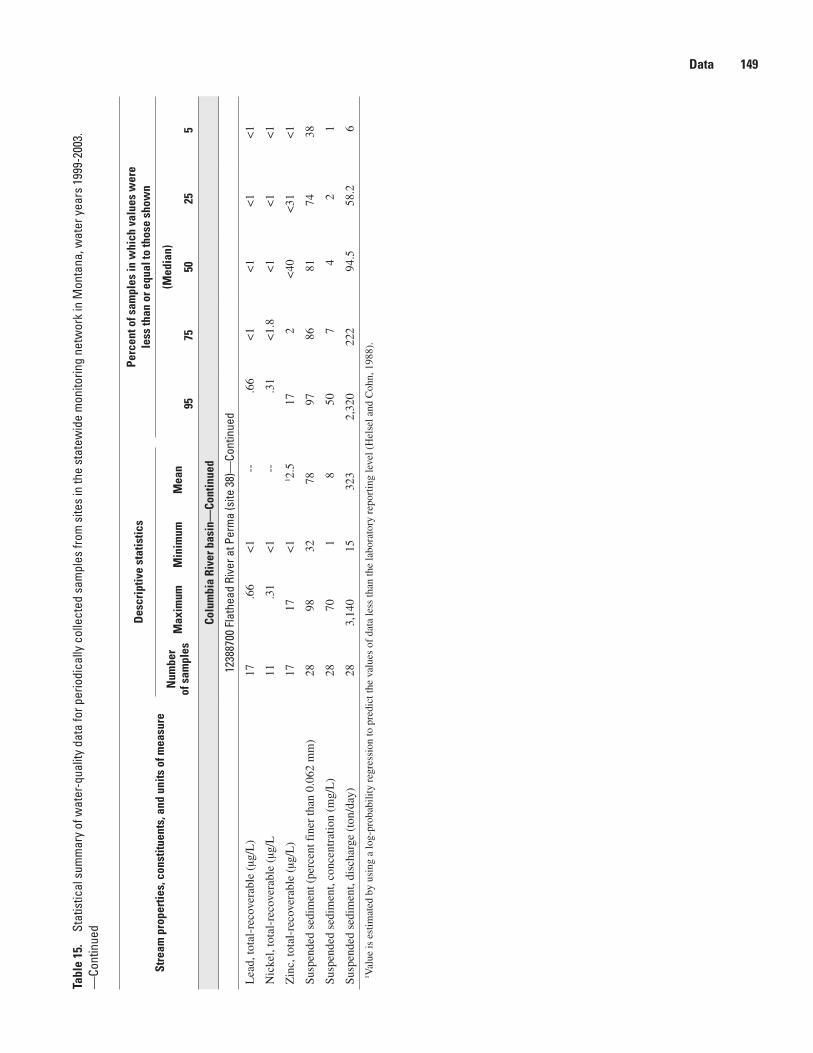
Stre
am p
rope
rtie
s, c
onst
ituen
ts, a
nd u
nits
of m
easu
re
Des
crip
tive
stat
istic
sPe
rcen
t of s
ampl
es in
whi
ch v
alue
s w
ere
le
ss th
an o
r equ
al to
thos
e sh
own
Num
ber
of s
ampl
esM
axim
umM
inim
umM
ean
(Med
ian)
9���
�02�
�
Colu
mbi
a Ri
ver b
asin
—Co
ntin
ued
1238
8700
Fla
thea
d Ri
ver a
t Per
ma
(site
38)
—Co
ntin
ued
Lea
d, to
tal-
reco
vera
ble
(µg/
L)
17.6
6<
1--
.66
<1
<1
<1
<1
Nic
kel,
tota
l-re
cove
rabl
e (µ
g/L
11.3
1<
1--
.31
<1.
8<
1<
1<
1
Zin
c, to
tal-
reco
vera
ble
(µg/
L)
1717
<1
1 2.5
172
<40
<31
<1
Susp
ende
d se
dim
ent (
perc
ent f
iner
than
0.0
62 m
m)
2898
3278
9786
8174
38
Susp
ende
d se
dim
ent,
conc
entr
atio
n (m
g/L
)28
701
850
74
21
Susp
ende
d se
dim
ent,
disc
harg
e (t
on/d
ay)
283,
140
1532
32,
320
222
94.5
58.2
61 V
alue
is e
stim
ated
by
usin
g a
log-
prob
abili
ty r
egre
ssio
n to
pre
dict
the
valu
es o
f da
ta le
ss th
an th
e la
bora
tory
rep
ortin
g le
vel (
Hel
sel a
nd C
ohn,
198
8).
Data 1�9Ta
ble
1�.
Stat
istic
al s
umm
ary
of w
ater
-qua
lity
data
for p
erio
dica
lly c
olle
cted
sam
ples
from
site
s in
the
stat
ewid
e m
onito
ring
netw
ork
in M
onta
na, w
ater
yea
rs 1
999-
2003
. —
Cont
inue
d

For additional information contact:Director, Montana Water Science CenterU.S. Geological Survey3162 Bozeman AvenueHelena, Montana 59601Telephone: 1-406-457-5900World Wide Web: http://mt.water.usgs.gov/