Montana Highway Patrol 2009 Annual Report
49
Montana Highway Patrol March 2010 Prepared by the Montana Highway Patrol 2009 Annual Report Montana Highway Patrol - Helena, MT May 1935 75TH ANNIVERSARY
-
Upload
khangminh22 -
Category
Documents
-
view
0 -
download
0
Transcript of Montana Highway Patrol 2009 Annual Report
Montana Highway Patrol
March 2010
Prepared by the
Montana Highway Patrol
2009 Annual Report
Montana Highway Patrol - Helena, MT May 1935
75TH ANNIVERSARY

Content Section
i -ii
iii
iv
Division Goals . . . . . . . . . . . . . . . . . . . . . . . . . . . . . . . v
Mission Statement . . . . . . . . . . . . . . . . . . . . . . . . . . . . . . . vi
vii
Page
1
2
3
4
5
6
7
8
9
10
10
11
11
11
11
12
13
14
14
15
16
17
18
19
20
21
22
23
23
24
24
24
25
26
Fatalities by Age and Sex
Drivers by Belt Use / Injury Classification . . . . . . . . . . . . . . . . . . .
Non-Drivers by Belt Use / Injury Classification . . . . . . . . . . . . . . .
All Fatalities . . . . . . . . . . . . . . . . . . . . . . . . . . . . . .
Vehicle Occupants Only (does not include pedestrians) . . .
i
Fatalities by County
1935 to 1944 . . . . . . . . . . . . . . . . . . . . . . . . . . . . . . .
1945 to 1954 . . . . . . . . . . . . . . . . . . . . . . . . . . . . . . .
1955 to 1964 . . . . . . . . . . . . . . . . . . . . . . . . . . . . . . .
Crashes by County . . . . . . . . . . . . . . . . . . . . . . . . . . . . . . . . . . .
Drivers by Police Reported Alcohol / Drugs Presence . . . . . . . . . . . .
2004 to 2009 . . . . . . . . . . . . . . . . . . . . . . . . . . . . . . .
Crashes by Collision Type . . . . . . . . . . . . . . . . .. . . . . . . . . . . .
Where Crashes Occurred . . . . . . . . . . . . . . . . . . . . . . . . . . . . . .
Crashes Investigated By . . . . . . . . . . . . . . . . . . . . . . . . . . . . . . .
1975 to 1984 . . . . . . . . . . . . . . . . . . . . . . . . . . . . . . .
1965 to 1974 . . . . . . . . . . . . . . . . . . . . . . . . . . . . . . .
1985 to 1994 . . . . . . . . . . . . . . . . . . . . . . . . . . . . . . .
1995 to 2003 . . . . . . . . . . . . . . . . . . . . . . . . . . . . . . .
Drivers Involved . . . . . . . . . . . . . . . . . . . . . . . . . . . . . . . . . . . .
Seat Belt Usage Rates . . . . . . . . . . . . . . . . . . . . . . . . . . . . . . . .
Fatality Calendar . . . . . . . . . . . . . . . . . . . . . . . . . . . . . . . . . . . .
Fatalities During Major Holiday Periods . . . . . . . . . . . . . . . . . . . .
District 5 - Glendive . . . . . . . . . . . . . . . . . . . . . . . . .
District 6 - Kalispell . . . . . . . . . . . . . . . . . . . . . . . . .
District 7 - Belgrade / Bozeman . . . . . . . . . . . . . . . . .
Highway Patrol Activity . . . . . . . . . . . . . . . . . . . . . . . . . . . . . . .
Annual Traffic Rates . . . . . . . . . . . . . . . . . . . . . . . . . . . . . . . . .
When Crashes Occurred . . . . . . . . . . . . . . . . . . . . . . . . . . . . . . .
District 8 - Havre . . . . . . . . . . . . . . . . . . . . . . . . . . . .
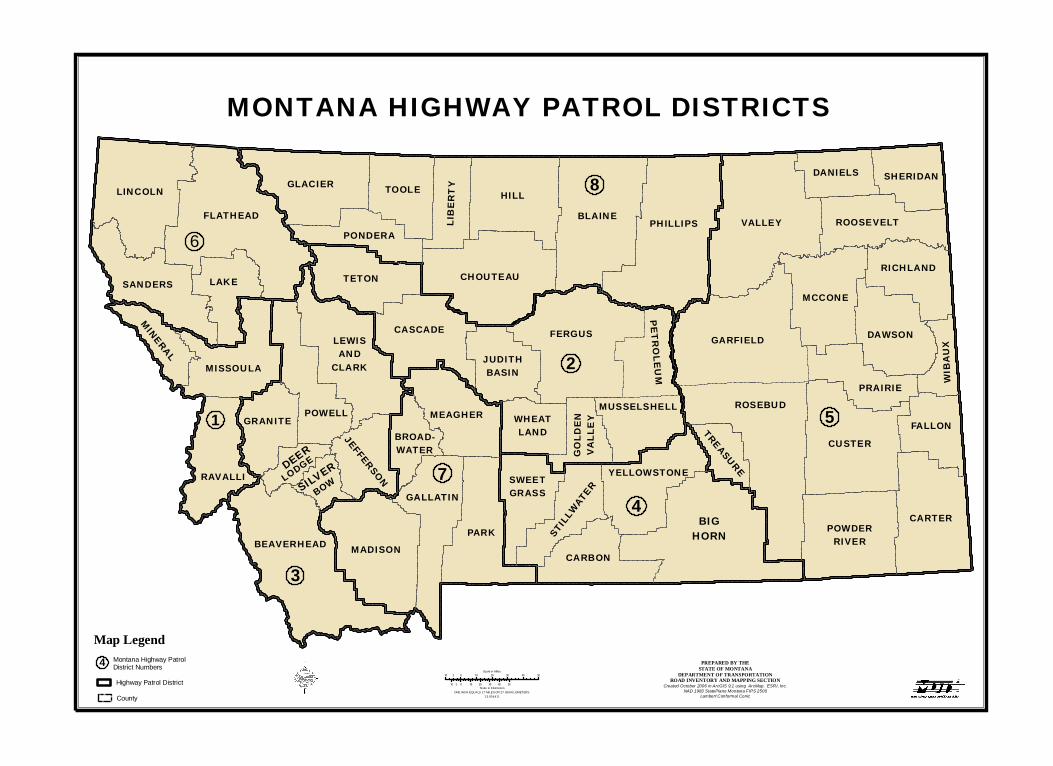
Montana Highway Patrol District Map . . . . . . . . . . . . . . . . . . . . .
Montana Highway Patrol Districts
District 1 - Missoula . . . . . . . . . . . . . . . . . . . . . . . . .
District 2 - Great Falls . . . . . . . . . . . . . . . . . . . . . . . .
District 3 - Butte . . . . . . . . . . . . . . . . . . . . . . . . . . . .
District 4 - Billings . . . . . . . . . . . . . . . . . . . . . . . . . .
Attorney General Steve Bullock . . . . . . . . . . . . . . . . .
Colonel Michael Tooley . . . . . . . . . . . . . . . . . . . . . .
Montana Highway Patrol2009 Annual Report
Table of Contents
Table of Contents . . . . . . . . . . . . . . . . . . . . . . . . . . . . . . . . . . .
Letters

27
27
27
28
28
28
29
30
31
31
31
32
32
32
33
33
33
34-35
36
37
38
39
39
39
39
40
40
ii
Fatal Crashes . . . . . . . . . . . . . . . . . . . . . . . . . . . . . .
All Crashes . . . . . . . . . . . . . . . . . . . . . . . . . . . . . . .
Fatal Crashes . . . . . . . . . . . . . . . . . . . . . . . . . . . . . .
All Crashes . . . . . . . . . . . . . . . . . . . . . . . . . . . . . . .
Crashes by Trafficway
Driver Related Contributing Circumstances by Roadway Type . . . . . .
Totals . . . . . . . . . . . . . . . . . . . . . . . . . . . . . . . . . . .
Where Crashes Occurred . . . . . . . . . . . . . . . . . . . . . .
Motorcyclist Sobriety (drivers only) . . . . . . . . . . . . . . .
Helmet Usage by Age of Driver . . . . . . . . . . . . . . . . . .
Helmet Usage by Age of Passenger . . . . . . . . . . . . . . . .
Crashes by Light Condition
Crashes by Road Condition
Crash / Injury Severity During Daylight Hours . . . . . . . . . . . . . . . .
Fatal Crashes . . . . . . . . . . . . . . . . . . . . . . . . . . . . . .
All Crashes . . . . . . . . . . . . . . . . . . . . . . . . . . . . . . .
Motorcycle Crashes
Vehicles by First Harmful Event . . . . . . . . . . . . . . . . . . . . . . . . .
Vehicles by Most Harmful Event . . . . . . . . . . . . . . . . . . . . . . . . .
Vehicles by Body Style . . . . . . . . . . . . . . . . . . . . . . . . . . . . . . .
Fatal Crashes . . . . . . . . . . . . . . . . . . . . . . . . . . . . . .
All Crashes . . . . . . . . . . . . . . . . . . . . . . . . . . . . . . .
Crashes by Month
Fatal Crashes . . . . . . . . . . . . . . . . . . . . . . . . . . . . . .
All Crashes . . . . . . . . . . . . . . . . . . . . . . . . . . . . . . .
Crash / Injury Severity During Non-Daylight Hours . . . . . . . . . . . . .
Crashes by Day-of-Week

ATTORNEY GENERAL State of Montana
Steve Bullock Department of Justice
Attorney General 215 North Sanders
P.O. Box 201401
Helena, MT 59620-1401 Fellow Montanans: In January 2010, the Montana Highway Patrol celebrated the graduation of its 50th Recruit Academy. At the graduation ceremony, the widow of Trooper Mike Haynes presented an award she conceived to honor the memory of her husband. Mike died in March 2009 from the injuries he received when his patrol car was hit head on by a drunk driver. “It is my hope that this award will be a lasting reminder of the service and sacrifice of my husband, Michael. He served his country and his community with integrity and honor, with humor and a strong sense of duty,” Tawny Haynes said. “It is my desire that this award be in recognition of those qualities and values, and be an acknowledgment of seeing them in another Trooper.” Tawny selected Trooper Cody Ruane from Butte to receive the first Trooper Michael W. Haynes Award. Like Tawny I am confident that, despite the dangers, the Patrol will continue its strong commitment to public safety and to serving with honor. Drivers in our state can expect to see the Patrol working hard to keep our fatality statistics headed in the right direction. Reducing impaired driving is a major piece of the Patrol’s overall strategy to reduce injuries and fatalities. So too, are seat belt and speed enforcement. With the full support of my office, the Patrol will continue its efforts to reduce the prevalence and acceptance of impaired driving in Montana. Making progress in this area remains one of my highest priorities. Families and communities all across Montana are ready for change. While it will take more than just new laws to address the systemic problems of impaired driving, the Patrol has been playing a leading role in helping lawmakers understand that more can be done. In 2009, as in every year in the Patrol’s history, troopers were essential in keeping our highways and our citizens safe. The Patrol will continue to do its part, and I am optimistic that our legislature and community leaders will also do theirs. Sincerely, Steve Bullock Attorney General
TELEPHONE: (406) 444-2026 FAX: (406) 444-3549
Telephone (406) 444-3780 Fax (406) 444-4169
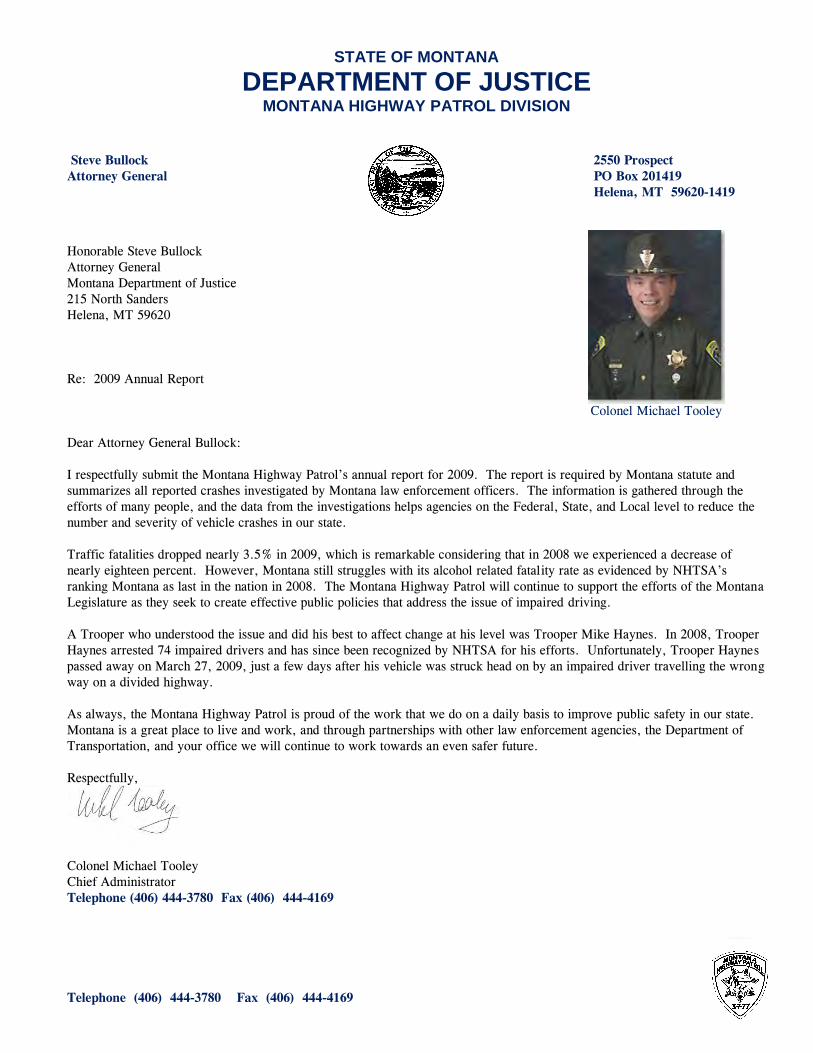
STATE OF MONTANA
DEPARTMENT OF JUSTICE MONTANA HIGHWAY PATROL DIVISION
Steve Bullock 2550 Prospect
Attorney General PO Box 201419
Helena, MT 59620-1419
Honorable Steve Bullock
Attorney General
Montana Department of Justice
215 North Sanders Helena, MT 59620
Re: 2009 Annual Report
Colonel Michael Tooley
Dear Attorney General Bullock:
I respectfully submit the Montana Highway Patrol’s annual report for 2009. The report is required by Montana statute and
summarizes all reported crashes investigated by Montana law enforcement officers. The information is gathered through the
efforts of many people, and the data from the investigations helps agencies on the Federal, State, and Local level to reduce the
number and severity of vehicle crashes in our state.
Traffic fatalities dropped nearly 3.5% in 2009, which is remarkable considering that in 2008 we experienced a decrease of
nearly eighteen percent. However, Montana still struggles with its alcohol related fatality rate as evidenced by NHTSA’s
ranking Montana as last in the nation in 2008. The Montana Highway Patrol will continue to support the efforts of the Montana
Legislature as they seek to create effective public policies that address the issue of impaired driving.
A Trooper who understood the issue and did his best to affect change at his level was Trooper Mike Haynes. In 2008, Trooper
Haynes arrested 74 impaired drivers and has since been recognized by NHTSA for his efforts. Unfortunately, Trooper Haynes
passed away on March 27, 2009, just a few days after his vehicle was struck head on by an impaired driver travelling the wrong
way on a divided highway.
As always, the Montana Highway Patrol is proud of the work that we do on a daily basis to improve public safety in our state.
Montana is a great place to live and work, and through partnerships with other law enforcement agencies, the Department of
Transportation, and your office we will continue to work towards an even safer future.
Respectfully,
Colonel Michael Tooley
Chief Administrator
Telephone (406) 444-3780 Fax (406) 444-4169

MONTANA HIGHWAY PATROL
Division Goals 2010
• To maintain the Highway Patrol Division's excellent public
relations with citizens of the State of Montana and other law enforcement agencies.
• To build and maintain partnerships with the Indian Nations, surrounding states and Canada in order to continually improve the delivery of efficient and professional law enforcement services to the motoring public.
• To live our core values of Service, Integrity, and Respect in order to maintain the public trust.
• To make efficient and effective use of time by diligently detecting and making contact with people who violate traffic and criminal laws on Montana's roadways as mandated by the citizens of the State of Montana, especially those laws concerning driving under the influence and occupant protection.
• To have pride in the Highway Patrol Division and the professional image all employees present to the public.
Colonel Michael T. Tooley 1/27/2010 Chief Administrator Date
v

vi
DEPARTMENT OF JUSTICE
MISSION STATEMENT
The Department of Justice will pursue activities and
programs that seek to ensure and promote the public
interest, safety and well-being through leadership,
advocacy, education, regulation and enforcement.
MONTANA HIGHWAY PATROL
MISSION STATEMENT
The mission of the Highway Patrol Division is to
safeguard the lives and property of the people using
the highway traffic system of Montana through
education, service and enforcement.
BIGHORN
DEERSILVER
GALLATIN
PARKCARBON
POWDERRIVERMADISONBEAVERHEAD STILLW
ATERSWEETGRASSBOW
CARTER
LODGE
TREASUREYELLOWSTONE
JEFFERSON
GOLD
ENVA
LLEY
RAVALLI
MUSSELSHELLFALLONBROAD-WATER
ROSEBUDGRANITE
CUSTERMEAGHER
PRAIRIEJUDITHBASIN WIB
AUX
PETROLEUM
MINERAL
POWELL
MISSOULA
CASCADE FERGUS DAWSONLEWISANDCLARK
GARFIELD
LAKEMCCONE
TETON RICHLANDCHOUTEAUSANDERS
PONDERA ROOSEVELTHILL
BLAINELIBER
TY
PHILLIPS
TOOLEVALLEY
DANIELSGLACIERFLATHEAD
SHERIDANLINCOLN
WHEATLAND
1:3,924,411ONE INCH EQUALS 17 MILES OR 27.359 KILOMETERS
Scale in Kilometers
Scale in Miles
10 0 10 20 30 40 505
10 0 10 20 30 40 505
PREPARED BY THESTATE OF MONTANA
DEPARTMENT OF TRANSPORTATIONROAD INVENTORY AND MAPPING SECTION
Created October 2006 in ArcGIS 9.1 using ArcMap. ESRI, Inc.NAD 1983 StatePlane Montana FIPS 2500
Lambert Conformal Conic
MONTANA HIGHWAY PATROL DISTRICTS
6
8
3
2
4
5
Map Legend
CountyHighway Patrol District
Montana Highway PatrolDistrict Numbers4
7
1
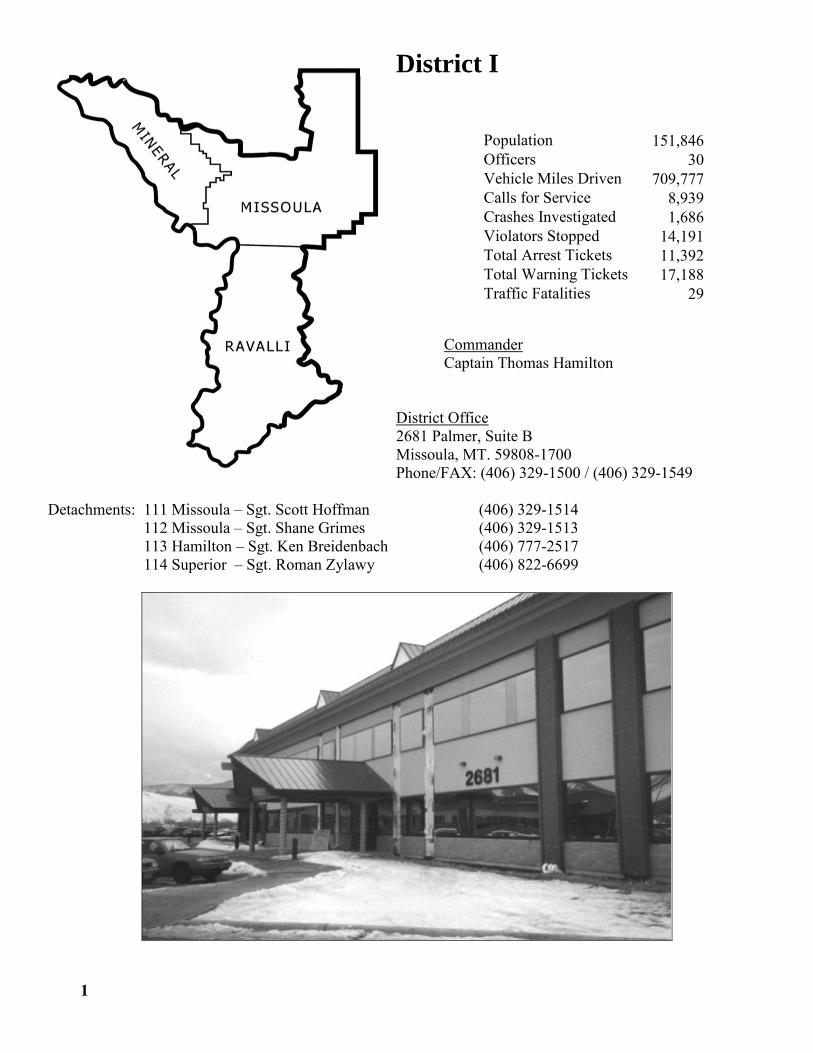
District I Commander Captain Thomas Hamilton District Office 2681 Palmer, Suite B Missoula, MT. 59808-1700 Phone/FAX: (406) 329-1500 / (406) 329-1549
Detachments: 111 Missoula – Sgt. Scott Hoffman (406) 329-1514 112 Missoula – Sgt. Shane Grimes (406) 329-1513 113 Hamilton – Sgt. Ken Breidenbach (406) 777-2517 114 Superior – Sgt. Roman Zylawy (406) 822-6699
1
Population 151,846 Officers 30 Vehicle Miles Driven 709,777 Calls for Service 8,939 Crashes Investigated 1,686 Violators Stopped 14,191 Total Arrest Tickets 11,392 Total Warning Tickets 17,188 Traffic Fatalities 29

District II
Commander District Office Captain Kenton Hickethier 812 14th Street North Great Falls, MT. 59401-5595 Phone/FAX: (406) 453-1121 / (406) 454-2119
Detachments: 212 Great Falls – Sgt. Robert Armstrong (406) 453-1121 213 Great Falls – Sgt. Shawn Hazelton (406) 453-1121= 222 Lewistown – Kelly Mantooth (406) 538-1335
2
Population 109,252 Officers 21 Vehicle Miles Driven 537,465 Calls for Service 4,977 Crashes Investigated 848 Violators Stopped 11,737 Total Arrest Tickets 8,290 Total Warning Tickets 12,609 Traffic Fatalities 8

District III Commander Captain Gary Becker District Office 3615 Wynne Butte, MT. 59701 Phone/FAX: (406) 494-3233 / (406) 494-8264
Detachments: 311 Butte – Sgt. Jason Hildenstab (406) 533-6622 313 Butte – Sgt. Arthur Collins (406) 494-3233 321 Helena – Sgt. Michael Swingley (406) 442-0477 322 Helena – Sgt. Andrew Knapp (406) 442-0477
3
Population 132,591 Officers 31 Vehicle Miles Driven 914,102 Calls for Service 8,551 Crashes Investigated 1,654 Violators Stopped 16,601 Total Arrest Tickets 10,216 Total Warning Tickets 14,435 Traffic Fatalities 49
4
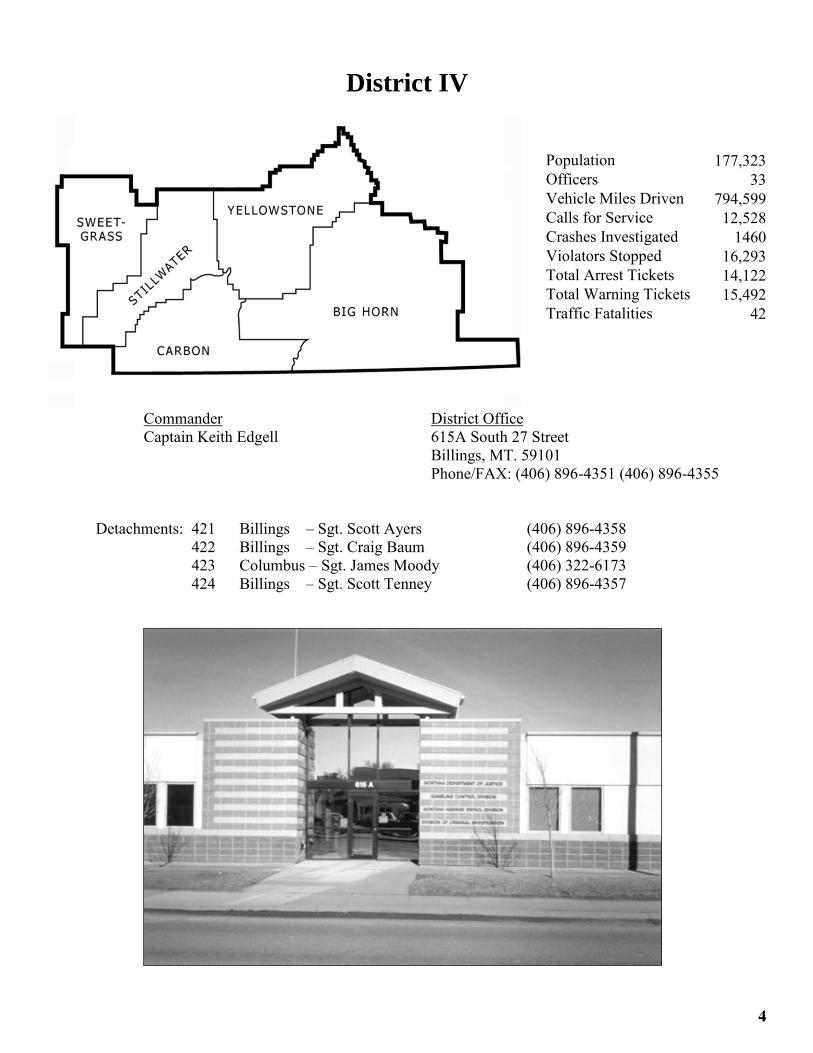
District IV
Commander District Office Captain Keith Edgell 615A South 27 Street
Billings, MT. 59101 Phone/FAX: (406) 896-4351 (406) 896-4355
Detachments: 421 Billings – Sgt. Scott Ayers (406) 896-4358 422 Billings – Sgt. Craig Baum (406) 896-4359 423 Columbus – Sgt. James Moody (406) 322-6173 424 Billings – Sgt. Scott Tenney (406) 896-4357
Population 177,323 Officers 33 Vehicle Miles Driven 794,599 Calls for Service 12,528 Crashes Investigated 1460 Violators Stopped 16,293 Total Arrest Tickets 14,122 Total Warning Tickets 15,492 Traffic Fatalities 42

District V
Commander Captain Edward Hilbert
District Office 76 Highway 16 Glendive, MT. 59330-9502 Phone/FAX: (406) 377-5238 / (406) 377-8504
Detachments: 511 Glendive – Sgt. James Hunter (406) 377-5238 512 Wolf Point – Sgt. Jeffrey Kent (406) 653-6708 513 Miles City – Sgt. Calvin Schock (406) 874-3395
5
Population 71,077 Officers 23 Vehicle Miles Driven 746,111 Calls for Service 6,949 Crashes Investigated 633 Violators Stopped 12,654 Total Arrest Tickets 8,747 Total Warning Tickets 11,208 Traffic Fatalities 28
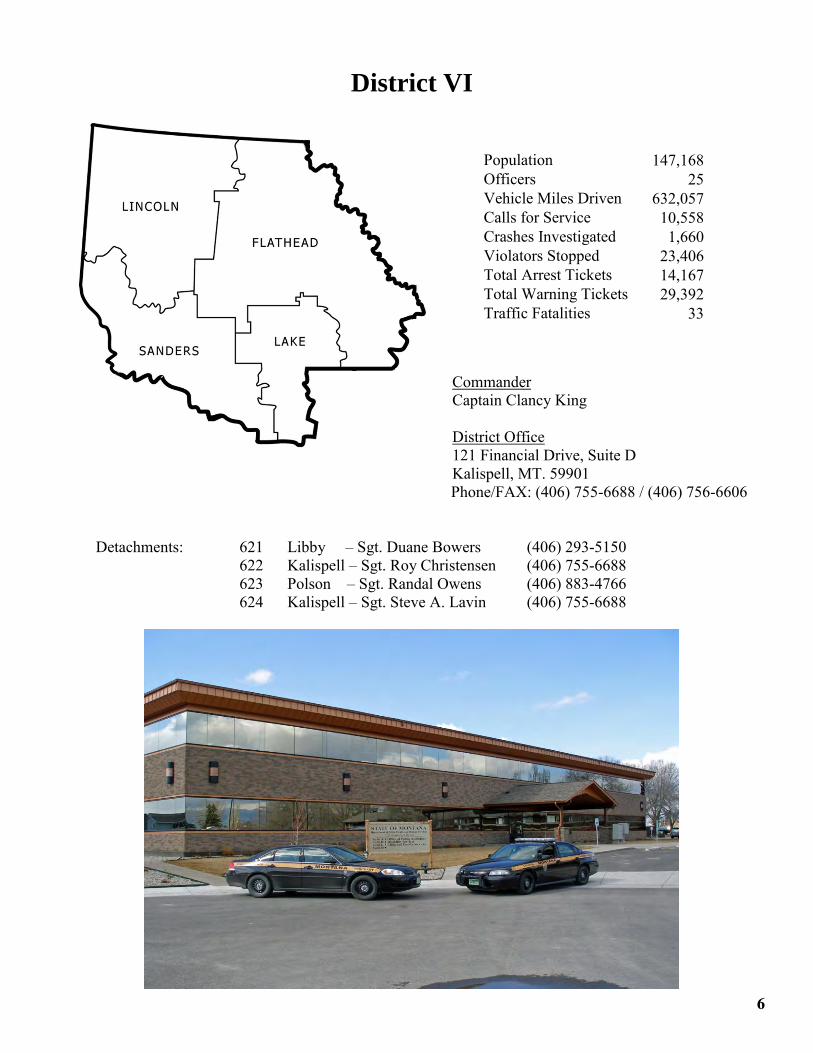
District VI
Commander Captain Clancy King District Office 121 Financial Drive, Suite D Kalispell, MT. 59901
Phone/FAX: (406) 755-6688 / (406) 756-6606
Detachments: 621 Libby – Sgt. Duane Bowers (406) 293-5150
622 Kalispell – Sgt. Roy Christensen (406) 755-6688 623 Polson – Sgt. Randal Owens (406) 883-4766 624 Kalispell – Sgt. Steve A. Lavin (406) 755-6688
6
Population 147,168 Officers 25 Vehicle Miles Driven 632,057 Calls for Service 10,558 Crashes Investigated 1,660 Violators Stopped 23,406 Total Arrest Tickets 14,167 Total Warning Tickets 29,392 Traffic Fatalities 33

District VII
Commander Captain Michael Reddick
District Office 91 East Central, Suite A
Belgrade, MT. 59714 Phone/FAX: (406) 388-3190 / (406) 388-3198
Detachments: 712 Bozeman Sgt. Jay Nelson (406) 388-3190 721 Bozeman Sgt. Patrick McCarthy (406) 388-3190 723 Three Forks Sgt. Daniel Martin (406) 285-3265 724 Livingston Sgt. Steven Wisniewski (406) 222-4618
7
Population 120,094 Officers 28 Vehicle Miles Driven 751,329 Calls for Service 6,926 Crashes Investigated 1,209 Violators Stopped 14,797 Total Arrest Tickets 7,934 Total Warning Tickets 16,517 Traffic Fatalities 13

8
District VIII
Commander Captain Brad Sangray
District Office 1708 Second Street West, Suite A Havre, MT 59501 Phone/FAX: (406) 265-6420 / (406) 265-6430
Detachments: 811 Shelby -Sgt. Robert Bender (406) 424-8778
821 Havre- Sgt. Mark Bosch (406) 265-6420
Population 58,089 Officers 16 Vehicle Miles Driven 457,417 Calls for Service 4,234 Crashes Investigated 587 Violators Stopped 7,308 Total Arrest Tickets 5,245 Total Warning Tickets 6,793 Traffic Fatalities 19

3,244 2,564 2,375 2,486 2,283
853 542 411 471 339
50,920 41,785 37,494 37,639 37,921
10,752 8,100 7,749 9,399 10,483
Stolen Vehicles Recovered 166 60 58 23 20
Warrants Served 2,433 1,827 1,410 1,238 895
Violators Stopped 128,635 110,398 104,001 106,522 116,906
14,694 12,986 12,718 12,916 11,492
104,034 85,437 78,975 68,710 80,079
132,598 109,247 103,396 85,832 123,579
13,915 10,444 9,092 11,499 13,230
6,624 5,802 5,942 7,897 8,807
16,509 13,336 15,301 15,848 13,333
4,156 2,265 2,639 6,977 7,841
351 219 285 123 107
784 642 516 661 678
935 849 621 685 529
34 48 19 19 11
76,126 60,926 61,367 66,908 63,627
6,262,447 5,420,029 5,420,952 5,817,503 5,538,996
5,562 3,881 4,272 4,585 4,737
9
D.U.I./Per Se
Speed - Basic Rule
Speed - Over Legal
Liability Insurance
Total Miles Driven
Illegal Drug Arrests
Illegal Possession, Alcohol
Safety Education Talks
Number of: 2009
Furn. Liquor to a Minor
Calls for Service
2006
Investigations - Traffic
non-accident
Assist Other Law Enf.
2007
Seat Belt
Total Arrest Tickets
Assist Public
Assist Other Gvt. Agency
2005
Highway Patrol Activity 2009
20062005Citations
Issued2008
School Bus Inspections
Total Warning Tickets
20082007
2009
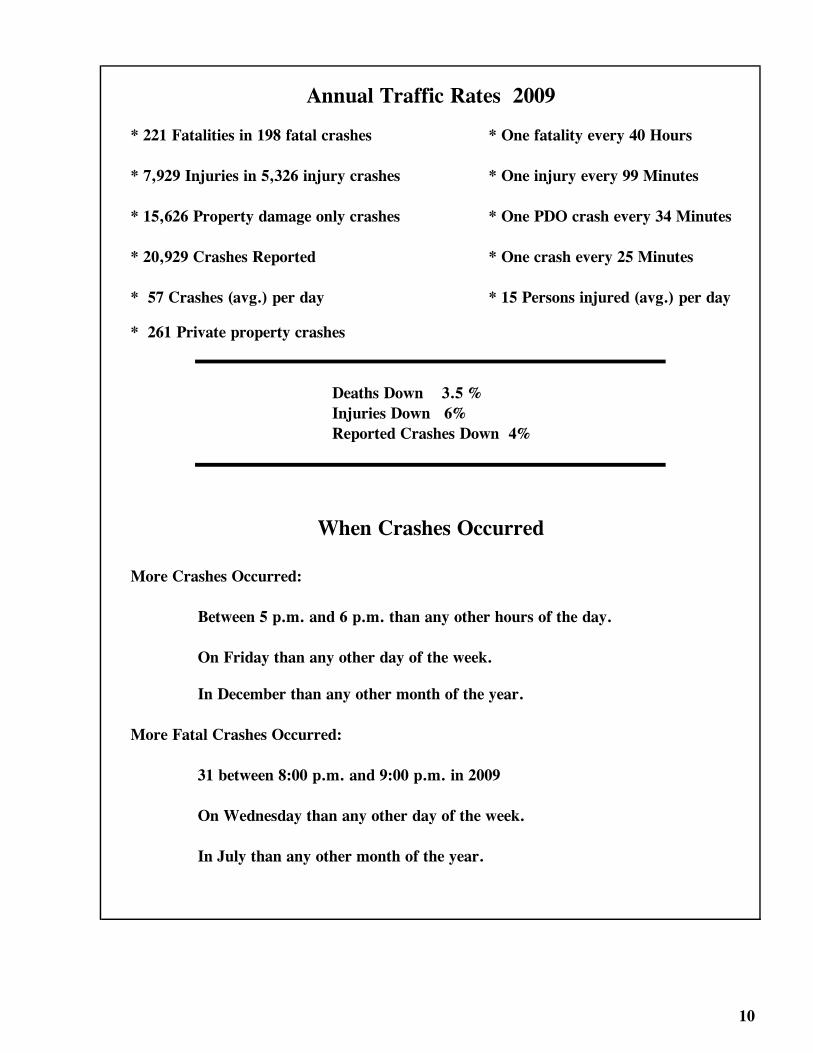
* 261 Private property crashes
More Crashes Occurred:
More Fatal Crashes Occurred:
10
Annual Traffic Rates 2009
* One crash every 25 Minutes
Reported Crashes Down 4%
* One fatality every 40 Hours
* One injury every 99 Minutes
* 15,626 Property damage only crashes * One PDO crash every 34 Minutes
Deaths Down 3.5 %
* 221 Fatalities in 198 fatal crashes
* 7,929 Injuries in 5,326 injury crashes
* 20,929 Crashes Reported
Injuries Down 6%
On Wednesday than any other day of the week.
In July than any other month of the year.
* 57 Crashes (avg.) per day * 15 Persons injured (avg.) per day
When Crashes Occurred
Between 5 p.m. and 6 p.m. than any other hours of the day.
On Friday than any other day of the week.
In December than any other month of the year.
31 between 8:00 p.m. and 9:00 p.m. in 2009

Fatal *Percent Total *Percent
Crashes Change Crashes Change
36 -5.00% 2,585 -9.00%
84 20.00% 5,644 10.00%
37 27.00% 1,982 -23.00%
23 -39.00% 5,436 -21.00%
18 -61.00% 5,175 17.00%
0 0.00% 107 -29.00%
198 -5.00% 20,929 -4.00%
Male 18,351 Drivers InvolvedFemale 13,170
Not Stated 2,886
Total 34,407
Year Interstate Primary City Other All Roads
2006 92.60% 81.70% 64.90% 72.60% 79.00%
2007 92.20% 82.10% 67.40% 70.50% 79.60%
2008 92.10% 81.70% 66.60% 70.70% 79.30%
2009 82.90% 83.90% 64.90% 75.60% 79.20%
* Source: State Highway Traffic Safety Bureau, MT. Dept. of Transportation
11
Where Crashes Occurred 2009
Interstate Highways
Where
Unknown
Primary Highways
Rural Routes
Secondary Routes
Urban Streets
Crashes Investigated By
Total
Seat Belt Usage Rates *
* Percent change is the percent increase (+) or decrease (-) from the previous year.
Highway Patrol 48%
Other Agencies 52%
S M T W T F S S M T W T F S S M T W T F S
1 1 3 1 1
1 1 2 1
1 1 2 4 2 2 2 3
3 1 1 3 1
2
1
8 14 19
8 22 41
S M T W T F S S M T W T F S S M T W T F S
1 2 2
5 1 2 1 1 1 1 1 1 1 2 2
1 1 3 3 1 2
1 2 1 1 1 1 1 4 2 3 1
2 2 2
20 17 22
61 78 100
S M T W T F S S M T W T F S S M T W T F S
1 2 1 3 1 1 1
2 1 3 2 1 2 2 2 1 3
1 1 3 1 1 1 2 1 1 2 2
1 3 2 4 2 1 1 1 2
2 1 2 1 1 1 1 1 1
31 20 22
131 151 173
S M T W T F S S M T W T F S S M T W T F S
1 1 1 2 1 2 1 2
2 1 3 1 1 1 1
1 5 1 1 1 1 1 3
1 1 1 2
1 1 2 1 3
17 8 23
190 198 221
12
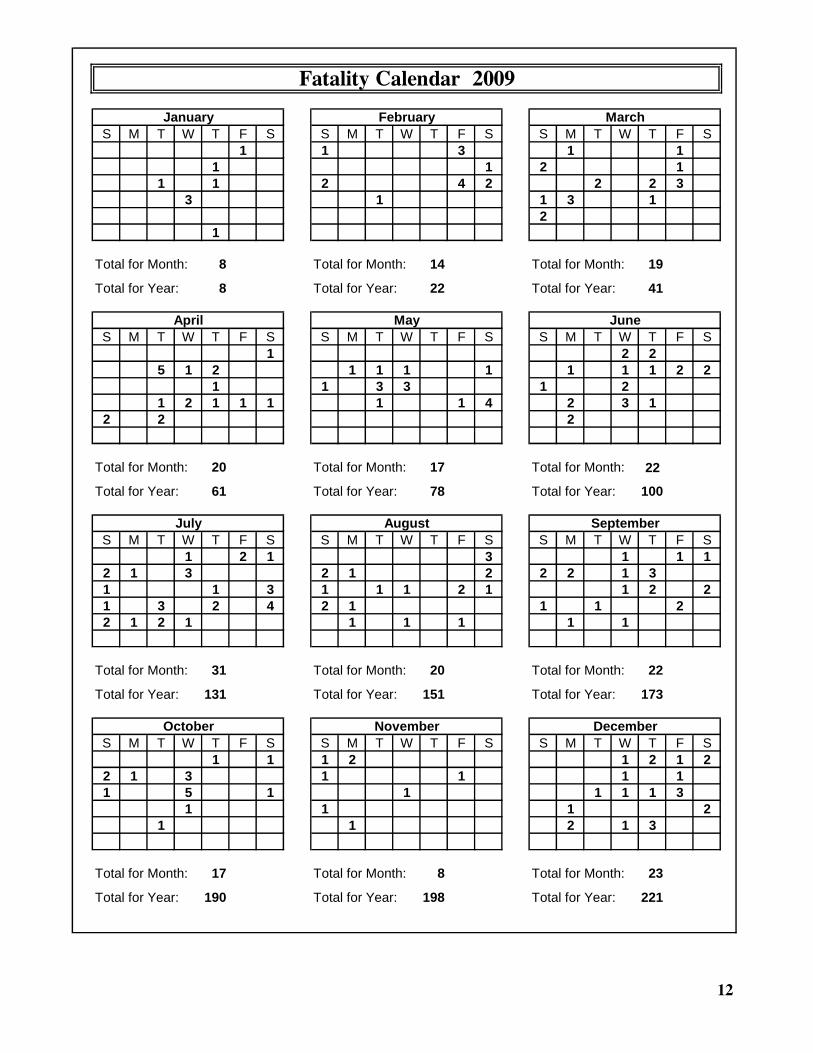
Fatality Calendar 2009
Total for Month:
Total for Year:
Total for Month:
January February March
April
Total for Year:
Total for Month:
Total for Year:
Total for Month:
Total for Year:
July August September
October November
Total for Month:
Total for Year:
Total for Month:
Total for Year:
Total for Month:
Total for Year:
Total for Year: Total for Year:
December
Total for Month:
Total for Year:
Total for Month:
Total for Month:
Total for Year:
Total for Month:
Total for Year:
June
Total for Month:
May
13
Fatal Fatal Fatal Fatal Fatal Fatal
Crashes Fatalities Crashes Fatalities Crashes Fatalities Crashes Fatalities Crashes Fatalities Crashes Fatalities
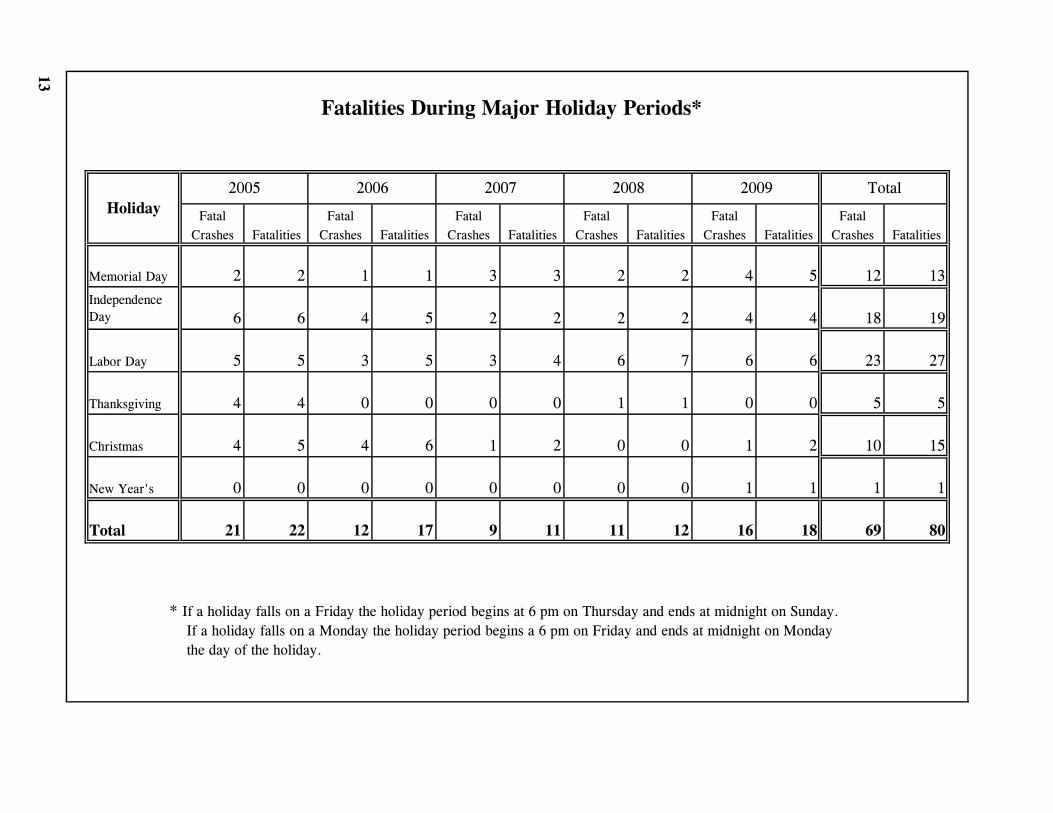
Memorial Day 2 2 1 1 3 3 2 2 4 5 12 13
Independence
Day 6 6 4 5 2 2 2 2 4 4 18 19
Labor Day 5 5 3 5 3 4 6 7 6 6 23 27
Thanksgiving 4 4 0 0 0 0 1 1 0 0 5 5
Christmas 4 5 4 6 1 2 0 0 1 2 10 15
New Year's 0 0 0 0 0 0 0 0 1 1 1 1
Total 21 22 12 17 9 11 11 12 16 18 69 80
*
the day of the holiday.
Total
Holiday
2009
If a holiday falls on a Monday the holiday period begins a 6 pm on Friday and ends at midnight on Monday
If a holiday falls on a Friday the holiday period begins at 6 pm on Thursday and ends at midnight on Sunday.
2005 2006 2007 2008
Fatalities During Major Holiday Periods*

1935 1936 1937 1938 1939 1940 1941 1942 1943 1944 Page Total 1935 1936 1937 1938 1939 1940 1941 1942 1943 1944 Page
Total
3 2 1 1 2 1 2 6 0 0 18 1 2 0 2 1 0 2 1 2 1 124 4 10 4 1 5 5 2 1 0 36 0 1 0 0 1 2 0 1 0 0 52 2 5 2 6 2 3 1 4 1 28 0 3 4 2 3 4 3 4 0 1 240 3 1 3 1 0 5 4 0 0 17 8 15 11 6 11 7 11 5 0 1 753 2 2 6 1 3 5 4 3 3 32 5 1 0 1 1 2 2 2 1 4 19
0 2 0 0 1 0 0 0 0 0 3 3 4 2 5 6 2 11 1 3 1 3818 16 12 9 9 15 14 9 5 3 110 0 0 0 0 2 6 2 2 0 0 12
2 2 5 0 2 0 0 0 1 2 14 6 1 4 3 0 1 3 1 1 1 212 2 2 1 2 1 10 2 1 0 23 3 5 1 2 4 2 4 1 1 4 270 0 2 1 0 0 2 1 0 1 7 0 0 1 1 0 0 0 0 0 1 3
2 3 2 1 1 1 1 0 3 0 14 4 1 3 6 4 2 3 3 1 1 285 5 5 1 9 2 7 2 4 2 42 0 1 2 0 0 1 1 0 0 5 100 0 0 0 1 1 1 1 1 2 7 4 4 3 9 4 3 1 1 2 1 325 3 3 2 0 0 4 1 0 1 19 0 1 3 3 2 3 1 3 5 2 239 4 5 3 6 1 8 2 3 4 45 2 0 2 2 1 6 1 1 0 1 16
8 8 4 3 8 3 4 3 1 5 47 0 2 1 2 0 2 1 1 2 0 110 3 1 1 0 3 2 0 0 0 10 1 0 1 0 2 4 5 2 0 1 164 2 2 0 4 1 4 2 7 3 29 2 1 0 1 0 0 2 1 2 2 110 0 0 0 0 0 0 1 0 0 1 11 17 12 11 10 13 16 5 6 8 1090 2 7 3 4 3 1 2 0 0 22 2 2 0 0 4 2 1 3 1 0 15
6 3 2 1 2 0 4 2 2 1 23 1 1 3 1 0 0 3 2 0 0 111 3 6 4 6 5 3 0 0 2 30 0 0 1 3 0 1 0 0 2 1 82 2 0 3 0 2 0 2 0 0 11 3 2 3 1 1 7 3 0 3 1 243 6 5 5 5 8 2 1 0 2 37 0 0 1 0 0 0 1 0 0 1 35 5 6 10 5 1 9 4 3 3 51 8 5 5 4 3 2 7 1 4 3 42
0 0 0 1 1 1 0 0 0 2 5 1 0 1 2 1 0 0 0 0 2 71 1 2 3 3 0 1 2 3 2 18 0 0 2 0 0 0 1 0 0 0 30 1 3 1 0 0 1 1 1 0 8 11 11 14 9 9 11 11 8 13 6 103
161 166 173 145 150 142 194 104 92 88 1,415
Valley
Teton
Totals
14
County
Wheatland
Wibaux
Yellowstone
Toole
Treasure
Sanders
Sheridan
Silver Bow
Stillwater
Sweet Grass
Prairie
Ravalli
Richland
Roosevelt
Rosebud
Petroleum
Phillips
Pondera
Powder River
Powell
McCone
Meagher
Mineral
Missoula
Musselshell
Liberty
Park
Hill
Jefferson
Lincoln
Madison
Judith Basin
Lake
Lewis & Clark
Gallatin
Garfield
Glacier
Golden Valley
Granite
Dawson
Deer Lodge
Fallon
Fergus
Flathead
Carter
Cascade
Choteau
Custer
Daniels
Big Horn
Blaine
Broadwater
Carbon
Fatalities by County 1935 to 1944
County
Beaverhead

1945 1946 1947 1948 1949 1950 1951 1952 1953 1954 Page Total 1945 1946 1947 1948 1949 1950 1951 1952 1953 1954 Page
Total
3 1 5 3 3 0 4 4 3 2 28 0 0 1 1 0 0 1 4 5 2 141 3 6 1 2 2 5 4 7 3 34 0 2 0 1 0 2 4 3 3 1 160 2 8 3 5 8 9 0 8 4 47 1 2 3 0 10 2 2 5 1 4 302 2 2 3 0 2 2 1 0 0 14 8 12 6 4 7 15 3 9 8 8 806 6 6 5 3 5 3 8 7 6 55 1 1 0 2 2 3 2 1 2 3 17
0 0 1 0 0 1 2 0 0 1 5 4 2 0 3 4 2 4 9 3 4 357 12 11 19 4 11 12 14 13 18 121 0 0 0 0 1 2 3 0 0 0 62 2 1 1 2 1 2 5 5 4 25 4 3 3 3 1 4 4 7 2 4 353 7 2 1 3 6 2 5 4 7 40 0 0 0 2 4 1 3 6 6 2 241 0 1 0 0 3 0 2 0 1 8 1 1 1 0 1 1 1 0 1 2 9
1 2 5 2 2 5 1 6 8 4 36 4 2 1 5 3 2 1 8 2 3 311 8 4 1 0 8 8 6 3 6 45 0 0 0 1 2 2 1 1 4 3 142 2 0 2 0 0 3 1 0 0 10 4 4 1 3 3 2 1 4 3 4 292 3 10 6 3 9 3 3 4 7 50 2 0 1 3 0 3 3 2 1 2 172 7 7 12 3 2 11 7 18 11 80 3 2 3 1 8 5 3 10 5 12 52
3 5 4 4 9 11 7 7 3 8 61 1 5 4 6 1 3 2 2 6 2 321 0 0 1 1 0 0 0 7 2 12 1 3 7 3 3 0 2 1 6 0 260 3 4 4 4 6 2 5 7 9 44 2 3 1 3 2 3 0 6 0 3 230 0 1 1 1 0 0 0 1 1 5 5 8 11 4 7 10 10 13 15 10 932 2 1 3 1 4 2 1 3 2 21 1 4 4 1 2 7 7 0 0 4 30
1 4 0 2 2 3 6 2 2 4 26 1 1 2 0 1 4 3 6 5 1 244 1 5 0 4 1 5 11 7 4 42 2 4 1 0 3 3 1 1 4 0 192 0 1 4 2 2 1 2 2 1 17 2 4 0 2 3 4 5 5 6 1 322 0 5 5 6 1 2 2 7 8 38 0 1 1 3 2 1 0 2 0 2 122 10 3 0 7 12 2 8 4 5 53 1 2 4 2 2 2 9 2 12 6 42
0 0 1 0 0 0 0 0 1 0 2 0 2 0 4 5 3 0 0 0 3 170 3 0 6 1 2 3 8 9 6 38 0 1 1 1 1 3 1 0 1 0 90 2 2 0 1 0 0 5 2 2 14 14 6 15 17 15 8 9 17 14 8 123
112 162 167 164 162 202 182 241 250 220 1,862
Fatalities by County 1945 to 1954
County
Beaverhead
Carter
Cascade
Choteau
Big Horn
Blaine
Broadwater
Carbon
Deer Lodge
Fallon
Fergus
Flathead
Custer
Daniels
Dawson
Golden Valley
Granite
Hill
Gallatin
Garfield
Glacier
Musselshell
Liberty
Jefferson
Lincoln
Madison
Judith Basin
Lake
Lewis & Clark
Park
Petroleum
Phillips
Pondera
McCone
Meagher
Mineral
Missoula
Ravalli
Richland
Roosevelt
Powder River
Powell
Prairie
Stillwater
Sweet Grass
Teton
Rosebud
Sanders
Sheridan
Silver Bow
15
Totals
County
Wheatland
Wibaux
Yellowstone
Toole
Treasure
Valley

1955 1956 1957 1958 1959 1960 1961 1962 1963 1964 Page Total 1955 1956 1957 1958 1959 1960 1961 1962 1963 1964 Page
Total
4 2 6 4 4 5 2 3 5 4 39 0 0 4 1 2 1 3 1 0 0 128 11 2 4 2 4 7 7 15 10 70 1 0 2 0 3 0 1 3 4 0 141 3 2 3 6 2 7 5 2 5 36 4 3 0 1 4 5 7 10 9 1 441 4 5 5 6 1 0 0 3 0 25 17 15 8 10 19 6 11 7 9 6 1083 4 4 2 6 2 5 2 3 6 37 10 5 2 4 0 1 4 2 0 0 28
1 1 0 0 0 2 0 0 0 0 4 3 6 6 3 6 5 5 4 3 5 4612 13 13 14 10 13 24 24 12 15 150 0 0 0 0 0 1 0 0 0 1 2
2 6 2 1 5 0 2 4 3 7 32 2 6 5 1 0 5 0 7 0 1 273 5 5 3 7 4 11 2 2 5 47 3 7 4 3 3 2 9 3 1 3 381 1 0 3 1 0 0 1 0 0 7 2 5 1 0 2 0 1 0 1 0 12
9 2 5 4 0 3 1 2 4 6 36 4 10 0 5 3 4 8 1 2 5 428 11 4 3 3 5 8 6 5 6 59 0 2 2 5 0 2 3 7 4 2 272 1 2 2 0 1 0 0 0 0 8 1 4 5 8 6 5 1 7 1 6 446 4 2 1 5 3 5 6 5 6 43 4 4 3 3 3 1 2 7 6 3 364 9 5 2 14 12 15 11 2 13 87 14 6 9 5 7 13 2 7 5 7 75
4 7 4 7 8 9 23 5 13 13 93 3 5 5 3 10 3 3 7 4 5 480 0 1 6 1 1 2 0 3 5 19 1 0 4 5 5 3 0 1 3 4 26
13 14 1 7 8 12 8 8 10 7 88 3 2 3 0 3 3 1 3 1 2 212 0 1 1 2 0 3 2 4 1 16 6 8 5 4 6 4 3 15 4 9 640 2 0 9 3 2 1 5 1 0 23 2 2 2 2 2 3 3 5 2 0 23
9 9 6 4 4 9 6 6 5 6 64 3 2 1 2 6 2 1 3 6 5 317 3 9 2 8 4 7 2 2 4 48 0 8 2 0 1 2 2 1 3 4 231 1 2 4 2 4 9 1 2 1 27 6 1 5 4 1 1 3 2 3 7 335 10 4 3 4 11 4 8 10 7 66 1 2 3 1 0 1 2 0 2 1 131 8 8 3 6 12 15 4 6 12 75 8 10 8 6 11 10 7 7 9 1 77
4 0 6 1 2 0 0 0 1 1 15 4 1 7 4 2 3 5 0 2 2 308 6 7 4 3 4 5 6 6 3 52 1 1 1 0 1 0 0 1 1 0 61 3 0 1 5 1 4 6 5 3 29 13 12 7 10 17 10 14 19 14 33 149
236 267 210 193 248 222 275 256 228 259 2,394 Totals
County
Wheatland
Wibaux
Yellowstone
Toole
Treasure
Valley
Sanders
Sheridan
Silver Bow
Stillwater
Sweet Grass
Teton
Prairie
Ravalli
Richland
Roosevelt
Rosebud
Petroleum
Phillips
Pondera
Powder River
Powell
McCone
Meagher
Mineral
Missoula
Musselshell
Liberty
Park
Hill
Jefferson
Lincoln
Madison
Judith Basin
Lake
Lewis & Clark
Gallatin
Garfield
Glacier
Golden Valley
Granite
Dawson
Deer Lodge
Fallon
Fergus
Flathead
Carter
Cascade
Choteau
Custer
Daniels
16
Fatalities by County 1955 to 1964
County
Beaverhead
Big Horn
Blaine
Broadwater
Carbon

1965 1966 1967 1968 1969 1970 1971 1972 1973 1974 Page Total 1965 1966 1967 1968 1969 1970 1971 1972 1973 1974 Page
Total
5 11 5 5 6 3 3 4 4 6 52 0 3 1 3 5 1 6 3 1 1 249 10 11 17 11 19 11 9 14 5 116 1 1 4 1 2 0 0 2 2 1 143 2 11 3 3 3 4 10 3 4 46 8 3 9 7 6 12 3 8 11 6 730 2 1 1 0 3 2 12 1 0 22 25 21 20 10 18 19 33 35 25 16 2226 4 5 2 3 6 3 3 3 4 39 3 1 1 1 1 1 5 6 3 5 27
2 2 5 1 0 0 0 2 0 1 13 1 10 4 6 5 5 6 5 7 9 5817 17 17 7 23 23 15 15 8 16 158 1 0 0 0 4 1 1 1 2 1 11
2 1 4 3 5 7 1 6 11 1 41 4 1 3 3 3 4 5 3 2 4 324 2 3 4 6 2 9 13 8 8 59 1 6 5 2 13 4 5 4 1 0 411 1 1 5 2 1 0 0 2 2 15 1 0 3 3 10 4 3 0 0 2 26
2 6 4 10 5 5 3 9 3 4 51 6 7 11 10 9 5 6 11 10 7 825 7 6 7 2 5 4 6 5 5 52 4 0 1 2 3 1 5 1 2 0 191 1 0 1 3 2 1 4 2 1 16 7 5 8 10 5 7 7 8 9 5 715 5 1 5 7 3 3 6 6 8 49 3 0 4 3 4 2 2 4 2 3 27
10 6 23 8 15 19 21 16 25 13 156 8 3 6 6 4 2 6 9 3 6 53
8 9 4 13 13 11 13 13 11 10 105 4 5 1 6 7 20 9 3 8 7 703 0 2 1 1 0 2 3 1 2 15 2 8 4 5 2 4 1 5 1 4 365 15 3 9 13 8 17 10 11 9 100 1 3 6 3 3 4 4 5 2 0 310 0 0 1 4 1 3 3 1 2 15 13 13 10 3 13 10 5 12 13 10 1026 1 6 4 5 6 2 1 2 4 37 2 1 4 5 9 0 2 6 3 6 38
5 5 12 5 4 5 5 9 0 3 53 11 5 6 5 0 0 4 6 9 1 476 4 5 4 6 6 5 9 8 8 61 4 1 1 0 8 4 2 5 0 2 270 2 9 5 4 1 1 3 1 1 27 3 2 5 5 0 4 1 0 3 2 25
10 9 11 13 8 16 19 16 11 16 129 0 1 1 3 0 3 0 1 1 0 1011 21 10 6 15 15 14 15 8 14 129 6 5 7 10 6 8 3 6 5 7 63
1 0 0 5 8 1 0 3 2 2 22 1 0 0 1 1 0 1 7 2 2 157 9 9 10 6 4 15 5 12 7 84 3 1 1 1 0 1 1 1 2 1 125 3 6 2 1 3 2 9 1 2 34 18 15 19 18 19 14 24 24 30 33 214
280 276 319 289 339 318 328 395 323 299 3,166
Fatalities by County 1965 to 1974
County
Beaverhead
Carter
Cascade
Choteau
Big Horn
Blaine
Broadwater
Carbon
Deer Lodge
Fallon
Fergus
Flathead
Custer
Daniels
Dawson
Golden Valley
Granite
Hill
Gallatin
Garfield
Glacier
Musselshell
Liberty
Jefferson
Lincoln
Madison
Judith Basin
Lake
Lewis & Clark
Park
Petroleum
Phillips
Pondera
McCone
Meagher
Mineral
Missoula
Ravalli
Richland
Roosevelt
Powder River
Powell
Prairie
Stillwater
Sweet Grass
Teton
Rosebud
Sanders
Sheridan
Silver Bow
17
Totals
County
Wheatland
Wibaux
Yellowstone
Toole
Treasure
Valley
1975 1976 1977 1978 1979 1980 1981 1982 1983 1984 Page Total 1975 1976 1977 1978 1979 1980 1981 1982 1983 1984 Page
Total
12 11 6 5 10 6 11 4 6 2 73 0 1 3 1 2 3 6 2 4 0 2215 14 3 8 14 11 14 7 5 5 96 1 4 1 5 3 4 4 0 1 0 23
2 4 11 4 4 3 6 5 3 5 47 6 3 6 8 11 7 1 5 9 1 572 0 2 4 5 2 2 2 1 3 23 23 21 20 21 28 28 16 20 17 14 2080 1 5 3 3 5 3 5 3 2 30 1 2 4 1 1 2 1 0 2 2 16
0 3 0 0 2 1 1 0 2 2 11 1 5 3 5 8 6 3 7 6 3 4720 20 35 19 20 20 17 14 18 10 193 0 1 0 0 0 0 2 0 2 0 5
3 2 2 2 1 3 3 4 1 0 21 0 3 11 2 7 12 7 3 2 2 495 3 3 4 2 2 8 3 1 3 34 4 3 4 1 6 4 1 2 0 2 272 3 0 0 0 5 1 2 1 0 14 1 2 0 1 1 1 0 2 2 2 12
1 5 3 1 2 6 9 2 3 4 36 4 9 1 5 7 6 6 5 5 7 556 4 8 4 4 3 1 1 4 2 37 3 0 0 2 1 3 0 0 1 1 113 1 0 0 2 1 2 2 1 3 15 7 7 4 8 2 6 9 9 8 4 644 3 6 8 3 11 3 1 9 5 53 1 4 4 3 5 6 11 8 3 4 49
12 12 26 18 21 17 19 5 17 25 172 11 7 6 6 8 6 14 8 6 9 81
8 10 10 12 10 8 15 12 7 9 101 12 7 11 7 7 5 4 2 10 6 711 0 1 1 2 1 1 2 4 3 16 9 10 1 3 9 3 9 3 11 8 66
14 17 13 14 16 14 9 9 12 5 123 1 1 1 1 2 4 2 2 3 2 190 5 0 0 2 0 2 2 0 0 11 16 10 10 3 11 8 10 8 4 5 856 0 1 4 3 5 3 1 1 1 25 0 5 1 4 9 4 5 3 2 3 36
5 5 12 0 8 6 7 11 3 2 59 10 1 4 4 0 2 1 4 4 3 334 8 8 9 3 3 2 6 6 9 58 5 4 5 1 2 2 3 3 2 0 272 1 0 3 1 1 0 3 0 4 15 3 9 3 0 1 1 3 3 4 3 30
18 9 8 11 13 11 14 13 9 6 112 2 1 2 0 1 0 0 0 1 0 714 8 9 10 15 12 12 13 11 8 112 0 1 6 3 2 6 9 8 1 2 38
0 2 1 1 1 0 0 0 6 1 12 2 0 0 3 0 0 1 0 2 1 94 4 4 3 4 2 6 3 5 6 41 0 0 0 3 1 2 1 0 0 3 103 9 5 6 6 4 5 2 5 3 48 9 15 22 16 20 31 33 13 30 23 212
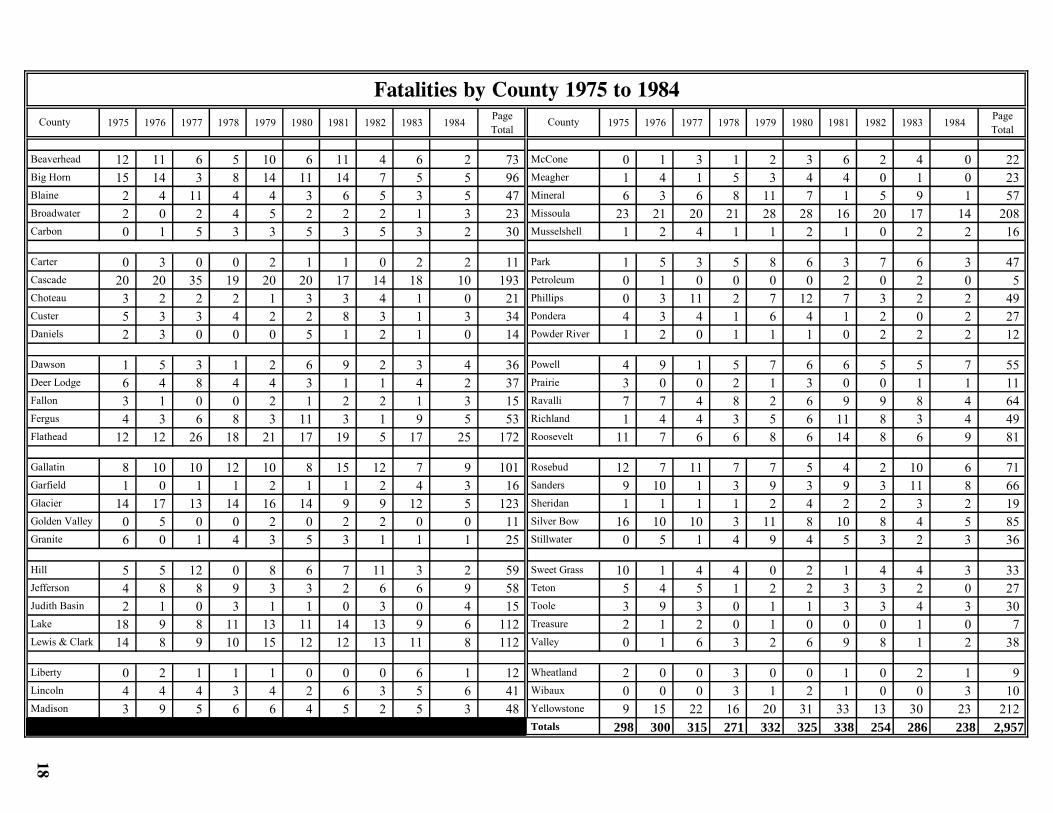
298 300 315 271 332 325 338 254 286 238 2,957
18
Fatalities by County 1975 to 1984
County
Beaverhead
Big Horn
Blaine
Broadwater
Carbon
Carter
Cascade
Choteau
Custer
Daniels
Dawson
Deer Lodge
Fallon
Fergus
Flathead
Gallatin
Garfield
Glacier
Golden Valley
Granite
Hill
Jefferson
Lincoln
Madison
Judith Basin
Lake
Lewis & Clark
McCone
Meagher
Mineral
Missoula
Musselshell
Liberty
Park
Petroleum
Phillips
Pondera
Powder River
Stillwater
Powell
Prairie
Ravalli
Richland
Roosevelt
County
Wheatland
Wibaux
Yellowstone
Toole
Treasure
Rosebud
Sanders
Sheridan
Silver Bow
Valley
Sweet Grass
Teton
Totals
19
1985 1986 1987 1988 1989 1990 1991 1992 1993 1994 Page Total 1985 1986 1987 1988 1989 1990 1991 1992 1993 1994 Page
Total
4 5 4 6 3 3 3 3 6 12 49 1 3 0 2 0 0 1 0 0 0 75 5 8 12 5 11 12 8 10 10 86 3 0 1 0 0 1 2 0 1 0 82 5 0 1 5 8 3 2 4 1 31 2 3 2 6 2 5 2 5 6 3 365 1 1 0 5 0 1 1 1 3 18 22 8 12 15 22 14 11 11 9 10 1344 3 2 3 1 1 2 3 3 2 24 0 1 2 3 1 2 0 1 1 0 11
0 2 1 0 0 0 1 1 1 0 6 3 3 3 4 3 1 3 6 1 4 3111 9 12 12 10 14 16 13 11 14 122 0 0 1 0 0 0 3 0 0 0 4
2 3 1 1 2 3 0 0 1 3 16 2 1 5 3 0 3 1 1 1 0 170 4 3 6 1 2 2 2 1 2 23 0 7 2 3 0 3 0 0 1 3 190 1 0 0 0 0 0 0 0 0 1 0 3 2 1 0 1 1 2 1 1 12
3 1 5 1 0 2 2 3 1 3 21 4 5 8 2 2 6 2 4 2 5 405 2 5 0 7 6 2 0 1 1 29 0 1 1 0 0 1 0 0 0 0 31 2 1 0 0 0 0 0 1 0 5 9 6 7 5 1 3 4 5 0 12 523 0 6 2 5 3 7 3 3 3 35 4 0 3 3 0 4 2 2 1 1 20
15 10 22 19 14 16 16 17 13 7 149 5 9 3 8 5 5 3 3 10 4 55
13 4 13 5 1 5 22 15 5 5 88 8 7 3 2 5 6 2 8 7 3 510 1 1 1 0 0 1 0 0 1 5 0 3 3 2 7 7 4 1 2 2 31
11 6 14 5 6 1 10 4 11 6 74 1 2 1 2 0 0 0 1 1 0 82 1 1 0 0 1 0 0 0 0 5 2 10 2 5 8 11 3 5 7 9 623 3 0 1 0 5 2 3 1 3 21 1 4 3 1 4 2 0 2 4 5 26
4 7 4 0 3 4 5 2 7 2 38 1 2 3 3 2 0 1 0 2 1 157 2 1 2 2 7 4 3 4 7 39 0 0 5 3 1 1 1 2 1 2 160 0 0 4 0 2 1 2 2 0 11 1 5 2 2 1 0 0 2 2 0 157 11 12 10 8 10 8 8 9 21 104 0 0 0 2 0 0 1 3 0 0 69 9 15 13 7 6 8 10 11 3 91 3 5 3 1 4 2 1 2 1 2 24
0 0 0 0 0 0 0 0 1 1 2 2 1 0 1 1 1 0 1 0 1 812 6 8 2 3 6 4 5 9 6 61 0 0 2 0 1 0 0 0 1 1 5
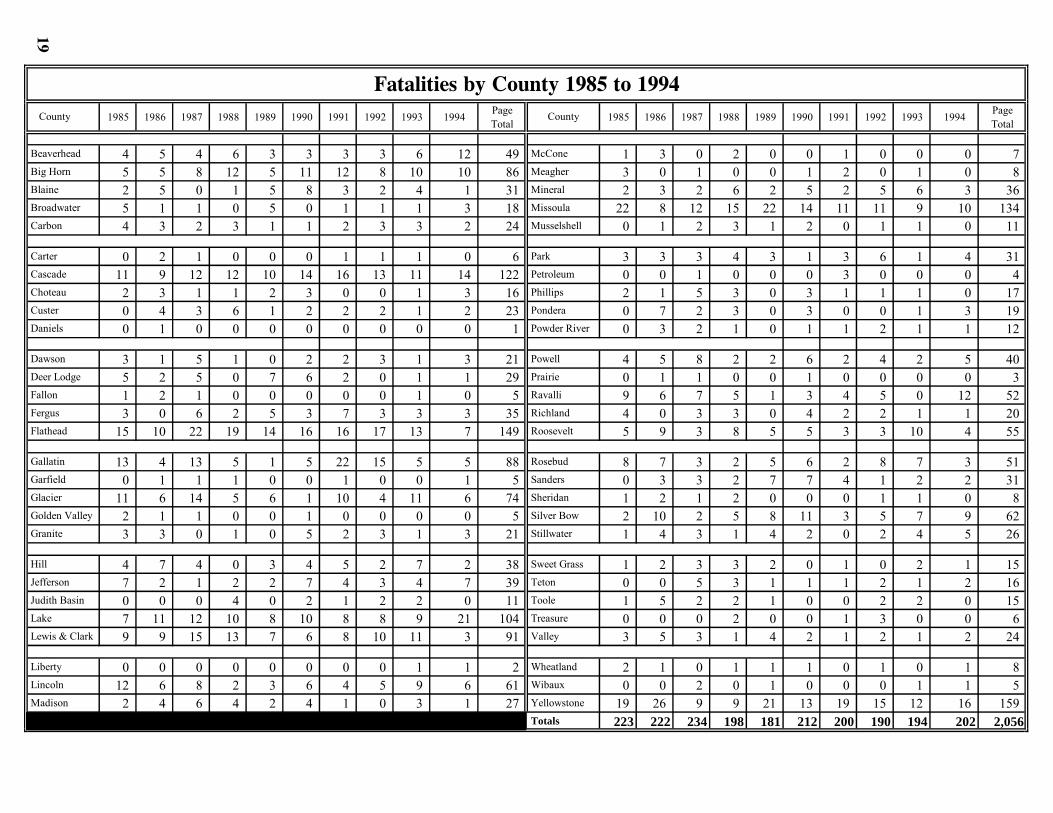
2 4 6 4 2 4 1 0 3 1 27 19 26 9 9 21 13 19 15 12 16 159223 222 234 198 181 212 200 190 194 202 2,056
Fatalities by County 1985 to 1994
County
Carter
County
Carbon
Beaverhead
Big Horn
Blaine
Cascade
Choteau
Custer
Daniels
Broadwater
Dawson
Deer Lodge
Fallon
Fergus
Flathead
Gallatin
Garfield
Glacier
Golden Valley
Granite
Hill
Jefferson
Lincoln
Madison
Judith Basin
Lake
Lewis & Clark
McCone
Meagher
Mineral
Missoula
Musselshell
Liberty
Park
Petroleum
Phillips
Pondera
Powder River
Powell
Prairie
Ravalli
Richland
Roosevelt
Rosebud
Sanders
Sheridan
Silver Bow
Stillwater
Wheatland
Wibaux
Toole
Treasure
Valley
Sweet Grass
Teton
Totals
Yellowstone
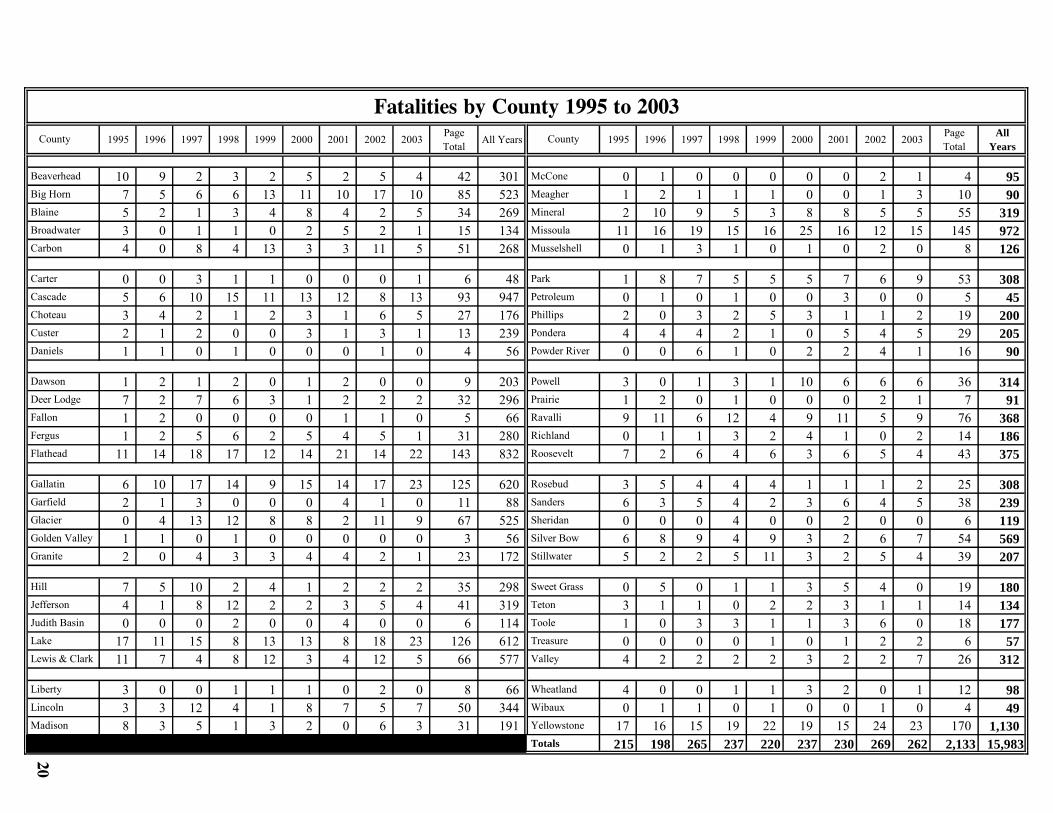
1995 1996 1997 1998 1999 2000 2001 2002 2003 Page Total All Years 1995 1996 1997 1998 1999 2000 2001 2002 2003 Page
TotalAll
Years
10 9 2 3 2 5 2 5 4 42 301 0 1 0 0 0 0 0 2 1 4 95
7 5 6 6 13 11 10 17 10 85 523 1 2 1 1 1 0 0 1 3 10 90
5 2 1 3 4 8 4 2 5 34 269 2 10 9 5 3 8 8 5 5 55 319
3 0 1 1 0 2 5 2 1 15 134 11 16 19 15 16 25 16 12 15 145 972
4 0 8 4 13 3 3 11 5 51 268 0 1 3 1 0 1 0 2 0 8 126
0 0 3 1 1 0 0 0 1 6 48 1 8 7 5 5 5 7 6 9 53 308
5 6 10 15 11 13 12 8 13 93 947 0 1 0 1 0 0 3 0 0 5 45
3 4 2 1 2 3 1 6 5 27 176 2 0 3 2 5 3 1 1 2 19 200
2 1 2 0 0 3 1 3 1 13 239 4 4 4 2 1 0 5 4 5 29 205
1 1 0 1 0 0 0 1 0 4 56 0 0 6 1 0 2 2 4 1 16 90
1 2 1 2 0 1 2 0 0 9 203 3 0 1 3 1 10 6 6 6 36 314
7 2 7 6 3 1 2 2 2 32 296 1 2 0 1 0 0 0 2 1 7 91
1 2 0 0 0 0 1 1 0 5 66 9 11 6 12 4 9 11 5 9 76 368
1 2 5 6 2 5 4 5 1 31 280 0 1 1 3 2 4 1 0 2 14 186
11 14 18 17 12 14 21 14 22 143 832 7 2 6 4 6 3 6 5 4 43 375
6 10 17 14 9 15 14 17 23 125 620 3 5 4 4 4 1 1 1 2 25 308
2 1 3 0 0 0 4 1 0 11 88 6 3 5 4 2 3 6 4 5 38 239
0 4 13 12 8 8 2 11 9 67 525 0 0 0 4 0 0 2 0 0 6 119
1 1 0 1 0 0 0 0 0 3 56 6 8 9 4 9 3 2 6 7 54 569
2 0 4 3 3 4 4 2 1 23 172 5 2 2 5 11 3 2 5 4 39 207
7 5 10 2 4 1 2 2 2 35 298 0 5 0 1 1 3 5 4 0 19 180
4 1 8 12 2 2 3 5 4 41 319 3 1 1 0 2 2 3 1 1 14 134
0 0 0 2 0 0 4 0 0 6 114 1 0 3 3 1 1 3 6 0 18 177
17 11 15 8 13 13 8 18 23 126 612 0 0 0 0 1 0 1 2 2 6 57
11 7 4 8 12 3 4 12 5 66 577 4 2 2 2 2 3 2 2 7 26 312
3 0 0 1 1 1 0 2 0 8 66 4 0 0 1 1 3 2 0 1 12 98
3 3 12 4 1 8 7 5 7 50 344 0 1 1 0 1 0 0 1 0 4 49
8 3 5 1 3 2 0 6 3 31 191 17 16 15 19 22 19 15 24 23 170 1,130
215 198 265 237 220 237 230 269 262 2,133 15,983
20
Fatalities by County 1995 to 2003
County
Beaverhead
Big Horn
Blaine
Broadwater
Carbon
Carter
Cascade
Choteau
Custer
Daniels
Dawson
Deer Lodge
Fallon
Fergus
Flathead
Gallatin
Garfield
Glacier
Golden Valley
Granite
Hill
Jefferson
Lincoln
Madison
Judith Basin
Lake
Lewis & Clark
McCone
Meagher
Mineral
Missoula
Musselshell
Liberty
Park
Petroleum
Phillips
Pondera
Powder River
Powell
Prairie
Ravalli
Richland
Roosevelt
Rosebud
Sweet Grass
Teton
Totals
Sanders
Sheridan
Silver Bow
Stillwater
County
Wheatland
Wibaux
Yellowstone
Toole
Treasure
Valley

2004 2005 2006 2007 2008 2009 2010 2011 2012 All Years 2004 2005 2006 2007 2008 2009 2010 2011 2012 All
Years
5 4 3 1 8 6 27 3 0 0 0 1 0 4
8 10 9 11 12 9 59 1 2 1 1 3 0 8
3 3 2 4 4 1 17 5 4 7 7 7 3 33
5 2 4 4 2 3 20 13 18 16 23 20 15 105
6 2 4 4 3 7 26 0 1 2 6 0 1 10
0 0 0 0 4 0 4 5 5 5 6 1 3 25
10 9 11 13 7 6 56 2 4 0 2 0 1 9
5 5 2 2 3 4 21 1 3 1 4 1 2 12
1 5 1 6 4 2 19 5 1 2 0 0 4 12
0 0 0 0 0 0 0 2 0 4 2 0 0 8
3 1 0 2 1 2 9 1 5 3 5 1 6 21
1 3 3 2 1 3 13 0 0 1 1 1 1 4
2 1 0 0 0 2 5 6 7 6 10 3 6 38
1 5 3 2 9 0 20 3 2 4 4 7 0 20
19 17 30 26 25 16 133 0 1 3 5 3 5 17
16 11 22 14 13 7 83 5 6 7 3 3 12 36
0 1 0 1 0 1 3 7 6 7 8 7 7 42
11 5 8 14 7 5 50 1 0 1 1 0 0 3
0 1 0 1 0 1 3 6 7 6 3 5 10 37
3 5 1 2 2 3 16 6 3 1 4 1 1 16
3 1 3 4 3 2 16 2 3 1 3 1 1 11
6 5 3 8 5 8 35 1 0 1 3 1 0 6
0 2 1 4 0 0 7 0 4 2 0 0 0 6
12 14 22 10 4 8 70 0 0 1 1 1 0 3
4 11 11 11 13 13 63 4 2 4 1 1 3 15
0 1 0 0 0 0 1 0 3 0 2 0 0 5
1 7 6 6 3 6 29 1 3 3 0 0 0 7
4 7 5 6 6 1 29 20 23 20 13 22 24 122
229 251 263 276 229 221 1,469 Totals
County
Wheatland
Wibaux
Yellowstone
Toole
Treasure
Valley
Stillwater
Sweet Grass
Teton
Rosebud
Sanders
Sheridan
Silver Bow
Ravalli
Richland
Roosevelt
Powder River
Powell
Prairie
Park
Petroleum
Phillips
Pondera
McCone
Meagher
Mineral
Missoula
Liberty
Lincoln
Madison
Judith Basin
Lake
Lewis & Clark
Hill
Jefferson
Gallatin
Garfield
Glacier
Golden Valley
Granite
Fallon
Fergus
Flathead
Daniels
Dawson
Deer Lodge
Choteau
Custer
21
Fatalities by County 2004 - 2009
County
Carbon Musselshell
Beaverhead
Big Horn
Blaine
Broadwater
Carter
Cascade
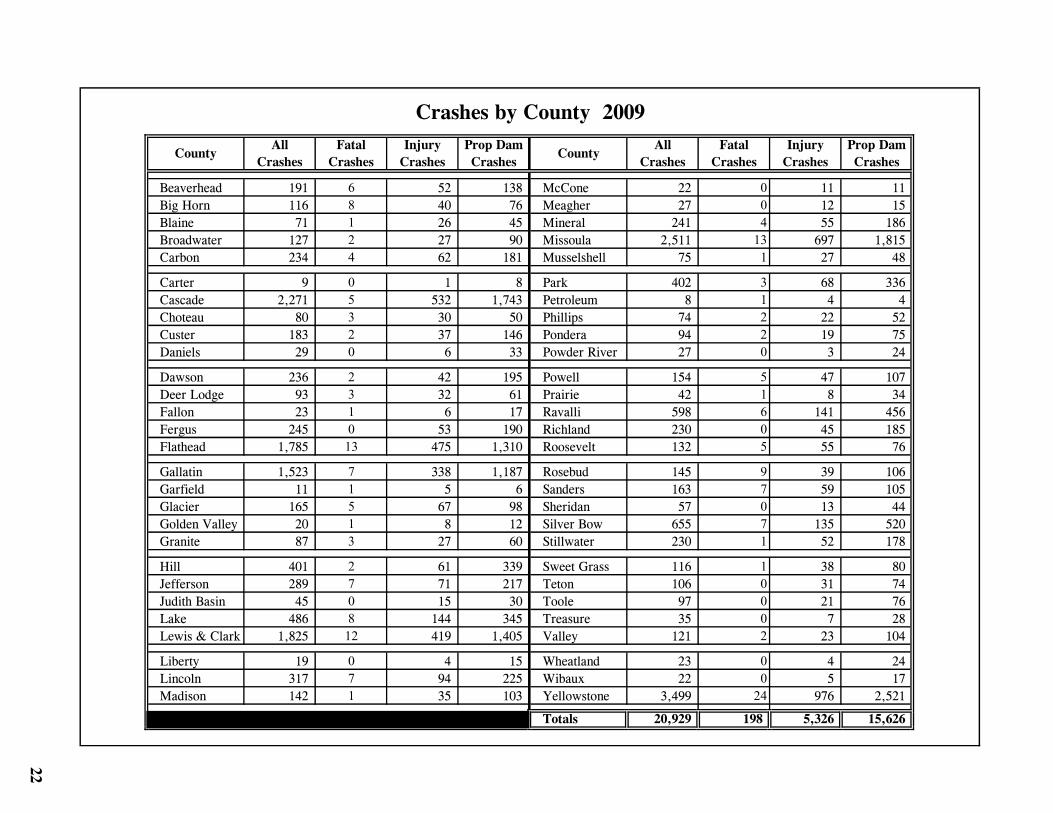
Beaverhead 191 6 52 138 McCone 22 0 11 11
Big Horn 116 8 40 76 Meagher 27 0 12 15
Blaine 71 1 26 45 Mineral 241 4 55 186
Broadwater 127 2 27 90 Missoula 2,511 13 697 1,815
Carbon 234 4 62 181 Musselshell 75 1 27 48
Carter 9 0 1 8 Park 402 3 68 336
Cascade 2,271 5 532 1,743 Petroleum 8 1 4 4
Choteau 80 3 30 50 Phillips 74 2 22 52
Custer 183 2 37 146 Pondera 94 2 19 75
Daniels 29 0 6 33 Powder River 27 0 3 24
Dawson 236 2 42 195 Powell 154 5 47 107
Deer Lodge 93 3 32 61 Prairie 42 1 8 34
Fallon 23 1 6 17 Ravalli 598 6 141 456
Fergus 245 0 53 190 Richland 230 0 45 185
Flathead 1,785 13 475 1,310 Roosevelt 132 5 55 76
Gallatin 1,523 7 338 1,187 Rosebud 145 9 39 106
Garfield 11 1 5 6 Sanders 163 7 59 105
Glacier 165 5 67 98 Sheridan 57 0 13 44
Golden Valley 20 1 8 12 Silver Bow 655 7 135 520
Granite 87 3 27 60 Stillwater 230 1 52 178
Hill 401 2 61 339 Sweet Grass 116 1 38 80
Jefferson 289 7 71 217 Teton 106 0 31 74
Judith Basin 45 0 15 30 Toole 97 0 21 76
Lake 486 8 144 345 Treasure 35 0 7 28
Lewis & Clark 1,825 12 419 1,405 Valley 121 2 23 104
Liberty 19 0 4 15 Wheatland 23 0 4 24
Lincoln 317 7 94 225 Wibaux 22 0 5 17
Madison 142 1 35 103 Yellowstone 3,499 24 976 2,521
Totals 20,929 198 5,326 15,626
22
Injury
Crashes
Prop Dam
Crashes
Crashes by County 2009
County CountyAll
Crashes
Fatal
Crashes
Injury
Crashes
Prop Dam
Crashes
All
Crashes
Fatal
Crashes
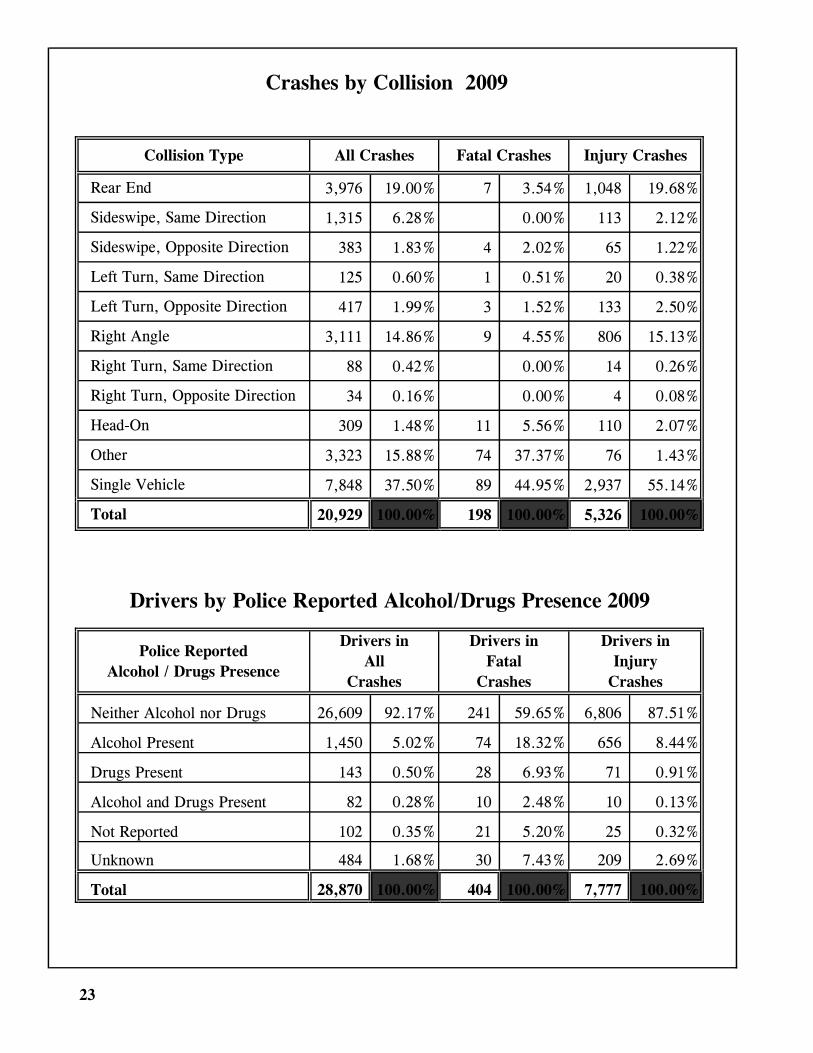
3,976 19.00% 7 3.54% 1,048 19.68%
1,315 6.28% 0.00% 113 2.12%
383 1.83% 4 2.02% 65 1.22%
125 0.60% 1 0.51% 20 0.38%
417 1.99% 3 1.52% 133 2.50%
3,111 14.86% 9 4.55% 806 15.13%
88 0.42% 0.00% 14 0.26%
34 0.16% 0.00% 4 0.08%
309 1.48% 11 5.56% 110 2.07%
3,323 15.88% 74 37.37% 76 1.43%
7,848 37.50% 89 44.95% 2,937 55.14%
20,929 100.00% 198 100.00% 5,326 100.00%
26,609 92.17% 241 59.65% 6,806 87.51%
1,450 5.02% 74 18.32% 656 8.44%
143 0.50% 28 6.93% 71 0.91%
82 0.28% 10 2.48% 10 0.13%
102 0.35% 21 5.20% 25 0.32%
484 1.68% 30 7.43% 209 2.69%
28,870 100.00% 404 100.00% 7,777 100.00%
23
Crashes by Collision 2009
Left Turn, Opposite Direction
Right Angle
Right Turn, Opposite Direction
All Crashes Fatal Crashes Injury Crashes
Right Turn, Same Direction
Other
Rear End
Sideswipe, Same Direction
Collision Type
Sideswipe, Opposite Direction
Left Turn, Same Direction
Head-On
Unknown
Single Vehicle
Total
Drivers by Police Reported Alcohol/Drugs Presence 2009
Not Reported
Police Reported
Alcohol / Drugs Presence
Drivers in
All
Crashes
Drivers in
Fatal
Crashes
Drivers in
Injury
Crashes
Total
Neither Alcohol nor Drugs
Alcohol Present
Drugs Present
Alcohol and Drugs Present
24
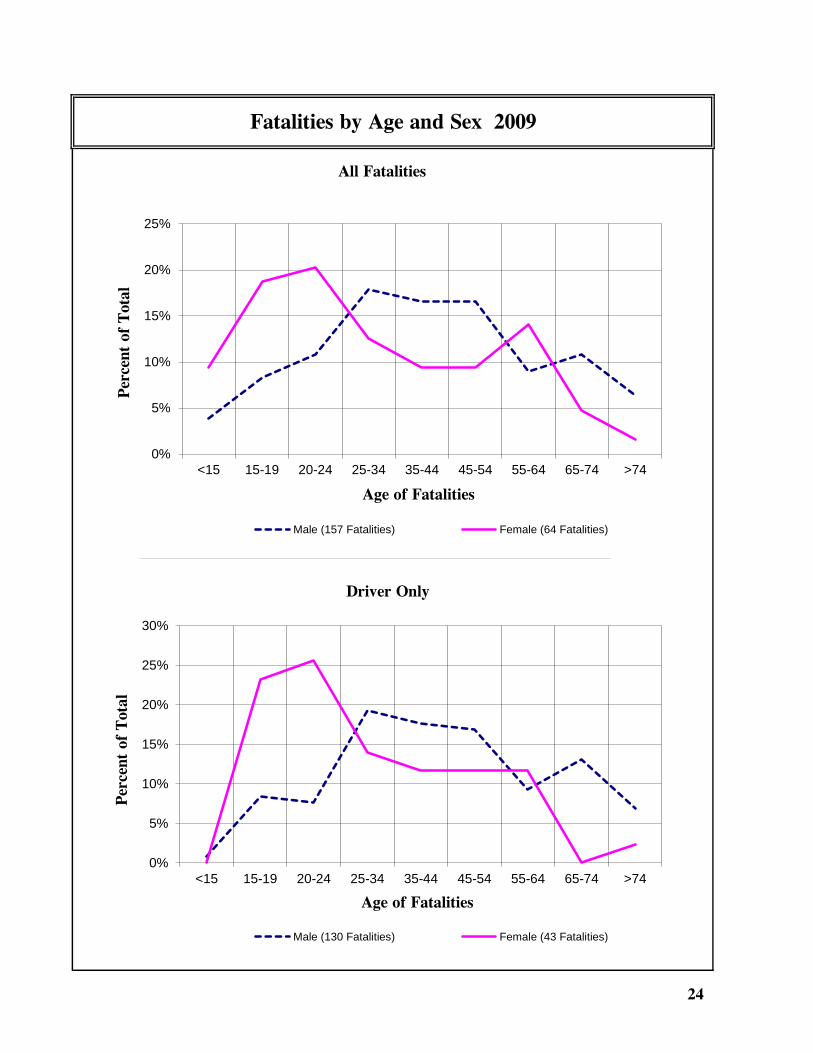
Fatalities by Age and Sex 2009
0%
5%
10%
15%
20%
25%
<15 15-19 20-24 25-34 35-44 45-54 55-64 65-74 >74
Per
cent
of
Tota
l
Age of Fatalities
All Fatalities
Male (157 Fatalities) Female (64 Fatalities)
0%
5%
10%
15%
20%
25%
30%
<15 15-19 20-24 25-34 35-44 45-54 55-64 65-74 >74
Per
cent
of
Tota
l
Age of Fatalities
Driver Only
Male (130 Fatalities) Female (43 Fatalities)
25
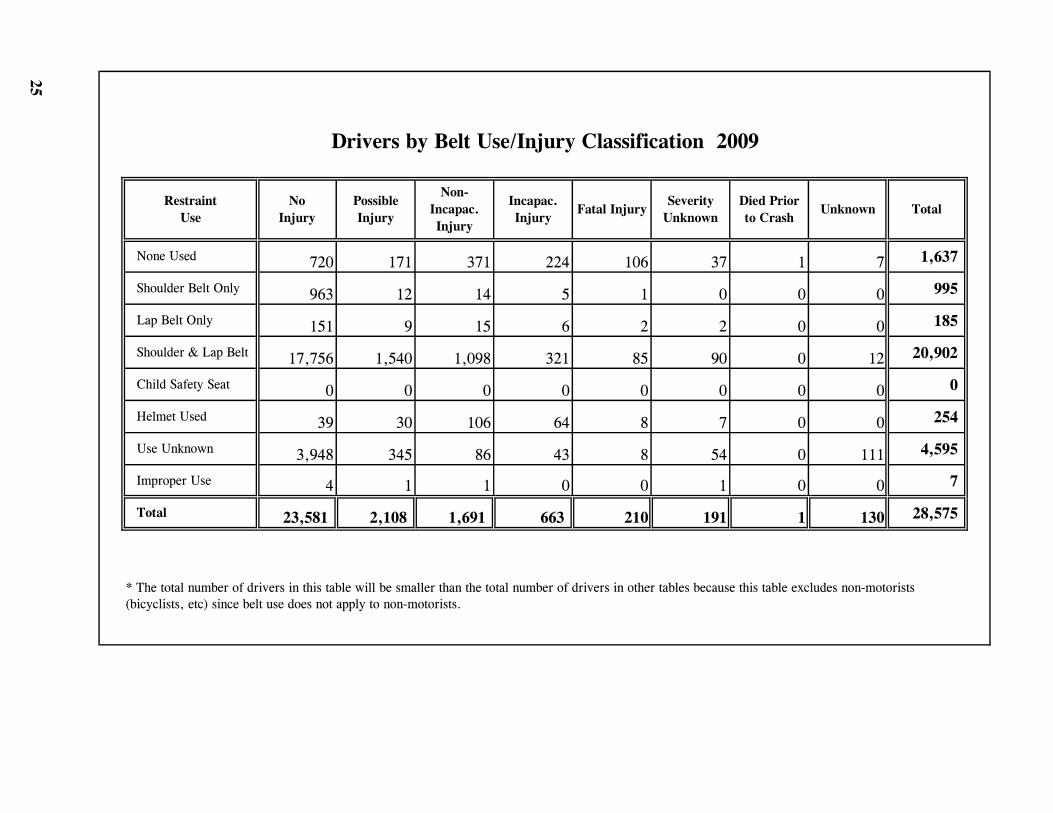
720 171 371 224 106 37 1 7 1,637
963 12 14 5 1 0 0 0 995
151 9 15 6 2 2 0 0 185
17,756 1,540 1,098 321 85 90 0 12 20,902
0 0 0 0 0 0 0 0 0
39 30 106 64 8 7 0 0 254
3,948 345 86 43 8 54 0 111 4,595
4 1 1 0 0 1 0 0 7
23,581 2,108 1,691 663 210 191 1 130 28,575Total
Shoulder Belt Only
Use Unknown
Lap Belt Only
Shoulder & Lap Belt
Helmet Used
Drivers by Belt Use/Injury Classification 2009
Restraint
Use
No
Injury
Possible
Injury
Non-
Incapac.
Injury
(bicyclists, etc) since belt use does not apply to non-motorists.
Improper Use
Incapac.
Injury
* The total number of drivers in this table will be smaller than the total number of drivers in other tables because this table excludes non-motorists
Fatal InjurySeverity
Unknown
Died Prior
to CrashTotal
Child Safety Seat
None Used
Unknown

411 116 182 109 42 21 0 4 885
79 6 3 1 0 3 0 0 92
234 19 23 5 3 1 0 0 285
5,558 541 395 118 45 31 0 9 6,697
1,058 99 34 2 7 3 0 5 1,208
6 1 16 10 6 1 0 0 40
2,223 123 21 11 3 12 0 27 2,420
7 0 1 0 0 1 0 0 9
9,576 905 675 256 106 73 0 45 11,636
26
Total
None Used
Shoulder Belt Only
Lap Belt Only
Non-Drivers by Belt Use/Injury Classification 2009
Restraint
Use
No
Injury
Possible
Injury
Non-
Incapac.
Injury
Incapac.
Injury
Fatal
Injury
Severity
Unknown
Died Prior
to CrashUnknown
Improper Use
* The total number of drivers in this table will be smaller than the total number of drivers in other tables because this table excludes non-motorists
(bicyclists, etc) since belt use does not apply to non-motorists.
Shoulder & Lap Belt
Child Safety Seat
Helmet Used
Use Unknown
Total
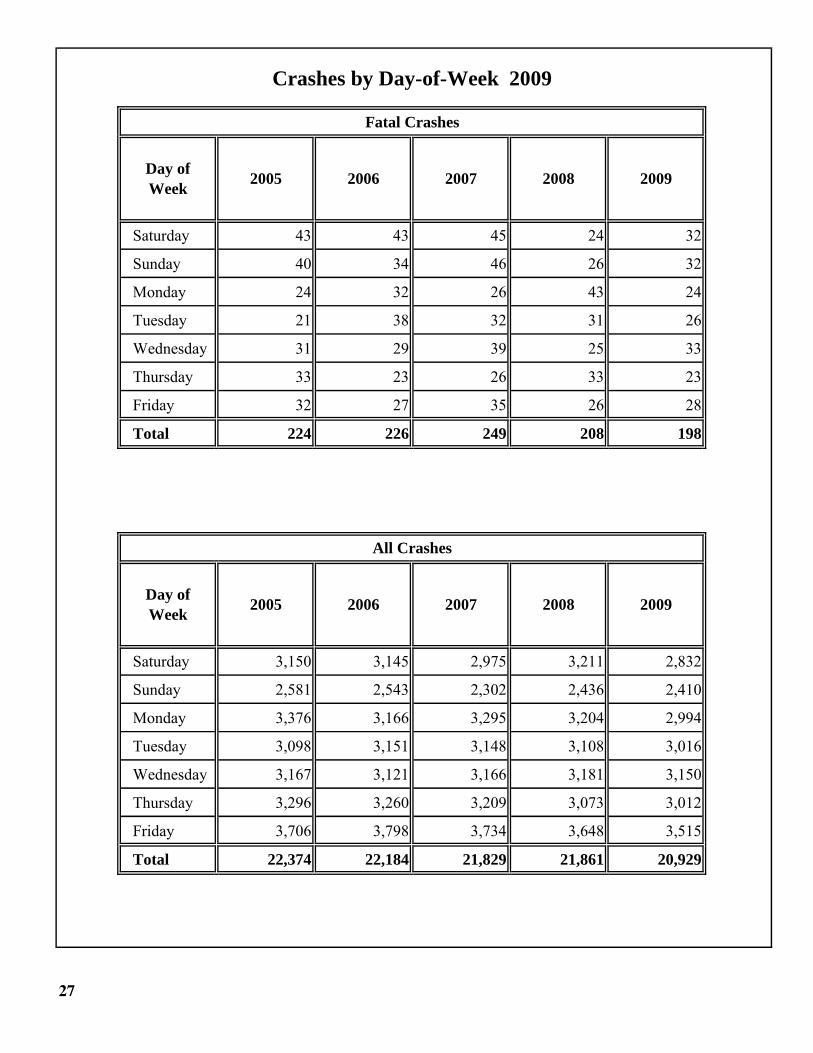
Saturday 43 43 45 24 32
Sunday 40 34 46 26 32
Monday 24 32 26 43 24
Tuesday 21 38 32 31 26
Wednesday 31 29 39 25 33
Thursday 33 23 26 33 23
Friday 32 27 35 26 28
Total 224 226 249 208 198
Saturday 3,150 3,145 2,975 3,211 2,832
Sunday 2,581 2,543 2,302 2,436 2,410
Monday 3,376 3,166 3,295 3,204 2,994
Tuesday 3,098 3,151 3,148 3,108 3,016
Wednesday 3,167 3,121 3,166 3,181 3,150
Thursday 3,296 3,260 3,209 3,073 3,012
Friday 3,706 3,798 3,734 3,648 3,515
Total 22,374 22,184 21,829 21,861 20,929
27
20092005
Day of
Week
2007
All Crashes
Day of
Week2006
2007
2008
2009
Crashes by Day-of-Week 2009
Fatal Crashes
20082005 2006
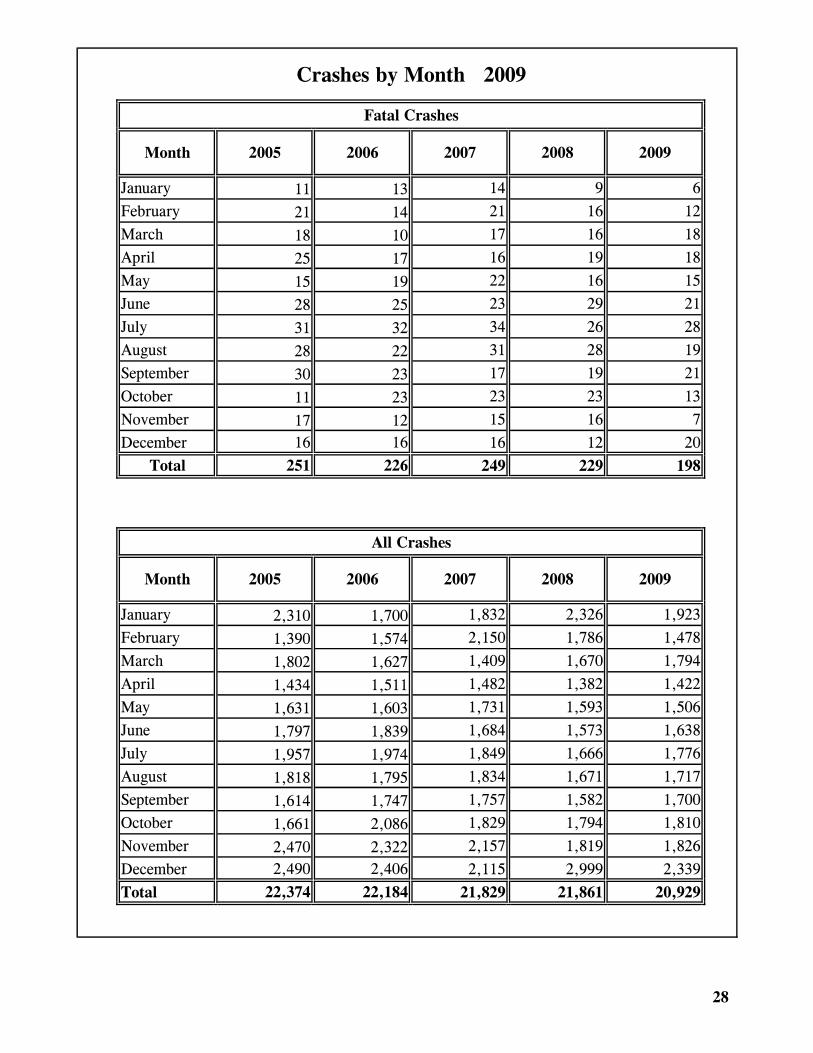
January 11 13 14 9 6
February 21 14 21 16 12
March 18 10 17 16 18
April 25 17 16 19 18
May 15 19 22 16 15
June 28 25 23 29 21
July 31 32 34 26 28
August 28 22 31 28 19
September 30 23 17 19 21
October 11 23 23 23 13
November 17 12 15 16 7
December 16 16 16 12 20
Total 251 226 249 229 198
January 2,310 1,700 1,832 2,326 1,923
February 1,390 1,574 2,150 1,786 1,478
March 1,802 1,627 1,409 1,670 1,794
April 1,434 1,511 1,482 1,382 1,422
May 1,631 1,603 1,731 1,593 1,506
June 1,797 1,839 1,684 1,573 1,638
July 1,957 1,974 1,849 1,666 1,776
August 1,818 1,795 1,834 1,671 1,717
September 1,614 1,747 1,757 1,582 1,700
October 1,661 2,086 1,829 1,794 1,810
November 2,470 2,322 2,157 1,819 1,826
December 2,490 2,406 2,115 2,999 2,339
Total 22,374 22,184 21,829 21,861 20,929
28
All Crashes
Month 20082005 2006 2007 2009
Crashes by Month 2009
Fatal Crashes
Month 20082005 2006 2007 2009
29
*All Interstate Primary Secondary *All Interstate Primary Secondary
Roads Only Only Only Roads Only Only Only
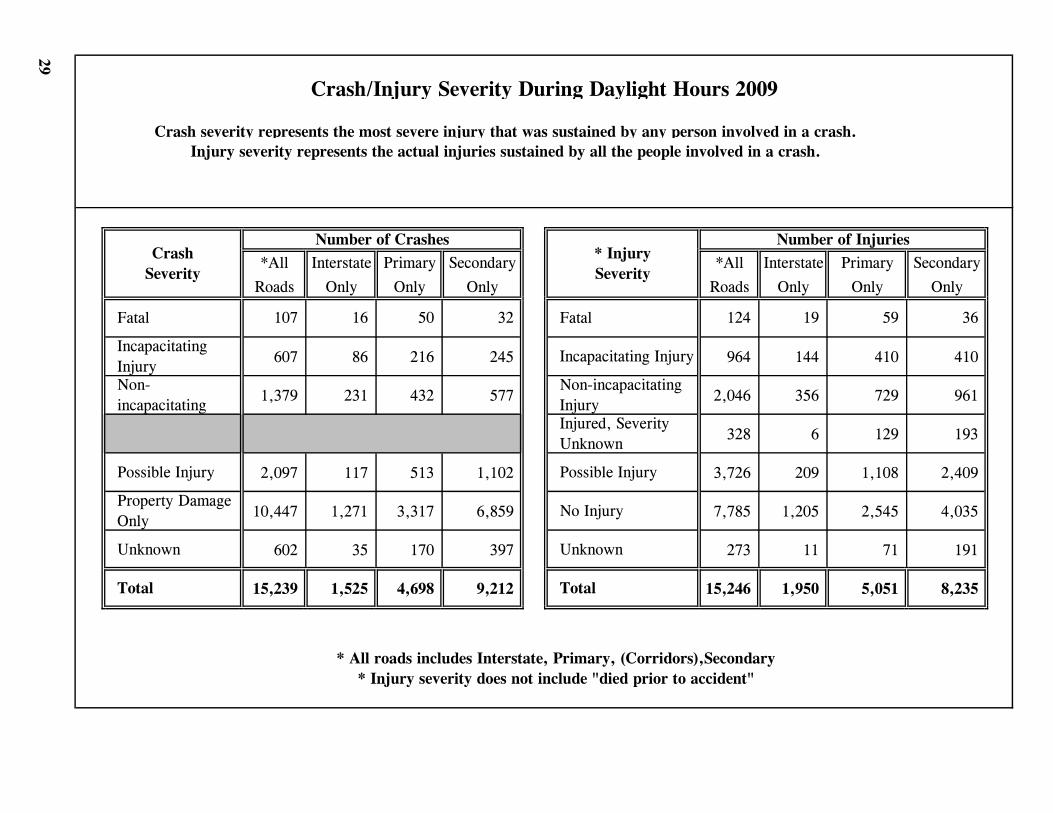
607 86 216 245 964 144 410 410
1,379 231 432 577 2,046 356 729 961
328 6 129 193
2,097 117 513 1,102 3,726 209 1,108 2,409
10,447 1,271 3,317 6,859 7,785 1,205 2,545 4,035
602 35 170 397 273 11 71 191
15,239 1,525 4,698 9,212 15,246 1,950 5,051 8,235
Property Damage
OnlyNo Injury
Possible Injury Possible Injury
36107 124 19
Incapacitating
Injury
Injured, Severity
Unknown
* Injury
Severity
Crash severity represents the most severe injury that was sustained by any person involved in a crash.
59
Number of Injuries
Injury severity represents the actual injuries sustained by all the people involved in a crash.
Number of Crashes
* Injury severity does not include "died prior to accident"
Crash/Injury Severity During Daylight Hours 2009
16 Fatal32
Total
Non-incapacitating
Injury
50Fatal
* All roads includes Interstate, Primary, (Corridors),Secondary
Total
UnknownUnknown
Crash
Severity
Incapacitating Injury
Non-
incapacitating

*All Interstate Primary Secondary *All Interstate Primary Secondary
Roads Only Only Only Roads Only Only Only
269 44 97 128 404 68 150 186
679 112 249 318 931 163 348 420
72 1 17 54
506 51 157 370 673 82 172 419
4,915 873 1,554 2,488 4,886 873 1,554 2,459
528 14 69 313 241 13 86 142
6,988 1,003 2,157 3,652 7,304 1,221 2,366 3,716
30
* Injury severity does not include "died prior to accident"
Crash/Injury Severity During Non-Daylight Hours 2009
21 Fatal35
Total
Non-incapacitating
Injury
31Fatal
* All roads includes Interstate, Primary, (Corridors),Secondary, Rural and Urban
Total
UnknownUnknown
Crash
Severity
Incapacitating Injury
Non-
incapacitating
* Injury
Severity
Crash severity represents the most severe injury that was sustained by any person involved in a crash.
39
Number of Injuries
Injury severity represents the actual injuries sustained by all the people involved in a crash.
Number of Crashes
Property Damage
OnlyNo Injury
Possible Injury Possible Injury
3691 97 21
Incapacitating
Injury
Injured, Severity
Unknown
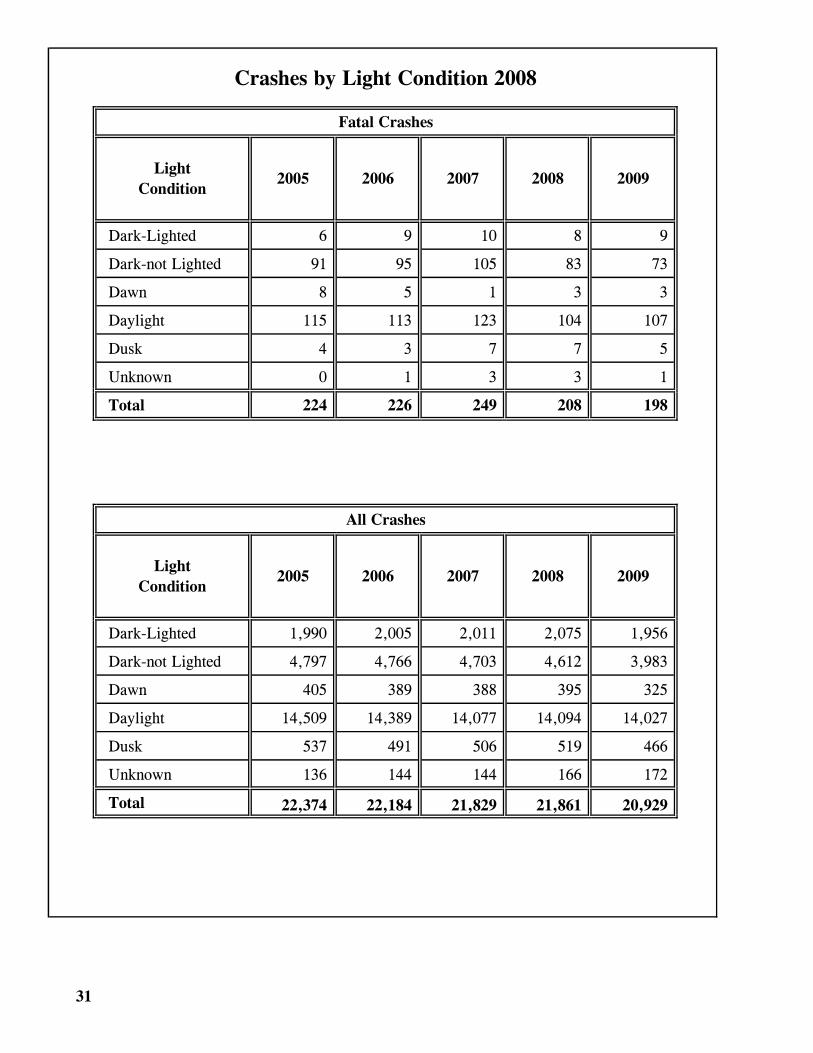
Dark-Lighted 6 9 10 8 9
Dark-not Lighted 91 95 105 83 73
Dawn 8 5 1 3 3
Daylight 115 113 123 104 107
Dusk 4 3 7 7 5
Unknown 0 1 3 3 1
Total 224 226 249 208 198
Dark-Lighted 1,990 2,005 2,011 2,075 1,956
Dark-not Lighted 4,797 4,766 4,703 4,612 3,983
Dawn 405 389 388 395 325
Daylight 14,509 14,389 14,077 14,094 14,027
Dusk 537 491 506 519 466
Unknown 136 144 144 166 172
Total 22,374 22,184 21,829 21,861 20,929
31
Crashes by Light Condition 2008
Fatal Crashes
Light
Condition20082005 2006 2007 2009
2005
All Crashes
Light
Condition2006 2007 2008 2009
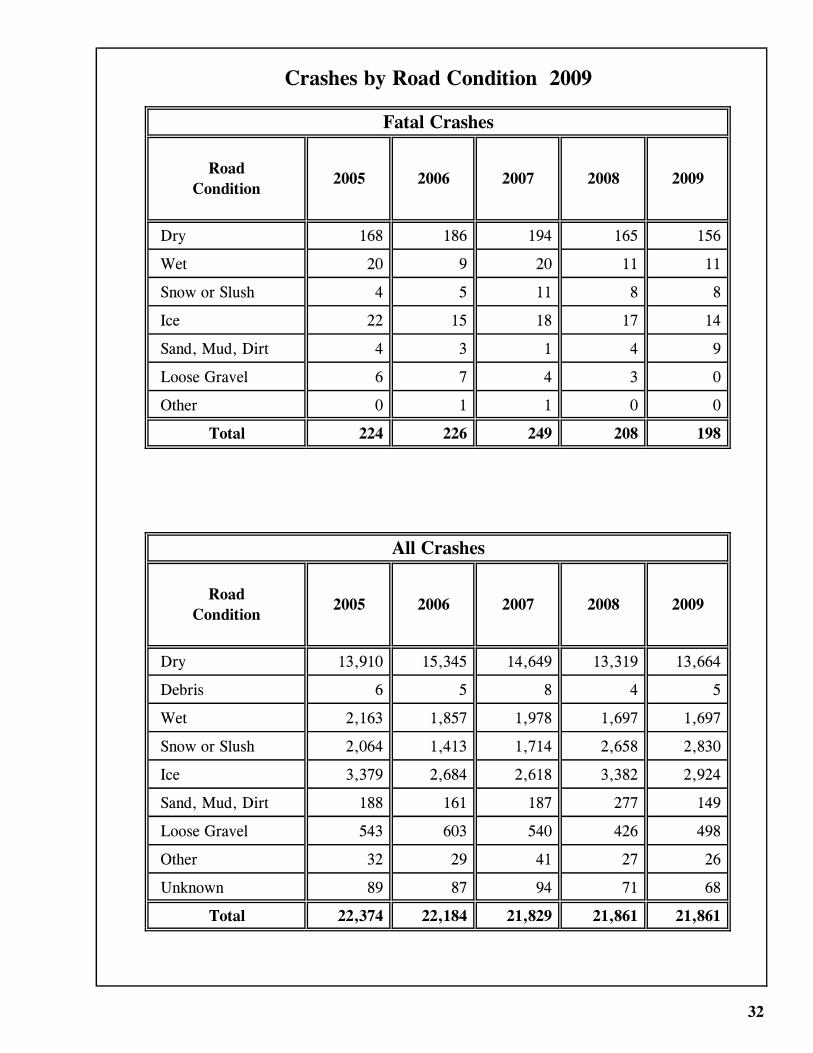
Dry 168 186 194 165 156
Wet 20 9 20 11 11
Snow or Slush 4 5 11 8 8
Ice 22 15 18 17 14
Sand, Mud, Dirt 4 3 1 4 9
Loose Gravel 6 7 4 3 0
Other 0 1 1 0 0
Total 224 226 249 208 198
Dry 13,910 15,345 14,649 13,319 13,664
Debris 6 5 8 4 5
Wet 2,163 1,857 1,978 1,697 1,697
Snow or Slush 2,064 1,413 1,714 2,658 2,830
Ice 3,379 2,684 2,618 3,382 2,924
Sand, Mud, Dirt 188 161 187 277 149
Loose Gravel 543 603 540 426 498
Other 32 29 41 27 26
Unknown 89 87 94 71 68
Total 22,374 22,184 21,829 21,861 21,861
32
All Crashes
2007 20082005Road
Condition2006 2009
Crashes by Road Condition 2009
Road
Condition2008
Fatal Crashes
2005 2006 2007 2009
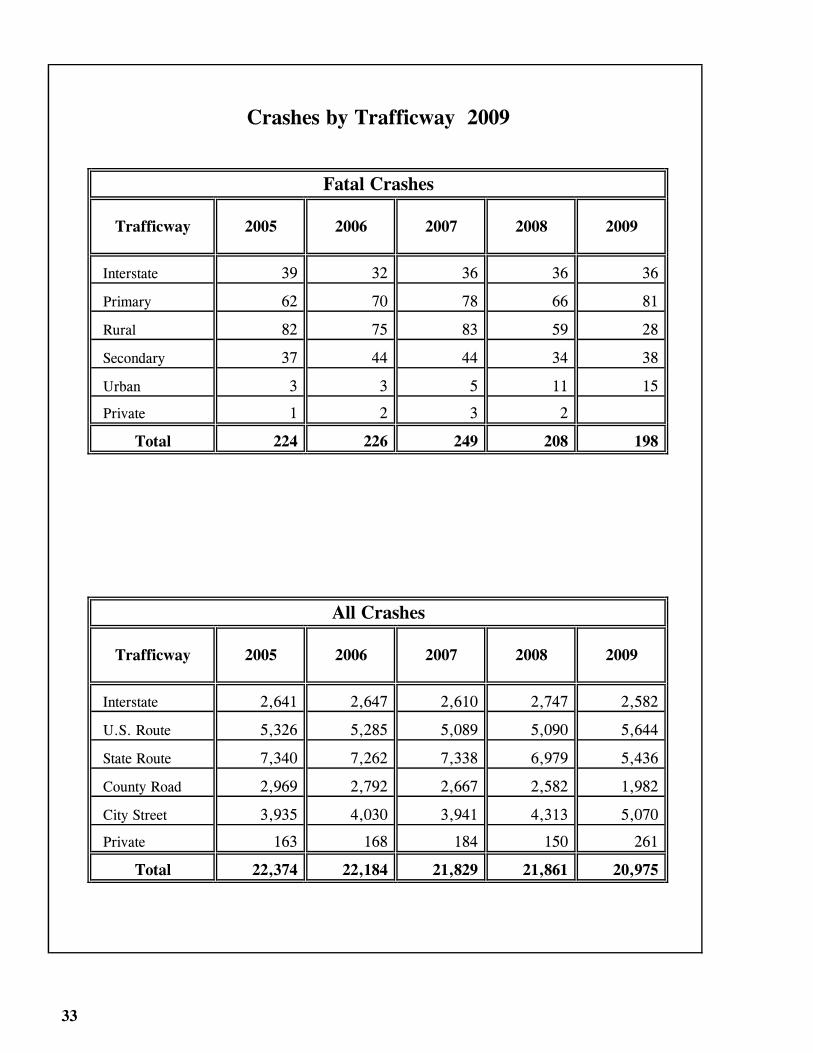
Interstate 39 32 36 36 36
Primary 62 70 78 66 81
Rural 82 75 83 59 28
Secondary 37 44 44 34 38
Urban 3 3 5 11 15
Private 1 2 3 2
Total 224 226 249 208 198
Interstate 2,641 2,647 2,610 2,747 2,582
U.S. Route 5,326 5,285 5,089 5,090 5,644
State Route 7,340 7,262 7,338 6,979 5,436
County Road 2,969 2,792 2,667 2,582 1,982
City Street 3,935 4,030 3,941 4,313 5,070
Private 163 168 184 150 261
Total 22,374 22,184 21,829 21,861 20,975
33
Crashes by Trafficway 2009
Trafficway
Fatal Crashes
2005 2006 20082007 2009
Trafficway 2006
All Crashes
20082005 2007 2009

Interstate Interstate Primary Primary Secondary Secondary
Fatals Totals Fatal Total Fatal Total
Cell Phone, Electronic Comm Device 0 11 2 60 1 53
Disregarded Traffic Mark/Sign/Signal 4 36 3 239 6 355
Exceeded Posted Speed Limit 4 24 9 65 10 84
External Distraction
(Outside The Vehicle) 0 57 2 84 0 34
Failed to Keep in Proper Lane 4 85 19 148 0 51
Failed to Yield Right of Way 0 58 10 731 12 991
Fell Asleep, Fainted, Etc. 0 5 0 24 0 38
Followed too Closely 2 106 3 634 0 748
Improper Backing Operation 0 6 0 55 0 117
Improper Lane Change 0 5 0 102 0 162
Improper Parking 0 0 0 4 0 8
Improper Passing 0 18 2 83 0 49
Improper Signals 0 0 0 7 0 2
Improper Turn 0 9 0 164 1 215
Inattentive driving 1 56 1 852 1 1,461
License Restrict Non-Compliance 0 0 0 11 1 26
Operated Motor Vehicle in Erratic,
Reckless, Careless, Negligent Manner 11 410 31 1,433 16 1,471
Other Contributing Actions 5 186 12 267 3 214
Other Electronic Devices (Navigation
Device, DVD Player, Etc.) 0 14 1 22 1 7
Other Inside of Vehicle 0 41 2 104 0 31
Over-Correcting, Over- Steering 16 449 29 482 14 229
Ran Off Roadway 13 366 27 543 17 270
Swerved or Avoided Due to Wind,
Slippery Surface, Motor Vehicle,
Object or Person in Roadway, Etc. 1 140 4 156 0 67
Too Fast For Conditions 11 698 9 611 5 599
Under Influence of Alcohol 8 76 22 308 24 377
Under Influence of Drugs 6 15 23 53 6 48
Unknown 0 30 15 101 8 86
Wrong Side or Wrong Way 2 10 11 69 1 71
Total 88 2,911 237 7,412 127 7,86434
Driver-Related Contributing Circumstances
By Roadway Type 2009
Contributing Circumstances

Rural/County Rural/County Urban/Local Urban/Local Totals Total
Fatals Total Fatals Total Fatal
Cell Phone, Electronic Comm Device 0 34 0 61 3 219
Disregarded Traffic Mark/Sign/Signal 1 42 0 190 14 862
Exceeded Posted Speed Limit 5 45 6 148 34 366
External Distraction
(Outside the Vehicle) 0 64 0 69 2 308
Failed to Keep in Proper Lane 3 106 3 89 29 479
Failed to Yield Right of Way 0 93 2 950 24 2,823
Fell Asleep, Fainted, Etc. 0 1 0 41 0 109
Followed too Closely 0 40 0 172 5 1,700
Improper Backing Operation 0 70 0 422 0 670
Improper Lane Change 0 0 0 23 0 292
Improper Parking 0 1 0 48 0 61
Improper Passing 0 15 0 40 2 205
Improper Signals 0 0 0 6 0 15
Improper Turn 0 37 1 118 2 543
Inattentive driving 0 18 2 1,085 5 3,472
License Restrictn Non-Compliance 0 2 0 14 1 53
Operated Motor Vehicle in Erratic,
Reckless, Careless, Negligent Manner 14 527 9 1,490 81 5,331
Other Contributing Actions 5 158 1 268 26 1,093
Other Electronic Devices (Navigation Device,
DVD Player, Etc.) 0 10 0 9 2 62
Other Inside of Vehicle 0 79 0 53 2 308
Over-Correcting, Over-Steering 9 353 7 198 75 1,711
Ran Off Roadway 19 548 8 327 84 2,054
Swerved or Avoided Due to Wind,
Slippery Surface, Motor Vehicle,
Object or Person in Roadway, Etc. 1 104 0 66 6 533
Too Fast For Conditions 10 515 6 813 41 3,236
Under Influence of Alcohol 14 198 6 453 74 1,412
Under Influence of Drugs 3 21 0 42 38 179
Unknown 4 54 2 187 29 458
Wrong Side or Wrong Way 2 15 1 80 17 245
Total 90 3,150 54 7,462 596 28,799
35 Driver-Related Contributing Circumstances
By Roadway Type 2009
Contributing Circumstances

36
All Fatal Injury All Fatal Injury
Crashes Crashes Crashes Crashes Crashes Crashes
12 0 3
60 0 0 61 0 19
12 0 0 11 0 5
90 1 17 314 0 74
376 3 117 21,692 129 5,696
1,793 31 913 100 1 0
95 1 21 236 0 66
0 0 324 4 69
8 0 1 249 2 56
68 1 13 238 5 75
14 0 2 4 0 1
66 2 25 2,334 2 277
141 3 40 132 0 101
460 7 148 167 15 128
174 2 23 19 0 3
460 8 181 11 0 2
569 4 112 410 8 133
128 3 113 215 1 41
479 6 10 2,095 4 139
180 0 28
33,797 243 8,652
Overhead Sign Support
Parked Motor Vehicle
PedalcycleCurb
Ditch
Domestic Animal
Embankment
Utility Pole
Wild Animal
Total
Pedestrian
Railway Train
Fence
Guardrail End
Guardrail Face
Highway Traffic Sign Post
Rock or Boulder
Tree
MV in Transp. Other roadway
Motor Vehicle in Transport
Mail Box
Median Barrier
Other Post
Other Fixed Object
Other Object, not FixedBridge Parapet End
Bridge Rail
Bridge/Pier/Abutment
Culvert
Jackknife
Other Non-collision
Overturn
Collision With
Unknown
Fire/Explosion
Immersion
Vehicles by First Harmful Event 2009
First Harmful
Event
Non-Collision
First Harmful
Event
Impact Attenuator
Luminaire/Light Support
Motor Veh. At RR Crossing

All Fatal Injury All Fatal Injury
Crashes Crashes Crashes Crashes Crashes Crashes
7
82 5 6 70 15
13 12 5
78 9 313 70
267 1 84 21,496 123 5,622
2,225 83 1,180 82 10
210 1 125 299 49
373 4 88
9 3 442 1 72
79 1 14 148 1 22
19 2 4 15 4
57 2 20 1,947 2 230
57 1 14 135 1 102
445 5 140 161 15 123
172 1 22 31 9
369 2 143 18 4
503 2 59 463 12 157
130 3 3 269 1 63
412 1 89 1,986 4 127
149 16 33,543 274 8,703
37
Vehicles by Most Harmful Event 2009
Most Harmful
Event
Non-Collision
Most Harmful
Event
Impact Attenuator
Fire/Explosion
Immersion
Jackknife
Other Non-collision
Overturn
Collision With
Bridge Parapet End
Bridge Rail
Unknown
Domestic Animal
Embankment
Fence
Guardrail End
Highway Traffic Sign Post
Luminaire/Light Support
Motor Veh. At RR Crossing
MV in Transp. Other roadway
Motor Vehicle in Transport
Guardrail Face
Bridge/Pier/Abutment
Culvert
Curb
Ditch
Other Post
Overhead Sign Support
Parked Motor Vehicle
Pedalcycle
Mail Box
Median Barrier
Other Fixed Object
Other Object, not Fixed
Utility Pole
Wild Animal
Total
Pedestrian
Railway Train
Rock or Boulder
Tree

Body Style All Crashes Fatal Crashes Injury Crashes
Passenger Car (Unknown) 8,430 76 1,917
Van 1,314 8 332
Bus 76 10
School Bus 72 1 14
Pickup (Category Unknown) 4,913 68 1,250
Truck/Truck-Tractor 1,065 22 216
Motorhome 58 25 8
Motorcycle 442 25 347
Ambulance 5
Farm Tractor/Machinery 4 1
Construction Equipment 25 4
Pickup with Camper 15 6
Bicycle 134 101
Snowmobile 10 6
Other 117 1 22
Fire Truck 5 1
Small Pickup 811 205
Standard Pickup 2,354 1 546
Subcompact Car 152 41
Compact Car 1,607 1 401
Mid-Size Car 3,511 5 895
Large Passenger Car 315 208
Small Station Wagon 208 60
Mid-Size Station Wagon 158 43
Large Station Wagon 35 14
Moped 6 4
Mini Van 441 143
Sport Utility 5,530 37 1,483
Tow Truck in Transit 10 4
All Terrain Vehicle 74 5 57
Working Construction Equipment 17 2
Unknown Vehicle Type 581 53
Total 32,495 275 8,394
38
Vehicles by Body Style 2009

442
25
353
27
393
Total Fatal Total Fatal Total Fatal
236 9 136 2 100 7
28 4 21 3 7 1
3 1 0 0 3 1
5 1 0 0 5 1
0 2 0 0 0 0
2 1 11 2 0 0
274 18 168 7 115 10
39
Total Crashes
Fatal Crashes
Injury Crashes
Persons Killed
Motorcycle Crashes 2009
City Streets
Total
39
162
120
28
65
Fatal
County Roads
Where Crash Occurred
Interstate Highways
U.S. Highways
3
10
3State Highways
Not Reported
(drivers only)
Neither Alcohol nor Drugs Present
Motorcyclist Sobriety
28
442
Persons Injured
* Rural = Statewide minus City
2
7
0Other Trafficways
Alcohol Present
Alcohol and Drugs Present
Drugs Present
*Rural
Total
25Total
Unknown
Statewide City

Used Not Used Not Used Not Used Not Used Not Used Not
5 1 0 0 4 1 0 0 1 0 0 0
1 1 0 0 1 1 0 0 1 0 0 0
5 3 0 0 4 4 0 0 1 0 0 0
15 6 1 1 21 17 0 1 0 0 1 0
18 15 0 5 14 15 0 2 4 0 0 3
109 72 2 12 18 30 0 2 91 42 2 10
9 5 0 2 5 3 0 1 4 2 0 1
7 0 2 0 30 0 1 0 0 0 1 0
169 103 5 20 97 71 1 6 72 32 4 14
Used Not Used Not Used Not Used Not Used Not Used Not
4 0 0 0 1 4 0 0 3 0 0 0
1 0 0 0 0 1 0 0 1 0 0 0
1 1 0 0 0 1 0 0 1 0 0 0
0 11 0 0 0 1 0 0 0 10 1 0
3 1 0 1 1 0 0 0 2 1 0 3
28 9 1 0 0 4 0 0 28 5 2 10
1 1 0 0 0 0 0 0 1 1 0 1
0 0 0 0 5 0 0 0 0 0 1 0
38 23 1 1 7 11 0 0 31 12 1 1
40
Helmet Usage by Age of Driver 2009
*Rural
Total FatalAge
Not Stated
14 & Under
15 to 17
18 to 19
20 to 24
Total
Statewide City
Total Fatal Total Fatal
25 to 34
35 to 64
20 to 24
65 & Over
Helmet Usage by Age of Passenger
Statewide City *Rural
Age Fatal Total FatalTotal Fatal Total
14 & Under
15 to 17
18 to 19
* Rural = Statewide minus City
Total
25 to 34
35 to 64
65 & Over
Not Stated

The Montana State Patrol is looking for qualified applicants to become part of our team. You may be eligible to join the Patrol if you possess any of the
following:
► High school diploma (or GED)
► Montana Basic POST certificate
► Out of State POST certificate Testing dates and locations are posted on our website
If you are interested in being a part of Montana’s premier law enforcement agency, now is your chance. For more information call the number below
or contact the recruiting officer @ 406-444-3284 or email [email protected]
The Montana Highway Patrol is an AA/EEO Employer