Water pollutant fingerprinting tracks recent industrial transfer from coastal to inland China: a...
6
Water pollutant fingerprinting tracks recent industrial transfer from coastal to inland China: A case study Weiwei Zheng 1 *, Xia Wang 1 *, Dajun Tian 1 *, Songhui Jiang 1 , Melvin E. Andersen 2 , Gengsheng He 1 , M. James C. Crabbe 3 , Yuxin Zheng 4 , Yang Zhong 5,6 & Weidong Qu 1,7 1 Key Laboratory of Public Health Safety, Ministry of Education, Department of Environmental Health, School of Public Health, Fudan University, Shanghai 200032, China, 2 Institutes for Chemical Safety Sciences, The Hamner Institutes for Health Sciences, Research Triangle Park, North Carolina 27709, USA, 3 Institute of Biomedical and Environmental Science & Technology, Faculty of Creative Arts, Technologies and Science, University of Bedfordshire, Luton LU1 3JU, United Kingdom, 4 National Institute of Occupational Health and Poison Control, Chinese Center for Disease Control & Prevention, Beijing 100050, China, 5 Institute of Biodiversity Science and Institute of High Altitude Medicine, Tibet University, Lhasa 850000, China, 6 School of Life Sciences, Fudan University, Shanghai 200433, China, 7 Center of Global Health, School of Public Health, Fudan University, Shanghai 200032, China. In recent years, China’s developed regions have transferred industries to undeveloped regions. Large numbers of unlicensed or unregistered enterprises are widespread in these undeveloped regions and they are subject to minimal regulation. Current methods for tracing industrial transfers in these areas, based on enterprise registration information or economic surveys, do not work. We have developed an analytical framework combining water fingerprinting and evolutionary analysis to trace the pollution transfer features between water sources. We collected samples in Eastern China (industrial export) and Central China (industrial acceptance) separately from two water systems. Based on the water pollutant fingerprints and evolutionary trees, we traced the pollution transfer associated with industrial transfer between the two areas. The results are consistent with four episodes of industrial transfers over the past decade. Our results also show likely types of the transferred industries - electronics, plastics, and biomedicines - that contribute to the water pollution transfer. T he ‘Rise of Central China’ Plan has become the cornerstone of Chinese economic development strategy 1,2 , following the previous development of coastal regions 3 . Central areas of China, with their high population densities and developmental potential, are also very attractive sites for industrial development 1,4 . Today, this transfer of industrial activity is already in progress between developing and developed regions. The scales, temporal-spatial pattern, transfer process and intensity of industrial transfer vary significantly from area to area 5,6 . Water pollution inevitably accompanies the transfer of manufacturing enterprises between regions 7 . Due to limited regulation and registration in the undeveloped areas, there are a large number of unlicensed or unregistered enterprises in these undeveloped regions 8,9 . Therefore, economic surveys or use of economic geo- graphy, the usual method for tracing industrial transfer, are not useful 10,11 . We tackled the problem of accounting for pollution transfer by identifying the pollutant composition (fin- gerprint) in water bodies from various regions. The pollutant profiles, with appropriate analysis, reflect current pollution status of particular water sources and infer the transfer process. To assure that water fingerprint samples were representative of transfer activities, we selected two areas to serve as prototypical export and acceptance regions (Fig. 1). The export region located in the Yangtze Delta includes the developed coastal area in Eastern China 1 . This region has transferred various enterprises in recent years to central areas, such as Henan province 4 . With the soaring economic development in the past two decades, water bodies have received significant increases in organic pollutants 12,13 . In particular, parts of the Huai River basin located in Henan segment experienced increased organic pollution discharge 12 . These two areas, separately affiliated to the two main, relatively isolated river basins in China, can sufficiently visualize the image of industrial (pollution) transfer process based on their geographic, climatic, economic, developmental and urban-rural differences. Water fingerprints evolve by a process of descent with changes 14 . Pollutant components of water bodies in different regions and periods originate from the same or different pollution sources; similarities among water fingerprints reflect water-body relationships (Supplementary Information 1) 15 . The evolutionary process gives SCIENTIFIC REPORTS SREP-12-02550-T.3d 21/12/12 10:49:11 SUBJECT AREAS: EVOLUTION ENVIRONMENTAL SCIENCES RISK FACTORS CHEMISTRY Received 21 August 2012 Accepted 14 December 2012 Published 7 January 2013 Correspondence and requests for materials should be addressed to Y.Z. (yxzheng@163bj. com) or Y.Z. (yangzhong@fudan. edu.cn) or W.Q. ([email protected]) * These authors contributed equally to this work. SCIENTIFIC REPORTS | 3 : 1031 | DOI: 10.1038/srep01031 1
-
Upload
independent -
Category
Documents
-
view
0 -
download
0
Transcript of Water pollutant fingerprinting tracks recent industrial transfer from coastal to inland China: a...
Water pollutant fingerprinting tracksrecent industrial transfer from coastal toinland China: A case studyWeiwei Zheng1*, Xia Wang1*, Dajun Tian1*, Songhui Jiang1, Melvin E. Andersen2, Gengsheng He1,M. James C. Crabbe3, Yuxin Zheng4, Yang Zhong5,6 & Weidong Qu1,7
1Key Laboratory of Public Health Safety, Ministry of Education, Department of Environmental Health, School of Public Health, FudanUniversity, Shanghai 200032, China, 2Institutes for Chemical Safety Sciences, The Hamner Institutes for Health Sciences, ResearchTriangle Park, North Carolina 27709, USA, 3Institute of Biomedical and Environmental Science & Technology, Faculty of CreativeArts, Technologies and Science, University of Bedfordshire, Luton LU1 3JU, United Kingdom, 4National Institute of OccupationalHealth and Poison Control, Chinese Center for Disease Control & Prevention, Beijing 100050, China, 5Institute of BiodiversityScience and Institute of High Altitude Medicine, Tibet University, Lhasa 850000, China, 6School of Life Sciences, Fudan University,Shanghai 200433, China, 7Center of Global Health, School of Public Health, Fudan University, Shanghai 200032, China.
In recent years, China’s developed regions have transferred industries to undeveloped regions. Largenumbers of unlicensed or unregistered enterprises are widespread in these undeveloped regions and they aresubject to minimal regulation. Current methods for tracing industrial transfers in these areas, based onenterprise registration information or economic surveys, do not work. We have developed an analyticalframework combining water fingerprinting and evolutionary analysis to trace the pollution transfer featuresbetween water sources. We collected samples in Eastern China (industrial export) and Central China(industrial acceptance) separately from two water systems. Based on the water pollutant fingerprints andevolutionary trees, we traced the pollution transfer associated with industrial transfer between the two areas.The results are consistent with four episodes of industrial transfers over the past decade. Our results alsoshow likely types of the transferred industries - electronics, plastics, and biomedicines - that contribute tothe water pollution transfer.
The ‘Rise of Central China’ Plan has become the cornerstone of Chinese economic development strategy1,2,following the previous development of coastal regions3. Central areas of China, with their high populationdensities and developmental potential, are also very attractive sites for industrial development1,4. Today, this
transfer of industrial activity is already in progress between developing and developed regions. The scales,temporal-spatial pattern, transfer process and intensity of industrial transfer vary significantly from area toarea5,6. Water pollution inevitably accompanies the transfer of manufacturing enterprises between regions7.Due to limited regulation and registration in the undeveloped areas, there are a large number of unlicensed orunregistered enterprises in these undeveloped regions8,9. Therefore, economic surveys or use of economic geo-graphy, the usual method for tracing industrial transfer, are not useful10,11.
We tackled the problem of accounting for pollution transfer by identifying the pollutant composition (fin-gerprint) in water bodies from various regions. The pollutant profiles, with appropriate analysis, reflect currentpollution status of particular water sources and infer the transfer process. To assure that water fingerprint sampleswere representative of transfer activities, we selected two areas to serve as prototypical export and acceptanceregions (Fig. 1). The export region located in the Yangtze Delta includes the developed coastal area in EasternChina1. This region has transferred various enterprises in recent years to central areas, such as Henan province4.With the soaring economic development in the past two decades, water bodies have received significant increasesin organic pollutants12,13. In particular, parts of the Huai River basin located in Henan segment experiencedincreased organic pollution discharge12. These two areas, separately affiliated to the two main, relatively isolatedriver basins in China, can sufficiently visualize the image of industrial (pollution) transfer process based on theirgeographic, climatic, economic, developmental and urban-rural differences.
Water fingerprints evolve by a process of descent with changes14. Pollutant components of water bodies indifferent regions and periods originate from the same or different pollution sources; similarities among waterfingerprints reflect water-body relationships (Supplementary Information 1)15. The evolutionary process gives
SCIENTIFIC REPORTS SREP-12-02550-T.3d 21/12/12 10:49:11
SUBJECT AREAS:EVOLUTION
ENVIRONMENTAL SCIENCES
RISK FACTORS
CHEMISTRY
Received21 August 2012
Accepted14 December 2012
Published7 January 2013
Correspondence andrequests for materials
should be addressed toY.Z. (yxzheng@163bj.
com) or Y.Z.(yangzhong@fudan.
edu.cn) or W.Q.([email protected])
* These authorscontributed equally to
this work.
SCIENTIFIC REPORTS | 3 : 1031 | DOI: 10.1038/srep01031 1
rise to diversities of fingerprints among various water bodies15.Similarly, in species evolving from ancestors, random mutationsand variation caused by environmental pressure (insertion, substi-tution and deletion) of biological sequences produce the diversities ofspecies (Supplementary Information 1)16,17. Reconstructing ancestralorigin discloses complex relationships among species based on com-parison of similarity and variation between existent biologicalsequences16,17. Tree topology, which powerfully reflects natural his-tory and biological phylogeny18–22, effectively identifies the relation-ships of the pollution fingerprints in various water bodies23.
In this study, we developed an analytical framework combiningwater fingerprint and evolutionary analysis, examined the diversitiesof water fingerprints and temporal-spatial relationships among thewater sources, and explicitly traced industrial transfer processes andcommon features between different regions. In addition, we analyzedtarget compounds in the water sources for identifying possible typesof industrial transfer.
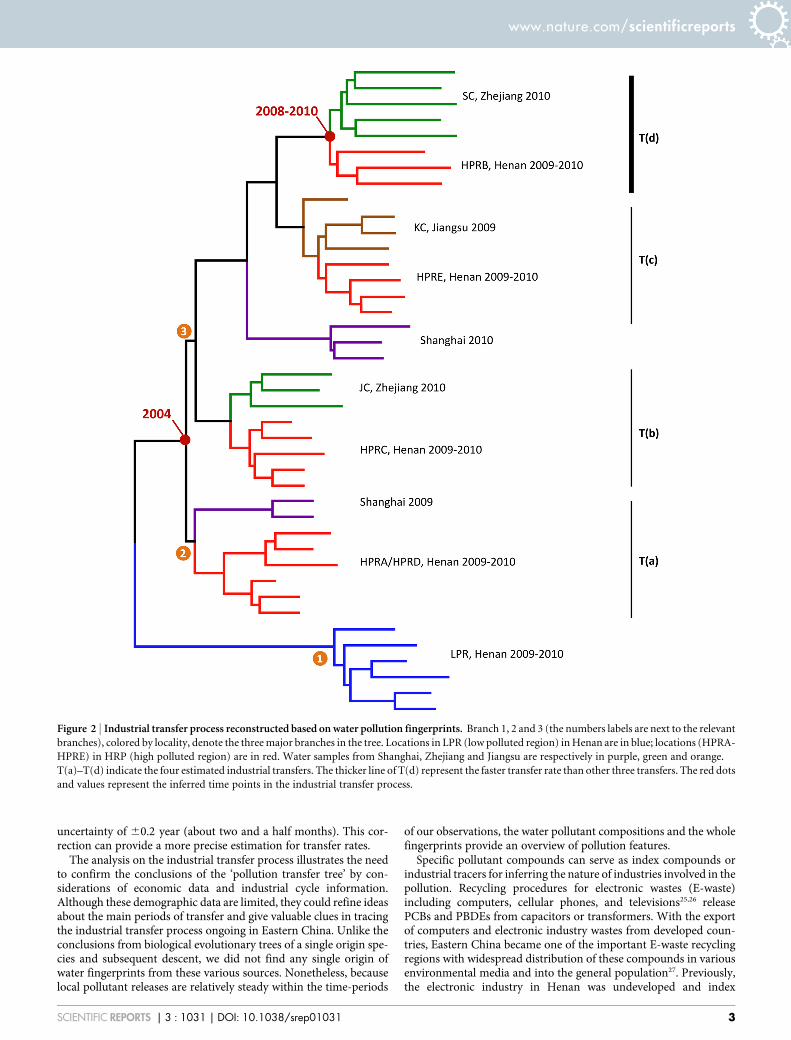
ResultsFig. 2 demonstrates the tree constructed for the water fingerprints invarious regions. The red (highly polluted regions in Henan), purple(Shanghai), green (Zhejiang) and orange (Jiangsu) branches clustertogether in main branch 2 and 3. The blue branches (low pollutedregions in Henan) are in a separate main branch 1. Thus, fingerprintsof water samples in highly polluted regions of Henan were moresimilar to those of Eastern regions than were those of low pollutedregions (control regions) in Henan. This observation confirms thepollution transfer between the industrial export and acceptanceregions. Thus, the water bodies in industrial export regions serveas a ‘source’ and those in the industrial acceptance regions appearas a ‘sink’.
In two main branches of the tree (branch 2 and branch 3), the redbranches with highly polluted region A, B, C, D, and E in Henanactually clustered with the water sources from Shanghai, Zhejiangand Jiangsu in four clades - T(a), T(b), T(c), and T(d). Though A, B,C, D, and E localities had relative proximity (Fig. 1), the water fin-gerprint samples from these five localities were more closely relatedto those from water sources in Eastern regions than to each other.The local water fingerprints in A–E localities belonged to four dis-tinct lineages. Since the reconstructed relationships of water pol-lution fingerprints represented the origin of pollution relationshipsbetween different regions (Supplementary Information 1), thesepollution lineages are suggestive of four pollution origin episodes.Additionally, each lineage showed the same or similar pollution
origin transferred from industrial export regions to acceptanceregions. Therefore, these four episodes are likely to represent inde-pendent events. T(a), T(b), T(c), and T(d) then are likely to representfour episodes of pollution (industrial) transfer from Eastern toCentral China (Fig. 2).
The transfer rate heterogeneity among these four pollution trans-fers was analyzed by the relative rate test between the lineages in thetree. T(d) had relatively faster rates than other three transfers; how-ever, no significant rate differences were observed between every twotransfers of T(a), T(b) and T(c) (Table 1 and Fig. 2). Therefore, thegrouping [T(a), T(b) and T(c)] had different transfer features com-pared to T(d), indicating two different stages of industrial transferfrom east to west.
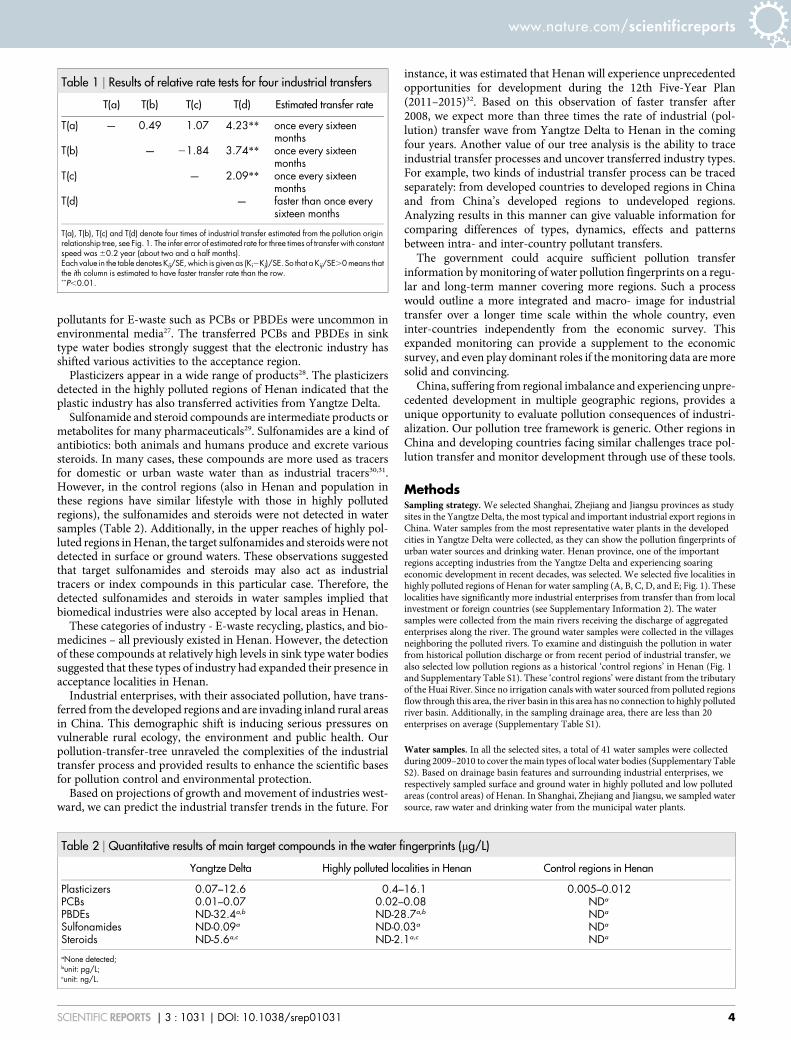
Our analysis of the target compounds in the water samplesrevealed that the water fingerprints from high polluted regions inHenan and from the Yangtze Delta identified relatively high concen-trations of plasticizers, polychlorinated biphenyls (PCBs), polybro-minated diphenyl ethers (PBDEs) and sulfonamide or steroidcompounds; these pollutants were not found in the low pollutionarea of Henan (Table 2).
DiscussionBased on the specific outcomes from the reconstructed ‘pollutioncladogram’ and rate heterogeneity test for transfer, we now can focuson the process of these four episodes of industrial transfer. In China,the industrial transfer began in 200424. Local economic statistics alsoindicated that the highly polluted regions in Henan accepted indus-tries on a relative large scale for the first time during 2004–2005(Supplementary Information 2). Owing to the global financial crisisafter 20084, China experienced significant adjustments and changesin industrial policies and economic strategies. During this period, thedeveloped regions accelerated the pace of industrial transfer. Thus,we hypothesized that T(d), with its faster rate, happened in this morerecent economic cycle and was the fourth transfer. The previousthree industrial transfers, T(a) through T(c), occurred during2004–2008, with a constant rate of one episode every sixteen months(Table 1).
The occurrence or evolution of pollution is now extremely rapid inthis era of intensive industrialization. Our results also show thatpollution transfers vary on a year-to-year scale in emerging econom-ies. The ability to estimate timing of events in industrial transferprocesses requires much smaller errors than in biological or lin-guistic evolution processes. Based on the inferred errors in the rateheterogeneity test (Table 1), each constant rate has an associated
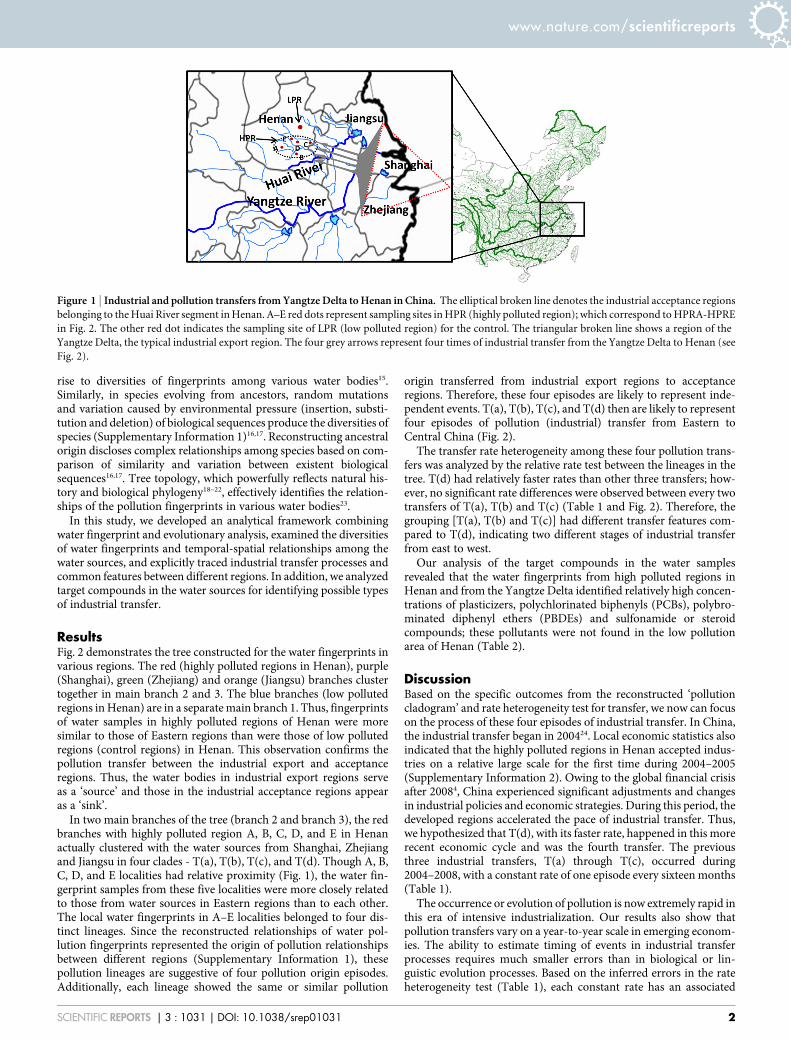
Figure 1 | Industrial and pollution transfers from Yangtze Delta to Henan in China. The elliptical broken line denotes the industrial acceptance regions
belonging to the Huai River segment in Henan. A–E red dots represent sampling sites in HPR (highly polluted region); which correspond to HPRA-HPRE
in Fig. 2. The other red dot indicates the sampling site of LPR (low polluted region) for the control. The triangular broken line shows a region of the
Yangtze Delta, the typical industrial export region. The four grey arrows represent four times of industrial transfer from the Yangtze Delta to Henan (see
Fig. 2).
www.nature.com/scientificreports
SCIENTIFIC REPORTS | 3 : 1031 | DOI: 10.1038/srep01031 2
uncertainty of 60.2 year (about two and a half months). This cor-rection can provide a more precise estimation for transfer rates.
The analysis on the industrial transfer process illustrates the needto confirm the conclusions of the ‘pollution transfer tree’ by con-siderations of economic data and industrial cycle information.Although these demographic data are limited, they could refine ideasabout the main periods of transfer and give valuable clues in tracingthe industrial transfer process ongoing in Eastern China. Unlike theconclusions from biological evolutionary trees of a single origin spe-cies and subsequent descent, we did not find any single origin ofwater fingerprints from these various sources. Nonetheless, becauselocal pollutant releases are relatively steady within the time-periods
of our observations, the water pollutant compositions and the wholefingerprints provide an overview of pollution features.
Specific pollutant compounds can serve as index compounds orindustrial tracers for inferring the nature of industries involved in thepollution. Recycling procedures for electronic wastes (E-waste)including computers, cellular phones, and televisions25,26 releasePCBs and PBDEs from capacitors or transformers. With the exportof computers and electronic industry wastes from developed coun-tries, Eastern China became one of the important E-waste recyclingregions with widespread distribution of these compounds in variousenvironmental media and into the general population27. Previously,the electronic industry in Henan was undeveloped and index
Figure 2 | Industrial transfer process reconstructed based on water pollution fingerprints. Branch 1, 2 and 3 (the numbers labels are next to the relevant
branches), colored by locality, denote the three major branches in the tree. Locations in LPR (low polluted region) in Henan are in blue; locations (HPRA-
HPRE) in HRP (high polluted region) are in red. Water samples from Shanghai, Zhejiang and Jiangsu are respectively in purple, green and orange.
T(a)–T(d) indicate the four estimated industrial transfers. The thicker line of T(d) represent the faster transfer rate than other three transfers. The red dots
and values represent the inferred time points in the industrial transfer process.
www.nature.com/scientificreports
SCIENTIFIC REPORTS | 3 : 1031 | DOI: 10.1038/srep01031 3
pollutants for E-waste such as PCBs or PBDEs were uncommon inenvironmental media27. The transferred PCBs and PBDEs in sinktype water bodies strongly suggest that the electronic industry hasshifted various activities to the acceptance region.
Plasticizers appear in a wide range of products28. The plasticizersdetected in the highly polluted regions of Henan indicated that theplastic industry has also transferred activities from Yangtze Delta.
Sulfonamide and steroid compounds are intermediate products ormetabolites for many pharmaceuticals29. Sulfonamides are a kind ofantibiotics: both animals and humans produce and excrete varioussteroids. In many cases, these compounds are more used as tracersfor domestic or urban waste water than as industrial tracers30,31.However, in the control regions (also in Henan and population inthese regions have similar lifestyle with those in highly pollutedregions), the sulfonamides and steroids were not detected in watersamples (Table 2). Additionally, in the upper reaches of highly pol-luted regions in Henan, the target sulfonamides and steroids were notdetected in surface or ground waters. These observations suggestedthat target sulfonamides and steroids may also act as industrialtracers or index compounds in this particular case. Therefore, thedetected sulfonamides and steroids in water samples implied thatbiomedical industries were also accepted by local areas in Henan.
These categories of industry - E-waste recycling, plastics, and bio-medicines – all previously existed in Henan. However, the detectionof these compounds at relatively high levels in sink type water bodiessuggested that these types of industry had expanded their presence inacceptance localities in Henan.
Industrial enterprises, with their associated pollution, have trans-ferred from the developed regions and are invading inland rural areasin China. This demographic shift is inducing serious pressures onvulnerable rural ecology, the environment and public health. Ourpollution-transfer-tree unraveled the complexities of the industrialtransfer process and provided results to enhance the scientific basesfor pollution control and environmental protection.
Based on projections of growth and movement of industries west-ward, we can predict the industrial transfer trends in the future. For
instance, it was estimated that Henan will experience unprecedentedopportunities for development during the 12th Five-Year Plan(2011–2015)32. Based on this observation of faster transfer after2008, we expect more than three times the rate of industrial (pol-lution) transfer wave from Yangtze Delta to Henan in the comingfour years. Another value of our tree analysis is the ability to traceindustrial transfer processes and uncover transferred industry types.For example, two kinds of industrial transfer process can be tracedseparately: from developed countries to developed regions in Chinaand from China’s developed regions to undeveloped regions.Analyzing results in this manner can give valuable information forcomparing differences of types, dynamics, effects and patternsbetween intra- and inter-country pollutant transfers.
The government could acquire sufficient pollution transferinformation by monitoring of water pollution fingerprints on a regu-lar and long-term manner covering more regions. Such a processwould outline a more integrated and macro- image for industrialtransfer over a longer time scale within the whole country, eveninter-countries independently from the economic survey. Thisexpanded monitoring can provide a supplement to the economicsurvey, and even play dominant roles if the monitoring data are moresolid and convincing.
China, suffering from regional imbalance and experiencing unpre-cedented development in multiple geographic regions, provides aunique opportunity to evaluate pollution consequences of industri-alization. Our pollution tree framework is generic. Other regions inChina and developing countries facing similar challenges trace pol-lution transfer and monitor development through use of these tools.
MethodsSampling strategy. We selected Shanghai, Zhejiang and Jiangsu provinces as studysites in the Yangtze Delta, the most typical and important industrial export regions inChina. Water samples from the most representative water plants in the developedcities in Yangtze Delta were collected, as they can show the pollution fingerprints ofurban water sources and drinking water. Henan province, one of the importantregions accepting industries from the Yangtze Delta and experiencing soaringeconomic development in recent decades, was selected. We selected five localities inhighly polluted regions of Henan for water sampling (A, B, C, D, and E; Fig. 1). Theselocalities have significantly more industrial enterprises from transfer than from localinvestment or foreign countries (see Supplementary Information 2). The watersamples were collected from the main rivers receiving the discharge of aggregatedenterprises along the river. The ground water samples were collected in the villagesneighboring the polluted rivers. To examine and distinguish the pollution in waterfrom historical pollution discharge or from recent period of industrial transfer, wealso selected low pollution regions as a historical ‘control regions’ in Henan (Fig. 1and Supplementary Table S1). These ‘control regions’ were distant from the tributaryof the Huai River. Since no irrigation canals with water sourced from polluted regionsflow through this area, the river basin in this area has no connection to highly pollutedriver basin. Additionally, in the sampling drainage area, there are less than 20enterprises on average (Supplementary Table S1).
Water samples. In all the selected sites, a total of 41 water samples were collectedduring 2009–2010 to cover the main types of local water bodies (Supplementary TableS2). Based on drainage basin features and surrounding industrial enterprises, werespectively sampled surface and ground water in highly polluted and low pollutedareas (control areas) of Henan. In Shanghai, Zhejiang and Jiangsu, we sampled watersource, raw water and drinking water from the municipal water plants.
Table 2 | Quantitative results of main target compounds in the water fingerprints (mg/L)
Yangtze Delta Highly polluted localities in Henan Control regions in Henan
Plasticizers 0.07–12.6 0.4–16.1 0.005–0.012PCBs 0.01–0.07 0.02–0.08 NDa
PBDEs ND-32.4a,b ND-28.7a,b NDa
Sulfonamides ND-0.09a ND-0.03a NDa
Steroids ND-5.6a,c ND-2.1a,c NDa
aNone detected;bunit: pg/L;cunit: ng/L.
Table 1 | Results of relative rate tests for four industrial transfers
T(a) T(b) T(c) T(d) Estimated transfer rate
T(a) — 0.49 1.07 4.23** once every sixteenmonths
T(b) — 21.84 3.74** once every sixteenmonths
T(c) — 2.09** once every sixteenmonths
T(d) — faster than once everysixteen months
T(a), T(b), T(c) and T(d) denote four times of industrial transfer estimated from the pollution originrelationship tree, see Fig. 1. The infer error of estimated rate for three times of transfer with constantspeed was 60.2 year (about two and a half months).Each value in the table denotes Kij/SE, which is given as (Ki2Kj)/SE. So that a Kij/SE.0 means thatthe ith column is estimated to have faster transfer rate than the row.**P,0.01.
www.nature.com/scientificreports
SCIENTIFIC REPORTS | 3 : 1031 | DOI: 10.1038/srep01031 4
Whole-pollution-fingerprints analysis. To examine pollutant discharge, organicfingerprints of various water samples, analyzed by gas chromatography-massspectrum (GC-MS) and liquid chromatography-tandem mass spectrometry (LC-MS/MS), traced the pollutant discharges and provided the data matrix for creating theevolutionary tree. Each water sample (40 L) was first filtered through a 0.45 mm glassfiber membrane and extracted by passing through 10 g XAD-2 cartridge. Afterelution and concentration, the whole pollutant fingerprint in each extract wasdetected by GC-MS23,33 and LC-MS/MS (detailed information in SupplementaryInformation 4 and Supplementary Information 5).
Common compound matching between water fingerprints. We developedprograms and macrocommands in SAS 9.234 for automatically matching the resolvedspectra between every two water pollution samples. As the retention time of the peakscould not give sufficient information for identifying compounds, the resolved massspectra were combined to ascertain that the same compound was represented by thesame variable number in all samples. We evaluated similarity between spectradepending on several guides23,35,36. Finally, we calculated the integrated areas of theremaining resolved chromatograms. In the resulting data matrix (X), each rowrepresented one sample and each column denoted one compound, the latteridentified by its mean retention time. The numbers of detected peaks in all waterfingerprints from 41 water samples ranged from 240 to 392. The total number ofcommon compounds (appeared in at least two samples) in all water pollutionfingerprints was 1522 based on similarity matching among all resolved peaks usingboth retention time and mass spectrum information. On average, between every twopollution fingerprints of water samples, 148 common compounds (ranging from 115to 192) were matched.
Data matrix conversion23. After establishing a data matrix (X), the presence orabsence of each compound was coded as ‘1’ or ‘0’, respectively, to produce a binarymatrix (Y) of all matched and included compounds in X. Then the converted datamatrix (Y) can be used for character-feature-based tree-building methods.
Distance matrix establishment23. Using the information of overlapped compoundsbetween every two water fingerprints, we defined and calculated a distance matrix of‘intersection and union ratio (IUR)’ of all 41 water pollution samples. Detaileddescriptions and formulae are in Supplementary Information 3 and SupplementaryTable S3.
Tree construction. The neighbor-joining (NJ) method was used to construct trees ofcomplex water fingerprints through MEGA 4.137 based on IUR distance matrix. Thebinary data matrix (Y) was used for constructing ‘pollution trees’ by maximumparsimony (MP) and maximum likelihood (ML) methods through PAUP 4.038.Topological robustness was investigated using 10000 non-parametric bootstrapreplicates.
Relative rate test. The relative-rate tests of between the lineages in the waterfingerprint tree were performed with the proposed method39 and using PAML 4.540.The binary transferred matrix was used for relative rate tests.
Quantitative analysis for target compounds. The target compounds in the waterfingerprints such as plastics, PCBs, PBDEs, sulfonamides and steroidal compounds(the detailed compound list see Supplementary Table S4) were quantitativelyinvestigated. The phthalate esters (PAEs), PCBs and PBDEs were detected by solidphase extraction (SPE) with GC-MS41–44. To detect the trace-level PCBs and PBDEs inwater samples, a large-volume (20 L) of water was used for extracting targetcompounds in each sample41,44. Sulfonamides and steroids were analyzed by SPE withliquid chromatography-tandem mass spectrometry (LC-MS/MS)31,45. Only thesulfonamides were quantified by external standard curves, all the other targetcompounds were quantified by internal standard calibration procedures. Thecorrelation coefficients of the calibration curves for all target compounds were greaterthan 0.99 (Supplementary Information 5 and Supplementary Table S5, S7, S8 and S9).The limit of detection (LOD) was defined as a signal of 3 times the noise level. TheLOD for PAEs (0.2–1.4 ng/L), and, PCBs (2–8 pg/L), PBDEs (0.08–6 pg/L),sulfonamides (0.2–0.8 ng/L) and steroids (0.02–0.06 ng/L) are shown inSupplementary Information 5 and Supplementary Table S5, S7, S8 and S9. For everybatch of 10 samples, a solvent blank and a procedural blank were added. Therecoveries of surrogate standards, spiked blank samples and spiked matrix blanksamples were analyzed to evaluate the repeatability and accuracy of analyticalprocedures. The sample preparation, parameters of instrumental analysis and resultsof quality assurance (QA) and quality control (QC) are shown in SupplementaryInformation (Supplementary Information 5 and Supplementary Table S5–S9).
1. Zheng, Y. N. & Chen, M. J. China’s regional disparity and its policy response.,http://www.nottingham.ac.uk/cpi/documents/briefings/briefing-25-china-regional-disparity.pdf. (2007) (Accessed 15th March 2011).
2. Yu, Y. Y. & Gao, L. Central China rise and ideological construction. Int. Biz. Mgmt.1, 1–6 (2010).
3. Ke, S. Agglomeration, productivity, and spatial spillovers across Chinese cities.Ann. Reg. Sci. 45, 157–179 (2010).
4. Liu, D. Factor flow and transfer of the processing trade in China: from coastline tocentral and west areas. ,www.academicpub.org/essr/download.aspx?ID5118.
(2011) (Accessed 20th January 2012).5. Liu, Y. & Huang, Y. Impact analysis of international industrial transfer on SMEs in
Zhejiang. 2011 International Conference on E-business and E-government.,http://ieeexplore.ieee.org/xpls/abs_all.jsp?arnumber55882151. (2011)(Accessed 20th January 2012).
6. Huai, J. Industrial transfer and economic development in less developed regions.2010 International Conference on E-business and E-government. ,http://ieeexplore.ieee.org/xpl/articleDetails.jsp?reload5true&arnumber55592344.
(2010) (Accessed 2nd December 2011).7. Mehra, M. K. & Das, S. P. North-South trade and pollution migration: the debate
revisited. Environ. Resources Econ. 40, 139–164 (2007).8. State Administration for Industry & Commerce of the People’s Republic of China.
Yearbook of Industry and Commerce Administration of China 2011. (ChinaIndustry and Commerce Associated Press, Beijing, 2011) (in Chinese).
9. Kushnir, K., Mirmulstein, M. L. & Ramalho, R. Micro, small, and mediumenterprises around the world: how many are there, and what affects the count?IFC and the World Bank.,http://www1.ifc.org/wps/wcm/connect/9ae1dd80495860d6a482b519583b6d16/MSME-CI-AnalysisNote.pdf?MOD5
AJPERES&CACHEID59ae1dd80495860d6a482b519583b6d16. (2010)(Accessed 2nd December 2011).
10. Boschma, R. & Frenken, K. Why is economic geography not an evolutionaryscience? Towards an evolutionary economic geography. J. Econ. Geogr. 6, 273–302(2006).
11. Frenken, K. & Boschma, R. A theoretical framework for evolutionary economicgeography: industrial dynamics and urban growth as a branching process. J. Econ.Geogr. 7, 635–649 (2007).
12. National Bureau of Statistics of China. China Statistical Yearbook 2001–2010.,http://www.stats.gov.cn/tjsj/ndsj/. (2001–2010) (Accessed 6th June 2011).
13. Bao, L. J., Maruya, K. A., Snyder, S. A. & Zeng, E. Y. China’s water pollution bypersistent organic pollutants. Environ. Pollut. 163, 100–108 (2012).
14. Qureshi, I. H. Antarctic marine sediments as fingerprints of pollution migration.J. Radioanal. Nucl. Ch. 250, 97–107 (2001).
15. Pal, A., Gin, Y. H., Lin, Y. C. & Reinhard, M. Impacts of emerging organiccontaminants on freshwater resources: Review of recent occurrences, sources, fateand effects. Sci. Total. Environ. 408, 6062–6069 (2010).
16. Nei, M. & Kumar, S. Molecular evolution and phylogenetics. (Oxford Press, NewYork, 2000).
17. Yang, Z. Computational molecular evolution. (Oxford Unv. Press, 2006).18. Barbrook, A. C., Howe, C. J., Blake, N. & Robinson, P. The phylogeny of The
Canterbury Tales. Nature 394, 839 (1998).19. Gray, R. D. & Atkinson, Q. D. Language-tree divergence times support the
Anatolian theory of Indo-European origin. Nature 426, 435–439 (2003).20. Rexova, K., Frynta, D. & Zrzavy, J. Cladistic analysis of languages: Indo-European
classification based on lexicostatistical data. Cladistics 19, 120–127 (2003).21. Pagel, M., Atkinson, Q. D. & Meade, A. Frequency of word-use predicts rates of
lexical evolution throughout Indo-European history. Nature 449, 717–720(2007).
22. Dunn, M., Greenhill, S. J., Levinson, S. C. & Gray, R. D. Evolved structure oflanguage shows lineage-specific trends in word-order universal. Nature 473,79–82 (2011).
23. Zheng, W. et al. Pollution trees: Identifying similarities among complex pollutantmixtures in water and correlating them to mutagenicity. Environ. Sci. Technol. 46,7274–7282 (2012).
24. People’s Daily Online. Industrial transfer boosts central China. ,http://english.peopledaily.com.cn/200604/19/eng20060419_259440.html. (2006)(Accessed 25th October 2011).
25. Ni, H. G., Zeng, H., Tao, S. & Zeng, E. Y. Environmental and human exposure topersistent halogenated compounds derived from e-waste in China. Environ.Toxicol. Chem. 29, 1237–47 (2010).
26. Robinson, B. H. E-waste: an assessment of global production and environmentalimpacts. Sci. Total Environ. 408, 183–91 (2009).
27. Breivik, K., Gioia, R., Chakraborty, P., Zhang, G. & Jones, K. C. Are reductions inindustrial organic contaminants emissions in rich countries achieved partly byexport of toxic wastes? Environ. Sci. Technol. 45, 9154–9160 (2011).
28. Zhou, Y., Wang, H., Chen, Y. & Jiang, Q. Environmental and food contaminationwith plasticisers in China. Lancet 378, e4 (2011).
29. Peng, X., Tan, J., Tang, C., Yu, Y. & Wang, Z. Multiresidue determination offluoroquinolone, sulfonamide, trimethoprim, and chloramphenicol antibiotics inurban waters in China. Environ. Toxicol. Chem. 27, 73–79 (2008).
30. Li, W., Shi, Y., Gao, Y., Liu, J. & Cai, Y. Occurrence of antibiotics in water,sediments, aquatic plants, and animals from Baiyangdian Lake in North China.Chemosphere 89, 1307–1315 (2012).
31. Tolgyesi, A., Verebey, Z., Sharma, V. K., Kovacsics, L. & Fekete, J. Simultaneousdetermination of corticosteroids, androgens, and progesterone in river water byliquid chromatography-tandem mass spectrometry. Chemosphere 78, 972–979(2010).
32. People’s Daily Online. Henan’s advantages go hand in hand with development.,http://www.chinadaily.com.cn/kindle/2011-09/08/content_13647469.htm.
(2011) (Accessed 18th February 2012).
www.nature.com/scientificreports
SCIENTIFIC REPORTS | 3 : 1031 | DOI: 10.1038/srep01031 5
33. Chen, L. et al. Status of trace organic pollution in the network water came fromHuangpu River. J. Hygiene. Res. 3, 137–143 (in Chinese) (2008).
34. SAS Institute, Cary, North Carolina (2008).35. Eide, I. et al. Resolution of GC-MS data of complex PAC mixtures and regression
modeling of mutagenicity by PLS. Environ. Sci. Technol. 35, 2314–2318 (2001).36. Eide, I., Neverdal, G., Thorvaldsen, B., Grung, B. & Kvalheim, O. M. Toxicological
evaluation of complex mixtures by pattern recognition: correlating chemicalfingerprints to mutagenicity. Environ. Health. Perspect. 110(suppl 6), 985–988(2002).
37. Tamura, K., Dudley, J., Nei, M. & Kumar, S. MEGA, version 4.1. ,http://www.megasoftware.net/mega4/index.html. (2008) (Accessed 12th April 2010).
38. Swofford, D. L. PAUP*. Phylogenetic Analysis Using Parsimony (* and OtherMethods). Version 4. (Sinauer Associates: Sunderland, Massachusetts, 2002).
39. Li, W. H. Unbiased estimation of the rates of synonymous and nonsynonymoussubstitution. J. Mol. Evol. 36, 96–99 (1993).
40. Yang, Z. PAML 4: a program package for phylogenetic analysis by maximumlikelihood. Mol. Bio. Evol. 24, 1586–1591 (2007).
41. Dachs, J. & Bayona, J. M. Large volume preconcentration of dissolvedhydrocarbons and polychlorinated biphenyls from sea water: Intercomparisonbetween C18 disks and XAD-2 column. Chemosphere 35, 1669–1679 (1997).
42. Berrojalbiz, N. et al. Persistent organic pollutants in Mediterranean seawater andprocesses affecting their accumulation in plankton. Environ. Sci. Technol. 45,4315–4322 (2011).
43. Mai, B. et al. Distribution of polybrominated diphenyl ethers in sediments of thePearl River Delta and adjacent South China Sea. Environ. Sci. Technol. 39,3521–3527 (2005).
44. Peng, X. et al. Concentrations, transport, fate, and releases of polybrominateddiphenyl ethers in sewage treatment plants in the Pearl River Delta, South China.Environ. Int. 35, 303–309 (2009).
45. Zhang, D., Lin, L., Luo, Z., Yan, C. & Zhang, X. Occurrence of selected antibioticsin Jiulongjiang River in various seasons, South China. J. Environ. Monit. 13,1953–1960 (2011).
AcknowledgementsWe would like to thank Guozhou Zhang, Lihong Yin, Wei Xie, Zhihong Zhang, Li Chen,Xiao Wei, Ying Zhou, Hao Zhang, Li Liu, and Xin Chen for the help in sample collection;Weidong Tian (Fudan University) for the advice and comments. This project wassupported by National Key Technology R&D Program in the 11th Five Year Plan (No.2006BAI19B02), Key Project of National High-tech R&D Program of China (863 Program)(2008AA062501 & 2013AA061804), National Natural Science Foundation of China(30972438, 81202165 & 81273035), Shanghai Municipal Health Bureau Leading AcademicDiscipline Project (No. 08GWD14), ‘Dawn’ Program of Shanghai Education Commission(No. 07SG01).
Author ContributionsAll authors contributed to project led by W. Qu and Y. Zhong. W. Qu, W. Zheng, Y. Zhongand Y. Zheng designed this research and analytical approach and wrote the manuscript. W.Zheng, X. Wang, D. Tian, S. Jiang and G. He collected all the water samples, analyzed waterfingerprints, and established database. W. Zheng, Y. Zheng, M. E. Andersen, M. J. C.Crabbe, Y. Zhong and W. Qu conducted data analysis and wrote the manuscript.
Additional informationSupplementary information accompanies this paper at http://www.nature.com/scientificreports
Competing financial interests: The authors declare no competing financial interests.
License: This work is licensed under a Creative CommonsAttribution-NonCommercial-NoDerivs 3.0 Unported License. To view a copy of thislicense, visit http://creativecommons.org/licenses/by-nc-nd/3.0/
How to cite this article: Zheng, W. et al. Water pollutant fingerprinting tracks recentindustrial transfer from coastal to inland China: A case study. Sci. Rep. 3, 1031;DOI:10.1038/srep01031 (2013).
www.nature.com/scientificreports
SCIENTIFIC REPORTS | 3 : 1031 | DOI: 10.1038/srep01031 6