Water, energy and agricultural landuse trends at Shiroro ...
9
Proc. IAHS, 376, 35–43, 2018 https://doi.org/10.5194/piahs-376-35-2018 © Author(s) 2018. This work is distributed under the Creative Commons Attribution 4.0 License. Open Access Water security and the food–water–energy nexus: drivers, responses and feedbacks at local to global scales Water, energy and agricultural landuse trends at Shiroro hydropower station and environs Olubunmi Adegun, Olalekan Ajayi, Gbolahan Badru, and Shakirudeen Odunuga Department of Geography, University of Lagos, Lagos, Nigeria Correspondence: Olubunmi Adegun ([email protected]) Received: 14 June 2017 – Accepted: 26 July 2017 – Published: 1 February 2018 Abstract. The study examines the interplay among water resources, hydropower generation and agricultural landuse at the Shiroro hydropower station and its environs, in north-central Nigeria. Non-parametric trend anal- ysis, hydropower footprint estimation, reservoir performance analysis, change detection analysis, and inferential statistics were combined to study the water-energy and food security nexus. Results of Mann–Kendall test and Sen’s slope estimator for the period 1960 to 2013 showed a declining rainfall trend at Jos, around River Kaduna headwaters at -2.6 mm yr -1 , while rainfall at Kaduna and Minna upstream and downstream of the reservoir respectively showed no trend. Estimates of hydropower footprint varied between 130.4 and 704.1m 3 GJ -1 be- tween 1995 and 2013. Power generation reliability and resilience of the reservoir was 31.6 and 38.5 % respec- tively with year 2011 being the most vulnerable and least satisfactory. In addition to poor reliability and resilience indices, other challenges militating against good performance of hydropower generation includes population growth and climate change issues as exemplified in the downward trend observed at the headwaters. Water in- flow and power generation shows a weak positive relationship with correlation coefficient (r ) of 0.48, indicating less than optimal power generation. Total area of land cultivated increased from 884.59km 2 in 1986 prior to the commissioning of the hydropower station to 1730.83 km 2 in 2016 which signifies an increased contribution of the dam to ensuring food security. The reality of reducing upstream rainfall amount coupled with high water footprint of electricity from the reservoir, therefore requires that a long term roadmap to improve operational coordination and management have to be put in place. 1 Introduction The interdependence of water, food and energy are widely recognised as important drivers of socioeconomic develop- ment. The importance of these natural resources are embed- ded in the United Nations (UN) 2030 Agenda for Sustainable Development Goals (SDG) 2, 6, 7 (UN SDG Report, 2016; ICSU-ISSC, 2015). With Nigeria’s population expected to increase to 262, 599 000 by 2030 (UNDESA, 2015), the country faces a great challenge of meeting these goals. For example, energy demand in the country averages 7 % per year, with an estimated increase in demand for years 2000 and 2012 which is put at 14 and 37 TWh respectively, and es- timates for 2020, 2030 and 2040 put at 68, 146 and 291 TWh. Similarly, this challenge may become more glaring with more than 90 million people not having access to grid elec- tricity in Nigeria, yet the widespread use of back-up genera- tors has further reduced the number of people without access to any form of electricity significantly (IEA, 2014). The link between the food-water-energy nexus and cli- mate, especially rainfall in the study area greatly influences water availability, agricultural production, and electricity generation and supply, in the long run. For instance, high inter-annual variability and marked seasonality of rainfall, coupled with episodes of streamflow drought, have often re- sulted in reduced power production of hydropower stations in the country owing to low gauge height level, while exces- sive rainfall sometimes results in downstream flooding with dire consequences especially for the cultivated lands. Furthermore, the location of the country’s hydropower sta- tions in the savannah region suggests that a high volume of water will be lost through evaporation hence the need to know the water footprint of these reservoirs. Published by Copernicus Publications on behalf of the International Association of Hydrological Sciences.
-
Upload
khangminh22 -
Category
Documents
-
view
0 -
download
0
Transcript of Water, energy and agricultural landuse trends at Shiroro ...
Proc. IAHS, 376, 35–43, 2018https://doi.org/10.5194/piahs-376-35-2018© Author(s) 2018. This work is distributed underthe Creative Commons Attribution 4.0 License.
Open Access
Watersecurity
andthe
food–water–energy
nexus:drivers,responsesand
feedbacksatlocalto
globalscales
Water, energy and agricultural landuse trends at Shirorohydropower station and environs
Olubunmi Adegun, Olalekan Ajayi, Gbolahan Badru, and Shakirudeen OdunugaDepartment of Geography, University of Lagos, Lagos, Nigeria
Correspondence: Olubunmi Adegun ([email protected])
Received: 14 June 2017 – Accepted: 26 July 2017 – Published: 1 February 2018
Abstract. The study examines the interplay among water resources, hydropower generation and agriculturallanduse at the Shiroro hydropower station and its environs, in north-central Nigeria. Non-parametric trend anal-ysis, hydropower footprint estimation, reservoir performance analysis, change detection analysis, and inferentialstatistics were combined to study the water-energy and food security nexus. Results of Mann–Kendall test andSen’s slope estimator for the period 1960 to 2013 showed a declining rainfall trend at Jos, around River Kadunaheadwaters at −2.6 mm yr−1, while rainfall at Kaduna and Minna upstream and downstream of the reservoirrespectively showed no trend. Estimates of hydropower footprint varied between 130.4 and 704.1 m3 GJ−1 be-tween 1995 and 2013. Power generation reliability and resilience of the reservoir was 31.6 and 38.5 % respec-tively with year 2011 being the most vulnerable and least satisfactory. In addition to poor reliability and resilienceindices, other challenges militating against good performance of hydropower generation includes populationgrowth and climate change issues as exemplified in the downward trend observed at the headwaters. Water in-flow and power generation shows a weak positive relationship with correlation coefficient (r) of 0.48, indicatingless than optimal power generation. Total area of land cultivated increased from 884.59 km2 in 1986 prior to thecommissioning of the hydropower station to 1730.83 km2 in 2016 which signifies an increased contribution ofthe dam to ensuring food security. The reality of reducing upstream rainfall amount coupled with high waterfootprint of electricity from the reservoir, therefore requires that a long term roadmap to improve operationalcoordination and management have to be put in place.
1 Introduction
The interdependence of water, food and energy are widelyrecognised as important drivers of socioeconomic develop-ment. The importance of these natural resources are embed-ded in the United Nations (UN) 2030 Agenda for SustainableDevelopment Goals (SDG) 2, 6, 7 (UN SDG Report, 2016;ICSU-ISSC, 2015). With Nigeria’s population expected toincrease to 262, 599 000 by 2030 (UNDESA, 2015), thecountry faces a great challenge of meeting these goals. Forexample, energy demand in the country averages 7 % peryear, with an estimated increase in demand for years 2000and 2012 which is put at 14 and 37 TWh respectively, and es-timates for 2020, 2030 and 2040 put at 68, 146 and 291 TWh.Similarly, this challenge may become more glaring withmore than 90 million people not having access to grid elec-tricity in Nigeria, yet the widespread use of back-up genera-
tors has further reduced the number of people without accessto any form of electricity significantly (IEA, 2014).
The link between the food-water-energy nexus and cli-mate, especially rainfall in the study area greatly influenceswater availability, agricultural production, and electricitygeneration and supply, in the long run. For instance, highinter-annual variability and marked seasonality of rainfall,coupled with episodes of streamflow drought, have often re-sulted in reduced power production of hydropower stationsin the country owing to low gauge height level, while exces-sive rainfall sometimes results in downstream flooding withdire consequences especially for the cultivated lands.
Furthermore, the location of the country’s hydropower sta-tions in the savannah region suggests that a high volumeof water will be lost through evaporation hence the need toknow the water footprint of these reservoirs.
Published by Copernicus Publications on behalf of the International Association of Hydrological Sciences.
36 O. Adegun et al.: Water, energy and agricultural landuse trends at Shiroro hydropower station and environs
A number of approaches have been used to estimate thefootprint of hydropower reservoirs in different parts of theworld. Bueno et al. (2016) used the conventional gross waterfootprint method for the Camargos Hydropower Reservoir inBrazil, and reported that the average hydropower footprintin Brazil exceeded the global average. Herath et al. (2011)estimated the hydropower footprint of all major hydropowerreservoirs in New Zealand using a combination of the con-sumptive water use method, the net consumptive water usemethod, and the net water balance method.
Zhao and Liu (2015) developed a method that utilises anallocation coefficient to allocate water footprint among thedifferent ecosystem services offered by the Three GorgesReservoir in China. The study also compared the estimatesof the water footprint obtained with the values derived fromestimation based on the gross water footprint method. Theresult of the study showed that the gross water footprintmethod over-estimated the hydropower footprint. Mekonenand Hoekstra (2012) employed the gross water footprintmethod to estimate the hydropower footprint of 35 selectedhydropower reservoirs in different parts of the world. Thestudy revealed that hydropower reservoirs located in Ghana,Mozambique, Zambia, Zimbabwe, and Kenya all had highhydropower footprint, with Akosobo-Kpong reservoirs hav-ing the highest value globally.
In evaluating the performance of water resources systems,Hashimoto et al. (1982) used three indices; reliability, re-silience and vulnerability to evaluate the performance of awater resources system. The indices have also been used toassess water resources systems performance under differentprevailing natural and operational conditions. For example,Longobardi et al. (2014) used the 3 indices to assess theperformance of a multi-purpose dam in southern Italy underconditions of climate variability. Gohraian et al. (2016) usedthe 3 performance indices in combination with a hydrologi-cal model, a water system model and climate change projec-tions in a study of the Salt Lake City’s water supply systemunder climate change conditions. In a study by Raje and Mu-jumdar (2010) the reliability index was used to evaluate theperformance of a reservoir in Orissa, India, with respect tohydropower generation, irrigation and flood control. The in-dices of resiliency and vulnerability were used to assess thesystem’s performance in relation to hydropower generationonly.
With respect to the performance of the Shiroro Hy-dropower facility as a water resources system, only a fewstudies exist in the literature. This include a study bySule (1988), in which the future operations and performanceof the reservoir system which was still under constructionwere simulated under different operating scenarios using acombination of Probabilistic Dynamic Programming Opti-misation Model and the indices of reliability, resilience andvulnerability. The result of the scenario simulation showedsevere and frequent failures at the 70 % plant factor recom-mended for Nigeria. Based on this result, it was concluded
that reservoir operations should be carried out at 40 to 50 %power plant factor. Similarly, a recent study by Gbadamosi etal. (2015), which analysed the performance and efficiency ofthe Shiroro Hydropower Station using the plant availabilityfactor, the capacity factor and the overall efficiency factor,showed that the capacity factor of the hydropower systemvaried between 23.5 and 50.7 % compared with internation-ally benchmark of 80 %.
With regards to the estimation of water footprint inthe studies highlighted above, hydropower generation wasshown as a large consumer of water, and the method, a veri-table indicator of resource use. The general output from thereview of studies on water resources systems performanceindicated that the 3 indices are useful tools in the descriptionof the frequency and duration of system failure and recovery.The studies also showcase how the indices can serve as a ba-sis for the improvement of the operations and managementof different water resources infrastructures and systems.
Considering the importance of the Shiroro hydropowerstation in the water-energy and its food security intercon-nections within the River Kaduna catchment, and indeed thecounty at large, there is a need to have a better understandingof the drivers and feedback mechanisms at play. To achievethis therefore, this study utilises a combination of statisticalanalyses, hydropower water footprint estimation based on thegross water footprint method, water resources systems per-formance indices evaluation and change detection analysis.
2 Study area
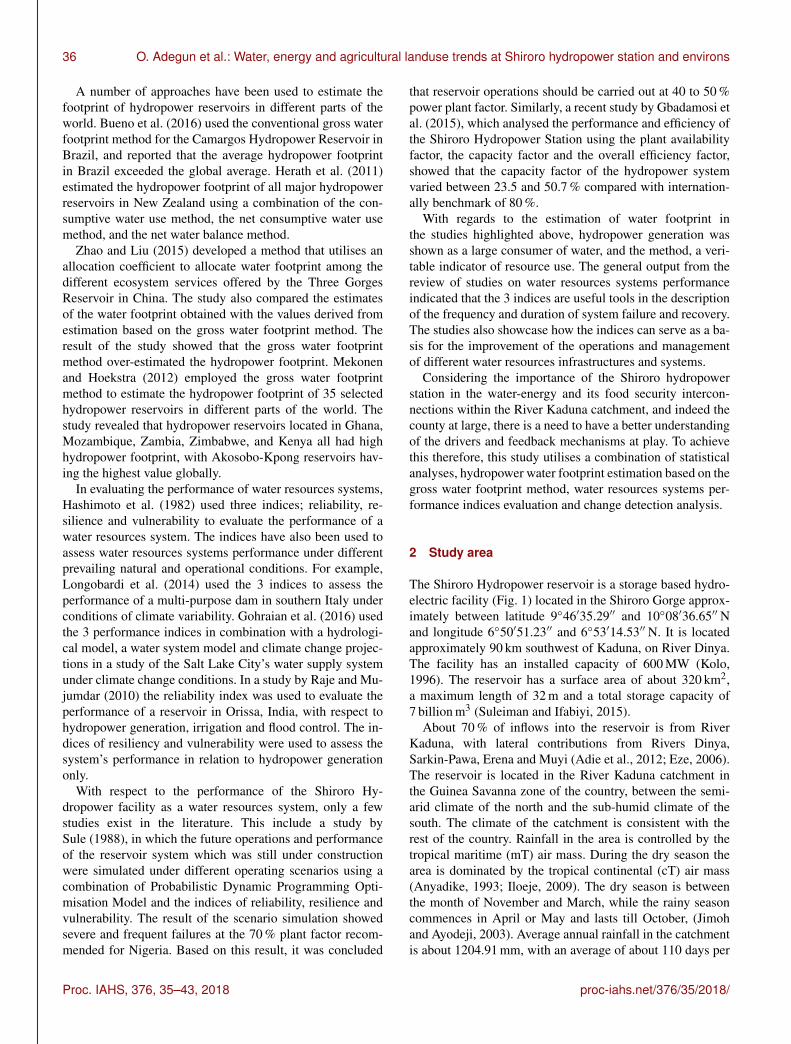
The Shiroro Hydropower reservoir is a storage based hydro-electric facility (Fig. 1) located in the Shiroro Gorge approx-imately between latitude 9◦46′35.29′′ and 10◦08′36.65′′ Nand longitude 6◦50′51.23′′ and 6◦53′14.53′′ N. It is locatedapproximately 90 km southwest of Kaduna, on River Dinya.The facility has an installed capacity of 600 MW (Kolo,1996). The reservoir has a surface area of about 320 km2,a maximum length of 32 m and a total storage capacity of7 billion m3 (Suleiman and Ifabiyi, 2015).
About 70 % of inflows into the reservoir is from RiverKaduna, with lateral contributions from Rivers Dinya,Sarkin-Pawa, Erena and Muyi (Adie et al., 2012; Eze, 2006).The reservoir is located in the River Kaduna catchment inthe Guinea Savanna zone of the country, between the semi-arid climate of the north and the sub-humid climate of thesouth. The climate of the catchment is consistent with therest of the country. Rainfall in the area is controlled by thetropical maritime (mT) air mass. During the dry season thearea is dominated by the tropical continental (cT) air mass(Anyadike, 1993; Iloeje, 2009). The dry season is betweenthe month of November and March, while the rainy seasoncommences in April or May and lasts till October, (Jimohand Ayodeji, 2003). Average annual rainfall in the catchmentis about 1204.91 mm, with an average of about 110 days per
Proc. IAHS, 376, 35–43, 2018 proc-iahs.net/376/35/2018/
O. Adegun et al.: Water, energy and agricultural landuse trends at Shiroro hydropower station and environs 37
Figure 1. Location of Shiroro hydropower dam.
year receiving a rainfall amount of 0.1 mm (Okafor et al.,2017). Annual temperature around the reservoir varies be-tween 27 and 35 ◦C (Suleiman and Ifabiyi, 2015).
3 Methodology
Historical monthly rainfall data for locations within thecatchment, Jos, Kaduna and Minna for 1960 to 2013 was ob-tained from the Nigerian Meteorological Agency (NIMET).Monthly data on inflow, turbine discharge, reservoir evapo-ration and energy generated for 1995 to 2013 was obtainedfrom the Shiroro Hydropower Station.
To establish the presence or absence of trend in rainfallwithin the catchment, a Mann–Kendall trend test was carriedout in XLSTAT. The Mann–Kendall test statistic is expressedas:
Zc
S− 1√
var(S), S > 0
0 S = 0S+ 1√var(S)
, S < 0
(1)
in which
S =
n−1∑i=1
n∑k=i+1
sgn(xk − xi) (2)
where xk , xj are the sequential data values, n is the lengthdata set, and sgn(θ ) is equal to 1, 0, −1 if θ is greater than,
equal to, or less than zero, respectively. The Sen’s slope esti-mator is expressed as:
β =Median(xi − xj
i− j
), ∀j < i (3)
in which 1<j < I <n. β is the median overall combinationof the record pairs for the whole dataset, and therefore resis-tant to extreme observation or outliers. A positive value of theβ indicates a slope of an upward trend and a negative valuerepresents a downward trend (Machiwal and Jha, 2012).
The water footprint of electricity from hydropower genera-tion was estimated based on Mekonnen and Hoekstra (2012).This is expressed as:
WF=WEEG
. (4)
The total volume of water evaporated (WE, m3 yr−1) fromthe reservoir on an annual basis is expressed in Eq. (5) as:
WE=
(10×
365∑t−1
E
)×A. (5)
The system performance evaluation of the hydropower sta-tion was based on Hashimoto et al. (1982). The 3 indices ofsystem performance, reliability, resilience and vulnerabilityare stated in Eq. (6)–(8) respectively as:
rt = 1−fp
n0≤ rt ≤ 1, fp ≤ n (6)
proc-iahs.net/376/35/2018/ Proc. IAHS, 376, 35–43, 2018
38 O. Adegun et al.: Water, energy and agricultural landuse trends at Shiroro hydropower station and environs
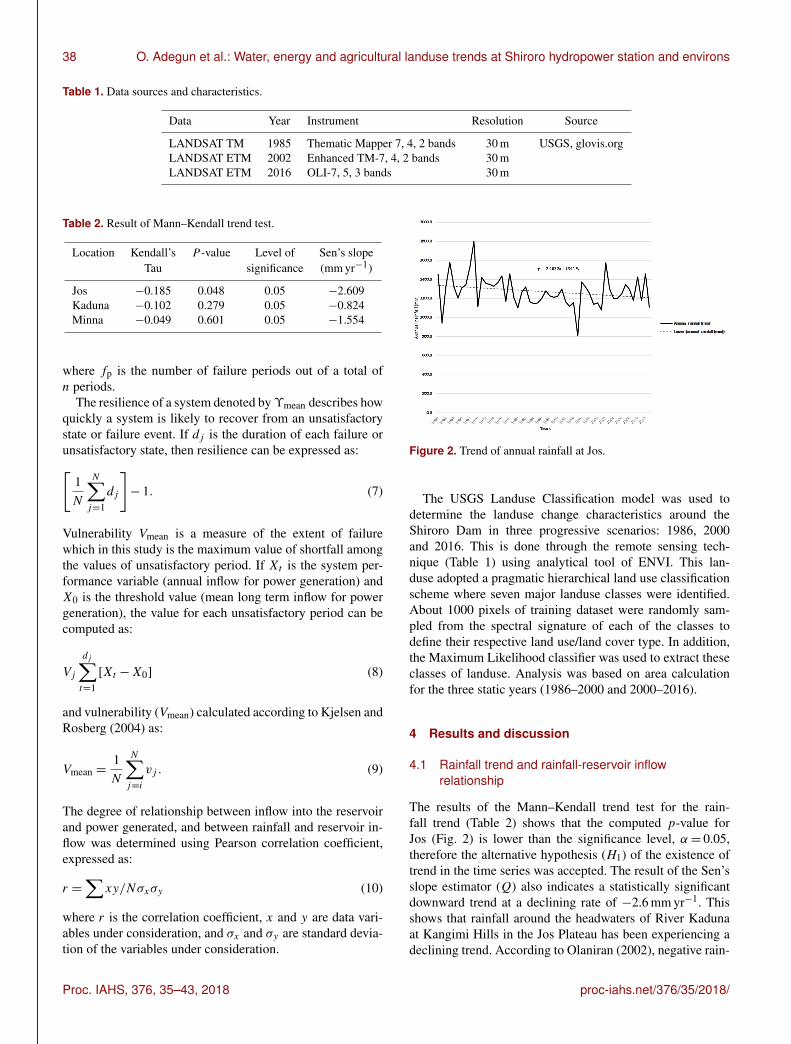
Table 1. Data sources and characteristics.
Data Year Instrument Resolution Source
LANDSAT TM 1985 Thematic Mapper 7, 4, 2 bands 30 m USGS, glovis.orgLANDSAT ETM 2002 Enhanced TM-7, 4, 2 bands 30 mLANDSAT ETM 2016 OLI-7, 5, 3 bands 30 m
Table 2. Result of Mann–Kendall trend test.
Location Kendall’s P -value Level of Sen’s slopeTau significance (mm yr−1)
Jos −0.185 0.048 0.05 −2.609Kaduna −0.102 0.279 0.05 −0.824Minna −0.049 0.601 0.05 −1.554
where fp is the number of failure periods out of a total ofn periods.
The resilience of a system denoted byϒmean describes howquickly a system is likely to recover from an unsatisfactorystate or failure event. If dj is the duration of each failure orunsatisfactory state, then resilience can be expressed as:[
1N
N∑j=1
dj
]− 1. (7)
Vulnerability Vmean is a measure of the extent of failurewhich in this study is the maximum value of shortfall amongthe values of unsatisfactory period. If Xt is the system per-formance variable (annual inflow for power generation) andX0 is the threshold value (mean long term inflow for powergeneration), the value for each unsatisfactory period can becomputed as:
Vj
dj∑t=1
[Xt −X0] (8)
and vulnerability (Vmean) calculated according to Kjelsen andRosberg (2004) as:
Vmean =1N
N∑j=i
vj . (9)
The degree of relationship between inflow into the reservoirand power generated, and between rainfall and reservoir in-flow was determined using Pearson correlation coefficient,expressed as:
r =∑
xy/Nσxσy (10)
where r is the correlation coefficient, x and y are data vari-ables under consideration, and σx and σy are standard devia-tion of the variables under consideration.
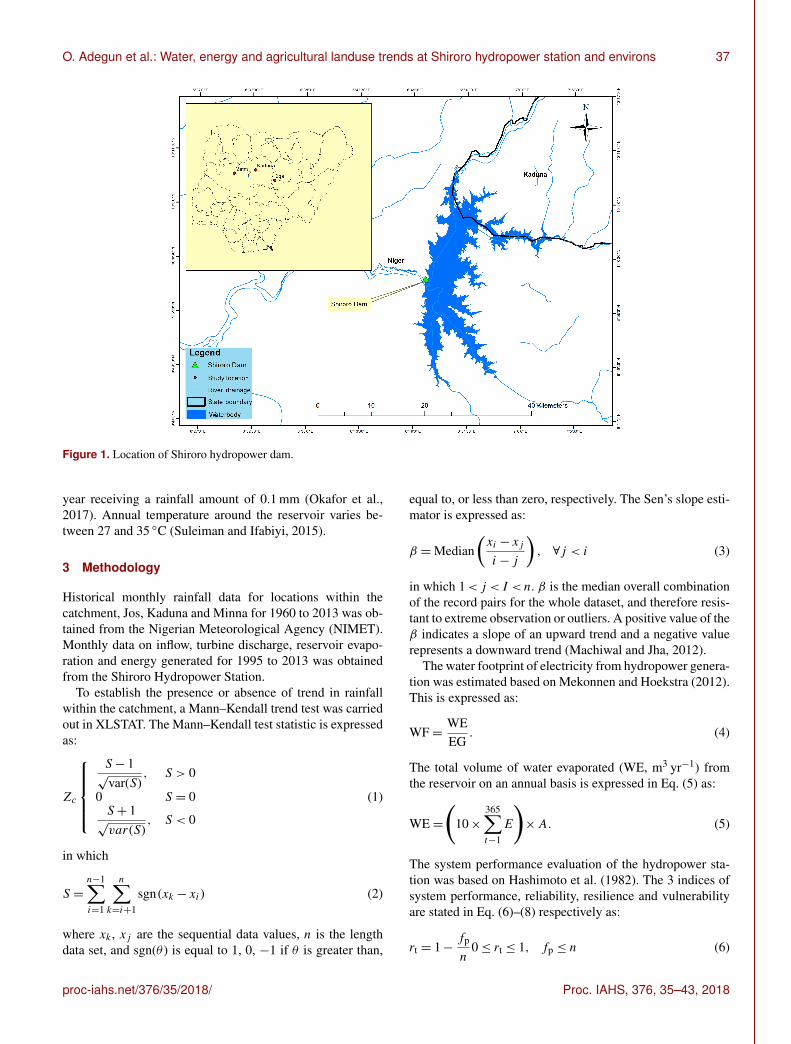
Figure 2. Trend of annual rainfall at Jos.
The USGS Landuse Classification model was used todetermine the landuse change characteristics around theShiroro Dam in three progressive scenarios: 1986, 2000and 2016. This is done through the remote sensing tech-nique (Table 1) using analytical tool of ENVI. This lan-duse adopted a pragmatic hierarchical land use classificationscheme where seven major landuse classes were identified.About 1000 pixels of training dataset were randomly sam-pled from the spectral signature of each of the classes todefine their respective land use/land cover type. In addition,the Maximum Likelihood classifier was used to extract theseclasses of landuse. Analysis was based on area calculationfor the three static years (1986–2000 and 2000–2016).
4 Results and discussion
4.1 Rainfall trend and rainfall-reservoir inflowrelationship
The results of the Mann–Kendall trend test for the rain-fall trend (Table 2) shows that the computed p-value forJos (Fig. 2) is lower than the significance level, α= 0.05,therefore the alternative hypothesis (H1) of the existence oftrend in the time series was accepted. The result of the Sen’sslope estimator (Q) also indicates a statistically significantdownward trend at a declining rate of −2.6 mm yr−1. Thisshows that rainfall around the headwaters of River Kadunaat Kangimi Hills in the Jos Plateau has been experiencing adeclining trend. According to Olaniran (2002), negative rain-
Proc. IAHS, 376, 35–43, 2018 proc-iahs.net/376/35/2018/
O. Adegun et al.: Water, energy and agricultural landuse trends at Shiroro hydropower station and environs 39
Table 3. Annual water footprint of Shiroro hydropower reservoir between 1995 and 2013.
Year 1995 1996 1997 1998 1999 2000 2001 2002
WFP 668.0 431.6 NA∗ 384.6 NA∗ 468.1 328.4 489.1(m3 GJ−1)
Year 2003 2004 2005 2006 2007 2008 2009 2010
WFP 368.9 340.6 704.1 130.4 320.5 348.9 341.2 353.6(m3 GJ−1)
Year 2011 2012 2013
WFP 297.0 281.5 269.3(m3 GJ−1)
NA∗ = not available.
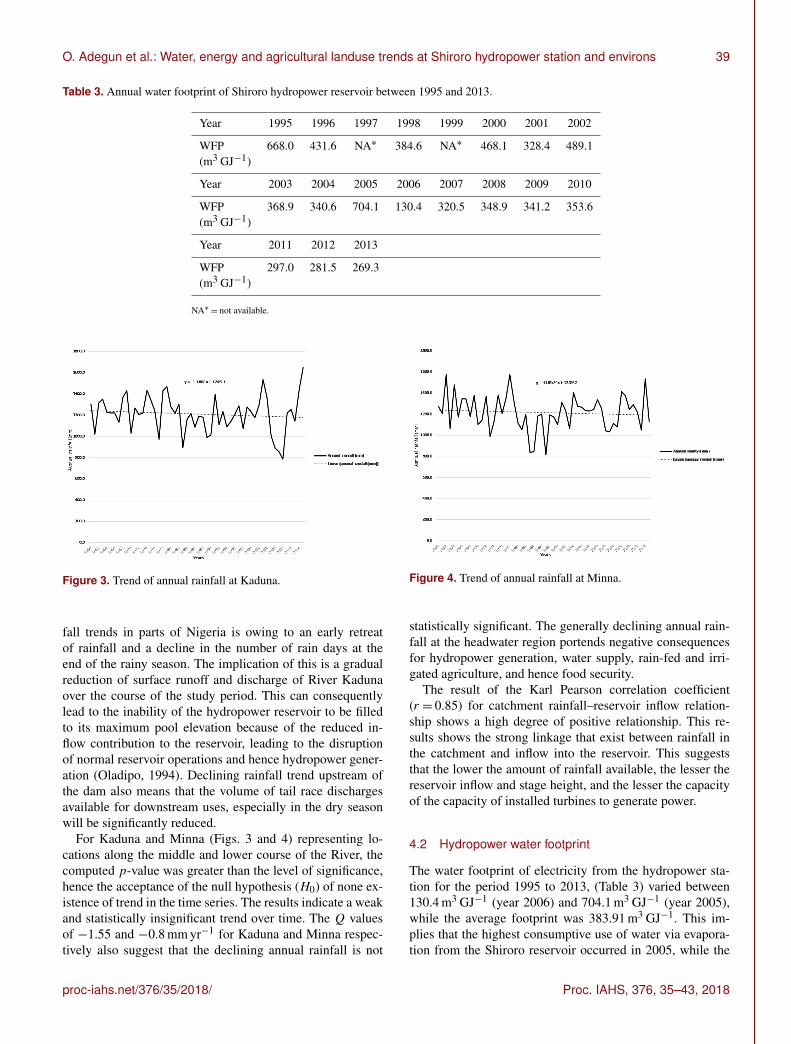
Figure 3. Trend of annual rainfall at Kaduna.
fall trends in parts of Nigeria is owing to an early retreatof rainfall and a decline in the number of rain days at theend of the rainy season. The implication of this is a gradualreduction of surface runoff and discharge of River Kadunaover the course of the study period. This can consequentlylead to the inability of the hydropower reservoir to be filledto its maximum pool elevation because of the reduced in-flow contribution to the reservoir, leading to the disruptionof normal reservoir operations and hence hydropower gener-ation (Oladipo, 1994). Declining rainfall trend upstream ofthe dam also means that the volume of tail race dischargesavailable for downstream uses, especially in the dry seasonwill be significantly reduced.
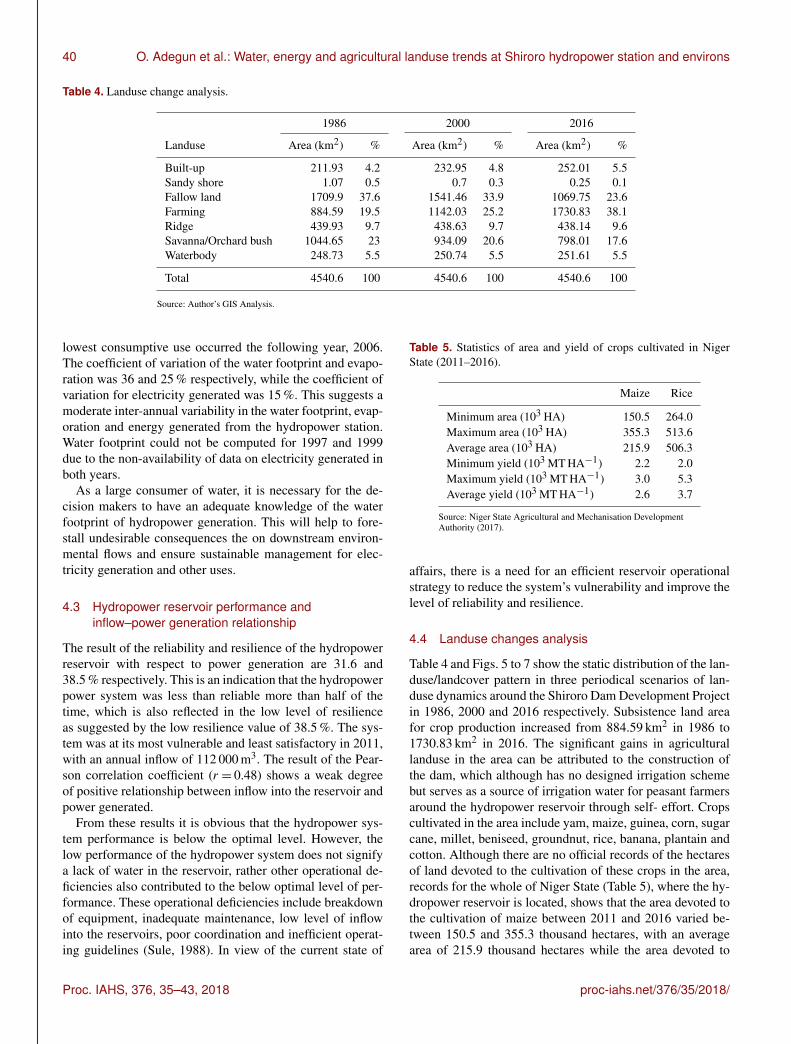
For Kaduna and Minna (Figs. 3 and 4) representing lo-cations along the middle and lower course of the River, thecomputed p-value was greater than the level of significance,hence the acceptance of the null hypothesis (H0) of none ex-istence of trend in the time series. The results indicate a weakand statistically insignificant trend over time. The Q valuesof −1.55 and −0.8 mm yr−1 for Kaduna and Minna respec-tively also suggest that the declining annual rainfall is not
Figure 4. Trend of annual rainfall at Minna.
statistically significant. The generally declining annual rain-fall at the headwater region portends negative consequencesfor hydropower generation, water supply, rain-fed and irri-gated agriculture, and hence food security.
The result of the Karl Pearson correlation coefficient(r = 0.85) for catchment rainfall–reservoir inflow relation-ship shows a high degree of positive relationship. This re-sults shows the strong linkage that exist between rainfall inthe catchment and inflow into the reservoir. This suggeststhat the lower the amount of rainfall available, the lesser thereservoir inflow and stage height, and the lesser the capacityof the capacity of installed turbines to generate power.
4.2 Hydropower water footprint
The water footprint of electricity from the hydropower sta-tion for the period 1995 to 2013, (Table 3) varied between130.4 m3 GJ−1 (year 2006) and 704.1 m3 GJ−1 (year 2005),while the average footprint was 383.91 m3 GJ−1. This im-plies that the highest consumptive use of water via evapora-tion from the Shiroro reservoir occurred in 2005, while the
proc-iahs.net/376/35/2018/ Proc. IAHS, 376, 35–43, 2018
40 O. Adegun et al.: Water, energy and agricultural landuse trends at Shiroro hydropower station and environs
Table 4. Landuse change analysis.
1986 2000 2016
Landuse Area (km2) % Area (km2) % Area (km2) %
Built-up 211.93 4.2 232.95 4.8 252.01 5.5Sandy shore 1.07 0.5 0.7 0.3 0.25 0.1Fallow land 1709.9 37.6 1541.46 33.9 1069.75 23.6Farming 884.59 19.5 1142.03 25.2 1730.83 38.1Ridge 439.93 9.7 438.63 9.7 438.14 9.6Savanna/Orchard bush 1044.65 23 934.09 20.6 798.01 17.6Waterbody 248.73 5.5 250.74 5.5 251.61 5.5
Total 4540.6 100 4540.6 100 4540.6 100
Source: Author’s GIS Analysis.
lowest consumptive use occurred the following year, 2006.The coefficient of variation of the water footprint and evapo-ration was 36 and 25 % respectively, while the coefficient ofvariation for electricity generated was 15 %. This suggests amoderate inter-annual variability in the water footprint, evap-oration and energy generated from the hydropower station.Water footprint could not be computed for 1997 and 1999due to the non-availability of data on electricity generated inboth years.
As a large consumer of water, it is necessary for the de-cision makers to have an adequate knowledge of the waterfootprint of hydropower generation. This will help to fore-stall undesirable consequences the on downstream environ-mental flows and ensure sustainable management for elec-tricity generation and other uses.
4.3 Hydropower reservoir performance andinflow–power generation relationship
The result of the reliability and resilience of the hydropowerreservoir with respect to power generation are 31.6 and38.5 % respectively. This is an indication that the hydropowerpower system was less than reliable more than half of thetime, which is also reflected in the low level of resilienceas suggested by the low resilience value of 38.5 %. The sys-tem was at its most vulnerable and least satisfactory in 2011,with an annual inflow of 112 000 m3. The result of the Pear-son correlation coefficient (r = 0.48) shows a weak degreeof positive relationship between inflow into the reservoir andpower generated.
From these results it is obvious that the hydropower sys-tem performance is below the optimal level. However, thelow performance of the hydropower system does not signifya lack of water in the reservoir, rather other operational de-ficiencies also contributed to the below optimal level of per-formance. These operational deficiencies include breakdownof equipment, inadequate maintenance, low level of inflowinto the reservoirs, poor coordination and inefficient operat-ing guidelines (Sule, 1988). In view of the current state of
Table 5. Statistics of area and yield of crops cultivated in NigerState (2011–2016).
Maize Rice
Minimum area (103 HA) 150.5 264.0Maximum area (103 HA) 355.3 513.6Average area (103 HA) 215.9 506.3Minimum yield (103 MT HA−1) 2.2 2.0Maximum yield (103 MT HA−1) 3.0 5.3Average yield (103 MT HA−1) 2.6 3.7
Source: Niger State Agricultural and Mechanisation DevelopmentAuthority (2017).
affairs, there is a need for an efficient reservoir operationalstrategy to reduce the system’s vulnerability and improve thelevel of reliability and resilience.
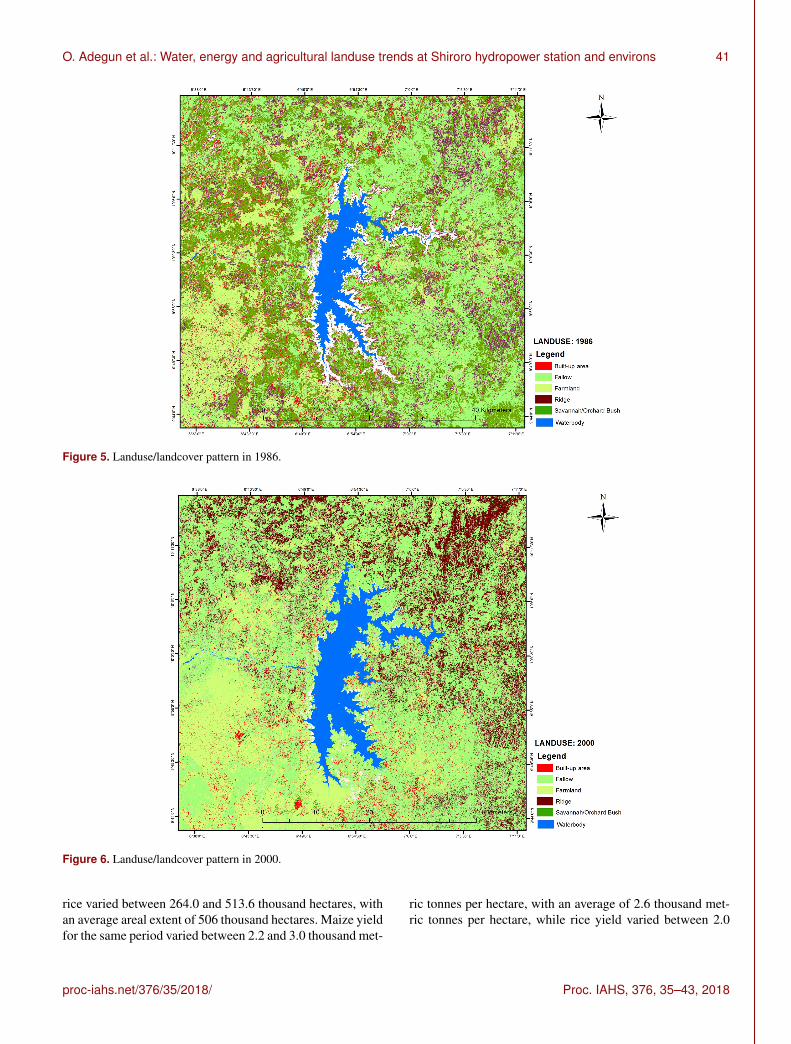
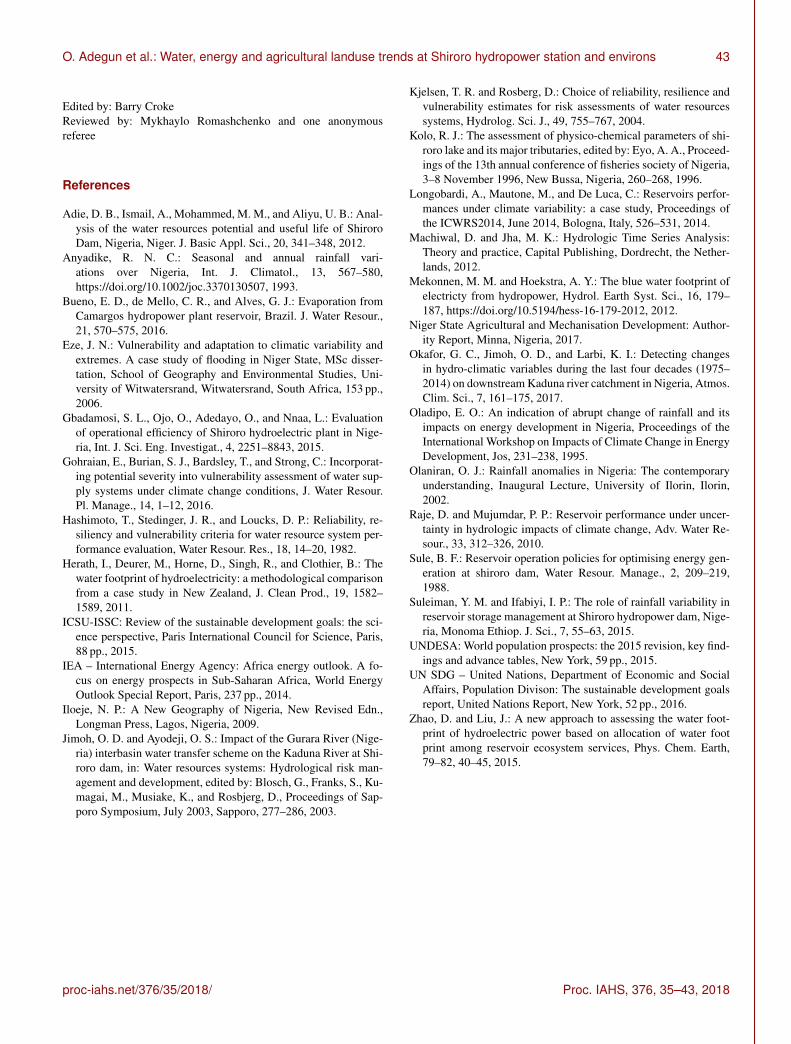
4.4 Landuse changes analysis
Table 4 and Figs. 5 to 7 show the static distribution of the lan-duse/landcover pattern in three periodical scenarios of lan-duse dynamics around the Shiroro Dam Development Projectin 1986, 2000 and 2016 respectively. Subsistence land areafor crop production increased from 884.59 km2 in 1986 to1730.83 km2 in 2016. The significant gains in agriculturallanduse in the area can be attributed to the construction ofthe dam, which although has no designed irrigation schemebut serves as a source of irrigation water for peasant farmersaround the hydropower reservoir through self- effort. Cropscultivated in the area include yam, maize, guinea, corn, sugarcane, millet, beniseed, groundnut, rice, banana, plantain andcotton. Although there are no official records of the hectaresof land devoted to the cultivation of these crops in the area,records for the whole of Niger State (Table 5), where the hy-dropower reservoir is located, shows that the area devoted tothe cultivation of maize between 2011 and 2016 varied be-tween 150.5 and 355.3 thousand hectares, with an averagearea of 215.9 thousand hectares while the area devoted to
Proc. IAHS, 376, 35–43, 2018 proc-iahs.net/376/35/2018/
O. Adegun et al.: Water, energy and agricultural landuse trends at Shiroro hydropower station and environs 41
Figure 5. Landuse/landcover pattern in 1986.
Figure 6. Landuse/landcover pattern in 2000.
rice varied between 264.0 and 513.6 thousand hectares, withan average areal extent of 506 thousand hectares. Maize yieldfor the same period varied between 2.2 and 3.0 thousand met-
ric tonnes per hectare, with an average of 2.6 thousand met-ric tonnes per hectare, while rice yield varied between 2.0
proc-iahs.net/376/35/2018/ Proc. IAHS, 376, 35–43, 2018

42 O. Adegun et al.: Water, energy and agricultural landuse trends at Shiroro hydropower station and environs
Figure 7. Landuse/landcover pattern in 1986.
and 5.3 thousand metric tonnes per hectare, with an averageyield of 3.7 thousand metric tonnes per hectare.
Looking at the emergence of the hydropower facility andthe trend of agricultural landuse in the area, the inter-playof water, energy and agricultural nexus in Shiroro can bedeemed to have had a positive impact on the livelihood of thelocal populace and food security in the area and the countryat large.
5 Summary and conclusion
The study showed how a combination of methods can beused to investigate feedback mechanisms operational at thefood-water-energy nexus at the Shiroro hydropower stationand its environs. Although the results of the reliability andresilience of the hydropower reservoir with respect to hy-dropower generation are below the average performance withless than 40 % for all indices. The comparative gain in agri-cultural sector through water utilisation by peasant farmersactually provide an additional gain derived from the inter-play of food-water-energy nexus. In the face of a reducingupstream rainfall amount coupled the with high water foot-print of electricity from the reservoir, it is recommended thata long term roadmap to improve the operational coordinationand management has to be put in place. Also, a formal irri-gation scheme should be provided to strengthen agriculturalproduction in the area.
Data availability. Links to the USGS Satellite Imagery data isavailable at Earth explorer http://earthexplorer.usgs.gov. The hydro-meteorological and agricultural data is not publicly accessible.
Author contributions. OAd conceptualized and lead the team onthis research. She also wrote the manuscript and effected the correc-tions during the write-up. OAj gathered and processed all the spatialdata used for this article. GB assisted in the gathering of the hydro-meteorological data used for the study. SO reviewed the write-upfrom time to time for necessarycorrections.
Competing interests. The authors declare that they have no con-flict of interest.
Special issue statement. This article is part of the special is-sue “Water security and the food-water-energy nexus: drivers, re-sponses and feedbacks at local to global scales”. It is a result ofthe IAHS Scientific Assembly 2017, Port Elizabeth, South Africa,10–14 July 2017.
Acknowledgements. The authors wish to express their profoundgratitude to the following institutions. The Nigerian MeteorologicalAgency for the climatic data, the Shiroro Hydropower Station forthe hydrological and power generation data, and the Niger StateAgricultural and Mechanisation Development Authority for theagricultural yield data.
Proc. IAHS, 376, 35–43, 2018 proc-iahs.net/376/35/2018/
O. Adegun et al.: Water, energy and agricultural landuse trends at Shiroro hydropower station and environs 43
Edited by: Barry CrokeReviewed by: Mykhaylo Romashchenko and one anonymousreferee
References
Adie, D. B., Ismail, A., Mohammed, M. M., and Aliyu, U. B.: Anal-ysis of the water resources potential and useful life of ShiroroDam, Nigeria, Niger. J. Basic Appl. Sci., 20, 341–348, 2012.
Anyadike, R. N. C.: Seasonal and annual rainfall vari-ations over Nigeria, Int. J. Climatol., 13, 567–580,https://doi.org/10.1002/joc.3370130507, 1993.
Bueno, E. D., de Mello, C. R., and Alves, G. J.: Evaporation fromCamargos hydropower plant reservoir, Brazil. J. Water Resour.,21, 570–575, 2016.
Eze, J. N.: Vulnerability and adaptation to climatic variability andextremes. A case study of flooding in Niger State, MSc disser-tation, School of Geography and Environmental Studies, Uni-versity of Witwatersrand, Witwatersrand, South Africa, 153 pp.,2006.
Gbadamosi, S. L., Ojo, O., Adedayo, O., and Nnaa, L.: Evaluationof operational efficiency of Shiroro hydroelectric plant in Nige-ria, Int. J. Sci. Eng. Investigat., 4, 2251–8843, 2015.
Gohraian, E., Burian, S. J., Bardsley, T., and Strong, C.: Incorporat-ing potential severity into vulnerability assessment of water sup-ply systems under climate change conditions, J. Water Resour.Pl. Manage., 14, 1–12, 2016.
Hashimoto, T., Stedinger, J. R., and Loucks, D. P.: Reliability, re-siliency and vulnerability criteria for water resource system per-formance evaluation, Water Resour. Res., 18, 14–20, 1982.
Herath, I., Deurer, M., Horne, D., Singh, R., and Clothier, B.: Thewater footprint of hydroelectricity: a methodological comparisonfrom a case study in New Zealand, J. Clean Prod., 19, 1582–1589, 2011.
ICSU-ISSC: Review of the sustainable development goals: the sci-ence perspective, Paris International Council for Science, Paris,88 pp., 2015.
IEA – International Energy Agency: Africa energy outlook. A fo-cus on energy prospects in Sub-Saharan Africa, World EnergyOutlook Special Report, Paris, 237 pp., 2014.
Iloeje, N. P.: A New Geography of Nigeria, New Revised Edn.,Longman Press, Lagos, Nigeria, 2009.
Jimoh, O. D. and Ayodeji, O. S.: Impact of the Gurara River (Nige-ria) interbasin water transfer scheme on the Kaduna River at Shi-roro dam, in: Water resources systems: Hydrological risk man-agement and development, edited by: Blosch, G., Franks, S., Ku-magai, M., Musiake, K., and Rosbjerg, D., Proceedings of Sap-poro Symposium, July 2003, Sapporo, 277–286, 2003.
Kjelsen, T. R. and Rosberg, D.: Choice of reliability, resilience andvulnerability estimates for risk assessments of water resourcessystems, Hydrolog. Sci. J., 49, 755–767, 2004.
Kolo, R. J.: The assessment of physico-chemical parameters of shi-roro lake and its major tributaries, edited by: Eyo, A. A., Proceed-ings of the 13th annual conference of fisheries society of Nigeria,3–8 November 1996, New Bussa, Nigeria, 260–268, 1996.
Longobardi, A., Mautone, M., and De Luca, C.: Reservoirs perfor-mances under climate variability: a case study, Proceedings ofthe ICWRS2014, June 2014, Bologna, Italy, 526–531, 2014.
Machiwal, D. and Jha, M. K.: Hydrologic Time Series Analysis:Theory and practice, Capital Publishing, Dordrecht, the Nether-lands, 2012.
Mekonnen, M. M. and Hoekstra, A. Y.: The blue water footprint ofelectricty from hydropower, Hydrol. Earth Syst. Sci., 16, 179–187, https://doi.org/10.5194/hess-16-179-2012, 2012.
Niger State Agricultural and Mechanisation Development: Author-ity Report, Minna, Nigeria, 2017.
Okafor, G. C., Jimoh, O. D., and Larbi, K. I.: Detecting changesin hydro-climatic variables during the last four decades (1975–2014) on downstream Kaduna river catchment in Nigeria, Atmos.Clim. Sci., 7, 161–175, 2017.
Oladipo, E. O.: An indication of abrupt change of rainfall and itsimpacts on energy development in Nigeria, Proceedings of theInternational Workshop on Impacts of Climate Change in EnergyDevelopment, Jos, 231–238, 1995.
Olaniran, O. J.: Rainfall anomalies in Nigeria: The contemporaryunderstanding, Inaugural Lecture, University of Ilorin, Ilorin,2002.
Raje, D. and Mujumdar, P. P.: Reservoir performance under uncer-tainty in hydrologic impacts of climate change, Adv. Water Re-sour., 33, 312–326, 2010.
Sule, B. F.: Reservoir operation policies for optimising energy gen-eration at shiroro dam, Water Resour. Manage., 2, 209–219,1988.
Suleiman, Y. M. and Ifabiyi, I. P.: The role of rainfall variability inreservoir storage management at Shiroro hydropower dam, Nige-ria, Monoma Ethiop. J. Sci., 7, 55–63, 2015.
UNDESA: World population prospects: the 2015 revision, key find-ings and advance tables, New York, 59 pp., 2015.
UN SDG – United Nations, Department of Economic and SocialAffairs, Population Divison: The sustainable development goalsreport, United Nations Report, New York, 52 pp., 2016.
Zhao, D. and Liu, J.: A new approach to assessing the water foot-print of hydroelectric power based on allocation of water footprint among reservoir ecosystem services, Phys. Chem. Earth,79–82, 40–45, 2015.
proc-iahs.net/376/35/2018/ Proc. IAHS, 376, 35–43, 2018