Agricultural transformation. Trends in farm size, crop ...
92
Agricultural transformation Trends in farm size, crop diversification, and mechanization in Nicaragua and Peru SERIES 194 NATURAL RESOURCES AND DEVELOPMENT ISSN 2664-4541 Sinduja Srivinasan Milagro Saborío Adrián Rodríguez Cristian Morales
-
Upload
khangminh22 -
Category
Documents
-
view
1 -
download
0
Transcript of Agricultural transformation. Trends in farm size, crop ...

Agricultural transformation
Trends in farm size, crop diversification, and mechanization
in Nicaragua and Peru
SERIES
194NATURAL RESOURCES AND DEVELOPMENT
ISSN 2664-4541
Sinduja Srivinasan Milagro Saborío
Adrián Rodríguez Cristian Morales

ECLACPublications
Thank you for your interest in
this ECLAC publication
Please register if you would like to receive information on our editorial
products and activities. When you register, you may specify your particular
areas of interest and you will gain access to our products in other formats.
www.cepal.org/en/publications
Publicaciones www.cepal.org/apps
3 ECLAC – Natural Resources and Development N° .. Agricultural transformation, trends in farm size…
Agricultural transformation
Trends in farm size, crop diversification,
and mechanization in Nicaragua and Peru
Sinduja Srivinasan
Milagro Saborío
Adrián Rodríguez
Cristian Morales
194

This report was elaborated by Sinduja Srinivasan, Economic Affairs Officer in the Agricultural Development Unit
of the Division of Production, Productivity and Management of the Economic Commission for Latin America and
the Caribbean (ECLAC) and Milagro Saborío, consultant with the same Division, under the general supervision of
Adrián Rodríguez, Chief of the Agricultural Development Unit and Cristian Morales (ESA/FAO), with contributions
from Francisco Cerecera, Andrés Mondaini (consultants) and Bernardo Mayorga (intern). The research was
funded by the agreement between FAO and ECLAC, “Patterns in the agricultural transformation process in Latin
American countries: farm size, diversification and mechanization”.
The views expressed in this document, which has been reproduced without formal editing, are those of the
authors and do not necessarily reflect the views of the Organization.
United Nations publication
ISSN: 1680-9025 (electronic version)
ISSN: 1680-9017 (print version)
LC/TS.2020/23
Distribution: L
Copyright © United Nations, 2020
All rights reserved
Printed at United Nations, Santiago
S.19-00862
This publication should be cited as: S. Srivinasan, M. Saborío, A. Rodríguez and C. Morales, “Agricultural transformation:
trends in farm size, crop diversification, and mechanization in Nicaragua and Peru”, Natural Resources and Development
series, No. 194 (LC/TS.2020/23), Santiago, Economic Commission for Latin America and the Caribbean (ECLAC), 2020.
Applications for authorization to reproduce this work in whole or in part should be sent to the Economic Commission for
Latin America and the Caribbean (ECLAC), Publications and Web Services Division, [email protected]. Member
States and their governmental institutions may reproduce this work without prior authorization but are requested to
mention the source and to inform ECLAC of such reproduction.

3 ECLAC – Natural Resources and Development Series N° 194 Agricultural transformation: trends in farm size…
Contents
Summary ................................................................................................................................................................... 7
Introduction ............................................................................................................................................................. 11
A. Theories about structural change .................................................................................................. 11
B. Agricultural trends of interest ........................................................................................................ 13
I. National contexts ....................................................................................................................................... 15
A. Nicaragua ........................................................................................................................................... 15
1. Land reform ............................................................................................................................... 15
2. Sectoral trends .......................................................................................................................... 16
B. Peru ...................................................................................................................................................... 17
1. Land reform ............................................................................................................................... 17
2. Sectoral trends .......................................................................................................................... 18
3. Labor market ............................................................................................................................. 18
C. Summary of Possible Hypotheses ................................................................................................ 19
1. Nicaragua................................................................................................................................... 19
2. Peru .............................................................................................................................................20
II. Nicaragua .................................................................................................................................................... 21
A. Trends in land use and the crop distribution............................................................................. 21
B. Farm size distribution ..................................................................................................................... 24
1. National and regional trends ............................................................................................... 24
2. Changes in land use and farm sizes .................................................................................... 27
C. Land tenure ........................................................................................................................................35
D. Labor ....................................................................................................................................................36
E. Mechanization ...................................................................................................................................38

4 ECLAC – Natural Resources and Development Series N° 194 Agricultural transformation: trends in farm size…
III. Peru .............................................................................................................................................................. 43
A. Trends in land use and crops ....................................................................................................... 43
B. Farm size distribution ..................................................................................................................... 46
C. Land tenure ....................................................................................................................................... 48
D. Labor ....................................................................................................................................................50
E. Mechanization ................................................................................................................................... 51
IV. Comparative analysis and policy discussion ....................................................................................... 57
A. Comparative Analysis ...................................................................................................................... 57
1. Trends in land use ................................................................................................................... 57
2. Trends in crop production .....................................................................................................59
3. Trends in inequality ................................................................................................................. 61
4. Trends in land tenure ..............................................................................................................62
5. Trends in labor..........................................................................................................................62
B. Policy discussion ...............................................................................................................................63
1. Sustainable land use and land expansion. .........................................................................63
2. Increased land security .......................................................................................................... 64
3. Increased job security for agricultural employees. ..........................................................65
4. Increased temporary employment and lack of remunerated job opportunities
in other rural sectors ...............................................................................................................65
Bibliography ............................................................................................................................................................ 67
Annexes ................................................................................................................................................................... 71
Annex 1: Complementary tables to text .............................................................................................. 72
Annex 2: Identifying different types of labor ..................................................................................... 84
Annex 3: Glossary ......................................................................................................................................86
Natural Resources and Development Series: issues published..................................................................89
Tables
Table II.1 Nicaragua: distribution of total agricultural land by uses, 2001 and 2011 ..................22
Table II.2 Nicaragua: distribution of total agricultural land in regions by uses,
2001 and 2011 ............................................................................................................................22
Table II.3 Nicaragua: area and contribution to the total cultivated land of main crops,
2001 and 2011 ........................................................................................................................... 24
Table II.4 Nicaragua: indicators of farm size distribution, 2001 and 2011.....................................25
Table II.5 Nicaragua: median farm size (hectares), 2001 and 2011 ................................................. 27
Table II.6 Nicaragua: contribution (%) of the different farm sizes to absolute changes
in area, 2001 and 2011 .............................................................................................................28
Table II.7 Pacific region: top five crops, by farm size, 2001 and 2011 ............................................ 31
Table II.8 Central region: top five crops, by farm size, 2001 and 2011 ..........................................32
Table II.9 Atlantic region: top five crops, by farm size, 2001 and 2011..........................................33
Table II.10 Nicaragua: national and regional crop distribution comparison,
2001 and 2011 ........................................................................................................................... 34

5 ECLAC – Natural Resources and Development Series N° 194 Agricultural transformation: trends in farm size…
Table II.11 Nicaragua: classification of farmers according to land tenure by region,
2001 and 2011 ............................................................................................................................35
Table II.12 Nicaragua: classification of farmers according to land tenure by size,
2001 and 2011 ............................................................................................................................36
Table II.13 Nicaragua: labor indicators by farm size, 2001 and 2011 ............................................... 37
Table II.14 Nicaragua: ratio labor units to hectares by farm size, 2001 and 2011 .........................38
Table II.15 Nicaragua: use of agricultural machinery and tools, average ratio
units to hectares and average area of farms using the items, for selected items,
2001 and 2011 ............................................................................................................................38
Table II.16 Nicaragua: use of agricultural machinery and tools, percentage
of farms using items, for selected items with positive change in
the percentage, 2001 and 2011 .............................................................................................39
Table II.17 Nicaragua: use of agricultural machinery and tools, average ratio units
to hectares and average area of farms using the items, for selected items,
and two farm size categories, 2001 and 2011 ................................................................... 40
Table II.18 Nicaragua: percentage of farms using agricultural machinery and tools, for
selected items, and two farm size categories, 2001 and 2011 ....................................... 41
Table III.1 Peru: distribution of total agricultural land by uses, 1994 and 2012 .......................... 44
Table III.2 Peru: distribution of total agricultural land in regions by uses,
1994 and 2012 .......................................................................................................................... 45
Table III.3 Peru: area and contribution to the total cultivated land (%) of main crops,
1994-2012 .................................................................................................................................. 46
Table III.4 Peru: indicators of farm size distribution, 1994 and 2012 ..............................................47
Table III.5 Peru: absolute changes in farms and area by farm size,
between 1994 and 2012 ..........................................................................................................47
Table III.6 Peru: median farm size, 1994 and 2012 ............................................................................. 48
Table III.7 Peru: description of national and regional distribution of farms
according to land tenure 1994 and 2012 .......................................................................... 49
Table III.8 Peru: distribution of farms according to land tenure by size, 1994 and 2012 .......... 49
Table III.9 Peru: labor indicators by farm size, 1994 and 2012 .........................................................50
Table III.10 Peru: ratio labor units to hectares, by farm size, 1994 and 2012 .................................. 51
Table III.11 Peru: shares of farms owning equipment and average units per hectare
by item, 1994 and 2012 ...........................................................................................................52
Table III.12 Peru: regional shares of farms owning equipment and average units
per hectare by item, 1994 and 2012 ....................................................................................53
Table III.13 Peru: shares of farms owning equipment and average units per hectare
by farm size and item 1994 and 2012 ................................................................................ 54
Table III.14 Peru: shares of farms using tractors by farm size, 1994 and 2012 ...............................55
Table IV.1 Nicaragua and Peru: summary of trends in land use categories,
by region ....................................................................................................................................58
Table IV.2 Nicaragua and Peru: changes in crop production, by region and farm sizes ..........59
Table IV.3 Nicaragua: indicators of land concentration, 2001 and 2011 ......................................... 61
Table IV.4 Peru: indicators of land concentration, 1994 and 2012...................................................62
Table IV.5 Nicaragua and Peru: summary of trends in land tenure, by region ............................62
Table IV.6 Nicaragua and Peru: summary of trends in labor, by farm size ...................................63
6 ECLAC – Natural Resources and Development Series N° 194 Agricultural transformation: trends in farm size…
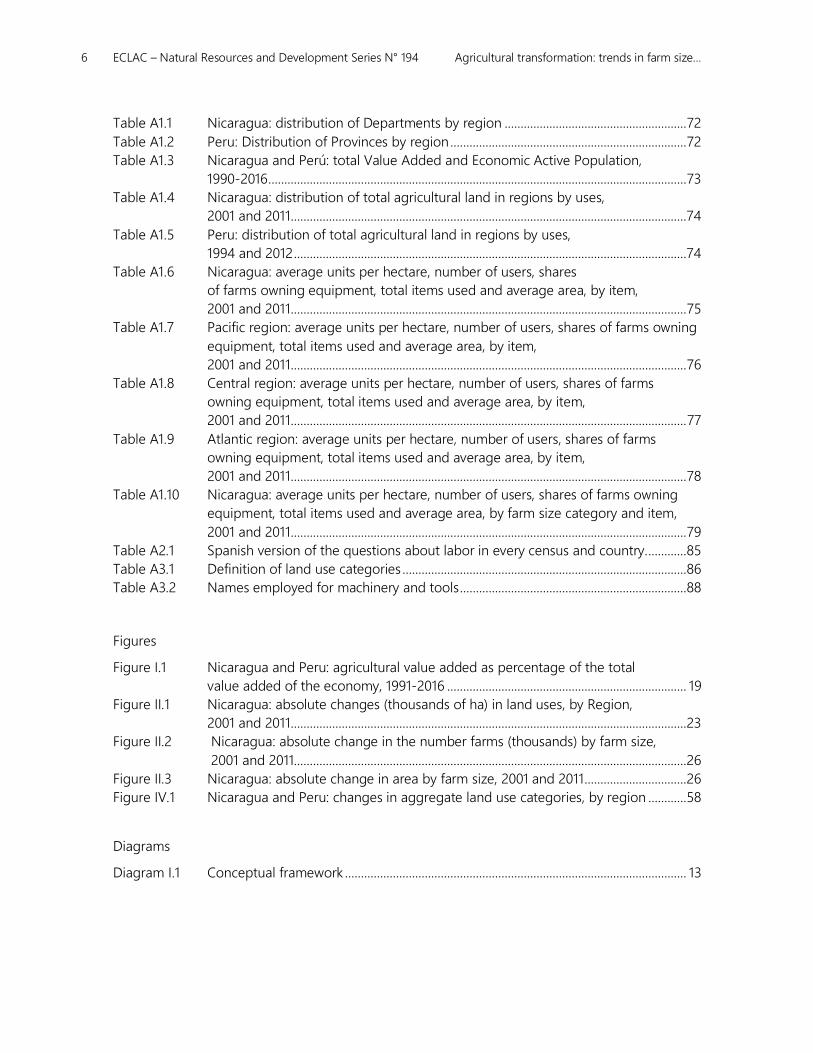
Table A1.1 Nicaragua: distribution of Departments by region ......................................................... 72
Table A1.2 Peru: Distribution of Provinces by region .......................................................................... 72
Table A1.3 Nicaragua and Perú: total Value Added and Economic Active Population,
1990-2016 ................................................................................................................................... 73
Table A1.4 Nicaragua: distribution of total agricultural land in regions by uses,
2001 and 2011 ............................................................................................................................74
Table A1.5 Peru: distribution of total agricultural land in regions by uses,
1994 and 2012 ...........................................................................................................................74
Table A1.6 Nicaragua: average units per hectare, number of users, shares
of farms owning equipment, total items used and average area, by item,
2001 and 2011 ............................................................................................................................ 75
Table A1.7 Pacific region: average units per hectare, number of users, shares of farms owning
equipment, total items used and average area, by item,
2001 and 2011 ............................................................................................................................ 76
Table A1.8 Central region: average units per hectare, number of users, shares of farms
owning equipment, total items used and average area, by item,
2001 and 2011 ............................................................................................................................ 77
Table A1.9 Atlantic region: average units per hectare, number of users, shares of farms
owning equipment, total items used and average area, by item,
2001 and 2011 ............................................................................................................................ 78
Table A1.10 Nicaragua: average units per hectare, number of users, shares of farms owning
equipment, total items used and average area, by farm size category and item,
2001 and 2011 ............................................................................................................................ 79
Table A2.1 Spanish version of the questions about labor in every census and country. ............85
Table A3.1 Definition of land use categories .........................................................................................86
Table A3.2 Names employed for machinery and tools .......................................................................88
Figures
Figure I.1 Nicaragua and Peru: agricultural value added as percentage of the total
value added of the economy, 1991-2016 ........................................................................... 19
Figure II.1 Nicaragua: absolute changes (thousands of ha) in land uses, by Region,
2001 and 2011 ............................................................................................................................23
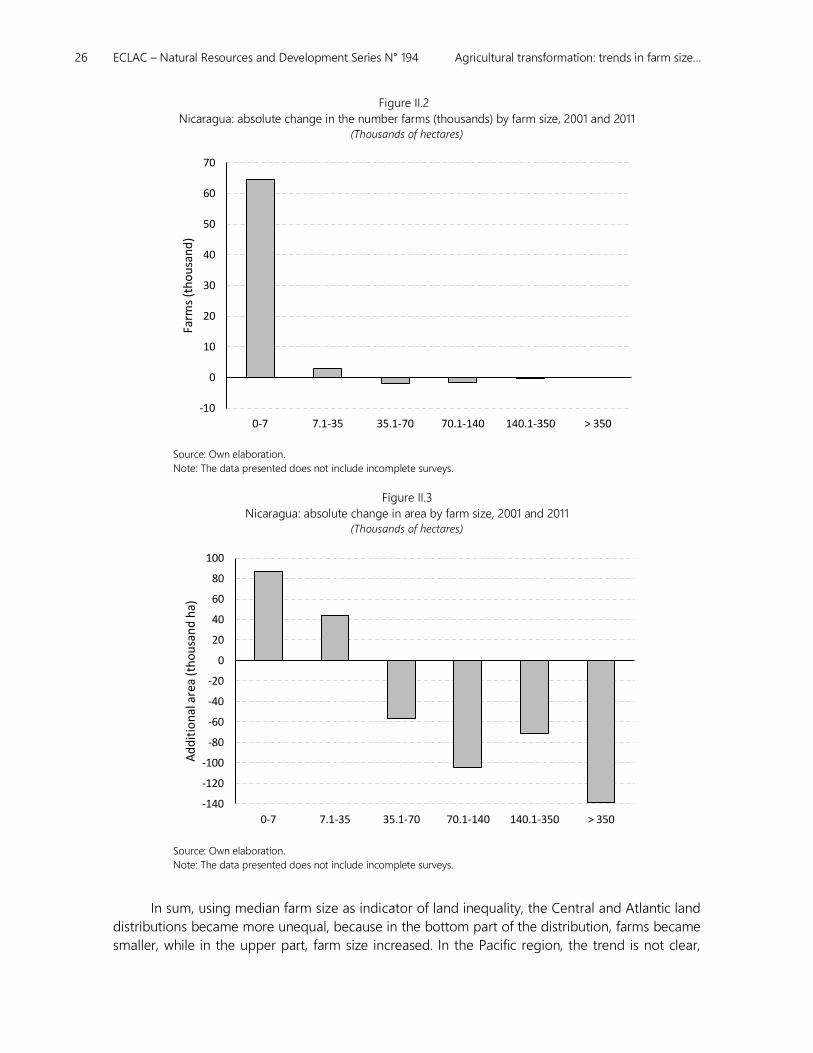
Figure II.2 Nicaragua: absolute change in the number farms (thousands) by farm size,
2001 and 2011...........................................................................................................................26
Figure II.3 Nicaragua: absolute change in area by farm size, 2001 and 2011 ................................26
Figure IV.1 Nicaragua and Peru: changes in aggregate land use categories, by region ............58
Diagrams
Diagram I.1 Conceptual framework ........................................................................................................... 13

7 ECLAC – Natural Resources and Development Series N° 194 Agricultural transformation: trends in farm size…
Summary
Structural change is a process in which the amount of labor, capital, and land dedicated to
agriculture (and other sectors) changes over time. In this study, we research Peru and Nicaragua,
utilizing the two most recent agricultural censuses administered in each country. The agricultural
censuses permit us to identify dimensions and information available to study the process of
structural change in Latin America over the last 20 years.
In Chapter I, we provide an overview of the theory of structural change and identify
agricultural trends of specific interest to this study. The literature on structural change focuses on
drivers that cause the proportion of labor in agriculture to decrease, a phenomenon observed in
many countries along their path of economic growth and development. Growth models provide
two explanations for decreased agricultural employment within closed economies. The first is
demand-driven: as countries transition from pre-industrial economies to industrial ones, relative
demand for agricultural goods decreases, causing agricultural employment to contract. On the
supply side, growth models suggest that as technology results in increased agricultural productivity,
demand for agricultural labor decreases. An increase in labor productivity is the most common
trend documented in the context of decreased agricultural employment and rapid growth (Timmer,
1988). Decreased employment in agriculture may stem from out-migration and a move to another
sector, such as manufacturing or services. Utilization of the same amount of land with less labor
may result in a concentration of land ownership. In the data, we observe that the distribution of
farm sizes is bipolar both in Nicaragua and in Peru: most farms are either small or big, with very few
farms in the middle of the distribution. We also observe socioeconomic differences across this
bipolarization: small farms are family farms in contrast to the bigger, commercial farms. Therefore,
the bipolarization of the distribution may be matched by a difference in management practices and
other key elements of production.

8 ECLAC – Natural Resources and Development Series N° 194 Agricultural transformation: trends in farm size…
In Chapter II we discuss political and sectoral trends that affected the process of agricultural
structural change in Nicaragua and Peru. Nicaragua elected a democratic government in 1990,
which implemented a process of land redistribution, reallocating land from state farms cooperatives
to individuals.1 However, the expansion of the agricultural frontier in formerly state-owned lands
and other institutional factors created conditions of uncertainty about land tenure; many owners
lack a registered title and some plots have more than one registered owner (Baumeister, 2012). After
1990, the government eliminated price controls, and macroeconomic policy was directed towards
stabilizing the economy and reducing the size of the state, resulting in small farms having little or
no access to credit (Pérez and Féguin-Gresh, 2014; Jonakin, 1996). Uncertainty about property rights
and exclusion from credit markets may have affected investment decisions and crop selection, which
we consider in our analysis.
In Peru, we also concentrate on the post-1990 period, which marks the start of Fujimori’s
government. The government implemented a new law removing previous rules dictating size limits,
restrictions to sell land, and the prohibition of indirect management (Remy and de los Ríos, 2012
and Burneo, 2011). Normally, such changes would accelerate land concentration, but by 1994 land
was more equally distributed (Remy and de los Ríos, 2012). From 1991 to 2009, arable land increased
from 1.8 to 3.1 million hectares, driven mainly by irrigation projects, increased investment, and
exports (Velazco and Velazco, 2012). Credit programs and tax exemptions were used to promote
agriculture, providing farmers with access to loans and easier terms for tax payments. These policies
and trends indicate a likely expansion of the agricultural sector, possibly skewed towards small
farmers. We examine this in detail in our analysis.
In Chapter III we analyze the process of structural change in Nicaragua, between 2001 and
2011, in five areas: (A) land use, (B) the crop and farm size distribution, (C) land tenure, (D) labor
trends, and (E) mechanization. We find that although the total amount of land allocated for
agricultural use declined slightly between 2001 and 2011, a much higher percentage of land was
used for cultivation and pastures (likely for livestock), which was accompanied by some
deforestation. Three traditional crops (corn, beans and coffee) continued to dominate throughout
the country. Although land inequality increased slightly, there was almost a 33 percent increase in
the share of producers with small farms (0-7 ha), and the share of land in this size category more
than doubled as well. This trend was complemented by a nearly 60 percent increase in the number
of farms in the 0-7 ha category, and a 120 percent increase in the number of temporary workers
employed on these farms. Finally, mechanization in farms smaller than 7 ha increased greatly as
well, because of an expansion in the use of agricultural tools and machines. Combined, these trends
indicate that in Nicaragua, agriculture is an expanding sector, attracting both labor and capital.
In Chapter IV we undertake our analysis of agricultural structural change in Peru, between
1994 and 2012, with respect to (A) land use and crops, (B) farm size distribution, (C) land tenure, (D)
labor, and (E) mechanization. Over two decades, Peru saw its total agricultural land increase by
about 10 percent. The distribution within the total was skewed towards land allocated for
“permanent use” (perennial cultivation), which more than doubled its share, a trend experienced in
all regions. The shift in land use correlates with the principal crops cultivated in Peru (corn, potatoes,
coffee, and rice), which comprised about half of all cultivated land by 2012. However, more
agricultural land and increased cultivation did not translate to a more equal distribution of farmland.
1 In fact, land reform was implemented in both previous governments: the Somoza dictatorship (1963) and the Sandinistas
(1979-1984).

9 ECLAC – Natural Resources and Development Series N° 194 Agricultural transformation: trends in farm size…
In particular, land shifted from the smallest farms (less than 7 ha) to larger farms. As noted in
Section C, trends in land distribution and use were probably affected by changes in land tenure.
While the overall share of farms with registered land rights increased, a higher share of large
farms (greater than 350 ha) reported having registered rights than small farms, in both 1994
and 2012. Increases in total land and cultivation correlate with increases in labor (Section D), a
doubling or more in the number of temporary farm employees, across all size categories, which
was accompanied by an increase in mechanization (Section E).
We close our analysis for agricultural structural change in Latin America in Chapter V, with a
series of policy recommendations. For Nicaragua and Peru to continue their agricultural expansion
equitably and sustainably, we recommend 1) Sustainable land and land-use expansion, 2) Increased
land security, and 3) Increased job security for agricultural employees.


11 ECLAC – Natural Resources and Development Series N° 194 Agricultural transformation: trends in farm size…
Introduction
Structural change is a process in which the amount of labor, capital, and land dedicated to
agriculture (and other sectors) changes over time. The drivers of such change are numerous and
interrelated. In this section, we present some of these drivers and discuss their connectedness.
Utilizing the economic theory of structural change, we aim to explain national or regional (sub-
national) trends in agriculture.
A. Theories about structural change
The literature on structural change focuses on drivers that cause the proportion of labor in
agriculture to decrease, a phenomenon observed in many countries along their path of economic
growth and development. We summarize the literature according to three strands. The first strand
discusses growth models, climate change is introduced in the second, and the last strand examines
the role of institutions.
Growth models provide two explanations for decreased agricultural employment within
closed economies. The first describes the transition from a pre-industrial economy to an industrial
one. In this context, consumer preferences are biased towards agricultural goods (Kongsamut,
Rebelo, and Xie, 2001). This bias stems from a mechanism that requires a minimum consumption
(subsistence level) of agricultural goods. Once the threshold is reached, any subsequent income
growth consumers experience results in the demand for non-agricultural goods increasing at a
faster rate than that for agricultural goods.2 Consequently, labor demand and wages increase faster
in the non-agricultural sector than in the agricultural sector, so agricultural employment declines.
2 This result rests on assumption that the income elasticity of demand is greater than one for non-agricultural goods and
lower than one for agricultural goods.

12 ECLAC – Natural Resources and Development Series N° 194 Agricultural transformation: trends in farm size…
The nineteenth century economic boom experience in the United States is the typical example of
industrialization within a closed economy.
The second explanation provided by growth models analyzing the closed economy context
is linked to the supply or production side. Matsuyama (1992) formalizes this theory using a model
in which agricultural technological progress increases labor productivity.3 Such technological
progress explains the trends observed in the Green Revolution (Matsuyama, 1992); however, other
processes altering the agricultural production function and costs could play the same role in the
model, with a similar effect on agricultural employment and productivity.
Growth models also consider the open economy case where international factors drive
declines in agricultural employment. Murata (2008) pinpoints the driver absent from closed models:
trade costs (e.g., transportation costs, trade tariffs, and other trade barriers).4 As trade costs for
manufactured goods fall, so do their prices, thus increasing demand. The subsequent impact on
agricultural employment is the same as from an increase in income: labor is reallocated from
agriculture to non-agriculture. Thus, trade may be a driver of structural change because it expands
the final markets.
The second strand of literature on structural change analyzes the impact of climate change
on agriculture. To the extent of our knowledge, both strands have not been linked in a theoretical
growth model of structural change. However, the link is easy to construct. Mendelsohn, Nordhaus,
and Shaw (1996) study the impact of climate change on agriculture. In their Ricardian model,
changes in temperature and rain exogenously affect agricultural productivity, resulting in a
reallocation towards crops that are relatively more profitable. However, structural change models
predict that exogenous changes in productivity (such as a technological innovation in Matsuyama
(1992)) drive a decline of labor in agriculture. Consequently, the former implies that climate change
may modify the agricultural landscape, while the latter implies that the location and use of labor
and capital may also change.
Finally, the last strand of the literature considers the role of institutions. We highlight the role
of agricultural prices and organizations. Specifically, agricultural producers (individual farmers or
commercial farms) may engage in activities to control prices and reduce their volatility. If these
practices affect the cost structure at the national or regional level, the impact will be equivalent to
a technological innovation, shifting the share of labor employed in agriculture. Institutional effects
are bidirectional in their impact on structural change. The integration of value chains, which are an
alliance-based governance structure to improve logistics and the flow of products, result in reduced
risk and increased profits in the United States, thus affecting the share of labor in agriculture, as
well as farm sizes (Boehle, 1999). However, Chavas (2011) argues that establishing agricultural
organizations has stabilized some agricultural prices and reduced income uncertainty in such a way
that investment in the sector has been increased.
3 In Matsuyama (1992), agricultural employment declines because consumers are similarly biased toward agricultural
goods as mentioned previously. However, there are models in which this bias in preferences is not assumed: Echeverria
(1997), Ngai and Pisarrides (2007) and Acemoglu and Guerrieri (2008). 4 Matsuyama (1992) also develops some consequences of structural change in a context of an open economy. However,
the question he answers is how structural change affects the growth of the non-agricultural sector if the economy is
open and has comparative advantage in agriculture.

13 ECLAC – Natural Resources and Development Series N° 194 Agricultural transformation: trends in farm size…
Diagram I.1 summarizes the drivers of structural change: demand for labor in non-agriculture,
technological innovation, trade costs, climate change, and agricultural organizations. Also, we account
for the role of public policies, since they can affect any of the other drivers, intentionally or incidentally.
Diagram I.1
Conceptual framework
Source: Own elaboration
B. Agricultural trends of interest
The literature on structural change explains the decline of agricultural labor in developed countries
in a general equilibrium context. However, to have a perspective about the trends observed in
agricultural employment in developing economies, it is also necessary to examine other factors.
In this study, we research structural change in Peru and Nicaragua, utilizing the two most
recent agricultural censuses administered in each country. The direct empirical evidence on
structural change discusses temporal changes in the use of labor in agriculture, the use of physical
capital (e.g., mechanization of farming practices), and the allocation of land to different uses, for
example forest versus agricultural land. Additionally, these changes may be accompanied by
modifications in the bundle of agricultural products. Reallocation of labor, capital, and land may
influence trends in labor productivity, and farm size.
An increase in labor productivity is the most common trend documented in the context of
decreased agricultural employment and rapid growth (Timmer, 1988). For example, China (Cao and
Birchenall, 2013) and India (Grabowski, 2013) experienced increased labor productivity while their
economies were growing quickly. In China, the use of labor in agriculture, measured as hours per
14 ECLAC – Natural Resources and Development Series N° 194 Agricultural transformation: trends in farm size…
hectare, dropped, while at the same time the use of inputs (e.g., fertilizers) and mechanization
increased (Chen, Li, Tian, and Tan, 2009).
One of the central issues of study, in the context of structural change, is trends in farm size.
Decreasing employment in agriculture may imply out-migration and a move to another productive
sector, such as manufacturing or services. The exploitation of the same land with less labor may
result in a concentration of land ownership. However, it may be the concentration of land ownership
driving out-migration and an increase in labor in other sectors. In any case, the average farm size
may change. Chavas (2011) identifies the major drivers of a concentration in land ownership
(increased farm size) as technological change, economies of scale, economies of scope, and farm
organization. Iraizoz, Gorton, and Davidova (2007) argue for a trend that creates a bipolar
distribution of farm sizes, where farms are either small or big, with very few medium-sized farms.
Finally, small farms in the distribution could be family farms while big farms may be mostly
commercial farms. Therefore, the bipolarization of the distribution may be accompanied by a
difference in management and, probably, access to credit, training, and technology. Additionally, a
change in the number of family farms is of interest because they constitute a central part of the
agricultural landscape and rural culture.
15 ECLAC – Natural Resources and Development Series N° 194 Agricultural transformation: trends in farm size…
I. National contexts
This section summarizes different trends in Nicaragua and Peru related to land reform and agricultural
production, especially in the period between 1990 and 2010. Based on these trends, we propose
preliminary hypotheses about the process of agricultural structural change in Peru and Nicaragua.
A. Nicaragua
Recent Nicaraguan history can be divided in three periods. The first, from 1950 to 1979, is
characterized by the rule of the Somoza family. In the second period, 1979 to 1990, the Sandinista
government was in power. Finally, after 1990 a democratic period started. The role of markets and
the state differs in each period: in the first and last periods, Nicaragua became more integrated with
international markets, with greater private ownership of land and firms. During the Sandinista
government, in line with socialist principles, the state had a greater role in production and markets
were more controlled. In this section, we describe the dominant policies and economic trends,
especially for the era starting in 19905.
1. Land reform
Land reform started in 1963, during Somoza’s government, at a moment in which 1.5% of farms owned
41.2% of the cultivated land (Pérez and Fréguin-Gresh, 2014). In the following years, the total cultivated
area expanded, but the distribution of land remained polarized until 1978, despite the enactment of an
expropriation law in 1976 (Austin, Fox and Kruger, 1985; Pérez and Fréguin-Gresh, 2014).
The process of land reform was restarted during the Sandinista government. According to
Austin, Fox and Kruger (1985), from 1979 to 1984, the reform was organized as follows:
5 The census data we analyze is from 2001 and 2011.
16 ECLAC – Natural Resources and Development Series N° 194 Agricultural transformation: trends in farm size…
• Immediately after the revolution, the state took control of 23% of the arable land that
formerly belonged to the Somoza family. The Asociación de Trabajadores del Campo
(Association of Countryside Workers) played a role in the organization of production. This
association had 120,000 members in 1980.
• The Ministry of Agrarian Reform lead the creation of state-owned enterprises.
• The Land Reform Act of 1981 established that productive (farming) land could not be reformed.
• By regulating rent prices, the government increased access to rented land. It also
prohibited sharecropping.
• Through the establishment of cooperatives, the government promoted collective production.
As the process of land reform progressed, farmers demanded greater access to land. Thus in
1986, the Land Reform Act was modified and more land was allocated to individual farmers (Pérez
and Fréguin-Gresh, 2014 and Baumeister, 2012). With reference to the 1978-1988 period, Baumeister
(2012) reports that 81.6% of land reallocated in the reform initially belonged to estates with 350
hectares (ha) or more. The reallocated land was directed to state-owned firms and cooperatives,
which received 42.1% and 49.6% of the reformed land, respectively.
In 1990, the newly elected democratic government passed laws to regulate and implement a
redistribution of land previously already reformed under the Sandinistas. Some collective lands,
owned by cooperatives and other organizations, were parceled into individual plots (Jonakin, 1996).
Additionally, some lands were returned to the previous owners (Pérez and Fréguin-Gresh, 2014).
Pérez and Fréguin-Gresh (2014) estimate that by 2001, 75% of the reformed land was not owned by
the original beneficiaries of the reform. In fact, Baumeister (2012) estimates that the land reallocated
between 1988 and 2001 (land that was formerly owned by state farms and cooperatives) was
distributed in 2001 as follows: 6.6% of farms with fewer than 7 ha, 15.6% of farms between 7 and 35
ha, 63.6% of farms between 35 and 350 ha, and 14.2% of farms with more than 350 ha. However,
the overall result of the land reform seems to be positive. In 1963 41.2% of cultivated land was in
farms with more than 350 ha, while in 2001 and 2011, that percentage was 19.8 and 19.2, respectively.
(Pérez and Féguin-Gresh, p. 236 with census data).
The reallocation of reformed land, after 1990, the existence of collective ownership of land, in
indigenous communities, the expansion of the agricultural frontier in formerly state-owned lands,
and other institutional factors have created conditions of uncertainty about land tenure, as for
example, owners lacking a registered title and plots having more than one registered owner
(Baumeister, 2012). Uncertainty about property rights may affect investment decisions and selection
of crops, so this is an important aspect to be considered in future analyses.
2. Sectoral trends
The Nicaraguan economy has long been linked to international markets (Pérez and Féguin-Gresh, 2014).
In Somoza´s government, traditional exports, such as cotton, coffee, meat, sugar cane and tobacco, were
supported with policies that included investment in infrastructure, such as roads and storage, processing
and marketing facilities, expansion of the maxiumum amount of credit, favorable exchange rates, and
price controls (Austin, 1985). After 1990, the promotion of exports was again a priority, especially for
coffee, meat, soya and sugar cane (Pérez and Féguin-Gresh, 2014).
17 ECLAC – Natural Resources and Development Series N° 194 Agricultural transformation: trends in farm size…
After 1990, the government eliminated price controls, and macroeconomic policy was
directed to stabilizing the economy and reducing the size of the state (Pérez and Féguin-Gresh,
2014). One of the services affected was credit. During the Sandinista government, BANDES (National
Development Bank) managed agricultural credit. After 1990 small farmers had little or no access,
due to the introduction of tight eligibility rules (Jonakin, 1996).
After 1990 the amount of arable land expanded, especially for basic grains production
(increasing by 105% between 1987 and 2005) and new pastures for livestock (Baumeister, 2012).6
Part of the expansion of arable land occurred along the agricultural frontier, where farmers acquired
property rights over the forest they then converted to agricultural land (Baumeister, 2012). In terms
of production after 2000, Baumeister (2012) reports projects in the following areas: reforestation,
cattle, oil palm, sugar cane, and oranges, which are mainly for the external market.
The trends experienced by the agricultural sector occurred while the whole economy was
growing. Between 1991 and 2011, the average annual growth rate of the Total Value Added was
3.2%, while the economically active population’s average annual growth 3.0% (See Table A3 in the
Annex). In this context, the share of the agricultural value added to the total value added increased
from 15.3% in 1990 to around 18%, in the 2007-2011 period. After 2012, the share decreased to
15.6%, but the latter period is not part of this study.
B. Peru
Peru, like Nicaragua, experienced democratic and non-democratic governments since 1950. Here
we pay special attention to the period after 19907, a year that marks the beginning of Fujimori’s
government and the end of a debt crisis and hyperinflation. In addition, guerrilla conflicts decreased
with the imprisonment of the Sendero Luminoso leader in 1992. Further, Fujimori’s government
changed the rules of land ownership. In the years following, exports and investment in agriculture
were promoted.
1. Land reform
Land reform in Peru was implemented from 1962 to 1979, a period in which Peru was mostly ruled
by military, non-democratic governments. Between 1969 and 1979, a total of 8.5 million hectares
were reallocated to final owners that were mainly cooperatives and farm associations (Eguren,
2006). The government established limits on farm sizes; in addition, reformed land could not be
sold (Meynard, 2014, and Remy and de los Ríos 2012). The reform was intended to promote a
collective management of land that would generate employment and produce food. Consequently,
only a small amount of reformed land (7.7%) was reallocated to individual farmers and the law
prohibited “indirect management” (former business groups managing cooperatives or farm
associations), so that only members of these associations could play a role in management decisions
(Remy and de los Ríos, 2012).
In 1980, the democratically elected government enacted a new law parceling most of the land
that was formerly organized in cooperatives. This especially affected irrigated lands on the Coast,
except those producing sugar cane (Remy and de los Ríos, 2012 and Burneo, 2011). Cooperative
6 Particularly in Chontales, Matagalpa and the Autonomous regions (Baumeister,2012, p. 351). 7 The census data we analyze is from 1994 and 2012.
18 ECLAC – Natural Resources and Development Series N° 194 Agricultural transformation: trends in farm size…
lands were equally shared among members, according to rules that created small and dispersed
plots (Remy and de los Ríos, 2012).
In 1995, after Fujimori’s government enacted a new Constitution, a new law removed the
previous rules dictating size limits, restrictions to sell land, and the prohibition of indirect
management (Remy and de los Ríos, 2012 and Burneo, 2011). In this context, Burneo (2011)
hypothesized that a process of land concentration took place, with three main drivers: the new
legislation that permitted the concession of irrigated land, low dynamism in the land market, and
the privatization of sugar cooperatives. However, using census data from 1961 and 1994, Remy and
de los Ríos (2012) find that the land Gini decreased: land became more equally distributed.
2. Sectoral trends
Starting in 1990, Peru implemented economic stabilization and adjustment programs,
macroeconomic policies emphasizing tax reforms, reductions in government expenditures, and
market determination of exchange rate and interest rates. (Velazco and Velazco, 2012).
From 1991 to 2009, arable land increased from 1.8 to 3.1 million hectares, driven mainly by
irrigation projects, increased investment, and exports (Velazco and Velazco, 2012). Regarding
irrigation projects, state-owned unproductive lands with irrigation potential were developed by the
state or by concessionary firms (Remy and de los Ríos, 2012, and Burneo 2011).
During these years policies promoting traditional and non-traditional agricultural exports had
a clear impact as the share of exports to value added in agriculture increased from 21%, in 2000, to
38% in 2010 (Velazco and Velazco, 2012). Within traditional exports, coffee experienced the greatest
growth in total area, due to programs replacing illegal crops with legal ones, an increased role of
cooperatives, high export prices, and access to international markets. Among the non-traditional
exports, the main crops were asparagus, artichokes, mangoes, beans, bananas, grapes, avocados,
onions, olives, and quinoa (Velazco and Velazco, 2012). Additionally, the promotion of bio-fuels
bolstered sugar cane and oil palm production (Burneo, 2011).
The government also used credit and tax exemptions to promote agriculture. “Fondeagro”,
an agricultural credit program, provided US$280 million in loans from 1992 to 1994 (Velazco, 2001).
In 1995, a “Special Taxation Program” (PERT) provided farmers, livestock producers, and
agribusinesses with easier terms for tax payments (Velazco, 2001).
3. Labor market
Between 1994 and 2012, the Peruvian economy experienced high rates of GDP growth, with an
average annual rate equal to 5.3% (see Table A.3 in the Annex). Consequently, the economically
active population expanded at an average annual rate of 2.9%. Moller et al. (2010) estimate that
between 2002 and 2008 the Peruvian labor force increased from 12 to 15.1 million workers, and the
dynamism of the labor market also implied high migration between regions (6% of the population).
The contribution of agriculture to the total value added of the economy decreased from 8.4% in
1994, to 7.3% in 2012.

19 ECLAC – Natural Resources and Development Series N° 194 Agricultural transformation: trends in farm size…
According to Moller et al. (2010), employment in Peru is characterized by low productivity and
high informality (three in every four jobs are informal). Economic growth may have reduced the rate of
informal employment (76% in 1997 to 73% in 2008) (Moller et al., 2010). However, changes in the
formality of employment may also reflect two institutional changes: (1) the creation in 2003 of a regime
for micro and small firms that reduced firms’ non-wage costs (such as vacations and liquidation
payments) per employee, and (2) an improvement in the monitoring of labor benefits (Chacaltana, 2016).
Figure I.1
Nicaragua and Peru: agricultural value added as percentage of the
total value added of the economy, 1991-2016
Percentages
Source: Own elaboration with data from ECLAC.
C. Summary of Possible Hypotheses
With a better understanding of the political and economic factors at play in both countries, we infer
a series of hypotheses about agricultural structural transformation in Nicaragua and Peru.
1. Nicaragua
Between 2001 and 2011, we anticipate the following trends in Nicaragua:
HN1 Ambiguous impact on land distribution: The various land reforms attempted to
improve land equality. However, uncertainty about land tenure and the inability of
farmer to access credit could mean that small farmers sell their land and leave
agriculture altogether, thus increasing land inequality.
HN2 Decreased land ownership: Those small farmers who remained may have wanted the
flexibility to leave agriculture quickly, so more of them are renting land.
0
2
4
6
8
10
12
14
16
18
20
19
91
19
92
19
93
19
94
19
95
19
96
19
97
1998
19
99
2000
20
01
2002
20
03
2004
20
05
2006
20
07
20
08
20
09
20
10
20
11
20
12
20
13
20
14
20
15
20
16
Per
cen
tage
Nicaragua Peru

20 ECLAC – Natural Resources and Development Series N° 194 Agricultural transformation: trends in farm size…
HN3 Crop distribution skewed towards cash crops: Without credit and working on rented
land, small farmers, now having a shorter planning horizon, may turn to cash crops,
which will affect the crop distribution and, potentially, the types of crops exported.
HN4 Deforestation: We also expect to see more land used for agricultural purposes, as
forests are converted to arable land.
2. Peru
For Peru, we expect the following to occur, between 1994 and 2012:
HP1 Ambiguous impact on land distribution and median farm size: The lifting of farm size
restrictions may cause an increase in land concentration (increasing the median farm
size). However, the increased access to credit may allow small farmers to enter
agriculture more easily (reducing the median farm size).
HP2 Changes in the crop distribution: Export policies and a reduction in illegal crops could
see farmers planting a very different set of crops in 2012 versus 1994.
HP3 Depending on how these factors combine, the number of people employed in
agriculture could increase or decrease.
21 ECLAC – Natural Resources and Development Series N° 194 Agricultural transformation: trends in farm size…
II. Nicaragua
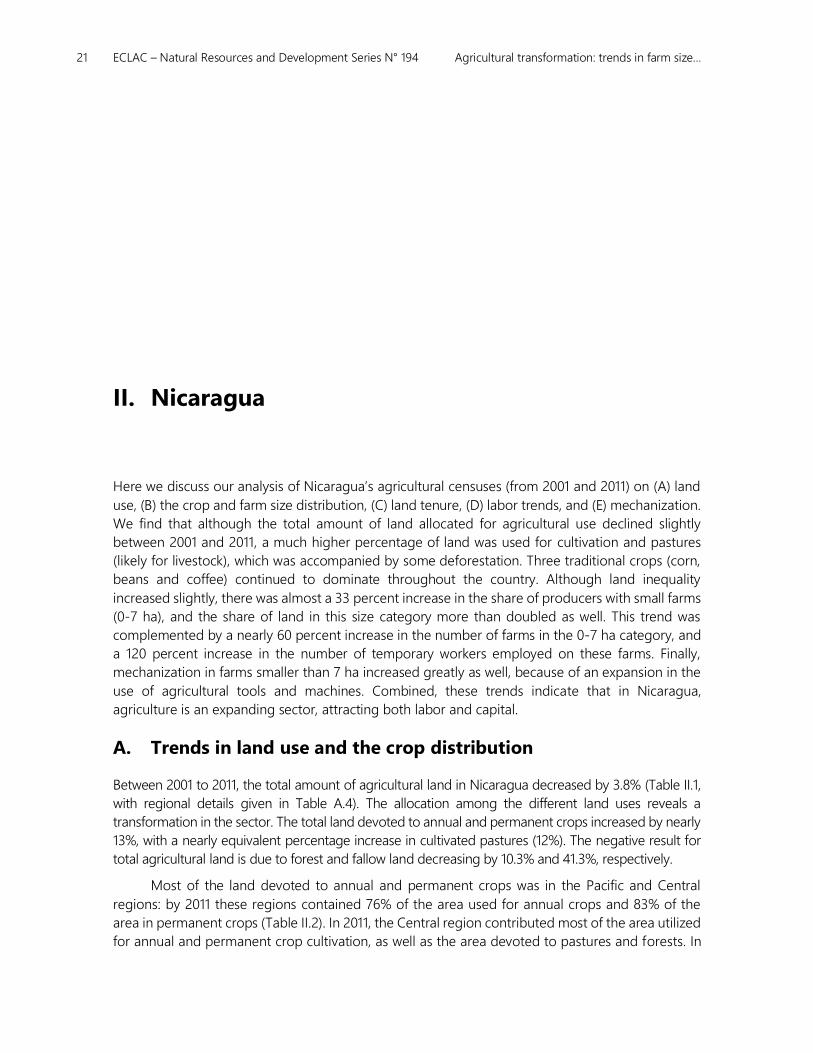
Here we discuss our analysis of Nicaragua’s agricultural censuses (from 2001 and 2011) on (A) land
use, (B) the crop and farm size distribution, (C) land tenure, (D) labor trends, and (E) mechanization.
We find that although the total amount of land allocated for agricultural use declined slightly
between 2001 and 2011, a much higher percentage of land was used for cultivation and pastures
(likely for livestock), which was accompanied by some deforestation. Three traditional crops (corn,
beans and coffee) continued to dominate throughout the country. Although land inequality
increased slightly, there was almost a 33 percent increase in the share of producers with small farms
(0-7 ha), and the share of land in this size category more than doubled as well. This trend was
complemented by a nearly 60 percent increase in the number of farms in the 0-7 ha category, and
a 120 percent increase in the number of temporary workers employed on these farms. Finally,
mechanization in farms smaller than 7 ha increased greatly as well, because of an expansion in the
use of agricultural tools and machines. Combined, these trends indicate that in Nicaragua,
agriculture is an expanding sector, attracting both labor and capital.
A. Trends in land use and the crop distribution
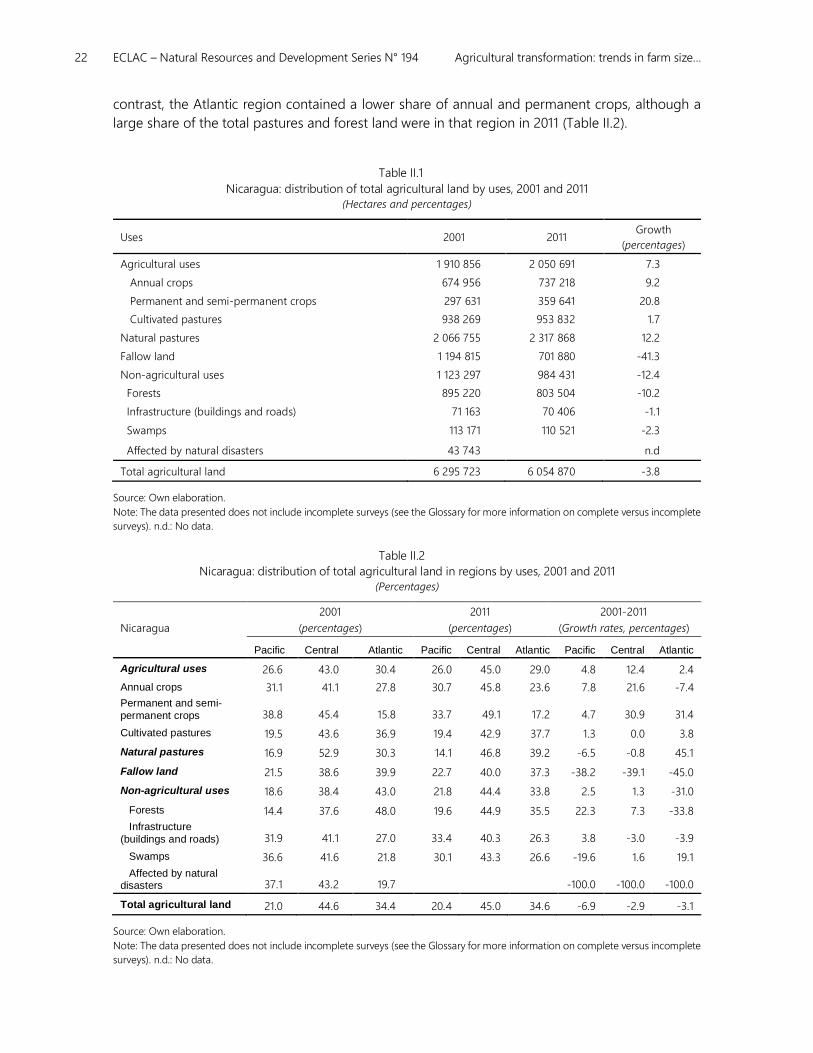
Between 2001 to 2011, the total amount of agricultural land in Nicaragua decreased by 3.8% (Table II.1,
with regional details given in Table A.4). The allocation among the different land uses reveals a
transformation in the sector. The total land devoted to annual and permanent crops increased by nearly
13%, with a nearly equivalent percentage increase in cultivated pastures (12%). The negative result for
total agricultural land is due to forest and fallow land decreasing by 10.3% and 41.3%, respectively.
Most of the land devoted to annual and permanent crops was in the Pacific and Central
regions: by 2011 these regions contained 76% of the area used for annual crops and 83% of the
area in permanent crops (Table II.2). In 2011, the Central region contributed most of the area utilized
for annual and permanent crop cultivation, as well as the area devoted to pastures and forests. In
22 ECLAC – Natural Resources and Development Series N° 194 Agricultural transformation: trends in farm size…
contrast, the Atlantic region contained a lower share of annual and permanent crops, although a
large share of the total pastures and forest land were in that region in 2011 (Table II.2).
Table II.1
Nicaragua: distribution of total agricultural land by uses, 2001 and 2011
(Hectares and percentages)
Uses 2001 2011 Growth
(percentages)
Agricultural uses 1 910 856 2 050 691 7.3
Annual crops 674 956 737 218 9.2
Permanent and semi-permanent crops 297 631 359 641 20.8
Cultivated pastures 938 269 953 832 1.7
Natural pastures 2 066 755 2 317 868 12.2
Fallow land 1 194 815 701 880 -41.3
Non-agricultural uses 1 123 297 984 431 -12.4
Forests 895 220 803 504 -10.2
Infrastructure (buildings and roads) 71 163 70 406 -1.1
Swamps 113 171 110 521 -2.3
Affected by natural disasters 43 743 n.d
Total agricultural land 6 295 723 6 054 870 -3.8
Source: Own elaboration.
Note: The data presented does not include incomplete surveys (see the Glossary for more information on complete versus incomplete
surveys). n.d.: No data.
Table II.2
Nicaragua: distribution of total agricultural land in regions by uses, 2001 and 2011
(Percentages)
Nicaragua
2001
(percentages)
2011
(percentages)
2001-2011
(Growth rates, percentages)
Pacific Central Atlantic Pacific Central Atlantic Pacific Central Atlantic
Agricultural uses 26.6 43.0 30.4 26.0 45.0 29.0 4.8 12.4 2.4
Annual crops 31.1 41.1 27.8 30.7 45.8 23.6 7.8 21.6 -7.4
Permanent and semi-
permanent crops 38.8 45.4 15.8 33.7 49.1 17.2 4.7 30.9 31.4
Cultivated pastures 19.5 43.6 36.9 19.4 42.9 37.7 1.3 0.0 3.8
Natural pastures 16.9 52.9 30.3 14.1 46.8 39.2 -6.5 -0.8 45.1
Fallow land 21.5 38.6 39.9 22.7 40.0 37.3 -38.2 -39.1 -45.0
Non-agricultural uses 18.6 38.4 43.0 21.8 44.4 33.8 2.5 1.3 -31.0
Forests 14.4 37.6 48.0 19.6 44.9 35.5 22.3 7.3 -33.8
Infrastructure
(buildings and roads) 31.9 41.1 27.0 33.4 40.3 26.3 3.8 -3.0 -3.9
Swamps 36.6 41.6 21.8 30.1 43.3 26.6 -19.6 1.6 19.1
Affected by natural disasters 37.1 43.2 19.7 -100.0 -100.0 -100.0
Total agricultural land 21.0 44.6 34.4 20.4 45.0 34.6 -6.9 -2.9 -3.1
Source: Own elaboration.
Note: The data presented does not include incomplete surveys (see the Glossary for more information on complete versus incomplete
surveys). n.d.: No data.

23 ECLAC – Natural Resources and Development Series N° 194 Agricultural transformation: trends in farm size…
The transformation of Nicaraguan agriculture from 2001 to 2011 was characterized by the
addition of pasturelands and the utilization of land that was formerly fallow. In all regions, the
amount of fallow land decreased (Figure II.1). In contrast, the pastureland expansion occurred
exclusively in the Atlantic region; the area devoted to pastures decreased in the Pacific and Central
regions (Figure II.1). In the Atlantic region, the expansion of pastureland was accompanied by a
contraction of fallow and forest land. This indicates that in the process of agricultural expansion,
fallow land and forests are being converted to pastures, which is consistent with the transformation
process discussed by Pérez and Fréguin-Gresh (2014) and Baumeister (2012) and hypothesis HN4.
Figure II.1
Nicaragua: absolute changes (thousands of ha) in land uses, by Region, 2001 and 2011
(Thousands of hectares)
Source: Own elaboration.
Note: The data presented does not include incomplete surveys.
The additional area dedicated to annual crops was concentrated in the Central region, with
some area also added in the Pacific. In the Atlantic region, the area for annual crops decreased.
Land for permanent crops increased in all the regions, but most of the expansion took place in the
Central region. In sum, the trends in the expansion of annual and permanent crops contributed to
the preeminence of the Central Region as the agricultural hub of the country.
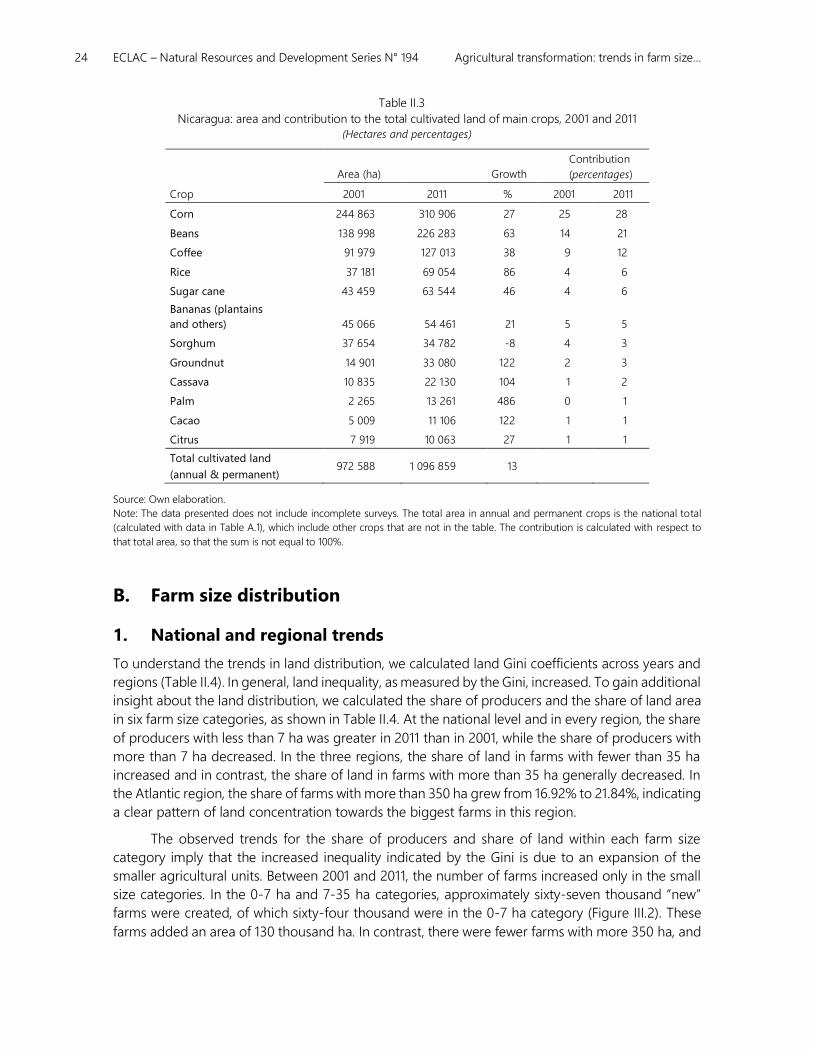
Overall, cultivated land is used mainly for traditional crops. Corns, beans, coffee, rice, sugar
cane, and plantains and others comprised 78% of the land in annual and permanent crops in 2011.
From the traditional crops, the three with the greatest area, i.e., corn, beans and coffee, took up
61% of the land. Between 2001 and 2011, the area dedicated to traditional crops increased from 62%
to 78%, indicating that the expansion of agricultural land was mainly used for the cultivation of
these crops. Among the traditional crops, coffee, sugar, and beans are among the most important
exports (in nominal value) according to United Nations international trade data (COMTRADE).
Other crops gained importance in the period of interest. The area devoted to palm,
groundnut, cacao, and cassava expanded considerably between 2001 and 2011: palm cultivation
increased 486% (Table II.3).
62 6216
251
-493
-92
16 5 2
-23
-98
2960 42
0 -8
-180
25
-14
15 13
282
-214
-145
-600
-500
-400
-300
-200
-100
0
100
200
300
400
Annual crops Permanent crops Cultivatespastures
Natural pastures Fallow lands Forests
National Pacific Central Atlantic
24 ECLAC – Natural Resources and Development Series N° 194 Agricultural transformation: trends in farm size…
Table II.3
Nicaragua: area and contribution to the total cultivated land of main crops, 2001 and 2011
(Hectares and percentages)
Area (ha) Growth
Contribution
(percentages)
Crop 2001 2011 % 2001 2011
Corn 244 863 310 906 27 25 28
Beans 138 998 226 283 63 14 21
Coffee 91 979 127 013 38 9 12
Rice 37 181 69 054 86 4 6
Sugar cane 43 459 63 544 46 4 6
Bananas (plantains
and others) 45 066 54 461 21 5 5
Sorghum 37 654 34 782 -8 4 3
Groundnut 14 901 33 080 122 2 3
Cassava 10 835 22 130 104 1 2
Palm 2 265 13 261 486 0 1
Cacao 5 009 11 106 122 1 1
Citrus 7 919 10 063 27 1 1
Total cultivated land
(annual & permanent) 972 588 1 096 859 13
Source: Own elaboration.
Note: The data presented does not include incomplete surveys. The total area in annual and permanent crops is the national total
(calculated with data in Table A.1), which include other crops that are not in the table. The contribution is calculated with respect to
that total area, so that the sum is not equal to 100%.
B. Farm size distribution
1. National and regional trends
To understand the trends in land distribution, we calculated land Gini coefficients across years and
regions (Table II.4). In general, land inequality, as measured by the Gini, increased. To gain additional
insight about the land distribution, we calculated the share of producers and the share of land area
in six farm size categories, as shown in Table II.4. At the national level and in every region, the share
of producers with less than 7 ha was greater in 2011 than in 2001, while the share of producers with
more than 7 ha decreased. In the three regions, the share of land in farms with fewer than 35 ha
increased and in contrast, the share of land in farms with more than 35 ha generally decreased. In
the Atlantic region, the share of farms with more than 350 ha grew from 16.92% to 21.84%, indicating
a clear pattern of land concentration towards the biggest farms in this region.
The observed trends for the share of producers and share of land within each farm size
category imply that the increased inequality indicated by the Gini is due to an expansion of the
smaller agricultural units. Between 2001 and 2011, the number of farms increased only in the small
size categories. In the 0-7 ha and 7-35 ha categories, approximately sixty-seven thousand “new”
farms were created, of which sixty-four thousand were in the 0-7 ha category (Figure III.2). These
farms added an area of 130 thousand ha. In contrast, there were fewer farms with more 350 ha, and

25 ECLAC – Natural Resources and Development Series N° 194 Agricultural transformation: trends in farm size…
the total area in those farms decreased by 139 thousand hectares, reducing their share in the total
land dedicated to agriculture (Figure II.3).
Table II.4
Nicaragua: indicators of farm size distribution, 2001 and 2011
(Gini value and percentages)
National Pacific Central Atlantic
2001 2011 2001 2011 2001 2011 2001 2011
Land Gini 0.73 0.78 0.82 0.85 0.72 0.77 0.58 0.63
Share of
producers
0-7 43.33 57.50 62.87 74.41 42.78 58.36 13.15 43.33
7.1-35 33.08 26.17 26.34 18.58 36.15 27.27 36.36 33.08
35.1-70 12.36 8.62 5.35 3.57 11.29 7.67 26.28 12.36
70.1-140 6.85 4.64 2.87 1.85 5.96 4.05 15.47 6.85
140.1-350 3.41 2.40 1.71 1.09 2.98 2.10 7.21 3.41
> 350 0.98 0.67 0.87 0.50 0.83 0.56 1.53 0.98
Share of land
area
0-7 3.25 4.96 6.29 8.83 3.78 6.14 0.70 3.25
7.1-35 16.98 18.37 18.83 20.00 19.87 20.88 12.11 16.98
35.1-70 17.69 17.41 12.03 12.10 17.66 17.38 21.16 17.69
70.1-140 19.31 18.33 12.68 12.10 18.44 17.98 24.47 19.31
140.1-350 20.94 20.56 17.01 16.10 19.93 19.96 24.65 20.94
> 350 21.84 20.37 33.17 30.88 20.32 17.65 16.92 21.84
Source: Own elaboration.
Note: The data presented does not include incomplete surveys.
To get a more complete description of the changes in the distribution of farm sizes, we calculated
the median farm size within each farm size category (Table II.5). In the smaller farm size ranges (0-7ha
and 7-35ha) both the number of farms and the total area increased between 2001 and 2011, making it
difficult to hypothesize if the median farm size increased or decreased a priori. Table II.3 shows that, at
the national level, the median farm size diminished for farms in the 0-7 ha range, and remained the
same for farms in the 7-35 ha range, which is consistent with the increase in the number of small farms.
In the Pacific and Central regions, the results are similar, while in the Atlantic region, the median farm
size decreased for farms in the 0-7 ha range and in the 7-35 ha range.
For farms with more than 35 ha, both the number of farms and the total area were smaller in
2011 than in 2001, again resulting in an ambiguous impact on the median farm size. At the national
level and in every region, the median farm size increased for farms in the 35-70 ha category. For
the other categories, regions differed. In the 70-140 ha category, the median size increased in the
Pacific and Atlantic region, while it shrunk in the Central region. For categories above 140 ha, the
median farm size increased in the Central and Atlantic regions. In the Pacific region, the median
farm size was unchanged in the 140-350 ha category and increased among farms with more than
350 ha.
26 ECLAC – Natural Resources and Development Series N° 194 Agricultural transformation: trends in farm size…
Figure II.2
Nicaragua: absolute change in the number farms (thousands) by farm size, 2001 and 2011
(Thousands of hectares)
Source: Own elaboration.
Note: The data presented does not include incomplete surveys.
Figure II.3
Nicaragua: absolute change in area by farm size, 2001 and 2011
(Thousands of hectares)
Source: Own elaboration.
Note: The data presented does not include incomplete surveys.
In sum, using median farm size as indicator of land inequality, the Central and Atlantic land
distributions became more unequal, because in the bottom part of the distribution, farms became
smaller, while in the upper part, farm size increased. In the Pacific region, the trend is not clear,
-10
0
10
20
30
40
50
60
70
0-7 7.1-35 35.1-70 70.1-140 140.1-350 > 350
Farm
s (t
ho
usa
nd
)
-140
-120
-100
-80
-60
-40
-20
0
20
40
60
80
100
0-7 7.1-35 35.1-70 70.1-140 140.1-350 > 350
Ad
dit
ion
al a
rea
(th
ou
san
d h
a)

27 ECLAC – Natural Resources and Development Series N° 194 Agricultural transformation: trends in farm size…
because the median size decreased or stagnated in the 0-7 ha and above 140 ha size categories;
the median size increased in the middle of the distribution, but the changes were small.
The different regional trends are consistent with hypothesis HN1, ambiguity of the impact of
land reforms and other factors on the land distribution. The interactions of climate, expansion in
the number of farms, changes in land use, and the selection of crops in each region distinctly
affected distribution of land between small and large farms, resulting in some regions facing less
land inequality, while others experienced greater land concentration.
Table II.5
Nicaragua: median farm size (hectares), 2001 and 2011
National Pacific Central Atlantic
Farm size
category 2001 2011 2001 2011 2001 2011 2001 2011
0-7 2.1 1.4 1.8 1.1 2.1 1.6 2.8 2.5
7.1-35 14.1 14.1 13.0 13.1 14.1 14.1 17.6 16.9
35.1-70 42.3 43.7 44.4 45.8 42.3 44.4 42.3 42.7
70.1-140 84.6 85.0 86.0 86.7 84.6 86.0 81.1 84.6
140.1-350 176.3 183.3 197.4 197.4 176.3 181.4 176.3 179.4
> 350 493.5 493.5 564.0 549.9 479.4 492.4 423.0 443.4
Source: Own elaboration.
Note: The data presented does not include incomplete surveys.
2. Changes in land use and farm sizes
The trends in median size and the farm size distribution are linked to transformations in land use
(Table II.6). Between 2001 and 2011, an additional 82,422 ha were employed in the production of
annual crops. Of this total, 77% were in farms with less than 35 ha, while the rest were in farms with
more than 350 ha. The additional area devoted to permanent crops was similarly allocated, mainly
to farms with less than 35 ha (53.5%) and more than 350 ha. Thus, farms in the middle part of the
size distribution (between 35 and 350 ha) were not contributing to the increased production of
annual or permanent crops. In contrast, the additional pastoral area came mainly from farms with
7 to 350 ha.
While pastures and cultivated land expanded, fallow land decreased in all the farm size
categories, especially in farms with more than 7 ha (Table II.6). The contraction of forest land was
concentrated in farms with more than 70 ha; among farms with less than 35 ha, the amount of
forest increased. Table II.6 shows a clear pattern differentiating farms in the below and above 35 ha
categories.
The evidence in Table II.6 indicates that the dynamics of land use differed across farm size
categories. In Tables II.7, II.8 and II.9, we summarize information on the predominant crops by
region and farm size to describe the mix of agricultural activities carried out. We list the top 5 crops
cultivated, from greatest to least area in 2001 and 2011.
In the Pacific region (Table II.7), corn, beans, and sorghum were among the top five crops in
farms with less than 70 ha, in 2001 and 2011. Within these farms, rice is gaining importance. Bananas
(plantains and others) were among the top five crops in the farms with less than 35 ha. The top

28 ECLAC – Natural Resources and Development Series N° 194 Agricultural transformation: trends in farm size…
crops by area were not so different for the farms with more than 70 ha, among which were corn,
sorghum, and rice. Groundnut was also important in all categories above 70 ha and sugar cane was
important in farms with more than 140 ha.
In the Central region (Table II.8), the top five crops for all farms smaller than 350 ha included
corn, beans, coffee, and bananas (plantains and others). From this bundle, corn, beans, and coffee
were also among the top five crops in the farms with more than 350 ha. There was a pattern of
differentiation, with sorghum belonging to the set of top five crops only among farms smaller than
35ha, rice being in the top five in farms with more than 35 ha, and, in 2011, palm gaining a position
in the top five in farms with more than 350 ha.
Table II.6
Nicaragua: contribution (%) of the different farm sizes to absolute changes in area, 2001 and 2011
(Hectares and percentages)
Increase in area Decrease in area
Annual crops Perm. crops Pastures Forest Forest Fallow land
Absolute change (ha) 82 422 67 062 274 567 34 967 -126 684 -492 935
Farm size (ha) Percentage contributed
0-7 58.8 22.5 5.8 22.0 1.0
7.1-35 18.2 31.0 31.1 78.0 19.5
35.1-70 6.6 24.5 6.0 21.9
70.1-140 0.2 12.7 19.7 20.7
140.1-350 25.8 24.8 18.5
> 350 23.0 39.6 49.4 18.5
Source: Own elaboration.
Note: The data presented does not include incomplete surveys.
In the Atlantic region (Table II.9), farms in all categories, except for those with more than 350
ha, shared the same bundle of crops, which included corn, beans, bananas (plantains and others),
rice, and cassava. Among farms with more than 350 ha, corn, beans, and bananas (plantains and
others) were also in the top five crops, but cacao (in 2001), cassava (in 2011) and palm (in both years)
were also important.
Overall, there was a consistency in the annual and permanent crops cultivated. In the Central
and Atlantic regions, corn, beans, and bananas (plantains and others) were important in all years
and farm size categories. Coffee was among the top crops in the Central region, across all farm size
categories. Cassava’s importance was exclusive to the Atlantic region, independent of farm size.
Rice was among the top five crops across the three regions, but not across all farm sizes, being
more important in farms with more than 35 ha. Sorghum and groundnut were important in the
Pacific region, among farms with less than 35 ha and more than 70 ha, respectively. These patterns
by region and farm size were consistent between 2001 and 2011: the set of crops comprising most
of the cultivated land remained almost the same in every region and size category, as shown in
Tables II.7, II.8, and II.9. As such, the additional land allocated to cultivation between 2001 and 2011,
was used to produce the same crops as in 2001. Furthermore, traditional crops, as corn, beans,
coffee, and bananas (plantains and others), continued to dominate the agricultural landscape.

29 ECLAC – Natural Resources and Development Series N° 194 Agricultural transformation: trends in farm size…
However nationally, the trend for pastures was not as consistent as for crops. In the Atlantic
region, the area devoted to pastures increased for all farm size categories, between 2001 and 2011
(Tables II.7, II.8, and II.9). In contrast, in the Pacific and Central regions, the pasture area increased
only in farms with less than 140 ha and 70 ha, respectively, and it decreased in the other size
categories. We calculated the ratio of the area in annual and permanent crops to the area in
pastures for every size category and region (Tables II.7, II.8, and II.9). For all regions and for farms
with more than 7 ha, the area devoted to annual and permanent crops was smaller than the pastoral
area. This result reflects a pattern of specialization in all regions, with the land in small farms (0-7
ha) devoted mainly to annual and permanent crops, while pastures was the main land use in farms
larger than 7 ha.
Comparing the national crop distribution (Table III.3) to the disaggregated crop distributions
(Tables II.7-II.9) reveals an interesting trend. Nationally, the crop distribution remained stable
between 2001 and 2011, with corn, beans, coffee, rice, and sugarcane being the top five crops in
both years. However, for most farms in 2001, rice and sugarcane do not appear in the top five crops.
Table II.10 shows the differences between cultivated areas in the disaggregated crop distribution in
each region and the actual area dedicated to these five crops at the national level. Within each
region and for each census year, the amount of area cultivated is summed across farm size
categories for each of the top five crops listed in the aggregated national crop distribution in
Table II.3. These regional figures are summed in the fourth column, to give the “derived national
cultivation distribution”, which we then compare to the “actual cultivation distribution”.
At first glance these differences may seem difficult to reconcile. However, the figures are quite
revelatory. Within the crop distribution for individual farms, corn and beans have been consistently
important, hence the ratio of the derived to the actual national distribution is 1 (or nearly 1) in 2001
and 2011. Conversely, coffee, rice, and sugarcane did not dominate the crop distribution within
farms in 2001. Rather, it seems many farms cultivated these crops on a small scale; when all these
cultivated acres were summed together, then coffee, rice, and sugarcane become important at the
national level. However, by 2011, rice and sugarcane gained importance within farms, as evidence
by the derived-to-actual cultivation ratio approaching 1. We interpret this increase in the ratio as a
homogenization in the crop distribution on individual farms. Rather than specializing in one or two
crops (namely corn and beans) and having a diversified crop distribution across the rest of their
acreage, farms in Nicaragua converged on the five crops of corn, beans, coffee, rice, and sugarcane
by 2011.
The convergence of the derived and national rice productions is especially interesting. There
are two types of rice cultivated in Nicaragua: 1) upland (paddy) rice, which is grown by small
producers who often have little resources and, 2) irrigated rice, which is cultivated by large
producers and dominates Nicaraguan rice production. Further irrigated rice producers are highly
organized within the Nicaraguan Rice Association (ANAR), which controls the entire vertical chain
of production, from individual farms to the international market (ECLAC, 2010). In 2001, ANAR
established the Rice Producers’ Support Programme (PAPA) to control rice production and ensure
ANAR producers receive a higher price (ECLAC, 2010). These protections combined with the paddy
rice quotas imposed by the Central American Free Trade Agreement (CAFTA), effectively meant that
small rice producers were pushed out of the market.

30 ECLAC – Natural Resources and Development Series N° 194 Agricultural transformation: trends in farm size…
In response, we would expect to see an increase in rice cultivation amongst large-scale
farmers. This is exactly what Tables II.7-II.9 exhibit, particularly in the Pacific and Central regions. As
rice came to dominate the crop distribution within large farms, the disaggregated production
approached the national production, resulting in the increased ratio as shown in Table II.10.
Thus, we see that nationally, the Nicaraguan crop distribution in 2001 and 2011 exhibited
stability. However, delving into individual crop distributions, we find that farms shifted towards both
staples (rice) and cash crops (coffee and sugarcane), which HN3 did not predict. Rather, farmers are
cultivating more homogenized distributions, in response to domestic organization of the
production chain and external market forces.

31
EC
LAC
– N
atu
ral R
eso
urce
s and
Deve
lop
men
t Serie
s N° 19
4
Ag
ricultu
ral tra
nsfo
rmatio
n: tre
nd
s in fa
rm size
…
Table II.7
Pacific region: top five crops, by farm size, 2001 and 2011
(Total crops is the sum of annual and permanent. Ratio is Total crops/Pasturelands and % is the contribution of the crop with respect to Total crops)
Size (ha): 0-7 Size (ha): 7.1-35
2001 Area % 2011 Area % 2001 Area % 2011 Area %
Corn 15 166 27 Corn 23 749 35 Corn 19 105 24 Corn 22 769 29
Beans 7 765 14 Beans 11 805 17 Sorghum 7 593 10 Beans 10 020 13
Bananas (plantains and
others) 4 340 8
Bananas (plantains and
others) 7 429 11 Beans 7 305 9 Sorghum 7 040 9
Sorghum 2 622 5 Sorghum 3 766 6
Bananas (plantains and
others) 4 788 6
Bananas (plantains and
others) 6 199 8
Coffee 2 374 4 Rice 3 735 6 Coffee 3 286 4 Rice 4 115 5
Total crops 56 784 Total crops 67 754 Total crops 79 876 Total crops 77 190
Pasturelands 11 652 Pasturelands 17 343 Pasturelands 91 892 Pasturelands 105 351
Ratio crops/pasture 487 Ratio crops/pasture 391 Ratio crops/pasture 87 Ratio crops/pasture 73
Size (ha): 35.1-70 Size (ha): 70.1-140
2001 Area % 2011 Area % 2001 Area % 2011 Area %
Corn 5 195 15 Corn 6 510 22 Corn 3 910 12 Rice 4 423 15
Sorghum 3 835 11 Sorghum 3 301 11 Sorghum 3 590 11 Corn 4 038 14
Coffee 3 061 9 Beans 2 758 9 Sugar cane 2 839 9 Groundnut 3 361 11
Beans 2 024 6 Coffee 2 505 8 Coffee 2 784 8 Sorghum 3 042 10
Sugar cane 1 842 5 Rice 2 315 8 Groundnut 2 430 7 Coffee 2 881 10
Total crops 34 023 Total crops 29 601 Total crops 33 096 Total crops 29 604
Pasturelands 70 192 Pasturelands 74 063 Pasturelands 76 071 Pasturelands 72 305
Ratio crops/pasture 48 Ratio crops/pasture 40 Ratio crops/pasture 44 Ratio crops/pasture 41
Size (ha): 140.1-350 Size (ha): > 350
2001 Area % 2011 Area % 2001 Area % 2011 Area %
Sugar cane 6 766 14 Groundnut 7 465 21 Sugar cane 26 543 36 Sugar cane 50 415 47
Sorghum 5 866 12 Rice 6 517 18 Rice 6 350 9 Groundnut 19 176 18
Groundnut 5 400 11 Corn 3 698 10 Sorghum 6 139 8 Rice 13 336 12
Corn 4 065 9 Sorghum 3 594 10 Groundnut 4 984 7 Corn 4 151 4
Rice 2 923 6 Sugar cane 3 559 10 Corn 3 680 5 Sorghum 3 747 4
Total crops 47 049 Total crops 35 965 Total crops 74 455 Total crops 107 039
Pasturelands 95 089 Pasturelands 92 036 Pasturelands 186 866 Pasturelands 150 451
Ratio crops/pasture 49 Ratio crops/pasture 39 Ratio crops/pasture 40 Ratio crops/pasture 71
Source: Own elaboration

32
EC
LAC
– N
atu
ral R
eso
urce
s and
Deve
lop
men
t Serie
s N° 19
4
Ag
ricultu
ral tra
nsfo
rmatio
n: tre
nd
s in fa
rm size
…
Table II.8
Central region: top five crops, by farm size, 2001 and 2011
(Total crops is the sum of annual and permanent. Ratio is Total crops/Pasturelands and % is the contribution of the crop with respect to Total crops)
Size (ha): 0-7 Size (ha): 7.1-35
2001 Area % 2011 Area % 2001 Area % 2011 Area %
Corn 20 636 31 Beans 45 739 40 Corn 46 136 31 Corn 65 495 36
Beans 17 830 27 Corn 44 524 39 Beans 34 650 23 Beans 58 ,651 33
Coffee 11 730 17 Coffee 24 156 21 Coffee 22 392 15 Coffee 36 491 20
Bananas (plantains and
others) 1 713 3
Bananas (plantains and
others) 3 222 3
Bananas (plantains and
others) 4 387 3
Bananas (plantains and
others) 7 284 4
Sorghum 1 666 2 Sorghum 2 803 2 Sorghum 2 953 2 Sorghum 3 557 2
Total crops 67 236 Total crops 114 699 Total crops 148 955 Total crops 179 445
Pasturelands 18 412 Pasturelands 25 744 Pasturelands 225 131 Pasturelands 245 200
Ratio crops/pasture 365 Ratio crops/pasture 446 Ratio crops/pasture 66 Ratio crops/pasture 73
Size (ha): 35.1-70 Size (ha): 70.1-140
2001 Area % 2011 Area % 2001 Area % 2011 Area %
Corn 20 173 29 Corn 25 728 33 Corn 12 182 25 Corn 15 486 30
Beans 13 448 20 Beans 21 786 28 Coffee 9 085 19 Beans 12 344 24
Coffee 9 931 14 Coffee 14 498 19 Beans 7 932 16 Coffee 11 688 22
Bananas (plantains and
others) 2 438 4 Rice 3 519 5 Rice 2 337 5 Rice 2 903 6
Rice 1 190 2
Bananas (plantains and
others) 3 269 4
Bananas (plantains and
others) 1 731 4
Bananas (plantains and
others) 2 080 4
Total crops 68 872 Total crops 77 530 Total crops 48 201 Total crops 52 086
Pasturelands 262 790 Pasturelands 269 416 Pasturelands 324 010 Pasturelands 311 330
Ratio crops/pasture 26 Ratio crops/pasture 29 Ratio crops/pasture 15 Ratio crops/pasture 17
Size (ha): 140.1-350 Size (ha): > 350
2001 Area % 2011 Area % 2001 Area % 2011 Area %
Coffee 11 231 28 Coffee 13 003 31 Coffee 8 793 23 Rice 10 933 22
Corn 7 798 19 Corn 9 491 23 Corn 5 355 14 Coffee 10 457 21
Beans 4 905 12 Beans 6 926 17 Rice 4 789 12 Corn 4 779 10
Rice 3 492 9 Rice 3 609 9 Beans 3 435 9 Beans 4 532 9
Bananas (plantains and
others) 1 257 3
Bananas (plantains and
others) 1 459 4 Citrus 1 652 4 Palm 3 915 8
Total crops 40 545 Total crops 41 374 Total crops 38 649 Total crops 48 943
Pasturelands 367 175 Pasturelands 363 184 Pasturelands 303 985 Pasturelands 278 037
Ratio crops/pasture 11 Ratio crops/pasture 11 Ratio crops/pasture 13 Ratio crops/pasture 18
Source: Own elaboration

33
EC
LAC
– N
atu
ral R
eso
urce
s and
Deve
lop
men
t Serie
s N° 19
4
Ag
ricultu
ral tra
nsfo
rmatio
n: tre
nd
s in fa
rm size
…
Table II.9
Atlantic region: top five crops, by farm size, 2001 and 2011
(Total crops is the sum of annual and permanent. Ratio is Total crops/Pasturelands and % is the contribution of the crop with respect to Total crops)
Size (ha): 0-7 Size (ha): 7.1-35
2001 Area % 2011 Area % 2001 Area % 2011 Area %
Corn 3 085 34 Corn 4 752 34 Corn 22 366 36 Corn 25 823 37
Beans 1 814 20 Beans 3 570 25 Beans 11 263 18 Beans 16 565 24
Bananas (plantains and
others) 840 9 Rice 1 321 9
Bananas (plantains and
others) 4 646 8
Bananas
(plantains and
others) 5 461 8
Rice 360 4
Bananas (plantains and
others) 1 284 9 Rice 1 914 3 Cassava 4 773 7
Cassava 284 3 Cassava 1 264 9 Cassava 1 768 3 Rice 3 416 5
Total crops 8 951 Total crops 14 081 Total crops 61 432 Total crops 69 434
Pasturelands 2 381 Pasturelands 5 187 Pasturelands 93 783 Pasturelands 145 682
Ratio crops/pasture 376 Ratio crops/pasture 271 Ratio crops/pasture 66
Ratio
crops/pasture 48
Size (ha): 35.1-70 Size (ha): 70.1-140
2001 Area % 2011 Area % 2001 Area % 2011 Area %
Corn 22 882 36 Corn 20 609 35 Corn 18 074 36 Corn 15 775 36
Beans 10 728 17 Beans 12 602 22 Beans 7 148 14 Beans 8 222 19
Bananas (plantains and
others) 4 776 7
Bananas (plantains and
others) 4 241 7
Bananas (plantains and
others) 3 842 8 Cassava 2 787 6
Cassava 1 879 3 Cassava 4 066 7 Cassava 1 388 3
Bananas
(plantains and
others) 2 774 6
Rice 1 788 3 Rice 2 426 4 Rice 1 268 3 Rice 1 320 3
Total crops 63 956 Total crops 58 491 Total crops 50 390 Total crops 43 931
Pasturelands 189 862 Pasturelands 246 753 Pasturelands 246 496 Pasturelands 297 897
Ratio crops/pasture 34 Ratio crops/pasture 24 Ratio crops/pasture 20
Ratio
crops/pasture 15
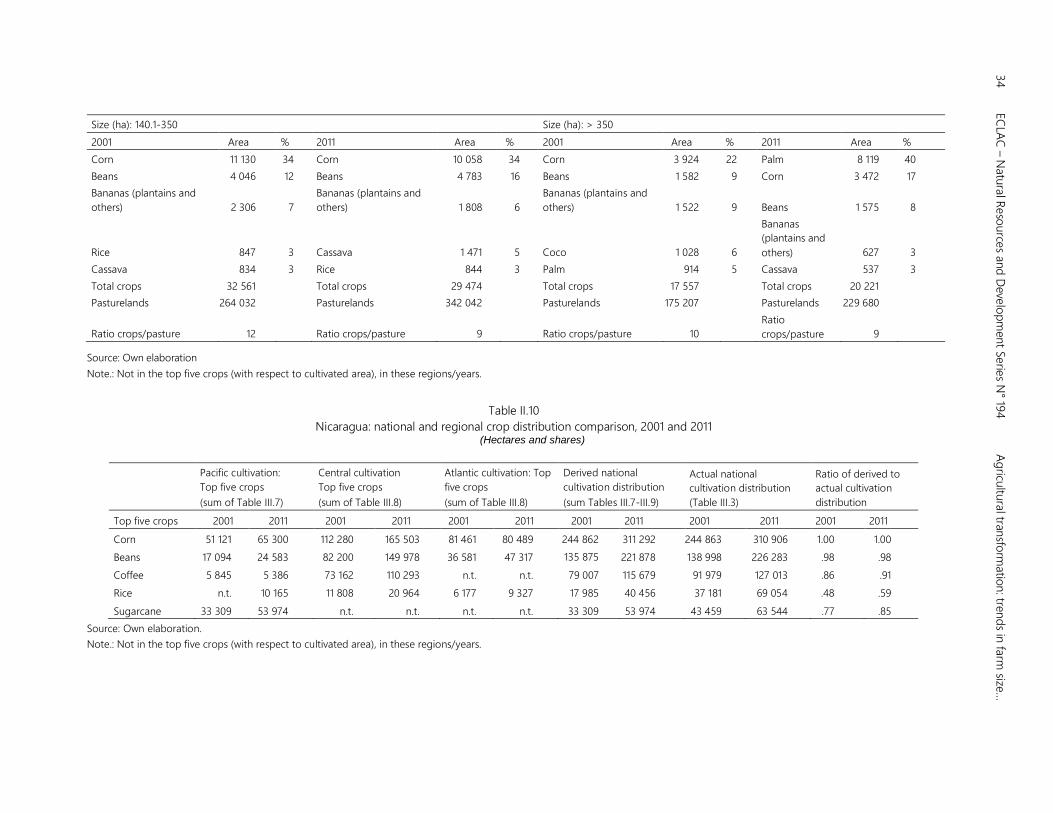
34
EC
LAC
– N
atu
ral R
eso
urce
s and
Deve
lop
men
t Serie
s N° 19
4
Ag
ricultu
ral tra
nsfo
rmatio
n: tre
nd
s in fa
rm size
…
Size (ha): 140.1-350 Size (ha): > 350
2001 Area % 2011 Area % 2001 Area % 2011 Area %
Corn 11 130 34 Corn 10 058 34 Corn 3 924 22 Palm 8 119 40
Beans 4 046 12 Beans 4 783 16 Beans 1 582 9 Corn 3 472 17
Bananas (plantains and
others) 2 306 7
Bananas (plantains and
others) 1 808 6
Bananas (plantains and
others) 1 522 9 Beans 1 575 8
Rice 847 3 Cassava 1 471 5 Coco 1 028 6
Bananas
(plantains and
others) 627 3
Cassava 834 3 Rice 844 3 Palm 914 5 Cassava 537 3
Total crops 32 561 Total crops 29 474 Total crops 17 557 Total crops 20 221
Pasturelands 264 032 Pasturelands 342 042 Pasturelands 175 207 Pasturelands 229 680
Ratio crops/pasture 12 Ratio crops/pasture 9 Ratio crops/pasture 10
Ratio
crops/pasture 9
Source: Own elaboration
Note.: Not in the top five crops (with respect to cultivated area), in these regions/years.
Table II.10
Nicaragua: national and regional crop distribution comparison, 2001 and 2011 (Hectares and shares)
Pacific cultivation:
Top five crops
(sum of Table III.7)
Central cultivation
Top five crops
(sum of Table III.8)
Atlantic cultivation: Top
five crops
(sum of Table III.8)
Derived national
cultivation distribution
(sum Tables III.7-III.9)
Actual national
cultivation distribution
(Table III.3)
Ratio of derived to
actual cultivation
distribution
Top five crops 2001 2011 2001 2011 2001 2011 2001 2011 2001 2011 2001 2011
Corn 51 121 65 300 112 280 165 503 81 461 80 489 244 862 311 292 244 863 310 906 1.00 1.00
Beans 17 094 24 583 82 200 149 978 36 581 47 317 135 875 221 878 138 998 226 283 .98 .98
Coffee 5 845 5 386 73 162 110 293 n.t. n.t. 79 007 115 679 91 979 127 013 .86 .91
Rice n.t. 10 165 11 808 20 964 6 177 9 327 17 985 40 456 37 181 69 054 .48 .59
Sugarcane 33 309 53 974 n.t. n.t. n.t. n.t. 33 309 53 974 43 459 63 544 .77 .85
Source: Own elaboration.
Note.: Not in the top five crops (with respect to cultivated area), in these regions/years.
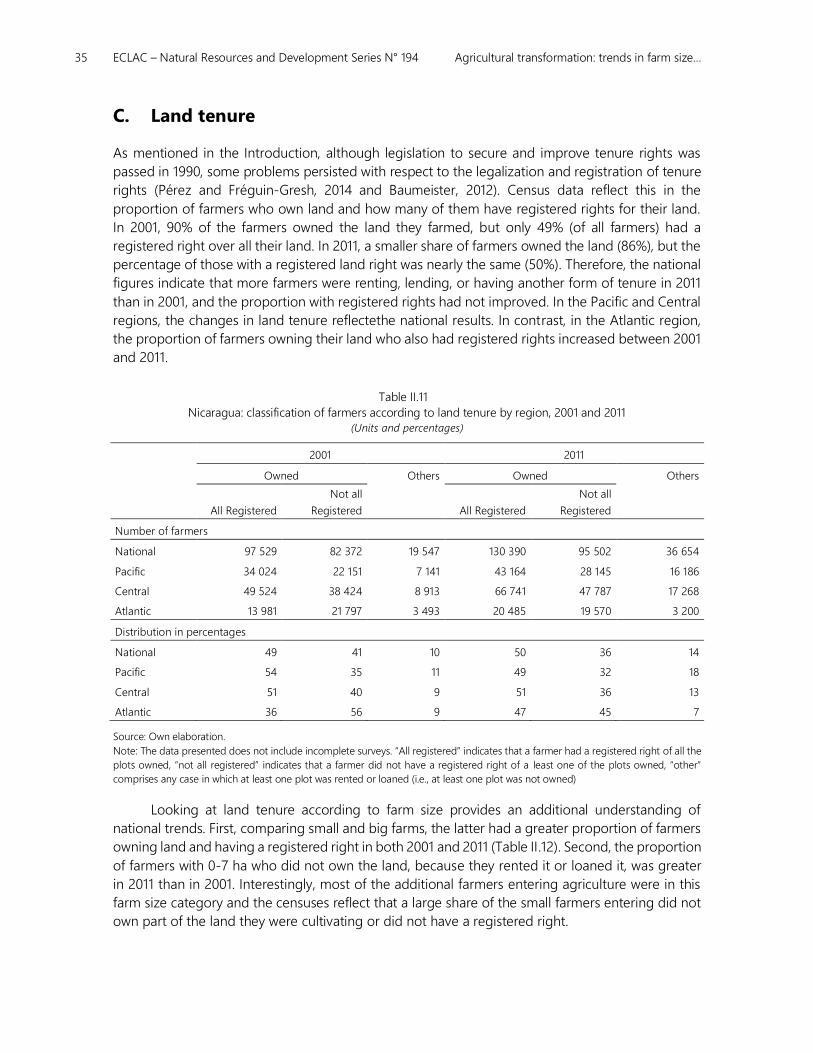
35 ECLAC – Natural Resources and Development Series N° 194 Agricultural transformation: trends in farm size…
C. Land tenure
As mentioned in the Introduction, although legislation to secure and improve tenure rights was
passed in 1990, some problems persisted with respect to the legalization and registration of tenure
rights (Pérez and Fréguin-Gresh, 2014 and Baumeister, 2012). Census data reflect this in the
proportion of farmers who own land and how many of them have registered rights for their land.
In 2001, 90% of the farmers owned the land they farmed, but only 49% (of all farmers) had a
registered right over all their land. In 2011, a smaller share of farmers owned the land (86%), but the
percentage of those with a registered land right was nearly the same (50%). Therefore, the national
figures indicate that more farmers were renting, lending, or having another form of tenure in 2011
than in 2001, and the proportion with registered rights had not improved. In the Pacific and Central
regions, the changes in land tenure reflectethe national results. In contrast, in the Atlantic region,
the proportion of farmers owning their land who also had registered rights increased between 2001
and 2011.
Table II.11
Nicaragua: classification of farmers according to land tenure by region, 2001 and 2011
(Units and percentages)
2001 2011
Owned Others Owned Others
All Registered
Not all
Registered All Registered
Not all
Registered
Number of farmers
National 97 529 82 372 19 547 130 390 95 502 36 654
Pacific 34 024 22 151 7 141 43 164 28 145 16 186
Central 49 524 38 424 8 913 66 741 47 787 17 268
Atlantic 13 981 21 797 3 493 20 485 19 570 3 200
Distribution in percentages
National 49 41 10 50 36 14
Pacific 54 35 11 49 32 18
Central 51 40 9 51 36 13
Atlantic 36 56 9 47 45 7
Source: Own elaboration.
Note: The data presented does not include incomplete surveys. “All registered” indicates that a farmer had a registered right of all the
plots owned, “not all registered” indicates that a farmer did not have a registered right of a least one of the plots owned, “other”
comprises any case in which at least one plot was rented or loaned (i.e., at least one plot was not owned)
Looking at land tenure according to farm size provides an additional understanding of
national trends. First, comparing small and big farms, the latter had a greater proportion of farmers
owning land and having a registered right in both 2001 and 2011 (Table II.12). Second, the proportion
of farmers with 0-7 ha who did not own the land, because they rented it or loaned it, was greater
in 2011 than in 2001. Interestingly, most of the additional farmers entering agriculture were in this
farm size category and the censuses reflect that a large share of the small farmers entering did not
own part of the land they were cultivating or did not have a registered right.

36 ECLAC – Natural Resources and Development Series N° 194 Agricultural transformation: trends in farm size…
These trends are consistent with hypothesis HN2, although through a different channel than
the one suggested. Rather than existing small farmers becoming renters, it seems that small farmers
entering agriculture do not have the resources or support to purchase land outright. This will have
implications for the crop distribution and income inequality in the future.
Table II.12
Nicaragua: classification of farmers according to land tenure by size, 2001 and 2011
(Units and percentages)
2001 2011
Owned Others Total Owned Others Total
All
Registered
Not all
Registered
All
Registered
Not all
Registered
Number of farmers
0-7 39 783 34 588 12 039 86 410 66 699 53 181 31 079 150 959
7.1-35 30 924 30 017 5 028 65 969 36 828 27 676 4 214 68 718
35.1-70 12 813 10 489 1 339 24 641 13 427 8 433 764 22 624
70.1-140 8 063 4 930 682 13 675 7 818 4 030 338 12 186
140.1-350 4 544 1 915 344 6 803 4 392 1 725 181 6 ,298
> 350 1 402 433 115 1 950 1 226 457 78 1 761
Total 97 529 82 372 19 547 199 448 130 390 95 502 36 654 262 546
Distribution in percentages
0-7 46 40 14 100 44 35 21 100
7.1-35 47 46 8 100 54 40 6 100
35.1-70 52 43 5 100 59 37 3 100
70.1-140 59 36 5 100 64 33 3 100
140.1-350 67 28 5 100 70 27 3 100
> 350 72 22 6 100 70 26 4 100
Total 49 41 10 100 50 36 14 100
Source: Own elaboration.
Note: The data presented does not include incomplete surveys. “All registered” indicates that a farmer had a registered right of all the
plots owned, “not all registered” indicates that a farmer did not have a registered right of a least one of the plots owned, “other”
comprises any case in which at least one plot was rented or loaned (i.e., at least one plot was not owned)
D. Labor
The Nicaraguan agricultural censuses provide data on the hired labor, permanent and temporary,
used by each farm, as well as the number of household members contributing to farming activities.
We also use the data to calculate the number of farmers working on their own farms. To do so, we
counted the household heads that directly manage their farms and did not work in any activity
outside of the farm. The results are in Table II.13. Between 2001 and 2011, the number of farmers (as
defined by our measure) increased for farms in the 0-7 ha category. Household labor also had the
same trend, with expansion in the farm size category 0-7 ha. Both results are consistent with the
entry of small-scale farms into agriculture, as noted in previous sections. This boosted the demand
for permanent and temporary labor among small farms (Table II.13), so that the ratio of total labor

37 ECLAC – Natural Resources and Development Series N° 194 Agricultural transformation: trends in farm size…
to total area increased from 2001-2011 (Table II.14), even though the total land area also increased
in the same period.
Permanent and temporary hired labor was higher in 2011 than in 2001, but the temporary
labor increased in all farm size categories (Table II.13), as did the labor to land ratio (Table II.14). In
contrast, the demand for permanent labor increased only in farms with fewer than 35 ha and in
farms with at least 350 ha (Table II.13).
Table II.13
Nicaragua: labor indicators by farm size, 2001 and 2011
(Units and percentages)
Farmers a Total household labor b
2001 2011 % Change 2001 2011 % Change
0-7 63 450 99 520 57 213 478 407 612 91
7.1-35 54 496 54 925 1 197 014 173 458 -12
35.1-70 20 297 18 365 -10 79 572 50 240 -37
70.1-140 10 408 9 299 -11 45 165 25 523 -43
140.1-350 4 282 4 306 1 21 413 13 651 -36
> 350 799 893 12 5 130 3 952 -23
Total 153 732 187 308 22 561 772 674 436 20
Permanent Temporary
2001 2011 % Change 2001 2011 % Change
0-7 16 233 23 039 42 117 574 262 698 123
7.1-35 27 439 29 381 7 166 811 255 273 53
35.1-70 18 277 17 575 -4 78 586 94 400 20
70.1-140 21 186 18 390 -13 66 601 72 519 9
140.1-350 23 130 20 307 -12 68 138 73 261 8
> 350 19 536 23 753 22 54 199 59 444 10
Total 125 801 132 445 5 551 909 817 595 48
Source: Own elaboration.
Note: The data presented does not include incomplete surveys. a Farmers is calculated as the heads of the household who managing
directly the farm and who did not work in other activities. b Total household labor corresponds to all the household members older
than 12, working on the farm. See Annex B for more details.
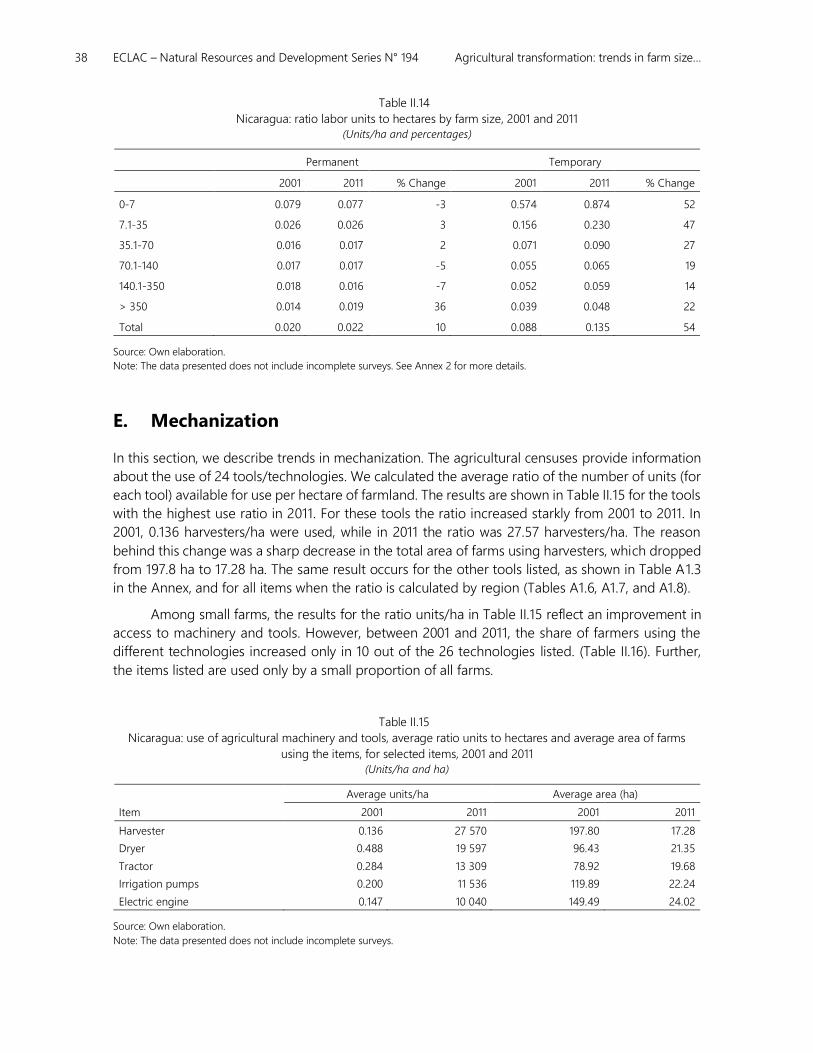
38 ECLAC – Natural Resources and Development Series N° 194 Agricultural transformation: trends in farm size…
Table II.14
Nicaragua: ratio labor units to hectares by farm size, 2001 and 2011
(Units/ha and percentages)
Permanent Temporary
2001 2011 % Change 2001 2011 % Change
0-7 0.079 0.077 -3 0.574 0.874 52
7.1-35 0.026 0.026 3 0.156 0.230 47
35.1-70 0.016 0.017 2 0.071 0.090 27
70.1-140 0.017 0.017 -5 0.055 0.065 19
140.1-350 0.018 0.016 -7 0.052 0.059 14
> 350 0.014 0.019 36 0.039 0.048 22
Total 0.020 0.022 10 0.088 0.135 54
Source: Own elaboration.
Note: The data presented does not include incomplete surveys. See Annex 2 for more details.
E. Mechanization
In this section, we describe trends in mechanization. The agricultural censuses provide information
about the use of 24 tools/technologies. We calculated the average ratio of the number of units (for
each tool) available for use per hectare of farmland. The results are shown in Table II.15 for the tools
with the highest use ratio in 2011. For these tools the ratio increased starkly from 2001 to 2011. In
2001, 0.136 harvesters/ha were used, while in 2011 the ratio was 27.57 harvesters/ha. The reason
behind this change was a sharp decrease in the total area of farms using harvesters, which dropped
from 197.8 ha to 17.28 ha. The same result occurs for the other tools listed, as shown in Table A1.3
in the Annex, and for all items when the ratio is calculated by region (Tables A1.6, A1.7, and A1.8).
Among small farms, the results for the ratio units/ha in Table II.15 reflect an improvement in
access to machinery and tools. However, between 2001 and 2011, the share of farmers using the
different technologies increased only in 10 out of the 26 technologies listed. (Table II.16). Further,
the items listed are used only by a small proportion of all farms.
Table II.15
Nicaragua: use of agricultural machinery and tools, average ratio units to hectares and average area of farms
using the items, for selected items, 2001 and 2011
(Units/ha and ha)
Average units/ha Average area (ha)
Item 2001 2011 2001 2011
Harvester 0.136 27 570 197.80 17.28
Dryer 0.488 19 597 96.43 21.35
Tractor 0.284 13 309 78.92 19.68
Irrigation pumps 0.200 11 536 119.89 22.24
Electric engine 0.147 10 040 149.49 24.02
Source: Own elaboration.
Note: The data presented does not include incomplete surveys.

39 ECLAC – Natural Resources and Development Series N° 194 Agricultural transformation: trends in farm size…
Table II.16
Nicaragua: use of agricultural machinery and tools, percentage of farms using items, for selected items with
positive change in the percentage, 2001 and 2011
(Percentages)
Item % Farms using
% Growth 2001 2011
1 Grass and sugar cane cutter 1.2 3.0 153.8
2 Electric generator 0.5 1.0 85.1
3 Saw 3.8 6.7 75.4
4 Non-manual fumigating pump 2.8 4.5 62.2
5 Electric engine 1.3 2.0 57.2
6 Dryer 0.3 0.5 56.3
7 Coffee mill 0.4 0.5 42.2
8 Decorticator 0.1 0.1 31.0
9 Irrigation pumps 1.5 2.0 30.4
10 Manual fumigating pump 50.9 57.0 12.1
Source: Own elaboration.
Note: The data presented does not include incomplete surveys.
The patterns of machinery and tool use differ across farm size. Table II.17 shows the average
ratio units/ha for a set of technologies, for the smallest and biggest farm sizes (Annex Table A1.9
has the use ratios for all farm size categories). The average size of farms utilizing these technologies
decreased not only for farms in the 0-7 ha range, but also for those with more than 350 ha.
Generally, farms with more than 350 ha had a greater unit/ha ratio in 2011 than in 2001.

40 ECLAC – Natural Resources and Development Series N° 194 Agricultural transformation: trends in farm size…
Table II.17
Nicaragua: use of agricultural machinery and tools, average ratio units to hectares and average area of farms
using the items, for selected items, and two farm size categories, 2001 and 2011
(Units/ha and ha)
Average units/ha Average area (ha)
Item 2001 2011 2001 2011
Size category 0-7ha
Harvester 0.548 38 683 3.29 1.72
Dryer 1 335 33 060 3.25 2.23
Tractor 0.597 19 014 2.89 1.73
Irrigation pumps 0.561 17 551 3.09 1.76
Electric engine 0.641 17 126 3.20 2.00
Rice mill 0.646 16 402 3.25 1.80
Non-manual fumigating pump 0.631 14 772 3.10 2.07
Truck 0.868 14 743 2.90 1.93
Agricultural wagon 0.723 14 015 2.88 1.92
Wood plows 0.650 12 610 2.86 1.93
Size category > 350 ha
Dryer 0.003 0.004 967.43 567.20
Harvester 0.003 0.003 1 109.22 525.08
Electric engine 0.004 0.003 974.68 590.35
Manual fumigating pump 0.007 0.003 671.95 666.62
Truck 0.003 0.003 1 028.70 493.32
Electric generator 0.003 0.003 1 066.06 659.49
Non-manual fumigating pump 0.006 0.003 895.09 616.17
Boat 0.004 0.003 1 243.03 795.97
Wood plows 0.004 0.003 630.09 761.34
Pulper machine 0.004 0.002 621.35 542.07
Source: Own elaboration.
Note: The data presented does not include incomplete surveys.
For farms smaller than 7 ha and larger than 350 ha, Table II.18 shows the percentage of farms
using the different technologies, when the usage rate is at least 2% in 2011 (Annex Table A1.9
presents all the technologies). In the 0-7 ha category, the 2011 technology usage rate was higher
than in 2001 for all tools except wood plows, tractors, and threshing machines (manual) (not shown
in Table II.18). In contrast, among farms with more than 350 ha, the usage rate decreased for all
tools. As a result, in 2011 the proportion of farms using the items was similar, across these two farm
size categories, while in 2001, the farms with more than 350 ha used the items at a higher rate.
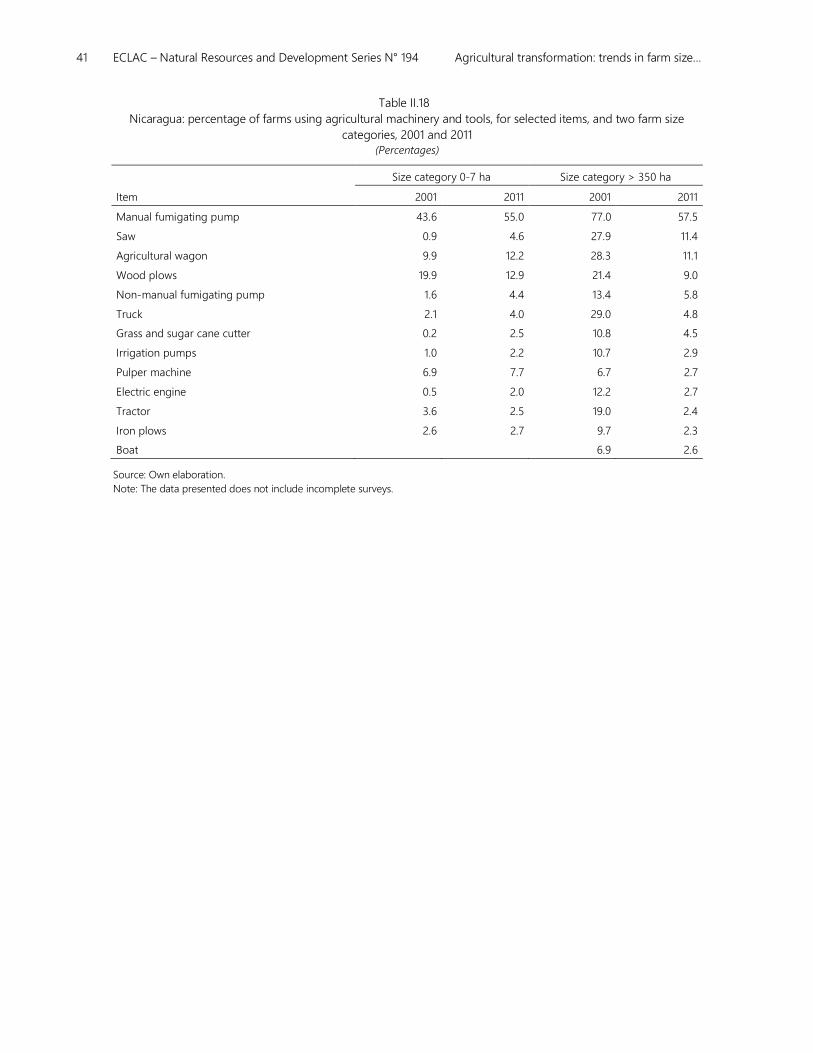
41 ECLAC – Natural Resources and Development Series N° 194 Agricultural transformation: trends in farm size…
Table II.18
Nicaragua: percentage of farms using agricultural machinery and tools, for selected items, and two farm size
categories, 2001 and 2011
(Percentages)
Size category 0-7 ha Size category > 350 ha
Item 2001 2011 2001 2011
Manual fumigating pump 43.6 55.0 77.0 57.5
Saw 0.9 4.6 27.9 11.4
Agricultural wagon 9.9 12.2 28.3 11.1
Wood plows 19.9 12.9 21.4 9.0
Non-manual fumigating pump 1.6 4.4 13.4 5.8
Truck 2.1 4.0 29.0 4.8
Grass and sugar cane cutter 0.2 2.5 10.8 4.5
Irrigation pumps 1.0 2.2 10.7 2.9
Pulper machine 6.9 7.7 6.7 2.7
Electric engine 0.5 2.0 12.2 2.7
Tractor 3.6 2.5 19.0 2.4
Iron plows 2.6 2.7 9.7 2.3
Boat 6.9 2.6
Source: Own elaboration.
Note: The data presented does not include incomplete surveys.


43 ECLAC – Natural Resources and Development Series N° 194 Agricultural transformation: trends in farm size…
III. Peru
This section analyzes Peru’s agricultural censuses (1994 and 2012) with respect to (A) land use and
crops, (B) farm size distribution, (C) land tenure, (D) labor, and (E) mechanization. Over two decades,
Peru saw its total agricultural land increase by about 10 percent. The distribution within the total
was skewed towards land allocated for “permanent use” (perennial cultivation), which more than
doubled its share, a trend experienced in all regions. The shift in land use correlates with the
principal crops cultivated in Peru (corn, potatoes, coffee, and rice), which comprised about half of
all cultivated land by 2012. However, more agricultural land and increased cultivation did not
translate to a more equal distribution of farmland. In particular, land shifted from the smallest farms
(less than 7 ha) to larger farms. As noted in Section C, trends in land distribution and use were
probably affected by changes in land tenure. While the overall share of farms with registered land
rights increased, a higher share of large farms (greater than 350 ha) reported having registered
rights than small farms, in both 1994 and 2012. Increases in total land and cultivation correlated with
increases in labor (Section D), a doubling or more in the number of temporary farm employees,
across size categories, which was accompanied by an increase in mechanization (Section E).
A. Trends in land use and crops
In Peru, the total land allocated to agricultural units (farms) amounted to 38.7 million hectares in
2012, with the land mainly devoted to non-managed natural pastures, forests, and arable land
(Table III.1; Table A.5 provides the regional details). Between 1994 and 2012, the main change was
the increase in land allocated towards permanent uses, especially the area for permanent crops.
The area in managed natural pastures also expanded. In contrast, the following uses experienced a
contraction: associated crops, annual crops, and other nonagricultural uses.
Table III.2 depicts the area devoted to the different uses, disaggregated by region. In 2012,
the Selva region contained 31.1% of the total area dedicated to permanent crops in the country,

44 ECLAC – Natural Resources and Development Series N° 194 Agricultural transformation: trends in farm size…
while the other regions contained 43.0% (Sierra region) and 25.9% (Costa region). With respect to
annual crop area, the Selva region only contributed 13.7% in 2012, with the majority in the Costa
(38.7%) and Sierra (47.6%) regions. Between 1994 and 2012 all regions saw growth in the area
allocated to permanent crops, with the largest change occurring in the Selva region. Nationally and
in the Selva and Sierra regions, the area of annual crops dropped, while in the Costa, the area
increased 27.3% from 1994 to 2012. Natural pastures and forests expanded in all the regions, but
natural pastures were mainly located in Costa and Sierra regions, while most of the forests were in
Selva and Sierra regions (Table III.2).
Table III.1
Peru: distribution of total agricultural land by uses, 1994 and 2012
(Hectares and percentages)
1994 2012 Growth (%)
Agricultural uses 3 277 854.7 4 155 678.1 26.8
Annual crops 2 115 226.3 1 912 989.4 -9.6
Permanent crops 494 137.3 1 234 632.7 149.9
Associated crops 270 310.2 229 994.1 -14.9
Cultivated pastures 398 181.0 778 061.9 95.4
Natural pastures 16 906 470.5 18 018 794.9 6.6
Managed natural pastures 628 245.0 1 559 337.5 148.2
Non-managed pastures 16 278 225.6 16 459 457.4 1.1
Fallow lands 2 199 121.9 2 969 329.7 35.0
Fallow lands (to be cropped) 936 246.1 1 431 640.1 52.9
Other fallow lands 550 957.2 762 807.3 38.5
Not cropped ag. Land 711 918.6 774 882.3 8.8
Nonagricultural use 12 998 362.0 13 598 662.5 4.6
Forests 9 053 705.6 10 939 274.6 20.8
Other 3 944 656.4 2 659 388.0 -32.6
Total agricultural land 35 381 809.2 38 742 465.1 9.5
Source: Official data
Note: Among the fallow category there are three uncultivated type of uses: (1) fallow lands, (2) to be cropped, which is land that will
be cultivated within the agricultural year; and (3) not to be cultivated, which is land that the farmers cannot cultivate due to different
reasons as lack of water, lack of credit and others.

45 ECLAC – Natural Resources and Development Series N° 194 Agricultural transformation: trends in farm size…
Table III.2
Peru: distribution of total agricultural land in regions by uses, 1994 and 2012
(Hectares)
1994
(%) 2012 (%)
1994-2012
(Growth rate, %)
Selva Coast Sierra Selva Coast Sierra Selva Coast Sierra
Agricultural uses 21.7 25.6 52.7 22.2 32.9 44.9 30.0 63.0 7.9
Annual crops 18.7 27.5 53.8 13.7 38.7 47.5 -33.6 27.3 -20.1
Permanent crops 18.4 21.0 60.6 31.1 25.9 43.0 321.7 208.6 77.2
Associated crops 24.3 20.7 55.0 31.3 21.6 47.1 9.5 -11.2 -27.1
Cultivated pastures 39.7 24.3 36.0 26.3 32.9 40.8 29.4 164.7 121.3
Natural pastures 2.2 35.3 62.4 3.0 37.4 59.6 42.5 12.9 1.7
Managed natural pastures 13.5 18.8 67.8 13.2 23.6 63.2 142.9 212.4 131.5
Non-managed pastures 1.8 36.0 62.2 2.0 38.7 59.2 13.7 8.8 -3.7
Fallow lands 14.2 23.6 62.2 11.1 34.2 54.6 6.1 95.3 18.7
Fallow lands (to be cropped) 10.2 32.1 57.7 13.3 36.6 50.1 98.6 74.4 32.9
Other fallow lands 0.0 16.4 83.6 0.9 21.2 77.9 5102.8 79.5 29.0
Not cropped ag. Land 30.4 18.2 51.4 17.3 42.6 40.1 -38.0 154.7 -15.1
Nonagricultural use 48.8 21.7 29.6 55.4 15.1 29.5 18.7 -27.0 4.5
Forests 67.7 7.8 24.5 67.8 7.3 24.9 21.0 13.2 22.8
Other 5.3 53.5 41.1 4.2 47.3 48.5 -46.9 -40.5 -20.5
Total agricultural land 21.9 28.7 49.4 24.1 28.9 47.1 20.4 10.2 4.3
Source: Official data.
In Table III.3, we show the top 20 crops, which comprised 83% of the total area devoted to
annual and permanent crops. Four crops (corn, coffee, potatoes, and rice) comprised 46% of the
cultivated area in 1994. Each one of these crops was allocated more area in 2012: together, they reached
49% of the total cultivated area. Additionally, the following crops at least doubled in area between 1994
and 2012: cacao, avocado, grapes, asparagus, and mangoes. These results are somewhat consistent with
hypothesis HP2. Although the same crops dominated in 1994 and 2012, the additional area allocated to
them could indicate the transition away from illegal crops to legal products.

46 ECLAC – Natural Resources and Development Series N° 194 Agricultural transformation: trends in farm size…
Table III.3
Peru: area and contribution to the total cultivated land (%) of main crops, 1994-2012
(Hectares and percentages)
Area Change Contribution
1994 2012 % 1994 2012
Corn 483 853 575 737 19 18.8 18.5
Coffee 203 033 425 416 110 7.9 13.7
Potatoes 341 590 367 657 8 13.3 11.8
Rice 135 405 167 093 23 5.3 5.4
Sugar cane 125 201 151 809 21 4.9 4.9
Plantain 154 851 145 737 -6 6.0 4.7
Cacao 48 768 144 232 196 1.9 4.6
Cassava 129 415 94 646 -27 5.0 3.0 Fodder/feed
crops 35 803 82 317 130 1.4 2.7
Avocado 7 852 65 658 736 0.3 2.1
Broad beans 55 942 45 787 -18 2.2 1.5
Barley 125 848 45 367 -64 4.9 1.5
Wheat 98 615 45 249 -54 3.8 1.5
Beans 39 715 44 288 12 1.5 1.4
Grapes 10 731 43 820 308 0.4 1.4
Asparagus 15 041 39 629 163 0.6 1.3
Mangoes 9 087 39 036 330 0.4 1.3
Pea 32 294 31 214 -3 1.3 1.0
Cotton 87 998 27 141 -69 3.4 0.9
Palm 8 691 26 740 208 0.3 0.9
Total annual + permanent 2 576 777 3 103 839 20
Source: Official data.
B. Farm size distribution
The farm size distribution was more unequal in 2012 than in 1994 (Table III.4). The Gini
increased nationally and in every region. Further, compared to 1994, the share of producers with
farms smaller than 7 ha increased in 2012, while for all farms larger than 7 ha, the share of producers
in these categories dropped. Nationally the share of land in farms smaller than 350 ha decreased,
with the Sierra and Costa regions following the national trend. In the Selva region, the trend differed
slightly, with the share of area in farms with 0-7 ha increasing, instead of decreasing.
The changes observed in the farm size distribution reflect a reconfiguration in Peruvian
agriculture. Between 1994 and 2012, the number of farms increased by 28.1%, nearly 500,000
“new” farms (Table III.5). However, the aggregate figure hides the fact that the number of farms
increased only in the 0-7 ha category, while in the other categories, the number of farms
decreased, especially in the 7-35 ha range.
The concentration of land in farms with more than 350 ha is due to the additional area
accrued by the biggest farms (Table III.4). The national median size for farms larger than 350 ha
increased by 3% between 1994 and 2012 (Table IV.6). In the Selva and Sierra regions, the median
farm size in this category was also greater in 2012 than in 1994, but in the Costa region, the median
farm size dropped for the farms with more than 350 ha.

47 ECLAC – Natural Resources and Development Series N° 194 Agricultural transformation: trends in farm size…
Table III.4
Peru: indicators of farm size distribution, 1994 and 2012
(Gini value and percentages)
National Selva Costa Sierra
1994 2012 1994 2012 1994 2012 1994 2012
Land Gini 0.90 0.93 0.87 0.90 0.92 0.95 0.89 0.92
Share of producers
0-7 80.04 86.54 55.33 65.74 88.01 92.88 81.20 87.74
7.1-35 16.03 10.69 35.13 27.48 10.02 5.85 15.08 9.60
35.1-70 2.00 1.42 6.19 4.68 0.67 0.39 1.79 1.25
70.1-140 0.92 0.61 2.22 1.34 0.43 0.23 0.89 0.64
140.1-350 0.54 0.38 0.66 0.36 0.43 0.28 0.56 0.43
> 350 0.48 0.36 0.48 0.40 0.45 0.38 0.49 0.34
Share of land area
0-7 8.57 8.15 4.29 4.94 9.47 8.33 9.90 9.57
7.1-35 11.75 9.21 14.70 12.59 6.55 4.47 12.94 9.92
35.1-70 4.91 4.09 7.78 6.36 1.71 1.18 5.21 4.43
70.1-140 4.44 3.47 5.40 3.55 2.19 1.39 5.09 4.44
140.1-350 5.82 4.79 3.57 2.07 5.03 3.94 7.11 6.47
> 350 64.51 70.29 64.27 70.48 75.05 80.70 59.76 65.15
Source: Own elaboration.
Table III.5
Peru: absolute changes in farms and area by farm size, between 1994 and 2012
(Thousands of farms and hectares)
Farms
(thousands)
Area
(hectares)
0-7 544.0 126.8
7.1-35 -41.3 -587.8
35.1-70 -3.1 -154.4
70.1-140 -2.3 -225.7
140.1-350 -0.8 -205.1
> 350 -0.4 4 406.8
Total 496.1 3 360.7
Source: Own elaboration
For farms in intermediate categories (between 7 ha and 350 ha), the trend in median farm
size differed across regions. In the Selva region, the median farm size either decreased or remained
the same. In the Sierra region, the median farm size either increased or was unchanged. In the Costa
region, there was a small decrease in the median size for farms with 7-35 ha. For farms in the 35-
70 ha and 140-350 ha categories the median size increased, especially in the latter category, while
the median farm size in the 70-140 ha category did not change.
These results are somewhat consistent with hypothesis HP1. Although Peru experienced an
unambiguous increase in land inequality between 1994 and 2012, the impact on median farm size
is not so straightforward. Land concentration generally increased the median farm size for the
largest farms, but the influx of famers into agriculture had distinct effects on median farm size,
depending on the region and farm size category.

48 ECLAC – Natural Resources and Development Series N° 194 Agricultural transformation: trends in farm size…
Table III.6
Peru: median farm size, 1994 and 2012
(Hectares)
National Selva Costa Sierra
1994 2012 1994 2012 1994 2012 1994 2012
0-7 1.6 1.0 3.0 2.0 1.5 1.0 1.5 1.0
7.1-35 12.0 12.0 14.5 14.5 10.5 10.0 12.0 12.0
35.1-70 49.6 50.0 50.0 48.0 49.0 50.0 49.0 50.0
70.1-140 98.1 97.5 96.0 90.0 100.0 100.0 97.5 99.5
140.1-350 200.0 200.0 200.0 200.0 203.0 215.0 200.0 200.0
> 350 949.7 980.0 2 440.1 2 605.0 928.8 860.0 860.4 900.0
Source: Own elaboration.
C. Land tenure
In Peru, changes in land tenure legislation were likely drivers of trends in land use, the entry of
producers into agriculture, the addition of area into agriculture, and the crop distribution.
Nationally, there were three distinct changes in land tenure. First, the proportion of farmers with a
communal right decreased from 27% to 14%. Second, the share of farmers with a registered right
increased from 17% to 25%. Third, there were more farmers with other types of tenure (e.g. renting
land) in 2012 (16%) than in 1994 (10%). The changes in the Costa and Sierra regions followed the
national pattern. In contrast, in the Selva region, the percentage of farmers with a communal right
decreased only slightly (from 18% to 16%), and the percentage of farmers with registered right
increased from 11% to 52% (Table III.7). Analysis of land tenure by farm size (Table III.8) reveals that
a lower proportion of small farmers own the land. For example, in 2012, nearly 90% of farms larger
than 350 ha were owned outright; in contrast, the ownership rate was less than 70% for farms under
7 ha. Between 1994 and 2012, the share of farmers with communal rights decreased, while the share
with other types of tenure increased, in all size categories (Table III.8).

49 ECLAC – Natural Resources and Development Series N° 194 Agricultural transformation: trends in farm size…
Table III.7
Peru: description of national and regional distribution of farms according to land tenure
1994 and 2012
(Units and percentages)
1994 2012
Owned
Communal right Others
Owned Communal
right Others
All
Registered
Not all
Registered
All
Registered
Not all
Registered
Number of farms
National 303 070 805 897 468 635 168 172 545 156 990 564 310 642 364 606
Selva 22 474 101 493 35 608 36 410 131 494 41 757 40 551 41 047
Costa 109 562 192 455 97 579 44 399 168 093 217 572 62 312 125 800
Sierra 171 034 511 949 335 448 87 363 245 569 731 235 207 779 197 759
Distribution in percentages
National 17 46 27 10 25 45 14 16
Selva 11 52 18 19 52 16 16 16
Costa 25 43 22 10 29 38 11 22
Sierra 15 46 30 8 18 53 15 14
Source: Own elaboration.
Note: “All registered” indicates that a farmer had a registered right of all the plots owned, “not all registered” indicates that a farmer did not have
a registered right of a least one of the plots owned, “communal right” means that the farmers owns at least one plot with right that is collective;
“other” comprises any case in which at least one plot was rented or loaned (i.e., at least one plot was not owned).
Table III.8
Peru: distribution of farms according to land tenure by size, 1994 and 2012
(Units and percentages)
1994 2012
Owned Communal
right Others Total
Owned Communal
right Others Total
All
Registered
Not all
Registered
All
Registered
Not all
Registered
Number of farms
0-7 234 047 628 453 395 268 135 806 1 257 768 448 067 879 475 270 001 320 335 1 597 543
7.1-35 51 352 142 344 62 661 26 507 256 357 76 562 87 935 33 052 35 730 197 549
35.1-70 7 330 18 489 6 072 3 340 31 891 10 779 10 007 4 677 4 779 25 463
70.1-140 3 764 8 147 2 878 1 396 14 789 4 201 5 267 1 808 1 967 11 276
140.1-350 2 648 4 575 1 399 822 8 622 2 571 4 009 823 1 053 7 403
> 350 3 929 3 889 357 301 8 175 2 976 3 871 281 742 7 128
Total 303 070 805 897 468 635 168 172 1 577 602 545 156 990 564 310 642 364 606 1 846 362
Distribution in percentages
0-7 17 45 28 10 100 23 46 14 17 83
7.1-35 18 50 22 9 100 33 38 14 15 85
35.1-70 21 52 17 9 100 36 33 15 16 84
70.1-140 23 50 18 9 100 32 40 14 15 85
140.1-350 28 48 15 9 100 30 47 10 12 88
> 350 46 46 4 4 100 38 49 4 9 91
Total 17 46 27 10 100 25 45 14 16 84
Source: Own elaboration.
Note: “All registered” indicates that a farmer had a registered right of all the plots owned, “not all registered” indicates that a farmer did not have
a registered right of a least one of the plots owned, “communal right” means that the farmers owns at least one plot with right that is collective;
“other” comprises any case in which at least one plot was rented or loaned (i.e., at least one plot was not owned).

50 ECLAC – Natural Resources and Development Series N° 194 Agricultural transformation: trends in farm size…
D. Labor
The expansion in the number of farms that occurred exclusively among farms with less than 7 ha
was accompanied by an expansion in the number of farmers within this category. In other
categories, the number of farmers decreased between 1994 and 2012 (Table III.9). We derived the
number of farmers by counting the individual producers who did not earn additional income from
activities outside the farm. We also calculated if other household members were involved in
agricultural activities on the farm. In the period of study, the number of household members
involved decreased for all farms, including those with less than 7 ha.
Apart from relying on household labor, farms also utilized paid labor (Table III.10). The
amount of paid permanent labor is relatively small, compared with the number of farmers and the
amount of paid temporary labor. The use of paid permanent labor decreased in farms with less
than 35 ha, and increased among the other categories. In contrast, between 1994 and 2012, every
farm size category saw the use of paid temporary labor increase at a fast rate.
Table III.9
Peru: labor indicators by farm size, 1994 and 2012
(Units and percentages)
Farmers a Total household labor b
1994 2012 %Change 1994 2012 % Change
0-7 1 006 400 1 134 727 13 3 311 874 2 195 100 -34
7.1-35 210 350 150 229 -29 776 881 320 338 -59
35.1-70 24 943 19 393 -22 97 272 41 758 -57
70.1-140 10 832 7 866 -27 43 981 17 770 -60
140.1-350 5 285 4 514 -15 24 086 10 894 -55
> 350 1 720 1 814 5 8 651 4 501 -48
Total 1 259 530 1 318 543 5 4 262 745 2 590 361 -39
Permanent Temporary
1994 2012 % Change 1994 2012 % Change
0-7 96 809 57 172 -41 4 997 469 9 600 152 92
7.1-35 56 400 36 541 -35 1 893 209 3 393 624 79
35.1-70 11 281 13 205 17 230 134 450 342 96
70.1-140 7 376 10 605 44 94 642 190 574 101
140.1-350 5 185 14 299 176 45 975 125 450 173
> 350 17 789 48 756 174 42 305 107 248 154
Total 194 840 180 578 -7 7 303 734 13 867 390 90
Source: Own elaboration
Note: a Farmers is calculated as heads of the household managing directly the farm and who do not work to get off-farm income. b Household labor is calculated as members of the household older than 15 working on the farm and it does not include the head.
More information about the definitions of labor are Annex 2.

51 ECLAC – Natural Resources and Development Series N° 194 Agricultural transformation: trends in farm size…
We also calculated the ratio of employed labor units per hectare (Table III.10). The
employment ratio for paid permanent labor increased only in farms above 70 ha. The ratio of paid
temporary labor to area increased for all farms.
Table III.10
Peru: ratio labor units to hectares, by farm size, 1994 and 2012
(Units/ha and percentages)
Permanent Temporary
Farm size
(ha) 1994 2012 % Change 1994 2012 % Change
0-7 0.031 0.018 -41 1.649 3.040 84
7.1-35 0.016 0.010 -35 0.455 0.951 109
35.1-70 0.007 0.008 17 0.132 0.284 115
70.1-140 0.005 0.008 44 0.060 0.142 135
140.1-350 0.003 0.008 176 0.022 0.068 203
> 350 0.001 0.002 174 0.002 0.004 112
Total 0.005 0.005 -7 1.159 0.358 -69
Source: Own elaboration
Note: More information about the definitions of labor are in Annex 2.
E. Mechanization
For additional insight on trends in Peruvian agriculture, we turn to the ownership of agricultural
tools and machinery. The agricultural census allows a comparison of eight different items
(Table III.11). Overall, between 1994 and 2012, the share of farmers owning these items, and the ratio
of technological units used per hectare (the use ratio) increased, indicating a process of
mechanization. The exceptions were (Tables III.12, III.13 and III.14):
• Chaquitaclla (Andean foot plough): The share of farmers owning this tool, but not the
average ratio of units per hectare, decreased nationally and in the Costa and Sierra
regions. The share of farmers owning chaquitacllas and the use ratio decreased in all the
farm size categories above 7 ha, while in farms with less than 7 ha, the share of use
decreased and the average ratio units/area increased (Tables III.12, III.13 and III.14).
• Plough: Nationally and across the regions, the percentage of farmers owning ploughs,
made of iron or wood, decreased, except for iron ploughs in the Sierra region. The
ownership rate for both plough technologies decreased for all farms. The use ratio for
both plough types also decreased, except among farms under 70 ha and with more than
350 ha; iron plough use increased in the 7-35 ha category.
• Non-manual fumigating pump: The use ratio decreased at the national level, due to
decreases in the 0-7 ha farm size category and for all farms in the Costa region.
• Manual fumigating pump: The use ratio decreased in Selva region; the ownership rate
dropped among farms with more than 350 ha.
• Well pump: The national decrease in the use ratio was driven by the Costa region and
farms smaller than 140 ha.

52 ECLAC – Natural Resources and Development Series N° 194 Agricultural transformation: trends in farm size…
• Truck: The use ratio decreased in the Selva region. The share of farmers owning this item
decreased in the Sierra region and among farmers with more than 350 ha.
• Grain mill: The use ratio decreased in all farms above 35 ha, except for the 140-350 ha
category, in which it remained the same.
Table III.11
Peru: shares of farms owning equipment and average units per hectare by item, 1994 and 2012
(Percentages and units/ha)
Share of farmers Average units/ha a
Item 1994 2012 % Growth 1994 2012 % Growth
Manual fumigating pump 17.0 32.6 92 1.57 2.40 53
Chaquitacllas 22.5 16.5 -27 2.49 6.23 150
Grain mill 1.5 3.2 116 0.52 1.48 187
Iron plows 4.0 3.1 -24 1.60 2.01 26
Wood plows 32.0 3.1 -90 1.46 3.38 131
Non-manual fumigating pump 1.0 2.5 149 1.43 0.93 -35
Truck 1.6 1.7 3 0.84 1.34 60
Well pump 0.4 0.7 76 1.17 1.11 -5
Source: Own elaboration. a Units per hectare are calculated at the farm level and averaged over the farms with positive ownership.
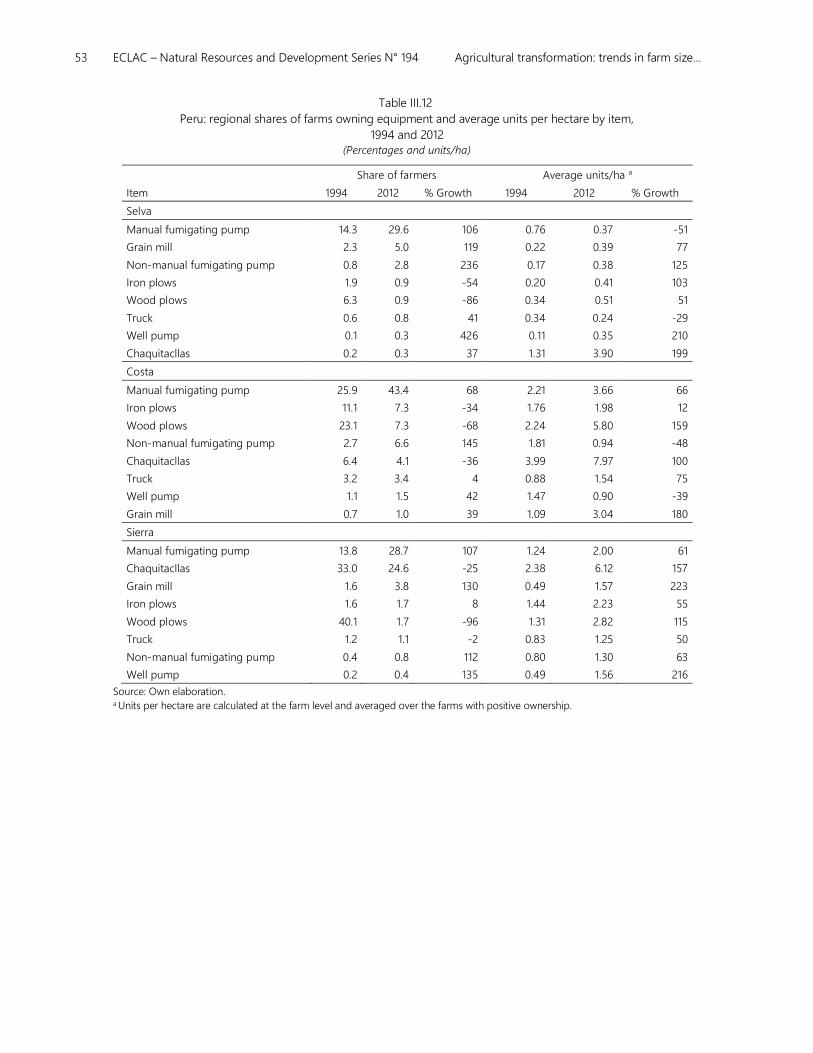
53 ECLAC – Natural Resources and Development Series N° 194 Agricultural transformation: trends in farm size…
Table III.12
Peru: regional shares of farms owning equipment and average units per hectare by item,
1994 and 2012
(Percentages and units/ha)
Share of farmers Average units/ha a
Item 1994 2012 % Growth 1994 2012 % Growth
Selva
Manual fumigating pump 14.3 29.6 106 0.76 0.37 -51
Grain mill 2.3 5.0 119 0.22 0.39 77
Non-manual fumigating pump 0.8 2.8 236 0.17 0.38 125
Iron plows 1.9 0.9 -54 0.20 0.41 103
Wood plows 6.3 0.9 -86 0.34 0.51 51
Truck 0.6 0.8 41 0.34 0.24 -29
Well pump 0.1 0.3 426 0.11 0.35 210
Chaquitacllas 0.2 0.3 37 1.31 3.90 199
Costa
Manual fumigating pump 25.9 43.4 68 2.21 3.66 66
Iron plows 11.1 7.3 -34 1.76 1.98 12
Wood plows 23.1 7.3 -68 2.24 5.80 159
Non-manual fumigating pump 2.7 6.6 145 1.81 0.94 -48
Chaquitacllas 6.4 4.1 -36 3.99 7.97 100
Truck 3.2 3.4 4 0.88 1.54 75
Well pump 1.1 1.5 42 1.47 0.90 -39
Grain mill 0.7 1.0 39 1.09 3.04 180
Sierra
Manual fumigating pump 13.8 28.7 107 1.24 2.00 61
Chaquitacllas 33.0 24.6 -25 2.38 6.12 157
Grain mill 1.6 3.8 130 0.49 1.57 223
Iron plows 1.6 1.7 8 1.44 2.23 55
Wood plows 40.1 1.7 -96 1.31 2.82 115
Truck 1.2 1.1 -2 0.83 1.25 50
Non-manual fumigating pump 0.4 0.8 112 0.80 1.30 63
Well pump 0.2 0.4 135 0.49 1.56 216
Source: Own elaboration. a Units per hectare are calculated at the farm level and averaged over the farms with positive ownership.

54 ECLAC – Natural Resources and Development Series N° 194 Agricultural transformation: trends in farm size…
Table III.13
Peru: shares of farms owning equipment and average units per hectare by farm size and item
1994 and 2012
(Percentages and units/ha)
Share of farmers Average units/ha a
Item 1994 2012 % Growth 1994 2012 % Growth
0-7
Manual fumigating pump 15.5 31.0 101 2 119 2 893 37
Chaquitacllas 24.1 16.8 -30 2 884 7 023 144
Iron plows 3.9 3.1 -22 2 031 2 301 13
Wood plows 32.6 3.1 -91 1 756 3 697 111
Grain mill 1.0 2.7 171 0.911 2 028 123
Non-manual fumigating pump 0.7 2.0 185 2 490 1 299 -48
Truck 1.2 1.2 7 1 425 2 081 46
Well pump 0.3 0.5 64 1 846 1 670 -9
7.1-35
Manual fumigating pump 23.3 45.0 93 0.118 0.130 10
Chaquitacllas 16.5 14.4 -13 0.191 0.169 -12
Grain mill 3.5 6.8 93 0.087 0.086 -1
Non-manual fumigating pump 2.1 5.8 177 0.099 0.126 27
Truck 3.2 4.4 39 0.092 0.096 4
Iron plows 5.0 3.3 -35 0.119 0.122 2
Wood plows 32.3 3.3 -90 0.167 0.152 -9
Well pump 0.7 1.7 140 0.105 0.099 -5
35.1-70
Manual fumigating pump 23.5 41.0 74 0.033 0.037 13
Chaquitacllas 14.7 13.4 -8 0.048 0.043 -10
Grain mill 3.9 7.4 91 0.026 0.024 -7
Non-manual fumigating pump 2.6 5.3 103 0.031 0.038 23
Truck 4.3 4.7 11 0.028 0.029 4
Iron plows 2.9 2.2 -25 0.034 0.031 -9
Wood plows 20.5 2.2 -89 0.045 0.040 -10
Well pump 0.8 1.9 132 0.031 0.031 -2
70.1-140
Manual fumigating pump 22.6 36.6 62 0.018 0.022 25
Chaquitacllas 17.7 14.9 -16 0.024 0.022 -9
Non-manual fumigating pump 3.3 6.9 112 0.016 0.020 29
Grain mill 3.3 6.8 102 0.013 0.013 -5
Truck 4.8 5.8 22 0.014 0.015 6
Well pump 0.7 2.7 292 0.022 0.019 -14
Iron plows 2.3 1.9 -21 0.020 0.015 -23
Wood plows 17.0 1.9 -89 0.023 0.020 -13
140.1-350
Manual fumigating pump 17.6 23.1 31 0.009 0.014 56
Chaquitacllas 17.7 12.6 -29 0.012 0.011 -13
Truck 5.4 6.3 16 0.007 0.010 39
Non-manual fumigating pump 2.7 5.8 114 0.008 0.011 32
Grain mill 2.8 4.0 42 0.006 0.006 0

55 ECLAC – Natural Resources and Development Series N° 194 Agricultural transformation: trends in farm size…
Share of farmers Average units/ha a
Item 1994 2012 % Growth 1994 2012 % Growth
Well pump 0.6 2.8 369 0.012 0.012 4
Iron plows 1.9 1.3 -32 0.010 0.009 -10
Wood plows 11.9 1.3 -89 0.012 0.010 -17
> 350
Manual fumigating pump 16.6 14.6 -12 0.002 0.006 153
Chaquitacllas 9.7 7.2 -26 0.006 0.005 -28
Truck 7.6 5.5 -27 0.001 0.004 157
Non-manual fumigating pump 2.5 3.4 38 0.002 0.004 143
Well pump 0.3 2.4 616 0.004 0.006 55
Grain mill 2.4 2.3 -6 0.002 0.002 -3
Iron plows 2.5 2.1 -16 0.002 0.005 89
Wood plows 7.4 2.1 -71 0.004 0.004 2
Source: Own elaboration. a Units per hectare are calculated at the farm level and averaged over the farms with positive ownership.
With respect to tractors, the available information is about use, in contrast with ownership,
as in the case of the other agricultural tools and machines. The use of tractors is shown in
Table III.14. for every farm size and region. In all the cases, the percentage of farms increased
between 1994 and 2012, except in Selva region among the farms with more than 350 ha. In sum,
this evidence also indicates a process of mechanization.
Table III.14
Peru: shares of farms using tractors by farm size, 1994 and 2012
(Percentages)
National Selva
Farm size
(hectares) 1994 2012 % Growth 1994 2012 % Growth
Total 11.2 22.3 99 2.1 4.5 116
0-7 11.0 22.3 102 1.4 4.3 207
7.1-35 12.7 23.5 85 2.9 5.1 74
35.1-70 9.0 16.0 77 2.7 4.0 44
70.1-140 8.4 17.0 102 3.2 6.0 85
140.1-350 7.8 14.5 86 5.2 7.5 46
> 350 9.9 12.4 25 4.8 2.6 -46
Costa Sierra
1994 2012 % Growth 1994 2012 % Growth
Total 18.5 30.4 65 9.9 22.1 124
0-7 16.9 28.9 71 9.6 21.9 128
7.1-35 32.7 55.3 69 11.4 25.2 121
35.1-70 30.0 40.9 36 9.7 21.1 118
70.1-140 18.3 31.5 72 8.8 19.1 117
140.1-350 7.3 19.3 165 8.5 14.3 68
> 350 6.9 14.0 103 11.9 13.8 15
Source: Own elaboration.


57 ECLAC – Natural Resources and Development Series N° 194 Agricultural transformation: trends in farm size…
IV. Comparative analysis and policy discussion
In the final chapter of this report, we undertake a comparative analysis, to understand the similarities
and differences of structural transformation in Peru and Nicaragua. We then outline a series of policy
options to ensure those employed in the sector are not only supported but thrive in agriculture.
A. Comparative Analysis
Peru and Nicaragua have faced similar growth and development paths. Both countries experienced
alternating periods of non-democratic and democratic governments, which affected the agricultural
sector through access to land (land reform policies), market integration, and wages/labor supply. This
section compares and contrasts the process of agricultural structural transformation in both countries.
1. Trends in land use
In both countries three agricultural regions are identified: a) a coastal region (Pacific in Nicaragua
and Coast in Peru), which in both countries is characterized by dry conditions; b) a central region
(Central in Nicaragua and Sierra in Peru), with land of higher altitudes vis-à-vis the other two
regions; and c) a western region (Atlantic in Nicaragua and Selva in Peru), which can be
characterized as “frontier agricultural” regions.
Farm land decreased in Nicaragua, by around 4% nationally, and in all agricultural regions,
with the largest decrease in the Pacific Region (close to 7%). On the contrary, farm land in Peru
increased, nationally by around 7%, with the largest increase in the Selva region at just over 20%.
However, both countries experienced net increases in the total amount of land dedicated to
agricultural uses: in Nicaragua about 7%, and in Peru about 27%; but the mechanism of expansion
differed across the countries. At the national level, agricultural land in Nicaragua increased through
deforestation and a reduction in fallow land, which were then used for annual/permanent crops
and pastures (Table III.1). In Peru, both fallow land and forest land increased, but land allocated for

58 ECLAC – Natural Resources and Development Series N° 194 Agricultural transformation: trends in farm size…
annual crops decreased by 10%, land used for associated crops decreased by nearly 15%, and land
in the “residual” category other uses in non-agricultural uses decreased by almost 33% (Table III.1).
Table IV.1 and Figure IV.1 summarize the trends in land use in Nicaragua and Peru, at the
national level, and by region.
Table IV.1
Nicaragua and Peru: summary of trends in land use categories, by region
(Trends)
Nicaragua (2001-2011) Peru (1994-2012)
National Pacific Central Atlantic National Coast Sierra Selva
Agricultural land (farm land) ↓ ↓ ↓ ↓ ↑ ↑ ↑ ↑
In agricultural uses ↑ ↑ ↑ ↑ ↑ ↑ ↑ ↑
Annual crops ↑ ↑ ↑ ↓ ↓ ↑ ↓ ↓
Permanent crops ↑ ↑ ↑ ↑ ↑ ↑ ↑ ↑
Natural pastures ↑ ↓ ↓ ↑ ↑ ↑ ↑ ↑
Fallow lands ↓ ↓ ↓ ↓ ↑ ↑ ↑ ↑
In nonagricultural uses ↓ ↑ ↑ ↓ ↑ ↓ ↑ ↑
Forest ↓ ↑ ↑ ↓ ↑ ↑ ↑ ↑
Source: Own elaboration.
Figure IV.1
Nicaragua and Peru: changes in aggregate land use categories, by region
(Thousand hectares)
Source: Own elaboration.
-500
-400
-300
-200
-100
0
100
200
300
400
Ag
ricultu
ral u
se
s
Na
tura
l pa
stu
res
Fa
llow
la
nd
No
n-a
gri
cura
l u
se
To
tal fa
rmla
nd
A. Nicaragua (2001-2011)
National Pacific Central Atlantic
-1000
-500
0
500
1000
1500
2000
2500
3000
3500
Ag
ricultu
ral u
se
s
Na
tura
l pa
stu
res
Fa
llow
la
nd
s
No
n a
gricultura
l use
To
tal fa
rmla
nd
B. Peru (1994-2012)
National Coast Sierra Selva

59 ECLAC – Natural Resources and Development Series N° 194 Agricultural transformation: trends in farm size…
2. Trends in crop production
Whatever the source of the additional agricultural land, both countries saw it used for increased
cultivation of staples (e.g., corn, beans, and rice) and cash crops, specifically coffee. Corn saw the
second largest increase in area in Nicaragua and the third largest in Peru; coffee was third in
Nicaragua and the first in Peru. Table IV.2 provides a summary of the area changes by region and
farm sizes in both countries.
Table IV.2
Nicaragua and Peru: changes in crop production, by region and farm sizes
(Main crops)
Nicaragua (2001-2011)
(3 crops with the largest absolute increases in area - out of the 10 most important)
Peru (1994 -2012)
(3 crops with the largest absolute increases in area - out of the 10 most important)
Farm size (hectares) Pacific Central Atlantic Coast Sierra Selva
0 – 7 Corn
Beans
Bananas & plantains
Beans
Corn
Coffee
Beans
Corn
Cassava
Corn
Rice
Potatoes
Corn
Potatoes
Coffee
Coffee
Corn
Rice
7.1 – 35 Corn
Beans
Bananas & plantains
Beans
Corn
Coffee
Beans
Corn
Cassava
Rice
Corn
Cotton
Coffee
Oats
Rice
Coffee
Corn
Rice
35.1 – 70 Corn
Rice
Beans
Beans
Corn
Coffee
Cassava
Beans
Rice
Corn
Rice
Cotton
Oats
Corn
Rice
Corn
Coffee
Rice
70.1 – 140 Rice
Groundnut
Corn
Beans
Coffee
Corn
Cassava
Beans
Rice
Avocado
Cacao
Mango
Corn
Oats
Rice
Rice
Corn
Coffee
140.1 – 350 Rice
Groundnut
Beans
Coffee
Corn
Beans
Cassava
Corn
Grape wines
Cacao
Corn
Potatoes
Oats
Rice
Coffee
Corn
> 350 Sugarcane
Groundnut
Rice
Palm
Rice
Beans
Beans
Palm
Avocado
Potatoes
Corn
Grape wines
Corn
Potatoes
Avocado
Corn
Rice
Coffee
National (crops with the largest increase in area)
1). Beans, 2). Corn, 3). Coffee, 4). Rice, 5). Sugarcane, 6). Groundnut, 7). Cassava, 8). Palm, 9). Bananas, 10).
Cacao, 11). Citrus
1). Coffee, 2). Cacao, 3). Corn, 4). Avocado, 5.) Fodder/feed crops, 6). Grape wines, 7). Rice, 8). Mangoes, 9). Sugar cane, 9).
Potatoes, 11). Asparagus, 12). Palm
Source: Own elaboration.
Five crops are important in both countries: two staple crops (rice and corn), and three cash
crops (coffee, cacao, and sugarcane). The dynamic of these crops by regions and farm size are
summarized as follows8:
8 The census data do not provide price information. Thus, we take production changes as an indicator for a crop’s
profitability/value.

60 ECLAC – Natural Resources and Development Series N° 194 Agricultural transformation: trends in farm size…
• Corn: In Nicaragua the increase in area occurred mainly in small and medium sized farms
(less than 70 ha), in all regions. In Peru increases in area took place in all regions and
across all farm sizes.
• Rice: In Nicaragua, the area dedicated to rice increased significantly in the Pacific and
Atlantic regions, specifically in medium to large farms (over 35 ha), while in the Central
region increases occurred only among the largest farms (over 350 ha). In Peru the
dynamics differed in each region: in the Coast, increases were concentrated in small and
medium sized farms (less than 70 ha), in the Sierra in farms between 7 and 140 ha, while
in the Selva region the rice area increased across all farm sizes.
• Coffee: In Nicaragua the increase in coffee was limited to the Central region, across all
farm sizes (except those with more than 350 ha). In Peru trends were regional: the coffee
area increased in farms with less than 35 ha in the Sierra and in all farm sizes in the Selva
region.
• Cacao: The increase in cacao area was significant in Peru (it is the crop with the second
largest area increase), more than in Nicaragua (crop with the tenth largest increase). In
Peru the increases took place mid-sized farms (70–350 ha) in the Coastal region.
• Sugarcane: The crop with the fifth largest increase in Nicaragua and ninth in Peru. In
Nicaragua the increases were noticeable only in farms over 350 ha in the Pacific region.
In Peru, sugarcane did not appear among the three crops with the largest increase in
cultivated area in any region.
There are other crops which are country specific. In Nicaragua:
o Beans are an important staple crop and it is one of the three crops with largest
increases in the Pacific region, among farms with less than 70 ha, and among all
farm sizes in the Central and Atlantic regions.
o Cassava is also an important staple crop, with significant production increases in
the Atlantic region among farms with less than 350 ha.
o Groundnuts exhibited significant increases in farms over 7 ha in the Coastal region.
o Palm showed significant increases in the largest farms (over 350 ha) in the Central
and Atlantic regions.
In Peru:
o Oats were one of the three crops with the largest area increases in the Sierra region,
in medium sized farms (7-350 ha).
o Avocados, mangos and, grapes are the three cash crops that gained in area,
especially among larger Coastal farms: avocados in farms over 70 ha (and over 350
ha in the Sierra), mangoes in farms 70-140 ha, and grapes in farms over 140 ha.
There are also some similarities across regions and farm size categories:
o Corn and rice were among the crops with largest increases in cultivated area
among farms with less than 70 ha in the Pacific region of Nicaragua and the
Coastal region of Peru.
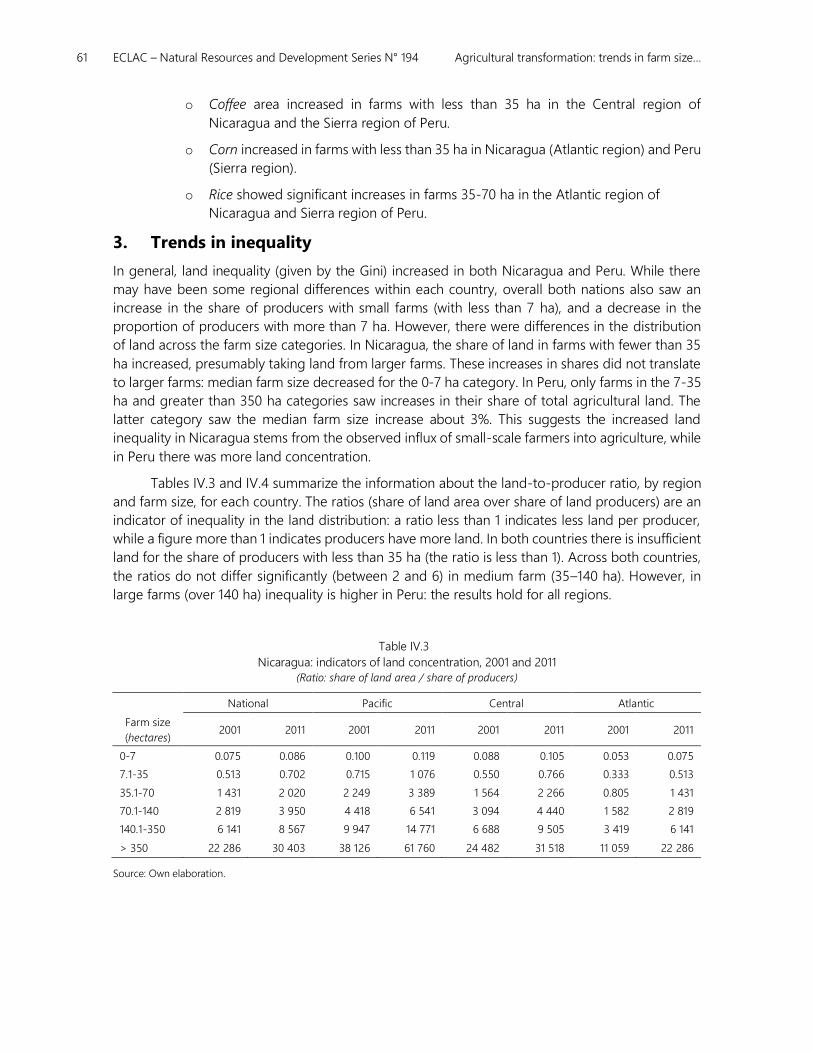
61 ECLAC – Natural Resources and Development Series N° 194 Agricultural transformation: trends in farm size…
o Coffee area increased in farms with less than 35 ha in the Central region of
Nicaragua and the Sierra region of Peru.
o Corn increased in farms with less than 35 ha in Nicaragua (Atlantic region) and Peru
(Sierra region).
o Rice showed significant increases in farms 35-70 ha in the Atlantic region of
Nicaragua and Sierra region of Peru.
3. Trends in inequality
In general, land inequality (given by the Gini) increased in both Nicaragua and Peru. While there
may have been some regional differences within each country, overall both nations also saw an
increase in the share of producers with small farms (with less than 7 ha), and a decrease in the
proportion of producers with more than 7 ha. However, there were differences in the distribution
of land across the farm size categories. In Nicaragua, the share of land in farms with fewer than 35
ha increased, presumably taking land from larger farms. These increases in shares did not translate
to larger farms: median farm size decreased for the 0-7 ha category. In Peru, only farms in the 7-35
ha and greater than 350 ha categories saw increases in their share of total agricultural land. The
latter category saw the median farm size increase about 3%. This suggests the increased land
inequality in Nicaragua stems from the observed influx of small-scale farmers into agriculture, while
in Peru there was more land concentration.
Tables IV.3 and IV.4 summarize the information about the land-to-producer ratio, by region
and farm size, for each country. The ratios (share of land area over share of land producers) are an
indicator of inequality in the land distribution: a ratio less than 1 indicates less land per producer,
while a figure more than 1 indicates producers have more land. In both countries there is insufficient
land for the share of producers with less than 35 ha (the ratio is less than 1). Across both countries,
the ratios do not differ significantly (between 2 and 6) in medium farm (35–140 ha). However, in
large farms (over 140 ha) inequality is higher in Peru: the results hold for all regions.
Table IV.3
Nicaragua: indicators of land concentration, 2001 and 2011
(Ratio: share of land area / share of producers)
National Pacific Central Atlantic
Farm size
(hectares) 2001 2011 2001 2011 2001 2011 2001 2011
0-7 0.075 0.086 0.100 0.119 0.088 0.105 0.053 0.075
7.1-35 0.513 0.702 0.715 1 076 0.550 0.766 0.333 0.513
35.1-70 1 431 2 020 2 249 3 389 1 564 2 266 0.805 1 431
70.1-140 2 819 3 950 4 418 6 541 3 094 4 440 1 582 2 819
140.1-350 6 141 8 567 9 947 14 771 6 688 9 505 3 419 6 141
> 350 22 286 30 403 38 126 61 760 24 482 31 518 11 059 22 286
Source: Own elaboration.

62 ECLAC – Natural Resources and Development Series N° 194 Agricultural transformation: trends in farm size…
Table IV.4
Peru: indicators of land concentration, 1994 and 2012
(Ratio: share of land area / share of producers)
National Coast Sierra Selva
Farm size (hectares)
1994 2012 1994 1994 2012 2012 1994 2012
0-7 0.107 0.094 0.108 0.078 0.075 0.090 0.122 0.109
7.1-35 0.733 0.862 0.654 0.418 0.458 0.764 0.858 1 033
35.1-70 2 455 2 880 2 552 1 257 1 359 3 026 2 911 3 544
70.1-140 4 826 5 689 5 093 2 432 2 649 6 043 5 719 6 938
140.1-350 10 778 12 605 11 698 5 409 5 750 14 071 12 696 15 047
> 350 134 396 195 250 166 778 133 896 176 200 212 368 121 959 191 618
Source: Own elaboration.
4. Trends in land tenure
In both Nicaragua and Peru, small farms have had less secure land rights. However, in Peru, the
share of farms with registered land rights is half that of Nicaragua (25% versus 50% in the most
recent census year). This trend is likely related to the entry of small farmers into agriculture in the
two countries. In fact, there was nearly a 60% increase in the number of farmers with 0-7 ha in
Nicaragua, between 2001 and 2011 (other farm size categories faced at most an increase one-fifth
as large, or saw a contraction). In Peru the increase in the number of registered farmers with 0-7 ha
was about 13%. But, like Nicaragua, the other farm size categories experienced a decrease in the
number of farmers with registered land rights. Table IV.5 provides a summary of trends in land
tenure in both countries by region.
Table IV.5
Nicaragua and Peru: summary of trends in land tenure, by region
(Trends)
Nicaragua (2001-2011) Peru (1994-2012)
National Pacific Central Atlantic National Coast Sierra Selva
Owned – registered ↔ ↓ ↔ ↑ ↑ ↑ ↑ ↑
Owned – not registered ↓ ↓ ↓ ↓ ↔ ↓ ↑ ↓
Communal rights ↓ ↓ ↓ ↓
Other ↑ ↑ ↑ ↓ ↑ ↑ ↑ ↓
Source: Own elaboration.
5. Trends in labor
The farmers entering agriculture did hire additional labor, mainly temporary, to support their farms.
In Nicaragua, the number of temporary employees working on farms with less than 7 ha more than
doubled between 2001 and 2011, a trend nearly matched in Peru. However, in Peru permanent labor
on these smaller farms decreased by 50%, while in Nicaragua permanent labor on farms 0-7 ha
increased by almost 50%. It may be that because small farms in Peru lack security in their land rights,
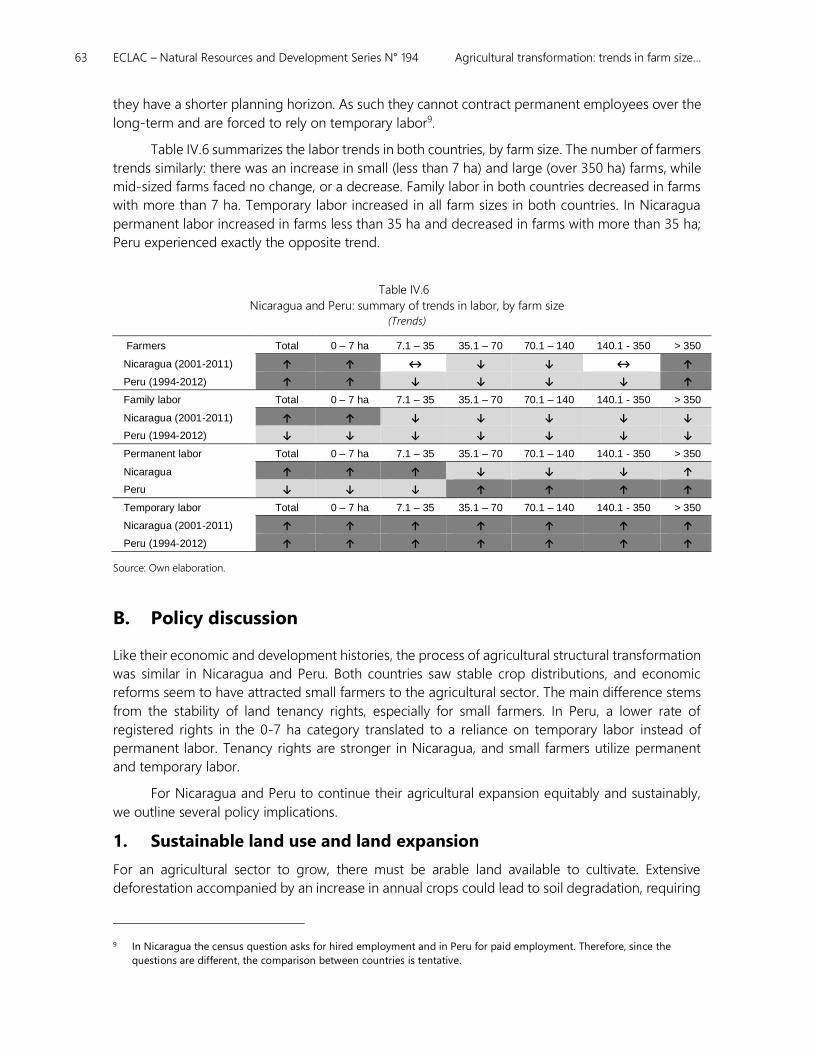
63 ECLAC – Natural Resources and Development Series N° 194 Agricultural transformation: trends in farm size…
they have a shorter planning horizon. As such they cannot contract permanent employees over the
long-term and are forced to rely on temporary labor9.
Table IV.6 summarizes the labor trends in both countries, by farm size. The number of farmers
trends similarly: there was an increase in small (less than 7 ha) and large (over 350 ha) farms, while
mid-sized farms faced no change, or a decrease. Family labor in both countries decreased in farms
with more than 7 ha. Temporary labor increased in all farm sizes in both countries. In Nicaragua
permanent labor increased in farms less than 35 ha and decreased in farms with more than 35 ha;
Peru experienced exactly the opposite trend.
Table IV.6
Nicaragua and Peru: summary of trends in labor, by farm size
(Trends)
Farmers Total 0 – 7 ha 7.1 – 35 35.1 – 70 70.1 – 140 140.1 - 350 > 350
Nicaragua (2001-2011) ↑ ↑ ↔ ↓ ↓ ↔ ↑
Peru (1994-2012) ↑ ↑ ↓ ↓ ↓ ↓ ↑
Family labor Total 0 – 7 ha 7.1 – 35 35.1 – 70 70.1 – 140 140.1 - 350 > 350
Nicaragua (2001-2011) ↑ ↑ ↓ ↓ ↓ ↓ ↓
Peru (1994-2012) ↓ ↓ ↓ ↓ ↓ ↓ ↓
Permanent labor Total 0 – 7 ha 7.1 – 35 35.1 – 70 70.1 – 140 140.1 - 350 > 350
Nicaragua ↑ ↑ ↑ ↓ ↓ ↓ ↑
Peru ↓ ↓ ↓ ↑ ↑ ↑ ↑
Temporary labor Total 0 – 7 ha 7.1 – 35 35.1 – 70 70.1 – 140 140.1 - 350 > 350
Nicaragua (2001-2011) ↑ ↑ ↑ ↑ ↑ ↑ ↑
Peru (1994-2012) ↑ ↑ ↑ ↑ ↑ ↑ ↑
Source: Own elaboration.
B. Policy discussion
Like their economic and development histories, the process of agricultural structural transformation
was similar in Nicaragua and Peru. Both countries saw stable crop distributions, and economic
reforms seem to have attracted small farmers to the agricultural sector. The main difference stems
from the stability of land tenancy rights, especially for small farmers. In Peru, a lower rate of
registered rights in the 0-7 ha category translated to a reliance on temporary labor instead of
permanent labor. Tenancy rights are stronger in Nicaragua, and small farmers utilize permanent
and temporary labor.
For Nicaragua and Peru to continue their agricultural expansion equitably and sustainably,
we outline several policy implications.
1. Sustainable land use and land expansion
For an agricultural sector to grow, there must be arable land available to cultivate. Extensive
deforestation accompanied by an increase in annual crops could lead to soil degradation, requiring
9 In Nicaragua the census question asks for hired employment and in Peru for paid employment. Therefore, since the
questions are different, the comparison between countries is tentative.

64 ECLAC – Natural Resources and Development Series N° 194 Agricultural transformation: trends in farm size…
the increased use of fertilizers and pesticides, eventually making the land unsuitable for cultivation.
In contrast, permanent crops form deeper root systems, which reduces nutrient leaching, allowing
for increased agricultural productivity over a longer period. Between 1994 and 2012, Peru increased
the amount of forest land, fallow land, and the land dedicated to permanent crops, while decreasing
the land used for annual crops. Continuing these trends will ensure that Peruvian farmers will have
sufficient arable land in the future. However, between 2001 and 2011 in Nicaragua, land dedicated
to permanent crops increased at the expense of forest and fallow land. Further, land used to
cultivate annual crops in Nicaragua also increased. If Nicaragua maintains this trajectory in the
absence of other policies (e.g. agro-environmental, sustainable intensification), soil degradation
could lead to agricultural instability.
Relatedly, both countries saw increases in the total amount of pasture land, implying that
farms are raising more livestock. Increases in livestock can have negative environmental
implications: it requires the cultivation of additional animal feed, which are the very annual crops
that are environmentally destructive (staples such as corn, rice, wheat, and oats). Further, more
animals will increase ambient methane levels, contributing to the greenhouse gas effect.
Apart from their inherent importance, sustainable land use and land expansion are relevant
for the following SDG related targets:
• Target 2.4: By 2030, ensure sustainable food production systems and implement resilient
agricultural practices that increase productivity and production, that help maintain
ecosystems, that strengthen capacity for adaptation to climate change, extreme weather,
drought, flooding and other disasters and that progressively improve land and soil quality
• Target 5.3 By 2030, combat desertification, restore degraded land and soil, including land
affected by desertification, drought and floods, and strive to achieve a land degradation-
neutral world
2. Increased land security
As discussed in Sections IV.5 and IV.6, small farmers in Nicaragua and Peru have lower security with
respect to land and tenancy rights, compared to their large farm counterparts. Farmers facing high
land insecurity will not have the liberty to pursue a long-term land development strategy. In fact,
insecure land rights could impede the development of a land market and could lead farmers to
engage in practices that ensure high returns in the short-run (such as deforestation, high pesticide
and fertilizer use, and a reliance on non-permanent crops), but are detrimental to their own
agricultural livelihoods and the environment in the long-run. By ensuring small farmers own their
land, governments will exhibit a strong commitment to equitable development in the agricultural
sector and ensure the income security of small farmers. Secure land tenure rights will also contribute
to the development of land markets and could spur farmers to engage in forward looking agro-
environmental practices.
Further, governments that combine increased land security with a greater understanding of
small farm operations can implement a comprehensive policy package to address the needs of
small farmers. For example, our analysis of the predominant technological practices in Peru indicates
that by 2012 small farmers essentially stopped using wood ploughs, but continue to rely on manual
fumigating pumps. Nicaragua experienced a similar (but less pronounced) trend. What remains to
be understood is why small farms experience these trends. With this information, governments can
65 ECLAC – Natural Resources and Development Series N° 194 Agricultural transformation: trends in farm size…
assist small farms in their technological transition, by providing access to credit to allow farmers to
purchase new technologies and technological training as well.
Therefore, governments should make effort to grant small farmers land ownership rights and
facilitate their technological transition.
Increased land tenure security is relevant for the following SDG related targets:
• Target 1.4: By 2030, ensure that all men and women, in particular the poor and the
vulnerable, have equal rights to economic resources, as well as access to basic services,
ownership and control over land and other forms of property, inheritance, natural
resources, appropriate new technology and financial services, including microfinance
• Target 2.3: By 2030, double the agricultural productivity and incomes of small-scale food
producers, in particular women, indigenous peoples, family farmers, pastoralists and
fishers, including through secure and equal access to land, other productive resources and
inputs, knowledge, financial services, markets and opportunities for value addition and
non-farm employment
• Target 5.a: Undertake reforms to give women equal rights to economic resources, as well
as access to ownership and control over land and other forms of property, financial services,
inheritance and natural resources, in accordance with national laws
3. Increased job security for agricultural employees
This issue is closely linked to that of land security. Depending on the type of crop, if growers are
not secure in their own land rights, they cannot offer permanent/long-term contracts to employees.
Without job security, agricultural laborers may be forced to leave the sector altogether.
Governments can improve agricultural job security by maintaining a register of employees and their
contract status, and helping workers find work in other sectors during the agricultural off-season.
Increased job security for agricultural employees is relevant for the following SDG related
targets:
• Target 8.5: By 2030, achieve full and productive employment and decent work for all women
and men, including for young people and persons with disabilities, and equal pay for work
of equal value.
4. Increased temporary employment and lack of remunerated job
opportunities in other rural sectors
Although the agricultural censuses do not provide information on rural labor markets, recent
evidence from household surveys indicates that those leaving agriculture could face difficulties
transitioning to remunerated non-farm activities due to a lack of skills (ECLAC-FAO-IICA, 2017).
People leaving agriculture must have access to training and retraining programs so they have
the appropriate skills for non-agricultural work. Therefore, as indicated in ECLAC-FAO-IICA (2017),
designing these skills acquisition programs in conjunction with the private sector ensures workers
will have the skills firms are demanding. Further, it will reduce government costs if firms are
providing the training. In the short-term, workers will be able to manage the transition from
agriculture to non-agriculture more easily, without facing extended unemployment. In the long-
run, these additional skills can support socioeconomic mobility. Governments can incentivize

66 ECLAC – Natural Resources and Development Series N° 194 Agricultural transformation: trends in farm size…
corporate participation in employee training by providing tax credits for firms offering retraining
courses or working with training centers to design effective curricula.
Increased temporary employment in small-scale farms and lack of remunerated job
opportunities in other sectors is relevant for the following SDG related targets:
• Target 4.4: By 2030, substantially increase the number of youth and adults who have
relevant skills, including technical and vocational skills, for employment, decent jobs and
entrepreneurship.
• Target 8.b: By 2020, develop and operationalize a global strategy for youth employment
and implement the Global Jobs Pact of the International Labour Organization.

67 ECLAC – Natural Resources and Development Series N° 194 Agricultural transformation: trends in farm size…
Bibliography
Acemoglu, Daron, and Veronica Guerrieri. 2008. “Capital Deepening and Nonbalanced Economic
Growth.” Journal of Political Economy 116 (3): 467–98. https://doi.org/10.1086/589523.
Austin, James, Jonathan Fox, and Walter Kruger. 1985. “The Role of the Revolutionary State in the
Nicaraguan Food System.” World Development 13 (1): 15–40. https://doi.org/10.1016/0305-
750X(85)90064-6.
Baumeister, Eduardo. 2012. “El caso de Nicaragua.” In Dinámicas del Mercado de la Tierra en América
Latina y el Caribe. Edited by Soto Barquero, Fernando y Gómez, Sergio. Rome: FAO.
Boehlje, M. (1999). “Structural change in the agricultural industries: how do we measure, analyze and
understand them?” American Journal of Agricultural Economics, 81 (5), Proceedings Issue: 1028-1041
Burneo, Zulema. (2011). “El Proceso de Concentración de La Tierra En El Perú.” CEPES, CIRAD and
International land coalition. Lima: Coalisión internacional para el acceso a la tierra.
Cao, Kang Hua, and Javier A. Birchenall. 2013. “Agricultural Productivity, Structural Change, and Economic
Growth in Post-Reform China.” Journal of Development Economics 104: 165–80.
https://doi.org/10.1016/j.jdeveco.2013.06.001.
Chacaltana, Juan. 2016. “Perú, 2002-2012: Crecimiento, Cambio Estructural y Formalización.” Cepal
Review 2016 (119): 47–68.
Chavas, J. P. (2001). “Structural change in agricultural production: economics, technology and policy.” In:
Gardner and Rousser (Ed.) Handbook of Agricultural Economics, Vol 1, Part A: 263-285. Elsevier
Science B.V.
Chen, Yuqi, Xiubin Li, Yujun Tian, and Minghong Tan. 2009. “Structural Change of Agricultural Land Use
Intensity and Its Regional Disparity in China.” Journal of Geographical Sciences 19 (5): 545–56.
https://doi.org/10.1007/s11442-009-0545-7.
ECLAC-FAO-IICA. (2017). The Outlook for Agriculture and Rural Development in the Americas: A
Perspective on Latin America and the Caribbean 2017-2018. IICA, San Jose, Costa Rica.
Echevarría, C. (1997). “Changes in sectoral composition associated with economic growth.” International
Economic Review, 38: 431-452.

68 ECLAC – Natural Resources and Development Series N° 194 Agricultural transformation: trends in farm size…
Economic Commission for Latin America and the Caribbeans (2010). “Transmisión de precios en los
mercados de maíz y arroz en América Latina.” Serie Desarrollo Productivo, No. 190, Santiago, Chile.
Eguren, Fernando. 2006. “La reforma agraria en el Perú” Debate Agrario, 44: 63-100.
Fréguin-Gresh, Sandrine, and Francisco Pérez. 2014. “Classifying Agricultural Holdings in Nicaragua:
Proposal of a Typology Based on the IV Agricultural Census.” Managua.
Fujita, M., Krugman, P. and Venables, A. (1999). The spatial economy: Cities, Regions and International
trade. MIT Press, Cambridge, England.
Grabowski, Richard. 2013. “Agricultural Distortions and Structural Change.” Journal of Asian Economics
24.: 17–25. https://doi.org/10.1016/j.asieco.2012.10.002.
Iraizoz, Belen, Matthew Gorton, and Sophia Davidova. 2007. “Segmenting Farms for Analysing
Agricultural Trajectories: A Case Study of the Navarra Region in Spain.” Agricultural Systems 93
(1–3): 143–69. https://doi.org/10.1016/j.agsy.2006.05.002.
Jonakin, Jon. 1996. “The Impact of Structural Adjustment and Property Rights Conflicts on Nicaraguan
Agrarian Reform Beneficiaries.” World Development 24 (7): 1179–91. https://doi.org/10.1016/0305-
750X(96)00029-0.
Kongsamut, Piyabha, Sergio Rebelo, and Danyang Xie. 2011. “Beyond Balanced Growth.” Review of
Economic Dynamics 68 (4): 869–82.
Matsuyama, K. (1992). “Agricultural productivity, comparative advantage, and economic growth.” Journal
of Economic Theory, 58, 317-334.
Mendelsohn, Robert, William D Nordhaus, and Daigee Shaw. 1994. “The Impact of Global Warning on
Agriculture: A Ricardian Analysis.” American Economic Review 84 (4): 753–71.
https://doi.org/10.2307/2118029.
Meynard, Francisca. 2014. “Perú: A La Espera de Políticas Específicas para la Agricultura Familar.” In:
Políticas Públicas y Agriculturas Familiares en América Latina y el Caribe: Balance, Desafíos y
Perspectivas., edited by Eric Sabourin, Mario Samper, and Octavio Sotomayor, 257–73. Santiago,
Chile: Naciones Unidas.
Moller, Lars, Carlos Silva-Jauregui, Rodrigo Chaves, Carlos Jaramillo, and Pamela Cox. 2010. “El Mercado
Laboral Peruano durante el Auge y Caída.” Washington, D.C.
Murata, Yasusada. 2008. “Engel’s Law, Petty’s Law, and Agglomeration.” Journal of Development
Economics 87 (1): 161–77. https://doi.org/10.1016/j.jdeveco.2007.06.001.
Ngai, L. Rachel, and Christopher A Pissarides. 2007. “Structural Change in a Multisector Model of Growth.”
American Economic Review 97 (1): 429–43.
Pérez, Francisco and Sandrine, Fréguin-Gresh. 2014. “Nicaragua: evoluciones y perspectivas” In:
Políticas Públicas y Agriculturas Familiares en América Latina y el Caribe: Balance, Desafíos y
Perspectivas., edited by Eric Sabourin, Mario Samper, and Octavio Sotomayor, 257–73. Santiago,
Chile: Naciones Unidas.
Puga, Diego. 1999. “The Rise and Fall of Regional Inequalities.” European Economic Review 43 (2):
303–34. https://doi.org/10.1016/S0014-2921(98)00061-0.
Remy, María Isabel y Carlos de los Ríos. 2012. “El caso de Perú.” In Dinámicas del Mercado de la Tierra
en América Latina y el Caribe. Edited by Soto Barquero, Fernando y Gómez, Sergio. Rome: FAO.
Ruiz, Alfredo, and Yuri Marín. 2005. “Revisitando el Agro Nicaraguense: Tipologia de los Sistemas de
Produccion y Zonificacion Agro-Socioeconomica.” Managua.
Timmer, C.P. (1988). The agricultural transformation. In: Chennery and Srinivasan (Ed.). Handbook of
development economics, Vol 8, 275-331. Elsevier Science B.V.
Velazco, Jackeline, and Julia Velazco. 2012. “Características del Empleo Agrícola en el Perú.” In Empleo y
Protección Social, edited by Cecilia Garavito and Ismael Muñoz, 1st ed., 161–211. Lima:
Departamento de Economía, Pontificia Universidad Católica del Perú.
http://econpapers.repec.org/RePEc:pcp:pucchp:lde-2012-01-06.

69 ECLAC – Natural Resources and Development Series N° 194 Agricultural transformation: trends in farm size…
Velazco, Jaqueline. 2001. “Agricultural Production in Peru (1950-1995): Sources of Growth.” In Agricultural
Investment and Productivity in Developing Countries., edited by Ly Zepeda, 93–119. Rome: FAO.
Sources of official data:
Nicaragua
http://www.inide.gob.ni/cenagro/portaltabulados.htm (Cuadro 18)
http://www.inide.gob.ni/Cenagro/INFIVCENAGRO/IVCENAGROINFORME/assets/basic-
html/page22.html
Perú
http://censos.inei.gob.pe/bcoCuadros/IIIcenagro.htm (Cuadro 23)
http://censos.inei.gob.pe/cenagro/tabulados/ (Cuadro 36)
Source of data on exports:
COMTRADE: https://comtrade.un.org/


71 ECLAC – Natural Resources and Development Series N° 194 Agricultural transformation: trends in farm size…
Annexes

72 ECLAC – Natural Resources and Development Series N° 194 Agricultural transformation: trends in farm size…
Annex 1: Complementary tables to text
Table A1.1
Nicaragua: distribution of Departments by region
Pacific Central Atlantic
Chinandega Nueva Segovia Región Autónoma Atlántico Norte (RAAN)
León Jinoteca Región Autónoma Atlántico Sur (RAAS)
Managua Madriz
Masaya Estelí
Granada Matagalpa
Carazo Boaco
Rivas Chontales
Rio San Juan
Source: Official data
Table A1.2
Peru: Distribution of Provinces by region
Selva Costa Sierra
Amazonas Ancash Ayacucho
Loreto Arequipa Cajamarca
Madre de Dios Callao Cuzco
Ucayali Ica Huancavelica
San Martin Lambayeque Huanuco
Lima Pasco
Tacna Puno
Tumbes Junin
Moquegua La Libertad
Piura
Apurimac
Source: Official data

73 ECLAC – Natural Resources and Development Series N° 194 Agricultural transformation: trends in farm size…
Table A1.3
Nicaragua and Perú: total Value Added and Economic Active Population, 1990-2016
(Million US$, number of people and percentage growth rates)
Nicaragua Perú
Year
Total Value Added
% Growth
PEA
% Growth
Total Value Added
% Growth
PEA
% Growth
1990 4 385
1 365 544
54 254
8 145 796
1991 4 299 -2.0 1 405 486 2.9 55 350 2.0 8 442 235 3.6
1992 4 346 1.1 1 447 931 3.0 55 091 -0.5 8 752 086 3.7
1993 4 323 -0.5 1 491 969 3.0 57 885 5.1 9 071 962 3.7
1994 4 457 3.1 1 536 724 3.0 64 898 12.1 9 398 219 3.6
1995 4 725 6.0 1 581 385 2.9 69 508 7.1 9 726 976 3.5
1996 4 954 4.8 1 626 398 2.8 71 605 3.0 10 055 589 3.4
1997 5 098 2.9 1 672 970 2.9 76 116 6.3 10 385 469 3.3
1998 5 273 3.4 1 721 533 2.9 75 708 -0.5 10 718 303 3.2
1999 5 786 9.7 1 772 734 3.0 77 176 1.9 11 055 600 3.1
2000 6 004 3.8 1 827 138 3.1 79 287 2.7 11 398 739 3.1
2001 6 239 3.9 1 885 386 3.2 79 741 0.6 11 745 463 3.0
2002 6 258 0.3 1 947 844 3.3 84 144 5.5 12 092 301 3.0
2003 6 439 2.9 2 014 012 3.4 87 562 4.1 12 438 987 2.9
2004 6 849 6.4 2 082 795 3.4 91 804 4.8 12 785 556 2.8
2005 7 140 4.2 2 152 828 3.4 97 327 6.0 13 132 408 2.7
2006 7 409 3.8 2 223 365 3.3 104 831 7.7 13 480 153 2.6
2007 7 718 4.2 2 293 689 3.2 113 910 8.7 13 827 565 2.6
2008 7 901 2.4 2 363 097 3.0 123 879 8.8 14 174 170 2.5
2009 7 666 -3.0 2 431 051 2.9 125 309 1.2 14 516 831 2.4
2010 7 925 3.4 2 497 207 2.7 135 052 7.8 14 853 464 2.3
2011 8 408 6.1 2 561 826 2.6 143 961 6.6 15 186 068 2.2
2012 8 860 5.4 2 625 316 2.5 152 378 5.8 15 516 096 2.2
2013 9 279 4.7 2 687 576 2.4 160 976 5.6 15 840 890 2.1
2014 9 716 4.7 2 748 489 2.3 164 760 2.4 16 157 753 2.0
2015 10 149 4.5 2 807 904 2.2 170 540 3.5 16 463 991 1.9
2016 10 600 4.4 2 865 956 2.1 177 130 3.9 16 759 438 1.8
Average
1991-2011 3.2 3.0
1991-2012 4.9 3.0
Study period 3.1 3.1 5.3 2.9
Source: Official data

74 ECLAC – Natural Resources and Development Series N° 194 Agricultural transformation: trends in farm size…
Table A1.4
Nicaragua: distribution of total agricultural land in regions by uses, 2001 and 2011
(Hectares)
Pacific Central Atlantic
Uses 2001 2011 2001 2011 2001 2011
Agricultural uses 508 069 532 305 821 620 923 142 581 167 595 246
Annual crops 209 674 226 071 277 477 337 325 187 805 173 823
Permanent and semi-
permanent crops 115 609 121 081 134 980 176 752 47 043 61 808
Cultivated pastures 182 787 185 153 409 163 409 065 346 320 359 614
Natural pastures 348 976 326 397 1 092 339 1 083 845 625 440 907 626
Fallow land 257 388 159 107 461 016 280 808 476 411 261 965
Non-agricultural use 209 244 214 505 431 379 437 063 482 674 332 862
Forests 128 931 157 701 336 173 360 879 430 115 284 923
Infrastructure (buildings and roads)
22 669 23 530 29 246 28 372 19 248 18 504
Swamps 41 410 33 274 47 049 47 812 24 712 29 435
Affected by natural disasters
16 234 0 18 910 0 8 599 0
Total agricultural land 1 323 677 1 232 314 2 806 353 2 724 858 2 165 693 2 097 698
Source: Own elaboration.
N.d.: No data.
Note: The data presented does not include incomplete surveys (see the Glossary for more information on complete versus incomplete
surveys).
Table A1.5
Peru: distribution of total agricultural land in regions by uses, 1994 and 2012
(Hectares)
Selva Costa Sierra
1994 2012 1994 2012 1994 2012
Agricultural uses 710 415 923 385 838 644 1 367 353 1 728 797 1 864 941
Annual crops 395 497 262 796 582 130 741 126 1 137 600 909 067
Permanent crops 91 070 384 038 103 789 320 269 299 279 530 326
Associated crops 65 804 72 035 55 900 49 620 148 607 108 339
Cultivated pastures 158 045 204 516 96 825 256 337 143 311 317 209
Natural pastures 379 412 540 574 5 976 089 6 744 842 10 550 970 10 733 379
Managed natural pastures 84 512 205 256 117 916 368 336 425 818 985 746
Non-managed pastures 294 900 335 319 5 858 173 6 376 506 10 125 153 9 747 633
Fallow lands 312 118 331 043 520 048 1 015 650 1 366 956 1 622 637
Fallow lands (to be cropped) 95 735 190 132 300 272 523 790 540 240 717 719
Other fallow lands 132 6 849 90 294 162 074 460 532 593 884
Not cropped ag. Land 216 252 134 062 129 482 329 786 366 184 311 035
Nonagricultural use 6 339 407 7 527 785 2 817 102 2 056 068 3 841 853 4 014 810
Forests 6 128 783 7 415 862 705 779 799 145 2 219 144 2 724 ,267
Other 210 624 111 923 2 111 323 1 256 923 1 622 709 1 290 543
Total agricultural land 7 741 352 9 322 787 10 151 882 11 183 912 17 488 577 18 235 767
Source: Official data.
Note: Among the fallow category there are three uncultivated type of uses: (1) fallow lands, (2) to be cropped, which is land that will
be cultivated within the agricultural year; and (3) not to be cultivated, which is land that the farmers cannot cultivate due to different
reasons as lack of water, lack of credit and others.

75
EC
LAC
– N
atu
ral R
eso
urce
s and
Deve
lop
men
t N° 19
4
Ag
ricultu
ral tra
nsfo
rmatio
n: tre
nd
s in fa
rm size
…
Table A1.6
Nicaragua: average units per hectare, number of users, shares of farms owning equipment, total items used and average area, by item, 2001 and 2011
(Units/ha, absolute figures (of users and units), percentages and hectares)
Average units/ha Users % users Total items used Average area
Item 2001 2011 2001 2011 2001 2011 2001 2011 2001 2011
Agricultural wagon 0.313 9 055 22 081 28 574 11.1 10.9 25 136 33 524 48.92 19.82
Iron plows 0.255 7 658 6 447 6 425 3.2 2.4 7 966 7 527 55.38 20.64
Wood plows 0.323 8 396 39 376 29 270 19.7 11.1 48 030 35 489 28.98 17.45
Manual fumigating pump 0.321 6 776 101 423 149 678 50.9 57.0 137 224 214 810 40.15 23.75
Non-manual fumigating pump 0.200 8 296 5 522 11 790 2.8 4.5 8 068 16 547 84.88 25.22
Threshing machines (manual) 0.192 6 626 3 603 2 566 1.8 1.0 3 997 3 088 54.47 20.37
Threshing machines (mechanical) 0.241 4 022 1 154 1 355 0.6 0.5 1 237 1 439 57.08 17.31
Tractor 0.284 13 309 7 412 5 386 3.7 2.1 9 365 8 095 78.92 19.68
Harvester 0.136 27 570 553 663 0.3 0.3 835 1 283 197.80 17.28
Electric engine 0.147 10 040 2 531 5 237 1.3 2.0 4 593 8 321 149.49 24.02
Electric generator 0.086 6 668 1 034 2 519 0.5 1.0 1 276 2 912 236.11 27.38
Grass and sugar cane cutter 0.056 5 425 2 397 8 007 1.2 3.0 2 591 8 595 133.47 32.42
Pulper machine 0.252 3 488 16 199 17 896 8.1 6.8 17 500 19 312 28.42 12.63
Coffee mill 0.162 3 142 750 1 404 0.4 0.5 792 1 520 59.61 12.35
Rice mill 0.171 9 292 131 163 0.1 0.1 150 275 389.89 19.34
Dryer 0.488 19 597 608 1 251 0.3 0.5 2 537 5 944 96.43 21.35
Saw 0.090 4 588 7 630 17 621 3.8 6.7 8 604 19 408 121.03 36.83
Camioneta 0.218 7 427 8 436 10 149 4.2 3.9 10 060 12 480 106.10 22.70
Truck 0.220 9 272 1 747 2 237 0.9 0.9 2 479 3 591 151.55 21.98
Boat 0.214 4 447 2 108 2 478 1.1 0.9 2 819 3 176 124.93 45.88
Irrigation pump 0.200 11 536 2 985 5 125 1.5 2.0 4 253 7 430 119.89 22.24
Decorticator 0.112 5 566 178 307 0.1 0.1 232 413 132.20 28.78
Sugar cane mill 0.067 5 995 798 601 0.4 0.2 822 632 87.79 30.53
Light aircraft 0.182 3 560 40 48 0.0 0.0 83 64 421.79 20.05
Source: Own elaboration

76
EC
LAC
– N
atu
ral R
eso
urce
s and
Deve
lop
men
t N° 19
4
Ag
ricultu
ral tra
nsfo
rmatio
n: tre
nd
s in fa
rm size
…
Table A1.7
Pacific region: average units per hectare, number of users, shares of farms owning equipment, total items used and average area, by item,
2001 and 2011
(Units/ha, absolute figures (of users and units), percentages and hectares)
Average units/ha Users % users Total items used Average area
Item 2001 2011 2001 2011 2001 2011 2001 2011 2001 2011
Agricultural wagon 0.397 13 211 12 948 14 156 20.4 16.2 14 740 16 194 37.23 15.36
Iron plows 0.337 9 744 3 523 3 219 5.6 3.7 4 459 3 730 37.40 17.81
Wood plows 0.401 10 376 19 095 16 373 30.2 18.7 23 231 19 306 23.20 16.04
Manual fumigating pump 0.512 12 092 31 403 40 313 49.6 46.1 42 552 54 255 29.31 14.56
Non-manual fumigating pump 0.257 16 971 3 101 3 364 4.9 3.8 4 288 4 820 76.72 16.79
Threshing machines (manual) 0.271 10 936 1 708 931 2.7 1.1 1 915 1 124 38.37 11.30
Threshing machines (mechanical) 0.254 5 252 755 814 1.2 0.9 803 870 55.60 19.79
Tractor 0.298 15 598 5 697 4 210 9.0 4.8 7 281 6 499 66.31 17.53
Harvester 0.130 34 323 391 495 0.6 0.6 625 1 052 209.68 16.44
Electric engine 0.228 18 165 881 1 918 1.4 2.2 2 219 3 978 179.98 19.26
Electric generator 0.121 12 915 353 805 0.6 0.9 445 998 307.42 23.56
Grass and sugar cane cutter 0.054 12 671 714 1 471 1.1 1.7 804 1 604 174.69 19.34
Pulper machine 0.100 11 732 175 129 0.3 0.1 226 153 119.24 12.12
Coffee mill 0.112 14 159 37 36 0.1 0.0 54 47 321.71 7.12
Rice mill 0.200 22 683 51 59 0.1 0.1 62 65 318.33 10.59
Dryer 0.217 14 200 78 109 0.1 0.1 107 135 286.15 35.25
Saw 0.173 12 899 1 689 3 445 2.7 3.9 1 923 3 879 127.11 23.15
Camioneta 0.401 13 281 3 534 3 522 5.6 4.0 4 332 4 640 87.82 15.50
Truck 0.367 14 620 811 939 1.3 1.1 1 300 1 786 151.60 14.87
Boat 0.442 16 398 290 322 0.5 0.4 422 509 158.10 21.56
Irrigation pump 0.221 13 486 1 154 2 494 1.8 2.9 1 926 3 847 164.43 17.08
Decorticator 0.095 14 274 40 60 0.1 0.1 60 72 284.90 29.26
Sugar cane mill 0.126 15 837 125 92 0.2 0.1 136 104 109.22 10.54
Light aircraft 0.057 1 106 18 14 0.0 0.0 49 20 646.72 22.94
Source: Own elaboration.

77
EC
LAC
– N
atu
ral R
eso
urce
s and
Deve
lop
men
t N° 19
4
Ag
ricultu
ral tra
nsfo
rmatio
n: tre
nd
s in fa
rm size
…
Table A1.8
Central region: average units per hectare, number of users, shares of farms owning equipment, total items used and average area, by item, 2001 and 2011
(Units/ha, absolute figures (of users and units), percentages and hectares)
Average units/ha Users % users Total items used Average area
Item 2001 2011 2001 2011 2001 2011 2001 2011 2001 2011
Agricultural wagon 0.204 5 538 8 382 12 623 8.7 9.6 9 435 15 121 59.26 20.49
Iron plows 0.168 6 057 2 635 2 931 2.7 2.2 3 151 3 448 69.91 19.01
Wood plows 0.260 6 204 19 210 11 962 19.8 9.1 23 582 14 996 31.78 16.85
Manual fumigating pump 0.283 5 885 55 388 85 557 57.2 64.9 77 607 127 468 36.47 20.72
Non-manual fumigating pump 0.134 5 686 2 215 6 887 2.3 5.2 3 546 9 742 94.71 21.21
Threshing machines (manual) 0.143 4 686 1 465 1 278 1.5 1.0 1 612 1 535 63.30 18.62
Threshing machines (mechanical) 0.223 2 227 380 526 0.4 0.4 405 551 55.66 12.54
Tractor 0.241 5 370 1 652 1 112 1.7 0.8 1 963 1 525 117.20 27.17
Harvester 0.155 8 116 155 158 0.2 0.1 201 219 160.80 18.86
Electric engine 0.108 6 162 1 566 2 859 1.6 2.2 2 279 3 836 117.33 21.50
Electric generator 0.071 4 461 624 1 310 0.6 1.0 769 1 479 194.19 22.28
Grass and sugar cane cutter 0.058 4 359 1 614 5 451 1.7 4.1 1 713 5 842 114.49 31.41
Pulper machine 0.260 3 464 15 437 17 308 15.9 13.1 16 665 18 678 26.88 12.41
Coffee mill 0.170 2 947 685 1 318 0.7 1.0 709 1 418 45.64 12.29
Rice mill 0.173 2 130 69 82 0.1 0.1 77 188 168.33 22.96
Dryer 0.583 23 308 471 969 0.5 0.7 2 306 5 459 63.81 16.43
Saw 0.079 3 508 4 079 8 642 4.2 6.6 4 645 9 576 109.84 29.72
Camioneta 0.092 4 793 4 508 5 864 4.7 4.4 5 294 6 984 109.59 22.12
Truck 0.093 6 169 856 1 104 0.9 0.8 1 077 1 548 151.62 24.05
Boat 0.173 3 565 750 799 0.8 0.6 1 011 987 154.14 60.14
Irrigation pump 0.191 10 319 1 769 2 405 1.8 1.8 2 250 3 283 88.59 23.27
Decorticator 0.150 4 797 49 175 0.1 0.1 68 262 86.85 20.08
Sugar cane mill 0.068 6 020 486 348 0.5 0.3 495 360 76.43 20.00
Light aircraft 0.311 5 536 20 28 0.0 0.0 32 38 256.96 13.70
Source: Own elaboration.

78
EC
LAC
– N
atu
ral R
eso
urce
s and
Deve
lop
men
t N° 19
4
Ag
ricultu
ral tra
nsfo
rmatio
n: tre
nd
s in fa
rm size
…
Table A1.9
Atlantic region: average units per hectare, number of users, shares of farms owning equipment, total items used and average area, by item,
2001 and 2011
(Units/ha, absolute figures (of users and units), percentages and hectares)
Average units/ha Users % users Total items used Average area
Item 2001 2011 2001 2011 2001 2011 2001 2011 2001 2011
Agricultural wagon 0.077 1.017 751 1 795 1.9 4.1 961 2 209 135.10 50.37
Iron plows 0.053 0.314 289 275 0.7 0.6 356 349 142.05 71.08
Wood plows 0.060 1.772 1 071 935 2.7 2.2 1,217 1 187 81.71 49.70
Manual fumigating pump 0.053 0.973 14 632 23 808 37.3 55.0 17 065 33 087 77.36 50.22
Non-manual fumigating pump 0.048 1.017 206 1 539 0.5 3.6 234 1 985 101.89 61.59
Threshing machines (manual) 0.044 2.333 430 357 1.1 0.8 470 429 88.38 50.24
Threshing machines (mechanical) 0.072 0.200 19 15 0.0 0.0 29 18 144.25 50.19
Tractor 0.057 0.695 63 64 0.2 0.1 121 71 215.86 30.60
Harvester 0.018 0.658 7 10 0.0 0.0 9 12 353.81 34.25
Electric engine 0.033 0.265 84 460 0.2 1.1 95 507 429.32 59.52
Electric generator 0.035 1.373 57 404 0.1 0.9 62 435 253.31 51.53
Grass and sugar cane cutter 0.034 0.959 69 1 085 0.2 2.5 74 1 149 150.68 55.25
Pulper machine 0.105 2.083 587 459 1.5 1.1 609 481 41.75 20.91
Coffee mill 0.043 0.363 28 50 0.1 0.1 29 55 54.84 17.65
Rice mill 0.022 0.079 11 22 0.0 0.1 11 22 2,111.48 29.31
Dryer 0.095 2.210 59 173 0.2 0.4 124 350 106.06 40.18
Saw 0.040 1.101 1 862 5 534 4.7 12.8 2 036 5 953 140.02 56.44
Camioneta 0.026 0.653 394 763 1.0 1.8 434 856 230.23 60.37
Truck 0.075 1.044 80 194 0.2 0.4 102 257 150.27 44.59
Boat 0.181 2.131 1 068 1 357 2.7 3.1 1 386 1 680 95.40 43.25
Irrigation pump 0.056 2.961 62 226 0.2 0.5 77 300 183.81 68.21
Decorticator 0.099 0.179 89 72 0.2 0.2 104 79 88.54 49.51
Sugar cane mill 0.026 0.315 187 161 0.5 0.4 191 168 102.99 64.73
Light aircraft 0.026 0.064 2 6 0.0 0.0 2 6 45.83 42.95
Source: Own elaboration

79
EC
LAC
– N
atu
ral R
eso
urce
s and
Deve
lop
men
t N° 19
4
Ag
ricultu
ral tra
nsfo
rmatio
n: tre
nd
s in fa
rm size
…
Table A1.10
Nicaragua: average units per hectare, number of users, shares of farms owning equipment, total items used and average area,
by farm size category and item, 2001 and 2011
(Units/ha, absolute figures (of users and units), percentages and hectares)
Average units/ha Users % users Total items used Average area
Item 2001 2011 2001 2011 2001 2011 2001 2011 2001 2011
Size 0-7ha
Agricultural wagon 0.723 14 015 8 525 18 413 9.9 12.2 9 012 21 512 2.88 1.92
Iron plows 0.638 11 922 2 205 4 114 2.6 2.7 2 429 4 779 3.00 1.97
Wood plows 0.650 12 610 17 183 19 431 19.9 12.9 18 495 23 288 2.86 1.93
Manual fumigating pump 0.758 12 149 37 673 83 053 43.6 55.0 42 819 119 195 2.78 2.08
Non-manual fumigating pump 0.631 14 772 1 399 6 597 1.6 4.4 1 538 9 550 3.10 2.07
Threshing machines (manual) 0.557 11 033 1 011 1 535 1.2 1.0 1 059 1 842 3.20 2.06
Threshing machines (mechanical) 0.515 5 674 468 956 0.5 0.6 472 1 004 3.08 2.12
Tractor 0.597 19 014 3 145 3 763 3.6 2.5 3 258 5 768 2.89 1.73
Harvester 0.548 38 683 104 472 0.1 0.3 110 946 3.29 1.72
Electric engine 0.641 17 126 414 3 060 0.5 2.0 495 4 894 3.20 2.00
Electric generator 0.530 12 177 116 1 374 0.1 0.9 134 1 619 3.37 2.09
Grass and sugar cane cutter 0.428 11 473 170 3 767 0.2 2.5 174 4 037 3.69 2.11
Pulper machine 0.582 5 329 5 944 11 628 6.9 7.7 5 996 12 564 3.10 2.31
Coffee mill 0.469 4 824 201 907 0.2 0.6 205 985 3.25 2.38
Rice mill 0.646 16 402 29 92 0.0 0.1 35 178 3.25 1.80
Dryer 1 335 33 060 144 737 0.2 0.5 457 3 852 3.25 2.23
Saw 0.639 11 606 756 6 919 0.9 4.6 811 7 743 3.22 2.21
Camioneta 0.870 12 395 1 830 6 061 2.1 4.0 2 037 7 707 2.98 1.94
Truck 0.868 14 743 382 1 403 0.4 0.9 483 2 453 2.90 1.93
Boat 0.714 11 479 532 953 0.6 0.6 629 1 264 3.40 2.40
Irrigation pump 0.561 17 551 880 3 361 1.0 2.2 982 5 006 3.09 1.76
Decorticator 0.531 11 793 26 144 0.0 0.1 30 210 3.62 2.07
Sugar cane mill 0.327 12 078 74 297 0.1 0.2 74 320 3.74 2.03
Light aircraft 1 462 7 035 4 24 0.0 0.0 10 32 2.38 2.10
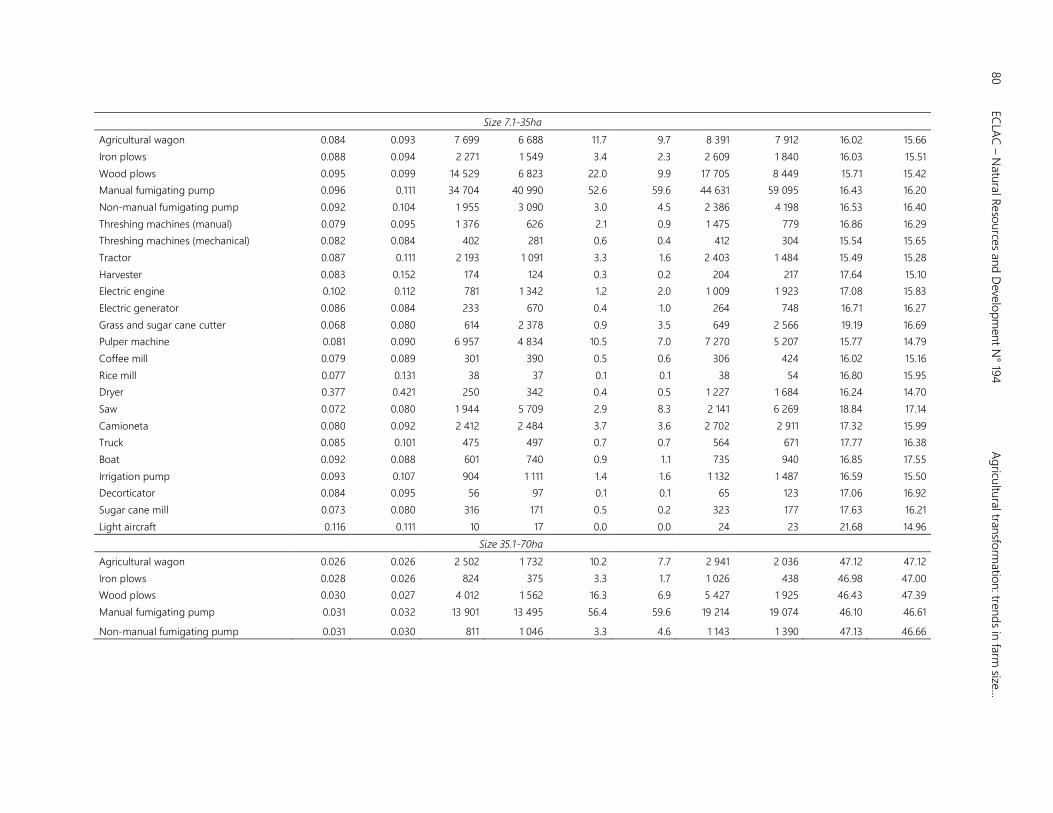
80
EC
LAC
– N
atu
ral R
eso
urce
s and
Deve
lop
men
t N° 19
4
Ag
ricultu
ral tra
nsfo
rmatio
n: tre
nd
s in fa
rm size
…
Size 7.1-35ha
Agricultural wagon 0.084 0.093 7 699 6 688 11.7 9.7 8 391 7 912 16.02 15.66
Iron plows 0.088 0.094 2 271 1 549 3.4 2.3 2 609 1 840 16.03 15.51
Wood plows 0.095 0.099 14 529 6 823 22.0 9.9 17 705 8 449 15.71 15.42
Manual fumigating pump 0.096 0.111 34 704 40 990 52.6 59.6 44 631 59 095 16.43 16.20
Non-manual fumigating pump 0.092 0.104 1 955 3 090 3.0 4.5 2 386 4 198 16.53 16.40
Threshing machines (manual) 0.079 0.095 1 376 626 2.1 0.9 1 475 779 16.86 16.29
Threshing machines (mechanical) 0.082 0.084 402 281 0.6 0.4 412 304 15.54 15.65
Tractor 0.087 0.111 2 193 1 091 3.3 1.6 2 403 1 484 15.49 15.28
Harvester 0.083 0.152 174 124 0.3 0.2 204 217 17.64 15.10
Electric engine 0.102 0.112 781 1 342 1.2 2.0 1 009 1 923 17.08 15.83
Electric generator 0.086 0.084 233 670 0.4 1.0 264 748 16.71 16.27
Grass and sugar cane cutter 0.068 0.080 614 2 378 0.9 3.5 649 2 566 19.19 16.69
Pulper machine 0.081 0.090 6 957 4 834 10.5 7.0 7 270 5 207 15.77 14.79
Coffee mill 0.079 0.089 301 390 0.5 0.6 306 424 16.02 15.16
Rice mill 0.077 0.131 38 37 0.1 0.1 38 54 16.80 15.95
Dryer 0.377 0.421 250 342 0.4 0.5 1 227 1 684 16.24 14.70
Saw 0.072 0.080 1 944 5 709 2.9 8.3 2 141 6 269 18.84 17.14
Camioneta 0.080 0.092 2 412 2 484 3.7 3.6 2 702 2 911 17.32 15.99
Truck 0.085 0.101 475 497 0.7 0.7 564 671 17.77 16.38
Boat 0.092 0.088 601 740 0.9 1.1 735 940 16.85 17.55
Irrigation pump 0.093 0.107 904 1 111 1.4 1.6 1 132 1 487 16.59 15.50
Decorticator 0.084 0.095 56 97 0.1 0.1 65 123 17.06 16.92
Sugar cane mill 0.073 0.080 316 171 0.5 0.2 323 177 17.63 16.21
Light aircraft 0.116 0.111 10 17 0.0 0.0 24 23 21.68 14.96
Size 35.1-70ha
Agricultural wagon 0.026 0.026 2 502 1 732 10.2 7.7 2 941 2 036 47.12 47.12
Iron plows 0.028 0.026 824 375 3.3 1.7 1 026 438 46.98 47.00
Wood plows 0.030 0.027 4 012 1 562 16.3 6.9 5 427 1 925 46.43 47.39
Manual fumigating pump 0.031 0.032 13 901 13 495 56.4 59.6 19 214 19 074 46.10 46.61
Non-manual fumigating pump 0.031 0.030 811 1 046 3.3 4.6 1 143 1 390 47.13 46.66

81
EC
LAC
– N
atu
ral R
eso
urce
s and
Deve
lop
men
t N° 19
4
Ag
ricultu
ral tra
nsfo
rmatio
n: tre
nd
s in fa
rm size
…
Threshing machines (manual) 0.025 0.026 528 214 2.1 0.9 589 247 46.25 45.67
Threshing machines (mechanical) 0.025 0.022 101 61 0.4 0.3 116 63 47.39 47.83
Tractor 0.027 0.034 649 241 2.6 1.1 802 382 47.37 47.54
Harvester 0.028 0.040 62 25 0.3 0.1 82 47 49.58 45.66
Electric engine 0.047 0.029 352 409 1.4 1.8 925 534 47.82 46.85
Electric generator 0.023 0.025 139 236 0.6 1.0 149 265 49.18 46.57
Grass and sugar cane cutter 0.023 0.023 520 902 2.1 4.0 549 949 48.16 47.21
Pulper machine 0.025 0.023 1 848 869 7.5 3.8 2 053 906 46.01 46.60
Coffee mill 0.025 0.023 107 64 0.4 0.3 117 66 46.50 46.85
Rice mill 0.024 0.035 16 21 0.1 0.1 17 30 46.73 42.65
Dryer 0.092 0.051 70 86 0.3 0.4 273 198 45.37 47.15
Saw 0.024 0.024 1 603 2 528 6.5 11.2 1 739 2 742 47.15 46.61
Camioneta 0.025 0.025 1 244 810 5.0 3.6 1 456 929 48.29 46.91
Truck 0.026 0.031 231 152 0.9 0.7 286 209 48.60 46.44
Boat 0.027 0.029 340 388 1.4 1.7 414 501 46.40 45.59
Irrigation pump 0.030 0.035 365 296 1.5 1.3 508 467 48.72 47.37
Decorticator 0.030 0.027 29 34 0.1 0.2 42 43 48.77 48.95
Sugar cane mill 0.023 0.022 203 58 0.8 0.3 209 58 46.69 47.04
Light aircraft 0.020 0.028 6 4 0.0 0.0 6 6 53.05 55.87
Size 70.1-140ha
Agricultural wagon 0.014 0.013 1 672 987 12.2 8.1 2 047 1 157 92.48 92.05
Iron plows 0.020 0.014 563 218 4.1 1.8 1 001 267 92.47 92.65
Wood plows 0.018 0.014 2 101 802 15.4 6.6 3 219 991 90.51 92.89
Manual fumigating pump 0.019 0.016 8 739 7 362 63.9 60.4 14 449 10 538 90.27 91.19
Non-manual fumigating pump 0.018 0.015 607 626 4.4 5.1 1 014 849 95.53 91.31
Threshing machines (manual) 0.014 0.012 371 119 2.7 1.0 451 131 91.62 93.43
Threshing machines (mechanical) 0.011 0.011 77 33 0.6 0.3 80 34 94.17 92.00
Tractor 0.017 0.020 552 148 4.0 1.2 856 265 95.67 91.54
Harvester 0.014 0.021 53 23 0.4 0.2 69 41 98.26 92.07
Electric engine 0.016 0.041 354 235 2.6 1.9 522 730 97.58 92.59
Electric generator 0.014 0.013 171 137 1.3 1.1 221 154 97.33 91.36
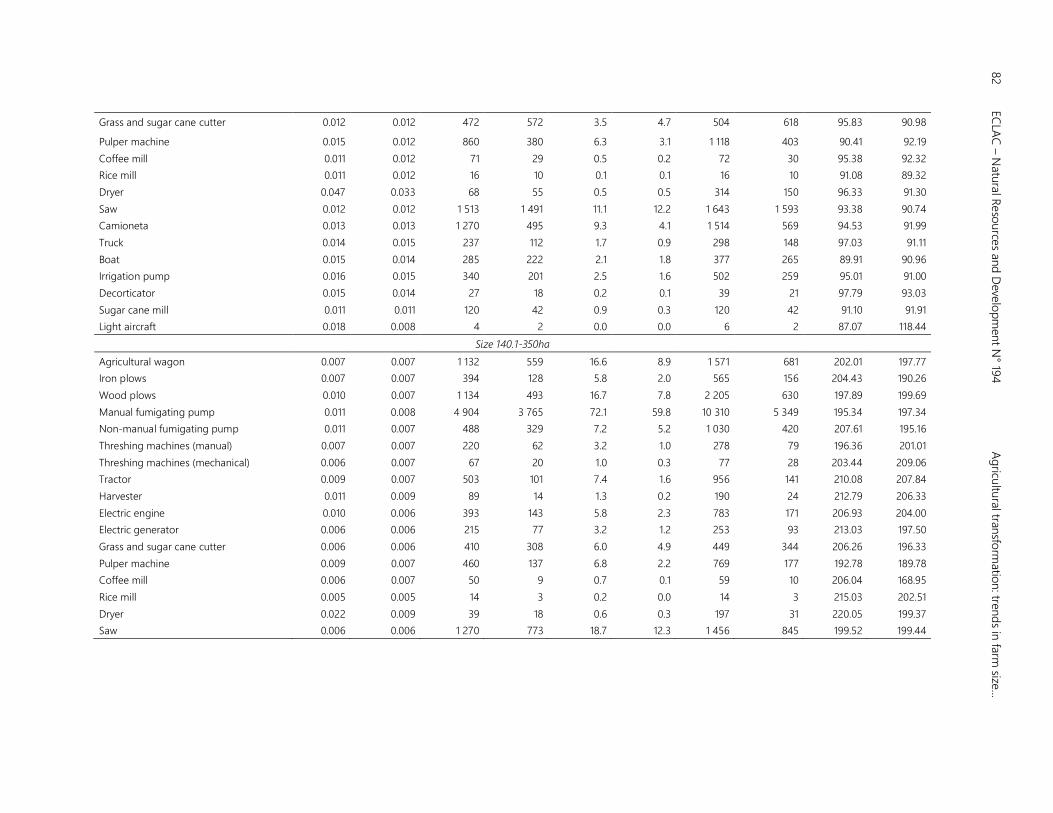
82
EC
LAC
– N
atu
ral R
eso
urce
s and
Deve
lop
men
t N° 19
4
Ag
ricultu
ral tra
nsfo
rmatio
n: tre
nd
s in fa
rm size
…
Grass and sugar cane cutter 0.012 0.012 472 572 3.5 4.7 504 618 95.83 90.98
Pulper machine 0.015 0.012 860 380 6.3 3.1 1 118 403 90.41 92.19
Coffee mill 0.011 0.012 71 29 0.5 0.2 72 30 95.38 92.32
Rice mill 0.011 0.012 16 10 0.1 0.1 16 10 91.08 89.32
Dryer 0.047 0.033 68 55 0.5 0.5 314 150 96.33 91.30
Saw 0.012 0.012 1 513 1 491 11.1 12.2 1 643 1 593 93.38 90.74
Camioneta 0.013 0.013 1 270 495 9.3 4.1 1 514 569 94.53 91.99
Truck 0.014 0.015 237 112 1.7 0.9 298 148 97.03 91.11
Boat 0.015 0.014 285 222 2.1 1.8 377 265 89.91 90.96
Irrigation pump 0.016 0.015 340 201 2.5 1.6 502 259 95.01 91.00
Decorticator 0.015 0.014 27 18 0.2 0.1 39 21 97.79 93.03
Sugar cane mill 0.011 0.011 120 42 0.9 0.3 120 42 91.10 91.91
Light aircraft 0.018 0.008 4 2 0.0 0.0 6 2 87.07 118.44
Size 140.1-350ha
Agricultural wagon 0.007 0.007 1 132 559 16.6 8.9 1 571 681 202.01 197.77
Iron plows 0.007 0.007 394 128 5.8 2.0 565 156 204.43 190.26
Wood plows 0.010 0.007 1 134 493 16.7 7.8 2 205 630 197.89 199.69
Manual fumigating pump 0.011 0.008 4 904 3 765 72.1 59.8 10 310 5 349 195.34 197.34
Non-manual fumigating pump 0.011 0.007 488 329 7.2 5.2 1 030 420 207.61 195.16
Threshing machines (manual) 0.007 0.007 220 62 3.2 1.0 278 79 196.36 201.01
Threshing machines (mechanical) 0.006 0.007 67 20 1.0 0.3 77 28 203.44 209.06
Tractor 0.009 0.007 503 101 7.4 1.6 956 141 210.08 207.84
Harvester 0.011 0.009 89 14 1.3 0.2 190 24 212.79 206.33
Electric engine 0.010 0.006 393 143 5.8 2.3 783 171 206.93 204.00
Electric generator 0.006 0.006 215 77 3.2 1.2 253 93 213.03 197.50
Grass and sugar cane cutter 0.006 0.006 410 308 6.0 4.9 449 344 206.26 196.33
Pulper machine 0.009 0.007 460 137 6.8 2.2 769 177 192.78 189.78
Coffee mill 0.006 0.007 50 9 0.7 0.1 59 10 206.04 168.95
Rice mill 0.005 0.005 14 3 0.2 0.0 14 3 215.03 202.51
Dryer 0.022 0.009 39 18 0.6 0.3 197 31 220.05 199.37
Saw 0.006 0.006 1 270 773 18.7 12.3 1 456 845 199.52 199.44

83
EC
LAC
– N
atu
ral R
eso
urce
s and
Deve
lop
men
t N° 19
4
Ag
ricultu
ral tra
nsfo
rmatio
n: tre
nd
s in fa
rm size
…
Camioneta 0.007 0.007 1 115 215 16.4 3.4 1 404 268 203.44 196.59
Truck 0.008 0.009 259 50 3.8 0.8 383 80 205.81 194.15
Boat 0.009 0.006 215 130 3.2 2.1 347 145 196.30 190.07
Irrigation pump 0.008 0.007 288 105 4.2 1.7 423 146 204.17 198.75
Decorticator 0.006 0.007 28 12 0.4 0.2 33 14 206.46 194.14
Sugar cane mill 0.006 0.006 62 26 0.9 0.4 64 28 202.22 188.54
Light aircraft 0.011 0.005 7 1 0.1 0.0 18 1 240.91 197.40
350ha and more
Agricultural wagon 0.003 0.002 551 195 28.3 11.1 1 174 226 782.54 735.15
Iron plows 0.003 0.002 190 41 9.7 2.3 336 47 751.06 933.68
Wood plows 0.004 0.003 417 159 21.4 9.0 979 206 630.09 761.34
Manual fumigating pump 0.007 0.003 1 502 1 013 77.0 57.5 5 801 1 559 671.95 666.62
Non-manual fumigating pump 0.006 0.003 262 102 13.4 5.8 957 140 895.09 616.17
Threshing machines (manual) 0.003 0.002 97 10 5.0 0.6 145 10 703.42 554.17
Threshing machines (mechanical) 0.003 0.002 39 4 2.0 0.2 80 6 833.72 1 724.30
Tractor 0.004 0.002 370 42 19.0 2.4 1 090 55 953.16 876.62
Harvester 0.003 0.003 71 5 3.6 0.3 180 8 1 109.22 525.08
Electric engine 0.004 0.003 237 48 12.2 2.7 859 69 974.68 590.35
Electric generator 0.003 0.003 160 25 8.2 1.4 255 33 1 066.06 659.49
Grass and sugar cane cutter 0.002 0.002 211 80 10.8 4.5 266 81 723.57 710.93
Pulper machine 0.004 0.002 130 48 6.7 2.7 294 55 621.35 542.07
Coffee mill 0.002 0.002 20 5 1.0 0.3 33 5 858.98 413.84
Rice mill 0.001 18 0 0.9 0.0 30 0 2 507.08
Dryer 0.003 0.004 37 13 1.9 0.7 69 29 967.43 567.20
Saw 0.003 0.002 544 201 27.9 11.4 814 216 761.24 639.38
Camioneta 0.003 0.002 565 84 29.0 4.8 947 96 780.38 631.56
Truck 0.003 0.003 163 23 8.4 1.3 465 30 1 028.70 493.32
Boat 0.004 0.003 135 45 6.9 2.6 317 61 1 243.03 795.97
Irrigation pump 0.004 0.002 208 51 10.7 2.9 706 65 1 111.83 738.50
Decorticator 0.002 0.002 12 2 0.6 0.1 23 2 1 053.86 613.70
Sugar cane mill 0.002 0.002 23 7 1.2 0.4 32 7 1 359.19 497.53
Light aircraft 0.002 9 0 0.5 0.0 19 0 1 588.06
Source: Own elaboration

84 ECLAC – Natural Resources and Development N° 194 Agricultural transformation: trends in farm size…
Annex 2: Identifying different types of labor
Nicaraguan Censuses
In Nicaragua, the questions about hired labor are divided in two categories: permanent (hired six
or more months in the farm) and temporary (hired less than six months). The questions asked in
2001 and 2011 are the same.
There are separate questions about household members working on the agricultural unit,
which differ across censuses. The 2001 census asked about the number of household members
involved, including the head of the household. The answer was reported for members (male and
female) younger and older than 12 years. In 2011, the question was asked to every member older
than 10 years old. In both censuses, the question refers to all agriculture and livestock related tasks.
To have a uniform indicator, we create a variable with all the household members, including the
head, who are older than 12 and work in the farm.
Finally, we calculate the number of farmers, which is not explicitly reported in the censuses.
Individual producers are identified, but some individual producers may devote their time to other
economic activities. Therefore, we approximate the number of farmers by counting the agricultural
units in which: (a) the interviewee declares working directly the farm, and (b) the interviewee does
not work off-farm. In doing so, our calculation may underestimate the labor of farmers. Both
censuses used exactly the same wording for the relevant questions.
Table A2.1 lists all the questions used in these calculations.
Peruvian Censuses
In Peru, the questions about hired labor are divided in two categories: permanent and temporary.
The questions asked in 1994 and 2012 are the same.
As in Nicaragua, the questions about household labor differ across censuses. In 1994, the
question is about the whole household, and the answers reported as the total number of male and
female members involved in farm activities, separated between those older and younger than 15.
In 2011, the question was asked to every household member older than 6. The wording of the
questions is similar. We calculate farm labor of household members (other than the head) older
than 15.
Finally, to calculate the number of farmers, we use criteria similar to Nicaragua. We count the
individual producers meeting the following conditions: (a) absence of a remunerated farm manager,
and (b) the interviewee does not work off-farm to gain extra income. Both censuses used similar
wording for the relevant questions.
Table A2.1 lists all the questions used in these calculations.

85 ECLAC – Natural Resources and Development N° 194 Agricultural transformation: trends in farm size…
Table A2.1
Spanish version of the questions about labor in every census and country.
Nicaragua 2001 2011
Permanent labor ¿Cuántas personas se contrataron para
trabajar permanentemente, por seis meses o
más, en las labores agrícolas y/o ganaderas,
durante el año agrícola 2000-2001?
¿Cuántas personas se contrataron para trabajar
permanentemente, por seis meses o más, en las
labores agrícolas y/o ganaderas, durante el año
agrícola 2010-2011?
Temporary labor ¿Cuántas personas se contrataron para
trabajar temporalmente, por menos de seis
meses, en las labores agrícolas y/o
ganaderas, durante el año agrícola 2010-
2001?
¿Cuántas personas se contrataron para trabajar
temporalmente, por menos de seis, en las
labores agrícolas y/o ganaderas, durante el año
agrícola 2010-2001?
Household labor in
the farm
(includes the head)
Incluyéndose usted, ¿cuántas personas de su
hogar trabajaron en labores agrícolas o
ganaderas en su EA durante el año 2000-
2001?
(Llenar tabla con el número de hombres y
mujeres menores y mayores de 12 años)
Se preguntó a cada miembro del hogar:
-Edad
-(Mayores de 10 años) ¿Durante este año
agrícola, trabajó en actividades agropecuarias
dentro de la EA?
Identification of
farmers
(Working directly on the farm)
¿Quién está manejando la explotación
agropecuaria?
(Opción de respuesta 1)
El productor o productora directamente.
(Working directly on the farm)
¿Quién está manejando la explotación
agropecuaria?
(Opción de respuesta 1)
El productor o productora directamente.
(Off-farm labor supply)
Durante el año agrícola 2000-2001, además
de trabajar como productor(a) agropecuario,
¿realizó otro trabajo dentro o fuera de la
explotación agropecuaria?
(Off-farm labor supply)
¿Durante el año agrícola 2010-2011, además de
trabajar como productor(a) agropecuario, realizó
otro trabajo dentro o fuera de la explotación
agropecuaria?
Peru 1994 2012
Permanent and
temporary labor
(Durante la campaña anterior)
¿Cuántos trabajadores remunerados,
hombres y mujeres, ha tenido
permanentemente o de manera eventual la
UA? (Incluye al administrador)
(Llenar una tabla con el total de
permanentes y eventuales, separados en
hombres y mujeres)
En la última campaña agrícola, de agosto 2011 a
julio 2011, ¿ha tenido trabajadores remunerados?
(Llenar una tabla con el total de permanentes y
eventuales, separados en hombres y mujeres)
Household labor in
the farm
(does not include
the head)
¿Cuántas personas conforman el hogar
censal y de ellas cuántas participan en
labores agrícolas o pecuarias de su UA?
(Llenar tabla con el número de hombres y
mujeres menores y mayores de 15 años,
separados en hijos/as y otros)
Se preguntó a cada miembro del hogar:
-Edad
-(Mayores de 6 años) ¿Participa en las labores
agrícolas de sus parcelas o chacras o en la
crianza de sus animales?
Source: Official data

86 ECLAC – Natural Resources and Development N° 194 Agricultural transformation: trends in farm size…
Annex 3: Glossary
Table A3.1
Definition of land use categories
Nicaragua Perú
Concept Concept (Spanish) Definition Concept
(Spanish)
Definition
Annual crops Cultivos anuales y
temporales
Crops with a less than one-
year growing cycle and
which must be newly sown
or planted for further
production after the harvest.
(1) and (2)
Cultivos
transitorios
Crops with a less than one-
year growing cycle and
which must be newly sown
or planted for further
production after the
harvest.(3)
Fallow land Tierras en
descanso y
tacotales
Area no cultivated for a
period of three to five years
that will be cultivated in the
future and was cultivated in
the past. (1) and (2)
En Descanso Land that is not used during
a period larger than a year
and which could be as long
as 15 years. The purpose is
to recover fertility. This
category was recorded only
in Selva region. (3)
To be
cropped
En barbecho Land that will be cultivated
withing the agricultural year.
(3)
Not cropped Tierras
agrícolas no
trabajas
This land will not be
cultivated due to problems
as lack of water, lack of
credit and lack of labor. (3)
Permanent
and semi-
permanent
crops
Cultivos
permanentes y
semipermanentes
In 2001, it is defined as crops
that no need to be
replanted after every
harvest, the growing cycle
lasts more than one year
and the crop is compactly
distributed in the area. (1)
In 2011, it is defined as crops
that no need to be
replanted after every
harvest, the growing cycle
lasts more than one year.
These crops may be of any
age (productive or not). (2)
Cultivos
permanentes
propiamente
dichos
The productive cycle is
longer than a year and
require an investment.
Include cacao, coffee, and
production of fruits
Cultivated
pastures
Pastos cultivados Area mostly dedicated to
pastures cultivated for
livestock or harvesting and
under some agricultural
practice. (1) and (2)
Pastos en la
categoría de
cultivos
permanentes
Cultivated pastures, with
alfalfa, rye grass, and others.
(3)
Forest
plantations
Cultivos
forestales
Forest plantations. (3)
Forests Bosques In 2001, it is defined as the
area covered with bushes or
trees growing naturally or
planted, that could have
value because of the
production of firewood,

87 ECLAC – Natural Resources and Development N° 194 Agricultural transformation: trends in farm size…
Nicaragua Perú
Concept Concept (Spanish) Definition Concept
(Spanish)
Definition
wood, or other forest
products. (1)
In 2011, it is defined as the
area mostly covered by trees
of at least five meters height
growing naturally or
planted, that could have
value because of the
production of firewood,
wood, or other forest
products. (2)
Natural
pastures
Pastos naturales Area mostly dedicated to
pastures established and
developed spontaneously.
(1) and (2)
Infrastructure
(buildings and
roads)
Instalaciones y
viales
Infrastructure built in the
agricultural unit; for
example, houses, roads,
storage facilities, etc. (1) and
(2)
Swamps Pantanos,
pedregales y otras
Land that cannot be
cultivated because it is
covered by low water or
loose stones. (1) and (2)
Affected by
natural
disasters
Afectado por
desastres
naturales
Area affected by floods,
storms, hurricanes, etc. (1)
Arable land Tierras de
labranza
Comprises annual crops,
fallow land, not to be
cropped and to be cropped.
(3)
Permanent
uses
Cultivos
permanentes
Comprise permanents crops,
permanent pastures and
forest plantations. (3)
Associated
crops
Cultivos
asociados
Crops cultivated in the same
area for which it is
impossible to calculate the
area separately (3)
Non-
agricultural
land
Superficie no
agrícola
Natural pastures, forests and
others. (3)
Source:
Official website 2001 Census: http://www.inide.gob.ni/cenagro/conceptosdefini.htm
Official website 2011 Census: http://www.inide.gob.ni/Cenagro/INFIVCENAGRO/IVCENAGROINFORME/assets/basic-
html/page54.html
Offical website 2012 Census, ennumerator´s instructions:
https://proyectos.inei.gob.pe/CenagroWeb/resources/documentos/metodologicos/manualdelcensista.pdf
Official FAO definition http://www.fao.org/faostat/en/#data/RL

88
EC
LAC
– N
atu
ral R
eso
urce
s and
Deve
lop
men
t N° 19
4
Ag
ricultu
ral tra
nsfo
rmatio
n: tre
nd
s in fa
rm size
…
Table A3.2
Names employed for machinery and tools
English Nicaragua (spanish version) Perú (spanish version)
Agricultural wagon Carreta
Iron plows Arado de hierro de tracción animal (mejorado) Arado de hierro
Wood plows Arado de madera de tracción animal(tradicional) Arado de palo
Manual fumigating pump Bombas de fumigación manual Fumigadora manual
Non-manual fumigating pump Bombas de fumigación a motor Fumigadora a motor
Threshing machines (manual) Desgranadora manual
Threshing machines (mechanical) Desgranadora mecánica
Tractor Tractor
Harvester Cosechadora
Electric engine Motor eléctrico
Electric generator Generador eléctrico
Grass and sugar cane cutter Picadora de pasto y/o caña
Pulper machine Despulpadora
Coffee mill Trilladora de café (Beneficio)
Rice mill Trilladora de arroz (Beneficio)
Dryer Secadoras
Saw Motosierra
Jeep / Camioneta Camioneta
Truck Camión
Boat Bote / Lancha o Panga
Irrigation pump Bombas de riego
Decorticator Descortezadora
Sugar cane mill Trapiche
Light aircraft Avioneta
Well pump
Bomba para pozo
Chaquitacllas
Chaquitacllas
Grain mill
Molino para grano
Source: Official data

89 ECLAC – Natural Resources and Development N° 194 Agricultural transformation: trends in farm size…
Series
Natural Resources and Development.
Issues published
A complete list as well as pdf files are available at
www.eclac.org/publicaciones
194. Agricultural transformation: trends in farm size, crop diversification, and mechanization in Nicaragua and
Peru, Sinduja Srivinasan, Milagro Saborío, Adrián Rodríguez, Cristian Morales, (LC/TS.2020/23), 2020.
193. El financiamiento de la bioeconomía en América Latina: identificación de fuentes nacionales, regionales y de
cooperación internacional, Adrián G. Rodríguez y Rafael H. Aramendis (LC/TS.2019/82), 2019.
192. Guía para la elaboración de estudios de caso sobre la gobernanza de los recursos naturales, Mauricio León
y Cristina Muñoz (LC/TS.2019/52), 2019.
191. Hacia una bioeconomía sostenible en América Latina y el Caribe: elementos para una visión regional, Adrián
G. Rodríguez, Mónica Rodrigues y Octavio Sotomayor (LC/TS.2019/25), 2019.
190. Revisión del desempeño de la seguridad vial en la República Dominicana, José Ignacio Nazif-Muñoz y Gabriel
Pérez, (LC/TS.2018/84), 2018.
189. Lineamientos de políticas públicas: un mejor manejo de las interrelaciones del Nexo entre el agua, la energía
y la alimentación, Antonio Embid y Liber Martín, (LC/TS.2018/74), 2018.
188. La movilidad fluvial en América del Sur: avances y tareas pendientes en materia de políticas públicas, Azhar
Jaimurzina y Gordon Wilmsmeier, (LC/TS.2017/133), 2017.
187. Inversiones en infraestructura en América Latina: tendencias, brechas y oportunidades, Ricardo J. Sánchez,
Jeannette Lardé, Pablo Chauvet y Azhar Jaimurzina, (LC/TS.2017/132), 2017.
186. Reflexiones sobre el futuro de los puertos de contenedores, Ricardo J. Sánchez, Eliana P. Barleta y Lara
Mouftier, (LC/TS.2017/131), 2017.
185. Institucionalidad y políticas de logística: lecciones para América Latina y el Caribe, del proceso implementado
por la República de Corea, Gabriel Pérez, (LC/TS.2017/126), 2017.
184. Género y transporte: experiencias y visiones de política pública en América Latina, Azhar Jaimurzina, Cristina
Muñoz Fernández y Gabriel Pérez (LC/TS.2017/125), 2017.
183. La discriminación de costos y beneficios en la evaluación de proyectos transnacionales de infraestructura y
otros métodos complementarios, Ricardo J Sánchez (LC/TS.2017/124), 2017.
182. El nexo entre el agua, la energía y la alimentación en Costa Rica: el caso de la cuenca alta del río Reventazón,
Maureen Ballestero Vargas y Tania López Lee (LC/TS.2017/105), 2017.

NATURAL RESOURCES AND DEVELOPMENT Issues published:
194 Agricultural transformationTrends in farm size, crop diversification, and mechanization in Nicaragua and PeruSinduja Srivinasan, Milagro Saborío, Adrián Rodríguez and Cristian Morales
193 El financiamiento de la bioeconomía en América LatinaIdentificación de fuentes nacionales, regionales y de cooperación internacionalAdrián G. Rodríguez y Rafael H. Aramendis
192 Guía para la elaboración de estudios de caso sobre la gobernanza de los recursos naturales Mauricio León y Cristina Muñoz
191 Hacia una bioeconomía sostenible en América Latina y el CaribeElementos para una visión regionalAdrián G. Rodríguez, Mónica Rodrigues y Octavio Sotomayor
LC/TS.2020/23