Water distribution at the electrified interface of deep eutectic ...
10
Water distribution at the electrified interface of deep eutectic solvents† Mesfin Haile Mamme, * ab Samuel L. C. Moors, b El Amine Mernissi Cherigui, a Herman Terryn, a Johan Deconinck, c Jon Ustarroz ‡ * a and Frank De Proft‡ b Deep eutectic solvents (DESs) are a new class of solvents with wider potential window than that of water and high electrochemical stability, making them potential candidates for a wide range of electrochemical systems. However, due to the hygroscopic nature of DESs, the pres- ence of latent water is unavoidable. Therefore, understanding the interfacial structure and the electrosorption and distribution of residual water at the electrified interface is of great importance for the use of these solvents in electrochemical systems. Using atomistic molecular dynamics, we explore the electrosorption and distribution of different amounts of water in 1 : 2 choline chloride–urea DES (Reline) at the electrified graphene interface. We found that both the water distribution and the interfacial structure are sensitive to the electrification of the graphene electrode. As a result, it is found that for moderately charged electrodes, water shows a preferential asym- metric adsorption in the vicinity of the positively charged electrode, partly due to strong intermolecular interactions with anions through hydrogen bonds. In contrast, for highly charged electrodes, water adsorbs at both electrodes due to a strongly enhanced external electrostatic interaction between the electrodes and the water dipoles. 1 Introduction Room temperature ionic liquids (RTILs) have attracted consid- erable attention as a new class of solvents that offer a number of advantages compared to traditional aqueous and organic media. The typical advantages of RTILs over traditional solvents are, in general, wide electrochemical potential windows which enable a wide operating voltage; low vapor pressure; high thermal stability; and their ability to dissolve a wide range of organic, inorganic and organometallic compounds that would not be simultaneously soluble in traditional solvents. However, despite their interesting physico-chemical properties, using RTILs at the industrial scale has a number of drawbacks, the most signicant of which is the high cost, and also low biode- gradability, low moisture tolerance and (for some) their toxicity. 1–3 In this context, deep eutectic solvents (DESs) are a more sustainable and low-cost alternative to RTILs. 4–8 DESs are considered as RTIL analogues, and share some of their features while overcoming some of their drawbacks. DESs are composed of a mixture of at least two components: a hydrogen bond donor (HBD, such as urea, glycerol and ethylene glycol) and a hydrogen bond acceptor (HBA, such as choline chloride) in a eutectic molar ratio. As such, they have a melting point lower than their individual components. Although the potential window of DESs is considerably smaller, these solvents offer several advantages over RTILs. They can be prepared from sustainable and inexpensive materials with less demanding preparation methods (no purication is required) and they are non-toxic. 4–6,9,10 Due to these compelling unusual physico- chemical properties, DESs have been increasingly used in a vast number of applications with success, including solvent extraction, 11,12 biodiesel production, 13 organic synthesis, 5,10,14,15 lubrication, 5 nanoporous carbon synthesis, 16,17 fuel treat- ment, 10,11,18 gas capture 19–21 and DNA stabilization. 22,23 Besides, they have also been extensively used as solvents for many elec- trochemical purposes such as electrodeposition, 24–29 energy conversion, 30 energy storage, 31–34 etc. 4,31,35,36 Extensive experimental and computational studies have been dedicated to rationalize the correlation between melting point depression and the hydrogen bond strength and its inuence on the thermo-physical properties of DESs, with special emphasis on 1:2 choline chloride–urea (Reline). 4–9,35,37–39 Thus, it has been proposed that the DES a Vrije Universiteit Brussel (VUB), Research Group Electrochemical and Surface Engineering (SURF), Pleinlaan 2, 1050 Brussels, Belgium. E-mail: mmamme@vub. be; mes[email protected]; [email protected] b Vrije Universiteit Brussel (VUB), Eenheid Algemene Chemie (ALGC), Pleinlaan 2, 1050 Brussels, Belgium c Vrije Universiteit Brussel (VUB), Department of Electrical Engineering and Energy Technology (ETEC), Pleinlaan 2, 1050 Brussels, Belgium † Electronic supplementary information (ESI) available. See DOI: 10.1039/c9na00331b ‡ These co-last authors contributed equally to this work. Cite this: Nanoscale Adv., 2019, 1, 2847 Received 26th May 2019 Accepted 4th July 2019 DOI: 10.1039/c9na00331b rsc.li/nanoscale-advances This journal is © The Royal Society of Chemistry 2019 Nanoscale Adv., 2019, 1, 2847–2856 | 2847 Nanoscale Advances COMMUNICATION Open Access Article. Published on 04 July 2019. Downloaded on 6/22/2022 2:48:06 PM. This article is licensed under a Creative Commons Attribution-NonCommercial 3.0 Unported Licence. View Article Online View Journal | View Issue
-
Upload
khangminh22 -
Category
Documents
-
view
1 -
download
0
Transcript of Water distribution at the electrified interface of deep eutectic ...
NanoscaleAdvances
COMMUNICATION
Ope
n A
cces
s A
rtic
le. P
ublis
hed
on 0
4 Ju
ly 2
019.
Dow
nloa
ded
on 6
/22/
2022
2:4
8:06
PM
. T
his
artic
le is
lice
nsed
und
er a
Cre
ativ
e C
omm
ons
Attr
ibut
ion-
Non
Com
mer
cial
3.0
Unp
orte
d L
icen
ce.
View Article OnlineView Journal | View Issue
Water distributio
aVrije Universiteit Brussel (VUB), Researc
Engineering (SURF), Pleinlaan 2, 1050 Bru
be; [email protected]; jon.ustarroz@bVrije Universiteit Brussel (VUB), Eenheid Alg
Brussels, BelgiumcVrije Universiteit Brussel (VUB), Departme
Technology (ETEC), Pleinlaan 2, 1050 Bruss
† Electronic supplementary informa10.1039/c9na00331b
‡ These co-last authors contributed equal
Cite this:Nanoscale Adv., 2019, 1, 2847
Received 26th May 2019Accepted 4th July 2019
DOI: 10.1039/c9na00331b
rsc.li/nanoscale-advances
This journal is © The Royal Society of C
n at the electrified interface ofdeep eutectic solvents†
Mesfin Haile Mamme, *ab Samuel L. C. Moors,b El Amine Mernissi Cherigui,a
Herman Terryn,a Johan Deconinck, c Jon Ustarroz ‡*a and Frank De Proft‡b
Deep eutectic solvents (DESs) are a new class of solvents with wider
potential window than that of water and high electrochemical stability,
making them potential candidates for a wide range of electrochemical
systems. However, due to the hygroscopic nature of DESs, the pres-
ence of latent water is unavoidable. Therefore, understanding the
interfacial structure and the electrosorption and distribution of
residual water at the electrified interface is of great importance for the
use of these solvents in electrochemical systems. Using atomistic
molecular dynamics, we explore the electrosorption and distribution
of different amounts of water in 1 : 2 choline chloride–urea DES
(Reline) at the electrified graphene interface. We found that both the
water distribution and the interfacial structure are sensitive to the
electrification of the graphene electrode. As a result, it is found that for
moderately charged electrodes, water shows a preferential asym-
metric adsorption in the vicinity of the positively charged electrode,
partly due to strong intermolecular interactions with anions through
hydrogen bonds. In contrast, for highly charged electrodes, water
adsorbs at both electrodes due to a strongly enhanced external
electrostatic interaction between the electrodes and the water
dipoles.
1 Introduction
Room temperature ionic liquids (RTILs) have attracted consid-erable attention as a new class of solvents that offer a number ofadvantages compared to traditional aqueous and organicmedia. The typical advantages of RTILs over traditional solvents
h Group Electrochemical and Surface
ssels, Belgium. E-mail: mmamme@vub.
vub.be
emene Chemie (ALGC), Pleinlaan 2, 1050
nt of Electrical Engineering and Energy
els, Belgium
tion (ESI) available. See DOI:
ly to this work.
hemistry 2019
are, in general, wide electrochemical potential windows whichenable a wide operating voltage; low vapor pressure; highthermal stability; and their ability to dissolve a wide range oforganic, inorganic and organometallic compounds that wouldnot be simultaneously soluble in traditional solvents. However,despite their interesting physico-chemical properties, usingRTILs at the industrial scale has a number of drawbacks, themost signicant of which is the high cost, and also low biode-gradability, low moisture tolerance and (for some) theirtoxicity.1–3
In this context, deep eutectic solvents (DESs) are a moresustainable and low-cost alternative to RTILs.4–8 DESs areconsidered as RTIL analogues, and share some of their featureswhile overcoming some of their drawbacks. DESs are composedof a mixture of at least two components: a hydrogen bond donor(HBD, such as urea, glycerol and ethylene glycol) anda hydrogen bond acceptor (HBA, such as choline chloride) ina eutectic molar ratio. As such, they have a melting point lowerthan their individual components. Although the potentialwindow of DESs is considerably smaller, these solvents offerseveral advantages over RTILs. They can be prepared fromsustainable and inexpensive materials with less demandingpreparation methods (no purication is required) and they arenon-toxic.4–6,9,10 Due to these compelling unusual physico-chemical properties, DESs have been increasingly used ina vast number of applications with success, including solventextraction,11,12 biodiesel production,13 organic synthesis,5,10,14,15
lubrication,5 nanoporous carbon synthesis,16,17 fuel treat-ment,10,11,18 gas capture19–21 and DNA stabilization.22,23 Besides,they have also been extensively used as solvents for many elec-trochemical purposes such as electrodeposition,24–29 energyconversion,30 energy storage,31–34 etc.4,31,35,36
Extensive experimental and computational studies havebeen dedicated to rationalize the correlation between meltingpoint depression and the hydrogen bond strength and itsinuence on the thermo-physical properties of DESs, withspecial emphasis on 1 : 2 choline chloride–urea(Reline).4–9,35,37–39 Thus, it has been proposed that the DES
Nanoscale Adv., 2019, 1, 2847–2856 | 2847

Nanoscale Advances Communication
Ope
n A
cces
s A
rtic
le. P
ublis
hed
on 0
4 Ju
ly 2
019.
Dow
nloa
ded
on 6
/22/
2022
2:4
8:06
PM
. T
his
artic
le is
lice
nsed
und
er a
Cre
ativ
e C
omm
ons
Attr
ibut
ion-
Non
Com
mer
cial
3.0
Unp
orte
d L
icen
ce.
View Article Online
mixture melting point depression depends on the lattice ener-gies of the DESs, the anion–HBD interaction, and the change inentropy due to formation of the liquid phase.9 Following this,Perkins et al.40 provided the rst molecular structural insightsusing infrared spectroscopy (IR) experiments and moleculardynamics (MD) simulations. They found a higher number ofHBDs (i.e., urea molecules) around the anions (i.e., chlorideions) than around the cations (i.e., choline ions). Their simu-lation results were in good agreement with IR spectroscopyexperimental results. The same problem was studied by Suet al.37 using MD simulations. Their results revealed that theaddition of urea leads to a signicant disruption of the elec-trostatic interaction between the choline and chloride, resultingin urea–chloride interactions being predominant. Morerecently, a number of similar computational and experimentalstudies have been reported and reviewed.10,15,41–48
Nonetheless, bringing these solvents from moisturecontrolled laboratory experiments to practical industrial appli-cations is a big challenge due to their hygroscopic nature. Thepresence of water in DESs is almost inevitable and impossible toeliminate.6,7,24,49,50 The presence of latent water in DESs hasa signicant impact on the physico-chemical properties of DESsincluding the structure, dynamics, electrochemical window andmelting point.7,8 Because of this, a number of experimental andcomputational studies have been dedicated to the investigationof the inuence of water on the physico-chemical properties ofDESs, with special emphasis on Reline.4,6–8 It has been reportedthat the presence of small amounts of water inuences the bulkstructure and dynamics of Reline.7,8 At lower water concentra-tions (less than 5 wt%), the water molecules preferentiallyhydrate chloride ions by the weakening of the strong hydrogenbond between chloride and urea and enhancing urea–ureainteraction. In contrast, at higher water fractions (more than5 wt%), all species are solvated by water molecules. This leads todrastic changes in the structure of Reline, viscosity and self-diffusion of choline cations, chloride anions and urea mole-cules.6 This was also conrmed by an ab initio moleculardynamics study.39 On the other hand, more recently, it has beenshown that the presence of small amounts of residual orintentionally added water in Reline could be benecial forcontrolling the size, shape and distribution of depositednanoparticles.5,24,26,29,49,51,52 Also, in a carbon dioxide gas captureexperiment, it has been shown that the solubility of carbondioxide in a mixed water–Reline solvent is strongly dependenton the amount of water, and that increasing the amount ofwater leads to a decrease in carbon dioxide solubility.37
Despite a number of studies of bulk water–DES mixtures, theeffect of residual water on the electried interface in DESs hasnot been studied yet. Just recently, when the present work wascompleted, Hammond et al.53 reported the inuence of highconcentrations of water (10–50 wt%) on the electrical doublelayer structure formation of DESs at a platinum electrode usingcontact mode atomic force microscopy (AFM). Alternatively,studying the electrosorption of residual water as a function ofwater content and surface polarization at a molecular scale hasgreat practical implications for electrodeposition, energyconversion, energy storage and other electrochemical
2848 | Nanoscale Adv., 2019, 1, 2847–2856
processes. Even though it has been previously reported thathaving small amounts of latent/intentionally added water isbenecial for some applications,24,49,54 the effect on the electri-ed DES–electrode interface can be anticipated to be quitecomplex. Since water is a polar molecule, it should interact withthe electried electrode. This may lead to preferentialadsorption/desorption of water in/from the vicinity of the elec-trode–DES interfacial region.
In practice, electrosorption of water has both positive andnegative impacts. On the positive side, for the synthesis ofnanomaterials, the size and shape of the nanoparticles can betuned by varying the amount of water in DESs.4,24,26,49 In addition,the electrochemical behavior of DESs can be further tunedaccording to the application of interest bymixing DESs and waterat a certain ratio.7,8,24,49,54 In contrast, if water molecules accu-mulate close to the electrode surface, at high electrode surfacepolarization, electrolysis of water can take place, producinghydroxide ions (OH�) and hydrogen gas (H2) at the cathode andoxygen (O2) at the anode.26,29 The presence of OH
�, generated bywater splitting, at the electrode–electrolyte interface could lead tothe chemical breakdown of DESs,26,29,55 which compromises theelectrochemical potential window. Recently, this has beenconrmed experimentally using combined electrochemical andsurface analysis techniques.56,57 On the other hand, in closedelectrochemical systems, such as batteries and supercapacitors,high surface polarization leads to electrolysis of water in thevicinity of the electrode surface which results in formation ofhydrogen and oxygen gas. Because of the gas formation, theinternal pressure increases and the active site/pores of the elec-trode surface are blocked by the gas bubbles. All of this leads tocurrent leakage, decrease in capacity and irreversible processes.31
In this work, we have scrutinized for the rst time the elec-trochemical interfacial structure and electrosorption of latentwater from 1 : 2 choline chloride–urea (Reline) onto a chargedand uncharged graphene surface, at a molecular level, usingatomistic molecular dynamics simulation. In this systematicstudy, we focused on the inuence of surface charge polariza-tion on the spatial distribution of latent water in the electriedReline–graphene system. The simulations reveal that the waterdistribution and electrosorption are sensitive to electrication.More interestingly, water shows preferential asymmetricadsorption at moderately charged surfaces. These ndingsprovide a signicant benchmark for better control, design andfurther optimization of a variety of electrochemical systems thatemploy DESs as solvents.
2 Methods
Atomistic molecular dynamics simulations were carried out tostudy the inuence and distribution of latent water in electried1 : 2 choline chloride–urea DES using the GROMACS 5.1.2soware package. The system setup is shown in Fig. 1. Periodicboundary conditions are applied in the Y and Z dimensions.There is no periodicity in the direction perpendicular to thegraphene electrode. We adopt parallel graphene sheets (4.55 nm� 4.31 nm) as positive and negative electrodes. The grapheneatomic positions are frozen throughout the simulations. The
This journal is © The Royal Society of Chemistry 2019

Fig. 1 System setup: simulated graphene electrified humid Relinedeep eutectic solvent along the x direction. The graphene electrodeswere separated by 9.37 nm for 1 wt%, 9.52 nm for 3 wt% and 10.3 nmfor 10 wt% water content in Reline. Water molecules are representedas red-white spheres (red, oxygen; white, hydrogen) and all othermolecules and ions are represented by colored lines (choline, ochre;chloride, tan; and urea, cyan). The blue-colored electrode is negativelycharged and the red-colored electrode is positively charged.
Communication Nanoscale Advances
Ope
n A
cces
s A
rtic
le. P
ublis
hed
on 0
4 Ju
ly 2
019.
Dow
nloa
ded
on 6
/22/
2022
2:4
8:06
PM
. T
his
artic
le is
lice
nsed
und
er a
Cre
ativ
e C
omm
ons
Attr
ibut
ion-
Non
Com
mer
cial
3.0
Unp
orte
d L
icen
ce.
View Article Online
system studied consists of 500 choline cations (Ch+), 500 chlo-ride anions (Cl�) and 1000 urea (URE) molecules, mixed withdifferent amounts of water molecules (1 wt%, 3 wt% and10 wt%). The distance between graphene sheets is xed to 9.37–10.3 nm, depending on the amount of water in the system(1 wt%, 9.37 nm; 3 wt%, 9.52 nm; and 10 wt%, 10.3 nm). Theforce eld parameters for Reline species, which were taken fromthe SwissParam web server,58 are derived from the MerckMolecular Force Field (MMFF) and have been validated andused to predict the physico-chemical properties of mixed water–Reline with high accuracy, when compared with experiments.7
Water was simulated with the 3-site SPC/E water model.7 TheLennard-Jones (LJ) parameters used for the graphene carbonatoms are sc¼ 3.55� 10�1 nm and 3c ¼ 2.9288� 10�1 kJ mol�1.
To determine the simulation domain size for the interfacialcalculation, we rst performed an energy minimization fol-lowed by a 200 ns isothermal–isobaric (NPT) and a canonical(NVT) equilibration for each bulk Reline–water mixture ata temperature of 300 K (maintained with a V-rescale thermostat)and a pressure of 1 bar (maintained with a Parrinello–Rahmanbarostat). Once the nal density of the system was reached, theresulting conguration was sandwiched between grapheneelectrodes and used for an additional 100 ns NVT equilibration,followed by 300 ns production runs. In all simulations, 1 fs timesteps were adopted. Here it is important to note that, sinceReline is highly viscous, much longer simulation times thanusual7,37 are necessary to obtain reliable results.
Long range electrostatic interactions were computed withthe Particle Mesh Ewald summation (PME) method59 using anFFT grid spacing of 0.16 nm and a fourth order interpolation. Acutoff of 1.0 nmwas used for the short-range Lennard-Jones andCoulomb interactions. The simulation results were analyzedwith GROMACS analysis tools and Visual Molecular Dynamics(VMD).60 Note that, number density calculations were per-formed using the center-of-mass of the respective species.
This journal is © The Royal Society of Chemistry 2019
3 Results and discussionElectrochemical ngerprints of water
An important question is whether the interfacial structure andelectrosorption of water is affected by the presence of a differenthumidity percentage in DESs and the change in surface polar-ization (equivalent to electrode potential) of the grapheneelectrode. First, we evaluate the amount of water in the vicinityof the graphene electrode by integrating and normalizing thenumber density of water molecules within the region of 0 to 3.5A (Fig. 2). We set these dimensions for the vicinity of the surfaceconsidering that the van der Waals radius of graphene carbonand water are �1.8 A and �1.7 A, respectively. Such a region ishenceforth referred to as the “interfacial region”. Fig. 2 showsthe averaged (a) and the normalized (b) number density oflatent water adsorbed in the interfacial region as a function ofsurface polarization for different amounts of water (1 wt%,3 wt% and 10 wt%). In all considered cases, regardless of thewater concentrations, there is a clear tendency for the adsorbedwater to increase in the interfacial region for large surfacepolarization. Fig. 2(b) shows that in the interfacial region of anuncharged graphene electrode, the amount of water is the sameas that in the bulk section. For the moderately negativelycharged graphene electrode, the water molecules are depletedcompared to the bulk, regardless of the amount of the latentwater in the solution. Besides, a further increase in surfacecharge density of the negatively charged electrode (s < �0.16 Cm�2) leads to an increase in water adsorption. This is mainlydue to the enhancement of the electrostatic interaction betweenthe charged graphene electrode and the water molecules. Onthe other hand, for a positively charged graphene electrode,enrichment of water molecules in the interfacial region alsooccurs for low polarization. This implies that water moleculesare preferentially adsorbed asymmetrically on the positivelyrather than on the negatively charged graphene electrode. Inaddition, from Fig. 2(a) it can be seen that the number ofadsorbed water molecules at the interface at �0.32 C m2 ishigher than that at +0.32 C m2. This is mainly related to the lesssensitive nature of the choline cation for an increase in negativepolarization (see ESI Fig. S1†) and the structural rearrangementof both molecules (URE and H2O) to a more packed confor-mation (mixed parallel and perpendicular alignment). Thisallows more free spaces for the accumulation of more watermolecules in the vicinity of the negatively charged surface, whencompared to the positively charged side, which features a morecompact conformation (at alignment). This is further dis-cussed below.
To get a better understanding of the preferential adsorptionand distribution of water in the vicinity of the electrode inter-face, we closely examined the details of the electrochemicaldouble layer structure (EDLS) and intermolecular interactionsfor the case of a 3 wt% humidity. For simplicity, choline isdenoted as Ch+, urea as URE, chloride as Cl�, water as H2O andgraphene electrode as GRE. Fig. 3 shows the normalizednumber density of all species (a–d) and the snapshots of theresidual water distribution (e–h), which are computed along the
Nanoscale Adv., 2019, 1, 2847–2856 | 2849
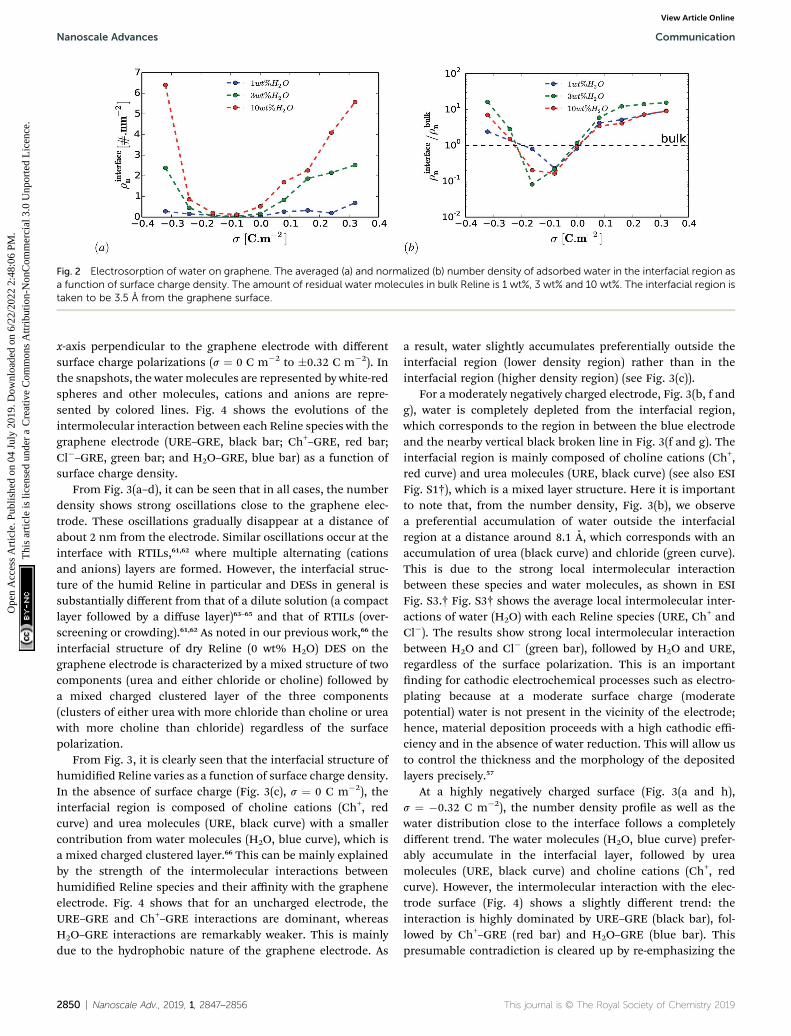
Fig. 2 Electrosorption of water on graphene. The averaged (a) and normalized (b) number density of adsorbed water in the interfacial region asa function of surface charge density. The amount of residual water molecules in bulk Reline is 1 wt%, 3 wt% and 10 wt%. The interfacial region istaken to be 3.5 A from the graphene surface.
Nanoscale Advances Communication
Ope
n A
cces
s A
rtic
le. P
ublis
hed
on 0
4 Ju
ly 2
019.
Dow
nloa
ded
on 6
/22/
2022
2:4
8:06
PM
. T
his
artic
le is
lice
nsed
und
er a
Cre
ativ
e C
omm
ons
Attr
ibut
ion-
Non
Com
mer
cial
3.0
Unp
orte
d L
icen
ce.
View Article Online
x-axis perpendicular to the graphene electrode with differentsurface charge polarizations (s ¼ 0 C m�2 to �0.32 C m�2). Inthe snapshots, the water molecules are represented by white-redspheres and other molecules, cations and anions are repre-sented by colored lines. Fig. 4 shows the evolutions of theintermolecular interaction between each Reline species with thegraphene electrode (URE–GRE, black bar; Ch+–GRE, red bar;Cl�–GRE, green bar; and H2O–GRE, blue bar) as a function ofsurface charge density.
From Fig. 3(a–d), it can be seen that in all cases, the numberdensity shows strong oscillations close to the graphene elec-trode. These oscillations gradually disappear at a distance ofabout 2 nm from the electrode. Similar oscillations occur at theinterface with RTILs,61,62 where multiple alternating (cationsand anions) layers are formed. However, the interfacial struc-ture of the humid Reline in particular and DESs in general issubstantially different from that of a dilute solution (a compactlayer followed by a diffuse layer)63–65 and that of RTILs (over-screening or crowding).61,62 As noted in our previous work,66 theinterfacial structure of dry Reline (0 wt% H2O) DES on thegraphene electrode is characterized by a mixed structure of twocomponents (urea and either chloride or choline) followed bya mixed charged clustered layer of the three components(clusters of either urea with more chloride than choline or ureawith more choline than chloride) regardless of the surfacepolarization.
From Fig. 3, it is clearly seen that the interfacial structure ofhumidied Reline varies as a function of surface charge density.In the absence of surface charge (Fig. 3(c), s ¼ 0 C m�2), theinterfacial region is composed of choline cations (Ch+, redcurve) and urea molecules (URE, black curve) with a smallercontribution from water molecules (H2O, blue curve), which isa mixed charged clustered layer.66 This can be mainly explainedby the strength of the intermolecular interactions betweenhumidied Reline species and their affinity with the grapheneelectrode. Fig. 4 shows that for an uncharged electrode, theURE–GRE and Ch+–GRE interactions are dominant, whereasH2O–GRE interactions are remarkably weaker. This is mainlydue to the hydrophobic nature of the graphene electrode. As
2850 | Nanoscale Adv., 2019, 1, 2847–2856
a result, water slightly accumulates preferentially outside theinterfacial region (lower density region) rather than in theinterfacial region (higher density region) (see Fig. 3(c)).
For a moderately negatively charged electrode, Fig. 3(b, f andg), water is completely depleted from the interfacial region,which corresponds to the region in between the blue electrodeand the nearby vertical black broken line in Fig. 3(f and g). Theinterfacial region is mainly composed of choline cations (Ch+,red curve) and urea molecules (URE, black curve) (see also ESIFig. S1†), which is a mixed layer structure. Here it is importantto note that, from the number density, Fig. 3(b), we observea preferential accumulation of water outside the interfacialregion at a distance around 8.1 A, which corresponds with anaccumulation of urea (black curve) and chloride (green curve).This is due to the strong local intermolecular interactionbetween these species and water molecules, as shown in ESIFig. S3.† Fig. S3† shows the average local intermolecular inter-actions of water (H2O) with each Reline species (URE, Ch+ andCl�). The results show strong local intermolecular interactionbetween H2O and Cl� (green bar), followed by H2O and URE,regardless of the surface polarization. This is an importantnding for cathodic electrochemical processes such as electro-plating because at a moderate surface charge (moderatepotential) water is not present in the vicinity of the electrode;hence, material deposition proceeds with a high cathodic effi-ciency and in the absence of water reduction. This will allow usto control the thickness and the morphology of the depositedlayers precisely.57
At a highly negatively charged surface (Fig. 3(a and h),s ¼ �0.32 C m�2), the number density prole as well as thewater distribution close to the interface follows a completelydifferent trend. The water molecules (H2O, blue curve) prefer-ably accumulate in the interfacial layer, followed by ureamolecules (URE, black curve) and choline cations (Ch+, redcurve). However, the intermolecular interaction with the elec-trode surface (Fig. 4) shows a slightly different trend: theinteraction is highly dominated by URE–GRE (black bar), fol-lowed by Ch+–GRE (red bar) and H2O–GRE (blue bar). Thispresumable contradiction is cleared up by re-emphasizing the
This journal is © The Royal Society of Chemistry 2019

Fig. 3 Electrical double layer structure. The normalized number density profiles of all species (urea, URE; choline, Ch+; chloride, Cl�; and water,H2O) as a function of the distance from the electrodes for different surface charge densities (a–d) for 3% wt H2O. Snapshots of the watermolecule distribution (e–h). The uncharged electrode is colored grey, whereas negatively and positively charged electrodes are colored blue andred, respectively. Water molecules are represented as red-white spheres (red, oxygen; white, hydrogen) and all other molecules and ions arerepresented by colored lines. The vertical black dashed line marks the distance 3.5 A from the electrode surface.
Communication Nanoscale Advances
Ope
n A
cces
s A
rtic
le. P
ublis
hed
on 0
4 Ju
ly 2
019.
Dow
nloa
ded
on 6
/22/
2022
2:4
8:06
PM
. T
his
artic
le is
lice
nsed
und
er a
Cre
ativ
e C
omm
ons
Attr
ibut
ion-
Non
Com
mer
cial
3.0
Unp
orte
d L
icen
ce.
View Article Online
fact that the number density is normalized according to thedensity of the cations/anions/molecules in the bulk of thehumid Reline. Hence, an increase in the number of watermolecules, which are a minority in the humid Reline comparedto urea (URE) and choline (Ch+), will have a more pronouncedeffect on the normalized number density prole compared tothe one of urea (URE) or choline (Ch+). Here it is also important
This journal is © The Royal Society of Chemistry 2019
to mention that prior studies of electrodeposition of nickel fromReline DES with different amounts of water (#10 wt%) showedthe adsorption and electrolysis of water are remarkable at highcathodic potentials (E # �0.9 V vs. Ag QRE).56
Alternatively, at the positively charged electrode, the inter-facial region starts accommodating water even at a lowersurface charge and further increasing the electrode charge leads
Nanoscale Adv., 2019, 1, 2847–2856 | 2851

Fig. 4 Influence of surface polarization on intermolecular interaction energy: intermolecular interactions between urea and graphene (URE–GRE, black bar), choline and graphene (Ch+–GRE, red bar), chloride and graphene (Cl�–GRE, green bar) and water and graphene (H2O–GRE,blue bar) as a function surface charge density.
Nanoscale Advances Communication
Ope
n A
cces
s A
rtic
le. P
ublis
hed
on 0
4 Ju
ly 2
019.
Dow
nloa
ded
on 6
/22/
2022
2:4
8:06
PM
. T
his
artic
le is
lice
nsed
und
er a
Cre
ativ
e C
omm
ons
Attr
ibut
ion-
Non
Com
mer
cial
3.0
Unp
orte
d L
icen
ce.
View Article Online
to the accumulations of a higher amount of water molecules inthe interfacial region. This is shown in Fig. 3(d) and (f–h) (i.e.,the region between the red electrode and the nearby verticalblack dashed line). The interfacial region is mainly composed ofchloride anions (Cl�), urea (URE) and water molecules (H2O),a mixed charged clustered layer.66 This is mainly due to thesynergistic effect of the intermolecular (hydrogen bonding:URE–Cl� and H2O–Cl
�) and the electrostatic interactions withthe polarized electrode surface.
Further, we also investigated the local charge density asa function of distance from the electrode surface for differentsurface polarizations. Fig. 5(a–c) show the local charge densityproles of urea (red curve), choline (black curve) and chloride(green curve) and the normalized number density of water (bluedashed curve) as a function of distance from the electrodesurface. Fig. 5(a–c) show that water adsorption peaks (bluedashed curve) are strongly correlated with local excess chargeregions (the maxima of the absolute value of the local chargedensity, |re|). This implies that there are strong local electro-static interactions, specically ion–dipole and dipole–dipoleinteractions. Since, water is a dipolar molecule, its local elec-trostatic interaction with ions is quite strong, and specically,the H2O–Cl
� interaction is stronger than that of H2O–Ch+ (see
ESI Fig. S3†). This implies that water molecules are preferen-tially adsorbed on the positively charged electrode followingchloride anions rather than on the negatively charged electrodewhere choline cations accumulate. This argument is well in linewith the simulated normalized number density of water mole-cules and chloride anions for different surface charge densitiesas a function of distance from the electrode surface, shown inESI Fig. S2.† Fig. S2† shows that increasing the negative surfacepolarization up to �0.16 C m�2 results in a positive shi(shiing away from the electrode surface) of both chloride andwater accumulation. On the other hand, increasing the positivesurface charge leads to accumulation of both chloride and water
2852 | Nanoscale Adv., 2019, 1, 2847–2856
in the interfacial region. This can also explained by the inter-molecular interactions (Fig. 4). For positively and moderatelynegatively polarized surfaces, the evolution of the H2O–GREinteraction strictly follows the trend of Cl�–GRE interaction.Alternatively, at a highly negatively charged electrode (s <�0.16C m�2) the water molecules no longer follow the chlorideanions. This is related to the strong electrostatic interactionbetween charged graphene and the water dipole, which isenhanced by increasing the surface polarization (see Fig. 3(aand h) and 4). It is also important to note that Ch+–GRE andURE–GRE interactions follow different trends. The Ch+–GREinteraction increases monotonically from +0.32 C m�2 to �0.32Cm�2, which is expected and can be explained by an increase ofthe electrostatic interaction between the choline cation and thenegatively charged graphene. In contrast, the URE–GRE inter-action rst decreases, following the Cl–GRE interaction from+0.32 C m�2 to �0.08 C m�2, and then increases with strongernegative polarization. This can be explained by the fact that atmoderate polarization, the local intermolecular interactionbetween urea molecule and the other species (URE–Ch+, URE–Cl� and URE–H2O) becomes predominant, whereas for a highsurface polarization the local intermolecular predominance isovertaken by the strongly enhanced external electrostaticinteraction between the urea dipole and graphene.66
Interdependency of the electric eld distribution andpreferential adsorption of water
It is well known that the electric potential oscillates in the EDLSregion due to the overscreening phenomena and graduallydamps out as a function of distance from the electrode surface.This results in the oscillation of the electric eld. Since thewater molecule is polar with a high dipole moment, it willexperience a net force due to a nonuniform electric eld. If weconsider water as a point dipole oriented in the direction of the
This journal is © The Royal Society of Chemistry 2019

Fig. 5 Correlation between electrosorption of water and local interactions. The local space charge density profile of URE, Ch+ and Cl� (re, leftaxis) and the normalized number density of water molecules (rn/r
bulkn , right axis) for surface charge densities �0.32 C m�2 (a), 0 C m�2 (b) and
0.32 C m�2 (c) as a function of distance from the graphene electrode.
Communication Nanoscale Advances
Ope
n A
cces
s A
rtic
le. P
ublis
hed
on 0
4 Ju
ly 2
019.
Dow
nloa
ded
on 6
/22/
2022
2:4
8:06
PM
. T
his
artic
le is
lice
nsed
und
er a
Cre
ativ
e C
omm
ons
Attr
ibut
ion-
Non
Com
mer
cial
3.0
Unp
orte
d L
icen
ce.
View Article Online
electric eld, then, the net force experienced by the watermolecule in the interfacial region can be written as:
Fx
�! ¼ Px
d Ex
�!dx
(1)
where~Fx is the net force on the dipole, Px is the dipole momentand~Ex is the average electric eld perpendicular to the charged/uncharged graphene electrode. Hence, in the electrical doublelayer region, the water molecule will move toward the directionwhere the magnitude of the electric eld (|~Ex|) increases andwill accumulate at the position where the net force is zero d Ex�! ¼ 0dx
!. Thus, the water molecules are preferentially
accumulated in positions that satisfy the extrema of the electriceld (i.e., local minima/maxima and global minimum/maximum). Hereaer, we refer to the local minimum andmaximum as metastable positions and absolute minimum andmaximum as stable positions.
To support the above arguments we calculated the averageelectric eld perpendicular to the surface of the electrode asa function of distance. Fig. 6 shows the averaged electric eld(red curve) and the normalized number density of water (bluedashed curve) as a function of distance from the surface of theelectrode for a surface charge of �0.32 C m�2 (a), 0 C m�2 (b)and 0.32 C m�2 (c). Even though this model does not considerthe nite size of water dipoles, it nevertheless provides a good
This journal is © The Royal Society of Chemistry 2019
correlation between the preferential adsorbed water peaks andthe metastable and stable positions of the averaged electriceld. However, in some cases this correspondence does nothold. For instance, for the uncharged electrode, Fig. 6(b), onecould have anticipated that there would be an accumulation ofwater molecules at the electrically stable position, x ¼ 5.2 A.However, at this position water is depleted whereas the highestaccumulation of water was found at x¼ 7.8 A. This can be due totwo reasons. First, at lower surface charge densities, the localintermolecular interactions between water molecules and thesurrounding Reline species are predominant, as shown inFig. 3–5 and ESI Fig. S2.† Second, since there exists anotherpolar molecule (i.e., urea) in the system, there will be competi-tion between H2O and URE to accumulate at the metastable andstable positions. On top of this, it is also important to note that,since the water molecule is not a point dipole, exact corre-spondences between the water accumulation peak and stableand metastable positions are not expected.
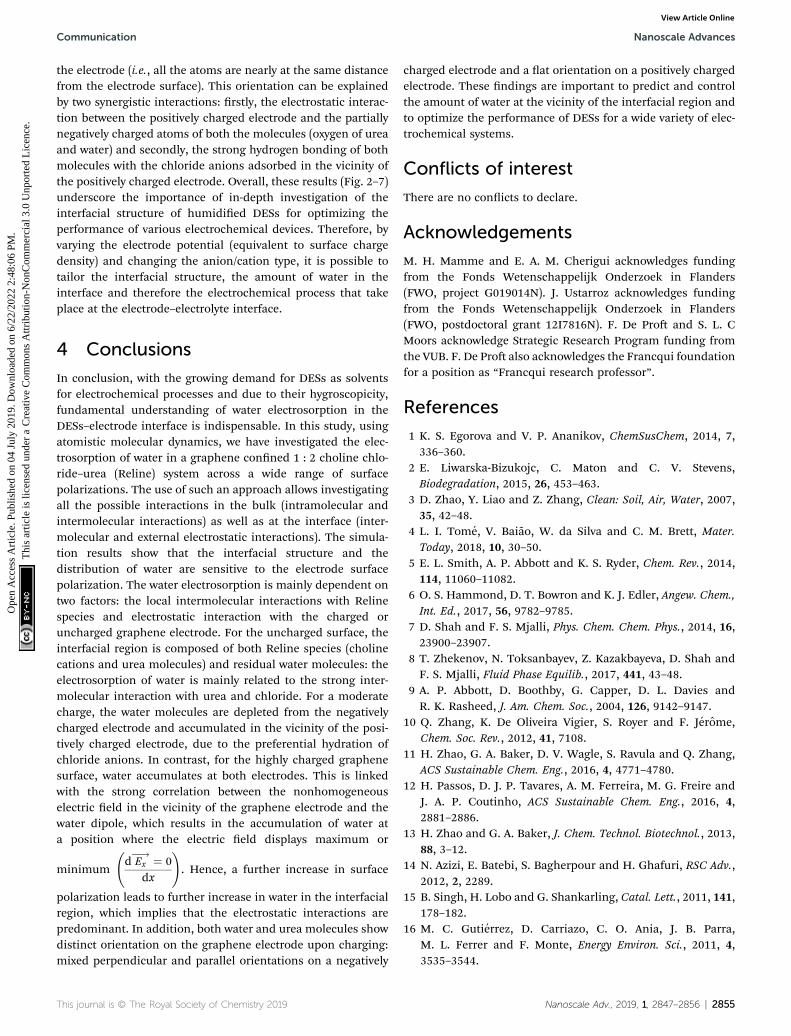
The other interesting point is that at the interfacial region,where the electric eld is not homogeneous, both polar mole-cules (i.e., urea and water) exhibit distinct orientations (seeFig. 7(a–c)). Fig. 7(a–c) show the orientational arrangement ofurea (le column) and water (right column) molecules in thevicinity of the electrode surface for a surface charge density of�0.32 C m�2 (a), 0 C m�2 (b) and 0.32 C m�2 (c). To explain theorientation of the two polar molecules in the vicinity of the
Nanoscale Adv., 2019, 1, 2847–2856 | 2853
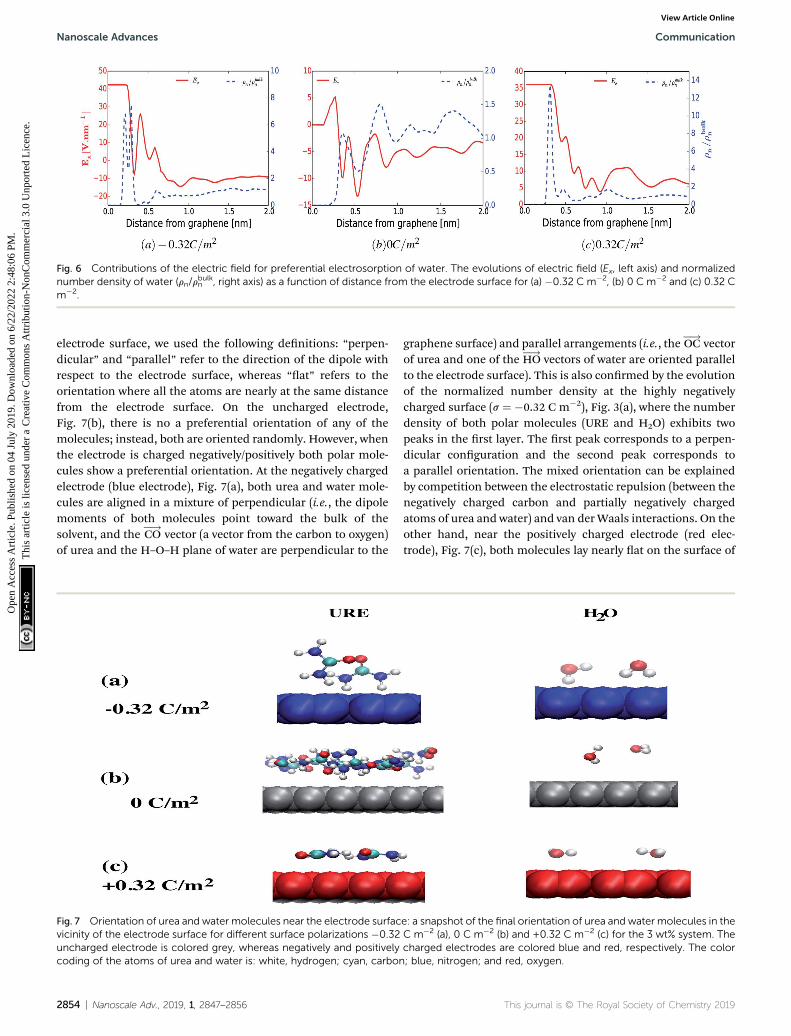
Fig. 6 Contributions of the electric field for preferential electrosorption of water. The evolutions of electric field (Ex, left axis) and normalizednumber density of water (rn/r
bulkn , right axis) as a function of distance from the electrode surface for (a) �0.32 C m�2, (b) 0 C m�2 and (c) 0.32 C
m�2.
Nanoscale Advances Communication
Ope
n A
cces
s A
rtic
le. P
ublis
hed
on 0
4 Ju
ly 2
019.
Dow
nloa
ded
on 6
/22/
2022
2:4
8:06
PM
. T
his
artic
le is
lice
nsed
und
er a
Cre
ativ
e C
omm
ons
Attr
ibut
ion-
Non
Com
mer
cial
3.0
Unp
orte
d L
icen
ce.
View Article Online
electrode surface, we used the following denitions: “perpen-dicular” and “parallel” refer to the direction of the dipole withrespect to the electrode surface, whereas “at” refers to theorientation where all the atoms are nearly at the same distancefrom the electrode surface. On the uncharged electrode,Fig. 7(b), there is no a preferential orientation of any of themolecules; instead, both are oriented randomly. However, whenthe electrode is charged negatively/positively both polar mole-cules show a preferential orientation. At the negatively chargedelectrode (blue electrode), Fig. 7(a), both urea and water mole-cules are aligned in a mixture of perpendicular (i.e., the dipolemoments of both molecules point toward the bulk of thesolvent, and the CO
�!vector (a vector from the carbon to oxygen)
of urea and the H–O–H plane of water are perpendicular to the
Fig. 7 Orientation of urea and water molecules near the electrode surfacvicinity of the electrode surface for different surface polarizations �0.32uncharged electrode is colored grey, whereas negatively and positivelycoding of the atoms of urea and water is: white, hydrogen; cyan, carbon
2854 | Nanoscale Adv., 2019, 1, 2847–2856
graphene surface) and parallel arrangements (i.e., the OC�!
vectorof urea and one of the HO
�!vectors of water are oriented parallel
to the electrode surface). This is also conrmed by the evolutionof the normalized number density at the highly negativelycharged surface (s ¼ �0.32 C m�2), Fig. 3(a), where the numberdensity of both polar molecules (URE and H2O) exhibits twopeaks in the rst layer. The rst peak corresponds to a perpen-dicular conguration and the second peak corresponds toa parallel orientation. The mixed orientation can be explainedby competition between the electrostatic repulsion (between thenegatively charged carbon and partially negatively chargedatoms of urea and water) and van derWaals interactions. On theother hand, near the positively charged electrode (red elec-trode), Fig. 7(c), both molecules lay nearly at on the surface of
e: a snapshot of the final orientation of urea and water molecules in theC m�2 (a), 0 C m�2 (b) and +0.32 C m�2 (c) for the 3 wt% system. Thecharged electrodes are colored blue and red, respectively. The color; blue, nitrogen; and red, oxygen.
This journal is © The Royal Society of Chemistry 2019
Communication Nanoscale Advances
Ope
n A
cces
s A
rtic
le. P
ublis
hed
on 0
4 Ju
ly 2
019.
Dow
nloa
ded
on 6
/22/
2022
2:4
8:06
PM
. T
his
artic
le is
lice
nsed
und
er a
Cre
ativ
e C
omm
ons
Attr
ibut
ion-
Non
Com
mer
cial
3.0
Unp
orte
d L
icen
ce.
View Article Online
the electrode (i.e., all the atoms are nearly at the same distancefrom the electrode surface). This orientation can be explainedby two synergistic interactions: rstly, the electrostatic interac-tion between the positively charged electrode and the partiallynegatively charged atoms of both the molecules (oxygen of ureaand water) and secondly, the strong hydrogen bonding of bothmolecules with the chloride anions adsorbed in the vicinity ofthe positively charged electrode. Overall, these results (Fig. 2–7)underscore the importance of in-depth investigation of theinterfacial structure of humidied DESs for optimizing theperformance of various electrochemical devices. Therefore, byvarying the electrode potential (equivalent to surface chargedensity) and changing the anion/cation type, it is possible totailor the interfacial structure, the amount of water in theinterface and therefore the electrochemical process that takeplace at the electrode–electrolyte interface.
4 Conclusions
In conclusion, with the growing demand for DESs as solventsfor electrochemical processes and due to their hygroscopicity,fundamental understanding of water electrosorption in theDESs–electrode interface is indispensable. In this study, usingatomistic molecular dynamics, we have investigated the elec-trosorption of water in a graphene conned 1 : 2 choline chlo-ride–urea (Reline) system across a wide range of surfacepolarizations. The use of such an approach allows investigatingall the possible interactions in the bulk (intramolecular andintermolecular interactions) as well as at the interface (inter-molecular and external electrostatic interactions). The simula-tion results show that the interfacial structure and thedistribution of water are sensitive to the electrode surfacepolarization. The water electrosorption is mainly dependent ontwo factors: the local intermolecular interactions with Relinespecies and electrostatic interaction with the charged oruncharged graphene electrode. For the uncharged surface, theinterfacial region is composed of both Reline species (cholinecations and urea molecules) and residual water molecules: theelectrosorption of water is mainly related to the strong inter-molecular interaction with urea and chloride. For a moderatecharge, the water molecules are depleted from the negativelycharged electrode and accumulated in the vicinity of the posi-tively charged electrode, due to the preferential hydration ofchloride anions. In contrast, for the highly charged graphenesurface, water accumulates at both electrodes. This is linkedwith the strong correlation between the nonhomogeneouselectric eld in the vicinity of the graphene electrode and thewater dipole, which results in the accumulation of water ata position where the electric eld displays maximum or
minimum
d Ex�! ¼ 0dx
!. Hence, a further increase in surface
polarization leads to further increase in water in the interfacialregion, which implies that the electrostatic interactions arepredominant. In addition, both water and urea molecules showdistinct orientation on the graphene electrode upon charging:mixed perpendicular and parallel orientations on a negatively
This journal is © The Royal Society of Chemistry 2019
charged electrode and a at orientation on a positively chargedelectrode. These ndings are important to predict and controlthe amount of water at the vicinity of the interfacial region andto optimize the performance of DESs for a wide variety of elec-trochemical systems.
Conflicts of interest
There are no conicts to declare.
Acknowledgements
M. H. Mamme and E. A. M. Cherigui acknowledges fundingfrom the Fonds Wetenschappelijk Onderzoek in Flanders(FWO, project G019014N). J. Ustarroz acknowledges fundingfrom the Fonds Wetenschappelijk Onderzoek in Flanders(FWO, postdoctoral grant 12I7816N). F. De Pro and S. L. CMoors acknowledge Strategic Research Program funding fromthe VUB. F. De Pro also acknowledges the Francqui foundationfor a position as “Francqui research professor”.
References
1 K. S. Egorova and V. P. Ananikov, ChemSusChem, 2014, 7,336–360.
2 E. Liwarska-Bizukojc, C. Maton and C. V. Stevens,Biodegradation, 2015, 26, 453–463.
3 D. Zhao, Y. Liao and Z. Zhang, Clean: Soil, Air, Water, 2007,35, 42–48.
4 L. I. Tome, V. Baiao, W. da Silva and C. M. Brett, Mater.Today, 2018, 10, 30–50.
5 E. L. Smith, A. P. Abbott and K. S. Ryder, Chem. Rev., 2014,114, 11060–11082.
6 O. S. Hammond, D. T. Bowron and K. J. Edler, Angew. Chem.,Int. Ed., 2017, 56, 9782–9785.
7 D. Shah and F. S. Mjalli, Phys. Chem. Chem. Phys., 2014, 16,23900–23907.
8 T. Zhekenov, N. Toksanbayev, Z. Kazakbayeva, D. Shah andF. S. Mjalli, Fluid Phase Equilib., 2017, 441, 43–48.
9 A. P. Abbott, D. Boothby, G. Capper, D. L. Davies andR. K. Rasheed, J. Am. Chem. Soc., 2004, 126, 9142–9147.
10 Q. Zhang, K. De Oliveira Vigier, S. Royer and F. Jerome,Chem. Soc. Rev., 2012, 41, 7108.
11 H. Zhao, G. A. Baker, D. V. Wagle, S. Ravula and Q. Zhang,ACS Sustainable Chem. Eng., 2016, 4, 4771–4780.
12 H. Passos, D. J. P. Tavares, A. M. Ferreira, M. G. Freire andJ. A. P. Coutinho, ACS Sustainable Chem. Eng., 2016, 4,2881–2886.
13 H. Zhao and G. A. Baker, J. Chem. Technol. Biotechnol., 2013,88, 3–12.
14 N. Azizi, E. Batebi, S. Bagherpour and H. Ghafuri, RSC Adv.,2012, 2, 2289.
15 B. Singh, H. Lobo and G. Shankarling, Catal. Lett., 2011, 141,178–182.
16 M. C. Gutierrez, D. Carriazo, C. O. Ania, J. B. Parra,M. L. Ferrer and F. Monte, Energy Environ. Sci., 2011, 4,3535–3544.
Nanoscale Adv., 2019, 1, 2847–2856 | 2855

Nanoscale Advances Communication
Ope
n A
cces
s A
rtic
le. P
ublis
hed
on 0
4 Ju
ly 2
019.
Dow
nloa
ded
on 6
/22/
2022
2:4
8:06
PM
. T
his
artic
le is
lice
nsed
und
er a
Cre
ativ
e C
omm
ons
Attr
ibut
ion-
Non
Com
mer
cial
3.0
Unp
orte
d L
icen
ce.
View Article Online
17 M. C. Gutierrez, D. Carriazo, A. Tamayo, R. Jimenez, F. Pico,J. M. Rojo, M. L. Ferrer and F. del Monte, Chem.–Eur. J., 2011,17, 10533–10537.
18 W. Zhu, C. Wang, H. Li, P. Wu, S. Xun, W. Jiang, Z. Chen,Z. Zhao and H. Li, Green Chem., 2015, 17, 2464–2472.
19 L. L. Sze, S. Pandey, S. Ravula, S. Pandey, H. Zhao, G. A. Bakerand S. N. Baker, ACS Sustainable Chem. Eng., 2014, 2, 2117–2123.
20 M. Francisco, A. van den Bruinhorst, L. F. Zubeir, C. J. Petersand M. C. Kroon, Fluid Phase Equilib., 2013, 340, 77–84.
21 T. J. Trivedi, J. H. Lee, H. J. Lee, Y. K. Jeong and J. W. Choi,Green Chem., 2016, 18, 2834–2842.
22 I. Mamajanov, A. Engelhart, H. Bean and N. Hud, Angew.Chem., Int. Ed., 2010, 49, 6310–6314.
23 D. Mondal, M. Sharma, C. Mukesh, V. Gupta and K. Prasad,Chem. Commun., 2013, 49, 9606.
24 C. Du, B. Zhao, X.-B. Chen, N. Birbilis and H. Yang, Sci. Rep.,2016, 6, 29225.
25 A. H. Whitehead, M. Polzler and B. Gollas, J. Electrochem.Soc., 2010, 157, D328–D334.
26 E. A. Mernissi Cherigui, K. Sentosun, P. Bouckenooge,H. Vanrompay, S. Bals, H. Terryn and J. Ustarroz, J. Phys.Chem. C, 2017, 121, 9337–9347.
27 P. Sebastian, M. I. Giannotti, E. Gomez and J. M. Feliu, ACSAppl. Energy Mater., 2018, 1, 1016–1028.
28 L. Wei, B. Lu, M. Sun, N. Tian, Z. Zhou, B. Xu, X. Zhao andS. Sun, Nano Res., 2016, 9, 3547–3557.
29 J. Aldana-Gonzalez, M. Romero-Romo, J. Robles-Peralta,P. Morales-Gil, E. Palacios-Gonzalez, M. Ramırez-Silva,J. Mostany and M. Palomar-Pardave, Electrochim. Acta,2018, 276, 417–423.
30 H.-R. Jhong, D. S.-H. Wong, C.-C. Wan, Y.-Y. Wang andT.-C. Wei, Electrochem. Commun., 2009, 11, 209–211.
31 M. H. Chakrabarti, F. S. Mjalli, I. M. AlNashef, M. A. Hashim,M. A. Hussain, L. Bahadori and C. T. J. Low, RenewableSustainable Energy Rev., 2014, 30, 254–270.
32 D. Lloyd, T. Vainikka and K. Kontturi, Electrochim. Acta,2013, 100, 18–23.
33 Y.-J. Ju, C.-H. Lien, K.-H. Chang, C.-C. Hu and D. S.-H. Wong,J. Chin. Chem. Soc., 2012, 59, 1280–1287.
34 D. Lloyd, T. Vainikka, L. Murtomaki, K. Kontturi andE. Ahlberg, Electrochim. Acta, 2011, 56, 4942–4948.
35 A. P. Abbott, G. Capper, K. J. McKenzie and K. S. Ryder,Electrochim. Acta, 2006, 51, 4420–4425.
36 J. A. Hammons and J. Ilavsky, Electrochim. Acta, 2017, 228,462–473.
37 W. C. Su, D. S. H. Wong and M. H. Li, J. Chem. Eng. Data,2009, 54, 1951–1955.
38 O. Ciocirlan, O. Iulian, O. Croitoru, et al., Rev. Chim., 2010,61, 721–723.
39 E. O. Fetisov, D. B. Harwood, I.-F. W. Kuo, S. E. Warrag,M. C. Kroon, C. J. Peters and J. I. Siepmann, J. Phys. Chem.B, 2018, 122, 1245–1254.
40 S. L. Perkins, P. Painter and C. M. Colina, J. Phys. Chem. B,2013, 117, 10250–10260.
2856 | Nanoscale Adv., 2019, 1, 2847–2856
41 R. Stefanovic, M. Ludwig, G. B. Webber, R. Atkin andA. J. Page, Phys. Chem. Chem. Phys., 2017, 19, 3297–3306.
42 S. Zahn, B. Kirchner and D. Mollenhauer, ChemPhysChem,2016, 17, 3354–3358.
43 G. Garcıa, M. Atilhan and S. Aparicio, Chem. Phys. Lett., 2015,634, 151–155.
44 D. V. Wagle, G. A. Baker and E. Mamontov, J. Phys. Chem.Lett., 2015, 6, 2924–2928.
45 D. V. Wagle, C. A. Deakyne and G. A. Baker, J. Phys. Chem. B,2016, 120, 6739–6746.
46 S. Zahn, Phys. Chem. Chem. Phys., 2017, 19, 4041–4047.47 D. Wagle, L. Adhikari and G. Baker, Fluid Phase Equilib.,
2017, 448, 50–58.48 C. R. Ashworth, R. P. Matthews, T. Welton and P. A. Hunt,
Phys. Chem. Chem. Phys., 2016, 18, 18145–18160.49 C. Du, H. Yang, X.-B. Chen, L. Wang, H. Dong, Y. Ning,
Y. Lai, J. Jia and B. Zhao, J. Mater. Sci., 2018, 53, 10758–10771.
50 M. Forsyth, P. C. Howlett, A. E. Somers, D. R. MacFarlaneand A. Basile, npj Mater. Degrad., 2017, 1, 18.
51 H.-G. Liao, Y.-X. Jiang, Z.-Y. Zhou, S.-P. Chen and S.-G. Sun,Angew. Chem., 2008, 120, 9240–9243.
52 A. P. Abbott and K. J. McKenzie, Phys. Chem. Chem. Phys.,2006, 8, 4265–4279.
53 O. S. Hammond, H. Li, C. Westermann, A. Y. Al-Murshedi,F. Endres, A. P. Abbott, G. G. Warr, K. J. Edler andR. Atkin, Nanoscale Horiz., 2019, 4, 158–168.
54 Y. Dai, G.-J. Witkamp, R. Verpoorte and Y. H. Choi, FoodChem., 2015, 187, 14–19.
55 F. P. McCullough, Flexible carbon ber electrode with lowmodulus and high electrical conductivity, batteryemploying the carbon ber electrode, and method ofmanufacture, US Pat. 5,532,083, 1996.
56 E. A. Mernissi Cherigui, K. Sentosun, M. H. Mamme,M. Lukaczynska, S. Bals, H. Terryn and J. Ustarroz, J. Phys.Chem. C, 2018, 112, 23129–23142.
57 M. Lukaczynska, E. A. Mernissi Cherigui, K. Van Den, J. DeStrycker, H. Terryn and J. Ustarroz, Electrochim. Acta, 2019,319, 690–704.
58 V. Zoete, M. A. Cuendet, A. Grosdidier and O. Michielin, J.Comput. Chem., 2011, 32, 2359–2368.
59 T. Darden, D. York and L. Pedersen, J. Chem. Phys., 1993, 98,10089–10092.
60 W. Humphrey, A. Dalke and K. Schulten, J. Mol. Graphics,1996, 14, 33–38.
61 M. V. Fedorov and A. A. Kornyshev, Chem. Rev., 2014, 114,2978–3036.
62 S. Baldelli, Acc. Chem. Res., 2008, 41, 421–431.63 S. Lamperski, C. Outhwaite and L. Bhuiyan, J. Phys. Chem. B,
2010, 114, 3075.64 D. C. Grahame, Chem. Rev., 1947, 41, 441–501.65 G. Jiang, C. Cheng, D. Li and J. Z. Liu, Nano Res., 2016, 9,
174–186.66 M. H. Mamme, S. Moors, H. Terryn, J. Deconinck, J. Ustarroz
and F. De Pro, J. Phys. Chem. Lett., 2018, 9, 6296–6304.
This journal is © The Royal Society of Chemistry 2019