Meta-analysis of viscosity of aqueous deep eutectic ... - Nature
11
1 Vol.:(0123456789) Scientific Reports | (2020) 10:21395 | https://doi.org/10.1038/s41598-020-78101-y www.nature.com/scientificreports Meta‑analysis of viscosity of aqueous deep eutectic solvents and their components Gudrun Gygli 1,3 , Xinmeng Xu 2,3 & Jürgen Pleiss 2* Deep eutectic solvents (DES) formed by quaternary ammonium salts and hydrogen bond donors are a promising green alternative to organic solvents. Their high viscosity at ambient temperatures can limit biocatalytic applications and therefore requires fine‑tuning by adjusting water content and temperature. Here, we performed a meta‑analysis of the impact of water content and temperature on the viscosities of four deep eutectic solvents (glyceline, reline, N,N‑diethylethanol ammonium chloride‑glycerol, N,N‑diethylethanol ammonium chloride‑ethylene glycol), their components (choline chloride, urea, glycerol, ethylene glycol), methanol, and pure water. We analyzed the viscosity data by an automated workflow, using Arrhenius and Vogel–Fulcher–Tammann–Hesse models. The consistency and completeness of experimental data and metadata was used as an essential criterion of data quality. We found that viscosities were reported for different temperature ranges, half the time without specifying a method of desiccation, and in almost half of the reports without specifying experimental errors. We found that the viscosity of the pure components varied widely, but that all aqueous mixtures (except for reline) have similar excess activation energy of viscous flow E excess η = 3–5 kJ/mol, whereas reline had a negative excess activation energy ( E excess η = − 19 kJ/mol). The data and workflows used are accessible at https://doi.org/10.15490/FAIRDOMHUB.1.STUDY.767.1. Deep eutectic solvents (DES) are mixtures of a quaternary ammonium salt and a hydrogen bond donor, which are of growing interest in biocatalysis and chemistry as a green alternative to organic solvents 1–3 . eir melting points are lower than that of their components, and they readily mix with water. Because DESs are efficient sol- vents for hydrophobic substrates and benign towards enzymes 4–6 , they are promising media for enzyme catalyzed reactions under non-aqueous conditions. Unfortunately, their high viscosity at ambient temperatures limits their applicability in biocatalysis. Adding small amounts of water or increasing the temperature decreases the viscosity and increases catalytic activity 6–8 . However, catalytic activity has a sharp optimum of water content and tempera- ture: at high water content, undesired side reactions involving water becomes limiting, and at high temperature catalytic activity decrease due to thermal inactivation of the enzyme 9 . erefore, the dependency of viscosity on temperature and on water content is crucial for designing biocatalytic processes with DES. Another crucial parameter for designing DES is the molar ratio of the DES components. While the temperature dependency of viscosity can be modelled phenomenologically using the linear Arrhenius model or the Vogel–Fulcher–Tam- man–Hesse model (VFT) 10–12 , no general model for the deviation of the viscosity of aqueous DES–water mixtures from ideal mixing is available. Experimentally determined viscosities of DES–water mixtures under varying water content and temperature are becoming more prevalent 13–36 . Due to the wealth of data available, it is now possible to perform meta-analyses of different mixtures at different temperatures and water contents. Meta-analyses are common practice in the health and environmental sciences 37 . Meta-analyses profit from complete and accessible data, from data quality estimates, and from community standards for data reporting. Completeness and standardization are crucial for the reporting of metadata such as the experimental methods, information about the devices used for viscosity measurement, the temperature, the pressure, and the units of the reported values. Complete reporting of data and metadata is also essential for quality control 38 . Low quality data and incomplete reporting of experimental methods are the two major reasons for the observed reproducibility crisis 39 . Community standards such as the STRENDA guidelines for reporting of enzyme-catalyzed reactions 40,41 or the STROBE checklists for reporting of epidemiology data 42,43 have been OPEN 1 Institute for Biological Interfaces (IBG 1), Karlsruhe Institute of Technology (KIT), Hermann-von-Helmholtz-Platz 1, 76344 Karlsruhe, Germany. 2 Institute of Biochemistry and Technical Biochemistry, University of Stuttgart, Allmandring 31, 70569 Stuttgart, Germany. 3 These authors contributed equally: Gudrun Gygli and Xinmeng Xu. * email: [email protected]
-
Upload
khangminh22 -
Category
Documents
-
view
0 -
download
0
Transcript of Meta-analysis of viscosity of aqueous deep eutectic ... - Nature

1
Vol.:(0123456789)
Scientific Reports | (2020) 10:21395 | https://doi.org/10.1038/s41598-020-78101-y
www.nature.com/scientificreports
Meta‑analysis of viscosity of aqueous deep eutectic solvents and their componentsGudrun Gygli1,3, Xinmeng Xu2,3 & Jürgen Pleiss 2*
Deep eutectic solvents (DES) formed by quaternary ammonium salts and hydrogen bond donors are a promising green alternative to organic solvents. Their high viscosity at ambient temperatures can limit biocatalytic applications and therefore requires fine‑tuning by adjusting water content and temperature. Here, we performed a meta‑analysis of the impact of water content and temperature on the viscosities of four deep eutectic solvents (glyceline, reline, N,N‑diethylethanol ammonium chloride‑glycerol, N,N‑diethylethanol ammonium chloride‑ethylene glycol), their components (choline chloride, urea, glycerol, ethylene glycol), methanol, and pure water. We analyzed the viscosity data by an automated workflow, using Arrhenius and Vogel–Fulcher–Tammann–Hesse models. The consistency and completeness of experimental data and metadata was used as an essential criterion of data quality. We found that viscosities were reported for different temperature ranges, half the time without specifying a method of desiccation, and in almost half of the reports without specifying experimental errors. We found that the viscosity of the pure components varied widely, but that all aqueous mixtures (except for reline) have similar excess activation energy of viscous flow Eexcess
η =
3–5 kJ/mol, whereas reline had a negative excess activation energy ( Eexcess
η = − 19 kJ/mol). The data and
workflows used are accessible at https ://doi.org/10.15490 /FAIRD OMHUB .1.STUDY .767.1.
Deep eutectic solvents (DES) are mixtures of a quaternary ammonium salt and a hydrogen bond donor, which are of growing interest in biocatalysis and chemistry as a green alternative to organic solvents1–3. Their melting points are lower than that of their components, and they readily mix with water. Because DESs are efficient sol-vents for hydrophobic substrates and benign towards enzymes4–6, they are promising media for enzyme catalyzed reactions under non-aqueous conditions. Unfortunately, their high viscosity at ambient temperatures limits their applicability in biocatalysis. Adding small amounts of water or increasing the temperature decreases the viscosity and increases catalytic activity6–8. However, catalytic activity has a sharp optimum of water content and tempera-ture: at high water content, undesired side reactions involving water becomes limiting, and at high temperature catalytic activity decrease due to thermal inactivation of the enzyme9. Therefore, the dependency of viscosity on temperature and on water content is crucial for designing biocatalytic processes with DES. Another crucial parameter for designing DES is the molar ratio of the DES components. While the temperature dependency of viscosity can be modelled phenomenologically using the linear Arrhenius model or the Vogel–Fulcher–Tam-man–Hesse model (VFT)10–12, no general model for the deviation of the viscosity of aqueous DES–water mixtures from ideal mixing is available.
Experimentally determined viscosities of DES–water mixtures under varying water content and temperature are becoming more prevalent13–36. Due to the wealth of data available, it is now possible to perform meta-analyses of different mixtures at different temperatures and water contents. Meta-analyses are common practice in the health and environmental sciences37. Meta-analyses profit from complete and accessible data, from data quality estimates, and from community standards for data reporting. Completeness and standardization are crucial for the reporting of metadata such as the experimental methods, information about the devices used for viscosity measurement, the temperature, the pressure, and the units of the reported values. Complete reporting of data and metadata is also essential for quality control38.
Low quality data and incomplete reporting of experimental methods are the two major reasons for the observed reproducibility crisis39. Community standards such as the STRENDA guidelines for reporting of enzyme-catalyzed reactions40,41 or the STROBE checklists for reporting of epidemiology data42,43 have been
OPEN
1Institute for Biological Interfaces (IBG 1), Karlsruhe Institute of Technology (KIT), Hermann-von-Helmholtz-Platz 1, 76344 Karlsruhe, Germany. 2Institute of Biochemistry and Technical Biochemistry, University of Stuttgart, Allmandring 31, 70569 Stuttgart, Germany. 3These authors contributed equally: Gudrun Gygli and Xinmeng Xu. *email: [email protected]
2
Vol:.(1234567890)
Scientific Reports | (2020) 10:21395 | https://doi.org/10.1038/s41598-020-78101-y
www.nature.com/scientificreports/
proposed, but still are not fully accepted by the scientific community. Enforcing guidelines upon publication was successful to improve quality and reproducibility of crystal structure data in the Protein Data Bank (PDB)44,45, but required cooperation between the scientific community and the scientific journals.
Meta-analyses would greatly benefit from machine readable data, thus automating the selection of relevant sources and the extraction of data and metadata from sources. Machine readable data can be collected and ana-lyzed by automated workflows, therefore replacing time intensive and error prone manual search, extraction, and analysis of data. Consequently, machine readability and automation is crucial to guarantee completeness and consistency of data as proposed by the F.A.I.R. guidelines (Findable, Accessible, Interoperable, Reusable)46. Therefore, data should not be hidden in publications as plain text, tables, or figures. Instead, data and metadata should be reported in an exchange format such as XML, which allows data to be linked to dictionaries contain-ing pre-defined ontologies. The Chemical Markup Language (CML) has been developed to represent chemical information47 and has been used previously to store structured data on the density, viscosity, conductivity, and water activity of DES48.
In this study, published data on the viscosity of aqueous solution of two salts (choline chloride, ChCl and N,N-diethylethanol ammonium chloride, DAC), three hydrogen bond donors (urea, glycerol, and ethylene glycol), and the respective DESs were collected and systematically analyzed. For comparison, pure water and aqueous methanol mixtures were included in the analysis. To our knowledge, this is the first time that viscosity data from a large number of aqueous DES mixtures at different temperatures have been collected, compared, and consist-ently analyzed by an Arrhenius model and the Vogel–Fulcher–Tamman–Hesse model, thus demonstrating the challenges of data quality and validation methods and the value of data integration and analysis48.
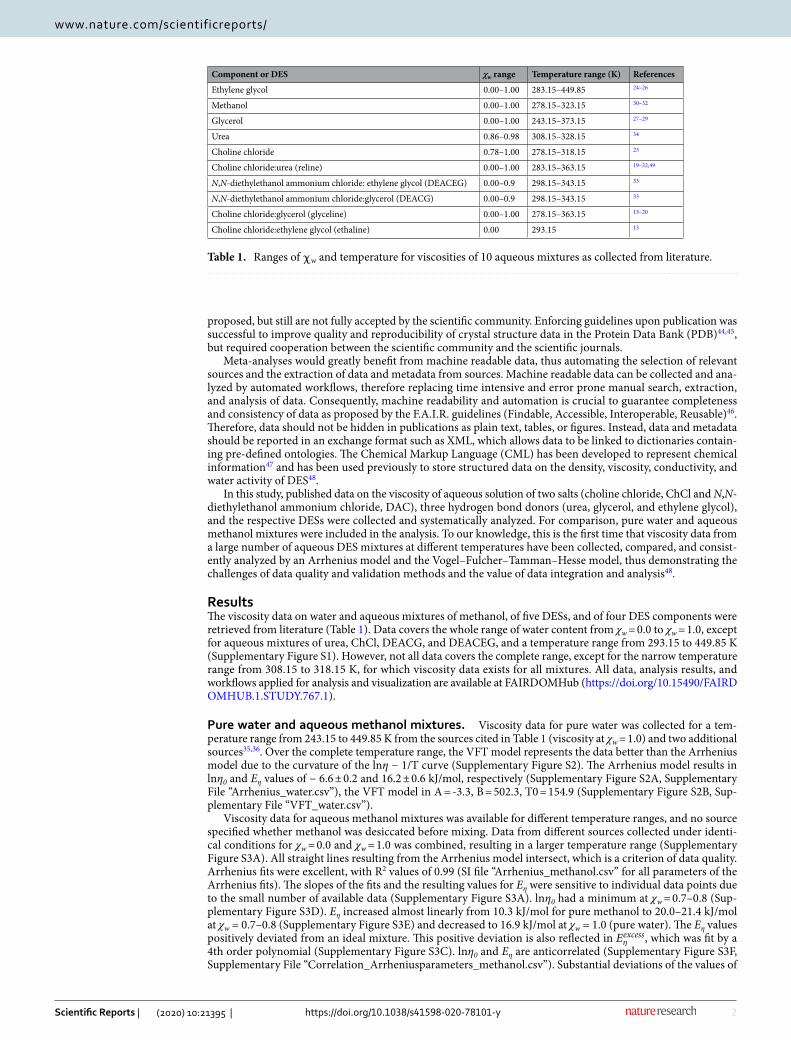
ResultsThe viscosity data on water and aqueous mixtures of methanol, of five DESs, and of four DES components were retrieved from literature (Table 1). Data covers the whole range of water content from χw = 0.0 to χw = 1.0, except for aqueous mixtures of urea, ChCl, DEACG, and DEACEG, and a temperature range from 293.15 to 449.85 K (Supplementary Figure S1). However, not all data covers the complete range, except for the narrow temperature range from 308.15 to 318.15 K, for which viscosity data exists for all mixtures. All data, analysis results, and workflows applied for analysis and visualization are available at FAIRDOMHub (https ://doi.org/10.15490 /FAIRD OMHUB .1.STUDY .767.1).
Pure water and aqueous methanol mixtures. Viscosity data for pure water was collected for a tem-perature range from 243.15 to 449.85 K from the sources cited in Table 1 (viscosity at χw = 1.0) and two additional sources35,36. Over the complete temperature range, the VFT model represents the data better than the Arrhenius model due to the curvature of the lnη − 1/T curve (Supplementary Figure S2). The Arrhenius model results in lnη0 and Eη values of − 6.6 ± 0.2 and 16.2 ± 0.6 kJ/mol, respectively (Supplementary Figure S2A, Supplementary File “Arrhenius_water.csv”), the VFT model in A = -3.3, B = 502.3, T0 = 154.9 (Supplementary Figure S2B, Sup-plementary File “VFT_water.csv”).
Viscosity data for aqueous methanol mixtures was available for different temperature ranges, and no source specified whether methanol was desiccated before mixing. Data from different sources collected under identi-cal conditions for χw = 0.0 and χw = 1.0 was combined, resulting in a larger temperature range (Supplementary Figure S3A). All straight lines resulting from the Arrhenius model intersect, which is a criterion of data quality. Arrhenius fits were excellent, with R2 values of 0.99 (SI file “Arrhenius_methanol.csv” for all parameters of the Arrhenius fits). The slopes of the fits and the resulting values for Eη were sensitive to individual data points due to the small number of available data (Supplementary Figure S3A). lnη0 had a minimum at χw = 0.7–0.8 (Sup-plementary Figure S3D). Eη increased almost linearly from 10.3 kJ/mol for pure methanol to 20.0–21.4 kJ/mol at χw = 0.7–0.8 (Supplementary Figure S3E) and decreased to 16.9 kJ/mol at χw = 1.0 (pure water). The Eη values positively deviated from an ideal mixture. This positive deviation is also reflected in Eexcessη , which was fit by a 4th order polynomial (Supplementary Figure S3C). lnη0 and Eη are anticorrelated (Supplementary Figure S3F, Supplementary File “Correlation_Arrheniusparameters_methanol.csv”). Substantial deviations of the values of
Table 1. Ranges of χw and temperature for viscosities of 10 aqueous mixtures as collected from literature.
Component or DES χw range Temperature range (K) References
Ethylene glycol 0.00–1.00 283.15–449.85 24–26
Methanol 0.00–1.00 278.15–323.15 30–32
Glycerol 0.00–1.00 243.15–373.15 27–29
Urea 0.86–0.98 308.15–328.15 34
Choline chloride 0.78–1.00 278.15–318.15 23
Choline chloride:urea (reline) 0.00–1.00 283.15–363.15 19–22,49
N,N-diethylethanol ammonium chloride: ethylene glycol (DEACEG) 0.00–0.9 298.15–343.15 33
N,N-diethylethanol ammonium chloride:glycerol (DEACG) 0.00–0.9 298.15–343.15 33
Choline chloride:glycerol (glyceline) 0.00–1.00 278.15–363.15 13–20
Choline chloride:ethylene glycol (ethaline) 0.00 293.15 13

3
Vol.:(0123456789)
Scientific Reports | (2020) 10:21395 | https://doi.org/10.1038/s41598-020-78101-y
www.nature.com/scientificreports/
Eη derived from two sources31,32 were observed at χw = 0.7–0.9 (Supplementary Figure E). These deviations are due to the consistently steeper slopes obtained by the Arrhenius fits for the data from31 compared to the other data. Notably, the 4th order fit of Eexcessη fits better to the data from32 (Supplementary Figure S3C). Fits using the VFT model resulted in excellent fits (R2 = 0.99), but not only with convex curvature, but also with almost linear and even concave curvature (Supplementary Figure S3B, see Supplementary File “VFT_methanol.csv” and Sup-plementary Figure S4A–C for all VFT-parameters (A, B and T0, respectively).
Aqueous binary mixtures of DES components. Aqueous solutions of ChCl and urea are limited by the solubility of the salts in water, leading to a narrow range of χw that was studied (Table 1). Viscosity data for ethaline was only available for one temperature and the pure DES. Therefore, no further analysis was performed for these mixtures.
Viscosity data for aqueous glycerol mixtures was available for different temperature ranges and no source specified whether glycerol was desiccated before mixing (Supplementary Figures S5A, S6A, S7A). By combin-ing data from different sources collected under identical χw in the range 0.5–1.0, a larger temperature range was covered (Supplementary Figure S5). Performing Arrhenius modelling for different temperature ranges resulted in different fits. For each range, the fits were excellent (SI file “Arrhenius_glycerol.csv” for all parameters of the Arrhenius fits). All straight lines resulting from the Arrhenius model intersected for data from the same source. The source of the data influenced the slopes of the fits, and therefore lnη0 and Eη values, Eexcessη and the relationship between lnη0 and Eη (Supplementary Figure S5C–F, Supplementary File “Correlation_Arrheniusparameters_glyc-erol.csv”,). Therefore, a separate analysis was performed for data from each source (Supplementary Figures S6, S7). lnη0 and Eη values were calculated from the Arrhenius fits using Eq. (4) (Supplementary Figures S6D,E, S7D,E). Eη decreased with increasing χw with a slightly concave curvature (Supplementary Figures S6E, S7E). For data from Sheely et al. Eη was 63.9 kJ/mol for pure glycerol and 17.3 kJ/mol for pure water28 (Supplementary Figure S6E). For data from Segur et al., Eη was 56.3 kJ/mol for pure glycerol and 15.4 kJ/mol for pure water27 (Supplementary Figure S7E). The positive deviation of Eη from an ideal mixture was reflected in a positive Eexcessη , which was fit by a 4th order polynomial (Supplementary Figures S6C, S7C). lnη0 and Eη were anticorrelated (Sup-plementary Figures S6F, S7F, “Correlation_Arrheniusparameters_glycerol_DOI1.csv”, “Correlation_Arrheniuspa-rameters_glycerol_DOI2.csv”). The two series of Eη values can be explained by the consistently steeper slopes of the Arrhenius fits for the data from Sheely et al.28 as compared to the data from Segur et al.27. The deviation from an ideal mixture ( Eexcessη ) was smallest for data from Segur et al.27 (Supplementary Figure S7C, see Supplementary Figures S5C, S6C for comparison). The size of the error bars depended on the number of data points available to perform Arrhenius fits, resulting in larger error bars if more data is available (Supplementary Figures S6D,E vs S7D,E). The VFT model resulted in excellent fits (Supplementary Figures S5B, S6B, S7B, see Supplementary File “VFT_glycerol.csv”, “VFT_glycerol_DOI1.csv”, “VFT_glycerol_DOI2.csv” and Supplementary Figures S8A–C for all VFT-parameters (A, B and T0, respectively) of all data, S8D, E, and F for data from Sheely et al.28 and S8G, H and I for data from Segur et al.27).
Viscosity data for aqueous ethylene glycol mixtures was available for different temperature ranges, and data from Sun et al.25 covered the highest temperatures (Supplementary Figure S9A). Only one source24 specified how ethylene glycol was desiccated before mixing (Supplementary Figures S9A,B, S10A,B). Data from different sources collected under identical χw (0.9–1.0) was combined (Supplementary Figure S9A). Arrhenius fits were excellent (SI file “Arrhenius_ ethylene glycol.csv” for all parameters of the Arrhenius fits). Straight lines resulting from the Arrhenius model intersected for data from the same source.
The source of the data influenced the slopes of the fits, and therefore lnη0 and Eη values, Eexcessη and the relationship between lnη0 and Eη (Supplementary Figure S9C–F, Supplementary File “Correlation_Arrhenius-parameters_ethylene glycol.csv”). Therefore a separate analysis was performed for data from Yang et al.24 (Sup-plementary Figure S10). lnη0 and Eη values were calculated from the Arrhenius fits using Eq. (4) (Supplementary Figure S10D,E). Eη was 27.4 kJ/mol for pure ethylene glycol and 14.8 kJ/mol for pure water (Supplementary Figure S10E). The Eη values deviated from an ideal mixture (Supplementary Figure S10E). The positive deviation was reflected in Eexcessη , which was fit by a 4th order polynomial (Supplementary Figure S10C). lnη0 and Eη were anticorrelated (Supplementary Figure S10F Supplementary File “Correlation_Arrheniusparameters_ethylene glycol_DOI1.csv”). The VFT model resulted in excellent fits (Supplementary Figure S10B, see Supplementary File “VFT_ethylene glycol_DOI1.csv” and Supplementary Figure S11A–C for all VFT-parameters (A, B and T0, respectively) of all data, S11D, E, and F for data from Yang et al.24).
DES mixtures. Viscosity data for aqueous reline mixtures was available mostly from one source21, but multi-ple sources reported data for pure reline. Only one source49 specified how the DES components were desiccated before mixing (Fig. 1A,B). Arrhenius fits were excellent (R2 = 0.99, Supplementary File “Arrhenius_ reline.csv” for all parameters of the Arrhenius fits), and all straight lines resulting from the Arrhenius model intersected (Fig. 1A). lnη0 and Eη values were calculated from the Arrhenius fits using Eq. (4) (Fig. 1D,E). Eη was 51.2 kJ/mol for pure reline and 12.4 kJ/mol for pure water, and the values deviated considerably from an ideal mixture (Fig. 1E). The Eη deviations resulted in negative values for Eexcessη , which was fit by a 4th order polynomial (Fig. 1C). lnη0 and Eη were anticorrelated (Fig. 1F, Supplementary File “Correlation_Arrheniusparameters_reline.csv”). Fits using the VFT model were excellent (R2 = 0.99, Fig. 1B, see Supplementary File “VFT_reline.csv” and Supplementary Figures S12A, B, and C for all VFT-parameters (A, B and T0, respectively).
Viscosity data for glyceline–water mixtures was available mostly from one source15, but multiple sources reported data for pure glyceline. Only one source16 specified how the DES components were desiccated before mixing (Fig. 2A,B). Arrhenius fits were excellent (SI file “Arrhenius_glyceline.csv” for all parameters of the Arrhenius fits), and all straight lines resulting from the Arrhenius model intersected. lnη0 and Eη values were

4
Vol:.(1234567890)
Scientific Reports | (2020) 10:21395 | https://doi.org/10.1038/s41598-020-78101-y
www.nature.com/scientificreports/
calculated from the Arrhenius fits using Eq. (4) (Fig. 2D,E). Eη was 42.3 kJ/mol for pure glyceline and 14.0 kJ/mol for pure water (Fig. 2E). The Eη values deviated from an ideal mixture (Fig. 2E), resulting in positive values of Eexcessη (Fig. 2C). The data could not be fitted by a 4th order polynomial fit of good quality, mainly due to an outlier from one source16 (Fig. 2C). lnη0 and Eη were anticorrelated (Fig. 2F, Supplementary File “Correla-tion_Arrheniusparameters_glyceline.csv”). Fits using the VFT model were excellent (Fig. 2B, see Supplementary File “VFT_glyceline.csv” and Supplementary Figure S13A–C for all VFT-parameters (A, B and T0, respectively).
Viscosity data for aqueous DEACG mixtures was available from a single source33 (Supplementary Fig-ure S14A). Arrhenius fits were excellent (SI file “Arrhenius_DEACG.csv” for all parameters of the Arrhenius fits), and all straight lines resulting from the Arrhenius model intersected. lnη0 and Eη values were calculated from the Arrhenius fits using Eq. (4) (Supplementary Figure S14D,E). Eη was 46.7 kJ/mol for pure DEACG and 19.1 kJ/mol for χw = 0.9 (Supplementary Figure S14E). The Eη values deviated from an ideal mixture (Supplementary Figure S14E), resulting in positive values of Eexcessη , which were fit by a 4th order polynomial (Supplementary Figure S14C). lnη0 and Eη were anticorrelated (Supplementary Figure S14F, Supplementary File “Correlation_Arrheniusparameters_DEACG.csv”). Fits using the VFT model were excellent [Supplementary Figure S14B, see Supplementary File “VFT_DEACG.csv” and Supplementary Figure S15A–C for all VFT-parameters (A, B and T0, respectively)].
Viscosity data for aqueous DEACEG mixtures was available from a single source33 (Supplementary Fig-ure S16A). Arrhenius fits were excellent (SI file “Arrhenius_DEACEG.csv” for all parameters of the Arrhenius fits), and all straight lines resulting from the Arrhenius model intersected. lnη0 and Eη were calculated from the Arrhenius fits using Eq. (4) (Supplementary Figure S16D,E). Eη was 30.4 kJ/mol for pure DEACEG and 17.3 kJ/mol for χw = 0.9 (Supplementary Figure S16E). The Eη values deviated from an ideal mixture (Supplementary Figure S16E), resulting in positive values of Eexcessη , which were fit by a 4th order polynomial (Supplementary Figure S16C). lnη0 and Eη were anticorrelated (Supplementary Figure S16F, Supplementary File “Correlation_Arrheniusparameters_DEACEG.csv”), but the quality of the fit was influenced by deviating data points at low and high Eη. The 4th order fit of Eexcessη was excellent (Supplementary Figure S16C). Fits using the VFT model
Figure 1. Reline–water mixtures. (A) Arrhenius fits (using a minimum of 3 data points). Dots and thick lines are the experimental data and the respective fit. The dashed lines are extensions of the fit. Colors of the dashed lines indicate the source of the data. Yellow: multiple data points from different sources were be combined. (B) VFT fits using a minimum of 4 data points. (C) Eexcessη calculated based on the red line in (E). Colors of the data points indicate the source of the data. (D) lnη0 at different χw. Error bars are calculated based on the fit in (A). Colors of the dashed lines indicate source of the data. (E) Eη at different χw. The red line indicates the behavior of an ideal binary mixture and was used to calculate Eexcessη . (F) Correlation between lnη0 and Eη.

5
Vol.:(0123456789)
Scientific Reports | (2020) 10:21395 | https://doi.org/10.1038/s41598-020-78101-y
www.nature.com/scientificreports/
were excellent [Supplementary Figure S16B, see Supplementary File “VFT_DEACEG.csv” and Supplementary Figure S17A–C for all VFT-parameters (A, B and T0, respectively)].
DiscussionExperimental data on viscosity of aqueous DES mixtures and their components was found for the whole range of χw between 0 and 1 (except for urea, ChCl, DEACG, and DEACEG), though the temperature ranges of each source differed and overlapped only for a narrow region between 308.15 and 318.15 K. Because lnη was not strictly linear in T−1, but slightly convex, Eη and lnη0 as obtained by the Arrhenius model depended on the ana-lyzed temperature range. Therefore, for methanol, glycerol, and ethylene glycol mixtures, separate data analyses were performed for datasets from different sources, resulting in different dependencies of Eη(χw) and lnη0(χw).
Fitting lnη−1/T data by an Arrhenius model requires viscosity to be measured for at least three different temperatures. However, combining data from different sources to derive Eη(χw) and lnη0(χw) was not always possible, because the values of χw at which viscosity was measured differed between the sources by more than 0.05. As a consequence, for many mixtures the number of different temperatures reported was too small for a reliable analysis, resulting in a considerable loss of data during analysis. For aqueous glyceline mixtures, data was collected from eight different sources (SI, exp_ChCl_glycerol.csv), but only data from two sources could be used for the analyses by the Arrhenius model. Therefore, guidelines for a more systematic exploration of temperature ranges and a minimal number of data points to report are needed for compatibility between data from different sources, which then can be used for a consistent data analysis.
A major experimental challenge is the high hygroscopy of DES and the sensitive dependence of viscosity on the water content, especially at χw close to 050–52. However, only half of the sources reported the method of desiccation of the DES components prior to experimentation. For glyceline–water mixtures, data from sources which reported the desiccation method and from sources which did not report the method were consistent (Fig. 2), whereas for aqueous glycerol and ethylene glycol mixtures, the lack of reporting the desiccation method resulted in outliers (Supplementary Figures S5 or S9) or substantial deviations in data from different sources
Figure 2. Glyceline–water mixtures. (A) Arrhenius fits (using a minimum of 3 data points). Dots and thick lines are the experimental data and the respective fit. The dashed lines are extensions of the fit. Colors of the dashed lines indicate the source of the data. Yellow: multiple data points from different sources were be combined. (B) VFT fits using a minimum of 4 data points. (C) Eexcessη , calculated based on the red line in (E). Colors of the data points indicate the source of the data. (D) lnη0 at different χw. Error bars are calculated based on the fit in (A). Colors of the dashed lines indicate source of the data. (E) Eη at different χw, same logic as (D). The red line indicates the behavior of an ideal binary mixture and was used to calculate Eexcessη . (F) Correlation between lnη0 and Eη.

6
Vol:.(1234567890)
Scientific Reports | (2020) 10:21395 | https://doi.org/10.1038/s41598-020-78101-y
www.nature.com/scientificreports/
(e.g. methanol–water mixtures, Supplementary Figure S3). Therefore, we support previous calls for community standards on measurement protocols and the complete reporting of metadata to ensure reproducibility39.
A comprehensive analysis of data from different sources is pivotal for assessing the quality of individual data sources. For reline and glyceline–water mixtures, data retrieved from a source in a predatory journal53 (as per these lists: https ://beall slist .net/ and https ://preda toryj ourna ls.com/journ als/#I) behaved completely different from data from other sources (Figs. 1, 2 vs Fig. 3 and Supplementary Figure S18A–F). This data also deviated from the other data in the Arrhenius fits (Fig. 3A), resulting in a linear rather than a convex dependency of lnη0
Figure 3. Dubious quality data for reline-water mixtures. (A) Arrhenius fits (using a minimum of 3 data points). Dots and thick lines are the experimental data and the respective fit. The dashed lines are extensions of the fit. Colors of the dashed lines indicate the source of the data. Yellow means multiple data points from different sources were be combined. (B) VFT fits (using a minimum of 4 data points). (C) Eexcessη , calculated based on the red line in (E). Colors of the data points indicate the source of the data. (D) lnη0 at different χw. Error bars are calculated based on the fit in (A).The red arrow highlights the data point affected by a presumed typo. Colors of the dashed lines indicate the source of the data. Yellow means multiple data points from different sources were be combined. (E) Eη at different χw. The red line indicates the behavior of an ideal binary mixture and was used to calculate Eexcessη (C). (F) Correlation between lnη0 and Eη. (G–I): same as (D–F), but without data from the source in a predatory journal, but with the data point affected by a presumed typo (red arrow in G).
7
Vol.:(0123456789)
Scientific Reports | (2020) 10:21395 | https://doi.org/10.1038/s41598-020-78101-y
www.nature.com/scientificreports/
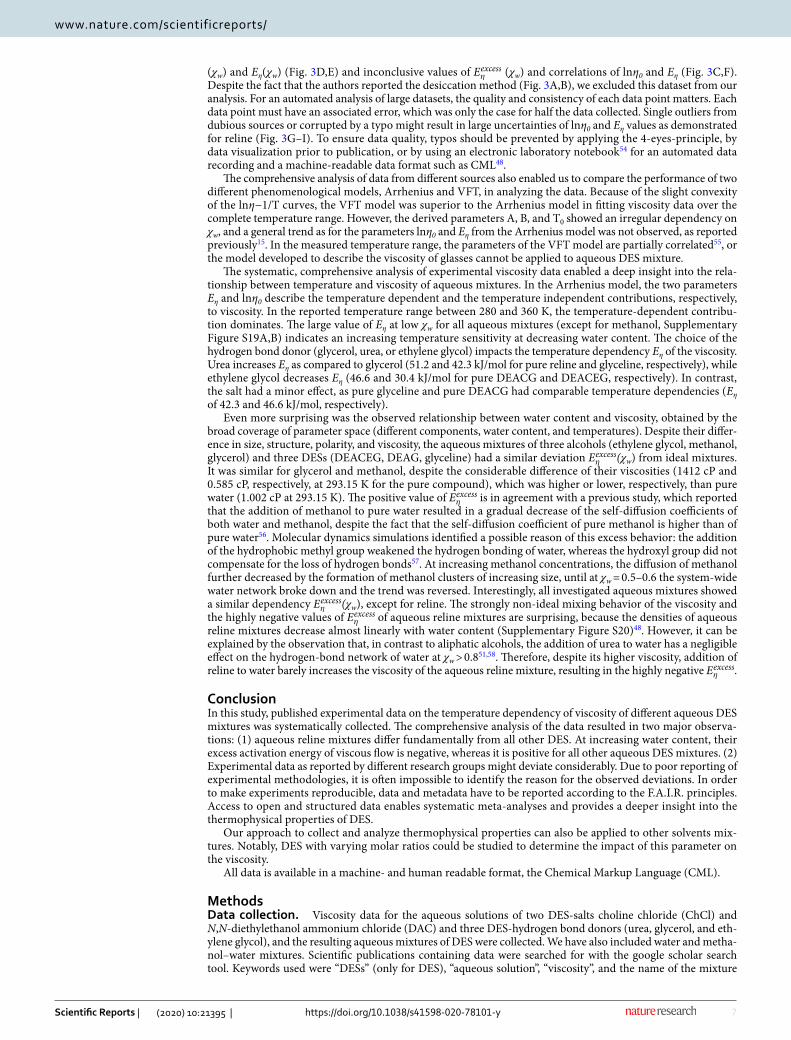
(χw) and Eη(χw) (Fig. 3D,E) and inconclusive values of Eexcessη (χw) and correlations of lnη0 and Eη (Fig. 3C,F). Despite the fact that the authors reported the desiccation method (Fig. 3A,B), we excluded this dataset from our analysis. For an automated analysis of large datasets, the quality and consistency of each data point matters. Each data point must have an associated error, which was only the case for half the data collected. Single outliers from dubious sources or corrupted by a typo might result in large uncertainties of lnη0 and Eη values as demonstrated for reline (Fig. 3G–I). To ensure data quality, typos should be prevented by applying the 4-eyes-principle, by data visualization prior to publication, or by using an electronic laboratory notebook54 for an automated data recording and a machine-readable data format such as CML48.
The comprehensive analysis of data from different sources also enabled us to compare the performance of two different phenomenological models, Arrhenius and VFT, in analyzing the data. Because of the slight convexity of the lnη−1/T curves, the VFT model was superior to the Arrhenius model in fitting viscosity data over the complete temperature range. However, the derived parameters A, B, and T0 showed an irregular dependency on χw, and a general trend as for the parameters lnη0 and Eη from the Arrhenius model was not observed, as reported previously15. In the measured temperature range, the parameters of the VFT model are partially correlated55, or the model developed to describe the viscosity of glasses cannot be applied to aqueous DES mixture.
The systematic, comprehensive analysis of experimental viscosity data enabled a deep insight into the rela-tionship between temperature and viscosity of aqueous mixtures. In the Arrhenius model, the two parameters Eη and lnη0 describe the temperature dependent and the temperature independent contributions, respectively, to viscosity. In the reported temperature range between 280 and 360 K, the temperature-dependent contribu-tion dominates. The large value of Eη at low χw for all aqueous mixtures (except for methanol, Supplementary Figure S19A,B) indicates an increasing temperature sensitivity at decreasing water content. The choice of the hydrogen bond donor (glycerol, urea, or ethylene glycol) impacts the temperature dependency Eη of the viscosity. Urea increases Eη as compared to glycerol (51.2 and 42.3 kJ/mol for pure reline and glyceline, respectively), while ethylene glycol decreases Eη (46.6 and 30.4 kJ/mol for pure DEACG and DEACEG, respectively). In contrast, the salt had a minor effect, as pure glyceline and pure DEACG had comparable temperature dependencies (Eη of 42.3 and 46.6 kJ/mol, respectively).
Even more surprising was the observed relationship between water content and viscosity, obtained by the broad coverage of parameter space (different components, water content, and temperatures). Despite their differ-ence in size, structure, polarity, and viscosity, the aqueous mixtures of three alcohols (ethylene glycol, methanol, glycerol) and three DESs (DEACEG, DEAG, glyceline) had a similar deviation Eexcessη (χw) from ideal mixtures. It was similar for glycerol and methanol, despite the considerable difference of their viscosities (1412 cP and 0.585 cP, respectively, at 293.15 K for the pure compound), which was higher or lower, respectively, than pure water (1.002 cP at 293.15 K). The positive value of Eexcessη is in agreement with a previous study, which reported that the addition of methanol to pure water resulted in a gradual decrease of the self-diffusion coefficients of both water and methanol, despite the fact that the self-diffusion coefficient of pure methanol is higher than of pure water56. Molecular dynamics simulations identified a possible reason of this excess behavior: the addition of the hydrophobic methyl group weakened the hydrogen bonding of water, whereas the hydroxyl group did not compensate for the loss of hydrogen bonds57. At increasing methanol concentrations, the diffusion of methanol further decreased by the formation of methanol clusters of increasing size, until at χw = 0.5–0.6 the system-wide water network broke down and the trend was reversed. Interestingly, all investigated aqueous mixtures showed a similar dependency Eexcessη (χw), except for reline. The strongly non-ideal mixing behavior of the viscosity and the highly negative values of Eexcessη of aqueous reline mixtures are surprising, because the densities of aqueous reline mixtures decrease almost linearly with water content (Supplementary Figure S20)48. However, it can be explained by the observation that, in contrast to aliphatic alcohols, the addition of urea to water has a negligible effect on the hydrogen-bond network of water at χw > 0.851,58. Therefore, despite its higher viscosity, addition of reline to water barely increases the viscosity of the aqueous reline mixture, resulting in the highly negative Eexcessη .
ConclusionIn this study, published experimental data on the temperature dependency of viscosity of different aqueous DES mixtures was systematically collected. The comprehensive analysis of the data resulted in two major observa-tions: (1) aqueous reline mixtures differ fundamentally from all other DES. At increasing water content, their excess activation energy of viscous flow is negative, whereas it is positive for all other aqueous DES mixtures. (2) Experimental data as reported by different research groups might deviate considerably. Due to poor reporting of experimental methodologies, it is often impossible to identify the reason for the observed deviations. In order to make experiments reproducible, data and metadata have to be reported according to the F.A.I.R. principles. Access to open and structured data enables systematic meta-analyses and provides a deeper insight into the thermophysical properties of DES.
Our approach to collect and analyze thermophysical properties can also be applied to other solvents mix-tures. Notably, DES with varying molar ratios could be studied to determine the impact of this parameter on the viscosity.
All data is available in a machine- and human readable format, the Chemical Markup Language (CML).
MethodsData collection. Viscosity data for the aqueous solutions of two DES-salts choline chloride (ChCl) and N,N-diethylethanol ammonium chloride (DAC) and three DES-hydrogen bond donors (urea, glycerol, and eth-ylene glycol), and the resulting aqueous mixtures of DES were collected. We have also included water and metha-nol–water mixtures. Scientific publications containing data were searched for with the google scholar search tool. Keywords used were “DESs” (only for DES), “aqueous solution”, “viscosity”, and the name of the mixture
8
Vol:.(1234567890)
Scientific Reports | (2020) 10:21395 | https://doi.org/10.1038/s41598-020-78101-y
www.nature.com/scientificreports/
[ChCl, DAC, urea, glycerol, ethylene glycol, reline, glyceline, DAC-glycerol (DEACG), DAC-ethylene glycol (DEACEG), methanol or water]. Data was extracted from tables where possible, and if only plots were available, data was extracted using PlotDigitizer (version 2.6.8).
Most of the published datasets on aqueous mixtures also included the viscosity of pure water (χw = 1.0). These data points were analyzed separately and compared to viscosity data for pure water from two other sources35,36. The workflow used for handling, analyzing, and plotting data is available on FAIRDOMHub (https ://doi.org/10.15490 /FAIRD OMHUB .1.STUDY .767.1). All data sources are referenced by their DOI in the CML file.
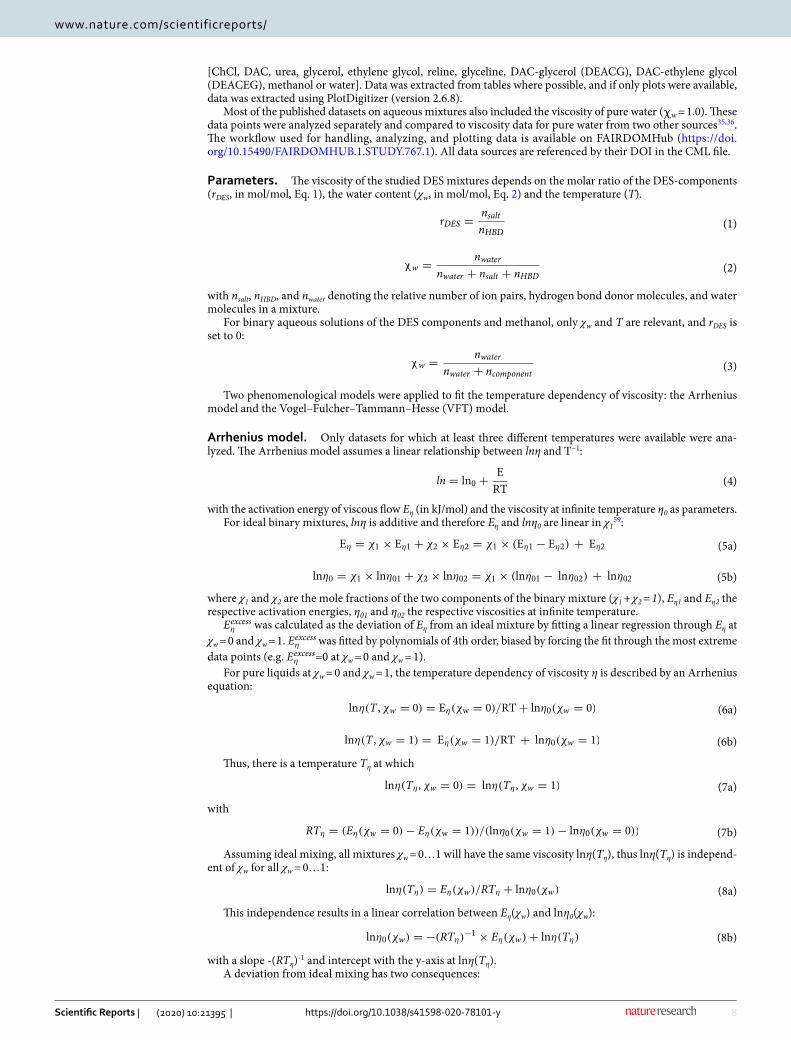
Parameters. The viscosity of the studied DES mixtures depends on the molar ratio of the DES-components (rDES, in mol/mol, Eq. 1), the water content (χw, in mol/mol, Eq. 2) and the temperature (T).
with nsalt, nHBD, and nwater denoting the relative number of ion pairs, hydrogen bond donor molecules, and water molecules in a mixture.
For binary aqueous solutions of the DES components and methanol, only χw and T are relevant, and rDES is set to 0:
Two phenomenological models were applied to fit the temperature dependency of viscosity: the Arrhenius model and the Vogel–Fulcher–Tammann–Hesse (VFT) model.
Arrhenius model. Only datasets for which at least three different temperatures were available were ana-lyzed. The Arrhenius model assumes a linear relationship between lnη and T−1:
with the activation energy of viscous flow Eη (in kJ/mol) and the viscosity at infinite temperature η0 as parameters.For ideal binary mixtures, lnη is additive and therefore Eη and lnη0 are linear in χ1
59:
where χ1 and χ2 are the mole fractions of the two components of the binary mixture (χ1 + χ2 = 1), Eη1 and Eη2 the respective activation energies, η01 and η02 the respective viscosities at infinite temperature.
Eexcessη was calculated as the deviation of Eη from an ideal mixture by fitting a linear regression through Eη at χw = 0 and χw = 1. Eexcessη was fitted by polynomials of 4th order, biased by forcing the fit through the most extreme data points (e.g. Eexcessη =0 at χw = 0 and χw = 1).
For pure liquids at χw = 0 and χw = 1, the temperature dependency of viscosity η is described by an Arrhenius equation:
Thus, there is a temperature Tη at which
with
Assuming ideal mixing, all mixtures χw = 0…1 will have the same viscosity lnη(Tη), thus lnη(Tη) is independ-ent of χw for all χw = 0…1:
This independence results in a linear correlation between Eη(χw) and lnη0(χw):
with a slope -(RTη)-1 and intercept with the y-axis at lnη(Tη).A deviation from ideal mixing has two consequences:
(1)rDES =nsalt
nHBD
(2)χw =nwater
nwater + nsalt + nHBD
(3)χw =nwater
nwater + ncomponent
(4)ln = ln0 +E
RT
(5a)Eη = χ1 × Eη1 + χ2 × Eη2 = χ1 × (Eη1 − Eη2) + Eη2
(5b)lnη0 = χ1 × lnη01 + χ2 × lnη02 = χ1 × (lnη01 − lnη02) + lnη02
(6a)lnη(T ,χw = 0) = Eη(χw = 0)/RT+ lnη0(χw = 0)
(6b)lnη(T ,χw = 1) = Eη(χw = 1)/RT + lnη0(χw = 1)
(7a)lnη(Tη ,χw = 0) = lnη(Tη ,χw = 1)
(7b)RTη = (Eη(χw = 0)− Eη(χw = 1))/(lnη0(χw = 1)− lnη0(χw = 0))
(8a)lnη(Tη) = Eη(χw)/RTη + lnη0(χw)
(8b)lnη0(χw) = −(RTη)−1
× Eη(χw)+ lnη(Tη)

9
Vol.:(0123456789)
Scientific Reports | (2020) 10:21395 | https://doi.org/10.1038/s41598-020-78101-y
www.nature.com/scientificreports/
1. Not all curves lnη(T, χw) will intersect at T = Tη (Eq. 8a)2. There will be deviations from the linear correlation (Eq. 8b)
For non-ideal mixtures, Eη(χw) deviates from its ideal value Eηideal(χw) by Eexcessη (χw) :
with
Because lnη0(χw) depends on Eη(χw) according to (Eq. 8b), lnη(T, χw) of a binary mixture can be predicted by determining by experiment or by simulation:
1. Eη and lnη0 of the two pure components (χw = 0 and χw = 1)2. Eexcessη (χw) of the binary mixtures
Vogel–Fulcher–Tammann–Hesse model. Only datasets for which at least four different temperatures were available were analyzed. The Vogel–Fulcher–Tammann–Hesse (VFT) model (Eq. 11) was developed to describe the temperature dependency of viscosity10–12 and can be applied to ionic liquids60–62.
The empirical constants A, B, and T0 were determined using initial parameters derived from Yadav et al. (A = − 2, B = 800, T0 = 170 K)15.
Data quality. The data sets were manually curated and checked to eliminate copy-paste errors. A recurring issue was the use of “,” or “.” as a symbol for the decimal point when using the “German-language-Microsoft-Excel”. This issue lead to 0,809 (instead of 0.809) to become 809, when the csv file was opened in Excel. A further complication was the use of different units (e.g. mP or cP). One data point from 10.1021/je5001796 was removed because it was assumed to be a typing error (η = 17.742 cP at rDES = 0.5, T = 353.15 K, χw = 0.126, see Discussion, Supplementary Figure S10, S18). Data from a source in a predatory journal53 (as per these lists: https ://beall slist .net/ and https ://preda toryj ourna ls.com/journ als/#I) was also removed (see “Discussion”, Supplementary Figs. S18. S19).
Chemical markup language. The chemical markup language (CML) was used to integrate the viscos-ity data retrieved from literature. The data was copied manually from literature into csv files, which were then converted to CML using Python scripts as previously described. The CML concepts were defined using the CompChem Convention63 to describe mixtures and their viscosities, the origin of the data (experiment), data properties (DOI, ID, value, error), and parameters (molar ratio of DES, mole fraction of water, and temperature). As previously described, the CML data was then analyzed and visualized using Python scripts48.
Workflow used for analysis. The analysis scripts are organized in a workflow which requires the user to modify the names.py script and run the wrapper.py script. Names.py contains the name of files and parameters that will be analyzed with the workflow. Data can be filtered using the variables ‘quality’, ‘variables’ and ‘myfilters’. Wrapper.py will import all the required functionalities from the provided scripts. Details can be found in sec-tion 2 in Supplementary Information (“Instructions for using the workflow”).
XML files were written and parsed with xml.etree.cElementTree64. The values of Eη and lnη0 and their error estimates were obtained by the curve_fit function from Scipy65. The fitting of excess Eη was achieved through numpy Polynomial module66. The figures were visualized by python modules matplotlib.pyplot67 and library seaborn69. Additional python libraries used were pandas69, sys70, os71, subprocess72.
Received: 25 August 2020; Accepted: 5 November 2020
References 1. Torregrosa-Crespo, J., Marset, X., Guillena, G., Ramón, D. J. & María Martínez-Espinosa, R. New guidelines for testing “Deep
eutectic solvents” toxicity and their effects on the environment and living beings. Sci. Total Environ. 704, 135382 (2020). 2. Kudłak, B., Owczarek, K. & Namieśnik, J. Selected issues related to the toxicity of ionic liquids and deep eutectic solvents—a review.
Environ. Sci. Pollut. Res. 22, 11975–11992 (2015). 3. Radošević, K. et al. Evaluation of toxicity and biodegradability of choline chloride based deep eutectic solvents. Ecotoxicol. Environ.
Saf. 112, 46–53 (2015). 4. Vanda, H., Dai, Y., Wilson, E. G., Verpoorte, R. & Choi, Y. H. Green solvents from ionic liquids and deep eutectic solvents to natural
deep eutectic solvents. Comptes Rendus Chim. 21, 628–638 (2018). 5. Kim, S. H. et al. Effect of deep eutectic solvent mixtures on lipase activity and stability. J. Mol. Catal. B Enzym. 128, 65–72 (2016). 6. Juneidi, I., Hayyan, M., Hashim, M. A. & Hayyan, A. Pure and aqueous deep eutectic solvents for a lipase-catalysed hydrolysis
reaction. Biochem. Eng. J. 117, 129–138 (2017). 7. Gotor-Fernández, V. & Paul, C. E. Deep eutectic solvents for redox biocatalysis. J. Biotechnol. 293, 24–35 (2019).
(9)Eη(χw) = Eidealη (χw)+ Eexcessη (χw)
(10)Eidealη (χw) = (1− χw)× Eη(χw = 0)+ χw × Eη(χw = 1)
(11)ln = A+B
T − T0

10
Vol:.(1234567890)
Scientific Reports | (2020) 10:21395 | https://doi.org/10.1038/s41598-020-78101-y
www.nature.com/scientificreports/
8. Pätzold, M. et al. Deep Eutectic Solvents as Efficient Solvents in Biocatalysis. Trends Biotechnol. 37, 943–959 (2019). 9. Xu, P., Zheng, G. W., Zong, M. H., Li, N. & Lou, W. Y. Recent progress on deep eutectic solvents in biocatalysis. Bioresour. Bioprocess.
4, 20 (2017). 10. Vogel, H. Das Temperaturabhaengigkeitsgesetz der Viskositaet von Fluessigkeiten. Phys. Z. 22, 645 (1921). 11. Fulcher, G. S. Analysis of recent measurements of the viscosity of glasses. J. Am. Ceram. Soc. 8, 339–355 (1925). 12. Gustav Tammann, W. H. Die Abhängigkeit der Viscosität von der Temperatur bei unterkühlten Flüssigkeiten. Z. Anorg. Allg. Chem.
156, 245–257 (1926). 13. Abbott, A. P., Harris, R. C. & Ryder, K. S. Application of hole theory to define ionic liquids by their transport properties. J. Phys.
Chem. B 111, 4910–4913 (2007). 14. Dai, Y., van Spronsen, J., Witkamp, G. J., Verpoorte, R. & Choi, Y. H. Natural deep eutectic solvents as new potential media for
green technology. Anal. Chim. Acta 766, 61–68 (2013). 15. Yadav, A., Trivedi, S., Rai, R. & Pandey, S. Densities and dynamic viscosities of (choline chloride+glycerol) deep eutectic solvent
and its aqueous mixtures in the temperature range (283.15-363.15)K. Fluid Phase Equilib. 367, 135–142 (2014). 16. Lapeña, D., Lomba, L., Artal, M., Lafuente, C. & Giner, B. The NADES glyceline as a potential Green Solvent: A comprehensive
study of its thermophysical properties and effect of water inclusion. J. Chem. Thermodyn. 128, 164–172 (2019). 17. Alomar, M. K. et al. Glycerol-based deep eutectic solvents: Physical properties. J. Mol. Liq. 215, 98–103 (2016). 18. Abbott, A. P. et al. Glycerol eutectics as sustainable solvent systems. Green Chem. 13, 82–90 (2011). 19. D’Agostino, C., Harris, R. C., Abbott, A. P., Gladden, L. F. & Mantle, M. D. Molecular motion and ion diffusion in choline chloride
based deep eutectic solvents studied by1H pulsed field gradient NMR spectroscopy. Phys. Chem. Chem. Phys. 13, 21383–21391 (2011).
20. D’Agostino, C. et al. Molecular and ionic diffusion in aqueous-deep eutectic solvent mixtures: Probing inter-molecular interactions using PFG NMR. Phys. Chem. Chem. Phys. 17, 15297–15304 (2015).
21. Yadav, A. & Pandey, S. Densities and viscosities of (choline chloride + urea) deep eutectic solvent and its aqueous mixtures in the temperature range 293.15 K to 363.15 K. J. Chem. Eng. Data 59, 2221–2229 (2014).
22. Abbott, A. P., Capper, G., Davies, D. L., Rasheed, R. K. & Tambyrajah, V. Novel solvent properties of choline chloride/urea mixtures. Chem. Commun. 9, 70–71 (2003).
23. Shaukat, S. & Buchner, R. Densities, viscosities [from (278.15 to 318.15) K], and electrical conductivities (at 298.15 K) of aqueous solutions of choline chloride and chloro-choline chloride. J. Chem. Eng. Data 56, 4944–4949 (2011).
24. Yang, C., Ma, P., Jing, F. & Tang, D. Excess molar volumes, viscosities, and heat capacities for the mixtures of ethylene glycol + water from 273.15 K to 353.15 K. J. Chem. Eng. Data 48, 836–840 (2003).
25. Sun, T. & Teja, A. S. Density, viscosity, and thermal conductivity of aqueous ethylene, diethylene, and triethylene glycol mixtures between 290 K and 450 K. J. Chem. Eng. Data 48, 198–202 (2003).
26. Tsierkezos, N. G. & Molinou, I. E. Thermodynamic properties of water + ethylene glycol at 283.15, 293.15, 303.15, and 313.15 K. J. Chem. Eng. Data 43, 989–993 (1998).
27. Segur, J. B. & Oderstar, H. E. Viscosity of glycerol and its aqueous solutions. Ind. Eng. Chem. 43, 2117–2120 (1951). 28. Sheely, M. L. Glycerol viscosity tables. Ind. Eng. Chem. 24, 1060–1064 (1932). 29. Trejo González, J. A., Longinotti, M. P. & Corti, H. R. The viscosity of glycerol–water mixtures including the supercooled region.
J. Chem. Eng. Data 56, 1397–1406 (2011). 30. Isdale, J. D., Easteal, A. J. & Woolf, L. A. Shear viscosity of methanol and methanol + water mixtures under pressure. Int. J. Ther-
mophys. 6, 439–450 (1985). 31. González, B., Calvar, N., Gómez, E. & Domínguez, Á. Density, dynamic viscosity, and derived properties of binary mixtures of
methanol or ethanol with water, ethyl acetate, and methyl acetate at T = (293.15, 298.15, and 303.15) K. J. Chem. Thermodyn. 39, 1578–1588 (2007).
32. Mikhail, S. Z. & Kimel, W. R. Densities and viscosities of methanol–water mixtures. J. Chem. Eng. Data 6, 533–537 (1961). 33. Siongco, K. R., Leron, R. B. & Li, M. H. Densities, refractive indices, and viscosities of N, N-diethylethanol ammonium chloride-
glycerol or -ethylene glycol deep eutectic solvents and their aqueous solutions. J. Chem. Thermodyn. 65, 65–72 (2013). 34. Motin, M. A., Biswas, T. K. & Huque, E. M. Volumetric and viscometric studies on an aqueous urea solution. Phys. Chem. Liq. 40,
593–605 (2002). 35. Zwolinski, B. J. & Eicher, L. D. High-precision viscosity of supercooled water and analysis of the extended range temperature
coefficient. J. Phys. Chem. 75, 2016–2024 (1971). 36. Korson, L., Drost-Hansen, W. & Millero, F. J. Viscosity of water at various temperatures. J. Phys. Chem. 73, 34–39 (1969). 37. Siddaway, A. P., Wood, A. M. & Hedges, L. V. How to do a systematic review: A best practice guide for conducting and reporting
narrative reviews, meta-analyses, and meta-syntheses. Annu. Rev. Psychol. 70, 747–770 (2018). 38. Frenkel, M. et al. New global communication process in thermodynamics: Impact on quality of published experimental data. J.
Chem. Inf. Model. 46, 2487–2493 (2006). 39. Baker, M. 1,500 scientists lift the lid on reproducibility. Nature 533, 452–454 (2016). 40. Swainston, N. et al. STRENDA DB: Enabling the validation and sharing of enzyme kinetics data. FEBS J. 285, 2193–2204 (2018). 41. STRENDA Guidelines. https ://www.beils tein-insti tut.de/en/proje cts/stren da/guide lines /. 42. von Elm, E., Altman, D. G., Egger, M., Pocock, S. J. & Gøtzsche, P. C. V. J. The strengthening the reporting of observational studies
in epidemiology (STROBE) statement: Guidelines for reporting observational studies. J. Clin. Epidemiol. 61, 344–349 (2008). 43. STROBE checklists. https ://www.strob e-state ment.org/index .php?id=avail able-check lists . 44. Stephen, K. B. et al. RCSB Protein Data Bank: Biological macromolecular structures enabling research and education in funda-
mental biology, biomedicine, biotechnology and energy. Nucleic Acids Res. 47, D464–D474 (2019). 45. Berman, H. M. et al. The Protein Data Bank. Nucleic Acids Res. 20, 235–242 (2000). 46. Wilkinson, M. D. et al. The FAIR Guiding Principles for scientific data management and stewardship. Sci. Data https ://doi.
org/10.1038/sdata .2016.18 (2016). 47. Murray-Rust, P. & Rzepa, H. S. CML: Evolution and design. J. Cheminform. https ://doi.org/10.1186/1758-2946-3-44 (2011). 48. Xu, X., Range, J., Gygli, G. & Pleiss, J. Analysis of thermophysical properties of deep eutectic solvents by data integration. J. Chem.
Eng. Data 65, 1172–1179 (2020). 49. Abbott, A. P., Capper, G. & Gray, S. Design of improved deep eutectic solvents using hole theory. ChemPhysChem 7, 803–806
(2006). 50. Smith, P. J., Arroyo, C. B., Lopez Hernandez, F. & Goeltz, J. C. Ternary deep eutectic solvent behavior of water and urea choline
chloride mixtures. J. Phys. Chem. B 123, 5302–5306 (2019). 51. Sapir, L. & Harries, D. Restructuring a deep eutectic solvent by water: The nanostructure of hydrated choline chloride/urea. J.
Chem. Theory Comput. 16, 3335–3342 (2020). 52. Chen, Y., Yu, D., Chen, W., Fu, L. & Mu, T. Water absorption by deep eutectic solvents. Phys. Chem. Chem. Phys. 21, 2601–2610
(2019). 53. Abdullah, G. H. & Kadhom, M. A. Studying of two choline chloride’s deep eutectic solvents in their aqueous mixtures. Int. J. Eng.
Res. Dev. 12, 73–80 (2016). 54. Tremouilhac, P. et al. Chemotion ELN: An Open Source electronic lab notebook for chemists in academia. J. Cheminform. 9, 1–13
(2017).

11
Vol.:(0123456789)
Scientific Reports | (2020) 10:21395 | https://doi.org/10.1038/s41598-020-78101-y
www.nature.com/scientificreports/
55. Nascimento, M. L. F. & Aparicio, C. Data classification with the Vogel–Fulcher–Tammann–Hesse viscosity equation using cor-respondence analysis. Phys. B Condens. Matter 398, 71–77 (2007).
56. Derlacki, Z. J., Easteal, A. J., Edge, A. V. J., Woolf, L. A. & Roksandic, Z. Diffusion coefficients of methanol and water and the mutual diffusion coefficient in methanol–water solutions at 278 and 298 K. J. Phys. Chem. 89, 5318–5322 (1985).
57. Benson, S. P. & Pleiss, J. Incomplete mixing versus clathrate-like structures: A molecular view on hydrophobicity in methanol–water mixtures. J. Mol. Model. 19, 3427–3436 (2013).
58. Rezus, Y. L. A. & Bakker, H. J. Effect of urea on the structural dynamics of water. Proc. Natl. Acad. Sci. USA 103, 18417–18420 (2006).
59. Katti, P. K. & Chaudhri, M. M. Viscosities of binary mixtures of benzyl acetate with dioxane, aniline, and m-Cresol. J. Chem. Eng. Data 9, 442–443 (1964).
60. Jin, H. et al. Physical properties of ionic liquids consisting of the 1-butyl-3-methylimidazolium cation with various anions and the bis(trifluoromethylsulfonyl)imide anion with various cations. J. Phys. Chem. B 112, 81–92 (2008).
61. Okoturo, O. O. & VanderNoot, T. J. Temperature dependence of viscosity for room temperature ionic liquids. J. Electroanal. Chem. 568, 167–181 (2004).
62. Miran, M. S., Kinoshita, H., Yasuda, T., Susan, M. A. B. H. & Watanabe, M. Physicochemical properties determined by ΔpKa for protic ionic liquids based on an organic super-strong base with various Brønsted acids. Phys. Chem. Chem. Phys. 14, 5178–5186 (2012).
63. Murray-Rust, P., Townsend, J. A., Adams, S. E., Phadungsukanan, W. & Thomas, J. The semantics of chemical markup language (CML): Dictionaries and conventions. J. Cheminform. 3, 43 (2011).
64. xml.etree.cElementTree. https ://docs.pytho n.org/3/libra ry/xml.etree .%0Aele mentt ree.html. 65. Jones, E., Oliphant, T. & Peterson, P. SciPy: Open Source Scientific Tools for Python. (2001). 66. Van Der Walt, S., Colbert, S. C. & Varoquaux, G. The NumPy array: A structure for efficient numerical computation. Comput. Sci.
Eng. 13, 22–30 (2011). 67. Hunter, J. D. Matplotlib: A 2D graphics environment. Comput. Sci. Eng. 9, 99–104 (2007). 68. Waskom, M. et al. mwaskom/seaborn: v0.8.1. Zenodo https ://doi.org/10.5281/zenod o.88385 9 (2017). 69. McKinney, W. Data structures for statistical computing in Python. 51–56 (2010). 70. sys library. https ://docs.pytho n.org/3.7/libra ry/sys.html. 71. os library. https ://docs.pytho n.org/3.7/libra ry/os.html. 72. subprocess library. https ://docs.pytho n.org/3.7/libra ry/subpr ocess .html.
AcknowledgementsThis work was funded by the German Research Foundation (DFG, grant EXC 2075) and by the Swiss National Science Foundation (SNF, Early Postdoc Mobility Fellowship).
Author contributionsG.G. and J.P. designed the research; G.G. and X.M.X. performed the research; G.G., X.M.X., and J.P. analyzed data and wrote the paper; all authors reviewed the manuscript
FundingOpen Access funding enabled and organized by Projekt DEAL.
Competing interests The authors declare no competing interests.
Additional informationSupplementary information is available for this paper at https ://doi.org/10.1038/s4159 8-020-78101 -y.
Correspondence and requests for materials should be addressed to J.P.
Reprints and permissions information is available at www.nature.com/reprints.
Publisher’s note Springer Nature remains neutral with regard to jurisdictional claims in published maps and institutional affiliations.
Open Access This article is licensed under a Creative Commons Attribution 4.0 International License, which permits use, sharing, adaptation, distribution and reproduction in any medium or
format, as long as you give appropriate credit to the original author(s) and the source, provide a link to the Creative Commons licence, and indicate if changes were made. The images or other third party material in this article are included in the article’s Creative Commons licence, unless indicated otherwise in a credit line to the material. If material is not included in the article’s Creative Commons licence and your intended use is not permitted by statutory regulation or exceeds the permitted use, you will need to obtain permission directly from the copyright holder. To view a copy of this licence, visit http://creat iveco mmons .org/licen ses/by/4.0/.
© The Author(s) 2020