Deep Eutectic Solvents: Structure, Solvation, and Synthesis
325
University of Bath PHD Deep Eutectic Solvents: Structure, Solvation, and Synthesis Hammond, Oliver Award date: 2019 Awarding institution: University of Bath Link to publication Alternative formats If you require this document in an alternative format, please contact: [email protected] Copyright of this thesis rests with the author. Access is subject to the above licence, if given. If no licence is specified above, original content in this thesis is licensed under the terms of the Creative Commons Attribution-NonCommercial 4.0 International (CC BY-NC-ND 4.0) Licence (https://creativecommons.org/licenses/by-nc-nd/4.0/). Any third-party copyright material present remains the property of its respective owner(s) and is licensed under its existing terms. Take down policy If you consider content within Bath's Research Portal to be in breach of UK law, please contact: [email protected] with the details. Your claim will be investigated and, where appropriate, the item will be removed from public view as soon as possible. Download date: 19. Jul. 2022
-
Upload
khangminh22 -
Category
Documents
-
view
2 -
download
0
Transcript of Deep Eutectic Solvents: Structure, Solvation, and Synthesis

University of Bath
PHD
Deep Eutectic Solvents: Structure, Solvation, and Synthesis
Hammond, Oliver
Award date:2019
Awarding institution:University of Bath
Link to publication
Alternative formatsIf you require this document in an alternative format, please contact:[email protected]
Copyright of this thesis rests with the author. Access is subject to the above licence, if given. If no licence is specified above,original content in this thesis is licensed under the terms of the Creative Commons Attribution-NonCommercial 4.0International (CC BY-NC-ND 4.0) Licence (https://creativecommons.org/licenses/by-nc-nd/4.0/). Any third-party copyrightmaterial present remains the property of its respective owner(s) and is licensed under its existing terms.
Take down policyIf you consider content within Bath's Research Portal to be in breach of UK law, please contact: [email protected] with the details.Your claim will be investigated and, where appropriate, the item will be removed from public view as soon as possible.
Download date: 19. Jul. 2022

Deep Eutectic Solvents:
Structure, Solvation and Synthesis
Oliver Hammond
COPYRIGHT: Attention is drawn to the fact that copyright of this thesis/portfolio rests with the author and copyright of any
previously published materials included may rest with third parties. A copy of this thesis/portfolio has been supplied on condition that
anyone who consults it understands that they must not copy it or use material from it except as permitted by law or with the consent
of the author or other copyright owners, as applicable.
Professor Karen Edler (University of Bath, Department of Chemistry)
Dr Daniel Bowron (STFC ISIS Neutron and Muon Source)
Dr Salvador Eslava (University of Bath, Department of Chemical Engineering)
This PhD thesis is submitted in fulfilment of the requirements for the degree of Doctor of Philosophy
October 2018

2

3
Acknowledgements As this major chapter of my life draws to its inexorable close, I would like to take a moment to
reflect on the adventure. It has been long and trying; there have been difficulties and a few bleak
moments, but these have been balanced by amazing experiences and, most importantly, people.
A PhD can at times feel like a one-man space program; it is impossible to go alone, and is an effort
not only of its author, but of their mentors, their friends, and the opportunities which have
presented themselves. I have been fortunate in all of these aspects.
So firstly, an emphatic thank-you to Karen and Daniel, who have been quite amazing in supervising
me. I have learnt a lot throughout the process, about life as well as science, which ultimately is
what a PhD is all about. I feel privileged to have done so in the environment you have cultivated.
I would also like to thank my array of ‘second’ supervisors, who have become involved at some
stage and helped me onwards, be that as a supervisor, by helping out with experiments, or even
just taking an interest. My second thank-you is therefore to Salvador, Laura, James, Tom, and
Andrew. A special shout-out goes to Rob, Hua, Greg, and Liliana, who I had the privilege to meet
and work with during a 3-month visit to Australia, and who made my time enjoyable and valuable.
Perhaps most importantly, I want to thank my family, friends and colleagues for the unerring
support which they have offered me, and without which I would not be able to complete this thesis.
My parents cultivated my interest in science from the start, and the friends I have made throughout
may not be aware that they have given me the strength to see it through. This manner of help
takes many forms which are easy to overlook, but it does not matter where it comes from: doing
experiments together, working through tough problems, discussing things over a coffee, tea, lunch,
or dinner break, chatting after a few beers (and indeed, generally overindulging), travelling and
seeing the world together, or any other number of things. Without any of these things I would not
have reached this point, and as the full list is too extensive, I direct my final round of thanks towards
my parents and siblings, Naomi, Adrian, Drew, Ria, Andi, Manuel, Peter, Julien, and my friends in
the CSCT.
“There is an art, it says, or rather, a knack to flying. The knack lies in learning how to throw yourself at the
ground and miss... Clearly, it is this second part, the missing, that presents the difficulties.” - Douglas Adams

4
Papers published during the PhD
(1) Hammond, O. S.; Bowron D. T.; Edler, K. J. Liquid structure of the choline chloride-urea
deep eutectic solvent (reline) from neutron diffraction and atomistic modelling. Green Chem. 2016,
18, 2736–2744.
(2) Toolan, D. T. W.; Isakova, A.; Hodgkinson, R.; Reeves-Mclaren, N.; Hammond, O. S.; Edler,
K. J.; Briscoe, W. H.; Arnold, T.; Gough, T.; Topham, P. D.; Howse, J. R. Insights into the Influence of
Solvent Polarity on the Crystallization of Poly(ethylene oxide) Spin-Coated Thin Films via in Situ
Grazing Incidence Wide-Angle X‑ray Scattering. Macromolecules 2016, 49, 4579–4586.
(3) Hammond, O. S.; Edler, K. J.; Bowron, D. T.; Torrente-Murciano, L. Deep eutectic-
solvothermal synthesis of nanostructured ceria. Nat. Commun. 2017, 8, 14150.
(4) Hammond, O. S.; Eslava, S.; Smith, A. J.; Zhang, J.; Edler, K. J. Microwave-assisted deep
eutectic solvothermal preparation of iron oxide nanoparticles for photoelectrochemical solar
water splitting. J. Mater. Chem. A 2017, 5, 16189–16199.
(5) Hammond, O. S.; Bowron, D. T.; Jackson, A. J.; Arnold, T.; Sanchez-Fernandez, A.;
Tsapatsaris, N.; Sakai, V. G.; Edler, K. J. Resilience of Malic Acid Natural Deep Eutectic Solvent
Nanostructure to Solidification and Hydration. J. Phys. Chem. B 2017, 121, 7473–7483.
(6) Hammond, O. S.; Bowron, D. T.; Edler, K. J. The Effect of Water upon Deep Eutectic Solvent
Nanostructure: An Unusual Transition from Ionic Mixture to Aqueous Solution. Angew. Chemie -
Int. Ed. 2017, 56, 9782–9785.
(7) Sanchez-Fernandez, A.; Hammond, O. S.; Jackson, A. J.; Arnold, T.; Doutch, J.; Edler, K. J.
Surfactant-Solvent Interaction Effects on the Micellization of Cationic Surfactants in a Carboxylic
Acid-Based Deep Eutectic Solvent. Langmuir 2017, 33, 14304–14314.
(8) Sanchez-Fernandez, A.; Hammond, O. S.; Edler, K. J.; Arnold, T.; Doutch, J.; Dalgliesh, R.
M.; Li, P.; Ma, K.; Jackson, A. J. Counterion binding alters surfactant self-assembly in deep eutectic
solvents. Phys. Chem. Chem. Phys. 2018, 20, 13952-13961.
(9) Hammond, O. S.; Li, H.; Westermann, C.; Endres, F.; Al-Murshedi, A. Y. M.; Abbott, A. P.;
Warr, G. G.; Edler, K. J.; Atkin, R. Nanostructure of the deep eutectic solvent / platinum electrode
interface as a function of potential and water content. Nanoscale Horiz. 2019, 4, 158-168.
(10) Hammond, O. S.; Bowron, D. T.; Edler, K. J.; Structure and Properties of “Type IV”
Lanthanide Nitrate Hydrate:Urea Deep Eutectic Solvents. ACS Sus. Chem. Eng. 2019, 7, 4932-4940.

5
Abstract
Deep Eutectic Solvents (DES) are a recently-discovered category of potentially more sustainable
alternative solvents. They are liquid eutectics formed upon the combination of various precursors,
normally organic halide salts and neutral species. The most common DES is a 1:2 mixture of choline
chloride:urea. DES are beginning to be used as non-aqueous alternative solvents for a variety of
processes, such as synthesis of small molecules and materials, and electrodeposition.
For the successful development and implementation of DES as a drop-in green solvent, it
is important to build a strong fundamental understanding of the structure and properties. This will
aid in the realisation of DES as ‘task-specific’ solvents which can be rationally tuned to fit the
application of interest. There are several fundamental issues presently impeding the progression
of the field of DES. Firstly, due to their similar properties and designer nature, DES are often
presented as a sub-category of ionic liquids (ILs) though the combination of ionic and molecular
species will yield a more structurally complex system, with contributions from electrostatic forces
as well as H-bonding. In this thesis the structure of various DES has been explored primarily using
neutron diffraction and atomistic modelling studies. These works showed evidence for a
disordered and extensive H-bond network in the liquid rather than extensive ion complexation,
which has important consequences for the design of chemical processes using DES.
Another issue impeding the progress of research is that pure DES are often very viscous
which causes handling issues and often imposes a diffusion limitation upon processes. Moreover,
being charge-dense liquids, they are hygroscopic and quickly absorb large quantities of water, and
it is not known what structurally occurs to DES upon hydration. To reconcile this issue, we have
studied the solvation of water by DES, and what happens to the interactions between DES
components when hydrated, at known water contents, using neutron diffraction studies as well as
study of the DES/solid interface using AFM. It was found that low-level water, such as that
absorbed during preparation and handling, does not significantly perturb the DES structure but
alters the intermolecular interaction strength. Up to a threshold concentration, the DES structure
resists hydration and strong choline-water interactions are seen, but the system becomes an
aqueous solution when the water volume fraction dominates. The same behaviour was observed
at a Pt electrode interface, with unusually strong structure induced when water was added. These
findings show the potential of using hydrated DES as replacement green solvents.
Finally, it was attempted to apply DES and hydrated DES in the synthesis of nanostructured
iron and cerium oxide and make use of the insights gained of the solvent structure. It was found
that pure DES formed small nanoparticles whereas hydrated DES formed highly extended 1D

6
morphologies which were active catalysts. Initially, neutron diffraction was used to understand the
solvation of metal ions in the pure DES, which showed unusual structuring between reactive
components. Later studies of the hydrated system revealed that this structure is not retained on
addition of water, as DES ligands are substituted by water. Time-resolved studies using EXAFS and
SANS respectively gave evidence for the solvent breakdown and structural rearrangement around
metal ions, and the nanoparticle self-assembly process.
Overall, this thesis is a coherent body of independent systematic investigations into the
solvent structure and solvation behaviour of DES, and synthesis of nanoparticles with wide-
reaching environmental applications. We have built further upon the fundamental understanding
of DES and have drawn comparison between systematic structural observations and the
performance of DES in relevant applications. It is hoped that these findings will help with the
onward development of DES as alternative solvents for efficient and sustainable future industrial
technologies, which can make the world a cleaner place.

7
Glossary of terms
DES = Deep Eutectic Solvent
NADES = Natural Deep Eutectic Solvent
IL = Ionic Liquid
ML = Molecular Liquid
SIL = Solvate Ionic Liquid
w = molar equivalents of water in terms of salt:water ratio
HBD/HBA = Hydrogen Bond Donor / Hydrogen Bond Acceptor
FTO = Fluorine-doped Tin Oxide
ChCl = Choline chloride
EAN = Ethylammonium nitrate
[‘n’mim] = 1-n-alkyl-3-methylimidazolium cation
SAS/SAXS/SANS = Small-Angle (X-Ray or Neutron) Scattering
XRD = X-Ray Diffraction
EXAFS = Extended X-Ray Absorption Fine Structure spectroscopy
RDF = Radial Distribution Function
SDF = Spatial Density Function
pRDF = Partial Radial Distribution Function
VDF = Void Distribution Function
MD = Molecular Dynamics
QENS = Quasi-Elastic Neutron Scattering
EPSR = Empirical Potential Structure Refinement
TEM/SEM = Transmission/Scanning Electron Microscopy
AFM = Atomic Force Microscopy
OCP = Open Circuit Potential
PCA = Principal Component Analysis

8
Table of Contents 1. Introduction ................................................................................................................ 13
1.1. Liquid Solvents ..................................................................................................... 13 1.1.1. Outlook ......................................................................................................... 13 1.1.2. Molecular Liquids (MLs) ................................................................................ 13 1.1.3. Ionic liquids (ILs) ........................................................................................... 14
1.2. Deep Eutectic Solvents (DES) ............................................................................... 16 1.2.1. Fundamentals ............................................................................................... 16 1.2.2. Physicochemical properties .......................................................................... 19 1.2.3. DES as green solvents ................................................................................... 21
1.3. Literature Review: Structure in DES ..................................................................... 22 1.3.1. Outlook ......................................................................................................... 22 1.3.2. Complex ion model ....................................................................................... 23 1.3.3. The Hydrogen-Bond network model: ‘Alphabet Soup’ ................................ 24 1.3.4. Non-cholinium DES ....................................................................................... 35 1.3.5. Structure of DES at a solid interface ............................................................. 38 1.3.6. References .................................................................................................... 40
2. Theory ......................................................................................................................... 43 2.1. Structure of disordered materials ........................................................................ 43
2.1.1. Structure in a liquid ...................................................................................... 43 2.1.2. Distribution functions ................................................................................... 44
2.2. Scattering techniques........................................................................................... 46 2.2.1. Background and principles ........................................................................... 46 2.2.2. X-Ray and Neutron radiation for scattering experiments ............................ 48 2.2.3. Crystallography and powder diffraction ....................................................... 50 2.2.4. Small-angle scattering (SAS) ......................................................................... 51 2.2.5. Total (wide Q-range) neutron scattering ...................................................... 55 2.2.6. Empirical Potential Structure Refinement (EPSR) modelling ....................... 57 2.2.7. Extended X-Ray Absorption Fine Structure (EXAFS) spectroscopy .............. 59
2.3. References ............................................................................................................ 63 3. Liquid structure of the choline chloride-urea deep eutectic solvent (reline) from neutron diffraction and atomistic modelling .................................................................... 64
3.1. Overview .............................................................................................................. 64 3.2. Statement of contribution ................................................................................... 66 3.3. Abstract ................................................................................................................ 67 3.4. Introduction ......................................................................................................... 67 3.5. Experimental ........................................................................................................ 69
3.5.1. Preparation of isotopically substituted DES ................................................. 69 3.5.2. Neutron diffraction ....................................................................................... 69
3.6. Results and discussion.......................................................................................... 71 3.6.1. Fits to the data .............................................................................................. 71 3.6.2. Reline radial distribution functions .............................................................. 72 3.6.3. Partial radial distribution functions .............................................................. 75 3.6.4. Spatial density functions ............................................................................... 79 3.6.5. Hole theory ................................................................................................... 82
3.7. Conclusions .......................................................................................................... 83 3.8. Acknowledgements .............................................................................................. 84 3.9. References ............................................................................................................ 84

9
4. Deep Eutectic-Solvothermal Synthesis of Nanostructured Ceria .............................. 86 4.1. Overview ............................................................................................................... 86 4.2. Statement of contribution .................................................................................... 88 4.3. Abstract ................................................................................................................ 89 4.4. Introduction .......................................................................................................... 89 4.5. Experimental ........................................................................................................ 90
4.5.1. Deep Eutectic Solvents and neutron diffraction ........................................... 90 4.5.2. Deep Eutectic-Solvothermal synthesis of ceria ............................................ 91 4.5.3. Characterisation of nanostructured ceria ..................................................... 91
4.6. Results and discussion .......................................................................................... 92 4.6.1. Synthesis ....................................................................................................... 92 4.6.2. Solvothermal reaction mechanism ............................................................... 94 4.6.3. Porosity of the materials ............................................................................... 97 4.6.4. Carbon monoxide oxidation performance .................................................... 98
4.7. Conclusions ........................................................................................................... 99 4.8. Acknowledgements ............................................................................................ 100 4.9. References .......................................................................................................... 101
5. Resilience of Malic Acid Natural Deep Eutectic Solvent Nanostructure to Solidification and Hydration ............................................................................................ 102
5.1. Overview ............................................................................................................. 102 5.2. Statement of contribution .................................................................................. 104 5.3. Abstract .............................................................................................................. 105 5.4. Introduction ........................................................................................................ 105 5.5. Experimental ...................................................................................................... 107
5.5.1. Preparation of isotope-substituted DES and hydrated DES ....................... 107 5.5.2. Neutron total scattering experiments ........................................................ 107 5.5.3. Quasi-Elastic Neutron Scattering (QENS) .................................................... 109
5.6. Results and discussion ........................................................................................ 110 5.6.1. Experimental neutron diffraction data and fits .......................................... 110 5.6.2. Malicine nanostructure ............................................................................... 112 5.6.3. DES solidification: 1st order or glass transition? ......................................... 114 5.6.4. Effect of water upon DES nanostructure .................................................... 116 5.6.5. Specific solvation structure ......................................................................... 118
5.7. Conclusions ......................................................................................................... 124 5.8. Acknowledgements ............................................................................................ 125 5.9. References .......................................................................................................... 125
6. Microwave-assisted deep eutectic-solvothermal preparation of iron oxide nanoparticles for photoelectrochemical solar water splitting ....................................... 127
6.1. Overview ............................................................................................................. 127 6.2. Statement of contribution .................................................................................. 129 6.3. Abstract .............................................................................................................. 130 6.4. Introduction ........................................................................................................ 130 6.5. Experimental ...................................................................................................... 131
6.5.1. DES preparation .......................................................................................... 131 6.5.2. Solvothermal synthesis ............................................................................... 132 6.5.3. Synchrotron small- and wide-angle X-Ray scattering ................................. 132 6.5.4. Nanomaterial characterisation ................................................................... 133 6.5.5. Photoanode fabrication .............................................................................. 134 6.5.6. Photoelectrochemical testing ..................................................................... 134
6.6. Results and discussion ........................................................................................ 135

10
6.6.1. Deep Eutectic-Solvothermal Microwave synthesis .................................... 135 6.6.2. Characterisation of nanomaterials ............................................................. 136 6.6.3. Solvothermal reaction mechanism and solvent degradation structural studies…….. ................................................................................................................ 141 6.6.4. Application as photoelectrodes .................................................................. 145
6.7. Conclusions ........................................................................................................ 150 6.8. Acknowledgements ............................................................................................ 151 6.9. References .......................................................................................................... 151
7. The Effect of Water upon Deep Eutectic Solvent nanostructure: An Unusual Transition from Ionic Mixture to Aqueous Solution ....................................................... 153
7.1. Overview ............................................................................................................ 153 7.2. Statement of contribution ................................................................................. 156 7.3. Abstract .............................................................................................................. 157 7.4. Introduction ....................................................................................................... 157 7.5. Experimental ...................................................................................................... 158 7.6. Results and discussion........................................................................................ 158 7.7. Conclusions ........................................................................................................ 163 7.8. Acknowledgements ............................................................................................ 164 7.9. References .......................................................................................................... 164
8. Structure and properties of ‘Type IV’ lanthanide nitrate hydrate:urea deep eutectic solvents ............................................................................................................................. 165
8.1. Overview ............................................................................................................ 165 8.2. Statement of contribution ................................................................................. 167 8.3. Abstract .............................................................................................................. 168 8.4. Introduction ....................................................................................................... 168 8.5. Experimental ...................................................................................................... 170
8.5.1. Lanthanide DES ........................................................................................... 170 8.5.2. Radiation total scattering measurements .................................................. 170 8.5.3. Empirical Potential Structure Refinement Modelling ................................ 171
8.6. Results and discussion........................................................................................ 172 8.6.1. Lanthanide DES ........................................................................................... 172 8.6.2. Neutron and X-Ray diffraction fits and data ............................................... 174 8.6.3. Coordination network of Ce3+ ..................................................................... 175 8.6.4. Intercalating nanostructure ........................................................................ 178
8.7. Conclusions ........................................................................................................ 182 8.8. Acknowledgements ............................................................................................ 183 8.9. References .......................................................................................................... 183
9. Nanostructure of the deep eutectic solvent / platinum electrode interface as a function of potential and water content ........................................................................ 185
9.1. Overview ............................................................................................................ 185 9.2. Statement of contribution ................................................................................. 187 9.3. Abstract .............................................................................................................. 188 9.4. Introduction ....................................................................................................... 188 9.5. Experimental ...................................................................................................... 190 9.6. Results and discussion........................................................................................ 191 9.7. Conclusions ........................................................................................................ 203 9.8. Acknowledgements ............................................................................................ 204 9.9. References .......................................................................................................... 204
10. From ion to iron: Towards a better Understanding of materials synthesis in DES 207 10.1. Abstract .......................................................................................................... 207

11
10.2. Introduction .................................................................................................... 208 10.3. Experimental ................................................................................................... 209
10.3.1. Preparation of DES ...................................................................................... 209 10.3.2. Neutron diffraction ..................................................................................... 210 10.3.3. X-Ray diffraction .......................................................................................... 211 10.3.4. Empirical Potential Structure Refinement (EPSR) modelling ...................... 211 10.3.5. Small-angle neutron scattering ................................................................... 212 10.3.6. Small-angle X-Ray scattering of ‘frozen’ reactions ..................................... 212 10.3.7. Extended X-Ray Absorption and Fine Structure (EXAFS) measurements ... 213 10.3.8. Off-line synthesis of nanoparticles ............................................................. 214 10.3.9. Analysis of products .................................................................................... 214
10.4. Results & Discussion ....................................................................................... 214 10.4.1. Initial speciation of Fe3+: EXAFS data and fits ............................................. 214 10.4.2. Initial solvent structure and solvation of Fe3+: Neutron and X-Ray diffraction data and fits ............................................................................................................... 217 10.4.3. Evolution of mesoscopic structure in iron: Event mode small-angle neutron scattering studies ....................................................................................................... 229 10.4.4. Local structure of iron: EXAFS study of reaction in situ .............................. 241 10.4.5. Steady-state structural measurements ...................................................... 248
10.5. Conclusions ..................................................................................................... 252 10.6. References ...................................................................................................... 255
11. Conclusions and future work .................................................................................... 257 11.1. Findings ........................................................................................................... 257 11.2. Future work ..................................................................................................... 259 11.3. References ...................................................................................................... 262
12. Appendix .................................................................................................................... 264 12.1. Appendix 1: Supporting information for Chapter 3 ........................................ 264
12.1.1. Theory ......................................................................................................... 264 12.1.2. Empirical Potential Structure Refinement .................................................. 265 12.1.3. Simulation method ...................................................................................... 265 12.1.4. Lennard-Jones parameters used in EPSR modelling ................................... 267 12.1.5. Complete set of partial (site-site) radial distribution functions for reline.. 268
12.2. Appendix 2: Supporting information for Chapter 4 ........................................ 280 12.2.1. Supplementary figures ................................................................................ 280 12.2.2. Supplementary tables ................................................................................. 281 12.2.3. Supplementary methods ............................................................................. 282
12.3. Appendix 3: Supporting information for Chapter 5 ........................................ 284 12.3.1. EPSR background ......................................................................................... 284 12.3.2. EPSR methodology ...................................................................................... 284 12.3.3. SDFs for vitrified malicine (208 K) ............................................................... 286
12.4. Appendix 4: Supporting information for Chapter 6 ........................................ 287 12.4.1. Raman Spectroscopy of prepared iron oxides ............................................ 287 12.4.2. Residual mass within the autoclaves .......................................................... 288 12.4.3. Heat treatment experiments on Deep Eutectic Solvents ........................... 289 12.4.4. Front and back illumination comparison for photoanodes ........................ 293
12.5. Appendix 5: Supporting information for Chapter 7 ........................................ 294 12.5.1. Preparation of hydrated and isotopically-substituted reline samples ....... 294 12.5.2. Neutron diffraction experiments ................................................................ 295 12.5.3. Empirical Potential Structure Refinement (EPSR) modelling ...................... 297 12.5.4. SDF plots ...................................................................................................... 298

12
12.5.5. Calculated Intermolecular Coordination Numbers .................................... 300 12.5.6. Integrated partial (site-site) coordination numbers ................................... 303
12.6. Appendix 6: Supporting information for Chapter 8 ....................................... 311 12.6.1. Tg measurements of the Pr(NO3)3.6H2O:urea DES ..................................... 311 12.6.2. Advanced reaction media: Direct combustion synthesis of lanthanide oxides from lanthanide DES .................................................................................................. 312 12.6.3. Empirical Potential Structure Refinement (EPSR) modelling background . 314 12.6.4. EPSR model parameters ............................................................................. 315 12.6.5. Calculated pRDFs for non-cerium species .................................................. 315
12.7. Appendix 7: Supporting information for Chapter 9 ....................................... 317 12.7.1. High-water force-distance curves ............................................................... 317
12.8. Appendix 8: Supporting information for Chapter 10 ..................................... 318 12.8.1. Characterisation of final state .................................................................... 318 12.8.2. Other in situ measurements ....................................................................... 320 12.8.3. PCA fitting of kinetic data ........................................................................... 321
12.9. References ...................................................................................................... 324

13
1. INTRODUCTION
1.1. Liquid Solvents
1.1.1. Outlook
Solution-based processes, where liquids are used as solvents, involve the dissolution of solutes into
a liquid to form a macroscopically homogeneous mixture. Such processes (in water) define
biology.1 Solution processes dominate industrial and laboratory chemistry because they are simple,
convenient, cheap, and scalable.2 This means that solvents are crucial to the current global supply
chain, forming a multi-billion-dollar industry. Solvents are essential to processing raw materials (ie.
separation/extraction of minerals), manufacturing valuable and essential products (ie. plastics and
drugs), and then transporting these items around the world (ie. using lubricants and fuels).3
1.1.2. Molecular Liquids (MLs)
The term ‘solvent’ has referred most popularly to molecular liquids (MLs). MLs are the liquid phases
of polar or nonpolar molecules which bear no formal charge. Examples of common MLs include
water, alcohols (ie. methanol), hydrocarbons (ie. cyclohexane), fluorocarbons (ie.
perfluorooctane), carboxylic acids (ie. acetic acid), amines (ie. octylamine), tetrahydrofuran, and
various amides. MLs generally have liquid structures that are dominated by strong, short-range
hydrogen bonding and van der Waals forces, that make their liquid state accessible under standard
conditions.4 MLs are ubiquitous and presently used for the majority of chemical processes in
industry.
Despite the clear convenience and importance of solution-processing, there are significant
environmental, safety, and health challenges associated with these methods. Non-aqueous MLs
are often toxic if ingested, and if emitted to the environment they are capable of bioaccumulation.
Such solvents tend to be volatile, making it difficult to avoid environmental health issues during
their storage, transportation, and usage. Furthermore, most common solvents derive from finite
petrochemical feedstocks or fresh water, and can require significant inputs of energy to
manufacture and dispose of safely.3 To mitigate these negative consequences there is now a drive
to replace MLs with solvent-free conditions,5 and supercritical fluids such as CO2.6 However,
solution-processing is convenient, and industrial settings often have expensive systems such as
continually-stirred tank reactors (CSTR) which can be used for different solution processes,

14
whereas introducing sc-CO2 chemistry can require expensive new infrastructure.6 Therefore, as
well as a drive towards replacing conventional solvents, there is a movement which aims to retain
solution-processing7 and address its drawbacks by introducing drop-in replacements.8,9 This has
been termed the ‘green solvents’ movement, which aims to innovate sustainable ‘solvents of the
future’. 8,10
1.1.3. Ionic liquids (ILs)
ILs are arbitrarily defined as molten salts that are liquid at less than 100 °C.11 Some authors
distinguish further, by referring to ILs and room-temperature ILs (RTILs) separately, but here the
term IL will solely be used. The first ionic liquid was reported by Paul Walden, who prepared a
molten ethylammonium nitrate salt (EAN) in 1914.12 The existence of this ionic liquid, so similar in
properties to water, was a revolutionary finding during a time when the existence of ions in
solution was still a fresh discovery by Arrhenius.3 Ionic Liquids (ILs) are the general classification of
solvent into which Deep Eutectic Solvents (DES) are categorised.
Since the first discovery by Walden, and particularly in the past 30 years, research interest
in ILs has intensified considerably. The discipline is no longer focused on electrochemistry, and is
now truly multidisciplinary, having been driven by potential applications in green chemistry.13 ILs
are now widely studied for processing, chemical synthesis, and self-assembly applications.11,14,15
The properties of ILs, and in particular the low-melting nature, are defined by the chemical
structure. The anisotropy and asymmetry of the cation and anion is used to destabilise the solid
phase, and make the less-ordered liquid phase preferable.11 Most ‘modern’ ILs are based around
1,3-alkyl-imidazolium cations with various anions, but there is an enormous variety of viable ILs, as
depicted in Figure 1.1. Simply, the ion-ion interactions and symmetry must be balanced to create
a liquid with the desired properties.

15
Figure 1.1. Examples of some of the most common cations and anions used to prepare ionic liquids. Reprinted with permission from the American Chemical Society.3
The interesting properties of ILs are defined by the pronounced solvent nanostructure. A
number of models have been put forward to describe this structure, such as ion pair models, H-
bond networks, ion clusters, and self-assembled nanostructures, but because of the wide variety
of ILs studied and various techniques used to study them, it is difficult to isolate a specific set of
‘rules’ that describe the structure of an IL.3 The most consistent explanation for their behaviour is
a regular fluid, that is coherent but heterogeneous at the nanoscale: Structurally, ILs are defined
by a repeat interdomain spacing (d-spacing) between ionic regions, which contrasts with MLs and
dilute electrolyte solutions, which only have short-range order.3 This description is a long way from
Bernal’s initial model of liquids as totally disordered, homogeneous phases.16,17
Subcategories of ILs exist which are considered as distinct from the original classification;
these include (poly)ionic liquids, surfactant ILs, switchable ILs, mixtures of ILs with other ILs and
with neutral species, as well as deep eutectic solvents, the topic of this thesis.18 Solvate Ionic
Liquids (SILs) are one such ‘sub-class’ of ILs that were proposed by Angell and formalised by Mandai
et al.19 Many ILs comprise large, noncoordinating ions which generally do not form complexes with
metal ions, or are made of strongly coordinating anions such as Cl-.20 This means that the rich
inorganic chemistry functionality involving coordination complexes is generally not present in ILs.21
Solvate ILs, conversely, are liquids made solely of coordinated ions.22 Strong, chelating Lewis acidic
groups are used, forming complexes with a variety of small, hard inorganic cations, with the most
famous examples being made of lithium salts.22–24 Molten inorganic hydrate salts were therefore
the first known examples of SILs, but the most well-known examples are stoichiometric mixtures
of oligoethers (glymes) with metal salts.19 These are sub-classified into ‘good’ and ‘poor’ SILs,
depending upon how well the counterion interacts with the ions to form the desired solvate
complexes.25

16
SILs therefore challenge current ways of thinking about ILs and DESs. This is because a
molten salt hydrate, ie. [Ca(H2O)4](NO3)2, can now be considered as an ionic liquid in its own right,
because the metal-aqua ion complexes have a long persistence.19 At the same time, it is clear that
there are numerous DESs based on metal ion and hydrated metal ions that are stoichiometrically
mixed with chelating Lewis acid molecules.26 There is therefore likely to be some significant overlap
between the structural characteristics of these systems, despite the different naming.20
1.2. Deep Eutectic Solvents (DES)
1.2.1. Fundamentals
Deep Eutectic Solvents (DES) are a category of ionic solvents that were discovered in 2001 by the
work of Abbott et al.27 Like SILs, DES are commonly described as a ‘sub-class’ of ILs. The group had
found that neutral ‘hydrogen bond donor’ (HBD) molecules (ie. urea; Tmelt = 133 ˚C) would interact
profoundly when mixed in a certain ratio with quaternary ammonium ‘hydrogen bond acceptor’
(HBA) salts (ie. choline chloride aka. ChCl; Tmelt = 302 ˚C), which in this case was 1 salt:2 HBD.28 The
melting point of the ChCl:urea mixture was reported as 12 ˚C, and unusual solvent properties were
observed. Hence, ‘Deep Eutectic Solvent’ was coined later in 2003 by the same group, based
around the classical idea that a liquid eutectic phase is formed by mixing two solids with higher
melting points.28 The same group subsequently found the same stark eutectic behaviour for a
number of different starting materials, such as carboxylic acids,29 and alcohols.30 As the field has
expanded over the years, the number of DES systems have risen accordingly. Now, over 106 DESs
are theorised to be possible, and a wide variety of systems have already been reported, with an
outline shown in Figure 1.2.31

17
Figure 1.2. Exemplar molecular structures of some common DES precursors (non-exhaustive). Reprinted without modification with permission from Wiley-VCH.31 Note that the molecular structure for ethylammonium chloride should be rendered as [CH3CH2NH3
+][Cl-].
Figure 1.2 shows the wealth of different molecular functionality that can be introduced
into the solvent environment by using DESs. As such, DESs have been touted as the ‘ultimate’
designer solvent. This means that the solvent environment of a DES can be tuned to be task-specific
with very few design limits, because a DES is simply described as a combination of Lewis or
Brønsted acids or bases with a cation or anion, in a certain molar ratio.32 For example, there are
DESs that have been tuned to be hydrophobic for extraction applications,33 and metallic DESs that
are used for metal electrodeposition.34 Accordingly, there are now several different sub-
classifications of DESs, which have been described by the generalised formula:
HBD ∶ Cation ∶ Anion Equation 1
Where n describes the number of moles of cation and anion, and the HBD:cation (or anion)
ratio is given by x. Typically, the cationic species is an ammonium salt. However, the cation could
also be a metal, or an equivalent phosphonium or sulfonium species. The anionic species must be
capable of forming H-bonds and is most commonly a halide but may also be for example a nitrate

18
anion. The HBD species is neutral and must simply be capable of forming H-bonds. Therefore, the
four main ‘sub-types’ of DES are typically described as:
Type I: Quaternary ammonium salt + metal salt, eg. ChCl:ZnCl2;35 ChCl:SnCl2.36 Similar to
extensively-studied imidazolium salt mixtures, ie. FeCl3:1-butyl-3-methylimidazolium chloride.37
Type II: Quaternary ammonium salt + hydrated metal salt, eg. ChCl:CrCl3.6H2O; ChCl:LaCl3.6H2O;
ChCl:CaCl2.6H2O; ChCl:Zn(NO3)2.4H2O.26 Identical to Type I DESs, but more numerous and easier to
process due to lower viscosity.
Type III: Quaternary ammonium halide + neutral HBD, eg. ChCl:urea (reline); ChCl:ethylene glycol
(ethaline); ChCl:glycerol (glyceline).32 Type III are the archetype DESs, and have received the most
research interest.
Type IV: Metal salt + neutral HBD, eg. ZnCl2:urea; ZnCl2:acetamide; ZnCl2:ethylene glycol; ZnCl2:1,2-
hexanediol;35 CrCl3.6H2O:3.5 urea.38 Related to Type I and Type II DES, but the ammonium salt is
substituted for an HBD molecule. Therefore, these are more like IL-HBD mixtures, ie. glucose:1-
butyl-3-methylimidazolium chloride.39
DES are currently experiencing an exponential surge in research interest, with most of the
studies revolving around ‘Type III’ DES, and a graph of publication quantity against time is shown
in Figure 1.3. One decade after the initial discovery (October 2012), approximately 200 publications
citing DES as the subject matter had been printed. One year into the PhD research (September
2016), this had reached 1321 articles regarding DES (CAS SciFinder search for ‘deep eutectic
solvent’). Whereas the field took 15 years to reach this point, this figure more than doubled over
the following 2 years, reaching 2872 articles at time of writing (20th September 2018).

19
Figure 1.3. Total number of publications as a function of time in the field of DES showing the exponential growth in publication count, as compiled from CAS SciFinder searches.
1.2.2. Physicochemical properties
The properties of DES and ILs are different, but relatable to IL-mixtures (eg. Imidazolium IL-glucose
mixtures).39 The chemical properties vary more than the physical properties which are remarkably
similar, and the converse is true with respect to MLs; DES occupy a compositional space
somewhere between MLs and ILs and this is manifested in the physicochemical properties.40 DES
are in a sense more similar to ILs, as they are both regarded as innately tuneable. The idea is that
a DES can be made task-specific, by varying the components to make a solvent system with the
required melting point, conductivity, pH, or viscosity, for example.41 A study by Mjalli et al. of
phosphonium salt-based DESs showed that the physical properties are strongly affected by not
only the salt, but also the HBD, and the mole fraction of each species.42 This raises an interesting
point, because a range of eutectic compositions is reported for each mixture, whereas in a ‘classic’
eutectic the eutectic point is a single specific mole fraction. However, in DES the transition
temperature is often difficult to accurately determine. This is due to several factors; several
techniques have been reported, of which differential scanning calorimetry (DSC) is most
appropriate, but measurements are affected by temperature ramp rate and metastability of the
Year (A.D.)
2000 2010 2020 2030 2040 2050
DE
S P
ub
lica
tio
ns
0
500
1000
1500
2000
2500
3000
3500

20
liquid state arising from the viscosity leading to supercooling.43 Furthermore, the ChCl:urea (reline)
DES was initially reported to melt at 12 ˚C using a laboratory melting point apparatus,27 but later
and more detailed investigations suggest that it actually melts at 25 ˚C.44 Pure ChCl:urea samples
solidify slowly at room temperature, and so this discrepancy has been assigned to the hygroscopic
nature of DESs: a reline sample that melts at 12 ˚C is a ternary mixture, containing approximately
5 wt. % of absorbed atmospheric H2O.45
One of the most commonly-stated advantages of ILs is their low vapour pressure, which
reduces atmospheric pollution when applied to processing.46 As such, given their pseudo-ionic
nature, DES are also commonly stated to have negligible vapour pressures.32,40,47 However, choline
chloride DES smells strongly ammoniacal when even trace water is present, which suggests that
the vapour pressure is non-negligible. Indeed, experimental evidence is emerging showing that DES
have a more complex vapour pressure relationship than ILs and MLs, that cannot be explained
using the conventional Antoine model.48 In general, DES have a detectable vapour pressure, but
this is still quite low relative to MLs, and higher than ILs. Significantly (given the hygroscopic nature
of DES), it has been shown that the vapour pressure of DES increases when water is added to the
solvent, with the magnitude of this being related to the melting point of the DES.49
The viscosity of DES tends to be high, and the conductivity quite low when compared to
MLs and ILs, whereas the surface tension of DES is generally high, comparable to alcohols and
water.50 This has been assigned to the intermolecular bonding in DESs, as well as the large mean
ion size, and the free volume of the ionic systems.51 A significant body of work, largely lead by
Abbott et al., has focused on assigning this to the average void radius of the liquid, which relates
the molar conductivity (Λ) with the fluidity (η-1) of the liquid.29 Their ‘hole theory’ assumes the
existence of empty ‘void’ spaces upon melting because of local density fluctuations. Under this
assumption, voids are under constant flux, and are random in size and location;52 charge transport
is therefore limited by the voids in the liquid, and as these are assumed to be at infinite dilution,
the Nernst-Einstein equation is said to be valid.53 The average void radius (r) is related to the
surface tension (γ) of the DES or IL by:
4 = Equation 2
Where kB is the Boltzmann constant, and T the temperature. It is frequently described that
hole theory can accurately predict physical properties of DESs.54 However, hole theory predicts a
viscosity of 11 cP for the most popular DES reline, whereas the lowest experimental value is 169
cP. For now, it seems that the assumptions of hole theory make it suitable only for a ballpark guess,
with a standard error of over ± an order of magnitude. It has been suggested that the assumed
Gaussian distribution of voids with 4 Å diameter is physically unlikely for DESs.55

21
1.2.3. DES as green solvents
‘Type III’ DES are the most commonly-researched DES sub-type. They have been applied most
widely in metal electrodeposition,56 and separation-extraction applications such as fuel
purification,57 and sequestering CO2.58 DES have also begun to find use as alternative organic
reaction media for traditional and metal-catalysed reactions,59-60 and inorganic synthesis.61 Of the
Type III DESs, the most popular are (in descending order): ChCl:urea (reline), ChCl:glycerol
(glyceline), and ChCl:ethylene glycol (ethaline).32 These DESs are regarded as the most viable
systems because they have tractable physical properties, and are based on cheap and ubiquitous
HBDs such as urea, which is the most widespread nitrogenous fertiliser in the world.31 Similarly,
the cholinium cation is produced as a supplement for animal feed on the megaton scale (typically
as the chloride salt ChCl) via a one-step, gas-phase reaction between HCl, trimethylamine, and
ethylene oxide. This process is efficient and produces little waste overall, but the petrochemical
feedstocks must be acknowledged: although the aforementioned DES are generally benign,
biodegradable, and non-cytotoxic,62–64 they are not perfectly green solvents.
Some recent developments into new types of DES may shape the future of DES research,
and particularly their sustainability. First among these was the coining of the natural deep eutectic
solvent (NADES) in 2011 by Choi et al.65 The group described NADES as DES that are made entirely
from naturally-sourced chemicals. They reported that liquids were formed from over 30
combinations of natural carboxylic and amino acids, sugars, and water, which could be classified
as Type III DESs. The same group went on to show yet more examples of NADESs in 2013, and
demonstrated their efficacy in certain extraction-separation experiments.66,67 Interestingly, Choi et
al. hypothesised that such DESs would be formed in plants under desiccating conditions, effectively
acting as a cryoprotectant, and subsequent work by Francisco et al. showed the formation of
numerous NADESs from sugar-amino acid mixtures.68 It is argued that under the correct
circumstances, NADESs can be the perfect green solvent, with ‘drinkable’ components and sourced
from renewable feedstocks, but there are drawbacks; as has been found in the biofuel industry,
repurposing arable land for the production of sugars for fuel and solvents can be problematic.69
Secondly, NADES are mixtures of natural acids and sugars, giving poor thermal stability due to
Maillard and caramelisation reactions, and pyrolysis. Finally, a fundamental question is highlighted
by the water content of many NADES: are such systems truly DES, or are they simply aqueous
dilutions of the individual DES components?
The group of Abbott et al. have proposed novel and more economically viable DES based
around sodium salts with cheap and readily-available HBD molecules. They have posited that the
cheapest DES would in fact be a Type IV mixture of NaCl and glycerol, rather than any of the popular

22
cholinium-HBD DESs.70 They found that the proposed NaCl:glycerol DES is not viable, but group 1
metal salts, especially with sodium acetate, can form liquids with DES-like physical properties,
albeit with no real eutectic point. Whether or not these systems are DES is only a semantic issue:
a useful, affordable, sustainable DES or IL-analogue that is derived from bulk commodity chemicals
would be a significant and useful discovery.
1.3. Literature Review: Structure in DES
1.3.1. Outlook
Deep Eutectic Solvents (DES) are most commonly described as binary liquid mixtures, resulting
from the combination of two components, which are typically but not exclusively solids, to form a
mixture that is fluid in a specified mixing ratio at the desired temperature. DES are therefore
necessarily mixed systems, and examples have been reported where combinations of component
[A] and [B] yield liquids that are entirely ionic, partially-ionic, or non-ionic. As a category of solvents
this has a major implication: DES cover a broader range of compositional space than either
molecular or ionic liquids (MLs or ILs), with wide-ranging properties and an accordingly high degree
of complexity, which carries forward into studies of every discipline. This is because, as has been
found for ILs, the solvent structure of the chosen DES defines the properties, and the catalogue of
all possible mixtures of associating, H-bonding compounds covers a huge proportion of the library
of known compounds, far greater than the catalogue of ionic compounds that can be used to build
ILs. Yet, even excluding mixtures, the potential quantity of pure ILs alone has been estimated to be
as high as 1018.3 This gives a sense of scale for the number of potential DES, and the size of the
problem for someone seeking to definitively identify their architecture.
Given this backdrop it seems almost impossible to offer an answer to the question of ‘What
is the structure of a DES?’, because of the scale and composition-dependence of the problem.
Furthermore, at this stage the fundamental understanding of DES structure remains in a relatively
infant state; reports thus far generally study only the structures of the most popular DES mixtures
(ie. mixtures of choline chloride (ChCl) with urea, glycerol, or ethylene glycol), and do not yet cover
the full range of available characterization techniques. This is unfortunate because of the currently
rapid, exponential growth in the number of reports of new applications of DES, that require an
innate understanding of the solvent structure and its implications, which is only presently
formulating. Accordingly, we aim to review recent studies that have been aimed towards
improving the fundamental knowledge regarding DES structure, with focus on the most popular

23
ChCl systems. We will explore the initial understanding that defined the field and critically explore
how this view has changed over time. We will also examine reports of DES structure at the interface
with chemical third parties, such as DES/solid interfaces, solutes, and co-solvents. In doing so, we
aim to compose a more nuanced view of the nature of DES; if fundamental, common aspects of
the structure and interactions for different DES can be ascertained, then answers to the other
unaddressed questions about DES may begin to follow, as has been previously observed in the
fields of pure ILs and MLs.
1.3.2. Complex ion model
The field of DES came from the Abbott group, who at the time were working with eutectic mixtures
of metal salts with quaternary ammonium salts, and had identified the surprisingly large melting
point depression offered by eutectic mixtures incorporating common organic cations with
relatively low-order symmetry, explicitly (cholinium)+.27 The first literature coinage of the term
‘deep eutectic solvents’ was a 2003 study by the same group, which introduced a DES made of ChCl
and urea in a 1:2 eutectic ratio (Figure 1.4, left), and a series of DES with derivatized urea molecules
as the secondary component.28 Accordingly, ChCl-urea, which is often called ‘reline’ for
convenience, is regarded as the archetypal DES. This work was important because as well as ChCl-
urea, this work introduced the initial complex ion model of DES structure (Figure 1.4, right). The
fundamental properties (and hence structure) of the solvent were ascribed to a significant charge-
delocalization from the chloride anion onto the urea, forming a complex ion. Indirect evidence of
this was presented; 1H-19F HOESY 2D NMR spectroscopy showed, for a model ChF-urea DES, strong
dynamic association between the fluoride and urea protons. The hypothesis was further
strengthened by the features at m/z of 95 and 155 in negative-ion-mode FAB-MS spectra, assigned
respectively as the chelated anion clusters [Cl(CO(NH2))]- and [Cl(CO(NH2))2]-, ie. 1 urea:1 Cl- and 2
urea:1 Cl-, that were formed when the DES was ionized under fast atom bombardment.

24
Figure 1.4. (Left) The eutectic phase diagram for the ChCl:urea DES, as initially reported by Abbott et al. The eutectic point is the minimum, at a 1:2 ratio of ChCl:urea. The absolute value of this transition temperature has since been disputed due to water content.45 Reprinted with permission from the Royal Society of Chemistry.71 The components of the DES are shown alongside (right) with a demonstration of the initially-proposed complex-anion structure.
The inferences made by Abbott’s group led to the now-common terminology introduced
in a follow-up work, where the primary component of the DES (normally the halide salt, such as
ChCl) is described as the ‘hydrogen bond acceptor’ (HBA) and, as the complexing agent, the
secondary component (normally the neutral molecule, such as urea) is called the ‘hydrogen bond
donor’ (HBD).29 The proposed complex ion model of solvent structure, containing an HBA and HBD,
can be related closely to the structure of metal salt eutectics. This is noteworthy as it is relatively
distant from the nanostructural classifications proposed for most pure organic ILs, but DES are
commonly described as an extension or subtype of these.3 The first publication attempting to cover
the nanoscale interactions in DES in detail was a 1H pulsed field gradient NMR spectroscopy study
by D’Agostino et al.72 This technique is limited by the low NMR sensitivity towards Cl- as well as the
quadrupolar interactions exhibited by this nucleus, and so data were analysed assuming full
association of HBD and chloride. Significant differences were observed between the diffusion
coefficients of the HBD-chloride component and choline, with the long-range diffusion coefficients
of neutral hydrogen bond donors (ie. glycerol) appearing faster than that of choline. One exception
was observed for a 1:1 ChCl-malonic acid DES, where the HBD diffused more slowly than choline,
which in this model was attributed to malonic acid oligomerization in the bulk.
1.3.3. The Hydrogen-Bond network model: ‘Alphabet Soup’
As the works heretofore laid the foundation for the field of DES in the broader sense, they also
defined the fundamental understanding of the nanostructure of DES in terms of a complex ion
model for the bulk structure of DES. Hence, most major reviews to date continue to describe the
structure and properties of DES in terms of a complex ion model, in which substantial delocalization

25
of charge from anion to HBD is seen, and the idea of a greater H-bond network is used
heuristically.31,32,40,69 In this section we aim to chronologically review works which paint a more
sophisticated picture of DES structure, as well as the gradual evolution of understanding. These
studies tend towards usage of high-level analytical techniques, or are computational in nature, or
even combine these two approaches; advanced analysis and simulations such as MD or DFT can
give insights into correlations and interactions that can be difficult to rationalize for such complex
solvent systems, as has been seen in the field of ILs.3
Rimsza and René Corrales first performed quantum chemical simulations to assess the
relative stability of ion clusters in ChCl-urea, and the feasibility of proton transfer from urea to
chloride to form HCl and anionic urea.72 It was found that the solvent had a low propensity towards
forming urea anions, with the majority of the bulk containing neutral urea molecules. Additionally,
a higher stability was found for the charge-neutral stoichiometric complex of choline-chloride-
urea-urea. Sun et al. used MD simulation to investigate ChCl-urea mixtures, including the DES, as
a function of composition.73 This work showed a complicated set of convoluted radial distribution
functions (RDFs). Surprisingly, analysis of the RDFs and H-bond lifetimes (Table 1.1) showed that
the strongest and longest-lived H-bond in the DES is the choline O-H⋅⋅⋅Cl interaction; this H-bond
had the shortest length and its lifetime was found to be longer than urea N-H⋅⋅⋅Cl bonding by a
factor ~5. For comparison, continuous and intermittent residence times for water, glycerol, N-
methylacetamide and the ionic liquid [Emim]Cl are shown alongside in Table 1.1. Furthermore, the
ensemble interaction energy was deconvoluted to the contributions from each component at each
composition. It was observed that when choline is in excess the cation-anion interaction
dominates, as in crystalline ChCl, and vice versa when urea is in excess. However, at the eutectic
ratio, the cation-anion and anion-urea interaction energies are almost balanced. Hence, this was
the first indication of a more complicated picture than the complex ion model, because alongside
the strong choline-chloride interaction, strong H-bonding between urea and chloride was
observed, and a balance between these interactions (notwithstanding choline-urea interactions)
appears necessary to form a DES.
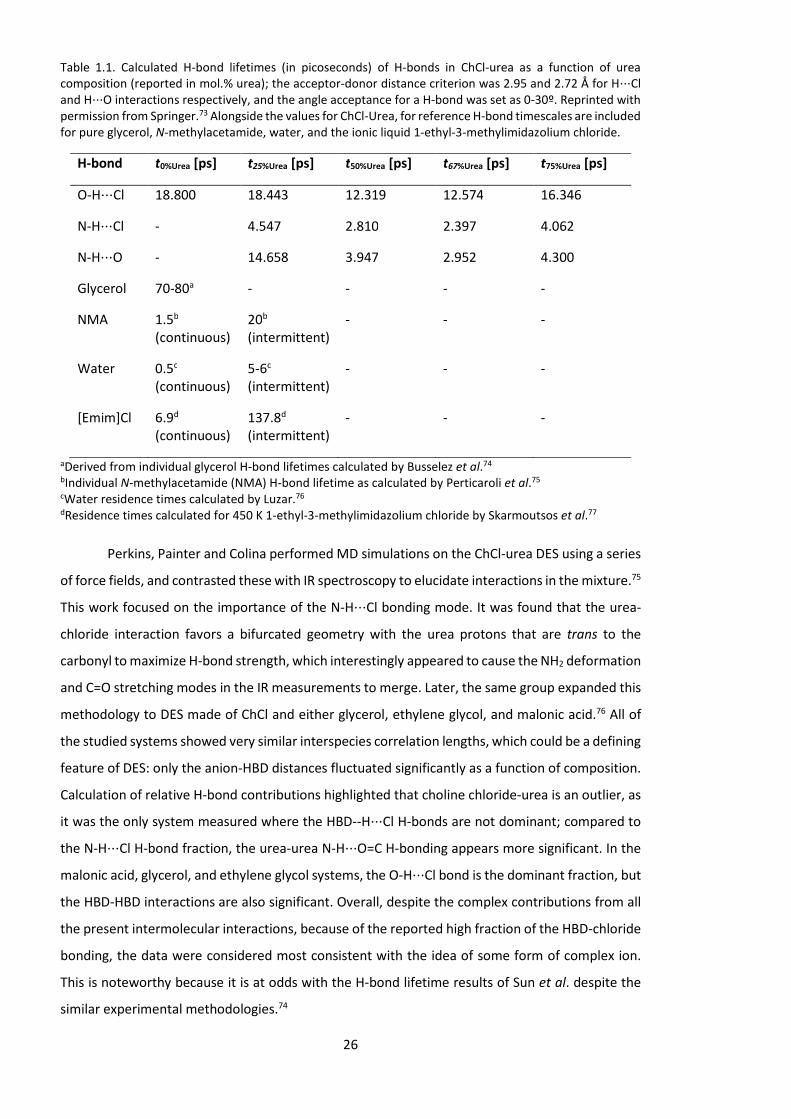
26
Table 1.1. Calculated H-bond lifetimes (in picoseconds) of H-bonds in ChCl-urea as a function of urea composition (reported in mol.% urea); the acceptor-donor distance criterion was 2.95 and 2.72 Å for H⋅⋅⋅Cl and H⋅⋅⋅O interactions respectively, and the angle acceptance for a H-bond was set as 0-30º. Reprinted with permission from Springer.73 Alongside the values for ChCl-Urea, for reference H-bond timescales are included for pure glycerol, N-methylacetamide, water, and the ionic liquid 1-ethyl-3-methylimidazolium chloride.
H-bond t0%Urea [ps] t25%Urea [ps] t50%Urea [ps] t67%Urea [ps] t75%Urea [ps]
O-H⋅⋅⋅Cl 18.800 18.443 12.319 12.574 16.346
N-H⋅⋅⋅Cl - 4.547 2.810 2.397 4.062
N-H⋅⋅⋅O - 14.658 3.947 2.952 4.300
Glycerol 70-80a - - - -
NMA 1.5b
(continuous) 20b (intermittent)
- - -
Water 0.5c (continuous)
5-6c (intermittent)
- - -
[Emim]Cl 6.9d (continuous)
137.8d (intermittent)
- - -
aDerived from individual glycerol H-bond lifetimes calculated by Busselez et al.74 bIndividual N-methylacetamide (NMA) H-bond lifetime as calculated by Perticaroli et al.75 cWater residence times calculated by Luzar.76 dResidence times calculated for 450 K 1-ethyl-3-methylimidazolium chloride by Skarmoutsos et al.77
Perkins, Painter and Colina performed MD simulations on the ChCl-urea DES using a series
of force fields, and contrasted these with IR spectroscopy to elucidate interactions in the mixture.75
This work focused on the importance of the N-H⋅⋅⋅Cl bonding mode. It was found that the urea-
chloride interaction favors a bifurcated geometry with the urea protons that are trans to the
carbonyl to maximize H-bond strength, which interestingly appeared to cause the NH2 deformation
and C=O stretching modes in the IR measurements to merge. Later, the same group expanded this
methodology to DES made of ChCl and either glycerol, ethylene glycol, and malonic acid.76 All of
the studied systems showed very similar interspecies correlation lengths, which could be a defining
feature of DES: only the anion-HBD distances fluctuated significantly as a function of composition.
Calculation of relative H-bond contributions highlighted that choline chloride-urea is an outlier, as
it was the only system measured where the HBD--H⋅⋅⋅Cl H-bonds are not dominant; compared to
the N-H⋅⋅⋅Cl H-bond fraction, the urea-urea N-H⋅⋅⋅O=C H-bonding appears more significant. In the
malonic acid, glycerol, and ethylene glycol systems, the O-H⋅⋅⋅Cl bond is the dominant fraction, but
the HBD-HBD interactions are also significant. Overall, despite the complex contributions from all
the present intermolecular interactions, because of the reported high fraction of the HBD-chloride
bonding, the data were considered most consistent with the idea of some form of complex ion.
This is noteworthy because it is at odds with the H-bond lifetime results of Sun et al. despite the
similar experimental methodologies.74

27
García, Atilhan and Aparicio aimed to correlate the structure in DES with the melting point
depression, by analysing the electron density distribution of a variety of DES, simulated using
density functional theory (DFT).71 Models were built from clusters of DES constituent molecules in
the eutectic ratio, and then the geometries were optimized. Some optimized structures are shown
in Figure 1.5. Results were interpreted by looking at the density of the cage critical points (CCP), cf.
Bader’s ‘Atoms in Molecules’ Theory (AIM). A linear relationship was found between the computed
CCP electron density, and the transition temperature of the DES: the lowest melting points were
found for DES clusters with low electron density, and in these systems the charge delocalization
was inferred to be the strongest. It is significant that this structural model, with DES components
incorporated into stoichiometric clusters, was found to have a strong linear relationship with the
physical properties of the mixtures, suggesting an additional layer of complexity to the structuring
found in DES: such clusters existing in the bulk would simultaneously rationalize previous findings
on strong chloride H-bonding with HBD and cation, and help to explain the eutectic point
depression.
Figure 1.5. A selection of the optimized cluster geometries for some of the energy-optimized DES are shown alongside their intermolecular H-bonds (dashed lines), and cage critical points (purple spheres). DES are (1) 1:2 ChCl:urea, (2) 1:2 ChCl:glycerol, (3) 1:3 ChCl:glycerol, (4) 1:1 ChCl:malonic acid. Reprinted with permission from the Elsevier.71
Quasielastic neutron scattering (QENS) is an advanced neutron spectroscopy technique
which provides information on intermolecular diffusion dynamics on the pico-to-nanosecond
timescale, allowing direct resolution of nanometre and sub-nanometre motion in a sample, and is
particularly sensitive to proton motion. This technique was used by Wagle, Baker and Mamontov
to investigate the detailed dynamics of the ChCl:glycerol DES.77 Whereas the previous NMR
experiments by D’Agostino et al. had suggested that the slowest long-range translational diffusion
was seen for choline, being the largest cation,72 the QENS data showed that choline actually
diffuses most quickly at short length scales (ie. 1 Å – 1 nm). Chloride diffusion was seen to be the

28
slowest, while glycerol diffusion was between the two, but closer to that of chloride. This was
rationalized by considering the short-range structure to be a dynamic cage where both choline and
glycerol compete for chloride H-bonds, but glycerol forms more, and stronger bonds than choline.
This causes a stronger transient confinement of glycerol, allowing choline to move more freely,
and simultaneously highlighting that chloride plays a pivotal role in the hydrogen bond network.
The first experimental study directly measuring the structure of DES was a multidisciplinary
approach reported by Hammond, Bowron and Edler, which took liquid-phase neutron diffraction
measurements at 303 K of deuterium-substituted ChCl:urea DES and refined the structure against
the data using atomistic modelling.55 Firstly, the data confirmed the expected urea-chloride
correlation described by most of the previous works. However, it also pinpointed that the choline-
chloride O-H⋅⋅⋅Cl bond is relatively strong and stable, and the interplay between this bond and the
urea N-H⋅⋅⋅Cl bonding, as well as the urea N-H⋅⋅⋅O bonding, defines the structure of the system.
Indeed, there is a synergy between the strong and weak H-bonds and Coulombic forces described
by the 120 individual radial distribution functions (as parameterized). The measured mean bulk
structure can be considered as a dynamic cage centred about chloride, which urea and choline
compete to H-bond with. From the balance between electrostatics and H-bonding, chloride was
shown to sit preferentially in a region between choline’s hydroxyl group and ammonium moiety,
but the choline-chloride RDF shows a bimodal distribution arising from a secondary occupation at
the positively-charged end of choline. Simultaneously, urea H-bonds with the chloride via both its
proximal and distal protons, whilst also forming a distinct urea-urea network. The proposed
structure combines aspects of the previously-discussed ideas of charge delocalization and complex
ion formation, with a key role for chloride and H-bonding competition between the various species
in the mixture.

29
Figure 1.6. Simplified representation of urea-chloride clusters, where each ‘arrow’ represents the N-C-N ‘backbone’ of urea, and green circles represent chloride anions. Relative energies are shown in brackets in units of kJ mol-1. Reprinted with permission from the Royal Society of Chemistry.78
Ashworth et al. published a thorough analysis of the possible structures in ChCl-urea DES,
using quantum chemical calculations78. The energies of a representative set of DES-DES
interactions, ie. choline-urea, urea-urea, choline-chloride, and urea-chloride, in various optimized
dimers, trimers and clusters, were computed for a total of 172 individual H-bonds, leading to
several important conclusions. Firstly, many of the possible interactions were found to be
energetically favourable and hence competitive in the mixture, with no truly dominant mode.
Indeed, examination of the hypothetical urea:chloride clusters (shown in Figure 1.6) suggested that
they were not structurally dominant in DES, predominantly from competition from a urea[choline]+
species, because the strongest H-bond was found to be a cationic choline-urea OH⋅⋅⋅O=C bond.
Additional contributions were found from urea-urea and choline-chloride interactions, which were
found to have higher average H-bond strengths than the chloride-based bonding. The moderate
H-bonding propensity of all the components generates a wide gamut of competitive structures
with low energies, therefore making the total system entropy very high. Moreover, the
delocalization of charge was assessed, showing limited transfer from chloride to other species and

30
highlighting that because urea can both donate and receive H-bonds, urea can therefore act as a
charge reservoir, dynamically accepting or donating small quantities of electron density as
required. This hints at a favourable ‘charge diffuse’ complex of urea[Cl]-.urea[Ch]+, in agreement
with the suggestions of Hammond et al.55 and Wagle et al.77 from neutron experiments, as well as
the DFT calculations of García et al.71 This paper was therefore the first to coin the term ‘Alphabet
Soup’ to describe the structural model that this and other recent works were beginning to describe,
with a very heterogeneous H-bonding environment between all extant species involving nonionic,
and singly or doubly ionic H-bonds. In this model, some local short-lived cluster structure is seen
but overall, the structure is highly disordered.
The spreading of charge in ChCl:Glycerol, ChCl:Urea and ChCl:Oxalic acid (1:1) liquids was
further investigated by Zahn, Kirchner and Mollenhauer, using ab initio MD simulations79. While
reduced ionic charges are seen, it was found that there is negligible charge spreading from chloride
to urea, and in ChCl:Urea in particular this charge is mainly spread onto the cation due to stronger
H-bonding, as found by Ashworth’s analysis78. H-bond analysis showed that the strongest chloride-
neutral transfer corresponded with the strongest H-bond between these two components, which
was found for the oxalic acid system, but this was also found to decrease spreading of the positive
charge. Thus, the work presented further evidence for a more complex structural model, and the
suggestion that the deep eutectic melting point is not from a charge-transfer, chloride-urea
complex, but rather from the strong disorder in the liquid structure. Meanwhile, a key step forward
was made in the development of force fields for DES, because of the strong composition-
dependence of charge scaling which was interrogated. Another important computational study of
DES was that of Stefanovic et al., who used quantum mechanical molecular dynamics (QM-MD)
simulations to study the bulk nanostructures of ChCl:Urea, ChCl:Ethylene glycol, and ChCl:Glycerol,
and corroborate these with experimental viscosity trends80. The structure of ChCl:U was found to
generally agree with recent works; choline-chloride H-bonding is observed but concluded not to
be the dominant factor in forming the DES, urea-chloride bonding is seen via proximal urea
protons, and significant competition from other interactions is seen. Interestingly, some of the
stronger interactions highlighted by Ashworth’s cluster models are lost when modelling the bulk,
such as the preferred urea-urea interactions. Distinct urea-urea clustering was indeed seen by
Stefanovic et al., predominantly through the urea distal protons, but the urea-chloride bonding
was found to be more significant78. The structures of the ChCl:EG and ChCl:G DES were found to
be comparable, and relatable to ChCl:U, but with a much stronger self-interaction of the glycerol
or glycol, leading to stronger cation-anion interactions in polyol DES. This was assigned to a lower
ability to intercalate the ChCl lattice; while amide and hydroxyl groups have similar H-bond
acidities, the latter is limited to linear H-bonding whereas the former can bond nonlinearly.
Furthermore, the neutral self-association is stronger for glycerol; if chloride is coordinating with all

31
available hydroxyl sites, chloride is coordinatively saturated by glycol, whereas when glycerol is
used there is an excess of glycerol -OH sites, permitting more glycerol-glycerol interactions. The H-
bond density of ChCl:U, ChCl:G and ChCl:EG were calculated to be 13.8, 10.8 and 9.4 bonds nm-3
respectively, allowing nanoscale rationalization of the DES viscosity trends if a similar net attractive
electrostatic force per unit volume is assumed. This is significant because it shows that the widely-
applied assumption of hole theory is not necessary to explain the viscosity of DES52,54,81, which was
also suggested by the lack of solvent extrinsic porosity noted in neutron analysis.55
Zahn subsequently published an analysis of both the structure and dynamics of ChCl:U
using ab initio MD simulations, to test whether the DES can simply be described by the notion „like
dissolves like“82. Emphasis was placed on the hypothetical existence of long-lived clusters and their
diffusion in the bulk. These were shown to be essentially absent, with the dynamics closer to that
of ILs, where molecules rattle within cages, cf. Wagle’s QENS findings77. Indeed, similarities with
recent studies are also seen in the structural details from computed RDFs and SDFs, in terms of the
nearest-neighbour distances and preferential conformations55,77,78,80. The depth of the eutectic
depression was postulated to arise from a balance of interactions between choline, and the urea
oxygen atom and chloride, creating an array of potential energy minima which facilitates high
entropy. The choline hydroxyl proton was shown to be a strong H-bond donator but poor acceptor;
particularly long H-bond lifetimes, signifying relatively rigid and H-bonding with narrow angular
distributions, are seen for the O-H⋅⋅⋅Cl (choline-chloride; 10.3 ps) and O-H⋅⋅⋅OU (choline-urea; 6.4
ps) interactions. Clearly, this agrees with the findings of Sun et al.74 and the local choline-chloride
structure suggested by neutron diffraction measurements, but it is repeatedly stated to show the
opposite to the latter, possibly due to misinterpretation of the model. Indeed, a wide band of
potential chloride locations around choline was shown in SDFs55, but this arises from free rotation
of the adjacent ethyl group, and not the O-H⋅⋅⋅Cl bond itself which appears to be strong, long-lived
and near-linear in these media55,74,80.
Mainberger et al. screened a series of DES with different force fields, to assess the
suitability of MD for rapid screening of DES using off-the-shelf potentials. The DES studied were
ChCl:Glycerol, ChCl:1,4-butanediol, and ChCl:Levulinic acid, as well as an esoteric Betaine:Levulinic
acid mixture83. The latter mixture is of interest due to the use of betaine, which is zwitterionic and
hence chloride-free, yet a structurally analogous ChCl replacement. Despite the obvious structural
differences, the Betaine:Lev DES was found to behave similarly to the ChCl:Lev, with pronounced
disorder but close-range cage-like H-bonding structure especially between carboxylate and
hydroxyl groups, and similar betaine-betaine distances as choline-choline (ca. 6 Å). In ChCl:G, the
choline hydroxyl group was found to be 45% associated with chloride, with 33-54% H-bonding with
glycerol (depending on the chosen potentials), and the role of the weak H-bonding from cationic
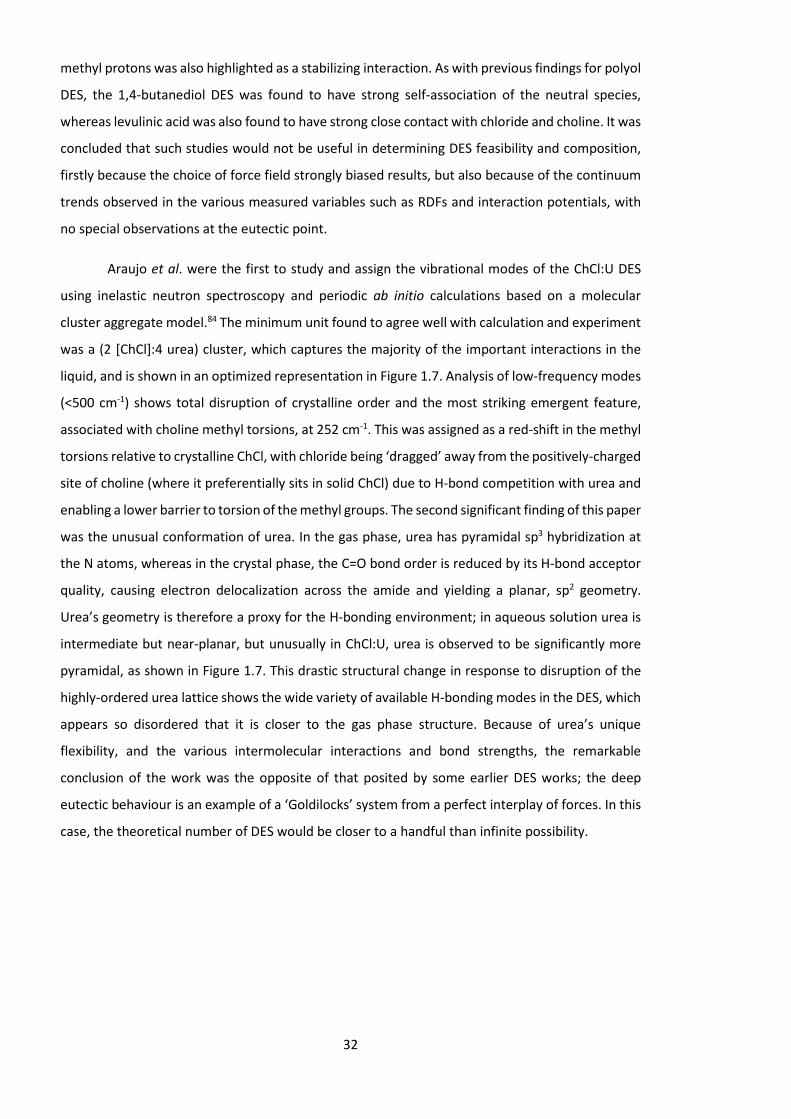
32
methyl protons was also highlighted as a stabilizing interaction. As with previous findings for polyol
DES, the 1,4-butanediol DES was found to have strong self-association of the neutral species,
whereas levulinic acid was also found to have strong close contact with chloride and choline. It was
concluded that such studies would not be useful in determining DES feasibility and composition,
firstly because the choice of force field strongly biased results, but also because of the continuum
trends observed in the various measured variables such as RDFs and interaction potentials, with
no special observations at the eutectic point.
Araujo et al. were the first to study and assign the vibrational modes of the ChCl:U DES
using inelastic neutron spectroscopy and periodic ab initio calculations based on a molecular
cluster aggregate model.84 The minimum unit found to agree well with calculation and experiment
was a (2 [ChCl]:4 urea) cluster, which captures the majority of the important interactions in the
liquid, and is shown in an optimized representation in Figure 1.7. Analysis of low-frequency modes
(<500 cm-1) shows total disruption of crystalline order and the most striking emergent feature,
associated with choline methyl torsions, at 252 cm-1. This was assigned as a red-shift in the methyl
torsions relative to crystalline ChCl, with chloride being ‘dragged’ away from the positively-charged
site of choline (where it preferentially sits in solid ChCl) due to H-bond competition with urea and
enabling a lower barrier to torsion of the methyl groups. The second significant finding of this paper
was the unusual conformation of urea. In the gas phase, urea has pyramidal sp3 hybridization at
the N atoms, whereas in the crystal phase, the C=O bond order is reduced by its H-bond acceptor
quality, causing electron delocalization across the amide and yielding a planar, sp2 geometry.
Urea’s geometry is therefore a proxy for the H-bonding environment; in aqueous solution urea is
intermediate but near-planar, but unusually in ChCl:U, urea is observed to be significantly more
pyramidal, as shown in Figure 1.7. This drastic structural change in response to disruption of the
highly-ordered urea lattice shows the wide variety of available H-bonding modes in the DES, which
appears so disordered that it is closer to the gas phase structure. Because of urea’s unique
flexibility, and the various intermolecular interactions and bond strengths, the remarkable
conclusion of the work was the opposite of that posited by some earlier DES works; the deep
eutectic behaviour is an example of a ‘Goldilocks’ system from a perfect interplay of forces. In this
case, the theoretical number of DES would be closer to a handful than infinite possibility.

33
Figure 1.7. The crystalline lattices of (a) ChCl, (b) urea and (c) the optimized ChCl:urea DES geometry; unit cells for ChCl and urea are shown in the boxes along the c axis of ChCl and the b axis of urea. (Bottom) A comparison of the planar and pyramidal configurations of the urea molecules, for crystalline urea and urea found in the ChCl:urea DES. The average value is given for the DES, since the model bears different parameters for each molecule. The bond lengths and torsion angles are determined from calculations (CASTEP). Reprinted with permission from the Royal Society of Chemistry.84
It has been hypothesized in the literature that naturally-occurring DES (NADES) are used
by plants, firstly to help protect against freezing damage by instead vitrifying, and secondly to
protect against desiccation by sequestering water.65 To probe this, a ChCl:Malic acid DES was
studied,85 using a similar neutron scattering and atomistic modelling methodology as the previous
measurements of ChCl:U55. Additional structural studies were made of a weakly hydrated DES,
containing 2 mol equivalents of water (ca. 11.6 wt.%), as well as QENS measurements of the dry
and hydrated DES to probe the dynamics of the phase change. Hammond et al. found that the
structural minutiae were relatable to ChCl:U, with discrepancies easily rationalized by the larger
and more richly functionalized malic acid molecule, which yields a 1:1 eutectic. Chloride is clearly
displaced from the ammonium end of choline towards H-bonding with the hydroxyl group, in
competition with malic acid, and in this DES the clusters within which the molecules dynamically
‘rattle’ seemed more strongly associated. Interestingly, addition of water (2 mol. equiv) barely
affects the solvent structure, as it occupies interstitial sites and minimizes disruption, despite
constituting 50 mol.%. Analysis of the phase transition using QENS showed a gradual reduction and
eventual halt in proton motion with no step change, demonstrating a glass transition rather than

34
an explicit freezing point. Overall, this provided credence to the prospects of natural sugar-based
and amino acid DES as plant preservation agents.
Figure 1.8. SDF plots showing correlation within ChCl:urea (a,b) and ChCl:oxalic acid (c,d) at high temperature. The central molecule in the first column is choline and in the second column is the respective HBD, Yellow isosurfaces represent choline, cyan represent the HBD, while chloride is represented in green. Surfaces are calculated to the 15% probability level. Reprinted with permission from AIP publishing.86
Most of the above experiments and simulations have been at ambient conditions. Because
of the growing interest in solvothermal synthesis using DES,87–89 it is important to understand the
temperature-dependence of nanostructure, and so Gilmore et al. were the first to report high-
temperature structures of ChCl:U, as well as ChCl:oxalic acid.86 Using neutron diffraction and EPSR
measurements at 338 K, it was shown that ChCl:U rearranges at high temperatures. The short-
range choline O-H⋅⋅⋅Cl bonding lengthened from 2.1 to 2.8 Å, and hence weakened substantially.
Meanwhile, the urea N-H⋅⋅⋅N bonding mode becomes dominant, whereas at 303 K this association
appears to be present but the N-H⋅⋅⋅O bond is stronger; as the choline-chloride interaction is
weakened, the liquid reorganization alters the urea-urea self-correlation, with overall loss of
directional order, and SDF plots demonstrating this change in order are shown in Figure 1.8. The
ChCl:ox data showed stronger association of the oxalic acid and chloride, comparable with the
structure of ChCl:malic acid, and assigned to the lower number of H-bonding sites in the carboxylic
DES than the urea. However, the same temperature-dependent weakening and lengthening of O-
H⋅⋅⋅Cl H-bonding was observed.85 The self-association of oxalic acid was explored, cf. reports of
malonic acid chain formation,72 but remarkably little acid-acid interaction was seen in the model.

35
Faraone et al. built upon their previous QENS study of ChCl:glycerol with a neutron spin-
echo (NSE) study of the same solvent, combined with dielectric spectroscopy, to understand
microscale dynamics.90 Interestingly, it was shown that for this system, the local H-bond dynamics
are completely defined by glycerol, rather than the ChCl. The DES could be described as a highly-
correlated network of H-bonded glycerol molecules, which are plasticized by ChCl ions which
occupy interstitial voids in the network structure to form ionic domains. Both NSE and dielectric
relaxation timescales were found to coincide more closely with pure glycerol than with the DES
itself. Additionally, nanoscale structuring between glycerol and choline molecules was observed at
1.26 nm, which is more commensurate with a [Choline+.Cl-.(glycerol)2] entity than molecular-scale
interactions, and thus concluded to represent the average ionic-molecular domain separation. The
choline ions were confirmed to be decoupled from the coherent glycerol network by computing
the combined NSE correlation function, which represents the choline-rich domain dynamics with
respect to the molecule domain, showing largely uncorrelated and dynamic fluctuations within the
ionic region.
1.3.4. Non-cholinium DES
Kaur, Gupta and Kashyap presented one of the few structural studies on non-cholinium DES with
MD simulations of lithium perchlorate mixtures with alkylamides (acetamide and propionamide).91
Such lithium ion systems are likely to represent a development of DES into useful materials for
energy applications. The solvents were the first DES that were found to explicitly segregate and
form distinct hydrophobic (alkyl) and charged domains, where the domain size and occurrence
scales with alkyl chain length. From the models, X-Ray and neutron scattering functions were
predicted, allowing the presence of electrolyte to be determined as essential for the formation of
these ordered domains because of its pronounced structural contribution to the prepeak in the
S(q). The high charge density causes the Li+⋅⋅⋅ClO4- electrostatic to dominate, leading to the
formation of dual-domain nanostructure, where an ion-rich domain coexists with the alkyl-rich
nonpolar domain. Further, Cui et al. have used a combined approach of 2D FTIR spectroscopy and
MD simulations to investigate nanoscale heterogeneity in a series of trifluoroacetamide (TFAm)
DES where the chloride counterion of the salt was varied from choline to chlorocholine,
tetramethylammonium, tetraethylammonium and benzyltriethylammonium. FTIR revealed that
the TFAm amide band does not alter significantly despite the variable structure and levels of
symmetry in the cation.92 This was assigned to the two species only interacting at the interface
between segregated nanodomains. The timescale of rapid thermal H-bond formation and breaking
for the amide species (~1 ps) is similar across solvents and relatable to typical ML H-bond lifetimes

36
(water and methanol). This effect occurs alongside an HBA-dependent slow dynamic component
that was related to the reverse micelle effect, where interfacial water molecules slow down the
solvent dynamics, thus providing further evidence for the existence of aggregates. The IR
experiments agreed with analysis of RDFs from MD simulations, confirming the nanoscopic
heterogeneity of the mixture.
McDonald et al. presented a study of DES composed of ethyl-, propyl-, and
butylammonium bromide and glycerol, which are more closely relatable to the most popular DES.93
This is slated as the first study where amphiphilically-segregated nanostructure has been observed
in DES using neutron diffraction and EPSR, and is shown in Figure 1.9. The work highlights that the
cation must be sufficiently amphiphilic to drive partitioning into hydrophobic and polar domains;
choline-based DES have thus far not shown this nanostructure strongly,94 because of the terminal
-OH group which disrupts the solvophobic effect. Simply removing this moiety appears to be a
sufficient driving force to ‘switch on’ the formation of hydrophobic domains, especially in a system
where glycerol will form a dominant network structure alone,90 and extending the chain (or indeed
using alkylamides for the basis of the DES91,92) makes this effect more pronounced. The alkyl chains
form bilayer-type continuous structures and were therefore related to previous studies of ionic
liquid self-segregation, with differences assigned to the variable composition, ie. the quantity of
uncharged species, charge density, and the anion propensity to form H-bonds. As with the work of
Faraone et al., glycerol was found to form a continuous network which is relatively uninterrupted
by the neutral component and forming a H-bond network,90 which was said to facilitate the
solvophobic self-assembly process by permitting nonpolar domains to percolate within network
void space. The formation of domains was confirmed by analysis of cluster formation above the
percolation threshold, ie. p(n) = n-2.2. Thus, it is highlighted that solvophobic segregated
nanostructures are accessible states that are potentially useful for DES, such as in optimising
properties for extractions, but require more mindful design to attain.

37
Figure 1.9. Simulation box snapshots taken of the alkylammonium bromide:glycerol DES fits at 300 K. The first column shows all atoms in the simulation coloured to aid visualization; glycerol OH (red) and CH2 yellow, cation alkyl (grey) and ammonium (blue), and Br- (maroon). The second column shows ions only (alkylammonium and Br-), and the final column shows glycerol only. In the latter two columns, colours are conventional. The snapshots aid in the visualization of the segregated structure. Reprinted with permission from the American Chemical Society.93
The physicochemical properties and H-bonding in proline:glycolic acid and proline:malic
acid DES were investigated using MD simulation by van den Bruinhorst et al.95 One important
finding of this study was the esterification of DES components under certain preparation
conditions. The degree of oligomerization was directly correlated with the physical properties such
as viscosity. This highlights an interesting point that has been touched upon previously;96,97 DES are
generally assumed to be pure, but the simple heating and stirring preparation can cause

38
degradation.98 Nonetheless, analysis of the MD simulations showed that introduction of proline to
the respective acid facilitated limited acid-acid dimerization, but that the interspecies (proline-
acid) H-bonds are the major contributor to liquid structure in this case, and are formed because of
the disruption to acid self-association. The RDFs also showed some relatively ‘long-range’ order >1
nm for the system, therefore highlighting how a subtle change in components can totally alter the
nature of the nanostructure.
1.3.5. Structure of DES at a solid interface
Chen et al. were the first to examine the structure of DES at an electrode interface using AFM.99
This technique has commonly been used in determining the interfacial structure of liquids such as
ILs as it has the required combination of pN-level sensitivity and sub-nm resolution.100 AFM force
curves were taken of the ‘original trio’ of DES (the most widely-reported ‘Type III’ ChCl mixtures
with glycerol, ethylene glycol and urea) at the interface with a highly-ordered pyrolytic graphite
(HOPG) electrode, both with and without applied potential. Interestingly, it was found that in all
cases, the interface excluded the molecular component at all applied potentials and there is an
ever-present Stern layer in contact with the surface which the AFM tip cannot displace. Applying
positive or negative potentials cause chloride or choline, respectively, to be attracted towards the
Stern layer. Generally, the number of layers was less than that seen in pure ILs, and so were the
layer push-through forces, which describe the layer cohesive energy. This was rationalised by
considering that, relative to pure ILs, the additional molecular component allows more efficient
packing without the formation of a layered structure. These findings were further confirmed by
first-principle DFT calculations.
Atilhan et al. have performed simulations of several DES at the interface. First, MD
simulations of the (100) surface of relevant face-centred cubic metals Ag, Al, and Pt were
performed for an interesting ChCl:levulinic acid system. It was found that two well-defined layers
were adsorbed and held within a range of ≤1 nm, though the DES structure was perturbed up to 3
nm into the bulk. Chloride was found to adsorb most closely to the surface, while the first layer is
formed of parallel arrangements of levulinic acid and choline molecules; this allows the adsorbed
layer to maintain the DES stoichiometry, although the H-bonding is weakened and the diffusion
rate in the adsorbed layer is significantly lower than in the bulk. The DES-surface interaction
strength was found to follow the trend Pt > Ag > Al. The same group subsequently carried out MD
and DFT calculations for a series of cholinium DES at a graphene interface, where the chosen HBDs
were urea, glycerol, malonic acid, levulinic acid and phenylacetic acid. DFT showed strong cation-
graphene and weaker HBD-graphene interactions, with the choline-surface interaction defined by

39
the charge transfer from the graphene. MD results showed a primary adsorbed layer, 0.5 nm in
width, before a transition region of the same width, before surface effects on the bulk structure
vanish. Both techniques confirmed the previous observation of ChCl:levulinic acid DES on fcc
metals, that the two components arrange in parallel with respect to the graphene surface. Similar
observations were made of ChCl:urea on a graphene surface, in MD studies performed by Kaur et
al. 101 The presence of both charged DES components forming a multilayer at <1.2 nm from the
electrode lead to screening of electrode charge, with urea also weakly able to participate in this
process, as evidenced by adopting different configurations depending on applied potential.
Chen et al. have applied AFM to understand the interfacial structure of alkylammonium
bromide:glycerol DES on a mica (model anionic) surface, as alkyl chain length is varied from ethyl,
to propyl, and butyl.102 Not only was it was shown that the near-surface layer increases in size as
the alkyl chain length is increased, but bulk properties such as surface tension, viscosity and
conductivity were found to vary. The interface was found to be enriched in cations due to the
negative surface charge, and the alkyl chains of this first adsorbed layer and a second, less well-
orientated layer of cations, which also contains other components. Overall, this paper constituted
the first experimental evidence that the alkyl chain of cations could associate into solvophobically-
segregated clusters in the nanostructure.

40
1.3.6. References
1 J. Finney and A. Soper, Chem. Soc. Rev., 1994, 23, 1–10. 2 C. Reichardt, Solvents and solvent effects in organic chemistry, Wiley-VCH, Weinheim, 2003. 3 R. Hayes, G. G. Warr and R. Atkin, Chem. Rev., 2015, 13, 6357–6426. 4 A. K. Soper, ISRN Phys. Chem., 2013, 2013, 279463. 5 K. Tanaka, Solvent-Free Organic Synthesis, Wiley-VCH, Weinheim 2009. 6 J. Peach and J. Eastoe, Beilstein J. Org. Chem., 2014, 10, 1878–1895. 7 I. T. Horváth, Green Chem., 2008, 10, 1024. 8 C. J. Clarke, W. C. Tu, O. Levers, A. Bröhl and J. P. Hallett, Chem. Rev., 2018, 118, 747–800. 9 N. V. Plechkova and K. R. Seddon, Methods and Reagents for Green Chemistry: An Introduction,
Wiley, Hoboken, 2007, 103–130. 10 R. A. Sheldon, Green Chem., 2017, 19, 18–43. 11 R. D. Rogers and K. R. Seddon, Science, 2003, 302, 792–793. 12 P. Walden, Bull. l’Académie Impériale des Sci. St.-pétersbg., 1914, 8, 405–422. 13 N. V Plechkova and K. R. Seddon, Chem. Soc. Rev., 2008, 37, 123–150. 14 H. Wang, G. Gurau and R. D. Rogers, Chem. Soc. Rev., 2012, 41, 1519-1537. 15 T. L. Greaves and C. J. Drummond, Chem. Soc. Rev., 2008, 37, 1709–1726. 16 J. D. Bernal, Proc. R. Inst. G. Br., 1959, 37, 355–393. 17 J. D. Bernal and R. H. Fowler, J. Chem. Phys., 1933, 1, 515–548. 18 D. MacFarlane, A. L. Chong, M. Forsyth, M. Kar, V. Ranganathan, A. Somers and J. M. Pringle, Faraday
Discuss., 2018, 206, 9–28. 19 T. Mandai, K. Yoshida, K. Ueno, K. Dokko and M. Watanabe, Phys. Chem. Chem. Phys., 2014, 16,
8761–8772. 20 J. Estager, J. D. Holbrey and M. Swadźba-Kwaśny, Chem. Soc. Rev., 2014, 43, 847–886. 21 K. Yoshida, M. Tsuchiya, N. Tachikawa, K. Dokko and M. Watanabe, J. Phys. Chem. C, 2011, 115,
18384–18394. 22 K. Ueno, K. Yoshida, M. Tsuchiya, N. Tachikawa, K. Dokko and M. Watanabe, J. Phys. Chem. B, 2012,
116, 11323–11331. 23 K. Shimizu, A. A. Freitas, R. Atkin, G. G. Warr, P. A. FitzGerald, H. Doi, S. Saito, K. Ueno, Y. Umebayashi,
M. Watanabe and J. N. Canongia Lopes, Phys. Chem. Chem. Phys., 2015, 17, 22321–22335. 24 Z. Chen, S. McDonald, P. A. Fitzgerald, G. G. Warr and R. Atkin, Phys Chem Chem Phys, 2016, 18,
14894–14903. 25 T. Murphy, S. K. Callear, N. Yepuri, K. Shimizu, M. Watanabe, J. N. Canongia Lopes, T. A. Darwish, G.
Warr and R. Atkin, Phys. Chem. Chem. Phys., 2016, 18, 17224–17236. 26 A. P. Abbott, G. Capper, D. L. Davies and R. K. Rasheed, Chem. - A Eur. J., 2004, 10, 3769–3774. 27 A. P. Abbott, G. Capper, D. L. Davies, H. L. Munro, R. K. Rasheed and V. Tambyrajah, Chem. Commun.,
2001, 19, 2010–2011. 28 A. P. Abbott, G. Capper, D. L. Davies, R. K. Rasheed and V. Tambyrajah, Chem. Commun., 2003, 0, 70–
71. 29 A. P. Abbott, D. Boothby, G. Capper, D. L. Davies and R. K. Rasheed, J. Am. Chem. Soc., 2004, 126,
9142–9147. 30 A. P. Abbott, G. Capper, D. L. Davies, K. J. McKenzie and S. U. Obi, J. Chem. Eng. Data, 2006, 51, 1280–
1282. 31 M. Francisco, A. Van Den Bruinhorst and M. C. Kroon, Angew. Chemie - Int. Ed., 2013, 52, 3074–3085. 32 E. L. Smith, A. P. Abbott and K. S. Ryder, Chem. Rev., 2014, 114, 11060–11082. 33 D. J. G. P. van Osch, L. F. Zubeir, A. van den Bruinhorst, M. A. A. Rocha and M. C. Kroon, Green Chem.,
2015, 17, 4518–4521. 34 K. Haerens, E. Matthijs, A. Chmielarz and B. Van der Bruggen, J. Environ. Manage., 2009, 90, 3245–
3252. 35 A. P. Abbott, J. C. Barron, K. S. Ryder and D. Wilson, Chem. - A Eur. J., 2007, 13, 6495–6501. 36 A. P. Abbott, G. Capper, D. L. Davies and R. Rasheed, Inorg. Chem., 2004, 43, 3447–3452. 37 M. S. Sitze, E. R. Schreiter, E. V. Patterson and R. G. Freeman, Inorg. Chem., 2001, 40, 2298–2304. 38 A. P. Abbott, A. A. Al-Barzinjy, P. D. Abbott, G. Frisch, R. C. Harris, J. Hartley and K. S. Ryder, Phys.
Chem. Chem. Phys., 2014, 16, 9047-9055. 39 T. G. A. Youngs, J. D. Holbrey, C. L. Mullan, S. E. Norman, M. C. Lagunas, C. D’Agostino, M. D. Mantle,
L. F. Gladden, D. T. Bowron and C. Hardacre, Chem. Sci., 2011, 2, 1594-1605. 40 B. Tang and K. H. Row, Monatshefte fur Chemie, 2013, 144, 1427–1454. 41 D. A. Alonso, A. Baeza, R. Chinchilla, G. Guillena, I. M. Pastor and D. J. Ramón, European J. Org. Chem.,

41
2016, 4, 612–632. 42 M. A. Kareem, F. S. Mjalli, M. A. Hashim and I. M. AlNashef, J. CHem. Eng. Data, 2010, 55, 4632–4637. 43 M. Francisco, A. van den Bruinhorst, L. F. Zubeir, C. J. Peters and M. C. Kroon, Fluid Phase Equilib.,
2013, 340, 77–84. 44 H. G. Morrison, C. C. Sun and S. Neervannan, Int. J. Pharm., 2009, 378, 136–139. 45 X. Meng, K. Ballerat-Busserolles, P. Husson and J.-M. Andanson, New J. Chem., 2016, 40, 4492–4499. 46 Y. U. Paulechka, D. H. Zaitsau, G. J. Kabo and A. A. Strechan, Thermochim. Acta, 2005, 439, 158–160. 47 S. Khandelwal, Y. K. Tailor and M. Kumar, J. Mol. Liq., 2016, 215, 345–386. 48 K. Shahbaz, F. S. Mjalli, G. Vakili-Nezhaad, I. M. AlNashef, A. Asadov and M. M. Farid, J. Mol. Liq.,
2016, 222, 61–66. 49 S. H. Wu, A. R. Caparanga, R. B. Leron and M. H. Li, Thermochim. Acta, 2012, 544, 1–5. 50 T. Arnold, A. J. Jackson, A. Sanchez-Fernandez, D. Magnone, A. E. Terry and K. J. Edler, Langmuir,
2015, 31, 12894–12902. 51 A. Yadav and S. Pandey, J. Chem. Eng. Data, 2014, 59, 2221–2229. 52 A. P. Abbott, ChemPhysChem, 2004, 5, 1242–1246. 53 A. P. Abbott, ChemPhysChem, 2005, 6, 2502–2505. 54 A. P. Abbott, R. C. Harris and K. S. Ryder, J. Phys. Chem. B, 2007, 111, 4910–4913. 55 O. S. Hammond, D. T. Bowron and K. J. Edler, Green Chem., 2016, 18, 2736–2744. 56 Q. Zhang, Q. Wang, S. Zhang, X. Lu and X. Zhang, ChemPhysChem, 2016, 17, 335–351. 57 B. Tang, H. Zhang and K. H. Row, J. Sep. Sci., 2015, 38, 1053–1064. 58 G. Garcia, S. Aparicio, R. Ullah and M. Atilhan, Energy & Fuels, 2015, 29, 2616–2644. 59 P. Liu, J.-W. Hao, L.-P. Mo and Z.-H. Zhang, RSC Adv., 2015, 5, 48675–48704. 60 J. García-Álvarez, Eur. J. Inorg. Chem., 2015, 31, 5147–5157. 61 D. V Wagle, H. Zhao and G. A. Baker, Acc. Chem. Res., 2014, 47, 2299–2308. 62 M. Hayyan, M. A. Hashim, M. A. Al-Saadi, A. Hayyan, I. M. AlNashef and M. E. S. Mirghani,
Chemosphere, 2013, 93, 455–459. 63 Q. Wen, J.-X. Chen, Y.-L. Tang, J. Wang and Z. Yang, Chemosphere, 2015, 132, 63–69. 64 M. Hayyan, M. A. Hashim, A. Hayyan, M. A. Al-Saadi, I. M. AlNashef, M. E. S. Mirghani and O. K.
Saheed, Chemosphere, 2013, 90, 2193–2195. 65 Y. H. Choi, J. van Spronsen, Y. Dai, M. Verberne, F. Hollmann, I. W. C. E. Arends, G.-J. Witkamp and R.
Verpoorte, Plant Physiol., 2011, 156, 1701–1705. 66 Y. Dai, J. van Spronsen, G. J. Witkamp, R. Verpoorte and Y. H. Choi, Anal. Chim. Acta, 2013, 766, 61–
68. 67 Y. Dai, G. J. Witkamp, R. Verpoorte and Y. H. Choi, Anal. Chem., 2013, 85, 6272–6278. 68 M. Francisco, A. van den Bruinhorst and M. C. Kroon, Green Chem., 2012, 14, 2153-2157. 69 A. Paiva, R. Craveiro, I. Aroso, M. Martins, R. L. Reis and A. R. C. Duarte, ACS Sustain. Chem. Eng.,
2014, 2, 1063–1071. 70 A. P. Abbott, C. D’Agostino, S. Davis, L. F. Gladden and M. Mantle, Phys. Chem. Chem. Phys., 2016,
18, 25528-25537. 71 G. García, M. Atilhan and S. Aparicio, Chem. Phys. Lett., 2015, 634, 151–155. 72 C. D’Agostino, R. C. Harris, A. P. Abbott, L. F. Gladden and M. D. Mantle, Phys. Chem. Chem. Phys.,
2011, 13, 21383–21391. 73 J. M. Rimsza and L. R. Corrales, Comput. Theor. Chem., 2012, 987, 57–61. 74 H. Sun, Y. Li, X. Wu and G. Li, J. Mol. Model., 2013, 19, 2433–2441. 75 S. L. Perkins, P. Painter and C. M. Colina, J. Phys. Chem. B, 2013, 117, 10250–10260. 76 S. L. Perkins, P. Painter and C. M. Colina, J. Chem. Eng. Data, 2014, 59, 3652–3662. 77 D. V. Wagle, G. A. Baker and E. Mamontov, J. Phys. Chem. Lett., 2015, 6, 2924–2928. 78 C. R. Ashworth, R. P. Matthews, T. Welton and P. A. Hunt, Phys. Chem. Chem. Phys., 2016, 18, 18145–
18160. 79 S. Zahn, B. Kirchner and D. Mollenhauer, ChemPhysChem, 2016, 17, 3354–3358. 80 R. Stefanovic, M. Ludwig, G. B. Webber, R. Atkin and A. J. Page, Phys. Chem. Chem. Phys., 2017, 19,
3297–3306. 81 A. P. Abbott, G. Capper and S. Gray, Chemphyschem, 2006, 7, 803–806. 82 S. Zahn, Phys. Chem. Chem. Phys., 2017, 19, 4041–4047. 83 S. Mainberger, M. Kindlein, F. Bezold, E. Elts, M. Minceva and H. Briesen, Mol. Phys., 2017, 8976, 1–
13. 84 C. F. Araujo, J. A. P. Coutinho, M. M. Nolasco, S. F. Parker, P. J. A. Ribeiro-Claro, S. Rudić, B. I. G. Soares
and P. D. Vaz, Phys. Chem. Chem. Phys., 2017, 19, 17998–18009. 85 O. S. Hammond, D. T. Bowron, A. J. Jackson, T. Arnold, A. Sanchez-Fernandez, N. Tsapatsaris, V. G.
Sakai and K. J. Edler, J. Phys. Chem. B, 2017, 121, 7473–7483.
42
86 M. Gilmore, L. M. Moura, A. H. Turner, M. Swadźba-Kwaśny, S. K. Callear, J. A. McCune, O. A. Scherman and J. D. Holbrey, J. Chem. Phys., 2018, 148, 193823.
87 E. A. Drylie, D. S. Wragg, E. R. Parnham, P. S. Wheatley, A. M. Z. Slawin, J. E. Warren and R. E. Morris, Angew. Chemie - Int. Ed., 2007, 46, 7839–7843.
88 O. S. Hammond, K. J. Edler, D. T. Bowron and L. Torrente-Murciano, Nat. Commun., 2017, 8, 14150. 89 O. S. Hammond, S. Eslava, A. J. Smith, J. Zhang and K. J. Edler, J. Mater. Chem. A, 2017, 5, 16189–
16199. 90 A. Faraone, D. V Wagle, G. A. Baker, E. C. Novak, M. Ohl, D. Reuter, P. Lunkenheimer, A. Loidl and E.
Mamontov, J. Phys. Chem. B, 2018, 122, 1261–1267. 91 S. Kaur, A. Gupta and H. K. Kashyap, J. Phys. Chem. B, 2016, 120, 6712–6720. 92 Y. Cui and D. G. Kuroda, J. Phys. Chem. A, 2018, 122, 1185-1193. 93 S. McDonald, T. Murphy, S. Imberti, G. G. Warr and R. Atkin, J. Phys. Chem. Lett., 2018, 9, 3922–3927. 94 H. J. Jiang, R. Atkin and G. G. Warr, Curr. Opin. Green Sustain. Chem., 2018, 12, 27–32. 95 A. van den Bruinhorst, T. Spyriouni, J.-R. Hill and M. C. Kroon, J. Phys. Chem. B, 2018, 122, 369–379. 96 C. Florindo, F. S. Oliveira, L. P. N. Rebelo, A. M. Fernandes and I. M. Marrucho, ACS Sustain. Chem.
Eng., 2014, 2, 2416–2425. 97 M. C. Gutiérrez, M. L. Ferrer, C. R. Mateo and F. Del Monte, Langmuir, 2009, 25, 5509–5515. 98 D. E. Crawford, L. A. Wright, S. L. James and A. P. Abbott, Chem. Commun., 2016, 52, 4215–4218. 99 Z. Chen, B. McLean, M. Ludwig, R. Stefanovic, G. G. Warr, G. B. Webber, A. J. Page and R. Atkin, J.
Phys. Chem. C, 2016, 120, 2225–2233. 100 R. Hayes, G. G. Warr and R. Atkin, Phys. Chem. Chem. Phys., 2010, 12, 1709–1723. 101 S. Kaur, S. Sharma and H. K. Kashyap, J. Chem. Phys., 2017, 147, 194507. 102 Z. Chen, M. Ludwig, G. G. Warr and R. Atkin, J. Colloid Interface Sci., 2017, 494, 373–379.

43
2. THEORY
2.1. Structure of disordered materials
2.1.1. Structure in a liquid
The liquid phase is so ubiquitous that it is remarkable to consider that, unlike for gases and solids,
the nature of structure in a liquid is nontrivial to define. This arises from the combination of
physical properties. A liquid is a fluid with solid-like density and a gas-like ability to flow. A liquid
cannot be considered as perfectly disordered (like a gas), nor perfectly ordered (like a solid), but it
has density like a solid and the ability to flow like a gas. Liquids do not have strongly-defined and
repeating long-range order like in solid crystalline materials, but neither are they totally non-
correlated, like a gas; rather, they have Å-to-nanoscale order that is highly transient, with a
timescale of movements between 10-9 to 10-15 s. This disorder is the same for a glass, with the
exception that motion is essentially frozen in the glassy state.1 Hence, it is inappropriate to simplify
the complex structure of these disordered materials as either a ‘densified gas’ or an ‘imperfect
solid’, as it has become evident that liquids have a structure that is not only spatial, but also
temporal.2 An example of the difference in structure between the solid and supercooled liquid
states of nickel is shown in Figure 2.1.
Figure 2.1. Measured structure factor S(Q) for solid Ni (left) and supercooled liquid Ni (right). In the liquid state, the correlations have similar spacing, but are more diffuse and lower in amplitude, and no long-range correlation is seen. Reproduced from an open source RAL Technical Report written by Alan K. Soper.3
Water is a good example of liquid structure theory development. The discoverer of X-Rays,
Wilhelm Röntgen, was one of the first to propose a model for liquid water in 1891, and this is now
known as the ‘mixture model’. Röntgen proposed a mixture of ice-like clusters and free water

44
molecules in the liquid. In 1933, Bernal and Fowler developed a model for water that was based
on a tetrahedral arrangement of hydrogen bonds, akin to a distorted quartz structure.4 Later, in
the 1950s, work by Charles Frank showed that the icosahedron is a common short-range structural
motif in certain simple liquids such as molten metals, with any crystalline arrangement frustrated
by the five-fold symmetry.5 Hearing of this work caused Bernal to return to his own, concluding
that it had implied a greater degree of structuring in the liquid than what actually existed. Bernal
went on to devise a locally-tetrahedral model of water, situated in a hydrogen-bonded network
with no long-range order.6 Further models have been mooted since (and of course, these are not
just for water) but it is only very recently that evidence is appearing to suggest the microscopic
origin of liquid properties such as fluidity; it remains a matter of debate whether the fluidity of a
liquid arises from its innate irregularity, from defects such as bifurcated hydrogen-bonds,7 from
translational motion into vacant liquid ‘hole’ sites,8 or from the local (hydrogen) bonding
dynamics.9,10 Mixture models describing strong close-range order, such as those initially proposed
by Röntgen, remain some of the most persistent descriptions. Models of this type are still described
for various systems such as ionic liquids,11 and other systems, even in the modern day,12 and are
extensible to various network glass-forming systems.1
The notion held persistently in the field has been that there is some degree of local order
in liquids, within a greater sea of disorder at long length scales. Therefore, liquids appear simple,
but are challenging to visualise or relate to. This makes the problem conceptually challenging for
scientists to explain, particularly to lay audiences. Another issue is that determining the nature of
a liquid is relatable to the Heisenberg uncertainty principle; liquids are both spatially and
temporally structured and experiments tend to either be structural or dynamic in nature, with each
technique being generally complex. This is an issue because it is important to understand both the
structure and dynamics to fully understand the liquid state of interest, but both structural and
dynamic understanding alone are greatly diminished in value without understanding the other.
2.1.2. Distribution functions
The simplest function that is used to describe the structure of a disordered material is the radial
distribution function G(r) (RDF). This is interchangeably referred to as the pair correlation function
(PCF) or the pair distribution function G(r) (PDF), although formally the RDF is the ensemble
average of the PCF over all directions of r (ie. directional information is lost).
" = ⟨"$⟩Ω Equation 3

45
The directional dependence of r can be ignored in isotropic, atomic liquids away from
boundaries (ie. G(r) ≡ G(r)), but in the case of anisotropic molecular liquids, these functions look
different (ie. G(r) ≠ G(r)). Strictly speaking, G(r) describes the local number density of atom type j,
rather than describing the probability of finding an atom at a certain place. Crystalline materials
have a regularly repeating structure due to their unit cell, and hence a regular fluctuation in density
is observed throughout the material. However, in a liquid or glass this strongly-defined density
fluctuation is not necessarily observed because of the lack of repeating order. The number density
nj(r) of an atom j is derived from its position Rj by the expression:
'$ = ∑ )$ − +,, Equation 4
Once an autocorrelation is performed on this density distribution, and terms where j = i
are separated from terms where j ≠ i, we can formally define G(r) in terms of an expression
containing a ‘self’ term describing atomic autocorrelations, and a ‘distinct’ term that describes
interactions between different atom types:
"$ = ) + ./ ∑ ) + 0, − 0112, = ) + 3" Equation 5
Where the average atomic number density ρ is expressed in units of atoms Å-3. G(r)
therefore effectively describes being ‘sat’ on one atom and counting all the atoms found at a given
radius r from that atom, before calculating this number as a local density that is averaged over all
the atoms in the system for comparison. G(r) is interchangeably written as G2(r1,r2), because it is
the correlation between two atoms, respectively at positions r1 and r2, where r = r2 – r1. These
multi-body correlation functions can be defined hierarchically, such that three atoms could be
defined as G3(r1,r2,r3) (these multi-body terms can be spurious, as one G2(r1,r2) function can be
resolved by several G3(r1,r2,r3) functions). An exemplar G(r) for liquid nickel is shown in Figure 2.2.
At the origin, the distribution function is zero, as two atoms cannot occupy the same space, and
the ‘ripples’ that begin to appear beyond 2 Å are also a result of this close-range repulsive potential.

46
Figure 2.2. G(r) for supercooled liquid nickel, reproduced from an open source RAL Technical Report written by Alan K. Soper.3
The G(r) that have been discussed so far are valid for monatomic systems. When there are
many (x) atom types, G(r) is split into N partial pair correlation functions gij(r), where N = x(x+1)/2.
In this instance, the pair correlation function is the sum of the partial pair coordination functions
(gij(r), also known as site-site correlation functions), and is expressed as:
"$ = ∑ 41)$ + 3 ∑ 2 − )1,414,61,$1,,811 Equation 6
Where ρi is the number density of atom type i, ci = ρi/ρ, and δij is the Kronecker delta, included to
prevent multiple counting of like atom pairs. Given the partial, or total pair correlation function, it
is possible to calculate the coordination number of another species around the central atom. This
is achieved by integrating the PCF up to a certain radius, typically taken as the first of the minima
in the abscissa.3
2.2. Scattering techniques
2.2.1. Background and principles
The scattering of incident radiation by a material has become an indispensable tool for scientists
studying the structure of matter from the subatomic (0.1 Å) to large (1 μm) length scales, be it
crystal, glass, biomolecule, nanomaterial, or colloid. Because of its non-invasive in situ nature and

47
strong relevance over a wide length scale, scattering is an immensely versatile technique;
accordingly, only the most relevant fraction of this broad field will be addressed here (ie. coherent,
elastic scattering). This chapter will therefore focus mainly on the small-to-wide-angle scattering
of neutron and X-Ray radiation, with emphasis on nanostructure determination for disordered
materials using total scattering experiments, the study of colloidal dispersions using small-angle
scattering, and the characterisation of crystalline nanomaterials using traditional diffraction.
Figure 2.3. Schematic diagram showing a scattering event, whereby an incident beam of wavelength λ is scattered by an angle θ, in accordance with the magnitude of the momentum transfer Q.
The basic premise of a scattering experiment is relatively simple. An incident beam of
monochromatic radiation with wavelength λ is shone upon a sample and is then scattered by an
angle θ (it is noteworthy that this is but one convention of many), to be subsequently detected by
an appropriate detector. The variable scattering vector Q is important, as it determines the length
scale of the scattering experiment with inverse proportionality (distance ~2π/Q): measurements
at small Q correspond with large-scale structures, whilst large Q values yield smaller distances. The
relationship between Q, θ and λ in a typical scattering experiment is shown in Figure 2.3, and is
related to the wavelength and scattering angle by:
9 = :; <=>/@ Equation 7
The theoretically trivial scattering procedure is contrived by several experimental
challenges. Crystalline samples are relatively easy to measure because of strongly repetitive
structural features, whereas it is difficult to measure the weak and diffuse scattering for weakly
ordered structures such as liquids, glasses, and micelles.13 Such already weakly-scattering liquid
samples must be held in an environment such as a quartz or glass cell, which alongside any path

48
length of air that an instrument has, will cause some background scattering signal that must be
subtracted. If scattering occurs, corrections must be made for the attenuation of the beam by the
sample and its environment (alternatively, no corrections could be made, and information is
accepted as lost). Further corrections can be necessary for multiple scattering events, whereby
radiation is scattered more than once on its path through the sample; approximately, if a sample
scatters the beam by x percent, the proportion of multiple scattering will be x percent of this
primary scattering. Inelastic collisions such as nuclear recoil for neutrons and electron recoil for X-
Rays can further distort scattering patterns and need to be accounted for. Further sample-
dependent complications can also be present, such as the fluorescence of a sample during X-Ray
beam exposure, and beam damage.14
2.2.2. X-Ray and Neutron radiation for scattering
experiments
It is important that the radiation used for a scattering experiment has a wavelength appropriate
for the length scale to be probed and generates sufficient contrast between the scattering material
and dispersant for data to be of sufficient resolution. For example, visible light has a wavelength
of 400-600 nm, making it most appropriate for particles larger than 10 nm, wherein scattering
occurs due to variances in refractive index between solvent and particles. Scattering with visible
light is not generally appropriate for probing (sub)molecular length scales.15
An alternative, and more energetic source of electromagnetic radiation for scattering
experiments is offered by X-Rays, which are classified as photons with energies from 0.5 – 500 keV,
corresponding with wavelengths of 25 – 0.25 Å. The useful range of wavelengths provided by
laboratory X-Ray sources varies from about 2.29 Å (Cr target) to 0.56 Å (Ag target); longer
wavelengths tend to be absorbed too strongly to be useful. X-Rays interact with diffuse electron
clouds, giving scattering data based on the fluctuations in the mean electron density in a sample.
This means that X-Rays have excellent contrast between elements of low and high atomic number,
such as a colloid of metallic nanoparticles in water, but poor contrast for light-element systems,
such as dispersions of small-molecule amphiphiles in water (ie. micelles). Laboratory X-Ray sources
most commonly use a sealed-tube, rotating, or liquid jet anode, with brighter microfocus X-Ray
sources becoming increasingly common due to advances in materials. The copper target is the
most commonplace, generating X-Rays with a wavelength of 1.5418 Å that are appropriate for
traditional diffraction measurements and small-angle scattering studies of structural features
below 1 μm in size. Whilst it is useful that X-Rays can be produced in a laboratory from a complete,

49
off-the-shelf instrument, the flux of such sources can still be a limiting factor, and as such the
radiation produced by synchrotron sources such as Diamond (Didcot, UK), ESRF (Grenoble, France),
and MAX IV (Lund, Sweden) can be advantageous. In these facilities, X-Rays are produced by
magnetic deflection of high-energy electrons siphoned from a large storage ring (synchrotron
emission). The flux from a synchrotron source can be many orders of magnitude greater than a
laboratory source. To some degree, this brute force of flux can help to overcome the statistical
issue in the often-low X-Ray scattering contrast that exists for light element systems. However,
casting greater X-Ray flux towards a sample is not always feasible, as even current-generation
synchrotron sources can cause irreparable beam damage to a sample in seconds, and the detector
must be able to resist this.
Neutrons are a type of uncharged subatomic particles (rather than electromagnetic
radiation), with a mass of 1.675 x 10⁻²⁷ kg (1839 electron masses), spin ½, and a magnetic moment
of -1.913 nuclear magnetons. Neutrons have an associated de Broglie wavelength, with a
wavelength range of 1-20 Å useful for elastic scattering, making them ideal for structural studies
ranging from the atomic length scale up to the micron range, as with X-Rays. As this wavelength is
104 greater than nuclear dimensions, this allows there to be no angular momentum transfer during
a scattering event (ie. the scattering is s-wave), if the neutron energy does not coincide with any
nuclear resonances. To a neutron, an atom therefore appears as a small point in space, as opposed
to the diffuse cloud of electron density around a nucleus that is experienced by a passing X-Ray.
This allows neutrons to be more strongly penetrating than X-Rays with a lower degree of sample
interaction. Neutron scattering does not depend upon the atomic number in the same way as X-
Rays, meaning that scattering of neutrons is generally more suitable for the study of light element
systems. Furthermore, neutrons can interact differently with various isotopes of the same
element, allowing the usage of isotope substitution techniques, for example using hydrogen and
deuterium, to acquire different scattering patterns from the same structures. The strength of
scattering is dictated by neutron and X-Ray ‘scattering length’; examples are depicted in Table 2.1.
Table 2.1. Variation in coherent scattering length (b) for nuclei as a function of atomic number (Z). Neutron scattering length does not scale linearly with Z, as is the case with X-Ray scattering length (f), and can vary for different isotopes, eg. H/D. A positive scattering length signifies a repulsive well potential.
Element H D U Fe Co Ba O V Ti Zr
X-ray f (0°) (Z) 1 1 92 26 27 56 8 23 22 40
Neutron b (fm) -3.74 6.674 8.42 9.45 2.78 5.28 5.805 -0.3824 -3.438 5.28
The unique and useful properties of neutrons also lend themselves to difficulties in their
creation and usage. It is not currently possible to generate neutrons with a meaningful flux for

50
scattering experiments on the laboratory scale, or with typical laboratory budgets. There are
currently two main ways to generate neutrons for scattering experiments, both of which involve
large-scale facilities. The first method, as employed by various global facilities such as Institut Laue-
Langevin (Grenoble, France), ANSTO (Australia), and various, small European and American
University research reactors such as at TU Delft (Netherlands), uses neutrons that are liberated by
neutron-induced nuclear fission of plutonium or uranium nuclei. These energetic neutrons are
subsequently moderated by hydrogenous material to more usable energies. The second major
method is called spallation, and is used by facilities including ISIS (Didcot, UK), J-PARC (Tokai, Japan)
and ESS (Lund, Sweden). Spallation neutron sources produce neutrons by accelerating proton
bunches in either a linac or synchrotron to extremely high energies, and then guiding these into
heavy metal targets. Highly energetic nuclear states yielded by these collisions decay, jettisoning
neutrons as spall. It is relatively trivial to design a reactor source that is of extremely high flux, but
reactor sources are limited by cooling and the availability and disposal of nuclear fuel. However,
the pulsed nature of proton beams in spallation sources (400 ns pulse width at ISIS) allows the
measurement of neutron energy by time-of-flight. This removes the requirement for
monochromation, therefore drastically increasing the neutron efficiency of a spallation source
relative to a reactor. Spallation is also significantly safer as it produces far less high-level radioactive
waste, does not require a sustained nuclear fission reaction (with all associated safety provisos),
and can be shut down immediately.
2.2.3. Crystallography and powder diffraction
Crystallography is technique which dates back as far as the 1600s. The entirety of the classical
theory behind the field was completely developed by the end of the 19th century. ‘Classic’
crystallography relies on the elastic, coherent scattering of an incident wave through the infinitely-
repeating Bravais lattice of a single crystal, according to Bragg’s Law. Both X-Rays and neutrons are
commonly used for crystallographic investigations. Constructive interferences between diffracted
waves yield an effective scattering pattern; the lattice planes act as an atomically-sized diffraction
grating, yielding a diffraction pattern with a series of intense spots at particular (typically wide,
high-Q) angles.16 Resolving this data allows the calculation of the interatomic spacing and geometry
of the unit cell of the Bravais lattice, and hence information about the solid-state structure of a
compound. Unfortunately, many chemical compounds cannot be isolated as a sufficiently-sized
single crystal for traditional diffraction studies and can only be isolated as polycrystalline samples
containing some substantial number of small crystallites. Several breakthroughs, including the
introduction of Scherrer analysis, and then in the 70s Rietveld refinement (alongside improved

51
computing), have allowed the diffraction technique to successfully extend into the measurement
of polycrystalline compounds.17
Figure 2.4. Single crystal 2D diffraction data (red spots) overlaid on their corresponding powder diffraction pattern (blue lines). The powder diffraction is radially averaged due to isotropic dispersion of crystallite orientations. Reprinted with permission from reference 18. Copyright The Royal Society of Chemistry.
Unlike the anisotropic crystal that is measured in single crystal diffraction, powders have
an isotropic distribution of possible crystallite orientations. This leads to radially-averaged
scattering for powders, as opposed to distinct Laue spots, and is demonstrated in Figure 2.4.18
Otherwise, powder diffraction is functionally identical to single crystal diffraction.19 The single
crystal technique remains far more powerful for structure determination, because of the full
retention of 2D spatial resolution of Laue spots. However, when the growth and isolation of large,
perfect single crystals proves as challenging as it can often be, powder diffraction is a rapid, non-
destructive and high-throughput alternative that requires minimal sample preparation and is
especially useful for fingerprinting. Mixed phases cannot be studied in single crystal experiments
but can be readily analysed using powder diffraction. If modern high-flux synchrotron sources (X-
Ray) are used alongside high-resolution neutron powder diffraction with contrast variation, it is
possible to resolve a complex unit cell with simple powder diffraction.20
2.2.4. Small-angle scattering (SAS)
Small-angle scattering (SAS) shares its basic premise with crystal diffraction, with the measurement
of typically either X-Ray (SAXS) or neutron radiation (SANS), which is elastically and coherently
scattered by a sample to an angle θ. In contrast with single-crystal and powder diffraction
techniques that generally study high-Q scattering data to observe miniscule fluctuations in unit cell
dimensions, small-angle scattering is more concerned with measurement of ‘large-scale’ structures

52
that are far greater than the atomic length scale. Such structures are directly relevant to many
biomolecules, and chemical systems such as microemulsions, nanoparticles and surfactant
aggregates.21 Accordingly, small scattering angles are measured, or more accurately, small Q
values, as the specific combination of θ and λ is not the important quantity.
The scattering lengths discussed previously referred to the scattering properties of
individual nuclei. Small-angle scattering is dependent upon an assembly of atoms (ie. multiple
molecules) having different scattering properties to its dispersant (itself another assembled
mixture of molecules). In this case, it becomes simpler to define these separate scattering regions
using the concept of ‘scattering length density’ (SLD). This term is defined as the sum of scattering
lengths (bi) for a set of atoms, normalised by the volume (V) that these atoms occupy in solution.
For neutrons, this can be expressed as:
ABC = ∑ DEFEG Equation 8
Recalling that X-Rays interact with diffuse electron clouds rather than the atomic point-
scatterers that neutrons interact with, the expression for X-Ray SLD must be calculated using the
expression:
ABC = ∑ HEIJFE G Equation 9
This expression further considers the atomic number of the atom (Zi), and the classical
electron radius (2.818 x 10⁻¹⁵ m). Because small-angle scattering necessarily probes regions with
different SLDs, such as colloidal dispersions, the technique lends itself well to neutron contrast-
variation experiments. Contrast-variation experiments exploit the differences in coherent neutron
scattering lengths between isotopes. The most common example of this is deliberately substituting
molecules containing protons (1H; b=-3.74 fm) for deuterons (2H; b=6.674 fm). This technique
works by maximising the contrast term (δSLD) in the generalised expression for scattering intensity
for a particle (p) in a dispersant (d):
K9 = LMNMOABCM − ABCPQR9A9 + S Equation 10
Where the number of scattering particles is given by Np, the volume occupied by these
particles is Vp, the form factor describing particle shape is described by the function P(Q), and the
structure factor function describing inter-particle interactions (typically only relevant for
concentrated samples) is described by S(Q). Practically, this means that the same region can be
studied with different contrasts to give complementary structural information (cf. Babinet’s
principle), or different structural sub-regions can be studied with sharp contrast to give more
detailed information about the structure. For example, a microemulsion droplet contains a core of
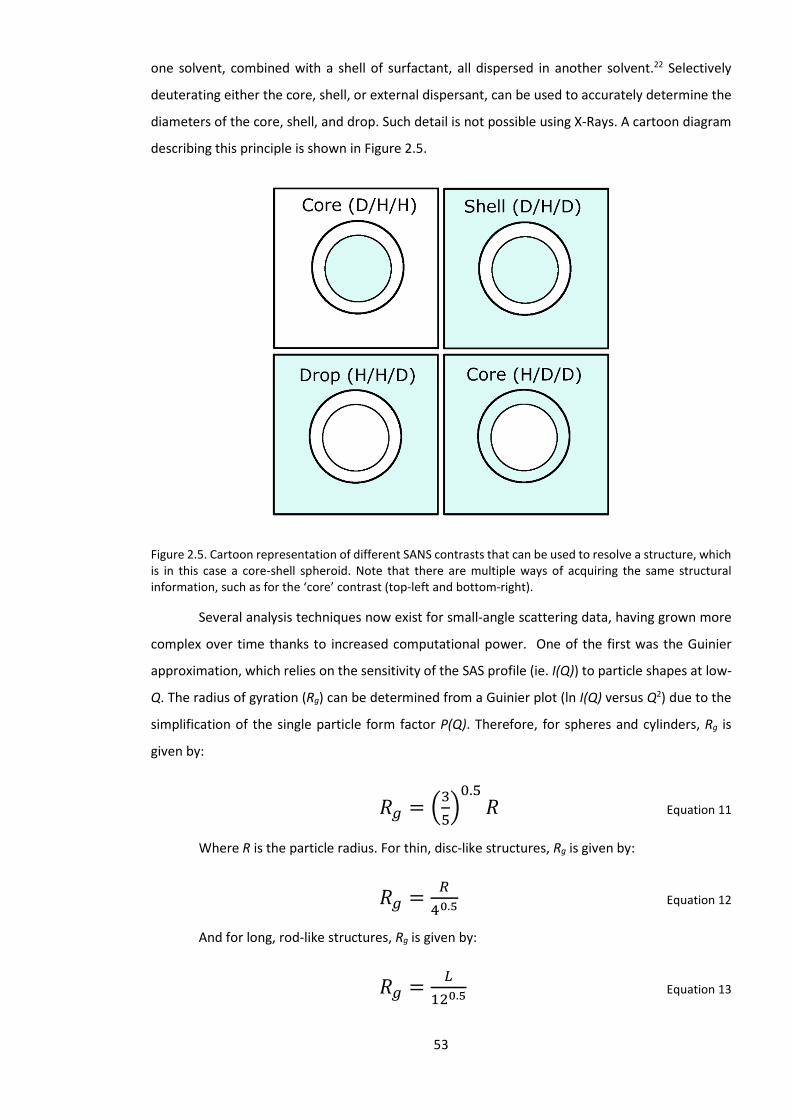
53
one solvent, combined with a shell of surfactant, all dispersed in another solvent.22 Selectively
deuterating either the core, shell, or external dispersant, can be used to accurately determine the
diameters of the core, shell, and drop. Such detail is not possible using X-Rays. A cartoon diagram
describing this principle is shown in Figure 2.5.
Figure 2.5. Cartoon representation of different SANS contrasts that can be used to resolve a structure, which is in this case a core-shell spheroid. Note that there are multiple ways of acquiring the same structural information, such as for the ‘core’ contrast (top-left and bottom-right).
Several analysis techniques now exist for small-angle scattering data, having grown more
complex over time thanks to increased computational power. One of the first was the Guinier
approximation, which relies on the sensitivity of the SAS profile (ie. I(Q)) to particle shapes at low-
Q. The radius of gyration (Rg) can be determined from a Guinier plot (ln I(Q) versus Q2) due to the
simplification of the single particle form factor P(Q). Therefore, for spheres and cylinders, Rg is
given by:
0T = UVWXY.W 0 Equation 11
Where R is the particle radius. For thin, disc-like structures, Rg is given by:
0T = [:\.] Equation 12
And for long, rod-like structures, Rg is given by:
0T = ^.\.] Equation 13

54
Where L is the length of the rod. Guinier linearisation is unfortunately liable to structure
factor effects, and as such is only appropriate for dilute solutions. Another early approximation for
the analysis of SAS data is the Porod approximation. At high Q (short range), SAS intensity is mainly
derived from the step in SLD at the interface of a scattering particle, rather than other inter-particle
correlations. The power dependence of the scattering slope at high Q in a Porod plot therefore
gives information about particle shape; for example, a Q-4 slope denotes spherical particles,
whereas a Q-2 slope is a structural signature of lamellae. A Porod plot (ln (I) versus ln (Q)) gives
information about particle shape in accordance with fractal forms because the scattering intensity
depends only upon the contrast term:
K9 ≈ 2AOABCM − ABCPQ9: Equation 14
This equation is known as Porod’s law. I(Q) can be therefore be used to determine surface
area in monodisperse, smooth powders and dispersions. The Porod plot has the significant
disadvantage of requiring very accurate subtraction of the incoherent scattering background,
because it is reliant upon the region most strongly affected by incoherent scattering. Both Guinier
and Porod analyses are useful tools in SAS analysis, but should not be used as conclusive analysis
because of their drawbacks; further to the drawbacks discussed heretofore, these linearisation
procedures can introduce further data uncertainties, by visually skewing the weighting of data
points either towards the low-Q (Guinier) or high-Q (Porod) regions.
Indirect Fourier Transformation (IFT) is one of the two presently widely-used approaches
for SAS data analysis.23 In this method, Rg is obtained by using a model-free numerical method,
where data is fitted in real space. The pair distance distribution function, p(r), is first determined
by using an a priori value of maximum particle dimension (Dmax), and assumes monodisperse
particles of low concentration, with negligible interparticle interactions.24 The p(r) correlation
tends about zero within a finite real space region from zero to Dmax, and enables an approximation
of Rg alongside the direct assessment of the particle shape, from the shape of the function. Any
information obtained from the p(r) analysis can then be used to inform the fitting of a structural
model to the data.25
The second of the two most modern (and generally regarded as most appropriate)
methods for fitting SAS data leverages computational power to fit a structural model to data using
the least-squares method.26 These structural models contain functions describing the SLDs of each
component in the mixture, the form factor P(Q) for the scattering particle, and an optional
structure factor S(Q) for interacting particles. Modern fitting software such as SasView also allow
for the fitting of polydisperse models with included corrections for instrumental smearing.27 If the
data are normalised to an absolute scale (as is often the case for neutron, but rarely for X-Ray data)

55
this approach also allows the accurate calculation of scattering particle volume fractions.
Regardless, the experimenter must remain cautious when using this fitting method: the fact that a
model is an adequate fit to a dataset does not constitute proof that it is the most appropriate
model, and so this method should be supported by proof from the previously mentioned analysis
techniques where possible.28
2.2.5. Total (wide Q-range) neutron scattering
Scattering techniques addressed up to this point in the text have been concerned with
either large-scale structures or small-scale structures. A scattering field that is rapidly gathering
interest is called total scattering (specifically of neutrons), and this seeks to bridge the gap between
the two techniques. This development has been facilitated by performance of modern detector
arrays, data acquisition electronics (DAE) and improved instrument design. An example of the
design of a broad Q-range scattering instrument (NIMROD) is given in Figure 2.6.
Figure 2.6. Schematic diagram of the NIMROD instrument, with a key overview of essential components. Reprinted from the American Institute of Physics.29
In a total scattering experiment, data are simultaneously collected at low-Q values typical
of SAS experiments, and at high-Q values, typical of diffraction experiments. This reflects the fact
that many interesting materials have structural features on both the atomic scale and the
nanoscale, for example transition metal oxide nanoparticles, mesoporous silica, or micelles.
Otherwise, the technique is functionally identical to the others in terms of the underlying theory.
Exemplar data showing a comparison between the Q-ranges of small-angle and total scattering in
studies of micelles of CnTAB surfactant micelles are shown in Figure 2.7.13 This immediately shows
the relevance of the broad Q-range technique: interesting structural features associated with the
intermolecular interactions that are important in micellisation lie at greater values of Q than are

56
accessible with small-angle scattering alone, but traditional wide-angle measurements do not
capture the important low-Q data describing the structure of the aggregates.
Figure 2.7. Example of small-angle scattering results and model-based fits to C14TAB micelles (left), and wide Q-range scattering data for C10TAB micelles alongside EPSR fits as measured on SANDALS (right). Reprinted with permission from Elsevier.13
In a total scattering experiment, much in the same way as SAS, we begin by measuring the
differential scattering cross section (DCS; dσ/dΩ) of a sample, which describes the fraction of the
beam scattered to the angle ΔΩ. Normalising the DCS atomically gives the ensemble-averaged
expression:
K9 = ./ ⟨∑ ∑ `1/,a./1a. ,e1cOIEIdQ⟩ Equation 15
Where the scattering length of an atom i is given by bi, the number of atoms in the system
is given by N, Q is the magnitude of the momentum transfer (ie. the scattering vector), and r is the
position vector. The DCS is subsequently calibrated using a standard, and corrections are made for
inelastic scattering,30 multiple scattering, and the inherent instrument background (the total
scattering instruments SANDALS and NIMROD that are used in these investigations have an
evacuated flight path, and hence there is no further air background scattering).29 The result of
these corrections is the total structure factor, F(Q):
e9 = ∑ 2 − )1,414,`1 ,A1,91,, Equation 16
Where the concentrations of each of the atomic constituents of a sample are given by ci,
bi are the scattering lengths of these atomic constituents, and Sij(Q) are the partial structure

57
factors. Partial structure factors denote all structural correlations in Q-space between the atom
types i and j, and can be derived from the partial pair distribution functions gij(r) by Fourier
transform, with the relation:
A1,9 = 1 + :;g\c h "1,$ sin9 . jkY Equation 17
Where the partial radial distribution functions gij(r) are defined as gij(r) = Gij(r) + 1, and the
atomic number density of the sample is given as ρ0.3
As discussed in the theory section for small-angle scattering, the best SAS signal is obtained
by maximising contrast between scattering regions, using isotope substitution. The same is true of
total scattering experiments; the greatest signal-to-noise at low Q is obtained by having, for
example, a hydrogenated aggregate dispersed in a deuterated medium. The substitution concept
is slightly more convoluted for total scattering, however, as the scale probed means that such
isotope substitutions will also affect the various atomic pair correlations at high Q, as can be seen
in Figure 2.7. Because each different isotopic contrast gives a different Fi(Q), it is theoretically
possible to mask, or accentuate, certain correlations, and therefore fully determine all of the
individual partial structure factors Sαβ(Q). Practically, this is impossible for systems more complex
than liquid water, or aromatics such as benzene, as it is often chemically impossible to selectively
deuterate each site in a complex mixture,31 and beamtime is a limited commodity. In this instance,
the best technique is to run as many unique isotopic contrasts as is feasible, and resolve the
structure using a modelling procedure, with associated caveats. As with SAS, the most common
isotope substitution technique involves substituting 1H for 2H, although other isotopes can be
usefully substituted if the material to be studied facilitates this, such as 6Li-7Li substitution.32
2.2.6. Empirical Potential Structure Refinement (EPSR)
modelling
Empirical Potential Structure Refinement (EPSR) is a simulation procedure designed for the
interpretation of scattering data, and is a derivative of the Reverse Monte Carlo (RMC) method.33
EPSR is designed to simulate a 3D configuration of atoms or molecules that is objectively consistent
with a set of experimental scattering data.34 Like RMC, EPSR uses experimental data as a constraint
upon the simulation, but the two techniques diverge in the potentials that are used and the
refinement condition. RMC uses hard sphere potentials, and a refinement move is either accepted

58
or rejected depending on whether the fit has improved or not. Conversely, EPSR achieves a
consistent fit to data by using atom-centric point charges and periodic boundary conditions,35 to
define a simulated ‘reference potential’ (RP) that is derived from a Lennard-Jones (12-6) potential,
a Coulombic interaction, and a repulsive interaction:
lmnO1,Q = 4omn pqrmn1, s. − qrmn1, stu + vmvn4oY1, + wmnexp q1z Omn − 1,Qs
Equation 18
Where γ is a term to set the hardness of the repulsive potential (the typical value used in
these EPSR models is 0.3 Å), Cαβ is a term that imposes the minimum pair separation distance for
atoms α and β as r ≤ rαβ. The Lennard-Jones well-depth εαβ, and the range parameter σαβ are
typically combined using Lorentz-Berthelot mixing rules. It is noteworthy that this RP has no long-
range corrections, and is truncated with various functions.36 Once the RP has been calculated, an
Empirical Potential (EP) is calculated from the residuals between the RP and the experimental data.
To prevent any of the spurious signals that can be introduced into data from the Fourier transform,
the EP is introduced into the RP using a series of Poisson functions.37
The experimental scattering data for an ith dataset, Di(Q), of a total of M datasets, are
brought into the EPSR model by using an expression for the weighted sum of all atom pairs, that
are related to the partial structure factors:
C19 = ∑ 1,,A,9,a.,/ Equation 19
Where j represents an index that covers the number of partial structure factors (N), where
N is defined using the total number of atomic constituents [ie. N = x(x+1)/2]. wij defines the weights
matrix [ie, for neutrons wij = (2-δαβ)cα(b(i)α)cβ(b(i)
β)]. As discussed previously, it is likely that there are
more partial structure factors then datasets because of practical difficulties in isotope substitution;
M < N. In this case, the inversion of the weights matrix is indeterminate, as the system is physically
under-determined. The simulation itself is therefore effectively used as an additional dataset,
permitting inversion of the weights matrix under any condition. This has the advantage of slightly
biasing the structure away from experimental data that can sometimes be not entirely trustworthy
(ie. containing systematic errors or artefacts), but also permits the simultaneous inversion of a
separate neutron weights matrix and X-Ray weights matrix. EPSR therefore permits the co-
refinement of neutron and X-Ray wide Q-range scattering data.38 Using an additional X-Ray dataset
in this manner allows an additional degree of confidence in the structure refinement procedure.
The EPSR quality of fit is further improved by using several techniques. The first of these is
that EPSR allows a degree of intramolecular disorder, in a clear deviation from classical simulation.

59
This methodology allows for a better fit to experimental data, especially for systems that are
innately disordered, such as liquids, glasses, and colloids. EPSR permits molecular translation and
rotation, the rotation of individual moieties (if defined), and movement of atoms within a
molecule.36 These moves are accepted or rejected in accordance with Metropolis conditions: if the
potential energy change ΔU ≤ 0, the move is accepted. If the potential energy change ΔU ≥ 0, then
the move is accepted with a probability of:
exp |− ∆l1I + . ∆l[ + ∆l Equation 20
Handling the movements in this manner gives each molecule an individual geometry that
is not weighted thermally (~kBT ). Furthermore, the physicochemical properties of a system are
used as an additional constraint upon the data; the density of a system, as well as its molecular
structure and exact chemical composition act to constrain molecular configurations and the way
they overlap.
The result of the EPSR modelling procedure is therefore an objectively experimentally-
consistent 3D configuration. At this point, the model has equilibrated fully to both the reference
and empirical potential, and the EP will no longer vary. Once this point is reached, a wide variety
of different ensemble-averaged data regarding the physical structure of a system can be extracted
from the EPSR model.
2.2.7. Extended X-Ray Absorption Fine Structure (EXAFS)
spectroscopy
EXAFS (alternately, XAFS) is a spectroscopic technique derived from X-Ray Absorption
Spectroscopy (XAS). As an extension of XAS, EXAFS probes the variance in the absorption (µ) of X-
Rays across an energy range, which occurs due to the photoelectric effect, where incident photons
are absorbed by electrons in the tightly-bound core states of an atom (ie. 1s, 2p).39 Core-level
electrons absorb photons when their binding energy is less than that of the incident radiation;
these quantum states are preserved when they have a higher binding energy than the incident X-
Ray energy. As the X-Ray energy is increased to become equal to the binding energy of an electronic
core state, a strong increase in absorption is seen as a function of photon energy due to the
absorption of X-Rays by the sample. This sharp increase in the absorption coefficient at a specific
energy is known as an absorption edge, and is caused by the promotion of the electron from its
ground state to the continuum (excited) level. After excitation, the electron subsequently de-
excites to re-occupy the core hole which has been formed; this typically occurs rapidly by
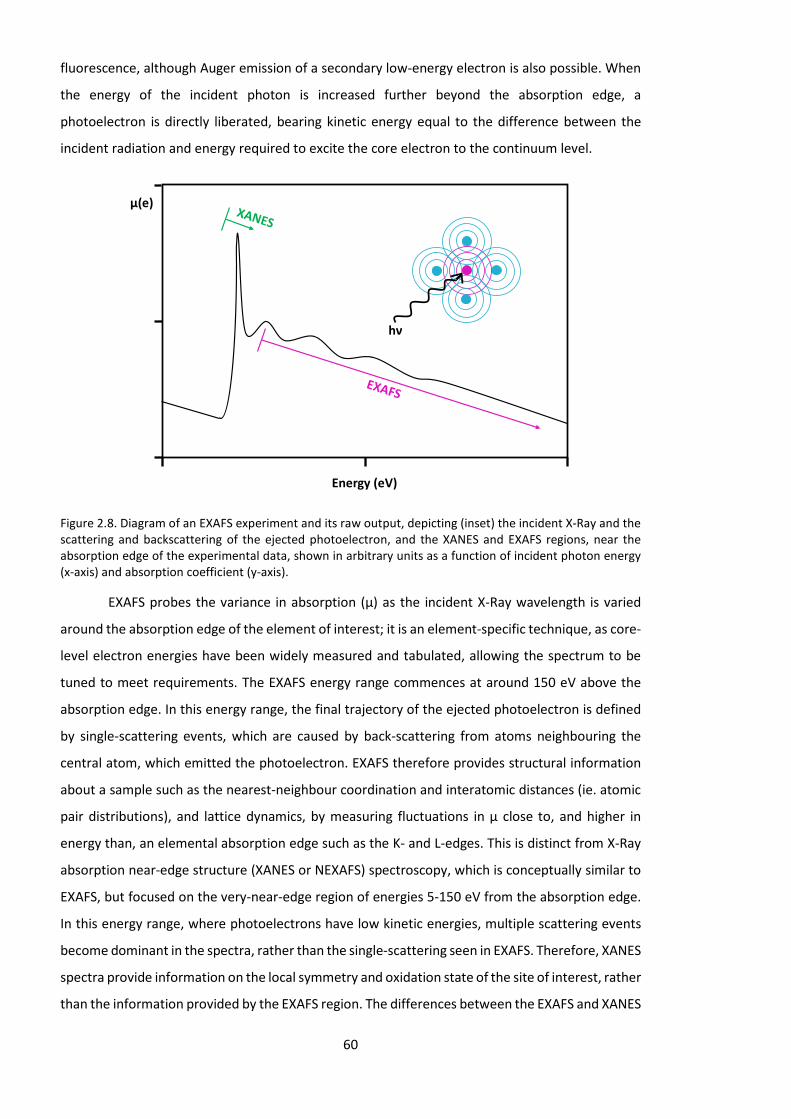
60
fluorescence, although Auger emission of a secondary low-energy electron is also possible. When
the energy of the incident photon is increased further beyond the absorption edge, a
photoelectron is directly liberated, bearing kinetic energy equal to the difference between the
incident radiation and energy required to excite the core electron to the continuum level.
Figure 2.8. Diagram of an EXAFS experiment and its raw output, depicting (inset) the incident X-Ray and the scattering and backscattering of the ejected photoelectron, and the XANES and EXAFS regions, near the absorption edge of the experimental data, shown in arbitrary units as a function of incident photon energy (x-axis) and absorption coefficient (y-axis).
EXAFS probes the variance in absorption (µ) as the incident X-Ray wavelength is varied
around the absorption edge of the element of interest; it is an element-specific technique, as core-
level electron energies have been widely measured and tabulated, allowing the spectrum to be
tuned to meet requirements. The EXAFS energy range commences at around 150 eV above the
absorption edge. In this energy range, the final trajectory of the ejected photoelectron is defined
by single-scattering events, which are caused by back-scattering from atoms neighbouring the
central atom, which emitted the photoelectron. EXAFS therefore provides structural information
about a sample such as the nearest-neighbour coordination and interatomic distances (ie. atomic
pair distributions), and lattice dynamics, by measuring fluctuations in µ close to, and higher in
energy than, an elemental absorption edge such as the K- and L-edges. This is distinct from X-Ray
absorption near-edge structure (XANES or NEXAFS) spectroscopy, which is conceptually similar to
EXAFS, but focused on the very-near-edge region of energies 5-150 eV from the absorption edge.
In this energy range, where photoelectrons have low kinetic energies, multiple scattering events
become dominant in the spectra, rather than the single-scattering seen in EXAFS. Therefore, XANES
spectra provide information on the local symmetry and oxidation state of the site of interest, rather
than the information provided by the EXAFS region. The differences between the EXAFS and XANES
Energy (eV)
µ(e)
hν

61
regions are shown in Figure 2.8, alongside an impression of the multiple-single-backscattering
events which interfere constructively and destructively to form the EXAFS region of the spectrum.
In the case of a non-polarised light source measuring non-oriented samples such as powders,
gases, liquids and solutions, the EXAFS signal χ(k) can be analytically expressed as:
= . AY ∑ /E[E exp−2r exp U[E@X |1| sin20 + 1
Equation 21
Where k is the photoelectron wave vector; Ni is the number of atoms of type i at distance
Ri from the central absorbing species; |fi(k)| is the ith atom’s characteristic scattering amplitude;
Φi(k) is a phasing function to account for the varying potential field which is experienced by the
photoelectron; the first exponential term exp(-2σ2k2) accounts for subtle thermal and structural
perturbations by introducing Gaussian distance distributions; the second exponential term exp(-
2Ri/λ(k)) accounts for the mean free photoelectron paths, which are finite under elastic conditions
(ie. 5-10 Å for energies 30-1000 eV); and S02 is the average amplitude-reduction factor, which
weights the main excitation route relative to other possible channels and typically has a value of
0.8-0.9. This expression is valid when only single scattering processes are considered.40
In a typical experiment, an incident beam of X-Ray radiation is tuned to provide an energy
range from approximately 100 eV below, and up to several thousand eV above, the absorption
edge of an element of interest. There is no strict requirement for samples to be held under specific
conditions such as vacuum, but an intense source of polychromatic radiation is required, meaning
that EXAFS is typically measured at synchrotron sources. Classically, measurements are then made
by slowly varying the incident energy using a monochromator, although new techniques such as
energy-dispersive EXAFS (EDE) are capable of recording spectra using a bent polychromator crystal
with a convergent beam to deliver the full radiation spectrum at once.41 By delivering a massive
flux of polychromatic radiation, synchrotron EDE measurements can be used for the measurement
of ultra-fast kinetic processes with microsecond resolution.42 Once the raw EXAFS data has been
obtained, the local structure can be determined from the measured experimental cross-section
after removal of the background from the EXAFS signal. The wave vector must be defined by
selecting a threshold energy, and then the pre-edge must be extrapolated (µ0x) and the atomic
absorption must be accounted for (µ1x). Once these variables have been defined, the EXAFS signal
is then obtained from:
= \ Equation 22
This extracted EXAFS signal contains the structural contribution from all neighbouring
atoms, each of which is approximately equal to a sinusoidal function in k- (or inverse) space, where

62
the frequency derives proportionally from the absorber-scatterer distance.43 Fourier
transformation of the k-space EXAFS signal yields the data in a real-space distance distribution. It
is possible to fit the reduced data by calculating the theoretical scattering of the ‘nearest-
neighbour’ environment using the EXAFS equation above, which accounts for the different
scattering paths, which can be different atoms with different separations. By starting with a
chemically-reasonable ‘guess’ of the ligand environment, it is possible to refine these parameters
to the experimental data using routines such as FEFF, and therefore obtain structural information
such as the atom types and bond distances.44 However, fitting in real-world samples is challenging
due to a number of complications. Firstly, a huge number of potential variables can be fitted, and
the data impose a limit on the maximum number of free variables from the spatial resolution of
datapoints (ie. the k-range, Δk and R-range of ΔR). Moreover, in real-world measurements, signals
overlap and photoelectrons undergo not only single but also multiple scattering paths; it is
therefore often difficult or impossible to fully resolve even ‘simple’ structures, such as the
coordination of metal ions by organic ligands, where each ligand is distinct but structurally similar.

63
2.3. References
1 C. A. Angell, Science, 1995, 267, 1924–1935. 2 P. Ball, Nat. Mater., 2014, 13, 758-759. 3 A. K. Soper, GudrunN and GudrunX: Programs for Correcting Raw Neutron and X-ray Diffraction Data
to Differential Scattering Cross Section. Rutherford Appleton Laboratory Technical Report RAL-TR-
2011-013, STFC, 2011. 4 J. D. Bernal and R. H. Fowler, J. Chem. Phys., 1933, 1, 515–548. 5 F. C. Frank, Proc. R. Soc. Lond. Ser. A, 1952, 215, 43–46. 6 J. D. Bernal, Proc. R. Inst. G. Br., 1959, 37, 355–393. 7 F. Sciortino, A. Geiger and H. E. Stanley, Nature, 1991, 354, 218–221. 8 A. P. Abbott, R. C. Harris and K. S. Ryder, J. Phys. Chem. B, 2007, 111, 4910–4913. 9 T. Iwashita, B. Wu, W.-R. Chen, S. Tsutsui, A. Q. R. Baron and T. Egami, Sci. Adv., 2017, 3, e1603079. 10 S. Perticaroli, B. Mostofian, G. Ehlers, J. C. Neuefeind, S. O. Diallo, C. B. Stanley, L. Daemen, T. Egami,
J. Katsaras, X. Cheng and J. D. Nickels, Phys. Chem. Chem. Phys., 2017, 19, 25859–25869. 11 R. Hayes, G. G. Warr and R. Atkin, Chem. Rev., 2015, 13, 6357–6426. 12 C. Huang, K. T. Wikfeldt, T. Tokushima, D. Nordlund, Y. Harada, U. Bergmann, M. Niebuhr, T. M.
Weiss, Y. Horikawa, M. Leetmaa, M. P. Ljungberg, O. Takahashi, A. Lenz, L. Ojamae, A. P. Lyubartsev, S. Shin, L. G. M. Pettersson and A. Nilsson, PNAS, 2009, 106, 15214–15218.
13 K. J. Edler and D. T. Bowron, Curr. Opin. Colloid Interface Sci., 2015, 20, 227–234. 14 B. R. Pauw, J. Phys. Condens. Matter, 2013, 25, 383201. 15 T. Cosgrove, Colloid Science: Principles, Methods and Applications, Wiley, Hoboken 2010. 16 H. A. Hauptman, Science of Crystal Structures: Highlights in Crystallography, Springer, New York
2015. 17 D. J. Morgan, Clay Miner., 1990, 25, 544–545. 18 L. B. McCusker and C. Baerlocher, Chem. Commun. (Camb)., 2009, 12, 1439–1451. 19 J. I. Langford and D. Louër, Reports Prog. Phys., 1996, 59, 131–234. 20 H. Stanjek and W. Häusler, Hyperfine Interact., 2004, 154, 107–119. 21 J. Eastoe, Surfactant Chemistry, Wuhan University Press, Wuhan, 2003, 59–95. 22 J. Eastoe and R. F. Tabor, Surfactants and Nanoscience, Elsevier, Amsterdam, 2014. 23 R. Botet and B. Cabane, J. Appl. Crystallogr., 2012, 45, 406–416. 24 O. Glatter, J. Appl. Crystallogr., 1979, 12, 166–175. 25 O. Glatter, G. Fritz, H. Lindner, J. Brunner-Popela, R. Mittelbach, R. Strey and S. U. Egelhaaf, Langmuir,
2000, 16, 8692–8701. 26 V. Castelletto and I. W. Hamley, Curr. Opin. Colloid Interface Sci., 2002, 7, 167–172. 27 SasView; Small -angle scattering fitting software. Available from: https://www.sasview.org 28 B. R. Pauw, J. Phys. Condens. Matter, 2013, 25, 383201. 29 D. T. Bowron, A. K. Soper, K. Jones, S. Ansell, S. Birch, J. Norris, L. Perrott, D. Riedel, N. J. Rhodes, S.
R. Wakefield, A. Botti, M.-A. Ricci, F. Grazzi and M. Zoppi, Rev. Sci. Instrum., 2010, 81, 033905. 30 A. K. Soper, Mol. Phys., 2009, 107, 1667–1684. 31 J. Finney and A. Soper, Chem. Soc. Rev., 1994, 23, 1–10. 32 S. Saito, H. Watanabe, Y. Hayashi, M. Matsugami, S. Tsuzuki, S. Seki, J. N. Canongia Lopes, R. Atkin,
K. Ueno, K. Dokko, M. Watanabe, Y. Kameda and Y. Umebayashi, J. Phys. Chem. Lett., 2016, 7, 2832–2837.
33 R. L. McGreevy, J. Phys. Condens. Matter, 2001, 13, R877–R913. 34 A. K. Soper, Chem. Phys., 1996, 202, 295–306. 35 A. K. Soper, Chem. Phys., 2000, 258, 121–137. 36 A. K. Soper, Mol. Phys., 2001, 99, 1503–1516. 37 A. K. Soper, Phys. Rev. B, 2005, 72, 104204. 38 A. K. Soper, J. Phys. Condens. Matter, 2007, 19, 335206. 39 J. Yano and V. K. Yachandra, Photosynth. Res., 2009, 102, 241-254. 40 E. A. Stern, Phys. Rev. B, 1974, 10, 3027–3037. 41 E. Dartyge, C. Depautex, J. M. Dubuisson, A. Fontaine, A. Jucha, P. Leboucher and G. Tourillon, Nucl.
Inst. Methods Phys. Res. A, 1986, 246, 452–460. 42 D. T. Bowron and S. Díaz-Moreno, Anal. Chem., 2005, 77, 6445–6452. 43 G. Vlaic and L. Olivi, Croat. Chem. Acta, 2004, 77, 427–433. 44 M. Newville, Rev. Mineral. Geochemistry, 2014, 78, 33–74.

64
3. LIQUID STRUCTURE OF THE CHOLINE CHLORIDE-UREA DEEP
EUTECTIC SOLVENT (RELINE) FROM NEUTRON DIFFRACTION AND
ATOMISTIC MODELLING
3.1. Overview
On the basis of their ionic nature, DES are generally described in the literature as a category of
ionic liquid (IL).1 However, when examining studies of the fundamental characteristics of DES in
the early literature, it appears that this is not a cut-and-dry issue, a conclusion which it is also
possible to reach by considering the issue in terms of the ionic strength of the mixture. Choline
chloride:urea is the most widely-known deep eutectic solvent, and at the 1:2 eutectic ratio, the
mixture contains one uncharged molecule for each ion, which represents a significant dilution by
molecular species (the so-called) hydrogen bond donor, or HBD). It is argued that despite this fact,
DES are a type of ‘complex-ionic’ liquid, where the properties of ILs are retained after dilution with
the molecular component, because the HBD complexes with the anion in a H-bond donor/acceptor
system, to make a liquid of [cholinium]+ [urea:chloride:urea]- which retains the properties of ILs.2
The aim of this work was therefore to investigate the structure of this DES in the liquid
state to test for the presence of such complexation and compare it to prior work on protic ILs. This
would therefore answer this question definitively, of whether DES are truly a category of ILs.
Building this understanding of liquid structure is important in the application of DES, not only
semantically, but because it will allow structure-property relationships to be determined, and
therefore facilitate the development of DES as task-specific solvents by optimising the
nanostructure for performance in applications such as extraction,3 which is often stated as the
ultimate aim for these systems.
Neutron diffraction was used, as a technique uniquely able to resolve the structure within
a liquid. While urea-chloride H-bonding was observed, analysis of the atomistic models did not
show robust evidence for the formation of complex ions, but nor did it show any ‘true’
nanostructure, as typically described.3 Rather, the picture presented from these experiments was
one of extensive short-range ordering, with no long-range structure, no real stand-out interaction
that would suggest the formation of complex ions, and >100 weak H-bonding interactions. This
suggests that a structural model for DES which describes these solvents as an extensive H-bonding

65
network (enhanced by Coulombic contributions) is more appropriate than the complex-ion model.
Surprisingly, it was observed that the choline-chloride H-bond via the hydroxyl group was the
strongest in the system under the experimental conditions, giving some suggestion of the existence
of charge-neutral stoichiometric complexes. Overall, the insights presented from this paper have
highlighted that DES are not necessarily the same as ILs in structure. Following this, other groups
have come to similar conclusions based on the findings here, using different methodologies, most
of which have been computational, and some of which have also used neutron techniques.4–7
These findings have therefore contributed significantly to the field of DES since its publication,
which have caused it to become a highly cited paper in the field of Deep Eutectic Solvents (Web of
Science search, September 2018), and has contributed to the onward development of the field. A
consensus is beginning to form that DES of this type are not a complex-ionic liquid but a weakly-
ordered liquid.
This paper is reproduced with minor adaptations to match the thesis formatting
specifications from the final accepted version published in Green Chemistry. The associated
electronic supporting information is provided in Appendix 1.
1 E. L. Smith, A. P. Abbott and K. S. Ryder, Chem. Rev., 2014, 114, 11060–11082. 2 A. P. Abbott, G. Capper, D. L. Davies, R. K. Rasheed and V. Tambyrajah, Chem. Commun., 2003, 0, 70–
71. 3 R. Hayes, G. G. Warr and R. Atkin, Chem. Rev., 2015, 13, 6357–6426. 4 R. Stefanovic, M. Ludwig, G. B. Webber, R. Atkin and A. J. Page, Phys. Chem. Chem. Phys., 2017, 19,
3297-3306. 5 C. R. Ashworth, R. P. Matthews, T. Welton and P. A. Hunt, Phys. Chem. Chem. Phys., 2016, 18, 18145–
18160. 6 M. Gilmore, L. M. Moura, A. H. Turner, M. Swadźba-Kwaśny, S. K. Callear, J. A. McCune, O. A.
Scherman and J. D. Holbrey, J. Chem. Phys., 2018, 148, 193823. 7 C. F. Araujo, J. A. P. Coutinho, M. M. Nolasco, S. F. Parker, P. J. A. Ribeiro-Claro, S. Rudić, B. I. G. Soares
and P. D. Vaz, Phys. Chem. Chem. Phys., 2017, 19, 17998–18009.

66
3.2. Statement of contribution
This declaration concerns the article entitled:
Liquid structure of the choline chloride-urea deep eutectic solvent (reline) from neutron
diffraction and atomistic modelling
Publication status (tick one)
draft
manuscript Submitted
In
review Accepted Published
Publication details
O. S. Hammond, D. T. Bowron, K. J. Edler, Green Chemistry, 2016, 18, 2734-2744
DOI: http://dx.doi.org/10.1039/c5gc02914g
Candidate’s
contribution to
the paper
(detailed, and
also given as a
percentage).
The candidate contributed to/ considerably contributed to/predominantly
executed the…
Formulation of ideas:
The initial idea was formulated by KJE and DTB. It was jointly decided between
KJE/DTB/OSH to study the reline DES with wide-angle scattering. 50%
Design of methodology:
DTB gave significant input into the design of experiment. The design of the EPSR
analysis procedure was handled by OSH. 75%
Experimental work:
100% of the experimental work and data analysis was carried out by OSH.
Presentation of data in journal format:
All data analysis, and the first draft was handled by OSH. Subsequent drafts
were reworked by OSH following feedback from KJE and DTB. 85%
Statement from
Candidate This paper reports on original research I conducted during the period of my Higher
Degree by Research candidature.
Signed
Date
20/09/18

67
3.3. Abstract
The liquid structure of the archetypal Deep Eutectic Solvent (DES) reline, a 1:2 molar mixture of
choline chloride and urea, has been determined at 303 K. This is the first reported liquid-phase
neutron diffraction experiment on a cholinium DES. H/D isotopic substitution is used to obtain
differential neutron scattering cross sections, and an Empirical Potential Structure Refinement
(EPSR) model is fitted to the experimental data. Radial distribution functions (RDFs) derived from
EPSR reveal the presence of the anticipated hydrogen bonding network within the liquid, with
significant ordering interactions not only between urea and chloride, but between all DES
components. Spatial density functions (SDFs) are used to map the 3D structure of the solvent.
Interestingly, choline is found to contribute strongly to this bonding network via the hydroxyl
group, giving rise to a radially layered structure with ordering between all species. The void size
distribution function calculated for reline suggests that the holes present within DESs are far
smaller than previously suggested by hole theory. These observations have important implications
in the future development of these ‘designer solvents’.
3.4. Introduction
Deep Eutectic Solvents (DESs) are a sub-category of ionic liquids (ILs), first reported in 2001 by
Abbott et al.1 Unlike the binary ion pairing defining classic IL structure, DESs are made by the
complexation of a hydrogen bond-capable salt (frequently ammonium halides) with a neutral
hydrogen bond donor species (HBD).2 The term ‘Deep Eutectic Solvent’ hails from the low glass
transition temperature at a specific molar ratio of salt to HBD.3,4 ILs and DESs share common
benefits such as low vapour pressure and a tuneable, designer nature; 5 like ILs, over 106 DESs are
hypothesized to exist.6 The additional component in DES formulations permits fine-tuning of
physicochemical properties. For example, the solvent hydrophobicity can be varied,7 and the
compatibility of many DESs with H2O can make systems more tractable whilst preserving the
hypothesized supramolecular structure (≤50 wt.% H2O).8 The most widely-studied DES to date is
the 1:2 choline chloride:urea Type III DES, also known as reline and amongst the first to be
reported.9 Reline is a tractable room temperature ionic mixture with facile preparation from cheap,
naturally-occurring and readily-available precursors,10 making reline a biodegradable, bactericidal,
non-cytotoxic designer solvent.11,12
The primary application of DESs thus far has been as metal electrodeposition agents.13
DESs have also been applied as environmentally-friendly alternatives to molecular solvents in

68
synthesis,14 particularly metal-catalysed reactions,15 and the synthesis of functional
nanomaterials.16 DESs have also found green applications in extraction and separation, such as in
the purification of biodiesel,17 and CO2 sequestration.18 DESs are one of the few nonaqueous
solvent systems capable of supporting spontaneous self-assembly of anionic,19 cationic,20 and
phospholipid-based amphiphiles.21 It has also been hypothesised that glass-forming natural DESs
(NADESs) act as plant cryoprotectants.22
The key physical driving force for the formation of DESs is generally attributed to charge
delocalization between the anion and HBD upon mixing as a result of the formation of hydrogen
bonds.23 This assertion is mainly experimentally supported spectroscopically; HOESY NMR
experiments by Abbott et al. revealed a correlation between urea and fluoride in a choline fluoride
DES.4 The presence of hydrogen bonds in various alcoholic and carboxylic NADESs was shown in
NOESY NMR and FT-IR experiments by Dai et al.8,24 Trends observed in DES conductivity and
viscosity by Abbott et al. for choline chloride-glycerol support the existence of a 3D intermolecular
H-bonding network.25 PFG-NMR spectroscopy experiments by D’Agostino et al. hint at extensive
hydrogen-bonded chains of malonic acid molecules in a malonic acid-choline chloride DES,26 and
later inferred that there exists a complex set of interactions between different species in DESs, by
analysis of the respective diffusion coefficients.27 Solvatochromic probe behaviour was studied
spectroscopically in a variety of DESs by the group of Pandey et al., revealing the polarity of DESs
and the presence of solvent-solvent interactions attributed to interspecies hydrogen bonding.28,29
Quasi-elastic neutron scattering (QENS) was applied to a choline chloride-glycerol DES by Wagle et
al., finding that the DES components have varying differential localized mobilities because of their
different interaction strengths.30
To date and despite significant interest, no experimental technique has therefore been
applied to DESs that is able to fully probe the phenomena driving DES formation and structuring,
as has been extensively studied previously in ILs.31 Methods applied so far are either indirect (such
as NMR) with substantial interpretation of dynamic intermolecular interactions, or involve doping
with an additive that impacts upon the solvent structure, or are solely computational
approaches.32–35 Wide Q-range neutron diffraction is a well-established method for directly
measuring the structure of a disordered material.36 In this paper, we present experimental neutron
diffraction data of four H/D isotopic contrasts of the DES reline. The structure of the DES is resolved
using a reverse modelling protocol, generating 3D configurations commensurate with the
measured diffractograms and known physical parameters. We therefore report a complete
experimental account of the interactions governing the unique properties of the reline DES,
including their geometry and length scale.

69
3.5. Experimental
3.5.1. Preparation of isotopically substituted DES
Hydrogenated choline chloride (≥98 %) and urea (≥99 %) were purchased from Sigma-Aldrich and
used without further purification. d4-urea (CO(ND2)2, 99.6 % pure, 99.8 atom % D) and d9-choline
chloride ((CD3)3N(CH2)2OHCl), 99 % pure, 99.6 atom % D) were purchased from QMX laboratories
and used without further purification. Reline samples with isotopic substitution were prepared by
mixing protonated and deuterated choline chloride and urea in the eutectic molar ratio at 60 ˚C to
form four DESs with respective choline chloride:urea deuterations of H:H, H:D, D:H and D:D.
Samples were dried under vacuum at 60 ˚C and were determined, using a Mettler-Toledo DL32
Karl Fischer titrator, to have a mean water content of 2252 ± 519 ppm (0.2 % H2O) at the point of
measurement.
3.5.2. Neutron diffraction
Diffraction data were collected using the SANDALS diffractometer, located in Target Station 1 in
the ISIS Neutron and Muon Facility, Rutherford Appleton Laboratories, Harwell Campus, UK.
SANDALS is a time-of-flight diffractometer optimized for the study of structurally disordered light
element systems, operating using forward scattering detector geometry and a neutron wavelength
range of 0.05 to 4.5 Å. Data were collected over the full Q-range of 0.1 to 50 Å -1 using a circularly-
collimated neutron beam of diameter 30 mm. Approximately 2 g of each DES sample was added to
null-scattering, vacuum-sealed Ti0.68Zr0.32 alloy flat plate cells. The internal dimensions of the cell
are 1 x 35 x 35 mm with a wall thickness of 1 mm, giving a sample thickness of 1 mm. A 3 mm thick
vanadium standard, the empty instrument, and empty sample cells were measured in addition to
the samples for data normalization and instrument calibration. The samples were placed in an
auto-changer and the temperature maintained at 303 K using a Julabo circulating heater to
preserve the DES liquid phase over the ~8 h of counting time per sample.
Experimental data analysis is achieved using GudrunN, an analysis suite based on the
ATLAS software package that is designed to correct raw neutron total scattering data.37 The sample
environment background is subtracted and the data normalized to yield differential scattering
cross sections that are consistent with the sample isotopic compositions. The inelastic scattering
of hydrogen is then subtracted to form merged interference differential scattering cross section

70
datasets that are amenable to analysis using empirical potential structure refinement (EPSR).38
Details on the EPSR procedure are provided in the Appendix, and the assigned bond lengths and
atom types are described in Table 3.1.
Table 3.1. Molecules used to create the EPSR reference potential labelled with atom number and atom type, and the assigned interatomic bond length constraints alongside the permitted variance in bond length. Multiple atom types are listed for common bond lengths between common atom types, and do not imply length constraints between non-bonded atom pairs.
atom A atom B bond length / Å ± bond length / Å
1 2 1.49 0.097
1 3, 4, 5 1.48 0.096
2 6, 8 1.11 0.072
2 7 1.54 0.100
3, 4, 5 9 - 17 1.11 0.072
7 20 1.40 0.091
7 18, 19 1.11 0.072
20 21 0.99 0.064
22 23 1.22 0.079
22 24, 25 1.39 0.025
24, 25 26, 28 1.01 0.066
24, 25 27, 29 1.01 0.066
71
3.6. Results and discussion
3.6.1. Fits to the data
Inspection of the experimental diffraction patterns shown in Figure 3.1 alongside their EPSR fits
reveals that the EPSR model has been able to equilibrate to the experimental data very closely,
and transforming the data into r-space further demonstrates the quality of this fit. EPSR calculates
a value indicating the quality of fit called the R-factor, where a low R-factor means a better fit. The
mean R-factor value over the approximately 4000 iterations accumulated over the refinement
procedure was 0.029, a comparatively low value indicating that the EPSR model is as objectively
representative of the experimental data as it is possible for it to be.39 It is noted that the major
source of discrepancy occurs at Q ≤ 2 Å-1, which is the region affected by the inelastic scattering of
light hydrogen. It was not possible to obtain perdeuterated choline chloride, and so the
disagreement here between model and experimental data for all isotopic contrasts can be
attributed to slight over- or under-subtraction of the substantial wavevector-dependent inelastic
scattering background that light hydrogen produces. This is a known issue in the analysis of data
from neutron scattering experiments.40,41

72
Figure 3.1. EPSR fits (solid coloured lines) to the total diffraction profiles (coloured circles), shown as a function of Q (upper figure) and r (lower figure) space.
3.6.2. Reline radial distribution functions
Figure 3.2 displays the molecularly centred radial distribution functions (or pair correlation
functions) derived from EPSR simulation for all of the molecules that are present in reline. These
RDFs were computed up to 20 Å, the approximate reliable size resolution of the simulation box.
However, the RDFs converge and above approximately 10 Å, there is no evident long-range
structural order in reline in the liquid phase. The RDFs are therefore truncated to aid viewing.

73
Figure 3.2. Radial distribution functions between all different species present in the DES mixture. For these RDFs, the molecular centres are defined as the centre of mass.
In previous, similar studies on the structure of conventional 1,3-dialkylimidazolium ILs, the
generalized structure comprises each individual ion being solvated by a shell of 7 gegenions.42,43
For reline, we find each choline cation solvated by a shell of approximately 7 other choline cations
(intermolecular coordination numbers are shown in Table 3.2). In the RDF for a typical binary
imidazolium-based IL, one would therefore expect to see progressive out-of-phase ion
distributions around one another. In the DES system this feature is not seen quite so sharply. There
is a clear first feature in the RDF between urea and chloride at 4 Å, which also shows a second peak
at 8 Å correlating with a second solvation shell. However, the RDFs for urea-urea and choline-
chloride also contribute to the close-range ordering at 4 Å, and the urea-urea RDF has a similar
second shell to the urea-chloride RDF at 8 Å. Because these RDFs are derived from the molecular
centre of mass, this falls on a length scale commensurate with hydrogen bonds between all of
these species. The determined RDF between urea and chloride tends to agree with prior MD work
on reline, but due to the manner in which the authors present their data it is almost impossible to
draw further meaningful comparisons with other RDFs, other than the observation that the pure
MD data appear relatively over-structured.35

74
Table 3.2. Molecularly-centred coordination numbers determined for the reline system. Mean coordination numbers are obtained by integrating the corresponding RDF over a radius range spanning from the onset of the primary correlation peak up to the first minimum, and the cited mean radii are taken as the peak maxima, accurate to ± 0.05 Å. Molecular centres are defined as the CU atom of urea and the C2N atom of choline. Errors are calculated to one standard deviation, and reflect the ability of EPSR to permit intermolecular disorder.
molecule A molecule B mean radius / Å Ncoord
Urea Chloride 3.9 2.08 ± 1.01
Choline Chloride 4.2 4.35 ± 1.30
Choline Urea 5.5 5.91 ± 2.84
Choline Choline 6.3 6.74 ± 2.16
Urea Urea 4.4 6.77 ± 3.05
The RDF for choline-chloride has a distinct shoulder at 5 Å, which implies a second major
interaction between choline and chloride that is at a slightly greater length scale than the hydrogen
bonding interactions. The alternating oscillation in the structuring between RDFs can be observed
in the case of the choline-choline RDF, which shows a major correlation at 6 Å. A broad correlation
is also observed between choline and urea, at 4 Å to 6 Å. The length scale of interactions in DESs
are generally 1 Å shorter than those found in imidazolium-based ILs31 and mixtures of glucose with
imidazolium ILs, which show glucose-ion correlations at 5 Å rather than 4 Å in the DES.44 The close-
range interactions in the DES suggests that at the high 2:1 ratio of HBD:salt, the structure of reline
is driven and dominated by the HBD, rather than the HBD being accommodated with only minor
effects, as is the case for ILs at lower HBD:salt ratios.
The insight from these molecular RDFs must therefore be that DESs and ILs share a similar
structure of concentric solvation shells, but in the DES this structure is more convoluted than ILs,
having a strong close-range interaction with contributions from both choline and urea with
chloride, and between separate urea molecules. This implies that rather than the radial,
differentially charged solvation shells found in ILs, in this DES a complex structure is formed, driven
by hydrogen bonding interactions. The existence of such a structure would allow reline to be
stoichiometric and charge-balanced at a localized level due to the presence of the neutral urea
molecules, and is complementary to charge delocalization being the main driving force behind DES
formation,45,46 whilst also in agreement with prior DFT results for reline.32 This also explains the
unusually high stability of proteins in DESs.47

75
3.6.3. Partial radial distribution functions
Partial (site-site) RDFs between all different atom types that are used in the EPSR simulation give
more insight into specific structuring. In the case of reline there are 120 such partial RDFs, many of
which provide limited information. The RDFs best describing the structuring within reline are
plotted in Figure 3.3, and a complete set of RDFs is supplied in the Supporting Information.
The partial RDFs between the two different hydrogen environments of the urea molecule
with chloride (Figure 3.3a) show a significant first correlation at approximately 2.2 Å. Interestingly,
the magnitude of this interaction is significantly stronger for the HU1 hydrogens, which are the two
hydrogen atoms furthest from the central axis of the urea molecule. This indicates a preference
for urea to form hydrogen bonds with chloride in this direction, perhaps allowing the molecule to
orient itself in a configuration that maximizes the interaction energy of its components with other
atom types. The second coordination peak of HU1 and HU2 with chloride at ~4 Å shows a slight
preference for HU2, which is a secondary feature from a hydrogen bond that has been formed by
HU1 with a chloride. Indeed, the mean coordination number of HU1 (1.73, shown in Table 3.3) is
significantly higher than that of HU2 (1.25) about chloride, demonstrating this preferential
orientation. On average, each chloride is coordinated by 4 urea nitrogen atoms at a radius of 3.15
Å. The length scale of the interactions of chloride with urea, particularly HU1 and HU2, prove that
urea forms relatively strong hydrogen bonds with chloride as previously hypothesized, at an
average coordination of two urea molecules per chloride.

76
Figure 3.3. Partial (site-site) radial distribution functions between all different species present in the DES mixture. These RDFs are centred on specific atom types most strongly demonstrating the structuring within liquid reline for simplicity.

77
Table 3.3. Determined coordination numbers for each partial RDF shown in Figure 3. Mean coordination numbers are obtained by integrating the corresponding RDF over a radius range (rcoord) spanning from the onset of the primary correlation peak up to the first minimum. Errors are calculated to one standard deviation, and reflect the ability of EPSR to permit intermolecular disorder.
RDF atom A atom B rcoord / Å Ncoord
U-Cl Cl CU 3.3 – 5.2 3.76 ± 2.27
Cl NU 2.8 – 4.3 4.10 ± 2.63
Cl HU1 1.7 – 3.1 1.73 ± 1.58
Cl HU2 1.7 – 3.1 1.25 ± 1.15
Ch-Cl HOH Cl 1.6 – 3.4 0.66 ± 0.50
MT Cl 2.6 – 4.0 0.70 ± 0.66
HCN Cl 2.6 – 4.2 0.73 ± 0.67
HCO Cl 2.6 – 4.0 0.70 ± 0.66
Ch-U HCN OU 2.2 – 3.5 0.41 ± 0.60
MT OU 2.2 – 3.4 0.48 ± 0.66
HCO OU 2.2 – 3.6 0.45 ± 0.64
HOH OU 1.3 – 2.6 0.16 ± 0.38
HOH NU 1.8 – 4.2 2.08 ± 1.68
Ch-Ch N N 4.6 - 6.7 3.48 ± 1.72
N C2N 4.2 - 7.5 5.34 ± 2.03
N COH 4.0 – 5.9 2.05 ± 1.34
N OH 3.2 – 5.2 2.31 ± 1.11
N HOH 3.2 – 5.5 2.73 ± 1.31
U-U OU NU 2.5 – 3.7 2.25 ± 1.50
OU HU1 1.4 – 2.6 0.62 ± 0.84
OU HU2 1.4 – 2.7 2.33 ± 0.95
NU HU1 1.8 – 4.6 5.62 ± 2.65
NU HU2 1.8 – 4.6 5.77 ± 2.50
The RDFs between choline and chloride demonstrate a significant level of ordering (Figure
3.3b). Particularly, the hydroxyl hydrogen of choline has an intense correlation peak at ~2.1 Å,
which shows that choline is participating in strong hydrogen bonding with chloride as the most
preferential interaction with 0.7 chlorides coordinated on average. The RDFs of chloride around

78
the other hydrogen atoms of choline show lower hydrogen-bonding with a first correlation at
approximately 3 Å, which is the likely cause of the 5 Å shoulder in the choline-chloride RDF.
Subsequent features in these other hydrogen RDFs between 4 Å – 7 Å show the less-preferred
configurations where the chloride is not bound to the hydroxyl group. These RDFs all show very
similar structuring, and there is no clear difference between any particular hydrogen sites in terms
of chloride coordination number, indicating little preference for chloride to interact with any
hydrogen atom other than the strongly hydrogen-bonding hydroxyl group. The free rotation of the
hydroxyl group permits many strongly preferred configurations of chloride around choline.
The RDFs describing the orientation of urea around choline show a generally sparse set of
interactions (Figure 3.3c), with the strongest interaction between the hydroxyl choline hydrogen
with the nitrogen of urea at ~2 Å, and a mean coordination number of 2 over this radius, giving
one urea that is associated with the hydroxyl group. This can be rationalized by strong hydrogen
bonding, with exchange occurring between the hydroxyl moiety of choline and NU atoms of urea,
in addition to secondary structuring effects from the more favourable interactions of urea with
atom types such as chloride. The small correlation at 2.4 Å between the urea oxygen atom and the
various non-hydroxyl hydrogens of choline shows that the hydrogen bonding for the hydrocarbon
chain and methyl hydrogen atoms is relatively weak. This is supported by the relatively low
coordination numbers of urea around the moieties of choline other than the hydroxyl group; the
second urea molecule around choline is associated weakly between these groups.
The interactions seen between like choline molecules are generally relatively weak and
over a longer length scale (Figure 3.3d). The most distinct interaction is between like N atoms, with
a peak centred at 6 Å and a mean coordination number of 3.4 at this distance. The RDFs between
N-OH and N-HOH are similar, but with a slight weighting towards the N-OH correlation. There is
therefore no specific preference towards the N correlation with the hydroxyl hydrogen over the
hydroxyl oxygen, which rules out inter-choline bridging by chloride bonding. Interestingly, the RDF
between N and C2N is approximately 1.3 Å further than the N-COH RDF. Because the C2N carbon
atom is closer to the N atom than COH, this means that the ~7 choline molecules in the solvation
shell at 6 Å radius from the central choline are significantly more likely to be oriented with their
hydroxyl group pointing in the opposite direction to that of the central choline molecule, which is
further confirmed by the hydroxyl partial RDFs main correlation occurring even closer to the N
group, and higher coordination numbers for the closer atom types. It is possible that this structural
solution most effectively distributes the balance of charge.
There is clear structuring occurring between separate urea molecules (Figure 3.3e).
Particularly, it seems that a strong hydrogen bond is formed between urea hydrogen atoms and
urea oxygen atoms, as may be expected from their electronegativity difference. The HU2 proton

79
shows much stronger structuring with urea at closer range, coordinating 2.3 OU atoms at 2.2 Å.
The RDF between the OU and NU atom types has a sharp feature at 2.8 Å, showing the compound
of urea hydrogen bonding with urea oxygen atoms. The urea self-correlation function in reline is
of the same length scale as that which is observed for urea in water at high concentrations.48 Some
inter-urea exchange can be inferred from the high coordination numbers of HU1 and HU2 around
NU, demonstrating that the solvent structure also permits urea clusters as a secondary structure,
again perhaps with a charge balancing function. Clustering of the HBD species in this manner was
observed in previous similar experiments of eutectic mixtures of glucose with imidazolium ionic
liquids.44
3.6.4. Spatial density functions
Each chloride, therefore, is solvated by an average of two urea molecules, hydrogen bonded at a
distance of 2.2 Å. Every urea molecule is associated with several other urea molecules via urea-
urea hydrogen bonding at between 2 Å – 3 Å. Each chloride is also strongly associated with one
choline molecule mostly via hydrogen bonding with the hydroxyl group, at a distance of 2.2 Å.
Finally, each choline is solvated by a shell of 7 other choline molecules, each 6 Å from the origin
and likely oriented in opposite directions. A spatial density function (SDF) tracks the distribution of
molecular centres in 3D. A set of SDFs for reline may be seen in Figure 3.4. To determine these
SDFs, the molecular centre of urea was defined as the CU atom, and the centre of choline was
taken as the midpoint of atom types N, C2N and COH.

80
Figure 3.4. Spatial density functions (SDFs) showing probabilistic 3D structures of the components of reline. Isosurfaces are drawn of the 7.5 % most likely configurations of molecular centres. Yellow surfaces depict choline cations, purple surfaces represent urea molecules and green show chloride anions. Each plot represents the SDF for a particular molecule. Two isosurfaces are plotted per SDF to provide a visual reference to aid 3D interpretation.
The SDF of chloride around urea shows very clearly a tightly focused distribution of
chloride around the hydrogen bond-donating hydrogen atoms of urea, confirming the strong
hydrogen bonding between these species, as was demonstrated previously. The SDF plot of choline
around urea shows that the interaction between these two species is not predominantly hydrogen
bond driven, with choline molecules more likely to be found radially around the C=O axis of urea.
Adopting this configuration allows choline to form very strong hydrogen bonds with chloride via
its hydroxyl proton, whilst maximizing its interaction energy by also forming weak hydrogen bond
interactions with electronegative urea atoms. At the same time, urea is able to coordinate chloride
with strong hydrogen bonds. This forms a complementary shell of choline around urea and
chloride. A second urea molecule is also able to participate in further hydrogen bonding with the
chloride ion that is centred on a first urea, whilst itself interacting with the same choline. This
second urea molecule is small enough to be able to occupy a space that cannot be occupied by the
bulky choline cation.

81
The chloride SDFs centred about choline show that there is a high level of order around
choline. However, even at the high probability level selected, plotting the most likely 7.5 % portion
of the spatial density function, the isosurfaces are relatively large, indicating that there are many
available structural conformations that are preferable. It can be seen that chloride is associated
most strongly in a circular band around the free rotor hydroxyl group, with which it forms strong
hydrogen bonds. In addition to this, the ‘shoulder’ in the choline-chloride RDF at 5 Å can be seen
as a second chloride surface at the ammonium moiety of choline. Chloride is the closest species
around choline, and is strongly associated with urea. Again, urea is ordered around choline but
with many possible conformations. It can be observed that the urea and choline molecules work
synergistically to sandwich the chloride ion with hydrogen bonding forces whilst maximizing their
interaction energy with one another. Radially further still can be seen the choline solvation shell
about choline, which is most strongly associated with the urea shell. This demonstrates how the
separate components of DESs form a radially layered sandwich structure, allowing for the best
distribution of charge between each component.
It appears that at the eutectic point, the molar ratio of urea and choline is such that the
intermolecular hydrogen bonding forces between these two species and chloride becomes
balanced, and chloride is therefore strongly affiliated with both species in a sandwich structure.
This ability to form strong hydrogen bonds and therefore generate significant intermolecular order,
whilst maintaining a sufficient quantity of separate favourable interactions such that the mixture
is frustrated from crystallization, can therefore be viewed as the geometric driving force for the
formation of the deep eutectic mixture. This is complementary to the argument that charge
delocalization causes DES formation, as clearly the ability of urea to delocalize charge drives the
formation of the interspecies hydrogen bonds that give rise to the sandwich structure where each
chloride is strongly associated with one choline and two urea molecules, as has previously been
predicted by DFT.32
It is interesting that the ordering observed around choline is so strong. Although a few studies to
date have hinted at a set of complex interactions between all of the components of the DES,27,30
most attribute the effect solely to the HBD. However, choline appears to be a relatively special case
in forming DESs, with its ability to participate strongly in hydrogen bonding whilst also frustrating
crystallization with its bulky, anisotropic structure.

82
3.6.5. Hole theory
Traditionally, the differential ionic mobilities in DESs have been rationalized using hole theory,25
and this model has been applied successfully in the prediction of physicochemical properties of
DESs such as conductivity.30 This is achieved by considering the liquid as an ionic lattice with a given
number of vacancies, where this void concentration and size is determined from the properties of
the liquid including its surface tension. Diffusivity is obtained by comparing the radius of an
available void space with the hydrodynamic radius of a diffusing species, which then performs a
diffusional ‘jump’ into this void space.49,50
Using surface tension data, it was determined that the DES reline has a Gaussian
distribution of hole sizes centred at a radius of 2 Å, with 9.1 % free space in the liquid and a mean
activation barrier for diffusion of 58 kJ mol-1.51 EPSR was used to determine the void radial
distribution function (VDF) within the DES, which can be seen in Figure 3.5. The VOIDS routine
translates the simulation box into pixels, and either assigns these pixels as occupied or empty,
depending on whether or not there are any atoms within the specified radius. VDFs were calculated
for representative radii of 1.8, 2.0 and 2.2 Å.
Figure 3.5. Radial distribution functions of void space in the EPSR model. Separate curves show the result of using different radii from each void origin to define empty spaces.
An exponentially decaying void distribution is observed with the VDFs beginning at a radius
of 0.3 Å. The rise in void density at short radii is due to void pixels being more likely to be adjacent
to a high density of void pixels than at longer distances. Voids of radius 2 Å are found with a mean
occurrence of 1.3 per simulation box, giving a 2 Å void fraction of 0.061%, which is an order of
magnitude smaller than the 0.763% previously calculated. This may explain the predicted reline

83
viscosity being low by a similar magnitude (11 cP calculated, 169 cP experimental at 40 ˚C) from
hole theory.51 If there are density fluctuations in the model, as would be observed for spherical
voids of 4 Å diameter, the VDF would show oscillating structures, but this is not observed for reline,
showing that the liquid mixture is homogeneous even at molecular length scales. Despite being a
useful tool for prediction of DES properties, our EPSR model suggests that the void size distribution
from hole theory may therefore not be true in the case of reline, and we suggest that the existence
of spherical 4 Å diameter holes in this DES is unlikely when considering the strength of the
intermolecular interactions.
3.7. Conclusions
Wide Q-range neutron diffraction measurements of isotopically-substituted samples of the deep
eutectic solvent reline have been interpreted using EPSR modelling to generate, for the first time,
an experimentally-validated atomistic configuration of this increasingly popular liquid.
We have found that the DES reline does indeed have a strong and complex hydrogen-
bonding network between species, but this study builds upon previous works by showing the
precise nature of this previously-hypothesized structuring. A significant correlation between the
hydrogen bond donor molecule urea and the chloride anion, as had previously been shown by NMR
experiments, is shown to be a strong hydrogen bonding interaction. Importantly, we also find that
choline interacts very strongly with chloride by hydrogen bonding. This leads to the formation of a
complex ion as a most likely 3D configuration, involving one choline, one chloride and two urea
molecules. This structure is stabilized by the complementary hydrogen bond formation of choline
and urea with chloride, and further by other favourable weak hydrogen bonds that are formed
between the different molecules. This set of interactions causes the formation of a radially layered
sandwich structure where choline and urea work synergistically to bond with chloride whilst
maximizing their own weaker interaction. This sandwich structure can also be visualized as a
charge-delocalized, locally stoichiometric cage centred on chloride. The delicate balance of strong
forces between all species is sufficient to prevent the crystallization of the mixture at room
temperature, thereby accounting for the deep eutectic behaviour of reline.
The information regarding DES structure that has been elucidated in this study will no
doubt be able to aid in the informed design of DESs in the future as well as promoting
understanding of the properties of the current selection of DESs, hopefully enabling a generation
of designer solvents that are ‘green, and finally green enough.’

84
3.8. Acknowledgements
O.S.H. is thankful to STFC and EPSRC for co-funding a PhD studentship via the EPSRC Centre for
Doctoral Training in Sustainable Chemical Technologies (Studentship 3578). We thank the ISIS
Pulsed Neutron and Muon Source for allocation of experimental beamtime on SANDALS under
project RB1510465.
3.9. References
1 A. P. Abbott, G. Capper, D. L. Davies, H. L. Munro, R. K. Rasheed and V. Tambyrajah, Chem. Commun., 2001, 19, 2010–2011.
2 M. Francisco, A. Van Den Bruinhorst and M. C. Kroon, Angew. Chemie - Int. Ed., 2013, 52, 3074–3085. 3 H. G. Morrison, C. C. Sun and S. Neervannan, Int. J. Pharm., 2009, 378, 136–139. 4 A. P. Abbott, G. Capper, D. L. Davies, R. K. Rasheed and V. Tambyrajah, Chem. Commun., 2003, 0, 70–
71. 5 E. L. Smith, A. P. Abbott and K. S. Ryder, Chem. Rev., 2014, 114, 11060–11082. 6 N. V. Plechkova and K. R. Seddon, Methods and Reagents for Green Chemistry: An Introduction,
Wiley, Hoboken, 2007, 103–130. 7 D. J. G. P. van Osch, L. F. Zubeir, A. van den Bruinhorst, M. A. A. Rocha and M. C. Kroon, Green Chem.,
2015, 17, 4518–4521. 8 Y. Dai, G.-J. Witkamp, R. Verpoorte and Y. H. Choi, Food Chem., 2015, 187, 14–19. 9 B. Tang and K. H. Row, Monatshefte fur Chemie, 2013, 144, 1427–1454. 10 Q. Zhang, K. De Oliveira Vigier, S. Royer and F. Jérôme, Chem. Soc. Rev., 2012, 41, 7108–7146. 11 Q. Wen, J.-X. Chen, Y.-L. Tang, J. Wang and Z. Yang, Chemosphere, 2015, 132, 63–69. 12 M. Hayyan, M. A. Hashim, M. A. Al-Saadi, A. Hayyan, I. M. AlNashef and M. E. S. Mirghani,
Chemosphere, 2013, 93, 455–459. 13 Q. Zhang, Q. Wang, S. Zhang, X. Lu and X. Zhang, ChemPhysChem, 2015, 17, 335–351. 14 P. Liu, J.-W. Hao, L.-P. Mo and Z.-H. Zhang, RSC Adv., 2015, 5, 48675–48704. 15 J. García-Álvarez, Eur. J. Inorg. Chem., 2015, 31, 5147–5157. 16 D. V Wagle, H. Zhao and G. A. Baker, Acc. Chem. Res., 2014, 47, 2299–2308. 17 B. Tang, H. Zhang and K. H. Row, J. Sep. Sci., 2015, 38, 1053–1064. 18 G. Garcia, S. Aparicio, R. Ullah and M. Atilhan, Energy & Fuels, 2015, 29, 2616–2644. 19 T. Arnold, A. J. Jackson, A. Sanchez-Fernandez, D. Magnone, A. E. Terry and K. J. Edler, Langmuir,
2015, 31, 12894–12902. 20 M. Pal, R. K. Singh and S. Pandey, ChemPhysChem, 2015, 16, 2538–2542. 21 S. J. Bryant, R. Atkin and G. G. Warr, Soft Matter, 2016, 12, 1645–1648. 22 Y. H. Choi, J. van Spronsen, Y. Dai, M. Verberne, F. Hollmann, I. W. C. E. Arends, G.-J. Witkamp and R.
Verpoorte, Plant Physiol., 2011, 156, 1701–1705. 23 A. Paiva, R. Craveiro, I. Aroso, M. Martins, R. L. Reis and A. R. C. Duarte, ACS Sustain. Chem. Eng.,
2014, 2, 1063–1071. 24 Y. Dai, J. van Spronsen, G. J. Witkamp, R. Verpoorte and Y. H. Choi, Anal. Chim. Acta, 2013, 766, 61–
68. 25 A. P. Abbott, R. C. Harris, K. S. Ryder, C. D’Agostino, L. F. Gladden and M. D. Mantle, Green Chem.,
2011, 13, 82-90. 26 C. D’Agostino, R. C. Harris, A. P. Abbott, L. F. Gladden and M. D. Mantle, Phys. Chem. Chem. Phys.,
2011, 13, 21383–21391. 27 C. D’Agostino, L. F. Gladden, M. D. Mantle, A. P. Abbott, I. Ahmed, Essa, A. Y. M. Al-Murshedi and R.
C. Harris, Phys. Chem. Chem. Phys., 2015, 17, 15297–15304.

85
28 A. Pandey, R. Rai, M. Pal and S. Pandey, Phys. Chem. Chem. Phys., 2014, 16, 1559–1568. 29 A. Pandey and S. Pandey, J. Phys. Chem. B, 2014, 118, 14652–14661. 30 D. V. Wagle, G. A. Baker and E. Mamontov, J. Phys. Chem. Lett., 2015, 6, 2924–2928. 31 R. Hayes, G. G. Warr and R. Atkin, Chem. Rev., 2015, 13, 6357–6426. 32 G. García, M. Atilhan and S. Aparicio, Chem. Phys. Lett., 2015, 634, 151–155. 33 S. L. Perkins, P. Painter and C. M. Colina, J. Chem. Eng. Data, 2014, 59, 3652–3662. 34 D. Shah and F. S. Mjalli, Phys. Chem. Chem. Phys., 2014, 16, 23900–23907. 35 H. Sun, Y. Li, X. Wu and G. Li, J. Mol. Model., 2013, 19, 2433–2441. 36 K. J. Edler and D. T. Bowron, Curr. Opin. Colloid Interface Sci., 2015, 20, 227–234. 37 A. K. Soper, GudrunN and GudrunX: Programs for Correcting Raw Neutron and X-ray Diffraction Data
to Differential Scattering Cross Section. Rutherford Appleton Laboratory Technical Report RAL-TR-
2011-013, STFC, 2011. 38 A. K. Soper, Phys. Rev. B, 2005, 72, 104204. 39 A. K. Soper, Mol. Phys., 2001, 99, 1503–1516. 40 A. K. Soper, Mol. Phys., 2009, 107, 1667–1684. 41 A. K. Soper, ISRN Phys. Chem., 2013, 2013, 279463. 42 M. Deetlefs, C. Hardacre, M. Nieuwenhuyzen, A. A. H. Padua, O. Sheppard and A. K. Soper, J. Phys.
Chem. B, 2006, 110, 12055–12061. 43 C. Hardacre, J. D. Holbrey, S. E. J. McMath, D. T. Bowron and A. K. Soper, J. Chem. Phys., 2003, 118,
273–278. 44 T. G. A. Youngs, J. D. Holbrey, C. L. Mullan, S. E. Norman, M. C. Lagunas, C. D’Agostino, M. D. Mantle,
L. F. Gladden, D. T. Bowron and C. Hardacre, Chem. Sci., 2011, 2, 1594-1605. 45 D. Carriazo, M. C. Serrano, M. C. Gutiérrez, M. L. Ferrer and F. del Monte, Chem. Soc. Rev., 2012, 41,
4996-5014. 46 K. Haerens, S. Van Deuren, E. Matthijs and B. Van der Bruggen, Green Chem., 2010, 12, 2182-2188. 47 H. Monhemi, M. R. Housaindokht, A. A. Moosavi-Movahedi and M. R. Bozorgmehr, Phys. Chem.
Chem. Phys., 2014, 16, 14882–14893. 48 A. K. Soper, E. W. Castner and A. Luzar, Biophys. Chem., 2003, 105, 649–666. 49 A. P. Abbott, ChemPhysChem, 2004, 5, 1242–1246. 50 A. P. Abbott, R. C. Harris and K. S. Ryder, J. Phys. Chem. B, 2007, 111, 4910–4913. 51 A. P. Abbott, G. Capper and S. Gray, Chemphyschem, 2006, 7, 803–806.

86
4. DEEP EUTECTIC-SOLVOTHERMAL SYNTHESIS OF NANOSTRUCTURED CERIA
4.1. Overview
Some recent works from the Morris group have highlighted that one of the potentially-useful
avenues of research in the field of DES is in the preparation of functional materials, which were in
their case predominantly porous framework materials such as zeolites.1–4 This methodology was
described as ‘ionothermal synthesis’, as an ionic liquid derivative of conventional hydrothermal
synthesis, that progressed from using conventional ILs into using DES. The ionothermal
methodology using DES was proposed as a potentially novel alternative with a major benefit: DES
are not chemically stable solvents and can break down under conditions which can be controlled,
and the products of this breakdown could template the pore structure in the materials. The work
in this chapter therefore follows on from the information on solvent structure presented in chapter
3, and also represents the first foray into using hydrated DES as reaction media.
This project has aimed to extend the above procedure to the synthesis of nanostructured metal
oxide materials, which are often of enormous utility in environmental applications due to their
catalytic activity, but are structurally completely different from the framework materials prepared
by Morris et al. Understanding the potential of DES for such syntheses is therefore essential for the
full realisation of DES as potential alternative ‘drop-in’ green solvents. Furthermore, demonstrating
that such syntheses are possible in simple conditions using a model DES is a necessary prerequisite
to developing these systems as media for the controlled soft templating of nanostructured
inorganic materials. In this work the metal oxide of interest was ceria (CeO2), which is potentially
useful as a CO oxidation catalyst and so is used in catalytic converters. In car exhausts, ceria is
doped with other elements such as zirconia to enhance the activity, which is limited in the pure
bulk.5 Another strategy is to create nanostructured ceria, which can have far higher specific activity
due to the high surface-area-to-volume ratio and proportion of high-energy surface facets.
Therefore, it is desirable to have methodologies to produce nanostructured ceria.
A series of DES were trialled for the synthesis but only choline chloride-urea was effective,
suggesting that the reaction necessitated the breakdown of urea. Because cerium carbonate was
produced prior to final calcination,6 the mechanism was therefore confirmed to proceed via
thermal hydrolysis of urea, where one of the products is carbonate. 2 This also confirmed that the
presence of water is required for this synthesis, found in the pure DES from atmospheric absorption

87
and the cerium salt’s water of crystallisation. Following this, the reaction was trialled with variable
water contents to make a DES:water mixture, at water mole ratios 1:0 (pure DES) 1:2, 1:5, and
1:10. This caused the morphology of the ceria nanoparticles to change from small, globular and
monodisperse (0w) to highly elongated nanorods and nanowires (10w), despite the lack of
structuring agent and the low temperature and short reaction time. This affects the material
porosity and CO oxidation activity. The structure of the pure solvent was measured using neutron
diffraction, showing an unusual ligand environment complexing the cerium ion, such as urea and
nitrate, as well as water. This led to the suggestion that the formation of such 1D nanostructures
was facilitated by the solvent, either by the formation of a pre-structured complex of the reactants,
or otherwise due to surface capping by the DES components. This paper has therefore presented,
for the first time, a true solvothermal method using DES which are controllably broken down to
form nanoparticulate metal oxides with the desired morphology. The term ‘deep eutectic-
solvothermal’ was used herein rather than ‘ionothermal’; this choice considers the findings of the
previous publication which suggests that DES are not complex-ionic liquids and acknowledges the
water content of many of our preparations. As well as these formalisms, the insights presented
here have contributed to the field of nanomaterial synthesis in DES, which is currently growing
rapidly due to the potential to tune DES,7 and have highlighted the benefits of understanding links
between synthesis and solution structure.
This paper is reproduced with minor adaptations to match the thesis formatting specifications from
the final accepted version published in Nature Communications. The associated electronic
supporting information is provided in Appendix 2.
1 E. A. Drylie, D. S. Wragg, E. R. Parnham, P. S. Wheatley, A. M. Z. Slawin, J. E. Warren and R. E. Morris, Angew. Chemie - Int. Ed., 2007, 46, 7839–7843.
2 E. R. Parnham, E. A. Drylie, P. S. Wheatley, A. M. Z. Slawin and R. E. Morris, Angew. Chemie - Int. Ed., 2006, 45, 4962–4966.
3 E. R. Cooper, C. D. Andrews, P. S. Wheatley, P. B. Webb, P. Wormald and R. E. Morris, Nature, 2004, 430, 1012–1016.
4 E. R. Parnham and R. E. Morris, Acc. Chem. Res., 2007, 40, 1005–1013. 5 Q. Wang, G. Li, B. Zhao and R. Zhou, Fuel, 2011, 90, 3047–3055. 6 M. Wu, Q. Zhang, Y. Liu, Q. Fang and X. Liu, Mater. Res. Bull., 2009, 44, 1437–1440. 7 D. V Wagle, H. Zhao and G. A. Baker, Acc. Chem. Res., 2014, 47, 2299–2308.

88
4.2. Statement of contribution
This declaration concerns the article entitled:
Deep eutectic-solvothermal synthesis of nanostructured ceria
Publication status (tick one)
draft
manuscript Submitted
In review Accepted Published
Publication
details
O. S. Hammond, K. J. Edler, D. T. Bowron and L. Torrente-Murciano, Nat.
Commun., 2017, 8, 14150.
DOI: https://dx.doi.org/10.1038/ncomms14150
Candidate’s
contribution to
the paper
(detailed, and
also given as a
percentage).
The candidate contributed to/ considerably contributed
to/predominantly executed the…
Formulation of ideas:
The idea of using DES to synthesise nanomaterials was conceived by
LTM and KJE. The idea to use reline DES with varied water content was
from OSH. 50%
Design of methodology:
OSH designed the synthetic methodology, and the set of experiments
required to analyse the ceria materials were conceived with input from
LTM, DTB, KJE. 75%
Experimental work:
OSH has done all experimental work and data analysis with some help
from DTB, LTM and KJE on the latter. 90%
Presentation of data in journal format:
OSH prepared the initial manuscript, with significant input from other
authors into re-writing into later drafts. 75%
Statement from
Candidate This paper reports on original research I conducted during the period
of my Higher Degree by Research candidature.
Signed
Date
20/09/18

89
4.3. Abstract
Here we report the synthesis of nanostructured ceria using the green Deep Eutectic Solvent reline,
which allows not only morphology and porosity control of the resulting materials, but also presents
one of the less energy-intensive routes reported to date. Using wide Q-range liquid-phase neutron
diffraction, we elucidate the mechanism of reaction at a molecular scale at considerably milder
conditions than the conventional hydrothermal synthetic routes. In this case, the reline solvent
plays the role of a latent supramolecular catalyst where the increase in reaction rate from solvent-
driven pre-organization of the reactants is most significant. This fundamental understanding of
deep eutectic-solvothermal methodology will enable future developments in low-temperature
synthesis of nanostructured ceria, facilitating its large-scale manufacturing using green, economic,
non-toxic solvents and their implementation in areas such as catalysis and solid-oxide fuel cells.
4.4. Introduction
Cerium (IV) oxide (ceria) is the stable, pale yellow oxide form of the most abundant rare earth
metal. Driven by a ground state cerium 4f electron, the powerful Ce3+ to Ce4+ redox couple,1
alongside rapid oxygen diffusion facilitated by a cubic fluorite structure, makes ceria a responsive
oxygen buffer, with lattice oxygen abstracted or replenished depending on the chemical
environment.2 Ceria is therefore a technologically important material for catalytic oxidation of
hydrocarbons and CO, and consequently it has a significant application in automobile emission
control, particularly when doped with other transition metals.3 Approaching the nanoscale, ceria
catalysts become profoundly more active due to their enhanced surface area to volume ratio,
reactive surface oxygen vacancy concentration and superior oxygen storage capacity.4 The catalytic
activity, especially at low temperatures, can be further enhanced by controlling the morphology at
the nanoscale; 1D assemblies such as nanorods selectively expose the highly reactive (100) and
(110) crystal planes, enhancing activity further.5 True morphological control over nanoceria is
therefore a significant milestone, with the potential to negate the requirement for the addition of
scarce precious metals to achieve sufficiently active catalysts even at low temperatures. Several
synthetic avenues exist for this purpose, which are addressed in a recent review by Sun et al.6
Hydrothermal conditions are particularly malleable;7–10 for example, various ceria nanostructures
are obtained by varying reaction time, temperature or base concentration,11 surfactant self-
assembly can provide additional morphological control,12 and urea can be introduced to form
fractal, dendritic ceria from hydrolysis products.13 Solvothermal methods, reviewed by Walton, are
a particularly interesting development as synthetic control is obtained by direct modification of

90
the solvent environment.14 In this context, Deep Eutectic Solvents (DESs) are an extended class of
ionic liquids (ILs) made by complexing a (typically ammonium halide) salt with hydrogen bond
donor (HBD) molecules, depressing the glass transition temperature (Tg) at the eutectic molar
ratio.15 Like ILs, DESs are green solvents with low vapor pressure and a tunable nature; the
hydrophobicity and physicochemical properties of the solvent can be altered by changing the salt
or HBD, or by addition of various additive compounds.16–18 DESs are prepared from many species,
including metal ions and plant metabolites. Choline chloride (ChCl) systems have gathered the
most interest, with the 1:2 ChCl:urea DES (reline) proving most popular, due to being particularly
tractable, low cost, biodegradable and non-cytotoxic.19,20 Primarily, DESs have found use as media
for metal electrodeposition,21 but are also applied in metal-catalyzed organic synthesis22 and
nanomaterial synthesis,23 alongside separation/extraction applications such as biodiesel
purification24 and CO2 sequestration.25 Ionothermal synthesis, an IL analogue of
hydro/solvothermal conditions, has recently been developed for synthesizing metal-organic
frameworks and zeolitic materials using DESs.26–28 In these syntheses, the solvent environment acts
as an organic structuring framework, whilst the DES delivers templating agents from thermal
degradation.
4.5. Experimental
4.5.1. Deep Eutectic Solvents and neutron diffraction
Reline was prepared as per the literature method,29 from choline chloride (≥98%) and urea
(≥99.5%), used as received from Sigma-Aldrich. The water content of the prepared pure reline was
found to be 2252 ± 519 ppm, using a Mettler-Toledo DL32 Karl Fischer titrator. Eutectic mixtures
were prepared by mixing reline with Ce(NO3)3.6H2O (Acros, ≥99.5%). Neutron diffraction
experiments utilized the SANDALS wide Q-range neutron diffractometer at the ISIS facility, RAL,
UK,30 using the previously described method, with 1:2:0.01 choline chloride:urea:Ce(NO3)3.6H2O
eutectic mixtures (equivalent to ~43 mM Ce(NO3)3.6H2O) and choline chloride:urea isotope-
substituted contrasts of H:H, H:D, D:H and D:D.31 Further background on the neutron diffraction
technique can be found alongside the computational methodology, in the Supplementary.

91
4.5.2. Deep Eutectic-Solvothermal synthesis of ceria
In a typical synthesis 80 cm3 of either reline, or reline and water (Elga, 18.2 MΩ) in the required
molar ratio, was added to a PTFE autoclave liner. 1.5 g of Ce(NO3)3.6H2O was added to the vessel
and homogenized before sealing. When specified, the surfactant sodium dodecyl sulfate (SDS,
Sigma-Aldrich, ≥99%) was added to the mixture at a Ce:SDS molar ratio of 0.33. The liner was placed
inside a stainless steel autoclave, which was heated to the chosen temperature at 10 ˚C min-1 in an
air-circulating oven, and held at this temperature for 10 hours before cooling to ambient. The
reaction mixture was diluted to 300 cm3 with water and centrifuged for 20 minutes at 7500 rpm.
The solids were separated by filtration, washed with water and ethanol, dried in a vacuum oven at
80 ˚C, and calcined at 500 ˚C for 4 hours with a ramp rate of 10 ˚C min-1. Grinding with pestle and
mortar yielded a series of pale yellow powders of varying hues and densities, with a mean yield of
0.6 g.
4.5.3. Characterisation of nanostructured ceria
Powder X-Ray diffraction utilized a Bruker D8 ADVANCE, equipped with a Bruker VÅNTEC-1
detector and Cu Kα radiation (λ = 1.5418 Å). Average crystallite size is calculated applying the
Scherrer equation to the diffraction peaks (111). The values corresponding to the other reflections
are shown in the SI, Table S1. N2 sorption analysis was conducted using a Micromeritics ASAP 2020
at 77 K, after degassing under vacuum at 150 °C for 2 hours. TPR measurements were performed
using a Micromeritics ASAP 2920 instrument equipped with a TCD detector. The samples were
treated under 50 cm3 min-1 of 5% H2/He gas while the temperature was increased from ambient to
1000 °C at 10 °C min-1. Imaging was performed using a JEOL JEM1200EXII (TEM), and a JEOL
FESEM6301F (Field-Emission SEM) with no conductive coating and 2 kV accelerating potential. CO
oxidation catalytic tests were carried out in a differential reactor inside a PID temperature
controlled oven. 15 mg of the ceria material were diluted in SiC to form a 4 cm3 catalytic bed. The
gas inlet feed consisted of 50 cm3 min-1 of a mixture of CO/O2/N2 in molar ratio 0.2/0.2/99.6.
Experiments were conducted from 25 to 500 ˚C with temperature increments of 50 ˚C. After
reaching the steady state at each temperature, the outlet gas CO concentration was determined
by a Fuji Electric ZRH Infrared Gas Analyzer.

92
4.6. Results and discussion
4.6.1. Synthesis
These previous studies have inspired us to develop a novel solvothermal synthesis protocol using
DESs for morphology-tunable nanoceria synthesis. We demonstrate that reline acts as a latent
supramolecular catalyst by bringing the reactive components together in the presence of water
which at the same time acts as a directing agent. Reline and its aqueous mixtures are compatible
with metal ions, including common ceria precursors such as Ce(NO3)3∙6H2O or CeCl3, negating the
need for the high concentration of solubilizing base that is required in equivalent hydrothermal
synthesis. In addition, we use catalytic data to relate the physicochemical properties of the
resulting ceria materials with the synthetic conditions. We initially trialed the popular DESs reline
and ethaline (1:2 ChCl:ethylene glycol), under similar synthetic temperatures (100-180 ˚C) to those
used in hydrothermal methods which apply highly-concentrated NaOH solutions and cerium
nitrate as the precursor.11 Following reaction at 100 ˚C under autogenous pressure, the reline
system gelled to a clouded rose-pink suspension which could be precipitated using water as an
anti-solvent. In contrast, the counterpart ethaline system underwent no apparent reaction; optical
clarity was retained after the same treatment, and the system was stable to the addition of anti-
solvent H2O and ethanol with no solid precipitation even after several months. Consequently, the
rest of the study was focused on the reline-based ceria synthesis method. Interestingly, it was
found that the morphology of the resulting ceria materials could be finely tuned at the nanoscale
by addition of controlled amounts of water. Several DES hydration ratios (w), defined as the
H2O:reline molar ratio equal to 0, 2, 5, and 10 respectively were used systematically. Water
addition has the effect of diluting the DES, whilst remaining in a regime of hydration in which the
DES structure is purportedly retained (i.e. below 50 wt.% H2O; xwater = 0.83; w = 14.4).17 The
different ceria materials are accordingly labelled Ce-x-y, where x is synthesis temperature and y
the DES molar hydration ratio (w). Representative TEM images of the synthesized ceria at different
synthetic temperatures and water contents are shown in Figure 4.1a. In general, syntheses from
reline-aqueous mixtures yielded a white solid precipitate compared to a sol-gel in the pure reline
synthesis, likely due to the formation of a nanoparticulate cerium compound network in the more
viscous pure reline. Indeed, in the absence of added water (beyond the water of hydration found
in the cerium nitrate precursor), only particulated ceria is formed, independent of the temperature
of synthesis (100 – 180 ˚C). Increasing the water content (w) at constant synthesis temperature
increases the aspect ratio of the materials, such that Ce-100-10 is mainly comprised of 1D
nanowires of up to 10 nm diameter and several microns in length, revealing the role of water as
directing agent due to the presence of hydroxyl groups which have previously been shown to limit
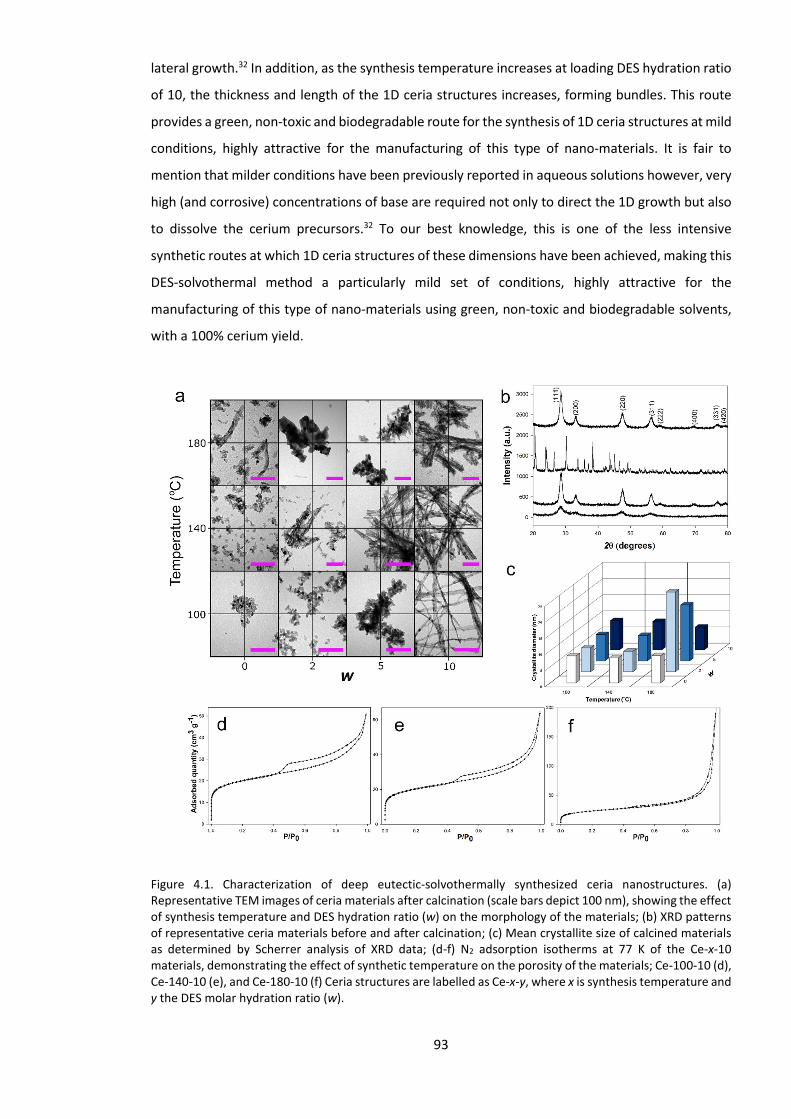
93
lateral growth.32 In addition, as the synthesis temperature increases at loading DES hydration ratio
of 10, the thickness and length of the 1D ceria structures increases, forming bundles. This route
provides a green, non-toxic and biodegradable route for the synthesis of 1D ceria structures at mild
conditions, highly attractive for the manufacturing of this type of nano-materials. It is fair to
mention that milder conditions have been previously reported in aqueous solutions however, very
high (and corrosive) concentrations of base are required not only to direct the 1D growth but also
to dissolve the cerium precursors.32 To our best knowledge, this is one of the less intensive
synthetic routes at which 1D ceria structures of these dimensions have been achieved, making this
DES-solvothermal method a particularly mild set of conditions, highly attractive for the
manufacturing of this type of nano-materials using green, non-toxic and biodegradable solvents,
with a 100% cerium yield.
Figure 4.1. Characterization of deep eutectic-solvothermally synthesized ceria nanostructures. (a) Representative TEM images of ceria materials after calcination (scale bars depict 100 nm), showing the effect of synthesis temperature and DES hydration ratio (w) on the morphology of the materials; (b) XRD patterns of representative ceria materials before and after calcination; (c) Mean crystallite size of calcined materials as determined by Scherrer analysis of XRD data; (d-f) N2 adsorption isotherms at 77 K of the Ce-x-10 materials, demonstrating the effect of synthetic temperature on the porosity of the materials; Ce-100-10 (d), Ce-140-10 (e), and Ce-180-10 (f) Ceria structures are labelled as Ce-x-y, where x is synthesis temperature and y the DES molar hydration ratio (w).

94
4.6.2. Solvothermal reaction mechanism
To determine the structure of the solvated cerium species in reline that underpins the mechanism
of the solvothermal reaction, wide Q-range liquid-phase neutron diffraction was performed on
pure reline-cerium nitrate mixtures at the synthetic cerium concentration and varying deuteration
as isotopic contrast. Details of the computational methodology are provided in Supplementary
Figure 1 and Table 4.1, and the Supplementary Methods 1-3. We have recently demonstrated the
structure of bulk reline using this method, showing hydrogen-bonded clusters of the eutectic
stoichiometry, where a chloride ion is chelated by one choline and two urea molecules.31 The
calculated intermolecular coordination numbers for this system are shown in Table 4.1. The reline
structure is tolerant to the addition of cerium nitrate hexahydrate, with around a 10% decrease in
urea-urea coordination and a 10% increase in the choline-urea coordination numbers. Significant
short range association of cerium and nitrate ions are observed around both choline and urea
(Figure 4.2). Both urea and choline participate in hydrogen bonding with nitrate anions, forming
ordered clusters similar to the chloride cage that is formed in the pure DES. It is also interesting to
note that the cerium nitrate water of hydration has a higher affinity for association with urea than
choline via its hydrophilic functional groups, and there is only vague cerium-water structuring at
distances greater than 5 Å. The cerium ion preferentially binds with four chloride anions and lone
pairs of electronegative oxygen atoms, forming a near-charge balanced, highly fluxional complex
that can be nominally described as [Ce3+(Cl)-3.9(Choline)+
1.1(NO3)-0.5(Urea)1.7]-0.3. The strong Lewis
acid-base interactions observed between Ce3+ and the ligating O atoms resemble a dilute form of
the solvation structure of solvate ionic liquids (SILs), that are eutectic mixtures of glymes and
lithium salts.33 Urea and choline molecules, as well as water molecules from the cerium nitrate
hexahydrate, are capable of forming Ce-O bonds and simultaneously hydrogen bonding with
ligated chlorides, allowing the integration of the complex ion into the greater hydrogen-bonding
solvent structure without significant perturbation, as illustrated in Figure 4.2d. Importantly, we
found that the solvent structure drives reactive elements towards being tightly bound; cerium is
ligated by urea, which itself forms a strong hydrogen-bonding network with water. It is likely that
this facilitates both the hydrolysis of urea (shown in reaction (1)) and the targeted delivery of urea
hydrolysis products (such as CO3- and NH4
+) towards these reactive cerium centers, with the solvent
pre-structuring (as shown in reaction (2)) effectively reducing the reaction activation energy, and
therefore rationalizing the milder conditions of nanorod formation and growth.
CO(NH2)2 + 2H2O CO32- + 2NH4
+ (1)
[(Ce)23+(L)x
n(H2O)y]z + 3CO32- Ce2O(CO3)2H2O + CO2 + (L)x + (y-1)H2O (2)

95
where (L)xn describes the ligands solvating cerium, which can be charge-positive (choline), negative
(chloride), or neutral (urea).
Table 4.1. Intermolecular coordination numbers determined by EPSR.
Molecule A Molecule B rmax (Å) Ncoord
Choline Choline 8.1 6.33 ± 1.89
Choline Chloride 7.0 4.15 ± 1.33
Choline Urea 6.9 6.69 ± 2.46
Urea Choline 5.0 0.78 ± 0.85
Urea Chloride 5.5 2.14 ± 1.02
Urea Urea 6.2 6.11 ± 2.53
Cerium Choline 5.5 1.09 ± 0.74
Cerium Chloride 3.5 3.90 ± 0.99
Cerium Urea 4.3 1.67 ± 1.11
Cerium Nitrate 4.2 0.48 ± 0.50
Water Choline 4.0 0.37 ± 0.54
Water Chloride 4.4 0.85 ± 0.57
Water Urea 4.5 2.55 ± 1.55
Nitrate Choline 4.6 1.50 ± 0.95
Nitrate Chloride 5.5 1.60 ± 1.04
Nitrate Urea 5.5 3.50 ± 1.56
The molecular centers for polyatomic species are taken to be the choline C2N atom, the urea CU atom, the O1 atom of water and the NN atom of nitrate. Intermolecular coordination numbers are determined using the first minima in RDFs (±0.05 Å) between molecules as the maximum radius of integration (rmax), and the fluctuation in this value is calculated by EPSR over 6000 iterations of the model.
Further insights into the relationship between the nature of the DES and product
morphology are required to elucidate the role of potential electrostatic interactions on capping
surface lattice planes, similar to the ones observed in the presence of surfactants,34 in promoting
the 1D growth. It is important to mention the difference in temperature of the wide Q-range
neutron scattering experiments carried out at 303 K and actual ceria synthesis carried out under
solvothermal conditions at the temperatures stated. However the pre-ordering observed will occur
in the reaction mixtures upon mixing as they are loaded into the reactor, and thus will form a
starting configuration for the synthesis.
In contrast, in the ethaline DES synthesis, and although this remains to be tested in detail,
we suggest that the Ce3+ ion is strongly chelated by non-hydrolysable ethylene glycol molecules in
a similar fashion, explaining the lack of product formation in this system. We therefore show here
that the benefits of using reline as a solvent in ceria synthesis are afforded by the solvent playing

96
the role of a latent supramolecular catalyst (as shown by reaction (2)), where the increase in
reaction rate from solvent-driven pre-organization of the reactants is most significant.
Figure 4.2. Results from neutron diffraction and EPSR analysis. (a) Experimental data (dotted lines) and EPSR fits (solid lines) for the four different reline isotopic contrasts; (b) Radial distribution functions (RDFs) of Ce(NO3)3.6H2O components around choline ions; (c) RDFs of Ce(NO3)3.6H2O components around urea molecules; (d) Snapshot demonstrating the variety in bonding interactions around the cerium ion taken from an iteration of the EPSR simulation. Bound chloride anions are stabilized by hydrogen bonding with choline and urea molecules, DES components ligate cerium via oxygen lone pair donation, and water and nitrate also contribute to the hydrogen bonding network; (e) Spatial density function (SDF) plot showing the 7.5% most likely 3D configurations of nitrate (blue) and cerium (orange) around choline ions; (f) SDF plot showing the 7.5% most likely 3D configurations of nitrate (blue) and cerium (orange) ions around urea molecules.
Following calcination, XRD patterns of the nanoparticles synthesized from reline were
fitted to the cubic ceria fluorite structure (JCPDS 34-0394). Pre-calcination structures synthesized
in reline-water mixtures were assigned to orthorhombic monohydrated cerium oxycarbonate
(Ce2O(CO3)2∙H2O (JCPDS 44-0617),35 calcining to form ceria (Figure 4.1b) as has previously been
reported for urea-hydrothermal synthesis,36 and concordant with the mechanisms predicted by
our neutron diffraction analysis. In this study, samples were calcined at 500C to ensure full solvent
removal but we have also demonstrated that conversion of cerium oxycarbonate to ceria takes
place at temperatures as low as 200C, in line with earlier reports.36 However, samples synthesized
in the absence of added water (e.g. Ce-100-0, Figure 4.1b) showed characteristic diffuse ceria
diffraction peaks before being calcined to remove amorphous reline remnants; nitrate anions held
proximal to the cerium complex during synthesis in the pure reline environment may be capable
of directly oxidizing it to ceria when conditions do not favor the urea-hydrolytic pathway, although
interestingly in these cases 1D growth is not achieved. Alternatively, oxygen dissolved in these
solutions can be responsible for such oxidation similarly to previous observation in hydrothermal
synthesis.32 The thermal hydrolysis of urea above 80 ˚C to form CO3- and NH4
+ therefore occurs in
both reline and reline-aqueous mixtures, as in aqueous urea solutions. We have found that the

97
rate of this process is clearly suppressed at lower water concentrations and temperatures, with
the reaction not running to completion after 10 hours of solvothermal treatment at 80 °C. The
underlying mechanism of crystal growth is therefore not the unique facet of the DES-based
synthesis; carbonate ions react with solvated cerium centers to form oxycarbonates that grow into
crystallites via an aggregation-dissolution-recrystallization type mechanism.37 The mean crystallite
size (shown in Figure 4.1c) of the different Ce-x-y materials ranges between 5-8 nm, with the
differences within the experimental error, with the exception of the Ce-180-2 and Ce-180-5
materials which show particularly large crystallites. However, 1D growth is still not achieved in this
case, despite the apparent increase in aspect ratio observed for Ce-140-y materials relative to Ce-
100-y materials, which is likely due to a greater degree of crystallite concatenation from more
favorable growth kinetics as temperature is further increased to 180C.
4.6.3. Porosity of the materials
Although meso- and microporosity is desirable for ceria materials, the former often has poor
thermal stability due to pore collapse, especially during calcination when surfactants are used in
the synthesis,38 and few microporous ceria synthetic strategies have been reported.39 Herein, we
find that ceria porosity can be tuned by careful selection of solvothermal reaction conditions, with
porosity retained after calcination. As an example, Figure 4.1d shows the N2 adsorption isotherms
of the ceria nanorods formed in more highly hydrated (w = 10) aqueous reline mixtures, and the
associated pore size distributions are shown in Figure 4.3c. Despite presenting similar 1D
morphologies, increasing the synthesis temperature favors the formation of larger mesopores and
even macropores, with the former more likely due to the agglomeration of wires and rods. This
relative loss of small pores can be attributed to more rapid aggregation and growth of crystallites
as the dissolution/recrystallization kinetics scale with temperature. In addition, increasing the
value of w favors the formation of microporous ceria. These effects can be applied synergistically
to produce ceria materials with the desired porosity, in a solvothermal process which is
considerably less intensive than previously-reported hydrothermal methods using highly
concentrated base.32,40

98
Figure 4.3. Structure-property relationships for the Ce-x-10 materials. (a) Catalytic CO oxidation conversion as a function of temperature; (b) Temperature-Programmed Reduction (data normalized to mass of material); (c) Pore size distributions.
4.6.4. Carbon monoxide oxidation performance
In general, the CO oxidation reaction rate of reline-synthesized ceria products showed a
comparable morphology relation to other ceria syntheses, with particularly high specific turn-over
frequency (TOF) values found for ceria nanorods as compared to nanoparticulate materials, as
these morphologies preferentially expose the more reactive surface lattice planes (100) and
(110).11 Evaluation of the relationship between the synthesis conditions of the ceria materials and
their physicochemical properties was carried out for the Ce-x-10 materials, all of which have a pure
1D morphology (Figure 4.3). Further microstructure characterization of the different materials is
shown in Supplementary Figure and Table 2. Increasing synthetic temperature promotes the
dissolution/recrystallization growth step (as previously observed with other 1D materials) leading
to a decrease of the aspect ratio.41 Ce-140-10 ceria nanorods, particularly rich in micro- and
mesoporosity, are especially effective oxidation catalysts and competitive with the best literature
examples of undoped ceria under comparable CO oxidation conditions with a rate of reaction of
69 µmol g-1 s-1 at 300°C.32 This high activity is directly related to the high reducibility of the high
concentration of readily available surface oxygen as shown by the low temperature peak in the

99
temperature-programmed reduction (TPR) analysis (Figure 4.3b).42 The CO oxidation reaction is
well-known to follow the Mars van Krevelen mechanism where the adsorbed carbon monoxide
reactant is oxidised by readily available surface oxygen species, creating an oxygen vacancy on the
surface of the ceria material that is then restored by oxygen in the gas phase, closing the catalytic
cycle. It is important to mention that bulk oxygen (whose concentration is proportional to the high-
temperature peak in the TPR experiment) does not play a significant role in the catalytic activity of
the material. Ce-100-10 ceria rods show a slightly lower oxidation activity than their Ce-140-10
counterpart due to a lower concentration of readily available oxygen species as shown by the
decrease in intensity of the low-temperature peak in the TPR analyses (Figure 4.3b),42 combined
with relatively smaller mesopores (~10 nm in Ce-100-10 versus ~30 nm in Ce-140-10). On the other
hand, the Ce-180-10 ceria material shows considerably lower oxidation catalytic activity despite
comparable morphology, surface area (~73-80 m2 g-1), and crystallite size (~4-8 nm) with the other
two materials. In this case, the ceria rods align into bundles with significantly higher mesopore
volume. The accelerated kinetics of growth at this higher temperature is also reflected in the
reducibility of the readily available oxygen at higher temperature, which is translated into a lower
oxidation catalytic activity. Interestingly, reduction of the bulk oxygen (second peak of the TPR,
Figure 4.3b) of the Ce-180-10 ceria material takes place at relatively lower temperatures than the
other Ce-x-10 materials, however, these species are not involved in the oxidation cycle. All samples
were found to have stable performance over six consecutive temperature cycles between ambient
temperature and 500 ˚C.
4.7. Conclusions
The reline system offers a feasible route for the synthesis of 1D ceria materials due to two
complementary effects. On one side, the controlled degradation of the DES components, in this
case urea, reacts with the cerium precursor salts while simultaneously the strong urea interaction
with the metal ion facilitates the reaction path as demonstrated here. These aspects justified the
lack of conversion observed with the ethaline system which shows a strong interaction between
the glycol and the metal ion but which does not undergo degradation to allow the reaction.
It is noteworthy that we attempted further structuring of the pure reline syntheses by
adding the anionic surfactant sodium dodecyl sulfate (SDS) as a templating agent (3.8 wt. %; Ce:SDS
molar ratio = 0.33). This concentration of SDS in reline is known to form cylindrical micelles rather
than the spheroids that are formed in water.50 However, SDS added to the reline solvent did not
act as organic templates during the ceria synthesis and only resulted in the formation of bulk ceria

100
with negligible (10-12 m2 g-1) surface area and catalytic activity. Increasing the synthesis
temperature (180 ˚C) caused surfactant pyrolysis. This lack of templating effect is likely to be
related to SDS degradation, and to the competing interactions between the SDS and the reline
components with the cerium ions and the water molecules.
We have therefore demonstrated significant control over the morphology, porosity,
reducibility, and consequently the catalytic activity of nanostructured ceria materials by direct
modification of the solvent environment and synthetic conditions. Current methods for
synthesizing 1D ceria nanoparticles require either higher temperatures or longer synthesis times
than the relatively mild conditions of this solvothermal method although a post-calcination step is
required to produce the final ceria product. Using DESs to synthesize ceria is therefore a step
forward in both environmental and economic terms; this relatively mild route, using cheap, benign
and biodegradable precursors alongside water as a structure-modulating agent, yields thermally-
stable ceria nanostructures (rods and particles) with equivalent activity to similar materials
synthesized under conventional, more intensive conditions. Using liquid-phase neutron diffraction,
we have demonstrated that cerium nitrate is readily integrated into the DES matrix of reline by
hydrogen bonding and the formation of fluxional, chelated cerium complexes with the DES
components, analogous to solvate ionic liquids. Reline is not denatured by the addition of the
cerium precursor salt, and instead forms a pre-structured liquid where the reactive components
are sandwiched together, with the solvent environment functioning as a supramolecular catalyst.
This fundamental understanding sets the foundations of a new synthetic route, where the
solvothermal method may also be used to directly produce ceria at even lower temperatures via
ligated nitrate anions, potentially de-intensifying the process further by negating the requirement
for calcination.
4.8. Acknowledgements
The authors thank the UK ISIS Pulsed Neutron and Muon source at the Rutherford Appleton
Laboratory and the UK Engineering and Physical Sciences Research Council (EPSRC) for co-funding
a PhD studentship for OSH in the Centre for Doctoral Training in Sustainable Chemical Technologies
at the University of Bath (EP/L016354/1; STFC Studentship Agreement #3578) and LTM EPSRC’s
Fellowship EP/L020432/2. We thank the ISIS Pulsed Neutron and Muon Source for beam time on
the SANDALS instrument under allocation RB1510465. We thank Ursula Potter (Bath) for help with
SEM and TEM imaging.

101
4.9. References
1 K. Reed, A. Cormack, A. Kulkarni, M. Mayton, D. Sayle, F. Klaessig and B. Stadler, Environ. Sci. Nano, 2014, 1, 390–405.
2 F. Esch, S. Fabris, L. Zhou, T. Montini, C. Africh, P. Fornasiero, G. Comelli and R. Rosei, Science, 2005, 309, 752–755.
3 J. Kašpar, P. Fornasiero and M. Graziani, Catal. Today, 1999, 50, 285–298. 4 J. Manuel, A. L. Gilbank, T. García, B. Solsona, S. Agouram and L. Torrente-Murciano, Appl. Catal. B
Environ., 2015, 174–175, 403–412. 5 Q. Yuan, H. H. Duan, L. Le Li, L. D. Sun, Y. W. Zhang and C. H. Yan, J. Colloid Interface Sci., 2009, 335,
151–167. 6 C. Sun, H. Li and L. Chen, Energy Environ. Sci., 2012, 5, 8475-8505. 7 C. Sun, H. Li, H. Zhang, Z. Wang and L. Chen, Nanotechnology, 2005, 16, 1454-1463. 8 C. Sun, H. Li and L. Chen, J. Phys. Chem. Solids, 2007, 68, 1785–1790. 9 C. Sun and L. Chen, Eur. J. Inorg. Chem., 2009, 2, 3883–3887. 10 C. Sun, H. Li, Z. Wang, L. Chen and X. Huang, Chem. Lett., 2004, 33, 662–663. 11 L. Torrente-Murciano, A. Gilbank, B. Puertolas, T. Garcia, B. Solsona and D. Chadwick, Appl. Catal. B
Environ., 2013, 132–133, 116–122. 12 A. Bumajdad, J. Eastoe and A. Mathew, Adv. Colloid Interface Sci., 2009, 147–148, 56–66. 13 D. Zhang, X. Du, L. Shi and R. Gao, Dalt. Trans., 2012, 41, 14455–14475. 14 R. I. Walton, Prog. Cryst. Growth Charact. Mater., 2011, 57, 93–108. 15 E. L. Smith, A. P. Abbott and K. S. Ryder, Chem. Rev., 2014, 114, 11060–11082. 16 Y. Dai, J. van Spronsen, G. J. Witkamp, R. Verpoorte and Y. H. Choi, Anal. Chim. Acta, 2013, 766, 61–
68. 17 Y. Dai, G.-J. Witkamp, R. Verpoorte and Y. H. Choi, Food Chem., 2015, 187, 14–19. 18 A. Kadyan, K. Behera and S. Pandey, RSC Adv., 2016, 6, 29920–29930. 19 Q. Wen, J.-X. Chen, Y.-L. Tang, J. Wang and Z. Yang, Chemosphere, 2015, 132, 63–69. 20 Q. Zhang, K. De Oliveira Vigier, S. Royer and F. Jérôme, Chem. Soc. Rev., 2012, 41, 7108–7146. 21 Q. Zhang, Q. Wang, S. Zhang, X. Lu and X. Zhang, ChemPhysChem, 2015, 17, 335–351. 22 J. García-Álvarez, Eur. J. Inorg. Chem., 2015, 31, 5147–5157. 23 D. V Wagle, H. Zhao and G. A. Baker, Acc. Chem. Res., 2014, 47, 2299–2308. 24 B. Tang, H. Zhang and K. H. Row, J. Sep. Sci., 2015, 38, 1053–1064. 25 G. Garcia, S. Aparicio, R. Ullah and M. Atilhan, Energy & Fuels, 2015, 29, 2616–2644. 26 E. R. Cooper, C. D. Andrews, P. S. Wheatley, P. B. Webb, P. Wormald and R. E. Morris, Nature, 2004,
430, 1012–1016. 27 E. R. Parnham and R. E. Morris, Acc. Chem. Res., 2007, 40, 1005–1013. 28 E. R. Parnham, E. A. Drylie, P. S. Wheatley, A. M. Z. Slawin and R. E. Morris, Angew. Chemie - Int. Ed.,
2006, 45, 4962–4966. 29 A. P. Abbott, G. Capper, D. L. Davies, H. L. Munro, R. K. Rasheed and V. Tambyrajah, Chem. Commun.,
2001, 19, 2010–2011. 30 K. J. Edler and D. T. Bowron, Curr. Opin. Colloid Interface Sci., 2015, 20, 227–234. 31 O. S. Hammond, D. T. Bowron and K. J. Edler, Green Chem., 2016, 18, 2736–2744. 32 C. Pan, D. Zhang, L. Shi and J. Fang, Eur. J. Inorg. Chem., 2008, 15, 2429–2436. 33 T. Murphy, S. K. Callear, N. Yepuri, K. Shimizu, M. Watanabe, J. N. Canongia Lopes, T. A. Darwish, G.
Warr and R. Atkin, Phys. Chem. Chem. Phys., 2016, 18, 17224–17236. 34 A. Vantomme, Z. Y. Yuan, G. Du and B. L. Su, Langmuir, 2005, 21, 1132–1135. 35 M. Hirano and E. Kato, J. Mater. Sci. Lett., 1999, 18, 403–405. 36 B. Bakiz, F. Guinneton, J. P. Dallas, S. Villain and J. R. Gavarri, J. Cryst. Growth, 2008, 310, 3055–3061. 37 M. Sun, G. Zou, S. Xu and X. Wang, Mater. Chem. Phys., 2012, 134, 912–920. 38 C. Sun, J. Sun, G. Xiao, H. Zhang, X. Qiu, H. Li and L. Chen, J. Phys. Chem. B, 2006, 110, 13445–13452. 39 N. C. Strandwitz and G. D. Stucky, Chem. Mater., 2009, 21, 4577–4582. 40 Z. Ji, X. Wang, H. Zhang, S. Lin, H. Meng, B. Sun, S. George, T. Xia, A. E. Nel and J. I. Zink, ACS Nano,
2012, 6, 5366–5380. 41 L. Torrente-Murciano, A. A. Lapkin and D. Chadwick, J. Mater. Chem., 2010, 20, 6484–6489. 42 J. Xu, J. Harmer, G. Li, T. Chapman, P. Collier, S. Longworth and S. C. Tsang, Chem. Commun. (Camb).,
2010, 46, 1887–1889. 43 T. Arnold, A. J. Jackson, A. Sanchez-Fernandez, D. Magnone, A. E. Terry and K. J. Edler, Langmuir,
2015, 31, 12894–12902.

102
5. RESILIENCE OF MALIC ACID NATURAL DEEP EUTECTIC SOLVENT
NANOSTRUCTURE TO SOLIDIFICATION AND HYDRATION
5.1. Overview
Though it is the most popular system, choline chloride-urea is not necessarily representative of the
field of DES. Many examples include ‘naturally-sourced’ hydrogen bond donors with carboxylic and
alcohol groups, and different cations.1 Therefore, it was necessary to expand studies of the solvent
structure to include a carboxylic acid DES to represent the ‘natural DES’ that are increasingly
described in the literature.2 This chapter therefore tangentially extends the solvent structure
studies detailed in chapter 1 to new and interesting systems, and goes into further depth on their
phase behaviour and response to the introduction of co-solvents.
‘Natural DES’ (NADES) are defined as eutectics containing secondary metabolites, which
are organic compounds formed by plants but not thought to be directly involved in biologically
essential processes.3 We took an interest in exploring the hypothesis that such systems form
natural glasses in living organisms to protect from adverse conditions such as drought and freezing
temperatures.4 This paper therefore aimed to determine the structure of the choline
chloride:malic acid NADES, which forms an extremely low-melting eutectic (ca. -70 °C) with a 1:1
mixing ratio, rather than the 1:2 ratio seen in many other systems, and making it of further
fundamental interest. As these studies are intended to give insights into in vitro conditions, this
necessitates the study of liquid structure in a DES water-mixture for the first time. To fully probe
the biological cryoprotectant hypothesis, it is also necessary to measure the structure under
cryogenic conditions, below the melting point, to determine the nature of any structural changes.
Neutron diffraction measurements were made of the pure and hydrated system at
ambient conditions, and of the pure system under cryogenic conditions to determine the change
in structure. Measurement of the pure system gave the same overall picture as the data in the
previous paper on choline chloride-urea, suggesting that DES are liquids bearing strong local
bonding arising from numerous competing interactions, but weak order. The increased H-bond
strength and functionality of malic acid was related to the slightly higher intermolecular order seen
in this solvent and the 1:1 eutectic formation, relative to choline chloride:urea, though none of the
previously-hypothesised acid-acid oligomerisation was seen.5 When hydrated with 2 mol

103
equivalents of water to form a 1:1:2 choline chloride:malic acid:water mixture, the structure was
surprisingly retained with only ca. 10% deviation despite the high mole fraction of water. It was
observed that the water occupied interstitial regions that did not disrupt the DES ordering and
formed small discrete water-rich clusters or domains. Finally, the pure system was cooled to below
its transition temperature and measured. In this experiment, the data were qualitatively identical
and analysis revealed minimal structural change, signifying the formation of a glass rather than
undergoing a first-order phase transition, which is contended for DES in the literature.6 This
observation was further confirmed by quasi-elastic neutron scattering (QENS) experiments, which
showed that proton motion gradually halted, rather than undergoing a sharp change in behaviour.
This work contained several ‘stories’ and provided fundamental understanding from
structural data to support all of these. Firstly, that DES are potentially a naturally-occurring
phenomena in plants, capable of preventing the formation of damaging ice crystals both by the
frustration of crystallisation and by forming domains of bound water. Secondly, this paper
contributed further to the debate on the fundamental structure of DES, which appeared similar to
our work on choline chloride:urea. Finally, this work suggested for the first time that small
quantities of water do not disrupt the DES structure, which is an important finding when
considering that most DES contain some water from hygroscopicity, and the same debate
frustrated efforts in the field of pure ionic liquids for some time before accepting that the impact
of water is minimal.7
This paper is reproduced with minor adaptations to match the thesis formatting
specifications from the final accepted version published in J. Phys. Chem. B. The associated
electronic supporting information is provided in Appendix 3.
1 M. Francisco, A. Van Den Bruinhorst and M. C. Kroon, Angew. Chemie - Int. Ed., 2013, 52, 3074–3085. 2 A. Paiva, R. Craveiro, I. Aroso, M. Martins, R. L. Reis and A. R. C. Duarte, ACS Sustain. Chem. Eng.,
2014, 2, 1063–1071. 3 Y. Dai, J. van Spronsen, G. J. Witkamp, R. Verpoorte and Y. H. Choi, Anal. Chim. Acta, 2013, 766, 61–
68. 4 Y. H. Choi, J. van Spronsen, Y. Dai, M. Verberne, F. Hollmann, I. W. C. E. Arends, G.-J. Witkamp and R.
Verpoorte, Plant Physiol., 2011, 156, 1701–1705. 5 C. D’Agostino, R. C. Harris, A. P. Abbott, L. F. Gladden and M. D. Mantle, Phys. Chem. Chem. Phys.,
2011, 13, 21383–12391. 6 X. Meng, K. Ballerat-Busserolles, P. Husson and J.-M. Andanson, New J. Chem., 2016, 40, 4492–4499. 7 Y. Kohno and H. Ohno, Chem Commun, 2012, 48, 7119–7130.

104
5.2. Statement of contribution
This declaration concerns the article entitled:
Resilience of malic acid natural deep eutectic solvent nanostructure to solidification and hydration
Publication status (tick one)
draft
manuscript Submitted
In
review Accepted Published
Publication details
O. S. Hammond, D. T. Bowron, A. J. Jackson, T. Arnold, A. Sanchez-Fernandez, N.
Tsapatsaris, V. G. Sakai and K. J. Edler, J. Phys. Chem. B, 2017, 121, 7473–7483.
DOI: https://dx.doi.org/10.1021/acs.jpcb.7b05454
Candidate’s
contribution to
the paper
(detailed, and
also given as a
percentage).
The candidate contributed to/ considerably contributed to/predominantly
executed the…
Formulation of ideas:
The neutron diffraction experiment was formulated BY KJE and DTB, as well as
collaborators TA and AJJ. The QENS experiments were formulated by VGS, ASF and
AJJ. 40%
Design of methodology:
Experimental methodology for the diffraction experiment was formulated by KJE,
DTB, TA and AJJ. Methodology for the analysis of data was handled by OSH. 60%
Experimental work:
The diffraction experiment was carried out by KJE, DTB, TA and AJJ, and the QENS
experiment by ASF, AJJ and VGS. All analytical work was performed by OSH. 75%
Presentation of data in journal format:
Analysis and presentation of data and the first draft was handled by OSH.
Subsequent drafts were reworked by OSH following feedback from KJE, DTB,
ASF and AJJ, with the QENS experiments subsequently included. 85%
Statement from
Candidate This paper reports on original research I conducted during the period of my Higher
Degree by Research candidature.
Signed
Date
20/09/18

105
5.3. Abstract
Little is presently known about the unique nanostructure of DES. The order of the liquid-solid phase
transition is contended and whether DES-water mixtures are merely aqueous solutions, or have
properties dominated by the eutectic pair, is unclear. Here, we unambiguously show the structure
of choline chloride-malic acid (malicine) as a liquid, and also in solid and hydrated forms, using
wide Q-range neutron diffraction (QENS) on D/H isotope-substituted samples, and quasi-elastic
neutron scattering. Data were refined using Empirical Potential Structure Refinement. We show a
stoichiometric complex ion cluster in the disordered liquid, with strong choline-chloride bonding
and a hydrogen bond donor (HBD) contribution. The 1:1 eutectic stoichiometry makes these ionic
domains more well-defined, with less HBD clustering than seen previously for reline. There is
minimal structural difference for the solidified material, demonstrating that this NADES
solidification is a glass transition rather than a first order phase change. QENS data support this by
showing a gradual change in solvent dynamics rather than a step change. The DES structure is
mostly retained upon hydration, with water acting both as a secondary smaller HBD at closer range
to choline than malic acid, and forming transient wormlike aggregates. This new understanding of
DES structure will aid understanding of the properties of these novel green solvents on the
molecular length scale in chemical processes, as well as giving an insight into the apparent role of
NADESs in plant physiology.
5.4. Introduction
Solution processes are ubiquitous in chemistry due to the convenience and versatility offered by
solvents. However, molecular solvents have numerous drawbacks arising from variable toxicity,
bioaccumulation, volatility, and unsustainable sources. Deep Eutectic Solvents (DESs) are a
recently-discovered type of molecular-ionic mixed liquid systems, prepared by combining salts
with neutral hydrogen bond donor (HBD) species in the eutectic molar ratio.1 DESs therefore
leverage the positive attributes that have aided the uptake of ILs (ionic liquids),2 such as lower
vapor pressures than many common and volatile organic solvents, and the intrinsically ‘designer’
nature, whereby DESs can be tuned for task-specificity by varying the salt or HBD composition.3
The most popular DESs are based around bulky organic salts, such as the prototype DES reline, a
1:2 choline chloride-urea mixture.4 Over 106 of this type of DESs are theorized,5 and of particular
interest are Natural Deep Eutectic Solvents (NADESs), which are derived from naturally-occurring
compounds including organic (amino) acids and sugars.6 The potential applications of situation-
specific solvent systems that are non-toxic, biodegradable, and renewable are clearly wide.7 For

106
example, DES and their aqueous mixtures can be used as intrinsically structure-directing and
greener media for solvothermal synthesis of nanomaterials,8 and currently unexplored applications
are likely to emerge from other fundamental studies; DES are unusual nonaqueous media with the
ability to promote the spontaneous self-assembly of phospholipids,9 and small-molecule
cationic10,11 and anionic amphiphiles.12–14
Advances in the understanding of IL nanostructure have facilitated the growth of IL
research into a vast interdisciplinary field.15 The same field with respect to DES research remains
in relative infancy, with most studies to date focusing on electrochemistry16 or organic synthesis,17
much like the state of the art of ILs three decades ago. For example, so little is known about DES
structuring that even the nature of the solidification of DESs (ie. first order or glass transition)
remains unclear in the literature.1,18 Furthering the understanding of DES nanostructure, mixing,
and phase behavior may therefore drive uptake of DESs for new applications in the field. Initial
FAB-MS experiments suggested that DESs are ionic liquid subtypes comprising [Choline]+ and
[Haliden-HBDz]n- complex anions.18–21 However, it is becoming evident that the nanostructure of
these systems is more like a disordered, high-entropy state, with various strong and weak H-bonds
bearing similar interaction strengths.22–30 In the disordered liquid, we have shown evidence for a
transient complex ion cluster in the eutectic stoichiometry, where chloride is located at the center
of a H-bonded ionic domain, not just urea-chloride complexes.24 We also observe significant urea-
urea clustering, indicative of hydrogen-bonded regions of urea molecules akin to concentrated
aqueous urea solutions,31 and similar to the solvation structure of HBD molecules in ionic liquids.32
Due to the H-bonded nature of DESs, most are water-miscible and hygroscopic,33 and DES-
aqueous mixtures (up to 50 wt.% H2O) display modified physical properties, such as drastically
reduced viscosity.34–37 Despite the potential utility of these greener media in applications such as
separation,38 the role of this additional water has received little attention, and it is not truly known
whether water affects the DES structure negatively or constructively, or forms a biphasic system.
PFG-NMR showed remarkably high water self-diffusivity in DESs, with the authors inferring
microscale phase separation of DESs and water.39 The 1:1 choline chloride:malic acid DES (malicine)
is a NADES where the eutectic composition is shifted to 1:1 rather than 1:2 in reline; this behaviour
appears to be a result of the dicarboxylic acid facilitating dual-site HBD interactions,18 and is
common to similar oxalic, fumaric and citric acid DES systems.25 That enzymes are stable in
malicine but inactive until sufficiently hydrated has led to the hypothesis that water becomes
sequestered in NADESs, potentially shielding a host plant from desiccation or freezing.40 Indeed,
malicine has a low glass transition temperature of 217 K,18 but upon hydration with two mole
equivalents of water (water:DES molar ratio w = 2; referred to as malicine-2w), the glass transition
is depressed further to 202 K,6 with viscosity and density also reduced. In this paper, we therefore

107
present a study of the malicine NADES using neutron total scattering, to simultaneously provide
experimental evidence for the hydration and solidification behavior of DESs, alongside the
nanostructural differences between reline and carboxylic-type DESs of variable eutectic
stoichiometry. We demonstrate the structure of the pure solvent under ambient and cryogenic
conditions, as well as the hydrated solvent, and resolve the nanostructure in each case using a
reverse structural modelling protocol.41 To provide further evidence for the nature of the phase
transition, we show results from quasi-elastic neutron scattering (QENS) experiments that describe
the changing solvent dynamics of these systems.21
5.5. Experimental
5.5.1. Preparation of isotope-substituted DES and hydrated
DES
Hydrogenated choline chloride (≥98%) and malic acid (≥99%) were purchased from Sigma-Aldrich
and used without further purification. 2,3,3-d3-(DL)-malic acid (HO2CCD2CD(OH)CO2H) (98.1 atom
% D, 98% pure) and trimethyl-d9-choline chloride ((CD3)3N(CH2)2OHCl) (99.6 atom % D, 99 % pure)
were purchased from QMX laboratories and used as provided. The eutectic mixtures were
prepared via the standard literature route of mixing at 80 ˚C,42 to make three contrasts of the pure
NADES with isotopic compositions of H:H, H:D and D:D (malic acid:choline chloride). 2 mole
equivalents of water (Elga, 18.2 MΩ), or deuterium oxide (Sigma-Aldrich, 99.9 atom % D) or an
equimolar mixture of these, was added to the malicine mixtures with gentle heating and mixing
until the mixtures appeared homogenized. This yielded a series of eight malicine-2w contrasts, in
isotopic compositions of H:H:H, H:H:D, H:D:D, H:D:H, D:D:D, H:H:D/H, H:D:D/H, H:D/H:D, and
D/H:D/H:D/H (malic acid:choline chloride:water), where D/H signifies an equimolar mixture of both
hydrogenated and deuterated forms.
5.5.2. Neutron total scattering experiments
Neutron diffraction experiments were performed on the SANDALS diffractometer at Target Station
1 of the STFC ISIS Neutron and Muon Source, Rutherford Appleton Laboratory, Harwell, UK. Using
time-of-flight, SANDALS is optimized for the study of disordered systems comprising light elements,
using neutrons of wavelength 0.05 ≤ λ ≤ 4.5 Å and a forward scattering detector geometry. Data

108
were collected over the full available Q-range of 0.1 ≤ Q ≤ 50 Å-1, using a 30 mm diameter circularly-
collimated neutron beam. Approximately 2 g of each DES sample (with the exception of D:D
malicine) was added to null-scattering Ti0.68Zr0.32 alloy flat-plate cells with 1 mm path length and
PTFE vacuum seals. 0.8 g of D:D malicine was added to the cell, and the accurate masses recorded
in order to calculate a suitable scaling factor for these data. For instrument calibration and data
normalization, a 3 mm thick vanadium standard was measured, in addition to the empty
instrument and empty TiZr cells. Cells containing the pure malicine DES samples were first
measured in the liquid phase (298 K), and then vitrified to a temperature point 20 K below the
onset of the glass transition of each different isotopic contrast, as determined by DSC at a cooling
rate of 5˚C min-1. Samples were allowed to equilibrate to temperature prior to measurement, with
temperature control achieved using a helium closed-cycle refrigerator. Aqueous malicine-2w
mixtures were placed into a sample changer and measured at 298 K, with temperature regulated
by a Julabo FP52 recirculating ethylene glycol/water bath.
Figure 5.1. Atom types assigned to the choline, chloride, malic acid and water molecules used in the EPSR simulation of diffraction data. Non-exchangeable hydrogen atoms that were deuterium-substituted are labelled M.
The experimental data were corrected for attenuation, multiple scattering and background
contributions and normalized to absolute units using the scattering from the vanadium standard
using the GudrunN software.43 After correction for inelastic scattering arising from the light
elements in the samples (hydrogen),44 the analysis results in a series of merged interference
differential scattering cross-section datasets that may be interpreted using empirical potential

109
structure refinement (EPSR).45 The details of the EPSR procedure are supplied in the Supporting
Information. For reference, the various atom types used in the EPSR analysis of the data are shown
in Figure 5.1.
5.5.3. Quasi-Elastic Neutron Scattering (QENS)
Quasi-elastic neutron scattering (QENS) measurements were performed on the IRIS instrument at
ISIS Spallation Source.46 In a QENS experiment, the energy exchange between incident and
scattered neutrons is measured within a predefined dynamic energy window. Neutrons scattered
without energy exchange or with energy exchange below the energy resolution of the instrument
will appear to be elastic (ΔE = 0). The signal arising in the quasi-elastic region, a broadening close
to the elastic signal, is indicative of localized and long-range hydrogen dynamics. Therefore the
investigation of the scattering in this energy window will provide information regarding low energy
molecular reorientations, translations and diffusion of solvent molecules. In particular, measuring
the change of the integral under the elastic line as a function of temperature and momentum
transfer is commonly called the elastic window scan. It is the preferred method to determine the
change of the dynamical response and the change of short- or long-range order in a molecular
system, for instance a glass transition.
IRIS is a time-of-flight indirect geometry spectrometer optimized for high-resolution QENS
experiments. The experiment was performed using the PG002 analyser providing an energy
resolution of 17.5 µeV, a dynamic range from -0.54 meV to 0.64 meV and a Q-range of 0.42-1.85
Å-1. Fully protonated 1:1 choline chloride:malic acid and 1:1:2 choline chloride:malic acid:water
were measured as a function of temperature. For both samples an elastic window scan was made
in order to follow changes in the dynamics from 7 K to 294 K using a 7 K step. The sample thickness
inside the flat aluminium cans was 1 mm. The scattering was corrected for detector efficiency using
a vanadium standard. Data were normalized and analyzed using the standard procedures of
Mantid.47

110
5.6. Results and discussion
5.6.1. Experimental neutron diffraction data and fits
The experimental neutron scattering cross sections for the various isotopic mixtures of the three
systems are assumed to represent a common structure, with the variable scattering a product of
differing isotopic contributions. In each case, the EPSR model has converged upon a state closely
representing the experimental structure factor, and these experimental diffraction data are shown
alongside their respective fits in Figure 5.2. The minor divergences observed in the region Q ≤ 2 Å-
1 are attributable to the inelastic scattering corrections for 1H nuclei.44,48 The most intense
scattering appears over a broadly similar scale of Q as was shown previously for the DES reline,24
albeit with subtle differences in the form of the various peaks. For example, the prominent
scattering seen at 1.45 Å-1 in the D:D contrast of the reline system is shifted to 1.15 Å-1 in malicine
and with relatively stronger scattering in the latter, indicating some difference in the interaction
strength and length scales for carboxylic DESs. There is almost no discernible difference between
the experimental scattering of the malicine system at 298 K and at 208 K. This provides an initial
indication that there is no onset of long-range periodically ordered crystalline structure upon
solidification as would be expected if a freezing transition had occurred, instead suggesting that
the system forms an amorphous glassy phase. The scattering of the hydrated malicine-2w system
is also similar to that of the pure solvent at 298 K, with no clear difference above the contribution
of the different hydrogen/deuterium fractions found in the hydrated system. This is not entirely
unexpected as malicine-2w constitutes 11.62 wt.% water, and trends reported in the various
physicochemical properties of DESs imply that below a level of hydration around 50 wt.%, some
DES character remains.34

111
Figure 5.2. Experimental neutron total scattering profiles (colored circles) and the EPSR fits to these data (solid lines), for the pure malicine DES (a), for the solidified malicine DES (b), and the hydrated malicine-2ω DES (c). Each separate contrast is offset to aid viewing.

112
5.6.2. Malicine nanostructure
Figure 5.3 shows the molecularly-centered RDFs determined from the EPSR fits to the data shown
in Figure 5.2, and the calculated parameters for these are listed in Table 5.1. These data highlight
the differences in bonding between malicine and reline, which is shown for comparison in Figure
5.3d. Namely, the choline-choline and choline-chloride interactions bear a length scale comparable
to the urea eutectic, with convergence of the first solvation region occurring at comparable radii.
Conversely, the length scale of the RDFs describing correlations that include the HBD are generally
extended by 1 – 2 Å in malicine relative to reline. This slight increase in length scale could be
attributable to the larger average molecular size in malicine. Regardless, there appears to be no
significant long-range structural order in the malicine DES, and the RDFs are truncated to 10 Å here
to facilitate comparison. The significant choline-chloride correlation is almost identical in both
reline and malicine systems, with both showing the distinct ‘shoulder’ at 5 Å. This feature
represents a coordination where chloride ions are organized next to the positively-charged
trimethylammonium moiety of choline, rather than sited in the more favoured choline hydroxyl
group hydrogen-bonding region represented by the 4 Å peak. Interestingly, it appears that the ion
clusters in the malicine DES are somewhat more well-defined to a slightly greater radius (Table 5.1)
than the reline system, with each malicine choline associating strongly with just one chloride anion
up to a radius of 4.5 Å rather than ~4 chlorides, as is seen over a similar length scale in reline.
Further, there appears to be no strong 4 Å HBD self-correlation in the malicine system, with this
feature instead shifted to 6 Å, resembling the choline-choline RDF much more closely. It could be
hypothesized that the self-clustering of HBD molecules in 1:1 eutectics is less significant, which can
be demonstrated by contrasting with the calculated intermolecular coordination numbers (Table
5.1); the malic acid-malic acid self-correlation is approximately half of that found for urea-urea,
which is likely because of the 1:2 salt:HBD stoichiometry of reline and similar systems. Such
clustering seems facilitated by higher mole fractions of HBD, but the bulkier molecular geometry
and greater hydrogen-bonding functionality of malic acid and similar organic acids (ie. oxalic and
malonic acid) permit the formation of stable 1:1 eutectics with choline chloride. Similarly, the
strong hydrogen-bonding correlation at 4 Å between the HBD species and the anion is observed in
malicine, but the intensity of this correlation is markedly lower than reline, with the malic acid-
chloride coordination number again being approximately half that of the urea-chloride
coordination. The choline-malic acid correlation is also relatively stronger than choline-urea,
supporting the relatively lower incidence of malic acid clusters, whilst the near-identical
coordination number and length scale for the choline-choline and choline-malic acid RDFs at 8.5 Å
demonstrates a relatively well-defined first solvation shell of ~7 choline-malic acid-chloride ion
clusters. The septet primary solvation shell is evocative of the same structure that is seen in ionic

113
liquids,32 as well as previously for the choline-choline correlation in reline, and it seems that as in
these two examples, this shell is a result of the necessity to balance charge. Analysis of these RDFs
therefore supports the stoichiometric complex ion cluster model suggested for DESs, whereby the
anion forms the center of an ionic domain, chelated by hydrogen-bonding with both the HBD and
choline. The strong chelation of chloride in this manner correlates with the low chloride mobility
in DES found by QENS experiments.21 However, in the case of 1:1 eutectics the complex ion appears
somewhat more robust with respect to dissociation into HBD-HBD clusters, which may explain the
significant depth of the non-ideal eutectic point depression that is observed for malicine.
Figure 5.3. Radial distribution functions showing all interspecies interactions, for the pure malicine DES (a), for the vitrified malicine DES (b), and the hydrated malicine-2w DES (c) The data for the previously-measured DES reline are also shown to facilitate comparison (d), reproduced from ref. 24 with permission from the Royal Society of Chemistry. The defined molecular centers for these RDFs are taken to be the centers of mass.

114
Table 5.1. Coordination numbers for the various systems calculated using EPSR.
Ncoord (a) Ncoord (b) Rmax / Å Malicine (298 K) Malicine (208 K) Malicine-2w (298 K)
Choline Malic acid 8.5 6.78 ± 1.93 6.68 ± 2.01 6.22 ± 1.78
Choline Chloride 4.5 0.98 ± 0.78 1.01 ± 0.80 0.85 ± 0.72
Choline Choline 8.5 6.44 ± 1.80 6.44 ± 1.80 5.75 ± 1.63
Malic acid Chloride 4.6 1.11 ± 0.82 1.07 ± 0.76 1.04 ± 0.78
Malic acid Malic acid 7.0 3.64 ± 1.52 3.74 ± 1.71 3.19 ± 1.40
Chloride Chloride 5.3 0.78 ± 0.76 0.76 ± 0.76 0.71 ± 0.74
Choline Water 4.1 - - 0.94 ± 0.90
Malic acid Water 4.3 - - 1.47 ± 1.20
Chloride Water 4.2 - - 2.05 ± 1.26
Water Water 3.8 - - 1.54 ± 1.24
5.6.3. DES solidification: 1st order or glass transition?
The RDFs derived from neutron diffraction data and EPSR modelling of the solidified malicine
samples show negligible differences between the absolute intensities of the various correlations
and peak widths. Little variance is seen above the inherent error of the neutron diffraction
experiment and EPSR fitting procedure, for both the length scales of the various intermolecular
interactions, and the calculated intermolecular coordination numbers. These results therefore
suggest that malicine undergoes a reversible change to a glassy state rather than a true phase
transition, which has been suspected to be the case from DSC experiments on the solidification of
various DESs.49

115
Figure 5.4. QENS data measured on IRIS showing the elastic intensity as a function of temperature for (a) the pure malicine DES and (b) the 1:1:2 DES-water mixture, shown at three constant momentum transfers of 0.59, 1.20 and 1.64 Å-1. Data were normalized to the lowest temperature. Lines are included as a visual guide and where error bars are not visible, the error magnitude is smaller than the marker.
In order to further understand the nature of the melting transition for this DES, Quasi-
Elastic Neutron Scattering (QENS) measurements were made of the pure and hydrated solvent to
show the changing solvent dynamics over the course of the transition. These data are shown in
Figure 5.4. The elastic intensity can be observed to decrease with increasing temperature. The
absence of any sharp changes in the dynamics of the solvent revealed that the system is
characterized by the lack of a first order melting transition, and this is indicative of the presence of
a glass transition. This feature has been previously reported for the choline chloride:glycerol DES.21
This would imply the lack of a major re-arrangement of the solvent structure when heating from
116
cryogenic temperatures to room temperature, as suggested by our structural investigations. The
DES system containing water shows similar behavior, but with a further decrease in the elastic
intensity at the same temperature. This suggests an increase in the molecular mobility and
diffusion of components relative to the pure DES, even at the very low temperatures measured
here. Critically, the DES/water mixture high momentum transfer data (red trace of Figure 5.4b)
show that the most significant change in hydrogen mobility is observed towards the glass transition
point, and within an average interaction length of ca. 2π/1.64 Å-1 = 3.8 Å. This is suggestive of the
initiation of increased levels of inter-molecular proton-proton exchange or diffusion between the
DES constituents and water molecules near the glass transition point.21
Therefore, the combination of data reported here from QENS and neutron total scattering
supports the hypothesis that DESs comprised of naturally-occurring organic acids and sugars act as
cryptobiosis agents in plants beyond their colligative contribution, by forming a preservative glass
that shields fragile cellular componentry against adverse cold and dehydration.40
5.6.4. Effect of water upon DES nanostructure
The hydrated malicine-2w DES sees significant water-water (2.8 Å) and water-chloride (3 Å)
hydrogen-bonding interactions dominating the set of computed RDFs, alongside additional
choline-water and malic acid-water correlations at 4 Å. The DES-water correlations are relatively
highly coordinated; each choline molecule is on average solvated by 1 water and malic acid by 1.5
waters, whilst chloride is solvated by 2 water molecules and the prominent water-water RDF
represents a small degree of H2O self-clustering, with a mean coordination of 1.5 Although the
various malicine-2w RDFs appear consistent with the pure DES despite the prominent water
interactions, upon hydration the DES is slightly disrupted, with the various DES intermolecular
coordination numbers decreasing to an average of 90% of the value seen in pure malicine. The
magnitude of this deviation is commensurate with the mass or volume fraction of added water,
but in molar terms this is a remarkably small variance when considering that the H2O mole fraction
in the hydrated mixture is 0.5. The simultaneous aggregation of water and conservation of DES
structure would be consistent with the formation of the phase-separated system predicted by
NMR39, but this seems unlikely given the significant levels of hydrogen-bonding participation of
water shown in the DES RDFs (specifically water-chloride) in Figure 5.3. Any major self-assembly of
water aggregates would be apparent within the Q-range used for this scattering experiment, and
the relatively small size of the water clusters that exist at this level of hydration is shown in Figure
5.5. The largest water clusters are only 10 Å in length and are rarely greater in width than one or
two water molecules.

117
Figure 5.5. (a) EPSR model snapshot showing clustering of water molecules. Scaling is to 100% of the respective van der Waals radii; (b) The same EPSR model snapshot depicted as isosurfaces of hydrogen-bonded water molecules to better depict any aggregation. Amongst the many dispersed water molecules, transient and wormlike water clusters of 1-10 Å in length are seen, that are in most cases not more than one molecule in diameter.
It therefore appears that at this degree of hydration, water does not destroy the DES or
form a biphasic system, but is sequestered into the malicine ion cluster at a slightly
substoichiometric (with respect to water) coordination of ~1.5 water molecules per cluster. The
remnant water contributes to the greater hydrogen-bonding structure of the DES, fluxionally
occupying interstitial sites that cannot be occupied by larger choline and malic acid molecules, and
forming transient, wormlike aggregates. The incorporation of water into the ionic domains found
in DES whilst forming wormlike aggregates that conjoin multiple ion clusters would help to explain

118
the interesting nonlinear trends that have been observed in the enzyme activity, conductivity,
solubilisation behavior, water activity and viscosity of DES-aqueous mixtures as a function of water
mole fraction.6,34,40
5.6.5. Specific solvation structure
By careful analysis of the large number of discrete partial RDFs (190 for malicine, or 231 for
malicine-2w) generated in the refined atomistic models, which represent interactions between all
separate atom types in a system, any specifically favorable set of 3D conformations can be
elucidated for a disordered material if any are present.50 Owing to the complexity of the system,
several of the key correlations describing intermolecular bonding and the hydrogen-bonded
structure of malicine are shown in Figure 5.6. As an amorphous solid, the partial RDFs for the
vitrified (208 K) malicine system generally represent facsimiles of the pure liquid system, with
almost imperceptibly heightened ordering between components because of the lower thermal
motion at 208 K. The discussion of specific structuring in the pure liquid is therefore equally
applicable to the glassy state of malicine; further information on the glassy state is given in the
appendix.
Figure 5.6. Representative partial radial distribution functions for select atom-atom correlations as calculated by EPSR, offset to facilitate viewing; (a-e) Comparative partial RDFs between DES species in the room temperature liquid (black line), the glassy state (red line) and the hydrated DES (blue line); (f) Interactions between the various different DES species and water for the hydrated system only.
The dominant ordering interaction in malicine is the HOH-Cl hydrogen bonding interaction,
at a length scale of 2.1 Å (Figure 5.6b), with 0.52 ± 0.5 chlorides coordinated, on average, up to a
radius of 3.1 Å (Table 5.2). The chloride anion is found mostly in a strongly hydrogen-bonded band
around the freely rotating choline hydroxyl proton, as shown by the equal coordination numbers

119
for HCN-Cl and HCO-Cl, radially about which this band is located. The second, less favored position
for chloride is at the positively-charged ammonium moiety of choline, where it is held by
electrostatics and weak hydrogen bonding, but, as with reline, there appears to be minimal
preference for one weakly hydrogen-bonding site over another in terms of the partial RDF
magnitudes and coordination numbers and radii.24 Interestingly, the primary peaks of most
choline-chloride RDFs are altered in the presence of water, particularly the RDFs N-Cl, MT-Cl, and
HCN-Cl that are diagnostic of the coordination of chloride at the ammonium terminus of choline,
though the first and second solvation shells remain visible and unaltered in these functions at
greater range. The HOH-Cl correlation is broadly unaffected, despite the strong HOH-O1 interaction
(Figure 5.6f) that signifies the contribution of water to the DES ion cluster. It appears that at this
level, water effectively acts as a secondary HBD molecule in the DES. The other site-site
coordination numbers fall to 90% of the value in the pure solvent, demonstrating the weakly
denaturing effect of water on the DES. Indeed, contrasting these with the choline-water RDFs
shown in Figure 6f shows a particularly strong N-O1 interaction, with equal HCO-O1 and HCN-O1
contributions and particularly high coordination numbers for these three RDFs. The mechanism for
this reduction in coordination number therefore appears to be preferential solvation of water
molecules at the positively-charged nitrogen moiety of choline, in accordance with the known
ability of water to strongly solvate alkylammonium species.51 The nature of this interaction is
shown in a schematic representation in the Spatial Density Function (SDF) plot in Figure 5.7e, with
water becoming the innermost solvation lobe of choline, whilst not displacing chloride.

120
Table 5.2. Calculated coordination numbers from integrating the partial RDFs shown in Figure 4 up to a value of Rmax, which is taken as the first minimum in the primary correlation peak for pure malicine and held constant to ease comparison with the hydrated system. Errors are calculated to one standard deviation, using statistics collected from 4000 iterations of the disordered EPSR DES models. It is noteworthy that many of these interactions show variances that are equivalent to or greater than the principal value. Such interactions represent non-persistent correlations that do not play a significant role in the average structure. Conversely, the liquid properties are strongly defined by the correlations where the coordination number variance is significantly smaller than the average value.
Ncoord
pRDF Rmax / Å Malicine (298 K) Malicine (208 K) Malicine-2w (298 K)
Cho-Mal OH-H 2.3 0.13 ± 0.34 0.14 ± 0.35 0.14 ± 0.35
OH-HH 2.3 0.07 ± 0.25 0.07 ± 0.26 0.03 ± 0.17 HOH-OC 2.3 0.16 ± 0.37 0.14 ± 0.36 0.11 ± 0.32 N-C 8.0 5.85 ± 1.82 5.72 ± 1.85 5.21 ± 1.66 COH-C 6.2 2.37 ± 1.16 2.31 ± 1.23 2.13 ± 1.15
Cho-Cl HOH-Cl 3.1 0.52 ± 0.51 0.52 ± 0.51 0.48 ± 0.51 N-Cl 6.0 3.22 ± 1.19 3.25 ± 1.21 2.86 ± 1.15 HCN-Cl 4.0 0.65 ± 0.64 0.66 ± 0.64 0.56 ± 0.61 HCO-Cl 4.0 0.66 ± 0.66 0.69 ± 0.68 0.58 ± 0.65 MT-Cl 3.8 0.59 ± 0.62 0.61 ± 0.64 0.48 ± 0.58
Cho-Cho N-N 8.0 5.35 ± 1.63 5.36 ± 1.64 4.59 ± 1.47 N-C2N 8.0 6.39 ± 1.67 6.50 ± 1.67 5.72 ± 1.63 N-COH 6.0 2.84 ± 1.20 2.86 ± 1.19 2.66 ± 1.08 C-OH 5.2 2.19 ± 1.00 2.16 ± 1.03 2.01 ± 0.99 N-HOH 6.0 3.01 ± 1.28 3.00 ± 1.32 2.75 ± 1.12
Mal-Cl H-Cl 3.1 0.62 ± 0.51 0.60 ± 0.51 0.54 ± 0.53 HH-Cl 3.3 0.56 ± 0.54 0.54 ± 0.52 0.53 ± 0.50 C-Cl 4.6 1.11 ± 0.82 1.07 ± 0.76 1.03 ± 0.78 CM-Cl 4.6 1.06 ± 0.80 1.06 ± 0.81 0.98 ± 0.81
Mal-Mal OC-H 2.3 0.25 ± 0.47 0.25 ± 0.47 0.22 ± 0.43 OC-HH 2.6 0.17 ± 0.39 0.17 ± 0.39 0.15 ± 0.38 OC-M 3.3 2.59 ± 1.01 2.67 ± 1.02 2.70 ± 0.91 O-OO 3.7 0.93 ± 0.70 0.99 ± 0.72 0.86 ± 0.65 O-O 3.7 0.73 ± 0.78 0.72 ± 0.78 0.63 ± 0.75
Cl-Cl Cl-Cl 5.3 0.78 ± 0.76 0.76 ± 0.76 0.71 ± 0.74
Cho-H2O N-O1 6.0 - - 4.94 ± 2.10 HOH-O1 2.3 - - 0.17 ± 0.39 HCN-O1 3.6 - - 0.65 ± 0.78 HCO-O1 3.6 - - 0.73 ± 0.78
Mal-H2O H-O1 2.3 - - 0.19 ± 0.39 HH-O1 2.3 - - 0.12 ± 0.33 M-O1 3.6 - - 0.73 ± 0.79
Cl-H2O Cl-O1 4.2 - - 2.05 ± 1.26
H2O-H2O O1-O1 3.8 - - 1.54 ± 1.24
Although not as prominent as the choline-chloride interaction, there are also strong
hydrogen-bonding interactions between malic acid and chloride (Figure 5.6d; Figure 5.7d), as has

121
been predicted previously for this system using DFT.25 In particular, there are prominent short-
range H-Cl and HH-Cl correlations signifying strong hydrogen bonds between chloride and the
terminal carboxylic group or malic acid hydroxyl group respectively, with mean chloride
coordination numbers of 0.62 and 0.56. Although the H-Cl coordination number is marginally
higher, the HH-Cl interaction is in fact the preferable conformation, as signaled by the higher
absolute intensity in the primary solvation peak for the HH-Cl RDF, and the 1:2 stoichiometry of the
HH:H moieties in malic acid. This preferred orientation is corroborated by a slightly higher
coordination number for the C-Cl (1.11) correlation relative to CM-Cl (1.06). Considering the malic
acid-chloride and choline-chloride interactions in isolation therefore leads to the conclusion that
the cholinium ion and malic acid HBD form a hydrogen-bonded chelate around the chloride anion,
with a preference for chloride to be orientated in a band around the hydroxyl proton, and
hydrogen-bonding most frequently with the hydroxyl proton of malic acid. This radially sandwiched
structure involving choline, malic acid and chloride can be seen in the SDF plots shown in Figure
5.7a, and is reminiscent of that seen in DES previously.
Figure 5.7. Spatial Density Function (SDF) plots showing the 7.5% most likely 3D solvation configurations of molecules. Green isosurfaces correspond with chloride anions, orange isosurfaces are malic acid molecules, yellow isosurfaces are choline cations and blue isosurfaces are water molecules. The central molecules are choline (a,b,e), or malic acid (c,d,f). The top row (a-d) represents isosurfaces of the pure malicine system at 298 K, and the bottom row is the same SDF for the hydrated malicine-2w DES; (e,f) SDFs from the EPSR model showing nanostructuring of water molecules at close range in the hydrated malicine-2w only, around choline and malic acid respectively.
Under hydration, the malic acid-chloride interactions undergo a different trend to that
which is seen in the hydrated choline-chloride RDFs. The relatively weak water-malic acid
correlations (Figure 5.6f; Figure 5.7f) O1-M, O1-HH and O1-H demonstrate that water is
preferentially sequestered to choline, and solvates malic acid more weakly, despite the presence
of hydrogen bonds between water and malic acid. The relative correlation intensities of the partial
malic acid-chloride RDFs appear to increase and the coordination numbers are better-conserved,
indicating that the favorable solvation of choline by water leads chloride to become relatively more

122
well-solvated by malic acid in response. As with choline, the H-Cl and HH-Cl hydrogen-bonding
interactions (the latter in particular) are mostly unaltered in the presence of water, and the
preferred orientation of malic acid is retained. This signifies the contribution of the additional
water at this level of hydration towards the hydrogen-bonding cluster, rather than totally
denaturing the DES. This slightly different solvation behavior under hydration can be seen in Figure
5.7c, and the hydration structure of the malic acid is shown in Figure 5.7f. When water solvates
malic acid, these interactions occur at a shorter length scale than other DES components, and
without perturbing the chloride structure. The correlations between choline and malic acid (Figure
5.7a) are particularly weak and the most distant correlations are of a much greater length scale
than the interactions between either species with chloride. The strong hydrogen bonds that are
formed at 1.8 – 2.0 Å have a very low coordination number, and just 0.13 H or 0.07 HH malic acid
protons coordinate with the hydroxyl proton of choline at this distance. The shorter length scale
of the COH-C correlation relative to the N-C correlation, as well as this minor preference for the OH-
HH correlation over OH-H (after accounting for stoichiometry) reinforces the preference for the
more richly functionalized hydrogen-bonding terminus (hydroxyl and carboxyl groups) of the malic
acid molecule to align at the hydroxyl end of the choline molecules. They align, in a coordination
that permits the two molecules to chelate chloride more strongly in a synergistic manner, or even
the simultaneous hydrogen bonding of choline, malic acid, and chloride. The choline-malic acid
correlations are weakened for malicine-2w, as the presence of closely-bound, small water
molecules screens certain interactions between the two species. This can be seen by comparing
the intermolecular coordination numbers; as with many of the other RDFs the intermolecular
coordination numbers are reduced to 90% of their value in the pure system, but here the OH-HH
and HOH-OC coordination numbers drop to 43% and 69% of the pure malicine respectively, whilst
the OH-H coordination is retained. However, this information cannot be used to infer that the
presence of water truly ‘breaks’ the DES as these particular interactions were relatively minor to
begin with, and water is contributing to the major hydrogen-bonding interaction. With respect to
the choline-malic acid case, water simply acts to modify the character of the DES by favoring one
3D orientation over another. This is shown in Figure 5.7c; under hydration the radial core-shell
structure of solvating choline in the DES varies, and it becomes somewhat more favorable for
choline molecules to sit at the termini of malic acid molecules due to the retention of the OH-H
coordination.
Similarly, the malic acid-malic acid RDFs (Figure 5.6e) represent a series of interactions that
are relatively strong in nature and of a relatively short length scale, but are not favored to any
appreciable degree. For example, there are some strong OC-H and OC-HH hydrogen-bonding
interactions at 2 Å that represent the formation of dimeric malic acid and higher n-mer malic acid
chains. Extended chains of this nature had been suspected previously by PFG-NMR experiments on

123
the choline-chloride malonic acid DES (maline) which is chemically similar to malicine.19 However,
low coordination numbers of 0.25 and 0.17 for these correlations respectively show that they are
transient in nature and chains do not dominate the structuring within the liquid; the high
coordination numbers seen for the O-O and OC-M correlations instead represent malic acid
molecules that are oriented radially and in parallel with the long axis of a central malic acid, and
are solvated more strongly by separate choline molecules. It is interesting that there is so little HBD
self-clustering in this malicine system compared to the reline system, but this can entirely be
rationalized by the strong chelation of chloride by the malic acid hydroxyl and carboxyl groups, as
well as the much greater molecular volume and anisotropy of malic acid relative to urea, making
malicine DES clusters more strongly metastable with respect to kinetic diffusion. When hydrated
the malic acid-malic acid correlations again do not change markedly, with most coordinations being
reduced to 90% of the pure malicine value as before, but some become relatively more favored,
such as the OC-M partial RDF and coordination, which increases from 2.59 to 2.70. When
considering that water-malic acid interactions are less favorable than water-choline interactions,
and the malic acid-malic acid interactions are minor, this is not unexpected. The tendency for malic
acid to form some transient end-end hydrogen bonds can be seen in Figure 5.7d, though under
hydration this structure is slightly lost because the presence of water causes the choline-malic acid
hydrogen bonding to become more favored (Figure 5.7c).
The RDFs describing the self-correlation of choline molecules (Figure 5.6c) for the pure DES
malicine show remarkable similarities with the same RDFs in the reline DES, with nearly identical
radial separations for the various correlations.24 The most dominant N-N and N-C2N correlations,
when integrated up to 8 Å, give coordination values of 5.35 and 6.39 choline molecules
respectively, representing the first solvation shell of DES clusters as can be seen in the full choline-
choline RDFs (Figure 5.3). The preferential orientation of these choline molecules arranged radially
about the central cluster can be inferred by observing the gradually shorter length scale of the
choline self-correlation when travelling towards the hydroxyl moiety of a central choline molecule.
The choline molecules situated in this primary solvation sphere are more likely to be oriented with
the hydroxyl terminus pointing in the opposite direction. This causes each chloride to be situated
more closely to the positively charged end of another choline molecule, balancing the electrostatic
charge of each ionic domain more effectively, akin to a complexed version of the radially
oppositely-charged solvation shells that are observed in ionic liquids.52 The N-N correlation
changes most markedly when malicine is hydrated, because of the strong close-range hydration of
the choline ammonium moiety that is shown in Figure 5.6f and discussed previously. Otherwise,
the various choline-choline interactions are denatured to a coordination number that is on average
90% of that seen in the pure DES. The preferential bulk nanostructure of the DES and the integrity
of the ion clusters does not appear to be compromised by the presence of water. The core-shell

124
choline structure seen in reline can also be seen to some degree in malicine in Figure 5.7b, with
the most common N-N and N-C2N correlations apparent as a lobe at the nitrogenous end of choline.
The marked change in N-N structure under hydration is also depicted in the SDF plot, as this
nitrogen-centered solvation band of choline becomes more strongly defined, possibly because of
the strong solvation of choline molecules at the charged moiety by water (Figure 5.7e).
5.7. Conclusions
By analyzing experimental neutron diffraction data with an atomistic modelling approach, we have
shown the structure of a 1:1 carboxylic acid:cholinium NADES (malicine), in the liquid phase, in a
glassy phase and under hydration. This is an important development in the emergent field of DESs,
as there is wide interest in many of the different compositions of these solvents. Further, it seems
clear that with the retention of DES properties under hydration, DES-aqueous mixtures offer an
interesting route towards the future of greener solvation processes.
We provide evidence for the existence of complexed ion clusters of the eutectic
stoichiometry in the DES, with malic acid and choline working synergistically to sandwich a chloride
anion by hydrogen bonding and electrostatics, forming an ionic domain. This has been seen
previously for the urea-based DES reline. However, the larger malic acid molecules with richer
hydrogen bonding functionality yield a 1:1 eutectic, and we observe that the malic acid DES is more
resilient to dissociation into clusters of the HBD molecules than is seen in reline. This structure is
somewhat stabilized by hydrogen bonding interactions between the HBD and choline molecules.
This charge-delocalized cage is surrounded by 6-7 other such cages, much in the same way as ionic
liquids form radial structures of variable charge.
We observe no significant structural change as the DES is solidified, signifying a halt in
thermal motion rather than a first order phase transition, consistent with the formation of a glassy
phase. This is consistent with our QENS experiments, which show the gradual reduction in
dynamics rather than a sharp transition. This proof for the formation of glassy phases in NADES
gives credence to the hypothesis that such systems form part of the arsenal of protectants against
adverse conditions that are available to plants. Conversely, the addition of water to a mole fraction
of 0.5 only affects the DES nanostructure slightly, with most interactions between DES components
reduced to 90% of the value seen in the pure system, and a preferential solvation of choline over
malic acid is seen. Some water-water clustering is observed in the model, with the molecules
forming some small and transient wormlike aggregates, conjoining like DES clusters. However, the
solvent structure is broadly retained, due to the small size of water molecules permitting them to

125
sit close to choline and malic acid, whilst not significantly perturbing the structure. In this respect,
water therefore acts as a second, smaller HBD, and it can be concluded that an aqueous solution
at this level of hydration can still be called a DES. Looking forward, it will be fascinating to see the
potential of DES-aqueous mixtures as green media as well as their structures and properties, and
as such we have commenced further studies into these novel systems using neutron total
scattering.
5.8. Acknowledgements
The authors thank the UK Science and Technology Facilities Council (STFC) and the UK Engineering
and Physical Sciences Research Council (EPSRC) for co-funding a PhD studentship for OSH in the
Centre for Doctoral Training in Sustainable Chemical Technologies at the University of Bath
(EP/L016354/1; STFC Studentship Agreement #3578). We thank the ISIS Pulsed Neutron and Muon
Source for beam time on the SANDALS instrument under allocation RB1410216. We thank Dr Sam
Callear for aid with the experimental setup on the SANDALS instrument.
5.9. References
1 A. P. Abbott, G. Capper, D. L. Davies, H. L. Munro, R. K. Rasheed and V. Tambyrajah, Chem. Commun., 2001, 19, 2010–2011.
2 M. J. Earle and K. R. Seddon, Pure Appl. Chem., 2000, 72, 1391–1398. 3 A. Kadyan, K. Behera and S. Pandey, RSC Adv., 2016, 6, 29920–29930. 4 Q. Zhang, K. De Oliveira Vigier, S. Royer and F. Jérôme, Chem. Soc. Rev., 2012, 41, 7108–7146. 5 E. L. Smith, A. P. Abbott and K. S. Ryder, Chem. Rev., 2014, 114, 11060–11082. 6 Y. Dai, J. van Spronsen, G. J. Witkamp, R. Verpoorte and Y. H. Choi, Anal. Chim. Acta, 2013, 766, 61–
68. 7 A. Paiva, R. Craveiro, I. Aroso, M. Martins, R. L. Reis and A. R. C. Duarte, ACS Sustain. Chem. Eng.,
2014, 2, 1063–1071. 8 O. S. Hammond, K. J. Edler, D. T. Bowron and L. Torrente-Murciano, Nat. Commun., 2017, 8, 14150. 9 S. J. Bryant, R. Atkin and G. G. Warr, Soft Matter, 2016, 12, 1645–1648. 10 M. Pal, R. K. Singh and S. Pandey, ChemPhysChem, 2015, 16, 2538–2542. 11 X. Tan, J. Zhang, T. Luo, X. Sang, C. Liu, B. Zhang, L. Peng, W. Li and B. Han, Soft Matter, 2016, 12,
5297–5303. 12 T. Arnold, A. J. Jackson, A. Sanchez-Fernandez, D. Magnone, A. E. Terry and K. J. Edler, Langmuir,
2015, 31, 12894–12902. 13 A. Sanchez Fernandez, K. J. Edler, T. Arnold, R. K. Heenan, L. Porcar, N. J. Terrill, A. Terry and A. J.
Jackson, Phys. Chem. Chem. Phys., 2016, 18, 14063–14070. 14 M. Pal, R. Rai, A. Yadav, R. Khanna, G. A. Baker and S. Pandey, Langmuir, 2014, 30, 13191–13198. 15 R. Hayes, G. G. Warr and R. Atkin, Chem. Rev., 2015, 13, 6357–6426. 16 Q. Zhang, Q. Wang, S. Zhang, X. Lu and X. Zhang, ChemPhysChem, 2015, 17, 335–351. 17 P. Liu, J.-W. Hao, L.-P. Mo and Z.-H. Zhang, RSC Adv., 2015, 5, 48675–48704. 18 M. Francisco, A. Van Den Bruinhorst and M. C. Kroon, Angew. Chemie - Int. Ed., 2013, 52, 3074–3085. 19 C. D’Agostino, R. C. Harris, A. P. Abbott, L. F. Gladden and M. D. Mantle, Phys. Chem. Chem. Phys.,

126
2011, 13, 21383–21391. 20 A. P. Abbott, R. C. Harris, K. S. Ryder, C. D’Agostino, L. F. Gladden and M. D. Mantle, Green Chem.,
2011, 13, 82-90. 21 D. V. Wagle, G. A. Baker and E. Mamontov, J. Phys. Chem. Lett., 2015, 6, 2924–2928. 22 R. Stefanovic, M. Ludwig, G. B. Webber, R. Atkin and A. J. Page, Phys. Chem. Chem. Phys., 2017, 19,
3297-3306. 23 C. R. Ashworth, R. P. Matthews, T. Welton and P. A. Hunt, Phys. Chem. Chem. Phys., 2016, 18, 18145–
18160. 24 O. S. Hammond, D. T. Bowron and K. J. Edler, Green Chem., 2016, 18, 2736–2744. 25 G. García, M. Atilhan and S. Aparicio, Chem. Phys. Lett., 2015, 634, 151–155. 26 S. L. Perkins, P. Painter and C. M. Colina, J. Chem. Eng. Data, 2014, 59, 3652–3662. 27 H. Sun, Y. Li, X. Wu and G. Li, J. Mol. Model., 2013, 19, 2433–2441. 28 D. V. Wagle, C. A. Deakyne and G. A. Baker, J. Phys. Chem. B, 2016, 120, 6739–6746. 29 S. Zahn, Phys. Chem. Chem. Phys., 2017, 19, 4041–4047. 30 S. Kaur, A. Gupta and H. K. Kashyap, J. Phys. Chem. B, 2016, 120, 6712–6720. 31 A. K. Soper, E. W. Castner and A. Luzar, Biophys. Chem., 2003, 105, 649–666. 32 T. G. A. Youngs, J. D. Holbrey, C. L. Mullan, S. E. Norman, M. C. Lagunas, C. D’Agostino, M. D. Mantle,
L. F. Gladden, D. T. Bowron and C. Hardacre, Chem. Sci., 2011, 2, 1594-1605. 33 X. Meng, K. Ballerat-Busserolles, P. Husson and J.-M. Andanson, New J. Chem., 2016, 40, 4492–4499. 34 Y. Dai, G.-J. Witkamp, R. Verpoorte and Y. H. Choi, Food Chem., 2015, 187, 14–19. 35 A. Pandey and S. Pandey, J. Phys. Chem. B, 2014, 118, 14652–14661. 36 R. B. Leron and M. H. Li, Thermochim. Acta, 2012, 530, 52–57. 37 M. C. Gutiérrez, M. L. Ferrer, C. R. Mateo and F. del Monte, Langmuir, 2009, 25, 5509–5515. 38 Y. Dai, G. J. Witkamp, R. Verpoorte and Y. H. Choi, Anal. Chem., 2013, 85, 6272–6278. 39 C. D’Agostino, L. F. Gladden, M. D. Mantle, A. P. Abbott, I. Ahmed, Essa, A. Y. M. Al-Murshedi and R.
C. Harris, Phys. Chem. Chem. Phys., 2015, 17, 15297–15304. 40 Y. H. Choi, J. van Spronsen, Y. Dai, M. Verberne, F. Hollmann, I. W. C. E. Arends, G.-J. Witkamp and R.
Verpoorte, Plant Physiol., 2011, 156, 1701–1705. 41 A. K. Soper, Mol. Phys., 2001, 99, 1503–1516. 42 A. P. Abbott, D. Boothby, G. Capper, D. L. Davies and R. K. Rasheed, J. Am. Chem. Soc., 2004, 126,
9142–9147. 43 A. K. Soper, GudrunN and GudrunX: Programs for Correcting Raw Neutron and X-ray Diffraction Data
to Differential Scattering Cross Section. Rutherford Appleton Laboratory Technical Report RAL-TR-
2011-013, STFC, 2011. 44 A. K. Soper, ISRN Phys. Chem., 2013, 2013, 279463. 45 A. K. Soper, Phys. Rev. B, 2005, 72, 104204. 46 C. J. Carlile and M. A. Adams, Phys. B Phys. Condens. Matter, 1992, 182, 431–440. 47 O. Arnold, J. C. Bilheux, J. M. Borreguero, A. Buts, S. I. Campbell, L. Chapon, M. Doucet, N. Draper, R.
Ferraz Leal, M. A. Gigg, V. E. Lynch, A. Markvardsen, D. J. Mikkelson, R. L. Mikkelson, R. Miller, K. Palmen, P. Parker, G. Passos, T. G. Perring, P. F. Peterson, S. Ren, M. A. Reuter, A. T. Savici, J. W. Taylor, R. J. Taylor, R. Tolchenov, W. Zhou and J. Zikovsky, Nucl. Instruments Methods Phys. Res. Sect.
A Accel. Spectrometers, Detect. Assoc. Equip., 2014, 764, 156–166. 48 A. K. Soper, Mol. Phys., 2009, 107, 1667–1684. 49 M. Francisco, A. van den Bruinhorst, L. F. Zubeir, C. J. Peters and M. C. Kroon, Fluid Phase Equilib.,
2013, 340, 77–84. 50 C. Hardacre, J. D. Holbrey, S. E. J. McMath, D. T. Bowron and A. K. Soper, J. Chem. Phys., 2003, 118,
273–278. 51 E. J. Nilsson, V. Alfredsson, D. T. Bowron and K. J. Edler, Phys. Chem. Chem. Phys., 2016, 18, 11193–
11201. 52 D. T. Bowron, C. D’Agostino, L. F. Gladden, C. Hardacre, J. D. Holbrey, M. C. Lagunas, J. McGregor, M.
D. Mantle, C. L. Mullan and T. G. A. Youngs, J. Phys. Chem. B, 2010, 114, 7760–7768.
127
6. MICROWAVE-ASSISTED DEEP EUTECTIC-SOLVOTHERMAL
PREPARATION OF IRON OXIDE NANOPARTICLES FOR
PHOTOELECTROCHEMICAL SOLAR WATER SPLITTING
6.1. Overview
Grätzel et al. have demonstrated that nanostructured α-Fe2O3 (haematite or hematite) is a
promising photoelectrode material, as it is earth-abundant, cheap, non-toxic, and has a viable
bandgap,1,2 meaning that it can be used to split water into H2 to be used as fuel using solar energy.3
To fully explore the potential of DES as media for the synthesis of nanostructured materials, it is
necessary to demonstrate that they are viable for the synthesis of different materials such as this,
with different applications and properties, which do not readily form carbonate intermediates such
as the lanthanides do.4 Moreover, it is necessary to prove that similar structural control can be
achieved over these different materials even if they proceed by a different mechanism, and also
to quantify the details of this synthesis procedure, by understanding what happens when the
solvent breaks down. In this chapter, we are therefore building not only on the understanding of
synthesis in DES as shown in chapter 4, but also on the solvent structure explored in chapter 3 and
the beginnings of the understanding of water content in DES which were measured in chapter 5.
Therefore, this paper aimed to explore the synthesis of haematite nanoparticles for use in
photoanodes using DES. Based on the known aqueous chemistry of iron,5 and the basic products
formed on DES breakdown as demonstrated in the previous work on ceria, the choline
chloride:urea DES was used, with and without 10 mol. equiv of water content (ca. 41 wt% water)
to produce nanoparticles. Previous reports of formation of iron oxides using DES were precipitation
routes rather than shape-controlled solvothermal processes.6,7 The process was designed to be ‘as
green as possible’: microwave heating was used, requiring only a few hundred watts of power for
15 minutes of reaction, and products were purified with dialysis.
Despite the differences in chemistry and synthesis procedure, the procedure gave similar
control over particle shape as the ceria synthesis: small monodisperse nanoparticles of a few nm
for the pure DES, and large 1D nanostructures for the high-water synthesis, with the extent of

128
growth also affected by temperature. The iron oxide nanoparticles formed in the pure DES
synthesis were small enough that they showed superparamagnetic behaviour, implying utility in
medical imaging applications. The purified nanoparticles were then cast into photoanodes. The
nanostructured photoanodes gave relatively good performance for the simple preparation
method, but no new insight into DES-based photoanode preparation was gained here because this
process used a known colloidal solution-based route with conventional solvents.3 One potentially
interesting avenue of future research would be developing techniques to deposit such films
directly from DES, without generating solvent vapour waste.
An important fundamental contribution from this paper was that the thermal hydrolysis of
the solvent was tracked using NMR. This degradation has long been suspected as an important
factor, both in synthesis of nanoparticles and in preparation of the DES itself, but it is not generally
characterised and reported in the literature. These experiments showed a small amount of urea
degradation except in the most extreme conditions (200 °C, 10w) where 50% of the urea was lost,
and synchrotron SWAXS experiments indicated a subtle change in solvent structure in this case.
Overall, this work further demonstrated the potential of DES as green solvothermal reaction media
with potential viability in the synthesis of a wide variety of metal oxide nanoparticles while
enforcing morphological control, which is an important development.
This paper is reproduced with minor adaptations to match the thesis formatting
specifications from the final accepted version published in J. Mater. Chem. A. The associated
electronic supporting information is provided in Appendix 4.
1 J. Brillet, M. Grätzel and K. Sivula, Nano Lett., 2010, 10, 4155–4160. 2 A. Kay, I. Cesar and M. Grätzel, J. Am. Chem. Soc., 2006, 7, 15714–15721. 3 K. Sivula, R. Zboril, F. Le Formal, R. Robert, A. Weidenkaff, J. Tucek, J. Frydrych and M. Grätzel, J. Am.
Chem. Soc., 2010, 132, 7436–7444. 4 O. S. Hammond, K. J. Edler, D. T. Bowron and L. Torrente-Murciano, Nat. Commun., 2017, 8, 14150. 5 M. Mohapatra and S. Anand, Int. J. Eng. Sci. Technol., 2010, 2, 127–146. 6 F. Chen, S. Xie, J. Zhang and R. Liu, Mater. Lett., 2013, 112, 177–179. 7 Q. Q. Xiong, J. P. Tu, X. Ge, X. L. Wang and C. D. Gu, J. Power Sources, 2015, 274, 1–7.

129
6.2. Statement of contribution
This declaration concerns the article entitled:
Microwave-assisted deep eutectic-solvothermal preparation of iron oxide nanoparticles for
photoelectrochemical solar water splitting
Publication status (tick one)
draft
manuscript Submitted
In
review Accepted Published
Publication details
O. S. Hammond, S. Eslava, A. J. Smith, J. Zhang and K. J. Edler, J. Mater. Chem. A,
2017, 5, 16189–16199.
DOI: https://dx.doi.org/10.1039/C7TA02078C
Candidate’s
contribution to
the paper
(detailed, and
also given as a
percentage).
The candidate contributed to/ considerably contributed to/predominantly
executed the…
Formulation of ideas:
SE suggested the project idea to try making haematite photoelectrodes from DES.
The idea to use chcl-urea DES in microwave synthesis with water content was from
OSH. 50%
Design of methodology:
Experiments and analytical procedures were designed by OSH with input from KJE
and SE.
Experimental work:
Experiments were performed by OSH. Setup of experiments was aided by JZ
(photoelectrochemistry) and AS (SAXS). 95%
Presentation of data in journal format:
OSH analysed the data, prepared graphics and wrote the manuscript, which was
then improved with input from co-authors. 90%
Statement from
Candidate This paper reports on original research I conducted during the period of my Higher
Degree by Research candidature.
Signed
Date
20/09/16

130
6.3. Abstract
Here, we present a new microwave-solvothermal method for the preparation of iron oxide
nanostructures using deep eutectic solvents as a more sustainable reaction medium. By varying
the synthesis temperature and solvent water fraction, the methodology offers control over iron
oxide phase, size, and morphology, using efficient, rapid (10 minute) microwave heating. Synthesis
with pure DES gives small (<5 nm) superparamagnetic samples of γ-Fe2O3 or α-Fe2O3, whereas
hydrated DES yielded either nanoshards or large rhombohedral nanoparticles without the
superparamagnetic response. Nanostructures were solution-cast onto F:SnO2 films. The
photoelectrochemical response of the prepared photoanodes was assessed, with a maximum
measured photocurrent response of 0.7 mA cm-2 at 1.23 V vs. RHE. We measured the solvent
structure using synchrotron WAXS, demonstrating the differences between the dry and hydrated
solvent before and after heat-treatment, and showing that the hydrated solvent is remarkably
resilient to extensive degradation.
6.4. Introduction
Solution processes, whereby liquid solvents are used to facilitate chemical reactions and processes,
dominate chemistry because of the unmatched convenience that they offer.1 This fact is
problematic in the face of increasing levels of environmental regulation that curtail the application
of volatile organic solvents, which make up the majority of solvents that are used today.2
Therefore, there is an increasing drive towards replacing traditional solvent systems with more
environmentally-friendly ones. Important developments have included systems such as
supercritical fluids,3 greener alternative molecular solvents,4 and ionic liquids (ILs).5 Of these
alternative solvents, ionic liquids are particularly fascinating because of their intrinsically ‘designer’
nature that allows them to be optimised and tuned to suit certain processes.6 Deep Eutectic
Solvents (DESs) represent another, newer, class of alternative mixed solvent system, formed upon
the complexation of various hydrogen-bonding salts and charge-neutral species, to create a low-
melting liquid from the ensuing melting point depression.7 Originally described as a sub-category
of ILs, an increasing bank of evidence suggests that they are more akin to an ionic mixture,8 with
high entropy arising from a relatively disordered nanostructure9 comprising hundreds of
intermolecular bonding interactions with similar strengths.10 Regardless, this broad definition
allows DES to be made from a wide array of components, providing even more ways to tune and
tailor the solvent around the matter of interest.11 As a result, DES offer new and unprecedented
opportunities to improve upon the sustainability of important and industrially-relevant chemical

131
processes.12 Research interest is therefore increasing rapidly in these solvents,7,13 particularly for
the preparation of nanomaterials,14 where new structure-directing effects are becoming
apparent.15
Iron is the most common element on Earth. Because of their inherent sustainability and
combination of interesting physicochemical properties, iron oxides are used for a wide variety of
applications. For example, magnetic iron oxide nanoparticles such as Fe3O4 (magnetite) have useful
applications in medicine (ie. magnetic resonance imaging),16 ferrofluids, and biosensors.17
Haematite (α-Fe2O3) nanomaterials have attracted significant research interest as a vector for the
sustainable storage of solar energy,18 much like many other metal oxides, because it can split water
into H2 and O2 in a photoelectrochemical (PEC) process.19–28 This is facilitated by the 2.2 eV bandgap
of haematite, allowing it to absorb a meaningful component of solar radiation. However, the PEC
performance of haematite has been limited because of various factors; charge transport is often
poor, the photon penetration depth produces carriers far from the active liquid junction, and the
carriers that are produced subsequently recombine on the picosecond timescale.22 Therefore, a
significant level of effort has gone towards nanostructuring haematite films to improve their PEC
performance,21 and has resulted in structures such as nanowires,18 nanorods,29 and extremely
active highly fractal structures,23 all offering various levels of activity. A common theme amongst
newly-developed nanostructuring techniques for haematite thin film photoelectrodes is spiralling
levels of complexity. Many nanostructures require increasingly exotic reagents, and experimental
techniques with expensive instruments such as chemical vapour deposition,23 or spray pyrolysis
and plasma-based methods.18 Here, we aim to use DESs as an alternative green solvent medium
towards the goal of active haematite photoelectrodes. We present a synthesis of nanostructured
iron oxides using a highly simple, fast, efficient and low-toxicity solvothermal process based on the
biodegradable choline chloride-urea DES and its aqueous mixtures.30 To do this, we utilise a simple,
energy-efficient microwave-solvothermal methodology.31
6.5. Experimental
6.5.1. DES preparation
The DES components choline chloride (Acros, 99%), and urea (Sigma-Aldrich, ≥99.5%) were used
as provided. The deep eutectic solvent reline (1 choline chloride:2 urea) was prepared by mixing
the two components in a sealed container and heating to 60 ˚C with regular agitation. After the
formation of a homogeneous phase, the mixture was dried using a lyophiliser for one week,

132
yielding the pure DES with a water content of 100.6 ppm, as assessed by 1H NMR. Hydrated DESs
were subsequently prepared from dry reline by the addition of several mole equivalents of water,
giving a choline chloride:urea:water ratio of 1:2:10, referred to here as reline-10w.
6.5.2. Solvothermal synthesis
In a polytetrafluoroethylene (PTFE) autoclave liner (CEM OMNI XP-1500), 5 g of Fe(NO3)3.9H2O
(Acros, ≥99%) was added to 50 g of the chosen DES composition (either pure reline or reline-10w)
to obtain a constant molal concentration of 0.25 mol kg-1. A standard (solvent only) sample was
simultaneously prepared in a separate vessel, using the same quantity of the same DES
composition but with no inorganic precursor. The two vessels were sealed, jacketed, and placed
into a CEM Corporation MARS-5 microwave reactor equipped with temperature and pressure
sensors. Using a maximum of 300 W of microwave power, the vessels were heated, and regulated
to a maximum pressure of 5.5 MPa up to the desired temperature (100 ˚C, 150 ˚C or 200 ˚C) for a
duration of 10 minutes. Following reaction, the samples were left to cool to below 60 °C before
isolation. The reacted mixture containing inorganic materials was decanted into cellulose dialysis
tubing (Sigma-Aldrich, 99.99% retention, MWCO 12.4 kDa) and dialysed against purified water
(Elga, 18.2 MΩ) to remove ionic impurities. The products were then washed with ethanol to
remove organic impurities prior to drying in an oven, yielding a series of fine powders of varying
hue, from amber to crimson.
6.5.3. Synchrotron small- and wide-angle X-Ray scattering
Synchrotron SWAXS measurements of the as-prepared and heat-treated DES were made using the
I22 instrument at Diamond Light Source, Harwell, UK. The incoming beam was monochromated at
18 keV, giving effective q-ranges for the two Dectris Pilatus-2M detectors of 0.007 Å-1 ≤ q ≤ 0.6 Å-1
at small-angle, and 0.4 Å-1 ≤ q ≤ 8 Å-1 for the wide-angle array. Samples were placed into soda-glass
X-Ray capillaries with a path-length of 1.5 mm and wall diameter of 10 μm. The capillaries were
measured in a water-recirculating brass block sample holder with the temperature regulated to 30
°C. The instrumental background was removed and the data were reduced using the standard
procedures of the DAWN software suite.32

133
6.5.4. Nanomaterial characterisation
Powder X-Ray diffraction of the prepared inorganic samples was carried out using a Bruker D8-
ADVANCE instrument equipped with a Bruker VÅNTEC-1 CCD X-Ray detector. The monochromated
Cu-Kα radiation from the X-Ray source has a wavelength of 1.5418 Å, and is slit-collimated to
coincide upon the powder sample under Bragg-Brentano geometry. Diffraction data was collected
across a scattering vector range of 1.42 Å-1 ≤ q ≤ 5.76 Å-1, corresponding with an angular range of
20˚ - 90˚ 2θ in this configuration. Laboratory small- and wide-angle X-Ray scattering (SWAXS)
measurements of the prepared powders, films, and colloids were made using an Anton Paar
SAXSess instrument, using a slit-collimated beam of Cu-Kα radiation and a static phosphorescent
image plate as a SWAXS detector, to achieve a q-range of 0.01 Å-1 ≤ q ≤ 2.80 Å-1. The desmearing
procedure for the slit geometry and subsequent SWAXS data processing was completed using
Anton Paar SAXSQuant software. 1D 1H NMR experiments were carried out using d6-DMSO as a
solvent, with data collected using an Agilent ProPulse 500 MHz NMR system, and processed using
Bruker TopSpin software. Preliminary SEM and EDX measurements were made using a JEOL
SEM6480LV instrument. FE-SEM images of the prepared photoanodes were collected using a JEOL
JSM6301F instrument using 10 nm of conductive chromium coating. TEM imaging of the prepared
nanoparticles was done using a JEOL JEM-2100 Plus instrument operating with 200 kV of
accelerating potential.
The magnetic properties of the prepared nanoparticles were determined using instrumentation at
the Materials Characterisation Lab of the STFC ISIS Pulsed Neutron and Muon Source. Analogous
procedures were carried out using either a Quantum Design PPMS Vibrating Sample
Magnetometer, or a Quantum Design MPMS-XL SQUID Magnetometer. Samples (~100 mg) were
weighed into a gelatin capsule and packed with PTFE tape. The M(T) measurement of the magnetic
moment as a function of temperature was carried out by first cooling the sample under zero-field
conditions. After charging the instrument to a field of 100 Oersted, measurements were
periodically made as the sample chamber was heated to 300 K at a ramp rate of 10 K min-1. The
magnetic moment of the samples was measured as a function of applied field at 300 K. The M(H)
scan began under zero-field, before ramping the applied field to 5000 Oe at a rate of 100 Oe min-
1. After settling at the desired field strength, the hysteresis behaviour was determined by ramping
the field to -5000 Oe and back again to 5000 Oe at the same rate. Finally, the measured magnetic
moment data were normalised to absolute units of emu g-1.

134
6.5.5. Photoanode fabrication
Photoanodes were prepared by adapting a previously-described solution-processed colloidal
method from Sivula et al.22 A paste was prepared from 100 mg of the desired iron oxide powder
and 0.1 mL of a 10% solution of acetylacetone (acac) in octanol. This paste was subsequently
diluted by the addition of aliquots of a 10% solution of acac in isopropanol (IPA), until 2.5 mL of the
acac/IPA solution had been added. The dispersions were then sonicated using an ultrasonic bath
for 10 minutes. At this stage, a small (~200 µL) aliquot of each colloid was sampled in case further
(SWAXS) analysis was necessary. 1 mL of a 10% solution of hydroxypropylcellulose in IPA was then
added to the colloidal dispersions as a porogen and viscosity-modifier, before a final sonication
step of ten minutes. Aluminoborosilicate glass slides (Solaronix) coated with F:SnO2 (FTO) as a
transparent conducting layer were used as a substrate, with a spacer of 40 μm invisible Scotch tape
(3M). The final colloidal iron solution was doctor-bladed onto the substrate and allowed to air-dry.
The dried films were pre-treated to ensure the removal of organics by heating in a tubular furnace
up to 400 °C, with a temperature ramp rate of 1.5 °C min-1 and holding at temperature for 12 hours.
After allowing to cool, the final treatment step was performed by placing samples directly into a
tubular furnace at 800 °C for 20 minutes.
6.5.6. Photoelectrochemical testing
The solar photoelectrochemical water splitting performance of the prepared films was estimated
using in-house photocurrent measurements. The Fe2O3-coated substrate was connected as the
working electrode of a three-electrode cell, with an electrolyte solution of 1 M NaOH, a platinum
counter electrode and a Ag/AgCl (3.5 M KCl) reference electrode. A PTFE circular mask (radius 0.3
cm) was placed on the reverse (uncoated) side of the sample, and this slide side was subsequently
illuminated. Back illumination was used because the entire surface area of the film is wetted due
to the high porosity, and therefore photogenerated hole sites are able to reach the liquid junction
at any point within the film structure, and an optimal photocurrent value is subsequently obtained.
A representa~ve comparison of front and back illumina~on is given in the ESI†. Linear sweep
voltammetry (LSV) measurements were made of the prepared photoanodes, under dark conditions
and under simulated sunlight, and finally using a chopped shutter oscillating between light and
dark conditions with a periodicity of 0.5 s-1. The prepared Fe2O3 electrodes were scanned between
-300 mV and 800 mV against the Ag/AgCl reference using a scan rate of 20 mV s-1, and data
reported herein are stated against the potential of the reversible hydrogen electrode (RHE).
Simulated sunlight was calibrated to standard solar conditions (100 mW cm-2) at the sample
position, derived from a 300 W Xe lamp and an AM1.5 filter. The electrode stability was assessed

135
by holding the electrode at a constant potential of 0.22 V vs. Ag/AgCl (1.25 V vs. RHE), cycling
between illuminated and dark conditions every 3 minutes for one hour.
6.6. Results and discussion
6.6.1. Deep Eutectic-Solvothermal Microwave synthesis
As far as was possible, elements of the synthesis described herein were specifically designed with
the principles of green chemistry in mind.33 For example, reactive mixtures were prepared using a
relatively high constant molal concentration of the iron precursor (0.25 mol kg-1), which takes
advantage of the high mutual compatibility of many metal salts in DESs,34 thereby maximising the
atom efficiency of the process whilst minimising solvent requirements. The choline chloride-urea
DES (reline) was chosen for various positive attributes; it is simple to prepare, it is derived from
cheap, abundant and natural precursors, and is biodegradable.35 Furthermore, we have shown
previously that in inorganic syntheses based around metal nitrate precursors containing a highly-
charged cation, the reline solvent effectively acts as a supramolecular catalyst for the reaction,
with a pre-structuring effect bringing the reactants together to enable milder synthesis
conditions.15 A microwave-solvothermal methodology was chosen because of obvious rate and
efficiency improvements from microwave heating, which has already been shown to work
synergistically with the benefits offered by using DESs as reaction media in the synthesis of organic
molecules.36 Anhydrous procedures using reline and FeCl3 were discarded because HCl was
liberated during the strongly exothermic mixing, which formed an intractable and corrosive brown
mixture. Hydrated iron (III) nitrate (Fe(NO3)3.9H2O) was favoured, due to mixing safely,
spontaneously and endothermically with the DES, and with the additional benefit of increasing
tractability relative to the pure DES due to the presence of small hydrogen-bonding molecules
(water and nitrate). A further viscosity improvement was achieved by dosing the DES with a known
quantity of water to produce a DES-water mixture with hydration level of 10w (~41 wt.% H2O).37
This additional water eases the processing of the products,38 and simultaneously modifies the
solvent environment, whilst remaining below the hydration level where DESs are aqueous
solutions.30 Although different reaction times were trialled the results presented here are derived
solely from the shortest reaction time (10 minutes) in the interests of energy efficiency; although
in some cases relatively high (100, 150, and 200 ˚C) temperatures are used for the solvothermal
reaction, in every case the power input was limited to a maximum of 300 W of microwave
irradiation. Products are purified by dialysis against deionised water, such that a final ethanol rinse
is the only time that a ‘traditional’ molecular volatile organic solvent is used. Hereafter, inorganic

136
products are described as Fe-x-y, where x refers to the synthesis temperature and y refers to the
chosen DES-water molar hydration ratio (w).15,30
6.6.2. Characterisation of nanomaterials
Characterisation of the as-prepared iron oxide nanoparticles using powder X-Ray diffraction (Figure
6.1) demonstrated an unusual variation of phase as a function of the chosen synthesis
temperature, occurring independently of the solvent composition. Samples synthesised at 200 ˚C
demonstrated reflections corresponding with the rhombohedral α-Fe2O3 structure (haematite;
JCPDS 85-0987). Conversely, those synthesised at 150 ˚C yielded Bragg peaks corresponding with
one of either of the indistinguishable phases Fe3O4 (magnetite; JCPDS 85-1436) or γ-Fe2O3
(maghemite; JCPDS 25-1402). With γ-Fe2O3 representing a defect structure of Fe3O4, other
techniques are required to distinguish between these two spinel ferrites. Efforts to characterise
the different phases using Raman spectroscopy (shown in the ESI†) were confounded by their
tendency to oxidise to α-Fe2O3 under even weak and brief laser illumination.39 However, as these
conditions do not contain a Fe2+ ion source and are performed under air at a reasonably high
temperature, γ-Fe2O3 is the most likely product.17 The XRD data also highlighted differences in the
particle sizes between the products synthesised in hydrated and pure DESs, which is evident from
the greater Bragg peak height and width for the hydrated syntheses. For the Fe-150-0 product no
scattering features are observed, and the sample is essentially X-Ray amorphous, due to peak
broadening arising from small particle size. Scherrer analysis of the peak FWHM for the dominant
(104) and (110) reflections of the haematite-type Fe-200-y products shows a mean crystallite size
of 15.9 nm for Fe-200-0, as compared to 49.1 nm for the Fe-200-10 product. This suggests a greater
degree of crystallite growth in the hydrated case, likely to reflect the faster kinetics of the less
viscous aqueous mixture.

137
Figure 6.1. Powder X-Ray diffraction data for the iron oxide nanoparticles prepared using pure reline and hydrated reline. Pseudo-Voigt fits calculated using Fityk software are shown for the haematite-type iron oxide products.40 Bragg peaks suspected to correspond with the γ-Fe2O3 phase are denoted with an asterisk.
TEM imaging of the iron oxide nanoparticles showed a variety of nanostructures, with size
and morphology determined by the synthesis conditions. Representative images are displayed in
Figure 6.2. In all cases, the prepared nanoparticles showed a strong tendency to aggregate, which
is not surprising since no stabilising species were used. We observe that in the case of the reline-
0w synthesis at 150 ˚C, aggregated spongelike composite spheres are formed with an average
diameter of 50 nm. Interestingly, these spheres are composed of many extremely small spherical
nanoparticles, which have an individual size of 2 – 3 nm and are relatively homogeneous. Upon
adding water and reacting at the same temperature, a completely different 1D nanoshard
morphology is formed, rather than the extremely small nanoparticles. These nanostructures are
not as homogeneous as the particles prepared in the water-free case, and accurately determining
a mean size is difficult because of the bundle formation. However, the nanoshards generally display
a width ranging from 10 – 20 nm, with lengths of 80 – 100 nm. Interestingly, the lattice planes of
the γ-Fe2O3 nanoshards can be seen in the TEM imaging without extremely high levels of
magnification, and were found universally to run parallel with the major axis of extension. The TEM
data therefore suggest that the main reason for the diffuse X-Ray scattering of the Fe-150-0
product is small particle size and the accompanying peak broadening rather than any amorphous
nature, and we believe that this is the same γ-Fe2O3 phase as the Fe-150-10 product, which is

138
clearly larger and evidently crystalline. The nanoshard morphology may be driven by the selective
capping of certain crystal planes by the DES components during crystal growth.
Figure 6.2. TEM images of the prepared iron oxide nanoparticles as a function of synthesis temperature, and DES hydration level.
Increasing the synthesis temperature, the Fe-200-0 product also yields a system of
relatively monodisperse spheroid nanoparticles with a tendency to aggregate, much like Fe-150-0.
In this case, the morphology is similar to the Fe-150-0 particles but with slightly larger sub-particles,
with an apparent size of around 5 nm. This suggests once again that the diffuse α-Fe2O3 Bragg
peaks in the XRD data are indicative not of an amorphous nature, but a small particle size.
Increasing the water content for the 200 ˚C synthesis yields again a completely different
nanostructure. Very large nanoparticles are formed, displaying a rhombohedral morphology that
is evocative of the crystal structure of α-Fe2O3. The prepared particles are not homogeneous, and
range from 100 nm – 200 nm in length, with a width of around 100 nm. These data therefore make
it clear that the reaction temperature and reaction water content are two independent variables
that both have an impact upon the nanoparticle growth rate. Additionally, there appears to be a
subtle structure-directing effect exerted by the DES, because a similar morphological relation of
the prepared nanoparticles was observed for a DES-solvothermal preparation of ceria, with
smaller, less crystalline materials when the pure DES is used relative to the hydrated system, and
1D nanostructures formed in hydrated DES at low reaction temperatures.15 This is particularly
interesting because ceria has a cubic fluorite structure that is entirely different from either the α-
Fe2O3 or γ-Fe2O3 unit cell. The Fe-200-10 synthesis combines the most extreme reaction conditions
of the highest water content and highest temperature, to give the highest in situ autoclave

139
pressure and the most rapid kinetics of reaction and growth. The DES-solvothermal methodology
therefore offers tuneability of the size, shape, and phase of the prepared iron oxide nanoparticles,
and does so whilst being rapid, simple, and environmentally friendly.
Figure 6.3. Magnetometry measurements showing variations in the magnetic moment of the samples as a function of the sample temperature, for the Fe-x-0 materials (upper panel) and the Fe-x-10 materials (lower panel). Measurements were made under a constant external field of 100 Oe.
The magnetic properties of iron oxide nanoparticles are known to have a strong
dependence upon the morphology, phase, and size. This has given rise to a number of important
medical applications, such as their usage in bioseparations or as MRI contrast agents.16 The
magnetisation of the prepared materials was therefore measured firstly as a function of
temperature under 100 Oe of applied field, having been cooled under zero-field conditions (ZFC).
Following this, M(H) measurements were made on the samples at 300 K to determine the
hysteresis behaviour as the field was varied from 5000 Oe to -5000 Oe. The results of the M(T)
scans are shown in Figure 6.3. The observed ZFC magnetisation curves show completely different
behaviours that can be related to the nanoparticle phase and size, which are themselves a function

140
of the synthesis temperature and water content. The Fe-150-0 and Fe-200-0 nanoparticles show
analogous behaviour, with a sharp rise in magnetisation as the temperature is increased, with a
relatively strong peak of 0.16 emu g-1 for Fe-150-0 and 0.23 emu g-1 for Fe-200-0, before the
magnetisation falls with increasing temperature. γ-Fe2O3 generally displays ferrimagnetic
behaviour in the bulk phase, whereas α-Fe2O3 is typically a weak ferromagnet or canted
antiferromagnet.41 This kind of magnetisation response is characteristic of superparamagnetic iron
oxide particles, which are formed with hyperfine nanoparticles that are below 10 nm, such that
each nanoparticle acts as a single-domain paramagnet, not large enough to have multi-domain
ordering.41 This is confirmed by the observations made during TEM experiments. The
superparamagnetic blocking temperatures for the prepared Fe-150-0 and Fe-200-0, respectively,
are 69 K and 62 K.
Figure 6.4. Magnetometry measurements showing the variations in the magnetic moment as a function of applied field, for the Fe-x-0 materials (upper panel) and Fe-x-10 materials (lower panel). Measurements were made using a field sweep rate of 100 Oe minute-1.

141
Conversely, the nanoparticles synthesised in hydrated DES show an entirely different and
far weaker magnetic response. The Fe-150-10 product shows a minor fluctuation in the degree of
magnetisation as a function of temperature, with two ‘fine’ transitions occurring at 110 K and 250
K, which is a more typical response for a nanoparticulate maghemite phase. The Fe-200-10 product
shows classic α-Fe2O3 characteristics, with minimal magnetic response until a temperature of 250
K, at which point it undergoes the Morin transition to either a canted antiferromagnetic or
ferromagnetic state.17 This is in accordance with the large, highly crystalline nanoparticles that can
be observed using TEM. The suspected magnetic phases are confirmed by M(H) measurements at
room temperature, which are shown in Figure 6.4. The Fe-150-0 and Fe-200-0 products both show
a completely straight line with negligible hysteresis, characteristic of a paramagnetic, or
superparamagnetic state, in this case. The Fe-200-10 product shows a classic ferromagnetic
behaviour, with a weak hysteresis of approximately 0.06 emu g-1. The Fe-150-10 material shows a
weak ferrimagnetic response at room temperature with very minor hysteresis and curvature, and
so this sample was also measured at 220 K, below the fine transition observed at 250 K. An increase
in the overall magnetic moment and a slightly stronger hysteresis behaviour was observed,
consistent with an increase in magnetic ordering occurring as the nanoparticles are cooled.42
Additionally, these magnetisation measurements offer definitive proof that the Fe-150-y
nanoparticles are composed of a γ-Fe2O3 phase rather than Fe3O4, because the measured
magnitude of the magnetisation is significantly lower than would be seen for magnetite.16
6.6.3. Solvothermal reaction mechanism and solvent
degradation structural studies
Efforts were made to determine the mechanism of solvothermal reaction. We note that this is not
the first time that DES have been used for the preparation of iron oxides; Chen et al. used a co-
precipitation route to prepare magnetic Fe3O4 nanoparticles,43 and Xiong et al. prepared haematite
nanospindles using a precipitation method from heated, dry DES upon the addition of water.44
Despite the promising properties of the prepared materials, these precipitation methods cannot
truly be described as a solvothermal process, but there are obvious similarities in the conditions
because they propose the same urea-hydrolytic pathway that has been seen in numerous other
preparations.45 The materials characterisation detailed above provided no evidence that the novel
methodology reported here represents a significant deviation from other solvothermal protocols
in terms of the urea hydrolysis and subsequent iron-oxide forming mechanisms, which have been
previously and exhaustively addressed.15,46–48

142
The reaction temperature and water fraction have an important effect upon the urea hydrolysis
rate in DESs. The decomposition of DES at elevated temperature was noted previously by Parnham
et al. in their studies of DESs as alternative solvent media for the synthesis of hybrid inorganic
materials.46,47 Interestingly, they observed that the DES predominantly plays a templating function,
with the controlled degradation of the labile species such as urea and its functionalised analogues
delivering structuring agents for the synthesis. In our studies of the more closely related metal
oxide ceria, we directly observed a pre-structuring of the reactive components within the reline
mixture, effectively decreasing the activation energy for the reaction, whilst also noting hydrolysis
and subsequent reaction of urea with solvated cerium ions.15 Based on the morphological
dependence upon synthesis conditions, there may be some similar processes occurring in the iron
oxide synthesis. Samples of the pure reline-0w and reline-10w solvents (50 g) without iron
precursor were therefore placed into separate vessels and exposed to the microwave heating
treatment alongside the reacting samples. The urea decomposition was monitored using 1H NMR
spectroscopy, the results of which are shown in Table 6.1. It was observed that the pure reline DES
did not undergo any significant urea hydrolysis after heat treatment at either 100 ˚C or 150 ˚C. The
pure DES had to be heated to 200 ˚C before there was any quantifiable degradation of urea, with
the choline chloride-urea ratio diminished to around 1:1.8 after this treatment. Interestingly, the
iron-forming reactions for the pure DES were found to form a water-soluble crust around the
autoclave lid. Analysis of this product using 1H NMR and powder X-Ray diffraction suggests it
contained a highly crystalline combination of the various likely DES degradation products, such as
biuret, cyanuric acid, and ammonium carbonate (see ESI†). For the hydrated DES, significantly
more urea hydrolysis was seen. Treatment at 100 ˚C and 150 ˚C again yielded almost identical
results of a 1:1.8 choline chloride-urea final ratio, and in the most extreme circumstances, the 200
˚C hydrated synthesis resulted in a 1:1, distinctly off-eutectic mixture of choline chloride-urea
following the thermal treatment. Unlike the study of Querejeta-Fernandéz et al., we do not
observe any significant signal corresponding with the formation of NH4OH in the solvent.48
Generally, when contrasting with previous syntheses, we observe significantly less solvent
degradation, which is almost certainly a product of the rapid reaction times facilitated by the
efficiency of microwave heating. This can be visualised by the relative simplicity of the NMR spectra
collected aer treatment (see ESI†), which can be contrasted with the extensive degrada~on
observed when a DES is heat-treated in a conventional oven for a week.46

143
Table 6.1. Changes in the eutectic ratio after microwave heat-treatment in PTFE microwave autoclaves, as measured by 1H NMR spectroscopy of the heat-treated mixtures in d6-DMSO. Eutectic data are derived from integrating the urea region (δ = 5.5 ppm), using the choline methyl signal (-CH3)3) for the reference integral.
DES composition [Urea/ChCl] 100 ˚C [Urea/ChCl] 150 ˚C [Urea/ChCl] 200 ˚C
Reline-0w 2.086 ± 0.104 1.939 ± 0.097 1.781 ± 0.089
Reline-10w 1.773 ± 0.089 1.804 ± 0.092 1.014 ± 0.051
It should be noted that the measured hydrolysis in the pure DES may not necessarily be representative of the reacting system, which contains additional low-level water from the iron precursor, and may experience some further effect from the paramagnetic iron content. Errors are stated assuming a standard 5% deviation in the veracity of the NMR integrals.
We subsequently aimed to determine the degradative effects of urea hydrolysis upon the
nanostructure of the DES and the hydrated DES. It is unclear what effect that both the loss of urea,
and the subsequent integration of the hydrolysis products themselves, have on the overall solvent
structure in the case of both the pure and hydrated systems.49 To understand this, measurements
of the primary structure factor S(Q) of the solvents were made using synchrotron wide-angle X-Ray
scattering (WAXS) at beamline I22 of Diamond Light Source, UK. Data were collected before and
after heat-treatment, with background-corrected and normalised scattering patterns shown in
Figure 6.5. In pure d17-choline chloride:urea, there are two primary constructive scattering
interferences, giving peaks at 1.45 and 2.15 Å-1, which represent the two most common interaction
lengths in the disordered liquid, and respectively describing real-space separations of 4.3 and 2.9
Å (d=2π/q). The measured X-Ray structure factor S(Q) for reline therefore matches accurately with
the scattering form factor and primary correlation lengths observed in the pure DES by wide q-
range neutron diffraction.9 Upon adding water, the data show that the system becomes more
disordered, signified here by the additional peak broadening.50 The intensity of the secondary
‘shoulder’ peak at 2.15 Å-1 is increased noticeably in the hydrated system, signifying the partial loss
of the DES-DES (ie. the choline-choline, choline-chloride, choline-urea, urea-urea and urea-
chloride) interactions.8 Despite this, the position of the main scattering feature (at q=1.45 Å-1;
d=4.3 Å) remains in the hydrated system. This demonstrates that the hydrated DES still contains a
significant portion of the pure DES hydrogen-bonding nanostructure,30 and validates the approach
of adding water as a processing enhancement option for DES.37

144
Figure 6.5. WAXS data from beamline I22, Diamond Light Source, UK, showing untreated and microwave-treated samples of the pure reline-0w DES (a), and the hydrated reline-10w DES (b). Data are background-corrected and the intensity of the major correlation peak scaled to unity, to facilitate comparison and account for manufacturing variations in the X-Ray capillaries used for measurement.
In the case of the 100 ˚C and 150 ˚C heat treatments, there is very little variation in the
structure between both the pure solvent and the hydrated solvent before and after microwave
treatments. The pure DES is confirmed to degrade slightly because of the minor peak broadening
observed when the solvent is treated at 150 or 200 ˚C, whereas the reline-10w DES sees some
broadening alongside a significant extension to the satellite correlation at 2.15 Å-1, signifying that
the hydrated DES is somewhat more affected by the heat treatment, as was suggested by the NMR
analysis. However, in both instances the DES display remarkable nanostructural resilience with
regard to shifting to an off-eutectic composition.8 This is likely to be a product of the short reaction
time that is facilitated by the usage of microwave irradiation, the hydrogen-bonding contribution
of certain likely degradation product molecules such as isocyanuric acid and biuret, and the
hydrogen-bonding contribution from water in the hydrated system. These findings raise the
possibility that the DES could even be recovered and recycled after such syntheses, further
improving the efficiency.

145
Attempts to further reduce the reaction time and temperature met kinetic limitations;
unlike the 150 ˚C or 200 ˚C preparations, syntheses performed for 10 minutes at 100 ˚C had only
fractional Fe2O3 yields of 40% (Fe-100-0) or 73% (Fe-100-10). EDX measurements suggested that
the prepared Fe-100-0 product had only a surface coating of the desired Fe2O3, with the particulate
bulk composed of crystallised FeCl3. Because this salt was not used, this must represent the
dominant dynamically-solvated iron species in the reline DES, which is necessarily chloride-rich.51
In spite of any preferential solvent-reactant structuring, it seems likely that in this case the kinetic
limitation of the pure DESs lies in their relatively high viscosity, which represents a diffusion-limited
regime. In the case of the aqueous DES this kinetic limitation is mitigated, as the additional water
has the effect of dramatically reducing the solvent viscosity and hence, increasing the solvent self-
diffusion coefficient relative to the pure DES.49 Therefore, there are clearly some synthetic
advantages to be had by using hydrated DESs over the pure form. The optimal conditions for a
hydrated deep eutectic-solvothermal reaction can be found by tailoring the DES hydration level to
obtain the desired combination of solvent diffusion and pre-structuring effects, whilst remaining
below an aqueous regime.37
6.6.4. Application as photoelectrodes
Photoanodes were prepared by adapting a previously-described solution-processed colloidal
methodology, rather than developing a DES-based method because of the likely introduction of
impurities such as chloride and other organics from the incomplete calcination of the low vapour
pressure ionic mixture.52 In this process, a stable colloid of the iron oxide nanoparticles is
prepared,22 using acetylacetone to stabilise the nanoparticles by acting as a ‘capping’ hydrotrope
within the isopropanol dispersant phase. A structure-directing agent (hydroxypropylcellulose) is
then added to ensure the produced electrodes are porous after the thermal treatment.21 The films
were cast onto F:SnO2-coated aluminoborosilicate glass and heat-treated in two steps, with a
preliminary 400 ˚C, 12 hour treatment to remove the organic residues and convert the γ-Fe2O3
phase to the photoactive and stable α-Fe2O3 phase. The final step is a fast 20 minute treatment at
800 ˚C. This latter treatment is unfortunately intensive, but is necessary to produce sufficiently
active haematite photoelectrodes without precious metal dopants, because the Sn4+ diffuses into
the iron oxide during sintering, modifying the lattice parameters and resulting in electronic
modification.22 The optical properties were found to vary according to the nanoparticle size, with
the most transparent films prepared from the smallest nanoparticles (Fe-150-0) and the most
opaque films derived from the largest nanoparticles (Fe-200-10). FE-SEM measurements of the
prepared photoanodes after the dual heat treatments yielded a similar morphology to those

146
prepared previously from the related casting method, with iron oxide from the thermal
decomposition of Fe(CO)5,22 and these are shown in Figure 6.6. These images show the partial
sintering and growth of the nanoparticles, which form necked aggregates reaching a diameter of
around 50 nm in the Fe-150-0 film and 100 nm in the Fe-150-10 film. The larger feature size of the
Fe-150-10 film can be related to the larger size of the nanoshards that are used for the preparation,
as compared to the miniscule Fe-150-0 nanoparticles. This is additionally reflected in the clearly
more tightly-packed Fe-150-0 film, and the very large feature size of the Fe-200-10 film. The porous
nature of the photoelectrode is confirmed by the imaging, suggesting a high accessible surface
area, ideal for the photoelectrochemical splitting of water.21
Figure 6.6. FE-SEM images of the Fe-150-0 (a), Fe-150-10 (b), Fe-200-0 (c) and Fe-200-10 (d) films after calcination, measured using a thin-film coating (10 nm) of chromium. Scale bars depict 1 µm.
The prepared photoanodes were measured under standard solar conditions (100 mW cm-
2 at the sample position) in a three-electrode configuration, using a 1 M NaOH electrolyte, platinum
counter-electrode and 3.5 M KCl reference electrode. The reverse (uncoated) side of the electrode
was found to give the maximum photocurrent response, because despite the complete wetting of
the electrode nanostructures by the electrolyte, more photoinduced electrons are generated
closer to the FTO substrate than with front illumination, with more electrons then moving to the
cathode. Additionally, there is inevitable absorption of light with a corresponding decay in intensity
when films are greater than a threshold thickness.53 An example of front vs. back illumination
performance is given in the supporting information. Linear sweep voltammetry data for the

147
electrodes under both light and dark conditions are shown in Figure 6.7, and the calculated values
of the photocurrent density at 1.23 V versus the RHE are shown in Table 6.2. The majority of the
prepared systems deliver a photocurrent density competitive with other examples in the literature,
which can be related to the properties of the iron oxides used to prepare the respective
photoelectrodes. The Fe-150-0 electrode has a photocurrent of 0.53 mA cm-2 at 1.23 V vs. RHE,
identical to the value obtained for the Fe-200-0 electrode. This is representative of the very similar
nanoparticle size and morphology of the two systems, with the minor differences between the two
systems negated after the high-temperature sintering treatment. The anode derived from the Fe-
200-10 rhombohedral nanoparticles gave the weakest measured photocurrent response of 0.19
mA cm-2. This can be related to the particularly large and more difficult to coalesce, low-surface
area nanoparticles that this anode is derived from. Conversely, the strongest observed
photocurrent response was for the Fe-150-10 film, derived from the nanoshards prepared in the
hydrated DES at lower temperature. This anode gave a photocurrent response of 0.7 mA cm-2 at
1.23 V vs. RHE, which is competitive with other literature preparations, and notably higher than
photoanodes prepared using the thermal decomposition method from Fe(CO)5, despite the
possibility of our products passing through a hydroxyl-containing goethite phase due to the
synthesis mechanism.54 The FE-SEM data (Figure 6.6) reflect this, in the high solvent-accessible
surface area of this electrode and the high quantity of elongated, necked arrays that are derived
from the sintered shard nanostructures. We note that the average width of the features is
commensurate with the photon penetration depth in haematite.22 This level of photocurrent
response does not match extremely high performance benchmarks such as the 2.2 mA cm-2 that
can be achieved by chemical vapour deposition of high-surface-area, porous cauliflower-type
fractal haematite.23 However, the simple solvothermal process reported here is comparatively
rapid, facile, and more environmentally benign, whilst not requiring CVD equipment, or volatile
and harmful reagents such as tetraethylorthosilicate (TEOS).21

148
Figure 6.7. Photoelectrochemical water oxidation data showing the normalised photocurrent density as a function of potential for the Fe-x-0 products (upper panel) and the Fe-x-10 products (lower panel), measured either in the dark (dashed lines) or under illumination (solid lines). Analogous data for the Fe-150-y samples are shown in the inset, measured using a chopping light shutter whilst a standard sweep of current as a function of voltage is performed.
Table 6.2. Experimentally-determined values for the photocurrent density taken at 1.23 V versus the RHE, for the iron oxides synthesised at 150 or 200 ˚C, using either hydrated or pure DES.
DES composition J150˚C (mA cm-2) J200˚C (mA cm-2)
Reline-0w 0.528 ± 0.015 0.532 ± 0.012
Reline-10w 0.701 ± 0.008 0.187 ± 0.002
Data are calculated as the mean photocurrent density from data measured during a sweep with a rate of 20 mV s-1, across the potential range 1.22 V – 1.24 V versus the RHE, corresponding with a measurement time of 1 s. Errors are reported as the standard deviation of this value.
Some interesting differences were observed in the photocurrent response between those
products isolated from dry and hydrated DESs. Firstly, the different DES resulted in a slight shift in
the position of the dark current onset potential. The dark current occurs at approximately 1.6 V for

149
the Fe-x-0 materials, but consistently occurs at a lower potential of 1.55 V for the Fe-x-10 products.
Moreover, the Fe-150-0 measurements do not show any significant transient in the dark current
alongside the photocurrent onset potential, whereas there is a slight dark current at lower
potentials for the Fe-x-10 films, likely due to trace contamination. Finally, an interesting feature is
noted in the insets of Figure 6.7. The prepared samples were also measured using sweeping
current-potentiometry scans with a chopped shutter in order to determine the presence of
photocurrent transients as the incident light is periodically cycled between on and off. The Fe-x-10
photoanodes show sharper characteristic transient spikes upon cycling, corresponding with a high
concentration of photo-generated hole sites being generated within 100 nm of the semiconductor
liquid junction (SCLJ).55 This suggests that the recombination step is likely to be limiting for both
sets of materials,29 which can occur either in the bulk or at grain boundaries.18
Figure 6.8. Stability testing data for the fabricated Fe-200-y photoanodes. The incident simulated-solar radiation was chopped on or off every 3 minutes for a total of one hour, whilst the photoanodes were held at a constant potential of 0.22 V vs. Ag/AgCl (1.25 V vs. RHE).
Finally, the stability of the prepared photoanodes was measured in order to demonstrate
the resilience of the prepared films. This was done by measuring at a constant potential, cycling
between illuminated and dark with a periodicity of 0.33 min-1 for one hour, and representative
data for the Fe-200-y electrodes are shown in Figure 6.8. In each case, the fabricated photoanodes
show good resistance to the repeated cycling. For the Fe-200-0 thin film, the average first
photocurrent response of 0.532 ± 0.005 mA cm-2 drops to 0.526 ± 0.004 mA cm-2 after one hour of
this treatment. This corresponds with an activity reduction of 5.3 μA cm-2, or just 1% of the total
activity. Similarly, the Fe-200-10 photoanode response falls from the first average of 0.114 ± 0.001
mA cm-2 to the final measurement of 0.108 ± 0.001 mA cm-2, corresponding with a comparable
absolute loss in photocurrent of 5.5 μA cm-2, but a 5% loss in this case due to the lower total

150
photocurrent density of this anode. Therefore, the prepared electrodes are remarkably stable, with
only minimal loss in photocurrent density after repetitive on-off cycling.
6.7. Conclusions
We have demonstrated that the DES reline and its hydrated mixtures can be used as viable
sustainable alternative solvents in the manufacturing of green materials for the
photoelectrochemical splitting of water to hydrogen. The microwave-assisted solvothermal
methodology is rapid, malleable, and represents a significantly more environmentally-friendly
route towards this goal due to lower energy usage than traditional solvothermal methods and the
avoidance of volatile organic solvents. We have found that the reaction mechanism is similar to
previous preparations following a urea-hydrolysis pathway. The solvent degradation was
monitored, showing that following the reaction the mixtures are in an off-eutectic composition.
Synchrotron WAXS measurements showed that this has surprisingly little effect on the major
correlation structure in the solvent, signifying their resistance to this change. We find additionally
using WAXS that the hydrated solvent has a different structure from the pure system, with a more
disordered structure, but one that retains some of the DES intermolecular bonding.
The prepared iron oxide nanostructures vary in phase, size, and morphology as the
synthesis conditions are varied. The DES was found to have some inherent structuring effect, in
line with previous studies. Preparations using the pure DES always yielded very small
nanoparticulates, whereas synthesis using hydrated DESs gave either 1D nanoshards at 150 ˚C, or
large rhombohedral nanoparticles at 200 ˚C. Samples prepared at 150 ˚C were the γ-Fe2O3 phase,
whereas the syntheses conducted at 200 ˚C yielded the α-Fe2O3 phase. Investigations into the
magnetic properties of these nanoparticles showed that the small γ-Fe2O3 and α-Fe2O3
nanoparticles were sufficiently small that they exhibited superparamagnetic behaviour. The large,
more crystalline samples synthesised with hydrated DESs showed ferrimagnetic or ferromagnetic
hysteresis. Photoanodes were prepared from the nanoparticles using a previously-developed
solution-processed colloidal method, and photoelectrochemical measurements of these showed a
competitive photocurrent density, with a maximum measured photocurrent of 0.7 mA cm-2 at 1.23
V vs. RHE. Whilst short of the most extreme reported values, this is a strong response when
considering the environmental credentials of the process that was used to prepare them. We
additionally demonstrate that the measured photocurrent is remarkably stable under repeated
cycling.

151
We therefore present here a new route towards functional and highly active iron oxide
nanomaterials to be used in photocatalytic water splitting applications, based around greener DESs
as a structure-directing solvent medium. These new fundamental insights into the DES role in
nanomaterials synthesis, and in particular the solvent structure information from synchrotron
WAXS studies will aid with the development of future, greener processes towards other
nanomaterials using DESs and hydrated DESs.
6.8. Acknowledgements
Data supporting this paper have been made openly available, using the University of Bath Research
Data Archive system (DOI: 10.15125/BATH-00376). We acknowledge the STFC ISIS Pulsed Neutron
and Muon source (Rutherford Appleton Laboratory) and the UK Engineering and Physical Sciences
Research Council (EPSRC) for co-funding the PhD studentship of OSH in the Centre for Doctoral
Training in Sustainable Chemical Technologies, at the University of Bath (EP/L016354/1; STFC
Studentship Agreement 3578). SE acknowledges EPSRC funding EP/P008097/1. We thank Diamond
Light Source for access to the I22 SWAXS instrument under beamtime allocation SM15194. We
thank the ISIS Pulsed Neutron and Muon source for access to VSM and SQUID magnetometers in
the Materials Characterisation Laboratory (MCL), and Dr Gavin Stenning for aid in magnetometer
operation. We acknowledge the University of Bath Chemical Characterisation and Analysis Facility
(CCAF) for providing access to NMR spectroscopy. We thank the University of Bath Microscopy and
Analysis Suite (MAS) for access to Raman spectroscopy, SEM, FE-SEM and TEM imaging, and aid
with collecting data using the instrumentation.
6.9. References
1 C. Reichardt, Solvents and solvent effects in organic chemistry, Wiley-VCH, Weinheim, 2011. 2 F. M. Kerton, Alternative Solvents for Green Chemistry, Royal Society of Chemistry, Cambridge, 2009. 3 J. Peach and J. Eastoe, Beilstein J. Org. Chem., 2014, 10, 1878–1895. 4 P. G. Jessop, Green Chem., 2011, 13, 1391-1398. 5 R. Hayes, G. G. Warr and R. Atkin, Chem. Rev., 2015, 13, 6357–6426. 6 N. V. Plechkova and K. R. Seddon, Methods and Reagents for Green Chemistry: An Introduction,
Wiley, Hoboken, 2007, 103–130. 7 Q. Zhang, K. De Oliveira Vigier, S. Royer and F. Jérôme, Chem. Soc. Rev., 2012, 41, 7108–7146. 8 R. Stefanovic, M. Ludwig, G. B. Webber, R. Atkin and A. J. Page, Phys. Chem. Chem. Phys., 2017, 19,
3297-3306. 9 O. S. Hammond, D. T. Bowron and K. J. Edler, Green Chem., 2016, 18, 2736–2744. 10 C. R. Ashworth, R. P. Matthews, T. Welton and P. A. Hunt, Phys. Chem. Chem. Phys., 2016, 18, 18145–
18160.
152
11 M. Francisco, A. Van Den Bruinhorst and M. C. Kroon, Angew. Chemie - Int. Ed., 2013, 52, 3074–3085. 12 A. Paiva, R. Craveiro, I. Aroso, M. Martins, R. L. Reis and A. R. C. Duarte, ACS Sustain. Chem. Eng.,
2014, 2, 1063–1071. 13 D. A. Alonso, A. Baeza, R. Chinchilla, G. Guillena, I. M. Pastor and D. J. Ramón, European J. Org. Chem.,
2016, 4, 612–632. 14 D. V Wagle, H. Zhao and G. A. Baker, Acc. Chem. Res., 2014, 47, 2299–2308. 15 O. S. Hammond, K. J. Edler, D. T. Bowron and L. Torrente-Murciano, Nat. Commun., 2017, 8, 14150. 16 M. Mohapatra and S. Anand, Int. J. Eng. Sci. Technol., 2010, 2, 127–146. 17 G. Sharma and P. Jeevanandam, RSC Adv., 2013, 3, 189–200. 18 B. D. Chernomordik, H. B. Russell, U. Cvelbar, J. B. Jasinski, V. Kumar, T. Deutsch and M. K. Sunkara,
Nanotechnology, 2012, 23, 194009. 19 C. Ray and T. Pal, J. Mater. Chem. A, 2017, 5, 9465–9487. 20 J. Gu, Y. Yan, J. W. Krizan, Q. D. Gibson, Z. M. Detweiler, R. J. Cava and A. B. Bocarsly, J. Am. Chem.
Soc., 2014, 136, 830–833. 21 J. Brillet, M. Grätzel and K. Sivula, Nano Lett., 2010, 10, 4155–4160. 22 K. Sivula, R. Zboril, F. Le Formal, R. Robert, A. Weidenkaff, J. Tucek, J. Frydrych and M. Grätzel, J. Am.
Chem. Soc., 2010, 132, 7436–7444. 23 A. Kay, I. Cesar and M. Grätzel, J. Am. Chem. Soc., 2006, 7, 15714–15721. 24 I. Cesar, K. Sivula, A. Kay, R. Zboril and M. Grätzel, J. Phys. Chem. C, 2009, 113, 772–782. 25 Y. Ling, G. Wang, D. A. Wheeler, J. Z. Zhang and Y. Li, Nano Lett., 2011, 11, 2119–2125. 26 I. Cesar, A. Kay, J. A. G. Martinez and M. Grätzel, J. Am. Chem. Soc., 2006, 128, 4582–4583. 27 S. D. Tilley, M. Cornuz, K. Sivula and M. Grätzel, Angew. Chemie - Int. Ed., 2010, 49, 6405–6408. 28 K. Sivula, F. Le Formal and M. Grätzel, ChemSusChem, 2011, 4, 432–449. 29 N. Beermann, L. Vayssieres, S.-E. Lindquist and A. Hagfeldt, J. Electrochem. Soc., 2000, 147, 2456-
2461. 30 O. S. Hammond, D. T. Bowron and K. J. Edler, Angew. Chemie - Int. Ed., 2017, 56, 9782-9785. 31 L. Pan, X. Liu, Z. Sun and C. Q. Sun, J. Mater. Chem. A, 2013, 1, 8299-8326. 32 M. Basham, J. Filik, M. T. Wharmby, P. C. Y. Chang, B. El Kassaby, M. Gerring, J. Aishima, K. Levik, B.
C. A. Pulford, I. Sikharulidze, D. Sneddon, M. Webber, S. S. Dhesi, F. Maccherozzi, O. Svensson, S. Brockhauser, G. Náray and A. W. Ashton, J. Synchrotron Radiat., 2015, 22, 853–858.
33 P. Anastas and N. Eghbali, Chem. Soc. Rev., 2010, 39, 301–312. 34 A. P. Abbott, G. Capper, D. L. Davies and R. K. Rasheed, Chem. - A Eur. J., 2004, 10, 3769–3774. 35 Q. Wen, J.-X. Chen, Y.-L. Tang, J. Wang and Z. Yang, Chemosphere, 2015, 132, 63–69. 36 K. M. Taylor, Z. E. Taylor and S. T. Handy, Tetrahedron Lett., 2017, 58, 240–241. 37 Y. Dai, G.-J. Witkamp, R. Verpoorte and Y. H. Choi, Food Chem., 2015, 187, 14–19. 38 N. Fechler, N. P. Zussblatt, R. Rothe, R. Schlögl, M.-G. Willinger, B. F. Chmelka and M. Antonietti, Adv.
Mater., 2015, 28, 1287–1294. 39 M. Hanesch, Geophys. J. Int., 2009, 177, 941–948. 40 M. Wojdyr, J. Appl. Crystallogr., 2010, 43, 1126–1128. 41 F. Bødker, M. Hansen, C. Koch, K. Lefmann and S. Mørup, Phys. Rev. B, 2000, 61, 6826–6838. 42 C. Pascal, J. L. Pascal, F. Favier, M. L. E. Moubtassim and C. Payen, Chem. Mater., 1999, 11, 141–147. 43 F. Chen, S. Xie, J. Zhang and R. Liu, Mater. Lett., 2013, 112, 177–179. 44 Q. Q. Xiong, J. P. Tu, X. Ge, X. L. Wang and C. D. Gu, J. Power Sources, 2015, 274, 1–7. 45 F. N. Sayed and V. Polshettiwar, Sci. Rep., 2015, 5, 9733. 46 E. R. Parnham, E. A. Drylie, P. S. Wheatley, A. M. Z. Slawin and R. E. Morris, Angew. Chemie - Int. Ed.,
2006, 45, 4962–4966. 47 E. R. Parnham and R. E. Morris, Acc. Chem. Res., 2007, 40, 1005–1013. 48 A. Querejeta-Fernàndez, J. C. Hernàndez-Garrido, H. Yang, Y. Zhou, A. Varela, M. Parras, J. J. Calvino-
Gàmez, J. M. Gonzàlez-Calbet, P. F. Green and N. A. Kotov, ACS Nano, 2012, 6, 3800–3812. 49 C. D’Agostino, L. F. Gladden, M. D. Mantle, A. P. Abbott, I. Ahmed, Essa, A. Y. M. Al-Murshedi and R.
C. Harris, Phys. Chem. Chem. Phys., 2015, 17, 15297–15304. 50 T. Zhekenov, N. Toksanbayev, Z. Kazakbayeva, D. Shah and F. S. Mjalli, Fluid Phase Equilib., 2017, 441,
1–6. 51 J. M. Hartley, C. M. Ip, G. C. H. Forrest, K. Singh, S. J. Gurman, K. S. Ryder, A. P. Abbott and G. Frisch,
Inorg. Chem., 2014, 53, 6280–6288. 52 O. Aschenbrenner, S. Supasitmongkol, M. Taylor and P. Styring, Green Chem., 2009, 11, 1217–1221. 53 S. Eslava, G. Eymery, P. Marsik, F. Iacopi, C. E. A. Kirschhock, K. Maex, J. A. Martens and M. R.
Baklanov, J. Electrochem. Soc., 2008, 155, G115–G120. 54 D. Maiti, V. Aravindan, S. Madhavi and P. Sujatha Devi, J. Power Sources, 2015, 276, 291–298. 55 J. Krysa, M. Zlamal, S. Kment, M. Brunclikova and Z. Hubicka, Molecules, 2015, 20, 1046–1058.

153
7. THE EFFECT OF WATER UPON DEEP EUTECTIC SOLVENT
NANOSTRUCTURE: AN UNUSUAL TRANSITION FROM IONIC MIXTURE
TO AQUEOUS SOLUTION
7.1. Overview
Throughout this PhD project, the pursuit of even trivial experiments, such as filling sample vials for
measurement, became extremely demanding and time-consuming due to the high viscosity of pure
DES.1 At the same time, we had noticed that even trace amounts of water cause a massive
reduction in the viscosity of pure DES.2 Furthermore, as discussed in the previous chapters, water
needs to be present for the controlled hydrolysis of urea in our solvothermal reactions, and it is
impossible to fully remove water from DES due to their hygroscopicity. Therefore, as others who
have worked with DES concluded, we also arrived at the question: ‘Why not simply add water to
DES in known quantities to make them easier to use, if it is going to be there anyway, and we need
it?’2–5 The answer to this appeared to be: ‘Because then, you will have an aqueous solution of the
DES components, and not a DES.’ However, our work on small quantities of water in the choline
chloride:malic acid DES showed that small quantities of water did not disrupt the structure,6 and
PFG-NMR experiments in Abbott’s group suggested that the water diffuses at a different rate to
rest of the DES, suggesting micro-segregated domains.3 This being the case, the burning question
became: ‘How far can we push the water content before it is not a DES?’ Here, therefore, we aim
to answer the questions that have been raised in our own work on the synthesis of nanostructured
materials in DES using water in chapter 4 and 6, as well as building upon the understanding of the
fundamental ‘pure’ solvent structure in chapter 3, and the first work on the solvation of water by
DES in chapter 5.
This work was therefore devised to characterise the nanostructure (if any) in DES-water
mixtures of the most popular choline chloride:urea DES, across a wide range of hydration, to
observe any changes in behaviour. Neutron scattering with atomistic modelling was used to
measure solution structure in choline chloride:urea:water compositions of 1:2:1, 1:2:2, 1:2:5,
1:2:10, 1:2:15, 1:2:20, and 1:2:30 – corresponding with an approximate range of 5 – 70 wt% water,
with the latter considered a ‘swamping’ mole fraction of water (91 mol%). Measuring 5 isotopic

154
contrasts per system made this a significant project requiring several experiments to collect the
data, and a large amount of modelling.
We did not find any nanostructured water domains as suggested, and as with the pure DES
structural data, the picture is one of local ordering rather than any regular, segregated repeat long-
range ordering as is seen in ILs and their mixtures with amphiphiles.7 At low water contents the
DES structure undergoes only slight disruption, and certain intermolecular interactions actually
increase in strength, such as choline-urea H-bonding. This proved that the innate water content of
DES is not a huge issue for the field, as long as authors make efforts to report it for their systems.
A discontinuity is seen between 10w-15w, where the choline-choline interactions suddenly
increase massively, whilst the choline-water interactions decrease slightly. Above this level, water-
water interactions plateau and the length scale of these is the same as in aqueous solution.
Therefore, we have interpreted this discontinuity as the ‘transition point’ where a hydrated DES
becomes an aqueous solution of DES components. Above this concentration of water, all of the
DES constituents are fully hydrated, but below this point they are not despite water being in molar
excess. This is assigned to the smaller molar volume of water, and the fact that it appears to
hydrate choline ions first, which effectively protects the other components in the mixture from
being hydrated until higher water mole fractions. The transition point could not be determined
with higher precision because of the requirement for further neutron experiments, but it lies
somewhere between 10-15w (41-51 wt%; 77-83 mol% H2O), which is approximately equal to 50
vol% H2O, which would be the point at which water structure would naturally begin to percolate
throughout the system.
This paper has therefore reported on the significant fundamental observation that DES can
be somewhat hydrated without loss of structural properties, and that there is a water-in-DES to
DES-in-water transition point. It is stressed that this is just one system, and the occurrence or
position of such a transition point may vary for DES containing different cations, anions, HBD
molecules and different co-solvents; this will be a fruitful area for future study. Nevertheless, the
insights provided here will help the field of DES overcome the barrier posed by the question of
water content, which had hindered progress in the field of pure ILs for many years before
conciliation.8
This paper is reproduced with minor adaptations to match the thesis formatting
specifications from the final accepted version published in Angewandte Chemie – International
Edition. The associated electronic supporting information is provided in Appendix 5.
1 E. L. Smith, A. P. Abbott and K. S. Ryder, Chem. Rev., 2014, 114, 11060–11082. 2 Y. Dai, G.-J. Witkamp, R. Verpoorte and Y. H. Choi, Food Chem., 2015, 187, 14–19. 3 C. D’Agostino, L. F. Gladden, M. D. Mantle, A. P. Abbott, I. Ahmed, Essa, A. Y. M. Al-Murshedi and R.
C. Harris, Phys. Chem. Chem. Phys., 2015, 17, 15297–15304.

155
4 A. Sanchez-Fernandez, K. J. Edler, T. Arnold, D. Alba Venero and A. J. Jackson, Phys. Chem. Chem.
Phys., 2017, 19, 8667–8670. 5 M. C. Gutiérrez, M. L. Ferrer, C. R. Mateo and F. Del Monte, Langmuir, 2009, 25, 5509–5515. 6 O. S. Hammond, D. T. Bowron, A. J. Jackson, T. Arnold, A. Sanchez-Fernandez, N. Tsapatsaris, V. G.
Sakai and K. J. Edler, J. Phys. Chem. B, 2017, 121, 7473–7483. 7 H. J. Jiang, P. A. FitzGerald, A. Dolan, R. Atkin and G. G. Warr, J. Phys. Chem. B, 2014, 118, 9983–9990. 8 Y. Kohno and H. Ohno, Chem Commun, 2012, 48, 7119–7130.

156
7.2. Statement of contribution
This declaration concerns the article entitled:
The Effect of Water upon Deep Eutectic Solvent Nanostructure: An Unusual Transition from Ionic
Mixture to Aqueous Solution
Publication status (tick one)
draft
manuscript Submitted
In
review Accepted Published
Publication details
O. S. Hammond, D. T. Bowron and K. J. Edler, Angew. Chemie - Int. Ed., 2017, 56,
9782–9785.
DOI: https://dx.doi.org/10.1002/anie.201702486
Candidate’s
contribution to
the paper
(detailed, and
also given as a
percentage).
The candidate contributed to/ considerably contributed to/predominantly
executed the…
Formulation of ideas:
The initial idea of KJE and DTB was to measure chcl:urea with small amounts of
water to test for bound water. Following this, it was the idea of OSH to measure
increasing water contents to see if the behaviour changed. 70%.
Design of methodology:
Experiments were jointly designed by KJE, DTB and OSH. Analysis routines in EPSR
were made by OSH. 70%
Experimental work:
OSH prepared samples, performed neutron experiments, and simulated the data.
100%
Presentation of data in journal format:
OSH wrote the paper with subsequent refinement from DTB and KJE. 90%
Statement from
Candidate This paper reports on original research I conducted during the period of my Higher
Degree by Research candidature.
Signed
Date
20/09/18

157
7.3. Abstract
The nanostructure of a series of choline chloride-urea-water deep eutectic solvent mixtures was
characterized across a wide hydration range, using neutron total scattering and empirical potential
structure refinement (EPSR). Since structure is significantly altered, even at low hydration levels,
reporting DES water content is important. However, DES nanostructure is retained to a remarkably
high level of water (10w, ~42 wt.% H2O) because of solvophobic sequestration of water into
nanostructured domains around cholinium cations. At 51 wt. % / 83 mol % H2O this segregation
becomes unfavorable, and the DES structure is disrupted, instead dominated by water-water and
DES-water interactions. At and above this hydration level, the DES-water mixture is best described
as an aqueous solution of DES components.
7.4. Introduction
Deep Eutectic Solvents (DES) are a compositionally diverse range (>106) of low-transition-
temperature mixtures, and represent a set of intrinsically ‘designer solvents’, prepared by mixing
H-bonding salts and neutral species in the eutectic molar ratio.1 The physicochemical properties of
DES are related to those of ionic liquids and their mixtures;2 DES are hybrid systems, where
molecular-ionic clusters are found within a complex and disordered H-bonding network.3 This
nanostructure can be adjusted by selection of the mixing ratio and molecular chemical moieties,4
and this additional degree of design freedom has aided development of DES as ‘greener’
alternative media for organic and inorganic synthesis,5 electrochemistry, separation, extraction,
and biotransformations.6
DES are made of coordinating, H-bonding ions and molecules, making them strongly water-
miscible and hygroscopic. Latent absorbed water is unavoidable, and impacts upon
physicochemical properties of DESs such as the melting point, with inadequate characterization
leading to poor reproducibility.7 A relatively new approach leverages the favorable
physicochemical properties of DES-water mixtures, such as lowered viscosity.8 Trends in these
properties suggest that there is an upper limit to this hydration, above which DES are more like
aqueous solutions.9–11 However, it is not known how far such mixtures can be hydrated before
they cease to be DES on a nanostructural level, because only a limited compositional range has
been probed experimentally in detail using NMR,12 which has also been used extensively for IL-
water mixtures.13,14 The effect of water on DES, and hence their classification, therefore remains
one of the most significant unanswered questions in the field; do they resemble ILs, ionic mixtures,

158
or merely solutions of ions? Here, we analyzed the nanostructure of the archetypal choline
chloride-urea DES,15 across a wide range of hydration. In doing so, we have identified a structure
transition point from DES-water mixture to a state closer to an aqueous solution of individually
solvated DES components. This fundamental insight will aid the understanding, development and
application of DES as advanced reaction and processing media.
7.5. Experimental
Pure DES were prepared by mixing the components in the required molar ratio and heating at 60
˚C until a homogenized, transparent phase was formed. Water was then added to meet the desired
hydration. The full set of DES compositions and isotopic substitutions are described in Supporting
Information.
Samples were measured using the NIMROD or SANDALS total scattering instruments at
ISIS Neutron and Muon Source;3 raw diffraction data can be accessed using the ISIS-ICAT system,
under experiment numbers RB1510465, RB1610312 and RB1620479. DES compositional purity
(≤0.4 mol.% absorbed atmospheric H2O) was assessed by contrasting the calculated and measured
neutron differential scattering cross-sections. The corrected diffraction data were analysed using
EPSR modelling;16,17 corrected data is available via the University of Bath Research Data Archive
system (DOI: 10.15125/BATH-00359).
7.6. Results and discussion
Aqueous mixtures were prepared by mixing DES with water in a series of DES:water molar ratios
(x), described as reline-xw, ie. 1:2:5 choline chloride:urea:water is reline-5w. The set of DES:water
molar ratios were 1, 2, 5, 10, 15, 20, and 30w, and these are given as corresponding weight and
molar percentages in Supporting Information. Solvent structures were measured using neutron
total scattering, with five H/D isotope contrasts per composition. Atomistic models were resolved
to the data using Empirical Potential Structure Refinement (EPSR).16 Details are provided in the
appendix.
No small-angle scattering (Q = 0.01 - 0.5 Å-1; d = 1.2 - 60 nm) is observed, demonstrating
that these mixtures are not classically phase separated. Therefore, the neutron diffraction data in
Figure 7.1 demonstrate an intermolecular-scale nanostructure transition from the pure DES to that

159
of water. Pure deuterated reline has two primary scattering features at Q = 1.45 and 2.15 Å-1, where
the latter merges with the D2O peak found at 2 Å-1. The 1.45 Å-1 structuring decreases (relative to
2 Å-1) as water mole fraction increases. At 10w of hydration the 2 Å-1 correlation is slightly greater,
yet at ≥15w the interaction at 1.45 Å-1 disappears almost completely, leaving one dominant
structuring feature. The data therefore highlight a contraction in the major intermolecular
interaction length (which is the most likely mean pair separation distance in the liquid) from 4.3 Å
in the pure DES to 3.1 Å, the value found for water. This process is gradual up to 10w, and sudden
at 15w. A similar contraction is observed at wider angles, with the pure DES diffraction features (6
Å-1; 1.05 Å) converging upon the water peak (8 Å-1; 0.79 Å) at 15w.
Figure 7.1. Experimental neutron diffraction data as 3D or 2D (inset) plots, for perdeuterated DES mixtures. Data for reline3 and D2O17 are as previously published, with the D2O data plotted at w = 50 for convenience. The ordinate F(Q) is normalised to units of barn atom-1 steradian-1.

160
Figure 7.2. Experimental intermolecular coordination number data for DES-DES interactions (top panel) and DES-water interactions (bottom panel). Reline-0w data are as previously published.3
The EPSR models equilibrated closely to the neutron data (see Supporting Information).
Atomistic data from EPSR models is interpreted by integrating partial radial distribution functions
(pRDFs) up to the first minima (Rmax). The resulting coordination number (Ncoord) describes the
number of nearest-neighbor molecules, and these are displayed in Figure 7.2. High Ncoord shows
important structural features in the disordered liquid. A discontinuity is observed at 1w, a
concentration chosen to reflect the latent absorbed water in DES.7 All DES interactions are

161
weakened upon addition of 1 mole of water, excepting a strengthened choline-urea strong
hydrogen bonding interaction (OH---NH2), reflected in the coordination numbers shown in the
Supporting Information. This unexpected increase in intermolecular interaction strength explains
why DES-1w systems do not undergo the anticipated viscosity reduction.8,12 Whilst 80% (on
average) of the original nanostructure is retained at 1w, even low-level DES-water mixtures clearly
differ from pure DES, with water contributing to the nanostructure and hence altering
physicochemical properties. As such, appropriate practice is to accurately determine and report
the water content of DES.18
Interactions between DES components weaken systematically but non-linearly as water is
introduced, and are retained up to high water mole fractions (10w). On average, 50% of the pure
DES nature remains at 10w (ie. 77 mol% water). Whilst weakening of the ‘DES-DES’ interactions
(namely the choline-urea, choline-chloride, choline-choline, urea-chloride, urea-urea, and
chloride-chloride H-bonds, which may be strong or weak, and nonionic, ionic or doubly ionic19) by
water is anticipated,20 this deviates significantly from Raoult’s ideal, entropic dissolution.21 This is
corroborated by the DES-water Ncoord (namely choline-water, urea-water, and chloride-water
interactions), most of which increase as a function of hydration (Figure 7.2). A noteworthy
exception to this is the choline-water correlation, which increases super-stoichiometrically,
seemingly because of a strong hydration preference relatable to the aqueous solvation of
ammonium salts.22 Therefore, up to 10w, the system resists hydration to retain most of the initial
nanostructure. In this solvation regime, water contributes to the slightly-ordered H-bonding
network in the mixture,19 and is mostly sequestered by choline cations via short-range Coulombic
and H-bonding interactions. This explains the tolerance of the DES nanostructure and properties
towards hydration, and can be related to the solvophobic accommodation of solutes in ILs;2
‘solvent-separated ion pairs’ are seen in many IL-cosolvent mixtures.21 A transient water-rich
sequestered domain around choline helps to rationalize unusual properties of hydrated DESs such
as low water activity,23 and a high water self-diffusion coefficient.12 The retention of the DES
‘pseudo-IL’ character at such low ionic strengths is remarkable.
At 15w (83 mol%; 51 wt.% H2O) a second discontinuity in the intermolecular interactions
is observed. Our experimentally-validated models allow us to assign this as the nanostructure
transition from a ‘water-in-DES’ to a ‘DES-in-water’ regime. The choline-choline and choline-water
interactions are most markedly affected. At 15w, the number of water molecules solvating choline
falls from 15 to 10, whilst the choline-choline Ncoord rises from 2.5 to 4.4. Above this level, DES-DES
interactions continue to weaken, whilst the DES-water correlations intensify. Furthermore, except
for the choline-choline and water-water interactions it is surprising not to observe any length scale
change in DES-DES interactions from this point to 30w. At 15w, the water-water Ncoord plateaus at

162
a value equal to pure water.24 Therefore, above this point it is inappropriate to describe the system
as a DES, and it should instead be considered as a solution of DES components in water.
Importantly, this nanostructure transition point correlates with trends in the physical properties of
cholinium DES-water mixtures.8,12,23
Specific nanostructure analysis shows only subtle differences across the hydration range,
shown as 3D Spatial Density Function (SDF) plots in Figure 7.3, which are projections of the most
likely configurations. Even at high w, the preferred orientations of urea and chloride around choline
cations are retained. However, choline-choline structuring is affected by the strong water
interaction. Water systematically occupies a radial H-bonded solvation band around the choline –
OH group at shorter length scales than urea or chloride, and along the urea H-bonding axes. At
15w, the choline-urea interaction is diminished, because the close-range choline-water and urea-
water interactions dominate. The hydration of DES components increases with water volume
fraction, and at 15w the urea molecule has a saturated first hydration shell, with a similar increase
in crowding for choline. Additional SDF plots of water-chloride (and choline-water at 10w, the
maximized interaction point) are given as Supporting Information. These demonstrate that
solvation of water by chloride increases with hydration, further signifying the transition from DES
to aqueous solution. Breakdown of DES structure therefore correlates with the point where DES-
water interactions dominate DES-DES interactions.
From these insights, we propose a mechanism for the transition from hydrated DES to DES
aqueous solution. Between 1w and 15w there is a solvent-separated ionic cluster regime, with
preferential water-choline nanostructuring driven by solvophobic segregation. This explains DES
hydration tolerance, and trends in physicochemical properties.2 However, this sequestered water
reaches an over-crowding point (15w). Here, it becomes preferable for DES components to be fully
solvated by water and for the system to become an aqueous solution. Some DES-DES bonding still
exists in this regime because the DES components are not non-interacting, ideal solutes. However,
the proportion of these interactions relative to the water-water pRDFs is so low that such systems
do not represent the DES nanostructure, and should not be characterized as DES.

163
Figure 7.3. SDF plots describing 3D nanostructure of reline-1w (top) and 15w (bottom). Isosurfaces denote chloride (green), urea (lilac), choline (yellow) and water (blue) molecules at the 7.5% probability level. Central molecules are choline (left), urea (centre) and choline (right).
7.7. Conclusions
In summary, we have analyzed the nanostructure of the hydrated reline DES system across a wide
hydration range. At low levels (≤1w) water contributes slightly to (rather than disrupting) the H-
bonding network, and strengthens choline-urea bonding. This alters the structure enough that it is
important for the water content of DES to be characterized. Between 2w - 10w, the DES-water
mixture is in a regime where DES clusters remain, but are separated by the diluent. DES
intermolecular bonding persists as far as 10w, because of the solvophobic sequestration of water
into nanostructured domains around choline. At 15w, we observe a step change in solvation where
many of the DES structural motifs cease to be prevalent, as water clusters become unfavorable. At
this point, the system is best described as an aqueous solution of DES components at the molecular
level. These developments give credence to the trend of researchers using hydration as a tool to
overcome the limitations of DES such as viscosity, and will aid development of advanced DES and
IL mixtures as greener processing and reaction media. DES compositions are highly variable, and
whilst the nature of the transition highlighted by this work is likely to be similar in other systems,
the water content at which this manifestation occurs may differ for systems with differing
composition so that further case studies remain to be undertaken.

164
7.8. Acknowledgements
We thank ISIS Pulsed Neutron & Muon Source for access to SANDALS and NIMROD under
allocations RB1510465, RB1610312, and RB1620479. OSH thanks STFC (Studentship 3578) and
EPSRC for PhD studentship in the EPSRC Centre for Doctoral Training in Sustainable Chemical
Technologies (EP/L016354/1).
7.9. References
1 M. Francisco, A. Van Den Bruinhorst and M. C. Kroon, Angew. Chemie - Int. Ed., 2013, 52, 3074–3085. 2 R. Hayes, G. G. Warr and R. Atkin, Chem. Rev., 2015, 13, 6357–6426. 3 O. S. Hammond, D. T. Bowron and K. J. Edler, Green Chem., 2016, 18, 2736–2744. 4 R. Stefanovic, M. Ludwig, G. B. Webber, R. Atkin and A. J. Page, Phys. Chem. Chem. Phys., 2017, 19,
3297-3306. 5 O. S. Hammond, K. J. Edler, D. T. Bowron and L. Torrente-Murciano, Nat. Commun., 2017, 8, 14150. 6 E. L. Smith, A. P. Abbott and K. S. Ryder, Chem. Rev., 2014, 114, 11060–11082. 7 X. Meng, K. Ballerat-Busserolles, P. Husson and J.-M. Andanson, New J. Chem., 2016, 40, 4492–4499. 8 Y. Dai, G.-J. Witkamp, R. Verpoorte and Y. H. Choi, Food Chem., 2015, 187, 14–19. 9 H. Passos, D. J. P. Tavares, A. M. Ferreira, M. G. Freire and J. A. P. Coutinho, ACS Sustain. Chem. Eng.,
2016, 4, 2881–2886. 10 D. Shah and F. S. Mjalli, Phys. Chem. Chem. Phys., 2014, 16, 23900–23907. 11 M. C. . Gutiérrez, M. L. . Ferrer, C. R. Mateo and F. del Monte, Langmuir, 2009, 25, 5509–5515. 12 C. D’Agostino, L. F. Gladden, M. D. Mantle, A. P. Abbott, I. Ahmed, Essa, A. Y. M. Al-Murshedi and R.
C. Harris, Phys. Chem. Chem. Phys., 2015, 17, 15297–15304. 13 Y. Kohno and H. Ohno, Chem Commun, 2012, 48, 7119–7130. 14 Y. Nikawa, K. Fujita and H. Ohno, Phys. Chem. Chem. Phys., 2017, 19, 8148–8151. 15 A. P. Abbott, G. Capper, D. L. Davies, R. K. Rasheed and V. Tambyrajah, Chem. Commun., 2003, 0, 70–
71. 16 A. K. Soper, Mol. Phys., 2001, 99, 1503–1516. 17 A. K. Soper, J. Phys. Condens. Matter, 2007, 19, 335206. 18 S. J. Bryant, R. Atkin and G. G. Warr, Soft Matter, 2016, 12, 1645–1648. 19 C. R. Ashworth, R. P. Matthews, T. Welton and P. A. Hunt, Phys. Chem. Chem. Phys., 2016, 18, 18145–
18160. 20 T. Zhekenov, N. Toksanbayev, Z. Kazakbayeva, D. Shah and F. S. Mjalli, Fluid Phase Equilib., 2017, 441,
1–6. 21 H. Niedermeyer, J. P. Hallett, I. J. Villar-Garcia, P. A. Hunt and T. Welton, Chem. Soc. Rev., 2012, 41,
7780–7802. 22 E. J. Nilsson, V. Alfredsson, D. T. Bowron and K. J. Edler, Phys. Chem. Chem. Phys., 2016, 18, 11193–
11201. 23 Y. Dai, J. van Spronsen, G. J. Witkamp, R. Verpoorte and Y. H. Choi, Anal. Chim. Acta, 2013, 766, 61–
68. 24 A. K. Soper, ISRN Phys. Chem., 2013, 2013, 279463.

165
8. STRUCTURE AND PROPERTIES OF ‘TYPE IV’ LANTHANIDE NITRATE HYDRATE:UREA DEEP EUTECTIC
SOLVENTS
8.1. Overview
The systems which have been explored so far in this thesis have been the ‘Type III’ DES, as they are
described in the literature, made of choline chloride and an H-bond donor. However, this only
represents a small proportion of the systems which have been described as DES, which also include
mixtures of anhydrous or hydrated metal salts with choline chloride, and anhydrous or hydrated
metal salts with H-bond donor molecules.1 This latter class is known as the ‘Type IV’ DES, and
Abbott et al. have shown the primary example of this in the literature, a ZnCl2:urea eutectic mixture
in a 1:3.5 molar ratio, with eutectic mixtures with other metal salts such as AlCl3 and CrCl3.6H2O
also reported.2,3 It was reported that these systems have unusual physical properties distinct from
other classifications of DES such as remarkably low conductivity, which has been assigned to a
disproportionation reaction to form a complex-ionic liquid containing metal chloride cations and
anions, and thus leading to a lower proportion of free charge carriers.4 These mixtures have been
demonstrated as viable, cheap and simple alternatives in metal electrodeposition. This work is
therefore an extension of solvent structure and hydration studies as well as understanding of the
metal ion solvation that was explored before upon dissolution of cerium nitrate in the choline
chloride:urea DES.
Although this thesis is not concerned with electrodeposition, it is possible that novel Type
IV eutectics could offer opportunities in the preparation of nanostructured materials by design of
the solvent to direct reactions of metal salts. We were particularly interested in the possibility of
creating lanthanide mixtures and using these to prepare oxides such as CeO2. A series of lanthanide
DES were therefore prepared using Ce, Pr and Nd nitrate hexahydrate salts mixed across a variety
of molar ratios, with the liquid formed by the 1:3.5 mixture selected for further study. As well as
being the first reported lanthanide-urea liquids, these mixtures are rare due to being chloride-free
DES. These liquids were found to have unusual properties such as extremely high density and
surface tension, low viscosity, and a melting point far lower than the components. To determine
the origin of these properties, the cerium system was taken as a model and its structure was
measured with a combination of neutron diffraction and X-Ray diffraction.

166
Analysis of the structure showed that the system is unique and distinct from typical ILs and
from the DES we have also studied. There is strong metal-ligand bonding, forming an ionic network
predominantly of cerium and nitrate, to make polyanions and polycations. However, this can occur
without electron transfer, suggesting that disproportionation is not necessarily the cause of the
polyanionic complexes observed by Abbott et al.4 At the same time, an extensive H-bond network
predominantly of urea and water was observed, which is separate from the ionic region. The
charge-dense and uncharged networks are fluxional, and no real nanostructure (in terms of the
inter-region d-spacing seen in ILs) is observed, suggesting that the system is not ‘microemulsion-
like’ and does not contain truly separate phases. However, this structure allows for explanation of
properties such as the surface tension being higher than water, by considering the system as a
‘Coulombic-enhanced’ H-bond network of water and urea. This work therefore presented liquid
lanthanide-urea mixtures, demonstrating the possibility to tune the metal ion present in the
system. In this case, it was also shown that the solvent could be heat-treated to form lanthanide
carbonates and lanthanide oxides, demonstrating the potential of such mixtures in materials
synthesis. The concept of a lanthanide DES is fundamentally of value for many applications such as
electrodeposition, and revisiting these ‘Type IV’ systems has suggested that the nanostructure is,
as for the ‘Type III’ DES, not as simple as expected.
This paper is reproduced with minor adaptations to match the thesis formatting
specifications from the version prepared for submission. The associated electronic supporting
information is provided in Appendix 7.
1 E. L. Smith, A. P. Abbott and K. S. Ryder, Chem. Rev., 2014, 114, 11060–11082. 2 A. P. Abbott, J. C. Barron, K. S. Ryder and D. Wilson, Chem. - A Eur. J., 2007, 13, 6495–6501. 3 H. M. A. Abood, A. P. Abbott, A. D. Ballantyne and K. S. Ryder, Chem. Commun. (Camb)., 2011, 47,
3523–3525. 4 A. P. Abbott, A. A. Al-Barzinjy, P. D. Abbott, G. Frisch, R. C. Harris, J. Hartley and K. S. Ryder, Phys.
Chem. Chem. Phys., 2014, 16, 9047.

167
8.2. Statement of contribution
This declaration concerns the article entitled:
Structure and properties of ‘Type IV’ lanthanide nitrate hydrate:urea deep eutectic solvents
Publication status (tick one)
draft manuscript
Submitted
In review Accepted Published
Publication details
O. S. Hammond, D. T. Bowron and K. J. Edler; To be submitted to ACS Sustainable Chemistry
and Engineering
Candidate’s
contribution to
the paper
(detailed, and
also given as a
percentage).
The candidate contributed to/ considerably contributed to/predominantly executed the…
Formulation of ideas:
OSH devised the idea to prepare and measure lanthanide DES. 100%
Design of methodology:
Experiments were designed by OSH with input from DTB and KJE on neutron
measurements and rheology respectively. 85%
Experimental work:
OSH performed all experimental work and data analysis. 100%
Presentation of data in journal format:
The analysed data were included in the first manuscript draft written by OSH. Subsequent
drafts iteratively improved the manuscript thanks to input from KJE and DTB. 90%
Statement from
Candidate This paper reports on original research I conducted during the period of my Higher Degree
by Research candidature.
Signed
Date
20/09/18

168
8.3. Abstract
A series of lanthanide nitrate hydrate:urea ‘Type IV’ deep eutectic solvents (DES; Ln=Ce,Pr,Nd)
were prepared and their physical properties measured, showing very high surface tension and
density, with low viscosity and glass transition temperature. Calculated Gordon parameters were
similar to water, with lower molecular volumes than ‘Type III’ DES. The LnDES were used as reaction
media for efficient combustion synthesis of lanthanide oxides. The nanostructure of the
Ce(NO3)3.6H2O:urea DES was measured using neutron and X-Ray scattering and resolved with
empirical potential structure refinement (EPSR) atomistic modelling. The models showed the
existence of strongly-bonded yet fluxional oligomeric [-Ce-NO3-] polyanions and polycations.
Because of the excess of the molecular component in the mixture, an intercalating H-bonded
nanostructure containing mainly water and urea was observed, relatable to the structure of ‘poor’
solvate ionic liquids. This dichotomous structural observation helps to explain some of the unusual
physical properties such as low viscosity and high surface tension, while also challenging the
fundamental definitions of DES.
8.4. Introduction
Deep Eutectic Solvents (DES) are gaining attention as inherently tunable and potentially more
environmentally friendly drop-in replacements for traditional organic solvents.1 DES are
extensively H-bonding eutectic mixtures of molecular and ionic compounds, forming a partially-
ionic liquid phase at desirable temperatures, and are very often based around choline chloride
(ChCl) and/or urea.2 Being partially-ionic, DES have been described as a ‘4th generation’ ionic liquid
(IL);3 the two categories share qualities such as reduced flammability and toxicity compared to
molecular solvents.4 Furthermore, the judicious design of DES to meet specific requirements can
allow optimization within the framework of green chemistry,5 leading towards reduced waste and
hence improving the E-factor of processes.6
As defined above, the term ‘DES’ covers a huge compositional space. Abbott et al. initially
proposed a classification system with 4 types of DES; 7 ‘Type I’ DES are mixtures of metal salts and
quaternary ammonium salts (ie. ChCl:ZnCl2), ‘Type II’ DES are hydrated variants of the former (ie.
ChCl:ZnCl2.3H2O), ‘Type III’ DES are the most commonly studied and are made of ionic-molecular
eutectic mixtures (ie. ChCl:urea), and ‘Type IV’ DES are mixtures of metal salts with molecular
components (ie. ZnCl2:urea). Other variants have been reported which fall outside these categories
but still form useful liquids, including hydrophobic DES,8–10 and hydrated metal salts.11 Hence, many

169
now describe these systems using umbrella terminology such as ‘Low-Melting Mixtures’ (LMMs)
or ‘Low Transition Temperature Mixtures’ (LTTMs),2,12–15 though the terminology DES will be used
herein. In the initial framework of DES, all ‘Type I-IV’ systems were said to contain some form of
complex-ion, based on mass spectrometry data.7,16 However, this technique is now regarded as
inappropriate for characterization of ionic liquids and speciation; MS destructively ionizes the bulk
liquid, and analysis of the gas-phase products usually leads to spurious conclusions.17 For example,
understanding of ‘Type III’ DES nanostructure has evolved from a complex-ion model (ie.
[(urea)2.Cl]- + [cholinium]+) as concluded from MS,18 to an ‘alphabet soup’ model with multifaceted
disorder,19,20 with H-bonding contributions from all the various species,21–23 and minimal evidence
for the initially-posited charge delocalization and complex-ion formation as the driver for eutectic
formation.18,24,25 Studies have also investigated the effect of water on ‘Type III’ DES, showing that
it contributes to the overall H-bonding network at low volume fractions without significant
perturbation,26 but overwhelms the interesting intermolecular structuring that defines DES above
a threshold water volume fraction of ca. 0.5.27 Overall, sophisticated studies into DES continue to
unearth interesting results, with potential impact on their applications, and are beginning to
challenge the basis of the current dividing lines between DES and IL mixtures,28,29 but have been
generally limited to the ‘Type III’ systems.
Very few ‘Type IV’ DES have been explored and the understanding is limited to mass
spectrometric interpretations of a few metal halide systems, such as ZnCl2:urea, AlCl3:urea and
CrCl3.6H2O:urea, where it is suggested that complex cations and anions exist arising from
disproportionation.7,11,16,30–33 Halide-free metallic DES can be more sustainable and functional,34
and demonstrating new systems with different metal ions may offer new utility. For example,
lanthanide-containing DES could be designed as a greener task-specific solvent or CVD precursor
for lanthanide-containing materials, which are useful in applications such as superconductors,
lasers, magnets, catalysis, and electronics.35–37 In this paper, we will therefore describe the first
lanthanide ‘Type IV’ DES based around urea mixtures with lanthanide nitrate hydrates. Their
structure will be resolved using neutron diffraction measurements with isotopic labelling,
alongside X-Ray diffraction, as constraints upon an atomistic model. Such neutron scattering
measurements have enabled significant advances in the understanding of IL structure,1,17 and are
beginning to extend to DES, but thus far only metal-free or dilute metal systems have been
reported.38 We will explore the formation of complex ions, the intercomponent structuring and
clustering, and the behavior of water, to assess where they sit in the greater framework of liquids.
In doing so, we aim to demonstrate the potential of DES as task-specific green solvents, as well as
challenge the current perception of these systems.

170
8.5. Experimental
8.5.1. Lanthanide DES
Lanthanide DES were prepared using urea (Sigma-Aldrich, ≥99.5 %) and the respective lanthanide
(III) hydrate; cerium (III) nitrate hexahydrate (Acros, ≥99.99%), neodymium (III) nitrate hexahydrate
(Alfa Aesar, 99.9%) or praseodymium (III) nitrate hexahydrate (Acros, 99.9%). The two components
were mixed in the molar ratio of 3.5 urea : 1 Ln(NO3)3.6H2O salt,39 at room temperature, until a
single homogeneous and transparent phase had formed; heating was avoided because the thermal
decomposition of urea is anticipated to cause precipitation of lanthanide carbonates. The surface
tension was measured using a Sigma Attension instrument equipped with a platinum du Nöuy ring.
The ring was repeatedly flamed until red-hot using a butane torch and washed with deionized
water to ensure the full removal of organic and inorganic impurities. Density was measured using
a pycnometer calibrated against water (Elga, 18.2 MΩ), and viscosity was measured using a TA
Instruments HR-3 Discovery Hybrid Rheometer.
8.5.2. Radiation total scattering measurements
Wide Q-range neutron diffraction measurements were made of urea-cerium nitrate mixtures using
the NIMROD diffractometer (beamtime allocation RB1610312), located at TS2 of the STFC
Rutherford Appleton Laboratory, Harwell, Oxford, UK. NIMROD uses time-of-flight neutrons of
wavelength 0.05 ≤ λ ≤ 11 Å, with detector banks spanning the angular range of 0.6 – 37.5°, yielding
an effective Q-range of 0.01 ≤ Q ≤ 50 Å-1, or an approximate real-space length scale of 0.1 – 300 Å.
Two isotopic contrasts of the samples were used for measurements, using either
protonated or d4-urea with Ce(NO3)3.6H2O. The samples were loaded into flat-plate sample cells of
null-scattering TiZr alloy (0.68:0.32 Ti:Zr molar ratio). The cells are vacuum-sealed, with a 1 mm
pathlength and 1 mm wall thickness, accommodating approximately 1.5 g of sample within the
30x30 mm square NIMROD incident neutron beam footprint. Filled cells are mounted directly into
a metal sample changer, throughout which a water/ethylene glycol mixture is recirculated using a
Julabo heater/chiller unit to regulate the temperature to 303 ± 0.1 K at the sample positions.
Measurements were also made of empty cells, the empty instrument, and a standard 3
mm thick sample of V for calibration and normalization of the instrument and data. Measurements
were made for a median of 2 hours, with some variation in counting time depending on the
deuteration state of the sample. Processing of the raw data was accomplished using the GudrunN

171
software package;40 corrections were made for the sample multiple scattering and the inherent
background of the sample environment, as well as for attenuation, normalization and a final
iterative hydrogen inelasticity subtraction. This produces datasets that can be modelled using
Empirical Potential Structure Refinement modelling (EPSR). The computed and measured
scattering cross-sections agreed strongly, confirming the atomic composition of the sample and its
high purity.
In addition to the neutron measurements, the protonated samples were measured using
X-Ray total scattering (aka. XPDF) using a Panalytical X’Pert Pro II diffractometer with Ag radiation
(λ = 0.5594 Å). Samples were sealed into quartz glass X-Ray capillaries of 2 mm diameter and 0.01
mm wall thickness and mounted on a capillary spinner for measurement. The data were reduced
using the GudrunX software package, which corrects for the geometry and composition of the
sample, Compton and multiple scattering, absorption, fluorescence, background, and the
Bremsstrahlung radiation inherent to the incident beam. Data are normalized to the atomic self-
scattering level of the sample and finally used as a further experimental constraint upon the
subsequent atomistic model alongside neutron data.
Figure 9.1. Cartoons showing the atom type labels that were used in EPSR simulations and will be used throughout the text.
8.5.3. Empirical Potential Structure Refinement Modelling
Empirical Potential Structure Refinement (EPSR) is an atomistic model-based fitting approach that
is derived initially from the Reverse Monte Carlo (RMC) method, which uses diffraction data as an
experimental constraint upon a classical simulation.41 Full details of the procedures are given in
the supporting information, as well as the parameterization of the molecules. The assigned names

172
of each atom type for each molecule that will be referred to throughout the text are presented in
Figure 9.1.
8.6. Results and discussion
8.6.1. Lanthanide DES
Lanthanide DES (LnDES) were found to form homogeneous room-temperature liquids when mixed
in a lanthanide nitrate hydrate:urea mixing ratio of 1:3.5, commensurate with the previously-
reported ‘Type IV’ Cr(Cl)3.6H2O : urea DES.42 The Tg was determined using extrapolation of the
viscosity/temperature relationship with the Vogel-Fulcher-Tammann (VFT) equation and
differential scanning calorimetry (DSC), shown in the supporting information.43,44 Both techniques
suggest a Tg of 215 K, which is a significant eutectic depression when compared with the melting
points of the urea (406 K), and lanthanide precursors ie. Ce(NO3)3.6H2O (369 K), and relatable to
the more extreme eutectic depressions such as that of ChCl:urea.45 Refrigerated samples were
stable, though the urea-Ce(NO3)3.6H2O system formed trace pale precipitate, likely a cerium
carbonate or oxide, when kept for long times (>1 year) at RT. The solvents adopted the native Ln3+
cation coloration, colorless for cerium, bright green for praseodymium, whilst the neodymium
sample displays the Alexandrite effect where the color of the sample ranges from lilac to blue
depending on the lighting. These colors are shown in Figure 9.2. Furthermore, the DES were
investigated as reaction media for the formation of lanthanide oxides; an efficient self-solvated
direct combustion synthesis method was developed, which is detailed in the supporting
information.
Figure 9.2. Photographs of (a) the 3.5 Urea : 1 Ce(NO3)3.6H2O, (b) 3.5 Urea : 1 Pr(NO3)3.6H2O, and (c) 3.5 Urea : 1 Nd(NO3)3.6H2O LnDES, taken under Hg-vapor fluorescent strip lighting.

173
Table 9.1. Measured physical properties at room temperature (298 K) of LnDES and the computed Gordon Parameter, alongside literature data for H2O and the ‘Type III’ ChCl:Urea DES.
Ln Density / g cm-3
Viscosity / mPa.s
Surface Tension / mN m-1
Gordon Parametera (G) / J
m-3 Ce 1.789 168 83.33 ± 0.32 2.79 Pr 1.795 181 81.41 ± 0.47 2.73 Nd 1.801 168 82.82 ± 0.26 2.77 H2O 1.0b 0.889b 71.99c 2.74-2.75d
ChCl:U 1.2e 750f 66.0 ± 1.0g 1.57g aG is calculated using the equation G = γ/( 3√Vm), where γ is the air-solvent interfacial tension, and Vm is the molar volume. The molar volume, though varying subtly due to the different counterion mass, was calculated to be around 26.67 cm3 mol-1, as determined from the densities and mean molar mass (47.73 g mol-1) of the multicomponent solvents. bDerived from Kestin et al.46 cTaken from Vargaftik et al.47 dAs published by Greaves and Drummond.48 eDerived from data collected by Shah et al.49 fData reported by D’Agostino et al.50 gAs reported by Arnold et al.51
An interesting combination of physical properties were measured, shown in Table 9.1.
They are very dense liquids of ca. 1.8 g cm-3, which partially derives from the relatively high
concentration of heavy lanthanide ions; the Ce-based LnDES is composed of 21.74 wt.% lanthanide,
32.62 wt.% urea, 16.77 wt.% water and 28.87 wt.% nitrate. Despite the presence of very heavy
ions, the large proportion of small molecules gives a low average computed Mr (Ce LnDES = 47.73
g mol-1), when compared to ‘Type III’ DES which have much bulkier components and higher
viscosities, such as choline chloride:urea (average Mr = 86.6 g mol-1).52 The LnDES also have
remarkably high surface tensions, higher than the majority of typical ILs (ca. 40-50 mN m-1),53 ‘Type
III’ DES, (ca. 60-70 mN m-1),51 and even higher than water (72 mN m-1), implying strong H-bonding
associations. From these properties, the solvent cohesive energy density (Gordon parameter, G)
was calculated.48 ‘Type III’ DES such as ChCl:urea have Gordon parameters of around 1.5 J m-3,
which is within the range of typical molecular solvents (1-2 Jm-3), above most ILs (generally 0.5-1.5
J m-3) but far below that of water (2.743 J m-3).48 The computed G of the LnDES is ≥2.73 J m-3, making
their cohesive energy density comparable to, and in some cases slightly higher than water. A similar
set of properties were observed for a ‘Type IV’ CrCl3.6H2O:urea DES,16 where it was highlighted that
the low viscosity was due to Cl- being the main mobile species, and hole theory suggested a void
radius of 1.16 Å. However, when considering the viscosity, density, surface tension, calculated G,
and lack of Cl- in our samples, it seems that the viscosity is adequately explained by the much lower
average Mr and hence molar volume (26.7 cm3 mol-1) when compared to ChCl:urea (75.3 cm3 mol-
1).51 This points towards a structural model where the viscosity and associated physical properties
simply arise from the dynamics of local bond-making and bond-breaking, cf. Egami et al.’s universal
framework for the molecular origin of viscosity,54,55 rather than from the population of vacant
liquid ‘holes’,16,56–58 which were not observed in previous structural studies.19 The importance of
understanding the fundamental nanostructure, as well as the dynamics, of such systems is
therefore highlighted.

174
8.6.2. Neutron and X-Ray diffraction fits and data
Neutron diffraction data for the two isotopic contrasts of the 3.5:1 Urea: Ce(NO3)3.6H2O DES are
shown in Figure 9.3 alongside corresponding X-Ray data and fits using empirical potential structure
refinement (EPSR) modelling, in both Q and r space. The DES based on the cerium salt is considered
an adequate proxy for the solution structure of the other systems due to the chemical similarities,
and measurement of the Pr(NO3)3.6H2O and Nd(NO3)3.6H2O-based DES using this method on the
utilized pulsed neutron source instrument (NIMROD) would be complicated by neutron
resonances, particularly for the neodymium containing sample. The model refines well to both
neutron and X- data despite the difficulties of co-refinement, with only minor discrepancies in the
neutron data at Q ≤ 2 Å due to residual proton inelasticity, which is challenging to subtract from
the data.59 No small-angle scattering was observed. The X-Ray contrast proved essential because
X-Rays are sensitive to electron density and hence highlight the lanthanide coordination, shown by
the prominent peak in the X-Ray data at Q = 2.8 Å-1. Simultaneously, the X-Ray data and fits also
match well with the major ‘solvent structure’ peak seen at Q = 1.85 Å-1 in the two neutron
contrasts, which are more sensitive to proton positions. This peak occurs at slightly higher-Q, and
therefore shorter real-space distances, than the same peak in the previously-studied ‘Type III’ DES
ChCl:urea (1.45 Å-1),19 and ChCl:malic acid (1.15 Å-1)26 but at longer distances than in D2O (2 Å-1),60
proving that the major correlation lengths of the systems are distinct. Shorter average length scales
of interaction in the ‘Type IV’ DES reflect the higher charge density, and hence stronger Coulombic
attractions arising from the high concentration of highly-charged ions in the mixture, as well as a
smaller average molecular radius.

175
Figure 9.3. Corrected neutron and X-Ray diffraction data (colored markers) and EPSR fits to the models (dashed black lines) are shown as a function of Q-space (a), and r-space (b). Discrepancies in the r-space data below approximately 1 Å are spurious features carried forward from the Fourier transform of high-Q noise, especially for the X-Ray measurement.
8.6.3. Coordination network of Ce3+
As ‘Type IV’ DES have been related to complex-ionic liquids such as the well-known halometallates,
the speciation of the metal centers was investigated first. Figure 9.4 shows the cerium-centered
partial radial distribution functions (pRDFs), computed by accumulating the EPSR model of the
experimental neutron and X-Ray data shown in Figure 9.3. From these, the coordination numbers
were calculated and are shown in Table 9.2. Full convergence of the pRDFs is generally seen at 1

176
nm, with no long-range bulk order, and most of the pRDFs show a very strong nearest-neighbor
interaction and insignificant higher-order solvation. The most dominant bonds are close range Ce-
O ligation with nitrate, water, and urea, displayed in Figure 4a. The Ce-O1 and Ce-OU ordering are
distributed normally around 2.5 Å-1, whereas the Ce-NN and Ce-ON associations show a clear
bimodal distribution with two different coordination environments and different interaction
lengths. Contrasting these pRDFs with their corresponding coordination numbers (Table 9.2)
reveals that each cerium center is solvated by 3 water and 1.5 urea molecules, and two shells of
nitrate, approximately distributed as 1 close-range and 4 more distant anions, where the proximal
ON is centered at 2.5 A, and the distal ON is found at 4.5 Å. This would therefore suggest a range of
cerium species, which are on average anionic, with cerium centers relatively over-coordinated by
nitrate, but which also feature water and urea.16
Figure 9.4. Calculated partial radial distribution functions (pRDFs) showing the coordination of species around cerium ions. These pRDFs are an ensemble average of >5000 iterations of the EPSR model.

177
Table 9.2. Calculated coordination numbers (Ncoord) around cerium ions. The presented numbers are the mean, calculated from >5000 iterations of the EPSR average, and the displayed errors represent one standard deviation in coordination number as the system rearranges about equilibrium. Rmax displays the maximum radius of integration for coordination numbers (ie. the first minima in respective pRDFs) accurate to 1 data bin, where the minimum radius of integration is set to an arbitrary value before the onset of the peak.
aRmin = 3.3 Å.
From these various interactions, it can be inferred that in the absence of halides, the Ce-
‘X’ correlations occur generally through a strong Ce-O bond, and binding with nitrate is
electrostatically favored. The weaker close-range interactions such as those shown in Figure 9.4b,
ie. the Ce-H1 and Ce-HU1 interactions, are merely a consequence of Ce-O ligation and interactions
between molecules, such as urea-water H-bonding. Interestingly, most interaction distances are
short, and the Ce-Ce distance is the only prominent longer-range interaction in the mixture, which
peaks at 6.4 Å, with each Ce surrounded by 3.25 other Ce centers. This is a remarkably short
separation for charge-dense cations, implying effective short-range screening by the solvation
corona of NO3-. Coincidentally the Ce-Ce separation is almost exactly twice that of the Ce-NN (the
nitrate center-of-mass), which may help to explain the unusually large second-shell coordination
of nitrate, if nitrate is acting as a bridging ligand to form concatenated chains of Ce3+. Simply
viewing the EPSR box shows that many oligomeric [-Ce-NO3-] species can be found in the LnDES,
an example of which is shown in a snapshot in Figure 9.5. The variety of oligomers throughout the
box (see supporting information) supports the idea that ‘Type IV’ DES contain both positive and
negative complex ions, but does not necessarily support disproportionation.16 Having hidden the
other neutral ligands, which are of course still present and tightly bound in reality, the species in
Figure 9.5 would be [Ce3(NO3)7]2+, and if only considering the nearest-neighbor of each lanthanide
A B Rmax Ncoord
Ce Ce 7.6 3.25 ± 1.60
Ce O1 3.2 2.90 ± 1.56
Ce H1 3.7 5.91 ± 3.11
Ce NN 3.3 0.77 ± 0.81
Ce NN 4.2a 3.72 ± 1.36
Ce NN 4.2 4.49 ± 1.20
Ce ON 3.3 5.29 ± 1.55
Ce ON 5.2a 10.25 ± 2.56
Ce ON 5.2 15.54 ± 3.47
Ce CU 4.3 1.49 ± 1.20
Ce OU 3.4 1.47 ± 1.19
Ce NU 5.4 5.62 ± 2.52
Ce HU2 5.4 6.33 ± 2.46
Ce HU1 6.4 10.96 ± 3.50
Ce HU1 5.4 4.06 ± 2.09

178
center, the mean Ce formal charge is cancelled without undergoing redox. The dominance of the
Ce-O structuring and the transient formation of oligomeric cerium species is reminiscent of the
polymeric chains found in glasses, and when considering this it seems more closely related to
these, and to halometallate ILs,17 than the structure of most organic molecular liquids, ILs,1 and
‘Type III’ DES.28,29 It is noteworthy that this poly-conjugated Ce-network structure is the maximum-
entropy solution to the measured structure, with EPSR being an RMC-derived technique.61,62
Figure 9.5. Example oligomeric [-Ce-NO3-] complex taken from a snapshot of the EPSR model. Nitrates that are not within bonding distance have been omitted for clarity, alongside urea and water, though these are also present as ligands. Here, O atoms are coloured red, N atoms are coloured blue, and Ce atoms are coloured pale yellow.
8.6.4. Intercalating nanostructure
Considering the SDF plots in Figure 9.6 (orange surfaces, bottom row) supports the expected Ce-O
bonding modes described above. However, when these are considered alongside the neutral
species, and their calculated pRDFs (Figure 9.7) and associated coordination numbers (given in
supporting information), a secondary picture of the solvent nanostructure becomes apparent, as
these pRDFs give site-specific structural information for all atom types.

179
Figure 9.6. Spatial Density Function (SDF) plots showing the most likely 3D configuration of each molecule with respect to one another, computed from >5000 iterations of the model. The top row shows urea (purple isosurfaces) and water (dark blue isosurfaces), whereas the bottom row shows cerium (orange isosurfaces) and nitrate (cyan isosurfaces), respectively around water (first column), nitrate (second column), and urea (third column). The probability level of each isosurface is variable to facilitate viewing;
The unbound neutral species appear to form an independent hydrogen-bonded network.
There is significant self-structuring of each component; as shown in the water-centric pRDFs in
Figure 9.7a, each water molecule is directly bound to 1 other water at close-range with 6.3 waters
in the second solvation shell (O1-O1 and O1-H1). Meanwhile, urea-urea interactions (Figure 9.7b)
are predominantly through HU12-OU H-bonds, where each urea carbonyl group may be bound to
either the proximal or distal urea protons, with no significant preference for either. The primary
solvation shell of urea, determined from each molecular center (the CU carbon atom) is at relatively
long range (Rmax = 5.9), and 4.9 neighboring ureas are found within this sphere. The urea-urea and
water-water interactions are shown in the SDF plots in Figure 9.6 (blue and purple surfaces, top
row), which also highlights the interspecies interactions. Water is generally found close to the
water O1, and the urea-water SDF also demonstrates how water is capable of donating H-bonds to
the urea OU or accepting them from the urea HU2 protons. The strong H-bonds between urea and
water are reflected in the O1-OU and O1-HU12 pRDFs and Ncoords. On average, each water has 1.5 urea
molecules in its primary solvation shell as determined from the O1-OU pRDF, though considering
the low Ncoords for the O1-HU12 interactions, it appears that water is a more capable donor of H-
bonds to urea than the reverse. The combination of urea-urea, water-water and urea-water H-
bonding interactions in the LnDES is evocative of the nanostructure of concentrated urea-water
aqueous solutions.63

180
Figure 9.7. Calculated pRDFs showing site-site correlations; (a) describes water-‘x’ interactions centered around the water O atom, (b) shows interactions urea-‘x’ interactions based around either the urea C or O, (c) shows nitrate-‘x’ interactions for both nitrate O and N, and (d) shows proton-based interactions. The displayed pRDFs represent a statistical average of >5000 model iterations.
The contribution of the nitrate must also be considered (Figure 9.7c). As with the neutral
species, much of the nitrate is tightly bound to cerium centers via Ce-O bonding, and probably
more so due to the Coulombic attractions and effective close-range charge screening that is
inferred. However, nitrate-nitrate, nitrate-urea, and nitrate-water interactions are still clearly
observed. 2.43 nitrates are associated with each water molecule (O1-NN), while 4.15 nitrates are
associated with each urea (NN-CU), and each nitrate center sees 3.61 neighboring nitrates in its first
solvation shell (NN-NN). Such high coordination, especially the nitrate-nitrate interaction, is likely
to be a secondary effect from neighbors in the oligomeric [-Ce-NO3-] chains, when considering the
like-charge repulsions between anions and the dominance of the cerium-centered interaction
strength. Similarly, the high urea-nitrate and water-nitrate Ncoords are likely to be a secondary
feature, from nearest-neighbor and second-neighbor interactions within these species. The
nitrate-based interactions can be visualized in Figure 5 (bottom row, cyan surfaces), helping to
describe this effect. For example, water is seen to form a strong and directional Ce-O bond, and
while water-nitrate interactions are also seen in terms of strong H-bonds between protons and ON
atoms, further water-nitrate structuring can be seen extending in the same plane as the Ce-O bond.
Nitrates occupy the spaces between the linear ON-Ce bonding axes, while strong H-bonds are also
seen between the HU12-ON atom types, with relatively small Ncoords of 0.35 and 0.38 with significant
standard deviations.

181
Figure 9.8. EPSR model snapshots showing the position and distribution of (a) water, (b) urea, and (c) nitrate molecules, represented as shaded isosurfaces to aid with the visualization of the clustering phenomena. For scale, the box side length is 4.93 nm in every case. Arbitrary colors are used except in the case of urea (b), where the color represents the distribution of nitrogen-rich (blue), hydrogen-rich (white) and oxygen-rich (red) sub-domains.
Overall, considering the cerium-centered and molecular-centered pRDF analysis as well as
the SDFs gives a picture of two separate, but interacting nanostructures in the liquid bulk, which is
demonstrated by comparing snapshots of water and urea clusters (Figure 9.8a,b) and nitrate
clusters (Figure 9.8c). First there is a charge-dense pseudophase, containing predominantly cerium
centers and tightly-bound ligands, which include all the species present in the mixture but are
mostly nitrate, forming a network which contains fluxional oligomeric [-Ce-NO3-] polycations and
polyanions. Secondly, there is a mostly uncharged pseudophase, which is an H-bonded network
predominantly of urea and of water, though some nitrate is present. This less metal-rich
nanostructure still appears to be associated with the cerium centers and their complexes, likely
leading to fluxional behavior and constant ligand exchange. However, the reason behind the
secondary pseudophase is evident when considering the system stoichiometry: for each metal ion,
there are 3 anions and 9.5 uncharged molecules. Hence, despite the strong Ce-O ligation, only so
many species can coordinate each cation at a time due to steric crowding. Despite the usage of
the term ‘pseudophase’, we stress that the system is fully miscible and hence there is no true phase
separation, and these are only transient structures which do not give any experimental small-angle
signal, and hence are not genuine large-scale structures with long lifetimes. Even oligomeric [-Ce-
NO3-] species are too small and transient to cause small-angle scattering; these structures are
simply manifestations of the differing degrees of short-range order. The term ‘microemulsion’ is
not appropriate for such phases, which are more adequately described by a bicontinuous,
constantly interchanging and fluxional structure. This is consistent with the overall picture of protic
ionic liquids presented by Hayes et al., where all PILs were found to have a nanoscale structure
that could be described by a bicontinuous, spongelike model.64,65 The nanostructure described here
also aligns with the ‘plasticised Coulombic’ region described by MacFarlane et al. for mixtures of
ILs with molecular solvents.3 Such systems could also be considered as an extended subclass of
‘poor’ solvate ionic liquids where the molecular species is a good donor, but present in excess.66–68
Overall, the existence of these pseudophases can help to explain the unusual physical properties
182
of ‘Type IV’ DES; the abnormally low viscosity and high calculated Gordon parameters can both be
understood in terms of strongly-bound transient oligomers in flux with an interpenetrating H-bond
network of small species.
8.7. Conclusions
We have reported here the first lanthanide-based DES (LnDES), have investigated their structure
using neutron and X-Ray scattering and atomistic modelling, and correlated this with their physical
properties.
The LnDES have unusual physical properties, including low viscosity and high surface tension, and
Gordon parameters higher than water. Analysis of neutron and X-Ray diffraction data shows that
their structure does not align closely with ‘Type III’ DES and is more relatable to chlorometallate
ILs. In the cerium-based DES that we have studied in detail, the nanostructure is dominated by Ce-
O interactions, which are sufficiently strong that transient, network-like oligomeric species of [-Ce-
NO3-] are seen, forming a variety of polyanions and polycations, which was previously
hypothesized of ‘Type IV’ DES. Neutral species participate in this bonding, but stoichiometrically
the cerium centers are overcrowded, and the remnants form a H-bond-rich pseudophase that is
more closely related to the ‘Type III’ DES structure, but is even more like concentrated mixtures of
urea and water. Our findings contrast with previous descriptions of metallic DES structures which
were considered as true ILs with perhalogenated metal complex ions, or disproportionated
complexes. Our findings are therefore in line with previous studies of ‘Type IV’ DES which
suggested the formation of complex ions, but diffraction techniques offer a more nuanced view of
the structure, which is relatable to the ‘poor’ solvate ionic liquids. Ongoing fundamental studies
into DES therefore continue to show unexpected structures and outcomes and are challenging the
fundamental definition of what constitutes a DES. The considerations shown here are potentially
of broad interest to groups working with DES and attempting to apply these neoteric solvents in
any discipline; we have demonstrated this by showing the viability of LnDES for the direct
combustion synthesis of lanthanide oxides for the first time. Clearly, there is a vast scope for
further structural studies of DES in general including the LnDES presented here.

183
8.8. Acknowledgements
O. S. H. thanks the STFC and EPSRC for co-funding a PhD studentship via the EPSRC Centre for
Doctoral Training in Sustainable Chemical Technologies (Studentship 3578). We thank the ISIS
Pulsed Neutron and Muon Source for allocation of experimental beamtime on NIMROD and for
access to the X-Ray diffraction instrument under allocation RB1610312.
8.9. References
1 R. Hayes, G. G. Warr and R. Atkin, Chem. Rev., 2015, 13, 6357–6426. 2 M. Francisco, A. Van Den Bruinhorst and M. C. Kroon, Angew. Chemie - Int. Ed., 2013, 52, 3074–3085. 3 D. MacFarlane, A. L. Chong, M. Forsyth, M. Kar, V. Ranganathan, A. Somers and J. M. Pringle, Faraday
Discuss., 2018, 206, 9–28. 4 P. G. Jessop, Green Chem., 2011, 13, 1391-1398. 5 P. Anastas and N. Eghbali, Chem. Soc. Rev., 2010, 39, 301–312. 6 R. A. Sheldon, Green Chem., 2017, 19, 18–43. 7 E. L. Smith, A. P. Abbott and K. S. Ryder, Chem. Rev., 2014, 114, 11060–11082. 8 D. J. G. P. van Osch, L. F. Zubeir, A. van den Bruinhorst, M. A. A. Rocha and M. C. Kroon, Green Chem.,
2015, 17, 4518–4521. 9 B. D. Ribeiro, C. Florindo, L. C. Iff, M. A. Z. Coelho and I. M. Marrucho, ACS Sustain. Chem. Eng., 2015,
3, 2469–2477. 10 D. J. G. P. van Osch, D. Parmentier, C. H. J. T. Dietz, A. van den Bruinhorst, R. Tuinier and M. C. Kroon,
Chem. Commun., 2016, 52, 11987–11990. 11 Y. Marcus, ACS Sustain. Chem. Eng., 2017, 5, 11780–11787. 12 M. Francisco, A. van den Bruinhorst, L. F. Zubeir, C. J. Peters and M. C. Kroon, Fluid Phase Equilib.,
2013, 340, 77–84. 13 M. Francisco, A. van den Bruinhorst and M. C. Kroon, Green Chem., 2012, 14, 2153-2157. 14 M. Francisco, A. S. B. González, S. L. García de Dios, W. Weggemans, M. C. Kroon, V. Gomis, R.
Pedraza, O. Francés, A. Font, J. C. Asensi, et al. RSC Adv., 2013, 3, 23553-23561. 15 D. Rengstl, V. Fischer and W. Kunz, Phys. Chem. Chem. Phys., 2014, 16, 22815–22822. 16 A. P. Abbott, A. A. Al-Barzinjy, P. D. Abbott, G. Frisch, R. C. Harris, J. Hartley and K. S. Ryder, Phys.
Chem. Chem. Phys., 2014, 16, 9047-9055. 17 J. Estager, J. D. Holbrey and M. Swadźba-Kwaśny, Chem. Soc. Rev., 2014, 43, 847–886. 18 A. P. Abbott, G. Capper, D. L. Davies, R. K. Rasheed and V. Tambyrajah, Chem. Commun., 2003, 0, 70–
71. 19 O. S. Hammond, D. T. Bowron and K. J. Edler, Green Chem., 2016, 18, 2736–2744. 20 C. R. Ashworth, R. P. Matthews, T. Welton and P. A. Hunt, Phys. Chem. Chem. Phys., 2016, 18, 18145–
18160. 21 C. F. Araujo, J. A. P. Coutinho, M. M. Nolasco, S. F. Parker, P. J. A. Ribeiro-Claro, S. Rudić, B. I. G. Soares
and P. D. Vaz, Phys. Chem. Chem. Phys., 2017, 19, 17998–18009. 22 R. Stefanovic, M. Ludwig, G. B. Webber, R. Atkin and A. J. Page, Phys. Chem. Chem. Phys., 2017, 19,
3297-3306. 23 M. Gilmore, L. M. Moura, A. H. Turner, M. Swadźba-Kwaśny, S. K. Callear, J. A. McCune, O. A.
Scherman and J. D. Holbrey, J. Chem. Phys., 2018, 148, 193823. 24 S. Zahn, Phys. Chem. Chem. Phys., 2017, 19, 4041–4047. 25 S. Zahn, B. Kirchner and D. Mollenhauer, ChemPhysChem, 2016, 17, 3354–3358. 26 O. S. Hammond, D. T. Bowron, A. J. Jackon, T. Arnold, A. Sanchez-Fernandez, N. Tsapatsaris, V. G.
Sakai and K. J. Edler, J. Phys. Chem. B, 2017, 121, 7473–7483. 27 O. S. Hammond, D. T. Bowron and K. J. Edler, Angew. Chemie - Int. Ed., 2017, 56, 9782–9785. 28 T. G. A. Youngs, J. D. Holbrey, C. L. Mullan, S. E. Norman, M. C. Lagunas, C. D’Agostino, M. D. Mantle,
L. F. Gladden, D. T. Bowron and C. Hardacre, Chem. Sci., 2011, 2, 1594-1605.

184
29 T. Murphy, R. Hayes, S. Imberti, G. G. Warr and R. Atkin, Phys. Chem. Chem. Phys., 2014, 16, 13182–13190.
30 K. Shahbaz, I. M. Alnashef, R. J. T. Lin, M. A. Hashim, F. S. Mjalli and M. M. Farid, Sol. Energy Mater.
Sol. Cells, 2016, 155, 147–154. 31 H. M. A. Abood, A. P. Abbott, A. D. Ballantyne and K. S. Ryder, Chem. Commun. (Camb)., 2011, 47,
3523–3525. 32 I. Juneidi, M. Hayyan and M. A. Hashim, RSC Adv., 2015, 5, 83636–83647. 33 C. Li, J. Zhang, Z. Li, J. Yin, Y. Cui, Y. Liu and G. Yang, Green Chem., 2016, 18, 3789–3795. 34 L. Adhikari, N. E. Larm, N. Bhawawet and G. A. Baker, ACS Sustain. Chem. Eng., 2018, 6, 5725–5731. 35 J. Wu, K. Fujii, M. Yashima, A. Staykov, T. Akbay, T. Ishihara and J. A. Kilner, J. Mater. Chem. A, 2018,
6, 11819-11829. 36 M. Shibasaki and N. Yoshikawa, Chem. Rev., 2002, 102, 2187–2209. 37 G. Wang, Q. Peng and Y. Li, Acc. Chem. Res., 2011, 44, 322–332. 38 O. S. Hammond, K. J. Edler, D. T. Bowron and L. Torrente-Murciano, Nat. Commun., 2017, 8, 14150. 39 A. P. Abbott, G. Capper, D. L. Davies and R. K. Rasheed, Chem. - A Eur. J., 2004, 10, 3769–3774. 40 A. K. Soper, GudrunN and GudrunX: Programs for Correcting Raw Neutron and X-ray Diffraction Data
to Differential Scattering Cross Section. Rutherford Appleton Laboratory Technical Report RAL-TR-
2011-013, STFC 2011. 41 A. K. Soper, Chem. Phys., 1996, 202, 295–306. 42 A. P. Abbott, J. C. Barron, K. S. Ryder and D. Wilson, Chem. - A Eur. J., 2007, 13, 6495–6501. 43 C. A. Angell, Science, 1995, 267, 1924–1935. 44 S. Bulut, P. Eiden, W. Beichel, J. M. Slattery, T. F. Beyersdorff, T. J. S. Schubert and I. Krossing,
ChemPhysChem, 2011, 12, 2296–2310. 45 G. García, M. Atilhan and S. Aparicio, Chem. Phys. Lett., 2015, 634, 151–155. 46 J. Kestin, M. Sokolov and W. A. Wakeham, J. Phys. Chem. Ref. Data, 1978, 7, 941–948. 47 N. B. Vargaftik, B. N. Volkov and L. D. Voljak, J. Phys. Chem. Ref. Data, 1983, 12, 817–820. 48 T. L. Greaves and C. J. Drummond, Chem. Soc. Rev., 2013, 42, 1096–1120. 49 A. . Yadav and S. Pandey, J. Chem. Eng. Data, 2014, 59, 2221–2229. 50 C. D’Agostino, L. F. Gladden, M. D. Mantle, A. P. Abbott, I. Ahmed, Essa, A. Y. M. Al-Murshedi and R.
C. Harris, Phys. Chem. Chem. Phys., 2015, 17, 15297–15304. 51 T. Arnold, A. J. Jackson, A. Sanchez-Fernandez, D. Magnone, A. E. Terry and K. J. Edler, Langmuir,
2015, 31, 12894–12902. 52 M. Pal, R. Rai, A. Yadav, R. Khanna, G. A. Baker and S. Pandey, Langmuir, 2014, 30, 13191–13198. 53 M. Tariq, M. G. Freire, B. Saramago, J. A. P. Coutinho, J. N. C. Lopes and L. P. N. Rebelo, Chem. Soc.
Rev., 2012, 41, 829–868. 54 S. Perticaroli, B. Mostofian, G. Ehlers, J. C. Neuefeind, S. O. Diallo, C. B. Stanley, L. Daemen, T. Egami,
J. Katsaras, X. Cheng and J. D. Nickels, Phys. Chem. Chem. Phys., 2017, 19, 25859–25869. 55 T. Iwashita, B. Wu, W.-R. Chen, S. Tsutsui, A. Q. R. Baron and T. Egami, Sci. Adv., 2017, 3, e1603079. 56 A. P. Abbott, G. Capper and S. Gray, Chemphyschem, 2006, 7, 803–806. 57 A. P. Abbott, R. C. Harris and K. S. Ryder, J. Phys. Chem. B, 2007, 111, 4910–4913. 58 A. P. Abbott, ChemPhysChem, 2004, 5, 1242–1246. 59 A. K. Soper, Mol. Phys., 2009, 107, 1667–1684. 60 A. K. Soper, ISRN Phys. Chem., 2013, 2013, 279463. 61 R. L. McGreevy, J. Phys. Condens. Matter, 2001, 13, R877–R913. 62 A. K. Soper, Mol. Phys., 2001, 99, 1503–1516. 63 A. K. Soper, E. W. Castner and A. Luzar, Biophys. Chem., 2003, 105, 649–666. 64 R. Hayes, S. Imberti, G. G. Warr and R. Atkin, Angew. Chemie - Int. Ed., 2013, 52, 4623–4627. 65 R. Hayes, S. Imberti, G. G. Warr and R. Atkin, Angew. Chemie - Int. Ed., 2012, 51, 7468–7471. 66 T. Mandai, K. Yoshida, K. Ueno, K. Dokko and M. Watanabe, Phys. Chem. Chem. Phys., 2014, 16,
8761–8772. 67 K. Yoshida, M. Tsuchiya, N. Tachikawa, K. Dokko and M. Watanabe, J. Phys. Chem. C, 2011, 115,
18384–18394. 68 S. W. Coles, M. Mishin, S. Perkin, M. V. Fedorov and V. B. Ivaništšev, Phys. Chem. Chem. Phys., 2017,
19, 11004–11010.

185
9. NANOSTRUCTURE OF THE DEEP EUTECTIC SOLVENT / PLATINUM
ELECTRODE INTERFACE AS A FUNCTION OF POTENTIAL AND
WATER CONTENT
9.1. Overview
Deep Eutectic Solvents (DESs) are attracting significant research interest as electrochemical
solvents, especially for electrodeposition, as they share many of the useful properties of ionic
liquids, but are generally cheaper and have the potential to be more environmentally friendly.1,2
Despite this, the interfacial liquid (double layer) structure of DESs at metal electrodes has been
completely unexplored. Moreover, despite their hygroscopicity and an increasing trend to
introduce water to DES to make them more tractable, the effect of added water on the interfacial
structure is also unknown, and the only structural study of the effect of water on DES has been our
previous work on the bulk.3 This therefore represents a further extension of Chapters 3, 5, and 7,
by probing the surface structure of a variety of DES, with and without water. Furthermore,
observations of near-surface layering from AFM measurements have implications in the
preparation of nanostructured materials in DES, by giving evidence for the proposed selective
capping of surface facets by DES components and therefore affecting the self-assembly process.
Here we therefore probed the interfacial nanostructure of the three most widely studied
DESs at a Pt electrode as a function of applied potential and water content. By determining the
interfacial structure, it is possible to draw conclusions and determine structure-property
relationships to correlate with electrodeposition characteristics, and compare these with trends
seen in pure ionic liquids.4 AFM Force-distance curves were used to measure choline chloride:urea,
choline chloride:ethylene glycol, and choline chloride:glycerol DES at a Pt (111) interface.
The pure DES were found to have minimal structure at the interface, which is logical when
considering that they are structurally relatable to the slightly-diluted protic ILs such as
ethylammonium nitrate (EAN), which show the same interfacial structure when a small amount of
a molecular species is present.5 Remarkably, added water increases interfacial liquid layering at
water contents of up to 40–50 wt%, and a series of near-surface steps are seen extending several
nanometres into the bulk of the DES. This corresponds with the water concentration just prior to
the transition to an aqueous solution in the bulk structure, where choline-water superstructuring

186
is observed. Above these concentrations this structure is lost in the bulk, as it is at the interface,
and above this level of water only a signal which corresponded to a short-range exponential decay
with reduced tip-surface screening is observed, as seen in dilute electrolyte solutions. Interestingly,
application of potential also causes this structure to be lost, and the system behaves like a dilute
electrolyte solution. It is proposed that the structuring is caused as the surface, and first and second
strongly-bound layers, template structure further into the bulk, and at 40 wt% water in the urea
system, it is known that the choline-water interaction is maximised.
These results have important implications for the rational design of DES electrochemical
systems, and for other applications incorporating a solid interface such as heterogeneous catalysis,
particle stability, lubrication, and so on. Most importantly, the results presented here imply that
the experimental and theoretical trends and results for ionic liquid systems cannot be assumed to
hold true for DES. Because the structure formed under a potential is also not relatable to ILs, it
seems likely that this work will have a significant impact in the field of DES electrodeposition, but
also in the field of DES and IL structure. Further measurement of related and more esoteric DES
systems at a variety of interfaces, applied potentials, and co-solvent compositions. will provide
edifying results, with techniques such as AFM and the surface forces apparatus (SFA).
This paper is reproduced with minor adaptations to match the thesis formatting
specifications from the final accepted version published in Nanoscale Horizons. The associated
electronic supporting information is provided in Appendix 8.
1 M. Armand, F. Endres, D. R. MacFarlane, H. Ohno and B. Scrosati, Nat. Mater., 2009, 8, 621–629. 2 A. P. Abbott and K. J. McKenzie, Phys. Chem. Chem. Phys., 2006, 8, 4265–4279. 3 O. S. Hammond, D. T. Bowron and K. J. Edler, Angew. Chemie - Int. Ed., 2017, 56, 9782-9785. 4 F. Endres, O. Hofft, N. Borisenko, L. H. Gasparotto, A. Prowals, R. Al-Salman, T. Carstens, R. Atkin, A.
Bund and S. Z. El Abedin, Phys. Chem. Chem. Phys., 2010, 12, 1724–2732. 5 J. A. Smith, O. Werzer, G. B. Webber, G. G. Warr and R. Atkin, J. Phys. Chem. Lett., 2010, 1, 64–68.

187
9.2. Statement of contribution
This declaration concerns the article entitled:
Nanostructure of the deep eutectic solvent / platinum electrode interface as a function of potential
and water content
Publication status (tick one)
draft
manuscript Submitted
In
review Accepted Published
Publication details
O. S. Hammond, H. Li, C. Westermann, F. Endres, A. Y. M. Al-Murshedi, A. P. Abbott,
G. Warr, K. J. Edler and R. Atkin, Nanoscale Horizons, 2018 (Advance Article)
DOI: https://dx.doi.org/10.1039/C8NH00272J
Candidate’s
contribution to
the paper
(detailed, and
also given as a
percentage).
The candidate contributed to/ considerably contributed to/predominantly
executed the…
Formulation of ideas:
KJE and RA discussed collaborating initially. RA, APA and OSH decided on the
precise nature of the project during the 2017 Faraday Discussion on ILs. 50%.
Design of methodology:
OSH, RA, and HL discussed and designed experiments to test the hypothesis. 50%
Experimental work:
OSH carried out 80% of the AFM experiments. Due to time constraints, some
further measurements were carried out by CW and HL to complete the datasets.
Presentation of data in journal format:
OSH analysed his collected data and drafted the initial manuscript. Analysis of data
from CW and HL was done by HL. The final manuscript was reworked by RA with
input from all authors: 70%.
Statement from
Candidate This paper reports on original research I conducted during the period of my Higher
Degree by Research candidature.
Signed
Date
20/09/18

188
9.3. Abstract
The interfacial nanostructure of the three most widely-studied Deep Eutectic Solvents (DESs),
choline chloride:urea (ChCl:Urea), choline chloride:ethylene glycol (ChCl:EG), and choline
chloride:glycerol (ChCl:Gly) at a Pt(111) electrode has been studied as a function of applied
potential and water content up to 50 wt%. Contact mode atomic force microscope (AFM) force-
distance curves reveal that for all three DESs, addition of water increases interfacial nanostructure
up to ~40 wt%, after which it decreases. This differs starkly from ionic liquids, where addition of
small amounts of water rapidly decreases interfacial nanostructure. For the pure DESs, only one
interfacial layer is measured at OCP at 0.5 nm, which increases to 3 to 6 layers extending ~ 5 nm
from the surface at 40 or 50 wt% water. Application of a potential of ±0.25 V to the Pt electrode
for the pure DESs increases the number of near surface layers to 3. However, when water is present
the applied potential attenuates the steps in the force curve, which are replaced by a short-range
exponential decay. This change was most pronounced for ChCl:EG with 30 wt% or 50 wt% water,
so this system was probed using cyclic voltammetry, which confirms the interfacial nanostructure
is akin to a salt solution.
9.4. Introduction
Deep Eutectic Solvents (DES) are produced by mixing a high melting point salt with a molecular
‘hydrogen bond donor’ (HBD) at the eutectic composition, where the depression in melting point
is greatest. DES can easily be formed from a wide range of commonly available, biocompatible
and/or biodegradable, inexpensive components including amides, fatty acids, glycols and sugars.1–
4 The most widely studied DES combine choline or metal chlorides with urea, ethylene glycol or
glycerol. For example, mixing choline chloride (ChCl; MP = 303 °C) and urea (MP = 134 °C) in a 1:2
molar ratio produces a room-temperature liquid. At least one of the DES ions (typically the cation)
has low symmetry and the capacity to form a variety of H-bonds, as does the molecular
component.5–9 High entropy derived from this range of potential interactions between liquid
components yields low-melting mixtures at or near eutectic compositions.
DES were originally developed as greener and cheaper alternatives to the related class of
ionic liquids (ILs),10 and like ILs can be tailored for specific applications.4 More recently, DES have
been designated a subset of the ‘4th generation of ionic liquids’,11 and are now used as solvents
for organic synthesis,12 polymers,13 and nanomaterials14 such as metal oxides15,16 and porous
carbons.17–20 Emerging DES applications include separations and extractions,21 CO2 sequestration,22

189
and the self-assembly of large-scale structures such as micelles,23–29 polymers,30 lipids,31 and
biomolecules.32–34 However, the most important DES research area is electrochemistry, especially
metal electrodeposition.35 DES can be designed to have good solubility for metal ions36 and optimal
electrochemical windows37 while having minimal environmental impact.38 This, along with strong
industrial demand for high-quality metal coatings and films,39 means that DES are poised to
become next-generation electrochemical solvents.40 However, as with ILs, the structure of DES
components at an electrode interface must be known to rationally optimise electrochemical
processes;41–43 In the absence of fundamental understanding of the structure of the DES electrical
double layer, this goal cannot be achieved.
To date few fundamental studies of the DES double layer structure have appeared. Chen
et al. examined a series of DES at HOPG electrode interfaces as a function of potential, using AFM
and DFT.44 Multilayer nanostructures were found, but they were weaker (fewer layers and lower
push-through forces) than for typical ILs.45 Atilhan et al. performed MD simulations for a
ChCl:levulinic acid DES on the (100) surface of Ag, Al, and Pt,46 and subsequently performed DFT
calculations for a series of DES on graphene.47 The structures reported for graphene were
consistent with AFM measurements on HOPG,44 as well as subsequent MD simulations by Kaur et
al.48, who reported an 0.5 nm thick layer in contact with the surface, but minimal surface-induced
structure beyond 1 nm. DES-metal interactions obeyed the ordering strength Pt > Al > Ag, with
well-defined layers seen up to 1 nm, and weak perturbation up to 3 nm from the interface.46 Chen
et al. have also studied the effect of aliphatic chain length in alkylammonium bromide DES on the
interfacial structure,49 and observed that layer thickness grew proportionately with the alkyl
moiety. Vieira et al. measured ChCl:ethylene glycol (EG) on a glassy carbon electrode with infrared
reflection-absorption spectroscopy (IRRAS), which reveals strong surface adsorption of the EG with
competition from cholinium ions.50 Other electrochemical studies assume the interfacial
structure,35 or infer the structure indirectly.51,52
DESs are typically highly hygroscopic and very difficult to dry completely,53 so
understanding the effect of water on the DES electrical double layer is critical for optimising
electrodeposition conditions. It has recently been reported that the liquid structure of DES is
largely retained in the presence of water up to 50 vol. %,9 while transport properties are improved
due to reduced viscosity, meaning there may be significant advantages for using wet DESs in
electrochemistry. At solid - IL interfaces, nanostructure decreases with increasing water content,
and above ~ 50 vol% water, the IL-water mixture behaves like an aqueous electrolyte solution and
interfacial nanostructure is absent.54–56 In this communication, we present results from the first
study of DES nanostructure at a metal (Pt) electrode. Choline chloride:urea (ChCl:Urea), choline
chloride:ethylene glycol (ChCl:EG), and choline chloride:glycerol (ChCl:Gly) are investigated as a

190
function of water content and applied potential. Remarkably, and in stark contrast to ILs, the DES
interfacial nanostructure increases with water content up to 40 vol%, which has important
consequences for electrochemical behaviour.
9.5. Experimental
Pure DES were prepared by the common route of mixing as-received choline chloride (Sigma-
Aldrich, ≥98%) in a 1:2 ratio with either ethylene glycol (Sigma-Aldrich, ≥99.8%), glycerol (Sigma-
Aldrich, ≥99%), or urea (Sigma-Aldrich, ≥99.5%), with vigorous mixing and heating at 60 ºC in an oil
bath until the earliest point at which a homogeneous liquid formed. DES-water mixtures were
subsequently prepared from these stock solutions by adding deionised H2O (Elga, 18.2 MΩ) with
stirring or shaking until a homogeneous solution was formed, with complete mixing of the two
mutually compatible liquids of different refractive index and density57 signalled by the
disappearance of schlieren textures. As expected, low-level water was present in all the pure DES
(≤0.34 %) as measured by KF titration.
AFM measurements were performed using a Bruker Nanoscope IV multimode instrument
operating in contact mode. For all measurements, the chosen mixture was syringed into a AFM
liquid cell, where the DES was isolated from the atmosphere and held by a PTFE O-ring next to a
polycrystalline platinum surface (a 60 nm layer, nominally of Pt (111), deposited onto a silicon
wafer), with measured RMS roughness of 0.6 nm over a 500 nm×500 nm area. Standard Si AFM
cantilevers (model NSC36, MikroMasch, Sofia, Bulgaria) were used throughout, and the
composition of the tip reflective coating was not observed to have an effect (Au or Al). Both surface
and cantilever were cleaned of organics by washing thoroughly with deionised water and absolute
ethanol, before drying and irradiating using a UV-Ozone cleaner for 20 minutes prior to use. The
measured steps were reproducible regardless of the ramp rate or size; the higher resolution of a
smaller, slower approach or retraction is offset by proportionally higher experimental noise.
Electrochemical measurements were performed using cyclic voltammetry with an Autolab
PGSTAT20 software-controlled potentiostat using three electrodes; a 0.5 mm platinum wire as the
working electrode, a silver wire as the reference electrode and a platinum sheet as the counter
electrode. Cyclic voltammetry was performed for sodium iodide dissolved in pure ChCl:EG and
repeated for each with different water contents.
191
9.6. Results and discussion
Figure 9.1 presents AFM curves for pure ChCl:Urea at a Pt electrode at OCP, and OCP ±0.25 V. This
potential window was examined to avoid electrochemical processes associated with water in later
experiments. For all systems and potentials, the force curves presented were selected by
determining the mean number of steps and push-through force for more than 100 force curves
acquired over several days, which allows selection of a typical force curve which closely matches
the average values. This approach is favoured over an “average” force curve, as averaging hides
features that, although consistent, occur at small normal forces or slightly different separations.
In Figure 9.1, all force curves exhibit short-range repulsions that resolve into discrete steps
between near-vertical force walls at small separations. The sub-nm widths of these steps are
consistent with near surface liquid layers of ionic or molecular components of the DES, and show
negligible underlying van der Waals attractions.
In ChCl:Urea (Figure 9.1), only one step is present at OCP, but at 0.25V and –0.25V, the
step number is increased to 3, and the ‘push-through’ force required to displace the final layer
increases from 1 nN to at least 2.5 nN. While the last measured steps are almost vertical (i.e.
incompressible), those further from the surface are compressible. More steps and higher push-
through forces with an applied potential have been observed previously for ionic liquids on metal
electrodes.41 Both here and in prior work, this has been attributed to counterion enrichment in the
Stern layer, which templates better defined structure in near surface layers and through this,
stronger cohesive interactions.

192
Figure 9.1. AFM Force-Distance profiles for pure ChCl:Urea at OCP, and OCP ±0.25V. The dashed vertical line is at 0.45 nm.
At positive potentials, the counterion (Stern) layer in contact with the electrode surface
must be enriched in Cl-. However, the 0.45 nm final “push-through” layer , is too large to be Cl-
(0.35 nm). This means, as we have found previously for ChCl:Urea on graphite,44 and many ionic
liquid systems,58 at zero apparent separation the AFM tip is pushing against a counterion layer that
it cannot displace. The question, then, is whether the layer in contact with the chloride-rich Stern
layer is enriched in choline or urea. Previous AFM studies have shown that the liquid layers of pure
glycerol and ethylene glycol in contact with a graphite surface are 0.33 nm and 0.23 nm thick,
respectively. HBD-rich layers in ChCl:EG, ChCl:Gly, and ChCl:Urea DESs were also only ~0.3 nm
thick.44 The thickness of the innermost measured layer on Pt at positive potentials is, however,
consistent with the diameter of Ch+ (0.43 nm).44 Therefore, at positive potentials the chloride-rich
Stern layer in contact with the Pt surface which the AFM tip cannot displace is followed by a
choline-rich near-surface layer. Electrostatic considerations mean the choline charge group is
preferentially orientated toward the chloride and alcohol groups towards the bulk. Subsequent
steps are too weak and compressible to permit an unambiguous interpretation of their
composition.

193
At negative potentials, the Stern layer must similarly be enriched in choline, with charged
groups preferentially orientated towards the surface and hydroxyl groups facing the bulk liquid.
The thickness of the final measured layer is 0.3 nm, which is too thin to be either choline (0.43 nm)
or chloride (0.35 nm), but is consistent with the urea-rich layers seen on graphite.44 Thus, the final
measured step at positive potentials is due to a urea-rich layer, which is in contact with a choline-
rich Stern layer the tip cannot displace. As with negative potentials, subsequent steps are weak.
At OCP (no applied potential) the 0.45 nm thickness of the final push-through distance is
too large to indicate enrichment in chloride or urea. Therefore, we conclude the final measured
layer is choline rich, as seen at positive applied potentials. Here, however, it is unclear whether this
final measured layer is the Stern layer or first near surface layer. The single step seen in ChCl:Urea
is much fewer than the 4 or 5 steps routinely observed in ionic liquids with similarly sized and
structured ions (e.g. ethylammonium nitrate (EAN)) at surfaces with roughness similar to the Pt
electrode.59,60 This is because in ChCl:Urea the ions are diluted by 2 urea molecules, whereas EAN
is a pure salt. Liquid cohesion within layers is therefore reduced in the DES due to reduced
electrostatics, and packing considerations.
The interfacial structure of ChCl:Urea at a Pt electrode differs markedly from that at a
graphite electrode. There the thickness of the final displaceable layer was found constant between
+1 V and -0.5, and attributed to displacement of a HBD rich layer in contact with an underlying
impenetrable Stern layer.44 This difference is attributed to the atomically smooth graphite surface
strongly aligning counterions.
Figure 9.2 presents force data for ChCl:Urea at a Pt electrode at OCP as a function of water
content up to 50 wt%. To our knowledge, the effect of water on DES interfacial structure has not
previously been reported using AFM force curves or any other technique. Addition of 10 wt% water
changes range and form of the force markedly, adding compressible steps with push-through
jumps at 1.4 nm and 2 nm. At 20 wt% water, the number and position of the steps is the same,
but they are more pronounced, and at 30 wt% water, a fourth weak step appears at ~ 2.7 nm.
When the water content is further increased to 40 wt% there are at least 6 steps in the force curve
extending 5.5 nm into solution, and the force required to rupture the final layer increases from 2
nN to 5 nN. At 50 wt% water, the push through force is again reduced to 2 nN, but at least 5
interfacial layers remain visible, extending further into the liquid than at water contents of 30 wt%
and lower. The thickness of the final penetrable layer increases with water content from 0.45 nm
at in pure ChCl:Urea to ~0.55 nm for 40 and 50 wt% water.

194
Figure 9.2. AFM Force-Distance profiles for ChCl:Urea with different water contents at OCP. The dashed vertical line is at 0.55 nm (see text).
This trend of water increasing DES interfacial nanostructure up to 40 wt%, followed by a
slight weakening at 50 wt%, stands in stark contrast to ionic liquid systems, where added water

195
only weakens interfacial nanostructure. For example, for a silica substrate (which has roughness
comparable to the Pt electrode) in contact with EAN, the interfacial nanostructure associated with
the pure liquid is almost completely eliminated by addition of 10 wt% water, and by 25 wt% water
the force curves are consistent with a salt solution.54
To understand the trends in ChCl:Urea interfacial nanostructure, the force data must be
considered in conjunction with the bulk liquid structure of ChCl:Urea5 and its mixtures with water.61
Neutron diffraction and fitting reveals that in bulk ChCl:urea, the choline and urea preferentially
bind to chloride atoms while maximising weaker interactions with each other.5 Water added to
ChCl:urea up to 40 wt% preferentially associates with the cholinium ion, with corresponding
weakening of interactions between the DES components (cholinium, chloride and urea). Water
hydrates the pure DES by sequestration around the cholinium cation, but the liquid structure is
otherwise little changed.18,61,62 . Beyond 40 wt% water the mixture is much less structured, and is
better described as a solution of DES components in water.
In the context of these bulk trends, the changes in ChCl:Urea interfacial nanostructure as
a function of water content can be understood. Up to 30 wt%, added water associates with the
cholinium ions (probably via the outward-facing hydroxyls) in the last penetrable layer such that
its thickness remains approximately constant at 0.45 nm. Its participation in the hydrogen bond
network of the mixture strengthens cohesive interactions laterally in this layer, which increases
the push-through force and templates stronger structure in near-surface molecules and ions,
leading to the detection of additional layers. These layers also contain water, as neutron diffraction
shows significant chloride-water and urea-water interactions (but weaker than for cholinium
water). The number and strength of layers increases with water content up to at least 30 wt% as
the choline-water coordination number grows.
The most highly-structured interface (highest push through forces and greatest number of
layers) occurs at 40 wt% water. Here the cholinium ion corordination by water is at a maximum,
but has not yet transitioned to a DES-in-water solution. The hydrogen bond network of water and
the DES components leads to an increase in the thickness of the final layer, and the sharply
increased number of layers results from the combined effects of the smooth, solid surface, and the
cohesive forces that drive the underlying liquid structure; a well-formed first layer templates
structure in the second layer, and so on, with order gradually decaying into the bulk. These swollen
DES structures, are less deformable under the pressure of the AFM, which leads to more vertical
steps and higher push through forces.
At 50 wt% water in ChCl:urea, the bulk data reveals a DES-in-water mixture. However,
accumulation of ions at the Pt surface will lead to a higher interfacial ion concentration than in the

196
bulk, especially when confined by the AFM tip, the surface of which has its own, less well defined,63–
65 interfacial nanostructure. Consequentially, the elevated interfacial ion concentration causes
much of the strong interfacial nanostructure observed at 40 wt% water to be retained at 50 wt%
water. The decrease in push through forces and number of layers, the compressibility of near
surface layers, and decreased width of the final step in the force data at 50 wt% water is consistent
with the system tending towards a DES-in-water solution.
Figure 9.3 presents AFM force data for ChCl:Urea with 30 and 50 wt% water at OCP, and
±0.25V; the OCP data is reproduced from Figure 9.2 to enable direct comparison. The steps in the
force data at OCP are significantly altered when a potential is applied, such that a short-range
exponential decay becomes the dominant feature, superimposed with weak steps. At negative
potentials, a weak attraction is observed between 3 nm and 5.5 nm for both 30 and 50 wt% water.
Figure 9.3. AFM Force-Distance profiles for ChCl:Urea with 30 wt% water (left) and 50 wt% water (right) at OCP, and OCP ±0.25V.
When a potential is applied to the Pt electrode, counterions are attracted to the interfacial
regions, and co-ions repelled.66 This means that when a positive or negative potential is applied,
the counterion to co-ion ratio in the liquid ratio adjacent to the adsorbed layer is unbalanced,

197
which hinders ion packing into layers, and the AFM tip measures an exponential decay consistent.
Any weak steps in the force curves are due to the weakly structured counterion layers.
AFM force curve data as a function of potential and water content for the two most studied
polyol-based DESs, ChCl:EG, and ChCl:Gly parallel many of the results found in ChCl:Urea. Much
less is known about the bulk liquid structures of pure ChCl:EG, and ChCl:Gly than ChCl:Urea at the
molecular level, and almost nothing about their the effect of added water; neutron spin-echo
measurements suggest that the ChCl:Gly structure is reminiscent of glycerol, with the ions
occupying interstitial voids.67
Figure 9.4 shows that the interfacial nanostructure of pure ChCl:EG and ChCl:Gly at a Pt
electrode at is strongly affected by applied of potential. At positive potentials, when an
impenetrable, chloride-rich Stern layer in contact with the surfaces defines zero apparent
separation, the layer nearest the surface of both DESs is 0.45 nm thick. This layer must be enriched
in choline in both ChCl:EG, and ChCl:Gly, just as it is in ChCl:Urea, as it is too thick to be due to
either chloride or the HBD. At negative potentials, the Stern layer is enriched in choline with
charged groups facing the electrode and alcohol groups facing the bulk liquid. The thicknesses of
the final displaceable layers of ChCl:EG, and ChCl:Gly are 0.25 nm and 0.30 nm, respectively, which
are close to the corresponding layer thicknesses of pure ethylene glycol (0.23 nm) and glycerol
(0.33 nm). In both ChCl:EG and ChCl:Gly the final measured layer at negative potentials is HBD-rich,
sitting atop a choline-rich impenetrable Stern layer. At OCP, the thicknesses of the final measured
layers are 0.45 nm and 0.50 nm for ChCl:EG, and ChCl:Gly, respectively. This thickness is again
consistent with a choline enriched layer but, as with ChCl:Urea, it is unclear whether this
corresponds to the Stern layer, or the first near surface layer.

198
Figure 9.4. AFM Force-Distance profiles for pure ChCl:EG (left) and ChCl:Gly (right) at OCP, and OCP ±0.25V. The dashed vertical lines are at 0.45 nm.
At larger separation there is evidence for liquid nanostructure extending into solution. At
OCP in ChCl:Gly a weak second layer is detected, and in ChCl:EG, additional steps are superimposed
on a weak exponential decay consistent with a salt solution.
Application of ±0.25V to the Pt electrode surface increases the force required to rupture
the final layer of both ChCl:EG and ChCl:Gly. As with ChCl:Urea, this is attributed to counterion-
enriched, well ordered, Stern layers enhancing structure, templating subsequent near surface
layers. This is seen in an increase in the number of steps in the force curve of ChCl:Gly, just as in
ChCl:Urea, but not for ChCl:EG. This suggests differences between the H-bond networks supported
by the three HBDs analogous to the effects of molecular flexibility disrupting interfacial layering in
ionic liquids59 and pure molecular liquids.68 This would be consistent with bulk liquid structures
that became more like electrolyte solutions as one progresses from urea to glycerol to ethylene
glycol.
Figure 9.5 shows that water addition to ChCl:Gly at OCP also parallels the behaviour of
ChCl:urea, but ChCl:EG is again qualitatively different. Water addition to ChCl:Gly increases the

199
number of discrete steps from two to 4 at 30 wt% water, and then decreases as the layering
becomes less pronounced. This shows that, like ChCl:urea, interfacial structure is strongest for
ChCl:Gly in the range 30-40 wt%. As water content is increased, the thickness of the step nearest
the surface remains approximately constant at 0.5 nm, but the width of subsequent steps is much
greater, at ~0.9 nm. This is too large to be due to any individual or hydrated DES component. This
reveals water molecules drive stronger associations between DES components, which are
displaced from the space between the AFM tip and the Pt electrode as aggregates.
The effect of added water on ChCl:EG is dramatic, c.f. Figure 9.5. The 0.5 nm step nearest
the surface and subsequent weak exponential decay measured in the pure DES are replaced by
two (or more) layers each 1 nm thick. The interfacial structure as measured by the number and
definition of layers clearly increases with water addition up to 50 wt%. Further increasing water
content up to 90 wt% water diminishes the observed structure (see Figure E1 of the electronic
supplementary information). Notably, in Figure E1, a clear step in the force curve is observed even
for 80 wt% water, and attractive interactions consistent with a high salt concentration aqueous
solution only emerge between 80 wt% and 90 wt% water. This is dramatically different from EAN,
where attractive forces are detected above 75 wt% water due to van der Waals forces dominating
the overall interaction.

200
Figure 9.5. AFM Force-Distance profiles for ChCl:EG (left) and ChCl:Gly (right) with different water contents as indicated. The vertical line is at 1 nm for ChCl:EG and 0.5 nm ChCl:Gly.
Force data at OCP, and OCP ±0.25V, for ChCl:EG with 30 wt% water and 50 wt% water is
presented in Figure 9.6, and ChCl:Gly with 30 wt% water and 50 wt% water in Figure 9.7. For

201
ChCl:EG the pronounced steps at OCP, indicating strong interfacial structure, almost disappear
when a potential is applied and are replaced with a short-range exponential decay. A similar effect
is noted for ChCl:Gly, but some weak steps can be discerned superimposed on the exponential
decay. This is surprising, given that the steps in the force curve at OCP are significantly wider and
have higher push through forces for ChCl:EG than ChCl:Gly. This shows the DES nanostructure at
OCP is not strongly related to the structure when a potential is applied. On the evidence available
it is concluded that the exponential decay is a consequence of counterions and being attracted
into, and co-ions repelled from the Stern and near surface liquid layers when a potential is applied,
as per the ChCl:urea data presented in Figure 9.3, and the environment experienced by the tip is
more like a salt solution.
Figure 9.6. AFM Force-Distance profiles for ChCl:EG with 30 wt% water (left) and 50 wt% water (right) at OCP, and OCP ±0.25V.
Of the three DESs investigated in this work, the effect of applying a potential to the Pt
electrode when water is present (at either 30 wt% or 50 wt%) is greatest for ChCl:EG: this system
has the largest steps at OCP with added water, and these steps almost completely disappear when
a potential is applied. OCP interfacial structure is weaker for ChCl:urea than ChCl:Gly at 30 wt%
water, and especially 50 wt% water, and when a potential is applied weak steps overlay the
exponential decay. Therefore, as the effect of potential with added water was greatest for ChCl:EG,
this system was studied more closely using cyclic voltammetry.

202
Figure 9.7. AFM Force-Distance profiles for ChCl:Gly with 30 wt% water (left) and 50 wt% water (right) at OCP, and OCP ±0.25V.
Figure 9.8 (left) shows cyclic voltammograms obtained in ChCl:EG containing 0.1 mol dm-3 sodium
iodide at a scan rate of 10 mVs-1. In pure ChCl:EG two well-defined electrochemically reversible
redox peaks can be observed for NaI with formal potentials of 0.73 V and 0.92 V. The first peak is
related to the electrochemical oxidation of iodide to form triiodide. The peak occurring at more
positive potentials is related to the oxidation of triiodide to iodine as per Equation (1) and (2).69,70
3I- - 2e- ↔ I3- (1)
I3- - e- ↔ 3/2I2 (2)
Iodine is relatively hydrophobic and is relatively insoluble in aqueous solutions, so it tends
to precipitate on the electrode surface. However, we have recently shown that iodine is very
soluble in DESs due to the formation of I2Cl-, but as the water content increases the solubility of
iodine decreases significantly.71,72 Therefore, changing double layer from ion dominated to water
dominated should be evident in the shape of the voltammogram. Figure 9.8 (right) shows the cyclic
voltammograms for 0.1 mol dm-3 sodium iodide with water contents from 0 to 50 wt% at a scan
rate of 4 mVs-1. The electrochemical response changes as water is added, with the second peak

203
becoming much sharper with an increased amount of water in the mixture. The nanoscale
heterogeneity of DES-water mixtures has been demonstrated using Brillouin spectroscopy,62
neutron diffraction,9,61 and PFG-NMR,72 the latter of which highlighted variability between the
diffusion coefficients of water and DES components. Considering this alongside the known strong
interaction between water and halide anions, it is proposed that I- will preferentially transport
through water-rich regions.5 At 50 wt% water, the voltammogram is characteristic of the response
obtained in an aqueous solution of iodide, confirming the presence of water in the double layer.
Figure 9.8. Cyclic voltammograms of 0.1 mol dm-3 NaI in (left) ChCl:EG and (right) ChCl:EG with 10% water (red line), 40% water (blue line) and 50% water (teal dashed line), measured at a scan rate of 4 mV s-1.
9.7. Conclusions
AFM force curves have been used to probe the liquid interfacial (double layer) structure of the
three most widely used DESs (ChCl:Urea, ChCl:EG and ChCl:Gly) at a Pt electrode as a function of
applied potential and water contents. Analysis of the data reveals the interfacial arrangements of
liquid components depends strongly upon water content and applied potential, Differences
between DES with different HBD type are less pronounced.
For the pure DESs, 1 or 2 steps are measured at OCP, which increases to 2 or 3 steps upon
application of a ±0.25V potential. This is attributed to increased ordering of Stern layer ions
templating structure in subsequent layers.
When water is added to the DESs, interfacial nanostructure increases up to 40 wt% for
ChCl:Urea, 30% for ChCl:Gly, and 50 wt% for ChCl:EG. This is a startling result, as added water
dilutes the ions, which was expected to decrease interfacial nanostructure, as foreseen previously
in ionic liquids. The increases in interfacial nanostructure with added water is attributed to water

204
molecules solvating and swelling the native ChCl:Urea liquid structure, and participating in the
hydrogen bond network of the mixture, combined with the smooth, solid surface inducing a
layered morphology; a well-defined first layer templates structure in the second layer, and so on,
with ordering gradually decaying towards the bulk.
A similarly surprising result was obtained for DESs when water is present (30 wt% or 50
wt%) and a potential of ±0.25V is applied. The steps in the force curve essentially disappear, and
are replaced by a short range exponential decay reminiscent of a electrolyte solution.
These results reveal that, while DESs may be considered ‘cousins’ to ionic liquids, their
interfacial behaviour at an electrode interface are vastly different, especially of the effects of added
water and applied potential. This means results for ionic liquid systems cannot be assumed to hold
true for DESs.42,73,74
9.8. Acknowledgements
O.S.H. thanks STFC and EPSRC for a co-funded PhD scholarship in the Centre for Doctoral Training
in Sustainable Chemical Technologies at the University of Bath (EP/L016354/1; STFC Studentship
Agreement 3578) and acknowledges travel funding from said CDT to pursue an internship at UWA.
AYMA would like to thank the Ministry of Higher Education in Iraq for funding a studentship and
the University of Kufa for permitting study leave to carry out research. R.A. acknowledges new staff
start-up funding from UWA.
9.9. References
1 E. L. Smith, A. P. Abbott and K. S. Ryder, Chem. Rev., 2014, 114, 11060–11082. 2 Q. Zhang, K. De Oliveira Vigier, S. Royer and F. Jérôme, Chem. Soc. Rev., 2012, 41, 7108–7146. 3 A. Paiva, R. Craveiro, I. Aroso, M. Martins, R. L. Reis and A. R. C. Duarte, ACS Sustain. Chem. Eng.,
2014, 2, 1063–1071. 4 M. Francisco, A. Van Den Bruinhorst and M. C. Kroon, Angew. Chemie - Int. Ed., 2013, 52, 3074–3085. 5 O. S. Hammond, D. T. Bowron and K. J. Edler, Green Chem., 2016, 18, 2736–2744. 6 C. F. Araujo, J. A. P. Coutinho, M. M. Nolasco, S. F. Parker, P. J. A. Ribeiro-Claro, S. Rudić, B. I. G. Soares
and P. D. Vaz, Phys. Chem. Chem. Phys., 2017, 19, 17998–18009. 7 R. Stefanovic, M. Ludwig, G. B. Webber, R. Atkin and A. J. Page, Phys. Chem. Chem. Phys., 2017, 19,
3297-3306. 8 C. R. Ashworth, R. P. Matthews, T. Welton and P. A. Hunt, Phys. Chem. Chem. Phys., 2016, 18, 18145–
18160. 9 O. S. Hammond, D. T. Bowron, A. J. Jackson, T. Arnold, A. Sanchez-Fernandez, N. Tsapatsaris, V. G.
Sakai and K. J. Edler, J. Phys. Chem. B, 2017, 121, 7473–7483. 10 A. P. Abbott, G. Capper, D. L. Davies, H. L. Munro, R. K. Rasheed and V. Tambyrajah, Chem. Commun.,

205
2001, 19, 2010–2011. 11 D. MacFarlane, A. L. Chong, M. Forsyth, M. Kar, V. Ranganathan, A. Somers and J. M. Pringle, Faraday
Discuss., 2018, 206, 9–28. 12 D. A. Alonso, A. Baeza, R. Chinchilla, G. Guillena, I. M. Pastor and D. J. Ramón, European J. Org. Chem.,
2016, 2016, 612–632. 13 J. D. Mota-Morales, R. J. Sánchez-Leija, A. Carranza, J. A. Pojman, F. del Monte and G. Luna-Bárcenas,
Prog. Polym. Sci., 2017, 78, 139–153. 14 D. V Wagle, H. Zhao and G. A. Baker, Acc. Chem. Res., 2014, 47, 2299–2308. 15 O. S. Hammond, S. Eslava, A. J. Smith, J. Zhang and K. J. Edler, J. Mater. Chem. A, 2017, 5, 16189–
16199. 16 O. S. Hammond, K. J. Edler, D. T. Bowron and L. Torrente-Murciano, Nat. Commun., 2017, 8, 14150. 17 N. Fechler, N. P. Zussblatt, R. Rothe, R. Schlögl, M.-G. Willinger, B. F. Chmelka and M. Antonietti, Adv.
Mater., 2015, 28, 1287–1294. 18 E. Posada, N. López-Salas, D. Carriazo, M. A. Muñoz-Márquez, C. O. Ania, R. J. Jiménez-Riobóo, M. C.
Gutiérrez, M. L. Ferrer and F. del Monte, Carbon N. Y., 2017, 123, 536–547. 19 N. López-Salas, D. Carriazo, M. C. Gutiérrez, M. L. Ferrer, C. O. Ania, F. Rubio, A. Tamayo, J. L. G. Fierro
and F. del Monte, J. Mater. Chem. A, 2016, 4, 9146–9159. 20 K. Kapilov-Buchman, L. Portal, Y. Zhang, N. Fechler, M. Antonietti and M. S. Silverstein, J. Mater.
Chem. A, 2017, 5, 16376–16385. 21 B. Tang, H. Zhang and K. H. Row, J. Sep. Sci., 2015, 38, 1053–1064. 22 G. Garcia, S. Aparicio, R. Ullah and M. Atilhan, Energy & Fuels, 2015, 29, 2616–2644. 23 A. Sanchez-Fernandez, T. Arnold, A. J. Jackson, S. L. Fussell, R. K. Heenan, R. A. Campbell and K. J.
Edler, Phys. Chem. Chem. Phys., 2016, 18, 33240–33249. 24 A. Sanchez-Fernandez, O. S. Hammond, A. J. Jackson, T. Arnold, J. Doutch and K. J. Edler, Langmuir,
2017, 33, 14304–14314. 25 A. Sanchez Fernandez, K. J. Edler, T. Arnold, R. K. Heenan, L. Porcar, N. J. Terrill, A. Terry and A. J.
Jackson, Phys. Chem. Chem. Phys., 2016, 18, 14063–14070. 26 T. Arnold, A. J. Jackson, A. Sanchez-Fernandez, D. Magnone, A. E. Terry and K. J. Edler, Langmuir,
2015, 31, 12894–12902. 27 M. Pal, R. Rai, A. Yadav, R. Khanna, G. A. Baker and S. Pandey, Langmuir, 2014, 30, 13191–13198. 28 M. Pal, R. K. Singh and S. Pandey, ChemPhysChem, 2015, 16, 2538–2542. 29 X. Tan, J. Zhang, T. Luo, X. Sang, C. Liu, B. Zhang, L. Peng, W. Li and B. Han, Soft Matter, 2016, 12,
5297–5303. 30 L. Sapir, C. B. Stanley and D. Harries, J. Phys. Chem. A, 2016, 120, 3253–3259. 31 S. J. Bryant, R. Atkin and G. G. Warr, Soft Matter, 2016, 12, 1645–1648. 32 H. Monhemi, M. R. Housaindokht, A. A. Moosavi-Movahedi and M. R. Bozorgmehr, Phys. Chem.
Chem. Phys., 2014, 16, 14882–14893. 33 A. Sanchez-Fernandez, K. J. Edler, T. Arnold, D. Alba Venero and A. J. Jackson, Phys. Chem. Chem.
Phys., 2017, 19, 8667–8670. 34 I. Gállego, M. A. Grover and N. V. Hud, Angew. Chemie - Int. Ed., 2015, 54, 6765–6769. 35 Q. Zhang, Q. Wang, S. Zhang, X. Lu and X. Zhang, ChemPhysChem, 2016, 17, 335–351. 36 A. P. Abbott, G. Capper, D. L. Davies, K. J. McKenzie and S. U. Obi, J. Chem. Eng. Data, 2006, 51, 1280–
1282. 37 A. P. Abbott, J. C. Barron, M. Elhadi, G. Frisch, S. J. Gurman, A. R. Hillman, E. L. Smith, M. A.
Mohamoud, and K. S. Ryder, ECS Trans., 2009, 16, 47–63. 38 R. A. Sheldon, Green Chem., 2017, 19, 18–43. 39 A. P. Abbott, K. El Ttaib, K. S. Ryder and E. L. Smith, Trans. IMF, 2008, 86, 234–240. 40 C. J. Clarke, W. C. Tu, O. Levers, A. Bröhl and J. P. Hallett, Chem. Rev., 2018, 118, 747–800. 41 R. Hayes, N. Borisenko, M. K. Tam, P. C. Howlett, F. Endres and R. Atkin, J. Phys. Chem. C, 2011, 115,
6855–6863. 42 F. Endres, O. Hofft, N. Borisenko, L. H. Gasparotto, A. Prowals, R. Al-Salman, T. Carstens, R. Atkin, A.
Bund and S. Z. El Abedin, Phys. Chem. Chem. Phys., 2010, 12, 1724–1732. 43 R. Atkin, S. Z. El Abedin, R. Hayes, L. H. S. Gasparotto, N. Borisenko and F. Endres, J. Phys. Chem. C,
2009, 113, 13266–13272. 44 Z. Chen, B. McLean, M. Ludwig, R. Stefanovic, G. G. Warr, G. B. Webber, A. J. Page and R. Atkin, J.
Phys. Chem. C, 2016, 120, 2225–2233. 45 R. Hayes, G. G. Warr and R. Atkin, Chem. Rev., 2015, 13, 6357–6426. 46 M. Atilhan and S. Aparicio, J. Phys. Chem. C, 2016, 120, 10400–10409. 47 M. Atilhan, L. T. Costa and S. Aparicio, Langmuir, 2017, 33, 5154–5165. 48 S. Kaur, S. Sharma and H. K. Kashyap, J. Chem. Phys., 2017, 147, 194507.
206
49 Z. Chen, M. Ludwig, G. G. Warr and R. Atkin, J. Colloid Interface Sci., 2017, 494, 373–379. 50 L. Vieira, R. Schennach and B. Gollas, Phys. Chem. Chem. Phys., 2015, 17, 12870–12880. 51 R. Costa, M. Figueiredo, C. M. Pereira and F. Silva, Electrochim. Acta, 2010, 55, 8916–8920. 52 M. Figueiredo, C. Gomes, R. Costa, A. Martins, C. M. Pereira and F. Silva, Electrochim. Acta, 2009, 54,
2630–2634. 53 X. Meng, K. Ballerat-Busserolles, P. Husson and J.-M. Andanson, New J. Chem., 2016, 40, 4492–4499. 54 J. A. Smith, O. Werzer, G. B. Webber, G. G. Warr and R. Atkin, J. Phys. Chem. Lett., 2010, 1, 64–68. 55 Z. Wang, H. Li, R. Atkin and C. Priest, Langmuir, 2016, 32, 8818–8825. 56 R. G. Horn, D. F. Evans and B. W. Ninham, J. Phys. Chem., 1988, 92, 3531–3537. 57 K. Shahbaz, F. S. G. Bagh, F. S. Mjalli, I. M. AlNashef and M. A. Hashim, Fluid Phase Equilib., 2013, 354,
304–311. 58 R. Hayes, G. G. Warr and R. Atkin, Phys. Chem. Chem. Phys., 2010, 12, 1709–1723. 59 R. Atkin and G. G. Warr, J. Phys. Chem. C, 2007, 111, 5162–5168. 60 R. Atkin and G. G. Warr, J. Phys. Chem. B, 2007, 111, 9309–9316. 61 O. S. Hammond, D. T. Bowron and K. J. Edler, Angew. Chemie - Int. Ed., 2017, 56, 9782–9785. 62 E. Posada, N. López-Salas, R. J. Jiménez Riobóo, M. L. Ferrer, M. C. Gutiérrez and F. del Monte, Phys.
Chem. Chem. Phys., 2017, 19, 17103–17110. 63 T. Carstens, R. Gustus, O. Hoefft, N. Borisenko, F. Endres, H. Li, R. J. Wood, A. J. Page and R. Atkin, J.
Phys. Chem. C, 2014, 118, 10833–10843. 64 A. Elbourne, K. Voïtchovsky, G. G. Warr and R. Atkin, Chem. Sci., 2015, 6, 527–536. 65 A. J. Page, A. Elbourne, R. Stefanovic, M. A. Addicoat, G. G. Warr, K. Voïtchovsky and R. Atkin,
Nanoscale, 2014, 6, 8100–8106. 66 D. J. Shaw, Introduction to Colloid and Surface Chemistry, Elsevier, Amsterdam, 1992. 67 A. Faraone, D. V Wagle, G. A. Baker, E. C. Novak, M. Ohl, D. Reuter, P. Lunkenheimer, A. Loidl and E.
Mamontov, J. Phys. Chem. B, 2018, 122, 1261–1267. 68 H. K. Christenson, R. G. Horn and J. N. Israelachvili, J. Colloid Interface Sci., 1982, 88, 79–88. 69 A. Ejigu, K. R. J. Lovelock, P. Licence and D. A. Walsh, Electrochim. Acta, 2011, 56, 10313–10320. 70 C. L. Bentley, A. M. Bond, A. F. Hollenkamp, P. J. Mahon and J. Zhang, J. Phys. Chem. C, 2015, 119,
22392–22403. 71 A. Y. M. Al-Murshedi, PhD Thesis, University of Leicester, 2018. 72 C. D’Agostino, L. F. Gladden, M. D. Mantle, A. P. Abbott, I. Ahmed, Essa, A. Y. M. Al-Murshedi and R.
C. Harris, Phys. Chem. Chem. Phys., 2015, 17, 15297–15304. 73 Q. Zhang, Q. Wang, S. Zhang, X. Lu and X. Zhang, ChemPhysChem, 2015, 17, 335–351. 74 M. Armand, F. Endres, D. R. MacFarlane, H. Ohno and B. Scrosati, Nat. Mater., 2009, 8, 621–629.
207
10. FROM ION TO IRON: TOWARDS A BETTER UNDERSTANDING OF MATERIALS SYNTHESIS IN DES
10.1. Abstract
Deep Eutectic Solvents and their hydrated mixtures have been used to prepare useful metal oxide
nanomaterials, such as iron oxide. Here we attempted to ‘bridge the gap’ of understanding and
perform a study of this solvothermal reaction process from beginning to end, to fully understand
the reaction, and the various processes leading to the self-assembly of nanoparticles. This was
achieved by measuring the initial speciation of iron in the DES solutions using EXAFS and measuring
the structure of the mixture using neutron and X-Ray diffraction and EPSR modelling. The reaction
was monitored using in situ analysis techniques including SANS, to determine mesoscopic changes,
and EXAFS, to determine local rearrangements of order around iron ions. It is shown that iron salts
dissolve to form an octahedral Fe(L)3(Cl)3 complex where (L) comprises a variety of O-containing
ligands. The addition of iron salt induced subtle structural rearrangements in the solvent system
due to the abstraction of chloride into complexes and distortion of H-bonding networks around
complexes. EXAFS experiments suggest that these complexes hydrolyse under heating due to the
generation of basic urea degradation products which scavenge Cl- from the complexes. In the
hydrated DES, the reaction proceeds linearly and quickly, whereas in the pure DES, the reaction
initially proceeds quickly, but suddenly slows after 5000 s. In situ SANS, and static SAXS
experiments reveal that 5000 s is the point at which nanoparticles suddenly self-assemble in the
pure DES, which affects the reduced reaction rate by decreasing the diffusion coefficient of the
sample due to local structural rearrangements and causing the reaction to become diffusion-
limited. Furthermore, SANS measurements suggest that the hydrated system forms nanoparticles
with 1D morphologies not because of solvent pre-structuring, which neutron diffraction suggests
is lost on the addition of water, but because of selective capping of surface crystal facets to direct
growth along certain axes; this is less favourable in the pure DES because the solvent structure
restricts it.
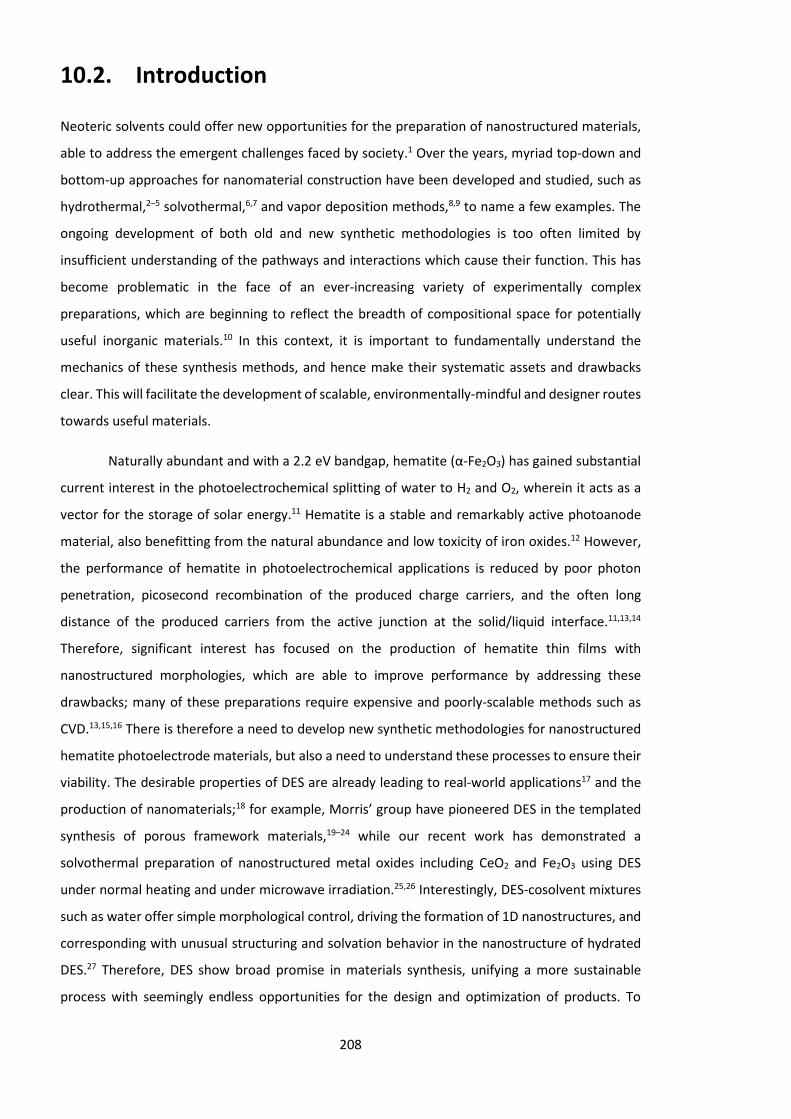
208
10.2. Introduction
Neoteric solvents could offer new opportunities for the preparation of nanostructured materials,
able to address the emergent challenges faced by society.1 Over the years, myriad top-down and
bottom-up approaches for nanomaterial construction have been developed and studied, such as
hydrothermal,2–5 solvothermal,6,7 and vapor deposition methods,8,9 to name a few examples. The
ongoing development of both old and new synthetic methodologies is too often limited by
insufficient understanding of the pathways and interactions which cause their function. This has
become problematic in the face of an ever-increasing variety of experimentally complex
preparations, which are beginning to reflect the breadth of compositional space for potentially
useful inorganic materials.10 In this context, it is important to fundamentally understand the
mechanics of these synthesis methods, and hence make their systematic assets and drawbacks
clear. This will facilitate the development of scalable, environmentally-mindful and designer routes
towards useful materials.
Naturally abundant and with a 2.2 eV bandgap, hematite (α-Fe2O3) has gained substantial
current interest in the photoelectrochemical splitting of water to H2 and O2, wherein it acts as a
vector for the storage of solar energy.11 Hematite is a stable and remarkably active photoanode
material, also benefitting from the natural abundance and low toxicity of iron oxides.12 However,
the performance of hematite in photoelectrochemical applications is reduced by poor photon
penetration, picosecond recombination of the produced charge carriers, and the often long
distance of the produced carriers from the active junction at the solid/liquid interface.11,13,14
Therefore, significant interest has focused on the production of hematite thin films with
nanostructured morphologies, which are able to improve performance by addressing these
drawbacks; many of these preparations require expensive and poorly-scalable methods such as
CVD.13,15,16 There is therefore a need to develop new synthetic methodologies for nanostructured
hematite photoelectrode materials, but also a need to understand these processes to ensure their
viability. The desirable properties of DES are already leading to real-world applications17 and the
production of nanomaterials;18 for example, Morris’ group have pioneered DES in the templated
synthesis of porous framework materials,19–24 while our recent work has demonstrated a
solvothermal preparation of nanostructured metal oxides including CeO2 and Fe2O3 using DES
under normal heating and under microwave irradiation.25,26 Interestingly, DES-cosolvent mixtures
such as water offer simple morphological control, driving the formation of 1D nanostructures, and
corresponding with unusual structuring and solvation behavior in the nanostructure of hydrated
DES.27 Therefore, DES show broad promise in materials synthesis, unifying a more sustainable
process with seemingly endless opportunities for the design and optimization of products. To

209
realize the extent of this potential, these new methodologies must be accompanied by advances
in fundamental understanding.
We will therefore explore here the formation of Fe2O3 (hematite) nanoparticles in a pure
choline chloride:urea DES (1:2) and its hydrated counterpart (1:2:10w; ca. 42 wt.% H2O). This is to
our knowledge the first kinetic study of a solvothermal reaction occurring in a DES; the only other
in situ material synthesis measurements reported to date were of metal film electrodeposition
from DES using reflectometry techniques.28,29 Studying such processes is experimentally
demanding, and necessitates a series of advanced techniques, sensitive to the variable length
scales and evolving constituent species as the reaction progresses, but unaffected by solution
properties such as high viscosity, gas evolution, and magnetism. Self-assembly of iron oxide NPs in
pure and hydrated DES will be assessed using SANS and SAXS, EXAFS, and neutron diffraction and
modelling studies, to allow resolution of the reaction from the beginning to the end. This work
therefore aims to understand the atomistic configurations found within the system as the reaction
begins, and how these begin to change as the reaction proceeds, ultimately forming nanoparticles
which change in size and shape over time depending on conditions.
10.3. Experimental
10.3.1. Preparation of DES
The choline chloride-urea DES was prepared according to the typical literature procedure of
mechanically stirring vacuum-dried choline chloride (Acros, 99.5%) and urea (Acros, 99.5%) in a
sealed vessel and with gentle heating until a monophasic, clear liquid was obtained.30 DES-water
mixtures were obtained by mixing pure DES stock solution with water (Elga, 18.2 MΩ) until a
homogenous solution of 1:2:10 choline chloride:urea:water (a hydration level described as 10w)
was made. Iron (III) nitrate nonahydrate (Acros, 99.9%) was mixed at room temperature with the
pure or hydrated DES at constant molal concentrations between 0.15 – 0.35 mol kg-1, and the
resulting bright yellow solution was used as the precursor material for all subsequent techniques.
The iron nitrate nonahydrate salt has a high water content and is dissolved at relatively high
concentrations. Varying the concentration of this species therefore has a significant effect on the
water content of the mixture in the absence of other added water. The water content of the various
pure DES mixtures are reported in Table 10.1.

210
Table 10.1. Calculated variance in the intrinsic solvent water content as a function of iron nitrate concentration. Water content is calculated assuming minimal water content in the pure solvent upon preparation from freshly vacuum-dried choline chloride and urea. In molar terms, the ratio of choline:Fe3+ in the pure solvent for 0.15, 0.25 and 0.35 mol kg-1 is 1:31, 1:19 and 1:13 respectively and for the same concentrations in the hydrated (10w) solvent these values are 1:18, 1:11 and 1:8 respectively. Mole fractions of the components can be calculated from the eutectic stoichiometry of 1:2:(10) choline chloride:urea:(water) and the iron complex stoichiometry and molal concentration. The variable choline:Fe3+ stoichiometry arises from the preparation of the hydrated solvent with 40.9 wt% water.
[Fe(NO3)3.9H2O] / mol kg-1 Solvent water content / wt%
0.15 2.29
0.20 3.00
0.25 3.68
0.35 4.97
10.3.2. Neutron diffraction
Liquid-phase neutron diffraction measurements were made upon a series of 0.25 mol kg-1 solutions
of Fe(NO3)3.9H2O, in isotope-substituted pure and hydrated (10w) DES using the NIMROD total
scattering instrument,31 at TS2 of the ISIS Neutron & Muon Source, Rutherford Appleton
Laboratory, UK, under beamtime allocation RB1620292. NIMROD covers a wide q-range of 0.01 ≤
Q ≤ 50 Å-1, using a wide angular detector coverage of 0.6 – 37.5°, and time-of-flight neutrons of
wavelength 0.05 ≤ λ ≤ 11 Å. Isotope-substituted DES were prepared in the same way as the
protonated samples, using the aforementioned reagents and, where necessary, substituting the
protonated components with d9-choline chloride (CK Isotopes, ≥99% pure, 98 atom% D), d4-urea
(QMX Laboratories, 99.6% pure, 99.8 atom% D), and D2O (Sigma-Aldrich, 99.9% pure, 99.9 atom%
D). The deuteration of the iron nitrate water of crystallization was not controlled. The resultant
isotopic contrast sets of choline chloride:urea in the pure DES were H:H, H:D, D:H, and D:D,
whereas for the hydrated DES the choline chloride:urea:water compositions were H:H:H, H:D:D,
D:H:D, D:D:H and D:D:D. Samples were transferred into null-scattering Ti0.32Zr0.68 cells with a wall
thickness and path length of 1 mm, which were sealed against vacuum and leak-tested before
transferring to the NIMROD sample changer environment, which is regulated to ca. 0.1 mbar and
30±0.1 °C for the duration of the measurement. Diffraction measurements were made for a mean
of two hours and scans were averaged for improved counting statistics. GudrunN was used to
process the raw neutron scattering data. Scans of the empty sample changer, a vanadium plate (3
mm), and each individual sample cell were used for background reduction and normalization,
before corrections for attenuation and multiple scattering, iterative subtraction of the inelastic

211
scattering contribution of hydrogen, and normalization to absolute units. The final set of corrected
and normalized data are then simulated using Empirical Potential Structure Refinement (EPSR).32
10.3.3. X-Ray diffraction
X-Ray diffraction measurements were made of 0.25 mol kg-1 solutions of Fe(NO3)3.9H2O in pure
and hydrated (10w) choline chloride-urea DES using a Panalytical Empyrean instrument, operating
using Ag kα radiation (λ = 0.5594 Å) and a solid-state GaliPIX3D area detector with a CdTe sensor.
Samples of protonated DES were sealed in 2 mm quartz glass X-Ray capillaries with a wall thickness
of 0.01 mm and measured on a rotating goniometer sample stage for one hour at room
temperature (21 ºC). Data were processed using GudrunX,33 which sequentially reduces and
normalizes the data by accounting for Compton and multiple scattering events, sample absorption,
fluorescence, composition and geometry, the incident beam Bremsstrahlung component, and the
background contribution from air and the empty capillary. The data are finally normalized to the
single-atom scattering and normalized to the single-atom scattering. The X-Ray diffraction data are
used alongside the neutron diffraction data as an additional experimental constraint upon the EPSR
model. Complementary information is provided by the two techniques. Broadly, neutrons allow
the determination of hydrogen site correlations as they have approximately equal sensitivity to the
nuclear positions of all the atoms in the system. Conversely, X-Rays are sensitive to electron density
and hence reinforce the structural information for heavy atoms, namely the Cl- and Fe3+ based
bonding modes, which are important in this system.34
10.3.4. Empirical Potential Structure Refinement (EPSR)
modelling
EPSR models were set up using both the reduced neutron and X-Ray data, using the same
potentials and geometries for urea, choline, chloride, water, and nitrate that have been described
previously.25,27,35 The potentials for Fe3+ were initially derived from the parameters provided by Li
et al. in their 12-6-4 Lennard-Jones type nonbonded model for highly charged metal ions.36
However, it was found that these values yielded poor fits, particularly for the close-range ‘nearest-
neighbour’ interaction and especially when the X-Ray contrast was introduced, which is most
sensitive to the Fe and Cl parameterisation due to the heightened electron density of these atom
types. Therefore, the Fe σ value (the Lennard-Jones well distance) was iteratively refined from the
literature value of 2.886 Å to 1.9 Å to achieve a better quality-of-fit. While the σ of Cl could also be

212
varied to improve the fit, Fe was chosen as the Cl parameters already appeared to give a good fit
for the Cl-rich pure solvent, and keeping this constant reduces the number of fitted parameters.
Following this, fitting proceeded routinely within the EPSR framework; the models were first
equilibrated to stability under the reference potential. Following this, the empirical potentially was
introduced, and the model was allowed to equilibrate for 10000 iterations. Over this time,
structural statistics were accumulated for parameters such as the radial distribution functions, and
hence coordination numbers and probabilistic spatial distribution.
10.3.5. Small-angle neutron scattering
SANS measurements of nanoparticle growth were performed in situ using the BILBY instrument,37
located at the OPAL reactor neutron source of the Australian Nuclear Science and Technology
Organisation, Sydney, Australia, under beamtime award P6216. Using four serially phased
mechanical choppers, BILBY was operated using time-of-flight neutrons to provide an effective q-
range of 0.00229 ≤ q ≤ 0.29031 Å-1, with the detector banks placed in the 12 m position. Samples
of deep eutectic solvent were prepared in various states of deuteration using d9-choline chloride,
d4-urea and D2O (as described above). High levels of deuteration were favoured to reduce the
incoherent scattering background and hence improve the signal-to-noise for the rapid kinetic
measurements; the selected choline chloride:urea:water substitutions were therefore H:D:D and
D:D:D. Samples (ca. 300 uL) were placed into ‘banjo’ Hellma cells of pathlength 1 mm and sealed
with a PTFE plug. The quartz cells were placed into individual metal holders to ensure uniform heat
distribution, and these were stored at room temperature so that no reaction occurred prior to
placing into the sample changer, which was held at a calibrated 90 °C at the sample position, using
a recirculating water bath set to 92 °C using a PID controller. The temperature at the sample
position was recorded.
10.3.6. Small-angle X-Ray scattering of ‘frozen’ reactions
SAXS measurements were made using a Xenocs nano-inXider instrument provided by the Materials
Characterisation Laboratory of the STFC ISIS Neutron & Muon source. The Xenocs instrument uses
a vertical pinhole geometry with a Dectris Pilatus detector and Cu-kα radiation, giving an accessible
Q-range of 0.0045 ≤ Q ≤ 0.37 Å-1. Samples were prepared by sealing 0.5 g of either pure or hydrated
chcl:urea:water, already containing iron nitrate, into small vials. Samples were placed into an air-
circulating temperature-regulated oven at 90 °C and removed after hourly intervals and at 90

213
minutes. At the time of removal, samples were placed directly into a freezer until use. Prior to X-
Ray measurement, the samples were placed into quartz glass X-Ray capillaries of 1.5 mm diameter
and 10 µm wall thickness and sealed using beeswax. Samples were measured using a multi-
capillary sample changer, under vacuum at room temperature (21 °C), for the measurement time
of several hours. The data were radially averaged and subtracted using an unreacted stock solution
of iron nitrate in either pure or hydrated chcl:urea. Data were analysed using a simulated annealing
method.
10.3.7. Extended X-Ray Absorption and Fine Structure (EXAFS)
measurements
High-quality EXAFS measurements of the samples reacted off-line were made using the I20-
Scanning instrument at Diamond Light Source, UK.38 Samples were measured under static
conditions, with optimal spectrometer settings for energy resolution, signal sensitivity and k-range,
with the synchrotron operating in low-α mode to prevent beam damage of the sample. The
scanning branch of the I20 beamline has an extremely high flux (>1012 photons s-1) and spectral
purity, using an insertion device and four-bounce monochromator.39 Samples were mounted into
flat-plate cells with 1.5 mm pathlength and Kapton thin film windows. The pure and hydrated DES
were prepared with 0.15, 0.20 and 0.25 mol kg-1 Fe(NO3)3.9H2O and measured both in their
unreacted state, and following reaction for 3 hours (hydrated) and 8 hours (pure), after which they
are anticipated to have reacted to completion. This provides measurements of both the ‘before’
and ‘after’ states to be fitted. Data were then processed and fitted using the Demeter software
package, giving certainty in the reaction starting and finishing points.40
EXAFS measurements were made of the reacting system using the parallel I20-EDE branch
of the I20 beamline at Diamond Light Source, UK.38 I20-EDE was optimised for kinetic data
collection, with energy resolution and k-range sacrificed relative to I20-Scanning to facilitate data
collection with shorter acquisition times. I20-EDE is an energy-dispersive XAS beamline, capable of
operating with a fan-shaped convergent polychromatic incident beam, but to prevent beam
damage caused by extensive exposure of pink-beam synchrotron radiation, the beamline was
operated in the ‘TurboXAS’ rather than energy-dispersive mode,41 with radiation tuned across the
Fe absorption edge at 7112 eV. As before, samples of the pure and hydrated DES were prepared
with 0.15, 0.20 and 0.25 mol kg-1 Fe(NO3)3.9H2O and syringed into aluminium flat-plate cells with
1.5 mm pathlength, Kapton windows and lined with lead tape to prevent spurious scattering. Filled
cells were sealed using epoxy resin to prevent outgassing. The sample environment was then

214
heated to a calibrated 90 °C at the sample position, before placing samples in the instrument and
measuring continuously over the course of the reaction. Kinetic measurements were made for 120
s each until no further apparent change was observed. Data were then processed in batch using a
routine which removed a flat background from the pre-edge slope and subtracting a fitted low-
order Chebyshev polynomial to the post-edge region. Kinetic data were then interpreted using a
2-state Principal Component Analysis of the data,42 having fitted the ‘before’ and ‘after’ data from
the high-resolution I20-Scanning measurements.
10.3.8. Off-line synthesis of nanoparticles
Precursor solutions (10 g) were placed into a Teflon-lined stainless-steel autoclave and reacted in
an oven at 90 °C for either 8 hours (dry DES) or 3 hours (hydrated DES), which were determined to
be past the reaction end point from analysis of SANS and EXAFS data. The products were decanted
directly into cellulose dialysis tubing (MWCO = 12.4 kDa) and dialyzed several times against
deionized water to remove ionic impurities, and then dried in air (60 °C) from ethanol, yielding dry
aggregated nanoparticulates.
10.3.9. Analysis of products
The prepared samples of iron oxide NPs produced off-line were characterized using a Bruker D8-
ADVANCE X-Ray diffractometer operating in Bragg-Brentano geometry with Cu Kα radiation (λ =
1.5418 Å) over 20-90° 2θ, giving a momentum transfer range from 1.42 – 5.76 Å-1, and therefore a
structural resolution (π/Qmax) of 0.55 Å. Transmission electron micrographs and electron diffraction
measurements were made using a JEOL JEM-2100Plus TEM with access provided by the Bath
Microscopy and Analysis Suite.
10.4. Results & Discussion
10.4.1. Initial speciation of Fe3+: EXAFS data and fits
For simple organic transformations, it is usually fairly simple to understand the starting point of a
reaction, which will take the form of solvated versions of the organic precursor molecules. Defining
the starting point of an inorganic reaction is less trivial because even in simple solvents such as

215
water, the dissolved ionic species form complexes where the speciation depends on the solvent
environment and presence of secondary solutes, as well as variables such as the pH and presence
of co-solutes. DES are a multicomponent liquid with a complicated nanostructure, which is not
readily comparable to either ILs, or simple molecular solvents such as water; this is further
convoluted by solutes.43 It is therefore necessary to use advanced characterization techniques such
as EXAFS for complete understanding of complexation in DES and ILs.44 EXAFS measurements were
made of precursor solutions of pure and hydrated (10w) choline chloride:urea DES containing 0.15
mol kg-1 of the inorganic iron nitrate precursor Fe(NO3)3.9H2O, using the high-resolution I20-
Scanning beamline at Diamond Light Source. Measurements were taken when the synchrotron was
operating in low-α mode, because beam damage was observed after just a few minutes of full-
intensity operation due to the high incident photon flux from the insertion device under normal
operating conditions; this signifies photoreduction of iron (III) ions.
Figure 10.1. Static EXAFS data taken from I20-Scanning (markers) for 0.15 mol kg-1 of Fe(NO3)3.9H2O in the Pure (a) and hydrated (b) DES. Fits are shown from Artemis software (black lines) and are shown in k-space with k2 weighting and without phase correction.
Data are shown for both pure and hydrated DES in Figure 10.1. Data were processed using
software in the Demeter package; data were reduced using Athena, and the fits to the data using
Artemis software are shown alongside the data.40 To fit the data, it was assumed in the first
instance that the Fe3+ coordination would be related to its octahedral configuration in basic
aqueous solution,45 because of the slightly basic nature of the choline chloride:urea DES,46 and
presence of water of crystallisation.47 An octahedral geometry was therefore assumed, and ligands
were assumed to be either Cl, or an non-specified oxygen-containing ligand ‘L’ which may be any
of the O-containing donor species present in the mixture, which could be nitrate, water, urea, or
choline. The geometry of the complex was obtained by floating the bond lengths, and altering the
ligand composition and degeneracy to obtain the best quality-of-fit which was chemically sensible,

216
which can be seen by the close agreement between data and fit in Figure 10.1 despite being plotted
using k2 weighting (k being the photoelectron wave vector) to exaggerate the abscissa. As is shown
in Figure 10.2, it is therefore proposed that the initial complex present in solution is an octahedral
Fe(L)3(Cl)3 complex, where the bound ligands (L) contain oxygen. The ligand identity cannot be
reliably determined further using this technique. The environments of both Cl and L are doubly-
degenerate, with one environment bearing two ligands seen at slightly shorter distance than the
second environment. It is also noteworthy that the initial state of the pure and hydrated DES were
also measured at Fe(NO3)3.9H2O concentrations of 0.20 and 0.25 mol kg-1. However, no qualitative
differences were observed in the experimental data for these systems and so these datasets were
not processed further; It was inferred that the speciation was nearly identical in each case, due to
the large excess of Cl- and O-containing ligands presented by the pure and hydrated DES
environment, even under relatively high Fe loadings.
Figure 10.2. Drawing of the proposed Fe(L)3(Cl)3 starting configuration complex ion calculated by fitting the EXAFS data using the fitting software Artemis, giving a perspective of the calculated different degenerate environments for Cl (green; 2.330 and 2.250 Å) and ‘O’ ligands (red; 1.865 and 1.902 Å).
Remarkably, the same assumptions regarding coordination environment fitted well to
both the pure and hydrated systems, despite the high fraction of water in the latter either by mass
(ca. 42 wt. %) or in molar terms (ca. 77 mol. %). The fits and assumptions presented here therefore
present a picture which is slightly at odds with the EXAFS study of metal ion speciation in DES
published by Hartley et al, who measured the species formed by Cr, Mn, Fe, Co, Ni, Cu, Zn, Pt, Au,
Pd, Ag, and Sn chloride salts in ChCl:urea, ethylene glycol, and glycerol DES.44 Hartley et al.
generally fitted the data to anionic perchloro metal complexes, and observed some chelation of
metal centres in the polyol-based DES. However, except for Cr3+ the systems all contained M2+ ions,

217
which may form different complexes than the Fe3+ measured here, especially when considering
hydration and differences between the chloride and nitrate anions used. Furthermore, this work
was collaborative with Abbott’s group, and so the fits and assumptions were likely influenced by
the original conception of DES as complex-ionic liquids.30,48 However, this thesis has highlighted
throughout that significant structural evidence has been presented since, showing that DES of this
type are H-bond rich solvents with little evidence for complex-ion formation.25,43,49–51 Therefore,
the interpretation presented here, where the Fe complexes contain a mixture of fluxional ligands,
remains sensible.
Having established that the species present at the beginning of the reaction is a Fe(L)3(Cl)3
complex, it is possible to gain further insights into the reaction mechanics and propose a reaction
mechanism. It was previously hypothesised that, under solvothermal conditions, the hydrolysis of
urea in the ChCl:urea DES in the presence of cerium salts caused the precipitation of cerium
carbonate species.25 However, iron is not known to undergo the same transformations as
lanthanides, and rather forms a gamut of dry and hydrated oxides, hydroxides and oxyhydroxides
in aqueous solution, which are well-known due to their occurrence in geochemical processes.52,53
However, it is still true that urea will thermally hydrolyse in these mixtures, leading to the
formation of basic products such as ammonia and carbonate.26 It is therefore proposed that the
Fe(L)3(Cl)3 complex is base-hydrolysed, with the Cl- being scavenged by ammonium ions to form
[NH4][Cl] in solution as NH4+ competes with Fe3+ to bind Cl-. The chloride species are abstracted in
a stepwise manner from the complex, eventually allowing the Fe(O)x centres to percolate and form
extended [-O-Fe-O-] network structures, which then precipitate as a solid phase of nanoparticulate
iron oxide. This hypothesis will be explored in the dynamic studies of the reaction in situ which
follows.
10.4.2. Initial solvent structure and solvation of Fe3+: Neutron
and X-Ray diffraction data and fits
While EXAFS is sensitive to the geometry and overall coordination of the starting iron complex, it
is not sensitive to the nature of the ligands, which is potentially important in such a complicated
multicomponent mixture. Furthermore, EXAFS is not able to explore the greater environment of
the solvent nanostructure, which may impose innately useful or fundamentally interesting
directing characteristics. This is important because it was previously proposed that the
coordination environment of DES exhibited a pre-structuring effect whereby metal centres are
proximal to reactive species and ligands in the mixture.25 Therefore, the structure of both pure and

218
hydrated DES containing Fe(NO3)3.9H2O was measured at 303 K using neutron total scattering and
deuterium-labelling. This data was fitted using a classical atomistic model and Empirical Potential
Structure Refinement (EPSR), which was used to co-refine the neutron data alongside X-Ray Pair
Distribution Function (XPDF) measurements as a further structural constraint, sensitive to
interactions between more electron-dense species such as iron or chloride. Data and fits are shown
as a function of Q-space in Figure 10.3, and are shown Fourier-transformed into r-space in Figure
10.4.
Figure 10.3. Neutron and X-Ray diffraction data (coloured markers) and fits to the data (black dashed lines) shown in Q-space, for the pure choline chloride:urea DES (left) and the hydrated choline chloride:urea:10 H2O DES (right), containing 0.25 mol kg-1 Fe(NO3)3.9H2O.
Figure 10.4. Neutron and X-Ray diffraction data (coloured markers) and fits to the data (black dashed lines) shown Fourier-transformed into R-space, for the pure choline chloride:urea DES (left) and the hydrated choline chloride:urea:10 H2O DES (right), containing 0.25 mol kg-1 Fe(NO3)3.9H2O.

219
The fits converge well upon the experimental neutron and X-Ray diffraction data for both
pure and hydrated systems. As is frequently the case for such measurements, the neutron data in
Q-space shows divergence at low Q-values due to proton inelasticity, which occurs most
prominently at ≤ 1 Å-1 and arises due to the difficulty of accurately subtracting this background
feature.54 Nevertheless, the quality-of-fit is verified when consulting real-space transforms of the
fits and data in Figure 10.4, which highlights that these discrepancies do not affect the major
structural correlations occurring between 0-2 Å. The X-Ray PDF data co-refine reasonably well
albeit not perfectly with the neutron data; the absolute peak intensities do not fully align which
implies that the (maximum-entropy) model solution is slightly understructured with respect to the
X-Ray contrast. It is likely that this occurs due to a combination of differences in the sample
environment, the nature of the radiation, scattering and corrections, as well as temperature
effects, with the neutron measurements performed at 30 °C and the X-rays performed at room
temperature (21 °C). This latter temperature is below the transition point for the pure solvent,
though the presence of the nitrate salt qualitatively appears to depress the solution melting point
markedly, such that it remains liquid even when refrigerated, whereas the pure DES slowly
crystallises at room temperature.55 Despite this, the X-Ray data align well with the phasing and
absolute distances predicted by the EPSR models.
Table 10.2. Molecularly-centred and ionically-centred coordination numbers, calculated from the radial distribution functions of the pure and hydrated choline chloride:urea DES using EPSR modelling. Non-integer coordination number values and variances (which represent one standard deviation in coordination number) arise from the accumulation of statistics over ≥10000 iterations of refinement against the experimental potential. Coordination numbers are calculated by integrating each pRDF to their first minima; Rmax describes this maximum radius of integration. Molecular centres for polyatomic species were: urea CN, nitrate NO, choline C2N, water O1.
‘A’ ‘B’ Rmax
(0w) (Å)
Rmax
(10w) (Å)
Ncoord (1w) Pure solvent
Ncoord (0w) With [Fe]
Ncoord (10w) Pure solvent
Ncoord (10w) With [Fe]
Fe3+ H2O 2.3 2.3 - 0.32 ± 0.52 - 2.41 ± 1.13
Fe3+ Cl- 3.0 3.0 - 2.77 ± 0.97 - 1.65 ± 1.15
Fe3+ Urea 4.0 4.0 - 0.89 ± 1.04 - 0.65 ± 0.79
Fe3+ NO3- 3.5 3.5 - 1.04 ± 0.96 - 1.05 ± 0.80
Fe3+ Fe3+ 6.7 5.5 - 0.12 ± 0.32 - 0.10 ± 0.30
Cho+ H2O 6.2 6.2 2.50 ± 1.56 2.54 ± 1.66 15.37 ± 3.08 15.45 ± 2.82
Urea H2O 4.9 4.9 1.48 ± 1.20 1.39 ± 1.15 8.09 ± 2.12 8.30 ± 2.23
Cl- H2O 4.5 4.4 1.18 ± 1.08 1.20 ± 1.15 5.78 ± 1.79 6.82 ± 1.82
H2O H2O 4.0 3.1 0.91 ± 0.97 0.77 ± 0.77 2.21 ± 1.05 1.98 ± 1.04
Cho+ Cho+ 7.8 7.8 4.58 ± 1.64 4.42 ± 1.42 2.48 ± 1.45 1.84 ± 1.14
Cho+ Cl- 4.7 4.7 1.04 ± 0.78 0.87 ± 0.82 0.58 ± 0.65 0.32 ± 0.53
Cho+ Urea 6.8 6.8 6.69 ± 2.18 6.47 ± 1.91 3.25 ± 1.63 3.40 ± 1.49
Urea Cl- 5.2 5.2 1.76 ± 0.94 1.66 ± 1.15 0.90 ± 0.78 0.67 ± 0.78
Urea Urea 5.7 5.7 4.01 ± 1.71 3.79 ± 1.70 2.39 ± 1.36 2.05 ± 1.33

220
Values are compared with data in the pure solvent for containing 10w (41 wt%) for the hydrated system and 1w (6.5 wt%) for the ‘pure’ system, as published previously.27 This is because the pure 1w solvent is closer in hydration to the pure solvent with 0.25 mol kg-1 of iron nitrate nonahydrate, which contains 3.7 wt% water, whereas the analysis of the pure iron-free DES was assumed to be anhydrous because the water content was measured and confirmed to be small.35
Following this, data were equilibrated for ≥10000 cycles to obtain ensemble information
on the structure. In the first instance, partial radial distribution functions (pRDFs) were averaged,
extracted and analysed. Coordination numbers (Ncoord) were calculated from the pRDFs by
integration up to the maximum radius of the first peak, and these are shown in Table 10.2 after
averaging over 10000 model cycles. It is noteworthy that EPSR generates an averaged picture of
speciation, so non-integer coordination numbers will represent some complex fluxionality, the
degree of which can be inferred from the deviation. All the expected oxygen-containing species
are seen to play some role in iron binding, except for choline, with is likely excluded from primary
coordination because of like charge repulsion between the organic and triply-charged cations;
similarly, Fe-Fe interactions are essentially zero for both systems. 2.77 ± 0.97 chlorides are bound
to iron centres on average in the pure DES, close to the number fitted in EXAFS (three), whereas in
the hydrated solvent EPSR finds that only 1.65 ± 1.15 chlorides are bound. The number of
coordinating urea molecules is also reduced from 0.89 ± 1.04 in the pure DES to 0.65 ± 0.79 in the
hydrated system, whereas one nitrate is present in the pure solvent (1.04 ± 0.96) and hydrated
solvent (1.05 ± 0.80), and even appears to be more tightly-bound in the hydrated system. Most
notably, the water coordination of 0.32 ± 0.52 in the pure system is essentially negligible, whereas
in the hydrated system 2.41 ± 1.13 waters are coordinated on average, making it the dominant
species. The spatial orientations of Fe3+ cations around the various species are shown in Figure
10.7, which highlight the anticipated Fe-O bonding modes, and also demonstrate the ability of Fe3+
to form ‘sandwich’ complexes with species such as nitrate and water, as in the iron/nitrate @ urea
0w SDF (mid-right), and the iron/nitrate @ choline SDFs (mid-left). This suggests that the ionic
species nitrate and choline may be strongly associated with Fe3+ in both the pure and hydrated
DES, in addition to chloride. Overall, despite not refining the EPSR model against the EXAFS data,
it is possible to analyse the pRDFs of Fe-centric interactions and gain insight into the nature of
complexation, and the differences between the nature of the ‘O’ containing ligands which form
the octahedral Fe(L)3(Cl)3 complex. While there is some deviation from the EXAFS fits, the
interpretation presented by EPSR analysis of neutron and X-Ray diffraction provides support for
our proposed octahedral complex with its mixed coordination sphere, with Ncoord summing
respectively to 5.02 and 5.76 for the pure and hydrated solvent, rather than the anionic perchloro
complexes proposed by Hartley et al.44 This is consistent with the observed formation of
tetrahedral iron-chloride complexes at very high chloride concentrations in aqueous solution,
rather than the octahedral iron-chloride complexes seen in more dilute solution. 45

221
Figure 10.5. Percentage change in intermolecular radial distribution functions for the pure and hydrated DES when iron nitrate salt is added at 0.25 mol kg-1, calculated from the values shown in Table 10.2. Values are relative to the coordination number seen in the pure solvent without salt, which is choline chloride:urea 10w for the hydrated system, and 1w for the ‘pure’ system, which contains 3.7 wt% water from the iron nitrate water of crystallisation. A tie line is drawn at the 100% level.
As with the iron-centric interactions, the EPSR models were also used to obtain average
information on the intermolecular coordination numbers for all species, allowing assessment of
how the coordination between molecules changes when the iron nitrate salt is dissolved, as
demonstrated in Table 10.2. The percentage change in coordination number upon dissolution was
calculated using the previous works as a reference,35,56 and is shown in Figure 10.5. Compared to
the low-water and high-water solvents without dissolved iron, little change is generally seen,
particularly for the choline-water and urea-water interactions, which either increase or decrease
in coordination by just a few percent, suggesting that this structuring is retained. However, some
0
20
40
60
80
100
120
140
Ncoord(Fe) / Ncoord(Pure) x102
Cho+-H2O
Urea-H2O
Cl--H2O
H2O-H2O
Cho+- Cho+
Cho+- Cl-
Cho+- Urea
Urea-Cl-
Urea-Urea
Pure
Hydrated

222
of the intermolecular coordination numbers are changed markedly, especially the interactions
involving chloride, or water, and it is interesting that several of these interactions experience a
significant increase, and these vary across the two systems. Particularly, the chloride-water
coordination is 1.18 ± 1.08 and 5.78 ± 1.79 in the pure low-water and high-water system,
respectively, yet the addition of iron causes these values to increase to 1.20 ± 1.15 and 6.82 ± 1.82.
This difference can potentially be assigned to the additional water that is capable of hydrating
chloride anions as the nitrate salt is dissolved, with the low-water DES having a higher capacity to
solvate this water, being in the ‘bound water’ region where low-level water does not significantly
perturb the DES structure.43
This interpretation allows the other coordination number differences to be rationalised
when considered alongside the strong iron-chloride coordination and high iron concentration; the
molar compositions are also outlined in the Table 10.1 header. For example, the choline-chloride
interaction is disrupted in both cases, from 1.04 ± 0.78 to 0.87 ± 0.82 in the low-water system, and
0.58 ± 0.65 to 0.32 ± 0.53 in high-water, which in the latter case is a reduction to 55% of the level
without iron. Similarly, the urea-chloride Ncoord is reduced from 1.76 ± 0.94 to 1.66 ± 1.15 in the
low-water system, and 0.90 ± 0.78 to 0.67 ± 0.78 in the high-water system, because of the lower
abundance of unbound chloride and preferred chloride-water interactions. These variances in
coordination have the knock-on effect of causing the self-correlations to decrease, with choline-
choline, urea-urea, and water-water interactions all decreasing by between 5-20% relative to the
system without iron salt. Interestingly, the intermolecular choline-urea coordination decreases
slightly from 6.69 ± 2.18 to 6.47 ± 1.91 in the low-water DES on addition of iron, but the same
interaction in the high-water DES increases slightly, from 3.25 ± 1.63 to 3.40 ± 1.49 coordinated
ureas. This highlights how the multicomponent complexity of DES, containing hundreds of different
potential H-bonding sites of various strengths, and potential molecular geometries, can cause
unpredictable changes in intermolecular structuring when the composition is varied when co-
solvent, or solute, is introduced.

223
Table 10.3. Calculated partial (site-site) coordination numbers for the pure and hydrated choline chloride:urea DES containing 0.25 mol kg-1 of Fe(NO3)3.9H2O. As with the molecular radial distribution function presented in Table 10.2, partial radial distribution functions are presented as ensemble averages, with the associated standard deviation, of 10000 iterations of the model as it evolves within the confines of the empirical potential. Coordination numbers are calculated by integrating each pRDF to their first minima; Rmax describes this maximum radius of integration.
‘A' ‘B' Rmax
(0w) (Å)
Rmax (10w) (Å)
Ncoord (1w) Pure solvent
Ncoord (0w) With [Fe]
Ncoord (10w) Pure solvent
Ncoord (10w) With [Fe]
Cl CU 5.0 5.2 3.25 ± 1.49 3.11 ± 1.43 1.79 ± 1.24 1.34 ± 1.01
Cl NU 3.9 4.1 3.10 ± 1.67 2.96 ± 1.59 1.71 ± 1.39 1.07 ± 0.99
Cl HU1 3.0 3.0 1.52 ± 1.36 1.31 ± 1.13 0.76 ± 1.00 0.43 ± 0.64
Cl HU2 3.0 3.0 1.02 ± 0.93 1.20 ± 1.02 0.44 ± 0.65 0.36 ± 0.58
HOH Cl 3.2 3.2 0.55 ± 0.51 0.32 ± 0.49 0.35 ± 0.48 0.12 ± 0.33
MT Cl 4.0 4.0 0.59 ± 0.62 0.58 ± 0.67 0.30 ± 0.49 0.23 ± 0.45
HCN Cl 4.0 4.0 0.59 ± 0.61 0.51 ± 0.62 0.33 ± 0.51 0.21 ± 0.44
HCO Cl 4.0 4.0 0.59 ± 0.62 0.45 ± 0.60 0.32 ± 0.51 0.17 ± 0.41
HCN OU 3.5 3.5 0.48 ± 0.62 0.65 ± 0.68 0.22 ± 0.45 0.34 ± 0.53
MT OU 3.4 3.5 0.52 ± 0.65 0.50 ± 0.63 0.25 ± 0.47 0.35 ± 0.55
HCO OU 3.6 3.6 0.54 ± 0.67 0.66 ± 0.70 0.27 ± 0.49 0.25 ± 0.46
HOH OU 2.5 2.5 0.19 ± 0.40 0.30 ± 0.47 0.10 ± 0.30 0.14 ± 0.35
HOH NU 4.3 4.3 2.49 ± 1.60 3.14 ± 1.65 1.21 ± 1.19 1.31 ± 1.23
N N 6.8 7.3 2.61 ± 1.28 2.41 ± 1.05 1.88 ± 1.25 1.46 ± 1.05
N C2N 7.5 7.7 4.98 ± 1.58 4.86 ± 1.28 3.41 ± 1.43 2.84 ± 1.21
N COH 6.2 6.4 2.88 ± 1.24 2.68 ± 1.05 2.09 ± 1.01 1.85 ± 0.81
N OH 5.2 5.4 2.08 ± 0.98 2.13 ± 0.92 1.62 ± 0.77 1.59 ± 0.68
N HOH 5.5 5.8 2.36 ± 1.10 2.45 ± 1.04 1.84 ± 0.90 1.78 ± 0.75
OU NU 3.5 3.6 3.31 ± 1.05 2.98 ± 0.92 2.78 ± 0.89 2.63 ± 0.79
OU HU1 2.6 2.6 0.46 ± 0.73 0.36 ± 0.58 0.25 ± 0.55 0.21 ± 0.45
OU HU2 2.6 2.6 1.73 ± 0.87 2.06 ± 0.79 1.51 ± 0.77 1.87 ± 0.67
NU HU1 4.6 4.6 4.87 ± 2.01 4.75 ± 1.96 3.49 ± 1.60 3.30 ± 1.52
NU HU2 4.6 4.6 4.97 ± 1.78 5.01 ± 1.75 3.57 ± 1.45 3.49 ± 1.39
Cl Cl 6.0 6.0 1.23 ± 0.91 1.93 ± 1.50 0.58 ± 0.69 1.22 ± 1.15
N O1 5.8 5.4 2.09 ± 1.41 2.18 ± 1.60 10.21 ± 2.42 9.94 ± 2.23
HOH O1 2.3 2.3 0.07 ± 0.26 0.12 ± 0.33 0.35 ± 0.48 0.54 ± 0.51
HCN O1 3.5 3.6 0.28 ± 0.52 0.25 ± 0.50 1.61 ± 1.05 1.88 ± 1.07
HCO O1 3.6 3.6 0.32 ± 0.56 0.36 ± 0.59 1.75 ± 1.12 2.24 ± 1.10
Cl O1 4.3 4.2 1.09 ± 1.03 1.13 ± 1.12 5.12 ± 1.66 6.15 ± 1.69
O1 O1 4.2 3.4 0.99 ± 1.02 0.85 ± 0.81 2.70 ± 1.16 2.89 ± 1.19
Values are compared with data in the pure solvent for containing 10w (41 wt%) for the hydrated system and 1w (6.5 wt%) for the ‘pure’ system, as published previously.27 This is because the pure 1w solvent is closer in hydration to the pure solvent with 0.25 mol kg-1 of iron nitrate nonahydrate, which contains 3.7 wt% water, whereas the analysis of the pure iron-free DES was assumed to be anhydrous.35

224
Figure 10.6. Percentage change in partial radial distribution functions for the pure and hydrated DES when iron nitrate salt is added at 0.25 mol kg-1, calculated from the values shown in Table 10.3. Values are relative to the coordination number seen in the pure solvent without salt, which is choline chloride:urea 10w for the hydrated system, and 1w for the ‘pure’ system, which contains 3.7 wt% water from the iron nitrate water of crystallisation. A tie line is drawn at the 100% level.
0
50
100
150
200
250
Ncoord(Fe) / Ncoord(Pure) x102
Cl-CUCl--Urea
Cho+-Cl-
Cho+-Urea
Cho+-Cho+
Urea-Urea
Cho+-Water
Cl-NU
Cl-HU1
Cl-HU2
HOH-Cl
MT-Cl
HCN-Cl
HCO-Cl
HCN-OU
MT-OU
HCO-OU
HOH-OU
HOH-NU
N-N
N-C2N
N-COH
N-OH
N-HOH
OU-NU
OU-HU1
OU-HU2
NU-HU1
NU-HU2
Cl-Cl
O1-O1
Cl-O1
HCO-O1
HCN-O1
HOH-O1
N-O1
Pure
Hydrated
Cl--Water
Water-Water
Cl--Cl-

225
Figure 10.7. SDF plots showing most likely 3D configurations of chloride, iron, nitrate, choline, and water, around central choline, urea, and water molecules, in both the pure and in the hydrated DES. Isosurfaces are universally plotted at the 7.5% probability level to facilitate comparison of the degree of order.

226
It is also possible to draw more specific structural insights by investigating the series of
partial radial distribution functions (pRDFs), between each site, present in the mixtures. The Ncoord
values calculated from pRDFs for the iron-containing models are shown in Table 10.3 alongside the
values for the solvents without solvated Fe3+, and as before the percentage change in coordination
upon solvation of iron nitrate is shown graphically in Figure 10.6. The radius of integration (Rmax)
was not found to vary significantly upon iron nitrate addition and so these values are the same as
the iron-free solvents. Moreover, it is possible to contrast the Ncoord values with the spatial density
function (SDF) plots shown in Figure 10.7 to understand the differences in intermolecular
interaction and solvation between the low- and high-water solvent in 3D representations.
Although they are not drawn as SDFs because EPSR routines treat single-atom species as
spherically symmetric, the pRDF which undergoes the most drastic change in both solvent systems
is the chloride-chloride interaction. When there is no solute present, the chloride coordination is
1.23 ± 0.91 (1w), which is reduced to 0.58 ± 0.69 when 10 mole equivalents of water are added
due to the disruption of DES-DES bonding and the competitive H-bonding interaction with water.
However, these coordination numbers increase to 1.93 ± 1.50 and 1.22 ± 1.15 within the primary
coordination sphere, which are remarkable increases of 57% and 110% respectively. At the same
time, the choline-chloride interactions universally decrease, especially the important HOH-Cl
choline-chloride hydrogen bond mode which is prominent in the pure DES at room temperature;35
the Ncoord for HOH-Cl interaction decreases from 0.55 ± 0.51 to 0.32 ± 0.49 in the low-water system,
and from 0.35 ± 0.48 to 0.12 ± 0.33 in the high-water system upon addition of iron salt, which is
essentially negligible. This is further reinforced when considering the magnitude of reduction in
the various choline-RDFs, which decrease in the order HOH-Cl << HCO-Cl < HCN-Cl < MT-Cl, which
matches the position of these moieties along the choline molecule. Therefore, it becomes
preferable for water molecules to interact in weak H-bonding with choline close to the charged
ammonium moiety, rather than at the hydroxyl group. This can also be seen in the disruption of
order around choline in the SDF plots in Figure 10.8 (top-left). Meanwhile, the chloride-water
ordering becomes slightly stronger, particularly for the high-water system which sees the Cl-O1
Ncoord increase from 5.12 ± 1.66 to 6.15 ± 1.69 upon iron addition. This is further shown in the Figure
10.8 SDF plots (top-right) which show that the occurrence of chloride (green isosurfaces) around
water molecules is much more narrowly distributed, particularly along the H-bonding axes,
showing the higher ordering. Generally, the urea-chloride ordering described by the Cl-NU, Cl-CU,
Cl-HU1, and Cl-HU2 interactions also decreases when iron salt is introduced, with one significant
exception: for the low-water system, the Cl-HU2 Ncoord is 18% higher, meaning that in these
conditions chloride is preferentially bound by the distal urea protons, closer to the central
rotational axis of urea.

227
The addition of Fe3+ also impacts upon the interaction of choline with choline, urea, and
water molecules. As discussed above, the occurrence of choline-chloride HOH-Cl H-bonding
becomes essentially negligible as the solvent becomes more hydrated and Fe3+ is introduced.
Analysing the choline-water Ncoords reveals that this corresponds with an increase in HOH-O1 H-
bonding, going from negligible coordination values of 0.07 ± 0.26 and 0.35 ± 0.48 to 0.12 ± 0.33
and 0.54 ± 0.51 respectively for the low-water and high-water systems, which is still negligible in
the former case but becomes significant in the latter. The trend in H-bond preference seen for the
HOH-Cl interaction is therefore reversed for the HOH-O1 H-bond, which increases in the order HOH-Cl
<< HCO-Cl < HCN-Cl < MT-Cl rather than decreasing. The bottom-left SDF plot in Figure 10.7 displays
this difference clearly, showing that in the high-water case, water begins to form the same H-
bonding corona around choline as seen in the HOH-Cl H-bond in the pure DES, whereas for the low-
water system, water interacts, but is not strongly ordered around choline. The interaction between
choline and urea also varies in an interesting way as Fe3+ becomes solvated by the DES, as the
correlations between these two species generally increase, but the variance between low-water
and high-water is pronounced. The backbone choline proton-urea oxygen weak-H bonds (HCN-OU
and HCO-OU correlations) appear to show significant fluctuation, but in both cases the coordination
numbers are low in the low-water solvent, vanishingly small at higher water levels and in every
case nearly equal to the deviation; the same is true of the MT-OU weak H-bonding interaction
between the urea oxygen and methyl protons. On the other hand, the Ncoord signifying the HOH-NU
H-bond, where the choline hydroxyl group acts as a H-bond donor and urea as the H-bond
acceptor, sees a small increase upon Fe3+ incorporation from 1.21 ± 1.19 to 1.31 ± 1.23 in the high-
water DES mixture, and a significant increase from 2.49 ± 1.60 to 3.14 ± 1.65 in the low-water DES.
It has been highlighted previously that choline-urea interactions are overall strengthened relative
to the pure solvent at low water contents,27 which correlates with a discontinuity in the viscosity
as a function of hydration.57 This strong interaction appears to be the mechanism for these
observations, as water outcompetes the H-bonding from choline hydroxyl protons to H-bond with
chloride, as was discussed above.
Finally, the molecular self-correlations, namely the choline-choline, water-water, and
urea-urea Ncoord numbers, exhibit small changes in structure when iron nitrate is dissolved into the
DES. The choline-choline interactions do not dominate the structure in the pure system,35 and
these coordination numbers are disrupted by up to 20% in the high-water DES mixture when iron
is introduced. The variance in Ncoord increases travelling along the long axis of the choline cation
from the hydroxyl group (N-HOH), which is only slightly diminished, to the charged nitrogen moiety
(N-N), which sees the biggest disruption. This suggests that like-charge ordering, which is already
subtle in DES and their mixtures (especially compared to ILs)1 is further disrupted when iron is
introduced and the water level is high. Conversely, when the water content of the solvent is low,

228
the choline-choline correlation is not disrupted as much, with the N-N correlation seeing the
biggest decrease from 2.61 ± 1.28 to 2.41 ± 1.05 choline molecules within the first solvation shell.
The N-HOH interaction is in fact slightly increased in this case, from an Ncoord of 2.36 ± 1.10 to 2.45
± 1.04, showing that the like-charge ordering might even be increased upon the formation of iron
complexes in the mixture. Pronounced association of urea molecules is observed in the pure DES,
which is relatable to the strong urea H-bonding networks formed in concentrated aqueous
solutions.58 Similarly, the urea-urea correlation is strong in both low-water and high-water systems,
with pronounced H-bonding between the urea nitrogen and oxygen acceptor groups and donor
protons (OU-HU1, OU-HU2, NU-HU1, NU-HU2). Most urea-urea interactions are slightly weakened
relative to the pure systems when Fe3+ ions are introduced, but again there is one notable
exception, in the form of the urea oxygen – distal proton H-bond (OU-HU2), where Ncoord increases
from 1.73 ± 0.87 to 2.06 ± 0.79 in the low-water solvent, and from 1.51 ± 0.77 to 1.87 ± 0.67 in the
first shell in the high-water DES. The variance in the water-water correlations for both solvent
systems can be assigned to subtle differences in the amount of water present in each system; in
the pure system, the water-water coordination decreases though these values are not directly
comparable as the water content of the 1w solvent used for comparison is slightly higher than the
pure DES containing iron nitrate nonahydrate (6.5 vs. 3.7 wt% H2O: for reference, a 1:2:1 and 1:2:2
mixture of choline chloride:urea:water would respectively be 6.5 and 12.2 wt%, or 25 and 40 mol%
water27). In the high-water DES mixture, the first hydration shell of water increases from 2.70 ±
1.16 to 2.89 ± 1.19 when the highly-hydrated iron nitrate is solubilised.
There are several overall implications of the neutron and X-Ray scattering of the structure
of DES-solutions containing iron nitrate salt, in pure and hydrated states. The first of these is that
the EPSR models of the data support our interpretation and fitting of the EXAFS data to an
octahedral Fe(L)3(Cl)3 complex structure, rather than exotic polyanionic species which have been
proposed elsewhere for similar systems which contain only anionic chloride.44 The EPSR models
show that the iron ligands are likely to be fluxional in nature, and most of the DES components
participate. Moreover, the nature of this complex changes slightly as water content is increased,
with more water participating when it is in excess in solution and taking preference over other
ligands at these hydration levels. From these calculations, EPSR also suggests a slightly higher total
coordination number for the complex when water content is higher, which raises the possibility
that the complex is 5-coordinate in the pure DES due to steric constraints, high chloride
concentration and/or multiple-bonding ligands, such as the nitrate bidentate binding mode. It was
previously hypothesised that the unusual coordination chemistry of metal ions in DES could lead
to potentially useful effects, such as the liquid-phase pre-structuring of reactive compounds, to
reduce the activation barrier to reactions.25 The observations here suggest that this is not the case
for anything but the pure DES, as even small quantities of water make the complex more like that

229
seen in aqueous solution; the relatively low molar mass of water in the solution means that even
small weight-percentages are ‘swamping’ in molar terms, but not in terms of volume occupied. The
liquid structure of the solutions was also explored and compared with values seen in DES samples
without dissolved iron salt. In all cases, the introduction of the iron salt disrupted the DES structure,
predominantly because the formed iron complex strongly sequesters Cl- from solution. This
process causes further local disruptions in the H-bond network due to the array of ligands. These
effects combine to cause a series of disruptions in the intermolecular and site-site coordination
numbers, which are difficult to predict a priori because of the multicomponent nature of the
system.
10.4.3. Evolution of mesoscopic structure in iron: Event mode
small-angle neutron scattering studies
Small-angle neutron scattering (SANS) was used to evaluate the self-assembly of nanoparticles in
the reacting system in situ. Neutrons are an ideal probe for such measurements because they are
non-destructive, sensitive to the light elements (ie. CHNO) which make up the H-bonded DES
environment, amenable to H/D isotope substitution to establish further information on the
relevant interactions, and finally have a profound scattering length contrast for iron (bFe = 9.45 fm)
relative to the organic solvent background. Results of the SANS measurements for the reaction in
the pure DES are shown in 3D Porod plots in Figure 10.8. It is noteworthy that attempts were also
made to study this reaction using the NIMROD neutron total scattering instrument used to
determine the initial structure and speciation, however these measurements exceeded the
available instrumental Q-range and are shown in the appendix.

230
Figure 10.8. Time-resolved SANS data taken for the pure DES as a function of initial Fe(NO3)3.9H2O mole fraction; (a-c) choline chloride:urea isotopic composition of H:D; (d-f) choline chloride:urea isotopic composition of D:D; (a,d) 0.15 mol kg-1, (b,e) 0.25 mol kg-1; (c,f) 0.35 mol kg-1.

231
Table 10.4. Computed neutron scattering length densities for the different contrasts, and demonstrating how the solvent SLD changes as a function of water content for 4 different water contents. SLDs are presented here with units of x10-6 Å-2. Here, only results for 0w (pure solvent) and 10w (hydrated solvent, ca. 42 wt.% H2O) are presented. Calculated values for the 2w and 5w systems are shown as these were intended to be measured also, though this proved impossible due to beamtime constraints and only an incomplete dataset of the 2w system was obtained.
0w 2w 5w 10w
D:D:(D) 5.61 5.78 5.96 6.16
H:D:(D) 3.27 3.75 4.26 4.83
Several conclusions can initially be reached upon simple visual inspection of the data.
Firstly, no scattering is seen initially, until 5000-10000 s have elapsed since the commencement of
heating. The Q-value at which peaks occur in the scattering cross-section provides information on
the object dimensionality from the relation D=2π/Q, and the exponent of the slope in a Porod plot
describes the shape of the scattering particle. The scattering patterns generally give a Porod
exponent of, or near to -4, indicating spheroid aggregates. Furthermore, the scattering cross-
section I(Q) levels off in intensity at low Q, within the experimental Q-range, implying no
aggregation, and that the ordering of the system falls within the instrumental resolution. There are
subtle differences between the two isotopic contrasts due to the substitution of H for D on choline.
The calculated Fe2O3 scattering length density (7.1 x10⁻⁶ Å-2) results in a far greater ΔSLD for the H:D
contrast (3.27 x10⁻⁶ Å-2) relative to the D:D contrast (5.61 x10⁻⁶ Å-2) of the pure solvent (see Table
10.4), giving higher measured scattering intensities for the H:D system. Simultaneously, the D:D
samples have far lower background because of the strong inelastic scattering of neutrons by the
choline protons in the H:D sample, and so the background is more reliably subtracted in the D:D
case, which is important due to the requirement for time-resolution and gives more confidence in
the data. Overall, the collected datasets are relatively noisy because of the 5-minute measurement
time, even with 1-hour background measurements; far better statistics would be possible at the
cost of lower time-resolution.
Due to the large volume of time-resolved data which were collected, data were treated
principally using batch Guinier analysis, as introduced in the theory chapter. This was the simplest
available model that fitted most of the data with a reasonable quality-of-fit. It was desired to use
a single model for fitting throughout to reduce variance in the interpretation, which would be
introduced by using different models for different systems and timepoints. Figure 10.9
demonstrates that Guinier fits are generally acceptable throughout, converging well upon the
experimental form factor with low chi-squared values, and confirming the relatively simple and
monodisperse nanoparticle geometry. As the reaction proceeds, the quality-of-decreases slightly
as the simple Guinier model cannot account for a structural complexity observed in the ‘mid-Q’ at
around 0.07 Å-1, which may indicate strong structuring at the solid/DES interface. This scattering

232
feature is more prominent in the H:D contrast, and the associated length scale suggests that this
may represent a choline-rich adsorbed surface layer. Examples of batch fits to the data using
Guinier analysis are shown in Figure 10.10. From these fits, the calculated Guinier scale factors are
shown in Figure 10.11, and the computed radius of gyration (Rg) values are given in Figure 10.12.
As well as no polydispersity, it is interesting that a good quality-of-fit was achieved with a simple
shape-independent model incorporating no S(Q) (structure factor). The implication of this is that,
despite the relatively high loadings of nanoparticles in the solvent which arise from the ≤350 mmol
kg-1 of iron nitrate precursor, the DES solvent environment completely shields particle-particle
interactions. This is interesting when considering the remarkably high structure factor calculated
for micelles in DES, which are at lower concentrations but often form large 1D structures.59–61
Furthermore, it was observed that the formed colloids of iron oxide nanoparticles in DES were
stable unless water was added, providing a simple route to precipitation of the products.
Figure 10.9. Example SANS data (markers) showing quality of Guinier fits (black lines) for the H:D contrast in the 0.25 mol kg-1 of iron nitrate sample. The feature appearing in the ‘mid-Q’ range (Q = 0.07 Å-1) is most prominent in the H:D contrast shown here. The ‘end’ sample (t = 10.2 hrs) is offset by y+10 to aid viewing.

233
Figure 10.10. Guinier fits to the time-resolved SANS data taken for the pure DES as a function of initial Fe(NO3)3.9H2O mole fraction; (a-c) choline chloride:urea isotopic composition of H:D; (d-f) choline chloride:urea isotopic composition of D:D; (a,d) 0.15 mol kg-1, (b,e) 0.25 mol kg-1; (c,f) 0.35 mol kg-1. Fits tending towards zero or negative background levels (ie. early timepoints in (a) and (c)) are due to sight oversubtraction of the background, which slightly changes over time due to degradation of the solvent, and is more apparent in the H:D contrast.
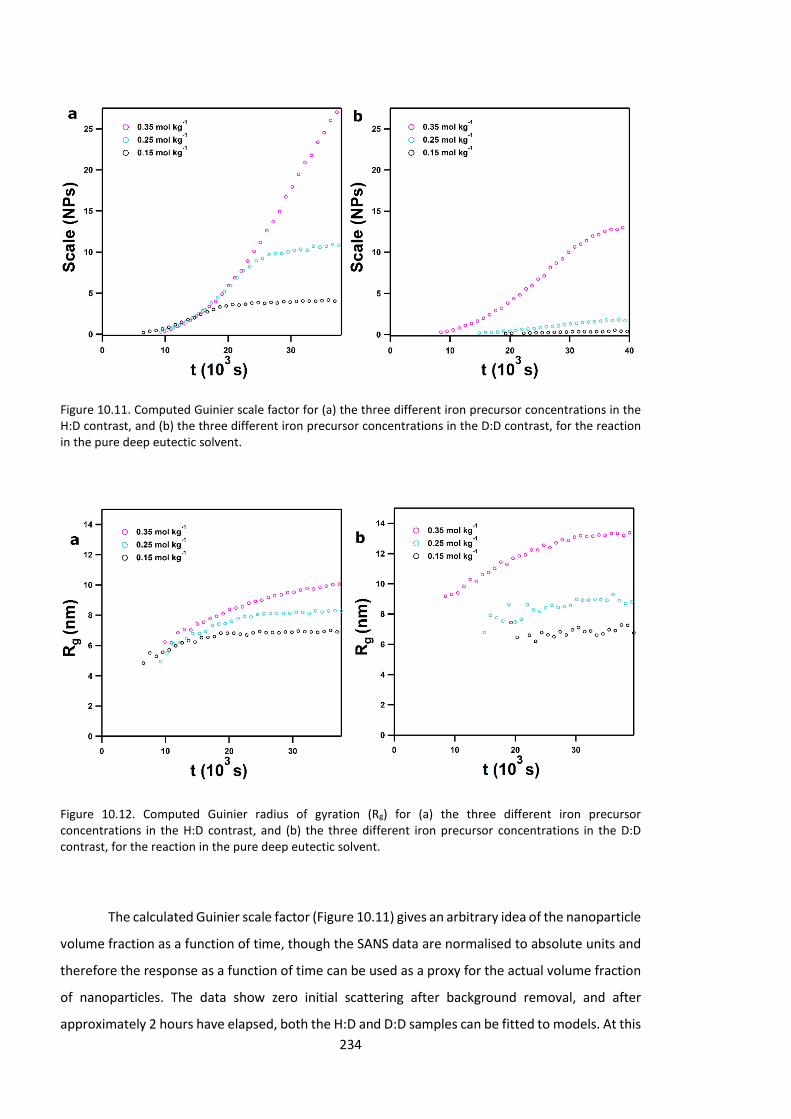
234
Figure 10.11. Computed Guinier scale factor for (a) the three different iron precursor concentrations in the H:D contrast, and (b) the three different iron precursor concentrations in the D:D contrast, for the reaction in the pure deep eutectic solvent.
Figure 10.12. Computed Guinier radius of gyration (Rg) for (a) the three different iron precursor concentrations in the H:D contrast, and (b) the three different iron precursor concentrations in the D:D contrast, for the reaction in the pure deep eutectic solvent.
The calculated Guinier scale factor (Figure 10.11) gives an arbitrary idea of the nanoparticle
volume fraction as a function of time, though the SANS data are normalised to absolute units and
therefore the response as a function of time can be used as a proxy for the actual volume fraction
of nanoparticles. The data show zero initial scattering after background removal, and after
approximately 2 hours have elapsed, both the H:D and D:D samples can be fitted to models. At this

235
point the nanoparticle volume fraction increases sigmoidally, although for the first several spectra
the counting statistics are very poor, especially for the D:D contrast which scatters more weakly,
due to the previously-mentioned lower ΔSLD. This behaviour, where nothing is initially observed but
nanoparticles begin to form after approximately 2 hours, is repeatable across different iron
precursor concentrations, as well as different contrasts. After this point, the nanoparticle volume
fraction slowly increases, giving a linear growth region before flattening out, signifying the end of
particulate precipitation. There appears to be a subtle isotope effect in the growth behaviour for
the two contrasts, with the lower-concentration (0.15 and 0.25 mol kg-1) D:D samples giving very
low scale factors and correspondingly poor measurement statistics. There are several potential
reasons for this behaviour which are not possible to deconvolute from this experiment, such as
primary or secondary kinetic isotope effects, subtle differences in the H- and D-bonding strength,
or viscosity effects.
The calculated radius of gyration (Rg) values from Guinier analysis are shown in Figure
10.12 as a function of time for the H:D and D:D contrasts at the various iron precursor
concentrations. Once scattering can be observed, the initial particle Rg for the first datapoints
which could be fitted is already remarkably large, ranging from 5-9 nm depending on the system.
This implies that there is a rapid growth step which cannot be reliably imaged using SANS. This may
be possible to track using SAXS, which has high flux and greater time-resolution especially when
using latest-generation synchrotron light sources. However, we have observed beam damage of
such samples in synchrotron measurements due to Fe photoreduction. Once growth has begun,
the trend in Rg follows that of the scale factor (volume fraction). Indeed, there are subtle
differences between contrasts and concentrations. As the iron precursor concentration is
increased from 0.15, to 0.25 and 0.35 mol kg-1 for the H:D contrast, the final Rg (averaged from the
final 5 datapoints, corresponding with 35-40 ks of elapsed reaction time) measures 6.92 ± 0.05,
8.27 ± 0.04, and 9.92 ± 0.13 nm respectively, whereas for the D:D contrast the same values are
calculated as 7.03 ± 0.23, 8.92 ± 0.22 and 13.29 ± 0.08 nm; intuitively, higher concentrations of
precursor naturally lead to larger particles. Furthermore, the D:D contrast also appears to yield
larger particles, which may be a ‘real’ effect, but this is counterintuitive when considering that the
reaction appears to be slower in the D:D system, as suggested by the volume fraction relations in
Figure 10.11. It appears more likely that this observation arises from a contrast effect, with the full
deuteration of solvent allowing the resolution of a nanoparticle ‘superstructure’ which
incorporates a solvation shell. This is consistent with the extensive observations of long-range
ordering at the surface of nanoparticles dispersed in DES by Hammons et al.62–64 The observed
monotonic growth behaviour and lack of S(Q) implies that the nanoparticles slowly grow on an
individual basis, rather than undergoing fusion to form aggregates.

236
To obtain further structural information, all data were also fitted using a model-based
(ellipsoid model) approach in SasView, using the SLDs detailed in Table 10.4. Exemplar fits using
this model are shown alongside extracted parameters in Figure 10.13, for the H:D contrast of the
0.15 mol kg-1 sample. Using the model-based approach, it is possible to obtain near-perfect fits to
the data, particularly at the mid-Q values around 0.1 Å-1 as shown in Figure 10.13a, again without
the use of polydispersity or S(Q) functions. A volume fraction can also be extracted (Figure 10.13b),
although as previously discussed this does not add a great deal of information over the Guinier
analysis as the scale factor is a multiplying factor in both models. Most interestingly, it is possible
to resolve the exact dimensions of the nanoparticles with this method. Data were fitted universally
to an oblate spheroid platelet, or burger-shaped particle. As before, the nanoparticles are already
surprisingly large at first observation as seen in Figure 10.13c; at 10 ks of reaction time the NPs are
2.2 nm (polar) and 8.4 nm (equatorial) in radius. Nanoparticles can be observed before this, though
the low volume fraction and short measurement time means that the computed radius error is
significant. Resolving the exact shape confirms the validity of the Guinier approach in this case; it
is highlighted that small-angle scattering is a solution-average technique, where the true shape is
obfuscated by rotation and tumbling of the scatterer on timescales far shorter than the
measurement making it difficult to resolve ellipsoids from polydisperse spheroids, and the major
and minor dimensions of the nanoparticle fall respectively above and below the calculated Guinier
Rg. Nevertheless, there is a subtle contraction in particle aspect ratio over time, from ~4 at first
appearance of the particles, to ~3 at the end of the measurement. Therefore, for this system more
advanced model-based fitting has been performed for all contrasts and concentrations, but only
provided information in the slight aspect ratio contraction over time relative to the more
rudimentary Guinier analysis, due to the basic shape and noninteracting nature of the system in
question.

237
Figure 10.13. (a) Example data and model-based (oblate-ellipsoid) fits for 0.15 mol kg-1 of Fe(NO3)3.9H2O in the pure choline chloride:urea DES in the H:D contrast; (b) calculated nanoparticle volume fraction as a function of time for 0.15 mol kg-1 of Fe(NO3)3.9H2O in the pure choline chloride:urea DES in the H:D contrast; (c) calculated equatorial and polar radii for 0.15 mol kg-1 of Fe(NO3)3.9H2O in the pure choline chloride:urea DES in the H:D contrast.
Small-angle neutron scattering (SANS) was also used to evaluate the self-assembly of
nanoparticles in the reacting high-water (10w) choline chloride:urea DES mixture in situ. Results of
the SANS measurements for these reactions are shown in 3D Porod plots in Figure 10.14. The
behaviour of this system was found to be completely different to that of the pure solvent. Firstly,
reactions were found to occur much more quickly, with no apparent change in scattering observed
after about 3 hours. Moreover, the appearance and stability of the systems were different; the
pure solvent forms stable iron oxide colloidal suspensions, dark red and transparent in appearance
and which cannot be separated. The hydrated system forms opaque orange colloidal suspensions
which are visibly prone to separation over time, forming a colourless liquid phase and a settled
sediment phase. The increased turbidity and tendency to separate implies the formation of large-
scale aggregates, which should manifest in the scattering. Indeed, after 3 hours of reaction the

238
scattering cross-section shows a pronounced low-Q rise, far beyond the achievable instrumental
resolution (Qmin = 0.00229 Å-1). While there is a low degree of certainty in the absolute size of these
particles because of this, they are clearly large (>300 nm). At the other end of the reaction,
scattering is seen almost immediately, always by the time of the second measurement (ca. 10 mins)
and occasionally in the first measurement (ca. 5 mins). At this point, the scattering indicates a
globular morphology, which appears to elongate over time as shown by the low-Q rise. The general
behaviour was repeatable across different iron precursor concentrations, and different isotopic
contrasts.

239
Figure 10.14. Time-resolved SANS data taken on the BILBY instrument at ANSTO for the hydrated (10w) DES as a function of initial Fe(NO3)3.9H2O mole fraction; (a-c) choline chloride:urea:water isotopic composition of H:D:D; (d-f) choline chloride:urea:water isotopic composition of D:D:D; (a,d) 0.15 mol kg-1, (b,e) 0.25 mol kg-1; (c,f) 0.35 mol kg-1. While the water used to formulate the solvent was D2O, the water of crystallization in the iron nitrate salt was not controlled and will exchange in the mixture to give a non-100% abundance of D2O. The lost data points in the middle of the medium-concentration, H:D:D sample (b) are due to an instrumental error.

240
Figure 10.15. Example data and model-based (oblate-ellipsoid) fits for 0.15 mol kg-1 of Fe(NO3)3.9H2O in the hydrated (10w) choline chloride:urea DES in the H:D:D contrast.
Unlike the reaction in the pure DES, simple shape-independent analysis routines do not
give good fits for the hydrated system that are consistent throughout the reaction. This is likely to
be because of the more complicated morphology, which appears to be highly elongated, as is
shown in the fits to the SANS data using an oblate ellipsoid model in Figure 10.15. At the first
measurement, after 5 minutes of reaction, the fits demonstrate that the particles are already large,
at approximately 80 x 25 nm. After this, the particles begin to grow, and do so preferentially in the
equatorial axis (Figure 10.15c). This is in line with expectations, as previous works have highlighted
the 1D morphology of nanoparticles that is generally observed in hydrated DES.25,26 Until around
5000 s, the polar radius of the nanoparticles remains roughly equal at 25 nm, and the equatorial
radius slowly grows to approximately 150 nm. After this point, the apparent size of the
nanoparticles begins to increase rapidly, almost doubling every two measurements between 5-
8000 s, and rapidly exceeding the available instrumental Q-range. This rapid growth behaviour,
with a doubling in size every 10 minutes, is indicative of an aggregation process. This implies that
at this point, something changes in the system which facilitates the rapid aggregation of the formed
nanoparticles, which may not in fact be changing in individual size. This also corresponds with an

241
interesting ‘spike’ feature which is seen in the calculated volume fraction of nanoparticles as a
function of time, which occurs at around 5000 seconds. It is possible that this arises from a contrast
condition as the sample composition is dynamic, because while this feature was observed in all
measurements, the feature is most pronounced in the H:D:D contrast at low iron concentration,
as seen in Figure 10.15b. Hammons et al. have published several works exploring the disruption of
DES structure at the interface, which have highlighted that dispersed nanoparticles can cause
solvent structure perturbations in the nm range.62,64 We have also shown that the addition of water
induces strong layering in DES at a solid interface in the absence of an applied potential.65
Therefore, it is proposed that at this point, it is possible that the reaction is very close to
completion, and the formed nanoparticles have a positively-charged corona, likely to be enriched
in species giving strong contrast in the H:D:D solvent but not in the D:D:D solvent, such as choline
and solvated Fe3+ ions, prior to the rapid aggregation and collapse of the colloids. Having
established using neutron diffraction that there is no preferential intercomponent nanostructuring
in the hydrated DES, it also seems likely that such a tightly-bound near surface layer would be the
main cause of the formation of 1D nanostructures, by forming a surface ‘cap’ on the polar axis
which favours the formation of more elongated structures; such surface capping is known for
cationic surfactants, to which choline is structurally related.6 The very large particle sizes seen at
this point greatly exceed the dimensions that are reliably experimentally available, especially for
this instrument, and so little confidence can be placed in the accuracy of the fits and the extracted
parameters after this aggregation process has occurred. This is further compounded by the highly
turbid concentrated solution of strongly-scattering and large iron oxide nanoparticles, which is
likely to lead to multiple scattering events. However, the experiment, fits and data analysis have
allowed the determination of the onset of this aggregation process for the high-water system, and
an indication of the particle geometry before this occurs, which is broadly similar to expectations.
10.4.4. Local structure of iron: EXAFS study of reaction in situ
To determine the origin of the observed self-assembly behaviour, time-resolved EXAFS
measurements were also made on the reacting system using the I20-EDE beamline at Diamond
Light Source, whereas the I20-Scanning beamline was used to take high-quality static local
structure snapshots of the local structural environments at defined ‘before’, ‘after’, and
‘intermediate’ states. Samples were initially measured using quartz-glass X-Ray capillaries of path
length 1.5 mm and wall thickness 10 µm. However, this led to several issues such as uneven heat
distribution, formation of bubbles and a nonuniform path length, which was problematic because
of the divergent fan-shaped beam. Therefore, samples were measured at a second session on I20-

242
EDE using bespoke flat-plate ‘sandwich’ cells, where the sample was held between steel plates and
Kapton film in a 1.5 mm PTFE spacer, and sealed using epoxy resin. Samples were measured using
the TurboXAS, rather than energy-dispersive mode, reducing the flux and therefore limiting sample
beam damage. It is highlighted here that different iron precursor concentrations were used in SANS
(0.15, 0.25, 0.35 mol kg-1) and EXAFS (0.15, 0.20, 0.25 mol kg-1), which is predominantly
experimental in origin. the techniques have a different ‘sweet spot’; high volume fractions of
nanoparticles give strong elastic scattering, which is actively measured in SANS, but is deleterious
to collection of good EXAFS spectra. Simultaneously, high concentrations of iron precursor gave an
increased likelihood of bubbling in the EXAFS experiments, likely due to the higher concentration
of nucleation sites for gases dissolved in the solvent and evolved through the reaction. Corrected
and Fourier-transformed (real-space) experimental EXAFS data of the reactions are shown in Figure
10.16 for the samples containing 0.15 and 0.20 mol kg-1 of iron precursor. The samples containing
0.25 mol kg-1 are included in the data analysis but not shown in Figure 10.16 because of the large
proportion of ‘glitched’ measurements, which occurred when spectra were spoiled by spurious
scattering from bubbles.

243
Figure 10.16. Corrected, time-resolved and Fourier-transformed EXAFS data for 0.15 mol kg-1 of Fe(NO3)3.9H2O in the pure (a) and hydrated (c) DES, and for 0.20 mol kg-1 of Fe(NO3)3.9H2O in the pure (b) and hydrated (d) DES. Measurements were also taken for 0.25 mol kg-1 of Fe(NO3)3.9H2O, in the pure and hydrated systems, which show the same trends, although these show large amounts of the ‘glitches’ which are seen at approximately t=15000 s in (b) and t=6000 s in (d), which correspond with spurious scattering signal from bubbles, which formed more frequently at high water content and high iron content, likely due to the higher concentration of nucleation sites.
The EXAFS data can be qualitatively analysed to observe differences in the behaviour of
the systems which corroborate with the SANS measurements. Firstly, it is possible to see
fluctuations in the extracted EXAFS signal as a function of time in the region 1-4 Å in all samples
shown in Figure 10.16. In the low-water systems, there is a structural feature between 1-2 Å, which
slowly and linearly diminishes over time until about 12000 s. This peak has a small structural
‘shoulder’, which is most prominent in Figure 10.16a, at 2-2.5 Å. Interestingly, there is a second
structural feature which can be seen at between 3-4 Å, although this peak is not seen immediately,
and only comes into existence after approximately 5000 s. This feature then slowly and linearly
grows. The end-point appears to be extended slightly as the iron concentration is increased, with

244
no further change observed in the EXAFS signal after approximately 10000 s in the 0.15 mol kg-1
sample, and 12000 s in the 0.20 mol kg-1 sample. The high-water samples behave differently; the
peaks at 1-2 Å and 3-4 Å fluctuate in the same linear way, but much more rapidly. There is no delay
before the structure at 3-4 Å begins to form, and this peak begins to increase linearly in intensity
after just a few spectra. The 0.15 mol kg-1 sample ceases changing after about 5000 s, whereas the
0.20 mol kg-1 sample sees no further apparent change in the EXAFS signal after around 6000 s.
A more quantitative analysis of this data can be obtained by performing a principal
component analysis (PCA) on the extracted EXAFS signal.42 In the two-component PCA routine, it
is assumed that the EXAFS signal is principally the result of two convoluted states, the ‘initial’ and
‘final’. These are fitted analytically, as shown in the appendix, and the variance in each state over
time is extracted and shown in Figure 10.17 for both systems at one concentration (0.15 mol kg-1
of iron nitrate precursor) to facilitate viewing; the other concentrations gave similar behaviour, but
do have subtle differences in endpoint which will be expanded upon later. The behaviour of the
two systems is clearly different, as highlighted by the extracted EXAFS signal. In the hydrated DES,
the reaction proceeds immediately, linearly, and quickly; no further change is observed after
around 5000 s, which is the point in the SANS data where the system begins to aggregate and there
is a spike in the apparent volume fraction. Conversely, the pure system initially undergoes a rapid
linear change, before a ‘spike’ and short plateau, which also commences at around 5000 s, and
may represent the formation of an intermediate state, or a sudden change in conditions at this
point. After this plateau, there is a near-linear region, and no further change is observed after
12000 s, highlighting the much slower behaviour of the pure system. The formation of this plateau
corresponds with the point where, when extrapolated, the nanoparticles begin to be observed in
SANS experiments.
It should be addressed that in this analysis, the assumption that the systems contain only
two states is a simplification which is not necessarily in keeping with the proposed mechanism,
which should have three states: an initial complex, a final nanoparticle, and a hydrolysed (Fe(L)6)
intermediate, and potentially also a [-O-Fe-O-] network structure which may be distinct from the
crystalline arrangement in Fe2O3. Indeed, the PCA fits shown in the appendix reveal that there is a
slight residual in the PCA fit to the intermediate state at around 5000 s in the pure DES, which is in
agreement with this. However, this set of assumptions is acceptable in this case because firstly,
there is a strong degree of confidence in the initial state, which was fitted using Artemis (Figure
10.1) to an octahedral complex (Figure 10.2) which was further confirmed by analysis of the EPSR
simulations of neutron and X-Ray diffraction data. There is also a good degree of confidence in the
final state, which was also fitted to a local structure corresponding with crystallographic data of
hematite nanoparticles using Artemis,40 and separately prepared under representative

245
solvothermal conditions and analysed using XRD and TEM; these analyses are shown in the
appendix. Finally, EXAFS as a technique is sensitive to ligand environments, but not acutely so; it is
difficult to resolve systems containing convoluted structures and complexes with subtle organic
ligand variations.44,66,687Thus the full separation of each individual state is beyond what can reliably
be determine using this technique, when considering the complexity and dynamic nature of the
reacting DES mixtures.
Figure 10.17. Example PCA output for the pure DES (left) and hydrated DES (right), for the reactions containing 0.15 mol kg-1 of iron nitrate nonahydrate precursor.

246
Figure 10.18. Analysis of the EXAFS data using PCA showing linear regions fitted to the kinetic data for the three starting concentrations of 0.15 (black), 0.20 (teal), and 0.25 (magenta) mol kg-1 of Fe(NO3)3.9H2O, for (a) the pure and (b) the hydrated DES. Data were linearised and fitted to extract kinetic information in the pre- and post-intermediate region for the pure DES (ca. 4900 s) and across the linear region from 0 – 5000 s in the hydrated DES. Fits were performed across the same timescale for each concentration series. For the high-water, high-concentration sample, datapoints were removed which had an unacceptably high level of background, arising from the uncontrollable formation of bubbles during the reaction which was particularly pronounced in this sample.
Despite fitting well to the data, the PCA is only semi-quantitative and provides only limited
information in and of itself. However, for this system we have established the precursor complex
and know its concentration, and the final state is well-established. Therefore, it seems likely that
the mechanism proceeds as previously discussed; thermal hydrolysis of urea yields basic products
such as [NH4]+, which abstract chloride from the precursor iron complex to yield a hydrolysed Fe(L)6
intermediate containing more ‘O’ ligands, which begins to percolate to form a network -O-Fe-O-
structure which rapidly demixes from the solution to make nanoparticles of large dimensions, as
shown by SANS. Under this set of assumptions, the percentage of component A in Figure 10.17
corresponds with the concentration of Fe(L)3(Cl)3 in solution, which is assumed to be converted
from the iron nitrate precursor with 100% yield If this scenario is taken to be the case, it is possible
to gain further insights from the EXAFS analysis by using the proportions of component ‘A’ and the
known concentrations of the starting solutions for each sample to generate the zero-order kinetic
plots shown in Figure 10.18.

247
Table 10.5. Calculated rate constants from interpretation of EXAFS data processed with PCA. Data were calculated assuming pseudo-zero order kinetics, with one step in the hydrated system, and two steps in the pure DES.
Initial [Fe(L)3(Cl)3] / mol kg-1 k1 / µmol kg-1 s-1 k2 / µmol kg-1 s-1
0.15 22.1 7.3
0.20 27.0 8.8
0.25 26.7 12.1
0.15* 28.6 -
0.20* 29.6 -
0.25* 27.0 -
*Data are for the hydrated choline chloride-urea-10w system.
As EXAFS is sensitive to changed in speciation around the iron centre, the kinetics were
analysed assuming the reaction is zero-order with respect to iron. The 10w systems were fitted
linearly, as shown in Figure 10.18, and extracted rate constants are shown in Table 10.5. The rate
constant for the hydrated systems does not vary significantly as a function of iron nitrate
nonahydrate; when increasing this concentration from 0.15 to 0.20 and finally 0.25 µmol kg-1 s-1,
the rate first increases slightly from 28.6 to 29.6 and then decreases slightly to 27.0 µmol kg-1 s-1.
These slight discrepancies are probably due to noise and experimental error in the sample
temperature, from differences in the contact between the cell and heating block, and room
temperature and water bath fluctuations causing different heat transfer in and out of the sample.
The samples were prepared with non-standardised quantities of cell sealant, sample volume and
sample composition, which causes the samples to have different heat capacities; furthermore, the
0.25 mol kg-1 sample had glitch spectra removed, but the higher noise from the higher nanoparticle
concentration and remnant glitches may still affect the interpretation. The similar rate constants
and zero-order kinetics at the iron centres gives different endpoints, with the highest-
concentration sample completing by 9000 s, and the low-concentration sample completing by
5000 s.
The samples prepared using pure DES were fitted to two linear regions before and after
the ‘intermediate state’; the regions of fitting are shown next to the data in Figure 10.18 and
extracted rate constants are shown in Table 10.5. The initial rate constant k1 is, apart from the
lowest-concentration sample, surprisingly high and within a few units of the rate constant of the
high-water systems, at 27.0 and 26.7 µmol kg-1 s-1 for the samples prepared using 0.20 or 0.25 mol
kg-1 of iron nitrate. k1 for the sample containing 0.15 mol kg-1 of iron nitrate is significantly lower,
at 22.0 µmol kg-1 s-1, which suggests that the rate of reaction in this case is more diffusion-limited
due to the lower water content of 2.3 wt%, as opposed to 3.0 and 3.7 wt% in the more
concentrated samples. Considering the overall similarity with the more hydrated systems, this

248
implies that the rate-determining step (RDS) is likely to be the rate of thermal hydrolysis of urea
molecules. Following this, there is a sudden intermediate state, where it has been established from
SANS measurements that nanoparticles of large dimensions begin to form, and after this point,
there is a second linear region. This k2 value is much lower than k1, equalling 7.3, 8.8, and 12.1
µmol kg-1 s-1 respectively. Because urea and water are in excess even in the least hydrated system,
this further implies that the sudden precipitation of nanoparticles causes the reaction to become
diffusion-limited, possibly due the formation of near-surface structuring,62,64,65 or an increase in
viscosity causing lower overall diffusion coefficient in the mixture.57 It is easy to rationalise the
differences in rate constants if the latter case is true, however, because the rate scales with the
amount of iron precursor, which defines the water content, with each mole of iron nitrate
containing an excess of water and decreasing the solution viscosity further.
It is interesting that despite the similar initial rates of reaction for the iron precursor
complexes (k1), there is no immediate precipitation in the pure DES observed in the SANS
measurements, whereas in the hydrated system nanoparticulate matter is immediately observed
in the SANS from even the first scattering measurement, after 5 minutes. This implies that under
the environment of the hydrated system, any intermediate complex is inherently unstable due to
the presence of a large molar excess of water which causes immediate precipitation, whereas in
the pure DES the product complex from this hydrolysis step is somewhat stabilised by the different
H-bonding environment presented by the pure DES, until a critical point is reached. This point
occurs at approximately the same time for the different iron nitrate levels, but the threshold
concentration varies slightly between iron precursor concentrations, which can be assigned to
slight solubility differences because of the presence of the iron nitrate water of crystallisation.
10.4.5. Steady-state structural measurements
For the pure DES, at the critical point highlighted by PCA analysis of the EXAFS data, and supported
by fitting of the SANS data, it appears that the iron oxide nanoparticles assemble suddenly and are
already a large size shortly after their appearance. This is not easily relatable to classical slow-
growth nucleation and crystallisation processes. It has been highlighted that measuring an evolving
system causes resolution issues because the measurement time is constrained. Rather, this
behaviour is more evocative of a spinodal nanoparticle self-assembly process where there is a
sudden demixing of an iron complex network from the bulk solvent phase, forming iron oxide
nanoparticles. In the pure DES, which is highly viscous68 and therefore closer to the diffusion limit
than the highly hydrated system, the sudden appearance of large nanoparticulates would likely
increase the viscosity further, which may affect the rate from both bulk dynamic viscosity effects

249
and substantial rearrangement of the DES structure at the NP interface. Under these
circumstances, it is possible to simultaneously rationalise the sudden appearance of nanoparticles
and the decrease in iron complex hydrolysis rate.
Table 10.6. Calculated Radius of gyration (Rg) from in situ neutron measurements and ex situ measurements using SAXS of samples reacted separately for the stated time points. Where no radius is listed for the neutron system, the measured scattering level in time-resolved measurements was insufficient to be fitted with certainty.
Time (s) Rg (H:D) (nm) Rg (D:D) (nm) Rg (SAXS) (nm)
5400 - - 7.12 7200 - - 7.21 10800 6.11 - 7.71 14400 6.79 6.78 8.15
To definitively prove this hypothesis, it is necessary to prove that no nanoparticles are
present at timepoints before the critical point. BILBY was selected as the ideal SANS instrument for
this purpose, being a reactor-source instrument using broad-wavelength time-of-flight neutrons to
provide high flux and therefore better measurement statistics and sensitivity. Despite this, it is
highlighted that these SANS measurements remain flux-constrained, due to the short (5 mins)
measurement times necessitated to resolve the evolving system, as well as the flux constraints of
SANS relative to other techniques such as synchrotron SAXS, which can offer higher flux at the
sample position, on the order of 1012 s-1 or more (for reference, 106 neutrons cm-2 s-1 is the order
of flux offered by current state-of-the-art instruments such as Sans2d). There is therefore a low
degree of certainty in the critical point determined from SANS at timepoints shortly after due to
the extrapolation, and it is difficult to assess whether a small concentration of small particulates
exists beforehand. However, we have found in our EXAFS measurements using the high-flux I20-
Scanning beamline that the iron-containing samples exhibit measurable beam damage after just
minutes of exposure, potentially due to photoreduction of iron by the high-energy incident X-Rays.
This means that in situ synchrotron SAXS measurements are not the solution.

250
Figure 10.19. SAXS data of iron oxide NPs taken using a laboratory SAXS instrument (markers) for different time points of the reaction of the pure DES sample containing 0.25 mol kg-1 of iron precursor and reacted in an oven at 90 ˚C for the listed time. Fits to the data (black lines) use software from the ATSAS package,70 which determines the overall nanoparticle shapes (inset) by simulated monophase annealing of dummy atoms.
Therefore, to prove this hypothesis with it will be necessary to perform ‘ideal’ steady-state
scattering measurements of the samples. To this end, samples (0.25 mol kg-1 of iron nitrate
nonahydrate) were reacted independently in an oven at 90 °C and then frozen at certain
timepoints. SAXS measurements were then made of the pure unreacted DES containing the iron
precursor, and then of samples reacted for 1 hour (3600 seconds, just before the critical point), 90
minutes (5400 seconds, shortly after the critical point), 2 hours, 3 hours, and 4 hours.
Measurement conditions were more optimised relative to the in situ experiments, with 4 hours
measurement time, samples mounted in a 1.5 mm quartz capillary with thin walls of 10 µm and
sealed under vacuum to reduce background, using a laboratory Xenocs nano-inXider SAXS

251
instrument. There is a high theoretical X-Ray scattering length contrast between iron oxide
nanoparticles and the largely organic solvent, making SAXS ideal for the determination of
structures such as those expected at the critical point, when there is a low volume fraction of
scatterers. The collected, corrected and background-reduced data are shown in Figure 10.19
alongside fits to the data using ATSAS software. Extracted radius of gyration values from the X-Ray
fits are shown in Table 10.6 alongside analogous values calculated from neutron experiments.
Figure 10.20 presents real-space fits to the SAXS data using the P(R) inversion method in GNOM.69
Figure 10.20. Normalised real-space P(R) inversions of the SAXS data collected for the pure DES systems containing 0.25 mol kg-1 of iron precursor, reacted for the listed times in an oven at 90 ˚C.
In the first instance these measurements demonstrate that it is possible to ‘pause’ the
reaction at a selected timepoint to obtain nanoparticles of known size and morphology, which is
facilitated by the slow growth rate in the order of <1 nm hr-1 after the initial growth step. This is
likely to be useful in biomedical applications applying superparamagnetic iron oxide, such as
magnetic resonance imaging.70 The pure DES signal was subtracted from the other samples as a

252
background. After background subtraction, only flat noise was observed in the sample reacted for
60 minutes, which suggests that no particles are present at this point. Moreover, scattering of large
particles (ca. 7.12 nm Rg) was observed in the 90 minute sample, with a low volume fraction which
can be inferred from the poor measurement statistics and large error bars even under the chosen
measurement conditions. This provides further evidence for the sudden spinodal demixing of an
iron oxide phase with large dimensions. After this point, the expected gradual growth of the
nanoparticles over time follows, as is shown in Table 10.6, with the Rg increasing to 7.21, 7.71, and
8.15 nm after 2, 3 and 4 hours respectively. This corresponds with a slight increase in polydispersity
which can be observed in the greater peak width at FWHM shown in the real-space P(R) inversions
of the data shown in Figure 10.20. As well as simple inversion methods (GNOM) in the ATSAS
software package, data were further analysed using the DAMMIN subroutine which fits the data
to an array of dummy atoms to provide an interpretation of the true nanoparticle shape; these are
shown as insets to the data and fits in Figure 10.19. The shape of the nanoparticle at the critical
point is narrow, seemingly disordered and wormlike, which is evocative of the geometries formed
under spinodal decomposition processes. Furthermore, this analysis confirms the slight
contraction in aspect ratio over time that was interpreted from the model fitting to the SANS data,
as the nanoparticles visually become less elongated and more globular over time.
10.5. Conclusions
A solvothermal reaction to form iron oxide nanoparticles in a deep eutectic solvent has been
followed in situ in the first measurements of their kind in these novel media. To ‘bridge the gap’
between understanding the atomistic rearrangements occurring during the reaction, and the
formation of mesoscale structures as nanoparticles begin to self-assemble, these measurements
required a series of advanced analytical techniques due to the systematic complexity, including
neutron and X-Ray diffraction, computational modelling, EXAFS, SANS, and SAXS. Measurements
were made of a pure choline chloride:urea DES, and a DES-water mixture containing 10 molar
equivalents of water (41 wt% water), both containing various concentrations of an iron (III) nitrate
nonahydrate precursor at relatively high loadings of 150-350 mmol kg-1.
EXAFS measurements were used to determine the speciation of the iron nitrate salt, and
hence determine the initial state of the reaction. Fitting of the extracted EXAFS data demonstrates
that the iron speciates to form an octahedral [Fe(L)3(Cl)3] complex in DES-solution, in both pure
and hydrated systems, where (L) could be any of the oxygen-containing ligands in the solution,
which are water, urea, choline, and nitrate. The initial speciation was then confirmed, and the

253
solvent structures also determined, using liquid-phase neutron and X-Ray diffraction, and refining
the scattering data against an atomistic model. The models firstly agree with the speciation
suggested by EXAFS fitting, and that the nature of the complex changes slightly between pure and
hydrated DES. In the hydrated DES more water is present as ligands, and in the pure DES it is more
likely that the complex is slightly substoichiometric with some multiple-bonding, or bulky ligands
(ie. nitrate or urea) present. Analysis of the solvent structure suggests that the iron salt subtly
disrupts ordering in the liquid relative to the pure solvents, mostly by the sequestration of chloride
to form tightly bound complexes, impacting the local H-bonding network around the Fe3+
complexes, and subtly increasing the mixture water content. This disruption causes a number of
unpredictable effects on the intermolecular ordering, such as slightly increasing the choline-urea
and choline-water overall coordination at low water contents, and disrupting the choline-chloride
bonding which is seen in the pure DES. This highlights the multicomponent complexity of the
mixture. It was previously observed that there is significant structuring between reactive
components around a metal ion complex in DES, namely urea and water around cerium cations,
which was hypothesised to reduce the activation barrier to reaction and hence promote the
formation of 1D nanostructures in the hydrated DES. We have found here that this structuring is
lost upon addition of water, and therefore that this argument is not applicable in any other
situation than the pure solvent, with water acting as a superior ligand and displacing the bulky
organic ligands such as urea, which bind to metal centres in pure DES. The 1D structuring seen in
hydrated systems is therefore more likely to arise from surface capping effects.
The mesoscopic variation occurring during the reaction was then probed using small-angle
neutron scattering to observe the formation and geometry of nanoparticles as the reaction
proceeds. In the pure case, no scattering was observed initially. SANS data were fitted using either
shape-independent Guinier analysis to extract the radii of gyration, and also using shape-based
(ellipsoid) model fitting to extract information on the exact shape of the particles, which gave
slightly better fits to the data. At first observation, the nanoparticles were already surprisingly large
oblate spheroids, which grew slowly over time with growth rates in the region of 1 nm hr-1.
Extrapolating backwards, it is suggested that the nanoparticles begin to form at a point around t =
5000 s. Subtle differences were seen between different iron concentrations, with higher
concentrations of precursor leading predictably to larger nanoparticle Rg values. Interestingly, the
reacted systems remained as stable deep red colloidal suspensions. Conversely, the hydrated
system reacts immediately, forming highly turbid brown solutions. In this case, nanoparticles could
not be fitted with shape-independent analysis, and were instead analysed using ellipsoid model-
based fitting, which was only capable of obtaining a good quality-of-fit at the beginning of the
reaction, where 1D nanoparticles were observed immediately. The nanoparticles formed in the
hydrated case are universally larger, and after a time of approximately 5000 s, begin to aggregate

254
to form extremely large species, the dimensions of which cannot be reliably determine from these
experiments. The aggregates are sufficiently large that the formed particles are not stable, and
visibly separate over time.
The local structure of iron was then measured as a function of time during the reaction
using in situ EXAFS, and analysed using PCA and zero-order kinetic analysis. The pure and hydrated
systems were found to react differently, with the hydrated system progressing rapidly, and linearly,
to the final state. The pure system was initially observed to proceed with a rate constant similar to
the hydrated system until 5000 s, until something happens, and after this the reaction slows. From
the precursor complex and EXAFS in situ data, it is inferred that the reaction in both pure and
hydrated media proceeds via thermal hydrolysis of urea to basic products, which reacts with the
Fe(L)3(Cl)3 complex by abstracting chloride to form solvated [NH4]+[Cl]- and eventually an Fe(L)6
oxygen-ligand rich product, which begins to percolate with like species to form an extended [-O-
Fe-O-] network. This Fe product complex was determined to be insoluble in the hydrated DES,
causing immediate precipitation evident in the SANS data, whereas in the pure solvent this
complex is partially soluble and is somewhat stabilised by the DES H-bonding environment before
precipitation at 5000 s, after which scattering from NPs is observed in the SANS. The precipitation
process slows the reaction by inducing local structural rearrangements in the solvent at the solid-
liquid interface, which makes the reaction more diffusion-limited, leading to lower k2.
Finally, static SAXS experiments were performed to determine whether nanoparticles are
present before 5000 s in the pure solvent, where the scattering cross-section is too low to be
measured in rapid time-resolved neutron measurements. These experiments supported the
hypothesis of hydrolysis of the iron complex by urea degradation products, and validated the
approach of 2-component PCA. Reactions were performed off-line, frozen at certain timepoints,
and measured in a SAXS instrument. Scattering was seen just after the critical point observed using
EXAFS and SANS, but not before, and growth was subsequently observed when the data were fitted
using simulated annealing and P(R) inversion approaches. Samples were found to be slightly bigger
in SAXS measurements than SANS measurements, potentially due to a contrast effect from long-
range structure being induced at the solid-liquid interface. This approach also confirmed that these
reactions can be ‘paused’ at defined timepoints to obtain stable iron oxide-in-DES colloids with
defined sizes, potentially useful for biomedical imaging applications.

255
10.6. References
1 R. Hayes, G. G. Warr and R. Atkin, Chem. Rev., 2015, 13, 6357–6426. 2 R. A. Laudise, Chem. Eng. News, 1987, 65, 30–43. 3 W. L. Suchanek and R. E. Riman, Adv. Sci. Technol., 2006, 45, 184–193. 4 C. S. Cundy and P. A. Cox, Chem. Rev., 2003, 103, 663–701. 5 S. Somiya and R. Roy, Bull. Mater. Sci., 2000, 23, 453–460. 6 R. I. Walton, Prog. Cryst. Growth Charact. Mater., 2011, 57, 93–108. 7 Y. L. Pang, S. Lim, H. C. Ong and W. T. Chong, Ceram. Int., 2015, 42, 9–34. 8 C. Burda, X. Chen, R. Narayanan and M. A. El-Sayed, Chem. Rev., 2005, 105, 1025-1102. 9 A. Kay, I. Cesar and M. Grätzel, J. Am. Chem. Soc., 2006, 7, 15714–15721. 10 D. W. Davies, K. T. Butler, A. J. Jackson, A. Morris, J. M. Frost, J. M. Skelton and A. Walsh, Chem, 2016,
1, 617–627. 11 K. Sivula, F. Le Formal and M. Grätzel, ChemSusChem, 2011, 4, 432–449. 12 I. Cesar, K. Sivula, A. Kay, R. Zboril and M. Grätzel, J. Phys. Chem. C, 2009, 113, 772–782. 13 S. D. Tilley, M. Cornuz, K. Sivula and M. Grätzel, Angew. Chemie - Int. Ed., 2010, 49, 6405–6408. 14 K. Sivula, R. Zboril, F. Le Formal, R. Robert, A. Weidenkaff, J. Tucek, J. Frydrych and M. Grätzel, J. Am.
Chem. Soc., 2010, 132, 7436–7444. 15 J. Brillet, M. Grätzel and K. Sivula, Nano Lett., 2010, 10, 4155–4160. 16 D. Maiti, V. Aravindan, S. Madhavi, P. Sujatha Devi, J. Power Sources, 2015, 276, 291-298. 17 E. L. Smith, A. P. Abbott and K. S. Ryder, Chem. Rev., 2014, 114, 11060–11082. 18 D. V Wagle, H. Zhao and G. A. Baker, Acc. Chem. Res., 2014, 47, 2299–2308. 19 E. R. Cooper, C. D. Andrews, P. S. Wheatley, P. B. Webb, P. Wormald and R. E. Morris, Nature, 2004,
430, 1012–1016. 20 R. E. Morris, Chem. Commun. (Camb)., 2009, 21, 2990–2998. 21 E. R. Parnham, E. A. Drylie, P. S. Wheatley, A. M. Z. Slawin and R. E. Morris, Angew. Chemie - Int. Ed.,
2006, 45, 4962–4966. 22 E. A. Drylie, D. S. Wragg, E. R. Parnham, P. S. Wheatley, A. M. Z. Slawin, J. E. Warren and R. E. Morris,
Angew. Chemie - Int. Ed., 2007, 46, 7839–7843. 23 H. G. Morrison, C. C. Sun and S. Neervannan, Int. J. Pharm., 2009, 378, 136–139. 24 E. R. Parnham and R. E. Morris, Acc. Chem. Res., 2007, 40, 1005–1013. 25 O. S. Hammond, K. J. Edler, D. T. Bowron and L. Torrente-Murciano, Nat. Commun., 2017, 8, 14150. 26 O. S. Hammond, S. Eslava, A. J. Smith, J. Zhang and K. J. Edler, J. Mater. Chem. A, 2017, 5, 16189–
16199. 27 O. S. Hammond, D. T. Bowron and K. J. Edler, Angew. Chemie - Int. Ed., 2017, 56, 9782–9785. 28 A. R. Hillman, R. Barker, R. M. Dalgliesh, V. C. Ferreira, E. J. R. Palin, R. M. Sapstead, E. L. Smith, N.-J.
Steinke, K. S. Ryder and A. D. Ballantyne, Faraday Discuss., 2018, 210, 429-449. 29 A. D. Ballantyne, R. Barker, R. M. Dalgliesh, V. C. Ferreira, A. R. Hillman, E. J. R. Palin, R. Sapstead, E.
L. Smith, N. J. Steinke and K. S. Ryder, J. Electroanal. Chem., 2018, 819, 511-523. 30 A. P. Abbott, G. Capper, D. L. Davies, R. K. Rasheed and V. Tambyrajah, Chem. Commun., 2003, 0, 70–
71. 31 D. T. Bowron, A. K. Soper, K. Jones, S. Ansell, S. Birch, J. Norris, L. Perrott, D. Riedel, N. J. Rhodes, S.
R. Wakefield, A. Botti, M.-A. Ricci, F. Grazzi and M. Zoppi, Rev. Sci. Instrum., 2010, 81, 033905. 32 A. K. Soper, Mol. Phys., 2001, 99, 1503–1516. 33 A. K. Soper, GudrunN and GudrunX: Programs for Correcting Raw Neutron and X-ray Diffraction Data
to Differential Scattering Cross Section. Rutherford Appleton Laboratory Technical Report RAL-TR-
2011-013, STFC, 2011. 34 A. K. Soper, J. Phys. Condens. Matter, 2007, 19, 335206. 35 O. S. Hammond, D. T. Bowron and K. J. Edler, Green Chem., 2016, 18, 2736–2744. 36 P. Li, L. F. Song and K. M. Merz, J. P, 2015, 119, 883–895. 37 A. Sokolova, J. Christoforidis, A. Eltobaji, J. Barnes, F. Darmann, A. E. Whitten and L. de Campo,
Neutron News, 2016, 27, 9–13. 38 S. Diaz-Moreno, S. Hayama, M. Amboage, A. Freeman, J. Sutter and G. Duller, J. Phys. Conf. Ser.,
2009, 190, 012038. 39 S. Hayama, G. Duller, J. P. Sutter, M. Amboage, R. Boada, A. Freeman, L. Keenan, B. Nutter, L. Cahill,
P. Leicester, B. Kemp, N. Rubies and S. Diaz-Moreno, J. Synchrotron Radiat., 2018, 25, 1556–1564. 40 B. Ravel and M. Newville, J. Synchrotron Radiat., 2005, 12, 537–541. 41 S. Pascarelli, T. Neisius and S. De Panfilis, J. Synchrotron Radiat., 1999, 6, 1044–1050.

256
42 D. T. Bowron and S. Díaz-Moreno, Anal. Chem., 2005, 77, 6445–6452. 43 O. S. Hammond, D. T. Bowron, A. J. Jackson, T. Arnold, A. Sanchez-Fernandez, N. Tsapatsaris, V. G.
Sakai and K. J. Edler, J. Phys. Chem. B, 2017, 121, 7473–7483. 44 J. M. Hartley, C. M. Ip, G. C. H. Forrest, K. Singh, S. J. Gurman, K. S. Ryder, A. P. Abbott and G. Frisch,
Inorg. Chem., 2014, 53, 6280–6288. 45 M. J. Apted, G. A. Waychunas and G. E. Brown, Geochim. Cosmochim. Acta, 1985, 49, 2081–2089. 46 A. P. Abbott, S. S. M. Alabdullah, A. Y. M. Al-Murshedi and K. S. Ryder, Faraday Discuss., 2017, 206,
365–377. 47 H. Ohtaki and T. Radnai, Chem. Rev., 1993, 93, 1157–1204. 48 A. P. Abbott, G. Capper, D. L. Davies, H. L. Munro, R. K. Rasheed and V. Tambyrajah, Chem. Commun.,
2001, 19, 2010–2011. 49 C. R. Ashworth, R. P. Matthews, T. Welton and P. A. Hunt, Phys. Chem. Chem. Phys., 2016, 18, 18145–
18160. 50 R. Stefanovic, M. Ludwig, G. B. Webber, R. Atkin and A. J. Page, Phys. Chem. Chem. Phys., 2017, 19,
3297-3306. 51 C. F. Araujo, J. A. P. Coutinho, M. M. Nolasco, S. F. Parker, P. J. A. Ribeiro-Claro, S. Rudić, B. I. G. Soares
and P. D. Vaz, Phys. Chem. Chem. Phys., 2017, 19, 17998–18009. 52 M. Hanesch, Geophys. J. Int., 2009, 177, 941–948. 53 M. Mohapatra and S. Anand, Int. J. Eng. Sci. Technol., 2010, 2, 127–146. 54 A. K. Soper, Mol. Phys., 2009, 107, 1667–1684. 55 X. Meng, K. Ballerat-Busserolles, P. Husson and J.-M. Andanson, New J. Chem., 2016, 40, 4492–4499. 56 O. S. Hammond, D. T. Bowron and K. J. Edler, Angew. Chemie, 2017, 56, 9782-9785. 57 C. D’Agostino, L. F. Gladden, M. D. Mantle, A. P. Abbott, I. Ahmed, Essa, A. Y. M. Al-Murshedi and R.
C. Harris, Phys. Chem. Chem. Phys., 2015, 17, 15297–15304. 58 A. K. Soper, E. W. Castner and A. Luzar, Biophys. Chem., 2003, 105, 649–666. 59 A. Sanchez-Fernandez, O. S. Hammond, K. J. Edler, T. Arnold, J. Doutch, R. M. Dalgliesh, P. Li, K. Ma
and A. J. Jackson, Phys. Chem. Chem. Phys., 2018, 20, 13952–13961. 60 A. Sanchez-Fernandez, O. S. Hammond, A. J. Jackson, T. Arnold, J. Doutch and K. J. Edler, Langmuir,
2017, 33, 14304–14314. 61 T. Arnold, A. J. Jackson, A. Sanchez-Fernandez, D. Magnone, A. E. Terry and K. J. Edler, Langmuir,
2015, 31, 12894–12902. 62 J. A. Hammons, J. Ustarroz, T. Muselle, A. A. J. Torriero, H. Terryn, K. Suthar and J. Ilavsky, J. Phys.
Chem. C, 2016, 120, 1534–1545. 63 J. A. Hammons, F. Zhang and J. Ilavsky, J. Colloid Interface Sci., 2018, 520, 81–90. 64 J. A. Hammons, T. Muselle, J. Ustarroz, M. Tzedaki, M. Raes, A. Hubin and H. Terryn, J. Phys. Chem.
C, 2013, 117, 14381–14389. 65 O. S. Hammond, H. Li, C. Westermann, F. Endres, A. Y. M. Al-Murshedi, A. P. Abbott, G. Warr, K. J.
Edler and R. Atkin, Nanoscale Horizons, 2019, 4, 158-168. 66 S. Diaz-Moreno, A. Munoz-Paez, J. M. Martinez, R. R. Pappalardo and E. Sanchez Marcos, J. Am.
Chem. Soc., 1996, 118, 12654–12664. 67 G. Vlaic and L. Olivi, Croat. Chem. Acta, 2004, 77, 427–433. 68 A. P. Abbott, ChemPhysChem, 2004, 5, 1242–1246. 69 D. Franke, M. V. Petoukhov, P. V. Konarev, A. Panjkovich, A. Tuukkanen, H. D. T. Mertens, A. G.
Kikhney, N. R. Hajizadeh, J. M. Franklin, C. M. Jeffries and D. I. Svergun, J. Appl. Crystallogr., 2017, 50, 1212–1225.
70 F. Bødker, M. Hansen, C. Koch, K. Lefmann and S. Mørup, Phys. Rev. B, 2000, 61, 6826–6838.

257
11. CONCLUSIONS AND FUTURE WORK
11.1. Findings
Initially, the overall theme and goal of this thesis was to study the nanostructure of deep eutectic
solvents (DES), the formation of nanostructured surfactant aggregates in the same systems, and
then apply this synergistic fundamental research by using DES-surfactant systems as media for the
soft templating of functional nanostructured materials. However, as this project has evolved, the
direction has changed due to the conclusions that have been reached, which has organically
resulted in several branches which have been dispersed throughout the thesis.
The thesis began by examining the nanostructure of the so-called ‘Type III’ deep eutectic
solvents, specifically the choline chloride:urea and choline chloride:malic acid systems, to probe
the literature hypothesis that DES are a type of ‘complex-ionic’ liquid formed by HBD-anion
complexation to form a [cation]+ [complex-anion]- system.1,2 To fully understand the implications
of these studies, it is necessary to understand the nanostructure of molecular and ionic liquids
(MLs and ILs). The uniting structural feature of ILs is that they show a sponge-like nanostructure
where there is a regular D-spacing between the ionic domains, which varies depending on the
structure of the component species.3 This is not observed in MLs, which do not normally show
repeat domain spacing and have local order which decays further than a few molecular diameters.
Our works showed limited evidence for either clustering or complexation. Interpretation of the
modelling allows the rationalisation of the structure in terms of a series of fluxional H-bonded
stoichiometric cages of the DES components. No nanometre-scale structure is observed in the
scattering data or in the models; bonding is generally local, and all structure occurs <1 nm.
Therefore, it appears that DES are weakly-structured systems with a variety of strong and weak H-
bonding interactions between the various functionalities within the given system and are overall
disordered liquids after a few molecular radii. These works demonstrate that despite their ionic
character, DES are not ILs in terms of the solvent structure. The picture of short-range bonding
more strongly represents ionic solutions or MLs. Furthermore, it is stated that the ‘complex ion’
model is less appropriate, and the ‘extended H-bond network’ or ‘H-bond alphabet soup’ model is
a more appropriate description of the structure in DES.4 However, the suggestion is not that DES
are somehow not a unique or interesting state of matter; follow-up works from other groups with
other techniques have made the suggestion that DES, particularly choline chloride:urea, represent
a ‘Goldilocks’ condition, where the liquid-phase structure is a perfectly disordered mixture
facilitated by the unexpected adoption of urea’s gas-phase structure.5 Furthermore, other groups

258
have recently demonstrated that nanostructured DES are possible, in the same way that
nanostructured MLs are possible, by deliberately introducing amphiphilicity.6 These findings
demonstrate that the study of DES remains of interest to those studying the liquid state on the
fundamental level, as a unique environment co-dominated by interspecies Coulombic interactions
and H-bonding. This has been demonstrated in the recent work on the lanthanide DES, which
display an unusual nanostructure containing a percolating molecular region and a strongly-bound
ionic region.
DES were subsequently applied in the solvothermal synthesis of the nanostructured
materials ceria and haematite to be used respectively as a CO oxidation catalyst and photocatalyst.
Initially, we had aimed to synthesise these nanomaterials using micellar phases of surfactants in
DES to induce nanostructure. However, it was discovered that this is not necessary for the synthesis
of nanostructured materials in DES. Instead, it was found that for both ceria and haematite, the
water content of the DES defines the morphology: fine nanoparticles <10 nm were formed in an
anhydrous DES, and elongated 1D nanowires and shard-like structures were formed when a
controlled amount of water was introduced to the DES ( <50 vol%).7,8 Investigations into this
process suggest that the nanomaterials are formed by controlled hydrolysis of the solvent, and the
rate of this appears to depend on the water content. As far as we have investigated, this is true
regardless of the final product nanomaterial. This discovery obviated the goal to use surfactant
templating with its associated caveats; the ‘greenness’ of using surfactants as templating agent
can be called into question due to their petrochemical sources and often high environmental
toxicity. Conversely, the Deep Eutectic-Solvothermal methodology takes an alternative solvent
which is itself regarded as more environmentally friendly than conventional solvents, and dilutes
it with water, which is in some ways the ‘ultimate’ green solvent, and is cheap and renewable.9
Most recently, in the final chapter, efforts were made to bridge the gap between molecular and
mesoscale understanding of these systems, and all aspects of the synthesis of haematite were
measured using a variety of techniques. These data further support the hydrolysis process in which
the solvent is controllably degraded, with remarkably similar initial iron speciation whether
hydrated or not. Furthermore, observations can be made of the nanoparticle precipitation and
growth, which is rapid and instant in the hydrated DES, and slow and delayed in the pure DES, likely
due to the higher solubility of the iron products in the DES H-bonding environment. This leads to
the differences in nanostructure, although it remains difficult using these techniques to fully
account for the 1D growth.
These findings raised new questions about the fundamental nature of the liquids that are
formed when DES are mixed with water in known quantities. Questions in this area have been
raised in the literature, as interest has been shown in the reduced viscosity and cost of DES-water

259
mixtures,10 and water affects the melting point of DES11 (some have even suggested that DES are
not viable if perfectly dry) but this issue has not been resolved. Our investigations of water in
choline chloride DES have revealed 3 ‘regions’ of different behaviour other than the pure DES. First,
there is the very low-water regime, approximately 5 wt% of water or below. In this regime, water
does not disrupt the DES structuring due to occupation of interstitial sites where DES-DES bonding
is sterically hindered. Due to the small molecular volume of water, this region extends to
surprisingly large molar equivalencies of water.12 Furthermore, this hydration regime facilitates
certain DES-DES bonding modes (ie. Choline-urea). Above this level of hydration, the next
behavioural regime is seen as DES components begin to become significantly hydrated, although
the different components in the mixture do not all become proportionally more hydrated. There
appears to be a strong hydration preference for the ionic species (choline and chloride), which
become hydrated first, which helps the DES structure to be somewhat retained.13 This is the
hydrated DES regime, which is structurally distinct from the pure DES and the final regime, which
occurs at and above 50 vol% water. Here, the bulk ordering resembles that of bulk water, as it
begins to percolate through the DES-water mixture and fully hydrate all of the components in the
mixture. At this point, the mixture is a simple aqueous solution containing the DES components.
These findings have significant implications in those using hydrated DES in any application due to
their favourable characteristics, such as in the study of protein stability and in food, because above
the transition point we have identified there is nothing structurally interesting or unique about
these solutions.10,14,15 AFM was then used to probe this effect at the DES/electrode interface. This
unexpectedly showed an increase in structure on addition of water until about 40 wt%, above
which the interface became the same as a salt solution, inadvertently displaying the same
structural trends to those seen in the liquid bulk. The structure at the solid/liquid interface also
became dilute electrolyte-like on application of potential.
11.2. Future work
The various findings presented within this thesis have directly contributed to fields of DES science
both on the fundamental and applied sides of the scientific spectrum. Fundamentally, significant
research problems were addressed to resolve significant unaddressed issues preventing the
onwards progression of the field, namely: ‘What is the structure of a DES – are they really like ionic
liquids?’, and ‘What happens when DES are mixed with water – is it not a simple aqueous
solution?’. The result of this has been a rewarding project which has always presented new
problems to solve following the resolution of each previous one, and which will probably remain
as the case for same time.
260
Fundamentally, our work on the liquid-state structure of choline chloride DES has offered
solid experimental evidence for a new interpretation of the solution structure.12,16 Namely, that
DES of this type are not strictly an IL subtype with repeating interdomain structure,3 and nor are
they complex-ionic liquids as initially suggested,1 but are locally-ordered ‘alphabet H-bond soups’.
Based on this work, other groups have been investigating such systems in greater detail, such as
with quantum chemical methods.4 Other examples include measurements of the structure of
choline chloride:urea at high temperature, where the choline-chloride OH-Cl H-bond is no longer
seen.17 Our structural interpretation also formed the basis by which inelastic neutron spectroscopy
data of choline chloride:urea were fitted.5 While this is proving to be an interesting area of
research, it is necessary to highlight here that this is only for one, very narrow, category of DES,
and even these studies are only for one example in the class. If the initial claims made regarding
the field are true, that millions of distinct systems are possible,2 then this has the potential to
evolve into an extremely broad spectrum of fundamental work with an even broader array of
potential applications. Conversely, it is possible that choline chloride:urea will remain as the
archetype DES, which has been described as a ‘Goldilocks’ example, and in this case relatively few
‘true’ DES will exist which show the behaviour.5 Indeed, as interest in the field is increasing, the
issues are coming under further scrutiny, and work by thermodynamicists is revisiting the
fundamental definition of ‘deep eutectic’.18 Particularly, it has been highlighted that although
millions of mixtures are hypothetically possible, it is important to understand the phase behaviour
because many systems are likely to simply be ideal mixtures rather than a strongly non-ideal deep
eutectic mixture such as choline chloride-urea is.19 It is presently impossible to predict where the
field will go, despite our best efforts, and it will be interesting to see the future evolution of this
research, and whether the level of intrigue and potential described in the introduction will persist.
Investigations of DES-water mixtures are likely to lead to a natural expansion of field of
DES, because DES-water mixtures are a simple solution to the issues found when working with DES
such as viscosity, expense, and a solvent environment which is potentially fundamentally
incompatible with solutes such as certain ions,20 proteins,15 surfactants,21,22 biomolecules,23 and
polymers.24 Our findings form the basis of this field as they prove that DES-water mixtures have a
distinct structure which means that they are a viable esoteric solvent for the further development
of such processes, within a certain region of the phase diagram.25 Our work proves that many of
these studies have used DES-water mixtures where the water content massively dominates, which
renders the work uninteresting as, under this new light, it often becomes an investigation of a
known solute in a known solvent: water.21 As well as further studies using DES-water mixtures, it
seems likely that this work will result in the further study of mixtures of DES with solutes and other
co-solvents. We have taken interest in the solvation of a variety of hydrophobic and amphiphilic
solutes in DES, which is a further avenue of work currently being explored but not a component of

261
this thesis. However, it is undoubtedly likely that DES-cosolvent mixtures will be a rich avenue of
research. In particular, it was found during the AFM study of DES-water mixtures that not only was
the interfacial structure lost under applied potential, but the electrochemical window became
radically smaller as the water mole fraction increased. This is not a positive when held under its
own context but highlights that work can be done to improve this, and to develop future DES-
cosolvent systems which can function effectively as materials for electrolysis, and as battery
electrolytes and lubricants. This will therefore lead to further studies in both fundamental and
applied science. Considering the unusual nature of the findings of this AFM study, it is likely that
other groups will perform similar experiments on different systems to determine if they also have
the unusual increase in structure on addition of cosolvent.
In terms of application, DES were principally pursued here as solvothermal reaction media
to produce metal oxides. It was found that in these syntheses, the shape of the products could be
selected by controlling the water content of the DES, from very fine metal oxides <10 nm (pure
DES) and very large (>100 nm in the major axis of rotation) 1D nanostructures. As demonstrated in
the respective chapters, nanostructured metal oxides of this type often have improved
performance in environmental remediation applications. The final chapter aimed to quantify a
number of the factors which are presently unknown, such as the mechanism of solvent
degradation, links between the reaction rate and solvent structure and speciation, and the nature
of the nanoparticle nucleation and growth. This avenue of work is therefore likely to lead to the
preparation of a wide catalogue of nanoparticles by the community interested in nonaqueous
materials synthesis,26 and those who need high performance catalytic materials for their desired
application. The reactive principles explored here are also likely to have important implications for
organic synthesis using DES. In future, it will be valuable to explore the synthesis of nanostructured
materials using a gamut of DES and conditions to explore the extensibility of this green, novel
synthesis method to as many useful catalytic systems as possible. Furthermore, it is worth
considering the development of the field of DES-solvothermal synthesis once insights are gained
from projects related to the initial conception of this thesis. Namely, fundamental work on
surfactant and polymer self-assembly in DES, will work synergistically with the findings present
here to achieve the goal of completely designer ‘bottom-up’ construction of nanostructured
materials using DES.
One of the grandest claims surrounding DES is that they are designer solvents with no
theoretical limit to their potential applications. It remains to be seen whether DES can offer
additional value over traditional solvents and alternatives such as ILs in a variety of representative
real-world industrial processes such as extractions and reactions. It is also unclear whether DES will
find widespread usage as green solvents in a range of commonplace chemical processes, or
262
otherwise only ever remain as niche media for bespoke applications where cost is not an issue. In
this context it is unimportant whether DES are semantically a type of ionic liquid. Only the
performance of DES for the task at hand, the overall economics, and environmental credentials are
truly important. Therefore, several questions must be addressed to reconcile the fundamental
unknowns of the field with this broadly-stated promise of DES. On a fundamental level, having
established that DES do not structurally occupy the same space as traditional ILs, further
experiments are necessary to establish the underlying nature of the phenomenon across all of the
DES ‘subtypes’ I-IV, to examine whether everything described under the family name ‘DES’ is
unique and cannot simply be described by a liquid solution of compound ‘A’ in compound ‘B’.
Experiments which could be conducted to explore this may include thorough exploration of the
solid-liquid equilibria of typical DES salt species such as choline chloride with common H-bonding
liquid solvents such as water, as well as typical DES HBD species such as glycerol, which would fully
establish whether this category of solvents represent a unique area. Alongside studies of
performance, structural studies of such mixtures should be carried out for these mixtures,
experimentally and computationally, at the bulk and interface, pure and in the present of solute,
and in the solid and liquid phase, to provide a more complete understanding of structure-property
relationships for DES. Structural studies will be complemented by fundamental studies into the
dynamic processes in DES, investigating the fundamental nature of the hydrogen bond in these
media, to elucidate timescale, and transient and persistent structuring. Perhaps most importantly,
workers in the field must be able to demonstrate the supposedly ‘designer’ nature of DES and
prove that DES can be designed for superior performance in a given application. Paradoxically, the
field of DES generally praises but does not explore the inherent tuneability of DES. The rational
design and study of novel DES is the most likely route towards impactful work in this area.
11.3. References
1 A. P. Abbott, G. Capper, D. L. Davies, R. K. Rasheed and V. Tambyrajah, Chem. Commun., 2003, 0, 70–71.
2 E. L. Smith, A. P. Abbott and K. S. Ryder, Chem. Rev., 2014, 114, 11060–11082. 3 R. Hayes, G. G. Warr and R. Atkin, Chem. Rev., 2015, 13, 6357–6426. 4 C. R. Ashworth, R. P. Matthews, T. Welton and P. A. Hunt, Phys. Chem. Chem. Phys., 2016, 18, 18145–
18160. 5 C. F. Araujo, J. A. P. Coutinho, M. M. Nolasco, S. F. Parker, P. J. A. Ribeiro-Claro, S. Rudić, B. I. G. Soares
and P. D. Vaz, Phys. Chem. Chem. Phys., 2017, 19, 17998–18009. 6 S. McDonald, T. Murphy, S. Imberti, G. G. Warr and R. Atkin, J. Phys. Chem. Lett., 2018, 9, 3922–3927. 7 O. S. Hammond, S. Eslava, A. J. Smith, J. Zhang and K. J. Edler, J. Mater. Chem. A, 2017, 5, 16189–
16199. 8 O. S. Hammond, K. J. Edler, D. T. Bowron and L. Torrente-Murciano, Nat. Commun., 2017, 8, 14150.

263
9 R. A. Sheldon, Green Chem., 2017, 19, 18–43. 10 Y. Dai, G.-J. Witkamp, R. Verpoorte and Y. H. Choi, Food Chem., 2015, 187, 14–19. 11 X. Meng, K. Ballerat-Busserolles, P. Husson and J.-M. Andanson, New J. Chem., 2016, 40, 4492–4499. 12 O. S. Hammond, D. T. Bowron, A. J. Jackson, T. Arnold, A. Sanchez-Fernandez, N. Tsapatsaris, V. G.
Sakai and K. J. Edler, J. Phys. Chem. B, 2017, 121, 7473–7483. 13 O. S. Hammond, D. T. Bowron and K. J. Edler, Angew. Chemie - Int. Ed., 2017, 56, 9782–9785. 14 H. Monhemi, M. R. Housaindokht, A. A. Moosavi-Movahedi and M. R. Bozorgmehr, Phys. Chem.
Chem. Phys., 2014, 16, 14882–14893. 15 A. Sanchez-Fernandez, K. J. Edler, T. Arnold, D. Alba Venero and A. J. Jackson, Phys. Chem. Chem.
Phys., 2017, 19, 8667–8670. 16 O. S. Hammond, D. T. Bowron and K. J. Edler, Green Chem., 2016, 18, 2736–2744. 17 M. Gilmore, L. M. Moura, A. H. Turner, M. Swadźba-Kwaśny, S. K. Callear, J. A. McCune, O. A.
Scherman and J. D. Holbrey, J. Chem. Phys., 2018, 148, 193823. 18 J. A. P. Coutinho and S. P. Pinho, Fluid Phase Equilib., 2017, 448, 1. 19 M. A. R. Martins, S. P. Pinho and J. A. P. Coutinho, J. Solut. Chem., 2018, 1–3. 20 A. Sanchez-Fernandez, O. S. Hammond, K. J. Edler, T. Arnold, J. Doutch, R. M. Dalgliesh, P. Li, K. Ma
and A. J. Jackson, Phys. Chem. Chem. Phys., 2018, 20, 13952–13961. 21 M. Pal, R. Rai, A. Yadav, R. Khanna, G. A. Baker and S. Pandey, Langmuir, 2014, 30, 13191–13198. 22 M. Pal, R. K. Singh and S. Pandey, ChemPhysChem, 2015, 16, 2538–2542. 23 I. Gállego, M. A. Grover and N. V. Hud, Angew. Chemie - Int. Ed., 2015, 54, 6765–6769. 24 L. Sapir, C. B. Stanley and D. Harries, J. Phys. Chem. A, 2016, 120, 3253–3259. 25 T. L. Greaves, D. F. Kennedy, A. Weerawardena, N. M. K. Tse, N. Kirby and C. J. Drummond, J. Phys.
Chem. B, 2011, 115, 2055–2066. 26 D. V Wagle, H. Zhao and G. A. Baker, Acc. Chem. Res., 2014, 47, 2299–2308.

264
12. APPENDIX
12.1. Appendix 1: Supporting information for Chapter
3
12.1.1. Theory
Neutron diffraction experiments rely on the often wide difference in coherent neutron scattering
lengths between atomic isotopes (bcoherent), for example hydrogen (bhydrogen = -3.74 fm) and
deuterium (bdeuterium = 6.67 fm). Each sample that is measured with different H/D isotopic
substitutions therefore yields a different set of structural information corresponding with the same
overall structure, assuming that the substitution does not affect it. For each sample, the
differential scattering cross-section is measured, which is then calibrated and background-
corrected before subtracting the multiple and inelastic scattering. The product of each contrast is
a total structure factor Fi(Q):
e19 = ∑ 2 − )mn4m`m4n nAmn9 − 1m,n8m (1)
where Q is defined as the total momentum transfer vector magnitude (Q = (4π/λ)sinθ), cα
are the concentrations of the atomic constituents of a sample and bα the scattering lengths
of these, and Sαβ(Q) are the partial structure factors, which are a measure of the structural
correlations between atoms of type α and β in Q-space, and is obtained from the Fourier
transform of the partial pair distribution functions Gαβ(r) by the relation:
Amn9 = 1 + :;g\c h "mn sin9 . jkY (2)
where ρ0 is the atomic number density, and the partial radial distribution functions gαβ(r)
are defined as gαβ(r) = Gαβ(r) + 1. As each isotopic contrast gives a different Fi(Q), full
determination of all Sαβ(Q) functions is theoretically possible, and subsequently gαβ(r). In
reality total isotopic contrast is unfeasible for most systems more complex than H2O, and
the system is underdetermined. In this instance, a structural model is refined to
experimental data using the known physicochemical properties of the system as
constraints such as density, charge and molecular structure. This enables the extraction of
the structural information of the system with an atomistic level of detail.1

265
12.1.2. Empirical Potential Structure Refinement
Empirical potential structure refinement (EPSR) is a 3D structural modelling technique that evolved
from the reverse Monte Carlo (RMC) method.2,3 The purpose of EPSR is to simulate a 3D
configuration that is the most objectively consistent with experimental diffraction data for a
system.4 To achieve a consistent fit to data, RMC uses hard sphere potentials and either accepts or
rejects a move depending on whether the fit has improved. Conversely, EPSR employs a Lennard-
Jones potential where εαβ and σαβ are given by typical Lorentz-Berthelot mixing rules, using atom-
centric point charges and periodic boundary conditions to generate a simulated reference
potential (RP) for a disordered system.5 The residuals between the RP and the experimental data
are used to calculate an empirical potential (EP) that is introduced to the RP as a series of Poisson
functions to suppress Fourier transform artefacts.6
EPSR uses a number of techniques to maximize the objectivity of the fit. Firstly, the properties of a
system, including its density, molecular structure, and composition, are used as severe
physicochemical constraints on configurations and their overlap. Secondly, EPSR deviates from
classical simulation by allowing a degree of intramolecular disorder that is obtained by sampling
harmonic potentials for each molecule, allowing for a better fit to experimental data.7 To fit the
diffraction data, the model is iteratively improved by adjusting the EP to bias the model towards
experimentally determined molecular configurations, with MC moves accepted or rejected based
around the Boltzmann factor:
exp |− ∆l1I + . ∆l[ + ∆l (3)
where ΔUintra,RP,EP are the energy differences between the new and old model configurations,
respectively due to the intramolecular, reference, and empirical potentials.
12.1.3. Simulation method
A set of molecules are first constructed to impose the mean intramolecular geometry by using
interatomic distance constraints, shown in the main text. These molecules are then parameterized
by assigning Lennard-Jones, charge, and atomic mass values to each distinct atom type, which can
be seen in Table 1. Parameters for urea were derived from those used by Soper et al. in previous
diffraction experiments on the aqueous structure of urea at very high concentrations,8 and
parameters for choline and chloride are derived from the OPLS All-Atom force field potential.9 200

266
choline, 200 chloride and 400 urea molecules are introduced to a simulation box which is
randomized to generate a disordered starting configuration. The density is initially set to 1/20 of
the experimental value to minimize the probability of molecular overlap.
The simulation is allowed to equilibrate in energy by running for a number of MC cycles, where
one cycle comprises an attempt to move every atom, rotate every rotational group, and rotate and
translate every molecule one time each. The box is compressed by approximately 10% and the
process repeated until the experimental density of 0.106 atoms Å-3 is obtained. Using the reference
potential only, the simulation continues to run until the energy of the system reaches a plateau.
By this point, the simulation has equilibrated as a cubic box of diameter 41.6 Å, allowing reliable
determination of structures up to d/2 = 20.8 Å in size. The empirical potential is then introduced
to begin the refinement against the neutron data, with one refinement cycle comprising five MC
cycles and the recalculation of the EP. Following equilibration of the model, the simulation is begun
by accumulating statistics over thousands of refinement cycles on the EP and all of the structural
information within the model, such as RDFs, SDFs, and coordination numbers. Molecular centre
radial distribution functions and spatial density functions that describe the configurations of
cations, anions and urea molecules around one another are determined using the spherical
harmonics (SHARM) routine of EPSR, and liquid ‘hole’ sites are determined using the VOIDS routine.

267
12.1.4. Lennard-Jones parameters used in EPSR modelling
Table A1. Lennard-Jones parameters, including the charges and masses used in the reference potential for simulations of reline.
atom type ε / kJ mol-1 σ / Å mass / amu q / e
N 0.700 3.200 14.0 1.000
C2N 0.800 3.700 12.0 -0.120
CT 0.800 3.700 12.0 -0.180
HCN 0.200 2.580 2.0 0.060
COH 0.800 3.700 12.0 0.145
MT 0.200 2.580 2.0 0.060
HCO 0.200 2.580 2.0 0.060
OH 0.650 3.100 16.0 -0.683
HOH 0.000 0.000 2.0 0.418
Cl 0.566 4.191 36.0 -1.000
CU 0.439 3.750 12.0 0.142
OU 0.878 2.960 16.0 -0.390
NU 0.711 3.250 14.0 -0.542
HU2 0.000 0.000 2.0 0.330
HU1 0.000 0.000 2.0 0.330

268
12.1.5. Complete set of partial (site-site) radial distribution
functions for reline
Figures A1-A24. The 120 partial radial distribution functions for reline, plotted in blocks of 5 to facilitate viewing. The solid lines show the partial RDF, and the dashed lines plotted in the same colour and at the same origin show the running integral of this peak, and hence the mean coordination number at a certain radius. Sharp peaks denote more intense structural correlations between species at a given radius; note the high relative intensity and short radius of strong hydrogen bonding interaction RDFs, particularly the HOH-Cl correlation.

269

270

271

272

273

274

275
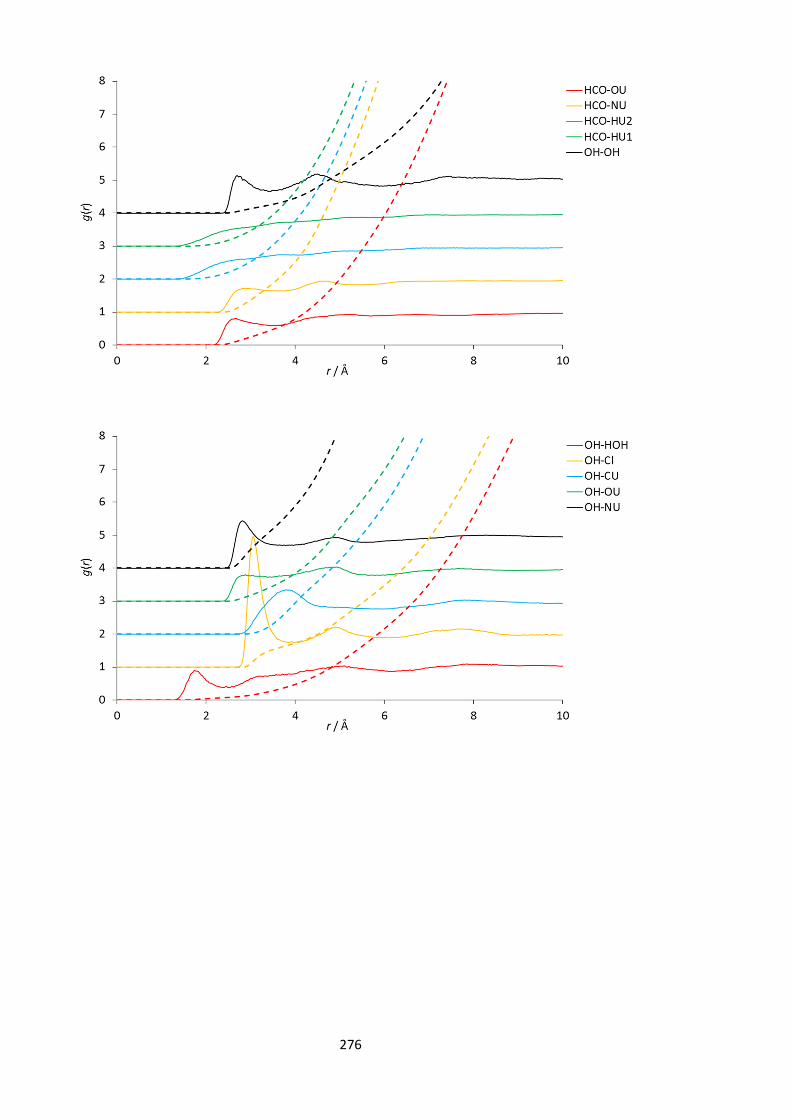
276

277

278

279

280
12.2. Appendix 2: Supporting information for Chapter
4
12.2.1. Supplementary figures
Figure A25. Atom types and molecules used in the EPSR simulation.
Figure A26. Characteristic TEM micrographs of the Ce-y-10 materials. (a) Ce-100-10; (b) Ce-140-10; (c) Ce-180-10 (scale bars denote 50 nm). The three materials present a 1D morphology with high morphological purity. It is known that rods preferentially expose more reactive surface lattice planes (100) and (110). Increasing synthetic temperature promotes the dissolution/recrystallization growth step (as previously observed with other 1D materials) leading to a decrease of the aspect ratio.

281
12.2.2. Supplementary tables
Table A2. Assigned EPSR parameters for modelling of experimental diffraction data.
Atom type ε (kJ mol-1) σ (Å) q (e)
N 0.700 3.200 1.000
C2N 0.800 3.700 -0.120
CT 0.800 3.700 -0.180
HCN 0.200 2.580 0.060
COH 0.800 3.700 0.145
MT 0.200 2.580 0.060
HCO 0.200 2.580 0.060
OH 0.650 3.100 -0.683
HOH 0.000 0.000 0.418
Cl 0.566 4.191 -1.000
CU 0.439 3.750 0.142
OU 0.878 2.960 -0.390
NU 0.711 3.250 -0.542
HU2 0.000 0.000 0.330
HU1 0.000 0.000 0.330
Ce 0.811 3.552 3.000
NN 0.711 3.250 0.845
ON 0.879 0.296 -0.615
O1 0.634 3.151 -0.834
H1 0.000 0.000 0.417

282
Table A3. Scherrer crystallite size corresponding with XRD data.
d / nm 111 200 220 311 222 400 331 420 422 Avg.
(2θ) 28.58 33.12 47.54 56.41 59.16 69.50 76.80 79.18 88.55
Ce-180-0 8.40 4.97 7.73 8.16 6.67 6.62 7.17 5.76 5.71 6.80
Ce-140-0 7.72 4.89 7.07 7.29 6.73 6.65 6.73 5.89 5.07 6.45
Ce-100-0 8.33 5.93 8.38 9.29 11.64 11.93 8.94 9.27 8.28 9.11
Ce-180-
10 7.05 6.65 5.96 6.80 2.21 4.57 5.29 3.56 3.36 5.05
Ce-140-
10 8.82 8.99 6.92 6.67 5.60 4.97 4.55 5.02 3.57 6.12
Ce-100-
10 9.09 7.17 7.66 7.79 9.84 11.73 7.28 7.40 6.48 8.27
Ce-180-2 24.74 17.66 25.76 25.57 22.44 21.45 18.70 19.30 15.71 21.26
Ce-140-2 6.39 4.06 5.45 5.83 4.90 4.95 5.51 3.99 4.15 5.02
Ce-100-2 7.45 6.44 6.97 7.16 8.83 7.41 6.16 4.90 4.98 6.70
Ce-180-5 17.36 13.16 18.69 19.32 15.09 17.59 14.84 14.62 12.47 15.90
Ce-140-5 7.85 7.22 8.32 7.65 8.92 9.50 6.25 6.95 5.97 7.63
Ce-100-5 8.16 5.21 6.91 7.48 10.14 11.24 7.43 6.83 6.15 7.73
The average crystallite size was determined by applying the Scherrer equation for all peaks that a Lorentzian function was fitted to, for the full angular range covered by the diffraction experiment (20-90 degrees 2theta). These diffraction peaks were: (111), (200), (220), (311), (222), (400), (331), (420), (422). The crystallite size calculated for each of the diffraction directions is similar to the average value, indicating the poly-crystallite nature of the 1D structures.
12.2.3. Supplementary methods
Empirical Potential Structure Refinement (EPSR) is a derivative of the Reverse Monte Carlo method,
and simulates a 3D configuration that is objectively consistent with experimentally-determined
diffraction data for a system.4 This is achieved by using standard Lennard-Jones parameters and
the known quantities of the system, such as molecular geometry and structure, density and
composition, as well as permitting intramolecular disorder. The set of molecules used in the
simulation are shown in Supplementary Figure 1, alongside their parameterization, in
Supplementary Table 1. Parameters for urea are derived from previous diffraction experiments on
high concentrations of aqueous urea,8 and choline and chloride parameters hail from the OPLS All-
Atom force field.9 The bond lengths and molecular geometries of these species are as described
previously.10 Nitrate parameters are as used in analysis of diffraction experiments on
alkylammonium nitrate ionic liquids,11,12 and cerium parameters are derived from a 12-6-4 LJ-Type

283
nonbonded model for highly charged metal centers.13 Water is modelled using standard TIP3P
parameters.14
215 choline, 215 chloride, 430 urea, 2 cerium, 6 nitrate and 12 water molecules are introduced to
a simulation box which is then randomized. The initial density is set to 5% of the experimental
value to allow reliable energy minimization. The model is allowed to run for a number of MC cycles
until it has equilibrated in energy, whilst being compressed by approximately 10% per cycle until
stabilizing at the experimental density.15 The empirical potential is then introduced to refine the
model to the neutron diffraction data, and approximately 6000 refinement cycles are performed
to accumulate statistics on the structural information including intermolecular coordination
numbers, radial distribution functions (RDFs) and spatial density functions (SDFs).
The COORD routine of EPSR runs alongside the fitting procedure, accumulating information on the
intermolecular coordination numbers between different components of the system as the
disordered system is allowed to evolve through the 6000 refinement cycles. Mean coordination
numbers are therefore calculated alongside their respective errors, and the magnitude of these
errors demonstrates the degree of intermolecular disorder between species. This calculation uses
the true molecular center of mass for monoatomic species, but for polyatomic molecules the
molecular centers are defined as the choline C2N atom, the urea CU atom, the O1 atom of water
and the NN atom of nitrate. The resultant coordination numbers are shown in Table 1 in the main
body text. Compared to the structure of the pure reline solvent, the structural change in the DES
in terms of the intermolecular coordination can be seen to be minimal.10

284
12.3. Appendix 3: Supporting information for Chapter
5
12.3.1. EPSR background
Empirical Potential Structure Refinement (EPSR) is a computational atomistic modelling protocol
evolved from the Reverse Monte Carlo (RMC) method.2,3 EPSR is designed to simulate a 3D
configuration of molecules that is as objectively consistent with a set of experimental diffraction
data for a system as it is possible for it to be.4 To achieve this fit, EPSR uses a Lennard-Jones
potential, where εαβ and σαβ are given by Lorentz-Berthelot mixing rules, with atom-centric point
charges and periodic boundary conditions to generate a simulated reference potential for a
disordered system; this differentiates EPSR from RMC, which uses hard sphere potentials that are
accepted or rejected depending upon whether the fit has improved.5 The residuals between the
reference potential and the experimental data are used to calculate an empirical potential (EP)
that is introduced to the reference potential as a series of Poisson functions to suppress spurious
scattering artefacts that are known to arise when performing Fourier transforms.6 EPSR maximises
the quality of fit by using the physicochemical properties of a system such as the density, molecular
structure and composition, and permits intramolecular disorder via the sampling of harmonic
potentials.7
12.3.2. EPSR methodology
The molecules shown in Figure 1 (main body text) are first constructed (using Jmol software) to
impose rigid physical constraints upon the system that is to be modelled. These are then
parameterized with Lennard-Jones, charge, and atomic mass values to every atom type that was
identified as chemically distinct. The values for these various parameters is shown in Table S1. The
parameters for choline, chloride and malic acid were derived from the OPLS All-Atom force field
potential,9 whereas standard TIP3P parameters were found to be an adequate definition.16
For the pure DES, 300 choline, 300 malic acid and 300 chloride molecules were introduced into a
box of a density one-twentieth that of the experimental density, whereas for the hydrated
malicine-2w system 200 choline, 200 malic acid, 200 chloride and 400 water molecules were added
to the box. The EPSR simulation is first allowed to equilibrate in energy by running for a number of
MC refinement cycles, each of which are comprised of an attempt to move every atom, rotate
every freely-rotating group and rotate and translate every molecule in the box. For each iteration
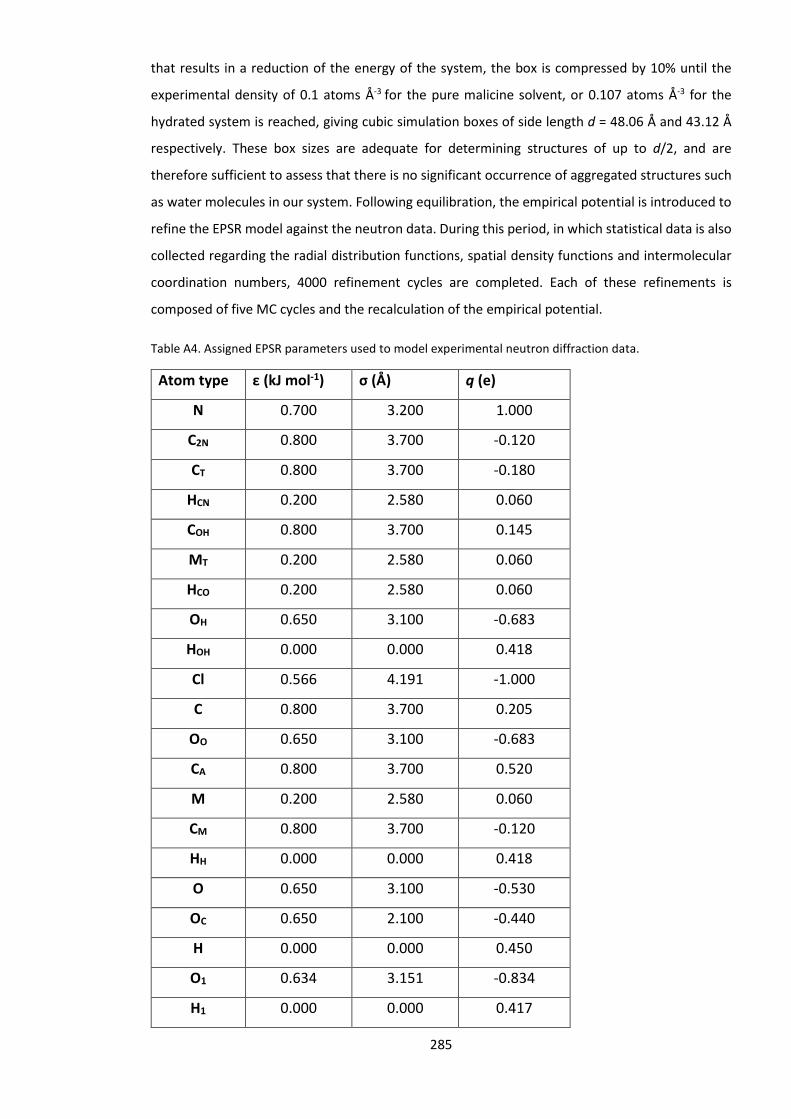
285
that results in a reduction of the energy of the system, the box is compressed by 10% until the
experimental density of 0.1 atoms Å-3 for the pure malicine solvent, or 0.107 atoms Å-3 for the
hydrated system is reached, giving cubic simulation boxes of side length d = 48.06 Å and 43.12 Å
respectively. These box sizes are adequate for determining structures of up to d/2, and are
therefore sufficient to assess that there is no significant occurrence of aggregated structures such
as water molecules in our system. Following equilibration, the empirical potential is introduced to
refine the EPSR model against the neutron data. During this period, in which statistical data is also
collected regarding the radial distribution functions, spatial density functions and intermolecular
coordination numbers, 4000 refinement cycles are completed. Each of these refinements is
composed of five MC cycles and the recalculation of the empirical potential.
Table A4. Assigned EPSR parameters used to model experimental neutron diffraction data.
Atom type ε (kJ mol-1) σ (Å) q (e)
N 0.700 3.200 1.000
C2N 0.800 3.700 -0.120
CT 0.800 3.700 -0.180
HCN 0.200 2.580 0.060
COH 0.800 3.700 0.145
MT 0.200 2.580 0.060
HCO 0.200 2.580 0.060
OH 0.650 3.100 -0.683
HOH 0.000 0.000 0.418
Cl 0.566 4.191 -1.000
C 0.800 3.700 0.205
OO 0.650 3.100 -0.683
CA 0.800 3.700 0.520
M 0.200 2.580 0.060
CM 0.800 3.700 -0.120
HH 0.000 0.000 0.418
O 0.650 3.100 -0.530
OC 0.650 2.100 -0.440
H 0.000 0.000 0.450
O1 0.634 3.151 -0.834
H1 0.000 0.000 0.417

286
12.3.3. SDFs for vitrified malicine (208 K)
Figure A27. SDF plots showing the 7.5% most likely 3D configurations of molecules. Green isosurfaces are chloride anions, yellow are choline cations and orange isosurfaces are malic acid molecules. The two leftmost SDF plots are centred on choline molecules, whilst the two SDFs on the right hand side are centred about malic acid molecules. These plots demonstrate the subtle increase in order relative to the pure system under ambient conditions when the system is cooled and vitrified, particularly in the case of the choline-choline, choline-malic acid and malic acid-malic acid SDFs.

287
12.4. Appendix 4: Supporting information for Chapter
6
12.4.1. Raman Spectroscopy of prepared iron oxides
A small amount (~1 mg) of each prepared iron oxide was placed on a clean glass slide and measured
for 30 seconds using a Renishaw inVia confocal Raman microscope with a 532 nm laser. All products
showed similar scattering, likely due to the action of the laser light upon the samples, either
oxidising or otherwise fusing nanoparticles to a crystalline α-Fe2O3 form.
Figure A28. Raman spectra for the prepared iron oxide samples. Data are smoothed and corrected for cosmic radiation.

288
12.4.2. Residual mass within the autoclaves
The nanoparticle-forming reactions performed using the iron precursors were found to form a
white crystalline crust around the top of the vessel. This was carefully removed from the autoclave
used for the Fe-200-0 synthesis for testing. Samples were measured using 1H NMR. Numerous
deuterated solvents were tried (acetone, acetonitrile, chloroform, methanol, ethanol) but the
product was only soluble in D2O. This suggests that the product likely contains a highly polar, ionic
species such as the anticipated ammonium carbonate. The 1H NMR spectrum of this product is
shown in Figure A29.
Figure A29. 1H NMR spectrum of the Fe-200-0 reactor residue collected using a 500 MHz Agilent ProPulse NMR Spectrometer. The solute was dissolved in D2O. The inset shows a zoomed region ~2 – 4 ppm.
Analysis of the products with powder X-Ray diffraction revealed strong scattering corresponding
with a highly crystalline material, shown in Figure A30. Because of the unknown composition of
the material, indexing was not attempted.

289
Figure A30. Powder X-Ray diffraction data for the residual crystalline product formed at the roof of the reactor for the high-temperature, low-water reaction.
12.4.3. Heat treatment experiments on Deep Eutectic
Solvents
1H NMR spectra for the heat treated DESs are shown in Figures A31-A36. Data were collected using
an Agilent ProPulse 500 MHz NMR spectrometer. Samples (~20 mg) were diluted into d6-DMSO
(~0.6 g). Integrals are shown below the peaks and the centre position shown above. The choline –
(CH3)3 feature was used universally as a reference integral.

290
Figure A31. 1H NMR spectrum of the 0w DES treated at 100 ˚C for 10 minutes.
Figure A32. 1H NMR spectrum of the 0w DES treated at 150 ˚C for 10 minutes.

291
Figure A33. 1H NMR spectrum of the 0w DES treated at 200 ˚C for 10 minutes.
Figure A34. 1H NMR spectrum of the 10w DES treated at 100 ˚C for 10 minutes.

292
Figure A35. 1H NMR spectrum of the 10w DES treated at 150 ˚C for 10 minutes.
Figure A36. 1H NMR spectrum of the 10w DES treated at 200 ˚C for 10 minutes.

293
12.4.4. Front and back illumination comparison for
photoanodes
It was typically found that ‘back illumination’, that is, the illumination of the uncoated side of the
FTO glass slide, gave far higher photocurrent densities than illuminating the coated side of the
sample. This is related to the thickness and porosity of the electrode; assuming that the highly
porous nature of our films allows the entire surface area of the nanostructures to be wetted by the
electrolyte solution, back illumination gives the highest photocurrent because more photoinduced
electrodes are produced closer to the FTO substrate, and more electrons are therefore able to
move to the cathode, with holes able to reach the liquid independent of this distance because of
the film porosity. Additionally, light intensity scales negatively with film thickness due to absorption
effects. An example of performance for front versus back illumination is shown in the following
figure.
Figure A37. The difference between front and back illumination for the Fe-150-10 film product is shown. The front illumination current is nearly imperceptible in comparison. Data were collected whilst chopping the shutter on and off with 0.5 s-1 periodicity.

294
12.5. Appendix 5: Supporting information for Chapter
7
12.5.1. Preparation of hydrated and isotopically-substituted
reline samples
Choline chloride (≥99%) was obtained from Fisher, and urea (≥99%) was obtained from Sigma-
Aldrich. d4-urea (CO(ND)2, 99.6% chemical purity, 99.8 atom-% D), and d9-choline chloride
((CD3)3N(CH2)2OHCl, ≥99% chemical purity) were sourced from QMX laboratories. All chemicals
were used as provided. Pure reline samples were first prepared by the literature route of mixing
the two desired isotopes in the eutectic molar ratio, followed by heating at 60 ˚C with regular
agitation. Water (Elga, 18.2 MΩ) or D2O (Sigma-Aldrich, ≥99.9% chemical purity and atom-% D) was
then added to create a series of five choline chloride:urea:water isotope substitutions of H:H:H,
H:D:D, D:H:D, D:D:H, and D:D:D. These isotope-substituted ternary DES-water mixtures were
prepared in a series of DES:water molar ratios (defined as w), that are described in Table A5.
Table A5. The series of DES sample compositions that were used in these experiments.
Mixture ChCl:U:W ratio Water / mol.% [a]Water / wt.%
Reline-1w 1:2:1 25.0 6.48
Reline-2w 1:2:2 40.0 12.18
Reline-5w 1:2:5 62.5 25.74
Reline-10w 1:2:10 76.9 40.95
Reline-15w 1:2:15 83.3 50.98
Reline-20w 1:2:20 87.0 58.10
Reline-30w 1:2:30 90.9 67.53
[a] The calculated weight percentage here is relevant only for ‘normal’ hydrogenous DES, and is a variable when the
system is deuterium-substituted.

295
12.5.2. Neutron diffraction experiments
Neutron diffraction experiments were performed using different, yet largely analogous
instruments. Samples of reline-1w, reline-2w, reline-15w and reline-20w were measured using the
SANDALS diffractometer (beamtime allocations RB1510465 and RB1620479), located at TS1 of the
STFC ISIS Neutron and Muon Source, Rutherford Appleton Laboratory, Harwell, UK. SANDALS is
optimised for disordered light-element systems, using time-of-flight (TOF) neutrons with
wavelength 0.05 ≤ λ ≤ 4.5 Å, and a forward scattering detector geometry spanning an angular range
of 3.8 - 35.4˚, to give a Q-range of 0.1 ≤ Q ≤ 50 Å-1. The NIMROD diffractometer, located in TS2 of
the same ISIS facility was also used (beamtime allocations RB1610312 and RB1620479) to measure
reline-1w, reline-2w, reline-5w, reline-10w, and reline-30w. With a wide neutron TOF spectral
range of 0.05 ≤ λ ≤ 11 Å facilitated by the 100 ms pulse width of the 10 Hz TS2 source,17 and
detectors across the angular range 0.6 – 37.5˚, NIMROD gives a wider Q-range than SANDALS. This
wide Q-range of 0.01 ≤ Q ≤ 50 Å-1 facilitates measurement of larger structures, and would therefore
allow the microscale phase separation suggested by D’Agostino et al. to be fully characterised.18
When measurements were taken using both instruments, the results were functionally identical
because no small-angle scattering signal was observed. For maximum consistency, SANDALS
datasets were therefore used for EPSR modelling only when no NIMROD dataset was available
(reline-15w and reline-20w), but instrumental similarity means that this has no bearing on the
results.
For both instruments null-scattering, vacuum-sealed Ti0.68Zr0.32 sample cells with a path-length of
1 mm were filled with around 1.5 g of each sample, before being placed in a sample changer. The
evacuated sample environment was regulated to 303 ± 0.1 K using a Julabo recirculating
water/ethylene glycol temperature controller. Measurements were performed using a circularly-
collimated neutron beam of 30 mm diameter, with a counting time of approximately 8 hours on
SANDALS, or 2 hours on NIMROD. Empty sample cells, the empty instrument, and a 3 mm thick
vanadium standard were also measured for data normalisation and instrument calibration. Data
were processed using GudrunN software.19 This involved adding corrections for attenuation,
multiple scattering and the sample environment background, and normalising the data using the
vanadium standard measurement. After a final correction for hydrogen inelasticity, a series of
datasets are produced that can be analysed using Empirical Potential Structure Refinement (EPSR)
modelling.
In each case, the accurate mass of each sample was recorded (weighing error ± 0.1 mg) in order to
determine the sample purity. This was achieved by comparing the measured neutron scattering
differential cross section (DCS) with the calculated DCS from the sample masses, using GudrunN

296
neutron total scattering data reduction software.19 Sample purity was determined to be adequate,
as assessed by being within a neutron DCS error margin of ±2% for fully deuterated samples, and
±10% for fully hydrogenous samples. This is within the error of the diffraction experiment and
sample preparation, with a higher error for more proton-rich samples because of the strong
inelastic scattering of neutrons by hydrogen nuclei.20 The experimental datasets are shown in
Figure A38.
Figure A38. Corrected experimental neutron diffraction data (markers) and fits from Empirical Potential Structure Refinement atomistic models (solid lines) for the seven systems studied here.

297
12.5.3. Empirical Potential Structure Refinement (EPSR)
modelling
Parameters for the water oxygen ‘O1’ and hydrogen ‘H1’ atoms were derived from the TIP3P
model,16 and are given in Table A6. The composition of each simulation box is shown in Table A7.
The DES components of the hydrated EPSR models were parameterised and labelled in exactly the
same way that was reported previously for the pure DES;10 the atom labels are shown again for
reference in Figure A39.
Table A6. EPSR parameters for water molecules that were used to model experimental diffraction data.
Atom type ε / kJ mol-1 σ / Å q / e
O1 0.634 3.151 -0.834
H1 0.000 0.000 0.417
Table A7. The quantity of each molecule type used to build the simulation boxes is shown, alongside the total number of atoms in each box and the equilibrated box diameter. Atomic densities are calculated using a combination of literature values and experimental scattering data for H:H:H hydrated reline systems, and fall within the propagated errors from the literature measurements.21
Mixture Choline Chloride Urea Water Total Box diameter / Å Density / atoms Å-3
Reline-1w 400 400 800 400 2000 54.025 0.104005
Reline-2w 300 300 600 600 1800 50.166 0.104553
Reline-5w 200 200 400 1000 1800 46.710 0.104012
Reline-10w 150 150 300 1500 2100 46.355 0.102405
Reline-15w 100 100 200 1500 1900 43.353 0.101861
Reline-20w 100 100 200 2000 2400 45.824 0.101846
Reline-30w 100 100 200 3000 3400 50.651 0.098500

298
Figure A39. DES molecules used to create the EPSR reference potential. The shown atom type labels will be referred to in the text. Reprinted with permission from the Royal Society of Chemistry.10
Otherwise, the experimental procedure for the EPSR modelling was functionally identical to
previous work on the pure reline DES.10 The reference potential for each system was allowed to
equilibrate to the experimental density described in Table A7, and the empirical potential was then
allowed to equilibrate. Finally, ensemble information was interrogated from the model to gain
information about the structure and bonding within these mixtures.
12.5.4. SDF plots
SDF plots are a way to aid with the visualisation of the 3D structure of a disordered liquid, with the
surfaces showing the most likely places that a solvating species can be found around a certain
molecule. Some additional spatial density function (SDF) plots are shown below, demonstrating
some of the interesting and subtle changes occurring throughout the regime change. Firstly, the
solvation of chloride by water is shown in supporting Figure A40, demonstrating the gradual
increase in water-chloride interactions as the hydration level is increased. The appearance of the
second solvation shell of chloride about water at 15w shows that water-chloride interactions are
dominant over choline-chloride, and urea-chloride interactions. Secondly, the hydration of choline
at 10w, the point at which this interaction is maximised, is shown in supporting Figure A41. Here,
the water forms a radial solvation band around the choline, much like is seen in the pure solvent,
for the choline-urea and choline-chloride interactions, but at closer length scale.

299
Figure A40. SDF plots centered on water molecules at different hydration levels, showing their solvation by chloride (green surfaces), and plotted at the 7.5% probability level. As the hydration level increases, the water-chloride interaction becomes more prevalent.
Figure A41. SDF plot showing hydration (blue surface) of choline at 10w, the point at which this interaction is maximised, and plotted at the 7.5% probability level.

300
12.5.5. Calculated Intermolecular Coordination Numbers
The tabulated intermolecular coordination numbers are shown in Tables A8-A14, and these were
calculated by integrating partial radial distribution functions (pRDFs) up to a radius Rmax
corresponding with their first minima, where Rmax is accurate to a maximum of one data bin, ie.
Rmax ± 0.02 A-1. For these intermolecular coordination numbers the polyatomic molecular centres
were defined as the C2N atom of choline, the CU atom of urea, and the O1 atom of water.
Table A8. Calculated intermolecular coordination numbers for reline-1w. The calculated ‘error’ represents one standard deviation in coordination number.
Molecule A Molecule B Rmax / Å Ncoord ±
Choline Water 6.2 2.50 1.56
Urea Water 4.9 1.48 1.20
Chloride Water 4.5 1.18 1.08
Water Water 4.0 0.91 0.97
Choline Choline 7.8 4.58 1.64
Choline Chloride 6.4 3.19 1.12
Choline Chloride 4.7 1.04 0.78
Choline Urea 6.8 6.69 2.18
Urea Chloride 5.2 1.76 0.94
Urea Urea 5.7 4.01 1.71
Table A9. Calculated intermolecular coordination numbers for reline-2w. The calculated ‘error’ represents one standard deviation in coordination number.
Molecule A Molecule B Rmax / Å Ncoord ±
Choline Water 6.2 4.81 2.22
Urea Water 4.9 2.62 1.60
Chloride Water 4.5 2.17 1.43
Water Water 4.0 1.65 1.24
Choline Choline 7.8 4.13 1.57
Choline Chloride 6.4 3.01 1.14
Choline Chloride 4.7 0.96 0.77
Choline Urea 6.8 6.33 2.12
Urea Chloride 5.2 1.60 0.92
Urea Urea 5.7 3.67 1.62

301
Table A10. Calculated intermolecular coordination numbers for reline-5w. The calculated ‘error’ represents one standard deviation in coordination number.
Molecule A Molecule B Rmax / Å Ncoord ±
Choline Water 6.2 10.08 3.03
Urea Water 4.9 5.28 2.06
Chloride Water 4.5 4.24 1.83
Water Water 3.3 1.83 1.08
Choline Choline 7.8 3.34 1.56
Choline Chloride 6.4 2.46 1.08
Choline Chloride 4.7 0.77 0.71
Choline Urea 6.8 4.88 1.89
Urea Chloride 5.2 1.26 0.86
Urea Urea 5.7 3.09 1.58
Table A11. Calculated intermolecular coordination numbers for reline-10w. The calculated ‘error’ represents one standard deviation in coordination number.
Molecule A Molecule B Rmax / Å Ncoord ±
Choline Water 6.2 15.37 3.08
Urea Water 4.9 8.09 2.12
Chloride Water 4.4 5.78 1.79
Water Water 3.1 2.21 1.05
Choline Choline 7.8 2.48 1.45
Choline Chloride 6.4 1.87 1.03
Choline Chloride 4.7 0.58 0.65
Choline Urea 6.8 3.25 1.63
Urea Chloride 5.2 0.90 0.78
Urea Urea 5.7 2.39 1.36

302
Table A12. Calculated intermolecular coordination numbers for reline-15w. The calculated ‘error’ represents one standard deviation in coordination number.
Molecule A Molecule B Rmax / Å Ncoord ±
Choline Water 6.2 10.15 6.32
Urea Water 4.9 7.61 3.90
Chloride Water 4.3 5.21 3.09
Water Water 3.0 2.64 1.27
Choline Choline 8.2 4.37 2.53
Choline Chloride 6.4 1.89 1.03
Choline Chloride 4.7 0.59 0.65
Choline Urea 6.8 3.23 1.79
Urea Chloride 5.2 0.84 0.77
Urea Urea 5.7 2.27 1.46
Table A13. Calculated intermolecular coordination numbers for reline-20w. The calculated ‘error’ represents one standard deviation in coordination number.
Molecule A Molecule B Rmax / Å Ncoord ±
Choline Water 6.2 14.18 5.44
Urea Water 4.9 9.19 3.30
Chloride Water 4.3 6.29 2.73
Water Water 3.0 2.63 1.18
Choline Choline 8.2 3.37 1.84
Choline Chloride 6.4 1.50 0.99
Choline Chloride 4.7 0.48 0.61
Choline Urea 6.8 2.64 1.54
Urea Chloride 5.2 0.67 0.69
Urea Urea 5.7 1.78 1.27

303
Table A14. Calculated intermolecular coordination numbers for reline-30w. The calculated ‘error’ represents one standard deviation in coordination number.
Molecule A Molecule B Rmax / Å Ncoord ±
Choline Water 6.2 19.03 4.07
Urea Water 4.9 10.84 2.50
Chloride Water 4.2 6.69 1.91
Water Water 3.0 2.68 1.09
Choline Choline 8.2 2.05 1.48
Choline Chloride 6.4 1.01 0.86
Choline Chloride 4.7 0.32 0.51
Choline Urea 6.8 1.56 1.17
Urea Chloride 5.2 0.48 0.62
Urea Urea 5.7 1.18 1.02
12.5.6. Integrated partial (site-site) coordination numbers
As with the intermolecular coordination numbers, the tabulated site-site radial distribution
function analysis is shown in Tables A15-A21. These values were calculated by integrating a
selection of partial radial distribution functions (pRDFs) best describing the specific intermolecular
bonding, up to a radius Rmax corresponding with their first minima, where Rmax is accurate to a
maximum of one data bin, ie. Rmax ± 0.02 A-1. For these coordination numbers, the ‘error’ reflects
the disorder present in the liquid, rather than a lack of general confidence in the data. In this case,
‘important’ coordination numbers are those which have a variance significantly smaller than the
coordination number itself, signifying a persistent correlation.

304
Table A15. Site-site coordination numbers calculated from selected pRDFs of reline-1w. The calculated ‘error’ represents one standard deviation in coordination number.
Atom A Atom B Rmax / Å Ncoord ±
Cl CU 5.0 3.25 1.49
Cl NU 3.9 3.10 1.67
Cl HU1 3.0 1.52 1.36
Cl HU2 3.0 1.02 0.93
HOH Cl 3.2 0.55 0.51
MT Cl 4.0 0.59 0.62
HCN Cl 4.0 0.59 0.61
HCO Cl 4.0 0.59 0.62
HCN OU 3.5 0.48 0.62
MT OU 3.4 0.52 0.65
HCO OU 3.6 0.54 0.67
HOH OU 2.5 0.19 0.40
HOH NU 4.3 2.49 1.60
N N 6.8 2.61 1.28
N C2N 7.5 4.98 1.58
N COH 6.2 2.88 1.24
N OH 5.2 2.08 0.98
N HOH 5.5 2.36 1.10
OU NU 3.5 3.31 1.05
OU HU1 2.6 0.46 0.73
OU HU2 2.6 1.73 0.87
NU HU1 4.6 4.87 2.01
NU HU2 4.6 4.97 1.78
Cl Cl 6.0 1.23 0.91
N O1 5.8 2.09 1.41
HOH O1 2.3 0.07 0.26
HCN O1 3.5 0.28 0.52
HCO O1 3.6 0.32 0.56
Cl O1 4.3 1.09 1.03
O1 O1 4.2 0.99 1.02
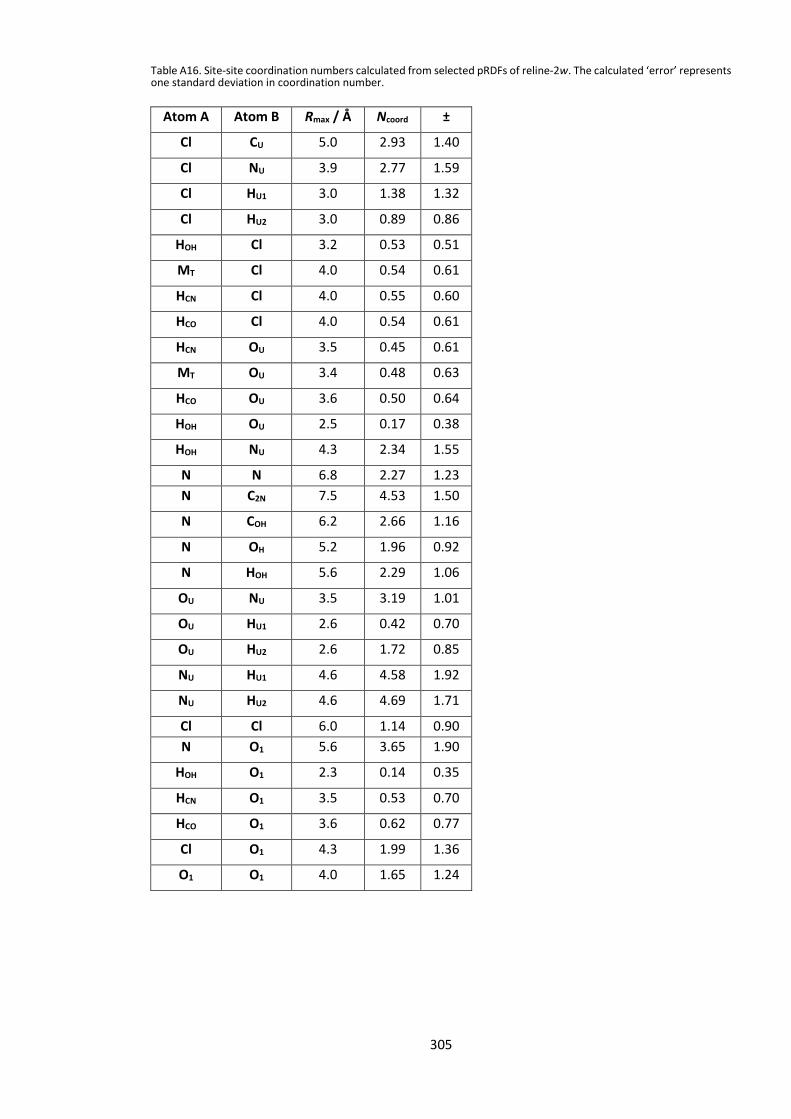
305
Table A16. Site-site coordination numbers calculated from selected pRDFs of reline-2w. The calculated ‘error’ represents one standard deviation in coordination number.
Atom A Atom B Rmax / Å Ncoord ±
Cl CU 5.0 2.93 1.40
Cl NU 3.9 2.77 1.59
Cl HU1 3.0 1.38 1.32
Cl HU2 3.0 0.89 0.86
HOH Cl 3.2 0.53 0.51
MT Cl 4.0 0.54 0.61
HCN Cl 4.0 0.55 0.60
HCO Cl 4.0 0.54 0.61
HCN OU 3.5 0.45 0.61
MT OU 3.4 0.48 0.63
HCO OU 3.6 0.50 0.64
HOH OU 2.5 0.17 0.38
HOH NU 4.3 2.34 1.55
N N 6.8 2.27 1.23
N C2N 7.5 4.53 1.50
N COH 6.2 2.66 1.16
N OH 5.2 1.96 0.92
N HOH 5.6 2.29 1.06
OU NU 3.5 3.19 1.01
OU HU1 2.6 0.42 0.70
OU HU2 2.6 1.72 0.85
NU HU1 4.6 4.58 1.92
NU HU2 4.6 4.69 1.71
Cl Cl 6.0 1.14 0.90
N O1 5.6 3.65 1.90
HOH O1 2.3 0.14 0.35
HCN O1 3.5 0.53 0.70
HCO O1 3.6 0.62 0.77
Cl O1 4.3 1.99 1.36
O1 O1 4.0 1.65 1.24

306
Table A17/ Site-site coordination numbers calculated from selected pRDFs of reline-5w. The calculated ‘error’ represents one standard deviation in coordination number.
Atom A Atom B Rmax / Å Ncoord ±
Cl CU 5.1 2.40 1.35
Cl NU 4.0 2.28 1.53
Cl HU1 3.0 1.08 1.17
Cl HU2 3.0 0.65 0.77
HOH Cl 3.2 0.43 0.50
MT Cl 4.0 0.42 0.55
HCN Cl 4.0 0.44 0.56
HCO Cl 4.0 0.43 0.56
HCN OU 3.5 0.33 0.54
MT OU 3.4 0.36 0.55
HCO OU 3.6 0.37 0.56
HOH OU 2.5 0.13 0.35
HOH NU 4.3 1.78 1.42
N N 6.8 1.76 1.16
N C2N 7.5 3.85 1.49
N COH 6.2 2.32 1.11
N OH 5.3 1.81 0.88
N HOH 5.6 2.01 0.98
OU NU 3.5 2.96 0.96
OU HU1 2.6 0.33 0.64
OU HU2 2.6 1.58 0.83
NU HU1 4.6 4.13 1.83
NU HU2 4.6 4.19 1.65
Cl Cl 6.0 0.85 0.80
N O1 5.4 6.82 2.41
HOH O1 2.3 0.25 0.44
HCN O1 3.6 1.13 0.95
HCO O1 3.6 1.23 1.01
Cl O1 4.3 3.83 1.71
O1 O1 3.5 2.07 1.16

307
Table A18. Site-site coordination numbers calculated from selected pRDFs of reline-10w. The calculated ‘error’ represents one standard deviation in coordination number.
Atom A Atom B Rmax / Å Ncoord ±
Cl CU 5.2 1.79 1.24
Cl NU 4.1 1.71 1.39
Cl HU1 3.0 0.76 1.00
Cl HU2 3.0 0.44 0.65
HOH Cl 3.2 0.35 0.48
MT Cl 4.0 0.30 0.49
HCN Cl 4.0 0.33 0.51
HCO Cl 4.0 0.32 0.51
HCN OU 3.5 0.22 0.45
MT OU 3.5 0.25 0.47
HCO OU 3.6 0.27 0.49
HOH OU 2.5 0.10 0.30
HOH NU 4.3 1.21 1.19
N N 7.3 1.88 1.25
N C2N 7.7 3.41 1.43
N COH 6.4 2.09 1.01
N OH 5.4 1.62 0.77
N HOH 5.8 1.84 0.90
OU NU 3.6 2.78 0.89
OU HU1 2.6 0.25 0.55
OU HU2 2.6 1.51 0.77
NU HU1 4.6 3.49 1.60
NU HU2 4.6 3.57 1.45
Cl Cl 6.0 0.58 0.69
N O1 5.4 10.12 2.42
HOH O1 2.3 0.35 0.48
HCN O1 3.6 1.61 1.05
HCO O1 3.6 1.75 1.12
Cl O1 4.2 5.12 1.66
O1 O1 3.4 2.70 1.16

308
Table A19. Site-site coordination numbers calculated from selected pRDFs of reline-15w. The calculated ‘error’ represents one standard deviation in coordination number.
Atom A Atom B Rmax / Å Ncoord ±
Cl CU 5.2 1.67 1.25
Cl NU 4.2 1.75 1.50
Cl HU1 3.0 0.77 1.05
Cl HU2 3.0 0.43 0.65
HOH Cl 3.2 0.38 0.49
MT Cl 4.0 0.32 0.50
HCN Cl 4.1 0.36 0.52
HCO Cl 4.1 0.37 0.53
HCN OU 3.6 0.26 0.49
MT OU 3.5 0.26 0.49
HCO OU 3.6 0.27 0.50
HOH OU 2.5 0.12 0.33
HOH NU 4.3 1.28 1.26
N N 7.7 3.58 2.22
N C2N 8.0 5.10 2.43
N COH 6.7 3.06 1.56
N OH 5.5 2.05 1.07
N HOH 6.0 2.47 1.32
OU NU 3.8 2.94 1.03
OU HU1 2.6 0.26 0.57
OU HU2 2.6 1.52 0.78
NU HU1 4.6 3.44 1.69
NU HU2 4.6 3.46 1.52
Cl Cl 6.0 0.48 0.63
N O1 5.5 7.00 4.49
HOH O1 2.3 0.25 0.44
HCN O1 3.6 0.99 1.08
HCO O1 3.6 1.09 1.17
Cl O1 4.1 4.59 2.73
O1 O1 3.3 3.59 1.56

309
Table A20. Site-site coordination numbers calculated from selected pRDFs of reline-20w. The calculated ‘error’ represents one standard deviation in coordination number.
Atom A Atom B Rmax / Å Ncoord ±
Cl CU 5.3 1.39 1.14
Cl NU 4.2 1.39 1.32
Cl HU1 3.0 0.62 0.91
Cl HU2 3.0 0.33 0.56
HOH Cl 3.2 0.29 0.46
MT Cl 4.0 0.25 0.46
HCN Cl 4.1 0.29 0.48
HCO Cl 4.1 0.28 0.48
HCN OU 3.6 0.21 0.44
MT OU 3.6 0.23 0.46
HCO OU 3.6 0.22 0.45
HOH OU 2.6 0.11 0.32
HOH NU 4.5 1.28 1.29
N N 8.0 3.10 1.74
N C2N 8.3 4.48 1.85
N COH 6.8 2.69 1.29
N OH 5.6 1.90 0.94
N HOH 6.2 2.30 1.14
OU NU 3.9 2.80 0.95
OU HU1 2.6 0.20 0.50
OU HU2 2.6 1.46 0.75
NU HU1 4.6 3.02 1.47
NU HU2 4.6 3.04 1.37
Cl Cl 6.0 0.36 0.57
N O1 5.6 10.29 4.11
HOH O1 2.3 0.34 0.48
HCN O1 3.6 1.35 1.14
HCO O1 3.6 1.50 1.22
Cl O1 4.1 5.51 2.41
O1 O1 3.3 3.56 1.40

310
Table A21. Site-site coordination numbers calculated from selected pRDFs of reline-30w. The calculated ‘error’ represents one standard deviation in coordination number.
Atom A Atom B Rmax / Å Ncoord ±
Cl CU 5.4 1.05 0.96
Cl NU 4.4 1.12 1.19
Cl HU1 3.1 0.49 0.83
Cl HU2 3.1 0.25 0.49
HOH Cl 3.2 0.21 0.40
MT Cl 4.0 0.17 0.38
HCN Cl 4.1 0.20 0.42
HCO Cl 4.2 0.20 0.41
HCN OU 3.6 0.13 0.35
MT OU 3.6 0.14 0.37
HCO OU 3.6 0.12 0.34
HOH OU 2.6 0.06 0.23
HOH NU 4.4 0.66 0.93
N N 8.2 2.04 1.43
N C2N 8.6 3.32 1.56
N COH 6.8 2.04 1.09
N OH 5.6 1.56 0.78
N HOH 6.3 1.82 0.95
OU NU 3.9 2.52 0.78
OU HU1 2.6 0.13 0.40
OU HU2 2.6 1.35 0.70
NU HU1 4.6 2.48 1.23
NU HU2 4.6 2.53 1.13
Cl Cl 6.0 0.25 0.48
N O1 6.0 17.01 3.63
HOH O1 2.3 0.47 0.51
HCN O1 3.6 1.80 1.14
HCO O1 3.6 1.97 1.22
Cl O1 4.1 6.24 1.82
O1 O1 3.3 3.52 1.22

311
12.6. Appendix 6: Supporting information for Chapter
8
12.6.1. Tg measurements of the Pr(NO3)3.6H2O:urea DES
The Tg of the Pr(NO3)3.6H2O:urea 1:3.5 DES was first estimated from a rheology experiment. This
was achieved by measuring the viscosity at a constant shear rate of 10 s-1 using a TA Instruments
HR-3 Discovery Hybrid Rheometer, operating in a flat plate geometry with Peltier temperature
control constantly sweeping temperature from 263 to 323 K at a rate of 5 K hr-1 and using glass
plates to prevent corrosion. The exponential viscosity-temperature relation was then fitted to the
Vogel-Fulcher-Tammann (VFT) equation.22 The fitted VFT constants were η0 = 3.87x10⁻⁴; B = 593.31;
T0 = 198.23. The fit was extrapolated to a viscosity of 1013 poise, which is stated by Angell et al. to
denote the sudden onset of the glass transition, and is shown in Figure A42 (inset).22 Using this
technique, Tg was estimated to be 215.52 K, which is consistent with the fluidity observed in
samples kept in cold storage. Furthermore, the VFT parameters allow derivation of Angell’s fragility
parameter D (D=B/T0) of 2.99 in this case, which describes the ‘fragility’ of the liquid, or deviation
from Arrhenius behavior; low ‘D’ values such as this correspond with fragile non-Arrhenius liquids,
which are often molecular, as opposed to the ‘strongest’ liquids which are generally simple ionic
melts, such as SiO2 or GeO2.22 The calculated value is consistent with previous similar
measurements of ILs.23
Subsequently, the same DES was measured using a TA instruments DSC-Q20 differential scanning
calorimeter (DSC). 3 repeat cooling/heating cycles were performed, first equilibrating at 293 K
before cooling to 208 K at a rate of 5 K min-1, Samples were held at 208 K for 5 minutes before
heating to 293 K at the same ramp rate, and held at 293 K for 5 minutes, before repeating. DSC
measurements are shown in Figure S1 and are relatively free of thermal events. The difficulty of
measuring DES Tg has been covered in the literature; melting points are challenging to reproduce
in DES due to supercooling, and cooling rate and sample environment (ie. confinement) effects,24,25
as well as instrumental limitations. However, there is a subtle baseline shift with onset of ~215 K
on both cooling and heating, which is behavior consistent with the slight change in specific heat
capacity upon glass transition. This correlates well with the extrapolated VFT fit to the viscosity
experiment which obtained a Tg of 215.52 K. This is extensible to the other lanthanide DES
presented here, which are compositionally identical and vary only in the valence electron
configuration of the lanthanide ion, which does not significantly affect the other physical
properties, as shown in the main text.

312
Figure A42. (Exo = up) Three concurrent DSC cooling cycles to determine the Tg of the praseodymium nitrate:urea DES. Temperature was ramped from 293 to 208 K (practical instrumental limit) at 5 K min-1 and held isothermally at 208 K for 5 minutes before heating and cycling. The slight exotherms about 208 K are an experimental artefact. The upper traces represent cooling, whereas the lower traces show the heating cycles, as shown by arrows. (Inset) Temperature-sweep rheology data (green line) showing the exponential relation between viscosity and temperature approaching the glass transition. Data were fitted to the Vogel-Fulcher-Tammann (VFT) equation (black line), which was extrapolated to the intercept of 1013 Poise to obtain an estimate of the glass transition temperature of the system.
12.6.2. Advanced reaction media: Direct combustion
synthesis of lanthanide oxides from lanthanide DES
DES have been described as ‘designer’ reaction media which could allow processes to developed
around the solvent, rather than the reactant.26 This would in theory allow economic and
environmental benefits from, for example, minimized waste and higher conversion.27 To
demonstrate this principle, the prepared solvents were used in a direct combustion preparation of
lanthanide oxide nanomaterials. The respective lanthanide nitrate DES (2 g) was measured into a

313
crucible and placed in a calcining oven. Samples were heated from ambient to 773 K at a rate of 1
K min-1, and then held at temperature for 4 hours before being allowed to cool, whereupon the
samples were collected, weighed, and ground with a pestle and mortar to yield powders of pale
yellow (Ce), dark brown (Pr) and pale blue (Nd) in quantitative yield.
The prepared oxides were characterized using a Bruker D8 ADVANCE powder X-Ray
diffractometer, operating using Cu Kα radiation (λ = 0.15418 nm) and a Bruker VÅNTEC-1 detector,
and shown in Figure A43. The Ce and Pr samples can be simply indexed to the expected cubic
structure of the oxides CeO2 and Pr6O11. Conversely, the Nd sample shows broad peaks
corresponding with small crystallites of Nd2O3 alongside the presence of impurities, consistent with
intermediate species such as NdOOH, Nd(OH)3 and Nd2O2CO3, which have been noted previously
in basic syntheses of Nd2O3; higher temperatures of 1173 K are required for full conversion.28,29
Indeed, the synthesis is expected to proceed via formation of lanthanide carbonates and/or
hydroxides in the basic solution as urea thermally hydrolyses.29,30
Figure A43. Powder XRD data (λ = 0.15418 nm) showing lanthanide oxide products from combustion of the lanthanide DES. Data are unedited with no background removal. Data were indexed to CeO2 (top), Pr6O11 (middle) and a mixture of Nd2O3 and intermediate carbonates and hydroxides and oxyhydroxide species (bottom).
Therefore, this method has the advantages of being single-step and solvent-free compared to
solvothermal processes which do not generally seek to recycle the reaction medium. The formation
of a DES allows self-solvation of the reacting mixture, and the only waste is the vaporized or reacted
water and the combusted organics. Furthermore, there is the potential to tune the solvent

314
composition to produce different materials such as mixed oxides, or to template nanostructure in
the desired materials. Inorganic DES can therefore be designed as efficient task-specific reaction
media to create metal oxides by a one-step combustion process.
12.6.3. Empirical Potential Structure Refinement (EPSR)
modelling background
EPSR is a 3D structural modelling technique which simulates molecule configurations that are
objectively consistent with experimental X-Ray and neutron diffraction data.2–4 EPSR initially uses
a standard Lennard-Jones type potential as its reference potential, using Lorentz-Berthelot mixing
rules, periodic boundary conditions and atom-centered point charges. The ‘empirical potential’
(EP) is calculated from the residuals between the reference potential and the data, and is
introduced as a series of Poisson functions to fit the data without introducing spurious artefacts
from Fourier transforms of the scattering data.6 As well as the neutron and X-Ray scattering data,
the quality-of-fit is ensured by using ‘chemical sense’, ie. an accurate set of measured physical
properties including the density, and molecular structures of the components.7
A fully randomized model is constructed from 200 Ce, 1200 water, 600 nitrate and 700 urea
molecules, and is first equilibrated without any external potential using a box size multiplication
factor of 20, which equilibrates to the measured experimental density of 0.09862 atoms Å-3 once
the simulation reaches a stable attractive potential, with a simulation box diameter of 4.93 nm.
The initial ‘off-the-shelf’ Lennard-Jones σ parameter for Ce of 3.552,13 is then modified manually
to achieve the closest fit to the Ce nearest-neighbor distance in the scattering profiles, yielding a
Ce σ of 3.22, which is necessary due to the formation of non-global energy minima when the
smaller σ is used from the outset, and the inability of the RMC-type algorithm to correct for this
distance.7 The experimental data are then introduced as a constraint, and once the empirical
potential reaches a stable state, statistics are accumulated of the model configurations yielding
information such as radial distribution functions and coordination numbers from >5000 iterations.

315
12.6.4. EPSR model parameters
Table A22. Assigned Lennard-Jones parameters which were used to model experimental neutron and X-Ray diffraction data of the cerium nitrate hexahydrate:urea ‘Type IV’ LDES. As stated above, the previously-described Ce potential was initially used to allow the system to achieve a global energy minimum, but this was then swapped to the value described in the table below, which gave a much closer fit to the measured cerium nearest-neighbor distances.
Atom type ε / kJ mol-1 σ / Å Charge / e
Ce 0.811 3.220 3.000
NN 0.711 3.250 0.845
ON 0.879 0.296 -0.615
H1 0.000 0.000 0.417
O1 0.634 3.151 -0.834
CU 0.439 3.750 0.142
OU 0.878 2.960 -0.390
NU 0.711 3.250 -0.542
HU1 0.000 0.000 0.330
HU2 0.000 0.000 0.330
12.6.5. Calculated pRDFs for non-cerium species
Table A23. Calculated coordination numbers (Ncoord) for species other than cerium. The presented numbers are the mean, calculated from >5000 iterations of the EPSR average, and the displayed errors represent one standard deviation in coordination number as the system rearranges about equilibrium. Rmax displays the maximum radius of integration for coordination numbers (ie. the first minima in respective pRDFs) accurate to 1 data bin, where the minimum radius of integration is set to an arbitrary value before the onset of the peak.
A B Rmax Ncoord
O1 O1 3.9 2.73 ± 1.45
O1 NN 4.7 2.43 ± 1.32
O1 H1 2.3 1.07 ± 0.94
O1 H1 4.3* 6.28 ± 2.93
O1 H1 4.3 7.36 ± 3.15
O1 ON 3.7 3.19 ± 2.03
O1 CU 5.0 2.94 ± 1.40
O1 OU 4.1 1.48 ± 1.09
O1 NU 4.0 2.48 ± 1.64
O1 HU2 2.3 0.17 ± 0.42
O1 HU1 2.3 0.22 ± 0.52

316
H1 H1 3.1 3.21 ± 1.60
H1 NN 3.3 0.61 ± 0.66
H1 ON 2.3 0.39 ± 0.56
H1 CU 5.5 3.91 ± 1.55
H1 OU 2.3 0.16 ± 0.37
H1 NU 4.4 3.74 ± 1.92
H1 HU2 3.0 0.86 ± 0.84
H1 HU1 3.0 0.80 ± 0.98
NN NN 5.6 3.61 ± 1.65
NN ON 4.7 9.06 ± 3.13
NN CU 5.7 4.15 ± 1.58
NN OU 4.7 2.04 ± 1.24
NN NU 4.6 3.73 ± 1.96
NN HU2 3.4 1.32 ± 1.05
NN HU1 3.4 1.18 ± 1.30
ON ON 3.8 4.62 ± 1.99
ON CU 4.8 2.16 ± 1.22
ON OU 3.9 0.94 ± 0.88
ON NU 3.9 1.78 ± 1.39
ON HU2 2.5 0.38 ± 0.61
ON HU1 2.5 0.35 ± 0.69
CU CU 5.9 4.90 ± 1.71
CU OU 4.8 3.21 ± 1.29
NU NU 4.2 3.79 ± 1.53
*Rmin = 2.3 Å

317
12.7. Appendix 7: Supporting information for Chapter
9
12.7.1. High-water force-distance curves
Figure A44. AFM Force-Distance profiles for ChCl:EG with 60, 70, 80 and 90 wt% water at OCP.

318
12.8. Appendix 8: Supporting information for Chapter
10
12.8.1. Characterisation of final state
Figure A45. EXAFS data taken of the final state of the pure and hydrated DES system using I20-Scanning in low-α mode, shown in k-space with k2 weighting (left) and r-space (right). Data are shown as black markers, and fits are shown as pink lines.
Figure A46. Transmission electron micrographs of iron oxide NPs from the pure, low-water DES reaction, prepared off-line, and (inset, bottom -right) electron diffraction (scale = 5 nm-1). Scales are 100 nm (left) and 10 nm (top-right).

319
Figure A47. Transmission electron micrographs of iron oxide NPs from the hydrated, high-water DES reaction, prepared off-line, and (inset, bottom -right) electron diffraction (scale = 5 nm-1). Scales are 100 nm (left) and 10 nm (top-right).
Figure A48. Powder X-Ray diffraction patterns of the isolated products of the off-line solvothermal reactions performed in stainless steel, PTFE-lined autoclaves.

320
12.8.2. Other in situ measurements
Figure A49. Raw In situ IR spectroscopy data for the high-water, hydrated DES system. The mixture was heated to 90 ˚C and measurements were taken once per minute for 3 hours using a ReactIR system.
Figure A50. Kinetic measurements of 0.25 mol kg-1 of iron nitrate in the pure DES taken of the fully protonated solvent in the NIMROD instrument.

321
Figure A51. Kinetic measurements of 0.25 mol kg-1 of iron nitrate in the hydrated DES taken of the fully protonated solvent in the NIMROD instrument.
12.8.3. PCA fitting of kinetic data
Figure A52. PCA fit to the first spectrum, the data for the first spectrum, and 10x the fit residual, for an initial kinetic (capillary) measurement of 0.35 mol kg-1 of iron nitrate in the pure, low-water DES.

322
Figure A53. PCA fit to the final spectrum, the data for the final spectrum, and 10x the fit residual, for an initial kinetic (capillary) measurement of 0.35 mol kg-1 of iron nitrate in the pure, low-water DES.
Figure A54. PCA fit to the spectrum corresponding with the intermediate state at t = 5400 s, the data for this intermediate state, and 10x the fit residual, for an initial kinetic (capillary) measurement of 0.35 mol kg-1 of iron nitrate in the pure, low-water DES.

323
Figure A55. Fourier transform showing data for the first and final spectrum, and the residual of the PCA fit to the intermediate state.

324
12.9. References
1 A. K. Soper, ISRN Phys. Chem., 2013, 2013, 279463. 2 A. C. Hannon, W. S. Howells and A. K. Soper, Inst. Phys. Conf. Ser., 1990, 107, 193–211. 3 R. L. McGreevy, J. Phys. Condens. Matter, 2001, 13, R877–R913. 4 A. K. Soper, Chem. Phys., 1996, 202, 295–306. 5 A. K. Soper, Chem. Phys., 2000, 258, 121–137. 6 A. K. Soper, Phys. Rev. B, 2005, 72, 104204. 7 A. K. Soper, Mol. Phys., 2001, 99, 1503–1516. 8 A. K. Soper, E. W. Castner and A. Luzar, Biophys. Chem., 2003, 105, 649–666. 9 W. L. Jorgensen, D. S. Maxwell and J. Tirado-Rives, J. Am. Chem. Soc., 1996, 118, 11225–
11236. 10 O. S. Hammond, D. T. Bowron and K. J. Edler, Green Chem., 2016, 18, 2736–2744. 11 R. Hayes, S. Imberti, G. Warr and R. Atkin, Phys. Chem. Chem. Phys., 2011, 13, 3237–3247. 12 R. Hayes, S. Imberti, G. Warr and R. Atkin, Phys. Chem. Chem. Phys., 2011, 13, 13544–13551. 13 P. Li, L. F. Song and K. M. Merz, J. P, 2015, 119, 883–895. 14 W. L. Jorgensen, J. Chandrasekhar, J. D. Madura, R. W. Impey, M. L. Klein, W. L. Jorgensen,
J. Chandrasekhar, J. D. Madura, R. W. Impey and M. L. Klein, J. Chem. Phys., 1983, 79, 926-935.
15 R. Hargreaves, D. T. Bowron and K. Edler, J. Am. Chem. Soc., 2011, 133, 16524–16536. 16 P. Mark and L. Nilsson, J. Phys. Chem. A, 2001, 105, 9954–9960. 17 D. T. Bowron, A. K. Soper, K. Jones, S. Ansell, S. Birch, J. Norris, L. Perrott, D. Riedel, N. J.
Rhodes, S. R. Wakefield, A. Botti, M.-A. Ricci, F. Grazzi and M. Zoppi, Rev. Sci. Instrum., 2010, 81, 033905.
18 C. D’Agostino, L. F. Gladden, M. D. Mantle, A. P. Abbott, I. Ahmed, Essa, A. Y. M. Al-Murshedi and R. C. Harris, Phys. Chem. Chem. Phys., 2015, 17, 15297–15304.
19 A. K. Soper, GudrunN and GudrunX: Programs for Correcting Raw Neutron and X-ray
Diffraction Data to Differential Scattering Cross Section. Rutherford Appleton Laboratory
Technical Report RAL-TR-2011-013, 2011. 20 A. K. Soper, Mol. Phys., 2009, 107, 1667–1684. 21 A. . Yadav and S. Pandey, J. Chem. Eng. Data, 2014, 59, 2221–2229. 22 C. A. Angell, Science, 1995, 267, 1924-1935. 23 S. Bulut, P. Eiden, W. Beichel, J. M. Slattery, T. F. Beyersdorff, T. J. S. Schubert and I. Krossing,
ChemPhysChem, 2011, 12, 2296–2310. 24 O. S. Hammond, D. T. Bowron, A. J. Jackson, T. Arnold, A. Sanchez-Fernandez, N. Tsapatsaris,
V. G. Sakai and K. J. Edler, J. Phys. Chem. B, 2017, 121, 7473–7483. 25 M. Francisco, A. van den Bruinhorst, L. F. Zubeir, C. J. Peters and M. C. Kroon, Fluid Phase
Equilib., 2013, 340, 77–84. 26 M. J. Earle and K. R. Seddon, Pure Appl. Chem., 2000, 72, 1391–1398. 27 R. A. Sheldon, Green Chem., 2017, 19, 18–43. 28 B. Vallina, J. D. Rodriguez-Blanco, A. P. Brown, J. A. Blanco and L. G. Benning, Nanoscale,
2015, 7, 12166–12179. 29 S. H. Jeon, K. Nam, H. J. Yoon, Y. Il Kim, D. W. Cho and Y. Sohn, Ceram. Int., 2017, 43, 1193–
1199. 30 O. S. Hammond, K. J. Edler, D. T. Bowron and L. Torrente-Murciano, Nat. Commun., 2017,
8, 14150.