Water availability at sowing and nitrogen management of durum wheat: a seasonal analysis with the...
11
Water availability at sowing and nitrogen management of durum wheat: a seasonal analysis with the CERES-Wheat model Michele Rinaldi * Istituto Sperimentale Agronomico, v. C. Ulpiani 5, 70125 Bari, Italy Received 10 September 2003; received in revised form 27 December 2003; accepted 15 January 2004 Abstract In water-limited environments soil water content at sowing is important in determining durum wheat germination, emergence and plant establishment. Soil water content interacts greatly with soil nitrogen content, affecting nitrogen uptake and crop productivity. Simulation models can be used to confirm the optimal strategy by testing several crop management scenarios. The CERES-Wheat model, previously calibrated and validated in southern Italy, has been used in a seasonal analysis to optimise nitrogen fertilisation of durum wheat at different levels of crop available water (CAW) at planting date in southern Italy. The simulation was carried out for a 48-year period with measured daily climatic data. The 99 simulated scenarios derived from the combinations of different CAW levels at sowing, nitrogen fertiliser rates and application times. The results obtained from the simulation indicated that the effect of CAWat sowing was relevant for durum wheat production at lowest and highest values, while the optimal sowing time to maximise yield and profit can be considered when CAW is 40– 60%. In the case study optimal N fertiliser amount was estimated to be 100 20 kg ha 1 , from a productive, environmental and economic point of view. The nitrogen split application—half at sowing and half at stem extension stage—resulted in the best management practice. This application of the CERES-Wheat model confirmed the capability of the model to compare several crop management strategies in a typical durum wheat cropping area. # 2004 Elsevier B.V. All rights reserved. Keywords: Durum wheat; Crop available water at sowing; Nitrogen fertilisation; CERES-Wheat; Yield; Economics 1. Introduction Durum wheat (Triticum durum Desf.) is largely sown in winter in Italy and its fine flour and pasta, represent some of Italy’s most valuable export pro- ducts. Technological quality of grain depends mainly on grain protein content that is influenced by crop nitrogen fertilisation, both by the application time and by the amount of nitrogen (Daniel and Triboi, 2000). In Mediterranean environments, where water resources are limited, nitrogen fertilisation is very important in the crop management because it can amplify the effect of soil water deficit on cereal crop growth and grain yield. Durum wheat is very sensitive to water stress during the germination-seedling emer- gence and spike formation; this latter phase normally occurs, in southern Italy, in February when a deep root system has been already developed and good water availability has been guaranteed by the winter rainfall. At the germination phase, on the contrary, the crop can be more frequently affected by water stress, because Field Crops Research 89 (2004) 27–37 * Tel.: þ39-080-5475016; fax: þ39-080-5475023. E-mail address: [email protected] (M. Rinaldi). 0378-4290/$ – see front matter # 2004 Elsevier B.V. All rights reserved. doi:10.1016/j.fcr.2004.01.024
-
Upload
independent -
Category
Documents
-
view
0 -
download
0
Transcript of Water availability at sowing and nitrogen management of durum wheat: a seasonal analysis with the...
Water availability at sowing and nitrogen management of durumwheat: a seasonal analysis with the CERES-Wheat model
Michele Rinaldi*
Istituto Sperimentale Agronomico, v. C. Ulpiani 5, 70125 Bari, Italy
Received 10 September 2003; received in revised form 27 December 2003; accepted 15 January 2004
Abstract
In water-limited environments soil water content at sowing is important in determining durum wheat germination, emergence
and plant establishment. Soil water content interacts greatly with soil nitrogen content, affecting nitrogen uptake and crop
productivity. Simulation models can be used to confirm the optimal strategy by testing several crop management scenarios.
The CERES-Wheat model, previously calibrated and validated in southern Italy, has been used in a seasonal analysis to
optimise nitrogen fertilisation of durum wheat at different levels of crop available water (CAW) at planting date in southern Italy.
The simulation was carried out for a 48-year period with measured daily climatic data. The 99 simulated scenarios derived from
the combinations of different CAW levels at sowing, nitrogen fertiliser rates and application times.
The results obtained from the simulation indicated that the effect of CAW at sowing was relevant for durum wheat production
at lowest and highest values, while the optimal sowing time to maximise yield and profit can be considered when CAW is 40–
60%. In the case study optimal N fertiliser amount was estimated to be 100 � 20 kg ha�1, from a productive, environmental and
economic point of view. The nitrogen split application—half at sowing and half at stem extension stage—resulted in the best
management practice.
This application of the CERES-Wheat model confirmed the capability of the model to compare several crop management
strategies in a typical durum wheat cropping area.
# 2004 Elsevier B.V. All rights reserved.
Keywords: Durum wheat; Crop available water at sowing; Nitrogen fertilisation; CERES-Wheat; Yield; Economics
1. Introduction
Durum wheat (Triticum durum Desf.) is largely
sown in winter in Italy and its fine flour and pasta,
represent some of Italy’s most valuable export pro-
ducts. Technological quality of grain depends mainly
on grain protein content that is influenced by crop
nitrogen fertilisation, both by the application time and
by the amount of nitrogen (Daniel and Triboi, 2000).
In Mediterranean environments, where water
resources are limited, nitrogen fertilisation is very
important in the crop management because it can
amplify the effect of soil water deficit on cereal crop
growth and grain yield. Durum wheat is very sensitive
to water stress during the germination-seedling emer-
gence and spike formation; this latter phase normally
occurs, in southern Italy, in February when a deep root
system has been already developed and good water
availability has been guaranteed by the winter rainfall.
At the germination phase, on the contrary, the crop can
be more frequently affected by water stress, because
Field Crops Research 89 (2004) 27–37
* Tel.: þ39-080-5475016; fax: þ39-080-5475023.
E-mail address: [email protected] (M. Rinaldi).
0378-4290/$ – see front matter # 2004 Elsevier B.V. All rights reserved.
doi:10.1016/j.fcr.2004.01.024
wheat is also sown in dry soil conditions, awaiting
winter rainfall. Moreover, high nitrogen availability
during the vegetative-to-reproductive phase stimulates
crop growth, resulting in greater yield in wet seasons.
In dry seasons, on the contrary, the increased water
uptake by N fertilised crops often causes a water deficit
and a lower yield than unfertilised crops, affecting
harvest index negatively (Dann, 1969; Anderson,
1985; Sherperd et al., 1986; Cooper et al., 1987;
Gonzales Ponce et al., 1993).
Good management of sowing date (dependent on
soil moisture) and nitrogen fertilisation of durum
wheat are essential to obtain high yields and profit.
Furthermore, it is important, from an economic point
of view, to keep the cost of inputs low. At the same
time, a reduction of N application is desirable to
reduce the risk of pollution as a consequence of nitrate
leaching and percolation (Sequi and Vittori Antistari,
1989; Mahler et al., 1994).
To determine the optimal time and amount of
nitrogen application necessitates long and expensive
field experiments. Besides, it is impossible to test all
the interactions between the amount of soil water
content at planting date and rainfall distribution in
spring months in order to assess the yearly variability.
Finally, the soil water content at sowing and winter
rainfall distribution represent important guidelines to
help farmers in nitrogen management.
Simulation models, once calibrated and validated
with experimental data, can help farmers in decision
making about nitrogen application strategies either
before sowing or during crop growth, taking into
account the multiple interactions among soil, climate,
genotype and crop management.
The CERES-Wheat model is one of the most popular
wheat models (Ritchie and Otter, 1985) and it is
embedded in the DSSAT, version 3.5 software program
(Jones et al., 2003). The model has been tested in many
sites across the world and the results proved its cap-
ability to simulate grain yields under various climates
(Savinetal.,1995;Pecetti andHollington,1997;Hundal
and Prabhjyot-Kaur, 1997; Alexandrov and Hoogen-
boom, 2001; Rinaldi, 2001), soil moisture conditions
(Timsina et al., 1995; Travasso and Delecolle, 1995)
and nitrogen fertilisation management (Kovacs et al.,
1995; Timsina et al., 1998; Hasegawa et al., 2000).
This study is an application of the CERES-Wheat
model: its aims are: (i) to analyse the influence of
crop available water at sowing on durum wheat grain
yield, and (ii) to optimise N fertilisation of durum
wheat cropped under the semi-arid climate of the
Mediterranean region, from a productive, N-fertilisa-
tion efficacy and economic points of view.
2. Materials and methods
2.1. The model
The CERES (crop-environment resource synthesis)
family of crop models has been used to simulate the
performance of several cereal crops (Steiner et al.,
1991; Timsina et al., 1995; Thornton et al., 1997;
Hundal and Prabhjyot-Kaur, 1997). The model user
must compile several input files to run the simulation,
in order to provide information about the experiment,
site, soil, climate and genotype.
The Experimental details file contains all the
information needed for the simulation of different
experimental treatments (location, sowing time and
irrigation), conditions (field characteristics, soil analy-
sis data, initial soil conditions, irrigation and fertiliser
management, organic residue application, chemical
application, harvest management) and simulation
control.
The Weather data file contains all the available
daily weather data, organised in standard format.
Air temperature (maximum and minimum), rainfall,
solar radiation are the minimum data required. Dew
point temperature, wind speed and photosynthetic
active radiation are optional input data.
The Soil data file reports for each layer, soil in-
formation, identifier, depth, chemical and physical
properties.
The Genotype data file contains cultivar-specific
genetic parameters (Table 1), related to vernalisa-
tion (P1V), photoperiod (P2D), grain filling duration
(P5), leaf development in term of phyllocron or
duration between successive leaf tip appearances
(PHINT) and three parameters related to grain growth
(G1–G3).
The Output file contains the overview of input
conditions and crop performance, summary of soil
characteristics and cultivar coefficients, crop and soil
status at the main development stages, temporal dis-
tribution of crop variables and soil water content.
28 M. Rinaldi / Field Crops Research 89 (2004) 27–37
The Soil water model is described by Ritchie
(1986). It operates on the basis of a cascading
approach and considers rainfall, infiltration and run-
off, drainage, soil evaporation, plant transpiration, root
absorption or flow to an adjacent layer. Upper and
lower limits of water availability are required as input
in the soil data file.
The Crop growth model considers a phasic devel-
opment with nine growth stages, from pre-sowing to
harvest. The duration of the phases is related to the
temperature, with cultivar-specific thermal times. The
model calculates biomass accumulation as the product
of radiation use efficiency and photosynthetically
active intercepted radiation. The number of growing
leaves is a function of leaf appearance rate (PHINT
parameter) and duration of grain filling (P5). Organ
extension depends on potential organ growth, while
limitation is imposed by temperature and availability
of water and nitrogen. Partitioning coefficients of dry
matter in the several parts of plant are included in
the model. Yield is modelled as the product of grain
number—calculated from G1 parameter (Table 1) and
plant population (input in experimental file)—and
grain weight at physiological maturity (calculated
from G2 parameter).
The Nitrogen balance model simulates the processes
of organic matter turnover with the associated miner-
alisation and/or immobilisation of nitrogen, nitrifica-
tion, denitrification, hydrolysis of urea, ammonia
volatilisation, N plant uptake and translocation to
the different organs during crop cycle. Transport of
nitrate occurs at the same rate as the flow of water
(Booltink et al., 1996).
Water and nitrogen submodels calculate feedback
effects on plant growth and development. A detailed
description of the model can be found in Ritchie
(1986) and Godwin and Jones (1991).
2.2. The site
The climatic and soil data for the simulation were
collected at the experimental farm of the Istituto
Sperimentale Agronomico, located at Foggia
(418270N, 38040E, 70 m a.s.l.), in southern Italy (Capi-
tanata Plain). The area (about 400,000 ha) is mainly
cultivated with durum wheat and the experimental
farm is representative of soil and climatic conditions
of this plain.
The soil is a vertisol of alluvial origin (2.0 m depth),
fine, termic, Typic Chromoxerert (according to Soil
Taxonomy, USDA), silty-clay with the following char-
acteristics: organic matter 2.1%; total N 0.122%;
NaHCO3-extractable P2O5 41 ppm; NH4OAc-extrac-
table K2O 1598 ppm; pH (water) 8.3; field capacity
0.396 m3 m�3; permanent wilting point 0.195 m3
m�3, available soil water 202 mm m�1.
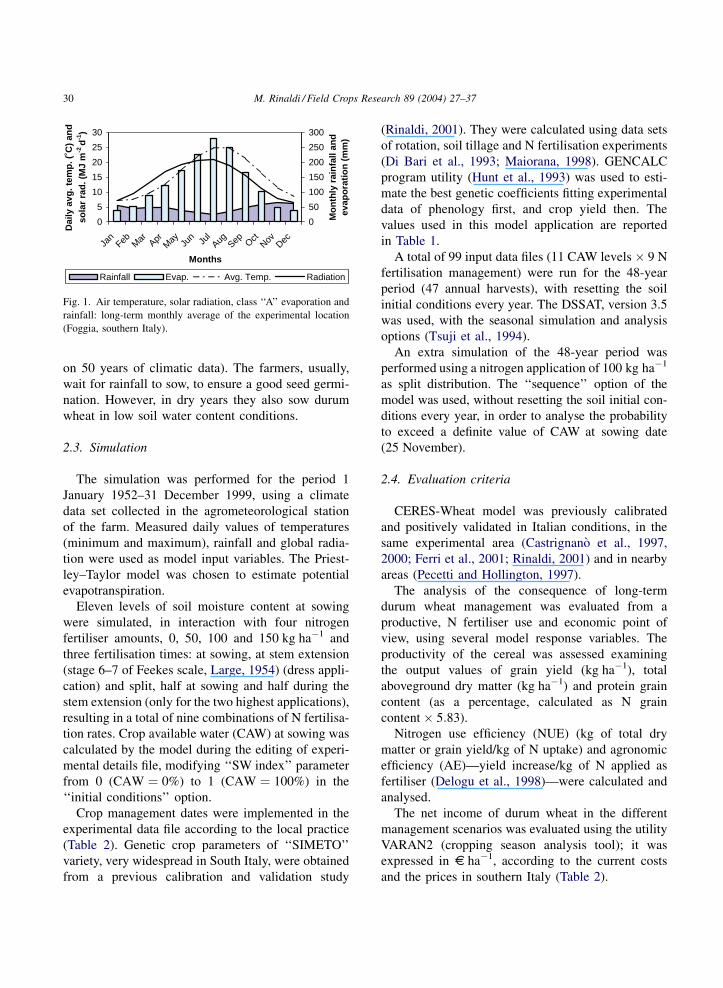
The climate is ‘‘accentuated thermo-Mediterra-
nean’’ (UNESCO–FAO classification), with tempera-
tures below 0 8C in winter and above 40 8C in summer.
Rainfall is unevenly distributed throughout the year,
mostly concentrated in winter months and class ‘‘A’’
pan evaporation exceeds 10 mm per day in summer.
The main climatic characteristics of the site are sum-
marised in Fig. 1.
The normal planting date of durum wheat in south-
ern Italy is between 1 November and 15 December in
the plains and about one month earlier on the hills and
in the northern regions. November is the rainiest
month in Capitanata Plain, with about 66 mm of
rainfall and a standard deviation of �43 mm (based
Table 1
Genetic coefficients calibrated for the durum wheat, cultivar ‘‘SIMETO’’, required by the CERES-Wheat model
Abbreviation Values
Relative decrease in development rate for each day of unfulfilled vernalisation P1V 2.0
Relative decrease in development rate when plants are grown in a photoperiod 1 h shorter than the optimum P2D 1.5
Relative grain filling duration based on thermal time (degree days calculated with a Tb of 1 8C):
each unit increase above zero adds 20 degree days to an initial value of 430 degree days
P5 6.0
Kernel number unit weight of stem plus spike at anthesis (g�1) G1 2.0
Kernel filling rate under optimum conditions (mg per day) G2 2.7
Non-stressed dry weight of a single stem and spike when elongation ceases (g) G3 1.9
Phyllochron interval (degree days) PHINT 100
M. Rinaldi / Field Crops Research 89 (2004) 27–37 29
on 50 years of climatic data). The farmers, usually,
wait for rainfall to sow, to ensure a good seed germi-
nation. However, in dry years they also sow durum
wheat in low soil water content conditions.
2.3. Simulation
The simulation was performed for the period 1
January 1952–31 December 1999, using a climate
data set collected in the agrometeorological station
of the farm. Measured daily values of temperatures
(minimum and maximum), rainfall and global radia-
tion were used as model input variables. The Priest-
ley–Taylor model was chosen to estimate potential
evapotranspiration.
Eleven levels of soil moisture content at sowing
were simulated, in interaction with four nitrogen
fertiliser amounts, 0, 50, 100 and 150 kg ha�1 and
three fertilisation times: at sowing, at stem extension
(stage 6–7 of Feekes scale, Large, 1954) (dress appli-
cation) and split, half at sowing and half during the
stem extension (only for the two highest applications),
resulting in a total of nine combinations of N fertilisa-
tion rates. Crop available water (CAW) at sowing was
calculated by the model during the editing of experi-
mental details file, modifying ‘‘SW index’’ parameter
from 0 (CAW ¼ 0%) to 1 (CAW ¼ 100%) in the
‘‘initial conditions’’ option.
Crop management dates were implemented in the
experimental data file according to the local practice
(Table 2). Genetic crop parameters of ‘‘SIMETO’’
variety, very widespread in South Italy, were obtained
from a previous calibration and validation study
(Rinaldi, 2001). They were calculated using data sets
of rotation, soil tillage and N fertilisation experiments
(Di Bari et al., 1993; Maiorana, 1998). GENCALC
program utility (Hunt et al., 1993) was used to esti-
mate the best genetic coefficients fitting experimental
data of phenology first, and crop yield then. The
values used in this model application are reported
in Table 1.
A total of 99 input data files (11 CAW levels � 9 N
fertilisation management) were run for the 48-year
period (47 annual harvests), with resetting the soil
initial conditions every year. The DSSAT, version 3.5
was used, with the seasonal simulation and analysis
options (Tsuji et al., 1994).
An extra simulation of the 48-year period was
performed using a nitrogen application of 100 kg ha�1
as split distribution. The ‘‘sequence’’ option of the
model was used, without resetting the soil initial con-
ditions every year, in order to analyse the probability
to exceed a definite value of CAW at sowing date
(25 November).
2.4. Evaluation criteria
CERES-Wheat model was previously calibrated
and positively validated in Italian conditions, in the
same experimental area (Castrignano et al., 1997,
2000; Ferri et al., 2001; Rinaldi, 2001) and in nearby
areas (Pecetti and Hollington, 1997).
The analysis of the consequence of long-term
durum wheat management was evaluated from a
productive, N fertiliser use and economic point of
view, using several model response variables. The
productivity of the cereal was assessed examining
the output values of grain yield (kg ha�1), total
aboveground dry matter (kg ha�1) and protein grain
content (as a percentage, calculated as N grain
content � 5:83).
Nitrogen use efficiency (NUE) (kg of total dry
matter or grain yield/kg of N uptake) and agronomic
efficiency (AE)—yield increase/kg of N applied as
fertiliser (Delogu et al., 1998)—were calculated and
analysed.
The net income of durum wheat in the different
management scenarios was evaluated using the utility
VARAN2 (cropping season analysis tool); it was
expressed in s ha�1, according to the current costs
and the prices in southern Italy (Table 2).
0
5
10
15
20
25
30
Jan
Feb Mar Apr
May Ju
n Jul
Aug Sep OctNov Dec
Months
Dai
ly a
vg. t
emp
. (˚C
) an
d
sola
r ra
d. (
MJ
m-2
d-1
)
0
50
100
150
200
250
300
Mo
nth
ly r
ain
fall
and
ev
apo
rati
on
(m
m)
Rainfall Evap. Avg. Temp. Radiation
Fig. 1. Air temperature, solar radiation, class ‘‘A’’ evaporation and
rainfall: long-term monthly average of the experimental location
(Foggia, southern Italy).
30 M. Rinaldi / Field Crops Research 89 (2004) 27–37
3. Results and discussion
3.1. Yields
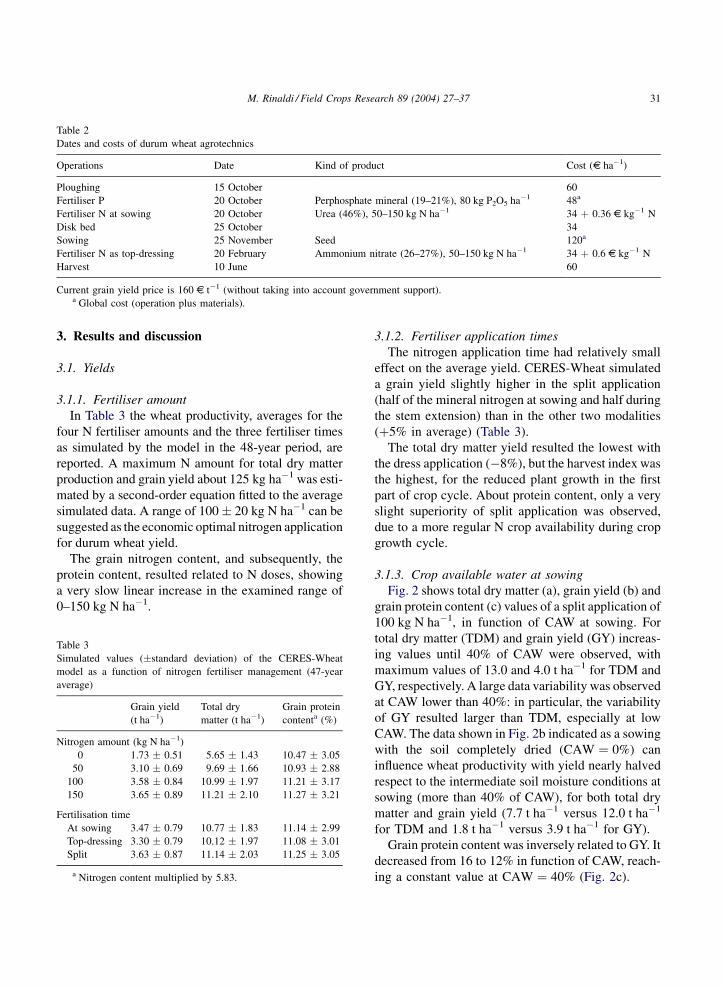
3.1.1. Fertiliser amount
In Table 3 the wheat productivity, averages for the
four N fertiliser amounts and the three fertiliser times
as simulated by the model in the 48-year period, are
reported. A maximum N amount for total dry matter
production and grain yield about 125 kg ha�1 was esti-
mated by a second-order equation fitted to the average
simulated data. A range of 100 � 20 kg N ha�1 can be
suggested as the economic optimal nitrogen application
for durum wheat yield.
The grain nitrogen content, and subsequently, the
protein content, resulted related to N doses, showing
a very slow linear increase in the examined range of
0–150 kg N ha�1.
3.1.2. Fertiliser application times
The nitrogen application time had relatively small
effect on the average yield. CERES-Wheat simulated
a grain yield slightly higher in the split application
(half of the mineral nitrogen at sowing and half during
the stem extension) than in the other two modalities
(þ5% in average) (Table 3).
The total dry matter yield resulted the lowest with
the dress application (�8%), but the harvest index was
the highest, for the reduced plant growth in the first
part of crop cycle. About protein content, only a very
slight superiority of split application was observed,
due to a more regular N crop availability during crop
growth cycle.
3.1.3. Crop available water at sowing
Fig. 2 shows total dry matter (a), grain yield (b) and
grain protein content (c) values of a split application of
100 kg N ha�1, in function of CAW at sowing. For
total dry matter (TDM) and grain yield (GY) increas-
ing values until 40% of CAW were observed, with
maximum values of 13.0 and 4.0 t ha�1 for TDM and
GY, respectively. A large data variability was observed
at CAW lower than 40%: in particular, the variability
of GY resulted larger than TDM, especially at low
CAW. The data shown in Fig. 2b indicated as a sowing
with the soil completely dried (CAW ¼ 0%) can
influence wheat productivity with yield nearly halved
respect to the intermediate soil moisture conditions at
sowing (more than 40% of CAW), for both total dry
matter and grain yield (7.7 t ha�1 versus 12.0 t ha�1
for TDM and 1.8 t ha�1 versus 3.9 t ha�1 for GY).
Grain protein content was inversely related to GY. It
decreased from 16 to 12% in function of CAW, reach-
ing a constant value at CAW ¼ 40% (Fig. 2c).
Table 2
Dates and costs of durum wheat agrotechnics
Operations Date Kind of product Cost (s ha�1)
Ploughing 15 October 60
Fertiliser P 20 October Perphosphate mineral (19–21%), 80 kg P2O5 ha�1 48a
Fertiliser N at sowing 20 October Urea (46%), 50–150 kg N ha�1 34 þ 0.36 s kg�1 N
Disk bed 25 October 34
Sowing 25 November Seed 120a
Fertiliser N as top-dressing 20 February Ammonium nitrate (26–27%), 50–150 kg N ha�1 34 þ 0.6 s kg�1 N
Harvest 10 June 60
Current grain yield price is 160 s t�1 (without taking into account government support).a Global cost (operation plus materials).
Table 3
Simulated values (�standard deviation) of the CERES-Wheat
model as a function of nitrogen fertiliser management (47-year
average)
Grain yield
(t ha�1)
Total dry
matter (t ha�1)
Grain protein
contenta (%)
Nitrogen amount (kg N ha�1)
0 1.73 � 0.51 5.65 � 1.43 10.47 � 3.05
50 3.10 � 0.69 9.69 � 1.66 10.93 � 2.88
100 3.58 � 0.84 10.99 � 1.97 11.21 � 3.17
150 3.65 � 0.89 11.21 � 2.10 11.27 � 3.21
Fertilisation time
At sowing 3.47 � 0.79 10.77 � 1.83 11.14 � 2.99
Top-dressing 3.30 � 0.79 10.12 � 1.97 11.08 � 3.01
Split 3.63 � 0.87 11.14 � 2.03 11.25 � 3.05
a Nitrogen content multiplied by 5.83.
M. Rinaldi / Field Crops Research 89 (2004) 27–37 31
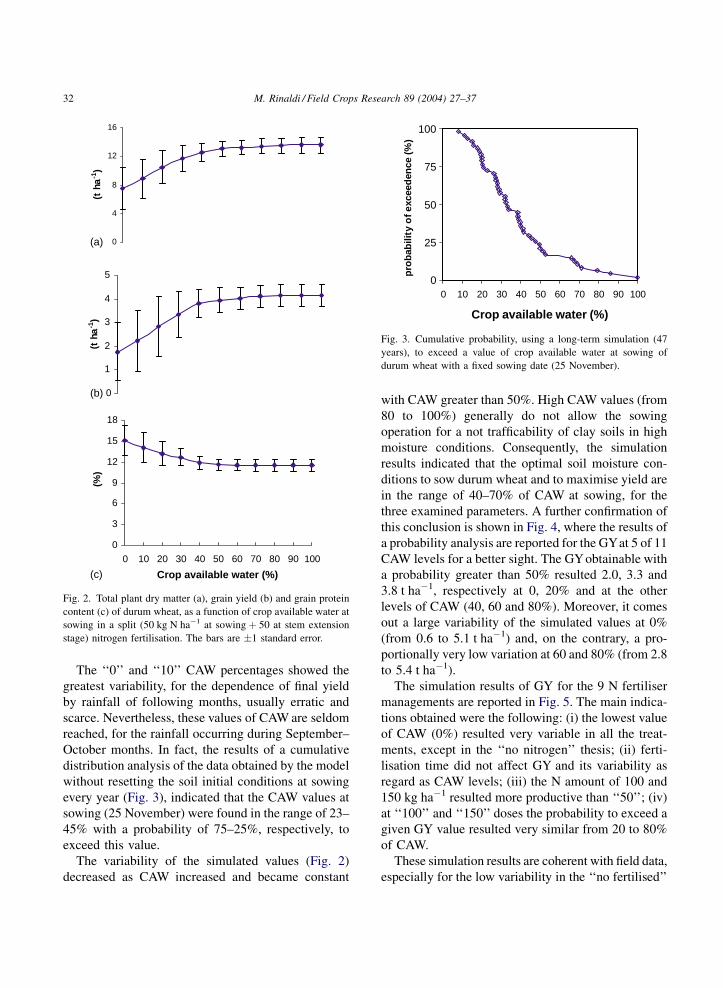
The ‘‘0’’ and ‘‘10’’ CAW percentages showed the
greatest variability, for the dependence of final yield
by rainfall of following months, usually erratic and
scarce. Nevertheless, these values of CAW are seldom
reached, for the rainfall occurring during September–
October months. In fact, the results of a cumulative
distribution analysis of the data obtained by the model
without resetting the soil initial conditions at sowing
every year (Fig. 3), indicated that the CAW values at
sowing (25 November) were found in the range of 23–
45% with a probability of 75–25%, respectively, to
exceed this value.
The variability of the simulated values (Fig. 2)
decreased as CAW increased and became constant
with CAW greater than 50%. High CAW values (from
80 to 100%) generally do not allow the sowing
operation for a not trafficability of clay soils in high
moisture conditions. Consequently, the simulation
results indicated that the optimal soil moisture con-
ditions to sow durum wheat and to maximise yield are
in the range of 40–70% of CAW at sowing, for the
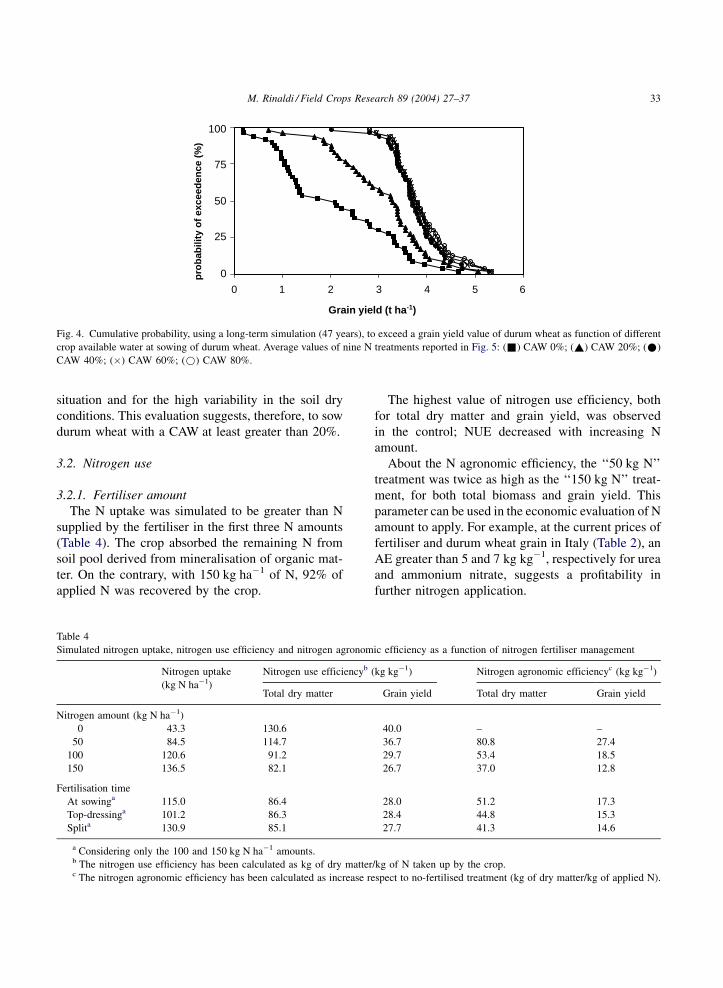
three examined parameters. A further confirmation of
this conclusion is shown in Fig. 4, where the results of
a probability analysis are reported for the GYat 5 of 11
CAW levels for a better sight. The GY obtainable with
a probability greater than 50% resulted 2.0, 3.3 and
3.8 t ha�1, respectively at 0, 20% and at the other
levels of CAW (40, 60 and 80%). Moreover, it comes
out a large variability of the simulated values at 0%
(from 0.6 to 5.1 t ha�1) and, on the contrary, a pro-
portionally very low variation at 60 and 80% (from 2.8
to 5.4 t ha�1).
The simulation results of GY for the 9 N fertiliser
managements are reported in Fig. 5. The main indica-
tions obtained were the following: (i) the lowest value
of CAW (0%) resulted very variable in all the treat-
ments, except in the ‘‘no nitrogen’’ thesis; (ii) ferti-
lisation time did not affect GY and its variability as
regard as CAW levels; (iii) the N amount of 100 and
150 kg ha�1 resulted more productive than ‘‘50’’; (iv)
at ‘‘100’’ and ‘‘150’’ doses the probability to exceed a
given GY value resulted very similar from 20 to 80%
of CAW.
These simulation results are coherent with field data,
especially for the low variability in the ‘‘no fertilised’’
0
4
8
12
16
(t h
a-1
)
0
1
2
3
4
5
(t h
a-1
)
0
3
6
9
12
15
18
0 10 20 30 40 50 60 70 80 90 100
Crop available water (%)
(%)
(a)
(b)
(c)
Fig. 2. Total plant dry matter (a), grain yield (b) and grain protein
content (c) of durum wheat, as a function of crop available water at
sowing in a split (50 kg N ha�1 at sowing þ 50 at stem extension
stage) nitrogen fertilisation. The bars are �1 standard error.
0
25
50
75
100
0 10 20 30 40 50 60 70 80 90 100
Crop available water (%)
pro
bab
ility
of e
xcee
den
ce (
%)
Fig. 3. Cumulative probability, using a long-term simulation (47
years), to exceed a value of crop available water at sowing of
durum wheat with a fixed sowing date (25 November).
32 M. Rinaldi / Field Crops Research 89 (2004) 27–37
situation and for the high variability in the soil dry
conditions. This evaluation suggests, therefore, to sow
durum wheat with a CAW at least greater than 20%.
3.2. Nitrogen use
3.2.1. Fertiliser amount
The N uptake was simulated to be greater than N
supplied by the fertiliser in the first three N amounts
(Table 4). The crop absorbed the remaining N from
soil pool derived from mineralisation of organic mat-
ter. On the contrary, with 150 kg ha�1 of N, 92% of
applied N was recovered by the crop.
The highest value of nitrogen use efficiency, both
for total dry matter and grain yield, was observed
in the control; NUE decreased with increasing N
amount.
About the N agronomic efficiency, the ‘‘50 kg N’’
treatment was twice as high as the ‘‘150 kg N’’ treat-
ment, for both total biomass and grain yield. This
parameter can be used in the economic evaluation of N
amount to apply. For example, at the current prices of
fertiliser and durum wheat grain in Italy (Table 2), an
AE greater than 5 and 7 kg kg�1, respectively for urea
and ammonium nitrate, suggests a profitability in
further nitrogen application.
0
25
50
75
100
0 1 2 3 4 5 6
Grain yield (t ha-1)
pro
bab
ility
of
exce
eden
ce (
%)
Fig. 4. Cumulative probability, using a long-term simulation (47 years), to exceed a grain yield value of durum wheat as function of different
crop available water at sowing of durum wheat. Average values of nine N treatments reported in Fig. 5: (&) CAW 0%; (~) CAW 20%; (*)
CAW 40%; (�) CAW 60%; (*) CAW 80%.
Table 4
Simulated nitrogen uptake, nitrogen use efficiency and nitrogen agronomic efficiency as a function of nitrogen fertiliser management
Nitrogen uptake
(kg N ha�1)
Nitrogen use efficiencyb (kg kg�1) Nitrogen agronomic efficiencyc (kg kg�1)
Total dry matter Grain yield Total dry matter Grain yield
Nitrogen amount (kg N ha�1)
0 43.3 130.6 40.0 – –
50 84.5 114.7 36.7 80.8 27.4
100 120.6 91.2 29.7 53.4 18.5
150 136.5 82.1 26.7 37.0 12.8
Fertilisation time
At sowinga 115.0 86.4 28.0 51.2 17.3
Top-dressinga 101.2 86.3 28.4 44.8 15.3
Splita 130.9 85.1 27.7 41.3 14.6
a Considering only the 100 and 150 kg N ha�1 amounts.b The nitrogen use efficiency has been calculated as kg of dry matter/kg of N taken up by the crop.c The nitrogen agronomic efficiency has been calculated as increase respect to no-fertilised treatment (kg of dry matter/kg of applied N).
M. Rinaldi / Field Crops Research 89 (2004) 27–37 33
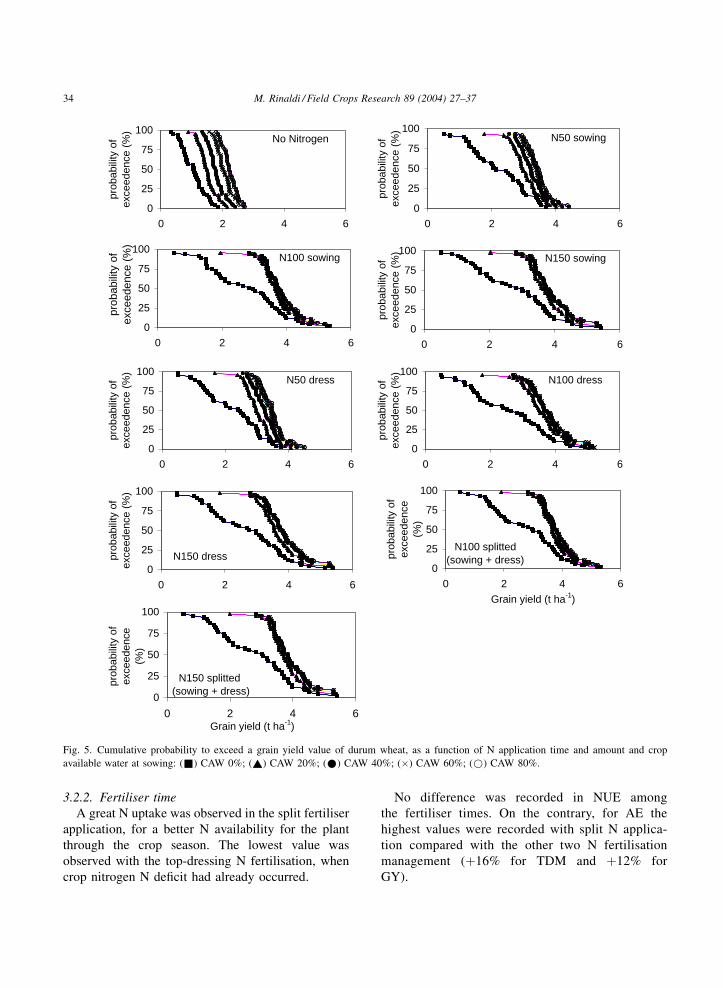
3.2.2. Fertiliser time
A great N uptake was observed in the split fertiliser
application, for a better N availability for the plant
through the crop season. The lowest value was
observed with the top-dressing N fertilisation, when
crop nitrogen N deficit had already occurred.
No difference was recorded in NUE among
the fertiliser times. On the contrary, for AE the
highest values were recorded with split N applica-
tion compared with the other two N fertilisation
management (þ16% for TDM and þ12% for
GY).
No Nitrogen
0
25
50
75
100
0 2 4 6
prob
abili
ty o
f ex
ceed
ence
(%
)
N50 dress
0
25
50
75
100
0 2 4 6
prob
abili
ty o
f ex
ceed
ence
(%
)
N100 dress
0
25
50
75
100
0 2 4 6
prob
abili
ty o
f ex
ceed
ence
(%
)
N150 dress 0
25
50
75
100
0 2 4 6
prob
abili
ty o
f ex
ceed
ence
(%
)
N100 splitted (sowing + dress)
0
25
50
75
100
0 2 4 6
Grain yield (t ha-1)
prob
abili
ty o
f ex
ceed
ence
(%
)
N150 splitted (sowing + dress)
0
25
50
75
100
0 2 4 6Grain yield (t ha-1)
prob
abili
ty o
f ex
ceed
ence
(%
)N50 sowing
0
25
50
75
100
0 2 4 6
prob
abili
ty o
f ex
ceed
ence
(%
)
N100 sowing
0
25
50
75
100
0 2 4 6
prob
abili
ty o
f ex
ceed
ence
(%
)
N150 sowing
0
25
50
75
100
0 2 4 6
prob
abili
ty o
f ex
ceed
ence
(%
)
Fig. 5. Cumulative probability to exceed a grain yield value of durum wheat, as a function of N application time and amount and crop
available water at sowing: (&) CAW 0%; (~) CAW 20%; (*) CAW 40%; (�) CAW 60%; (*) CAW 80%.
34 M. Rinaldi / Field Crops Research 89 (2004) 27–37
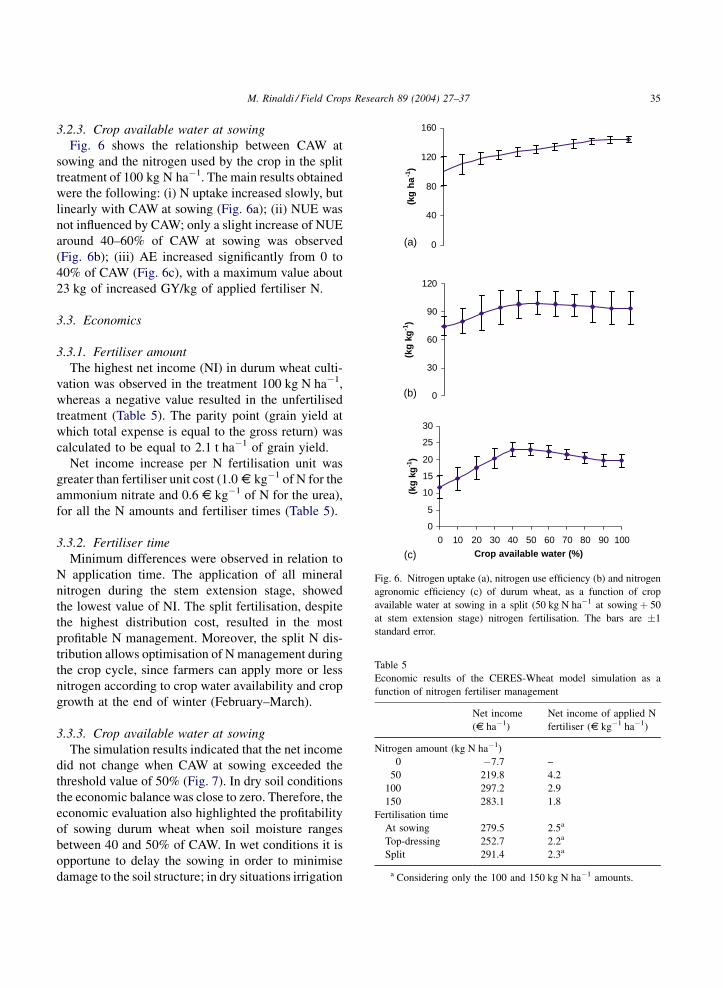
3.2.3. Crop available water at sowing
Fig. 6 shows the relationship between CAW at
sowing and the nitrogen used by the crop in the split
treatment of 100 kg N ha�1. The main results obtained
were the following: (i) N uptake increased slowly, but
linearly with CAW at sowing (Fig. 6a); (ii) NUE was
not influenced by CAW; only a slight increase of NUE
around 40–60% of CAW at sowing was observed
(Fig. 6b); (iii) AE increased significantly from 0 to
40% of CAW (Fig. 6c), with a maximum value about
23 kg of increased GY/kg of applied fertiliser N.
3.3. Economics
3.3.1. Fertiliser amount
The highest net income (NI) in durum wheat culti-
vation was observed in the treatment 100 kg N ha�1,
whereas a negative value resulted in the unfertilised
treatment (Table 5). The parity point (grain yield at
which total expense is equal to the gross return) was
calculated to be equal to 2.1 t ha�1 of grain yield.
Net income increase per N fertilisation unit was
greater than fertiliser unit cost (1.0 s kg�1 of N for the
ammonium nitrate and 0.6 s kg�1 of N for the urea),
for all the N amounts and fertiliser times (Table 5).
3.3.2. Fertiliser time
Minimum differences were observed in relation to
N application time. The application of all mineral
nitrogen during the stem extension stage, showed
the lowest value of NI. The split fertilisation, despite
the highest distribution cost, resulted in the most
profitable N management. Moreover, the split N dis-
tribution allows optimisation of N management during
the crop cycle, since farmers can apply more or less
nitrogen according to crop water availability and crop
growth at the end of winter (February–March).
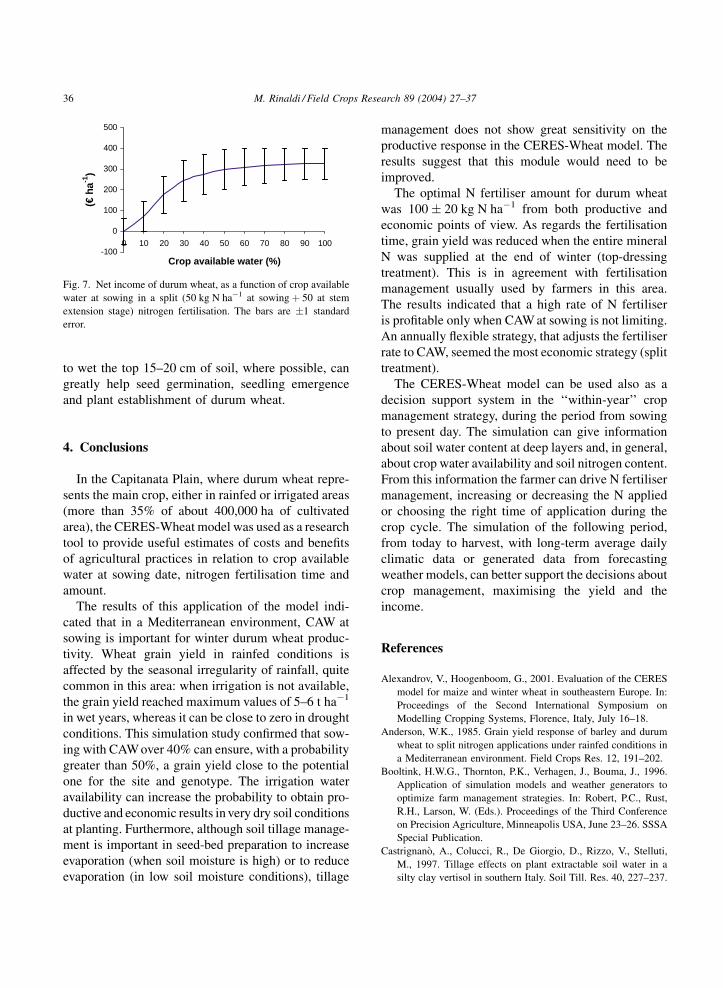
3.3.3. Crop available water at sowing
The simulation results indicated that the net income
did not change when CAW at sowing exceeded the
threshold value of 50% (Fig. 7). In dry soil conditions
the economic balance was close to zero. Therefore, the
economic evaluation also highlighted the profitability
of sowing durum wheat when soil moisture ranges
between 40 and 50% of CAW. In wet conditions it is
opportune to delay the sowing in order to minimise
damage to the soil structure; in dry situations irrigation
0
40
80
120
160
(kg
ha
-1)
0
30
60
90
120
(kg
kg-1
)
0
5
10
15
20
25
30
0 10 20 30 40 50 60 70 80 90 100
Crop available water (%)
(kg
kg-1
)
(c)
(b)
(a)
Fig. 6. Nitrogen uptake (a), nitrogen use efficiency (b) and nitrogen
agronomic efficiency (c) of durum wheat, as a function of crop
available water at sowing in a split (50 kg N ha�1 at sowing þ 50
at stem extension stage) nitrogen fertilisation. The bars are �1
standard error.
Table 5
Economic results of the CERES-Wheat model simulation as a
function of nitrogen fertiliser management
Net income
(s ha�1)
Net income of applied N
fertiliser (s kg�1 ha�1)
Nitrogen amount (kg N ha�1)
0 �7.7 –
50 219.8 4.2
100 297.2 2.9
150 283.1 1.8
Fertilisation time
At sowing 279.5 2.5a
Top-dressing 252.7 2.2a
Split 291.4 2.3a
a Considering only the 100 and 150 kg N ha�1 amounts.
M. Rinaldi / Field Crops Research 89 (2004) 27–37 35
to wet the top 15–20 cm of soil, where possible, can
greatly help seed germination, seedling emergence
and plant establishment of durum wheat.
4. Conclusions
In the Capitanata Plain, where durum wheat repre-
sents the main crop, either in rainfed or irrigated areas
(more than 35% of about 400,000 ha of cultivated
area), the CERES-Wheat model was used as a research
tool to provide useful estimates of costs and benefits
of agricultural practices in relation to crop available
water at sowing date, nitrogen fertilisation time and
amount.
The results of this application of the model indi-
cated that in a Mediterranean environment, CAW at
sowing is important for winter durum wheat produc-
tivity. Wheat grain yield in rainfed conditions is
affected by the seasonal irregularity of rainfall, quite
common in this area: when irrigation is not available,
the grain yield reached maximum values of 5–6 t ha�1
in wet years, whereas it can be close to zero in drought
conditions. This simulation study confirmed that sow-
ing with CAW over 40% can ensure, with a probability
greater than 50%, a grain yield close to the potential
one for the site and genotype. The irrigation water
availability can increase the probability to obtain pro-
ductive and economic results in very dry soil conditions
at planting. Furthermore, although soil tillage manage-
ment is important in seed-bed preparation to increase
evaporation (when soil moisture is high) or to reduce
evaporation (in low soil moisture conditions), tillage
management does not show great sensitivity on the
productive response in the CERES-Wheat model. The
results suggest that this module would need to be
improved.
The optimal N fertiliser amount for durum wheat
was 100 � 20 kg N ha�1 from both productive and
economic points of view. As regards the fertilisation
time, grain yield was reduced when the entire mineral
N was supplied at the end of winter (top-dressing
treatment). This is in agreement with fertilisation
management usually used by farmers in this area.
The results indicated that a high rate of N fertiliser
is profitable only when CAW at sowing is not limiting.
An annually flexible strategy, that adjusts the fertiliser
rate to CAW, seemed the most economic strategy (split
treatment).
The CERES-Wheat model can be used also as a
decision support system in the ‘‘within-year’’ crop
management strategy, during the period from sowing
to present day. The simulation can give information
about soil water content at deep layers and, in general,
about crop water availability and soil nitrogen content.
From this information the farmer can drive N fertiliser
management, increasing or decreasing the N applied
or choosing the right time of application during the
crop cycle. The simulation of the following period,
from today to harvest, with long-term average daily
climatic data or generated data from forecasting
weather models, can better support the decisions about
crop management, maximising the yield and the
income.
References
Alexandrov, V., Hoogenboom, G., 2001. Evaluation of the CERES
model for maize and winter wheat in southeastern Europe. In:
Proceedings of the Second International Symposium on
Modelling Cropping Systems, Florence, Italy, July 16–18.
Anderson, W.K., 1985. Grain yield response of barley and durum
wheat to split nitrogen applications under rainfed conditions in
a Mediterranean environment. Field Crops Res. 12, 191–202.
Booltink, H.W.G., Thornton, P.K., Verhagen, J., Bouma, J., 1996.
Application of simulation models and weather generators to
optimize farm management strategies. In: Robert, P.C., Rust,
R.H., Larson, W. (Eds.). Proceedings of the Third Conference
on Precision Agriculture, Minneapolis USA, June 23–26. SSSA
Special Publication.
Castrignano, A., Colucci, R., De Giorgio, D., Rizzo, V., Stelluti,
M., 1997. Tillage effects on plant extractable soil water in a
silty clay vertisol in southern Italy. Soil Till. Res. 40, 227–237.
-100
0
100
200
300
400
500
0 10 20 30 40 50 60 70 80 90 100
Crop available water (%)
(€
ha-1
)
Fig. 7. Net income of durum wheat, as a function of crop available
water at sowing in a split (50 kg N ha�1 at sowing þ 50 at stem
extension stage) nitrogen fertilisation. The bars are �1 standard
error.
36 M. Rinaldi / Field Crops Research 89 (2004) 27–37
Castrignano, A., Montemurro, F., Ferri, D., Lopez, N., 2000.
Simulazione dei rendimenti del frumento in relazione alla
variabilita chimica e fisica dei terreni. In: Atti XVIII Convegno
Nazionale SICA. Catania (I), Novembre 20–22, pp. 111–121.
Cooper, P.J.M., Gregory, P.J., Tully, D., Harris, H.C., 1987.
Improving water use efficiency of annual crops in the rainfed
farming systems of West Asia and North Africa. Exp. Agric.
Farming Syst. Ser. 23, 113–158.
Daniel, C., Triboi, E., 2000. Effects of temperature and nitrogen
nutrition on the grain composition of winter wheat: effects on
gliadin content and composition. J. Cereal Sci. 32, 45–56.
Dann, P.R., 1969. Response of wheat to phosphorus and nitrogen
with particular reference to ‘‘haying off’’. Aust. J. Exp. Agric.
Anim. Husb. 9, 625–629.
Delogu, G., Cattivelli, L., Pecchioni, N., De Falcis, D., Maggiore, T.,
Stanca, A.M., 1998. Uptake and agronomic efficiency of nitrogen
in winter barley and winter wheat. Eur. J. Agron. 9, 11–20.
Di Bari, V., Rizzo, V., Maiorana, M., De Giorgio, D., Rinaldi, M.,
1993. Variazioni produttive del frumento duro in avvicenda-
menti annuali e biennali sottoposti a differenti livelli agrotec-
nici con e senza intercalari. Agric. Ric. 151–152, 15–22.
Ferri, D., Castrignano, A., Convertini, G., Montemurro, F., 2001.
Sensibility of CERES-Wheat to variation of soil mineral N and
comparison with N-fertilization experiment. In: Proceedings of
the 11th Nitrogen Workshop, Reims (F), September 9–12,
pp. 445–446.
Godwin, D.C., Jones, C.A., 1991. Nitrogen dynamics in soil–plant
systems. In: Hanks, R.J., Ritchie, J.T. (Eds.), Modelling Plant
and Soil Systems. Monograph No. 31. ASA, CSSA, SSSA
Publication, Madison, WI.
Gonzales Ponce, R., Salas, M.L., Mason, S.C., 1993. Nitrogen use
efficiency by winter barley under different climatic conditions.
J. Plant Nutr. 16, 1249–1261.
Hasegawa, H., Bryant, D.C., Denison, R.F., 2000. Testing CERES
model predictions of crop growth and N dynamics, in cropping
systems with leguminous green manures in a Mediterranean
climate. Field Crops Res. 67 (3), 239–255.
Hundal, S.S., Prabhjyot-Kaur, 1997. Application of the CERES-
Wheat model to yield predictions in the irrigated plains of the
Indian Punjab. J. Agric. Sci. Camb. 129, 13–18.
Hunt, L.A., Pararajasingham, S., Jones, J.W., Hoogenboom, G.,
Imamura, D.T., Ogoshi, R.M., 1993. GENCALC—software to
facilitate the use of crop models for analysing field experi-
ments. Agron. J. (85), 1090–1094.
Jones, J.W., Hoogenboom, G., Porter, C.H., Boote, K.J., Batchelor,
W.D., Hunt, L.A., Wilkens, P.W., Singh, U., Gijsman, A.J.,
Ritchie, J.T., 2003. The DSSAT cropping system model. Eur. J.
Agron. 18, 235–265.
Kovacs, G.J., Nemeth, T., Ritchie, J.T., 1995. Testing simulation
models for the assessment of crop production and nitrate
leaching in Hungary. Agric. Syst. 49 (4), 385–397.
Large, E.C., 1954. Growth stages in cereals. Illustration of the
Feekes scale. Plant Pathol. 3, 128.
Mahler, R.L., Koehler, F.E., Lutcher, L.K., 1994. Nitrogen source,
timing of application, and placement: effects on winter wheat
production. Agron. J. 86, 637–642.
Maiorana, M., 1998. Interramento dei residui colturali di frumento
duro. L’Inform. Agric. LIV (18), 41–45.
Pecetti, L., Hollington, P.A., 1997. Application of the CERES-
Wheat simulation model to durum wheat in two diverse
Mediterranean environments. Eur. J. Agron. 6 (1–2), 125–139.
Rinaldi, M., 2001. Durum wheat simulation in southern Italy
using CERES-Wheat model. I. Calibration and validation. In:
Proceedings of the Second International Symposium on
Modelling Cropping Systems, Florence, Italy, July 16–18,
pp. 81–82.
Ritchie, J.T., Otter, S., 1985. Description and performance of
CERES-Wheat: a user-oriented wheat yield model. USDA–
ARS ARS-38, 159–175.
Ritchie, J.T., 1986. A user-oriented model of the soil water balance
in wheat. In: Day, W., Atkins, R.K. (Eds.), Wheat Growth and
Modelling. Plenum Press, New York, pp. 203–305.
Savin, R., Satorre, E.H., Hall, A.J., Slafer, G.A., 1995. Assessing
strategies for wheat cropping in the monsoonal climate of the
Pampas using the CERES-Wheat simulation-model. Field
Crops Res. 42 (2–3), 81–91.
Sequi, P., Vittori Antistari, L., 1989. Dinamismo chimico
dell’azoto: aspetti agronomici e ambientali. Riv. Agron. 23
(1), 30–42.
Sherperd, K.D., Cooper, P.J.M., Allan, A.Y., Drennan, D.S.H.,
1986. Growth, water use and yield of barley in Mediterranean-
type environments. J. Agric. Sci. Camb. 108, 365–378.
Steiner, J.L., Howell, T.A., Tolk, J.A., Schneider, A.D., 1991.
Evapotranspiration and growth predictions of CERES-Maize,
sorghum and wheat in the southern high plains. In: Proceedings
of the 1991 National Conference, July 22–26, 1991. ASCE,
Honolulu, HI.
Thornton, P.K., Bowen, W.T., Ravelo, A.C., Wilkens, P.W., Farmer,
G., Brock, J., Brink, J.E., 1997. Estimating millet production
for famine early warning: an application of crop simulation
modelling using satellite and ground-based data in Burkina
Faso. Agric. For. Meteorol. 83, 95–112.
Timsina, J., Singh, U., Badaruddin, M., Meisner, C., 1998. Cultivar,
nitrogen and moisture effects on a rice–wheat sequence:
experimentation and simulation. Agron. J. 90 (2), 119–130.
Timsina, J., Singh, U., Singh, Y., Lansigan, F.P., 1995. Addressing
sustainability of rice–wheat systems: testing and application of
CERES and SUCROS models. In: Proceedings of the
International Rice Research Conference, February 13–17,
1995. International Rice Research Institute, Manila, Philip-
pines, pp. 633–656.
Travasso, M.I., Delecolle, R., 1995. Adaptation of the CERES-
Wheat model for large area yield estimation in Argentina. Eur.
J. Agron. 4 (3), 347–353.
Tsuji, G., Uehara, G., Balas, S., 1994. DSSAT, version 3, vols. 1–3.
University of Hawaii, Honolulu, HI.
M. Rinaldi / Field Crops Research 89 (2004) 27–37 37