Organic Material on Ceres: Insights from Visible and Infrared ...
14
life Article Organic Material on Ceres: Insights from Visible and Infrared Space Observations Andrea Raponi 1, * , Maria Cristina De Sanctis 1 , Filippo Giacomo Carrozzo 1 , Mauro Ciarniello 1 , Batiste Rousseau 1 , Marco Ferrari 1 , Eleonora Ammannito 2 , Simone De Angelis 1 , Vassilissa Vinogradoff 3 , Julie C. Castillo-Rogez 4 , Federico Tosi 1 , Alessandro Frigeri 1 , Michelangelo Formisano 1 , Francesca Zambon 1 , Carol A. Raymond 4 and Christopher T. Russell 5 Citation: Raponi, A.; De Sanctis, M.C.; Giacomo Carrozzo, F.; Ciarniello, M.; Rousseau, B.; Ferrari, M.; Ammannito, E.; De Angelis, S.; Vinogradoff, V.; Castillo-Rogez, J.C.; Tosi, F.; et al. Or- ganic Material on Ceres: Insights from Visible and Infrared Space Observa- tions. Life 2021, 11, 9. https://dx.doi. org/10.3390/life11010009 Received: 22 October 2020 Accepted: 21 December 2020 Published: 24 December 2020 Publisher’s Note: MDPI stays neu- tral with regard to jurisdictional claims in published maps and institutional affiliations. Copyright: © 2020 by the authors. Li- censee MDPI, Basel, Switzerland. This article is an open access article distributed under the terms and conditions of the Creative Commons Attribution (CC BY) license (https://creativecommons.org/ licenses/by/4.0/). 1 Istituto Nazionale di Astrofisica–Istituto di Astrofisica e Planetologia Spaziali, 00133 Rome, Italy; [email protected] (M.C.D.S.); fi[email protected] (F.G.C.); [email protected] (M.C.); [email protected] (B.R.); [email protected] (M.F.); [email protected] (S.D.A.); [email protected] (F.T.); [email protected] (A.F.); [email protected] (M.F.); [email protected] (F.Z.) 2 Agenzia Spaziale Italiana, 00133 Rome, Italy; [email protected] 3 Physique des Interactions Ioniques et Moléculaires, PIIM, Université d’Aix-Marseille, 13013 Marseille, France; [email protected] 4 Jet Propulsion Laboratory, California Institute of Technology, Pasadena, CA 91109, USA; [email protected] (J.C.C.-R.); [email protected] (C.A.R.) 5 Earth Planetary and Space Sciences, University of California, Los Angeles, CA 90095, USA; [email protected] * Correspondence: [email protected] Abstract: The NASA/Dawn mission has acquired unprecedented measurements of the surface of the dwarf planet Ceres, the composition of which is a mixture of ultra-carbonaceous material, phyllosilicates, carbonates, organics, Fe-oxides, and volatiles as determined by remote sensing instruments including the VIR imaging spectrometer. We performed a refined analysis merging visible and infrared observations of Ceres’ surface for the first time. The overall shape of the combined spectrum suggests another type of silicate not previously considered, and we confirmed a large abundance of carbon material. More importantly, by analyzing the local spectra of the organic-rich region of the Ernutet crater, we identified a reddening in the visible range, strongly correlated to the aliphatic signature at 3.4 μm. Similar reddening was found in the bright material making up Cerealia Facula in the Occator crater. This implies that organic material might be present in the source of the faculae, where brines and organics are mixed in an environment that may be favorable for prebiotic chemistry. Keywords: astrobiology; organic material; Ceres; small bodies 1. Introduction Ceres is the largest object in the asteroid belt. Because of its size (~950 km in diameter) and its spheroidal shape, it has been classified as a dwarf planet. Spectrophotometric ground observations of Ceres have revealed a complex mineralogy from the absorption band depths and positions along the spectrum of the solar flux reflected by its surface. The low albedo and the relatively flat visible/near-IR (0.4–2.5 μm) spectrum suggest the presence of a dark component like magnetite [1,2]. Absorption bands at 3.3–3.4 μm and 3.8–4.0 μm have been interpreted by carbonates like dolomite, calcite, and magnesite, which is consistent with observations in the mid-infrared [1,2]. A narrow absorption at 3.06 μm has been attributed to different species, like ice frost [3], NH 4 -bearing minerals [4], irradiated organics and crystalline water ice [5], cronstedtite [6], and brucite [1]. The Dawn NASA mission represents a breakthrough for the investigation of Ceres. Dawn’s payload includes a visible and infrared mapping spectrometer (VIR) [7], a framing Life 2021, 11, 9. https://dx.doi.org/10.3390/life11010009 https://www.mdpi.com/journal/life
-
Upload
khangminh22 -
Category
Documents
-
view
0 -
download
0
Transcript of Organic Material on Ceres: Insights from Visible and Infrared ...
life
Article
Organic Material on Ceres: Insights from Visible and InfraredSpace Observations
Andrea Raponi 1,* , Maria Cristina De Sanctis 1, Filippo Giacomo Carrozzo 1 , Mauro Ciarniello 1 ,Batiste Rousseau 1 , Marco Ferrari 1 , Eleonora Ammannito 2, Simone De Angelis 1, Vassilissa Vinogradoff 3,Julie C. Castillo-Rogez 4, Federico Tosi 1, Alessandro Frigeri 1 , Michelangelo Formisano 1 , Francesca Zambon 1,Carol A. Raymond 4 and Christopher T. Russell 5
�����������������
Citation: Raponi, A.; De Sanctis, M.C.;
Giacomo Carrozzo, F.; Ciarniello, M.;
Rousseau, B.; Ferrari, M.; Ammannito,
E.; De Angelis, S.; Vinogradoff, V.;
Castillo-Rogez, J.C.; Tosi, F.; et al. Or-
ganic Material on Ceres: Insights from
Visible and Infrared Space Observa-
tions. Life 2021, 11, 9. https://dx.doi.
org/10.3390/life11010009
Received: 22 October 2020
Accepted: 21 December 2020
Published: 24 December 2020
Publisher’s Note: MDPI stays neu-
tral with regard to jurisdictional claims
in published maps and institutional
affiliations.
Copyright: © 2020 by the authors. Li-
censee MDPI, Basel, Switzerland. This
article is an open access article distributed
under the terms and conditions of the
Creative Commons Attribution (CC BY)
license (https://creativecommons.org/
licenses/by/4.0/).
1 Istituto Nazionale di Astrofisica–Istituto di Astrofisica e Planetologia Spaziali, 00133 Rome, Italy;[email protected] (M.C.D.S.); [email protected] (F.G.C.); [email protected] (M.C.);[email protected] (B.R.); [email protected] (M.F.); [email protected] (S.D.A.);[email protected] (F.T.); [email protected] (A.F.); [email protected] (M.F.);[email protected] (F.Z.)
2 Agenzia Spaziale Italiana, 00133 Rome, Italy; [email protected] Physique des Interactions Ioniques et Moléculaires, PIIM, Université d’Aix-Marseille, 13013 Marseille, France;
[email protected] Jet Propulsion Laboratory, California Institute of Technology, Pasadena, CA 91109, USA;
[email protected] (J.C.C.-R.); [email protected] (C.A.R.)5 Earth Planetary and Space Sciences, University of California, Los Angeles, CA 90095, USA;
[email protected]* Correspondence: [email protected]
Abstract: The NASA/Dawn mission has acquired unprecedented measurements of the surfaceof the dwarf planet Ceres, the composition of which is a mixture of ultra-carbonaceous material,phyllosilicates, carbonates, organics, Fe-oxides, and volatiles as determined by remote sensinginstruments including the VIR imaging spectrometer. We performed a refined analysis mergingvisible and infrared observations of Ceres’ surface for the first time. The overall shape of the combinedspectrum suggests another type of silicate not previously considered, and we confirmed a largeabundance of carbon material. More importantly, by analyzing the local spectra of the organic-richregion of the Ernutet crater, we identified a reddening in the visible range, strongly correlated tothe aliphatic signature at 3.4 µm. Similar reddening was found in the bright material making upCerealia Facula in the Occator crater. This implies that organic material might be present in the sourceof the faculae, where brines and organics are mixed in an environment that may be favorable forprebiotic chemistry.
Keywords: astrobiology; organic material; Ceres; small bodies
1. Introduction
Ceres is the largest object in the asteroid belt. Because of its size (~950 km in diameter)and its spheroidal shape, it has been classified as a dwarf planet. Spectrophotometricground observations of Ceres have revealed a complex mineralogy from the absorptionband depths and positions along the spectrum of the solar flux reflected by its surface.The low albedo and the relatively flat visible/near-IR (0.4–2.5 µm) spectrum suggest thepresence of a dark component like magnetite [1,2]. Absorption bands at 3.3–3.4 µm and3.8–4.0 µm have been interpreted by carbonates like dolomite, calcite, and magnesite,which is consistent with observations in the mid-infrared [1,2]. A narrow absorption at3.06 µm has been attributed to different species, like ice frost [3], NH4-bearing minerals [4],irradiated organics and crystalline water ice [5], cronstedtite [6], and brucite [1].
The Dawn NASA mission represents a breakthrough for the investigation of Ceres.Dawn’s payload includes a visible and infrared mapping spectrometer (VIR) [7], a framing
Life 2021, 11, 9. https://dx.doi.org/10.3390/life11010009 https://www.mdpi.com/journal/life

Life 2021, 11, 9 2 of 14
camera (FC) with seven wavelength filters [8] and a gamma ray and neutron detector(GRaND) [9]. The three instruments were complementary in inferring the surface propertiesof Ceres.
The VIR imaging spectrometer is composed of two channels: the VIS channel coversthe spectral range 0.25–1 µm, with a spectral sampling of ~2 nm, and the IR channel coversthe spectral range 1–5 µm, with a spectral sampling of ~10 nm. The VIR obtained spectra ofCeres with unprecedented quality and quantity for an icy body, without any limitations dueto atmospheric absorptions (which hide the range of 2.5–2.9 microns), and at a resolutionof about a few kilometers to tens of meters.
The first finding from the VIR-IR channel shows a global surface composed of a darkcomponent (carbon and/or magnetite), and Mg-carbonates such as dolomite, confirmingsome of the previous studies based on ground observations. The discovery of a strongabsorption at 2.7 µm (confirmed by data from the satellite AKARI [10]) was assigned toMg-phyllosilicates such as antigorite, and a better definition of the 3.06-µm absorption wasattributed to NH4-phyllosilicates [11].
Then, the GRaND instrument provided new constraints. Based on this elementaldata, in particular the abundance of C, H, K, and Fe, [12,13] it was established that thedark material that makes up most of Ceres’ surface composition should be rich in carbonand it resembles carbonaceous chondrite material [14,15] which is associated with a thickvolatile-rich crust, thus suggesting a large and diffuse presence of organic material.
Recent improvement in the VIS channel calibration [16,17] allows for extending therange of the VIR instrument to shorter wavelengths (0.25–1.0 µm). Here, we further refinethe calibration of the IR channel following Rousseau et al. [16,17]. The resulting VIR datain the visible range, together with the refined calibration in the IR channel provide newconstraints on Ceres mineralogy. Using this new capability, we performed spectral analysisand modelling to infer further details on the composition of the dwarf planet. In the presentwork, we focus on the average spectrum of Ceres. We also revise local spectra from theErnutet and Occator crater regions, where the VIR-IR instrument detected clear signaturesof aliphatic organics [18] and a mixture of dry and hydrated salts, respectively, with thepossible presence of organics [19].
2. Average Ceres Spectrum2.1. Calibration Refinement
We collected calibrated VIR data (available through the Planetary Data System (PDS)online data archive at: https://sbn.psi.edu/pds/resource/dawn/dwncvirL1.html). Thedata investigated in this work were acquired during different phases of the Dawn mis-sion at Ceres, and they provide almost complete coverage of Ceres’ surface. The cali-brated dataset was further refined with the procedure described in Carrozzo et al. [20]and Rousseau et al. [16], in order to correct for the odd-even effect and systematic arti-facts [20], and spurious spectral variations due to the detector temperature in the VISchannel [16]. Data were then photometrically corrected to standard viewing geometry(incidence angle = 30◦, emission angle = 0◦, phase angle = 30◦) by means of Hapke mod-eling [21,22] according to the photometric parameters derived by Ciarniello et al. [23].Moreover, we applied correction factors derived from ground-based observations to correctfor fictitious slopes on spectra of both VIR channels. These correction factors were firstderived by Carrozzo et al. [20]. In the present work, we used the updated version for theVIS channel derived by Rousseau et al. [17], and an updated version for the IR channel,here proposed, which was derived following the same procedure of Rousseau et al. [17].Here we summarize the main steps to produce the ground correction.
1. We collected ground observations of Ceres, which are mutually consistent in thespectral range, where they overlap [2,24–30].
2. For each ground full-disk observation (point 1), bidirectional reflectance was con-verted to standard viewing geometry (incidence angle = 30◦, emission angle = 0◦,

Life 2021, 11, 9 3 of 14
phase angle = 30◦) by means of Hapke modeling [22] according to the photometricparameters derived by [23].
3. Based on the ground-based spectra (point 2), we calculated a smooth average spectrumthat covers the whole spectral range of the infrared channel of the VIR spectrometer.
4. We calculated the average spectrum of VIR-IR calibrated data, after artifact andphotometric correction, as described above.
5. We calculated the ratio between the average spectrum from ground observations(point 3) with the average spectrum obtained from VIR data (point 4). This ratiospectrum is used as a multiplicative correction factor on every single VIR spectrum.
Merging the global average spectrum obtained in the VIS channel [17] with the averageIR spectrum derived here, we obtained a single global average spectrum of Ceres in therange of 0.25–5.0 µm. Then, we removed the thermal emission affecting the spectrumlongward of 3.5 µm, as discussed in Section 2.2 (Figure 1).
Life 2021, 11, x FOR PEER REVIEW 3 of 14
2. For each ground full-disk observation (point 1), bidirectional reflectance was con-verted to standard viewing geometry (incidence angle = 30°, emission angle = 0°, phase angle = 30°) by means of Hapke modeling [22] according to the photometric parameters derived by [23].
3. Based on the ground-based spectra (point 2), we calculated a smooth average spec-trum that covers the whole spectral range of the infrared channel of the VIR spec-trometer.
4. We calculated the average spectrum of VIR-IR calibrated data, after artifact and pho-tometric correction, as described above.
5. We calculated the ratio between the average spectrum from ground observations (point 3) with the average spectrum obtained from VIR data (point 4). This ratio spec-trum is used as a multiplicative correction factor on every single VIR spectrum. Merging the global average spectrum obtained in the VIS channel [17] with the aver-
age IR spectrum derived here, we obtained a single global average spectrum of Ceres in the range of 0.25–5.0 µm. Then, we removed the thermal emission affecting the spectrum longward of 3.5 µm, as discussed in Section 2.2 (Figure 1).
Figure 1. Average Ceres spectrum. The VIS channel (black) and IR channel (gray) have been merged to obtain a unique spectrum. The spectral range longward of 4.1 µm (not shown here) is affected by high noise level after the subtraction of the thermal emission.
2.2. Spectral Modeling To obtain information on the abundance of the surface minerals, we used a quantita-
tive spectral analysis of the composition using Hapke’s radiative transfer model [21,22]. Similar modeling has been described by De Sanctis et al. [11], Marchi et al. [14], and Raponi et al. [31]. The whole formulation of the bidirectional reflectance (r) is:
r = (SSA/4π) µ0/(µ+ µ0) × K [BSH p (g) + H (SSA, µ/K) H (SSA, µ0/K) − 1] × S (i, e, g, θ) BCB
where i, e., g are the incidence, emission, and phase angles, respectively, and µ0, µ are the cosines of the incidence and emission angles. These parameters come from the shape model and position of the spacecraft at the time of observation. The parameters that con-tain most of the spectral information are the single scattering albedo (SSA), and the related Ambartsumian–Chandrasekhar functions H (SSA, µ/K), which describe the multiple scat-tering components. Other parameters that describe the photometric behavior as a function of the viewing geometry are: the single particle phase function p (g); the shadow hiding opposition effect BSH (g); the coherent back-scattering opposition effect BCB (g); the shadow function modeling large-scale roughness S (i, e, g, θ), with θ being the average surface slope; and the porosity parameter, K linked to the filling factor [22]. These photometric parameters are fixed after Ciarniello et al. [23], who defined the average scattering prop-erties of Ceres’ regolith. The spectral properties are mainly affected by the SSA. The latter have been modeled for intimate mixing between different minerals, which implies that
Figure 1. Average Ceres spectrum. The VIS channel (black) and IR channel (gray) have been mergedto obtain a unique spectrum. The spectral range longward of 4.1 µm (not shown here) is affected byhigh noise level after the subtraction of the thermal emission.
2.2. Spectral Modeling
To obtain information on the abundance of the surface minerals, we used a quantita-tive spectral analysis of the composition using Hapke’s radiative transfer model [21,22].Similar modeling has been described by De Sanctis et al. [11], Marchi et al. [14], andRaponi et al. [31]. The whole formulation of the bidirectional reflectance (r) is:
r = (SSA/4π) µ0/(µ+ µ0) × K [BSH p (g) + H (SSA, µ/K) H (SSA, µ0/K) − 1] × S (i, e, g, θ) BCB
where i, e, g are the incidence, emission, and phase angles, respectively, and µ0, µare the cosines of the incidence and emission angles. These parameters come from theshape model and position of the spacecraft at the time of observation. The parametersthat contain most of the spectral information are the single scattering albedo (SSA), andthe related Ambartsumian–Chandrasekhar functions H (SSA, µ/K), which describe themultiple scattering components. Other parameters that describe the photometric behavioras a function of the viewing geometry are: the single particle phase function p (g); theshadow hiding opposition effect BSH (g); the coherent back-scattering opposition effectBCB (g); the shadow function modeling large-scale roughness S (i, e, g, θ), with θ beingthe average surface slope; and the porosity parameter, K linked to the filling factor [22].These photometric parameters are fixed after Ciarniello et al. [23], who defined the averagescattering properties of Ceres’ regolith. The spectral properties are mainly affected by theSSA. The latter have been modeled for intimate mixing between different minerals, whichimplies that the particles of the endmember materials are in contact with each other andare all involved in the scattering of a single photon. The SSA of each mineral is definedstarting from their grain size and their optical constants, as described in [18]. The optical
Life 2021, 11, 9 4 of 14
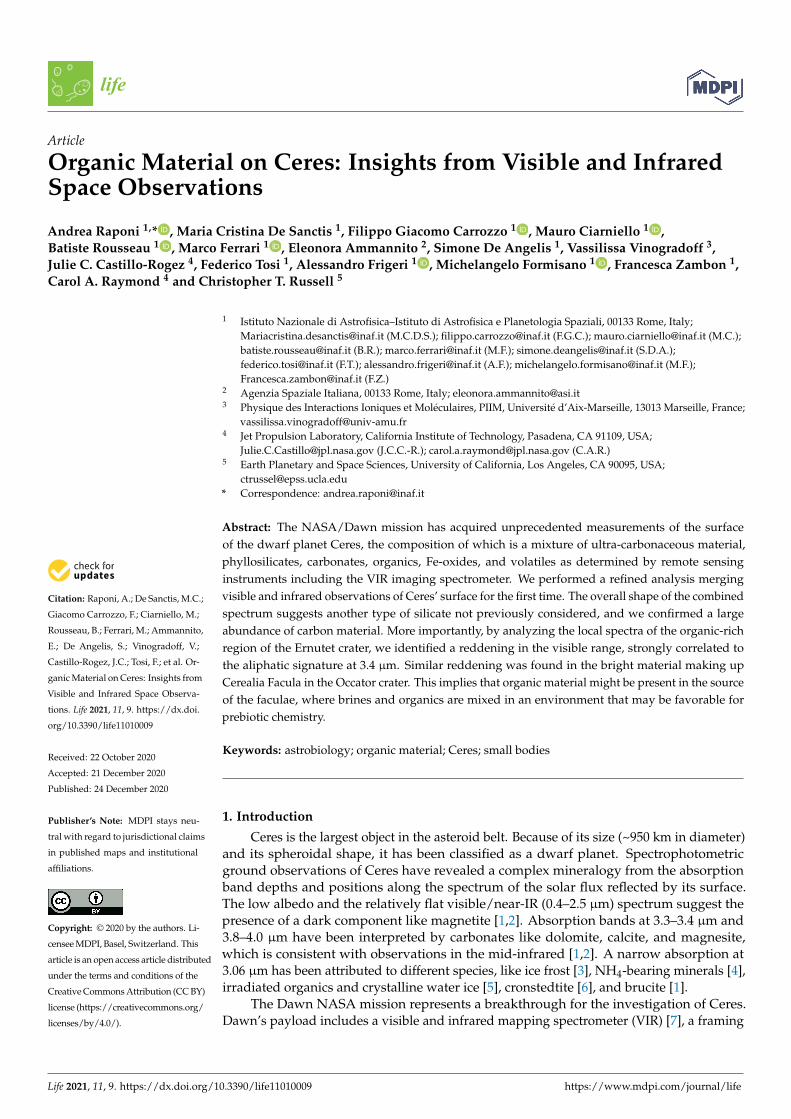
constants are derived from laboratory measurements (Table 1) with the method describedby Carli et al. [32]. The average SSA of the regolith is defined through the weight pi, whichis the cross section of all grains of the ith mineral as a fraction of the total area. To simplifythe model and minimize the number of free parameters, we assigned the same grain sizeto all endmembers. In this way, the relative cross section of each endmember is identicalto the relative volumetric abundance. The best result is obtained by comparison of themodel with the measured spectra by applying a curve-fitting procedure. The free modelparameters to be retrieved are: (i) abundance of the endmembers and the grain size, whichdefine the SSA; (ii) a multiplicative constant and additional slope to the SSA of the modelin order to account for uncertainties in the radiometric and photometric accuracies, aswell as other unknown neutral minerals making up the surface; and (iii) temperature Tand beaming function ∧ [33]. The latter is multiplied by the directional emissivity εd [22]to give the effective emissivity (εeff). The directional emissivity is a function of the SSA(wavelength-dependent) and the emission angle. The beaming function accounts for thefact that a macroscopically rough surface does not emit radiation in the same way as amacroscopically flat surface, since there are a variety of local normals across the surface [33].Interpretation of the modeled thermal emission is outside the scope of this work. The totalradiance is modeled by accounting for both the contribution of the reflected sunlight, andthe thermal emission:
Rad = r × F
Life 2021, 11, x FOR PEER REVIEW 4 of 14
the particles of the endmember materials are in contact with each other and are all in-volved in the scattering of a single photon. The SSA of each mineral is defined starting from their grain size and their optical constants, as described in [18]. The optical constants are derived from laboratory measurements (Table 1) with the method described by Carli et al. [32]. The average SSA of the regolith is defined through the weight pi, which is the cross section of all grains of the ith mineral as a fraction of the total area. To simplify the model and minimize the number of free parameters, we assigned the same grain size to all endmembers. In this way, the relative cross section of each endmember is identical to the relative volumetric abundance. The best result is obtained by comparison of the model with the measured spectra by applying a curve-fitting procedure. The free model param-eters to be retrieved are: (i) abundance of the endmembers and the grain size, which define the SSA; (ii) a multiplicative constant and additional slope to the SSA of the model in order to account for uncertainties in the radiometric and photometric accuracies, as well as other unknown neutral minerals making up the surface; and (iii) temperature T and beaming function ∧ [33]. The latter is multiplied by the directional emissivity εd [22] to give the effective emissivity (εeff). The directional emissivity is a function of the SSA (wavelength-dependent) and the emission angle. The beaming function accounts for the fact that a mac-roscopically rough surface does not emit radiation in the same way as a macroscopically flat surface, since there are a variety of local normals across the surface [33]. Interpretation of the modeled thermal emission is outside the scope of this work. The total radiance is modeled by accounting for both the contribution of the reflected sunlight, and the thermal emission:
Rad = r × Fʘ/D2 + εeff × B(λ, T)
where r is the Hapke bidirectional reflectance, Fʘ is the solar irradiance at 1 AU, D is the heliocentric distance (in AU), εeff is the effective emissivity, and B(λ, T) is the Planck func-tion. Thus, the estimation of the thermal emission is done simultaneously with the reflec-tance modeling to yield a consistent result between these two contributions to the total signal measured. Here, we show the measured spectra after the subtraction of thermal emission to isolate the contribution of the reflectance spectra.
We discarded the spectral range shortward of 0.36 µm from the analysis because it has a high level of uncertainty due to the low sensitivity of the detector, and the spectral range longward of 4.1 µm, because it is affected by a high noise level after the subtraction of the thermal emission.
The SSA was modeled starting with minerals that have already been discussed in De Sanctis et al. [11,34] (see Table 1). However, to account for the spectral shape in the VIS channel, we added the spectrum of lizardite measured by Hiroi and Zolensky [35] who heated the sample in a vacuum at 600°C to remove water contaminating the sample. Such a spectrum presents a peak close to 0.8 µm, which resembles the Ceres’ average spectrum. However, it is significantly different from the lizardite spectrum measured at ambient conditions. Along with dehydration caused by the reduction in the water absorption at 3 µm, the high temperature could have significantly dehydroxylated the sample, thus alter-ing its mineralogy and structure. The extent of this alteration deserves further investiga-tion. Here we refer to this sample as “heated lizardite”.
Table 1. Minerals considered for spectral modeling.
Mineral Type RELAB Sample ID/Reference Antigorite Mg-phyllosilicate AT-TXH-007
Heated Lizardite Mg-phyllosilicate [35] NH4-montmorillonite NH4-phyllosilicate JB-JLB-189
Dolomite Mg-Ca-Carbonate CB-EAC-003 Natrite Na-carbonate CB-EAC-034-C
Magnetite Iron oxide [36]
/D2 + εeff × B(λ, T)
where r is the Hapke bidirectional reflectance, F
Life 2021, 11, x FOR PEER REVIEW 4 of 14
the particles of the endmember materials are in contact with each other and are all in-volved in the scattering of a single photon. The SSA of each mineral is defined starting from their grain size and their optical constants, as described in [18]. The optical constants are derived from laboratory measurements (Table 1) with the method described by Carli et al. [32]. The average SSA of the regolith is defined through the weight pi, which is the cross section of all grains of the ith mineral as a fraction of the total area. To simplify the model and minimize the number of free parameters, we assigned the same grain size to all endmembers. In this way, the relative cross section of each endmember is identical to the relative volumetric abundance. The best result is obtained by comparison of the model with the measured spectra by applying a curve-fitting procedure. The free model param-eters to be retrieved are: (i) abundance of the endmembers and the grain size, which define the SSA; (ii) a multiplicative constant and additional slope to the SSA of the model in order to account for uncertainties in the radiometric and photometric accuracies, as well as other unknown neutral minerals making up the surface; and (iii) temperature T and beaming function ∧ [33]. The latter is multiplied by the directional emissivity εd [22] to give the effective emissivity (εeff). The directional emissivity is a function of the SSA (wavelength-dependent) and the emission angle. The beaming function accounts for the fact that a mac-roscopically rough surface does not emit radiation in the same way as a macroscopically flat surface, since there are a variety of local normals across the surface [33]. Interpretation of the modeled thermal emission is outside the scope of this work. The total radiance is modeled by accounting for both the contribution of the reflected sunlight, and the thermal emission:
Rad = r × Fʘ/D2 + εeff × B(λ, T)
where r is the Hapke bidirectional reflectance, Fʘ is the solar irradiance at 1 AU, D is the heliocentric distance (in AU), εeff is the effective emissivity, and B(λ, T) is the Planck func-tion. Thus, the estimation of the thermal emission is done simultaneously with the reflec-tance modeling to yield a consistent result between these two contributions to the total signal measured. Here, we show the measured spectra after the subtraction of thermal emission to isolate the contribution of the reflectance spectra.
We discarded the spectral range shortward of 0.36 µm from the analysis because it has a high level of uncertainty due to the low sensitivity of the detector, and the spectral range longward of 4.1 µm, because it is affected by a high noise level after the subtraction of the thermal emission.
The SSA was modeled starting with minerals that have already been discussed in De Sanctis et al. [11,34] (see Table 1). However, to account for the spectral shape in the VIS channel, we added the spectrum of lizardite measured by Hiroi and Zolensky [35] who heated the sample in a vacuum at 600°C to remove water contaminating the sample. Such a spectrum presents a peak close to 0.8 µm, which resembles the Ceres’ average spectrum. However, it is significantly different from the lizardite spectrum measured at ambient conditions. Along with dehydration caused by the reduction in the water absorption at 3 µm, the high temperature could have significantly dehydroxylated the sample, thus alter-ing its mineralogy and structure. The extent of this alteration deserves further investiga-tion. Here we refer to this sample as “heated lizardite”.
Table 1. Minerals considered for spectral modeling.
Mineral Type RELAB Sample ID/Reference Antigorite Mg-phyllosilicate AT-TXH-007
Heated Lizardite Mg-phyllosilicate [35] NH4-montmorillonite NH4-phyllosilicate JB-JLB-189
Dolomite Mg-Ca-Carbonate CB-EAC-003 Natrite Na-carbonate CB-EAC-034-C
Magnetite Iron oxide [36]
is the solar irradiance at 1 AU, D isthe heliocentric distance (in AU), εeff is the effective emissivity, and B(λ, T) is the Planckfunction. Thus, the estimation of the thermal emission is done simultaneously with thereflectance modeling to yield a consistent result between these two contributions to thetotal signal measured. Here, we show the measured spectra after the subtraction of thermalemission to isolate the contribution of the reflectance spectra.
We discarded the spectral range shortward of 0.36 µm from the analysis because it hasa high level of uncertainty due to the low sensitivity of the detector, and the spectral rangelongward of 4.1 µm, because it is affected by a high noise level after the subtraction of thethermal emission.
The SSA was modeled starting with minerals that have already been discussed inDe Sanctis et al. [11,34] (see Table 1). However, to account for the spectral shape in theVIS channel, we added the spectrum of lizardite measured by Hiroi and Zolensky [35]who heated the sample in a vacuum at 600 ◦C to remove water contaminating the sample.Such a spectrum presents a peak close to 0.8 µm, which resembles the Ceres’ averagespectrum. However, it is significantly different from the lizardite spectrum measuredat ambient conditions. Along with dehydration caused by the reduction in the waterabsorption at 3 µm, the high temperature could have significantly dehydroxylated thesample, thus altering its mineralogy and structure. The extent of this alteration deservesfurther investigation. Here we refer to this sample as “heated lizardite”.
Table 1. Minerals considered for spectral modeling.
Mineral Type RELAB SampleID/Reference
Antigorite Mg-phyllosilicate AT-TXH-007Heated Lizardite Mg-phyllosilicate [35]
NH4-montmorillonite NH4-phyllosilicate JB-JLB-189Dolomite Mg-Ca-Carbonate CB-EAC-003Natrite Na-carbonate CB-EAC-034-C
Magnetite Iron oxide [36]Kerite Organic material MA-ATB-043
Amorphous Carbon Organic material [37]

Life 2021, 11, 9 5 of 14
Marchi et al. [14] and Kurokawa et al. [15] found that a large fraction of the compositionof Ceres should be composed of material similar to carbonaceous chondrites (CC), whentaking into account both the IR global average spectrum and the elemental compositionfrom the GRaND measurement. In particular, [14] obtained best fits by adding the CCIvuna (CI type) or LAP (CM type) to the modeled mixtures; [15] obtained best fits usingIvuna (CI type), Tagish Lake (CM type), or Cold Bokkeveld (CM type). However, ouranalysis revealed that the above-mentioned CC cannot match both the VIS and IR regionsof the average spectrum of Ceres. Instead, we considered MAC 87300 (CM type), whichis already mentioned in [2], whose spectral shape is most similar to the Ceres’ spectrumacross the two spectral regions (Figure 2).
Life 2021, 11, x FOR PEER REVIEW 5 of 14
Kerite Organic material MA-ATB-043 Amorphous Carbon Organic material [37]
Marchi et al. [14] and Kurokawa et al. [15] found that a large fraction of the compo-sition of Ceres should be composed of material similar to carbonaceous chondrites (CC), when taking into account both the IR global average spectrum and the elemental compo-sition from the GRaND measurement. In particular, [14] obtained best fits by adding the CC Ivuna (CI type) or LAP (CM type) to the modeled mixtures; [15] obtained best fits using Ivuna (CI type), Tagish Lake (CM type), or Cold Bokkeveld (CM type). However, our analysis revealed that the above-mentioned CC cannot match both the VIS and IR regions of the average spectrum of Ceres. Instead, we considered MAC 87300 (CM type), which is already mentioned in [2], whose spectral shape is most similar to the Ceres’ spec-trum across the two spectral regions (Figure 2).
Figure 2. Average Ceres’ reflectance spectrum (black) and reflectance spectra of carbonaceous chondrites (in standard viewing geometry) used to produce the best fit with Ceres’ mineralogy and elemental composition.
The retrieved mineral abundances are listed in Table 2. Best fit and endmembers scaled for their abundances are shown in Figure 3. Elemental constraints from the GRaND measurements [12,13] (7 wt.% < C < 20 wt.%, H = 1.9 ± 0.2 wt.%, Fe = 16 ± 1 wt.%) are matched by the model (C = 16.5 wt.%, H = 1.8 wt.%, Fe = 16.5 wt.%), according to the densities and elemental compositions of the endmembers reported in [14] used to convert the abundance (vol.%) of minerals retrieved into the elemental composition (wt.%).
(a) (b)
Figure 3. Panel (a): measured (black) and modeled (red) average spectrum of Ceres in terms of I/F (r × π). Error bars indicate uncertainties on absolute calibration. The best fit including all endmembers is discussed in De Sanctis et al. [11] with the addition of heated-lizardite (see Table 1), and MAC 87,300 (see Figure 2). In panel (b), the single scattering albedo
Figure 2. Average Ceres’ reflectance spectrum (black) and reflectance spectra of carbonaceouschondrites (in standard viewing geometry) used to produce the best fit with Ceres’ mineralogy andelemental composition.
The retrieved mineral abundances are listed in Table 2. Best fit and endmembersscaled for their abundances are shown in Figure 3. Elemental constraints from the GRaNDmeasurements [12,13] (7 wt.% < C < 20 wt.%, H = 1.9 ± 0.2 wt.%, Fe = 16 ± 1 wt.%) arematched by the model (C = 16.5 wt.%, H = 1.8 wt.%, Fe = 16.5 wt.%), according to thedensities and elemental compositions of the endmembers reported in [14] used to convertthe abundance (vol.%) of minerals retrieved into the elemental composition (wt.%).
Table 2. Retrieved abundance and grain size of endmembers. In brackets the values retrieved forArea B have been reported when different from those of Area A.
Mineral Area A (Area B) Global Average
MAC 87300 56% 60%Heated Lizardite 12% 10%
Antigorite 1% 1%NH4-montmorillonite 5% 6%
Dolomite 2% 2%Natrite 1% 0%
Magnetite 1% 1%Kerite 2% 0%
Amorphous Carbon 20% 20%Grain size 270 µm 210 µm
Multiplicative factor 0.72 (0.74) 0.63Additional Slope 7.8 (7.6) 10−3 µm−1 7.8 10−3 µm−1

Life 2021, 11, 9 6 of 14
Life 2021, 11, x FOR PEER REVIEW 5 of 14
Kerite Organic material MA-ATB-043 Amorphous Carbon Organic material [37]
Marchi et al. [14] and Kurokawa et al. [15] found that a large fraction of the compo-sition of Ceres should be composed of material similar to carbonaceous chondrites (CC), when taking into account both the IR global average spectrum and the elemental compo-sition from the GRaND measurement. In particular, [14] obtained best fits by adding the CC Ivuna (CI type) or LAP (CM type) to the modeled mixtures; [15] obtained best fits using Ivuna (CI type), Tagish Lake (CM type), or Cold Bokkeveld (CM type). However, our analysis revealed that the above-mentioned CC cannot match both the VIS and IR regions of the average spectrum of Ceres. Instead, we considered MAC 87300 (CM type), which is already mentioned in [2], whose spectral shape is most similar to the Ceres’ spec-trum across the two spectral regions (Figure 2).
Figure 2. Average Ceres’ reflectance spectrum (black) and reflectance spectra of carbonaceous chondrites (in standard viewing geometry) used to produce the best fit with Ceres’ mineralogy and elemental composition.
The retrieved mineral abundances are listed in Table 2. Best fit and endmembers scaled for their abundances are shown in Figure 3. Elemental constraints from the GRaND measurements [12,13] (7 wt.% < C < 20 wt.%, H = 1.9 ± 0.2 wt.%, Fe = 16 ± 1 wt.%) are matched by the model (C = 16.5 wt.%, H = 1.8 wt.%, Fe = 16.5 wt.%), according to the densities and elemental compositions of the endmembers reported in [14] used to convert the abundance (vol.%) of minerals retrieved into the elemental composition (wt.%).
(a) (b)
Figure 3. Panel (a): measured (black) and modeled (red) average spectrum of Ceres in terms of I/F (r × π). Error bars indicate uncertainties on absolute calibration. The best fit including all endmembers is discussed in De Sanctis et al. [11] with the addition of heated-lizardite (see Table 1), and MAC 87,300 (see Figure 2). In panel (b), the single scattering albedo
Figure 3. Panel (a): measured (black) and modeled (red) average spectrum of Ceres in terms of I/F (r × π). Error barsindicate uncertainties on absolute calibration. The best fit including all endmembers is discussed in De Sanctis et al. [11]with the addition of heated-lizardite (see Table 1), and MAC 87,300 (see Figure 2). In panel (b), the single scattering albedo(SSA) of each endmember scaled for their respective relative abundance: MAC 87300 (orange), NH4-montmorillonite (darkgreen), heated lizardite (red), amorphous carbon (blue), dolomite (cyan), antigorite (purple), magnetite (pickle green).
The need for a multiplicative factor and an additional slope (see Table 2) wouldsuggest the presence of additional and/or different endmembers with respect to thoseassumed: the observed spectrum is darker and redder than the model derived from theendmembers listed in Table 1. However, unknown endmembers should be featureless inthe spectral range considered. On the other hand, this discrepancy could also be explainedby the effect of space weathering [38].
3. Organic-Rich Region3.1. Data Reduction
Close to the Ernutet crater (53.4 km diameter, at latitude ~53◦ N, longitude 45.5◦ E),a region of ~1000 km2 exhibits a prominent and complex 3.4-µm band, composed of sev-eral bands: near 3.38–3.39 µm, 3.40–3.42 µm, and 3.49–3.50 µm. These spectral featuresare characteristic of the symmetric and antisymmetric stretching frequencies of methyl(CH3) and methylene (CH2). The main candidates for these bands are organic materialscontaining aliphatic hydrocarbons [18,39], probably with some aromatic hydrocarbons andheteroatoms [34]. Mapping the band depth at 3.4 µm [18,34], the organic material is foundmainly in two broad areas: one close to the northwestern portion of the crater, and onelocated on the southwestern part. Here, we produced two average spectra considering rect-angular portions of these two regions (A and B, respectively), delimited by the coordinatesshown in Table 3 (Figure 4). Moreover, we accounted for a test area outside the organic-richregions to rule out any possible instrumental effects that may affect the specific data wecollected for the analysis of the organic-rich areas (Figure 4). We accounted for acquisitionsin the VIS and IR channel performed simultaneously, which covered the whole area ofinterest (spacecraft event time: 487085891). For each area, the average spectra obtainedfrom data from the VIS and IR channels were merged to obtain a single spectrum from 0.25to 5.0 µm.
Table 3. Range of coordinates of two rectangular areas inside the organic-rich regions, and a test area.The number of spatial pixels inside the areas used to perform the average spectra is provided.
Area Lon (◦) Lat (◦) N. Pixel VIS N. Pixel IR
A 39.0–41.5 54.5–56. 22 22B 40.0–44.0 48.5–52.5 184 180
Test 42.5–44.0 60.5–62.0 127 145

Life 2021, 11, 9 7 of 14Life 2021, 11, x FOR PEER REVIEW 7 of 14
Figure 4. Map of organics’ abundance reported from Raponi et al. [31], projected over a Framing Camera mosaic. The organic-rich areas A and B, and the test area have been marked. Coordinates of the areas are shown in Table 3.
Differences between the spectra of the organic-rich areas (A and B) and the test area with respect to the average Ceres spectrum, were highlighted by their normalization (Fig-ure 5). A distinct signature of aliphatic organics is visible at 3.4 microns. Moreover, the absorption at 4 µm shows a larger abundance of carbonates in the organic-rich regions. Such results have already been discussed in [31]. The spectrum of the test area does not present any relevant differences with respect to the average global spectrum, except a slope that is slightly bluer in the visible spectral range. This average test area also samples the typical background over which organic-rich regions stand. As a result, an unusual positive slope (redder) with respect to the global spectrum appears in the visible part of the organic-rich spectra, even more so if we consider the test area spectrum as back-ground. This confirms the previous analysis performed with framing camera data [40]. To interpret this spectral reddening, we performed spectral modeling (Section 3.2), and checked for spatial correlations of the organics with other endmembers (Section 3.3).
(a) (b)
Figure 5. Panel (a): Average spectra of area A (blue), B (red) and the test area (green). For comparison, shown is the average Ceres spectrum (black). Panel (b): same spectra of panel (a) in the VIS range, normalized at 0.8 micron.
Figure 4. Map of organics’ abundance reported from Raponi et al. [31], projected over a FramingCamera mosaic. The organic-rich areas A and B, and the test area have been marked. Coordinates ofthe areas are shown in Table 3.
Differences between the spectra of the organic-rich areas (A and B) and the test areawith respect to the average Ceres spectrum, were highlighted by their normalization(Figure 5). A distinct signature of aliphatic organics is visible at 3.4 microns. Moreover,the absorption at 4 µm shows a larger abundance of carbonates in the organic-rich regions.Such results have already been discussed in [31]. The spectrum of the test area does notpresent any relevant differences with respect to the average global spectrum, except aslope that is slightly bluer in the visible spectral range. This average test area also samplesthe typical background over which organic-rich regions stand. As a result, an unusualpositive slope (redder) with respect to the global spectrum appears in the visible part ofthe organic-rich spectra, even more so if we consider the test area spectrum as background.This confirms the previous analysis performed with framing camera data [40]. To interpretthis spectral reddening, we performed spectral modeling (Section 3.2), and checked forspatial correlations of the organics with other endmembers (Section 3.3).
Life 2021, 11, x FOR PEER REVIEW 7 of 14
Figure 4. Map of organics’ abundance reported from Raponi et al. [31], projected over a Framing Camera mosaic. The organic-rich areas A and B, and the test area have been marked. Coordinates of the areas are shown in Table 3.
Differences between the spectra of the organic-rich areas (A and B) and the test area with respect to the average Ceres spectrum, were highlighted by their normalization (Fig-ure 5). A distinct signature of aliphatic organics is visible at 3.4 microns. Moreover, the absorption at 4 µm shows a larger abundance of carbonates in the organic-rich regions. Such results have already been discussed in [31]. The spectrum of the test area does not present any relevant differences with respect to the average global spectrum, except a slope that is slightly bluer in the visible spectral range. This average test area also samples the typical background over which organic-rich regions stand. As a result, an unusual positive slope (redder) with respect to the global spectrum appears in the visible part of the organic-rich spectra, even more so if we consider the test area spectrum as back-ground. This confirms the previous analysis performed with framing camera data [40]. To interpret this spectral reddening, we performed spectral modeling (Section 3.2), and checked for spatial correlations of the organics with other endmembers (Section 3.3).
(a) (b)
Figure 5. Panel (a): Average spectra of area A (blue), B (red) and the test area (green). For comparison, shown is the average Ceres spectrum (black). Panel (b): same spectra of panel (a) in the VIS range, normalized at 0.8 micron.
Figure 5. Panel (a): Average spectra of area A (blue), B (red) and the test area (green). For comparison, shown is the averageCeres spectrum (black). Panel (b): same spectra of panel (a) in the VIS range, normalized at 0.8 micron.
3.2. Spectral Modeling
We performed spectral modeling following the approach in Section 2.2, using anintimate mixture of the endmembers listed in Table 1.

Life 2021, 11, 9 8 of 14
Spectral fits of the two organic-rich areas are shown in Figure 6. Retrieved abundancesand grain size are listed in Table 2. The results are very similar to those discussed in [31],except for the larger content of Mg-phyllosilicates due to the novel introduction of theheated lizardite to match the visible spectral range: the lower depth of the absorption bandat 2.7 µm in the spectrum of lizardite with respect to antigorite is compensated by its largerabundance.
Life 2021, 11, x FOR PEER REVIEW 8 of 14
3.2. Spectral Modeling We performed spectral modeling following the approach in Section 2.2, using an in-
timate mixture of the endmembers listed in Table 1. Spectral fits of the two organic-rich areas are shown in Figure 6. Retrieved abun-
dances and grain size are listed in Table 2. The results are very similar to those discussed in [31], except for the larger content of Mg-phyllosilicates due to the novel introduction of the heated lizardite to match the visible spectral range: the lower depth of the absorption band at 2.7 µm in the spectrum of lizardite with respect to antigorite is compensated by its larger abundance.
(a) (b)
Figure 6. Panels (a): measured (black) and modeled (red) average spectrum of Ceres in terms of I/F (r x π) of the organic-rich spectra from area A and area B, respectively. Error bars indicate calibration uncertainties. In panel (b), the relative SSA of each endmember scaled for their respective abundance (relative cross section): MAC 87300 (orange), NH4-mont-morillonite (dark green), heated lizardite (red), amorphous carbon (blue), dolomite (cyan), antigorite (purple), natrite (light green), magnetite (pickle green), kerite (black).
As in the case of the global spectrum, a further multiplicative constant and an addi-tional slope are needed to correctly fit the spectra (Table 2).
3.3. Spatial Correlations To attribute the changing slope (Figure 5b) to mineral or organic material requires a
comparison of the spatial distribution of the slope in the VIS range with the spatial distri-bution of compounds. The slope is calculated following Rousseau et al. [17]:
S0.48–0.80µm = [r (0.80 µm) − r (0.48 µm)]/[r (0.48 µm) (λ0.80µm − λ0.48µm)] Being: r (0.80 µm) the median of the reflectance over the range 0.75–0.85 µm (~50
band of the VIS channel), and r (0.48 µm) the median of the reflectance over the range 0.43–0.53 µm (~50 band of the VIS channel).
The mapped abundances of minerals have been reported by Raponi et al. [31], who used the same spectral modeling discussed in Section 2.2, but considering only the IR channel. Thus, the S0.48–0.80µm and the mineral abundances came from two independent da-tasets.
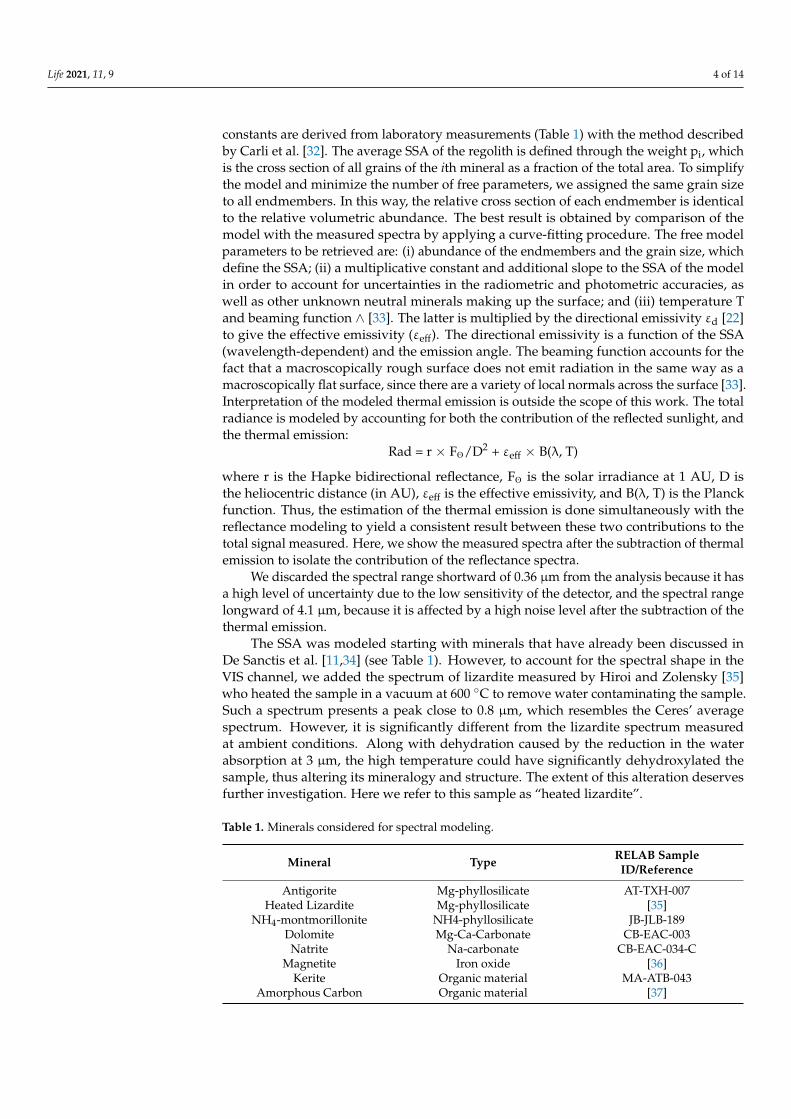
Comparison of panel (a) and (b) of Figure 7 reveals a spatial correlation between the S0.48–0.80µm and the abundance of organic matter. We also note that other minerals do not present the same degree of spatial correlation. In particular, carbonates are only more abundant in the southern area (B), and Mg-phyllosilicates are mostly anticorrelated. No spatial correlation can be noted for the other minerals (see [31]).
Figure 6. Panels (a): measured (black) and modeled (red) average spectrum of Ceres in terms of I/F (r x π) of the organic-richspectra from area A and area B, respectively. Error bars indicate calibration uncertainties. In panel (b), the relative SSA ofeach endmember scaled for their respective abundance (relative cross section): MAC 87300 (orange), NH4-montmorillonite(dark green), heated lizardite (red), amorphous carbon (blue), dolomite (cyan), antigorite (purple), natrite (light green),magnetite (pickle green), kerite (black).
As in the case of the global spectrum, a further multiplicative constant and an addi-tional slope are needed to correctly fit the spectra (Table 2).
3.3. Spatial Correlations
To attribute the changing slope (Figure 5b) to mineral or organic material requiresa comparison of the spatial distribution of the slope in the VIS range with the spatialdistribution of compounds. The slope is calculated following Rousseau et al. [17]:
S0.48-0.80µm = [r (0.80 µm) − r (0.48 µm)]/[r (0.48 µm) (λ0.80µm − λ0.48µm)]
Being: r (0.80 µm) the median of the reflectance over the range 0.75–0.85 µm (~50band of the VIS channel), and r (0.48 µm) the median of the reflectance over the range0.43–0.53 µm (~50 band of the VIS channel).
The mapped abundances of minerals have been reported by Raponi et al. [31], who usedthe same spectral modeling discussed in Section 2.2, but considering only the IR channel.Thus, the S0.48–0.80µm and the mineral abundances came from two independent datasets.
Comparison of panel (a) and (b) of Figure 7 reveals a spatial correlation betweenthe S0.48–0.80µm and the abundance of organic matter. We also note that other mineralsdo not present the same degree of spatial correlation. In particular, carbonates are onlymore abundant in the southern area (B), and Mg-phyllosilicates are mostly anticorrelated.No spatial correlation can be noted for the other minerals (see [31]).
Life 2021, 11, 9 9 of 14Life 2021, 11, x FOR PEER REVIEW 9 of 14
(a) (b)
(c) (d)
Figure 7. (Panel a): projected slope in the range 0.48–0.80 µm. Stripes visible on the maps are artifacts due to the low spatial resolution of the data considered. For comparison, the retrieved abundance of organics (panel b), carbonates (panel c), and Mg-phyllosilicates (panel d) reported from [31].
3.4. Cerealia Facula The most outstanding geological features on Ceres’ surface are the bright areas
known as the Ceralia and Vinalia Faculae in the geologically young Occator crater (15.8–24.9° N, 234.3–244.7° E, diameter ~90 km). The faculae have an albedo 5–10 times higher than the average surface [23], with Cerealia Facula being the brightest at the center of the crater. These faculae show distinct spectral differences from the typical crater floor. Ab-sorption at ~3.5 µm and ~4 µm increase toward the brightest areas and are consistent with enrichment in carbonates. A shift of the carbonate band center from 3.95 to 4.01 µm indi-cates a change in the mineralogy from Mg-carbonate to Na-Carbonate [41]. A complex absorption at 2.20–2.22 µm is observed only in the brightest areas. Raponi et al. [42] have shown that ammonium salts, and more specifically ammonium chloride (NH4Cl), provide the best match with this spectral feature. The overall band area between 2.6 µm and 3.7 µm increases from the crater floor to the brightest pixels, and several minima at 2.88, 3.2, 3.28, 3.38, and 3.49 µm emerge and become deeper, revealing the presence of hydrohalite [19]. Moreover, according to spectral modeling, aliphatic carbons, and aromatic hydrocar-bons may be present in a small percentage [19].
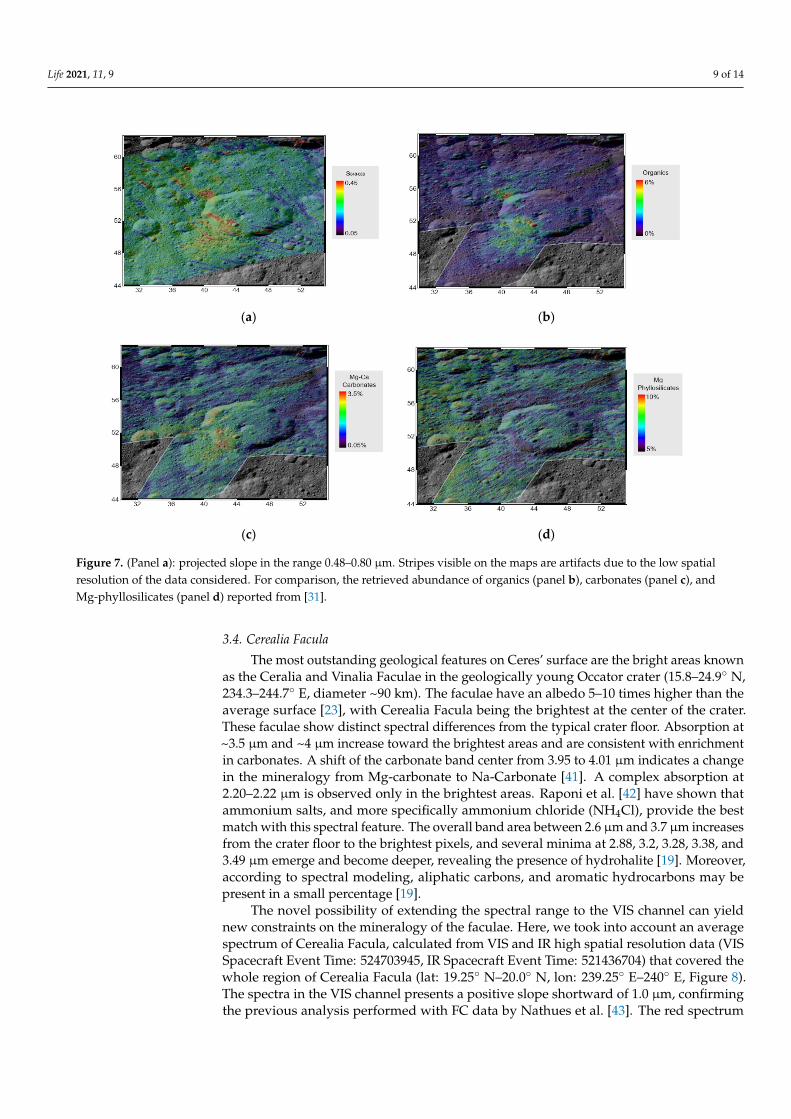
The novel possibility of extending the spectral range to the VIS channel can yield new constraints on the mineralogy of the faculae. Here, we took into account an average spec-trum of Cerealia Facula, calculated from VIS and IR high spatial resolution data (VIS Spacecraft Event Time: 524703945, IR Spacecraft Event Time: 521436704) that covered the whole region of Cerealia Facula (lat: 19.25° N–20.0° N, lon: 239.25° E–240° E, Figure 8). The spectra in the VIS channel presents a positive slope shortward of 1.0 µm, confirming the previous analysis performed with FC data by Nathues et al. [43]. The red spectrum
Figure 7. (Panel a): projected slope in the range 0.48–0.80 µm. Stripes visible on the maps are artifacts due to the low spatialresolution of the data considered. For comparison, the retrieved abundance of organics (panel b), carbonates (panel c), andMg-phyllosilicates (panel d) reported from [31].
3.4. Cerealia Facula
The most outstanding geological features on Ceres’ surface are the bright areas knownas the Ceralia and Vinalia Faculae in the geologically young Occator crater (15.8–24.9◦ N,234.3–244.7◦ E, diameter ~90 km). The faculae have an albedo 5–10 times higher than theaverage surface [23], with Cerealia Facula being the brightest at the center of the crater.These faculae show distinct spectral differences from the typical crater floor. Absorption at~3.5 µm and ~4 µm increase toward the brightest areas and are consistent with enrichmentin carbonates. A shift of the carbonate band center from 3.95 to 4.01 µm indicates a changein the mineralogy from Mg-carbonate to Na-Carbonate [41]. A complex absorption at2.20–2.22 µm is observed only in the brightest areas. Raponi et al. [42] have shown thatammonium salts, and more specifically ammonium chloride (NH4Cl), provide the bestmatch with this spectral feature. The overall band area between 2.6 µm and 3.7 µm increasesfrom the crater floor to the brightest pixels, and several minima at 2.88, 3.2, 3.28, 3.38, and3.49 µm emerge and become deeper, revealing the presence of hydrohalite [19]. Moreover,according to spectral modeling, aliphatic carbons, and aromatic hydrocarbons may bepresent in a small percentage [19].
The novel possibility of extending the spectral range to the VIS channel can yieldnew constraints on the mineralogy of the faculae. Here, we took into account an averagespectrum of Cerealia Facula, calculated from VIS and IR high spatial resolution data (VISSpacecraft Event Time: 524703945, IR Spacecraft Event Time: 521436704) that covered thewhole region of Cerealia Facula (lat: 19.25◦ N–20.0◦ N, lon: 239.25◦ E–240◦ E, Figure 8).The spectra in the VIS channel presents a positive slope shortward of 1.0 µm, confirmingthe previous analysis performed with FC data by Nathues et al. [43]. The red spectrum

Life 2021, 11, 9 10 of 14
detected in the VIS range is similar to those observed in the organic-rich spectra comingfrom the Ernutet regions discussed above (Figure 9).
Life 2021, 11, x FOR PEER REVIEW 10 of 14
detected in the VIS range is similar to those observed in the organic-rich spectra coming from the Ernutet regions discussed above (Figure 9).
Figure 8. Image of Cerealia Facula obtained by combining framing camera images acquired during LAMO phase with three images using spectral filters centered at 438, 550, and 965 nm. VIR pixel footprints inside the red rectangle (lat: 19.25° N–20.0° N, lon: 239.25° E–240° E) were averaged to obtain the reflectance spectrum [39].
(a) (b)
Figure 9. Panel (a): Cerealia Facula average I/F spectrum’s VIS and IR channels (gray) were merged to obtain a single spectrum. Spectral range longward of 4.1 µm (not shown here) is affected by a high noise level after the subtraction of the thermal emission. Panel (b): focus on the visible spectral range; the spectrum of Cerealia Facula, the global Ceres spectrum, and the organic rich regions (Area A and B) were normalized at 0.8 µm.
4. Discussion 4.1. Ceres Average Spectrum
The analysis of the average global spectrum of Ceres performed in this study con-firms the previous results of Marchi et al. [14], who combined mineralogy (from VIR data) and elemental composition (from GRaND data) to derive Ceres’ average surface compo-sition: the large abundance of carbon, which exceeds that of carbonaceous chondrites, found on a volatile-rich body implies that widespread organic chemistry could have oc-curred on Ceres.
The analysis of the average spectrum of Ceres was extended here to the visible part of the spectrum, taking into account the VIS channel of the VIR instrument, which is now
Figure 8. Image of Cerealia Facula obtained by combining framing camera images acquired duringLAMO phase with three images using spectral filters centered at 438, 550, and 965 nm. VIR pixelfootprints inside the red rectangle (lat: 19.25◦ N–20.0◦ N, lon: 239.25◦ E–240◦ E) were averaged toobtain the reflectance spectrum [39].
Life 2021, 11, x FOR PEER REVIEW 10 of 14
detected in the VIS range is similar to those observed in the organic-rich spectra coming from the Ernutet regions discussed above (Figure 9).
Figure 8. Image of Cerealia Facula obtained by combining framing camera images acquired during LAMO phase with three images using spectral filters centered at 438, 550, and 965 nm. VIR pixel footprints inside the red rectangle (lat: 19.25° N–20.0° N, lon: 239.25° E–240° E) were averaged to obtain the reflectance spectrum [39].
(a) (b)
Figure 9. Panel (a): Cerealia Facula average I/F spectrum’s VIS and IR channels (gray) were merged to obtain a single spectrum. Spectral range longward of 4.1 µm (not shown here) is affected by a high noise level after the subtraction of the thermal emission. Panel (b): focus on the visible spectral range; the spectrum of Cerealia Facula, the global Ceres spectrum, and the organic rich regions (Area A and B) were normalized at 0.8 µm.
4. Discussion 4.1. Ceres Average Spectrum
The analysis of the average global spectrum of Ceres performed in this study con-firms the previous results of Marchi et al. [14], who combined mineralogy (from VIR data) and elemental composition (from GRaND data) to derive Ceres’ average surface compo-sition: the large abundance of carbon, which exceeds that of carbonaceous chondrites, found on a volatile-rich body implies that widespread organic chemistry could have oc-curred on Ceres.
The analysis of the average spectrum of Ceres was extended here to the visible part of the spectrum, taking into account the VIS channel of the VIR instrument, which is now
Figure 9. Panel (a): Cerealia Facula average I/F spectrum’s VIS and IR channels (gray) were merged to obtain a singlespectrum. Spectral range longward of 4.1 µm (not shown here) is affected by a high noise level after the subtraction of thethermal emission. Panel (b): focus on the visible spectral range; the spectrum of Cerealia Facula, the global Ceres spectrum,and the organic rich regions (Area A and B) were normalized at 0.8 µm.
4. Discussion4.1. Ceres Average Spectrum
The analysis of the average global spectrum of Ceres performed in this study confirmsthe previous results of Marchi et al. [14], who combined mineralogy (from VIR data) andelemental composition (from GRaND data) to derive Ceres’ average surface composition:the large abundance of carbon, which exceeds that of carbonaceous chondrites, foundon a volatile-rich body implies that widespread organic chemistry could have occurredon Ceres.
The analysis of the average spectrum of Ceres was extended here to the visible partof the spectrum, taking into account the VIS channel of the VIR instrument, which is
Life 2021, 11, 9 11 of 14
now available after the setup of the calibration for that channel [16]. The overall shape ofCeres’ spectrum implies that an additional mineral is needed on top of those suggested inDe Sanctis et al. [11] and Marchi et al. [14] in order to match the spectral shape in the range0.3–1.0 µm. Here, we suggested the heated lizardite of Hiroi and Zolensky [35] as a possibleanalog. Lizardite, like antigorite, is a polymorph of serpentine; however, heating at 600 ◦Ccan lead to partial dihydroxylation and structural change, and thus to one or more differentsilicates. The fit with those thermally processed silicates does not necessarily imply thatCeres’ surface experienced similar temperatures. Instead, it is possible that these silicatesare of primary origin, i.e., they were accreted from planetesimals that were thermallyprocessed. Further laboratory measurements are needed to investigate the properties ofthis silicate, whose applicability to Ceres, if confirmed, would bring new constraints onCeres’ origin. Moreover, the need for a different carbonaceous chondrite (MAC 87300)than those considered in previous works [14,15], requires further analysis to explain whichspecific mineral phases determine its spectral shape and match with Ceres’ spectra.
The spectral modeling presented in this study requires an additional slope and amultiplicative constant, which reddens and darkens the spectrum, respectively, in order tomatch the observed average spectrum of Ceres. This would compensate for the possiblerole of space weathering [39].
4.2. Ernutet Organic-Rich Region
The introduction of the VIS channel data provided new possibilities for refining themodeled composition of the organic rich regions in the Ernutet crater area. Our estimatesof organic abundance do not differ significantly from the analysis of De Sanctis et al. [18,34]and Raponi et al. [31]. We point out that the amount of organic material retrieved is stronglydependent on the type of organic that is used for spectral modeling. The limit is repre-sented by the absorption depth of the laboratory spectrum, which cannot be less than theabsorption depth measured on Ceres’ surface. Hence, considering different endmembersto match the organic signatures could lead to much larger abundance estimates, e.g., areasmatched with 6% of kerite (Figure 7b) would instead require 25% of shocked asphaltite (AS-LXM-004, RELAB) [34]. The retrieved abundance can be even larger (45%–65%) if samplesof insoluble organic matter extracted from carbonaceous chondrites are assumed [44]: theless pronounced band at 3.4 µm of the laboratory samples can be compensated by a largerabundance retrieved from the spectral fit. However, we found that kerite provides the bestfit with data, both for the shape of the absorption at 3.4 µm and the degree of redness [39].
A significant finding obtained from the VIS channel analysis is the detection of anunusual red slope in the VIS range, which has a strong spatial correlation with aliphaticorganic abundance. This correlation suggests that this slope is produced by the sameorganic compound that produces the aliphatic stretching at 3.4 µm, or by a differentcompound that is closely linked to organics in their formation, conservation, and/ortransportation on the surface.
4.3. Cerealia Facula
Sodium salts (NaCl, NaHCO3, Na2CO3, NaCl·H2O) identified on Cerealia Faculahave also been detected in Enceladus’ plume, suggesting they are sourced from a similaralkaline environment. Furthermore, the presence of hydrated/hydroxylated salts indi-cates recent exposure of brines, as these compounds are not stable on Ceres’ surface [19].The current occurrence of brines in Ceres attests to the presence of liquid throughout Ceres’history. As with Enceladus, one expects that organic chemistry could have been ongoing inCeres [45,46].
The addition of the visible spectral range to the average spectrum of Cerealia Faculaadds new constraints on its mineralogy. Here, we highlighted a red slope shortward of1.0 µm that appears very similar to the absorption over the same wavelength range detectedin the Ernutet organic-rich regions. This similarity strongly suggests the presence of organicmaterial in the faculae material, as already suggested by De Sanctis et al. [19]. However,

Life 2021, 11, 9 12 of 14
the red slope of the facula with respect the average Ceres terrain could also be attributedto other physical properties of the material, such as different particle size, and/or spaceweather acting differently with respect to the rest of the surface because of its recent ageand unique mineralogy [38].
5. Conclusions
Based on the amount of data returned by the NASA/Dawn spacecraft and its scientificpayload, Ceres is now recognized as a target of astrobiological significance. In particular,Ceres is one of the few bodies where abundant water and organic matter have been found.Here, we reported further indications of an environment in Ceres that is favorable toprebiotic chemistry during the course of its history, and potentially, at present.
The analysis presented here may open new avenues of investigation on Ceres’ miner-alogy, in particular, the attribution of the red slope in the VIS range to organic matter andthe nature of the silicates that make up most of Ceres’ regolith (together with the carboncomponent). Indeed, phyllosilicates can protect organics from space weathering effectsbecause they efficiently absorb organic molecules [47,48]. Moreover, detailed spectralmodeling (including the visible range) of the bright material making up the faculae wouldbe desirable in order to improve our knowledge of this hydrated salt-rich mixture and forthe information it provides on Ceres’ brine environment. The prospect that organic mattermay be present in brines for extended periods of time further supports the value of Ceresas a target of astrobiological significance and calls for follow-up exploration.
Author Contributions: Conceptualization, A.R. and M.C.D.S.; methodology, A.R.; software, A.R.;resources, C.T.R., C.A.R. and M.C.D.S.; data curation, A.R., B.R., M.C., F.T., F.G.C. and F.Z.; writing—original draft preparation, A.R.; writing—review and editing, A.R., M.C.D.S., F.G.C., M.C., B.R., M.F.(Marco Ferrari), E.A., S.D.A., V.V., J.C.C.-R., F.T., A.F., M.F. (Michelangelo Formisano), F.Z., C.A.R. andC.T.R.; visualization, A.R. and F.G.C.; supervision, M.C.D.S.; project administration, C.T.R., C.A.R.and M.C.D.S.; funding acquisition, C.T.R., C.A.R. and M.C.D.S. All authors have read and agreed tothe published version of the manuscript.
Funding: The VIR is funded by the Italian Space Agency-ASI and was developed under the leadershipof INAF-Istituto di Astrofisica e Planetologia Spaziali, Rome-Italy. The instrument was built by Selex-Galileo, Florence-Italy. The authors acknowledge the support of the Dawn Science, Instrument, andOperations Teams. This work was supported by ASI-INAF n. I/004/12/0 and NASA.
Conflicts of Interest: The authors declare no conflict of interest.
References1. Milliken, R.E.; Rivkin, A.S. Brucite and carbonate assemblages from altered olivine-rich materials on Ceres. Nat. Geosci. 2009, 2,
258–261. [CrossRef]2. Rivkin, A.S.; Li, J.-Y.; Milliken, R.E.; Lim, L.F.; Lovell, A.J.; Schmidt, B.E.; McFadden, L.A.; Cohen, B.A. The Surface Composition
of Ceres. Space Sci. Rev. 2011, 163, 95–116. [CrossRef]3. Lebofsky, L.; Feierberg, M.; Tokunaga, A.; Larson, H.; Johnson, J. The 1.7–4.2 µm spectrum of asteroid 1 Ceres: Evidence for
structural water in clay minerals. Icarus 1981, 48, 453–459. [CrossRef]4. King, T.; Clark, R.; Calvin, W.; Sherman, D.; Brown, R. Evidence for ammonium bearing minerals on Ceres. Science 1992, 255,
1551–1553. [CrossRef] [PubMed]5. Vernazza, P.; Mothé-Diniz, T.; Barucci, M.A.; Birlan, M.; Carvano, J.M.; Strazzulla, G.; Fulchignoni, M.; Migliorini, A. Analysis of
near-IR spectra of 1 Ceres and 4 Vesta, targets of the Dawn mission. Astron. Astrophys. 2005, 436, 1113–1121. [CrossRef]6. Rivkin, A.S.; Volquardsen, E.L.; Clark, B.E. The surface composition of Ceres: Discovery of carbonates and iron-rich clays. Icarus
2006, 185, 563–567. [CrossRef]7. De Sanctis, M.C.; Coradini, A.; Ammannito, E.; Filacchione, G.; Capria, M.T.; Fonte, S.; Magni, G.; Barbis, A.; Bini, A.; The VIR
Team; et al. The VIR spectrometer. Space Sci. Rev. 2011, 163, 329–369. [CrossRef]8. Sierks, H.; Keller, H.U.; Jaumann, R.; Michalik, H.; Behnke, T.; Bubenhagen, F.; Büttner, I.; Carsenty, U.; Christensen, U.; Enge, R.;
et al. The dawn framing camera. Space Sci. Rev. 2011, 163, 263–327. [CrossRef]9. Prettyman, T.H.; Feldman, W.C.; McSween, H.Y.; Dingler, R.D.; Enemark Donald, C.; Patrick, D.E.; Storms, S.A.; Hendricks, J.S.;
Morgenthaler, J.P.; Pitman, K.M.; et al. Dawn’s gamma ray and neutron detector. Space Sci. Rev. 2011, 163, 371–459. [CrossRef]10. Usui, F.; Hasegawa, S.; Ootsubo, T.; Onaka, T. AKARI/IRC near-infrared asteroid spectroscopic survey: AcuA-spec. Publ. Astron.
Soc. Jpn. 2019, 71, 1. [CrossRef]

Life 2021, 11, 9 13 of 14
11. De Sanctis, M.C.; Ammannito, E.; Raponi, A.; Marchi, S.; McCord, T.B.; McSween, H.Y.; Capaccioni, F.; Capria, M.T.; Carrozzo, F.G.;Ciarniello, M.; et al. Ammoniated phyllosilicates with a likely outer Solar System origin on (1) Ceres. Nature 2015, 528, 241–244.[CrossRef] [PubMed]
12. Prettyman, T.H.; Yamashita, N.; Toplis, M.J.; McSween, H.Y.; Schörghofer, N.; Marchi, S.; Feldman, W.C.; Castillo-Rogez, J.;Forni, O.; Lawrence, D.J.; et al. Extensive water ice within Ceres’ aqueously altered regolith: Evidence from nuclear spectroscopy.Science 2017, 355, 55–59. [CrossRef]
13. Prettyman, T.H.; Yamashita, N.; Ammannito, E.; Castillo-Rogez, J.C.; Ehlmann, B.L.; McSween, H.Y.; Marchi, S.; Pieters, C.M.;Schorghofer, N.; Toplis, M.J.; et al. Carbon on Ceres: Implications for Origins and Interior Evolution. In Proceedings of the 49thLunar and Planetary Science Conference, Woodlands, TX, USA, 19–23 March 2018. Contribution No. 2083, ID 1151.
14. Marchi, S.; Raponi, A.; Prettyman, T.H.; De Sanctis, M.C.; Castillo-Rogez, J.; Raymond, C.A.; Ammannito, E.; Bowling, T.;Ciarniello, M.; Kaplan, H.; et al. An aqueously altered carbon-rich Ceres. Nat. Astron. 2019, 3, 140–145. [CrossRef]
15. Kurokawa, H.; Ehlmann, B.L.; De Sanctis, M.C.; Lapôtre, M.G.A.; Usui, T.; Stein, N.T.; Prettyman, T.H.; Raponi, A.; Ciarniello, M.A probabilistic approach to determination of Ceres’ average surface composition from Dawn VIR and GRaND data. J. Geophys.Res. Planets 2020, e2020JE006606. [CrossRef]
16. Rousseau, B.; Raponi, A.; Ciarniello, M.; Ammannito, E.; Carrozzo, F.G.; De Sanctis, M.C.; Fonte, S.; Frigeri, A.; Tosi, F. Correctionof the VIR-visible data set from the Dawn mission. Rev. Sci. Instrum. 2019, 90, 123110. [CrossRef]
17. Rousseau, B.; de Sanctis, M.C.; Raponi, A.; Ciarniello, M.; Ammannito, E.; Frigeri, A.; Ferrari, M.; de Angelis, S.; Carrozzo, F.C.;Tosi, F.; et al. The surface of (1) Ceres in visible light as seen by the Dawn/VIR. Astron. Astrophys. 2020, 642, A74. [CrossRef]
18. De Sanctis, M.C.; Ammannito, E.; McSween, H.Y.; Raponi, A.; Marchi, S.; Capaccioni, F.; Capria, M.T.; Carrozzo, F.G.; Ciarniello,M.; Fonte, S.; et al. Localized aliphatic organic material on the surface of Ceres. Science 2017, 355, 719–722. [CrossRef]
19. De Sanctis, M.C.; Ammannito, E.; Raponi, A.; Frigeri, A.; Ferrari, M.; Carrozzo, F.G.; Ciarniello, M.; Formisano, M.; Rousseau, B.;Tosi, F.; et al. Fresh emplacement of hydrated sodium chloride on Ceres from ascending salty fluids. Nat. Astron. 2020, 4, 786–793.[CrossRef]
20. Carrozzo, F.G.; Raponi, A.; De Sanctis, M.C.; Ammannito, E.; Giardino, M.; D’Aversa, E.; Fonte, S.; Tosi, F. Artifacts reduction inVIR/Dawn data. Rev. Sci. Instrum. 2016, 87, 124501. [CrossRef]
21. Hapke, B. Theory of Reflectance and Emittance Spectroscopy; Cambridge University Press: Cambridge, UK, 1993.22. Hapke, B. Theory of Reflectance and Emittance Spectroscopy, 2nd ed.; Cambridge University Press: Cambridge, UK, 2012.23. Ciarniello, M.; De Sanctis, M.C.; Ammannito, E.; Raponi, A.; Longobardo, A.; Palomba, E.; Carrozzo, F.G.; Tosi, F.; Li, J.-Y.;
Schröder, S.E.; et al. Spectrophotometric properties of dwarf planet Ceres from the VIR spectrometer on board the Dawn mission.Astron. Astrophys. 2017, 598, A130. [CrossRef]
24. Chapman, C.R.; Gaffey, M.J. Reflectance Spectra for 277 Asteroids; Asteroids. (A80-24551 08-91); University of Arizona Press: Tucson,AZ, USA, 1979; pp. 655–687.
25. Roettger, E.; Buratti, B. Ultraviolet Spectra and Geometric Albedos of 45 Asteroids. Icarus 1994, 112, 496. [CrossRef]26. Parker, J.W.; Stern, S.A.; Thomas, P.C.; Festou, M.C.; Merline, W.J.; Young, E.F.; Binzel, R.P.; Lebofsky, L.A. Analysis of the
First Disk-resolved Images of Ceres from Ultraviolet Observations with the Hubble Space Telescope. Astron. J. 2002, 123, 549.[CrossRef]
27. Bus, S.J.; Binzel, R.P. Phase II of the Small Main-Belt Asteroid Spectroscopic Survey. A Feature-Based Taxonomy. Icarus 2002,158, 146. [CrossRef]
28. Bus, S.J.; Binzel, R.P. Phase II of the Small Main-Belt Asteroid Spectroscopic Survey. The Observations. Icarus 2002, 158, 106.[CrossRef]
29. Lazzaro, D.; Ferraz-Mello, S.; Fernández, J.A. Asteroids, Comets, Meteors; IAU Symposium (Cambridge University Press):Cambridge, UK, 2006; Volume 229.
30. Li, J.-Y.; McFadden, L.A.; Parker, J.W.; Young, E.F.; Stern, S.A.; Thomas, P.C.; Russell, C.T.; Sykes, M.V. Photometric analysis of 1Ceres and surface mapping from HST observations. Icarus 2006, 182, 143. [CrossRef]
31. Raponi, A.; Carrozzo, F.G.; Zambon, F.; De Sanctis, M.C.; Ciarniello, M.; Frigeri, A.; Ammannito, E.; Tosi, F.; Combe, J.-P.;Longobardo, A.; et al. Mineralogical mapping of Coniraya quadrangle of the dwarf planet Ceres. Icarus 2019, 318, 99–110.[CrossRef]
32. Carli, C.; Ciarniello, M.; Capaccioni, F.; Serventi, G.; Sgavetti, M. Spectral variability of plagioclase-mafic mixtures (2): Investiga-tion of the optical constant and retrieved mineral abundance dependence on particle size distribution. Icarus 2014, 235, 207–219.[CrossRef]
33. Davidsson, B.J.R.; Gutiérrez, P.J.; Rickman, H. Physical properties of morphological units on Comet 9P/Tempel 1 derived fromnear-IR Deep Impact spectra. Icarus 2009, 201, 335–357. [CrossRef]
34. De Sanctis, M.C.; Vinogradoff, V.; Raponi, A.; Ammannito, E.; Ciarniello, M.; Carrozzo, F.G.; De Angelis, S.; Raymond, C.A.;Russell, C.T. Characteristics of organic matter on Ceres from VIR/Dawn high spatial resolution spectra. Mon. Not. R. Astron. Soc.2019, 482, 2407–2421. [CrossRef]
35. Hiroi, T.; Zolensky, E. UV-Vis-NIR absorption features of heated phyllosilicates as remote-sensing clues of thermal histories ofprimitive asteroids. Antarct. Meteor. Res. 1999, 12, 108.
36. Querry, M.R. Optical constants. Contractor Report, September 1982–May 1984; Missouri University: Kansas City, MO, USA, 1985.

Life 2021, 11, 9 14 of 14
37. Zubko, V.G.; Mennella, V.; Colangeli, L.; Bussoletti, E. Optical constants of cosmic carbon analogue grains—I. Simulation ofclustering by a modified continuous distribution of ellipsoids. Mon. Not. R. Astron. Soc. 1996, 282, 1321–1329. [CrossRef]
38. Lantz, C.; Brunetto, R.; Barucci, M.A.; Fornasier, S.; Baklouti, D.; Bourçois, J.; Godard, M. Ion irradiation of carbonaceouschondrites: A new view of space weathering on primitive asteroids. Icarus 2017, 285, 43–57. [CrossRef]
39. Moroz, L.; Arnold, G.; Korochantsev, A.; Wasch, R. Natural Solid Bitumens as Possible Analogs for Cometary and AsteroidOrganics: 1. Reflectance Spectroscopy of Pure Bitumens. Icarus 1998, 134, 253. [CrossRef]
40. Pieters, C.M.; Nathues, A.; Thangjam, G.; Hoffmann, M.; Platz, T.; de Sanctis, M.C.; Ammannito, E.; Tosi, F.; Zambon, F.; Pasckert,J.H.; et al. Geologic constraints on the origin of red organic-rich material on Ceres. Meteorit. Planet. Sci. 2018, 53, 1983–1998.[CrossRef]
41. De Sanctis, M.C.; Raponi, A.; Ammannito, E.; Ciarniello, M.; Toplis, M.J.; McSween, H.Y.; Castillo-Rogez, J.C.; Ehlmann, B.L.;Carrozzo, F.G.; Marchi, S.; et al. Bright carbonate deposits as evidence of aqueous alteration on (1) Ceres. Nature 2016, 536, 54–57.[CrossRef] [PubMed]
42. Raponi, A.; De Sanctis, M.C.; Carrozzo, F.G.; Ciarniello, M.; Castillo-Rogez, J.C.; Ammannito, E.; Frigeri, A.; Longobardo, A.;Palomba, E.; Tosi, F.; et al. Mineralogy of Occator crater on Ceres and insight into its evolution from the properties of carbonates,phyllosilicates, and chlorides. Icarus 2019, 320, 83–96. [CrossRef]
43. Nathues, A.; Platz, T.; Thangjam, G.; Hoffmann, M.; Scully, J.E.C.; Stein, N.; Ruesch, O.; Mengel, K. Occator crater in color athighest spatial resolution. Icarus 2019, 320, 24–38. [CrossRef]
44. Kaplan, H.H.; Milliken, R.E.; Alexander, C.M. New Constraints on Abundance and Composition of Organic Matter on Ceres fromLaboratory Reflectance Spectra. Geophys. Res. Lett. 2018, 45, 5274–5282. [CrossRef]
45. Postberg, F.; Schmidt, J.; Hillier, J.; Kempf, S.; Srama, R. A salt-water reservoir as the source of a compositionally stratified plumeon Enceladus. Nature 2011, 474, 620–622. [CrossRef]
46. Waite, J.H., Jr.; Lewis, W.S.; Magee, B.A.; Lunine, J.I.; McKinnon, W.B.; Glein, C.R.; Mousis, O.; Young, D.T.; Brockwell, T.;Westlake, J. Liquid water on Enceladus from observations of ammonia and 40Ar in the plume. Nature 2009, 460, 1164. [CrossRef]
47. Poch, O.; Jaber, M.; Stalport, F.; Nowak, S.; Georgelin, T.; Lambert, J.-F.; Szopa, C.; Coll, P. Effect of Nontronite Smectite Clayon the Chemical Evolution of Several Organic Molecules under Simulated Martian Surface Ultraviolet Radiation Conditions.Astrobiology 2015, 15, 221–237. [CrossRef] [PubMed]
48. Dos Santos, R.; Patel, M.; Cuadros, J.; Martins, Z. Influence of mineralogy on the preservation of amino acids under simulatedMars conditions. Icarus 2016, 277, 342–353. [CrossRef]